Notes
Article history
The research reported in this issue of the journal was funded by the EME programme as project number 10/60/37. The contractual start date was in April 2012. The final report began editorial review in June 2017 and was accepted for publication in December 2017. The authors have been wholly responsible for all data collection, analysis and interpretation, and for writing up their work. The EME editors and production house have tried to ensure the accuracy of the authors’ report and would like to thank the reviewers for their constructive comments on the final report document. However, they do not accept liability for damages or losses arising from material published in this report.
Declared competing interests of authors
Thomas Jaki has received grants from the NIHR (National Institute for Health Research) Health Technology Assessment programme and funding from the pharmaceutical industry [Roche (F.Hoffmann-La Roche Ltd, Basel, Switzerland), as a member of an Independent Data Monitoring Committee, a post-doctoral fellowship and as a member of the European Union (EU) project Improving Design, Evaluation and Analysis of early drug development Studies (IDEAS); Bayer (Bayer AG, Leverkusen, Germany) as a member of the EU project IDEAS; Novartis (Novartis International AG, Basel, Switzerland), as a member of the EU project IDEAS; Janssen (Janssen Pharmaceutica NV, Beerse, Belgium), for presentation at an internal conference and as a member of the EU project IDEAS; AstraZeneca (AstraZeneca Plc, Cambridge, UK), as a member of the EU project IDEAS; and Baxalta (Baxalta now part of Shire Plc, St Helier, Jersey), for a research project]. Saye Khoo has received grants from the pharmaceutical industry [Merck (Merck & Co. Inc., NJ, USA), Gilead (Gilead Sciences Inc., CA, USA), ViiV Healthcare (ViiV Healthcare, Middlesex, UK) and Janssen, as support for Liverpool human immunodeficiency virus Drug Interactions website; and Viiv and Merck, as support for research projects]. Paula Williamson has received income from AbbVie (AbbVie Inc., IL, USA) related to fees for the preparation of a clinical study report for the randomised controlled trial of the clinical effectiveness, safety and cost-effectiveness of adalimumab in combination with methotrexate for the treatment of juvenile idiopathic arthritis-associated uveitis (SYCAMORE). Munir Pirmohamed is programme director for the MRC Clinical Pharmacology Training Scheme which funded jointly by the Medical Research Council and industry [Roche, UCB (UCB, Brussels, Belgium), Novartis and Eli Lilly (Eli Lilly and Company, IN, USA)].
Permissions
Copyright statement
© Queen’s Printer and Controller of HMSO 2019. This work was produced by Pushpakom et al. under the terms of a commissioning contract issued by the Secretary of State for Health and Social Care. This issue may be freely reproduced for the purposes of private research and study and extracts (or indeed, the full report) may be included in professional journals provided that suitable acknowledgement is made and the reproduction is not associated with any form of advertising. Applications for commercial reproduction should be addressed to: NIHR Journals Library, National Institute for Health Research, Evaluation, Trials and Studies Coordinating Centre, Alpha House, University of Southampton Science Park, Southampton SO16 7NS, UK.
2019 Queen’s Printer and Controller of HMSO
Chapter 1 Introduction
Background
Combination antiretroviral therapy (cART) is the mainstay of treatment for human immunodeficiency virus (HIV) and has dramatically improved the morbidity and mortality associated with HIV, turning it into a chronic disease. However, cART, together with the virus itself, can lead to various metabolic complications such as obesity,1 type 2 diabetes mellitus (T2DM) and an increased risk of cardiovascular disease (CVD). These metabolic complications associated with cART are particularly prominent in patients with HIV-associated lipodystrophy (HIVLD) (also called fat redistribution syndrome), a clustering of morphological and metabolic abnormalities comprising peripheral fat loss (lipoatrophy), visceral lipid hypertrophy, insulin resistance and dyslipidaemia. 2 HIVLD is a predictor of metabolic syndrome (MS) and associated CVD risk. 3 However, metabolic complications are also seen in patients infected with HIV without HIVLD. A recent meta-analysis of 65 studies (n = 55,094 patients infected with HIV) utilised two of the most widely used MS criteria [Adult Treatment Panel (ATP) III-2004 and ATP III-2005] to calculate the prevalence of MS in HIV-infected people, which was found to be between 16.7% and 18%. 4 The HIV DAD (Data collection on Adverse events of anti-HIV Drugs) cohort, one of the largest HIV clinical cohorts (n = 33,347),5 found the prevalence of MS to increase from 19.4% to 41.6% over a 6-year period;6 importantly, patients with MS had a fourfold increase in the incidence of T2DM and a two to threefold increased risk of developing CVD. These results have been confirmed by other studies such as the Multicenter AIDS Cohort Study (n = 1278),7 a more recent analysis of the DAD cohort,8 and national representative surveys in the USA that observed a 3.8% higher T2DM prevalence in HIV-infected adults than in the general population. 9
Individuals infected with HIV show a higher risk of CVD than that observed in the general population;10 importantly, cumulative exposure to cART is also associated with an increased risk of CVD in HIV-infected patients. The DAD study reported a linear increase in the incidence of myocardial infarction with long-term cART exposure, with both protease inhibitors11 and nucleoside reverse transcriptase inhibitors (NRTIs). 12 A recent longitudinal cohort study13 of HIV-infected US veterans selected from the Veterans Health Administration Clinical Case Registry (n = 24,510; 164,059 person-years) observed a modestly increased risk of CVD with both individual antiretroviral (ARV) drugs and ARV drug combinations. Long-term use of cART also results in intima–media thickness and an increase in the prevalence of carotid lesions, making it a risk factor for subclinical atherosclerosis. 14 It is therefore clear that cART-treated HIV-infected patients are at increased risk of cardiometabolic problems.
Insulin resistance, a key feature of HIVLD and MS, has been described as central to cardiometabolic disease and is considered to be an important link between features of MS, obesity, dyslipidaemia, T2DM and CVD. 15 In vitro studies16 and single-drug studies in healthy individuals17 and HIV-infected patients18,19 have shown that protease inhibitors and NRTIs cause insulin resistance. The prevalence of insulin resistance in cART-treated HIV-infected patients ranges from 21% to 37%,20,21 indicating a significant role for cART in its development. In the Fat Redistribution and Metabolic Change in HIV Infection (FRAM) study21 (n = 926), a cross-sectional analysis showed the prevalence of insulin resistance to be 37%. Insulin resistance very much remains an important problem even with some of the newer ARVs; HIV patients (n = 328) randomised to tenofovir disoproxil fumarate/lamivudine (TDF/3TC) with either boosted atazanavir or boosted darunavir or raltegravir showed a 1.9-fold increase in homeostatic model assessment of insulin resistance (HOMA-IR) within 4 weeks with no change thereafter over a period of 96 weeks. 22 Several mechanisms have been suggested to be responsible for cART-induced insulin resistance, including cART-induced inhibition of adipocyte differentiation,23 increased secretion of adipokines such as interleukin 6 (IL-6) and tumour necrosis factor alpha (TNF-α)24 and impairment of the insulin signalling pathway. 16
Clinical intervention to arrest or reverse cART-associated insulin resistance has been suggested as a strategy to reduce the incidence of T2DM and CVD in HIV-infected patients. Insulin sensitisers such as thiazolidinediones and metformin have been trialled, but results from randomised clinical trials in HIV-infected patients have been mixed. 25,26 Moreover, the associated adverse effects may limit their use in HIV-infected patients. 27,28 Statins have been suggested as a potential strategy to reduce cardiometabolic events in patients infected with HIV;29 however, a recently concluded randomised, double-blinded, placebo-controlled trial in HIV-infected individuals [the SATURN-HIV (Stopping Atherosclerosis and Treating Unhealthy bone with Rosuvastatin in HIV) study]30 observed significant worsening of insulin resistance with 10 mg of rosuvastatin. Therefore, there is a need for novel clinical interventions with proven safety profiles that can reduce cART-induced insulin resistance in individuals infected with HIV.
Some angiotensin receptor blockers (ARBs) have a beneficial effect on insulin resistance and T2DM, owing to their partial agonistic activation of peroxisome proliferator-activated receptor (PPAR)-γ, an important regulator of adipocyte function. Telmisartan shows maximal potency on PPAR-γ when compared with other ARBs and has been reported to reduce insulin resistance in several in vitro,31,32 animal33,34 and clinical studies. 35–38 Prospective randomised clinical trials in patients with diabetes mellitus and those with MS have shown that telmisartan significantly reduces insulin resistance: (1) in 188 T2DM patients with MS, telmisartan significantly reduced HOMA-IR by 17% after 6 months’ treatment and by 29% after 12 months;35 and (2) in a comparison with other ARBs in non-diabetic patients (n = 151), telmisartan reduced HOMA-IR by 29% after 6 months’ treatment. 38 A meta-analysis of randomised controlled trials (RCTs) where telmisartan was compared against other antihypertensive drugs (33 RCTs; 2033 patients) found telmisartan to significantly reduce insulin resistance, with statistically significant reductions in insulin levels and HOMA-IR values. 39 Telmisartan also has wide-ranging beneficial effects on various components of MS; a limited meta-analysis of 10 RCTs40 (546 patients with MS) observed significant reductions in fasting glucose, insulin, glycosylated haemoglobin and homeostasis model assessment index and a significant increase in per cent changes of adiponectin. Telmisartan not only improved adiponectin levels,41 an important metabolic marker of insulin resistance and atherosclerotic disease, but also improved lipid control in these patients. 42 It also had favourable effects on fasting serum insulin and high-sensitivity C-reactive protein (hs-CRP; a marker of CVD). 35,43 Telmisartan has also been shown to reduce visceral, but not subcutaneous, fat accumulation, in patients with MS. 44,45 Telmisartan reduced cardiovascular events in a broad group of at-risk patients; one of the largest ARB outcome trials [ONTARGET (The Ongoing Telmisartan Alone and in Combination with Ramipril Global Endpoint Trial); 120,000 patient-years of follow-up]46 established telmisartan to confer similar cardiovascular protection as ramipril but was better tolerated. Importantly, the beneficial effects of telmisartan on insulin sensitivity have been observed at doses lower than those used for hypertension; 20 mg/day of telmisartan significantly reduced HOMA-IR after 20 months’ treatment in patients with non-alcoholic steatohepatitis. 36 In addition to its cardiometabolic beneficial effects, telmisartan also shows renoprotective effects;47 it has been shown to significantly reduce microalbuminuria in HIV-infected patients48 and may therefore have a positive impact on parameters of renal injury observed in cART-treated HIV-infected patients.
Rationale for the study
There is already strong evidence for the beneficial effects of telmisartan on insulin resistance and other markers of glycaemic control and cardiovascular health in non-HIV populations. This study, and others, has shown that antiretroviral drugs inhibit adipocyte differentiation,23,24 reduce adiponectin secretion,23,49 increase the secretion of detrimental cytokines, IL-6 and TNF-α,23,24 and impair GLUT-4 expression,50 all of which are suggested to contribute to the development of insulin resistance. This study has also shown that telmisartan partially reverses the antiadipogenic effects of antiretrovirals in vitro. 51 Telmisartan partially reversed the antiretroviral drug-induced inhibition of adipocyte lipid accumulation and downregulation of adiponectin and lipin-1. The beneficial effect of telmisartan on adipocyte function in the presence of antiretrovirals has also been shown by Boccara et al. 52 However, the clinical efficacy of telmisartan to reduce insulin resistance in cART-treated HIV-infected patients has not been assessed; this study was designed to address this.
This in vitro study observed a non-monotone relationship of telmisartan on adiponectin and lipin 1 secretion. A study in non-alcoholic steatohepatitis patients also observed that telmisartan improves insulin sensitivity at doses lower than those used for hypertension. 36 This indicates the need to carefully assess the dose–response relationship of telmisartan in vivo.
Chapter 2 Research objectives
Primary objective
To determine the effect of telmisartan on insulin resistance in individuals infected with HIV on cART using HOMA-IR as a measurable, validated surrogate marker of insulin resistance.
Secondary objectives
-
To define the optimal dose of telmisartan that can significantly reduce insulin resistance; this dose will then be taken forward into Phase III studies in the future.
-
To measure HOMA-IR values at the baseline (T0) and at 12, 24 and 48 weeks to provide data on time to, and sustainability of, reduction in HOMA-IR.
-
To utilise alternative indices of insulin resistance such as the Quantitative Insulin Sensitivity Check Index (QUICKI) and revised QUICKI to determine the effect of telmisartan on insulin resistance.
-
To mechanistically evaluate whether or not telmisartan favourably modulates the plasma concentrations of both beneficial (adiponectin) and adverse (leptin, resistin, TNF-α, hs-CRP) biomarkers, which may help in further stratifying telmisartan therapy in the future.
-
To determine whether or not telmisartan improves general lipid homeostasis and reduces visceral fat accumulation in individuals infected with HIV on cART over a 24-week period.
-
To determine, in a substudy, whether or not proton magnetic resonance spectroscopy (1H-MRS)-assessed intrahepatic and intramyocellular triglyceride content, markers of hepatic steatosis and insulin resistance, respectively, are reduced by telmisartan therapy. This will provide us with mechanistic insights into the ability of telmisartan to beneficially affect fat redistribution, hepatic steatosis and insulin resistance.
-
To determine whether or not telmisartan has an effect on urinary biomarkers [albumin-to-creatinine ratio (ACR), neutrophil gelatinase-associated lipocalin (NGAL)] of renal injury in individuals infected with HIV on cART.
-
To evaluate the tolerability of telmisartan in this patient group.
Chapter 3 Methods
Trial design
TAILoR was a multicentre, randomised open-labelled study with an adaptive design (Figure 1). We chose an adaptive design for the first stage of the study because our in vitro studies had shown a non-monotone relationship between telmisartan and various metabolic biomarkers. Furthermore, while there is a clear dose–response relationship with telmisartan in the treatment of hypertension, it is important not to assume that a similar relationship would exist in a repurposed indication. The adaptive trial design was thus designed to carefully assess the dose–response relationship of telmisartan on metabolic parameters, which was the main objective of this study.
FIGURE 1.
Summary of the design for stage 1 of the trial. MRI, magnetic resonance imaging.

The adaptive design consisted of two stages. In stage 1, eligible patients were randomised on a 1 : 1 : 1 : 1 basis to either no treatment or a 20-, 40- or 80-mg dose of telmisartan once daily. The duration of study treatment was a maximum of 48 weeks, with titration visits (if applicable) at 2 and/or 4 weeks and follow-up visits at 12, 24 and 48 weeks.
Magnetic resonance imaging: substudy 1
A subset of patients from Royal Liverpool and Broadgreen University Hospitals NHS Trust (RLBUHT) and the Manchester Centre for Sexual Health were asked to participate in the magnetic resonance imaging (MRI) substudy. It was necessary that these patients were also participating in the main study. The duration of the substudy was 24 weeks, and visits took place at both baseline and 24 weeks.
Interim analysis
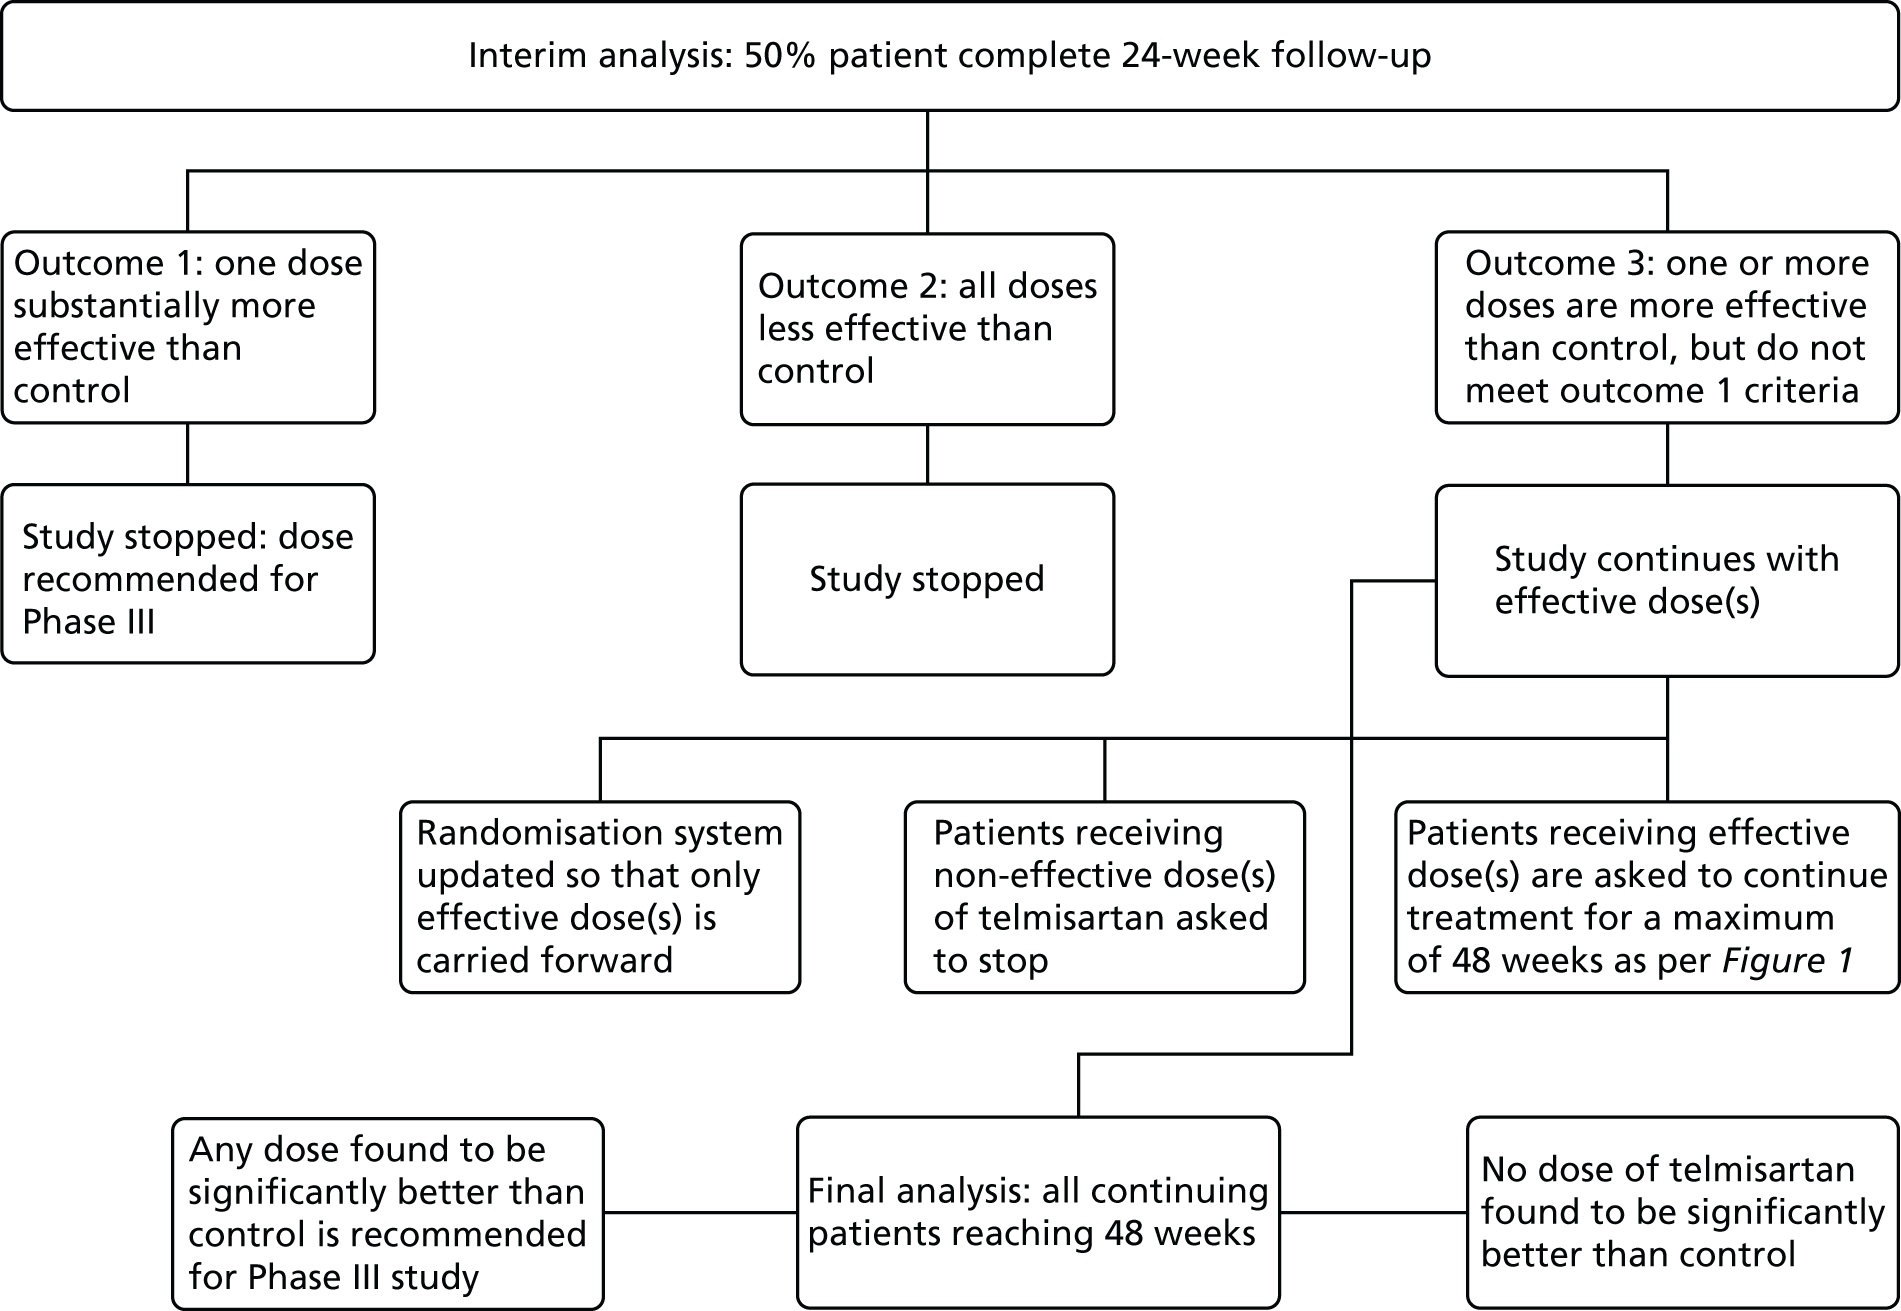
An interim analysis was performed when half of the planned maximum number of patients had been followed up for at least 24 weeks (Figure 2). As per the adaptive design, if one active dose group was substantially more effective than control then the study would have been stopped and the corresponding dose would be taken directly into Phase III. Any active dose groups that showed insufficient promise at the interim analysis would be dropped and the study would continue with the remaining doses and control. If no dose showed sufficient promise at the interim analysis, the study would have been stopped. If some improvement over control was detected for at least one of the doses at interim analysis, those dose(s) would be followed up along with the control for a further 24 weeks (total duration of 48 weeks).
FIGURE 2.
Schematic of stage 2 of the adaptive design following interim analysis.
Participants
TAILoR participants were adults with documented HIV infection, who had been receiving a stable cART for at least 6 months prior to randomisation.
Inclusion criteria
-
Adult (aged ≥ 18 years) HIV-positive individuals receiving antiretroviral therapy containing:
-
a boosted protease inhibitor (lopinavir/ritonavir, atazanavir/ritonavir, darunavir/ritonavir, fosamprenavir/ritonavir, saquinavir/ritonavir)
-
and/or efavirenz, rilpivirine, or etravirine for at least 6 months.
-
-
Ability to give informed consent.
-
Willingness to comply with all study requirements.
In relation to the antiretroviral therapy, the backbone was based on nucleotide reverse transcriptase inhibitors, raltegravir or maraviroc. Patients on protease inhibitor monotherapy were also included if they met other criteria. However, a decision was made not to include (1) patients on nevirapine or dolutegravir regimens, without concomitant boosted protease inhibitors, (2) patients on elvitegravir which is usually administered in combination with cobicistat [as Stribild® (Gilead Sciences Inc., CA, USA)] and (3) patients on unboosted atazanavir.
Exclusion criteria
The exclusion criteria were as follows:
-
Pre-existing diagnosis of type 1 or 2 diabetes mellitus [i.e. fasting glucose level of > 7.2mmol/l or glycated haemoglobin (HbA1c) level of ≥ 6.5% (48 mmol/mol) or an abnormal oral glucose tolerance test (OGTT) or random plasma glucose concentration of ≥ 11mmol/l].
-
Patients known to have consistently low blood pressure (pre-existing hypotension: a reading below a threshold of 100/60 mmHg on three separate occasions).
-
Patients with renal disease [i.e. an estimated glomerular filtration rate (eGFR) of < 60 ml/minute/1.73 m2 in the 6 months preceding randomisation].
-
Patients with known untreated renal artery stenosis.
-
Patients with cholestasis, biliary obstructive disorders or severe hepatic impairment.
-
Patients with evidence of an active chronic hepatitis C infection (a previously cleared infection is not an exclusion).
-
Patients who were on/have been on hormone therapy (e.g. growth hormone), anabolics (e.g. testosterone) or insulin sensitisers (e.g. metformin) within 6 months preceding randomisation. Patients who were on hormonal contraception were eligible.
-
Patients who were already on/had been on other ARBs, angiotensin-converting enzyme (ACE) inhibitors or direct renin inhibitors (e.g. aliskiren) within 4 weeks preceding randomisation.
-
Those with suspected poor compliance.
-
Pregnant or lactating women.
-
Women of childbearing age, unless using reliable contraception (e.g. coil, barrier method, hormonal contraceptive that does not interact with their antiretroviral therapy).
-
Co-enrolment in other drug trials.
-
Patients who had participated in a trial of an investigational medicinal product (IMP) likely to influence insulin sensitivity, plasma insulin, glucose levels or plasma lipid levels within 6 months preceding randomisation.
-
For the subcohort of patients undergoing MRI/magnetic resonance scanning (MRS), normal MRI exclusion criteria applied.
Study settings
The trial was conducted in 19 sexual health clinics and/or HIV treatment centres throughout the UK (see Appendix 1) and patients were recruited from March 2013 until July 2015.
Centre/clinician inclusion criteria
Each participating centre and principal investigator (PI) was identified on the basis of being a specialist HIV treatment centre; having at least one lead clinician with a specific interest in, and responsibility for supervision and management of, patients with HIV; enthusiasm to participate in the study; sufficient time, staff and adequate facilities available for the trial; identifying that they would be able to recruit the required number of patients; and acknowledging and agreeing to conform to the administrative, ethical and study specific requirements.
Any centre not meeting these criteria was deemed ineligible to participate in the trial.
Interventions
All patients either received no treatment or were treated with telmisartan as per their randomised allocation. Telmisartan was dispensed as either a 20-, 40- or 80-mg dose, depending on treatment allocation. All strengths of telmisartan were to be taken once daily with or without food. The duration of the treatment was a maximum of 48 weeks. The patients were asked to complete treatment diaries, detailing compliance, throughout the duration of treatment.
Investigational medicinal product
The IMP for the TAILoR trial was telmisartan. Telmisartan is an antihypertensive agent used to lower blood pressure and to reduce cardiovascular events in at-risk patients. For this trial, it was used outside the licensed indications of its different manufacturers. Telmisartan is available in doses of 20, 40 and 80 mg. It is produced by a range of manufacturers; the generic formulations were considered to be bioequivalent to the brand leader Micardis® (Boehringer Ingelheim Ltd, Ingelheim am Rhein, Germany). Appendix 2 details the brands of telmisartan approved for use in the trial.
The IMP was sourced through standard NHS procurement processes at each site and was dispensed to trial participants on receipt of a valid trial specific prescription. Study drug accountability was documented by the pharmacy teams at each site and was monitored by the trial co-ordinator/Clinical Trials Research Centre (CTRC).
Outcomes
Primary outcome
Reduction in insulin resistance (as measured by HOMA-IR) in telmisartan-treated arm(s) after 24 weeks of treatment in comparison with control. This was a pure efficacy outcome.
Secondary outcomes
-
Change in lipid profile at 12, 24 and 48 weeks [increase in high-density lipoprotein cholesterol (HDL-C), reduction in total cholesterol, triglycerides and low-density lipoprotein cholesterol (LDL-C)] between telmisartan-treated arm(s) and the control arm.
-
Change in body fat redistribution as measured by MRI/MRS at 24 weeks between telmisartan-treated arm(s) and control arm (reduction in visceral fat, change in intrahepatic fat, change in lower leg muscle fat).
-
Change in plasma concentrations of biomarkers [adiponectin, leptin, interleukin 8 (IL-8), TNF-α, resistin and hs-CRP] at 12, 24 and 48 weeks between telmisartan-treated arm(s) and the control arm.
-
Change in insulin resistance, measured longitudinally, in telmisartan-treated arm(s) in comparison with the control arm.
-
Difference in expected and unexpected serious adverse events between different telmisartan-treated dose arm(s) and the control arm.
Two additional secondary outcome measures were added on the advice of the Independent Data Safety and Monitoring Committee (IDSMC) and the PIs, which were added after recruitment began:
-
Reduction in insulin resistance (as measured by QUICKI and revised QUICKI) in telmisartan-treated arm(s) after 24 weeks of treatment in comparison with control.
-
Change in urinary biomarker levels (ACR; NGAL) at 12, 24 and 48 weeks between telmisartan-treated arm(s) and the control arm.
Data collection
Paper case report form
A paper case report form (CRF) was used to collect patient data at each study visit. Paper CRFs were designed especially for the study in line with the trial protocol.
Database
On receipt of paper CRFs at the CTRC, data were entered to a good clinical practice- (GCP) compliant database (MACRO 3, Elsevier, Amsterdam, the Netherlands) by trial staff at the CTRC. The configuration of the database was specific for the TAILoR trial, and it had built-in validations on certain aspects of the trial data. A full audit trail was maintained.
Timescale of evaluations
The first visit occurred on the same day as randomisation; subsequent visits took place at 12, 24 and 48 weeks. Patients randomised to higher doses of telmisartan (40 and 80 mg) also attended for dose titration visits (see Figure 1 and Table 1).
Schedule of investigations
A summary of tests and investigations undertaken in each patient is provided in Table 1.
| Time | Time point | Premature withdrawal of consent | ||||||
|---|---|---|---|---|---|---|---|---|
| Pre T0 | T0 | T + 2 weeks | T + 4 weeks | T + 12 weeks | T + 24 weeks | T + 48 weeks | ||
| At each recruitment site | Randomisation/baselinea | Dose titration for 40- or 80-mg arms (dose given: 40 mg) | Dose titration for 80-mg arm (dose given: 80 mg) | Follow-up | Follow-up | End of treatment | ||
| Database search to identify potential participants or clinic list review | ✓ | |||||||
| Information sheet provided to patient | ✓ | |||||||
| Signed informed consent | ✓ | |||||||
| Assessment of eligibility criteria by a medically qualified person | ✓ | |||||||
| Review of medical history (including collection of most recent blood test results for urea and electrolytes, eGFR, liver function, diabetes mellitus screening, etc. | ✓b | ✓ | ✓ | |||||
| Review of concomitant medications | ✓ | ✓ | ✓ | ✓ | ✓ | ✓ | ||
| Urine pregnancy test | ✓ | ✓ | ✓ | |||||
| Randomisation | ✓ | |||||||
| Study intervention | ✓ | ✓ | ✓ | ✓ | ✓ | |||
| Compliance with study intervention – patient diaries and pill counting | ✓ | ✓ | ✓ | ✓ | ✓ | |||
| Physical examination – complete | ✓ | |||||||
| Physical examination – symptom directed | ✓ | ✓ | ✓ | ✓ | ✓ | ✓ | ||
| Height | ✓ | ✓ | ✓ | ✓ | ||||
| Weight | ✓ | ✓ | ✓ | ✓ | ✓ | |||
| Waist/thigh circumference | ✓ | ✓ | ✓ | ✓ | ✓ | |||
| Heart rate, blood pressure | ✓ | ✓ | ✓ | ✓ | ✓ | ✓ | ✓ | |
| Collection of three fasting blood samples for bioanalysis | ✓ | ✓ | ✓ | ✓ | ✓ | ✓ | ✓ | |
| Collection of urine sample | ✓ | ✓ | ✓ | ✓ | ✓ | ✓ | ✓ | |
| Assessment of AEs | ✓ | ✓ | ✓ | ✓ | ✓ | ✓ | ✓ | |
| Consent for substudy | ✓ | ✓ | ✓ | ✓ | ✓ | ✓ | ||
| MRI/MRS scan for substudy | ✓ | ✓ | ✓ | ✓ | ✓ | ✓ | ||
Sample collection
Sample collection, processing and storage at participating sites
Biological samples (blood and urine) were collected at four time points during the trial at individual clinical sites participating in the study. For each patient, samples were collected at baseline, 12, 24 and 48 weeks/end of trial visits. At each time point, three fasting blood samples and one urine sample were collected from each participant. The blood samples were collected in:
-
9-ml tripotassium ethylenediaminetetraacetic acid (K3EDTA) VACUETTE® blood tubes (Grenier Bio-One International Ltd, Gloucestershire, UK) (for DNA extraction)
-
9-ml Z Serum Clot Activator VACUETTE tubes (for serum separation)
-
4-ml FX Sodium Fluoride/Potassium Oxalate VACUETTE tubes (for glucose estimation).
The K3EDTA tubes were stored at –20 °C; plasma and serum were extracted locally at each site by the research nurses and aliquoted into two 1.8-ml cryovial tubes (STARLAB, Milton Keynes, UK) and were immediately stored at a minimum temperature of –20 °C. The sample collection, sample processing and storage were all performed in accordance with standardised standard operating procedures (SOPs) supplied by the main study team at Liverpool (all laboratory SOPs can be made available on request).
Sample shipment
Packaging and shipping of all samples collected from the TAILoR study followed the Packaging Provisions for Biological Substances, Category B, UN 3373 and UN1845 (dry ice) guidelines. 53 A SOP was followed by all sites for packaging of samples and shipment of TAILoR samples. The samples were shipped on dry ice in sealed styrofoam™ (The Dow Chemical Company, Midland, MI, USA) boxes by a clinical trial specialist courier with a delivery time of within 24 hours.
Sample collection, processing and storage at the co-ordinating centre (University of Liverpool)
All samples were stored in the Bioanalytical Facility (BAF), Royal Liverpool Hospital, which is a category 2 laboratory equipped to handle and store infectious samples. All samples were stored at a minimum temperature of –20 °C until further processing. Sample transport log sheets were completed, dated and signed by the Wolfson Centre for Personalised Medicine, University of Liverpool, (WCPM) staff and countersigned by the BAF analyst.
The whole-blood samples collected in K3EDTA vacuettes were initially subjected to viral inactivation by incubating the samples at 58 °C in a water bath for 40 minutes. The inactivated samples were transferred to the WCPM for DNA extraction using a magnetic bead-based method on a chemagen chemagic MSM I platform (Perkin Elmer, Waltham, MA, USA). Briefly, a 4.5-ml whole-blood sample was added into 50-ml tubes containing lysis buffer and protease enzyme for cell lysis. Once lysis was completed, binding buffer and magnetic beads were added to elute the extracted DNA. The DNA was dissolved in Tris buffer and its quality and quantity were ascertained using a NanoDrop™ spectrophotometer (ThermoFisher Scientific Ltd, Paisley, UK). The DNA samples were stored at –20 °C for future use. The urine samples were aliquoted into cryovials and stored at –20 °C.
Investigations
A detailed laboratory analysis plan is provided in Appendix 3. All laboratory investigations specified below were conducted using SOPs, which can be made available on request.
Assessment of efficacy
Assessment of Homeostatic Model Assessment of Insulin Resistance
The objective measure of efficacy of trial treatment on insulin resistance was provided by a comparison of HOMA-IR values at baseline and at weeks 12, 24 and 48. HOMA-IR is a known surrogate marker for measuring insulin resistance.
For HOMA-IR, serum and plasma aliquots were sent to the Liverpool Clinical Laboratories (LCL), Royal Liverpool Hospital, for the estimation of insulin and glucose levels respectively. LCL is a Clinical Pathology Accredited (CPA) clinical laboratory that participates in the external quality assessment for the analysis of a number of analytes [UK National External Quality Assessment Service (NEQAS)].
Estimation of insulin
Serum insulin was measured using an electrochemiluminescence immunoassay on the Roche Modular e 602 analyzer (Roche Diagnostics Ltd, West Sussex, UK). The assay has a dynamic range of 0.2–1000 mU/l, with a lower detection limit of 3 mU/l. It has an intra-assay precision of between 1.5% and 2.0% for concentrations between 6.36 and 88.3 mU/l. The assay is unaffected by icterus, lipaemia, bilirubinaemia or drugs. However, haemolysis is known to interfere and no results were accepted for samples with a haem index exceeding 50. Internal quality control (IQC) assessments were conducted for the insulin assay and included analysis of three separate IQCs (Technopath Multichem IA Levels 1, 2 and 3, Technopath Clinical Diagnostics, Tipperary, Ireland) at the start of the day once the daily maintenance and any calibrations had been performed. The results for the IQCs had to fall within 2 standard deviations (SD) of the mean to be considered as acceptable performance to allow acceptance of the results. For External Quality Assessment (EQA), LCL received three samples for analysis every 6 weeks and these were processed as per the SOP for the Analysis of External Assessment Samples.
Estimation of glucose
Fluoride EDTA plasma was used for the estimation of glucose using a Roche cobas® c systems assay on a Roche cobas analyzer (Roche Diagnostics Ltd, West Sussex, UK). The assay has a range of 0.11–41.6 mmol/l in serum, with a lower detection limit of 0.11 mmol/l (2 mg/dl). The assay is unaffected by interference from lipaemia, haemolysis or bilirubinaemia. Two IQCs were used and the results for the IQCs had to fall within 2 SD of the mean to be considered as acceptable performance for the results to be included. LCL also takes part in EQA for glucose analysis on a fortnightly basis.
Calculation of Homeostatic Model Assessment of Insulin Resistance
Homeostatic model assessment of insulin resistance was calculated using the equation:
Other assessments
Quantitative insulin sensitivity check index
Fasting glucose and insulin levels were measured as stated in the section above. QUICKI was calculated using the equation:
Revised quantitative insulin sensitivity check index
Revised QUICKI was calculated using the equation:
Non-esterified fatty acids (NEFAs) were measured in serum samples at time points T0, T + 12, T + 24, and T + 48. Serum NEFA analysis was performed in the GCP Laboratory, University of Liverpool using a colorimetric assay on a RX Daytona analyser (Randox Laboratories Limited, UK). The serum was subjected to viral inactivation by treating with 1% Triton™ X-100 solution (Sigma-Aldrich Company Ltd, Dorset, UK) for 60 minutes at room temperature and then analysed. IQC assessments were conducted for the NEFA assay and included analysis of two separate IQCs (Multisera QC Levels 2 and 3, Randox Laboratories Ltd, County Antrim, UK) at the start of the day once the daily maintenance and any calibrations had been performed. The results for the IQCs had to fall within ± 2 standard deviations of the mean to be considered as acceptable performance to allow the results to be included in the analysis. All samples were analysed in triplicate. Results for any samples with a value outside the detection range or that failed in more than one replicate were not accepted.
Assessment of lipid profile
Fasting serum samples obtained at T0 and at the 12-, 24- and 48-week visits were analysed by the LCL for total cholesterol, triglycerides, LDL-C and HDL-C levels on the Roche modular e 602 analyzer.
The Roche Modular e 602 analyzer utilises an enzymatic colourimetric method for the analysis of total cholesterol. The assay has a measuring range of 0.1–20.7 mmol/l, with a lower detection limit of 0.1 mmol/l. For triglycerides, measuring range of the assay is 0.1–10.0 mmol/l, with a lower limit of detection (LLOD) at 0.1 mmol/l. For the high-density lipoprotein (HDL) assay, the measuring range is 0.08–3.12 mmol/l, with a lower detection limit of 0.08 mmol/l.
Assessment of high-sensitivity C-reactive protein
High-sensitivity C-reactive protein (hs-CRP) in the serum was measured at T0 and at the 12-, 24- and 48-week visits by LCL. The hs-CRP was measured using a particle enhanced immunoturbidimetric assay on a Roche cobas modular analyzer. The assay has a measuring range of 0.15–20.0 mg/l, with a lower detection limit of 0.15 mg/l. The assay is not affected by icterus (up to an I index of 60), haemolysis (up to a H index of 1000) and lipaemia (up to an L index of 600).
Assessment of novel biomarkers of metabolic function
We originally intended to measure the serum concentration of six biomarkers (adiponectin, leptin, IL-6, TNF-α, resistin and IL-8) at T0 and at the 12-, 24- and 48-week visits. However, following validation, the IL-6 assay was found not to meet the desired criteria and, hence, the marker was removed from the protocol (details given in the sample analysis plan in Appendix 3). The biomarker analyses were performed in the WCPM utilising human singleplex and/or multiplex kits using electrochemiluminescence-based immunoassays (Meso Scale Discovery, Rockville, MD, USA) as per the manufacturer’s protocol on a Meso Scale Discovery Sector Imager 2400A (Meso Scale Discovery, Rockville, MD, USA). Meso Scale Discovery assays use electrochemiluminescent labels called SULFO-TAG that are conjugated to detection antibodies and allow for ultrasensitive detection. The detection antibody for a specific protein target is coated on one electrode (or ‘spot’) per well. Once the biofluids are added to the detection wells, electricity is applied to the plate electrodes by a Meso Scale Discovery Sector Imager, leading to light emission by SULFO-TAG labels. Light intensity is then measured to quantify analytes in the sample. Investigators performed all analyte measurements blindly and were unaware of the patients’ clinical characteristics.
Assay validation
All assays obtained from the manufacturer were initially subjected to one or more validation runs in order to make sure that the assay was working to acceptable standards. Assays for each analyte were tested for a number of parameters such as sensitivity, reproducibility, linearity and analyte recovery. All analytes were quantified using an eight-point logarithmic standard curve that included a zero calibrator and each standard was run in triplicate. The detection range and the LLOD were assessed for each analyte. All validation experiments included 10 healthy control samples and 10 study specific samples (five each from two different time points). All samples were run in duplicate to assess the sensitivity of the assay. Only those values that were within the detection range (above the LLOD) were considered acceptable. For assessing reproducibility, six replicates of a pooled healthy volunteer sample (pooled serum from 10 healthy volunteers) were run on the same detection plate and the values were considered acceptable if the coefficient of variation was < 10%. Linearity was assessed by using at least two serial dilutions of the same sample. Selected samples were spiked with known concentrations of the standard analyte and percentage recovery was assessed; only those with a recovery of > 80% were considered acceptable. A universal plate plan was used for validation of all biomarkers. The dilutions (linearity) and spike concentrations (recovery) used for individual biomarkers are given in Table 2.
| Biomarker | Dilutions used (linearity) | Spike concentrations (recovery) |
|---|---|---|
| Adiponectin | 1 : 500, 1 : 1000, 1 : 2000, 1 : 4000 | 20–50 µg/ml |
| Leptin | Undiluted sample, 1 : 2, 1 : 4 | 5.56–50 µg/ml |
| IL-6 | 1 : 2, 1 : 4, 1 : 8 | 1.56–25 pg/ml |
| TNF-α | 1 : 2, 1 : 4, 1 : 8 | 0.99–15.885 pg/ml |
| Resistin | 1 : 20, 1 : 40, 1 : 80, 1 : 160 | 7.81–125 pg/ml |
| IL-8 | – | 1.56–25 pg/ml |
Adiponectin
Adiponectin was analysed using a single-spot human adiponectin sandwich immunoassay kit (K151-BXC3; Meso Scale Discovery, Rockville, MD, USA) using a seven-point standard curve run with fivefold serial dilution and a zero calibrator. The calibrator for the human adiponectin assay was supplied at 100 µg/ml. Briefly, the serum samples were diluted 1000-fold (1 : 1000) using Diluent 100 (Meso Scale Discovery, Rockville, MD, USA) and were added onto wells coated with the SULFO-TAG-labelled antibody within the detection plates and incubated. The labelled detection antibody bound to adiponectin was then detected using electrochemiluminescence. The LLOD for adiponectin was 0.005 ng/ml.
Leptin
Leptin was analysed using a single-spot human leptin sandwich immunoassay kit (K151-BYC3; Meso Scale Discovery, Rockville, MD, USA) using a seven-point standard curve run with threefold serial dilution and a zero calibrator. The calibrator for the human leptin assay was supplied at 10 µg/ml. Briefly, undiluted serum samples were added to wells coated with the SULFO-TAG-labelled antibody within the detection plates and incubated. The labelled detection antibody bound to leptin was then detected using electrochemiluminescence. The LLOD for leptin was 43 pg/ml.
Resistin
Resistin was analysed using a single-spot human resistin sandwich immunoassay kit (K151FND4; Meso Scale Discovery, Rockville, MD, USA) using a seven-point standard curve run with fourfold serial dilution and a zero calibrator. The calibrator for the human resistin assay was supplied at 50,000 pg/ml. Briefly, the serum samples were diluted 100-fold (1 : 100) using Diluent 2 (Meso Scale Discovery, Rockville, MD, USA) and were added onto wells coated with the SULFO-TAG-labelled antibody within the detection plates and incubated. The labelled antibody bound to resistin was then detected using electrochemiluminescence. The LLOD for resistin was 0.2 pg/ml.
Proinflammatory markers (tumour necrosis factor alpha and interleukin 8)
The proinflammatory markers TNF-α and IL-8 were analysed using a multispot V-PLEX human Proinflammatory Panel II (4-Plex) sandwich immunoassay (K15053D-1; Meso Scale Discovery, Rockville, MD, USA). A seven-point standard curve run with threefold serial dilution and a zero calibrator was used for the assay. The calibrator for the V-PLEX Human Proinflammatory Panel II was supplied at 500 pg/ml (IL-8) and 317 pg/ml (TNF-α), respectively. Briefly, the serum samples were diluted twofold (1 : 2) using Diluent 2 and were added onto wells coated with the SULFO-TAG-labelled antibody within the detection plates and incubated. The labelled antibody bound to individual proinflammatory analytes was then detected using electrochemiluminescence. The LLOD range for IL-8 was 0.01–0.11 pg/ml and for TNF-α was 0.01–0.13 pg/ml.
Assessment of renal biomarkers
Urine ACR and urinary NGAL levels were measured at T0 and at the 12-, 24- and 48-week visits. ACR was analysed by LCL, Royal Liverpool Hospital, and NGAL analysis was performed in the WCPM, utilising human singleplex kits (Meso Scale Discovery, Rockville, MD, USA) as specified in Assessment of novel biomarkers of metabolic function.
Urine albumin
Urine albumin was estimated using an immunoturbidimetric assay on a Roche cobas c systems analyzer. A six-point calibration curve was run using water and a Roche CFAS PUC calibrator (Roche Diagnostics Ltd, West Sussex, UK). IQC assessments were conducted for urine albumin using two separate IQCs (MAS UriChemTrak Human Level 1 and Level 2, ThermoFisher Scientific Ltd, Paisley, UK) at the start of the day once the daily maintenance and any calibrations had been performed. The results for the IQCs had to fall within 2 SDs of the mean to be considered as acceptable performance to allow the results to be included. LCL also participates in the EQA for urine albumin on a monthly basis. The assay has a range of 3–400 mg/l (for undiluted samples), with a lower detection limit of 3 mg/l. No significant interference is observed with icterus (up to 855 µmol/l of conjugated bilirubin) or haemolysis (haemoglobulin concentration up to 248 µmol/l).
Urine creatinine
Urine creatinine was estimated using a kinetic colorimetric assay based on the Jaffe method54 on a Roche cobas c analyzer. Calibration was conducted using a two-point calibration curve using deionised water and Roche CFAS reagent (Roche Diagnostics Ltd, West Sussex, UK). Calibration is performed every 4 weeks, if there is reagent lot change or if there is requirement as indicated by the IQCs. IQCs (UrichemTrak 1 and 2) were analysed at the start of the day following any maintenance and daily start up, and approximately every 3 hours throughout the day. The assay has got a range of 375–55,000 µmol/l, with a lower limit of detection of 375 µmol/l. No significant interference is observed with an I index of 10 (bilirubin concentration of 171 µmol/l), H index of 1000 (approximate haemoglobin concentration of 621 µmol/l) or L index of 800.
Urinary neutrophil gelatinase-associated lipocalin
A validation experiment was performed for NGAL to ensure the assay was working to acceptable standards. The assay was tested for several parameters such as sensitivity, reproducibility, linearity and analyte recovery. A seven-point logarithmic standard curve and a zero calibrator was utilised and each standard was run in triplicate. The detection range and the LLOD were assessed for NGAL. The validation experiment included 20 healthy control samples and 10 study-specific samples (five each from two different time points) in the analysis, with all samples being run in duplicate to assess the sensitivity of the assay. Only those values that were within the detection range (above LLOD) were considered to be acceptable. For assessing reproducibility, six replicates of a pooled healthy volunteer sample (pooled urine from 20 healthy volunteers) were run on the same detection plate and the values were considered acceptable if the %CV was < 10%. Linearity was assessed by using at least two serial dilutions of the same sample. Selected samples were spiked with a known concentration of standard analyte and percentage recovery was assessed; only those with a percentage recovery of > 80% were considered acceptable.
Neutrophil gelatinase-associated lipocalin was analysed with a single spot custom human NGAL sandwich immunoassay kit (N45CA-1; Meso Scale Discovery, Rockville, MD, USA) using a seven-point standard curve run and a zero calibrator. The calibrator for the human NGAL assay was supplied at 10,000 pg/ml. Briefly, the urine samples were diluted 250-fold (1 : 250) using Diluent 37 (Meso Scale Discovery, Rockville, MD, USA) and were added onto wells coated with the SULFO-TAG-labelled antibody within the detection plates and incubated. The labelled detection antibody bound to NGAL was then detected using electrochemiluminescence. The LLOD range for NGAL was 0.1–10 pg/ml.
Magnetic resonance imaging substudy
Magnetic resonance scanning was undertaken at the Magnetic Resonance Imaging and Analysis Research Centre, University of Liverpool, on the Siemens 1.5 T Symphony scanner (Siemens, Erlangen, Germany), using well-established methods. 55
Liver 1H-MRS spectra were acquired with the Siemens body coil (Siemens, Erlangen, Germany), using a point-resolved spectroscopy (PRESS) sequence [repetition time (TR) 1500 milliseconds/echo time (TE) 135 milliseconds] without water saturation, 64 signal averages. 55 Transverse magnetic resonance (MR) images were used to ensure accurate positioning of three 20 × 20 × 20 mm voxels, avoiding blood vessels, the gall bladder and fatty tissue.
Skeletal muscle 1H-MRS spectra were acquired using the Siemens CP extremity coil (Siemens, Erlangen, Germany) using PRESS (TR 1500 milliseconds /TE 135 milliseconds) without water saturation, 64 signal averages. 56 Transverse MR images were used to ensure accurate positioning of a 20- × 20- × 20-mm voxel in each of the soleus and tibialis anterior. Spectra were analysed in the time domain using the AMARES (advanced method for accurate, robust, and efficient spectra) algorithm included in the jMRUI 3.0 software package. Intramyocellular lipid is expressed as methylene relative to creatine signal. 56 Intrahepatic lipid is expressed as methylene relative to unsuppressed water.
Magnetic resonance imaging of total body adipose content was carried out by a method adapted from Thomas et al. 55 using T1-weighted MR images (TR 705 milliseconds, TE 12 milliseconds) in 10 overlapping blocks of 1-cm slices with a 1-cm gap, in upper and lower halves of the body separately. A validated semiautomatic program was used to segment and analyse the images into total body subcutaneous, total internal, subcutaneous abdominal and intra-abdominal adipose tissue volumes. This work was outsourced to a commercial analysis service, Vardis Group (London, UK).
The scanner was supported by the manufacturers’ top-level service contract, which incorporates specific elements of quality control for MRI.
Pharmacovigilance definitions and procedures
The following were used for the pharmacovigilance procedures in the trial:
Adverse event – any untoward medical occurrence in a subject to whom a medicinal product has been administered, including occurrences that are not necessarily caused by or related to that product.
Adverse reaction (AR) – any untoward and unintended response in a subject to an IMP that is related to any dose administered to that subject.
Unexpected AR – an AR, the nature and severity of which is not consistent with the information about the medicinal product in question set out in:
-
the summary of product characteristics for that product (in the case of a product with a marketing authorisation)
-
the investigator’s brochure relating to the trial in question (in the case of any other IMP product).
A serious adverse event (SAE), serious adverse reaction (SAR) or suspected unexpected serious adverse reaction (SUSAR) is any of the aforementioned that:
-
Results in death.
-
Is life-threatening (subject at immediate risk of death). Life-threatening in the definition of ‘serious’ refers to an event in which the patient was at risk of death at the time of the event; it does not refer to an event which hypothetically might have caused death if it were more severe.
-
Requires inpatient hospitalisation or prolongation of existing hospitalisation. Hospitalisation was defined as an inpatient admission, regardless of length of stay, even if the hospitalisation is a precautionary measure for continued observation. Hospitalisations for a pre-existing condition, including elective procedures that have not worsened, do not constitute a SAE.
-
Results in persistent or significant disability or incapacity, or consists of a congenital anomaly or birth defect.
-
Other important medical events that may not result in death, be life-threatening or require hospitalisation may be considered a SAE/experience when, based on appropriate medical judgement, they may jeopardise the subject and may require medical or surgical intervention to prevent one of the outcomes listed in this definition.
Causality
Unrelated: there is no evidence of any causal relationship, where an alternative cause for the adverse event (AE) is provided.
Unlikely: there is little evidence to suggest there is a causal relationship (e.g. the event did not occur within a reasonable time after administration of the trial medication). There is another reasonable explanation for the event (e.g. the participant’s clinical condition, other concomitant treatment).
Possibly: there is some evidence to suggest a causal relationship (e.g. because the event occurs within a reasonable time after administration of the trial medication). However, the influence of other factors may have contributed to the event (e.g. the participant’s clinical condition, other concomitant treatments).
Probably: there is evidence to suggest a causal relationship and the influence of other factors is unlikely.
Almost certainly: there is clear evidence to suggest a causal relationship and other possible contributing factors can be ruled out.
Period of observation
Adverse events/reactions for the TAILoR trial were monitored from the time of consent until 7 days after the patient had taken the final dose of telmisartan (wash-out period of telmisartan) after the patient’s participation in the trial was concluded.
Reporting procedures
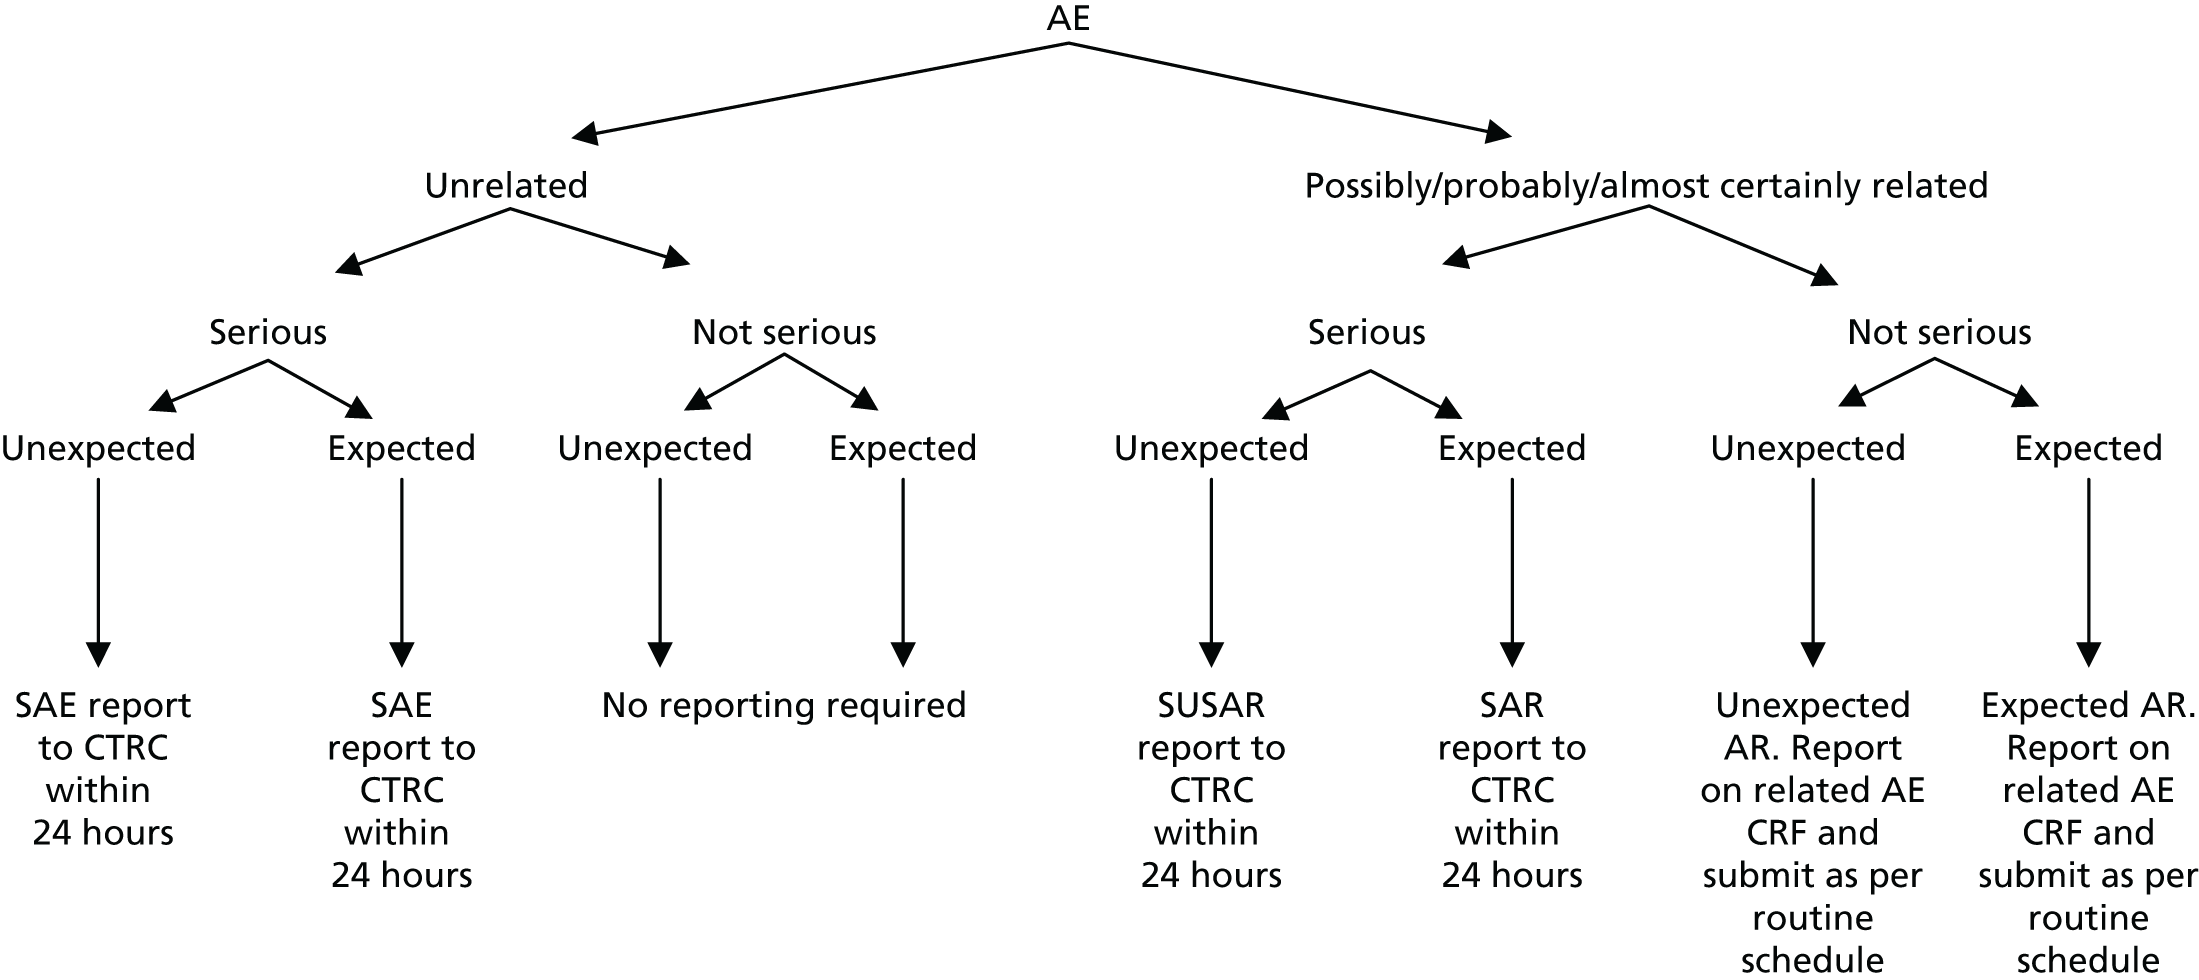
Adverse reactions and all SAEs (regardless of causality) were reported. The reporting procedures detailed in Figure 3 and below were followed.
FIGURE 3.
Schematic of pharmacovigilance reporting procedures.
Unrelated, non-serious adverse events
Given the patient group that we were recruiting in this clinical trial, it was assumed that there would be a high number of unrelated, non-serious AEs. It was therefore agreed early in the trial set up by the IDSMC, Trial Management Group (TMG) and Trial Steering Committee (TSC) that these types of AEs would not be reported as part of the trial processes.
Non-serious adverse reactions
All ARs (non-serious events suspected to be related to any dose of telmisartan) were reported.
Serious adverse reactions/adverse events/suspected unexpected serious adverse reactions
All events that met the serious criteria were reported (regardless of causality). SARs, SAEs and SUSARs were reported within 24 hours of the local site becoming aware of the event. The SAE form asked for the nature of event, date of onset, severity, corrective therapies given, outcome and causality. The responsible investigator signed the causality form. Additional information was required to be sent within 5 days if the reaction had not resolved at the time of reporting.
The CTRC was responsible for notifying the Medicines and Healthcare products Regulatory Agency (MHRA) and main Research Ethics Committee (REC) of any SUSARs that occurred during the study according to the following timelines: fatal and life-threatening within 7 days of notification and non-life-threatening within 15 days. All investigators were informed of all SUSARs occurring throughout the study. Local investigators were asked to report any SUSARs and/or SAEs as required by their local research and development (R&D) office.
Annual safety reports
Annual safety reports were prepared and provided to the MHRA and main REC on an annual basis. As per the regulatory guidelines, reports were submitted on an annual basis within 60 days of the Clinical Trial Authorisation anniversary. A total of four reports were submitted (in 2013, 2014, 2015 and 2016).
Statistical considerations
Sample size
Original aim
The original maximum total sample size of the study was 336 patients. The primary response from each patient was the difference between the HOMA-IR score at 24 weeks and the baseline HOMA-IR score (so that negative values indicate improvement). The design had been constructed under the assumption that for all patients this response is normally distributed with a common standard deviation, σ. The sample size calculation was based on a one-sided type I error of 5% and a power of 90%.
In a conventional comparison of one active treatment against a control treatment, a criterion was set so that if the measure of advantage of the active over the control exceeded some critical value, the outcome was declared positive. As a negative outcome was indicative of an improvement here, we wanted the measure of advantage to be lower than some critical value. It was required that a positive outcome (i.e. a reduction in HOMA-IR) should occur with probability α if the effects of the treatments were identical (α is the one-sided type I error rate), and with probability 1 – β if the true treatment advantage takes some negative value (1 – β is the power of the study). Here, we adopted a generalisation of this power requirement to multiple active treatments following Dunnett. 57 If there was no difference between the mean response on any treatment and that on control, then a probability of α = 0.05 was set for the risk of erroneously ending the study with a recommendation that any treatment be tested further. To fix a power requirement, effect sizes were specified in terms of the percentage chance of a patient on active treatment achieving a greater reduction in HOMA-IR score than a patient on the control arm; as such, the specification did not require knowledge of the value of the common standard deviation σ. The requirement was that if a patient on the best of the active doses had a 65% chance of showing a better response than a patient on control, whereas patients on either of the other two active treatments had a 55% chance of showing a better response than a patient on control, then the best active dose was to be recommended for further testing with probability 1 – β = 0.90. This condition demanded a high power of making the correct choice if one active dose was substantially better than control, whereas the others showed some advantage, albeit not enough to be recommended for use. The critical values for recommending that a treatment was taken to further testing at the interim and final analyses (–2.782 and –2.086) had been chosen to guarantee these properties using a method described by Magirr and Whitehead,58 generalising the approach of Whitehead and Jaki. 59 These properties pertain to the whole two-stage testing procedure.
A 55% chance of achieving a better response on active dose relative to control corresponded to a reduction in mean HOMA-IR score of about one-sixth of the standard deviation (0.178 σ), whereas the clinically relevant effect of 65% corresponded to a reduction of about half a standard deviation (0.545 σ). The standard deviation was reported to be around 5. 60,61 Although this value was not felt to be sufficiently reliable to base the design on, were it to be true, and if the changes in HOMA-IR were normally distributed, then the 55% and 65% chances of better outcomes corresponded to mean changes in HOMA-IR of –0.890 and –2.725, respectively.
Although the original maximum sample size of the study was 336 evaluable patients, it was acknowledged that the interim analysis could reduce both the sample size and the study duration, as outlined above. The study was designed to recruit additional patients to ensure that the target number of 24-week responses was achieved in the presence of an anticipated 10% dropout rate (which increased the sample size to 370 patients).
Post-interim analysis
Interim analysis showed that there was a higher than anticipated rate of withdrawals and/or missing primary outcome data. To ensure that we had the required number of patients for the final analysis, the sample size was increased to 377 patients.
Sample size for the substudy 1 (magnetic resonance imaging/proton magnetic resonance spectroscopy)
To explore the secondary objective of using MRI/1H-MRS in a subset of patients to identify the effect of telmisartan on visceral fat distribution and hepatic and muscle fat, we intended to recruit 48 patients locally (12 each in telmisartan dose arms and 12 in the control arm) to undergo whole-body MRI scans and liver and calf MRS at baseline and at 24 weeks. There is limited information44,45 on the effect of telmisartan on visceral fat distribution for the dose groups considered and no reliable estimates of the within-group variance were available to carry out a formal power calculation. A sample size of 10 patients per group was expected to provide enough data for a reliable estimate of the within-group variance (sample size was increased to 12 to account for 10% dropout). To put this into context, the proposed sample size would allow the detection of a linear reduction in visceral fat of at least 10 cm2/20 mg with an 80% power at the 5% significance level, assuming a within-group standard deviation of visceral fat reduction, σ = 27 cm2. Even if deviations from the sample standard deviation (σ = 27 cm2) occurred (e.g. σ increases to 40 cm2), the sample size proposed would still have been sufficient to detect a linear reduction in visceral fat distribution ≥ 15 cm2/20 mg (nQuery calculator, version 6; Statistical Solutions Ltd, Cork, Ireland). The final sample size achieved was affected by a lower recruitment rate than initially expected and by the decision to stop recruitment for the main study for treatment arms B and C.
Sample size for substudy 2 (renal biomarkers)
To explore the secondary objective of whether or not there was a change in urinary biomarker levels at 12, 24 and 48 weeks between telmisartan-treated arm(s) and the control arm, we used the same sample size as for the main study.
Interim analysis and stopping guidelines
The interim analysis was scheduled to take place once the 24-week change in HOMA-IR score was available for at least 42 patients in each arm (n = 168, which was half of the planned maximum of 336 patients). The sample standard deviation pooled across all four arms was used to construct test statistics expressing the advantage of each of the three active treatments over the control arm. The prespecified analysis was as follows:
-
If the largest of these statistics is below a critical value (equal to –2.782), this would mean that one active dose group shows a substantially higher mean reduction of 24-week HOMA-IR score than the control group and, therefore, the study will be stopped and the corresponding dose will be recommended for further testing.
-
If any active dose shows no improvement over control (i.e. has an increase in HOMA-IR), that active dose will be dropped from the second stage.
-
If all three active doses satisfy this criterion, then the study will be stopped and no significant improvement over control will be claimed for any of the active doses.
-
If some improvement over control is detected for at least one of the doses (i.e. if at least one test statistic is between 0 and –2.782), then the study will progress to the second stage.
Consequently, if arms are dropped after the interim analysis, randomisation will continue to be in an equal ratio (i.e. 1 : 1 or 1 : 1 : 1).
Effect of interim analysis on the sample size and study duration
At the interim analysis, doses may be dropped from the trial, or the trial may be stopped altogether. Consequently, the sample size when the decision is reached could be smaller than the maximum stated number of 336 patients. Given the structure of the design, the values 168 patients (if the study is stopped following interim analysis), 252 patients (if one active dose arm is promoted to the second stage), 294 patients (if two active dose arms are promoted to second stage) and 336 patients (if all three active dose arms are promoted to second stage) are possible. Under the situation in which one treatment has a 65% chance of giving a better outcome than control, while the others achieve 55%, the four sample sizes occur with probabilities of 0.40, 0.08, 0.19 and 0.33, respectively. In this same situation, the probability of dropping the best treatment at the interim analysis is 0.006 and it is even smaller for treatments with larger effects. The reduced sample sizes of 168, 252 and 294 patients mentioned above refer to the numbers of patients with 24-week HOMA-IR scores that are included in the analysis. There will be additional patients who have been recruited and treated during the 24 weeks prior to extracting the data for interim analysis and during the time when the analysis take place, and their number will depend on the recruitment rate achieved. Nevertheless, taking these patients into account, it can be deduced that the impact of the interim analysis will be to shorten the study duration by about 12 months if the conclusion is clear-cut and to reduce the sample size by an expected 40 patients (this figure is calculated by taking into account the number of patients recruited during the conduct of interim analysis from months 24 to 26 and, therefore, does not actually contribute to the analysis).
The IDSMC remit included giving advice on whether or not the accumulated data from the interim analysis justified continuing recruitment of further patients and further follow-up. If a decision was made to continue, the IDSMC were tasked to advise on the frequency of future reviews of the data on the basis of accrual and event rates. The IDSMC was to make recommendations to the TSC regarding continuation of the trial. A decision to discontinue recruitment, in all patients or in selected subgroups, would be made by the IDSMC on the basis of results from the interim analysis.
Blinding
The TAILoR trial was an open trial, with the investigators and patients not blinded to the allocated treatment. However, allocation concealment was possible as participants were randomised using a secure (24-hour) web-based randomisation program controlled centrally by the CTRC.
Method of assignment to treatment
In the first stage of the study, patients were randomised in a 1 : 1 : 1 : 1 ratio to receive 20, 40 or 80 mg of telmisartan or no intervention (control) using a secure (24 hour) web-based randomisation program controlled centrally by the CTRC CTU.
Randomisation lists were generated in a 1 : 1 : 1 : 1 ratio using simple block randomisation with random variable block length. For each recruiting centre, randomisation was stratified by ethnicity (black or non-black). Following the interim analysis, as the trial continued, those eligible that consented to take part in the study were randomised in an equal ratio to receive one of the remaining doses or no intervention (control).
During both stages of the trial, patients were enrolled to the study by clinicians and/or research nurses at each individual site who were delegated to do so by the PI.
Sequence and duration of all study periods
A schematic of the study design can be found in Data collection, including descriptions and timings of all assessments and procedures that were needed throughout. In summary, follow-up assessments occurred at 12, 24 and 48 weeks after randomisation.
Statistical analysis plan
Statistical analysis plans were developed for the interim and final analyses of the trial by the trial investigators and trial statistician, and were reviewed and agreed by the TSC and Data Monitoring and Ethics Committee prior to the end of the recruitment period at each stage of the trial. The complete detail of all statistical analysis plans are given in Appendix 4.
Statistical methods
Primary outcome analysis
In order to satisfy the primary objective, we evaluated three different doses against control in the first stage of the study and conducted an interim analysis that allowed ineffective doses to be eliminated quickly while a dose showing a reduction in HOMA-IR was taken forward. At the interim analysis, the sample standard deviation pooled across all four arms was determined and used to construct test statistics expressing the advantage of each of the three active treatments over control. These statistics were adjusted for the stratification factor (ethnicity). The smallest of these test statistics was to be compared with the interim critical value (–2.782). Observing a test statistic below this value corresponded to a significant improvement in HOMA-IR score for the corresponding dose over control and would have led to this dose being immediately taken forward for further study, and to the trial being stopped. Any dose corresponding to a positive test statistic would have been dropped and if all doses were dropped, the trial would also have been stopped. If some reduction in HOMA-IR over control was detected for at least one of the active doses (i.e. test statistic of between 0 and -2.782), then the study would continue after the interim analysis. At the final analysis, if the smallest comparative test statistic was below the final critical value (–2.086) then this dose would be recommended for further study. Adjustments were made to allow for any discrepancies between target and actual sample sizes while still preserving the one-sided type I error rate at 0.05.
The design was constructed under the assumption that for all patients the response (HOMA-IR score) is normally distributed with a common standard deviation, σ. If HOMA-IR score was not normally distributed, then a log with base e transformation was used.
Sensitivity analyses
Missing HOMA-IR values at 24 weeks were imputed by the MICE (Multivariate Imputation by Chained Equations)62 algorithm (MICE package; version 3.3.0) conditional on HOMA-IR values at baseline, HOMA-IR values at 12 weeks and stratification factor (ethnicity). A compliance-adjusted primary outcome analysis was undertaken using instrumental variable (IV) regression, in order to estimate the effect of actual dose on outcome. Further IV regression was carried out but additionally accounting for baseline HIV viral load. More information on sensitivity analyses is provided in the statistical analysis plans (see Appendix 4).
Secondary outcome analysis
Biomarker analysis
To explore the secondary objective of identifying longitudinal change in the expression of biomarkers in telmisartan-treated arm(s) in comparison with controls, joint models63,64 were used to fully exploit the serial nature of these outcomes accounting for informative loss to follow-up and missingness. The models are adjusted for ethnicity, the stratification factor at randomisation. The joint model was constructed under the assumption that longitudinal outcomes were normally distributed. If any biomarker value was not normally distributed, then a log with base e transformation was used.
Analysis of changes in body fat redistribution and intrahepatic and intramyocellular lipid content
The aim of this analysis was to identify the effect of telmisartan on visceral fat distribution and hepatic and muscle fat. The change in visceral fat at 24 weeks was compared across the three treatment groups and the control using multiple linear regression. A multiple linear regression model was considered to explore the differences in visceral fat change between the treatment groups while accounting for potential confounders. The model was adjusted for the relative change of total external fat to account for any confounding effect. The standard error of each estimator of the model coefficients, p-values, as well as the 95% confidence intervals (CIs) for the coefficient parameters were provided. A similar strategy was adopted for the analysis of liver and calf MRS data.
Evaluation of alternative methods of insulin resistance (Quantitative Insulin Sensitivity Check Index and Revised Quantitative Insulin Sensitivity Check Index)
The aim of this analysis was to see if telmisartan showed a similar direction of change in insulin resistance measured by QUICKI and revised QUICKI to that observed with HOMA-IR. We used the same analysis as that described in Primary outcome analysis for the two alternative measures.
Renal biomarker analysis
Longitudinal measurements of urinary biomarkers were analysed using linear mixed-effect models adjusting for age, weight change and sex, which were included in the final model if found significant. For analysis of NGAL, the sample set was divided into tertiles. For analysis of ACR, the sample set was divided into two subsets based on the KDIGO (Kidney Disease Improving Global Outcomes) 2012 clinical practice guideline for the evaluation and management of chronic kidney disease65 (i.e. an ACR of < 3 mg/mmol, normal; an ACR of > 3 mg/mmol, microalbuminuria).
Additional analysis
All analyses were undertaken adjusting for weight change. Joint models included data from the dropped arms at the interim analysis and were fitted with longitudinal measurements from all four arms to adjust for informative dropout further and to account for changes in weight over time. Bivariate joint models were fitted using the joineRML package in R (The R Foundation for Statistical Computing, Vienna, Austria). 66,67 Two additional ad hoc exploratory compliance-adjusted analysis were undertaken for HOMA-IR at 24 weeks to address some selection bias.
Trial organisation
Trial management
The trial was managed by the CTRC at the University of Liverpool, which is a UK Clinical Research Collaboration (UKCRC) – Registered Clinical Trial Unit (CTU), a part of the Liverpool Trials Collaborative. The CTRC was responsible for trial management, quality assurance, data management and trial statistics. A dedicated trial manager, data manager and statistician were appointed to the CTRC.
Trial sponsor
The TAILoR trial was co-sponsored by the University of Liverpool and the Royal Liverpool and Broadgreen University Hospitals NHS Trust.
Ethical considerations, regulatory requirements, and research governance framework
The TAILoR trial was conducted in accordance with the European Clinical Trials Directive, ICH GCP Guidelines, the Declaration of Helsinki, NHS Research governance framework, and the Medicines for Human Use (Clinical Trials) Regulations 2004.
The trial was authorised to proceed by the MHRA on 29 June 2012. Its EudraCT number is 2012-000935-18. The trial also received REC (National Research Ethics Service committee – North West – Liverpool Central) approval prior to the start of the study (original approval dated 2 April 2012).
Prior to beginning research at each participating site, REC approval was sought as were local permissions from the R&D departments at each site.
Trial registration
National Institute for Health Research portfolio
The TAILoR trial was adopted onto the National Institute for Health Research (NIHR) portfolio and fulfilled the criteria for UK Clinical Research Network support.
Summary of protocol amendments
During the course of the trial, a number of amendments were made to the TAILoR protocol. Each amendment was assessed by the TMG, Trial Steering Group and the funder. Each amendment was approved by the REC and, if appropriate, by the MHRA. A full list of amendments and summarises can be found in Appendix 5.
Trial committees
Trial Management Group
A TMG was set up to be responsible for the day-to-day management of the TAILoR trial. The TMG met on a monthly basis to discuss the conduct and progress of the trial. The TMG membership was as follows:
-
Professor Sir Munir Pirmohamed (chief investigator)
-
Claire Taylor (trial co-ordinator)
-
Catherine Spowart (until June 2016) (supervisory trial manager)
-
Dr Ruwanthi Kolamunnage-Dona (study statistician)
-
Professor Thomas Jaki (senior study statistician)
-
Professor Paula Williamson (senior statistician and co-applicant)
-
Dr Sudeep Pushpakom (co-applicant and scientist)
-
Professor Saye Khoo (co-applicant and PI at RLBUHT)
-
Professor John Whitehead (until retirement in 2014; co-applicant and statistician)
-
Helen Reynolds (research nurse at RLBUHT)
-
Jenny Harrison (until October 2015; research nurse at RLBUHT)
-
Dr Duncan Churchill (PI at the Elton John Centre)
-
Dr Gabriel Schembri (PI at the Manchester Centre for Sexual Health)
-
Steve Earle (patient representative).
Trial Steering Committee
The TSC was established to provide overall supervision of the trial and to ensure that the trial was conducted to ICH GCP guidelines. The TSC met annually throughout the course of the trial via both teleconference and e-mail. Copies of the minutes were provided to the study funder (NIHR). The TSC were also consulted about any amendments to the trial protocol. The TSC membership was as follows:
-
Professor Stephane de Wit (chairperson)
-
Professor Lucinda Billingham (independent member)
-
Professor Mahesh Parmar (independent member)
-
Simon Collins (independent member, patient representative)
-
Professor Sir Munir Pirmohamed (chief investigator)
-
Professor Paula Williamson (co-applicant).
Meetings were also attended by members of the TMG and sponsor representatives:
-
Claire Taylor (trial co-ordinator)
-
Catherine Spowart (until June 2016; supervisory trial manager)
-
Dr Ruwanthi Kolamunnage-Dona (study statistician)
-
Professor Thomas Jaki (senior study statistician)
-
Dr Sudeep Pushpakom (co-applicant and scientist)
-
Professor Saye Khoo (co-applicant and PI at RLBUHT)
-
Professor John Whitehead (until retirement in 2014; co-applicant and statistician)
-
Heather Rogers (RLBUHT sponsor representative)
-
Lindsay Carter (April 2012–March 2013; University of Liverpool sponsor representative)
-
Karen Wilding (University of Liverpool sponsor representative).
Independent Data and Safety Monitoring Committee
An Independent Data and Safety Monitoring Committee (IDSMC) was established at the start of the trial. Its purpose was to review trial data, assess safety issues and/or address any ethics concerns. The IDSMC met annually throughout the course of the trial by both teleconference and e-mail. The IDSMC also received safety reports on a quarterly basis. The IDSMC assessed the interim analysis to decide on the ongoing format of the trial. The IDSMC members were:
-
Professor Sir Ian Weller (chairperson)
-
Dr Adrian Mander (independent statistician)
-
Professor Jacqueline Capeau (independent member).
Risk assessment, monitoring and data management
Risk assessment
A risk assessment was performed by the CTRC team in collaboration with the chief investigator and sponsor at the beginning of the trial. The risk assessment indicated that the TAILoR study was a low-risk study and that monitoring would take place centrally, with site visits taking place if required to resolve issues.
Monitoring and data management
Monitoring was performed centrally. The MACRO database (version 3) contained predefined ranges that flagged queries to the study data manager if data outside the ranges were entered. In addition, the trial statistician performed regular checks on the data to produce IDSMC and trial monitoring reports to look for errors and inconsistencies and to highlight any protocol deviations.
Sites were requested to fax consent forms to the trial co-ordinator within 7 days of completion and these were then checked by the trial co-ordinator to ensure that they were valid.
Site training/initiation visits took place at all participating sites. On site monitoring visits took place if central monitoring indicated a need (e.g. CRFs not being returned/returned late, inconsistencies in CRFs).
Patient and public involvement
Patient representatives were identified early on in the trial and were involved in the oversight of the trial. One representative sat on the TSC and one on the TMG. Both attended regular meetings throughout the course of the trial. The patient representatives reviewed the study website, clinic poster, participant information sheets and consent forms. The design and format of the patient information sheets was altered in response to their feedback. They also gave opinions on how recruitment process could be improved.
Chapter 4 Results
Participant recruitment
Screening and participant flow
In total, 1950 patients were screened at the participating centres over the duration of the trial. Of the 1118 patients meeting the eligibility criteria, 698 declined to participate. Tables 14–16 in Appendix 6 summarise the numbers screened and eligible patients recruited to the trial. Further details of screening are given in Appendix 6, with Table 16 summarising the reasons for non-recruitment. The flow of patients is summarised in Figure 4, including the numbers of patients screened, randomised, followed up and analysed.
FIGURE 4.
Consolidated Standards of Reporting Trials flow diagram. a, Screening data are missing for three patients. b, A patient was randomised in arm B, even before they attended the clinic, because of a communication error. c, Patient concerned about leg swelling (not an AE) and decided to stop study drug. d, Patient has left the country; patient preference. e, Medication ran out 2 days before final visit; appointment was missed, as patient misunderstood the follow-up schedule; patient lost study medication and failed to inform research team until 48-week follow-up visit. f, Patient moved to London with no forwarding address; did not wish to continue the study because of organisational reasons; because of advice from study team following MRI incidental finding; to enter another clinical trial; eGFR < 60 ml/minute/1.73 m2 at screening; on nevirapine. g, Patient developed a cough and wanted to discontinue study medication; taking Rampiril (general practitioner’s orders); switch in ARV; not able to commit to study; eGFR < 60 ml/minute/1.73 m2 at baseline; did not meet eligibility criteria; did not return for appointment and did not respond to contacts; decided to become pregnant. h, Patient ran out of study medication; eGFR < 60 ml/minute/1.73 m2; patient ran out of study medication but did not collect extra medication; forgot to take study medication when on holiday abroad; ran out of study medication; ran out of study medication but was unable to come to collect extra medication; did not take study medication as required. i, All three patients had run out of study drug.
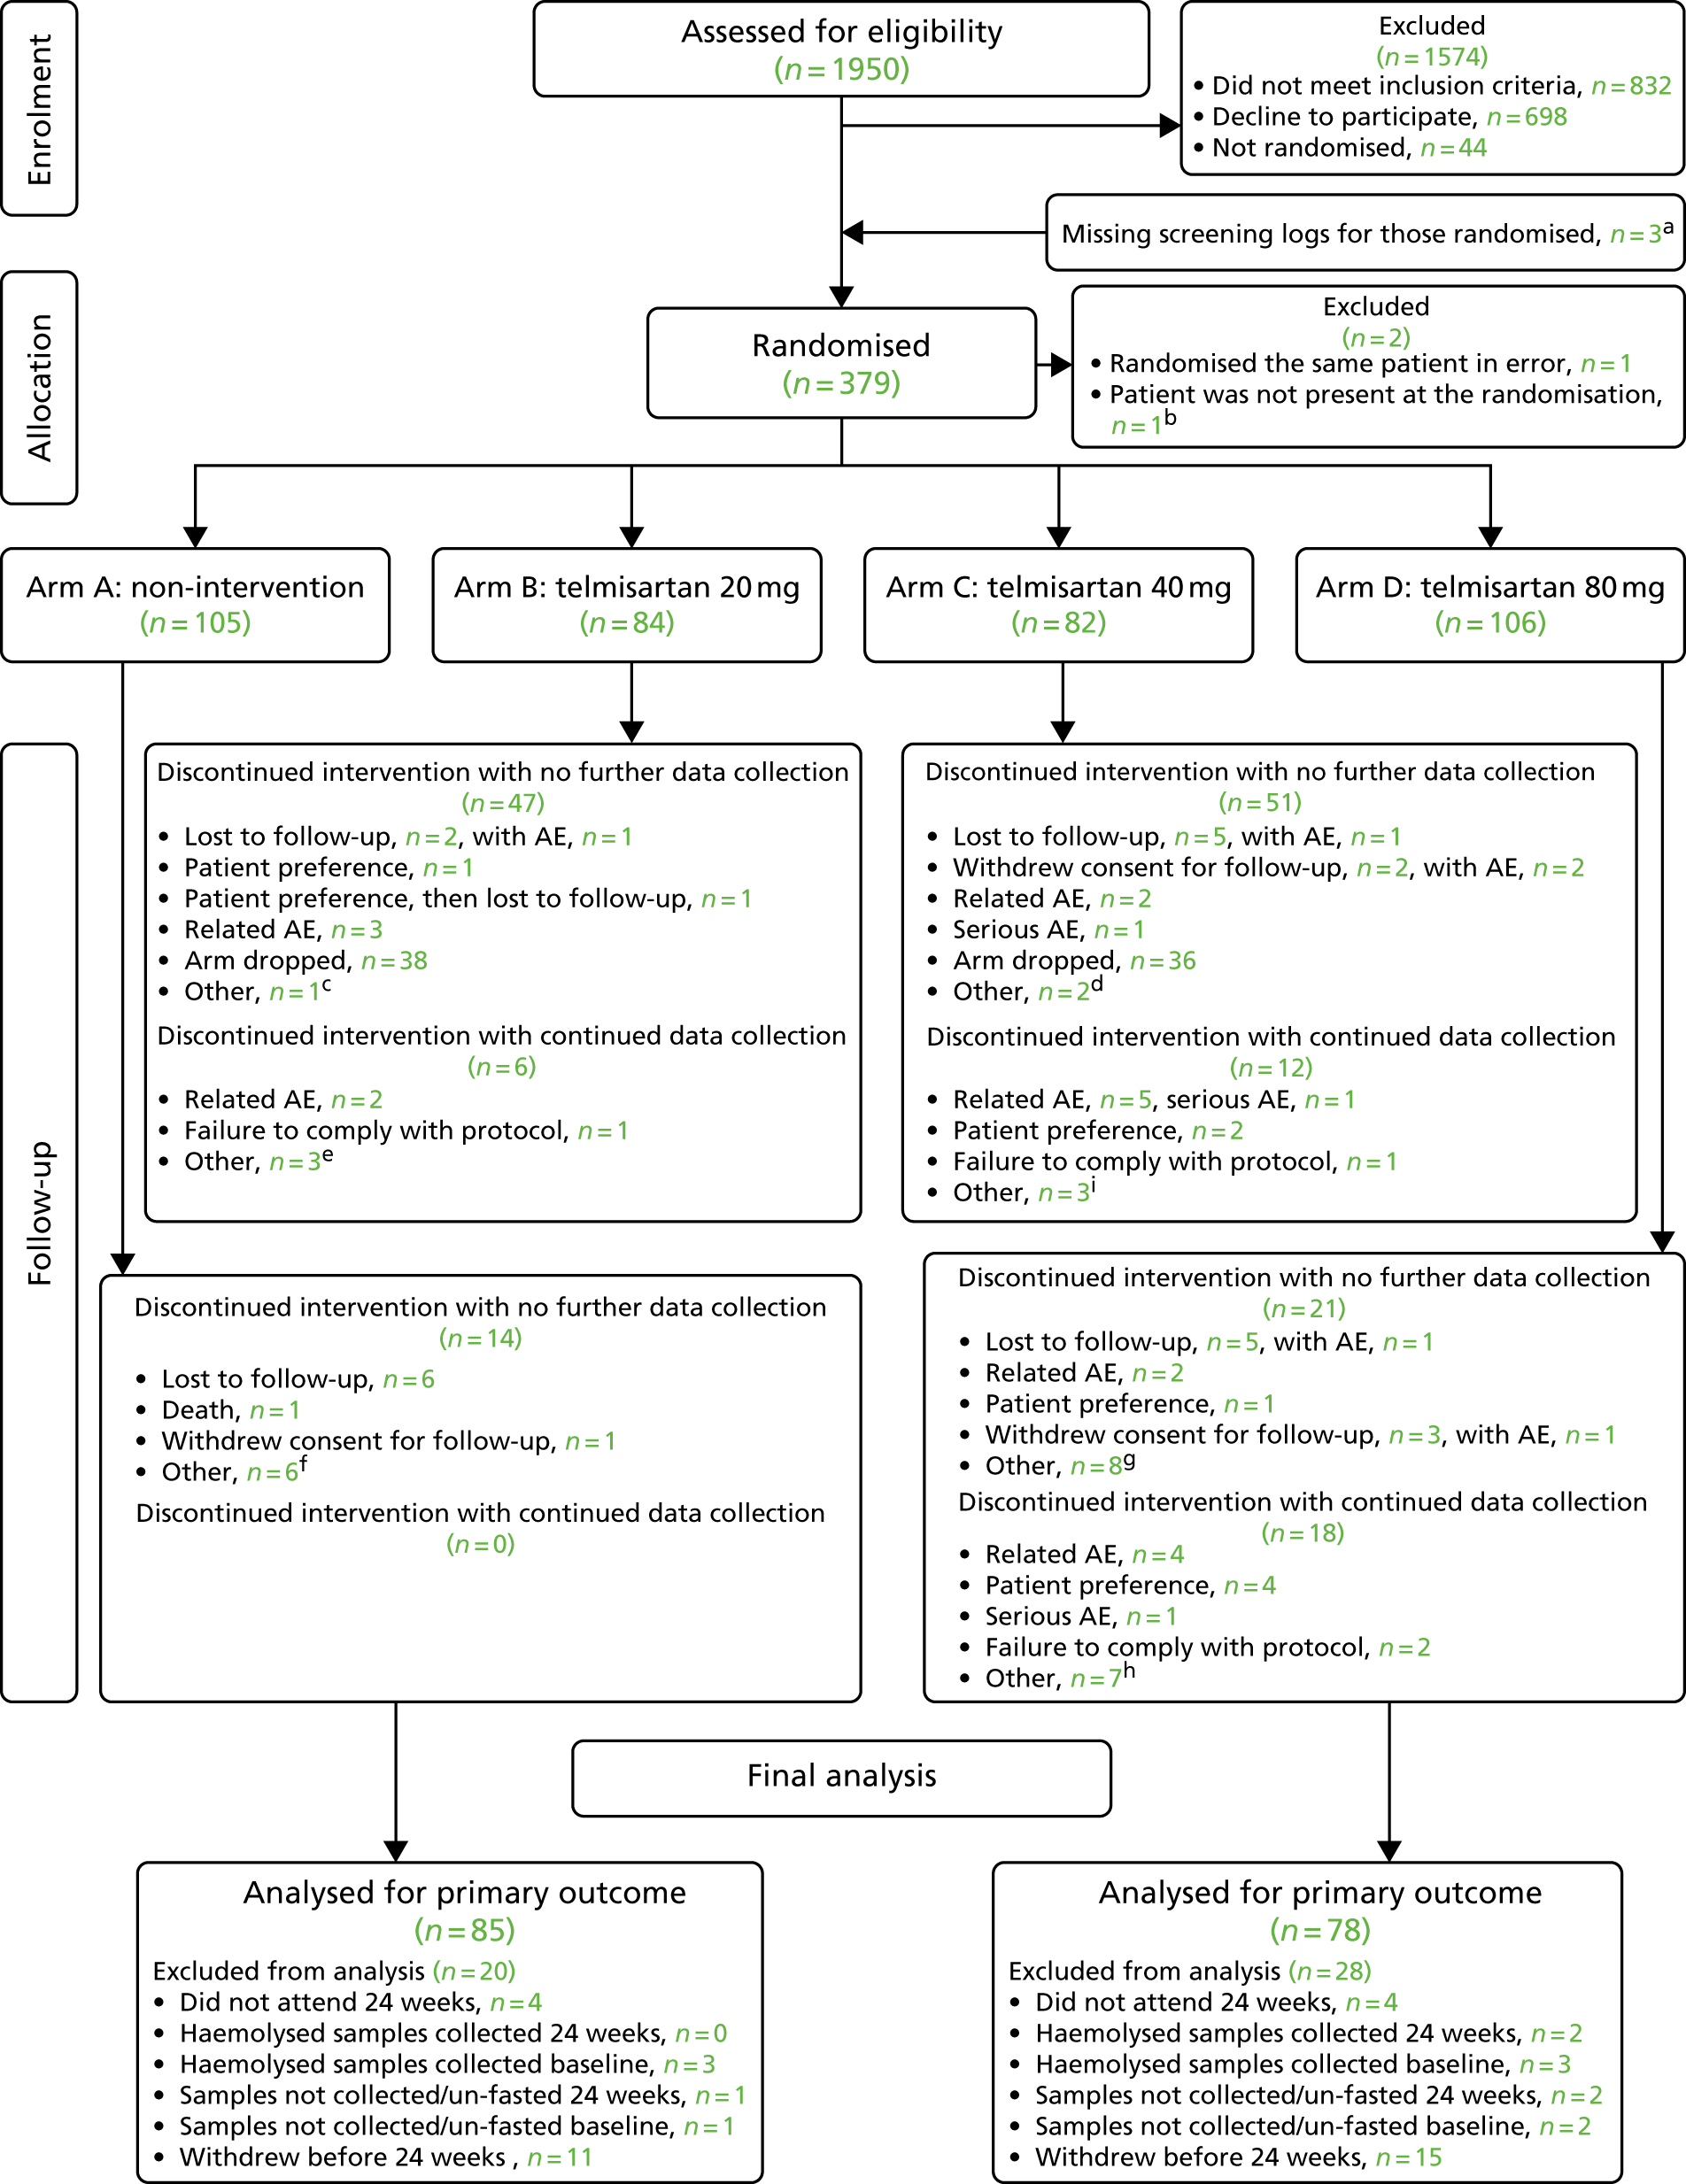
Randomisation checking
Randomisation numbers were sequential by date randomised, and there were no missing randomisation numbers. The last day of randomisation was 20 July 2015. Treatments were balanced across strata (ethnicity) (Table 3).
| Ethnicity | Treatment arm, n (%) | |||
|---|---|---|---|---|
| Arm A (control) (N = 105) | Arm B (20 mg) (N = 84) | Arm C (40 mg) (N = 82) | Arm D (80 mg) (N = 106) | |
| Black | 22 (20.9) | 18 (21.4) | 16 (19.51) | 22 (20.8) |
| Non-black | 83 (79.0) | 66 (78.6) | 66 (80.49) | 84 (79.2) |
Recruitment and retention
Recruitment took place from March 2013 until July 2015, taking a total of 28 months. This was longer than the originally allocated recruitment period of 1 year. There were a number of delays in starting the trial and in the opening of sites to recruitment. The major issues encountered were:
-
lack of funding for excess treatment costs (ETCs)
-
slower recruitment
-
increased participant dropout and subsequent need to increase from the original sample size
-
high staff turnover at some participating sites, which further contributed to delay/interruption in recruitment.
The TAILoR team took a number of measures to counter the above cited impediments:
-
A waiver to underwrite the ETCs was negotiated with the trial sponsor (University of Liverpool) to get the trial started. Over the course of the trial, all participating sites were contacted to cover ETCs and this was eventually agreed by all sites by the time the last patient was recruited.
-
Setting up of additional sites to reach the recruitment target in the same time frame – the number of recruitment sites was increased from the originally planned eight sites to 19 sites.
-
Encouraging patient participation and increasing publicity for the trial among the patient population – the trial team held discussions with the patient and public involvement representatives in the TMG and the TSC on ways to increase recruitment rates. As a result of this, the participant information sheet was altered to make them more reader friendly; we also developed posters for use in participating clinics, and developed a recommended recruitment pitch for researchers. A study website (www.tailortrial.org) was also created to increase visibility and to update the participants of the various developments related to the trial.
-
Ensuring recruiter engagement – to increase recruitment, we continued to engage with research teams at sites holding regular PI and research nurse meetings, and having regular newsletter updates.
Recruitment rate
The target recruitment rate for the study was two to five patients per month per site, based on the original eight sites recruiting and a target recruitment figure of 370 patients. Monthly and cumulative monthly accrual of patients was slower than anticipated and is shown in Figure 5.
FIGURE 5.
Monthly and cumulative monthly accrual of patients. Post interim analysis: interim analysis has shown that there was a higher than anticipated rate of withdrawals and/or missing primary outcome data. In order to have the required number of patients for final analysis, a total of 377 patients was required.
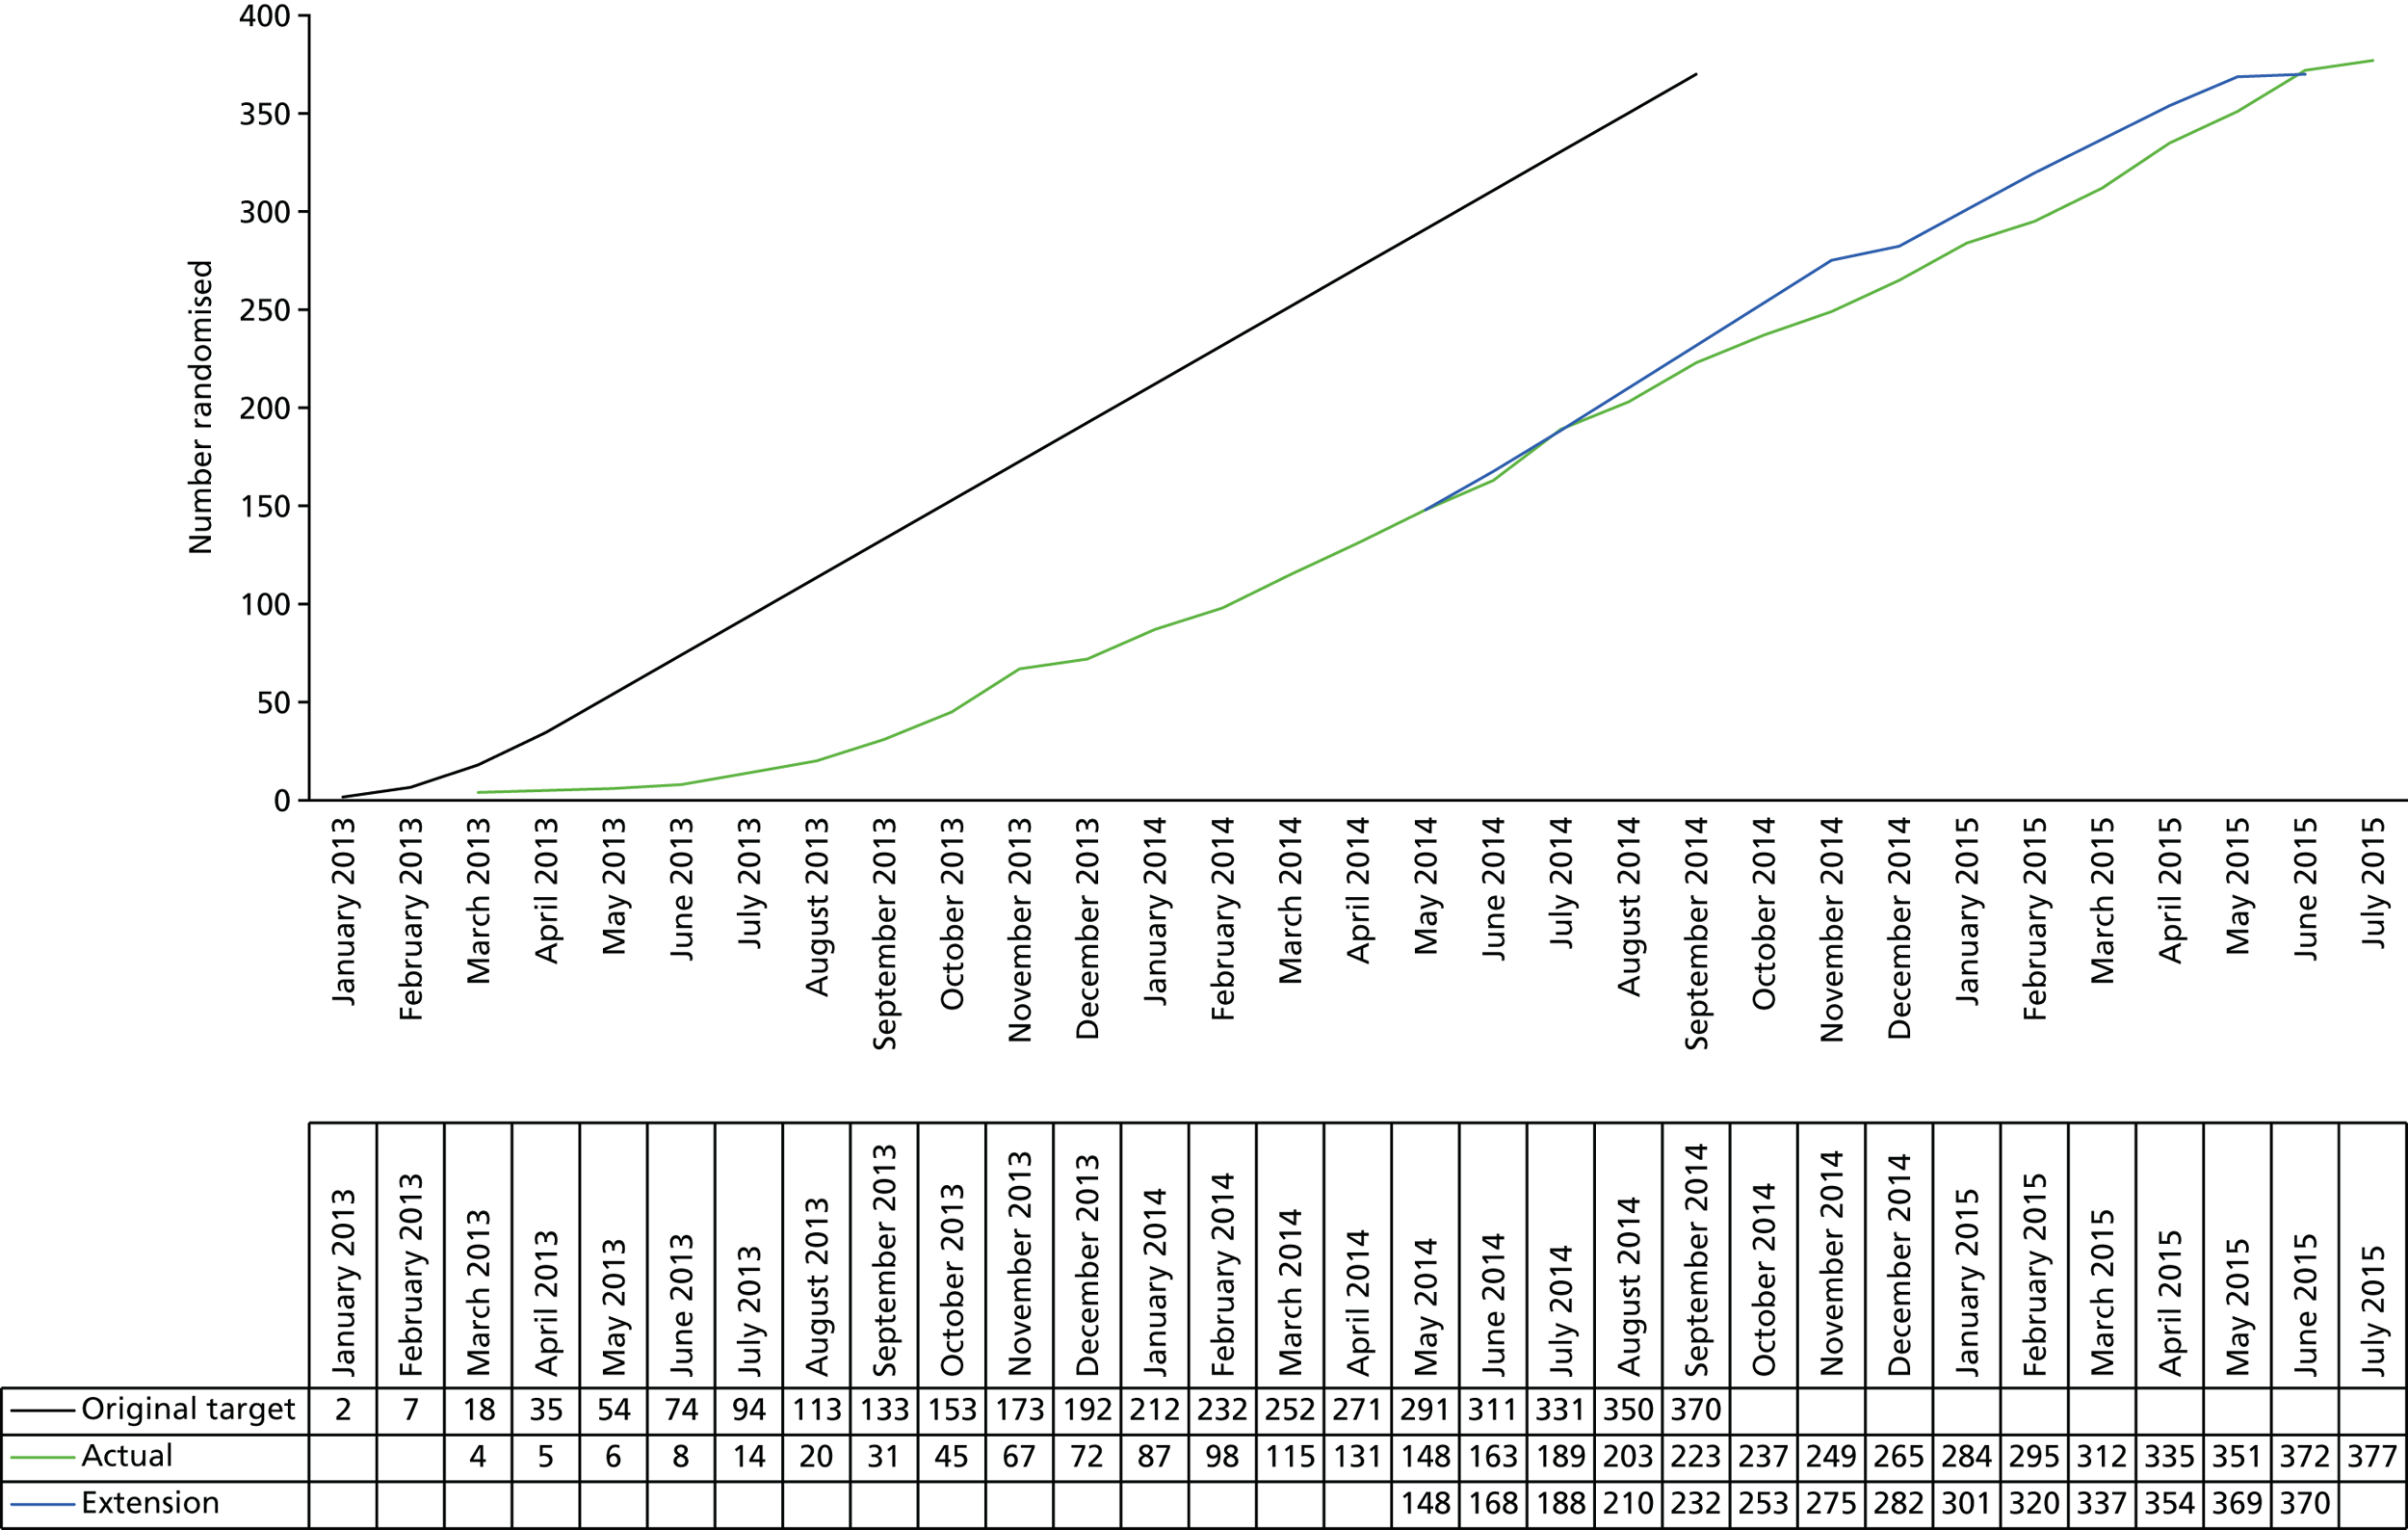
Baseline data
The baseline characteristics of all randomised patients are summarised by treatment arms (see Tables 4 and 5). Baseline characteristics were balanced across treatment arms. The median ages were comparable between all arms (Table 4). The study participants were predominantly male (ranging between 81.0% and 84.1% across the four arms; see Table 4). The body mass index (BMI) and other vital parameters of the participants were comparable between all four arms (see Table 4), as was the cluster of differentiation 4 (CD4) cell count (ranging between 580 and 598 cells/mm3; see Table 18 in Appendix 6). The baseline liver function and full blood count were also comparable between participants in all four arms (see Tables 19 and 20 in Appendix 6). The median HOMA-IR values ranged between 0.408 and 17.495 for the entire cohort (Table 5) and were comparable between all four arms. There was also no difference in baseline values for the secondary outcome measures (Table 5).
| Characteristic | Treatment arm | |||
|---|---|---|---|---|
| Arm A (N = 105) | Arm B (N = 84) | Arm C (N = 82) | Arm D (N = 106) | |
| Age (years) | ||||
| Median (IQR); min.–max. | 47.2 (39.8–52.4); 20.4–70.5 | 46.0 (41.0–52.2); 21.6–74.6 | 47.9 (43.3–51.5); 31.5–70.8 | 45.8 (38.2–51.7); 22.5–67.3 |
| Sex, n (%) | ||||
| Female | 20 (19.0) | 15 (17.9) | 13 (15.9) | 17 (16.0) |
| Male | 85 (81.0) | 69 (82.1) | 69 (84.1) | 89 (84.0) |
| BMI (kg/m2) | (n = 103) | (n = 81) | ||
| Median (IQR); min.–max. | 25.4 (23.1–29.2); 16.7–42.0 | 25.6 (23.3–29.2); 18.8–52.2 | 26.3 (24.4–29.6); 16.7–46.3 | 25.4 (23.0–27.8); 7.9–43.7 |
| Systolic blood pressure (mmHg) | (n = 81) | |||
| Mean (SD); min.–max. | 126.8 (13.9); 100.0–160.0 | 124.4 (14.2); 100.0–162.0 | 126.9 (14.3); 92.0–158.0 | 124.8 (15.4); 100.0–172.0 |
| Diastolic blood pressure (mmHg) | ||||
| Mean (SD); min.–max. | 80.0 (10.7); 60.0–122.0 | 78.2 (11.2); 56.0–107.0 | 79.7 (9.9); 54.0–102.0 | 78.6 (11.1); 55.0–107.0 |
| Heart rate (beats per minute) | (n = 82) | (n = 80) | ||
| Mean (SD); min.–max. | 73.0 (11.5); 50.0–101.0 | 72.5 (11.7); 51.0–105.0 | 71.6 (13.1); 39.0–113.0 | 72.8 (12.2); 51.0–115.0 |
| Temperature (°C) | (n = 99) | (n = 78) | (n = 78) | (n = 102) |
| Mean (SD); min.–max. | 36.3 (0.5); 35–38 | 36.3 (0.4); 35.3–37.8 | 36.4 (0.3); 35.5–37.1 | 36.3 (0.5); 34.5–37.8 |
| Respiratory rate (breaths per minute) | (n = 102) | (n = 83) | (n = 76) | (n = 103) |
| Mean (SD); min.–max. | 15.6 (2.9); 10.0–28.0 | 15.9 (4.0); 10.0–41.0 | 16.0 (4.2); 10.0–37.0 | 16.5 (3.4); 10.0–28.0 |
| Waist circumference (cm) | (n = 101) | (n = 83) | (n = 79) | (n = 102) |
| Mean (SD); min.–max. | 93.5 (11.8); 65.0–137.0 | 94.6 (14.7); 66.0–145.0 | 97.1 (12.2); 70.0–143.0 | 93.0 (11.6); 67.5–122.0 |
| Thigh circumference (cm) | (n = 101) | (n = 82) | (n = 77) | (n = 102) |
| Mean (SD); min.–max. | 50.8 (7.5); 33.5–80.0 | 52.3 (7.7); 39.0–90.5 | 51.8 (6.0); 37.0–69.0 | 49.6 (8.5); 22.7–84.0 |
| eGFRa (ml/minute/1.73 m2) | (n = 50) | (n = 41) | (n = 38) | (n = 54) |
| Mean (SD); min.–max. | 79.8 (13.6); 45.0–129.0 | 79.9 (10.8); 60.0–105.0 | 77.9 (10.5); 62.0–107.6 | 81.4 (14.5); 53.0–122.0 |
| < 60, n (%) | 0 (0.0) | 0 (0.0) | 0 (0.0) | 1 (0.9) |
| < 90, n (%) | 0 (1.0) | 0 (0.0) | 0 (0.0) | 0 (0.0) |
| > 60, n (%) | 24 (22.9) | 23 (27.4) | 25 (30.5) | 22 (20.8) |
| > 90, n (%) | 28 (26.7) | 19 (22.6) | 19 (23.2) | 28 (26.4) |
| Characteristic | Treatment arm | |||
|---|---|---|---|---|
| Arm A (N = 105) | Arm B (N = 84) | Arm C (N = 82) | Arm D (N = 106) | |
| Insulin (pmol/l) | (n = 102) | (n = 81) | (n = 78) | (n = 100) |
| Median (IQR); min.–max. | 54 (35–90); 11–279 | 57 (37–87); 21–319 | 61 (40–85); 21–432 | 51 (36.5–75.5); 21–454 |
| Glucose (mmol/l) | (n = 104) | (n = 83) | (n = 80) | (n = 104) |
| Mean (SD); min.–max. | 5.2 (0.5); 4.2–6.9 | 5.2 (0.58); 4.0–7.6 | 5.29 (0.7); 3.2–8.5 | 5.22 (0.54); 4.1–6.8 |
| NEFAs (mmol/l) | (n = 104) | (n = 82) | (n = 79) | (n = 102) |
| Median (IQR); min.–max. | 0.42 (0.27–0.615); 0.08–1.21 | 0.385 (0.25–0.58); 0.07–1.08 | 0.35 (0.25–0.55); 0.05–0.84 | 0.40 (0.30–0.59); 0.08–1.21 |
| HOMA-IR | (n = 100) | (n = 81) | (n = 78) | (n = 100) |
| Median (IQR); min.–max. | 1.808 (1.120–2.903); 0.408–10.775 | 1.860 (1.208–3.508); 0.578–9.800 | 2.117 (1.223–3.297); 0.618–17.495 | 1.628 (1.175–2.490); 0.591–16.852 |
| QUICKI | (n = 100) | (n = 81) | (n = 78) | (n = 100) |
| Mean (SD); min.–max. | 0.117 (0.009); 0.097–0.142 | 0.116 (0.009); 0.098–0.135 | 0.116 (0.010); 0.093–0.134 | 0.118 (0.009); 0.093–0.135 |
| Revised QUICKI | (n = 100) | (n = 81) | (n = 78) | (n = 99) |
| Mean (SD); min.–max. | 0.132 (0.017); 0.101–0.184 | 0.134 (0.019); 0.100–0.211 | 0.134 (0.019); 0.100–0.212 | 0.133 (0.016); 0.096–0.178 |
| HDL-C (mmol/l) | (n = 104) | (n = 82) | (n = 79) | (n = 103) |
| Median (IQR); min.–max. | 1.15 (0.9–1.4); 0.5–3.0 | 1.1 (1.0–1.4); 0.3–2.7 | (0.9–1.4); 0.2–2.8 | (1.0–1.4); 0.5–2.9 |
| Cholesterol (mmol/l) | (n = 104) | (n = 82) | (n = 79) | (n = 103) |
| Mean (SD); min.–max. | 5.01 (0.99); 2.2–8.2 | 5.0 (1.11); 2.6–8.3 | 4.83 (1.04); 2.5–7.1 | 4.97 (1.04); 2.9–7.64 |
| Triglycerides (mmol/l) | (n = 104) | (n = 82) | (n = 79) | (n = 103) |
| Median (IQR); min.–max. | 1.4 (1.0–2.0); 0.5–6.5 | 1.25 (0.9–1.8); 0.4–4.8 | 1.4 (1.0–1.9); 0.5–6.1 | 1.2 (0.9–1.8); 0.4–6.7 |
| LDL-C (mmol/l) | (n = 103) | (n = 81) | (n = 78) | (n = 102) |
| Mean (SD); min.–max. | 3.1 (0.91); 1.1–6.4 | 3.14 (0.97); 1.1–6.2 | 2.97 (0.9); 0.8–5.2 | 3.12 (0.91); 0.8–5.6 |
| Adiponectin (µg/ml) | (n = 104) | (n = 82) | (n = 78) | (n = 101) |
| Median (IQR); min.–max. | 14.62 (10.11–20.50); 3.14–44.34 | 16.27 (12.05–21.84); 1.73–60.49 | 13.69 (9.22–20.31); 2.01–66.19 | 13.47 (8.28–18.51); 2.74–129.01a |
| Leptin (pg/ml) | (n = 104) | (n = 81) | (n = 78) | (n = 103) |
| Median (IQR); min.–max. | 4856.7 (1885.9–13,879); 253.64–123,299 | 4688.7 (2149–15,786); 388.38–192,842 | 5227.2 (2271.4–9710); 168.11–119,430 | 4492.2 (2126.5–10,192); 502.59–104,002 |
| IL-8 (pg/ml) | (n = 104) | (n = 82) | (n = 78) | (n = 102) |
| Median (IQR); min.–max. | 17 (12.98–22.7); 5.67–744.98a | 14.38 (11.65–18.67); 5.18–166.7 | 16.32 (11.83–25.12); 6.04–187.86 | 18.57 (12.75–29.53); 4.51–368.69 |
| TNF-α (pg/ml) | (n = 103) | (n = 82) | (n = 78) | (n = 101) |
| Median (IQR); min.–max. | 2.31 (1.69–3.49); 0.58–12.61 | 2.1 (1.74–2.49); 1.04–6.27 | 2.39 (1.71–2.99); 0.49–8.11 | 2.35 (1.77–3.09); 0.85–56.89* |
| Resistin (pg/ml) | (n = 104) | (n = 82) | (n = 78) | (n = 101) |
| Median (IQR); min.–max. | 5602.7 (3936.6–7998.5); 1667.2–30,299 | 4790.2 (3713.7–6966.3); 1288.2–20,357 | 5114 (3656.4–6861); 1180–13,781 | 5684.9 (4590.9–8367.2); 1607.7–19,692 |
| hs-CRP (mg/ml) | (n = 104) | (n = 82) | (n = 78) | (n = 103) |
| Median (IQR); min.–max. | 2.24 (1.03–4.04); 0.31–98.12a | 1.4 (0.71–3.93); 0.35–18.97 | 1.32 (0.59–4.17); 0.25–91.56a | 1.32 (0.66–3.14); 0.28–41.74 |
| NGAL (pg/ml) | (n = 99) | (n = 82) | (n = 72) | (n = 101) |
| Median (IQR); min.–max. | 5.99 (1.98–15.31); 0.46–160.79 | 5.59 (2.38–15.76); 0.59–325.54 | 6.30 (1.70–17.59); 0.49–282.04 | 5.48 (1.85–15.85); 0.61–160.50 |
| ACR (mg/mmol) | (n = 40) | (n = 34) | (n = 31) | (n = 40) |
| Median (IQR); min.–max. | 0.8 (0.4–3.6); 0.2–37.0 | 0.9 (0.6–1.8); 0.2–8.5 | 0.9 (0.5–2.0); 0.2–7.4 | 0.5 (0.4–1.65); 0.3–38.8 |
Numbers analysed
In total, 307 (81%) of the patients attended all study assessment visits, and 72% of patients had complete records of longitudinal outcome as planned. Table 21 (see Appendix 6) shows the numbers for missed visits and missing data because of sample issues, and reasons for missingness are given in Table 22 (see Appendix 6).
Primary outcome results
Interim analysis
There were 48, 49, 47 and 45 patients who were randomised to arms A, B, C and D, respectively, with a total of 189 patients available for interim analysis. However, only 154 patients had a complete set of baseline and 24-week HOMA-IR data and were therefore included in the interim analysis. A total of 32 patients did not have a HOMA-IR value at the 24-week time point, and three patients did not have baseline HOMA-IR data. In 31 out of 32 cases, the 24-week HOMA-IR data were unavailable because of withdrawal from the study, visit not attended and loss to follow-up. There were seven patients (14.6%) in arm A, four patients (8.2%) in arm B, 11 patients (23.4%) in arm C and nine patients (20.0%) in arm D who were unavailable for interim analysis. Figure 6 shows the box plots for HOMA-IR at baseline and 24 weeks by treatment arm and the summary statistics are given in Table 23 (see Appendix 6).
FIGURE 6.
Box plots for HOMA-IR at baseline and 24 weeks by treatment arm at the interim analysis. A refers to the control arm; B, C and D refer to arms treated with 20, 40 and 80 mg of telmisartan, respectively. 0, baseline; 24, 24 weeks.

The HOMA-IR data were not normally distributed; hence the analysis was performed in log-scale. The model estimates are presented in Table 6; the t-statistic for arms B and C showed a positive value (i.e. higher than 0), which implied that there was no reduction in the HOMA-IR over control (arm A) for arms B and C and, therefore, these active dose arms were dropped from the second stage. As some improvement over control was detected for arm D (i.e. the t-statistic was between 0 and –2.782), this arm was selected to progress into the second stage of the study and the patients were thereafter randomised between arm D and the control arm (arm A).
| Variable | Parameter estimate | Standard error | t-value for treatment | Decision |
|---|---|---|---|---|
| Intercept | 0.3799 | 0.1414 | – | – |
| Log(HOMA-IR) at baseline | 0.5529 | 0.0681 | – | – |
| Ethnicity | –0.0164 | 0.1228 | – | – |
| Arm B vs. arm A | 0.0486 | 0.1300 | 0.3738 | Drop arm B |
| Arm C vs. arm A | 0.1009 | 0.1383 | 0.7297 | Drop arm C |
| Arm D vs. arm A | –0.0247 | 0.1386 | –0.1778 | Keep arm D |
Final analysis
At the end of the study, there were 105 patients randomised in arm A and 106 patients in arm D (total n = 211). One patient from arm D had an extreme HOMA-IR value at 24 weeks (62.0). This was because of a high insulin value of 1242 (glucose value was 7.8). The summary statistics for HOMA-IR at baseline and 24 weeks by treatment arm are given in Table 7, and the model estimates are presented in Table 8. As the HOMA-IR was not normally distributed, all analyses were performed in log scale. Since the test statistic (t-value 0.065) was not smaller than the critical value of –2.086, it was concluded that there was no significant difference in HOMA-IR between arms D and A (t-value 0.007, SE 0.106).
| Summary statistic | Time point | |||
|---|---|---|---|---|
| HOMA-IR at baseline | HOMA-IR at 24 weeks | |||
| Arm A (control) | Arm D (80 mg) | Arm A (control) | Arm D (80 mg) | |
| Number of patients (%) | 100 (95.2) | 100 (94.3) | 89 (84.8) | 82 (77.4) |
| Mean (SD), min.–max. | 2.5 (2.08), 0.4–10.8 | 2.5 (2.79), 0.6–16.9 | 3.0 (3.25), 0.6–19.6 | 3.4 (6.89), 0.6–62.0 |
| Median (IQR) | 1.8 (1.1–2.9) | 1.6 (1.2–2.5) | 2.1 (1.3–3.2) | 2.0 (1.1–3.6) |
| Missing (%) | 5 (4.8) | 6 (5.7) | 16 (15.2) | 24 (22.6) |
| Number of patients randomised | 105 | 106 | 105 | 106 |
| Variable | Parameter estimate | Standard error | t-value for treatment |
|---|---|---|---|
| Intercept | 0.428 | 0.135 | – |
| Log-(HOMA-IR) at baseline | 0.594 | 0.079 | – |
| Ethnicity (non-black) | 0.010 | 0.132 | – |
| Arm D vs. arm A | 0.007 | 0.106 | 0.065 |
We have investigated the effect of inclusion of this extreme value further by plotting the change in HOMA-IR at 24 weeks from baseline against HOMA-IR at baseline; this is presented in Figure 10 (see Appendix 6). This patient was considered to be a statistical outlier and was therefore excluded from the analyses shown below.
A total of 85 patients from arm A and 78 patients from arm D with both baseline and 24-week HOMA-IR measurements were included in the final analysis. Figure 7 shows the box plots for HOMA-IR at baseline and 24 weeks by treatment arm, and the summary statistics are given in Table 24 (see Appendix 6). The model estimates are presented in Table 25 (see Appendix 6). Since the test statistic (–0.347) was not smaller than the critical value of –2.086, it was concluded that there was no significant difference in HOMA-IR between arms D and A (–0.034, SE 0.099).
FIGURE 7.
Box plots for HOMA-IR at baseline and 24 weeks by treatment arm at the final analysis for continued treatment arms. A refers to the control arm; D refers to arm treated with 80 mg of telmisartan. 0, baseline; 24, 24 weeks.
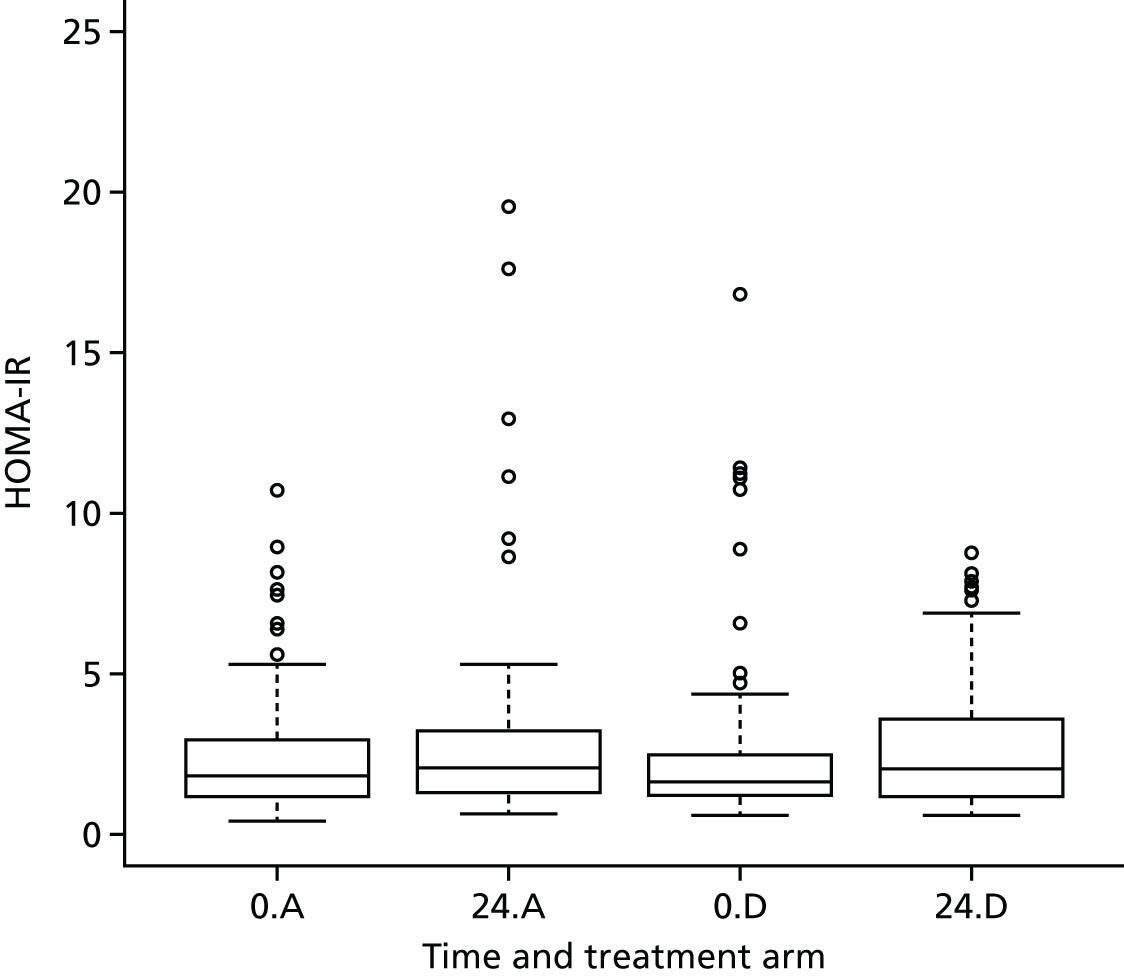
The model was further adjusted for change in weight between 24 weeks and baseline in a post hoc analysis. A total of 84 patients from arm A and 77 patients from arm D (one patient was excluded because of unavailability of weight at baseline data) were included in this analysis. The test statistic, –0.399, was still not smaller than the critical value (–2.086), and thus there was no significant difference in HOMA-IR between the two arms (–0.039, SE 0.097; see Appendix 6, Table 26).
Sensitivity analyses were also carried out to adjust for (1) potential missing HOMA-IR values and (2) treatment compliance. The parameter estimates in each of these sensitivity analyses [imputation for missing HOMA-IR, test statistic = –0.393, effect size –0.038, SE 0.096; treatment compliance, –0.010 (95% CI –0.028 to 0.008; p = 0.3] showed that there was no significant difference between arms A and D. Details of these analyses are presented in Appendix 6, Tables 27–30.
Secondary outcome results
Alternative indices of insulin resistance (Quantitative Insulin Sensitivity Check and revised Quantitative Insulin Sensitivity Check)
We used two alternative measures of insulin resistance, QUICKI and revised QUICKI, to further investigate the effect of telmisartan. Figure 8 shows the box plots for QUICKI and revised QUICKI at baseline and 24 weeks by treatment arm, and the summary statistics are given in Tables 31 and 32 (see Appendix 6).
FIGURE 8.
Box plots for QUICKI and revised QUICKI at baseline and 24 weeks by treatment arm. A refers to the control arm; D refers to arm treated with 80 mg of telmisartan. 0, baseline; 24, 24 weeks.

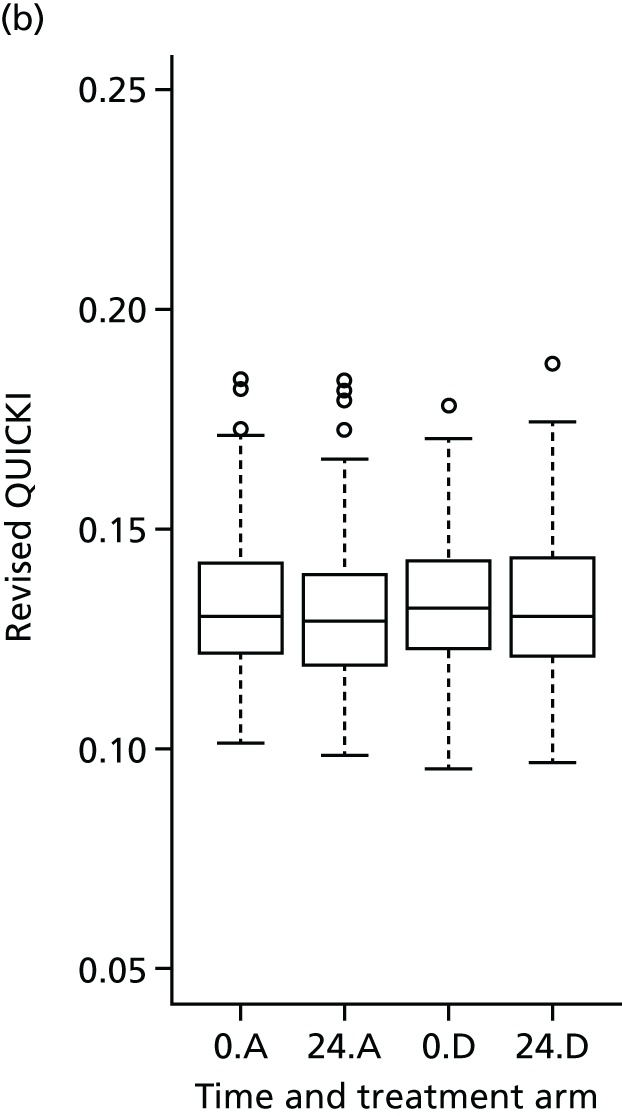
For QUICKI, the test statistic (0.4471) was not smaller than the critical value (–2.086), suggesting no difference between arms A and D (0.0006, SE 0.0013), a result similar to that observed with HOMA-IR (see Table 33 in Appendix 6). Similarly, for revised QUICKI, the test statistic (0.6882) was not smaller than the critical value (–2.086), again showing no difference between arms A and D (0.0017, SE 0.0025; see Table 34 in Appendix 6).
The model diagnostics related to the above models are shown in Appendix 6.
Longitudinal outcomes
Longitudinal analysis of Homeostatic Model Assessment of Insulin Resistance, Quantitative Insulin Sensitivity Check and revised Quantitative Insulin Sensitivity Check
The longitudinal profiles of HOMA-IR, QUICKI and revised QUICKI at weeks 12, 24 and 48 for all four arms were analysed using a bivariate joint model, adjusted for weight changes over time. A total of 321 patients and 812 individual measurements (320 patients and 808 individual measurements in the case of revised QUICKI) were included in this analysis.
There was no significant difference in HOMA-IR (treatment effect of arm D compared with arm A for the longitudinal log-HOMA-IR was –0.083, 95% CI –0.247 to 0.082; p = 0.3) and QUICKI (0.001, 95% CI –0.001 to 0.003; p = 0.3426) between the treatment and control arms over a period of 48 weeks. However, the treatment effect of arm D compared with arm A for the longitudinal revised QUICKI was marginally significant (0.004, 95% CI 0.000 to 0.008; p = 0.05), suggesting that telmisartan (80 mg) led to a small reduction in insulin resistance over a period of 48 weeks. The complete set of estimated parameters from the model is given in Appendix 6.
Longitudinal analysis of lipid profiles (high-density lipoprotein cholesterol, total cholesterol, triglycerides and low-density lipoprotein cholesterol)
The bivariate joint models included 328 patients and 845 individual measurements on average for the lipid profiles; HDL-C and triglycerides were fitted in log-transformed scale for normality. There was no significant difference between the treatment arm and the control arm with any of the lipid markers over a period of 48 weeks. The treatment effect [arm D (80 mg) compared with arm A (control)] on the longitudinal profiles of HDL-C, total cholesterol, triglycerides and LDL-C was 0.001 (95% CI –0.046 to 0.047: p = 1.0), 0.013 (95% CI –0.173 to 0.199; p = 0.9), 0.030 (95% CI –0.056 to 0.116; p = 0.5) and 0.000 (95% CI –0.145 to 0.144; p = 1.0), respectively. The longitudinal profiles and complete set of parameter estimates are given in Appendix 6.
Longitudinal analysis of plasma biomarkers
The longitudinal profiles of plasma biomarkers (adiponectin, leptin, IL-8, TNF-α, resistin and hs-CRP) at weeks 12, 24 and 48 were analysed using a bivariate joint model. The joint models included 326 patients and 840 individual measurements on average for each of the above plasma biomarkers and all were fitted in log-transformed scale for normality.
None of the plasma biomarkers apart from hs-CRP showed a significant change over time between the control and the telmisartan (80-mg) treatment arm. The estimated treatment effect on the longitudinal profiles of adiponectin, leptin, IL-8, TNF-α and resistin was 0.035 (95% CI –0.078 to 0.148; p = 0.5), 0.004 (95% CI –0.179 to 0.187; p = 1.0), 0.041 (95% CI –0.111 to 0.193; p = 0.6), –0.025 (95% CI –0.133 to 0.082; p = 0.6) and –0.066 (95% CI –0.171 to 0.039; p = 0.2), respectively. However, hs-CRP showed a significant change over time (treatment effect of –0.222, 95% CI –0.433 to –0.011; p = 0.04), with patients in the treatment arm showing significantly lower plasma hs-CRP levels over 48 weeks than those in the control arm. The longitudinal profiles and complete set of parameter estimates are given in Appendix 6.
An interaction between treatment and time was not considered as both treatment and time effects were not found to be significant in any outcome. In cases where only time effect was significant, a trend was revealed (i.e. the longitudinal outcome was changing over time) despite a significant treatment effect.
Substudy 1: magnetic resonance imaging
We assessed the effect of telmisartan (80 mg) on internal visceral fat and intrahepatic and intramyocellular (soleus and tibialis anterior) lipid content over a period of 24 weeks using MRI and 1H-MRS. The summary statistics for these are presented in Table 48 (see Appendix 6) and Figure 9. Other related outcome measures such as external abdominal fat, total internal fat, total external fat and total body fat were also assessed and the summary statistics are given in Table 49 (see Appendix 6).
FIGURE 9.
Box plots for the MRI and 1H-MRS measurements at baseline and 24 weeks by treatment arm (with individual data points). (a) Internal visceral fat; (b) intramyocellular triglyceride (soleus); (c) intrahepatic triglyceride; and (d) intramyocellular triglyceride (tibialis anterior). In all figures, A refers to the control arm; B, C and D refer to arms treated with 20, 40 and 80 mg of telmisartan, respectively; 0 refers to baseline and 24 refers to 24 weeks.
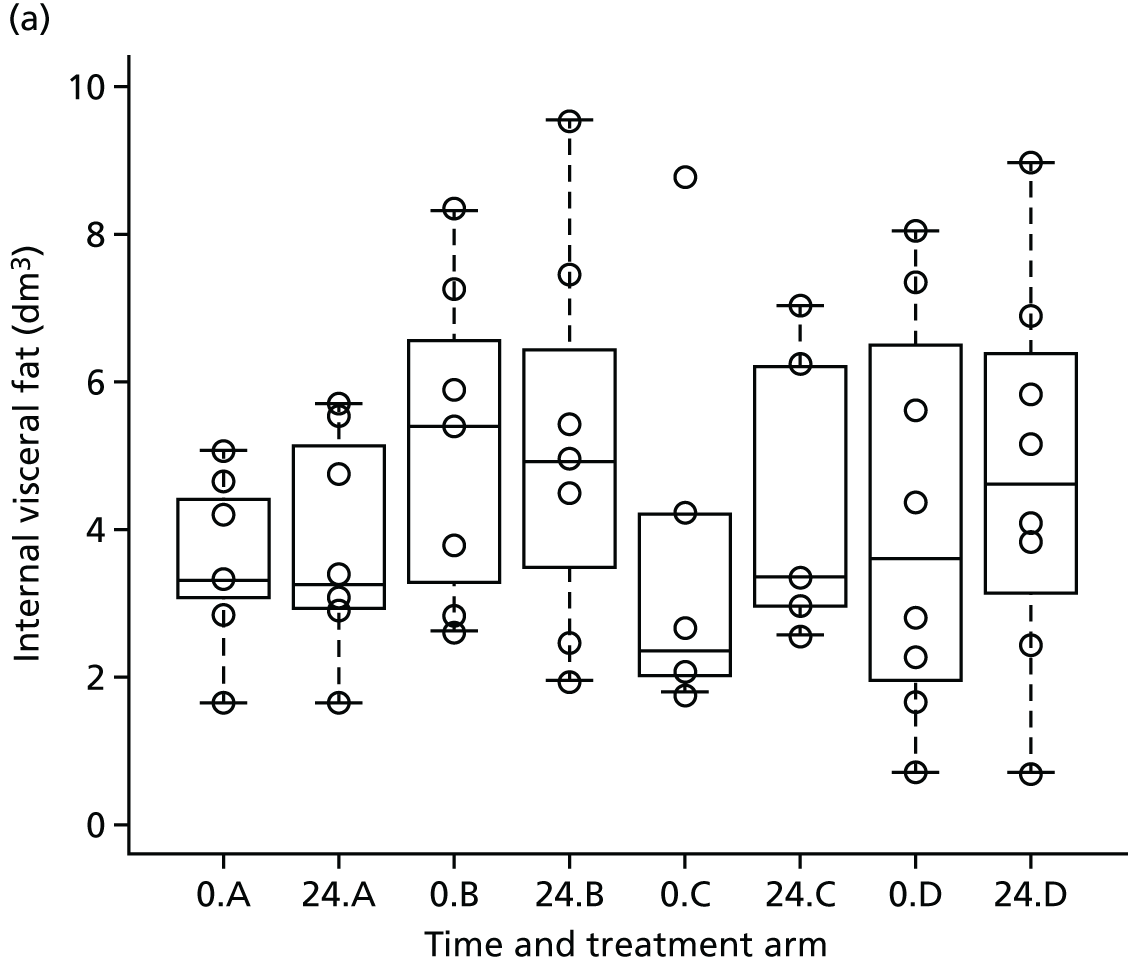
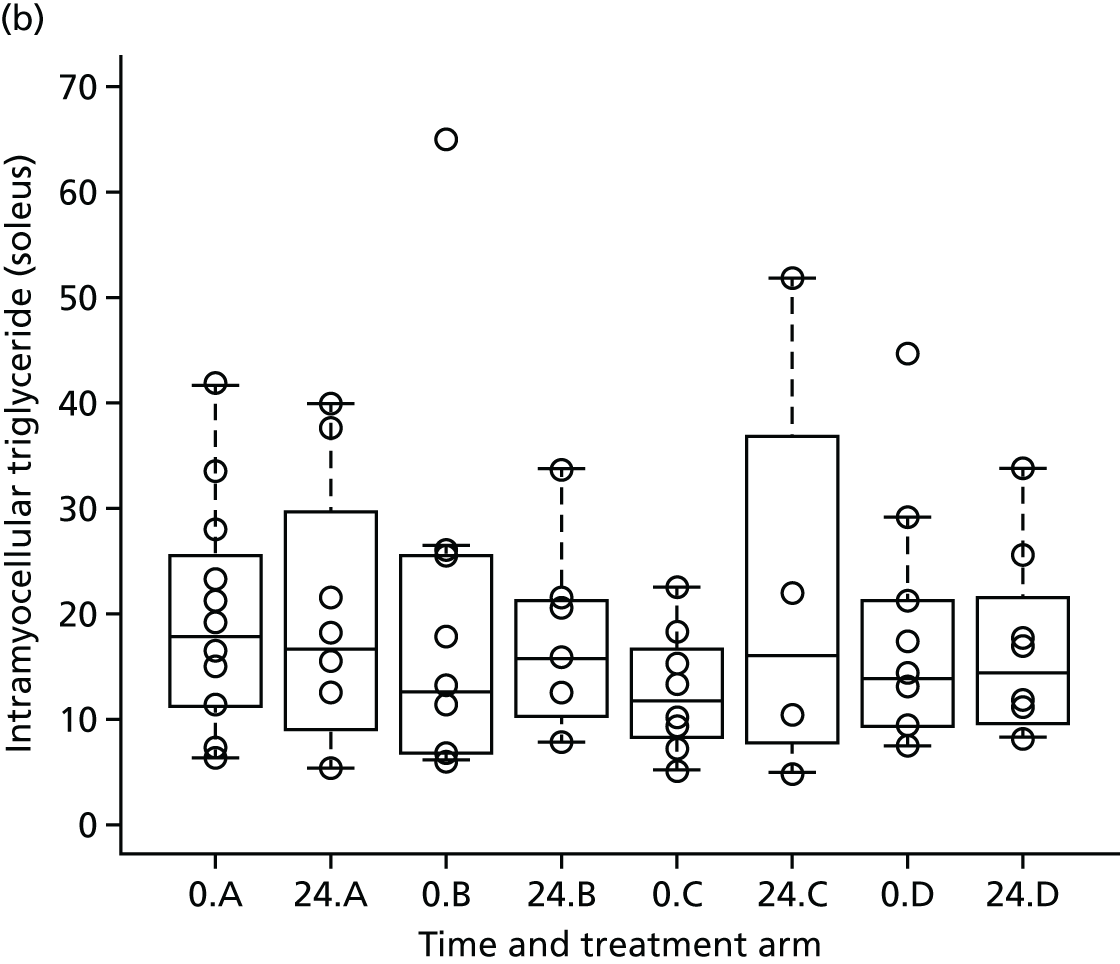

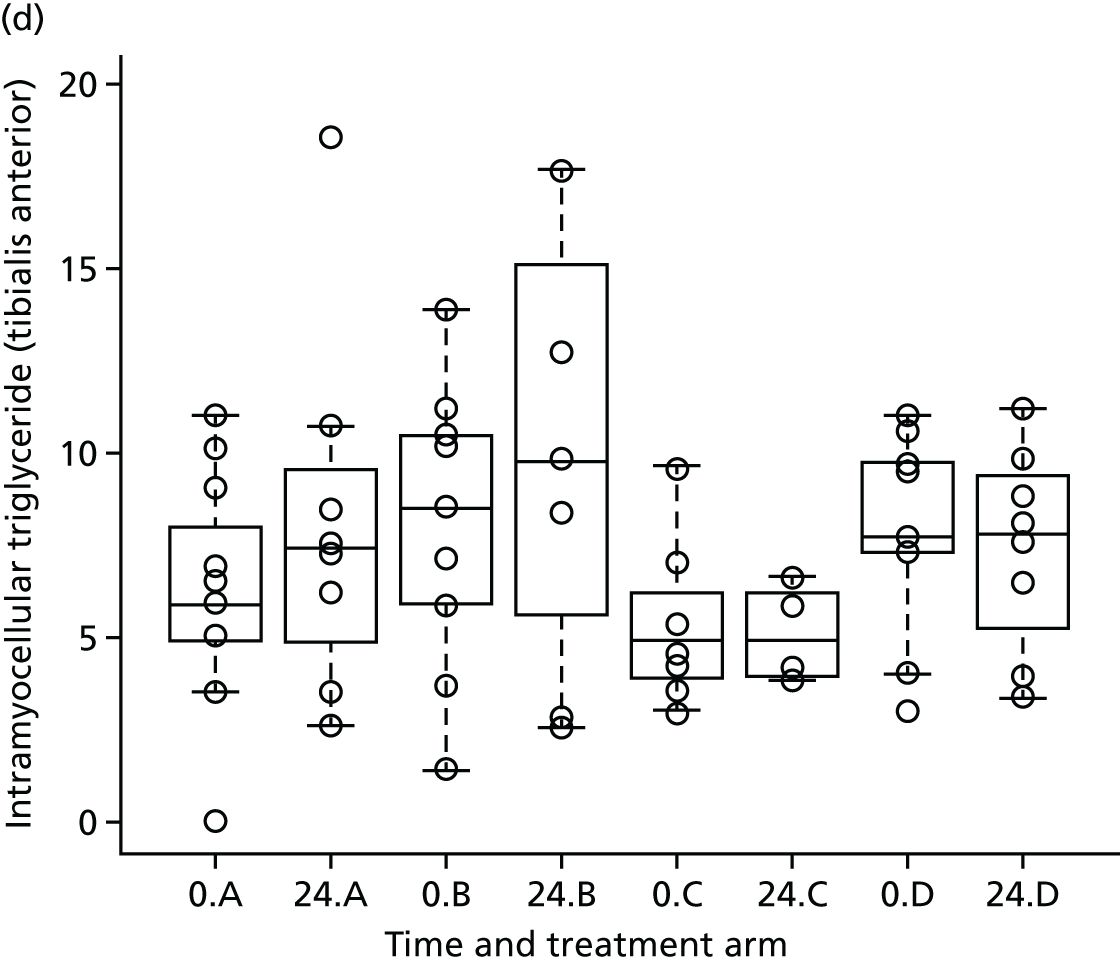
All models were adjusted for the baseline value of the outcome and for weight change between baseline and 24 weeks. No statistically significant differences were observed in internal visceral fat at 24 weeks between the treatment arm (80 mg) and the control arm (p = 0.9).
A statistically significant difference in the intrahepatic triglyceride content was observed at 24 weeks between arm D and arm A (the control group) (mean reduction 1.74, 95% CI –2.787 to –0.642; p = 0.005). Although the model was adjusted for differences in baseline, these results should be interpreted with caution given the large within-group variability and low sample size (as reflected by the wide 95% CIs). No statistically significant differences were observed in intramyocellular triglyceride content in the soleus and tibialis anterior at 24 weeks between the treatment (80 mg) and control groups (p = 0.8). The complete set of parameter estimates are shown in Appendix 6.
Substudy 2: urine/renal biomarkers
The longitudinal profiles of biomarkers NGAL and ACR were considered in subgroups defined by tertiles (for NGAL) and thresholds (for ACR) at baseline. For analysis of ACR, the sample set was divided into three subsets based on KDIGO 2012 clinical practice guideline for the evaluation and management of chronic kidney disease65 (ACR < 3 mg/mmol, normal; ACR 3–30 mg/mmol, microalbuminuria; ACR > 30 mg/mmol, macroalbuminuria). Given the lower number of dropout in each subgroup (< 20), linear mixed-effect models were used rather than joint models to analyse the longitudinal variations. The models were adjusted for ethnicity, age and sex.
The three tertile subgroups for NGAL included 106, 106 and 105 patients, respectively, and NGAL scores were fitted in log-transformed scale for normality. The changes in weight from baseline were not significant and the final models were adjusted for age and sex, and information from dropped arms. The estimated treatment effects [arm D (80 mg) compared with arm A (control)] on NGAL were not significant in any of the tertile subgroups: –0.215 (95% CI –0.627 to 0.196; p = 0.3), –0.065 (95% CI –0.512 to 0.382; p = 0.8) and –0.347 (95% CI –0.893 to 0.198); p = 0.3).
The subgroup of ACR < 3 mg/mmol included 70 patients; 21 were included in the subgroup of ACR 3–30 mg/mmol and just one patient had an ACR of > 30 mg/mmol. Therefore, subgroups of ACR 3–30 mg/mmol and ACR > 30 mg/mmol were combined. ACR scores were fitted in log-transformed scale for normality. The changes in weight from baseline or sex were not significant, and the final models for the subgroups ACR < 3 mg/mmol and ACR > 3 mg/mmol were adjusted for age and information from dropped arms. The treatment effect on the longitudinal ACR for the subgroup with an ACR of > 3mg/mmol was –0.665 (95% CI –1.310 to –0.019; p = 0.04), suggesting a significant but marginal treatment effect in arm D compared with the control arm.
There was no evidence of significant correlations between NGAL and ACR at baseline or at any other follow-up time points (p < 0.05). The longitudinal profiles, complete set of parameter estimates and scatterplots of ACR versus NGAL are shown in Appendix 6.
Safety data analysis
Each AR was categorised using the Medical Dictionary for Regulatory Activities (MedDRA)’s coding system organ class (SOC) terms (version 19.0) by the chief investigator. The number of ARs and number and percentage of patients affected in each category by treatment arm are presented in Table 9. Diarrhoea, fatigue, dizziness and pruritus were the most common ARs, observed in > 2% of patients. The number of occurrences of diarrhoea and dizziness was proportionately higher in the higher-dose arms. The number of ARs and number and percentage of patients affected in each category by treatment arm and by severity are shown in Table 58 (see Appendix 6).
| Category of events (SOC term) | AR description (PT) | Treatment arm | Total randomised (N = 377) | ||||||||||
|---|---|---|---|---|---|---|---|---|---|---|---|---|---|
| Arm B (20 mg) (N = 84) | Arm C (40 mg) (N = 82) | Arm D (80 mg) (N = 106) | |||||||||||
| Number of events | Number of patients | Percentage of patients | Number of events | Number of patients | Percentage of patients | Number of events | Number of patients | Percentage of patients | Number of events | Number of patients | Percentage of patients | ||
| Blood and lymphatic system disorders | Neutropenia | 0 | 0 | 0.0 | 0 | 0 | 0.0 | 1 | 1 | 0.9 | 1 | 1 | 0.3 |
| Cardiac disorders | Palpitations | 0 | 0 | 0.0 | 0 | 0 | 0.0 | 3 | 3 | 2.8 | 3 | 3 | 0.8 |
| Congenital, familial and genetic disorders | Double ureter | 0 | 0 | 0.0 | 1 | 1 | 1.2 | 0 | 0 | 0.0 | 1 | 1 | 0.3 |
| Ear and labyrinth disorders | Ear pain | 0 | 0 | 0.0 | 1 | 1 | 1.2 | 0 | 0 | 0.0 | 1 | 1 | 0.3 |
| Eye disorders | Dry eye | 0 | 0 | 0.0 | 0 | 0 | 0.0 | 2 | 1 | 0.9 | 2 | 1 | 0.3 |
| Lacrimation increased | 0 | 0 | 0.0 | 0 | 0 | 0.0 | 1 | 1 | 0.9 | 1 | 1 | 0.3 | |
| Vision blurred | 1 | 1 | 1.2 | 1 | 1 | 1.2 | 2 | 2 | 1.9 | 4 | 4 | 1.1 | |
| Visual impairment | 1 | 1 | 1.2 | 0 | 0 | 0.0 | 0 | 0 | 0.0 | 1 | 1 | 0.3 | |
| Gastrointestinal disorders | Abdominal distension | 0 | 0 | 0.0 | 3 | 3 | 3.7 | 1 | 1 | 0.9 | 4 | 4 | 1.1 |
| Abdominal pain (upper) | 0 | 0 | 0.0 | 0 | 0 | 0.0 | 1 | 1 | 0.9 | 1 | 1 | 0.3 | |
| Constipation | 0 | 0 | 0.0 | 1 | 1 | 1.2 | 0 | 0 | 0.0 | 1 | 1 | 0.3 | |
| Diarrhoea | 1 | 1 | 1.2 | 3 | 2 | 2.4 | 6 | 6 | 5.7 | 10 | 9 | 2.4 | |
| Dry mouth | 0 | 0 | 0.0 | 1 | 1 | 1.2 | 0 | 0 | 0.0 | 1 | 1 | 0.3 | |
| Dyspepsia | 2 | 2 | 2.4 | 1 | 1 | 1.2 | 1 | 1 | 0.9 | 4 | 4 | 1.1 | |
| Faeces (soft) | 0 | 0 | 0.0 | 1 | 1 | 1.2 | 0 | 0 | 0.0 | 1 | 1 | 0.3 | |
| Mouth ulceration | 0 | 0 | 0.0 | 0 | 0 | 0.0 | 2 | 2 | 1.9 | 2 | 2 | 0.5 | |
| Nausea | 1 | 1 | 1.2 | 3 | 2 | 2.4 | 2 | 1 | 0.9 | 6 | 4 | 1.1 | |
| Tongue coated | 0 | 0 | 0.0 | 0 | 0 | 0.0 | 1 | 1 | 0.9 | 1 | 1 | 0.3 | |
| Vomiting | 0 | 0 | 0.0 | 2 | 2 | 2.4 | 1 | 1 | 0.9 | 3 | 3 | 0.8 | |
| General disorders and administration site conditions | Asthenia | 0 | 0 | 0.0 | 1 | 1 | 1.2 | 0 | 0 | 0.0 | 1 | 1 | 0.3 |
| Chest pain | 0 | 0 | 0.0 | 1 | 1 | 1.2 | 1 | 1 | 0.9 | 2 | 2 | 0.5 | |
| Fatigue | 5 | 4 | 4.8 | 4 | 4 | 4.9 | 6 | 6 | 5.7 | 15 | 14 | 3.7 | |
| Feeling cold | 0 | 0 | 0.0 | 0 | 0 | 0.0 | 1 | 1 | 0.9 | 1 | 1 | 0.3 | |
| Feeling hot | 0 | 0 | 0.0 | 0 | 0 | 0.0 | 1 | 1 | 0.9 | 1 | 1 | 0.3 | |
| Influenza-like illness | 0 | 0 | 0.0 | 1 | 1 | 1.2 | 0 | 0 | 0.0 | 1 | 1 | 0.3 | |
| Malaise | 1 | 1 | 1.2 | 0 | 0 | 0.0 | 0 | 0 | 0.0 | 1 | 1 | 0.3 | |
| Pyrexia | 0 | 0 | 0.0 | 0 | 0 | 0.0 | 1 | 1 | 0.9 | 1 | 1 | 0.3 | |
| Infections and infestations | Acute sinusitis | 0 | 0 | 0.0 | 1 | 1 | 1.2 | 0 | 0 | 0.0 | 1 | 1 | 0.3 |
| Campylobacter gastroenteritis | 0 | 0 | 0.0 | 0 | 0 | 0.0 | 1 | 1 | 0.9 | 1 | 1 | 0.3 | |
| Influenza | 2 | 2 | 2.4 | 1 | 1 | 1.2 | 4 | 4 | 3.8 | 7 | 7 | 1.9 | |
| Lower respiratory tract infection | 0 | 0 | 0.0 | 0 | 0 | 0.0 | 1 | 1 | 0.9 | 1 | 1 | 0.3 | |
| Nasopharyngitis | 0 | 0 | 0.0 | 1 | 1 | 1.2 | 2 | 2 | 1.9 | 3 | 3 | 0.8 | |
| Onychomycosis | 1 | 1 | 1.2 | 0 | 0 | 0.0 | 0 | 0 | 0.0 | 1 | 1 | 0.3 | |
| Rhinitis | 0 | 0 | 0.0 | 0 | 0 | 0.0 | 1 | 1 | 0.9 | 1 | 1 | 0.3 | |
| Sinusitis | 0 | 0 | 0.0 | 1 | 1 | 1.2 | 0 | 0 | 0.0 | 1 | 1 | 0.3 | |
| Upper respiratory tract infection | 1 | 1 | 1.2 | 0 | 0 | 0.0 | 0 | 0 | 0.0 | 1 | 1 | 0.3 | |
| Urinary tract infection | 1 | 1 | 1.2 | 0 | 0 | 0.0 | 0 | 0 | 0.0 | 1 | 1 | 0.3 | |
| Injury, poisoning and procedural complications | Fall | 0 | 0 | 0.0 | 0 | 0 | 0.0 | 1 | 1 | 0.9 | 1 | 1 | 0.3 |
| Investigations | Hepatic enzyme increased | 0 | 0 | 0.0 | 1 | 1 | 1.2 | 0 | 0 | 0.0 | 1 | 1 | 0.3 |
| Weight increased | 0 | 0 | 0.0 | 1 | 1 | 1.2 | 0 | 0 | 0.0 | 1 | 1 | 0.3 | |
| Metabolism and nutrition disorders | Increased appetite | 0 | 0 | 0.0 | 1 | 1 | 1.2 | 0 | 0 | 0.0 | 1 | 1 | 0.3 |
| Musculoskeletal and connective tissue disorders | Arthralgia | 1 | 1 | 1.2 | 1 | 1 | 1.2 | 0 | 0 | 0.0 | 2 | 2 | 0.5 |
| Back pain | 2 | 2 | 2.4 | 0 | 0 | 0.0 | 1 | 1 | 0.9 | 3 | 3 | 0.8 | |
| Myalgia | 0 | 0 | 0.0 | 0 | 0 | 0.0 | 2 | 2 | 1.9 | 2 | 2 | 0.5 | |
| Neck pain | 1 | 1 | 1.2 | 0 | 0 | 0.0 | 0 | 0 | 0.0 | 1 | 1 | 0.3 | |
| Osteopenia | 0 | 0 | 0.0 | 0 | 0 | 0.0 | 1 | 1 | 0.9 | 1 | 1 | 0.3 | |
| Pain in jaw | 0 | 0 | 0.0 | 0 | 0 | 0.0 | 1 | 1 | 0.9 | 1 | 1 | 0.3 | |
| Nervous system disorders | Ageusia | 1 | 1 | 1.2 | 0 | 0 | 0.0 | 0 | 0 | 0.0 | 1 | 1 | 0.3 |
| Amnesia | 0 | 0 | 0.0 | 0 | 0 | 0.0 | 1 | 1 | 0.9 | 1 | 1 | 0.3 | |
| Burning sensation | 0 | 0 | 0.0 | 1 | 1 | 1.2 | 0 | 0 | 0.0 | 1 | 1 | 0.3 | |
| Disturbance in attention | 0 | 0 | 0.0 | 0 | 0 | 0.0 | 1 | 1 | 0.9 | 1 | 1 | 0.3 | |
| Dizziness | 6 | 6 | 7.1 | 7 | 6 | 7.3 | 17 | 16 | 15.1 | 30 | 28 | 7.4 | |
| Dysgeusia | 0 | 0 | 0.0 | 1 | 1 | 1.2 | 0 | 0 | 0.0 | 1 | 1 | 0.3 | |
| Headache | 6 | 6 | 7.1 | 7 | 7 | 8.5 | 11 | 9 | 8.5 | 24 | 22 | 5.8 | |
| Loss of consciousness | 0 | 0 | 0.0 | 0 | 0 | 0.0 | 1 | 1 | 0.9 | 1 | 1 | 0.3 | |
| Paraesthesia | 0 | 0 | 0.0 | 0 | 0 | 0.0 | 2 | 2 | 1.9 | 2 | 2 | 0.5 | |
| Somnolence | 0 | 0 | 0.0 | 1 | 1 | 1.2 | 0 | 0 | 0.0 | 1 | 1 | 0.3 | |
| Syncope | 1 | 1 | 1.2 | 0 | 0 | 0.0 | 0 | 0 | 0.0 | 1 | 1 | 0.3 | |
| Tension headache | 0 | 0 | 0.0 | 1 | 1 | 1.2 | 0 | 0 | 0.0 | 1 | 1 | 0.3 | |
| Tremor | 0 | 0 | 0.0 | 1 | 1 | 1.2 | 0 | 0 | 0.0 | 1 | 1 | 0.3 | |
| Trigeminal neuralgia | 1 | 1 | 1.2 | 0 | 0 | 0.0 | 0 | 0 | 0.0 | 1 | 1 | 0.3 | |
| Psychiatric disorders | Anxiety | 0 | 0 | 0.0 | 3 | 3 | 3.7 | 1 | 1 | 0.9 | 4 | 4 | 1.1 |
| Confusional state | 0 | 0 | 0.0 | 0 | 0 | 0.0 | 1 | 1 | 0.9 | 1 | 1 | 0.3 | |
| Depressed mood | 1 | 1 | 1.2 | 0 | 0 | 0.0 | 0 | 0 | 0.0 | 1 | 1 | 0.3 | |
| Depression | 0 | 0 | 0.0 | 1 | 1 | 1.2 | 0 | 0 | 0.0 | 1 | 1 | 0.3 | |
| Insomnia | 1 | 1 | 1.2 | 0 | 0 | 0.0 | 3 | 3 | 2.8 | 4 | 4 | 1.1 | |
| Morbid thoughts | 0 | 0 | 0.0 | 0 | 0 | 0.0 | 1 | 1 | 0.9 | 1 | 1 | 0.3 | |
| Renal and urinary disorders | Chromaturia | 0 | 0 | 0.0 | 0 | 0 | 0.0 | 1 | 1 | 0.9 | 1 | 1 | 0.3 |
| Haematuria | 0 | 0 | 0.0 | 1 | 1 | 1.2 | 0 | 0 | 0.0 | 1 | 1 | 0.3 | |
| Renal impairment | 0 | 0 | 0.0 | 0 | 0 | 0.0 | 1 | 1 | 0.9 | 1 | 1 | 0.3 | |
| Reproductive system and breast disorders | Ejaculation failure | 0 | 0 | 0.0 | 0 | 0 | 0.0 | 1 | 1 | 0.9 | 1 | 1 | 0.3 |
| Respiratory, thoracic and mediastinal disorders | Cough | 0 | 0 | 0.0 | 1 | 1 | 1.2 | 0 | 0 | 0.0 | 1 | 1 | 0.3 |
| Epistaxis | 0 | 0 | 0.0 | 0 | 0 | 0.0 | 2 | 2 | 1.9 | 2 | 2 | 0.5 | |
| Oropharyngeal pain | 0 | 0 | 0.0 | 1 | 1 | 1.2 | 1 | 1 | 0.9 | 2 | 2 | 0.5 | |
| Pulmonary fibrosis | 1 | 1 | 1.2 | 0 | 0 | 0.0 | 0 | 0 | 0.0 | 1 | 1 | 0.3 | |
| Sinus congestion | 1 | 1 | 1.2 | 0 | 0 | 0.0 | 0 | 0 | 0.0 | 1 | 1 | 0.3 | |
| Skin and subcutaneous tissue disorders | Angioedema | 1 | 1 | 1.2 | 0 | 0 | 0.0 | 0 | 0 | 0.0 | 1 | 1 | 0.3 |
| Dry skin | 0 | 0 | 0.0 | 1 | 1 | 1.2 | 0 | 0 | 0.0 | 1 | 1 | 0.3 | |
| Hyperhidrosis | 2 | 2 | 2.4 | 1 | 1 | 1.2 | 0 | 0 | 0.0 | 3 | 3 | 0.8 | |
| Photosensitivity reaction | 0 | 0 | 0.0 | 1 | 1 | 1.2 | 0 | 0 | 0.0 | 1 | 1 | 0.3 | |
| Pruritus | 4 | 4 | 4.8 | 1 | 1 | 1.2 | 3 | 3 | 2.8 | 8 | 8 | 2.1 | |
| Rash | 1 | 1 | 1.2 | 1 | 1 | 1.2 | 4 | 4 | 3.8 | 6 | 6 | 1.6 | |
| Vascular disorders | Haematoma | 0 | 0 | 0.0 | 0 | 0 | 0.0 | 1 | 1 | 0.9 | 1 | 1 | 0.3 |
| Hypertension | 1 | 1 | 1.2 | 0 | 0 | 0.0 | 0 | 0 | 0.0 | 1 | 1 | 0.3 | |
| Hypotension | 1 | 1 | 1.2 | 2 | 1 | 1.2 | 1 | 1 | 0.9 | 4 | 3 | 0.8 | |
| Orthostatic hypotension | 0 | 0 | 0.0 | 3 | 2 | 2.4 | 1 | 1 | 0.9 | 4 | 3 | 0.8 | |
| Total | 50 | 28 | 33.3 | 69 | 28 | 34.1 | 104 | 49 | 46.2 | 223 | 105 | 27.9 | |
Serious adverse events
From a total of 377 patients, 21 SAEs were reported from 19 (5.0%) patients: five patients (4.8% of the allocated 105 patients; six events) in arm A (control), three patients (3.6%; three events) in arm B (20 mg), four patients (4.9%; four events) in arm C (40 mg) and seven patients (6.6%; eight events) in arm D (80 mg). No SUSARs were reported (see Table 59 in Appendix 5 for full details). We compared the percentage of patients who had one or more SAEs between telmisartan-treated arms and the control arm using the Fisher’s exact test. There was no evidence of difference in percentage of SAEs between telmisartan-treated arms and the control arms (p = 0.8).
Compliance with study drug schedule
Any unused drug was collected during the follow-up and study medication compliance was assessed by counting the number of pills returned and entries made in the treatment diary. Table 57 (see Appendix 6) presents a descriptive summary of compliance of the total dose consumed according to the treatment diary and according to the number of pills returned at each visit (at weeks 2, 4, 12 and 24) split by treatment arm. The baseline characteristics of those who provided compliance information were compared with the characteristics of patients who did not provide compliance information (see Table 61 in Appendix 6).
There were no clinically important differences observed in the systolic or diastolic blood pressure, CD4 cell count and eGFR between those with compliance data and those without. However, on average, HIV viral load was higher in those who provided compliance data than in those who did not (see Table 61 in Appendix 6). Analysis according to compliance (dose received) was carried out as a sensitivity analysis using IV regression (with randomisation as the instrument). We also carried out two additional exploratory compliance-adjusted analyses for HOMA-IR at 24 weeks to address the selection bias, given the above observation on HIV viral load. The results remained the same as the original sensitivity analysis (see Appendix 6, Tables 28–30).
Chapter 5 Discussion
A number of small clinical studies in the non-HIV-infected population31,68–71 and meta-analyses of telmisartan’s effect on insulin resistance39 and other markers of glycaemic control41 have suggested that telmisartan has a beneficial effect on glucose and lipid homeostasis. This study51 and others52 have shown that telmisartan results in partial reversal of metabolic toxicity induced by antiretrovirals in vitro, suggesting a potential beneficial effect of telmisartan in individuals infected with HIV, in whom cART-induced cardiometabolic toxicity is a concern. Based on these observations, in order to determine whether or not telmisartan has clinical utility, a robust, methodologically sound, adequately powered, randomised clinical trial was needed in individuals infected with HIV to investigate the effect of telmisartan on various metabolic parameters. Our in vitro study51 also suggested a need for defining the dose–response of telmisartan; hence, a clinical trial with a novel adaptive design to investigate the effect of multiple doses of telmisartan was adopted. This was also considered to be necessary because it should not be assumed that the dose–response of telmisartan in hypertension (i.e. telmisartan is already licensed for use in the treatment of hypertension) would be equivalent in a repurposed indication (i.e. reduction of insulin resistance).
To the best of our knowledge, the TAILoR trial is the only RCT to date which has assessed the effect of telmisartan on insulin resistance in individuals infected with HIV. It is also important to note that this trial is also the largest RCT to investigate the effect of telmisartan on insulin resistance and other metabolic parameters in any clinical setting (HIV positive or negative).
Main findings
Primary outcome
The primary objective of the trial was to investigate whether or not telmisartan, at any of the doses tested, resulted in a reduction in HOMA-IR, a validated marker of insulin resistance, in individuals infected with HIV over a period of 24 weeks. Using a novel adaptive design, the trial was divided into two stages; the first was to identify the best dose(s) of telmisartan (20, 40 or 80 mg) when compared with current standard of care, and the second stage was to compare one or more doses of telmisartan for a further 24 weeks. The first stage, conducted in 154 patients, identified one dose (80 mg of telmisartan) that met the prespecified end point and was subsequently tested in the second stage. The final analysis, conducted in 211 individuals, demonstrated that telmisartan (80 mg) did not result in a statistically significant reduction in HOMA-IR when compared with the control arm over 24 weeks.
Secondary outcomes
We used QUICKI and revised QUICKI, two alternative indices of insulin resistance, to confirm the effect of telmisartan on HOMA-IR. Telmisartan did not show a statistically significant increase (QUICKI and revised QUICKI are log measures and, therefore, are expected to increase if there is any reduction in insulin resistance) in these indices at 24 weeks in comparison with the control arm.
A longitudinal analysis of the effect of telmisartan on HOMA-IR, QUICKI and revised QUICKI over a period of 48 weeks, when compared with the control arm, showed that while there was no change in HOMA-IR and QUICKI, there was a significant, but marginal, improvement in revised QUICKI (p = 0.05). Telmisartan (80 mg) did not have any effect on serum lipids (cholesterol, triglycerides, HDL-C and LDL-C) and adipokines (markers of homeostasis and inflammation: adiponectin, leptin, resistin, IL-8, TNF-α), but there was a significant decrease in hs-CRP over 48 weeks.
Two different substudies were conducted as part of this trial:
-
Substudy 1 was an exploratory evaluation of the effect of telmisartan on total body, liver (intrahepatic) and limb (intramyocellular) fat distribution using MRI and 1H-MRS. Telmisartan did not show any significant reduction in total body fat or limb fat, but significantly reduced liver fat over a period of 24 weeks.
-
Substudy 2 investigated the effect of telmisartan on renal parameters. Telmisartan (80 mg) showed a significant decrease in ACR (p = 0.04) over a period of 48 weeks in patients with microalbuminuria (ACR > 3 mg/mmol), but did not affect urinary NGAL, a marker of kidney disease.
There were no safety concerns with any of the doses of telmisartan and, although 21 SAEs were reported throughout the study, these were similar between the treatment arms and the non-intervention arm, and there was no dose-dependent increase in AEs. Of course, telmisartan has been used in a significant number of patients with hypertension, and it was not expected that this study would find any new, previously unreported, AEs. However, the finding of no decrease in blood pressure, even in patients without hypertension, was reassuring.
Interpretation and comparison with other studies
Telmisartan does not result in the reduction of Homeostatic Model Assessment of Insulin Resistance
Most of the evidence for telmisartan’s beneficial effect on insulin resistance and other glycaemic markers has so far come from non-HIV clinical studies. 35,38 Since the inception of this trial, three studies have reported in patients infected with HIV:
-
two observational studies showed a reduction in insulin resistance with telmisartan48,72 with smaller sample sizes (18 and 13 participants)
-
a single-arm open-label trial conducted in 35 individuals infected with HIV (the MATH trial73) that failed to find a significant change in HOMA-IR over 24 weeks.
Telmisartan has two main modes of action: it acts as an angiotensin II receptor antagonist and is a partial agonist at the adipocyte nuclear receptor PPAR-γ. Its effects have been attributed to the activation of PPAR-γ,74 but its anti-angiotensin effects may also play a role. 52
Human immunodeficiency virus causes disruption in glucose metabolism; in particular, the HIV viral protein inhibits PPAR-γ. 75 Adipose tissue, a major mediator of insulin sensitivity in the body, acts as a reservoir for HIV. 76 HIV infection causes inflammation that can lead to dysregulation of insulin signalling. HIV replication also causes upregulation of fatty acid synthase, an enzyme responsible for fatty acid synthesis;77 this increases the production of fatty acids, which could result in lipotoxicity and insulin resistance. In addition to the effect of HIV, cART is known to be toxic to adipose tissue, with cART-induced inhibition of PPAR-γ well documented. 52,78,79 Therefore, both HIV and cART, independently, have a direct effect on PPAR-γ. Therefore, our decision to trial telmisartan to reduce insulin resistance had a biological basis. The reason that we did not any reduction in HOMA-IR find may have been either because (1) telmisartan was not potent enough to compete with the adverse effects of HIV and cART on adipocytes and/or (2) the cause of the rise in insulin resistance in HIV is dependent on many other pathways, and blocking one is not adequate enough to lead to an improvement.
In the non-HIV setting, there have only been a handful of RCTs to assess the effect of telmisartan on insulin resistance as a primary outcome measure. Two of the largest RCTs compared telmisartan with other ARBs but in the presence of either rosiglitazone35 or rosuvastatin,38 two drugs with independent effects on glucose and lipid homeostasis. Derosa et al. ’s study35 in 188 T2DM patients with MS who were on rosiglitazone demonstrated that telmisartan (40 mg) significantly reduced HOMA-IR by 17% at 24 weeks and by 29% at 48 weeks. Rizos et al. ’s comparison38 of telmisartan (80 mg) with olmesartan and irbesartan (n = 151) in hypertensive individuals with impaired glucose function demonstrated that telmisartan reduced HOMA-IR by 29% (whereas the other ARBs resulted in an increase in HOMA-IR). It is important to note that the patients studied in these trials were highly insulin resistant at baseline (median baseline HOMA-IR was 7.2 in the telmisartan arm in Derosa et al. ;35 and 2.6 in the telmisartan arm in Rizos et al. 38). By contrast, in the present trial, the median baseline HOMA-IR was 1.6 in arm D. Therefore, detecting a reduction in HOMA-IR even further with telmisartan would be improbable without a much larger trial. It is also important to note that patients infected with HIV are treated with different cART combinations, each with a differing propensity to cause insulin resistance; this heterogeneity may have masked any positive effect, given the small numbers of patients in each drug combination group. Recruitment restricted to patients with higher HOMA-IRs may have been beneficial, but the feasibility of recruiting to such a trial would have been difficult.
Finally, it is important to highlight that 80 mg of telmisartan did have a positive impact on HOMA-IR. Even though patients in both the treatment and the control arms showed an increase in HOMA-IR between baseline and 24 weeks, the increase was of lesser magnitude in the treatment arm (+0.18; 7% increase) when compared with the control arm (+0.5; 20% increase). This was also observed at 48 weeks: HOMA-IR increased less with telmisartan (+0.74; 29% increase) than in the control arm (+1.2; 49% increase). It is not clear from the literature whether or not the effects of telmisartan increase with duration of treatment; we chose a 24-week time period based on observations in the non-HIV literature. A longer duration of treatment may have been more ideal but previous studies have shown that HOMA-IR changes within 4 weeks of starting antiretrovirals. 22
Telmisartan showed a marginal beneficial effect on revised QUICKI (p = 0.05) in a longitudinal analysis over 48 weeks. Although HOMA-IR has been most commonly used as an index of insulin resistance under fasting conditions, a meta-analysis of surrogate measures of insulin resistance/sensitivity under fasting conditions identified revised QUICKI as the index that has the strongest correlation (r = 0.68) with the gold standard, the hyperinsulinaemic–euglycaemic clamp. 80 Revised QUICKI takes into account fasting serum NEFA levels, in addition to plasma glucose and serum insulin, which has been suggested to improve its correlation with the clamp-based index of insulin sensitivity and its discriminatory power, particularly in non-obese individuals who present with mild insulin resistance. 81 Given that the TAILoR cohort had a median baseline BMI of 26.7 kg/m2 (marginally overweight as per NICE Clinical Guidelines82), revised QUICKI may be a more a sensitive indicator of the effect of telmisartan than HOMA-IR.
Telmisartan significantly reduced liver fat, but not total body or limb fat
A limited meta-analysis of three RCTs83 with telmisartan treatment duration of 16–24 weeks (combined sample size of 62 participants) showed that telmisartan caused a significant reduction in visceral, but not in subcutaneous, fat suggesting a beneficial effect on body fat. However, the current study did not observe any significant reduction in internal visceral fat with any of the telmisartan doses over a period of 24 weeks. This is in line with the findings from the only other study that assessed the effect of telmisartan in patients infected with HIV on cART. 73 It is possible a longer timeframe may be required to reduce visceral fat in patients infected with HIV.
Our trial did find a significant reduction in liver, but not limb, fat in the 80 mg of telmisartan arm over a period of 24 weeks. This is the first time a positive effect on liver fat has been reported with telmisartan in patients infected with HIV, but given the small numbers (n = 10 in each of the three treatment arms; n = 13 in the non-intervention arm), the findings have to be interpreted with caution. Indeed, intrahepatic fat has been suggested to be a better marker of metabolic disease than visceral fat,84 and may provide a better estimate of ectopic fatty acid deposition, which is one of the main reasons for the development of insulin resistance. However, our finding contrasts with a previous randomised trial85 in obese adult individuals using 160 mg of telmisartan that did not find any changes in total, liver or limb fat.
Telmisartan did not change any of the plasma markers except high-sensitivity C-reactive protein
Telmisartan treatment did not improve lipids (total cholesterol, triglycerides, HDL and LDL-C) or plasma adipokines (adiponectin, leptin, resistin, IL-8 and TNFα) over a period of 48 weeks. This is in line with results from the MATH trial,73 which also did not find any change in lipids or adipokines with the exception of a marginal increase in TNFα. However, meta-analyses of non-HIV clinical studies have shown that telmisartan results in a reduction in lipids42 and adiponectin. 41 The effect of telmisartan on leptin, resistin, IL-8 and TNFα in patients not infected with HIV, however, has been contradictory and may be primarily because of small scale studies with limited generalisability. 35,86,87 The lack of effect of telmisartan on lipids in our trial may be because of the more complex clinical picture in patients infected with HIV (interaction with HIV and cART, duration of treatment) and because 58 (15.4%) of our patients were already on statins.
Many non-HIV clinical studies,38,88 and a meta-analysis43 (n = 2632 patients), have shown that telmisartan reduces hs-CRP levels. We observed a similar effect of telmisartan on hs-CRP over a period of 48 weeks in this trial. C-reactive protein promotes the proatherogenic activity of angiotensin, directly and indirectly stimulates structural and functional modification of arterial walls, heart and vascular remodelling and is considered to be an inflammatory marker. 89 In patients infected with HIV, hs-CRP may be an independent predictor of CVD;90 the anti-inflammatory effect of telmisartan, through its direct blockade of angiotensin action, may be responsible for the reduction in hs-CRP in patients infected with HIV, and may thus have the potential to reduce the associated CVD risk.
Telmisartan and effect on microalbuminuria
There is already some preliminary evidence of the renoprotective effect of telmisartan in patients infected with HIV; Ucciferri et al. 48 showed that telmisartan reduced microalbuminuria in patients infected with HIV. A meta-analysis of 20 RCTs, including > 12,000 patients not infected with HIV on telmisartan, by Takagi et al. 47 also showed that telmisartan results in a significant reduction in urinary ACR. Our study was not designed to investigate renal outcomes, but telmisartan (80 mg) did result in a significant reduction (p = 0.04) in ACR over 48 weeks in patients with microalbuminuria (defined by an ACR of > 3 mg/mmol) when compared with the current standard of care. However, it should be noted that this effect was observed in a small sample size of only 22 participants who had microalbuminuria and, therefore, the results should be interpreted with caution. Telmisartan did not have an effect on NGAL, another marker of renal health. It may also be important to note that NGAL did not show any correlation with urinary ACR. ACR is a marker of glomerular injury, whereas NGAL is a marker of tubular damage.
Strength and weaknesses
Design of the study
The study used a novel adaptive design in order to investigate the optimal dose of telmisartan, with the potential to cause a reduction in HOMA-IR. Adaptive designs are allowed to incorporate a prospectively planned opportunity for modification of one or more specified aspects of the study design and hypotheses based on analysis of the interim data. 91 Adaptive trial designs are innovative designs recommended by both the US Food and Drug Administration92 and the European Medicines Agency93 for clinical R&D because they offer flexibility in identifying the optimal clinical benefit of the test treatment under study without undermining the validity and integrity of the study. In the current study, the adaptive design allowed for testing three different doses of telmisartan simultaneously and dropping two different ‘loser doses’ so that a potential ‘winner dose’ could be taken into the second stage of the study. Such a design also took into account the fact that the dose–response profile of telmisartan, when used, as in our study, to reduce insulin resistance, may differ from its dose–response profile when used for its licensed indication, which is to reduce hypertension. This design also provided an opportunity to stop the study at the interim analysis stage if the required benefit was not identified with any of the doses.
Given that no further data were collected on dose arms dropped at interim analysis, a potential weakness is our incomplete understanding of the effect of these dose arms.
Recruitment and retention
Despite positive results from feasibility assessments, recruitment to the study was slower than expected. Recruitment was also beset by delays in funding for extra treatment costs, which led to delays in the study set-up at various sites. We overcame these limitations, as described, but this nevertheless had an impact on the start of recruitment at different sites. The trial was supported by the Comprehensive Local Research Networks, which helped promote the trial nationally; this had a positive impact on recruitment.
Outcome measures and effect size
We used HOMA-IR as our primary outcome measure, which is the most commonly used measure of insulin resistance. In addition, several other markers of insulin resistance/sensitivity were used as secondary outcome measures. Ideally, an insulin clamp should have been used as the primary outcome measure, but the invasiveness and complexity of undertaking this in a large-scale trial ruled it out. Although there was no significant effect on HOMA-IR longitudinally over 48 weeks, there was a significant increase in revised QUICKI, which is biologically plausible, and perhaps is indicative of its greater sensitivity than HOMA-IR in evaluating changes in insulin action. Using QUICKI as a primary outcome measure may therefore have been preferable. A 24-week time point was selected for the primary outcome and 48 weeks for the total duration of drug treatment based on data on patients not infected with HIV. Whether or not a longer duration of treatment may show an effect is debatable. Furthermore, our patient group had relatively modest elevations in HOMA-IR and, it is possible, on the basis of data from patients not infected with HIV, that its effects may have been greater if the patients had been stratified to higher HOMA-IR elevations. The likely effect of HIV and cART on insulin resistance is likely to be complex and rely on multiple pathways; thus, blocking one pathway to overcome this may have been over simplistic.
Chapter 6 Conclusions and recommendations
In conclusion, this trial used a novel adaptive design to assess the effect of different doses of telmisartan on insulin resistance in patients infected with HIV on cART. There was no significant effect of telmisartan on our primary outcome measure, which was a reduction in HOMA-IR after 24 weeks’ treatment, although we found a smaller elevation in HOMA-IR in patients on telmisartan than in the control arm. Interestingly, a longitudinal analysis over 48 weeks showed telmisartan increased revised QUICKI, a sensitive surrogate marker of insulin sensitivity, indicating that it may have potential beneficial metabolic effects in this population. This is also consistent with the positive effects of telmisartan on hs-CRP and hepatic fat accumulation. Consistent with the vast body of literature, telmisartan also reduced ACR, even though we had only a small number of patients who were albuminuric at baseline. It is, however, important to note that many of the positive effects of telmisartan we identified in this trial were marginally significant and thus could be false positives as a result of multiple testing. This has to be balanced against the fact that all the effects are biologically plausible, and the combination of effects taken together, particularly at 48 weeks, suggests that telmisartan’s use in patients infected with HIV may have some benefits. However, whether or not improvement in these surrogate markers, which were secondary outcomes in our trial, would have any effect on clinical outcomes, including a reduction in cardiovascular events and mortality, is unclear.
Implications for clinical practice
Despite the use of newer agents and newer combinations, insulin resistance, related metabolic disease manifestations and the increased risk of CVD remain key problems in HIV-infected individuals on cART. Currently, these metabolic manifestations in patients infected with HIV are treated symptomatically using various drug classes such as statins (to reduce lipids), antidiabetic drugs such as metformin or glitazones (to lower glucose) and the growth hormone-releasing factor analogue tesamorelin. 94 Telmisartan is not used in current clinical practice for the prevention or treatment of metabolic disease, despite the accumulating evidence in the non-HIV setting. This trial does show some positive findings, such as telmisartan’s effect on revised QUICKI (a surrogate for insulin sensitivity), hs-CRP (a marker of CVD) and intrahepatic fat (a marker of metabolic disease). Based on the results of the trial, telmisartan did not affect our primary outcome measure, reduction in insulin resistance, in HIV-infected individuals.
Recommendations for future research
-
All the markers used in this trial, although clinically acceptable, are relatively crude. It is important to undertake detailed analysis in this patient group, for example of the lipidome, to understand in more detail the derangements that occur in adipocyte function with HIV infection and cART, and to understand more about the biology of this adipocyte dysfunction and whether or not drugs may be able to improve this.
-
The detrimental effect of HIV infection and cART may be complex and dependent on multiple pathways. Given that less toxic cART is now available, and widely used, any future studies should be adequately powered to evaluate improvements in milder degrees of insulin resistance and should consider the use of multiple drugs, affecting different biological pathways. The duration of the study should be dependent on the drug(s) studied and outcome measures, and should be determined carefully during study design.
-
Although the trial did not show any effect in our primary outcome measure over 24 weeks, there were improvements in some secondary outcome measures (revised QUICKI, hs-CRP and urinary albumin excretion over 48 weeks and hepatic fat accumulation over 24 weeks), all of which are biologically plausible and consistent with the literature. Whether or not telmisartan use would therefore lead to improvement in clinical outcomes is unclear. This remains an area of unmet medical need, not only in the HIV population, but also in the general population given the increasing prevalence of obesity and insulin resistance. Any future novel interventions, which may be individual therapies of novel targets or combination therapies (with or without telmisartan), should be powered on clinical outcome measures, with validation of some of the surrogate end points that have been used in this trial as well as novel biomarkers.
Acknowledgements
We would like to thank the following:
-
The TAILoR trial funder, the NIHR Efficacy and Mechanism Evaluation (EME) programme.
-
The patients who participated in the trial.
-
The Clinical Trials Research Centre (part of the Liverpool Trials Collaborative).
-
Trial Steering Committee members.
-
The IDSMC members.
-
The North West Coast Clinical Research Network.
-
The Bioanalytical Facility, Royal Liverpool and Broadgreen University Hospitals NHS Trust.
-
The TAILoR study group, which included the authors of the report, the PIs at the participating sites, Professor Jiten Vora and Professor John Whitehead.
The PIs at the participating sites were as follows:
-
Dr Duncan Churchill, Brighton and Sussex Hospitals NHS Trust – Elton John Centre.
-
Dr Satyajit Das, Coventry and Warwickshire NHS Trust.
-
Dr David Loay, George Elliot Hospital.
-
Dr Barry Peters, Guy’s and St Thomas’ Hospital.
-
Dr Fabiola Martin, Harrogate District Hospital.
-
Dr David Chadwick, James Cook University Hospital.
-
Dr Frank Post, King’s College Hospital.
-
Dr Jane Minton, Leeds Teaching Hospitals – St James’s University Hospital.
-
Dr Gabriel Schembri, Manchester Centre for Sexual Health.
-
Dr Jonathan Ainsworth, North Middlesex Hospital.
-
Dr Elbushra Hereika, Royal Bournemouth and Christchurch Hospital.
-
Professor Margaret Johnson, Royal Free London Hospital.
-
Professor Saye Khoo, Royal Liverpool Hospital.
-
Dr Mayur Chauhan, Royal Victoria Infirmary, Newcastle.
-
Dr Mark Gompels, Southmead Hospital, Bristol.
-
Dr Mas Chaponda, St Helens Hospital.
-
Professor Clifford Leen, Western General Hospital.
Contributions of authors
Sudeep Pushpakom (Lecturer, University of Liverpool) (co-applicant on grant) contributed to the conception and design of the study and study materials, participated in the set up of the trial, designed and performed laboratory analyses, contributed to the interpretation of data and participated in drafting and approving this report.
Ruwanthi Kolamunnage-Dona (Senior Statistician, University of Liverpool) (co-applicant on grant) contributed to the design of the study, performed analysis and interpretation of data and participated in drafting and approving this report.
Claire Taylor (Trial Coordinator, University of Liverpool) contributed to the design of the study and study materials, completed the set up of the trial and participated in drafting and approving this report.
Terry Foster (Research Technician, University of Liverpool) performed sample processing, labelling and storage and performed laboratory analyses.
Catherine Spowart (Supervisory Trial Manager, University of Liverpool) contributed to the design of the study, provided supervision for trial management activities and participated in drafting and approving this report.
Marta Garcia-Finana (Senior Statistician, University of Liverpool) contributed to the design of the MRI/MRS substudy, performed analysis of and interpreted MRI/MRS substudy data and participated in drafting and approving this report.
Graham J Kemp (Director of LiMRIC, University of Liverpool) contributed to the design of MRI/MRS substudy, contributed to the interpretation of analysis from MRI/MRS data and participated in drafting this report.
Thomas Jaki (Senior Lecturer in Medical Statistics, University of Lancaster) (co-applicant on grant) contributed to the design of the study, the design of the statistical analysis and participated in drafting and approving this report.
Saye Khoo (Professor of HIV medicine, University of Liverpool) (co-applicant on grant) (PI at RLBUHT) contributed to the conception and design of the study and participated in drafting and approving this report.
Paula Williamson (Professor of Biostatistics, University of Liverpool) (co-applicant on grant) contributed to the conception and design of the study, participated in the design of statistical analysis and interpretation of analyses and participated in drafting and approving this report.
Munir Pirmohamed (David Weatherall Chair of Medicine, University of Liverpool) (chief investigator) contributed to the design and conception of the study, obtained funding, provided guidance for the set up of the trial, supervised the conduct of the trial and chaired the TMG, contributed to the interpretation of data and participated in drafting and approving this report.
Publication
Pushpakom SP, Taylor C, Kolamunnage-Dona R, Spowart C, Vora J, Garcia-Finana M, et al. Telmisartan and Insulin Resistance in HIV (TAILoR): protocol for a dose-ranging phase II randomised open-labelled trial of telmisartan as a strategy for the reduction of insulin resistance in HIV-positive individuals on combination antiretroviral therapy. BMJ Open 2015;5:e009566.
Pushpakom S, Kolamunnage-Dona R, Taylor C, Foster T, Spowart C, García-Fiñana M, et al. TAILoR (TelmisArtan and InsuLin Resistance in HIV): an adaptive design dose-ranging Phase IIb randomised trial of telmisartan for the reduction of insulin resistance in HIV-positive individuals on combination antiretroviral therapy [published online ahead of print July 3 2019]. Clin Infect Dis 2019: in press. https://doi.org/10.1093/cid/ciz589
Data-sharing statement
All available data are contained within the report. All queries should be submitted to the corresponding author.
Patient data
This work uses data provided by patients and collected by the NHS as part of their care and support. Using patient data is vital to improve health and care for everyone. There is huge potential to make better use of information from people’s patient records, to understand more about disease, to develop new treatments, to monitor safety, and to plan NHS services. Patient data should be kept safe and secure, to protect everyone’s privacy, and it’s important that there are safeguards to make sure that it is stored and used responsibly. Everyone should be able to find out about how patient data are used. #datasaveslives You can find out more about the background to this citation here: https://understandingpatientdata.org.uk/data-citation.
Disclaimers
This report presents independent research. The views and opinions expressed by authors in this publication are those of the authors and do not necessarily reflect those of the NHS, the NIHR, the MRC, NETSCC, the EME programme or the Department of Health and Social Care. If there are verbatim quotations included in this publication the views and opinions expressed by the interviewees are those of the interviewees and do not necessarily reflect those of the authors, those of the NHS, the NIHR, NETSCC, the EME programme or the Department of Health and Social Care.
References
- Koethe JR, Jenkins CA, Lau B, Shepherd BE, Justice AC, Tate JP, et al. Rising obesity prevalence and weight gain among adults starting antiretroviral therapy in the United States and Canada. AIDS Res Hum Retroviruses 2016;32:50-8. https://doi.org/10.1089/aid.2015.0147.
- Carr A, Emery S, Law M, Puls R, Lundgren JD, Powderly WG. HIV Lipodystrophy Case Definition Study Group . An objective case definition of lipodystrophy in HIV-infected adults: a case-control study. Lancet 2003;361:726-35. https://doi.org/10.1016/S0140-6736(03)12656-6.
- Potthoff A, Brockmeyer NH, Gelbrich G, Neuhaus K, Esser S, Reinsch N, et al. Lipodystrophy – a sign for metabolic syndrome in patients of the HIV-HEART study. J Dtsch Dermatol Ges 2010;8:92-8. https://doi.org/10.1111/j.1610-0387.2009.07330.x.
- Nguyen KA, Peer N, Mills EJ, Kengne AP. A meta-analysis of the metabolic syndrome prevalence in the global HIV-infected population. PLOS ONE 2016;11. https://doi.org/10.1371/journal.pone.0150970.
- Friis-Møller N, Sabin CA, Weber R, d’Arminio Monforte A, El-Sadr WM, Reiss P, et al. Combination antiretroviral therapy and the risk of myocardial infarction. N Engl J Med 2003;349:1993-200. https://doi.org/10.1056/NEJMoa030218.
- Worm SW, Friis-Møller N, Bruyand M, D’Arminio Monforte A, Rickenbach M, Reiss P, et al. High prevalence of the metabolic syndrome in HIV-infected patients: impact of different definitions of the metabolic syndrome. AIDS 2010;24:427-35. https://doi.org/10.1097/QAD.0b013e328334344e.
- Brown TT, Cole SR, Li X, Kingsley LA, Palella FJ, Riddler SA, et al. Antiretroviral therapy and the prevalence and incidence of diabetes mellitus in the multicenter AIDS cohort study. Arch Intern Med 2005;165:1179-84. https://doi.org/10.1001/archinte.165.10.1179.
- De Wit S, Sabin CA, Weber R, Worm SW, Reiss P, Cazanave C, et al. Incidence and risk factors for new-onset diabetes in HIV-infected patients: the Data Collection on Adverse Events of Anti-HIV Drugs (D:A:D) study. Diabetes Care 2008;31:1224-9. https://doi.org/10.2337/dc07-2013.
- Hernandez-Romieu AC, Garg S, Rosenberg ES, Thompson-Paul AM, Skarbinski J. Is diabetes prevalence higher among HIV-infected individuals compared with the general population? Evidence from MMP and NHANES 2009–2010. BMJ Open Diabetes Res Care 2017;5. https://doi.org/10.1136/bmjdrc-2016-000304.
- Quiros-Roldan E, Raffetti E, Focà E, Brianese N, Ferraresi A, Paraninfo G, et al. Incidence of cardiovascular events in HIV-positive patients compared to general population over the last decade: a population-based study from 2000 to 2012. AIDS Care 2016;28:1551-8. https://doi.org/10.1080/09540121.2016.1198750.
- Friis-Møller N, Reiss P, Sabin CA, Weber R, Monforte Ad, El-Sadr W, et al. Class of antiretroviral drugs and the risk of myocardial infarction. N Engl J Med 2007;356:1723-35. https://doi.org/10.1056/NEJMoa062744.
- D:A:D Study Groups . Use of nucleoside reverse transcriptase inhibitors and risk of myocardial infarction in HIV-infected patients. AIDS 2008;22:F17-24. https://doi.org/10.1097/QAD.0b013e32830fe35e.
- Desai M, Joyce V, Bendavid E, Olshen RA, Hlatky M, Chow A, et al. Risk of cardiovascular events associated with current exposure to HIV antiretroviral therapies in a US veteran population. Clin Infect Dis 2015;61:445-52. https://doi.org/10.1093/cid/civ316.
- Lo J, Abbara S, Shturman L, Soni A, Wei J, Rocha-Filho JA, et al. Increased prevalence of subclinical coronary atherosclerosis detected by coronary computed tomography angiography in HIV-infected men. AIDS 2010;24:243-53. https://doi.org/10.1097/QAD.0b013e328333ea9e.
- Samaras K. Prevalence and pathogenesis of diabetes mellitus in HIV-1 infection treated with combined antiretroviral therapy. J Acquir Immune Defic Syndr 2009;50:499-505. https://doi.org/10.1097/QAI.0b013e31819c291b.
- Djedaini M, Peraldi P, Drici MD, Darini C, Saint-Marc P, Dani C, et al. Lopinavir co-induces insulin resistance and ER stress in human adipocytes. Biochem Biophys Res Commun 2009;386:96-100. https://doi.org/10.1016/j.bbrc.2009.05.148.
- Lee GA, Rao M, Mulligan K, Lo JC, Aweeka F, Schwarz JM, et al. Effects of ritonavir and amprenavir on insulin sensitivity in healthy volunteers. AIDS 2007;21:2183-90. https://doi.org/10.1097/QAD.0b013e32826fbc54.
- Bernal E, Masiá M, Padilla S, Ramos JM, Martín-Hidalgo A, Gutiérrez F. Insulin resistance in HIV-infected patients receiving long-term therapy with efavirenz, lopinavir/ritonavir and atazanavir. Med Clin 2007;129:252-4. https://doi.org/10.1157/13108348.
- Palacios R, Merchante N, Macias J, González M, Castillo J, Ruiz J, et al. Incidence of and risk factors for insulin resistance in treatment-naive HIV-infected patients 48 weeks after starting highly active antiretroviral therapy. Antivir Ther 2006;11:529-35.
- Araujo S, Bañón S, Machuca I, Moreno A, Pérez-Elías MJ, Casado JL. Prevalence of insulin resistance and risk of diabetes mellitus in HIV-infected patients receiving current antiretroviral drugs. Eur J Endocrinol 2014;171:545-54. https://doi.org/10.1530/EJE-14-0337.
- Grunfeld C, Rimland D, Gibert CL, Powderly WG, Sidney S, Shlipak MG, et al. Association of upper trunk and visceral adipose tissue volume with insulin resistance in control and HIV-infected subjects in the FRAM study. J Acquir Immune Defic Syndr 2007;46:283-90. https://doi.org/10.1097/QAI.0b013e31814b94e2.
- Dirajlal-Fargo S, Moser C, Brown TT, Kelesidis T, Dube MP, Stein JH, et al. Changes in insulin resistance after initiation of raltegravir or protease inhibitors with tenofovir-emtricitabine: AIDS Clinical Trials Group A5260s. Open Forum Infect Dis 2016;3. https://doi.org/10.1093/ofid/ofw174.
- Jones SP, Janneh O, Back DJ, Pirmohamed M. Altered adipokine response in murine 3T3-F442A adipocytes treated with protease inhibitors and nucleoside reverse transcriptase inhibitors. Antivir Ther 2005;10:207-13.
- Lagathu C, Bastard JP, Auclair M, Maachi M, Kornprobst M, Capeau J, et al. Antiretroviral drugs with adverse effects on adipocyte lipid metabolism and survival alter the expression and secretion of proinflammatory cytokines and adiponectin in vitro. Antivir Ther 2004;9:911-20.
- Benavides S, Nahata MC. Pharmacologic therapy for HIV-associated lipodystrophy. Ann Pharmacother 2004;38:448-57. https://doi.org/10.1345/aph.1D081.
- McGoldrick C, Leen CL. The management of dyslipidaemias in antiretroviral-treated HIV infection: a systematic review. HIV Med 2007;8:325-34. https://doi.org/10.1111/j.1468-1293.2007.00480.x.
- Nissen SE, Wolski K. Effect of rosiglitazone on the risk of myocardial infarction and death from cardiovascular causes. N Engl J Med 2007;356:2457-71. https://doi.org/10.1056/NEJMoa072761.
- Sheth SH, Larson RJ. The efficacy and safety of insulin-sensitizing drugs in HIV-associated lipodystrophy syndrome: a meta-analysis of randomized trials. BMC Infect Dis 2010;10. https://doi.org/10.1186/1471-2334-10-183.
- Eckard AR, Meissner EG, Singh I, McComsey GA. Cardiovascular disease, statins, and HIV. J Infect Dis 2016;214:83-92. https://doi.org/10.1093/infdis/jiw288.
- Erlandson KM, Jiang Y, Debanne SM, McComsey GA. Rosuvastatin worsens insulin resistance in HIV-infected adults on antiretroviral therapy. Clin Infect Dis 2015;61:1566-72. https://doi.org/10.1093/cid/civ554.
- Benndorf RA, Rudolph T, Appel D, Schwedhelm E, Maas R, Schulze F, et al. Telmisartan improves insulin sensitivity in nondiabetic patients with essential hypertension. Metab Clin Exp 2006;55:1159-64. https://doi.org/10.1016/j.metabol.2006.04.013.
- Younis F, Stern N, Limor R, Oron Y, Zangen S, Rosenthal T. Telmisartan ameliorates hyperglycemia and metabolic profile in nonobese Cohen-Rosenthal diabetic hypertensive rats via peroxisome proliferator activator receptor-gamma activation. Metab Clin Exp 2010;59:1200-9. https://doi.org/10.1016/j.metabol.2009.11.013.
- Foryst-Ludwig A, Hartge M, Clemenz M, Sprang C, Hess K, Marx N, et al. PPARgamma activation attenuates T-lymphocyte-dependent inflammation of adipose tissue and development of insulin resistance in obese mice. Cardiovasc Diabetol 2010;9. https://doi.org/10.1186/1475-2840-9-64.
- Souza-Mello V, Gregório BM, Cardoso-de-Lemos FS, de Carvalho L, Aguila MB, Mandarim-de-Lacerda CA. Comparative effects of telmisartan, sitagliptin and metformin alone or in combination on obesity, insulin resistance, and liver and pancreas remodelling in C57BL/6 mice fed on a very high-fat diet. Clin Sci 2010;119:239-50. https://doi.org/10.1042/CS20100061.
- Derosa G, Fogari E, D’Angelo A, Cicero AF, Salvadeo SA, Ragonesi PD, et al. Metabolic effects of telmisartan and irbesartan in type 2 diabetic patients with metabolic syndrome treated with rosiglitazone. J Clin Pharm Ther 2007;32:261-8. https://doi.org/10.1111/j.1365-2710.2007.00820.x.
- Georgescu EF, Ionescu R, Niculescu M, Mogoanta L, Vancica L. Angiotensin-receptor blockers as therapy for mild-to-moderate hypertension-associated non-alcoholic steatohepatitis. World J Gastroenterol 2009;15:942-54. https://doi.org/10.3748/wjg.15.942.
- Makita S, Abiko A, Naganuma Y, Moriai Y, Nakamura M. Effects of telmisartan on adiponectin levels and body weight in hypertensive patients with glucose intolerance. Metab Clin Exp 2008;57:1473-8. https://doi.org/10.1016/j.metabol.2008.05.019.
- Rizos CV, Milionis HJ, Kostapanos MS, Florentin M, Kostara CE, Elisaf MS, et al. Effects of rosuvastatin combined with olmesartan, irbesartan, or telmisartan on indices of glucose metabolism in Greek adults with impaired fasting glucose, hypertension, and mixed hyperlipidemia: a 24-week, randomized, open-label, prospective study. Clin Ther 2010;32:492-505. https://doi.org/10.1016/j.clinthera.2010.03.018.
- Takagi H, Umemoto T. All-Literature Investigation of Cardiovascular Evidence Group . A meta-analysis of randomized trials of telmisartan versus active controls for insulin resistance in hypertensive patients. J Am Soc Hypertens 2014;8:578-92. https://doi.org/10.1016/j.jash.2014.05.006.
- Takagi H, Niwa M, Mizuno Y, Goto SN, Umemoto T. ALICE (All-Literature Investigation of Cardiovascular Evidence) Group . Telmisartan as a metabolic sartan: the first meta-analysis of randomized controlled trials in metabolic syndrome. J Am Soc Hypertens 2013;7:229-35. https://doi.org/10.1016/j.jash.2013.02.006.
- Takagi H, Umemoto T. Telmisartan increases adiponectin levels: a meta-analysis and meta-regression of randomized head-to-head trials. Int J Cardiol 2012;155:448-51. https://doi.org/10.1016/j.ijcard.2011.11.071.
- Takagi H, Umemoto T. Telmisartan reduces triglyceride levels over other angiotensin II receptor blockers: a meta-analysis of randomized head-to-head trials. Int J Cardiol 2012;157:403-7. https://doi.org/10.1016/j.ijcard.2012.02.008.
- Takagi H, Yamamoto H, Iwata K, Goto SN, Umemoto T. Effects of telmisartan on C-reactive protein levels: a meta-analysis of randomized controlled trials. Int J Cardiol 2012;156:238-41. https://doi.org/10.1016/j.ijcard.2012.01.104.
- Chujo D, Yagi K, Asano A, Muramoto H, Sakai S, Ohnishi A, et al. Telmisartan treatment decreases visceral fat accumulation and improves serum levels of adiponectin and vascular inflammation markers in Japanese hypertensive patients. Hypertens Res 2007;30:1205-10. https://doi.org/10.1291/hypres.30.1205.
- Shimabukuro M, Tanaka H, Shimabukuro T. Effects of telmisartan on fat distribution in individuals with the metabolic syndrome. J Hypertens 2007;25:841-8. https://doi.org/10.1097/HJH.0b013e3280287a83.
- Yusuf S, Teo KK, Pogue J, Dyal L, Copland I, Schumacher H, et al. Telmisartan, ramipril, or both in patients at high risk for vascular events. New Engl J Med 2008;358:1547-59. https://doi.org/10.1056/NEJMoa0801317.
- Takagi H, Yamamoto H, Iwata K, Goto SN, Umemoto T. ALICE (All-Literature Investigation of Cardiovascular Evidence) Group . Effects of telmisartan on proteinuria or albuminuria: a meta-analysis of randomized trials. Int J Cardiol 2013;167:1443-9. https://doi.org/10.1016/j.ijcard.2012.04.058.
- Ucciferri C, Falasca K, Mancino P, Di Iorio A, Vecchiet J. Microalbuminuria and hypertension in HIV-infected patients: a preliminary study of telmisartan. Eur Rev Med Pharmacol Sci 2012;16:491-8.
- Lagathu C, Eustace B, Prot M, Frantz D, Gu Y, Bastard JP, et al. Some HIV antiretrovirals increase oxidative stress and alter chemokine, cytokine or adiponectin production in human adipocytes and macrophages. Antivir Ther 2007;12:489-500.
- Koster JC, Remedi MS, Qiu H, Nichols CG, Hruz PW. HIV protease inhibitors acutely impair glucose-stimulated insulin release. Diabetes 2003;52:1695-700. https://doi.org/10.2337/diabetes.52.7.1695.
- Pushpakom SP, Adaikalakoteswari A, Owen A, Back DJ, Tripathi G, Kumar S, et al. Telmisartan reverses antiretroviral–induced adipocyte toxicity and insulin resistance in vitro. Diab Vasc Dis Res 2018;15:233-42. https://doi.org/10.1177/1479164118757924.
- Boccara F, Auclair M, Cohen A, Lefèvre C, Prot M, Bastard JP, et al. HIV protease inhibitors activate the adipocyte renin angiotensin system. Antivir Ther 2010;15:363-75. https://doi.org/10.3851/IMP1533.
- World Health Organization (WHO) . Guidance on Regulations for the Transport of Infectious Substances 2007.
- Delanghe JR, Speeckaert MM. Creatinine determination according to Jaffe – what does it stand for?. NDT Plus 2011;4:83-6. https://doi.org/10.1093/ndtplus/sfq211.
- Thomas EL, Hamilton G, Patel N, O’Dwyer R, Doré CJ, Goldin RD, et al. Hepatic triglyceride content and its relation to body adiposity: a magnetic resonance imaging and proton magnetic resonance spectroscopy study. Gut 2005;54:122-7. https://doi.org/10.1136/gut.2003.036566.
- Rico-Sanz J, Thomas EL, Jenkinson G, Mierisová S, Iles R, Bell JD. Diversity in levels of intracellular total creatine and triglycerides in human skeletal muscles observed by 1H-MRS. J Appl Physiol 1999;87:2068-72. https://doi.org/10.1152/jappl.1999.87.6.2068.
- Dunnett C. Selection of the Best Treatment in Comparison to a Control with Application to a Medical Trial. New York, NY: Marcel Dekker; 1984.
- Magirr DJT, Whitehead J. A generalized Dunnett test for multi-arm multistage clinical studies with treatment selection. Biometrika 2012;99:494-501. https://doi.org/10.1093/biomet/ass002.
- Whitehead J, Jaki T. One- and two-stage design proposals for a phase II trial comparing three active treatments with control using an ordered categorical endpoint. Stat Med 2009;28:828-47. https://doi.org/10.1002/sim.3508.
- Carrizo E, Fernández V, Connell L, Sandia I, Prieto D, Mogollón J, et al. Extended release metformin for metabolic control assistance during prolonged clozapine administration: a 14 week, double-blind, parallel group, placebo-controlled study. Schizophr Res 2009;113:19-26. https://doi.org/10.1016/j.schres.2009.05.007.
- Hanefeld M, Herman GA, Wu M, Mickel C, Sanchez M, Stein PP. Sitagliptin Study 014 Investigators . Once-daily sitagliptin, a dipeptidyl peptidase-4 inhibitor, for the treatment of patients with type 2 diabetes. Curr Med Res Opin 2007;23:1329-39. https://doi.org/10.1185/030079907X188152.
- van Buuren S, Groothuis-Oudshoorn K. MICE: Multivariate Imputation by chained equations in R. J Stat Software 2011;45:1-67. https://doi.org/10.18637/jss.v045.i03.
- Henderson R, Diggle P, Dobson A. Joint modelling of longitudinal measurements and event time data. Biostatistics 2000;1:465-80. https://doi.org/10.1093/biostatistics/1.4.465.
- Williamson PR, Kolamunnage-Dona R, Philipson P, Marson AG. Joint modelling of longitudinal and competing risks data. Stat Med 2008;27:6426-38. https://doi.org/10.1002/sim.3451.
- Stevens PE, Levin A. Kidney Disease: Improving Global Outcomes Chronic Kidney Disease Guideline Development Work Group Members . Evaluation and management of chronic kidney disease: synopsis of the kidney disease: improving global outcomes 2012 clinical practice guideline. Ann Intern Med 2013;158:825-30. https://doi.org/10.7326/0003-4819-158-11-201306040-00007.
- CRAN Link n.d. https://cran.r-project.org/web/packages/joineRML/index.html (accessed 22 May 2017).
- Lin H, McCulloch CE, Mayne ST. Maximum likelihood estimation in the joint analysis of time-to-event and multiple longitudinal variables. Stat Med 2002;21:2369-82. https://doi.org/10.1002/sim.1179.
- Honjo S, Nichi Y, Wada Y, Hamamoto Y, Koshiyama H. Possible beneficial effect of telmisartan on glycemic control in diabetic subjects. Diabetes Care 2005;28. https://doi.org/10.2337/diacare.28.2.498.
- Nagel JM, Tietz AB, Göke B, Parhofer KG. The effect of telmisartan on glucose and lipid metabolism in nondiabetic, insulin-resistant subjects. Metab Clin Exp 2006;55:1149-54. https://doi.org/10.1016/j.metabol.2006.04.011.
- Shinohara T, Takahashi N, Abe I, Okada N, Wakisaka O, Yufu K, et al. Telmisartan effectively improves insulin sensitivity in hypertensive patients with insulin resistance. Obes Res Clin Pract 2011;5:e267-360. https://doi.org/10.1016/j.orcp.2011.03.011.
- Vitale C, Mercuro G, Castiglioni C, Cornoldi A, Tulli A, Fini M, et al. Metabolic effect of telmisartan and losartan in hypertensive patients with metabolic syndrome. Cardiovasc Diabetol 2005;4. https://doi.org/10.1186/1475-2840-4-6.
- Vecchiet J, Ucciferri C, Falasca K, Mancino P, Di Iorio A, De Caterina R. Antihypertensive and metabolic effects of telmisartan in hypertensive HIV-positive patients. Antivir Ther 2011;16:639-45. https://doi.org/10.3851/IMP1809.
- Lake JE, Tseng CH, Currier JS. A pilot study of telmisartan for visceral adiposity in HIV infection: the metabolic abnormalities, telmisartan, and HIV infection (MATH) trial. PLOS ONE 2013;8. https://doi.org/10.1371/journal.pone.0058135.
- Schupp M, Janke J, Clasen R, Unger T, Kintscher U. Angiotensin type 1 receptor blockers induce peroxisome proliferator-activated receptor-gamma activity. Circulation 2004;109:2054-7. https://doi.org/10.1161/01.CIR.0000127955.36250.65.
- Shrivastav S, Kino T, Cunningham T, Ichijo T, Schubert U, Heinklein P, et al. Human immunodeficiency virus (HIV)-1 viral protein R suppresses transcriptional activity of peroxisome proliferator-activated receptor {gamma} and inhibits adipocyte differentiation: implications for HIV-associated lipodystrophy. Mol Endocrinol 2008;22:234-47. https://doi.org/10.1210/me.2007-0124.
- Damouche A, Lazure T, Avettand-Fènoël V, Huot N, Dejucq-Rainsford N, Satie AP, et al. Adipose tissue is a neglected viral reservoir and an inflammatory site during chronic HIV and SIV infection. PLOS Pathog 2015;11. https://doi.org/10.1371/journal.ppat.1005153.
- Rasheed S, Yan JS, Lau A, Chan AS. HIV replication enhances production of free fatty acids, low density lipoproteins and many key proteins involved in lipid metabolism: a proteomics study. PLOS ONE 2008;3. https://doi.org/10.1371/journal.pone.0003003.
- Caron M, Vigouroux C, Bastard JP, Capeau J. Antiretroviral-related adipocyte dysfunction and lipodystrophy in HIV-infected patients: alteration of the PPARγ-dependent pathways. PPAR Res 2009;2009. https://doi.org/10.1155/2009/507141.
- Kannisto K, Sutinen J, Korsheninnikova E, Fisher RM, Ehrenborg E, Gertow K, et al. Expression of adipogenic transcription factors, peroxisome proliferator-activated receptor gamma co-activator 1, IL-6 and CD45 in subcutaneous adipose tissue in lipodystrophy associated with highly active antiretroviral therapy. AIDS 2003;17:1753-62. https://doi.org/10.1097/01.aids.0000076305.76477.ce.
- Otten J, Ahrén B, Olsson T. Surrogate measures of insulin sensitivity vs the hyperinsulinaemic–euglycaemic clamp: a meta-analysis. Diabetologia 2014;57:1781-8. https://doi.org/10.1007/s00125-014-3285-x.
- Perseghin G, Caumo A, Caloni M, Testolin G, Luzi L. Incorporation of the fasting plasma FFA concentration into QUICKI improves its association with insulin sensitivity in nonobese individuals. J Clin Endocrinol Metab 2001;86:4776-81. https://doi.org/10.1210/jcem.86.10.7902.
- NICE . Obesity: Identification, Assessment and Management. Clinical Guideline [CG189] 2014. www.nice.org.uk/guidance/cg189/ifp/chapter/obesity-and-being-overweight (accessed 20 June 2017).
- Choi GJ, Kim HM, Kang H, Kim J. Effects of telmisartan on fat distribution: a meta-analysis of randomized controlled trials. Curr Med Res Opin 2016;32:1303-9. https://doi.org/10.1185/03007995.2016.1171204.
- Fabbrini E, Magkos F, Mohammed BS, Pietka T, Abumrad NA, Patterson BW, et al. Intrahepatic fat, not visceral fat, is linked with metabolic complications of obesity. Proc Natl Acad Sci USA 2009;106:15430-5. https://doi.org/10.1073/pnas.0904944106.
- Chetty VT, Damjanovic S, Gerstein H, Singh N, Yusuf S, Anand SS, et al. Metabolic effects of telmisartan in subjects with abdominal obesity: a prospective randomized controlled trial. Blood Press 2014;23:54-60. https://doi.org/10.3109/08037051.2013.791411.
- de Luis DA, Conde R, González-Sagrado M, Aller R, Izaola O, Dueñas A, et al. Effects of telmisartan vs olmesartan on metabolic parameters, insulin resistance and adipocytokines in hypertensive obese patients. Nutr Hosp 2010;25:275-9.
- Wohl P, Krusinová E, Hill M, Kratochvílová S, Zídková K, Kopecký J, et al. Effect of telmisartan on selected adipokines, insulin sensitivity, and substrate utilization during insulin-stimulated conditions in patients with metabolic syndrome and impaired fasting glucose. Eur J Endocrinol 2010;163:573-83. https://doi.org/10.1530/EJE-10-0436.
- Satoh M, Tabuchi T, Minami Y, Takahashi Y, Itoh T, Nakamura M. Prospective, randomized, single-blind comparison of effects of 6 months of treatment with telmisartan versus enalapril on high-molecular-weight adiponectin concentrations in patients with coronary artery disease. Clin Ther 2009;31:2113-25. https://doi.org/10.1016/j.clinthera.2009.10.010.
- Koenig W. High-sensitivity C-reactive protein and atherosclerotic disease: from improved risk prediction to risk-guided therapy. Int J Cardiol 2013;168:5126-34. https://doi.org/10.1016/j.ijcard.2013.07.113.
- De Luca A, de Gaetano Donati K, Colafigli M, Cozzi-Lepri A, De Curtis A, Gori A, et al. The association of high-sensitivity c-reactive protein and other biomarkers with cardiovascular disease in patients treated for HIV: a nested case-control study. BMC Infect Dis 2013;13. https://doi.org/10.1186/1471-2334-13-414.
- Mahajan R, Gupta K. Adaptive design clinical trials: methodology, challenges and prospect. Indian J Pharmacol 2010;42:201-7. https://doi.org/10.4103/0253-7613.68417.
- Food and Drug Administration . Innovation or Stagnation: Critical Path Opportunities List 2006. www.fda.gov/downloads/ScienceResearch/SpecialTopics/CriticalPathInitiative/CriticalPathOpportunitiesReports/UCM077258.pdf (accessed 20 June 2017).
- European Medicines Agency . Reflection Paper on Methodological Issues in Confirmatory Clinical Trials With Flexible Design and Analysis Plan 2006. www.ema.europa.eu/docs/en_GB/document (accessed 20 June 2017).
- Lake JE, Currier JS. Metabolic disease in HIV infection. Lancet Infect Dis 2013;13:964-75. https://doi.org/10.1016/S1473-3099(13)70271-8.
Appendix 1 Trial sites and principal investigators
| Trial site | PI | Date opened |
|---|---|---|
| Brighton and Sussex Hospital | Dr Duncan Churchill | 23 September 2013 |
| Coventry and Warwickshire | Dr Satyajit Das | 20 September 2013 |
| George Eliot Hospital | Dr David Loay | 26 January 2015 |
| Guy’s and St Thomas’ | Dr Barry Peters | 14 June 2013 |
| Harrogate District Hospital | Dr Fabiola Martin | 10 June 2014 |
| James Cook University Hospital | Dr David Chadwick | 29 October 2013 |
| King’s College | Dr Frank Post | 4 June 2013 |
| Manchester Royal Infirmary | Dr Gabriel Schembri | 30 May 2014 |
| New Croft Clinic (Royal Victoria Infirmary) | Dr Mayur Chauhan | 15 April 2015 |
| North Middlesex Hospital | Dr Jonathan Ainsworth | 24 March 2014 |
| Royal Bournemouth and Christchurch Hospitals | Dr Elbushra Herieka | 2 May 2013 |
| Royal Free, London | Professor Margaret Johnson | 26 July 2013 |
| Royal Liverpool Hospital | Professor Saye Khoo | 21 February 2013 |
| Southmead Hospital | Dr Mark Gompels | 14 January 2015 |
| St Helens Hospital | Dr Mas Chapomda | 18 November 2014 |
| St James’s University Hospital | Dr Jane Minton | 19 September 2013 |
| St Stephen’s Trust at Chelsea and Westminster | Dr Graeme Moyle | 6 June 2014 |
| Western General Hospital | Professor Clifford Leen | 19 September 2013 |
| YorClinic | Dr Fabiola Martin | 4 December 2013 |
Appendix 2 List of approved brands of telmisartan
| Brand/manufacturer | Date approved by TMG | Date approved for use in trial |
|---|---|---|
| Actavis | 17 February 2014 | 4 April 2014 (needed MHRA approval to use generics) |
| Teva | 17 February 2014 | 4 April 2014 (needed MHRA approval to use generics) |
| Pritor | 20 February 2014 | 4 April 2014 (needed MHRA approval to use generics) |
| Tolura | 7 May 2014 | 7 May 2014 |
| Glenmark | 22 June 2014 | 22 June 2014 |
| Mylan | 10 November 2014 | 7 May 2014 |
Appendix 3 Sample analysis plan
Sample shipment and storage
-
The TAILoR trial will use a specialist clinical trial courier for shipping of samples at a cost of £80 per shipment. A definitive timetable for shipment of samples is not provided here; the aim is to have regular shipments of samples from all sites so that:
-
The shipment fits in with the analysis timelines presented in the progress reports and all outcome measures are analysed in time for statistical analysis.
-
There is always a readily available set of samples for transfer to the LCL for analysis.
-
Wherever possible, a full courier load is available so that the shipment is cost-effective.
-
All samples are shipped as soon as any site finishes the last follow-up of the last patient.
-
-
Shipments will also depend on individual site’s storage capacity.
-
The Trial Co-ordinator, in liaison with sites and the TAILoR team in the Wolfson Centre, will arrange shipment of samples to Liverpool.
-
All samples will be stored in the –40 °C and –20 °C freezers in the BAF in the Royal Liverpool Hospital.
-
Both BAF and TAILoR SOPs will be followed to verify the samples on receipt at the BAF and appropriate records for sample receipt and transfer will be retained by all parties concerned (BAF, Wolfson Centre and CTRC).
Standard operating procedures and log sheets relevant to shipping and storage:
-
SOP1 _ TAILoR Sample Processing and Storage. Version 1.0; dated 12 February 2013.
-
SOP2 _ TAILoR Sample Processing and Storage for Samples Processed Offsite. Version 1.0; dated 11 July 2013.
-
SOP3 _ TAILoR SOP _ Packaging and Shipment of Samples. Version 4.0; dated 24 March 2014.
-
TAILoR SOP _ Sample Reception. Version 3.0; dated 25 March 2014.
-
TAILoR Sample Transfer Log Sheet (BAF to Aintree Labs). Version 3.0; dated 10 April 2014.
-
TAILoR Sample Transfer Log Sheet (BAF to LCL and back). Version 1.0; dated 15 January 2015.
-
TAILoR Sample Transfer Log Sheet (BAF to WCPM). Version 1.0; dated 10 April 2014.
Laboratory analysis: primary outcome measure (Homeostatic Model Assessment of Insulin Resistance)
-
The primary outcome measure, HOMA-IR, is calculated using plasma glucose and serum insulin levels; both of these will be analysed in the LCL, Royal Liverpool Hospital.
-
Plasma glucose and serum insulin will be measured using standard clinical chemistry kits and analysers.
-
All samples will be analysed in duplicates.
-
Plasma and serum aliquots will be routinely batched and transferred to LCL. All samples will be analysed for plasma glucose, serum insulin, serum lipid profile and hs-CRP simultaneously.
-
Results will be uploaded by LCL in batches directly on to the designated folder in the VOCAL (UoL) for further analyses.
Laboratory analysis: secondary outcome measures
1. Lipid profile (high-density lipoprotein cholesterol, total cholesterol, triglycerides and low-density lipoprotein cholesterol).
-
High-density lipoprotein cholesterol, total cholesterol, triglycerides and LDL-C will be analysed by LCL using routine clinical chemistry methods.
2. Blood biomarkers (exploratory biomarkers).
-
High-sensitivity C-reactive protein: this will be analysed by LCL using routine clinical chemistry methods.
-
Adiponectin: this will be performed in the WCPM utilising electrochemiluminescence immunoassays (Meso Scale Discovery, Rockville, MD, USA) as per the manufacturer’s protocol and analysed on a Meso Scale Discovery Sector Imager 2400A (Meso Scale Discovery, Rockville, MD, USA).
-
All samples will be analysed in duplicate.
-
Appropriate validation of the assay will be conducted and parameters such as accuracy, precision, linearity, reproducibility, sample recovery after spiking, inter and intra-assay variability will be measured before undertaking full sample analysis.
-
-
Interleukin 6, TNF-α and resistin: this analysis will be performed in the WCPM, utilising electrochemiluminescence immunoassays as per the manufacturer’s protocol and analysed on a Meso Scale Discovery Sector Imager 2400A.
-
All samples will be analysed in duplicate.
-
Appropriate validation of the assay will be conducted and parameters such as accuracy, precision, linearity, reproducibility, sample recovery after spiking, inter and intra-assay variability will be measured before undertaking full sample analysis.
-
Following validation, the IL-6 mesoscale assay was found not to meet desired criteria and hence the marker has been removed from the protocol. An amendment of the protocol to this effect has been submitted.
-
Lipin 1: lipin 1 was originally included in the grant application on the assumption that it is secreted outside the adipose tissue and, therefore, measurable in plasma or serum using an enzyme-linked immunosorbent assay (ELISA). There is only one ELISA kit available in the market for human lipin 1 and this has been tested in-house but does not work. The current knowledge specifies that lipin 1 is integral to the cell and does not get secreted outside the cell. Therefore, the TMG has decided to replace lipin 1 with an alternative marker, leptin. An amendment of the protocol to this effect has been submitted.
-
Leptin: this will be performed in the WCPM utilising electrochemiluminescence immunoassays as per the manufacturer’s protocol and analysed on a Meso Scale Discovery Sector Imager 2400A.
-
All samples will be analysed in duplicate.
-
Appropriate validation of the assay will be conducted and parameters such as accuracy, precision, linearity, reproducibility, sample recovery after spiking, inter and intra-assay variability will be measured before undertaking full sample analysis.
-
-
Non-esterified fatty acids: NEFAs are a new marker included following discussion with the IDSMC. Serum NEFA levels will be analysed using a colorimetric method on Randox RX daytona (Randox Laboratories Ltd, County Antrim, UK) in the GCLP facility, Royal Liverpool Hospital.
-
All samples will be analysed in triplicate.
-
Appropriate validation of the assay will be conducted and parameters such as accuracy, precision, linearity, reproducibility, sample recovery after spiking, inter- and intra-assay variability will be measured before undertaking full sample analysis.
-
Standard operating procedures relevant to biomarker analyses
-
SOP _ Preparation of TAILoR Samples Master Plate. Version 2.0; dated 25 March 2016.
-
SOP _ Adiponectin Assay – TAILoR samples. Version 1.0; dated 25 March 2016.
-
SOP _ Resisitn Assay – TAILoR Samples. Version 2.0; dated 27 April 2016.
-
SOP _ Leptin Assay – TAILoR Samples. Version 2.0; dated 27 April 2016.
-
SOP _ Proinflammatory markers Assay – TAILoR Samples. Version 3.0; dated 25 April 2016.
3. Urinary biomarkers:
-
Neutrophil gelatinase-associated lipocalin: this will be performed in the WCPM utilising electrochemiluminescence immunoassays as per the manufacturer’s protocol and analysed on a Meso Scale Discovery Sector Imager 2400A.
-
All samples will be analysed in duplicate.
-
Appropriate validation of the assay will be conducted and parameters such as accuracy, precision, linearity, reproducibility, sample recovery after spiking, inter and intra-assay variability will be measured before undertaking full sample analysis.
-
-
Albumin-to-creatinine ratio: this will be carried out in the LCL, Royal Liverpool Hospital.
Appendix 4 Statistical analysis plans
Interim analysis
Patient groups for analysis
The principle of intention to treat (ITT), as far as is practically possible, will be the main strategy of the analysis adopted for the primary outcome. The analysis will be conducted on all patients randomised to the treatment arms.
Patients who withdrew consent for trial continuation will contribute outcome data up until the point of withdrawal, unless the patient specifically requests that the data not to be used.
The membership of the analysis set will be determined and documented, and reasons for participant exclusion will be given prior to the randomisation lists being requested. Reasons may include missing data, loss to follow-up and treatment withdrawal (not excluded for ITT analysis set).
Analysis of primary outcome
The primary analysis will use the principle of ITT based on all the randomised participants, as far as is practically possible.
Homeostatic model assessment of insulin resistance was calculated by:
The conversion factor for fasting insulin is 0.144 to convert from pmol/l to µU/ml.
In order to satisfy the primary objective, we will evaluate three different doses against control in the first stage of the study. We will conduct an interim analysis that will allow ineffective doses to be eliminated quickly, while a dose showing a positive effect can be taken forward.
At the interim analysis, an analysis of covariance (ANCOVA) model is used by fitting the regression model:
Analysis of covariance is a more efficient approach when dealing with small group numbers and when there is imbalance in baseline HOMA-IR.
The test statistics are given by the t-values for each active dose treatment.
The largest of these test statistics will be compared with the interim critical value (2.782). The above ANCOVA model means that the coefficient related to treatment is positive for an increase in HOMA-IR. Therefore, we look at the negative of the test statistic and use in the decision below. Exceeding this value would correspond to a significant improvement in HOMA-IR score for the corresponding dose over control and would lead to this dose being immediately taken forward for further study, and to the trial being stopped.
The analysis will be proceeding as follows:
-
If the largest of these statistics exceeds a critical value (equal to 2.782), this would mean that one active dose group shows a substantially higher mean reduction of 24-week HOMA-IR score than the control group and, therefore, the study will be stopped and the corresponding dose will be recommended for further testing.
-
If any active dose show no improvement over control (i.e. has a negative measure of advantage), then that active dose will be dropped from the second stage*.
-
If all three active doses satisfy this criterion, then the study will be stopped and no significant improvement over control will be claimed for any of the active doses.
-
If some improvement over control is detected for at least one of the doses (i.e. if at least one test statistic is between 0 and 2.782), the study will progress to the second stage and the patients will be randomised between these dose(s) and control.
The design has been constructed under the assumption that for all patients the response (HOMA-IR score) is normally distributed with a common standard deviation, σ. These assumptions will be checked at the interim analysis stage (Levene’s test for checking equal group variances and histogram for checking normality).
If any arm is dropped and the study progresses to the second stage, then the patients in the dropped arm(s) will stop the medication and will not be involved in second stage of the study.
Analysis of secondary efficacy outcomes
This analysis will not be presented in the interim analysis report.
Analyses of missing data/withdrawals
A summary table of the missing data will be presented, detailing the proportion of missing assessments overall and for each visit split by each treatment arm.
No sensitivity analyses will be carried out at this interim analysis stage.
The decision to drop treatments at the interim analysis stage will be based only on observed data at 24 weeks. The non-fasting samples data will be excluded from the analysis as they could interfere with the primary outcome (PI clinical judgement).
Final analysis
Data sets analysed
The principle of ITT, as far as is practically possible, will be the main strategy of the analysis adopted for the primary outcome. The analysis will be conducted on all patients randomised to the treatment arms, and for whom the outcome(s) of interest have been observed/measured. No imputations will be made.
The membership of the analysis set will be determined and documented, and reasons for participant exclusion will be given prior to the randomisation lists being requested. Reasons may include missing data, loss to follow-up and treatment withdrawal (not excluded for ITT analysis set).
Per-protocol analysis will not be considered.
Demographic and other baseline characteristics
Patients in each arm will be described separately with respect to sex, ethnicity, age, BMI, waist circumference (cm), systolic blood pressure (mmHg), diastolic blood pressure (mmHg), CD4 cell count (cells/mm3), HIV viral load (copies/ml), urea (mmol/l), potassium (mmol/l), creatinine (mmol/l), eGFR (ml/minute/1.73 m2), ALT (IU/l), albumin (g/l) and sodium (mmol/l).
Categorical data will be presented using counts and percentages, and continuous data will be presented using number of patients, mean, mode, median, SD, minimum, maximum and interquartile range (IQR). Tests of statistical significance will not be undertaken for baseline characteristics; rather, the clinical importance of any imbalance will be noted.
Compliance with treatment
A descriptive summary of compliance will be presented. Total dose consumed according to the treatment diary is summarised by mean, mode, median, SD, minimum, maximum and IQR and split by site and by treatment.
Total dose will also be calculated according to the number of pills returned at each visit (week 2, 4, 12 and 24).
Discrepancies between these two estimates of total dose will be summarised by mean, mode, median, SD, minimum, maximum and IQR and split by site and by treatment.
Analysis of the primary outcome
Derivation
HOMA-IR was calculated by:
The conversion factor for fasting insulin to convert from pmol/l to µU/ml is 0.144.
Analysis
In order to satisfy the primary objective, we will evaluate all doses remaining after the interim analysis against control. An ANCOVA model is used by fitting the regression model:
where HOMA-IR _ 0 is the HOMA-IR value at the baseline prior to randomisation and HOMA-IR _ 24 is the HOMA-IR value at 24 weeks. The treatment variable is categorical with control as the reference level.
The test statistics are given by the t-values for each active dose treatment. The smallest of these test statistics will be compared with the final critical value (–2.086). A test statistic below the critical value would correspond to a significant improvement in HOMA-IR score for the corresponding dose over control.
If the smallest of these statistics is below a critical value (equal to –2.086), this would mean that (at least) one active dose group shows a substantially higher mean reduction of 24-week HOMA-IR score than the control group.
The design has been constructed under the assumption that for all patients the response (HOMA-IR score) is normally distributed with a common standard deviation, σ. These assumptions will be checked at the final analysis (Levene’s test for checking equal group variances and histogram for checking normality). If HOMA-IR score is not normally distributed, then a log with base e transformation is used.
The primary decision will be based only on observed data at 24 weeks. The non-fasting sample data will be excluded from the primary analysis as HOMA-IR calculation required the fasting insulin and glucose to be a valid measurement.
Secondary outcome analyses
Longitudinal markers and outcomes
To identify change in the expression of the markers in telmisartan-treated arms remaining after the interim analysis in comparison with the control, a joint model of the longitudinal marker will be fitted adjusting for the dropout from the study. Patients who had a missing marker were considered as ‘dropouts’ and the first time point (t = 12, 24, or 48) at which the marker is missing will be taken as the time of dropout. Those who did not drop out from the study before t = 48 (i.e. had complete record of biomarker) were censored at 48 weeks.
Adjusting for the dropout, a joint model with random intercept and slope will be fitted to fully exploit the serial nature of the longitudinal marker data. The longitudinal submodel is defined by:
where Y(t) is the marker measurement at time t = 0 (baseline), T + 12 (t = 12), T + 24 (t = 24) and T + 48 (t = 48) weeks, and X includes categorical variables representing the treatment arm and stratification factor (black/non-black). β0, β1 and β2 = {β21, β22} are regression coefficients related to intercept, slope and the two covariates. ϵ(t) denotes the measurement error process and assumes Gaussian distribution with mean zero and variance σ2e. The hazard for dropout is modelled by:
where λ0(t) is an unspecified baseline hazard and β3 = {β31, β32} and γ are regression coefficients related to covariates and association between dropout and longitudinal HOMA-IR outcome over time (0 and 48 weeks). We assume W1(t) = U0 + U1t is an unobserved zero-mean Gaussian random process. β21 indicates the average treatment effect for each treatment arm compared with the control, once adjusted for potential informative dropout or missingness in the longitudinal marker outcome.
Difference in expected and unexpected serious adverse events
We compare the percentage of patients who had one or more SAEs using a chi-squared or Fisher’s exact test of independence (if numbers are below five).
Change in Quantitative Insulin Sensitivity Check Index and revised Quantitative Insulin Sensitivity Check Index after 24 weeks of treatment in comparison with control
The two alternative measures of insulin resistance are calculated as:
where G is fasting glucose (mg/dl), I is fasting insulin (µU/ml) and NEFA is plasma NEFAs concentration (mmol/l). Fasting glucose is recorded in mmol/l for the primary analysis and the conversion factor for fasting glucose to convert from mmol/l to mg/dl is 18 (1 mmol/l = 18 mg/dl; Blood Sugar Converter, www.diabetes.co.uk/blood-sugar-converter.html; accessed 23 February 2016).
The ANCOVA model (see Analysis of the primary outcome) is used to analyse the two alternative measures. If the measures were not normally distributed, then a log with base e transformation will be used.
Unlike HOMA-IR, the log-insulin and log-glucose values are in the denominator for QUICKI/revised QUICKI. If there is a reduction in insulin resistance (i.e. increased insulin sensitivity), the above two measures will be increased at 24 weeks as compared with that at the baseline. Therefore, the largest of the test statistics from the ANCOVA of each active treatment arm (against the control arm) will be compared with the final critical value of 2.086. A test statistic above the critical value would correspond to a significant improvement in the score for the corresponding dose over control.
The fasting insulin and glucose are required to be valid measurements.
Substudy 1: magnetic resonance imaging/magnetic resonance scanning
Change in visceral, hepatic and muscle fat will be calculated by subtracting the visceral, hepatic and muscle fat values at baseline visit from those at the 24-week visit.
Summary estimates of location and variability will be reported for all treatment arms. Mean, median, SD, IQR and maximum and minimum values will be reported at each time point (at baseline and at 24 weeks) for the MRI measurements of internal visceral fat (dm3), external abdominal fat (dm3), total internal fat (dm3), total external fat (dm3) and total body fat (dm3) and for the following 1H-MRS measurements: intrahepatic and intramyocellular triglyceride content in liver, soleus and tibialis anterior (without dimensions, measured as a percentage).
In addition, three separate multiple linear regression models will be fitted to explore the differences in outcomes between treatment arms with control as the reference level, while accounting for potential confounders:
-
Model 1: internal visceral fat at 24 weeks will be the outcome variable. A multiple linear regression model will be fitted. The relative change of total external fat [(value at 24 weeks – value at baseline) ÷ value at baseline] will be added to the model to account for this potential confounder.
-
Model 2: intrahepatic triglyceride content in liver at 24 weeks will be the outcome variable. A multiple linear regression model will be fitted.
-
Model 3: intramyocellular triglyceride content in the soleus and tibialis anterior at 24 weeks will be treated as a bidimensional outcome. A multivariate multiple regression model will be fitted.
The treatment arm (as a factor) and the corresponding baseline values will be added in all models and sex will be included as covariates. Model assumptions regarding residuals will be assessed and non-parametric models will be considered, if appropriate. Summary statistics for patients with baseline measurements but with missing measurement at 24 weeks will be described.
Substudy 2: longitudinal expressions of urinary biomarkers
Change in urinary biomarker levels [creatine, urea, total protein and novel biomarkers such as kidney injury molecule-1 (KIM-1), NGAL and retinol-binding protein (RBP)] at 12, 24 and 48 weeks between telmisartan-treated arm(s) and the control arm will be determined by a joint longitudinal biomarker. The dropout model with random intercept and slope will be fitted to fully exploit the serial nature of the longitudinal biomarker data.
Sensitivity analyses
A summary table of the missing primary outcome data will be presented detailing the proportion of missing assessments overall and for each visit split by each treatment arm.
Sensitivity analyses 1: imputing values for missing Homeostatic Model Assessment of Insulin Resistance at 24 weeks
Missing HOMA-IR at 24 weeks values will be imputed using the MICE algorithm, conditional on HOMA-IR values at baseline, HOMA-IR values at 12 weeks and stratification factor (black/non-black). This analysis of missing data will be restricted to the primary outcome only; no imputation methods will be used on any of the secondary outcomes.
Sensitivity analyses 2: joint modelling for missing Homeostatic Model Assessment of Insulin Resistance at 24 weeks
The problem of non-ignorable missingness for HOMA-IR at 24 weeks is addressed through joint modelling of the longitudinal HOMA-IR and the time to dropout from the study. In this analysis, time to dropout is defined by patients who withdrew from the study or had missing HOMA-IR for any other reason at times t = 0, 12, or 24. Those who did not drop out from the study before t = 24 and those who had complete record of HOMA-IR will be censored at 24 weeks.
Sensitivity analyses 3: compliance-adjusted analysis
A compliance-adjusted primary outcome analysis will be undertaken using IV regression, in order to estimate the effect of actual dose on outcome. In the event of a discrepancy between the two measures of total dose for a given patient, the average of these two total doses will be used. When compliance information is missing for a given patient for some (but not the entire) treatment period, doses will be imputed for the missing weeks using simple imputation (i.e. based on patient average compliance over the whole treatment period for which compliance data are available). If compliance data are missing entirely for a given patient, they will be excluded from any further compliance analyses.
The suitability of randomisation as the sole instrument will be assessed using tests of exogeneity, redundancy and under/weak identification. The IV regression analysis will be undertaken using data from only those patients who provided some compliance information. Thus, the baseline characteristics of patients without any compliance information (in particular, in terms of blood pressure, CD4 cell count, HIV viral load, eGFR) will be presented and compared with those who provided any compliance information, in order to aid interpretation (in terms of likely bias and generalisability) of the results of the IV regression.
Safety evaluations
Data sets analysed
The safety analysis dataset will contain all participants that are randomised and commenced treatment.
Presentation of the data
All ARs reported by the clinical investigator will be presented in a table. The number (and percentage) of patients experiencing each AR (in terms of MedDRA coding of PT and SOC) will be presented for each treatment arm categorised by severity (mild, moderate, severe). For each patient, only the maximum severity experienced of each type of AR will be displayed. The number (and percentage) of occurrences of each AR will also be presented for each treatment arm. No formal statistical testing will be undertaken.
Total number of SAEs/SUSARs will be presented for each treatment arm, along with line listings for each case, including the following: randomisation number, SAE number, report type (final/initial), description (PT), description (SOC), SAE number, seriousness, additional description if medically significant, treatment, severity, expectedness, relationship (PI assessment, chief investigator’s assessment), outcome and patient status in trial (continuing in trial/withdrawn from treatment).
All safety analyses will have independent quality control checking by an independent statistician.
Deviations from the final statistical analysis plan
Homeostatic Model Assessment of Insulin Resistance, Quantitative Insulin Sensitivity Check Index and revised Quantitative Insulin Sensitivity Check Index between 24 weeks and baseline
Analyses were undertaken adjusting for the weight change.
Change in weight (kg) is computed by: weight change = weight at 24 weeks – weight at baseline. Weight change is fitted as a continuous variable and fitted the ANCOVA model:
where HOMA-IR _ 0 is the HOMA-IR value at the baseline prior to randomisation and HOMA-IR _ 24 is the HOMA-IR value at 24 weeks.
Longitudinal outcomes
Analyses were undertaken adjusting for the weight change. Joint models for longitudinal outcomes also included data from the dropped arms.
We have used a bivariate joint model to simultaneously include longitudinal measurements of the marker and longitudinal weight as outcomes adjusting for the dropout. Data from the two dropped arms (B and C) were also included to further adjust for informative dropout and assumed that these patients completed the trial as planned. The fitted model takes the following form:
where Y1(t) is the marker measurement and Y2(t) is the weight at time t, where t = 12, 24 or 48 weeks, and X includes categorical variables representing the treatment arm (A, B, C and D), stratification factor (black/non-black) and marker or weight value at the baseline. β0, β1 and β2 are regression coefficients related to intercept, slope and the covariates. ϵ(t) denotes independent measurement error process. λ(t) models the hazard for dropout, λ0(t) is an unspecified baseline hazard and β3 and γ = {γ1,γ2} are regression coefficients related to covariates and association parameters. The dependence between the marker and weight was accounted for by correlated random-effects W11 and W12. We assumed W1(t) = U01 + U11t and W12(t) = U02 + U12t with {U01, U11, U02, U12} ∼ N4(0,Σ).
The treatment effect coefficient in β21 indicates the average treatment effect for each treatment arm compared with the control, once adjusted for potential informative dropout, while accounting for the weight changes over time. Approximate standard errors and 95% CIs were produced. The joineRML package in R was used for this analysis.
Magnetic resonance imaging/magnetic resonance scanning substudy
Models were fitted adjusted for weight change between baseline and 24 weeks. Change in weight is added as a covariate in the current model.
Longitudinal expressions of urinary biomarkers
Data were available for NGAL and ACR only.
The longitudinal profiles of the biomarker NGAL were considered in subgroups defined by tertiles at baseline (tertiles divide an ordered distribution of baseline NGAL into three parts, so each subgroup contains one-third of the sample).
For analysis of ACR, the subgroups were based on an ACR of < 3 mg/mmol, an ACR of 3–30 mg/mmol and an ACR of > 30 mg/mmol at baseline.
Given the lower number of dropouts in each subgroup (< 20), linear mixed-effect models were used to analyse the longitudinal variations rather than joint models. The models were adjusted for age. Weight change and sex were also added and, if found significant, they were included in the final model.
Sensitivity analyses 2: joint modelling for missing Homeostatic Model Assessment of Insulin Resistance at 24 weeks
The proposed joint model of random intercepts and random slopes was failed because the number of random effects and parameters requiring estimation exceeds the total number of observation points. Although fitting a joint model with random intercepts is possible in principle, the model may not fully initialise the parameter estimates for the baseline hazard function. Hence, the proposed analysis was not carried out.
Sensitivity analyses 3: compliance-adjusted analysis
Two additional ad hoc exploratory compliance-adjusted analyses were carried out for HOMA-IR at 24 weeks to address the selection bias that is evident in original compliance-adjusted analysis (see Sensitivity analyses), given that patients who provided some compliance data had higher HIV viral load at baseline than those who did not provide any compliance data.
-
Instrumental variable regression was as for sensitivity analysis 3 (i.e. using complete case population), but additionally accounting for baseline HIV viral load.
Assumption: baseline HIV viral load is missing at random and there are no other factors (i.e. other than HIV viral load) that influence whether or not patients provide compliance data.
-
Multiple imputation was used to impute missing compliance information prior to carrying out IV regression, with HIV viral load at baseline as the key predictor in the imputation model (i.e. imputed compliance information used for all participants who had missing compliance information but who had baseline HIV viral load data). The same conditions as above using multiple imputation (20 imputations per patient using predictive mean matching with baseline HIV viral load as predictor variable) rather than including baseline HIV viral load in model.
Appendix 5 Protocol amendments
| Amendment number | Details of amendment |
|---|---|
| Original application | Protocol version 1, 29 February 2012 |
| Modified submission | Additional exclusion criteria added to protocol (version 2, 14 June 2012) |
| Amendment 1 (substantial) | Additional exclusion criteria added to protocol (version 2, 14 June 2012) |
| Changes to PISC (version 3, 1 August 2012) to reflect transfer of data to a private company | |
| Change of PI at Brighton and Sussex Hospital | |
| Amendment 2 (substantial) | Number of changes to protocol (version 3, 2 November 2012) including change in central laboratory, change in exclusion criteria, change in number and type of biological samples to be collected |
| Changes to PISC (version 4.0, 2 November 2012) | |
| Addition of further site | |
| Amendment 3 (substantial) | Addition of Royal Bournemouth and Christchurch Hospitals as a participating site |
| Amendment 4 (non-substantial) | Minor amendments to treatment diary |
| Amendment 5 (substantial) | Addition of St James’s University Hospital Leeds |
| Margaret Johnson replaces Dr Mike Youle as PI at the Royal Free London | |
| Amendment 7 (minor) | Admin changes to protocol (version 4.0, 18 October 2013) including:
|
| Amendment 8 (substantial) | Addition of participating sites:
|
| Amendment 9 (substantial) | Change to protocol (version 5.0, 24 February 2014) to allow the use of generic IMP |
| Change to PISC (main study) (version 6.0, 3 February 2014) | |
| Amendment 10 (substantial) | Addition of participating site:
|
| Amendment 11 (substantial) | Change to protocol (version 6.0, 19 August 2014) to clarify drugs in inclusion criteria, to allow substudy to be performed at other sites |
| Change to PISC (version 7.0, 19 August 2014) main study | |
| Change to substudy PISC (version 6.0, 19 August 2014) | |
| Amendment 12 (substantial) | Addition of Newcastle Upon Tyne Foundation Trust as a participating site |
| Amendment 13 (substantial) | Change to PISC to reflect potential interim analysis results (version 8a, 8b, 8c, 8d, 8e, 8f, 8g, 16 March 2015) |
| Amendment 14 (substantial) | Change to PISC (version 9.0, 20/05/2015) |
| Production of additional information sheet (version 1.0, 29 May 2015) | |
| Increase in number of patients to be recruited (protocol version 7.0, 13 May 2016) | |
| Notification of extension | Notification of extension to recruitment period |
| Amendment 15 (substantial) | Letter to notify sub-study patients of typo in version 4 substudy PISC |
| Amendment 16 (substantial) | Update to serum biomarker tests to be performed |
| Urinary biomarkers to become a substudy | |
| Protocol version 8.0 |
Protocol deviations
The number of protocol deviations are summarised by treatment arm and presented in Table 13.
| Protocol deviation | Impact | Treatment arm, n (%) | Total number of patients, n (%) | |||
|---|---|---|---|---|---|---|
| Arm A (N = 105) | Arm B (N = 84) | Arm C (N = 82) | Arm D (N = 106) | |||
| Inclusion criteria – patients recruited that are not on an accepted drug treatment | Major | 1 (1.0) | 0 (0.0) | 0 (0.0) | 0 (0.0) | 1 (0.3) |
| Exclusion criteria – eGFR of < 60 ml/minute/1.73 m2 | Major | 1 (1.0) | 0 (0.0) | 0 (0.0) | 2 (1.9) | 3 (0.8) |
| Exclusion criteria – patients who are already on/have been on other ARBs and/or ACE inhibitors within 4 weeks preceding randomisation | Major | 1 (1.0) | 0 (0.0) | 0 (0.0) | 1 (0.9) | 2 (0.5) |
| Treatment regime – premature discontinuation of randomised treatment for safety reasons | Major | 1 (1.0) | 6 (7.1) | 12 (14.6) | 9 (8.5) | 28 (7.4) |
| Treatment regime – use of non-protocol dosing regime | Major | 0 (0.0) | 0 (0.0) | 0 (0.0) | 11 (10.4) | 11 (2.9) |
| Study assessments at 12 weeks – missing or visits that occur outside the 2-week window | Minor | 25 (23.8) | 4 (4.8) | 16 (19.5) | 17 (16.0) | 62 (16.4) |
| Study assessment at 48 weeks – missing or visits that occur outside the 2-week window | Minor | 30 (28.6) | 3 (3.6) | 25 (30.5) | 36 (34.0) | 94 (24.9) |
| Study assessment at 24 weeks – missing or visits that occur outside the 2-week window | Major | 31 (29.5) | 5 (6.0) | 19 (23.2) | 26 (24.5) | 81 (21.5) |
| Titration visit at 2 weeks – missing or visits that occur outside the 4-day window | Major | 0 (0.0) | 0 (0.0) | 13 (15.9) | 13 (12.3) | 26 (13.8)a |
| Titration visit at 4 weeks – missing or visits that occur outside the 4-day window | Major | 0 (0.0) | 0 (0.0) | 0 (0.0) | 23 (21.7) | 23 (21.7)b |
| Study assessments – samples not collected/unfasted at 12 weeks | Minor | 1 (1.0) | 1 (1.2) | 0 (0.0) | 4 (3.8) | 6 (1.6) |
| Study assessments – samples not collected/unfasted at 48 weeks | Minor | 3 (2.9) | 4 (4.8) | 3 (3.7) | 2 (1.9) | 12 (3.2) |
| Study assessments – haemolysed samples collected at 12 weeks | Minor | 2 (1.9) | 0 (0.0) | 2 (2.4) | 1 (0.9) | 5 (1.3) |
| Study assessments – haemolysed samples collected at 48 weeks | Minor | 2 (1.9) | 0 (0.0) | 3 (3.7) | 1 (0.9) | 6 (1.6) |
| Study assessments – samples not collected/unfasted at 24 weeks | Major | 1 (1.0) | 1 (1.2) | 1 (1.2) | 2 (1.9) | 5 (1.3) |
| Study assessments – haemolysed samples collected at 24 weeks | Major | 0 (0.0) | 1 (1.2) | 2 (2.4) | 2 (1.9) | 5 (1.3) |
| Study assessments – samples not collected/unfasted at baseline | Major | 1 (1.0) | 1 (1.2) | 0 (0.0) | 2 (1.9) | 4 (1.1) |
| Study assessments – haemolysed samples collected at baseline | Major | 3 (2.9) | 2 (2.4) | 2 (2.4) | 3 (2.8) | 10 (2.7) |
| Blood pressure not being checked at baseline and follow-up visits | Major | 0 (0.0) | 1 (1.2) | 1 (1.2) | 0 (0.0) | 2 (0.5) |
Appendix 6 Further details of results
Screening and participant flow
| Site | Date | Number of patients | |||
|---|---|---|---|---|---|
| Opened | First patient randomised | Last patient randomised | Screened | Recruited | |
| Brighton and Sussex Hospital | 23 September 2013 | 1 November 2013 | 15 June 2015 | 43 | 39 |
| Coventry and Warwickshire | 20 September 2013 | 23 September 2013 | 14 November 2014 | 50 | 22 |
| George Eliot Hospital | 26 January 2015 | 27 January 2015 | 26 June 2015 | 60 | 15 |
| Guy’s and St Thomas’ | 14 June 2013 | 25 July 2013 | 26 May 2015 | 109 | 47 |
| Harrogate District Hospital | 10 June 2014 | 11 June 2014 | 13 July 2015 | 10 | 6 |
| James Cook University Hospital | 29 October 2013 | 14 November 2013 | 14 May 2015 | 68 | 27 |
| King’s College | 4 June 2013 | 25 July 2013 | 3 July 2015 | 84 | 24 |
| Manchester Royal Infirmary | 30 May 2014 | 26 June 2014 | 17 June 2015 | 42 | 20 |
| New Croft Clinic (Royal Victoria Infirmary) | 15 April 2015 | 11 June 2015 | 9 July 2015 | 3 | 2 |
| North Middlesex Hospital | 24 March 2014 | 1 April 2014 | 18 May 2015 | 94 | 11 |
| Royal Bournemouth Hospital | 2 May 2013 | 25 July 2013 | 29 June 2015 | 525 | 14 |
| Royal Free, London | 26 July 2013 | 18 September 2013 | 28 April 2015 | 104 | 24 |
| Royal Liverpool Hospital | 21 February 2013 | 19 March 2013 | 10 April 2015 | 143 | 41 |
| Southmead Hospital | 14 January 2015 | 22 January 2015 | 20 July 2015 | 9 | 8 |
| St Helens Hospital | 18 November 2014 | 30 January 2015 | 7 July 2015 | 7 | 4 |
| St James’s University Hospital | 19 September 2013 | 28 November 2013 | 28 May 2015 | 134 | 11 |
| St Stephen’s Trust at Chelsea and Westminster | 6 June 2014 | 20 June 2014 | 16 June 2015 | 40 | 40 |
| Western General Hospital | 19 September 2013 | 10 March 2014 | 14 May 2015 | 287 | 12 |
| YorClinic | 4 December 2013 | 23 January 2014 | 16 April 2015 | 138 | 10 |
| Total | – | – | – | 1950 | 377 |
| Site ID | Site | Number of patients who were assessed for eligibility at the screening visit | Those who met the study inclusion criteria at screening prior to consent being sought, n (%) | Those who did not meet the study inclusion criteria at screening prior to consent being sought, n (%) | Those who were eligible at screening and consent obtained, n (%) | Those who were eligible at screening but consent not obtained, n (%) | Those who provided consent but were not randomised, n (%) | Those who provided consent and were randomised, n (%) |
|---|---|---|---|---|---|---|---|---|
| 0149 | Brighton and Sussex Hospital | 43 | 42 (97.7) | 1 (2.3) | 40 (95.2) | 2 (4.8) | 1 (2.5) | 39 (97.5) |
| 2575 | Coventry and Warwickshire | 50 | 50 (100.0) | 0 (0.0) | 22 (44.0) | 28 (56.0) | 0 (0.0) | 22 (100.0) |
| 0187 | George Eliot Hospital | 60 | 36 (60.0) | 24 (40.0) | 15 (41.7) | 21 (58.3) | 0 (0.0) | 15 (100.0) |
| 0241 | Guy’s and St Thomas’ | 109 | 101 (92.7) | 8 (7.3) | 47 (46.5) | 54 (53.5) | 0 (0.0) | 47 (100.0) |
| 0076 | Harrogate District Hospital | 10 | 10 (100.0) | 0 (0.0) | 6 (60.0) | 4 (40.0) | 0 (0.0) | 6 (100.0) |
| 0006 | James Cook University Hospital | 68 | 67 (98.5) | 1 (1.5) | 27 (40.3) | 40 (59.7) | 0 (0.0) | 27 (100.0) |
| 0161 | King’s College | 84 | 73 (86.9) | 11 (13.1) | 24 (32.9) | 49 (67.1) | 0 (0.0) | 24 (100.0) |
| 0080 | Manchester Royal Infirmary | 42 | 41 (97.6) | 1 (2.4) | 20 (48.8) | 21 (51.2) | 0 (0.0) | 20 (100.0) |
| 0072 | New Croft Clinic (Royal Victoria Infirmary) | 3 | 2 (66.7) | 1 (33.3) | 2 (100.0) | 0 (0.0) | 0 (0.0) | 2 (100.0) |
| 0145 | North Middlesex Hospital | 94 | 87 (92.6) | 7 (7.4) | 11 (12.6) | 76 (87.4) | 0 (0.0) | 11 (100.0) |
| 0112 | Royal Bournemouth Hospital | 525 | 123 (23.4) | 402 (76.6) | 50 (40.7) | 73 (59.3) | 36a (72.0) | 14 (28.0) |
| 0155 | Royal Free, London | 104 | 89 (85.6) | 15 (14.4) | 28 (31.5) | 61 (68.5) | 5 (17.9) | 23 (82.1) |
| 0046 | Royal Liverpool Hospital | 143 | 136 (95.1) | 7 (4.9) | 42 (30.9) | 94 (69.1) | 2 (4.8) | 40 (95.2) |
| 0230 | Southmead Hospital | 9 | 8 (88.9) | 1 (11.1) | 8 (100.0) | 0 (0.0) | 0 (0.0) | 8 (100.0) |
| 7478 | St Helens Hospital | 7 | 7 (100.0) | 0 (0.0) | 5 (71.4) | 2 (28.6) | 0 (0.0) | 5 (100.0) |
| 0050 | St James’s University Hospital | 134 | 79 (59.0) | 55 (41) | 11 (13.9) | 68 (86.1) | 0 (0.0) | 11 (100.0) |
| 0016 | St Stephen’s Trust at Chelsea and Westminster | 40 | 40 (100.0) | 0 (0.0) | 40 (100.0) | 0 (0.0) | 0 (0.0) | 40 (100.0) |
| 0361 | Western General Hospital | 287 | 72 (25.1) | 215 (74.9) | 12 (16.7) | 60 (83.3) | 0 (0.0) | 12 (100.0) |
| 9446 | YorClinic | 138 | 55 (39.9) | 83 (60.1) | 10 (18.2) | 45 (81.8) | 0 (0.0) | 10 (100.0) |
| TOTAL | 1950 | 1118 (57.3) | 832 (42.7) | 420 (37.6) | 698 (62.4) | 44 (10.5) | 376b (89.5) | |
| Site ID | Reason for ineligibility (n) | ||||||||||||||
|---|---|---|---|---|---|---|---|---|---|---|---|---|---|---|---|
| Aged < 18 years | Pre-existing diagnosis of diabetes mellitus | Participant has renal disease | Participant has known untreated renal artery stenosis | Participant has cholestasis, biliary obstructive disorders or severe hepatic impairment | Prior diagnosis of hepatitis C (+ve PCR result in previous 6 months) | Participant on unboosted atazanavir | Participant on on/has been on hormone therapy, anabolics and insulin sensitisers (previous 6 months) | Participant on/has been on other ARBs and/or ACE inhibitors (within 4 weeks before randomisation) | Suspected poor compliance | Pregnant/lactating | Women of childbearing age (unless using reliable contraception that does not interact with their antiretroviral therapy) | Co-enrolment in other drug trials | Participant in a trial of an IMP likely to influence insulin sensitivity | Other reason not eligible | |
| 0006 | 0 | 0 | 0 | 0 | 0 | 0 | 0 | 1 | 0 | 0 | 0 | 0 | 0 | 0 | 0 |
| 0016 | 0 | 0 | 0 | 0 | 0 | 0 | 0 | 0 | 0 | 0 | 0 | 0 | 0 | 0 | 0 |
| 0046 | 0 | 0 | 0 | 0 | 0 | 0 | 0 | 0 | 0 | 0 | 0 | 3 | 0 | 0 | 7 |
| 0050 | 0 | 2 | 5 | 0 | 0 | 4 | 3 | 0 | 0 | 6 | 5 | 2 | 0 | 0 | 28 |
| 0072 | 0 | 0 | 0 | 0 | 0 | 0 | 0 | 0 | 1 | 0 | 0 | 0 | 0 | 0 | 0 |
| 0076 | 0 | 0 | 0 | 0 | 0 | 0 | 0 | 0 | 0 | 0 | 0 | 0 | 0 | 0 | 0 |
| 0080 | 0 | 0 | 0 | 0 | 0 | 0 | 0 | 0 | 0 | 0 | 0 | 0 | 0 | 0 | 1 |
| 0112 | 5 | 55 | 26 | 7 | 7 | 23 | 16 | 2 | 42 | 151 | 10 | 9 | 11 | 0 | 40 |
| 0145 | 0 | 0 | 1 | 0 | 1 | 1 | 0 | 1 | 0 | 0 | 0 | 0 | 0 | 0 | 3 |
| 0149 | 0 | 0 | 1 | 0 | 0 | 0 | 0 | 0 | 0 | 0 | 0 | 0 | 0 | 0 | 0 |
| 0155 | 0 | 0 | 0 | 0 | 0 | 0 | 0 | 0 | 7 | 3 | 1 | 1 | 0 | 0 | 3 |
| 0161 | 0 | 0 | 0 | 0 | 0 | 1 | 0 | 0 | 5 | 0 | 0 | 0 | 0 | 0 | 5 |
| 0187 | 0 | 0 | 2 | 0 | 0 | 1 | 3 | 0 | 0 | 7 | 1 | 0 | 0 | 0 | 11 |
| 0230 | 0 | 0 | 0 | 0 | 0 | 0 | 0 | 0 | 0 | 0 | 0 | 0 | 0 | 0 | 1 |
| 0241 | 0 | 1 | 0 | 0 | 1 | 0 | 0 | 0 | 1 | 0 | 0 | 0 | 1 | 0 | 4 |
| 0361 | 0 | 15 | 26 | 0 | 4 | 44 | 1 | 5 | 31 | 10 | 1 | 1 | 2 | 0 | 92 |
| 2575 | 0 | 0 | 0 | 0 | 0 | 0 | 0 | 0 | 0 | 0 | 0 | 0 | 0 | 0 | 0 |
| 7478 | 0 | 0 | 0 | 0 | 0 | 0 | 0 | 0 | 0 | 0 | 0 | 0 | 0 | 0 | 0 |
| 9446 | 0 | 7 | 12 | 0 | 6 | 4 | 0 | 4 | 12 | 25 | 1 | 1 | 1 | 0 | 13 |
| TOTAL | 5 | 80 | 73 | 7 | 19 | 78 | 23 | 13 | 99 | 202 | 19 | 17 | 15 | 0 | 208 |
| Reason | Number of patients |
|---|---|
| Aged < 18 years | 5 |
| Pre-existing diagnosis of diabetes mellitus | 80 |
| Participant has renal disease | 73 |
| Participant has known untreated renal artery stenosis | 7 |
| Participant has cholestasis, biliary obstructive disorders or severe hepatic impairment | 19 |
| Prior diagnosis of hepatitis C (i.e. positive PCR result in previous 6 months) | 78 |
| Participant on unboosted atazanavir | 23 |
| Participant on on/have been on hormone therapy, anabolics and insulin sensitisers (previous 6 months) | 13 |
| Participant on/have been on other ARBs and/or ACE inhibitors (within 4 weeks before randomisation) | 99 |
| Suspected poor compliance | 202 |
| Pregnant/lactating | 19 |
| Women of childbearing age (unless using reliable contraception that does not interact with their antiretroviral therapy) | 17 |
| Co-enrolment in other drug trials | 15 |
| Participant in a trial of an IMP likely to influence insulin sensitivity | 0 |
| Other reason not eligiblea | 208 |
Baseline data
| Characteristic | Treatment arm | |||
|---|---|---|---|---|
| Arm A (N = 105) | Arm B (N = 84) | Arm C (N = 82) | Arm D (N = 106) | |
| CD4 cell count (cells/mm3) | (n = 102) | (n = 83) | (n = 78) | (n = 101) |
| Median (IQR); min.–max. | 598 (480–756); 200–1400 | 580 (425–792); 131–1501 | 582 (440–770); 129–1467 | 593 (427–783); 62–1674 |
| CD4 cell count and HIV viral load (%) | (n = 102) | (n = 81) | ||
| Mean (SD); min.–max. | 32.1 (7.7); 14.0–52.0 | 29.2 (8.6); 8.0–47.0 | 30.1 (9.3); 6.0–52.0 | 30.5 (7.9); 6.0–48.0 |
| HIV viral load (copies/ml) | (n = 35) | (n = 17) | (n = 31) | (n = 34) |
| Median (IQR); min.–max.a | 39 (0–40); 0–577 | 0 (0–39); 0–120 | 36 (0–44); 0–649 | 20 (0–39); 0–148 |
| < 10, n (%) | 2 (1.9) | 1 (1.2) | 2 (2.4) | 1 (0.9) |
| < 20, n (%) | 13 (12.4) | 20 (23.8) | 11 (13.4) | 23 (21.7) |
| < 40, n (%) | 50 (47.6) | 38 (45.2) | 35 (42.7) | 43 (40.6) |
| < 45, n (%) | 2 (1.9) | 6 (7.1) | 3 (3.7) | 3 (2.8) |
| < 100, n (%) | 0 (0.0) | 1 (1.2) | 0 (0.0) | 0 (0.0) |
| Characteristic | Treatment arm | |||
|---|---|---|---|---|
| Arm A (N = 105) | Arm B (N = 84) | Arm C (N = 82) | Arm D (N = 106) | |
| ALT (IU/l) | (n = 92) | (n = 75) | (n = 77) | (n = 96) |
| Median (IQR); min.–max. | 24.0 (17.5–33.5); 9.0–80.0 | 26.0 (19.0–36.0); 6.0–142.0 | 27.0 (20.0–35.0); 10.0–84.0 | 25.0 (18.0–38.0); 8.0–305.0a |
| ALP (IU/l) | (n = 103) | (n = 83) | (n = 74) | (n = 102) |
| Median (IQR); min.–max. | 88.0 (71.0–107.0); 30.0–371.0 | 85.0 (72.0–113.0); 40.0–403.0 | 77.0 (62.0–98.0); 32.0–179.0 | 80.0 (65.0–100.0); 35.0–309.0 |
| Albumin (g/l) | (n = 102) | (n = 83) | (n = 81) | (n = 103) |
| Mean (SD); min.–max. | 43.7 (4.1); 33.0–51.0 | 44.3 (3.5); 36.0–51.0 | 44.2 (3.2); 37.0–54.0 | 44.7 (3.8); 34.0–53.0 |
| Total protein (g/l) | (n = 72) | (n = 59) | (n = 59) | (n = 69) |
| Mean (SD); min.–max. | 74.5 (5.3); 63.0–87.0 | 73.7 (4.0); 66.0–84.0 | 74.2 (4.6); 65.0–85.0 | 73.4 (3.9); 65.0–84.0 |
| Bilirubin (µmol/l) | (n = 100) | (n = 78) | (n = 76) | (n = 98) |
| Median (IQR); min.–max.b | 6.0 (5.0–9.5); 2.0–67.0 | 7.0 (5.0–9.0); 3.0–82.0 | 8.0 (6.0–12.0); 3.0–100.0 | 7.0 (5.0–14.0); 2.0–68.0 |
| < 2, n (%) | 0 (0.0) | 1 (1.2) | 0 (0.0) | 0 (0.0) |
| < 3, n (%) | 3 (2.9) | 2 (2.4) | 2 (2.4) | 2 (1.9) |
| < 15, n (%) | 1 (1.0) | 2 (2.4) | 1 (1.2) | 4 (3.8) |
| Characteristic | Treatment arm | |||
|---|---|---|---|---|
| Arm A (N = 105) | Arm B (N = 84) | Arm C (N = 82) | Arm D (N = 106) | |
| Haematocrit (%) | (n = 70) | (n = 49) | (n = 50) | (n = 65) |
| Mean (SD); min.–max. | 42.23 (3.29); 34.2–53.0 | 42.16 (6.51); 5.1–51.0 | 42.82 (3.18); 34.6–49.9 | 42.46 (5.69); 5.3–50.0 |
| Haemoglobin (g/dl) | (n = 83) | |||
| Mean (SD); min.–max. | 143.77 (12.28); 114–171 | 144.16 (13.32); 107–173 | 146.73 (12.15); 114–177 | 145.72 (12.92); 80–171 |
| Red blood cell count (1012/l) | (n = 98) | (n = 79) | (n = 77) | (n = 97) |
| Mean (SD); min.–max. | 4.55 (0.44); 3.47–5.63 | 4.62 (0.44); 3.23–5.59 | 4.69 (0.41); 3.68–6.06 | 4.60 (0.44); 3.10–5.79 |
| White blood cell count (109/l) | (n = 105) | |||
| Median (IQR); min.–max. | 5.98 (4.78–7.60); 3.5–15.3 | 5.61 (4.8–7.2); 3.0–13.8 | 5.56 (4.8–6.7); 2.04–12.9 | 5.7 (4.8–7.2); 2.8–14.4 |
| Platelets (109/l) | (n = 104) | |||
| Median (IQR); min.–max. | 231.5 (198.5–271.5); 128–647 | 223.0 (193.0–252.0); 46–406 | 216.5 (182.0–266.0); 119–411 | 219.5 (185.0–262.0); 106–368 |
| Mean cell volume (fl) | (n = 104) | |||
| Mean (SD); min.–max. | 93.40 (5.65); 77.4–111.1 | 92.87 (5.48); 73.6–104.0 | 92.47 (5.48); 81.4–110.2 | 94.37 (5.33); 81.0–111.0 |
| Mean cell haemoglobin (pg) | (n = 80) | (n = 67) | (n = 60) | (n = 85) |
| Mean (SD); min.–max. | 31.49 (3.92); 3.6–39.7 | 31.35 (2.06); 24.1–36.7 | 31.34 (1.91); 26.6–36.6 | 31.35 (3.68); 2.59–37.0 |
| Mean cell haemoglobin concentration (g/dl) | (n = 68) | (n = 53) | (n = 53) | (n = 65) |
| Mean (SD); min.–max. | 340.71 (11.83); 309–366 | 335.28 (12.97); 302–366 | 340.57 (13.03); 315–367 | 336.55 (12.48); 293–357 |
| Neutrophils (109/l) | ||||
| Median (IQR); min.–max. | 3.15 (2.30–4.30); 1.16–12.60 | 2.90 (2.24–3.90); 1.10–9.70 | 2.90 (2.30–3.84); 0.83–8.70 | 3.00 (2.10–3.80); 0.88–10.00 |
| Lymphocytes (109/l) | ||||
| Median (IQR); min.–max. | 1.90 (1.60–2.55); 0.89–4.10 | 2.13 (1.71–2.50); 0.93–5.02 | 2.00 (1.62–2.31); 0.53–3.70 | 1.91 (1.60–2.50); 0.90–4.20 |
| Eosinophils (109/l) | (n = 104) | (n = 82) | ||
| Median (IQR); min.–max. | 0.11 (0.10–0.20); 0.00–1.11 | 0.10 (0.10–0.20); 0.00–0.60 | 0.12 (0.10–0.20); 0.00–0.41 | 0.12 (0.10–0.20); 0.00–0.50 |
| Basophils (109/l) | (n = 101) | (n = 80) | (n = 81) | (n = 103) |
| Median (IQR); min.–max. | 0.02 (0.00–0.05); 0.00–0.20 | 0.00 (0.00–0.04); 0.00–0.10 | 0.00 (0.00–0.03); 0.00–0.10 | 0.01 (0.00–0.06); 0.00–0.10 |
| Monocytes (109/l) | ||||
| Median (IQR); min.–max. | 0.50 (0.34–0.60); 0.00–1.10 | 0.44 (0.30–0.60); 0.19–1.20 | 0.48 (0.38–0.60); 0.16–1.02 | 0.42 (0.31–0.60); 0.10–1.49 |
Numbers analysed
| Visit | Treatment arm | Total (N = 377) | |||
|---|---|---|---|---|---|
| Arm A (N = 105) | Arm B (N = 84) | Arm C (N = 82) | Arm D (N = 106) | ||
| No missing assessment visit | 82 | 79 | 65 | 81 | 307 |
| Complete longitudinal record | 72 | 72 | 57 | 72 | 273 |
| Study assessment at 12 weeks | |||||
| Missing | 13 | 4 | 11 | 13 | 41 |
| Data invalida | 3 | 1 | 2 | 5 | 11 |
| Study assessment at 24 weeks | |||||
| Missing | 15 | 2 | 11 | 20 | 48 |
| Data invalida | 1 | 2 | 3 | 4 | 10 |
| Study assessment at 48 weeks | |||||
| Missing | 16 | 2 | 9 | 24 | 51 |
| Data invalida | 5 | 4 | 6 | 3 | 18 |
| Baseline | |||||
| Data invalida | 4 | 3 | 2 | 5 | 14 |
| Reason | Treatment arm | Total (N = 377) | |||
|---|---|---|---|---|---|
| Arm A (N = 105) | Arm B (N = 84) | Arm C (N = 82) | Arm D (N = 106) | ||
| Death | 1 | 0 | 0 | 0 | 1 |
| Loss to follow-up | 6 | 2 | 5 | 5 | 18 |
| Other reasonsa | 6 | 1 | 3 | 7 | 17 |
| SAR | 0 | 0 | 1 | 0 | 1 |
| Treatment arm dropped | 0 | 32 | 31 | 0 | 63 |
| Withdrawal of consent for follow-up | 1 | 0 | 3 | 4 | 8 |
| Total | 14 | 35 | 43 | 16 | 108 |
Interim analysis
| Summary statistic | Timeline | |||||||
|---|---|---|---|---|---|---|---|---|
| HOMA-IR at baseline | HOMA-IR at 24 weeks | |||||||
| Arm A (control) | Arm B (20 mg) | Arm C (40 mg) | Arm D (80 mg) | Arm A (control) | Arm B (20 mg) | Arm C (40 mg) | Arm D (80 mg) | |
| Number of patients | 39 | 45 | 35 | 35 | 39 | 45 | 35 | 35 |
| Mean (SD); min.–max. | 2.4 (2.0); 0.6–10.8 | 2.3 (1.6); 0.6–7.0 | 2.8 (3.9); 0.6–17.5 | 2.6 (2.7); 0.6–11.4 | 2.5 (1.9); 0.6–9.2 | 2.7 (1.9); 0.6–7.8 | 3.4 (4.4); 0.6–23.5 | 2.5 (1.7); 0.6–8.1 |
| Median (IQR) | 1.8 (1.0–3.5) | 1.6 (1.2–2.8) | 1.8 (1.2–2.5) | 1.6 (1.2–2.9) | 2.1 (1.2–3.2) | 2.4 (1.2–3.3) | 1.8 (1.4–3.4) | 1.8 (1.3–3.1) |
| Number of patients randomised | 48 | 49 | 47 | 45 | 48 | 49 | 47 | 45 |
Homeostatic Model Assessment of Insulin Resistance at primary end point
Investigation of the extreme Homeostatic Model Assessment of Insulin Resistance value
FIGURE 10.
Change in HOMA-IR at 24 weeks from baseline against HOMA-IR at baseline. (a) all values; (b) values excluding patient 01552152.
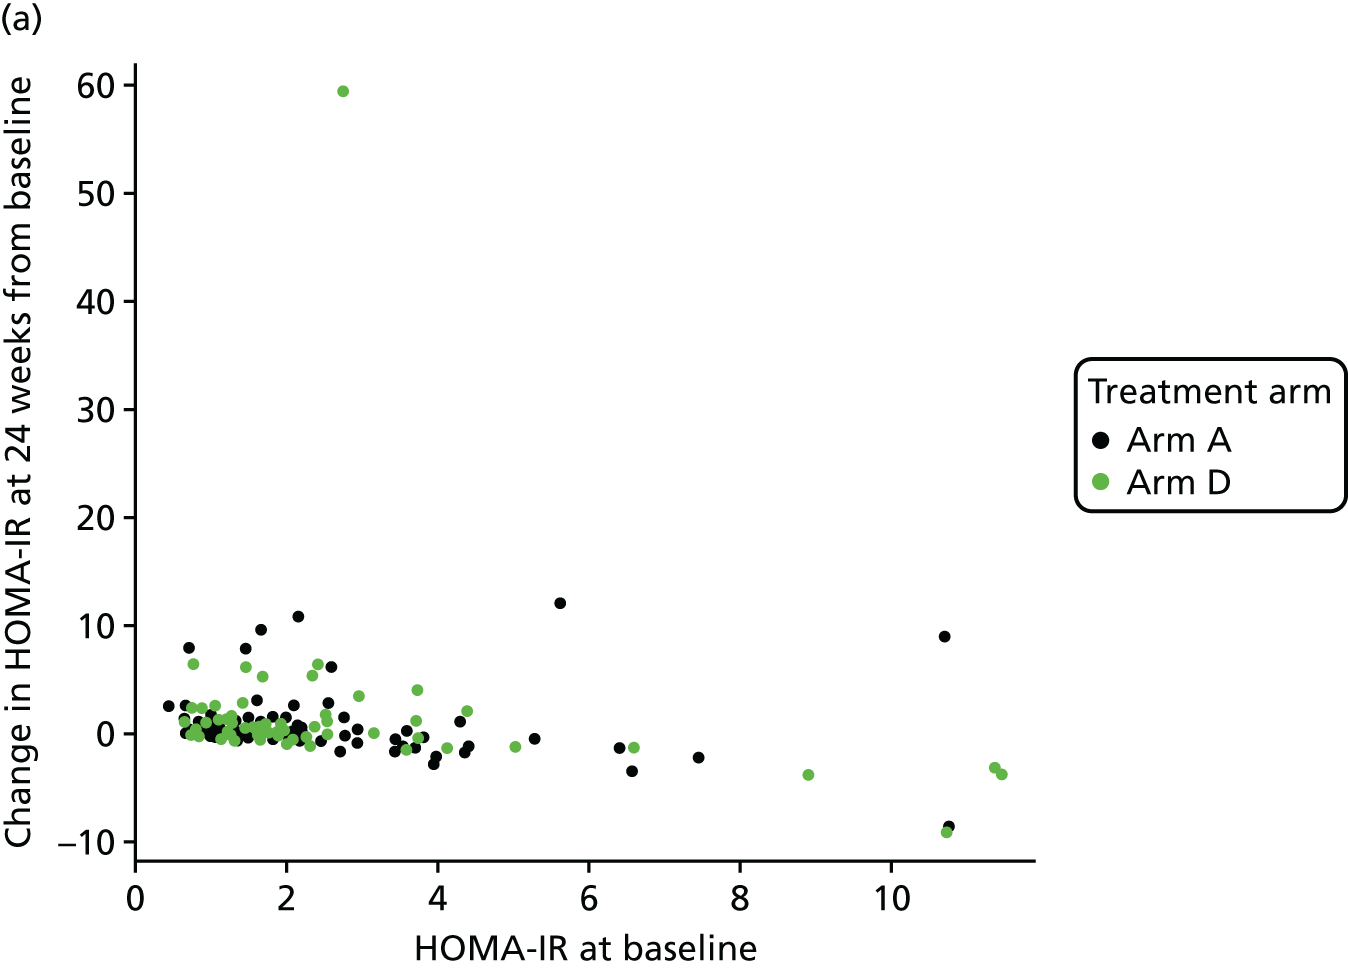
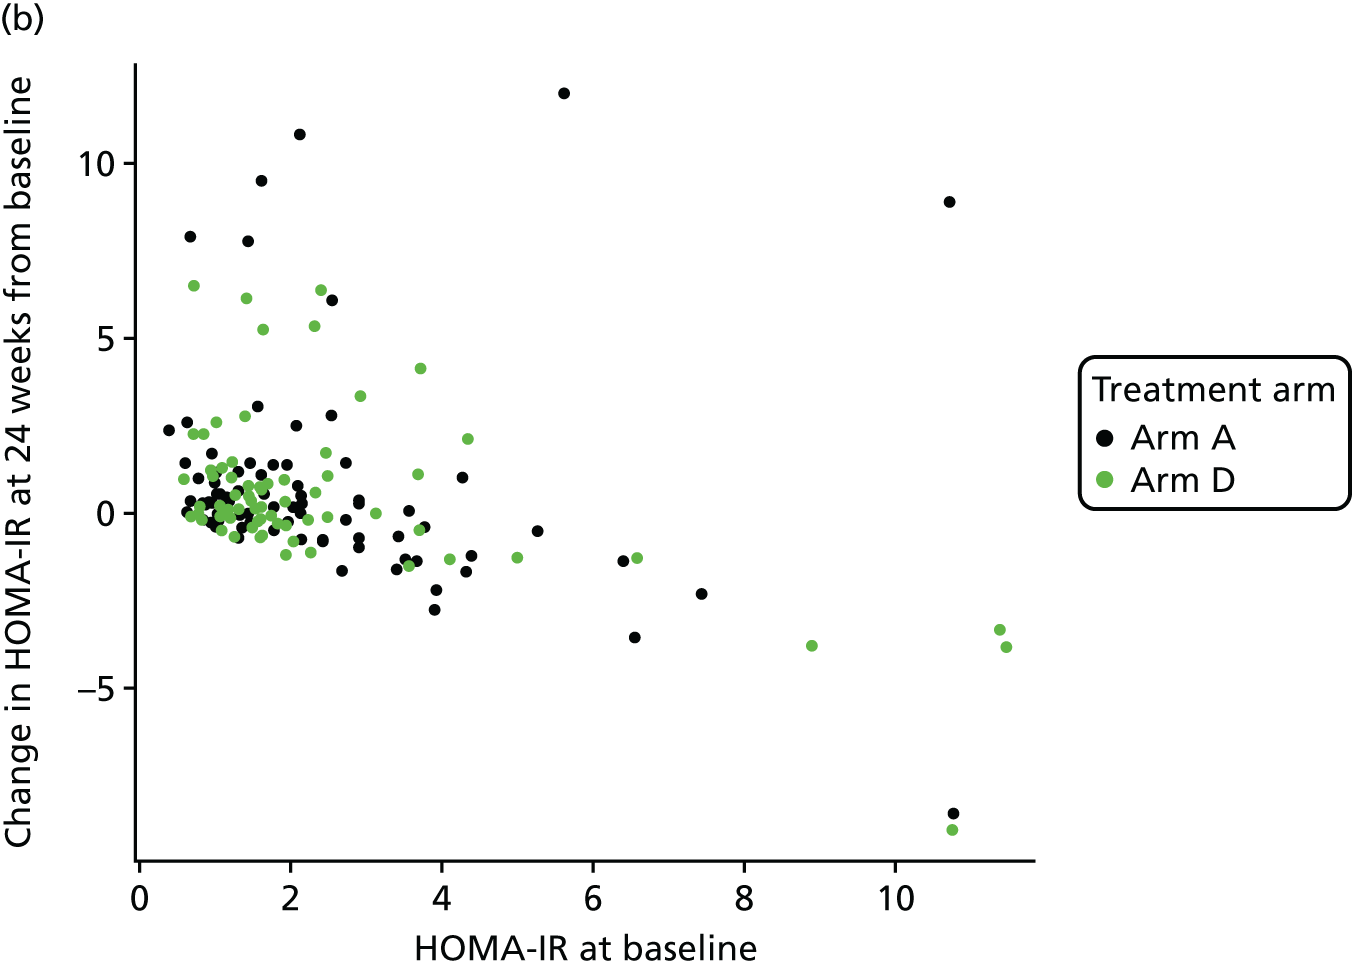
Excluding the outlier patient
| Summary statistic | Time point | |||
|---|---|---|---|---|
| HOMA-IR at baseline | HOMA-IR at 24 weeks | |||
| Arm A (control) | Arm D (80 mg) | Arm A (control) | Arm D (80 mg) | |
| Number of patients (%) | 100 (95.2) | 99 (93.4) | 89 (84.8) | 81 (76.4) |
| Mean (SD); min.–max. | 2.49 (2.08); 0.41–10.78 | 2.54 (2.81); 0.59–16.85 | 2.99 (3.25); 0.62–19.6 | 2.72 (2.15); 0.60–8.77 |
| Median (IQR) | 1.81 (1.12–2.90) | 1.62 (1.18–2.48) | 2.09 (1.29–3.17) | 1.99 (1.15–3.23) |
| Missing (%) | 5 (4.8) | 7 (6.6) | 16 (15.2) | 25 (23.6) |
| Number of patients randomised | 105 | 106 | 105 | 106 |
| Variable | Parameter estimate | Standard error | t-value for treatment |
|---|---|---|---|
| Intercept | 0.458 | 0.126 | – |
| Log-(HOMA-IR) at baseline | 0.575 | 0.074 | – |
| Ethnicity (non-black) | –0.012 | 0.123 | – |
| Arm D vs. arm A | –0.034 | 0.099 | –0.347 |
| Variable | Parameter estimate | Standard error | t-value for treatment |
|---|---|---|---|
| Intercept | 0.400 | 0.126 | – |
| Log-(HOMA-IR) at baseline | 0.581 | 0.072 | – |
| Ethnicity (non-black) | 0.031 | 0.122 | – |
| Weight change | 0.050 | 0.016 | – |
| Arm D vs. arm A | –0.039 | 0.097 | –0.399 |
Sensitivity analysis 1
We fitted the same ANCOVA model by imputing values for missing HOMA-IR values at baseline and 24 weeks using the MICE algorithm. The MICE algorithm imputed missing HOMA-IR values conditional on available HOMA-IR values at baseline, 12 weeks and 24 weeks, treatment allocation (arm D/arm A) and stratification factor (black/non-black).
| Variable | Parameter estimate | Standard error | t-value for treatment |
|---|---|---|---|
| Intercept | 0.393 | 0.123 | – |
| Log-(HOMA-IR) at baseline | 0.575 | 0.073 | – |
| Ethnicity (non-black) | 0.030 | 0.120 | – |
| Weight change | 0.052 | 0.016 | – |
| Arm D vs. arm A | –0.038 | 0.096 | –0.393 |
The test statistic is –0.393, and as this value is not smaller than the critical value (–2.086), we failed to reject the null hypothesis (i.e. no difference between arm D and arm A).
Sensitivity analysis 2
A compliance-adjusted primary outcome analysis was undertaken using IV regression, in order to estimate the effect of actual dose on outcome. The model included patients from arm A (assumed to have received a telmisartan dose of 0 mg) and patients from arm D who provided compliance data from both the treatment diary and pill count. Dose is based on the average between two measures of compliance (treatment diary and pill count).
| Variable | Parameter estimate | Standard error | 95% CI | p-value |
|---|---|---|---|---|
| Intercept | 0.408 | 0.132 | 0.149 to 0.667 | 0.0020 |
| Log-(HOMA-IR) at baseline | 0.589 | 0.077 | 0.438 to 0.741 | < 0.0001 |
| Ethnicity (non-black) | 0.040 | 0.131 | –0.218 to 0.297 | 0.7636 |
| Arm D dose (unit: 1000 mg) | –0.010 | 0.009 | –0.028 to 0.008 | 0.2885 |
The p-value (of 0.2885 > 0.05) implies that there is no effect of telmisartan after adjusting for dose. The test of endogeneity indicated that there was insufficient evidence to reject the null hypothesis of exogeneity (Durbin score, chi-squared(1) = 0.0234; p = 0.8783; Wu–Hausman F(1,138) = 0.0226; p = 0.8807), implying that dose is independent of the error and, thus, standard regression analysis is appropriate. The randomisation was an informative (strong) instrument in this analysis, as demonstrated by a high correlation between compliance and randomised treatment arm (0.9928) and a highly significant p-value (i.e. < 0.0001), rejecting the null hypothesis that randomised treatment is a weak instrument.
Same IV regression was carried out but additionally accounting for baseline HIV viral load. We assume that baseline HIV viral load was missing at random, and there were no other factors (i.e. other than HIV viral load) that influence whether or not patients provided compliance data.
| Variable | Parameter estimate | Standard error | 95% CI | p-value |
|---|---|---|---|---|
| Intercept | 0.431 | 0.167 | 0.103 to 0.759 | 0.0100 |
| Dose (unit: 1000 mg) | –0.011 | 0.009 | –0.029 to 0.008 | 0.2589 |
| Log-HOMA-IR at baseline | 0.591 | 0.078 | 0.439 to 0.743 | < 0.0001 |
| Ethnicity | 0.040 | 0.133 | –0.220 to 0.300 | 0.7639 |
| HIV viral load | –0.001 | 0.003 | –0.006 to 0.005 | 0.8288 |
In the next analysis, multiple imputation was used to impute missing compliance information prior to carrying out IV regression, with HIV viral load at baseline as the key predictor in the imputation model (i.e. imputed compliance information used for all participants who had missing compliance information but who had baseline HIV viral load data). Twenty imputations were generated per patient using predictive mean matching with baseline HIV viral load as predictor variable rather than including baseline HIV viral load in model.
| Variable | Parameter estimate | Standard error | 95% CI | p-value |
|---|---|---|---|---|
| Intercept | 0.458 | 0.125 | 0.213 to 0.704 | < 0.001 |
| Dose (unit: 1000 mg) | –0.003 | 0.009 | –0.020 to 0.014 | 0.725 |
| Log-HOMA-IR at baseline | 0.575 | 0.073 | 0.432 to 0.718 | < 0.001 |
| Ethnicity | –0.013 | 0.122 | –0.251 to 0.225 | 0.915 |
Quantitative Insulin Sensitivity Check Index and revised Quantitative Insulin Sensitivity Check Index at primary end point
| Summary statistic | Time point | |||
|---|---|---|---|---|
| QUICKI at baseline | QUICKI at 24 weeks | |||
| Arm A (control) | Arm D (80 mg) | Arm A (control) | Arm D (80 mg) | |
| Number of patients (%) | 100 (95.2) | 99 (93.4) | 89 (84.8) | 81 (76.4) |
| Mean (SD); min.–max. | 0.117 (0.0092); 0.097–0.142 | 0.118 (0.0092); 0.093–0.135 | 0.115 (0.0093); 0.092–0.134 | 0.116 (0.0099); 0.099–0.134 |
| Median (IQR) | 0.117 (0.111 –0.124) | 0.119 (0.113–0.123) | 0.115 (0.110–0.122) | 0.116 (0.110–0.124) |
| Missing (%) | 5 (4.8) | 7 (6.6) | 16 (15.2) | 25 (23.6) |
| Number of patients randomised | 105 | 106 | 105 | 106 |
| Summary statistic | Time point | |||
|---|---|---|---|---|
| Revised-QUICKI at baseline | Revised-QUICKI at 24 weeks | |||
| Arm A (control) | Arm D (80 mg) | Arm A (control) | Arm D (80 mg) | |
| Number of patients (%) | 100 (95.2) | 98 (92.4) | 88 (83.8) | 81 (76.4) |
| Mean (SD); min.–max. | 0.132 (0.0168); 0.101–0.184 | 0.133 (0.0156); 0.096–0.178 | 0.132 (0.0176); 0.099–0.183 | 0.134 (0.0174); 0.103–0.187 |
| Median (IQR) | 0.13 (0.122–0.142) | 0.132 (0.123–0.143) | 0.129 (0.119–0.140) | 0.131 (0.121–0.143) |
| Missing (%) | 5 (4.8) | 8 (7.5) | 17 (16.2) | 25 (23.6) |
| Number of patients randomised | 105 | 106 | 105 | 106 |
| Variable | Parameter estimate | Standard error | t-value for treatment |
|---|---|---|---|
| Intercept | 0.0493 | 0.0085 | – |
| QUICKI at baseline | 0.5624 | 0.0704 | – |
| Ethnicity (non-black) | –0.000035 | 0.0016 | – |
| Weight change | –0.000656 | 0.0002 | – |
| Arm D vs. arm A | 0.000563 | 0.0013 | 0.4471 |
| Variable | Parameter estimate | Standard error | t-value for treatment |
|---|---|---|---|
| Intercept | 0.0638 | 0.0109 | – |
| Revised QUICKI at baseline | 0.4932 | 0.0784 | – |
| Ethnicity (non-black) | 0.0028 | 0.0031 | – |
| Weight change | –0.0008 | 0.0004 | – |
| Arm D vs. arm A | 0.0017 | 0.0025 | 0.6882 |
Analysis of covariance model diagnostics of primary and secondary outcomes
The design has been constructed under the assumption that outcomes were normally distributed with a common standard deviation, σ. Levene’s test for checking equal group variances, and histograms for checking normality were used.
Histograms to check normality for Homeostatic Model Assessment of Insulin Resistance at baseline and 24 weeks
FIGURE 11.
Normality of HOMA-IR (a) at baseline; (b) at 24 weeks; (c) log-transformed at baseline; and (d) log-transformed at 24 weeks.
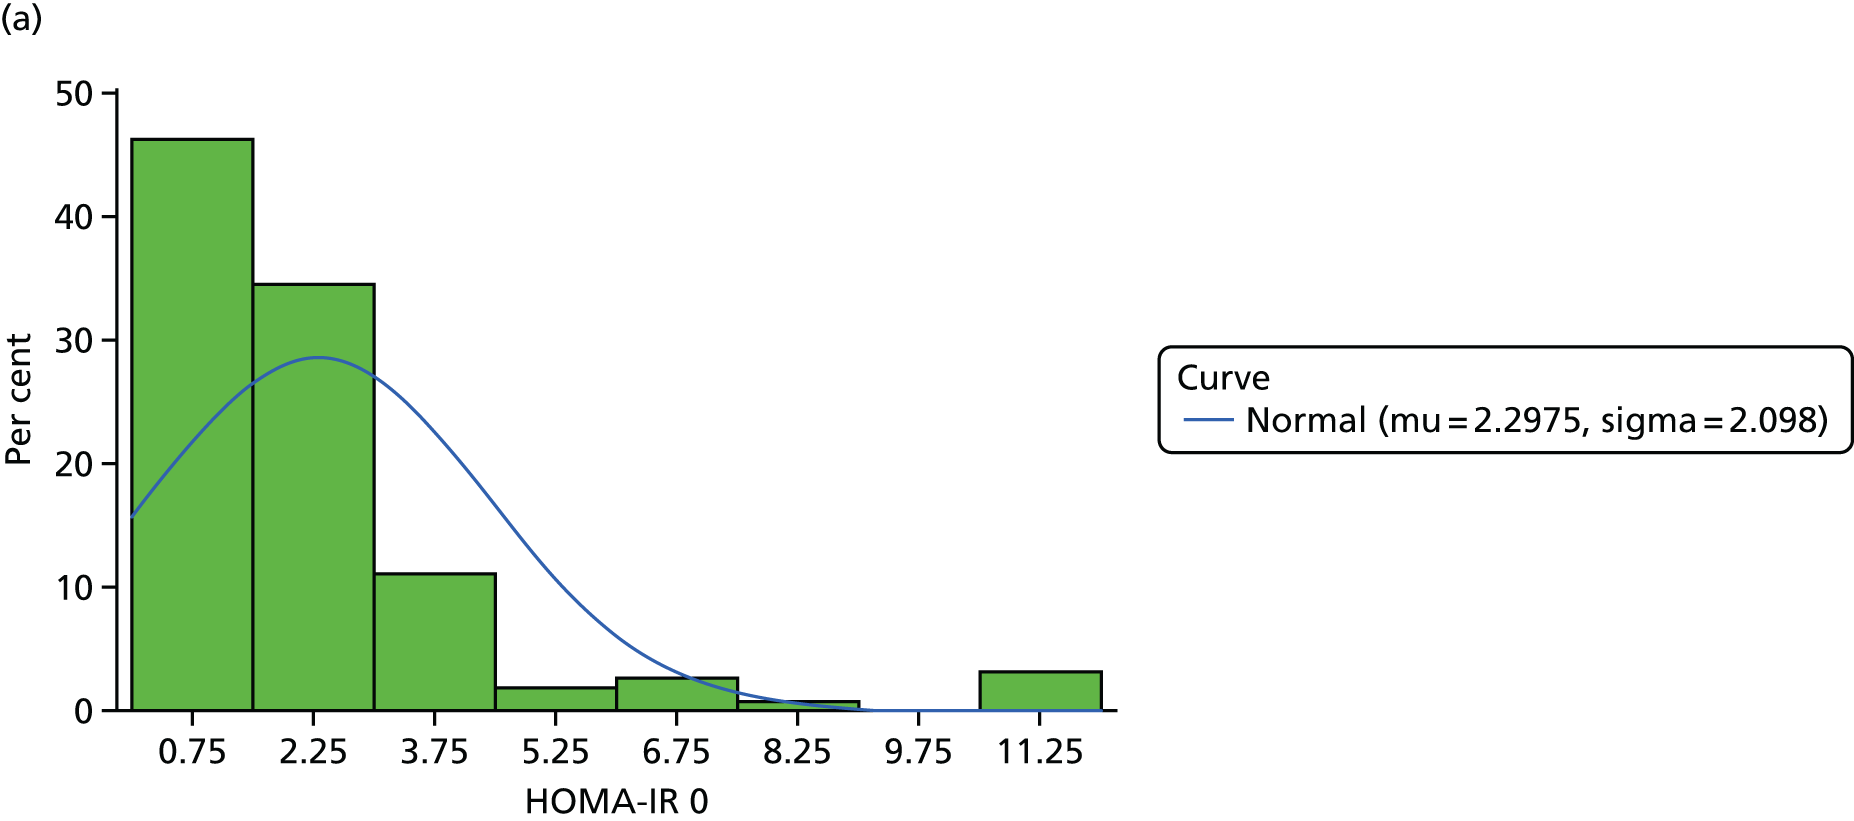
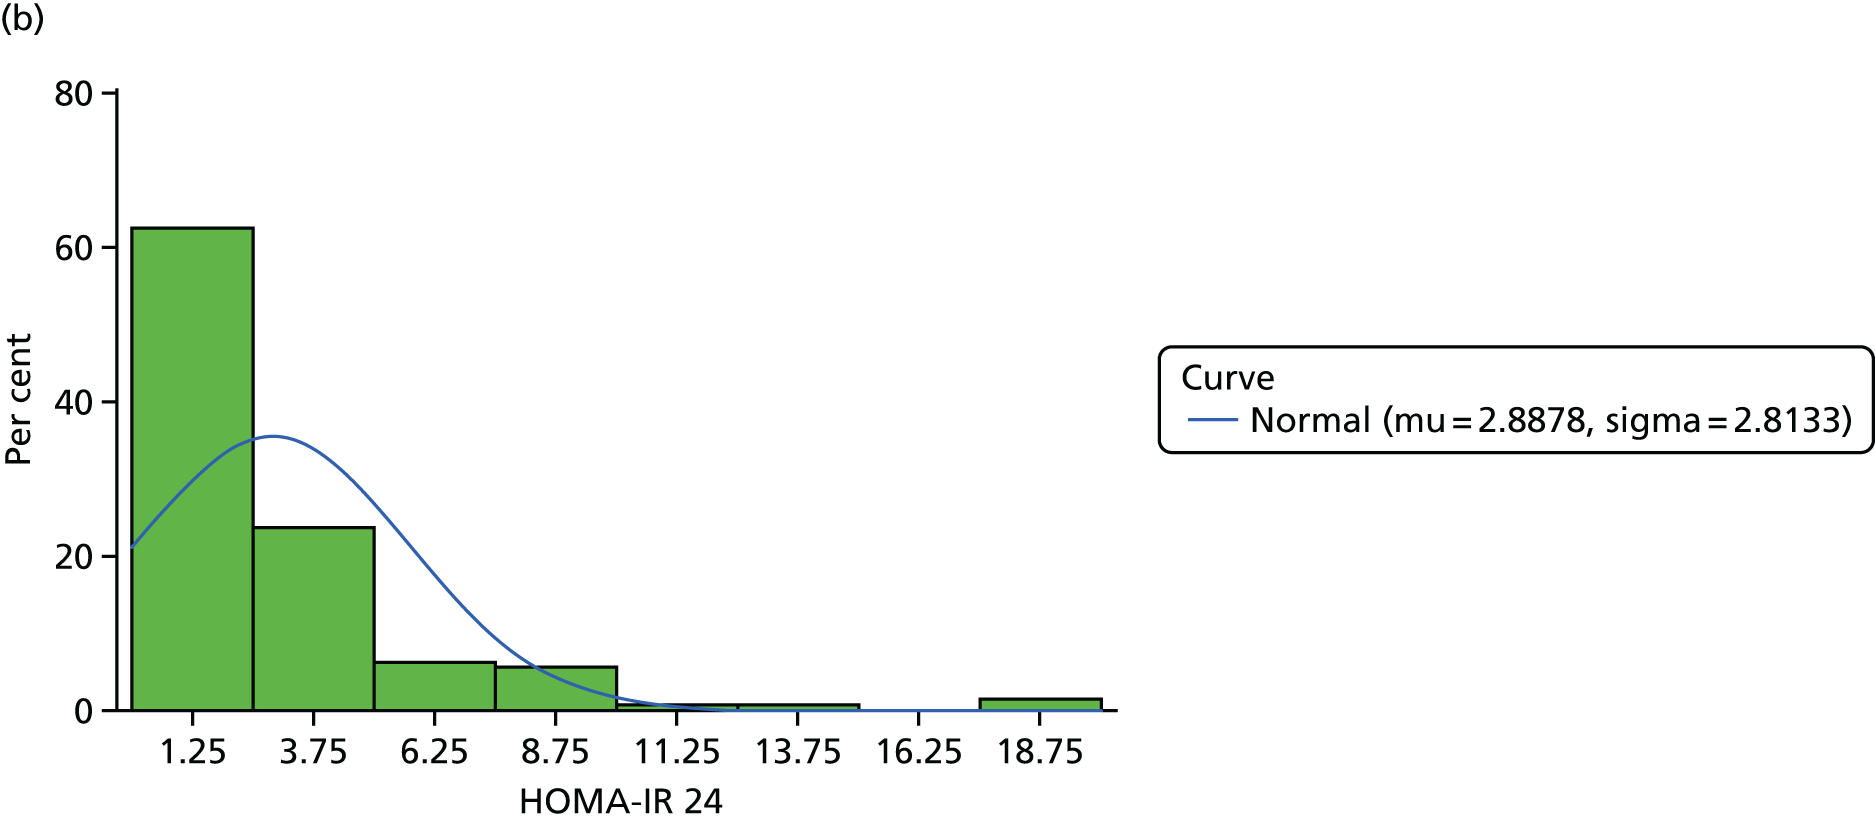
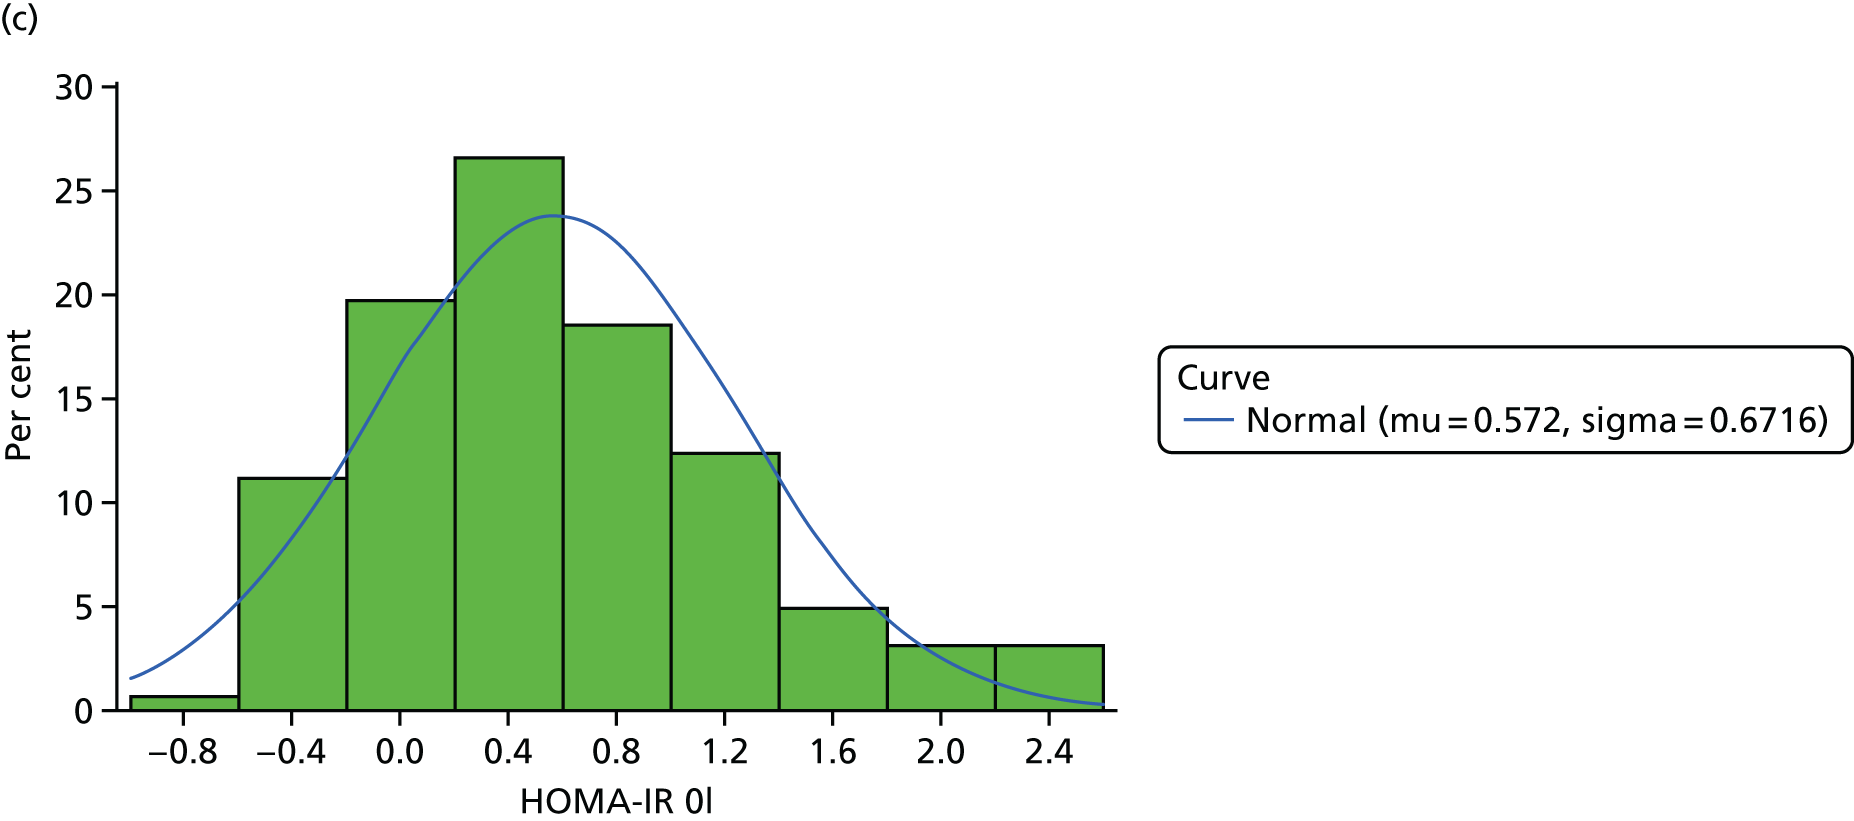

| Source | df | Sum of squares | Mean square | F-value | p-value |
|---|---|---|---|---|---|
| Treatment arm | 1 | 1588.3 | 1588.3 | 1.91 | 0.1684 |
Histograms to check normality for Quantitative Insulin Sensitivity Check Index at baseline and 24 weeks
FIGURE 12.
Normality of QUICKI at (a) baseline; and (b) 24 weeks.

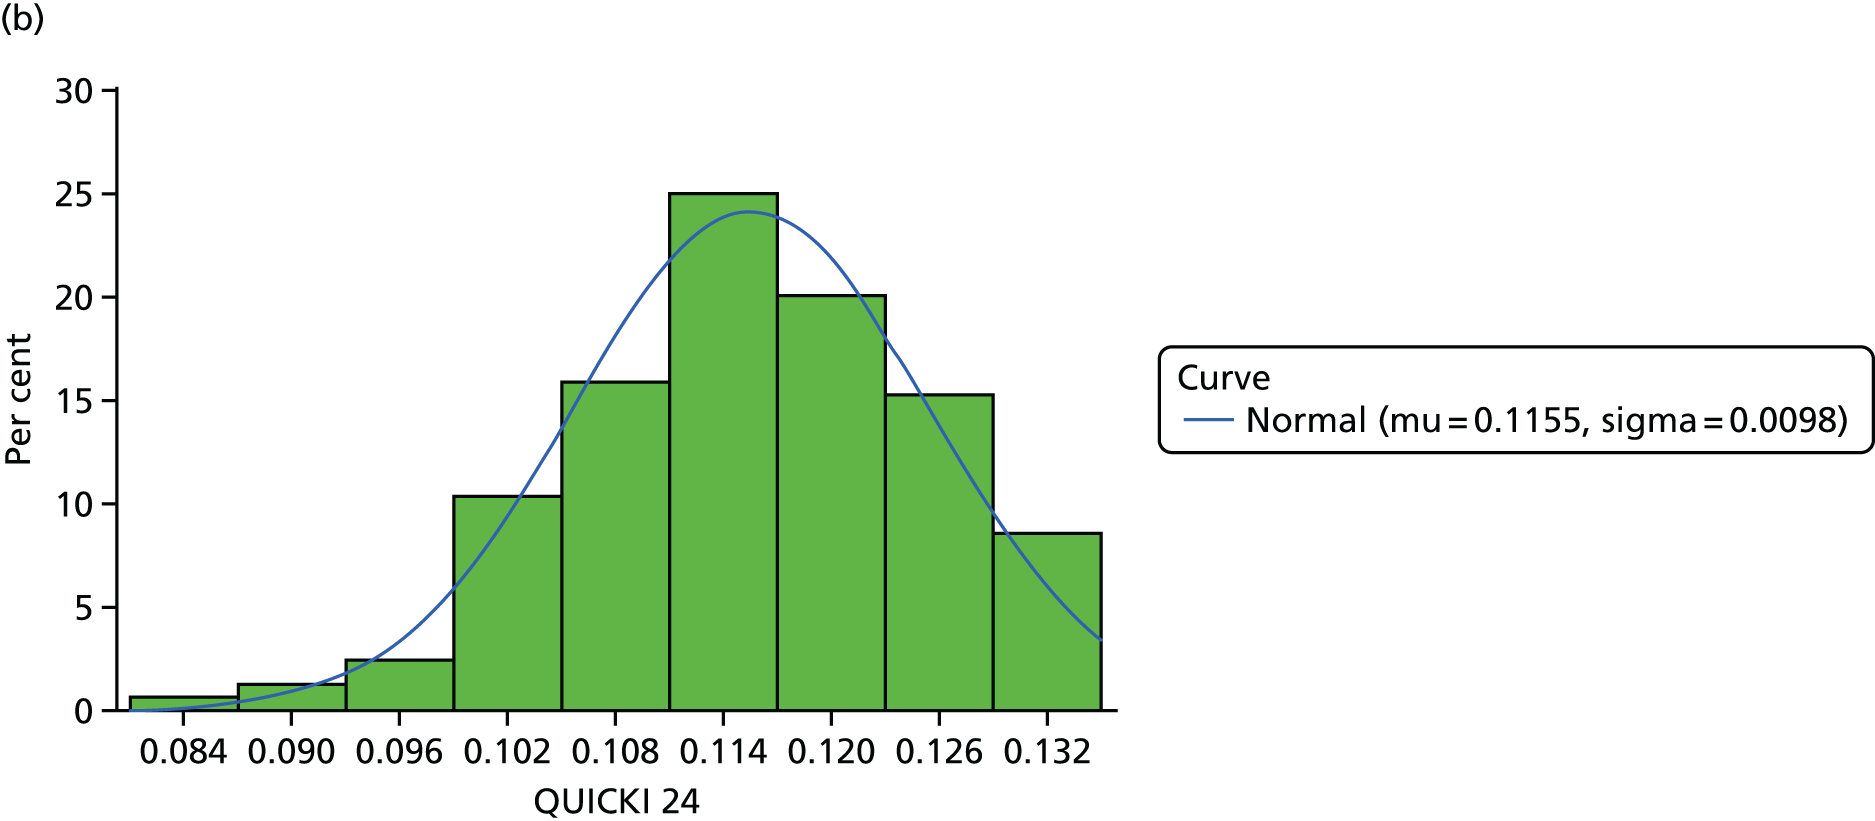
| Source | df | Sum of squares | Mean square | F-value | p-value |
|---|---|---|---|---|---|
| Treatment arm | 1 | 1.268 ×10⁻⁸ | 1.268E-8 | 0.68 | 0.4125 |
Histograms to check normality for revised Quantitative Insulin Sensitivity Check Index at baseline and 24 weeks
FIGURE 13.
Normality of revised QUICKI at (a) baseline; and (b) 24 weeks.


| Source | df | Sum of squares | Mean square | F-value | p-value |
|---|---|---|---|---|---|
| Treatment arm | 1 | 2.06 ×10⁻¹¹ | 2.06E-11 | 0.00 | 0.9928 |
Longitudinal analysis: profiles, model diagnostics and estimates
Homeostatic Model Assessment of Insulin Resistance
Histograms to check normality for Homeostatic Model Assessment of Insulin Resistance
FIGURE 14.
Normality of HOMA-IR. (a) original scale; and (b) log-transformed.

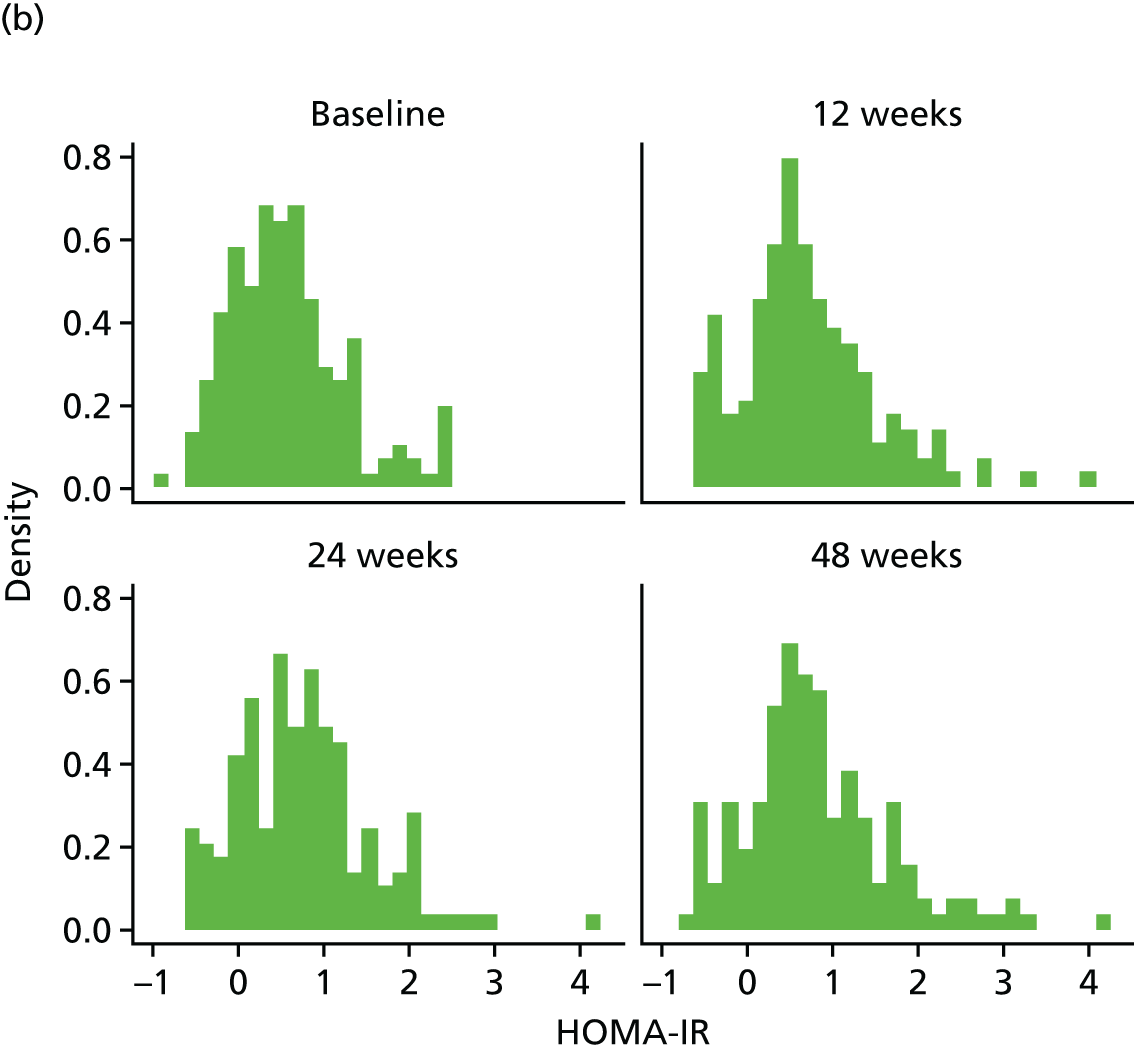
Three outlining HOMA-IR values were excluded from the longitudinal analysis [two from arm A (55.82720 at 12 weeks and 64.14336 at 48 weeks) and one from arm D (62.00064 at 24 weeks; this is the same value excluded at the primary analysis of HOMA-IR)].
FIGURE 15.
HOMA-IR mean profiles by treatment arm (original scale). (a) HOMA-IR profile plots; (b) HOMA-IR profile plots by dropout; and (c) HOMA-IR reverse-time profile plots.


| Component | Parameter | Estimate | 95% CI | p-value |
|---|---|---|---|---|
| Longitudinal marker | Intercept | 0.420 | 0.234 to 0.606 | < 0.0001 |
| Time | 0.003 | 0.001 to 0.006 | 0.0159 | |
| Baseline marker | 0.669 | 0.589 to 0.748 | < 0.0001 | |
| Treatment B vs. A | –0.084 | –0.245 to 0.077 | 0.3043 | |
| Treatment C vs. A | 0.010 | –0.172 to 0.193 | 0.9106 | |
| Treatment D vs. A | –0.083 | –0.247 to 0.082 | 0.3243 | |
| Ethnicity | –0.107 | –0.247 to 0.033 | 0.1343 | |
| Longitudinal weight | Intercept | 1.047 | –1.131 to 3.226 | 0.3459 |
| Time | 0.022 | –0.002 to 0.045 | 0.0686 | |
| Baseline weight | 0.987 | 0.965 to 1.008 | < 0.0001 | |
| Treatment B vs. A | 0.458 | –0.551 to 1.467 | 0.3741 | |
| Treatment C vs. A | 0.690 | –0.367 to 1.746 | 0.2008 | |
| Treatment D vs. A | 0.117 | –0.842 to 1.076 | 0.8111 | |
| Ethnicity | –0.246 | –1.055 to 0.562 | 0.5504 | |
| Dropout | Treatment B vs. A | –0.355 | –1.270 to 0.561 | 0.4477 |
| Treatment C vs. A | –0.076 | –0.976 to 0.824 | 0.8690 | |
| Treatment D vs. A | 0.081 | –0.716 to 0.877 | 0.8427 | |
| Ethnicity | –0.036 | –0.847 to 0.775 | 0.9300 | |
| Association parameters | Marker | –0.262 | –1.433 to 0.909 | 0.6611 |
| Weight | 0.044 | –0.208 to 0.296 | 0.7337 |
The bivariate joint model included 321 patients and 812 records. The treatment effect [arm D: telmisartan (80 mg daily) compared with arm A: non-intervention (control)] on the longitudinal log-HOMA-IR is –0.083 (95% CI –0.247 to 0.082; p = 0.3243), implying that there is no significant difference between the treatments on HOMA-IR.
Quantitative Insulin Sensitivity Check Index
Histograms to check normality for Quantitative Insulin Sensitivity Check Index
FIGURE 16.
Normality of QUICKI (original scale).
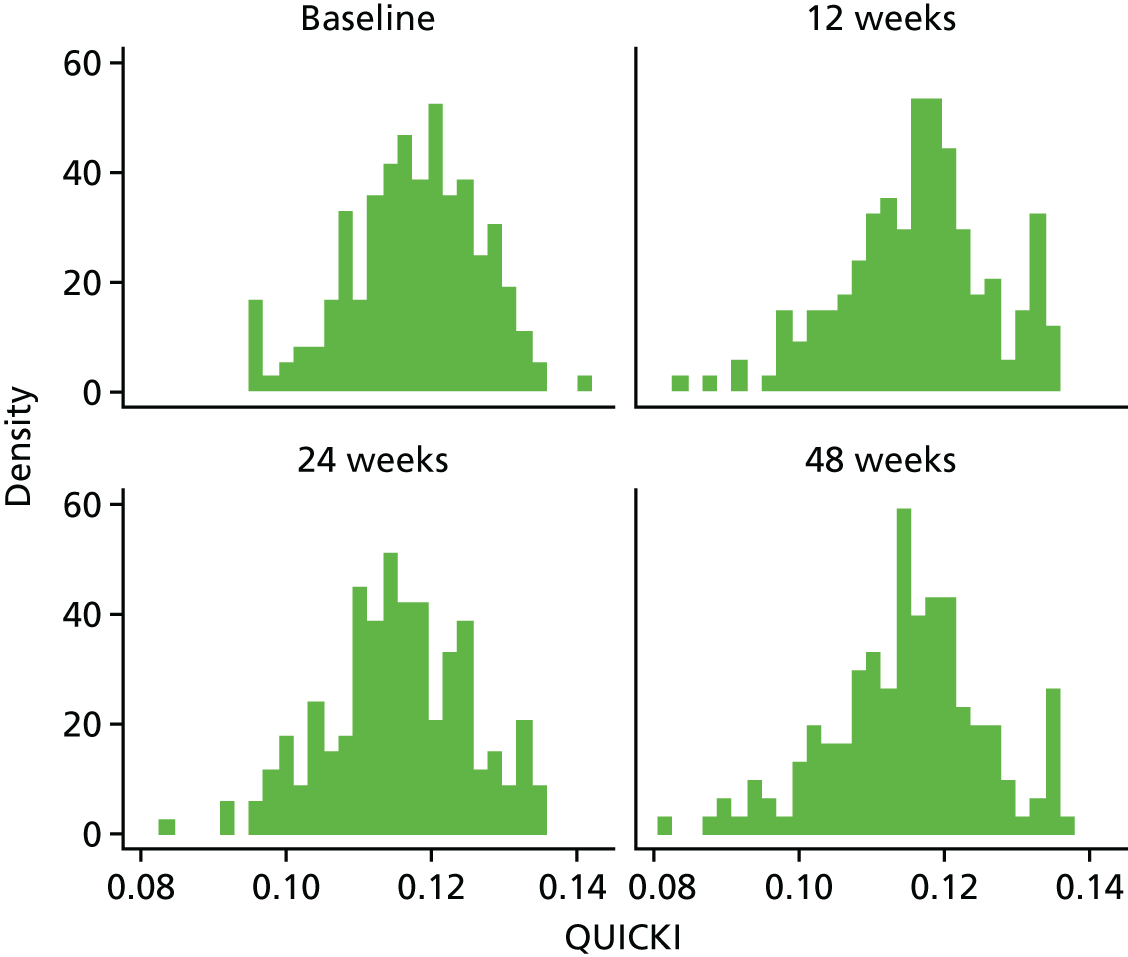
FIGURE 17.
QUICKI mean profiles by treatment arm (original scale). (a) QUICKI profile plots; (b) QUICKI profile plots by dropout; and (c) QUICKI reverse-time profile plots.
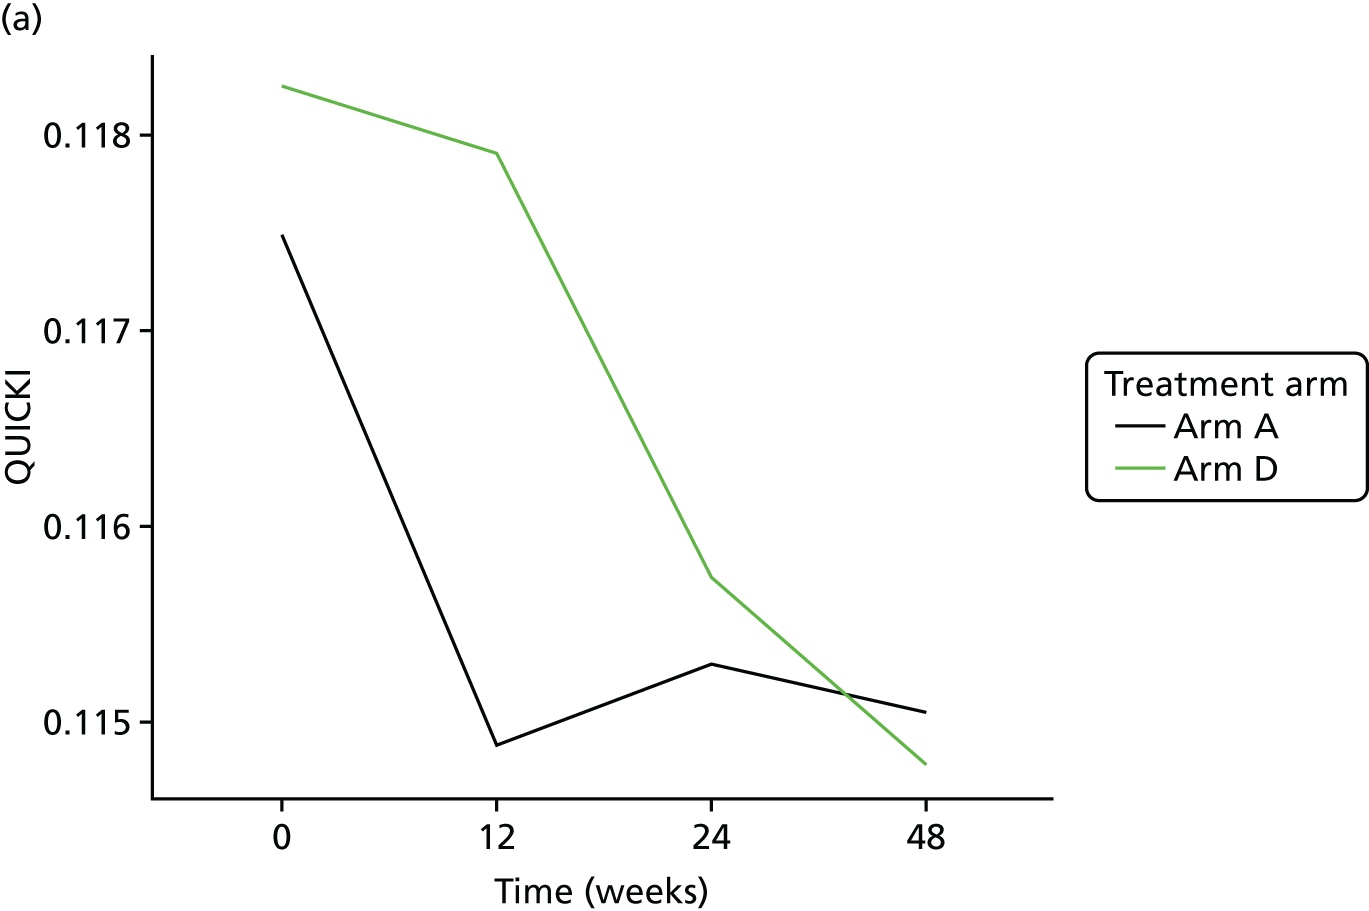
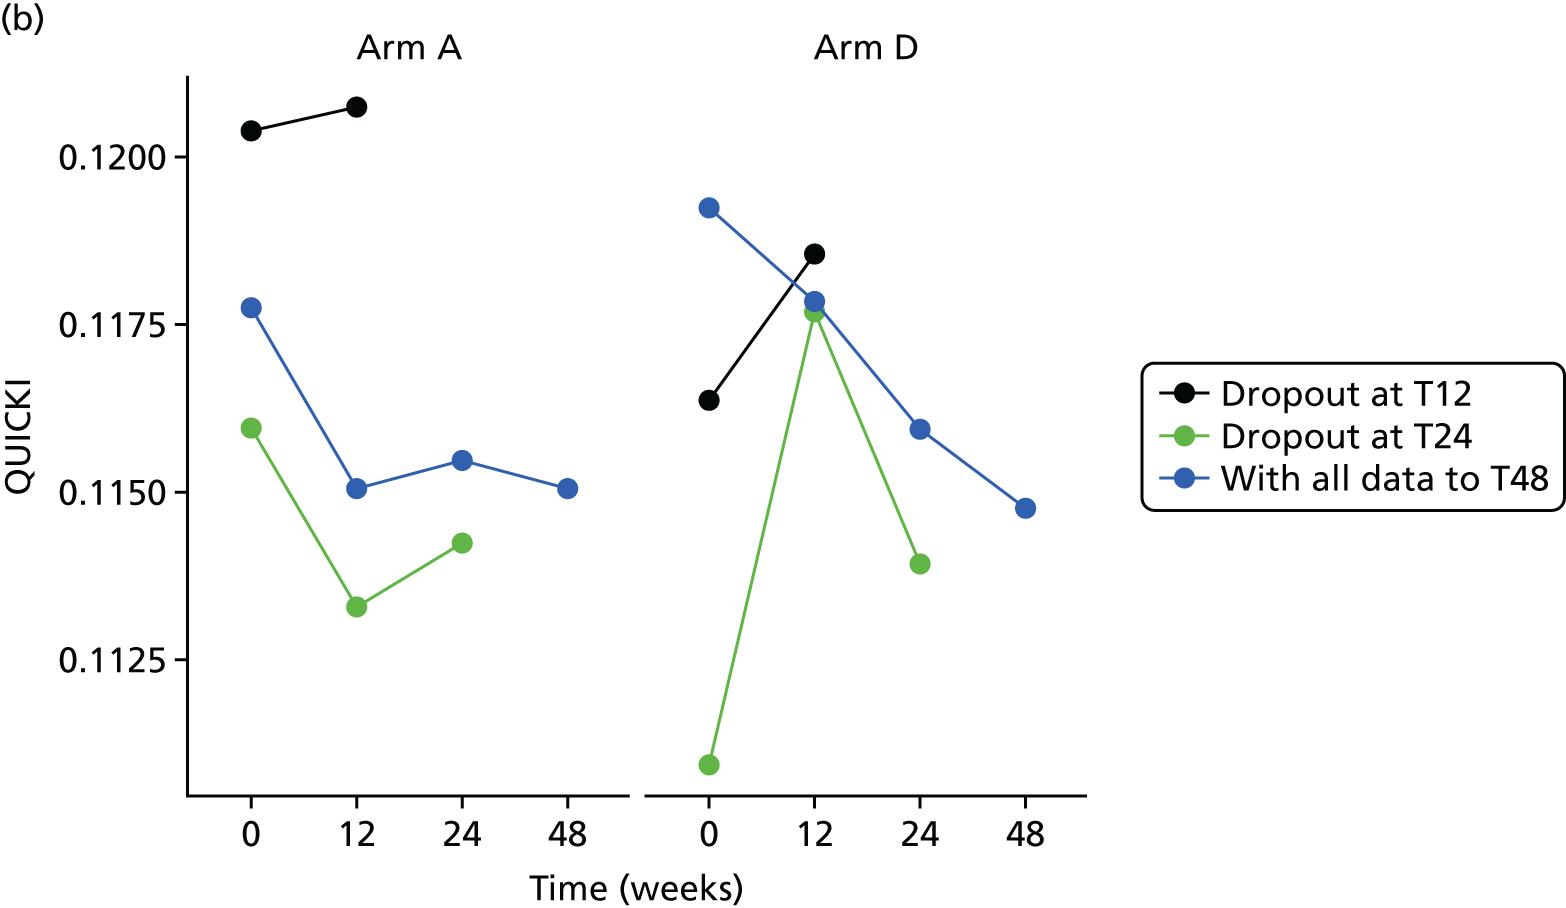
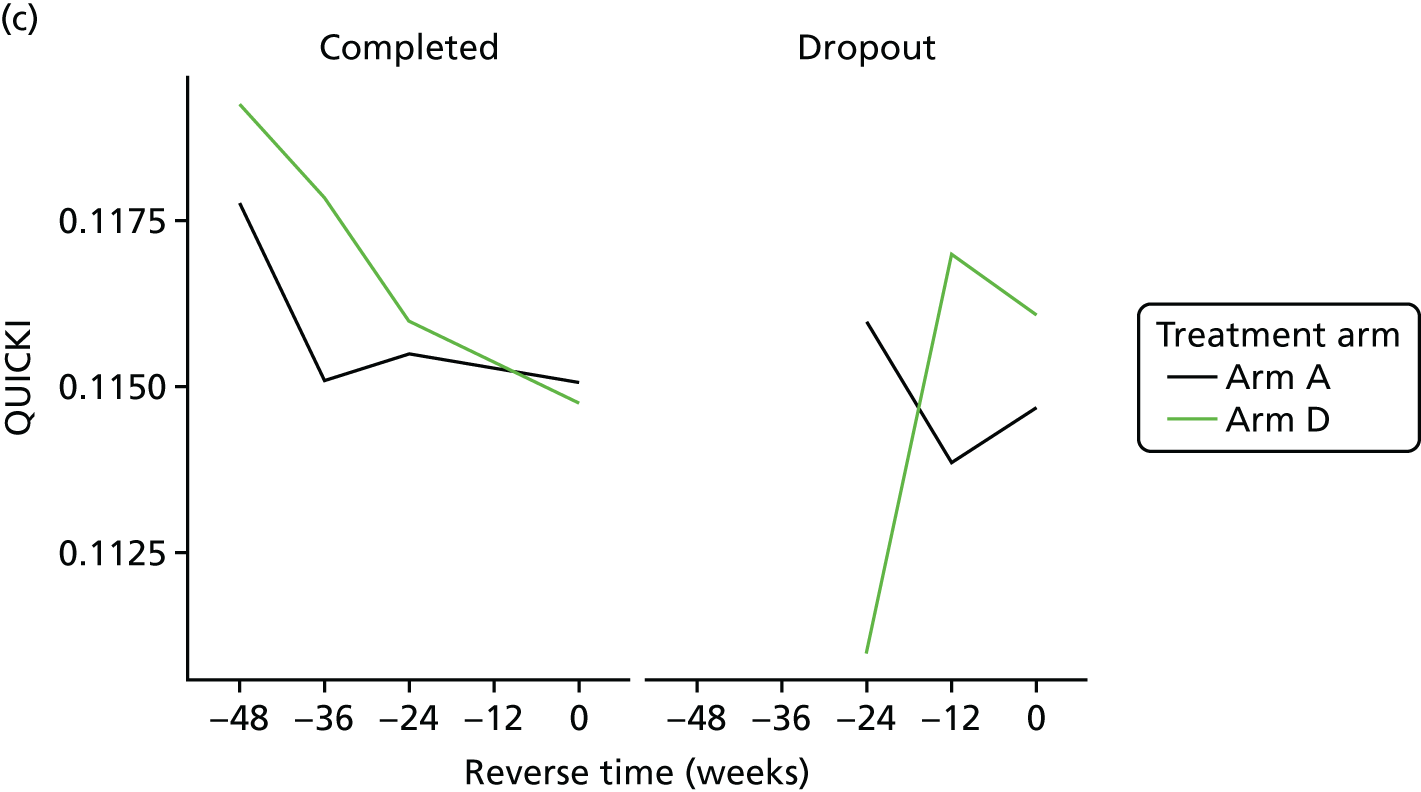
| Component | Parameter | Estimate | 95% CI | p-value |
|---|---|---|---|---|
| Longitudinal marker | Intercept | 0.039 | 0.029 to 0.048 | < 0.0001 |
| Time | 0.000 | 0.000 to 0.000 | 0.0126 | |
| Baseline marker | 0.649 | 0.572 to 0.726 | < 0.0001 | |
| Treatment B vs. A | 0.001 | –0.001 to 0.003 | 0.2596 | |
| Treatment C vs. A | 0.000 | –0.003 to 0.002 | 0.9125 | |
| Treatment D vs. A | 0.001 | –0.001 to 0.003 | 0.3426 | |
| Ethnicity | 0.001 | –0.001 to 0.003 | 0.2102 | |
| Longitudinal weight | Intercept | 1.091 | –1.066 to 3.248 | 0.3217 |
| Time | 0.021 | –0.002 to 0.045 | 0.0755 | |
| Baseline weight | 0.986 | 0.965 to 1.007 | < 0.0001 | |
| Treatment B vs. A | 0.479 | –0.533 to 1.490 | 0.3537 | |
| Treatment C vs. A | 0.704 | –0.348 to 1.756 | 0.1898 | |
| Treatment D vs. A | 0.135 | –0.823 to 1.093 | 0.7823 | |
| Ethnicity | –0.253 | –1.053 to 0.546 | 0.5344 | |
| Dropout | Treatment B vs. A | –0.354 | –1.269 to 0.561 | 0.4485 |
| Treatment C vs. A | –0.075 | –0.982 to 0.832 | 0.8714 | |
| Treatment D vs. A | 0.082 | –0.716 to 0.879 | 0.8408 | |
| Ethnicity | –0.037 | –0.835 to 0.762 | 0.9279 | |
| Association parameters | Marker | 18.535 | –75.599 to 112.668 | 0.6996 |
| Weight | 0.042 | –0.210 to 0.295 | 0.7428 |
The bivariate joint model included 321 patients and 812 records. The treatment effect [arm D: telmisartan (80 mg daily) compared with arm A: non-intervention (control)] on the longitudinal QUICKI is 0.001 (95% CI –0.001 to 0.003; p = 0.3426), implying that there is no significant difference between the treatments on QUICKI.
Revised Quantitative Insulin Sensitivity Check Index
Histograms to check normality for revised Quantitative Insulin Sensitivity Check Index
FIGURE 18.
Normality of revised QUICKI (original scale).
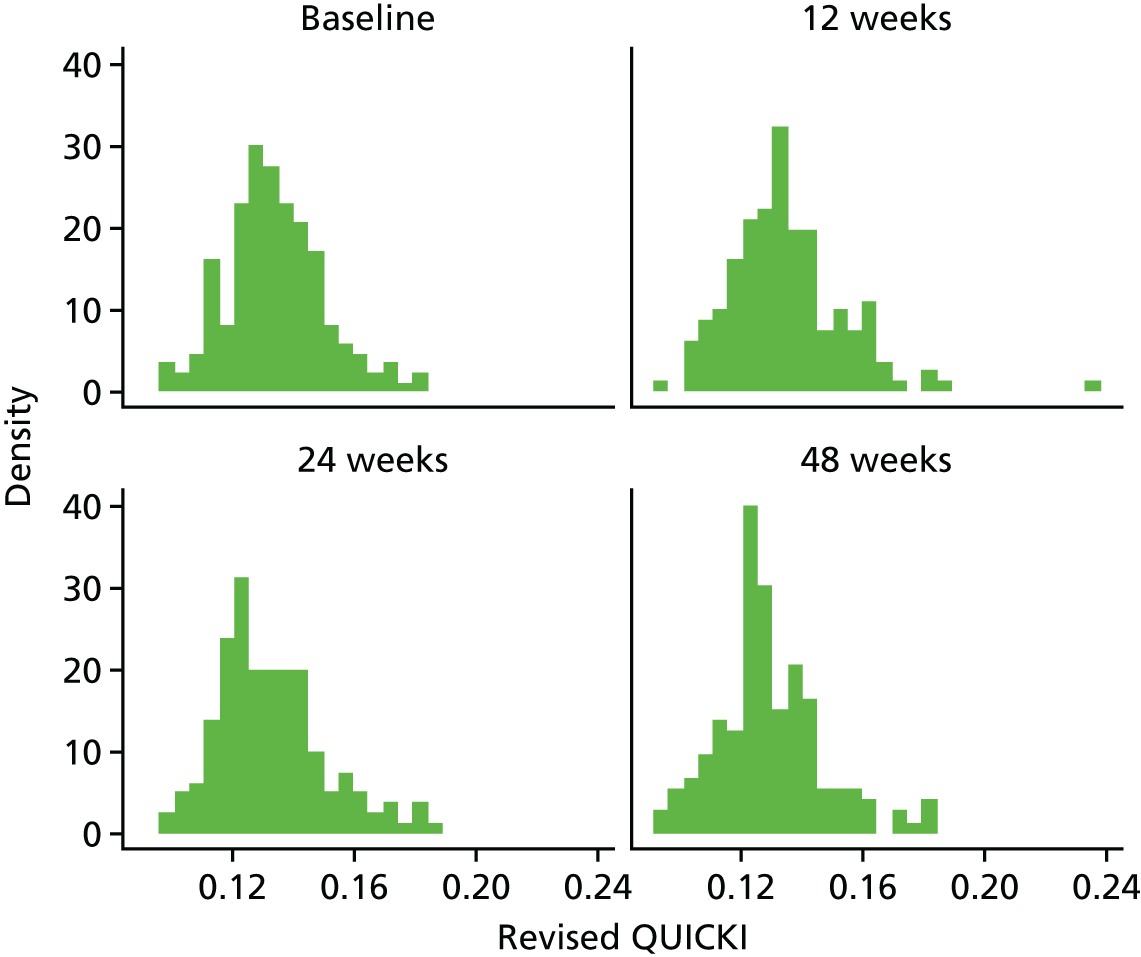
FIGURE 19.
Revised QUICKI mean profiles by treatment arm (original scale). (a) revised QUICKI profile plots; (b) revised QUICKI profile plots by dropout; and (c) revised QUICKI reverse-time profile plots.
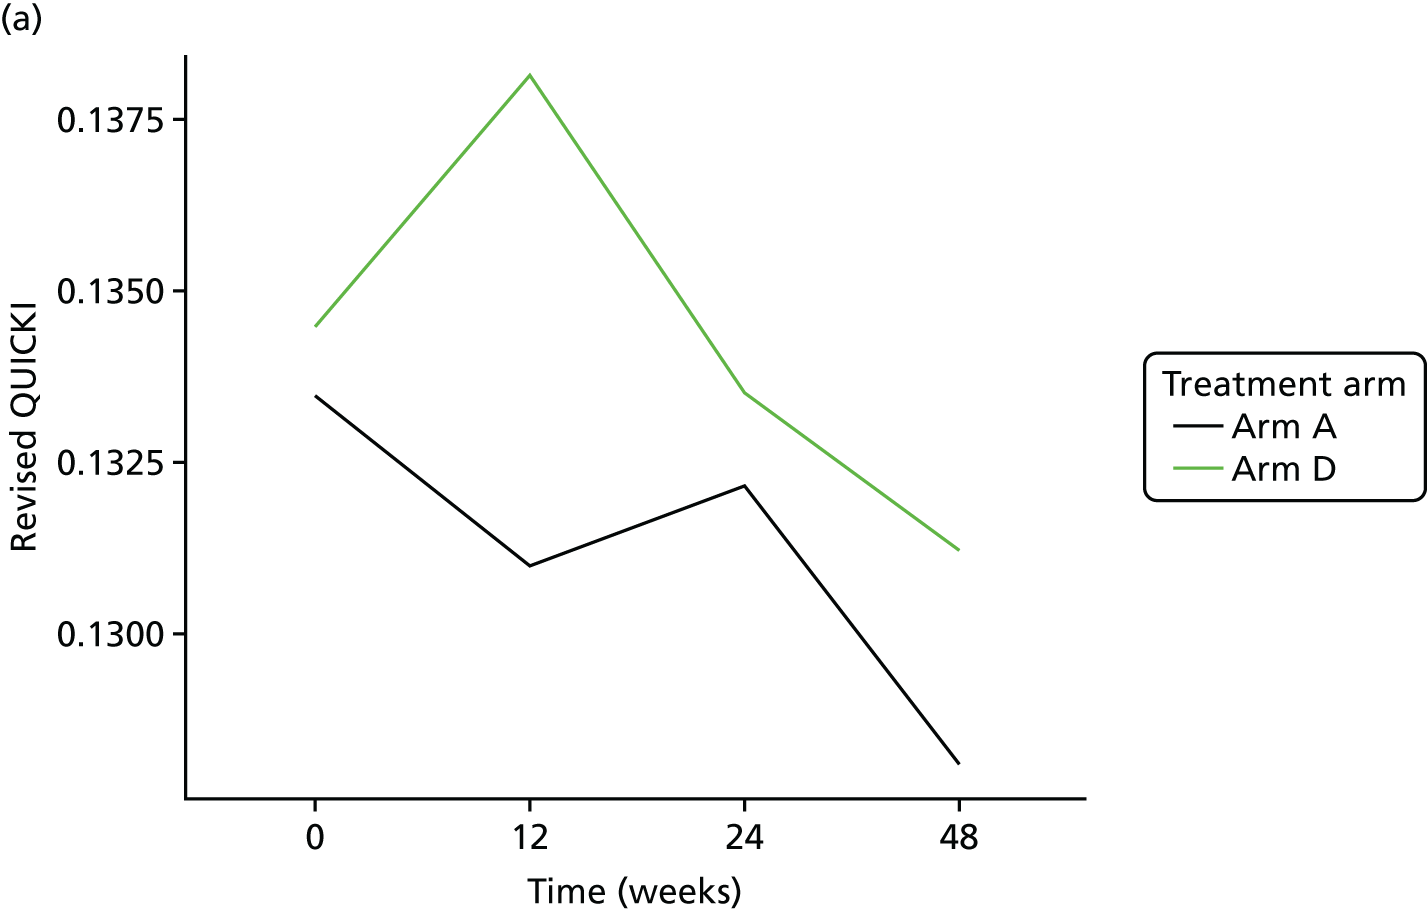
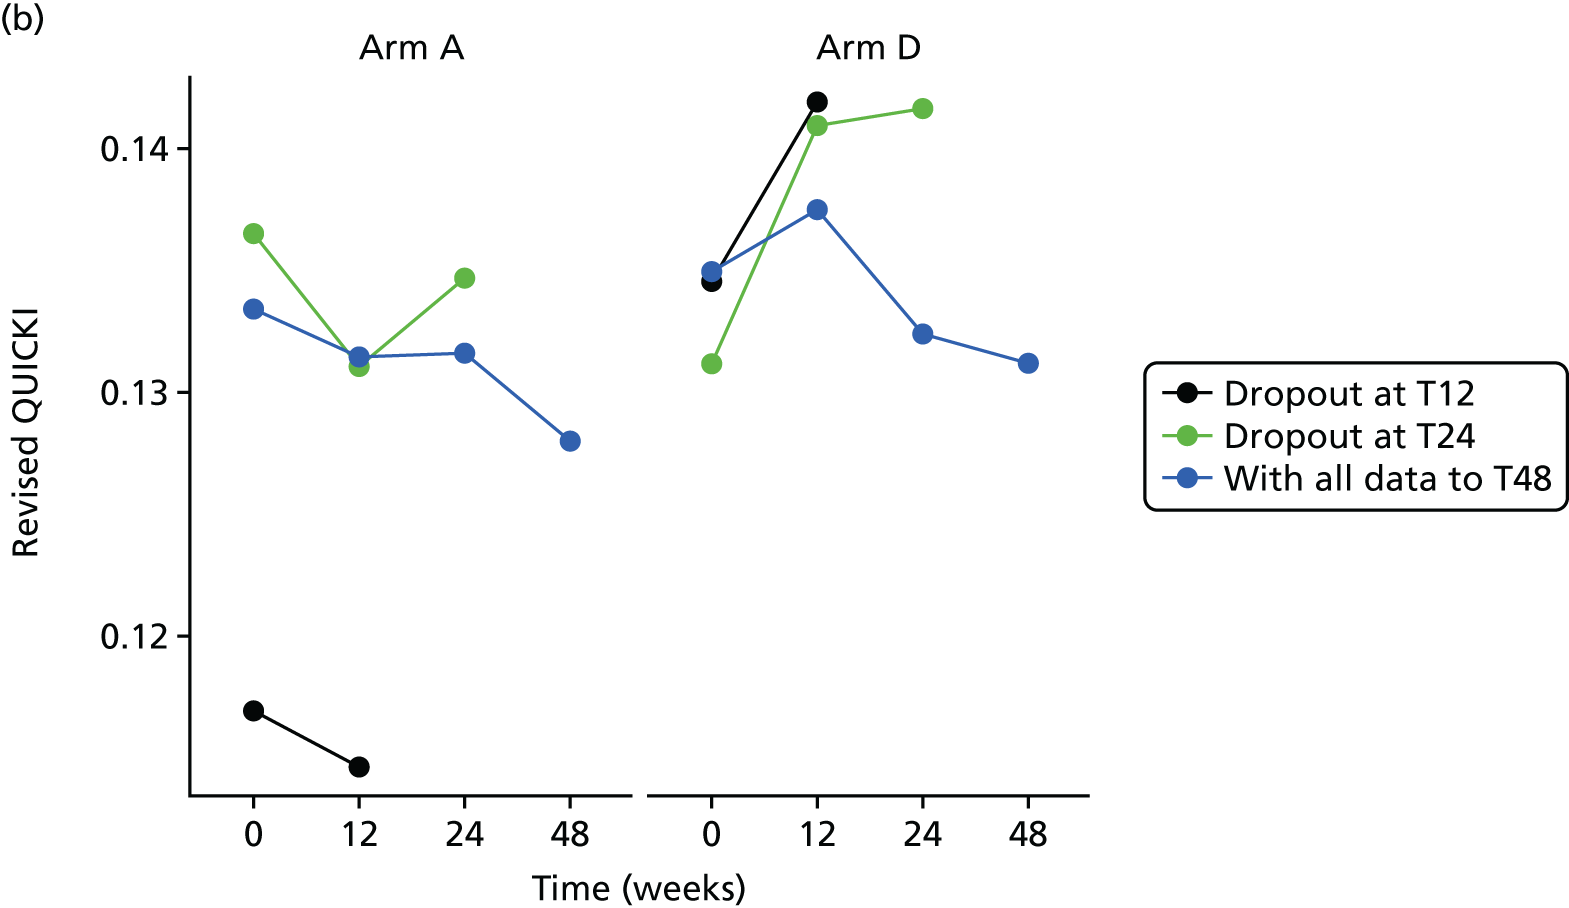
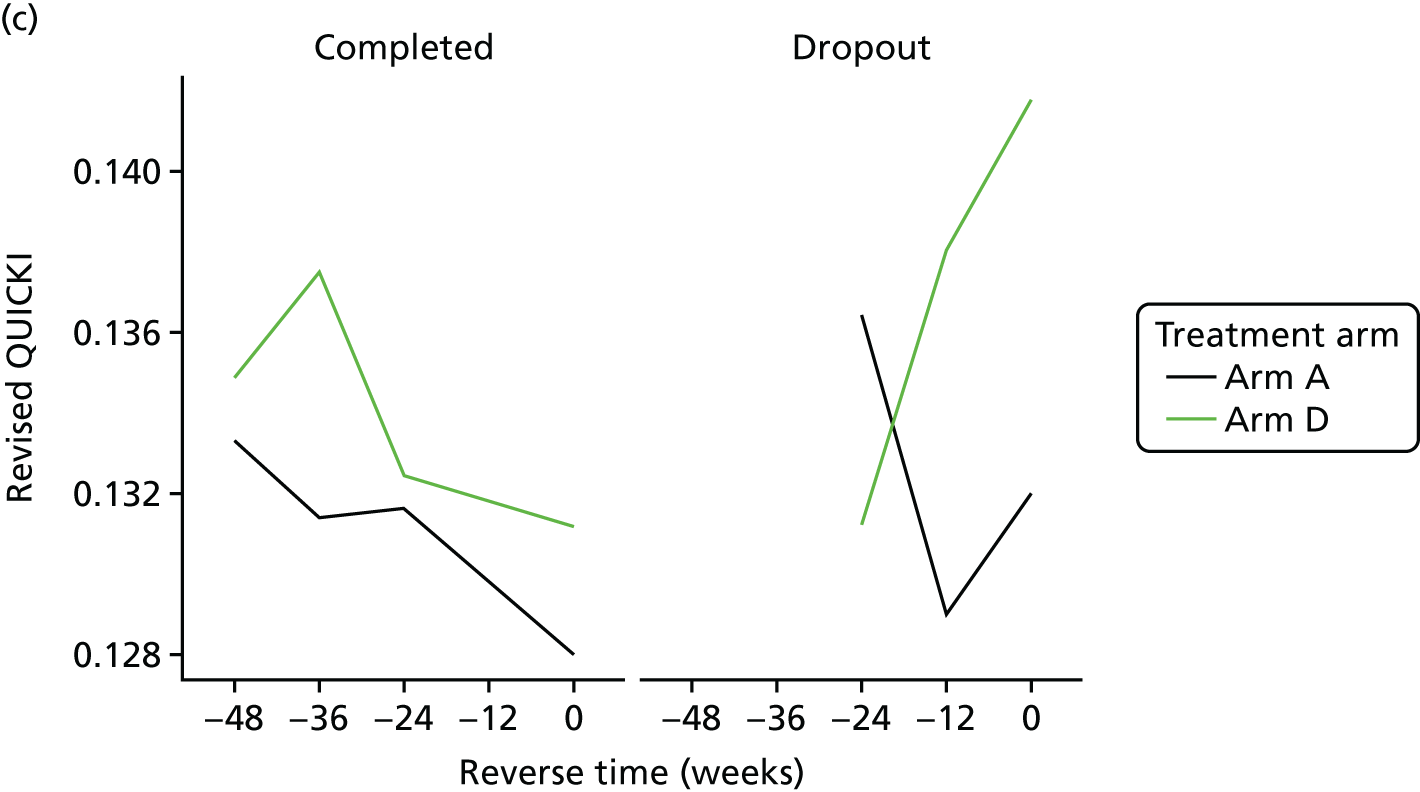
The bivariate joint model included 320 patients and 808 records. Revised QUICKI scores were fitted in their original scale.
The treatment effect [arm D (80 mg) compared with arm A (control)] on the longitudinal revised QUICKI was 0.004 (95% CI 0.000 to 0.008; p = 0.0510). As the p-value was just above 0.05, this implies a marginally significant difference between the treatments on revised QUICKI.
| Component | Parameter | Estimate | 95% CI | p-value |
|---|---|---|---|---|
| Longitudinal marker | Intercept | 0.058 | 0.046 to 0.070 | < 0.0001 |
| Time | 0.000 | 0.000 to 0.000 | 0.0402 | |
| Baseline marker | 0.550 | 0.473 to 0.627 | < 0.0001 | |
| Treatment B vs. A | 0.003 | –0.001 to 0.007 | 0.1023 | |
| Treatment C vs. A | 0.001 | –0.003 to 0.005 | 0.5993 | |
| Treatment D vs. A | 0.004 | 0.000 to 0.008 | 0.0510 | |
| Ethnicity | 0.001 | –0.002 to 0.004 | 0.5071 | |
| Longitudinal weight | Intercept | 1.039 | –1.087 to 3.164 | 0.3382 |
| Time | 0.020 | –0.003 to 0.044 | 0.0899 | |
| Baseline weight | 0.987 | 0.966 to 1.009 | < 0.0001 | |
| Treatment B vs. A | 0.473 | –0.493 to 1.438 | 0.3374 | |
| Treatment C vs. A | 0.690 | –0.310 to 1.690 | 0.1765 | |
| Treatment D vs. A | 0.187 | –0.748 to 1.123 | 0.6945 | |
| Ethnicity | –0.250 | –1.039 to 0.539 | 0.5340 | |
| Dropout | Treatment B vs. A | –0.364 | –1.272 to 0.544 | 0.4319 |
| Treatment C vs. A | 0.183 | –0.633 to 0.999 | 0.6608 | |
| Treatment D vs. A | 0.078 | –0.726 to 0.881 | 0.8496 | |
| Ethnicity | –0.087 | –0.845 to 0.671 | 0.8218 | |
| Association parameters | Marker | 10.682 | –47.031 to 68.395 | 0.7168 |
| Weight | 0.028 | –0.206 to 0.262 | 0.8153 |
Lipid profiles
High-density lipoprotein cholesterol
Histograms to check normality for high-density lipoprotein cholesterol
FIGURE 20.
Normality of HDL-C. (a) original scale; and (b) log-transformed.
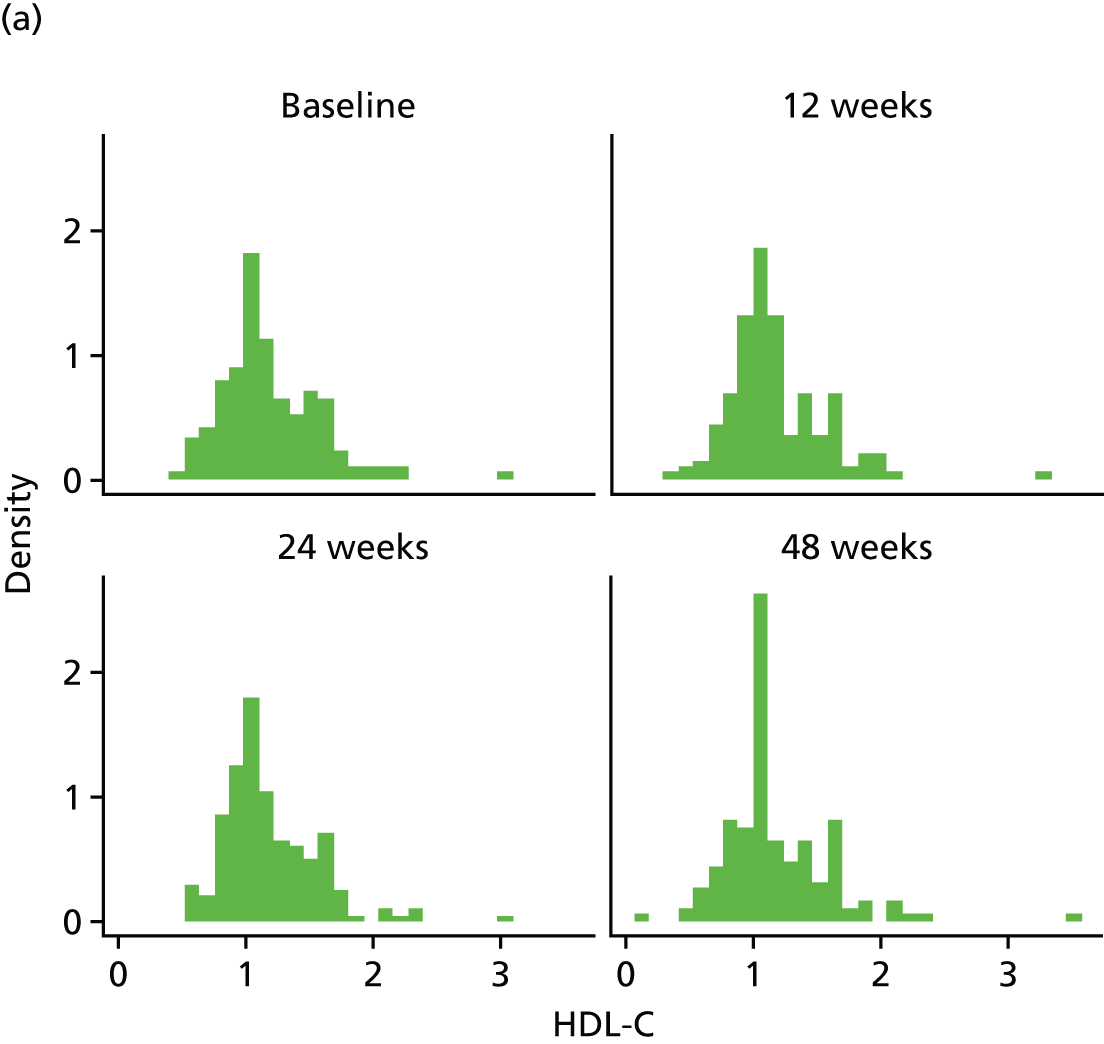
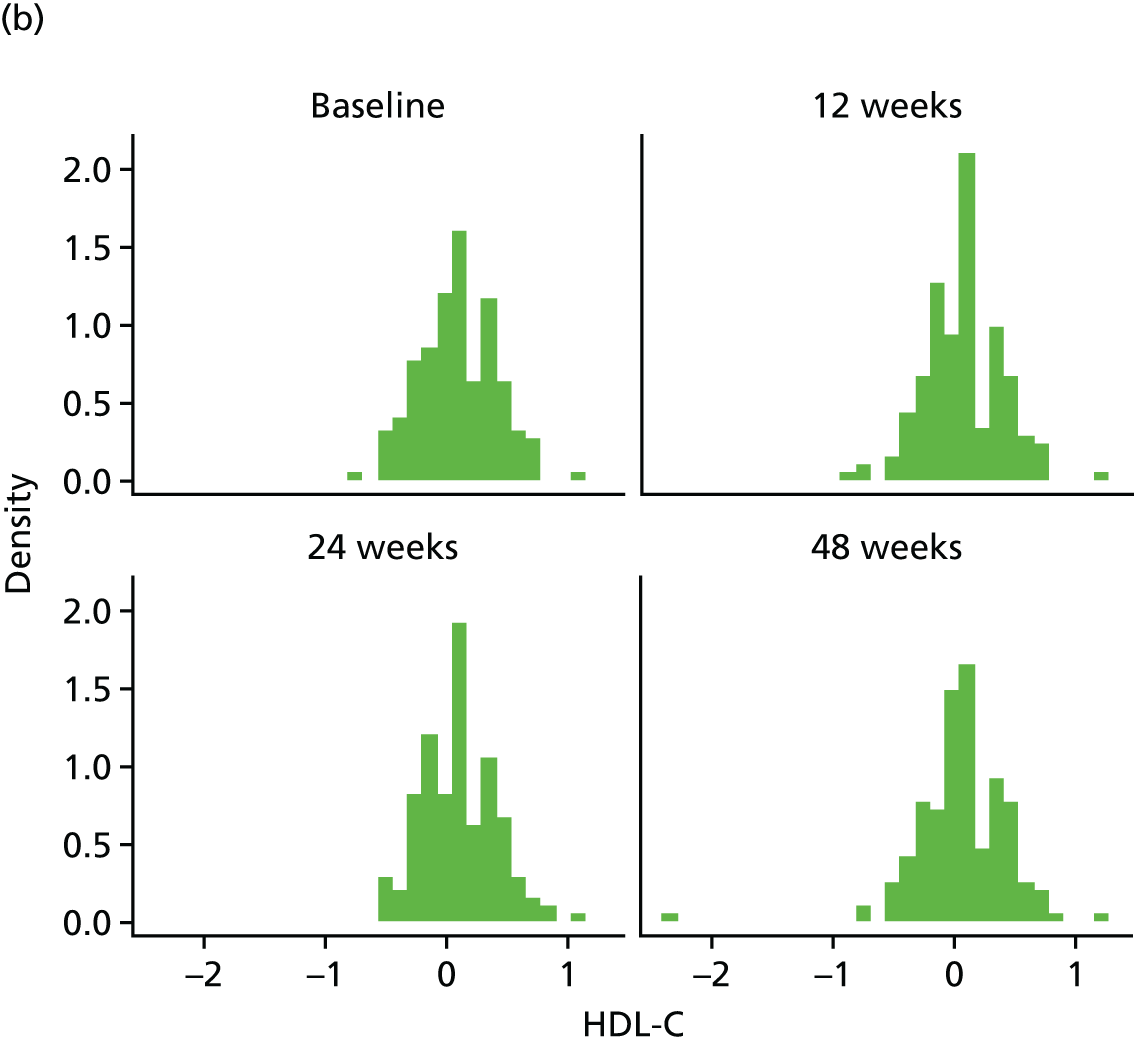
FIGURE 21.
The HDL-C mean profiles by treatment arm (original scale). (a) HDL-C profile plots; (b) HDL-C profile plots by dropout; and (c) HDL-C reverse-time profile plots.
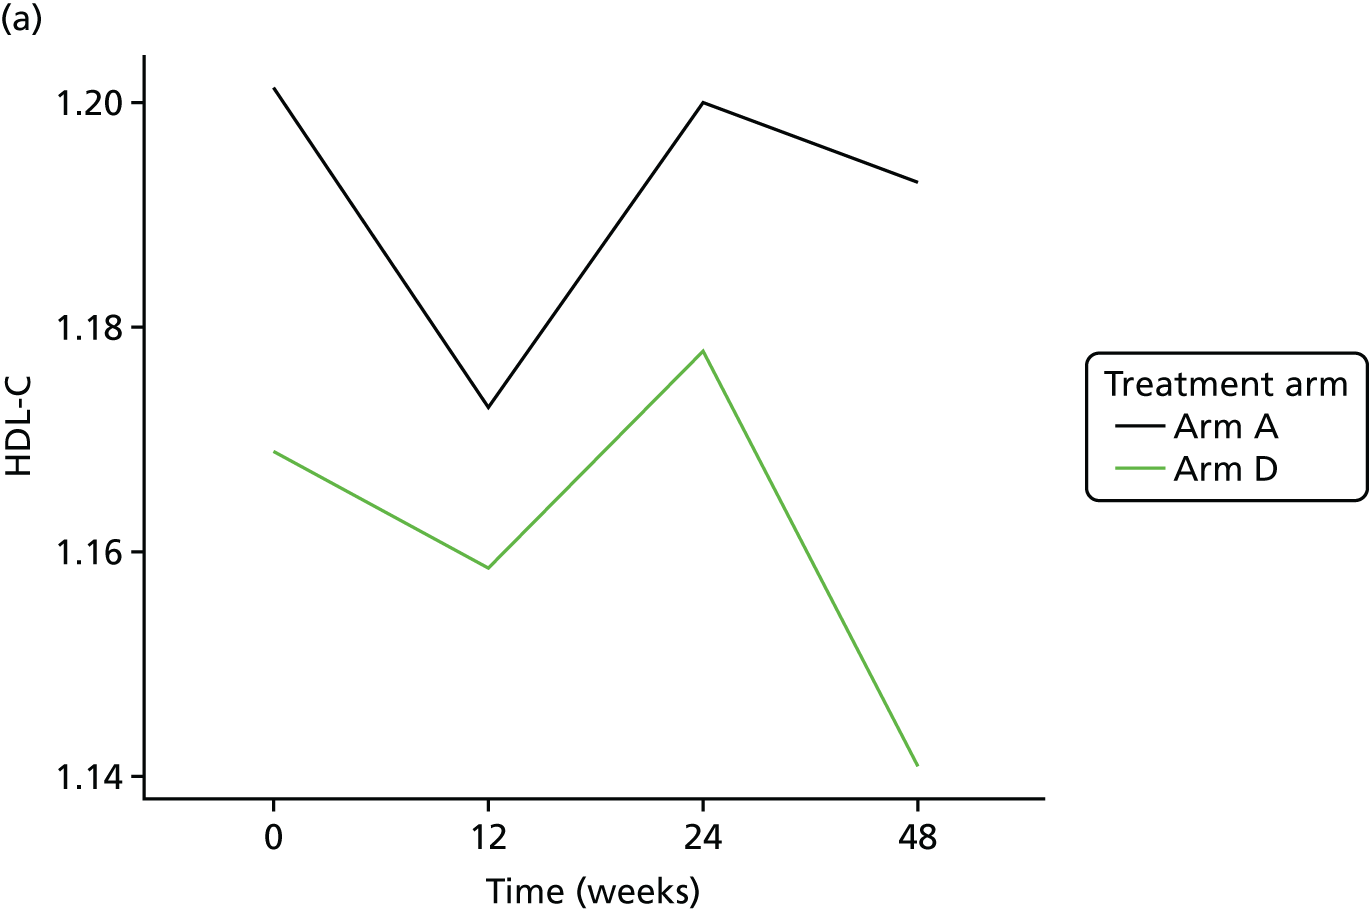
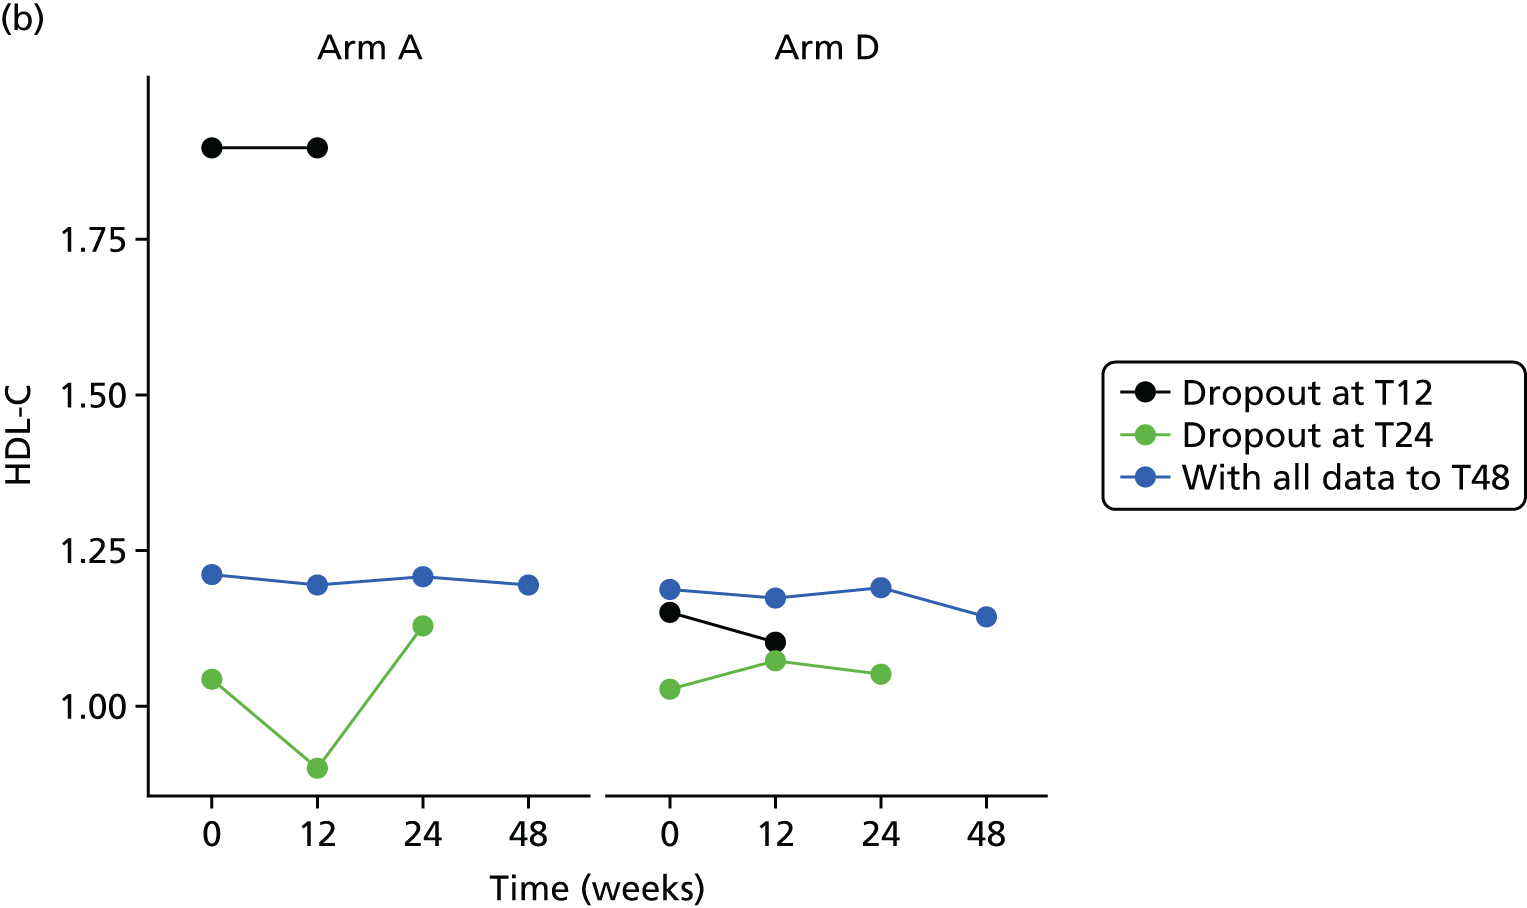

The bivariate joint model included 329 patients and 849 records. HDL-C scores were fitted in log-transformed scale for normality.
| Component | Parameter | Estimate | 95% CI | p-value |
|---|---|---|---|---|
| Longitudinal marker | Intercept | 0.021 | –0.034 to 0.076 | 0.4583 |
| Time | 0.000 | –0.001 to 0.001 | 0.6088 | |
| Baseline marker | 0.878 | 0.833 to 0.924 | < 0.0001 | |
| Treatment B vs. A | –0.012 | –0.060 to 0.035 | 0.6089 | |
| Treatment C vs. A | –0.038 | –0.085 to 0.008 | 0.1086 | |
| Treatment D vs. A | 0.001 | –0.046 to 0.047 | 0.9816 | |
| Ethnicity | –0.018 | –0.063 to 0.028 | 0.4455 | |
| Longitudinal weight | Intercept | 0.285 | –2.072 to 2.641 | 0.8129 |
| Time | 0.019 | –0.007 to 0.045 | 0.1537 | |
| Baseline weight | 0.994 | 0.971 to 1.017 | < 0.0001 | |
| Treatment B vs. A | 0.477 | –0.627 to 1.580 | 0.3972 | |
| Treatment C vs. A | 0.742 | –0.415 to 1.899 | 0.2088 | |
| Treatment D vs. A | 0.075 | –0.975 to 1.125 | 0.8881 | |
| Ethnicity | –0.067 | –0.945 to 0.811 | 0.8817 | |
| Dropout | Treatment B vs. A | 0.089 | –0.856 to 1.033 | 0.8540 |
| Treatment C vs. A | 0.036 | –0.986 to 1.058 | 0.9452 | |
| Treatment D vs. A | 0.329 | –0.545 to 1.204 | 0.4608 | |
| Ethnicity | –0.216 | –1.078 to 0.646 | 0.6232 | |
| Association parameters | Marker | –0.638 | –5.534 to 4.259 | 0.7986 |
| Weight | –0.046 | –0.244 to 0.151 | 0.6465 |
The treatment effect [arm D (80 mg) compared with arm A (control)] on the longitudinal log-HDL-C is 0.001 (95% CI –0.046 to 0.047), implying that there is no significant difference between the treatments on HDL-C.
Cholesterol
Histograms to check normality for cholesterol
FIGURE 22.
Normality of cholesterol (original scale).
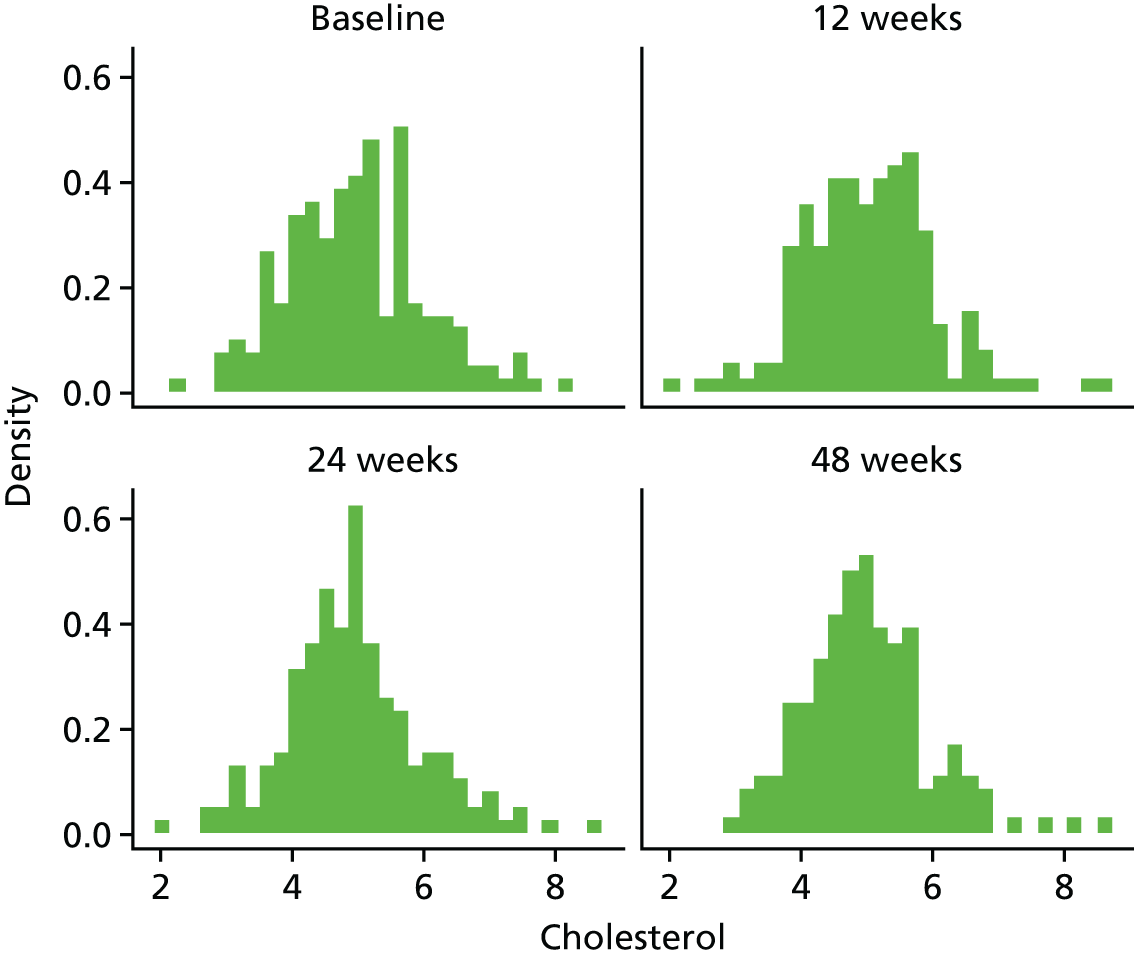
FIGURE 23.
Cholesterol mean profiles by treatment arm (original scale). (a) cholesterol profile plots; (b) cholesterol profile plots by dropout; and (c) cholesterol reverse-time profile plots.

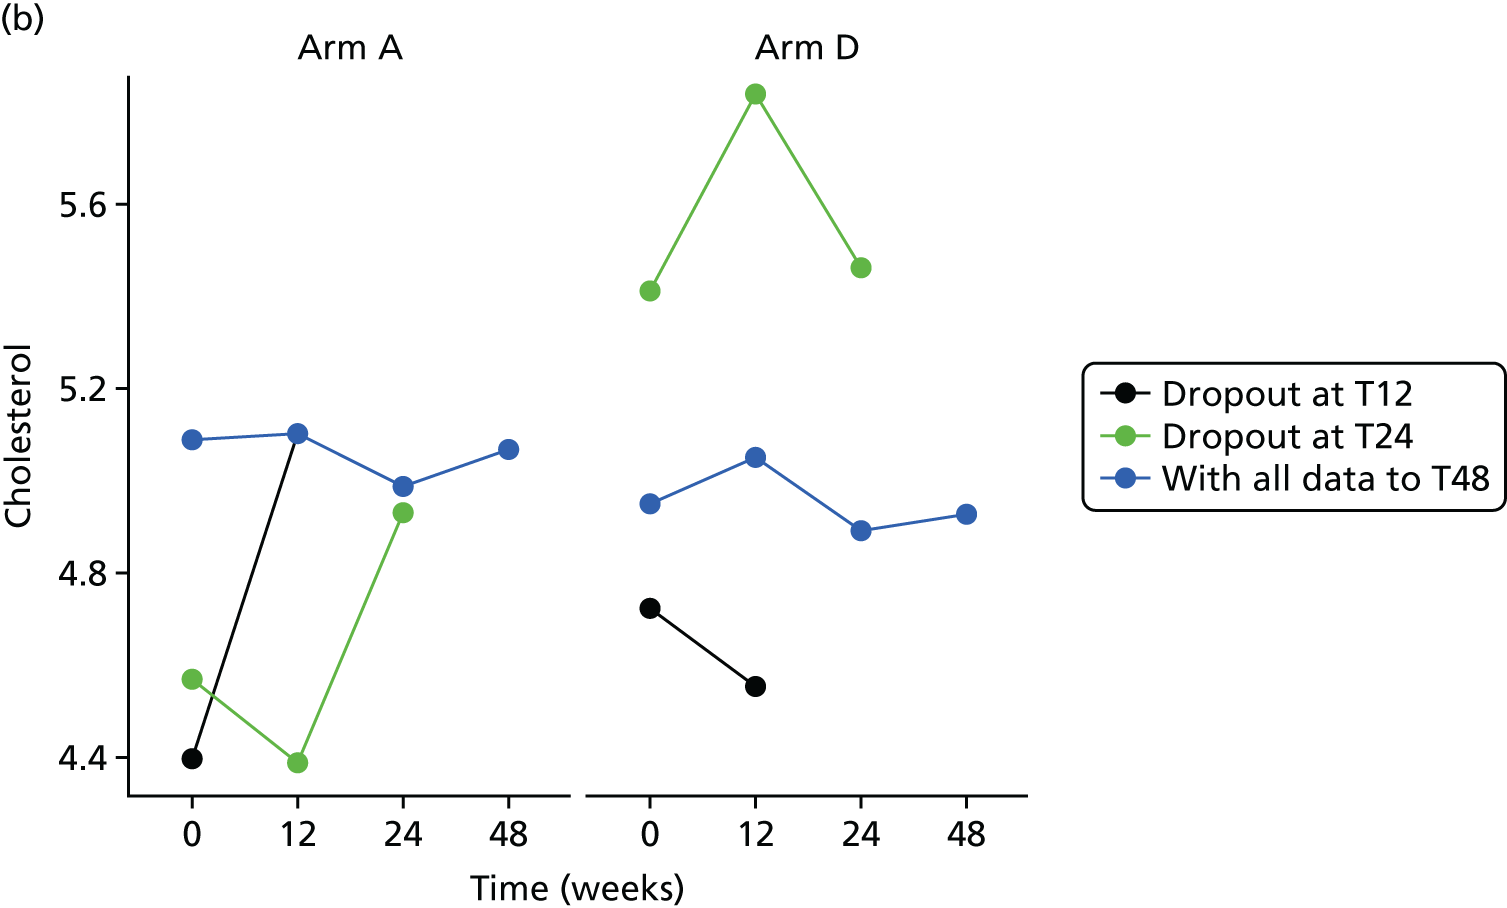
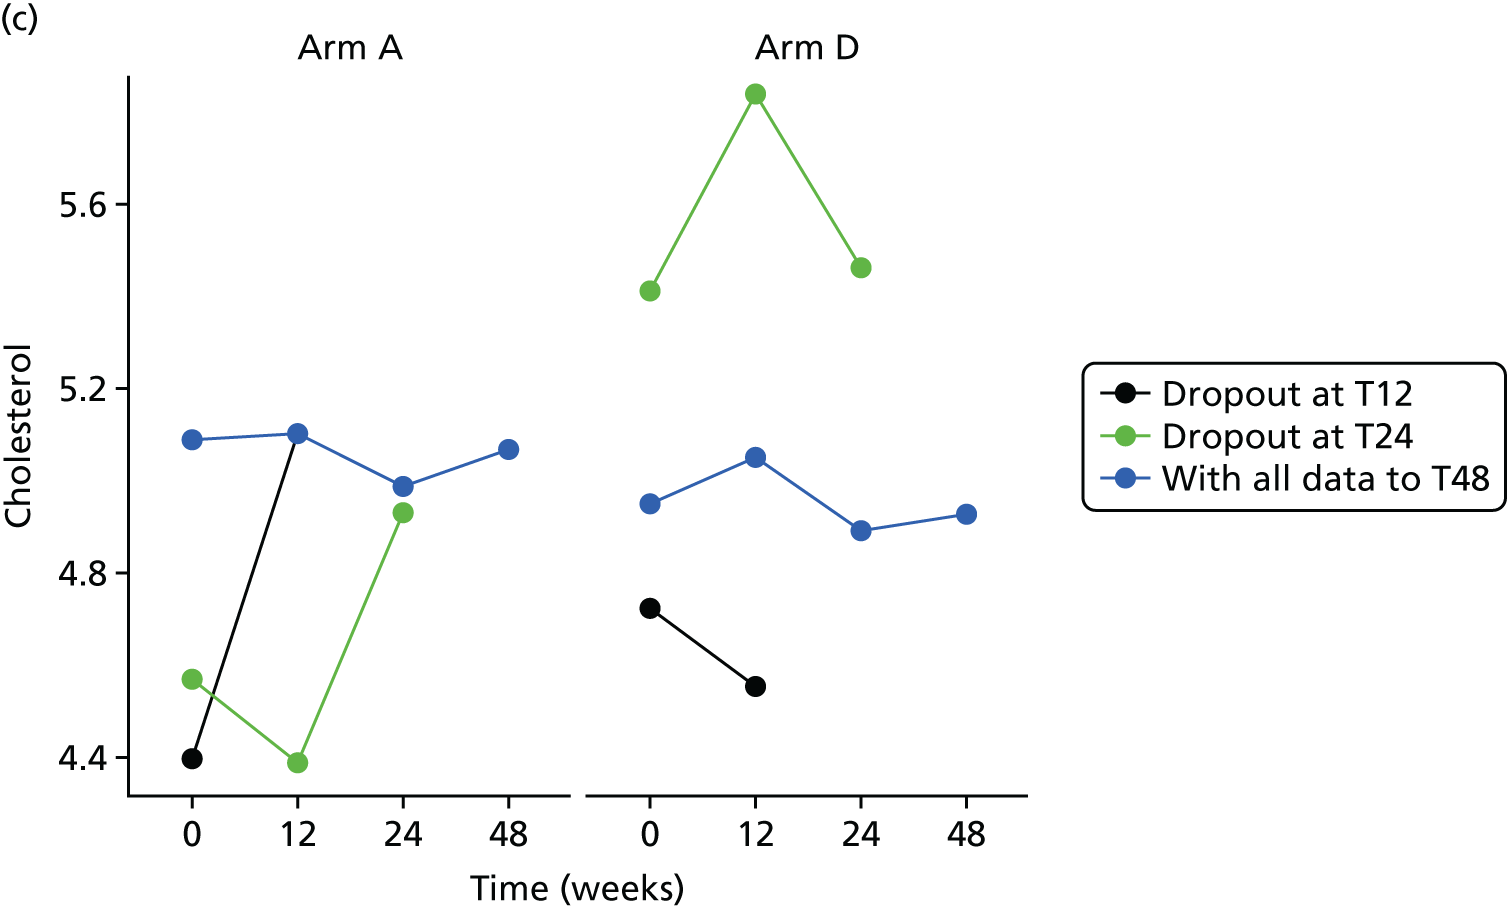
The bivariate joint model included 329 patients and 849 records. Cholesterol scores were fitted in their original scale.
| Component | Parameter | Estimate | 95% CI | p-value |
|---|---|---|---|---|
| Longitudinal marker | Intercept | 1.325 | 0.965 to 1.684 | < 0.0001 |
| Time | 0.000 | –0.002 to 0.003 | 0.8473 | |
| Baseline marker | 0.738 | 0.683 to 0.794 | < 0.0001 | |
| Treatment B vs. A | –0.046 | –0.234 to 0.142 | 0.6326 | |
| Treatment C vs. A | 0.061 | –0.117 to 0.238 | 0.5040 | |
| Treatment D vs. A | 0.013 | –0.173 to 0.199 | 0.8904 | |
| Ethnicity | –0.031 | –0.201 to 0.139 | 0.7219 | |
| Longitudinal weight | Intercept | 0.218 | –2.106 to 2.541 | 0.8544 |
| Time | 0.021 | –0.005 to 0.046 | 0.1115 | |
| Baseline weight | 0.995 | 0.972 to 1.017 | < 0.0001 | |
| Treatment B vs. A | 0.484 | –0.617 to 1.586 | 0.3886 | |
| Treatment C vs. A | 0.746 | –0.385 to 1.876 | 0.1960 | |
| Treatment D vs. A | 0.076 | –0.954 to 1.105 | 0.8854 | |
| Ethnicity | –0.090 | –0.982 to 0.802 | 0.8433 | |
| Dropout | Treatment B vs. A | 0.083 | –0.872 to 1.038 | 0.8649 |
| Treatment C vs. A | 0.027 | –0.971 to 1.026 | 0.9576 | |
| Treatment D vs. A | 0.324 | –0.549 to 1.197 | 0.4666 | |
| Ethnicity | –0.215 | –1.028 to 0.598 | 0.6042 | |
| Association parameters | Marker | –0.040 | –1.197 to 1.118 | 0.9466 |
| Weight | –0.043 | –0.249 to 0.163 | 0.6807 |
The treatment effect [arm D (80 mg) compared with arm A (control)] on the longitudinal cholesterol is 0.013 (95% CI –0.173 to 0.199), implying that there is no significant difference between the treatments on cholesterol.
Triglycerides
Histograms to check normality for triglycerides
FIGURE 24.
Normality of triglycerides. (a) original scale; and (b) log-transformed.
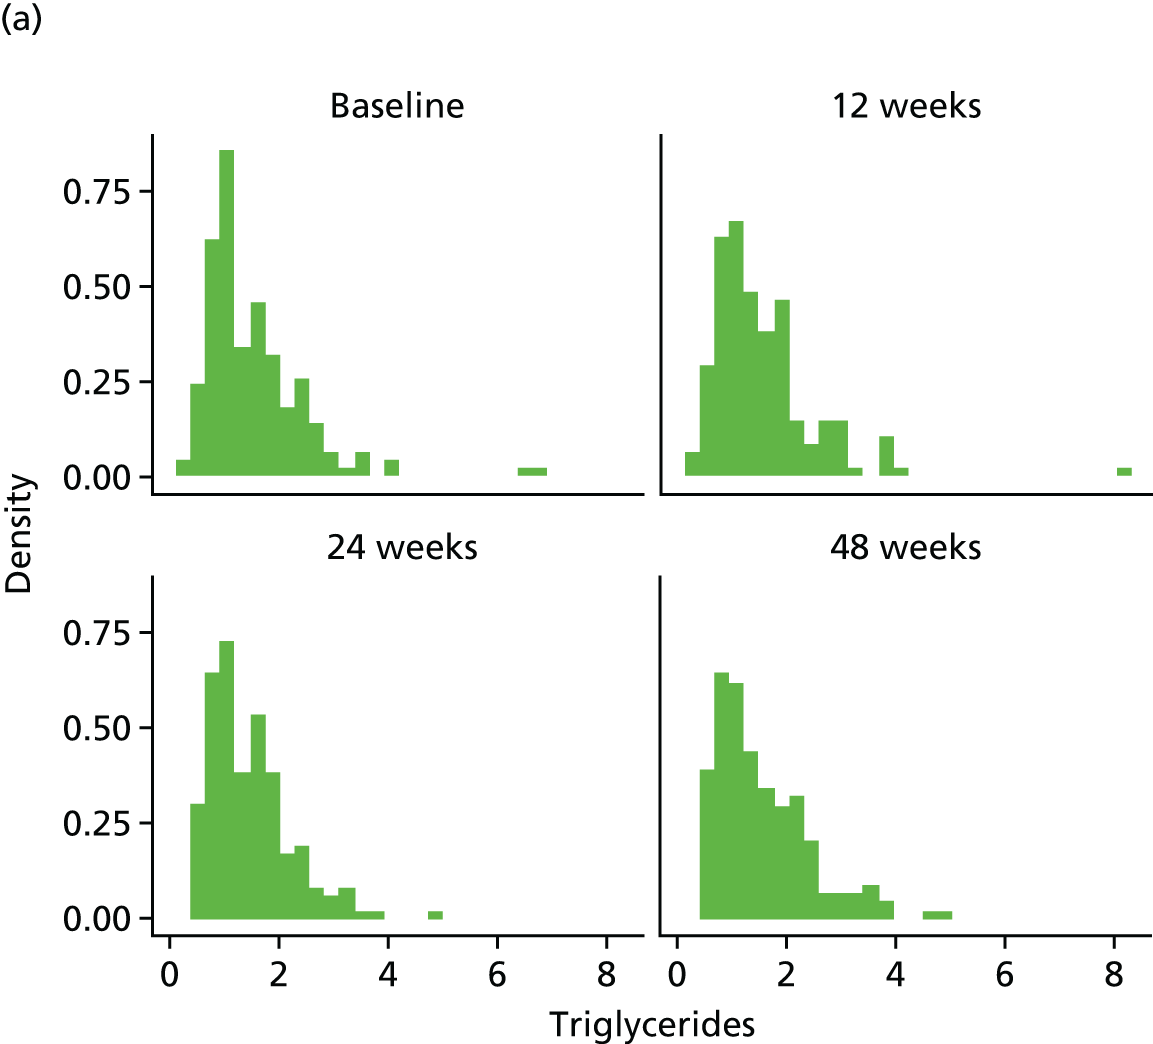

FIGURE 25.
Triglycerides mean profiles by treatment arm (original scale). (a) triglycerides profile plots; (b) triglycerides profile plots by dropout; and (c) triglycerides reverse-time profile plots.
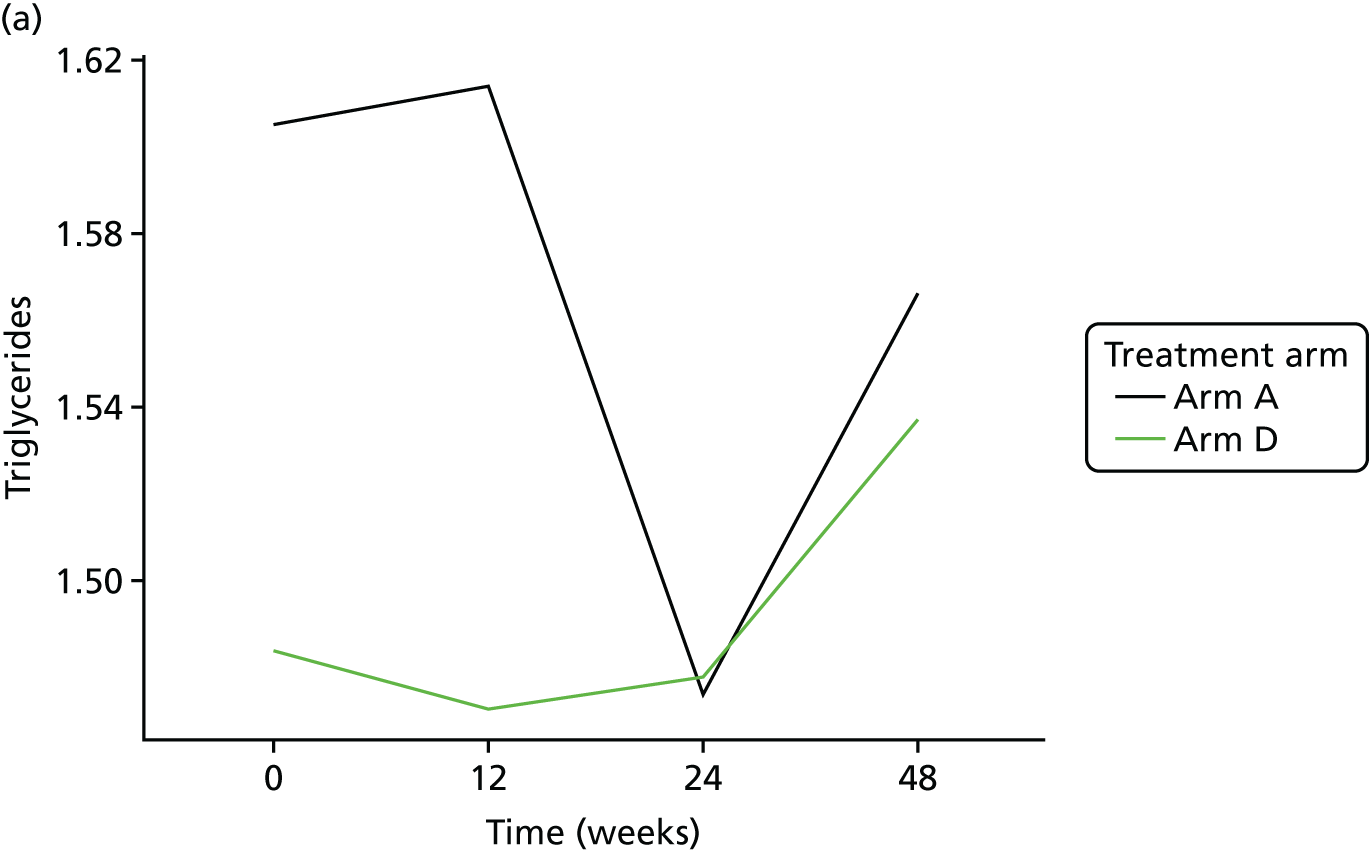
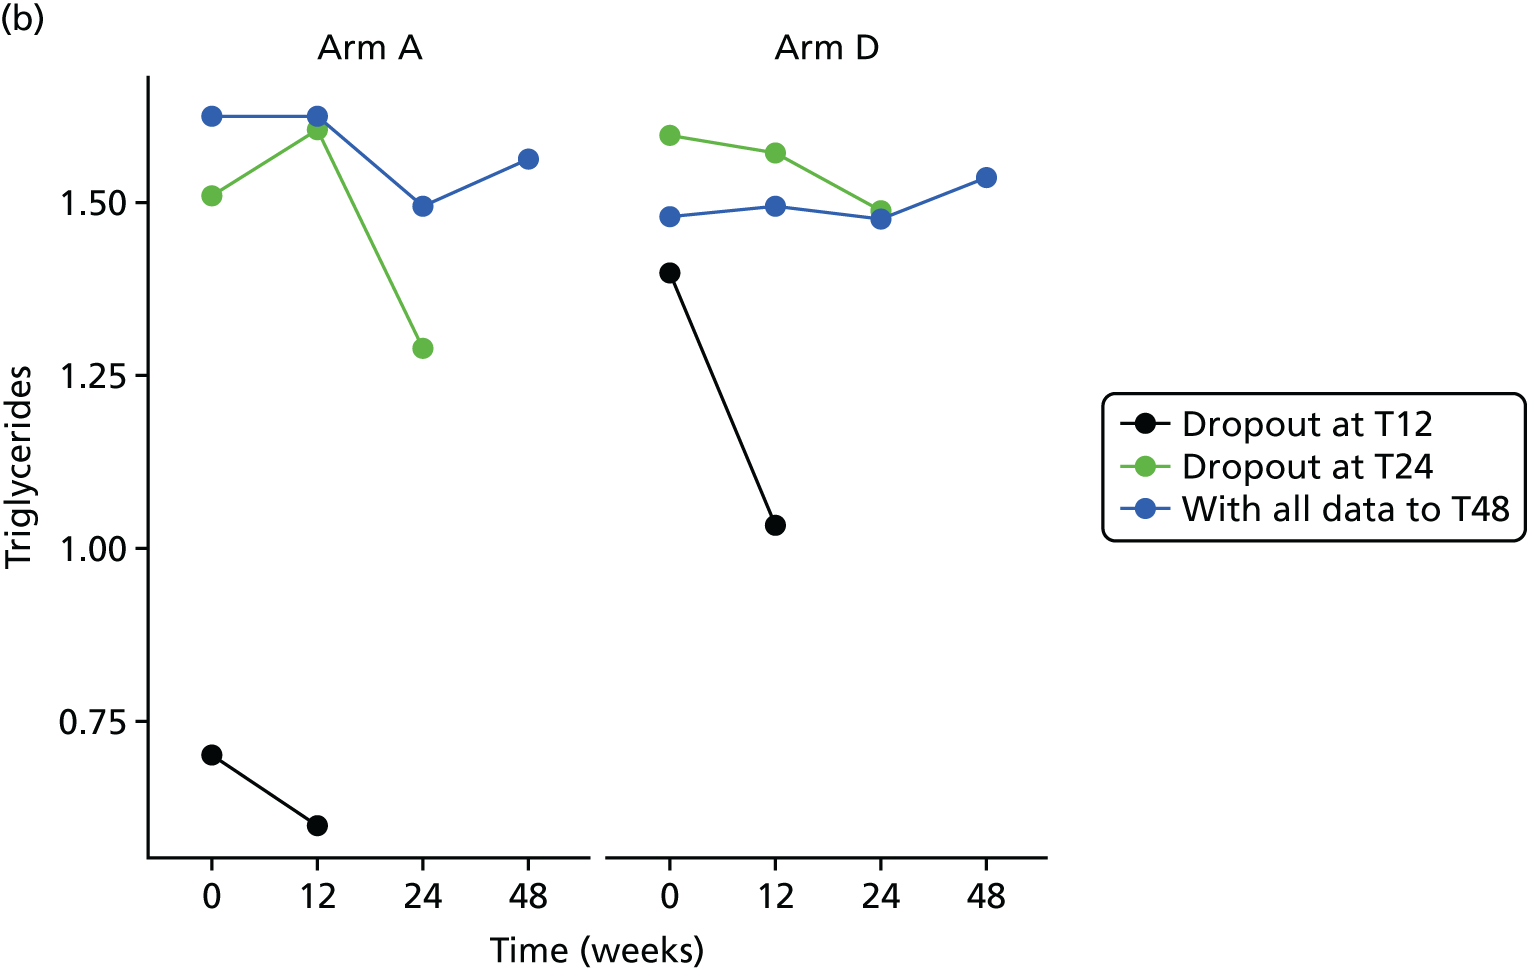
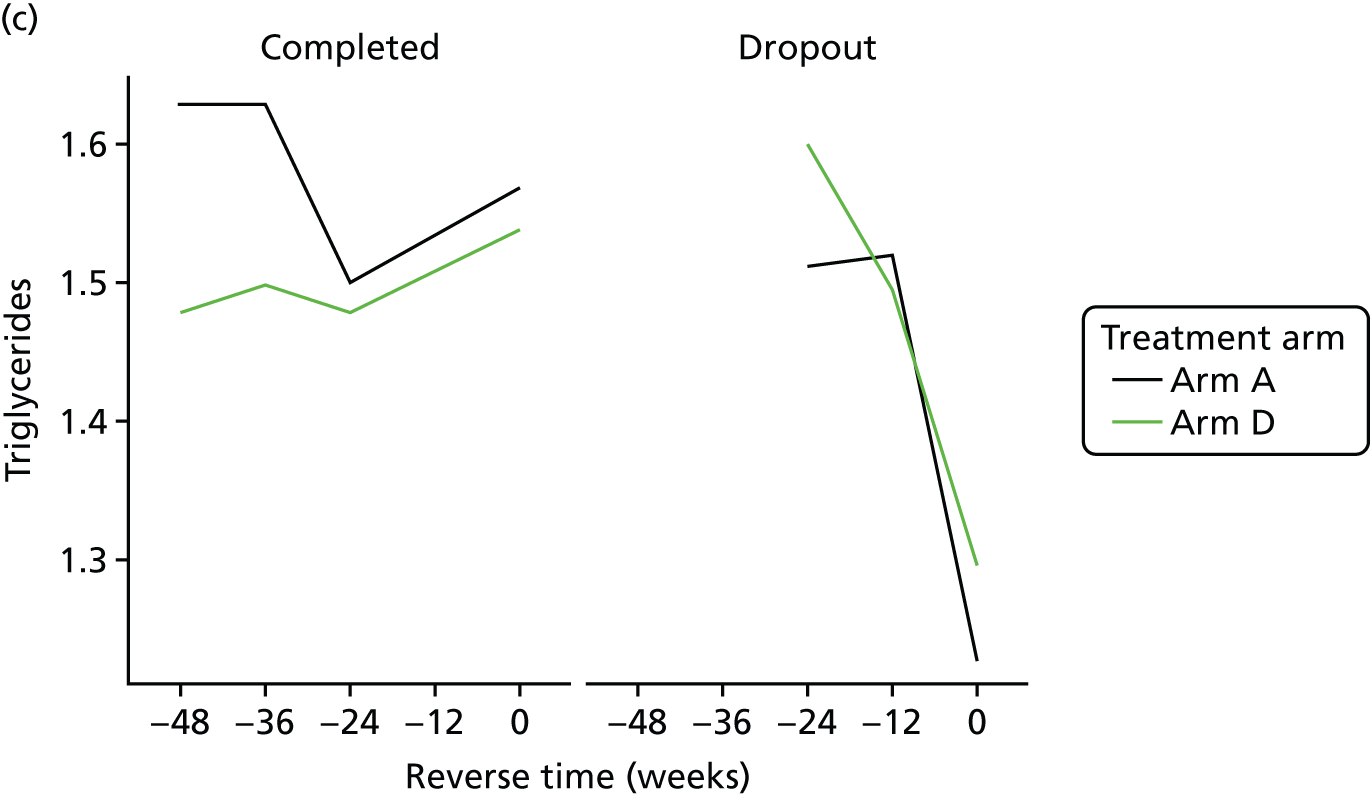
The bivariate joint model included 329 patients and 849 records. Triglycerides scores were fitted in log-transformed scale for normality.
| Component | Parameter | Estimate | 95% CI | p-value |
|---|---|---|---|---|
| Longitudinal marker | Intercept | 0.018 | –0.091 to 0.128 | 0.7450 |
| Time | 0.001 | –0.001 to 0.002 | 0.4220 | |
| Baseline marker | 0.779 | 0.713 to 0.845 | < 0.0001 | |
| Treatment B vs. A | 0.002 | –0.096 to 0.100 | 0.9614 | |
| Treatment C vs. A | 0.101 | 0.010 to 0.192 | 0.0291 | |
| Treatment D vs. A | 0.030 | –0.056 to 0.116 | 0.4885 | |
| Ethnicity | 0.005 | –0.089 to 0.099 | 0.9156 | |
| Longitudinal weight | Intercept | 0.646 | –1.688 to 2.980 | 0.5876 |
| Time | 0.021 | –0.004 to 0.046 | 0.0962 | |
| Baseline weight | 0.990 | 0.967 to 1.012 | < 0.0001 | |
| Treatment B vs. A | 0.445 | –0.602 to 1.491 | 0.4050 | |
| Treatment C vs. A | 0.676 | –0.463 to 1.815 | 0.2448 | |
| Treatment D vs. A | 0.043 | –0.953 to 1.039 | 0.9332 | |
| Ethnicity | –0.088 | –0.948 to 0.772 | 0.8412 | |
| Dropout | Treatment B vs. A | 0.085 | –0.876 to 1.046 | 0.8629 |
| Treatment C vs. A | 0.027 | –0.983 to 1.036 | 0.9588 | |
| Treatment D vs. A | 0.324 | –0.547 to 1.195 | 0.4656 | |
| Ethnicity | –0.219 | –1.031 to 0.593 | 0.5967 | |
| Association parameters | Marker | –0.392 | –3.779 to 2.996 | 0.8207 |
| Weight | –0.035 | –0.269 to 0.199 | 0.7722 |
The treatment effect [arm D (80 mg) compared with arm A (control)] on the longitudinal log-triglycerides is 0.030 (95% CI –0.056 to 0.116), implying that there is no significant difference between the treatments on triglycerides.
Low-density lipoprotein cholesterol
Histograms to check normality for low-density lipoprotein cholesterol
FIGURE 26.
Normality of LDL-C (original scale).

FIGURE 27.
LDL-C mean profiles by treatment arm (original scale). (a) LDL-C profile plots; (b) LDL-C profile plots by dropout; and (c) LDL-C reverse-time profile plots.
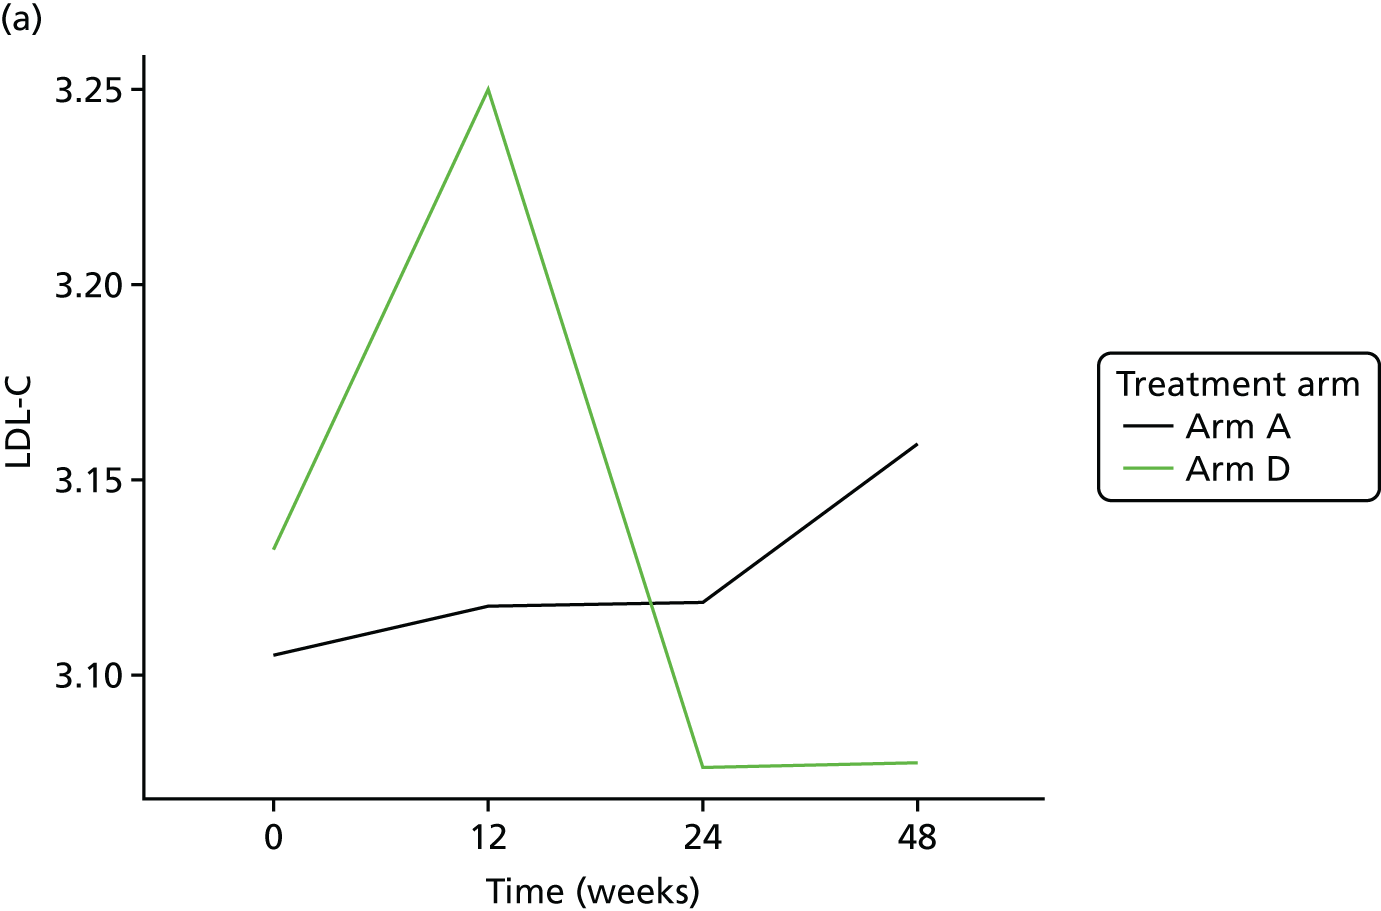
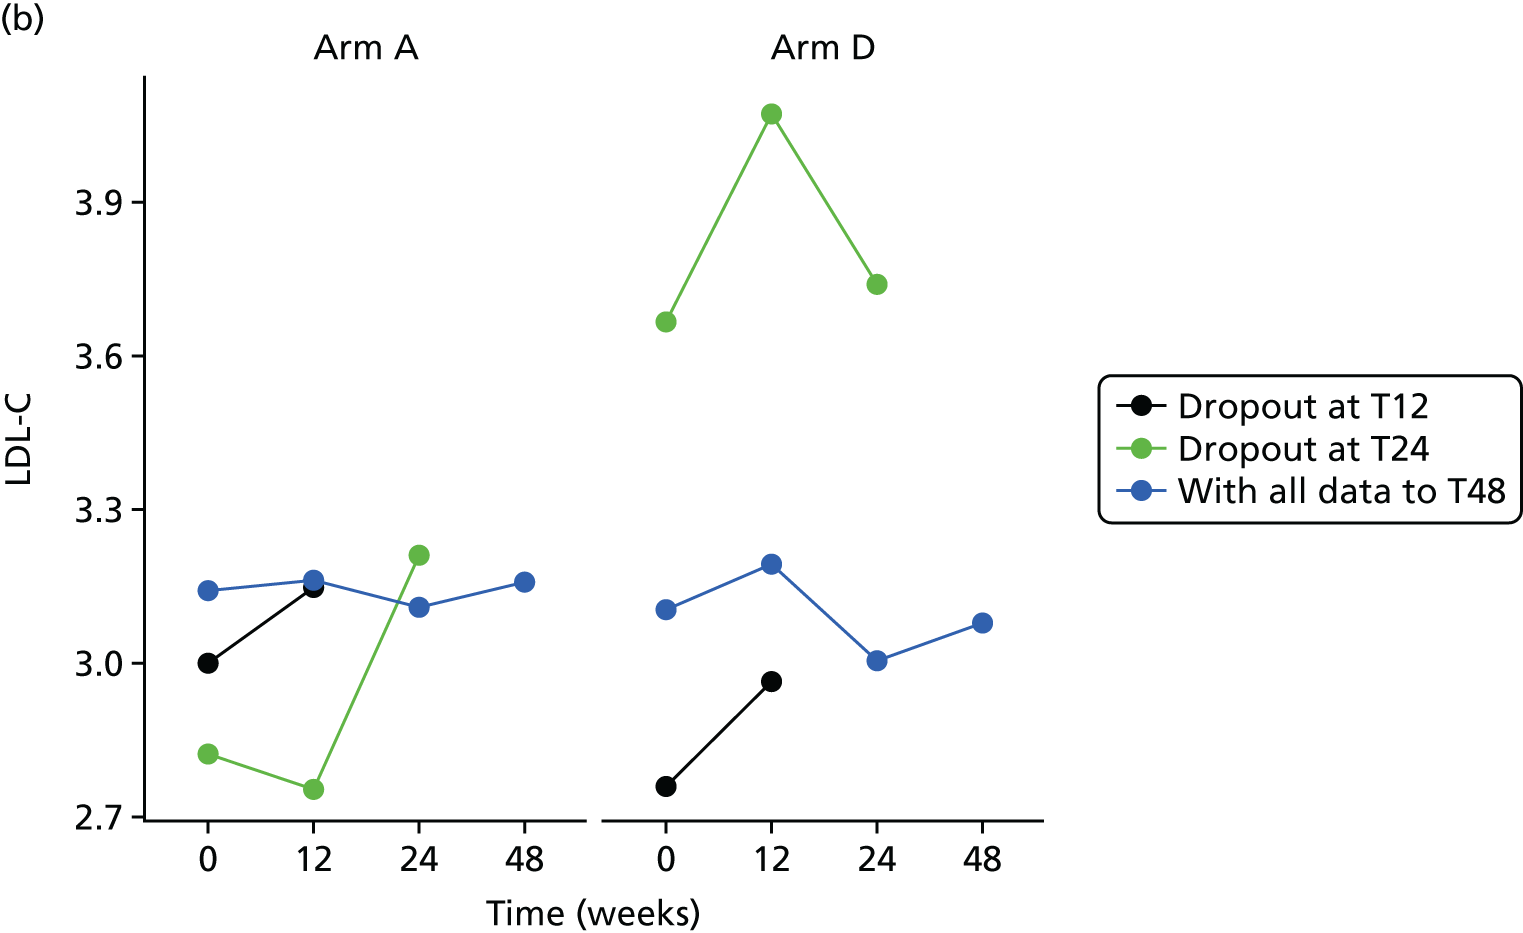
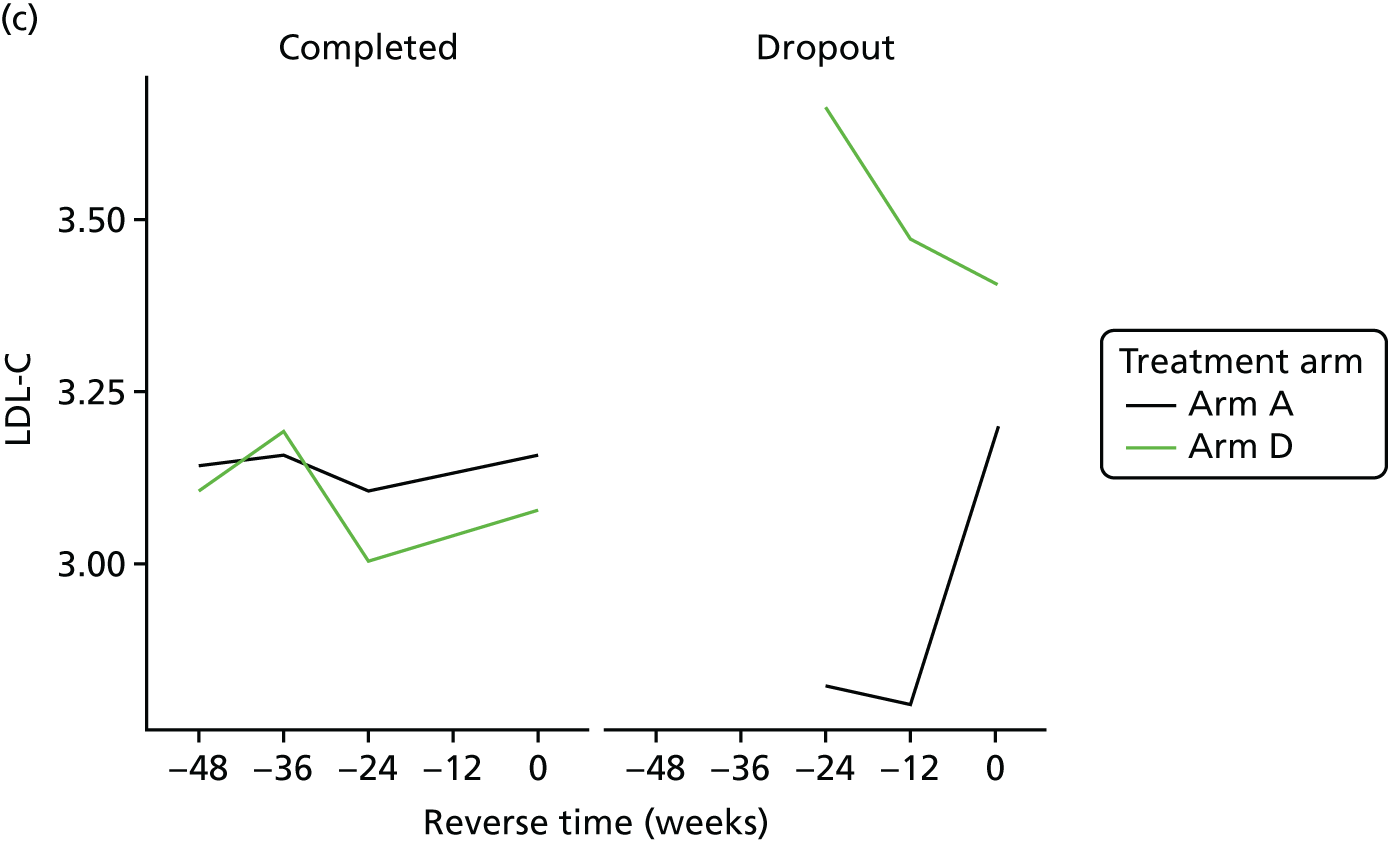
The bivariate joint model included 324 patients and 833 records. LDL-C scores were fitted in original scale.
| Component | Parameter | Estimate | 95% CI | p-value |
|---|---|---|---|---|
| Longitudinal marker | Intercept | 0.787 | 0.539 to 1.035 | < 0.0001 |
| Time | 0.000 | –0.002 to 0.002 | 0.9532 | |
| Baseline marker | 0.745 | 0.688 to 0.802 | < 0.0001 | |
| Treatment B vs. A | –0.008 | –0.158 to 0.142 | 0.9127 | |
| Treatment C vs. A | 0.019 | –0.135 to 0.172 | 0.8118 | |
| Treatment D vs. A | 0.000 | –0.145 to 0.144 | 0.9946 | |
| Ethnicity | 0.029 | –0.108 to 0.165 | 0.6820 | |
| Longitudinal weight | Intercept | 0.223 | –2.143 to 2.589 | 0.8536 |
| Time | 0.021 | –0.005 to 0.048 | 0.1170 | |
| Baseline weight | 0.995 | 0.971 to 1.018 | < 0.0001 | |
| Treatment B vs. A | 0.427 | –0.681 to 1.535 | 0.4505 | |
| Treatment C vs. A | 0.626 | –0.579 to 1.832 | 0.3086 | |
| Treatment D vs. A | 0.065 | –0.981 to 1.111 | 0.9027 | |
| Ethnicity | –0.099 | –1.003 to 0.806 | 0.8309 | |
| Dropout | Treatment B vs. A | –0.012 | –0.970 to 0.946 | 0.9799 |
| Treatment C vs. A | –0.192 | –1.232 to 0.848 | 0.7172 | |
| Treatment D vs. A | 0.222 | –0.645 to 1.089 | 0.6161 | |
| Ethnicity | –0.326 | –1.101 to 0.448 | 0.4086 | |
| Association parameters | Marker | 0.271 | –1.151 to 1.693 | 0.7086 |
| Weight | –0.059 | –0.253 to 0.135 | 0.5504 |
Plasma biomarkers
Adiponectin
Histograms to check normality for adiponectin
FIGURE 28.
Normality of adiponectin. (a) original scale; and (b) log-transformed.
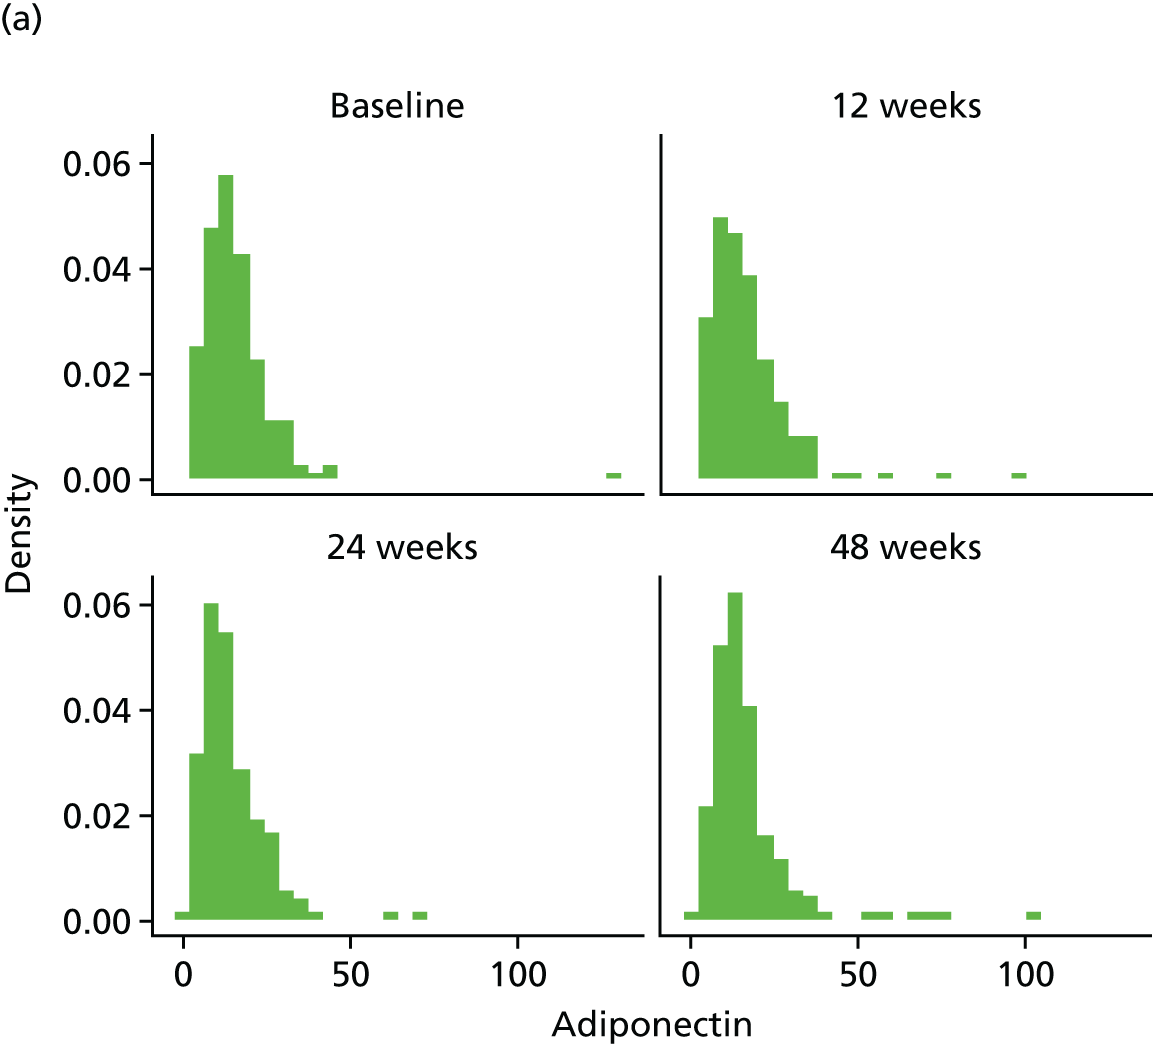

FIGURE 29.
Adiponectin mean profiles by treatment arm (original scale). (a) adiponectin profile plots; (b) adiponectin profile plots by dropout; and (c) adiponectin reverse-time profile plots.
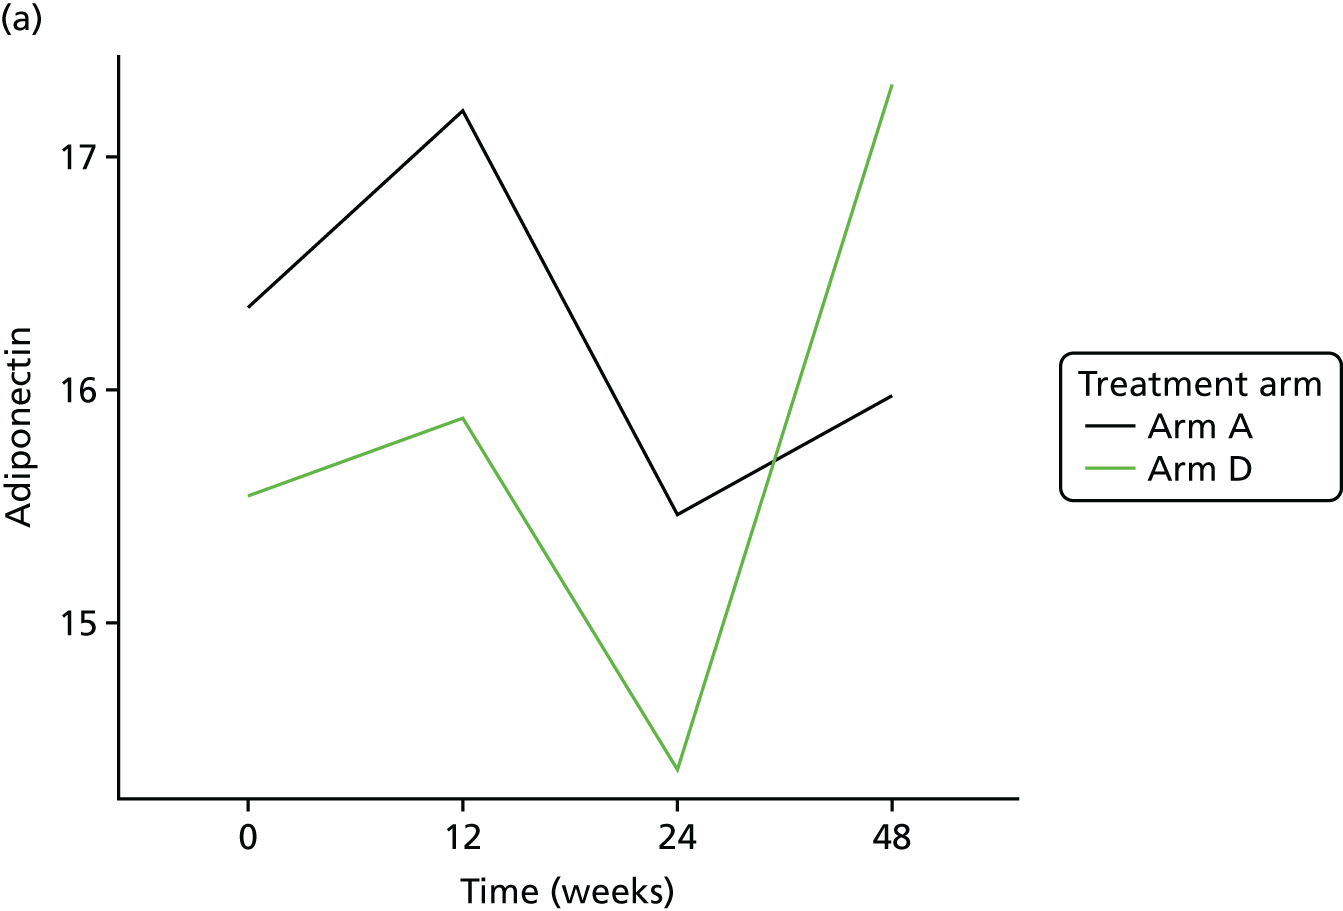
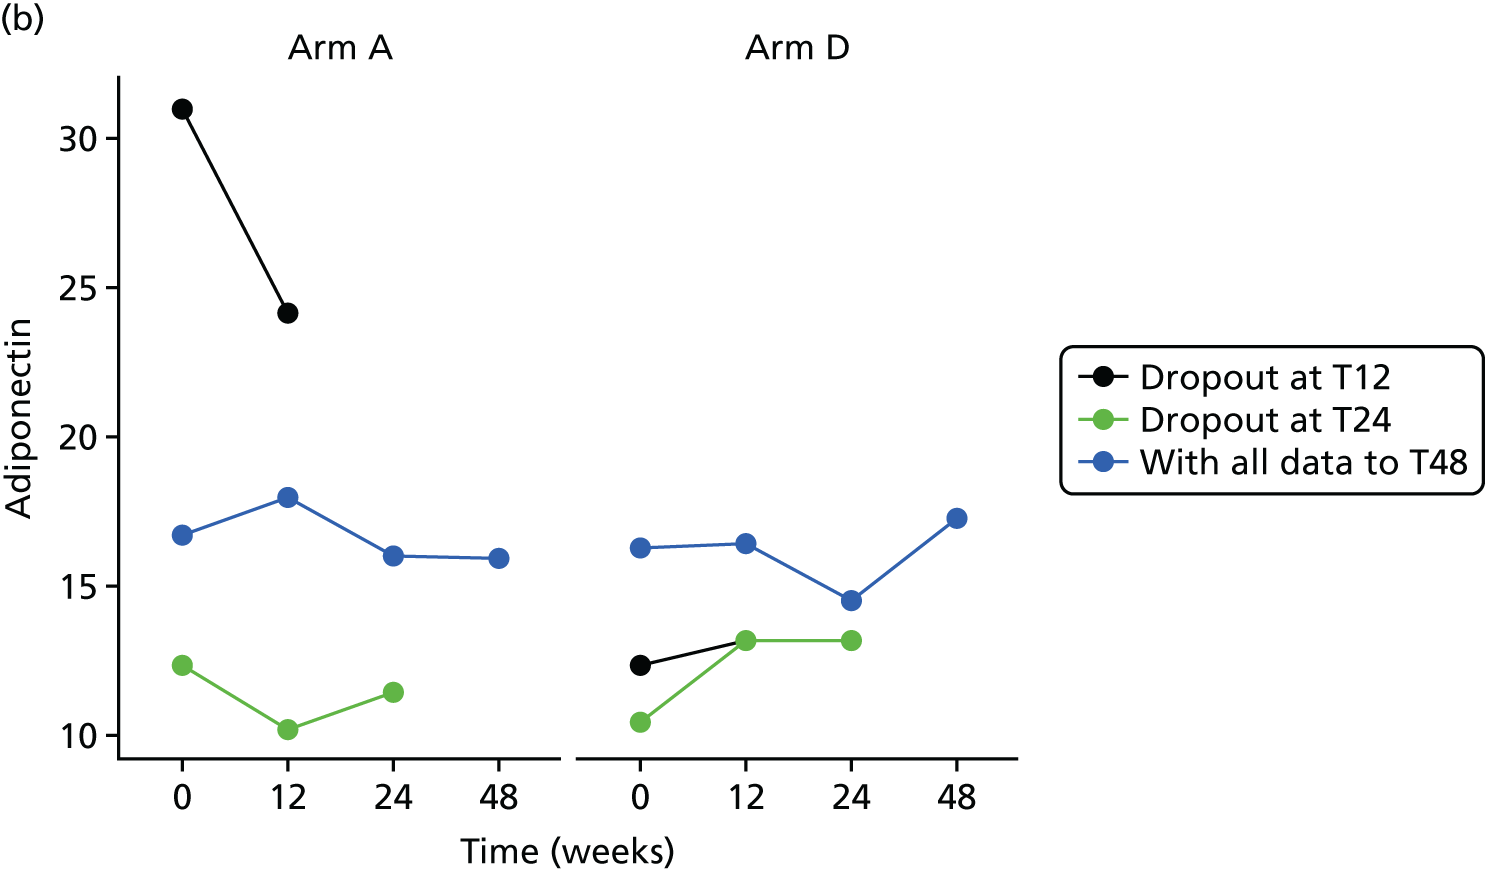
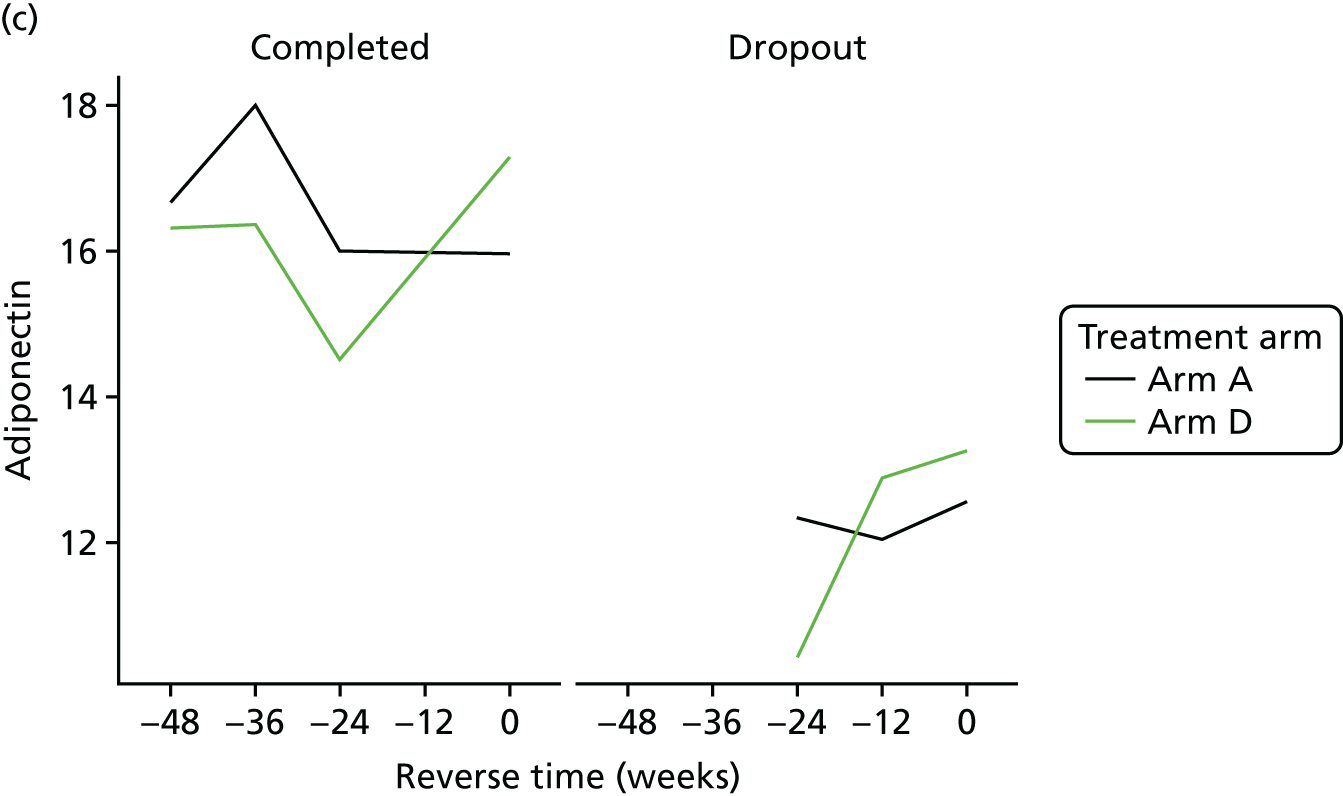
The bivariate joint model included 324 patients and 829 records. Adiponectin scores were fitted in log-transformed scale for normality.
| Component | Parameter | Estimate | 95% CI | p-value |
|---|---|---|---|---|
| Longitudinal marker | Intercept | 0.555 | 0.297 to 0.812 | < 0.0001 |
| Time | –0.001 | –0.003 to 0.001 | 0.3345 | |
| Baseline marker | 0.787 | 0.709 to 0.865 | < 0.0001 | |
| Treatment B vs. A | 0.072 | –0.060 to 0.204 | 0.2846 | |
| Treatment C vs. A | 0.045 | –0.077 to 0.168 | 0.4696 | |
| Treatment D vs. A | 0.035 | –0.078 to 0.148 | 0.5420 | |
| Ethnicity | –0.043 | –0.161 to 0.075 | 0.4731 | |
| Longitudinal weight | Intercept | 0.491 | –1.739 to 2.720 | 0.6661 |
| Time | 0.020 | –0.003 to 0.043 | 0.0941 | |
| Baseline weight | 0.992 | 0.970 to 1.013 | < 0.0001 | |
| Treatment B vs. A | 0.441 | –0.608 to 1.489 | 0.4103 | |
| Treatment C vs. A | 0.683 | –0.465 to 1.832 | 0.2437 | |
| Treatment D vs. A | 0.084 | –0.932 to 1.100 | 0.8713 | |
| Ethnicity | –0.054 | –0.931 to 0.824 | 0.9046 | |
| Dropout | Treatment B vs. A | 0.263 | –0.665 to 1.190 | 0.5791 |
| Treatment C vs. A | 0.023 | –1.000 to 1.046 | 0.9649 | |
| Treatment D vs. A | 0.260 | –0.625 to 1.146 | 0.5644 | |
| Ethnicity | –0.059 | –0.908 to 0.789 | 0.8912 | |
| Association parameters | Marker | 0.415 | –1.394 to 2.223 | 0.6529 |
| Weight | –0.034 | –0.242 to 0.174 | 0.7467 |
The treatment effect [arm D (80 mg) compared with arm A (control)] on the longitudinal log-adiponectin is 0.035 (95% CI –0.078 to 0.148), implying that there is no significant difference between the treatments on adiponectin.
Leptin
Histograms to check normality for leptin
FIGURE 30.
Normality of leptin. (a) original scale; and (b) log-transformed.
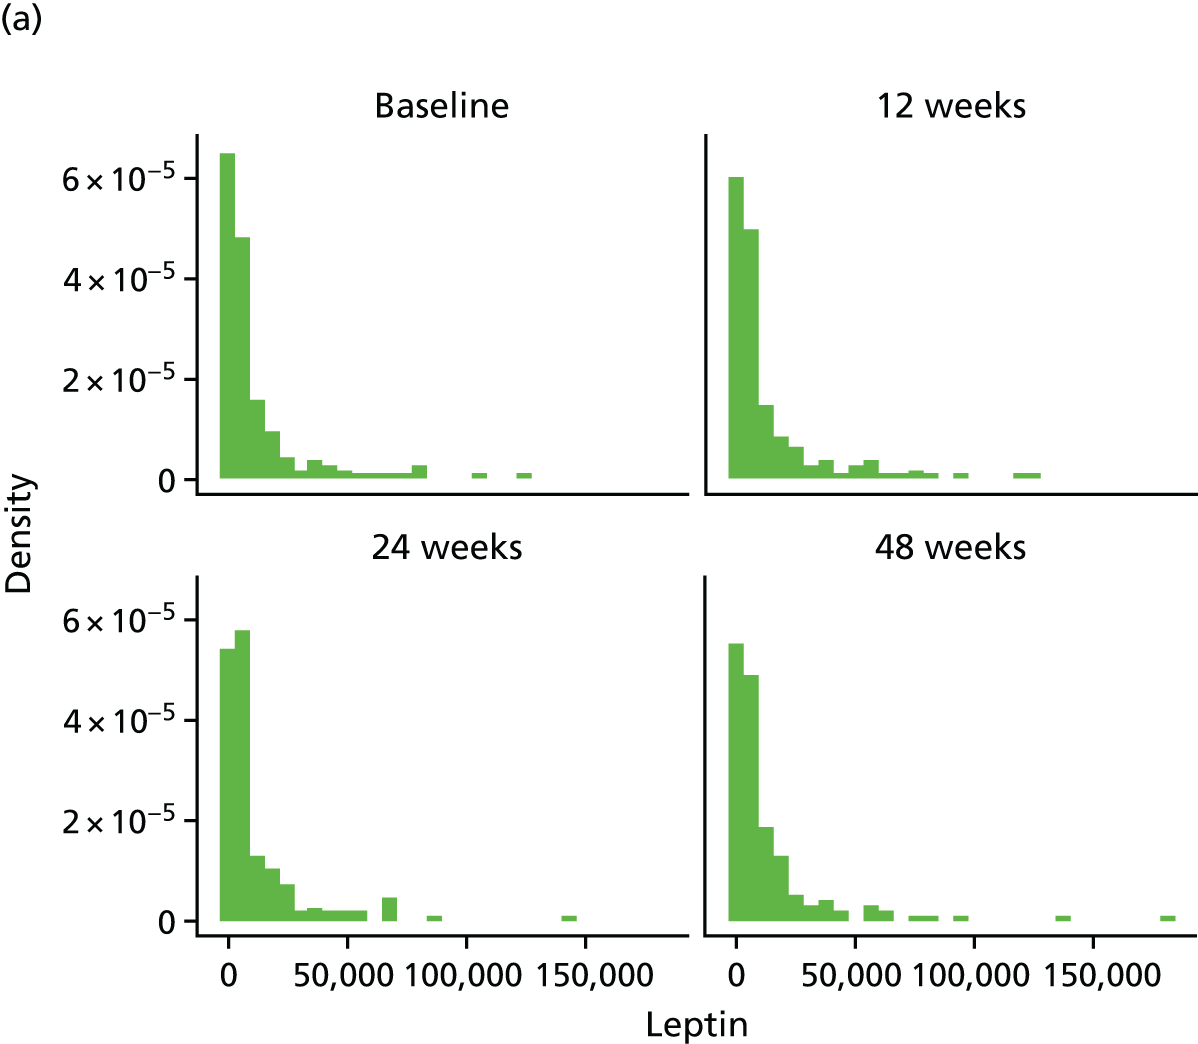

FIGURE 31.
Leptin mean profiles by treatment arm (original scale). (a) leptin profile plots; (b) leptin profile plots by dropout; and (c) leptin reverse-time profile plots.


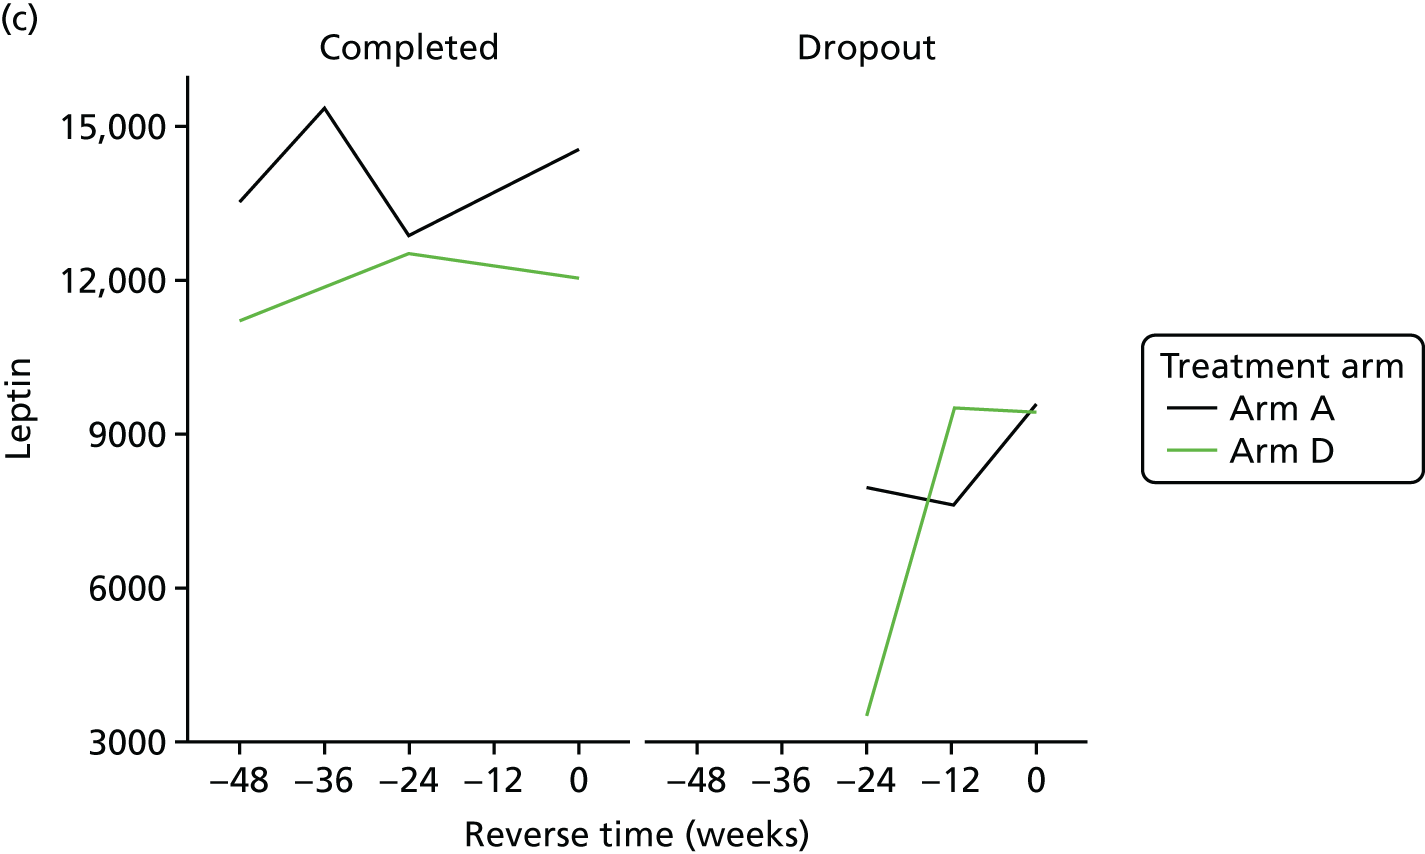
The bivariate joint model included 325 patients and 841 records. Leptin scores were fitted in log-transformed scale for normality.
| Component | Parameter | Estimate | 95% CI | p-value |
|---|---|---|---|---|
| Longitudinal marker | Intercept | 0.893 | 0.419 to 1.367 | 0.0002 |
| Time | 0.001 | –0.002 to 0.003 | 0.6639 | |
| Baseline marker | 0.906 | 0.857 to 0.956 | < 0.0001 | |
| Treatment B vs. A | –0.010 | –0.198 to 0.177 | 0.9132 | |
| Treatment C vs. A | 0.161 | –0.038 to 0.359 | 0.1126 | |
| Treatment D vs. A | 0.004 | –0.179 to 0.187 | 0.9664 | |
| Ethnicity | –0.061 | –0.226 to 0.105 | 0.4727 | |
| Longitudinal weight | Intercept | 1.017 | –1.224 to 3.258 | 0.3738 |
| Time | 0.020 | –0.008 to 0.048 | 0.1713 | |
| Baseline weight | 0.982 | 0.961 to 1.004 | < 0.0001 | |
| Treatment B vs. A | 0.386 | –0.671 to 1.443 | 0.4739 | |
| Treatment C vs. A | 0.840 | –0.248 to 1.929 | 0.1302 | |
| Treatment D vs. A | 0.148 | –0.817 to 1.113 | 0.7637 | |
| Ethnicity | 0.155 | –0.682 to 0.991 | 0.7174 | |
| Dropout | Treatment B vs. A | –0.020 | –1.047 to 1.007 | 0.9695 |
| Treatment C vs. A | 0.244 | –0.724 to 1.212 | 0.6213 | |
| Treatment D vs. A | 0.346 | –0.569 to 1.260 | 0.4588 | |
| Ethnicity | 0.122 | –0.773 to 1.016 | 0.7893 | |
| Association parameters | Marker | 0.050 | –1.425 to 1.524 | 0.9474 |
| Weight | –0.108 | –0.433 to 0.218 | 0.5168 |
The treatment effect [arm D (80 mg) compared with arm A (control)] on the longitudinal log-leptin is 0.004 (95% CI –0.179 to 0.187), implying that there is no significant difference between the treatments on leptin.
Interleukin 8
Histograms to check normality for interleukin 8
FIGURE 32.
Normality of IL-8. (a) original scale; and (b) log-transformed.
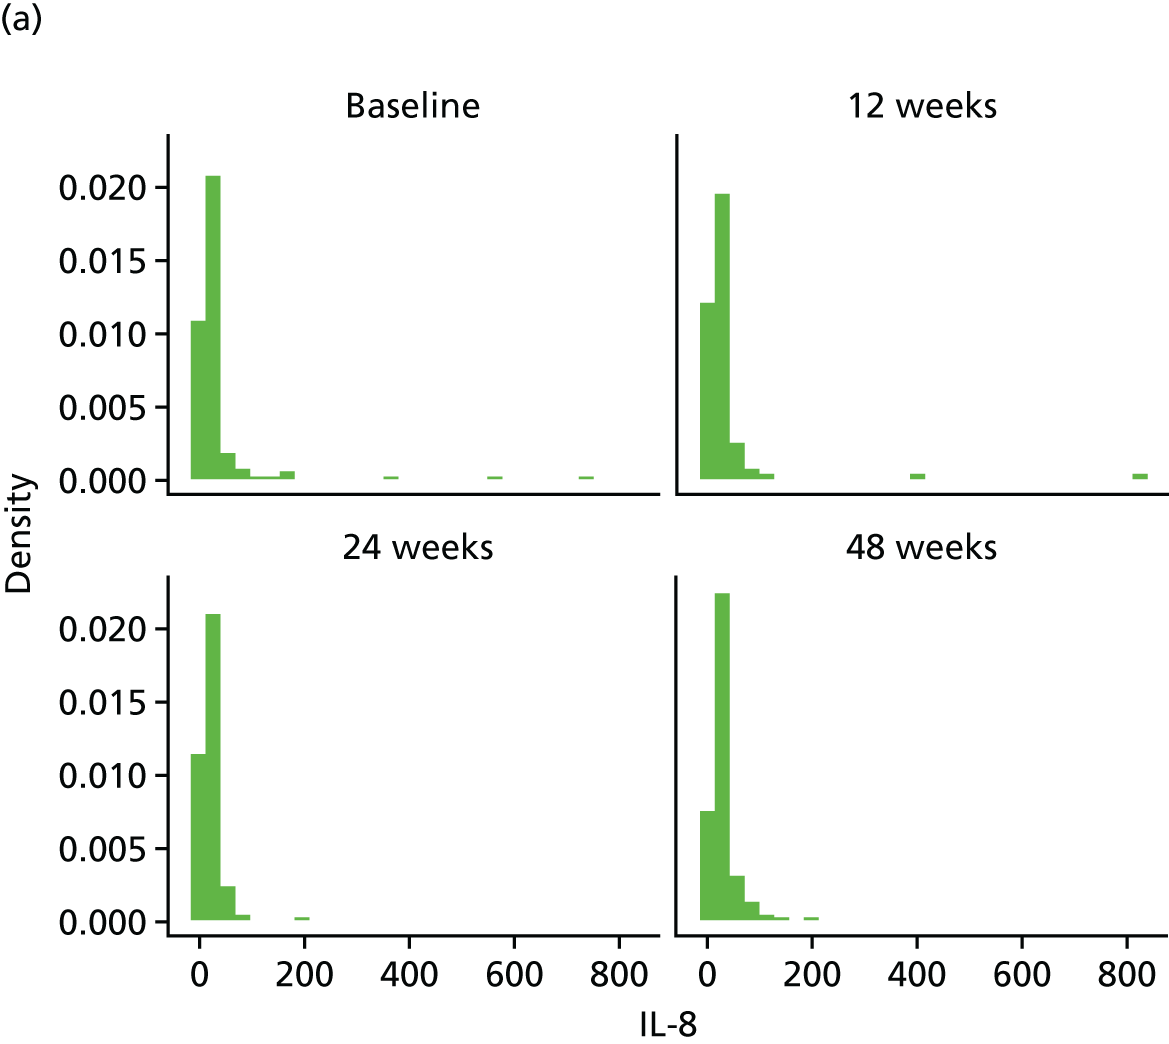
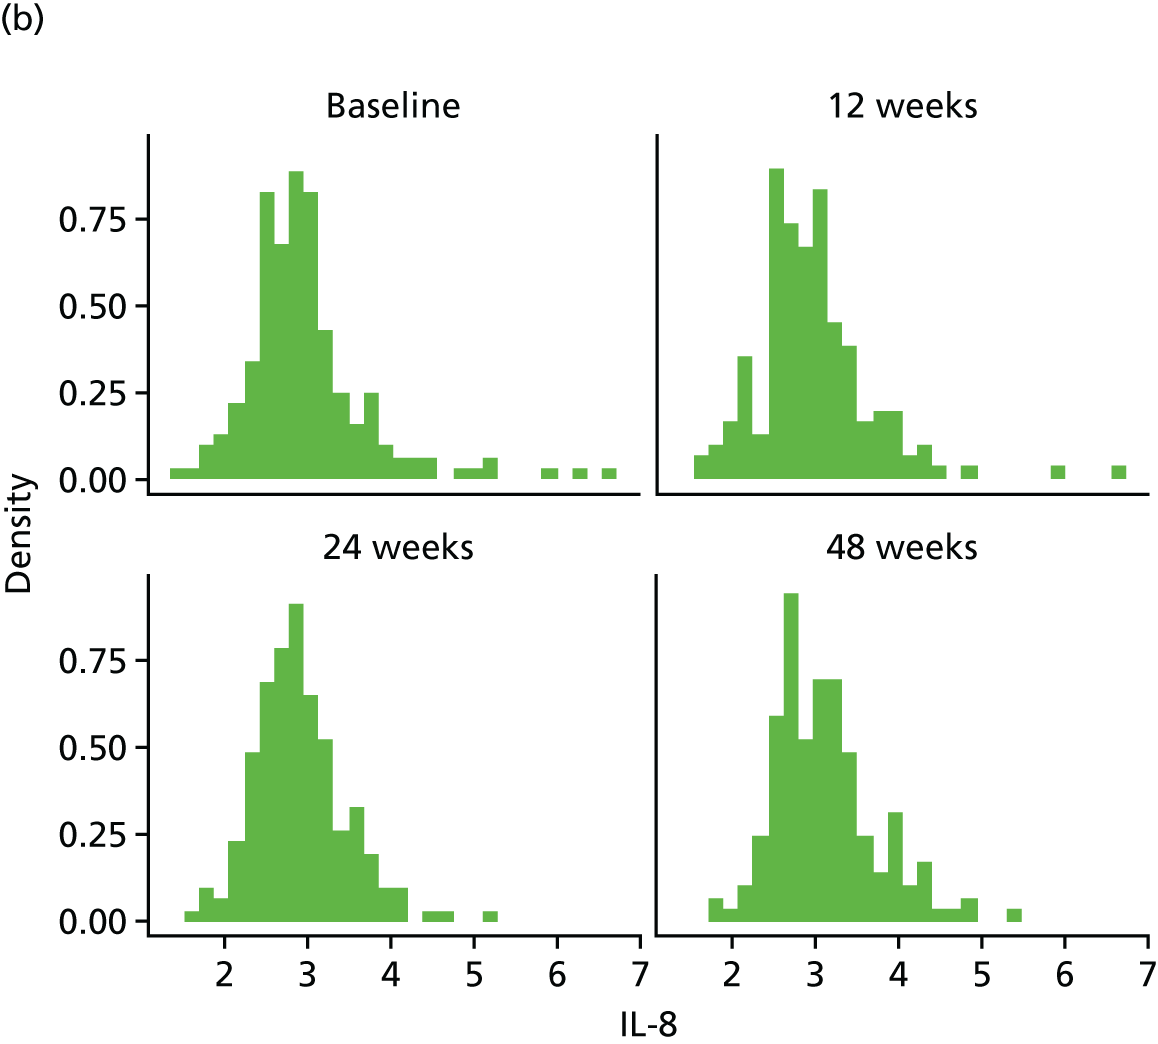
FIGURE 33.
IL-8 mean profiles by treatment arm (original scale). (a) IL-8 profile plots; (b) IL-8 profile plots by dropout; and (c) IL-8 reverse-time profile plots.


The bivariate joint model included 327 patients and 845 records. IL-8 scores were fitted in log-transformed scale for normality.
| Component | Parameter | Estimate | 95% CI | p-value |
|---|---|---|---|---|
| Longitudinal marker | Intercept | 1.851 | 1.594 to 2.107 | < 0.0001 |
| Time | 0.006 | 0.003 to 0.009 | 0.0004 | |
| Baseline marker | 0.297 | 0.246 to 0.348 | < 0.0001 | |
| Treatment B vs. A | 0.021 | –0.145 to 0.187 | 0.8029 | |
| Treatment C vs. A | –0.112 | –0.303 to 0.078 | 0.2480 | |
| Treatment D vs. A | 0.041 | –0.111 to 0.193 | 0.5950 | |
| Ethnicity | 0.103 | –0.042 to 0.249 | 0.1647 | |
| Longitudinal weight | Intercept | 0.436 | –1.841 to 2.712 | 0.7077 |
| Time | 0.020 | –0.002 to 0.043 | 0.0784 | |
| Baseline weight | 0.991 | 0.969 to 1.013 | < 0.0001 | |
| Treatment B vs. A | 0.506 | –0.525 to 1.537 | 0.3361 | |
| Treatment C vs. A | 0.689 | –0.409 to 1.788 | 0.2188 | |
| Treatment D vs. A | 0.194 | –0.807 to 1.195 | 0.7042 | |
| Ethnicity | –0.018 | –0.864 to 0.829 | 0.9675 | |
| Dropout | Treatment B vs. A | 0.166 | –0.776 to 1.108 | 0.7301 |
| Treatment C vs. A | 0.027 | –0.964 to 1.019 | 0.9568 | |
| Treatment D vs. A | 0.237 | –0.648 to 1.122 | 0.6000 | |
| Ethnicity | –0.353 | –1.166 to 0.460 | 0.3948 | |
| Association parameters | Marker | –0.006 | –1.347 to 1.335 | 0.9927 |
| Weight | –0.053 | –0.254 to 0.148 | 0.6050 |
The treatment effect [arm D (80 mg) compared with arm A (control)] on the longitudinal log-IL-8 is 0.041 (95% CI –0.111 to 0.193), implying that there is no significant difference between the treatments on IL-8.
Tumour necrosis factor alpha
Histograms to check normality for tumour necrosis factor alpha
FIGURE 34.
Normality of TNF-α. (a) original scale; and (b) log-transformed.

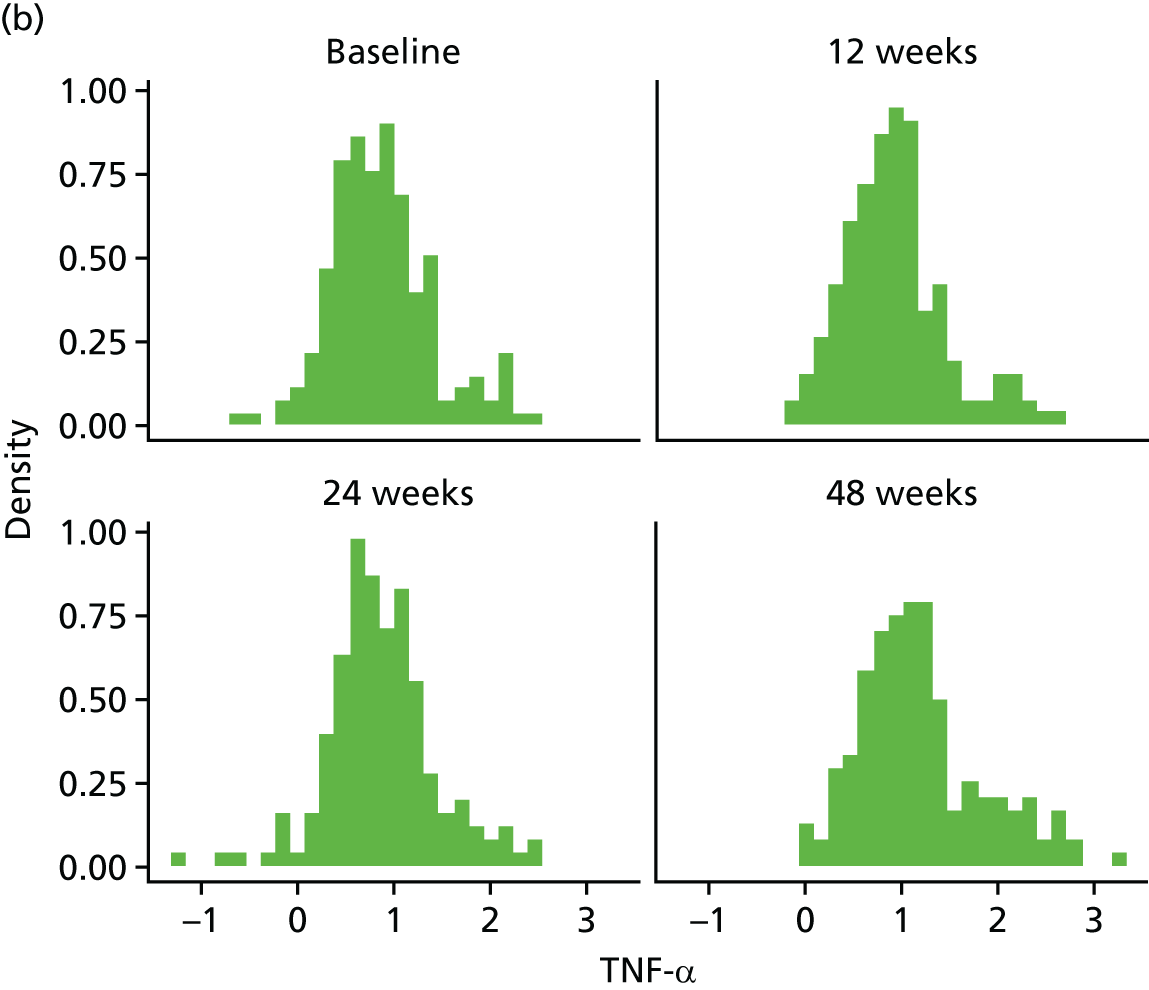
FIGURE 35.
TNF-α mean profiles by treatment arm (original scale). (a) TNF-α profile plots; (b) TNF-α profile plots by dropout; and (c) TNF-α reverse-time profile plots.


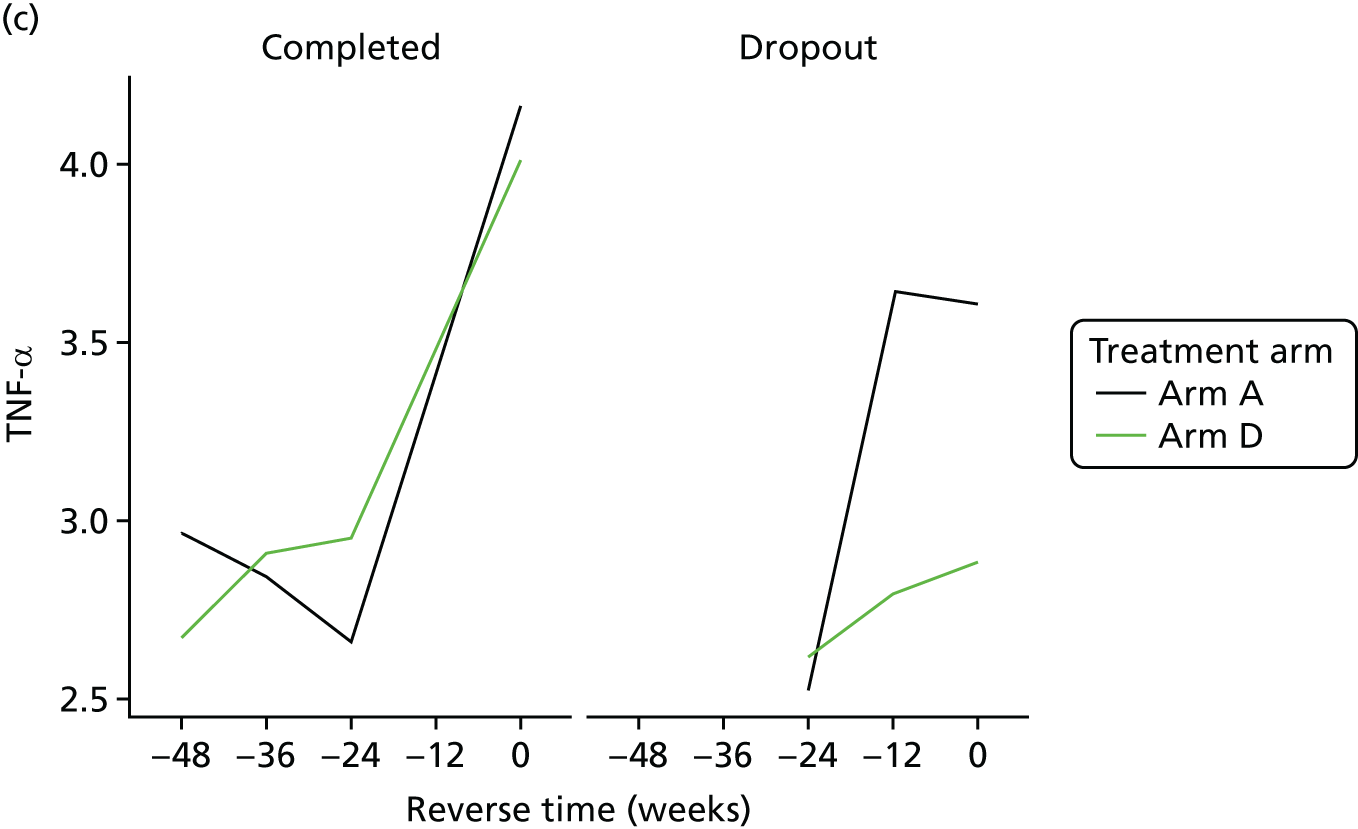
The bivariate joint model included 325 patients and 838 records. TNF-α scores were fitted in log-transformed scale for normality.
| Component | Parameter | Estimate | 95% CI | p-value |
|---|---|---|---|---|
| Longitudinal marker | Intercept | 0.154 | –0.011 to 0.319 | 0.0682 |
| Time | 0.007 | 0.004 to 0.009 | < 0.0001 | |
| Baseline marker | 0.642 | 0.561 to 0.723 | < 0.0001 | |
| Treatment B vs. A | 0.002 | –0.119 to 0.122 | 0.9800 | |
| Treatment C vs. A | –0.058 | –0.197 to 0.080 | 0.4093 | |
| Treatment D vs. A | –0.025 | –0.133 to 0.082 | 0.6412 | |
| Ethnicity | 0.119 | 0.005 to 0.233 | 0.0415 | |
| Longitudinal weight | Intercept | 0.433 | –1.940 to 2.806 | 0.7208 |
| Time | 0.020 | –0.006 to 0.047 | 0.1374 | |
| Baseline weight | 0.992 | 0.970 to 1.014 | < 0.0001 | |
| Treatment B vs. A | 0.492 | –0.560 to 1.544 | 0.3591 | |
| Treatment C vs. A | 0.736 | –0.392 to 1.864 | 0.2010 | |
| Treatment D vs. A | 0.107 | –0.920 to 1.134 | 0.8381 | |
| Ethnicity | –0.078 | –0.979 to 0.824 | 0.8656 | |
| Dropout | Treatment B vs. A | 0.169 | –0.826 to 1.164 | 0.7392 |
| Treatment C vs. A | 0.119 | –0.902 to 1.140 | 0.8190 | |
| Treatment D vs. A | 0.425 | –0.495 to 1.345 | 0.3653 | |
| Ethnicity | –0.236 | –1.052 to 0.579 | 0.5700 | |
| Association parameters | Marker | 0.492 | –1.269 to 2.252 | 0.5841 |
| Weight | –0.060 | –0.259 to 0.139 | 0.5545 |
The treatment effect [arm D (80 mg) compared with arm A (control)] on the longitudinal log-TNF-α is –0.025 (95% CI –0.133 to 0.082), implying that there is no significant difference between the treatments on TNF-α.
Resistin
Histograms to check normality for resistin
FIGURE 36.
Normality of resistin (a) original scale; and (b) log-transformed.
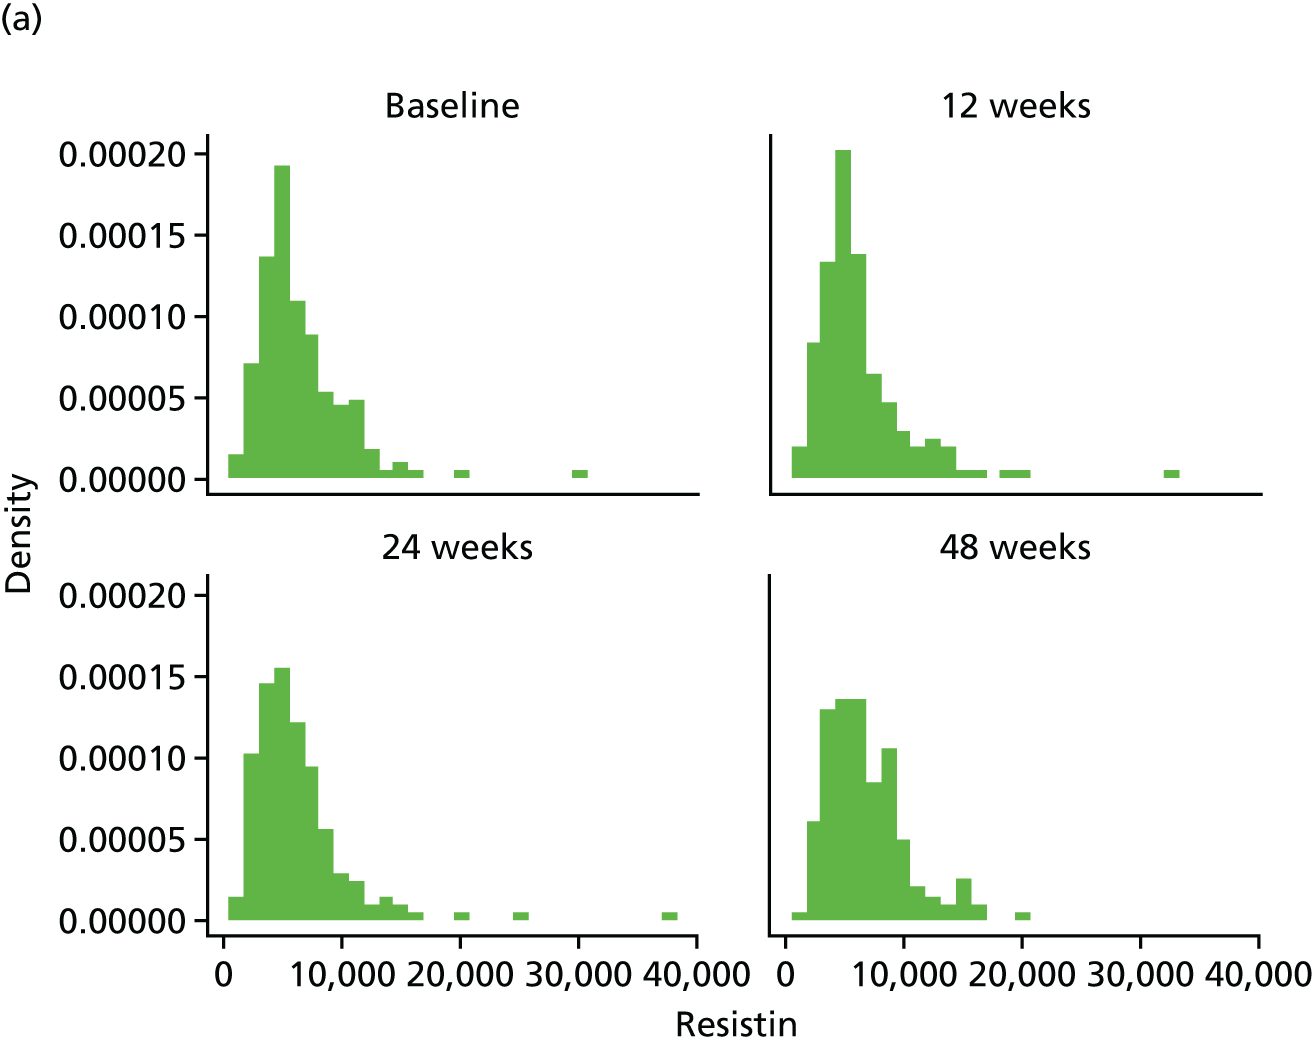
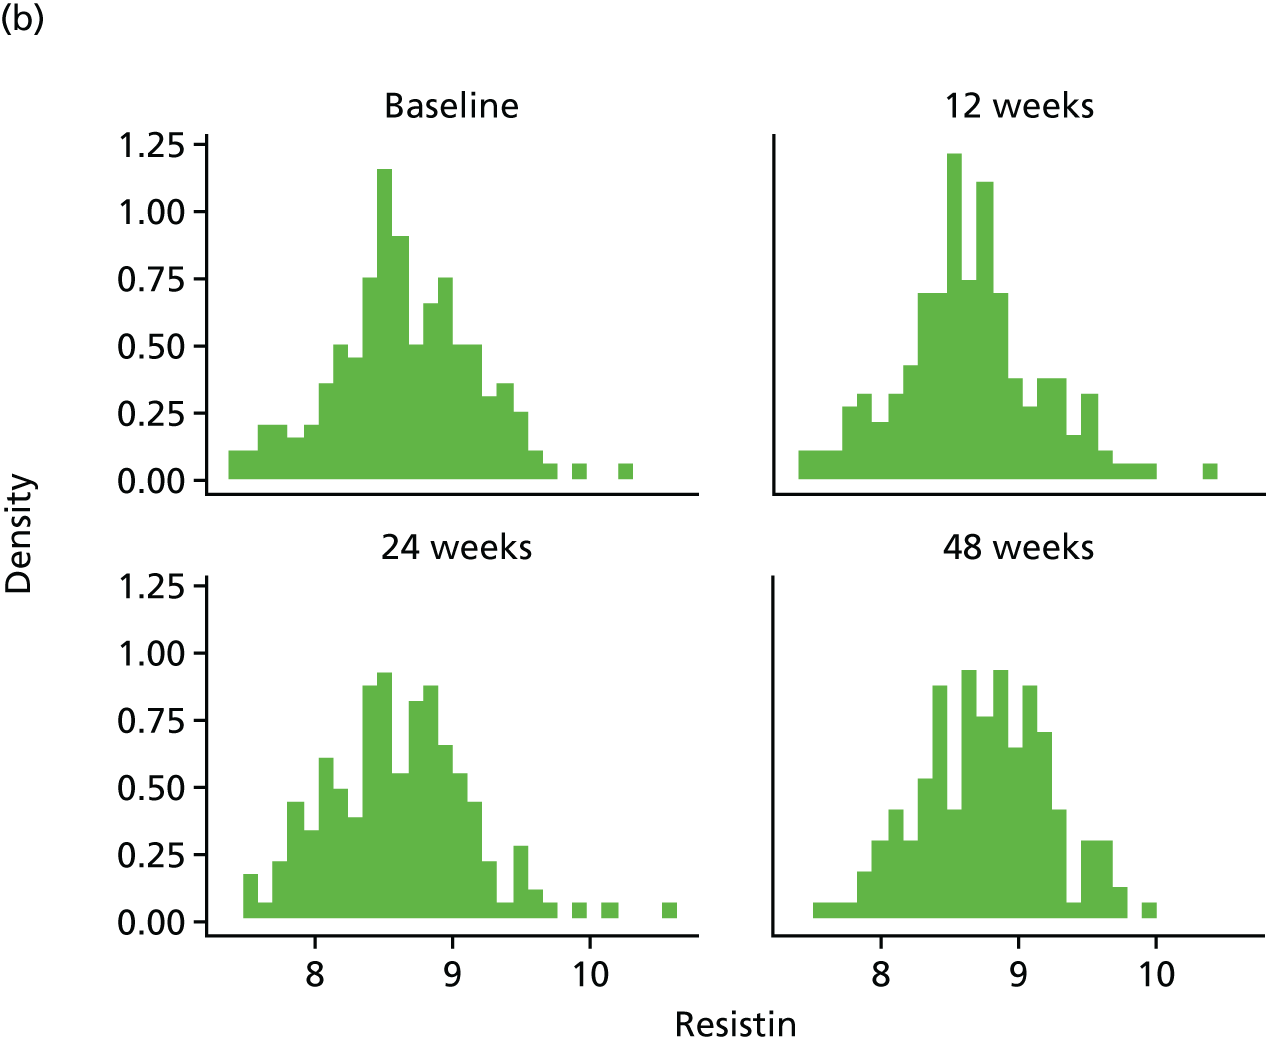
FIGURE 37.
Resistin mean profiles by treatment arm (original scale). (a) Resistin profile plots; (b) resistin profile plots by dropout; and (c) resistin reverse-time profile plots.
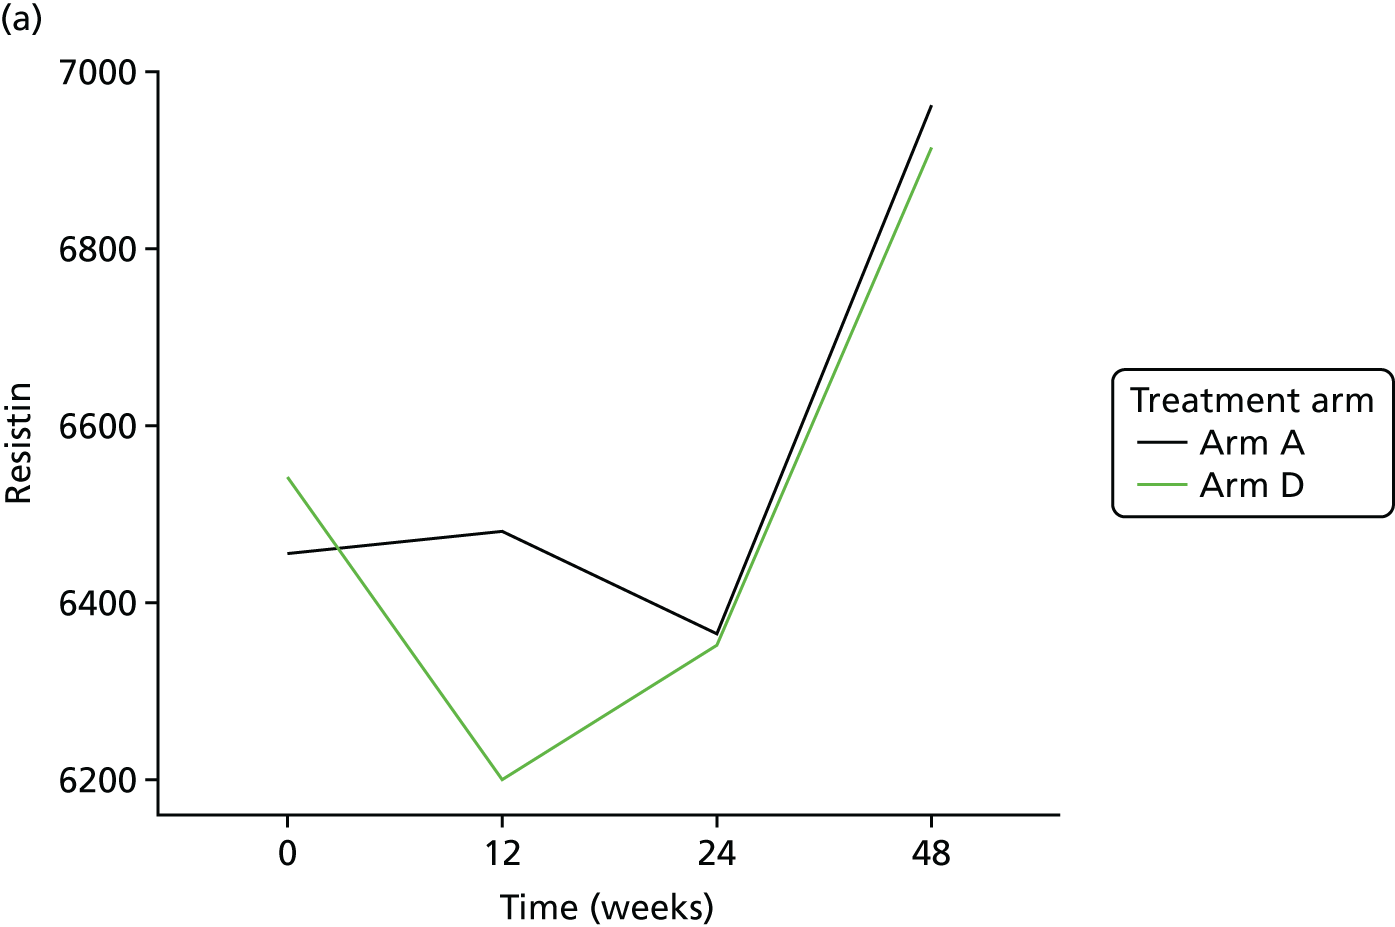
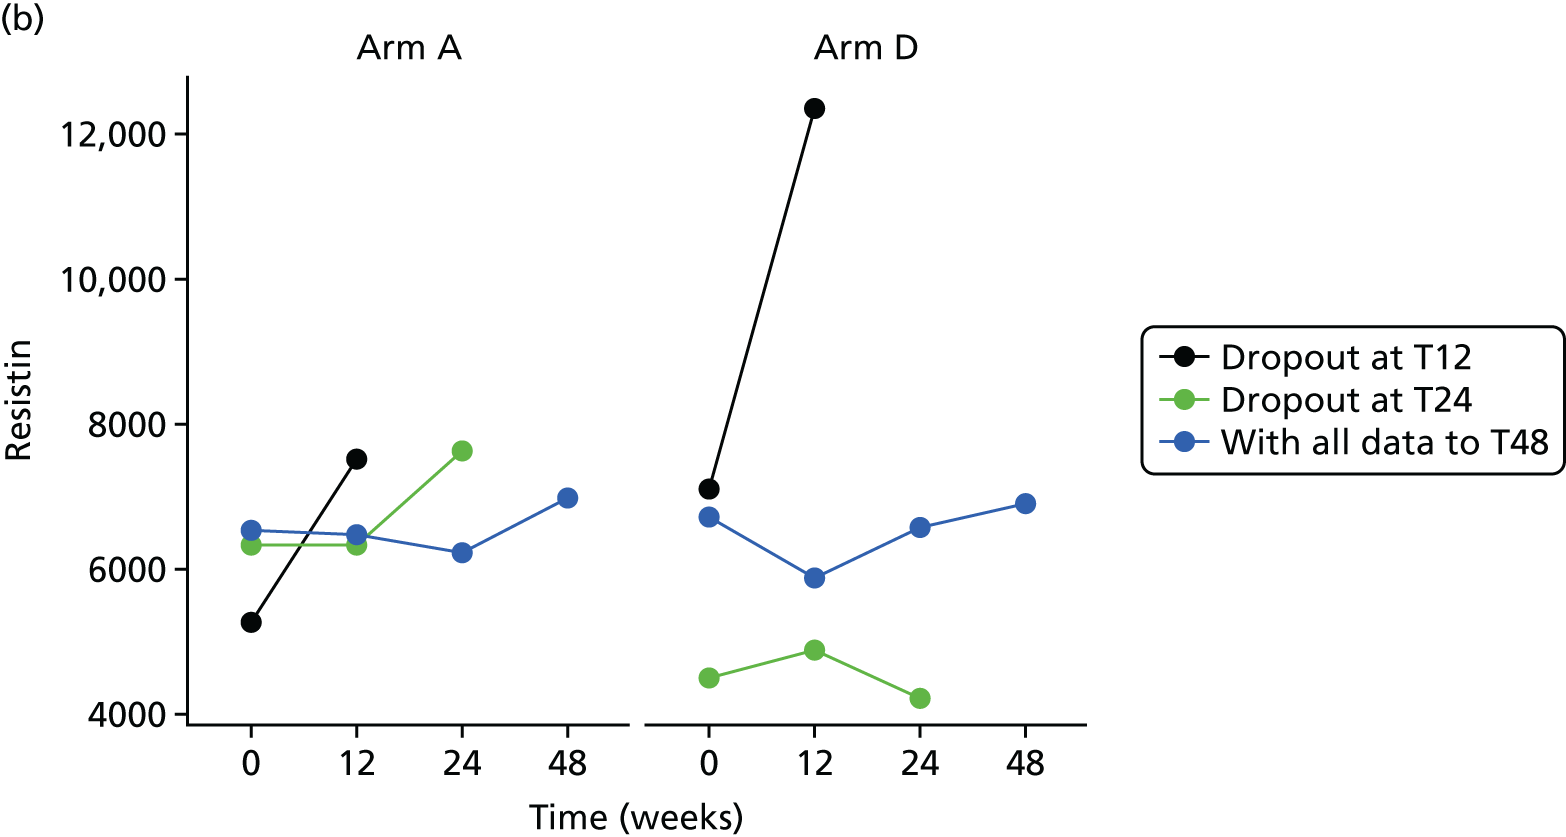

The bivariate joint model included 326 patients and 841 records. Resistin scores were fitted in log-transformed scale for normality.
| Component | Parameter | Estimate | 95% CI | p-value |
|---|---|---|---|---|
| Longitudinal marker | Intercept | 3.449 | 2.786 to 4.112 | < 0.0001 |
| Time | 0.004 | 0.002 to 0.005 | < 0.0001 | |
| Baseline marker | 0.591 | 0.518 to 0.665 | < 0.0001 | |
| Treatment B vs. A | –0.021 | –0.133 to 0.091 | 0.7126 | |
| Treatment C vs. A | –0.020 | –0.131 to 0.091 | 0.7211 | |
| Treatment D vs. A | –0.066 | –0.171 to 0.039 | 0.2201 | |
| Ethnicity | 0.038 | –0.066 to 0.143 | 0.4699 | |
| Longitudinal weight | Intercept | 0.265 | –1.993 to 2.522 | 0.8182 |
| Time | 0.021 | –0.003 to 0.045 | 0.0877 | |
| Baseline weight | 0.994 | 0.972 to 1.016 | < 0.0001 | |
| Treatment B vs. A | 0.436 | –0.620 to 1.493 | 0.4180 | |
| Treatment C vs. A | 0.699 | –0.394 to 1.793 | 0.2101 | |
| Treatment D vs. A | 0.076 | –0.919 to 1.070 | 0.8816 | |
| Ethnicity | –0.054 | –0.907 to 0.799 | 0.9009 | |
| Dropout | Treatment B vs. A | 0.174 | –0.750 to 1.098 | 0.7125 |
| Treatment C vs. A | 0.145 | –0.798 to 1.087 | 0.7636 | |
| Treatment D vs. A | 0.263 | –0.608 to 1.134 | 0.5545 | |
| Ethnicity | –0.192 | –1.075 to 0.691 | 0.6701 | |
| Association parameters | Marker | 0.710 | –0.679 to 2.099 | 0.3163 |
| Weight | –0.052 | –0.251 to 0.148 | 0.6119 |
The treatment effect [arm D (80 mg) compared with arm A (control)] on the longitudinal log-resistin is –0.066 (95% CI –0.171 to 0.039), implying that there is no significant difference between the treatments on resistin.
High-sensitivity C-reactive protein
Histograms to check normality for high-sensitivity C-reactive protein
FIGURE 38.
Normality of hs-CRP (a) original scale; and (b) log-transformed.

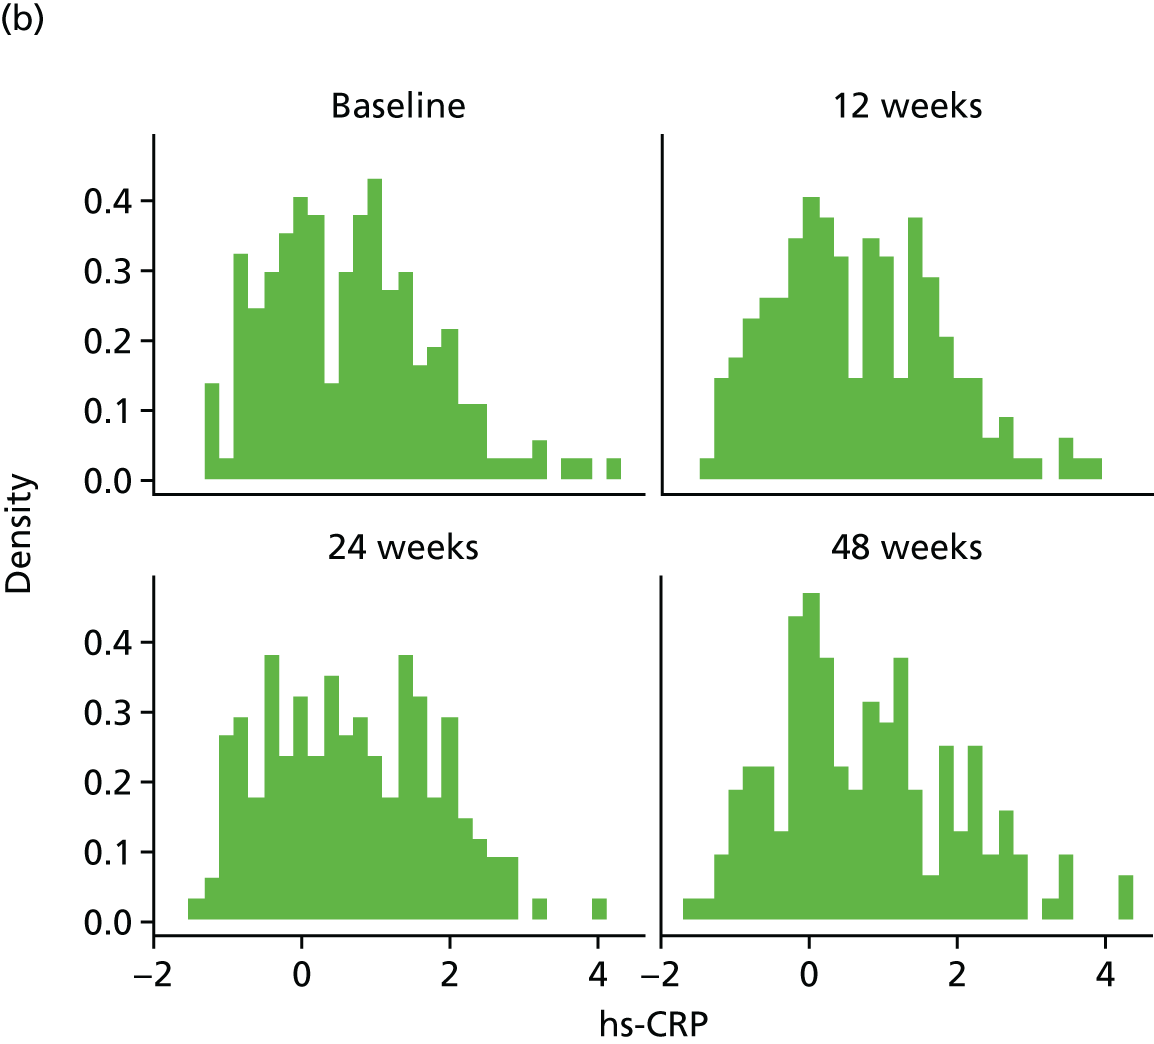
FIGURE 39.
hs-CRP mean profiles by treatment arm (original scale). (a) hs-CRP profile plots; (b) hs-CRP profile plots by dropout; and (c) hs-CRP reverse-time profile plots.

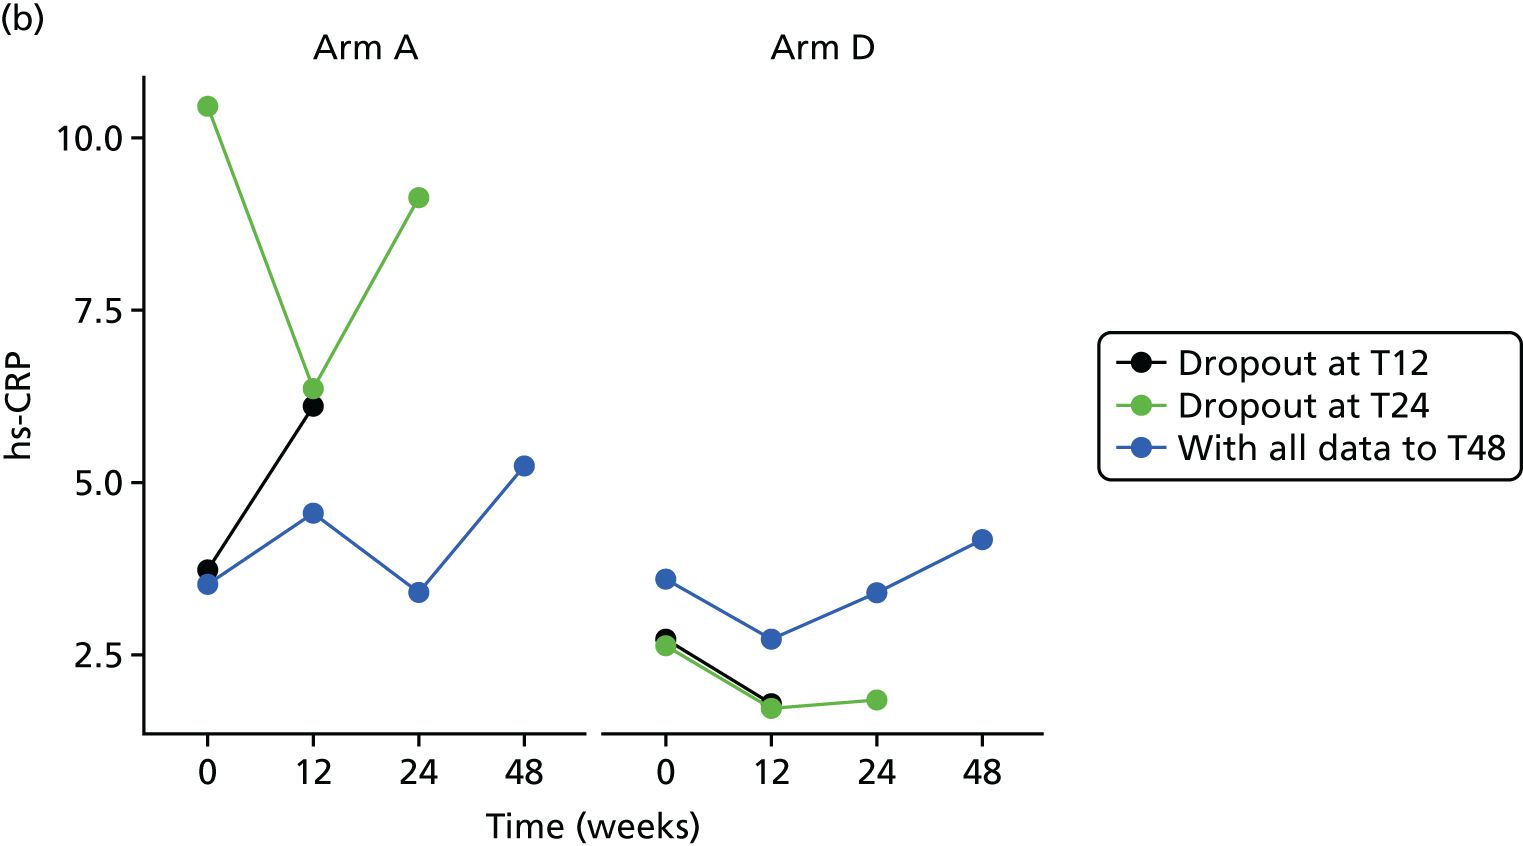

The bivariate joint model included 328 patients and 845 records. The hs-CRP scores were fitted in log-transformed scale for normality.
| Component | Parameter | Estimate | 95% CI | p-value |
|---|---|---|---|---|
| Longitudinal marker | Intercept | 0.582 | 0.293 to 0.871 | 0.0001 |
| Time | 0.001 | –0.003 to 0.006 | 0.6069 | |
| Baseline marker | 0.612 | 0.527 to 0.697 | < 0.0001 | |
| Treatment B vs. A | –0.207 | –0.444 to 0.030 | 0.0867 | |
| Treatment C vs. A | –0.204 | –0.443 to 0.036 | 0.0953 | |
| Treatment D vs. A | –0.222 | –0.433 to –0.011 | 0.0388 | |
| Ethnicity | –0.278 | –0.501 to –0.056 | 0.0141 | |
| Longitudinal weight | Intercept | 0.378 | –2.039 to 2.795 | 0.7593 |
| Time | 0.020 | –0.004 to 0.045 | 0.1074 | |
| Baseline weight | 0.993 | 0.969 to 1.016 | < 0.0001 | |
| Treatment B vs. A | 0.489 | –0.571 to 1.549 | 0.3656 | |
| Treatment C vs. A | 0.728 | –0.419 to 1.875 | 0.2135 | |
| Treatment D vs. A | 0.091 | –0.921 to 1.103 | 0.8599 | |
| Ethnicity | –0.095 | –0.972 to 0.782 | 0.8317 | |
| Dropout | Treatment B vs. A | 0.086 | –0.866 to 1.038 | 0.8592 |
| Treatment C vs. A | 0.046 | –0.931 to 1.024 | 0.9257 | |
| Treatment D vs. A | 0.321 | –0.579 to 1.222 | 0.4841 | |
| Ethnicity | –0.213 | –1.014 to 0.588 | 0.6017 | |
| Association parameters | Marker | 0.248 | –0.732 to 1.228 | 0.6197 |
| Weight | –0.046 | –0.234 to 0.142 | 0.6328 |
The treatment effect [arm D (80 mg) compared with arm A (control)] on the longitudinal log-hs-CRP is statistically significant with an estimated effect of –0.222 (95% CI –0.433 to –0.011), implying that hs-CRP is significantly lower among those patients randomised to arm D (80 mg).
Substudies
Magnetic resonance imaging
| Summary statistic | Time point | |||||||
|---|---|---|---|---|---|---|---|---|
| Baseline | 24 weeks | |||||||
| Arm A (control) | Arm B (20 mg) | Arm C (40 mg) | Arm D (80 mg) | Arm A (control) | Arm B (20 mg) | Arm C (40 mg) | Arm D (80 mg) | |
| Internal visceral fat (dm3) | ||||||||
| Number (%) | 8 (61.5) | 7 (70.0) | 6 (60.0) | 8 (80.0) | 8 (61.5) | 7 (70.0) | 5 (50.0) | 8 (80.0) |
| Mean (SD); min.–max. | 3.5 (1.1); 1.6–5.1 | 5.15 (2.20); 2.60–8.33 | 3.58 (2.70); 1.78–8.79 | 4.10 (2.71); 0.70–8.04 | 3.74 (1.43); 1.62–5.69 | 5.18 (2.67); 1.93–9.55 | 4.42 (2.06); 2.54–7.04 | 4.74 (2.59); 0.69–8.98 |
| Median (IQR) | 3.3 (2.8–4.2) | 5.4 (2.8–7.2) | 2.3 (2.0–4.2) | 3.6 (1.6–5.6) | 3.3 (2.9–4.7) | 4.9 (2.5–7.5) | 3.3 (2.9–6.2) | 4.6 (2.4–5.8) |
| Missing (%) | 5 (38.5) | 3 (30.0) | 4 (40.0) | 2 (20.0) | 5 (38.5) | 3 (30.0) | 5 (50.0) | 2 (20.0) |
| Intrahepatic triglyceride content | ||||||||
| Number (%) | 12 (92.3) | 10 (100.0) | 8 (80.0) | 10 (100.0) | 8 (62.0) | 7 (70.0) | 4 (40.0) | 8 (80.0) |
| Mean (SD); min.–max. | 8.2 (18.2); 0.4–64.8 | 6.7 (10.4); 0.4–30.7 | 1.9 (2.1); 0.3–6.4 | 2.2 (4.8); 0.1–14.0 | 3.0 (4.1); 0.1–12.8 | 7.3 (10.1); 0.2–25.1 | 1.2 (0.5); 0.7–1.7 | 1.6 (2.7); 0.3–6.9 |
| Median (IQR) | 1.7 (0.6–3.0) | 1.6 (0.4–8.4) | 1.2 (0.4–2.0) | 1.0 (0.6–1.5) | 1.8 (0.8–2.4) | 2.5 (0.4–18.3) | 1.3 (0.7–1.5) | 0.6 (0.3–1.3) |
| Missing (%) | 1 (7.7) | 0 (0.0) | 2 (20.0) | 0 (0.0) | 5 (38.0) | 3 (30.0) | 6 (60.0) | 2 (20.0) |
| Intramyocellular triglyceride content (soleus) | ||||||||
| Number (%) | 12 (92.3) | 10 (100.0) | 8 (80.0) | 10 (100.0) | 8 (62.0) | 7 (70.0) | 4 (40.0) | 8 (80.0) |
| Mean (SD); min.–max. | 19.5 (10.8); 6.2–41.8 | 19.0 (17.8); 6.1–65.1 | 12.6 (5.8); 5.0–22.4 | 17.3 (11.8); 7.4–44.5 | 19.5 (13.3); 5.2–40.0 | 17.1 (9.2); 7.7–33.7 | 22.2 (21.0); 4.8–51.9 | 16.6 (9.0); 8.2–33.6 |
| Median (IQR) | 17.8 (11.1–23.2) | 12.4 (6.8–25.6) | 11.8 (7.2–15.2) | 13.7 (9.2–21.1) | 16.7 (5.3–21.6) | 15.8 (7.8–21.5) | 16.1 (4.8–21.8) | 14.5 (8.2–17.5) |
| Missing (%) | 1 (7.7) | 0 (0.0) | 2 (20.0) | 0 (0.0) | 5 (38.0) | 3 (30.0) | 6 (60.0) | 2 (20.0) |
| Intramyocellular triglyceride content (tibialis anterior) | ||||||||
| Number (%) | 11 (84.6) | 10 (100.0) | 8 (80.0) | 9 (90.0) | 8 (62.0) | 7 (70.0) | 4 (40.0) | 8 (80.0) |
| Mean (SD); min.–max. | 6.3 (3.1); 0.0–11.0 | 8.1 (3.7); 1.4–13.9 | 5.3 (2.1); 3.0–9.6 | 7.8 (2.8); 3.0–11.0 | 8.1 (5.0); 2.6–18.6 | 10.2 (6.3); 2.5–17.7 | 5.1 (1.4); 3.8–6.6 | 7.4 (2.7); 3.4–11.2 |
| Median (IQR) | 5.9 (4.9–9.1) | 8.6 (5.9–10.5) | 4.9 (3.6–5.4) | 7.7 (7.3–9.7) | 7.4 (3.5–8.4) | 9.8 (2.8–17.6) | 4.9 (3.8–5.8) | 7.8 (3.9–8.8) |
| Missing (%) | 2 (15.4) | 0 (0.0) | 2 (20.0) | 1 (10.0) | 5 (38.0) | 3 (30.0) | 6 (60.0) | 2 (20.0) |
| Summary statistic | Time point | |||||||
|---|---|---|---|---|---|---|---|---|
| Baseline | 24 weeks | |||||||
| Arm A (control) | Arm B (20 mg) | Arm C (40 mg) | Arm D (80 mg) | Arm A (control) | Arm B (20 mg) | Arm C (40 mg) | Arm D (80 mg) | |
| External abdominal fat (dm3) | ||||||||
| Number (%) | 8 (61.5) | 7 (70.0) | 6 (60.0) | 8 (80.0) | 8 (61.5) | 7 (70.0) | 5 (50.0) | 8 (80.0) |
| Mean (SD); min.–max. | 5.0 (3.6); 1.7–12.2 | 6.4 (3.1); 2.6–10.9 | 4.1 (2.3); 1.3–6.7 | 3.4 (1.8); 0.8–6.7 | 5.1 (3.6); 1.2–12.1 | 6.7 (3.5); 2.2–11.1 | 5.06 (2.3); 1.8–7.5 | 3.8 (2.2); 0.8–8.0 |
| Median (IQR) | 3.8 (1.9–6.8) | 6.1 (2.6–8.8) | 4.7 (1.5–5.9) | 3.2 (2.4–3.6) | 3.8 (2.0–7.1) | 7.4 (2.4–9.1) | 5.0 (4.3–6.8) | 3.2 (2.9–3.8) |
| Missing (%) | 5 (38.5) | 3 (30.0) | 4 (40.0) | 2 (20.0) | 5 (38.5) | 3 (30.0) | 5 (50.0) | 2 (20.0) |
| Total internal fat (dm3) | ||||||||
| Number (%) | 8 (61.5) | 7 (70.0) | 6 (60.0) | 8 (80.0) | 8 (61.5) | 7 (70.0) | 5 (50.0) | 8 (80.0) |
| Mean (SD); min.–max. | 6.1 (1.6); 3.1–7.5 | 8.3 (2.7); 5.4–12.1 | 6.1 (3.7); 3.6–13.4 | 6.8 (4.1); 2.5–12.5 | 6.5 (1.9); 3.2–8.8 | 8.5 (3.2); 5.5–13.9 | 7.1 (2.5); 4.7–9.9 | 7.9 (3.3); 2.9–12.7 |
| Median (IQR) | 6.8 (4.7–7.0) | 8.7 (5.8–10.8) | 4.7 (3.9–6.3) | 6.0 (3.0–9.4) | 6.3 (5.0–7.9) | 7.5 (5.6–11.9) | 6.7 (4.9–9.5) | 7.8 (5.0–9.3) |
| Missing (%) | 5 (38.5) | 3 (30.0) | 4 (40.0) | 2 (20.0) | 5 (38.5) | 3 (30.0) | 5 (50.0) | 2 (20.0) |
| Total external fat (dm3) | ||||||||
| Number (%) | 8 (61.5) | 7 (70.0) | 6 (60.0) | 8 (80.0) | 8 (61.5) | 7 (70.0) | 5 (50.0) | 8 (80.0) |
| Mean (SD); min.–max. | 18.1 (11.0); 8.1–41.1 | 20.4 (7.3); 9.7–30.3 | 13.3 (5.4); 5.6–17.6 | 12.2 (5.4); 5.0–22.8 | 18.3 (11.1); 6.5–40.0 | 20.9 (8.3); 8.7–32.3 | 16.4 (5.4); 7.6–20.9 | 13.3 (5.1); 5.5–22.4 |
| Median (IQR) | 15.0 (9.0–20.8) | 22.3 (11.4–24.4) | 16.0 (7.2–17.5) | 12.0 (7.3–12.8) | 14.9 (9.4–22.1) | 22.7 (12.1–27.8) | 16.9 (16.1–20.4) | 12.6 (9.4–14.9) |
| Missing (%) | 5 (38.5) | 3 (30.0) | 4 (40.0) | 2 (20.0) | 5 (38.5) | 3 (30.0) | 5 (50.0) | 2 (20.0) |
| Total body fat (dm3) | ||||||||
| Number (%) | 8 (61.5) | 7 (70.0) | 6 (60.0) | 8 (80.0) | 8 (61.5) | 7 (70.0) | 5 (50.0) | 8 (80.0) |
| Mean (SD); min.–max. | 24.2 (11.5); 11.2–47.7 | 28.6 (9.5); 15.5–41.2 | 19.4 (7.4); 9.5–29.5 | 19.0 (8.4); 7.5–32.1 | 24.8 (11.6); 9.6–45.9 | 20.4 (11.2); 14.1–44.2 | 23.5 (5.9); 14.3–29.9 | 21.1 (7.6); 8.1–31.7 |
| Median (IQR) | 21.5 (15.9–25.5) | 31.0 (16.8–36.4) | 20.6 (12.4–23.9) | 19.8 (10.4–24.3) | 22.2 (16.0–27.0) | 30.1 (17.6–41.7) | 25.8 (21.7–25.9) | 21.5 (15.3–25.8) |
| Missing (%) | 5 (38.5) | 3 (30.0) | 4 (40.0) | 2 (20.0) | 5 (38.5) | 3 (30.0) | 5 (50.0) | 2 (20.0) |
| Variable | Parameter estimate | Standard error | 95% CI | p-value |
|---|---|---|---|---|
| Intercept (in dm3) | 0.129 | 0.333 | –0.604 to 0.861 | 0.7063 |
| Baseline value of internal visceral fat (in dm3) | 1.010 | 0.073 | 0.849 to 1.170 | < 0.0001 |
| Relative change in total external fat | 4.161 | 1.423 | 1.029 to 7.293 | 0.0138 |
| Change in weight (kg) | –0.034 | 0.063 | –0.173 to 0.104 | 0.5941 |
| Treatment arm D vs. control | 0.038 | 0.287 | –0.593 to 0.670 | 0.8961 |
| Variable | Parameter estimate | Standard error | 95% CI | p-value |
|---|---|---|---|---|
| Intercept | 1.359 | 0.375 | 0.542 to 2.177 | 0.0035 |
| Baseline value of intrahepatic triglyceride content in liver | 0.722 | 0.059 | 0.594 to 0.850 | < 0.0001 |
| Change in weight (kg) | 0.365 | 0.102 | 0.141 to 0.588 | 0.0039 |
| Treatment arm D vs. control | –1.714 | 0.492 | –2.787 to –0.642 | 0.0045 |
| Variable | Intercept | Baseline value | Change in weight (kg) | Treatment D vs. control |
|---|---|---|---|---|
| Soleus and tibialis anteriora | ||||
| Approximately F | 170.465 | 4.459 | 0.565 | 0.213 |
| Numerator df | 2 | 4 | 2 | 2 |
| Denominator df | 9 | 20 | 9 | 9 |
| p-value | < 0.0001 | 0.0097 | 0.5873 | 0.8123 |
| Soleusb | ||||
| Parameter estimate | 2.222 | 0.902 | –0.496 | –2.567 |
| Standard error | 3.589 | 0.143 | 0.724 | 2.559 |
| 95% CI | –5.677 to 10.121 | 0.587 to 1.216 | –2.089 to 1.097 | –8.200 to 3.066 |
| p-value | 0.5480 | < 0.0001 | 0.5070 | 0.3370 |
| Tibialis anteriorb | ||||
| Parameter estimate | 9.882 | –0.243 | –0.060 | –0.479 |
| Standard error | 3.087 | 0.420 | 0.522 | 2.472 |
| 95% CI | 0.3087 to 16.678 | –1.168 to 0.682 | –1.089 to 1.210 | –5.919 to 4.961 |
| p-value | 0.0080 | 0.5750 | 0.9100 | 0.8499 |
Urinary biomarkers
Neutrophil gelatinase-associated lipocalin
FIGURE 40.
Longitudinal NGAL mean profiles for arm A (control) and arm D (80 mg) over tertile subgroups. (a) NGAL < 2.28 at baseline; (b) NGAL > 2.28 and < 10.51 at baseline; and (c) NGAL > 10.51 at baseline.
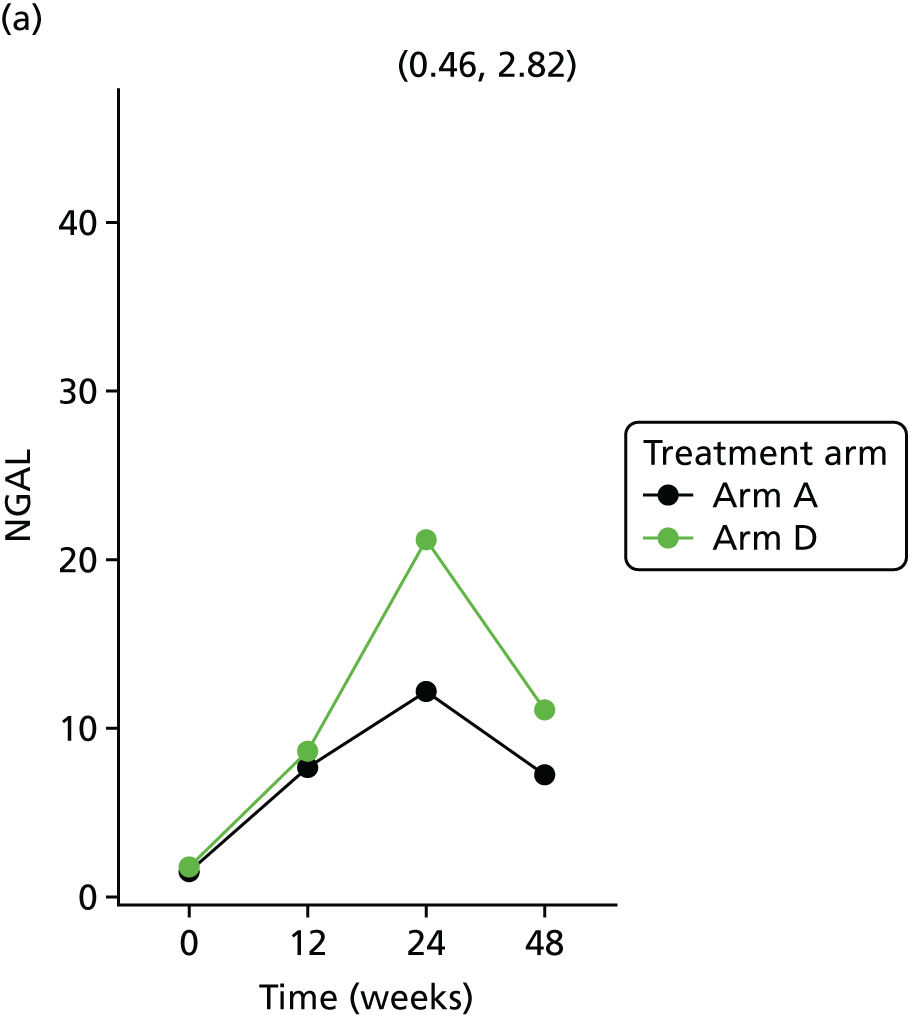


| Variable | Tertile | |||||||||||
|---|---|---|---|---|---|---|---|---|---|---|---|---|
| First | Second | Third | ||||||||||
| Parameter | SE | 95% CI | p-value | Parameter | SE | 95% CI | p-value | Parameter | SE | 95% CI | p-value | |
| Intercept | 2.271 | 0.469 | 1.345 to 3.197 | < 0.0001 | 0.180 | 0.691 | –1.184 to 1.543 | 0.7952 | 1.192 | 0.759 | –0.309 to 2.693 | 0.1186 |
| Time | 0.005 | 0.004 | –0.003 to 0.013 | 0.2545 | 0.006 | 0.004 | –0.003 to 0.015 | 0.1854 | 0.003 | 0.004 | –0.006 to 0.012 | 0.4670 |
| Baseline NGAL | 0.562 | 0.183 | 0.198 to 0.926 | 0.0028 | 0.480 | 0.227 | 0.031 to 0.930 | 0.0366 | 0.417 | 0.137 | 0.1460 to 0.688 | 0.0030 |
| Age | –0.015 | 0.009 | –0.032 to 0.002 | 0.0873 | 0.011 | 0.010 | –0.008 to 0.030 | 0.2635 | –0.002 | 0.010 | –0.022 to 0.018 | 0.8741 |
| Ethnicity | –0.057 | 0.249 | –0.551 to 0.437 | 0.8194 | 0.094 | 0.275 | –0.452 to 0.640 | 0.7336 | –0.232 | 0.303 | –0.833 to 0.368 | 0.4448 |
| Sex (male) | –0.500 | 0.250 | –0.997 to –0.004 | 0.0483 | 0.097 | 0.294 | –0.486 to 0.681 | 0.7413 | 0.048 | 0.307 | –0.562 to 0.657 | 0.8772 |
| Treatment B vs. A | –0.511 | 0.224 | –0.955 to –0.067 | 0.0247 | 0.075 | 0.234 | –0.390 to 0.540 | 0.7490 | –0.028 | 0.281 | –0.585 to 0.528 | 0.9195 |
| Treatment C vs. A | –0.300 | 0.240 | –0.776 to 0.175 | 0.2133 | –0.563 | 0.262 | –1.084 to –0.043 | 0.0343 | 0.080 | 0.291 | –0.498 to 0.658 | 0.7846 |
| Treatment D vs. A | –0.215 | 0.207 | –0.627 to 0.196 | 0.3018 | –0.065 | 0.225 | –0.512 to 0.382 | 0.7733 | –0.347 | 0.275 | –0.893 to 0.198 | 0.2093 |
Albumin-to-creatinine ratio
FIGURE 41.
Longitudinal ACR mean profiles for arm A (control) and arm D (80 mg) over threshold subgroups. Note: the profile shown in ACR > 30 includes a single patient. (a) ACR < 3 mg/mmol at baseline; (b) ACR between 3 and 30 mg/mmol at baseline; and (c) ACR > 30 mg/mmol at baseline.
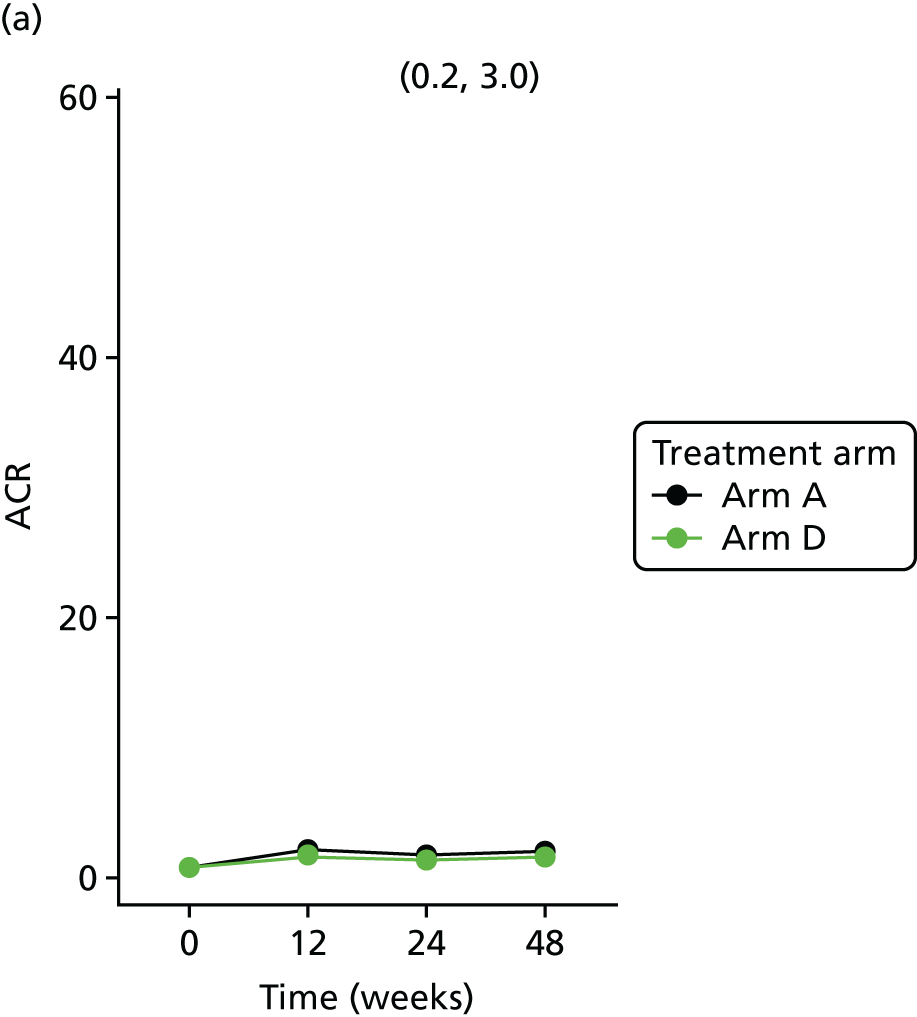
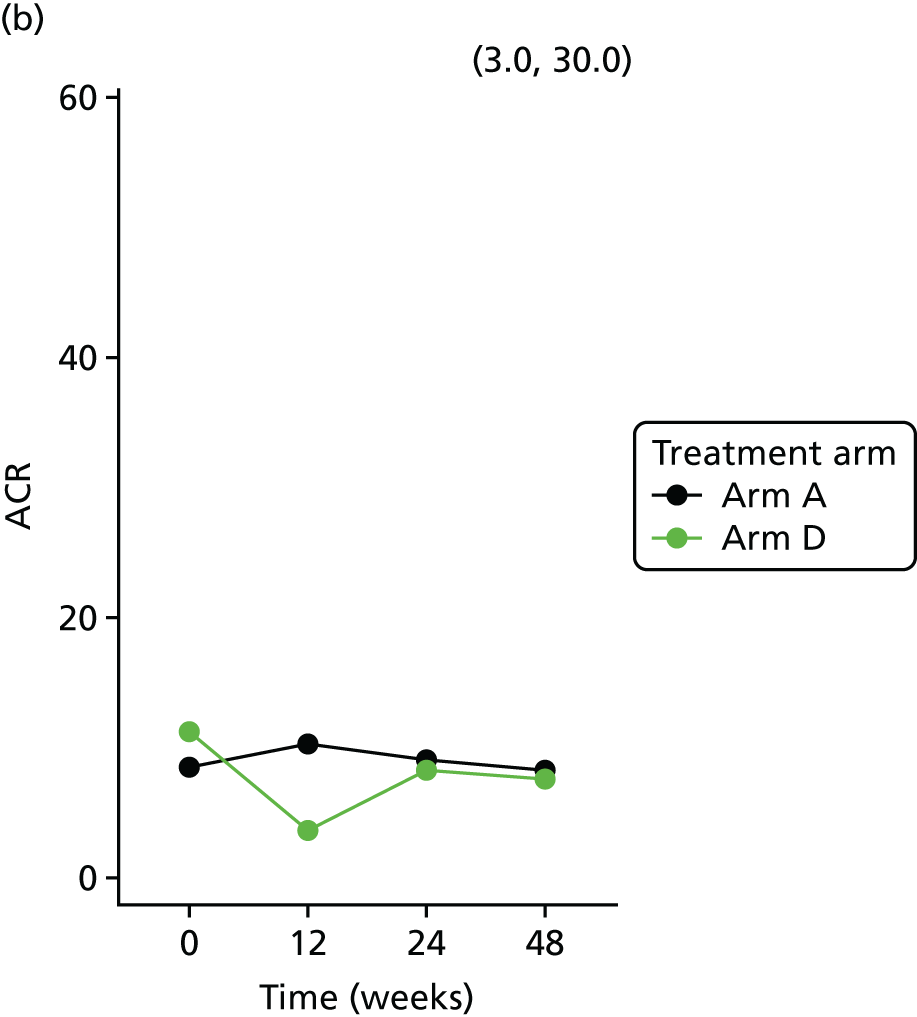
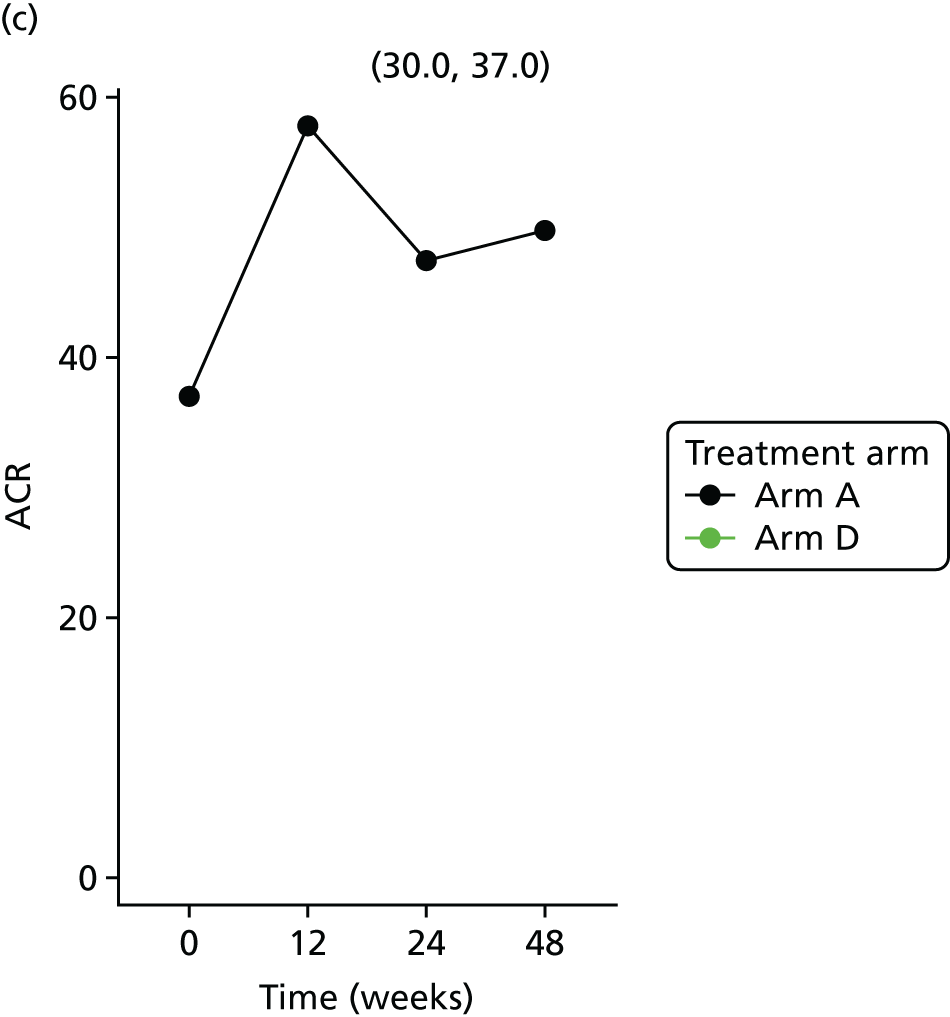
| Variable | ACR | |||||||
|---|---|---|---|---|---|---|---|---|
| < 3 | ≥ 3 | |||||||
| Parameter | SE | 95% CI | p-value | Parameter | SE | 95% CI | p-value | |
| Intercept | 0.336 | 0.668 | –0.999 to 1.672 | 0.6166 | –1.779 | 0.908 | –3.638 to 0.081 | 0.0601 |
| Time | 0.002 | 0.004 | –0.005 to 0.009 | 0.5727 | 0.007 | 0.007 | –0.006 to 0.021 | 0.2882 |
| Baseline ACR | 0.564 | 0.131 | 0.301 to 0.826 | 0.0001 | 0.877 | 0.221 | 0.406 to 1.347 | 0.0012 |
| Age | –0.007 | 0.013 | –0.032 to 0.018 | 0.5804 | 0.014 | 0.015 | –0.018 to 0.046 | 0.3696 |
| Ethnicity | 0.182 | 0.245 | –0.308 to 0.672 | 0.4616 | 1.159 | 0.403 | 0.300 to 2.019 | 0.0116 |
| Treatment B vs. A | –0.320 | 0.223 | –0.766 to 0.126 | 0.1567 | –0.903 | 0.382 | –1.718 to –0.088 | 0.0321 |
| Treatment C vs. A | –0.111 | 0.258 | –0.626 to 0.404 | 0.6676 | 0.643 | 0.480 | –0.381 to 1.667 | 0.2008 |
| Treatment D vs. A | –0.074 | 0.253 | –0.578 to 0.431 | 0.7715 | –0.665 | 0.303 | –1.310 to –0.019 | 0.0443 |
FIGURE 42.
Scatterplots showing the correlation between NGAL and ACR at baseline and follow-up time points. (a) All pairs; and (b) ACR 3–30.
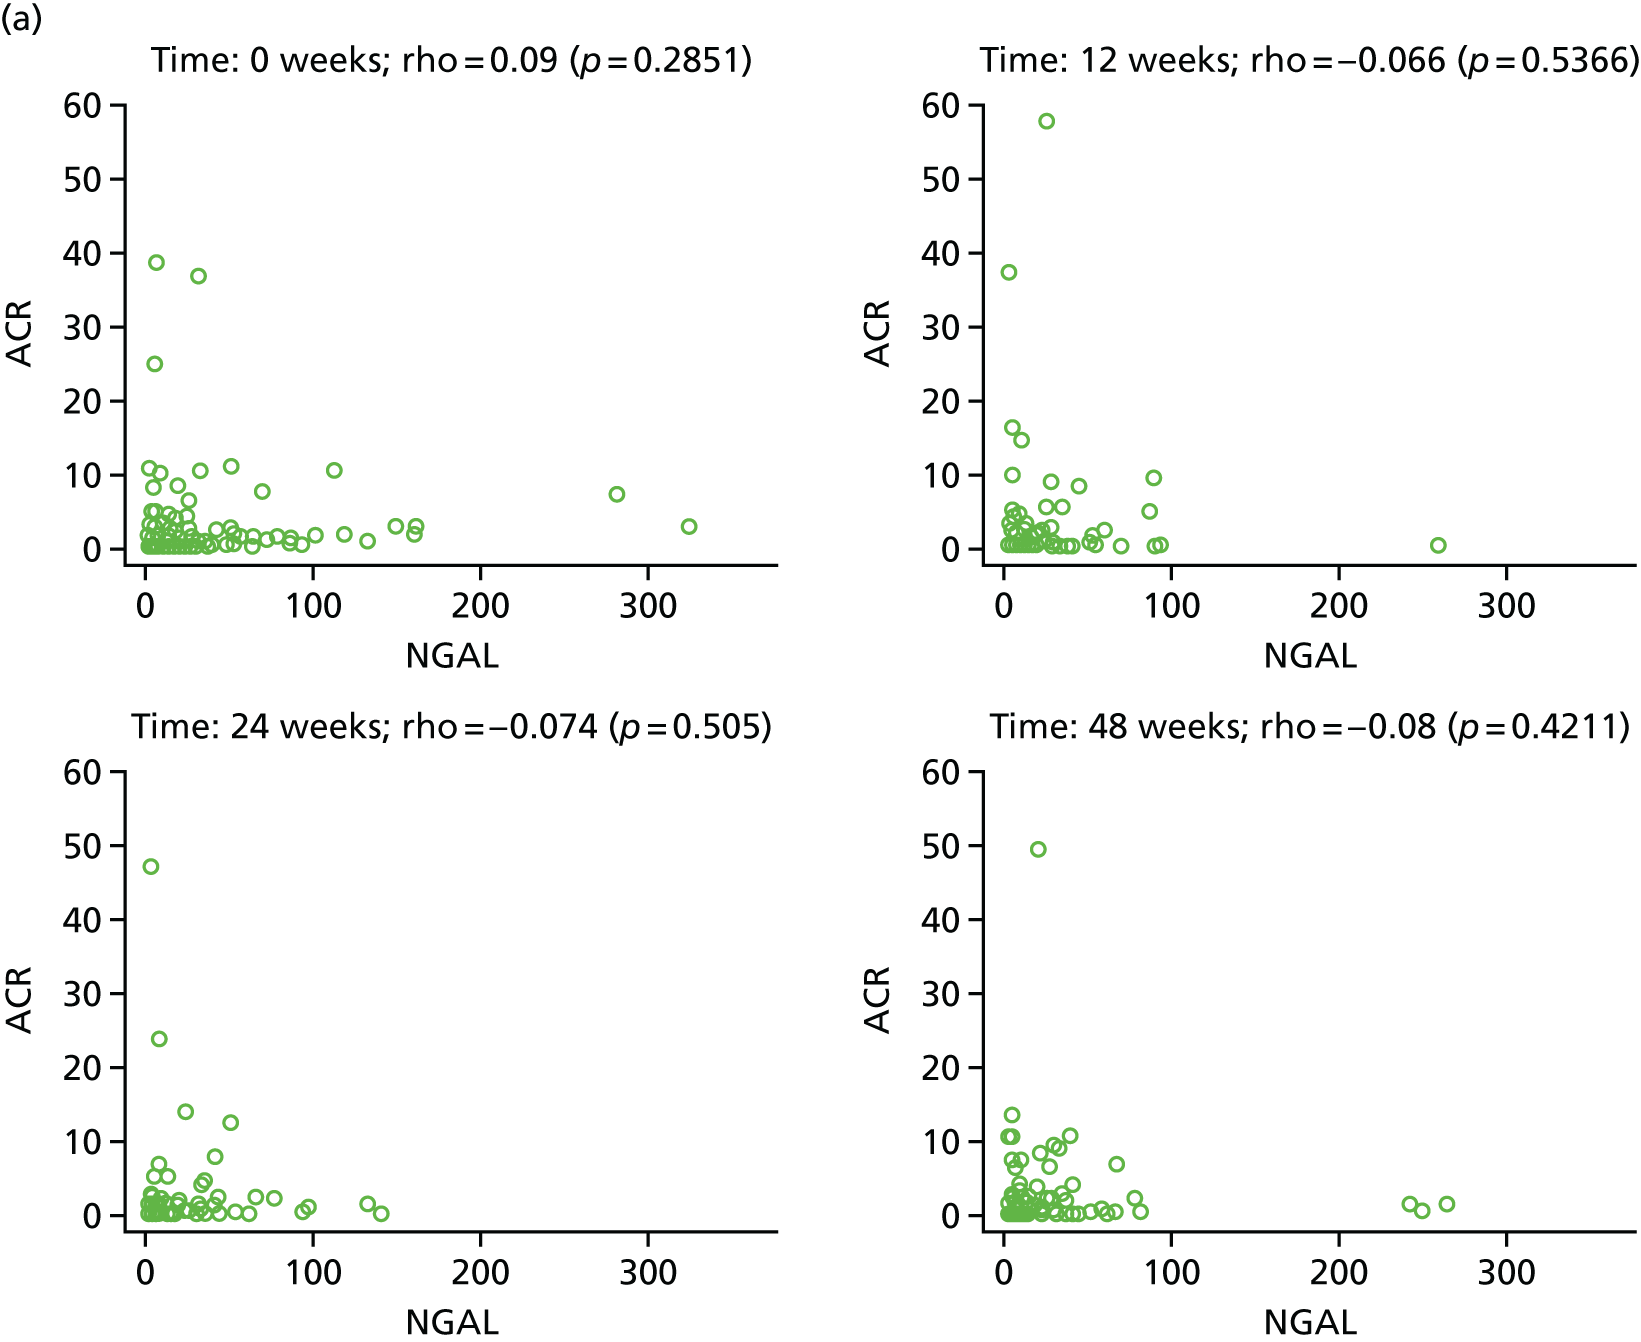

Safety data analysis
Adverse drug reactions by severity
The number of ARs and the number and percentage of patients affected in each category by treatment arm and by severity are provided in Table 58. For each patient, only the maximum severity experienced for each type of AR will be displayed.
| AR | Severity | Treatment arm | Total randomised (n = 377) | ||||||||||
|---|---|---|---|---|---|---|---|---|---|---|---|---|---|
| Arm B (20 mg) (N = 84) | Arm C (40 mg) (N = 82) | Arm D (80 mg) (N = 106) | |||||||||||
| Number of events | Number of patients | Percentage of patients | Number of events | Number of patients | Percentage of patients | Number of events | Number of patients | Percentage of patients | Number of events | Number of patients | Percentage of patients | ||
| Abdominal distension | Mild | 0 | 0 | 0.0 | 2 | 2 | 2.4 | 1 | 1 | 0.9 | 3 | 3 | 0.8 |
| Moderate | 0 | 0 | 0.0 | 1 | 1 | 1.2 | 0 | 0 | 0.0 | 1 | 1 | 0.3 | |
| Severe | 0 | 0 | 0.0 | 0 | 0 | 0.0 | 0 | 0 | 0.0 | 0 | 0 | 0.0 | |
| Abdominal pain upper | Mild | 0 | 0 | 0.0 | 0 | 0 | 0.0 | 0 | 0 | 0.0 | 0 | 0 | 0.0 |
| Moderate | 0 | 0 | 0.0 | 0 | 0 | 0.0 | 1 | 1 | 0.9 | 1 | 1 | 0.3 | |
| Severe | 0 | 0 | 0.0 | 0 | 0 | 0.0 | 0 | 0 | 0.0 | 0 | 0 | 0.0 | |
| Acute sinusitis | Mild | 0 | 0 | 0.0 | 1 | 1 | 1.2 | 0 | 0 | 0.0 | 1 | 1 | 0.3 |
| Moderate | 0 | 0 | 0.0 | 0 | 0 | 0.0 | 0 | 0 | 0.0 | 0 | 0 | 0.0 | |
| Severe | 0 | 0 | 0.0 | 0 | 0 | 0.0 | 0 | 0 | 0.0 | 0 | 0 | 0.0 | |
| Ageusia | Mild | 1 | 1 | 1.2 | 0 | 0 | 0.0 | 0 | 0 | 0.0 | 1 | 1 | 0.3 |
| Moderate | 0 | 0 | 0.0 | 0 | 0 | 0.0 | 0 | 0 | 0.0 | 0 | 0 | 0.0 | |
| Severe | 0 | 0 | 0.0 | 0 | 0 | 0.0 | 0 | 0 | 0.0 | 0 | 0 | 0.0 | |
| Amnesia | Mild | 0 | 0 | 0.0 | 0 | 0 | 0.0 | 0 | 0 | 0.0 | 0 | 0 | 0.0 |
| Moderate | 0 | 0 | 0.0 | 0 | 0 | 0.0 | 1 | 1 | 0.9 | 1 | 1 | 0.3 | |
| Severe | 0 | 0 | 0.0 | 0 | 0 | 0.0 | 0 | 0 | 0.0 | 0 | 0 | 0.0 | |
| Angioedema | Mild | 1 | 1 | 1.2 | 0 | 0 | 0.0 | 0 | 0 | 0.0 | 1 | 1 | 0.3 |
| Moderate | 0 | 0 | 0.0 | 0 | 0 | 0.0 | 0 | 0 | 0.0 | 0 | 0 | 0.0 | |
| Severe | 0 | 0 | 0.0 | 0 | 0 | 0.0 | 0 | 0 | 0.0 | 0 | 0 | 0.0 | |
| Anxiety | Mild | 0 | 0 | 0.0 | 1 | 1 | 1.2 | 0 | 0 | 0.0 | 1 | 1 | 0.3 |
| Moderate | 0 | 0 | 0.0 | 1 | 1 | 1.2 | 1 | 1 | 0.9 | 2 | 2 | 0.5 | |
| Severe | 0 | 0 | 0.0 | 1 | 1 | 1.2 | 0 | 0 | 0.0 | 1 | 1 | 0.3 | |
| Arthralgia | Mild | 1 | 1 | 1.2 | 0 | 0 | 0.0 | 0 | 0 | 0.0 | 1 | 1 | 0.3 |
| Moderate | 0 | 0 | 0.0 | 1 | 1 | 1.2 | 0 | 0 | 0.0 | 1 | 1 | 0.3 | |
| Severe | 0 | 0 | 0.0 | 0 | 0 | 0.0 | 0 | 0 | 0.0 | 0 | 0 | 0.0 | |
| Asthenia | Mild | 0 | 0 | 0.0 | 1 | 1 | 1.2 | 0 | 0 | 0.0 | 1 | 1 | 0.3 |
| Moderate | 0 | 0 | 0.0 | 0 | 0 | 0.0 | 0 | 0 | 0.0 | 0 | 0 | 0.0 | |
| Severe | 0 | 0 | 0.0 | 0 | 0 | 0.0 | 0 | 0 | 0.0 | 0 | 0 | 0.0 | |
| Back pain | Mild | 2 | 2 | 2.4 | 0 | 0 | 0.0 | 1 | 1 | 0.9 | 3 | 3 | 0.8 |
| Moderate | 0 | 0 | 0.0 | 0 | 0 | 0.0 | 0 | 0 | 0.0 | 0 | 0 | 0.0 | |
| Severe | 0 | 0 | 0.0 | 0 | 0 | 0.0 | 0 | 0 | 0.0 | 0 | 0 | 0.0 | |
| Burning sensation | Mild | 0 | 0 | 0.0 | 0 | 0 | 0.0 | 0 | 0 | 0.0 | 0 | 0 | 0.0 |
| Moderate | 0 | 0 | 0.0 | 1 | 1 | 1.2 | 0 | 0 | 0.0 | 1 | 1 | 0.3 | |
| Severe | 0 | 0 | 0.0 | 0 | 0 | 0.0 | 0 | 0 | 0.0 | 0 | 0 | 0.0 | |
| Campylobacter gastroenteritis | Mild | 0 | 0 | 0.0 | 0 | 0 | 0.0 | 0 | 0 | 0.0 | 0 | 0 | 0.0 |
| Moderate | 0 | 0 | 0.0 | 0 | 0 | 0.0 | 1 | 1 | 0.9 | 1 | 1 | 0.3 | |
| Severe | 0 | 0 | 0.0 | 0 | 0 | 0.0 | 0 | 0 | 0.0 | 0 | 0 | 0.0 | |
| Chest pain | Mild | 0 | 0 | 0.0 | 0 | 0 | 0.0 | 1 | 1 | 0.9 | 1 | 1 | 0.3 |
| Moderate | 0 | 0 | 0.0 | 1 | 1 | 1.2 | 0 | 0 | 0.0 | 1 | 1 | 0.3 | |
| Severe | 0 | 0 | 0.0 | 0 | 0 | 0.0 | 0 | 0 | 0.0 | 0 | 0 | 0.0 | |
| Chromaturia | Mild | 0 | 0 | 0.0 | 0 | 0 | 0.0 | 1 | 1 | 0.9 | 1 | 1 | 0.3 |
| Moderate | 0 | 0 | 0.0 | 0 | 0 | 0.0 | 0 | 0 | 0.0 | 0 | 0 | 0.0 | |
| Severe | 0 | 0 | 0.0 | 0 | 0 | 0.0 | 0 | 0 | 0.0 | 0 | 0 | 0.0 | |
| Confusional state | Mild | 0 | 0 | 0.0 | 0 | 0 | 0.0 | 0 | 0 | 0.0 | 0 | 0 | 0.0 |
| Moderate | 0 | 0 | 0.0 | 0 | 0 | 0.0 | 1 | 1 | 0.9 | 1 | 1 | 0.3 | |
| Severe | 0 | 0 | 0.0 | 0 | 0 | 0.0 | 0 | 0 | 0.0 | 0 | 0 | 0.0 | |
| Constipation | Mild | 0 | 0 | 0.0 | 0 | 0 | 0.0 | 0 | 0 | 0.0 | 0 | 0 | 0.0 |
| Moderate | 0 | 0 | 0.0 | 1 | 1 | 1.2 | 0 | 0 | 0.0 | 1 | 1 | 0.3 | |
| Severe | 0 | 0 | 0.0 | 0 | 0 | 0.0 | 0 | 0 | 0.0 | 0 | 0 | 0.0 | |
| Cough | Mild | 0 | 0 | 0.0 | 1 | 1 | 1.2 | 0 | 0 | 0.0 | 1 | 1 | 0.3 |
| Moderate | 0 | 0 | 0.0 | 0 | 0 | 0.0 | 0 | 0 | 0.0 | 0 | 0 | 0.0 | |
| Severe | 0 | 0 | 0.0 | 0 | 0 | 0.0 | 0 | 0 | 0.0 | 0 | 0 | 0.0 | |
| Depressed mood | Mild | 1 | 1 | 1.2 | 0 | 0 | 0.0 | 0 | 0 | 0.0 | 1 | 1 | 0.3 |
| Moderate | 0 | 0 | 0.0 | 0 | 0 | 0.0 | 0 | 0 | 0.0 | 0 | 0 | 0.0 | |
| Severe | 0 | 0 | 0.0 | 0 | 0 | 0.0 | 0 | 0 | 0.0 | 0 | 0 | 0.0 | |
| Depression | Mild | 0 | 0 | 0.0 | 0 | 0 | 0.0 | 0 | 0 | 0.0 | 0 | 0 | 0.0 |
| Moderate | 0 | 0 | 0.0 | 1 | 1 | 1.2 | 0 | 0 | 0.0 | 1 | 1 | 0.3 | |
| Severe | 0 | 0 | 0.0 | 0 | 0 | 0.0 | 0 | 0 | 0.0 | 0 | 0 | 0.0 | |
| Diarrhoea | Mild | 1 | 1 | 1.2 | 0 | 0 | 0.0 | 6 | 6 | 5.7 | 7 | 7 | 1.9 |
| Moderate | 0 | 0 | 0.0 | 3 | 2 | 2.4 | 0 | 0 | 0.0 | 3 | 2 | 0.5 | |
| Severe | 0 | 0 | 0.0 | 0 | 0 | 0.0 | 0 | 0 | 0.0 | 0 | 0 | 0.0 | |
| Disturbance in attention | Mild | 0 | 0 | 0.0 | 0 | 0 | 0.0 | 0 | 0 | 0.0 | 0 | 0 | 0.0 |
| Moderate | 0 | 0 | 0.0 | 0 | 0 | 0.0 | 1 | 1 | 0.9 | 1 | 1 | 0.3 | |
| Severe | 0 | 0 | 0.0 | 0 | 0 | 0.0 | 0 | 0 | 0.0 | 0 | 0 | 0.0 | |
| Dizziness | Mild | 6 | 6 | 7.1 | 4 | 4 | 4.9 | 13 | 13 | 12.3 | 23 | 23 | 6.1 |
| Moderate | 0 | 0 | 0.0 | 2 | 2 | 2.4 | 2 | 2 | 1.9 | 4 | 4 | 1.1 | |
| Severe | 0 | 0 | 0.0 | 0 | 0 | 0.0 | 1 | 1 | 0.9 | 1 | 1 | 0.3 | |
| Double ureter | Mild | 0 | 0 | 0.0 | 1 | 1 | 1.2 | 0 | 0 | 0.0 | 1 | 1 | 0.3 |
| Moderate | 0 | 0 | 0.0 | 0 | 0 | 0.0 | 0 | 0 | 0.0 | 0 | 0 | 0.0 | |
| Severe | 0 | 0 | 0.0 | 0 | 0 | 0.0 | 0 | 0 | 0.0 | 0 | 0 | 0.0 | |
| Dry eye | Mild | 0 | 0 | 0.0 | 0 | 0 | 0.0 | 2 | 1 | 0.9 | 2 | 1 | 0.3 |
| Moderate | 0 | 0 | 0.0 | 0 | 0 | 0.0 | 0 | 0 | 0.0 | 0 | 0 | 0.0 | |
| Severe | 0 | 0 | 0.0 | 0 | 0 | 0.0 | 0 | 0 | 0.0 | 0 | 0 | 0.0 | |
| Dry mouth | Mild | 0 | 0 | 0.0 | 1 | 1 | 1.2 | 0 | 0 | 0.0 | 1 | 1 | 0.3 |
| Moderate | 0 | 0 | 0.0 | 0 | 0 | 0.0 | 0 | 0 | 0.0 | 0 | 0 | 0.0 | |
| Severe | 0 | 0 | 0.0 | 0 | 0 | 0.0 | 0 | 0 | 0.0 | 0 | 0 | 0.0 | |
| Dry skin | Mild | 0 | 0 | 0.0 | 1 | 1 | 1.2 | 0 | 0 | 0.0 | 1 | 1 | 0.3 |
| Moderate | 0 | 0 | 0.0 | 0 | 0 | 0.0 | 0 | 0 | 0.0 | 0 | 0 | 0.0 | |
| Severe | 0 | 0 | 0.0 | 0 | 0 | 0.0 | 0 | 0 | 0.0 | 0 | 0 | 0.0 | |
| Dysgeusia | Mild | 0 | 0 | 0.0 | 1 | 1 | 1.2 | 0 | 0 | 0.0 | 1 | 1 | 0.3 |
| Moderate | 0 | 0 | 0.0 | 0 | 0 | 0.0 | 0 | 0 | 0.0 | 0 | 0 | 0.0 | |
| Severe | 0 | 0 | 0.0 | 0 | 0 | 0.0 | 0 | 0 | 0.0 | 0 | 0 | 0.0 | |
| Dyspepsia | Mild | 0 | 0 | 0.0 | 0 | 0 | 0.0 | 0 | 0 | 0.0 | 0 | 0 | 0.0 |
| Moderate | 2 | 2 | 2.4 | 1 | 1 | 1.2 | 1 | 1 | 0.9 | 4 | 4 | 1.1 | |
| Severe | 0 | 0 | 0.0 | 0 | 0 | 0.0 | 0 | 0 | 0.0 | 0 | 0 | 0.0 | |
| Ear pain | Mild | 0 | 0 | 0.0 | 1 | 1 | 1.2 | 0 | 0 | 0.0 | 1 | 1 | 0.3 |
| Moderate | 0 | 0 | 0.0 | 0 | 0 | 0.0 | 0 | 0 | 0.0 | 0 | 0 | 0.0 | |
| Severe | 0 | 0 | 0.0 | 0 | 0 | 0.0 | 0 | 0 | 0.0 | 0 | 0 | 0.0 | |
| Ejaculation failure | Mild | 0 | 0 | 0.0 | 0 | 0 | 0.0 | 0 | 0 | 0.0 | 0 | 0 | 0.0 |
| Moderate | 0 | 0 | 0.0 | 0 | 0 | 0.0 | 1 | 1 | 0.9 | 1 | 1 | 0.3 | |
| Severe | 0 | 0 | 0.0 | 0 | 0 | 0.0 | 0 | 0 | 0.0 | 0 | 0 | 0.0 | |
| Epistaxis | Mild | 0 | 0 | 0.0 | 0 | 0 | 0.0 | 2 | 2 | 1.9 | 2 | 2 | 0.5 |
| Moderate | 0 | 0 | 0.0 | 0 | 0 | 0.0 | 0 | 0 | 0.0 | 0 | 0 | 0.0 | |
| Severe | 0 | 0 | 0.0 | 0 | 0 | 0.0 | 0 | 0 | 0.0 | 0 | 0 | 0.0 | |
| Faeces soft | Mild | 0 | 0 | 0.0 | 0 | 0 | 0.0 | 0 | 0 | 0.0 | 0 | 0 | 0.0 |
| Moderate | 0 | 0 | 0.0 | 1 | 1 | 1.2 | 0 | 0 | 0.0 | 1 | 1 | 0.3 | |
| Severe | 0 | 0 | 0.0 | 0 | 0 | 0.0 | 0 | 0 | 0.0 | 0 | 0 | 0.0 | |
| Fall | Mild | 0 | 0 | 0.0 | 0 | 0 | 0.0 | 1 | 1 | 0.9 | 1 | 1 | 0.3 |
| Moderate | 0 | 0 | 0.0 | 0 | 0 | 0.0 | 0 | 0 | 0.0 | 0 | 0 | 0.0 | |
| Severe | 0 | 0 | 0.0 | 0 | 0 | 0.0 | 0 | 0 | 0.0 | 0 | 0 | 0.0 | |
| Fatigue | Mild | 5 | 4 | 4.8 | 3 | 3 | 3.7 | 2 | 2 | 1.9 | 10 | 9 | 2.4 |
| Moderate | 0 | 0 | 0.0 | 0 | 0 | 0.0 | 4 | 4 | 3.8 | 4 | 4 | 1.1 | |
| Severe | 0 | 0 | 0.0 | 1 | 1 | 1.2 | 0 | 0 | 0.0 | 1 | 1 | 0.3 | |
| Feeling cold | Mild | 0 | 0 | 0.0 | 0 | 0 | 0.0 | 1 | 1 | 0.9 | 1 | 1 | 0.3 |
| Moderate | 0 | 0 | 0.0 | 0 | 0 | 0.0 | 0 | 0 | 0.0 | 0 | 0 | 0.0 | |
| Severe | 0 | 0 | 0.0 | 0 | 0 | 0.0 | 0 | 0 | 0.0 | 0 | 0 | 0.0 | |
| Feeling hot | Mild | 0 | 0 | 0.0 | 0 | 0 | 0.0 | 0 | 0 | 0.0 | 0 | 0 | 0.0 |
| Moderate | 0 | 0 | 0.0 | 0 | 0 | 0.0 | 1 | 1 | 0.9 | 1 | 1 | 0.3 | |
| Severe | 0 | 0 | 0.0 | 0 | 0 | 0.0 | 0 | 0 | 0.0 | 0 | 0 | 0.0 | |
| Haematoma | Mild | 0 | 0 | 0.0 | 0 | 0 | 0.0 | 0 | 0 | 0.0 | 0 | 0 | 0.0 |
| Moderate | 0 | 0 | 0.0 | 0 | 0 | 0.0 | 1 | 1 | 0.9 | 1 | 1 | 0.3 | |
| Severe | 0 | 0 | 0.0 | 0 | 0 | 0.0 | 0 | 0 | 0.0 | 0 | 0 | 0.0 | |
| Haematuria | Mild | 0 | 0 | 0.0 | 1 | 1 | 1.2 | 0 | 0 | 0.0 | 1 | 1 | 0.3 |
| Moderate | 0 | 0 | 0.0 | 0 | 0 | 0.0 | 0 | 0 | 0.0 | 0 | 0 | 0.0 | |
| Severe | 0 | 0 | 0.0 | 0 | 0 | 0.0 | 0 | 0 | 0.0 | 0 | 0 | 0.0 | |
| Headache | Mild | 3 | 3 | 3.6 | 5 | 5 | 6.1 | 5 | 5 | 4.7 | 13 | 13 | 3.4 |
| Moderate | 2 | 2 | 2.4 | 1 | 1 | 1.2 | 5 | 4 | 3.8 | 8 | 7 | 1.9 | |
| Severe | 1 | 1 | 1.2 | 1 | 1 | 1.2 | 0 | 0 | 0.0 | 2 | 2 | 0.5 | |
| Hepatic enzyme increased | Mild | 0 | 0 | 0.0 | 0 | 0 | 0.0 | 0 | 0 | 0.0 | 0 | 0 | 0.0 |
| Moderate | 0 | 0 | 0.0 | 1 | 1 | 1.2 | 0 | 0 | 0.0 | 1 | 1 | 0.3 | |
| Severe | 0 | 0 | 0.0 | 0 | 0 | 0.0 | 0 | 0 | 0.0 | 0 | 0 | 0.0 | |
| Hyperhidrosis | Mild | 1 | 1 | 1.2 | 1 | 1 | 1.2 | 0 | 0 | 0.0 | 2 | 2 | 0.5 |
| Moderate | 1 | 1 | 1.2 | 0 | 0 | 0.0 | 0 | 0 | 0.0 | 1 | 1 | 0.3 | |
| Severe | 0 | 0 | 0.0 | 0 | 0 | 0.0 | 0 | 0 | 0.0 | 0 | 0 | 0.0 | |
| Hypertension | Mild | 1 | 1 | 1.2 | 0 | 0 | 0.0 | 0 | 0 | 0.0 | 1 | 1 | 0.3 |
| Moderate | 0 | 0 | 0.0 | 0 | 0 | 0.0 | 0 | 0 | 0.0 | 0 | 0 | 0.0 | |
| Severe | 0 | 0 | 0.0 | 0 | 0 | 0.0 | 0 | 0 | 0.0 | 0 | 0 | 0.0 | |
| Hypotension | Mild | 1 | 1 | 1.2 | 2 | 1 | 1.2 | 0 | 0 | 0.0 | 3 | 2 | 0.5 |
| Moderate | 0 | 0 | 0.0 | 0 | 0 | 0.0 | 1 | 1 | 0.9 | 1 | 1 | 0.3 | |
| Severe | 0 | 0 | 0.0 | 0 | 0 | 0.0 | 0 | 0 | 0.0 | 0 | 0 | 0.0 | |
| Increased appetite | Mild | 0 | 0 | 0.0 | 1 | 1 | 1.2 | 0 | 0 | 0.0 | 1 | 1 | 0.3 |
| Moderate | 0 | 0 | 0.0 | 0 | 0 | 0.0 | 0 | 0 | 0.0 | 0 | 0 | 0.0 | |
| Severe | 0 | 0 | 0.0 | 0 | 0 | 0.0 | 0 | 0 | 0.0 | 0 | 0 | 0.0 | |
| Influenza | Mild | 2 | 2 | 2.4 | 1 | 1 | 1.2 | 3 | 3 | 2.8 | 6 | 6 | 1.6 |
| Moderate | 0 | 0 | 0.0 | 0 | 0 | 0.0 | 1 | 1 | 0.9 | 1 | 1 | 0.3 | |
| Severe | 0 | 0 | 0.0 | 0 | 0 | 0.0 | 0 | 0 | 0.0 | 0 | 0 | 0.0 | |
| Influenza like illness | Mild | 0 | 0 | 0.0 | 1 | 1 | 1.2 | 0 | 0 | 0.0 | 1 | 1 | 0.3 |
| Moderate | 0 | 0 | 0.0 | 0 | 0 | 0.0 | 0 | 0 | 0.0 | 0 | 0 | 0.0 | |
| Severe | 0 | 0 | 0.0 | 0 | 0 | 0.0 | 0 | 0 | 0.0 | 0 | 0 | 0.0 | |
| Insomnia | Mild | 1 | 1 | 1.2 | 0 | 0 | 0.0 | 1 | 1 | 0.9 | 2 | 2 | 0.5 |
| Moderate | 0 | 0 | 0.0 | 0 | 0 | 0.0 | 2 | 2 | 1.9 | 2 | 2 | 0.5 | |
| Severe | 0 | 0 | 0.0 | 0 | 0 | 0.0 | 0 | 0 | 0.0 | 0 | 0 | 0.0 | |
| Lacrimation increased | Mild | 0 | 0 | 0.0 | 0 | 0 | 0.0 | 1 | 1 | 0.9 | 1 | 1 | 0.3 |
| Moderate | 0 | 0 | 0.0 | 0 | 0 | 0.0 | 0 | 0 | 0.0 | 0 | 0 | 0.0 | |
| Severe | 0 | 0 | 0.0 | 0 | 0 | 0.0 | 0 | 0 | 0.0 | 0 | 0 | 0.0 | |
| Loss of consciousness | Mild | 0 | 0 | 0.0 | 0 | 0 | 0.0 | 0 | 0 | 0.0 | 0 | 0 | 0.0 |
| Moderate | 0 | 0 | 0.0 | 0 | 0 | 0.0 | 1 | 1 | 0.9 | 1 | 1 | 0.3 | |
| Severe | 0 | 0 | 0.0 | 0 | 0 | 0.0 | 0 | 0 | 0.0 | 0 | 0 | 0.0 | |
| Lower respiratory tract infection | Mild | 0 | 0 | 0.0 | 0 | 0 | 0.0 | 0 | 0 | 0.0 | 0 | 0 | 0.0 |
| Moderate | 0 | 0 | 0.0 | 0 | 0 | 0.0 | 1 | 1 | 0.9 | 1 | 1 | 0.3 | |
| Severe | 0 | 0 | 0.0 | 0 | 0 | 0.0 | 0 | 0 | 0.0 | 0 | 0 | 0.0 | |
| Malaise | Mild | 1 | 1 | 1.2 | 0 | 0 | 0.0 | 0 | 0 | 0.0 | 1 | 1 | 0.3 |
| Moderate | 0 | 0 | 0.0 | 0 | 0 | 0.0 | 0 | 0 | 0.0 | 0 | 0 | 0.0 | |
| Severe | 0 | 0 | 0.0 | 0 | 0 | 0.0 | 0 | 0 | 0.0 | 0 | 0 | 0.0 | |
| Morbid thoughts | Mild | 0 | 0 | 0.0 | 0 | 0 | 0.0 | 1 | 1 | 0.9 | 1 | 1 | 0.3 |
| Moderate | 0 | 0 | 0.0 | 0 | 0 | 0.0 | 0 | 0 | 0.0 | 0 | 0 | 0.0 | |
| Severe | 0 | 0 | 0.0 | 0 | 0 | 0.0 | 0 | 0 | 0.0 | 0 | 0 | 0.0 | |
| Mouth ulceration | Mild | 0 | 0 | 0.0 | 0 | 0 | 0.0 | 1 | 1 | 0.9 | 1 | 1 | 0.3 |
| Moderate | 0 | 0 | 0.0 | 0 | 0 | 0.0 | 1 | 1 | 0.9 | 1 | 1 | 0.3 | |
| Severe | 0 | 0 | 0.0 | 0 | 0 | 0.0 | 0 | 0 | 0.0 | 0 | 0 | 0.0 | |
| Myalgia | Mild | 0 | 0 | 0.0 | 0 | 0 | 0.0 | 1 | 1 | 0.9 | 1 | 1 | 0.3 |
| Moderate | 0 | 0 | 0.0 | 0 | 0 | 0.0 | 1 | 1 | 0.9 | 1 | 1 | 0.3 | |
| Severe | 0 | 0 | 0.0 | 0 | 0 | 0.0 | 0 | 0 | 0.0 | 0 | 0 | 0.0 | |
| Nasopharyngitis | Mild | 0 | 0 | 0.0 | 1 | 1 | 1.2 | 1 | 1 | 0.9 | 2 | 2 | 0.5 |
| Moderate | 0 | 0 | 0.0 | 0 | 0 | 0.0 | 1 | 1 | 0.9 | 1 | 1 | 0.3 | |
| Severe | 0 | 0 | 0.0 | 0 | 0 | 0.0 | 0 | 0 | 0.0 | 0 | 0 | 0.0 | |
| Nausea | Mild | 1 | 1 | 1.2 | 3 | 2 | 2.4 | 2 | 1 | 0.9 | 6 | 4 | 1.1 |
| Moderate | 0 | 0 | 0.0 | 0 | 0 | 0.0 | 0 | 0 | 0.0 | 0 | 0 | 0.0 | |
| Severe | 0 | 0 | 0.0 | 0 | 0 | 0.0 | 0 | 0 | 0.0 | 0 | 0 | 0.0 | |
| Neck pain | Mild | 0 | 0 | 0.0 | 0 | 0 | 0.0 | 0 | 0 | 0.0 | 0 | 0 | 0.0 |
| Moderate | 1 | 1 | 1.2 | 0 | 0 | 0.0 | 0 | 0 | 0.0 | 1 | 1 | 0.3 | |
| Severe | 0 | 0 | 0.0 | 0 | 0 | 0.0 | 0 | 0 | 0.0 | 0 | 0 | 0.0 | |
| Neutropenia | Mild | 0 | 0 | 0.0 | 0 | 0 | 0.0 | 1 | 1 | 0.9 | 1 | 1 | 0.3 |
| Moderate | 0 | 0 | 0.0 | 0 | 0 | 0.0 | 0 | 0 | 0.0 | 0 | 0 | 0.0 | |
| Severe | 0 | 0 | 0.0 | 0 | 0 | 0.0 | 0 | 0 | 0.0 | 0 | 0 | 0.0 | |
| Onychomycosis | Mild | 1 | 1 | 1.2 | 0 | 0 | 0.0 | 0 | 0 | 0.0 | 1 | 1 | 0.3 |
| Moderate | 0 | 0 | 0.0 | 0 | 0 | 0.0 | 0 | 0 | 0.0 | 0 | 0 | 0.0 | |
| Severe | 0 | 0 | 0.0 | 0 | 0 | 0.0 | 0 | 0 | 0.0 | 0 | 0 | 0.0 | |
| Oropharyngeal pain | Mild | 0 | 0 | 0.0 | 1 | 1 | 1.2 | 1 | 1 | 0.9 | 2 | 2 | 0.5 |
| Moderate | 0 | 0 | 0.0 | 0 | 0 | 0.0 | 0 | 0 | 0.0 | 0 | 0 | 0.0 | |
| Severe | 0 | 0 | 0.0 | 0 | 0 | 0.0 | 0 | 0 | 0.0 | 0 | 0 | 0.0 | |
| Orthostatic hypotension | Mild | 0 | 0 | 0.0 | 3 | 2 | 2.4 | 1 | 1 | 0.9 | 4 | 3 | 0.8 |
| Moderate | 0 | 0 | 0.0 | 0 | 0 | 0.0 | 0 | 0 | 0.0 | 0 | 0 | 0.0 | |
| Severe | 0 | 0 | 0.0 | 0 | 0 | 0.0 | 0 | 0 | 0.0 | 0 | 0 | 0.0 | |
| Osteopenia | Mild | 0 | 0 | 0.0 | 0 | 0 | 0.0 | 1 | 1 | 0.9 | 1 | 1 | 0.3 |
| Moderate | 0 | 0 | 0.0 | 0 | 0 | 0.0 | 0 | 0 | 0.0 | 0 | 0 | 0.0 | |
| Severe | 0 | 0 | 0.0 | 0 | 0 | 0.0 | 0 | 0 | 0.0 | 0 | 0 | 0.0 | |
| Pain in jaw | Mild | 0 | 0 | 0.0 | 0 | 0 | 0.0 | 1 | 1 | 0.9 | 1 | 1 | 0.3 |
| Moderate | 0 | 0 | 0.0 | 0 | 0 | 0.0 | 0 | 0 | 0.0 | 0 | 0 | 0.0 | |
| Severe | 0 | 0 | 0.0 | 0 | 0 | 0.0 | 0 | 0 | 0.0 | 0 | 0 | 0.0 | |
| Palpitations | Mild | 0 | 0 | 0.0 | 0 | 0 | 0.0 | 2 | 2 | 1.9 | 2 | 2 | 0.5 |
| Moderate | 0 | 0 | 0.0 | 0 | 0 | 0.0 | 1 | 1 | 0.9 | 1 | 1 | 0.3 | |
| Severe | 0 | 0 | 0.0 | 0 | 0 | 0.0 | 0 | 0 | 0.0 | 0 | 0 | 0.0 | |
| Paraesthesia | Mild | 0 | 0 | 0.0 | 0 | 0 | 0.0 | 1 | 1 | 0.9 | 1 | 1 | 0.3 |
| Moderate | 0 | 0 | 0.0 | 0 | 0 | 0.0 | 1 | 1 | 0.9 | 1 | 1 | 0.3 | |
| Severe | 0 | 0 | 0.0 | 0 | 0 | 0.0 | 0 | 0 | 0.0 | 0 | 0 | 0.0 | |
| Photosensitivity reaction | Mild | 0 | 0 | 0.0 | 1 | 1 | 1.2 | 0 | 0 | 0.0 | 1 | 1 | 0.3 |
| Moderate | 0 | 0 | 0.0 | 0 | 0 | 0.0 | 0 | 0 | 0.0 | 0 | 0 | 0.0 | |
| Severe | 0 | 0 | 0.0 | 0 | 0 | 0.0 | 0 | 0 | 0.0 | 0 | 0 | 0.0 | |
| Pruritus | Mild | 4 | 4 | 4.8 | 1 | 1 | 1.2 | 2 | 2 | 1.9 | 7 | 7 | 1.9 |
| Moderate | 0 | 0 | 0.0 | 0 | 0 | 0.0 | 1 | 1 | 0.9 | 1 | 1 | 0.3 | |
| Severe | 0 | 0 | 0.0 | 0 | 0 | 0.0 | 0 | 0 | 0.0 | 0 | 0 | 0.0 | |
| Pulmonary fibrosis | Mild | 0 | 0 | 0.0 | 0 | 0 | 0.0 | 0 | 0 | 0.0 | 0 | 0 | 0.0 |
| Moderate | 0 | 0 | 0.0 | 0 | 0 | 0.0 | 0 | 0 | 0.0 | 0 | 0 | 0.0 | |
| Severe | 1 | 1 | 1.2 | 0 | 0 | 0.0 | 0 | 0 | 0.0 | 1 | 1 | 0.3 | |
| Pyrexia | Mild | 0 | 0 | 0.0 | 0 | 0 | 0.0 | 1 | 1 | 0.9 | 1 | 1 | 0.3 |
| Moderate | 0 | 0 | 0.0 | 0 | 0 | 0.0 | 0 | 0 | 0.0 | 0 | 0 | 0.0 | |
| Severe | 0 | 0 | 0.0 | 0 | 0 | 0.0 | 0 | 0 | 0.0 | 0 | 0 | 0.0 | |
| Rash | Mild | 1 | 1 | 1.2 | 1 | 1 | 1.2 | 2 | 2 | 1.9 | 4 | 4 | 1.1 |
| Moderate | 0 | 0 | 0.0 | 0 | 0 | 0.0 | 2 | 2 | 1.9 | 2 | 2 | 0.5 | |
| Severe | 0 | 0 | 0.0 | 0 | 0 | 0.0 | 0 | 0 | 0.0 | 0 | 0 | 0.0 | |
| Renal impairment | Mild | 0 | 0 | 0.0 | 0 | 0 | 0.0 | 1 | 1 | 0.9 | 1 | 1 | 0.3 |
| Moderate | 0 | 0 | 0.0 | 0 | 0 | 0.0 | 0 | 0 | 0.0 | 0 | 0 | 0.0 | |
| Severe | 0 | 0 | 0.0 | 0 | 0 | 0.0 | 0 | 0 | 0.0 | 0 | 0 | 0.0 | |
| Rhinitis | Mild | 0 | 0 | 0.0 | 0 | 0 | 0.0 | 0 | 0 | 0.0 | 0 | 0 | 0.0 |
| Moderate | 0 | 0 | 0.0 | 0 | 0 | 0.0 | 1 | 1 | 0.9 | 1 | 1 | 0.3 | |
| Severe | 0 | 0 | 0.0 | 0 | 0 | 0.0 | 0 | 0 | 0.0 | 0 | 0 | 0.0 | |
| Sinus congestion | Mild | 1 | 1 | 1.2 | 0 | 0 | 0.0 | 0 | 0 | 0.0 | 1 | 1 | 0.3 |
| Moderate | 0 | 0 | 0.0 | 0 | 0 | 0.0 | 0 | 0 | 0.0 | 0 | 0 | 0.0 | |
| Severe | 0 | 0 | 0.0 | 0 | 0 | 0.0 | 0 | 0 | 0.0 | 0 | 0 | 0.0 | |
| Sinusitis | Mild | 0 | 0 | 0.0 | 0 | 0 | 0.0 | 0 | 0 | 0.0 | 0 | 0 | 0.0 |
| Moderate | 0 | 0 | 0.0 | 1 | 1 | 1.2 | 0 | 0 | 0.0 | 1 | 1 | 0.3 | |
| Severe | 0 | 0 | 0.0 | 0 | 0 | 0.0 | 0 | 0 | 0.0 | 0 | 0 | 0.0 | |
| Somnolence | Mild | 0 | 0 | 0.0 | 1 | 1 | 1.2 | 0 | 0 | 0.0 | 1 | 1 | 0.3 |
| Moderate | 0 | 0 | 0.0 | 0 | 0 | 0.0 | 0 | 0 | 0.0 | 0 | 0 | 0.0 | |
| Severe | 0 | 0 | 0.0 | 0 | 0 | 0.0 | 0 | 0 | 0.0 | 0 | 0 | 0.0 | |
| Syncope | Mild | 1 | 1 | 1.2 | 0 | 0 | 0.0 | 0 | 0 | 0.0 | 1 | 1 | 0.3 |
| Moderate | 0 | 0 | 0.0 | 0 | 0 | 0.0 | 0 | 0 | 0.0 | 0 | 0 | 0.0 | |
| Severe | 0 | 0 | 0.0 | 0 | 0 | 0.0 | 0 | 0 | 0.0 | 0 | 0 | 0.0 | |
| Tension headache | Mild | 0 | 0 | 0.0 | 1 | 1 | 1.2 | 0 | 0 | 0.0 | 1 | 1 | 0.3 |
| Moderate | 0 | 0 | 0.0 | 0 | 0 | 0.0 | 0 | 0 | 0.0 | 0 | 0 | 0.0 | |
| Severe | 0 | 0 | 0.0 | 0 | 0 | 0.0 | 0 | 0 | 0.0 | 0 | 0 | 0.0 | |
| Tongue coated | Mild | 0 | 0 | 0.0 | 0 | 0 | 0.0 | 1 | 1 | 0.9 | 1 | 1 | 0.3 |
| Moderate | 0 | 0 | 0.0 | 0 | 0 | 0.0 | 0 | 0 | 0.0 | 0 | 0 | 0.0 | |
| Severe | 0 | 0 | 0.0 | 0 | 0 | 0.0 | 0 | 0 | 0.0 | 0 | 0 | 0.0 | |
| Tremor | Mild | 0 | 0 | 0.0 | 1 | 1 | 1.2 | 0 | 0 | 0.0 | 1 | 1 | 0.3 |
| Moderate | 0 | 0 | 0.0 | 0 | 0 | 0.0 | 0 | 0 | 0.0 | 0 | 0 | 0.0 | |
| Severe | 0 | 0 | 0.0 | 0 | 0 | 0.0 | 0 | 0 | 0.0 | 0 | 0 | 0.0 | |
| Trigeminal neuralgia | Mild | 1 | 1 | 1.2 | 0 | 0 | 0.0 | 0 | 0 | 0.0 | 1 | 1 | 0.3 |
| Moderate | 0 | 0 | 0.0 | 0 | 0 | 0.0 | 0 | 0 | 0.0 | 0 | 0 | 0.0 | |
| Severe | 0 | 0 | 0.0 | 0 | 0 | 0.0 | 0 | 0 | 0.0 | 0 | 0 | 0.0 | |
| Upper respiratory tract infection | Mild | 1 | 1 | 1.2 | 0 | 0 | 0.0 | 0 | 0 | 0.0 | 1 | 1 | 0.3 |
| Moderate | 0 | 0 | 0.0 | 0 | 0 | 0.0 | 0 | 0 | 0.0 | 0 | 0 | 0.0 | |
| Severe | 0 | 0 | 0.0 | 0 | 0 | 0.0 | 0 | 0 | 0.0 | 0 | 0 | 0.0 | |
| Urinary tract infection | Mild | 1 | 1 | 1.2 | 0 | 0 | 0.0 | 0 | 0 | 0.0 | 1 | 1 | 0.3 |
| Moderate | 0 | 0 | 0.0 | 0 | 0 | 0.0 | 0 | 0 | 0.0 | 0 | 0 | 0.0 | |
| Severe | 0 | 0 | 0.0 | 0 | 0 | 0.0 | 0 | 0 | 0.0 | 0 | 0 | 0.0 | |
| Vision blurred | Mild | 1 | 1 | 1.2 | 1 | 1 | 1.2 | 2 | 2 | 1.9 | 4 | 4 | 1.1 |
| Moderate | 0 | 0 | 0.0 | 0 | 0 | 0.0 | 0 | 0 | 0.0 | 0 | 0 | 0.0 | |
| Severe | 0 | 0 | 0.0 | 0 | 0 | 0.0 | 0 | 0 | 0.0 | 0 | 0 | 0.0 | |
| Visual impairment | Mild | 0 | 0 | 0.0 | 0 | 0 | 0.0 | 0 | 0 | 0.0 | 0 | 0 | 0.0 |
| Moderate | 1 | 1 | 1.2 | 0 | 0 | 0.0 | 0 | 0 | 0.0 | 1 | 1 | 0.3 | |
| Severe | 0 | 0 | 0.0 | 0 | 0 | 0.0 | 0 | 0 | 0.0 | 0 | 0 | 0.0 | |
| Vomiting | Mild | 0 | 0 | 0.0 | 1 | 1 | 1.2 | 1 | 1 | 0.9 | 2 | 2 | 0.5 |
| Moderate | 0 | 0 | 0.0 | 1 | 1 | 1.2 | 0 | 0 | 0.0 | 1 | 1 | 0.3 | |
| Severe | 0 | 0 | 0.0 | 0 | 0 | 0.0 | 0 | 0 | 0.0 | 0 | 0 | 0.0 | |
| Weight increased | Mild | 0 | 0 | 0.0 | 1 | 1 | 1.2 | 0 | 0 | 0.0 | 1 | 1 | 0.3 |
| Moderate | 0 | 0 | 0.0 | 0 | 0 | 0.0 | 0 | 0 | 0.0 | 0 | 0 | 0.0 | |
| Severe | 0 | 0 | 0.0 | 0 | 0 | 0.0 | 0 | 0 | 0.0 | 0 | 0 | 0.0 | |
| Grand total | Mild | 41 | 20 | 23.8 | 47 | 18 | 22.0 | 65 | 27 | 25.5 | 153 | 65 | 17.2 |
| Moderate | 7 | 6 | 7.1 | 18 | 8 | 9.8 | 36 | 21 | 19.8 | 61 | 35 | 9.3 | |
| Severe | 2 | 2 | 2.4 | 3 | 2 | 2.4 | 1 | 1 | 0.9 | 6 | 5 | 1.3 | |
Serious adverse events
| SAE number | Description (PT) | Description (SOC) | Seriousness | Allocation | Severity | Expectedness | Relationship | Withdrew from study drug | Outcome | Patient status | |
|---|---|---|---|---|---|---|---|---|---|---|---|
| PI’s assessment | Chief Investigator’s assessment | ||||||||||
| 1 | Laceration | Injury, poisoning and procedural complications | Required hospitalisation | Arm C (40 mg) | Grade 4, potentially life-threatening | Unexpected | Unrelated | Unrelated | No | Resolved | Continuing in trial |
| 2 | Plasmablastic lymphoma | Neoplasms benign, malignant and unspecified (including cysts and polyps) | Medically significant/important | Arm C (40 mg) | Grade 4, potentially life-threatening | Unexpected | Unrelated | Unrelated | Yes | Ongoing at final follow-up | Withdrawn from treatment |
| Plasmablastic large B-cell lymphoma | |||||||||||
| 3 | Paraesthesia | Nervous system disorders | Required hospitalisation | Arm C (40 mg) | Grade 2, moderate | Expected | Probably | Probably | Yes | Resolved | Withdrawn from treatment |
| 4 | Mastitis | Infections and infestations | Required hospitalisation | Arm D (80 mg) | Grade 1, mild | Unexpected | Unrelated | Unrelated | No | Resolved | Continuing in trial |
| 5 | Infected bites | Infections and infestations | Required hospitalisation | Arm A (control) | Grade 3, severe | NA | NA | NA | No | Resolved | Continuing in trial |
| 6 | Hepatitis C | Infections and infestations | Medically significant/important | Arm C (40 mg) | Grade 3, severe | Unexpected | Unlikely | Unrelated | Yes | Resolved | Withdrawn from treatment |
| Hepatitis C | |||||||||||
| 7 | Haemoptysis | Respiratory, thoracic and mediastinal disorders | Required hospitalisation | Arm B (20 mg) | Grade 3, severe | Unexpected | Unrelated | Unrelated | No | Resolved | Continuing in trial |
| 8 | Skin cancer | Neoplasms benign, malignant and unspecified (including cysts and polyps) | Medically significant/important | Arm D (80 mg) | Grade 4, potentially life-threatening | Unexpected | Unrelated | Unrelated | No | Not resolved/ongoing | Completed trial |
| Skin cancer recurrence | |||||||||||
| 9 | Limb injury | Injury, poisoning and procedural complications | Required hospitalisation | Arm B (20 mg) | Grade 2, moderate | Unexpected | Unrelated | Unrelated | No | Resolved | Completed trial |
| 10 | Laceration | Injury, poisoning and procedural complications | Required hospitalisation | Arm A (control) | Grade 1, mild | NA | NA | NA | No | Resolved | Continuing in trial |
| 11 | Pneumonia | Infections and infestations | Required hospitalisation | Arm A (control) | Grade 2, moderate | NA | NA | NA | No | Resolved | Continuing in trial |
| 12 | Joint dislocation | Injury, poisoning and procedural complications | Required hospitalisation | Arm D (80 mg) | Grade 3, severe | Unexpected | Unlikely | Unrelated | Yes | Resolved | Withdrawn from treatment |
| 13 | Groin pain | Musculoskeletal and connective tissue disorders | Required hospitalisation | Arm B (20 mg) | Grade 3, severe | Unexpected | Unrelated | Unrelated | No | Ongoing at final follow-up | Completed trial |
| 14 | Joint dislocation | Injury, poisoning and procedural complications | Required hospitalisation | Arm D (80 mg) | Grade 3, severe | Unexpected | Unlikely | Unrelated | Yes | Resolved | Continuing in trial |
| 15 | Convulsion | Nervous system disorders | Required hospitalisation | Arm A (control) | Grade 2, moderate | NA | NA | NA | No | Resolved | Continuing in trial |
| 16 | Chest pain | General disorders and administration site conditions | Required hospitalisation | Arm D (80 mg) | Grade 2, moderate | Unexpected | Unrelated | Unlikely | No | Resolved | Continuing in trial |
| 17 | Death | General disorders and administration site conditions | Required hospitalisation | Arm A (control) | Grade 5, death | NA | NA | NA | No | Fatal | Death |
| 18 | Abdominal pain upper | Gastrointestinal disorders | Required hospitalisation | Arm A (control) | Grade 2, moderate | NA | NA | NA | No | Resolved | Continuing in trial |
| 19 | Meningitis cryptococcal | Infections and infestations | Required hospitalisation | Arm D (80 mg) | Grade 2, moderate | Unexpected | Unrelated | Unrelated | No | Resolved | Continuing in trial |
| 20 | Gastroenteritis viral | Infections and infestations | Required hospitalisation | Arm D (80 mg) | Grade 2, moderate | Unexpected | Unrelated | Unrelated | No | Resolved | Continuing in trial |
| 21 | Pregnancy | Pregnancy, puerperium and perinatal conditions | Medically significant/important | Arm D (80 mg) | a | Unexpected | Unrelated | Unrelated | Yes | Not resolved/ongoing | Completed trial |
| Pregnancy | |||||||||||
Compliance with study drug schedule
| Variable and summary statistic | Treatment arm | ||
|---|---|---|---|
| Arm B (20 mg) (N = 84) | Arm C (40 mg) (N = 82) | Arm D (80 mg) (N = 106) | |
| Total dose (mg) consumed according to the treatment diary | n = 48 | n = 42 | n = 64 |
| Mean (SD), median; min.–max. | 3215.4 (558.62), 3360; 296–3360 | 6347.4 (396.42), 6440; 4042–6440 | 11,829.8 (893.53), 12,040; 5160–12,040 |
| n (%), missing | 36 (42.8) | 40 (48.8) | 42 (39.6) |
| Total dose (mg) according to total number of returned pills | n = 70 | n = 61 | n = 93 |
| Mean (SD), median; min.–max. | 3290.4 (112.89), 3360; 2880–3360 | 6155.4 (413.91), 6440; 4680–6440 | 11,146.8 (1181.00), 11,840; 7620–12,040 |
| n (%), missing | 14 (16.7) | 21 (25.6) | 13 (12.3) |
| Discrepancies between these two estimates of total dosea | n = 43 | n = 37 | n = 62 |
| Mean (SD), median; min.–max. | 52.7 (601.34), 0.0; –392–3064 | –234.3 (604.41), –120; –1120–2398 | –964.5 (1534.06), –605.5; –3857–6720 |
| n (%), missing | 41 (48.8) | 45 (54.9) | 44 (41.5) |
| Average of these two estimates of total dose | n = 43 | n = 37 | n = 62 |
| Mean (SD), median; min.–max. | 3238.3 (297.51), 3330; 1828–3360 | 6217.7 (249.28), 6180; 5241–6440 | 11,340.8 (745.23), 11,512.8; 8520–12,040 |
| n (%), missing | 41 (48.8) | 45 (54.9) | 44 (41.5) |
| Variable and summary statistic | Compliance data | |
|---|---|---|
| No (N = 36) | Some (N = 236) | |
| Systolic blood pressure (mmHg) | ||
| Mean (SD) | 127.5 (13.0) | 125.0 (15.0) |
| Median (IQR); min.–max. | 126.5 (118.5–136.5); 105–161 | 122 (115–135); 92–172 |
| Diastolic blood pressure (mmHg) | ||
| Mean (SD) | 76.0 (8.9) | 79.2 (11.0) |
| Median (IQR); min.–max. | 74 (70–81); 56–100 | 79 (71–87); 54–107 |
| CD4 cell count (cells/mm3) | (n = 226) | |
| Mean (SD) | 702.4 (255.0) | 603.1 (261.1) |
| Median (IQR); min.–max. | 680 (556–846.5); 81–1417 | 566.5 (425–770); 62–1674 |
| CD4 cell count and HIV viral load (%) | ||
| Mean (SD) | 31.0 (8.6) | 29.8 (8.5) |
| Median (IQR); min.–max. | 30 (27.5–34.5); 6–50 | 30 (24–36); 6–52 |
| HIV viral load – copies/ml | (n = 13) | (n = 69) |
| Mean (SD) | 16.8 (19.0) | 40.6 (85.0) |
| Median (IQR); min.–max.a | 3.5 (0–39); 0–39 | 26 (0–39); 0–649 |
| < 10, n (%) | 0 (0.0) | 4 (1.7) |
| < 20, n (%) | 2 (5.6) | 52 (22.1) |
| < 40, n (%) | 20 (55.6) | 96 (40.9) |
| < 45, n (%) | 0 (0.0) | 12 (5.1) |
| < 100, n (%) | 0 (0.0) | 1 (0.4) |
| eGFR (ml/minute/1.73 m2) | (n = 18) | (n = 115) |
| Mean (SD) | 76.7 (10.6) | 80.5 (12.6) |
| Median (IQR); min.–max.a | 77.2 (69–85); 53–90 | 79 (71–87); 56–122 |
| < 60, n (%) | 0 (0.0) | 1 (0.4) |
| > 60, n (%) | 4 (11.1) | 66 (28.1) |
| > 90, n (%) | 14 (38.9) | 52 (22.1) |
List of abbreviations
- ACE
- angiotensin-converting enzyme
- ACR
- albumin-to-creatinine ratio
- AE
- adverse event
- ANCOVA
- analysis of covariance
- AR
- adverse reaction
- ARB
- angiotensin receptor blocker
- ATP
- Adult Treatment Panel
- BAF
- Bioanalytical Facility
- BMI
- body mass index
- cART
- combination antiretroviral therapy
- CCRN
- Comprehensive Clinical Research Network
- CD4
- cluster of differentiation 4
- CI
- confidence interval
- CRF
- case report form
- CTRC
- Clinical Trials Research Centre
- CVD
- cardiovascular disease
- DAD
- Data collection on Adverse events of anti-HIV Drugs
- eGFR
- estimated glomerular filtration rate
- ELISA
- enzyme-linked immunosorbent assay
- EQA
- External Quality Assessment
- ETC
- excess treatment cost
- GCP
- good clinical practice
- 1H-MRS
- proton magnetic resonance spectroscopy
- HDL
- high-density lipoprotein
- HDL-C
- high-density lipoprotein cholesterol
- HIV
- human immunodeficiency virus
- HIVLD
- HIV-associated lipodystrophy
- HOMA-IR
- homeostatic model assessment of insulin resistance
- hs-CRP
- high-sensitivity C-reactive protein
- ICH
- International Conference on Harmonisation
- IDSMC
- Independent Data Safety and Monitoring Committee
- IL-6
- interleukin 6
- IL-8
- interleukin 8
- IMP
- investigational medicinal product
- IQC
- internal quality control
- IQR
- interquartile range
- ITT
- intention to treat
- IV
- instrumental variable
- K3EDTA
- tripotassium ethylenediaminetetraacetic acid
- LCL
- Liverpool Clinical Laboratories
- LDL-C
- low-density lipoprotein cholesterol
- LLOD
- lower limit of detection
- MedDRA
- Medical Dictionary for Regulatory Activities
- MHRA
- Medicines and Healthcare products Regulatory Agency
- MR
- magnetic resonance
- MRI
- magnetic resonance imaging
- MRS
- magnetic resonance scanning
- MS
- metabolic syndrome
- NEFA
- non-esterified fatty acid
- NGAL
- neutrophil gelatinase-associated lipocalin
- NIHR
- National Institute for Health Research
- NRTI
- nucleoside reverse transcriptase inhibitor
- PCR
- polymerase chain reaction
- PI
- principal investigator
- PPAR
- peroxisome proliferator-activated receptor
- PRESS
- point-resolved spectroscopy
- QUICKI
- Quantitative Insulin Sensitivity Check Index
- R&D
- research and development
- RCT
- randomised controlled trial
- REC
- Research Ethics Committee
- SAE
- serious adverse event
- SAR
- serious adverse reaction
- SD
- standard deviation
- SE
- standard error
- SOC
- system organ class
- SOP
- standard operating procedure
- SUSAR
- suspected unexpected serious adverse reaction
- T2DM
- type 2 diabetes mellitus
- TMG
- trial management group
- TNF-α
- tumour necrosis factor alpha
- TSC
- Trial Steering Committee
