Notes
Article history
The research reported in this issue of the journal was funded by the HS&DR programme or one of its proceeding programmes as project number 10/2000/68. The contractual start date was in October 2011. The final report began editorial review in July 2013 and was accepted for publication in March 2014. The authors have been wholly responsible for all data collection, analysis and interpretation, and for writing up their work. The HS&DR editors and production house have tried to ensure the accuracy of the authors’ report and would like to thank the reviewers for their constructive comments on the final report document. However, they do not accept liability for damages or losses arising from material published in this report.
Declared competing interests of authors
none
Permissions
Copyright statement
© Queen’s Printer and Controller of HMSO 2014. This work was produced by Crabb et al. under the terms of a commissioning contract issued by the Secretary of State for Health. This issue may be freely reproduced for the purposes of private research and study and extracts (or indeed, the full report) may be included in professional journals provided that suitable acknowledgement is made and the reproduction is not associated with any form of advertising. Applications for commercial reproduction should be addressed to: NIHR Journals Library, National Institute for Health Research, Evaluation, Trials and Studies Coordinating Centre, Alpha House, University of Southampton Science Park, Southampton SO16 7NS, UK.
Chapter 1 Are practical recommendations practised? A national multicentre cross-sectional study on frequency of visual field testing in glaucoma
Background
Chronic open-angle glaucoma (COAG) represents a major workload for UK eye hospitals. It is estimated that at least 480,000 people are affected by the condition in England alone, and they account for over 1 million related outpatient visits per year. 1 The prevalence of glaucoma rises exponentially with age, with 85% of cases of open-angle glaucoma occurring in people aged 60 years and above. 2 The ageing population means that these figures are destined to increase dramatically in future years. Glaucoma is a progressive disease and often asymptomatic, so it is vital that affected individuals are monitored routinely over time in order to control the disease and detect any signs of worsening damage. Any vision loss that occurs is irreversible, and so clinical care must aim to ultimately halt or ameliorate progression to a rate which is compatible with a sighted lifetime without significant disability. Nevertheless, at the present time, 10% of cases of registered blindness in the UK are attributed to glaucoma. This figure suggests that there is still room for improvement in terms of the efficiency of diagnosis and with regards to the quality and effectiveness of ongoing care from the point of first referral. 1
Clinical testing plays a large role in glaucoma monitoring and, therefore, much research is devoted to examining the relevance, reliability, variability and predictive powers of the various available tests for detection and progression. Standard automated perimetry (SAP), which is used to assess changes in the visual field (VF), lies at the forefront of assessments of visual function in glaucoma and is central to clinical management. Rates of VF progression in clinical populations can vary widely between patients; therefore, timely detection of progression requires accurate and consistent monitoring of the VF over time. Nevertheless, some evidence suggests a lack of consistency in terms of the rate of VF monitoring between clinics. 3,4 In 2009, guidelines for glaucoma published by the National Institute for Health and Care Excellence (NICE) highlighted a lack of evidence about how often patients with the condition should be monitored. 1 The first question in the report was:
. . . What is the clinical effectiveness and cost effectiveness of using different monitoring intervals to detect disease progression in people with glaucoma who are at risk of progression? . . .
The guidelines subsequently called for further research in this area, in order to form optimal recommendations for disease monitoring intervals. Some recent studies have attempted to address this dilemma by trying to identify practical recommendations for measuring clinically relevant rates of glaucomatous VF progression. A notable study by Chauhan et al. 5 demonstrated that the ability to detect the rate of VF change will depend on the variability of mean deviation (MD; an index of defect severity, measured in dB) over time, the number of examinations and the degree of change wished to detect. They concluded that, for a patient demonstrating average measurement variability, three examinations per year would be required to detect a change in MD of 4 dB over 2 years. This finding is supported by earlier research demonstrating that three examinations per year are needed to provide a good statistical compromise between sensitivity and specificity. 6
The evidence from these studies has subsequently informed current guidelines set by the European Glaucoma Society (EGS)7 recommending that newly diagnosed patients undergo VF testing six times in the first 2 years of their follow-up care in order to gain a more accurate depiction of the rate of progression. These guidelines complement current recommendations by NICE that the interval between VF tests should be between 2 and 6 months for newly diagnosed patients, and between 6 and 12 months for stable follow-up. However, NICE does not stipulate the period for which such monitoring should be maintained.
Objectives
This study aims to ascertain the current practice of VF testing for monitoring patients with glaucoma in England, and to evaluate this practice in relation to the EGS and NICE guidelines. Specifically, the study will test the hypothesis that follow-up intervals are highly variable in the clinic.
Methods
Participants
To estimate current clinical practice for the frequency of VF monitoring, a cross-sectional review of all patients with COAG attending specialist glaucoma clinics at UK hospitals was performed. Six hospitals in England were identified for the study to ensure good geographic coverage and there was even representation from district secondary units and tertiary centres. The participating hospital units were Calderdale and Huddersfield NHS Trust, Gloucestershire Hospitals NHS Trust, Norfolk and Norwich University Hospital NHS Trust, North Middlesex University Hospital NHS Trust, Southport and Ormskirk NHS Trust, and Portsmouth Hospitals NHS Trust. Consultant ophthalmologists with a subspecialist interest in glaucoma from each unit were invited to participate in the study.
All patients with COAG seen in specialist glaucoma clinics in the participating hospitals during the last week of January 2012 were included in the study, with their case records reviewed retrospectively. Patients were excluded from the study if they had undergone laser or ophthalmic surgery within 6 months prior to the day of their clinic visit.
Data collation and classification
Data including patient demographics, best corrected visual acuity (BCVA), stage of disease, intraocular pressure (IOP), frequency of VF testing (number and interval of tests) and planned monitoring interval were recorded using a standardised pro forma that was first piloted in each hospital before the final amended version was used. In addition, the clinician’s opinion on IOP stability, the clinical interpretation of VF, optic nerve head (ONH) appearance and overall disease stability were also recorded. The clinicians were given a selection of possible responses, which are displayed in Table 1. It is worth noting that the clinicians were deliberately unaware as to the purpose of the investigation in order to avoid alterations in behaviour in line with the study aims. The investigators, who were either specialist trainee doctors or optometrists, were also given written instructions about the pro forma to ensure consistency across the collected data.
| Question | Possible responses | |||
|---|---|---|---|---|
| Is the IOP on target? | IOP on target | – | IOP high | Not recorded |
| Is the VF defect progressing? | VF stable | Unsure, further observation required | VF progressing | Not recorded |
| Does the ONH appearance indicate progression? | ONH stable | Unsure, further observation required | ONH progressing | Not recorded |
| Is the patient’s overall condition progressing? | Overall stable | Unsure, further observation required | Overall progressing | Not recorded |
The VF was measured using the Humphrey Field Analyzer (HFA; Carl Zeiss Meditec, CA, USA). Estimates of the patient’s VF defect severity were gained using the MD value on the VF output. MD (dB) is a standard age-corrected clinical measure of the overall severity of VF loss, with more negative values indicating greater VF loss. Patients were also classified into different stages of disease based on the Canadian Ophthalmological Society (COS) glaucoma guidelines,8 with early disease defined as vertical cup to disc ratio ≤ 0.65 ± mild VF defect; moderate disease as vertical cup to disc ratio 0.7 to ≤ 0.85 or VF defect not involving 10° of fixation; advanced disease as vertical cup to disc ratio > 0.9 and/or VF defect within 10° of fixation. For ease of comparison, data were analysed based on worse-eye status for each patient, i.e. if the right eye of a patient had a higher IOP and more advanced disease than the left eye, the data for the right eye were used in analyses on the basis of IOP status. The monitoring interval was defined as the time assigned to the next VF examination (with or without ONH examination); if a VF test was not specifically booked, it was assumed that the next recorded appointment would include a VF test.
Analysis
All data were anonymised prior to analyses. Statistical analyses were carried out using the open-source environment, R 3.0.1 (The R Foundation for Statistical Computing, Vienna, Austria). The non-parametric Kruskal–Wallis test was used to compare data from different groups, with statistical significance defined as p < 0.05.
Ethics statement
This study was reviewed by the research and ethics committee at each hospital and is compliant with the Declaration of Helsinki. We certify that all applicable institutional and governmental regulations concerning the ethical use of human volunteers were followed during this research.
Results
Demographics
One hundred and four patients were included in this study; 54% were female. The median age was 77 years [interquartile range (IQR) 70–84 years]. The median time in attendance at the glaucoma clinic for COAG was 5.5 years (IQR 2.0–11.4 years), with 73 patients having at least 2 years of follow-up. The numbers of patients from each individual centre (after excluding glaucoma suspects, ocular hypertensives, secondary glaucoma and those with recent intraocular surgery) were as follows: 13 patients from Calderdale and Huddersfield NHS Trust; 20 from Gloucestershire Hospitals NHS Trust; 19 from Norfolk and Norwich University Hospital NHS Trust; 17 from North Middlesex University Hospital NHS Trust; 31 from Southport and Ormskirk NHS Trust; and four from Portsmouth Hospitals NHS Trust.
Data for right and left eyes were comparable, including BCVA [right eye: mean 0.23 logarithm of the minimum angle of resolution (log-MAR), standard deviation (SD) 0.34 log-MAR; left eye: mean 0.18 log-MAR, SD 0.25 log-MAR], VF mean deviations (right eye: –6.3 ± 8.2 dB; left eye –7.4 ± 7.9 dB) and IOP (right eye 15.4 ± 3.5 mmHg; left eye 15.5 ± 4.1 mmHg). The disease status (COS Glaucoma Guidelines) was also comparable between eyes: in the right and left eye, 28 and 32 cases, respectively, were at an early stage, 51 and 43, respectively, were at a moderate stage and 25 and 27, respectively, at an advanced stage (two patients had lost sight in the left eye).
Worse-eye characteristics are listed in Table 2. One patient had no follow-up details recorded and was excluded from further analysis. Of the remaining patients, 84.5% (87/103) did not have changes to their treatment after the study visit, 15.5% (16/103) had medications adjusted and 1.9% (2/103) were listed for surgery.
| Worse-eye characteristics | Summary values |
|---|---|
| Mean log-MAR visual acuity (SD) | 0.30 (0.35) |
| Severity of glaucoma | |
| Early | 20 |
| Moderate | 50 |
| Advanced | 34 |
| Mean IOP at study visit (SD), mmHg | 16.3 (3.9) |
| IOP status | |
| Adequate | 75 |
| Inadequate | 16 |
| Not recorded | 13 |
| VF MD at study visit (SD), dB | –7.17 (8.55) |
| VF status | |
| Stable | 39 |
| Progressing | 12 |
| Unsure | 7 |
| Not recorded | 46 |
| ONH status | |
| Stable | 60 |
| Progressing | 9 |
| Unsure | 3 |
| Not recorded | 32 |
| Overall clinical impression | |
| Stable | 70 |
| Progressing | 17 |
| Unsure | 5 |
| Not recorded | 12 |
Visual field testing frequency
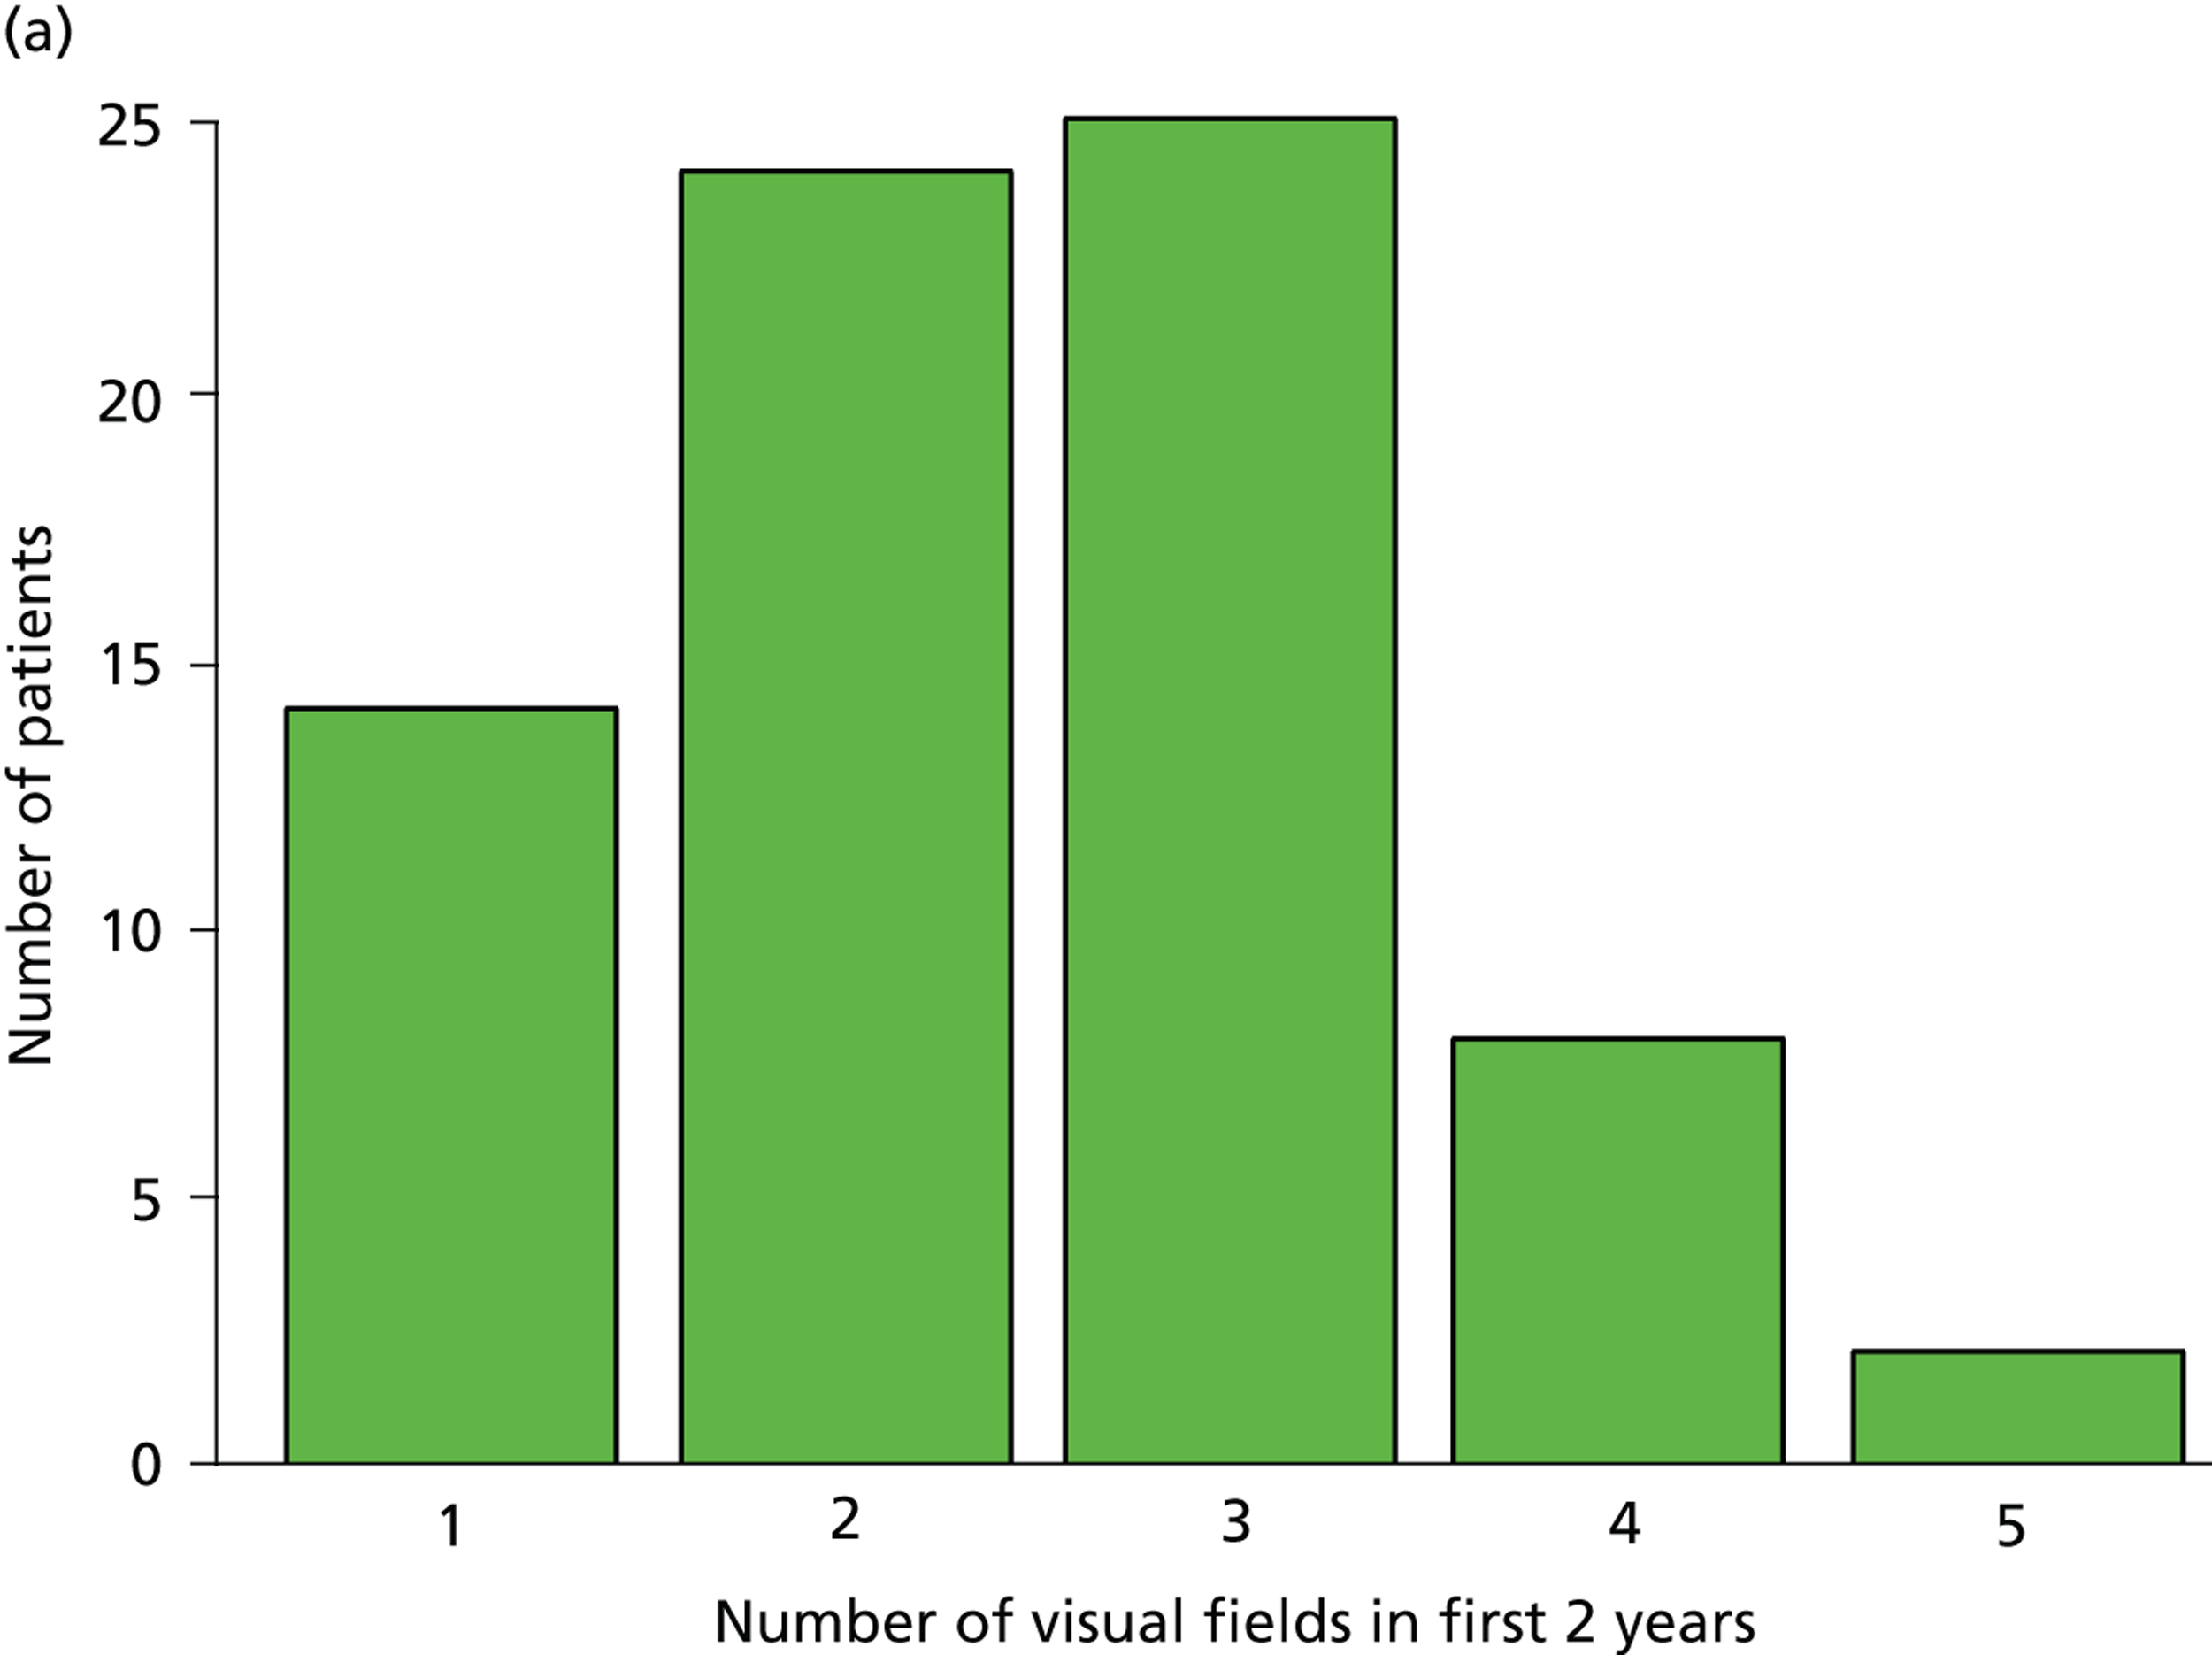
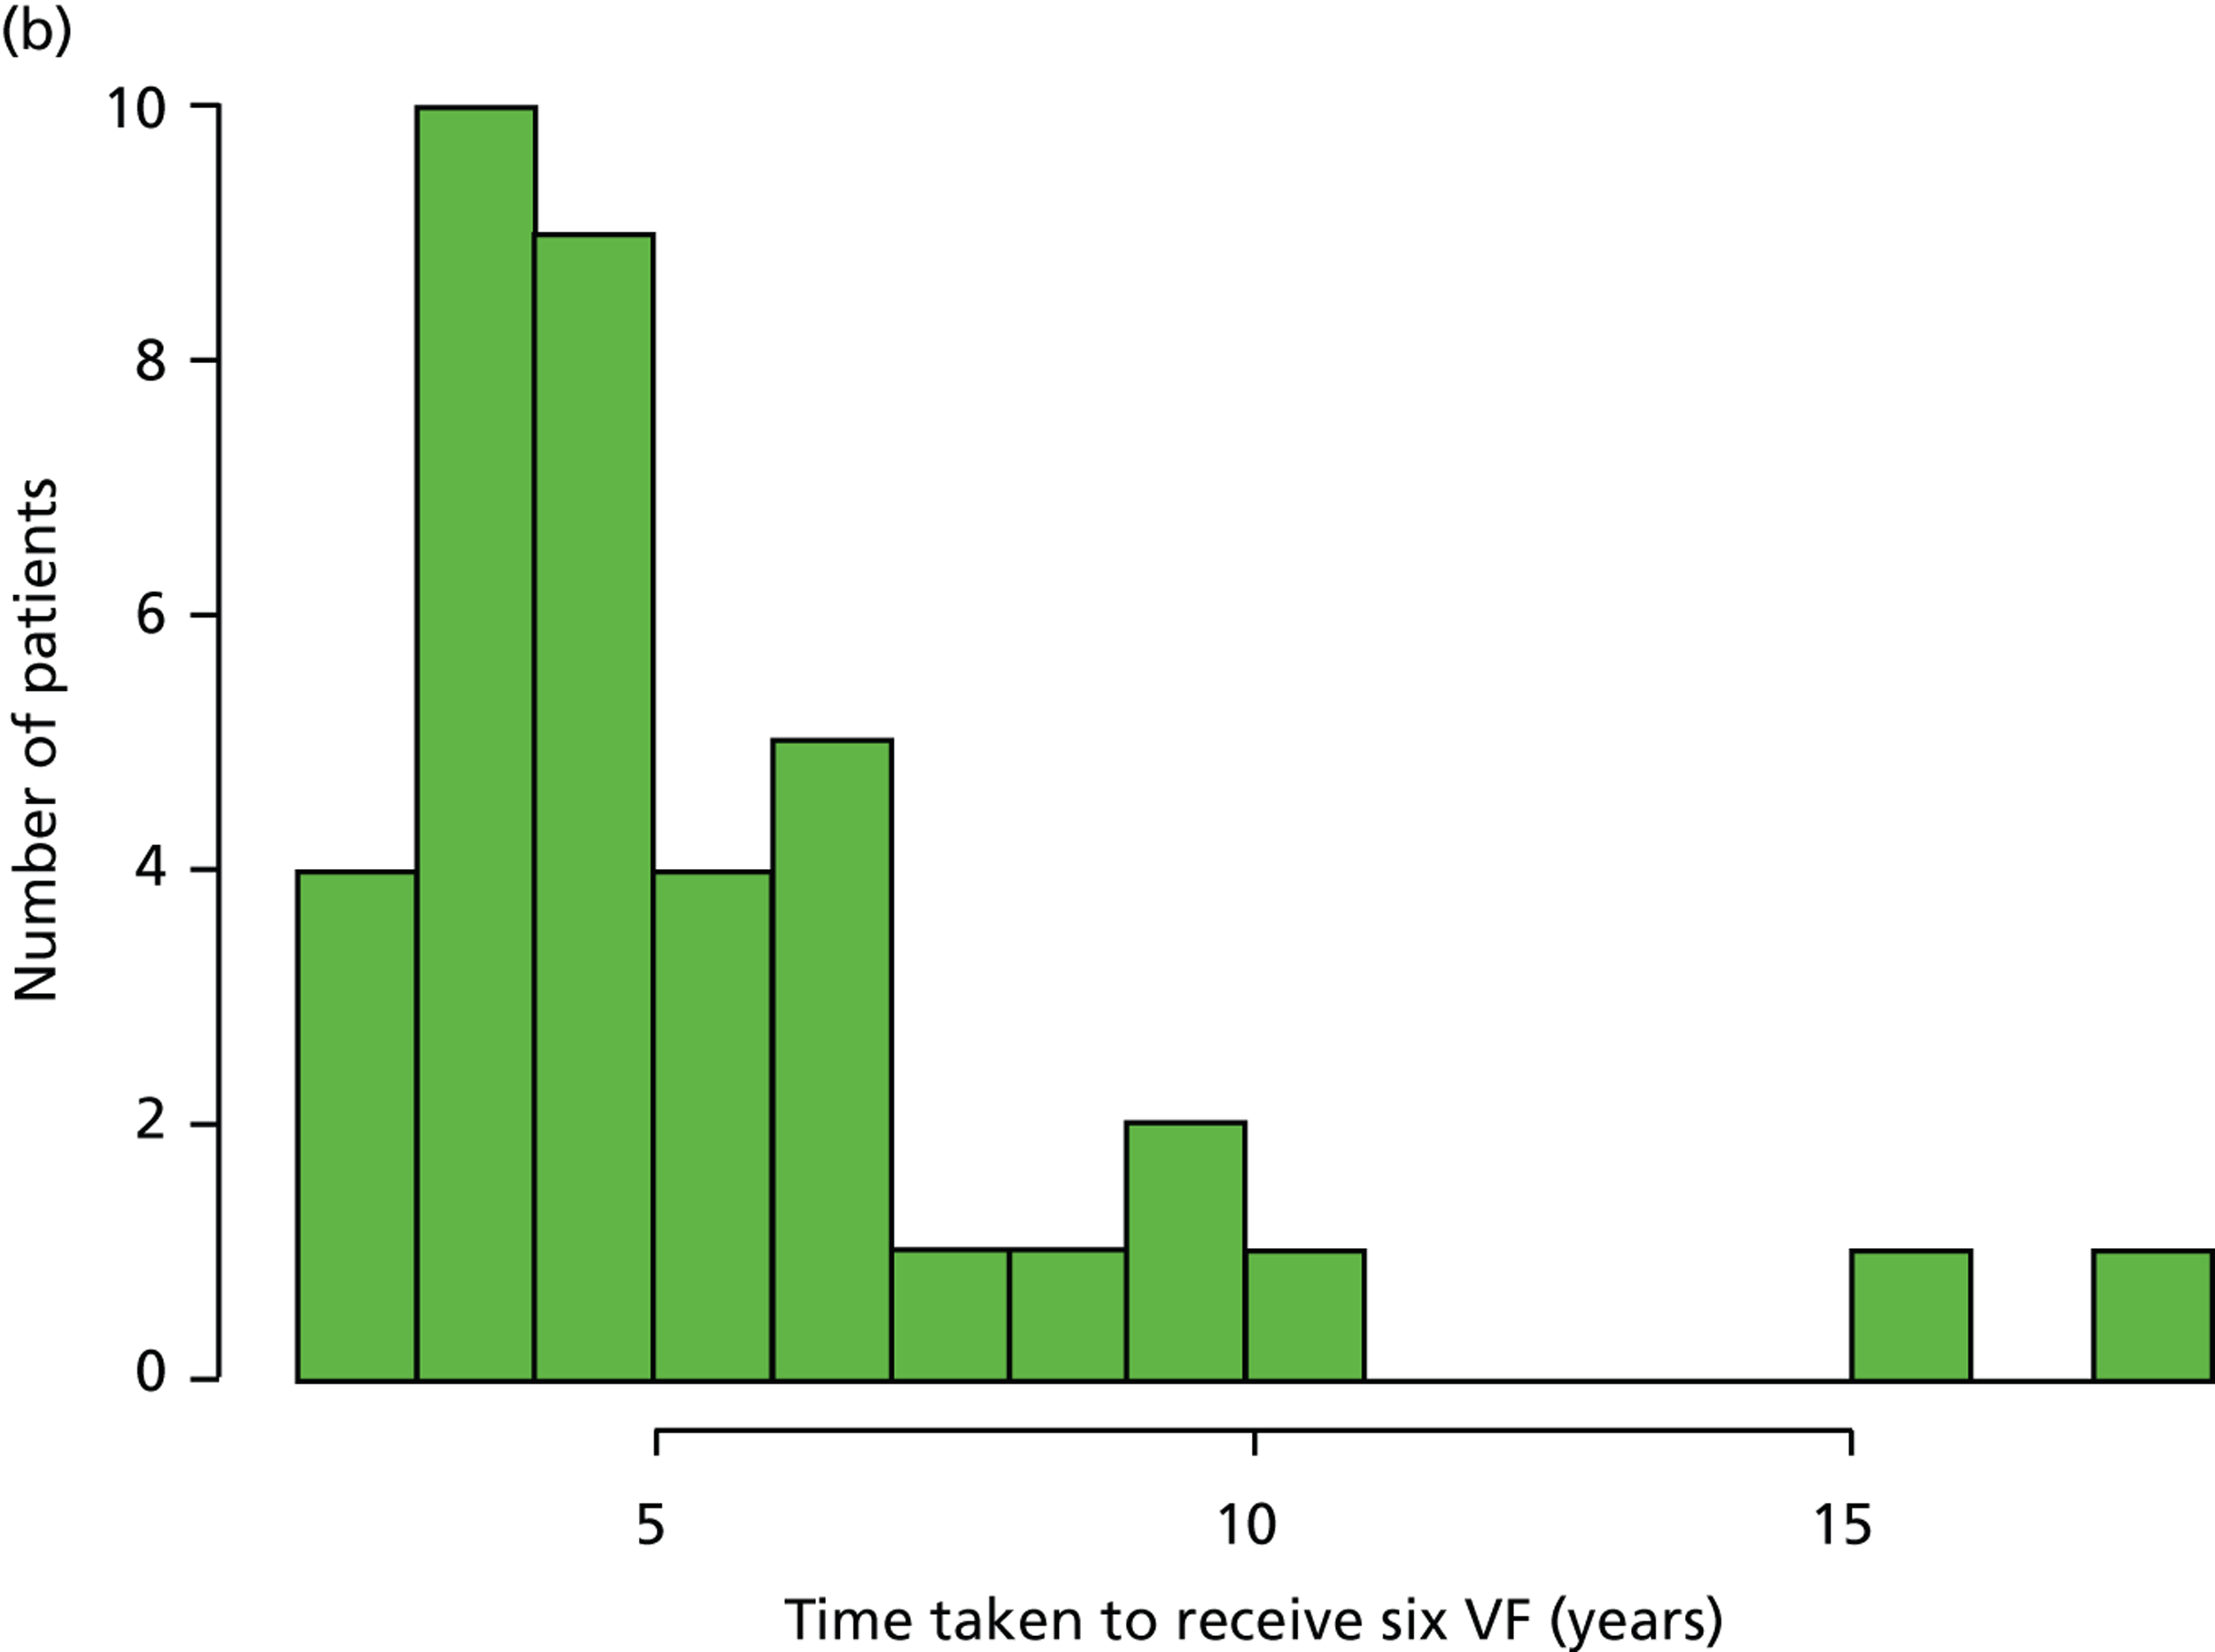
Patients had completed a median of four VF tests (IQR 2–7 VF tests) in total since being diagnosed. This finding equates to 0.7 VF tests per year over the average 7.2 years of follow-up. Within the first 2 years after diagnosis, patients completed a median of two VF tests (IQR 2–3 VF tests), ranging from one to five tests (Figure 1a). Notably, none of the patients met the EGS objective of six VF tests in the first 2 years. The number of patients diagnosed with COAG before publication of the EGS guidelines and Chauhan et al. 5 recommendations (pre 2009) was 69, while 35 patients were diagnosed in, or after, 2009. Thirty-nine patients had completed at least six VF tests during their follow-up, but took a median duration of 4.6 years (IQR 3.7–6.0 years; range 2.2–17.5 years) to achieve this landmark (Figure 1b). No statistically significant relationship was found (using the Kruskal–Wallis test) between the number of VF tests performed and disease stage (early, moderate, advanced), adequacy of the IOP control (adequate, inadequate, not recorded), VF status (stable, progressing, unsure, not recorded), ONH appearance (stable, progressing, unsure, not recorded) or overall stability of the conditions (stable, progressing, unsure, not recorded). These results are summarised in Table 3.
FIGURE 1.
Visual field testing. (a) The number of VF tests performed in the first 2 years in patients with minimum follow-up of 2 years; (b) time taken for patients to receive six VF tests. Adapted by permission from BMJ Publishing Group Limited. [Are practical recommendations practiced? A national multicentre cross-sectional study on frequency of visual field testing in glaucoma. Fung SS, Lemer C, Russell RA, Malik R, Crabb DP. Br J Ophthalmol. 97:843–7. 2013.]9
| Recorded parameters | Median number of VFs (IQR) |
|---|---|
| IOP status | |
| Adequate | 4 (2–7) |
| Inadequate | 2 (1–6) |
| Not recorded | 5 (3–6) |
| ONH status | |
| Stable | 4 (2–7) |
| Progressing | 3 (2–6) |
| Unsure | 5 (3–7) |
| Not recorded | 3 (1–6) |
| Overall clinical impression | |
| Stable | 4 (2–7) |
| Progressing | 3 (1–6) |
| Unsure | 7 (5–7) |
| Not recorded | 4 (3–6) |
| Severity of glaucoma | |
| Early | 3 (2–5) |
| Moderate | 4 (1–7) |
| Advanced | 6 (2–7) |
| VF status | |
| Stable | 5 (3–8) |
| Progressing | 5 (2–7) |
| Unsure | 4 (2–7) |
| Not recorded | 2 (1–5) |
Monitoring intervals
Two patients were scheduled to undergo surgery at the time of the study (one trabeculectomy and one cataract surgery) and thus they were excluded from this part of analysis. Fifty-nine patient records contained details regarding the length of time until the next VF examination, while 43 records specified only the time interval to the next appointment.
The overall median monitoring interval requested at the study visit was 7.5 months (IQR 3.8–8 months). In total, 84.5% of patients had no changes made to their management. When patient outcomes were considered according to NICE-recommended monitoring intervals for complete examination (i.e. including VF testing and ONH examination), 88 out of 101 patients (87.1%) were guidance compliant. Among the patients with non-compliant outcomes, five had be given a longer than recommended interval for IOP monitoring; three patients had longer than recommended VF monitoring intervals, while another three patients had shorter VF monitoring intervals than the NICE recommendations.
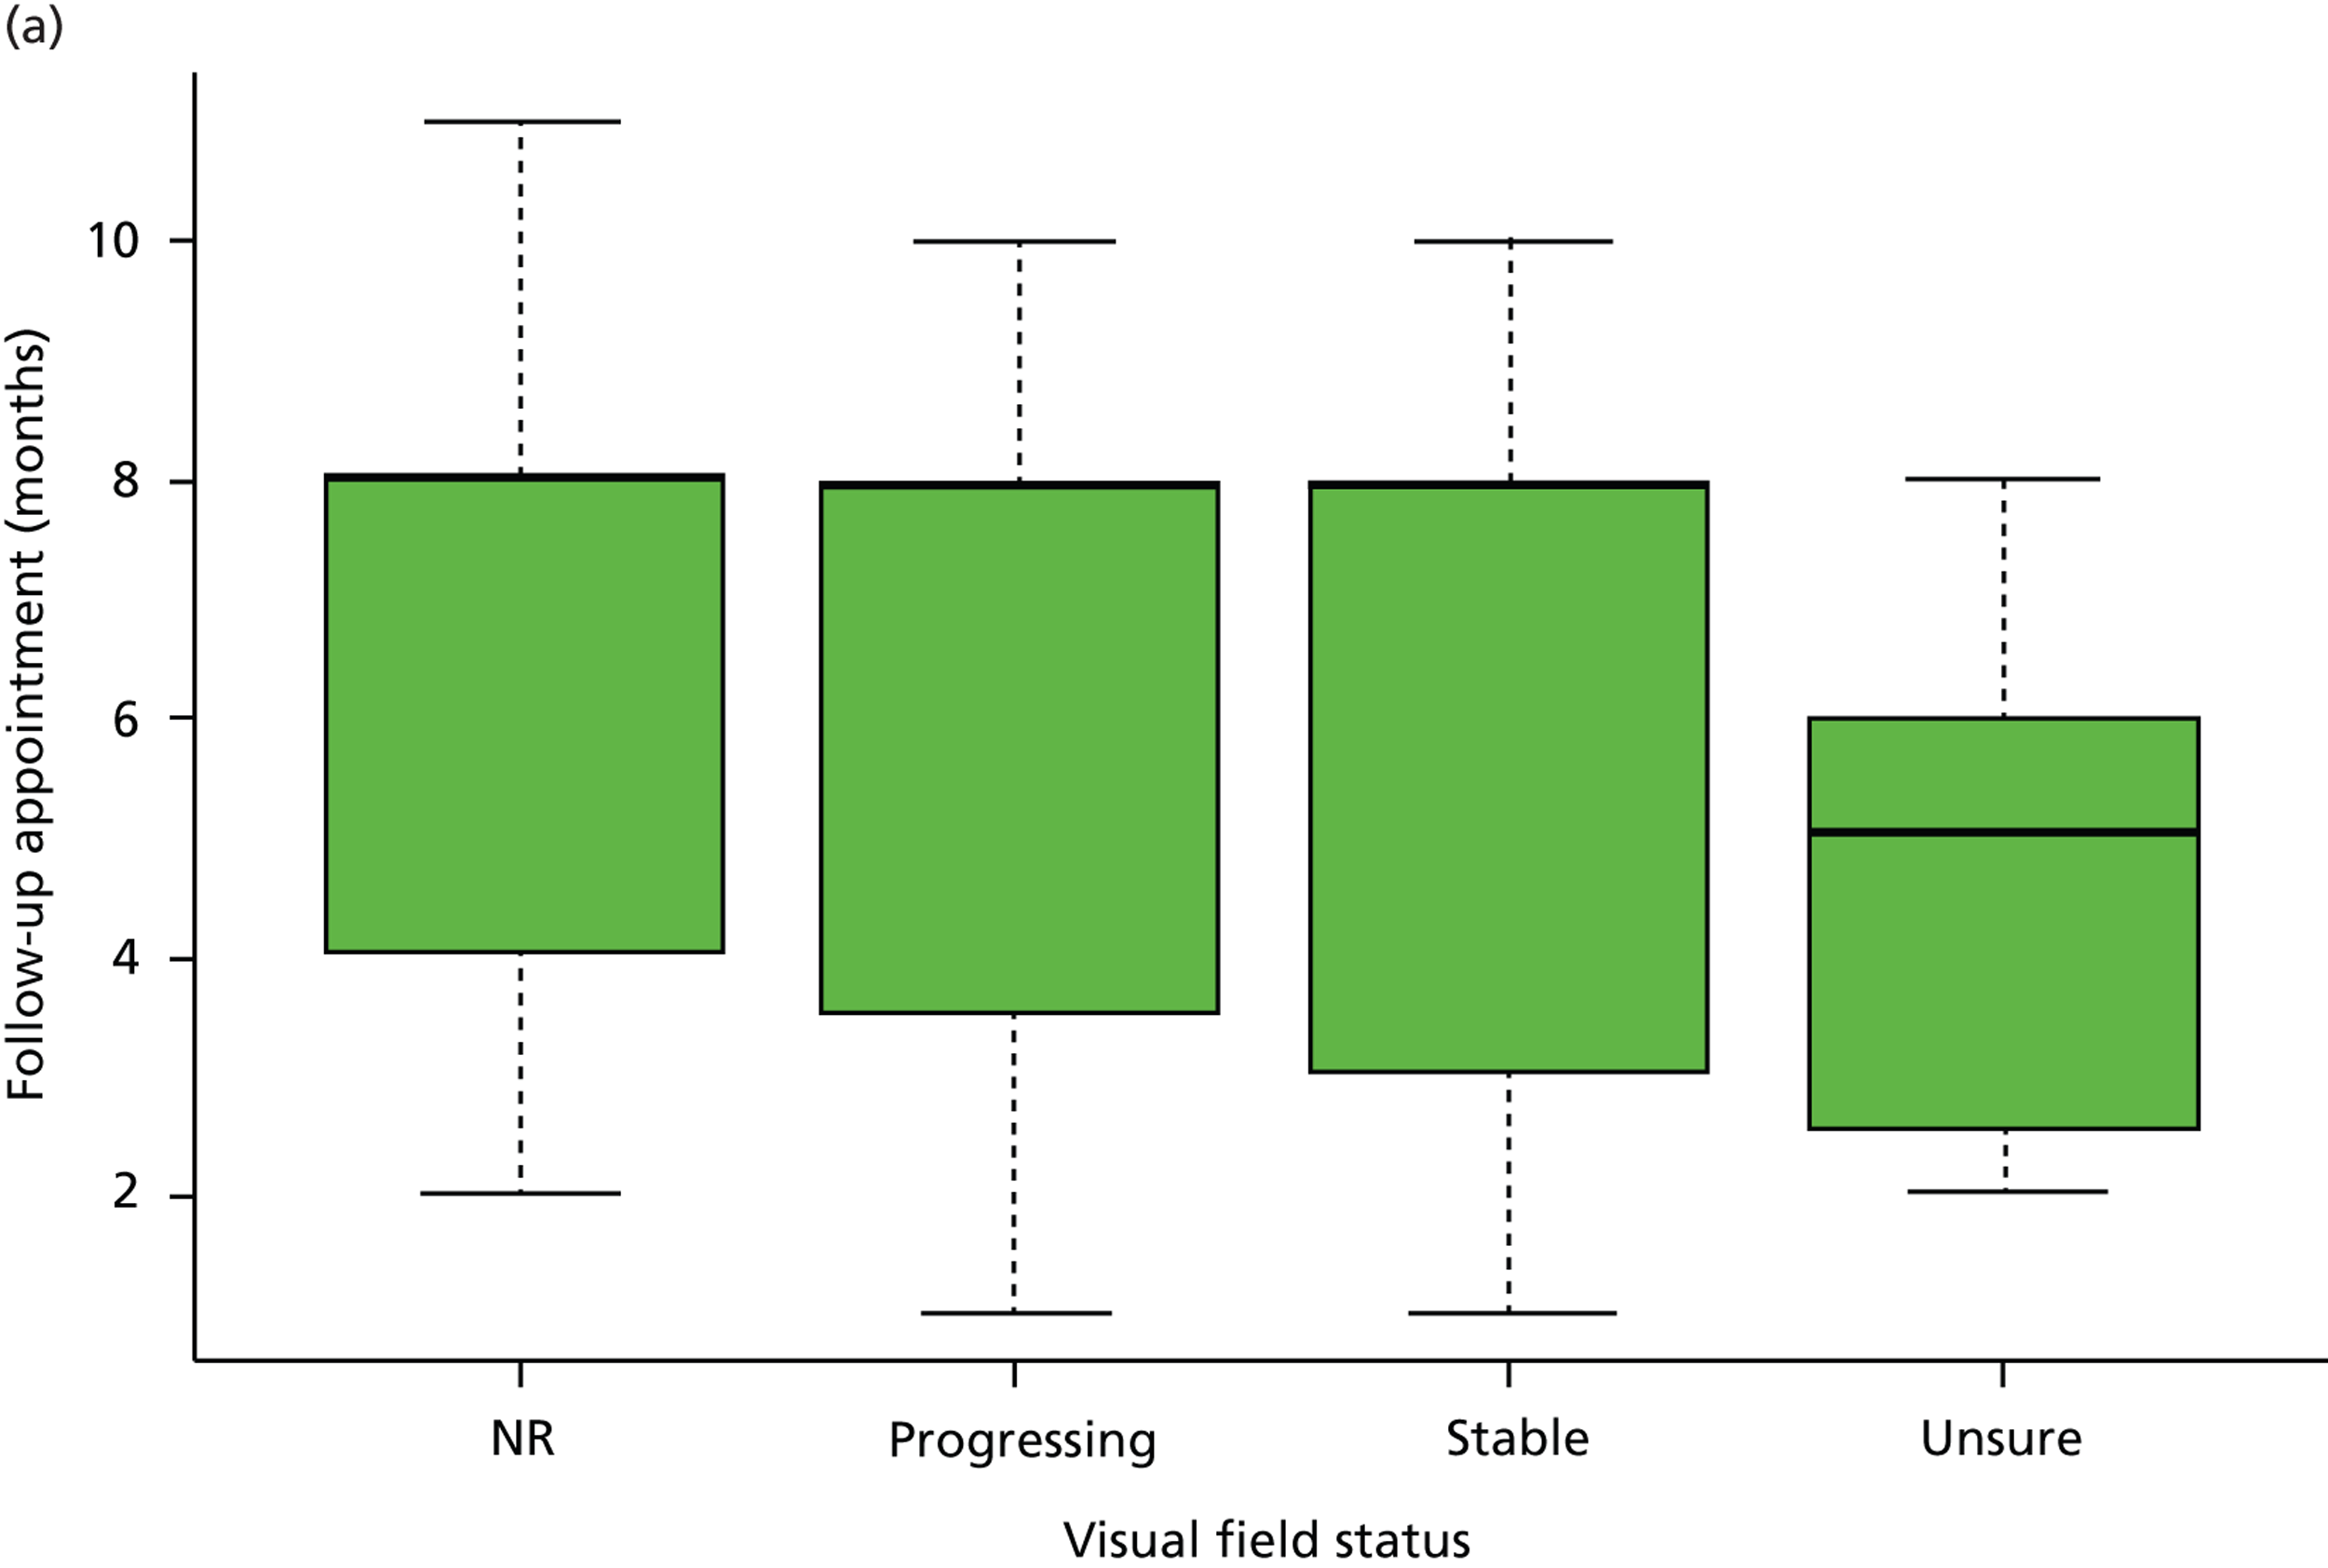
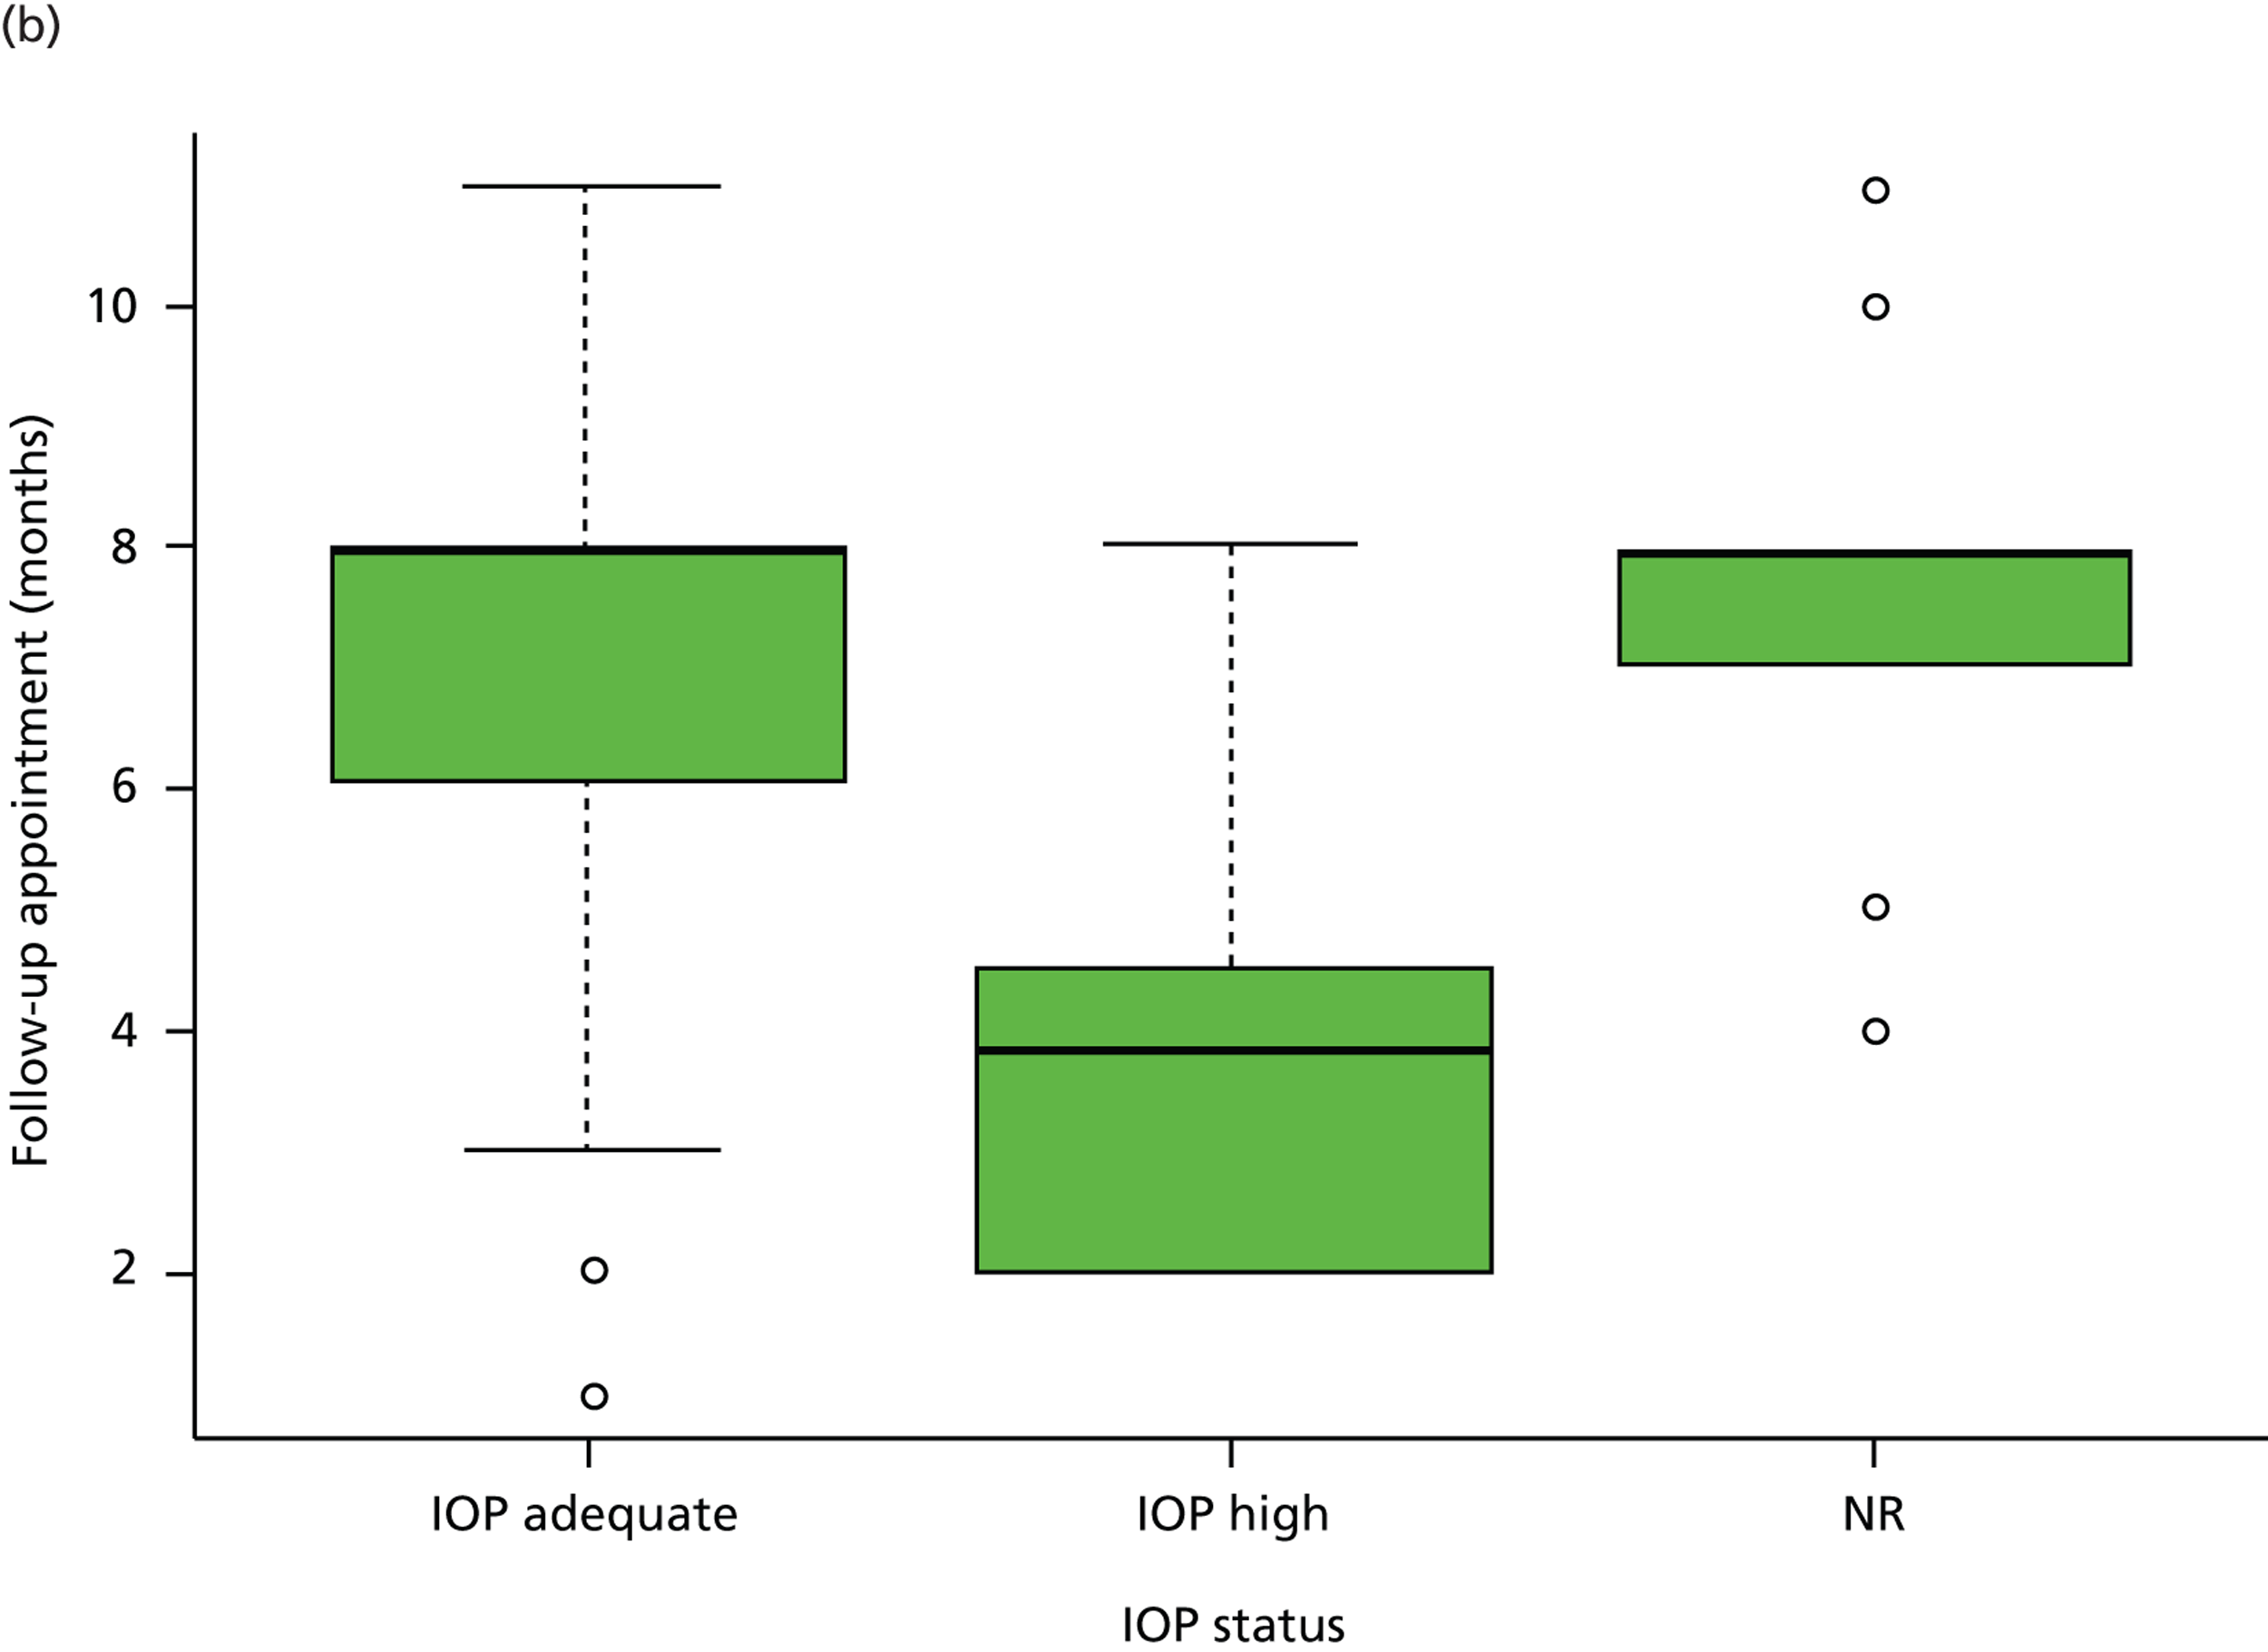
No relationship was found between stability of VF defects (Kruskal–Wallis test, p = 0.25) and the monitoring interval requested. The severity of disease also had no influence on the monitoring interval requested (Kruskal–Wallis test, p = 0.40). The median monitoring interval requested for early, moderate and advanced glaucoma was 7 months (IQR 3–8 months), 8 months (IQR 4–8 months) and 8 months (IQR 4–8 months), respectively, while the median interval requested was 8 months (IQR 3–8 months) for stable VF defects, 8 months (IQR 4–8 months) for progressing VF defects, 5 months (IQR 3–6 months) for uncertain VF progression and 8 months (IQR 4–8 months) for those with no comments on VF status (Figure 2a). In contrast, monitoring intervals were significantly shortened when patients had inadequate IOP control or when the overall clinical impression was disease progression (p < 0.001 and p < 0.001, respectively). The median monitoring interval was 8 months (IQR 3–8 months) for patients with adequate IOP control, 4 months (IQR 2–5 months) for those with inadequate IOP control and 8 months (IQR 7–8 months) for patients with no comments on IOP control (Figure 2b). For the overall impression of disease status, the median monitoring interval was 8 months (IQR 4–8 months) for stable patients, 4 months (IQR 2–5 months) for patients with disease progression, 6 months (IQR 4–6 months) for those with uncertain status and 6 months (IQR 5–8 months) for those with no comments on overall status.
FIGURE 2.
Patient monitoring in relation to clinical findings. (a) Follow-up interval by VF status; (b) follow-up interval by IOP status. (Horizontal lines represent medians. Boxes represent 25% and 75% quartiles. Each whisker extends 1.5 times the IQR and outliers are represented by dots.) NR, not recorded. Adapted by permission from BMJ Publishing Group Limited. [Are practical recommendations practiced? A national multicentre cross-sectional study on frequency of visual field testing in glaucoma. Fung SS, Lemer C, Russell RA, Malik R, Crabb DP. Br J Ophthalmol. 97:843–7. 2013.]9
This audit has its limitations. It is assumed that the six units sampled are representative of national practice. Being a cross-sectional study, sampling bias is an inherent issue. Furthermore, for each centre, the patients sampled during the study week is assumed to be representative of the general population of COAG patients seen in that unit. The number of patients from Portsmouth was only four, which is not comparable to other participating centres. However, out of the 32 patients seen in Portsmouth during the study week, 28 patients did not meet the study inclusion criteria (17 had a diagnosis other than COAG and 11 had recent intraocular surgery). It is also worth noting that patients requiring more intensive control are more likely to be included in the study, and so there are likely to be a higher proportion of patients with poor IOP control (and advanced glaucoma severity) than patients with adequate IOP control in the study population. However, this is likely to make the sample representative of the distribution of patients (in terms of proportions with different IOP control and disease severity) seen in the clinic annually. In addition, clinical note taking was often poor or incomplete; several patient records contained no comments on adequacy of IOP control, VF status or overall disease status. Inevitably with any retrospective analysis of patient records, it is difficult to draw certain conclusions, since notes are often made by multiple clinicians with varying levels of expertise. Where available, the clinician’s comments regarding optic disc and/or VF progression were assumed to be documented and an accurate representation of the patient’s clinical state in each case.
Conclusions
The results from this retrospective, multicentre cross-sectional study demonstrate that no patients received the frequency of VF testing recommended by Chauhan et al. 5 and the EGS guidelines (six VFs in the first 2 years). Instead, patients typically had only two or three VF tests in the first 2 years following diagnosis, typically taking more than 4 years on average to reach six VFs. While recommended monitoring intervals were considered as NICE compliant, it is worth noting that the intervals given by NICE are fairly wide (the permitted interval spans 2 to 6 months or 6 to 12 months), and suggested intervals were dependent on disease severity and IOP relative to target IOP. Indeed, NICE has recognised the current lack of evidence regarding the frequency of monitoring intervals for patients with glaucoma and recommended future research in this area of study to substantiate current practice. 1 From a health-care planning perspective, it is important to acknowledge that the cost of glaucoma management increases substantially with the severity of visual loss. 10,11 Therefore, there is a strong rationale for frequent monitoring from an early stage to detect rapidly progressing patients. However, a large number of patients will have stable treated disease and so there will also be cost implications for carrying out more tests than necessary. These results inform further studies regarding the effect of VF testing intervals on patient outcomes and cost-effectiveness. In addition, these findings open up the path for subsequent research into the types of factors affecting VF test frequency for newly diagnosed COAG patients in the first 2 years of follow-up.
Chapter 2 A survey of attitudes of glaucoma subspecialists in England and Wales to visual field test intervals in relation to National Institute for Health and Care Excellence guidelines
Background
Given that COAG accounts for a major proportion of ophthalmology workload, with an estimated 1 million outpatient visits in the UK taking place every year,1 the frequency of VF testing undoubtedly has important implications for resource management and service delivery, as well as cost in the outpatient setting. The frequency of VF tests over a given period for a patient with COAG is ultimately governed by the clinician’s estimate of the likelihood and speed of progression of disease, which, in turn, may depend on the level of IOP control, and stage of disease as well as other factors such as the age of the patient and degree of VF reliability. Test intervals are essentially a risk–benefit trade-off: an interval which is too long may allow timely detection of progressive VF loss to be missed, while multiple tests at short test intervals in patients at low risk of progression may mean unnecessary extra visits and use of hospital resource.
As discussed in the previous chapter, there are limited published guidelines available regarding the expected frequency of VF testing. Results from statistical modelling suggests that six VF tests in 2 years (i.e. approximately one every 4 months) in newly diagnosed patients may be necessary to allow detection of patients who may be progressing ‘rapidly’ in terms of VF loss. 5 The EGS therefore recommend that newly diagnosed patients receive six VF tests during the first 2 years of glaucoma follow-up. 7
Nevertheless, the audit described in the previous chapter demonstrated that the majority of newly diagnosed patients are not receiving the recommended number of VF tests in the first 2 years following diagnosis. It is worth noting that the ‘six VF tests in 2 years’ approach implies that a patient doing well under treatment receives the same number of tests as a patient heading for blindness. Ultimately, it is the clinician who drives decision-making as to how often VF tests take place. A subsequent study was therefore designed to establish the attitudes of glaucoma subspecialists to the frequency of VF testing and sought to investigate perceived barriers to frequent VF testing of patients with glaucoma.
Methods
Survey population
A five-item questionnaire was administered to all UK glaucoma specialists (n = 150) by two methods to ensure maximum response: (1) by hand at the UK and Eire Glaucoma Society (UKEGS) meeting in December 2011 in Manchester or (2) by post in February 2012. Each participant was required to self-complete the questionnaire and return it to the experimenters anonymously. The glaucoma consultants were identified using a list provided by the Royal College of Ophthalmologists. All identified UK glaucoma specialists received the questionnaire by post; however, those who had already participated in the study at the UKEGS meeting were requested not to respond again.
Survey design
There were five items in the questionnaire. Questions 1–3 of the survey were used to gather information about the grade and location of work (England and Wales) of the responders and to identify consultants with a subspecialist interest in glaucoma. Question 4 described three distinct situations designed to simulate common clinical scenarios. For patients with COAG who were being monitored on treatment and attending for a follow-up assessment, responders were asked to assign typical follow-up assessment intervals for a patient with IOP deemed to be at (or below) ‘target IOP’ and with:
-
no evidence of VF progression and no change in treatment
-
evidence of VF progression and change of treatment
-
uncertainty about VF progression and no change of treatment.
These scenarios were chosen to reflect the clinical situations which have been given by NICE. Follow-up intervals of 6–12 months for the first scenario and 2–6 months for the last two have been recommended by NICE.
The last question, question 5, was open-ended and specialists were asked about their views about the research that has suggested that all newly diagnosed patients would benefit from six VF examinations (every 4 months) in the first 2 years of follow-up from diagnosis in order to identify rapidly progressing patients.
Ethics statement
This study was reviewed and approved by the City University London School of Health Science Research and Ethics committee.
Analysis
All responses were anonymised and combined to form a single data set.
For each of the patient scenarios in question 4, the follow-up interval given by each responder was compared with the NICE-recommended intervals. The proportion of responses (with either the minimum or maximum interval) lying outside the NICE-recommended intervals were computed.
For question 5 (whether or not six VF tests should be performed in the first 2 years for newly diagnosed patients), responses were classified into five categories for the ease of reporting: ‘agree’, ‘disagree’, already represents ‘current practice’ locally, ‘not possible’ and possible ‘alternatives’ to this practice.
Results
The questionnaire was returned by 70 consultant ophthalmologists currently employed in England and Wales, with a self-declared specialist interest in glaucoma. For the clinical scenarios listed in question 4 for a hypothetical patient with ‘target’ IOP, 14 (20%) of responders gave follow-up intervals outside those recommended by NICE when the patient was said to show no evidence of VF progression and no change in treatment (scenario a). For clinicians asked to assign follow-up intervals for the hypothetical patient who showed evidence of VF progression and no change in treatment (scenario b), 33 (47%) responses fell outside the recommended intervals. Twenty-eight (40%) responders assigned follow-up intervals different to the NICE recommendations for a hypothetical patient showing uncertain VF progression and no change in treatment (scenario c). [The width of the 95% confidence interval (CI) associated with these estimates, with n = 70, is about ± 12%.]
Question 5 was answered by 57 out of the 70 specialists. Nearly half of these specialists (26/57, 46%) agreed that six VF tests in the first 2 years was ideal practice (Figure 3), but admitted that the practicalities of this would be challenging. Example responses that fell in this category included:
Agree but practical issues found in a busy glaucoma clinic may be a hurdle to achieve this target.
FIGURE 3.
Summary of views of responders to the suggestion that six VF tests should be performed in the first 2 years for a newly diagnosed patient with primary open-angle glaucoma.
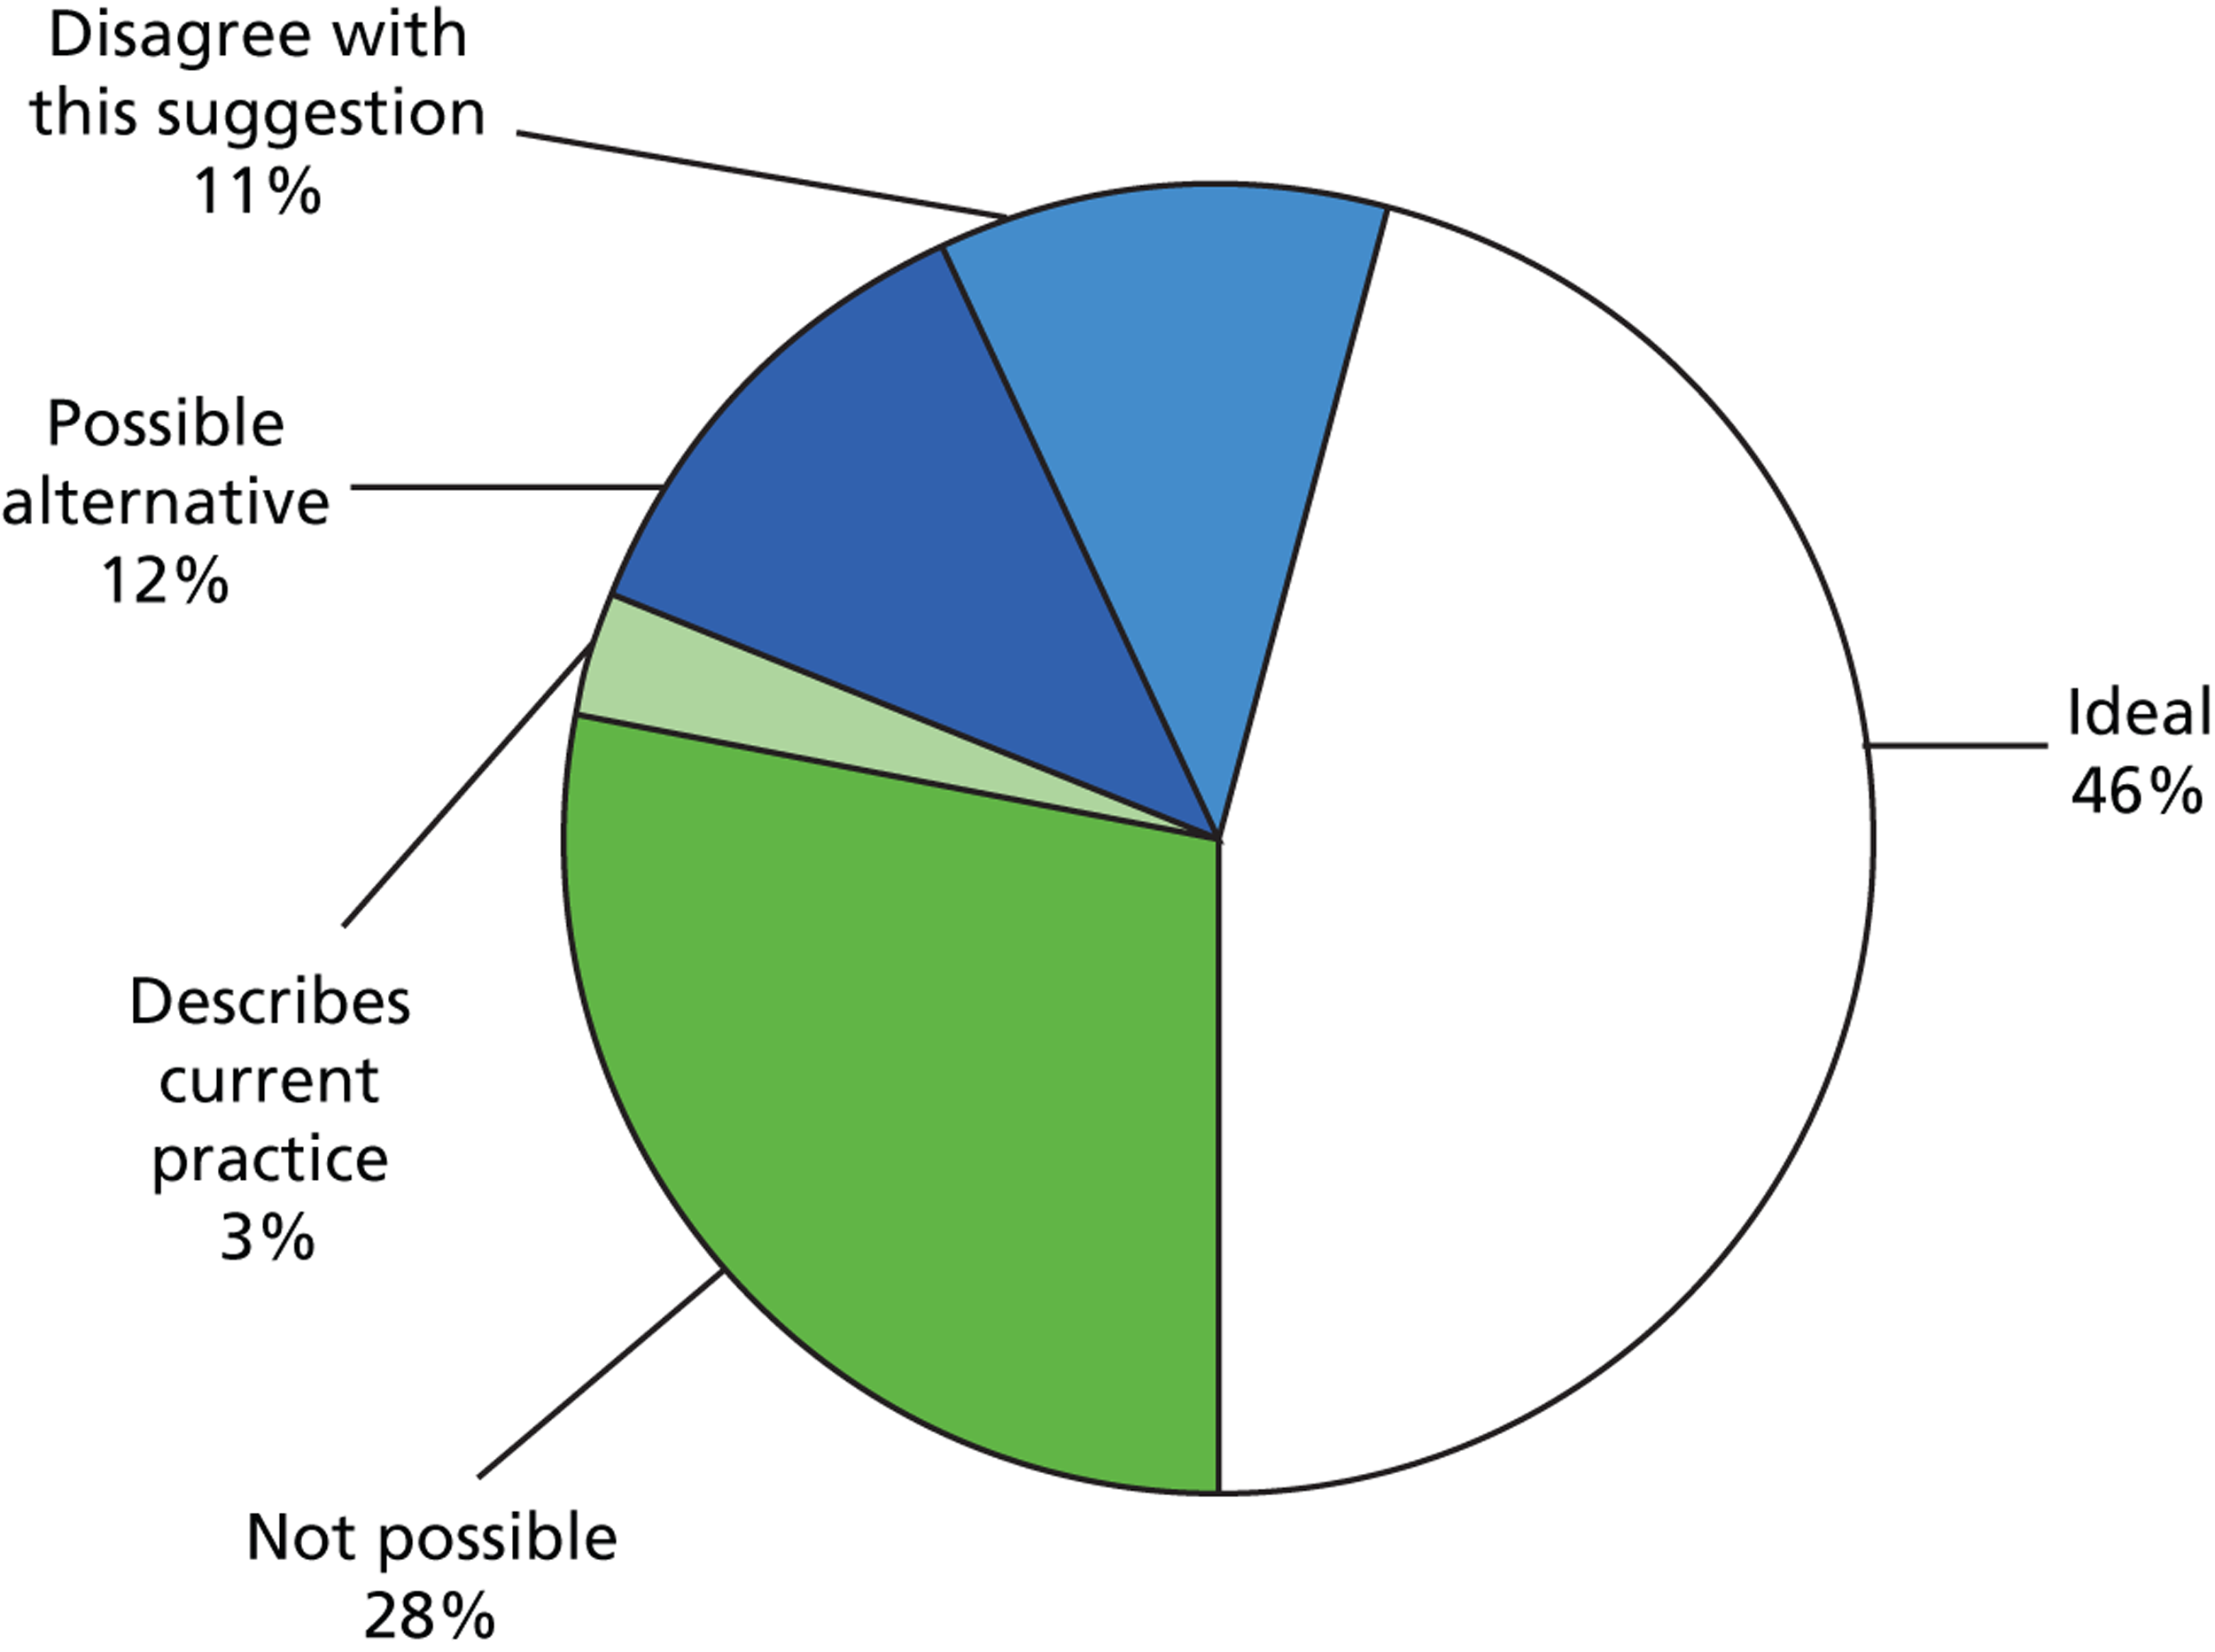
Two delegates (3%) indicated that this was already their current practice. Six specialists (11%) disagreed with the suggestion of six VF tests, while 16 (28%) said this was ‘not possible’, again listing limited ‘capacity’ or resources as a constraining factor. (The width of the 95% CI associated with these estimates, with n = 57, is about ± 15%.) Examples of responses that fell in the latter category included:
Totally out of touch with what is possible in the current NHS clinics with such limited capacity.
A few alternatives were suggested to six VF tests, including alternating imaging and VF tests for detecting progression. For example, one responder stated:
Instead of function tests, structural ones: GDx/OCT [scanning laser polarimetry/optical coherence tomography] would be better . . .
A limitation of this and all studies of this nature is the response rate. An assumption has been made that responses from the surveyed consultants are representative of subspecialist national practice in England and Wales. There are approximately 150 consultant ophthalmologists in the England and Wales with a glaucoma subspecialist interest as estimated from a list obtained from the Royal College of Ophthalmologists. Our surveyed population would, therefore, represent nearly half of glaucoma specialists nationally.
Conclusions
The results from this survey suggests that there is a large variation in attitudes to follow-up intervals for patients with glaucoma in the UK, with assigned intervals for VF testing often inconsistent with the guidelines from NICE. Nearly half of glaucoma specialists thought the suggestion of six VF examinations in the first 2 years after diagnosis, as recommended by EGS guidelines, to be ideal practice. However, an equal proportion of those surveyed thought the idea to be impractical, or not possible, in the current health setting.
Chapter 3 Patient views on the frequency of visual field testing for glaucoma monitoring
Background
Guidelines proposed by EGS recommend that six VF tests should be taken in newly diagnosed glaucoma patients within the first 2 years of follow-up. This recommendation is based on research evidence suggesting that this level of monitoring identifies patients with fast progression far quicker than annual testing. 5,6 However, the audit reported in Chapter 1 demonstrated that these guidelines are not being implemented within clinical practice, with patients typically receiving only two VF tests, on average, within the first 2 years of follow-up, and taking an average of 4 years to reach the recommended six VF tests. Furthermore, the results of the survey described in Chapter 2 revealed that VF monitoring intervals assigned by clinicians (for hypothetical patient scenarios) are very variable. While many specialists conceded that better surveillance of the VF would be helpful in managing patients, they viewed the recommendations as impractical in the current health setting. These results suggest that personal attitudes regarding the frequency of testing could play an important role in translating research into practice.
While it is the clinician who ultimately drives decision-making based on his or her estimates of the likelihood and speed of disease progression, establishing the most effective monitoring strategies may also require the input of the patients themselves. This is important because patient and public involvement in research is paramount to health care. 12,13 Wisdom gained anecdotally has, for a long time, suggested that patients dislike the VF test, and one systematic study found that patients rated the VF test poorly in comparison with other vision tests. 14 However, no study has asked patients with glaucoma, in detail, about their perceptions of the VF test and their follow-up care. Care plans that place burdens on patients may result in a reduced willingness to return for follow-up and could compromise the quality of the data obtained that is subsequently relied on during management. 15 It is, therefore, of value to consider their views to help establish the most effective strategies for glaucoma monitoring.
When considering patients’ perspective of their health condition, many studies opt to use questionnaires to quickly gather information about the perceptions of service users. However, this method can be restrictive, and patients may misinterpret the meaning of the question or simply not be given an appropriate opportunity to contribute all their views. Qualitative techniques, such as focus groups, offer an alternative method of gathering information about not only what a patient thinks, but also how they think or why they may hold a particular view. Group interaction encourages participants to explore and clarify individual and shared perspectives, and supports the participation of people who may be reluctant to contribute their views in a more formal one-to-one scenario. 16
Therefore, for the first time, the current study aims to explore patient views and experiences of glaucoma monitoring, via focus groups, particularly with regards to the type and frequency of VF testing.
Methods
Participants
Focus groups took place between May 2012 and January 2013 in the following locations: The Queen Alexandra Hospital, Portsmouth Hospitals NHS Trust, Portsmouth; Norfolk and Norwich University Hospital NHS Foundation Trust, Norwich; and Moorfields Eye Hospital NHS Foundation Trust, London. The study was multicentred to reduce the bias that might come from one geographical area and to encompass health-care trusts in both urban and rural locations. There were two focus groups at each site, with participants randomly allocated to one of the two groups at the corresponding hospital.
To take part, the participant was required to be aged 60 years and over and to be an established glaucoma patient who had been under review for at least 2 years. These criteria were chosen to ensure that participants had had sufficient experience of VF tests as part of their glaucoma follow-up. The study used purposeful sampling, whereby the consultant at each participating eye hospital selected participants who were suitable for the study based on these predetermined criteria. Suitable patients who had given their permission were then contacted by telephone and invited to take part by the research team. A total of 28 participants took part in the study across the six focus groups, and each group consisted of three to six patients with glaucoma.
Procedure and topic guide
A topic guide (available by request) was devised prior to beginning the study outlining question areas regarding general glaucoma care, leading on to more specific questions about experiences of the VF test in general, opinions about VF test frequency and suggestions for the future. The study topics were informed partially by an initial pilot exercise involving a small group of patients with glaucoma, who also provided additional verbal and written information about their experiences. The questions were broad, open and ‘non-leading’. Prompts were used to introduce topic areas and encourage respondents to elaborate; however, the onus was on the participants to supply the overall content of the discussion. In cases where the discussion went substantially off-topic, or one participant was dominating the discussion, the interviewer would reflect back to a previous topic and encourage other participants to contribute their views.
Prior to the study, participants were informed that they would be involved in ‘an open discussion about glaucoma care’, but were unaware of the desired emphasis on VF testing frequency. All focus groups were conducted by one of the authors (HB), a postdoctoral researcher who had prior experience of qualitative research involving patients with glaucoma. 17,18 The interviewer and participants had no prior knowledge of each other in a clinical or personal context, so each focus group began with general introductions to allow participants to become familiar with one another. Some field notes were taken during the sessions to aid later interpretation of the data, although note-taking was purposely minimal so that the interviewer could be fully attentive to the discussion. The focus groups lasted between 60 and 75 minutes.
The study was designed and reported in light of the Consolidated Criteria for Reporting Qualitative Research (COREQ) for interviews and focus groups. 19
Ethics statement
The study received approval from a UK NHS National Research Ethics Service (NRES) committee and was approved by research governance committees of the participating institutions. The study conformed to the Declaration of Helsinki and written consent from all participants was obtained prior to the start of each focus group.
Analysis
All focus groups were audiotaped. The dialogue from the audiotapes was later transcribed and reviewed by the investigators. Field notes were used to account for any information missed or incorrectly reported in the transcripts as a result of interfering factors, such as excessive background noise.
Data were analysed by two of the authors (HB and FCG) independently using the framework technique displayed in Table 4. Each investigator read and reread the transcripts, and manually identified the key themes from the data in addition to some key quotes to illustrate the main points. Note that one of the authors (FCG) was blind to the purpose of the study at the point of analysis. The qualitative software package NVivo 10.2 (QSR International, Cambridge, MA, USA) was used to help organise the thematic framework by refining and condensing the predefined categories and to also identify additional themes for exploration. Any differences of opinion regarding the meaning of sentences or the importance of themes were later discussed until a consensus was reached.
| Framework technique | ||
|---|---|---|
| 1. | Familiarisation | Reading and rereading the transcriptions |
| 2. | Identifying a thematic framework | Condense data into categories |
| 3. | Indexing | Codes systematically applied to the data |
| 4. | Charting | Rearranging the data according to the thematic content in a way which allows for a cross-case and within-case analysis |
| 5. | Mapping and interpretation | Interpretations and recommendations |
Results
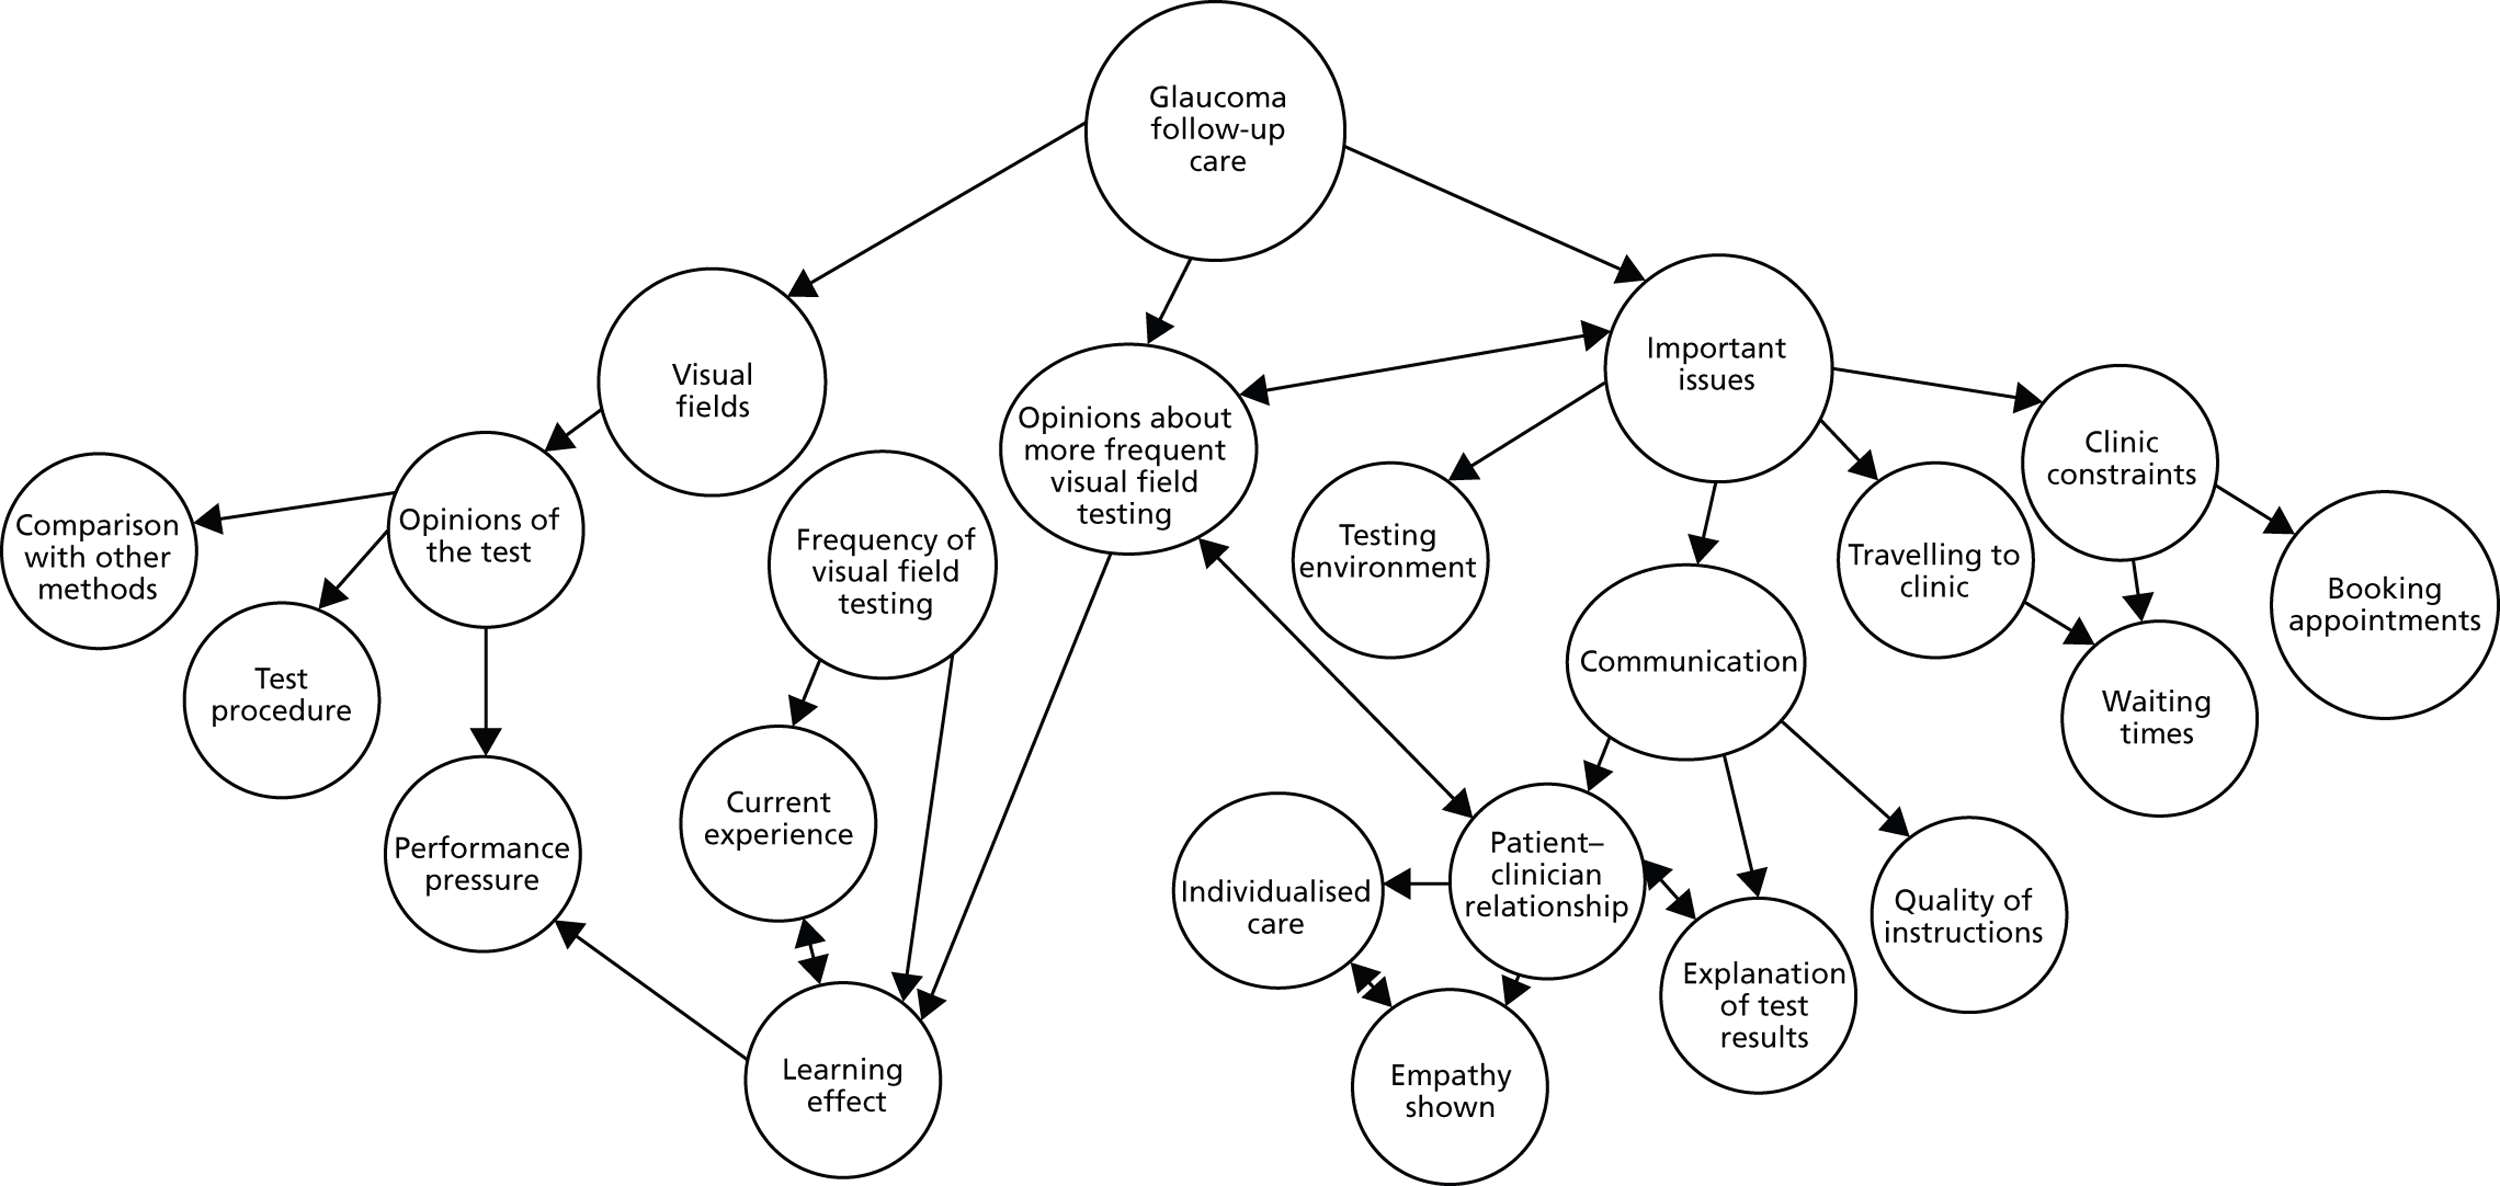
Data were initially indexed according to themes central to the main research questions, such as opinions of the VF test, current experience regarding the frequency of VF testing and opinions about more frequent VF testing. However, throughout the analysis a number of additional themes emerged, often with their own subthemes. These generally related to specific areas perceived to affect the follow-up experience, and included points relating to clinical constraints (waiting times, booking appointments), travel to the clinic, the testing environment and aspects of patient–clinician communication. Figure 4 summarises the key themes and subthemes that emerged from the analysis.
FIGURE 4.
Coding tree showing main themes and subthemes that emerged from the analysis, and how the categories relate to each other.
Direct quotes were taken from the transcripts and were chosen to illustrate the key themes that emerged from the focus groups. Excerpts are annotated with a pseudonym for the corresponding participant based on their gender [male (M) or female (F)] and the order in which they spoke in the interview. The location of the focus group and the session number (1 or 2) are also shown for each quote.
Visual fields
Patients expressed a general dislike for the VF test. They found the test long, old-fashioned and tiring and found it hard to concentrate throughout the test.
Well the reason why I don’t like them: I don’t like the dark, I don’t like confined spaces and I don’t like having one eye closed and having to concentrate, even if it’s for just a couple of minutes, because then my mind wanders . . .
F1, Portsmouth 1
It seems a bit antiquated, pressing the buttons . . . it doesn’t seem positive enough to me.
F3, Norwich 2
Many put pressure on themselves to perform the test well, as they felt there could be a lot riding on their performance.
There is pressure: I think it is because your eyes are so important for everyday living, that, you know, you’re frightened to [not do well].
F2, Portsmouth 1
There was a general appreciation that such testing was vital to preserve their vision.
Well . . . obviously I’m very grateful that I’m being monitored at all . . .
F4, London 1
. . . mine has been 10 years and you think, well how long will I have my sight? . . . My mum had lost her sight by then, you know. . .
F3, Norwich 2
. . . we are all grateful for what they do for us.
F1, Norwich 2
While patients found other vision assessments, such as visual acuity, pressure and imaging tests, less tiring and laborious, some felt the VF test was more ‘valuable’. The test also provided some reassurance that their condition was being investigated.
[With] the [imaging] there’s just one person, one machine and you, and it’s done and that’s it, it’s over . . . within minutes.
F3, Norwich 2
. . . they look in your eyes to measure your pressure but when you do that field test, they see more . . .
F1, London 2
Frequency of visual field testing
Current experience
Visual field tests were usually performed once or twice a year, either during or shortly before the patient’s general clinical appointment. Patients who visited the clinic more frequently would have a VF test at only some of their appointments. Patients were often unaware whether or not they would have a VF test during their visit, although some were told specifically when their VF tests would take place.
I mean they just say you’re going to come for your next appointment in whatsoever, whatever time, but they don’t say, ‘Oh, in that time you will be having a visual field check’, so that you know that you are going to have to be that little bit longer . . .
F2, Portsmouth 1
When patients were asked whether or not they would be willing to visit the clinic for VF testing more frequently, there was a reluctant agreement. The test was viewed as a ‘necessary evil’ and most were open to more frequent testing if the clinician felt it would enhance their prognosis, although there was still some scepticism as to how useful the test actually was.
If it was necessary.
F2, Portsmouth 2
You’d get on with it.
M1, Portsmouth 2
If it helps the cause so be it.
M2, Portsmouth 2
I don’t want to lose my sight, I’d come in whenever.
F2, Portsmouth 2
If it holds it back for 10 years . . . I’m happy with another 10 years!
M1, Norwich 2
. . . I suppose I’d accept it because I would hope that the reason for asking me was that they will get more information from that, which obviously deals with the whole problem but . . . I’m not really sure at all about how useful they are. I mean is it just statistics or whatever? . . . I’m sure they’re useful but I wonder in what proportion of use they are compared to, you know, looking in the eye and pressures and things . . .
F3, Norwich 2
However, patients tended to associate more frequent testing with worsening vision; therefore, being asked to come in for more testing could lead to some anxiety.
. . . you’d think they’ve called me back ‘cause it’s going, deteriorating. But I mean if they said to do it, I’ve always done . . . because they’re doing the best for me . . .
F3, Norwich 2
It was also felt that there was some form of learning effect with the VF test, where it took several attempts to feel comfortable with the procedure. Therefore, it was suggested that doing more than one VF test could initially be useful to gain a more accurate depiction of their vision. However, the repeated tests may only be worthwhile if they took place at the beginning of their follow-up care.
. . . interestingly I went and did one once and they said to me, ‘this has improved from the last time’ and I said ‘well I think I’m just getting better at computer games’ . . . I think you do know what’s coming and you can improve and I just feel more comfortable with doing it.
F1, Norwich 1
I think to do a field test right at the beginning, and to take that as being the definitive field test is wrong . . . because I think you need to do a test and think, and revise it in your mind what you’ve done and then do it again.
M1, Portsmouth 2
There was some debate as to how close together VF tests should take place.
I think you need to do a field test and then perhaps a month later do the second one.
M1, Portsmouth 2
Well not if you have a long gap between them.
F1, Norwich 2
I’ve got used to it now.
F2, Norwich 2
I don’t think it’s any different really.
F3, Norwich 2
The idea was raised that routine VF testing could be carried out in a more convenient location, such as a local optometrist practice. Some patients had previously visited a local optometrist to carry out a VF test for the purpose of assessing their fitness to drive. On the positive side, patients liked the convenience of doing so and the quiet, calming environment in which they performed the test. On the other hand, they questioned the competency of the staff, the quality of the equipment and the information trail back to the hospital.
The principle of having routine tests done locally is acceptable providing they are trained.
M1, London 1
I would be concerned about how often the machine was calibrated to get an accurate reading.
M2, London 1
Is the information going back to where it matters in my notes? Things do get lost, and will someone actually look at the test?
M1, London 2
Some felt they had built up a level of trust with the hospital eye service and would therefore prefer VF tests to be performed in this environment.
I’ve been here for quite a while now and I like coming to them, I don’t want to go anywhere else.
F1, London 2
I would feel the same because it’s a matter of trust.
M2, London 2
Perceived issues and barriers for successful follow-up care
Although they expressed some dislike for the VF test itself, patients were generally willing to undergo any amount of vision testing on the advice of the clinician. Nevertheless, a number of additional themes emerged during the analysis, highlighting a number of areas perceived to be important and potentially representing barriers to successful follow-up.
Communication
Visual field instructions
Having the VF test procedure fully explained to them, no matter how long they had been coming to the clinic, was seen not as patronising but as a positive thing. It was rare for a technician to stay with the patient throughout the test, but on the occasions it did happen, patients found the experience reassuring and felt the encouragement helped their performance.
. . . They say, ‘Have you done this before?’ You say ‘Yes’. And that’s it, you’re left there and eventually they say, ‘Have you finished?’
M1, Portsmouth 2
I had one about 3 weeks ago and it was a young nurse and it was a completely different experience. She was professional, polite, kind, she told me exactly what they were doing . . . it was almost a pleasant experience.
F1, Portsmouth 1
There was some debate regarding what would happen if patients failed to respond to a light displayed during the VF test. Being informed specifically about aspects of the testing procedure, such as the fact that if they did not respond to a certain light that it would be retested later on, was found to be reassuring. However, others expressed uncertainty and felt pressurised to hit the button anyway if they had not seen a light displayed for a while.
The staff told me: ‘don’t worry about missing [a light] because it’ll come later’, so you know you get a second chance.
F1, Norwich 1
. . . if in doubt press the button, don’t you?
F1, Portsmouth 2
Explanation of results
Most patients said they had to specifically enquire about their results to find out information about their vision and whether or not their condition had progressed since the last appointment. Some patients felt too intimidated to ask the doctor for feedback as to how they had performed, feeling they were being a nuisance or wasting the doctor’s time.
My wife always says ‘how did you get on?’ and I say ‘I don’t know’, and that’s one of the problems.
M2, Portsmouth 2
I don’t think they’ve got time to listen to you, or they don’t appear to, and I don’t know whether they would listen . . . You feel pathetic asking these questions.
F3, Portsmouth 1
It was felt that a better explanation of the test results after completing the VF test would ease some of the pressure felt when performing the test.
If the doctor actually spent a bit more time discussing it with you, would it maybe ease the pressure of actually doing the test?
I would . . .
I think possibly.
Yes, I mean I would still panic, but if I knew, yes.
Patients may be more inclined to have VF tests more frequently should they be informed clearly about what the results indicate about their prognosis.
I don’t mind how many times I do it providing I get a result of the test at that time compared to what the previous one was. Is there any improvement? Is there any downgrade?
M1, Portsmouth 1
The patient–clinician relationship
The quality of relationship with the clinical staff and aspects of patient–clinician communication also emerged as key factors influencing perceptions of the follow-up process.
A major discussion point was the lack of continuity of clinical staff from visit to visit.
The doctors seem to change . . . most of them I think tend to be all right but I still see this as a weakness, that you are unable to ask to see the same doctor every time you come in.
M2, London 2
Sometimes it’s good I think. You get a different opinion from a different person.
M3, Portsmouth 2
An apparent lack of personalised care also caused some unease: there was a sentiment that sometimes the clinician simply looked at the eyes and failed to consider the person’s individual needs.
You’re not a person, you know, you’ve just got eyes, they’re just going to deal with that and that’s it.
F3, Portsmouth 1
The experience was seen to be much more bearable if they felt the staff member dealing with them was empathetic.
Even buying a chop, you know: if the butcher’s interested, it helps doesn’t it?
M3, Norwich 1
The opportunity to spend more time with their consultant ophthalmologist was a key factor that influenced whether or not patients were open to visiting the clinic more frequently.
Not just for the field test . . . But I wouldn’t mind coming in more to see the doctor.
M2, London 2
Testing environment
The testing environment was another important theme. The dark room, especially if it was warm, made focusing on the tests difficult. Patients felt they performed better in the morning when they were more alert. Ambient noise in the room made it difficult to concentrate; technicians talking and doing the test at the same time as several other patients all had an effect on their ability to focus on the task.
I will also say that the staff chatter a lot, which is difficult for concentration; the doors open and close, there’s a lot of noise.
F1, Norwich 1
The times that I’ve had the visual field test done in a room where there’s just one [machine] I felt more confident to do it and it was much quieter and more relaxed and it seemed to be a lot quicker too.
F3, Norwich 2
I think having the quieter atmosphere would generally help I’m sure . . . just that feeling of slight calm, you can relax more and then it probably would be a lot quicker because maybe you’re not going to miss as many [lights] as you haven’t got other distractions.
F3, Norwich 2
Clinic constraints
Waiting times
Waiting times were a major concern at all locations. The standard time taken per visit was 2 hours, although the wait was often unpredictable. Established patients were used to the wait and tried not to let it affect them, but they still found the system frustrating. Patients were scared of missing their slots and, therefore, would not leave their seat in the waiting area.
No way I’m going to nip off . . . especially as now I’m on my own, no way . . . just even nipping off to the [bathroom] because you think, ‘He’s bound to call me. I can sit here for an hour and he’ll call me the minute I go to the [bathroom].
F2, Portsmouth 1
Likewise, the waiting environment outside the clinic was viewed extremely unfavourably.
The first time I came in I thought, ‘Oh my . . . ’ There were hundreds of people, it felt like hundreds, but we were all sat in a line. There’s nothing on the walls. There’s tiny writing on the notice board and you think, ‘Hang on, we‘ve all got eye problems in here, how are we supposed to read these signs?’ The walls are just blank – it’s a really miserable place, isn’t it?
F3, Portsmouth 1
One common technique for reducing waiting time was trying to schedule an appointment for early in the morning. Afternoon clinics were not as popular as the morning ones, as patients felt there was a tendency for the morning clinics to run into the afternoon sessions.
When I have an appointment at say 11 o’clock or half past 11, it runs over into the afternoon . . .
F2, London 1
Although it was repeatedly acknowledged that the clinics were very busy, which had the knock-on effect of increased waiting times, patients felt they were getting adequate treatment overall. It was suggested that there was a trade-off between longer waiting times and higher-quality treatment:
I think that’s a very fair price to pay for the fact that you’re being dealt with in a UK centre of excellence. There’s a trade-off in that you’re getting state of the art treatment but the price is you’ve got to sit around for it.
M1, London 1
Travelling to the clinic
Coming to the earlier appointments was simply not an option for some people. Many had to travel long distances to the clinic and could only use public transport after a certain time. Being forced to travel during rush hour was an unpleasant and frightening prospect. Some were concerned about the cost of long hospital visits, especially those who relied on taxis because of a fear of travelling alone as a result of their condition.
I think the problem is because I live nearly an hour away, for me the nearest hospital is an hour away . . .
F2, Norwich 2
Taxi is the only way I can do it now. You know, I can get to the station by bus and possibly with help to get on the train but it’s not easy . . . It’s horrific, frightening.
M2, London 1
The journey to the clinic together with these long waiting times were sometimes perceived to have a negative effect on test performance, as patients felt more tired when they actually sat down to do the VF test. However, others felt that it was not so much of an issue.
I think if you did the eye check later in the day, you know, if your eyes were tired . . . I wouldn’t see so well . . .
F2, Portsmouth 1
I don’t think it would with me.
F3, Portsmouth 1
Scheduling appointments
The scheduling of appointments was also a major concern, and often the systems were so overbooked that patients were unable to make their next appointment at their clinic visit. Some were asked to call to make an appointment 6 weeks before they were due to attend, while others were sent an appointment in the post at a much later date.
You can only make an appointment 6 weeks in advance. You used to get a 12-month appointment letter just after you had been for an appointment; now it’s 6 weeks before you are due.
M2, Norwich 1
Some patients had been asked to attend on a Saturday to reduce the back-log of appointments. The day was not seen as a problem, although the standard of care was questioned.
I’ve been asked to come on a Saturday which is not a problem but the trouble is you never see anyone who can make a decision. I ended up seeing a retina man. So after a couple of visits I asked to be seen on a weekday by a glaucoma specialist.
F1, Norwich 1
Often patients would receive an appointment only to have it cancelled a couple of weeks before the clinic was due to take place. This was not only frustrating to people who had made arrangements for their appointment, such as asking a friend to accompany them or arranging cover for sick spouses, it caused concern that their appointment was to be at a much later date than the consultant had originally requested.
So if you’ve been given a 6-month appointment and it’s cancelled, and you’re not given another one, you ring up and then they say ‘oh we can’t give you an appointment now ’til October’. That was 10 months. Now if your consultant says 6 [months] and now it is 10 and something’s gone wrong with your vision in between, you have no way of telling.
F2, Portsmouth 2
Patient recommendations
At the end of the groups patients were asked to give changes they would like to see made to improve their follow-up care. The recommendations were similar across all locations and the most popular suggestions are displayed in Box 1.
-
Less waiting and clinics running to time.
-
Flexible booking and changing of appointments.
-
To have a calmer, quieter environment in the VF test room with fewer people doing the test at the same time.
-
To have a more modernised VF test.
-
To have more continuity of care by seeing the same doctor each visit.
-
To receive better communication from the doctor.
Conclusions
Research based on statistical analyses and computer simulations has typically been used to investigate VF follow-up in glaucoma. This is the first study to examine the VF test and clinic experience from the patients’ perspective using a qualitative research approach. Although patients did not like the VF test, they accepted it as a ‘necessary evil’ for maintaining their vision. However, a number of possible actionable points were raised which were perceived to impact the effectiveness of follow-up care, including distracting testing environments and hospital constraints relating to excessive waiting times and appointment booking. Some patients also expressed particular concerns about patient–clinician communication, including the quality of test instructions, explanation of results and a lack of individual-centred care. Many of the viewpoints expressed coincided with previous evidence suggesting that these factors can influence VF data obtained during the follow-up process. 21–25 Ensuring that glaucoma monitoring is as clinically effective and cost-effective as possible will inevitably require the confidence and co-operation of the person at the heart of the treatment, so that the data are of a sufficient quality to inform further treatment decisions. Therefore, patient involvement could be important to not only address some, or all, of the perceived barriers highlighted in this study but ultimately to drive further research into the most efficient strategies for VF monitoring.
Chapter 4 Visual field statistical modelling of different monitoring intervals in glaucoma patients
Background
Accurately and precisely measuring VF progression in glaucoma patients is imperative. First, it is essential for effective clinical management of the disease. Second, VF measurements are the most commonly used end points for clinical trials in glaucoma. Monitoring VF status in the patient is achieved by SAP testing. Analyses to measure VF progression then require a sound understanding of the amount or rate of VF loss (dB per year), the period of observation, the effect of VF measurement variability, and the number of follow-up tests, as all these factors affect the ability to detect VF progression with adequate statistical power. 26 The number of VF tests required to detect change is often overlooked. VFs exhibit substantial measurement error and, therefore, clinical management decisions based on results from only one or two VF tests will, in general, be unreliable. A sufficiently long observation period and a suitable number of VF tests are essential to measure change with reasonable confidence. Furthermore, longitudinal studies5,27,28 and natural history data29,30 indicate that there is considerable between-patient variability in the rate of VF progression. The rate of VF loss cannot be well predicted at diagnosis, at an individual patient level, and is best estimated by collecting the results of several VF tests over a period of time. In a newly diagnosed patient, it would be ideal to first obtain an adequate number of reliable VF examinations over a period of time to exclude, or to detect, the presence of rapid VF progression. In this way, clinical treatment can be intensified for those patients (‘fast progressors’) that need it, thereby controlling the disease process. Until recently, there has been little research evidence concerning how frequently VF tests should be carried out to optimally detect progression. At present, the timetabling of VF tests in routine clinical practice is often intermittent and not well planned. 4
In 2008, Chauhan et al. 5 published recommendations for measuring rates of VF loss in newly diagnosed glaucoma patients based on statistical power calculations. Fundamental to their results was the key principle that an adequate number of VF tests must be performed over a given period in order to separate true disease progression from the measurement variability inherent in VF data. This conclusion is equivalent to the accepted notion that a clinical trial will not be sufficiently powered to detect an experimental effect if too few patients are enlisted. One particular finding from the Chauhan et al. study suggested that newly diagnosed glaucoma patients should undergo VF testing three times per year in the first 2 years post diagnosis. This frequency of testing identifies rapidly progressing eyes, losing average VF sensitivity (MD) of more than 2 dB per year, with greater certainty than if annual testing was implemented. Consequently, this recommendation has been adopted in the EGS guidelines on patient examination. 7 The idea that three SAP tests per year should be performed to measure visual progression is also supported by results from previous research using computer simulation6 and retrospective investigation of a large VF database. 31
This chapter aims to determine the clinical effectiveness of alternative monitoring regimes (including the recommended EGS strategy of six VF tests in the first 2 years) in newly diagnosed glaucoma patients. These questions are investigated using data from computer simulations. A second aim of this chapter is to explore the usefulness of computer simulation for optimising SAP testing when attempting to accurately detect progression in newly diagnosed glaucoma patients with different levels of baseline VF damage; this is informative about prioritising clinical management in those patients who may or may not require intensified treatment. For example, younger patients with more advanced glaucoma are at increased risk of visual disability in their lifetime compared with older patients with early VF damage.
Objectives
The objectives of this chapter are:
-
To retrospectively investigate the distribution of the rate of progression in a large cohort of patient records already archived from Moorfields Eye Hospital in London; Cheltenham General Hospital Gloucestershire Eye Unit and Calderdale Royal Hospital in West Yorkshire; and Queen Alexandra Hospital in Portsmouth. This will involve the interrogation of almost half a million VF tests, equivalent to around 25 million data points. Information about rates of progression in representative groups of glaucoma patients under clinical care will help us to model typical results achieved with currently available treatment modalities and inform about the magnitude of current and projected future visual function deficits caused by glaucoma.
-
To further develop our published model for generating virtual series of VF tests in order to explore different follow-up schemes for newly diagnosed glaucoma patients. In particular, annual testing against three tests per year in the first 2 years will be assessed for positive outcomes in determining glaucomatous progression.
Estimating rates of visual field progression
Glaucoma treatments attempt to slow the rate of progression of VF loss and generally aim to reduce IOP, which is the only known modifiable risk factor for the disease. Clearly, the key objective of clinical management is to prevent glaucoma patients advancing to visual impairment and blindness so that their quality of life remains unaffected. Once diagnosed, patients normally require lifelong treatment and monitoring so that any threatening rate of progression of VF loss can be detected and treatment can be changed accordingly. Thus, monitoring patients represents a considerable workload for glaucoma clinics. VF testing remains the only direct method for measuring patients’ visual function and, therefore, to gauge if a treatment is effective in avoiding future impairment. The amount of VF loss can be summarised using the MD measurement, which is the averaged difference between a patient’s VF and the VF from a person with healthy vision of the same age – the more negative the MD, the greater the amount of VF damage.
Many patients newly diagnosed with glaucoma are not at great risk of blindness. Retrospective analyses based on reviews of clinical notes suggest that the percentage of patients, under care, going blind is between 6% and 13%. 32–34 These studies, however, are somewhat limited at informing present-day prevalence, as VF tests were conducted using manual perimetry, and only relatively small numbers of patients (in all cases fewer than 300 patients) were investigated. Furthermore, all this research was carried out more than 10 years ago and, therefore, before the advent of new glaucoma medications, such as prostaglandins. The rate of progression of VF impairment varies greatly, but it is obvious that patients who experience rapid progression, the so-called ‘fast progressors’, are at highest risk of visual impairment, yet the incidence of fast progressors in clinical practice is uncertain. Cohort studies suggest that less than 5% of patients progress at a rate of –1.5 dB/year or worse. 35–37 However, results from retrospective studies are less optimistic, suggesting that the proportion of fast progressors varies from approximately 9% to 25% (with the use of different exclusion criteria). 38–40 In particular, a recent review by Heijl et al. 41 documented that 15% of patients investigated progressed at a rate faster than –1.5 dB/year.
Considering treatment and monitoring costs, it is essential that resources are prioritised towards patients at risk of significant visual disability in their lifetime. 42 Accordingly, a patient’s rate of VF loss over a period of time and the level of damage at presentation are extremely important factors. The research by Chauhan et al. has emphasised the clinical importance of establishing estimates of the rates of progression in glaucoma patients. 5 The first objective for this chapter is to estimate rates of MD progression, VF damage at presentation and age at presentation in a large cohort of glaucoma patients. The results of this analysis are extremely important to assess the cost-effectiveness of alternative VF monitoring regimes on long-term health outcomes. We therefore conducted a retrospective multicentre study of VF databases (PROGRESSOR Medisoft, Leeds, UK) to provide baseline population parameters for the health economic modelling discussed in the next chapter. This VF database comprised 473,252 VF tests of 88,954 patients from four separate hospitals: Moorfields Eye Hospital in London, Cheltenham General Hospital Gloucestershire Eye Unit, Calderdale Royal Hospital in West Yorkshire and Queen Alexandra Hospital in Portsmouth. In order to be included in the study, VF tests were required to utilise the 24-2 test pattern, a size III stimulus and the Swedish interactive threshold algorithm (SITA) Standard or SITA Fast testing algorithm.
This study centred on rates of VF loss progression in newly diagnosed glaucoma patients; consequently, to be included in the study, one of each patient’s eyes had to have a VF test series that was at least 2 years long, with at least six VF tests after discarding the first VF test for learning effects. This time period and number of VFs aligns with the proposed practice of testing patients six times in the first 2 years. If patients had two eyes meeting these criteria, the eye with the best (larger) MD at baseline was analysed; otherwise the patient’s single eye meeting the criteria was analysed. The patient’s better eye (the eye with the larger/healthier MD) was analysed rather than their worse eye because research suggests that the level of VF damage in a patient’s better eye has a closer relationship with functional vision and utility estimates relative to that of the worse eye. 43–46 As the analysis considered VF data and no other clinical information it was not possible to confirm whether individuals in the database were clinically diagnosed with glaucoma or were glaucoma suspects. In order to attempt to include only eyes with glaucomatous defects, the study required the eye’s MD or pattern SD value to be outside 95% normal limits in the baseline VF. We also included only patients of at least 35 years of age. Consequently, 5999 patients and 5999 eyes were left in the final analysis.
The level of VF damage at baseline, defined as a patient’s ‘health state’ in the health economic model that follows this chapter, was defined according to the Bascom Palmer glaucoma staging system. 47 This staging system identifies mild patients as those with an MD between 0 dB and –6 dB, moderate patients as those with an MD between –6 dB and –12 dB and severe patients as those with an MD between –12 dB and –20 dB, while patients with worse MDs are classified as visually impaired. Patients were therefore allocated to one of the four possible health states based on their baseline disease severity (Table 5).
| Health state | Description | MD (dB) |
|---|---|---|
| 1 | Mild | –0.01 to –6 |
| 2 | Moderate | –6.01 to –12 |
| 3 | Severe | –12.01 to –20 |
| 4 | Visually impaired | < –20 |
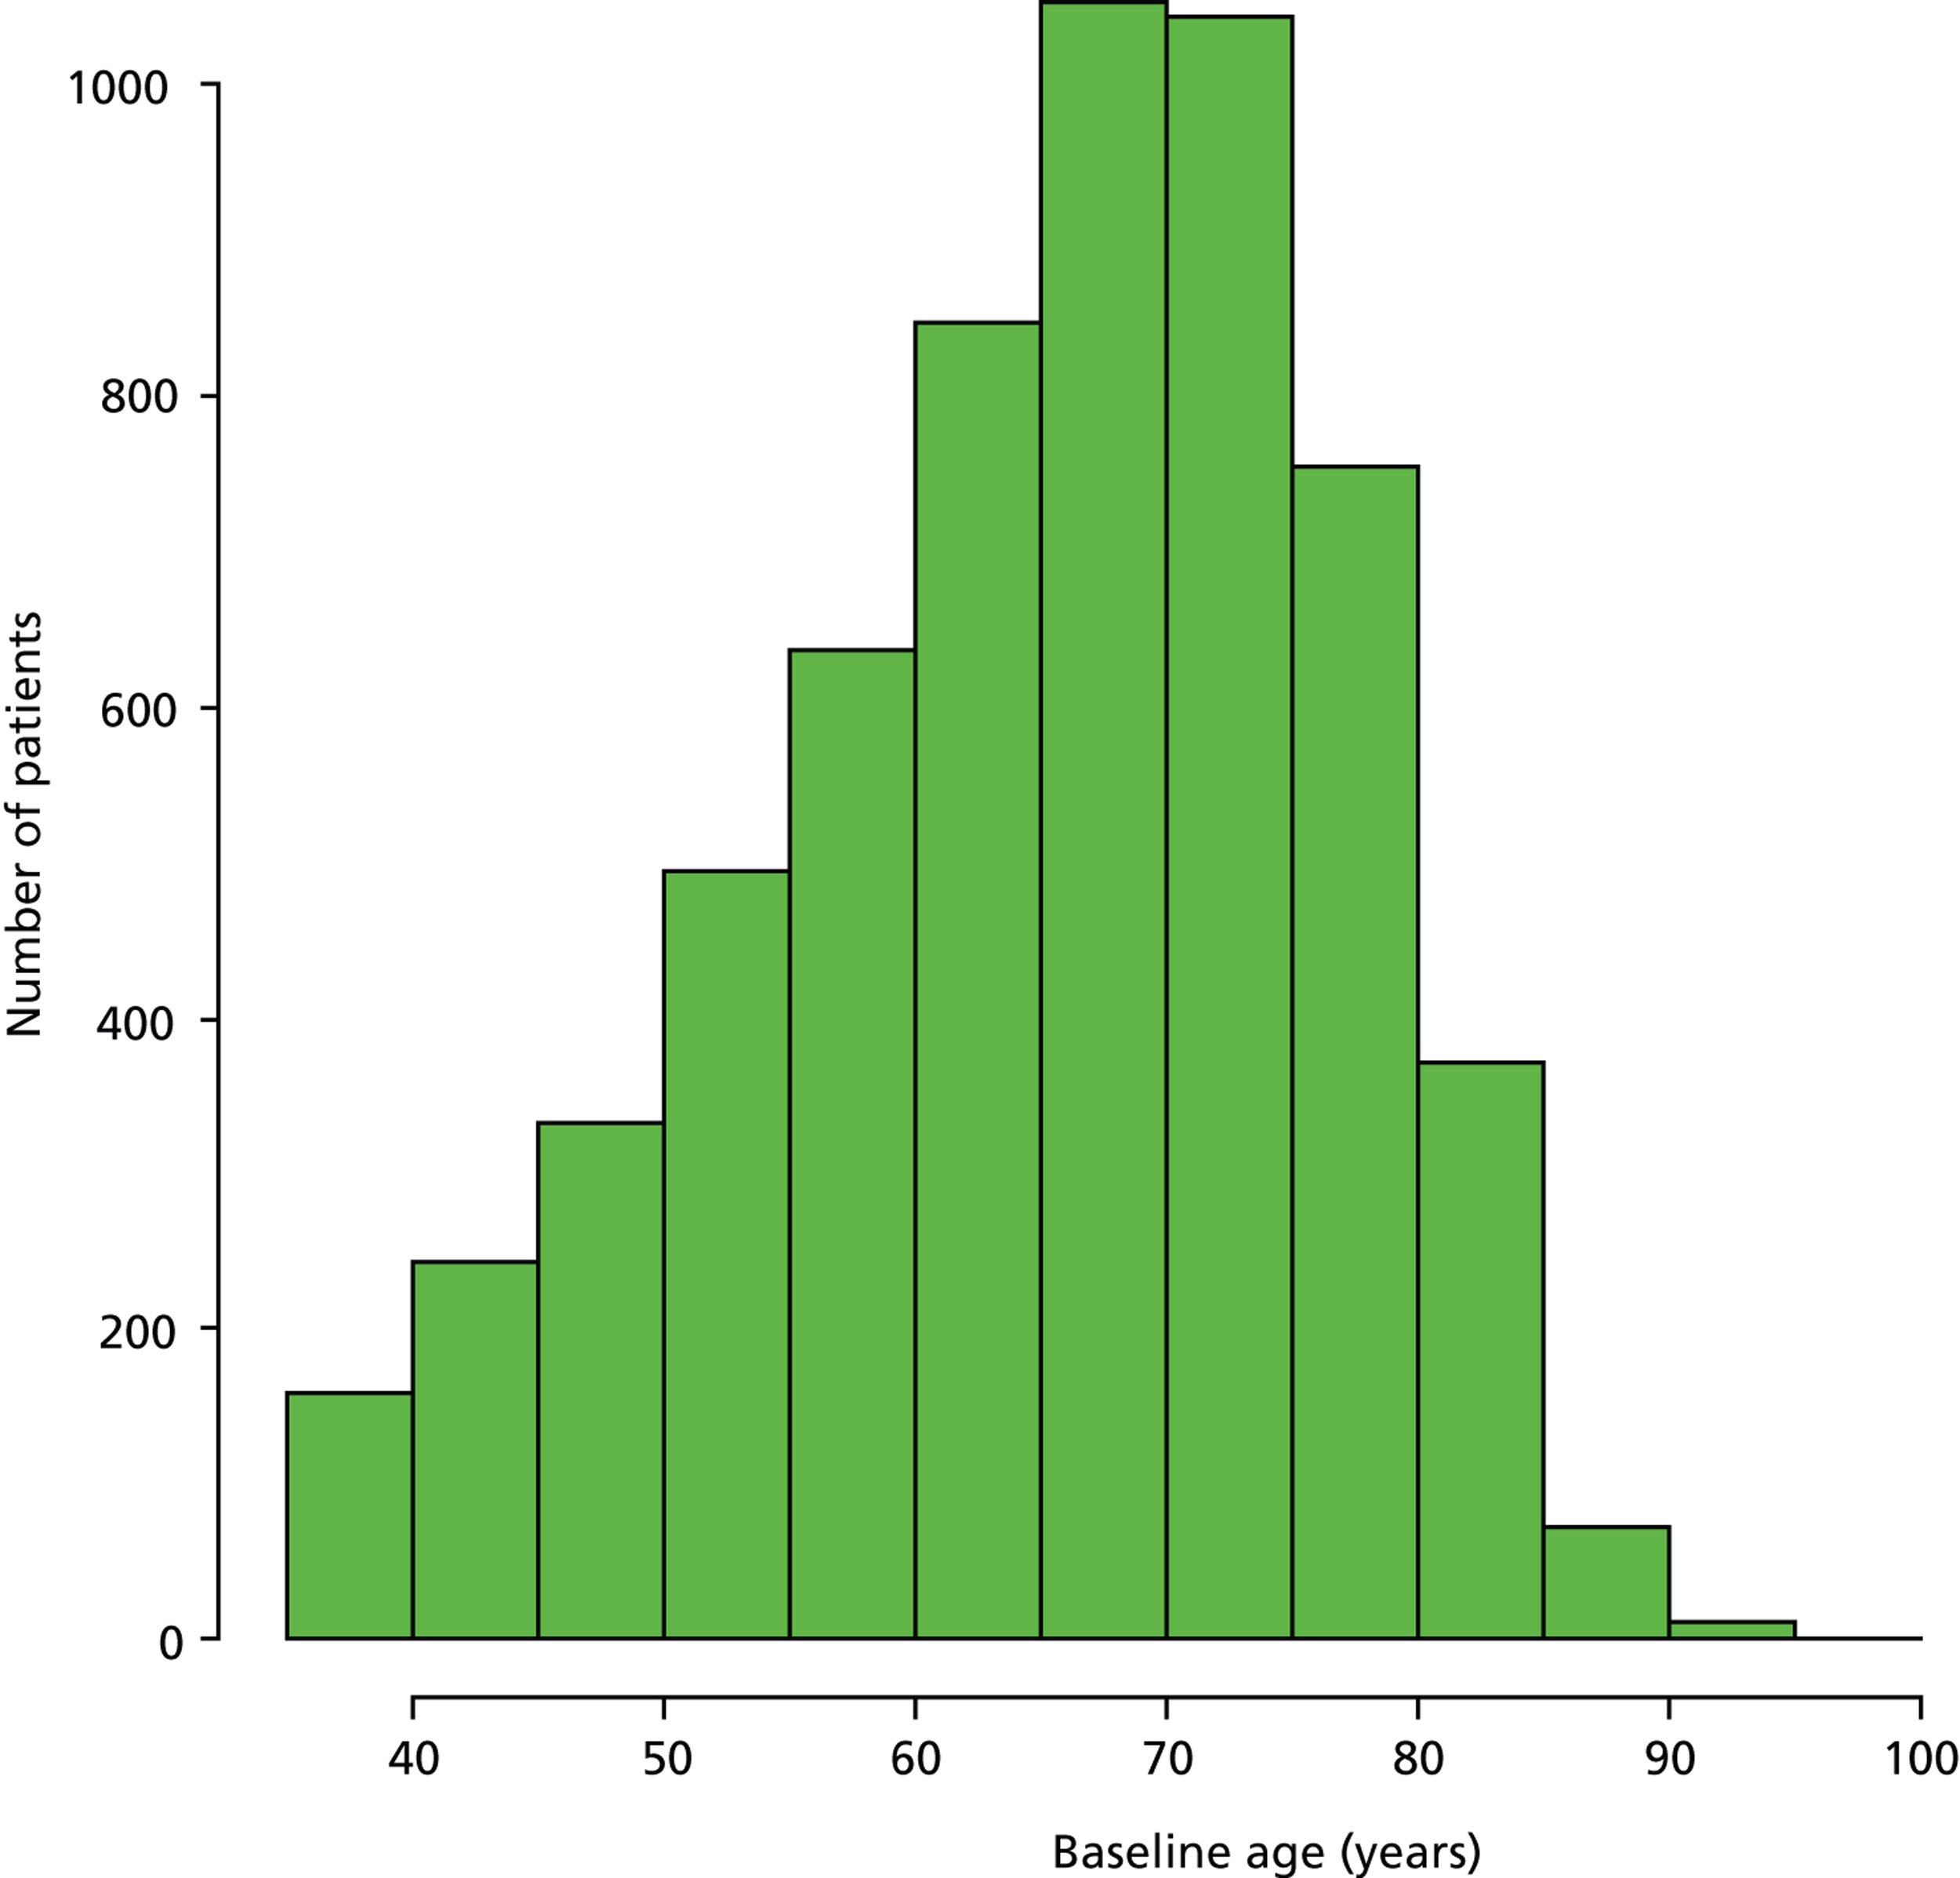
Figure 5 illustrates the distribution of the 5999 patients’ age at baseline; the asymmetry of the histogram suggests that there are two distinct groups of newly diagnosed glaucoma patients – a group of patients appear to present at an earlier age than the mode of the distribution (approximately 70 years). Hierarchical clustering for parameterised Gaussian mixture models48 with two mixture components (clusters) was carried out to determine the mean age of each of the two components. This clustering suggested that the distribution of ages could be represented as two clusters (normal distributions) with mean ages of 51.2 years and 70.2 years; we defined these two groups as the ‘younger’ and ‘older’ cohorts respectively.
FIGURE 5.
Distribution of patients’ age at baseline.
Intrinsic to the overall objectives of this research is how quickly patients progress to visual impairment from their level of VF damage at presentation. A key driver for this is the progression rate of the individual. We stratified patients in the VF database by their age grouping (younger cohort or older cohort) and measured their rate of progression of MD. Rates of MD loss were calculated in decibels per year (dB/year) using standard linear regression. Next, patients were subclassified according to whether they had stable, slow, medium or fast progression of MD, following the groupings in Chauhan et al. 5 (Table 6).
| Classification of rate | Rate of MD progression (dB/year) |
|---|---|
| Stable | > 0 |
| Slow | 0 to –0.5 |
| Medium | –0.5 to –1.5 |
| Fast | < –1.5 |
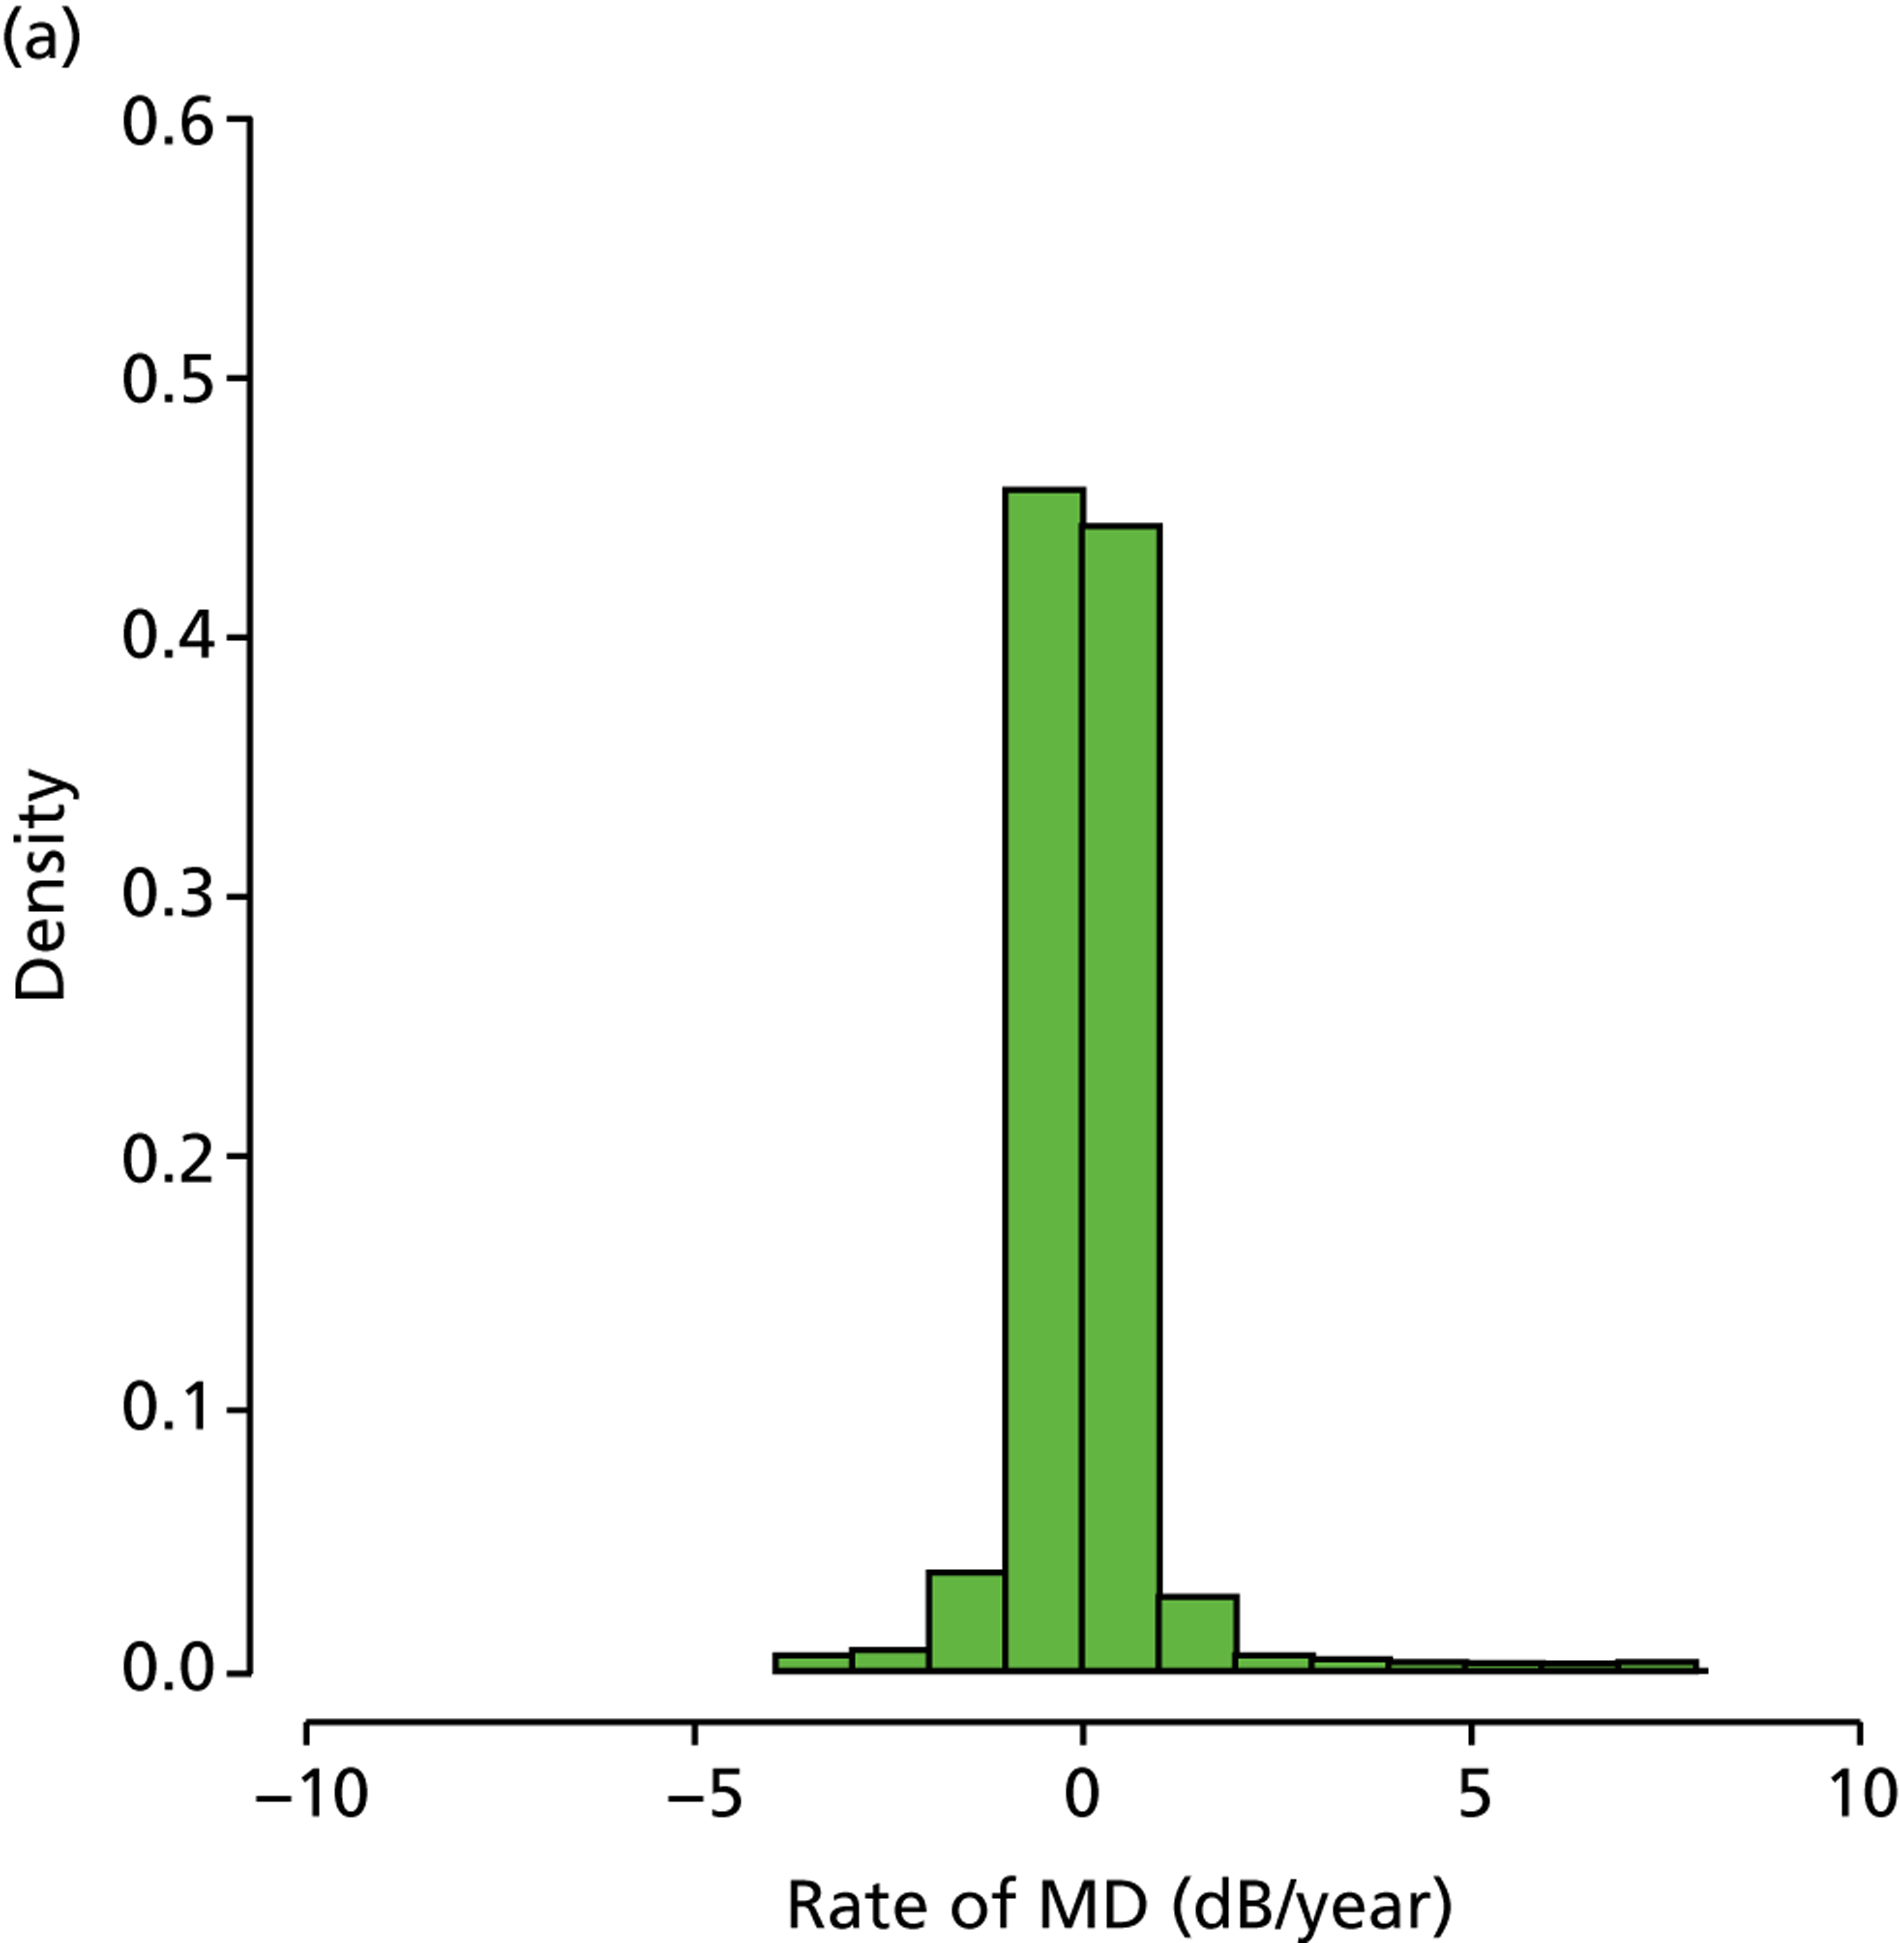
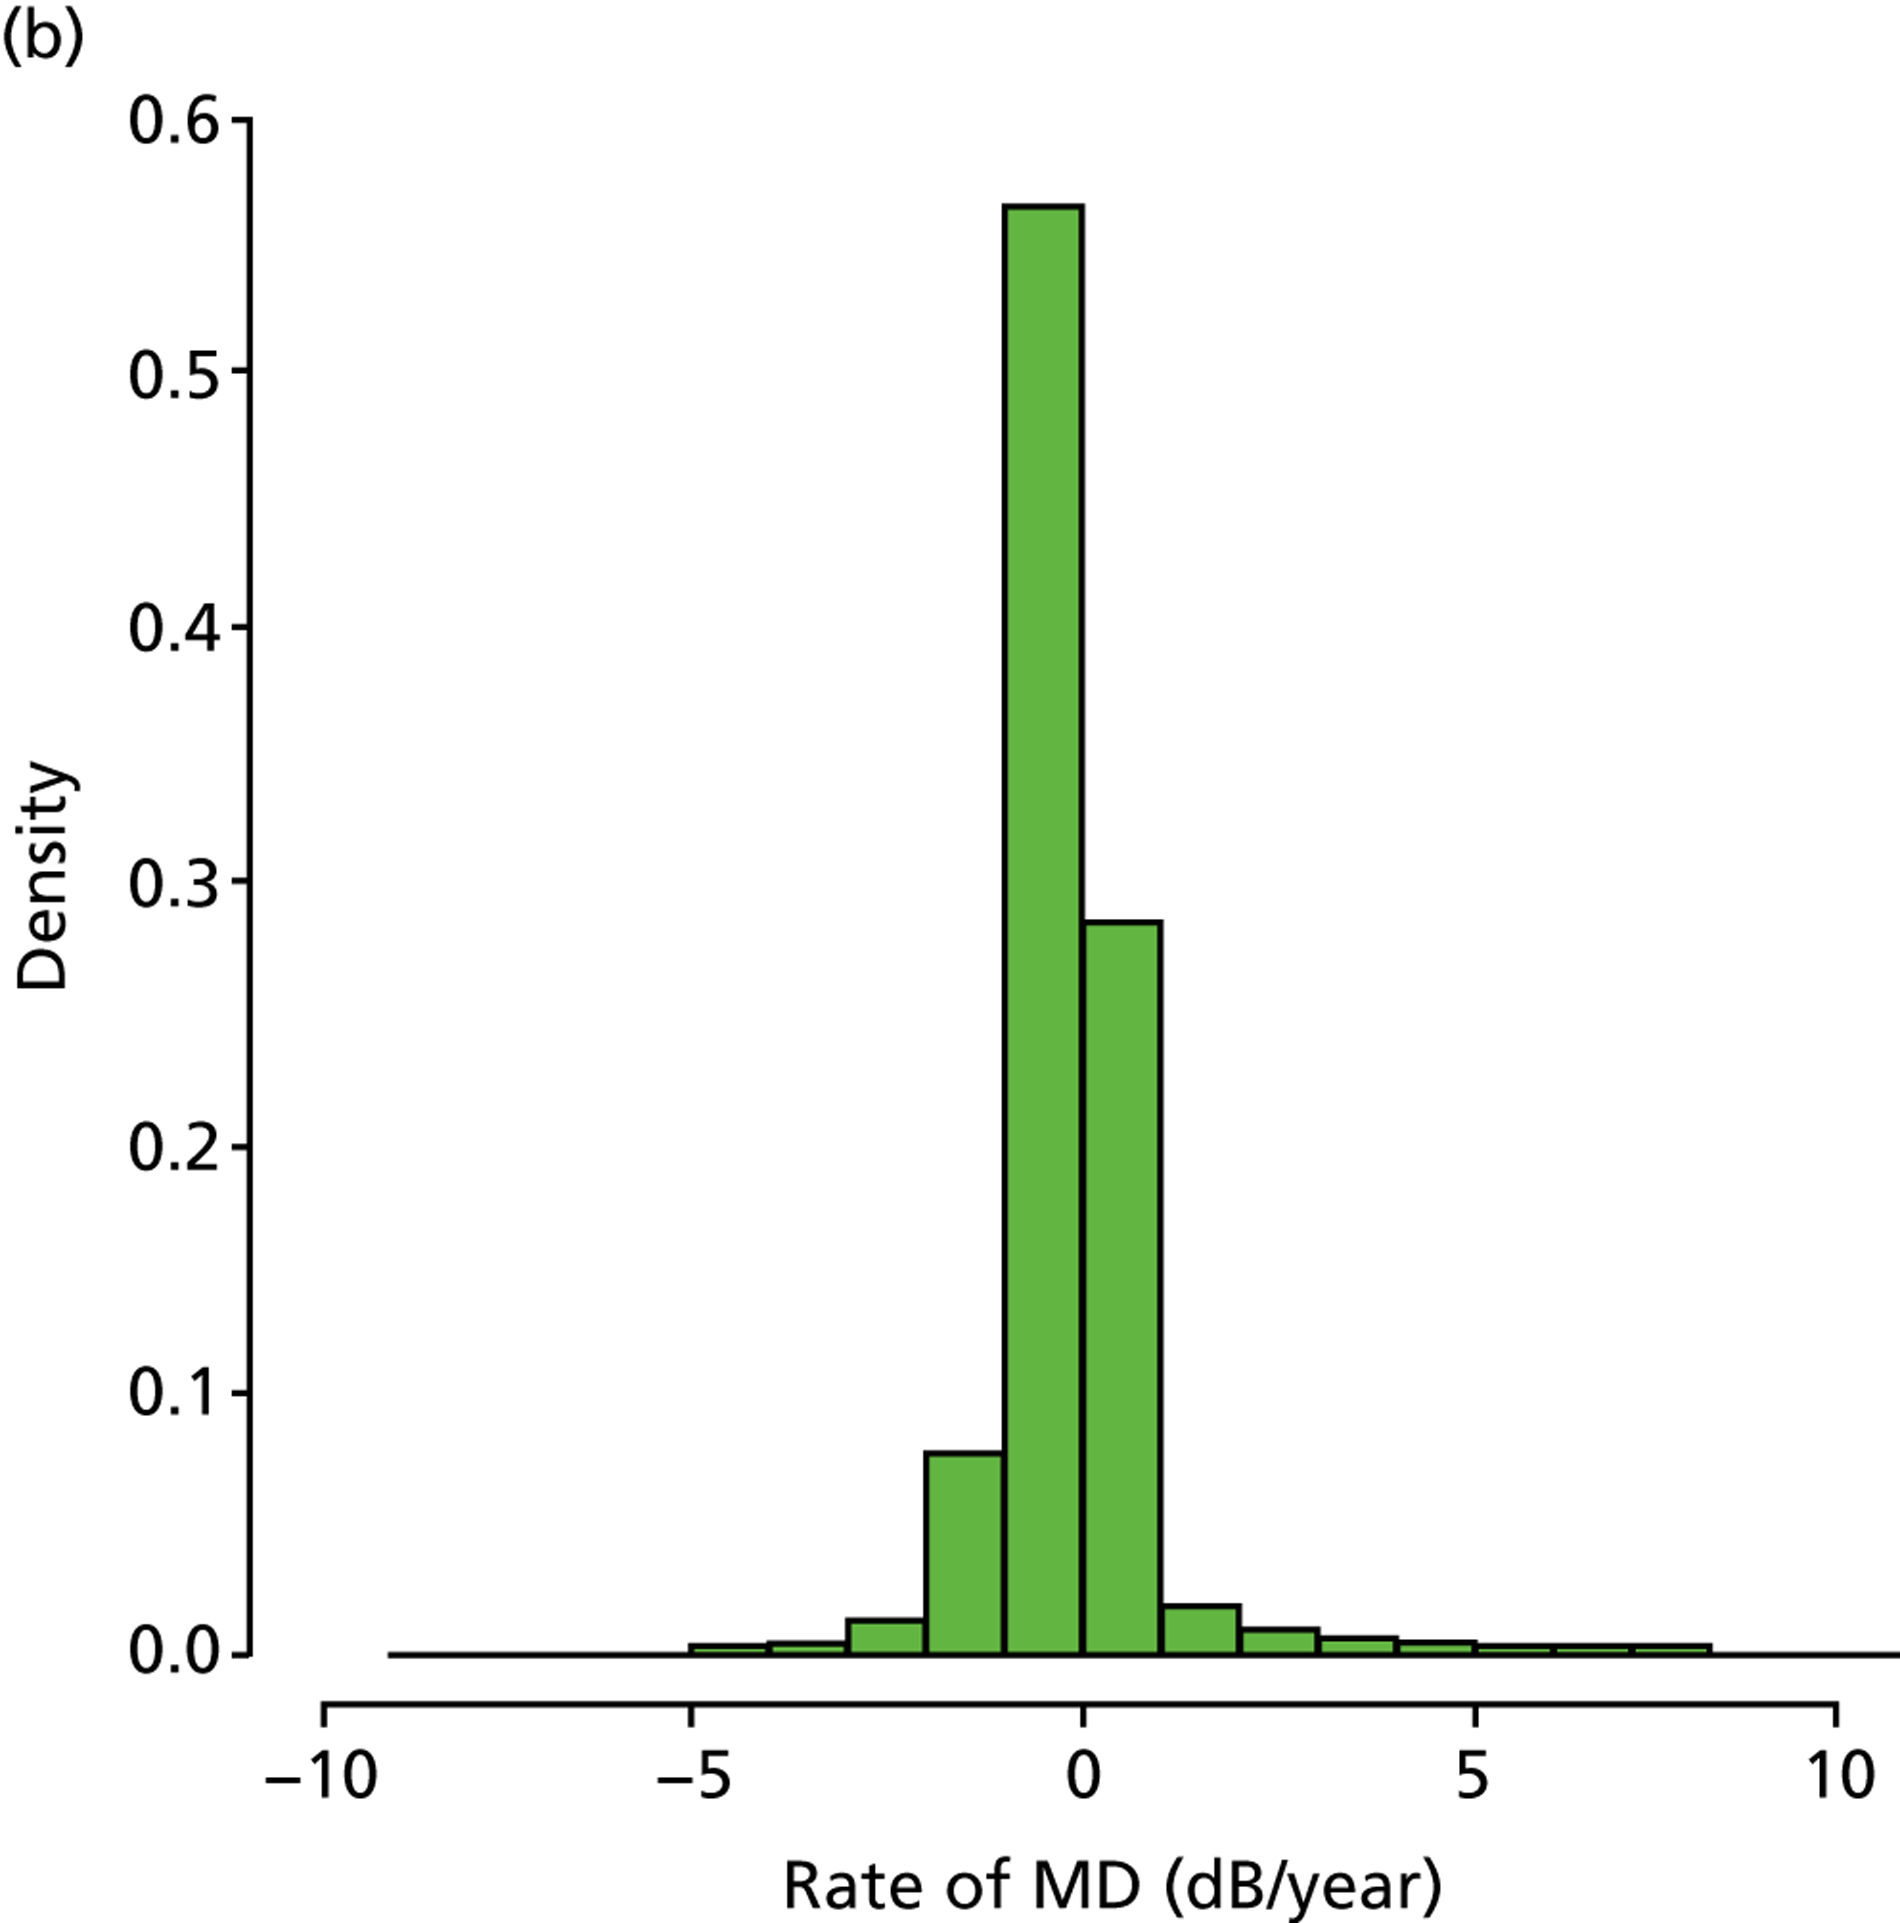
In those patients in the younger cohort, it was observed that 49.2%, 36.4%, 12.2% and 2.3% of patients analysed were characterised as being stable, slow, medium and fast progressors respectively. For patients in the older cohort, it was observed as 33.8%, 41.0%, 21.0% and 4.2%, respectively (Figure 6). Our finding that a larger percentage of older patients than of younger patients are fast progressors supports results in the Canadian Glaucoma Study, which showed that increasing age was associated with a worse MD rate. 36
FIGURE 6.
(a) Distribution of MD rates in younger cohort; and (b) distribution of MD rates in older cohort (eight patients have been removed to enhance visualisation, as their rates of MD exceeded 10 dB/year).
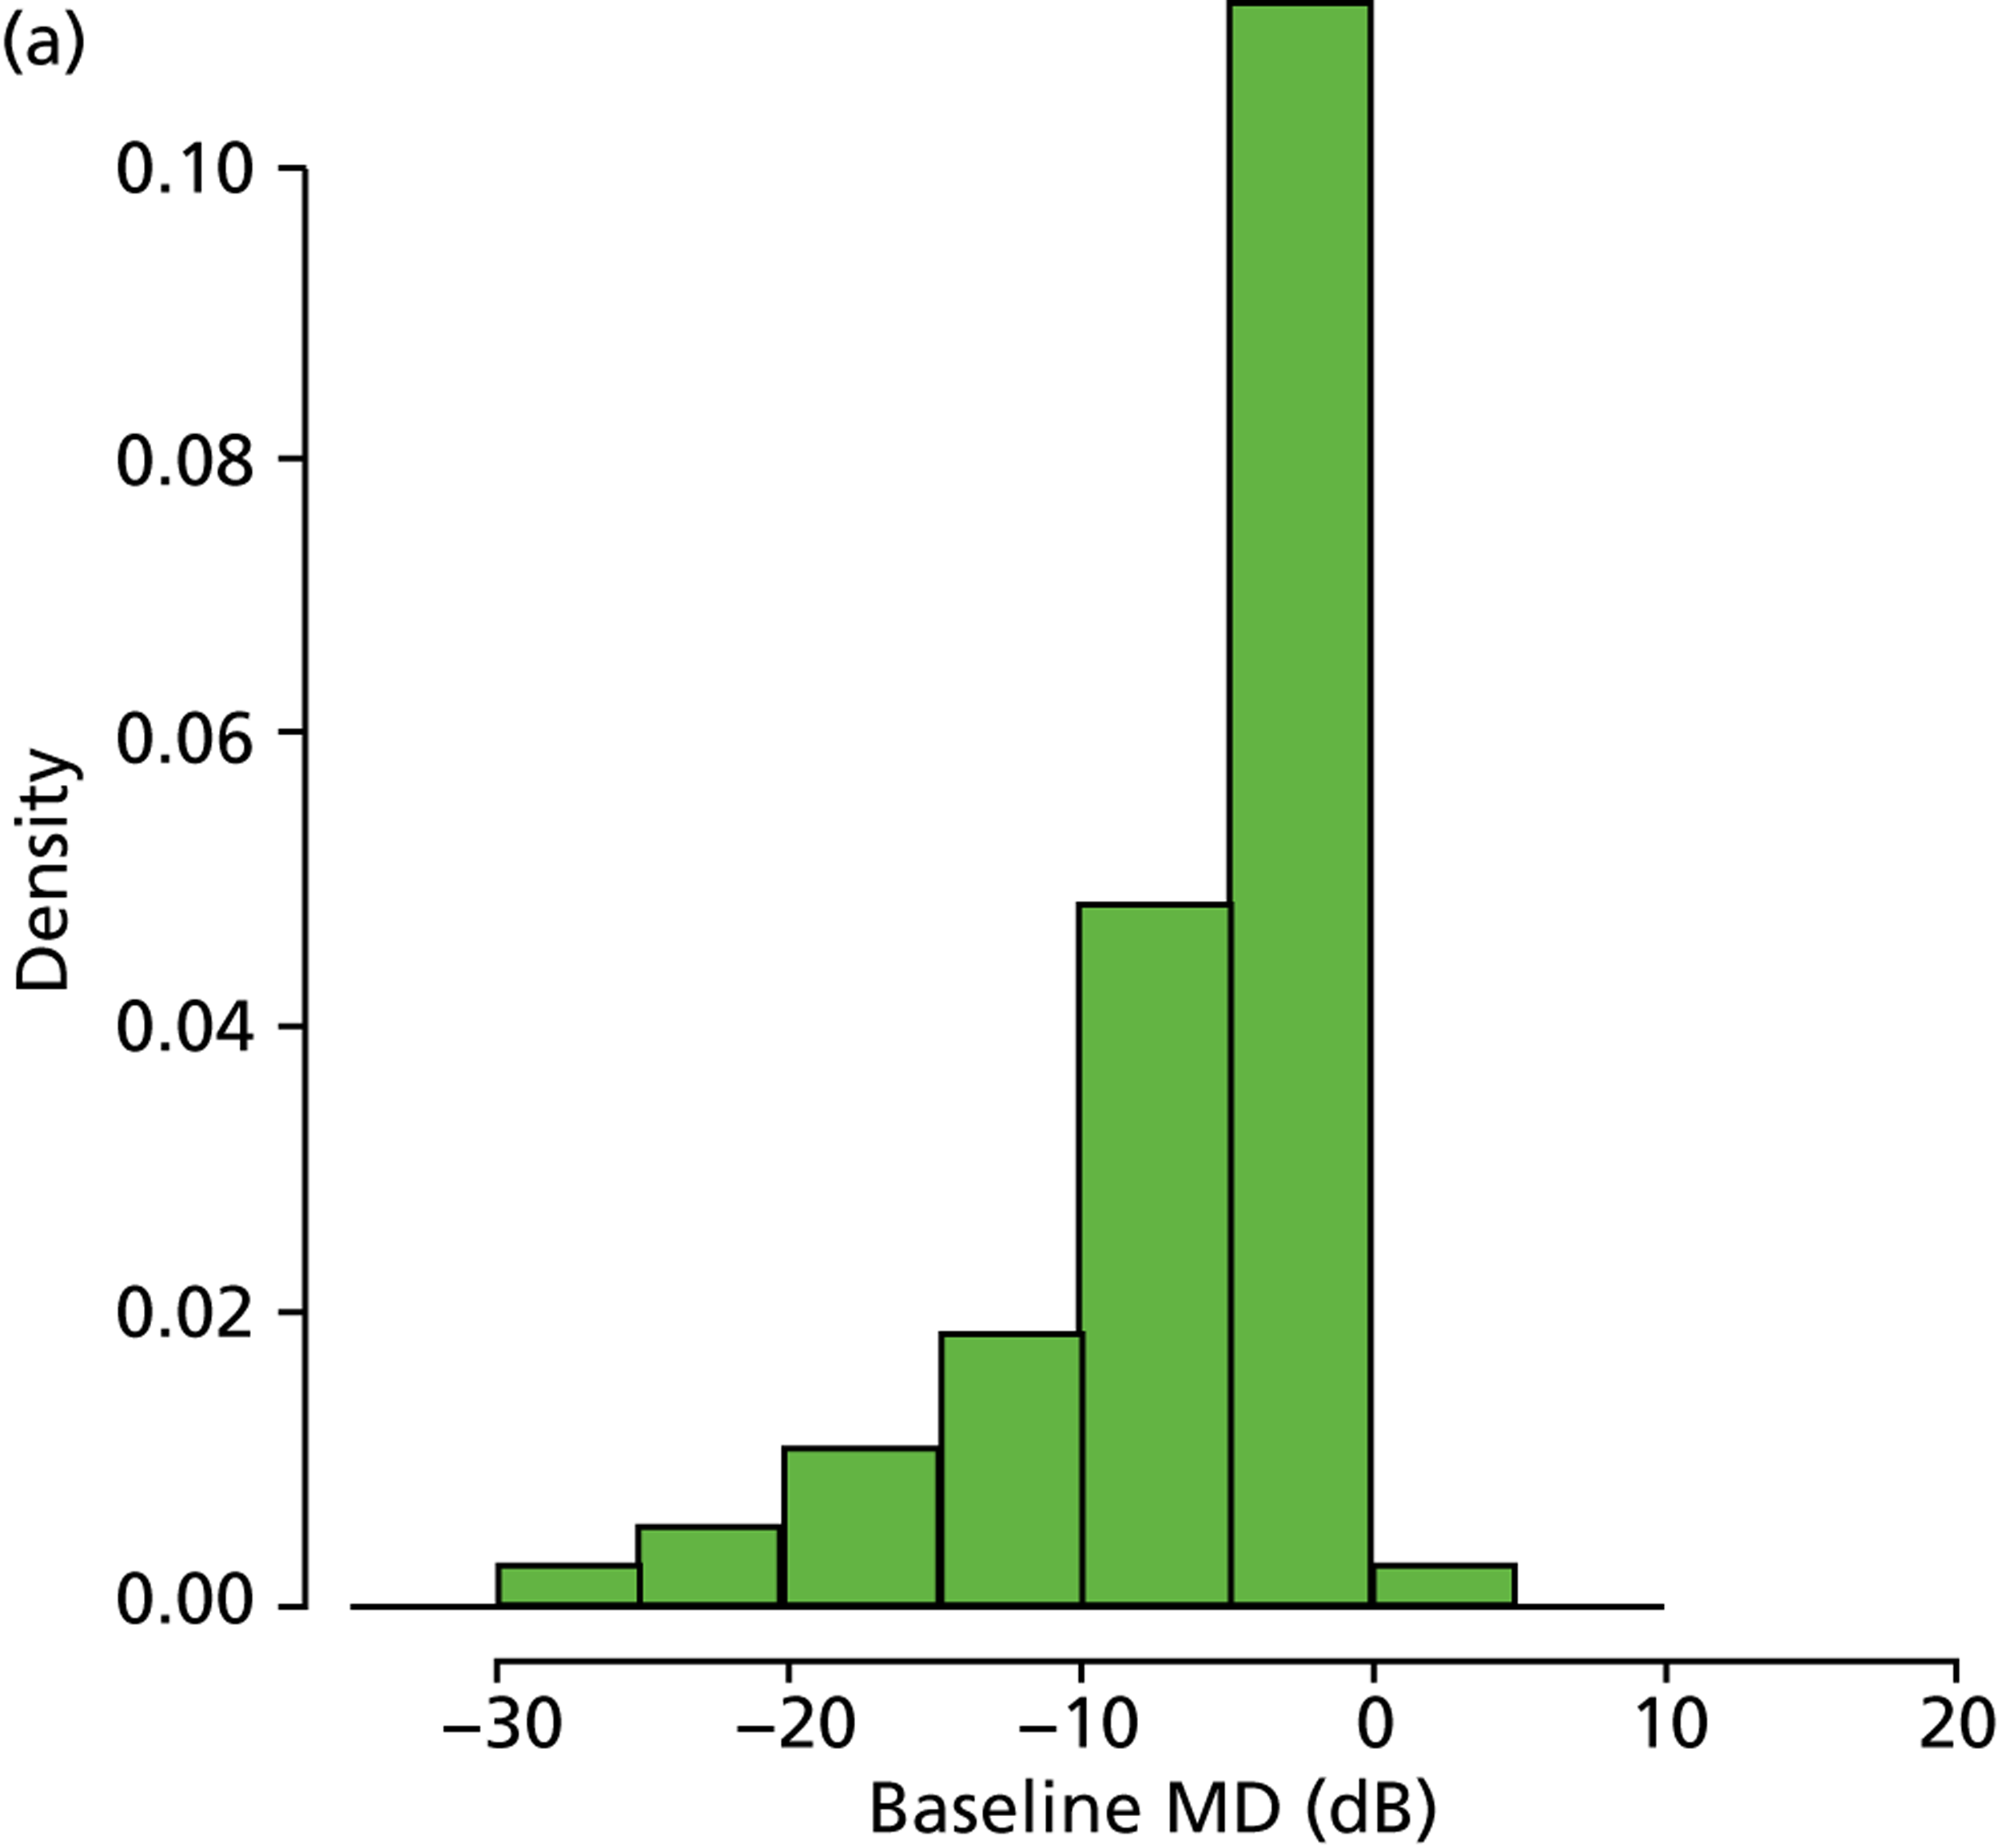
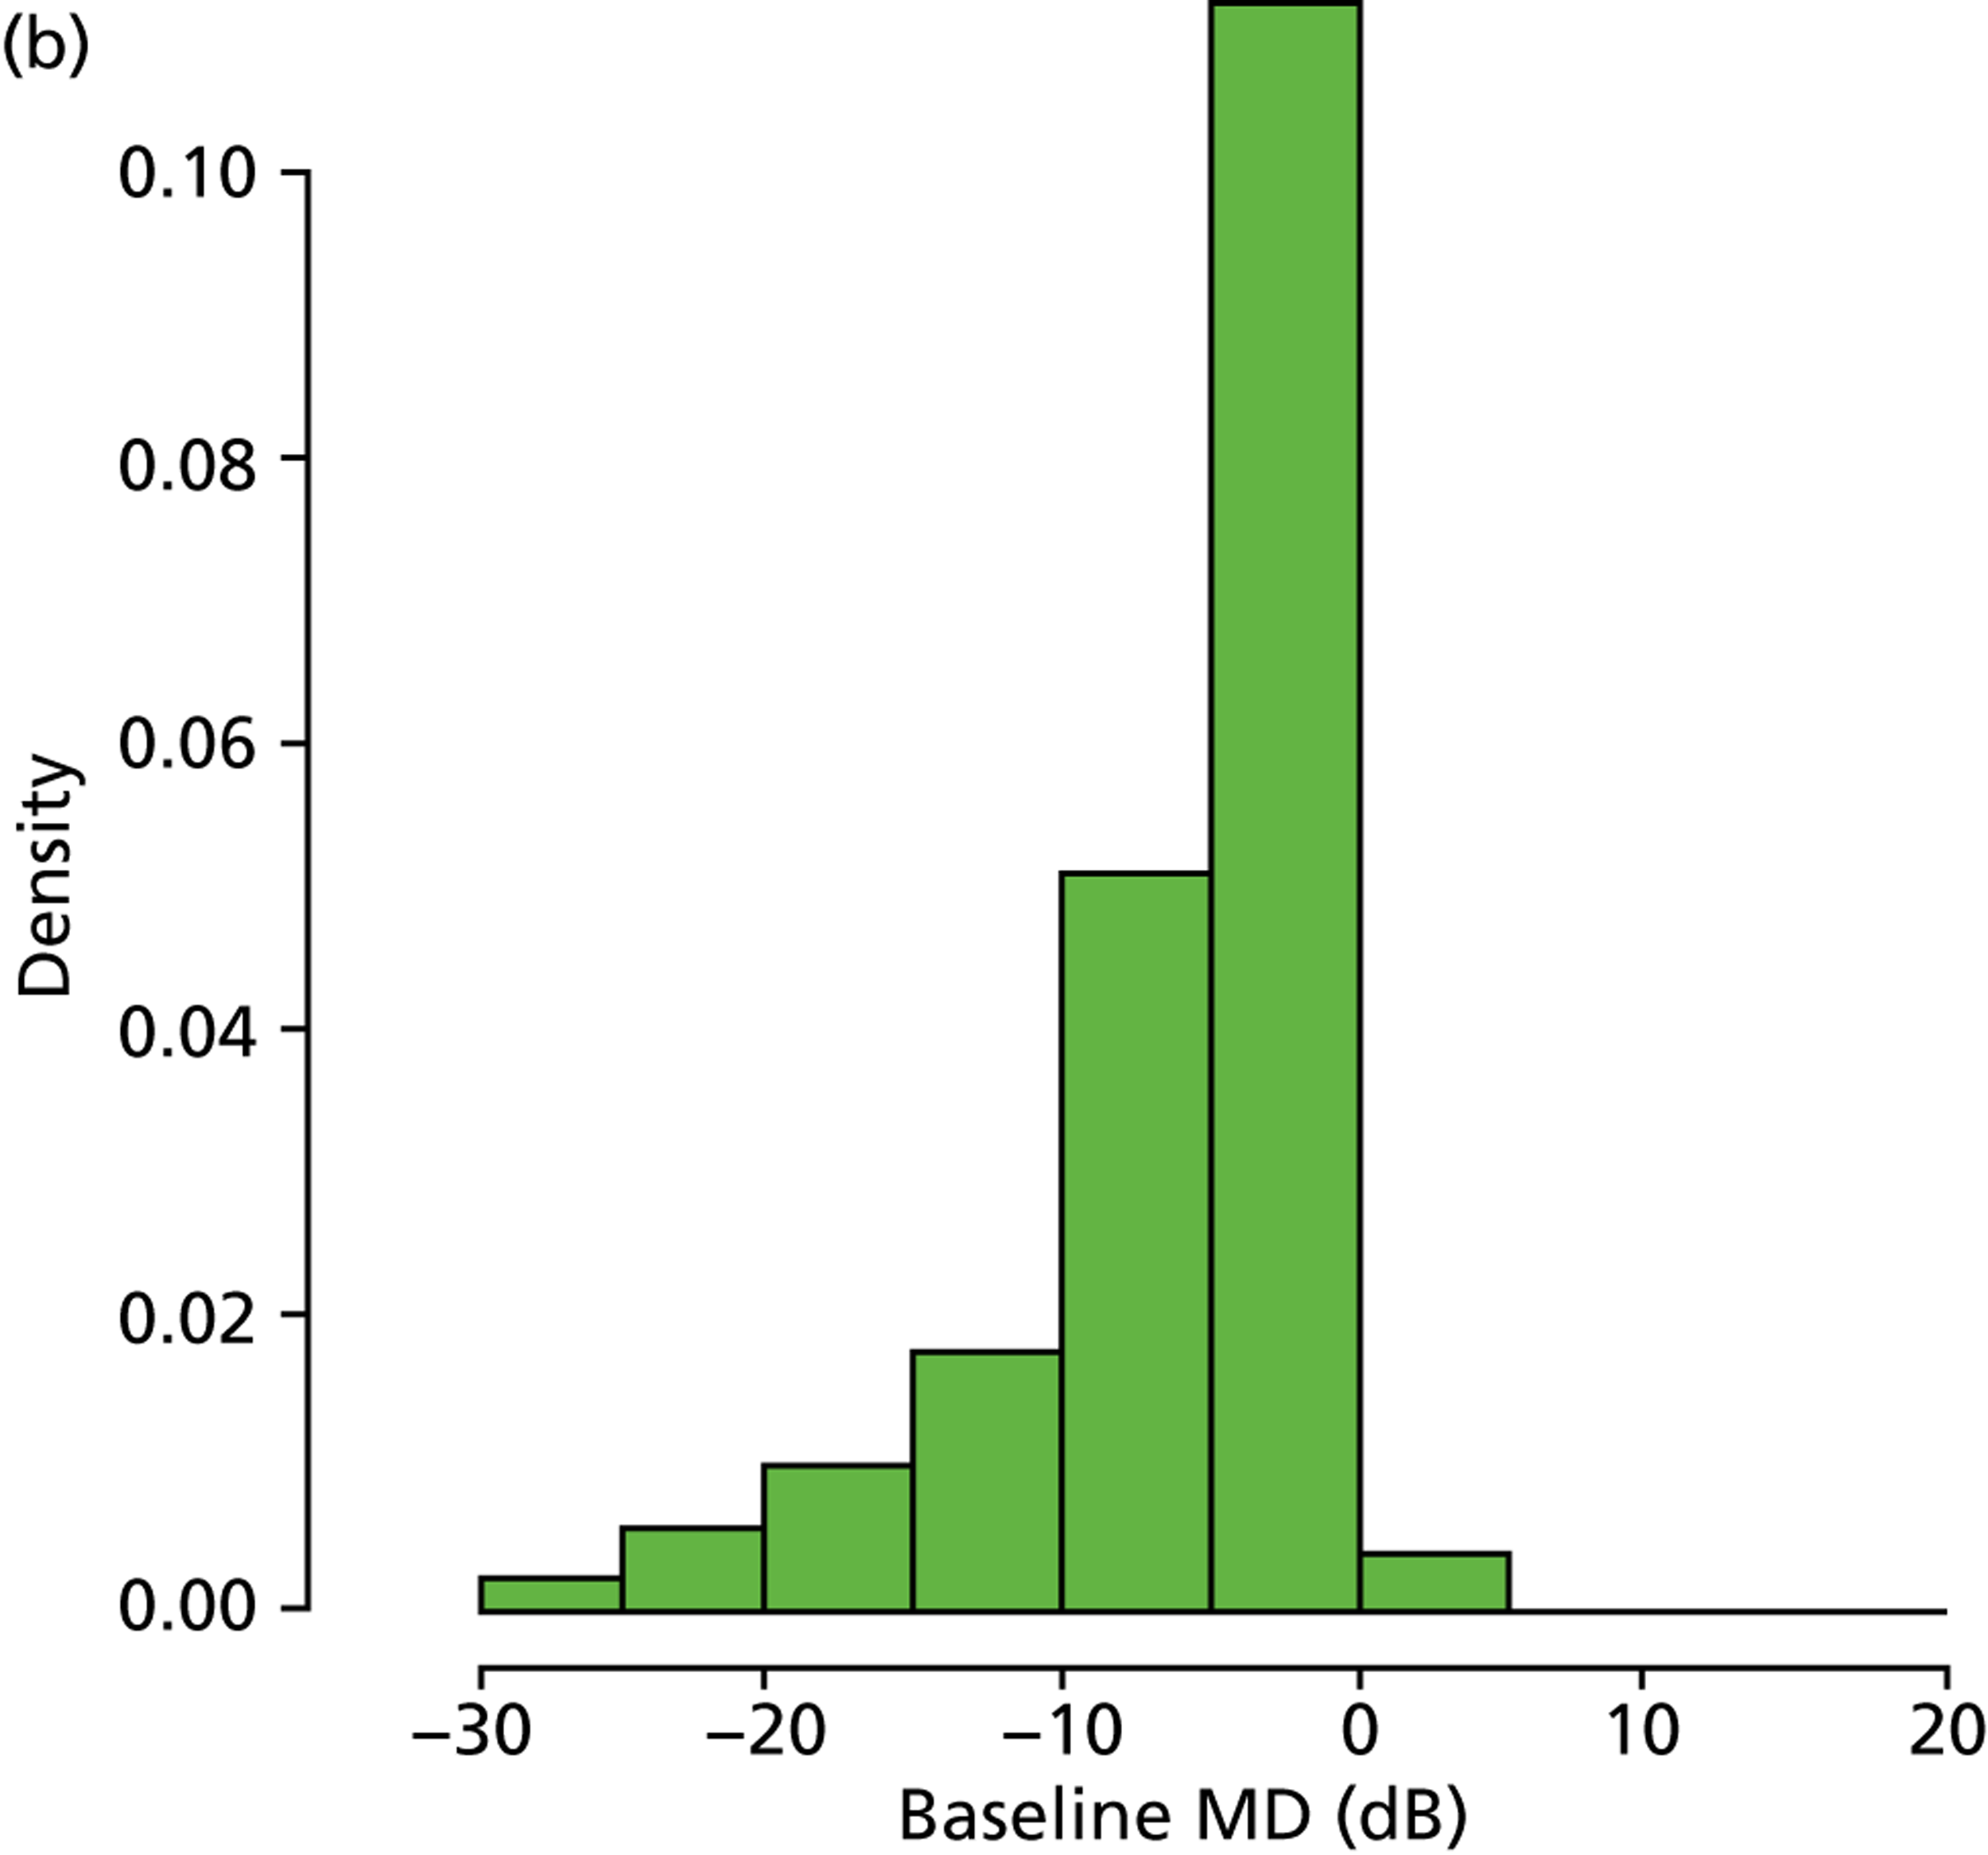
As already pointed out, one important aim of this research is to establish how rapidly newly diagnosed glaucoma patients progress to visual impairment; clearly, the amount of VF damage at presentation is another crucial factor (Figure 7). Analysis of the VF database indicated that, of the younger cohort, 65.0% patients were specified as having mild glaucoma, 21.4% were defined as having moderate glaucoma, 10.0% were specified as having severe glaucoma and 3.7% of patients were defined as visually impaired. In the older cohort, these figures were very similar, 66.2%, 20.9%, 9.3% and 3.7% respectively. The mean level of existing VF damage for the younger cohort was –3.1, –8.3, –15.5 and –24.0 dB for the mild, moderate, severe and visually impaired subgroups, respectively, whereas these figures were –3.1, –8.4, –15.4 and –23.6 dB for the older cohort respectively.
FIGURE 7.
(a) Distribution of baseline MDs younger cohort; and (b) distribution of baseline MDs for older cohort.
The analyses of VF data outlined above provided a number of interesting findings. In particular, the distribution of rates of MD loss shown in Figure 6b is reminiscent of similar results shown in prospective studies. 30,36 However, only a small proportion of glaucoma patients progress at a rate faster than –1.5 dB/year. This is in stark contrast to the findings from Heijl et al. ,41 who estimated that 15% of patients progressed at a rate faster than –1.5 dB/year, and the New York Progression Study, in which the number was in excess of 9%. 38–40 A possible explanation for this difference is the substantial percentage of patients with pseudoexfoliation glaucoma, which in the Heijl et al. study was associated with faster disease deterioration,41 and which is a condition not commonly seen in the UK. Another potential reason is that the patients in these other studies presented with more advanced glaucoma than observed here, which may be associated with more rapid progression. 36 Nevertheless, our estimates of the percentage of ‘fast progressors’ are similar to the results from controlled clinical cohort studies. 35–37 Notably, around half of the patients investigated had a positive rate of MD change, which is likely because of a combination of high VF measurement variability49,50 and learning effects. 51 We endeavoured to prevent learning effects by discarding patients’ first recorded VF tests, but, evidently, there remains a considerable difficulty in accurately measuring rates of MD change. This has significant consequences for the utility of VF testing in clinical practice. Patients who find VF testing difficult and produce unreliable measurements, or patients who simply are learning to do the test over time, should be identified as soon as possible because they are using resources that may be better utilised elsewhere.
Clinical trials and prospective studies principally inform clinical practice and decisions regarding health service delivery. On the other hand, retrospective examination of large numbers of data collected from the everyday clinical milieu over long periods of time also offers interesting insights, as our analysis shows. It is already recognised that participants in prospective glaucoma studies better adhere to prescribed therapy than patients in routine medical care;52 consequently, prospective studies and trials may sometimes misrepresent the routine clinical situation. However, any retrospective study, including our own, will have limitations. In particular, full patient records were not available, so analyses were based purely on age and VF data. As a result, some of the patients may have concomitant eye disease, principally cataract, and it is possible that a small minority of the patients did not have glaucoma at all, although it is unlikely given that all subjects were monitored at glaucoma clinics over at least 2 years.
The primary aim of this part of the research was to estimate the rates of MD progression and baseline VF damage observed in newly diagnosed glaucoma patients under clinical care, since, in order to model progression of VF loss, it is important that any model replicates data from the real clinical situation. Of course, it is assumed that the 5999 eyes selected are representative of all the patients made available to this study. One limitation is that those selected may be a biased sample of patients who are at more risk of progression. For example, there is a danger of selecting a group of patients who have actually been monitored quite intensively, perhaps because they are perceived to have been at high risk of rapid VF loss. Still, we think the very large sample is a reasonable representation of our target population and yields valuable data on rates of visual loss in clinics. For example, the interested reader is directed towards a paper describing a subsequent study that evaluated the proportion of patients in glaucoma clinics progressing at rates that would result in visual disability within their expected lifetime. 53 The information gathered in this section is thus essential to model the clinical effectiveness and cost-effectiveness of different VF monitoring regimes.
Computer model of visual fields
Gardiner and Crabb previously developed a computer model for generating series of VF tests. 6 In short, the model simulates series of VF tests with known properties, specifically baseline VF sensitivity, the length of series, the frequency of testing and the rate of loss. Variability or ‘noise’ around each measured value (VF sensitivity) is then added to the simulation by sampling randomly from a Gaussian distribution with mean zero and with a SD which increases as the underlying sensitivity decreases. A key objective of this chapter was to advance our published model for simulating VFs and, then, use simulations to investigate the clinical effectiveness of different VF testing schemes, namely annual testing against three tests per year in the first 2 years (following the recommendations by Chauhan et al. 5 and the EGS7).
As already pointed out, interpretation of results from SAP is difficult as VF measurements are highly variable, as shown by psychophysical experiments using frequency-of-seeing (FOS) measurements54–56 and test–retest studies. 50,57–62 VF variability dictates frequent monitoring and/or an extended period of time to accurately and precisely detect glaucomatous progression. 5,6 The lack of a ground-truth VF measurement in glaucoma makes it very difficult to measure the diagnostic performance of tests, such as SAP, to evaluate disease progression. Computer simulation thus provides a way to generate artificial VF data that reflect real results obtained with SAP. Indeed, simple computer simulations have been utilised to gauge VF test strategies for over 20 years. 6,63–70 Furthermore, simulation provides a reproducible and modifiable means to investigate the characteristics of cross-sectional and longitudinal VF data in large numbers. A key component of any computer model for VFs is the simulation of variability around VF sensitivity measurements.
The relationship between variability and sensitivity in visual field data
Previous research has explored the relationship between VF variability and sensitivity. In particular, Henson et al. and Henson collected FOS data, using SAP, from four VF locations in 71 subjects with a range of VF damage. 55,71 The authors concluded that variability (SD) was greater as VF sensitivity decreased and described the relationship using the following linear function:
where A = –0.081 and B = 3.27; R2 = 0.57. According to this equation, as sensitivity reduces there is an exponential increase in variability. This finding, however, is not directly relevant to clinical SAP test strategies, where measured thresholds are not constructed from FOS curves. Moreover, there was an extreme lack of measurements with reduced sensitivity and absolutely no data below 10 dB. A later study by Artes et al. overcame these limitations using test–retest data and studied the variability properties of SAP threshold estimates from the full threshold and SITA strategies of the HFA. 61 The authors investigated one eye of 49 patients with glaucoma, with a large range of VF damage, four times with each test strategy. The study found that variability increased as the ‘best available estimate of sensitivity’ (mean sensitivity from test–retesting) decreased up until about 10 dB, after which variability was found to reduce as sensitivity decreased further. For glaucomatous locations with a best available estimate of sensitivity equal to 10 dB, variability was so great that the fifth and 95th percentiles of the retest measurements covered 0 dB to 28 dB respectively.
In this section, we characterise VF variability by level of sensitivity using a statistical method to quantify heteroscedasticity in longitudinal data. The chief advantage of this approach is that inference is based on thousands of patients tested in standard clinical settings, rather than the tens of individuals reported in FOS and test–retest studies. We undertook a retrospective analysis of 14,887 VF tests from 2736 eyes in 2736 patients (if more than one eye was eligible, one eye was randomly selected) attending the Glaucoma Service of Moorfields Eye Hospital, London, between 1997 and 2009. VFs were anonymised prior to analysis. The study adhered to the tenets of the Declaration of Helsinki and was approved by the research governance committee of Moorfields Eye Hospital. All data were transferred to a secure computer database at City University London, London, UK.
All VF tests were carried out with the HFA using the 24-2 test pattern with a Goldmann size III target and the SITA Standard testing algorithm. VFs were considered unreliable and discarded according if fixation losses were ≥ 20% or false-positive errors were ≥ 15%. False-negative errors were not considered, as a higher false-negative rate is strongly correlated with field damage. 72 A patient’s series of VF tests had to number at least five and the first VF test was discarded to lessen the impact of perimetric learning effects. 51,73 The relationship between variability and sensitivity was analysed by examining the residuals from linear regression of pointwise sensitivity over time. Linear regression estimates the relationship between a predictor variable X and an outcome variable Y:
where a is the intercept, b is the slope and E is the error term. 74 The error term represents the part of the outcome variable that is not explained by the predictor variable. For the fitted function, the error term is estimated from the residuals, which are the vertical deviations from the fitted line.
The simplest and most common approach for fitting a regression line is to minimise the sum of squares of the residuals; this method is known as ordinary least squares linear regression (OLSLR). This technique assumes that the outcome variable is error free and that the error term is Gaussian distributed with mean zero and uniform variance across the range of the predictor measurement. Constant variance is known as homoscedasticity (‘equal scatter’). However, if the residuals alter according to the size of the measurement, this is referred to as heteroscedasticity (‘unequal scatter’), which indicates that the variance of the error term is not constant across observations. Linear regression coefficient estimates (i.e. the slope and intercept terms) are not biased by heteroscedasticity, but estimates of the variance of these coefficients are influenced. 75 Thus, OLSLR, in the presence of heteroscedasticity, offers an unbiased estimate for the relationship between the predictor variable and the outcome variable, but standard errors and, consequently, inferences on statistical significance may be incorrect. The residuals from OLSLR are hugely informative when examining heteroscedasticity. A scatterplot of the absolute or squared residuals against X, Y or Ŷ (the fitted value of Y) may be used to assess for non-uniform variance of the error term.
We investigated heteroscedasticity in longitudinal VF data by analysing the residuals from pointwise linear regression of sensitivity measurements (the Y variable in dB) against time (the X variable in years) for each eye’s series of VF tests using OLSLR and Tobit linear regression (TLR). 76 We previously discussed the usefulness of TLR for the analysis of VF sensitivity measurements in Russell et al. 77 When the response variable in a linear model is censored (as is the case for SAP sensitivity), the assumptions of OLSLR are not valid. TLR, on the other hand, employs a latent dependent variable, which respects left and/or right censoring and predicts the response only within the range specified. Thus, in contrast to OLSLR, TLR reconciles that a VF sensitivity measurement of 0 dB could be 0 dB, or, a value less than 0 dB (were SAP to have a larger dynamic range).
Regression models (TLR and OLSLR) were fitted to each eye’s series of VF sensitivity values (for each test point separately) against time (the patient’s age at each VF test); for an example, see Figure 8. The two locations adjacent to the blind spot were excluded, giving 52 thresholds for each VF.
FIGURE 8.
The solid line represents OLSLR of a patient’s VF measurements (at a given point in their VF) against their age. In this example the TLR line is no different to the OLSLR line.
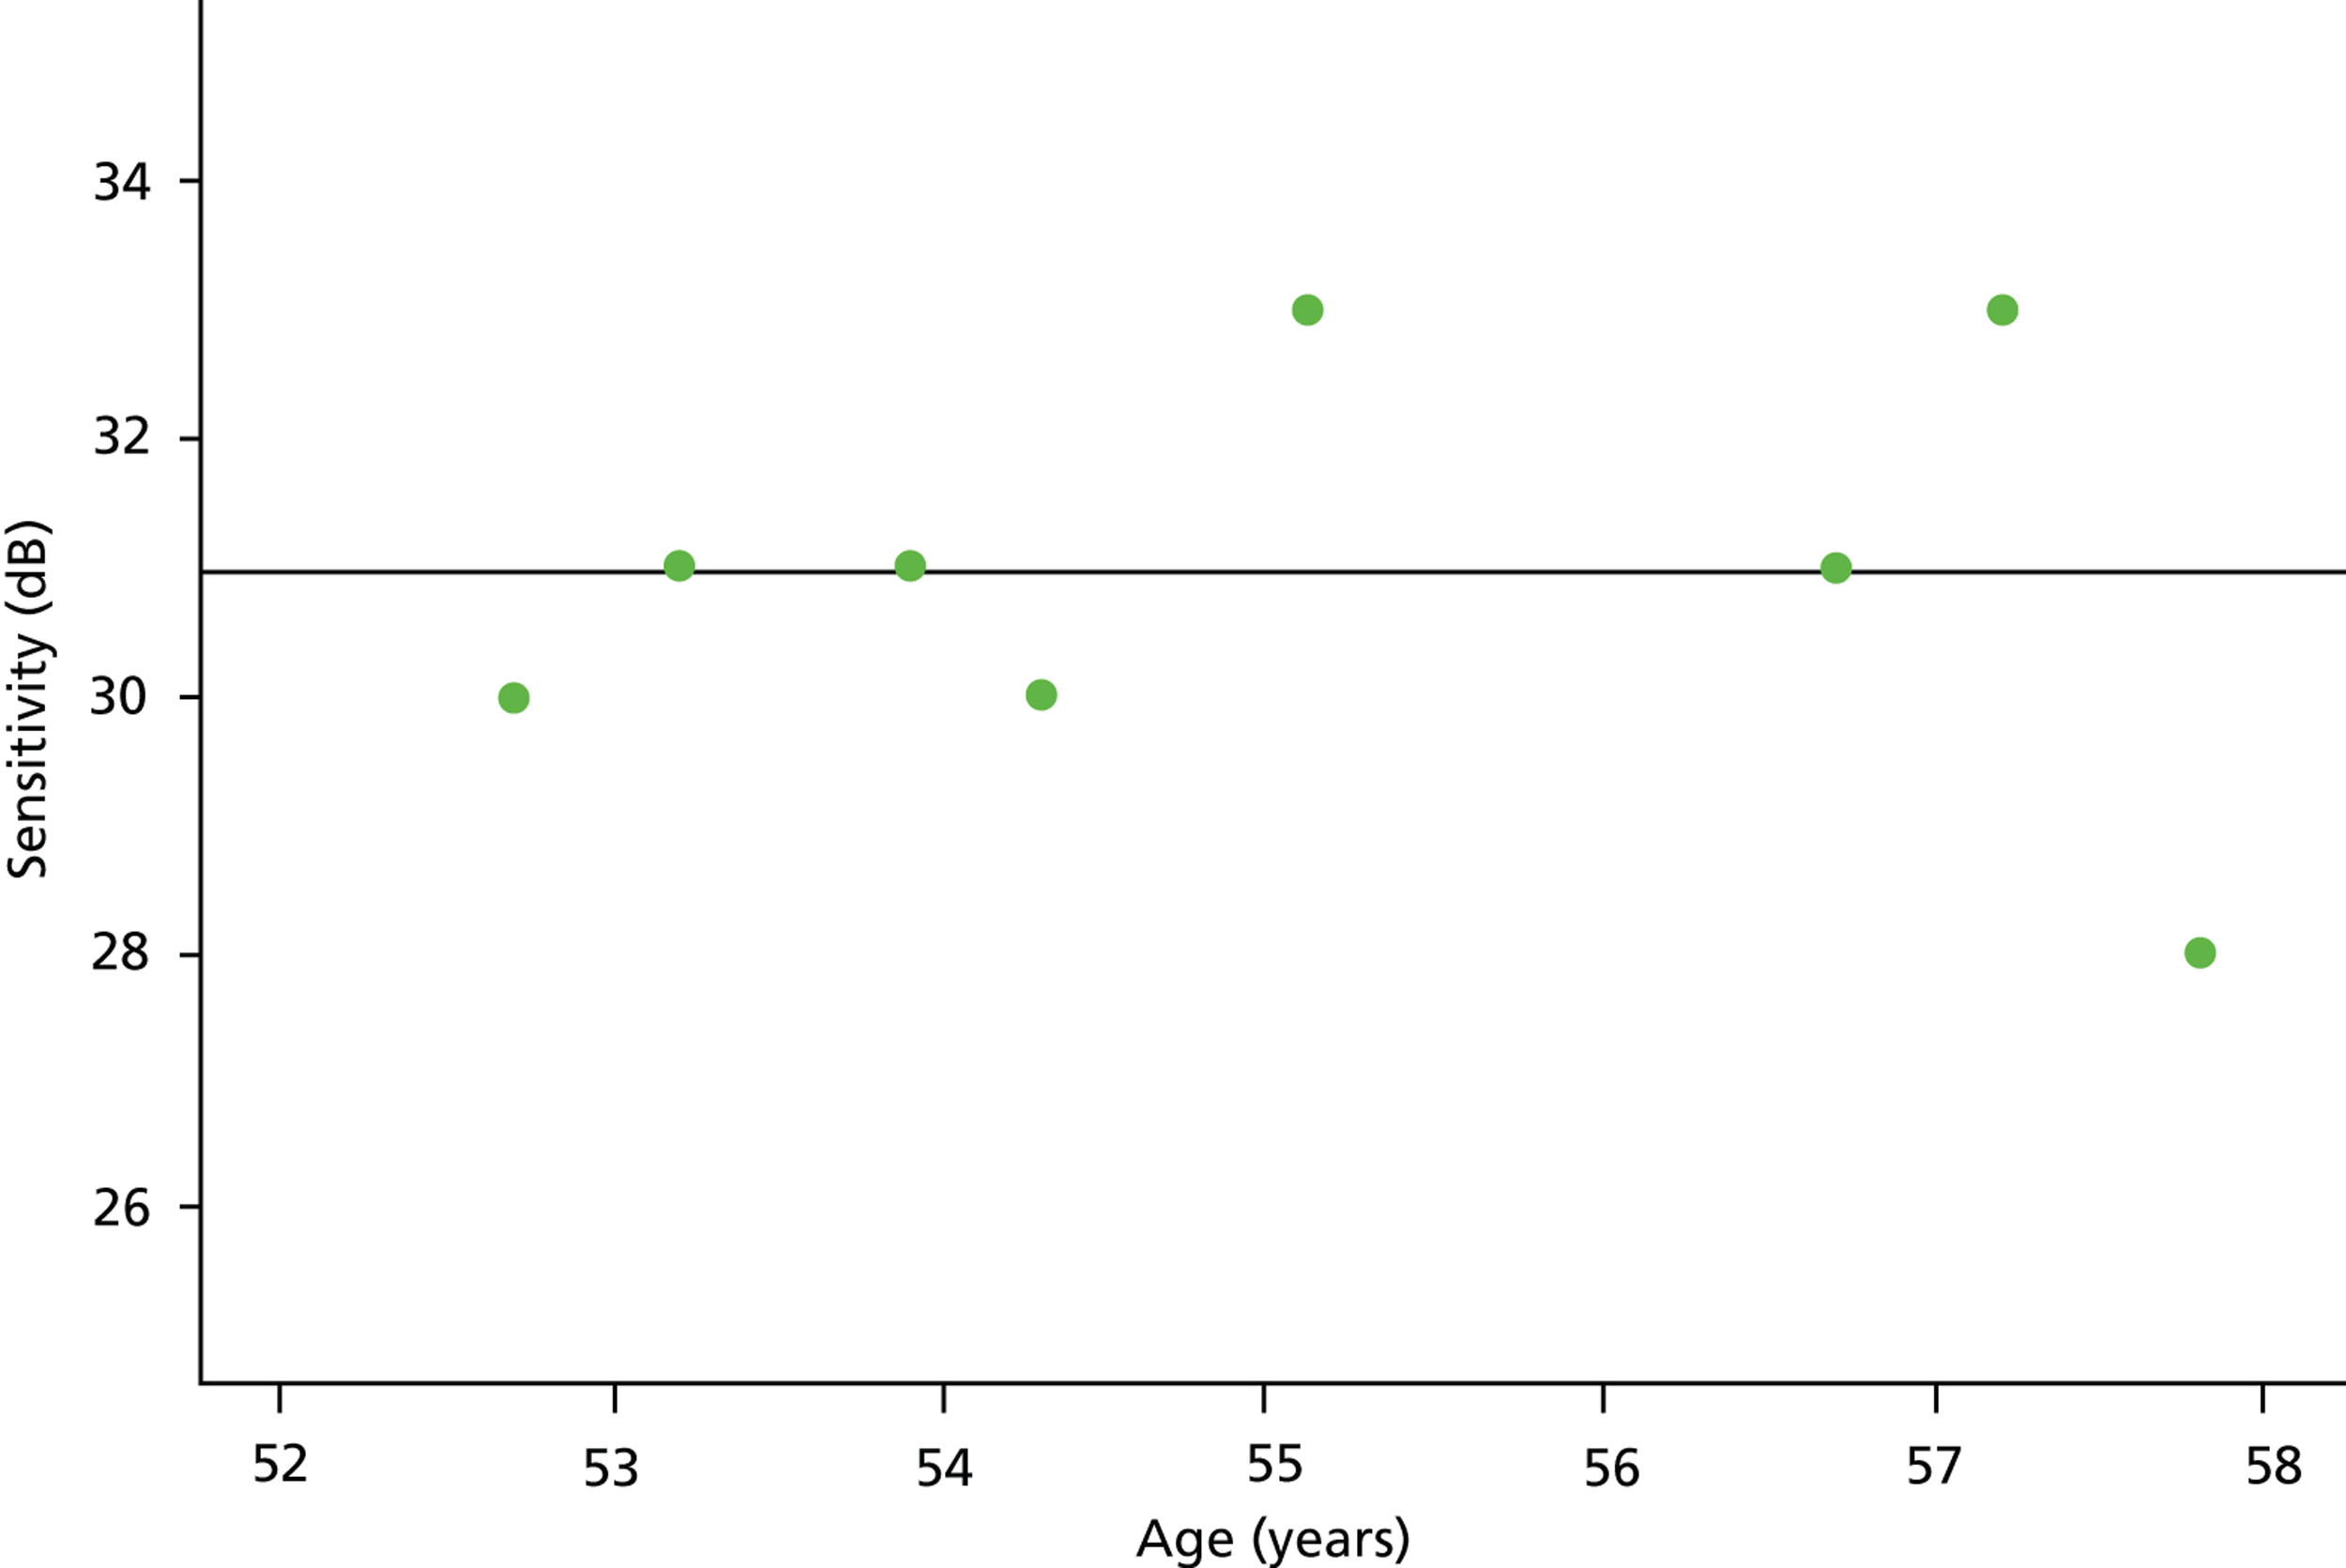
Next, least squares residuals (Ê) were extracted:
and binned according to measured sensitivity in the range 0–36 dB. Residuals were also grouped according to the fitted sensitivity value (rounded to the nearest whole decibel), Ŷ, as this value estimates ‘true’ sensitivity. The two binning strategies ask subtly different questions. First, binning by measured sensitivity investigates variability conditional on the measured threshold and, therefore, poses the question, given a measured threshold what is the underlying range of values for the ‘true’ value? This is akin to a study by Wall et al. 57 in which retest VF thresholds were compared with baseline threshold; in this case, as the authors state, ‘the first test is not meant to be the true sensitivity, as it has its own variability’. Second, binning by fitted sensitivity analyses variability conditional on the estimated true value and asks the question, given a ‘true’ threshold value what is the range of measured thresholds expected for any given test? This approach mirrors research by Artes et al. ,61 in which thresholds were compared against the average of several retest thresholds. The difference in the two binning strategies is shown in Figure 8. In this figure, the regression residuals are all associated with an OLSLR-fitted sensitivity of 31 dB; however, when the residuals are stratified by measured threshold, they are grouped into the following bins: 30, 31, 31, 30, 33, 31, 33 and 28 dB.
Table 7 summarises the characteristics of the study sample.
| Measurement | Median (IQR) |
|---|---|
| Baseline age (years) | 63.7 (54.0–71.2) |
| Baseline pointwise sensitivity (dB) | 28 (24–30) |
| Follow-up period (years) | 5.5 (3.9–7.0) |
| Number of VF tests | 6 (5–7) |
In total, 142,272 (52 × 2736) regression lines were fitted and approximately 1 million residuals recorded for each linear regression method. The residuals associated with fitted and measured sensitivity levels were evaluated as histograms for both the TLR and OLSLR models (Figure 9). Figure 9 highlights significant differences in the distributions of residuals at different sensitivity levels; for both linear regression methods, distributions were relatively condensed at large VF sensitivities (26–36 dB) but variability increased substantially as sensitivity decreased to a level of 10 dB. Indeed, for the 10-dB level, residuals spanned almost the entire dynamic range of SAP. Below 10 dB, there was some disparity between the distributions of residuals for the TLR and OLSLR models (see Figures 9a and e); this suggests that any reduction in variability below 10 dB is explained by the limited dynamic range of SAP, as evidenced by the negative skew in the histograms in Figure 9. In the range of 0–21 dB, the distributions of residuals for OLSLR are negatively skewed as a result of the limited dynamic range, and this is not observed, to the same extent, in the corresponding TLR distributions. The standard deviations of the residuals for each fitted and measured sensitivity level are shown in Figures 10a and 10b respectively; the blue lines result from binning OLSLR residuals, whereas the green lines are derived from binning TLR residuals. These are compared with variability estimates from Henson et al. 55 (yellow lines) and Artes et al. 61 (red lines).
FIGURE 9.
Distributions of residuals according to fitted-values values (left column) and measured values (right column) for 0, 10, 20 and 30 dB sensitivity levels. Distributions are illustrated as ‘back-to-back histograms’: the upper histogram (black bars) are residuals derived from OLSLR, whereas the lower histogram (green bars) are residuals derived from TLR. (a) Ŷ, = 0 dB; (b) Ŷ, = 10 dB; (c) Ŷ, = 20 dB; (d) Ŷ, = 30 dB; (e) Y = 0 dB; (f) Y = 10 dB; (g) Y = 20 dB; and (h) Y = 30 dB.
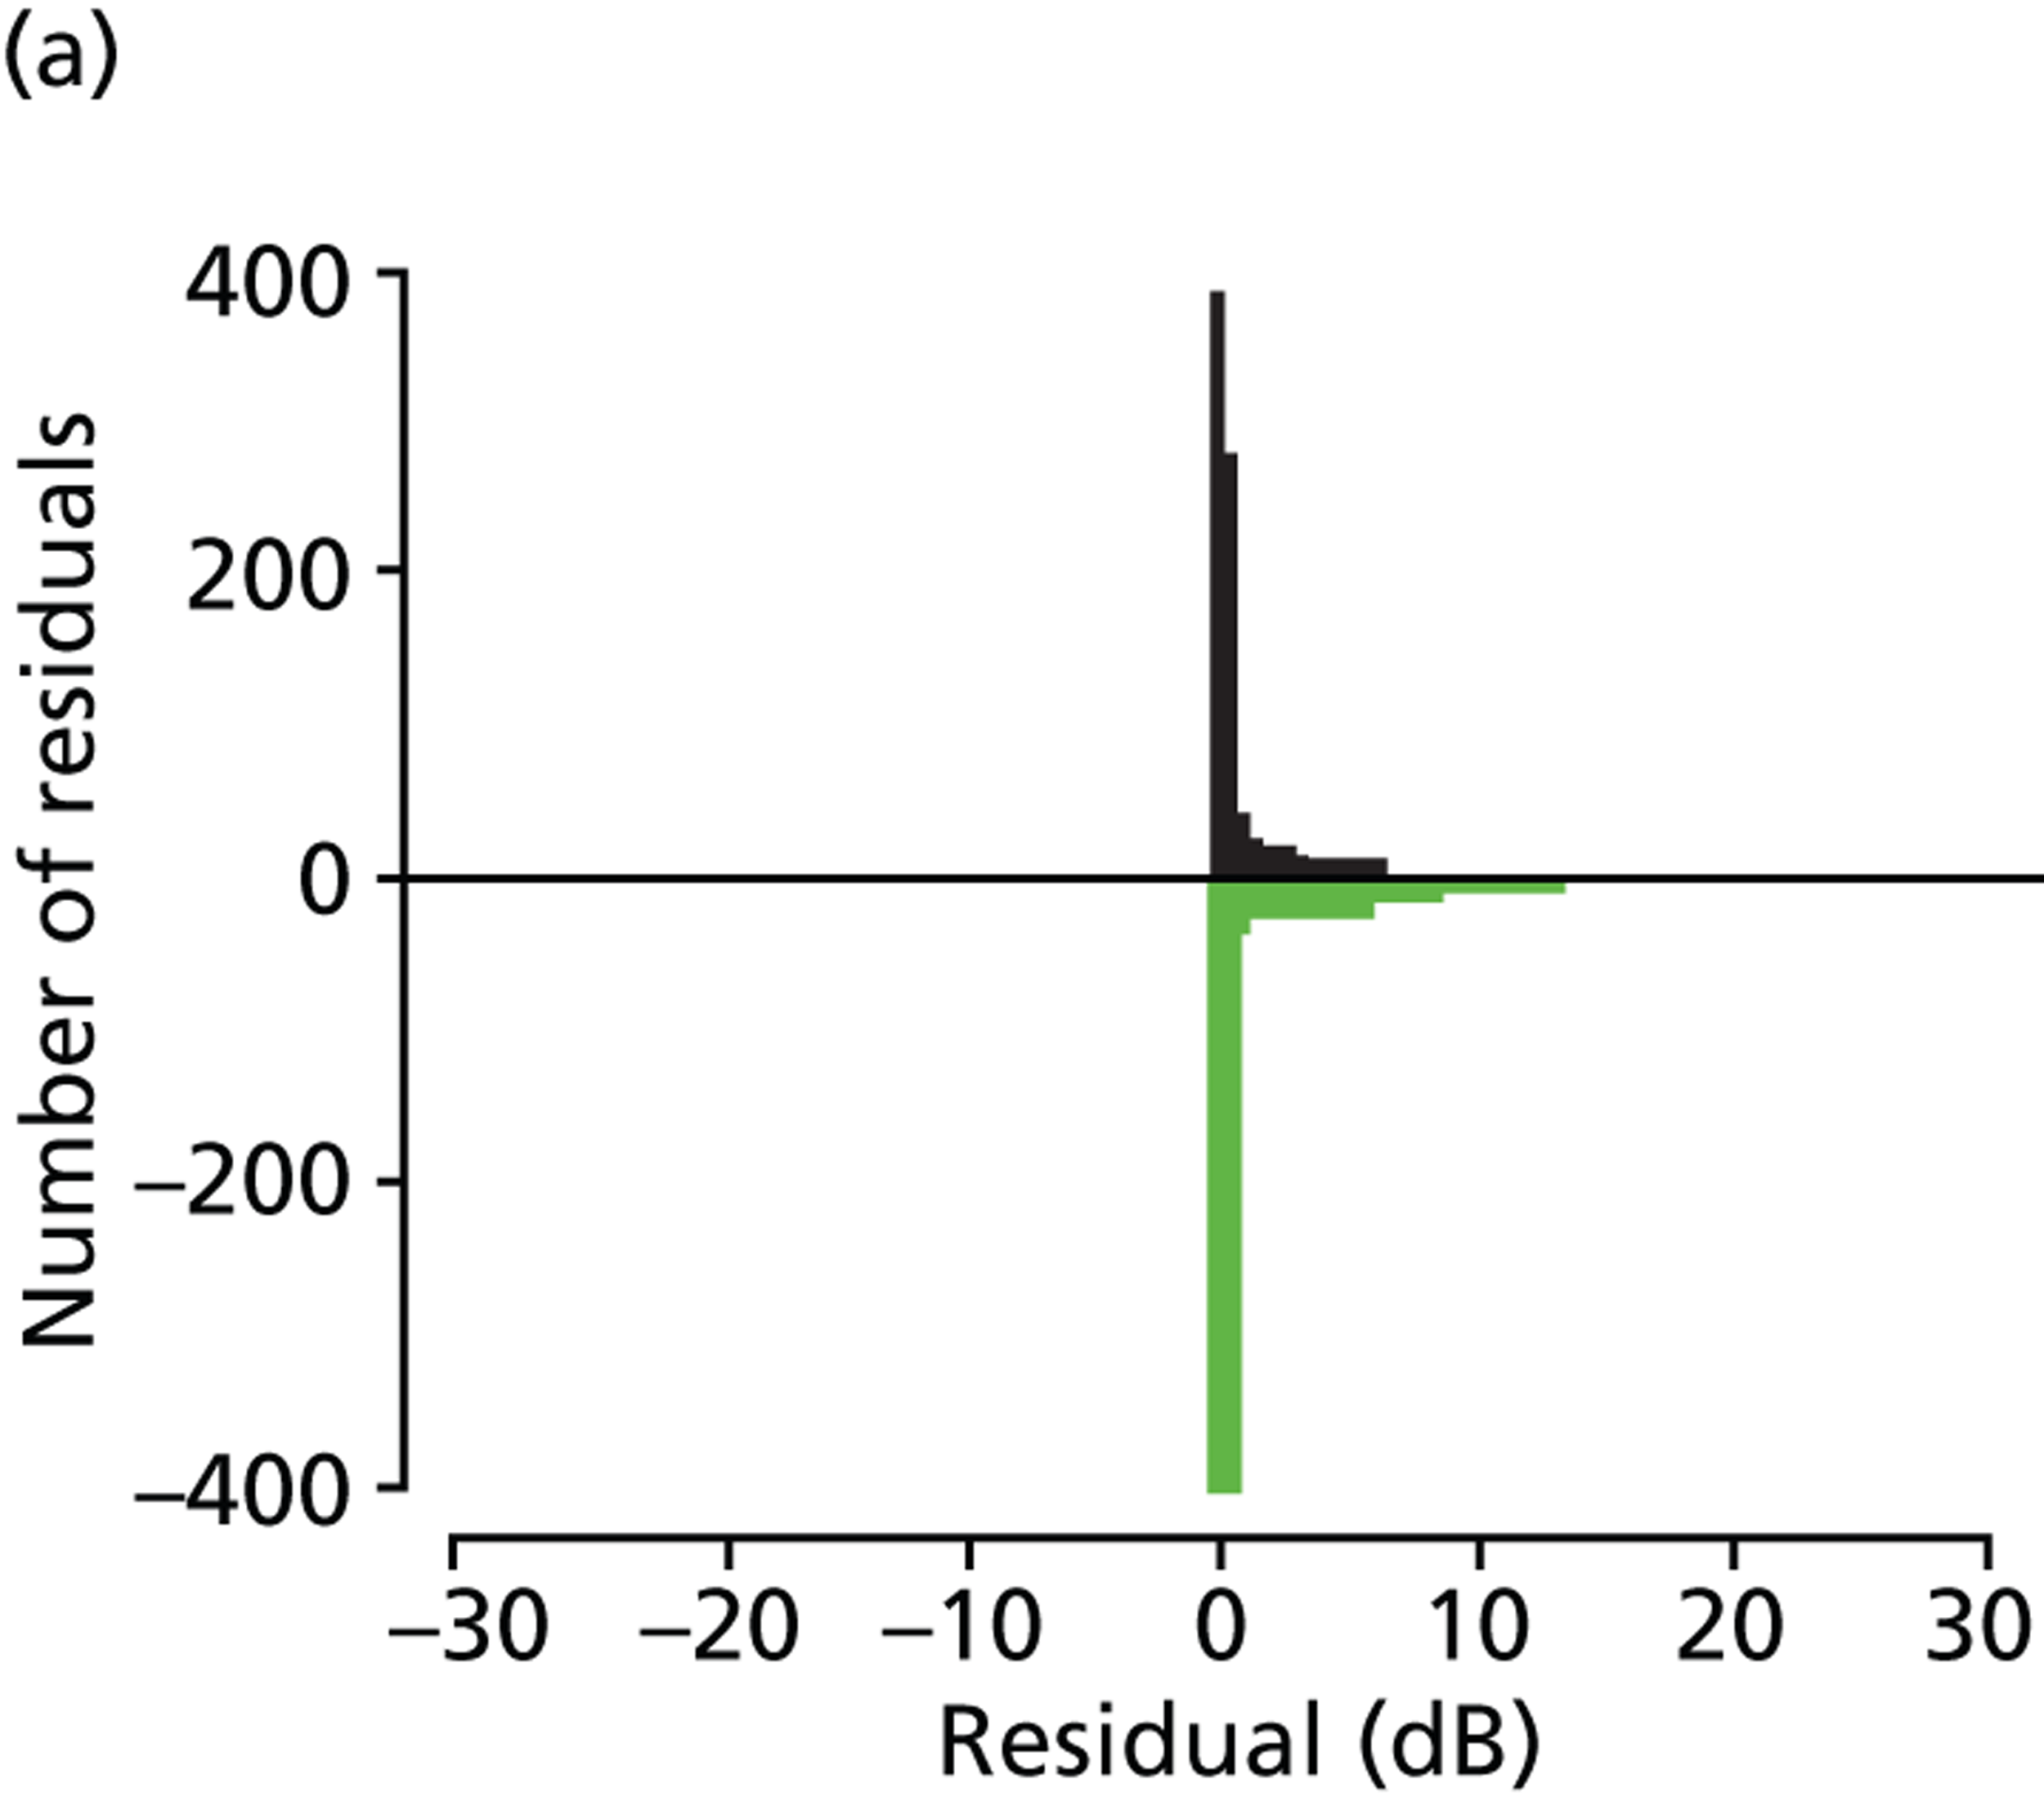
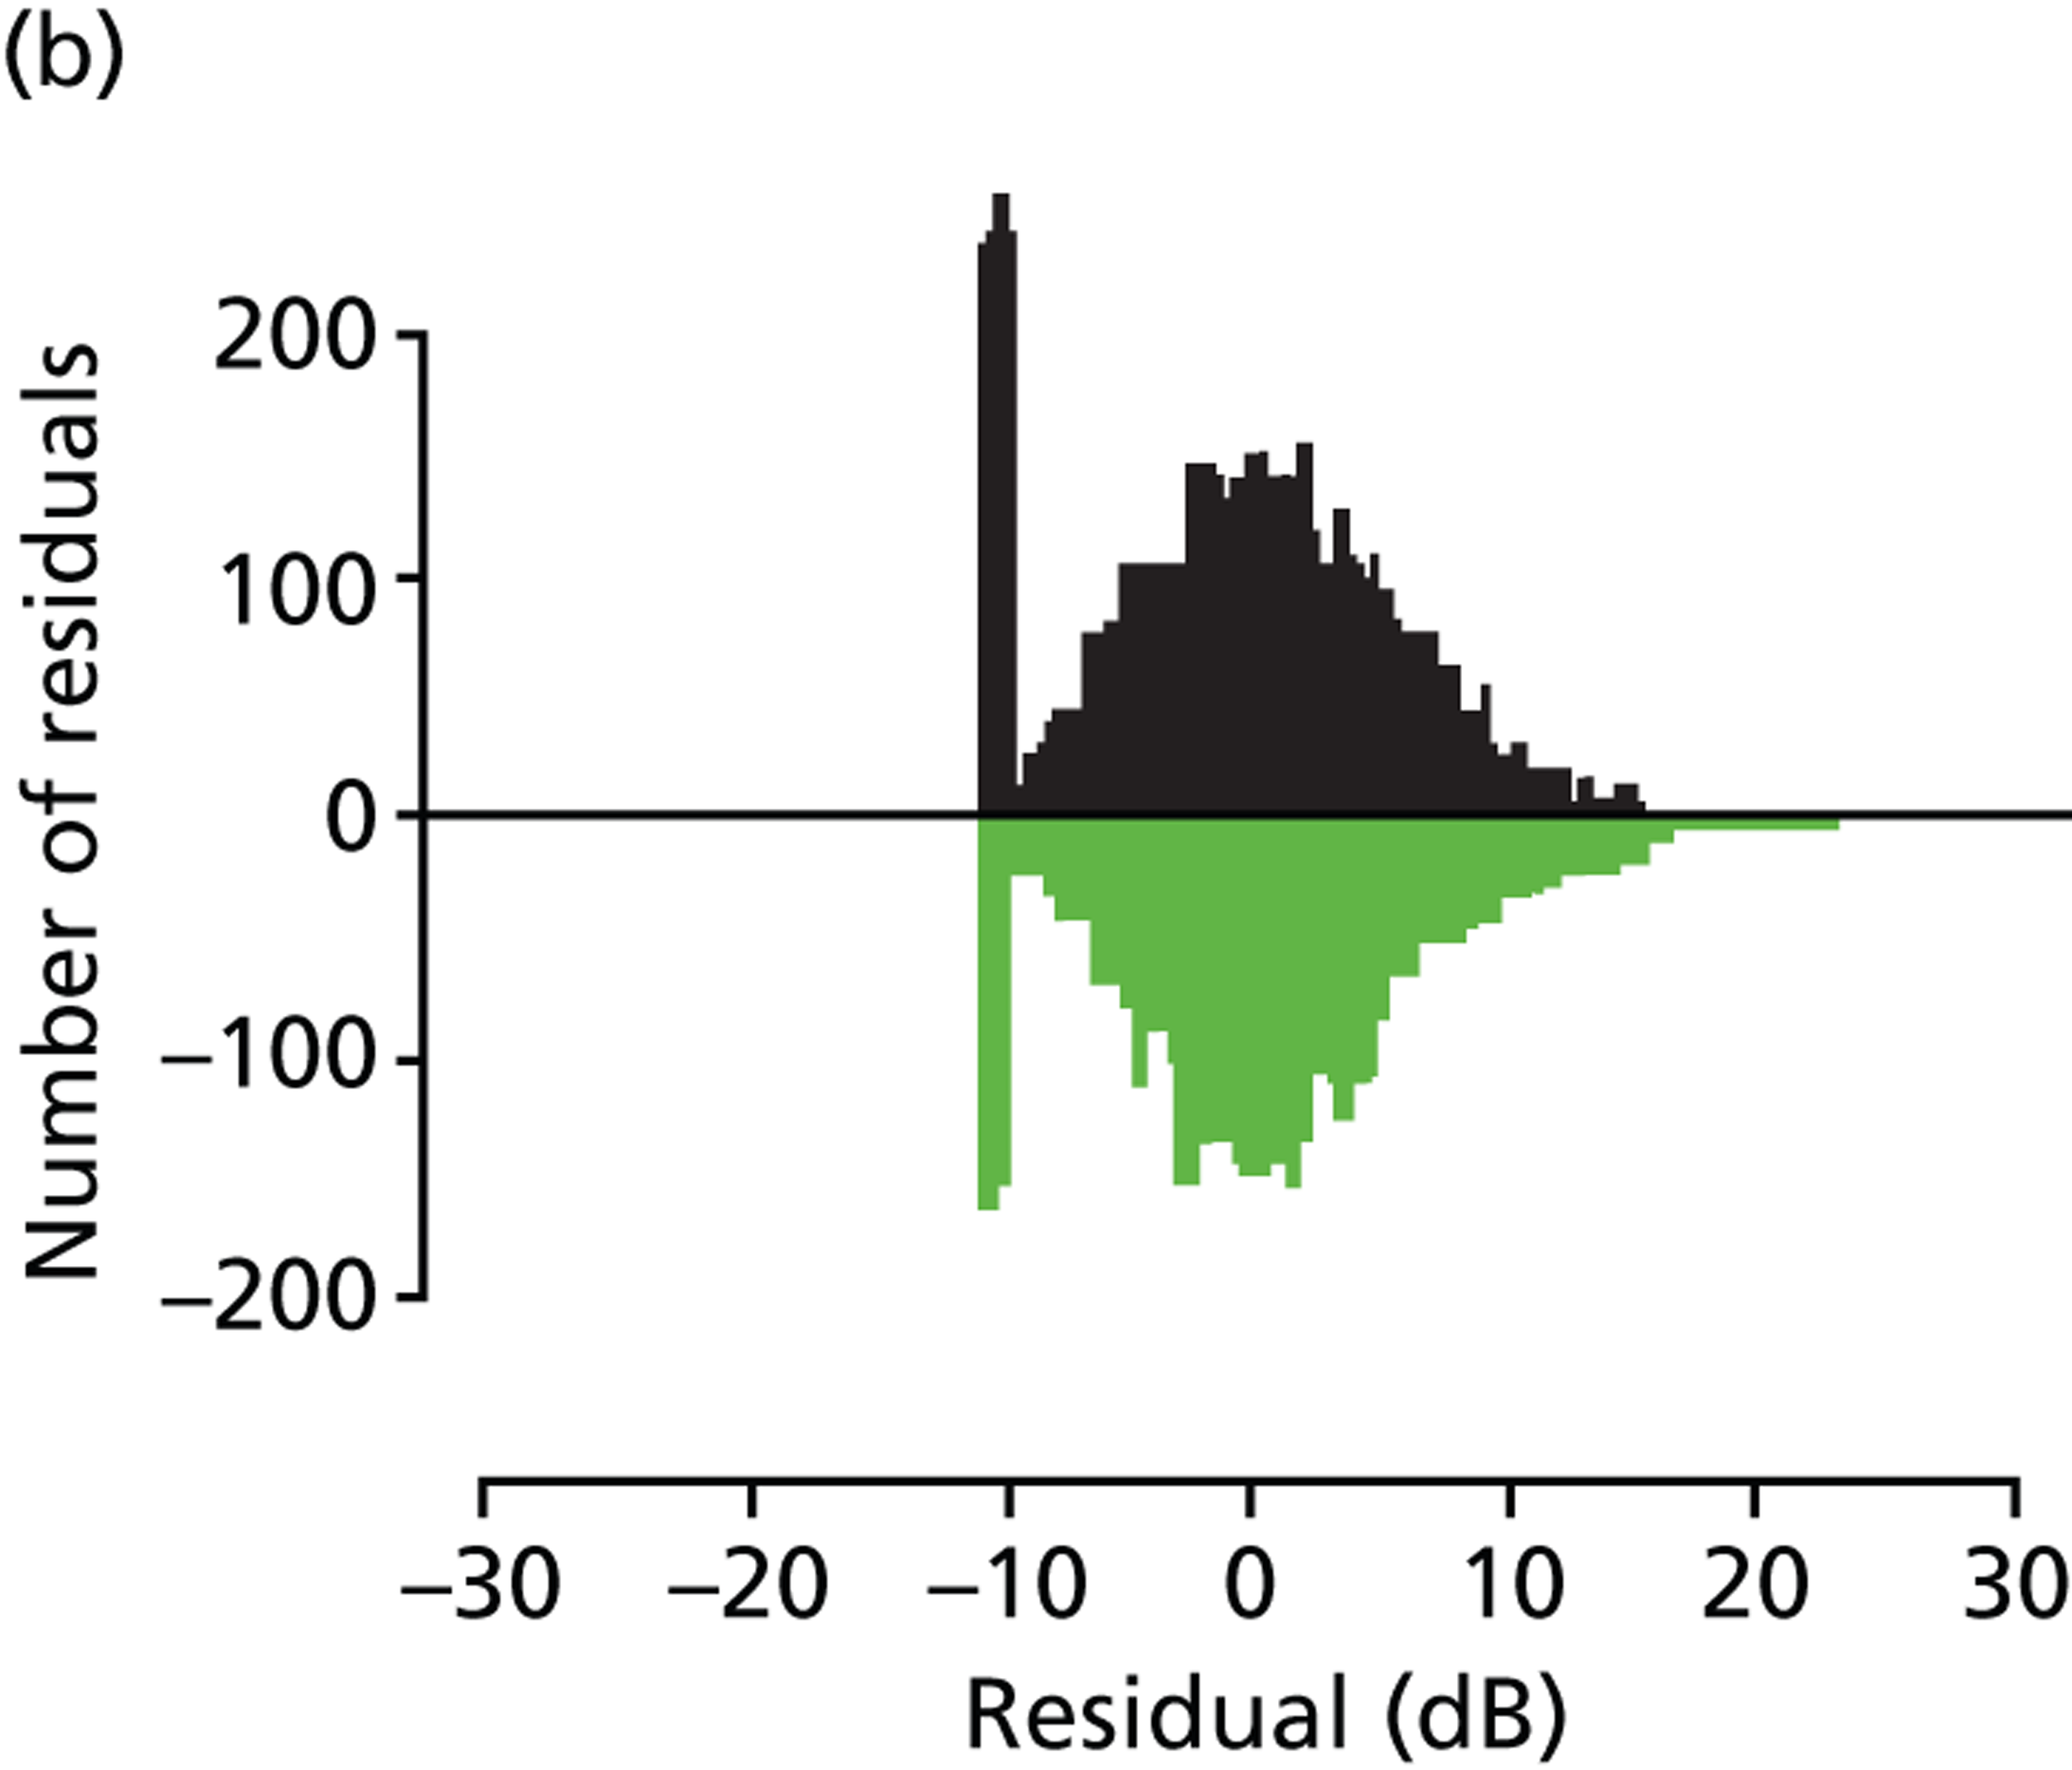
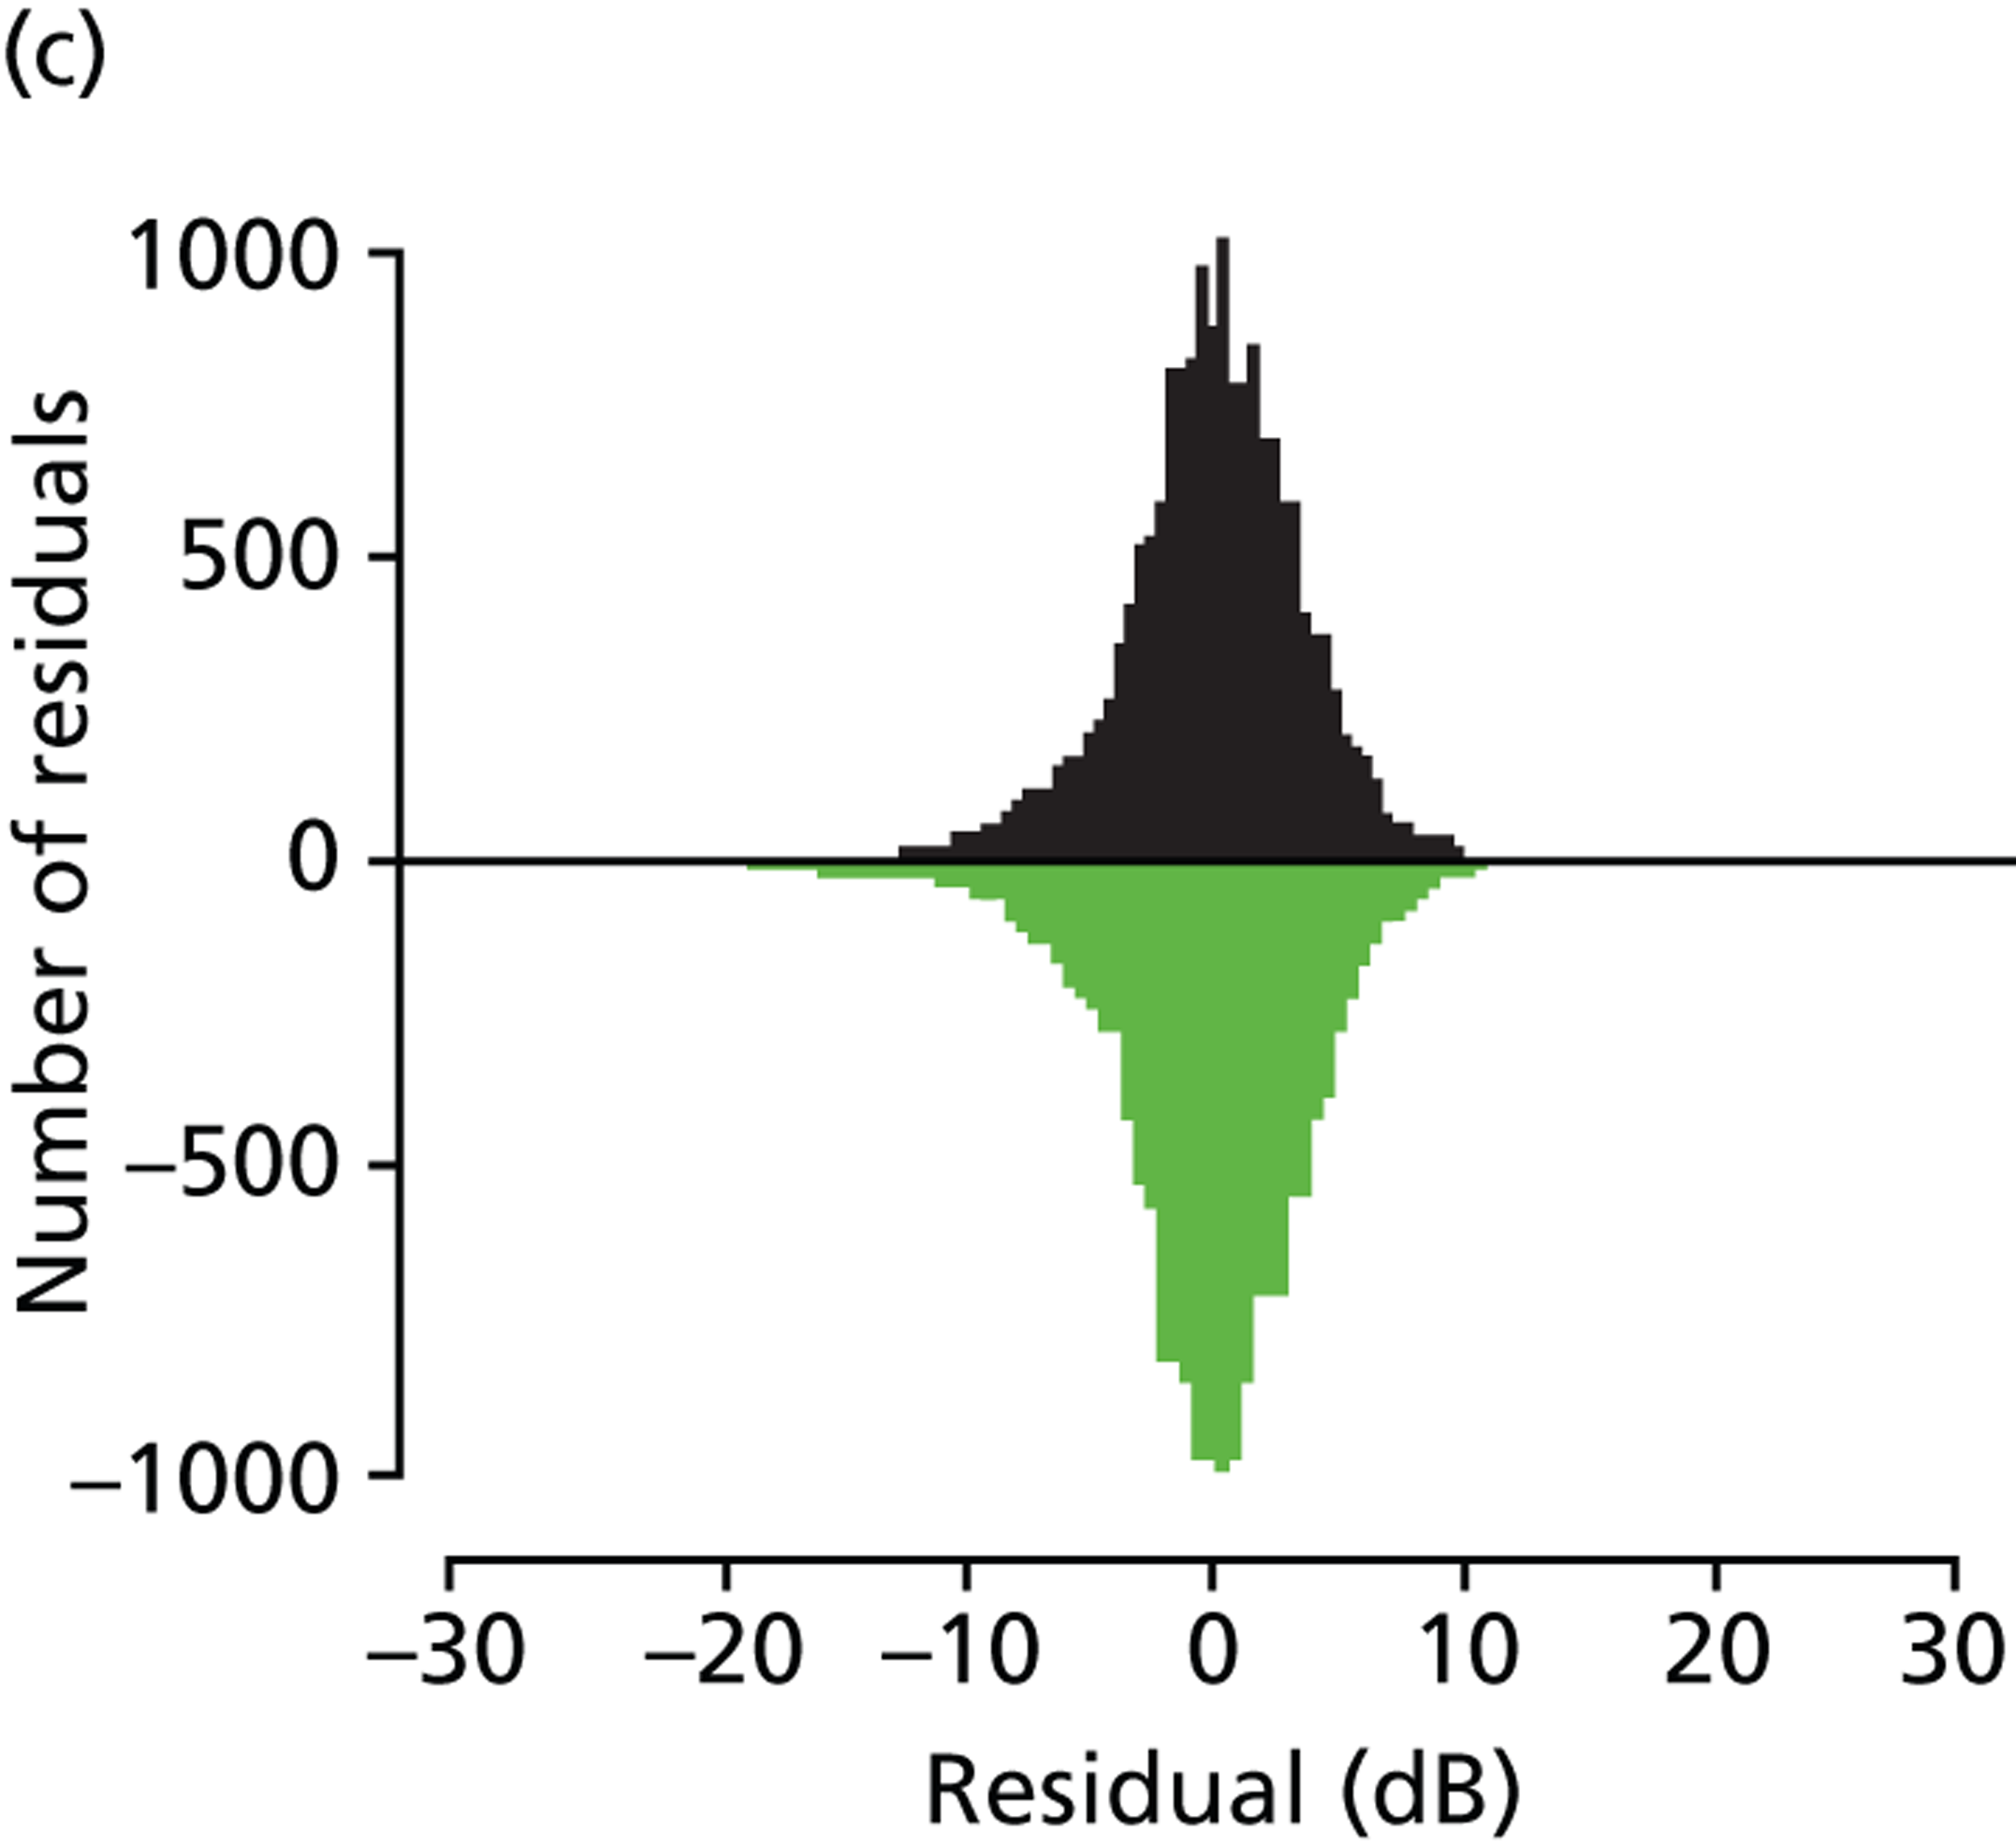
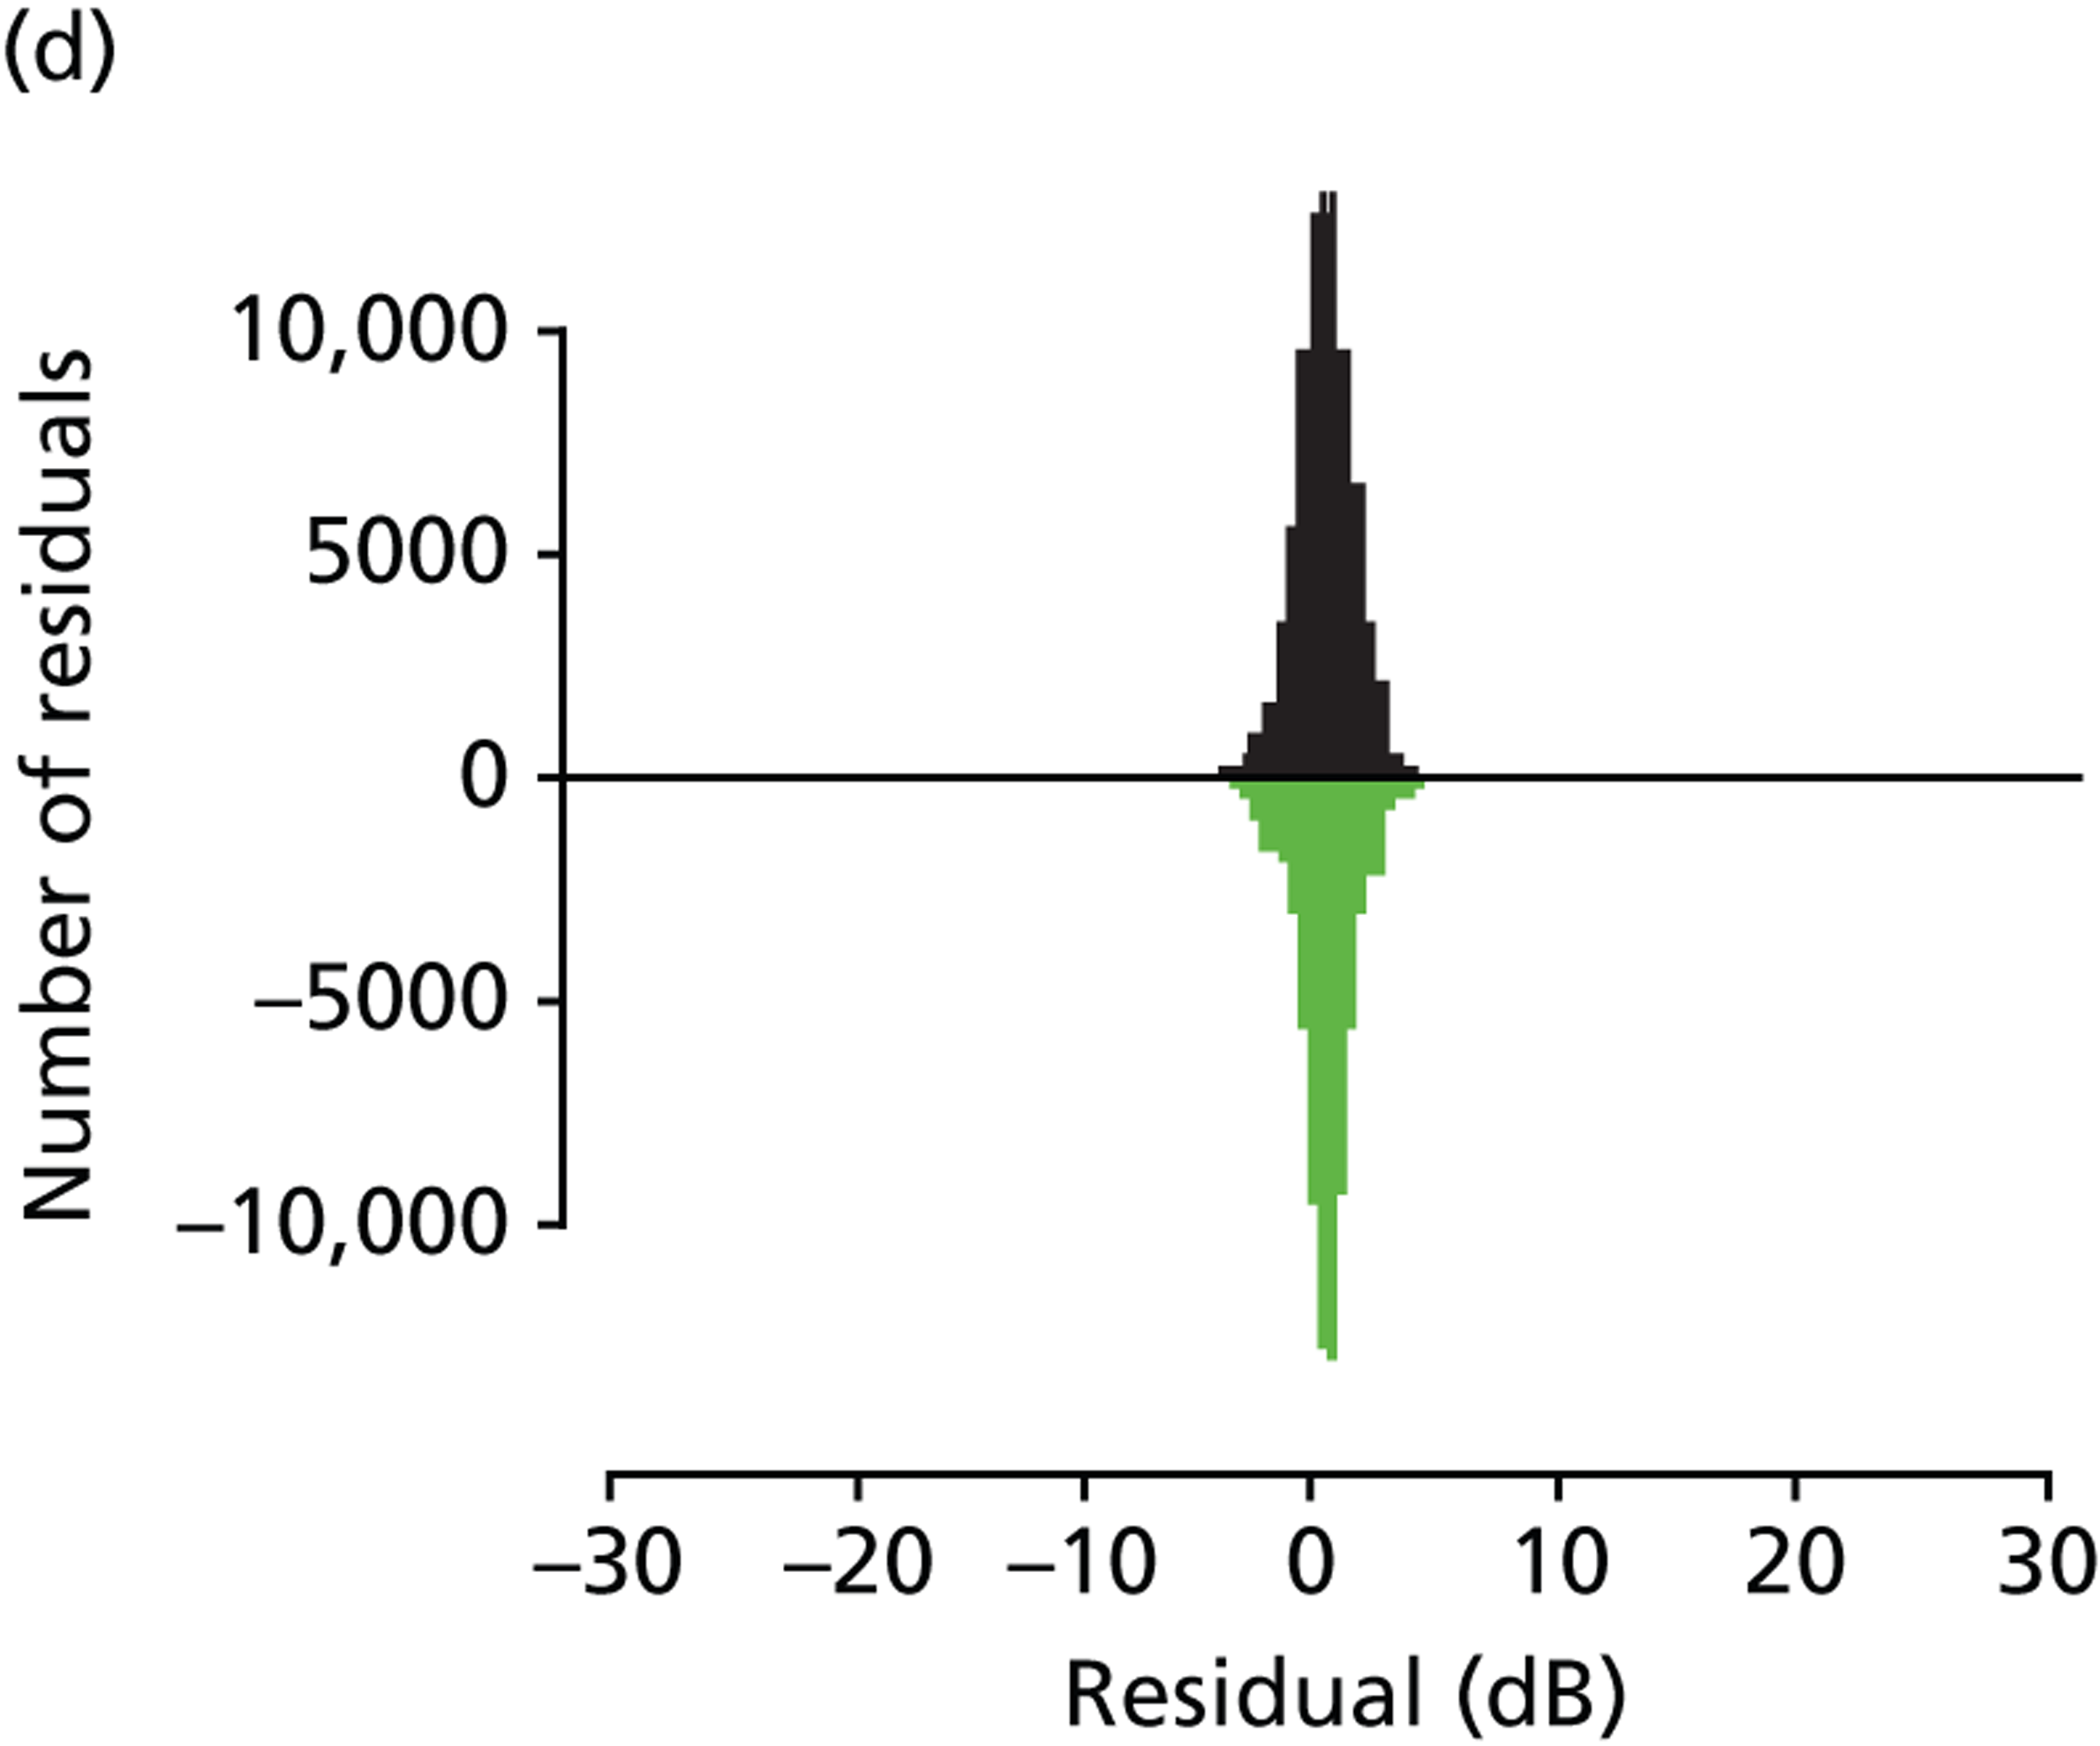
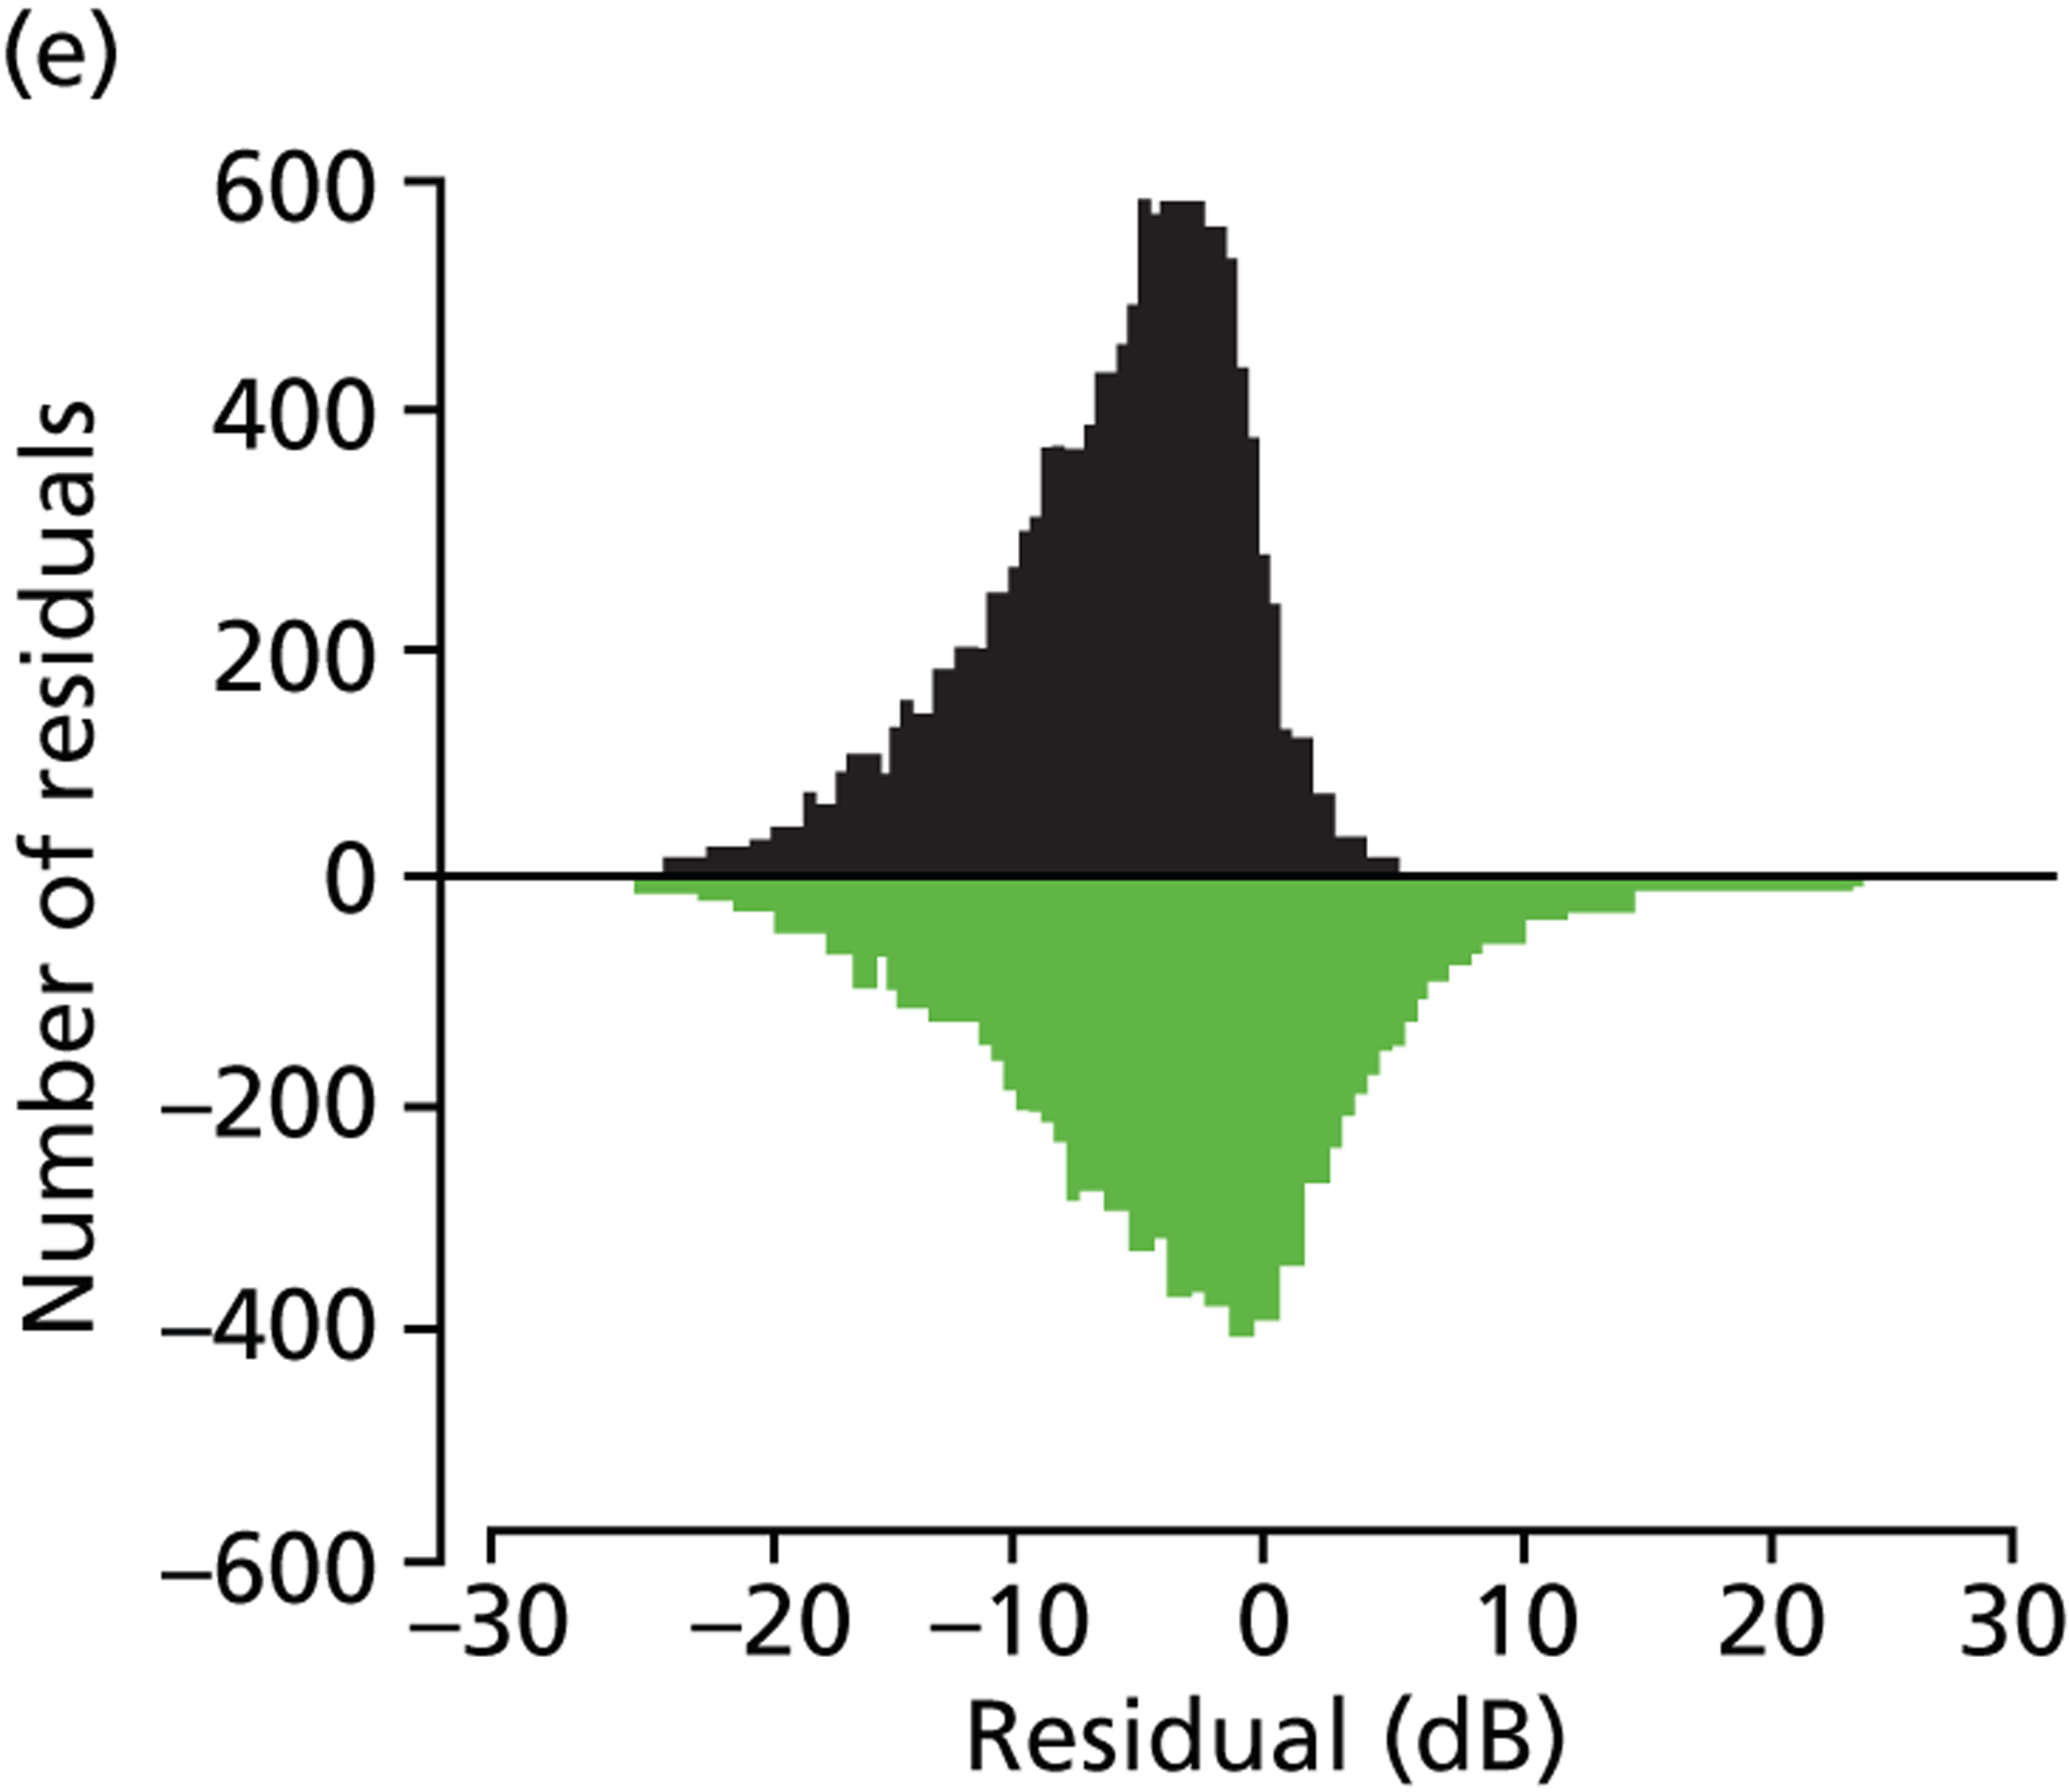
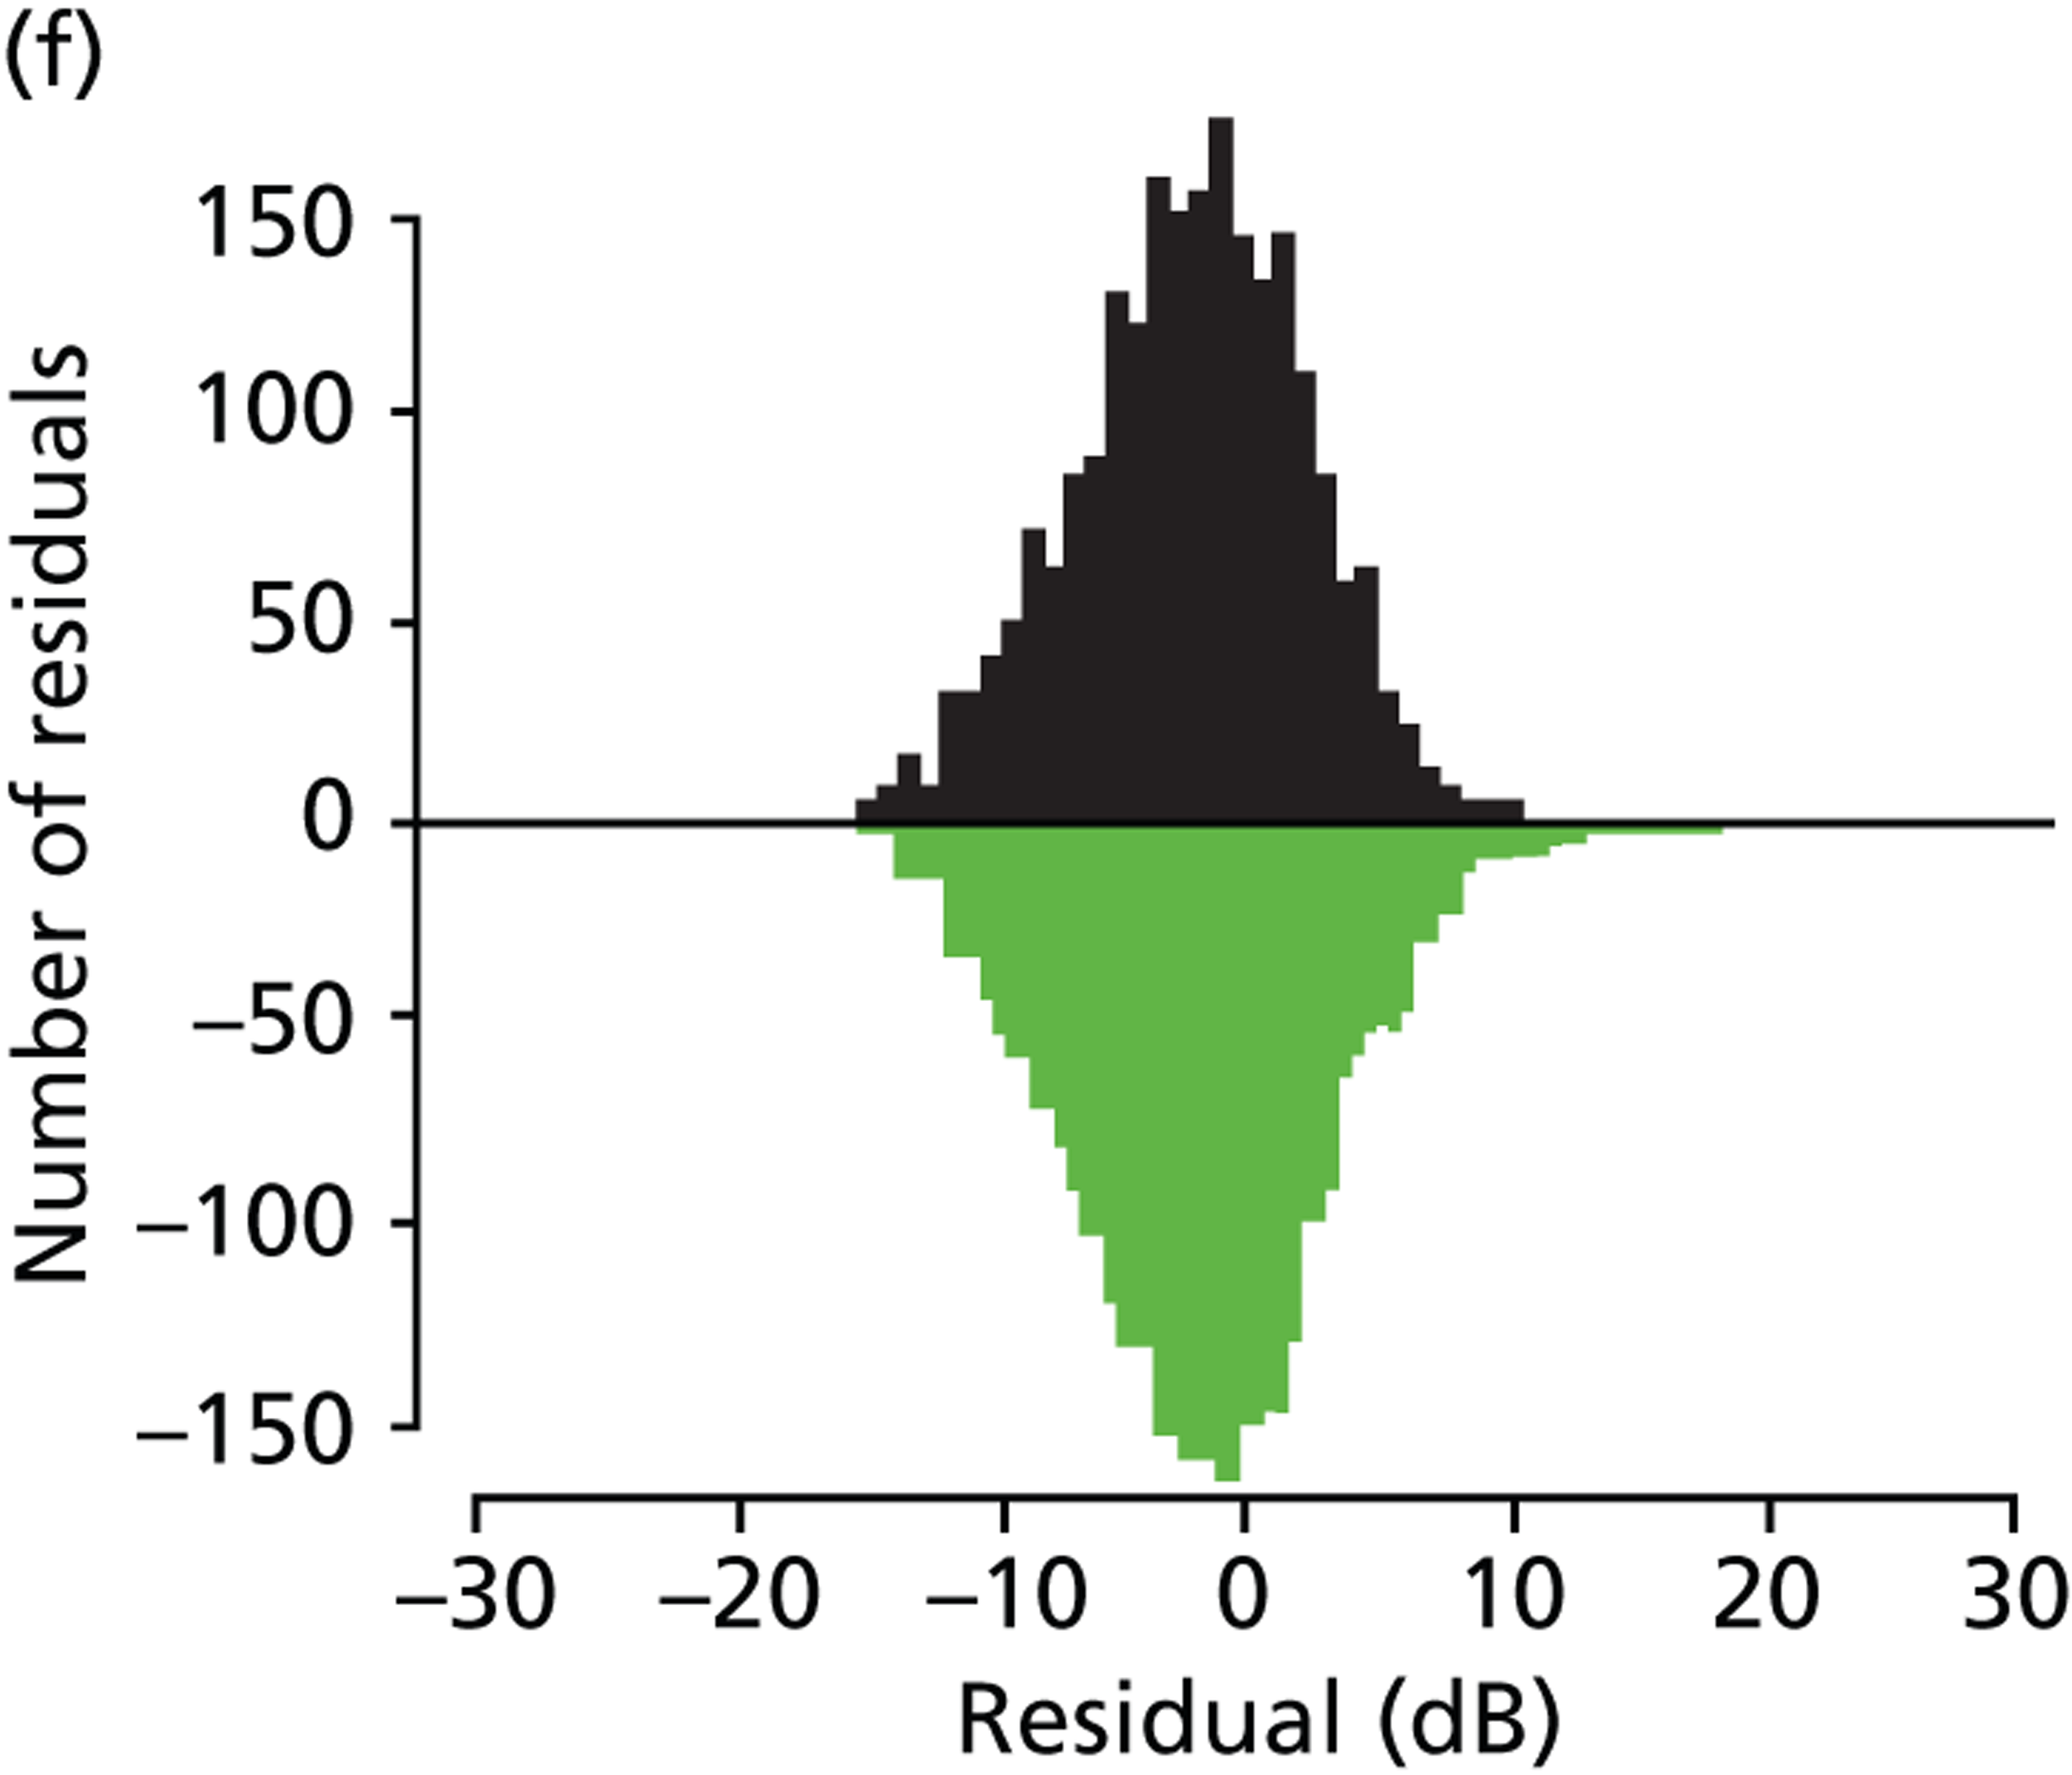
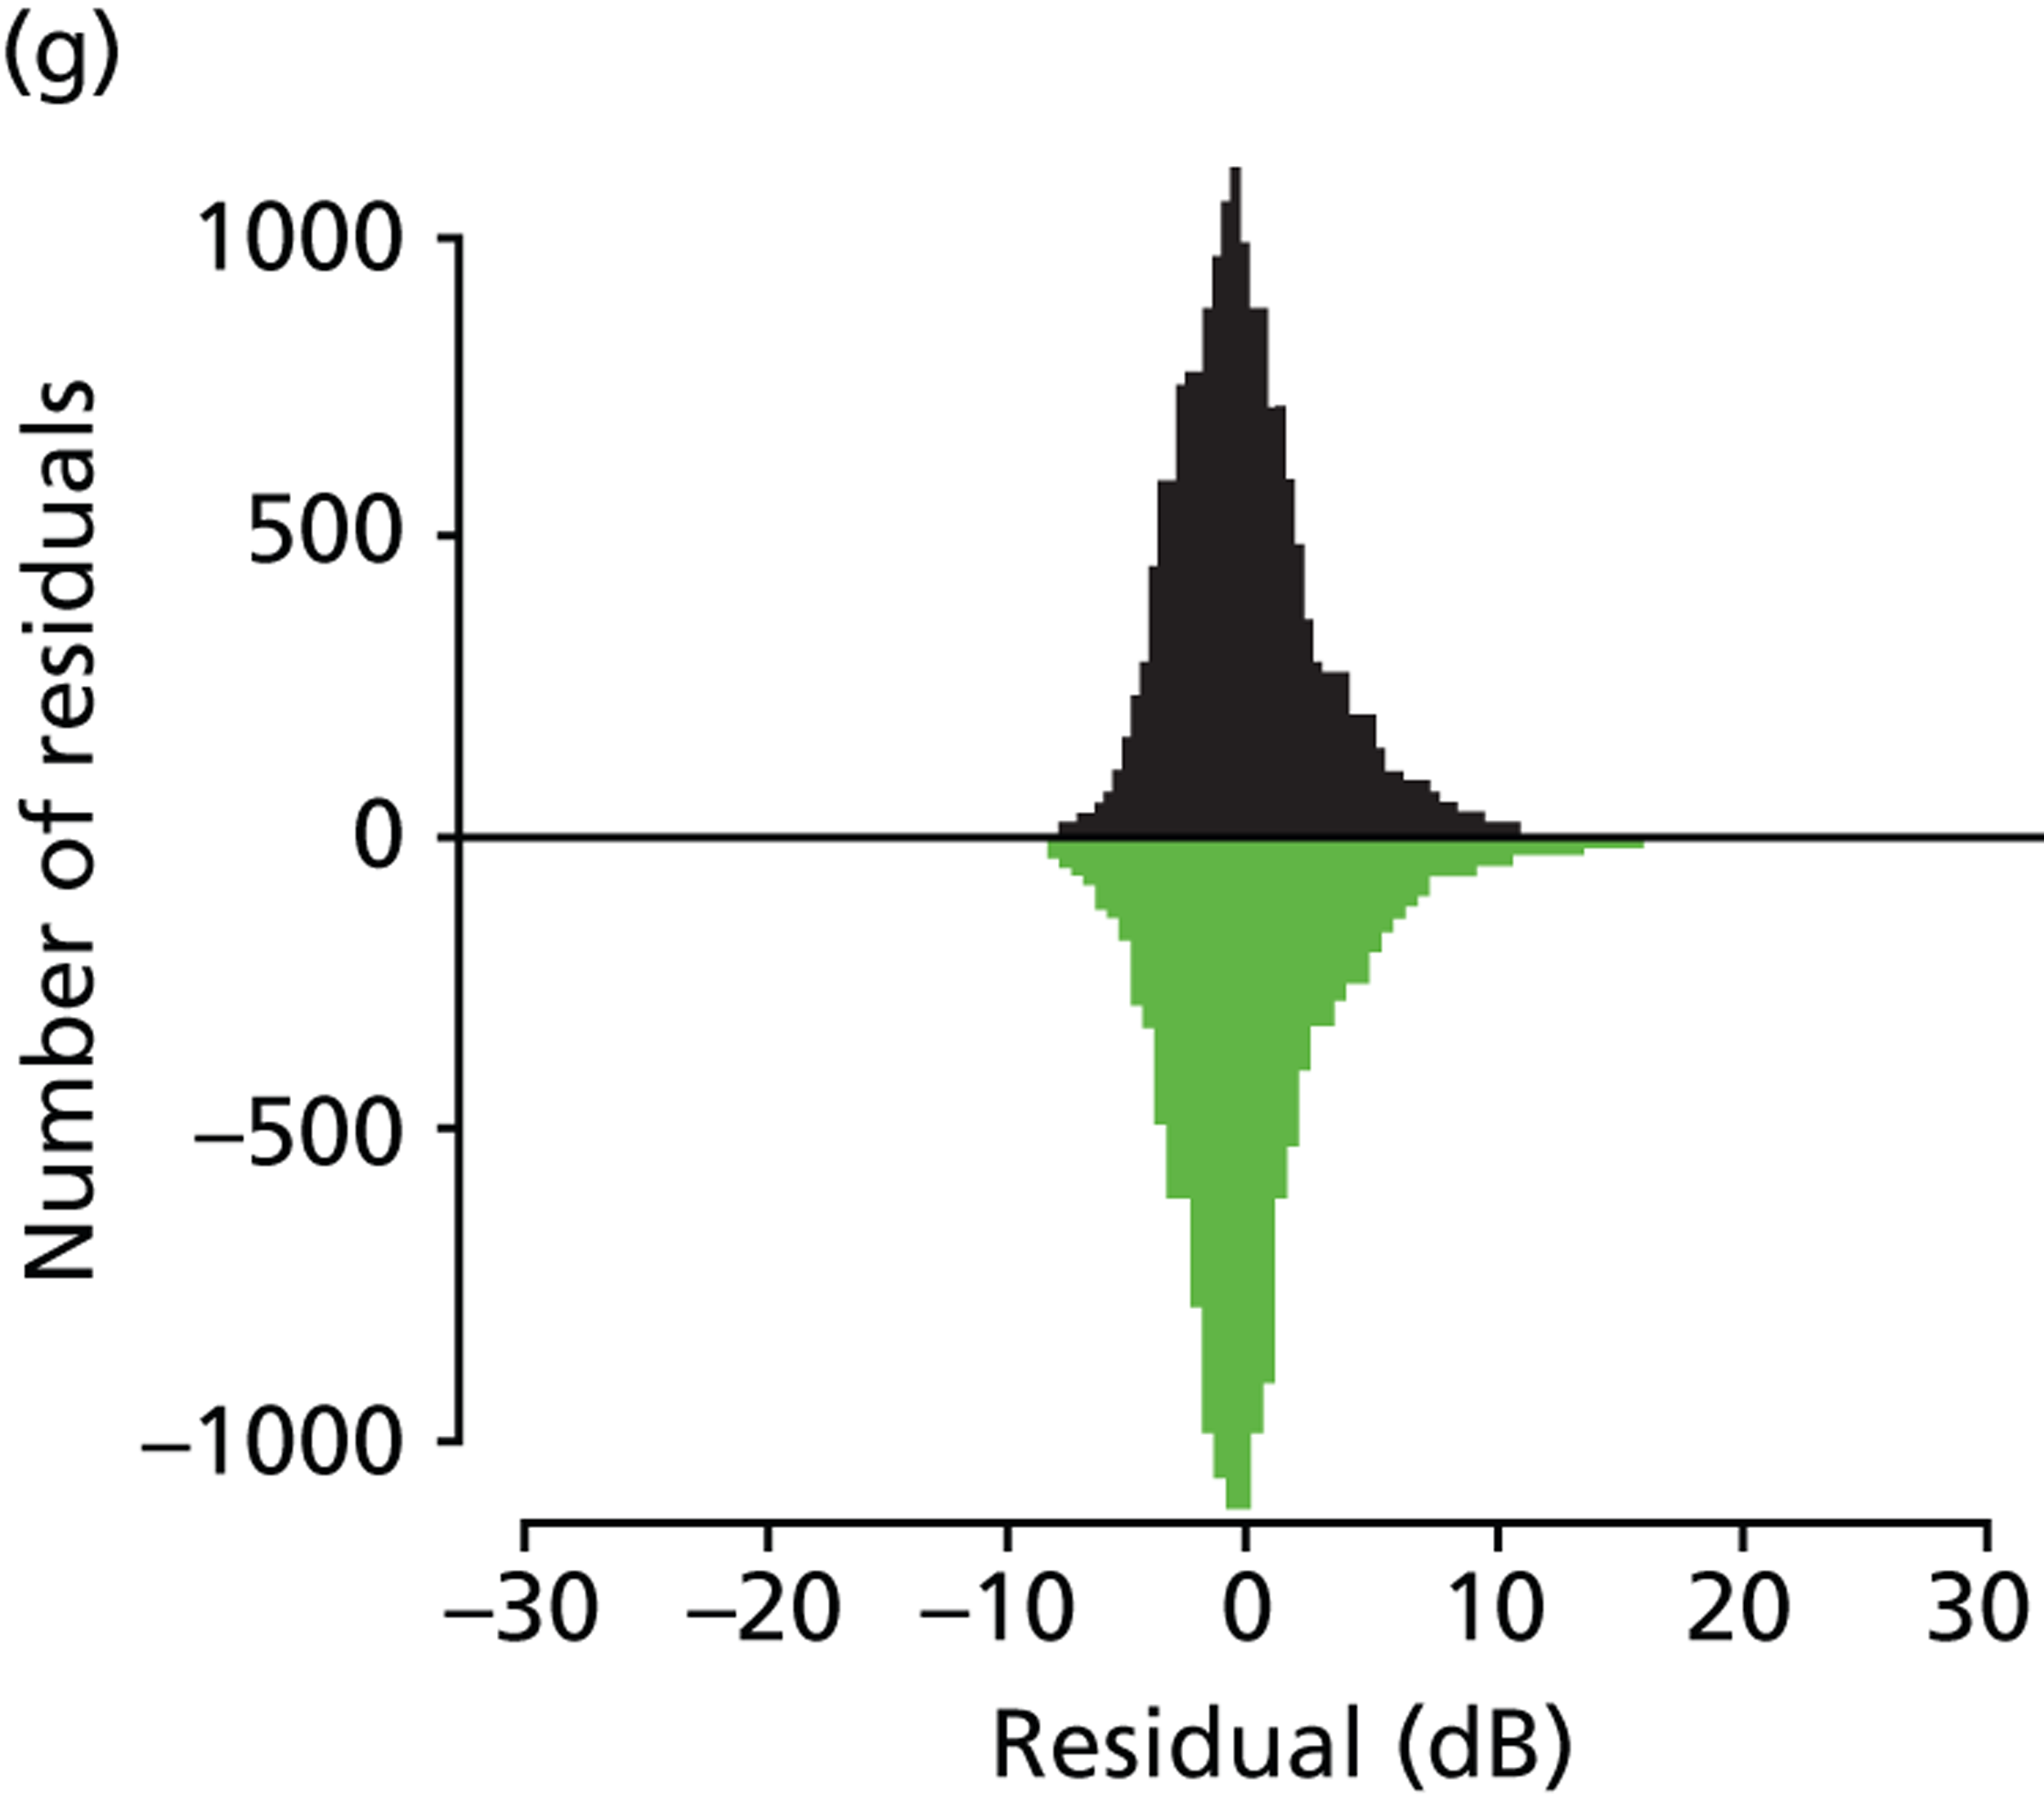
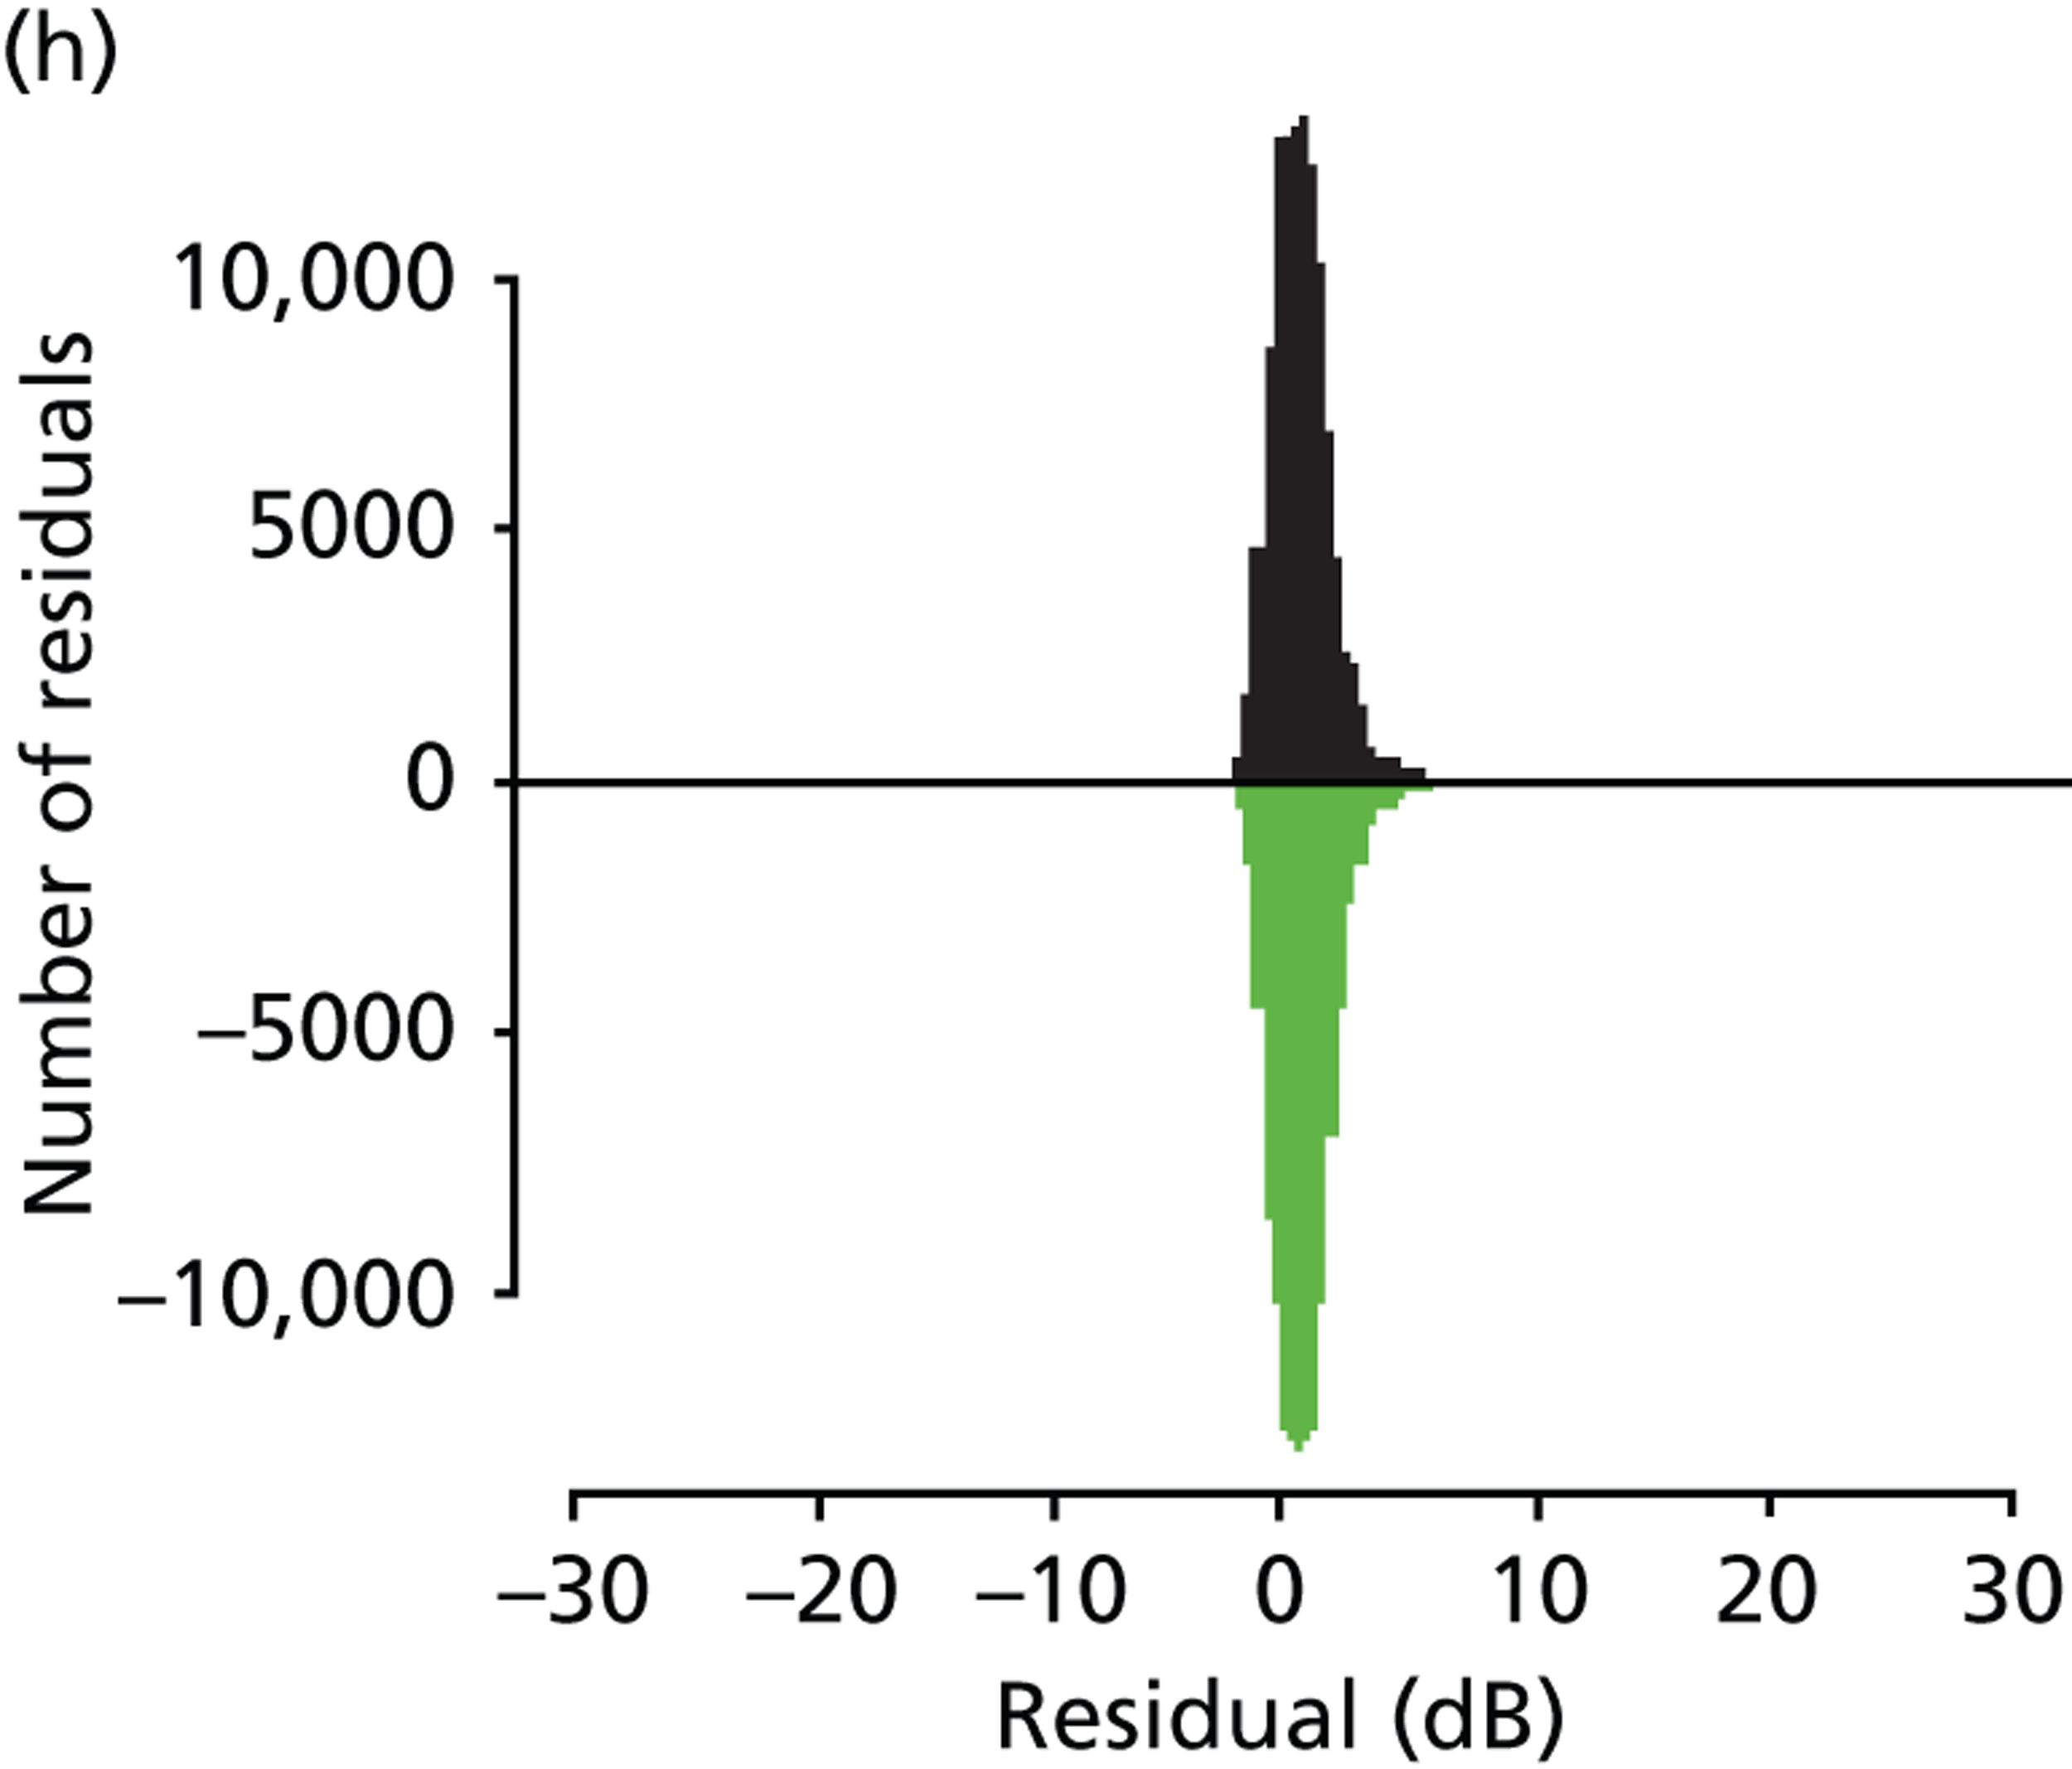
FIGURE 10.
(a) Plot of the SD of residuals for each fitted sensitivity level from OLSLR (blue line) and TLR (green line); and (b) plot of the SD of residuals for each measured sensitivity level from OLSLR (blue line) and TLR (green line). In both plots, variability estimates are compared with those from Henson et al. (yellow lines) and Artes et al. (red lines). 55,61 The blue-to-red background is a smoothed colour density representation of the scatterplot for all absolute residuals; the hotter the colour, the larger the sample at that level of sensitivity.
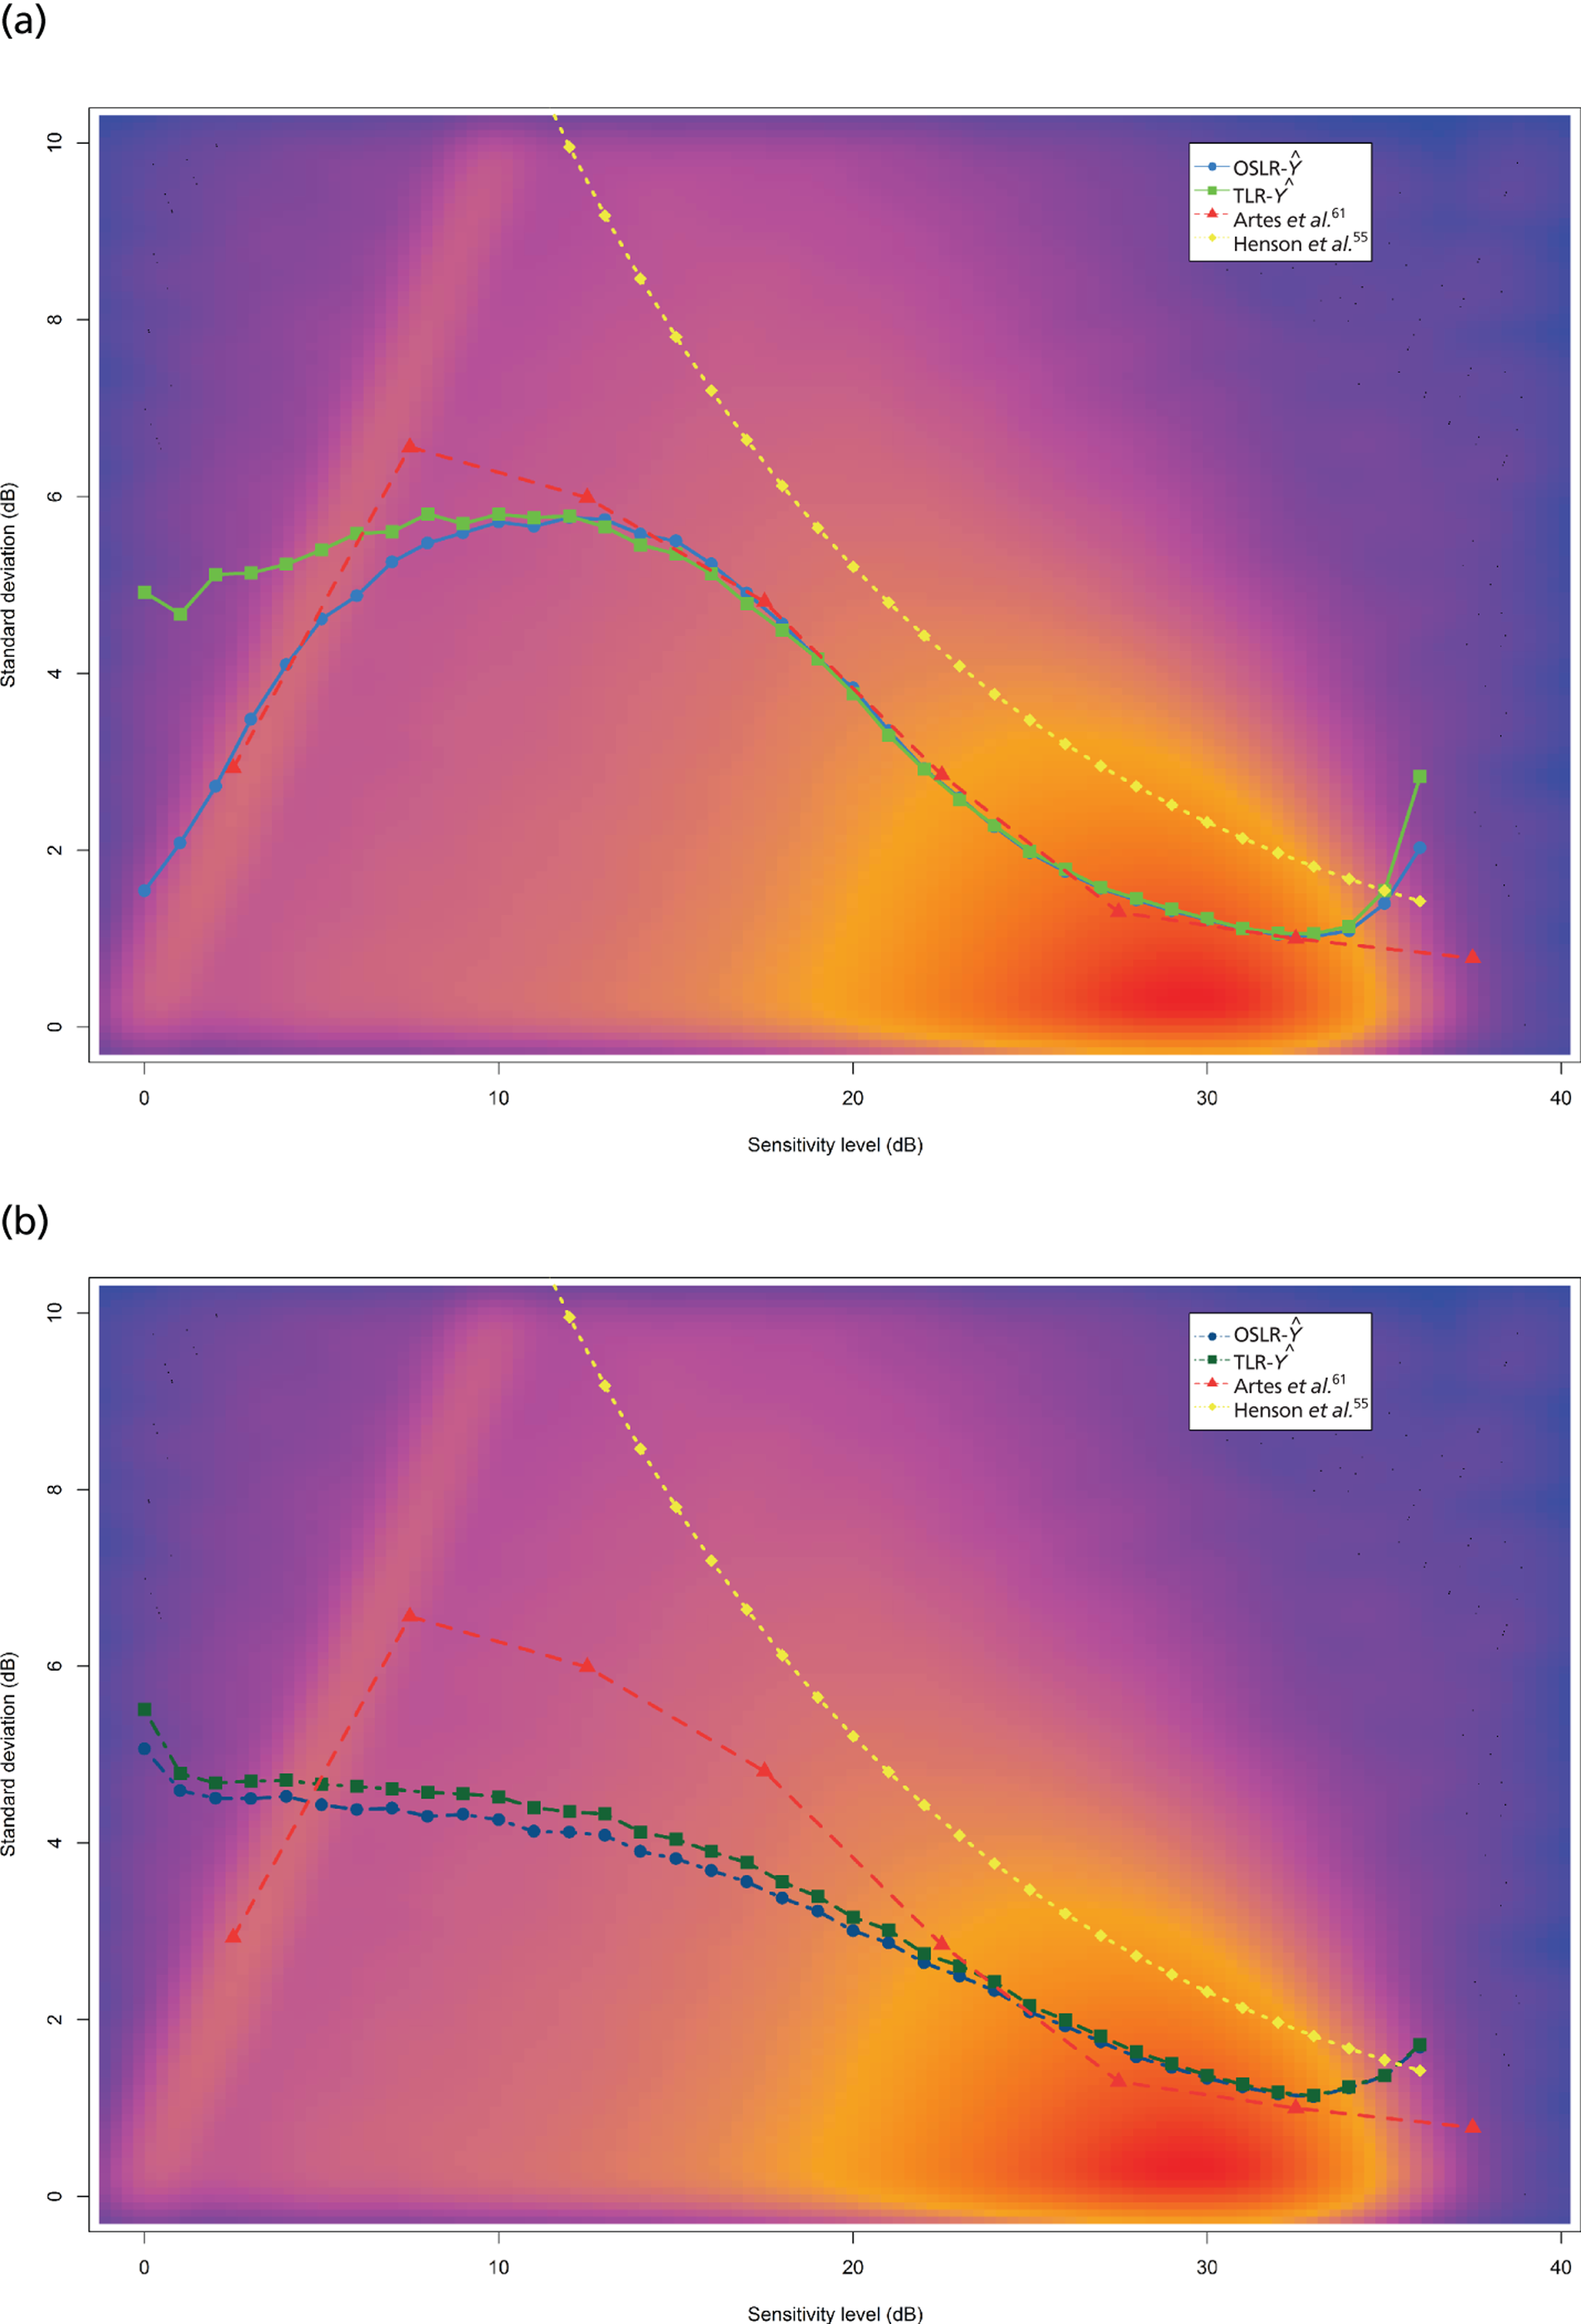
This study is unique in its analysis of the association between variability and sensitivity in VF tests. Previous research has studied this relationship with small numbers of patients, or people with normal vision, using FOS experiments or test–retest data in a research setting. In contrast, we analysed variability using linear regression analysis of retrospective large-scale longitudinal clinical data. The results confirm that a reduction in VF sensitivity is accompanied by a large increase in variability. 50,54,57,59–61,78,79 However, there are notable differences between this study and previous investigations of VF variability. Test–retest studies assume that VF measurements remain unchanged over the testing period and take an average of threshold values to approximate true sensitivity. Here we estimate two parameters, a slope and an intercept term, whereas test–retest studies estimate only the latter parameter, as they assume that the measurement does not change in the period of time over which the data are captured. Thus, a limitation of test–retest data is that they assume the absence of a perimetric learning effect, which can persist over tens of VF tests in some patients. 50,51,80 Nonetheless, our results are in good agreement with the findings of Artes et al. ,61 but are possibly more robust because of the large number of data investigated. Moreover, our study sample consists of patients from general ophthalmic clinics and not ‘perimetry athletes’ who are acquainted with SAP and, accordingly, may record less noisy measurements. In addition, since our analysis was carried out on retrospective data, the technique could be easily applied to other perimetry and imaging devices used in glaucoma assessment.
Both our method and the test–retest approach assume that the fitted value or mean of the measurements is the ‘true’ value. Using the mean to estimate true sensitivity makes statistical assumptions about VF measurements; in particular, the arithmetic mean is greatly affected by outliers, and is not robust to skewed and/or truncated distributions. This is reinforced by inspecting estimates of VF variability in the test–retest studies by Artes et al. 61 and Wall et al. 57 – when VF sensitivity is equal to 0 dB, the arithmetic mean is not robust to the truncated nature of VF measurements and the derived variability is artificially reduced (see Figure 10a). This truncation effect is very apparent in the distributions shown in Figure 9 and in similar figures in other studies. 57,61 Thus, our results emphasise that a reduction in VF variability for thresholds below 10 dB can fundamentally be attributed to the limited dynamic range of SAP. Unlike OLSLR, TLR attempts to take into account the truncation effect of VF sensitivity measurements. This is evident in Figure 9e, in which residuals binned by a measured threshold of 0 dB are symmetrically distributed for TLR, but are negatively skewed for OLSLR. As expected, positive skew is apparent in both distributions in Figure 9a, in which residuals are binned by a fitted value of 0 dB, because no measured value can ever be less than 0 dB. Furthermore, Figure 10a demonstrates that the SD of the residuals (binned according to the fitted value) is greater for TLR than for OLSLR. This is because fewer negative residuals are associated with TLR as it respects the left-censoring of VF measurements, whereas OLSLR does not respect this phenomenon.
Unlike previous research, this study also analysed variability as a function of measured sensitivity; this relationship is informative about the range of possible ‘true’ values associated with an observed measurement. The dashed dark green and dark blue lines in Figure 10b indicate the variability associated with measured sensitivity for the TLR and OLSLR models, respectively, whereas Figures 9e–h illustrate the distribution of residuals associated with measured sensitivity. Both sets of figures suggest that variability rises rapidly as measured threshold declines. This result has important implications for SAP. Wall et al. 57 suggested that threshold estimates below 20 dB have little worth for predicting the value at retest. Our results are comparable to the findings of Wall et al. and back their suggestion that, for the purposes of detecting progression, investigation of damaged VF test points could be valueless.
Visual field variability leads to false-positive diagnoses of progression when patients actually have stable glaucoma, which may lead to needless treatment changes and costs to both patient and health-care provider. 81 Conversely, progression may be overlooked if clinicians deem any reduction is as a result of inherent measurement variability. One particularly important application of these results is in VF simulations. Presently, there is no ground truth for the assessment of glaucomatous VF progression, so our results will now be used to build a non-parametric model of VF variability. VFs with known characteristics are simulated to investigate the variability of the MD index, which is important to assess the clinical effectiveness of proposed practice (six VFs in the first 2 years) and current practice (annual VF testing). Past VF simulation models6,69,70,82 have been based on Henson et al. ’s55 equation for VF variability, which may be less suitable than the results here as Henson et al. ’s results were grounded on FOS experiments, with no measurements below 10 dB. Conversely, the results presented here are based on thousands of clinic patients, with tens of thousands of measurements across the range of SAP sensitivity.
Model for generating visual field simulations
As there is no technique for measuring ground-truth VF sensitivity, it is difficult to gauge the performance of SAP to measure glaucomatous progression. Computer simulations can be used to provide virtual VF data consistent with real SAP test results. In the previous section, we investigated the relationship between VF variability and sensitivity. These results were used to construct a novel non-parametric model for generating VF simulations. We described the model and used it to generate 1 million VF simulations from 1000 ground-truth VFs (1000 simulations per real VF test). These simulations were then analysed to investigate the variability associated with the MD summary statistic, as a function of the level of MD. 79 It is worth noting, again, that MD measures the average increase or decrease of a patient’s overall VF compared with a person with healthy vision of the same age.
Mean deviation is especially important to the overall objectives of this research, since the proposed VF testing frequency (three times per year in the first 2 years post diagnosis) is based on this measurement. In particular, proposed practice is based on identifying rapidly progressing patients, who are defined as losing MD of more than 2 dB per year, with greater certainty than current practice (annual testing). In clinical practice, MD is often analysed in order to identify VF defects and monitor progression of glaucoma. Despite its importance, the relationship between the level of MD and variability of MD is uncertain. It has been suggested that MD variability is non-stationary, growing with VF damage,81,83,84 but no research has yet reported on the impact of pointwise VF variability and, therefore, the pattern of VF damage, on MD variability; such research would not be feasible without computer simulations.
The study sample used to derive pointwise VF variability, which forms the foundation of the simulation model, is described in the previous section. The residuals extracted from OLSLR of longitudinal pointwise VF sensitivity tell us the range of measured values expected for any given ‘true’ test result, thereby allowing pointwise sensitivity to be simulated (Figure 11). For example, to simulate VF sensitivity when the true value is equal to 22 dB, we randomly sample from the distribution of residuals associated with a fitted sensitivity of 22 dB. The simulation is demonstrated in Figure 11d (Ŷ = 22 dB); this histogram consists of roughly 50,000 residuals associated with an OLSLR-fitted sensitivity value of 22 dB, while the green line signifies the result from randomly drawing a single residual from this distribution. Thus, simulated VF sensitivity would be equal to 18 dB, since the sampled residual was equal to –4.07 dB. An entire VF test can be generated using one-by-one simulations for each test point (Figure 12). Raw sensitivities were converted to total deviation values using published normative values describing the relationship between age and sensitivity in healthy individuals. 79 MD was then calculated as the weighted mean of the total deviation values, with weights equal to the inverse of the variance observed at each VF test point in the healthy reference group. 79
FIGURE 11.
Distributions of VF variability according to OLSLR-fitted sensitivity levels. The green line in (a) Ŷ = 0 dB; (b) Ŷ = 6 dB; (c) Ŷ = 14 dB; (d) Ŷ = 22 dB; illustrates a single simulated draw from this distribution.
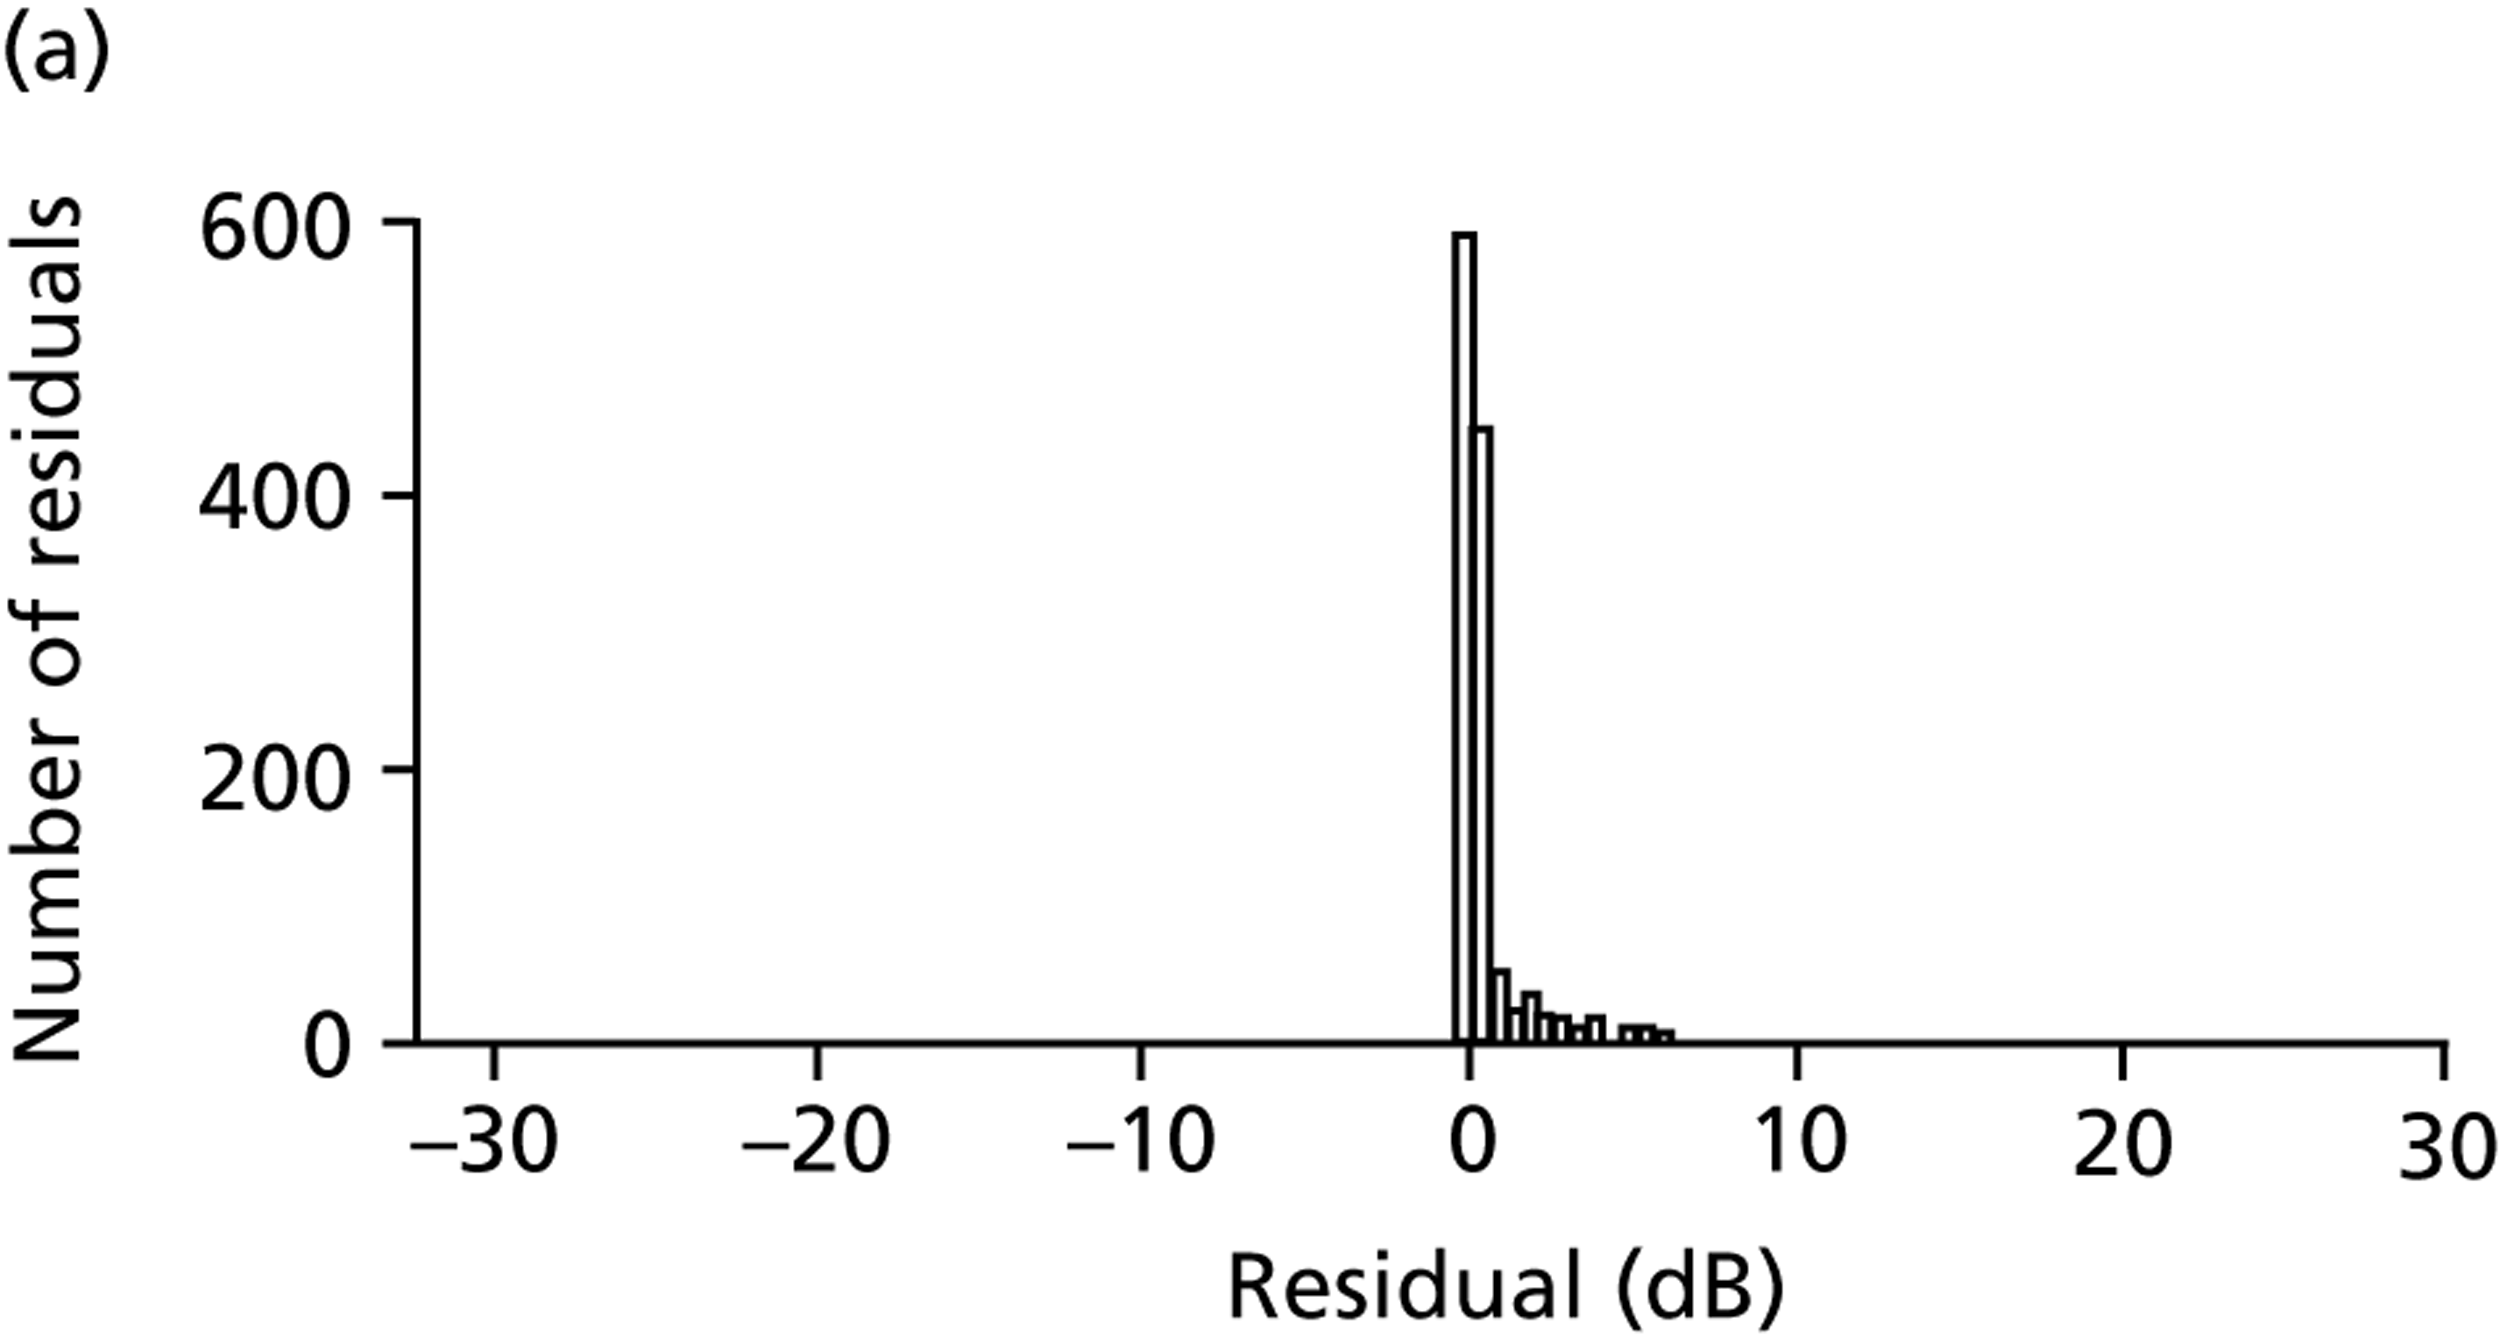
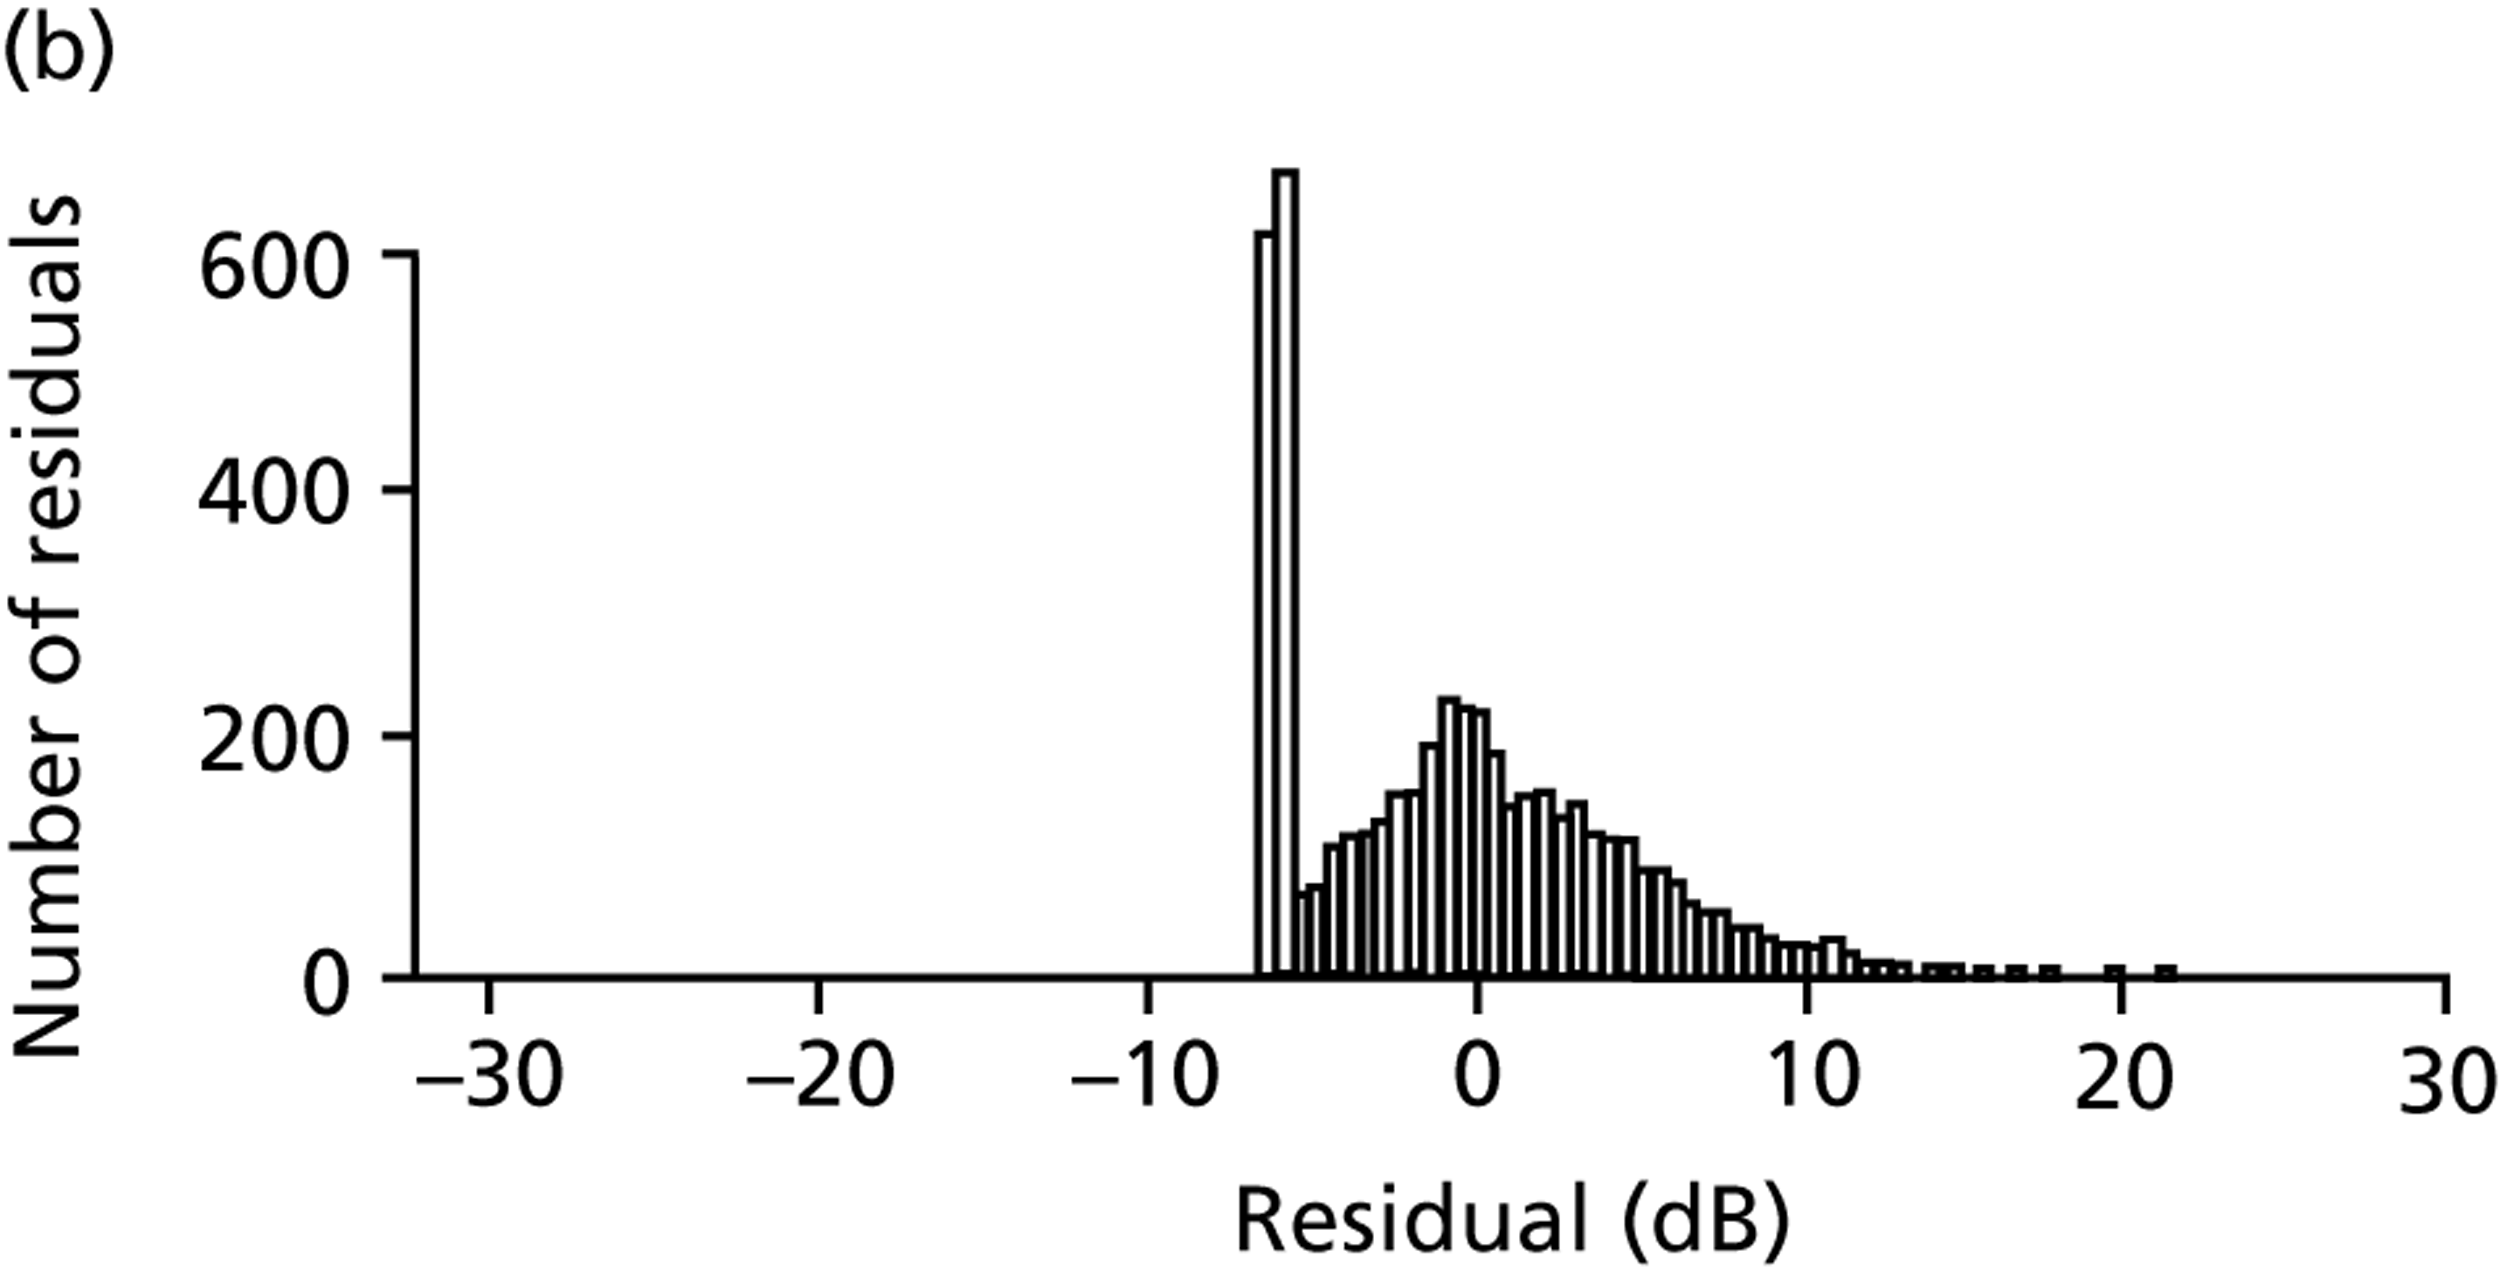
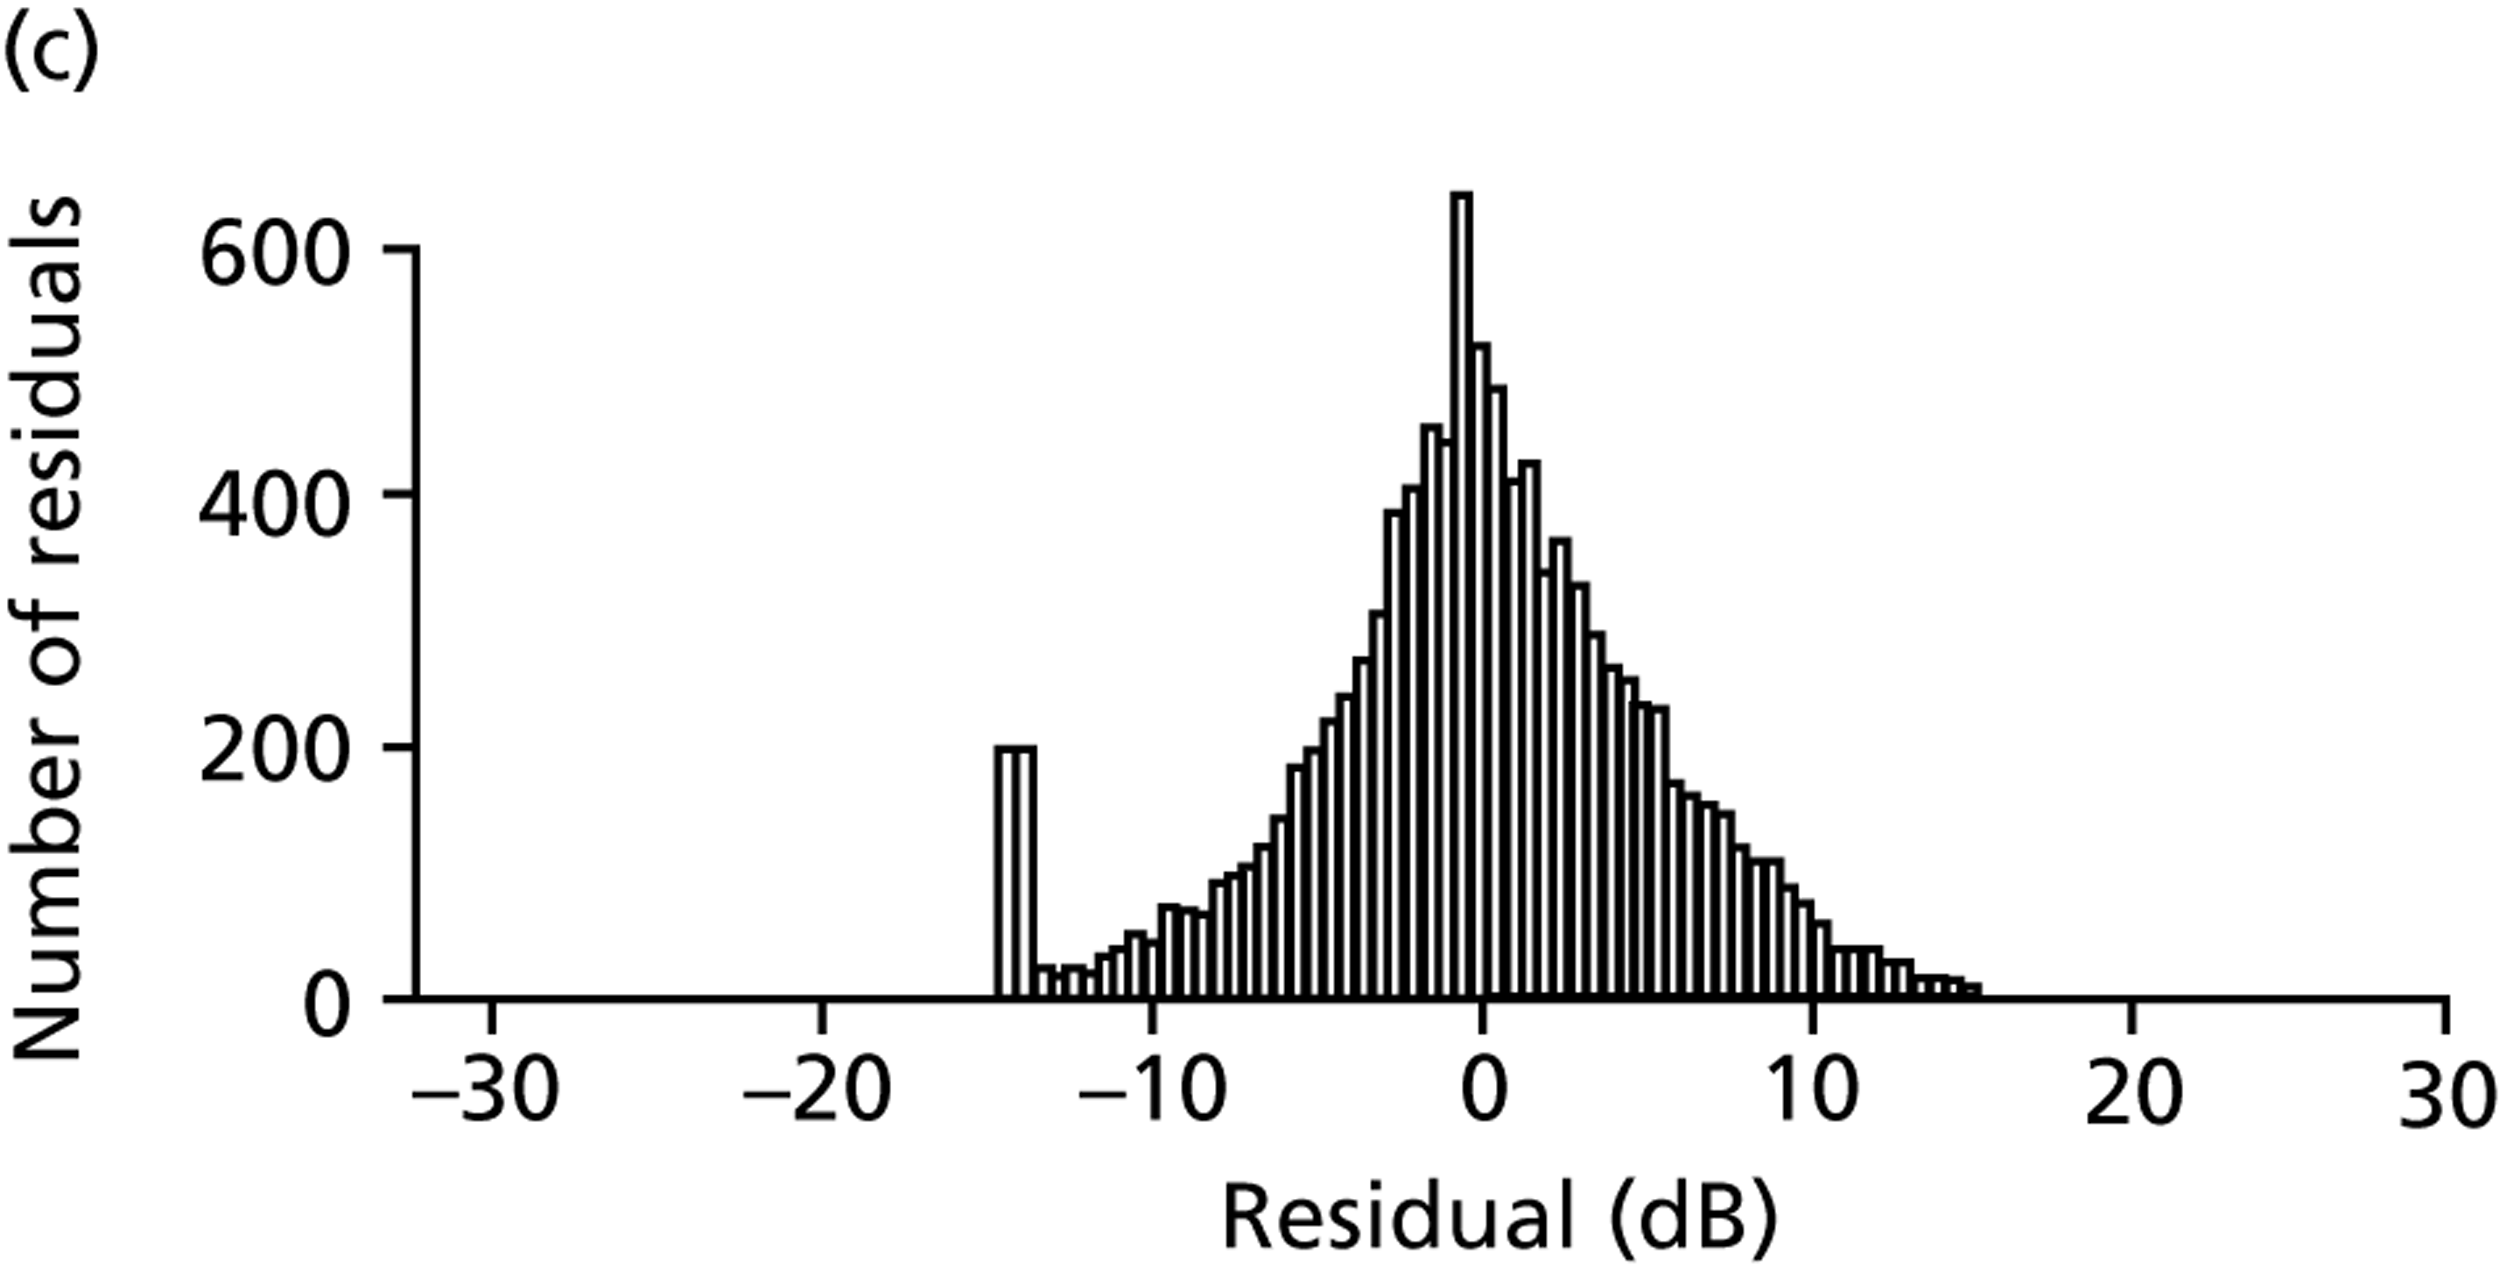
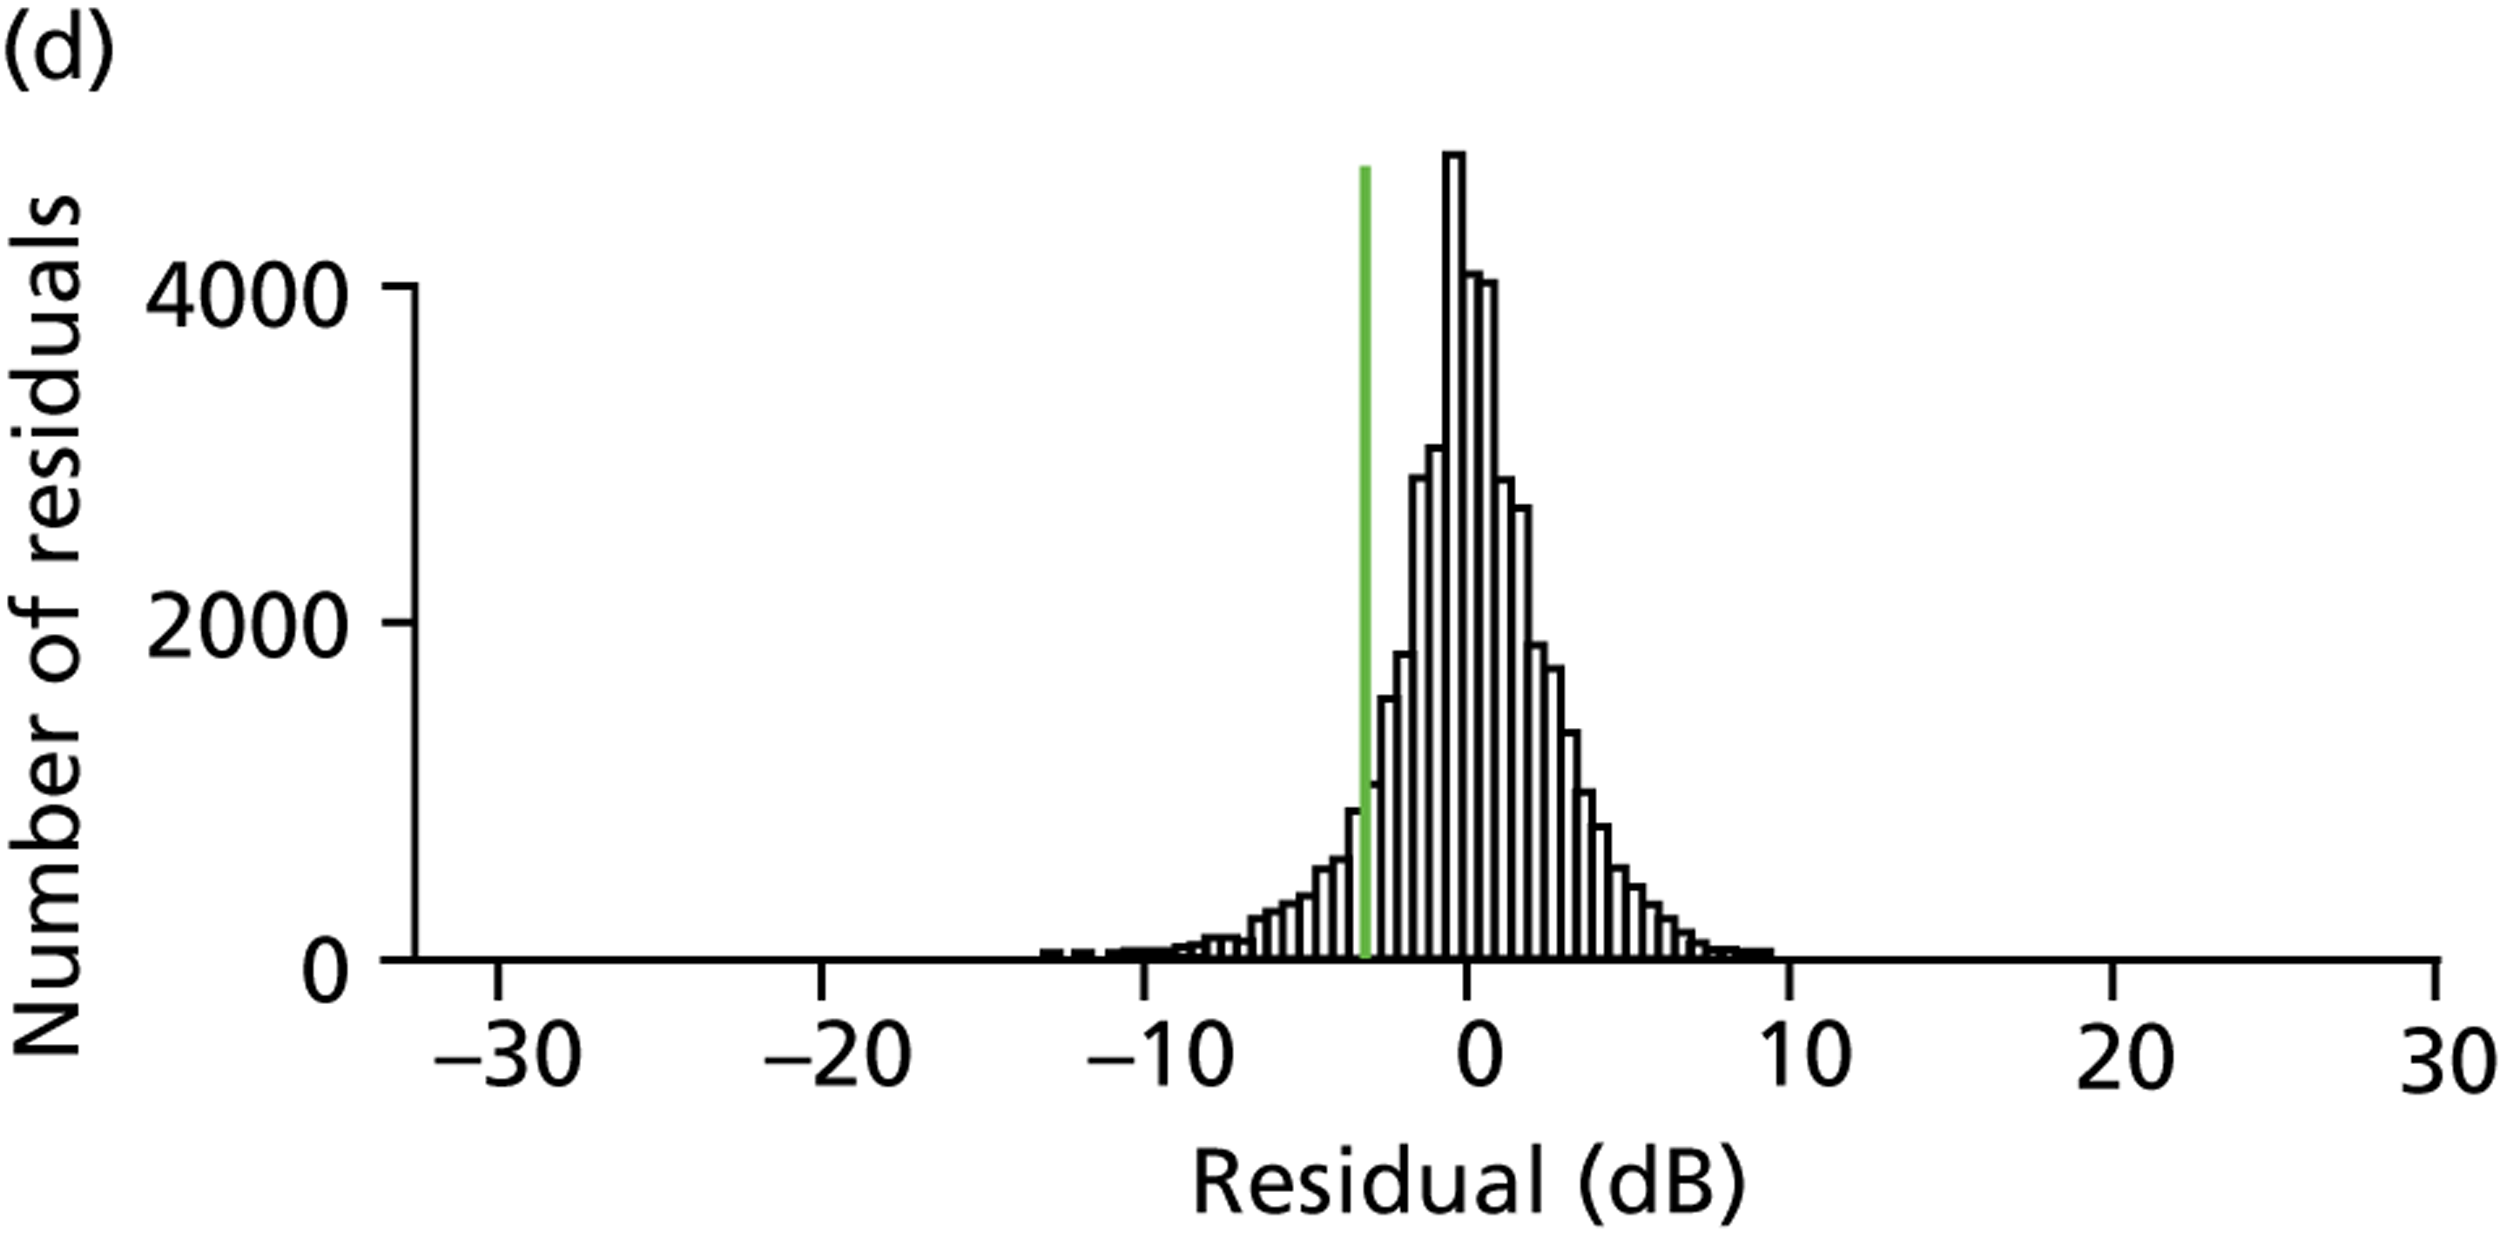
FIGURE 12.
(a) Ground-truth VF. The left-hand grid of numbers illustrates VF pointwise sensitivity, while the right-hand image is the corresponding greyscale plot. The variability of the shaded VF point (sensitivity equal to 22 dB) is indicated in Figure 11d. (b) VF simulated from ground-truth VF shown in (a). The left-hand plot illustrates simulated pointwise sensitivities for the above VF, while the right-hand image is the corresponding greyscale plot. The shaded VF point (sensitivity equal to 18 dB) was derived by the simulated draw shown in Figure 11d.
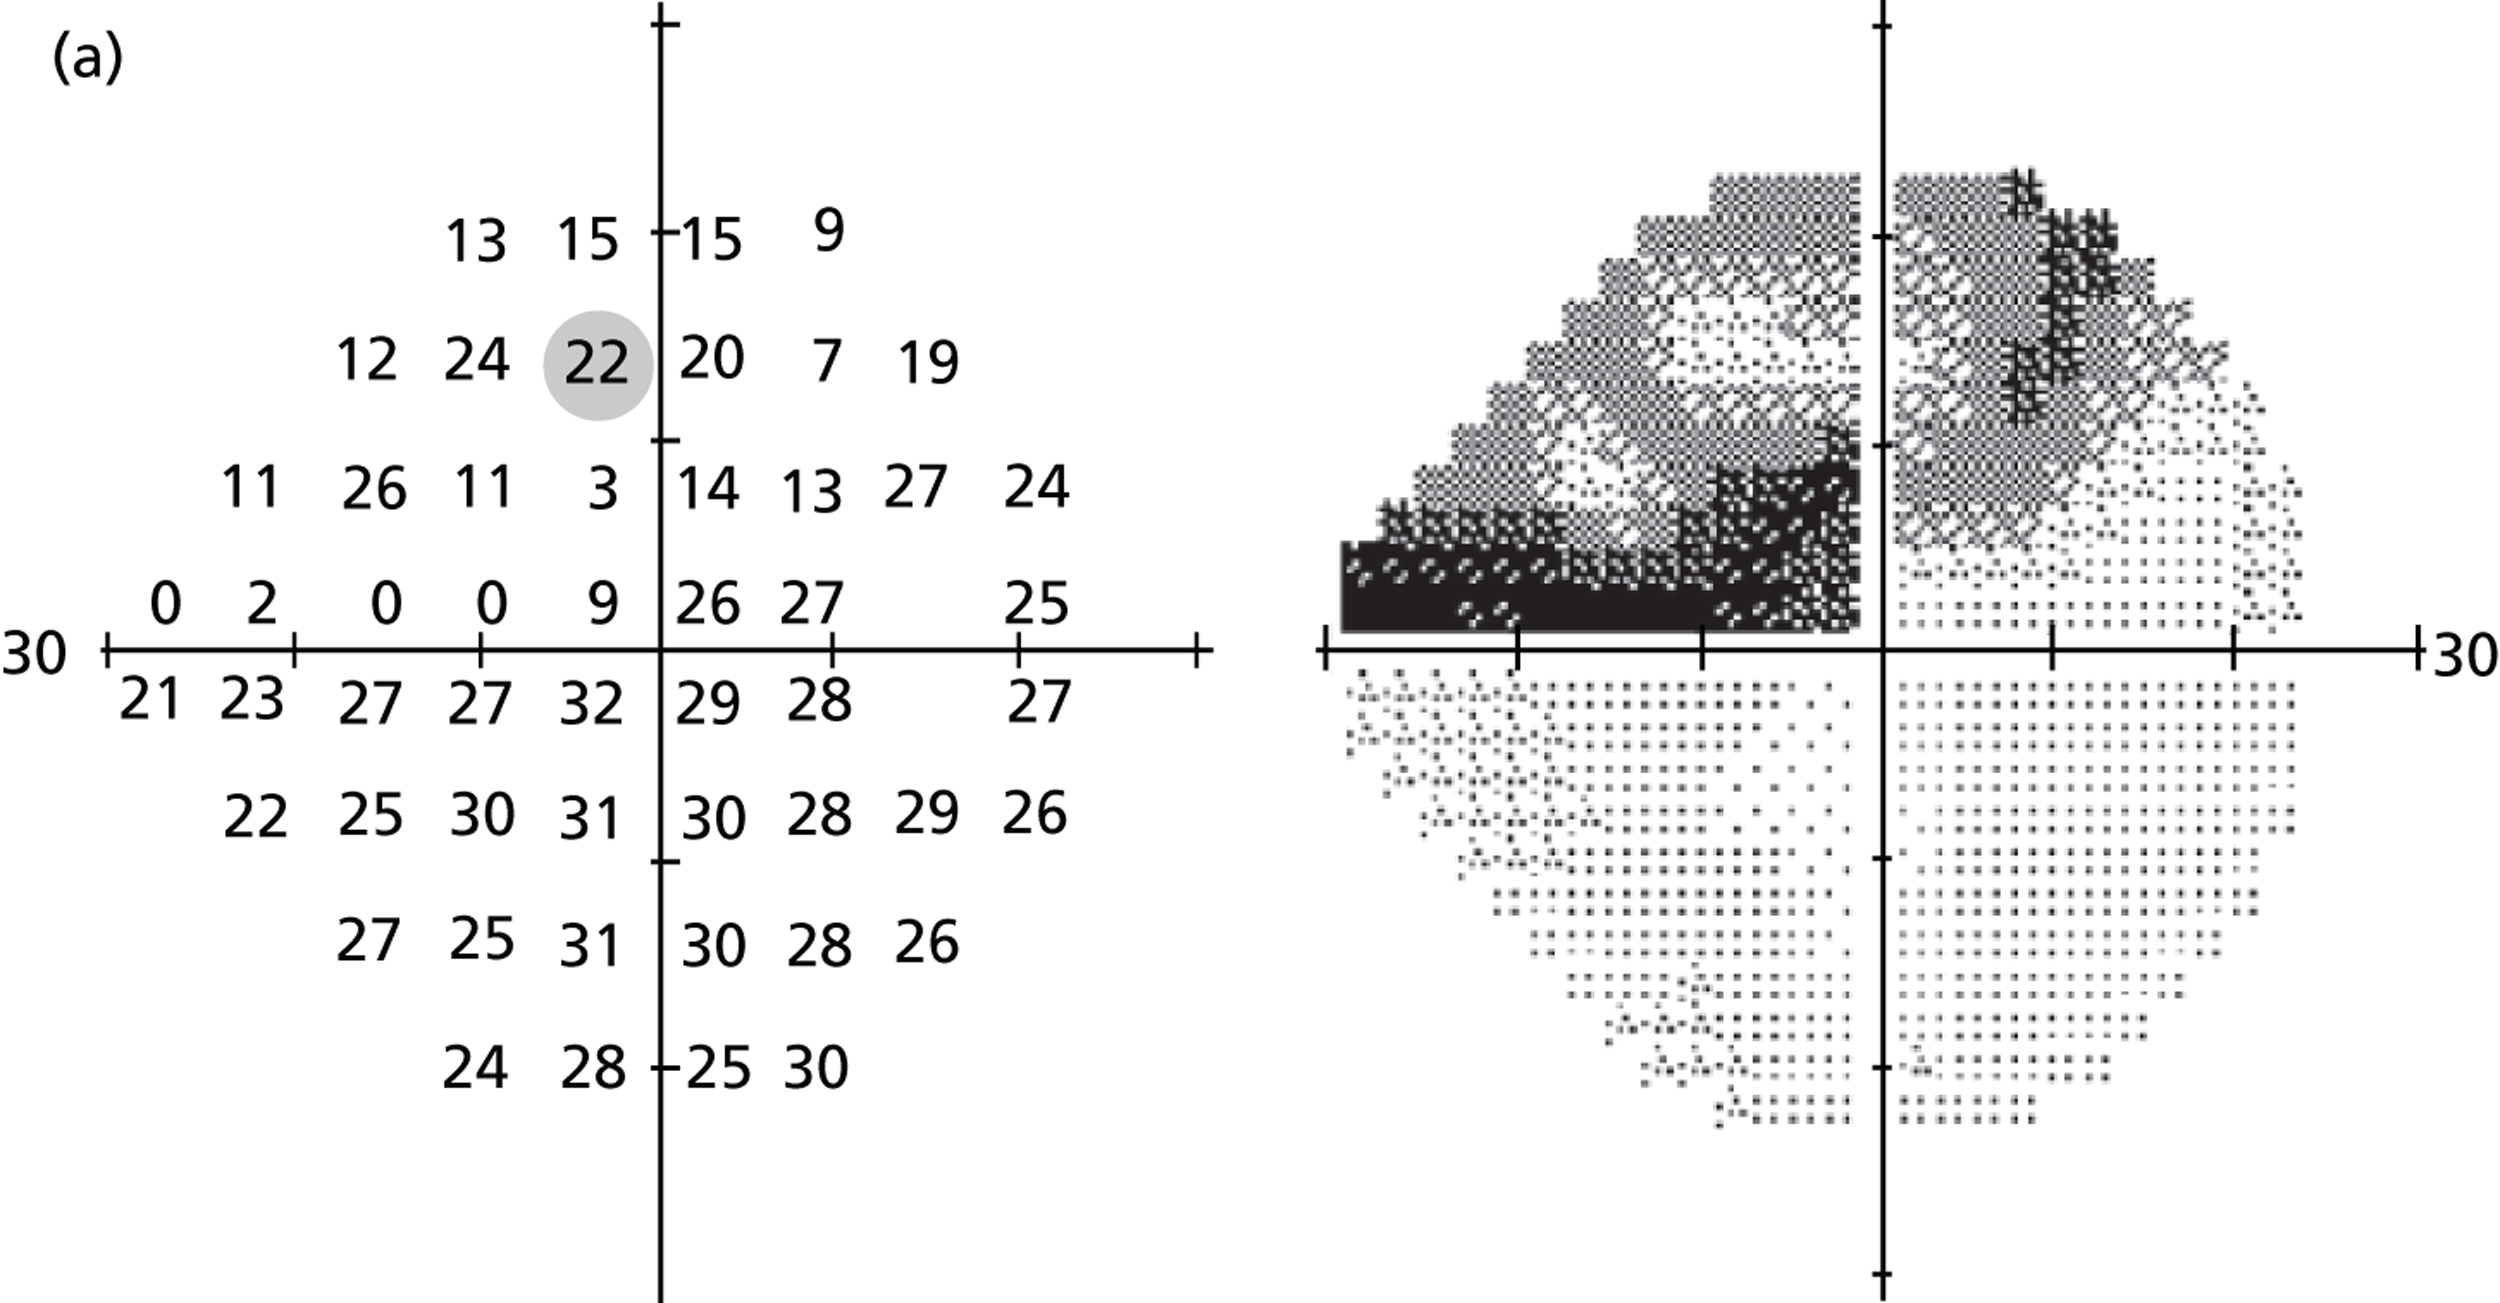
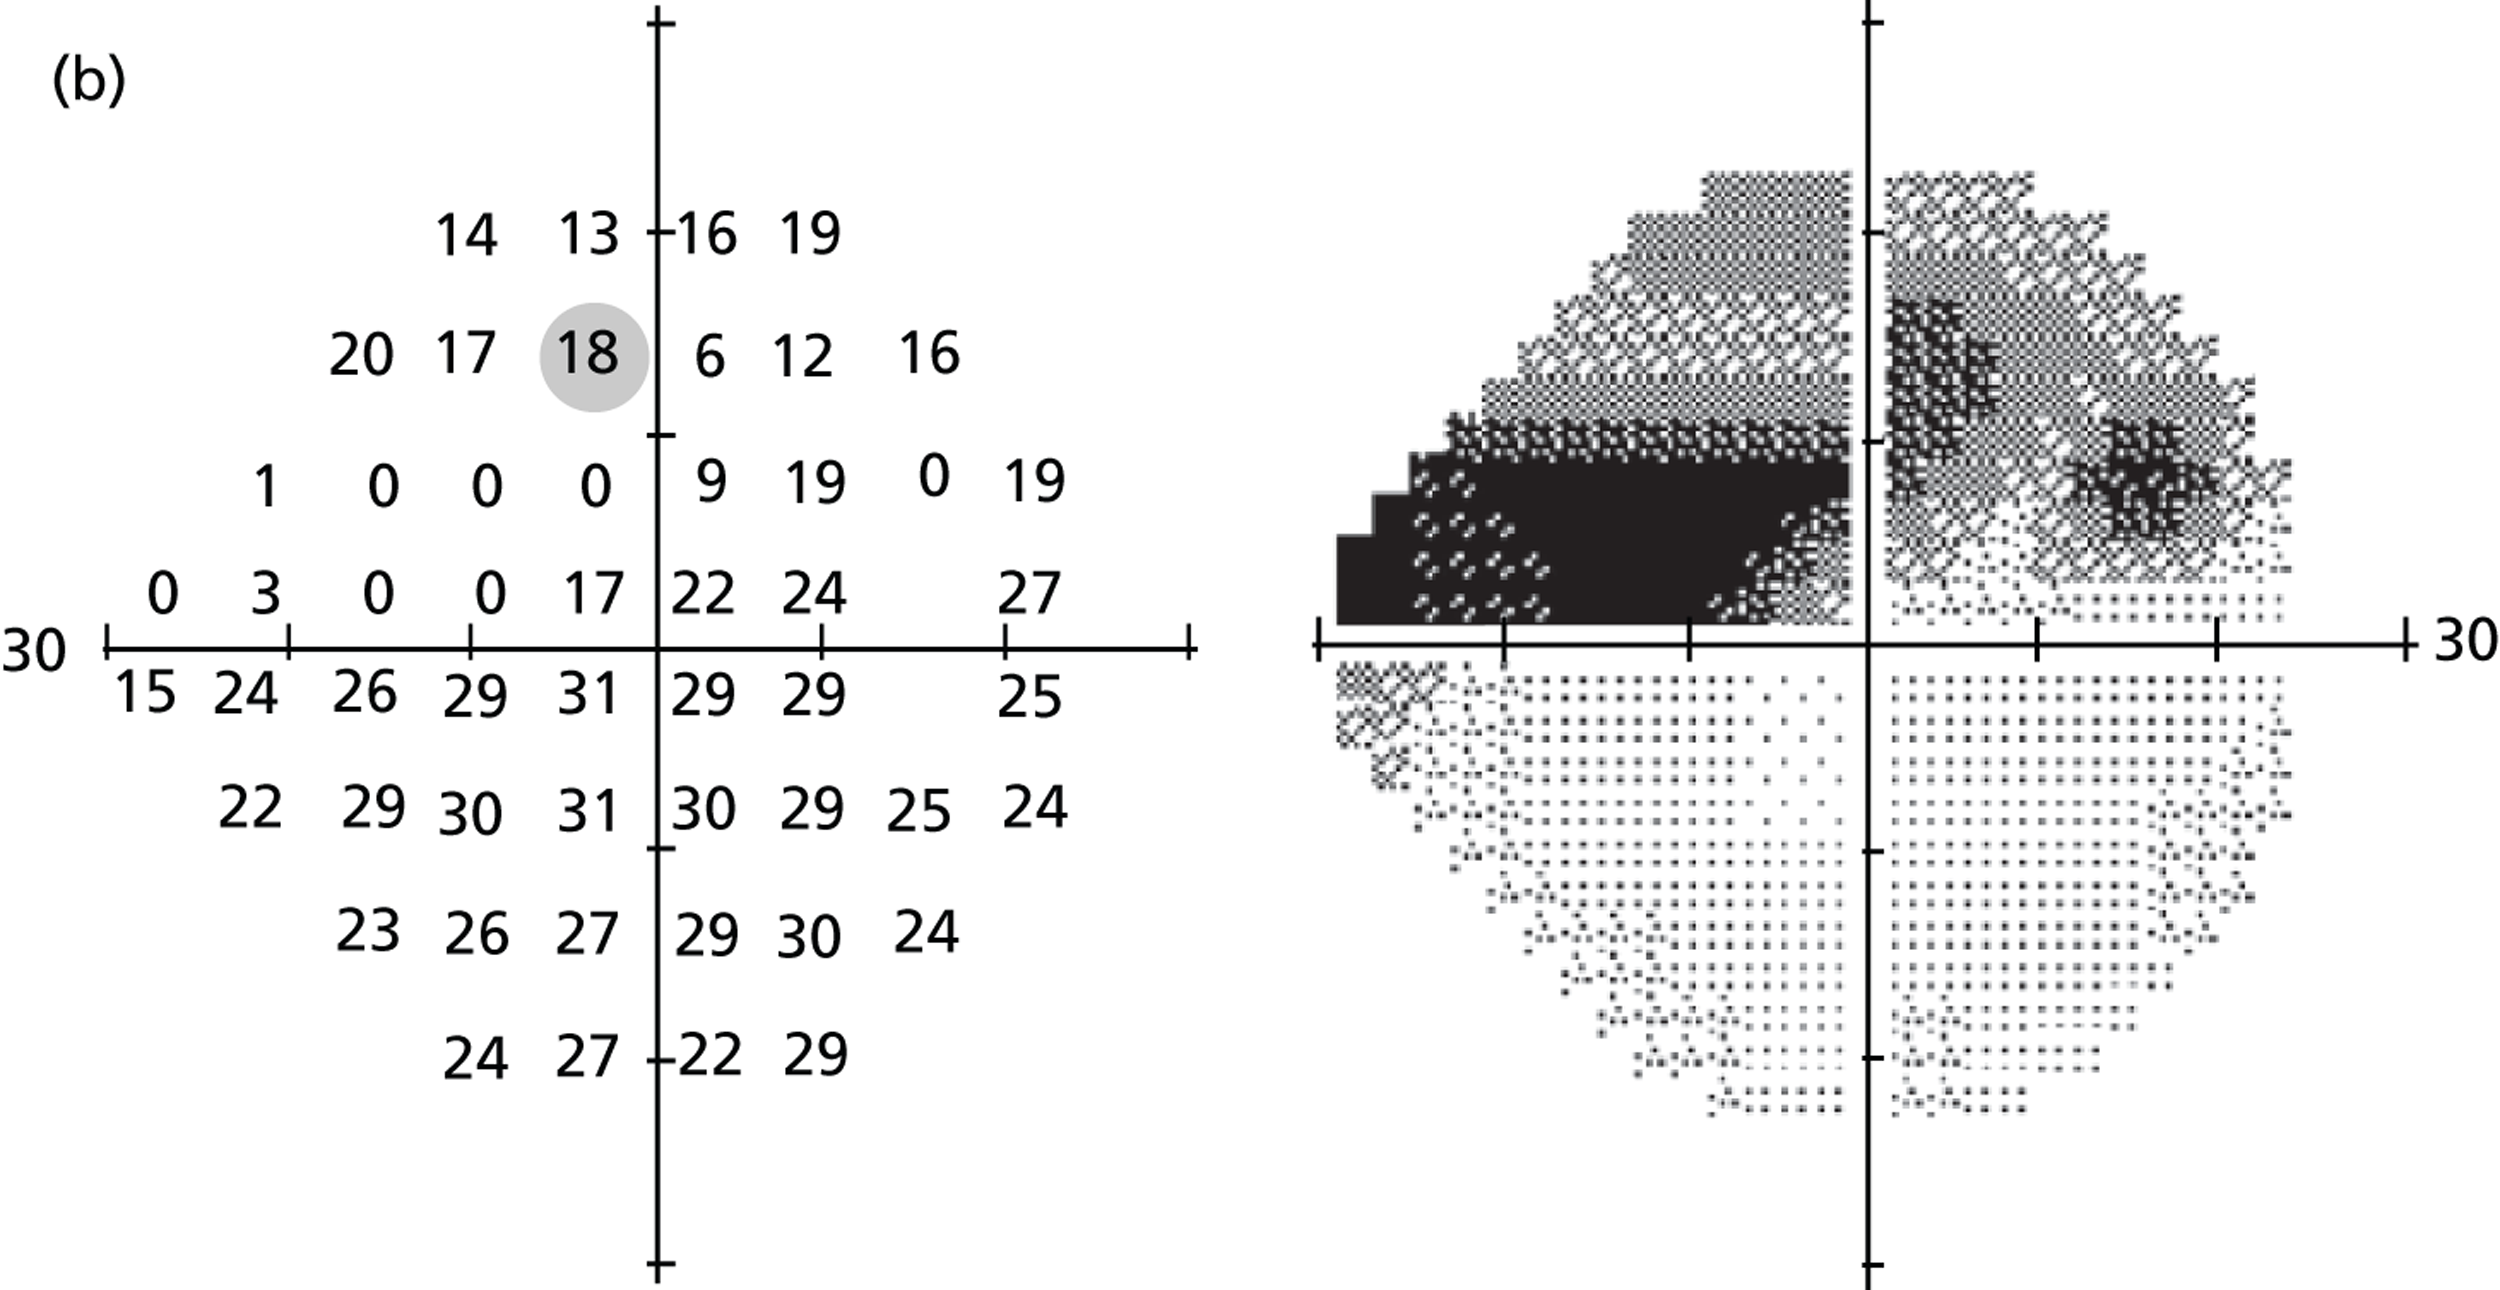
One thousand VFs were simulated from each of 1000 patients’ VF tests (1000 eyes) visiting Moorfields Eye Hospital between 1998 and 2009; note that these patients were not included in the analysis to establish pointwise VF variability. Once again, all VFs were carried out with the HFA using the 24-2 test pattern, a Goldmann size III target and the SITA Standard testing algorithm. Pointwise VF sensitivity was simulated via random sampling from the distribution of residuals associated with each true sensitivity (excluding locations in the blind spot). Entire HFA-like VF printouts including greyscales were then generated (Figure 13).
FIGURE 13.
Simulated VF shown as a HFA-like printout. The grid of numbers in the top left are simulated sensitivities, while the adjacent greyscale plot provides a graphical representation of the VF (darker areas indicate damage). The two grids of numbers below represent the difference in the patient’s VF sensitivities and those of an individual of the same age with healthy vision: without correction for a general reduction in retinal sensitivity (‘total deviation’; left-hand side); and with correction (‘pattern deviation’; right-hand side). Below these two grids are probability maps indicating whether or not the reductions in sensitivities are significant.
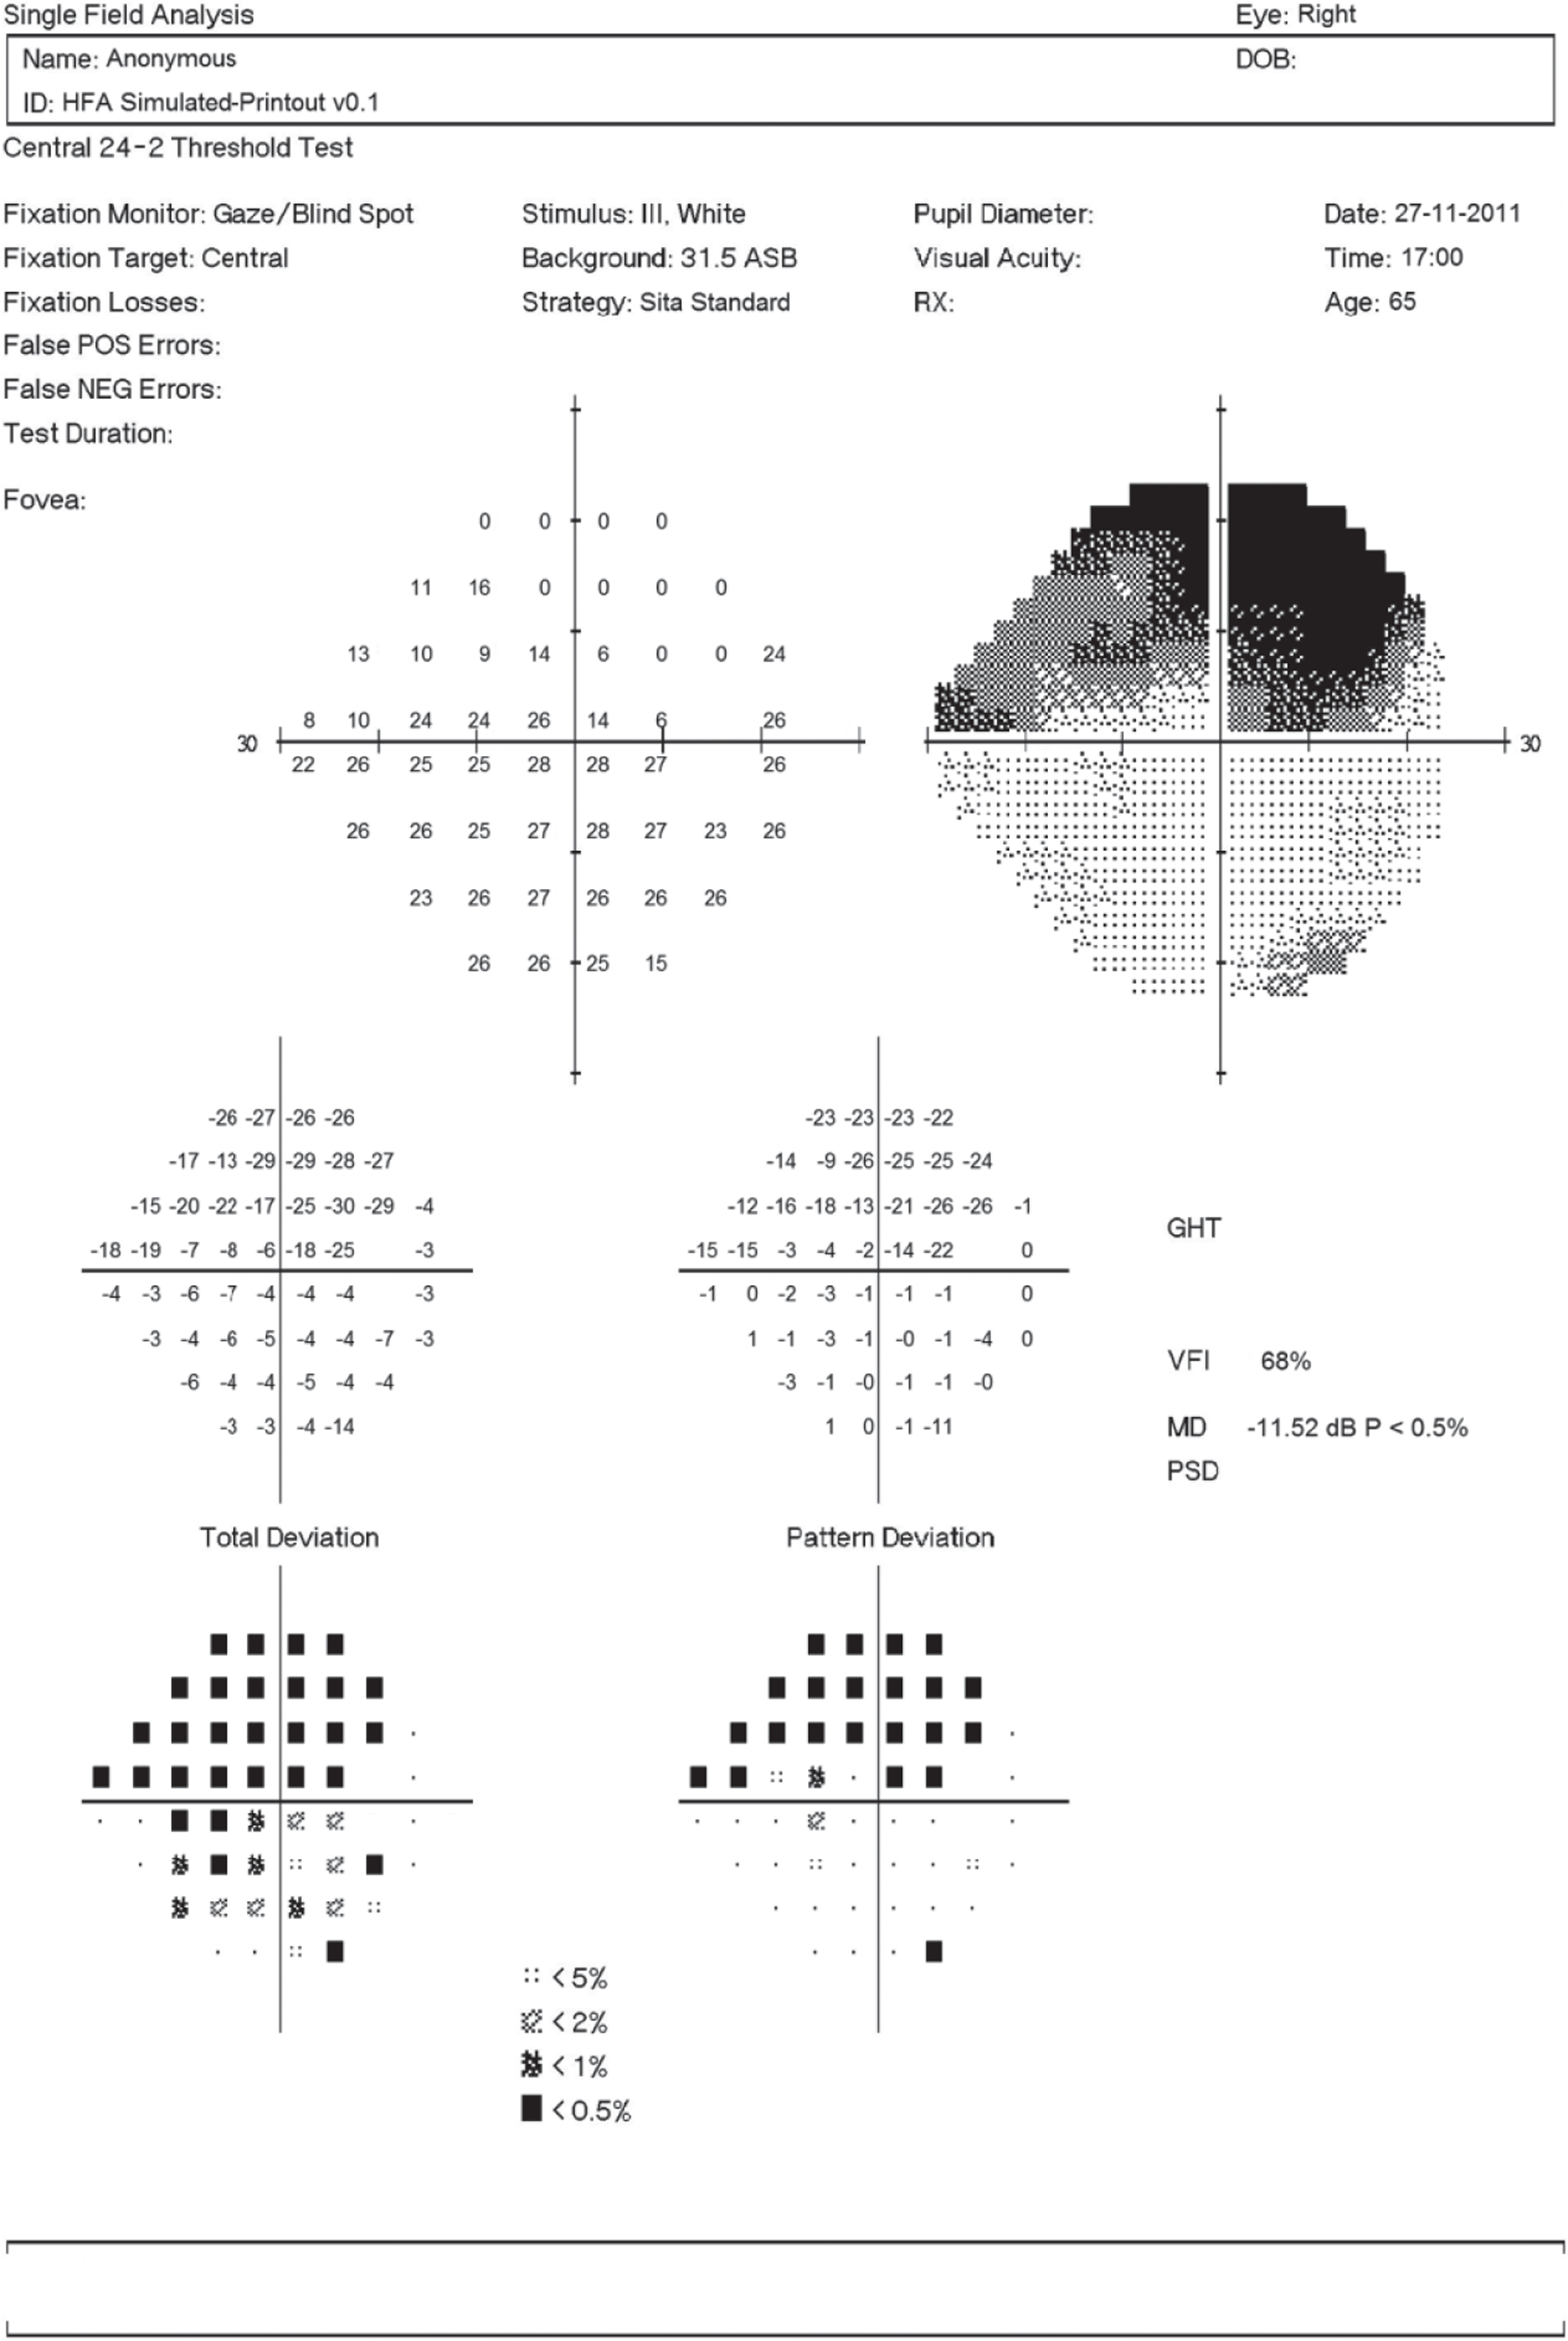
Table 8 describes the characteristics of the 1000 eyes that make up the 1000 ground-truth VFs.
| Measurement | Median (IQR) |
|---|---|
| Age (years) | 66.0 (55.8–75.5) |
| MD (dB) | –3.5 (–8.3 to –1.1) |
| Pointwise sensitivity (dB) | 27 (22–30) |
We analysed the relationship between MD variability, the level of MD, and the pattern of pointwise VF damage, using computer simulations. Figure 14 shows the variability of MD, according to the SD of 1000 simulated VF tests, as a function of the ground-truth level of MD. The dashed black line in Figure 14 indicates the locally weighted polynomial regression85 (‘LOESS’ regression), which illustrates how variability changes, on average, with MD. The figure suggests that variability tends to rise as MD decreases, with variability peaking around –20 dB. For early VF damage, when a significant amount of MD loss is approximately defined as –2 dB, variability is half that when MD is equal to –10 dB, which corresponds to VF loss associated with moderate glaucoma. 47 Interestingly, as revealed by the substantial scatter in Figure 14, the SD varied more than threefold between patients with roughly the same levels of ground-truth MDs, from about 0.2 dB to over 0.7 dB (see patients A–D in Figure 14).
FIGURE 14.
Variation of ground-truth MD according to level of MD and greyscale plots for four patients’ ground-truth VFs. (a) Variation of ground-truth MD; (b) patient A ground-truth MD = –11.4 dB, SD = 0.72 dB; (c) patient B ground-truth MD = –11.5 dB, SD = 0.19 dB; (d) patient C ground-truth MD = –20.4 dB, SD = 0.25 dB; and (e) patient D ground-truth MD = –20.5 dB, SD = 0.66 dB.
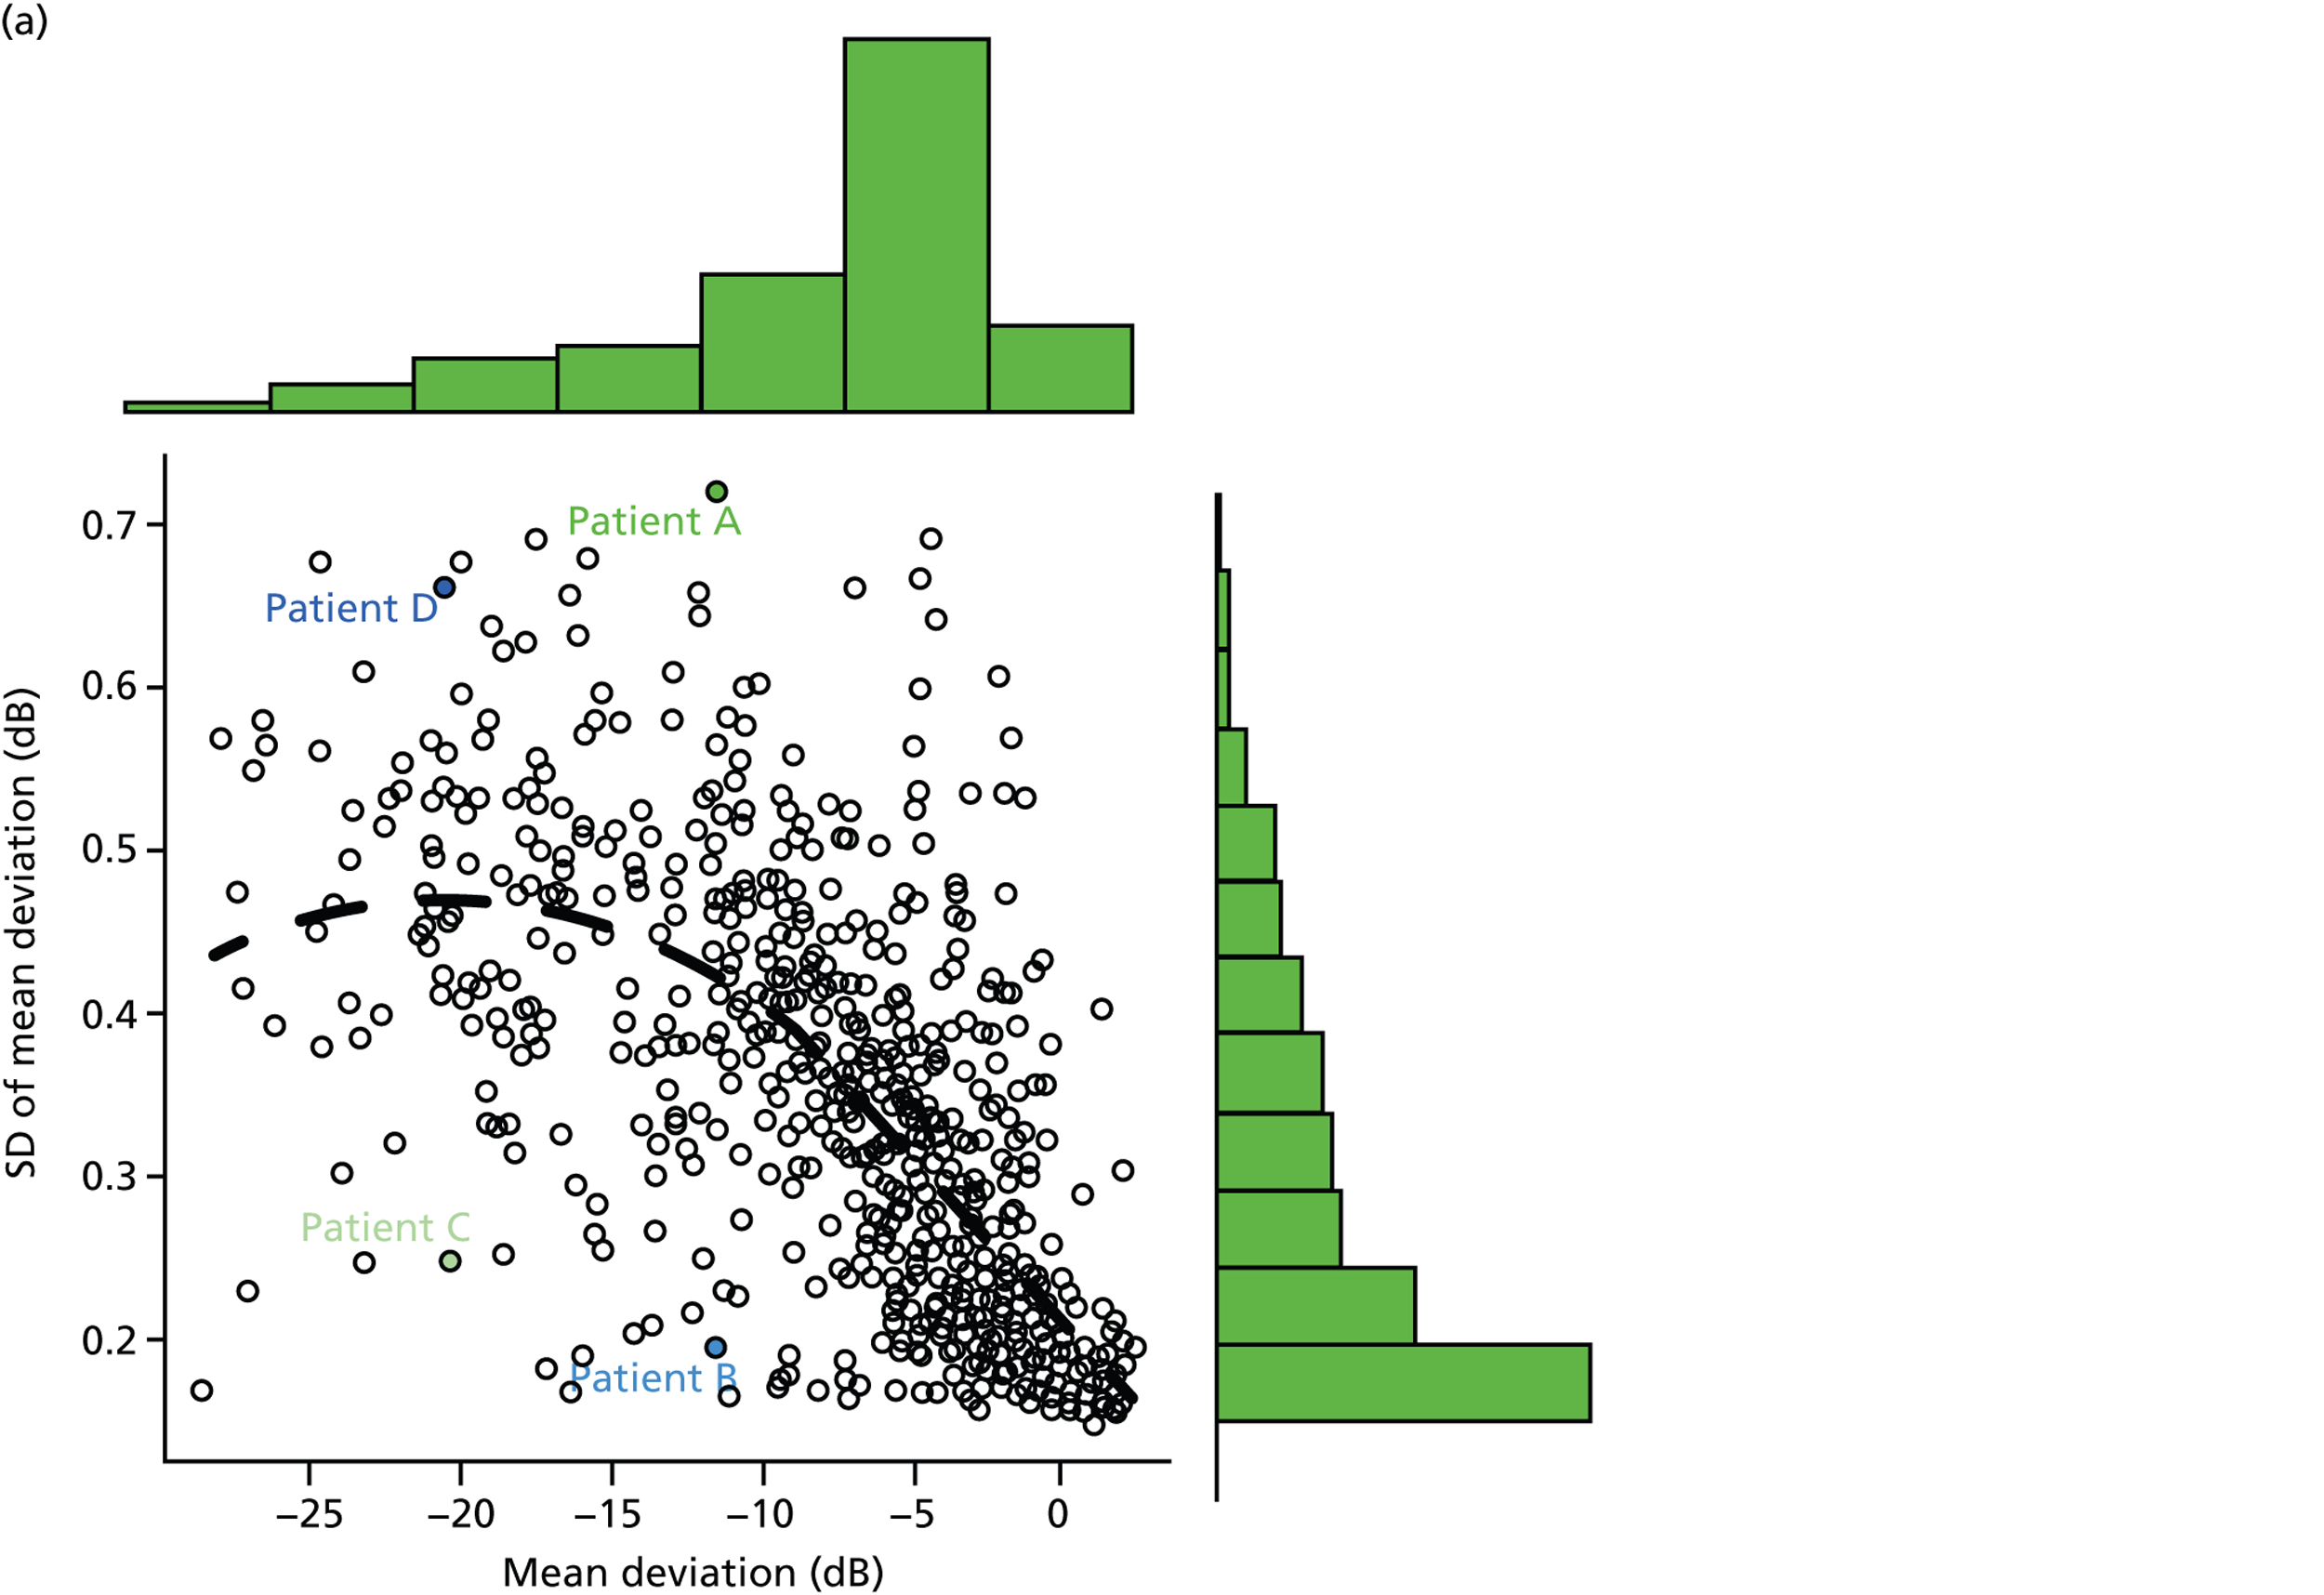
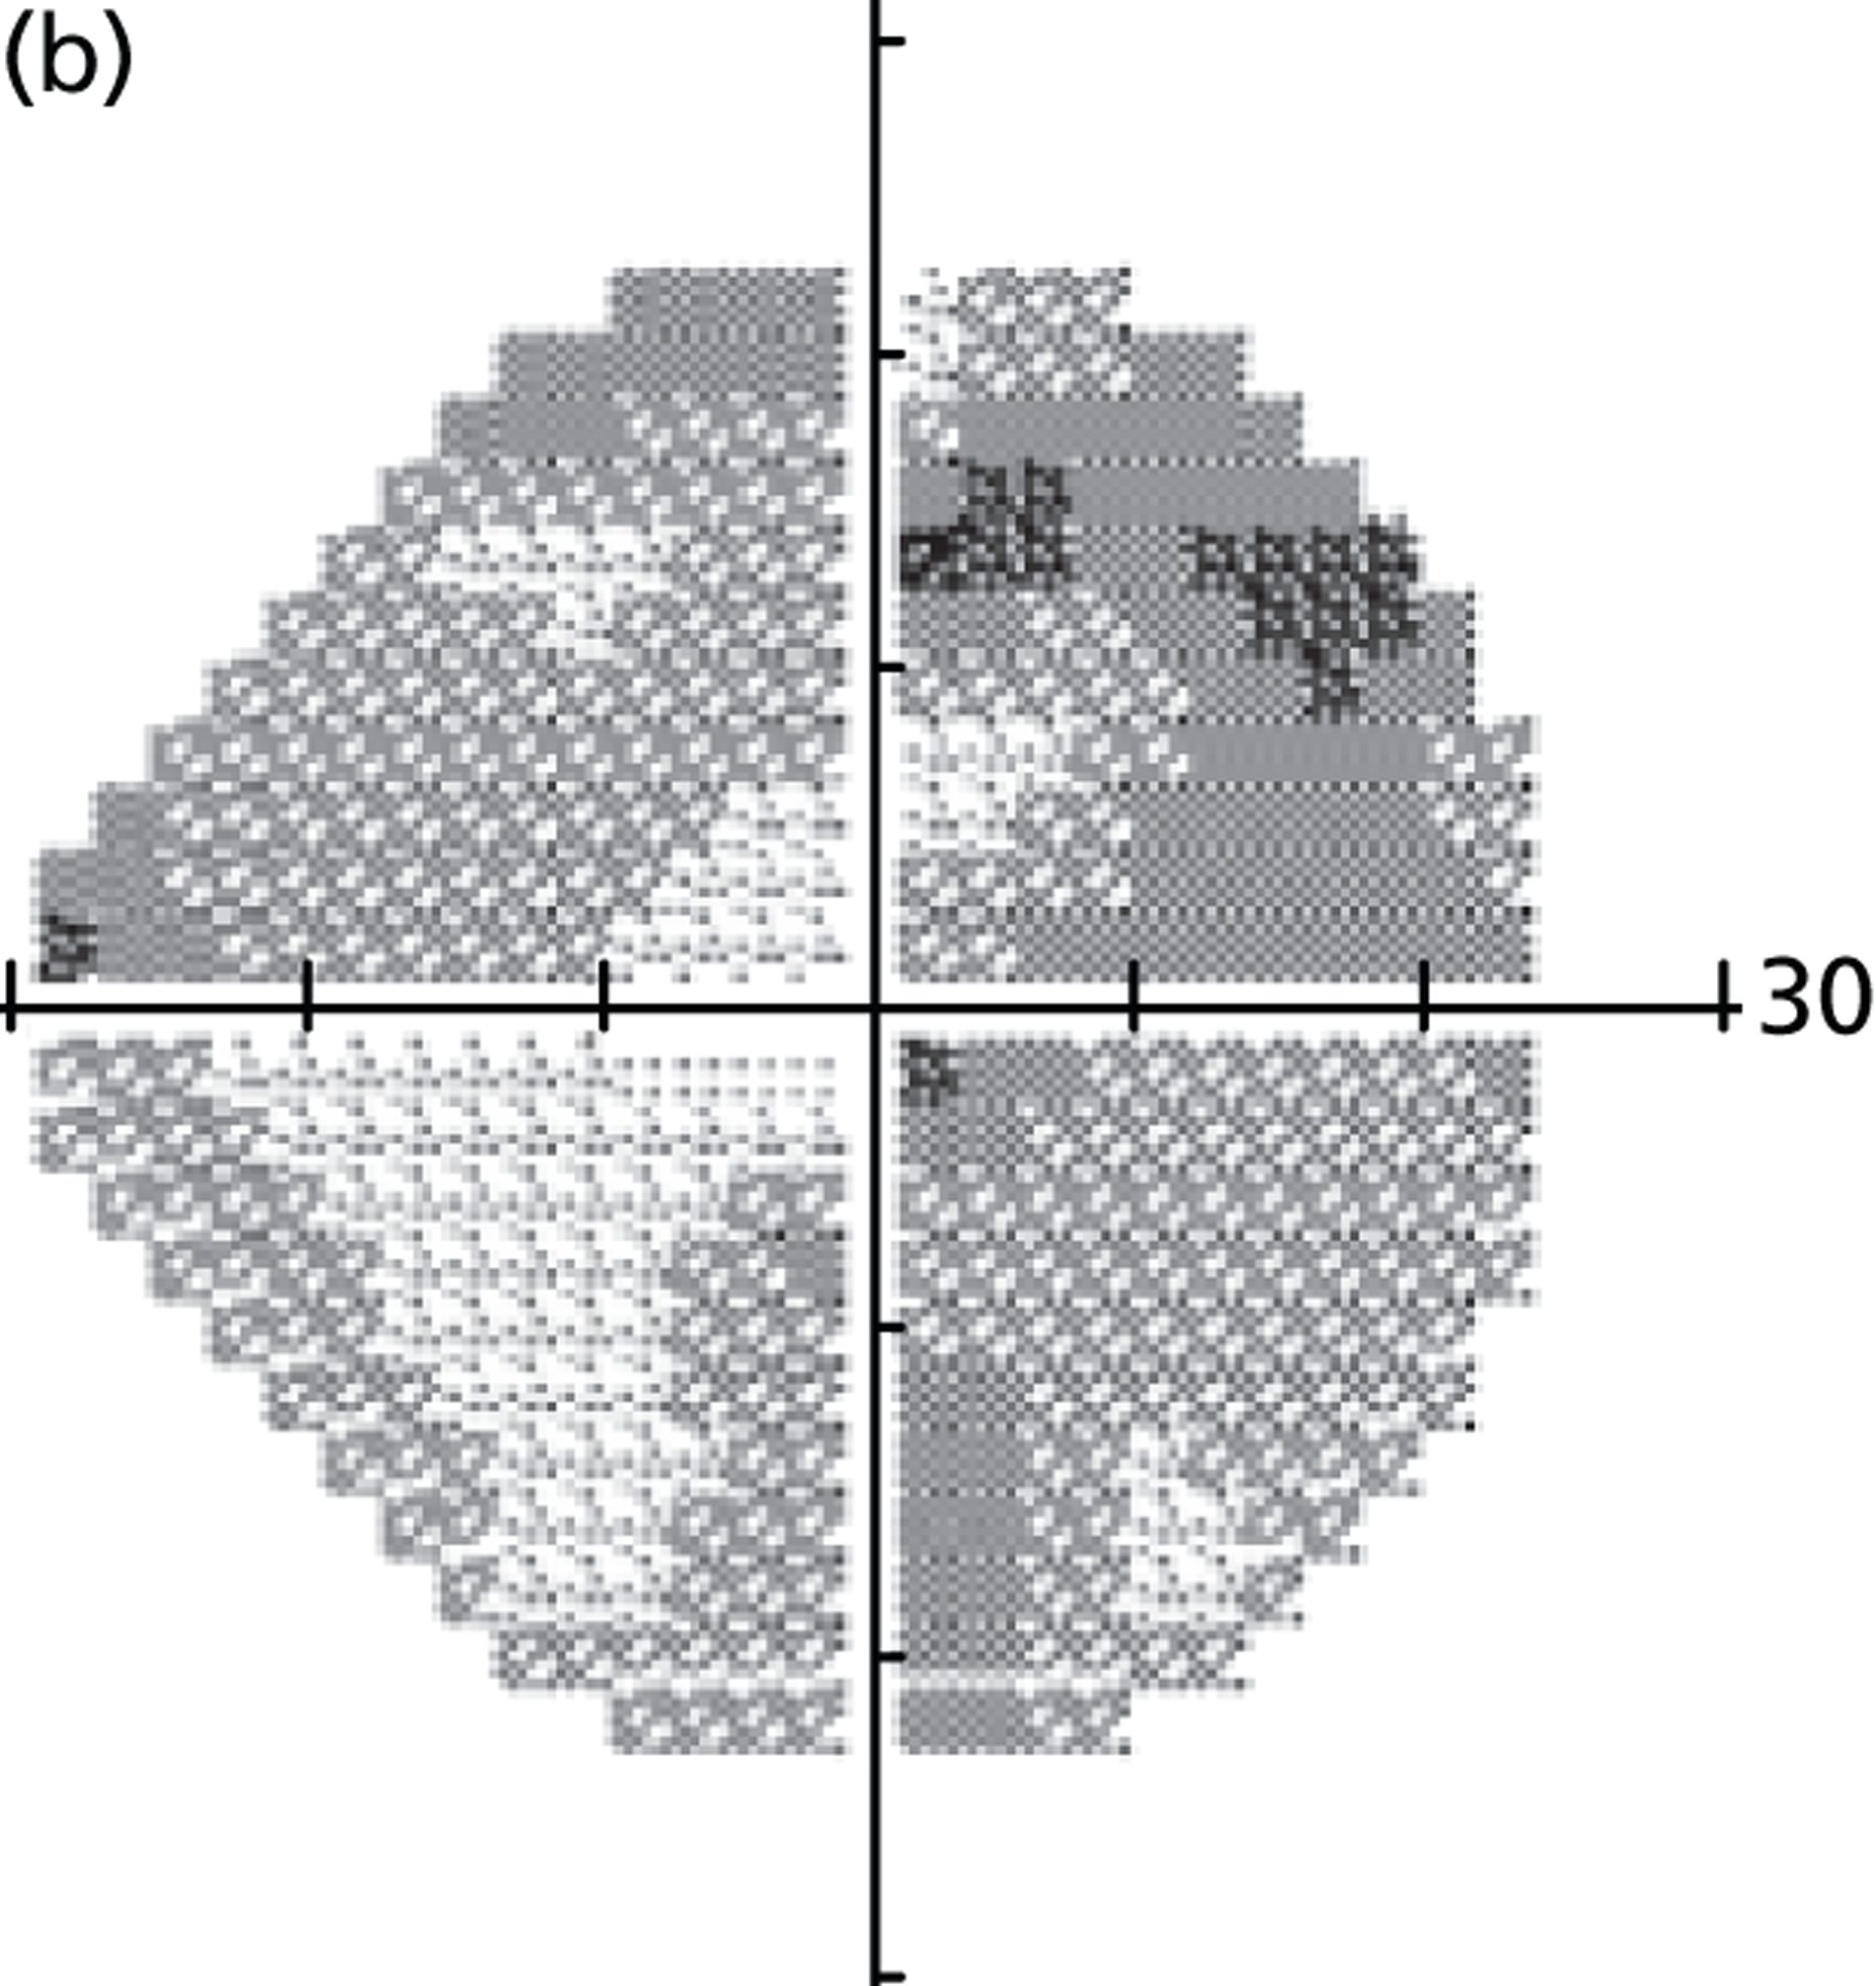
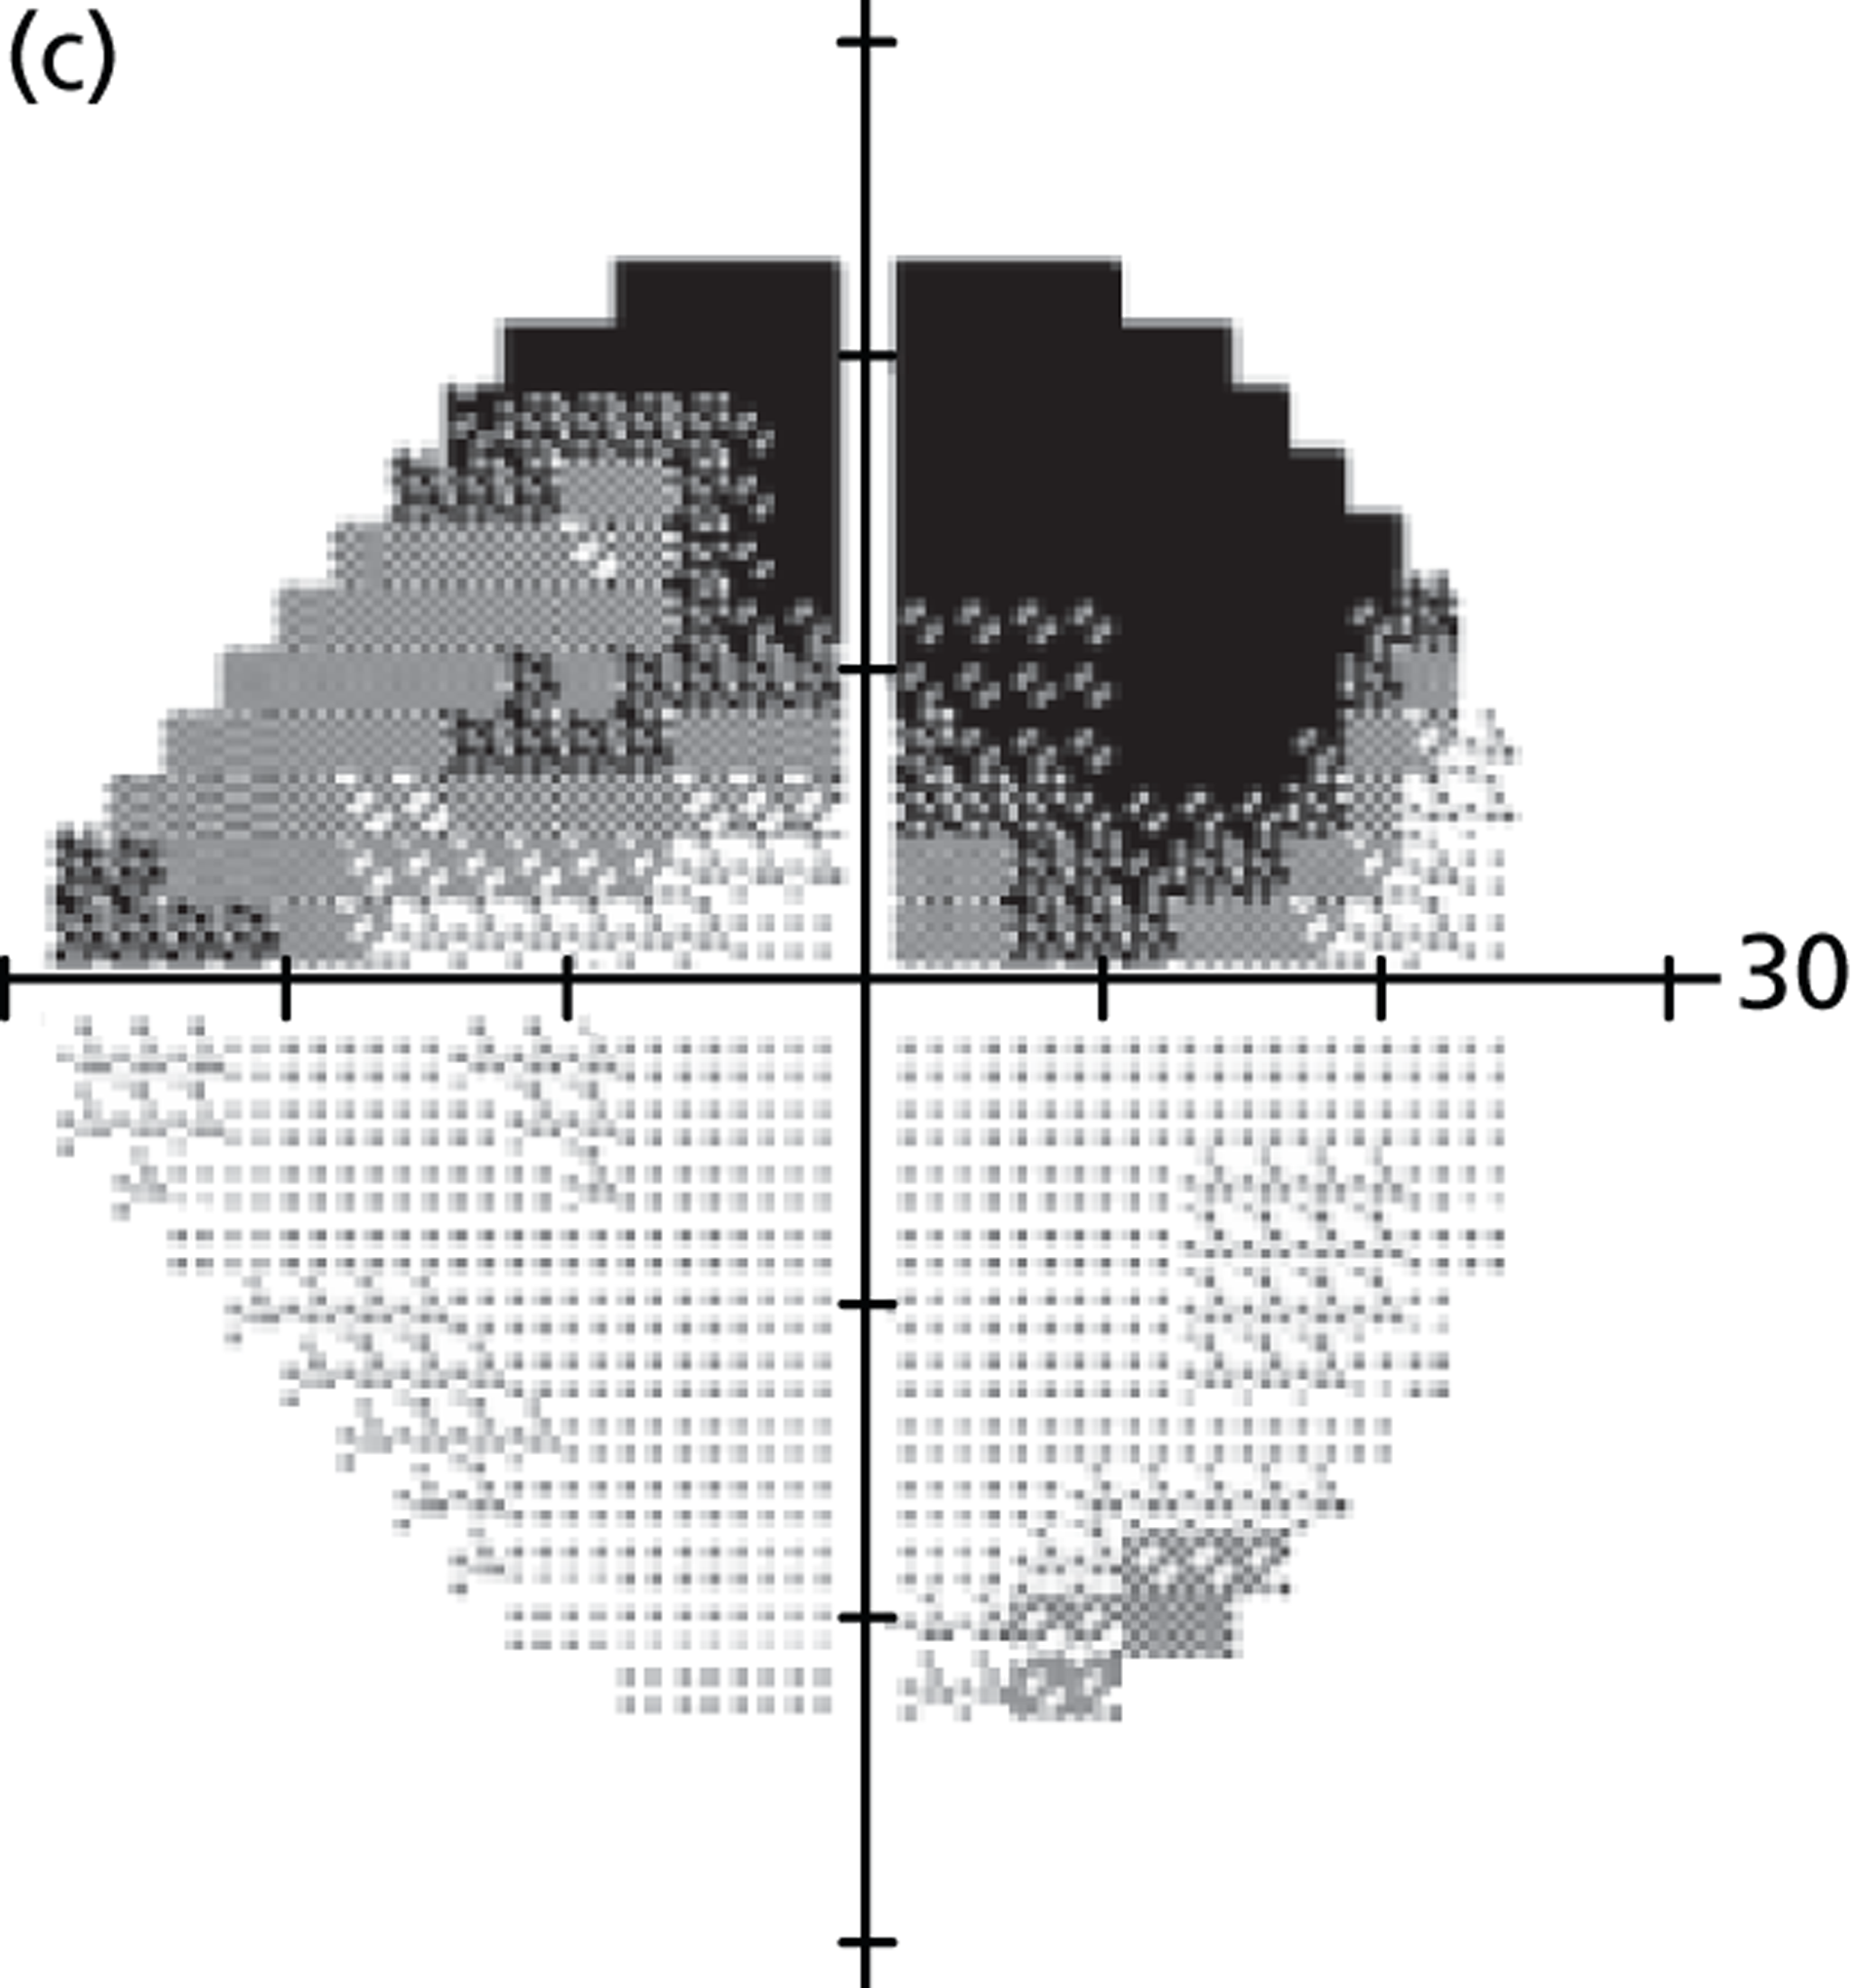
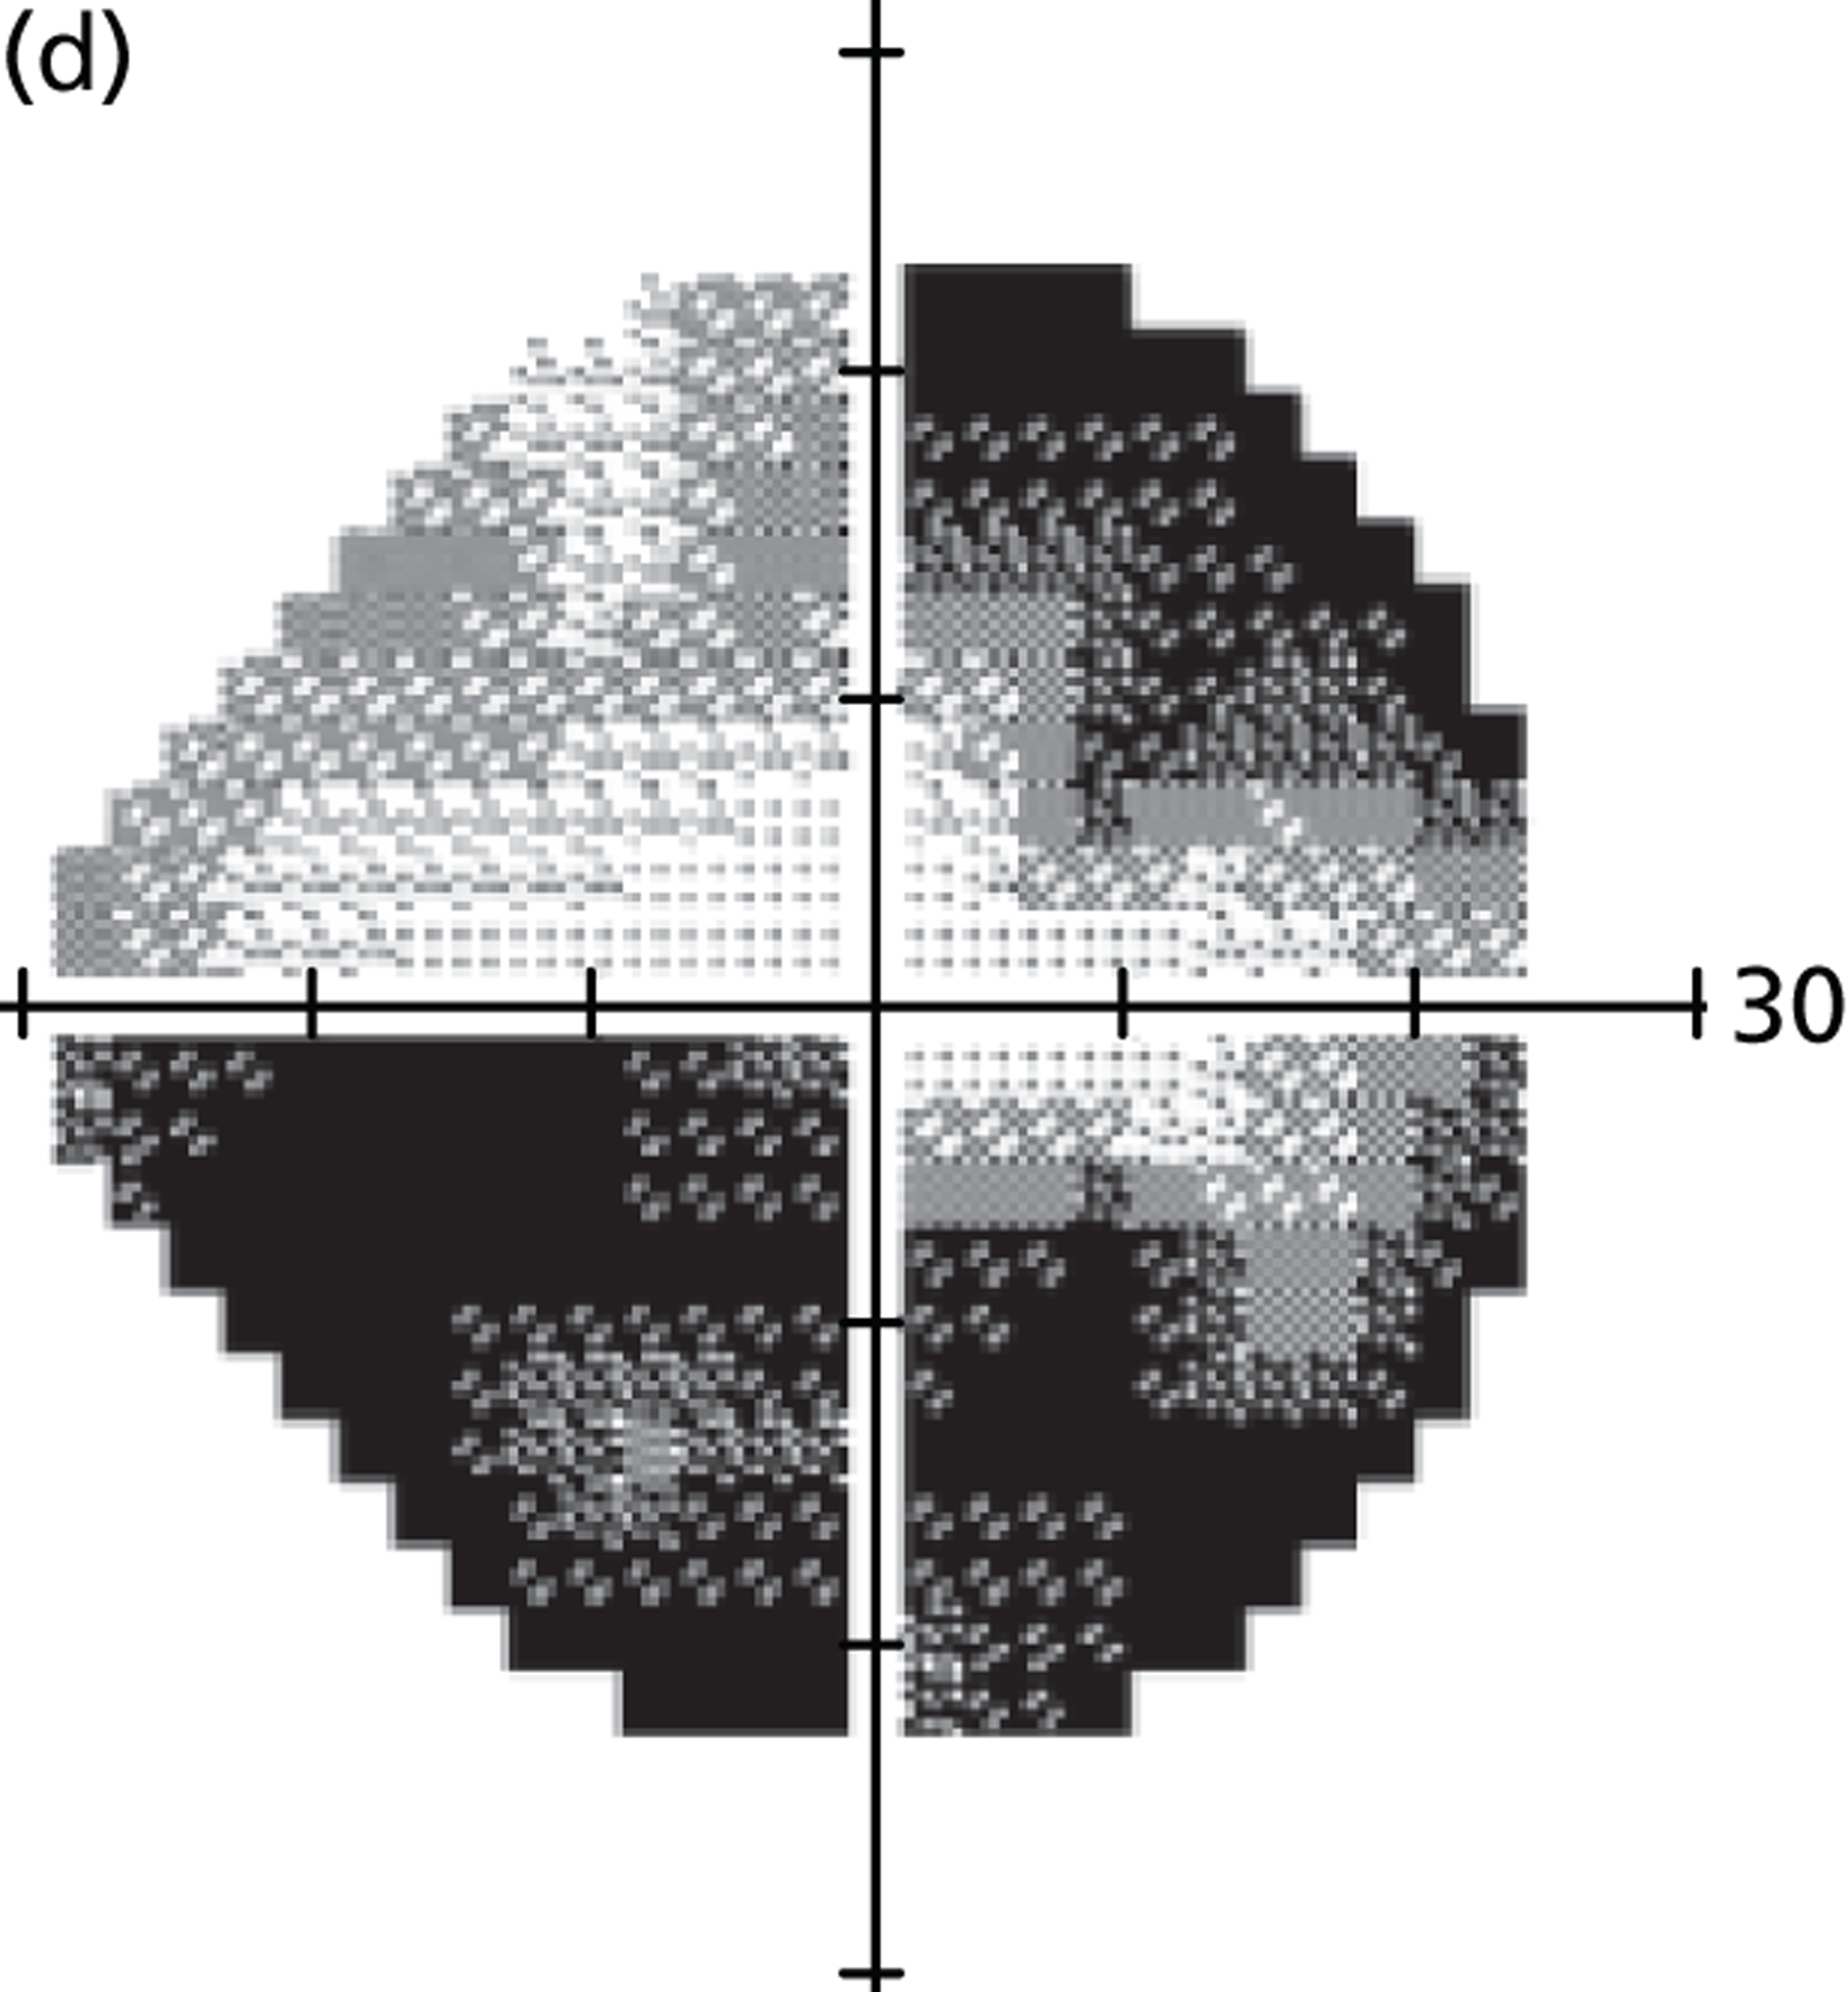
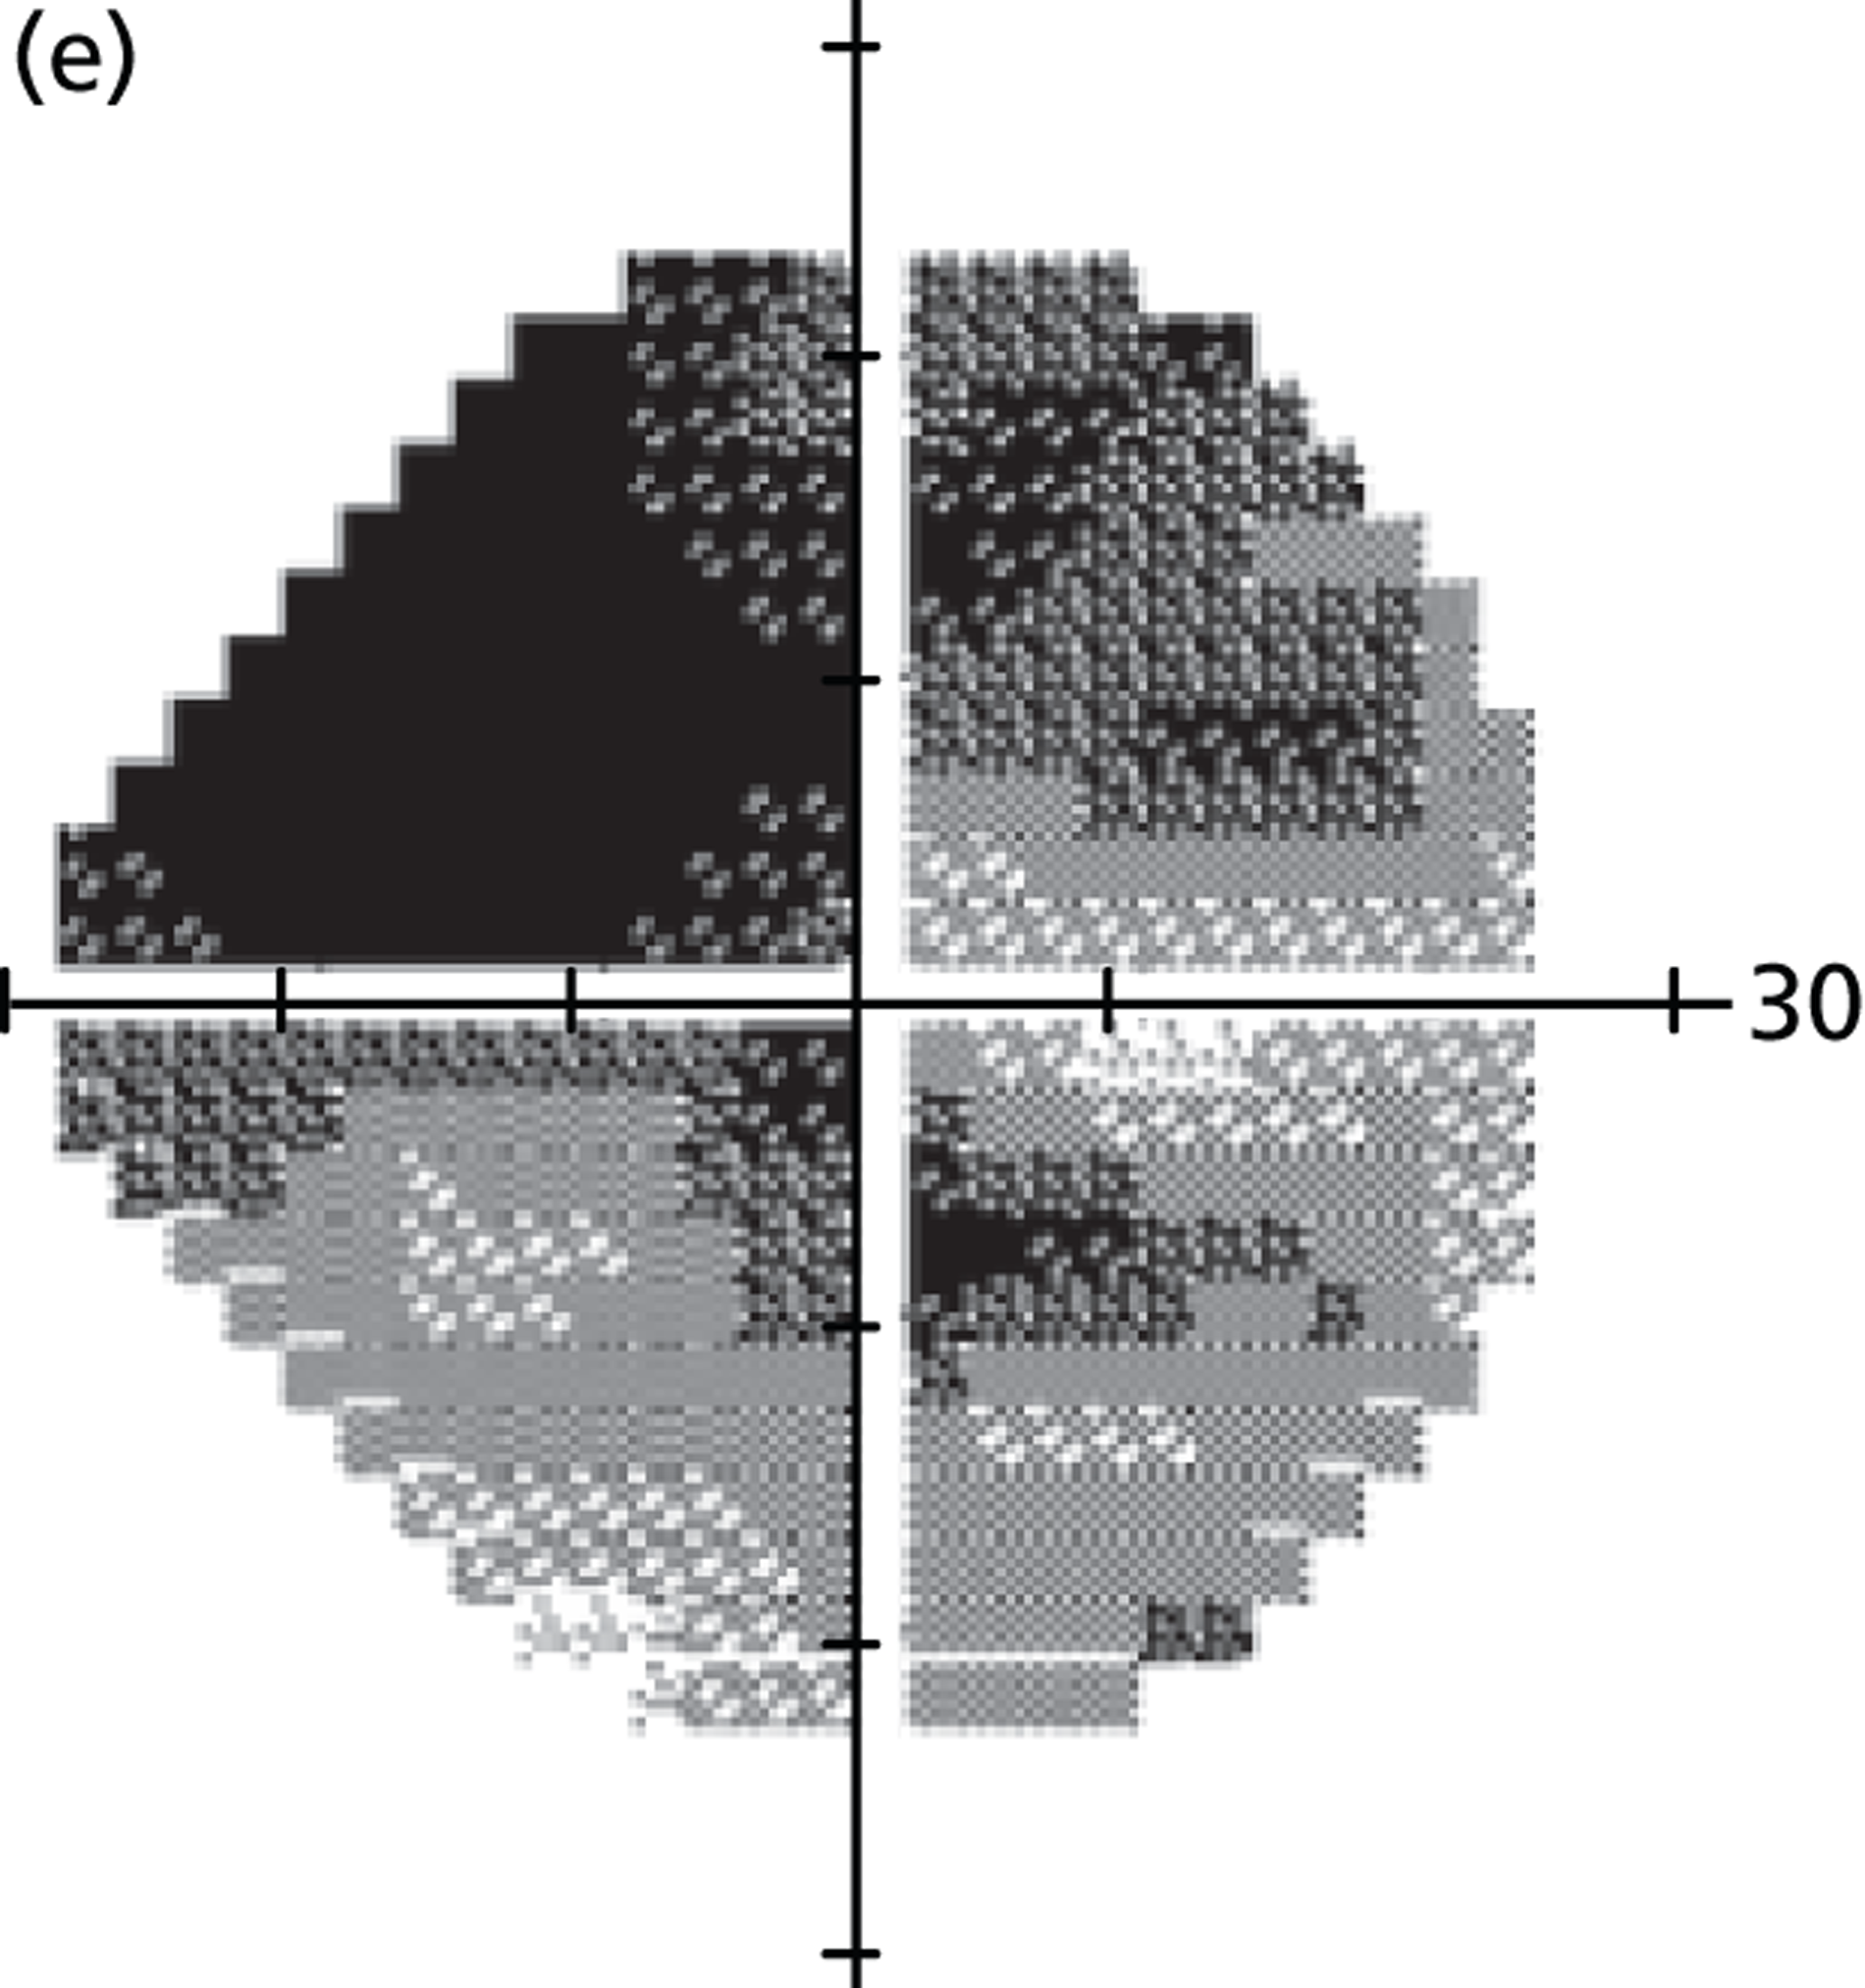
Standard automated perimetry is the benchmark for monitoring glaucoma in clinical practice and clinical trials of new therapies for the disease. Nonetheless, SAP measurements are influenced by factors such as learning effects and patient fatigue. 25,51 Measurement variability is also induced by errors associated with testing strategies, such as staircases, used in clinical SAP. 65,68 Several studies have shown that a decline in VF sensitivity is accompanied by a rise in variability. 50,57–62 Thus, differentiating true VF change from inherent noise is challenging, making glaucoma management and treatment decisions difficult.
Quantitatively characterising VF measurements and the performance of methods of measuring VF progression requires a gold standard, which is not available for VF contrast sensitivity. This fact is widely documented in glaucoma research so many approaches to estimating ‘true’ glaucomatous progression have been attempted. 68,86 Computer modelling of VFs permits large numbers of data to be simulated, with known characteristics. Thus, the effects of different variables on VF measurements can be investigated. Simulations have previously been used in glaucoma research to evaluate VF testing strategies and progression measurement methods. 6,63–69,87 However, these simulations have been based on imperfect VF data and may not accurately reflect clinical VF measurements. For instance, many models6,69,70,82 have been based on a linear equation for VF variability described in Henson et al. ,55 which was based on FOS curves with absolutely no VF measurements below 10 dB. The model described here is based on SAP results from thousands of clinic patients and empirical estimates of VF variability, but it is important to note that our VF simulations do not account for factors such as patient fatigue and learning effects. 25,51
Mean deviation is routinely used to summarise VF damage in patients. As MD is a weighted average, it is less sensitive to localised VF damage, but is consequently robust to measurement noise at individual test points. Some research has proposed that MD variability rises as the level of MD declines,81,83,84 but, until now, no study has looked at the influence of the pattern of VF damage on MD. Without computer simulations, such a study would be very difficult to achieve using clinical data, as it would be almost impossible to unravel the relationship between patient error, algorithm error and other measurement errors. Figure 14 shows that MD variability tends to increase as the level of MD decreases, with some evidence that variability peaks around –20 dB. For VF loss associated with early disease (MD ≈ –2 dB), variability is half that in moderate glaucoma (MD ≈ –10 dB). 47 Furthermore, variability can vary more than threefold between patients with roughly equivalent levels of MD; this suggests that the pattern of VF damage has a significant impact on MD variability. VFs with global diffuse damage (see patients A and D in Figure 14) tend to have higher MD variability than VFs with localised damage and other regions that are healthy (see patients B and C in Figure 14). This highlights the importance of measuring VF progression using individualised rather than population-based criteria.
There has been renewed interest in the MD statistic in recent years. Junoy Montolio et al. 23 showed that VF locations measuring blind on sequential tests can lead to an underestimation of MD, which could affect MD-based progression detection algorithms. This censoring will also decrease the dynamic range of MD and, therefore, reduce variability of MD. Our results are in good agreement with those from Junoy Montolio et al. ; Figure 14 suggests that MD variability starts to decrease at roughly –20 dB, which is unsurprising given that many points in the VF will probably be perimetrically blind at this level of damage. Furthermore, Junoy Montolio et al. showed that the number of VF test points excluded by the HFA ‘Guided Progression Analysis’ software (Carl Zeiss Meditec, Dublin, CA)88,89 rises with disease progression up to an MD of a proximately –20 dB but declines beyond this value. 23
A recent study by Wall et al. 84 investigated the variability of MD for Goldmann size III and size V stimuli. They found that size V MD was repeatability smaller than that for size III, but increased for both stimuli when VF damage worsened. They also suggested that, depending on the size of the stimulus and the amount of VF damage, a reduction in MD of 1.5–4 dB is necessary to be outside normal 95% confidence limits. 84 The results presented here suggest that such confidence limits also need to account for the pattern of VF damage and not just the level of MD. Wall et al. 84 concluded their research by stating that ‘further work needs to be done to determine criteria for identifying visual field change’. We consider VF simulations an excellent point of reference for gauging the performance of VF progression detection tools and developing new methods for measuring VF progression. One particularly important finding, with reference to the overall objectives of this research, is the need to account for the non-stationary variability observed with MD worsening if assessing the rate and significance of VF damage using linear regression of MD over time. In particular, detecting VF progression in newly diagnosed patients who present with advanced VF damage is challenging owing to the increased variability associated with this disease severity compared with early VF damage.
Modelling proposed practice
In this study, proposed practice consists of testing newly diagnosed glaucoma patients three times per year for the first 2 years. The recommendations by Chauhan et al. 5 purport that this VF testing strategy will result in 80% power to detect a rate of loss of 2 dB/year in MD with moderate variability. 5 As Chauhan et al. 5 comment, the ability (statistical power) to detect a given rate of MD change depends on the variability of MD over time, the number of examinations and the amount of change we wish to detect. In the research of Chauhan et al. ,5 moderate variability was defined such that the SD of MD measurements was equal to 1; this SD figure was based on retrospective analysis of glaucoma patients in a longitudinal study. 62 Our VF model described above suggests that this is an oversimplification and that MD variability also depends on the level of damage. However, a limitation of our simulations is that they do not incorporate factors such as patient fatigue and learning effects so the absolute magnitude of MD variability will be larger in clinical practice.
The VF monitoring regimes for proposed practice and current practice are summarised in Table 9.
| Current practice (months) | Proposed practice (months) |
|---|---|
| 0 | 0 |
| 4 | |
| 8 | |
| 12 | 12 |
| 16 | |
| 20 | |
| 24 | |
| 32 | |
| 44 |
We carried out simulations of MD over time with a SD of MD equal to 1 (‘moderate variability’) using the same methodology described in the Chauhan et al. paper. 5 However, our model was updated to account for a mistake in the simulations in Chauhan et al. , whereby the duration of follow-up was not considered. 5 Consequently, the Chauhan et al. findings were misleading, since, in order to establish whether or not such a proposed practice is a significant improvement over annual testing, the efficacy of increasing the frequency of field examinations compared with prolonging the duration of the follow-up needs to be established. 90 As already stated, the ability to detect progression, in this case a statistically significant slope, is determined by the variability of the measurement, the number of observations/examinations and the duration of follow-up. Furthermore, increasing the duration of follow-up is much more efficient, statistically speaking, than increasing the frequency of examinations. For example, six examinations in 2 years are less powerful in detecting change than six examinations in 6 years, as the total amount of change will be much lower after 1 year than after 6 years. Thus, we conducted further simulations and calculated the time period required to detect various rates of MD change with 80% power in VF tests with moderate MD variability using current practice and proposed practice (Table 10).
| Rate of MD (dB/year) | Our model of CP (years) | Our model of PP (years) | Chauhan et al. model of CP (years) | Chauhan et al. model of PP (years) |
|---|---|---|---|---|
| Slow | 13.0 | 11.0 | 19.0 | 6.3 |
| Medium | 6.0 | 4.0 | 9.0 | 3.0 |
| Fast | 5.0 | 3.0 | 6.0 | 2.0 |
The substantial differences in time to detect progression between the Chauhan et al. 5 model and our own model, summarised in Table 10, is extremely important. The Chauhan et al. model exaggerates the clinical effectiveness of proposed practice to identify MD progression; this is explained by the fact that the Chauhan et al. simulations did not account for the duration of follow-up. 5,90 Since our model accounts for the duration of follow-up in its simulations, it takes longer to identify progression with proposed practice so these time periods were used in the health economic model described in the next chapter.
Conclusion
When managing newly diagnosed glaucoma patients, the clinician’s goal is to preserve patients’ visual function during their lifetime. The risk of severe visual impairment depends on the stage of disease at presentation and the patient’s life expectancy, as well as on the rate of visual deterioration. Patients with fast progression of VF loss are in greater danger of going blind than patients with slow progression. One way to identify these ‘fast progressors’ sooner is to ascertain their rates of VF loss earlier. Considering treatment and monitoring costs, it is vital that resources are prioritised towards patients who are in greatest danger of suffering visual disability in their lifetime.
Chauhan et al. 5 recommend six VF tests in the first 2 years for all newly diagnosed glaucoma patients. Notably, this recommendation does not incorporate information about each patient’s level of VF damage at presentation, which is also hugely important when trying to ensure that a patient’s visual function remains unaffected. Further research is essential to provide evidence for advantages about adaptive testing regimes for each patient; for instance, studies could investigate the effectiveness of prescribing test intervals based on the rate of VF loss progression that a clinician wishes to detect in a given patient. One statistical consideration for adaptive testing is the relationship between VF variability and the level of VF damage. In this chapter we have shown that pointwise VF variability and MD variability increase as VF loss increases; this implies that prescriptions for the frequency of VF testing should also be dependent on the patient’s individual VF and level of damage. There might be significant service delivery advantages in monitoring patients who present with advanced VF damage more frequently than patients with early or moderate VF loss; this observation awaits further research. We support comments from Heijl that glaucoma management needs to be individualised; treatment and monitoring regimes should be tailored to the preferences of each patient, based on the risk of future loss of visual function. 42
Another strategy worth investigation is the sensible idea of varying intervals between VF tests to optimise detection of progression. 91 In one approach, the length of the interval between consecutive tests depends on the outcome of previous test results. 92 Other strategies including testing at evenly spaced intervals, such as every 6 months or annually, have also been suggested as a way of improving detection rates in clinical trials. 93 Furthermore, Crabb and Garway-Heath94 recently determined that estimates of MD progression are improved if examinations are clustered at the beginning and end of a predetermined observation period (the wait-and-see approach); the authors simulated patients with fast MD progression (–2 dB/year) with added MD measurement variability and estimated progression using linear regression of MD over time. One group of patients was measured every 6 months, another every 4 months, whereas the wait-and-see group was measured either two or three times at both baseline and at the end of a 2-year period. Stable patients (MD 0 dB/year) were generated to examine the effect of the follow-up patterns on false-positive progression identification. The wait-and-see method identified more patients with rapidly progressing VF loss with fewer false positives and one fewer VF test. The idea of scheduling VF tests in this way is particularly applicable to clinical trials in which progression of VF loss is the functional marker for glaucomatous change.
It is worth noting that an assumption of the recommendations from Chauhan et al. 5 is a linear rate of progression of MD over time. This may not reflect the true nature of glaucomatous deterioration given that there is some evidence to show patients tend to progress more quickly at older ages. 5 Nonetheless, linear regression of MDs is commonly employed in clinical practice. Furthermore, a linear decline in decibels represents an exponential decay in retinal sensitivity; thus, although loss of sensitivity could occur at greater than an exponential rate, no research to date has suggested that another type of model should be used to measure the rate of decay of MD.
In conclusion, the research presented in this chapter shows that proposed practice (six VF tests in the first 2 years) identifies progression sooner than current practice; however, the clinical effectiveness of proposed practice over current practice (annual VF testing), in terms of time to detect progression, is less effective than indicated in Chauhan et al. ’s study. 5 In the next chapter we investigate the cost-effectiveness of proposed practice and current practice.
Chapter 5 Health economic modelling of different monitoring intervals in glaucoma patients
Background
Glaucoma is a chronic condition: after diagnosis the patient requires care and management for life. Careful clinical follow-up is required in order to assess stability of the disease and to provide the appropriate level of treatment. The monitoring and management of the disease represents a significant economic burden to the NHS. Statistical modelling, described in the previous chapter, highlights the potential benefits of three VF tests in each of the first 2 years of follow-up in order to detect ‘fast’ progression of VF loss in newly diagnosed glaucoma patients. 5,7 However, the economic consequences relative to the utility that would derive from such a strategy have not been evaluated. Therefore, this chapter describes a study that examined the cost-effectiveness of existing practice (annual testing) compared with the recommended practice of six VF tests in the first 2 years in the newly diagnosed patient. The benefit of moving to such a strategy is that clinicians would have earlier access to the subject’s rate (speed) of VF loss instead of relying on risk factors for progression; something that is currently not possible with any certainty. 95,96 It would certainly help clinicians to identify rapidly progressing patients. By accounting for the rate of progression, clinicians can set better target services for those individuals most likely to move into a state of visual impairment in their lifetime. 5,42,97 Consequently, the productivity of services rendered by the NHS could be improved by reducing the level of resource consumption by those least likely to have their quality of life impacted by the disease.
Methods
This section reports the methodology underpinning the health economic model described in this chapter. Detail is provided on the estimations of parameters that support the model in addition to how the decisions nodes, which inform how patients move through the model, were identified and incorporated. This section also describes how the model was validated to ensure it estimates real-world glaucoma care service in England and Wales. Furthermore, sensitivity analyses are outlined, which were carried out to analyse how uncertainty in the model’s parameters affect final outcomes.
The model
A Markov model was constructed to model the proposed practice of increased VF monitoring frequency against existing practice. The Markov model was chosen because of its relative simplicity and relative transparency in comparison with other models (i.e. discrete event simulations). All the programming for the model was implemented in Excel (Microsoft Excel 2010; Microsoft Corporation, Redmond, WA, USA).
Markov models ‘stratify’ patients to be always a member of one of its constituent Markov states, a state that reflects the subject’s existing level of well-being. The members of each state can then move into other health states dependent on the transition probability. Each Markov state is designated a utility weight and the individual accumulates utility according to how long he or she remains a member of each state. The model is run for a length of time (e.g. 25 years) known as the ‘model time horizon’. This time horizon is broken down into equal parts, denoted as Markov cycles98 (e.g. 1-year intervals). In addition, all Markov models have at least one absorbing state in which all individuals will eventually enter if the model is given a sufficiently long time horizon.
Figure 15 presents a schematic representation of the Markov model constructed in this study. Markov states represent, from left to right, increasing disease severity. Individuals can start in any of these states according to the state of their disease at diagnosis. In a particular model cycle, patients can remain within their existing state of health, or progress towards increased disease severity. Most Markov models would allow for multidirectional transitional movement, but in the case of an irreversible disease, such as glaucoma, a unidirectional movement (towards a worse disease severity) is the only transition possible. In addition, it is assumed that patients move sequentially and cannot skip states because of the relatively slow evolution of the disease and the yearly defined cycle lengths defined in our model. Patients may also leave the model and move into the absorbing state (death).
FIGURE 15.
Markov model for a glaucoma ‘pathway’.

Strategies to follow up individuals with newly diagnosed glaucoma
Within this subsection the NICE guidelines and the proposal by Chauhan et al. 5 are reviewed. The subsection ends with a summary of the strategies included in the economic model.
National Institute for Health and Care Excellence guidelines for glaucoma
Guidelines were produced by NICE to improve the prevention of visual impairment in those with or suspected of having glaucoma by establishing clinical monitoring and treatment pathways. 1 Following identification of disease, long-term monitoring of IOP fluctuation, the ONH and the VF is required (Table 11).
| IOP at target | Progression | Patient monitoring intervals (months) | |
|---|---|---|---|
| IOP only | IOP, ONH, VF | ||
| Yes | No | n/a | 6–12 |
| Yes | Yes | 1–4 | 2–6 |
| Yes | Uncertain | n/a | 2–6 |
| No | No | 1–4 | 6–12 |
| No | Yes | 1–2 | 2–6 |
| No | Uncertain | 1–2 | 2–6 |
Those defined as experiencing disease progression should have their IOP, ONH and VF measured at 2- to 6-month intervals, while those not progressing are recommended to undergo the full spectrum of testing every 6–12 months. Those with an uncertain definition regarding progression status should be monitored at 2- to 6-month intervals irrespective of whether or not IOP is at target. Guidelines on IOP monitoring alone vary according to IOP control, with those achieving target IOP not recommended to undergo further testing unless progression is identified (1- to 4-month intervals). It is recommended that patients not achieving target IOP be monitored every 1–2 months if there is any suspicion of progression or every 1–4 months if progression is not suspected. 1
Treatment modalities offered to the patient, as with monitoring, vary according to the risk of the individual progressing to a state of visual impairment. Those newly diagnosed with early to moderate COAG and at risk of visual impairment in their lifetime should be offered pharmacological treatment depending on comorbidities and drug interactions. 1 Those with severe COAG and at risk of further visual impairment in their lifetime should be offered surgical intervention in conjunction with pharmacological treatment.
Monitoring of newly diagnosed glaucoma patients
The work described in the previous chapter supported the idea presented by Chauhan et al. 5 that performing three VF tests in each of the first 2 years of follow-up is helpful in detecting ‘fast’ progression of VF loss in newly diagnosed glaucoma patients. As discussed before, identification of these patients is hampered by the large variability of VF test results over time, and thus it was suggested that at least six VF tests are required in the first 2 years to identify those progressing rapidly (at a power of 80%). 5 Two different strategies, defined as current practice (annual VF testing) and proposed practice (three VF tests per year in the first 2 years after diagnosis), were modelled. Our specific hypothesis was constrained to investigating if the proposed practice was more cost-effective than current practice. In short, we seek the benefit of getting more precise information of progression earlier by using proposed practice. We speculate that this gain in information, especially in identifying rapidly progressing patients sooner, will yield improved cost-effectiveness of clinical care.
Model strategies
Table 12, a summary of Table 10 (see Chapter 4), shows how intervention points varied by strategy. Current practice was specified such that fast progressors (defined as those patients in whom VF MD worsens by –2 dB/year or more) would be identified after five VF tests, medium progressors (defined as –1 dB/year) identified after six VF tests, and slow progressors (defined as –0.25 dB/year) or patients defined as stable identified after 13 VF tests, that is a significant (p < 0.05) slope would be identified by linear regression of MD after these time periods. These intervention points are based on research by Chauhan et al. ;5 however, we further developed their model by taking into account duration of follow-up, as described by Alm. 90 Full details can be found in Chapter 4. Like the Chauhan et al. research, our simulations were based on a rate of progression of MD equal to slow (–0.25 dB/year), medium (–1 dB/year) or fast (–2 dB/year), with statistical power equal to at least 80% and moderate variability (SD of MD measurements equal to 1). The results of our simulations indicated that proposed practice (six VF tests in the first 2 years, followed by one VF test per year) identifies fast progressors by the fourth year of monitoring, medium progressors by the fifth year, and slow and stable progressors by the 12th year, with at least 80% power.
| Strategy | Speed | VFs required | Improved information intervention year |
|---|---|---|---|
| Current practice | Slow | 13 | 14 |
| Medium | 6 | 7 | |
| Fast | 5 | 6 | |
| Proposed practice | Slow | 15 | 12 |
| Medium | 8 | 5 | |
| Fast | 7 | 4 |
Treatment pathways
To model the decision-making process behind treatment allocation and its impact on the probability of transition to worse states of disease, ophthalmologists with a specialist interest in glaucoma on the project management group (hereafter referred to as ‘the clinical review panel’) were consulted to construct simplified treatment pathways that patients would face in a UK NHS tertiary setting. It was concluded that, at the initial stages of treatment, decisions on treatment allocation are largely informed by the patient’s risk of progression [informed by IOP, central corneal thickness, ONH and other clinical assessment], their existing level of damage and their age. Thus, treatment pathways were specified to depend on a variable that we denote to be progression risk, existing VF damage and the patient’s age. In short, those classified as a high priority were more likely to undergo surgical-based treatment strategy, whereas those categorised as a low priority were more likely to undergo a pharmacologically based treatment strategy.
In order to model the effects of treatment on the probability of transition to a more severe state, the proportional relationship between IOP reduction and rate of MD progression identified by Folgar et al. 99 was used; consequently, a 1 mmHg reduction in IOP translated to a 0.1 dB/year improvement in MD rate. In terms of the treatments, three lines of therapy were defined: first-line therapy was stated as a pharmacological-based regimen; second line as the patient undergoing argon laser trabeculoplasty (ALT) treatment alongside topical medication; and third line as surgery (i.e. trabeculectomy). Based on the recommendations of the clinical review panel, it was assumed that patients would be provided with pharmacotherapy from the point of identification as a glaucoma suspect; therefore, this level of treatment was modelled not to have any further reduction on progression rate and, consequently, the probability of transition. Following a review of literature, the mean improvement in MD rate following ALT (second-line treatment) was found to be equal to 0.74 dB/year (see Appendix 1, Table 24). In addition, literature on surgical intervention (trabeculectomy) suggests that it offers a mean improvement in MD rate of 1.22 dB/year (see Appendix 1, Table 25). Transition probabilities were adjusted for cases where second- and third-line levels of treatment were prescribed.
To map how patients filter through the model into different treatment modalities, treatment pathways were identified and constructed based on NICE guidelines and expertise from the clinical review panel. Hypothetical subjects were assigned and categorised according to characteristics based on age, risk of COAG progression, existing level of damage and rate of progression, resulting in 48 distinct patient groupings and pathways in the economic model. Within a time period described as ‘imperfect information’, where the managing clinician is ‘unaware’ of the patient’s rate of progression of glaucomatous VF damage, the clinical review panel was asked to grade the level of treatment that would be provided to the patient given his or her age, existing level of damage and risk of COAG conversion. After a defined number of VF tests, we identified the patient’s progression rate, and then entered into a time period defined as ‘perfect information’. The clinician now had the opportunity to continue to provide the patient with the existing degree of treatment, or to increase it (Tables 13 and 14a and b).
| Health state | 50-year-old | 70-year-old | ||
|---|---|---|---|---|
| High risk | Low risk | High risk | Low risk | |
| Treatment | Treatment | Treatment | Treatment | |
| 1 | 2 | 1 | 1 | 1 |
| 2 | 2 | 1 | 1 | 1 |
| 3 | 3 | 2 | 2 | 1 |
| 4 | 3 | 3 | 3 | 2 |
| Health state | High risk | Low risk | ||||||
|---|---|---|---|---|---|---|---|---|
| Stable | Slow | Medium | Fast | Stable | Slow | Medium | Fast | |
| 1 | 1 | 1 | 2 | 3 | 1 | 1 | 2 | 3 |
| 2 | 1 | 1 | 2 | 3 | 1 | 1 | 2 | 3 |
| 3 | 2 | 2 | 3 | 3 | 1 | 1 | 2 | 3 |
| 4 | 3 | 3 | 3 | 3 | 2 | 2 | 3 | 3 |
| Health state | High risk | Low risk | ||||||
|---|---|---|---|---|---|---|---|---|
| Stable | Slow | Medium | Fast | Stable | Slow | Medium | Fast | |
| 1 | 2 | 2 | 3 | 3 | 1 | 1 | 2 | 3 |
| 2 | 2 | 2 | 3 | 3 | 1 | 1 | 3 | 3 |
| 3 | 3 | 3 | 3 | 3 | 2 | 2 | 3 | 3 |
| 4 | 3 | 3 | 3 | 3 | 3 | 3 | 3 | 3 |
Tables 14a and b detail the interaction between decision nodes utilised in the economic model given ‘perfect information’. For example, a 50-year-old patient entering into glaucoma care at health state 1 (mild damage) and defined as being low risk of progression would receive the first line of treatment. If the patient was subsequently defined as a ‘fast progressor’, he or she would be moved on to third-line treatment as a result of the increased risk of moving into a state of visual impairment in his or her lifetime. This functionality was built into the model in order to reflect the resource reallocation that occurs once the clinician identifies those patients who are potentially undertreated. This temporal improvement in patient management is what underpins this study, as the more expedient allocation of efficient treatment modalities differentiates the proposed practice of increased VF monitoring from what is presently carried out in clinical practice.
Input data for the model
Baseline patient demographics for model
Health states were defined according to a modified Bascom Palmer glaucoma staging system47 (Table 15) because of its use of MD and to facilitate data synthesis from studies also using this staging system.
| Health state | Description | MD (dB) |
|---|---|---|
| 1 | Mild | –0.01 to –6 |
| 2 | Moderate | –6.01 to –12 |
| 3 | Severe | –12.01 to –20 |
| 4 | Visually impaired | –20 > |
This staging system identifies mild glaucomatous VF defects as those with a MD between 0 dB and –6 dB, moderate VF defects as those with a MD between –6 dB and –12 dB and severe VF defects as those with a MD between –12 dB and –20 dB; patients with worse MDs are classified as visually impaired. 10,11 These levels of damage were required to exist in the patient’s better eye (the eye with the larger/healthier MD) rather than their worse eye, since research suggests that the level of VF damage in a patient’s better eye has a closer relationship with functional vision and utility estimates relative to that of the worse eye. 43–46 Patients were, therefore, allocated to one of the four possible health states based on baseline disease severity.
A retrospective multicentre study of VF databases (PROGRESSOR) was performed to provide baseline population parameters for the Markov model (see Chapter 4 for details). Findings suggested that the distributions observed could be represented as two clusters with mean ages of 51.2 years (28%) and 70.2 years (72%); therefore, for simplicity, patients within the model were set to enter the analysis at either the age of 50 or 70 years in the proportions given (Table 16).
| Parameter | Stratification | Input | Source |
|---|---|---|---|
| Population | Male | 52.90% | VF database |
| Female | 47.10% | ||
| Age distribution at first presentation | 50 years | 28.15% | VF database |
| 70 years | 71.85% | ||
| Number of individuals modelled | 50 years | 2815 | VF database |
| 70 years | 7185 | ||
| Risk of COAG conversion distribution | High | 20.00% | Assumption |
| Low | 80.00% |
The ages at which patients are specified to enter are important, as returns on investments are dependent on the residual life expectancy of those being invested in; the longer the residual life expectancy, the greater the return of investment in terms of quality-adjusted life-years (QALYs) derived and years of visual impairment avoided. The ages chosen were also required to dichotomise younger patients and older patients with sufficient differential as decision nodes within the model also vary by age group.
As a result of the clustering analysis, four separate cohorts were identified for individual cohort analysis, in addition to an analysis of all cohorts (termed full simulation). Patients within the model were dichotomised by gender and by age characterisation such that we analysed separate cohorts of males aged 50 and 70 years (M50 and M70 cohorts, respectively) and females aged 50 and 70 years (F50 and F70 cohorts respectively). The results of the full simulation and the M70 cohort were of most interest, as the full simulation represents all patients within the UK glaucoma service, while the M70 cohort represents the group of patients least likely to provide cost-effective results, given they have the lowest residual life expectancies of all cohorts modelled.
In modelling existing damage at first presentation for the younger cohort, 65.0% of patients were specified as having mild glaucoma, 21.4% were defined as having moderate glaucoma, 10.0% were specified as having severe glaucoma and 3.7% of patients defined as visually impaired. In the older cohort, these figures were very similar, 66.2%, 20.9%, 9.3% and 3.7% respectively (Table 17). The mean level of existing VF damage for the younger cohort was –3.08 dB, –8.32 dB, –15.50 dB and –23.98 dB for the mild, moderate, severe and visually impaired subgroups, respectively, while these figures were –3.11, –8.42, –15.38 and –23.64, respectively, for the older cohort.
| Parameter | Subgroup | Stratification | Input |
|---|---|---|---|
| Progression rate distribution | 50 years old | Stable (%) | 49.15 |
| Slow (%) | 36.36 | ||
| Medium (%) | 12.16 | ||
| Fast (%) | 2.33 | ||
| 70 years old | Stable (%) | 33.82 | |
| Slow (%) | 41.00 | ||
| Medium (%) | 20.97 | ||
| Fast (%) | 4.22 | ||
| Health state distribution | 50 years old | Mild (%) | 65.00 |
| Moderate (%) | 21.40 | ||
| Severe (%) | 9.96 | ||
| Visually impaired (%) | 3.65 | ||
| 70 years old | Mild (%) | 66.20 | |
| Moderate (%) | 20.90 | ||
| Severe (%) | 9.25 | ||
| Visually impaired (%) | 3.72 | ||
| Initial mean damage | 50 years old | Mild (dB) | –3.08 |
| Moderate (dB) | –8.32 | ||
| Severe (dB) | –15.50 | ||
| Visually impaired (dB) | –23.98 | ||
| 70 years old | Mild (dB) | –3.11 | |
| Moderate (dB) | –8.42 | ||
| Severe (dB) | –15.38 | ||
| Visually impaired (dB) | –23.64 |
Progression and transition probabilities
The probability of transition from one state to another was defined as a function of the patient’s rate of progression and his or her existing level of damage (see Appendix 1, Tables 26–29). Following the methodology suggested by Hernández et al. ,100 the transition probability was calculated by first establishing the cohort mean level of damage then establishing the level of further damage required in order for a member of the cohort to move into the next health state. The years to threshold was established by dividing the change required to reach the threshold of the next state by the progression rate of the cohort. Finally, the transition probability was identified following the methods of Briggs et al. 101
Intrinsic to our model is how patients move across health states and progress from a mild disease severity to visual impairment. The key driver for this element of the model is the progression rate of the individual; patients are stratified by age group and according to whether they are stable, slow, medium or fast progressors. For patients in the younger cohort, it was observed that 49.2%, 36.4%, 12.2% and 2.3% were characterised as stable, slow, medium and fast progressors respectively. For those in the older cohort, these proportions were 33.8%, 41.0%, 21.0% and 4.2% respectively (see Table 17); these results are supported by the Canadian Glaucoma Study, which showed that increasing age was associated with a faster MD worsening rate. 36
Once the patient has received a specified number of VF tests, and depending on the patient’s underlying rate of progression, a period defined as ‘perfect information’ starts. The patient’s rate of progression is now measured with sufficient accuracy to inform and adjust treatment allocation. At this stage, the patient is allocated resources compatible with efficient use, depending on his or her risk of reaching visual impairment within his or her lifetime.
Costs specified within the model
Monitoring costs
A key driver of the cost-effectiveness of proposed practice is the cost of supplemental VF tests. In the main, these represent a short-term investment which may help clinicians to provide the appropriate level of service provision in the long term. For our health economic model, these extra VF tests were specified to be performed by technicians and costs, sourced from the National Schedule of Reference Costs (2010–11),102 were found to be £56.54 per additional test undertaken (see also Implementation costs).
Treatment costs
The costs of treatment were derived from Traverso et al. ,11 as the treatment patterns modelled by the authors were similar to those in the current study and the glaucoma staging system was identical; thus, facilitating the resource costs calculation associated with each health state. In seeking to study how glaucomatous disease severity interacted with resources consumed, the authors established costs for various stratified disease stages. As our analysis models only three possible lines of treatment, resource consumption was analysed within the findings of Traverso et al. 11 Thus, the treatment pathway identified by the authors for ‘mild glaucoma’ was specified as the first line of treatment, the pathway identified for ‘moderate glaucoma’ was specified as the second line of treatment and the pathway identified for ‘severe glaucoma’ was specified as the third line of treatment. These pathways were chosen as they bore the closest semblance to the three pathways specified in this economic model. Consequently, patients in the second line of treatment were costed to undergo a trabeculoplasty every 12.3 years (an average of two times over the 25-year time horizon utilised in this model), while those in the third line of treatment were costed to undergo a trabeculectomy every 11.2 years. Table 18 indicates that additional consumption of medications and alternative treatments within lines of treatment were possible. For example, those in the second line of treatment are costed to undergo a trabeculectomy every 37.0 years; however, given the starting ages of the cohorts and the 25-year time horizon used, trabeculectomy is a relatively small cost in this treatment line.
| Resource | Treatment line | ||
|---|---|---|---|
| First | Second | Third | |
| Cost (£) | 777.47 | 875.47 | 1083.23 |
| Office visits (per year) | 3.0 | 3.1 | 3.7 |
| Visual fields (per year) | 1.4 | 1.5 | 1.6 |
| Medications (per year) | 14.4 | 20.4 | 21.6 |
| Trabeculoplasties (per 100 years) | 3.5 | 8.1 | 5.3 |
| Trabeculectomies (per 100 years) | 2.5 | 2.7 | 8.9 |
Treatment costs were converted into pounds sterling, adjusted for inflation (where necessary) at an average rate of 3.5%, as suggested by Bank of England inflation calculators. 103 Consequently, mean intervention costs per year for first-, second- and third-line treatments were £777.47, £875.47 and £1083.23 respectively.
Implementation costs
The cost of the infrastructure required to perform increased monitoring at the earliest stage of glaucoma identification was factored into the analysis. It has been argued that UK ophthalmic services are already working at full capacity (see Chapter 2) and that increased VF testing would not be possible irrespective of the benefits that would accrue. 104 Therefore, the economic model was specified to assume that extra capacity would be required to perform more intensive VF testing. Very simple calculations were performed to estimate the costs of this extra capacity. Given an estimated yearly new incident glaucoma population of 10,000,1 current practice (annual VF testing) suggests that 20,000 VF tests would be performed on these patients in the first 2 years. With the proposed practice of six VF tests in the first 2 years, 60,000 VF tests would need to be performed in the first 2 years, representing a capacity shortfall of 40,000 VF tests. New infrastructure would therefore be required to enable these extra VF tests to be performed. Based on the assumption of a 5-day working week with two patients tested every hour per HFA, each machine would be able to perform 4160 VF tests per year; consequently, 10 HFAs and 10 technicians would be required to cover this shortfall. Furthermore, assuming an annual wage of £25,000 a year per technician and a £25,000 price per HFA, the cost of implementing the infrastructure required to fulfil the shortfall in VF tests would be £410,000. This cost was therefore added as a fixed cost within the model for proposed practice.
Utilities associated with each health state
The utility weights associated with each health state were derived from Burr et al. ,105 who performed a discrete choice experiment (DCE) focusing on the impact of glaucoma on quality of life. This study was selected as it was based in the UK and, therefore, of direct relevance to the model presented here, a requirement of NICE. 106 Participants in this study were asked to select one choice out of 32 discrete choice sets in order to indicate preferences in addition to completing European Quality of Life-5 Dimensions (EQ-5D) questionnaires and visual analogue scales (VASs). Patients were then objectively graded according to their binocular VFs using the integrated VF (IVF) method described by Crabb et al. 107 The data were consequently analysed through the use of regression techniques to establish utility weights for each dimension of the disease, resulting in the derivation of health state utility scores (Table 19). As such, based on the EQ-5D scores, mild, moderate, severe and visual impairment stages were found to be represented by utility scores of 0.8015, 0.7471, 0.7133 and 0.5350 respectively.
| Disease severity | Utility |
|---|---|
| Mild | 0.8015 |
| Moderate | 0.7471 |
| Severe | 0.7133 |
| Visually impaired | 0.535 |
Model validation
To ensure that the model reflected clinical management in a rational manner, internal and external model validation was undertaken. Internal validation was performed by varying the parameters used in the model and analysing whether or not expected and rational outputs were derived. The model was then adapted or corrected based on the outcomes of these variations relative to assumptions. External validation was achieved by supplying the clinical review panel with access to the model in order to establish whether or not modelled pathways were representative of that observed within clinical contexts. Feedback was also provided as to whether or not the model generated rational outputs when parameters were altered within rational limits.
Base case analysis
The economic evaluation of current practice compared with proposed practice was modelled in full (including all cohorts of glaucoma patients; ‘full simulation’) and then stratified by each cohort in order to analyse how the subgroups individually impacted on the model’s findings. Primarily, our analysis focuses on the findings of the full simulation and that of the M70 cohort, as this specific cohort represents the least cost-effective cohort within the analysis (given the lower residual life expectancies based on their gender and starting age). The main outcome of interest was the incremental cost-effectiveness ratio (ICER), representing the costs per QALY derived by proposed practice. ICERs were established by identifying the ratio of the changes in costs incurred to the QALYs achieved between current practice and the proposed strategy; therefore, all costs and effects associated with each strategy were modelled and quantified. The analysis was conducted from the perspective of the UK NHS, while costs were expressed in 2011–12 pound sterling. The cost and derived QALYs associated with future treatment were discounted at a rate of 3.5% per year, as specified by NICE,106 as costs and benefits accrued in the future are valued less than costs and benefits accrued today.
Sensitivity analysis
Sensitivity analysis seeks to assess how uncertainty in parameter values affects the final outcome of the Markov model; adjusting values that represent the foundation of the model may fundamentally affect the cost-effectiveness of compared practices and, therefore, represents a significant aspect of model development and evaluation. Preliminary sensitivity analysis was performed at the earliest stages of model development in order to facilitate the understanding of how inputs interact with model outcomes. The key factors driving cost-effectiveness within the model were established and further focus was placed on ensuring accuracy in the parameters defining them. One-way deterministic sensitivity analysis (DSA) and probabilistic sensitivity analysis (PSA) were performed on the outputs generated by the Markov model once rationality in these outputs was assumed. Finally, a combination between the DSA and PSA was undertaken in order to study the impact individual parameters have on the probability of acceptance of proposed practice.
Deterministic sensitivity analysis
One-way sensitivity analysis was undertaken in order to identify which parameters are most important on outcomes from the economic model; results were displayed as tornado diagrams. These diagrams utilise the maximal and minimal assumptions of each parameter (Table 20) to create a maximum and minimum derived ICER, the ratio between changes in costs and changes in effects, with differentials charted in order of magnitude (largest differentials are located at the top and the lowest at the bottom), creating the shape of a tornado.
| Description | Parameter | Parameter estimations | ||
|---|---|---|---|---|
| Baseline | Low | High | ||
| Discounting | Discount rate (%) | 3.50 | 1.75 | 5.25 |
| Cost | First line (£) | 777.47 | 388.74 | 1166.21 |
| Second line (£) | 875.47 | 437.74 | 1313.21 | |
| Third line (£) | 1083.23 | 541.62 | 1624.85 | |
| Utility | Health state 1 | 0.8015 | 0.7471 | 0.9720 |
| Health state 2 | 0.7471 | 0.7133 | 0.8015 | |
| Health state 3 | 0.7133 | 0.5350 | 0.7471 | |
| Health state 4 | 0.535 | 0.2700 | 0.7133 | |
| 50-year-old progression rate distribution | Stable (%) | 49.15 | 24.58 | 73.73 |
| Slow (%) | 36.36 | 18.18 | 54.54 | |
| Moderate (%) | 12.16 | 6.08 | 18.24 | |
| Fast (%) | 2.33 | 1.17 | 3.50 | |
| 70-year-old progression rate distribution | Stable (%) | 33.82 | 16.91 | 50.73 |
| Slow (%) | 41.00 | 20.50 | 61.50 | |
| Moderate (%) | 20.97 | 10.49 | 31.46 | |
| Fast (%) | 4.22 | 2.11 | 6.33 | |
| Treatment effect | First line | 0.00 | 0.00 | 0.00 |
| Second line | –0.74 | –0.51 | –0.95 | |
| Third line | –1.22 | –0.97 | –1.41 | |
| Risk | High risk (%) | 20.00 | 10.0 | 30.0 |
| Low risk (%) | 80.00 | 70.0 | 90.0 | |
| Implementation | Cost (£) | 410,000.00 | 287,000.00 | 820,000.00 |
Table 20 indicates the limits for the parameters examined in the tornado analysis. Discount rate, costs and progression rates were all varied by 50% in order to set maximum and minimum limits. Utility was limited such that maximum and minimum limits were set to baseline assumptions of the parameters above and below the specific health state. Treatment effects were limited to the maximum and minimum observations for MD change associated with the modality identified in the review of literature (see Appendix 1, Tables 24 and 25), while risk distributions were varied by 10% in either direction.
Further DSA, investigating the impact of marginal variations in parameters, was then performed focusing on the most important parameters identified in the tornado diagrams, namely the utility associated with health states, the costs of different treatment modalities, the treatment effects associated with these different treatment modalities, the implementation costs associated with proposed practice, time horizons modelled and the costs of patients being defined as visually impaired. One-way analysis investigated the impact caused by variation in individual parameters on ICERs identified. The parameters for health state utilities, treatment costs, treatment modality effects, time horizon lengths, costs of implementing the proposed strategy and the costs of being defined as visually impaired were chosen for investigation, as they were expected to have the greatest impact on outcomes.
Probabilistic sensitivity analysis
Model parameters were examined using PSA (Table 21), an analysis that attributes probability distributions around specified parameters with simulations consequently repeatedly performed to establish ICERs. Simulations were performed 10,000 times in this study, with incremental QALY gains, incremental costs and the resultant costs per QALY associated with each simulation recorded. Once simulated, ICERs were calculated and plotted on the incremental cost-effectiveness plane (CEP). From these, cost-effectiveness acceptability curves (CEACs) were formulated indicating the probability of proposed practice being accepted at given levels of willingness to pay.
| Description | Parameter | Mean | Distribution | Alpha | Beta |
|---|---|---|---|---|---|
| Utility | Health state 1 | 0.8015 | Beta | 37.94 | 9.40 |
| Health state 2 | 0.7471 | Beta | 278.07 | 94.13 | |
| Health state 3 | 0.7133 | Beta | 49.11 | 19.74 | |
| Health state 4 | 0.535 | Beta | 9.87 | 8.58 | |
| Costs | First line | £777.47 | Gamma | 15.37 | 50.60 |
| Second line | £875.47 | Gamma | 15.37 | 56.98 | |
| Third line | £1083.23 | Gamma | 15.37 | 70.50 | |
| Implementation | £410,000 | Gamma | 9.09 | 45,093.55 | |
| Treatment effects | First line | 0.00 dB | n/a | n/a | n/a |
| Second line | –0.74 dB | Gamma | 19.56 | 0.04 | |
| Third line | –1.22 dB | Gamma | 46.14 | 0.03 |
Combined deterministic and probabilistic sensitivity analysis
Finally, a combination of the PSA and the DSA was performed in order to further examine the relationships between important parameters in the model and the probability of acceptance of proposed practice at a given willingness to pay. VF test costs, discount rates, risk distributions and costs of visual impairment were all selected to be analysed in combination with the PSA. The cost of performing individual VF tests was varied to gauge its impact on probabilistic cost-effectiveness (see Appendix 1, Table 30); cost was varied from £38.76 (lowest estimation) to £70.45 (highest estimation) following the maximum and minimum assumptions of the National Schedule of Reference Costs (2010–11). 102 Discount rates were also varied to see how time preferences may impact on model findings. Time preference was varied between a low discount factor of 0% (future costs and utility valued the same as they would be today) and a high discount factor of 5% (future costs and utility valued less than they are today). The proportion of patients defined as being at high and low risk of progression was also varied to analyse how this parameter impacted on probabilistic cost-effectiveness. An initial division of 80% and 20% in low- and high-risk categories, respectively, was modelled. In the PSA, the percentages were varied to 90% and 10%, and to 70% and 30%, for the low- and high-risk groups respectively. Finally, as the economic model was performed from the perspective of the UK NHS, and thus did not account for the costs to society of patients progressing to visual impairment, analysis of the impact that a change in perspective may have on outcomes was introduced, with costs of patients being defined as visually impaired incorporated (see Appendix 1, Table 33). Per annum costs to society of £250, £500, £750, £1000 and £1758.50 (the figure at which costs of visual impairment cause proposed practice to derive a lower total cost than current practice, therefore dominating it) for each patient defined as visually impaired were, therefore, introduced.
Results
Base case analysis
In total, 10,000 patients entered into the model under the full simulation at the various defined health states, while 3801 patients entered into the model under the M70 cohort. Under the full simulation , a positive cost differential of £294 per patient was identified between proposed practice and current practice (Table 22), unsurprisingly implying that higher costs were associated with proposed practice. A positive utility differential of 0.01 QALYs per patient was also identified, implying greater utility associated with proposed practice. Thus, an ICER of £21,679 was derived for proposed practice, a figure within the hypothetical NICE ceiling ratio of £30,000. 109 For the M70 cohort, incremental costs per patient and incremental utility per patient between strategies were identified as £288 and 0.011 respectively. The resulting ICER was thus equal to £26,531/QALY, a ratio higher than that derived from the full simulation owing to the lower residual life expectancies of patients in the cohort.
| Cohort | CP | PP | Incremental | ICER (£) | ||||
|---|---|---|---|---|---|---|---|---|
| Average costs (£) | Average QALYs | Average costs (£) | Average QALYs | Cost (£) | QALYs | |||
| M | 50 | 12,903 | 10.97 | 13,204 | 10.98 | 301 | 0.02 | 17,655 |
| 70 | 5339 | 4.25 | 5627 | 4.26 | 288 | 0.01 | 26,531 | |
| F | 50 | 13,289 | 11.33 | 13,590 | 11.35 | 301 | 0.02 | 17,013 |
| 70 | 6065 | 4.91 | 6358 | 4.92 | 293 | 0.01 | 21,924 | |
| Full simulation | 7765 | 6.41 | 8059 | 6.43 | 294 | 0.01 | 21,679 | |
Findings were reflected in the F70 cohort with per patient cost and utility differentials of £293 and 0.013 QALYs, respectively, and an ICER equal to £21,923. Outcomes for the M50 and F50 cohorts were lower than that of the full simulation, as the residual life expectancies analysed for these cohorts were lower. Incremental costs per patient were equal to £301, incremental utility per patient equalled 0.017 QALYs and 0.018 QALYs and ICERs equalled £17,655/QALY and £17,013/QALY, for the M50 and F50 cohorts respectively.
Of the 10,000 patients who entered into the model under the full simulation, a total of 834.65 visual impairment-years were saved with proposed practice (Table 23). In the M70 cohort, this number was 229.18 years saved for proposed practice, while, in the M50, F50 and F70 cohorts, 173.97, 162.91 and 268.58 years were saved respectively.
| Cohort | VI-years saved | |
|---|---|---|
| M | 50 | 173.97 |
| 70 | 229.18 | |
| F | 50 | 162.91 |
| 70 | 268.58 | |
| Total | 834.65 | |
Probabilistic sensitivity analysis
Greater variability was observed in CEP plots for the 70-year-old cohorts than for the 50-year-old cohorts; simulated incremental costs associated with the 70-year-old cohorts were considerably higher than those associated with the 50-year-old cohorts because more older patients were simulated in the model, while incremental utilities were also significantly higher in the 70-year-old cohorts than in the 50-year-old cohorts (Figure 16). In addition, there were twice as many observations in the north-west (dominated) quadrant of the plane in the 50-year-old cohorts (M50 = 540, F50 = 578) than in the 70-year-old cohorts (M70 = 211, F70 = 219).
FIGURE 16.
Cost-effectiveness planes by cohort. (a) M50; (b) base case; (c) F50; and (d) F70.
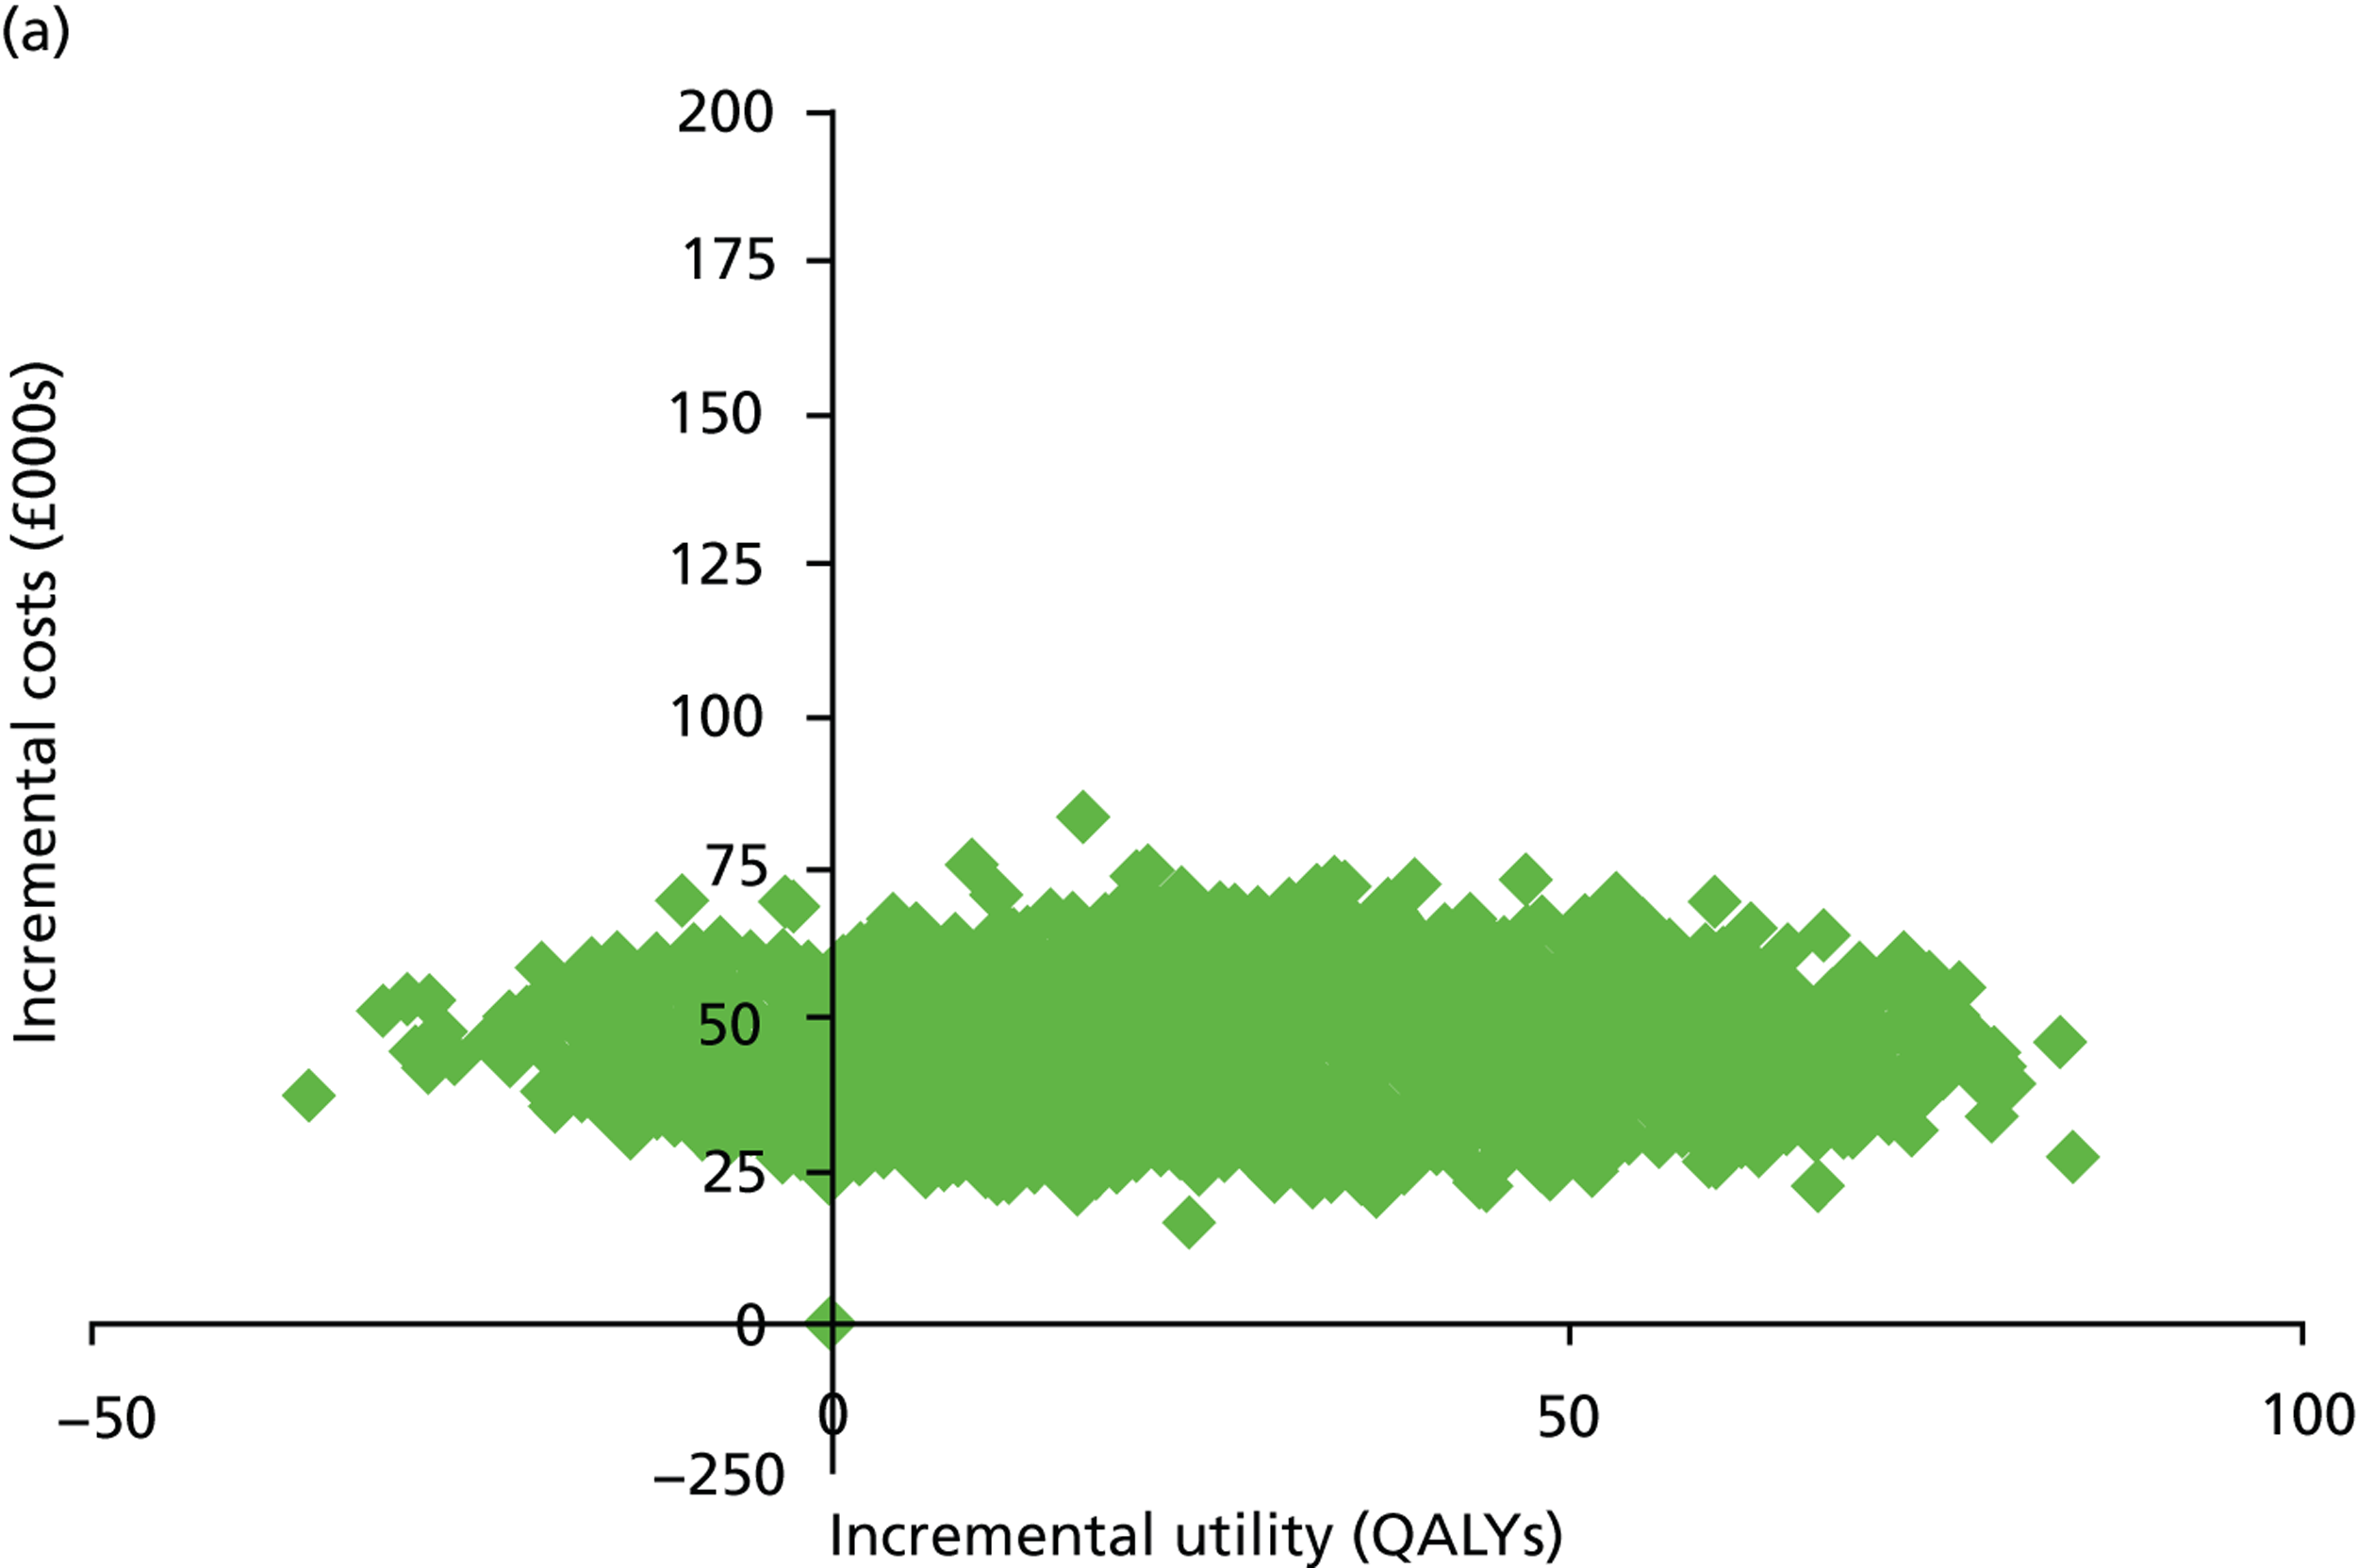
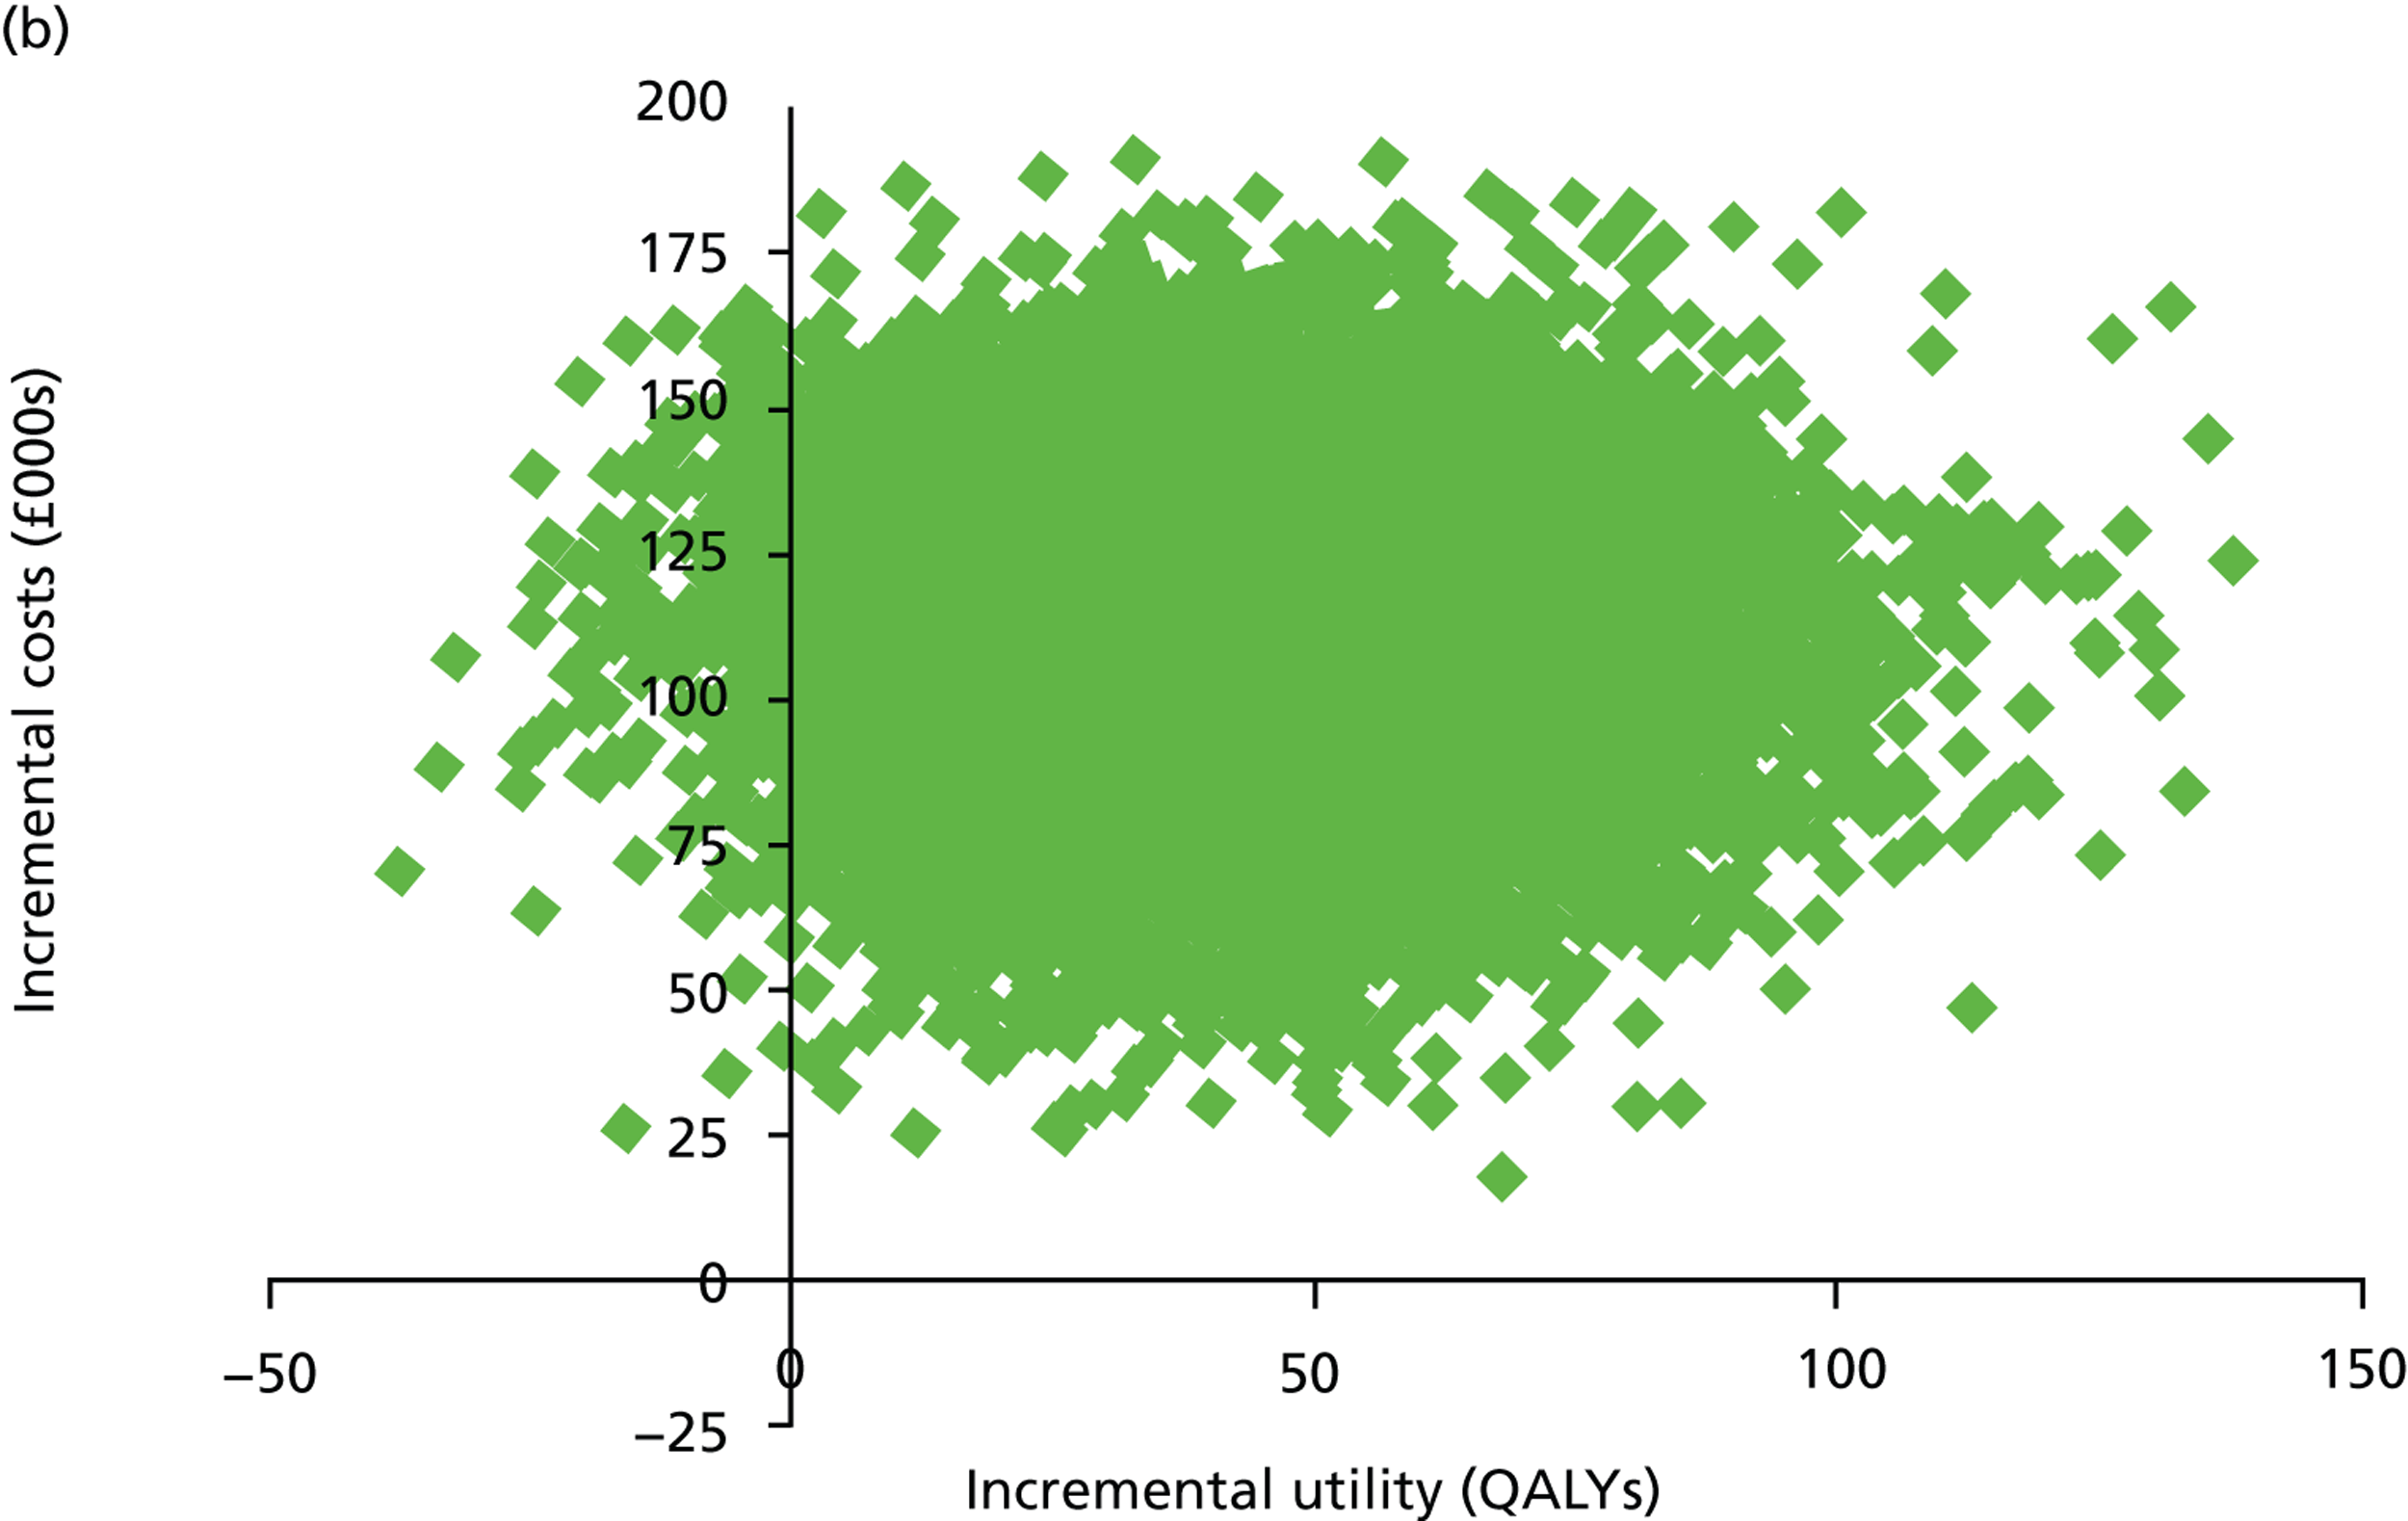
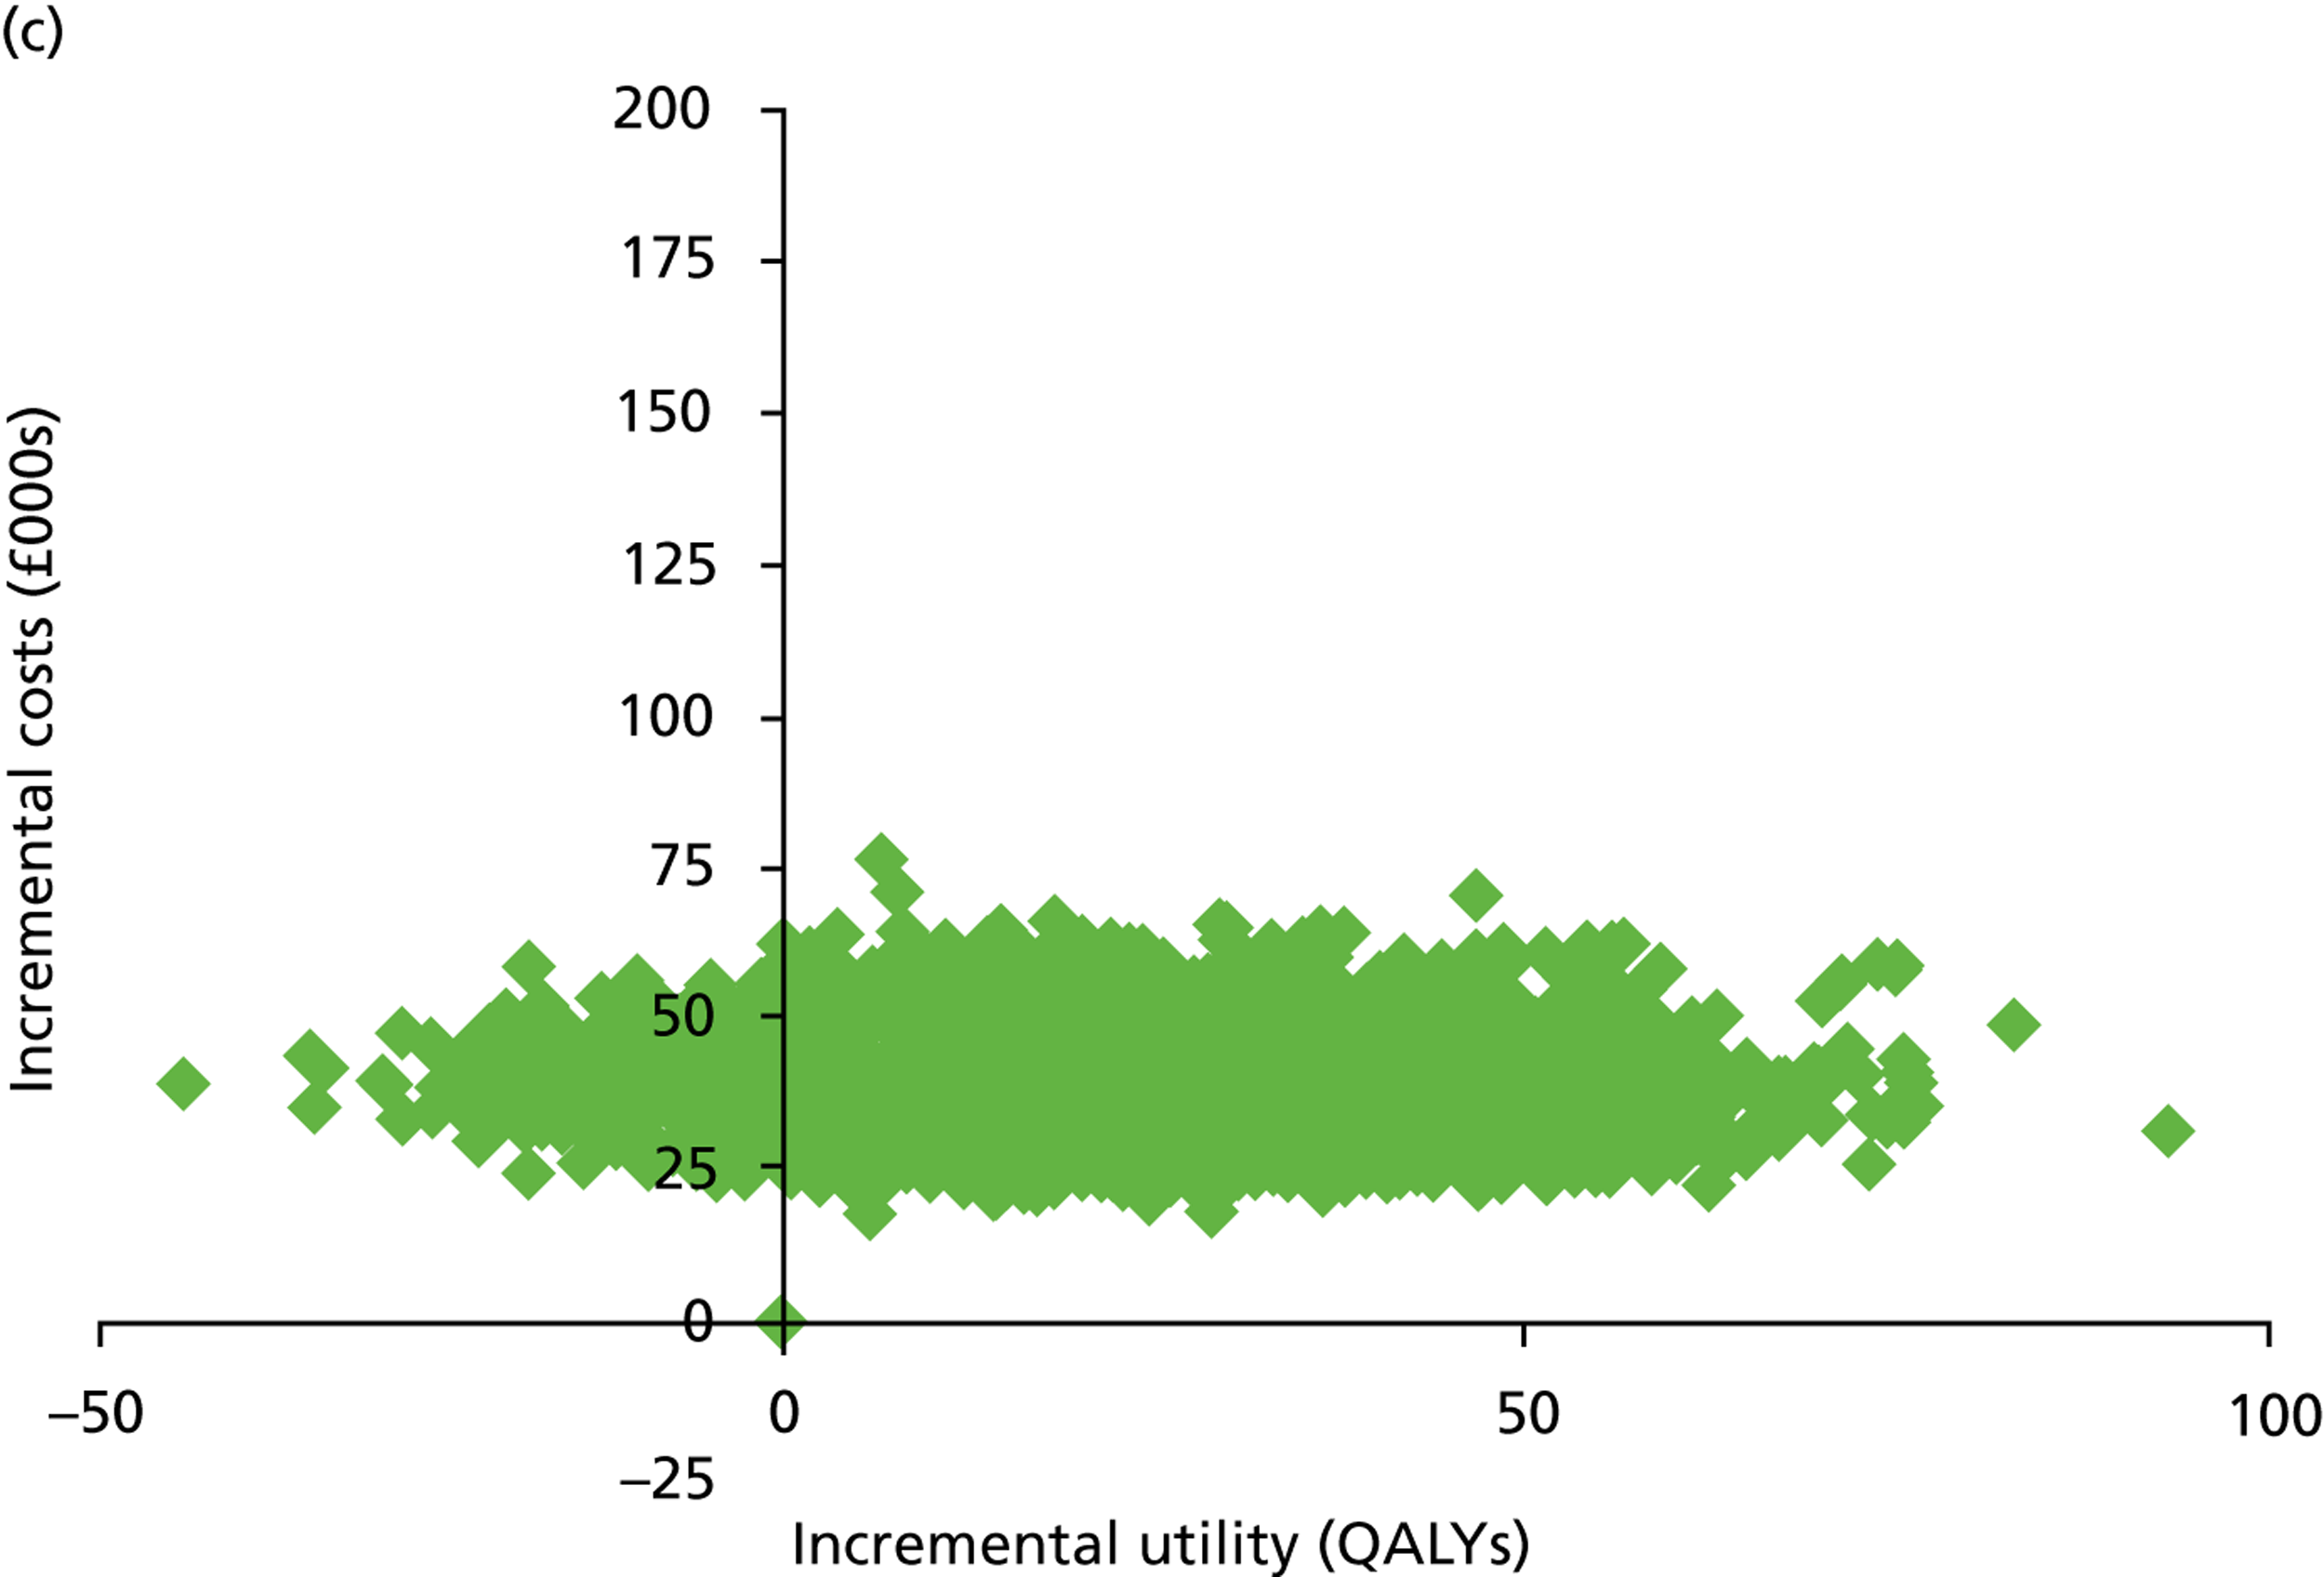
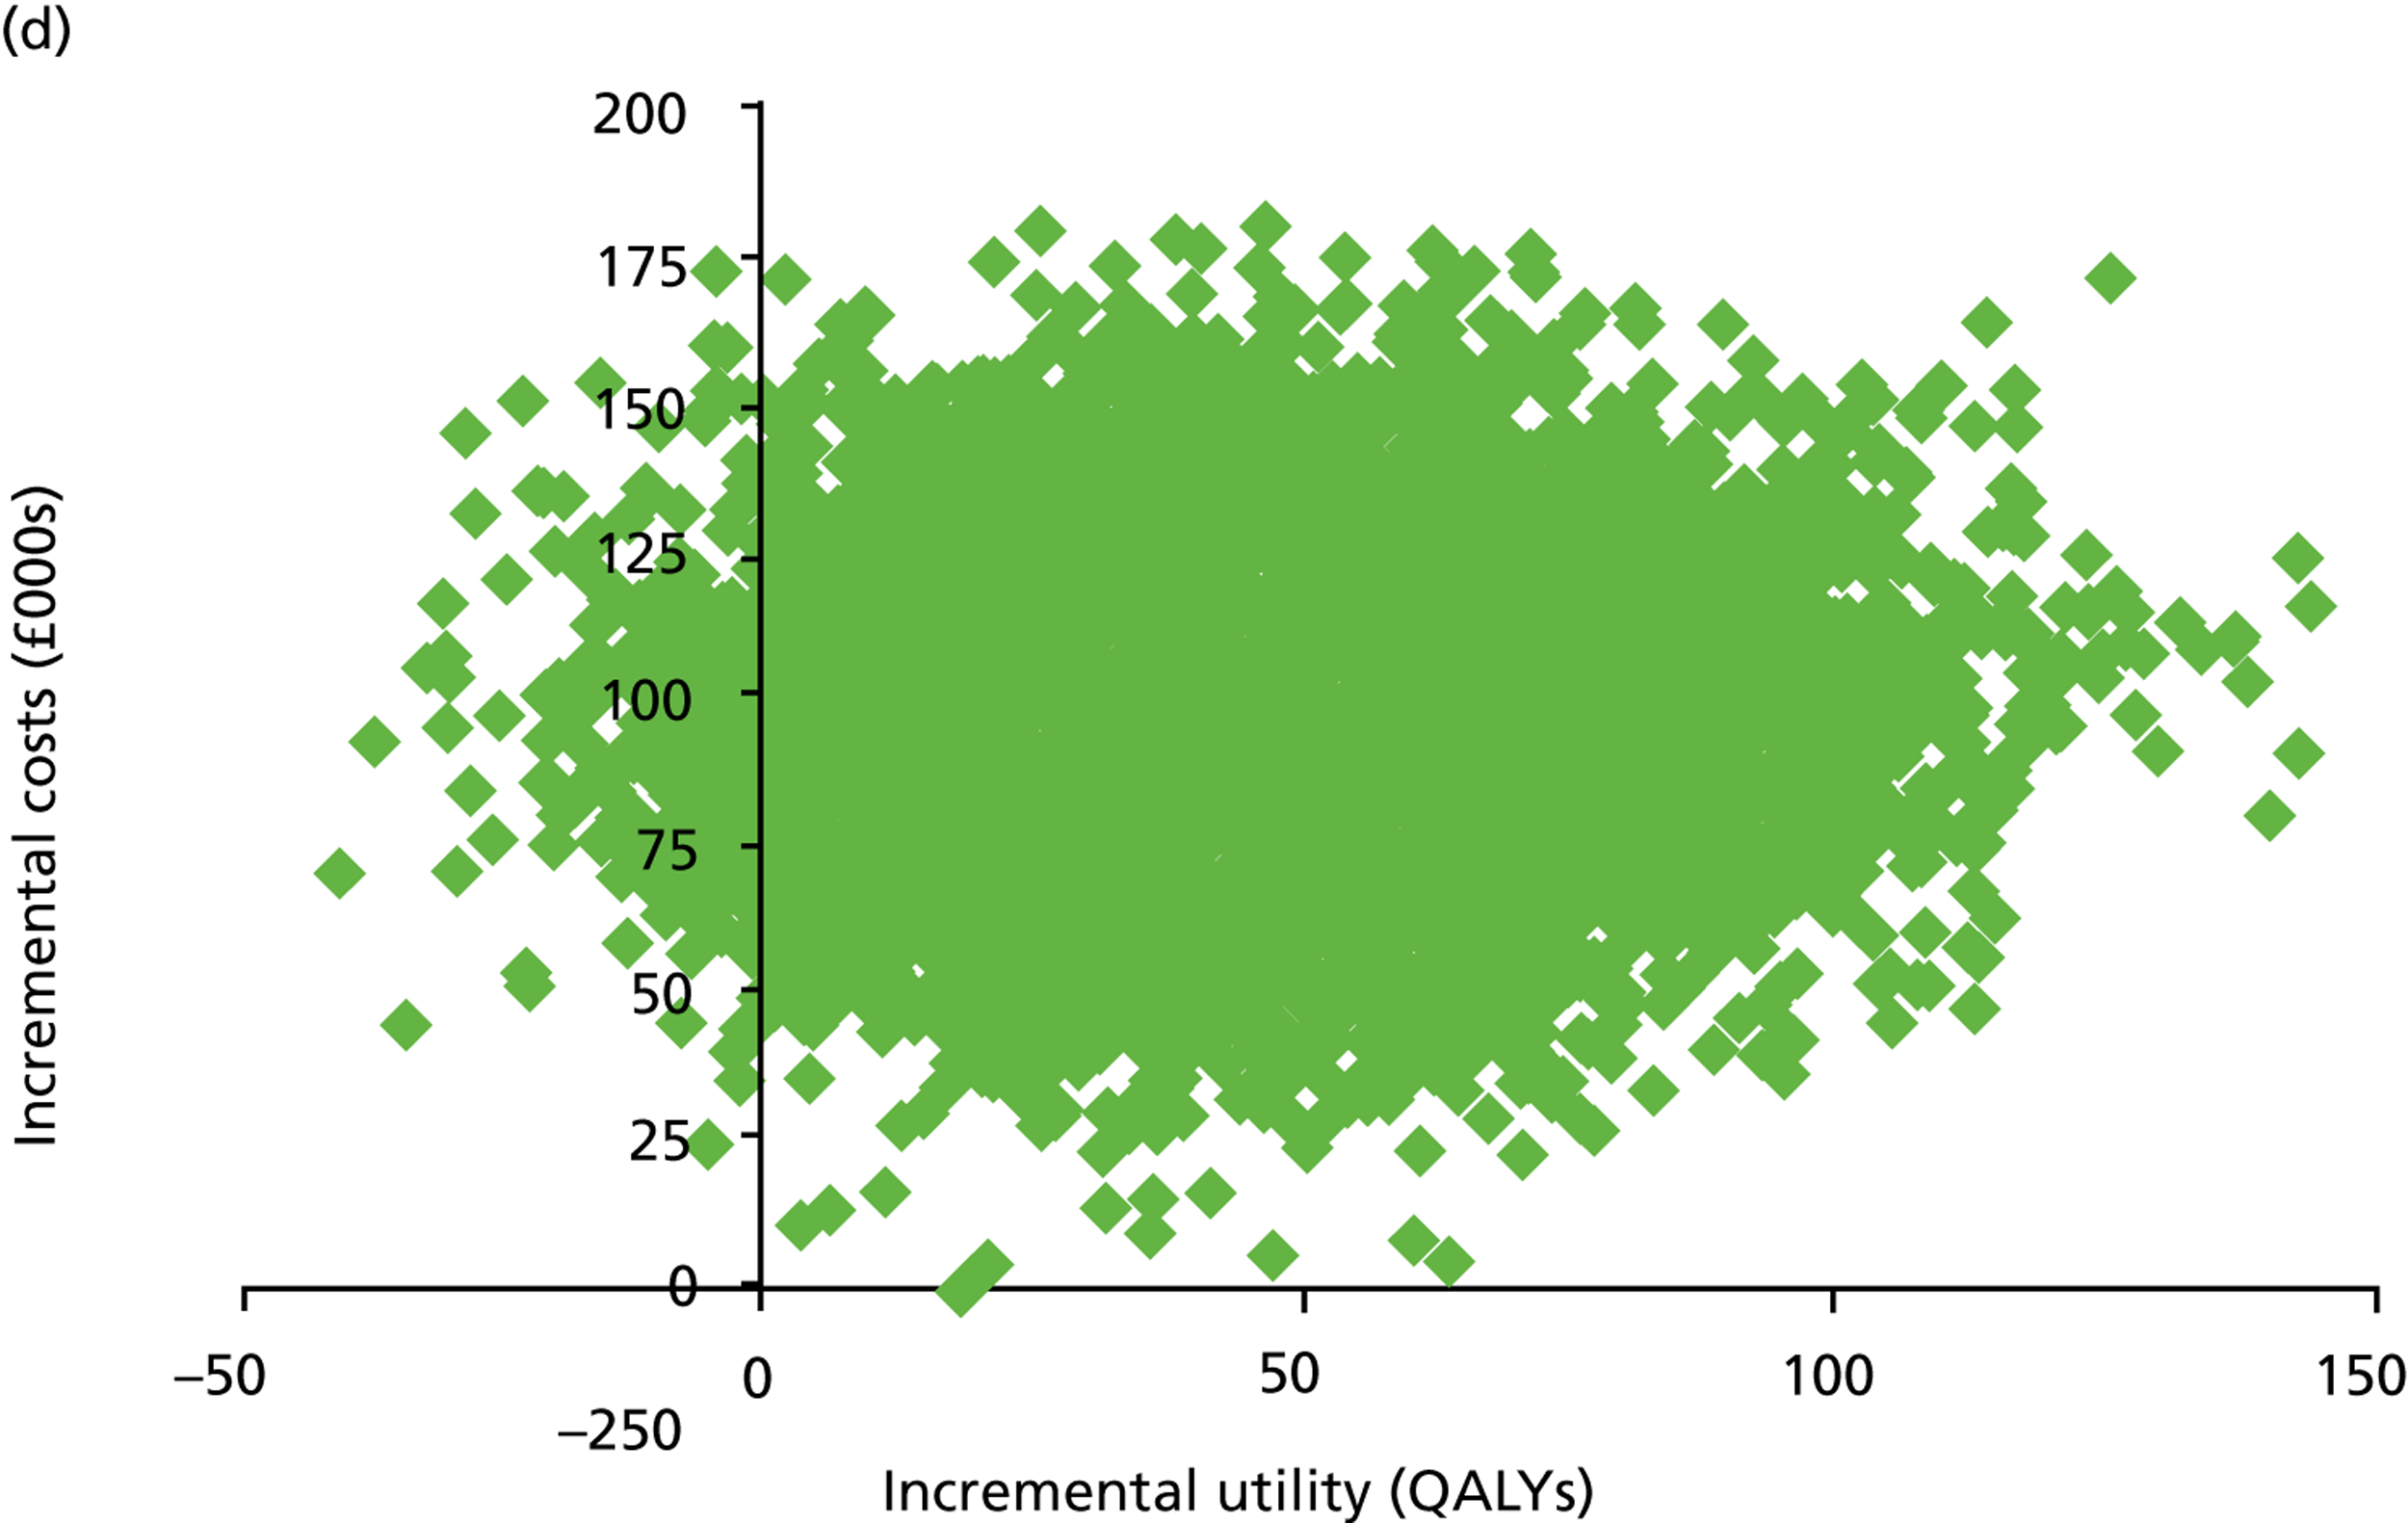
Subsequently, CEACs were defined from these simulations (Figure 17). Willingness to pay for each QALY gained was varied from £0 to £50,000 and the proportion of simulations deemed acceptable at this level was noted. Similarly shaped CEACs were observed for the M50 and F50 cohorts, and for the M70 and F70 cohorts. At a £30,000 cost per QALY ceiling ratio, the proportion of observations deemed acceptable in the M70, F70, M50 and F50 cohorts was 57.33%, 67.78%, 73.36%, and 74.26% respectively. When the ceiling ratio was increased to £50,000 cost per QALY, the proportion of observations deemed acceptable was 81.69%, 86.35%, 84.22%, and 84.44% for the M70, F70, M50 and F50 cohorts respectively. The 50-year-old cohorts’ CEACs were observed to plateau sooner than those for the 70-year-old cohorts, with the M70 cohort CEAC consistently lower than in other cohorts in terms of probability of acceptance. The F70 cohort’s CEAC was consistently lower than those from the 50-year-old cohorts up until the £42,000 per QALY mark, at which point its ICER had an increased probability of acceptance compared with the 50-year-old cohorts.
FIGURE 17.
Cost-effectiveness acceptability curves across all cohorts.
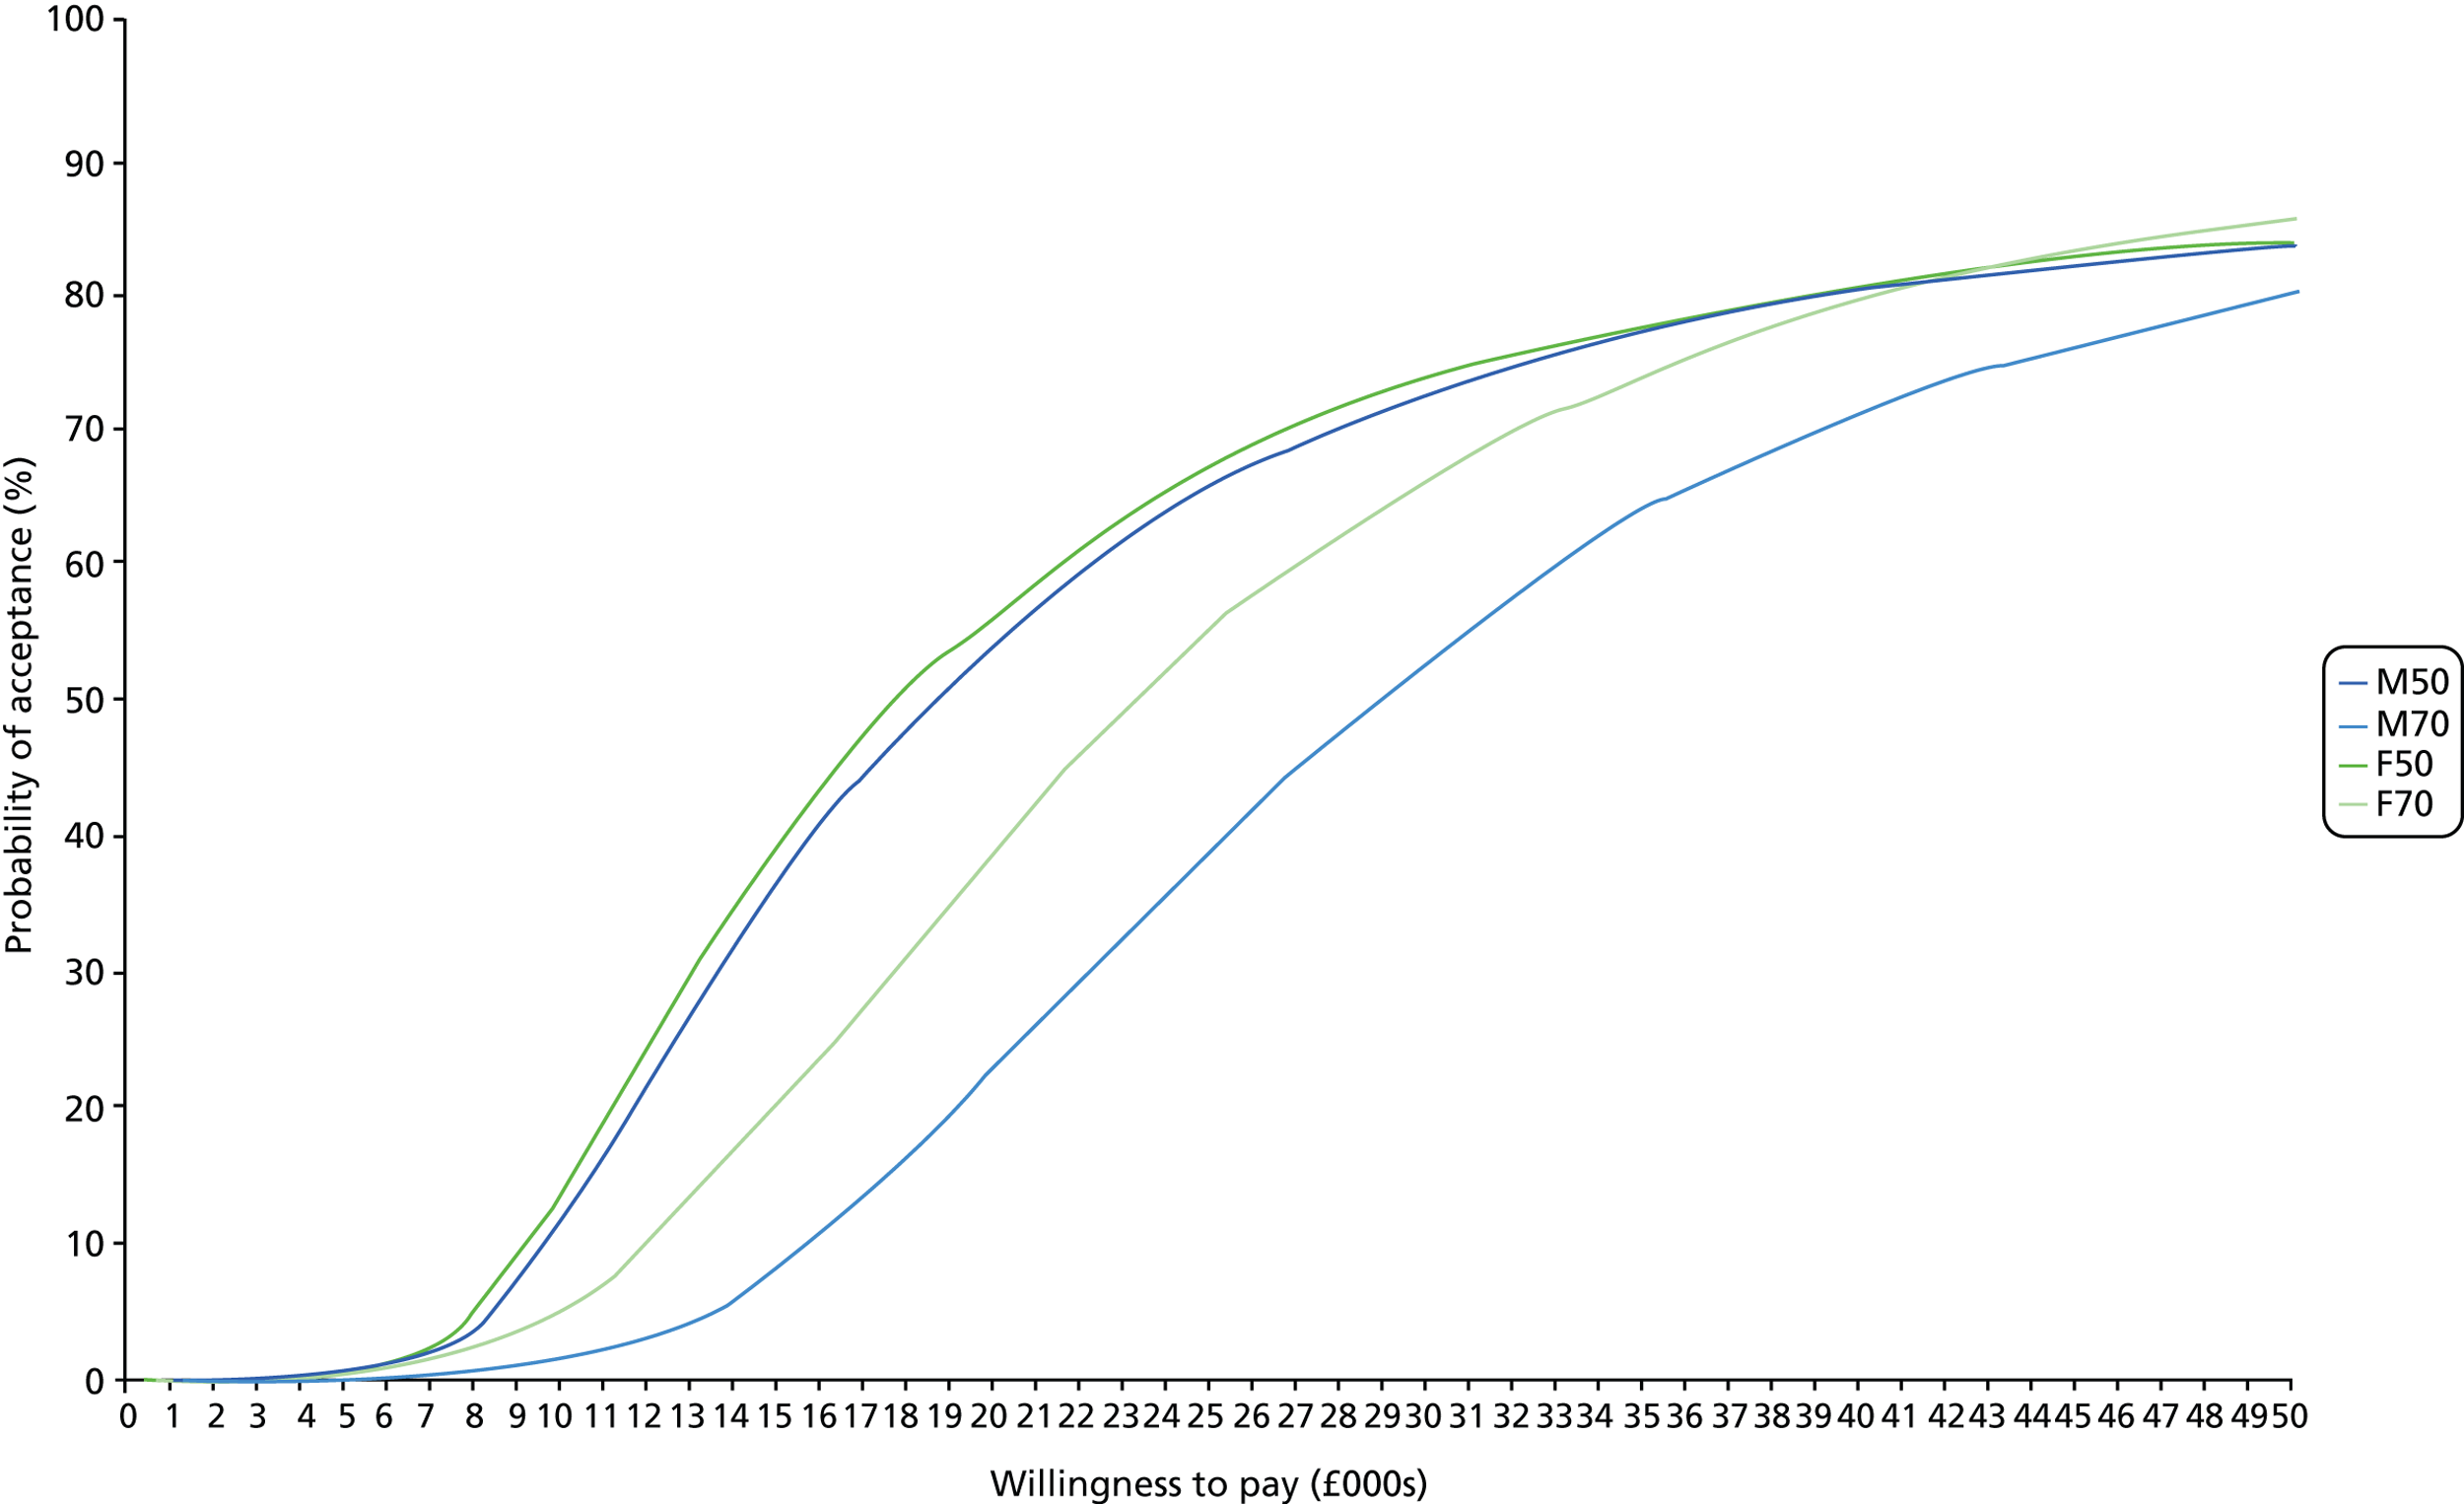
Deterministic sensitivity analysis: one-way analysis
One-way analyses verified that the M70 cohort was the least cost-effective subgroup for all parameters examined, while the F50 cohort the most cost-effective cohort; this result is expected given the differences in each cohort’s residual life expectancies and, therefore, the ability to recoup investment. In addition, the results for the M50 and F50 cohorts were closer than those observed between other combinations of cohorts owing to the similarities between these cohorts’ residual life expectancies.
Health state utilities
The utilities associated with health state membership were varied in 0.01-QALY increments from baselines of 0.8015, 0.7471, 0.7133 and 0.5350 for utility health states 1, 2, 3 and 4, respectively, and the impact on the ICER was assessed (Figure 18). A negative relationship between the parameters and ICERs was observed for the utility associated with health state 1 for all cohorts, although only a decrease in utility in the M70 cohort was found to push ICERs above £30,000 per QALY. Similar findings were observed for the utility associated with health state 2; however, a reduction in this utility caused an accelerated increase in ICERs for the M50 and F50 cohorts compared with the 70-year-old cohorts. When the utilities of health states 3 and 4 were examined, a positive relationship existed between the parameters and cohort ICERs. Within utility health state 3, the M70 and M50 cohorts were found to surpass the £30,000 per QALY ratio when utilities were increased; however, only the M70 cohort tipped this ratio when the utility of health state 4 was examined.
FIGURE 18.
One-way analysis of utility health states. (a) Utility health state 1, baseline = 0.8015 QALYs; (b) utility health state 2, baseline = 0.7471 QALYs; (c) utility health state 3, baseline = 0.7133 QALYs; and (d) utility health state 4, baseline = 0.5350 QALYs.
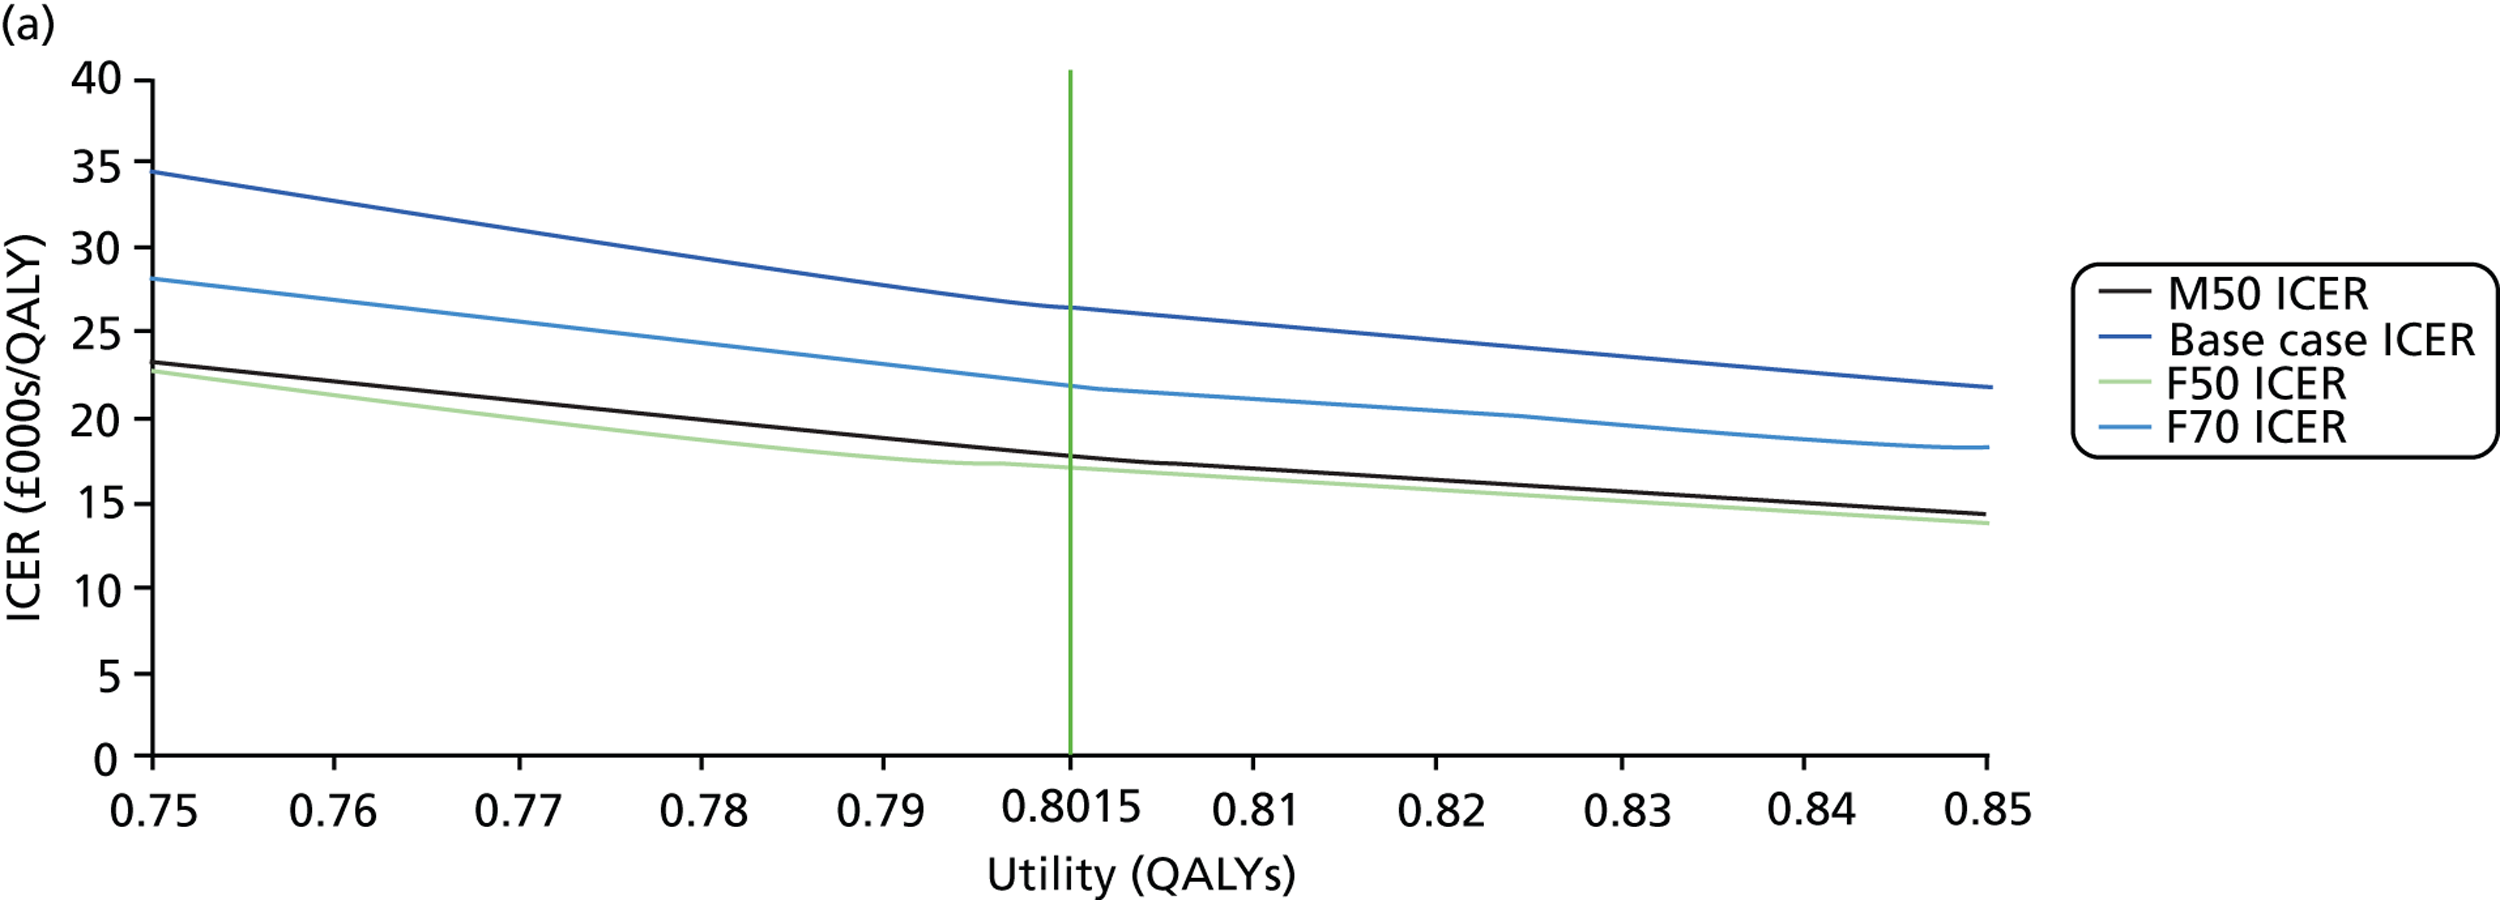
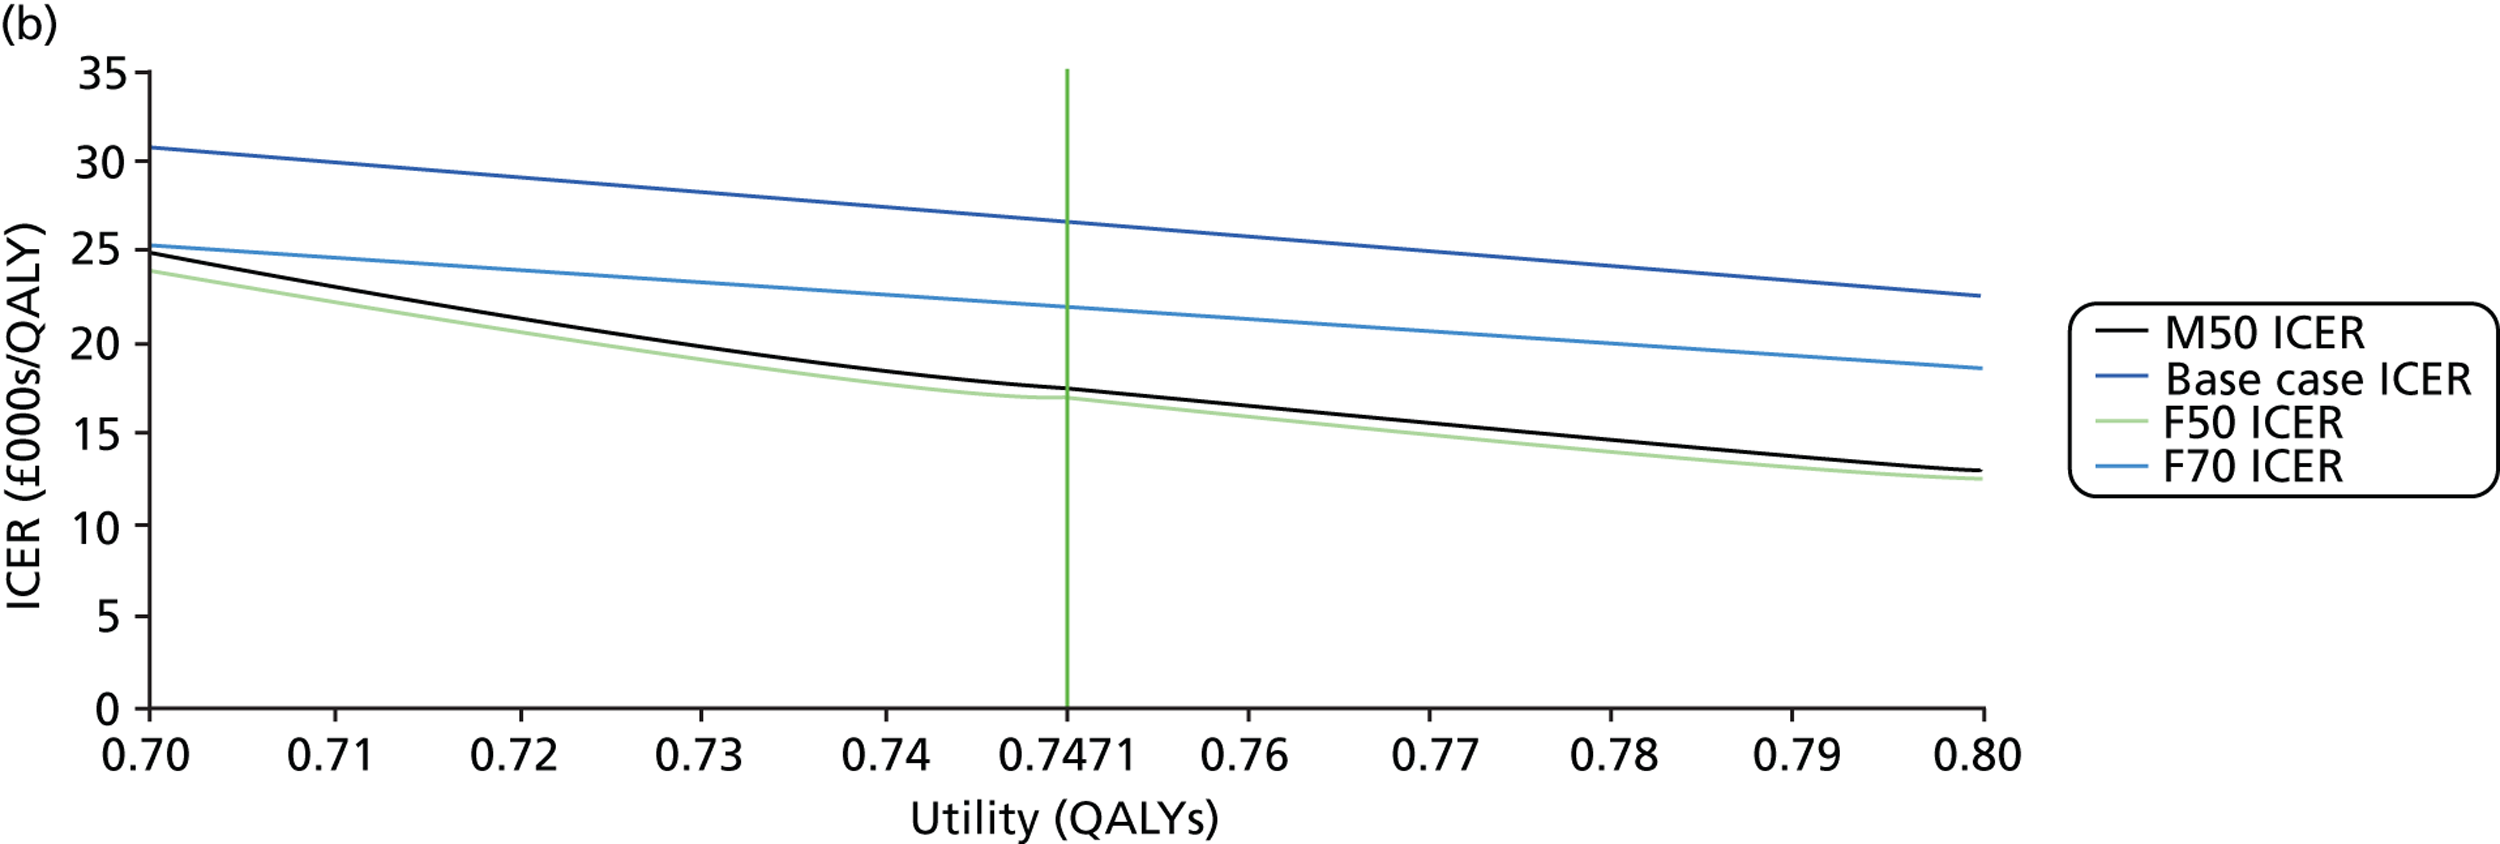
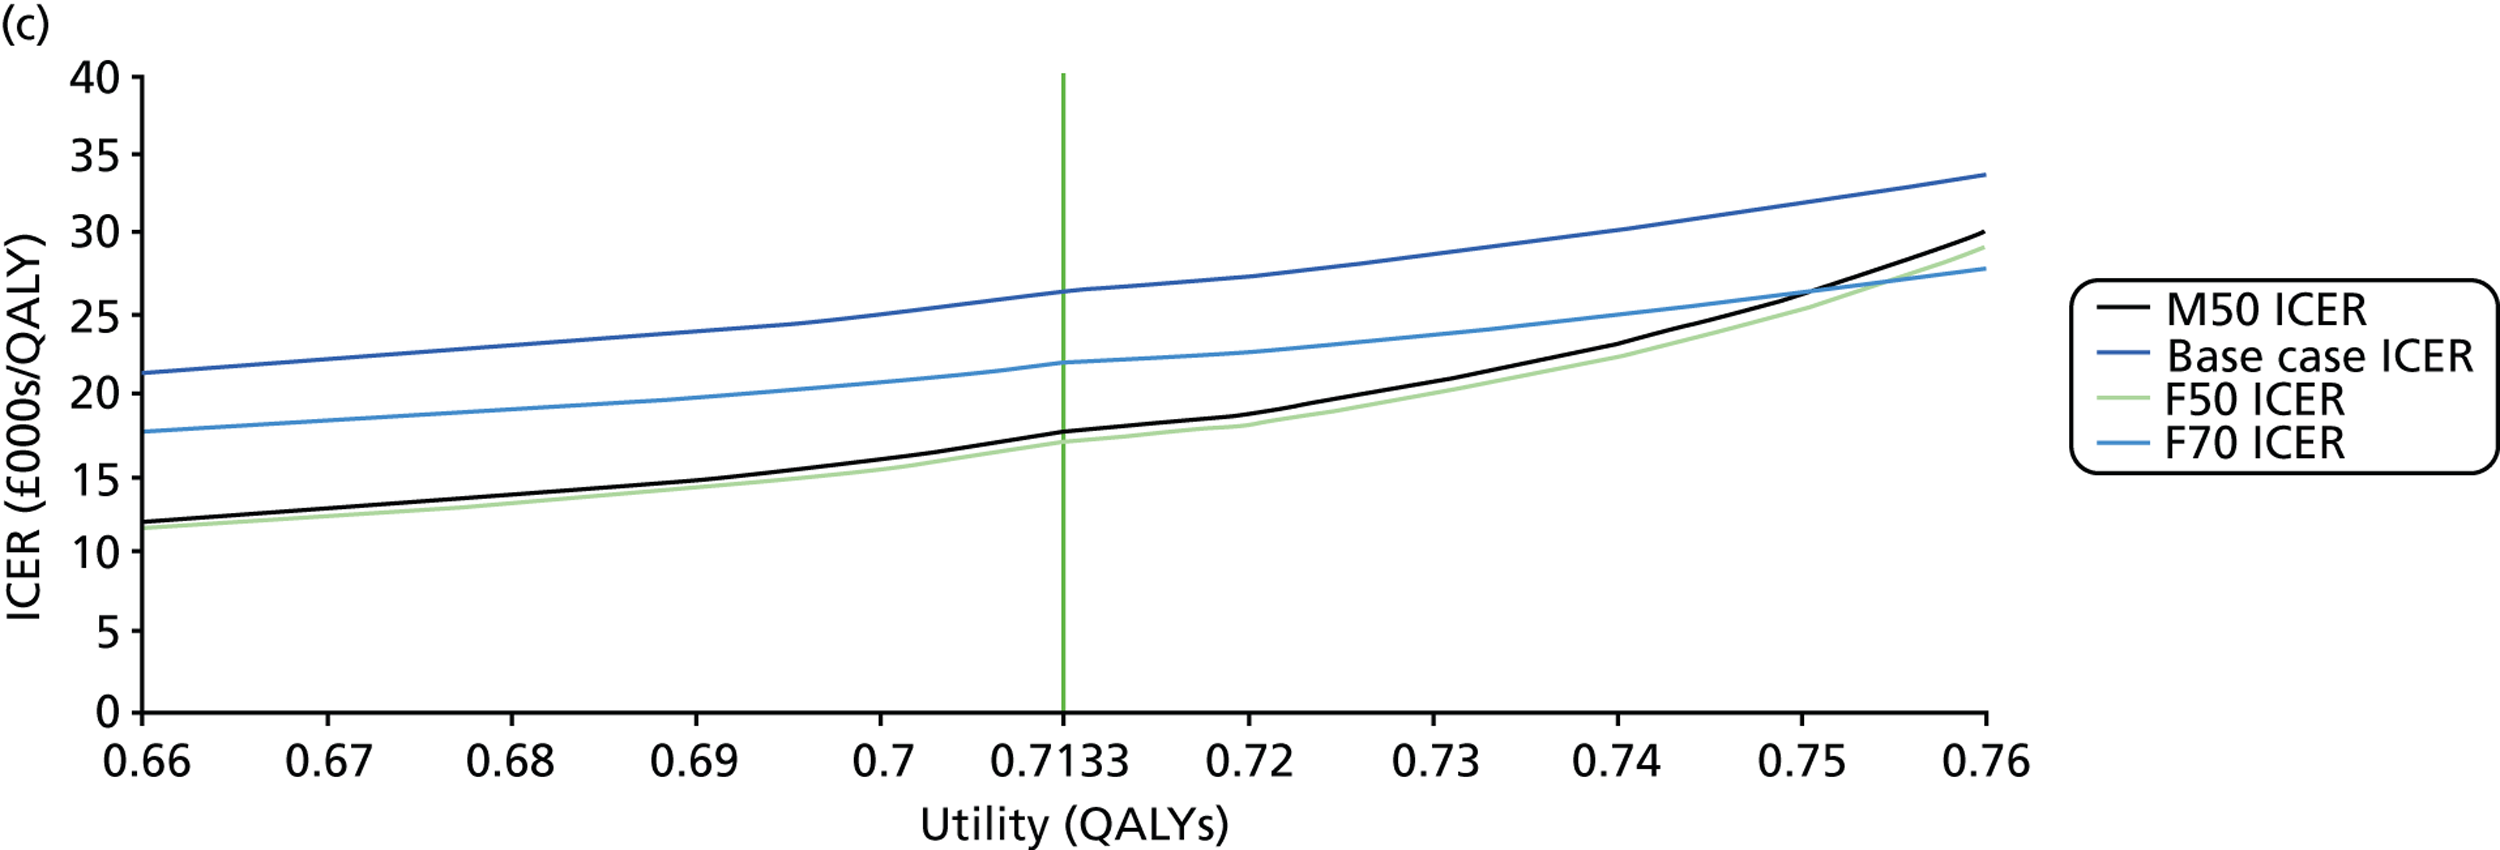

Treatment costs
Treatment costs were varied by increments and decrements of £25, in the range ± £125 from a baseline of £696.49, £784.28 and £970.40 for first-, second- and third-line treatment costs, respectively (Figure 19). For first-line treatment costs, a negative relationship was observed between this parameter and ICERs of all cohorts, but the M70 cohort was the only grouping to surpass the £30,000 per QALY mark when treatment costs were reduced to £600. For second-line treatment costs, a positive relationship was found in the M70 and F70 cohorts, while a marginal negative relationship was observed in the M50 and F50 cohorts; however, the £30,000 per QALY mark was not exceeded in any cohort. For third-line treatment costs, a slight positive relationship was observed in all cohorts; however, the £30,000 per QALY mark was not surpassed for any cohort. The nature of these relationships can be attributed to the fact that proposed practice and current practice utilises the different treatment lines to varying extents across the patient characteristic framework (for example, proposed practice implements the first line of treatment to a lesser degree than current practice, as it identifies fast progressors sooner and, thus, these patients receive more aggressive treatments lines earlier).
FIGURE 19.
One-way analysis of treatment costs. (a) First-line treatment costs; (b) second-line treatment costs; and (c) third-line treatment costs.
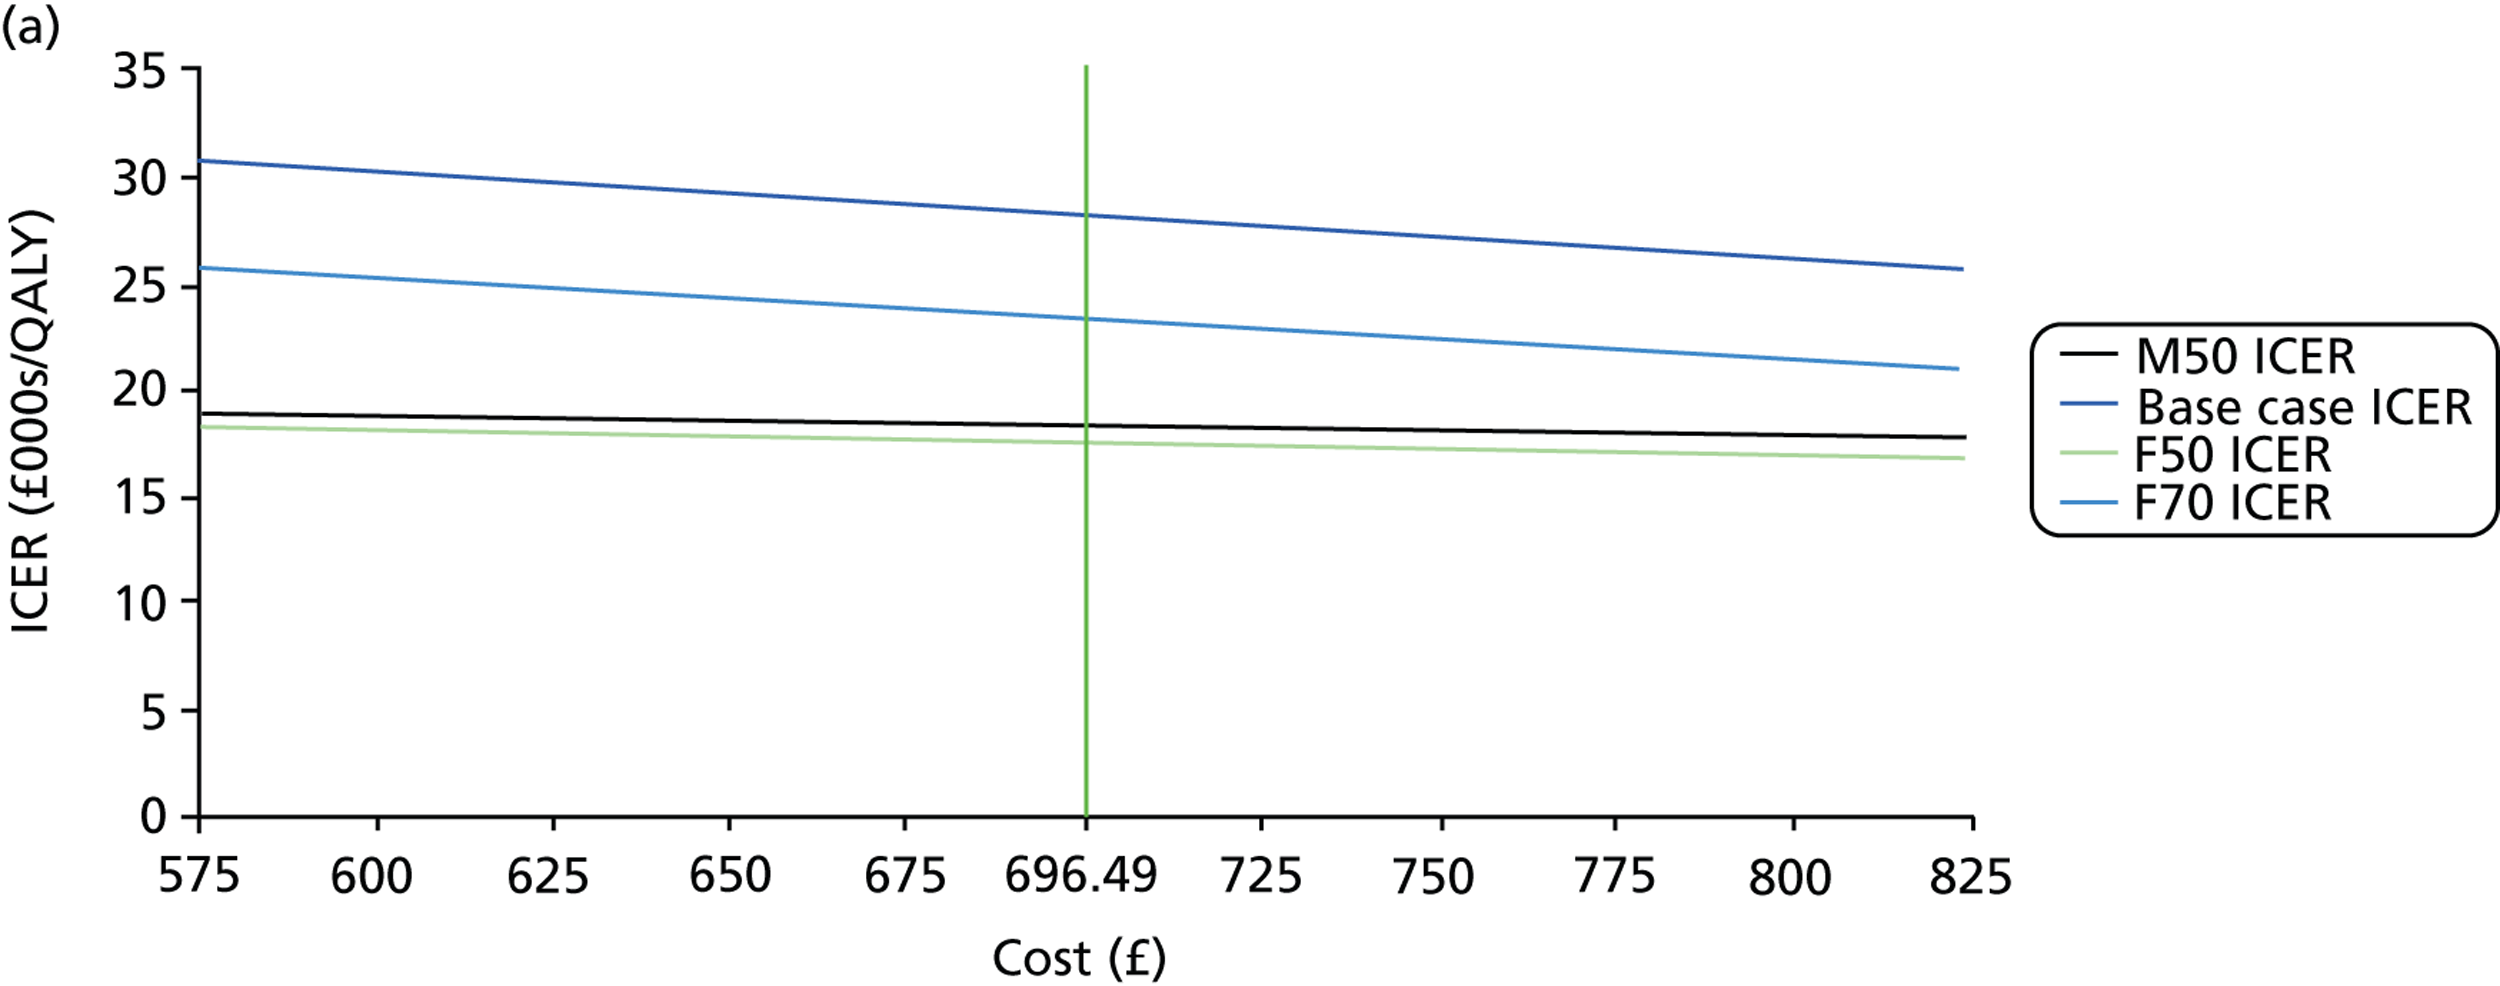
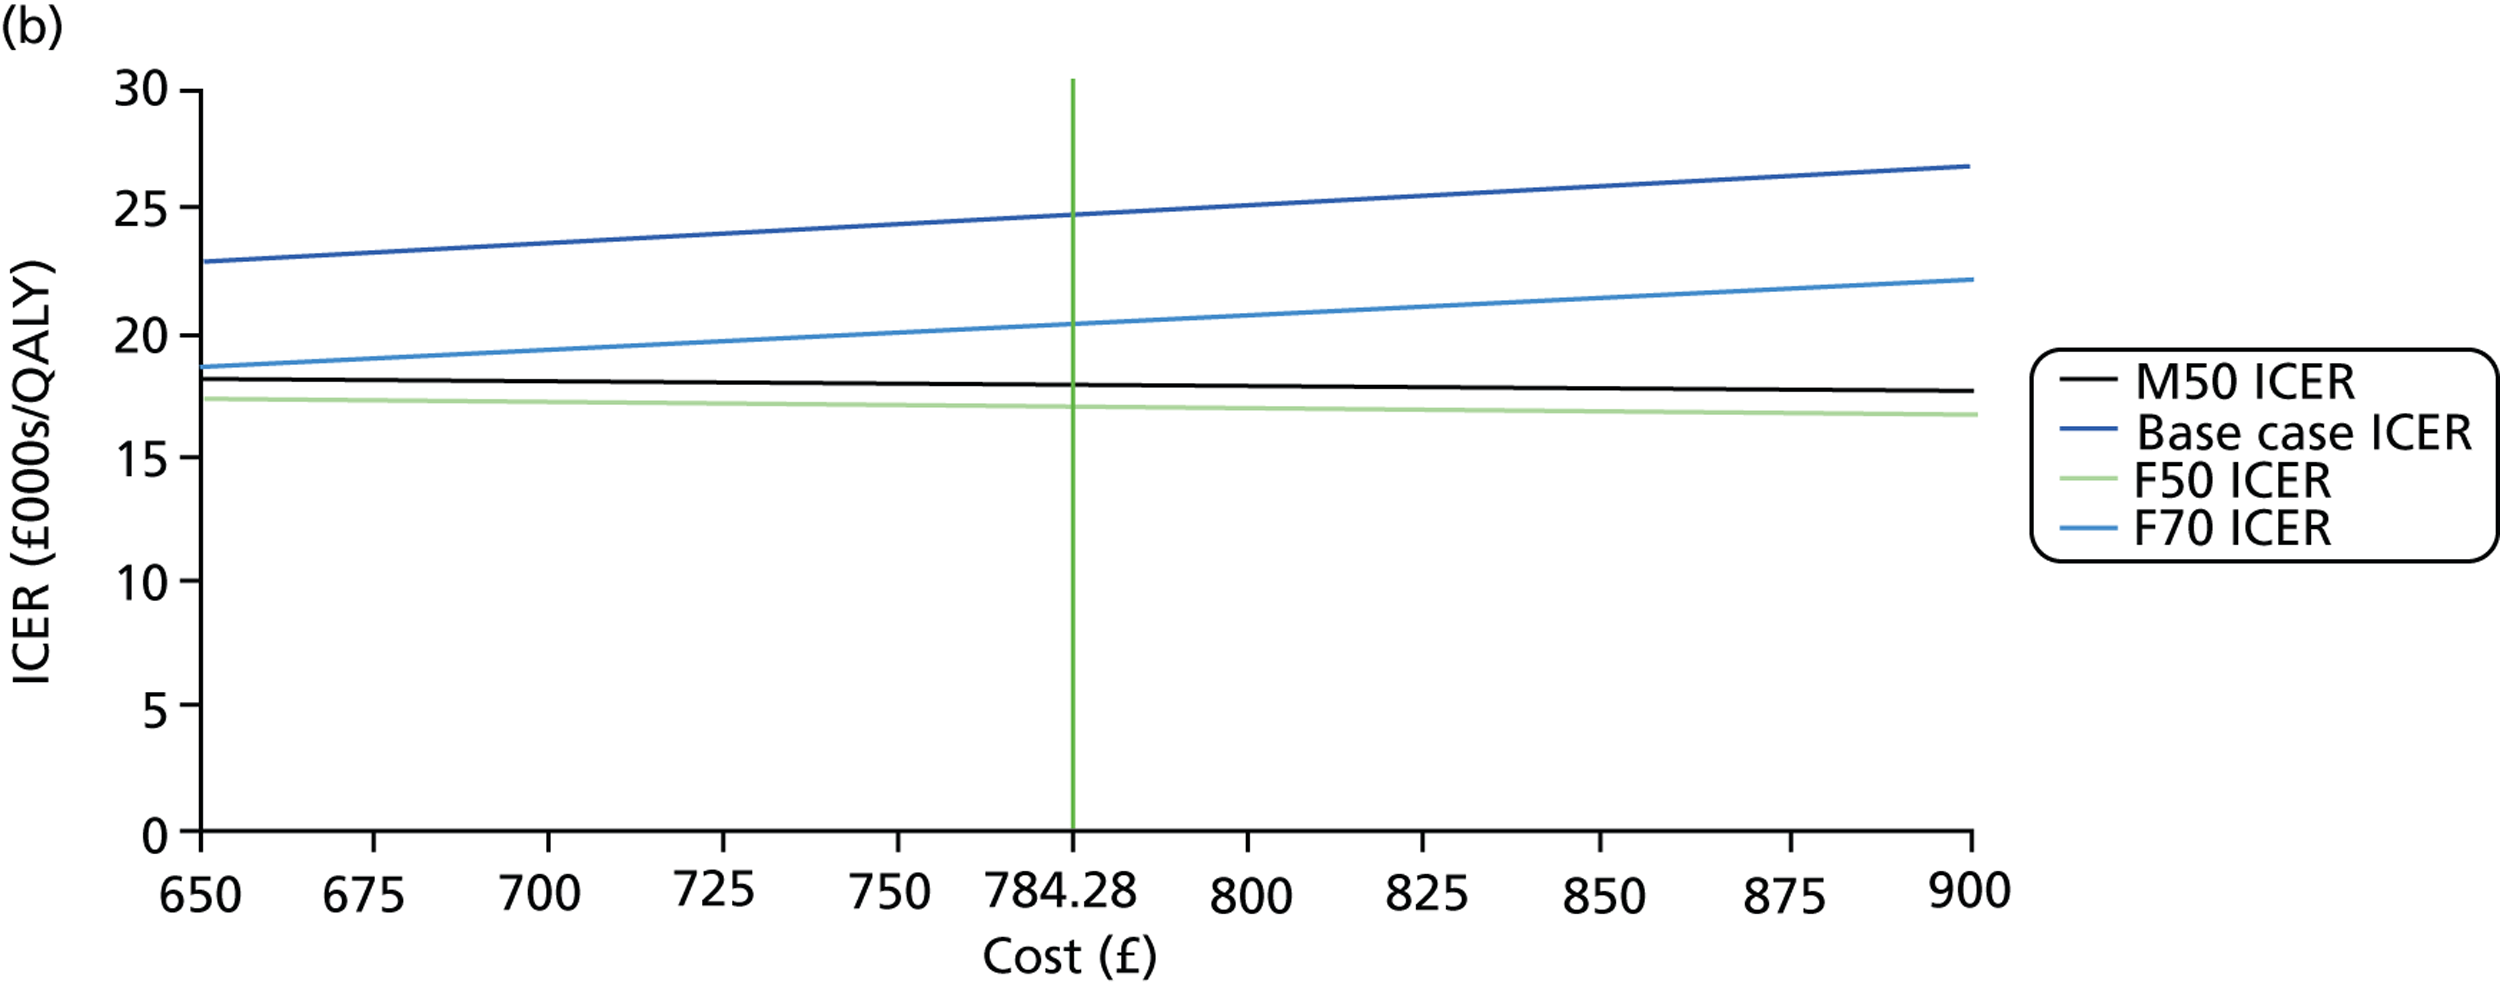
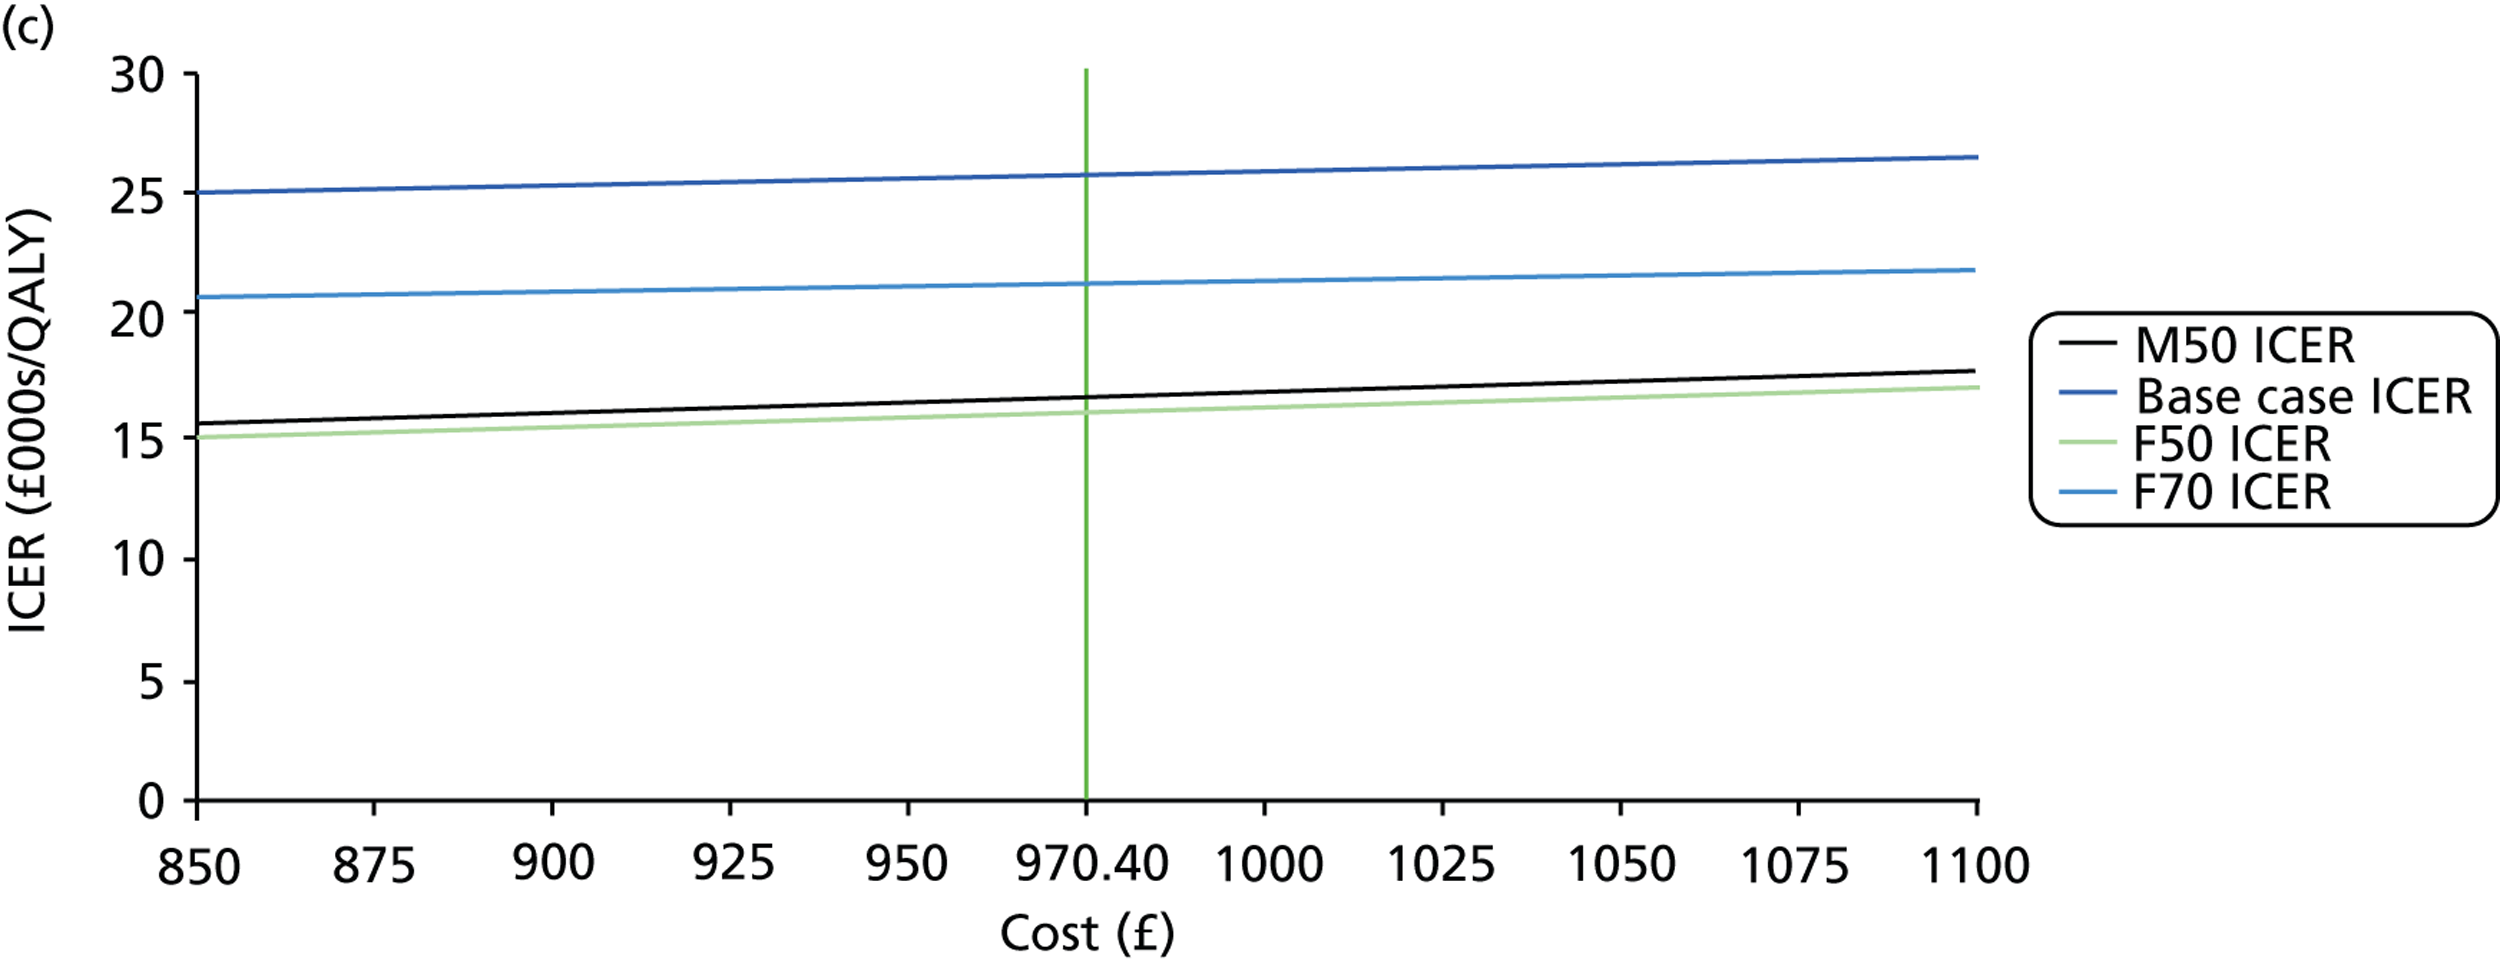
Treatment modality effects
First-line treatment effects on rate of VF progression were analysed in 0.05 dB/year decrements from 0 to –0.5 dB/year from a baseline of 0 dB/year, –0.74 dB/year and –1.22 dB/year for first-, second- and third-line treatment costs, respectively (Figure 20). It is worth noting here, again, that an improvement in treatment effects is associated with a decrease in the rate of MD progression. The second- and third-line treatment effects were varied in increments or decrements of 0.05 dB/year and the impact on the ICER was assessed in the range ± 0.25 dB/year. For first-line treatment effects, an improvement in effectiveness increased ICERs. The M70 cohort surpassed the £30,000 per QALY mark at –0.15 dB/year, while the F70 cohort exceeded this ceiling ratio at roughly –0.3 dB/year; the F50 and M50 cohorts did not surpass the £30,000 per QALY mark. When second-line treatment effects were examined, improving effectiveness increased ICERs in the M50 and F50 cohorts and decreased ICERs in the M70 and F70 cohorts. However, the £30,000 per QALY mark was only surpassed by the M70 cohort when the treatment effect was equal to approximately –0.6 dB/year. Improving effects for third-line treatment decreased ICERs for all cohorts, with no cohort surpassing the £30,000 per QALY mark.
FIGURE 20.
One-way analysis of treatment effects. (a) First-line treatment costs; (b) second-line treatment costs; and (c) third-line treatment costs.
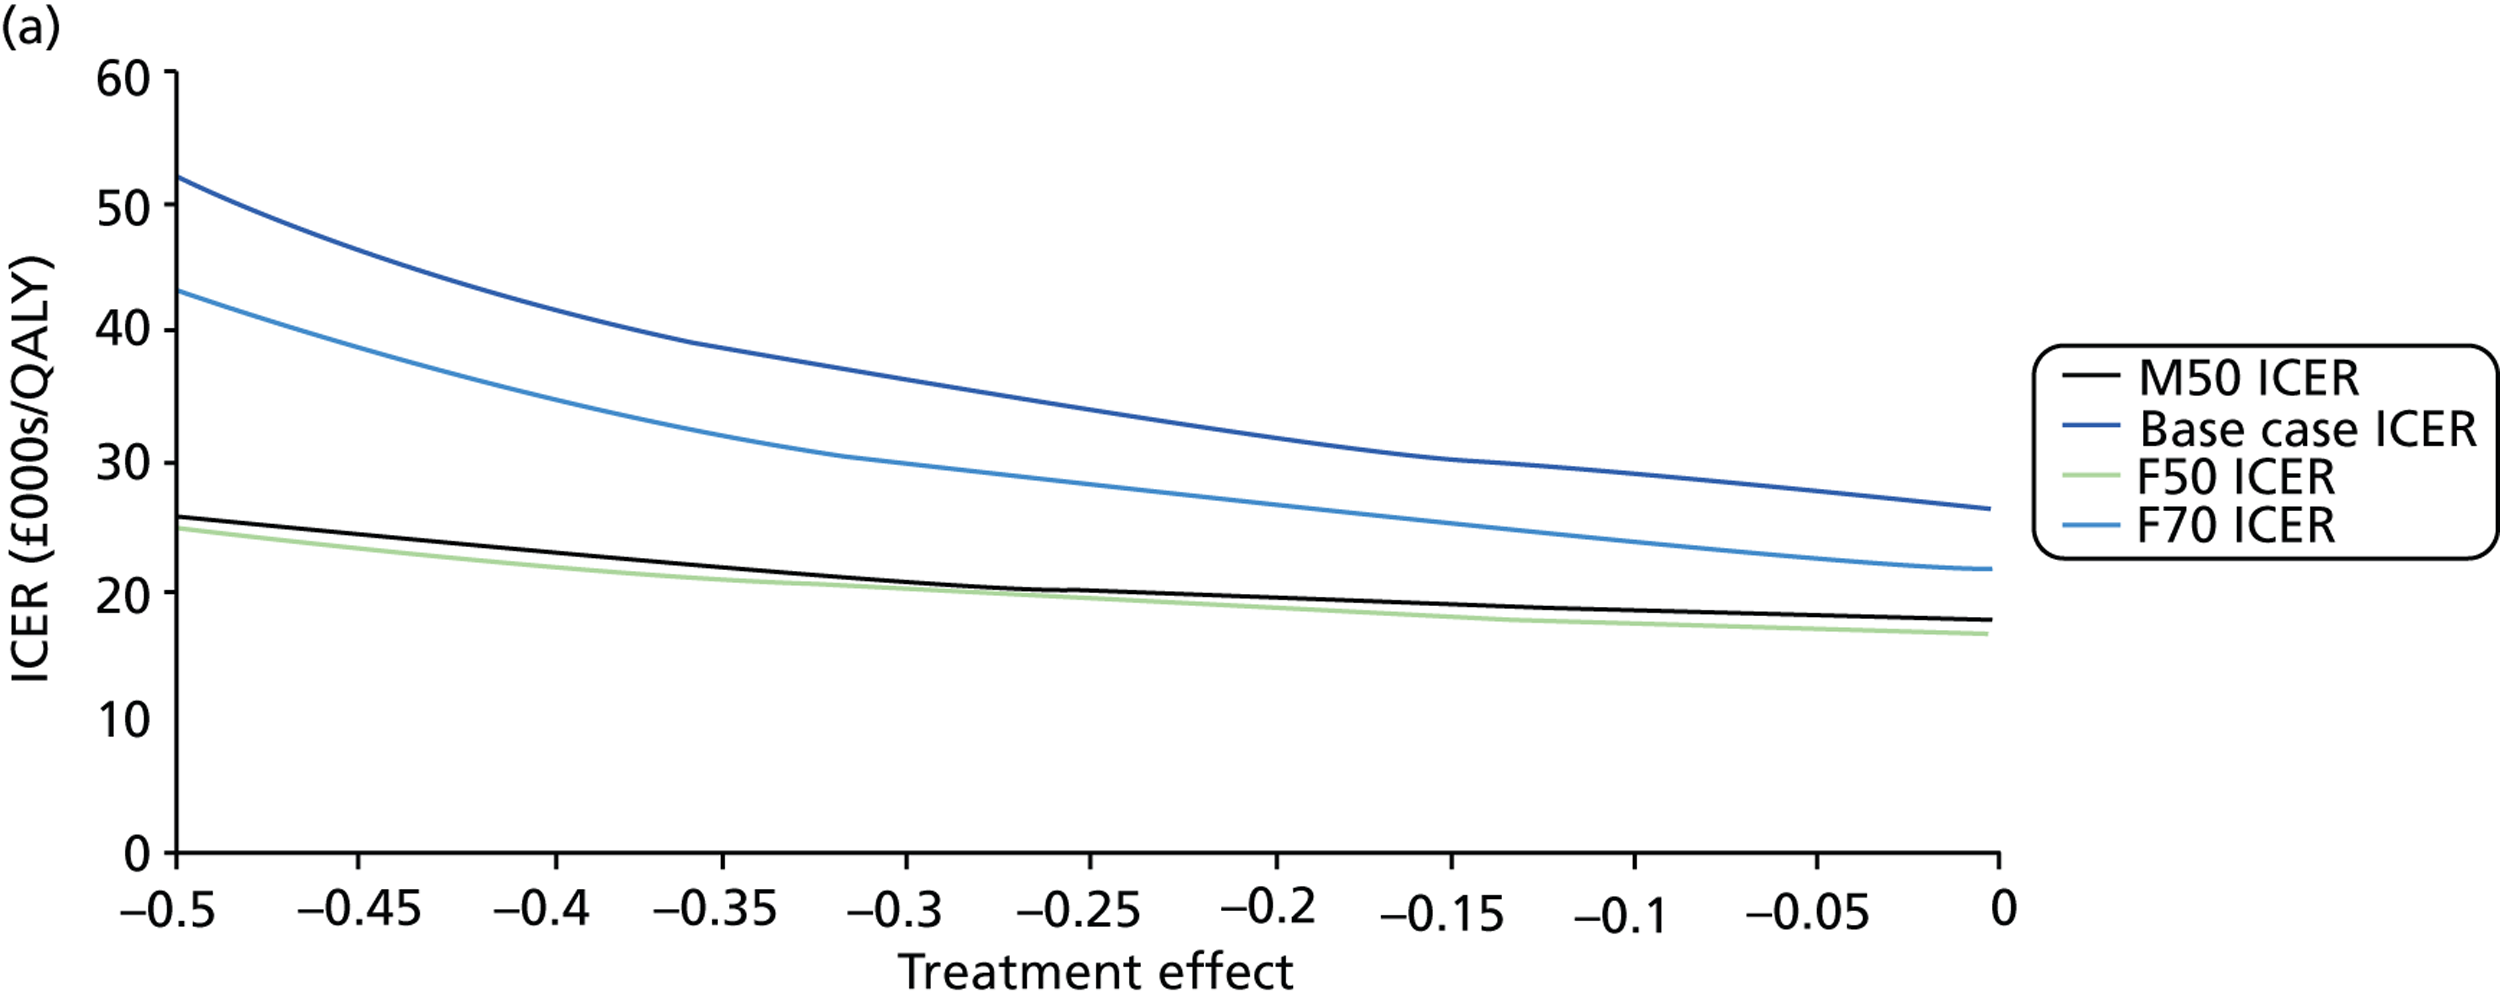
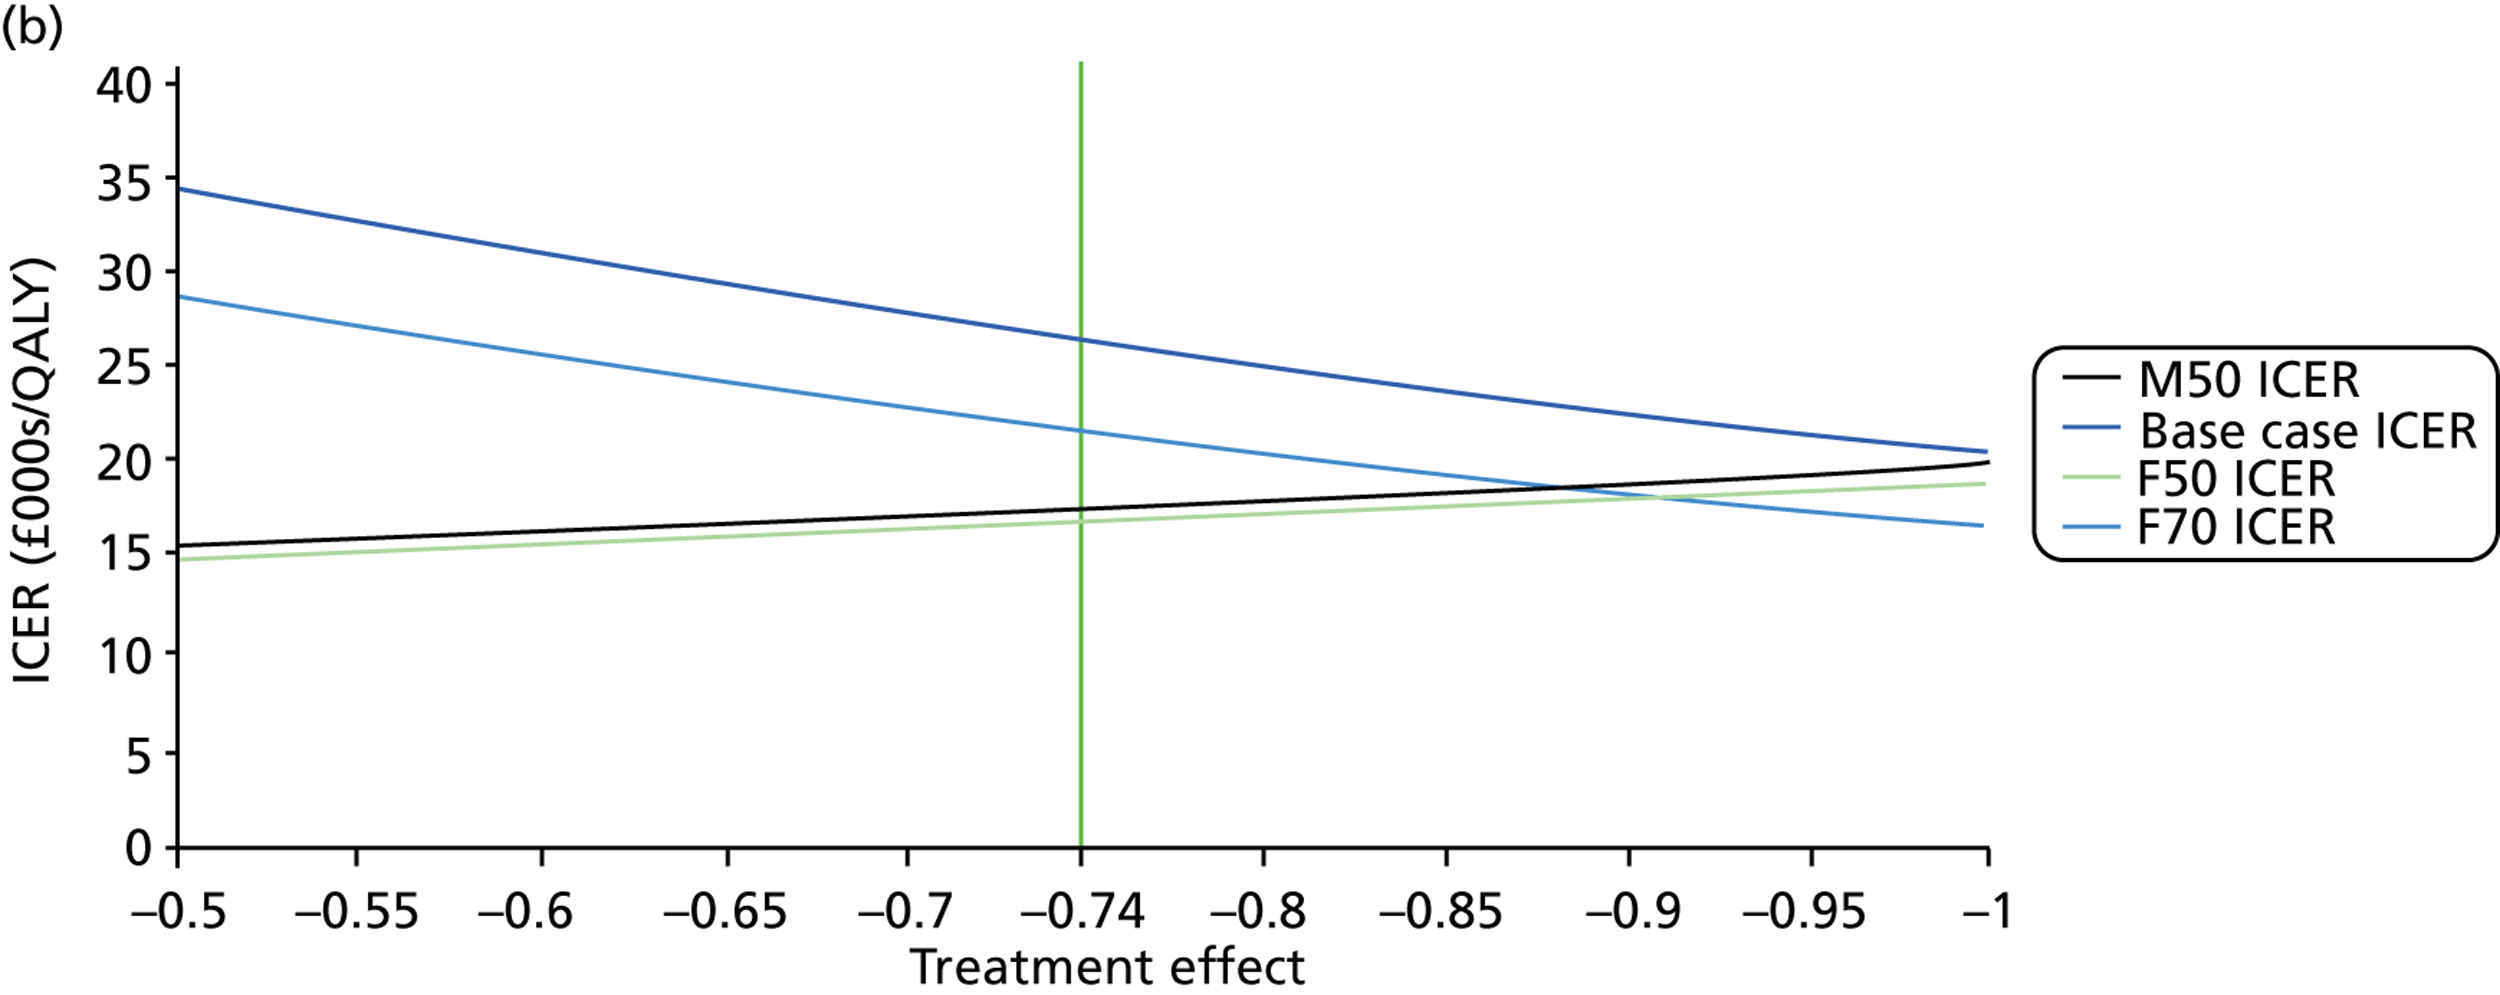
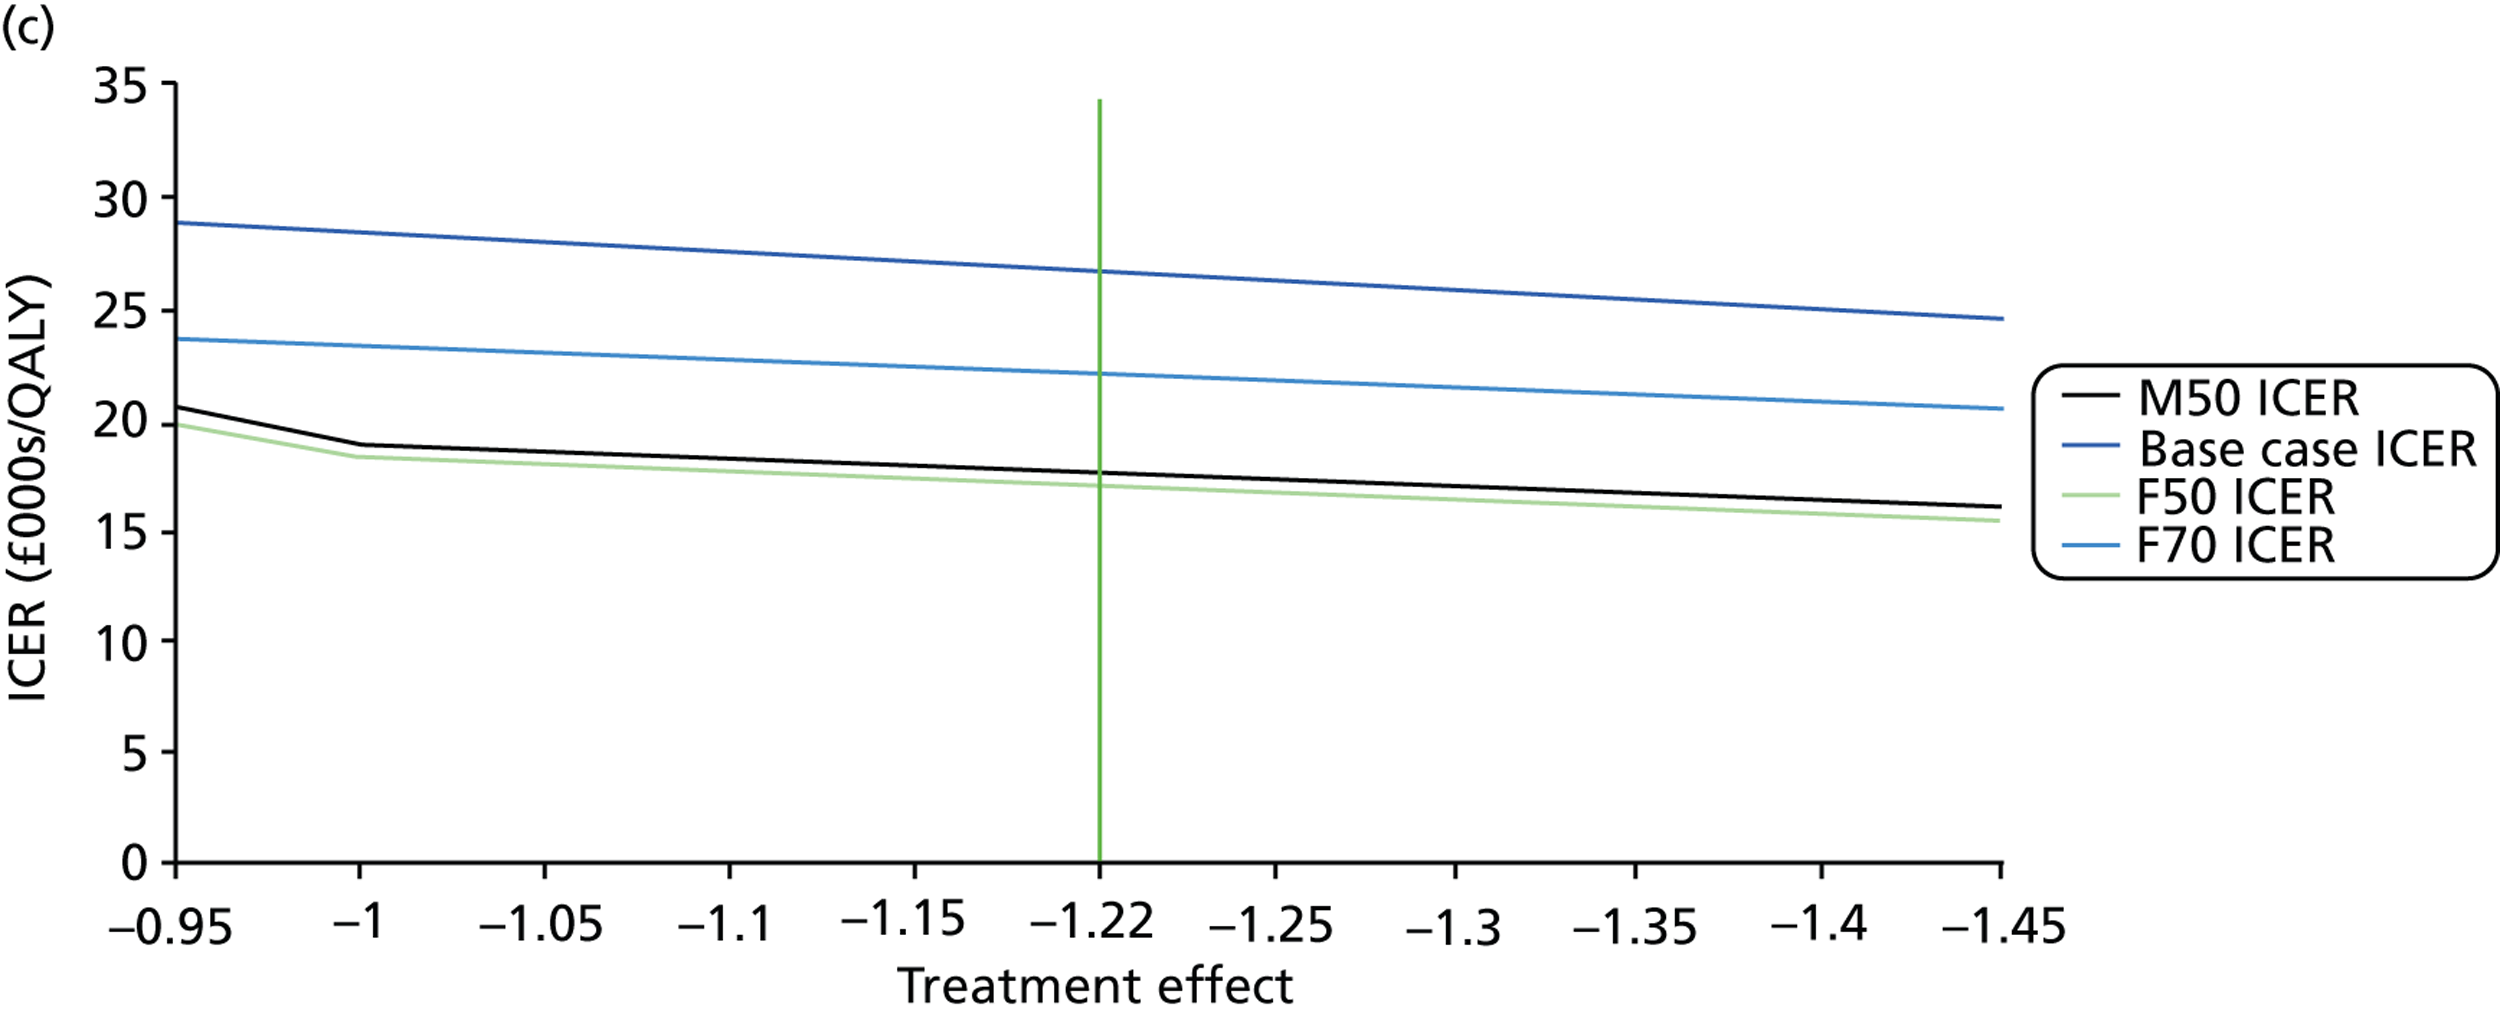
Implementation costs, visual impairment costs and time horizons
The costs of implementing proposed practice, the costs of patients progressing into a state of visual impairment and the time horizons utilised in the model were also chosen for one-way analysis. Implementation costs were varied between £0 and £900,000 in £100,000 steps and the impact on the ICER was assessed from a baseline of £410,000. Increasing implementation increased ICERs in all cohorts; the £30,000 ceiling ratio was exceeded in the M70 cohort only when this cost was equal to roughly £800,000. Costs of visual impairment were expanded to £9000 per subject in £1000 increments from the initial baseline assumption of £0 as a result of the NHS perspective of the model. As visual impairment costs increased, ICERs decreased for all cohorts, with the total cost associated with current practice superseding that of proposed practice over the 25-year time horizon at approximately £5000 for the M70 cohort, £4000 for the F70 cohort and £2500 for the M50 and F50 cohorts. The impact of the time horizon was examined at 5-year intervals in both directions. For all 70-year-old cohorts, ICERs were observed to begin plateauing after 15-year time horizons; however, ICERs grew exponentially below 15 years. For the 50-year-old cohorts, ICERs were observed to continually shrink as time horizons expanded with reductions beginning to plateau after a horizon length of 45 years. All cohorts surpassed the £30,000 per QALY mark when the time horizon was shortened to approximately 10 years in length.
Deterministic sensitivity analysis: tornado analysis
Tornado diagrams were constructed to represent model outcomes for the limits associated with each parameter, thereby mapping how the maximum and minimum values impact on ICERs. In addition, the costs associated with progressing into visual impairment were also explored using deterministic sensitivity analysis. For all parameters, outcomes were sorted in order of ICER impact, resulting in the tornado appearance. Tornado analysis was performed on both the full simulation results (Figure 21) and individual cohorts.
FIGURE 21.
Full simulation tornado diagram.
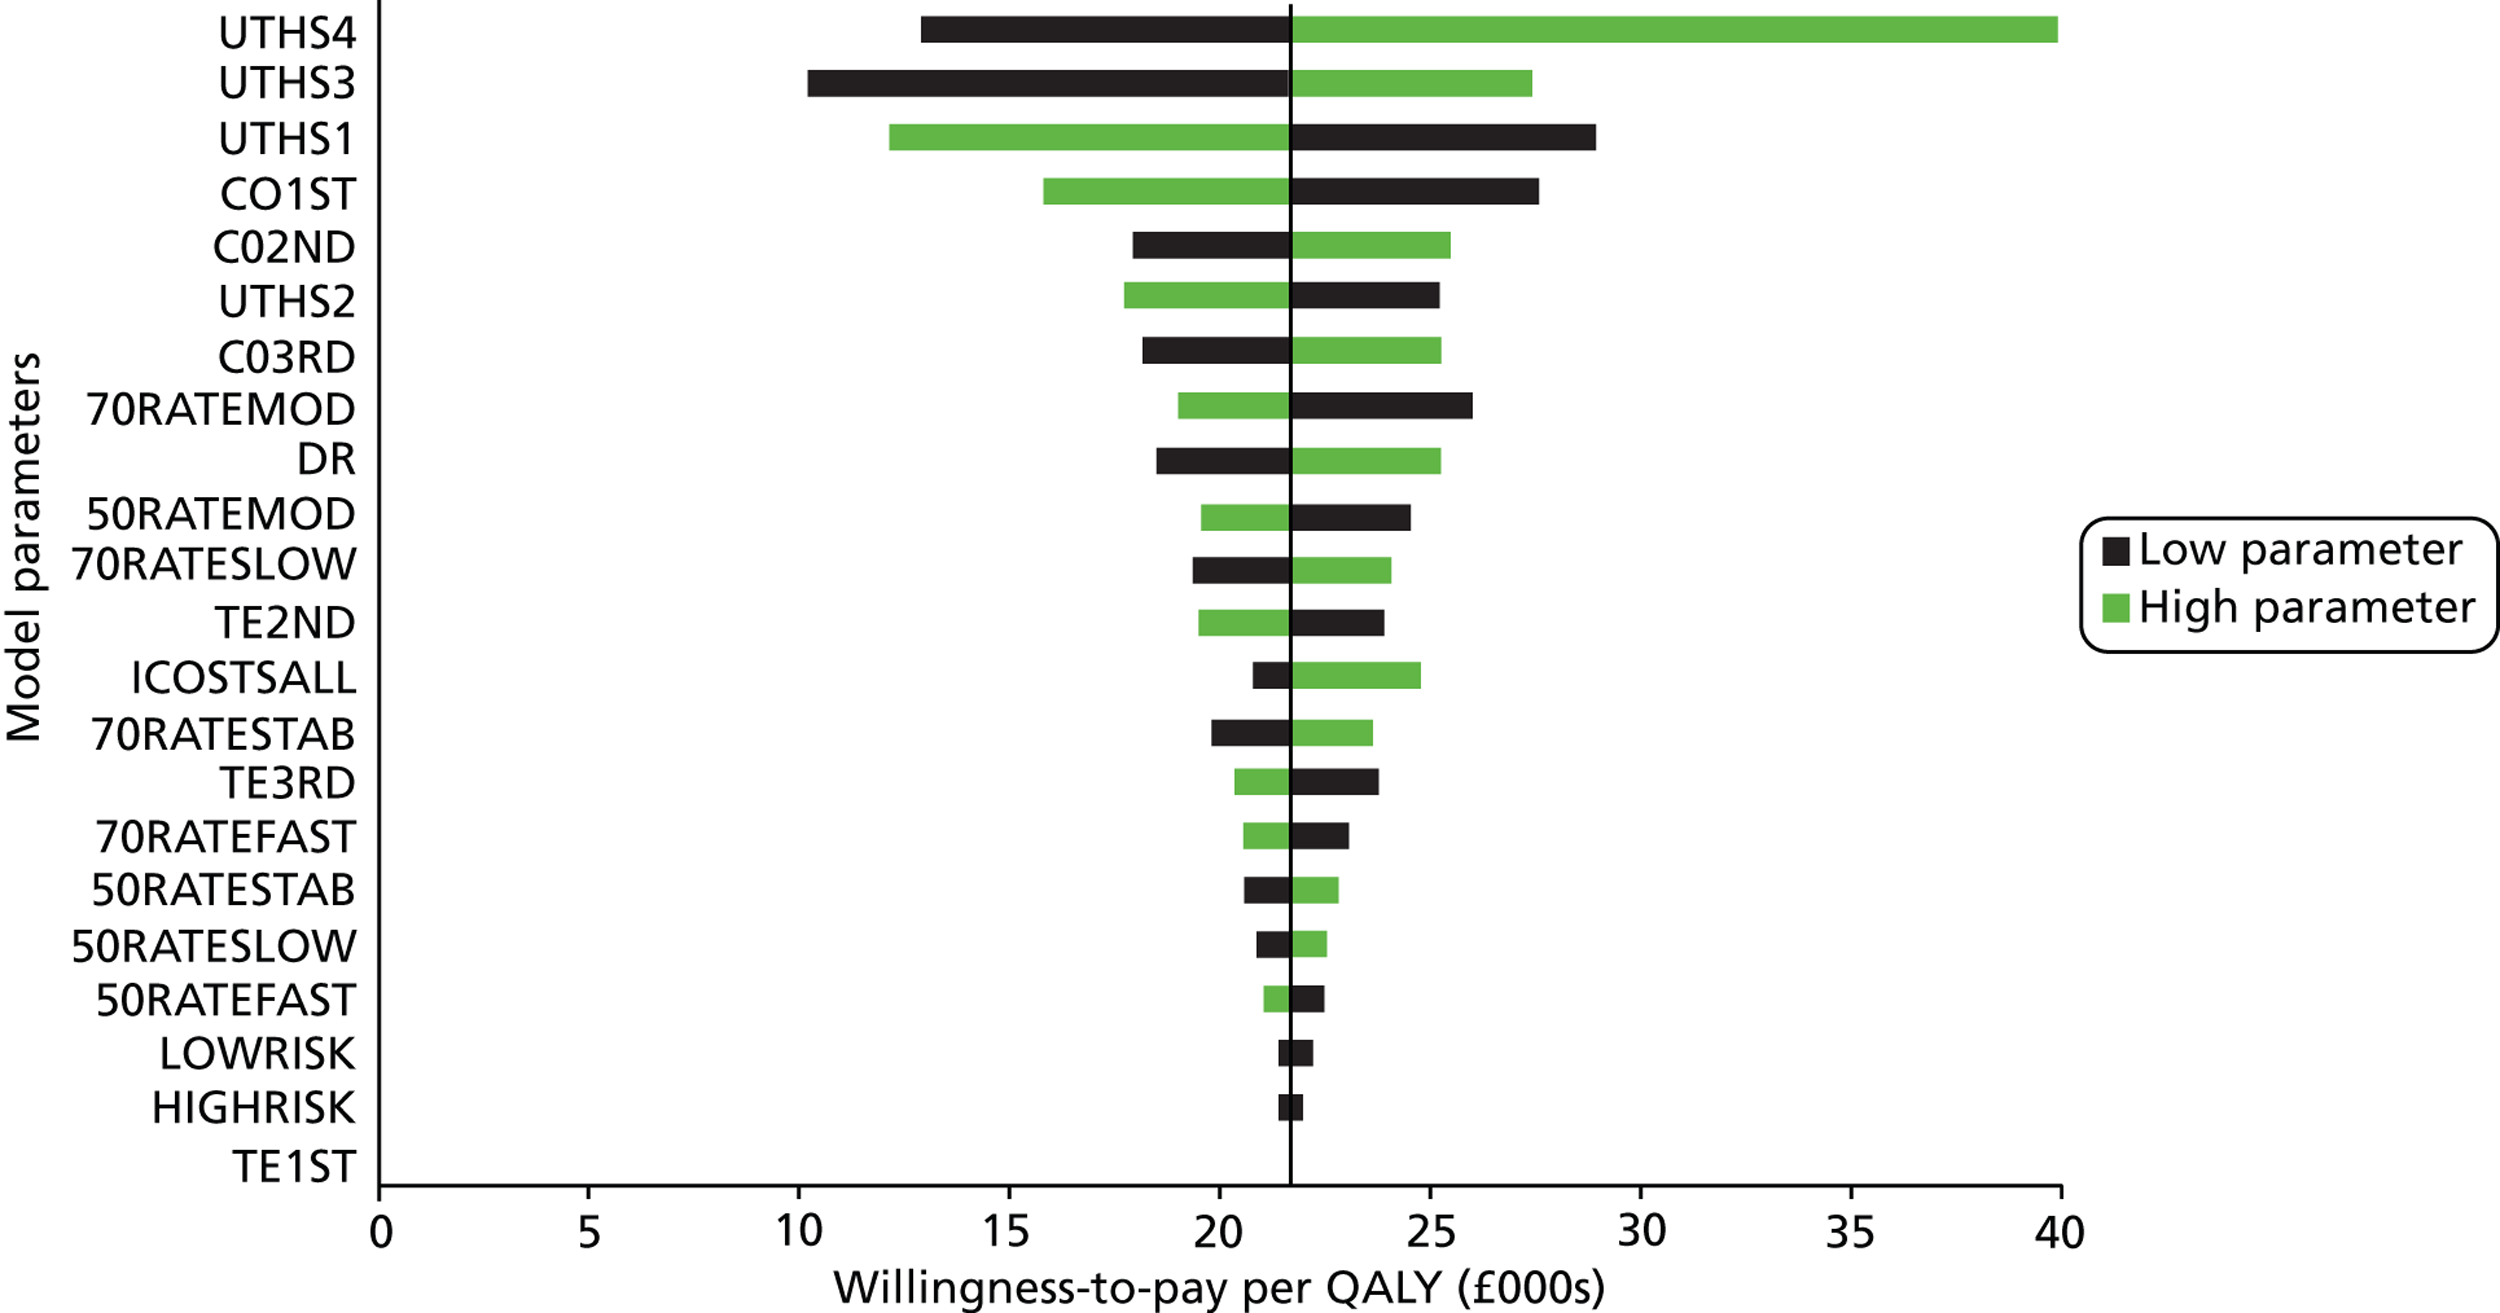
When analysing the full simulation data, utility health states were found to have the greatest impact on the derived ICER. In particular, utility health state 4 had the most significant impact, with findings suggesting that the variability around this parameter was sufficient to push the ICER beyond the £30,000 ceiling ratio. The projected cost of visual impairment was the next most important factor in the tornado analysis, altering the ICER by ±£12,326.98, with the lowest estimation of visual impairment costs sufficient to push the ICER beyond the £30,000 per QALY mark. Costs associated with the different treatment modalities were the next most important parameters with the variability around the cost of first-line treatment affecting the ICER most, followed by second- and, then, third-line treatments. The percentage of patients with a moderate rate of progression in the 70-year-old cohorts featured next in the diagram, followed by discount rate. All other parameters had less than a £5000 impact on the ICER from the minimum to maximum value.
When deterministic sensitivity analysis focused specifically on the M70 cohort, a greater number of parameters pushed the ICER beyond the £30,000 per QALY limit, including the utility associated with health states 1, 3 and 4, the costs of visual impairment, the costs of first- and second-line treatments, the proportion of patients with moderate or slow progression in the 70-year-old cohorts and, finally, the effects associated with second-line treatment. Within the M50 and F50 cohorts, the only parameter observed to drive the ICERs beyond the £30,000 cut-off was the cost of visual impairment. For the F70 cohort, three parameters forced ICERs beyond this ceiling ratio, namely the utility health state 4, the costs of visual impairment and the percentage of patients with moderate VF progression.
Deterministic and probabilistic sensitivity analyses combined
The DSA of VF costs, discount rates, risk distributions and costs of visual impairment was combined with PSA in order to examine how variation in this specific parameter may impact on the probability of acceptance for proposed practice at given willingness to pay (see Appendix 1, Tables 30–33).
In terms of VF costs, analysis was varied from the baseline of £56.54 and varied from a maximum of £70.45 to a minimum of £38.76. In the base-case analysis at a £30,000 willingness-to-pay threshold, an increase in the cost of a VF test reduced the probability of proposed practice being cost-effective from 57.33% to 45.63%, while the low estimation increased probability to 71.11%. Altering this cost in the other cohorts produced similar results, but with a smaller percentage change, particularly in the 50-year-old cohorts.
In terms of discount rates utilised, analysis was started from the baseline of 3.5% and varied from a maximum of 5% to a minimum of 0%. In the base-case cohort with a £30,000 willingness-to-pay threshold, the removal of discounting increased the probability of cost-effectiveness from 57.33% to 71.91%, while an increase in discounting reduced this probability to 49.13%; similar results were identified in the other cohorts. The differences in the probability of cost-effectiveness between the low discount and high discount were found to reduce as willingness to pay per QALY gained was increased.
In terms of the risk distributions assumed within the model, analysis started at the baseline of 80% low risk and 20% high risk, and this was varied from a ratio of 70% low risk : 30% high risk to 90% low risk : 10% high risk. In the base case with a £30,000 willingness-to-pay threshold, a decrease in the proportion of high-risk patients increased the probability of cost-effectiveness from 57.33% to 57.34%, while an increase resulted in a reduction of probability to 55.06%. These findings were generally reflected in the other cohorts.
Finally, in terms of the costs of visual impairment, analysis was varied from a baseline of £0 and varied from a maximum of £1758.50, the maximum degree of visual impairment costs before current practice became dominated by proposed practice. The introduction of costs of visual impairment to the base case increased the probability of proposed practice being cost-effective with visual impairment costs of £250, £500, £750, £1000 being associated with an increase in probability of 4.04%, 5.87%, 9.68%, 12.76% and 86.73%, respectively, at the £30,000 willingness-to-pay threshold.
Summary and discussion
The study described in this chapter sought to examine whether or not increased VF monitoring at the earliest stages of disease identification (i.e. six VF tests in the first 2 years after diagnosis) would be cost-effective compared with the current practice of one VF test per year. The economic evaluation results show that proposed practice is associated with higher costs, but more QALYs, than current practice. Under the full simulation, the ICER was £21,679 and 834.65 years of visual impairment were avoided with proposed practice (10,000 individuals). When the model was run for the male cohort who were 70 years old (lowest residual life expectancies relative to the other cohorts), the ICER rose to £26,531, with a probability of being cost-effective at 57.3% at £30,000 threshold value. Since the economic model was constructed from the perspective of the UK NHS, when societal gains are accounted for (the costs of visual impairment beyond the UK NHS), the cost-effectiveness of proposed practice expands.
Comprehensive DSA and PSA were performed. DSA identified that the ICERs were most sensitive to the uncertainty surrounding the parameters utilised for utility health states, particularly for utility health state 4, while the uncertainty associated with the costs of the different treatment lines was also found to impact on the derivation of the ICER.
It should be noted that the decision nodes informing the framework behind our model impact considerably on the differentials between proposed and current practice. While the clinical review panel was consulted during the formulation of the nodes, other glaucoma subspecialists may disagree with the step increases in treatment lines used. In particular, some clinicians may not subscribe to the view that the information gained from increased VF monitoring forms such a vital component in decision-making. Nevertheless, VF testing remains the only direct method for measuring patients’ visual function and, therefore, to gauge if a treatment is effective in avoiding future impairment.
Model baselines and patient characteristics
Key components of the economic evaluation of current practice compared with proposed practice were the patients’ demographics and characteristics of their glaucomatous VF defects. We undertook a comprehensive analysis of VF data from four eye hospitals in England, comprising almost half a million VF tests. Just over 2% of the 50-year-old cohorts progressed at a ‘fast’ rate, while 4.22% of the 70-year-old cohorts progressed at this rate. While these percentages were notably small, the relative values were also of interest, as they provide evidence that older patients tend to suffer a faster rate of progression than younger patients, supporting recent published research. 36 An attempt was made to ensure that the distribution of patients across different health states in the model was reflective of that observed in real clinics. For example, if the proportion of those already diagnosed with severe glaucoma or visual impairment in the model was overestimated, possible utility gains associated with proposed practice would be understated. Examination of the four VF databases revealed that more patients in the 50-year-old cohorts than in 70-year-old cohorts would be defined as having severe glaucoma, while the proportion of patients classified as visually impaired was similar in both cohorts.
Costs and utility outcomes
Costs of treatment
Under one-way analysis, an inverse relationship was observed between first-line costs and cost-effectiveness of proposed practice while the converse was true for second- and third-line treatments. This can be explained by the fact that proposed practice is less biased towards first-line treatment than current practice; decision nodes indicated that first-line treatment is prescribed in 7 out of the 16 (44%) possible patient characteristic combinations when patients’ rate of progression is unknown, while only 14 out of the 64 (22%) possible patient combinations were prescribed this level of treatment once rates of progression were identified. Proposed practice accelerates the time taken to identify the rate of progression and, therefore, first-line treatment is used to a lesser extent than in current practice. This implies that a reduction in costs of first-line treatment would reduce the cost of current practice more than proposed practice. Conversely, second- and third-line treatments are more prominent in proposed practice for the 70-year-old cohorts, causing ICERs to rise when the costs of these modalities rise. However, no major impact was observed with an ICER of £26,907 and £26,629 when second- and third-line treatment costs were expanded to £900 and £1100, respectively, in the M70 cohort. Tornado analysis suggested that first-line treatment cost is the most sensitive parameter, followed by second- and third-line treatment costs; however, 50% variations in these parameters were not significant enough to push ICERs beyond £30,000 per QALY.
Health state utilities
Tornado analysis under full simulation identified utility health state 4 as the most important parameter impacting on the ICER and, at its highest estimation, the ICER expanded to £38,829. Furthermore, it was the only utility parameter to push the estimation of cost-effectiveness beyond the accepted NICE £30,000/QALY ceiling ratio. It should be noted that the minimum value assumed for this parameter was adjusted to be equal to utility health state 3, implying that VF progression from severe glaucoma to visual impairment does not impact on patients’ quality of life. Thus, investing in the implementation of proposed practice depends on reducing the number of patients making the transition to severe glaucoma, which is accordingly less cost-effective. Cohort analysis of health state utilities indicated that the sensitivity of this parameter varied by age group. While utility weight for visual impairment state was identified as the most significant parameter for the 70-year-old cohorts, utility weight for severe glaucoma was found to be the most significant in the 50-year-old cohorts. This was expected because, on average, disease stage is more advanced and progression faster in 70-year-old cohorts than in 50-year-old cohorts.
Treatment modality effects
Deterministic sensitivity analysis was also performed on treatment effects associated with each line of treatment to assess their impact on findings. Treatment effects play a prominent role in the derivation of cost-effectiveness, as the benefit of early identification of fast progressors is to provide them with a level of treatment that allocates resources efficiently; thus, if treatments were found to be similar in terms of effects, the benefits of proposed practice would not be realised.
One-way analysis of first-line treatment effects was found to produce consistent outcomes, with an increase in efficacy expanding ICERs at an exponential rate. These findings were consistent with expectations because increase in efficacy at the first line of treatment reduces the productive efficiency gains associated with moving patients to the second and third lines of treatment. The variation in second-line treatment effect impacted on the 70-year-old cohorts in a consistent fashion, with an increase in treatment effect reducing ICERs, while a reduction in treatment effect expanded them. For the 50-year-old cohorts the reverse was the case, with an increase in treatment effect expanding ICERs and a decrease contracting them. This can be explained by the decision nodes attributed to each cohort, as, when the 50-year-old cohorts were prescribed the same lines of treatment as the 70-year-old cohorts, the ICERs produced a similar pattern of results in both groups of cohorts. Third-line treatment outcomes were consistent with expectations, with expansions in treatment effects reducing ICERs as patients are moved to the third line sooner with the proposed practice compared with current practice.
Tornado analysis of treatment effects found none of these parameters pushed ICERs beyond £30,000 per QALY. Thus, the model implies that the costs of increasing VF monitoring after VF diagnosis, even in all patients, would not be prohibitive. In addition, first-line treatment effect did not impact on the full simulation or individual cohort ICERs as the model was specified such that patients receive this line of treatment before commencement of these strategies. Under the cohort analysis, treatment effects did not have a significant impact on ICERs, with second-line treatment effects observed to have the biggest impact, especially in 70-year-old patients as a result of the fact that older patients are more likely to be conferred second-line treatment than third-line treatment compared with 50-year-old patients.
Modelled time horizons
One-way analysis of the time horizon utilised was performed in order to assess how cost and utility streams impact on the derived ICER. Within the context of this study, proposed practice frontloads costs as extra VF monitoring takes place at the early stages of analysis. Consequently, as the time horizon was contracted, the ICER for all cohorts became less cost-effective, especially as time horizons approached 5-year levels. Conversely, as time horizons expanded past 25 years, marginal gains were achieved, but these were limited by the residual life expectancies of the cohorts as a significant proportion of patients were absorbed by the death state after this period.
Cost-effectiveness acceptability curves were generated by varying willingness to pay; this analysis verified the hypothesis that the M70 cohort would provide the least cost-effective results with probabilities of acceptance lower than all other cohorts at all levels. The M50 and F50 cohorts produced similar outputs because of their similar residual life expectancies, and were more likely to be cost-effective as a cohort. It was also observed that the probability of the F70 group being cost-effective increased at a greater rate than other cohorts as willingness to pay expanded. This is explained by the fact that an increase in willingness to pay acts as a greater constraint to the probability of acceptance for older patients than younger patients given their lower residual life expectancies.
Deterministic sensitivity analysis was then combined with PSA in order to examine interactions with the derivation of CEACs. Each parameter was marginally altered and CEACs were resimulated to identify how these alterations impact on the probability of the proposed practice being acceptable at a given willingness to pay. Consequently, the impact of VF test costs, discount rates, risk distributions and costs of visual impairment on the CEACs was examined (see Appendix 1). The resultant CEACs produced rational results given the marginal variations in these parameters; however, it was noted that, in the case of the risk distributions, there was relatively little movement in the CEACs when this parameter was pushed to its rational limits. Furthermore, when costs of visual impairment were pushed to the limit identified as the watershed between which total costs of proposed practice became lower than those of current practice, the probability of acceptance of the proposed practice rose significantly, with low levels of willingness to pay still producing a considerable probability of acceptance.
The impact of VF test cost was larger in scale within the 70-year-old cohorts than within the 50-year-old cohorts, which was expected given that the younger cohorts have a longer period of time to recoup utility associated with the initial investment given their longer residual life expectancies.
The analysis performed in this study differs to that of van Gestel et al. 110 in several ways. We used a different type of model (Markov opposed to discrete event simulation [DES]) and a very different structural framework underpinning the models. We also sought to analyse the cost-effectiveness of increased monitoring at the earliest stages of glaucoma identification. van Gestel et al. 110 chose to increase follow-up across the full horizon of analysis, which largely explains the differentials in ICERs associated with each study. In contrast to our findings, the van Gestel et al. study suggests that reduced monitoring across their model’s full treatment horizon may result in productive gains at specific willingness-to-accept thresholds. Nevertheless, our study and the van Gestel et al. model are not directly comparable, with the latter focusing on lifelong IOP monitoring and management, whereas our study centres on VF progression. Furthermore, following NICE recommendations,106 our model primarily sourced data from the UK while van Gestel et al. used Dutch population data. Finally, our model had a single objective – to investigate the cost-effectiveness of increased early stage monitoring in the simplest, most accessible, method possible – whereas the DES model by van Gestel et al. aimed to provide a more complex and malleable model, therefore hindering comparison. However, it is worth noting that the economic model constructed in this study can be considered as a hybrid between Markov modelling and DES methods, as one significant benefit of the DES model is its ability to simulate patient characteristics within its framework, something that Markov models have not generally been able to do with transparency. 111 The Markov model has been constructed such that patient characteristics do inform how patients move across the model over time; patients’ ages, genders and risk profiles are all taken into account within decision nodes and, therefore, transition probabilities.
Clinical management
Intrinsic to any model mapping clinical management is ability to sufficiently replicate true practice. Economic models, whether in the form of Markov models or DESs, are quite limited in their ability to reproduce clinical decision-making in the real world. Our model sought to limit this constraint by seeking the advice of practising ophthalmologists in order to provide interpretation of what informs clinical decision-making in glaucoma management. Clearly, decision-making can vary from clinician to clinician; for example, some clinicians may take a more aggressive stance than others when it comes to glaucoma treatment.
In order to facilitate the transparency of the model, the decision nodes defining treatment pathways were simplified. As a consequence, it was not possible to include patient preferences in treatment prescription. Patient preferences represent a growing concern in health-care provision within the UK, with NICE explicitly identifying its incorporation as a key objective within its guidelines for treatment of glaucoma. 1 A key objective of NICE is to inform patients about treatments so that their preferences can be considered, maximising patient input. Within the context of the economic model here, it is possible that some glaucoma patients would wish to avoid surgical procedures despite being identified as fast progressors; this is important to bear in mind when interpreting the results from our model. If such a situation was included in the model, the cost-effectiveness of proposed practice would be reduced as the increase in power of information would not yield the same improvements in VF progression in these individuals.
Furthermore, it was assumed that patients entering into the model were immediately provided with first-line treatment, as this is usually prescribed as soon as an individual is identified as having COAG. This might be considered a limitation of our model. However, all patients were prescribed this treatment within the model’s decision nodes so as not to derive an increase in treatment effect and therefore a reduction in probability of transitioning to a worse health state. A small subset of patients may not be not prescribed prior treatment, but we reduced the likelihood of this event in the model by only including patients with significant VF damage at presentation (patients with an MD or pattern standard deviation outside 95% normal limits).
Trend of visual field deterioration
An assumption of our model is that progression of MD is linear. While many previous studies have modelled MD in this way,108 the analyses of VF data in this report provides evidence that this model may be an oversimplification. After bimodal stratification of patients’ age, it was observed that a larger proportion of older subjects than of younger subjects progressed at a fast rate; this finding is also supported by recent research. 36 Further studies are required to better understand the progression of glaucomatous VF loss and MD over time.
Within our Markov model, it was stipulated that stable patients would be provided with the same level of treatment as those identified as slow progressors. This stipulation is questionable as some clinicians may decide to monitor these patients less frequently if it appears that a reduction in quality of life will not occur within their lifetime. However, this would result in an increase in cost-effectiveness of early stage monitoring as, by removing or reducing treatment for this cohort, cost savings would be made without reducing the utility derived from proposed practice since disease is not worsening in this cohort.
Our model, and others, also fail to take account of false-positive decisions that might arise from increased testing. No attempt has been made to consider the prospect of false ‘overtreatment’. A discussion of this is given elsewhere. 94 A development of our model should include some attempt to consider this important aspect of managing patient.
Costs within the model
Given results from the multisite clinical audit (see Chapter 1), it was assumed that existing service provision was performing at 100% capacity and that further infrastructure would be required in order to undertake proposed practice. However, efficiency gains in the management and organisation of VF testing may be possible. It was beyond the scope of this study to examine in detail the costs associated with extra resource use, but cost of implementation was incorporated into DSA and PSA to gauge its impact on final outcomes; a parameter value of £410,000 was varied between a derived minimum limit of £287,000 and a maximum limit of £820,000, resulting in ICERs of £20,770 and £24,706 (full simulation) and £25,398 and £30,303 (M70 cohort) respectively. These findings are very important because they indicate that uncertainty around implementation costs should not necessarily limit the final assessment of model outcomes, as the parameter was only found to surpass £30,000 per QALY by £303 in the cohort deemed to be the least cost-effective. However, it should be noted that alternative methods of calculating implementation costs exist. For example, if the additional VF tests required for proposed practice (40,000) were to be multiplied by the costs of performing VF tests (£56.54), an implementation cost of £2,261,600 would be arrived at. If this implementation cost was utilised within our model, a full simulation ICER of £35,352 would be identified, a figure higher somewhat higher than the £30,000 per QALY ceiling ratio associated with NICE. A scoping exercise about service provision for increasing VF testing is therefore recommended.
Under the current health economic model, a static interpretation of costs across the 25-year time horizon was adopted, which does not account for the impact of pharmaceutical patent expiry and, thereby, the introduction of generic pharmacotherapy. The accessibility of generic medications to health-care providers would reduce costs associated with all three treatment modalities, since each includes topical medication components. Given that both current practice and proposed practice incur medication costs, the impact of a reduction in such costs on the ICER is difficult to theorise, as these cost parameters interact with each strategy to differing extents. It is worth noting that medical costs may also expand as a result of the introduction of generic medications. LeLorier et al. 112 examined the impact of the launch of the generic substitution of lamotrigine (Lamictal®, GlaxoSmithKline, Brentford, UK), an anti-epileptic drug, in Canada between 2002 and 2006; the authors found that generic lamotrigine was associated with higher overall medical costs than the branded alternative because of increases in non-pharmacotherapy cost components of treatments.
The economic model was specified from the perspective of the UK NHS; consequently, it accounts for only direct costs of the disease and not for any indirect costs or social costs. This is an important limitation and has consequences on the precision of our estimates for cost-effectiveness. Still, indirect costs and societal costs can only really add to the utility of the preferred practice. Previous studies have sought to quantify these costs in order to analyse their importance in glaucoma management and visual impairment. Lafuma et al. 113 estimated the non-medical costs associated with visual impairment in France, Italy, Germany and the UK. Local prevalence rates of visual impairment were established along with estimates for the rates of non-registered visually impaired persons. Estimates of non-medical costs included institutional care, non-medical devices, residential adaptations, burden on carer, paid home help, loss of income and social allowances related to visual impairment. The main community cost components of visual impairment in the UK were loss of income (between 23% and 43%), burden on carer (between 24% and 39%) and paid assistance (between 13% and 29%). The authors also estimated that the total annual cost of visual impairment in the UK was €15.18bn. If indirect and social costs were included in our model, proposed practice would be more cost-effective. Proposed practice dominated (i.e. generated more QALYs at a lower average cost) current practice for a cost of visual impairment above £1758.50. Existing studies have found that the costs to society are possibly three times that amount,114,115 suggesting there to be a stronger case for cost-effectiveness of increased early-stage monitoring when impact to society is accounted for.
Treatment effect deterioration
In our model the impact of treatment effects on the rate of VF progression did not decline across the time horizon. However, the impact of treatment is known to fall between retreatment sessions, so the impact of treatment may be overstated in this model, resulting in an overestimation of cost-effectiveness. Nonetheless, this limitation was constrained by the inclusion of complex treatment regimens as identified by Traverso et al. ,11 who found that treatment defined by glaucomatous health state incorporated a range of modalities spread over various time periods.
It was beyond the scope of the model to account for the development of side-effects that can occur as a result of glaucoma treatment. Modelling these factors is beyond the scope of this study, although our model did take into account treatment complications in terms of utility health states. Moreover, Burr et al. ,105 (DCE), in their derivation of the Glaucoma Utilities Index that was employed here, identified local side-effects as one of the least important factors informing quality of life, but this is still open to debate and further study.
Future research
Successful clinical management of glaucoma means making correct decisions about intensifying treatment, or initiating intervention, when patients are at risk of developing visual disability. Yet little is known about what VF defects at different stages of glaucoma specifically affect patients’ abilities to perform everyday visual tasks. Various studies have looked into differing methodologies of identifying and quantifying the relationship between quality of life and deteriorating health states caused by glaucoma. 116–120 In addition, little is known about ways in which patients can adapt to conditions in order to limit the impact on self-reported quality of life and the derived QALY estimates. 121 In such situations, factors such as patient characteristics and the time from diagnosis can significantly impact on QALYs associated with differing health states of the disease, with their quantification possibly being overestimated. Economic models using these quality-of-life metrics may, therefore, overestimate the benefits of strategies such as the one proposed in this study; further research is required.
In addition, further analysis of the cost of implementing a strategy to increase early-stage monitoring of glaucoma is required. While this economic model found the strategy to be cost-effective, it was identified that an alternative methodology of calculating implementation costs would derive different results. To accurately define this cost, the existing spare capacity within the UK NHS glaucoma services needs to be quantified in order to inform how much extra infrastructure is required to increase monitoring, as the investment in this infrastructure could play a significant role in whether strategies, such as the proposed practice studied here, are cost-effective.
The wisdom of relying on a simple measure such as change in MD over time to identify a trend towards VF deterioration requires further examination to improve the accuracy of economic modelling in glaucoma. It may be advisable to also consider other characteristics beyond MD, such as the location of damage when considering VF progression. Finally, it seems practical to consider stratifying patients to less or more intense VF testing, with an idea of moving away from one diet of testing to fit all. For example, it would be useful to investigate whether the reliability of test results varies according to the approach taken. Although our study has illuminated the benefit of getting more perfect clinical information, we must recognise that perimetry still seems to be an imperfect test. 122–124
Conclusion
In conclusion, this study supports the recommendation by NICE for a randomised comparative trial (RCT) to assess the real-world implications of increased monitoring at the earliest stage of glaucoma identification. In particular, the health economic model that we have described in this chapter has demonstrated that this proposed practice is likely to be cost-effective – the analyses revealed little evidence to suggest that the strategy would not be cost-effective. Further studies of the impact of the glaucoma on the quality of life of those with the condition are required to further the understanding of the cost-effectiveness of proposed practice, as sensitivity analysis suggested that health state utilities have a considerable influence on ICER results. In addition, the impact of diagnosis of glaucoma and subsequent ‘adjustment’ to the condition124,125 needs to be considered, as this may negatively bias patients’ perceptions of quality of life with glaucoma and, therefore, quantification of utility.
Summary of report conclusions
When managing a newly diagnosed glaucoma patient, the clinician’s goal is to preserve the patient’s visual function during their lifetime. The risk of severe visual impairment depends on the stage of disease at presentation, the patient’s life expectancy, as well as the rate (speed) of visual deterioration. A recent paper describing a subsequent study to those described in this report evaluated the proportion of patients in glaucoma clinics progressing at rates that would result in visual disability within their expected lifetime. 53 Patients who are in danger of significant VF impairment in their lifetime generally present with more severe VF damage. Also, patients in whom VF loss is progressing rapidly are in greater danger of going blind than patients with slow progression. The EGS guidelines recommend six VF tests in the first 2 years for all newly diagnosed glaucoma patients, since this monitoring programme will detect rapid progression more quickly than annual testing. In the audit work conducted as part of this study, we found that patients are rarely tested this frequently in clinics. The main result from the modelling experiments described in this report indicates that this proposed practice does identify rapid progression sooner than current practice. In addition, results from our health economic model suggested that proposed practice is likely to be cost-effective. Nevertheless, many glaucoma clinicians consider that increased surveillance of the VF would be impossible with current resources. In addition, patient focus groups raised significant concerns about VF testing, including the quality of VF test instructions, testing environment and explanation of results. In conclusion, the results from this study could inform the design of a prospective RCT of different VF monitoring intervals in glaucoma linked to stratifying patients according to risk factors for progression. Research is also required to determine strategies to overcome capacity issues in NHS glaucoma services. Moreover, ensuring the confidence and co-operation of the patient should be at the centre of this future research.
Acknowledgements
We would like to thank:
-
The patients who participated in focus group discussions.
-
The glaucoma subspecialists who responded to our questionnaire on opinions of the frequency of VF testing.
-
Adam Hustler, Alexander Silvester, Anas Injarie, Kate Doorduyn and Samiksha Fouzdar Jain, and participating eye hospitals, for their effort during data collection in our multicentre cross-sectional study on frequency of VF testing in glaucoma clinics.
-
David Broadway for helping to set up a focus group at the Norwich University Hospital NHS Foundation Trust.
-
Neil Shumsky (Senior Developer, Medisoft Limited) for assisting with collecting and sorting VF data.
-
The Royal College of Ophthalmologists for providing us with a list of glaucoma subspecialists in the UK.
-
Jennifer Burr, Edward White, David Wright, Heather Waterman for their support in initiating this study.
-
Kandy Woodfield and Meg Callanan who provided expert advice and guidance on the design, collection and analysis of qualitative data from the interviews and focus groups with patients.
Contributions of authors
David P Crabb (Professor, statistics and vision research) conceived and designed the research studies and provided methodological inputs for the whole project as well as assisting in writing all chapters.
Richard A Russell (postdoctoral research fellow, statistics) conducted the statistical analysis reported in Chapter 1, assisted in the analyses and data collection reported in Chapter 2, developed the computer model of VF tests reported in Chapter 4, assisted the development of the health economic model described in Chapter 5, led the writing of Chapter 4, assisted in writing Chapters 1, 2 and 5, drafted the main findings and summary sections and took a leading role in co-ordinating the entire study.
Rizwan Malik (clinical lecturer, ophthalmic translational research) assisted the design of the research presented in Chapters 1 and 2, conducted the analysis reported in Chapter 2, assisted in the analysis reported in Chapters 1, 4 and 5, led the writing of Chapter 2, assisted in writing Chapter 1 and took a leading role in co-ordinating the entire study.
Nitin Anand (glaucoma consultant) assisted VF data collection and assisted in the design of the research presented in Chapter 4.
Helen Baker (postdoctoral research assistant, Qualitative social research in glaucoma) assisted in the analyses and data collection reported in Chapter 2, assisted the design, led data collection and conducted analysis of research presented in Chapter 3, assisted in writing Chapter 2 and co-led writing Chapter 3.
Trishal Boodhna (PhD student, health economics) developed the health economic model described in Chapter 5 and led the writing of Chapter 5.
Carol Bronze (editorial and creative director, Publicis-Blueprint magazines London) is a glaucoma patient at Moorfields Eye Hospital who contributed to the initial study design from a patient perspective, helped pilot the study described in Chapter 3 and assisted in writing the scientific summary and plain English summary.
Simon SM Fung (specialty registrar in ophthalmology) conducted the analysis of research reported in Chapter 1 and led the writing of Chapter 1.
David F Garway-Heath assisted the design of the research presented in Chapter 4, assisted in writing Chapter 4 and supported the initial design of the overall study.
Fiona C Glen (postdoctoral research assistant, psychology and vision research) conducted the analysis of research presented in Chapter 3, assisted in writing Chapters 1 and 2, co-led the writing of Chapter 3 and edited the final draft of the report.
Rodolfo Hernández (research fellow, health economics) assisted the development of the computer model of VF tests in Chapter 4, assisted the development of the health economic model described in Chapter 5 and assisted in writing Chapter 5.
James F Kirwan (glaucoma consultant) assisted in VF data collection, helped facilitate the study described in Chapter 3 and assisted in the design of the research presented in Chapter 4.
Claire Lemer (operations manager for ophthalmology) assisted the design of and conducted the analysis of research reported in Chapter 1 and assisted writing Chapter 1.
Andrew I McNaught (glaucoma consultant) assisted in VF data collection and in the design of the research presented in Chapter 4.
Ananth C Viswanathan (glaucoma consultant) assisted in VF data collection and provided clinical advice on the health economic model described in Chapter 5.
All authors commented on the draft report.
Publications
Russell, RA, Garway-Heath, DF, Crabb, DP. New insights into measurement variability in glaucomatous visual fields from computer modelling, PLOS ONE 2013;8:e83595.
Malik, R, Baker, H, Russell, RA, Crabb, DP. A survey of attitudes of glaucoma subspecialists in England and Wales to visual field test intervals in relation to NICE guidelines, BMJ Open 2013;3:e002067.
Fung, SS, Lemer, C, Russell, RA, Malik, R., Crabb, DP. Are practical recommendations practiced? A national multicentre cross-sectional study on frequency of visual field testing in glaucoma, Br J Ophthalmol 2013;97:843–7.
Russell, RA, Crabb, DP, Malik, R, Garway-Heath, DF. The relationship between variability and sensitivity in large-scale longitudinal visual field data, Invest Ophthalmol Vis Sci 2012;53:5985–90.
Crabb, DP, Garway-Heath, DF. Intervals between visual field tests when monitoring the glaucomatous patient: wait-and-see approach, Invest Ophthalmol Vis Sci 2012;53:2770–6.
Patient and public involvement
The study in Chapter 3 involved patient focus groups to determine patient views of glaucoma follow-up care, particularly with regards to the type and frequency of VF testing. A total of 30 patients with glaucoma took part across one pilot exercise and six focus groups. Please refer to Chapter 3 for more detailed information regarding the study and the nature of patient involvement.
One of the co-applicants of this project is Carol Bronze, a glaucoma patient who has been attending clinics at Moorfields Eye Hospital for around 20 years. Carol advised on the design of the study and assisted with writing the scientific summary and plain English summary of this report. She insists that this contribution is voluntary and we are most grateful for her contribution.
Disclaimers
This report presents independent research funded by the National Institute for Health Research (NIHR). The views and opinions expressed by authors in this publication are those of the authors and do not necessarily reflect those of the NHS, the NIHR, NETSCC, the HS&DR programme or the Department of Health. If there are verbatim quotations included in this publication the views and opinions expressed by the interviewees are those of the interviewees and do not necessarily reflect those of the authors, those of the NHS, the NIHR, NETSCC, the HS&DR programme or the Department of Health.
References
- Diagnosis and Management of Chronic Open Angle Glaucoma and Ocular Hypertension. NICE Clinical Guideline 85. Manchester: NICE; 2009.
- Quigley HA, Vitale S. Models of open-angle glaucoma prevalence and incidence in the United States. Investig Ophthalmol Vis Sci 1997;38:83-91.
- Hertzog LH, Albrecht KG, LaBree L, Lee PP. Glaucoma care and conformance with preferred practice patterns. Examination of the private, community-based ophthalmologist. Ophthalmology 1996;103. http://dx.doi.org/10.1016/S0161-6420(96)30573-3.
- Friedman DS, Nordstrom B, Mozaffari E, Quigley HA. Glaucoma management among individuals enrolled in a single comprehensive insurance plan. Ophthalmology 2005;112:1500-4. http://dx.doi.org/10.1016/j.ophtha.2005.02.030.
- Chauhan BC, Garway-Heath DF, Goni FJ, Rossetti L, Bengtsson B, Viswanathan AC, et al. Practical recommendations for measuring rates of visual field change in glaucoma. Br J Ophthalmol 2008;92:569-73. http://dx.doi.org/10.1136/bjo.2007.135012.
- Gardiner SK, Crabb DP. Frequency of testing for detecting visual field progression. Br J Ophthalmol 2002;86:560-4. http://dx.doi.org/10.1136/bjo.86.5.560.
- Terminology and Guidelines for Glaucoma. Savona: Editrice Dogma; 2008.
- Canadian Ophthalmological Society Glaucoma Clinical Practice Guideline Expert Committee . Canadian Ophthalmological Society evidence-based clinical practice guidelines for the management of glaucoma in the adult eye. Can J Ophthalmol 2009;44:S7-S54. http://dx.doi.org/10.3129/i09.080.
- Fung SS, Lemer C, Russell RA, Malik R, Crabb DP. Are practical recommendations practiced? A national multicentre cross-sectional study on frequency of visual field testing in glaucoma. Br J Ophthalmol 2013;97:843-7. http://dx.doi.org/10.1136/bjophthalmol-2012-302903.
- Lee PP, Walt JG, Doyle JJ, Kotak SV, Evans SJ, Budenz DL, et al. A multicenter, retrospective pilot study of resource use and costs associated with severity of disease in glaucoma. Arch Ophthalmol 2006;124. http://dx.doi.org/10.1001/archopht.124.1.12.
- Traverso CE, Walt JG, Kelly SP, Hommer AH, Bron AM, Denis P, et al. Direct costs of glaucoma and severity of the disease: a multinational long term study of resource utilisation in Europe. Br J Ophthalmol 2005;89:1245-9. http://dx.doi.org/10.1136/bjo.2005.067355.
- Creating a Patient-led NHS: Delivering the NHS Improvement Plan. London: Department of Health; 2005.
- National Institute for Health and Care Excellence (NICE) . Patient and Public Involvement Policy 2012. www.nice.org.uk/media/A49/C2/NICEPatientAndPublicInvolvementPolicy.pdf (accessed May 2014).
- Gardiner SK, Demirel S. Assessment of patient opinions of different clinical tests used in the management of glaucoma. Ophthalmology 2008;115:2127-31. http://dx.doi.org/10.1016/j.ophtha.2008.08.013.
- Lacy NL, Paulman A, Reuter MD, Lovejoy B. Why we don’t come: patient perceptions on no-shows. Ann Fam Med 2004;2:541-5. http://dx.doi.org/10.1370/afm.123.
- Kitzinger J. Qualitative research: introducing focus groups. BMJ 1995;311:299-302. http://dx.doi.org/10.1136/bmj.311.7000.299.
- Green J, Siddall H, Murdoch I. Learning to live with glaucoma: a qualitative study of diagnosis and the impact of sight loss. Soc Sci Med 2002;55:257-67. http://dx.doi.org/10.1016/S0277-9536(01)00169-1.
- Patel D, Baker H, Murdoch I. Barriers to uptake of eye care services by the Indian population living in Ealing, west London. Health Ed J 2006;65:267-76. http://dx.doi.org/10.1177/0017896906067777.
- Tong A, Sainsbury P, Craig J. Consolidated criteria for reporting qualitative research (COREQ): a 32-item checklist for interviews and focus groups. Int J Qual Health Care 2007;19:349-57. http://dx.doi.org/10.1093/intqhc/mzm042.
- Ritchie K. Qualitative data analysis for applied policy research. London: Routledge; 1994.
- Wild JM, Kim LS, Pacey IE, Cunliffe IA. Evidence for a learning effect in short-wavelength automated perimetry. Ophthalmology 2006;113:206-15. http://dx.doi.org/10.1016/j.ophtha.2005.11.002.
- Rossetti L, Fogagnolo P, Miglior S, Centofanti M, Vetrugno M, Orzalesi N. Learning effect of short-wavelength automated perimetry in patients with ocular hypertension. J Glaucoma 2006;15:399-404. http://dx.doi.org/10.1097/01.ijg.0000212261.12112.99.
- Junoy Montolio FG, Wesselink C, Jansonius NM. Persistence, spatial distribution and implications for progression detection of blind parts of the visual field in glaucoma: a clinical cohort study. PLOS ONE 2012;7. http://dx.doi.org/10.1371/journal.pone.0041211.
- Kutzko KE, Brito CF, Wall M. Effect of instructions on conventional automated perimetry. Invest Ophthalmol Vis Sci 2000;41:2006-13.
- Heijl A, Asman P. Pitfalls of automated perimetry in glaucoma diagnosis. Curr Opin Ophthalmol 1995;6:46-51. http://dx.doi.org/10.1097/00055735-199504000-00008.
- Caprioli J. The importance of rates in glaucoma. Am J Ophthalmol 2008;145:191-2. http://dx.doi.org/10.1016/j.ajo.2007.12.003.
- Collaborative Normal-Tension Glaucoma Study Group . Comparison of glaucomatous progression between untreated patients with normal-tension glaucoma and patients with therapeutically reduced intraocular pressures. Am J Ophthalmol 1998;126:487-97. http://dx.doi.org/10.1016/S0002-9394(98)00223-2.
- Heijl A, Leske MC, Bengtsson B, Hyman L, Bengtsson B, Hussein M, et al. Reduction of intraocular pressure and glaucoma progression: results from the early manifest glaucoma trial. Arch Ophthalmol 2002;120:1268-79. http://dx.doi.org/10.1001/archopht.120.10.1268.
- Anderson DR, Drance SM, Schulzer M. Natural history of normal-tension glaucoma. Ophthalmology 2001;108:247-53. http://dx.doi.org/10.1016/S0161-6420(00)00518-2.
- Heijl A, Bengtsson B, Hyman L, Leske MC. Natural history of open-angle glaucoma. Ophthalmology 2009;116:2271-6. http://dx.doi.org/10.1016/j.ophtha.2009.06.042.
- Viswanathan AC, Hitchings RA, Fitzke FW. How often do patients need visual field tests?. Graefes Arch Clin Exp Ophthalmol 1997;235:563-8. http://dx.doi.org/10.1007/BF00947085.
- Chen PP. Blindness in patients with treated open-angle glaucoma. Ophthalmology 2003;110:726-33. http://dx.doi.org/10.1016/S0161-6420(02)01974-7.
- Kwon YH, Kim CS, Zimmerman MB, Alward WL, Hayreh SS. Rate of visual field loss and long-term visual outcome in primary open-angle glaucoma. Am J Ophthalmol 2001;132:47-56. http://dx.doi.org/10.1016/S0002-9394(01)00912-6.
- Hattenhauer MG, Johnson DH, Ing HH, Herman DC, Hodge DO, Yawn BP, et al. The probability of blindness from open-angle glaucoma. Ophthalmology 1998;105:2099-104. http://dx.doi.org/10.1016/S0161-6420(98)91133-2.
- Medeiros FA, Zangwill LM, Mansouri K, Lisboa R, Tafreshi A, Weinreb RN. Incorporating risk factors to improve the assessment of rates of glaucomatous progression. Invest Ophthalmol Vis Sci 2012;53:2199-207. http://dx.doi.org/10.1167/iovs.11-8639.
- Chauhan BC, Mikelberg FS, Artes PH, Balazsi AG, LeBlanc RP, Lesk MR, et al. Canadian Glaucoma Study: 3. Impact of risk factors and intraocular pressure reduction on the rates of visual field change. Arch Ophthalmol 2010;128:1249-55. http://dx.doi.org/10.1001/archophthalmol.2010.196.
- Reis AS, Artes PH, Belliveau AC, Leblanc RP, Shuba LM, Chauhan BC, et al. Rates of change in the visual field and optic disc in patients with distinct patterns of glaucomatous optic disc damage. Ophthalmology 2012;119:294-303. http://dx.doi.org/10.1016/j.ophtha.2011.07.040.
- De Moraes CG, Prata TS, Tello C, Ritch R, Liebmann JM. Glaucoma with early visual field loss affecting both hemifields and the risk of disease progression. Arch Ophthalmol 2009;127:1129-34. http://dx.doi.org/10.1001/archophthalmol.2009.165.
- Prata TS, De Moraes CG, Teng CC, Tello C, Ritch R, Liebmann JM. Factors affecting rates of visual field progression in glaucoma patients with optic disc hemorrhage. Ophthalmology 2010;117:24-9. http://dx.doi.org/10.1016/j.ophtha.2009.06.028.
- Teng CC, De Moraes CG, Prata TS, Tello C, Ritch R, Liebmann JM. Beta-zone parapapillary atrophy and the velocity of glaucoma progression. Ophthalmology 2010;117:909-15. http://dx.doi.org/10.1016/j.ophtha.2009.10.016.
- Heijl A, Buchholz P, Norrgren G, Bengtsson B. Rates of visual field progression in clinical glaucoma care. Acta Ophthalmol 2012;91:406-12. http://dx.doi.org/10.1111/j.1755-3768.2012.02492.x.
- Heijl A. The times they are a-changin’: time to change glaucoma management. Acta Ophthalmol 2013;91:92-9. http://dx.doi.org/10.1111/j.1755-3768.2011.02328.x.
- Sawada H, Yoshino T, Fukuchi T, Abe H. Assessment of the vision-specific quality of life using clustered visual field in glaucoma patients. J Glaucoma 2014;23:81-7. http://dx.doi.org/10.1097/IJG.0b013e318265bbdc.
- Gutierrez P, Wilson MR, Johnson C, Gordon M, Cioffi GA, Ritch R, et al. Influence of glaucomatous visual field loss on health-related quality of life. Arch Ophthalmol 1997;115:777-84. http://dx.doi.org/10.1001/archopht.1997.01100150779014.
- Sumi I, Shirato S, Matsumoto S, Araie M. The relationship between visual disability and visual field in patients with glaucoma. Ophthalmology 2003;110:332-9. http://dx.doi.org/10.1016/S0161-6420(02)01742-6.
- Magacho L, Lima FE, Nery AC, Sagawa A, Magacho B, Avila MP. Quality of life in glaucoma patients: regression analysis and correlation with possible modifiers. Ophthalmic Epidemiol 2004;11:263-70. http://dx.doi.org/10.1080/09286580490515251.
- Hodapp E, Parrish RI, Anderson DR. Clinical Decisions in Glaucoma. St Louis, MO: Mosby; 1993.
- Fraley C, Raferty AE. Model-based clustering, discriminant analysis, and density estimation. J Am Stat Assoc 2002;97:611-31. http://dx.doi.org/10.1198/016214502760047131.
- Russell RA, Crabb DP, Malik R, Garway-Heath DF. The relationship between variability and sensitivity in large-scale longitudinal visual field data. Invest Ophthalmol Vis Sci 2012;53:5985-90. http://dx.doi.org/10.1167/iovs.12-10428.
- Heijl A, Lindgren A, Lindgren G. Test–retest variability in glaucomatous visual fields. Am J Ophthalmol 1989;108:130-5.
- Heijl A, Bengtsson B. The effect of perimetric experience in patients with glaucoma. Arch Ophthalmol 1996;114:19-22. http://dx.doi.org/10.1001/archopht.1996.01100130017003.
- Henson DB, Shambhu S. Relative risk of progressive glaucomatous visual field loss in patients enrolled and not enrolled in a prospective longitudinal study. Arch Ophthalmol 2006;124:1405-8. http://dx.doi.org/10.1001/archopht.124.10.1405.
- Saunders LJ, Russell RA, Kirwan JF, McNaught AI, Crabb DP. Examining visual field loss in patients in glaucoma clinics during their predicted remaining lifetime. Invest Ophthalmol Visual Sci 2014;55:102-9. http://dx.doi.org/10.1167/iovs.13-13006.
- Chauhan BC, Tompkins JD, LeBlanc RP, McCormick TA. Characteristics of frequency-of-seeing curves in normal subjects, patients with suspected glaucoma, and patients with glaucoma. Invest Ophthalmol Vis Sci 1993;34:3534-40.
- Henson DB, Chaudry S, Artes PH, Faragher EB, Ansons A. Response variability in the visual field: comparison of optic neuritis, glaucoma, ocular hypertension, and normal eyes. Invest Ophthalmol Vis Sci 2000;41:417-21.
- Spry PG, Johnson CA, McKendrick AM, Turpin A. Variability components of standard automated perimetry and frequency-doubling technology perimetry. Invest Ophthalmol Vis Sci 2001;42:1404-10.
- Wall M, Woodward KR, Doyle CK, Artes PH. Repeatability of automated perimetry: a comparison between standard automated perimetry with stimulus size III and V, matrix, and motion perimetry. Invest Ophthalmol Vis Sci 2009;50:974-9. http://dx.doi.org/10.1167/iovs.08-1789.
- Piltz JR, Starita RJ. Test–retest variability in glaucomatous visual fields. Am J Ophthalmol 1990;109:109-11.
- Flammer J, Drance SM, Zulauf M. Differential light threshold: short-and long-term fluctuation in patients with glaucoma, normal controls, and patients with suspected glaucoma. Arch Ophthalmol 1984;102. http://dx.doi.org/10.1001/archopht.1984.01040030560017.
- Wall M, Johnson CA, Kutzko KE, Nguyen R, Brito C, Keltner JL. Long- and short-term variability of automated perimetry results in patients with optic neuritis and healthy subjects. Arch Ophthalmol 1998;116:53-61. http://dx.doi.org/10.1001/archopht.116.1.53.
- Artes PH, Iwase A, Ohno Y, Kitazawa Y, Chauhan BC. Properties of perimetric threshold estimates from Full Threshold, SITA Standard, and SITA Fast strategies. Invest Ophthalmol Vis Sci 2002;43:2654-9.
- Artes PH, Hutchison DM, Nicolela MT, LeBlanc RP, Chauhan BC. Threshold and variability properties of matrix frequency-doubling technology and standard automated perimetry in glaucoma. Invest Ophthalmol Vis Sci 2005;46:2451-7. http://dx.doi.org/10.1167/iovs.05-0135.
- Shapiro LR, Johnson CA. Quantitative evaluation of manual kinetic perimetry using computer simulation. Appl Opt 1990;29:1445-50. http://dx.doi.org/10.1364/AO.29.001445.
- Shapiro LR, Johnson CA, Kennedy RL, Heijl A. Perimetry Update 1988/1989. Amsterdam: Kugler and Ghedini; 1989.
- Johnson CA, Chauhan BC, Shapiro LR. Properties of staircase procedures for estimating thresholds in automated perimetry. Invest Ophthalmol Vis Sci 1992;33:2966-74.
- Glass E, Schaumberger M, Lachenmayr BJ. Simulations for FASTPAC and the standard 4-2 dB full-threshold strategy of the Humphrey Field Analyzer. Invest Ophthalmol Vis Sci 1995;36:1847-54.
- Spenceley SE, Henson DB. Visual field test simulation and error in threshold estimation. Br J Ophthalmol 1996;80:304-8. http://dx.doi.org/10.1136/bjo.80.4.304.
- Spry PG, Bates AB, Johnson CA, Chauhan BC. Simulation of longitudinal threshold visual field data. Invest Ophthalmol Vis Sci 2000;41:2192-200.
- Turpin A, McKendrick AM, Johnson CA, Vingrys AJ. Properties of perimetric threshold estimates from full threshold, ZEST, and SITA-like strategies, as determined by computer simulation. Invest Ophthalmol Vis Sci 2003;44:4787-95. http://dx.doi.org/10.1167/iovs.03-0023.
- Gardiner SK, Crabb DP. Examination of different point-wise linear regression methods for determining visual field progression. Invest Ophthalmol Vis Sci 2002;43:1400-7.
- Henson DB. Visual Fields. London: Elsevier Health Sciences; 2000.
- Bengtsson B, Heijl A. False-negative responses in glaucoma perimetry: indicators of patient performance or test reliability?. Invest Ophthalmol Vis Sci 2000;41:2201-4.
- Heijl A, Lindgren G, Olsson J. The effect of perimetric experience in normal subjects. Arch Ophthalmol 1989;107:81-6. http://dx.doi.org/10.1001/archopht.1989.01070010083032.
- Bland M. Introduction to Medical Statistics. Oxford: Oxford University Press; 2000.
- White H. A Heteroskedasticity-consistent covariance matrix estimator and a direct test for heteroskedasticity. Econometrica 1980;48:817-38. http://dx.doi.org/10.2307/1912934.
- Tobin J. Estimation of Relationships for Limited Dependent Variables. Econometrica 1958;26:24-36. http://dx.doi.org/10.2307/1907382.
- Russell RA, Malik R, Chauhan BC, Crabb DP, Garway-Heath DF. improved estimates of visual field progression using bayesian linear regression to integrate structural information in patients with ocular hypertension. Invest Ophthalmol Vis Sci 2012;53:2760-9. http://dx.doi.org/10.1167/iovs.11-7976.
- Holmin C, Krakau CE. Variability of glaucomatous visual field defects in computerized perimetry. Albrecht Von Graefes Arch Klin Exp Ophthalmol 1979;210:235-50. http://dx.doi.org/10.1007/BF00742288.
- Heijl A, Lindgren G, Olsson J. Normal variability of static perimetric threshold values across the central visual field. Arch Ophthalmol 1987;105:1544-9. http://dx.doi.org/10.1001/archopht.1987.01060110090039.
- Gardiner SK, Demirel S, Johnson CA. Is there evidence for continued learning over multiple years in perimetry?. Optom Vis Sci 2008;85:1043-8. http://dx.doi.org/10.1097/OPX.0b013e31818b9b40.
- Tattersall CL, Vernon SA, Menon GJ. Mean deviation fluctuation in eyes with stable Humphrey 24-2 visual fields. Eye 2007;21:362-6. http://dx.doi.org/10.1038/sj.eye.6702206.
- Turpin A, Jankovic D, McKendrick AM. Retesting visual fields: utilizing prior information to decrease test–retest variability in glaucoma. Invest Ophthalmol Vis Sci 2007;48:1627-34. http://dx.doi.org/10.1167/iovs.06-1074.
- Artes PH, Sharpe GP, O’Leary N, Crabb DP. Visual Field Progression in Glaucoma: The Specificity of the Guided Progression Analysis Varies Considerably Between Individual Patients 2011.
- Wall M, Doyle CK, Zamba KD, Artes P, Johnson CA. The repeatability of mean defect with size III and size V standard automated perimetry. Invest Ophthalmol Vis Sci 2013;54:1345-51. http://dx.doi.org/10.1167/iovs.12-10299.
- Cleveland WS, Grosse E, Chambers JM, Hastie TJ. Statistical Models in S. Pacific Grove, CA: Wadsworth & Brooks/Cole; 1992.
- Ernest PJ, Schouten JS, Beckers HJ, Hendrikse F, Prins MH, Webers CA. The evidence base to select a method for assessing glaucomatous visual field progression. Acta Ophthalmol 2012;90:101-8. http://dx.doi.org/10.1111/j.1755-3768.2011.02206.x.
- Chauhan BC, Johnson CA. Evaluating and optimizing test strategies in automated perimetry. J Glaucoma 1994;3:S73-S81. http://dx.doi.org/10.1097/00061198-199400321-00010.
- Leske MC, Heijl A, Hyman L, Bengtsson B. Early Manifest Glaucoma Trial: design and baseline data. Ophthalmology 1999;106:2144-53. http://dx.doi.org/10.1016/S0161-6420(99)90497-9.
- Bengtsson B, Olsson J, Heijl A, Rootzen H. A new generation of algorithms for computerized threshold perimetry, SITA. Acta Ophthalmol Scand 1997;75:368-75. http://dx.doi.org/10.1111/j.1600-0420.1997.tb00392.x.
- Alm A. Is a field every 4 month a significant improvement over a field every 6 months?. Br J Ophthalmol 2008.
- Jansonius NM. Towards an optimal perimetric strategy for progression detection in glaucoma: from fixed-space to adaptive inter-test intervals. Graefes Arch Clin Exp Ophthalmol 2006;244:390-3. http://dx.doi.org/10.1007/s00417-005-0032-5.
- Jansonius NM. Progression detection in glaucoma can be made more efficient by using a variable interval between successive visual field tests. Graefes Arch Clin Exp Ophthalmol 2007;245:1647-51. http://dx.doi.org/10.1007/s00417-007-0576-7.
- Schulzer M, Anderson DR, Drance SM. Sensitivity and specificity of a diagnostic test determined by repeated observations in the absence of an external standard. J Clin Epidemiol 1991;44:1167-79. http://dx.doi.org/10.1016/0895-4356(91)90149-4.
- Crabb DP, Garway-Heath DF. Intervals between visual field tests when monitoring the glaucomatous patient: wait-and-see approach. Invest Ophthalmol Vis Sci 2012;53:2770-6. http://dx.doi.org/10.1167/iovs.12-9476.
- De Moraes CG, Sehi M, Greenfield DS, Chung YS, Ritch R, Liebmann JM. A validated risk calculator to assess risk and rate of visual field progression in treated glaucoma patients. Invest Ophthalmol Visual Sci 2012;53:2702-7. http://dx.doi.org/10.1167/iovs.11-7900.
- Saunders LJ, Russell RA, Crabb DP. The co-efficient of determination: what determines a useful r2 statistic?. Invest Ophthalmol Visual Sci 2012;53:6830-2. http://dx.doi.org/10.1167/iovs.12-10598.
- Tuulonen A. Challenges of glaucoma care – high volume, high quality, low cost. Acta Ophthalmologica 2013;91:3-5. http://dx.doi.org/10.1111/aos.12088.
- Kobelt G. Health economics, economic evaluation, and glaucoma. J Glaucoma 2002;11:531-9. http://dx.doi.org/10.1097/00061198-200212000-00015.
- Folgar FA, de Moraes CGV, Prata TS, Teng CC, Tello C, Ritch R, et al. Glaucoma surgery decreases the rates of localized and global visual field progression. Am J Ophthalmol 2010;149:258-64.e2.
- Hernández RA, Burr JM, Vale LD. Economic evaluation of screening for open-angle glaucoma. Int J Technol Assess Health Care 2008;24:203-11. http://dx.doi.org/10.1017/S0266462308080288.
- Briggs AH, Claxton K, Sculpher MJ. Decision Modelling for Health Economic Evaluation. Oxford: Oxford University Press; 2006.
- National Schedule of Reference Costs (2010–11). London: Department of Health; 2012.
- Bank of England . Inflation Calculators 2012. www.bankofengland.co.uk/education/Pages/inflation/calculator/flash/default.aspx (accessed May 2014).
- Malik R, Baker H, Russell RA, Crabb DP. A survey of attitudes of glaucoma subspecialists in England and Wales to visual field test intervals in relation to NICE guidelines. BMJ Open 2013;3. http://dx.doi.org/10.1136/bmjopen-2012-002067.
- Burr JM, Kilonzo M, Vale L, Ryan M. Developing a preference-based Glaucoma Utility Index using a discrete choice experiment. Optom Vis Sci 2007;84:797-808. http://dx.doi.org/10.1097/OPX.0b013e3181339f30.
- Guideline Development Methods. London: NICE; 2005.
- Crabb DP, Viswanathan AC, McNaught AI, Poinoosawmy D, Fitzke FW, Hitchings RA. Simulating binocular visual field status in glaucoma. Br J Ophthalmol 1998;82:1236-41. http://dx.doi.org/10.1136/bjo.82.11.1236.
- Burr JM, Mowatt G, Hernández R, Siddiqui MA, Cook J, Lourenco T, et al. The clinical effectiveness and cost-effectiveness of screening for open-angle glaucoma: a systematic review and economic evaluation. Health Technol Assess 2007;11.
- Devlin N, Parkin D. Does NICE have a cost-effectiveness threshold and what other factors influence its decisions? A binary choice analysis. Health Econ 2004;13:437-52. http://dx.doi.org/10.1002/hec.864.
- van Gestel A, Webers CA, Severens JL, Beckers HJ, Jansonius NM, Hendrikse F, et al. The long-term outcomes of four alternative treatment strategies for primary open-angle glaucoma. Acta Ophthalmol 2012;90:20-31. http://dx.doi.org/10.1111/j.1755-3768.2011.02318.x.
- Davies R. An assessment of models of a health system. J Oper Res Soc 1985;36:679-87. http://dx.doi.org/10.1057/jors.1985.125.
- LeLorier J, Sheng Duh M, Emmanuel Paradis P, Latremouille-Viau D, Lefebvre P, Manjunath R, et al. Economic impact of generic substitution of lamotrigine: projected costs in the US using findings in a Canadian setting. Curr Med Res Opin 2008;24:1069-81. http://dx.doi.org/10.1185/030079908X280572.
- Lafuma A, Brezin A, Lopatriello S, Hieke K, Hutchinson J, Mimaud V, et al. Evaluation of non-medical costs associated with visual impairment in four European countries: France, Italy, Germany and the UK. Pharmacoeconomics 2006;24:193-205. http://dx.doi.org/10.2165/00019053-200624020-00007.
- Meads C, Hyde C. What is the cost of blindness?. Br J Ophthalmol 2003;87:1201-4. http://dx.doi.org/10.1136/bjo.87.10.1201.
- Colquitt JL, Jones J, Tan S, Takeda A, Clegg A, Price A. Ranibizumab and pegaptanib for the treatment of age-related macular degeneration: a systematic review and economic evaluation. Health Technol Assess 2008;12.
- Goldberg I, Clement CI, Chiang TH, Walt JG, Lee LJ, Graham S, et al. Assessing quality of life in patients with glaucoma using the Glaucoma Quality of Life-15 (GQL-15) questionnaire. J Glaucoma 2009;18:6-12. http://dx.doi.org/10.1097/IJG.0b013e3181752c83.
- Lee BL, Wilson MR. Health-related quality of life in patients with cataract and glaucoma. J Glaucoma 2000;9:87-94. http://dx.doi.org/10.1097/00061198-200002000-00015.
- McKean-Cowdin R, Wang Y, Wu J, Azen SP, Varma R. Impact of visual field loss on health-related quality of life in glaucoma: the Los Angeles Latino Eye Study. Ophthalmology 2008;115:941-8.e1.
- Kobelt G, Jonsson B, Bergström A, Chen E, Lindén C, Alm A. Cost-effectiveness analysis in glaucoma: what drives utility? Results from a pilot study in Sweden. Acta Ophthalmol Scand 2006;84:363-71. http://dx.doi.org/10.1111/j.1600-0420.2005.00621.x.
- Janz NK, Wren PA, Lichter PR, Musch DC, Gillespie BW, Guire KE. Quality of life in newly diagnosed glaucoma patients: The Collaborative Initial Glaucoma Treatment Study. Ophthalmology 2001;108:887-97. http://dx.doi.org/10.1016/S0161-6420(00)00624-2.
- Groot W. Adaptation and scale of reference bias in self-assessments of quality of life. J Health Econ 2000;19:403-20. http://dx.doi.org/10.1016/S0167-6296(99)00037-5.
- Caprioli J, Mock D, Bitrian E, Afifi AA, Yu F, Nouri-Mahdavi K, et al. A method to measure and predict rates of regional visual field decay in glaucoma. Invest Ophthalmol Vis Sci 2011;52:4765-73. http://dx.doi.org/10.1167/iovs.10-6414.
- Gardiner SK, Demirel S, Johnson CA, Swanson WH. Assessment of linear-scale indices for perimetry in terms of progression in early glaucoma. Vision Res 2011;51:1801-10. http://dx.doi.org/10.1016/j.visres.2011.06.009.
- Odberg T, Jakobsen JE, Hultgren SJ, Halseide R. The impact of glaucoma on the quality of life of patients in Norway. I. Results from a self-administered questionnaire. Acta Ophthalmol Scand 2001;79:116-20. http://dx.doi.org/10.1034/j.1600-0420.2001.079002116.x.
- Walsh E, Ayton P. What would it be like for me and for you? Judged impact of chronic health conditions on happiness. Med Decis Making 2009;29:15-22. http://dx.doi.org/10.1177/0272989X08326147.
- Melamed S, Ben Simon GJ, Levkovitch-Verbin H. Selective laser trabeculoplasty as primary treatment for open-angle glaucoma: A prospective, nonrandomized pilot study. Arch Ophthalmol 2003;121:957-60. http://dx.doi.org/10.1001/archopht.121.7.957.
- McIlraith I, Strasfeld M, Colev G, Hutnik CML. Selective laser trabeculoplasty as initial and adjunctive treatment for open-angle glaucoma. J Glaucoma 2006;15:124-30. http://dx.doi.org/10.1097/00061198-200604000-00009.
- Krug J, Chiavelli M, Borawski G, Devaney M, Melanson A, Epstein D, et al. The Glaucoma Laser Trial (GLT) and glaucoma laser trial follow-up-study. 7. Results. Am J Ophthalmol 1995;120:718-31.
- Juzych MS, Chopra V, Banitt MR, Hughes BA, Kim C, Goulas MT, et al. Comparison of long-term outcomes of selective laser trabeculoplasty versus argon laser trabeculoplasty in open-angle glaucoma. Ophthalmology 2004;111:1853-9. http://dx.doi.org/10.1016/j.ophtha.2004.04.030.
- El Sayyad F, Helal M, El-Kholify H, Khalil M, El-Maghraby A. Nonpenetrating deep sclerectomy versus trabeculectomy in bilateral primary open-angle glaucoma. Ophthalmology 2000;107:1671-4. http://dx.doi.org/10.1016/S0161-6420(00)00263-3.
- Kobayashi H, Kobayashi K, Okinami S. A comparison of the intraocular pressure-lowering effect and safety of viscocanalostomy and trabeculectomy with mitomycin C in bilateral open-angle glaucoma. Graefe Arch Clin Exp Ophthalmol 2003;241:359-66. http://dx.doi.org/10.1007/s00417-003-0652-6.
- Wilson MR, Mendis U, Paliwal A, Haynatzka V. Long-term follow-up of primary glaucoma surgery with ahmed glaucoma valve implant versus trabeculectomy. Am J Ophthalmol 2003;136:464-70. http://dx.doi.org/10.1016/S0002-9394(03)00239-3.
- Beckers HM, Kinders K, Webers CB. Five-year results of trabeculectomy with mitomycin C. Graefe Arch Clin Exp Ophthalmol 2003;241:106-10. http://dx.doi.org/10.1007/s00417-002-0621-5.
- Gedde SJ, Schiffman JC, Feuer WJ, Herndon LW, Brandt JD, Budenz DL. Treatment outcomes in the tube versus trabeculectomy study after one year of follow-up. Am J Ophthalmol 2007;143:9-22. http://dx.doi.org/10.1016/j.ajo.2006.07.020.
Appendix 1 Supplemental material for the health economic model
Treatment effects
Tables 24 and 25 present a collection of sources that inform the treatment effects in the model associated with each modality. The mean value represents the treatment effect while the highest and lowest MD reduction values represent the highest and lowest estimations used in sensitivity analysis.
| Source | Start IOP (mmHg) | End IOP (mmHg) | IOP reduction (mmHg) | IOP change (%) | MD reduction (dB) |
|---|---|---|---|---|---|
| Melamed et al. (2003)126 | 25.5 | 18.5 | 7.0 | 27.5 | –0.70 |
| Heijl (2002)28 | 20.6 | 15.5 | 5.1 | 24.8 | –0.51 |
| McIlraith et al. (2005)127 | 26.0 | 17.7 | 8.3 | 31.0 | –0.83 |
| Glaucoma Laser Trial (1995)128 | 27.2 | 17.7 | 9.5 | 35.0 | –0.95 |
| Juzych et al. (2004)129 | 24.3 | 17.0 | 7.3 | 30.0 | –0.73 |
| Average | –0.74 | ||||
| Source | Start IOP (mmHg) | End IOP (mmHg) | IOP reduction (mmHg) | IOP change (%) | MD reduction (dB) |
|---|---|---|---|---|---|
| El Sayyad et al. (2000)130 | 28.2 | 14.1 | 14.1 | 50.0 | –1.41 |
| Kobayashi et al. (2003)131 | 24.8 | 12.6 | 12.2 | 49.2 | –1.22 |
| Wilson et al. (2003)132 | 26.9 | 13.2 | 13.7 | 50.9 | –1.37 |
| Beckers et al. (2003)133 | 22.3 | 12.6 | 9.7 | 43.5 | –0.97 |
| Folgar et al. (2010)99 | 19.0 | 11.3 | 7.7 | 40.5 | –1.05 |
| Gedde et al. (2007)134 | 25.6 | 12.7 | 12.9 | 50.4 | –1.29 |
| Average | –1.22 | ||||
Transition probabilities
Tables 26–29 indicate how the probability of transitioning through the model was derived. Once the number of years until transition to the next threshold was identified, the probability of transition was identified by dividing 1 by this figure.
| Rate | State | Transition | State threshold | Change to threshold | Progression rate | Years to threshold | Transition probability |
|---|---|---|---|---|---|---|---|
| Slow | 1 | 1 > 2 | –6.01 | –2.90 | –0.25 | 11.60 | 0.09 |
| 2 > 3 | –12.01 | –6.00 | –0.25 | 35.60 | 0.03 | ||
| 3 > 4 | –20.01 | –8.00 | 0.00 | 0.00 | 0.00 | ||
| 2 | 2 > 3 | –12.01 | –3.59 | –0.25 | 14.36 | 0.07 | |
| 3 > 4 | –20.01 | –8.00 | 0.00 | 0.00 | 0.00 | ||
| 3 | 3 > 4 | –20.01 | –4.63 | 0.00 | 0.00 | 0.00 | |
| Medium | 1 | 1 > 2 | –6.01 | –2.90 | –1.00 | 2.90 | 0.34 |
| 2 > 3 | –12.01 | –6.00 | –1.00 | 8.90 | 0.11 | ||
| 3 > 4 | –20.01 | –8.00 | –0.28 | 37.09 | 0.03 | ||
| 2 | 2 > 3 | –12.01 | –3.59 | –1.00 | 3.59 | 0.28 | |
| 3 > 4 | –20.01 | –8.00 | –0.28 | 31.78 | 0.03 | ||
| 3 | 3 > 4 | –20.01 | –4.63 | –0.28 | 16.32 | 0.06 | |
| Fast | 1 | 1 > 2 | –6.01 | –2.90 | –1.50 | 1.93 | 0.52 |
| 2 > 3 | –12.01 | –6.00 | –1.50 | 5.93 | 0.17 | ||
| 3 > 4 | –20.01 | –8.00 | –0.78 | 16.14 | 0.06 | ||
| 2 | 2 > 3 | –12.01 | –3.59 | –1.50 | 2.39 | 0.42 | |
| 3 > 4 | –20.01 | –8.00 | –0.78 | 12.60 | 0.08 | ||
| 3 | 3 > 4 | –20.01 | –4.63 | –0.78 | 5.91 | 0.17 |
| Rate | State | Transition | State threshold | Change to threshold | Progression rate | Years to threshold | Transition probability |
|---|---|---|---|---|---|---|---|
| Slow | 1 | 1 > 2 | –6.01 | –2.90 | –0.25 | 11.60 | 0.09 |
| 2 > 3 | –12.01 | –6.00 | –0.25 | 35.60 | 0.03 | ||
| 3 > 4 | –20.01 | –8.00 | –0.25 | 67.60 | 0.01 | ||
| 2 | 2 > 3 | –12.01 | –3.59 | –0.25 | 14.36 | 0.07 | |
| 3 > 4 | –20.01 | –8.00 | –0.25 | 46.36 | 0.02 | ||
| 3 | 3 > 4 | –20.01 | –4.63 | –0.25 | 18.52 | 0.05 | |
| Medium | 1 | 1 > 2 | –6.01 | –2.90 | –1.00 | 2.90 | 0.34 |
| 2 > 3 | –12.01 | –6.00 | –1.00 | 8.90 | 0.11 | ||
| 3 > 4 | –20.01 | –8.00 | –1.00 | 16.90 | 0.06 | ||
| 2 | 2 > 3 | –12.01 | –3.59 | –1.00 | 3.59 | 0.28 | |
| 3 > 4 | –20.01 | –8.00 | –1.00 | 11.59 | 0.09 | ||
| 3 | 3 > 4 | –20.01 | –4.63 | –1.00 | 4.63 | 0.22 | |
| Fast | 1 | 1 > 2 | –6.01 | –2.90 | –1.50 | 1.93 | 0.52 |
| 2 > 3 | –12.01 | –6.00 | –1.50 | 5.93 | 0.17 | ||
| 3 > 4 | –20.01 | –8.00 | –1.50 | 11.27 | 0.09 | ||
| 2 | 2 > 3 | –12.01 | –3.59 | –1.50 | 2.39 | 0.42 | |
| 3 > 4 | –20.01 | –8.00 | –1.50 | 7.73 | 0.13 | ||
| 3 | 3 > 4 | –20.01 | –4.63 | –1.50 | 3.09 | 0.32 |
| Rate | State | Transition | State threshold | Change to threshold | Progression rate | Years to threshold | Transition probability |
|---|---|---|---|---|---|---|---|
| Slow | 1 | 1 > 2 | –6.01 | –2.90 | –0.25 | 11.60 | 0.09 |
| 2 > 3 | –12.01 | –6.00 | –0.25 | 35.60 | 0.03 | ||
| 3 > 4 | –20.01 | –8.00 | 0.00 | 0.00 | 0.00 | ||
| 2 | 2 > 3 | –12.01 | –3.59 | –0.25 | 14.36 | 0.07 | |
| 3 > 4 | –20.01 | –8.00 | 0.00 | 0.00 | 0.00 | ||
| 3 | 3 > 4 | –20.01 | –4.63 | 0.00 | 0.00 | 0.00 | |
| Medium | 1 | 1 > 2 | –6.01 | –2.90 | –0.28 | 10.22 | 0.10 |
| 2 > 3 | –12.01 | –6.00 | –0.28 | 31.36 | 0.03 | ||
| 3 > 4 | –20.01 | –8.00 | 0.00 | 0.00 | 0.00 | ||
| 2 | 2 > 3 | –12.01 | –3.59 | –0.28 | 12.65 | 0.08 | |
| 3 > 4 | –20.01 | –8.00 | 0.00 | 0.00 | 0.00 | ||
| 3 | 3 > 4 | –20.01 | –4.63 | 0.00 | 0.00 | 0.00 | |
| Fast | 1 | 1 > 2 | –6.01 | –2.90 | –0.12 | 25.08 | 0.04 |
| 2 > 3 | –12.01 | –6.00 | –0.12 | 76.96 | 0.01 | ||
| 3 > 4 | –20.01 | –8.00 | –0.12 | 146.13 | 0.01 | ||
| 2 | 2 > 3 | –12.01 | –3.59 | –0.12 | 31.04 | 0.03 | |
| 3 > 4 | –20.01 | –8.00 | –0.12 | 100.22 | 0.01 | ||
| 3 | 3 > 4 | –20.01 | –4.63 | –0.12 | 40.04 | 0.02 |
| Rate | State | Transition | State threshold | Change to threshold | Progression rate | Years to threshold | Transition probability |
|---|---|---|---|---|---|---|---|
| Slow | 1 | 1 > 2 | –6.01 | –2.90 | –0.25 | 11.60 | 0.09 |
| 2 > 3 | –12.01 | –6.00 | –0.25 | 35.60 | 0.03 | ||
| 3 > 4 | –20.01 | –8.00 | –0.25 | 67.60 | 0.01 | ||
| 2 | 2 > 3 | –12.01 | –3.59 | –0.25 | 14.36 | 0.07 | |
| 3 > 4 | –20.01 | –8.00 | –0.25 | 46.36 | 0.02 | ||
| 3 | 3 > 4 | –20.01 | –4.63 | –0.25 | 18.52 | 0.05 | |
| Medium | 1 | 1 > 2 | –6.01 | –2.90 | –0.28 | 10.22 | 0.10 |
| 2 > 3 | –12.01 | –6.00 | –0.28 | 31.36 | 0.03 | ||
| 3 > 4 | –20.01 | –8.00 | –0.28 | 59.56 | 0.02 | ||
| 2 | 2 > 3 | –12.01 | –3.59 | –0.28 | 12.65 | 0.08 | |
| 3 > 4 | –20.01 | –8.00 | –0.28 | 40.84 | 0.02 | ||
| 3 | 3 > 4 | –20.01 | –4.63 | –0.28 | 16.32 | 0.06 | |
| Fast | 1 | 1 > 2 | –6.01 | –2.90 | –0.12 | 25.08 | 0.04 |
| 2 > 3 | –12.01 | –6.00 | –0.12 | 76.96 | 0.01 | ||
| 3 > 4 | –20.01 | –8.00 | –0.12 | 146.13 | 0.01 | ||
| 2 | 2 > 3 | –12.01 | –3.59 | –0.12 | 31.04 | 0.03 | |
| 3 > 4 | –20.01 | –8.00 | –0.12 | 100.22 | 0.01 | ||
| 3 | 3 > 4 | –20.01 | –4.63 | –0.12 | 40.04 | 0.02 |
One-way analysis
Figures 22–24 present one-way deterministic sensitivity analysis of individual parameters and how their marginal variations impact on the resultant ICERs. Implementation costs, cost of visual impairment and time horizons were all examined by each cohort.
FIGURE 22.
One-way analysis of implementation costs.
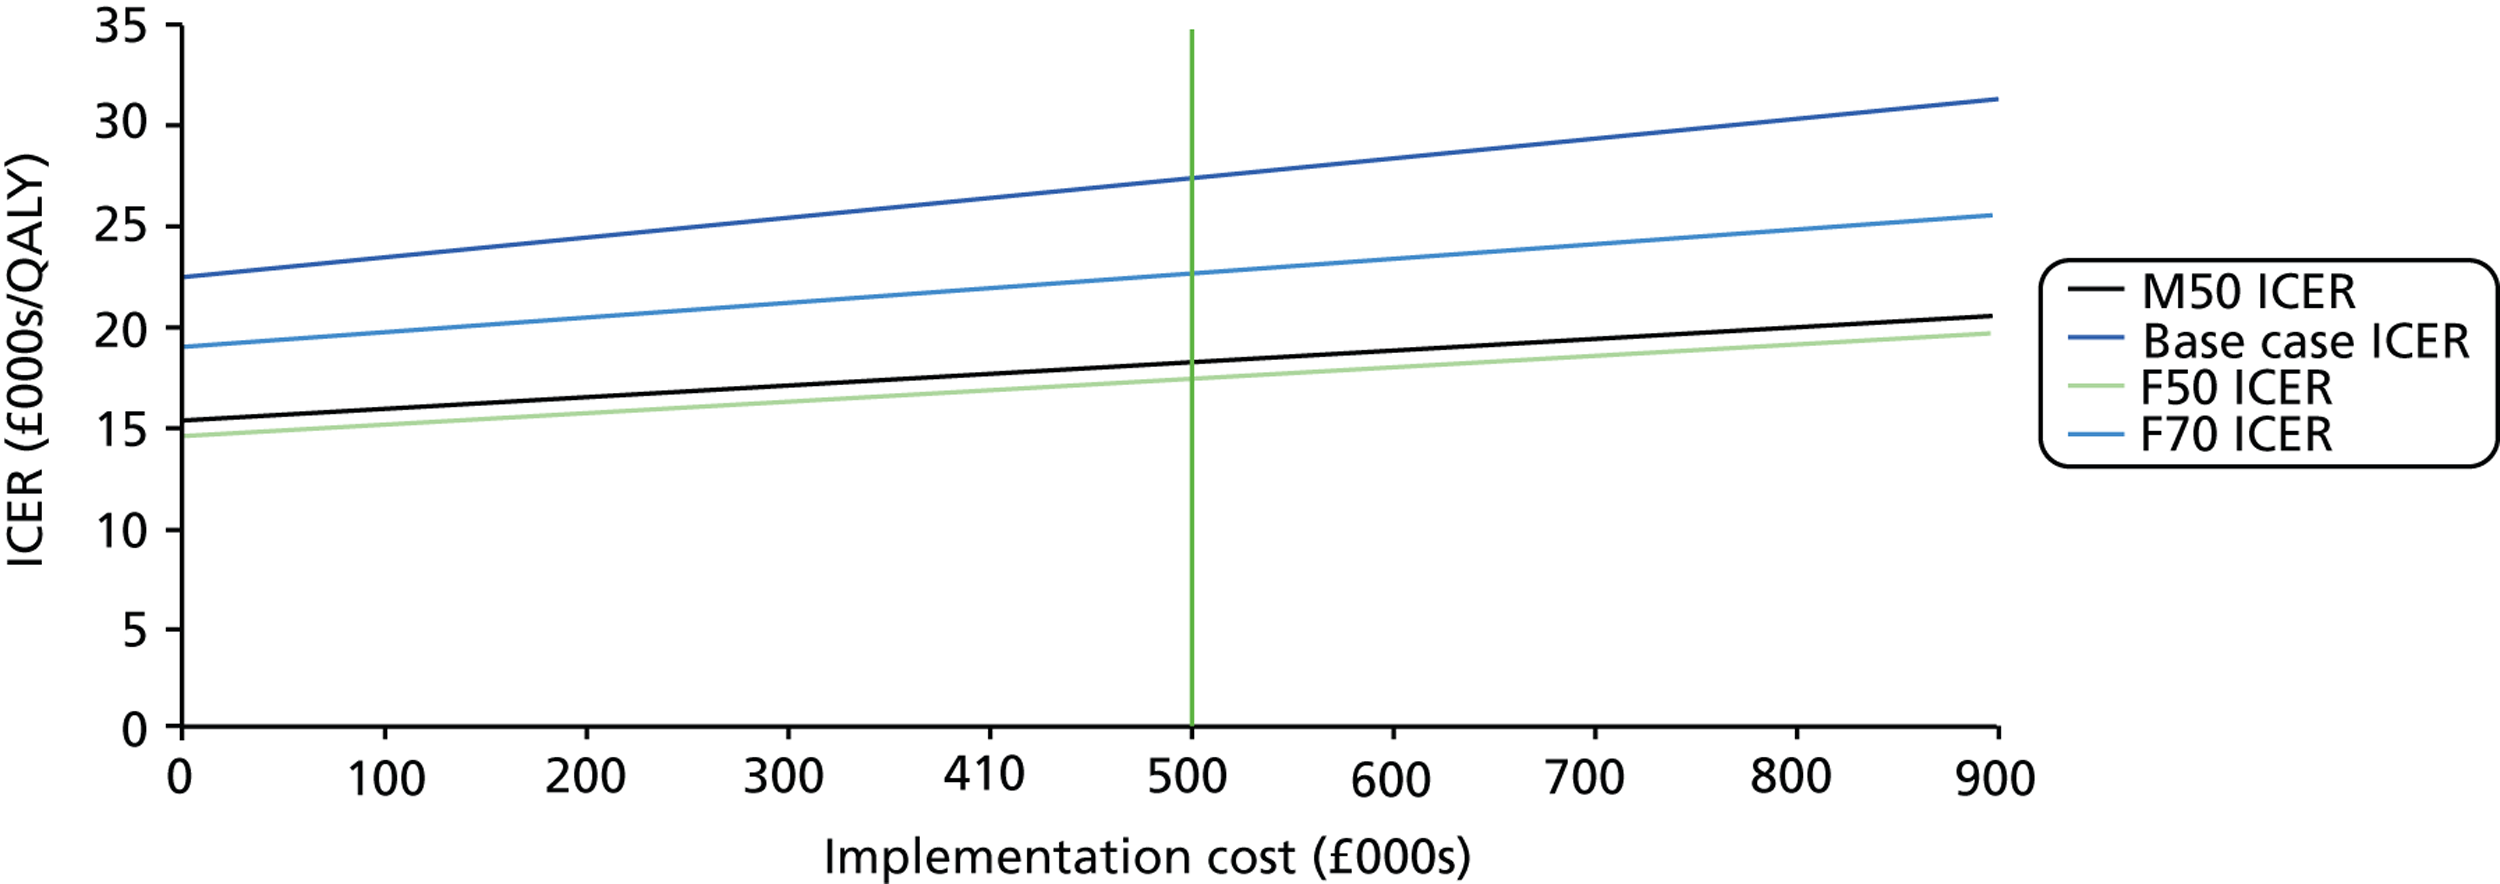
FIGURE 23.
One-way analysis of costs of visual impairment.
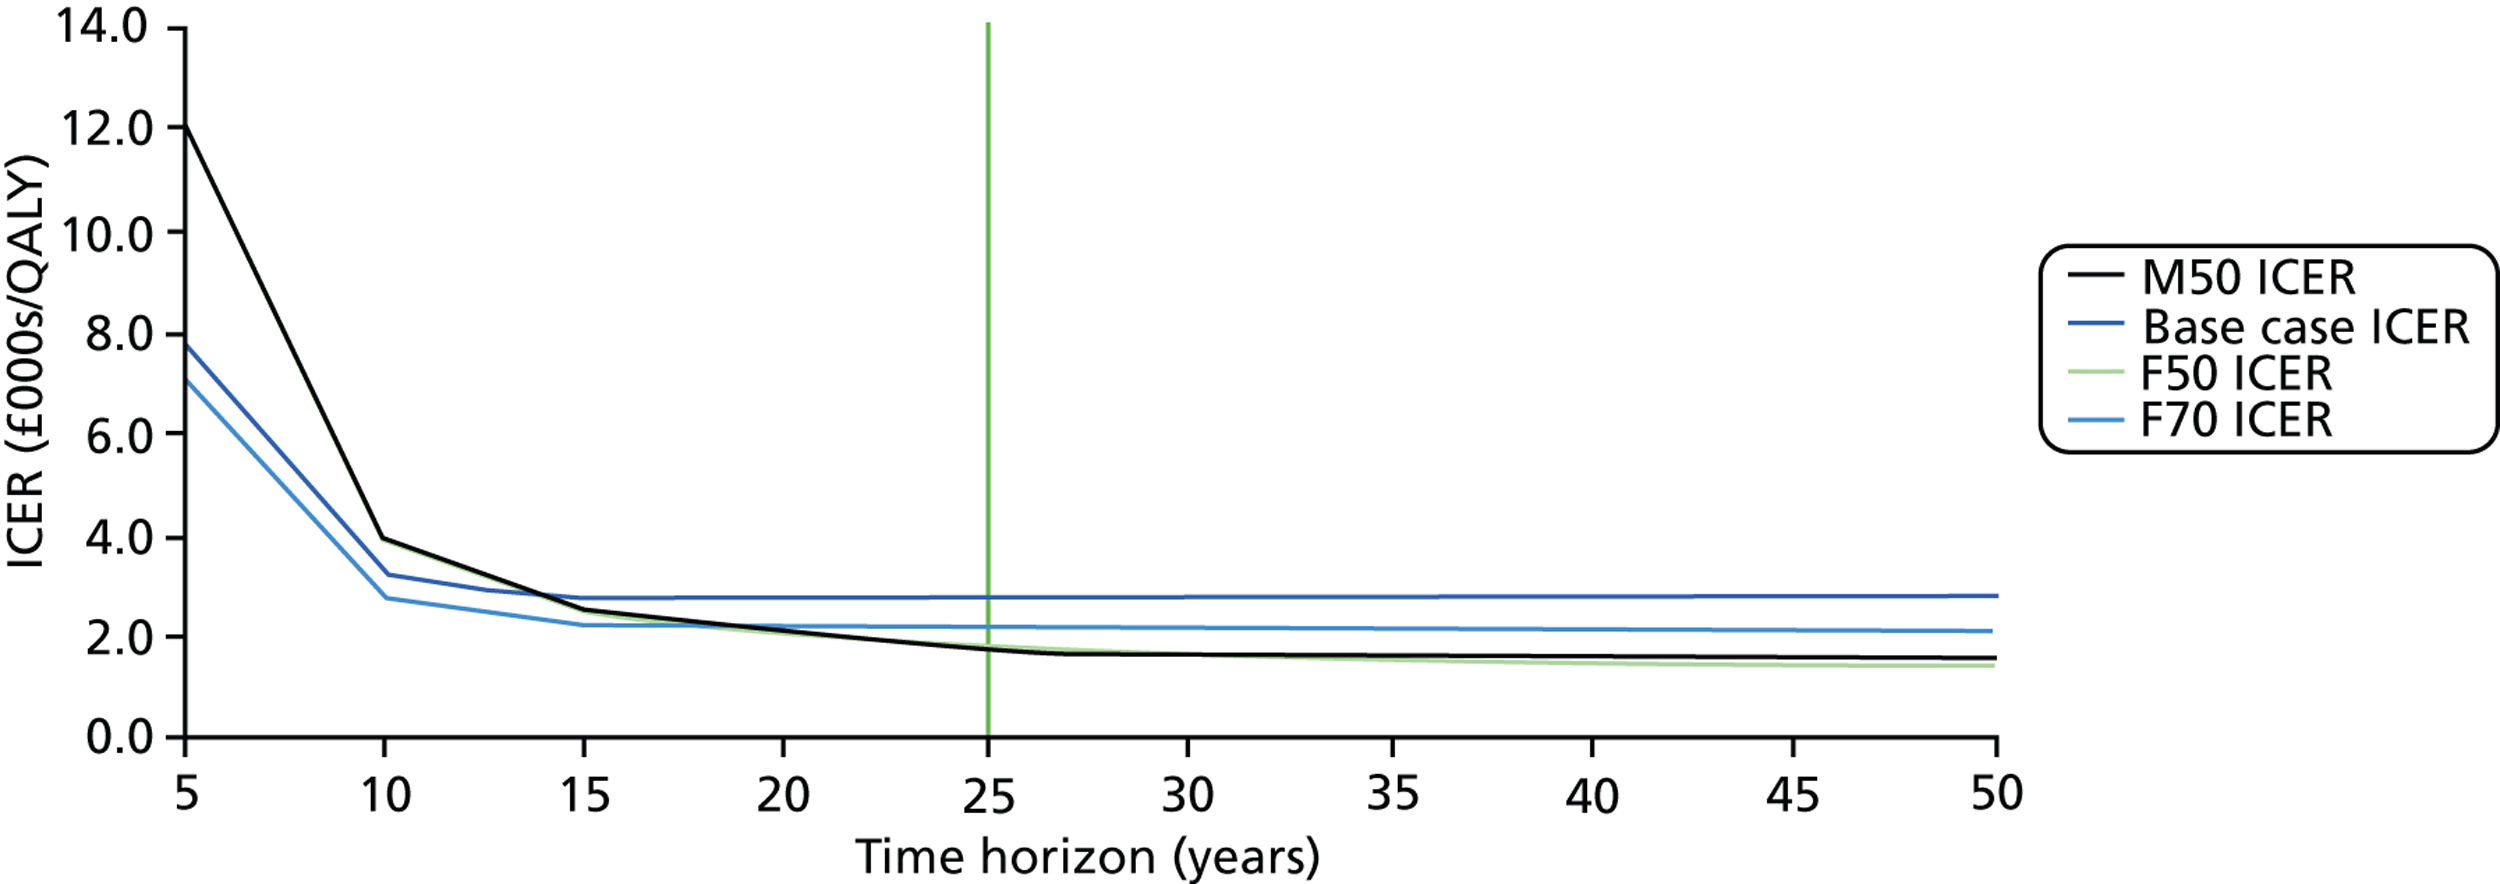
FIGURE 24.
One-way analysis of time horizons.
Tornado diagrams
A one-way tornado analysis of the parameters that derive the ICER is presented by cohort in Figure 25. Maximum and minimum parameter values were identified and the impact on the ICER for each cohort was identified, with parameters ordered by importance.
FIGURE 25.
Cohort tornado diagrams.
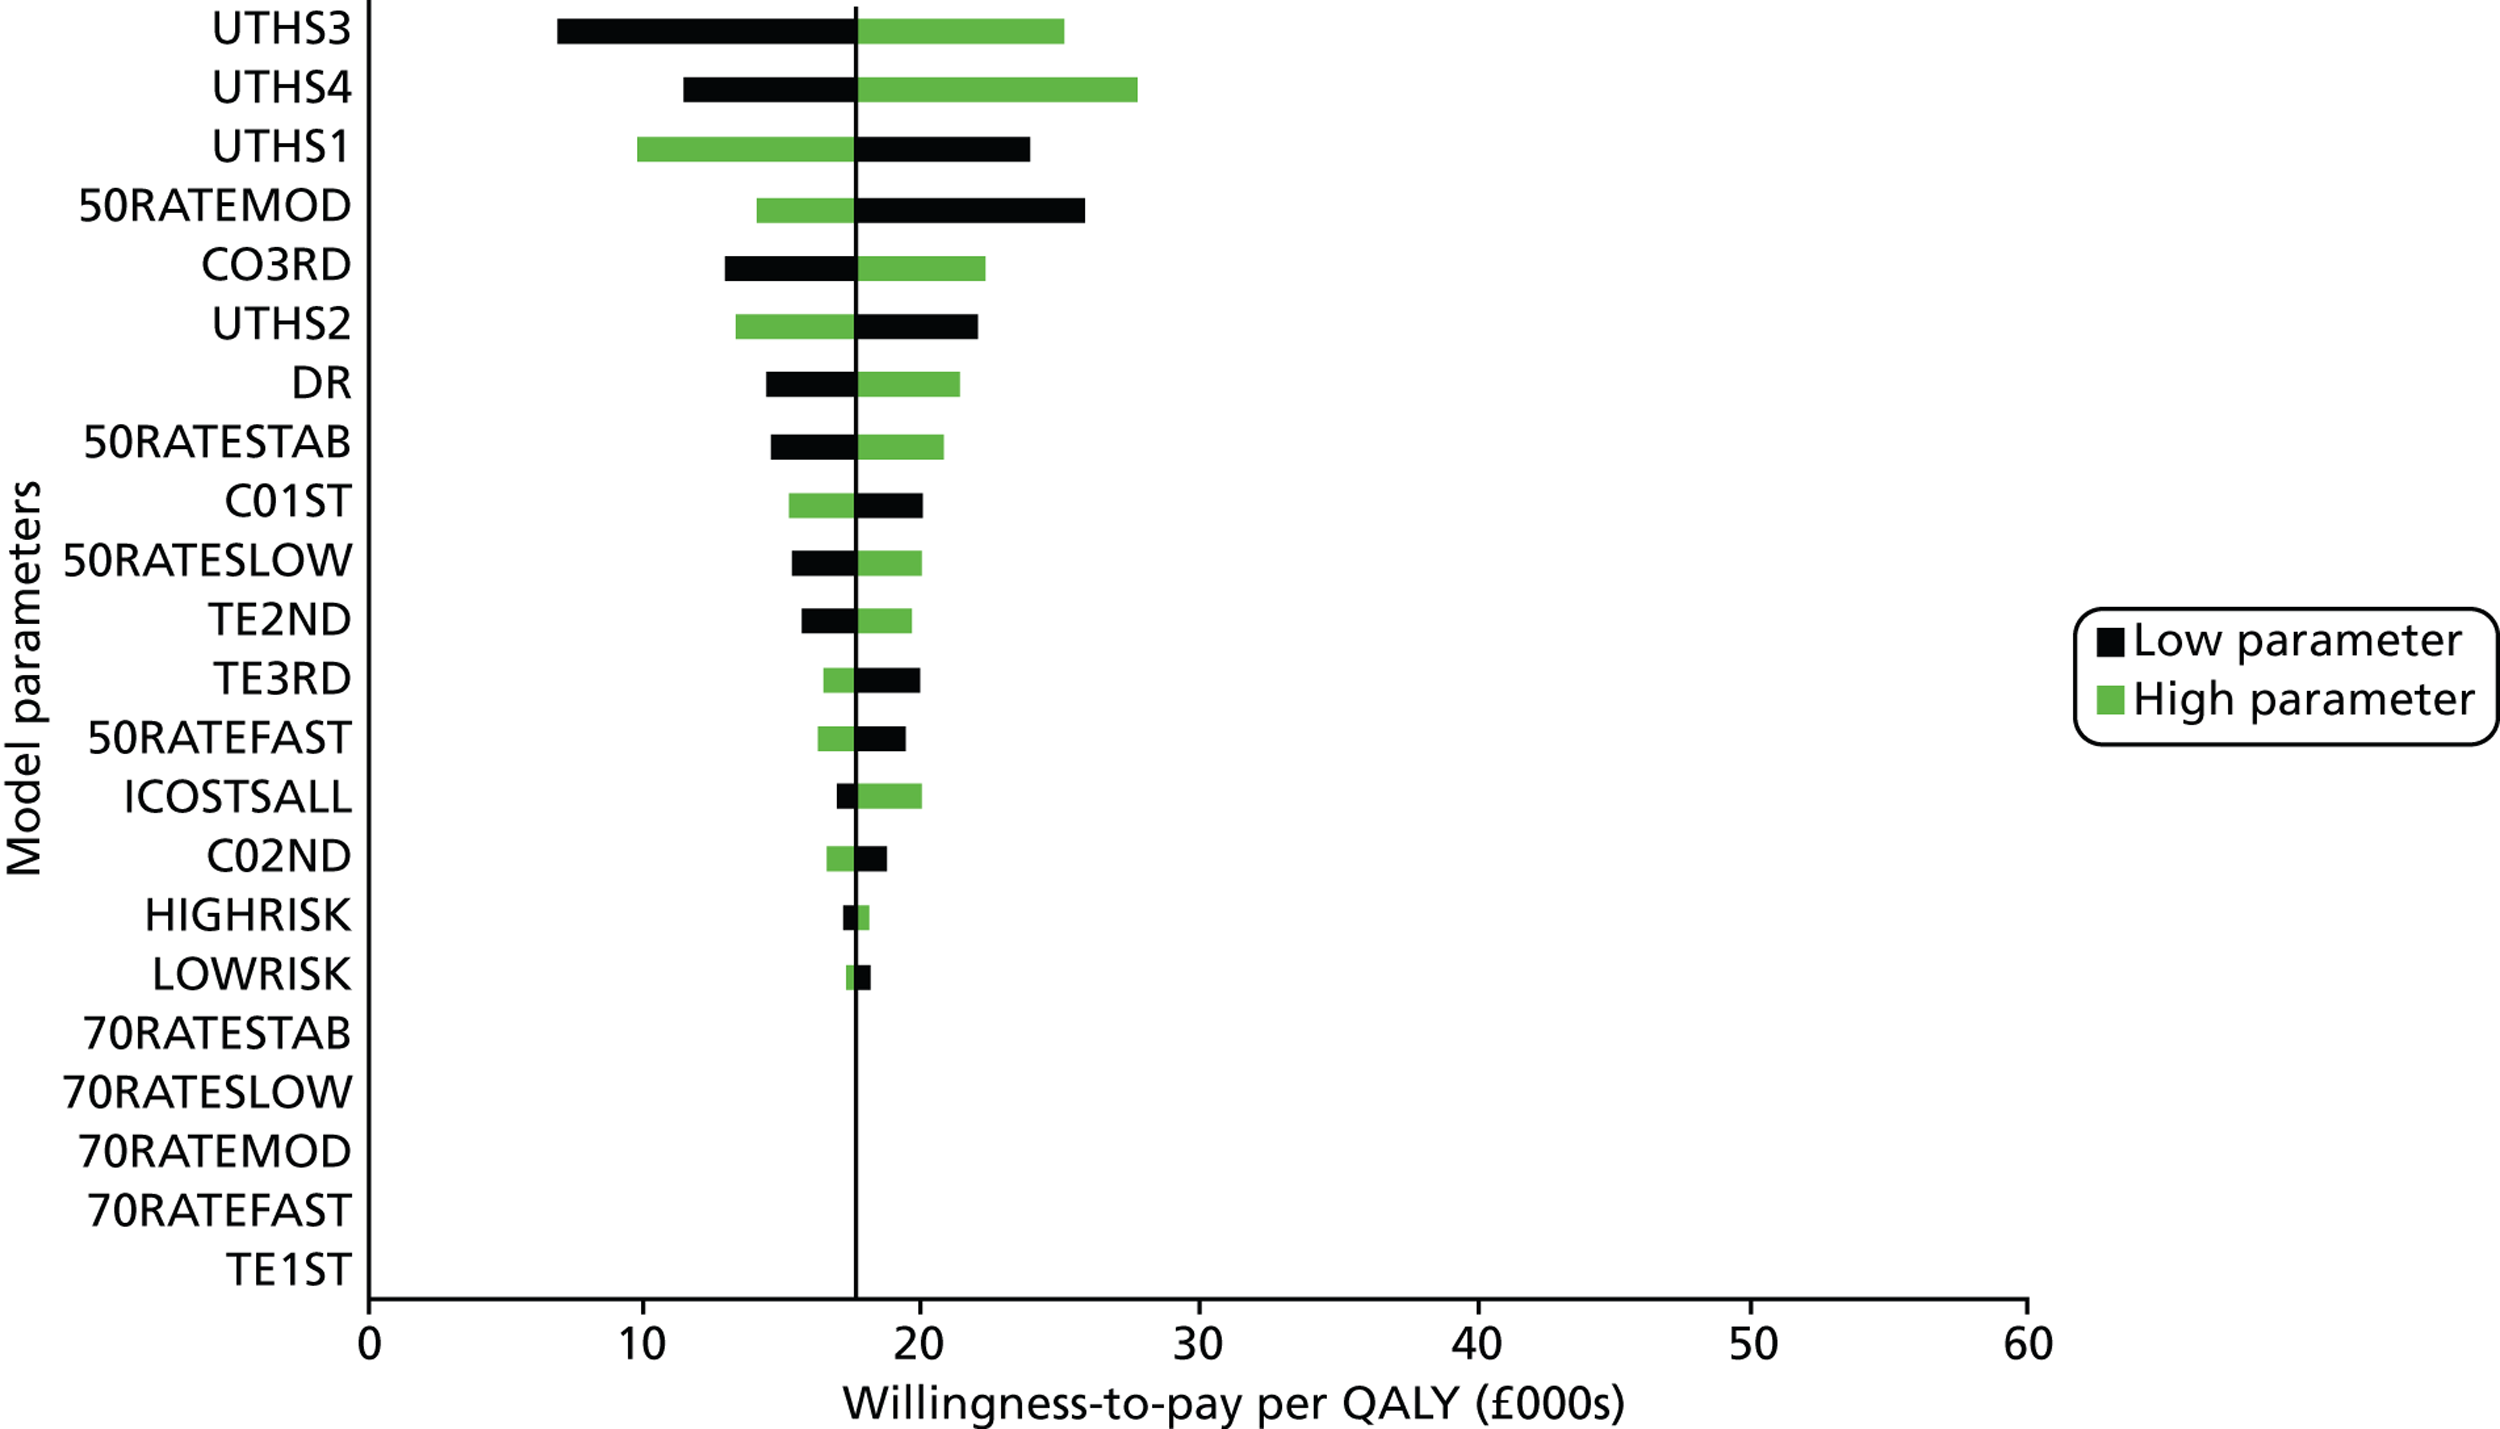
Combined probabilistic and deterministic sensitivity analysis
The analysis of the probability of acceptance at varying willingness to pay given baseline, maximum and minimum assumptions around influential parameters is presented in Tables 30–33. Cost per VF performed, discount rate, risk distributions and costs of visual impairment were all selected for analysis.
| Cohort | Parameter value (£) | Probabilistic cost-effectiveness for different thresholds of willingness to pay per QALY (%) | ||||
|---|---|---|---|---|---|---|
| £10,000 | £20,000 | £30,000 | £40,000 | £50,000 | ||
| Base case | 56.54 | 2.13 | 28.35 | 57.33 | 73.46 | 81.69 |
| 38.76 | 9.46 | 47.40 | 71.11 | 81.58 | 86.58 | |
| 70.45 | 0.52 | 16.53 | 44.63 | 64.56 | 75.48 | |
| M50 | 56.54 | 13.80 | 56.39 | 73.36 | 80.41 | 84.22 |
| 38.76 | 29.71 | 67.71 | 79.45 | 84.18 | 86.75 | |
| 70.45 | 6.81 | 46.38 | 67.44 | 76.76 | 81.59 | |
| F50 | 56.54 | 15.88 | 57.90 | 74.26 | 81.08 | 84.44 |
| 38.76 | 32.45 | 69.62 | 80.53 | 85.31 | 87.58 | |
| 70.45 | 7.72 | 49.99 | 69.63 | 78.69 | 82.96 | |
| F70 | 56.54 | 6.08 | 41.41 | 67.78 | 80.33 | 86.35 |
| 38.76 | 17.33 | 59.37 | 79.20 | 86.41 | 90.29 | |
| 70.45 | 2.02 | 29.42 | 57.33 | 73.52 | 81.58 | |
| Cohort | Parameter value (%) | Probabilistic cost-effectiveness for different threshold values of willingness to pay per QALY (%) | ||||
|---|---|---|---|---|---|---|
| £10,000 | £20,000 | £30,000 | £40,000 | £50,000 | ||
| Base case | 3.50 | 2.13 | 28.35 | 57.33 | 73.46 | 81.69 |
| 0.00 | 7.77 | 47.33 | 71.91 | 82.79 | 87.94 | |
| 5.00 | 0.98 | 20.74 | 49.13 | 67.49 | 77.56 | |
| M50 | 3.50 | 13.80 | 56.39 | 73.36 | 80.41 | 84.22 |
| 0.00 | 41.72 | 74.79 | 83.21 | 86.83 | 88.56 | |
| 5.00 | 6.85 | 46.81 | 67.31 | 76.69 | 81.62 | |
| F50 | 3.50 | 15.88 | 57.90 | 74.26 | 81.08 | 84.44 |
| 0.00 | 44.42 | 76.08 | 83.97 | 87.32 | 88.88 | |
| 5.00 | 8.00 | 49.36 | 69.72 | 77.98 | 82.14 | |
| F70 | 3.50 | 6.08 | 41.41 | 67.78 | 80.33 | 86.35 |
| 0.00 | 16.82 | 60.13 | 79.17 | 86.69 | 90.09 | |
| 5.00 | 3.65 | 34.62 | 61.59 | 76.11 | 83.48 | |
| Cohort | Parameter value (low risk : high risk) | Probabilistic cost-effectiveness for different threshold values of willingness to pay per QALY (%) | ||||
|---|---|---|---|---|---|---|
| £10,000 | £20,000 | £30,000 | £40,000 | £50,000 | ||
| Base case | 80 : 20 | 2.13 | 28.35 | 57.33 | 73.46 | 81.69 |
| 90 : 10 | 2.20 | 28.50 | 57.34 | 73.09 | 81.41 | |
| 70 : 30 | 1.63 | 26.62 | 55.06 | 70.98 | 79.84 | |
| M50 | 80 : 20 | 13.80 | 56.39 | 73.36 | 80.41 | 84.22 |
| 90 : 10 | 16.99 | 60.28 | 75.70 | 82.30 | 85.61 | |
| 70 : 30 | 11.45 | 53.70 | 71.83 | 79.65 | 83.67 | |
| F50 | 80 : 20 | 15.88 | 57.90 | 74.26 | 81.08 | 84.44 |
| 90 : 10 | 19.30 | 60.71 | 75.65 | 81.80 | 85.15 | |
| 70 : 30 | 13.35 | 55.56 | 72.87 | 79.85 | 84.04 | |
| F70 | 80 : 20 | 6.08 | 41.41 | 67.78 | 80.33 | 86.35 |
| 90 : 10 | 6.35 | 44.10 | 69.07 | 80.57 | 86.20 | |
| 70 : 30 | 5.17 | 39.92 | 66.86 | 79.56 | 85.79 | |
| Cohort | Parameter value (£) | Probabilistic cost-effectiveness for different threshold values of willingness to pay per QALY (%) | ||||
|---|---|---|---|---|---|---|
| £10,000 | £20,000 | £30,000 | £40,000 | £50,000 | ||
| Base case | 0 | 6.08 | 41.41 | 67.78 | 80.33 | 86.35 |
| 250 | 8.37 | 47.52 | 71.82 | 82.32 | 87.48 | |
| 500 | 11.88 | 51.41 | 73.65 | 83.64 | 88.63 | |
| 750 | 16.19 | 57.02 | 77.46 | 86.05 | 89.80 | |
| 1000 | 20.51 | 61.74 | 80.54 | 87.47 | 90.95 | |
| 1758.50 | 40.45 | 75.30 | 86.73 | 91.10 | 93.34 | |
| M50 | 0 | 13.80 | 56.39 | 73.36 | 80.41 | 84.22 |
| 250 | 20.26 | 62.00 | 76.07 | 82.74 | 85.84 | |
| 500 | 26.58 | 65.46 | 78.54 | 83.45 | 86.55 | |
| 750 | 35.87 | 70.68 | 81.23 | 85.38 | 87.52 | |
| 1000 | 43.77 | 73.86 | 82.61 | 86.45 | 88.30 | |
| 1758.50 | 67.67 | 83.47 | 87.76 | 89.83 | 90.82 | |
| F50 | 0 | 15.88 | 57.90 | 74.26 | 81.08 | 84.44 |
| 250 | 22.31 | 63.23 | 77.37 | 83.12 | 86.19 | |
| 500 | 30.39 | 68.10 | 79.61 | 84.30 | 86.86 | |
| 750 | 38.25 | 71.47 | 81.38 | 85.44 | 87.57 | |
| 1000 | 47.77 | 75.98 | 83.99 | 87.30 | 88.91 | |
| 1758.50 | 40.45 | 75.30 | 86.73 | 91.10 | 93.34 | |
| F70 | 0 | 6.08 | 41.41 | 67.78 | 80.33 | 86.35 |
| 250 | 8.37 | 47.52 | 71.82 | 82.32 | 87.48 | |
| 500 | 11.88 | 51.41 | 73.65 | 83.64 | 88.63 | |
| 750 | 16.19 | 57.02 | 77.46 | 86.05 | 89.80 | |
| 1000 | 20.51 | 61.74 | 80.54 | 87.47 | 90.95 | |
| 1758.50 | 70.53 | 84.52 | 88.46 | 90.23 | 91.42 | |
List of abbreviations
- ALT
- argon laser trabeculoplasty
- BCVA
- best corrected visual acuity
- CEAC
- cost-effectiveness acceptability curve
- CEP
- cost-effectiveness plane
- CI
- confidence interval
- COAG
- chronic open-angle glaucoma
- COS
- Canadian Ophthalmological Society
- DCE
- discrete choice experiment
- DES
- discrete event simulation
- DSA
- deterministic sensitivity analysis
- EGS
- European Glaucoma Society
- EQ-5D
- European Quality of Life-5 Dimensions
- FOS
- frequency of seeing
- HFA
- Humphrey Field Analyzer
- ICER
- incremental cost-effectiveness ratio
- IOP
- intraocular pressure
- IQR
- interquartile range
- log-MAR
- logarithm of the minimum angle of resolution
- MD
- mean deviation
- NICE
- National Institute for Health and Care Excellence
- OLSLR
- ordinary least squares linear regression
- ONH
- optic nerve head
- PSA
- probabilistic sensitivity analysis
- QALY
- quality-adjusted life-year
- RCT
- randomised comparative trial
- SAP
- standard automated perimetry
- SD
- standard deviation
- SITA
- Swedish interactive threshold algorithm
- TLR
- Tobit linear regression
- UKEGS
- UK and Eire Glaucoma Society
- VF
- visual field