Notes
Article history
The research reported in this issue of the journal was funded by the HS&DR programme or one of its proceeding programmes as project number 09/2000/58. The contractual start date was in April 2011. The final report began editorial review in May 2013 and was accepted for publication in July 2014. The authors have been wholly responsible for all data collection, analysis and interpretation, and for writing up their work. The HS&DR editors and production house have tried to ensure the accuracy of the authors’ report and would like to thank the reviewers for their constructive comments on the final report document. However, they do not accept liability for damages or losses arising from material published in this report.
Declared competing interests of authors
none
Permissions
Copyright statement
© Queen’s Printer and Controller of HMSO 2014. This work was produced by Gao et al. under the terms of a commissioning contract issued by the Secretary of State for Health. This issue may be freely reproduced for the purposes of private research and study and extracts (or indeed, the full report) may be included in professional journals provided that suitable acknowledgement is made and the reproduction is not associated with any form of advertising. Applications for commercial reproduction should be addressed to: NIHR Journals Library, National Institute for Health Research, Evaluation, Trials and Studies Coordinating Centre, Alpha House, University of Southampton Science Park, Southampton SO16 7NS, UK.
Chapter 1 Background
Place of death (PoD) is regarded and used as an outcome measure for end-of-life care. 1–3 It is important for public health planning and policy-making, and resource allocation, as well as effective service design and delivery. 4 It is closely related to the quality of life of the patient and their family members. A prospective and multicentre cohort study of 342 patients with advanced cancer and their carers found that those patients who died in a hospital or intensive care unit (ICU) had significantly worse quality of life, and they experienced more physical and emotional distress than patients who died at home with hospice service. 5 The study also found that, compared with home hospice death, ICU death was associated with a heightened risk for post-traumatic stress disorder and an increased risk for developing psychiatric illness in bereaved carers. 5 Similar associations are also evident in non-cancer terminal conditions, although the data are not as enriched as for cancer deaths. 6–8
Where a patient dies also has cost implications, as PoD is closely related to place of care and health-care utilisation. A large-scale empirical analysis on data from 58,732 Swiss residents revealed substantial and significant differences in health-care utilisation in the last 6 months of life according to PoD. 9 Those who died at home had only half of the expenditure on end-of-life care as those who died at hospital. Studies from other countries with similar or distinctive health-care systems are universally in agreement with the findings from the Swiss study, with reduced hospital admissions, short length of hospital stay and lower health-care costs all associated with dying at home. 10–14
The quality of care at the end of life is not only concerned with where people die, but also it is related to the preferred PoD and how people’s preferences are met when they are approaching the end of their life. 15 Evidence shows that the majority of people prefer to die at home, followed by a preference for hospice or residential home, with hospital being the least-preferred PoD. 16,17 However, hospital remains the most common PoD in most regions. 18 This is despite England being the country considered to be at the top of the quality-of-death ranking. 19
Place of death in England has been described at a population level in many different ways and from various angles, but most analyses are focused on a specific cause of death (CoD), are largely descriptive and cover only a short time period,20–22 limiting the comparability and interpretability of the research findings. Death registration data provide the most comprehensive record of deaths registered so far within each region. In England (and Wales), deaths should be registered within 5 days of the death occurring. Although there are some situations that result in death registration being delayed (e.g. if a death is unexpected, accidental or suspicious and is referred to a coroner for investigation), if analysing annual trends from non-external causes then the impact of delays to death registration is minor. 23
Temporal patterns in mortality are well recognised in a wide range of diseases. A Hong Kong-based study demonstrated that the effects of influenza on mortality were higher in winter and late spring/early summer than in other seasons. This two-peak pattern of seasonal effects on influenza was found for cardiorespiratory disease and subcategories pneumonia and influenza, chronic obstructive pulmonary disease (COPD), cerebrovascular diseases (CBDs) and ischaemic heart disease as well as for all-cause deaths. 24 Studies from England found that excess winter death (EWD) had clear seasonal patterns in deaths related to the following conditions: circulatory, coronary heart disease, stroke, respiratory, influenza and pneumonia or chronic lower respiratory diseases. 25,26 Increased risk of death has also been reported in relation to some specific time periods, for example when trainee/inexperienced doctors are on duty, at the weekend, and across the Christmas and New Year periods. 27–29 These studies confirm the presence of the temporal patterns in deaths; however, to our knowledge, no study has examined whether or not and how these patterns are affecting end-of-life care.
There are four basic health-care models in the world: the Beveridge model, the Bismarck model, the National Health Insurance model and the out-of-pocket model. 30 England represents the Beveridge model, in which health care is provided and financed by the government through tax payments. England is also the pioneer of hospice care. Therefore, a full review of PoD in England will provide important data on the quality of end-of-life care, identifying the gaps and the best way forward through contrasting information from various perspectives, for example regional and temporal variations, not only useful for England, but also relevant in international contexts. Understanding regional variation is useful for setting up priority agendas, identifying service gaps and informing resource allocation; the temporal variation is of particular value in making our service more responsive to service user’s needs, and understanding better variations in demanding, and more effectively using, existing health-care resources.
This report has been produced to describe the variations in PoD, and the factors that affect these, in order to improve the quality of care at the end-of-life and to enable more patients to die in their preferred PoD. The main objectives of this report are to (1) describe PoD in England by demographic, socioeconomic and temporal variables; (2) determine how much of the variation in PoD can be explained by potential explanatory variables at the area level, and building on this to develop individual-level multivariable regression models; and (3) evaluate factors associated with PoD and to construct risk assessment models to inform practice. The analysis has been run separately for the following seven defined causes of deaths: all causes, non-cancer, cancer, cardiovascular diseases (CVDs), CBDs, neurological conditions and COPDs.
Chapter 2 Methods
Data source
The death registration data collected by the Office for National Statistics (ONS) constitute the main data source for this report. Death registrations are widely recognised and used as a reliable data source to study and monitor the PoD in society. Death registration is the legal recording of all deaths in England and Wales. By law in England, a death must be registered within 5 days of its occurrence, although this period may be extended in certain circumstances, i.e. when a death is referred to a coroner. The death must be registered by a qualified informant and this person must be one of the following: (1) a relative, usually the closest; (2) someone who was present at the death; (3) someone who is instructing the funeral director; or (4) another person may qualify as an informant (in rare circumstances). It is possible to register the death as soon as the informant has obtained either a ‘Medical Certificate of Death’ from the hospital/doctor or a Form Part B from the coroner’s office, the only exception being when an inquest is being held. In this case the registration of death will occur only once the coroner has given his/her permission. A death can be registered only in the registration district in which the death occurred.
The death registration data reviewed in this report were based on the details collected after deaths have been certified and registered. There are some situations that resulted in the registration of the death being delayed. Those deaths referred to coroners may take many months or even years to be registered, and the ONS is not notified that a death has occurred until it is registered. Therefore, the death registration data collected by the ONS can only capture the deaths that are registered in a particular period, rather than the number of deaths that actually occurred in that period.
However, the cases of delays in death registration account for only a small minority of all deaths. For example, in 2011 there were 484,367 deaths registered in England and Wales, of which 463,450 occurred in 2011, representing 95.7% of the deaths registered; the proportion of registered deaths compared with those that occurred varies in terms of the underlying CoD.
In 2011, except for the causes of death [pregnancy, childbirth and the puerperium (chapter 15); external causes of morbidity and mortality (chapter 20)],31 the proportion of deaths registered in the same year as they occurred was consistently above 90% in all other causes of death. A further breakdown shows 98.1% for neoplasms, 96.1% for the nervous system, 97.1% for the circulatory system, and 96.6% for the respiratory system. 23
The information contained in the ONS database includes details from the death certificate: PoD, the deceased’s usual residential address, gender, date of death, date of birth, country of birth, the deceased’s occupation, marital status, informant relationship, underlying CoD and any mentioned CoD. Information on derived area-level variables based on place of usual residence, for example area-level deprivation indicator, local authority (LA) and primary care organisation (PCO) were also available. Prior to 2001, the CoD was coded according to the Ninth Revision of the International Classification of Diseases (ICD-9);32 from 2001, deaths were coded using the Tenth Revision of the International Classification of Diseases (ICD-10). 31
The CoD recorded on the death certificate consists of two parts: Part I and Part II. Part I is used to show the immediate CoD and any underlying cause or causes. Part II is used for any significant condition or disease that contributed to the death but which is not part of the sequence leading directly to death. In the death registry database, an underlying CoD is accompanied by a varied number of causes of death mentioned on the death certificate. The rules of determining the underlying CoD have been changed over time, introducing challenges to the interpretation of the data particularly for the time trend analysis. The rule changes mainly concern the method of selecting the underlying CoD, which has a different impact on disease-specific mortality statistics. 33
Study sample, design and settings
This is a population-based cross-sectional study. All deaths registered between 1984 and 2010 in England were included in the data set (n = 13,264,769) but excluding the following two groups: (1) all external causes of death, and (2) all of those who died at the age of ≤ 24 years, which, in total, account for 0.83% of all deaths. The focus on non-external causes of death is driven by the fact that these are the deaths that could have potentially benefited from palliative and end-of-life care planning. Children and young people have very different end-of-life care needs, so have been excluded to maintain sample homogeneity. 34
Outcome variables
The outcome variable was the PoD. The classification of the PoD was different according to the time period, detailed as below:
-
From 1984 to 1992 There were four categories, consisting of hospital, own home, other communal establishment and elsewhere. Hospitals included UK NHS and non-NHS non-psychiatric and psychiatric hospitals, and NHS and non-NHS nursing homes. ‘Hospice’ was not classified as a separate category but was usually included as a nursing home in the hospital category. ‘Other communal establishment’ comprised non-hospital communal places (e.g. residential home, social services home). All other deaths in places not included in the listed categories were grouped into ‘elsewhere’.
-
From 1993 to 2010 There were six categories, comprising hospital, own home, hospice, care home (including residential homes with and without nursing), other communal establishment and elsewhere. The proportion of hospital deaths in this period was therefore smaller than the earlier period, as hospice and nursing homes were counted separately. Accordingly, the proportion of deaths in ‘other communal establishment’ was also smaller, as these previously were communal places excluding care home with nursing.
In both periods, we grouped psychiatric hospitals with all other hospitals, as we assume that both types of hospitals had similar facilities for end-of-life and palliative care. We did not have sufficient information to identify the deaths that happened in palliative care wards within a hospital. Therefore, a death that occurred in hospital palliative care ward was counted as the death in hospital.
Explanatory variables
Two types of explanatory variables have been used for this analysis: individual level and area level. Individual-level variables included age, gender, underlying CoD, marital status, year of death, and the location of usual residence. Area-level variables were obtained through record linkage of the usual residence at the lower layer super output area (LSOA) level or other appropriate geographic boundaries. LSOAs are a geographic boundary designed to improve the reporting of small area statistics in England and Wales. Each LSOA has an approximately similar population size, ranging from 1000 to 3000 (average 1500) and contains 400–1200 households. There are a total of 32,482 LSOAs in England. LSOA boundaries have been subject to minor changes over time. The impacts and implications of these changes on this analysis are varied depending on purposes. 35
Age was predominantly analysed as a categorised variable in five groups: 25–54, 55–64, 65–74, 75–84 and 85+ years. The grouping took into account the commonly used age cut-off values to facilitate cross-study comparisons, and also the usefulness for policy development and targeting improvement. Gender was a binary variable (female vs. male).
The underlying CoD was classified into seven classes: all CoDs, excluding external CoDs; all non-cancer CoD; cancer; CVDs, CBDs, neurological conditions and COPDs. The International Classification of Diseases (ICD) codes used to identify these causes of death are listed in Table 1.
| CoD | ICD-9 (1984–2000)32 | ICD-10 (2001–10)31 |
|---|---|---|
| All excluding external | 001–799 | A00–R99 |
| All cancer | 140–209 | C00–C97 |
| All non-cancer | All excluding 140–209 | All excluding C00–C97 |
| CVDs | 390–429, 440–456 | I00–I52, I70–I99 |
| CBDs | 430–439 | G45-G46, I60–I69 |
| Neurological conditions | 330–337, 340 | G35–G37, G20, F02.3, G12 |
| COPDs | 490–492, 494–496 | J40–J44, J47 |
We planned to use the ‘country of birth’ variable but, when we looked into the details of this variable, we found coding inconsistencies that made its use problematic. The main problems were:
-
No country of birth information for pre-1988 data.
-
Pre- and post-1993 had substantially different recording schemes – the pre-1993 scheme had only 100 distinct codes recording country of birth, whereas the post-1993 scheme had a much more detailed set of country of birth codes, making the grouping and comparability with the earlier period significantly compromised.
-
Post-1993 codes were also problematic. In 2006, there was a coding scheme change by the ONS, with some codes in earlier periods overlapping with the later periods. For example, 012 was ‘Austria’ in the old scheme but was defined as ‘Algeria’ in the new scheme; 090 was ‘Hong Kong’ before and then as ‘Solomon Islands’ after. This made the 2006 data unusable.
Furthermore, there was a very imbalanced distribution of the country of birth variable across different disease groups. In some subgroup analysis it was hard to make sense or maintain statistical efficiency if we were to keep this variable as an explanatory variable. Therefore, we decided to use this section of information only in a specific subgroup analysis (see Appendix 2, Conferences abstracts and presentations, item 10).
Notwithstanding the difference in pre- and post-coding schemes, the data show that those who died in the study period were predominantly born in the UK (overall 91.3%; range 91.1% to 96.3%). On average, the pre-1993 coded data produced a consistently higher proportion of UK-born deaths than the post-1993 scheme (96.1% vs. 92.7%), suggesting a systematic discrepancy between the two coding systems. However, we acknowledge that the pre- and post-1993 difference may partly reflect a genuine consequence of changing levels of immigration over the middle decades of the twentieth century. We also tested the disease-specific distribution of the country of birth using the 2007–10 data. Post-1993 data also showed that 92.8% of those who died were born in the UK.
For the aforementioned reasons and findings from the empirical data, we do not feel there was merit to include this variable in the standard set of explanatory variables in the report. After consulting and discussing with the Project Advisory Group and the project team members, we decided to separately analyse the ‘country of birth’ variable in a subanalysis, through which we investigated the PoD with a special focus on ethnicity. To allow for full-scale exploration of the ethnicity issue, we chose London – a metropolitan city with high ethnic diversity – as the primary study sample (see Appendix 2, Conferences abstracts and presentations, item 10).
Marital status was included as an individual-level variable and grouped into five classes: married, widowed, divorced, single, and not stated or unknown. Marital status was not available in the data before 1988, and before 1993 the variable was not consistently coded, therefore analysis using this variable was carried out only for post-1993 data. Year of death was directly extracted from the date of death, as recorded on the death registration record. This was therefore the year that the death occurred.
The location of usual residence was used to derive in which health authority region the deceased had lived: North East, North West, Yorkshire and the Humber, East Midlands, West Midlands, East of England, London, South East Coast, South Central and South West.
An area-level variable – the Index of Multiple Deprivation (IMD) – was used in this report as a proxy measure of socioeconomic status (SES). The IMD is a measure of multiple deprivation for small areas in England. 36 Four versions of the IMD have been developed over the study period: IMD 2000, IMD 2004, IMD 2007 and IMD 2010. The IMD 2000 was measured at ward level, whereas the other IMD versions were measured at the LSOA level. The IMD is a composite of domains related to different aspects of deprivations. The IMD 2000 was based on six domains (income; employment; health deprivation and disability; education, skills and training; housing; geographical access to services). The later versions of the IMD were based on a consistent seven domains: income; employment; health and disability; education, skill and training; barriers to housing and services; living environment; and crime. A higher score in the indices indicates a higher level of deprivation. The areas were ranked by the IMD score and split into quintile groups (1 = most deprived, 5 = least deprived). Although the original area-specific composite scores of the IMD may have changed over time, the change in the quintile ranking score was not significant. There were significant changes in IMD ranking between IMD 2000 and the later versions of IMD; however, the IMD ranking movement was minimum between IMD 2004, IMD 2007 and IMD 2010 (Table 2). Therefore, we used IMD 2000 for the 1984–2000 data and IMD 2010 for the 2001–10 data.
| Quintile score | IMD 2000 | IMD 2004 | IMD 2007 | IMD 2010 |
|---|---|---|---|---|
| IMD 2000 | – | 55 | 56 | 57 |
| IMD 2004 | 12.7 | – | 19 | 24 |
| IMD 2007 | 13.7 | 0.1 | – | 17 |
| IMD 2010 | 14.8 | 0.3 | 0.0 | – |
We derived two temporal variables for this report: seasonal period (spring, summer, autumn, winter) and holiday period (Christmas, New Year and Easter). The seasonal period was defined by month of death according to the following cut-off: spring (March to May), summer (June to August), autumn (September to November) and winter (December to February). The Christmas, New Year and Easter holiday periods were defined as 3 days before and after the specified holiday. For example, a Christmas period was 3 days before and after 25 December, totalling seven calendar days (1 week). Weeks outside the holiday periods were defined as a normal period.
The pre-1993 data did not have the ‘informant relation’ variable, whereas 10.3% of the post-1993 death records had a ‘missing’ value for this variable. The ‘informant relation’ was noted in the database as ‘loosely coded’ short text, and therefore had little value as a proxy for indicating the social support of the deceased. There was no further information in the database available to compensate this. Therefore, we decided not to use ‘informant relation’ in this report.
Statistical analysis
Before the analysis, data were checked for completeness, problems and errors. Records with missing, illogical and invalid values on aforementioned variables were deleted. These included illogical range of data values, for example age > 300 years, year of death outside 1984–2010, month of death > 12 or < 1 and missing data on PoD.
Data were described for their characteristics, mainly using frequency, percentage and 95% confidence interval (CI). Continuous data were categorised as a categorical variable but also estimated for mean, median, standard deviation (SD) and range. The data were described for all listed causes of death in Table 1. The bivariate relationship between explanatory variables and PoD was plotted using appropriate graphs and the difference across groups was investigated using Pearson chi-squared statistics. The regional variation in PoD was displayed using geographic information system (GIS). PoD was described as a four- or six-category variable, depending on the time period.
Variations in PoDs at the aggregate LSOA level were analysed and modelled using a weighted linear regression model. The dependent variable was the area-specific percentage of hospital deaths, with the total number of deaths at the selected area level as one of the adjusted variables. The proportion that can be explained by the model was derived from the model and measured by a R square. The explanatory variables were derived from the data and introduced into the models as the percentage of defined subcategory (e.g. percentage female) or the average value for continuous data (e.g. age). The models were constructed using the data for the 1993–2010 period, as there were a limited number of demographic variables for the period 1984–92, and the geographic boundaries had changed significantly from the earlier period to the later periods. The explanatory variables included average age, percentage male, percentage married, year of death, average IMD score, percentage winter deaths or percentage deaths in the Christmas period. Area was defined at the PCO and LA levels, and modelled separately.
Factors associated with PoD were investigated using binomial regression models, or modified Poisson regression models in the case of convergence problem. 37,38 The dependent variable was a binary indicator of PoD. We considered the least preferred PoD [hospital (1)] compared with the number two or number three most common places of death (0), which was determined by the CoD of interest. All selected independent variables, as informed by the area-level modelling analysis and also checks for multicollinearity using variance inflation factor, were forced to stay in the model to adjust for potential confounding effects. The top three factors most strongly and significantly associated with PoD were tested for significance of the two-way interaction effects. The interaction effect was introduced into the model as a multiplicative term (e.g. age*cancer, age*marital status*cancer) along with the main effects. The prevalence proportion ratio, referred to in this report as proportion ratio (PR), derived from the multivariable models, was used to measure the strength of the association. The PR is a more appropriate relative risk measure than the widely misused odds ratio (OR); the latter tends to overestimate effect size, particularly when the outcome event of interest is common (≥ 10%). 39
We also constructed individual-level risk assessment models for listed CoDs, to assess an individual’s risk of dying in the hospital or non-hospital settings. A non-hospital was a place other than a NHS- or non-NHS hospital. Given the changing patterns we have found in a recently published study on cancer deaths in England,18 we used the recent 2006–9 data as the training set to build the model, and its predictive performance was tested using the 2010 data (validation set).
The model construction followed similar procedures, using binomial models or Poisson regression models in case of convergence problem of the former. Individual-level geographical and temporal variation modelling analysis involved additional steps to include all of the statistically significant or practically meaningful interaction effects. We used a stepwise selection method to select variables to be included in the final risk assessment model. 40 All variables or interaction terms that stayed in the final model needed to have a p-value of < 0.05 in the type 3 score statistics test. 41 Where possible, continuous variables were introduced, as this was found to be a more efficient way of using the available information. 42–46 We did not test for collinearity, as the primary concern for the model building was the prediction of accuracy for the risk of dying in hospital compared with a non-hospital setting. 47 The model performance validation was evaluated using (1) a Wald chi-squared test and (2) the area under the receiver operating characteristic curve (AUC) and its 95% CI. The AUC is a widely used statistical measure for assessing the discriminatory capacity of a predictive model. It represents the overall accuracy of the model, independent of the cut-off value. The AUC range goes from 0.5 to 1, with 0.5 showing no discrimination and being equivalent to coin tossing; an AUC value of 0.7 indicates good discriminating ability. 48
All analysis was carried out separately for all causes, non-cancer, cancer, CVD, CBD, neurological conditions and COPD. As this study is exploratory in nature, we did not adjust p-values for multiple testing. A p-value of < 0.05 is considered to be statistically significant. Data manipulation and statistical analysis were implemented by SAS 9.3 (SAS Institute Inc., Cary, NC, USA). Graphical presentations were completed by R 3.0.0 (The R Foundation for Statistical Computing, Vienna, Austria) and SAS 9.3.
Ethics
All analyses were based on fully anonymised patient-level records; therefore, no ethical approval was required according to the Information Commissioner’s Office guidelines, ONS procedures and those of the King’s College London’s (KCL) Research Ethics Committee. We have obtained an ethical clearance letter from the KCL ethics office. Following ONS procedures, a data access agreement was signed by both parties (researchers and ONS), and copies of all required forms were provided in a formal agreement of data management and protection for the project. Individual members of the project team had data access approvals from ONS.
Chapter 3 Results
Characteristics of the study sample
In total, 1716 (0.037%), 1471 (0.037%) and 1535 (0.034%) records with missing, illogical and invalid values on the standard sets of variables were deleted in periods of 1984–92, 1993–2000 and 2001–10, respectively. From 1984 to 2010, there was a total of 13,154,705 deaths (Table 3). The average annual death remained relatively stable at around 500,000 before 2001 but with a declining trend in the most recent 10-year period (n = 456,770). People died at an increasingly older age, with average age at death of 75.3 years in 1984–92, 76.8 years in 1993–2000, and 77.9 years in 2001–10. The proportion of those who died at > 75 years increased from 58.2% in 1984–92 to 67.9% in 2001–10. Slightly more women than men died in the study period (52.4% vs. 47.6%). CVDs were the most common CoD before 2001 (34.5%) but were overtaken by cancer (27.8%) and became the second most common CoD (26.9%) in the most recent 10-year period. CBD deaths also showed an overall reducing trend (12.7% in 1984–92, 10.4% in 2001–10). Those who were ‘widowed’ made up the largest proportion of the deceased (43.8%). ‘Married’ people accounted for around two in five deaths (40.2% and 38.5% in 1993–2000 and 2001–10, respectively).
| Variable | Value | 1984–92 | 1993–2000 | 2001–10 |
|---|---|---|---|---|
| All | All | 4,588,315 | 3,998,686 | 4,567,704 |
| Age, years (continuous) | Mean (SD), median (min., max.) | 75.3 (11.9), 77 (25, 114) | 76.8 (12.4), 79 (25, 116) | 77.9 (12.9), 80 (25, 115) |
| Age, years (categorised) | 25–54 | 5.7 | 5.8 | 5.9 |
| 55–64 | 11.4 | 8.8 | 8.8 | |
| 65–74 | 24.6 | 21.9 | 17.4 | |
| 75–84 | 36.1 | 34.3 | 33.4 | |
| 85+ | 22.2 | 29.3 | 34.5 | |
| Gender | Male | 48.5 | 47.3 | 47.1 |
| Female | 51.5 | 52.7 | 52.9 | |
| Cause of death | Cancer | 25.9 | 25.5 | 27.8 |
| CVDs | 36.5 | 32.5 | 26.9 | |
| CBDs | 12.7 | 10.8 | 10.4 | |
| COPD | 5.0 | 4.8 | 5.1 | |
| Neurological conditions | 1.5 | 1.2 | 1.4 | |
| Other | 18.5 | 25.1 | 28.5 | |
| Marital status | Married | NA | 40.2 | 38.6 |
| Widowed | NA | 43.9 | 43.7 | |
| Single | NA | 10.0 | 9.6 | |
| Divorced | NA | 5.1 | 7.5 | |
| Unknown | NA | 0.8 | 0.7 | |
| IMD | 1 (most deprived) | 32.0 | 30.0 | 21.3 |
| 2 | 22.5 | 22.4 | 20.7 | |
| 3 | 17.5 | 18.2 | 21.0 | |
| 4 | 14.4 | 15.0 | 19.9 | |
| 5 (least deprived) | 13.5 | 14.4 | 17.1 | |
| Region | North East | 6.0 | 5.8 | 5.7 |
| North West | 15.7 | 15.2 | 14.9 | |
| Yorkshire and the Humber | 10.8 | 10.5 | 10.6 | |
| East Midlands | 8.1 | 8.4 | 8.8 | |
| West Midlands | 10.6 | 10.8 | 10.9 | |
| East of England | 9.8 | 10.3 | 11.0 | |
| London | 13.2 | 12.2 | 10.9 | |
| South East Coast | 9.1 | 9.2 | 9.1 | |
| South Central | 6.4 | 6.8 | 7.0 | |
| South West | 10.4 | 10.8 | 11.2 | |
| Temporal | ||||
| Season | Spring | 25.5 | 24.6 | 25.3 |
| Summer | 22.5 | 22.5 | 22.9 | |
| Autumn | 23.6 | 23.9 | 23.9 | |
| Winter | 28.4 | 29.0 | 27.9 | |
| Holiday period | Christmas | 2.3 | 2.4 | 2.2 |
| New Year | 1.3 | 1.6 | 1.4 | |
| Easter | 1.9 | 1.9 | 1.9 | |
| Normal | 94.5 | 94.1 | 94.5 | |
| PoD | Hospital | 64.7 | 55.0 | 57.3 |
| Home | 24.1 | 20.4 | 19.0 | |
| Hospice | NA | 4.1 | 5.1 | |
| Care home | NA | 18.2 | 17.2 | |
| Other communal establishment | 7.1 | 0.3 | 0.1 | |
| Elsewhere | 4.0 | 2.0 | 1.3 | |
Deaths were clustered around the more deprived end of the population before 2001 (53.5% below the second quintile); however, the deceased were more evenly distributed across IMD quintiles between 2001 and 2010 (ranging from 17.1% to 21.3%). The regional distribution of deaths was broadly representative of the underlying population structure. 49 Deaths in winter accounted for the highest number of deaths, whereas summer had the lowest number of deaths. Christmas had higher-than-average proportions of deaths (2.3% vs. 1.9% in normal periods, given 52.1775 weeks in 1 year); the pattern remained similar throughout the study period. Hospital, home and care home were the three most common places of death; the deaths in hospital accounted for nearly three times the number of deaths at home or in care homes. From 1993 to 2010, although there was a slight increase in hospital deaths (55.0–57.3%) and a reduction in both home (20.4–19.0%) and care home deaths (18.2–17.2%), there was a nearly 25% increase in hospice deaths (4.1–5.1%).
People who died from cancer were the youngest, at 71.8 years, throughout the study period; CBDs had the oldest average age at death of 80.3 years among the selected causes of death (Tables 4–9). Although most CoDs showed a pattern of increasing age at death, neurological conditions showed a decrease from 1993 to 2010 (78.2 years in 1993–2000 to 76.3 years in 2001–10). The proportion of those who died at > 75 years varied across CoDs, with cancer having the lowest (51%) and the CBDs the highest (82%) in 2001–10. More men died from cancer, CVDs and COPD than women, whereas the deaths from non-cancer, CBDs and neurological conditions had an overall opposite gender profile. The deaths from neurological conditions showed a distinct pattern from other CoDs, with more men than women dying from this condition in 2001–10 (53.9% vs. 46.1%) and more women dying in earlier years.
| Variable | Value | 1984–92 | 1993–2000 | 2001–10 |
|---|---|---|---|---|
| All | All | 3,401,254 | 2,978,318 | 3,299,694 |
| Age, years (continuous) | Mean (SD), median (min., max.) | 76.8 (11.5), 78 (25, 114) | 78.5 (11.9), 81 (25, 116) | 79.8 (12.6), 82 (25, 115) |
| Age, years (categorised) | 25–54 | 4.3 | 4.6 | 5.0 |
| 55–64 | 9.2 | 6.7 | 6.4 | |
| 65–74 | 22.3 | 19.1 | 14.2 | |
| 75–84 | 37.9 | 35.2 | 33.3 | |
| 85+ | 26.3 | 34.4 | 41.0 | |
| Gender | Male | 47.2 | 45.6 | 45.1 |
| Female | 52.8 | 54.4 | 54.9 | |
| Marital status | Married | NA | 35.8 | 33.4 |
| Widowed | NA | 47.9 | 48.5 | |
| Single | NA | 10.6 | 10.2 | |
| Divorced | NA | 4.8 | 7.1 | |
| Unknown | NA | 0.8 | 0.7 | |
| IMD | 1 (most deprived) | 32.0 | 29.9 | 21.5 |
| 2 | 22.6 | 22.5 | 20.9 | |
| 3 | 17.6 | 18.3 | 21.1 | |
| 4 | 14.4 | 15.0 | 19.8 | |
| 5 (least deprived) | 13.4 | 14.3 | 16.7 | |
| Region | North East | 5.9 | 5.7 | 5.6 |
| North West | 15.8 | 15.2 | 14.9 | |
| Yorkshire and the Humber | 10.9 | 10.5 | 10.6 | |
| East Midlands | 8.1 | 8.4 | 8.8 | |
| West Midlands | 10.6 | 10.8 | 11.0 | |
| East of England | 9.7 | 10.3 | 11.0 | |
| London | 13.1 | 12.2 | 10.9 | |
| South East Coast | 9.2 | 9.2 | 9.2 | |
| South Central | 6.3 | 6.8 | 6.9 | |
| South West | 10.5 | 10.8 | 11.2 | |
| Temporal | ||||
| Season | Spring | 25.7 | 24.6 | 25.5 |
| Summer | 21.7 | 21.7 | 22.2 | |
| Autumn | 23.1 | 23.4 | 23.5 | |
| Winter | 29.5 | 30.3 | 28.9 | |
| Holiday period | Christmas | 2.4 | 2.6 | 2.3 |
| New Year | 1.4 | 1.7 | 1.5 | |
| Easter | 2.0 | 1.9 | 2.0 | |
| Normal | 94.2 | 93.8 | 94.3 | |
| PoD | Hospital | 63.5 | 57.1 | 61.2 |
| Home | 23.3 | 18.9 | 17.0 | |
| Hospice | NA | 0.3 | 0.4 | |
| Care home | NA | 21.2 | 20.0 | |
| Other communal establishment | 8.7 | 0.3 | 0.1 | |
| Elsewhere | 4.5 | 2.2 | 1.3 | |
| Variable | Value | 1984–92 | 1993–2000 | 2001–10 |
|---|---|---|---|---|
| All | All | 1,187,061 | 1,013,213 | 1,268,010 |
| Age, years (continuous) | Mean (SD), median (min., max.) | 70.7 (11.9), 72 (25, 108) | 71.8 (12.2), 73 (25, 108) | 73.1 (12.4), 75 (25, 109) |
| Age, years (categorised) | 25–54 | 9.5 | 9.5 | 8.1 |
| 55–64 | 17.7 | 14.8 | 15.0 | |
| 65–74 | 31.2 | 30.1 | 25.7 | |
| 75–84 | 31.0 | 31.5 | 33.4 | |
| 85+ | 10.6 | 14.1 | 17.7 | |
| Gender | Male | 52.3 | 52.2 | 52.2 |
| Female | 47.7 | 47.8 | 47.8 | |
| Marital status | Married | NA | 53.1 | 51.9 |
| Widowed | NA | 32.1 | 31.2 | |
| Single | NA | 8.2 | 7.8 | |
| Divorced | NA | 5.9 | 8.6 | |
| Unknown | NA | 0.7 | 0.5 | |
| IMD | 1 (most deprived) | 32.3 | 30.3 | 20.6 |
| 2 | 22.3 | 22.2 | 20.1 | |
| 3 | 17.3 | 18.0 | 20.8 | |
| 4 | 14.4 | 15.0 | 20.3 | |
| 5 (least deprived) | 13.7 | 14.6 | 18.2 | |
| Region | North East | 6.1 | 6.1 | 6.0 |
| North West | 15.2 | 15.1 | 14.8 | |
| Yorkshire and the Humber | 10.5 | 10.6 | 10.6 | |
| East Midlands | 8.0 | 8.4 | 8.7 | |
| West Midlands | 10.7 | 10.8 | 10.8 | |
| East of England | 10.0 | 10.4 | 11.0 | |
| London | 13.7 | 12.2 | 10.9 | |
| South East Coast | 9.0 | 9.0 | 8.9 | |
| South Central | 6.6 | 6.8 | 7.1 | |
| South West | 10.2 | 10.6 | 11.1 | |
| Temporal | ||||
| Season | Spring | 24.8 | 24.7 | 25.0 |
| Summer | 24.7 | 24.9 | 24.8 | |
| Autumn | 25.2 | 25.2 | 25.1 | |
| Winter | 25.3 | 25.2 | 25.2 | |
| Holiday period | Christmas | 2.0 | 2.0 | 2.0 |
| New Year | 1.1 | 1.2 | 1.1 | |
| Easter | 1.8 | 1.8 | 1.9 | |
| Normal | 95.1 | 95.0 | 95.0 | |
| PoD | Hospital | 68.2 | 48.6 | 47.3 |
| Home | 26.5 | 24.9 | 24.1 | |
| Hospice | NA | 15.4 | 17.1 | |
| Care home | NA | 9.3 | 10.1 | |
| Other communal establishment | 2.8 | 0.2 | 0.1 | |
| Elsewhere | 2.5 | 1.6 | 1.2 | |
| Variable | Value | 1984–92 | 1993–2000 | 2001–10 |
|---|---|---|---|---|
| All | All | 1,674,385 | 1,301,422 | 1,226,845 |
| Age, years (continuous) | Mean (SD), median (min., max.) | 75.4 (11.2), 77 (25, 111) | 77.0 (11.3), 78 (25, 115) | 78.6 (11.9), 81 (25, 112) |
| Age, years (categorised) | 25–54 | 4.6 | 4.4 | 4.6 |
| 55–64 | 11.6 | 8.6 | 7.8 | |
| 65–74 | 26.0 | 23.3 | 17.3 | |
| 75–84 | 36.7 | 36.6 | 35.4 | |
| 85+ | 21.1 | 27.2 | 34.9 | |
| Gender | Male | 52.2 | 51.6 | 51.7 |
| Female | 47.8 | 48.4 | 48.3 | |
| Marital status | Married | NA | 41.3 | 38.0 |
| Widowed | NA | 43.5 | 44.5 | |
| Single | NA | 9.5 | 9.5 | |
| Divorced | NA | 4.9 | 7.3 | |
| Unknown | NA | 0.8 | 0.7 | |
| IMD | 1 (most deprived) | 32.2 | 30.4 | 21.6 |
| 2 | 22.8 | 22.7 | 21.1 | |
| 3 | 17.6 | 18.2 | 21.2 | |
| 4 | 14.2 | 14.8 | 19.7 | |
| 5 (least deprived) | 13.1 | 13.9 | 16.5 | |
| Region | North East | 6.0 | 5.9 | 5.6 |
| North West | 16.1 | 15.5 | 15.1 | |
| Yorkshire and the Humber | 11.2 | 10.6 | 10.6 | |
| East Midlands | 8.2 | 8.4 | 8.7 | |
| West Midlands | 10.6 | 11.0 | 10.7 | |
| East of England | 9.4 | 10.1 | 11.0 | |
| London | 12.7 | 11.9 | 11.2 | |
| South East Coast | 9.2 | 9.1 | 9.3 | |
| South Central | 6.1 | 6.5 | 6.7 | |
| South West | 10.4 | 10.9 | 11.1 | |
| Temporal | ||||
| Season | Spring | 25.8 | 25.3 | 25.7 |
| Summer | 22.1 | 22.2 | 22.7 | |
| Autumn | 23.6 | 23.9 | 23.8 | |
| Winter | 28.6 | 28.6 | 27.8 | |
| Holiday period | Christmas | 2.2 | 2.4 | 2.2 |
| New Year | 1.3 | 1.5 | 1.4 | |
| Easter | 2.0 | 2.0 | 2.0 | |
| Normal | 94.5 | 94.1 | 94.5 | |
| PoD | Hospital | 52.2 | 54.4 | 58.1 |
| Home | 33.5 | 28.8 | 27.4 | |
| Hospice | NA | 0.1 | 0.3 | |
| Care home | NA | 12.5 | 11.6 | |
| Other communal establishment | 6.6 | 0.2 | 0.1 | |
| Elsewhere | 7.7 | 4.0 | 2.5 | |
| Variable | Value | 1984–92 | 1993–2000 | 2001–10 |
|---|---|---|---|---|
| All | All | 582,703 | 432,232 | 473,719 |
| Age, years (continuous) | Mean (SD), median (min., max.) | 78.8 (10.2), 80 (25, 113) | 80.2 (10.6), 82 (25, 110) | 81.9 (10.6), 84 (25, 111) |
| Age, years (categorised) | 25–54 | 2.6 | 2.9 | 2.8 |
| 55–64 | 5.8 | 4.6 | 3.9 | |
| 65–74 | 18.9 | 15.8 | 11.3 | |
| 75–84 | 42.6 | 38.2 | 35.5 | |
| 85+ | 30.1 | 38.5 | 46.4 | |
| Gender | Male | 37.6 | 37.1 | 38.3 |
| Female | 62.4 | 62.9 | 61.7 | |
| Marital status | Married | NA | 32.9 | 31.9 |
| Widowed | NA | 52.3 | 53.1 | |
| Single | NA | 9.9 | 8.7 | |
| Divorced | NA | 4.1 | 5.8 | |
| Unknown | NA | 0.7 | 0.5 | |
| IMD | 1 (most deprived) | 29.9 | 27.8 | 19.1 |
| 2 | 22.7 | 22.4 | 20.1 | |
| 3 | 18.1 | 18.8 | 21.6 | |
| 4 | 15.2 | 15.9 | 21.0 | |
| 5 (least deprived) | 14.1 | 15.1 | 18.2 | |
| Region | North East | 5.9 | 5.7 | 5.5 |
| North West | 15.7 | 15.5 | 14.9 | |
| Yorkshire and the Humber | 10.7 | 10.6 | 10.6 | |
| East Midlands | 8.2 | 8.4 | 8.5 | |
| West Midlands | 10.7 | 11.1 | 11.4 | |
| East of England | 9.8 | 10.3 | 10.8 | |
| London | 11.6 | 10.6 | 9.8 | |
| South East Coast | 9.5 | 9.6 | 9.3 | |
| South Central | 6.5 | 6.9 | 7.1 | |
| South West | 11.3 | 11.4 | 12.2 | |
| Temporal | ||||
| Season | Spring | 25.9 | 25.2 | 25.6 |
| Summer | 22.1 | 22.4 | 22.4 | |
| Autumn | 23.4 | 23.9 | 23.8 | |
| Winter | 28.6 | 28.6 | 28.2 | |
| Holiday period | Christmas | 2.3 | 2.3 | 2.2 |
| New Year | 1.3 | 1.5 | 1.3 | |
| Easter | 2.0 | 1.9 | 1.9 | |
| Normal | 94.4 | 94.3 | 94.5 | |
| PoD | Hospital | 78.9 | 64.1 | 64.7 |
| Home | 9.8 | 7.7 | 6.7 | |
| Hospice | NA | 0.1 | 0.2 | |
| Care home | NA | 27.3 | 27.9 | |
| Other communal establishment | 10.3 | 0.4 | 0.1 | |
| Elsewhere | 1.0 | 0.5 | 0.3 | |
| Variable | Value | 1984–92 | 1993–2000 | 2001–10 |
|---|---|---|---|---|
| All | All | 66,968 | 48,454 | 65,418 |
| Age, years (continuous) | Mean (SD), median (min., max.) | 75.3 (12.1), 78 (25, 106) | 78.2 (11.0), 80 (25, 107) | 76.3 (11.9), 79 (25, 105) |
| Age, years (categorised) | 25–54 | 6.7 | 3.9 | 6.3 |
| 55–64 | 9.3 | 6.3 | 9.2 | |
| 65–74 | 22.1 | 19.1 | 19.1 | |
| 75–84 | 40.4 | 40.3 | 39.9 | |
| 85+ | 21.4 | 30.4 | 25.4 | |
| Gender | Male | 47.4 | 46.4 | 53.9 |
| Female | 52.6 | 53.6 | 46.1 | |
| Marital status | Married | NA | 44.0 | 50.8 |
| Widowed | NA | 42.6 | 34.1 | |
| Single | NA | 9.1 | 8.0 | |
| Divorced | NA | 3.7 | 6.7 | |
| Unknown | NA | 0.6 | 0.4 | |
| IMD | 1 (most deprived) | 26.5 | 23.7 | 14.8 |
| 2 | 21.8 | 21.0 | 18.1 | |
| 3 | 18.6 | 19.9 | 21.8 | |
| 4 | 16.9 | 17.8 | 23.3 | |
| 5 (least deprived) | 16.2 | 17.7 | 22.1 | |
| Region | North East | 5.2 | 5.6 | 5.6 |
| North West | 14.0 | 13.2 | 12.6 | |
| Yorkshire and the Humber | 10.4 | 10.5 | 9.8 | |
| East Midlands | 8.0 | 8.0 | 8.5 | |
| West Midlands | 10.2 | 11.1 | 10.4 | |
| East of England | 10.8 | 11.6 | 13.0 | |
| London | 12.9 | 10.1 | 10.0 | |
| South East Coast | 10.3 | 9.7 | 9.9 | |
| South Central | 7.3 | 7.8 | 7.7 | |
| South West | 10.9 | 12.3 | 12.5 | |
| Temporal | ||||
| Season | Spring | 25.1 | 23.7 | 24.6 |
| Summer | 21.8 | 22.5 | 22.1 | |
| Autumn | 23.8 | 24.8 | 24.5 | |
| Winter | 29.3 | 29.0 | 28.8 | |
| Holiday period | Christmas | 2.4 | 2.5 | 2.3 |
| New Year | 1.4 | 1.4 | 1.4 | |
| Easter | 2.0 | 1.7 | 1.8 | |
| Normal | 94.2 | 94.4 | 94.5 | |
| PoD | Hospital | 71.8 | 35.9 | 46.1 |
| Home | 13.9 | 13.2 | 14.3 | |
| Hospice | NA | 2.3 | 3.5 | |
| Care home | NA | 47.6 | 35.2 | |
| Other communal establishment | 13.5 | 0.5 | 0.6 | |
| Elsewhere | 0.7 | 0.5 | 0.3 | |
| Variable | Value | 1984–92 | 1993–2000 | 2001–10 |
|---|---|---|---|---|
| All | All | 228,130 | 192,073 | 231,582 |
| Age, years (continuous) | Mean (SD), median (min., max.) | 75.7 (9.2), 76 (25, 108) | 76.8 (9.1), 77 (25, 108) | 78.0 (9.5), 79 (25, 108) |
| Age, years (categorised) | 25–54 | 1.7 | 1.6 | 1.7 |
| 55–64 | 10.1 | 7.4 | 7.7 | |
| 65–74 | 30.1 | 29.1 | 22.0 | |
| 75–84 | 41.2 | 41.4 | 43.1 | |
| 85+ | 16.9 | 20.6 | 25.5 | |
| Gender | Male | 67.0 | 58.6 | 52.9 |
| Female | 33.0 | 41.4 | 47.1 | |
| Marital status | Married | NA | 41.5 | 37.5 |
| Widowed | NA | 43.3 | 44.4 | |
| Single | NA | 8.0 | 7.5 | |
| Divorced | NA | 6.2 | 9.8 | |
| Unknown | NA | 0.9 | 0.8 | |
| IMD | 1 (most deprived) | 39.1 | 37.4 | 28.7 |
| 2 | 22.4 | 22.8 | 23.0 | |
| 3 | 15.6 | 16.0 | 19.5 | |
| 4 | 12.0 | 12.7 | 16.4 | |
| 5 (least deprived) | 10.8 | 11.1 | 12.4 | |
| Region | North East | 6.6 | 6.6 | 7.0 |
| North West | 17.9 | 17.8 | 16.8 | |
| Yorkshire and the Humber | 11.9 | 11.8 | 11.8 | |
| East Midlands | 8.1 | 8.1 | 8.5 | |
| West Midlands | 10.8 | 10.8 | 10.8 | |
| East of England | 8.5 | 9.0 | 9.8 | |
| London | 14.5 | 13.1 | 11.1 | |
| South East Coast | 7.6 | 7.9 | 8.1 | |
| South Central | 5.8 | 6.0 | 6.4 | |
| South West | 8.2 | 8.9 | 9.7 | |
| Temporal | ||||
| Season | Spring | 25.4 | 23.3 | 25.5 |
| Summer | 19.4 | 19.2 | 20.1 | |
| Autumn | 20.9 | 21.1 | 21.6 | |
| Winter | 34.4 | 36.4 | 32.7 | |
| Holiday period | Christmas | 2.8 | 3.4 | 2.8 |
| New Year | 1.8 | 2.5 | 1.9 | |
| Easter | 2.0 | 1.8 | 2.0 | |
| Normal | 93.4 | 92.3 | 93.3 | |
| PoD | Hospital | 65.9 | 64.8 | 68.3 |
| Home | 25.0 | 20.3 | 19.2 | |
| Hospice | NA | 0.2 | 0.6 | |
| Care home | NA | 13.2 | 10.9 | |
| Other communal establishment | 6.6 | 0.3 | 0.1 | |
| Elsewhere | 2.6 | 1.2 | 0.8 | |
Although over half of those who died from cancer were married, nearly half of patients dying from a non-cancer cause were widowed (47.9% and 48.5%); this remained the case for the other CoDs as well. Patients with COPD were more likely to live in the most deprived areas, although this had significantly reduced from 38.3% before 2001 to 28.7% after 2001. Other CoDs were more evenly distributed across the IMD quintiles. The regional distributions of deaths were following the pattern seen in the data for all of CoDs combined.
The EWDs were more pronounced in non-cancer causes, particularly in COPD: nearly one in three deaths occurred in winter, although the unequal distribution across seasons improved over time with the lowest at 19.2% and 20.1% in summer and 36.4% and 32.7% in winter for 1993–2000 and 2001–10, respectively. Deaths during Christmas were highest across the CoDs, again, COPD deaths were more likely to happen during the Christmas period (2.8–3.4%). The combined total deaths in holiday period were highest for COPD (6.7%) and lowest for cancer (5.0%). New Year had lower than average deaths irrespective of the CoD.
Place of death varied by CoD. Hospital was the most common PoD regardless of the underlying CoD. Neurological conditions had the lowest rate of hospital deaths (46.1% in 2001–10), whereas COPD deaths most commonly occurred in hospital (68.3% in 2001–10). The second most common PoD in cancer deaths was home (24.1%) but it was care home in non-cancer deaths (20.0%). In total, 27.4% of deaths from CVDs were at home but the figure for CBD deaths was only 6.7%. Neurological conditions had the highest proportion of care home deaths (35.2%); this was around 10% for the other conditions. A significant number of cancer deaths took place in hospices (17.1%). Less than 1% of deaths from the other CoDs occurred in a hospice, except for neurological conditions, which were the second largest group to most commonly die in a hospice (3.5%).
Bivariate association of place of death and selected explanatory variables
The plotted bivariate associations for all causes of death are shown in Figures 1–5. The geographical variations in PoD for all CoDs are shown in Figures 6–10. We also produced similar graphs for non-cancer deaths, cancer deaths, CVD and CBD deaths, neurological condition deaths and COPD deaths (see Appendix 1, Figures 18–41). All pairwise associations were statistically significant at the level of p < 0.001.
FIGURE 1.
Place of death by age group in all causes of death, England 1984–2010.
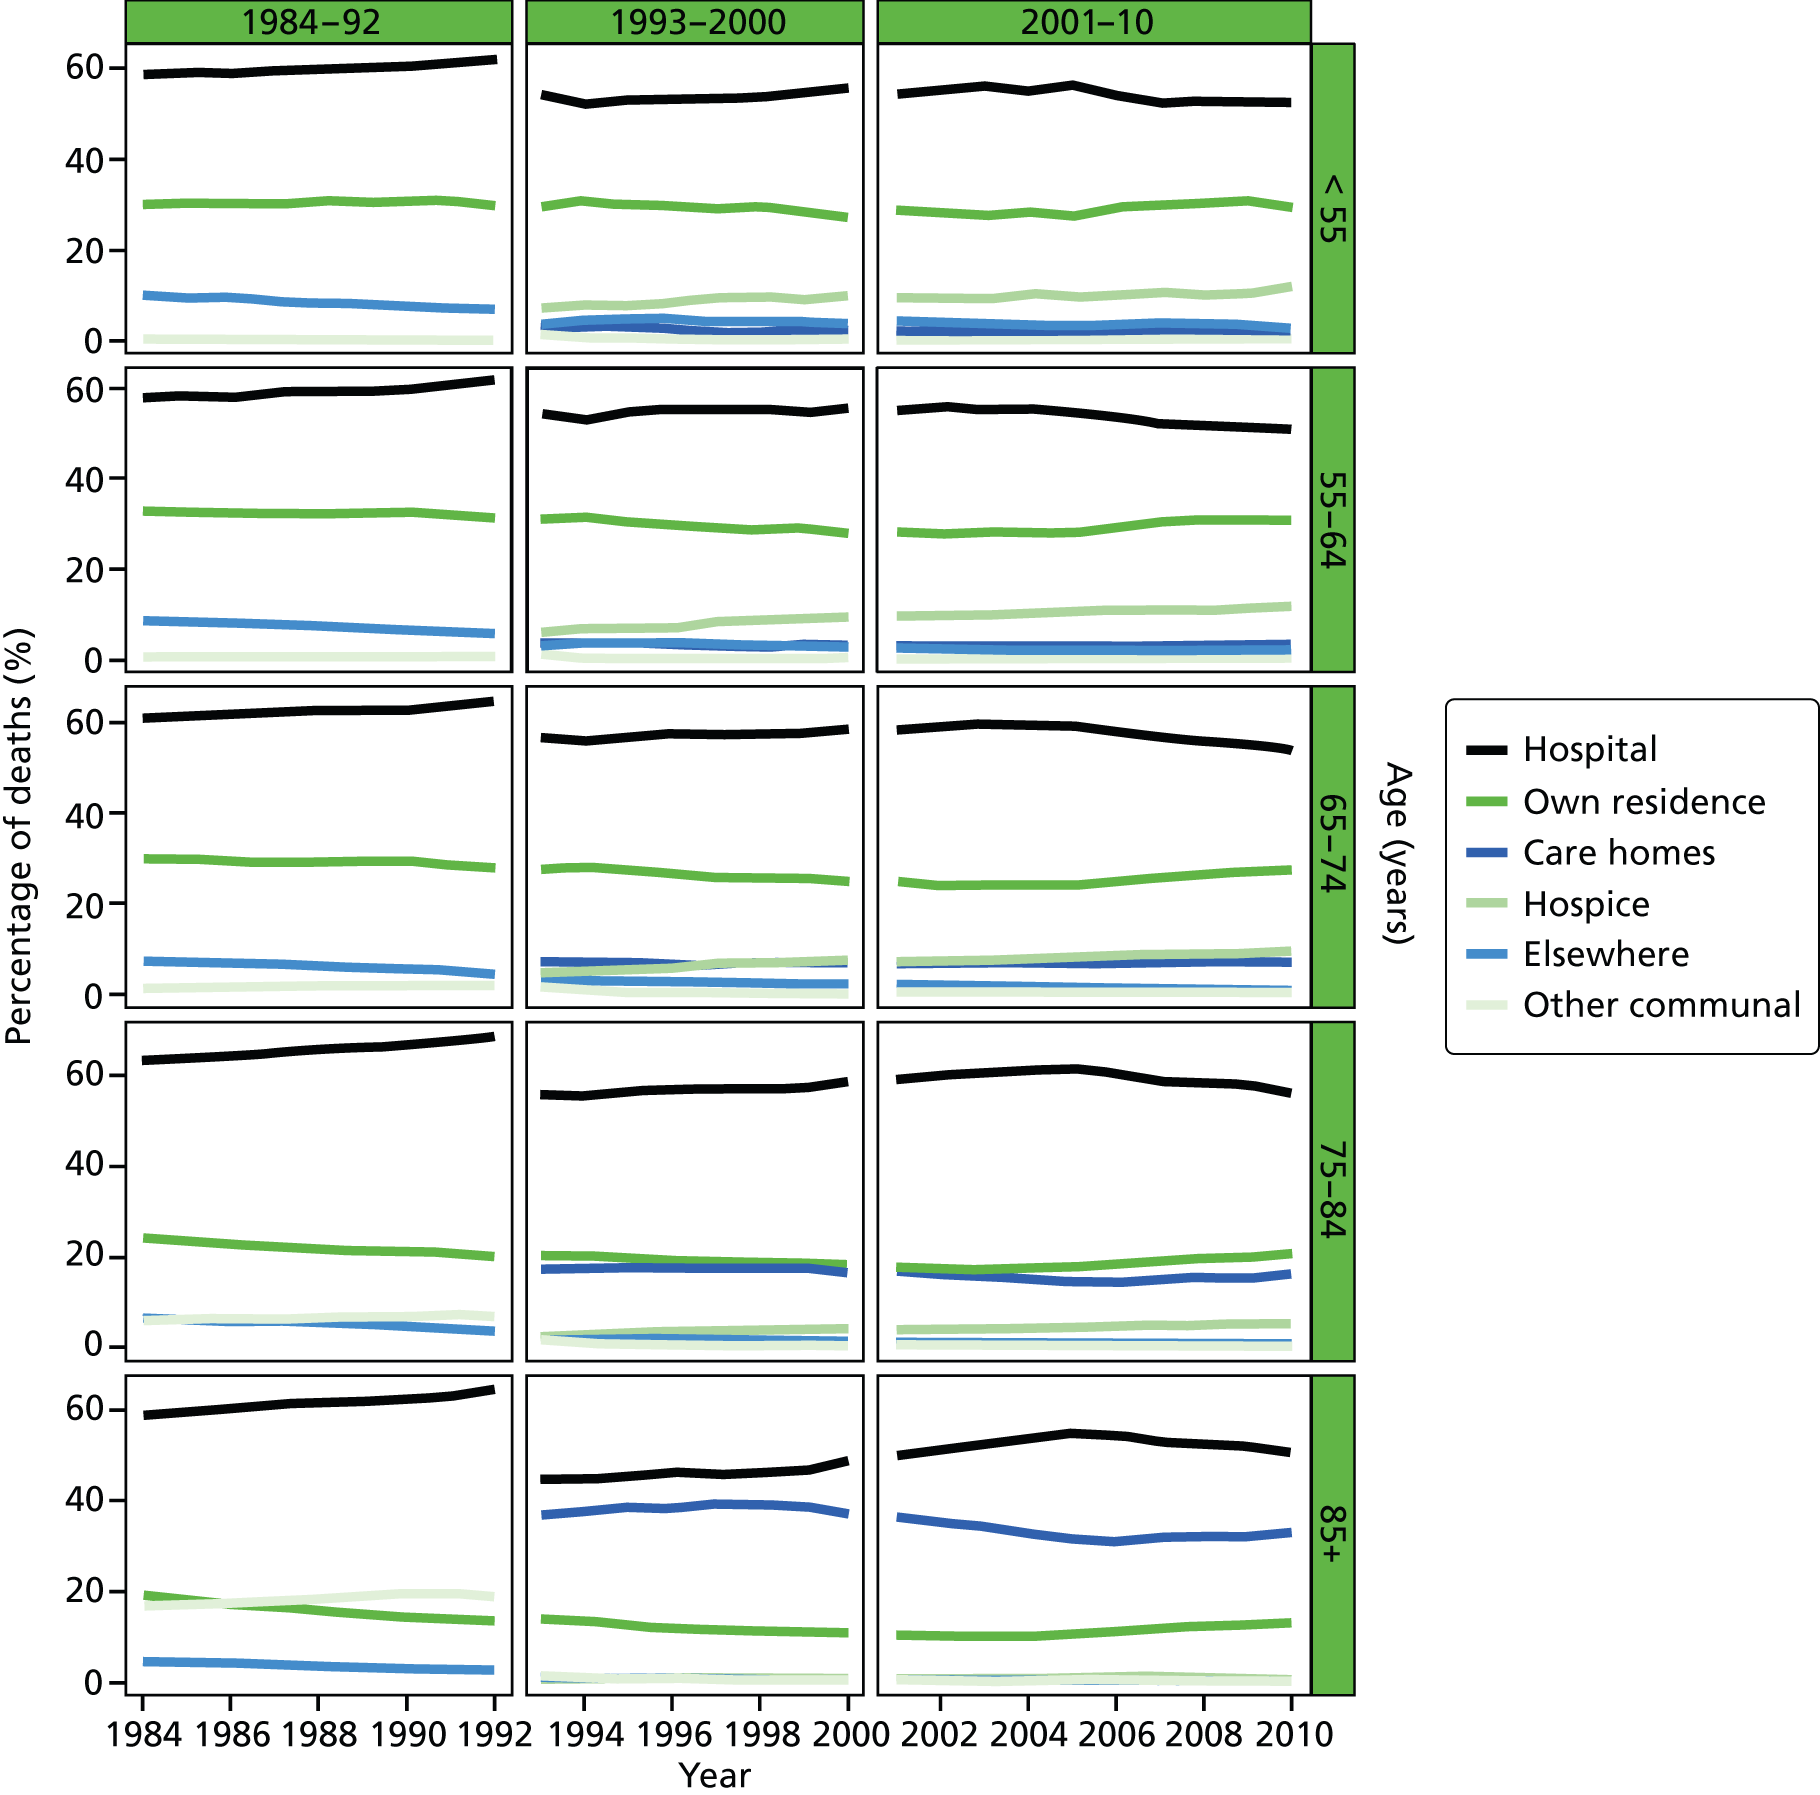
FIGURE 2.
Place of death by gender in all causes of death, England 1984–2010.
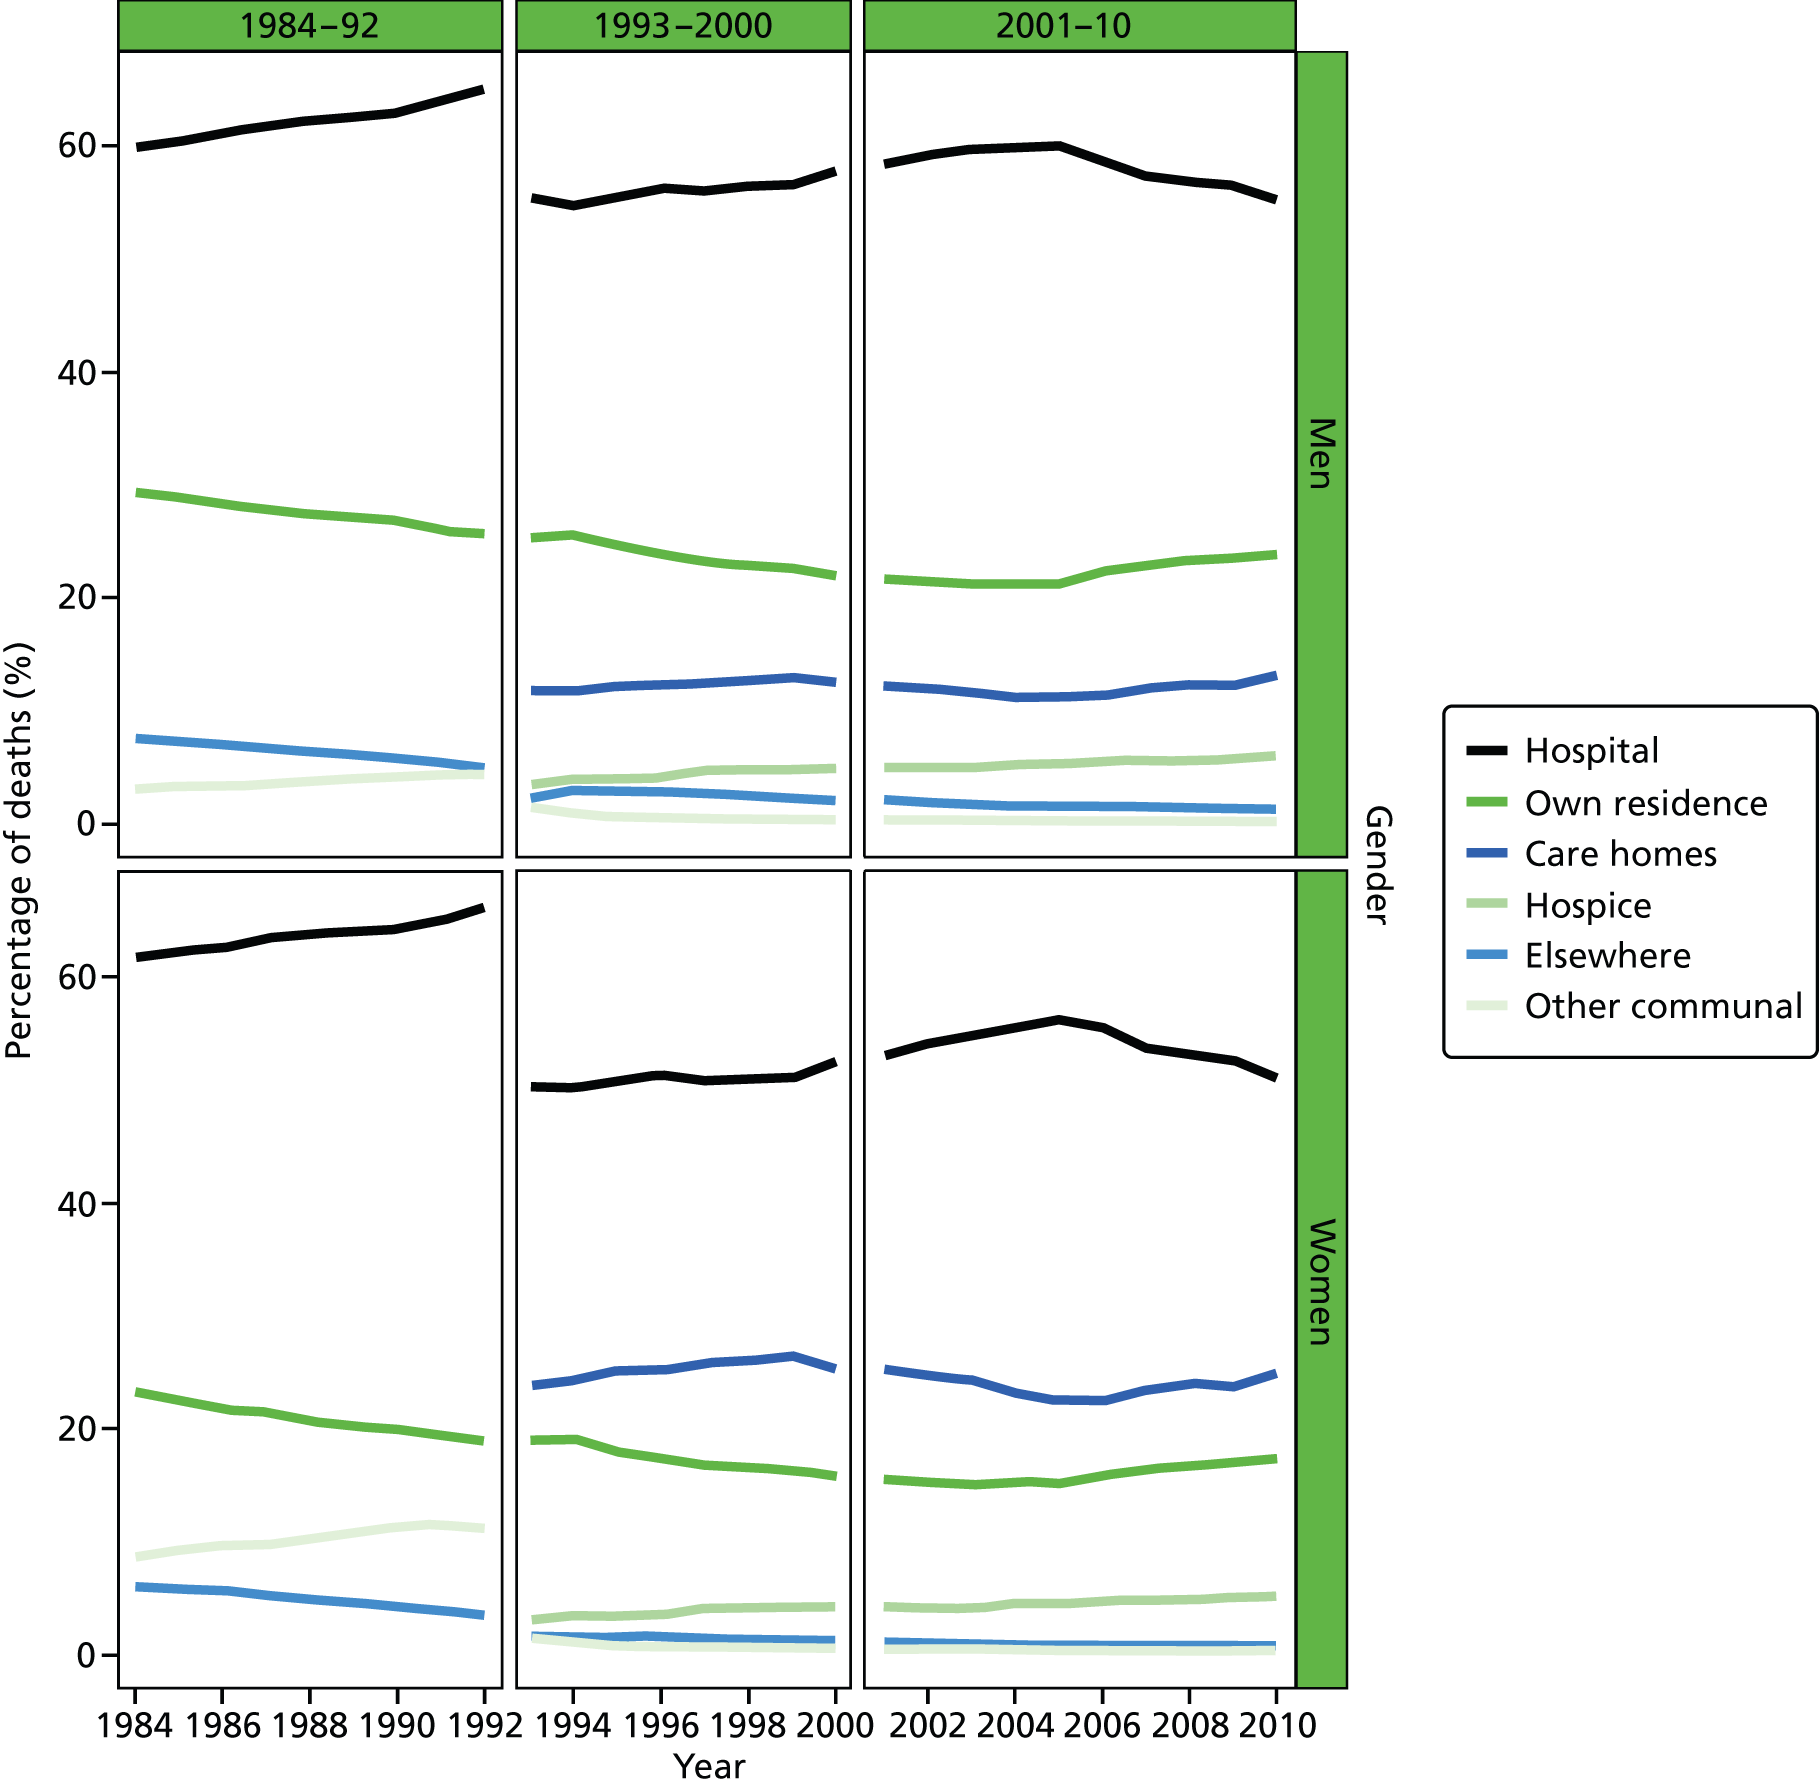
FIGURE 3.
Place of death by cause of death, England 1984–2010.
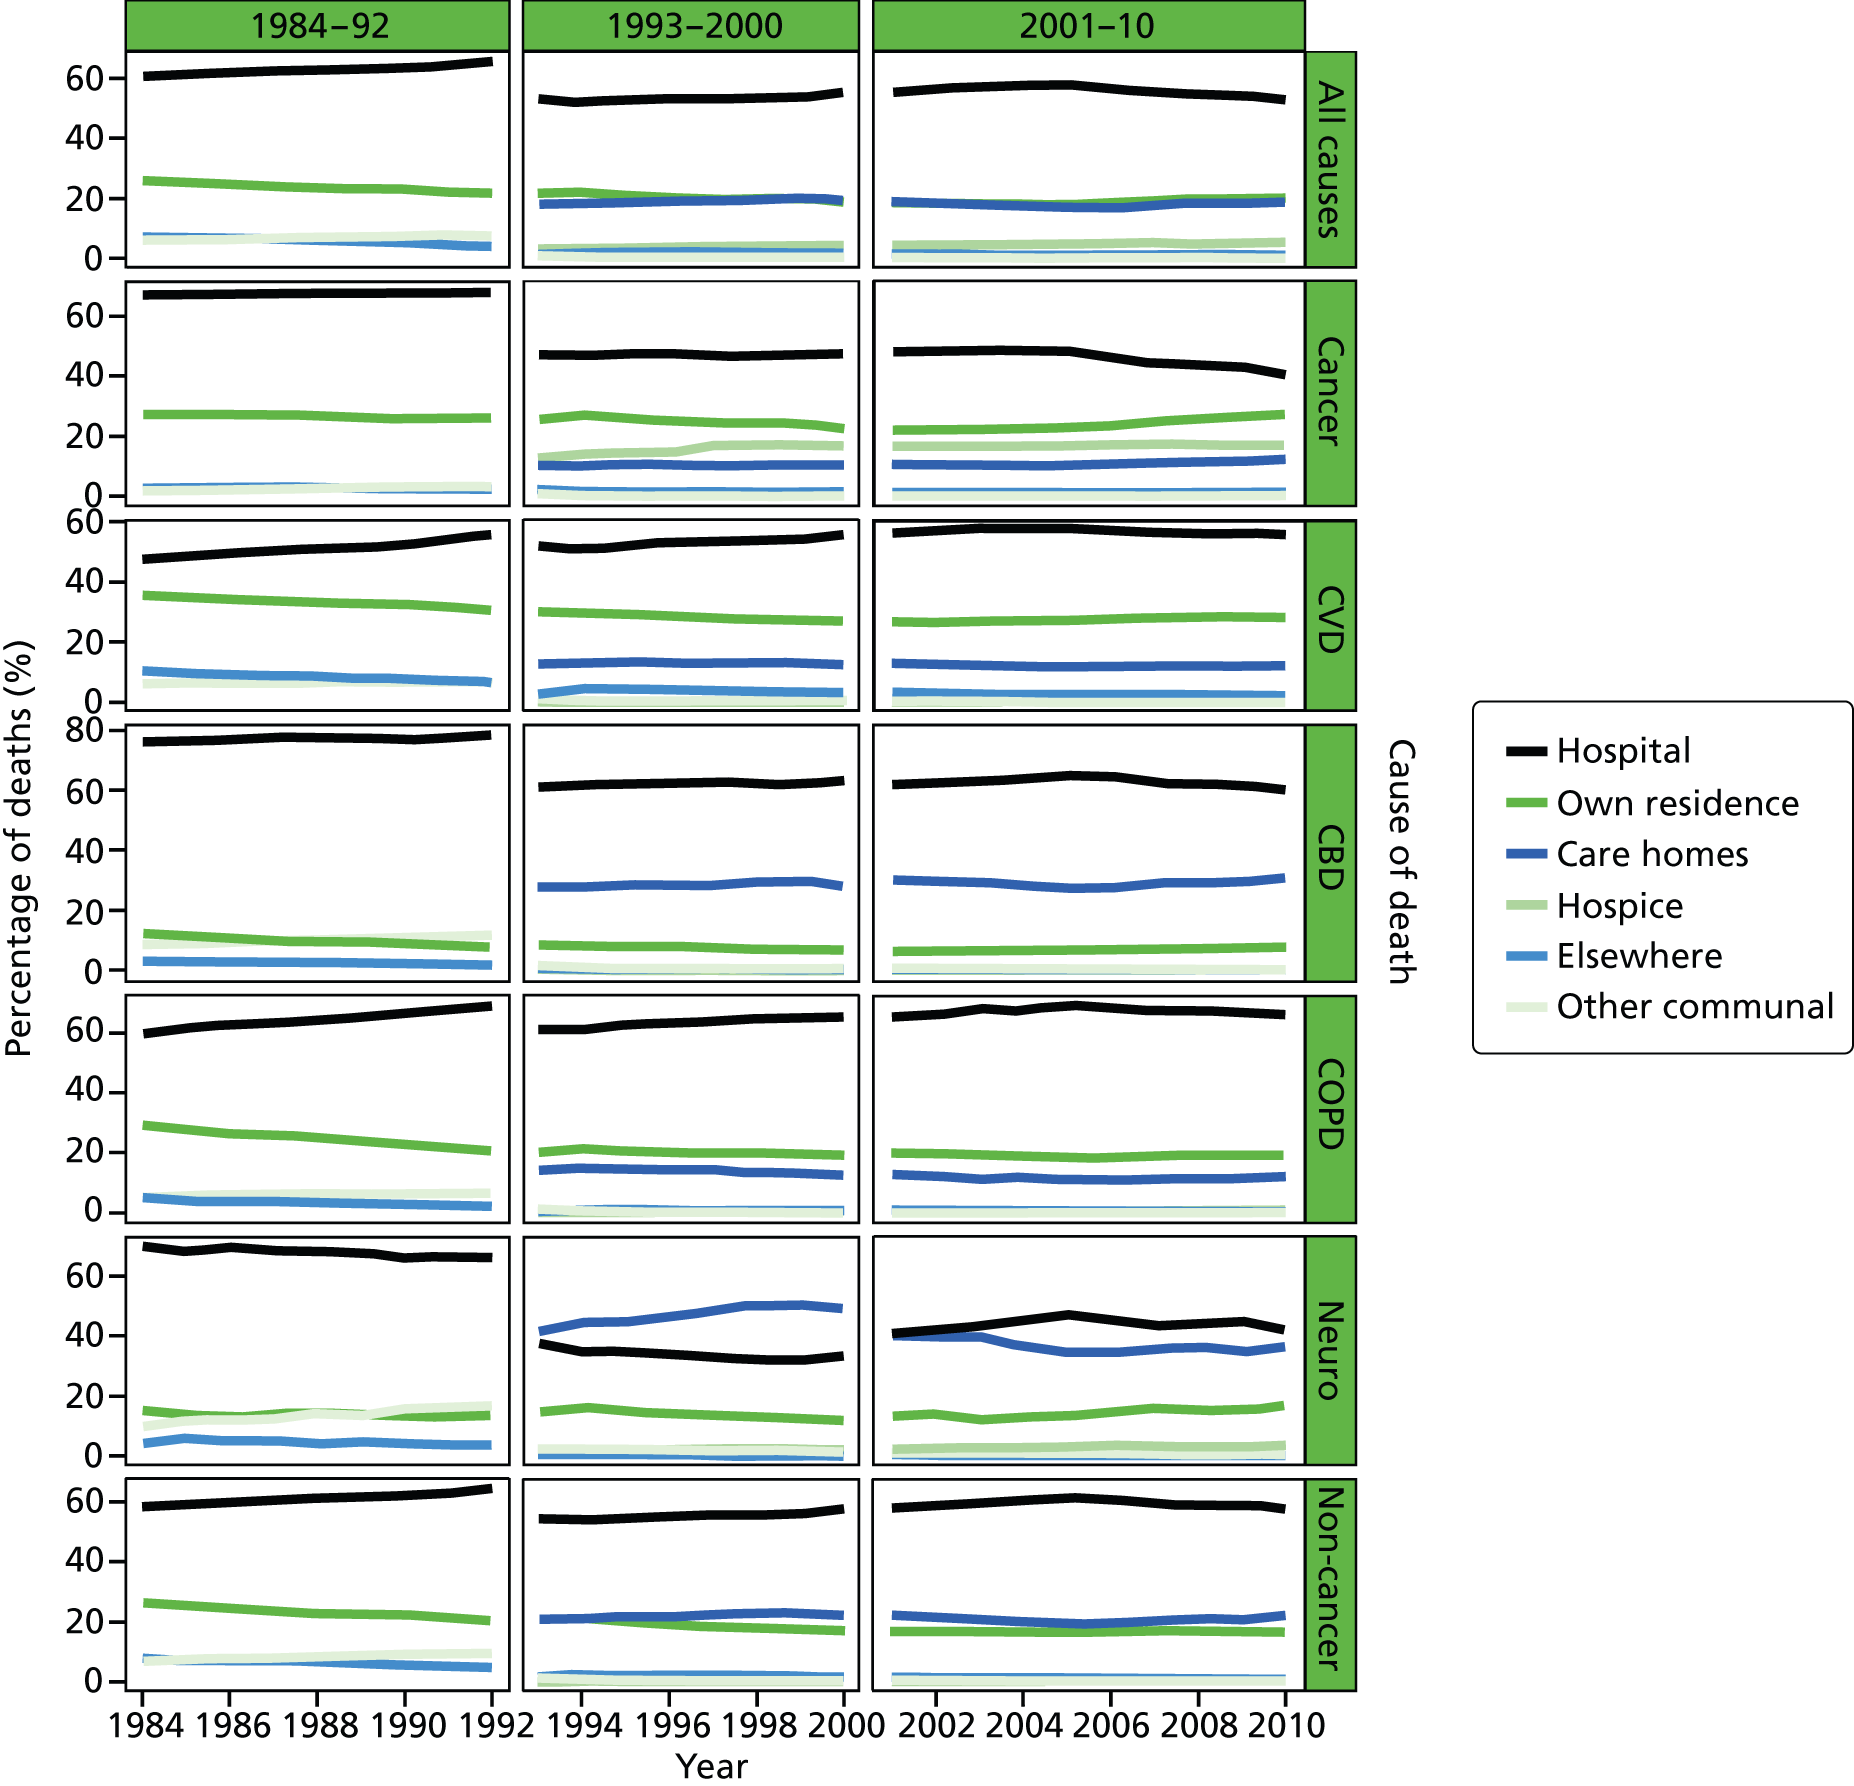
FIGURE 4.
Place of death by marital status in all cause of death, England 1988–2010.
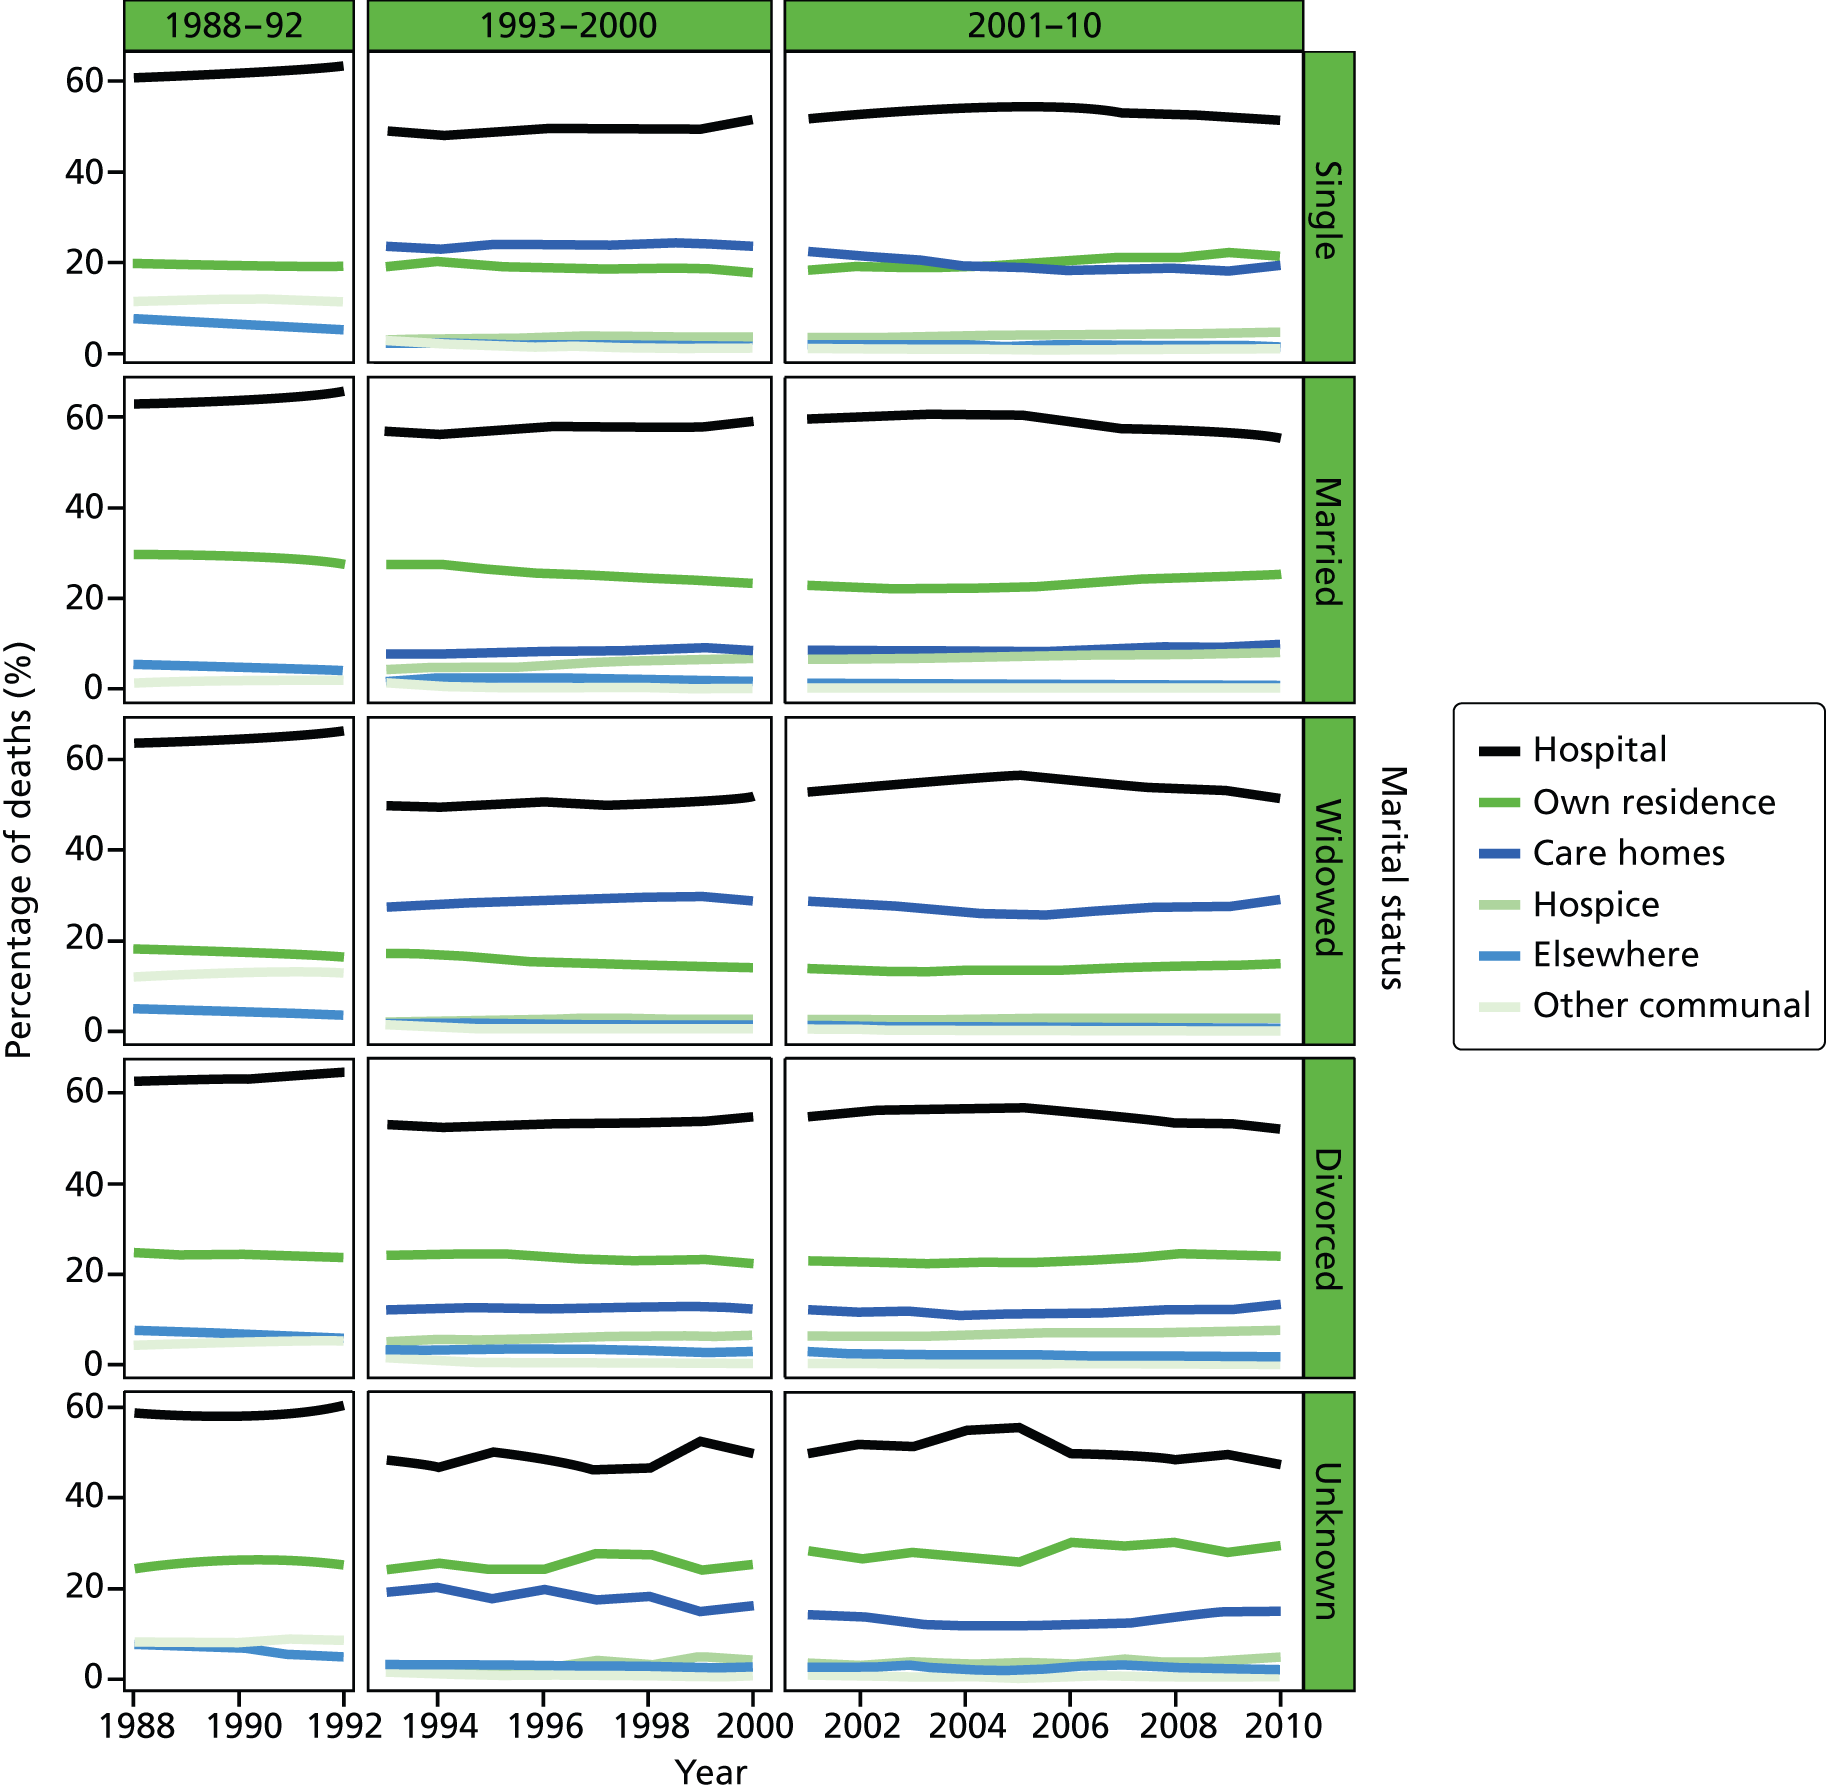
FIGURE 5.
Place of death by quintile of IMD (1 = most deprived, 5 = least deprived) in all causes of death, England 1984–2010.
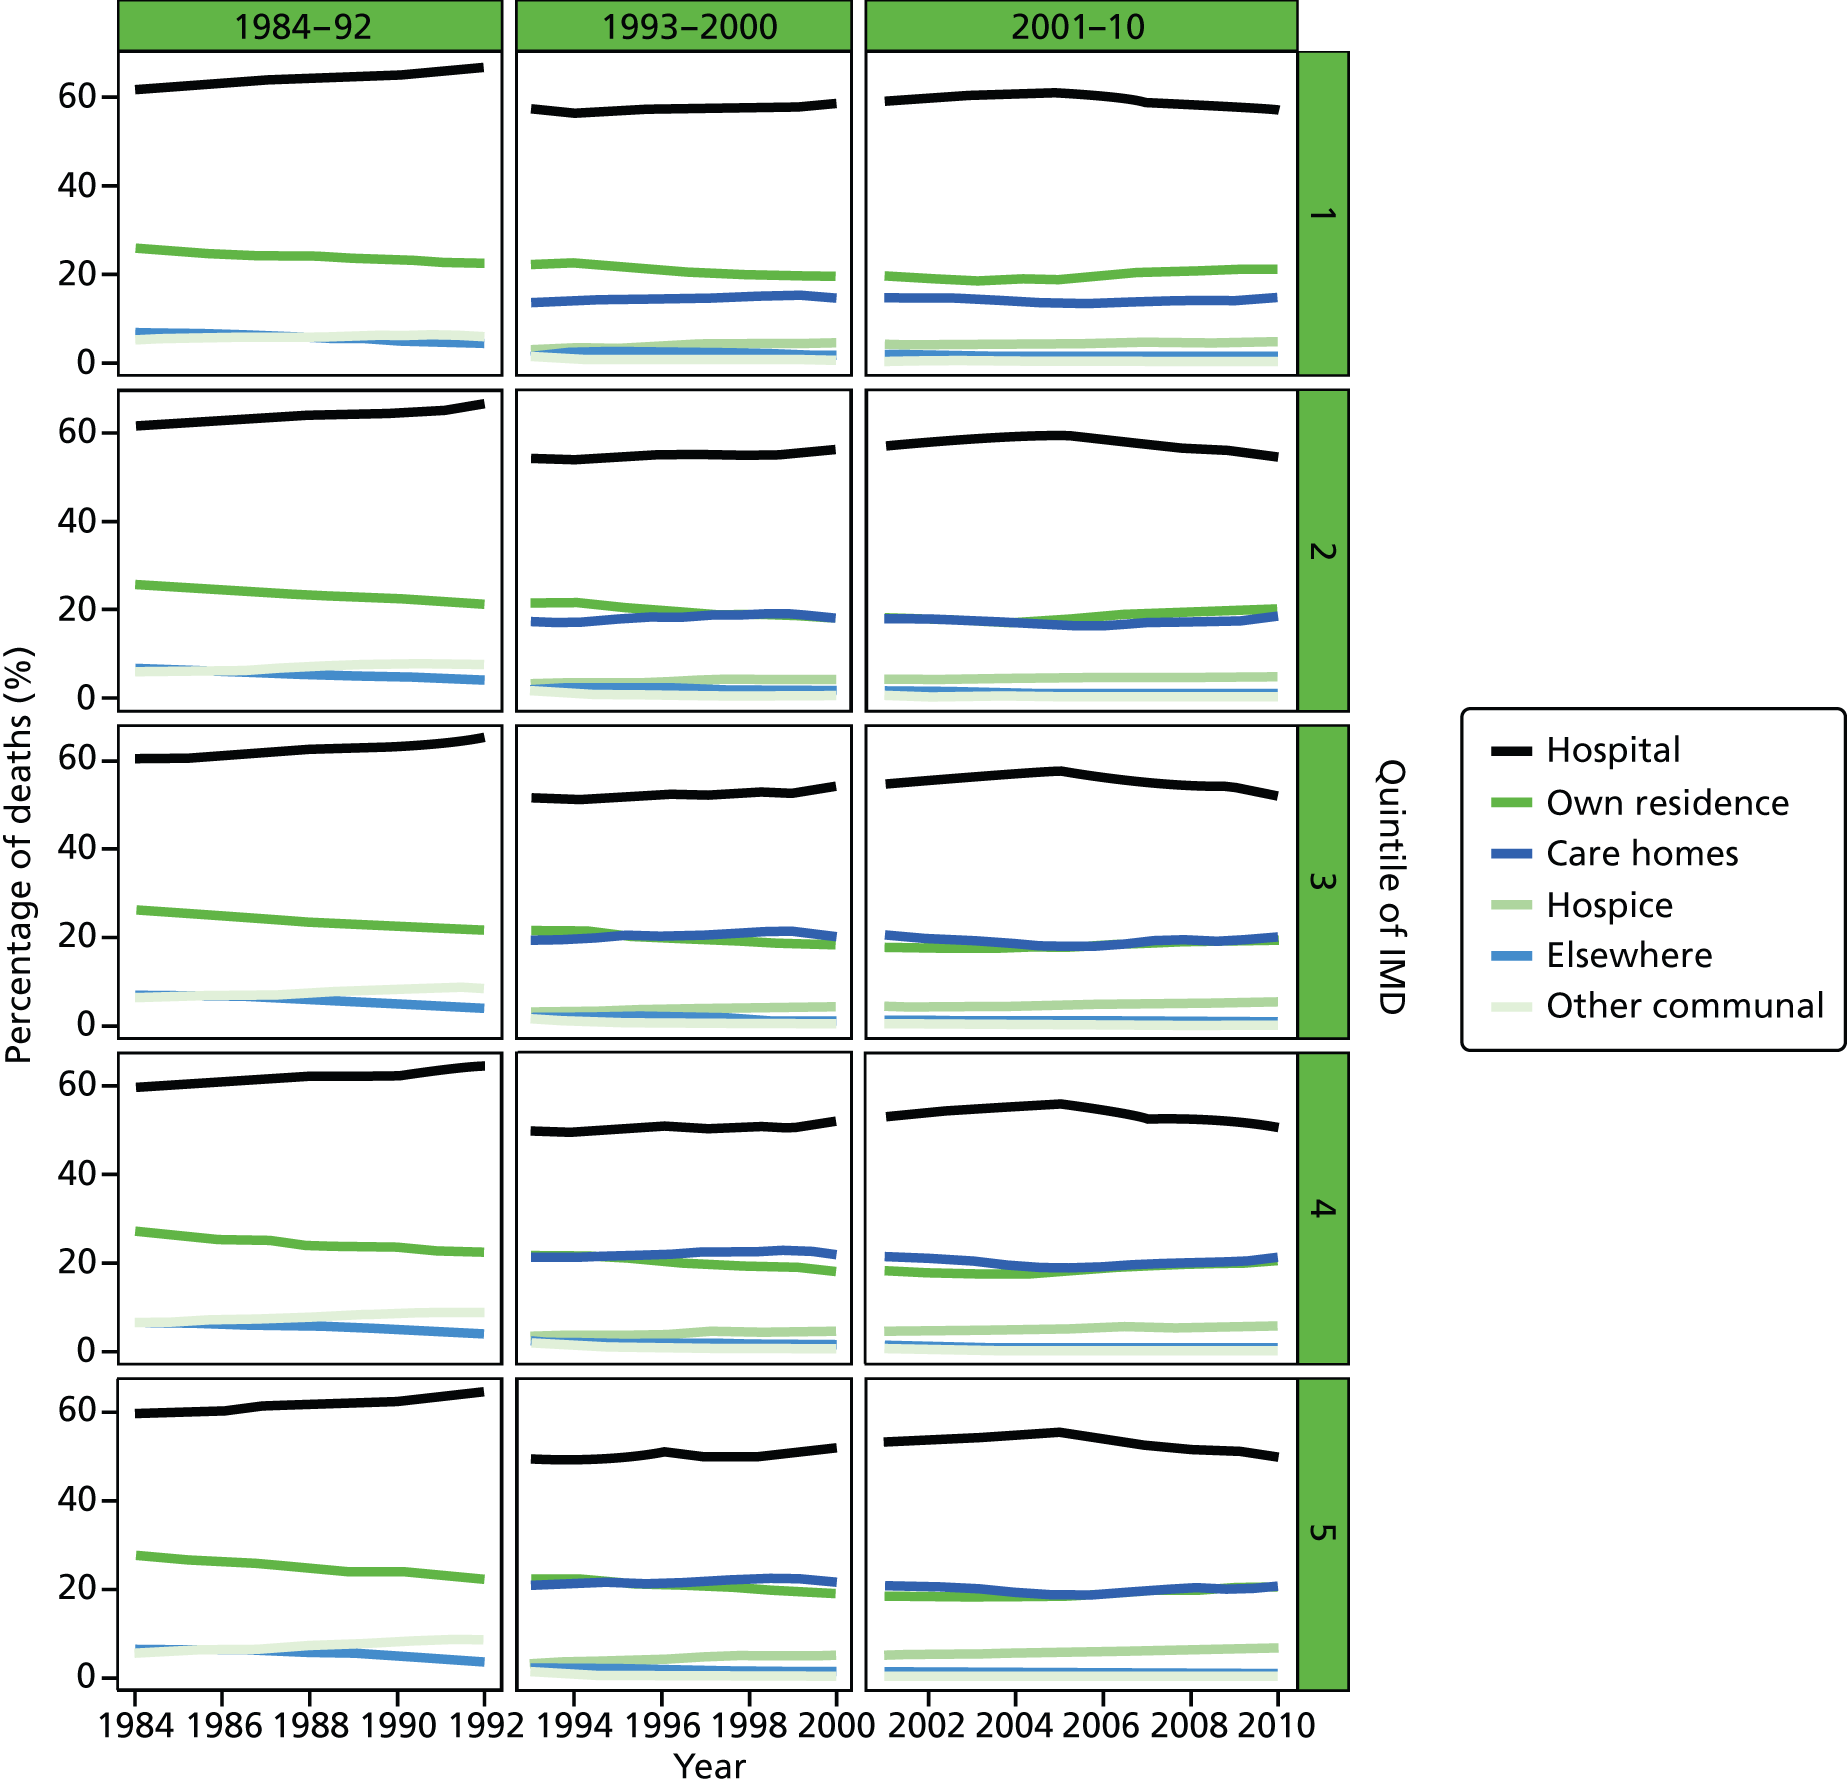
FIGURE 6.
Percentage of hospital (a) vs. home deaths (b) for all causes combined by geographical areas, England 1984–92.
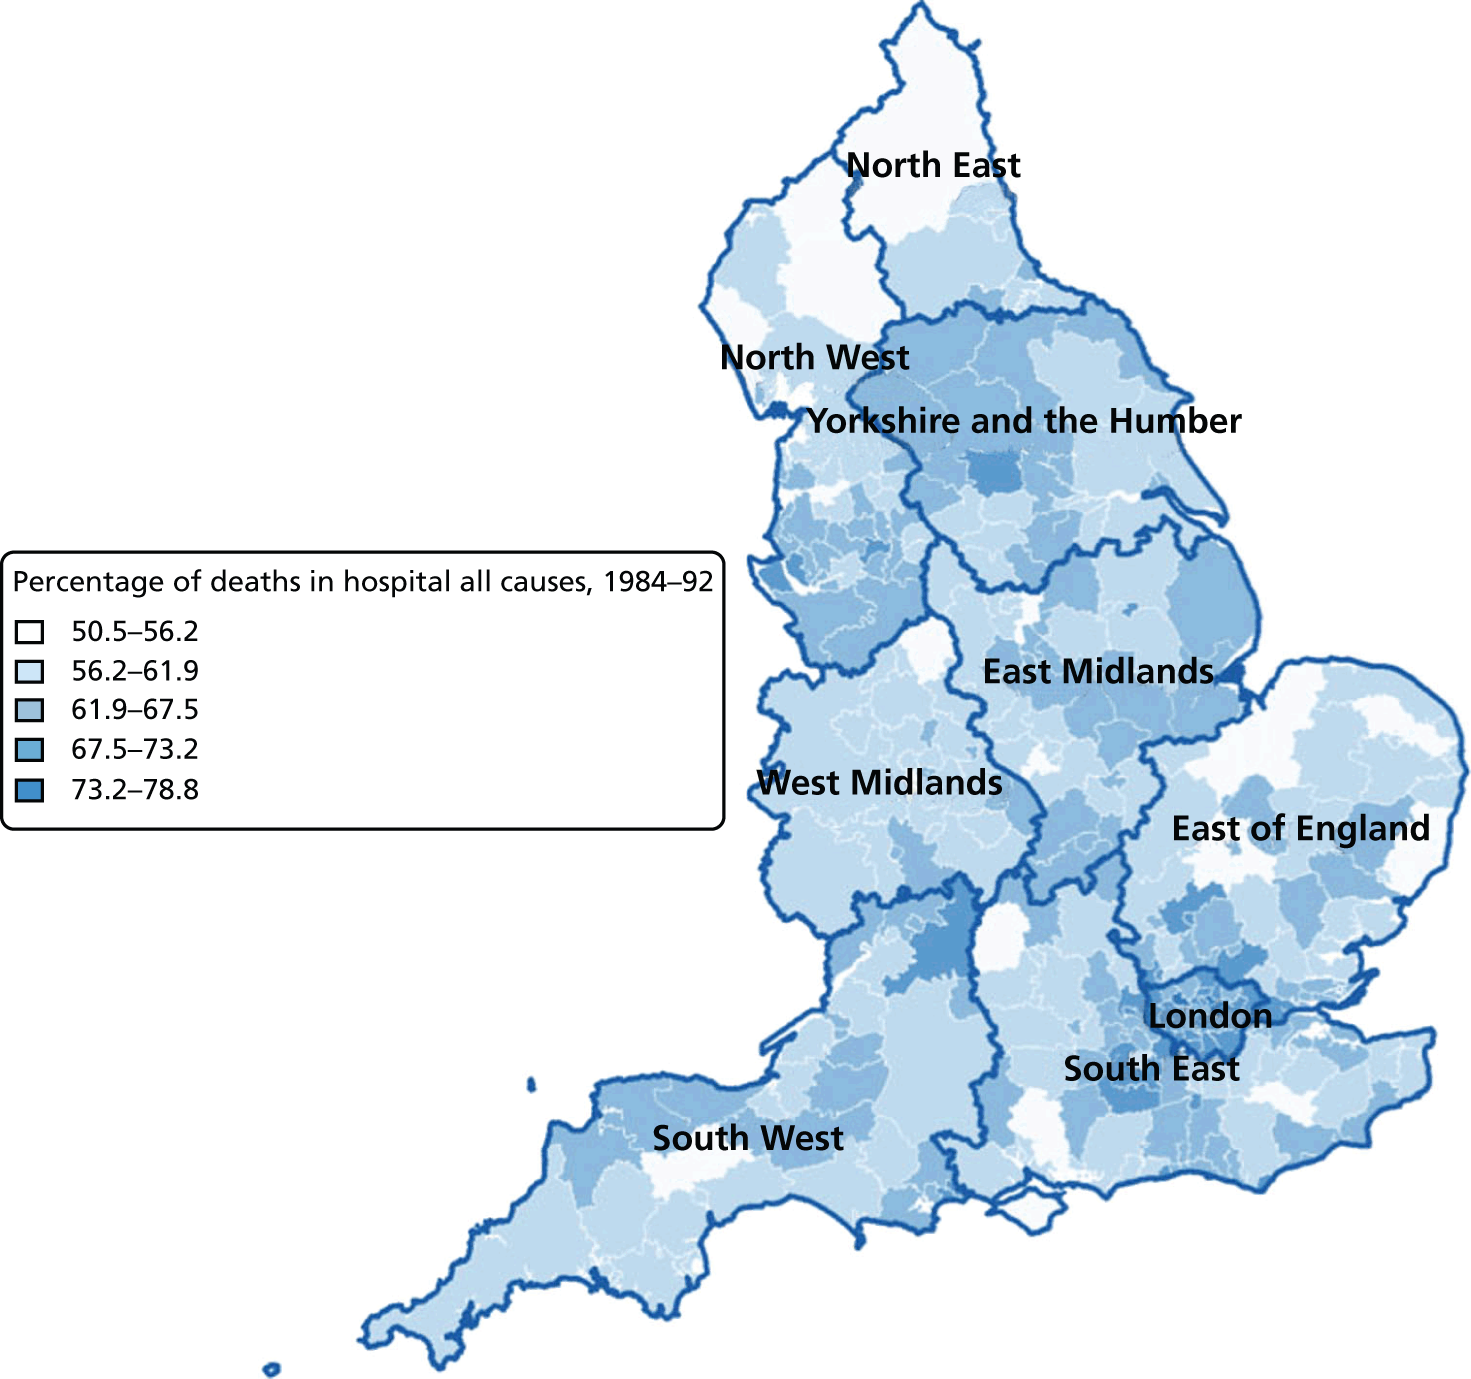
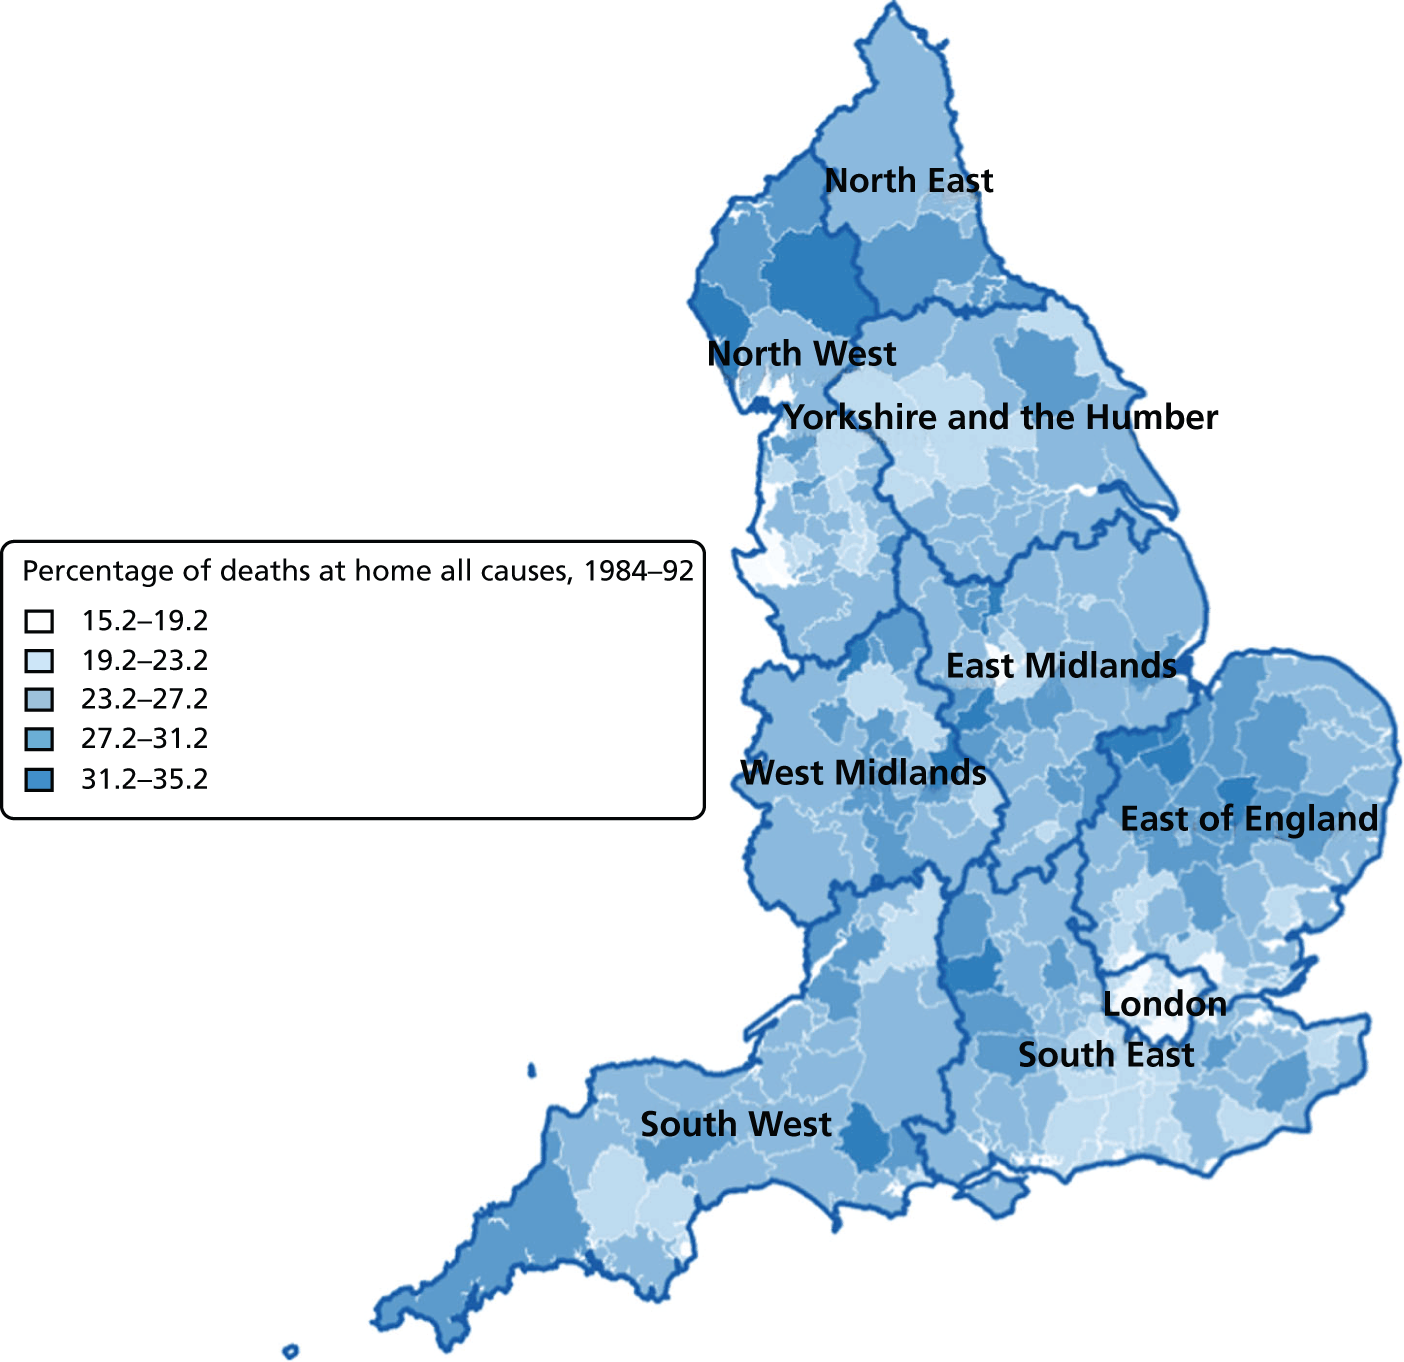
FIGURE 7.
Percentage of hospital (a) vs. home deaths (b) for all causes combined by geographical areas, England 1993–2000.
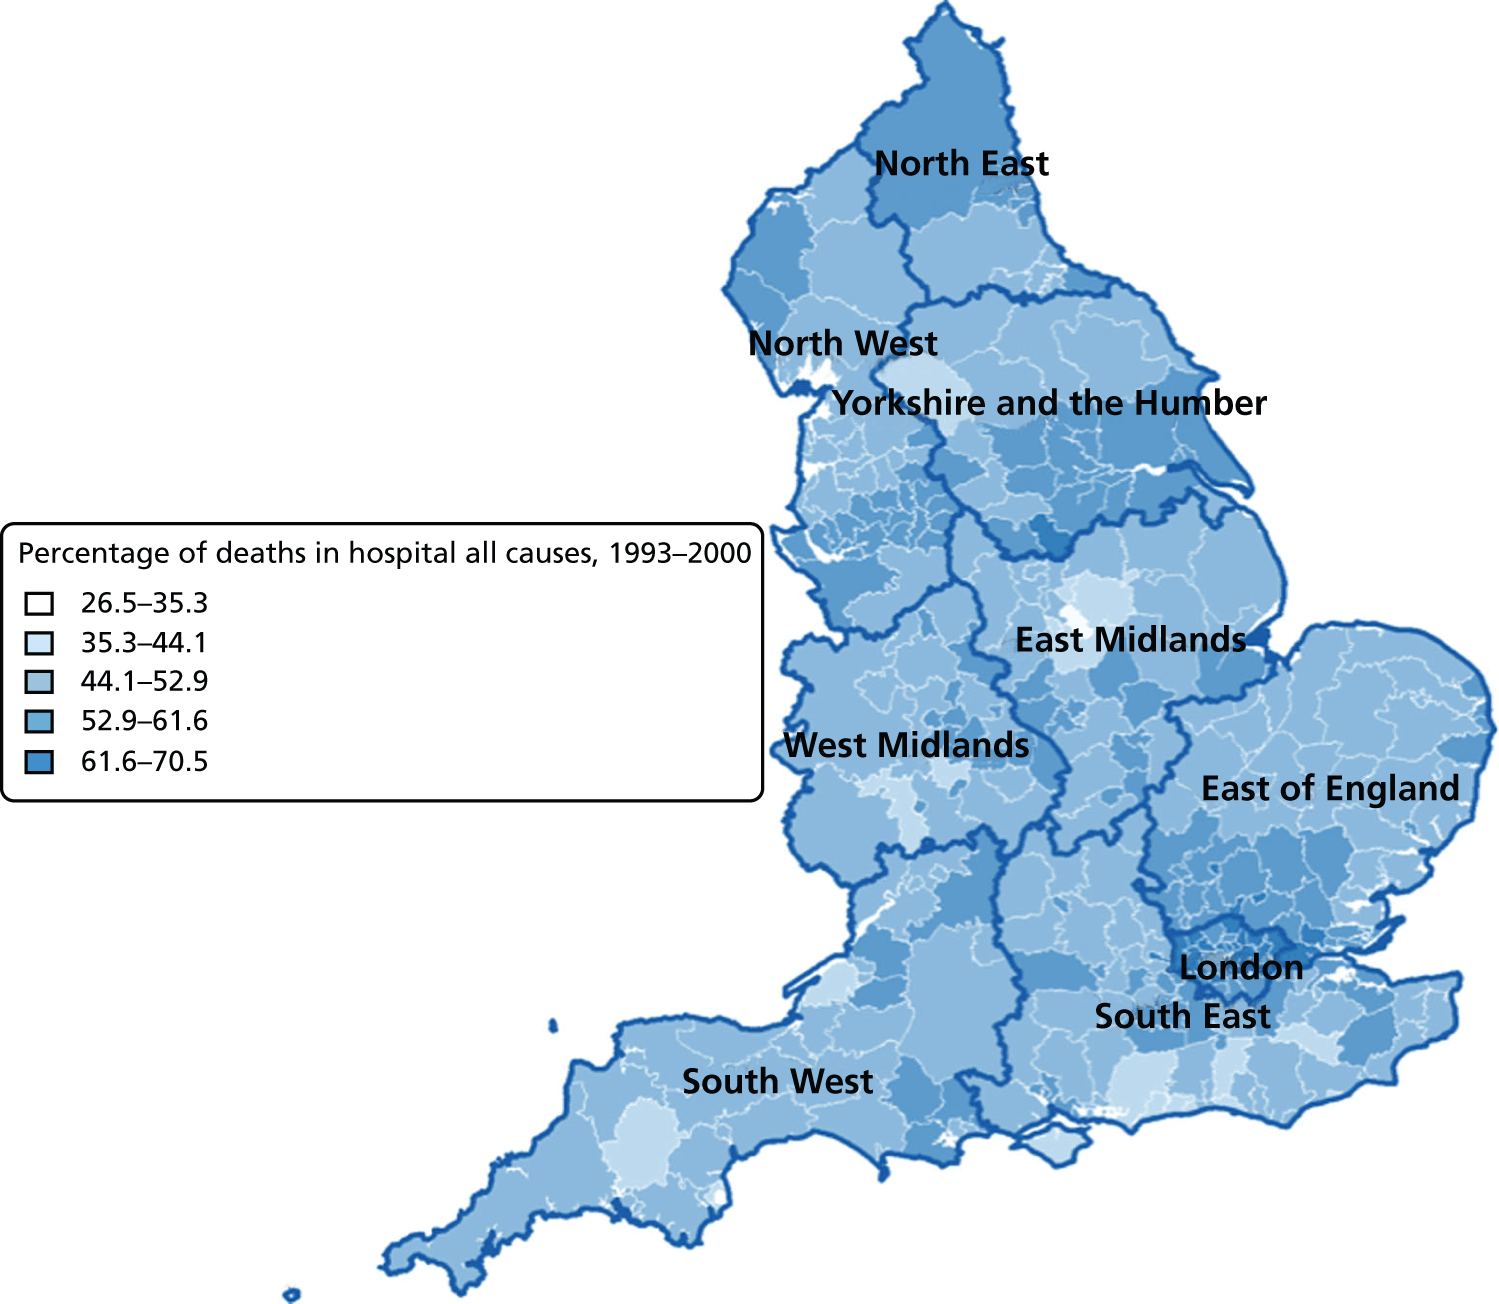
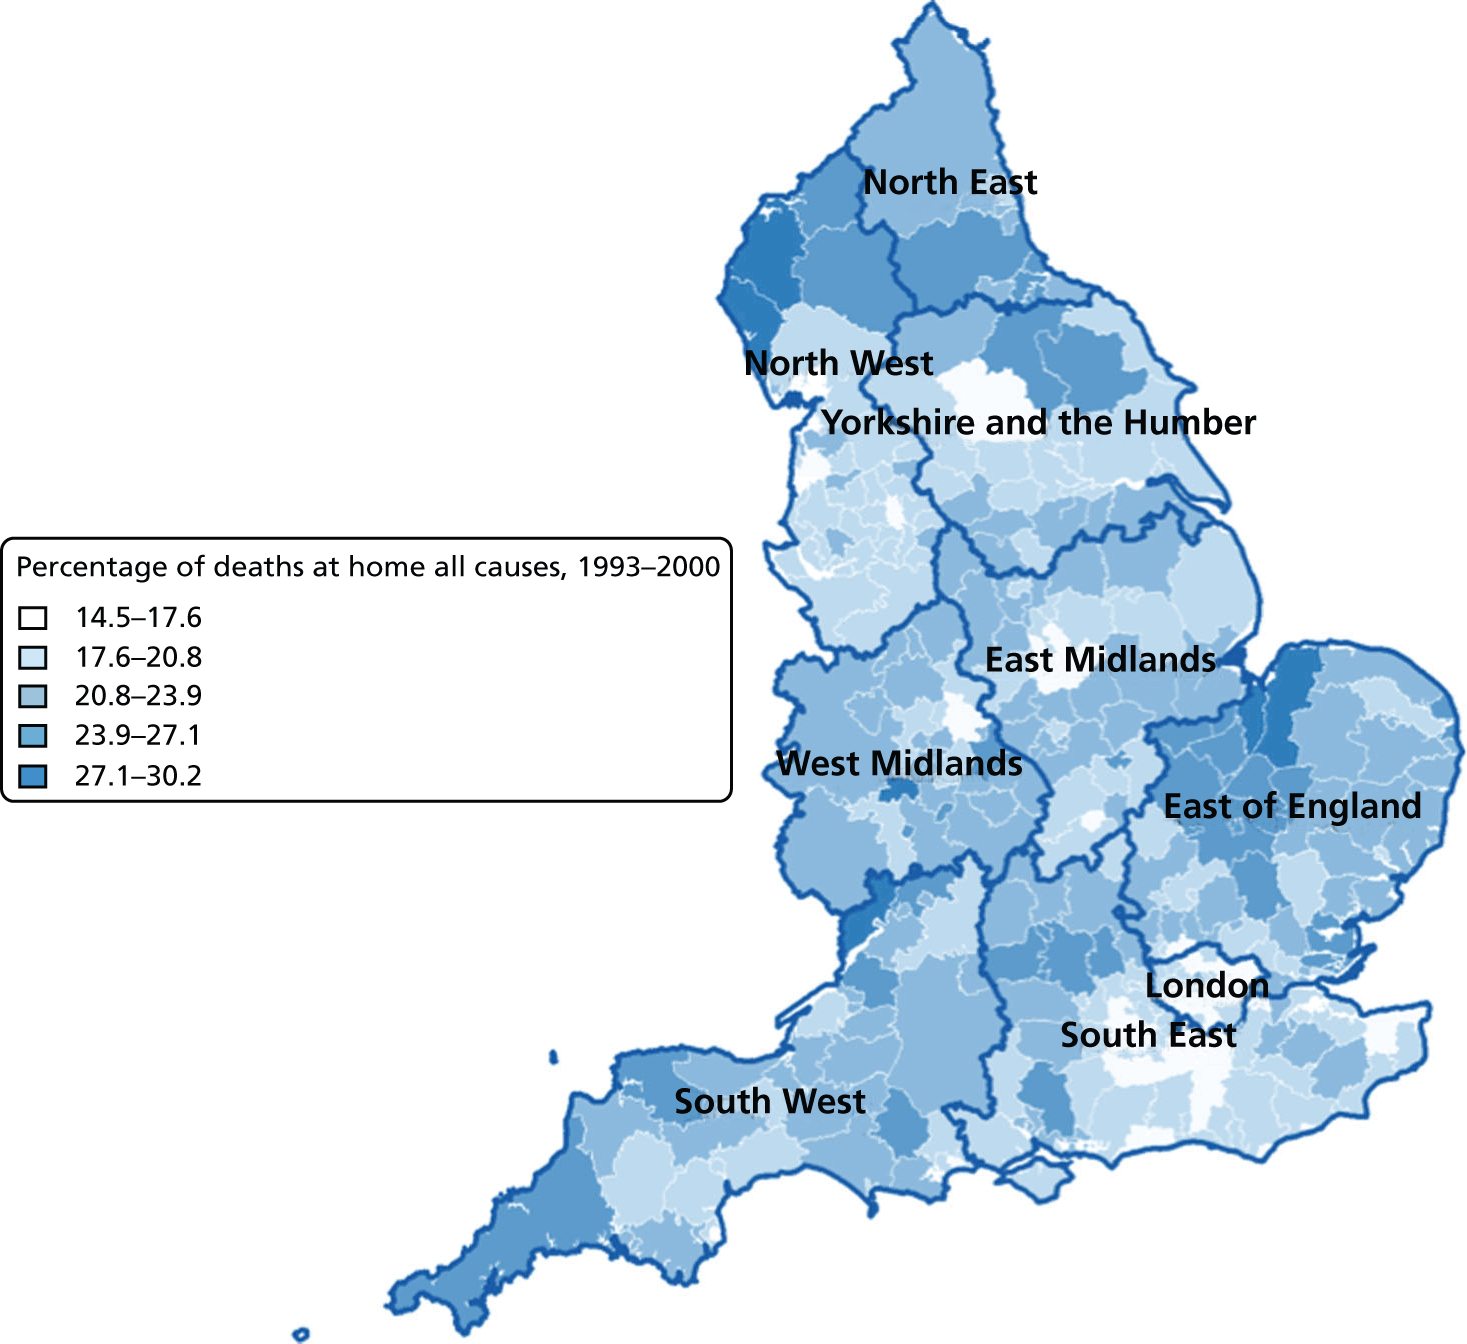
FIGURE 8.
Percentage of hospital (a) vs. home deaths (b) for all causes combined by geographical areas, England 2001–10.
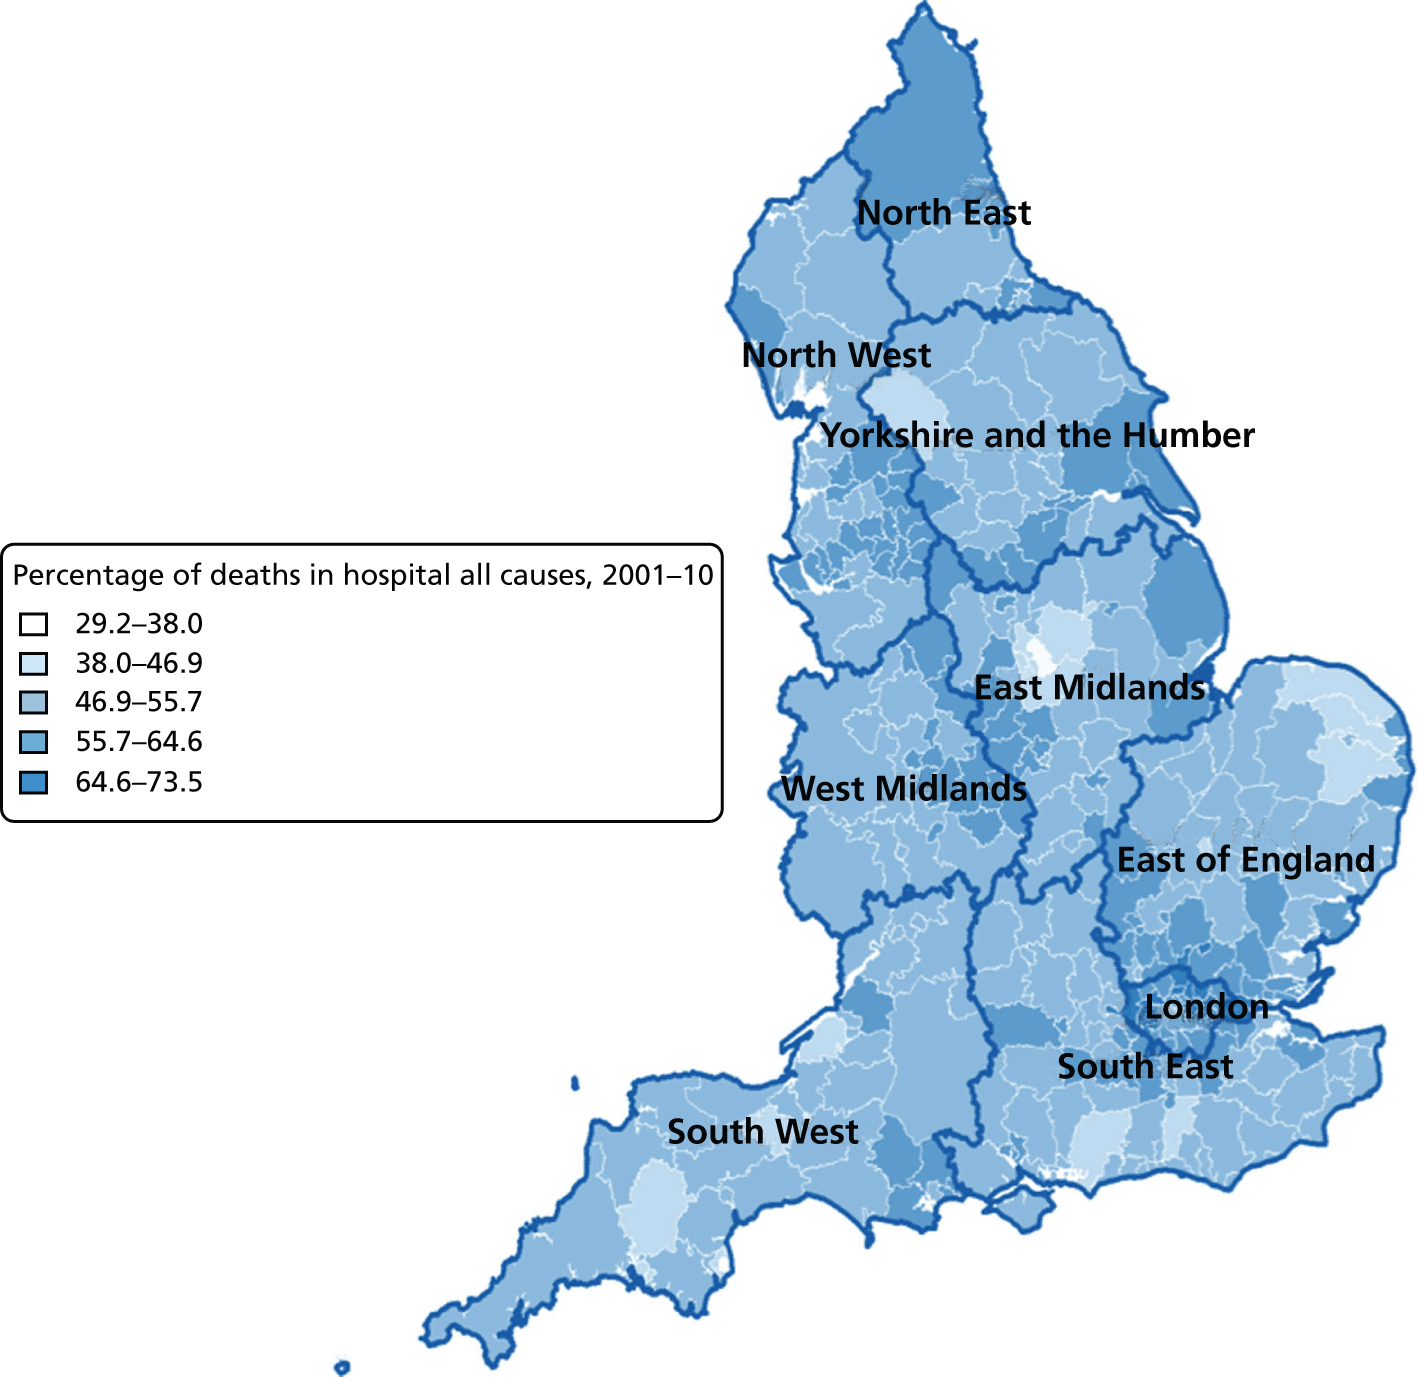
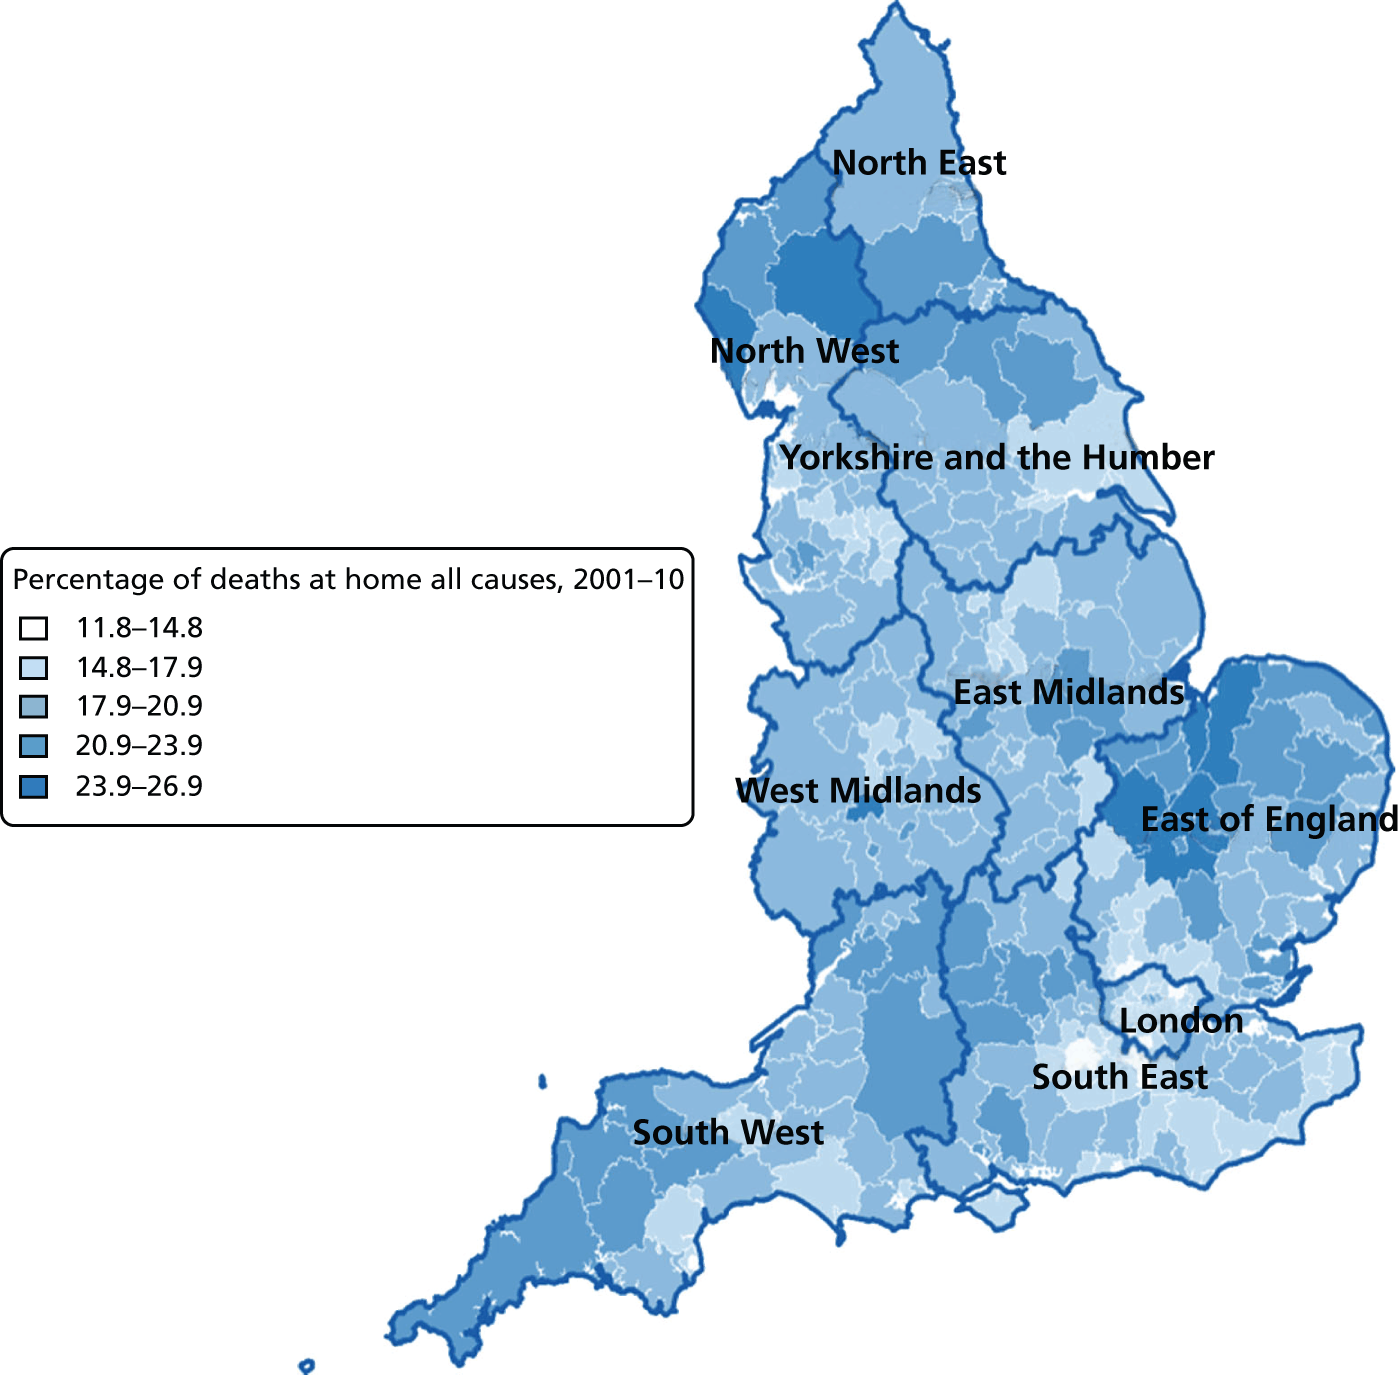
FIGURE 9.
Percentage of care home deaths for all causes, combined by geographical areas, England (a) 1993–2000; and (b) 2001–10.
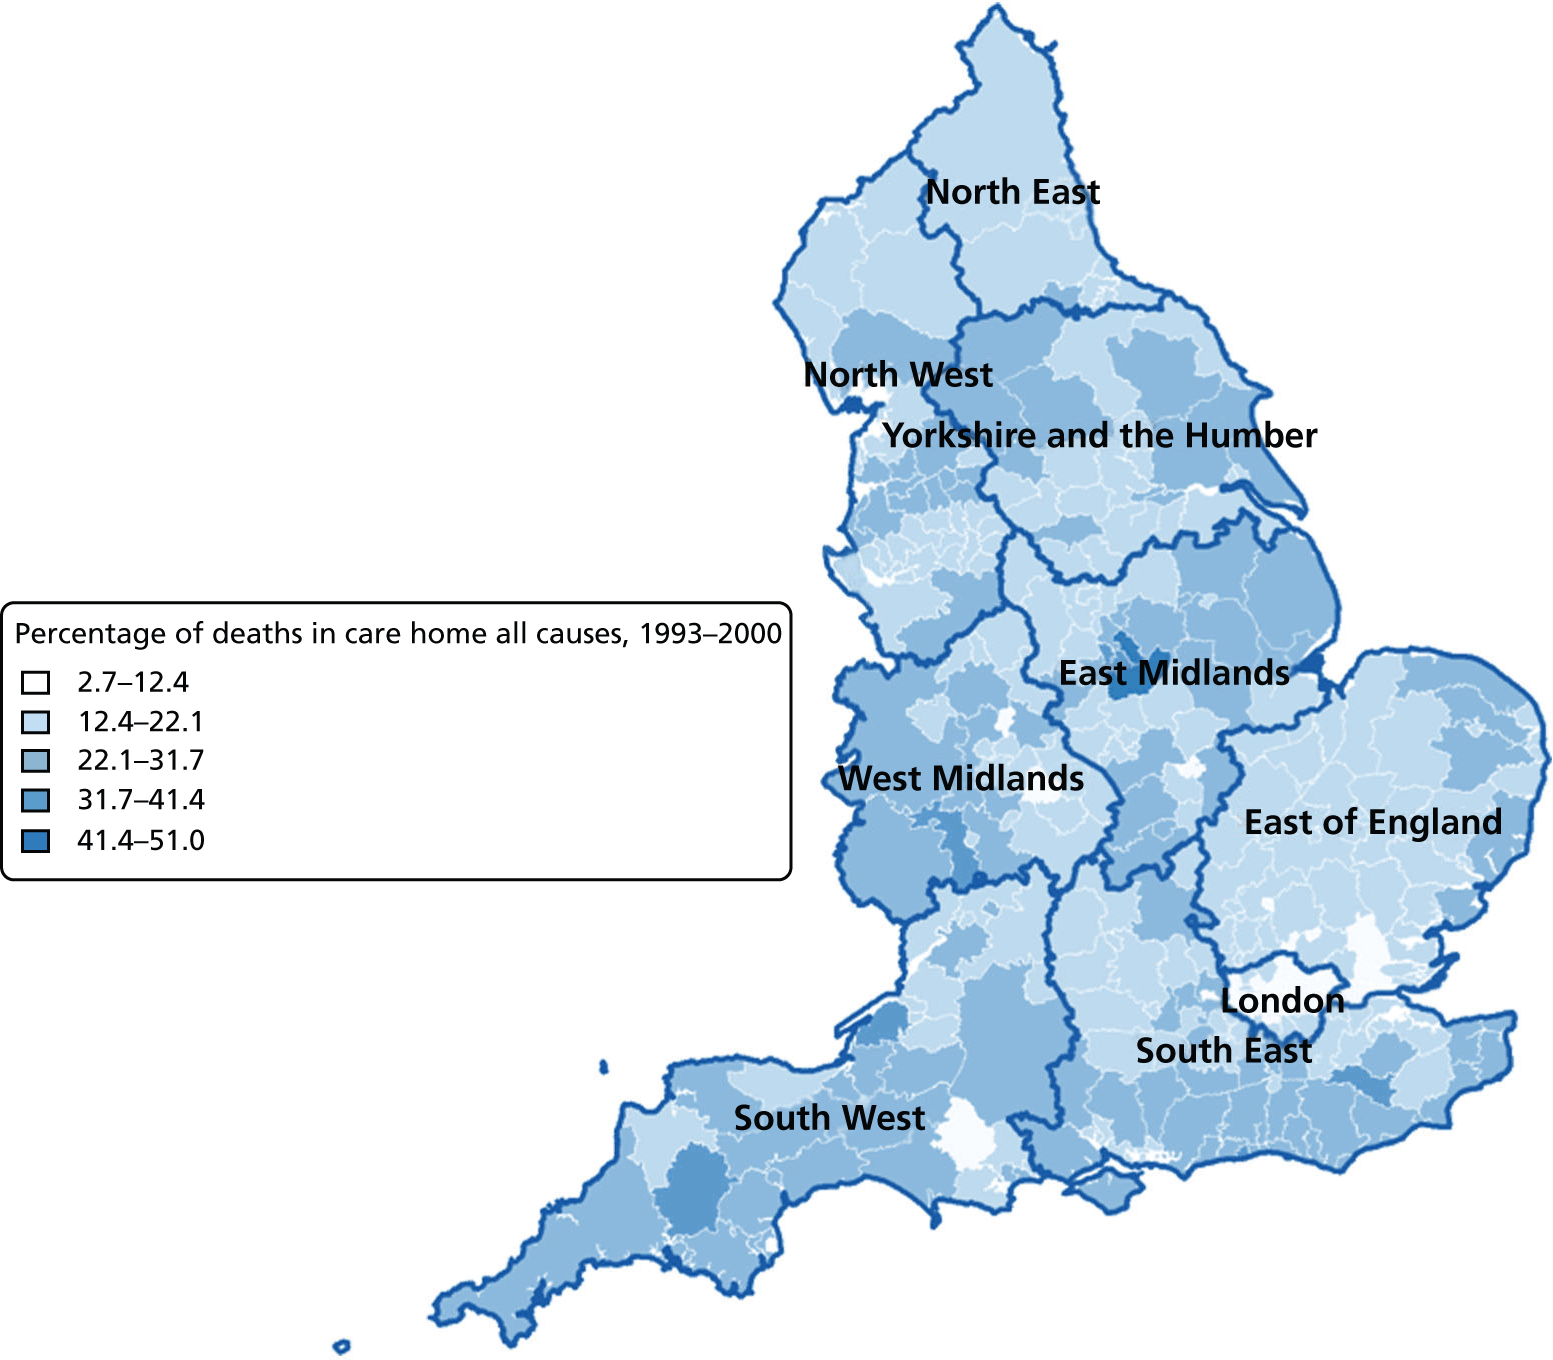
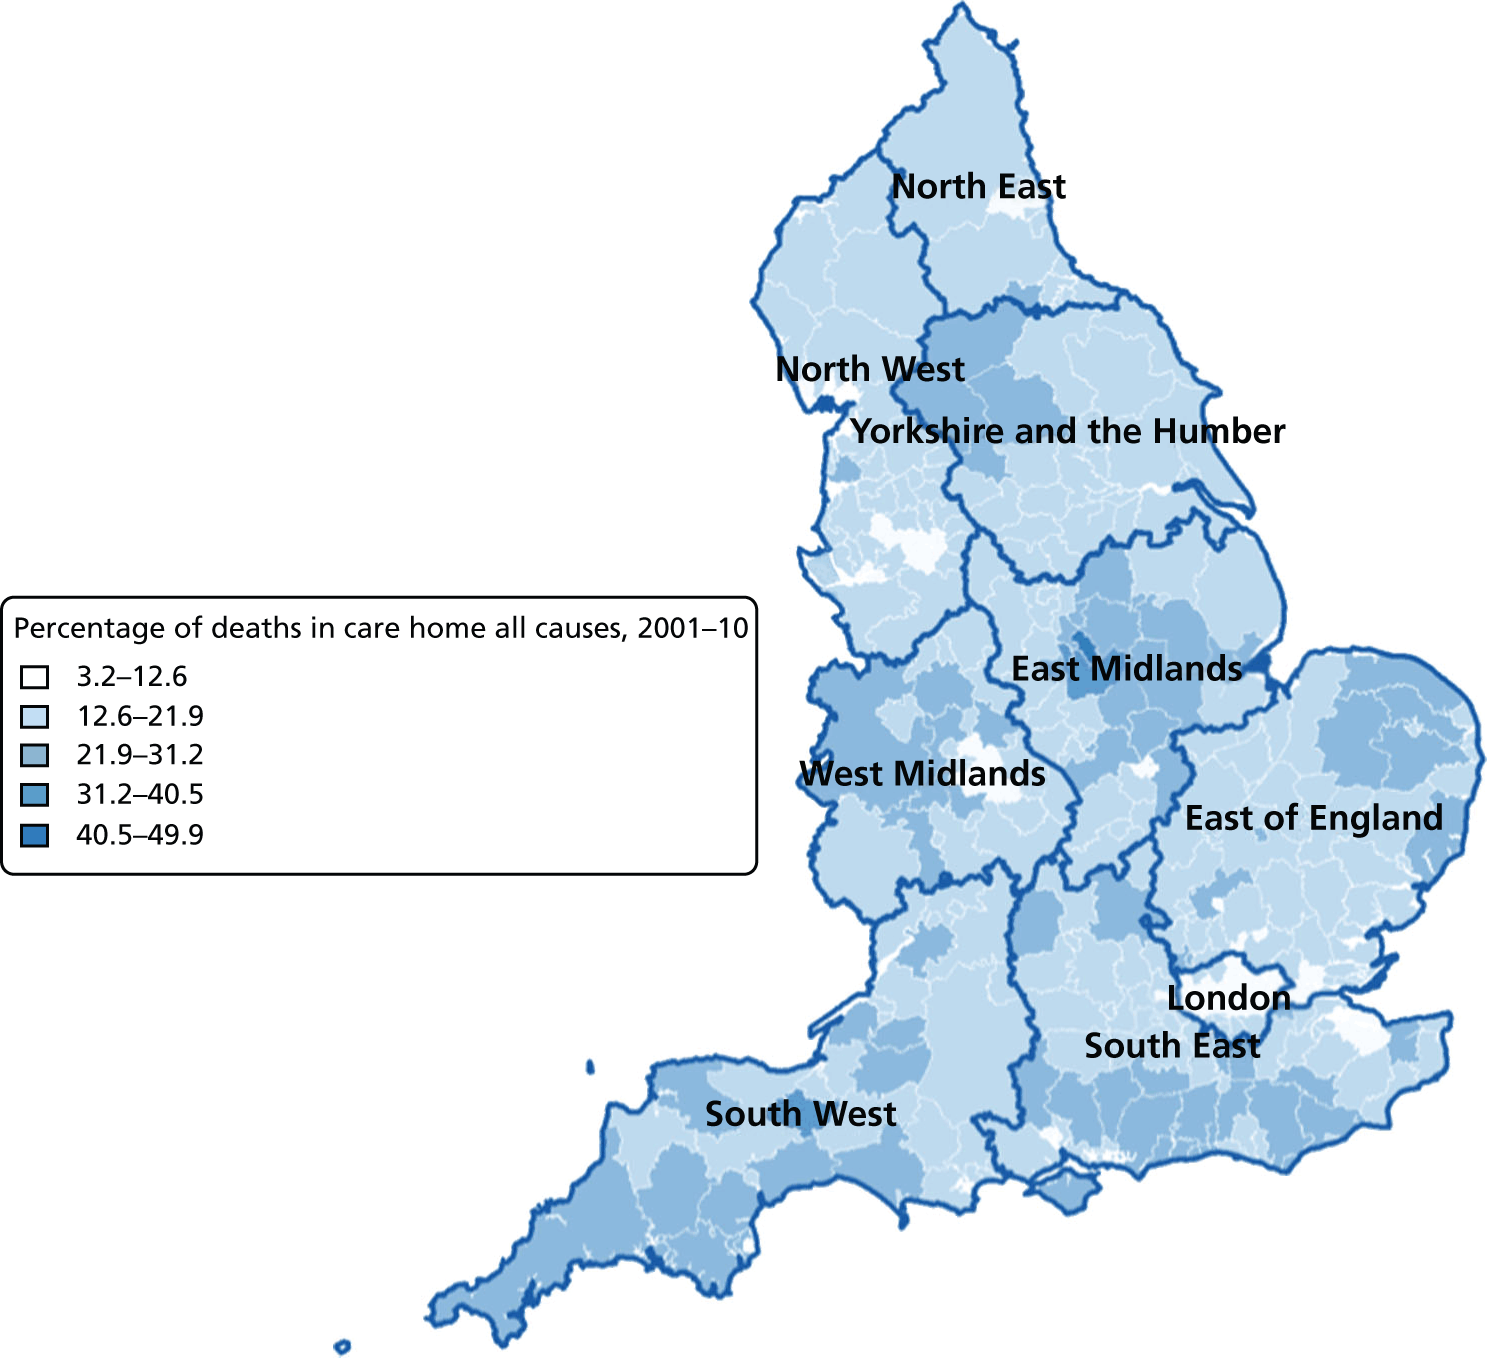
FIGURE 10.
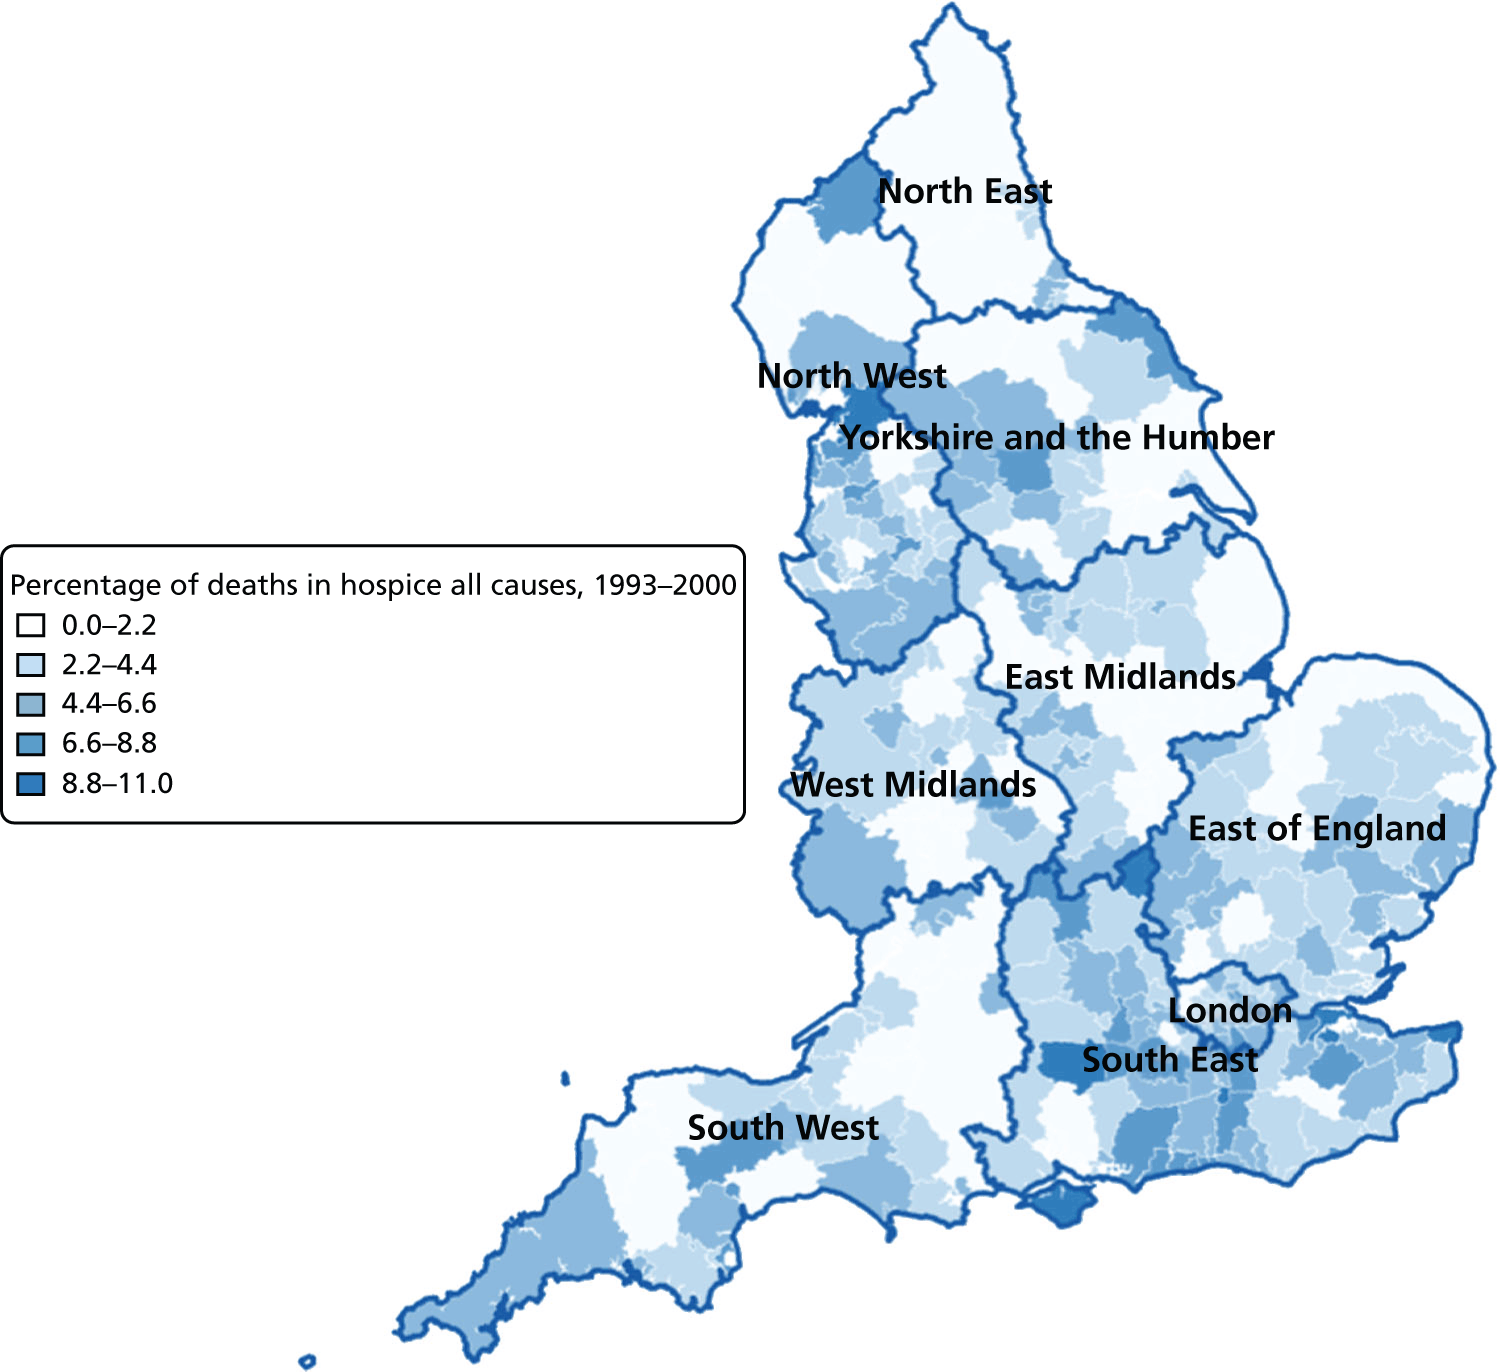
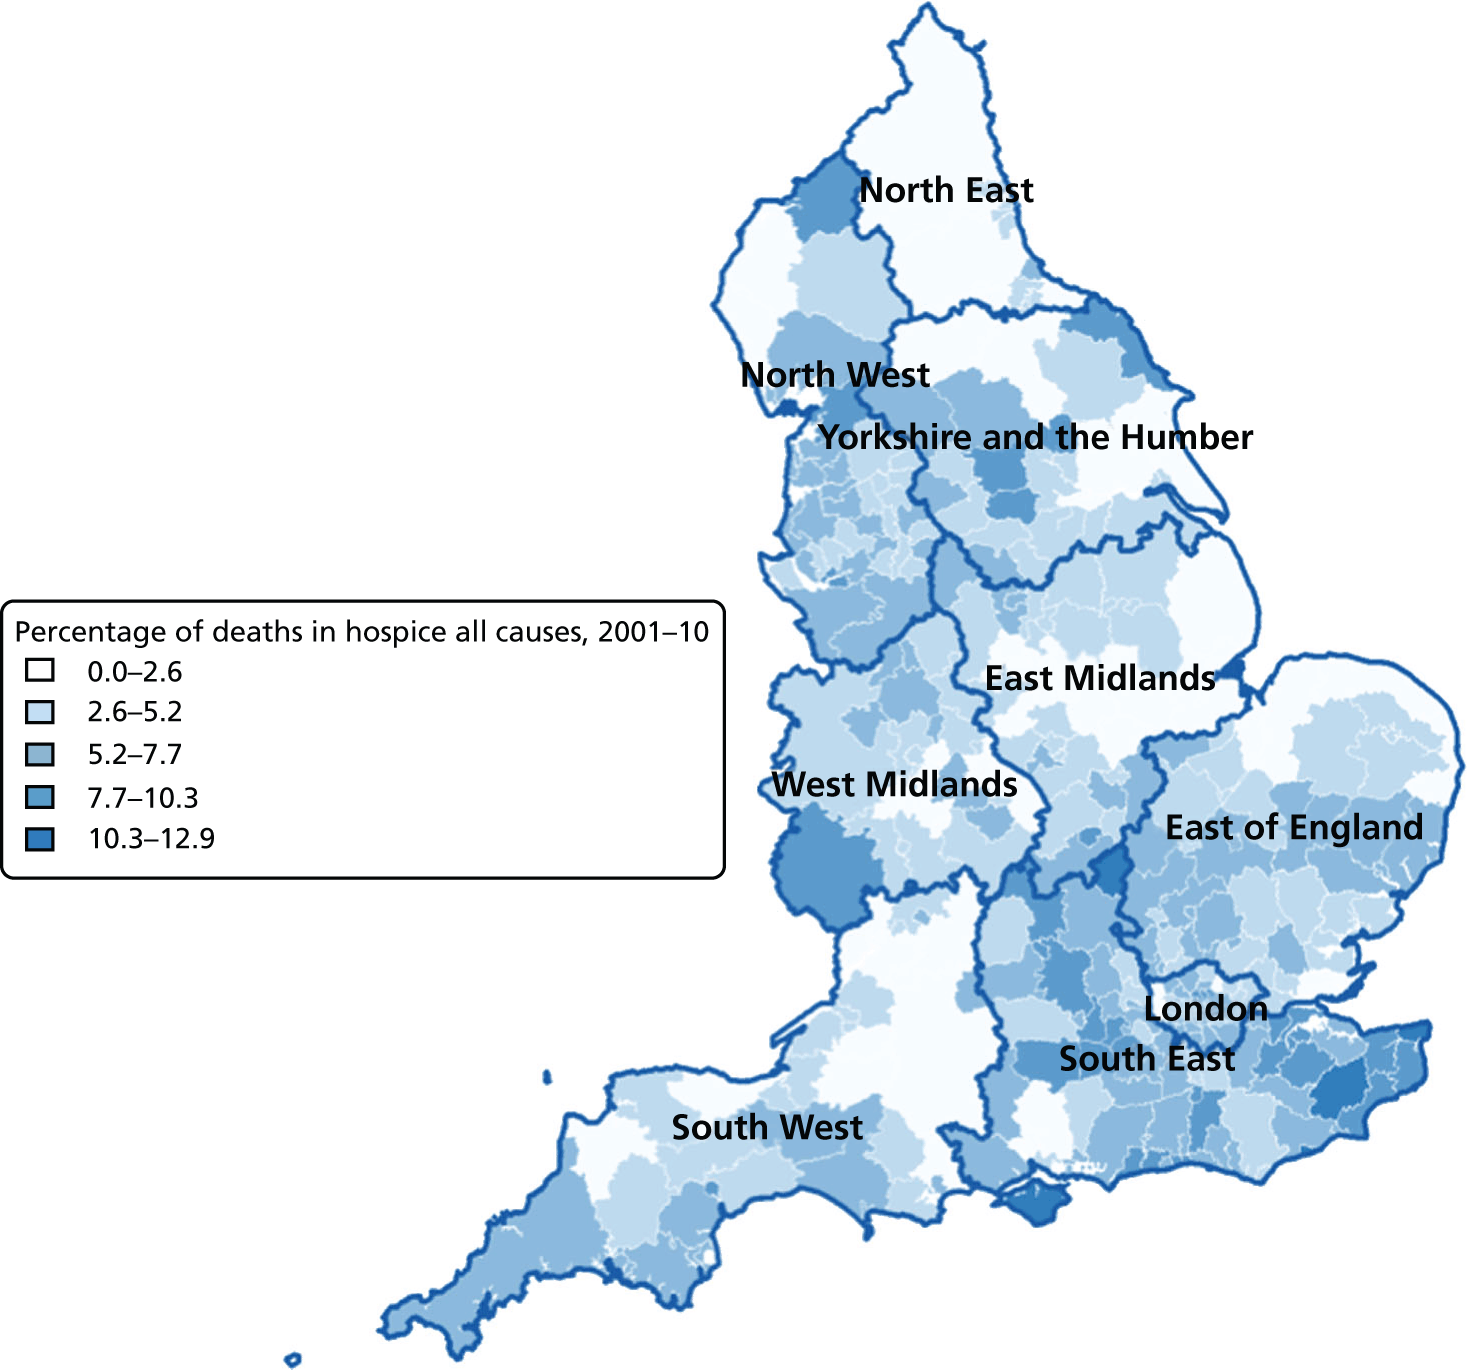
Percentage of hospice deaths for all causes, combined by geographical areas, England (a) 1993–2000; and (b) 2001–10.
Area-level regression analysis
Regional-level models on the basis of selected demographic and clinical variables together with a temporal variable (see Table 10) explained a statistically significant (p < 0.001) proportion of the variation in hospital deaths, ranging from 24.3% to 26.7% in the data with all causes combined. The models constructed at the PCO level tended to perform slightly better than those at the LA level; models incorporating holiday periods marginally outperformed those including the seasonal temporal variable. For every year increase in age, there was a 1.686% (95% CI 1.814% to 1.559%) to 1.613% (95% CI 1.829% to 1.397%) reduction in hospital deaths; every 1% increase in male proportion was associated with a 0.013% (95% CI 0.007% to 0.018%) to 0.005% (95% CI 0.000% to 0.010%) increase in deaths in hospitals; married marital status was negatively related to hospital deaths (−0.009%, 95% CI −0.012% to −0.006% for the PCO-level models; −0.012%, 95% CI −0.015% to −0.009% for the LA-level models). Year of death was positively related to proportion of hospital deaths, the more recent years’ deaths were more likely to occur in hospitals: every year was associated with 0.277–0.279% increase in hospital deaths for the PCO models with holiday and seasonal variables, respectively. The corresponding figures for the LA-level models were 0.332% (95% CI 0.300% to 0.364%) and 0.339% (95% CI 0.307% to 0.371%).
| Characteristics | All | Non-cancer | Cancer | CVD | CBD | Neurological conditions | COPD | |||||||
|---|---|---|---|---|---|---|---|---|---|---|---|---|---|---|
| Estimate | 95% CI | Estimate | 95% CI | Estimate | 95% CI | Estimate | 95% CI | Estimate | 95% CI | Estimate | 95% CI | Estimate | 95% CI | |
| n b | 2718 | 2718 | 2718 | 2718 | 2718 | 2711 | 2718 | |||||||
| Adjusted R square, % | 26.7 | 38.0 | 6.9 | 26.1 | 38.2 | 22.6 | 11.8 | |||||||
| Mean age, years | –1.613 | –1.829 to –1.397 | –2.011 | –2.218 to –1.804 | –0.413 | –0.731 to –0.095 | –1.588 | –1.780 to –1.396 | –2.586 | –2.833 to –2.340 | –0.407 | –0.590 to –0.225 | 0.012 | –0.209 to 0.233 |
| % male | 0.005 | 0.000 to 0.010 | 0.004 | –0.002 to 0.010 | 0.016 | –0.003 to 0.035 | –0.005 | –0.016 to 0.006 | 0.004 | –0.026 to 0.035 | 0.445 | 0.295 to 0.595 | –0.054 | –0.085 to –0.022 |
| % married | –0.009 | –0.012 to –0.006 | –0.013 | –0.017 to –0.009 | –0.002 | –0.013 to 0.010 | –0.033 | –0.040 to –0.025 | 0.055 | 0.026 to 0.084 | 0.262 | 0.114 to 0.409 | 0.023 | –0.013 to 0.059 |
| Year of death | 0.279 | 0.231 to 0.328 | 0.527 | 0.475 to 0.578 | –0.204 | –0.273 to –0.134 | 0.405 | 0.350 to 0.460 | 0.462 | 0.391 to 0.534 | 0.644 | 0.540 to 0.749 | 0.315 | 0.255 to 0.375 |
| Average IMD ranking | 0.415 | –0.043 to 0.874 | 1.175 | 0.718 to 1.632 | –1.459 | –2.066 to –0.851 | 1.280 | 0.862 to 1.698 | –0.642 | –1.185 to –0.099 | –3.882 | –4.617 to –3.147 | –1.412 | –1.861 to –0.964 |
| % death in winter | –0.001 | –0.006 to 0.004 | –0.002 | –0.007 to 0.003 | 0.015 | –0.006 to 0.035 | –0.011 | –0.022 to 0.001 | 0.000 | –0.028 to 0.029 | –0.020 | –0.170 to 0.131 | 0.023 | –0.007 to 0.053 |
| Adjusted R square, % | 26.7 | 38.0 | 6.8 | 26.1 | 39.0 | 25.5 | 11.8 | |||||||
| Mean age, years | –1.617 | –1.833 to –1.401 | –2.019 | –2.226 to –1.812 | –0.413 | –0.731 to –0.095 | –1.598 | –1.790 to –1.406 | –2.650 | –2.899 to –2.401 | –0.522 | –0.767 to –0.277 | –0.073 | –0.299 to 0.154 |
| % male | 0.005 | 0.000 to 0.010 | 0.004 | –0.002 to 0.010 | 0.016 | –0.003 to 0.035 | –0.006 | –0.017 to 0.005 | 0.003 | –0.027 to 0.034 | 0.360 | 0.202 to 0.517 | –0.057 | –0.088 to –0.025 |
| % married | –0.009 | –0.012 to –0.006 | –0.013 | –0.017 to –0.009 | –0.002 | –0.014 to 0.010 | –0.033 | –0.040 to –0.025 | 0.054 | 0.025 to 0.083 | 0.223 | 0.067 to 0.379 | 0.025 | –0.011 to 0.061 |
| Year of death | 0.277 | 0.228 to 0.326 | 0.524 | 0.473 to 0.576 | –0.202 | –0.272 to –0.133 | 0.410 | 0.354 to 0.465 | 0.470 | 0.399 to 0.541 | 0.684 | 0.555 to 0.813 | 0.307 | 0.246 to 0.367 |
| Average IMD ranking | 0.419 | –0.039 to 0.878 | 1.179 | 0.722 to 1.635 | –1.457 | –2.065 to –0.849 | 1.270 | 0.852 to 1.688 | –0.540 | –1.085 to 0.004 | –3.136 | –4.092 to –2.179 | –1.307 | –1.765 to –0.849 |
| % deaths in Christmas period | –0.007 | –0.020 to 0.007 | –0.011 | –0.026 to 0.004 | 0.009 | –0.061 to 0.080 | –0.012 | –0.044 to 0.021 | –0.038 | –0.134 to 0.058 | 0.067 | –0.519 to 0.653 | 0.025 | –0.068 to 0.118 |
A higher level of area deprivation was related to a higher proportion of hospital death at the PCO level. Every increasingly deprived IMD quintile was associated with a 0.415% (95% CI −0.043% to 0.874%) and 0.419% (95% CI −0.039% to 0.878%) increase in hospital deaths for the models with percentage winter deaths and percentage Christmas deaths. For the LA-level models, every increasingly deprived IMD quintile was associated with a 0.041% (95% CI −0.285% to 0.203%) reduction in proportion of hospital deaths in the seasonal model but an increase of 0.037% (95% CI −0.206% to 0.280%) in the holiday period model, although none of those was statistically significant. People who died in the winter had slightly lower but statistically non-significant chance of dying in hospital (−0.001%, 95% CI −0.006% to 0.004% for PCO-level model; −0.002%, 95% CI −0.008% to 0.003% for LA-level model); the Christmas period tended to be associated with an increased chance of people dying in hospital, with the −0.007% (95% CI −0.020% to 0.007%) of associated hospital deaths in the PCO-level model and −0.012% (95% CI −0.015% to −0.009%) in the LA model; the latter was statistically significant (p < 0.001).
The disease-specific models varied widely between diseases (Tables 10 and 11). The selected variables explained the least proportion of variation in the area-level models for cancer (5.4–6.9%), and the highest proportion for CBDs (38.2–39.0%) for PCO-level models and in non-cancer (36.5–37.2%) for LA-level models. The explained variation in hospital deaths by selected explanatory variables in CVDs, neurological conditions and COPD CoD accounted for between 6.6% and 26.1% of the observed variation. Overall, the holiday models performed equally well or slightly better than seasonal period models, the exception being in cancer deaths, for which seasonal models were slightly better, although the difference was minimal (6.9% vs. 6.8% for the PCO-level models and 5.5% vs. 5.4% for the LA models). The direction of travel for the individual explanatory variables in disease-specific models was consistent with that in all causes combined models for most disease groups, although the magnitude differed.
| Characteristics | All | Non-cancer | Cancer | CVD | CBD | Neurological conditions | COPD | |||||||
|---|---|---|---|---|---|---|---|---|---|---|---|---|---|---|
| Estimate | 95% CI | Estimate | 95% CI | Estimate | 95% CI | Estimate | 95% CI | Estimate | 95% CI | Estimate | 95% CI | Estimate | 95% CI | |
| n b | 5867 | 5867 | 5861 | 5864 | 5846 | 5676 | 5839 | |||||||
| Adjusted R square, % | 24.3 | 36.5 | 5.5 | 21.3 | 31.4 | 14.6 | 6.6 | |||||||
| Mean age | –1.630 | –1.757 to –1.503 | –2.250 | –2.378 to –2.121 | –0.204 | –0.382 to –0.027 | –1.569 | –1.690 to –1.447 | –2.391 | –2.541 to –2.241 | –0.536 | –0.656 to –0.416 | –0.402 | –0.546 to –0.257 |
| % male | 0.013 | 0.008 to 0.019 | 0.010 | 0.004 to 0.017 | 0.051 | 0.031 to 0.071 | –0.019 | –0.032 to –0.005 | 0.092 | 0.059 to 0.125 | 0.833 | 0.651 to 1.015 | –0.057 | –0.100 to –0.014 |
| % married | –0.012 | –0.015 to –0.009 | –0.012 | –0.016 to –0.008 | –0.029 | –0.041 to –0.017 | –0.038 | –0.047 to –0.029 | 0.089 | 0.055 to 0.122 | 0.301 | 0.119 to 0.483 | 0.026 | –0.021 to 0.073 |
| Year of death | 0.332 | 0.300 to 0.364 | 0.672 | 0.637 to 0.707 | –0.289 | –0.338 to –0.240 | 0.586 | 0.545 to 0.626 | 0.455 | 0.404 to 0.505 | 0.553 | 0.472 to 0.635 | 0.377 | 0.327 to 0.427 |
| Average IMD ranking | –0.041 | –0.285 to 0.203 | 0.719 | 0.460 to 0.979 | –0.965 | –1.306 to –0.625 | 0.601 | 0.341 to 0.861 | –1.490 | –1.820 to –1.161 | –4.386 | –4.867 to –3.905 | –1.088 | –1.417 to –0.760 |
| % death in winter | –0.002 | –0.008 to 0.003 | –0.004 | –0.010 to 0.002 | 0.012 | –0.012 to 0.035 | –0.013 | –0.027 to 0.000 | –0.003 | –0.037 to 0.030 | 0.033 | –0.149 to 0.214 | 0.029 | –0.015 to 0.072 |
| Adjusted R square, % | 25.0 | 37.2 | 5.4 | 23.0 | 32.9 | 20.0 | 7.2 | |||||||
| Mean age, years | –1.686 | –1.814 to –1.559 | –2.318 | –2.448 to –2.188 | –0.234 | –0.414 to –0.054 | –1.656 | –1.779 to –1.534 | –2.584 | –2.744 to –2.423 | –0.503 | –0.712 to –0.295 | –0.305 | –0.467 to –0.143 |
| % male | 0.013 | 0.007 to 0.018 | 0.009 | 0.002 to 0.015 | 0.050 | 0.030 to 0.070 | –0.023 | –0.036 to –0.010 | 0.081 | 0.047 to 0.115 | 0.870 | 0.627 to 1.113 | –0.061 | –0.104 to –0.018 |
| % married | –0.012 | –0.015 to –0.009 | –0.011 | –0.016 to –0.007 | –0.028 | –0.040 to –0.016 | –0.038 | –0.047 to –0.029 | 0.081 | 0.048 to 0.115 | 0.238 | –0.007 to 0.484 | 0.033 | –0.015 to 0.080 |
| Year of death | 0.339 | 0.307 to 0.371 | 0.681 | 0.646 to 0.716 | –0.282 | –0.331 to –0.234 | 0.609 | 0.569 to 0.648 | 0.485 | 0.433 to 0.537 | 0.690 | 0.562 to 0.817 | 0.361 | 0.307 to 0.414 |
| Average IMD ranking | 0.037 | –0.206 to 0.280 | 0.817 | 0.557 to 1.076 | –0.923 | –1.263 to –0.583 | 0.705 | 0.447 to 0.964 | –1.229 | –1.575 to –0.884 | –4.570 | –5.347 to –3.793 | –1.351 | –1.710 to –0.991 |
| % deaths in Christmas period | –0.012 | –0.029 to 0.004 | –0.020 | –0.039 to –0.001 | –0.013 | –0.091 to 0.065 | –0.006 | –0.047 to 0.035 | –0.021 | –0.137 to 0.094 | –0.037 | –1.076 to 1.002 | –0.013 | –0.148 to 0.122 |
Age was consistently associated with lower hospital deaths in disease-specific models; this remained the case for PCO- and LA-level models: a 1-year increase in age was linked with a 0.204–2.650% reduction in hospital deaths; the link was strongest in CBDs. However, COPD deaths had inconsistent age patterns for PCOs (0.012%, 95% CI −0.209% to 0.233% in the seasonal model; −0.073%, 95% CI −0.299% to 0.154% in the holiday model), although none of them were statistically significant and the associations were weak. At the LA level, age was consistently associated with lower hospital deaths in COPD (−0.402%, 95% CI −0.546% to −0.257% in the seasonal model; −0.305%, 95% CI −0.467% to −0.143% in the holiday temporal model).
Male gender was associated with lower hospital deaths for non-cancer, cancer, CBD and neurological condition CoDs (0.003–0.870, all significant at the level of p < 0.001), but not in deaths from COPD and CVDs, for which these deaths had a negative parameter estimate but only COPD’s parameters were statistically significant (−0.054%, 95% CI −0.085% to −0.022% for the seasonal model; −0.057%, 95% CI −0.088% to −0.025% for the holiday temporal model at the PCO level; and −0.057%, 95% CI −0.100% to −0.014% for the seasonal model; −0.061%, 95% CI −0.104% to −0.018% for the holiday temporal model at the LA level).
The proportion of married people who died from a non-cancer, cancer or CVD cause was associated with lower hospital deaths (−0.002% to −0.038%), whereas among deaths from CBDs, neurological conditions and COPD, marital status was linked with an increased proportion of hospital deaths (0.023–0.301%). Again, the link was strongest for deaths from neurological conditions (0.223–0.301%). Along with the year, the proportion of hospital deaths increased in all selected CoD (annual increase 0.361–0.690%), with the only exception being cancer deaths (annual decrease −0.282% to −0.202%). The hospital deaths in non-cancer and CVD causes were linked with increased area deprivation (0.601–1.280%); however, deaths in hospitals from cancer, CBD, neurological conditions and COPD were related to reduced area deprivation (−4.570% to −1.457%). The regional models showed most of the temporal trends were not significant, although the direction of effect varied by CoD. The only significant trend was that deaths over the Christmas period had a lower chance of taking place in hospital (−0.013%, 95% CI −0.017% to −0.009%) for the PCO-level model.
The visual inspection of overall fit of area-level models, influence of outliers, normality, homoscedasticity and linearity assumption showed a consistent misfit pattern with the R-squared statistics: models with a higher value on R squared (e.g. non-cancer, CBD vs. cancer and COPD) had a better visual fit. We carried out transformation of data in an attempt to improve less well-fitted models but no tangible improvement was observed. For the interests of simplicity and ease of interpretation, we presented raw data-based models only.
Factors associated with place of death: multivariable modelling
In this section, we report the multivariate adjusted association between factors and PoD. The measure of effect is expressed as the PR, a more conservative but more appropriate measure of association than OR when the outcome of interest is common (> 10%). It is useful to bear this in mind when interpreting these results, as the effect presented by PR tends to be smaller than that of OR. Bivariate and area-level modelling analyses indicate that the factors associated with PoD are very different by cause of death, therefore we ran the multivariable regression modelling analysis separately for all causes, non-cancer causes, cancer, CVDs, CBDs, neurological conditions and COPDs.
For all causes, home or care home death compared with hospital death
For all CoDs combined, the probability of a patient dying at home decreased with increasing age across the three time periods; however, the age gap showed a tendency towards narrowing (PRs range 0.863–1.016), compared with patients who died aged 25–54 years (Table 12). Patients aged 85+ years had the lowest chance of dying at home (PRs 0.863–0.946). Male gender was associated with an increased chance of death at home and this was more pronounced in the earlier period (PR 1.034, 95% CI 1.032 to 1.036) than in the more recent periods (PR 1.007, 95% CI 1.007 to 1.008 for 1993–2000; PR 1.009, 95% CI 1.008 to 1.009 for 2001–10). Divorced people were less likely to die in hospital (PR 0.998, 95% CI 0.997 to 0.999) in 1993–2000, but more likely to die in hospital in 2001–10 (PR 1.027, 95% CI 1.024 to 1.030). Compared with married people, individuals who were widowed or single were more likely to die in hospital (PRs 0.992–0.998). Over the study period, deaths in hospital became more likely [PR 1.001 (95% CI 1.000 to 1.002) in 2001–10 vs. PR 0.998 (95% CI 0.998 to 0.999) in 1993–2000]. Deprivation was associated with a higher chance of hospital death; this was more pronounced in 1984–92 than in 1993–2010 (PRs 1.000–1.010 vs. PRs 1.030–1.076 for less deprived compared with most deprived). Across all periods and compared with the North West region, people in London had the highest chance of dying in hospital (PRs 0.872–0.988), and people in the South West had the highest chance of a home death (PRs 1.010–1.062).
| Variable | Value | Time period | ||
|---|---|---|---|---|
| 1984–92 | 1993–2000 | 2001–10 | ||
| Age, years | 25–54 | 1.000 | 1.000 | 1.000 |
| 55–64 | 1.016 (1.012 to 1.020) | 0.998 (0.997 to 0.999) | 0.999 (0.998 to 1.000) | |
| 65–74 | 0.958 (0.954 to 0.961) | 0.984 (0.983 to 0.985) | 0.982 (0.981 to 0.983) | |
| 75–84 | 0.874 (0.871 to 0.877) | 0.962 (0.961 to 0.963) | 0.958 (0.958 to 0.959) | |
| 85+ | 0.863 (0.859 to 0.867) | 0.946 (0.945 to 0.947) | 0.938 (0.937 to 0.939) | |
| Gender | Female | 1.000 | 1.000 | 1.000 |
| Male | 1.034 (1.032 to 1.036) | 1.007 (1.007 to 1.008) | 1.009 (1.008 to 1.009) | |
| Marital status | Married | NA | 1.000 | 1.000 |
| Widowed | NA | 0.993 (0.993 to 0.994) | 0.993 (0.993 to 0.994) | |
| Single | NA | 0.992 (0.991 to 0.994) | 0.998 (0.997 to 0.999) | |
| Divorced | NA | 0.998 (0.997 to 0.999) | 1.001 (1.000 to 1.002) | |
| NS/unknown | NA | 1.019 (1.016 to 1.021) | 1.027 (1.024 to 1.030) | |
| Year of death | – | 1.001 (1.001 to 1.002) | 0.998 (0.998 to 0.999) | 1.001 (1.001 to 1.001) |
| IMD | Most deprived | 1.000 | 1.000 | 1.000 |
| 2 | 1.030 (1.025 to 1.035) | 1.001 (1.000 to 1.002) | 1.000 (0.999 to 1.001) | |
| 3 | 1.049 (1.043 to 1.055) | 1.005 (1.004 to 1.006) | 1.004 (1.003 to 1.005) | |
| 4 | 1.067 (1.061 to 1.073) | 1.009 (1.008 to 1.010) | 1.007 (1.006 to 1.008) | |
| 5 | 1.076 (1.070 to 1.083) | 1.010 (1.009 to 1.011) | 1.008 (1.007 to 1.009) | |
| Region | North West | 1.000 | 1.000 | 1.000 |
| East England | 0.975 (0.969 to 0.981) | 1.002 (1.001 to 1.004) | 1.005 (1.004 to 1.006) | |
| East Midlands | 1.004 (0.997 to 1.010) | 0.999 (0.998 to 1.001) | 1.000 (0.999 to 1.001) | |
| London | 0.872 (0.867 to 0.876) | 0.984 (0.982 to 0.985) | 0.988 (0.987 to 0.989) | |
| North East | 1.016 (1.009 to 1.023) | 1.000 (0.998 to 1.002) | 1.000 (0.998 to 1.001) | |
| South Central | 1.024 (1.017 to 1.031) | 1.008 (1.007 to 1.010) | 1.002 (1.000 to 1.003) | |
| South East Coast | 1.027 (1.020 to 1.034) | 1.001 (0.999 to 1.003) | 1.000 (0.998 to 1.001) | |
| South West | 1.062 (1.056 to 1.069) | 1.014 (1.012 to 1.015) | 1.010 (1.008 to 1.011) | |
| West Midlands | 1.057 (1.051 to 1.063) | 1.005 (1.004 to 1.006) | 0.998 (0.997 to 0.999) | |
| Yorkshire and the Humber | 1.001 (0.996 to 1.007) | 1.002 (1.001 to 1.004) | 1.001 (1.000 to 1.002) | |
Care home deaths were more likely among older people for all CoD combined in 1993–2010 (PRs 0.941–0.996) (Table 13). Compared with care home death, men were more likely to die in hospital than women were (PRs 1.008–1.010) in the whole period; those who were married had a higher chance of dying in hospital than those who were widowed, single, divorced or unknown marital status (PRs 0.984–0.992) in recent periods; in the periods of 1993–2000 and 2001–10, widowed people had the highest chance of a care home death (PR 0.980, 95% CI 0.979 to 0.981 in 1993–2000; PR 0.985, 95% CI 0.985 to 0.986 in 2001–10). The number of care home deaths fell slightly in the period 1984–2000 (PRs 1.001–1.022), but remained stable for the period of 2001–10 (PR 1.000, 95% CI 0.999 to 1.000). Care home deaths were less likely among the least deprived (PRs 0.992–0.997 compared with the most deprived). Care home deaths were less likely in London than in the North West (PRs 1.012–1.016) but the regional gap was reduced in 2001–10; the South West region had the highest chance of care home deaths (PRs 0.993–0.994). In the period of 1984–92, the distribution of the explanatory variables by PoD (hospital vs. care home) showed distinctive patterns compared with the later periods (1993–2010) due to the coding changes in PoD.
| Variable | Value | Time period | ||
|---|---|---|---|---|
| 1984–92b | 1993–2000 | 2001–10 | ||
| Age, years | 25–54 | 1.000 | 1.000 | 1.000 |
| 55–64 | 0.987 (0.982 to 0.992) | 0.996 (0.995 to 0.996) | 0.994 (0.993 to 0.994) | |
| 65–74 | 0.994 (0.990 to 0.999) | 0.987 (0.986 to 0.988) | 0.985 (0.984 to 0.985) | |
| 75–84 | 1.116 (1.110 to 1.122) | 0.968 (0.968 to 0.969) | 0.970 (0.969 to 0.970) | |
| 85+ | 1.386 (1.377 to 1.395) | 0.941 (0.941 to 0.942) | 0.948 (0.947 to 0.949) | |
| Gender | Female | 1.000 | 1.000 | 1.000 |
| Male | 0.887 (0.885 to 0.889) | 1.008 (1.008 to 1.009) | 1.010 (1.010 to 1.010) | |
| Marital status | Married | NA | 1.000 | 1.000 |
| Widowed | NA | 0.989 (0.988 to 0.989) | 0.991 (0.990 to 0.991) | |
| Single | NA | 0.980 (0.979 to 0.981) | 0.985 (0.985 to 0.986) | |
| Divorced | NA | 0.989 (0.989 to 0.990) | 0.992 (0.992 to 0.993) | |
| NS/unknown | NA | 0.984 (0.983 to 0.986) | 0.988 (0.986 to 0.989) | |
| Year of death | – | 1.022 (1.021 to 1.023) | 1.001 (1.001 to 1.001) | 1.000 (0.999 to 1.000) |
| IMD | Most deprived | 1.000 | 1.000 | 1.000 |
| 2 | 1.049 (1.019 to 1.080) | 0.997 (0.996 to 0.998) | 0.997 (0.996 to 0.998) | |
| 3 | 1.069 (1.034 to 1.105) | 0.994 (0.993 to 0.995) | 0.995 (0.995 to 0.996) | |
| 4 | 1.079 (1.041 to 1.118) | 0.992 (0.991 to 0.993) | 0.994 (0.993 to 0.995) | |
| 5 | 1.091 (1.051 to 1.133) | 0.992 (0.991 to 0.993) | 0.994 (0.993 to 0.995) | |
| Region | North West | 1.000 | 1.000 | 1.000 |
| East England | 0.875 (0.844 to 0.906) | 1.003 (1.002 to 1.005) | 1.001 (1.000 to 1.002) | |
| East Midlands | 0.987 (0.954 to 1.021) | 1.000 (0.998 to 1.001) | 0.998 (0.997 to 1.000) | |
| London | 0.643 (0.623 to 0.665) | 1.016 (1.015 to 1.017) | 1.012 (1.011 to 1.013) | |
| North East | 0.931 (0.889 to 0.973) | 0.992 (0.990 to 0.994) | 0.994 (0.993 to 0.996) | |
| South Central | 0.963 (0.928 to 0.998) | 1.006 (1.004 to 1.008) | 1.001 (0.999 to 1.002) | |
| South East Coast | 0.972 (0.939 to 1.006) | 0.998 (0.996 to 1.000) | 0.998 (0.997 to 1.000) | |
| South West | 1.045 (1.013 to 1.078) | 0.994 (0.992 to 0.995) | 0.993 (0.992 to 0.994) | |
| West Midlands | 0.938 (0.908 to 0.968) | 0.999 (0.997 to 1.000) | 0.998 (0.996 to 0.999) | |
| Yorkshire and the Humber | 0.928 (0.898 to 0.959) | 1.001 (1.000 to 1.003) | 0.996 (0.994 to 0.997) | |
For non-cancer causes, home or care home death compared with hospital death
Factors associated with non-cancer deaths followed similar patterns to that of all CoDs; the profile was similar in 1993–2000 and 2001–10, and distinctive from the period 1984–92 (Table 14). The chance of death in hospital compared with home increased with increasing age (PRs 0.912–1.026 in 1984–92; 0.954–0.998 in 1993–2000; 0.943–0.999 in 2001–10 for descending order of age groups). Male gender, marital status other than ‘married’ and living in a less-deprived area were all associated with increased chance of home death, compared with their respective reference groups (PRs 1.001–1.062). Men who died of non-cancer causes were more likely to die at home than women (PRs 1.013–1.046). Married people who died of non-cancer causes had higher chance of death at home than people who were widowed, single or divorced (PRs 1.009–1.054). There was a reduced chance of home deaths in the earlier periods (1984–2000), but in 2001–10 the probability of hospital compared with home death remained rather stable over the period (PR close to 1). Greater area-level deprivation increased the chance of home death in non-cancer causes of death, PRs increased with the increasingly deprived IMD quintiles (1.026–1.062 in 1984–92; 1.000–1.005 in 1993–2000; 0.999–1.003 in 2001–10). London had the lowest chances of home death for non-cancer causes (PRs 0.894–0.994) throughout the three-study period.
| Variable | Value | Time period | ||
|---|---|---|---|---|
| 1984–92 | 1993–2000 | 2001–10 | ||
| Age, years | 25–54 | 1.000 | 1.000 | 1.000 |
| 55–64 | 1.026 (1.020 to 1.031) | 0.998 (0.996 to 0.999) | 0.999 (0.998 to 1.000) | |
| 65–74 | 0.980 (0.975 to 0.985) | 0.988 (0.987 to 0.989) | 0.980 (0.979 to 0.981) | |
| 75–84 | 0.910 (0.905 to 0.914) | 0.968 (0.967 to 0.969) | 0.960 (0.959 to 0.961) | |
| 85+ | 0.912 (0.907 to 0.917) | 0.954 (0.952 to 0.955) | 0.943 (0.942 to 0.944) | |
| Gender | Female | 1.000 | 1.000 | 1.000 |
| Male | 1.046 (1.043 to 1.048) | 1.013 (1.012 to 1.013) | 1.015 (1.014 to 1.015) | |
| Marital status | Married | NA | 1.000 | 1.000 |
| Widowed | NA | 1.009 (1.008 to 1.010) | 1.011 (1.010 to 1.012) | |
| Single | NA | 1.016 (1.014 to 1.017) | 1.026 (1.025 to 1.027) | |
| Divorced | NA | 1.021 (1.019 to 1.022) | 1.026 (1.025 to 1.027) | |
| NS/unknown | NA | 1.038 (1.035 to 1.041) | 1.054 (1.051 to 1.056) | |
| Year of death | – | 0.997 (0.997 to 0.998) | 0.998 (0.998 to 0.998) | 1.000 (1.000 to 1.000) |
| IMD | Most deprived | 1.000 | 1.000 | 1.000 |
| 2 | 1.026 (1.020 to 1.032) | 1.000 (0.999 to 1.001) | 0.999 (0.998 to 1.000) | |
| 3 | 1.045 (1.038 to 1.051) | 1.003 (1.001 to 1.004) | 1.001 (1.000 to 1.002) | |
| 4 | 1.060 (1.053 to 1.067) | 1.005 (1.004 to 1.006) | 1.003 (1.002 to 1.004) | |
| 5 | 1.062 (1.055 to 1.069) | 1.005 (1.003 to 1.006) | 1.002 (1.001 to 1.003) | |
| Region | North West | 1.000 | 1.000 | 1.000 |
| East England | 1.009 (1.002 to 1.017) | 1.004 (1.002 to 1.006) | 1.007 (1.006 to 1.009) | |
| East Midlands | 1.046 (1.038 to 1.054) | 1.004 (1.002 to 1.006) | 1.003 (1.001 to 1.004) | |
| London | 0.894 (0.888 to 0.899) | 0.987 (0.986 to 0.989) | 0.994 (0.993 to 0.995) | |
| North East | 1.049 (1.041 to 1.058) | 1.001 (0.998 to 1.003) | 0.999 (0.997 to 1.001) | |
| South Central | 1.064 (1.055 to 1.073) | 1.013 (1.011 to 1.015) | 1.006 (1.004 to 1.007) | |
| South East Coast | 1.054 (1.046 to 1.062) | 1.003 (1.001 to 1.005) | 1.003 (1.002 to 1.005) | |
| South West | 1.105 (1.097 to 1.112) | 1.017 (1.016 to 1.019) | 1.013 (1.011 to 1.014) | |
| West Midlands | 1.078 (1.071 to 1.085) | 1.004 (1.003 to 1.006) | 1.000 (0.999 to 1.001) | |
| Yorkshire and the Humber | 1.009 (1.003 to 1.016) | 1.005 (1.004 to 1.007) | 1.005 (1.003 to 1.006) | |
As in the all-CoD combined analyses, the profile for the associated factors of hospital death compared with care home deaths showed a distinctive pattern in 1984–92, with reference to recent periods (Table 15). The hospital analysis compared with care home analysis exhibited divergent patterns, for example although increasing age was associated with increased chance of hospital death in 1993–2000 (PRs 0.943–0.996), it appeared to be the opposite in the period of 1984–92 (PRs 0.999–1.596). This was particularly true for regional variation, for which London had the highest chance of care home death in 1984–92 (PR 0.560, 95% CI 0.534 to 0.587), the corresponding figures for 1993–2010 showed the highest chance of hospital death (PRs 1.013–1.015). Increased age, unmarried marital status and less area deprivation were all associated with an increased chance of a care home death (PRs 0.943–0.997) in 1993–2010, whereas in the period of 1984–92, increased age and less area deprivation were related to increased chance of hospital death (PRs 1.053–1.596) for the period of 1984–92.
| Variable | Value | Time period | ||
|---|---|---|---|---|
| 1984–92a | 1993–2000 | 2001–10 | ||
| Age (years) | 25–54 | 1.000 | 1.000 | 1.000 |
| 55–64 | 0.999 (0.993 to 1.005) | 0.996 (0.996 to 0.997) | 0.996 (0.995 to 0.996) | |
| 65–74 | 1.058 (1.052 to 1.064) | 0.988 (0.987 to 0.988) | 0.987 (0.986 to 0.987) | |
| 75–84 | 1.259 (1.251 to 1.268) | 0.969 (0.968 to 0.970) | 0.972 (0.972 to 0.973) | |
| 85+ | 1.596 (1.584 to 1.608) | 0.943 (0.942 to 0.944) | 0.950 (0.950 to 0.951) | |
| Gender | Female | 1.000 | 1.000 | 1.000 |
| Male | 0.889 (0.886 to 0.892) | 1.009 (1.009 to 1.009) | 1.012 (1.011 to 1.012) | |
| Marital status | Married | NA | 1.000 | 1.000 |
| Widowed | NA | 0.991 (0.991 to 0.992) | 0.994 (0.994 to 0.995) | |
| Single | NA | 0.982 (0.982 to 0.983) | 0.989 (0.989 to 0.990) | |
| Divorced | NA | 0.992 (0.991 to 0.993) | 0.997 (0.996 to 0.998) | |
| NS/unknown | NA | 0.986 (0.985 to 0.988) | 0.994 (0.992 to 0.996) | |
| Year of death | – | 1.018 (1.017 to 1.019) | 1.001 (1.001 to 1.001) | 1.000 (1.000 to 1.000) |
| IMD region | Most deprived | 1.000 | 1.000 | 1.000 |
| 2 | 1.053 (1.015 to 1.091) | 0.996 (0.995 to 0.997) | 0.996 (0.995 to 0.997) | |
| 3 | 1.074 (1.031 to 1.120) | 0.993 (0.991 to 0.994) | 0.994 (0.993 to 0.995) | |
| 4 | 1.086 (1.040 to 1.135) | 0.990 (0.989 to 0.992) | 0.991 (0.990 to 0.993) | |
| 5 | 1.099 (1.050 to 1.151) | 0.989 (0.988 to 0.991) | 0.991 (0.990 to 0.993) | |
| North West | 1.000 | 1.000 | 1.000 | |
| East England | 0.825 (0.786 to 0.865) | 1.003 (1.001 to 1.005) | 1.002 (1.001 to 1.003) | |
| East Midlands | 0.965 (0.923 to 1.008) | 0.998 (0.996 to 1.000) | 0.998 (0.996 to 0.999) | |
| London | 0.560 (0.534 to 0.587) | 1.015 (1.014 to 1.016) | 1.013 (1.011 to 1.014) | |
| North East | 0.890 (0.837 to 0.948) | 0.991 (0.988 to 0.993) | 0.995 (0.993 to 0.996) | |
| South Central | 0.920 (0.877 to 0.965) | 1.005 (1.003 to 1.007) | 0.998 (0.997 to 1.000) | |
| South East Coast | 0.990 (0.946 to 1.036) | 0.996 (0.994 to 0.998) | 0.998 (0.996 to 0.999) | |
| South West | 1.038 (0.996 to 1.081) | 0.990 (0.989 to 0.992) | 0.991 (0.990 to 0.993) | |
| West Midlands | 0.924 (0.885 to 0.965) | 0.999 (0.997 to 1.000) | 0.998 (0.997 to 0.999) | |
| Yorkshire and the Humber | 0.918 (0.879 to 0.959) | 1.000 (0.999 to 1.002) | 0.997 (0.996 to 0.999) | |
For cancer causes, home or care home death compared with hospital death
Compared with those aged 25–54 years, people who died from cancer aged ≥ 65 years were more likely to die in hospital compared with home for all three periods (PRs 0.807–0.992), with the chance of dying at home (Table 16) decreasing with increasing age. For those in the 55- to 64-year age group, there was a higher chance of home death than for those aged 25–54 years (PRs 1.002–1.016); however, for the period 2001–10, the risk of hospital death was higher than for their younger peers (PR 0.999, 95% CI 0.998 to 1.001). Male gender, ‘unmarried’ marital status, and residing in regions other than the North West were all linked with hospital death with reference to home death (PRs 0.996–0.999), with the only exceptions being in the South West in 1993–2000 (PR 1.000, 95% CI 0.998 to 1.002) and the West Midlands in 1984–2000 (PR 1.013, 95% CI 1.006 to 1.021 in 1984–92; PR 1.005, 95% CI 1.004 to 1.007 in 1993–2000). Less area deprivation was consistently associated with an increased chance of home death (PRs 1.002–1.105). In 1984–92, male gender was related to increased probability of a home death (PR 1.016, 95% CI 1.014 to 1.019).
| Variable | Value | Time period | ||
|---|---|---|---|---|
| 1984–92 | 1993–2000 | 2001–10 | ||
| Age, years | 25–54 | 1.000 | 1.000 | 1.000 |
| 55–64 | 1.016 (1.011 to 1.022) | 1.002 (1.000 to 1.003) | 0.999 (0.998 to 1.001) | |
| 65–74 | 0.956 (0.951 to 0.961) | 0.992 (0.991 to 0.994) | 0.991 (0.990 to 0.993) | |
| 75–84 | 0.861 (0.856 to 0.865) | 0.974 (0.972 to 0.975) | 0.978 (0.976 to 0.979) | |
| 85+ | 0.807 (0.802 to 0.813) | 0.959 (0.957 to 0.961) | 0.962 (0.960 to 0.964) | |
| Gender | Female | 1.000 | 1.000 | 1.000 |
| Male | 1.016 (1.014 to 1.019) | 0.996 (0.995 to 0.996) | 0.995 (0.994 to 0.996) | |
| Marital status | Married | NA | 1.000 | 1.000 |
| Widowed | NA | 0.958 (0.957 to 0.959) | 0.961 (0.960 to 0.961) | |
| Single | NA | 0.935 (0.934 to 0.937) | 0.937 (0.936 to 0.938) | |
| Divorced | NA | 0.953 (0.952 to 0.955) | 0.956 (0.955 to 0.958) | |
| NS/unknown | NA | 0.971 (0.966 to 0.976) | 0.959 (0.954 to 0.964) | |
| Year of death | – | 1.010 (1.010 to 1.011) | 0.999 (0.999 to 0.999) | 1.003 (1.003 to 1.004) |
| IMD | Most deprived | 1.000 | 1.000 | 1.000 |
| 2 | 1.036 (1.030 to 1.041) | 1.002 (1.001 to 1.004) | 1.002 (1.001 to 1.003) | |
| 3 | 1.057 (1.050 to 1.063) | 1.008 (1.007 to 1.010) | 1.007 (1.005 to 1.008) | |
| 4 | 1.082 (1.075 to 1.089) | 1.015 (1.014 to 1.017) | 1.013 (1.012 to 1.015) | |
| 5 | 1.105 (1.098 to 1.112) | 1.020 (1.018 to 1.021) | 1.017 (1.015 to 1.018) | |
| Region | North West | 1.000 | 1.000 | 1.000 |
| East England | 0.902 (0.895 to 0.910) | 0.995 (0.993 to 0.997) | 0.997 (0.995 to 0.999) | |
| East Midlands | 0.914 (0.906 to 0.922) | 0.984 (0.982 to 0.986) | 0.990 (0.988 to 0.992) | |
| London | 0.828 (0.822 to 0.834) | 0.973 (0.971 to 0.974) | 0.972 (0.970 to 0.974) | |
| North East | 0.946 (0.937 to 0.955) | 0.996 (0.993 to 0.998) | 0.997 (0.994 to 0.999) | |
| South Central | 0.939 (0.931 to 0.948) | 0.996 (0.994 to 0.999) | 0.991 (0.989 to 0.993) | |
| South East Coast | 0.970 (0.961 to 0.978) | 0.994 (0.992 to 0.996) | 0.992 (0.990 to 0.994) | |
| South West | 0.973 (0.964 to 0.981) | 1.000 (0.998 to 1.002) | 0.999 (0.998 to 1.001) | |
| West Midlands | 1.013 (1.006 to 1.021) | 1.005 (1.004 to 1.007) | 0.992 (0.990 to 0.994) | |
| Yorkshire and the Humber | 0.983 (0.975 to 0.990) | 0.993 (0.991 to 0.995) | 0.992 (0.990 to 0.994) | |
For the period of 1993–2000, care home deaths for those dying of cancer were increasingly more likely with increasing age (PRs 0.940–0.995), unmarried marital status (PRs 0.973–0.982), male gender (PR 1.006, 95% CI 1.005 to 1.007) and less area deprivation (PRs 0.993–0.998) (Table 17). Over the study period, the most likely PoD for cancer changed from hospital (PR 1.032, 95% CI 1.031 to 1.032) in 1984–92 to care home (PR 0.998, 95% CI 0.998 to 0.998) in 2001–10. The overall risk pattern of hospital compared with care home for cancer deaths showed that dying in hospital was more likely among older ages (PRs 1.004–1.212), and for those from less-deprived areas (PRs 1.042–1.103) in 1984–92. Men were more likely to die in care homes than women in the early period (PR 0.903, 95% CI 0.900 to 0.906). The regional variations in hospital compared with care home death showed mixed patterns, with the majority of regions (seven out of nine in 1993–2000, four out of nine in 2001–10) having higher hospital deaths than the North West region, although in 1984–92, the only region with hospital deaths higher than the North West region was the South East Coast region (PR 1.059, 95% CI 1.044 to 1.074).
| Variable | Value | Time period | ||
|---|---|---|---|---|
| 1984–92b | 1993–2000 | 2001–10 | ||
| Age, years | 25–54 | 1.000 | 1.000 | 1.000 |
| 55–64 | 0.999 (0.992 to 1.005) | 0.995 (0.994 to 0.996) | 0.993 (0.992 to 0.993) | |
| 65–74 | 1.004 (0.998 to 1.010) | 0.988 (0.987 to 0.988) | 0.983 (0.982 to 0.984) | |
| 75–84 | 1.063 (1.056 to 1.070) | 0.971 (0.970 to 0.971) | 0.966 (0.965 to 0.967) | |
| 85+ | 1.212 (1.202 to 1.222) | 0.943 (0.942 to 0.944) | 0.940 (0.939 to 0.941) | |
| Gender | Female | 1.000 | 1.000 | 1.000 |
| Male | 0.903 (0.900 to 0.906) | 1.006 (1.005 to 1.007) | 1.006 (1.006 to 1.007) | |
| Marital status | Married | NA | 1.000 | 1.000 |
| Widowed | NA | 0.981 (0.980 to 0.982) | 0.979 (0.978 to 0.980) | |
| Single | NA | 0.973 (0.971 to 0.974) | 0.973 (0.972 to 0.974) | |
| Divorced | NA | 0.982 (0.981 to 0.983) | 0.980 (0.980 to 0.981) | |
| NS/unknown | NA | 0.977 (0.974 to 0.981) | 0.981 (0.978 to 0.984) | |
| Year of death | – | 1.032 (1.031 to 1.032) | 1.000 (1.000 to 1.000) | 0.998 (0.998 to 0.998) |
| IMD | Most deprived | 1.000 | 1.000 | 1.000 |
| 2 | 1.042 (1.032 to 1.052) | 0.996 (0.995 to 0.998) | 0.998 (0.997 to 0.999) | |
| 3 | 1.054 (1.043 to 1.065) | 0.995 (0.994 to 0.996) | 0.997 (0.996 to 0.999) | |
| 4 | 1.080 (1.068 to 1.092) | 0.993 (0.992 to 0.994) | 0.996 (0.995 to 0.997) | |
| 5 | 1.103 (1.091 to 1.115) | 0.994 (0.992 to 0.995) | 0.996 (0.995 to 0.997) | |
| Region | North West | 1.000 | 1.000 | 1.000 |
| East England | 0.813 (0.802 to 0.823) | 1.007 (1.005 to 1.009) | 1.001 (0.999 to 1.003) | |
| East Midlands | 0.804 (0.792 to 0.815) | 1.004 (1.002 to 1.006) | 0.999 (0.998 to 1.001) | |
| London | 0.896 (0.886 to 0.905) | 1.024 (1.022 to 1.025) | 1.014 (1.013 to 1.016) | |
| North East | 0.774 (0.761 to 0.787) | 0.995 (0.993 to 0.998) | 0.994 (0.992 to 0.997) | |
| South Central | 0.911 (0.897 to 0.926) | 1.012 (1.010 to 1.014) | 1.007 (1.006 to 1.009) | |
| South East Coast | 1.059 (1.044 to 1.074) | 1.002 (0.999 to 1.004) | 1.000 (0.998 to 1.002) | |
| South West | 0.965 (0.952 to 0.979) | 1.001 (0.999 to 1.002) | 0.997 (0.995 to 0.999) | |
| West Midlands | 0.963 (0.951 to 0.974) | 1.000 (0.998 to 1.002) | 0.997 (0.995 to 0.999) | |
| Yorkshire and the Humber | 0.971 (0.959 to 0.983) | 1.005 (1.003 to 1.007) | 0.993 (0.991 to 0.995) | |
The inequality in the hospital deaths compared with care home deaths tended to reduce over time; it was evident for almost all explanatory variables of interest, and more pronounced for level of area deprivation. Compared with the most deprived quintile, the lowest PR was 0.993 (95% CI 0.992 to 0.994) in 1993–2000; the lowest PR became 0.996 (95% CI 0.995 to 0.997) in 2001–10.
For cardiovascular and cerebrovascular diseases, home or care home death compared with hospital death
Compared with the other CoD, the risk profile for PoD was more homogeneous in the three periods for patients who died from CVDs (Table 18). The chance of hospital death for people who died from CVDs increased with increasing age in three time periods; PRs in ascending order of age groups compared with 25–54 years changed from a higher chance of home death (1.020, 95% CI 1.012 to 1.027 in 1984–92; 1.004, 95% CI 1.002 to 1.004 in 1993–2000; 1.010, 95% CI 1.008 to 1.012 in 2001–10) for 55–64 years to a higher chance of hospital death (0.931, 95% CI 0.925 to 0.938 in 1984–92; 0.962, 95% CI 0.960 to 0.963 in 1993–2000; 0.947, 95% CI 0.945 to 0.948 in 2001–10) for groups of 85+ years. There was an increased chance of home death for males but the chance of home death decreased from the earlier to later periods [PR 1.032 (95% CI 1.029 to 1.035) in 1984–92 to PR 1.017 (95% CI 1.016 to 1.018) in 2001–10]. Compared with married people who died from a CVD cause, people with ‘other marital status’ had an increased chance of home death (PRs 1.014–1.065); divorced people in the period 1993–2010 had the highest probability of a home death (PR 1.043, 95% CI 1.039 to 1.047 in 1993–2000; PR 1.065, 95% CI 1.060 to 1.069 in 2001–10).
| Variable | Value | Time period | ||
|---|---|---|---|---|
| 1984–92 | 1993–2000 | 2001–10 | ||
| Age, years | 25–54 | 1.000 | 1.000 | 1.000 |
| 55–64 | 1.020 (1.012 to 1.027) | 1.004 (1.002 to 1.006) | 1.010 (1.008 to 1.012) | |
| 65–74 | 1.001 (0.995 to 1.008) | 0.999 (0.997 to 1.001) | 0.995 (0.993 to 0.997) | |
| 75–84 | 0.955 (0.949 to 0.961) | 0.983 (0.981 to 0.985) | 0.975 (0.974 to 0.977) | |
| 85+ | 0.931 (0.925 to 0.938) | 0.962 (0.960 to 0.963) | 0.947 (0.945 to 0.948) | |
| Gender | Female | 1.000 | 1.000 | 1.000 |
| Male | 1.032 (1.029 to 1.035) | 1.014 (1.013 to 1.014) | 1.017 (1.016 to 1.018) | |
| Marital status | Married | NA | 1.000 | 1.000 |
| Widowed | NA | 1.014 (1.013 to 1.015) | 1.020 (1.020 to 1.021) | |
| Single | NA | 1.028 (1.026 to 1.029) | 1.044 (1.042 to 1.045) | |
| Divorced | NA | 1.031 (1.029 to 1.032) | 1.042 (1.040 to 1.043) | |
| NS/unknown | NA | 1.043 (1.039 to 1.047) | 1.065 (1.060 to 1.069) | |
| Year of death | – | 0.992 (0.992 to 0.993) | 0.998 (0.998 to 0.998) | 1.001 (1.001 to 1.001) |
| IMD | Most deprived | 1.000 | 1.000 | 1.000 |
| 2 | 1.024 (1.019 to 1.029) | 1.000 (0.999 to 1.001) | 0.999 (0.998 to 1.001) | |
| 3 | 1.041 (1.036 to 1.047) | 1.004 (1.003 to 1.006) | 1.002 (1.001 to 1.004) | |
| 4 | 1.048 (1.042 to 1.054) | 1.007 (1.006 to 1.009) | 1.004 (1.003 to 1.006) | |
| 5 | 1.049 (1.043 to 1.055) | 1.005 (1.004 to 1.007) | 1.002 (1.001 to 1.004) | |
| Region | North West | 1.000 | 1.000 | 1.000 |
| East England | 1.039 (1.031 to 1.047) | 1.010 (1.008 to 1.012) | 1.011 (1.009 to 1.013) | |
| East Midlands | 1.075 (1.066 to 1.083) | 1.010 (1.008 to 1.012) | 1.004 (1.002 to 1.006) | |
| London | 0.893 (0.887 to 0.899) | 0.986 (0.984 to 0.987) | 0.993 (0.991 to 0.994) | |
| North East | 1.077 (1.068 to 1.086) | 1.007 (1.005 to 1.010) | 1.006 (1.004 to 1.008) | |
| South Central | 1.091 (1.082 to 1.100) | 1.019 (1.017 to 1.021) | 1.009 (1.007 to 1.011) | |
| South East Coast | 1.064 (1.056 to 1.072) | 1.005 (1.003 to 1.007) | 1.006 (1.004 to 1.008) | |
| South West | 1.127 (1.119 to 1.134) | 1.025 (1.023 to 1.027) | 1.017 (1.015 to 1.019) | |
| West Midlands | 1.104 (1.096 to 1.111) | 1.006 (1.004 to 1.008) | 1.004 (1.002 to 1.005) | |
| Yorkshire and the Humber | 1.020 (1.013 to 1.027) | 1.007 (1.005 to 1.008) | 1.006 (1.005 to 1.008) | |
The likelihood of a patient dying in hospital decreased over time; the PRs of hospital deaths changed from 0.992 (95% CI 0.992 to 0.993) in 1984–92 to 0.998 (95% CI 0.998 to 0.998) in 1993–2000, to a higher chance of a home death, 1.001 (95% CI 1.001 to 1.001) in 2001–10. People were increasingly more likely to die in hospital with increased area deprivation, although the gap between IMD quintiles decreased (PRs 1.024–1.049 in 1984–92; PRs 1.000–1.007 in 1993–2000; PRs 0.999–1.004 in 2001–10). London had the highest chance of hospital death for patients who died from a CVD cause (PRs of 0.893, 0.986 and 0.993 for 1984–92, 1993–2000 and 2001–10, respectively).
Care home deaths in people who died from CVD causes compared with hospital death increased with increasing age in 1993–2010 PRs 0.955 (95% CI 0.954 to 0.956) for 85+ years to 1.000 (95% CI 0.999 to 1.001) for 55–64 years in 1993–2000; PRs 0.961 (95% CI 0.960 to 0.962) for 85+ years to 0.996 (95% CI 0.996 to 0.997) for 55–64 years in 2001–10] (Table 19). Men had a higher chance of care home death in the earlier period (PR 0.879, 95% CI 0.875 to 0.882), whereas in the later period men had a higher chance of hospital deaths (PRs 1.009–1.010). ‘Unmarried’ marital status (PRs 0.982–0.989) and higher level of area deprivation (PRs 0.991–0.997) were associated with higher chance of hospital death from CVD for the period 1993–2010. North and East Midlands and North East regions had a consistently higher chance of care home death than the North West region.
| Variable | Value | Time period | ||
|---|---|---|---|---|
| 1984–92b | 1993–2000 | 2001–10 | ||
| Age, years | 25–54 | 1.000 | 1.000 | 1.000 |
| 55–64 | 0.999 (0.992 to 1.006) | 1.000 (0.999 to 1.001) | 0.996 (0.996 to 0.997) | |
| 65–74 | 1.040 (1.032 to 1.047) | 0.997 (0.996 to 0.998) | 0.992 (0.992 to 0.993) | |
| 75–84 | 1.253 (1.244 to 1.263) | 0.984 (0.983 to 0.985) | 0.983 (0.982 to 0.983) | |
| 85+ | 1.691 (1.676 to 1.705) | 0.955 (0.954 to 0.956) | 0.961 (0.960 to 0.962) | |
| Gender | Female | 1.000 | 1.000 | 1.000 |
| Male | 0.879 (0.875 to 0.882) | 1.009 (1.008 to 1.009) | 1.010 (1.009 to 1.010) | |
| Marital status | Married | NA | 1.000 | 1.000 |
| Widowed | NA | 0.986 (0.986 to 0.987) | 0.989 (0.989 to 0.990) | |
| Single | NA | 0.978 (0.977 to 0.979) | 0.982 (0.981 to 0.983) | |
| Divorced | NA | 0.989 (0.988 to 0.990) | 0.991 (0.990 to 0.992) | |
| NS/unknown | NA | 0.984 (0.982 to 0.987) | 0.983 (0.980 to 0.986) | |
| Year of death | – | 1.008 (1.007 to 1.009) | 1.001 (1.001 to 1.001) | 1.000 (1.000 to 1.000)c |
| IMD | Most deprived | 1.000 | 1.000 | 1.000 |
| 2 | 1.055 (1.025 to 1.085) | 0.996 (0.995 to 0.997) | 0.997 (0.996 to 0.998) | |
| 3 | 1.084 (1.052 to 1.118) | 0.993 (0.992 to 0.994) | 0.995 (0.994 to 0.996) | |
| 4 | 1.081 (1.048 to 1.115) | 0.992 (0.990 to 0.993) | 0.993 (0.992 to 0.994) | |
| 5 | 1.096 (1.062 to 1.131) | 0.991 (0.990 to 0.992) | 0.994 (0.992 to 0.995) | |
| Region | North West | 1.000 | 1.000 | 1.000 |
| East England | 0.892 (0.864 to 0.921) | 1.006 (1.004 to 1.008) | 1.002 (1.001 to 1.004) | |
| East Midlands | 0.975 (0.944 to 1.006) | 0.999 (0.997 to 1.000) | 0.999 (0.997 to 1.000) | |
| London | 0.719 (0.699 to 0.740) | 1.015 (1.013 to 1.016) | 1.009 (1.008 to 1.010) | |
| North East | 0.925 (0.889 to 0.962) | 0.993 (0.991 to 0.996) | 0.995 (0.993 to 0.997) | |
| South Central | 0.975 (0.943 to 1.008) | 1.008 (1.006 to 1.010) | 1.000 (0.998 to 1.002) | |
| South East Coast | 1.045 (1.012 to 1.078) | 0.995 (0.993 to 0.997) | 0.995 (0.994 to 0.997) | |
| South West | 1.043 (1.013 to 1.074) | 0.993 (0.992 to 0.995) | 0.994 (0.992 to 0.995) | |
| West Midlands | 0.962 (0.934 to 0.991) | 0.999 (0.997 to 1.000) | 0.998 (0.996 to 0.999) | |
| Yorkshire and the Humber | 0.932 (0.904 to 0.960) | 1.003 (1.001 to 1.005) | 0.999 (0.997 to 1.000) | |
The risk profile for the factors associated with the CBD CoD followed that of people who died from CVD (Tables 20 and 21). The CBD deaths showed a tendency of increased probability of death in hospital compared with a home death, and a similar pattern can be seen for hospital compared with care home death modelling.
| Variable | Value | Time period | ||
|---|---|---|---|---|
| 1984–92 | 1993–2000 | 2001–10 | ||
| Age, years | 25–54 | 1.000 | 1.000 | 1.000 |
| 55–64 | 1.028 (1.008–1.048) | 0.990 (0.986 to 0.993) | 0.994 (0.991 to 0.997) | |
| 65–74 | 1.037 (1.019 to 1.056) | 0.984 (0.981 to 0.987) | 0.978 (0.975 to 0.981) | |
| 75–84 | 1.087 (1.069 to 1.106) | 0.977 (0.974 to 0.980) | 0.971 (0.969 to 0.974) | |
| 85+ | 1.229 (1.207 to 1.251) | 0.981 (0.978 to 0.984) | 0.970 (0.967 to 0.973) | |
| Gender | Female | 1.000 | 1.000 | 1.000 |
| Male | 0.980 (0.974 to 0.985) | 0.999 (0.998 to 1.000) | 0.999 (0.998 to 1.000) | |
| Married | NA | 1.000 | 1.000 | |
| Widowed | NA | 1.006 (1.005 to 1.008) | 1.004 (1.003 to 1.005) | |
| Single | NA | 1.009 (1.007 to 1.011) | 1.010 (1.008 to 1.012) | |
| Divorced | NA | 1.015 (1.012 to 1.018) | 1.013 (1.011 to 1.015) | |
| NS/unknown | NA | 1.016 (1.010 to 1.023) | 1.020 (1.013 to 1.027) | |
| Year of death | – | 1.003 (1.002 to 1.004) | 0.999 (0.998 to 0.999) | 1.000 (1.000 to 1.000) |
| IMD | Most deprived | 1.000 | 1.000 | 1.000 |
| 2 | 1.051 (1.039 to 1.063) | 1.001 (0.999 to 1.003) | 1.001 (0.999 to 1.003) | |
| 3 | 1.083 (1.070 to 1.097) | 1.006 (1.004 to 1.008) | 1.004 (1.003 to 1.006) | |
| 4 | 1.131 (1.116 to 1.145) | 1.009 (1.007 to 1.011) | 1.007 (1.005 to 1.009) | |
| 5 | 1.142 (1.126 to 1.157) | 1.011 (1.009 to 1.013) | 1.009 (1.006 to 1.011) | |
| Region | North West | 1.000 | 1.000 | 1.000 |
| East England | 0.933 (0.919 to 0.947) | 0.998 (0.995 to 1.000) | 1.002 (0.999 to 1.004) | |
| East Midlands | 0.982 (0.966 to 0.998) | 1.000 (0.997 to 1.002) | 1.001 (0.999 to 1.004) | |
| London | 0.852 (0.841 to 0.864) | 0.992 (0.990 to 0.994) | 0.995 (0.993 to 0.997) | |
| North East | 0.981 (0.964 to 0.998) | 0.992 (0.988 to 0.996) | 0.993 (0.990 to 0.997) | |
| South Central | 0.984 (0.966 to 1.001) | 1.003 (1.000 to 1.006) | 0.998 (0.995 to 1.001) | |
| South East Coast | 1.008 (0.991 to 1.024) | 1.000 (0.997 to 1.003) | 1.002 (0.999 to 1.004) | |
| South West | 1.041 (1.026 to 1.057) | 1.003 (1.001 to 1.006) | 1.004 (1.001 to 1.006) | |
| West Midlands | 1.016 (1.001 to 1.030) | 1.000 (0.998 to 1.003) | 0.996 (0.994 to 0.998) | |
| Yorkshire and the Humber | 0.973 (0.959 to 0.987) | 1.001 (0.999 to 1.004) | 1.000 (0.998 to 1.002) | |
| Variable | Value | Time period | ||
|---|---|---|---|---|
| 1984–92a | 1993–2000 | 2001–10 | ||
| Age, years | 25–54 | 1.000 | 1.000 | 1.000 |
| 55–64 | 1.088 (1.074 to 1.102) | 0.992 (0.990 to 0.994) | 0.994 (0.992 to 0.995) | |
| 65–74 | 1.180 (1.166 to 1.193) | 0.976 (0.975 to 0.978) | 0.975 (0.974 to 0.977) | |
| 75–84 | 1.386 (1.370 to 1.402) | 0.958 (0.957 to 0.960) | 0.957 (0.955 to 0.958) | |
| 85+ | 1.695 (1.675 to 1.716) | 0.939 (0.937 to 0.941) | 0.942 (0.941 to 0.944) | |
| Gender | Female | 1.000 | 1.000 | 1.000 |
| Male | 0.903 (0.899 to 0.908) | 1.003 (1.002 to 1.003) | 1.006 (1.005 to 1.007) | |
| Married | NA | 1.000 | 1.000 | |
| Widowed | NA | 0.992 (0.991 to 0.993) | 0.997 (0.996 to 0.998) | |
| Single | NA | 0.987 (0.986 to 0.989) | 0.994 (0.993 to 0.996) | |
| Divorced | NA | 0.992 (0.990 to 0.994) | 1.000 (0.999 to 1.002) | |
| NS/unknown | NA | 0.988 (0.984 to 0.992) | 1.003 (0.998 to 1.008) | |
| Year of death | – | 1.024 (1.022 to 1.025) | 1.000 (1.000 to 1.001) | 1.000 (1.000 to 1.000)c |
| IMD | Most deprived | 1.000 | 1.000 | 1.000 |
| 2 | 1.065 (1.034 to 1.097) | 0.994 (0.992 to 0.996) | 0.995 (0.993 to 0.997) | |
| 3 | 1.094 (1.059 to 1.130) | 0.989 (0.987 to 0.991) | 0.992 (0.990 to 0.994) | |
| 4 | 1.120 (1.083 to 1.158) | 0.986 (0.984 to 0.988) | 0.988 (0.986 to 0.990) | |
| 5 | 1.122 (1.084 to 1.161) | 0.986 (0.984 to 0.988) | 0.988 (0.986 to 0.990) | |
| Region | North West | 1.000 | 1.000 | 1.000 |
| East England | 0.863 (0.838 to 0.889) | 1.012 (1.009 to 1.014) | 1.007 (1.004 to 1.009) | |
| East Midlands | 0.939 (0.912 to 0.967) | 1.002 (0.999 to 1.005) | 0.998 (0.996 to 1.001) | |
| London | 0.713 (0.696 to 0.730) | 1.024 (1.022 to 1.026) | 1.020 (1.018 to 1.023) | |
| North East | 0.904 (0.871 to 0.939) | 0.992 (0.989 to 0.996) | 0.995 (0.991 to 0.998) | |
| South Central | 0.940 (0.910 to 0.971) | 1.008 (1.005 to 1.011) | 0.997 (0.994 to 1.000) | |
| South East Coast | 0.999 (0.969 to 1.029) | 0.999 (0.996 to 1.002) | 1.000 (0.997 to 1.002) | |
| South West | 1.034 (1.005 to 1.063) | 0.988 (0.985 to 0.991) | 0.986 (0.983 to 0.989) | |
| West Midlands | 0.962 (0.936 to 0.989) | 1.001 (0.999 to 1.004) | 0.998 (0.995 to 1.000) | |
| Yorkshire and the Humber | 0.939 (0.914 to 0.966) | 1.003 (1.000 to 1.005) | 0.999 (0.997 to 1.002) | |
For neurological conditions, home or care home death compared with hospital death
Hospital deaths from neurological conditions were increasingly more likely with increasing age of death than with home death. The gap was more pronounced in the earlier period (PRs 0.802–1.031) than the later period (PRs 0.926–0.988 for 1993–2000; 0.943–0.995 for 2001–10) (Table 22). Care home compared with hospital deaths showed a similar age pattern across the time periods (PRs 1.032–1.245 for 1984–92; 0.938–0.980 for 1993–2000; 0.927–0.993 for 2001–10) (Table 23). Men who died from neurological conditions had a higher risk of dying in hospital than in home (PRs 0.947–0.976) or care home (PRs 1.012–1.019 in 1993–2010), although in 1984–92 these men were more likely to have died in a care home (PR 0.882, 95% CI 0.870 to 0.893). Divorced, single and widowed individuals had a higher chance of a hospital death in the model contrasting hospital with home (PRs 0.941–0.976) and a higher chance of a care home death in the model contrasting hospital with care home (PRs 0.982–0.994). Chance of home death remained stable from 1993 to 2010 but increased [PR 1.031 (95% CI 1.028 to 1.033)] in the period of 1984–92; however, hospital death showed an increasing trend in the period of 1984–92 [PR 1.042 (95% 1.039 to 1.045)] compared with care home death.
| Variable | Value | Time period | ||
|---|---|---|---|---|
| 1984–92 | 1993–2000 | 2001–10 | ||
| Age, years | 25–54 | 1.000 | 1.000 | 1.000 |
| 55–64 | 1.031 (0.999 to 1.063) | 0.988 (0.971 to 1.005) | 0.995 (0.986 to 1.003) | |
| 65–74 | 0.894 (0.870 to 0.920) | 0.952 (0.938 to 0.966) | 0.974 (0.967 to 0.982) | |
| 75–84 | 0.819 (0.798 to 0.841) | 0.928 (0.915 to 0.942) | 0.947 (0.940 to 0.954) | |
| 85+ | 0.802 (0.779 to 0.824) | 0.926 (0.912 to 0.940) | 0.943 (0.935 to 0.950) | |
| Gender | Female | 1.000 | 1.000 | 1.000 |
| Male | 0.947 (0.936 to 0.960) | 0.972 (0.965 to 0.978) | 0.976 (0.972 to 0.980) | |
| Married | NA | 1.000 | 1.000 | |
| Widowed | NA | 0.976 (0.968 to 0.984) | 0.965 (0.960 to 0.970) | |
| Single | NA | 0.954 (0.943 to 0.965) | 0.956 (0.950 to 0.963) | |
| Divorced | NA | 0.970 (0.953 to 0.987) | 0.959 (0.952 to 0.966) | |
| NS/unknown | NA | 0.971 (0.939 to 1.005) | 0.941 (0.917 to 0.965) | |
| Year of death | – | 1.031 (1.028 to1.033) | 0.999 (0.997 to 1.000)b | 1.000 (1.000 to 1.001)b |
| IMD | Most deprived | 1.000 | 1.000 | 1.000 |
| 2 | 1.052 (1.027 to 1.077) | 1.000 (0.991 to 1.009) | 1.007 (1.001 to 1.014) | |
| 3 | 1.108 (1.081 to 1.136) | 1.013 (1.003 to 1.022) | 1.018 (1.011 to 1.025) | |
| 4 | 1.156 (1.127 to 1.186) | 1.024 (1.014 to 1.034) | 1.024 (1.017 to 1.031) | |
| 5 | 1.183 (1.152 to 1.214) | 1.032 (1.022 to 1.042) | 1.033 (1.026 to 1.040) | |
| Region | North West | 1.000 | 1.000 | 1.000 |
| East England | 0.928 (0.899 to 0.959) | 0.985 (0.973 to 0.997) | 0.999 (0.992 to 1.007) | |
| East Midlands | 0.966 (0.934 to 0.999) | 0.996 (0.984 to 1.008) | 0.999 (0.991 to 1.008) | |
| London | 0.857 (0.831 to 0.883) | 0.979 (0.969 to 0.990) | 0.990 (0.983 to 0.998) | |
| North East | 0.921 (0.883 to 0.960) | 0.950 (0.933 to 0.966) | 0.989 (0.979 to 0.998) | |
| South Central | 0.966 (0.932 to 1.001) | 0.987 (0.974 to 1.001) | 1.001 (0.991 to 1.010) | |
| South East Coast | 1.019 (0.987 to 1.051) | 0.994 (0.982 to 1.007) | 1.001 (0.993 to 1.009) | |
| South West | 1.043 (1.013 to 1.075) | 0.990 (0.978 to 1.002) | 1.004 (0.996 to 1.013) | |
| West Midlands | 0.995 (0.965 to 1.027) | 0.987 (0.976 to 0.999) | 0.998 (0.990 to 1.006) | |
| Yorkshire and the Humber | 0.940 (0.911 to 0.970) | 0.991 (0.979 to 1.002) | 0.989 (0.981 to 0.997) | |
| Variable | Value | Time period | ||
|---|---|---|---|---|
| 1984–92b | 1993–2000 | 2001–10 | ||
| Age, years | 25–54 | 1.000 | 1.000 | 1.000 |
| 55–64 | 1.032 (0.994 to 1.070) | 0.980 (0.966 to 0.994) | 0.993 (0.986 to 0.999) | |
| 65–74 | 1.060 (1.024 to 1.096) | 0.963 (0.951 to 0.975) | 0.962 (0.956 to 0.968) | |
| 75–84 | 1.167 (1.129 to 1.207) | 0.944 (0.933 to 0.956) | 0.937 (0.932 to 0.943) | |
| 85+ | 1.245 (1.202 to 1.289) | 0.938 (0.926 to 0.950) | 0.927 (0.922 to 0.933) | |
| Gender | Female | 1.000 | 1.000 | 1.000 |
| Male | 0.882 (0.870 to 0.893) | 1.012 (1.008 to 1.015) | 1.019 (1.016 to 1.022) | |
| Married | NA | 1.000 | 1.000 | |
| Widowed | NA | 0.989 (0.985 to 0.993) | 0.982 (0.979 to 0.985) | |
| Single | NA | 0.984 (0.978 to 0.990) | 0.986 (0.981 to 0.991) | |
| Divorced | NA | 0.985 (0.976 to 0.993) | 0.990 (0.985 to 0.995) | |
| NS/unknown | NA | 0.993 (0.977 to 1.010) | 0.994 (0.976 to 1.013) | |
| Year of death | – | 1.042 (1.039 to 1.045) | 0.998 (0.997 to 0.999) | 1.000 (1.000 to 1.001)c |
| IMD | Most deprived | 1.000 | 1.000 | 1.000 |
| 2 | 1.055 (1.025 to 1.085) | 0.990 (0.983 to 0.998) | 0.992 (0.987 to 0.998) | |
| 3 | 1.109 (1.077 to 1.143) | 0.985 (0.978 to 0.992) | 0.991 (0.986 to 0.996) | |
| 4 | 1.128 (1.096 to 1.162) | 0.975 (0.968 to 0.982) | 0.981 (0.975 to 0.986) | |
| 5 | 1.123 (1.089 to 1.157) | 0.973 (0.966 to 0.980) | 0.983 (0.978 to 0.989) | |
| Region | North West | 1.000 | 1.000 | 1.000 |
| East England | 0.866 (0.837 to 0.896) | 1.022 (1.013 to 1.031) | 1.006 (1.000 to 1.012) | |
| East Midlands | 0.938 (0.906 to 0.971) | 1.010 (1.001 to 1.019) | 0.990 (0.983 to 0.996) | |
| London | 0.772 (0.748 to 0.796) | 1.056 (1.047 to 1.065) | 1.031 (1.025 to 1.037) | |
| North East | 0.864 (0.829 to 0.901) | 0.986 (0.974 to 0.999) | 0.990 (0.982 to 0.998) | |
| South Central | 0.955 (0.920 to 0.992) | 1.017 (1.007 to 1.027) | 0.997 (0.989 to 1.004) | |
| South East Coast | 0.996 (0.964 to 1.029) | 1.004 (0.995 to 1.013) | 0.995 (0.989 to 1.002) | |
| South West | 1.014 (0.982 to 1.047) | 0.991 (0.982 to 1.000) | 0.975 (0.968 to 0.981) | |
| West Midlands | 0.933 (0.903 to 0.964) | 1.007 (0.998 to 1.016) | 0.990 (0.983 to 0.996) | |
| Yorkshire and the Humber | 0.918 (0.889 to 0.948) | 1.012 (1.004 to 1.021) | 0.992 (0.985 to 0.998) | |
Home death was consistently more likely than hospital death in the whole study period, along with less area deprivation (PRs 1.000–1.183). Care home death compared with hospital death showed different patterns in the periods of 1984–92 and 1993–2010: in the earlier period, hospital death was more likely (PRs 1.055–1.123), whereas in the later periods, care home death was more likely (PRs 0.973–0.992). Six out of nine regions had a higher chance of home death than hospital death than the North West region over the whole study period (PRs 0.857–0.999); only the North East region showed a consistent tendency of care home death in all three periods (PRs 0.864–0.990).
Over the study period, the regional variation in PoD was reducing. For example, the PR range of the PoD in home compared with hospital was 0.985 to 0.996 in 1993–2000, which changed to 0.989 to 1.004 in 2001–10; the PRs derived from care home compared with hospital models ranged from 0.981 to 1.056 in 1993–2000 to 0.009 to 1.006 in 2001–10. In the early period (1984–92), deaths were more likely to occur in hospital in most of the regions other than the South West, where the deaths in the earlier period were more likely in care homes.
For chronic obstructive pulmonary diseases, home or care home death compared with hospital death
In COPD, age was associated with an increased chance of hospital death compared with home death (PRs 0.905–0.965 in 1984–92; 0.957–0.986 in 1993–2000; 0.939–0.986 in 2001–10) (Table 24); in hospital compared with care home death models, similar age-PoD association was observed (Table 25). Men had an increased chance of dying in home throughout the three time periods [PR 1.032 (95% CI 1.024 to 1.041) in 1984–92; 1.011 (95% CI 1.009 to 1.013) in 1993–2000; 1.014 (95% CI 1.012 to 1.015) in 2001–10]. Widowed people who died from COPD were more likely to die in hospital (PRs 0.993–0.995), and divorced people were more likely to have died at home (PRs 1.002–1.009). There was a slightly increased trend for COPD patients dying in hospital over the year, which continued until 2000 [(PR 0.989, 95% CI 0.987 to 0.990) in 1984–92; 0.999 (95% CI 0.999 to 1.000) in 1993–2000]; in the period of 2001–10, the increasing trend was no longer significant (p > 0.05). Less area deprivation was associated with higher chance of home death (PRs 0.997–1.028 for 1984–92; 1.000–1.003 for 1993–2000; 0.998–1.002 for 2001–10). For the period of 1993–2000, patients with COPD who resided in North West region had the lowest chance of home death (PRs 1.000–1.013). In 1984–92, only East England, London and Yorkshire and the Humber had a lower chance of home death than North West regions (PRs 0.948–0.982).
| Variable | Value | Time period | ||
|---|---|---|---|---|
| 1984–92 | 1993–2000 | 2001–10 | ||
| Age, years | 25–54 | 1.000 | 1.000 | 1.000 |
| 55–64 | 0.965 (0.936 to 0.995) | 0.986 (0.979 to 0.993) | 0.986 (0.980 to 0.992) | |
| 65–74 | 0.943 (0.916 to 0.970) | 0.980 (0.973 to 0.987) | 0.967 (0.961 to 0.973) | |
| 75–84 | 0.923 (0.897 to 0.950) | 0.971 (0.964 to 0.978) | 0.954 (0.948 to 0.960) | |
| 85+ | 0.905 (0.878 to 0.932) | 0.957 (0.950 to 0.964) | 0.939 (0.933 to 0.945) | |
| Gender | Female | 1.000 | 1.000 | 1.000 |
| Male | 1.032 (1.024 to 1.041) | 1.011 (1.009 to 1.013) | 1.014 (1.012 to 1.015) | |
| Married | NA | 1.000 | 1.000 | |
| Widowed | NA | 0.993 (0.991 to 0.995) | 0.995 (0.993 to 0.997) | |
| Single | NA | 0.998 (0.994 to 1.002) | 1.006 (1.003 to 1.010) | |
| Divorced | NA | 1.002 (0.999 to 1.006) | 1.009 (1.006 to 1.012) | |
| NS/unknown | NA | 1.029 (1.020 to 1.039) | 1.027 (1.017 to 1.036) | |
| Year of death | – | 0.989 (0.987 to 0.990) | 0.999 (0.999 to 1.000) | 1.000 (1.000 to 1.000)b |
| IMD | Most deprived | 1.000 | 1.000b | 1.000c |
| 2 | 0.997 (0.986 to 1.008) | 1.001 (0.999 to 1.004) | 0.998 (0.995 to 1.000) | |
| 3 | 1.014 (1.002 to 1.027) | 1.000 (0.997 to 1.003) | 1.000 (0.998 to 1.002) | |
| 4 | 1.019 (1.005 to 1.033) | 1.001 (0.998 to 1.004) | 1.002 (0.999 to 1.004) | |
| 5 | 1.028 (1.013 to 1.043) | 1.003 (1.000 to 1.007) | 1.002 (1.000 to 1.005) | |
| Region | North West | 1.000 | 1.000 | 1.000 |
| East England | 0.982 (0.965 to 1.000) | 1.008 (1.004 to 1.012) | 1.005 (1.002 to 1.008) | |
| East Midlands | 1.026 (1.008 to 1.044) | 1.005 (1.001 to 1.009) | 1.005 (1.002 to 1.009) | |
| London | 0.948 (0.934 to 0.962) | 1.005 (1.001 to 1.008) | 1.004 (1.001 to 1.006) | |
| North East | 1.050 (1.031 to 1.069) | 1.000 (0.995 to 1.005) | 1.006 (1.002 to 1.009) | |
| South Central | 1.028 (1.008 to 1.049) | 1.012 (1.008 to 1.016) | 1.009 (1.006 to 1.013) | |
| South East Coast | 1.012 (0.994 to 1.030) | 1.009 (1.005 to 1.013) | 1.004 (1.001 to 1.007) | |
| South West | 1.031 (1.013 to 1.049) | 1.010 (1.006 to 1.014) | 1.013 (1.009 to 1.016) | |
| West Midlands | 1.054 (1.038 to 1.071) | 1.008 (1.004 to 1.011) | 1.003 (1.000 to 1.006) | |
| Yorkshire and the Humber | 0.972 (0.957 to 0.987) | 1.008 (1.005 to 1.012) | 1.011 (1.008 to 1.014) | |
| Variable | Value | Time period | ||
|---|---|---|---|---|
| 1984–92b | 1993–2000 | 2001–10 | ||
| Age, years | 25–54 | 1.000 | 1.000 | 1.000 |
| 55–64 | 0.993 (0.969 to 1.017) | 0.997 (0.993 to 1.001) | 0.998 (0.995 to 1.001) | |
| 65–74 | 1.078 (1.053 to 1.104) | 0.991 (0.987 to 0.996) | 0.993 (0.990 to 0.996) | |
| 75–84 | 1.310 (1.279 to 1.342) | 0.974 (0.970 to 0.978) | 0.981 (0.978 to 0.984) | |
| 85+ | 1.688 (1.646 to 1.732) | 0.946 (0.942 to 0.950) | 0.959 (0.956 to 0.962) | |
| Gender | Female | 1.000 | 1.000c | 1.000 |
| Male | 0.909 (0.901 to 0.917) | 0.999 (0.998 to 1.001) | 1.001 (1.000 to 1.002) | |
| Married | NA | 1.000 | 1.000 | |
| Widowed | NA | 0.985 (0.984 to 0.987) | 0.989 (0.988 to 0.990) | |
| Single | NA | 0.973 (0.970 to 0.975) | 0.982 (0.980 to 0.984) | |
| Divorced | NA | 0.985 (0.983 to 0.987) | 0.992 (0.991 to 0.994) | |
| NS/unknown | NA | 0.980 (0.974 to 0.986) | 0.984 (0.978 to 0.989) | |
| Year of death | – | 1.012 (1.010 to 1.013) | 1.001 (1.001 to 1.002) | 1.000 (1.000 to 1.000)d |
| IMD | Most deprived | 1.000 | 1.000 | 1.000 |
| 2 | 1.033 (1.015 to 1.052) | 0.995 (0.994 to 0.997) | 0.996 (0.995 to 0.998) | |
| 3 | 1.067 (1.046 to 1.089) | 0.991 (0.989 to 0.993) | 0.994 (0.992 to 0.996) | |
| 4 | 1.081 (1.059 to 1.104) | 0.987 (0.985 to 0.990) | 0.990 (0.989 to 0.992) | |
| 5 | 1.079 (1.056 to 1.103) | 0.985 (0.983 to 0.988) | 0.989 (0.988 to 0.991) | |
| Region | North West | 1.000 | 1.000 | 1.000 |
| East England | 0.896 (0.874 to 0.918) | 1.011 (1.008 to 1.014) | 1.003 (1.001 to 1.005) | |
| East Midlands | 0.976 (0.952 to 1.001) | 0.998 (0.995 to 1.001) | 0.999 (0.997 to 1.001) | |
| London | 0.814 (0.797 to 0.832) | 1.021 (1.019 to 1.023) | 1.012 (1.010 to 1.014) | |
| North East | 0.970 (0.942 to 0.999) | 0.989 (0.985 to 0.993) | 0.994 (0.992 to 0.997) | |
| South Central | 0.986 (0.958 to 1.014) | 1.010 (1.007 to 1.013) | 1.002 (1.000 to 1.005) | |
| South East Coast | 1.017 (0.991 to 1.043) | 0.999 (0.995 to 1.002) | 0.999 (0.997 to 1.001) | |
| South West | 1.002 (0.978 to 1.027) | 0.993 (0.990 to 0.996) | 0.994 (0.992 to 0.996) | |
| West Midlands | 0.946 (0.924 to 0.969) | 1.002 (0.999 to 1.004) | 1.000 (0.998 to 1.002) | |
| Yorkshire and the Humber | 0.946 (0.924 to 0.968) | 1.002 (1.000 to 1.005) | 0.997 (0.995 to 1.000) | |
Men had a higher chance of care home death in 1984–2000 (PRs 0.909–0.999) but an increased likelihood of hospital death in 2001–10 (PR 1.001, 95% CI 1.000 to 1.002) (Table 26). Married people had a consistent higher chance of hospital death than single, widowed or divorced people (PRs 0.973–0.989). There was an increased chance of hospital deaths and the trend persisted until 2000 (PRs 1.012–1.001), then became nearly a plateau but was still statistically significant (p = 0.003). Increased area deprivation was positively associated with probability of hospital death in 1984–92 (PRs 1.033–1.081); however, the direction of association turned into positive for care home death post-1992 (PRs 0.985–0.996). During the period of 1984 to 1992, seven out of nine regions had higher chance of care home death than in North West region (PRs 0.814–0.986); after 1992, only East England and North East regions remained to have higher chance of care home death but the contrasts were much less pronounced than for the earlier period in North West region (PRs 0.989–0.999).
| Cause of death | Holiday period | Time period | ||
|---|---|---|---|---|
| 1984–92 | 1993–2000 | 2001–10 | ||
| All | Normal | 1.000 | 1.000 | 1.000 |
| Christmas | 0.999 (0.994 to 1.004) | 1.000 (0.999 to 1.002) | 1.000 (0.998 to 1.001) | |
| Easter | 0.995 (0.990 to 1.001) | 1.000 (0.998 to 1.001) | 0.998 (0.997 to 0.999) | |
| New Year | 1.016 (1.009 to 1.023) | 1.004 (1.002 to 1.005) | 1.002 (1.000 to 1.003) | |
| Non-cancer | Normal | 1.000 | 1.000 | 1.000 |
| Christmas | 0.995 (0.989 to 1.001) | 1.002 (1.001 to 1.004) | 1.000 (0.999 to 1.001) | |
| Easter | 0.994 (0.987 to 1.000) | 0.999 (0.998 to 1.001) | 0.998 (0.997 to 1.000) | |
| New Year | 1.029 (1.021 to 1.037) | 1.007 (1.006 to 1.009) | 1.007 (1.005 to 1.009) | |
| Cancer | Normal | 1.000 | 1.000 | 1.000 |
| Christmas | 1.019 (1.009 to 1.029) | 0.999 (0.996 to 1.002) | 1.003 (1.000 to 1.006) | |
| Easter | 1.001 (0.990 to 1.011) | 1.002 (0.999 to 1.005) | 0.999 (0.997 to 1.002) | |
| New Year | 0.989 (0.976 to 1.003) | 0.996 (0.992 to 0.999) | 0.990 (0.987 to 0.994) | |
| CVD | Normal | 1.000 | 1.000 | 1.000 |
| Christmas | 0.996 (0.987 to 1.004) | 1.004 (1.001 to 1.006) | 1.001 (0.998 to 1.003) | |
| Easter | 0.999 (0.990 to 1.008) | 0.999 (0.997 to 1.002) | 0.999 (0.996 to 1.001) | |
| New Year | 1.035 (1.024 to 1.046) | 1.011 (1.009 to 1.014) | 1.010 (1.007 to 1.013) | |
| CBD | Normal | 1.000b | 1.000b | 1.000b |
| Christmas | 0.983 (0.967 to 0.999) | 0.997 (0.994 to 1.001) | 0.999 (0.995 to 1.002) | |
| Easter | 0.990 (0.973 to 1.008) | 0.997 (0.993 to 1.001) | 0.998 (0.995 to 1.002) | |
| New Year | 0.987 (0.966 to 1.009) | 1.001 (0.997 to 1.005) | 1.004 (0.999 to 1.008) | |
| Neurological conditions | Normal | 1.000 | 1.000 | 1.000 |
| Christmas | 1.052 (1.012 to 1.093) | 1.003 (0.983 to 1.023) | 0.994 (0.981 to 1.006) | |
| Easter | 0.960 (0.918 to 1.005) | 0.992 (0.968 to 1.016) | 1.008 (0.995 to 1.022) | |
| New Year | 0.946 (0.896 to 0.998) | 0.967 (0.940 to 0.996) | 0.983 (0.967 to 0.999) | |
| COPD | Normal | 1.000 | 1.000b | 1.000b |
| Christmas | 0.975 (0.953 to 0.998) | 0.998 (0.993 to 1.002) | 1.002 (0.997 to 1.006) | |
| Easter | 0.975 (0.949 to 1.002) | 0.997 (0.991 to 1.003) | 0.998 (0.993 to 1.003) | |
| New Year | 1.023 (0.995 to 1.053) | 1.003 (0.998 to 1.009) | 1.004 (0.999 to 1.010) | |
Variations in place of death by holiday period and season, home or care home death compared with hospital death
Compared with normal periods, there was a slightly increased chance of hospital death compared with home death during the Christmas period for non-cancer deaths in 1993–2000 [PR 1.002 (95% CI 1.001 to 1.004)], cancer deaths in 1984–92 [PR 1.019 (95% CI 1.009 to 1.029)] and in 2001–10 [PR 1.003 (95% CI 1.000 to 1.006)], CVD deaths in 1993–2000 [PR 1.004 (95% CI 1.001 to 1.006)] and neurological condition deaths in 1984–92 [PR 1.052 (1.012 to 1.093)] (see Table 26). The probability of home death increased during the Christmas period for COPD deaths in 1984–92 [PR 0.975 (95% CI 0.953 to 0.998)]. No statistically significant difference of the death between Christmas and normal period was found for CBD deaths in all three periods (p > 0.05).
A reduced chance of hospital deaths during the Easter period was observed for all CoD in 2001–10 [PR 0.998 (95% CI 0.997 to 0.999)], non-cancer death in 1984–92 [PR 0.994 (95% CI 0.987 to 1.000)] and in 2001–10 [PR 0.998 (95% CI 0.997 to 1.000)]. None of the other causes of death in the observation periods appeared to be statistically different from the normal period. The New Year period had increased hospital deaths for the whole study period (PRs 1.002–1.016) for all-cause death, non-cancer CoD (PRs 1.007–1.029), CVD CoD (PRs 1.010–1.035). However, there was an increased chance of dying at home for cancer in 1993–2000 [PR 0.996 (95% CI 0.992 to 0.999)] and in 2001–10 [PR 0.990 (95% CI 0.987 to 0.994)], and for neurological conditions in 1984–2010 (PRs 0.946–0.983).
With the season ‘spring’ as the reference group, all CoD during the summer season had a lower chance of hospital death in 1984–92 (PR 0.992, 95% CI 0.990 to 0.995), but the chance of hospital death increased to the similar level with the spring (PR 1.000, 95% CI 0.999 to 1.000) and up to the period 2001–10, the probability of hospital death in summer was higher than in spring for all-cause death (PR 1.002, 95% CI 1.001 to 1.002) (Table 27). A similar pattern was observed for all non-cancer deaths: 0.998 in 1984–92 to 0.999 in 1993–2000, and to 1.000 in 2001–10. Cancer deaths were less likely in hospital (PR 0.998, 95% CI 0.997 to 1.000) but more likely in hospital in 2001–10 (PR 1.002, 95% CI 1.001 to 1.003). Home deaths during summer were more likely for CVD deaths in 1984–2000 (PRs 0.983–0.998). During the autumn, deaths from all causes, non-cancer, CVD and COPD causes were more likely to have occurred in hospital for all three study periods (PRs 1.001–1.007 for all and non-cancer; PRs 1.001–1.005 for CVD; PRs 1.003–1.019 for COPD). Cancer deaths had a higher chance of occurring in hospital in 1984–92 (PR 1.005, 95% CI 1.001 to 1.009) and in 2001–10 (PR 1.002, 95% CI 1.001 to 1.003) but were more likely to be a home death in 1993–2000 (PR 0.998, 95% CI 0.996 to 0.999). Higher winter hospital deaths were exhibited for all causes, non-cancer and CVD causes of death (PRs 1.000–1.011 for all cause; PRs 1.002–1.018 for non-cancer; PRs 1.004–1.023 for CVD). Cancer showed higher home death in winter for the period of 1993–2010 (PRs 0.997–0.998), higher hospital death during winter for CBD presented only in the period of 1984–2000 (PRs 1.002–1.012). The temporal variation for hospital compared with home death tended to get smaller from the earlier period to the later period.
| Cause of death | Season | Time period | ||
|---|---|---|---|---|
| 1984–92 | 1993–2000 | 2001–10 | ||
| All | Spring | 1.000 | 1.000 | 1.000 |
| Summer | 0.992 (0.990 to 0.995) | 1.000 (0.999 to 1.000) | 1.002 (1.001 to 1.002) | |
| Autumn | 1.007 (1.005 to 1.010) | 1.001 (1.000 to 1.001) | 1.002 (1.002 to 1.003) | |
| Winter | 1.011 (1.009 to 1.013) | 1.000 (1.000 to 1.001) | 1.000 (1.000 to 1.001) | |
| Non-cancer | Spring | 1.000 | 1.000 | 1.000 |
| Summer | 0.988 (0.985 to 0.991) | 0.999 (0.999 to 1.000) | 1.000 (1.000 to 1.001) | |
| Autumn | 1.007 (1.004 to 1.010) | 1.001 (1.001 to 1.002) | 1.002 (1.001 to 1.002) | |
| Winter | 1.018 (1.015 to 1.021) | 1.002 (1.001 to 1.003) | 1.002 (1.001 to 1.002) | |
| Cancer | Spring | 1.000 | 1.000 | 1.000 |
| Summer | 0.997 (0.993 to 1.001) | 0.998 (0.997 to 1.000) | 1.002 (1.001 to 1.003) | |
| Autumn | 1.005 (1.001 to 1.009) | 0.998 (0.996 to 0.999) | 1.002 (1.001 to 1.003) | |
| Winter | 0.998 (0.994 to 1.002) | 0.997 (0.996 to 0.998) | 0.998 (0.997 to 0.999) | |
| CVD | Spring | 1.000 | 1.000 | 1.000 |
| Summer | 0.983 (0.979 to 0.987) | 0.998 (0.997 to 0.999) | 1.000 (0.999 to 1.001) | |
| Autumn | 1.005 (1.001 to 1.008) | 1.001 (1.000 to 1.002) | 1.002 (1.001 to 1.002) | |
| Winter | 1.023 (1.020 to 1.027) | 1.004 (1.003 to 1.005) | 1.004 (1.003 to 1.005) | |
| CBD | Spring | 1.000 | 1.000b | 1.000b |
| Summer | 0.998 (0.991 to 1.005) | 1.001 (0.999 to 1.002) | 0.999 (0.998 to 1.001) | |
| Autumn | 1.003 (0.996 to 1.009) | 1.002 (1.000 to 1.003) | 1.001 (0.999 to 1.002) | |
| Winter | 1.012 (1.005 to 1.018) | 1.002 (1.000 to 1.003) | 1.000 (0.999 to 1.001) | |
| Neurological conditions | Spring | 1.000b | 1.000b | 1.000 |
| Summer | 0.999 (0.981 to 1.018) | 1.006 (0.996 to 1.015) | 1.007 (1.002 to 1.012) | |
| Autumn | 1.003 (0.986 to 1.021) | 1.005 (0.996 to 1.015) | 1.002 (0.997 to 1.007) | |
| Winter | 0.990 (0.973 to 1.007) | 1.001 (0.993 to 1.010) | 1.000 (0.995 to 1.005) | |
| COPD | Spring | 1.000 | 1.000 | 1.000 |
| Summer | 1.006 (0.994 to 1.017) | 1.001 (0.999 to 1.004) | 1.002 (0.999 to 1.004) | |
| Autumn | 1.019 (1.007 to 1.030) | 1.003 (1.000 to 1.005) | 1.005 (1.003 to 1.007) | |
| Winter | 1.004 (0.994 to 1.014) | 0.997 (0.995 to 0.999) | 1.000 (0.998 to 1.001) | |
The care home model compared with the hospital model showed an increased chance of hospital death in 1984–92 during the Christmas period for all-cause, non-cancer, cancer, CVD and CBD deaths (PRs 1.023–1.034); for the later period (1993–2010), the pattern turned to an increased chance of care home death for all-cause, non-cancer and cancer deaths (PRs 0.995–0.998) and non-significant compared with the normal period for the remaining CoD (Table 28). No significant difference in hospital compared with care home death was observed during the Easter period for the majority of the selected CoD in the earlier period (1984–2000), but an slightly increased likelihood of care home death during the Easter period was revealed in 2001–10 for all causes, non-cancer, CBD and COPD (PRs 1.002–1.003). Cancer deaths in care homes during the Easter period were slightly increased in 1984–92 (PR 0.987, 95% CI 0.975 to 0.998). Non-cancer and CVD deaths in 1984–92, all causes, non-cancer, CVD and COPD deaths in 2001–10 had a higher chance of hospital compared with care home death during the New Year period (PRs 1.001–1.017).
| Cause of death | Holiday period | Time period | ||
|---|---|---|---|---|
| 1984–92b | 1993–2000 | 2001–10 | ||
| All | Normal | 1.000 | 1.000 | 1.000 |
| Christmas | 1.028 (1.022 to 1.034) | 0.998 (0.997 to 0.999) | 0.998 (0.997 to 0.998) | |
| Easter | 0.999 (0.992 to 1.005) | 1.000 (0.999 to 1.001) | 1.002 (1.001 to 1.003) | |
| New Year | 1.007 (0.999 to 1.014) | 0.998 (0.997 to 0.999) | 1.001 (1.000 to 1.002) | |
| Non-cancer | Normal | 1.000 | 1.000 | 1.000 |
| Christmas | 1.034 (1.027 to 1.040) | 0.998 (0.997 to 0.999) | 0.998 (0.997 to 0.999) | |
| Easter | 1.004 (0.997 to 1.011) | 1.000 (0.999 to 1.001) | 1.002 (1.001 to 1.003) | |
| New Year | 1.017 (1.008 to 1.025) | 0.998 (0.997 to 0.999) | 1.001 (1.000 to 1.002) | |
| Cancer | Normal | 1.000 | 1.000 | 1.000 |
| Christmas | 1.028 (1.017 to 1.040) | 0.998 (0.996 to 0.999) | 0.995 (0.994 to 0.997) | |
| Easter | 0.987 (0.975 to 0.998) | 0.998 (0.996 to 1.000) | 1.000 (0.999 to 1.002) | |
| New Year | 0.995 (0.980 to 1.010) | 0.999 (0.996 to 1.001) | 1.001 (0.999 to 1.003) | |
| CVD | Normal | 1.000 | 1.000c | 1.000c |
| Christmas | 1.023 (1.012 to 1.034) | 1.000 (0.998 to 1.001) | 0.999 (0.997 to 1.000) | |
| Easter | 1.014 (1.003 to 1.025) | 0.999 (0.998 to 1.001) | 0.999 (0.998 to 1.000) | |
| New Year | 1.015 (1.002 to 1.029) | 0.998 (0.997 to 1.000) | 1.001 (1.000 to 1.003) | |
| CBD | Normal | 1.000 | 1.000b | 1.000 |
| Christmas | 1.034 (1.019 to 1.048) | 1.000 (0.998 to 1.003) | 0.997 (0.995 to 1.000) | |
| Easter | 0.998 (0.983 to 1.014) | 1.000 (0.997 to 1.002) | 1.003 (1.000 to 1.005) | |
| New Year | 1.015 (0.996 to 1.034) | 1.001 (0.998 to 1.004) | 0.999 (0.996 to 1.003) | |
| Neurological conditions | Normal | 1.000c | 1.000c | 1.000c |
| Christmas | 1.033 (0.995 to 1.073) | 0.994 (0.984 to 1.004) | 0.999 (0.990 to 1.008) | |
| Easter | 0.970 (0.928 to 1.013) | 0.998 (0.986 to 1.010) | 1.004 (0.995 to 1.014) | |
| New Year | 0.975 (0.928 to 1.024) | 0.994 (0.980 to 1.008) | 0.999 (0.988 to 1.010) | |
| COPD | Normal | 1.000c | 1.000c | 1.000 |
| Christmas | 1.010 (0.986 to 1.034) | 1.001 (0.998 to 1.003) | 1.001 (0.999 to 1.004) | |
| Easter | 1.002 (0.975 to 1.030) | 0.999 (0.995 to 1.003) | 1.003 (1.000 to 1.006) | |
| New Year | 0.972 (0.944 to 1.001) | 1.002 (0.999 to 1.005) | 1.003 (1.000 to 1.006) | |
In 1984–92, non-cancer deaths was the only CoD category that had a higher chance of dying in care home during the summer [PR 0.995 (95% CI 0.993 to 0.998)] (Table 29). There was a slightly higher chance of death in hospital for those who died during the winter from all, non-cancer, CVD and CBD CoDs in 1984–92 (PRs 1.008–1.013). In the period of 1993–2010, winter deaths were slightly more likely to occur in care homes (PRs 0.998–0.999) for all, non-cancer, and CBD CoDs, contrasting with the higher hospital death in the earlier period.
| Cause of death | Season | Time period | ||
|---|---|---|---|---|
| 1984–92b | 1993–2000 | 2001–10 | ||
| All | Spring | 1.000 | 1.000 | 1.000 |
| Summer | 1.000 (0.998 to 1.003) | 1.000 (0.999 to 1.000) | 0.999 (0.998 to 0.999) | |
| Autumn | 1.005 (1.002 to 1.007) | 0.999 (0.999 to 1.000) | 0.997 (0.997 to 0.998) | |
| Winter | 1.008 (1.005 to 1.010) | 0.998 (0.998 to 0.998) | 0.998 (0.998 to 0.999) | |
| Non-cancer | Spring | 1.000 | 1.000 | 1.000 |
| Summer | 0.995 (0.993 to 0.998) | 0.999 (0.999 to 1.000) | 0.999 (0.998 to 0.999) | |
| Autumn | 0.998 (0.995 to 1.001) | 0.999 (0.999 to 0.999) | 0.997 (0.997 to 0.998) | |
| Winter | 1.013 (1.010 to 1.015) | 0.998 (0.997 to 0.998) | 0.998 (0.998 to 0.998) | |
| Cancer | Spring | 1.000 | 1.000 | 1.000 |
| Summer | 1.000 (0.996 to 1.005) | 1.001 (1.000 to 1.001) | 0.999 (0.998 to 1.000) | |
| Autumn | 1.013 (1.009 to 1.018) | 1.001 (1.000 to 1.001) | 0.999 (0.998 to 0.999) | |
| Winter | 1.002 (0.997 to 1.006) | 1.000 (0.999 to 1.000) | 0.999 (0.999 to 1.000) | |
| CVD | Spring | 1.000 | 1.000 | 1.000 |
| Summer | 0.999 (0.995 to 1.004) | 0.999 (0.998 to 0.999) | 0.999 (0.998 to 0.999) | |
| Autumn | 0.997 (0.993 to 1.002) | 1.000 (1.000 to 1.001) | 0.999 (0.998 to 1.000) | |
| Winter | 1.010 (1.006 to 1.015) | 0.999 (0.999 to 1.000) | 1.000 (0.999 to 1.000) | |
| CBD | Spring | 1.000 | 1.000c | 1.000 |
| Summer | 0.997 (0.991 to 1.004) | 0.999(0.998 to 1.000) | 0.999 (0.998 to 1.000) | |
| Autumn | 0.999 (0.993 to 1.006) | 0.999 (0.998 to 1.000) | 0.997 (0.996 to 0.998) | |
| Winter | 1.011 (1.005 to 1.017) | 0.999 (0.998 to 1.000) | 0.998 (0.997 to 0.999) | |
| Neurological conditions | Spring | 1.000c | 1.000c | 1.000c |
| Summer | 1.004 (0.987 to 1.022) | 0.997 (0.993 to 1.002) | 1.000 (0.996 to 1.003) | |
| Autumn | 1.011 (0.994 to 1.029) | 0.998 (0.994 to 1.003) | 0.995 (0.992 to 0.999) | |
| Winter | 1.004 (0.988 to 1.020) | 0.998 (0.994 to 1.003) | 0.998 (0.995 to 1.002) | |
| COPD | Spring | 1.000 | 1.000 | 1.000 |
| Summer | 0.999 (0.988 to 1.011) | 0.999 (0.998 to 1.001) | 0.997 (0.996 to 0.998) | |
| Autumn | 1.009 (0.997 to 1.021) | 1.000 (0.998 to 1.001) | 0.996 (0.994 to 0.997) | |
| Winter | 0.990 (0.980 to 1.000) | 1.003 (1.001 to 1.004) | 0.999 (0.998 to 1.000) | |
Risk assessment
The results for the Wald tests, and the AUCs and their respective 95% CIs for PoD were as follows: all causes of deaths 0.553 [95% CI 0.551 to 0.554; p < 0.001, χ2 = 3581.4, degrees of freedom (df) = 1], non-cancer deaths 0.592 (95% CI 0.590 to 0.594; p < 0.001, χ2 = 7579.1, df = 1), cancer deaths 0.554 (95% CI 0.551 to 0.557; p < 0.001, χ2 = 1098.1, df = 1), CVD deaths 0.576 (95% CI 0.573 to 0.580; p < 0.001, χ2 = 1815.3, df = 1), CBD deaths 0.637 (95% CI 0.632 to 0.643; p < 0.001, χ2 = 2344.0, df = 1), deaths from neurological conditions 0.599 (95% CI 0.586 to 0.612; p < 0.001, χ2 = 227.1, df = 1) and deaths from COPD 0.552 (95% CI 0.551 to 0.554; p < 0.001, χ2 = 3344.5, df = 1) (Figures 11–17).
FIGURE 11.
Receiver operating characteristic curve of risk assessment model for PoD in all-cause deaths, AUC = 0.5527.
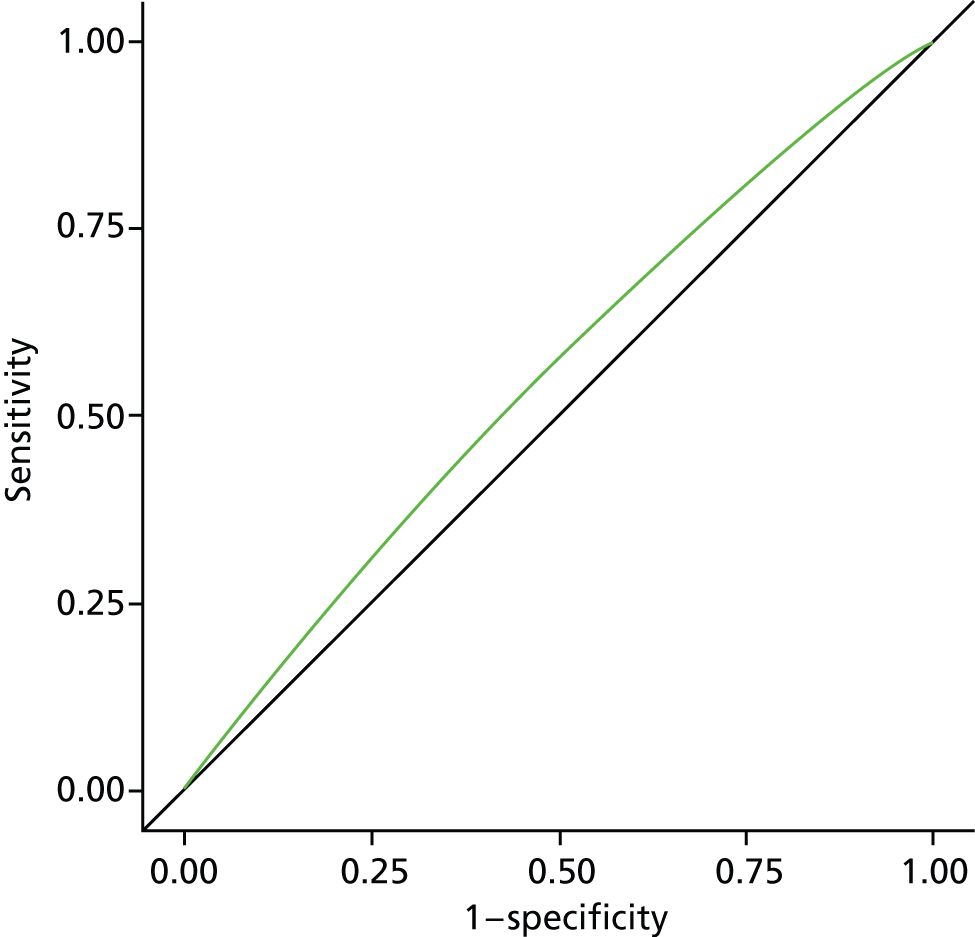
FIGURE 12.
Receiver operating characteristic curve of risk assessment model for PoD in non-cancer, AUC = 0.5919.
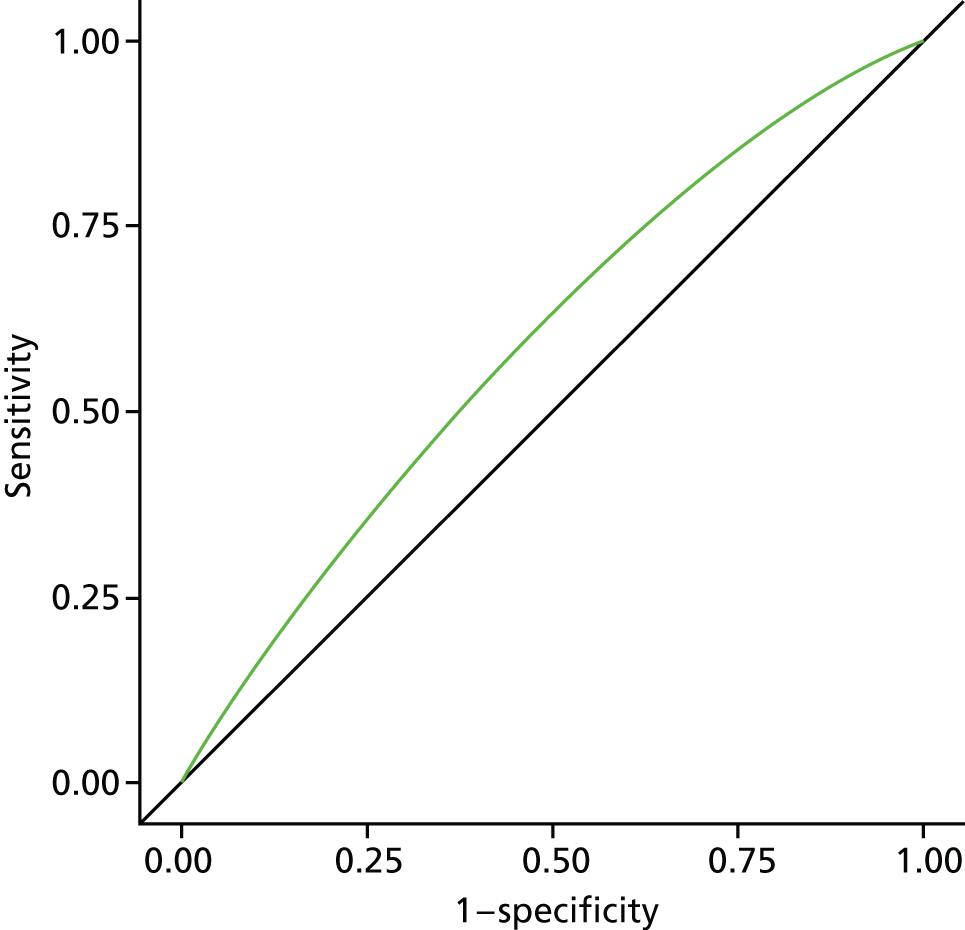
FIGURE 13.
Receiver operating characteristic curve of risk assessment model for PoD in cancer, AUC = 0.5540.
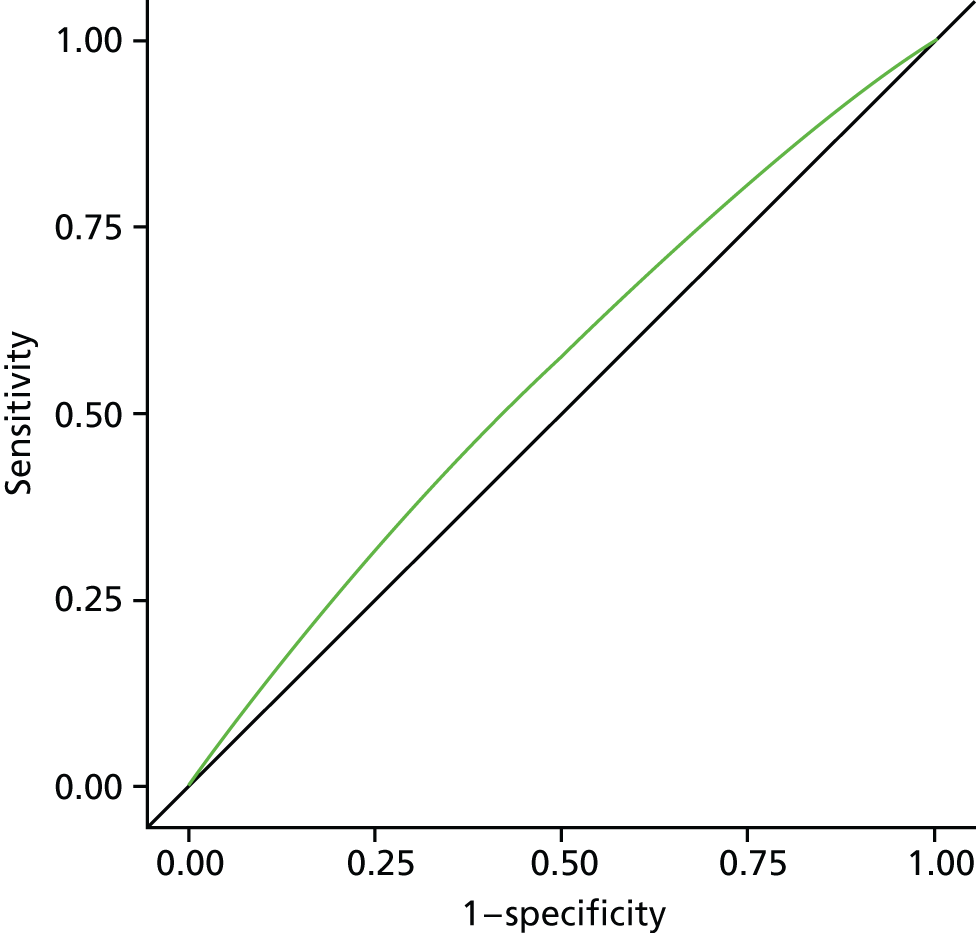
FIGURE 14.
Receiver operating characteristic curve of risk assessment model for PoD in CVDs, AUC = 0.5763.
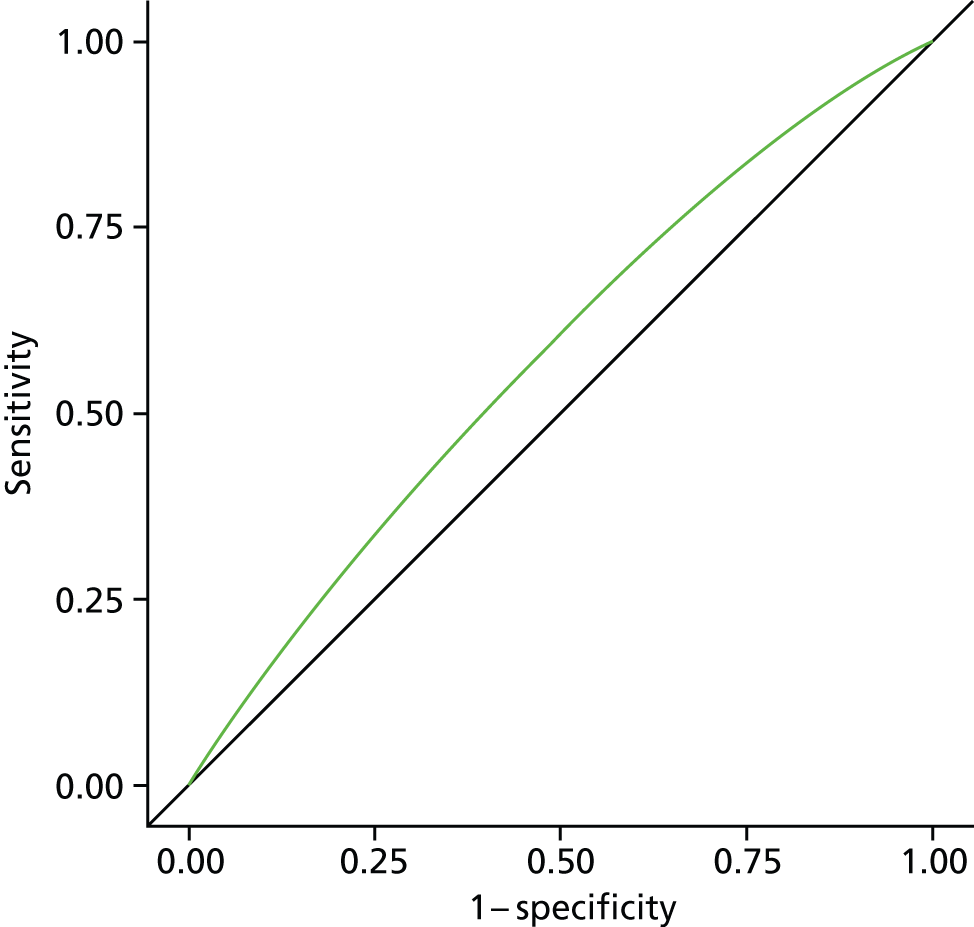
FIGURE 15.
Receiver operating characteristic curve of risk assessment model for PoD in CBDs, AUC = 0.6371.
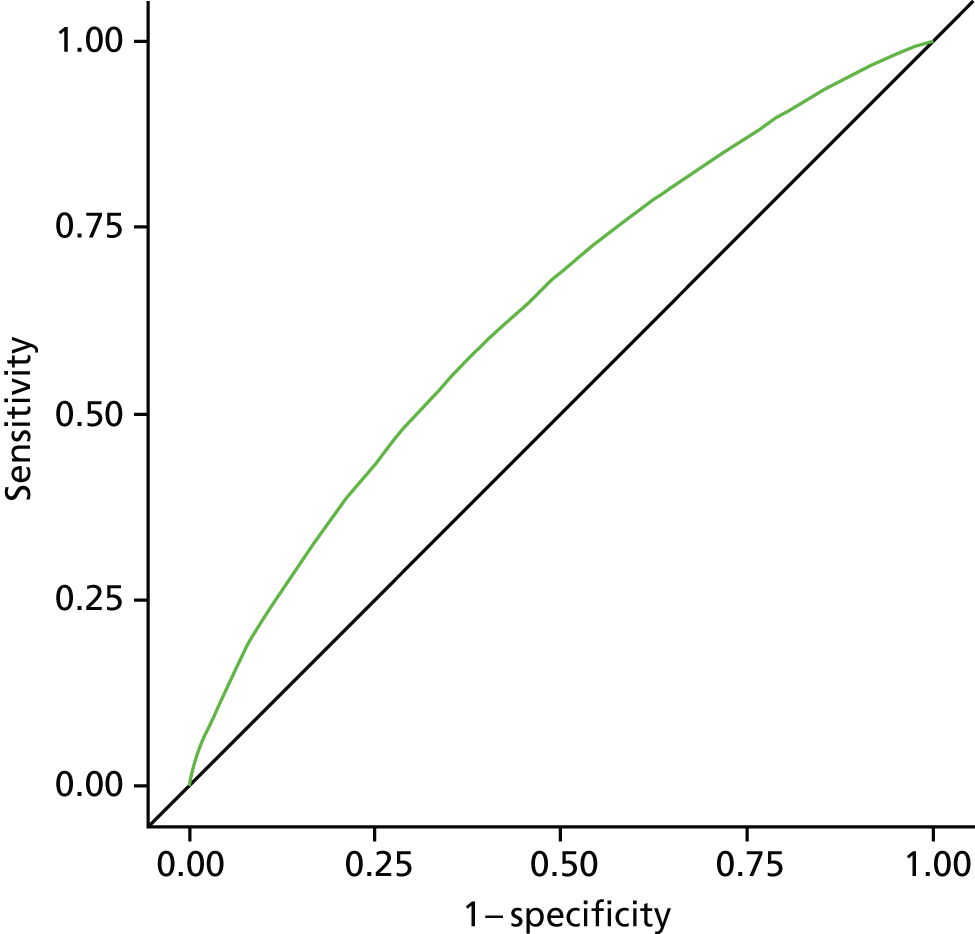
FIGURE 16.
Receiver operating characteristic curve of risk assessment model for PoD in neurological conditions, AUC = 0.5988.
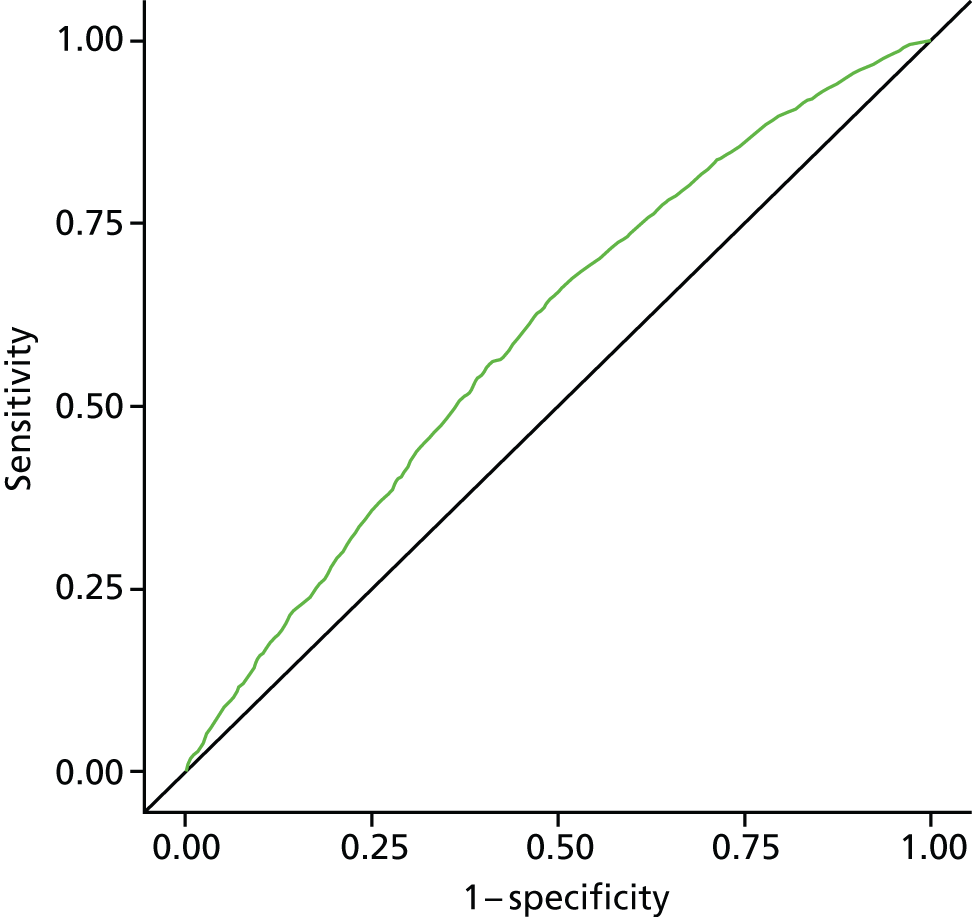
FIGURE 17.
Receiver operating characteristic curve of risk assessment model for PoD in COPD, AUC = 0.5522.
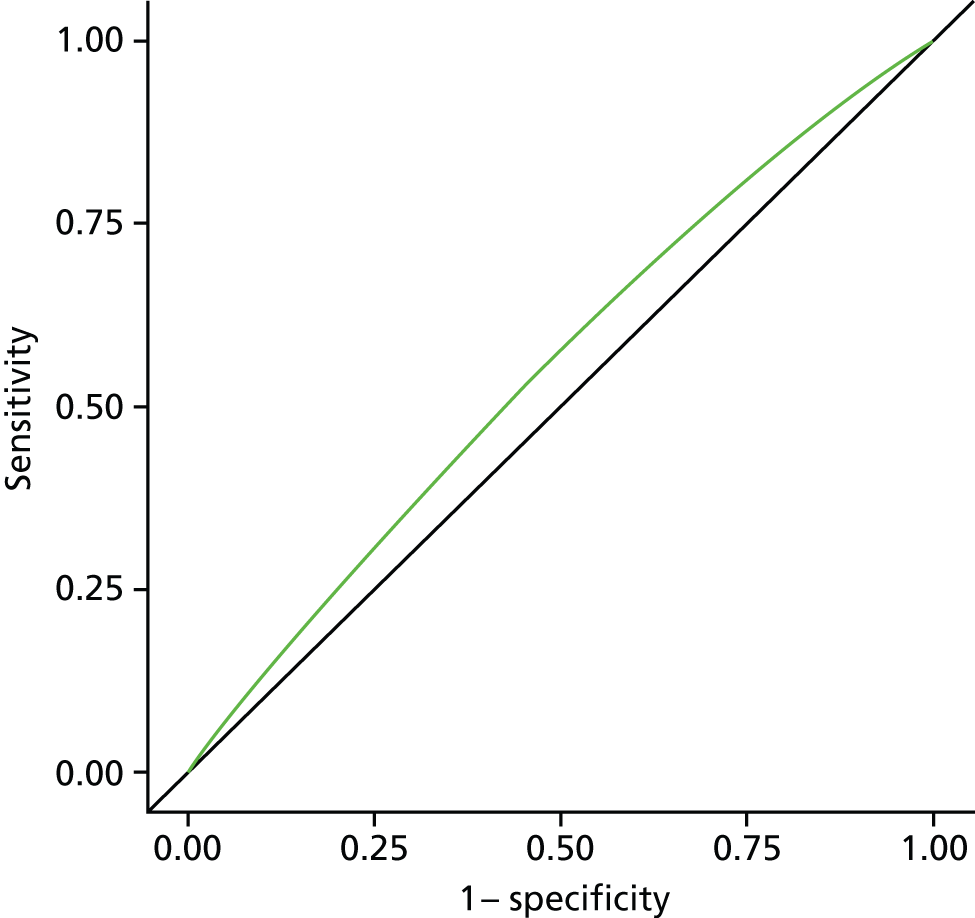
Chapter 4 Discussion
Several findings emerge from this large-scale population-based study. First, there exist common patterns in PoD. Hospital remains the most common PoD in England throughout the whole period and irrespective of CoD. Overall, around three in five non-cancer deaths and one in two cancer deaths occurred in hospitals. Deaths in hospital showed a decreasing trend from 1984 to 2010. The findings are consistent with previous reports from England and also from the other countries. 9,12,18,21,50–52 Home and care home were the second or third most common PoD, depending on CoD. Hospice deaths were more likely among cancer deaths than in other causes of death; hospice was also the third most common place for cancer deaths. ‘Home’ and ‘hospice’ are often reported as the number one and number two choices, respectively, for the preferred PoD. 15,53 In England, over the past 30 years, cancer deaths are becoming more closely matched to people’s preference for PoD. 18 By the end of 2010, hospice deaths accounted for 17.1% of all cancer deaths, in contrast, only 0.4% of non-cancer deaths occurred in a hospice. Deaths from neurological conditions are the second most likely to occur in a hospice. An encouraging finding is that both home and hospice deaths showed an increasing trend, mirroring the reduction in hospital deaths. However, one should not assume that home is always the most preferred PoD. Research found that some patients, particularly older people or patients with particular conditions, may well prefer to die in residential home or in hospital. 54–56
Second, PoD showed wide regional variations, and this was the case regardless of how the region was defined (e.g. LA, electoral ward, PCO). London, a modern and populated metropolitan city, had persistently high rates of hospital deaths compared with other regions across different causes of death. A three-country comparative study found similar regional variation. 57 Understanding the mechanisms behind this variation is key to improving regional inequality in PoD. A population-based questionnaire involving 4081 respondents (over response rate 50.2%) explored the relationship between end-of-life care decisions and metropolitan environment. 58 Authors argued that the end-of-life care decision may be influenced by ‘metropolitan issues’ that include population environment, social environment and municipal-level determinants, and all of these are collectively affecting where a patient die. Although London and other metropolitan cities may share similar characteristics, it needs to be confirmed in future studies.
Third, this study has for the first time systematically analysed the temporal patterns in PoD in England, using individual-level data and multivariable modelling techniques. We found modest but consistent variations across a number of temporal dimensions. Over the study period, we observed long-term patterns showing a decreasing trend in hospital deaths and an increasing trend in home and hospice deaths. We have also seen an increase in care home deaths and this trend looks likely to continue. These findings are important for considering how our end-of-life care facilities and service delivery models are going to meet these changing patterns in PoD. 21,59 We also observed clear seasonal patterns in PoD, although the patterns seem to have become less clear in the most recent period. Autumn was associated with a higher chance of hospital deaths in most conditions but was not significant in all-cause deaths. CVD and non-cancer deaths were associated with a higher probability of hospital deaths in winter. We also identified a higher chance of hospital deaths during the Easter period and slightly higher chance of home death during Christmas. These were consistent with previous studies on seasonal and cyclic patterns in mortality. 24–28 The mechanisms and the drivers of these patterns are beyond the scope of this report but should be topics for future explorations. These newly identified temporal patterns offer opportunities for health-care professionals, policy-makers and decision-makers to rethink our service structure and service organisations.
Some social demographic characteristics have also been found to be associated with PoD. Independent of the CoD, increasing age was consistently a predictor of reduced chance of home or hospice death. Higher levels of area-based deprivation were also associated with a greater chance of hospital death. Marital status, which is used here as a proxy measure for social support, was also found to affect where a person dies. This is an important finding in relation to the ageing population and the increasing number of people living as single, widowed or divorced. End-of-life care will need to respond to these changing demographics. 49 Nevertheless, as the effect from such vast samples tends to be statistically significant, parties who would like to use the findings from this large-scale study should pay more attention to what constitutes meaningful effect sizes in their application contexts.
We intended to construct the risk assessment models to help to guide practice. Although we did not expect the models to reach sufficient performance at the individual level, the performance indicator (AUC range 0.5527 to 0.6371) suggested that none of the models (even the best for CBD death 0.6371) was strong enough to be considered useful compared with commonly accepted satisfactory criteria (AUC = 0.7). 48
There are several reasons why we were able to explain only a small proportion of the variation in our model. Most importantly the data from death registration and our linkage to area-based sociodemographic factors did not include important determinants, in particular levels of service provision and individual-level sociodemographic variables. We consider the lack of local service provision data, in a reliable and consistent format, to be the most important piece of missing information. Service provision is an important factor in influencing PoD. 60 Information on local service provision, such as level of hospice provision, local hospital and nursing home beds, and community services (including out-of-hours care) would aid such analysis in the future. A recent Cochrane review has shown that home palliative care teams can double the odds of home death. 60
Second, our sociodemographic variables were limited. Although an area-level measure of deprivation was used (the IMD), this is not an ideal (although is the best available) proxy for individual socioeconomic status owing to the ‘ecological fallacy’. 61 Ecological fallacy occurs when a person is classified as deprived because they live in a deprived area when in fact they are not deprived, or vice versa, this occurs when using area-level measures, such as the IMD. Also, ‘less-deprived area’ does not necessarily mean a higher SES of the residents, as the ‘income’ domain of the IMD is based on the number of benefit claimant counts only. Despite this, the area-level modelling appears to be satisfactory, except for the cancer- and COPD-specific models. The other models using the selected variables can explain more than one-quarter of the variation in PoD, and for the CBD models the explained variation was nearly 40%.
Several limitations should be noted when interpreting the results from this report. The first is the issue of comparability. This is a study that covers a long period of time, the results across the time period may not be directly comparable owing to various reasons including ICD coding changes, recording practice changes and so on. In 2001, the ONS changed the disease classification system from the ICD-932 to the ICD-1031 coding scheme. The impacts of these coding changes, particularly with regard to rule changes, vary by underlying CoD. 62 For example, the change to rule 3 allows a condition that is reported in either Part I or Part II of the death certificate to take precedence over the condition selected using the other coding rules if it is obviously a direct consequence of that condition. In ICD-10,31 the list of conditions affected by rule 3 is more clearly defined than in ICD-9,32 and is also broader in scope. One of the most significant changes concerns assigning pneumonia and bronchopneumonia as the underlying CoD. 63,64 Another comparability issue concerns PoD and its associated CoD. The reliability of CoDs may vary significantly by PoD. Deaths in hospital may have better accuracy than in other places of death. 65–67
The way the variables are recorded may also have changed over time. For example, we planned to use country of birth as a proxy measure of ethnicity. However, when processing data, we found that the coding for country of birth in 2006 was unusable owing to a coding change in that year. There were a set of overlapping codes representing different country of birth in old and new coding schemes. This was noticed from the peculiar frequency distribution across the ethnicity. In addition, the analysis would benefit from a better individual-level measure of SES than is provided by the area-level IMD score/ranking. The social class variables contained in the database in its current format is hard to use. The value of this variable may be explored further in future studies.
Finally, the analysis was limited to some degree by the computationally highly demanding nature of this extremely large data set, prohibiting full exploration of the data. For most of the computational tasks, the computers had to be left running overnight. Two elements were extremely computationally demanding: data manipulation and individual-level modelling, particularly for large disease-group analysis. For example, it took a total of 13 hours, 33 minutes and 10 seconds for the computer to finish extracting 14 variables for seven defined causes of death from the full period of data (1984–2010). The time taken to run the individual-level modelling with six variables was 27 hours, 36 minutes and 7 seconds. The processor of the PC primarily used to complete the computational tasks was Intel® Xeon® CPU W3670 @3.20 GHz and RAM 4.00 GB. To make full use of this rich source of information and to be more efficient in the processing of this large number of data, the latest data-mining techniques or parallel computation facilities should be explored and incorporated.
There is tremendous value in having access to such a large-scale data set spanning 27 years to produce this report. There is still plenty of opportunity to enhance the value of the data set. For example, through data linkage we should be able to incorporate more information into the models therefore improving performance.
Chapter 5 Conclusions
In conclusion, this large-scale population-based study using 27 years of death certificate data for England found that the most common PoD remains hospital, followed by home or care home, depending on the CoD. The proportion of hospice deaths increased over time but varied significantly by CoD, from 17.1% in cancer, 3.5% in neurological conditions, to < 1% in other conditions. There were significant variations in PoD by region, with people from populated metropolitan areas (particularly London) being more likely to die in hospitals. PoD also differed by season and holiday period – with autumn and winter deaths (compared with spring deaths) having an increased chance of occurring in hospital, and a higher chance of home deaths during the Christmas period and hospital deaths during the New Year period compared with the normal period. There is evidence of inequality in PoD by age, marital status and deprivation. People who are aged 75+ years, single, divorced or widowed, and living in more deprived areas were more likely to die in hospital. Future studies are needed to confirm these findings, and the implication for service organisation and service delivery. The predictive performance of our risk assessment models was not satisfactory and needs further development taking into account service provision and the other important factors.
Recommendations for future research
Our work has identified the following priority research questions:
-
What is the pattern of health service utilisation in the last year of life and how is it related to where patients die?
-
How are clinical characteristics in the last year of life related to where patients die?
-
Is the distribution of end-of-life care facilities related to where patients die?
This report researched in detail the temporal and geographical patterns in PoD in several important causes of death, and found varied levels of inequality in PoD. However, with the cross-sectional death registry data we cannot know what happened before the final PoD, the transition of place of care and how these transitions related to PoD. We also believe it would be helpful to explore the distribution of end-of-life health-care facilities and its relationship with PoD.
We found a consistent inequality pattern in age, marital status and deprivation. The patients who died at older age (e.g. > 85 years); were single, divorced and widowed; and lived in deprived areas were more likely to die in hospital. The inequality in PoD is also evident in CoD, for example deaths from haematological and lung cancers were more likely to have occurred in hospitals.
We believe that enhanced community care and primary care facilities would be helpful in reducing the inequalities in PoD. Currently, our end-of-life health-care facilities are not optimised to enable people to die at their preferred place, which usually is at home or in a hospice. This research is important, as it can deepen our understanding of how we can make better use of existing resources to deliver quality care at the end of life; it can also help us to prioritise and plan for resource allocation.
There was a scarcity of UK data evaluating the relationship between end-of-life care patterns in the last year of life and PoD, although limited information on the topic is available from the USA, Canada and some Western European countries. We found two UK-based studies that assessed the service use in the last year of life and its relationship with PoD; however, both studies were conducted in specific settings (e.g. hospice) or subpopulations (e.g. aged > 75 years).
To the best of our knowledge, there are no data from wider end-of-life care settings or populations in the UK that address the proposed research questions. We believe that linked health-care data facilities can supply information to answer these important research questions and make improvements for end-of-life care policy.
Acknowledgements
Contribution of authors
Dr Wei Gao (Senior Lecturer in Statistics and Epidemiology, KCL) Co-leader of the project and project manager; undertook the analysis, and wrote the first draft of the report.
Mr Yuen K Ho (Research Assistant, KCL) Managed and maintained the database, prepared and linked the data, produced the bivariate graphs and GIS graphs. Assisted and supervised by WG and IJH.
Dr Julia Verne [Director for Knowledge & Intelligence (South West) and Clinical Lead – National End of Life Care Intelligence Network] Contributed to all phases of the project, and provided critical comments on the draft of the report and interpretation of the data.
Dr Emma Gordon (Head of Life Events Analysis, ONS) Contributed to all phases of the project, and provided critical comments on the draft of the report and interpretation of the data.
Professor Irene J Higginson (Professor of Palliative Care, KCL) Co-leader of the project; provided senior support for project management and significantly contributed to writing the first draft of the report;
All authors approved the final version.
The investigators of the GUIDE_Care project: Irene J Higginson (Principal Investigator), Wei Gao, Julia Verne, Myer Glickman and Barbara Gomes.
The Members of the Project Advisory Group (PAG): Tony Bonser, Shaheen Khan, Jonathan Koffman, Katie Lindsey, Roberta Lovick, Tariq Malik, Julie Messer, Carolyn Morris, Andy Pring, Stafford Scholes and Katherine Sleeman.
We thank the ONS for supplying data; ONS staff Claudia Wells and Vanessa Fearn for their advice and support in the preparation of the data for analysis, and for critically commenting on data-related issues.
We thank Miss Joanna Davies for proofreading the report and administrative support.
Patient and public involvement
Service users were involved through an existing group – the COMPASS Collaborative Consumer Group – with whom we have developed a close working relationship through other projects. Patients and service users have been involved in the project in the following ways: (1) provided lay feedback and comments; (2) monitored progress of the research as a member of the PAG; (3) helped to develop and implement dissemination plans; and (4) contributed/commented on reports/publications/findings establish links with wider (i.e. non-cancer) user groups.
Disclaimers
This report presents independent research funded by the National Institute for Health Research (NIHR). The views and opinions expressed by authors in this publication are those of the authors and do not necessarily reflect those of the NHS, the NIHR, NETSCC, the HS&DR programme or the Department of Health. If there are verbatim quotations included in this publication the views and opinions expressed by the interviewees are those of the interviewees and do not necessarily reflect those of the authors, those of the NHS, the NIHR, NETSCC, the HS&DR programme or the Department of Health.
Publications
Gao W, Ho YK, Verne J, Glickman M, Higginson IJ; project GUIDE_Care. Changing patterns in place of cancer death in England: a population-based study. PLOS Med 2013;10:e1001410. doi:10.1371/journal.pmed.1001410
Sleeman KE, Ho YK, Verne J, Glickman M, Silber E, Gao W, et al. Place of death, and its relation with underlying cause of death, in Parkinson’s disease, motor neurone disease, and multiple sclerosis: a population-based study. Palliat Med 2013;27:840–6. doi:10.1177/0269216313490436
Sleeman KE, Ho YK, Verne J, Gao W, Higginson IJ; GUIDE_Care project. Reversal of English trend towards hospital death in dementia. A population-based study of place of death and associated individual and regional factors, 2001–2010. BMC Neurol 2014;14:59.
Koffman J, Ho YK, Davies JM, Gao W, Higginson IJ. Does ethnicity affect where people with cancer die? A population based 10 year study [published online ahead of print. PLOS One 2014 April. doi:10.1371/journal.pone.0095052.
Evans CJ, Ho YK, Daveson BA, Hall S, Higginson IJ, and Gao W on behalf of the GUIDE_Care project. Place and cause of death of centenarians dying in care homes: a population-based observational study in England. PLoS Med 2014;11:6. e1001653.
References
- Hales S, Zimmermann C, Rodin G. Review: the quality of dying and death: a systematic review of measures. Palliat Med 2010;24:127-44. http://dx.doi.org/10.1177/0269216309351783.
- National End of Life Care Programme . National End of Life Care Programme 2012 n.d. www.endoflifecareforadults.nhs.uk/ (accessed 26 January 2013).
- Health, United States, 2010: With Special Feature on Death and Dying. NCHS: Hyattsville, MD; 2011.
- Cohen J, Bilsen J, Miccinesi G, Lofmark R, Addington-Hall J, Kaasa S, et al. Using death certificate data to study place of death in 9 European countries: opportunities and weaknesses. BMC Publ Health 2007;7. http://dx.doi.org/10.1186/1471-2458-7-283.
- Wright AA, Keating NL, Balboni TA, Matulonis UA, Block SD, Prigerson HG. Place of death: correlations with quality of life of patients with cancer and predictors of bereaved caregivers’ mental health. Am J Clin Oncol 2010;28:4457-64. http://dx.doi.org/10.1200/JCO.2009.26.3863.
- Schulz R, Mendelsohn AB, Haley WE, Mahoney D, Allen RS, Zhang S, et al. End-of-life care and the effects of bereavement on family caregivers of persons with dementia. N Engl J Med 2003;349:1936-42. http://dx.doi.org/10.1056/NEJMsa035373.
- Chochinov HM, Kristjanson LJ, Breitbart W, McClement S, Hack TF, Hassard T, et al. Effect of dignity therapy on distress and end-of-life experience in terminally ill patients: a randomised controlled trial. Lancet Oncol 2011;12:753-62. http://dx.doi.org/10.1016/S1470-2045(11)70153-X.
- Grande GE, Ewing G. National Forum for Hospice at H . Informal carer bereavement outcome: relation to quality of end of life support and achievement of preferred place of death. Palliat Med 2009;23:248-56. http://dx.doi.org/10.1177/0269216309102620.
- Reich O, Signorell A, Busato A. Place of death and health care utilization for people in the last 6 months of life in Switzerland: a retrospective analysis using administrative data. BMC Health Serv Res 2013;13. http://dx.doi.org/10.1186/1472-6963-13-116.
- Felder S, Meier M, Schmitt H. Health care expenditure in the last months of life. J Health Econ 2000;19:679-95. http://dx.doi.org/10.1016/S0167-6296(00)00039-4.
- Polder JJ, Barendregt JJ, van Oers H. Health care costs in the last year of life: the Dutch experience. Soc Sci Med 2006;63:1720-31. http://dx.doi.org/10.1016/j.socscimed.2006.04.018.
- Teno JM, Gozalo PL, Bynum JP, Leland NE, Miller SC, Morden NE, et al. Change in end-of-life care for Medicare beneficiaries: site of death, place of care, and health care transitions in 2000, 2005, and 2009. JAMA 2013;309:470-7. http://dx.doi.org/10.1001/jama.2012.207624.
- Blecker S, Herbert R, Brancati FL. Comorbid diabetes and end-of-life expenditures among Medicare beneficiaries with heart failure. J Card Fail 2012;18:41-6. http://dx.doi.org/10.1016/j.cardfail.2011.09.011.
- Understanding the Cost of End of Life Care in Different Settings. London: Marie Curie Cancer Care; 2012.
- Gomes B, Calanzani N, Gysels M, Hall S, Higginson IJ. Heterogeneity and changes in preferences for dying at home: a systematic review. BMC Palliat Care 2013;12. http://dx.doi.org/10.1186/1472-684X-12-7.
- Gomes B, Higginson IJ, Calanzani N, Cohen J, Deliens L, Daveson BA, et al. Preferences for place of death if faced with advanced cancer: a population survey in England, Flanders, Germany, Italy, the Netherlands, Portugal and Spain. Ann Oncol 2012;23:2006-15. http://dx.doi.org/10.1093/annonc/mdr602.
- Neergaard MA, Jensen AB, Sondergaard J, Sokolowski I, Olesen F, Vedsted P. Preference for place-of-death among terminally ill cancer patients in Denmark. Scand J Caring Sci 2011;25:627-36. http://dx.doi.org/10.1111/j.1471-6712.2011.00870.x.
- Gao W, Ho YK, Verne J, Glickman M, Higginson IJ. project GUC . Changing patterns in place of cancer death in England: a population-based study. PLOS Med 2013;10. http://dx.doi.org/10.1371/journal.pmed.1001410.
- The Quality of Death: Ranking End-of-Life Care Across the World. London: Economist Intelligence Unit; 2010.
- National End of Life Care Intelligence Network (NEoLCIN). National End of Life Care Publications n.d. www.endoflifecare-intelligence.org.uk/resources/publications/ (accessed 15 May 2013).
- Gomes B, Calanzani N, Higginson IJ. Reversal of the British trends in place of death: time series analysis 2004–2010. Palliat Med 2012;26:102-7. http://dx.doi.org/10.1177/0269216311432329.
- Higginson IJ, Astin P, Dolan S. Where do cancer patients die? Ten-year trends in the place of death of cancer patients in England. Palliat Med 1998;12:353-63. http://dx.doi.org/10.1191/026921698672530176.
- Office for National Statistics (ONS) . Impact of Registration Delays on Mortality Statistics, 2011, 2012 n.d. www.ons.gov.uk/ons/guide-method/user-guidance/health-and-life-events/impact-of-registration-delays-on-mortality-statistics/impact-of-registration-delays-on-mortality-statistics-article.pdf (accessed 30 November 2013).
- Yang L, Wong C, Chan K, Chau P, Ou C, Chan K, et al. Seasonal effects of influenza on mortality in a subtropical city. BMC Infect Dis 2009;9. http://dx.doi.org/10.1186/1471-2334-9-133.
- Public Health England . Excess Winter Deaths (EWD) in England 2013 n.d. www.wmpho.org.uk/excesswinterdeathsinEnglandatlas/ (accessed 16 May 2013).
- Excess Winter Mortality in England and Wales, 2010/11 (Provisional), 2009/10 (Final). London: ONS; n.d.
- Jen MH, Bottle A, Majeed A, Bell D, Aylin P. Early in-hospital mortality following trainee doctors’ first day at work. PLOS ONE 2009;4. http://dx.doi.org/10.1371/journal.pone.0007103.
- Phillips D, Barker GE, Brewer KM. Christmas and New Year as risk factors for death. Soc Sci Med 2010;71:1463-71. http://dx.doi.org/10.1016/j.socscimed.2010.07.024.
- Goddard AF, Lees P. Higher senior staffing levels at weekends and reduced mortality. BMJ 2012;344. http://dx.doi.org/10.1136/bmj.e67.
- Frontline . Health Care Systems – The Four Basic Models 2008 n.d. www.pbs.org/wgbh/pages/frontline/sickaroundtheworld/countries/models.html (accessed 15 May 2013).
- International Statistical Classification of Diseases and Related Health Problems. Geneva: WHO; 1992.
- International Classification of Diseases and Related Health Problems. Geneva: WHO; 1977.
- Pennington S, Snell K, Lee M, Walker R. The cause of death in idiopathic Parkinson’s disease. Parkinsonism Relat Disord 2010;16:434-7. http://dx.doi.org/10.1016/j.parkreldis.2010.04.010.
- Palliative Care Statistics for Children and Young Adults. London: DH; 2007.
- Office for National Statistics (ONS) . A Beginner’s Guide to UK Geography 2010 n.d. www.ons.gov.uk/ons/guide-method/geography/beginner-s-guide/index.html (accessed 8 April 2013).
- Payne RA, Abel GA. UK Indices of Multiple Deprivation – a Way to Make Comparisons across Constituent Countries. Health Stat Q 2012;53:22-37. www.ons.gov.uk/ons/rel/hsq/health-statistics-quarterly/no-–53--spring-2012/uk-indices-of-muliple-deprivation.pdf (accessed 10 January 2013).
- Barros AJ, Hirakata VN. Alternatives for logistic regression in cross-sectional studies: an empirical comparison of models that directly estimate the prevalence ratio. BMC Med Res Methodol 2003;3. http://dx.doi.org/10.1186/1471-2288-3-21.
- Zou G. A modified poisson regression approach to prospective studies with binary data. A J Epidemiol 2004;159:702-6. http://dx.doi.org/10.1093/aje/kwh090.
- Davies HT, Crombie IK, Tavakoli M. When can odds ratios mislead?. BMJ 1998;316:989-91. http://dx.doi.org/10.1136/bmj.316.7136.989.
- Greenland S. Modeling and variable selection in epidemiologic analysis. Am J Public Health 1989;79:340-9. http://dx.doi.org/10.2105/AJPH.79.3.340.
- SAS/STAT® 9.2 User’s Guide. Cary, NC: SAS Institute Inc.; 2008.
- Abbasi A, Peelen LM, Corpeleijn E, van der Schouw YT, Stolk RP, Spijkerman AM, et al. Prediction models for risk of developing type 2 diabetes: systematic literature search and independent external validation study. BMJ 2012;345. http://dx.doi.org/10.1136/bmj.e5900.
- Collins GS, Moons KG. Comparing risk prediction models. BMJ 2012;344. http://dx.doi.org/10.1136/bmj.e3186.
- Moons KG, Kengne AP, Grobbee DE, Royston P, Vergouwe Y, Altman DG, et al. Risk prediction models: II. External validation, model updating, and impact assessment. Heart 2012;98:691-8. http://dx.doi.org/10.1136/heartjnl-2011-301247.
- Moons KG, Kengne AP, Woodward M, Royston P, Vergouwe Y, Altman DG, et al. Risk prediction models: I. Development, internal validation, and assessing the incremental value of a new (bio)marker. Heart 2012;98:683-90. http://dx.doi.org/10.1136/heartjnl-2011-301246.
- van Dieren S, Beulens JW, Kengne AP, Peelen LM, Rutten GE, Woodward M, et al. Prediction models for the risk of cardiovascular disease in patients with type 2 diabetes: a systematic review. Heart 2012;98:360-9. http://dx.doi.org/10.1136/heartjnl-2011-300734.
- Harrell FE. Regression Modeling Strategies: With Applications to Linear Models, Logistic Regression, and Survival Analysis. New York, NY: Springer-Verlag; 2001.
- Fawcett T. An introduction to ROC analysis. Pattern Recognit Lett 2006;27:861-74. http://dx.doi.org/10.1016/j.patrec.2005.10.010.
- Dunnell K. The Changing Demographic Picture of the UK. London: Office for National Statistics; 2007.
- Costantini M, Camoirano E, Madeddu L, Bruzzi P, Verganelli E, Henriquet F. Palliative home care and place of death among cancer patients: a population-based study. Palliat Med 1993;7:323-31.
- Hunt RW, Bond MJ, Groth RK, King PM. Place of death in South Australia. Patterns from 1910 to 1987. Med J Aust 1991;155:549-53.
- Bruera E, Sweeney C, Russell N, Willey JS, Palmer JL. Place of death of Houston area residents with cancer over a two-year period. J Pain Symptom Manage 2003;26:637-43. http://dx.doi.org/10.1016/S0885-3924(03)00204-5.
- Higginson IJ, Sen-Gupta GJ. Place of care in advanced cancer: a qualitative systematic literature review of patient preferences. J Palliat Med 2000;3:287-300. http://dx.doi.org/10.1089/jpm.2000.3.287.
- Gott M, Seymour J, Bellamy G, Clark D, Ahmedzai S. Older people’s views about home as a place of care at the end of life. Palliat Med 2004;18:460-7. http://dx.doi.org/10.1191/0269216304pm889oa.
- Wilson DM, Cohen J, Deliens L, Hewitt JA, Houttekier D. The preferred place of last days: results of a representative population-based public survey. J Palliat Med 2013;16:502-8. http://dx.doi.org/10.1089/jpm.2012.0262.
- Holdsworth L, Fisher S. A retrospective analysis of preferred and actual place of death for hospice patients. Int J Palliat Nurs 2010;16.
- Houttekier D, Cohen J, Bilsen J, Addington-Hall J, Onwuteaka-Philipsen B, Deliens L. Place of death in metropolitan regions: metropolitan versus non-metropolitan variation in place of death in Belgium, The Netherlands and England. Health Place 2010;16:132-9. http://dx.doi.org/10.1016/j.healthplace.2009.09.005.
- Cohen J, Chambaere K, Bilsen J, Houttekier D, Mortier F, Deliens L. Influence of the metropolitan environment on end-of-life decisions: a population-based study of end-of-life decision-making in the Brussels metropolitan region and non-metropolitan Flanders. Health Place 2010;16:784-93. http://dx.doi.org/10.1016/j.healthplace.2010.04.003.
- Gomes B, Higginson IJ. Where people die (1974–2030): past trends, future projections and implications for care. Palliat Med 2008;22:33-41. http://dx.doi.org/10.1177/0269216307084606.
- Gomes B, Higginson IJ. Factors influencing death at home in terminally ill patients with cancer: systematic review. BMJ 2006;332:515-21. http://dx.doi.org/10.1136/bmj.38740.614954.55.
- Wakefield J, Shaddick G. Health-exposure modeling and the ecological fallacy. Biostatistics 2006;7:438-55. http://dx.doi.org/10.1093/biostatistics/kxj017.
- Richardson DB. The impact on relative risk estimates of inconsistencies between ICD-9 and ICD-10. Occup Environ Med 2006;63:734-40. http://dx.doi.org/10.1136/oem.2006.027243.
- Rooney C, Devis T. Mortality trends by cause of death in England and Wales 1980–94: the impact of introducing automated cause coding and related changes in 1993. Popul Trends 1996;86:29-35.
- Griffiths C, Brock A, Rooney C. The impact of introducing ICD-10 on trends in mortality from circulatory diseases in England and Wales. Health Stat Q n.d.;22:14-20.
- Lahti RA, Penttila A. The validity of death certificates: routine validation of death certification and its effects on mortality statistics. Forensic Sci Int 2001;115:15-32. http://dx.doi.org/10.1016/S0379-0738(00)00300-5.
- Sington JD, Cottrell BJ. Analysis of the sensitivity of death certificates in 440 hospital deaths: a comparison with necropsy findings. J Clin Pathol 2002;55:499-502. http://dx.doi.org/10.1136/jcp.55.7.499.
- Ravakhah K. Death certificates are not reliable: revivification of the autopsy. South Med J 2006;99:728-33. http://dx.doi.org/10.1097/01.smj.0000224337.77074.57.
Appendix 1 Bivariate graphs by causes of deaths
FIGURE 18.
Place of death by age groups in all non-cancer deaths, England 1984–2010.
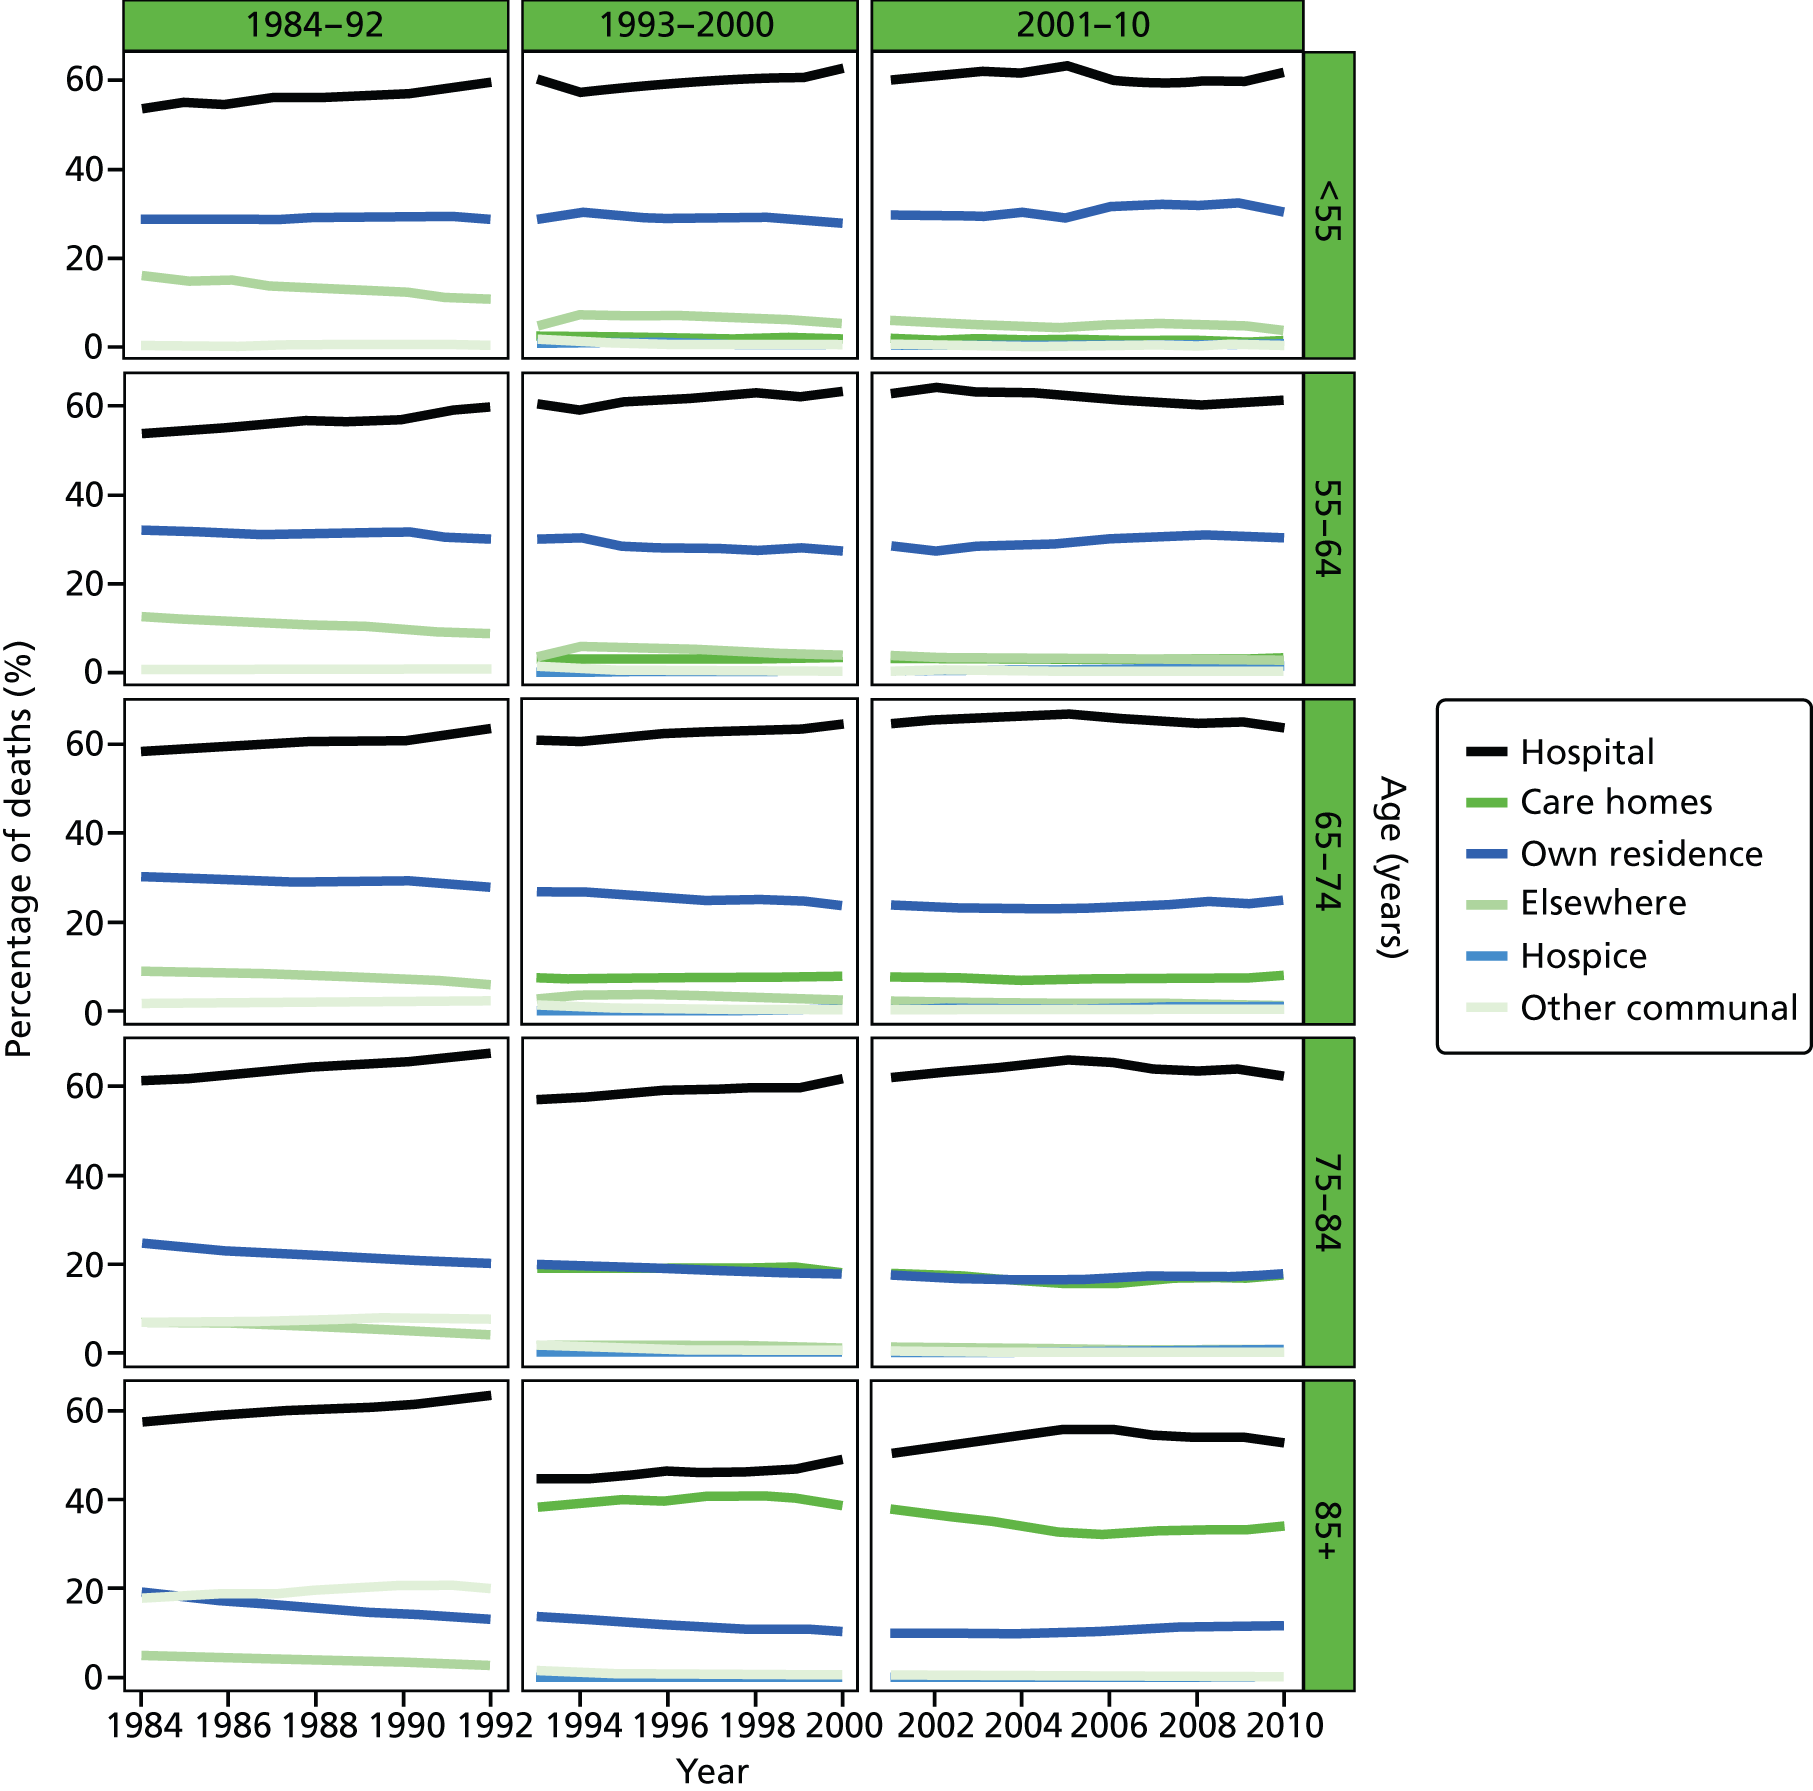
FIGURE 19.
Place of death by gender in all non-cancer deaths, England 1984–2010.
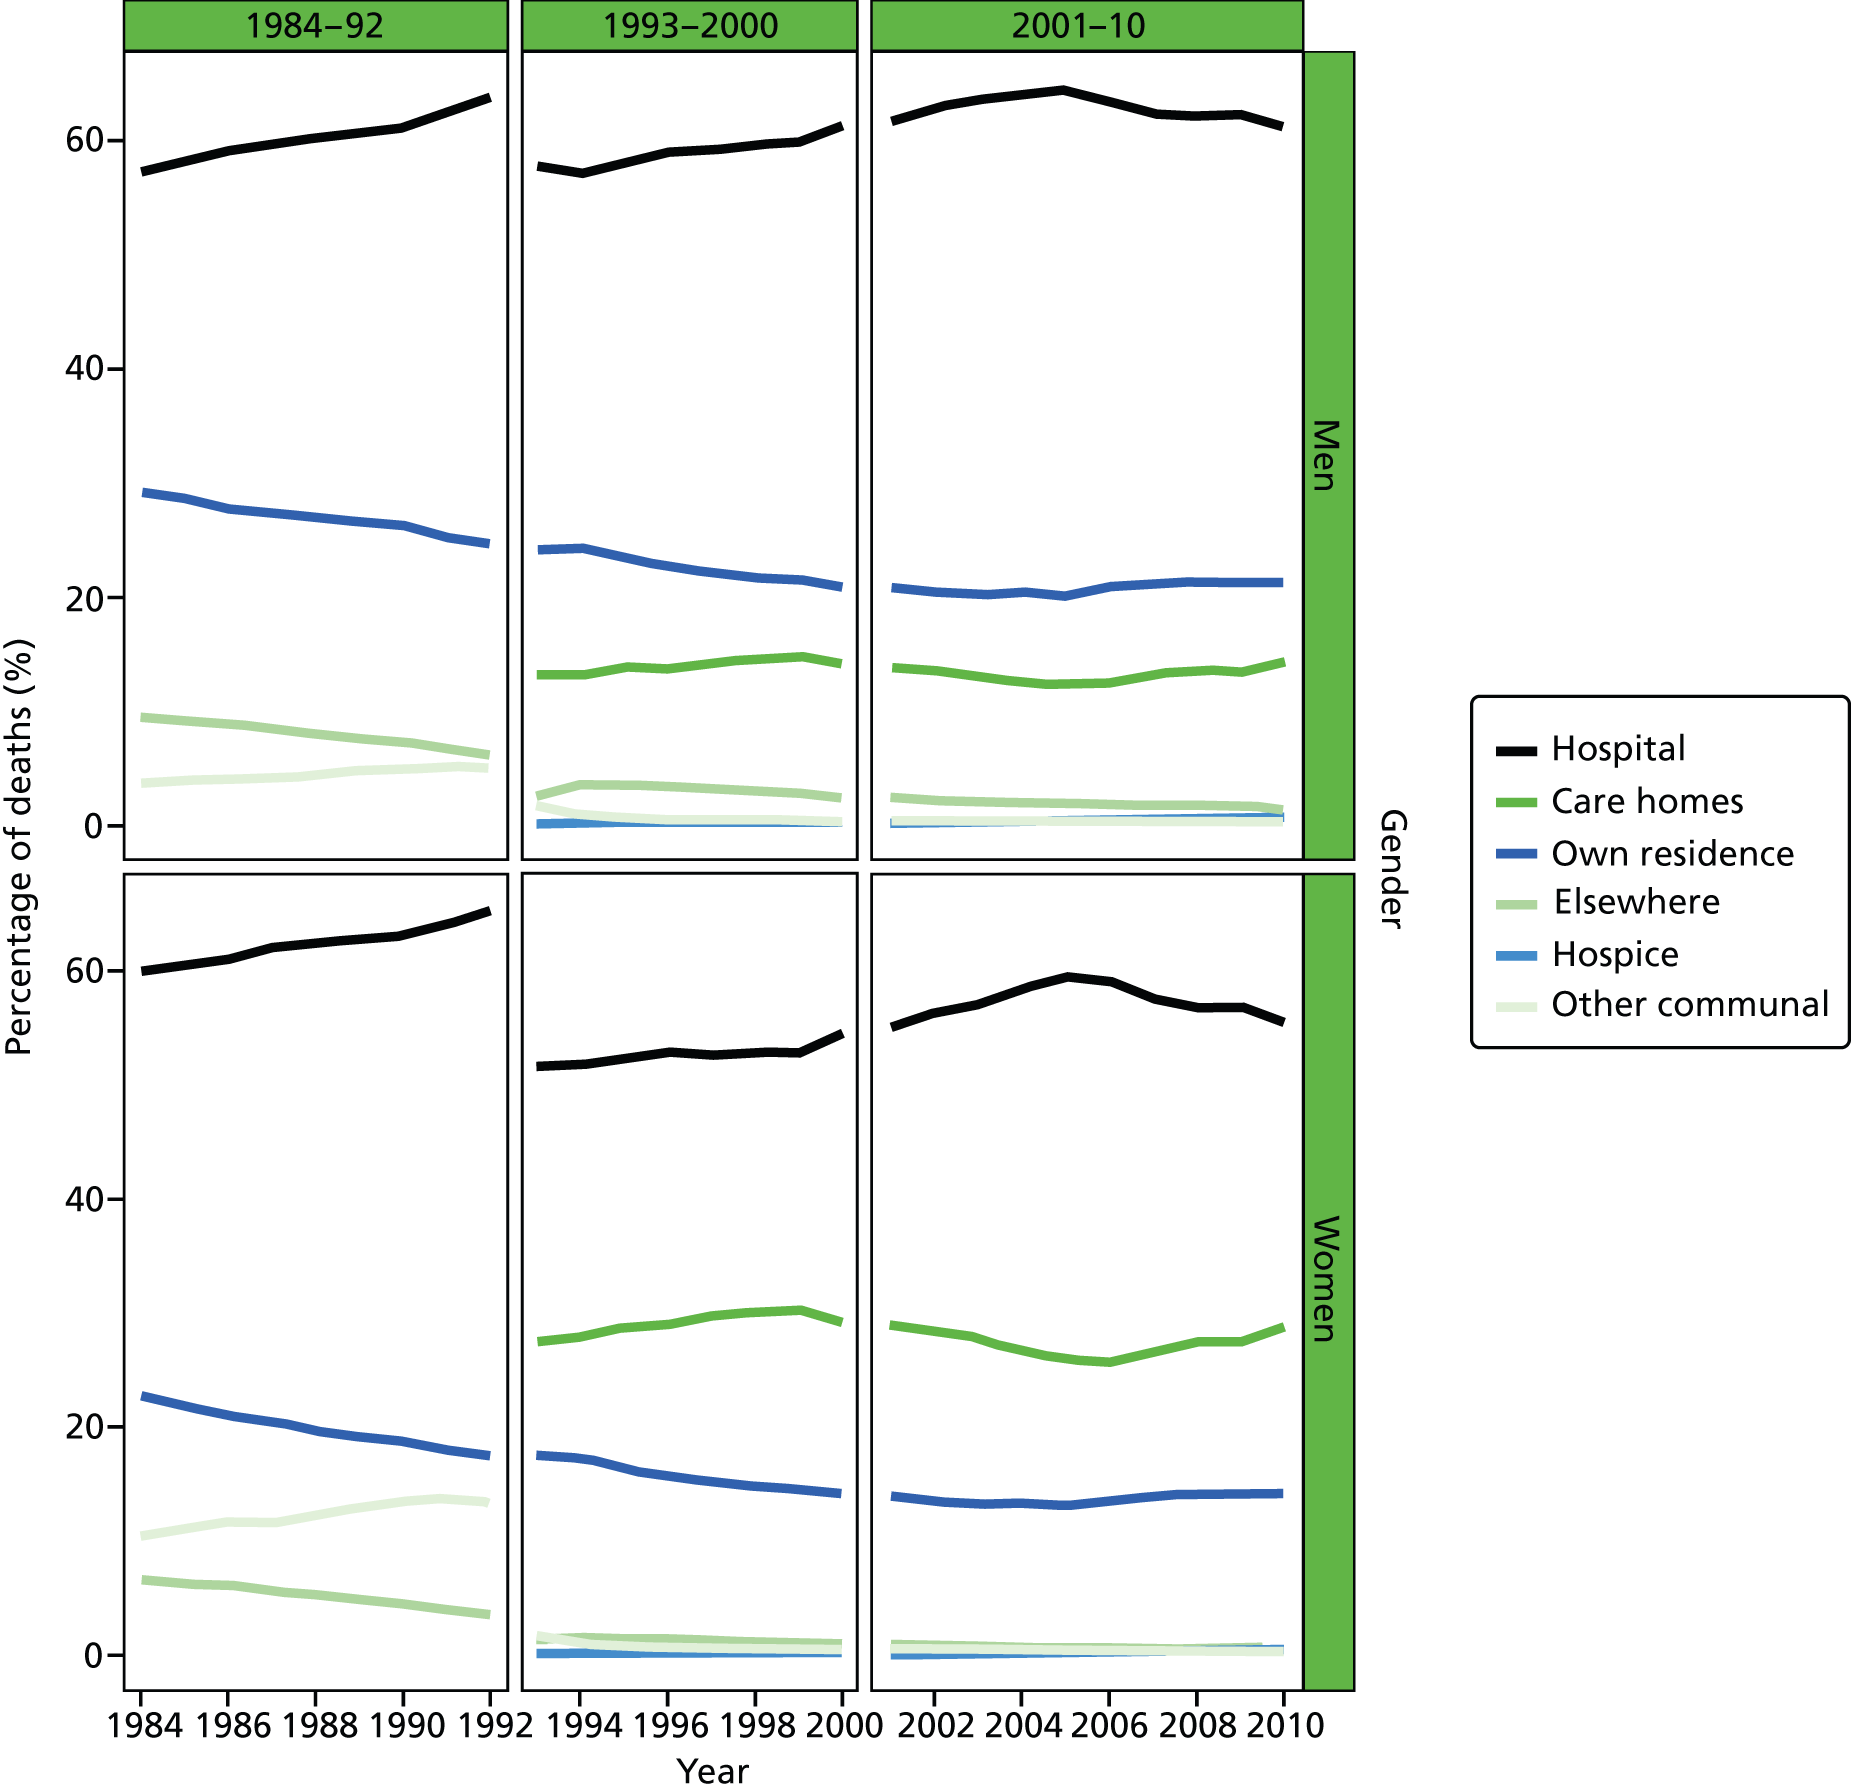
FIGURE 20.
Place of death by marital status in all non-cancer deaths, England 1988–2010.
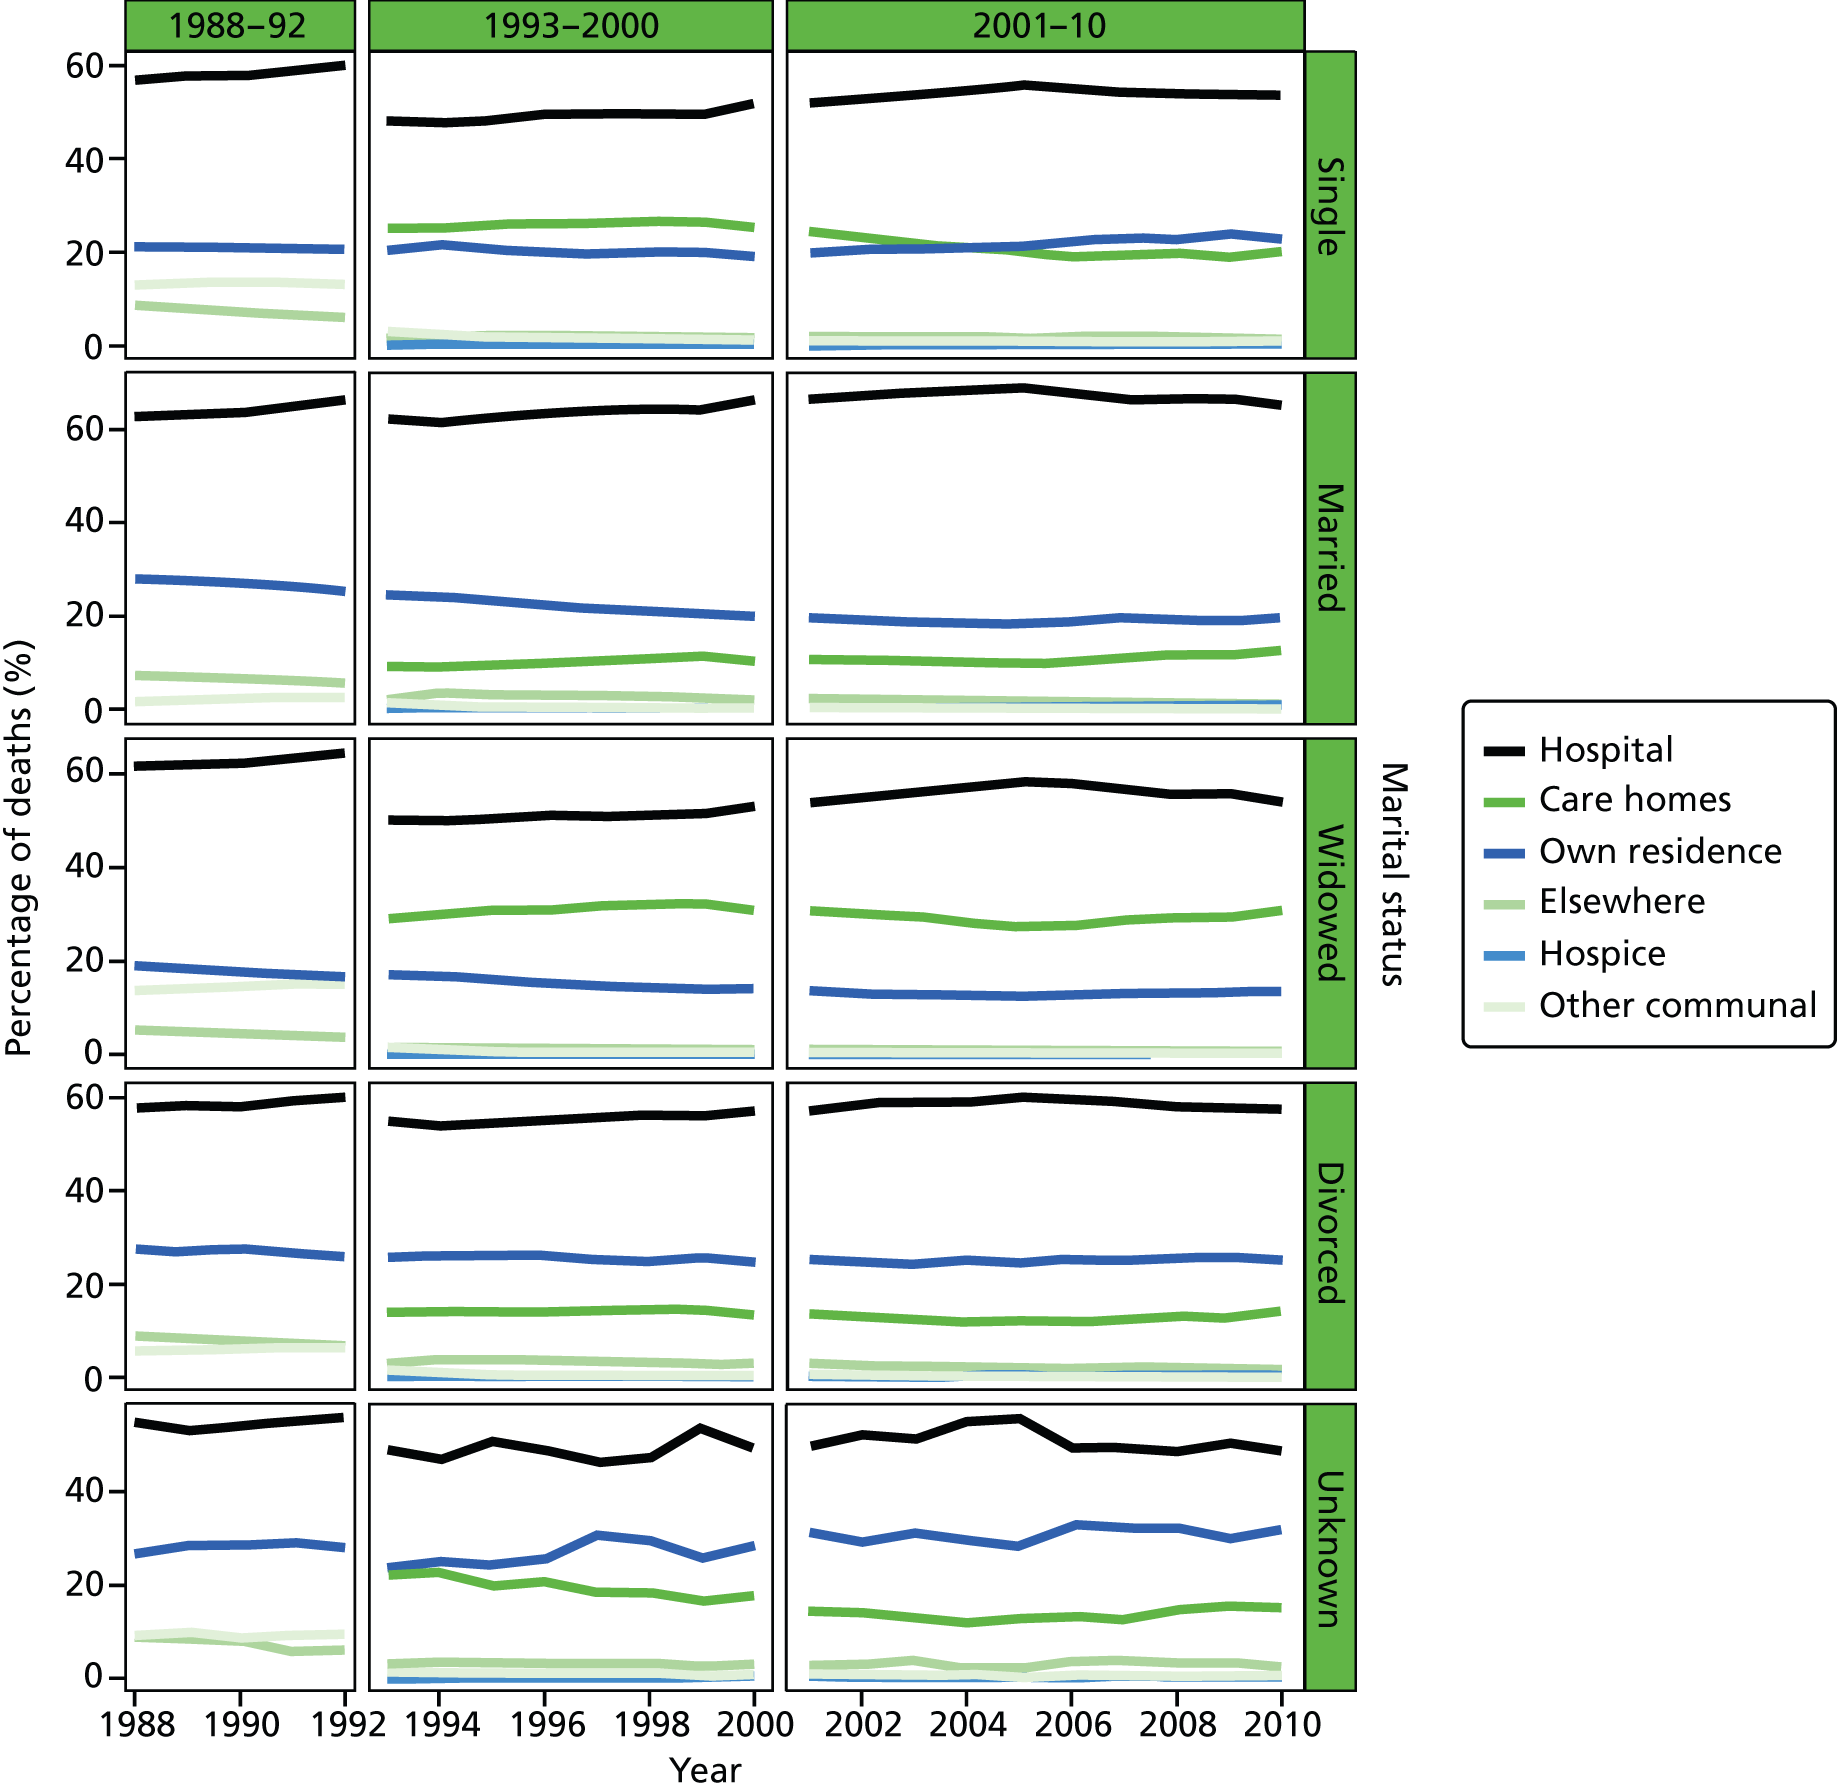
FIGURE 21.
Place of death by IMD ranking (1 = most deprived, 5 = least deprived) in all non-cancer deaths, England 1984–2010.
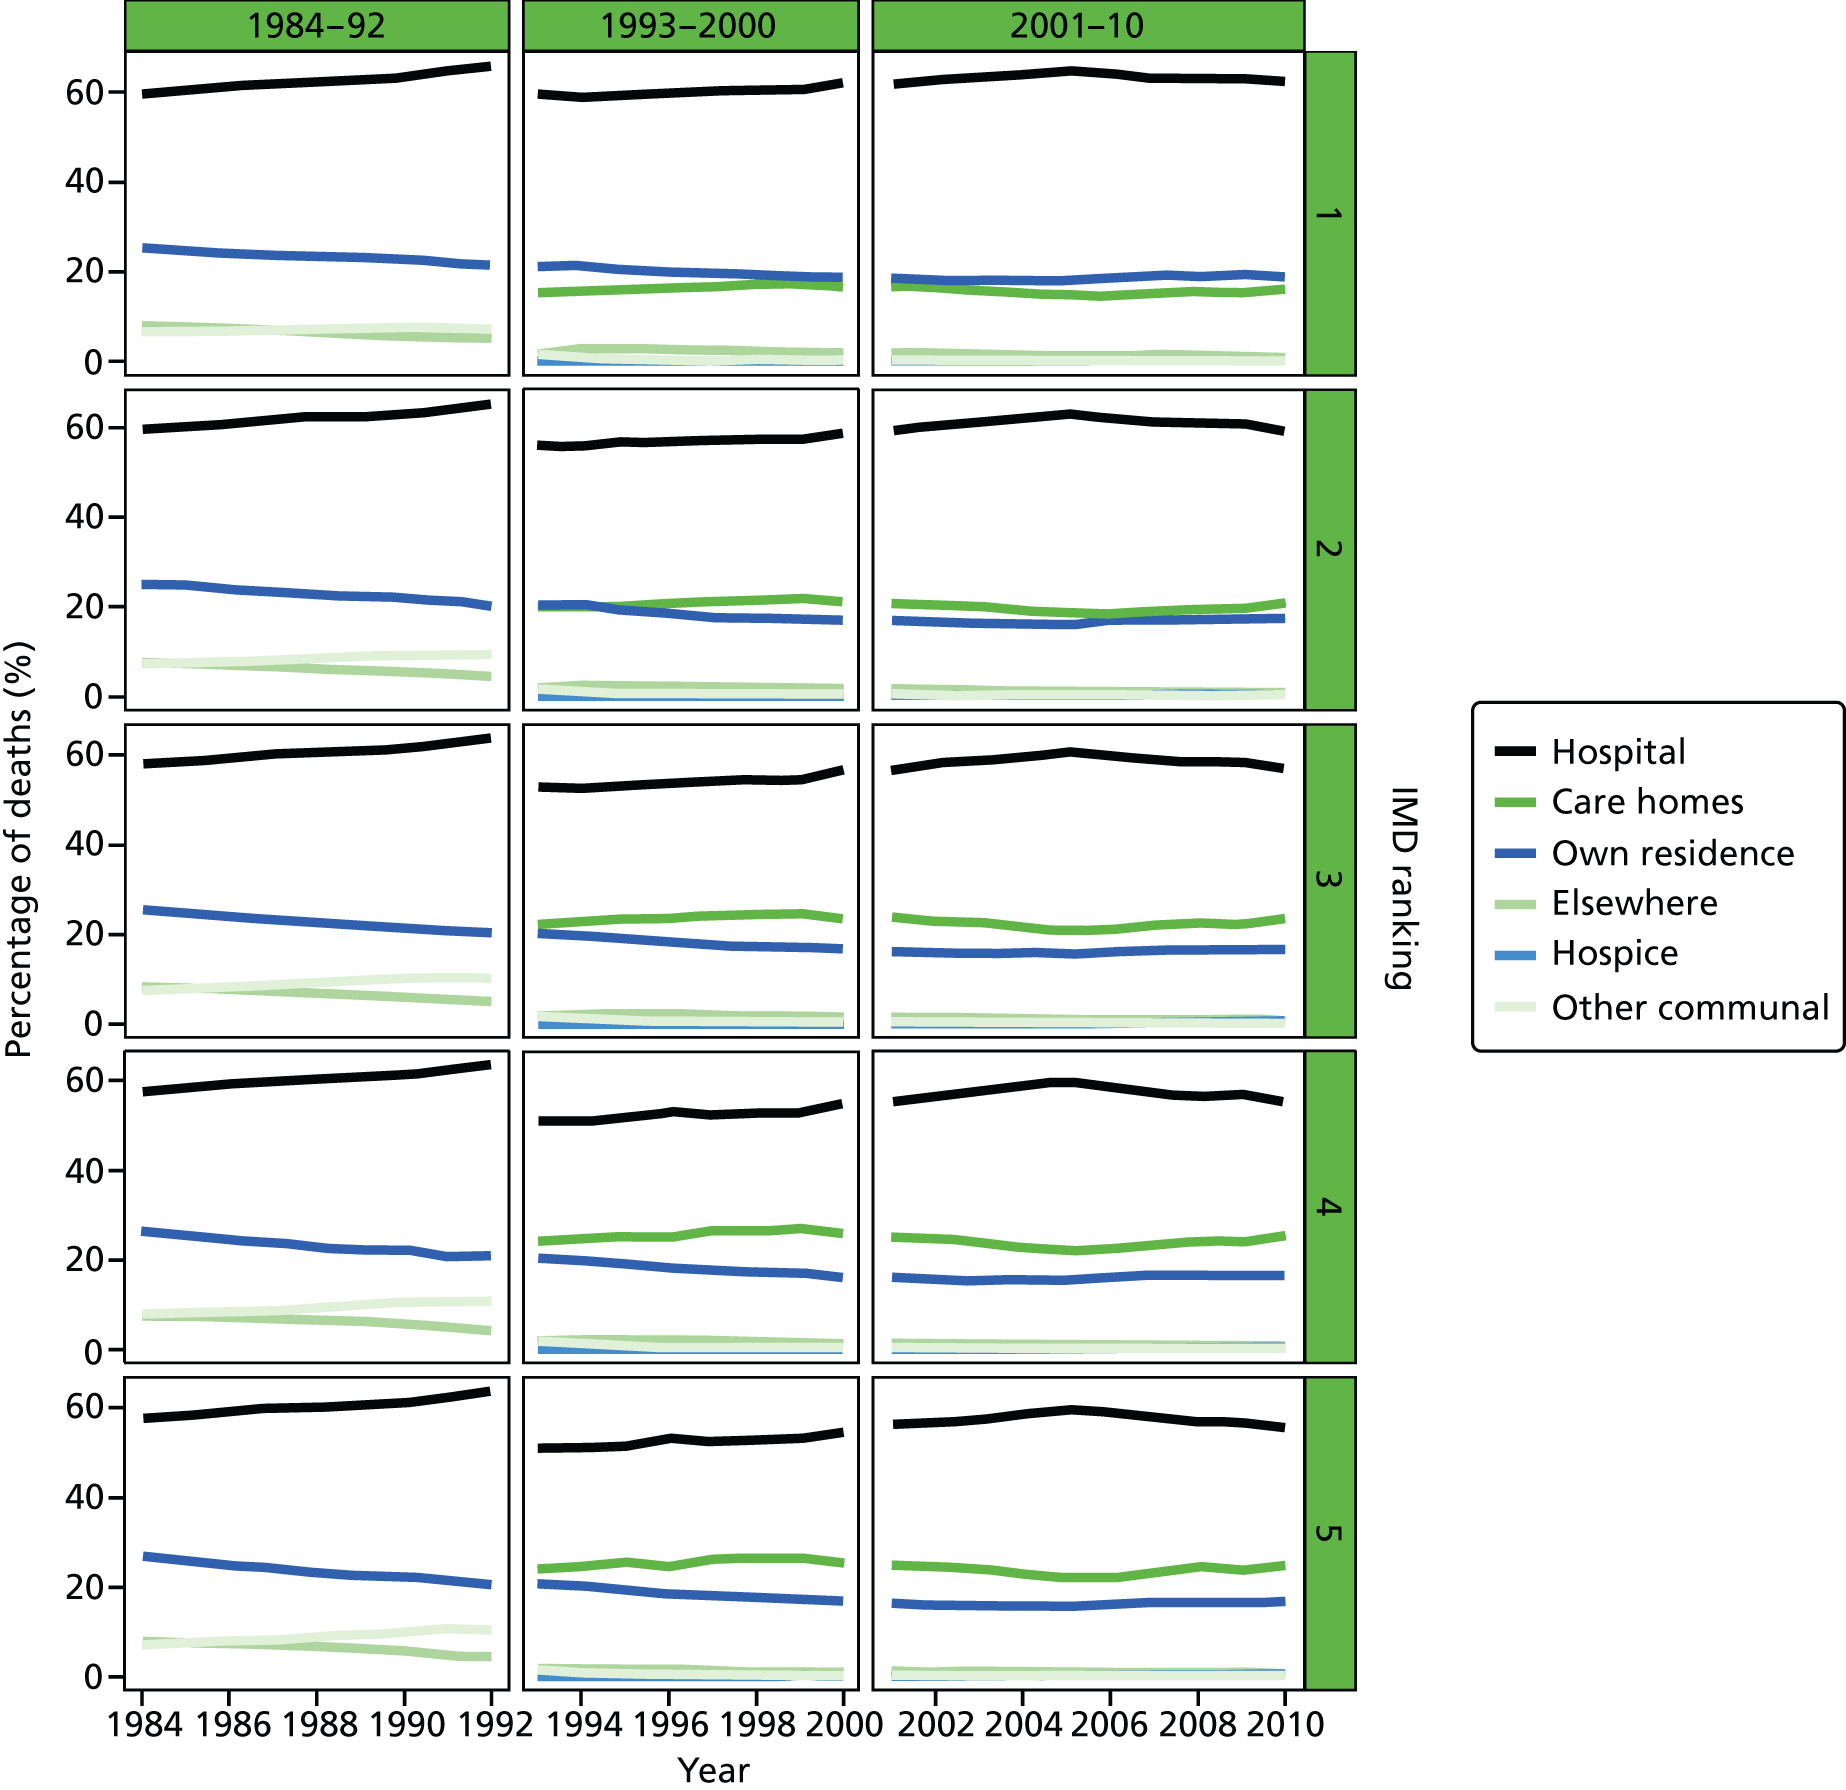
FIGURE 22.
Place of death by age groups in cancer deaths, England 1984–2010.
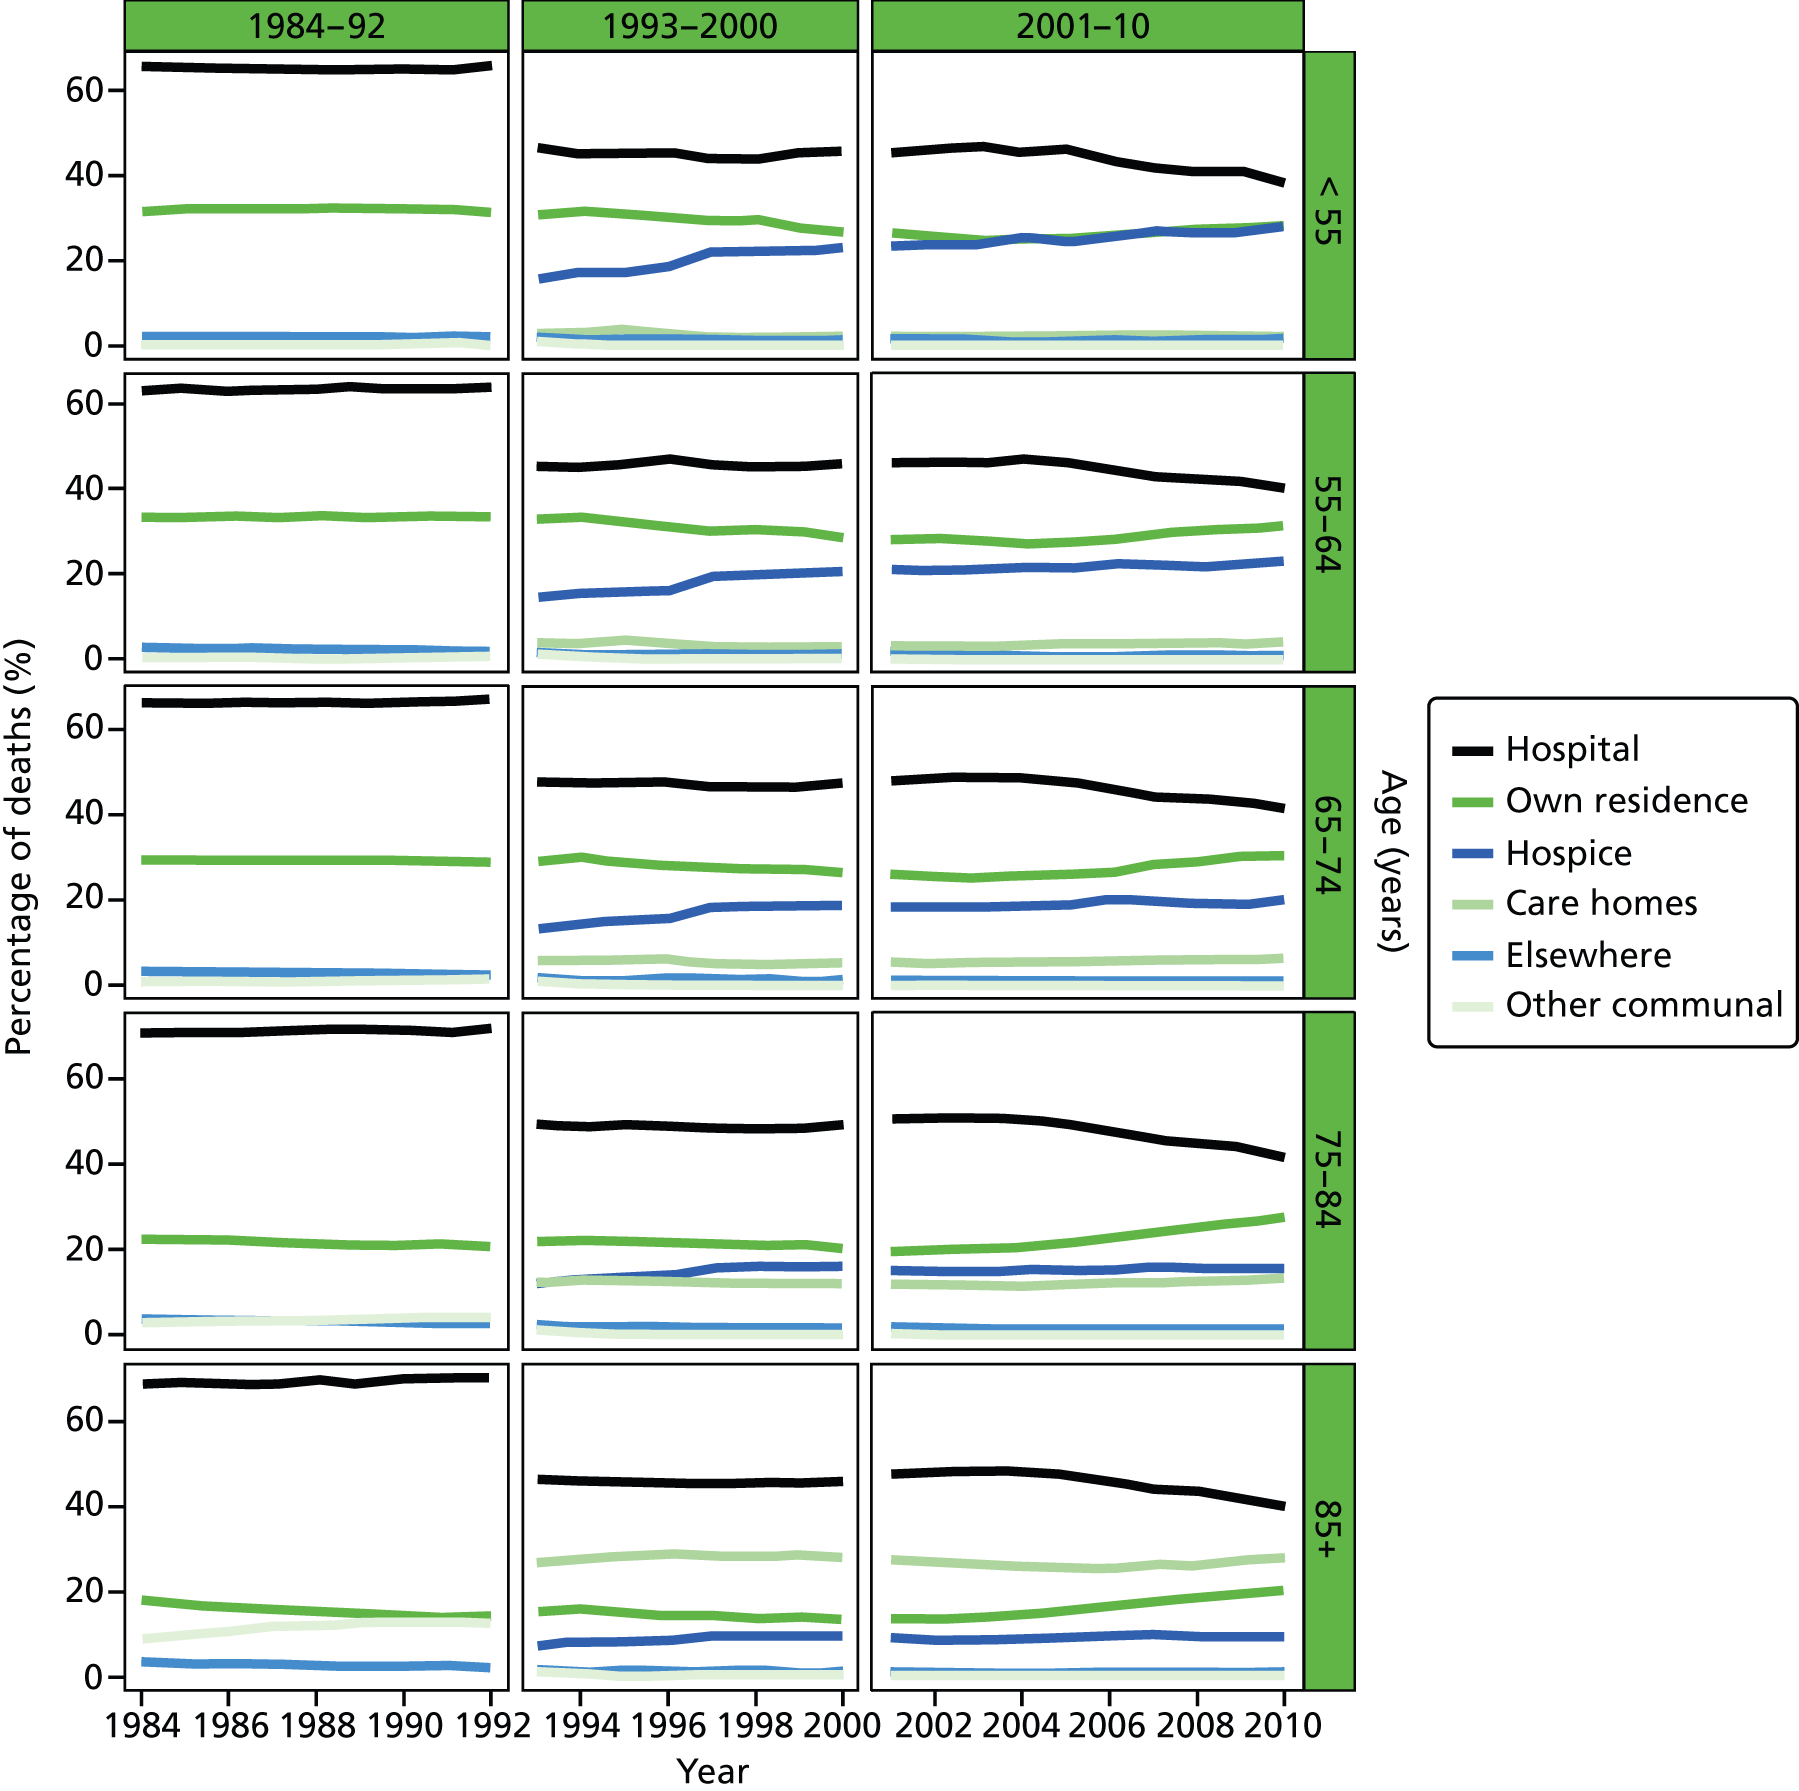
FIGURE 23.
Place of death by gender in cancer deaths, England 1984–2010.
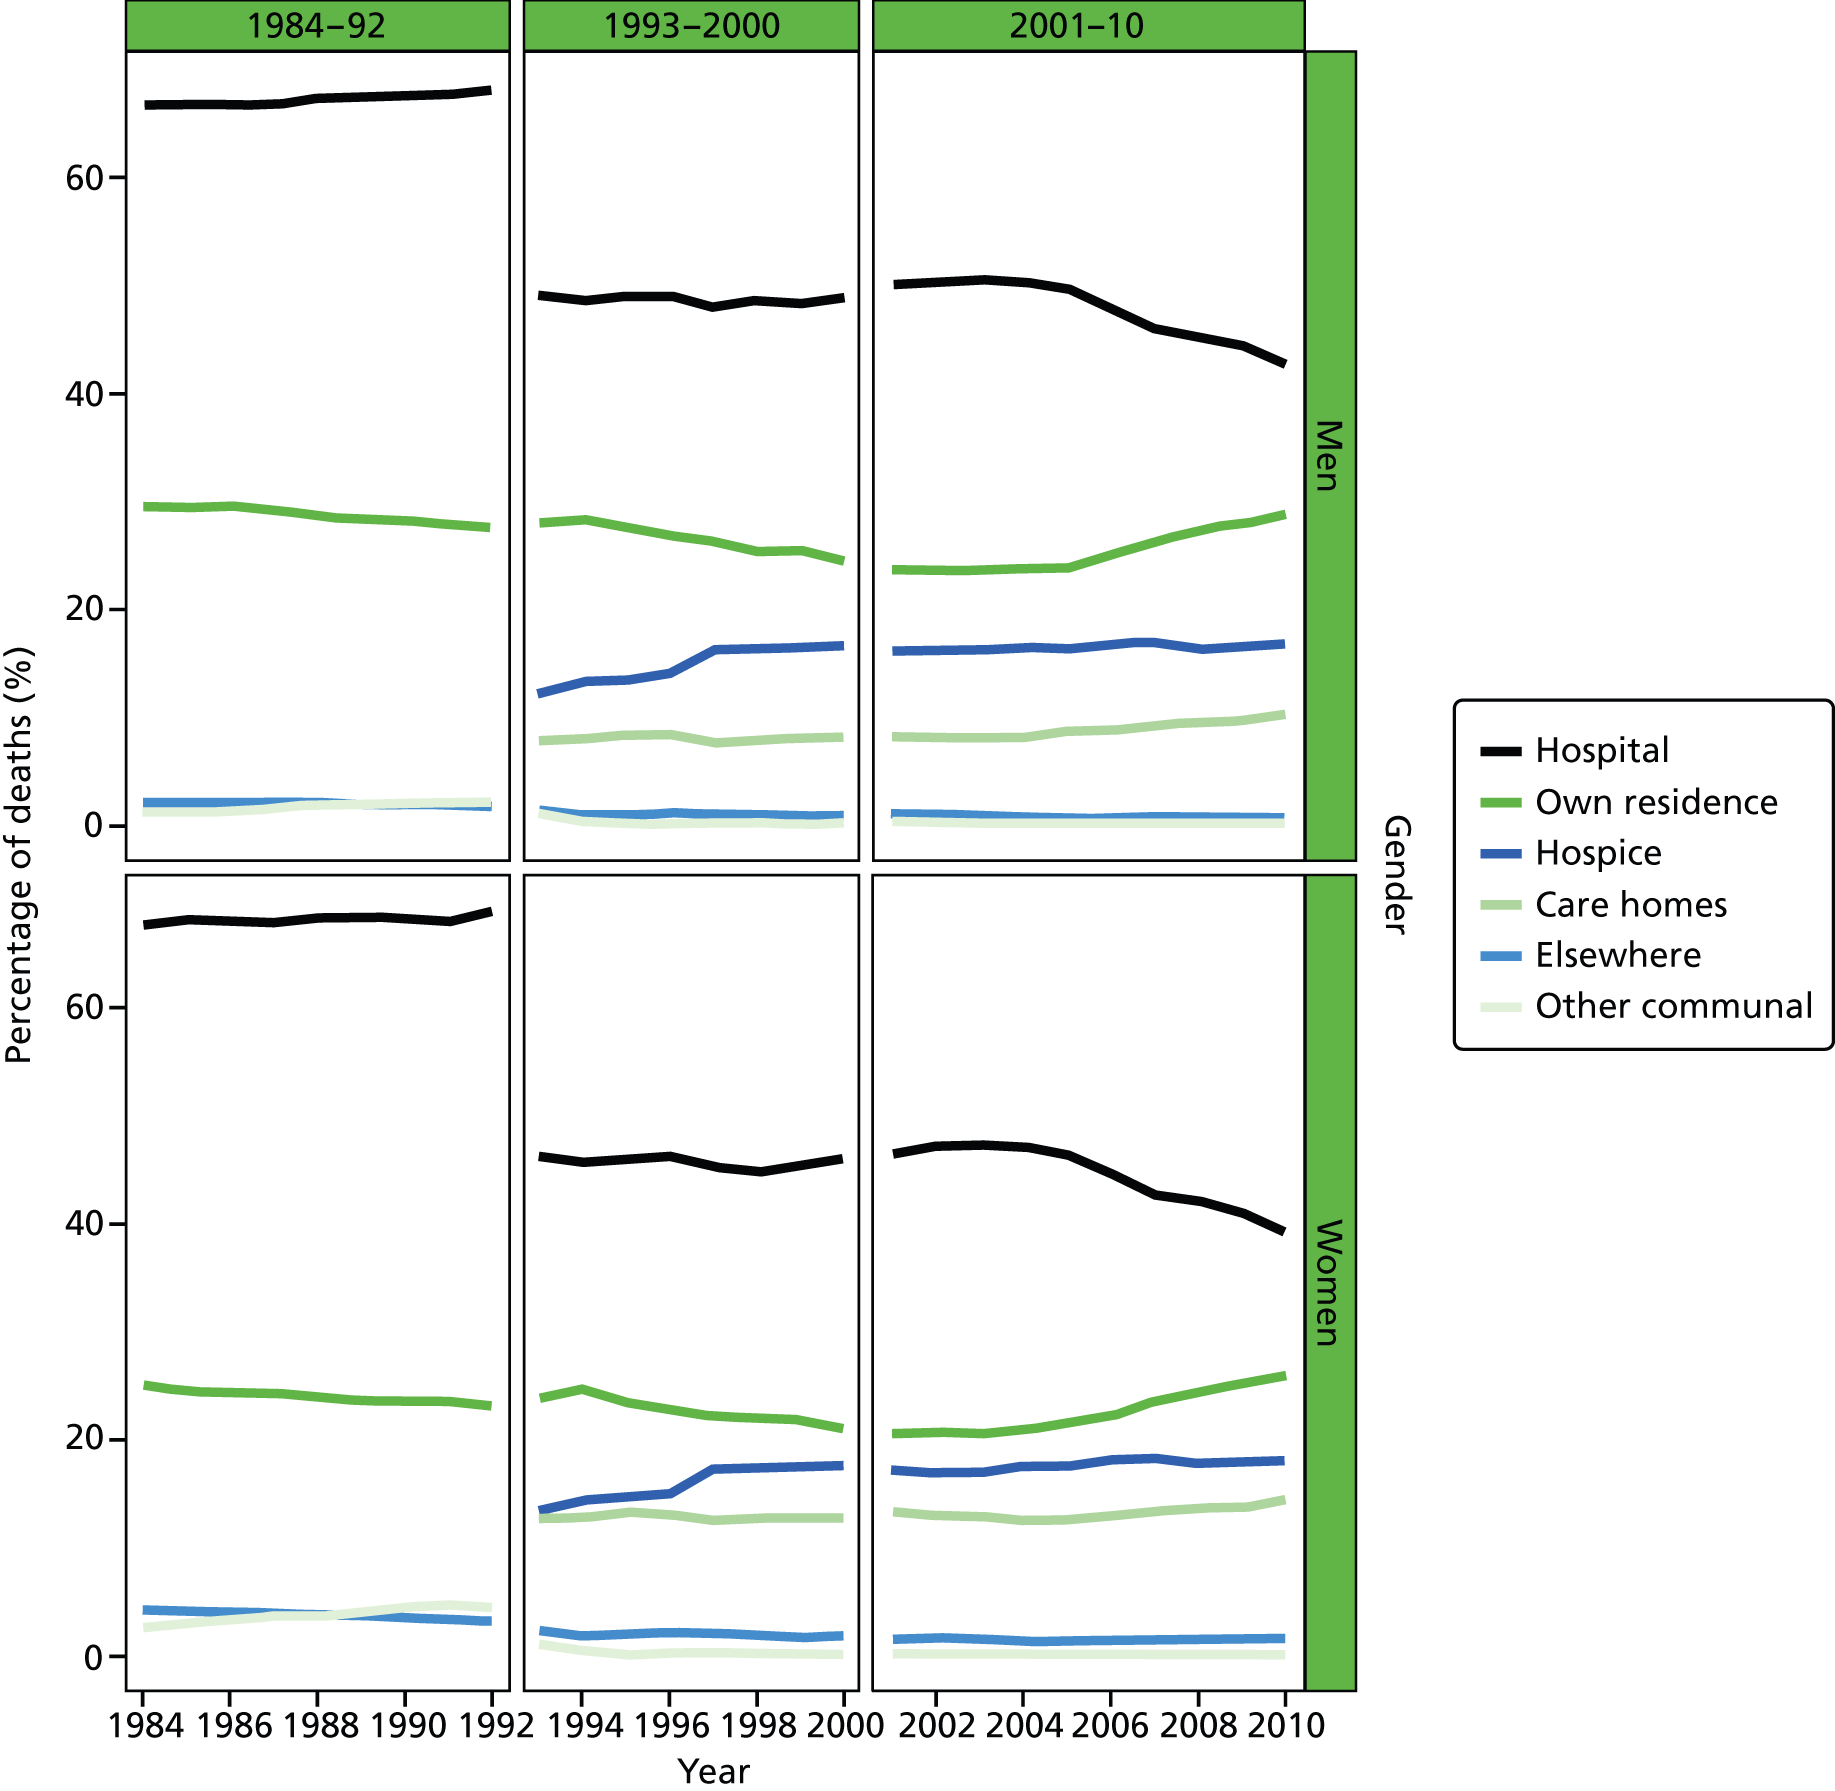
FIGURE 24.
Place of death by marital status in cancer deaths, England 1988–2010.
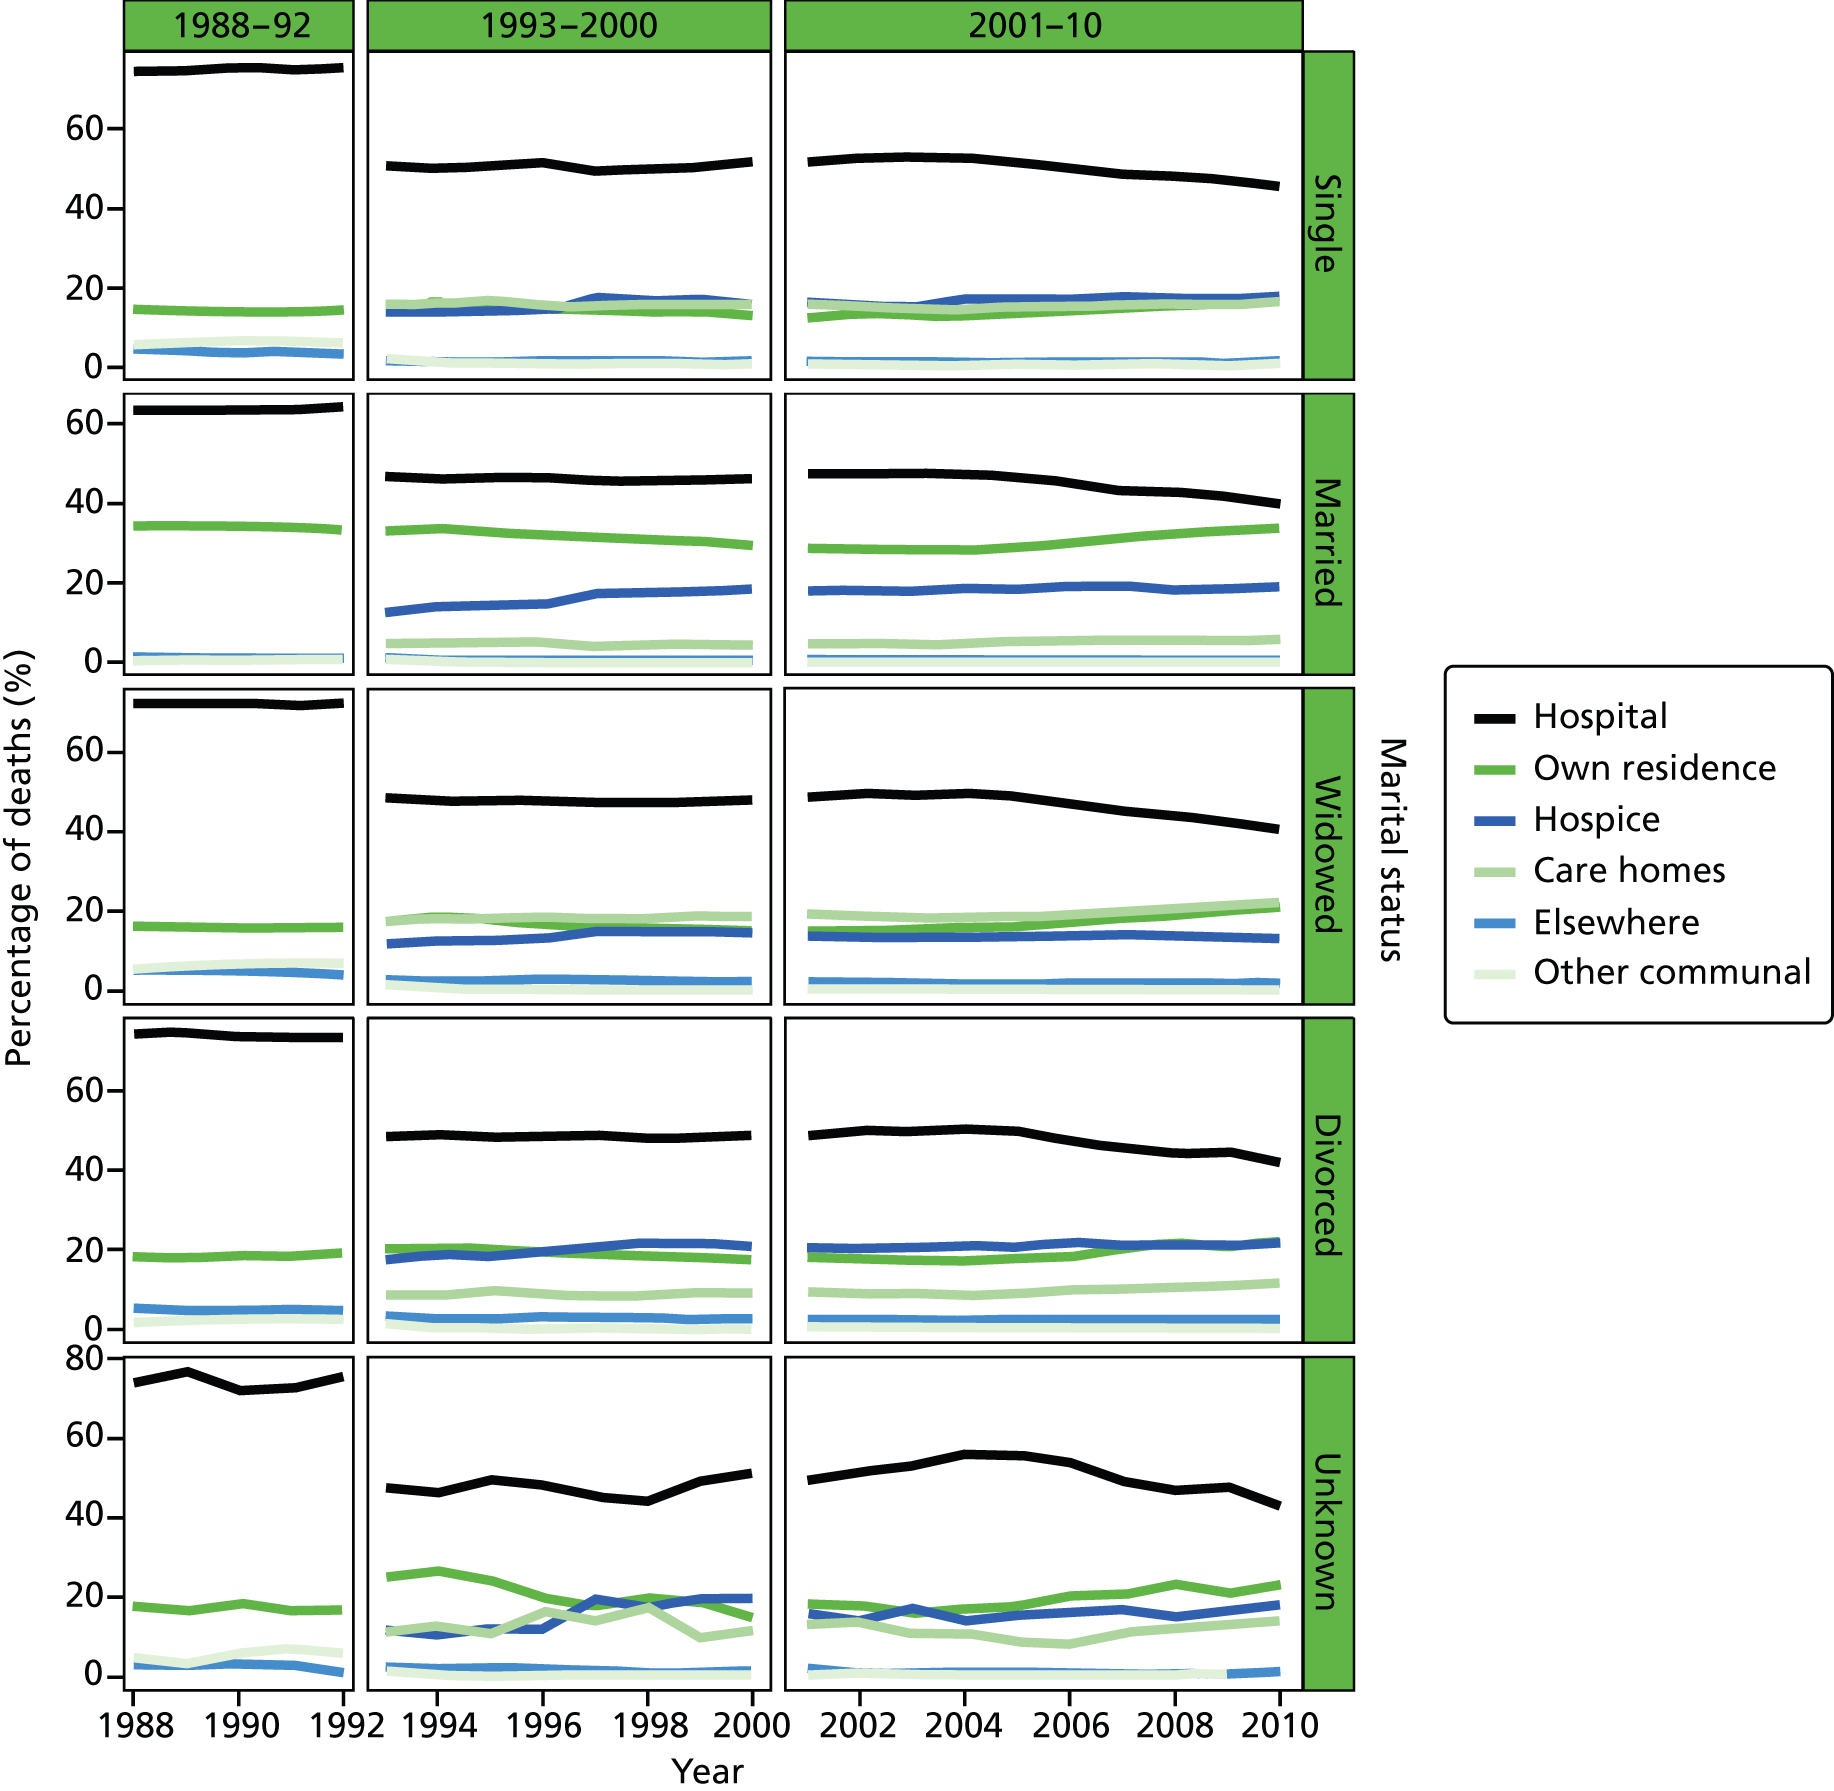
FIGURE 25.
Place of death by IMD ranking (1 = most deprived, 5 = least deprived) in cancer deaths, England 1984–2010.
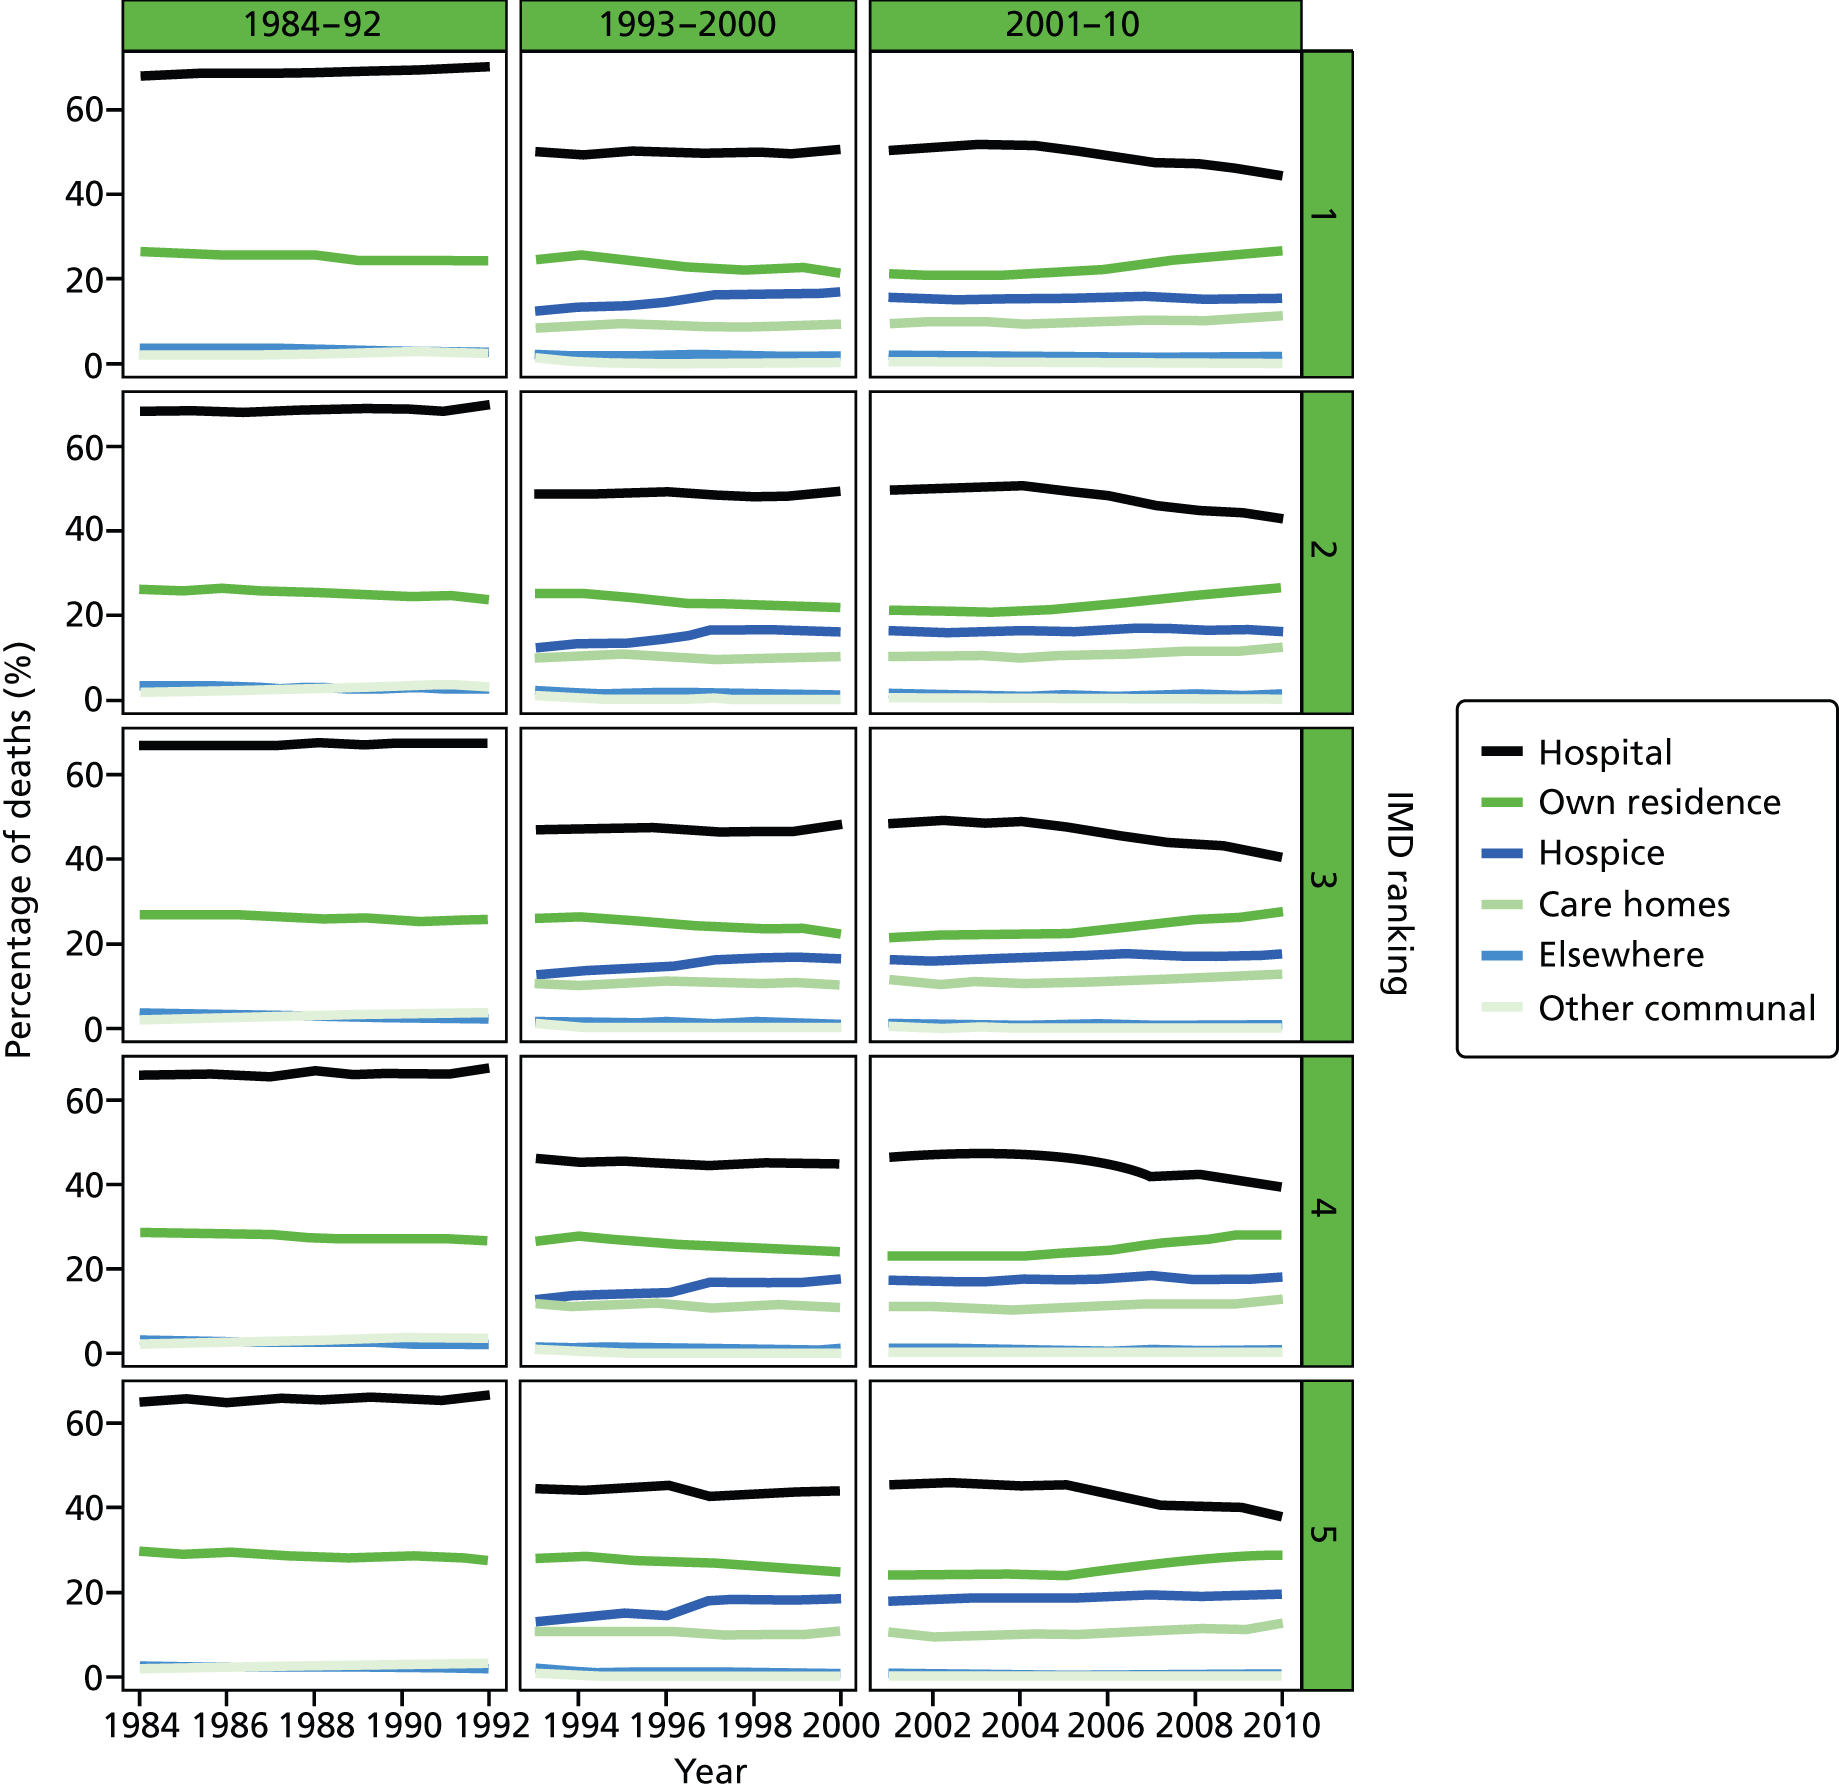
FIGURE 26.
Place of death by age groups in deaths from CVDs, England 1984–2010.
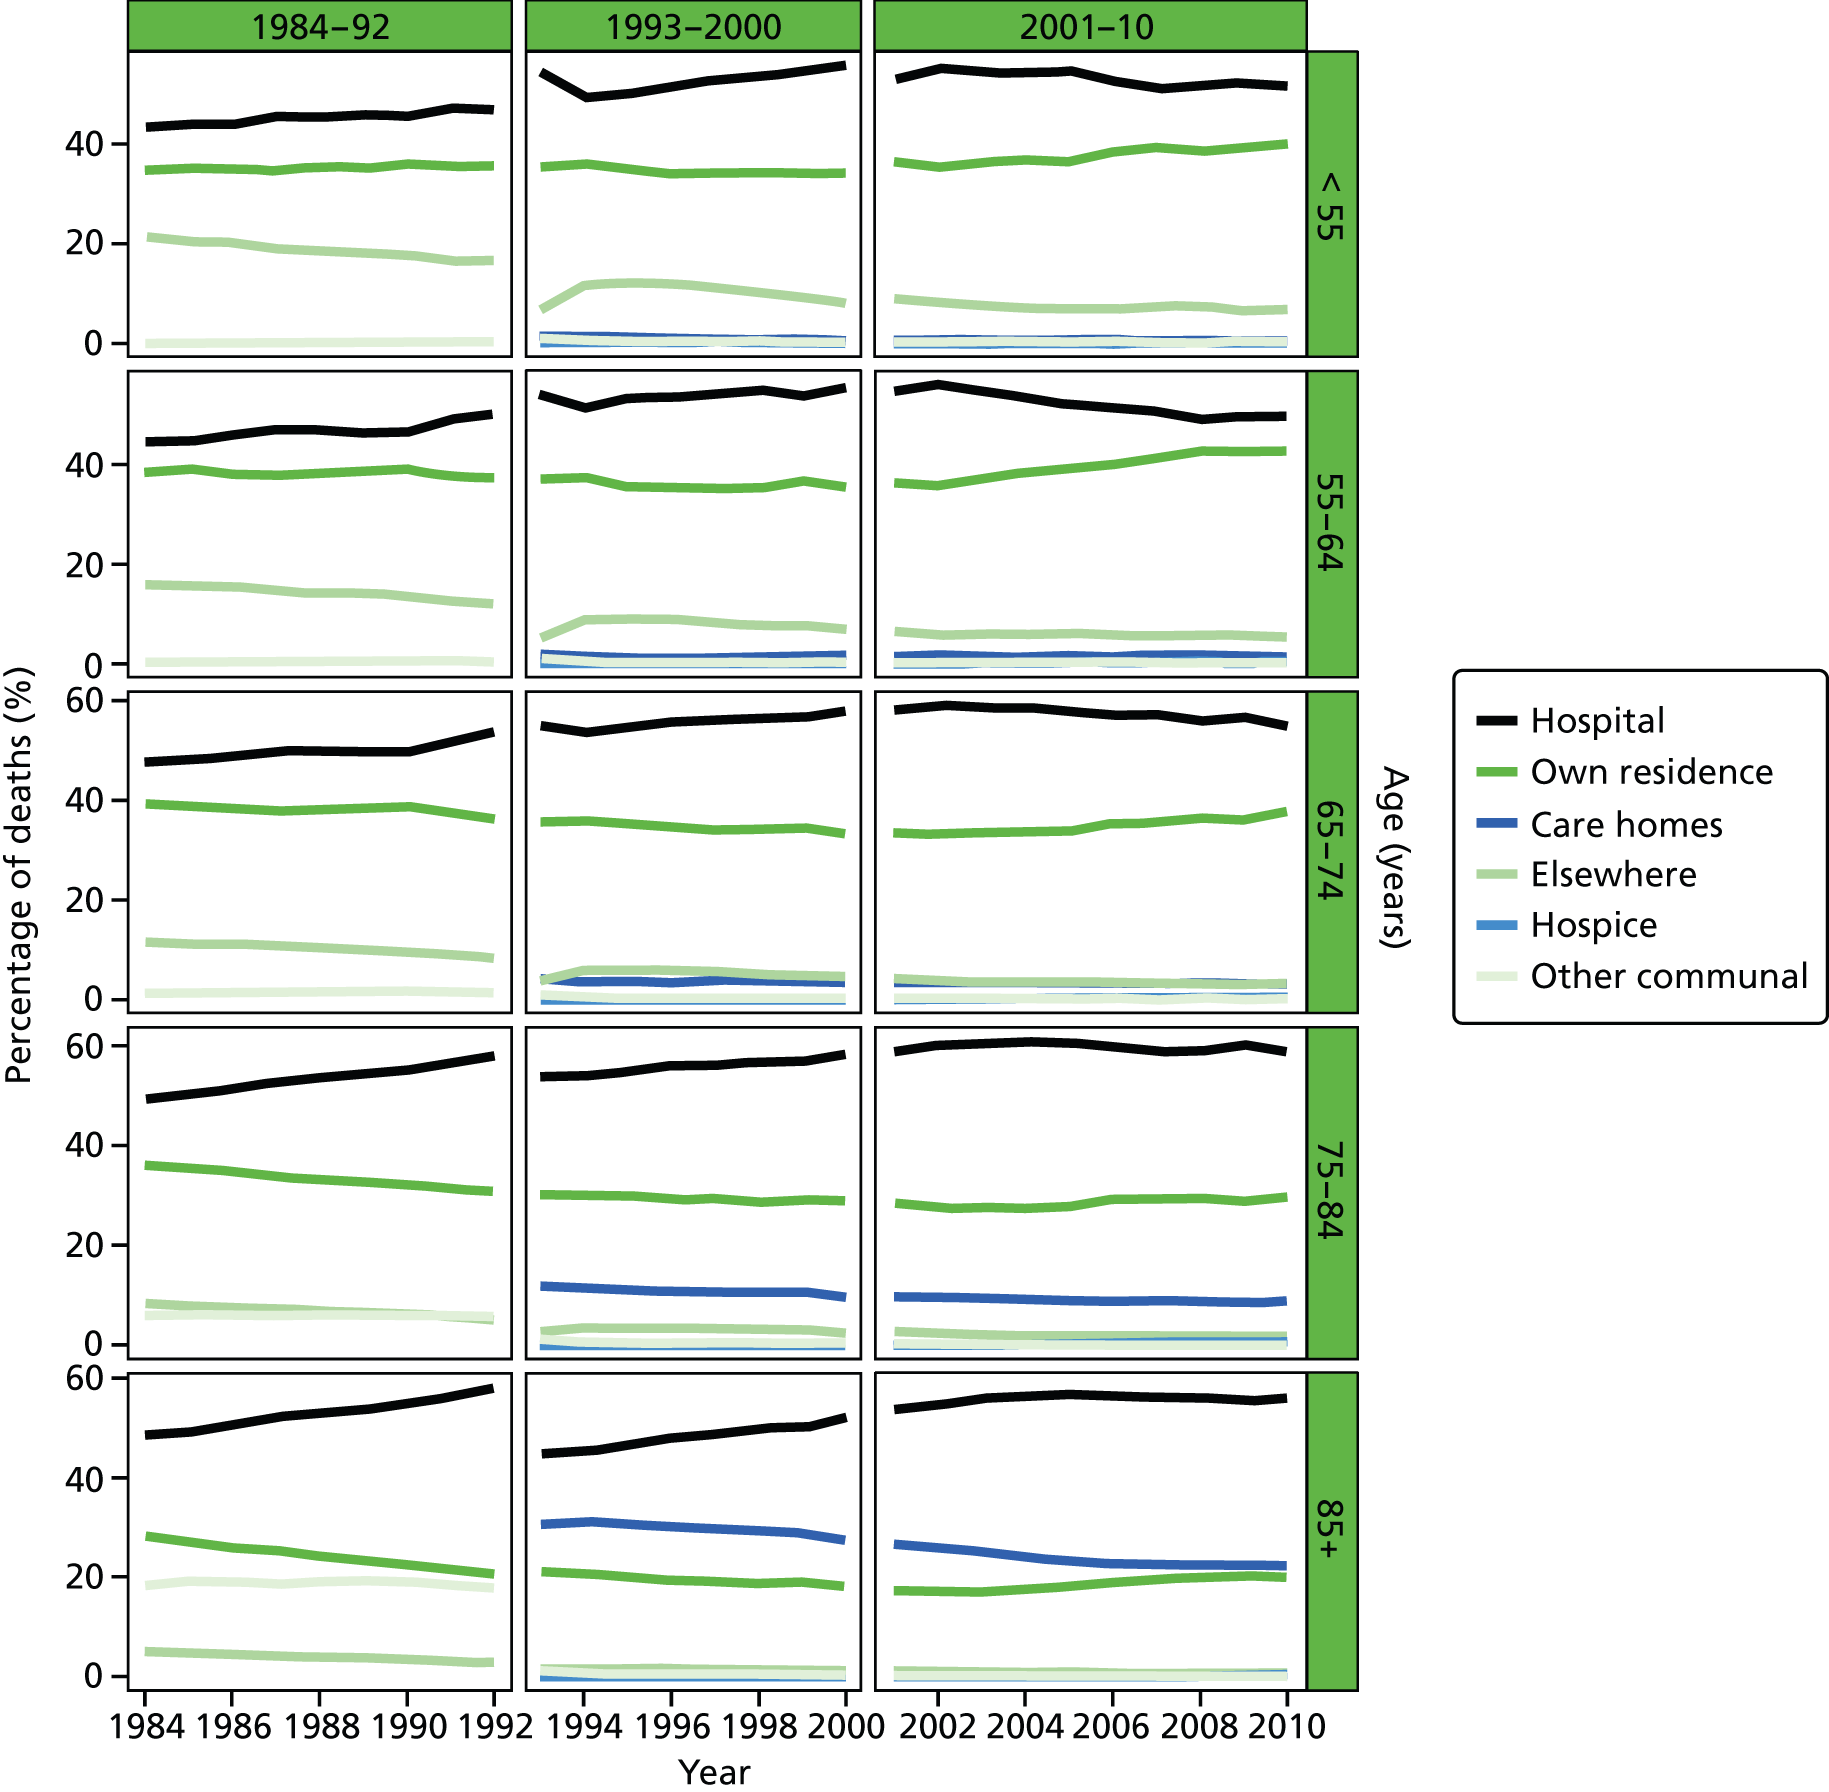
FIGURE 27.
Place of death by gender in deaths from CVDs, England 1984–2010.
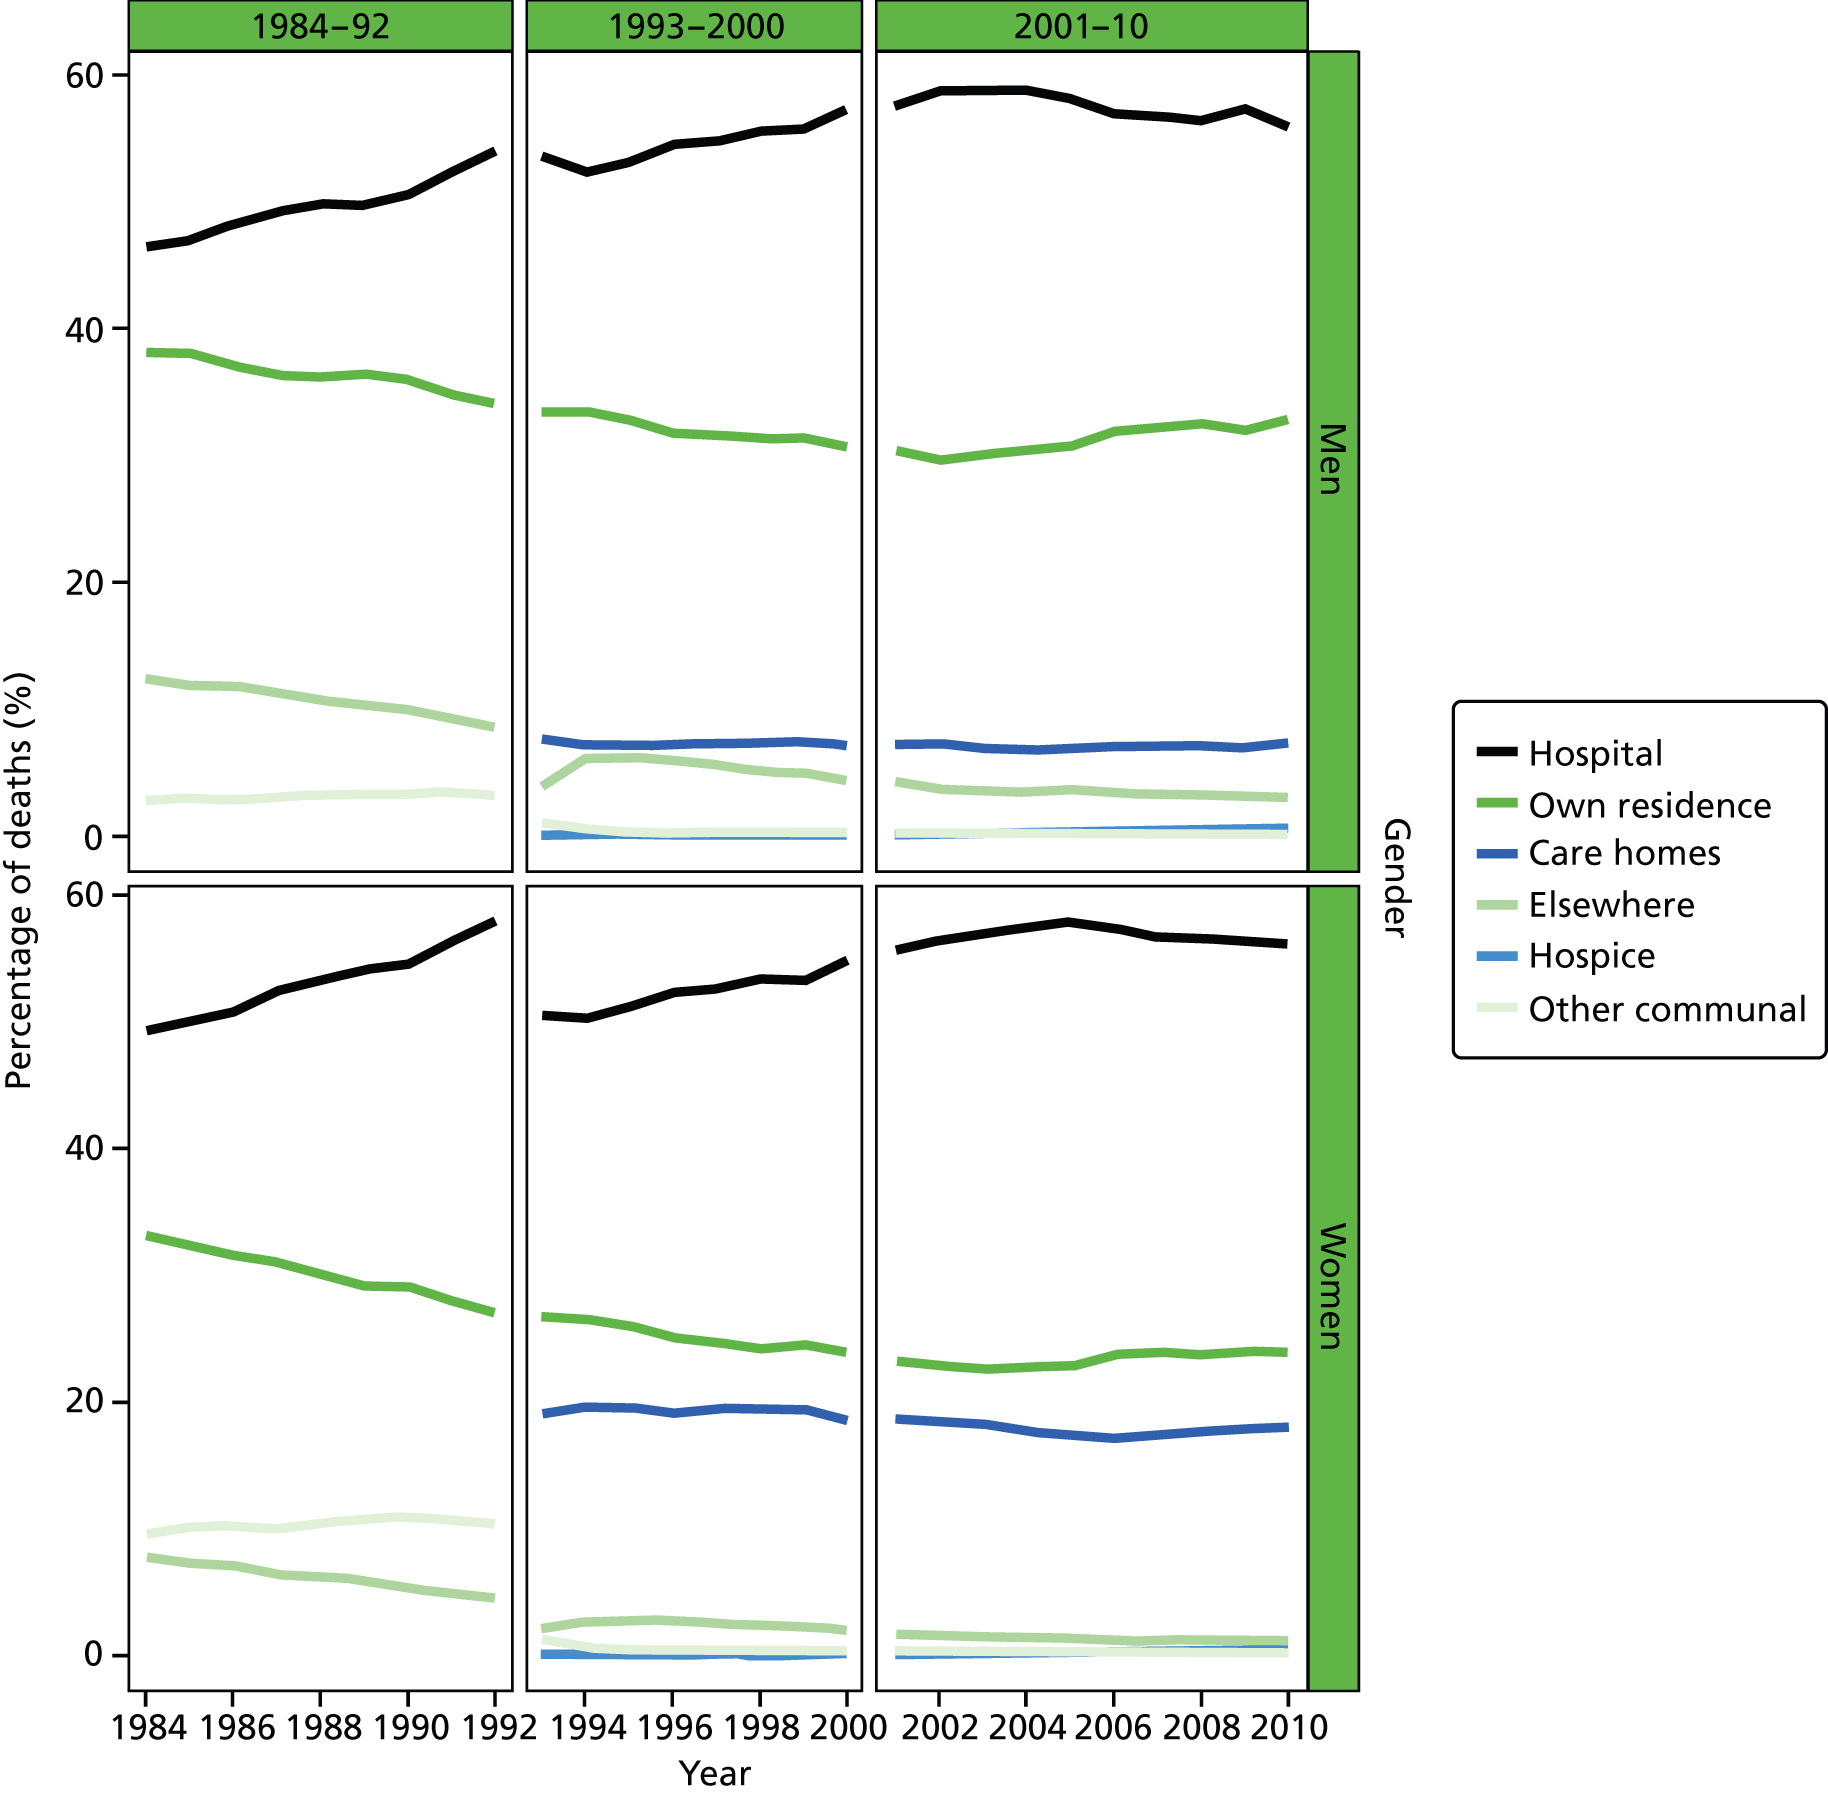
FIGURE 28.
Place of death by marital status in deaths from CVDs, England 1988–2010.
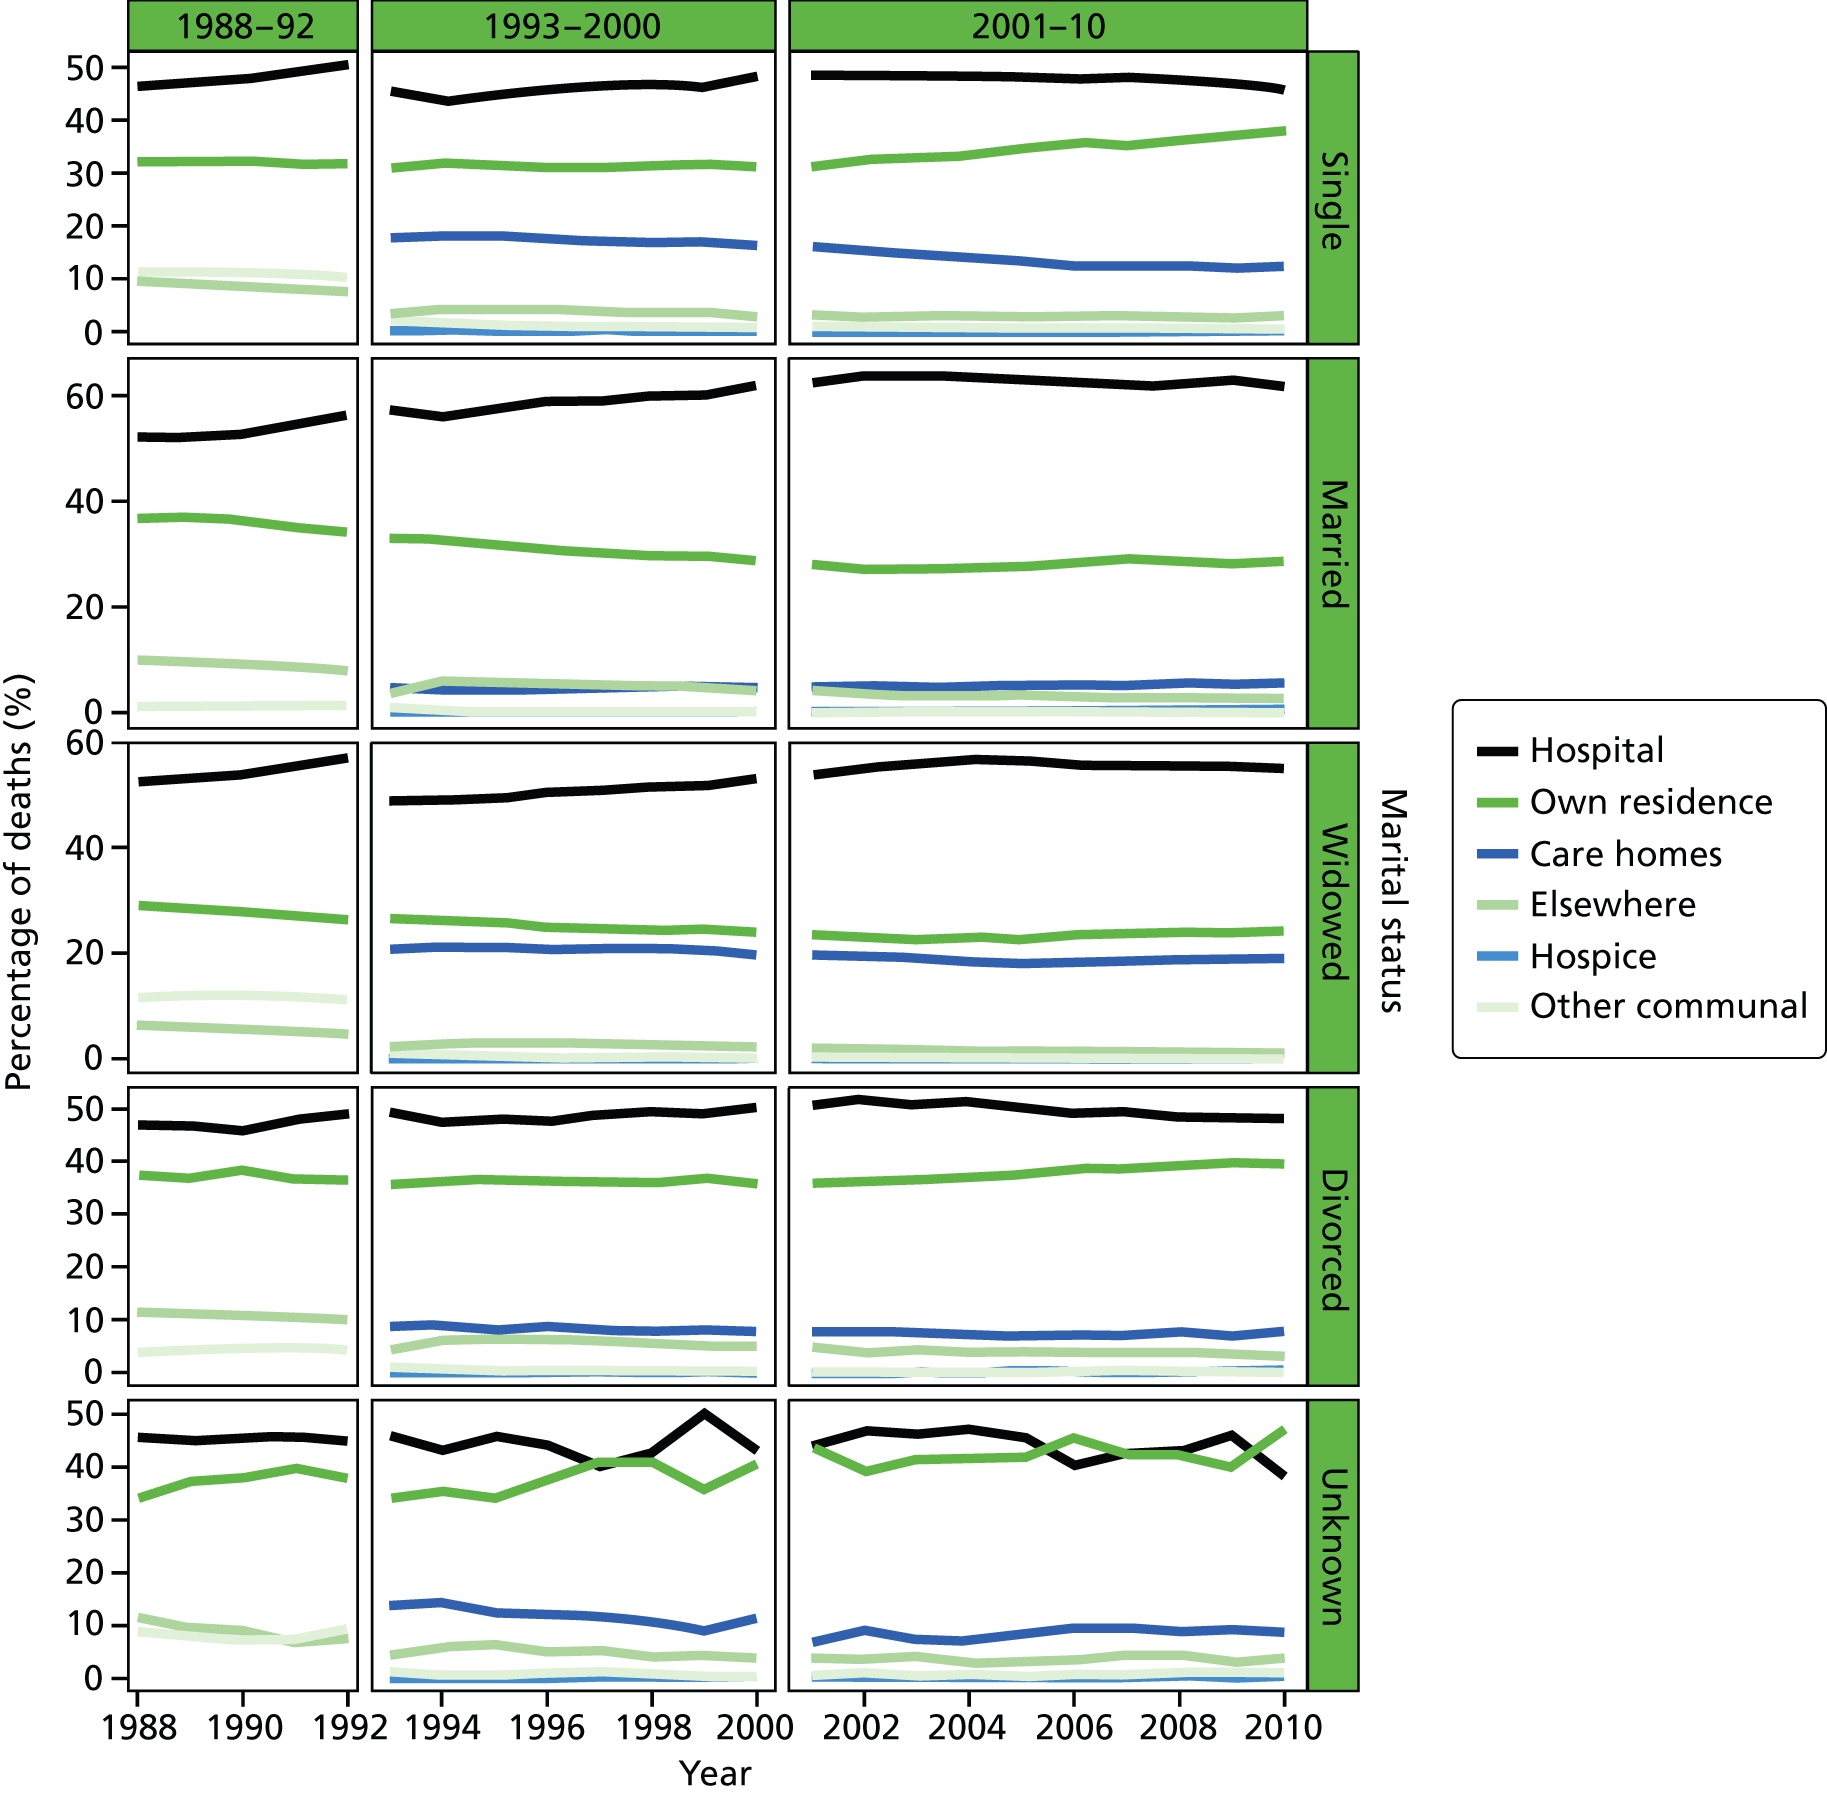
FIGURE 29.
Place of death by IMD ranking (1 = most deprived, 5 = least deprived) in deaths from CVDs, England 1984–2010.
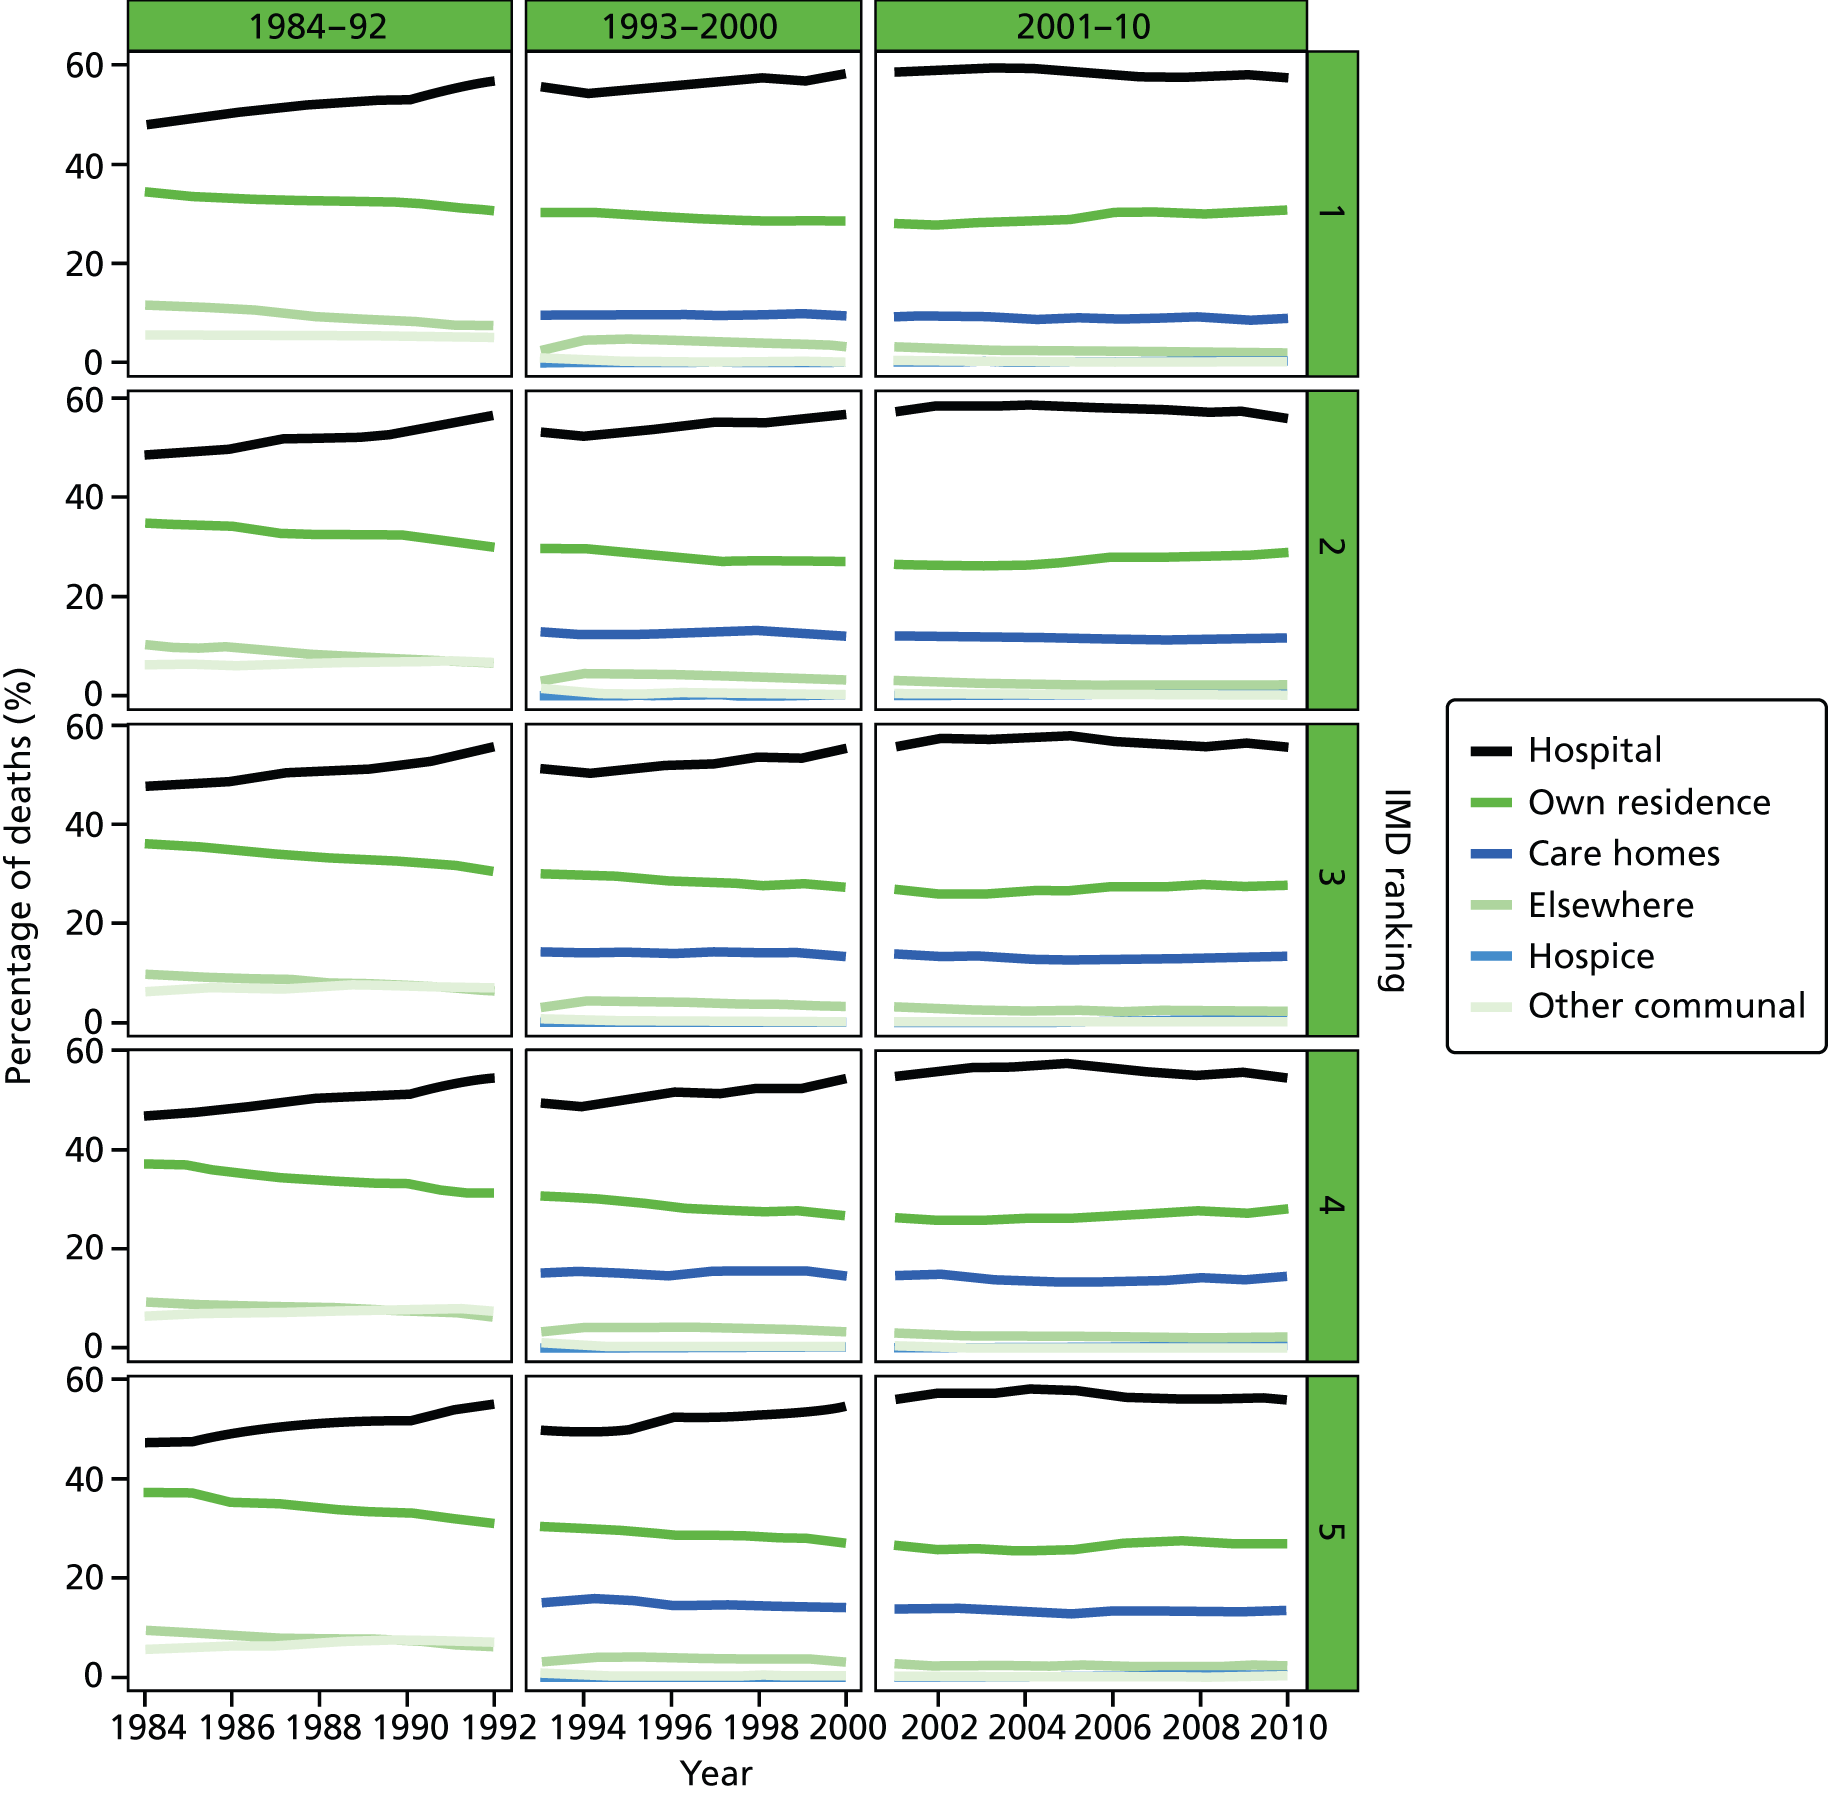
FIGURE 30.
Place of death by age groups in deaths from CBDs, England 1984–2010.
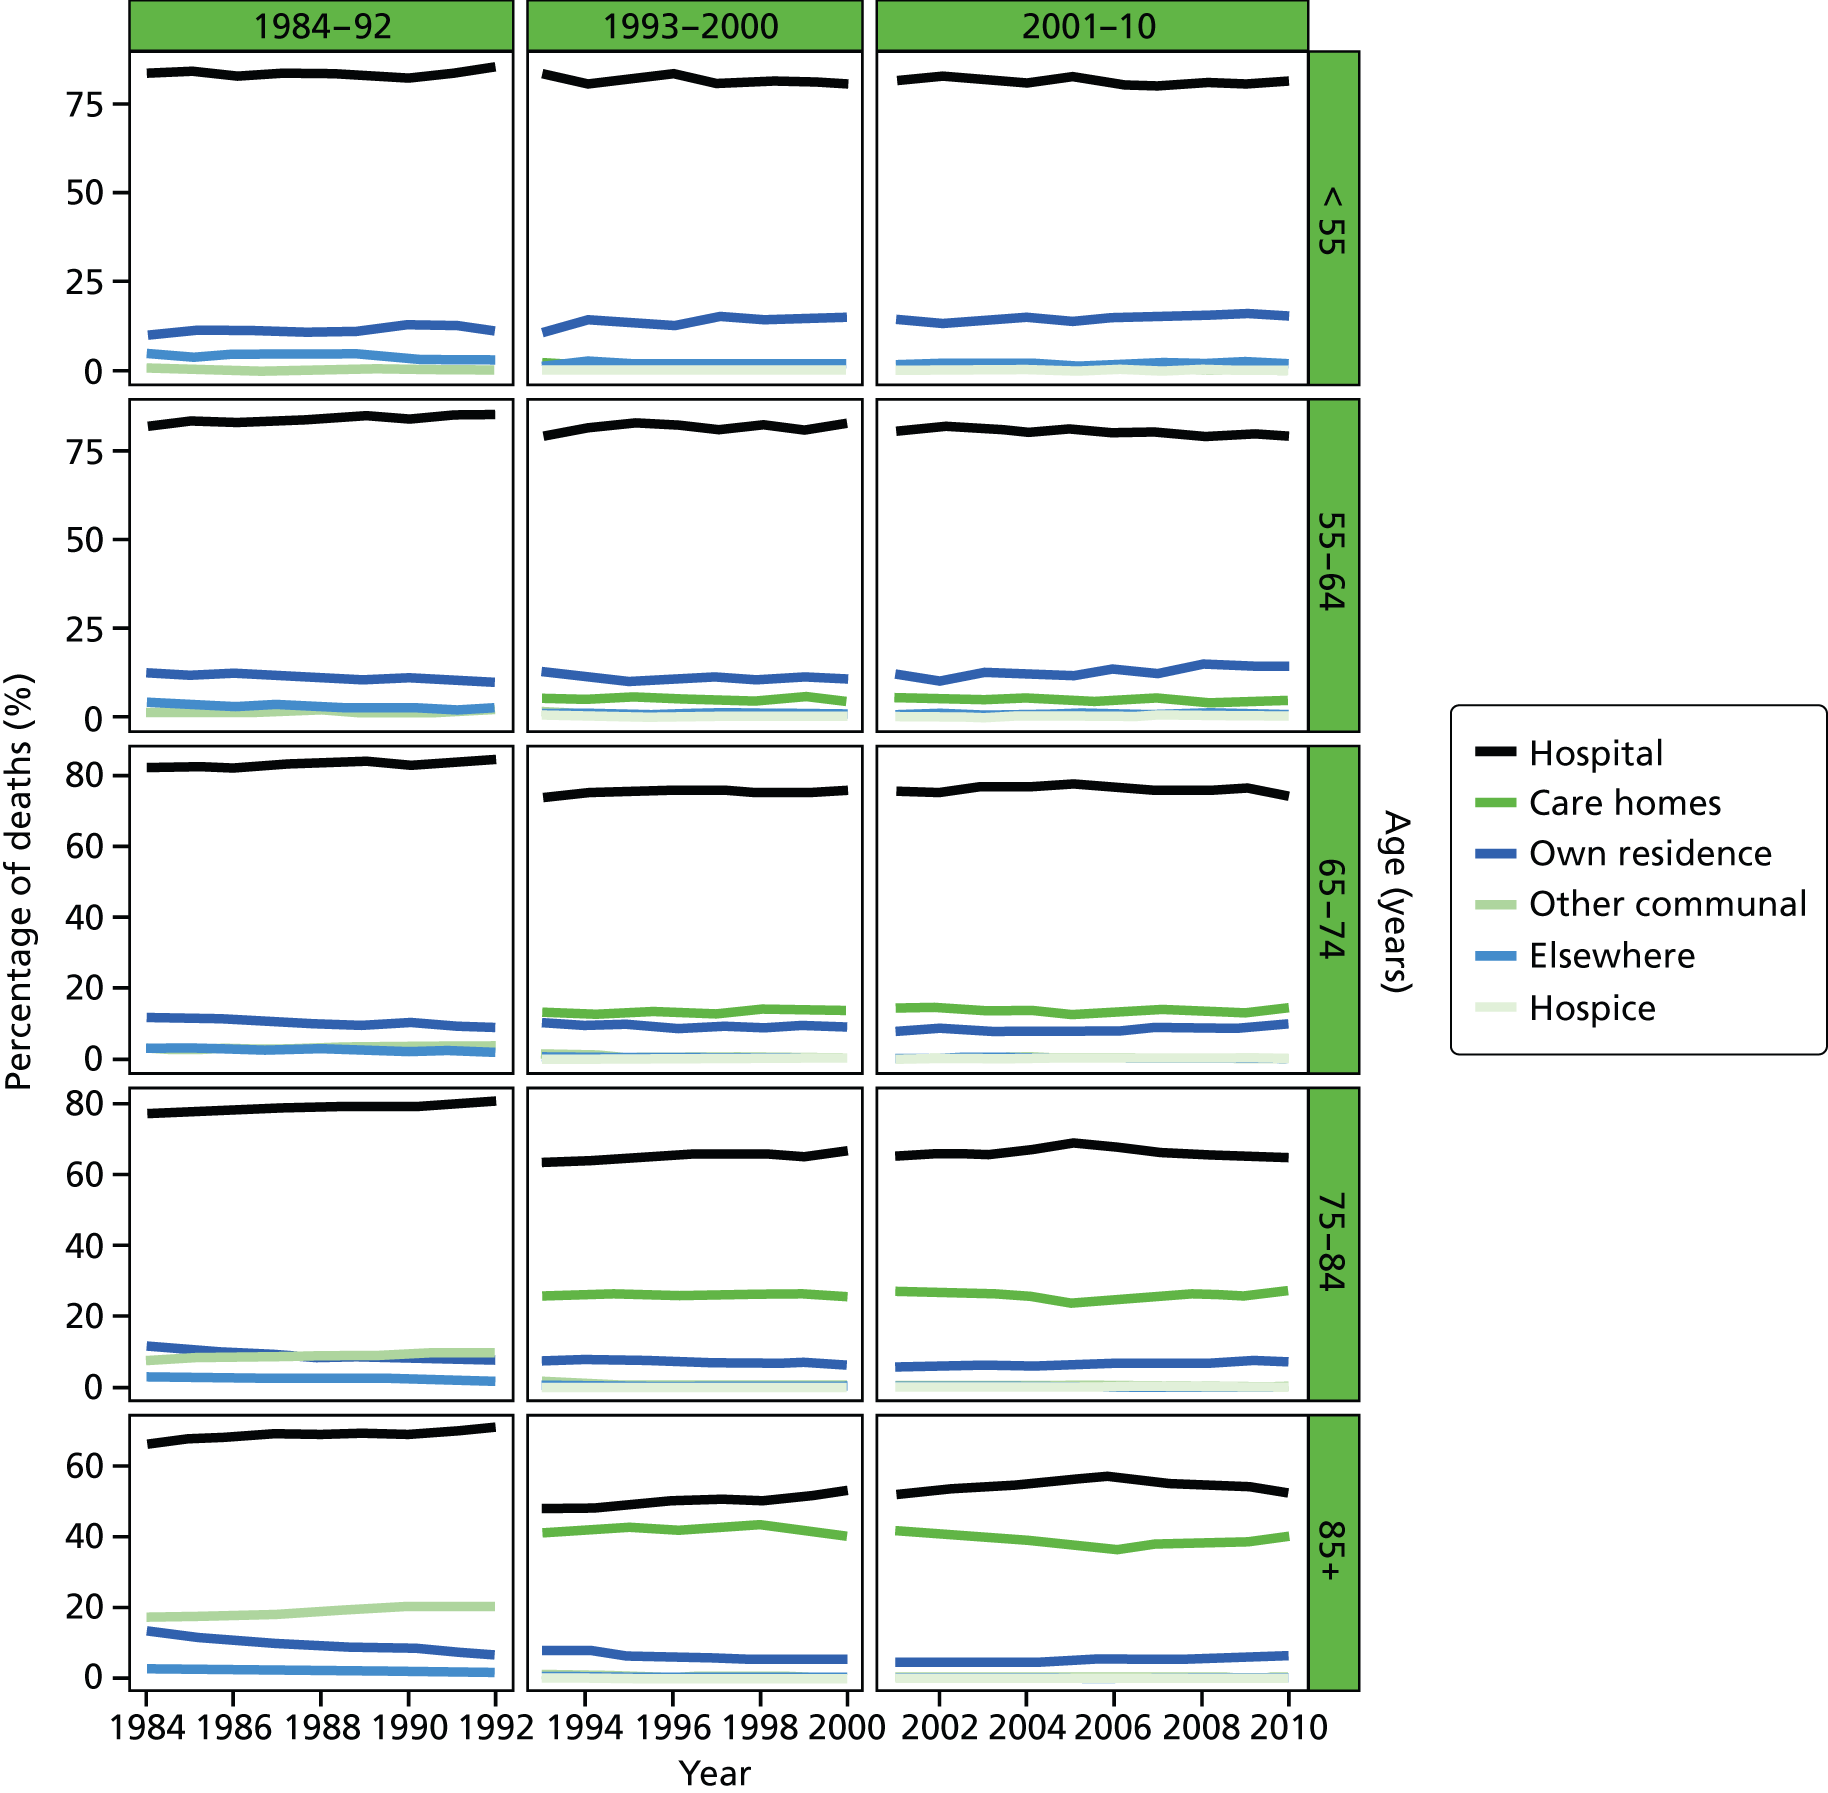
FIGURE 31.
Place of death by gender in deaths from CBDs, England 1984–2010.
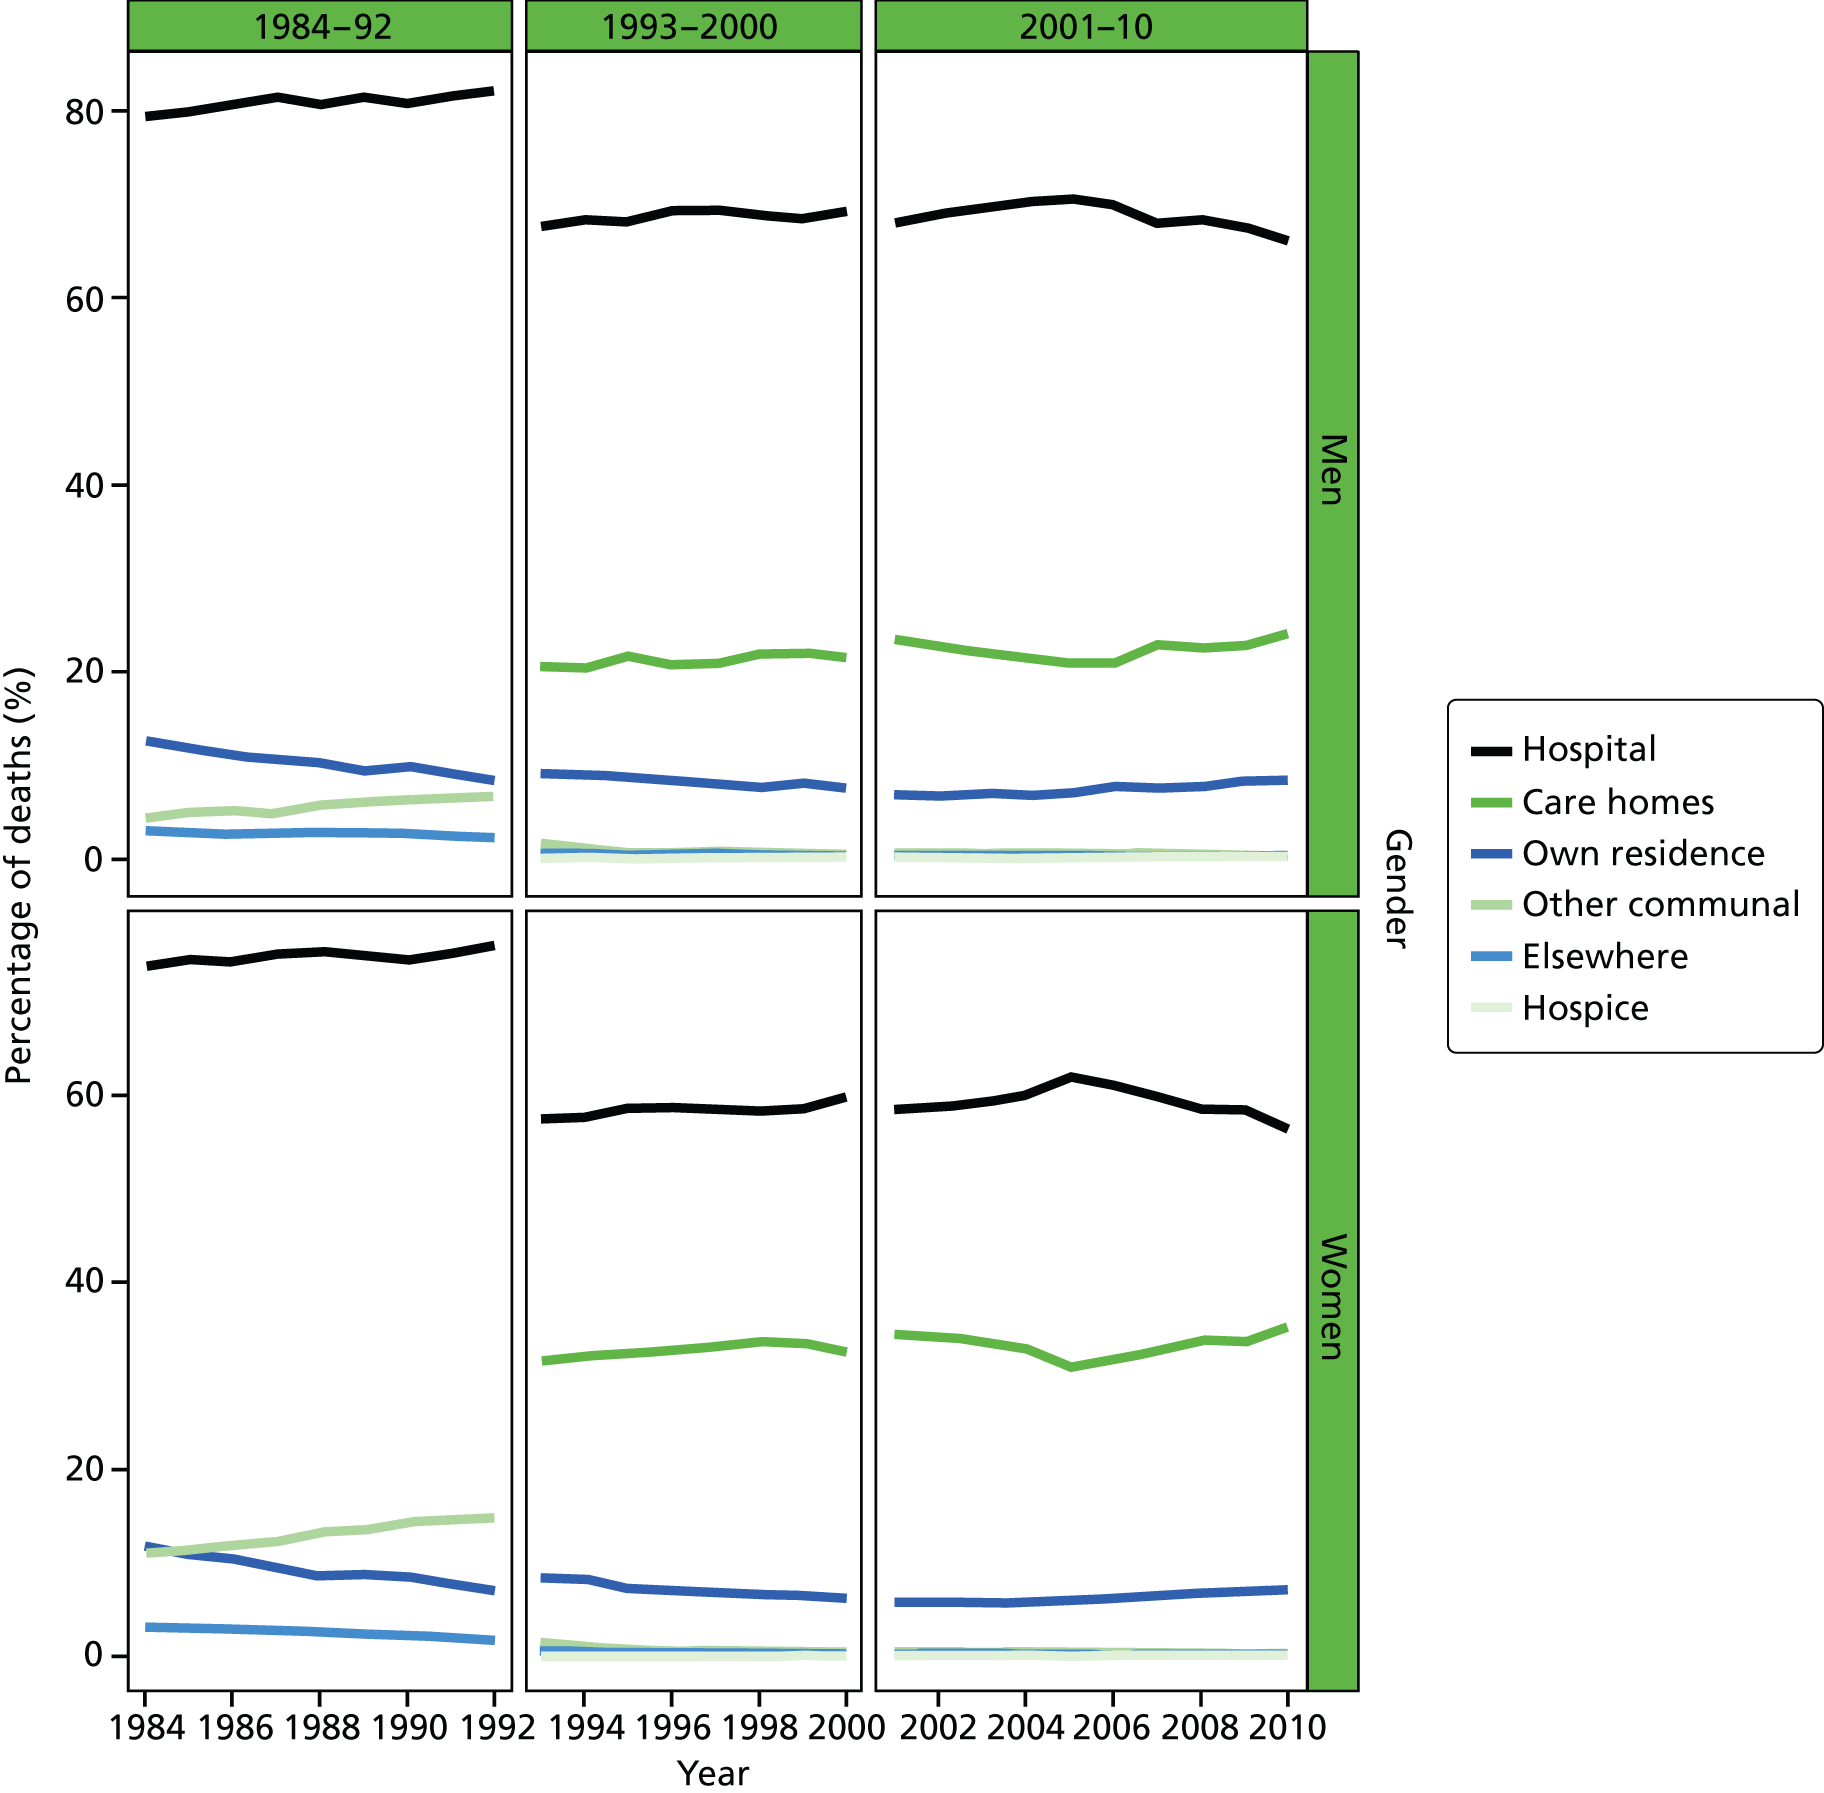
FIGURE 32.
Place of death by marital status in deaths from CBDs, England 1988–2010.
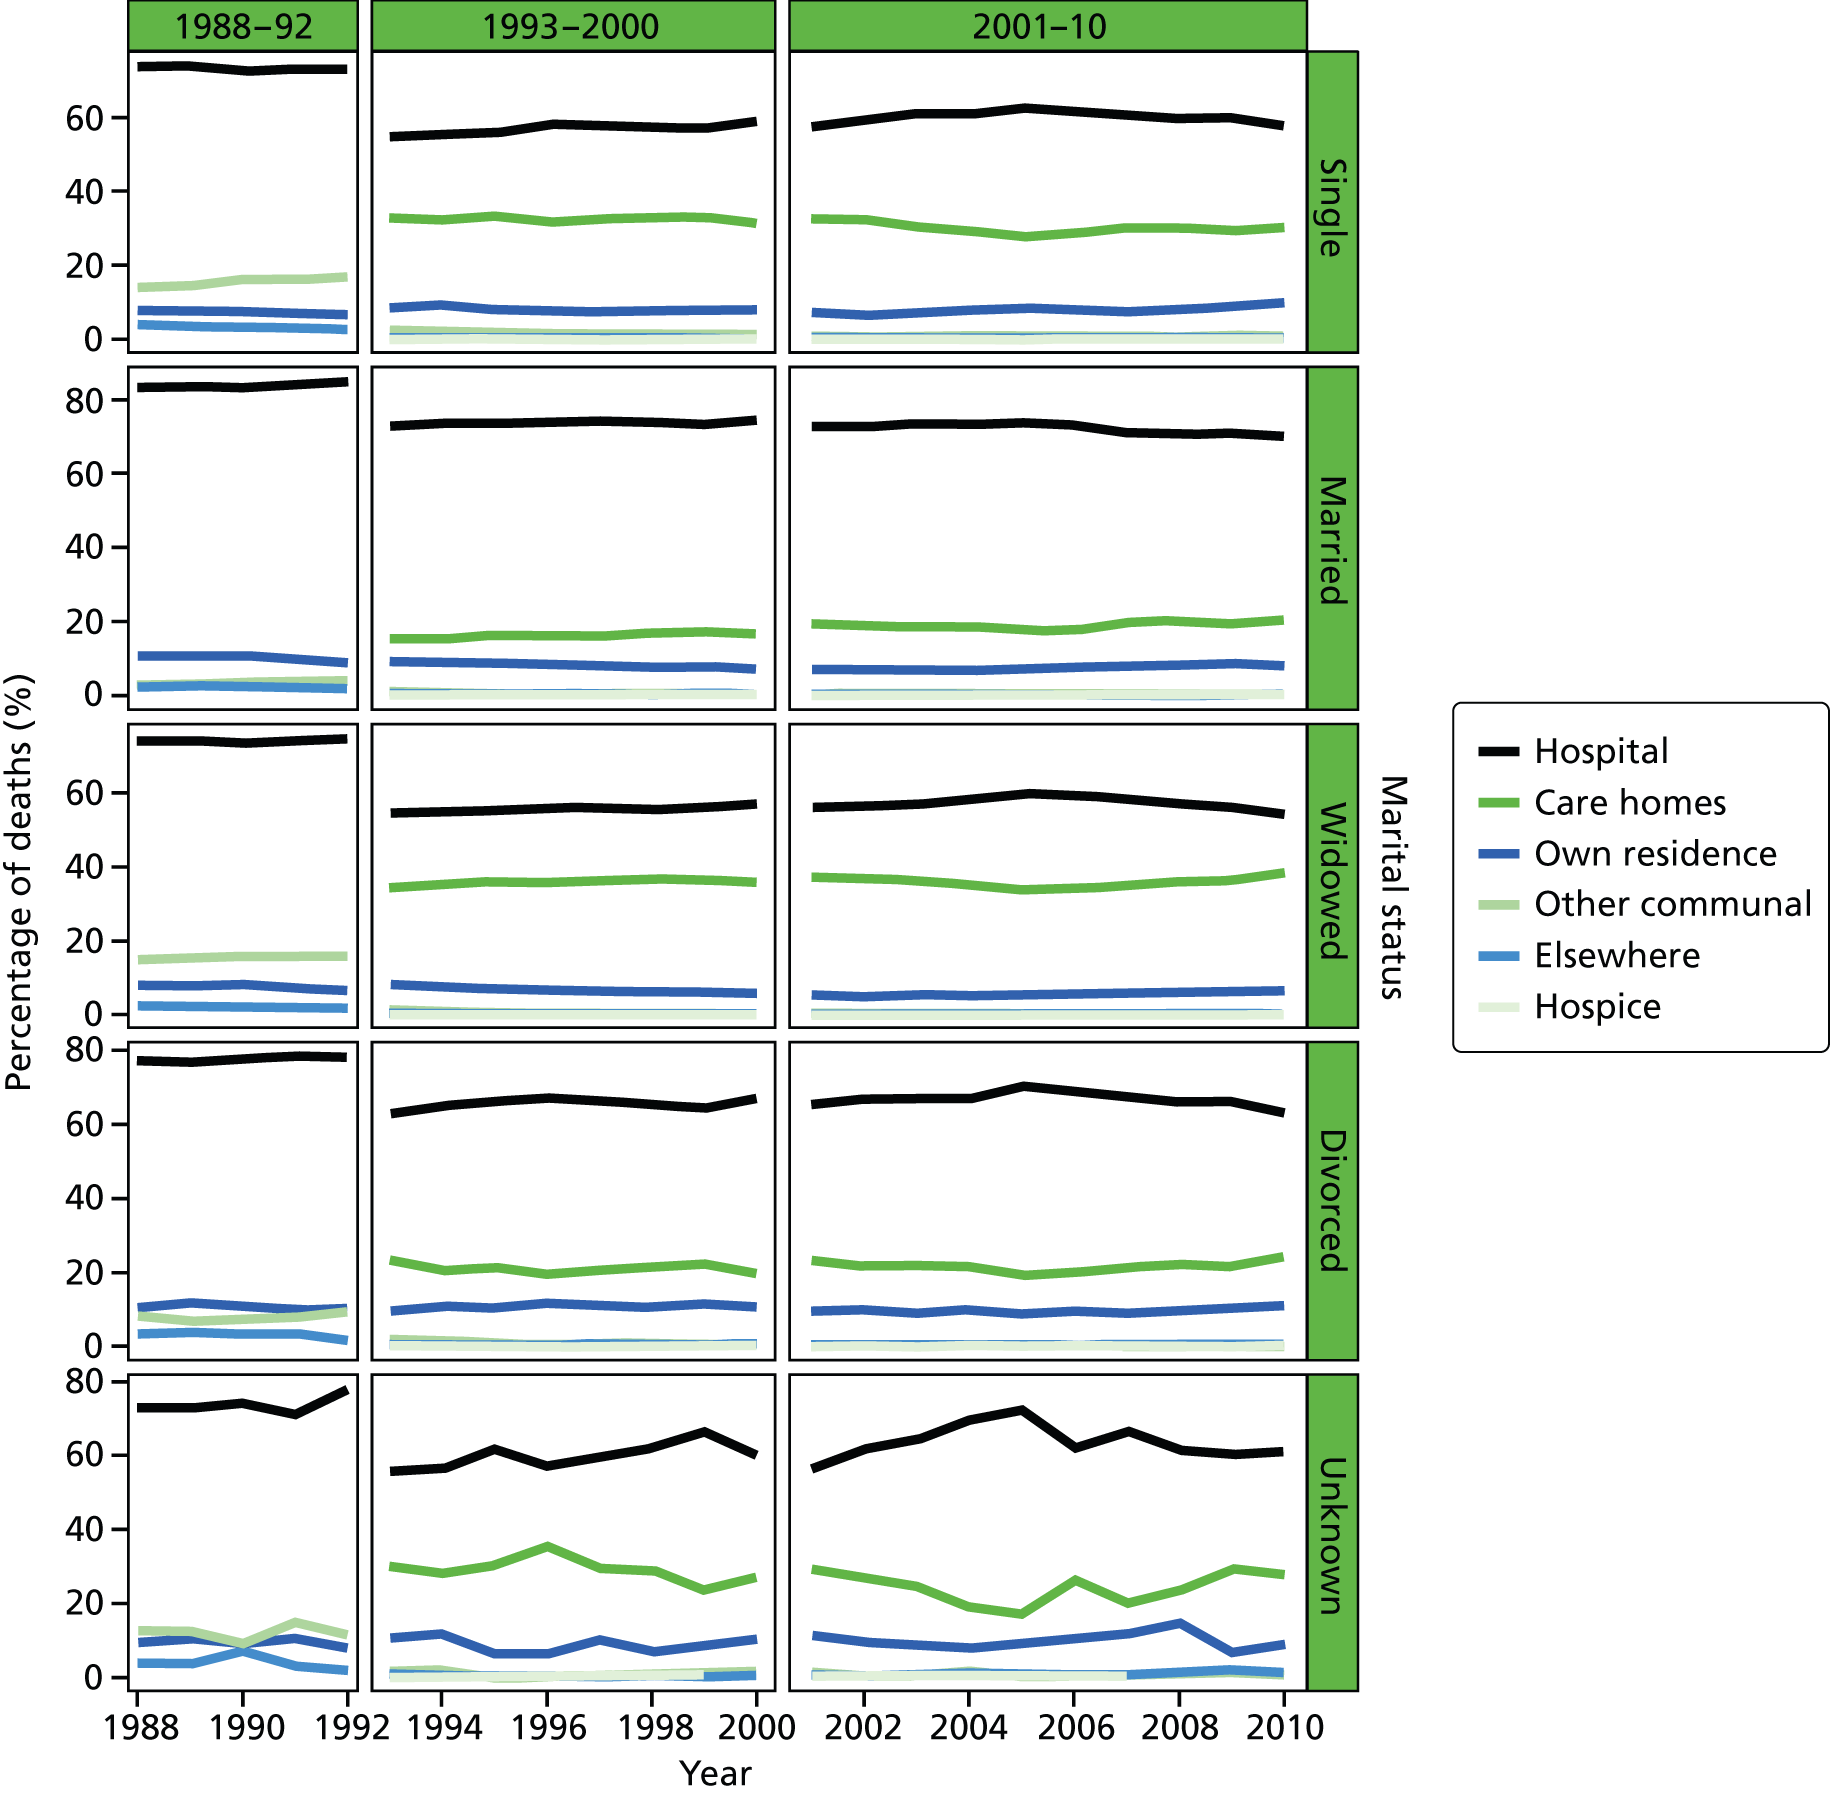
FIGURE 33.
Place of death by IMD ranking (1 = most deprived, 5 = least deprived) in deaths from CBDs, England 1984–2010.
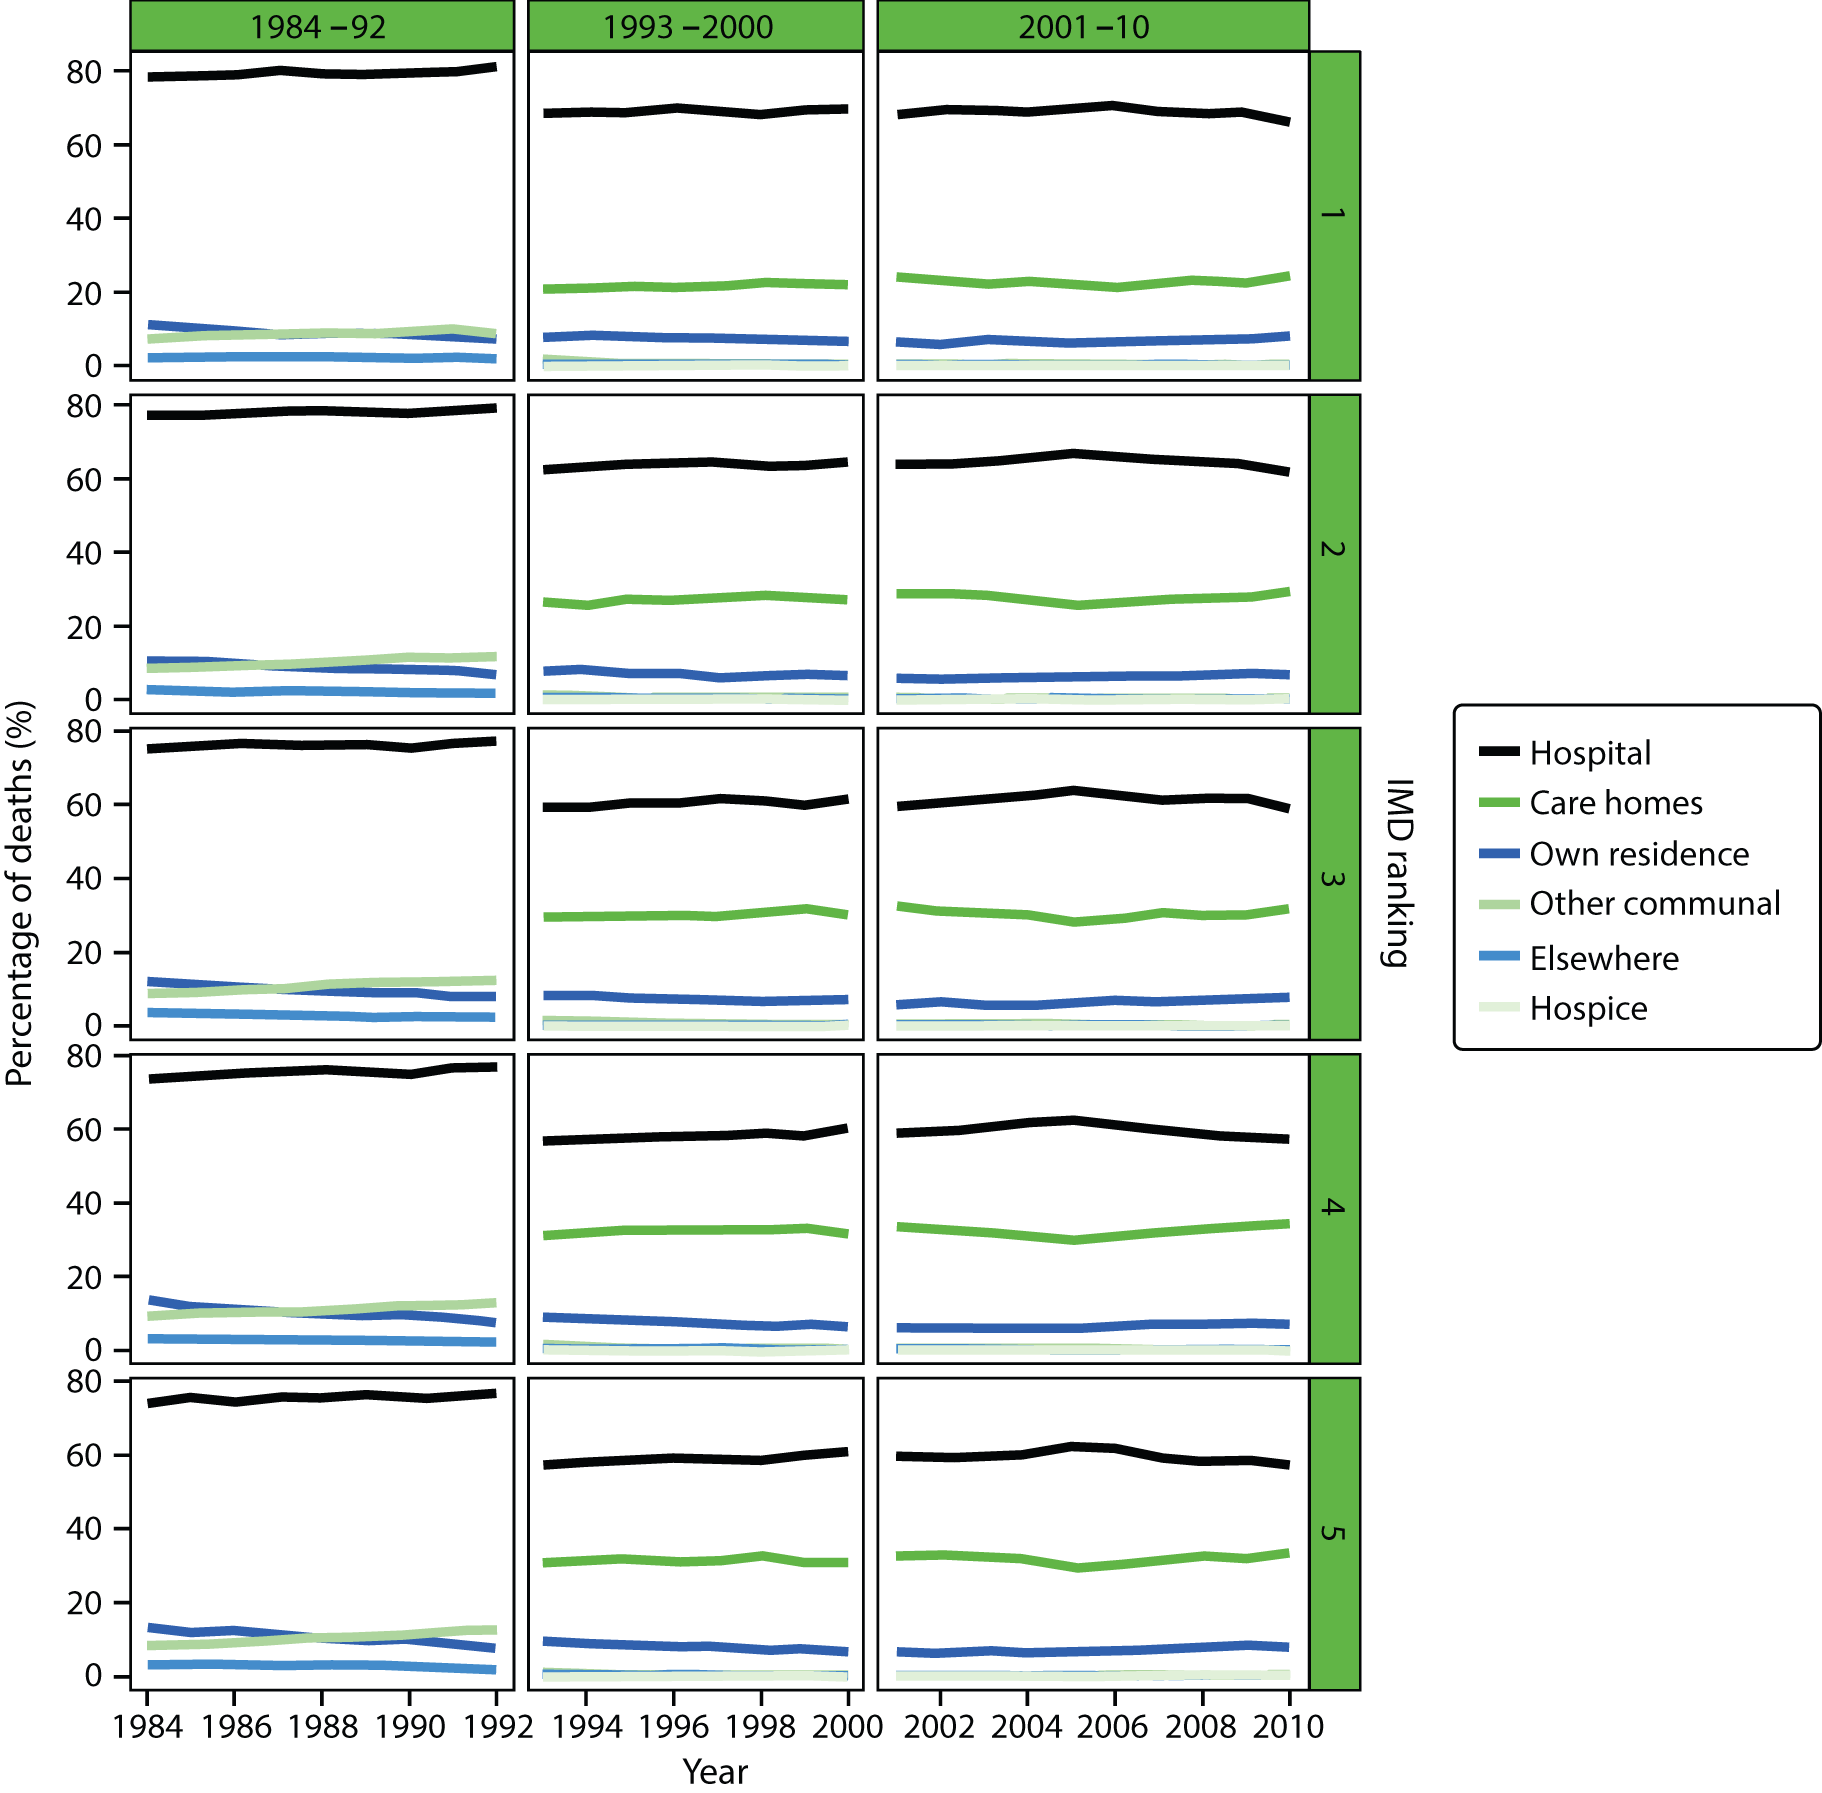
FIGURE 34.
Place of death by age groups in deaths from neurological conditions, England 1984–2010.
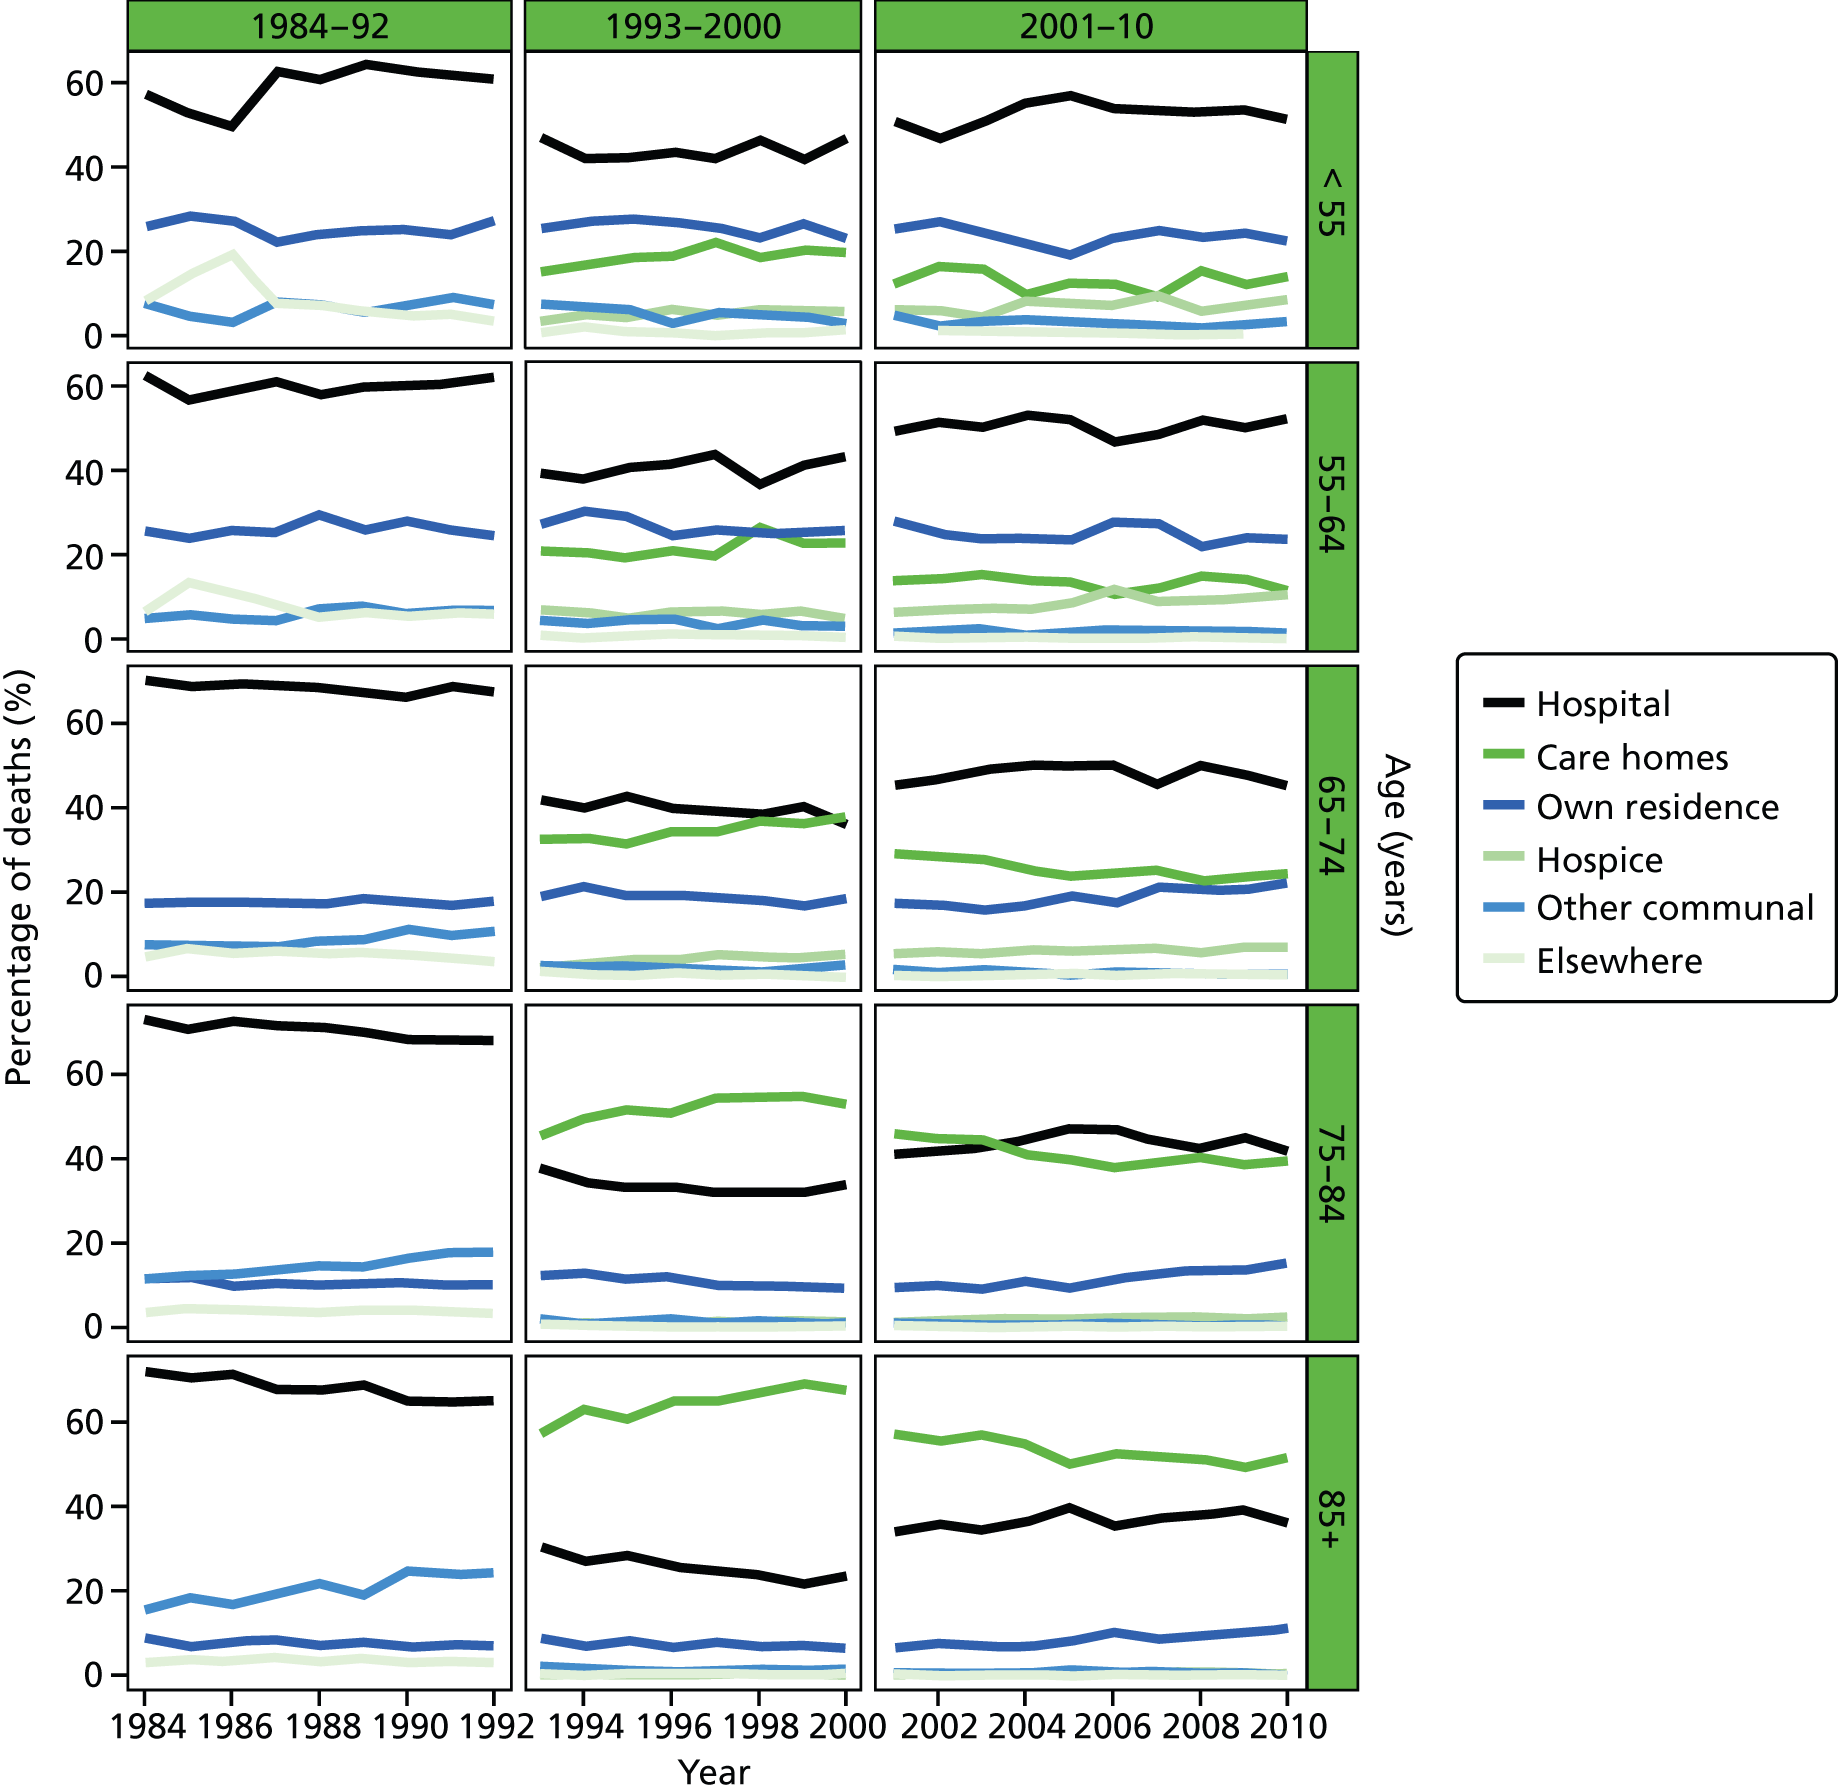
FIGURE 35.
Place of death by gender in deaths from neurological conditions, England 1984–2010.
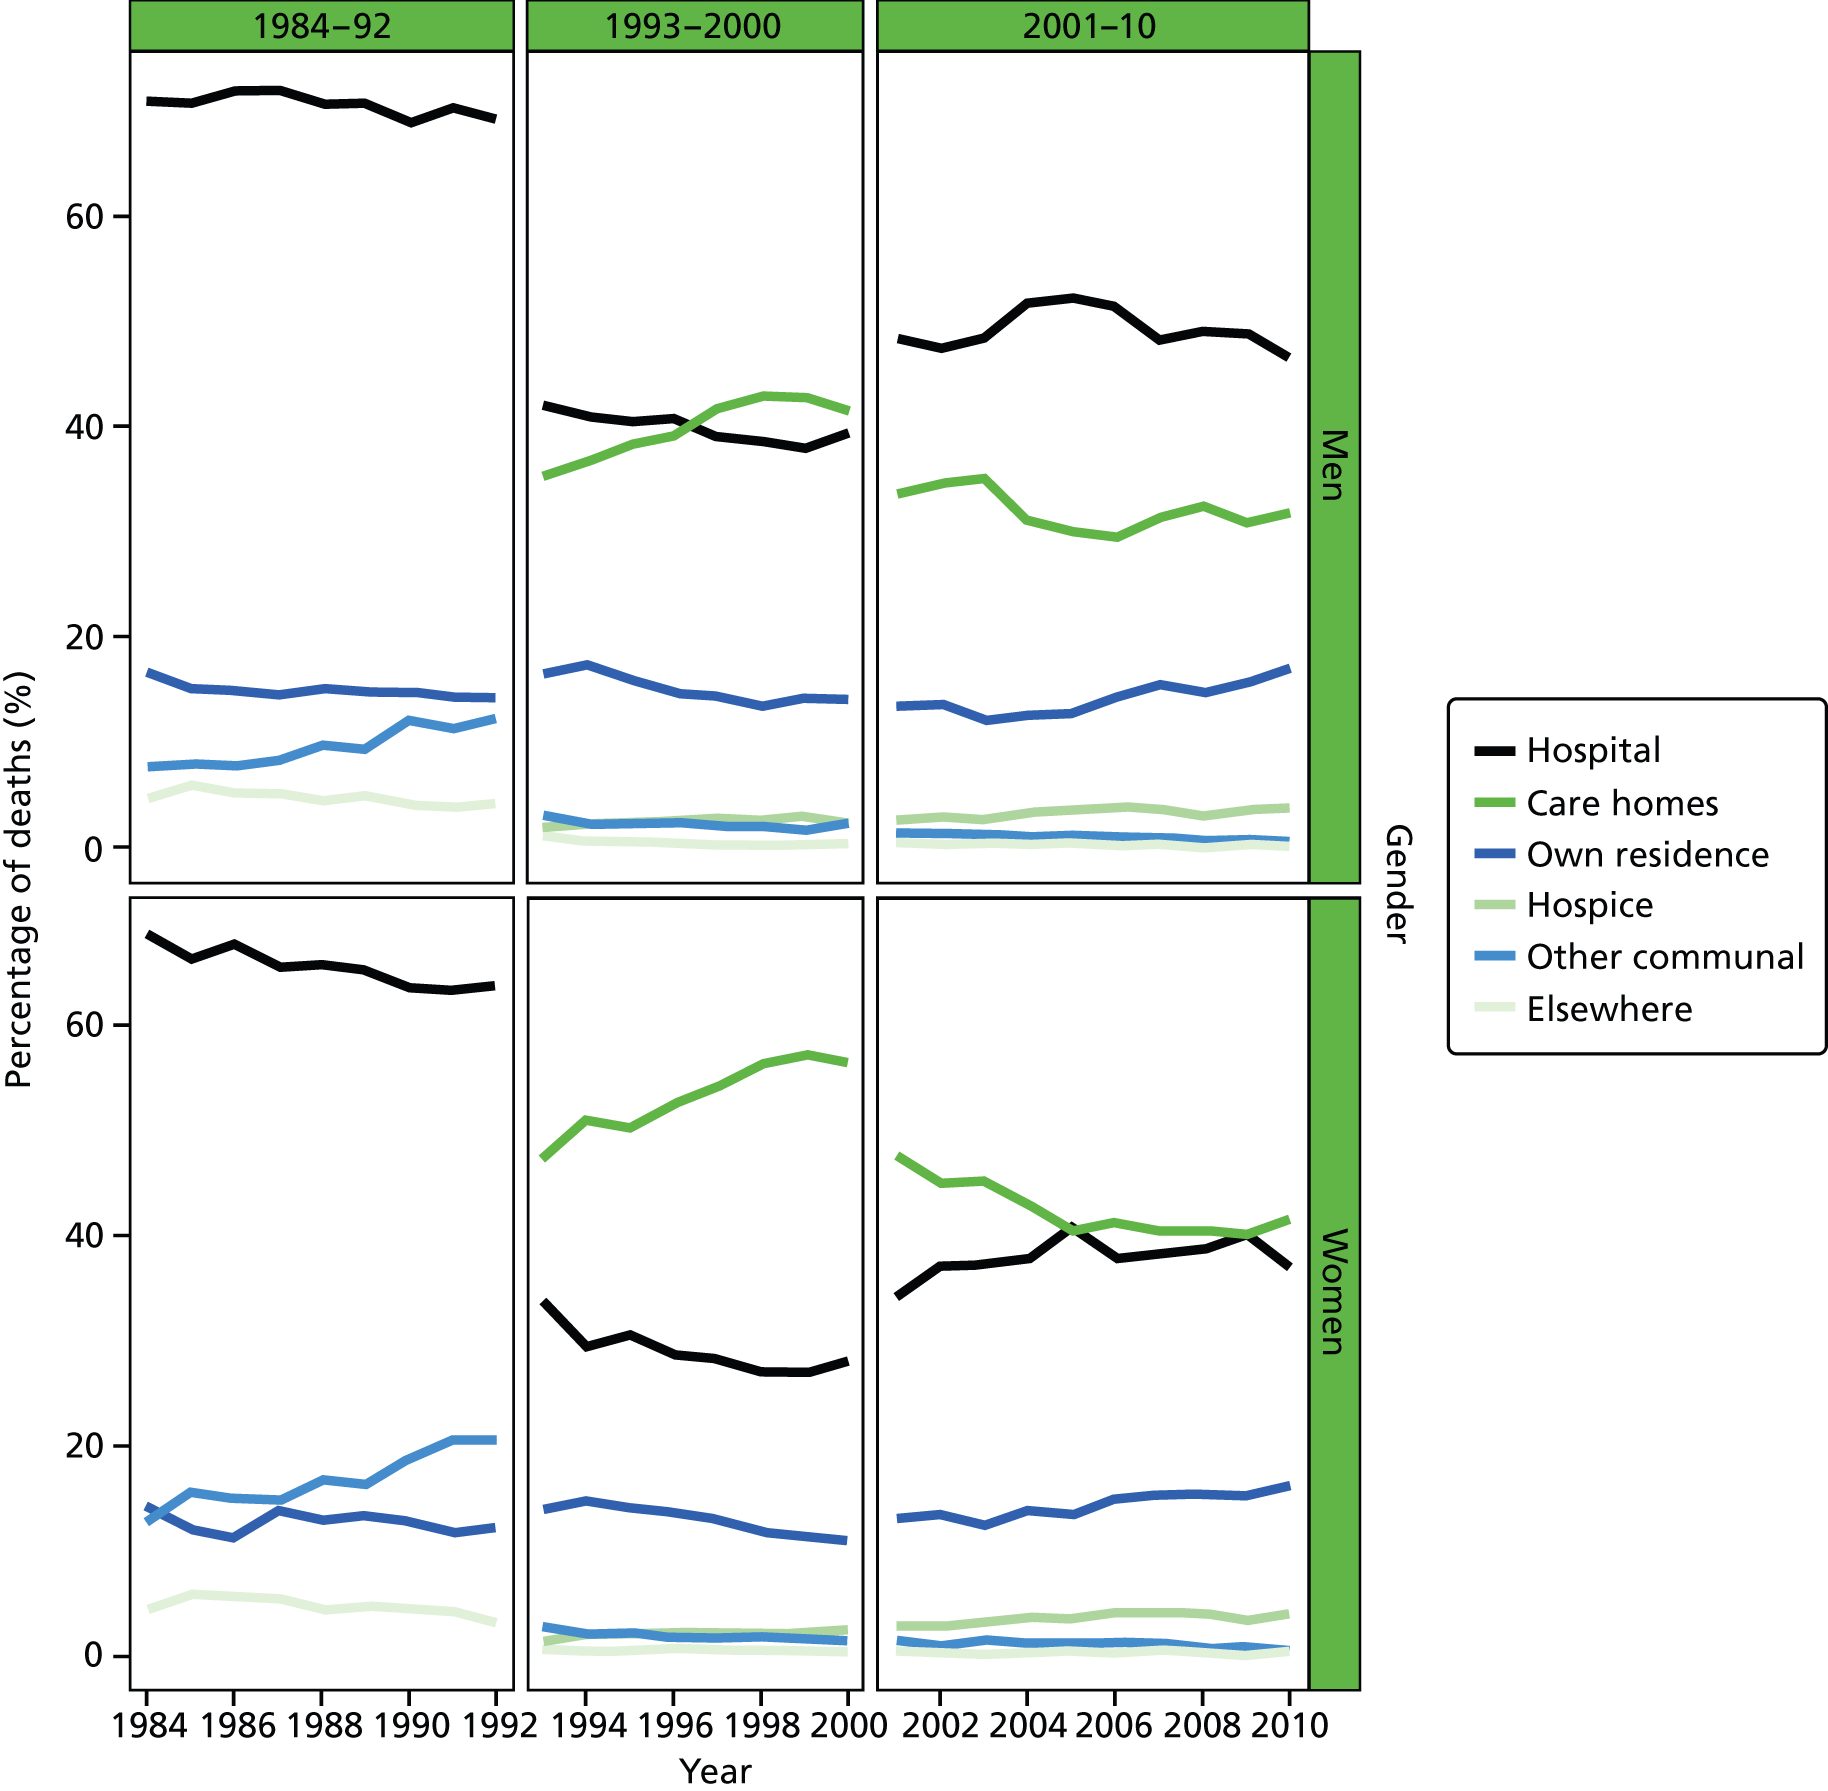
FIGURE 36.
Place of death by marital status in deaths from neurological conditions, England 1988–2010.
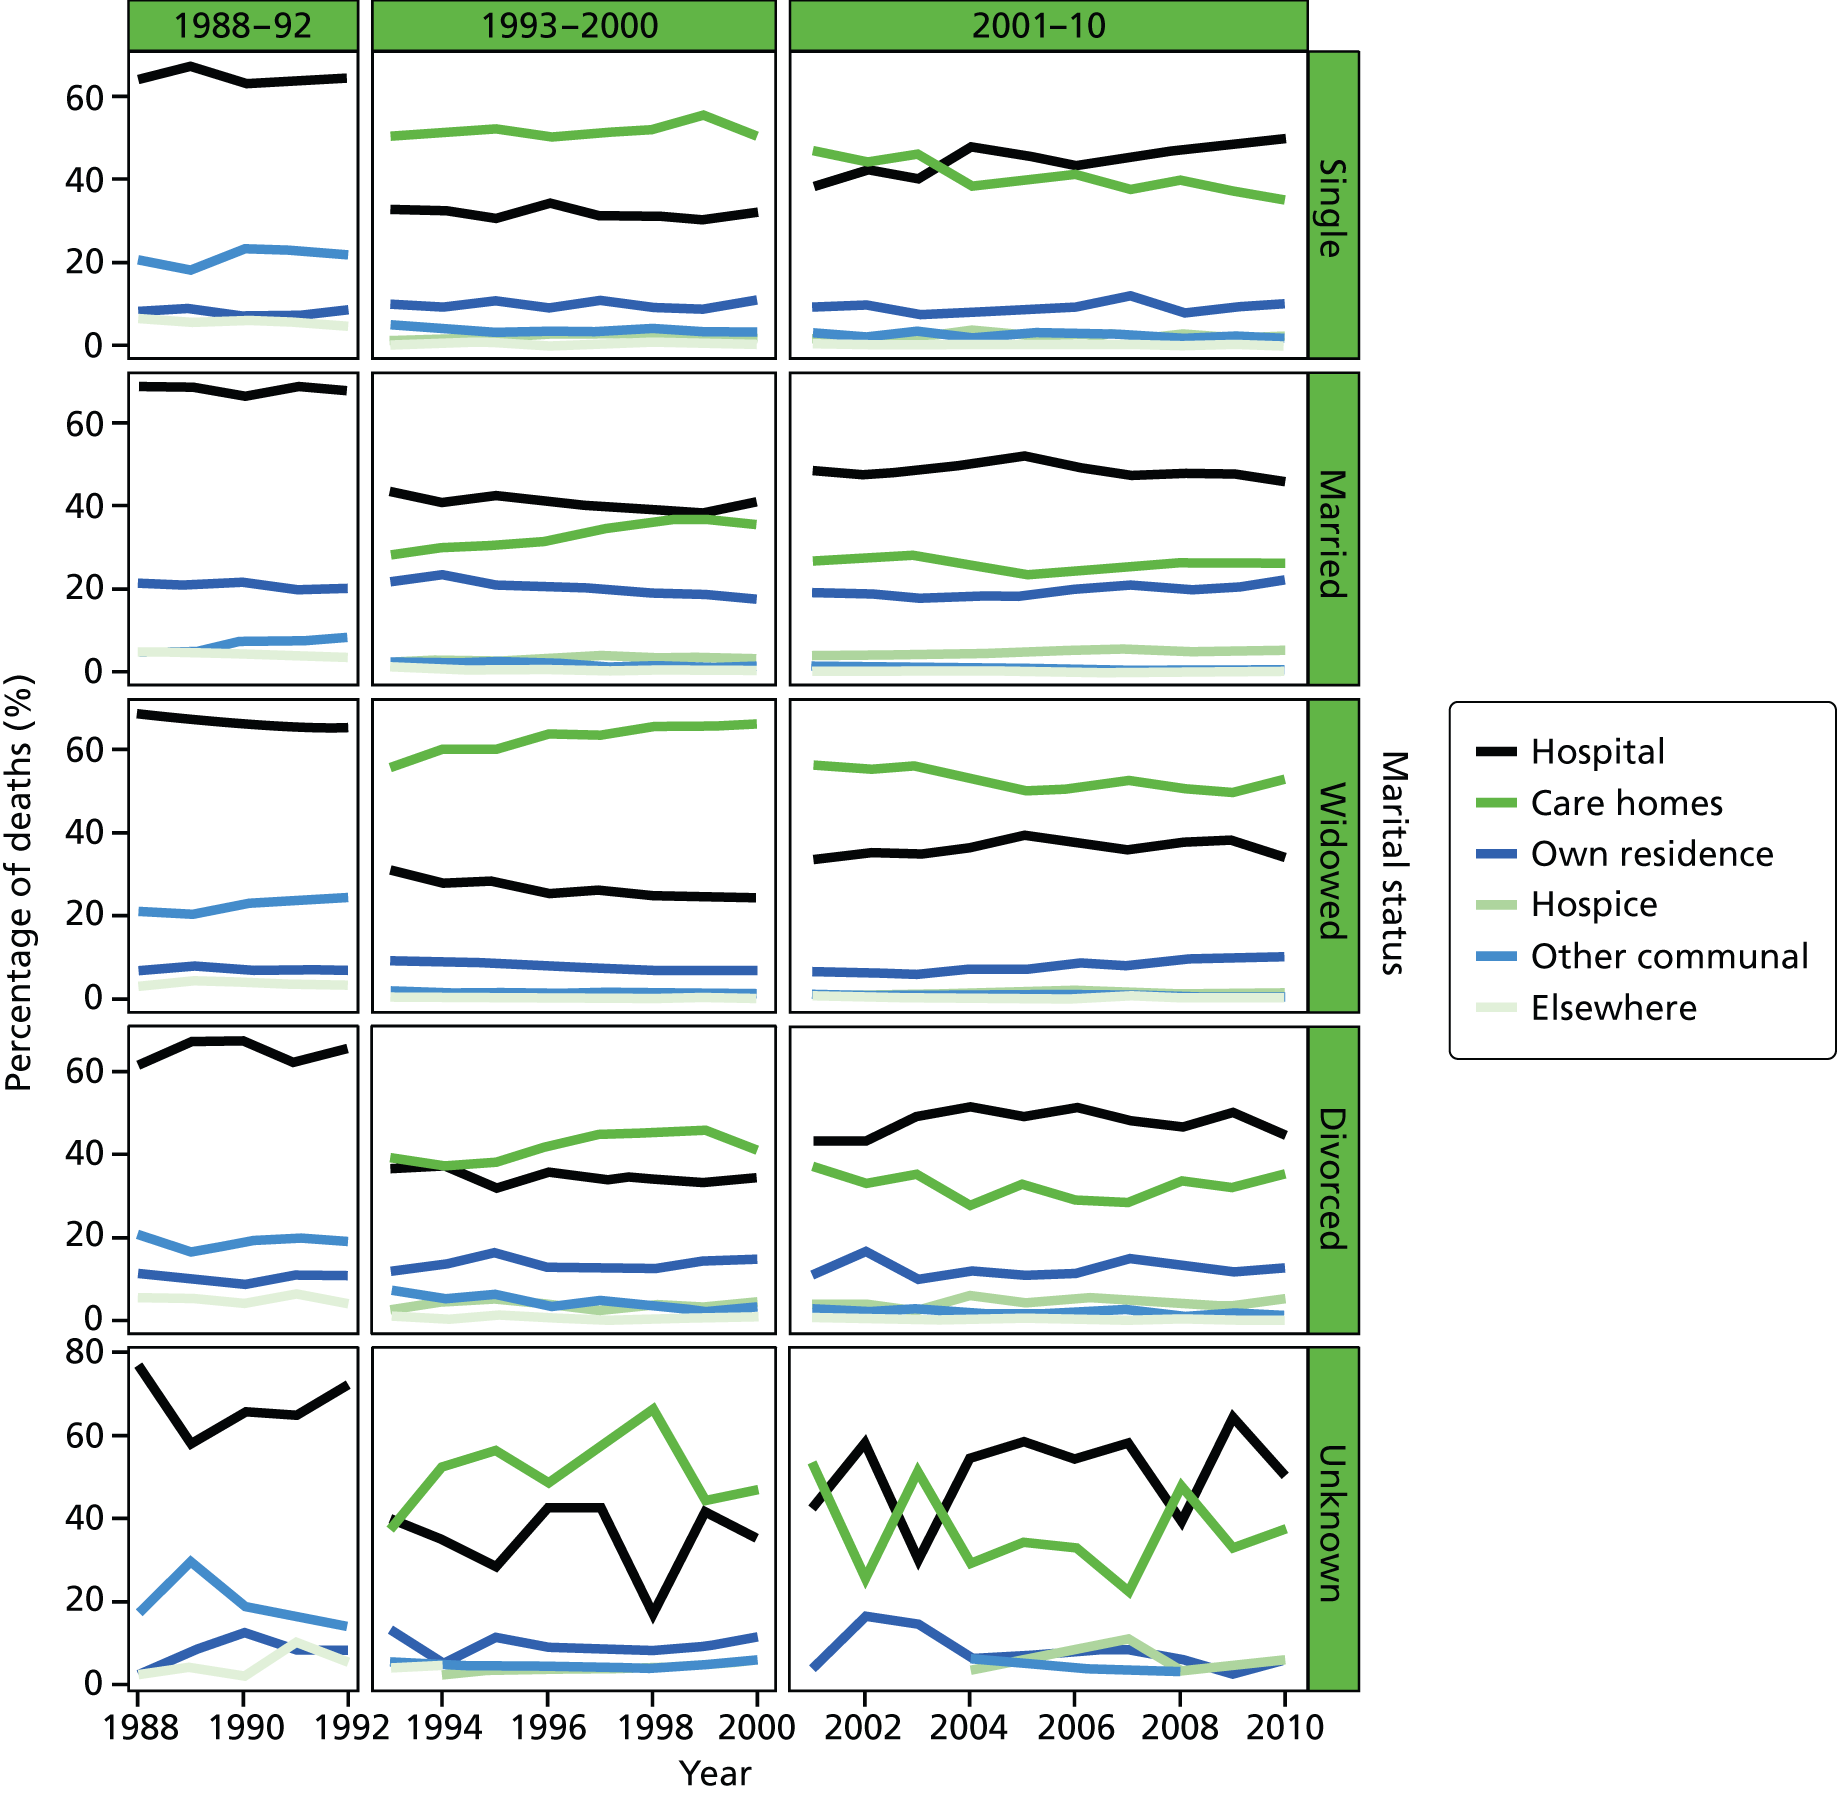
FIGURE 37.
Place of death by IMD ranking (1 = most deprived, 5 = least deprived) in deaths from neurological conditions, England 1984–2010.
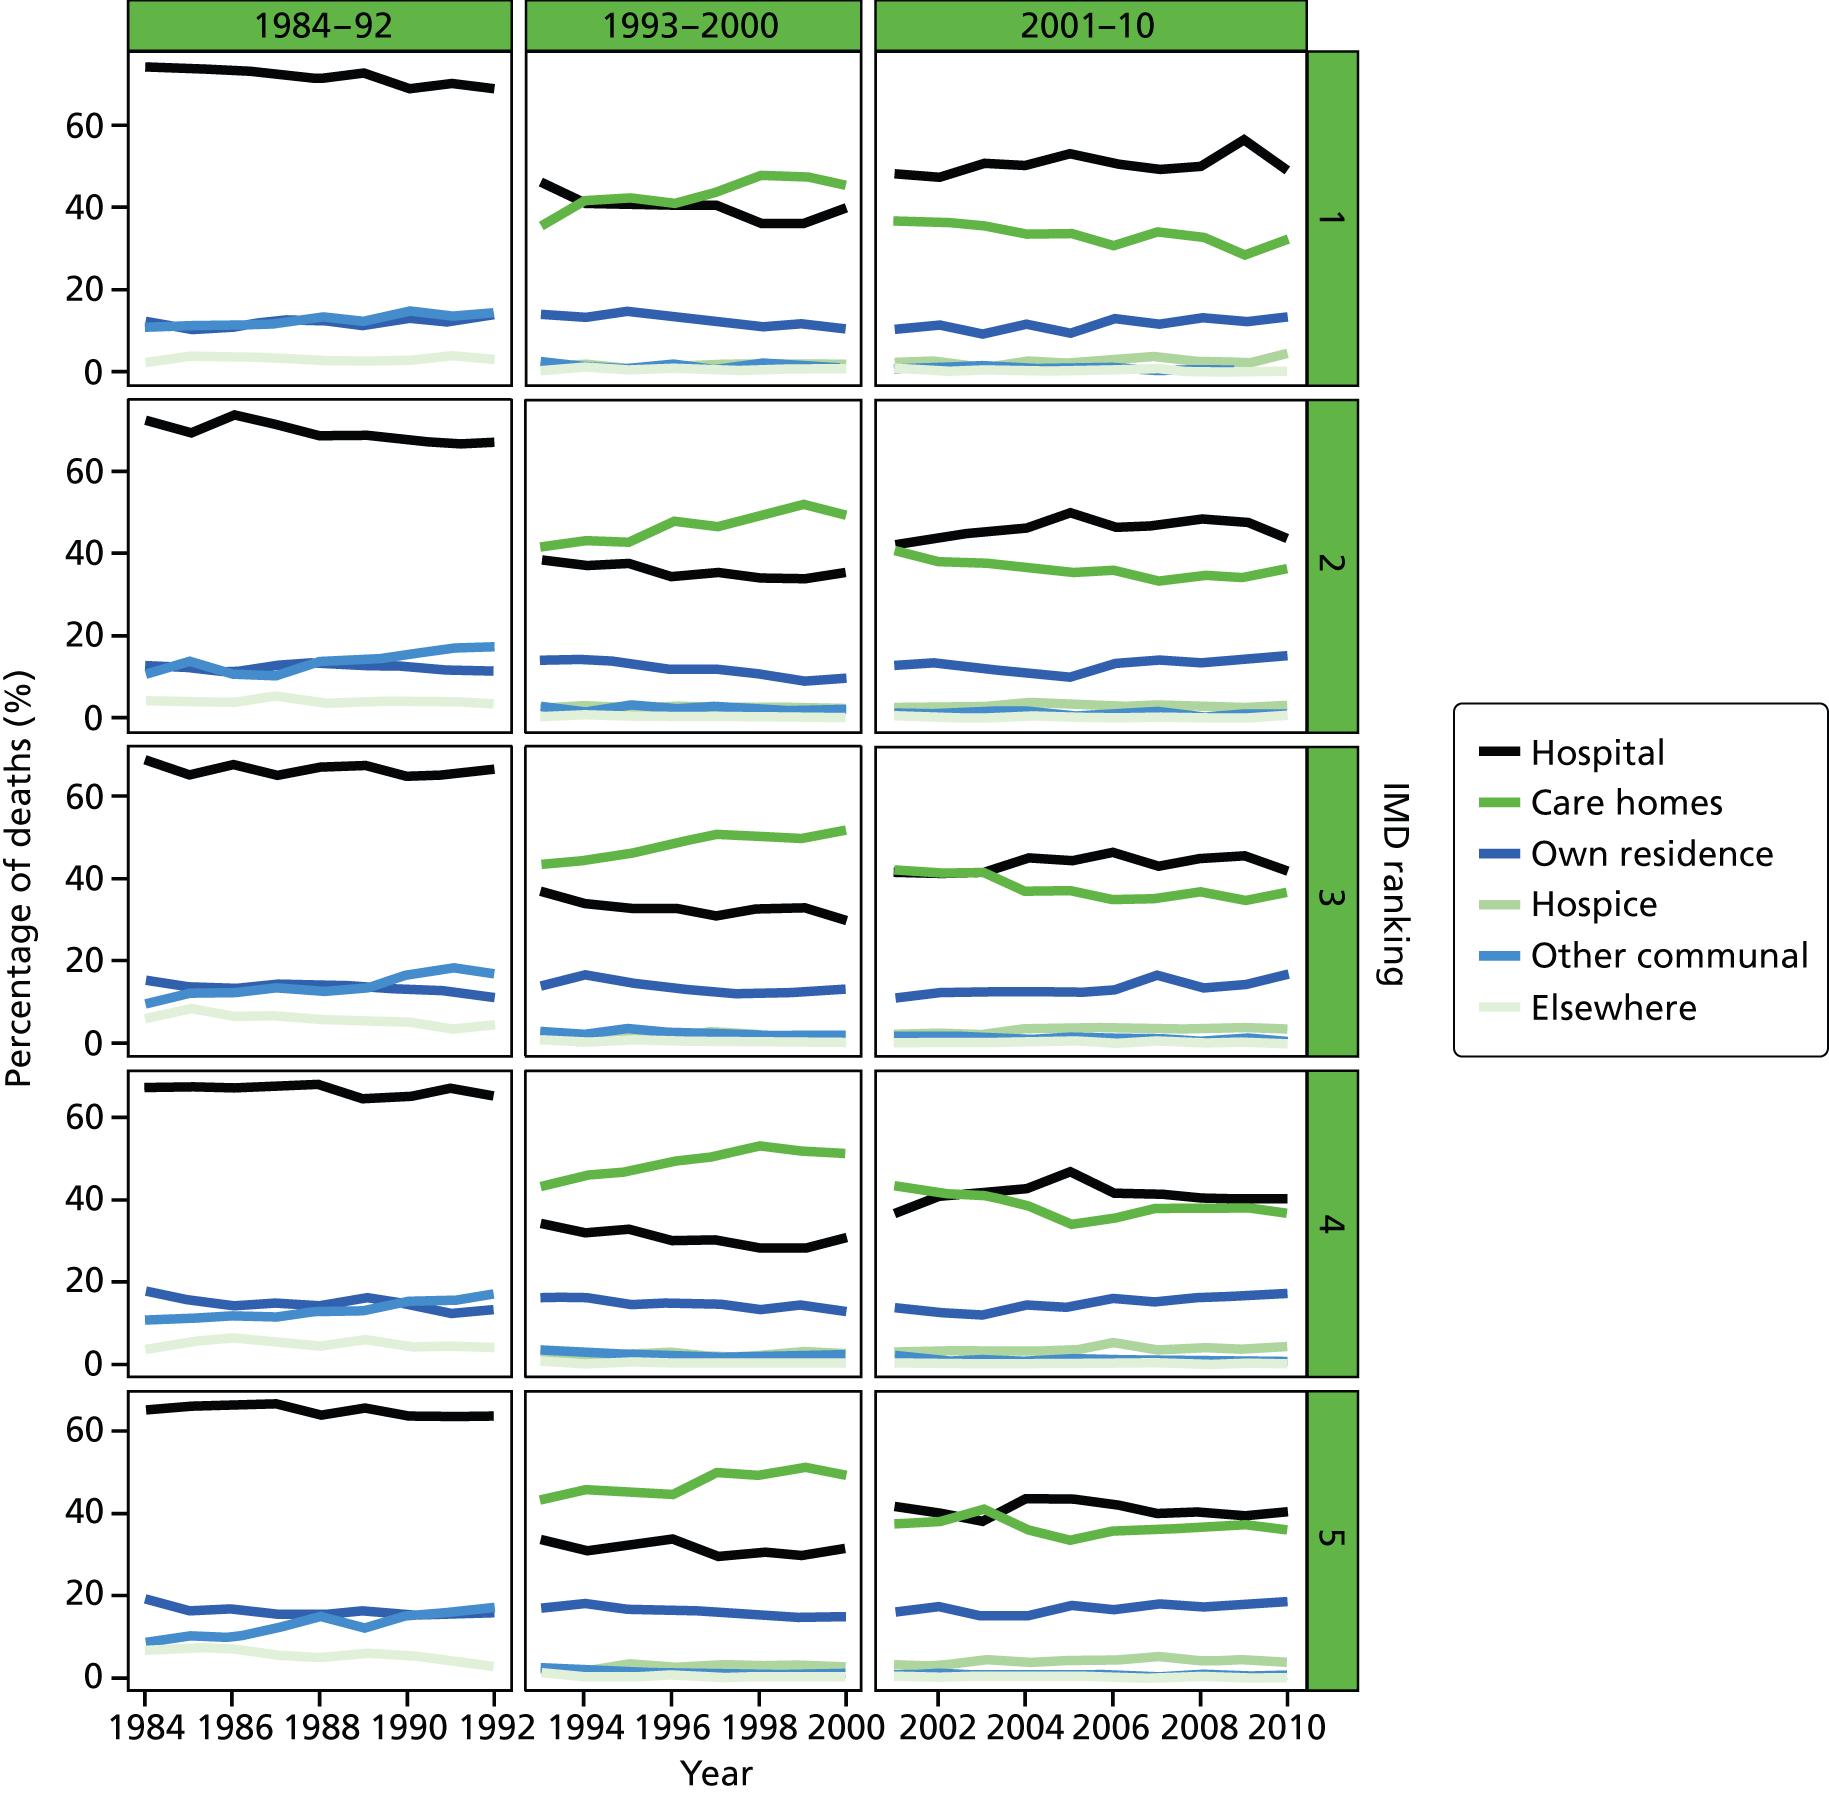
FIGURE 38.
Place of death by age groups in COPD deaths, England 1984–2010.
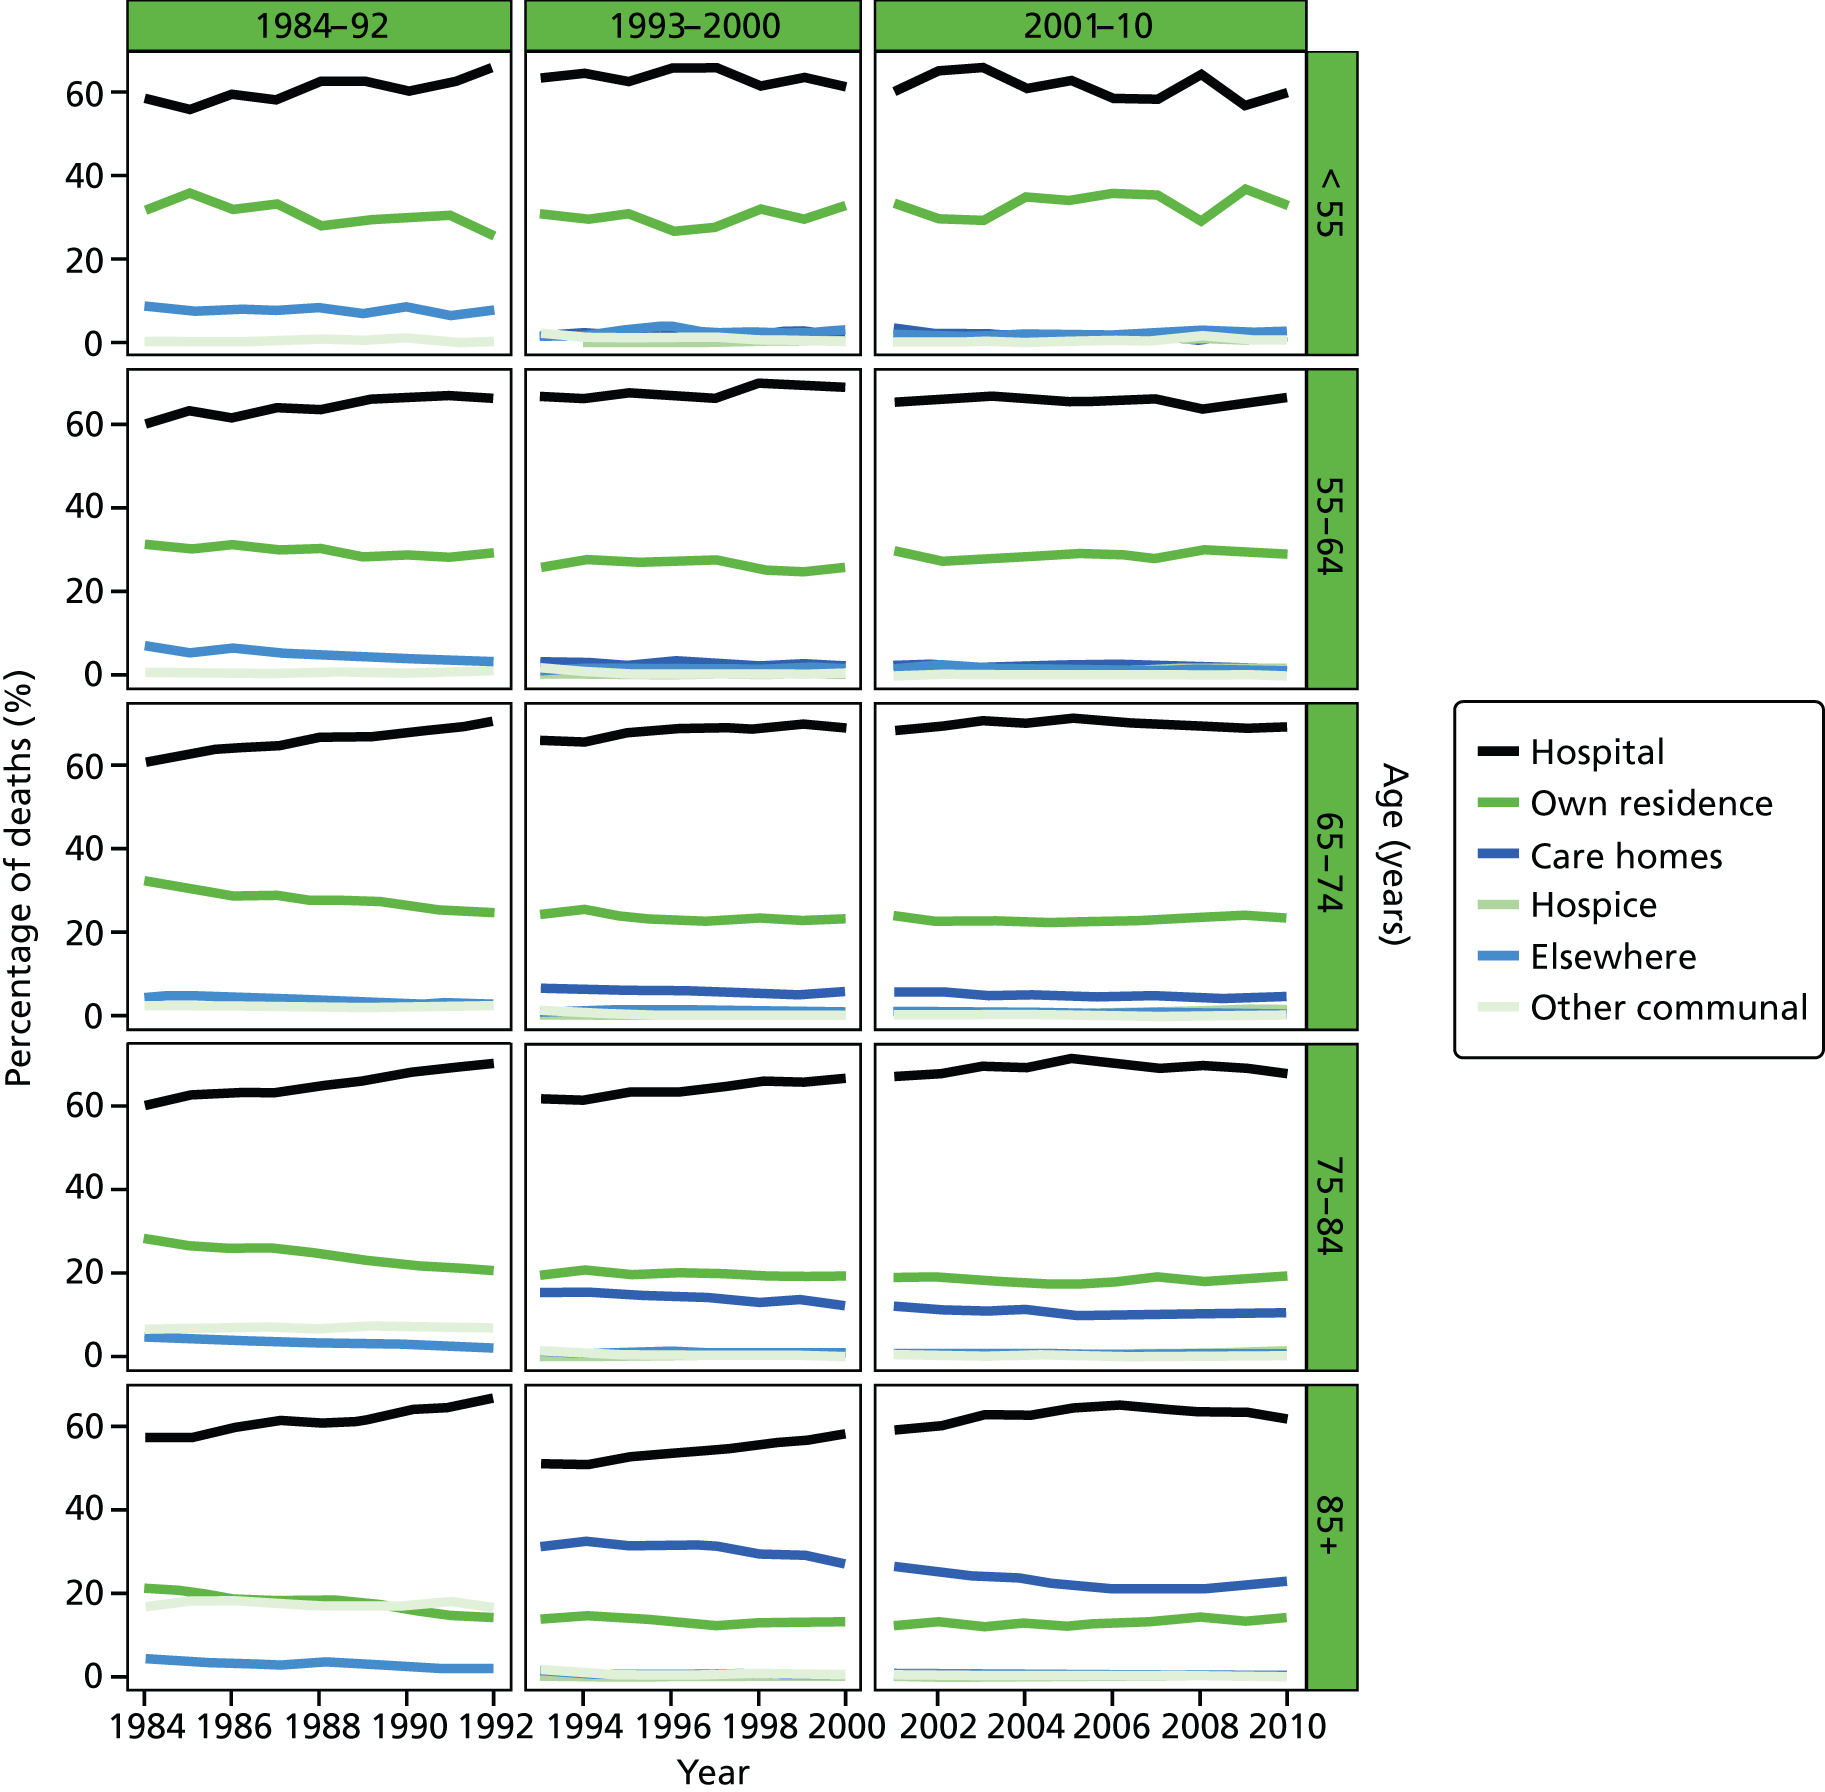
FIGURE 39.
Place of death by gender in COPD deaths, England 1984–2010.
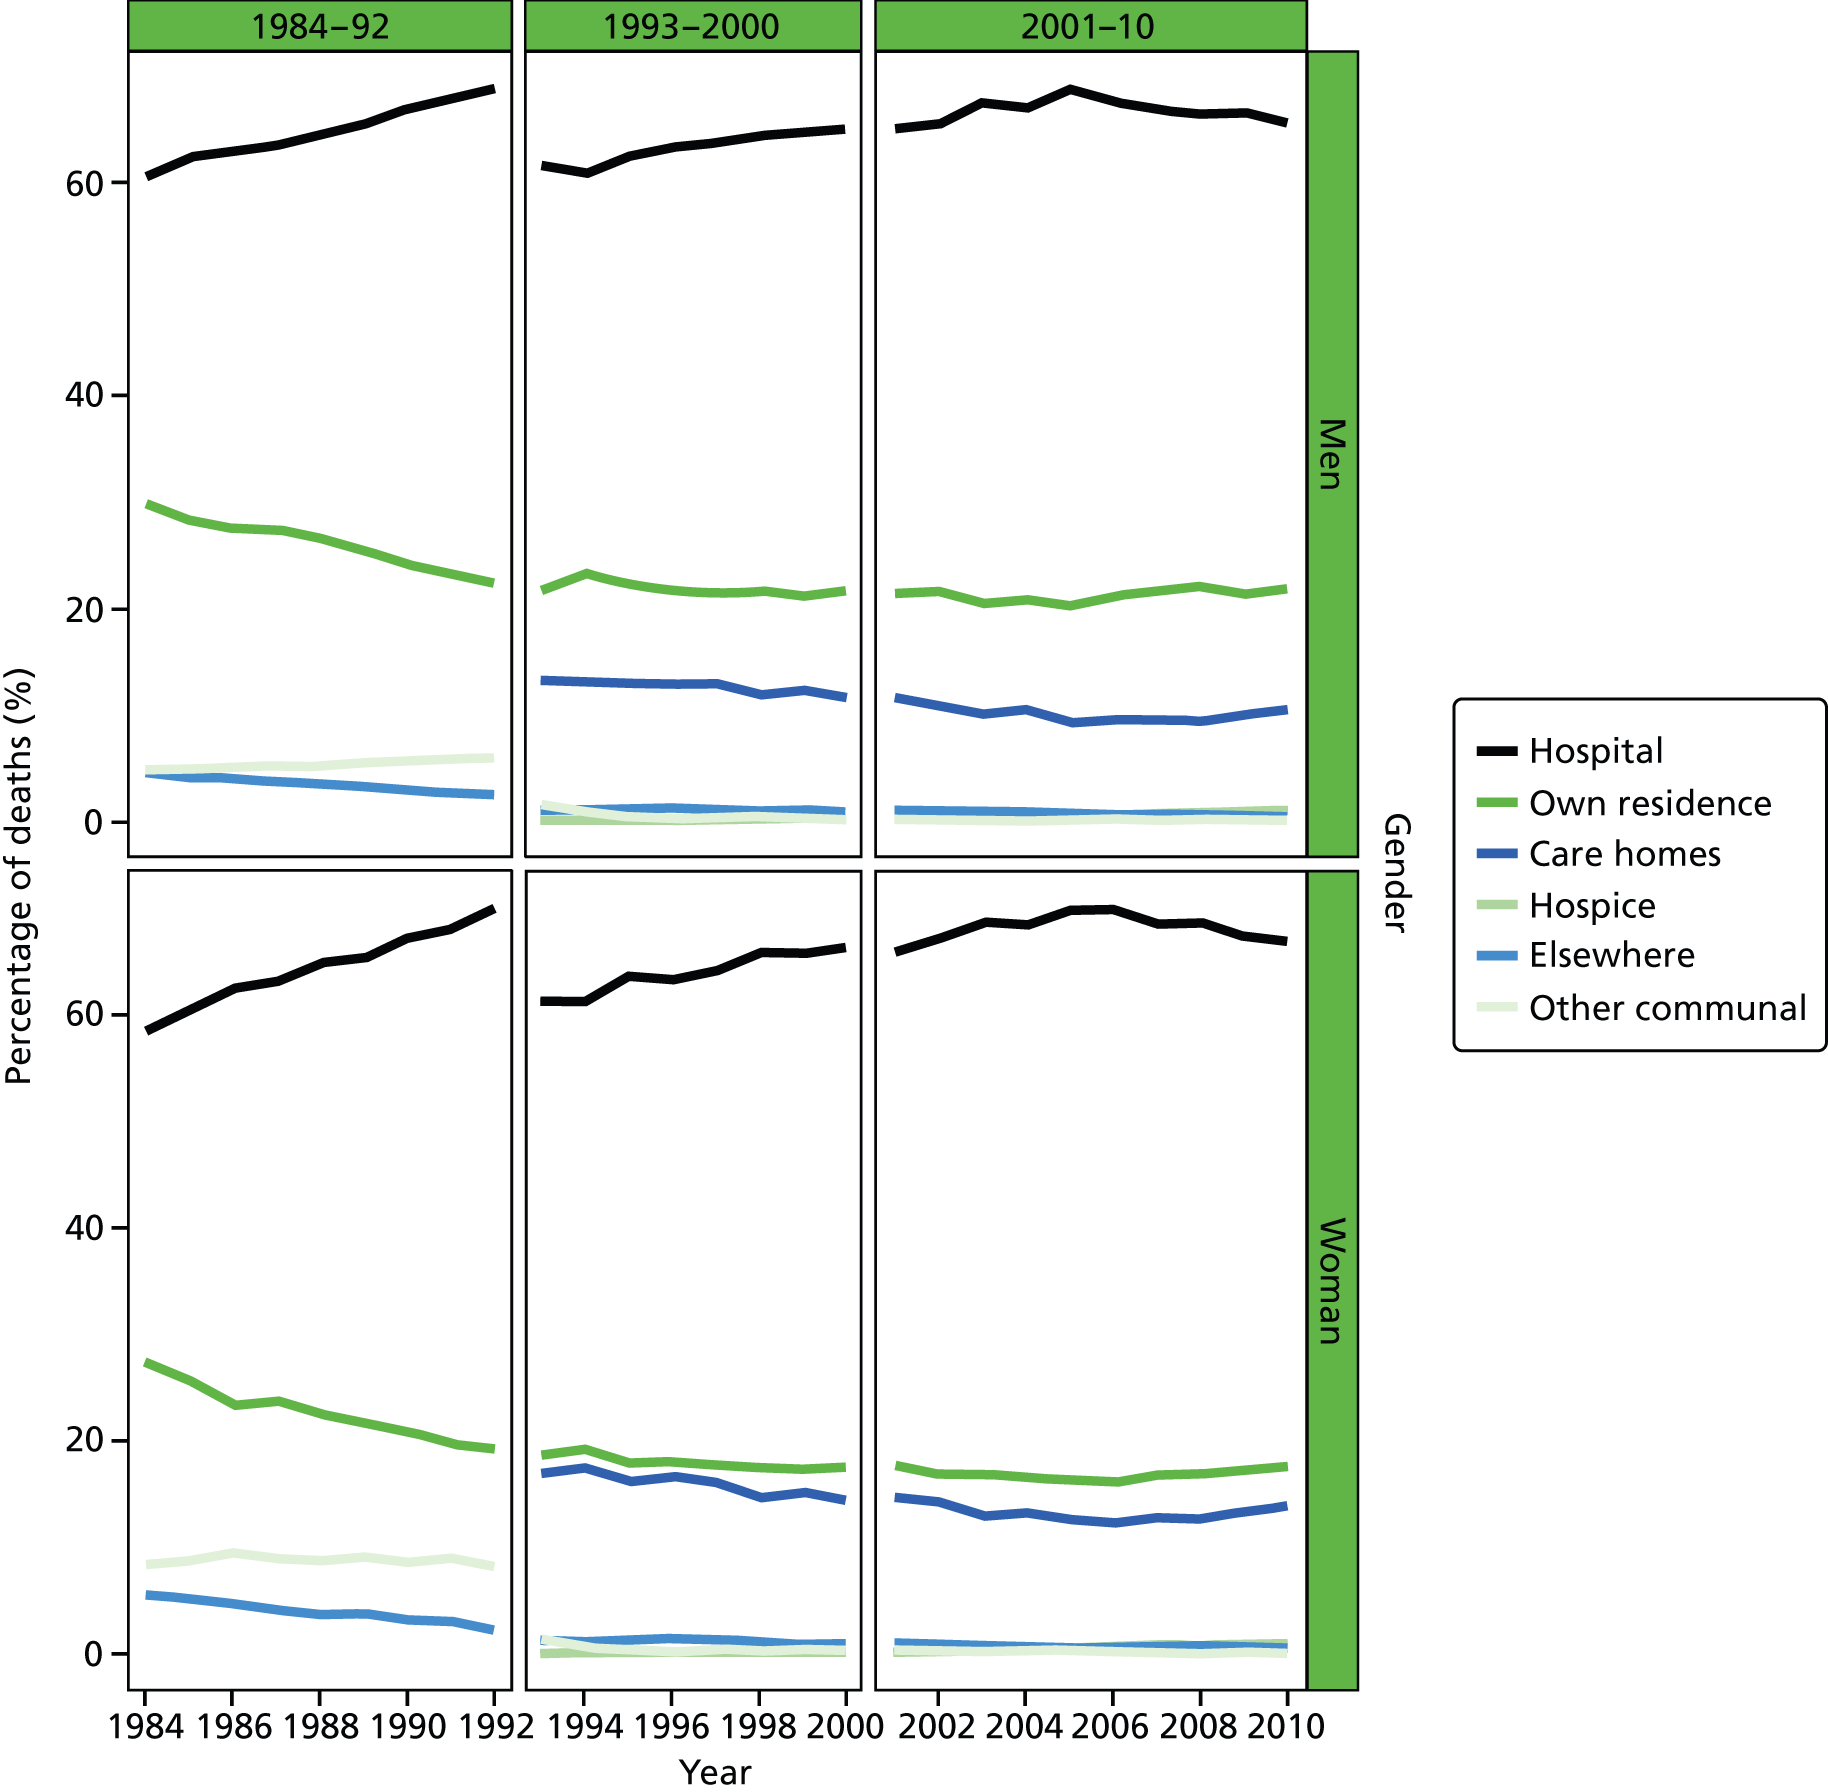
FIGURE 40.
Place of death by marital status in COPD deaths, England 1988–2010.
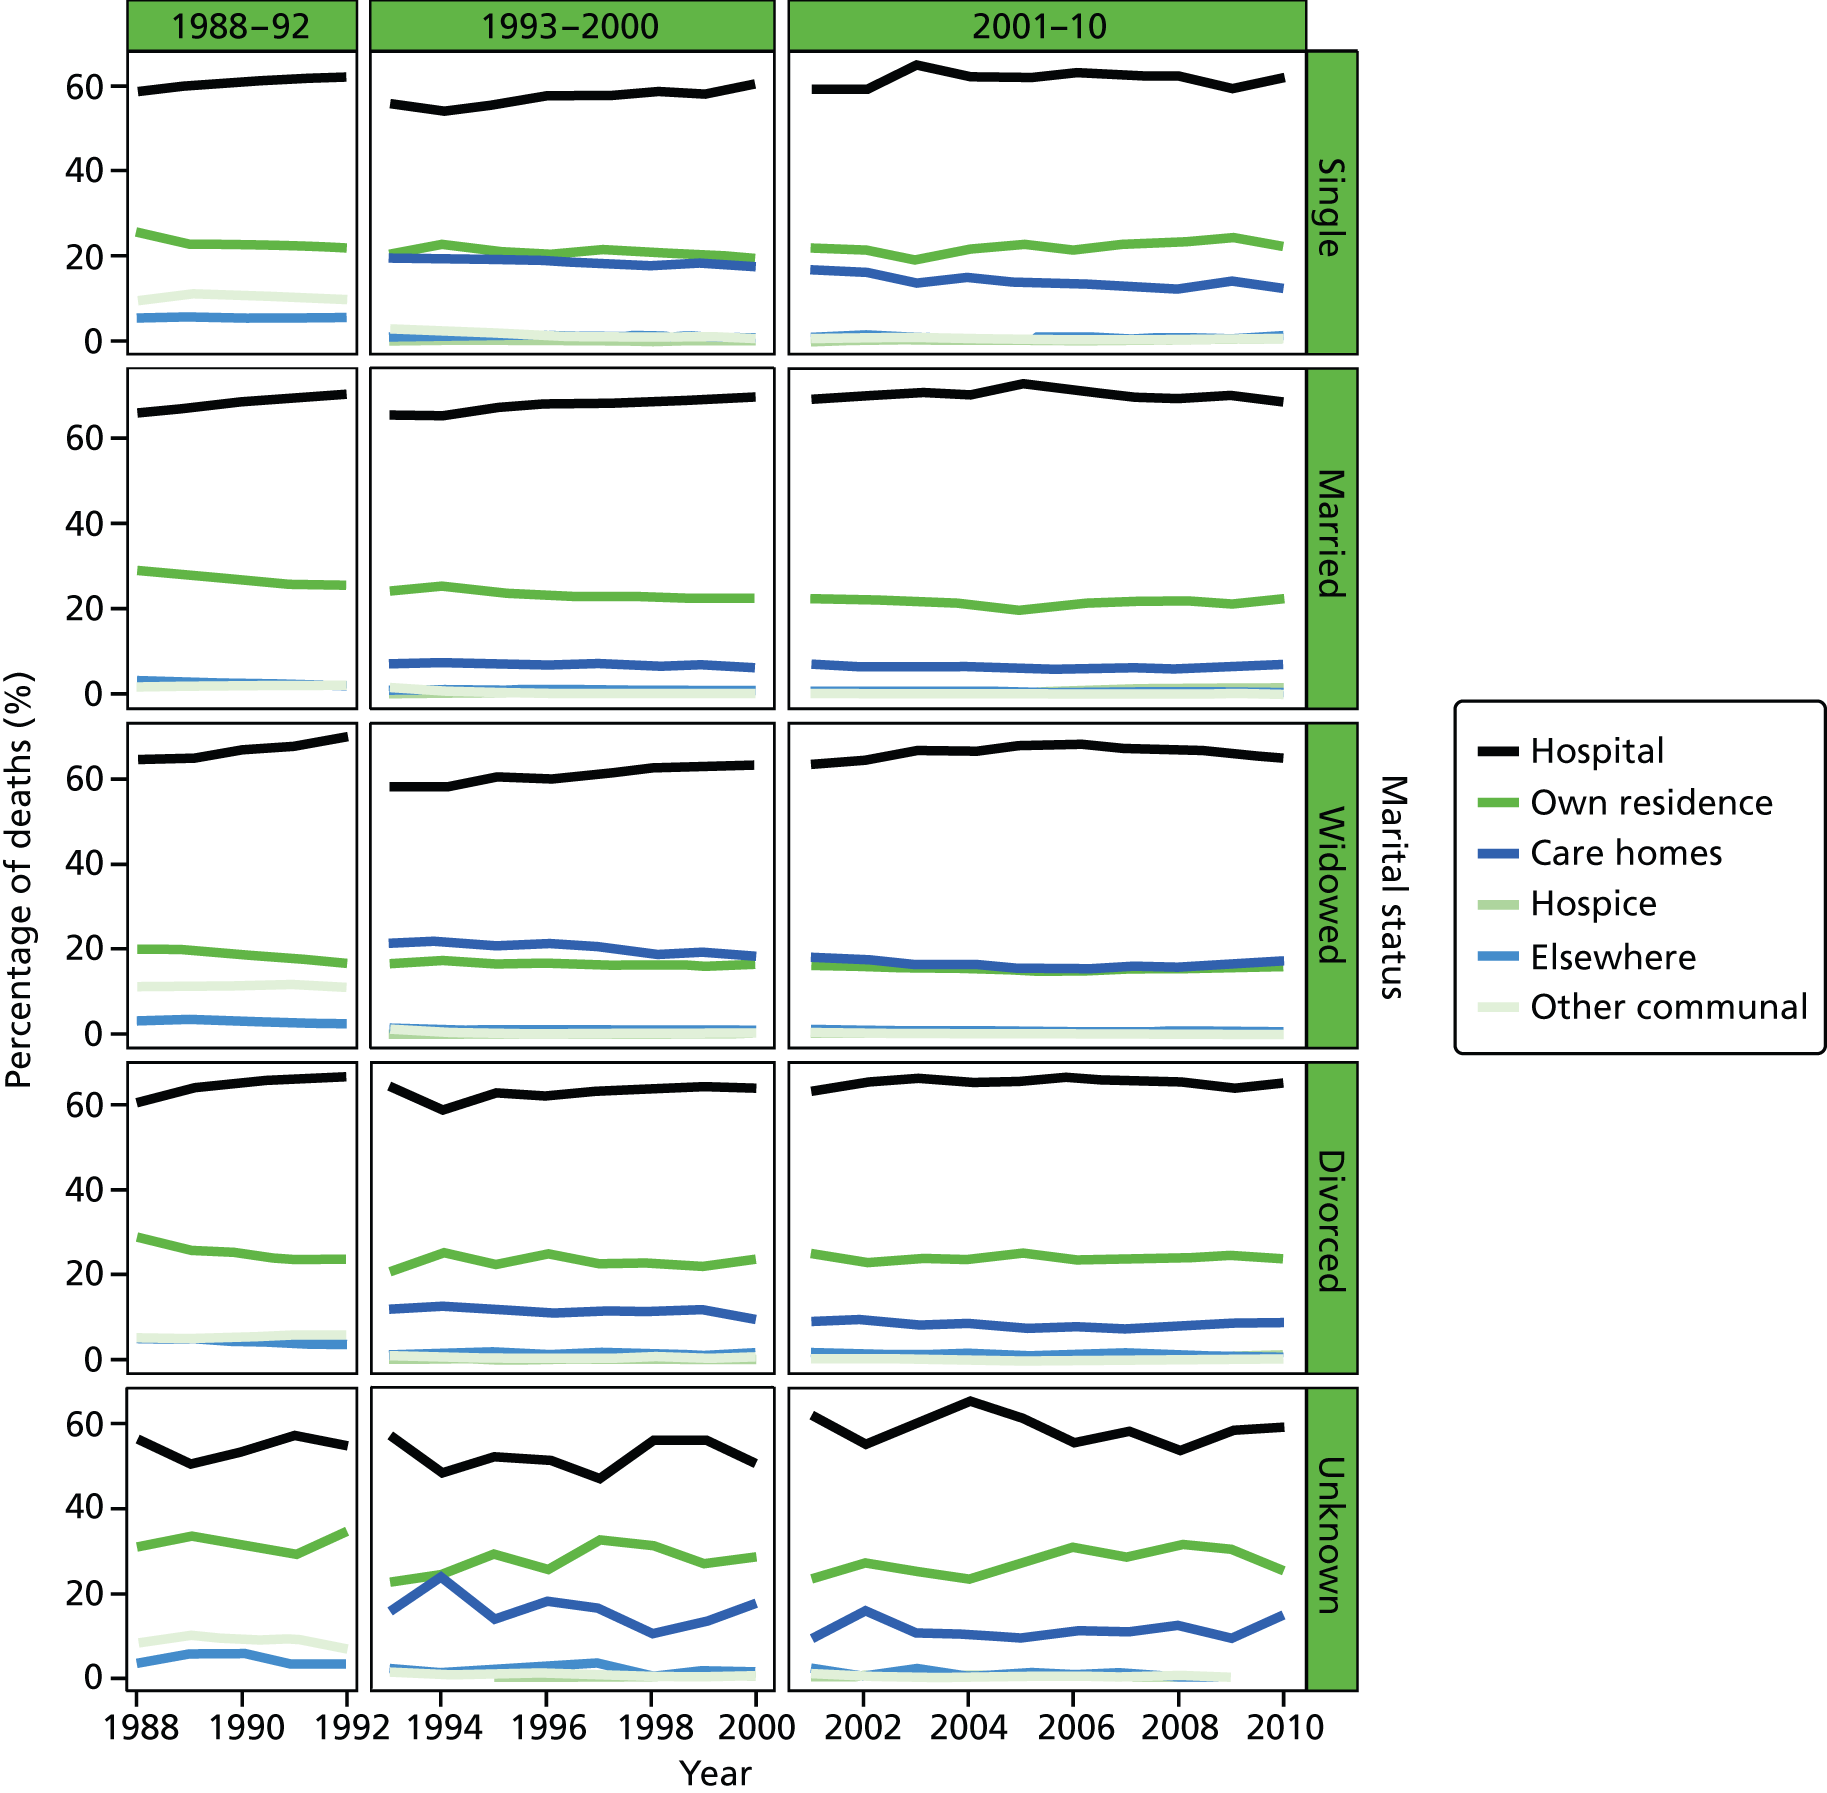
FIGURE 41.
Place of death by IMD ranking (1 = most deprived, 5 = least deprived) in COPD deaths, England 1984–2010.
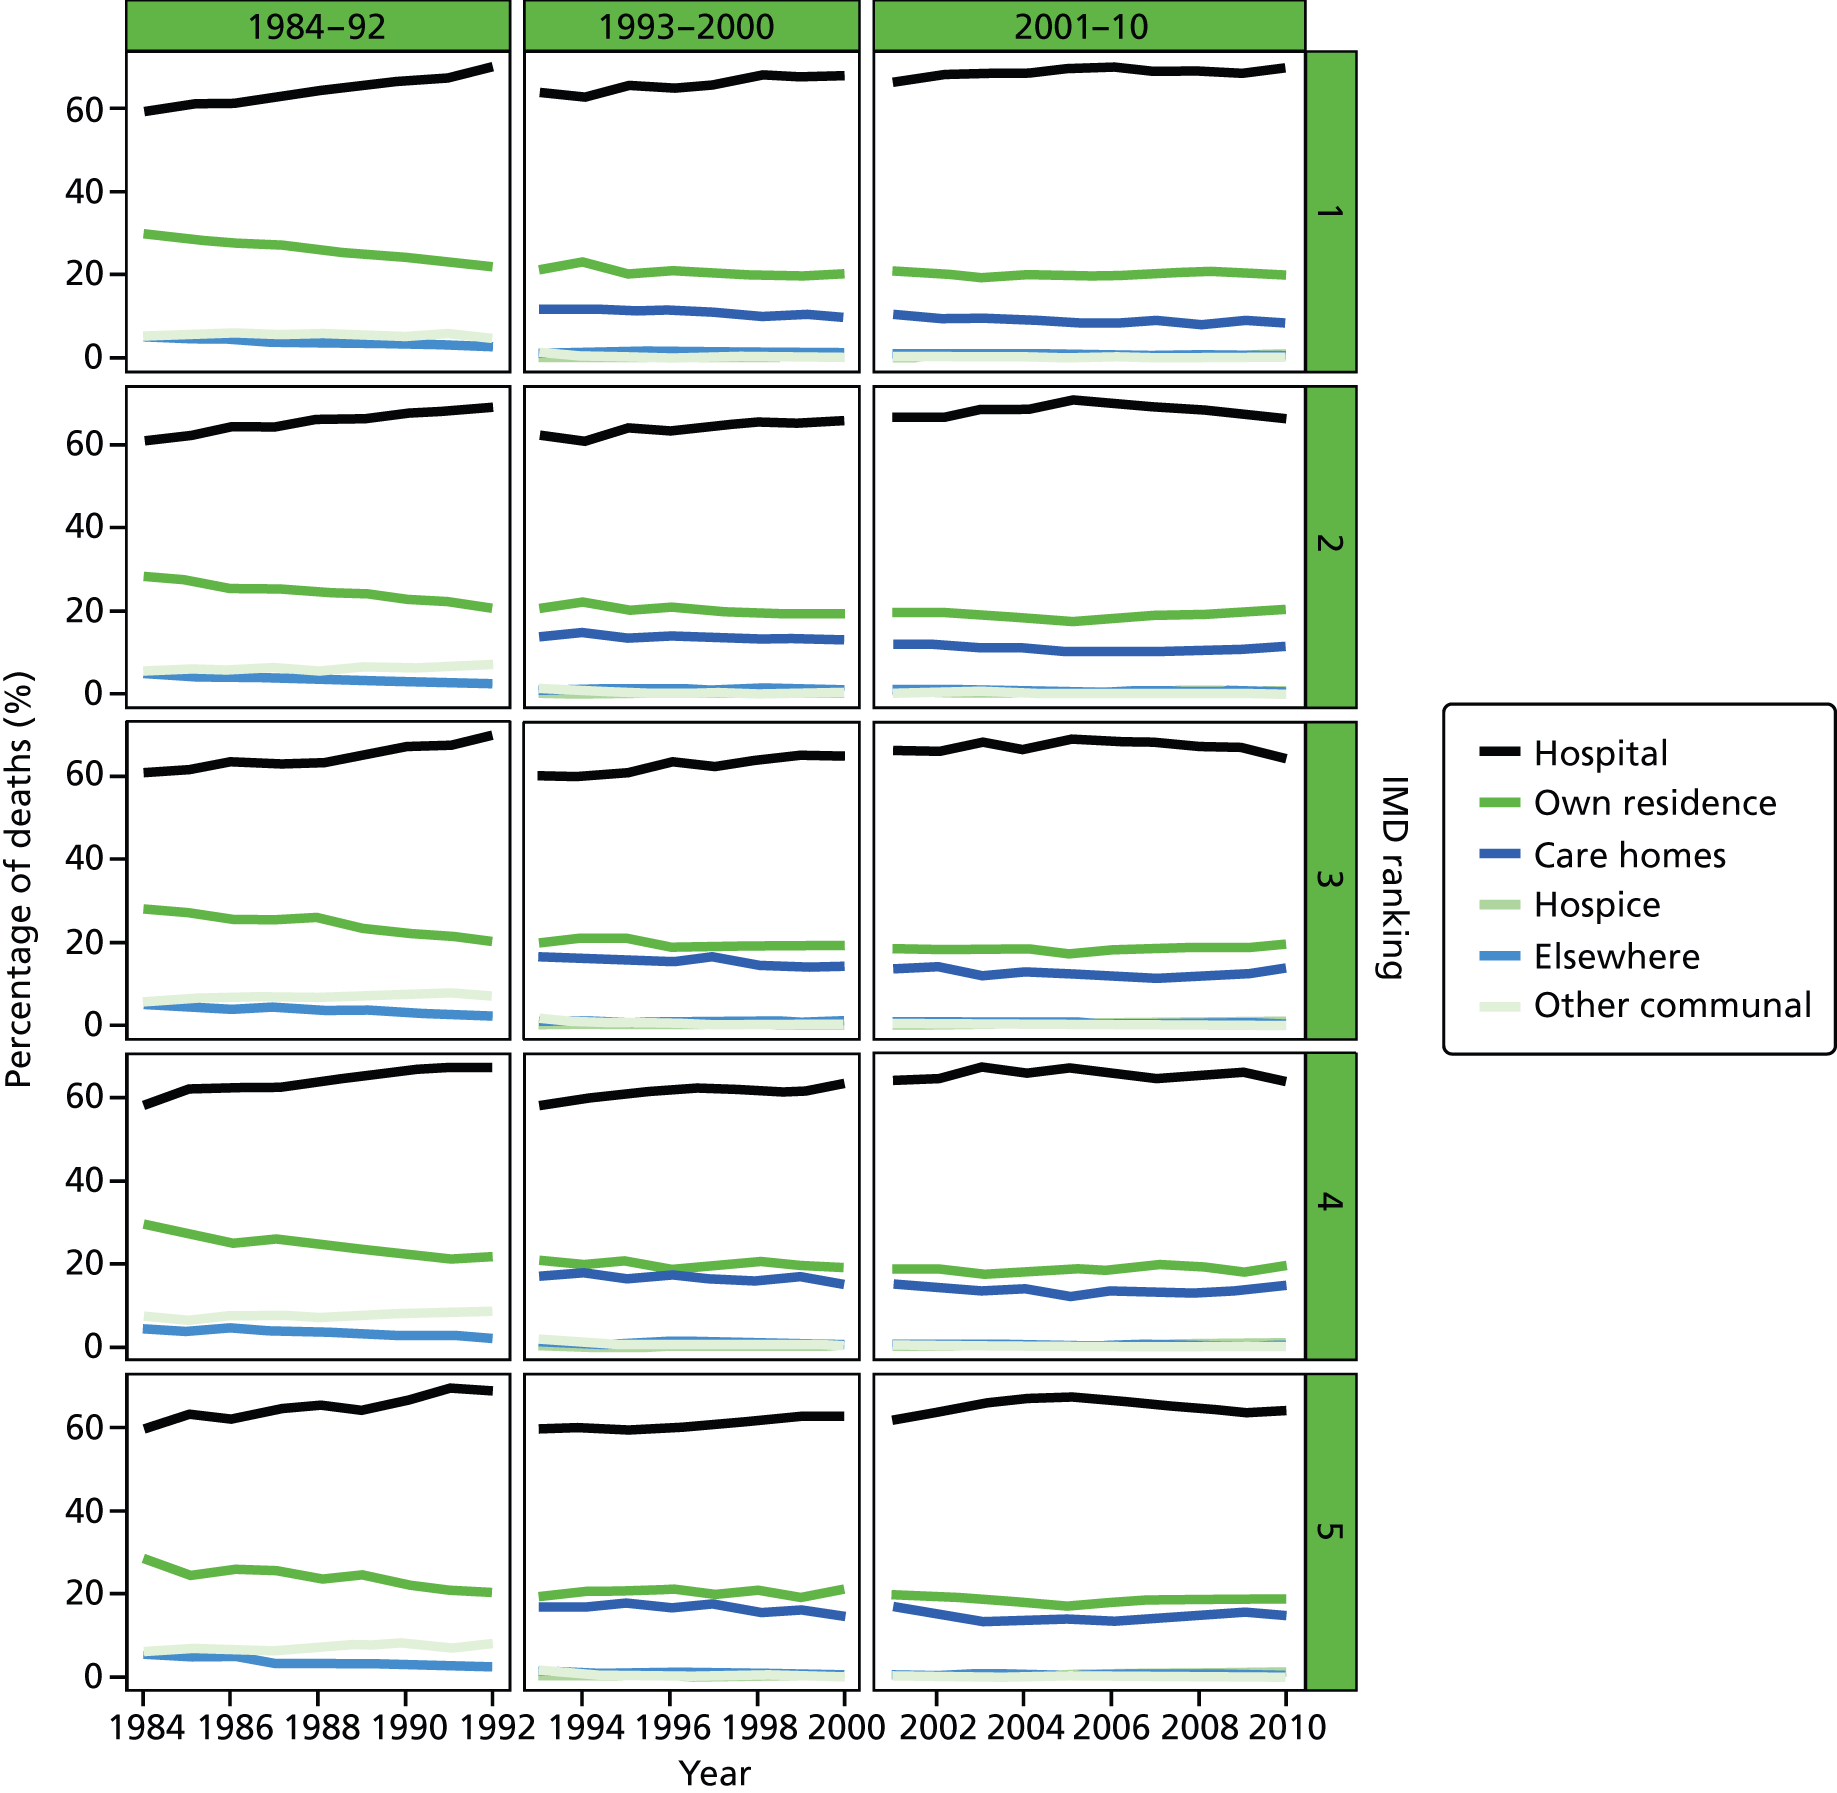
Appendix 2 List of research outputs
Peer-reviewed journal articles
Gao W, Ho YK, Verne J, Glickman M, Higginson IJ. Changing patterns in place of cancer death in England: a population-based study. PLOS Med 2013;10:e1001410. doi: 10.1371/journal
Sleeman KE, Ho YK, Verne J, Glickman M, Silber E, Gao W, et al. , on behalf of the GUIDE_Care Project. Place of death, and its relation with underlying cause of death, in Parkinson’s disease, motor neurone disease, and multiple sclerosis: a population-based study. Palliat Med 2013;27:840–6.
Sleeman KE, Ho YK, Verne J, Gao W, Higginson IJ, on behalf of the GUIDE_Care project. Reversal of English trend towards hospital death in dementia. A population-based study of place of death and associated individual and regional factors, 2001–2010. BMC Neurol 2014;14:59.
Koffman J, Ho YK, Davies JM, Gao W, Higginson IJ. Does ethnicity affect where people with cancer die? A population based 10 year study. PLOS One 2014;9:e95052. doi:10.1371/journal.pone.0095052
Evans CJ, Ho YK, Daveson BA, Hall S, Higginson IJ, and Gao W on behalf of the GUIDE_Care project. Hidden needs of centenarians dying in care homes: a population-based observational study in England. PLOS Med 2014;3:11. doi:10.1371/journal.pmed
Conference abstracts and presentations
Sleeman KE, Davies JM, Ho YK, Verne J, Gao W, Higginson IJ. The changing demographics of inpatient hospice deaths. Population based study in England 1993–2010. European Association for Palliative Care, Lleida, Spain, 4–7 June 2014.
Sleeman KE, Ho YK, Verne J, Gao W, Higginson IJ. Reversal of English trend towards hospital death in dementia: a population-based study of place of death and associated individual and regional factors, 2001–2010. European Association for Palliative Care, Lleida, Spain, 4–7 June 2014.
Koffma, J, Ho YK, Davies JM, Gao W. Higginson IJ. Does ethnicity affect where people with cancer die? A population-based 10 year study. HERON Conference, London, 14 May 2014.
Gao W, Verne J, Glickman M, Higginson IJ. Place of death is associated with holiday periods: implication for end of life care. 13th World Congress of the European Association for Palliative Care, Prague, CZ, 30 May 2013. URL: www.congressinfo.org/filerun/weblinks/?id=e94550c93cd70fe748e6982b3439ad3b&filename=EAPC-Abstract-Book_FINAL%20Version_small.pdf (accessed 27 October 2014).
Evans CJ, Ho YK, Daveson B, Hall S, Higginson IJH, Gao W. ‘Prolonged dwindling’; an over simplification of dying for centenarians? 13th World Congress of the European Association for Palliative Care, Prague, CZ, 30 May 2013. URL: www.congressinfo.org/filerun/weblinks/?id=e94550c93cd70fe748e6982b3439ad3b&filename=EAPC-Abstract-Book_FINAL%20Version_small.pdf (accessed 27 October 2014).
Gao W. Changing patterns in place of cancer deaths in England, 2001–2010: Time trends and associated factors. Society for Social Medicine 56th Annual Scientific Meeting, London, UK, 12 September 2012.
Gao W, Ho YK, Verne J, Glickman M, Higginson IJ. Place of cancer deaths in England, 2001–2010: Time trends and determinants. Society for Social Medicine 56th Annual Scientific Meeting; 2012 Sep 12; London, UK. J Epidemiol Community Health 2012;66(Suppl. I):A27.
Ho YK, Gao W, Verne J, Glickman M, Higginson IJ. Where do cancer patients die? An 18-year trend in England. 2012 NCRI Cancer Conference; Liverpool, UK, 5 November 2012. URL: http://conference.ncri.org.uk/abstracts/2012/abstracts/A170.html (accessed 27 October 2014).
Gao W, Ho YK, Verne J, Glickman M, Higginson IJ. Place of death in tuberculosis: an analysis from Death Registry in England, 2001–2010. 6th Conference of the Union Europe Region: International Union Against Tuberculosis and Lung, London, UK, 4 July 2012.
Sleeman K, Ho YK, Verne J, Gao W, Higginson IJ. Sociodemographic determinants of place of death in dementia: whole population cross-sectional analysis in England, 2001–10. Spring Meeting for Clinician Scientists in Training, 2013 Feb 27; London, UK. Lancet 2012;381:S101.
Sleeman K, Ho YK, Verne J, Gao W, Higginson IJ. Where do people with dementia die? Population-based study of ten year trends, and associated individual and regional factors. Spring Meeting for Clinician Scientists in Training, London, UK, 27 February 2013.
Sleeman K, Ho YK, Verne J, Glickman M, Silber E, Gao W, et al. Trends in place of death, and the effect of death certificate classification and coding changes, in Parkinson’s disease, motor neurone disease, and multiple sclerosis in England: 1993–2010. J Neurol Neurosurg Psychiatry 2012;83(Suppl. 2):A17.
Sleeman K, Ho YK, Verne J, Glickman M, Silber E, Gao W, et al. Trends in place of death and death certificate coding for Parkinson’s disease, motor neurone disease and multiple sclerosis in England 1993–2010. Poster session presented at King’s College London, London, UK, 10 May 12.
Sleeman K, Ho YK, Verne J, Glickman M, Silber E, Gao W, et al. Place of death and death certificate coding for Parkinson’s disease, motor neurone disease and multiple sclerosis in England 1993–2010. Poster session presented at conference of the Association of British Neurologists, Brighton, UK, 29 May 2012.
Press releases
National Institute for Health Research & EurekAlert. Hospital Remains Most Common Place of Death for Cancer Patients in England. 2013. URL: www.netscc.ac.uk/hsdr/news27032013.html, www.eurekalert.org/pub_releases/2013-03/plos-hrm032613.php (accessed 21 October 2014).
Cicely Saunders Institute. Home and Hospice Deaths Increasing Since the Launch of National Programme. 2013. URL: www.csi.kcl.ac.uk/home-and-hospice-deaths-increasing-since-the-launch-of-national-programme.html (accessed 21 October 2014).
BBC News, Health. Centenarians ‘Outliving Diseases of Old Age’. 2014. URL: www.bbc.co.uk/news/health-27682376 (accessed 18 September 2014).
List of abbreviations
- AUC
- area under the receiver operating characteristic curve
- CBD
- cerebrovascular disease
- CI
- confidence interval
- CoD
- cause of death
- COPD
- chronic obstructive pulmonary disease
- CVD
- cardiovascular disease
- df
- degrees of freedom
- EWD
- excess winter death
- GIS
- geographic information system
- ICD-9
- International Classification of Diseases, Ninth Edition
- ICD-10
- International Classification of Diseases, Tenth Edition
- ICD
- International Classification of Diseases
- ICU
- intensive care unit
- IMD
- Index of Multiple Deprivation
- KCL
- King’s College London
- LA
- local authority
- LSOA
- lower layer super output area
- ONS
- Office for National Statistics
- OR
- odds ratio
- PAG
- Project Advisory Group
- PCO
- primary care organisation
- PoD
- place of death
- PR
- proportion ratio
- SD
- standard deviation
- SES
- socioeconomic status