Notes
Article history
The research reported in this issue of the journal was funded by the HS&DR programme or one of its preceding programmes as project number 10/1011/48. The contractual start date was in January 2013. The final report began editorial review in June 2014 and was accepted for publication in January 2015. The authors have been wholly responsible for all data collection, analysis and interpretation, and for writing up their work. The HS&DR editors and production house have tried to ensure the accuracy of the authors’ report and would like to thank the reviewers for their constructive comments on the final report document. However, they do not accept liability for damages or losses arising from material published in this report.
Declared competing interests of authors
Sue Prosser is a senior neonatal nurse at the Royal Devon and Exeter Hospital.
Permissions
Copyright statement
© Queen’s Printer and Controller of HMSO 2015. This work was produced by Allen et al. under the terms of a commissioning contract issued by the Secretary of State for Health. This issue may be freely reproduced for the purposes of private research and study and extracts (or indeed, the full report) may be included in professional journals provided that suitable acknowledgement is made and the reproduction is not associated with any form of advertising. Applications for commercial reproduction should be addressed to: NIHR Journals Library, National Institute for Health Research, Evaluation, Trials and Studies Coordinating Centre, Alpha House, University of Southampton Science Park, Southampton SO16 7NS, UK.
Chapter 1 Clinical setting
In the UK roughly 80,000 infants (a little more than 1 in 10 newborns) are admitted to neonatal units each year. 1 Neonatal units in England are frequently under significant pressure and units are often required to transfer babies to another unit or work at higher than British Association of Perinatal Medicine (BAPM) guideline infant to staff ratios. In 2007 the neonatal charity Bliss reported:1
-
Neonatal units are, on average, understaffed by over a third.
-
Over 6 months, neonatal units were shut to new admissions for an average of 24 days.
-
One in 10 units exceeded its capacity for intensive care (IC) for more than 50 days during a 6-month period.
-
Sixty-five per cent of neonatal units providing the full range of IC did not have enough staffed cots for the infants admitted.
-
A quarter of twins or triplets were reported to be cared for in separate hospitals.
-
A common consequence of the lack of staffed cots is that infants need to be transferred elsewhere.
Reports other than BLISS’s have found units working above BAPM guidelines on workload per nurse; Pillay et al. 2 reported that in 2008/9 54% of nursing shifts in Staffordshire, Shropshire and the Black Country Newborn Network failed to meet nursing standards. The Department of Health (DH) neonatal planning toolkit recommends 80% occupancy of units3 but the National Institute for Health and Care Excellence has reported that ‘Expert opinion suggests that networks are often operating at a bed occupancy level of greater than 80%’. 4 The 80–85% occupancy target often used in the NHS is frequently derived from a modelling study by Bagust et al. 5 It should be noted that Bagust et al. assumed a 200-bed hospital and average hospital lengths of stay and suggested that an average 85% occupancy is required to prevent significant risk of there being no beds available. We believe it would be more appropriate to estimate this target occupancy in a model designed around neonatal care rather than using the output of a generic 200-bed hospital.
Worryingly, in this context, there is evidence to show that infant mortality increases when units work at higher-percentage occupancies. 6 General care is also compromised, with nursing activities more likely to be delayed or omitted when the unit is running with workloads above BAPM guidelines. 2
Neonatal care is described generally as having four levels. 3,7
-
Intensive care for the sickest infants involves care such as mechanical respiratory support or the presence of an arterial line. BAPM/DH recommends 1 : 1 nurse to infant ratios for IC.
-
High-dependency care (HDC) may involve care such as non-invasive respiratory support or parenteral nutrition. A nurse to infant ratio of 1 : 2 is recommended for HDC.
-
Special care (SC) may involve care such as intranasal oxygen or nasogastric feeding. A nurse to infant ratio of 1 : 4 is recommended for SC.
-
Transitional care (TC) is the lowest level of care, and may be shared between neonatal and maternity units. The mother is frequently considered the primary carer in TC, and no guidelines for staffing levels are given for this level of care.
In an observational study, Pillay et al. 2 also found that BAPM standards only just allow sufficient time for all nursing tasks in IC, and did not provide sufficient time for all tasks in HDC and SC. They concluded ‘Simply based on our observations, this study implies that BAPM/DOH [Department of Health] standards, far from being aspirational, are practically needed as the bare minimum for adequate service provision.’
A unit’s capacity may be limited either by the number or level of available cots (or associated equipment) or by the number of nurses.
In the UK, units are described as on three basic levels. 3,8 Neonatal IC (level 3) units provide all levels of care and local neonatal (level 2) units usually provide only up to HDC or very short-term IC, whereas SC (level 1) units provide only SC and a stabilisation facility prior to transfer to more specialist units. There may, however, be additional limitations or capabilities of individual units. Managed neonatal networks were introduced in the UK in 20049 and seek to co-ordinate care across a geographical region. Specialist care may be centralised in one or more level 3 units while low levels of care may be more evenly distributed across a network. The organisation of units into networks means that the workload in one unit is heavily dependent on the other units in a network. Reduction in the capacity of one unit may cause an increase in workload of other units in the network (and vice versa). This makes planning at a network level, rather than a unit level, essential for good overall system performance.
In 2003, a DH report highlighted the limited information on the possible options for matching the available, and potentially available, workforce to the demand. 10
The costs for parents when care is distant from their home location is significant. In a recent report from BLISS it was found that for those who responded to a survey there was an average cost of £282 a week, or £2256 over the course of their infant’s stay in hospital. 11
Chapter 2 Project aims and objectives
The overarching project aim is to improve the quality and efficiency of neonatal services by developing computer simulation tools, based on existing neonatal data sets, to test and plan the optimum configuration of neonatal networks.
The simulation will also be used to assess what level of resources is required to meet the BAPM and DH guidelines, allowing for variability of workloads.
Specific objectives were:
-
To develop a computer model that can mimic the current performance and costs of a neonatal network, and to predict costs and performance of alternative configurations.
-
To model the minimum network resources (cots and nurses) and costs required to meet BAPM/DH guidelines (including 1 : 1 care in IC) 80%, 90% and 95% of the time.
-
To use computer modelling to identify configurations and costs of resources that reduce the occurrence of overcrowding and increase the probability of an appropriate cot being available locally.
-
To develop a model that allows multinetwork analysis.
-
To develop a primary economic analysis which will focus on costs of neonatal care using differing network configurations. A secondary analysis will consider ways in which this analysis might be developed to look at longer-term economic impacts of differing models of care.
-
To develop a pilot national model that will identify the best locations, and estimate travel distances for parents, for any given number of hospitals.
-
To improve user (parent) involvement in health-care simulation and assess its value in planning, and to elicit feedback on what is important to parents.
Chapter 3 Previous neonatal care simulation and modelling work
There has been a variety of modelling and simulation work on neonatal care systems. These have included mathematical queuing models,12–16 a simulation model17 and a comparison of mathematical and system dynamics models. 18 These models are discussed in more detail in the discussion, in Chapter 12, Comparison with previous neonatal models.
Our model built on previous work in various significant aspects:
-
The model views the system from the perspectives of both the service provider and parents.
-
The model allows capacity to be constrained by a combination of physical cots and the nursing workforce caring for the infants (nursing load varies depending not only on the number of infants in care, but on the acuity mix of the infants in care).
-
The model allows a high degree of customisation of the capabilities of each hospital (such as gestational age limits on care).
-
The model allows for multinetwork analysis.
Chapter 4 Data sources and ethics
Neonatal care data
Neonatal care data were extracted from Badger data (www.clevermed.com/). Badger is the proprietary patient data management system used in all the hospitals in this study. Badger records the date, time, origin and reason for admission, and the date, time and destination of discharge (including if an infant is discharged for specialist surgical or cardiac care). For each day of care the interventions received are recorded and Badger then classifies an infant by care level according to BAPM 2001 or 2011 guidelines7 [the differences between 2001 and 2011 categories of care have been summarised by the neonatal data analysis unit (NDAU)19]. Appendix 1 gives an example of Badger data used for analysis and as the basis of modelling. The model was based on 2 years of admissions in Badger (January 2011 to December 2012 inclusive). In this period there were 6197 Badger episodes (a Badger episode occurs for each admission to a hospital) and 5665 unique infants (7.1% of infants had more than one episode). A subsequent 6 months of data was used to test and validate the model.
Nurse staffing
Information on nurse staffing came from a daily ring-around survey of the number of nurses present in the units. The daily ring-around involves the nurse in charge at each site. The numbers of clinical on-duty staff are recorded for day and night shifts, separated by those who are qualified in specialty and those not. These numbers exclude supernumerary staff such as managerial staff (including the nursing team leader if he or she is not on clinical duty, student nurses and staff involved in training/teaching). Staff who are rostered to be present but who are absent (e.g. because of illness) are not counted. Although there is good standardisation of the data collected, a limitation is that the reality may sometimes be more complicated. For example, many units may have a supernumerary team leader, especially during the day; the ring-around audit data assume that the leader will not be available for clinical duties, but if the unit is highly stretched the supernumerary nurse may lend a hand. We used the day shift numbers excluding supernumerary headcount and excluding one nurse dedicated to neonatal transfer duties. The data used were from January 2011 to December 2012. Our analyses do not seek to identify availability of nurses throughout a day: we have assumed that, if a nurse is present for a shift, then he or she meets the availability requirements to count as being able to care for infants throughout that day (e.g. one nurse would meet the standard of 1 : 1 care for an infant in IC throughout his or her shift, although there may be inevitable breaks in availability throughout that shift).
Travel distances and travel times
Travel distances and travel times were obtained using Microsoft MapPoint version 2013 (Microsoft Corporation, Redmond, WA, USA) using the MPMileCharter add-in (version 3.4, Winwaed Software Technology LLC, Dallas, TX, USA) to allow calculation of large matrices of routes. Travel times and distances are fastest routes by road unless otherwise stated. Public transport times were obtained using the Transport Direct search engine (www.transportdirect.info) run by a non-profit consortium appointed by the Department for Transport. See Chapter 6 for more details.
Demographic and births data
Demographic data for deprivation were obtained from the Office for National Statistics (ONS). 20 These were mapped using Google Fusion Tables (Google Inc., Mountain View, CA, USA). The number of women of child-bearing age (15–45 years) and the fertility rate of that age group were obtained from NHS England National General Practice Profiles. 21 The number of births in England was obtained from the ONS22,23 or from NHS Hospital Episode Statistics (HES), queried using the Signals From Noise tool from Lightfoot (version 8.9, Lightfoot Solutions Group Ltd, Bracknell, UK).
Ethical review
This project used anonymised secondary data only. Access to neonatal data (Badger) was approved by Proportionate Review by the Research Ethics Committee (REC Reference 12/SC/0675) and local Caldicott Guardian approval (approval obtained from Plymouth Derriford Hospital, the single point of access to all neonatal data used).
Chapter 5 What is discrete event simulation, and why use it?
Discrete event simulation (DES) is a method of simulating the behaviour and performance of a real-life process, facility or system. DES is being used increasingly in health-care services24–26 and the increasing speed and memory of computers has allowed the technique to be applied to problems of increasing size and complexity. DES models the system as a series of ‘events’ [e.g. a birth, a stay in an intensive care unit (ICU), a transfer or a discharge] that occur over time. DES assumes no change in the system between events. In DES, patients are modelled as independent entities each of which can be given associated attribute information. In the case of neonatal simulation this may include parameters such as gestational age or weight at birth, hospital of birth, singleton/twin and current location. The information may be modified as time runs in the simulation model (e.g. the location will be changed depending on the status of the units in the network, and the level of care being received will be modified as the infant progresses). The simulation also accounts for resources. In the neonatal model the key resources are cots (with the highest level of care for each cot specified) and nurses. In order to care for an infant a unit must have the necessary cot and the necessary nursing staff (applying appropriate guidelines). The model allows each unit to work to a specified level of overcapacity regarding nursing, but will monitor the time each unit is undergoing overcapacity. DES models also allow for complex rules specifying where infants may be accepted; for example, there may be two ICUs, but with different facilities (e.g. surgery) or with different limits on gestational ages. DES thus allows complex decision logic to be incorporated that is not as readily possible in other types of modelling.
Simulation allows many ‘what if?’ scenarios to be tested. This allows decision-makers to test and better understand alternative ways in which a new policy may be best met.
Chapter 6 Determining distance from parents’ home location to point of care
Microsoft MapPoint
For analysis and modelling of travel distances and times we have used Microsoft MapPoint. We used the MPMileCharter add-in to allow calculation of large matrices of routes.
Road distance and time versus straight-line distances
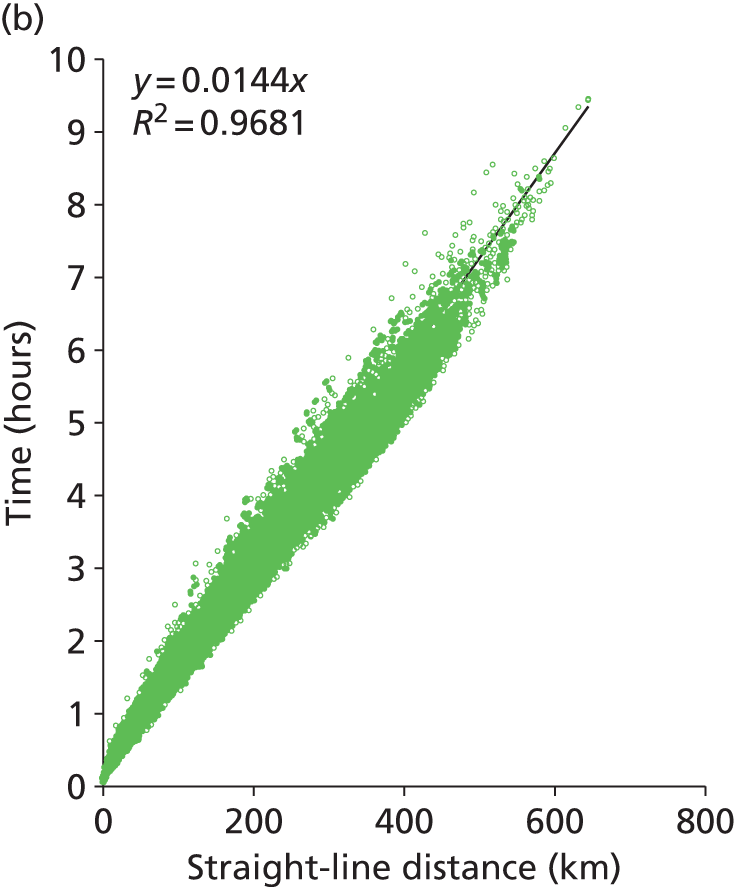
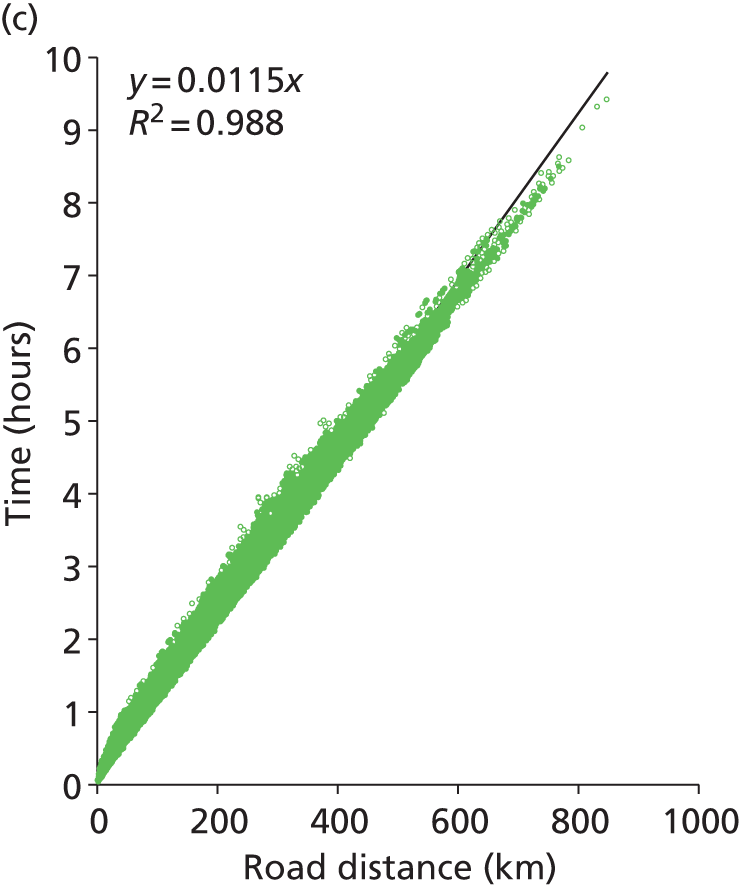
The current model uses fastest-route road distances and times between patient nodes and hospital locations. We have, however, looked at the feasibility of using straight-line distance should the model be expanded significantly. At a national scale we predict that there are 1.3 million routes to identify (routes from each GP location to all neonatal units). We estimate that this will take about up to 30 days of processor time to calculate using Microsoft MapPoint. Straight-line distances are rapid to calculate (less than 1 hour for all 1.3 million national routes). Two hundred postcodes were selected at random in England and straight-line distances, fastest-route road distance and fastest-route travel time between all postcodes were obtained from MapPoint (20,000 routes in total). We found a very high correlation (R2 = 0.98, Figure 1) between straight-line distances and road distances, with road distances on average being 24% greater than straight-line distances [median 25%, interquartile range (IQR) 20–32%]. Travel time correlated well with straight-line distance (R2 = 0.97), although the correlation was not as close as with road distance (R2 = 0.99).
FIGURE 1.
Comparison of straight-line distances, road distance and travel times (20,000 routes). (a) Comparison of road distance (fastest route) against straight-line distance. (b) Comparison of predicted travel time against straight-line distance. (c) Comparison of predicted travel time against road distance (fastest route).

Public versus private transport
A comparison of public and private transport times was made using the Transport Direct search engine run by a non-profit consortium appointed by the Department for Transport.
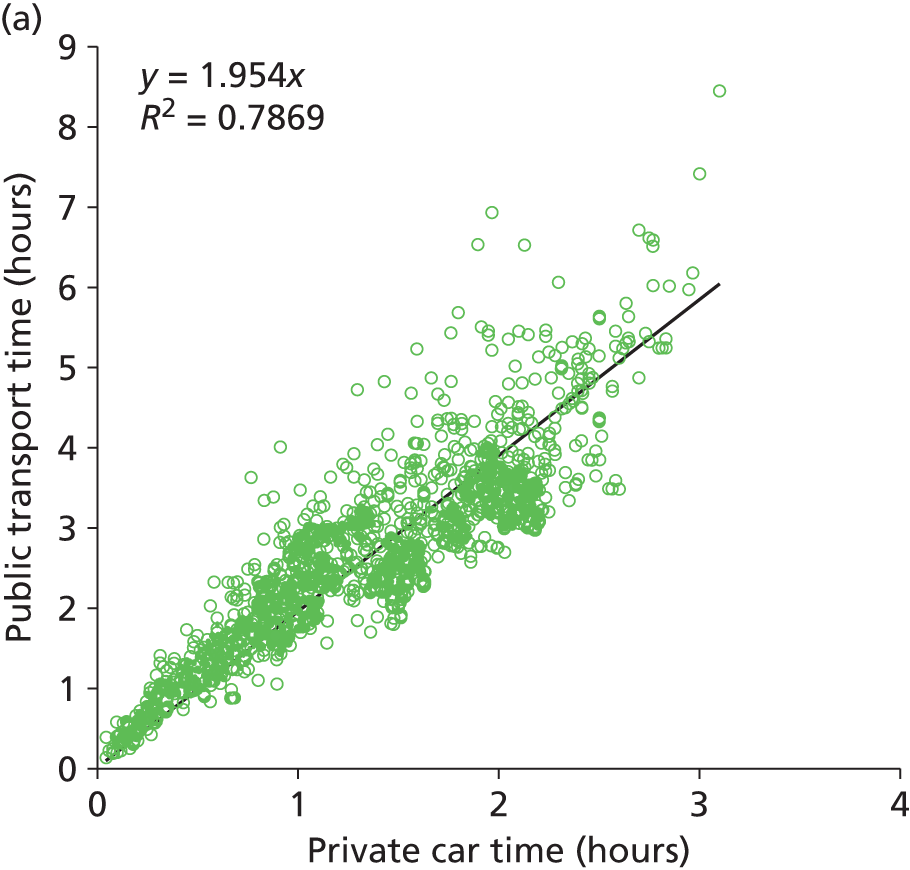
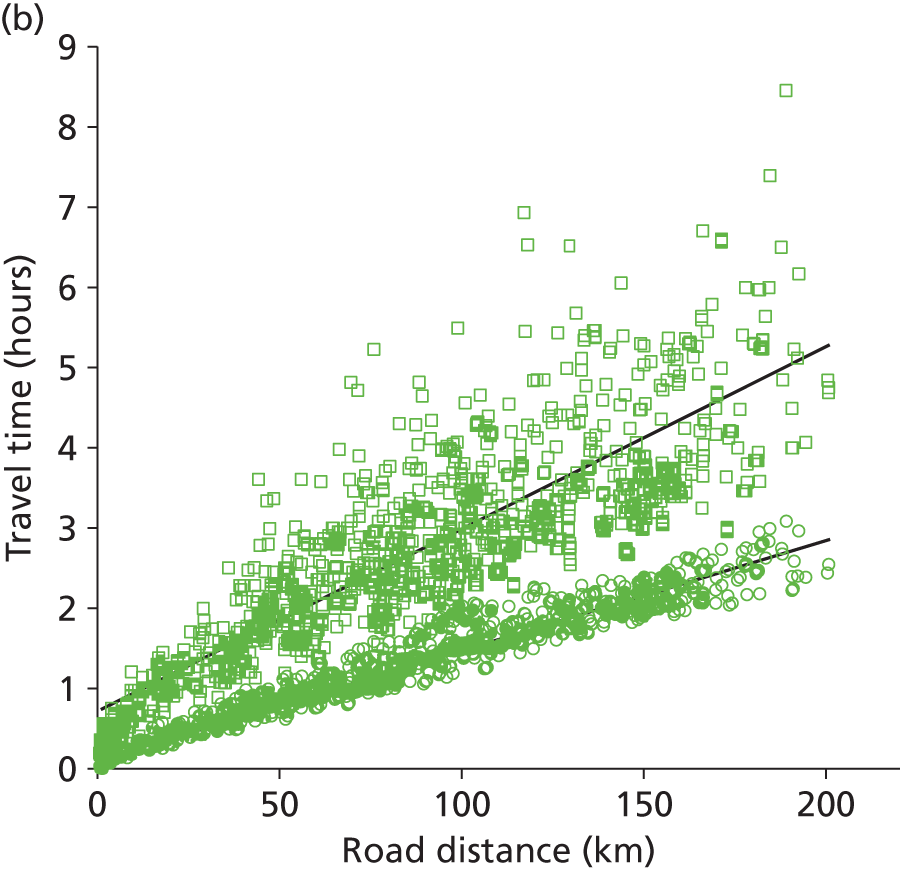
Public and private travel times were compared for all journeys in Devon and Cornwall (the 220 patient nodes to the five hospitals). The search engine returned both private and public transport times for 99% of all the possible combinations. Results are shown in Figure 2 and summarised in Table 1. On average, use of public transport takes twice as long as travel by car. We have generally assumed that a distance of 50 km (taking approximately an hour by car) represents a reasonable maximum travel distance, but it should be noted that parents relying on public transport may face significantly more time travelling, or may depend more on accommodation local to the neonatal unit. The distance able to be travelled using public transport, before local accommodation is required, is therefore likely often to be less than the acceptable distance for a private car driver. Feedback was received from a parent involvement focus group that this may occur if parents do not have access to a car that may be dedicated to travel to a neonatal unit, or may occur after a caesarean section.
FIGURE 2.
A comparison of public and private travel times between patient locations and hospitals in Devon and Cornwall. (a) Comparison of public transport times against private car travel. (b) Comparison of travel time against distance for private car (open circles) or public transport (open squares).
| Population parameter | Ratio |
|---|---|
| Mean | 2.02 |
| Fifth percentile | 1.45 |
| First quartile | 1.76 |
| Median | 2.06 |
| Third quartile | 2.43 |
| 95th percentile | 3.20 |
Chapter 7 Descriptive analysis of data
Analysis framework in R
Preparation and analysis of neonatal transition and length of stay (LoS) data was performed in the statistical computing language R version 3.0.2 (The R Foundation for Statistical Computing, Vienna, Austria). Additional analysis of Badger data was performed using Excel 2010, Microsoft Corporation, Redmond, WA, USA.
A bundle of R code was developed to carry out various analysis tasks. The code can work with both Badger data and output from Simul8 2013 (Simul8 Corporation, Boston, MA, USA) models. For example, it can be used to analyse lengths of stay, or for analysing transition probabilities between different levels of care (with or without analysis by gestational age group).
The tool is intended to be applicable more generally than in this project alone, so it:
-
is, in principle, able to process other or larger data sets in the Badger format (is ‘scalable’)
-
has been incorporated (along with relevant documentation and data) into an R ‘package’ called ‘Neonatal’ which can be shared with other analysts using R (an R ‘package’ is a standard way of collecting together code and data in a form that can be shared; many are available online at http://cran.r-project.org/).
The aim is that analysis tasks can be carried out in an interactive way with fairly simple commands, even though the analysis tasks themselves can be lengthy and involved. The R package takes four sets of data for its analysis (Figure 3):
FIGURE 3.
Combination of four data sources into a single Badger object.
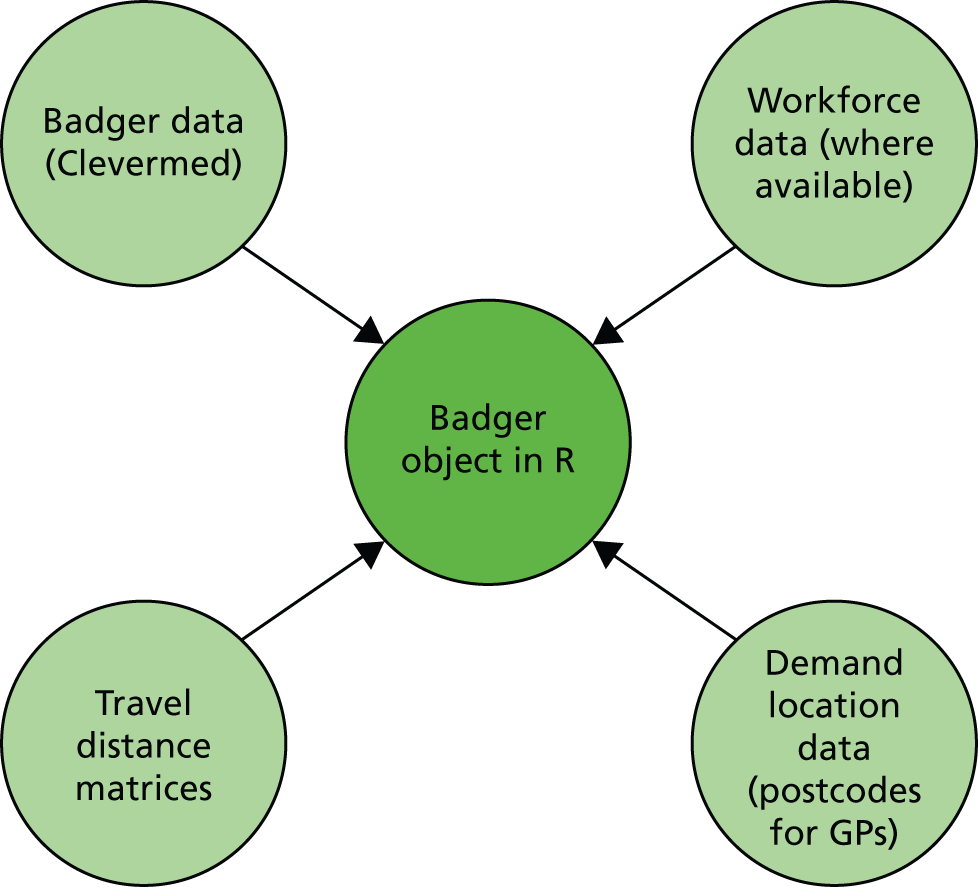
-
Badger data (from a standard Badger query, summarising lengths of stay in each episode for each infant)
-
workforce data (number of nurses on duty each day shift, where available)
-
demand location data (e.g. postcodes of mothers’ GPs)
-
travel distances matrices: fastest route distances between each demand node and hospital and between each hospital (data from Microsoft MapPoint).
The R package pre-processes the Badger data (Table 2) and merges with the other data sources (workforce, demand locations, distance matrices) to create a single R object of type ‘Badger’.
| Task | Details |
|---|---|
| Clean | Tidy (e.g. remove duplicates, remove orphan records, correct network affiliation of hospitals, merge capitalisation differences) |
| Infer which infants are twins | Look for identical values of:
|
| Create age categories | Calculates categories of gestational age at birth (see Chapter 8, Categorisation of infants) |
| Specify BAPM variables and nursing weights | Which version of BAPM variables to use (2011 or 2001) and apply nursing requirements (see Chapter 7, Quantification workload and lengths of stay in each care level) |
| Transform care records to prioritised integers | On any day, identify the highest level of care and attribute 1 day of care at that level |
| Censor outside stays | Remove records from Badger-like table where network is not visible |
| Adjust LoS | See Chapter 7, Quantification workload and lengths of stay in each care level |
| Infer which individual’s records are complete (i.e. all episodes are within the visible networks) | All these conditions fulfilled:
|
| Infer preferred location of care | Identify closest suitable cot for each level of care (based on infant characteristics and hospital types described in Chapter 8, Hospital types) |
| Identify surgical/cardiac infants | Mark infants whose discharge destination contains the substring cardiac or surg |
Following pre-processing, the Badger object contains a number of components as outlined in Table 3.
| Component | Description |
|---|---|
| BAPM | (2001/2011) Determines which LoS variables to use and their weights |
| visible.networks | Names of networks for which data are available (user-specified) |
| locations | Names of hospitals for which data are available (derived from the data) |
| episodes | Dataframe of time-dependent Badger data |
| subjects | Dataframe of individual-level Badger data |
| long.ts | Dataframe of time-related data in ‘long’ form, that is with a single record for each individual’s stay at any unit |
| wide.ts | Dataframe in ‘wide’ form, containing numbers of infants present at each level of care and in each hospital. There is one record for every occasion where an individual enters, leaves or moves between levels of care |
Analysis tasks can then be carried out on a Badger object in an interactive way with fairly simple commands, as indicated in Table 4. These commands can contain further options for finer control, such as restrictions on the time period of the data. Furthermore, many of these tasks can be ‘stratified’ so that analysis is split by other factors of interest (most likely age category or location of care).
| Task | Example command operating on a Badger object here called x |
|---|---|
| Calculation of transition probabilities and LoS statistics | transition.analysis(x) |
| Summary statistics of workload and numbers of infants | summary(x) |
Plotting, including:
|
plot(x, type = ‘workload’) |
| Calculation of numbers of transfers and transfer distances | transfer.analysis(x) |
Quantification of workload and lengths of stay in each care level
Note: Segregation into IC, HDC, SC or TC is by BAPM 20117 standards unless otherwise stated. All data refer to admissions in 2011 and 2012.
Infants in different levels of care require different levels of nursing according to DH and BAPM guidelines. 3,7 This is described in Table 5.
| Care level as described in this report | BAPM 2001 | BAPM 2011 | Workload (nurse equivalents required for care) |
|---|---|---|---|
| IC | Level 1 | Level 1 | 1 |
| HDC | Level 2 | Level 2 | 0.5 |
| SC | Level 3 | Level 3 | 0.25 |
| TC | Not applicable | Level 4 | 0.125a |
‘Workload’ in this report is the calculated number of nurses required to look after the infants present in the unit (Equation 1). A simplification in the simulation model is that requirements for different types of nurses are not determined; it is assumed that there is an appropriate skill mix of nurses for any particular unit (the skill mix is taken into account in economic analysis in Daily variation in case mix, workload and nursing numbers).
Equation 1: Workload calculation. Workload is the number of on-duty nurses required to care for the number and mix of infants present in the unit. Workload excludes supernumerary nurses (e.g. nurses dedicated to management or neonatal transfer).
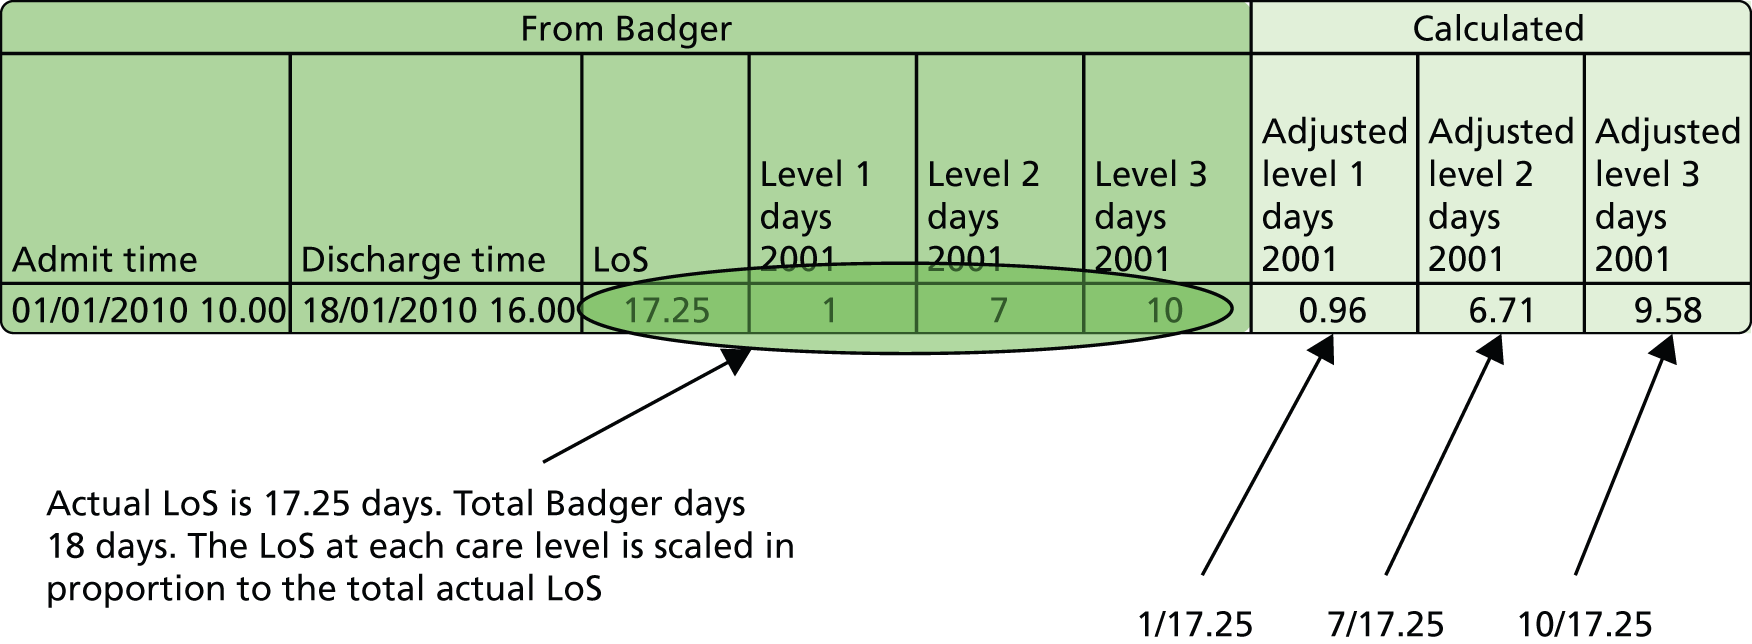
Badger data are summarised for each day of care. Total Badger care days add up to more than the actual LoS, as any part day is counted as a full day in Badger. We therefore adjusted the days in each level of care in proportion to the total LoS calculated from admission and discharge times (see Figure 4).
FIGURE 4.
Calculation of lengths of stay in different care levels. In Badger any part day at any level of care is recorded as a full day. Lengths of stay in each care level are adjusted to be in proportion to total LoS.
Location of demand
There are 220 GPs whose closest hospital is one of the five hospitals in our main study area. GPs are, on average, 2.9 km apart by straight-line distance (median 1.0 km, IQR = 0.4–4.8 km, distances calculated using Microsoft MapPoint with MPMileCharter add-in). GPs are, on average, 3.6 km apart by road (median 1.5 km, IQR = 0.6–6.0 km, distances calculated using Microsoft MapPoint with MPMileCharter add-in).
We extended this analysis to national distances between GPs. There are about 8000 GP practices in England, which on average are 1.4 km apart by straight-line distance (median 0.6 km, IQR = 0.3–1.3 km, distances calculated using Microsoft MapPoint with MPMileCharter add-in, practice locations from Public Health England Practice Profiles). This is in close alignment to a study in the South West of England which calculated the median straight-line distance from a patient’s home location to their GP as 1 km (IQR = 0.6–2.0 km), with 95% of electoral wards (98% of the population) being under 4.4 km, or 6.3 minutes, from their closest GP. 27
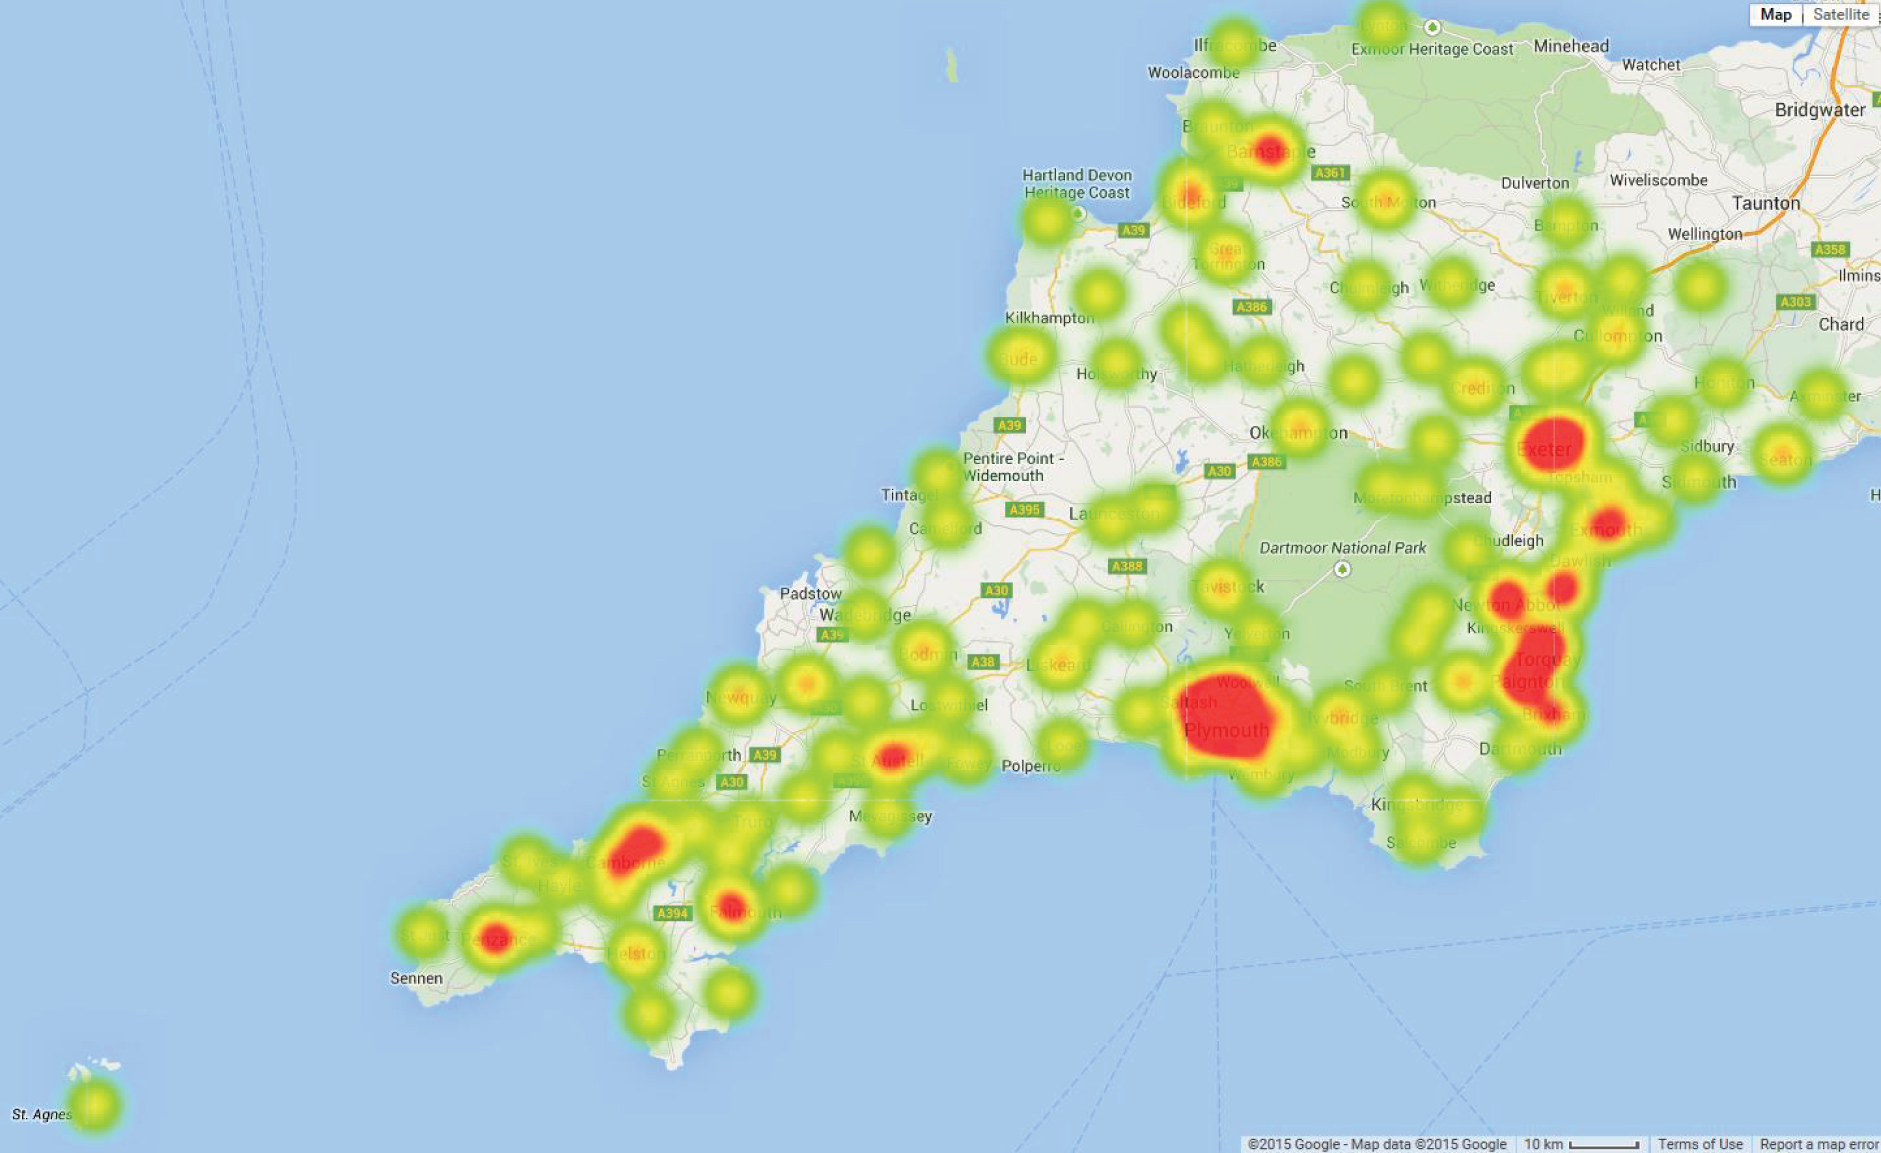
Figure 5 identifies locations of GPs and hospitals. Figure 6 shows demand by GP location as a heat map. Unsurprisingly, demand is highest around the main urban conurbations.
FIGURE 5.
Location of GPs (patient nodes, yellow circles) and hospitals (red flags) in the Peninsula region. © 2015 Google – Map data © 2015 Google.
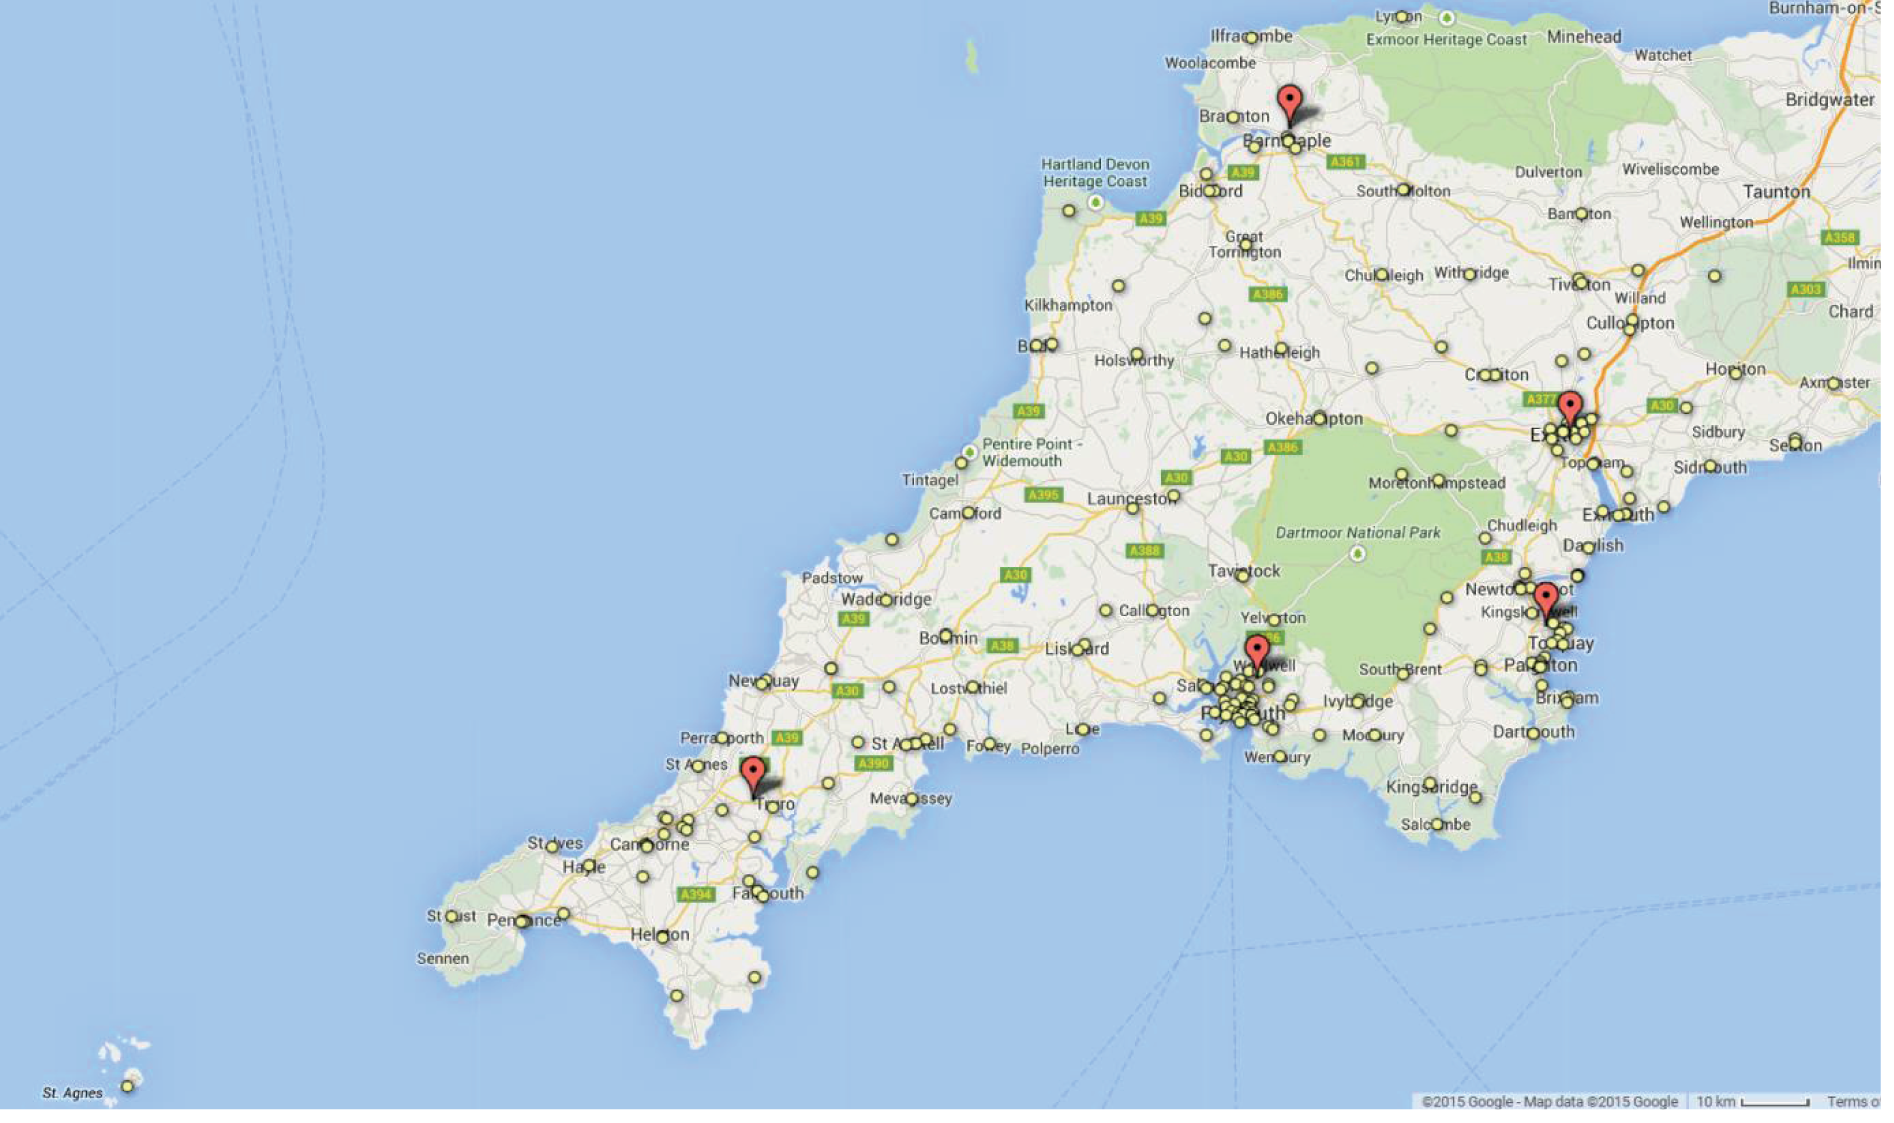
FIGURE 6.
Heat map of demand (births requiring care in a neonatal unit) by GP location in the Peninsula region. Red locations indicate the highest density of demand. © 2015 Google – Map data © 2015 Google.
Ninety-five per cent of infants were cared for, from birth to discharge, in the Peninsula region. Of those going outside the network, 52% went to a specialist surgical or cardiac unit.
Comparison of demand with births
For GPs whose closest hospital is one of the five hospitals of the main study area, there are a total of 17,753 births predicted per year (based on GP practice fertility rates and the number of women aged 15–45 years at each GP; data from NHS England). 21 This compares with 2012 statistics from the ONS of 18,186 live births across Devon and Cornwall. 23 Data from Badger showed 2580 admissions in 2012 from GPs whose closest hospital is one of the five hospitals of the main study area. Admission rates into neonatal units are therefore 15.5–16.0% (depending on the source of the number of births). Admission into IC was 386 births (based on BAPM 2011 guidelines) or 715 births (based on BAPM 2001 guidelines) in 2012, corresponding to admission rates into IC of 2.1% or 3.9% depending on which BAPM guidelines were used.
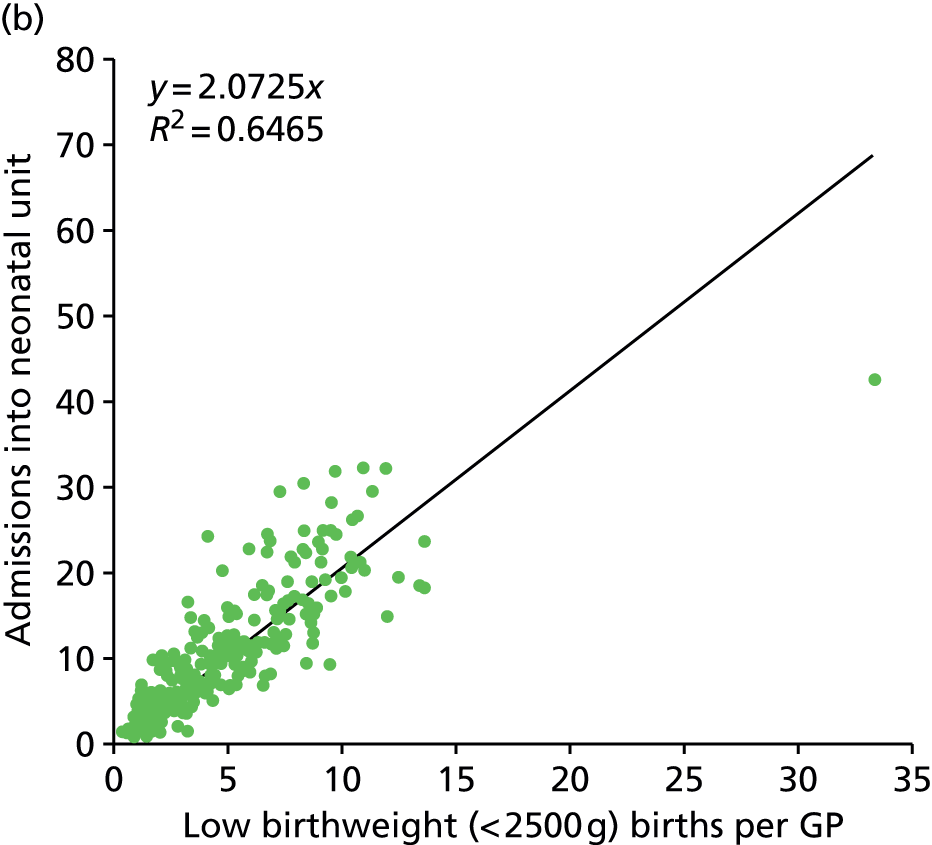
Figure 7 shows the correlation of admissions per GP with all births or with low birthweight (< 2500 g) births. Admissions correlate well with both indices (R2 0.70 and 0.65 respectively). The number of births and low birthweight births by general practice are available from NHS England. 21 Using births per GP provides an alternative input for later modelling.
FIGURE 7.
Correlation of neonatal admissions with births or low birthweight births per GP. (a) Comparison of the number of admissions into neonatal units from each GP with the total number of births per GP. (b) Comparison of the number of admissions into neonatal units from each GP with the total number of low birthweight (< 2500 g) births per GP.

In order to look at regional variation in admission into neonatal units we have used two data sources for births. The HES data set allows us to specifically query the number of births per GP for the period of Badger data we are using (2011 and 2012). When using HES data, however, we need to accept a small inconsistency with the number of births as recorded by the ONS. In 2012 there were 16,883 births in HES (extracted using procedure codes R14–R27). This is 93% of the births recorded by the ONS. There is therefore a small discrepancy between HES and ONS. However, in order to confirm any geographical pattern we also used the number of births per year per GP from the NHS England General Practice profiles. This birth rate is predicted from the fertility rate derived from ONS births, but is not specific to the period of Badger data.
We found that admission rates of births into neonatal care varied by geography (Figures 8 and 9). Generally, higher rates for admissions were found in and around Plymouth regardless of the birth data set used.
FIGURE 8.
Admission rates (% births) into neonatal care by GP location (births from HES 2011 and 2012). Each symbol indicates the location of GP practices. Symbol colour indicates the percentage of infants requiring care in a neonatal unit: green, < 10%; yellow, 10–20%; red, 20–30%; purple, > 30%. © 2015 Google – Map data © 2015 Google.
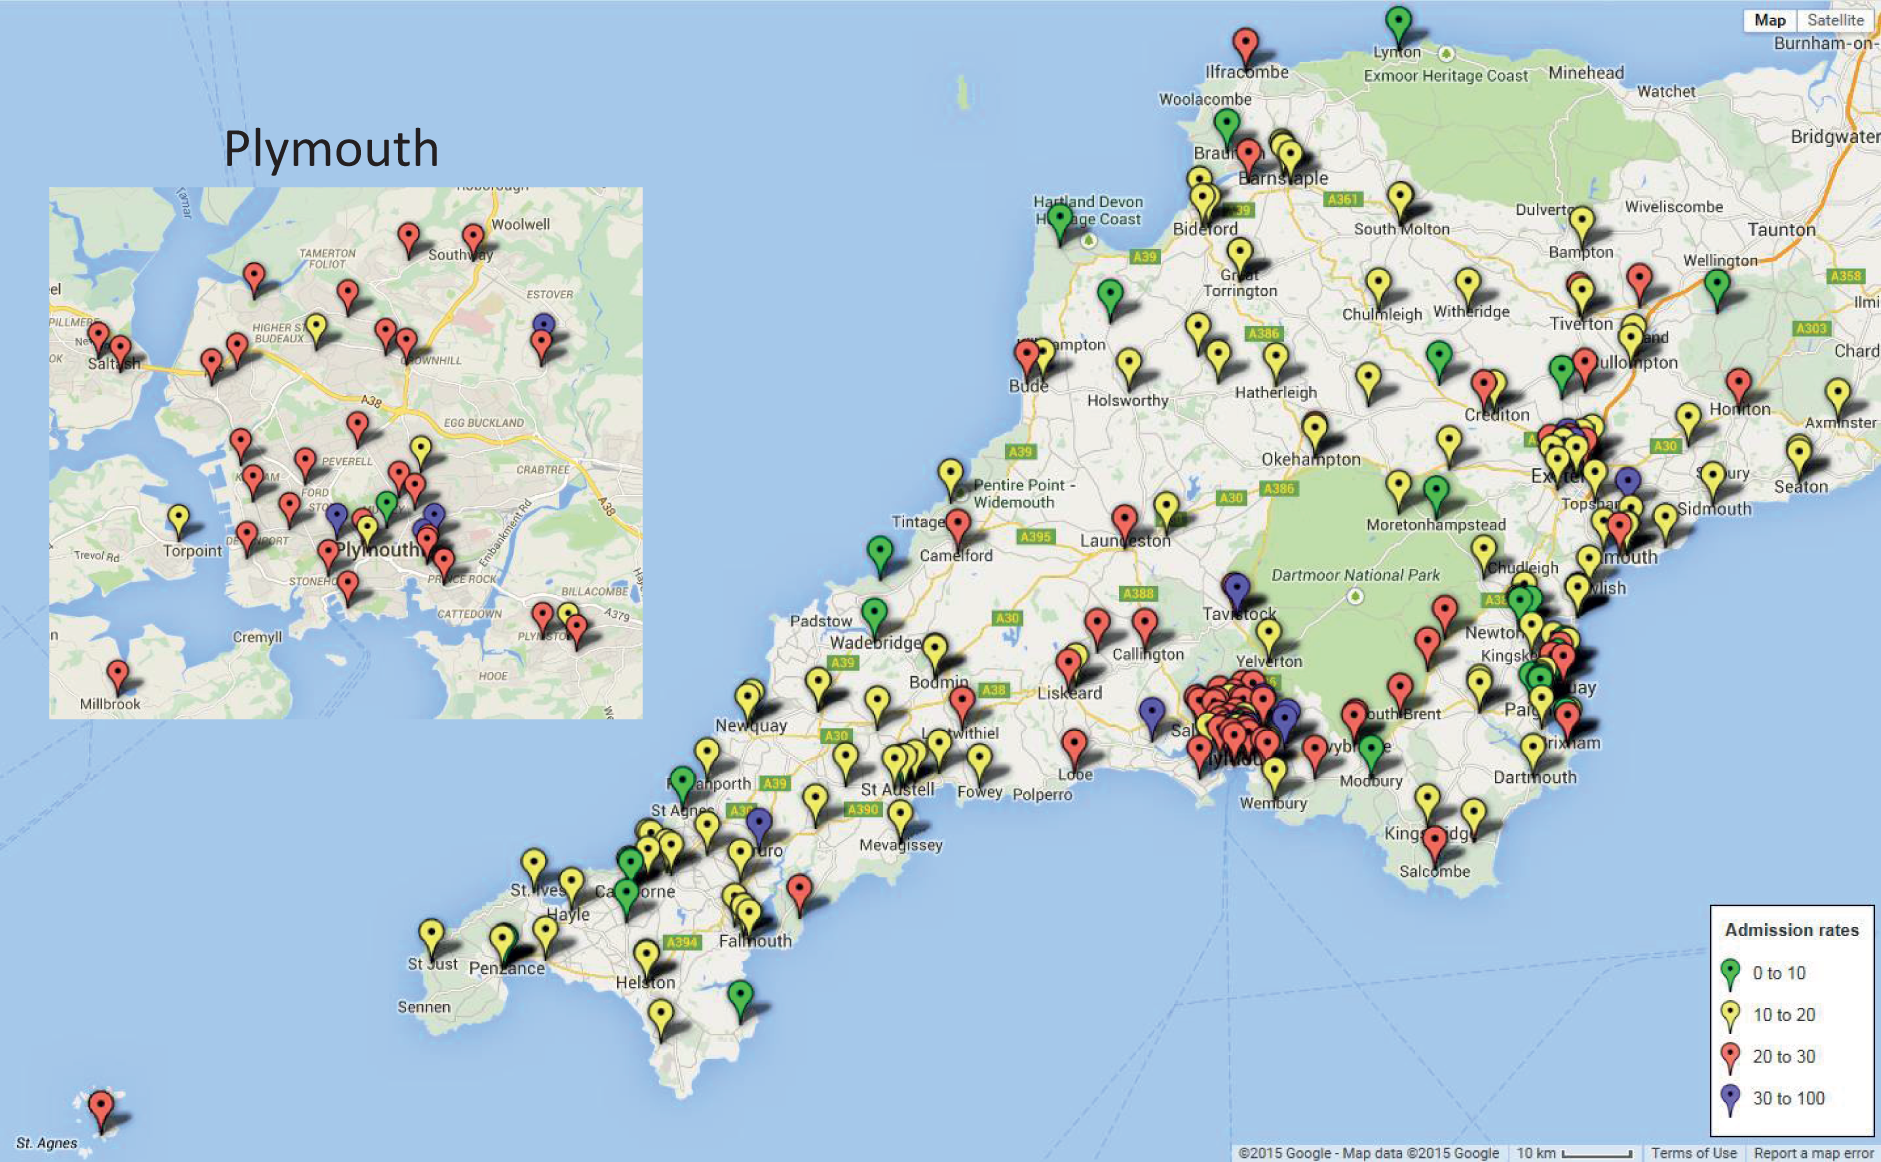
FIGURE 9.
Admission rates (% births) into neonatal care by GP location (births from Public Health England). Each symbol indicates the location of GP practices. Symbol colour indicates the percentage of infants requiring care in a neonatal unit: green, < 10%; yellow, 10–20%; red, 20–30%; purple, > 30%. © 2015 Google – Map data © 2015 Google.

In the Peninsula region, 98.7% of demand where the mother’s primary care trust affiliation was known, or 97.4% of all demand, came from GPs affiliated to the Peninsula region. Of the demand from women with GPs associated with the Peninsula region, 97.8% give birth in one of the five hospitals with a neonatal unit, 1.0% give birth in a local hospital without neonatal care, and 1.1% give birth at home. Of those booked into a main network hospital, 95% are booked into the hospital closest to their GP, 98% deliver in the booked hospital of delivery and 93% deliver in the hospital closest to their home location.
Deprivation scores for the region
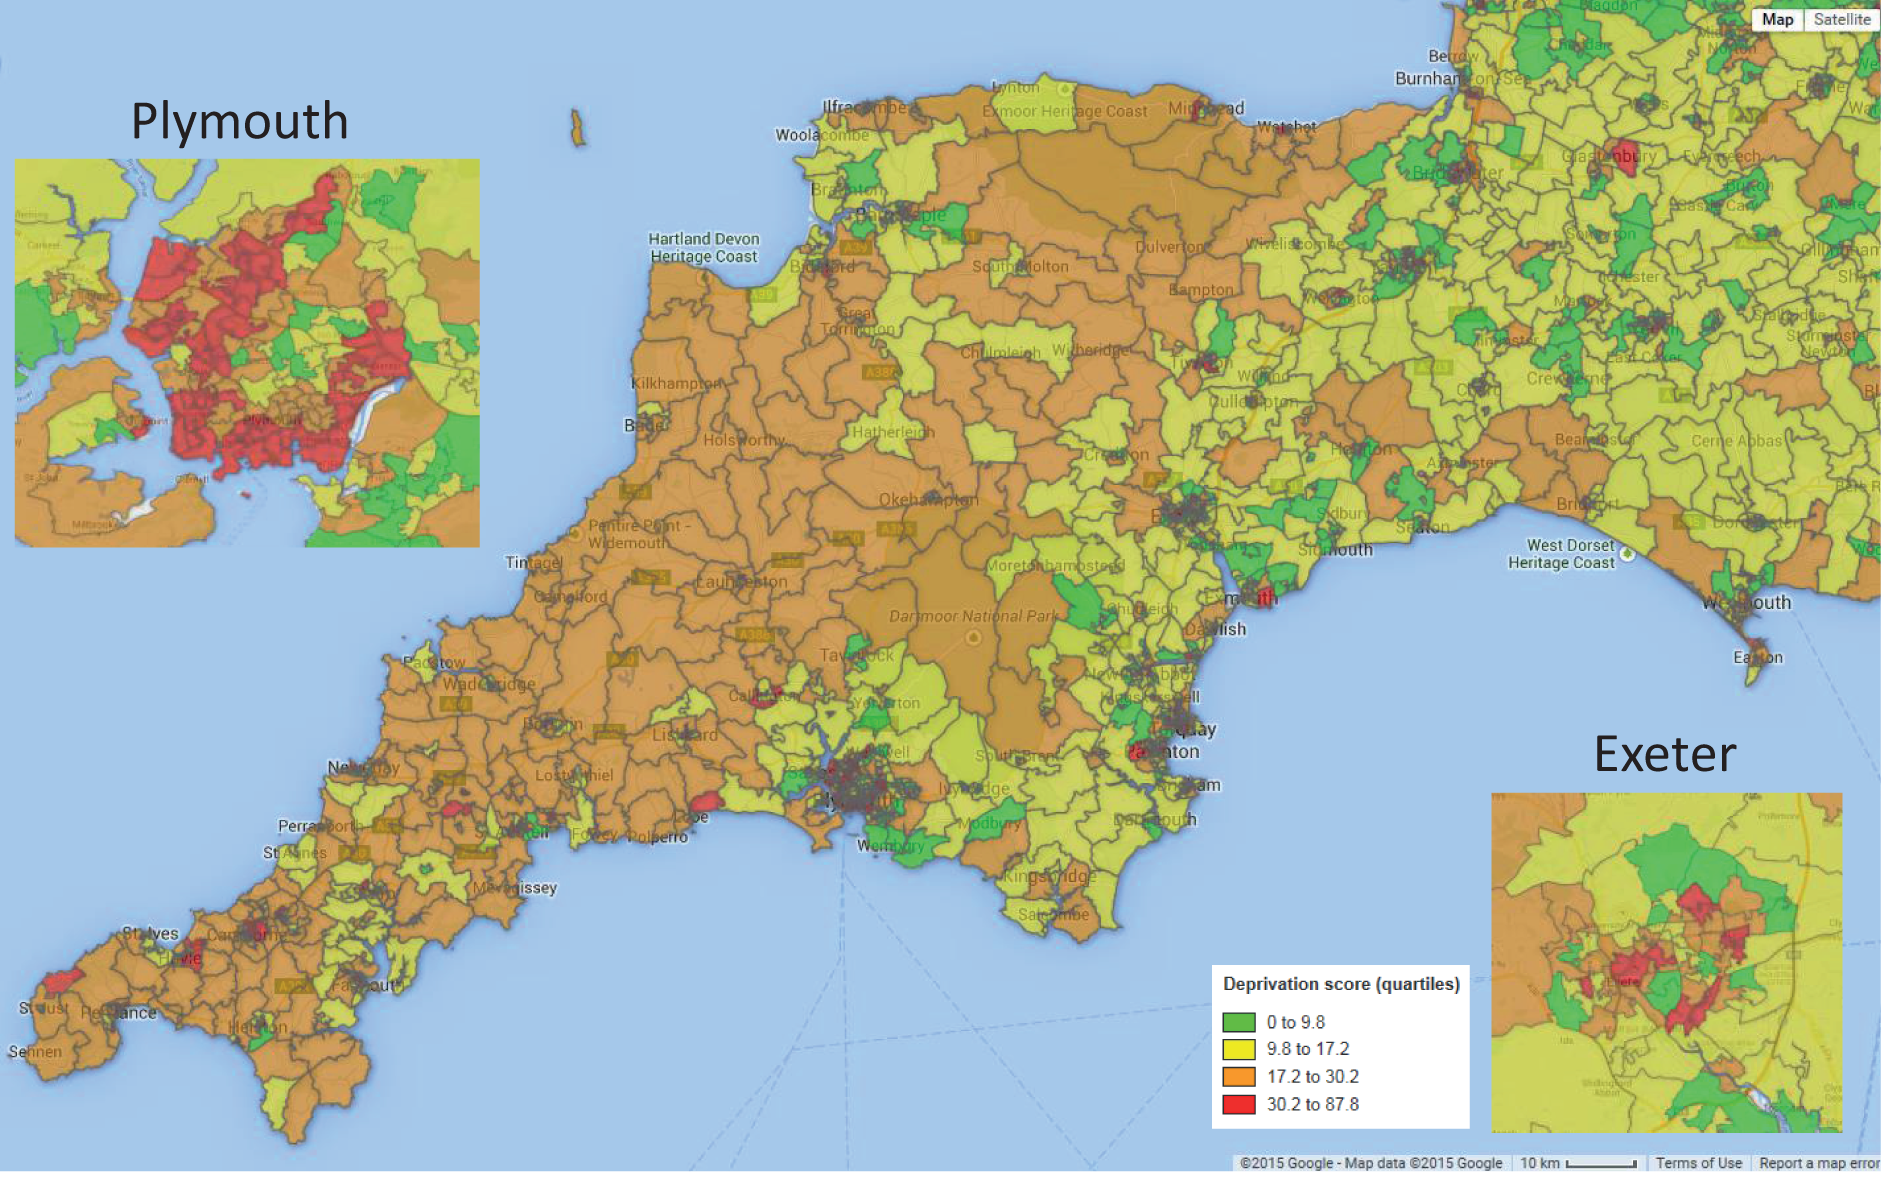
In order to better understand the demographics of the Peninsula region, the Index of Multiple Deprivation (IMD) for each Super Output Area was obtained from the ONS. 20 Super Output Areas are on average 2 km across (the average distance between centroids) and contain ≈ 1600 people. They are used by the ONS and are designed to be roughly equal in population across areas. The majority of the Devon and Cornwall region has higher than the national average index of deprivation, with Plymouth especially containing many Super Output Areas in the top national quartile of deprivation (Figure 10).
FIGURE 10.
Map showing deprivation index across the Peninsula region. Colours indicate national quartiles of IMD. IMDs are colour-coded as green, lowest quartile (IMD < 9.8); yellow, second quartile (IMD 9.8–17.2); orange, third quartile (IMD 17.2–30.2); red, highest quartile (IMD 30.2–87.8). © 2015 Google – Map data © 2015 Google.
Incidence of births requiring neonatal care
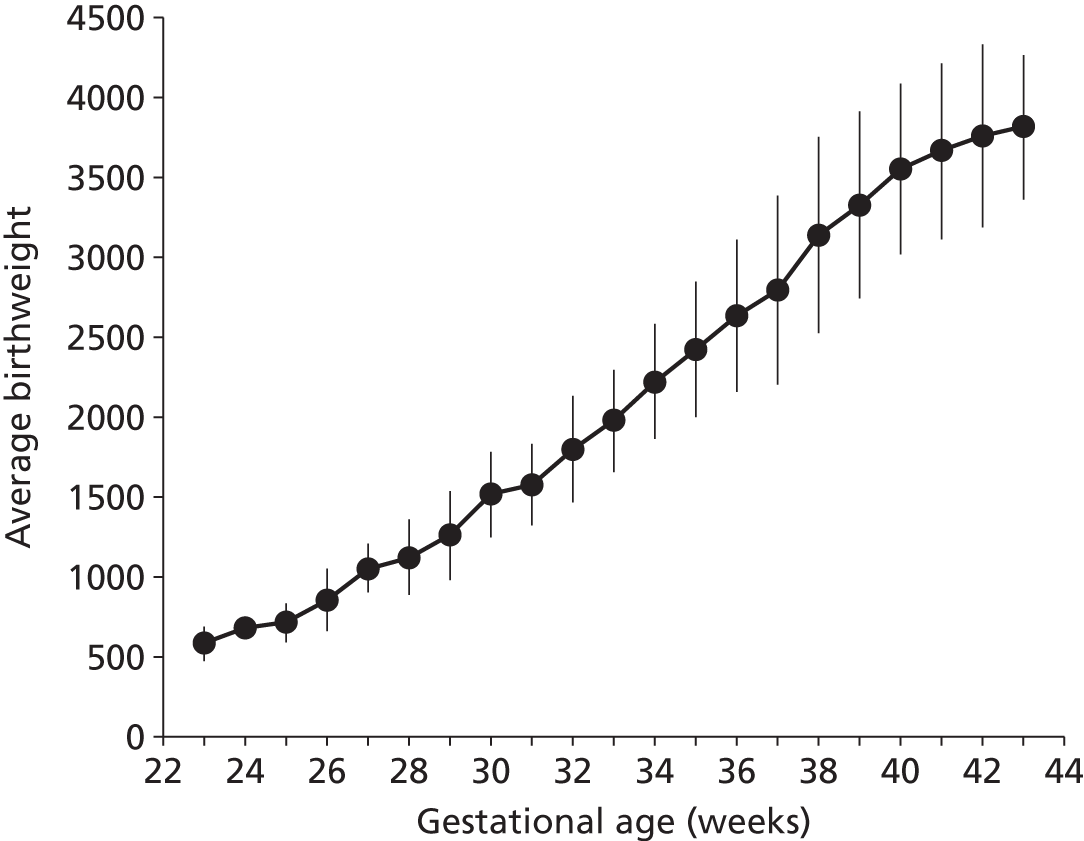
Although use of neonatal care is associated with low gestational age infants, we found that the majority of infants using neonatal care were of the higher gestational ages. Ninety per cent of those using neonatal care had a gestational age at birth of 32 weeks or higher, and 50% had a gestational age of 38 weeks or higher (Figure 11). Unsurprisingly, there was a strong link between gestation age at birth and birthweight (Figure 12).
FIGURE 11.
Frequency of infants in neonatal care by gestational age at birth. The bars show the proportion of infants in neonatal care categorised by gestational age at birth. The line shows the cumulative contribution.
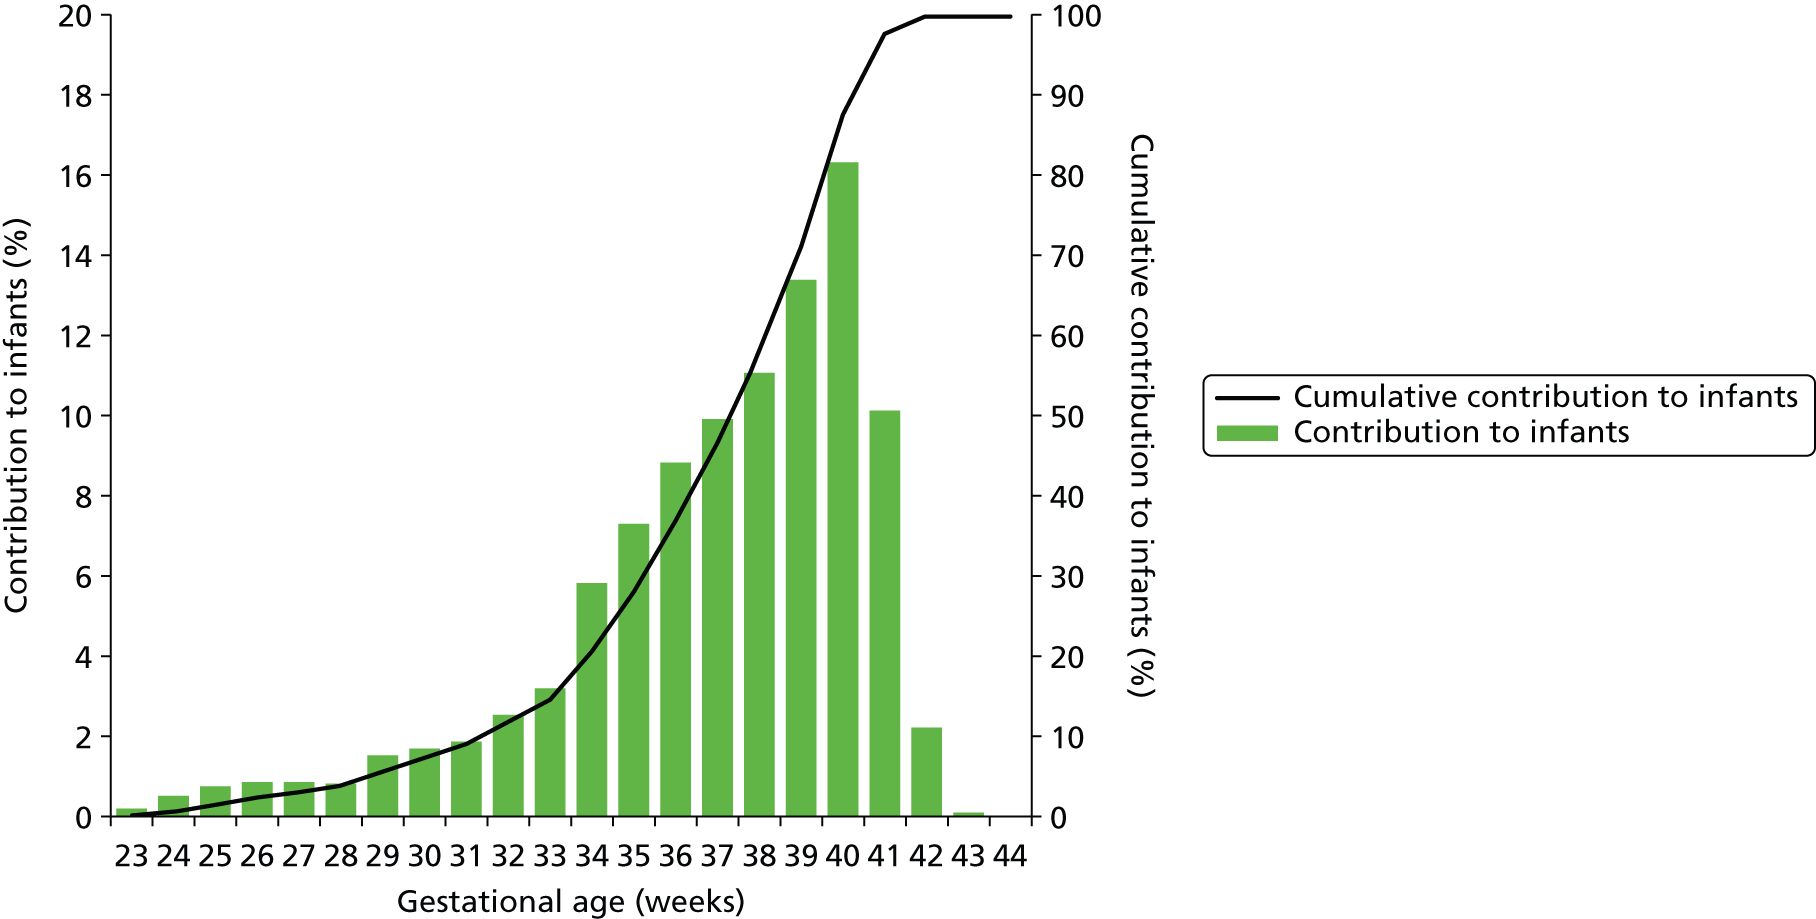
FIGURE 12.
Relationship between gestation age at birth and birthweight for infants requiring neonatal care.
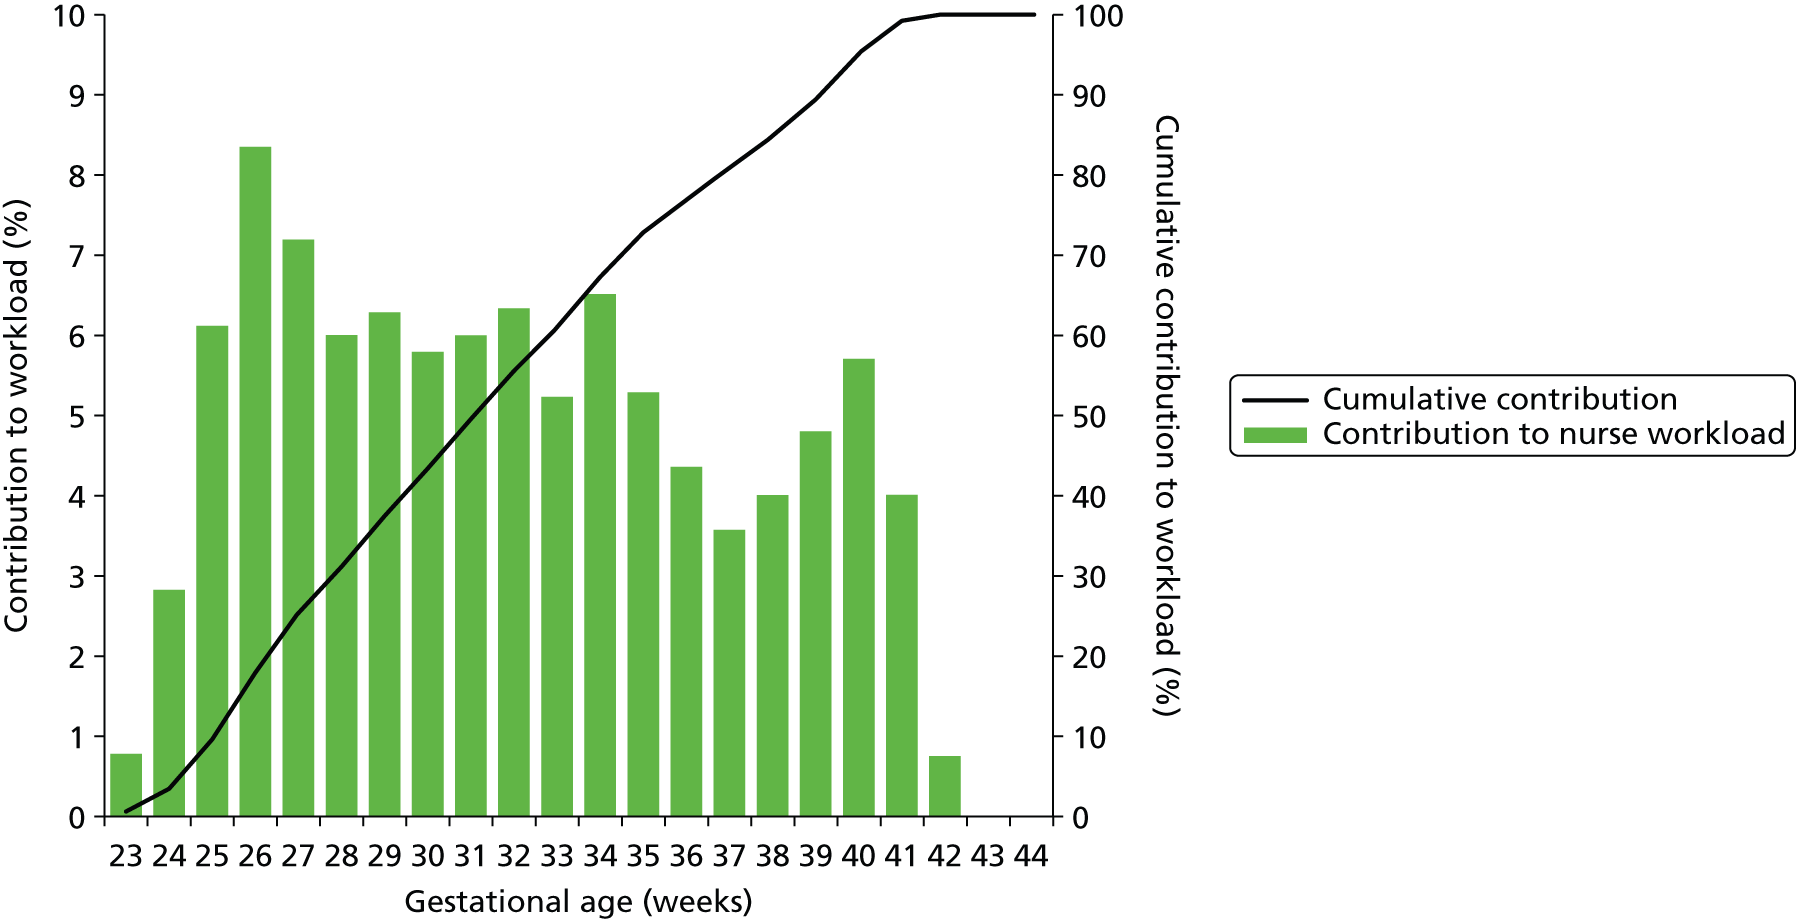
Although the majority of infants using neonatal care are of the higher gestational ages, the lower gestational ages make a greater contribution to total cot-days used (Figure 13) or total nurse workload (Figure 14). While infants under 34 weeks account for only 12% of all infants who enter into neonatal care, they account for 49% of all cot-days and 61% of nurse workload.
FIGURE 13.
Relative contribution to cot-days by gestational age. The bars show the proportion of cot-days contributed by infants categorised by gestational age at birth. The line shows the cumulative contribution.
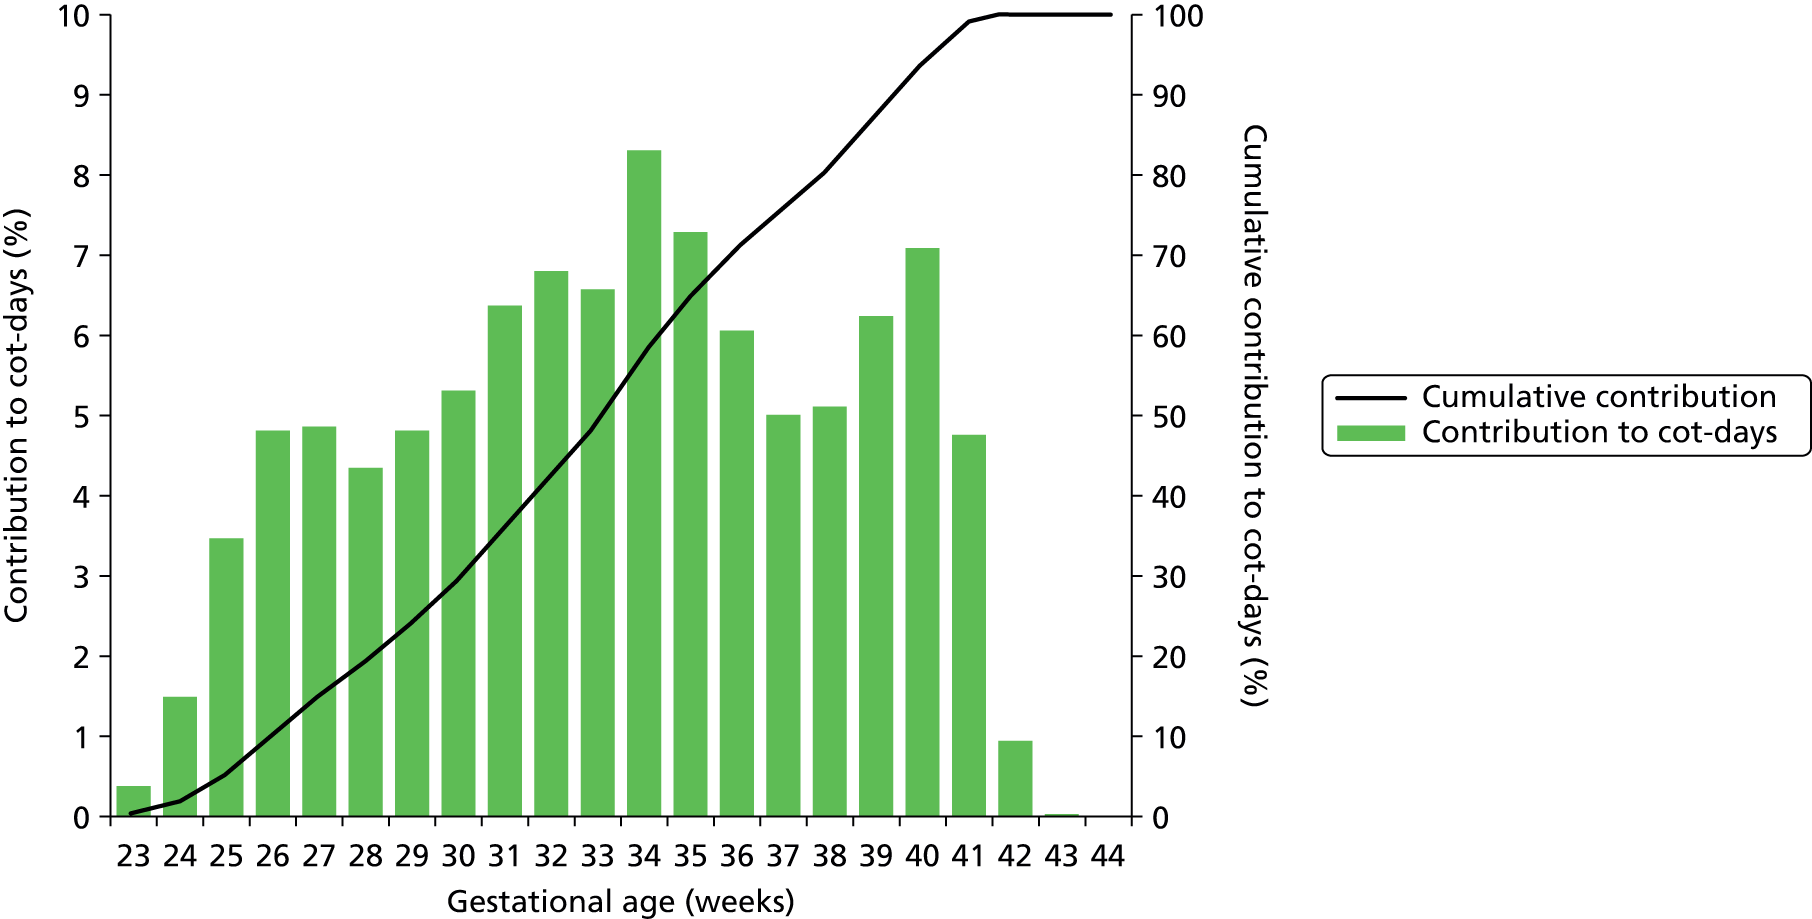
FIGURE 14.
Relative contribution to workload by gestational age. The bars show the proportion of workload (nurse equivalents required to care for the infant) contributed by infants categorised by gestational age at birth. The line shows the cumulative contribution.
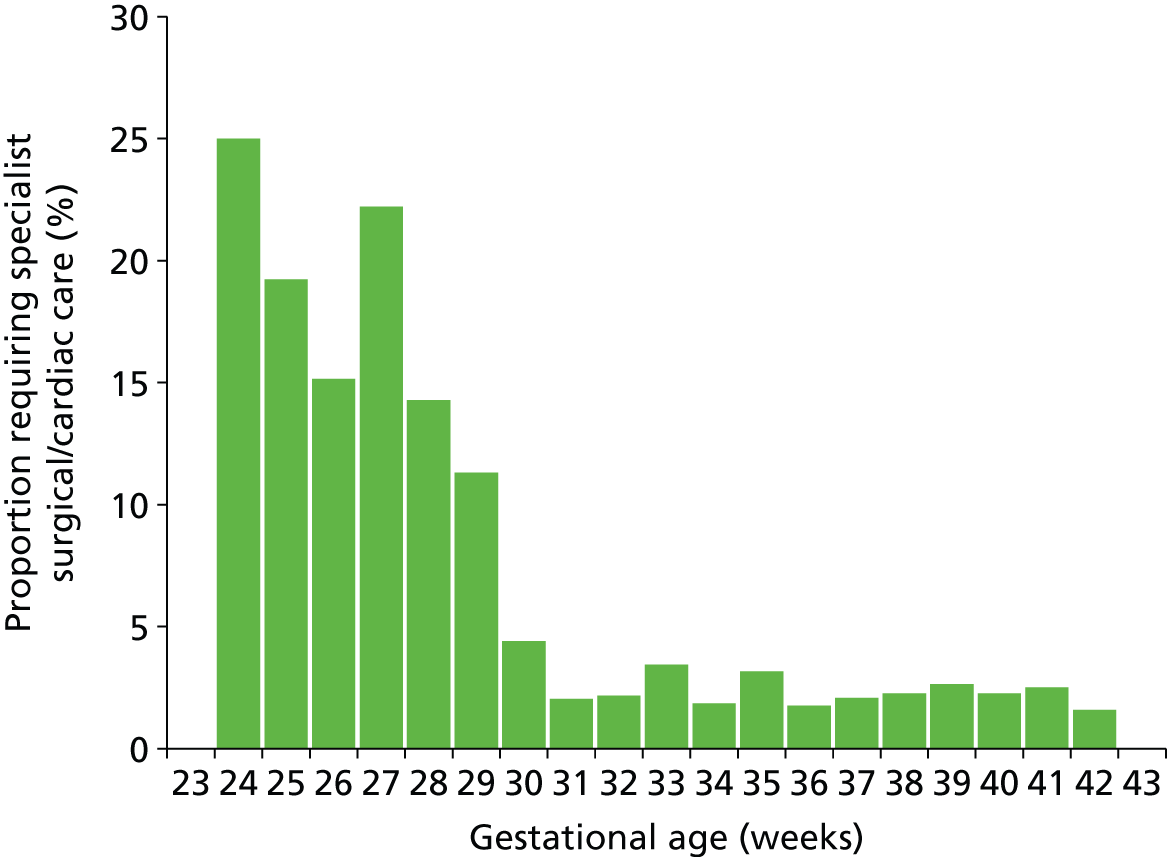
The South West Peninsula has no specialist surgical and cardiac care unit. Those infants requiring such specialist care must travel outside the network (usually to Bristol). Overall, 2.9% of infants required specialist surgical and cardiac care. The proportion was highly dependent on gestational age at birth (Figure 15). Of those under 30 weeks’ gestation at birth, 16% required surgical or cardiac care.
FIGURE 15.
Proportion of infants in neonatal care who also require care in specialist surgical/cardiac unit, categorised by gestational age at birth.
Contribution of care levels to infants in care and workload
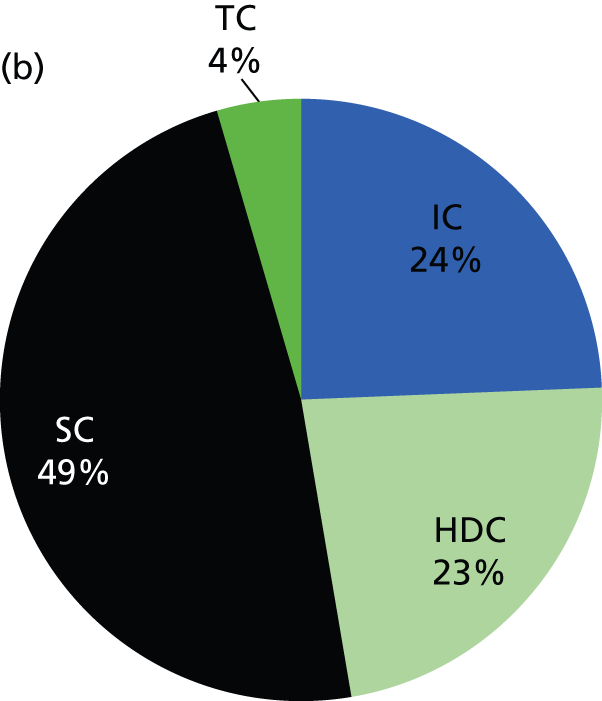
The contribution of each care level to the average number of infants present and the average workload across the network is shown in Figure 16. The higher levels of care, as expected, contribute to workload disproportionately to their numbers. For example, on average 8% of infants in care at any one time are in IC, but those infants account for 24% of the total workload. At the other end of the care spectrum, infants in TC account for 12% of infants in care at any one time, but for only 4% of the total workload.
FIGURE 16.
Contribution of different care levels to the average number of infants and total workload. (a) Average proportion of infants in each category of care present in the network. (b) Relative contribution of workload (nurse requirements) by category of care. IC infants, for example, account for 8% of infants present in neonatal care but 24% of the total nurse workload.

Use of care levels, and lengths of stay, by gestational age at birth
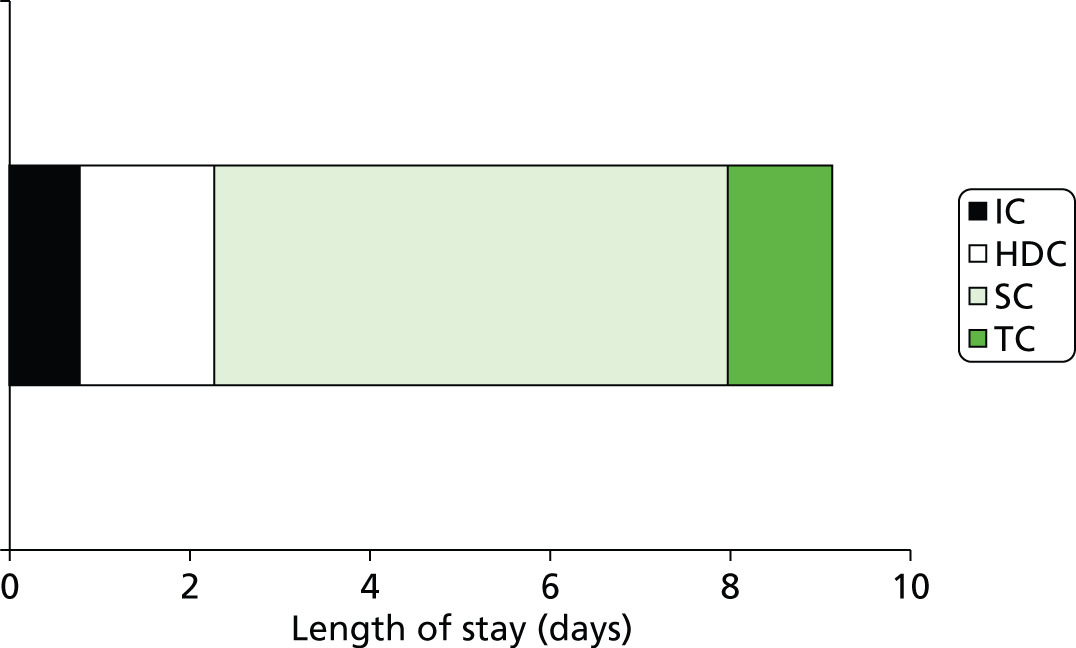
Across all gestational ages, 13% of infants use IC, 23% use HDC, 91% use SC and 61% use TC (Figure 17). Averaging across all gestational ages, the LoS per infant was 9.1 days (0.8 in IC, 1.5 in HDC, 5.7 in SC, 1.2 in TC; Figure 18).
FIGURE 17.
Care requirements for infants accessing neonatal care. The bars show the percentage of infants in neonatal care using each care level. HDU, high-dependency unit; SCU, special care uint.

FIGURE 18.
Average LoS (days) in neonatal care across all infants. Infants not requiring any particular level of care are assigned a zero LoS for that care level when calculating average lengths of stay.
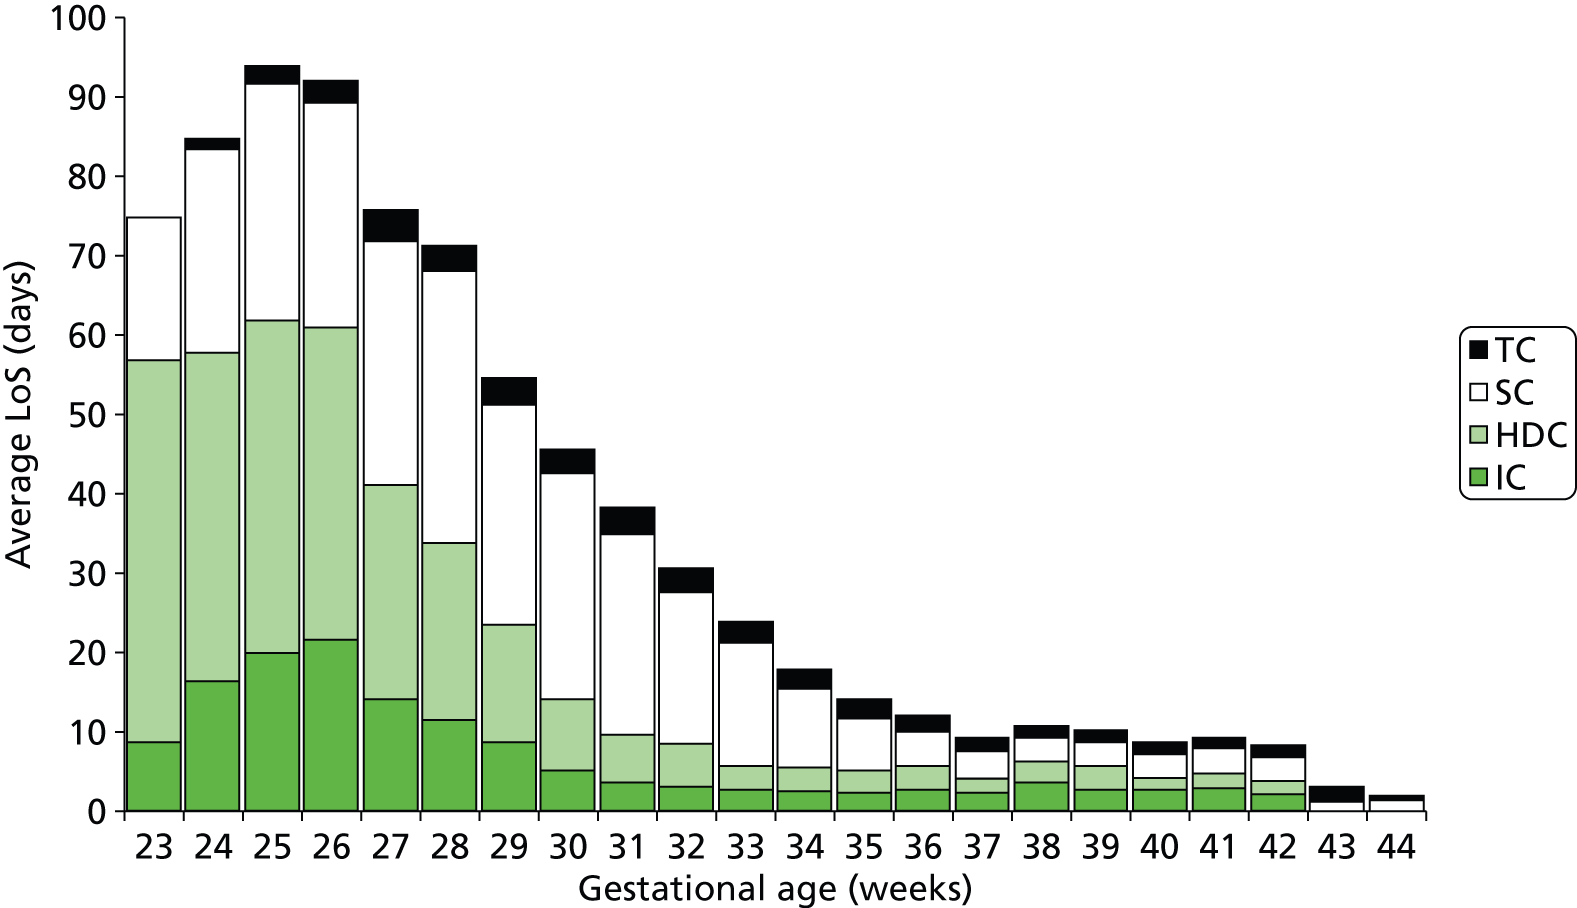
Use of different levels of care and lengths of stay in each level of care vary with gestational age at birth (Figures 19–21). Use of IC drops from 100% at 23 weeks to 70% at 30 weeks and 10% at 34 weeks. HDC use peaks at 92% at 27 weeks and is 90%, 43% and 12% at 30, 34 and 38 weeks. Use of SC is about 90% or higher from 27 weeks.
FIGURE 19.
Use of care levels stratified by gestational age at birth. The bars show the proportion of infants at each gestational age at birth requiring care in each of the four levels of care: (a) IC; (b) HDC; (c) SC; (d) TC.
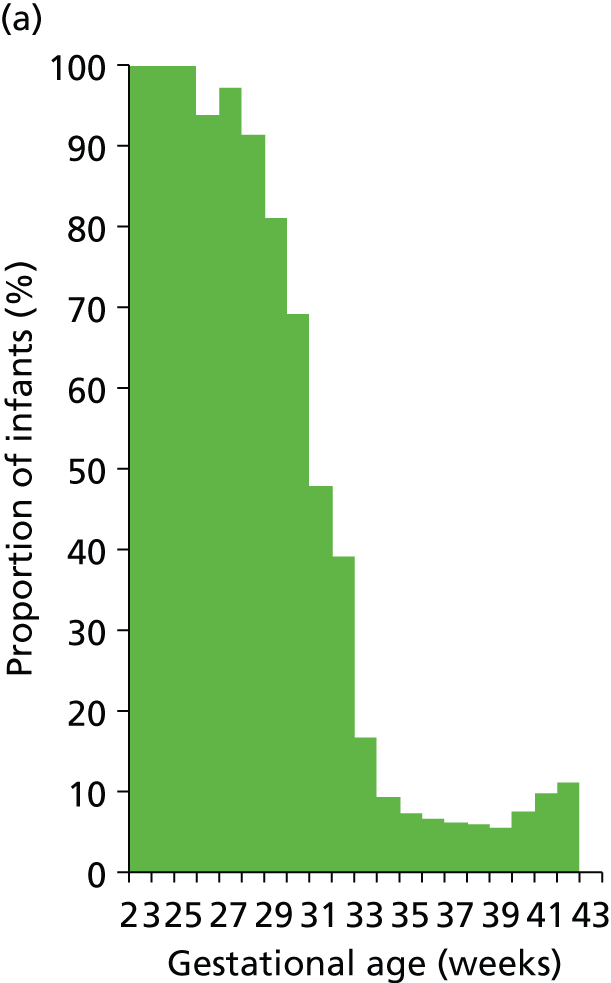
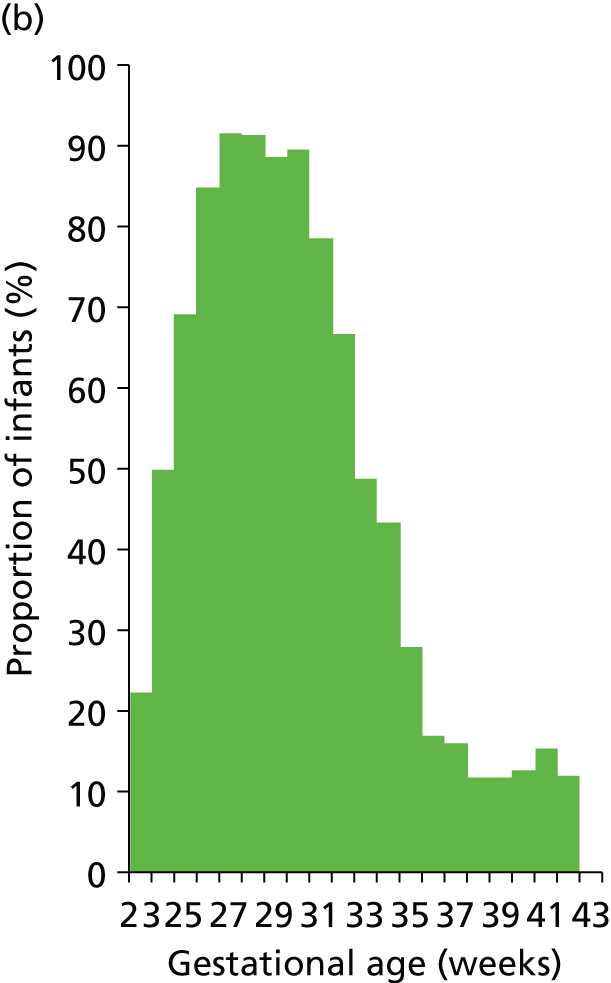
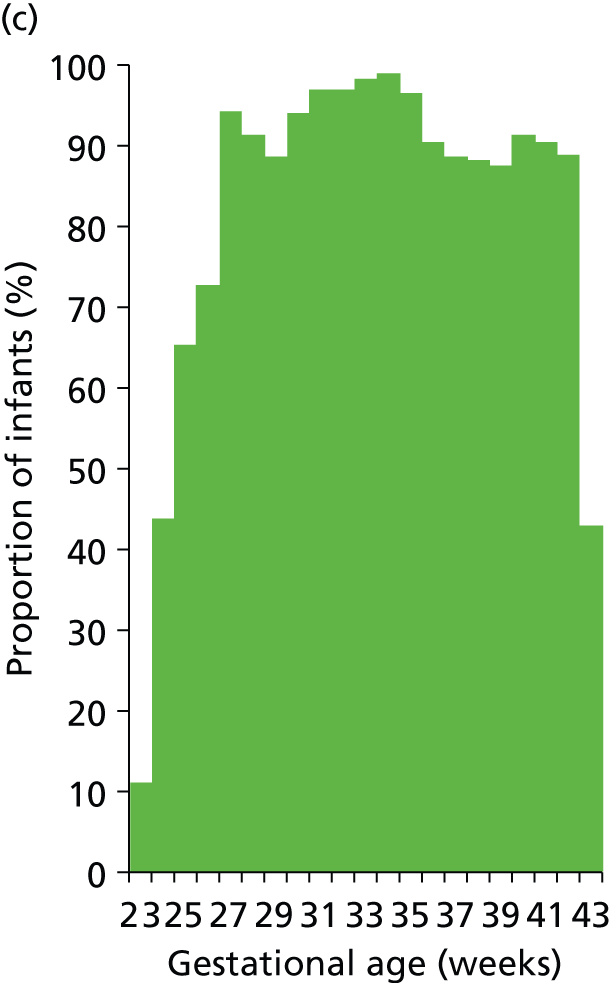

FIGURE 20.
Average LoS (including zero LoS) in neonatal care stratified by gestational age at birth (note: averages are for all infants of that gestational age; infants not using a particular care level are deemed to have zero LoS in this analysis).
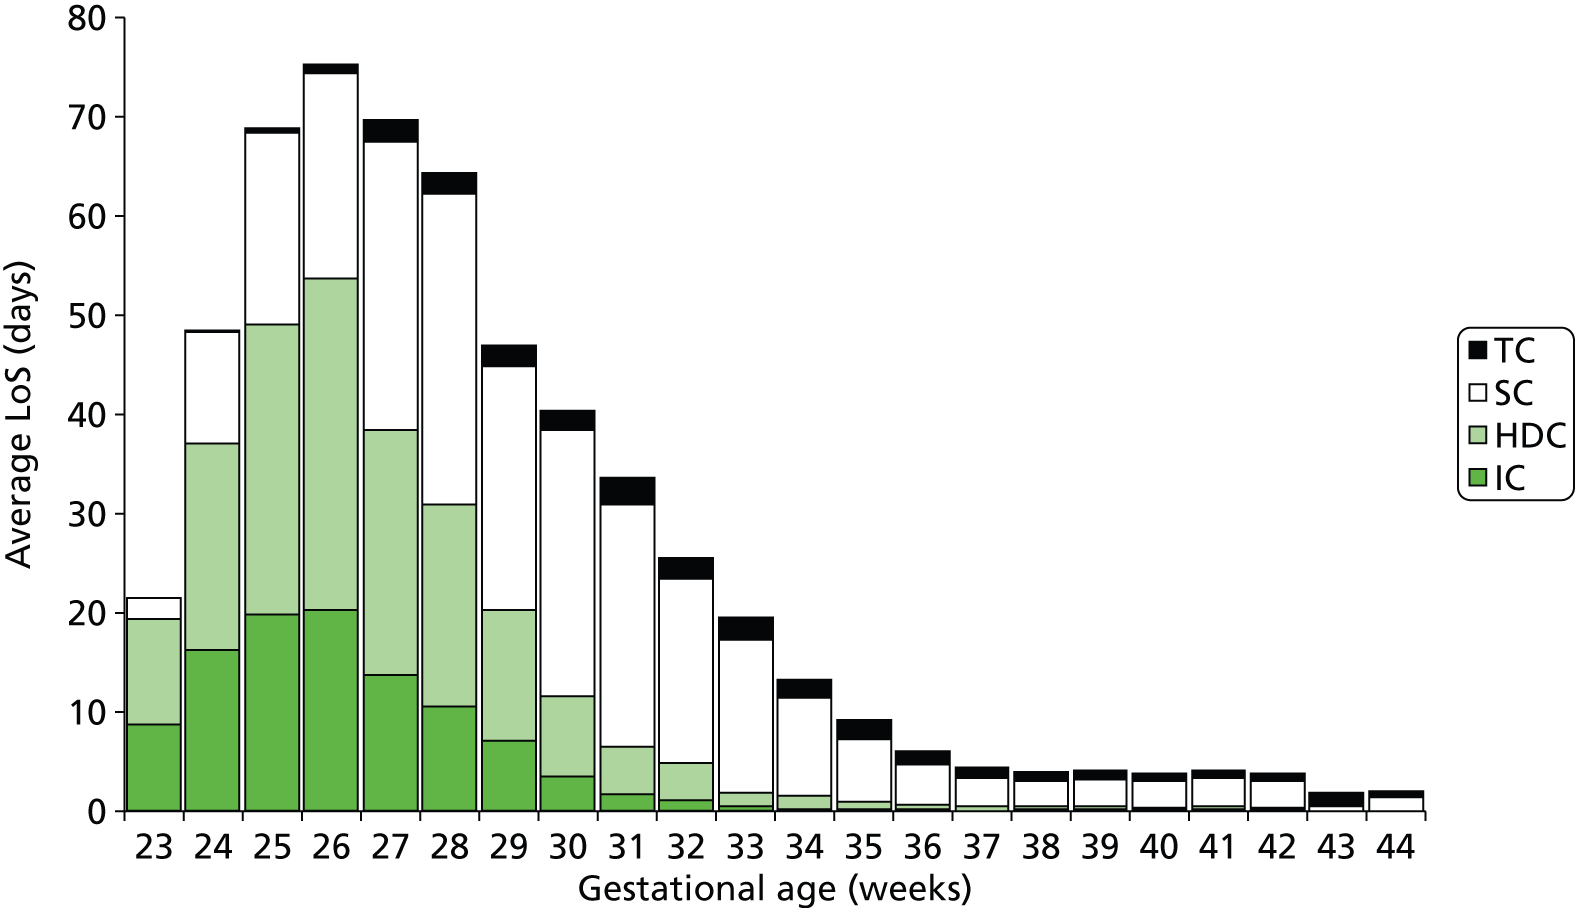
FIGURE 21.
Average LoS (excluding zero LoS) in neonatal care levels stratified by gestational age at birth (note: averages are for infants using a particular care level; infants not using a particular care level are excluded from the calculation).
In order to understand how frequently infants are likely to return to an ICU after transfer to a lower-graded hospital, we examined the number of infants, excluding surgical infants, who have more than one period of stay in IC at the network ICU at Plymouth. These returning infants accounted for 1.3% of all IC episodes at the network ICU.
We assessed how many infants had a contiguous stay in neonatal care by assessing the proportion of infants who had at least 1 day missing in accounted LoS between first admission and last charge (we excluded those infants sent out of network for surgical or cardiac care; some small gaps are expected when transfers occur, as the subsequent admission time will be later than the last recorded discharge time). A total of 98.3% of infants had a contiguous stay in neonatal care. We also found that only 0.3% of infants had a missing period of care of more than 7 days.
A total of 98.6% of infants were admitted into neonatal care within 1 week of their birth, 88.9% were admitted within 2 days of their birth and 81.5% were admitted within a day of their birth.
Gestational equivalent age at discharge
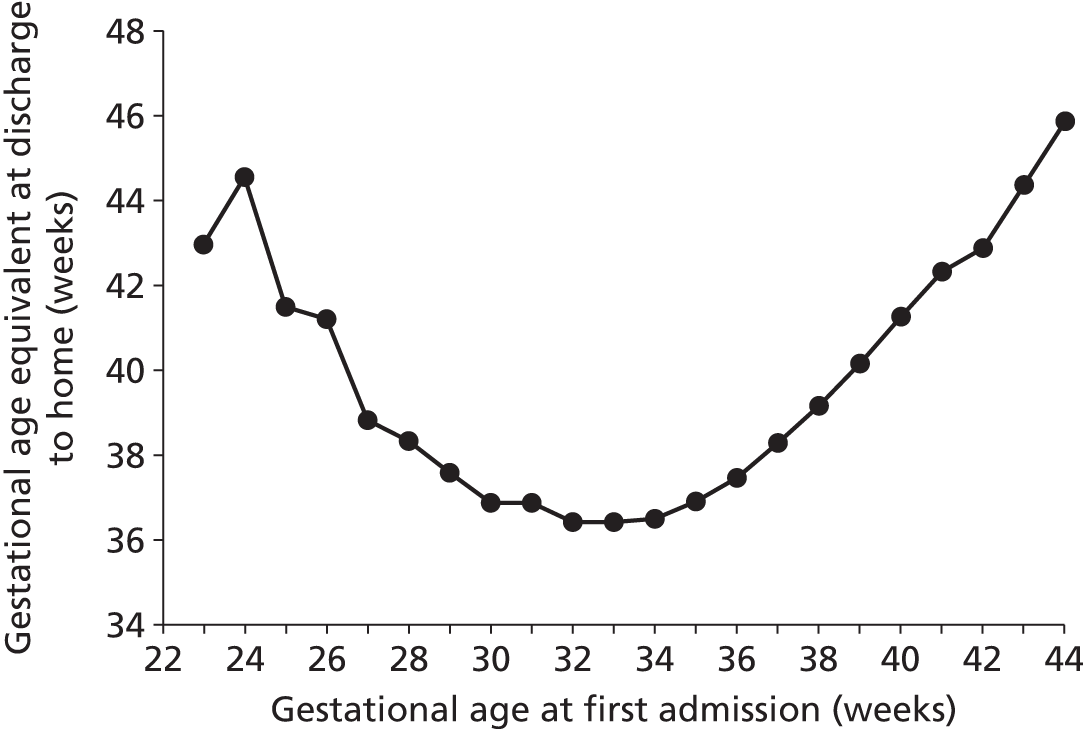
We analysed when infants were discharged home (including foster homes) expressed as gestational age equivalent (Figure 22). The overall average gestational age equivalent was 39.1 weeks. There was a clear relationship between gestational age at admission and gestational age at discharge, with gestational age at discharge first reducing as gestational age at admission increases and then, after about 34 weeks‘ gestational age at admission, increasing as gestational age at admission increases.
FIGURE 22.
Mean gestational age equivalent at discharge to home. Gestational age equivalent is calculated by adding the total LoS before final discharge to the gestational age at birth.
We saw a small but significant (p < 0.001, analysis of variance) effect of the last place of care on gestational age equivalent at discharge to home (Table 6 shows interhospital comparison). There was less than a 1-week difference between the lowest and highest gestational age equivalent at discharge, but we noted that the Royal Devon and Exeter Hospital had a statistically significant greater age at discharge to home than other hospitals.
| Location of care | n | Mean | Grouping | ||
|---|---|---|---|---|---|
| Exeter | 1559 | 39.44 | A | – | – |
| Plymouth | 2849 | 39.18 | – | B | – |
| Torquay | 716 | 39.11 | – | B | – |
| Barnstaple | 276 | 38.85 | – | B | C |
| Truro | 530 | 38.68 | – | – | C |
As all units have SC units (SCUs) and, at least in theory, all infants should have their SC episode in their local hospital, we performed some additional analysis on lengths of stay in SC when infants required only SC and had that SC in just one hospital (Table 7). Exeter had the longest average LoS in SC, at 6.6 days, with Plymouth having the shortest, at 4.0 days.
| Location of care | Days | Normalised % |
|---|---|---|
| Plymouth | 4.0 | 78 |
| Barnstaple | 5.9 | 114 |
| Truro | 5.8 | 113 |
| Exeter | 6.6 | 129 |
| Torquay | 4.4 | 85 |
| All | 5.1 | 100 |
Discharge destination
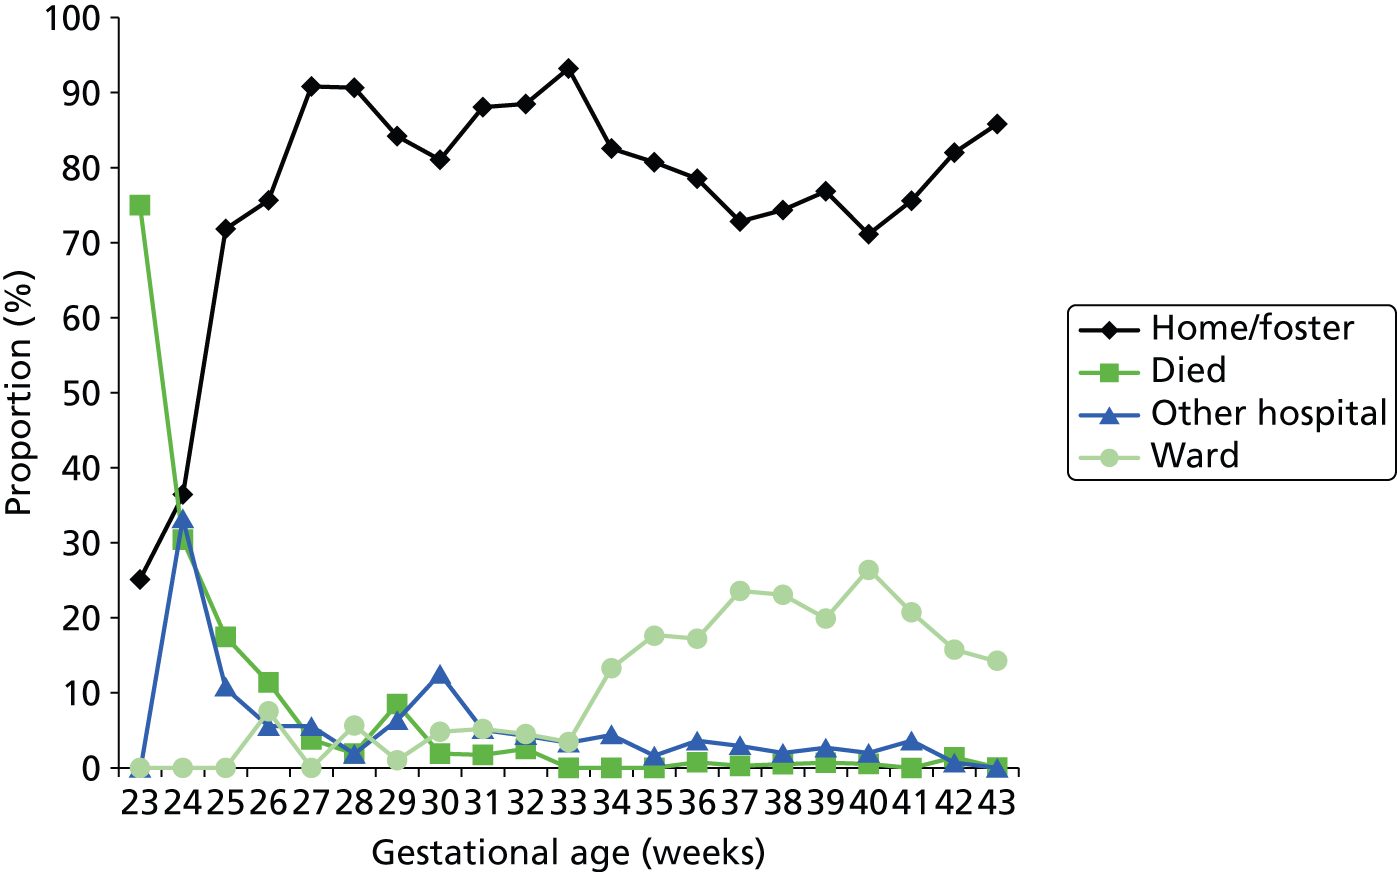
Figure 23 shows the discharge destination of the last episode. The final outcome cannot be accurately discerned from these data. For example, at early gestational age, up to 30% may be discharged to another hospital (e.g. a specialist surgical/cardiac unit). It is likely that many of these infants may have died, as they are not recorded as having returned from the other hospital. Likewise, from 34 weeks onwards, approximately 15–25% are recorded as being discharged to another ward in the hospital. It is likely that these are on their way home, but we cannot be sure from these data. However, it is clear that, as expected, mortality rates in neonatal units drop to near zero by 30 weeks of gestational age at birth.
FIGURE 23.
Recorded discharge destination of last episode of care. The lines show the proportion of infants, categorised by gestational age at birth, discharged to home (or foster care), another hospital or another ward (not in the neonatal unit) in the same hospital, or who died.
Of those who were sent to a specialist surgical or cardiac unit, 61% were recorded as going home on the last recorded discharge, 33% went to another hospital, 4% went to a ward outside the neonatal unit and 2% died (Figure 24).
FIGURE 24.
Recorded discharge destination, for last episode of care, of those receiving specialist cardiac or surgical care. The chart shows the proportion of infants discharged to home (or foster care), another hospital or another ward (not in the neonatal unit) in the same hospital, or who died.

Workload and infant numbers by location of care and closest hospital to home
We analysed workload by closest hospital to home and location of care (Table 8). For this analysis we included only those infants being cared for within the network. This was repeated for the count of infants (Table 9). Plymouth, as the network neonatal unit, took infants from all areas, although 77% of workload and 84% of infants came from its own catchment area. Plymouth catered for 93% of the workload and 94% of the infants from its own catchment area. Truro did not take any significant work from outside its own catchment area. Truro catered for 86% of the workload and 93% of the infants from its own catchment area. Exeter catered for 90% of the workload and 96% of the infants from its own catchment area. Twenty-seven per cent of infants and 32% of workload came from outside Exeter’s own catchment area. Barnstaple did not take any significant work from outside its own catchment area. Barnstaple catered for 53% of the workload and 65% of the infants from its own catchment area. Torbay did not take any significant work from outside its own catchment area. Torbay catered for 44% of the workload and 62% of the infants from its own catchment area.
| Location of care | Closest hospital | ||||||
|---|---|---|---|---|---|---|---|
| Plymouth | Barnstaple | Truro | Exeter | Torbay | Unknown | Total | |
| Plymouth | 6.3 | 0.4 | 0.7 | 0.4 | 0.6 | 0.2 | 8.7 |
| Barnstaple | 0.0 | 1.0 | 0.0 | 0.0 | 0.0 | 0.1 | 1.1 |
| Truro | 0.1 | 0.0 | 5.1 | 0.0 | 0.0 | 0.1 | 5.3 |
| Exeter | 0.2 | 0.5 | 0.1 | 4.3 | 0.7 | 0.4 | 6.3 |
| Torbay | 0.1 | 0.0 | 0.0 | 0.0 | 1.1 | 0.1 | 1.3 |
| Total | 6.8 | 1.9 | 5.9 | 4.8 | 2.5 | 1.0 | 22.8 |
| Location of care | Closest hospital | ||||||
|---|---|---|---|---|---|---|---|
| Plymouth | Barnstaple | Truro | Exeter | Torbay | Unknown | Total | |
| Plymouth | 20.6 | 0.6 | 1.0 | 0.6 | 1.2 | 0.7 | 24.6 |
| Barnstaple | 0.0 | 3.9 | 0.0 | 0.1 | 0.0 | 0.5 | 4.6 |
| Truro | 0.4 | 0.1 | 14.5 | 0.0 | 0.0 | 0.2 | 15.1 |
| Exeter | 0.7 | 1.3 | 0.1 | 14.9 | 1.9 | 1.3 | 20.4 |
| Torbay | 0.3 | 0.0 | 0.0 | 0.0 | 5.2 | 0.5 | 6.1 |
| Total | 22.0 | 6.0 | 15.6 | 15.5 | 8.4 | 3.3 | 70.8 |
Overall, 79% of workload and 83% of infants are catered for in the hospital closest to home.
Daily variation in case mix, workload and nursing numbers
Each record from Badger lists the entire episode from admission to discharge (see Figure 4). There is no distinction in the sequence of care-level days. When calculating occupancy by care level, we have used a working assumption that, when more than one care level is present in an infant’s spell, then the infant proceeds from higher to lower care levels. Hence, the sequence of stay is surgical → IC → HDC → SC → TC. Although this frequently will be the case, analysis based on this working assumption should be seen as a guide rather than fully definitive. This will not change estimates based on averages over time, or change the daily variation in total infants in care, but may cause small inaccuracies in the daily variation of individual care levels. The simulation model has been tested with the opposite assumption, that infants require increasing care levels (see Chapter 3, Patient flow).
When analysing the occupancy of the units we have used data from March 2011 to December 2012. The first 2 months of data (January and February 2011) provide a ‘run-in’ period, which is required, as calculated occupancy of the unit begins at zero on 1 January 2011 and we track new admissions from that date.
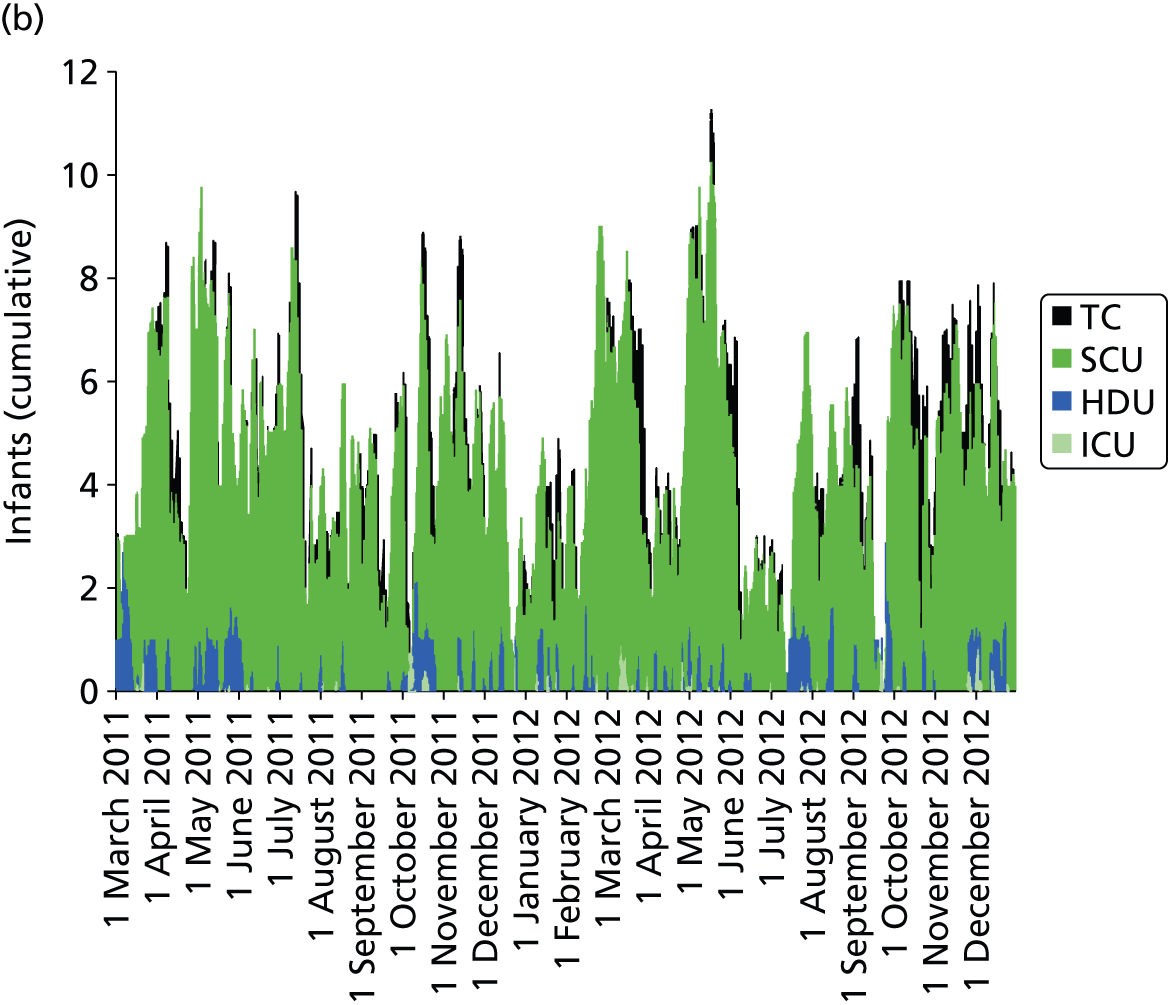
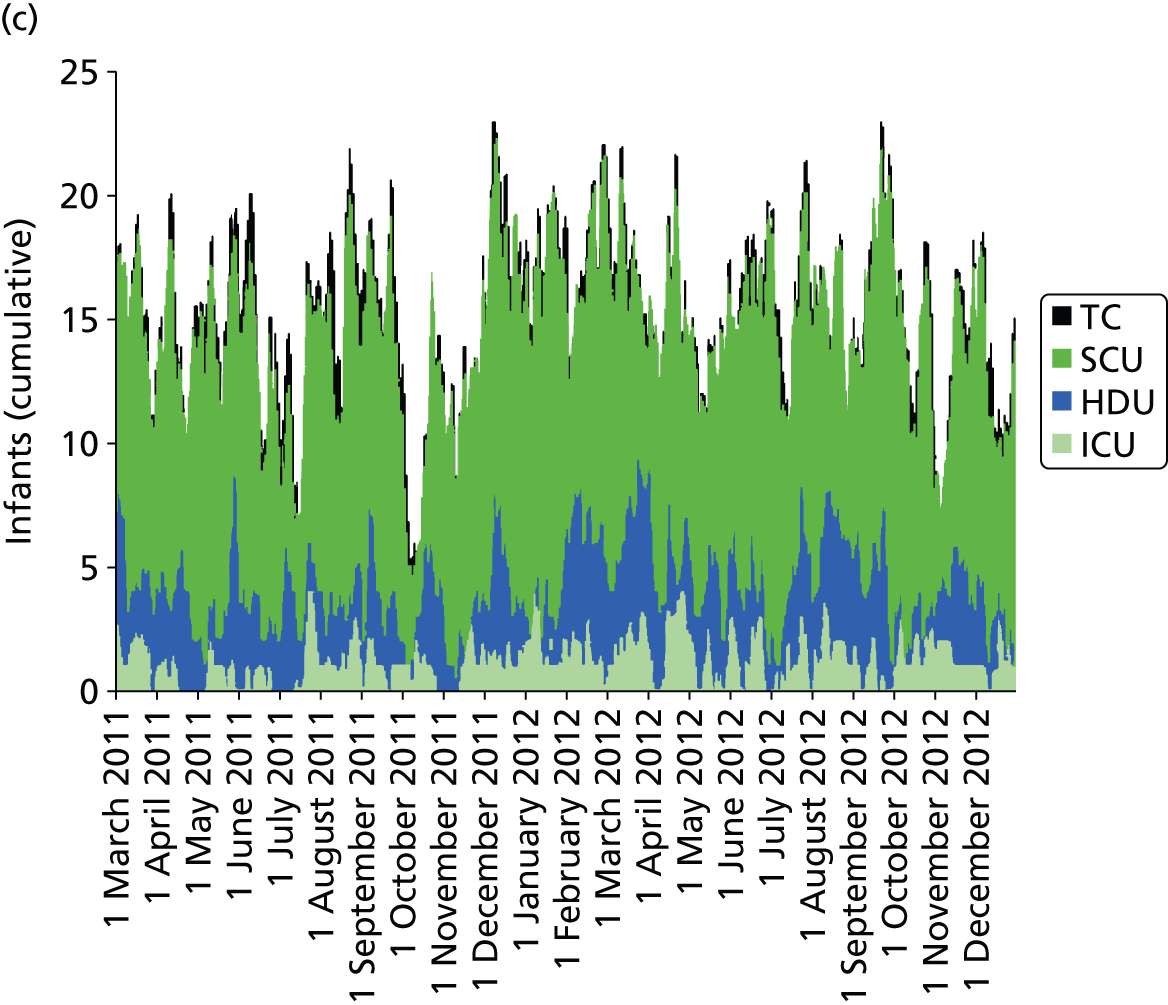
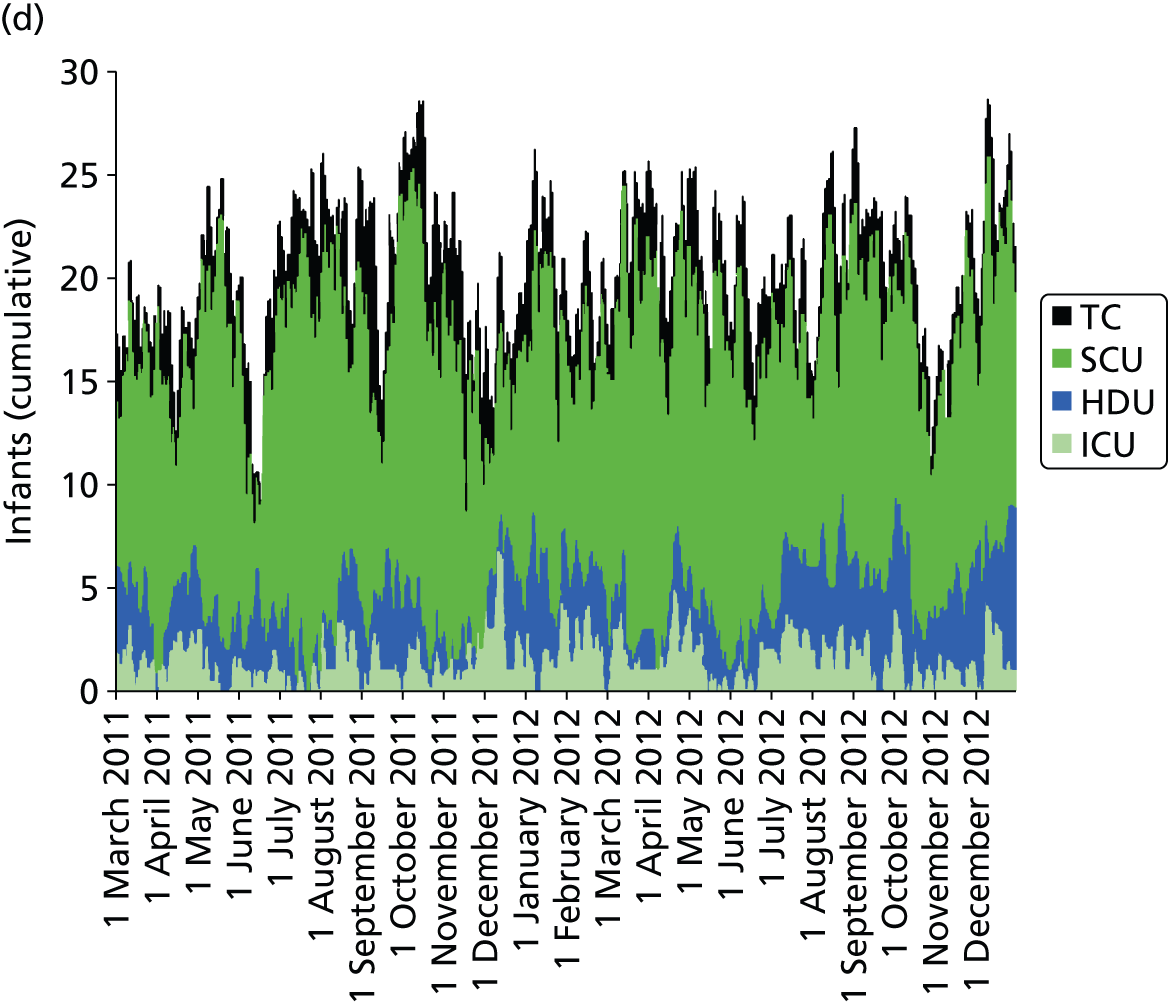
Day-to-day variation in infants in care at different care levels is shown for each hospital in Figure 25.
FIGURE 25.
Daily variation in infants and case mix. The charts show the number of infants (averaged across each day) in ICU (light green), HDU (blue), SCU (dark green) and TC (black). (a) Plymouth; (b) Barnstaple; (c) Truro; and (d) Exeter. HDU, high-dependency unit.

Day-to-day variation in infants, workload and nurses present (audited daily for the morning shift; data excluded staff dedicated to management or to transport services) is shown in Figure 26. Each day the nurse workload was calculated as described in Quantification of workload and lengths of stay in each care level. Where infants were present for only a portion of the day their contribution to workload was weighted accordingly (an infant receiving IC for half a day would contribute 0.5 to workload that day).
FIGURE 26.
Daily variation in infants, workload and nurses present in each hospital. The number of infants and the workload (the nurse equivalents required to care for infants in care) were averaged each day. The number of nurses is the number of nurses (excluding supernumerary nurses) recorded as being present on the day shift. (a) Plymouth; (b) Barnstaple; (c) Truro; and (d) Exeter.
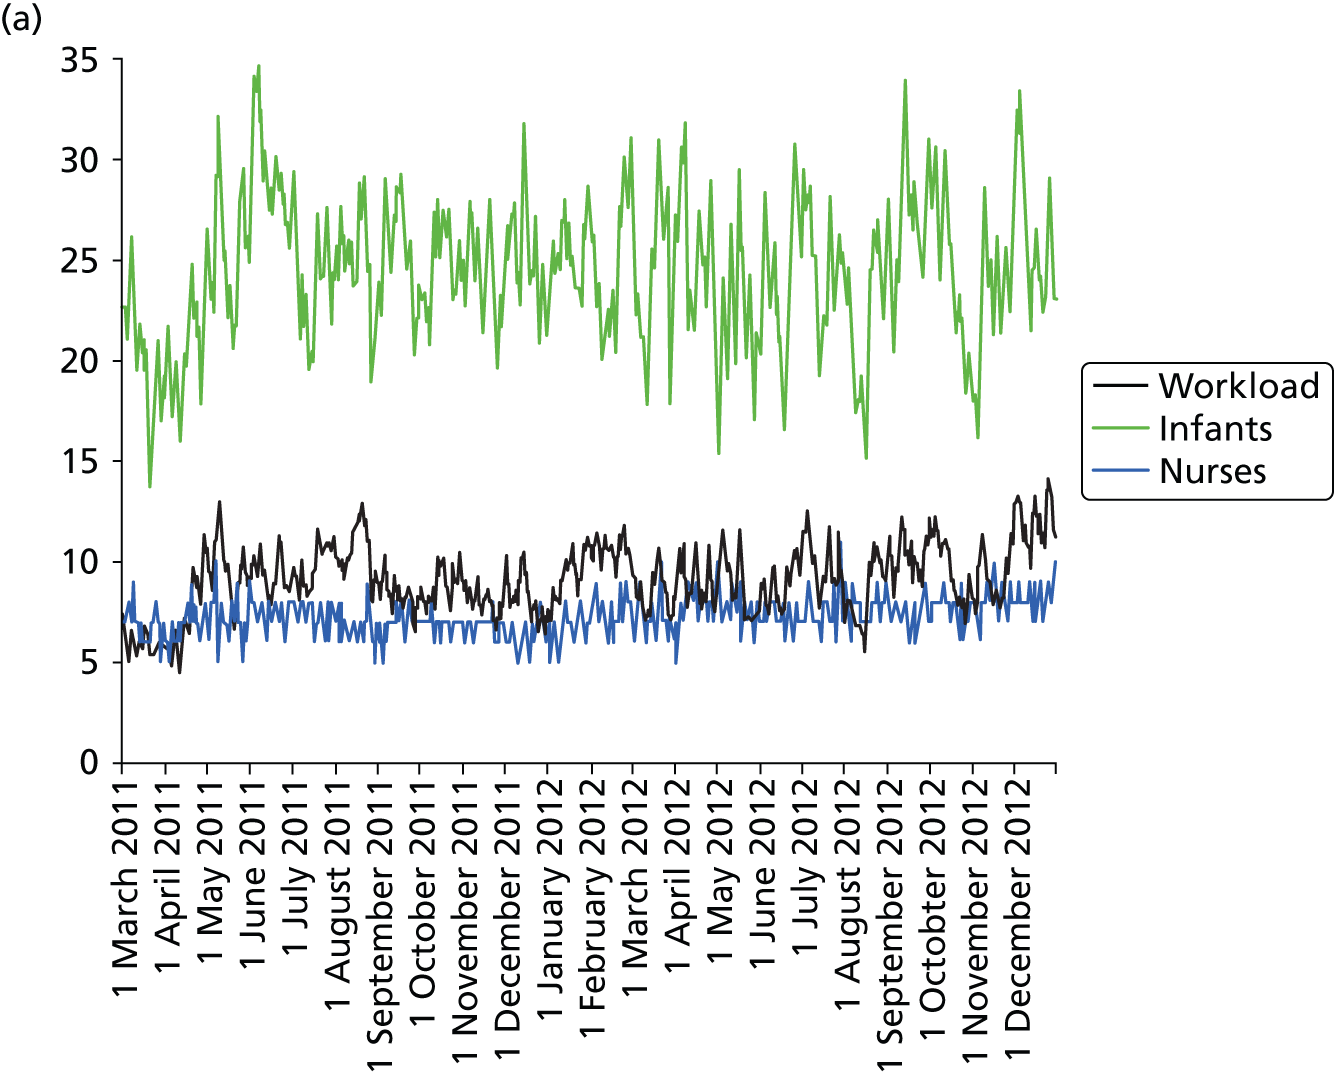
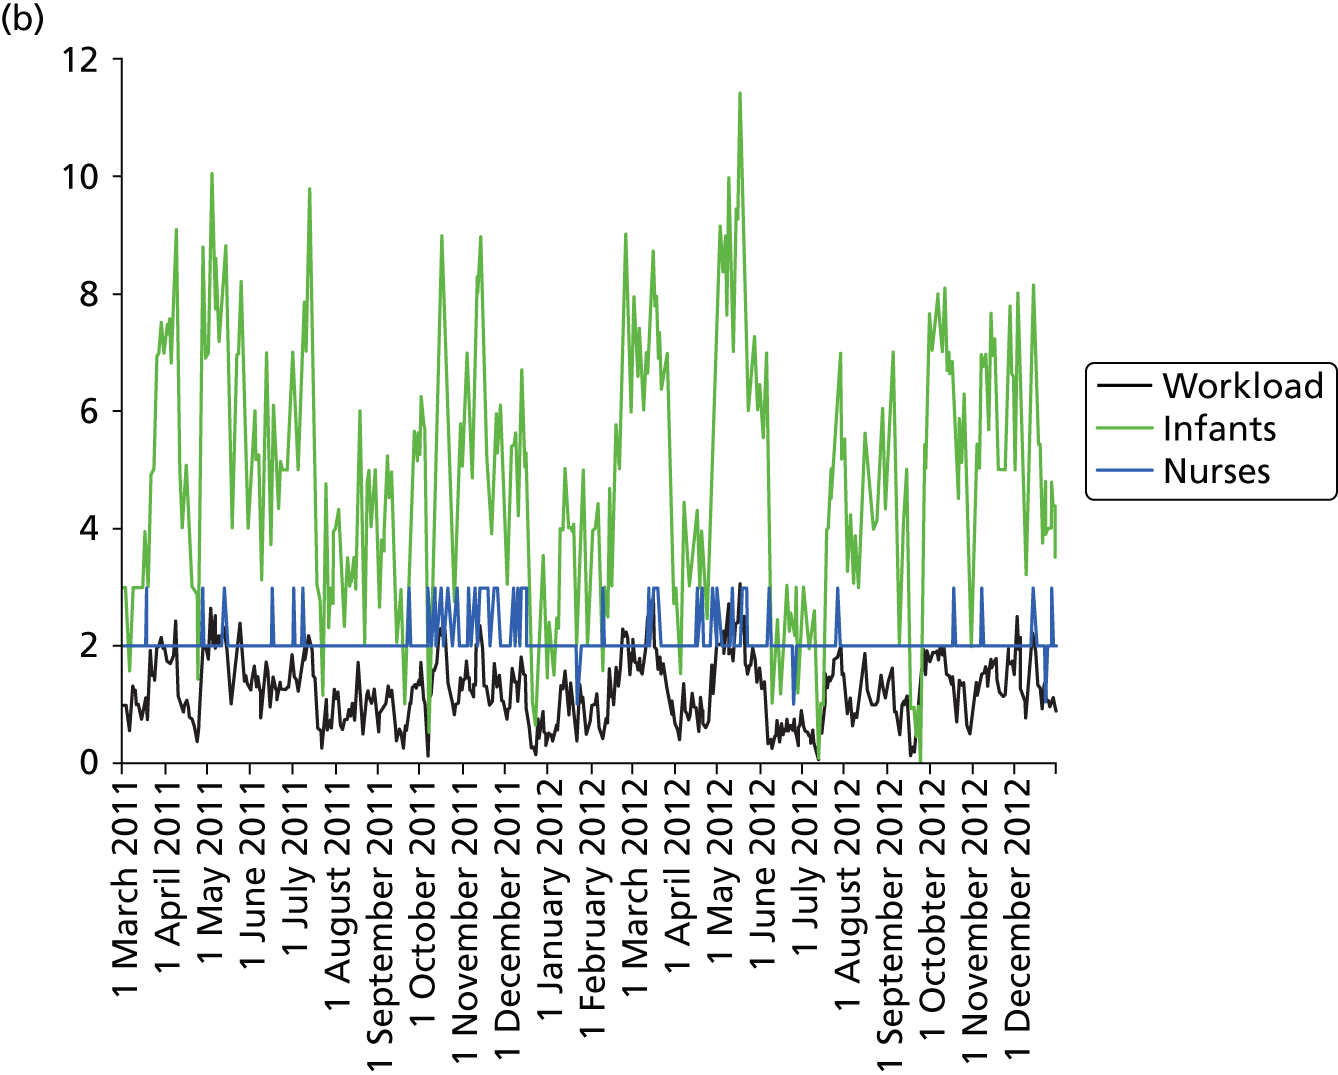
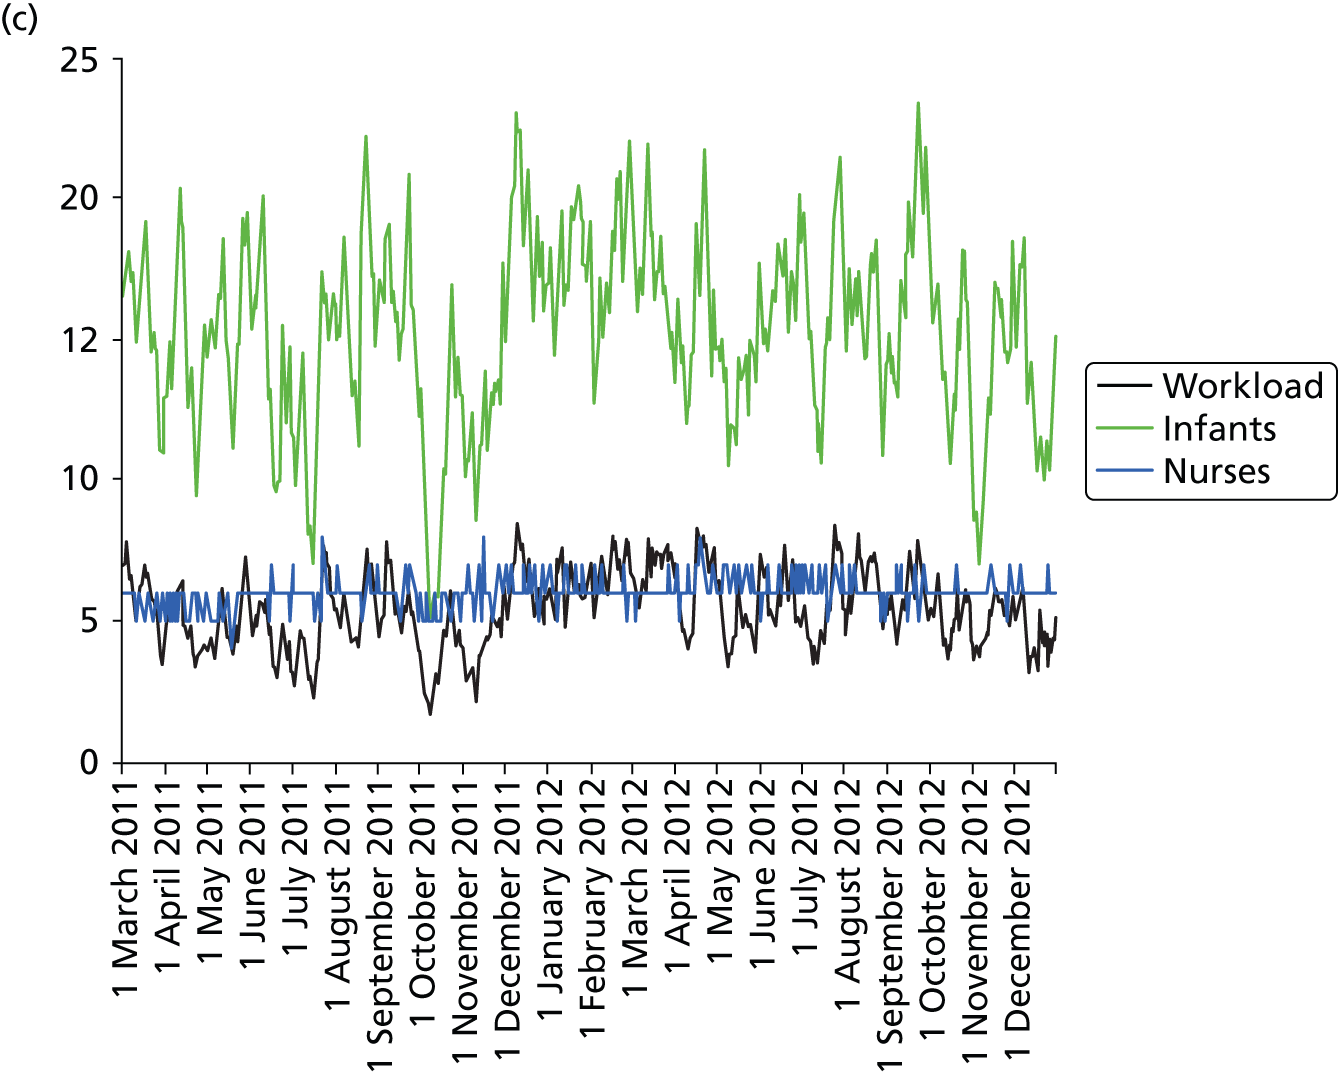
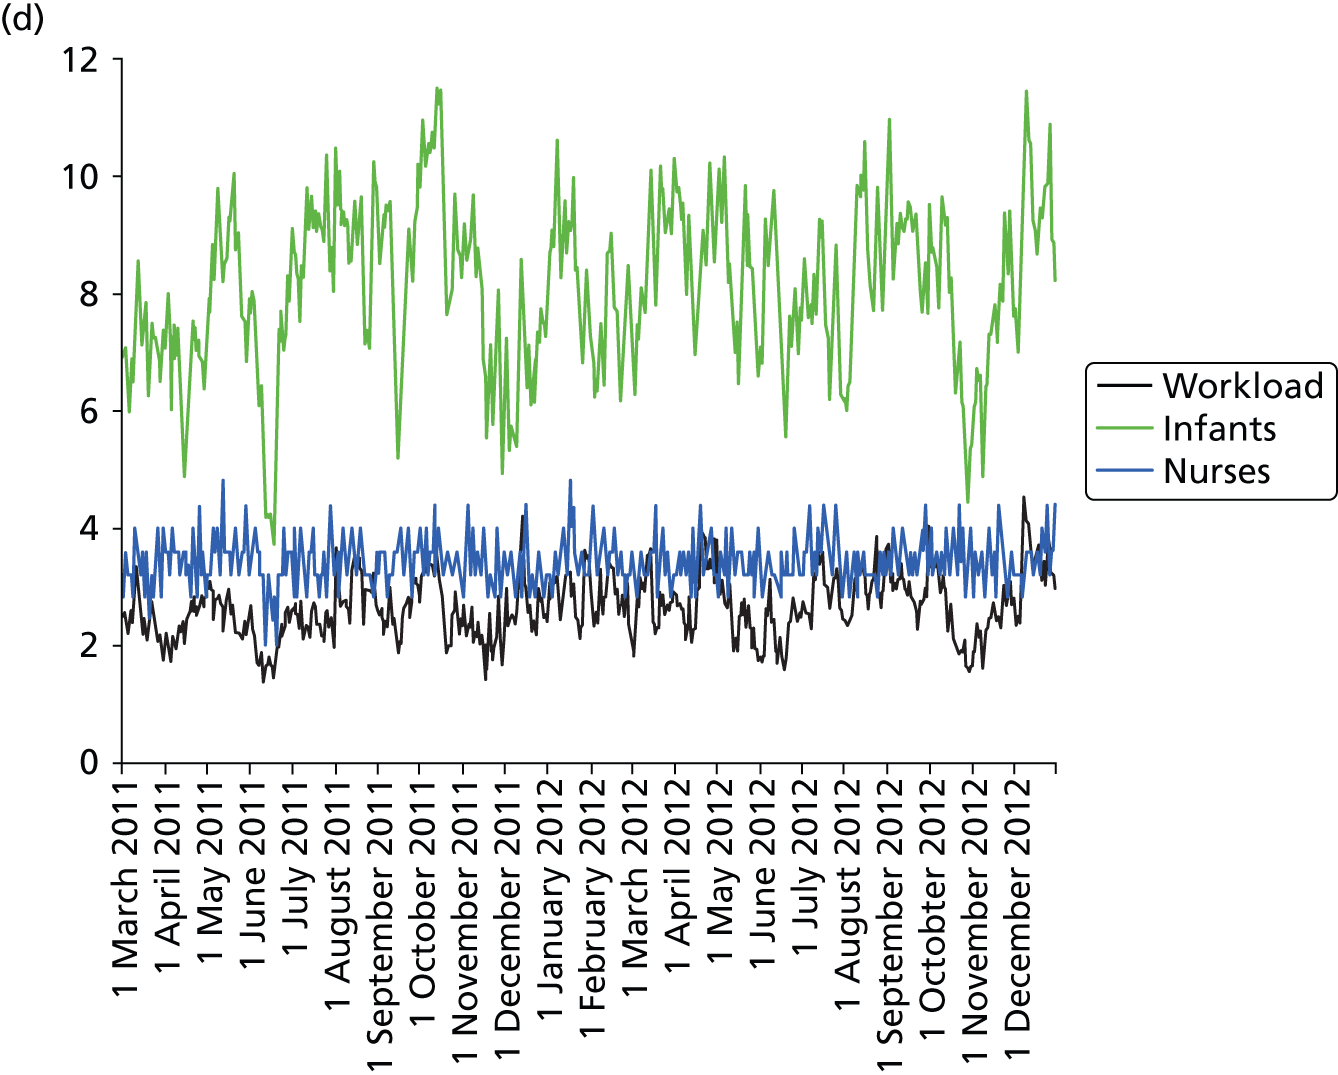
Figures 27 and 28 show the variation in workload relative to average workload in each hospital. Each day the nurse workload was calculated as described in Quantification of workload and lengths of stay in each care level weighted by how much of the day infants were present, and divided by the average workload for the 2-year analysis period.
FIGURE 27.
Distribution of inter-day variation in workload by hospital. Workload is normalised to average workload (values of less than 1 on the x-axis represent days with lower than average workload, and values greater than 1 represent days with higher than average workload). (a) Plymouth; (b) Barnstaple; (c) Truro; (d) Exeter; and (e) Torbay.
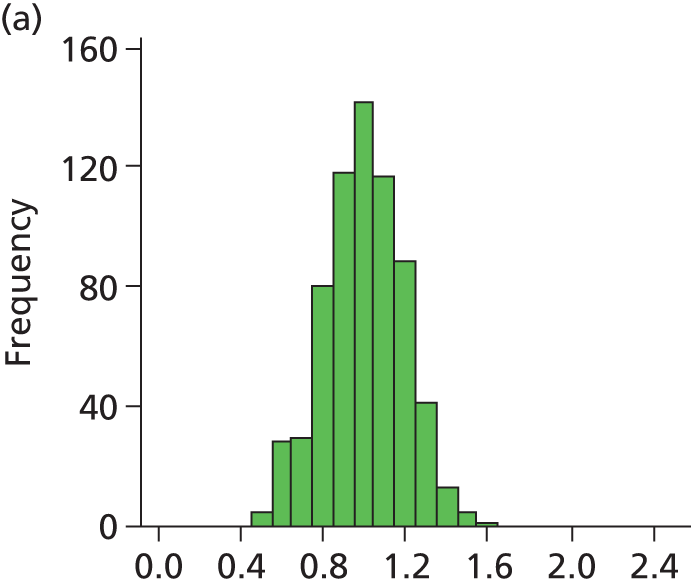


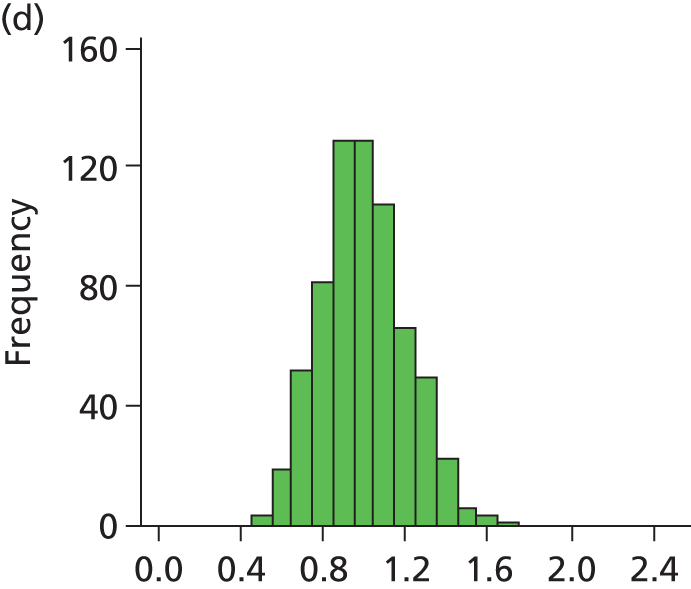
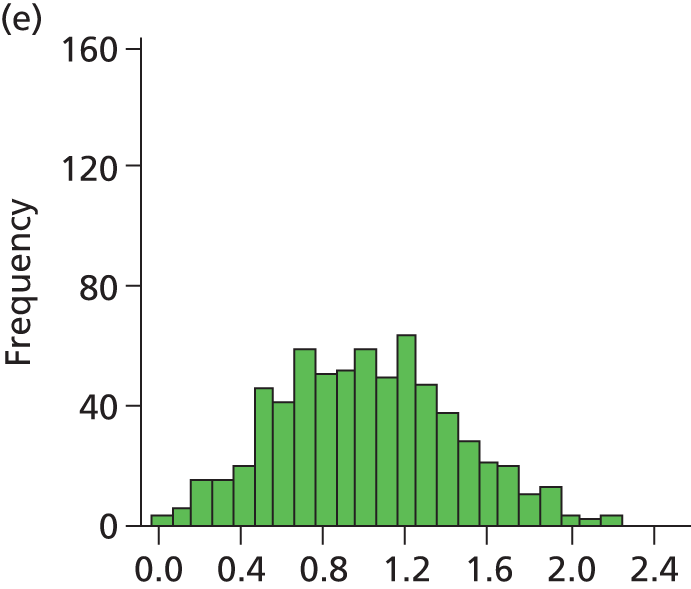
FIGURE 28.
Histogram of daily variation in the number of infants present in each hospital. Workload is expressed as a ratio to average number of infants present (values of less than 1 on the x-axis represent days with lower than average workload, and values greater than 1 represent days with higher than average workload). (a) Plymouth; (b) Barnstaple; (c) Truro; (d) Exeter; and (e) Torbay.
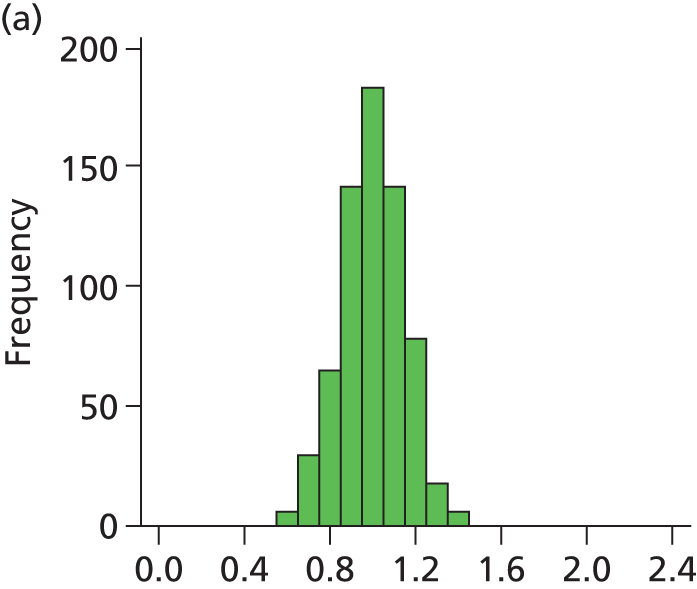

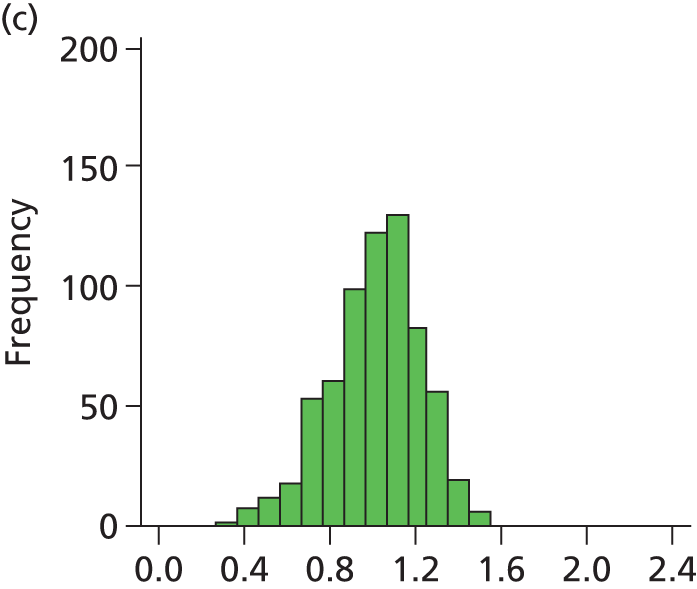
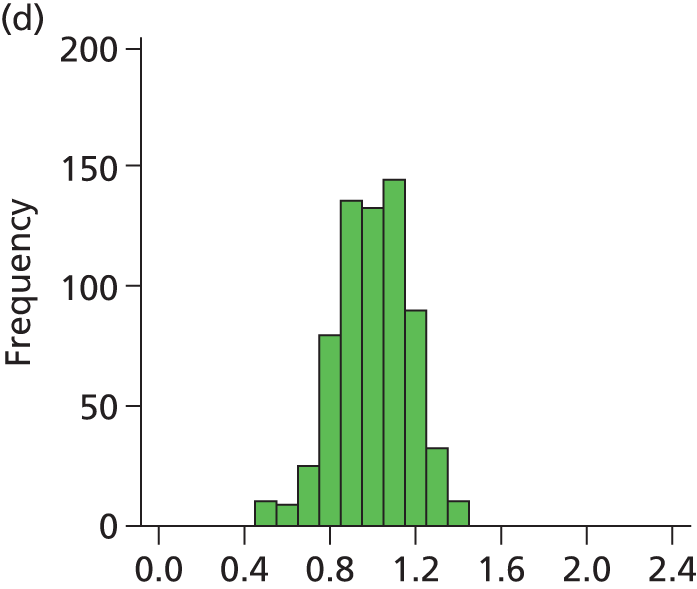
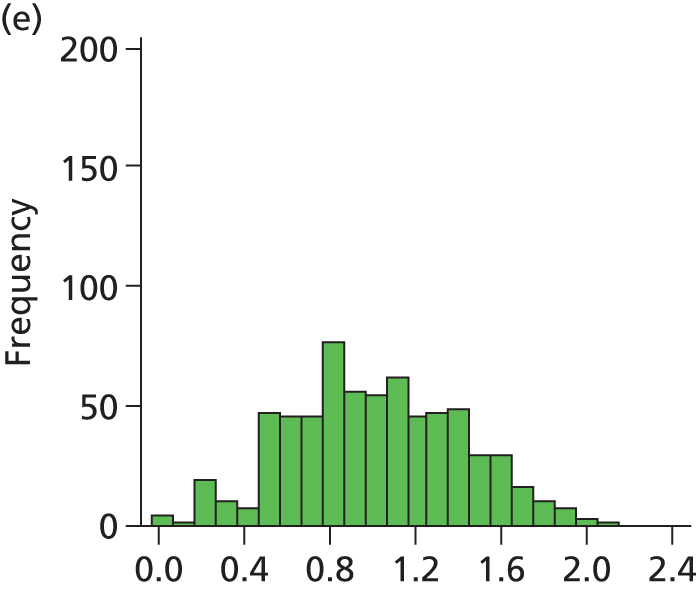
Figure 29 shows a frequency plot of nurse workload relative to the number of nurses present. Each day the nurse workload was calculated as described in Quantification of workload and lengths of stay in each care level weighted by how much of the day infants were present. This was divided by the number of nurses present on the day shift for that day. Numbers greater than 1 represent workload exceeding BAPM guidelines.
FIGURE 29.
Variation in ratio of nurses to workload (values of less than 1 represent workload that is within BAPM guidelines for the number of nurses present, values of greater than 1 represent workload in excess of BAPM guidelines).
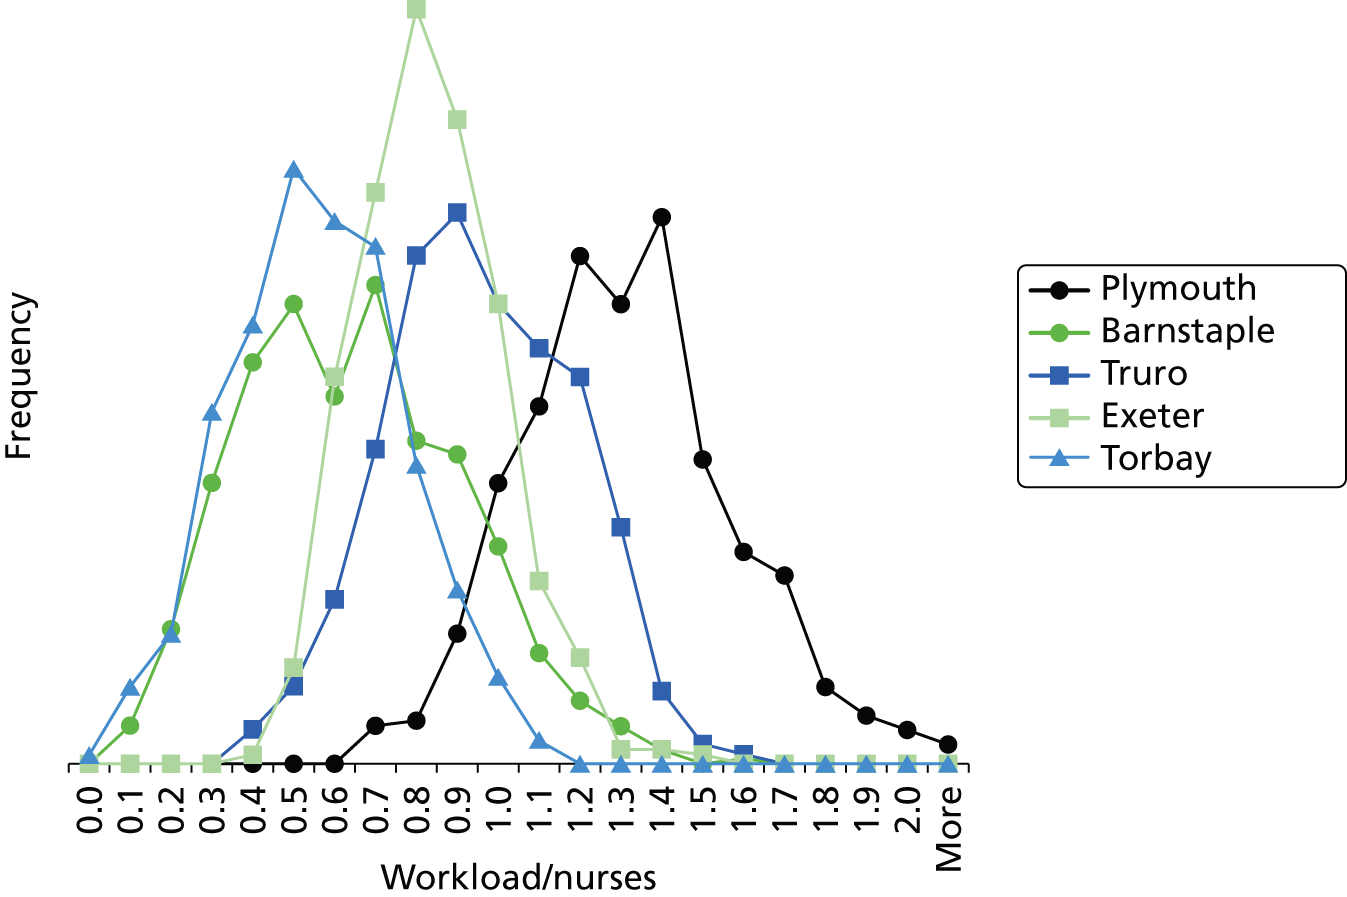
A statistical summary is shown in Table 10. Table 11 shows the ratio of peak to trough workloads at each hospital. Peak and trough workloads were taken as the 90th and 10th percentile workloads for each hospital. Eighty per cent of days fall between these levels; these levels therefore describe the commonly occurring peaks and troughs, rather than describing very rare variations in workload.
| Location of care | Occupancy measure | Mean | Standard deviation | Min. | 10th percentile | 25th percentile | Median | 75th percentile | 90th percentile | Max. |
|---|---|---|---|---|---|---|---|---|---|---|
| Plymouth | IC | 3.1 | 1.9 | 0.0 | 1.0 | 2.0 | 3.0 | 4.2 | 6.0 | 8.9 |
| HDC | 4.6 | 2.2 | 0.0 | 1.7 | 3.0 | 4.5 | 6.1 | 7.4 | 10.9 | |
| SC | 13.0 | 3.7 | 4.1 | 8.0 | 10.5 | 12.9 | 15.6 | 17.7 | 23.3 | |
| TC | 3.7 | 1.9 | 0.0 | 1.2 | 2.4 | 3.7 | 5.0 | 6.3 | 10.1 | |
| Workload | 9.1 | 1.7 | 4.5 | 6.9 | 8.0 | 9.2 | 10.4 | 11.3 | 14.2 | |
| Infants | 24.5 | 3.6 | 13.6 | 20.0 | 22.1 | 24.6 | 26.9 | 29.0 | 34.7 | |
| Nurses | 7.3 | 0.9 | 5.0 | 6.0 | 7.0 | 7.0 | 8.0 | 8.0 | 11.0 | |
| Workload/nurses | 1.27 | 0.26 | 0.62 | 0.96 | 1.09 | 1.27 | 1.42 | 1.62 | 2.46 | |
| % days over BAPM guidelines | 85 | |||||||||
| Barnstaple | IC | 0.0 | 0.1 | 0.0 | 0.0 | 0.0 | 0.0 | 0.0 | 0.0 | 1.0 |
| HDC | 0.3 | 0.5 | 0.0 | 0.0 | 0.0 | 0.0 | 0.6 | 1.0 | 2.5 | |
| SC | 4.0 | 2.0 | 0.0 | 1.5 | 2.5 | 4.0 | 5.3 | 6.8 | 10.2 | |
| TC | 0.5 | 0.7 | 0.0 | 0.0 | 0.0 | 0.0 | 0.8 | 1.4 | 4.0 | |
| Workload | 1.2 | 0.6 | 0.0 | 0.5 | 0.8 | 1.2 | 1.6 | 2.0 | 3.1 | |
| Infants | 4.8 | 2.1 | 0.0 | 2.0 | 3.0 | 4.8 | 6.5 | 7.6 | 11.4 | |
| Nurses | 2.1 | 0.3 | 1.0 | 2.0 | 2.0 | 2.0 | 2.0 | 3.0 | 3.0 | |
| Workload/nurses | 0.60 | 0.27 | 0.00 | 0.25 | 0.38 | 0.58 | 0.77 | 0.97 | 1.57 | |
| % days over BAPM guidelines | 7 | |||||||||
| Truro | IC | 1.2 | 0.9 | 0.0 | 0.0 | 0.6 | 1.0 | 2.0 | 2.5 | 4.0 |
| HDC | 3.1 | 1.7 | 0.0 | 1.0 | 2.0 | 3.0 | 4.3 | 5.2 | 8.6 | |
| SC | 10.2 | 3.0 | 2.0 | 6.5 | 8.1 | 10.3 | 12.3 | 13.9 | 18.6 | |
| TC | 0.8 | 0.8 | 0.0 | 0.0 | 0.0 | 0.6 | 1.1 | 2.0 | 5.2 | |
| Workload | 5.4 | 1.3 | 1.7 | 3.8 | 4.5 | 5.4 | 6.4 | 7.3 | 8.5 | |
| Infants | 15.3 | 3.4 | 5.0 | 10.8 | 13.3 | 15.5 | 17.6 | 19.4 | 23.4 | |
| Nurses | 6.0 | 0.5 | 4.0 | 5.0 | 6.0 | 6.0 | 6.0 | 7.0 | 8.0 | |
| Workload/nurses | 0.91 | 0.22 | 0.34 | 0.62 | 0.74 | 0.90 | 1.07 | 1.20 | 1.59 | |
| % days over BAPM guidelines | 35 | |||||||||
| Exeter | IC | 1.6 | 1.1 | 0.0 | 0.0 | 1.0 | 1.2 | 2.1 | 3.0 | 7.0 |
| HDC | 3.1 | 1.7 | 0.0 | 1.0 | 2.0 | 3.0 | 4.2 | 5.3 | 8.7 | |
| SC | 12.7 | 3.7 | 2.3 | 7.7 | 10.0 | 12.8 | 15.4 | 17.4 | 21.6 | |
| TC | 2.9 | 1.7 | 0.0 | 1.0 | 1.6 | 2.6 | 3.8 | 5.2 | 11.5 | |
| Workload | 6.6 | 1.3 | 3.4 | 4.9 | 5.8 | 6.6 | 7.5 | 8.5 | 11.3 | |
| Infants | 20.2 | 3.5 | 9.2 | 15.7 | 17.8 | 20.4 | 22.9 | 24.5 | 28.8 | |
| Nurses | 8.5 | 1.0 | 5.0 | 7.0 | 8.0 | 8.0 | 9.0 | 10.0 | 12.0 | |
| Workload/nurses | 0.78 | 0.17 | 0.38 | 0.56 | 0.67 | 0.78 | 0.90 | 1.00 | 1.43 | |
| % days over BAPM guidelines | 10 | |||||||||
| Torbay | IC | 0.1 | 0.2 | 0.0 | 0.0 | 0.0 | 0.0 | 0.0 | 0.2 | 1.6 |
| HDC | 0.3 | 0.5 | 0.0 | 0.0 | 0.0 | 0.0 | 0.6 | 1.0 | 2.5 | |
| SC | 4.5 | 2.1 | 0.0 | 2.0 | 3.0 | 4.4 | 6.0 | 7.1 | 13.0 | |
| TC | 1.4 | 1.1 | 0.0 | 0.0 | 0.6 | 1.1 | 2.0 | 3.0 | 5.9 | |
| Workload | 1.5 | 0.7 | 0.0 | 0.7 | 1.0 | 1.5 | 2.0 | 2.4 | 3.3 | |
| Infants | 6.3 | 2.5 | 0.0 | 3.0 | 4.6 | 6.0 | 8.0 | 9.7 | 13.2 | |
| Nurses | 3.0 | 0.3 | 2.0 | 3.0 | 3.0 | 3.0 | 3.0 | 3.0 | 4.0 | |
| Workload/nurses | 0.51 | 0.21 | 0.00 | 0.25 | 0.36 | 0.51 | 0.66 | 0.78 | 1.09 | |
| % days over BAPM guidelines | 1 | |||||||||
| Whole network | IC | 6.0 | 2.6 | 0.5 | 3.0 | 4.1 | 5.6 | 7.7 | 10.0 | 14.1 |
| HDC | 11.4 | 3.5 | 3.2 | 7.0 | 8.8 | 11.4 | 14.0 | 16.2 | 20.8 | |
| SC | 44.4 | 6.3 | 27.6 | 35.9 | 40.3 | 44.5 | 48.4 | 52.9 | 62.2 | |
| TC | 9.3 | 3.0 | 0.9 | 5.5 | 7.0 | 9.1 | 11.1 | 13.3 | 19.9 | |
| Workload | 24.0 | 3.0 | 16.3 | 20.0 | 21.6 | 23.9 | 26.2 | 28.0 | 32.0 | |
| Infants | 71.1 | 7.1 | 53.1 | 61.2 | 66.3 | 71.2 | 76.1 | 79.9 | 90.9 | |
| Occupancy measure | Plymouth | Barnstaple | Truro | Exeter | Torbay |
|---|---|---|---|---|---|
| Workload | 1.63 | 3.88 | 1.94 | 1.73 | 3.28 |
| Infants | 1.45 | 3.80 | 1.81 | 1.57 | 3.23 |
From the data it is apparent that hospitals must cope with very significant variability. The number of IC infants at Plymouth, for example, ranged from zero to nine, while the total number of infants in care ranged from 13 to 35.
We saw significant differences between hospitals in their workloads relative to BAPM standards. Nurse workload at Plymouth, the network ICU, was an average of 127% of BAPM guidelines and 85% of days were spent with workload in excess of BAPM guidelines. All other units worked within BAPM guidelines on average, although they had between 1% (Torbay) and 35% (Truro) of days with workload in excess of BAPM guidelines. At Plymouth, workload peaked at over twice BAPM guidelines whereas at other hospitals it peaked at about 50% above BAPM guidelines (apart from Torbay, which had a peak workload of 9% above BAPM guidelines).
Smaller units had relatively higher variability in the number of infants and workload, the normal range of variation being a greater percentage of average workload. We calculated the typical range of workload as being represented by the 10th percentile and 90th percentile workloads (Table 11 and see Figures 27 and 28 for histograms). The two smallest units had a range of three- to fourfold differences between peak load (90th percentile) and trough load (10th percentile) in both workload and the total number of infants present. The three larger units (Plymouth, Exeter and Truro) had typical ranges of workload and infants of 1.5–2.0 times. Smaller units thus require greater spare capacity to cope with the increased fluctuation in workload (if transfers due to lack of capacity are to be avoided).
Workload using 2011 versus 2001 guidelines from the British Association of Perinatal Medicine
In 2011, BAPM updated its guidelines on what level of care is ascribed to different care interventions. 7 In this report we are using the BAPM 2011 guidelines throughout, but Badger also reports 2001 levels of care, so we undertook a comparison (Table 12). Overall we found that calculated nurse workload (see Chapter 7, Analysis framework in R, for calculation) reduced by 14% between BAPM 2001 guidelines and BAPM 2011 guidelines if TC was excluded from the calculation or 9% if TC was included. Generally, Badger data indicate a reduction in IC days, an increase in HDC days, a reduction in SC days and the categorisation of some as TC (which was missing from the 2001 categorisation).
| BAPM 2001 average load | BAPM 2011 average load | Workload | BAPM 2011 workload/BAPM 2001 workload | |||||||||
|---|---|---|---|---|---|---|---|---|---|---|---|---|
| Level 1 (IC) | Level 2 (HDC) | Level 3 (SC) | Level 1 (IC) | Level 2 (HDC) | Level 3 (SC) | Level 4 (TC) | BAPM 2001 | BAPM 2011 excluding TC | BAPM 2011 including TC | BAPM 2011 workload (%) excluding TC | BAPM 2011 workload (%) including TC | |
| Plymouth | 3.9 | 4.3 | 16.5 | 3.1 | 4.7 | 13.1 | 3.7 | 10.1 | 8.7 | 9.2 | 86 | 91 |
| Barnstaple | 0.2 | 0.4 | 3.9 | 0.0 | 0.3 | 3.8 | 0.4 | 1.4 | 1.1 | 1.2 | 81 | 89 |
| Truro | 1.7 | 2.9 | 10.5 | 1.3 | 3.0 | 10.1 | 0.7 | 5.8 | 5.3 | 5.4 | 92 | 94 |
| Exeter | 2.2 | 2.4 | 15.8 | 1.5 | 3.1 | 12.9 | 2.8 | 7.3 | 6.3 | 6.7 | 86 | 91 |
| Torbay | 0.3 | 0.2 | 5.6 | 0.1 | 0.3 | 4.4 | 1.3 | 1.8 | 1.3 | 1.5 | 74 | 84 |
| All | 8.2 | 10.2 | 52.4 | 6.0 | 11.5 | 44.3 | 9.0 | 26.4 | 22.8 | 24.0 | 86 | 91 |
Chapter 8 Simulation model
Software
The model was built using Simul8 2012 Educational Edition (Simul8 Corporation, Boston, MA, USA) (equivalent to Simul8 2012 Professional).
Data used
Data used for the basis of input into the model were obtained from the Badger database of care. The model was built based on data from admissions between 1 January 2011 and 31 December 2012.
Model description
Categorisation of infants
For the model, infants were categorised into seven categories (Table 13). Six of the categories were divided by gestational age, while the seventh was a category for all infants requiring specialist surgical or cardiac care (regardless of gestational age). The gestational age categories were divided into 3-week divisions which aligned with rules governing which units could care for them (see Hospital types for more details).
| Category | Gestational age at birth | % of infants | % of infants who are twins | % of deliveriesa | % deliveries that are twins |
|---|---|---|---|---|---|
| 1 | < 24 | 0.23 | 22.2 | 0.21 | 12.50 |
| 2 | 24 to < 27b | 1.18 | 30.9 | 1.04 | 18.24 |
| 3 | 27 to < 30 | 1.83 | 13.0 | 1.79 | 6.96 |
| 4 | 30 to < 33 | 5.27 | 23.8 | 4.86 | 13.51 |
| 5 | 33 to < 36 | 16.27 | 21.6 | 15.18 | 12.10 |
| 6 | ≥ 36 | 72.63 | 4.5 | 74.28 | 2.29 |
| 7 | Surgical/cardiac | 2.60 | 6.8 | 2.63 | 3.50 |
The model simulates the occurrence of twins, but not greater parities. In the model the twins may be forced to be kept together (i.e. they must be kept at the same hospital), or may be separated (e.g. if there is capacity for one, but not two, infants in the hospital closest to the parents’ home). Where twins must be kept together, the model uses a simplification of assuming that the needs (use of care levels and lengths of stay) of the twins are identical. In this report, all results reported allow for twins to be separated if necessary.
Hospital types
The hospital types in the model are based on those published in the NHS standard contract for neonatal critical care8 and are described in Table 14. We have added one extra category of hospital, the ‘local neonatal unit +’ (LNU). This category of hospital extends the maximum permitted LoS in IC from 2 days to 28 days and reflects the historic use of two hospitals (Exeter and Truro) in the Peninsula network under study. The distinctions between units are simplified compared with the full description in the standard contract, but these rules maintain the major characteristics of the different types of units. Each hospital in the model may be individually customised but in this report all hospitals come from the five basic categories in Table 14.
| Hospital type | Surgical/cardiac provision | Care for < 24 weeks | Care for < 27 weeksa | Care for < 30 weeks | Max. permitted predicted ICU LoS (days) | Max. permitted predicted HDU LoS (days) | ICU transfers in allowed |
|---|---|---|---|---|---|---|---|
| 1: SCU | No | No | No | No | 0 | 2 | No |
| 2: LNU | No | No | No | Yes | 2 | No limit | No |
| 3: LNU + | No | No | No | Yes | 28 | No limit | Yes |
| 4: network neonatal unit | No | Yes | Yes | Yes | No limit | No limit | Yes |
| 5: surgical/cardiac unit | Yes | Yes | Yes | Yes | No limit | No limit | Yes |
When looking at the impact of changing the number of units, the model is designed to allow hospitals to remain open as birth centres. In this case, infants requiring neonatal care are present in the birth centre while awaiting transfer to a neonatal unit.
Patient flow
As described in Chapter 7, Daily variation in case mix, workload and nursing numbers, the Badger data we used did not describe the sequence of levels of care within a spell at one hospital. Although the model allows for complex routing we have assumed that the flow proceeds from more to less IC. Hence, the sequence of stay is surgical → IC → HDC → SC → TC (Figure 30). Infants may enter care at any level and exit from any level. Not all care levels between entry and exit points must be used (e.g. an infant may enter IC and transition to SC without using HDC). For modelling we have assumed that all neonatal care occurs continuously after first admission, that is there are no discharge/readmissions (in our data, fewer than 2% of infants had a break in care; see Chapter 7, Use of care levels, and lengths of stay, by gestational age at birth).
FIGURE 30.
Patient flow through model. Note: any one or more levels may be bypassed. An infant could, theoretically, exit IC and enter TC directly.
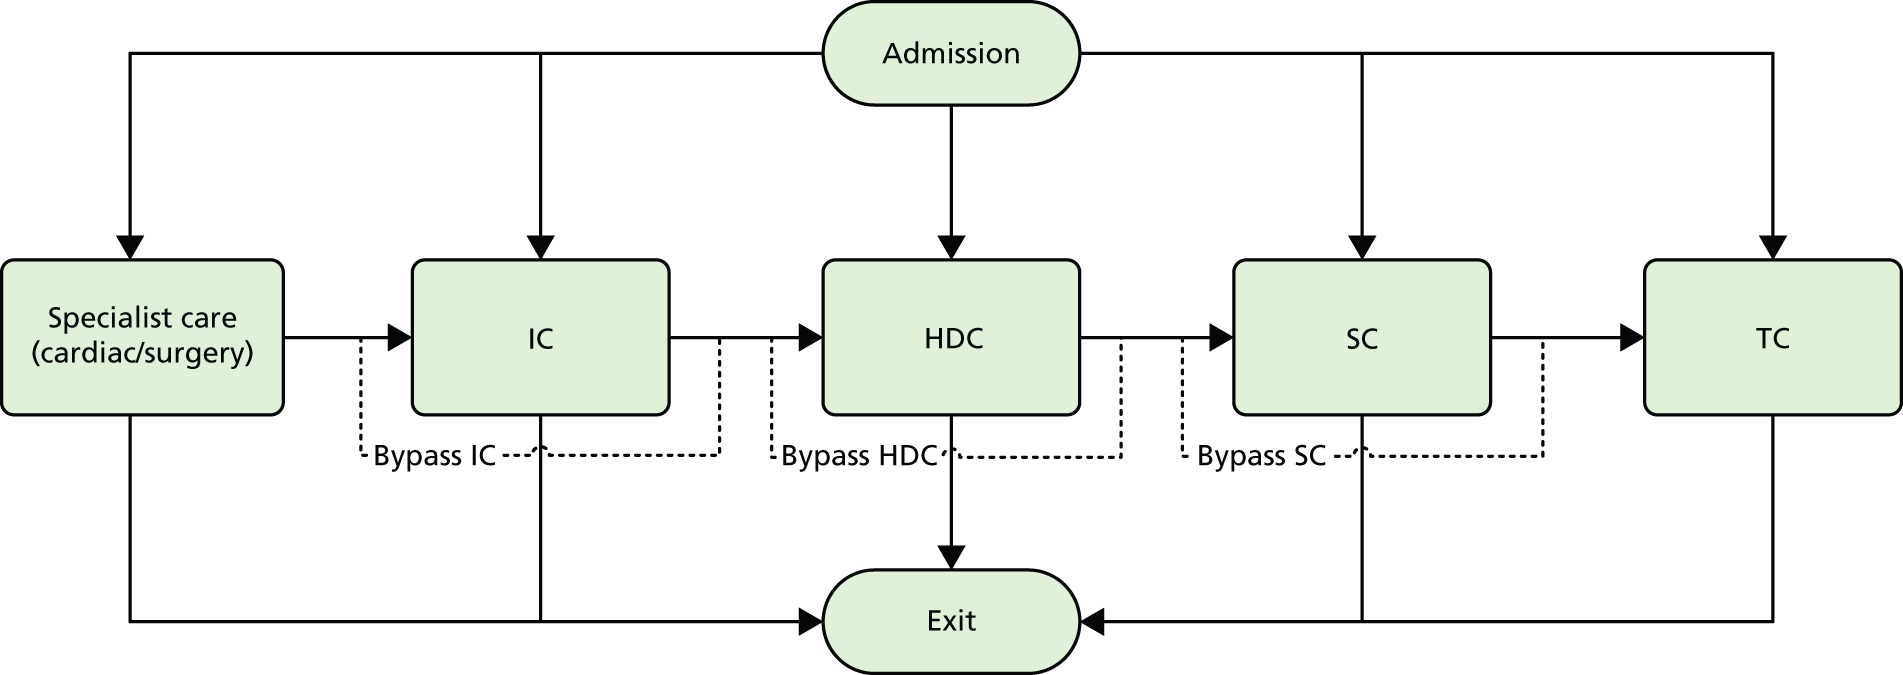
Table 15 describes the entry, exit and transition proportions. For example, of category 3 infants, 91.8% enter by way of needing IC, with the remainder entering through needing HDC. Of those who need IC, 94.0% proceed to HDC and 6.0% exit the system without use of any more care levels. Infants requiring surgical/cardiac care all enter by way of needing IC in the surgical/cardiac unit (this is a simplification compared with real life). Then 45% of those infants require a second spell of IC, but this may be in a non-specialist unit. Of those entering a second spell of IC, 33.3% move to HDC, 13.3% move directly to SC and the rest exit the system.
| Infant category | Entry point | Exit from IC | Exit from HDC | Exit from SC | |||||||||||
|---|---|---|---|---|---|---|---|---|---|---|---|---|---|---|---|
| IC | HDC | SC | TC | Exit | IC | HDC | SC | TC | Exit | SC | TC | Exit | TC | Exit | |
| 1 | 100.0 | 0.0 | 0.0 | 0.0 | 0.0 | NA | 11.1 | 0.0 | 0.0 | 88.9 | 100.0 | 0.0 | 0.0 | 0.0 | 100.0 |
| 2 | 100.0 | 0.0 | 0.0 | 0.0 | 0.0 | NA | 66.0 | 0.0 | 0.0 | 34.0 | 90.3 | 0.0 | 9.7 | 42.9 | 57.1 |
| 3 | 91.8 | 8.2 | 0.0 | 0.0 | 0.0 | NA | 94.0 | 0.0 | 0.0 | 6.0 | 98.6 | 0.0 | 1.4 | 75.0 | 25.0 |
| 4 | 49.2 | 35.5 | 15.3 | 0.0 | 0.0 | NA | 86.6 | 7.6 | 0.0 | 5.9 | 100.0 | 0.0 | 0.0 | 80.9 | 19.1 |
| 5 | 8.4 | 30.5 | 59.8 | 1.3 | 0.0 | NA | 83.1 | 16.9 | 0.0 | 0.0 | 99.7 | 0.3 | 0.0 | 80.0 | 20.0 |
| 6 | 6.1 | 10.7 | 73.9 | 9.3 | 0.0 | NA | 43.2 | 49.4 | 0.8 | 6.6 | 96.2 | 2.8 | 0.9 | 53.9 | 46.1 |
| 7 | NA | NA | NA | NA | NA | NA | 61.2 | 13.4 | 0.0 | 25.4 | 90.0 | 0.0 | 10.0 | 39.7 | 60.3 |
| a7* (surgical/cardiac unit) | 100.0 | 0.0 | 0.0 | 0.0 | 0.0 | 43.0 | 12.2 | 43.6 | 1.3 | 0.0 | |||||
In order to test the effect of the simplification that infants proceed from higher-dependency to lower-dependency levels of care, we ran the model with the reverse assumption (infants enter the system at the lowest level of care that they will receive and exit from the highest level of care that they receive). We found no significant difference in occupancy results in the model (R2 > 0.99 for comparison of occupancies of each unit at each care level) or parent travel distances (22.4 km when reversed, compared with 21.8 km when normal), although we did see a 20% reduction in transfers and 10% reduction in transfer distances when the clinical progression order was reversed for all infants. These results therefore suggest that occupancy and parent distance levels are unaffected by clinical progression order, but that the number and distance of transfers may be somewhat affected if normal clinical progression order is not from worse to better. See Appendix 2 for detailed results.
Further support that this generalised flow is a reasonable simplification to make is the observation that only 1.3% of IC episodes at the network ICU at Plymouth are infants returning from a lower-level unit.
A further simplification in the model is that neonatal care is assumed to occur in a contiguous sequence, without readmission after discharge (where there were readmissions in the observed data the total lengths of stay were summed when analysing lengths of stay). We believe this to be a reasonable simplification given that 98.7% of infants in our observed data did have a contiguous period in neonatal care.
Lengths of stay in each care level (where an infant uses that care level) are shown in Table 16. The length of spell in the surgical unit was estimated from the time the infant leaves the Peninsula network for the surgical/cardiac unit until the time they return. The resulting value of 5.8 days was extremely close to the 5.6 days reported in an analysis of the surgical/cardiac unit in Southampton. 28 Apart from category 7 infants (requiring specialist surgical or cardiac care), all lengths of stay were calculated for infants whose full care was available from the network Badger records (these accounted for 96% of all infants not requiring specialist surgical or cardiac care).
| Category of infant (gestational age) | LoS (mean days) | % CV | ||||||
|---|---|---|---|---|---|---|---|---|
| ICU | HDU | SCU | TC | ICU | HDU | SCU | TC | |
| 1 (< 24 weeks) | 4.5 | 76.7 | 17.9 | 0.0 | 85.9 | 0.0 | 0.0 | 0.0 |
| 2 (24 to < 27 weeks or < 28 weeks for twins) | 17.3 | 38.1 | 29.9 | 3.1 | 82.5 | 52.1 | 40.0 | 88.2 |
| 3 (27 to < 30 weeks) | 10.1 | 19.0 | 32.3 | 3.1 | 65.3 | 67.7 | 38.7 | 69.6 |
| 4 (30 to < 33 weeks) | 3.8 | 6.1 | 24.1 | 3.1 | 89.8 | 90.9 | 39.2 | 66.4 |
| 5 (33 to < 36 weeks) | 2.6 | 2.9 | 9.4 | 2.4 | 75.2 | 126.1 | 74.0 | 70.0 |
| 6 (≥ 36 weeks) | 2.7 | 2.3 | 3.2 | 1.6 | 100.0 | 198.8 | 123.5 | 78.9 |
| 7 (infants requiring specialist surgical/cardiac care), LoS outside surgical/cardiac unit | 10.8 | 16.5 | 9.7 | 1.9 | 116.2 | 116.9 | 149.1 | 114.6 |
| a7* LoS in surgical/cardiac unit | 5.80 | 100 | ||||||
The distribution of lengths of stay at all levels and stratification categories was examined (see Appendix 3 for details). The log-normal distribution offered a high degree of generality across the gestational age and care type, and so this distribution was selected for use for all lengths of stay.
Decision logic for placing infants
For each patient node the model has an ordered list of hospitals to search, ranging from closest to furthest within the network and then closest to furthest outside the network. The model looks for the cot that first meets the following criteria:
-
Unit has suitable surgical/cardiac specialist care if needed.
-
Unit accepts gestational age of infant (for IC spell).
-
Unit has appropriate care level (IC, HDC, SC).
-
Expected LoS is within permitted limit (see Table 14).
-
A free cot of the required type is available.
-
Total workload (nurse equivalents) is within acceptable limits.
Limiting capacity by cots or nurses: The model allows capacity to be limited by cots or nurses. The numbers of cots may be entered along with the highest level of care a cot may support (a cot may be used for an infant requiring a lower level of care, but cannot be used for an infant requiring a higher level of care than the cot is designated for). Infants are assumed to occupy a cot of their own care level apart from when they need to overflow into higher care categories. The model also allows for the expected number of nurses present. Nurse workload is calculated in the model and the unit may close when it reaches a given threshold above BAPM guidelines.
When talking to units we found that the number of cots and their care level were not easily identified by units. For example, a unit may nominally have six IC and six HDC cots but these may be used flexibly, or extra cots moved in, so long as nursing staff and necessary specialised equipment is available. In this report we have therefore used only nursing staff to limit capacity of units.
Transfers
Booking in to specialist unit
From the Badger data we identified that for 13% of women the booked hospital of birth was an IC-capable hospital that was different from their closest hospital (which had no IC). We assume in summarising transfer numbers and distances that 13% of women are booked into a hospital with IC (e.g. twins pregnancies or complex needs pregnancies) when their closest hospital does not offer IC.
Intrauterine transfers
In ≈ 15% of admissions to an ICU, from a mother whose birth was booked into a hospital with a SCU, the place of birth was an ICU. We assume in summarising transfer numbers and distances that 15% of first transfers are in-utero transfers.
Neonatal transfers
Transfers between units may occur at three points:
-
When a higher level of care is needed (e.g. infant requiring IC is born in a hospital with no IC cots).
-
When the infant is transitioning to a lower level of care and can move to a unit closer to home.
-
As 2, but transfer occurs during a period of care at one level. For example, moving the infant closer to home may not have been possible when the infant changed to a lower level if the closer hospital was full. The model checks for a closer cot each day. Transfers occur only if there are at least 3 days left in that care level. This value is adjustable in the model.
There is a set transfer delay between identifying an infant for transfer and the transfer occurring (this may be because of waiting for transfer or stabilisation of an infant prior to transfer). The default value used is 12 hours.
Mortality model
As part of the health economics evaluation, and in order to explore how we might link outcomes to the status of units, we linked mortality to the percentage occupancy of units, based on combining models developed by Tucker et al. ,29 who linked mortality to unit occupancy, and Manktelow et al. ,30 who linked mortality to infant characteristics. The infant characteristics are those found in most predictive models (i.e. gestation, gender and birthweight), which account for most infant mortality in this age group. 31 This is intended to be purely experimental. The equations used are shown in Appendix 4.
There are some challenges to replicating Tucker et al. ’s workload measure. 29 Tucker et al. used three workload measures, and reported that occupancy was statistically significant. Tucker et al. based occupancy on the maximum number of infants present in a unit over their study period but their measure is hard to operationalise in a model. We define occupancy as a proportion of the workload corresponding to 150% BAPM guidelines (i.e. we assume that units are full when at 150% guideline workload). Further, we measure occupancy at the moment of entry of infants to IC, which contrasts with Tucker et al. , who measured average occupancy using twice-daily sampling over the entire period of stay.
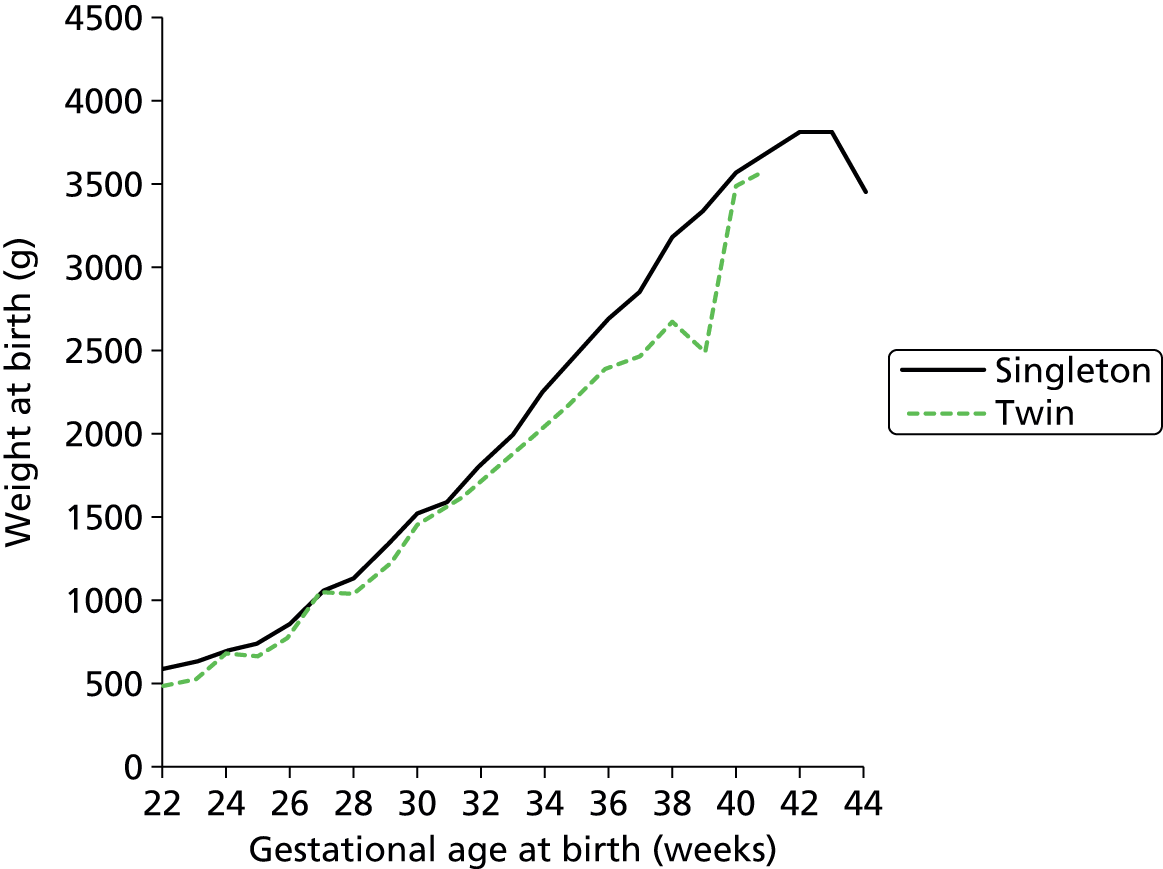
In this mortality model, infants are assigned a gestational age and weight according to the distribution found in the Peninsula network (Figure 31) applying an 8% coefficient of variation (CV) reflecting the average CV in the data.
FIGURE 31.
The relationship between gestational age at birth and birthweight used in model (based on Badger data).
In applying the mortality model we add Tucker et al. ’s workload measure to Manktelow et al. ’s 2013 model of infant mortality and make the following additional assumptions:
-
Mortality occurs to infants when in IC only (supported by Badger data).
-
When infants are discharged directly from IC it will be because of mortality (supported by Badger data).
In the USA it has been found that there is reduced mortality with increased centralisation; this is attributed to increased experience of staff in the more centralised units. 32 At the time of running the analysis, this finding had not been replicated in a UK setting, and it is not modelled here, but recent work has suggested that increased centralisation in the UK can reduce mortality. 33 There may also be risks associated with transfers of infants to IC, but circumstantial evidence suggests that these risks are quite small,33 and we not have modelled them here.
In the simulation model with a mortality component, the transition matrix (entry, transition and exit from levels of care, depending on gestational age category) was based on surviving infants only. Likewise, normal lengths of stay at each care level were based on surviving infants only. All mortality was considered to occur after the IC spell. If an infant was labelled as a mortality then the LoS in IC was set to the average of those infants who had died (this was 5.6 days with a 220% CV). The infant then exits the model after his or her IC stay.
Model run time
The model had a run-in period of 100 days (no data are collected during this period), followed by a data collection period of 60 years. A single long run was employed, with variation measured by dividing the run into 1-year batches. This ‘batching’ method of running the model has the advantage, over multiple independent runs, of being more efficient for computationally intensive models, and is reported to have greater accuracy in estimating steady-state means, as it is less prone to initiation bias. 34
When averaging occupancy levels for each year, this 60-year collection period gave a 95% confidence limit of less than 10% of the mean on all occupancy levels measured and a 95% confidence limit of less than 5% of the mean on more than 85% of the occupancy levels measured.
Simulation model validation
In order to validate the model, the output from the model was tested against actual data from 1 January 2013 to 30 June 2013 (a period of data outside that used to build the model). Two methods of determining the location of births were tested:
-
location of births requiring neonatal care based on actual demand by GP
-
demand based on all births; this was achieved by correlating demand (obtained from Badger) with the number of females aged 15–45 years and the fertility rate of those women (see Chapter 7, Comparison of demand with births, for details).
The expected range of results was estimated using Statistical Process Control methods, where control limits are set at ± 3 standard deviations either side of the mean (these limits are expected to contain 99.7% of data occurring within normal common-type variation). 35 As the model was being compared with 6 months of actual data, the 60-year simulation run was divided into 6-month batches and the mean occupancy levels for each 6-month period were calculated. The standard deviations between these batches were then calculated to set the Statistical Process Control limits.
For validation, the closure to new infant levels were set at 200% BAPM guidelines for Plymouth and 150% BAPM guidelines for other units (in line with observed peak workloads, see Chapter 7, Daily variation in case mix, workload and nursing numbers). Resources were set at the average number of nurses present in 2012 (capacity was limited only by nurses).
Comparison of actual data for training period and test period
The model was built based on data obtained from admissions from 1 January 2011 to 31 December 2012. For model validation, the modelled results were compared with a period of data (admissions from 1 January 2013 to 30 June 2013) independent of the training data. For comparison, Table 17 shows the actual infants in each care level and hospital in those two periods. Overall, the total number of infants in care dropped a little (–4%), as did the total calculated workload (–5%).
| Occupancy measure | Location of care | Actual January–June 2013 | Actual 2011 and 2012 |
|---|---|---|---|
| Infants | Plymouth Derriford | 23.9 | 24.5 |
| Royal Devon and Exeter | 18.3 | 20.2 | |
| Torbay Hospital | 6.8 | 6.3 | |
| Royal Truro | 14.8 | 15.3 | |
| Barnstaple | 4.6 | 4.8 | |
| Workload | Plymouth Derriford | 8.9 | 9.1 |
| Royal Devon and Exeter | 6.4 | 6.6 | |
| Torbay Hospital | 1.6 | 1.5 | |
| Royal Truro | 4.8 | 5.4 | |
| Barnstaple | 1.2 | 1.2 | |
| IC | Plymouth Derriford | 2.8 | 3.1 |
| Royal Devon and Exeter | 1.5 | 1.6 | |
| Torbay Hospital | 0.0 | 0.1 | |
| Royal Truro | 1.1 | 1.2 | |
| Barnstaple | 0.1 | 0.0 | |
| HDC | Plymouth Derriford | 5.3 | 4.6 |
| Royal Devon and Exeter | 3.4 | 3.1 | |
| Torbay Hospital | 0.2 | 0.3 | |
| Royal Truro | 1.4 | 3.1 | |
| Barnstaple | 0.3 | 0.3 | |
| SC | Plymouth Derriford | 12.0 | 13.0 |
| Royal Devon and Exeter | 12.0 | 12.7 | |
| Torbay Hospital | 5.1 | 4.5 | |
| Royal Truro | 11.4 | 10.2 | |
| Barnstaple | 3.7 | 4.0 | |
| TC | Plymouth Derriford | 3.8 | 3.7 |
| Royal Devon and Exeter | 1.4 | 2.9 | |
| Torbay Hospital | 1.4 | 1.4 | |
| Royal Truro | 0.9 | 0.8 | |
| Barnstaple | 0.5 | 0.5 |
Demand based on raw Badger data
In this model, the location of demand was based on the number of admissions per GP, derived directly from the Badger data. The average number of infants in each care level and the total workload are shown in Table 18. Total modelled workload and infants in care were 3% higher than actual levels (reflecting the small reduction in workload and infants between training and test periods of data; see previous subsection). The average number of infants in each care level was within ≈ 1 infant for all care levels, with the model generally having an average just higher than the actual (reflecting the lower demand in the test period).
| Occupancy measure | Actual January–June 2013 | Model | Error (model – actual) |
|---|---|---|---|
| Infants | 68.4 | 70.2 | 1.9 |
| Workload | 22.9 | 23.6 | 0.7 |
| IC | 5.5 | 5.8 | 0.3 |
| HDC | 10.6 | 11.2 | 0.6 |
| SC | 44.3 | 44.2 | –0.1 |
| TC | 8.0 | 9.0 | 1.1 |
The average number of infants in each hospital and care level are shown in Figure 32 and Table 19. The chart also shows the expected range of variation in 6-month mean occupancy levels (6 months is chosen because this is equivalent to the test period of data independent of the data used to create the model).
FIGURE 32.
Comparison of modelled with actual unit and care level occupancy levels, based on demand derived directly from Badger admissions. a, Workload = nurse equivalent of infant load = ICU + HDC unit/2 + SCU/4 +TC/8. The points show the predicted and actual average number of infants present in each hospital and care level over a 6-month period. The error bars show the expected range of variation for any 6-month average from the model. The dashed line shows equality between modelled and actual results. Coefficients of determination: infants in each unit/care level, R2 = 0.87; Total infants R2 = 0.94 and workload R2 = 0.97. Model trained with 2011/12 data, tested against 6-month data from 2013.

| Occupancy measure | Location of care | Actual January–June 2013 | Model | Error (model – actual) | Model SD between 6-month periods | 95% confidence limits |
|---|---|---|---|---|---|---|
| Infants | Plymouth Derriford | 23.9 | 28.3 | 4.4 | 2.4 | 0.3 |
| Royal Devon and Exeter | 18.3 | 15.8 | –2.4 | 1.5 | 0.3 | |
| Torbay Hospital | 6.8 | 6.7 | –0.1 | 0.8 | 0.2 | |
| Royal Truro | 14.8 | 14.6 | –0.2 | 1.6 | 0.3 | |
| Barnstaple | 4.6 | 4.8 | 0.2 | 0.7 | 0.1 | |
| Workload | Plymouth Derriford | 8.9 | 10.4 | 1.4 | 0.6 | 0.1 |
| Royal Devon and Exeter | 6.4 | 5.8 | –0.5 | 0.2 | 0.1 | |
| Torbay Hospital | 1.6 | 1.6 | 0.0 | 0.6 | 0.0 | |
| Royal Truro | 4.8 | 4.7 | –0.1 | 0.2 | 0.1 | |
| Barnstaple | 1.2 | 1.1 | –0.1 | 0.3 | 0.0 | |
| IC | Plymouth Derriford | 2.8 | 3.4 | 0.7 | 0.6 | 0.1 |
| Royal Devon and Exeter | 1.5 | 1.4 | –0.1 | 0.3 | 0.1 | |
| Torbay Hospital | 0.0 | 0.1 | 0.0 | 0.0 | 0.0 | |
| Royal Truro | 1.1 | 0.8 | –0.2 | 0.2 | 0.0 | |
| Barnstaple | 0.1 | 0.0 | 0.0 | 0.0 | 0.0 | |
| HDC | Plymouth Derriford | 5.3 | 4.5 | –0.8 | 0.8 | 0.1 |
| Royal Devon and Exeter | 3.4 | 4.1 | 0.7 | 0.8 | 0.1 | |
| Torbay Hospital | 0.2 | 0.1 | –0.1 | 0.0 | 0.0 | |
| Royal Truro | 1.4 | 2.4 | 1.0 | 0.6 | 0.1 | |
| Barnstaple | 0.3 | 0.1 | –0.2 | 0.0 | 0.0 | |
| SC | Plymouth Derriford | 12.0 | 16.9 | 4.9 | 1.5 | 0.2 |
| Royal Devon and Exeter | 12.0 | 8.6 | –3.4 | 0.9 | 0.2 | |
| Torbay Hospital | 5.1 | 5.4 | 0.2 | 0.8 | 0.2 | |
| Royal Truro | 11.4 | 9.5 | –2.0 | 1.1 | 0.2 | |
| Barnstaple | 3.7 | 3.9 | 0.1 | 0.6 | 0.1 | |
| TC | Plymouth Derriford | 3.8 | 3.4 | –0.4 | 0.3 | 0.0 |
| Royal Devon and Exeter | 1.4 | 1.7 | 0.3 | 0.2 | 0.0 | |
| Torbay Hospital | 1.4 | 1.1 | –0.2 | 0.1 | 0.0 | |
| Royal Truro | 0.9 | 1.9 | 1.0 | 0.2 | 0.0 | |
| Barnstaple | 0.5 | 0.8 | 0.3 | 1.0 | 0.0 |
Correlations of actual with modelled occupancy data were all high (R2 > 0.85 in all comparisons; R2 = 0.87 for comparison of infants present at each care level and hospital, R2 = 0.94 for total infants present at each hospital, R2 = 0.97 for workload at each hospital). These results reflect a generally high degree of fidelity between modelled and actual data.
While the model generally had very good predictive ability, some differences occurred between modelled and actual data. The model predicted 28 infants in care in Plymouth against an actual 24. This difference came mostly from SC infants, where the model predicted an average of 17 in care against an actual of 12. The reduced actual versus modelled results are not due to the model underestimating total infants in SC, as both the model and the actual results have an average of 44 infants in SC (see Table 18). Nor is the difference due to Plymouth discharging infants earlier (see Chapter 7, Gestational equivalent age at discharge). The difference appears to be due to the model placing more infants for SC in Plymouth rather than in Exeter, which shows an underestimate of 3.5 infants in SC, despite Exeter keeping infants in care until a slightly older gestational age equivalence (see Chapter 7, Gestational equivalent age at discharge). From our data we cannot determine why more SC infants are in Exeter and fewer are in Plymouth than the model predicts. Possibilities include (1) parents’ choice and (2) desire to reduce workload in Plymouth, moving infants who are approximately equidistant between Exeter and Plymouth.
Table 20 shows the difference between modelled and actual distances from hospital of care to home (GP) location, and the total number of transfers. The model predicted average distance of parents to home (GP) location within 2 km (within 10%) and the number of transfers very closely, within 2% accuracy. When comparing travel distances we have excluded those transfers in the model to the surgical/cardiac unit in Bristol because we do not have the parallel data in our Badger set. We might know they are transferred out to Bristol, but in the case of a death we do not know how long they spend in Bristol in the real data set. Elsewhere in the model results, all travel distances are included.
| Parameter | Actual | Model |
|---|---|---|
| Transfers/year | 389 | 384 |
| Average distance from home to hospital (km)a | 21.3 | 19.6 |
Demand based on births per general practitioner
In this model, demand was based on correlating demand from Badger with the number of females aged 15–45 years and the fertility rate of those women. GP Practice Profiles lists the number of women aged 15–45 years for each GP practice, and shows the fertility rate of those women. From these data we calculated births per year per GP. We correlated the number of births per year per GP with the number of neonatal admissions per GP per year from Badger. The demand was then based on the number of births per GP multiplied by the rate of admissions per birth (15.5%, see Chapter 7, Comparison of demand with births, for details). The average number of infants in each care level and the total workload are shown in Table 21. The model, again, showed very good prediction of the total number of infants in each care level, and total infants and workload.
| Occupancy measure | Actual January–June 2013 | Model | Error (model – actual) |
|---|---|---|---|
| Infants | 68.4 | 69.9 | 1.6 |
| Workload | 22.9 | 23.6 | 0.7 |
| IC | 5.5 | 5.9 | 0.4 |
| HDC | 10.6 | 11.1 | 0.5 |
| SC | 44.3 | 44.0 | –0.3 |
| TC | 8.0 | 8.9 | 1.0 |
The average number of infants in each hospital and care level are shown in Figure 33 and Table 22. Correlations of actual with modelled data were all high (R2 > 0.90 in all comparisons; R2 = 0.91 for comparison of infants present at each care level and hospital, R2 = 0.94 for total infants present at each hospital, R2 = 0.98 for workload at each hospital).
FIGURE 33.
Comparison of modelled with actual unit and care level occupancy levels, based on demand derived from births per GP. a, Workload = nurse equivalent of infant load = ICU + HDC unit/2 + SCU/4 +TC/8. The points show the predicted and actual average number of infants present in each hospital and care level over a 6-month period. The error bars show the expected range of variation for any 6-month average from the model. The dashed line shows equality between modelled and actual results. Coefficients of determination: infants in each unit/care level, R2 = 0.91; Total infants R2 = 0.94 and workload R2 = 0.98. Model trained with 2011/12 data, tested against 6-month data from 2013.
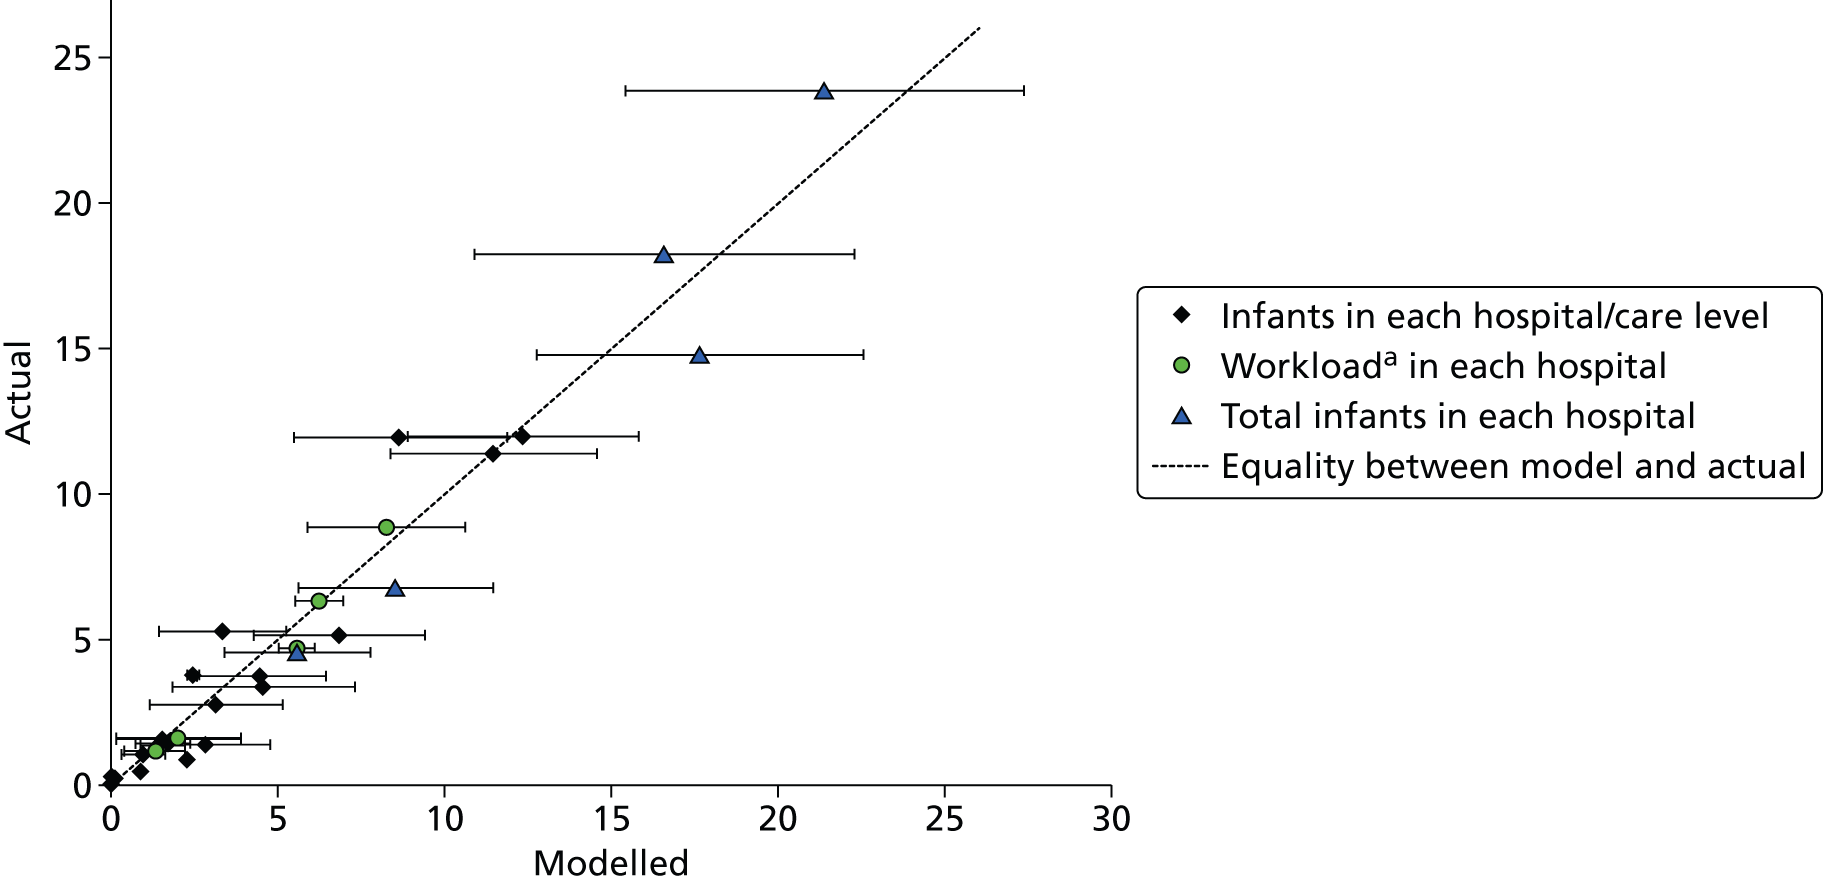
| Occupancy measure | Location of care | Actual January–June 2013 | Model | Error (model – actual) | Model SD between 6-month periods | 95% confidence limits |
|---|---|---|---|---|---|---|
| Infants | Plymouth Derriford | 23.9 | 21.4 | –2.4 | 2.0 | 0.3 |
| Royal Devon and Exeter | 18.3 | 16.6 | –1.7 | 1.9 | 0.3 | |
| Torbay Hospital | 6.8 | 8.5 | 1.8 | 1.0 | 0.2 | |
| Royal Truro | 14.8 | 17.7 | 2.9 | 1.6 | 0.3 | |
| Barnstaple | 4.6 | 5.6 | 1.0 | 0.7 | 0.1 | |
| Workload | Plymouth Derriford | 8.9 | 8.3 | –0.6 | 0.8 | 0.1 |
| Royal Devon and Exeter | 6.4 | 6.3 | –0.1 | 0.2 | 0.1 | |
| Torbay Hospital | 1.6 | 2.1 | 0.4 | 0.6 | 0.0 | |
| Royal Truro | 4.8 | 5.6 | 0.9 | 0.2 | 0.1 | |
| Barnstaple | 1.2 | 1.4 | 0.1 | 0.3 | 0.0 | |
| IC | Plymouth Derriford | 2.8 | 3.2 | 0.4 | 0.7 | 0.1 |
| Royal Devon and Exeter | 1.5 | 1.6 | 0.1 | 0.3 | 0.0 | |
| Torbay Hospital | 0.0 | 0.1 | 0.0 | 0.0 | 0.0 | |
| Royal Truro | 1.1 | 1.0 | –0.1 | 0.2 | 0.0 | |
| Barnstaple | 0.1 | 0.1 | 0.0 | 0.0 | 0.0 | |
| HDC | Plymouth Derriford | 5.3 | 3.4 | –1.9 | 0.6 | 0.1 |
| Royal Devon and Exeter | 3.4 | 4.6 | 1.2 | 0.9 | 0.2 | |
| Torbay Hospital | 0.2 | 0.1 | –0.1 | 0.0 | 0.0 | |
| Royal Truro | 1.4 | 2.9 | 1.4 | 0.7 | 0.1 | |
| Barnstaple | 0.3 | 0.1 | –0.2 | 0.0 | 0.0 | |
| SC | Plymouth Derriford | 12.0 | 12.4 | 0.4 | 1.2 | 0.2 |
| Royal Devon and Exeter | 12.0 | 8.7 | –3.3 | 1.1 | 0.2 | |
| Torbay Hospital | 5.1 | 6.9 | 1.7 | 0.9 | 0.1 | |
| Royal Truro | 11.4 | 11.5 | 0.1 | 1.0 | 0.2 | |
| Barnstaple | 3.7 | 4.5 | 0.8 | 0.6 | 0.1 | |
| TC | Plymouth Derriford | 3.8 | 2.5 | –1.3 | 0.2 | 0.0 |
| Royal Devon and Exeter | 1.4 | 1.7 | 0.3 | 0.2 | 0.0 | |
| Torbay Hospital | 1.4 | 1.4 | 0.1 | 0.2 | 0.0 | |
| Royal Truro | 0.9 | 2.3 | 1.4 | 0.2 | 0.0 | |
| Barnstaple | 0.5 | 0.9 | 0.5 | 1.0 | 0.0 |
Basing demand on births per GP produced correlations between actual and modelled occupancies of units and care levels that were as good as basing demand on admissions into neonatal care from each GP. The model produces some different results from basing demand on neonatal admissions. While overall correlations again are excellent, we see some individual results where we can spot some differences between modelled and actual results. The number of infants in Plymouth is now slightly underestimated (by an average of 2.4 infants or 10%) whereas the number of infants in Truro is slightly overestimated (by an average of 2.9 infants or 20%). It should be noted that these differences are within the expected range of variation between 6-month periods, but they may reflect the fact that demand does not match exactly to births (see Chapter 7, Comparison of demand with births, for more details).
Average distance of parents from the point of care to home (GP) location in this model is very close to actual results (21.2 km vs. 21.3 km, Table 23). The number of transfers (446 modelled vs. 389 actual) is higher in the model by about 15%.
| Parameter | Actual | Model |
|---|---|---|
| Transfers/year | 389 | 446 |
| Average distance from home to hospital (km)a | 21.3 | 21.2 |
Peninsula network: scenario results
Localisation versus centralisation: all levels of care
A key aim of the model was to evaluate the effect of altering the levels of localisation or centralisation on both units and parents. Eight example scenarios were used to assess this effect (Table 24). The scenarios are:
| Hospital | Scenario | |||||||
|---|---|---|---|---|---|---|---|---|
| 1 | 2 | 3 | 4 | 5 | 6 | 7 | 8 | |
| Plymouth Derriford | ICU | ICU | ICU | ICU | ICU | ICU | ICU | ICU |
| Royal Devon and Exeter | ICU | LNU+ | LNU | SCU | LNU | LNU | Births only | Closed |
| Torbay Hospital | ICU | SCU | SCU | SCU | Births only | Closed | Births only | Closed |
| Royal Truro | ICU | LNU+ | LNU | SCU | LNU | LNU | Births only | Closed |
| Northern Devon (Barnstaple) | ICU | SCU | SCU | SCU | Births only | Closed | Births only | Closed |
| St Michael’s Hospital, Bristol | Surgical | Surgical | Surgical | Surgical | Surgical | Surgical | Surgical | Surgical |
-
All Peninsula network units offer IC (surgical/cardiac support is offered in Bristol for all scenarios).
-
Plymouth is the network ICU. Exeter and Truro are classified as ‘LNU+’ ‘LNU+’ (see Hospital types for details of unit types) and Torbay and Barnstaple are SCUs.
-
As scenario 2 but Exeter and Torbay are classified as LNUs according to the NHS standard contract for neonatal critical care. 8
-
Plymouth is maintained as the network ICU and all other units are designated SCUs.
-
Plymouth is maintained as the network ICU; Exeter and Truro are classified as LNUs; Torbay and Barnstaple are converted to birthing centres but without any specialised neonatal care (all infants requiring SC or higher require transfer to another unit).
-
As scenario 5 but Torbay and Barnstaple are closed entirely (no births).
-
Plymouth is maintained as the network ICU. All other hospitals are birthing units only.
-
Plymouth is maintained as the sole birthing unit and network ICU. All other units are closed to births and neonatal care.
These scenarios were based on demand from Badger admissions (see Demand based on raw Badger data). The number of nurses required was derived by calculating the 80th, 90th and 95th percentiles of the distribution of workload at each hospital within the Peninsula network. In these scenarios, workload at units is not limited by capacity; these scenarios represent workload and travel distances if all infants are cared for according to planned location depending on unit capabilities.
Throughout all scenarios the number of infants and the total workload in the Peninsula region remained constant (Table 25 and Figure 34). However, the number of nurses required to meet BAPM standards for any given proportion of time fell as centralisation was increased. We saw a maximum 20% reduction in required nursing between the most localised (ICUs in all hospitals) and most centralised (Plymouth was the only birthing and neonatal unit). It should be noted, however, that this reduction was between extremes which are highly unlikely to be considered.
| Measure | Scenario (increasing centralisation) | |||||||
|---|---|---|---|---|---|---|---|---|
| 1 | 2 | 3 | 4 | 5 | 6 | 7 | 8 | |
| Hospital type | ||||||||
| Plymouth Derriford | ICU | ICU | ICU | ICU | ICU | ICU | ICU | ICU |
| Royal Devon and Exeter | ICU | LNU+ | LNU | SCU | LNU | LNU | Births only | Closed |
| Torbay Hospital | ICU | SCU | SCU | SCU | Births only | Closed | Births only | Closed |
| Royal Truro | ICU | LNU+ | LNU | SCU | LNU | LNU | Births only | Closed |
| Northern Devon (Barnstaple) | ICU | SCU | SCU | SCU | Births only | Closed | Births only | Closed |
| St Michael’s Hospital, Bristol | Surgical | Surgical | Surgical | Surgical | Surgical | Surgical | Surgical | Surgical |
| Average workload | ||||||||
| Plymouth Derriford | 9.0 | 10.4 | 12.4 | 15.6 | 12.6 | 12.7 | 22.5 | 23.5 |
| Royal Devon and Exeter | 4.5 | 5.8 | 4.5 | 2.5 | 6.7 | 7.2 | 0.3 | 0.0 |
| Torbay Hospital | 2.9 | 1.6 | 1.6 | 1.6 | 0.2 | 0.0 | 0.2 | 0.0 |
| Royal Truro | 5.1 | 4.7 | 3.9 | 2.7 | 3.9 | 3.9 | 0.3 | 0.0 |
| Northern Devon (Barnstaple) | 2.0 | 1.1 | 1.1 | 1.1 | 0.1 | 0.0 | 0.1 | 0.0 |
| Outside network | 1.4 | 1.4 | 1.4 | 1.3 | 1.3 | 1.1 | 1.3 | 1.2 |
| Average infants present | ||||||||
| Plymouth Derriford | 26.7 | 28.1 | 30.3 | 36.8 | 31.4 | 31.5 | 67.3 | 69.9 |
| Royal Devon and Exeter | 13.4 | 15.7 | 14.5 | 10.2 | 23.9 | 25.3 | 0.7 | 0.0 |
| Torbay Hospital | 8.5 | 6.7 | 7.0 | 6.7 | 0.5 | 0.0 | 0.5 | 0.0 |
| Royal Truro | 15.1 | 14.7 | 13.9 | 11.4 | 13.7 | 13.7 | 0.8 | 0.0 |
| Northern Devon (Barnstaple) | 6.1 | 4.8 | 4.8 | 4.7 | 0.3 | 0.0 | 0.3 | 0.0 |
| Outside network | 1.7 | 1.6 | 1.6 | 1.6 | 1.6 | 1.2 | 1.6 | 1.5 |
| General network statistics | ||||||||
| Network infants | 69.8 | 70.0 | 70.2 | 69.8 | 69.8 | 70.5 | 69.6 | 69.9 |
| Network workload | 23.5 | 23.6 | 23.5 | 23.5 | 23.5 | 23.8 | 23.4 | 23.5 |
| Network on-duty staff to meet BAPM standards 80% of time | 30.0 | 29.6 | 29.4 | 28.6 | 28.6 | 27.5 | 27.0 | 25.5 |
| Network on-duty staff to meet BAPM standards 90% of time | 33.9 | 33.0 | 32.6 | 31.8 | 31.8 | 30.3 | 30.3 | 27.3 |
| Network on-duty staff to meet BAPM standards 95% of time | 37.6 | 36.3 | 35.8 | 34.5 | 34.8 | 32.5 | 32.9 | 28.5 |
| Staff utilisation to meet BAPM standards 90% of time | 69% | 72% | 72% | 74% | 74% | 79% | 77% | 86% |
| Distances and transfers | ||||||||
| Mean distance from patient node to point of care (km) | 18.9 | 21.7 | 23.1 | 27.6 | 29.1 | 29.5 | 54.3 | 56.3 |
| % infants over 50 km from parents’ home | 3 | 6 | 9 | 16 | 15 | 15 | 55 | 58 |
| In-utero transfers/year | 10 | 26 | 36 | 53 | 98 | 26 | 231 | 10 |
| In-utero transfer (1000 km/year) | 3.6 | 5.7 | 7.5 | 10.5 | 14.6 | 6.2 | 39.0 | 3.7 |
| Total neonatal transfers/year | 130 | 352 | 509 | 711 | 771 | 350 | 1384 | 129 |
| Total neonatal transfer distance (1000 km/year) | 48.5 | 75.0 | 103.0 | 139.4 | 132.6 | 82.7 | 250.0 | 49.9 |
FIGURE 34.
Effect of centralisation on network workload and nursing requirements. The graph shows the average workload (the number of nurses required to care for infants in care, black triangles), and 80th (green square), 90th (blue triangle) and 95th percentile (light green circle) workload. The light green circles, for example, show the number of nurses required to meet BAPM standards (without neonatal transfers) 95% of the time.
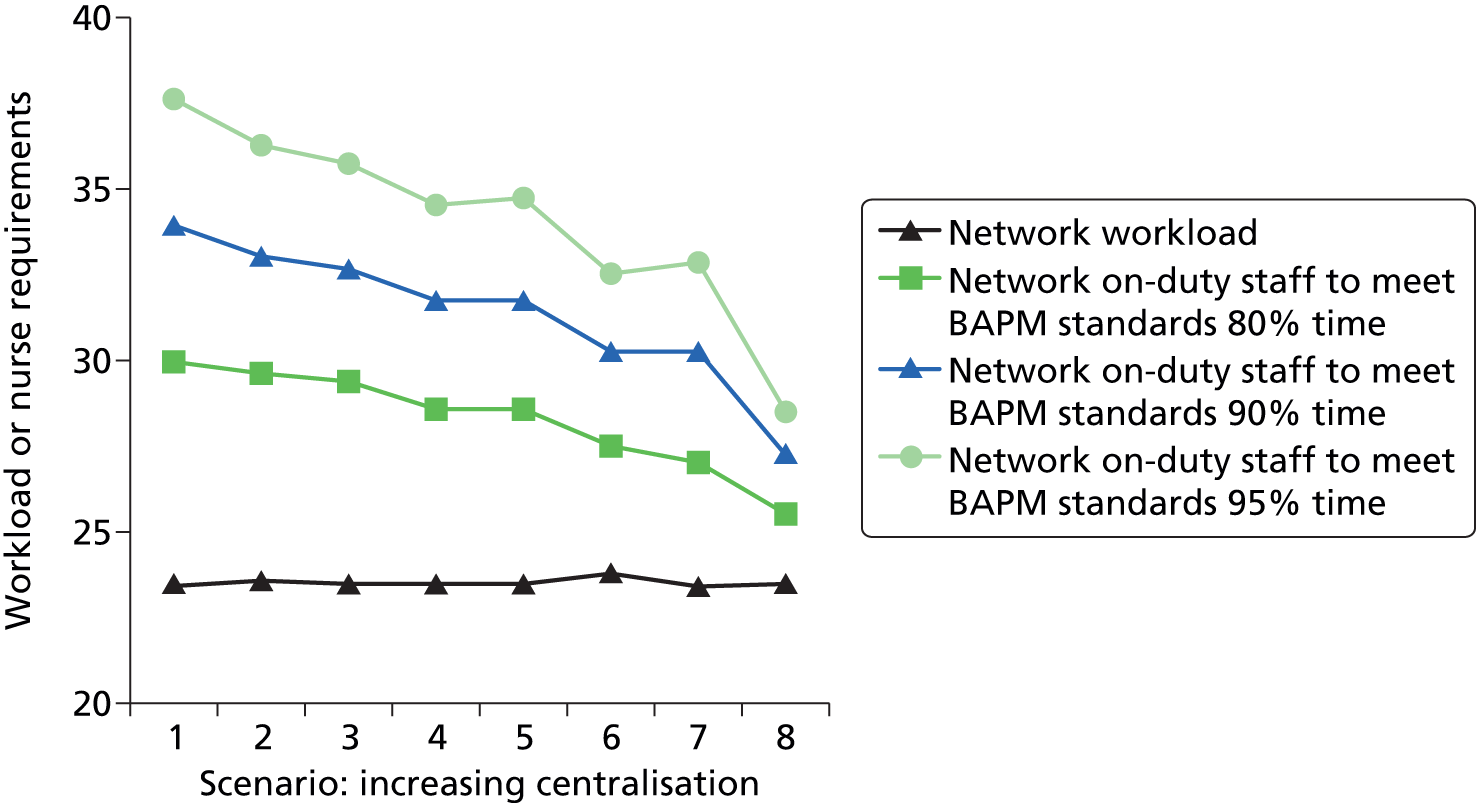
An issue that the model helps to expose, and to quantify, is the problem of trying to dissociate neonatal planning from maternity planning. Where it is possible to increase efficiency by pooling neonatal care, the benefits are attenuated if neonatal nursing expertise must be retained when the hospitals with closed neonatal units retain birthing facilities. For example, if nursing staff levels are set to achieve BAPM standards 90% of the time, then a theoretical 7% reduction in nursing may be achieved if Torbay and Barnstaple, the two smallest units, are closed, but if neonatal staff must remain to care for infants prior to transfer this saving is reduced to 2.5% unless the temporary neonatal care may be absorbed by the maternity unit.
While the model suggests that savings in nursing staff and cots are possible by consolidating units, it also helps to inform the expected effect this will have on parents and transport services (Table 25 and Figure 35). With the most localised configuration (all hospitals have IC) the average distance from the parents’ home location to the point of care is 19 km (road distance), with 97% being within 50 km (roughly equivalent to a 1-hour journey, see Chapter 6, Road distance and time versus straight-line distances). The configuration approximating current set-up has an average distance of 22 km from the parents’ home location to the point of care, with 94% being within 50 km. If Exeter and Truro are converted to LNUs according to the NHS standard contract for neonatal critical care8 then the model predicts an average distance from the parents’ home location to the point of care of 23 km, with 91% being within 50 km. Closure of the two smallest units (Barnstaple and Torbay) results in an average distance of 29 km from the parents’ home location to the point of care, with 85% being within 50 km. Extreme centralisation, with all neonatal care at Plymouth, would be expected to result in an average distance of ≈ 55 km from the parents’ home location to the point of care, with 42–45% being within 50 km.
FIGURE 35.
Effect of centralisation on distance from parents’ home to location of care. The black circles show the average distance from the point of care to the parents’ home, and the green squares show the percentage of infants cared for more than 50 km away from the parents’ home.
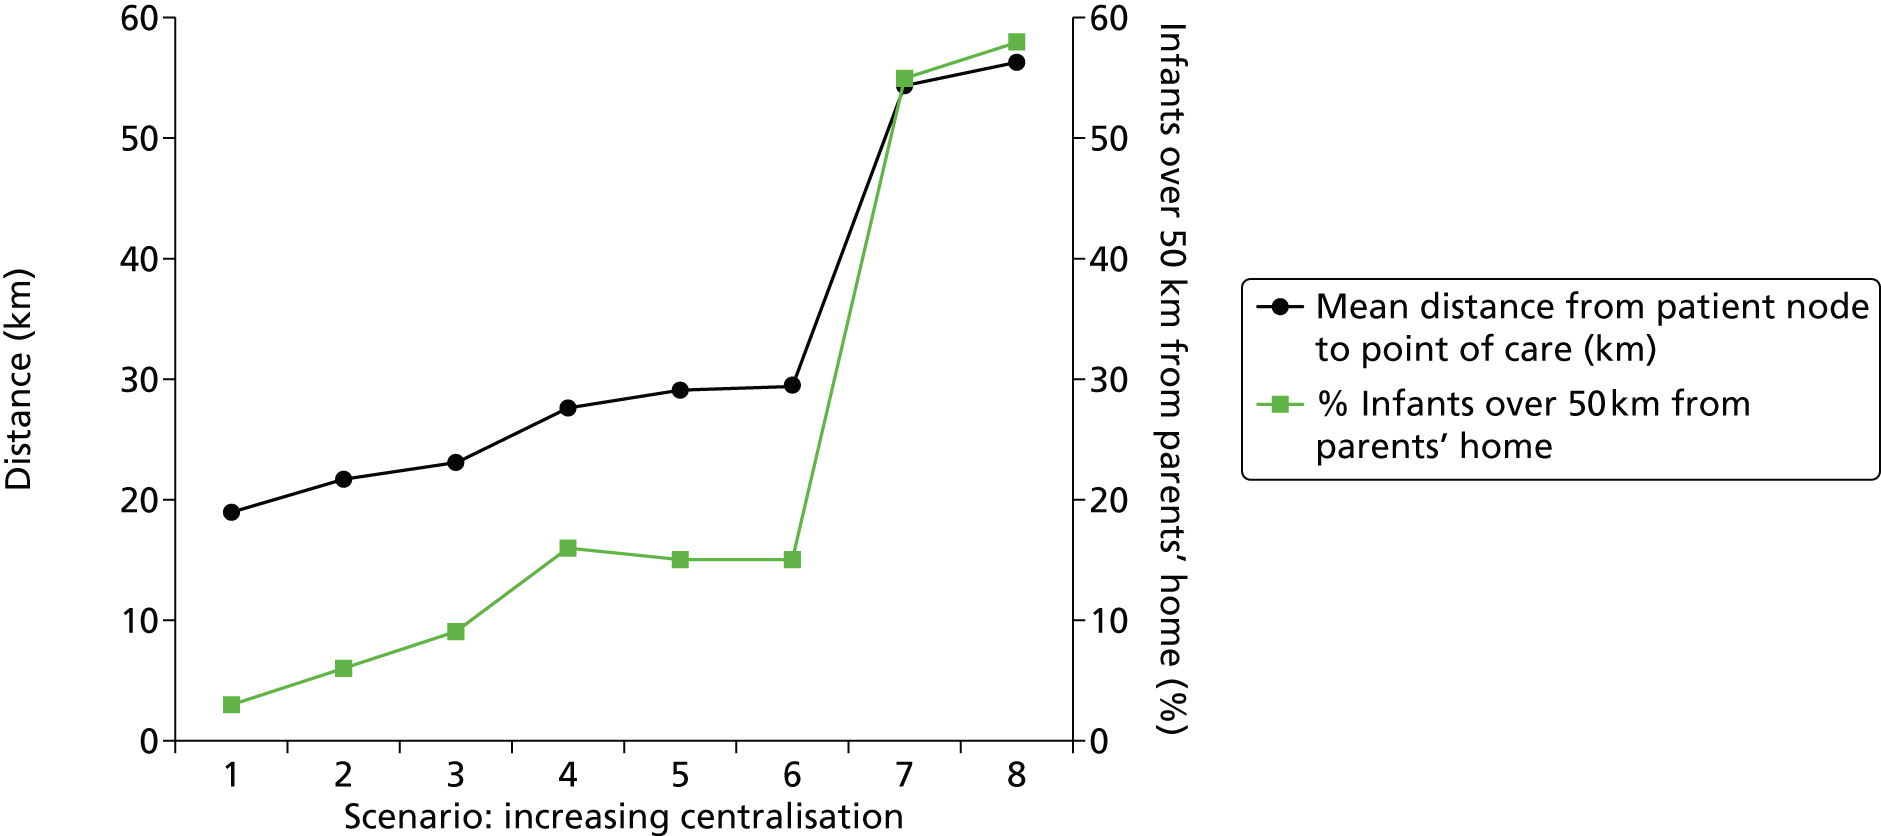
The degree of centralisation also has a very significant effect on the number and distances of transfers in the model (Figure 36 and Table 25). With the most localised scenario (all hospitals have IC) the only transfers required are to and from the surgical/cardiac unit. This amounts to ≈ 130 transfers covering ≈ 50,000 km per year. In this model we assume all transfers require independent to/from journeys; in the real world there may be some efficiencies by carrying infants both ways in the same ambulance, that is taking one infant and collecting another. This compares with the approximately current-state model of ≈ 350 transfers covering ≈ 75,000 km per year. If Exeter and Truro are converted to LNUs according to the NHS standard contract for neonatal critical care8 then the model predicts that transfers increase to ≈ 500 covering ≈ 105,000 km per year. At the most extreme form of centralisation (neonatal care offered only in Plymouth, although births continue at local hospitals) there are potentially ≈ 1400 transfers covering ≈ 250,000 km per year. Clearly any potential gain in nursing and cot-use efficiency must be weighed against increased numbers and distances of transfers as well as the impact on parents.
FIGURE 36.
Effect of centralisation on number and total distance of transfers. The black circles show the expected neonatal transfers per year, and the green squares the total travel distance (assuming a return journey between the two transfer hospitals).
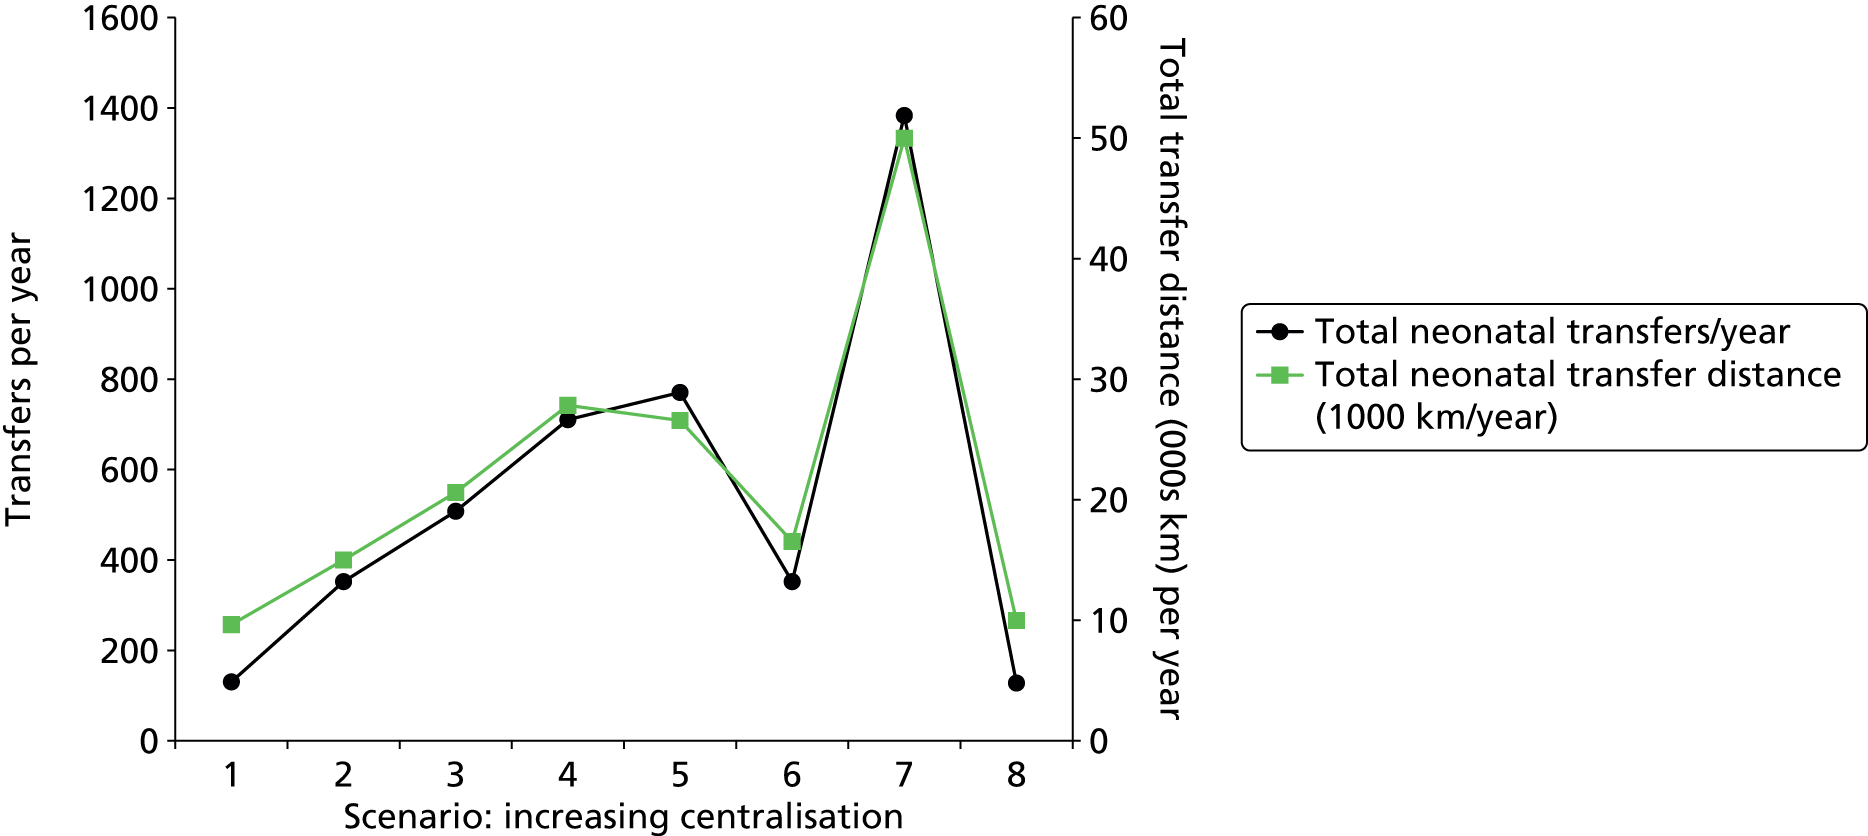
We again see a significant effect of dissociating neonatal care from births. For example in scenarios where two SCUs (Torbay and Barnstaple) are closed (see scenarios 5 and 6, Table 25), the number and distance of transfers are ≈ 770 transfers covering ≈ 130,000 km per year if the units are kept open as birthing units and ≈ 350 transfers covering ≈ 80,000 km per year if the units are closed for both births and neonatal care. If neonatal units are closed while the number of birthing units remains the same, then significant increases in demand on transportation services would be expected.
Localisation versus centralisation: effect on intensive care and high-dependency care
The previous section described modelling around all levels of care. All hospitals offer SC to infants; the specialisation and centralisation are performed at HDC and IC levels. Therefore, in this section we examine, in more detail, the effect of centralisation on IC and HDC only. The workload described is workload just for network IC and HDC levels of care and the travel distances refer only to infants in IC and HDC levels of care. Infants in the surgical unit outside the regional network are also excluded from this analysis. In these models, hospitals are not limited by capacity; all infants are cared for in the planned location.
In this analysis we look at five scenarios (Table 26). To simplify the analysis we assume a zero transfer time from the units not supporting either IC or HDC. The five scenarios are:
-
All five network hospitals are network ICUs (see Hospital types for description of unit types).
-
Plymouth, Truro and Exeter are network ICUs. Torbay and Barnstaple offer no IC or HDC.
-
Plymouth is the network ICU. Exeter and Truro are classified as LNU+ (this approximates current state).
-
As scenario 2 but Exeter and Torbay are classified as LNUs according to the NHS standard contract for neonatal critical care. 8
-
Intensive care and HDC offered in Plymouth only.
| Location of care | Scenario | ||||
|---|---|---|---|---|---|
| 1 | 2 | 3 | 4 | 5 | |
| Plymouth Derriford | ICU | ICU | ICU | ICU | ICU |
| Royal Devon and Exeter | ICU | ICU | LNU+ | LNU | – |
| Torbay Hospital | ICU | – | – | – | – |
| Royal Truro | ICU | ICU | LNU+ | LNU | – |
| Northern Devon (Barnstaple) | ICU | – | – | – | – |
Centralisation, in the studied scenarios, does not affect total network workload, infants or the number of infants in IC or HDC. The average number of infants in IC or HDC is 17. If infants are to be cared for in the planned location (no transfers due to lack of local capacity) then we see that centralisation does reduce the total number of IC/HDC-capable cots required (Figure 37 and Table 27). With full localisation, 29 cots are required, which is the equivalent of IC and HDC having to run at 58% cot utilisation to avoid unplanned transfers for 90% of IC and HDC infants. Having IC and HDC at only three hospitals (as currently) reduces the required cots to ≈ 27, or 63% target utilisation to avoid unplanned transfers. Interestingly, the designation of Exeter and Truro as ICU, LNU+ or LNU (see Hospital types for description of unit types) has little effect on this number. If all IC and HDC is centralised in Plymouth then the number of cots required is 23, equivalent to IC and HDC having to run at 73% cot utilisation to avoid unplanned transfers for 90% of IC and HDC infants. This latter number of 23 IC/HDC cots is also the total number of IC and HDC cots required to cope with network IC and HDC workload 90% of the time if transfers are allowed to smooth demand across the network. It should be noted that this cot utilisation is significantly below the 85% bed utilisation suggested by Bagust et al. 5 for a 200-bed hospital; this difference is due to the greater variability in workload experienced when average numbers of patients being cared for are lower (as previously discussed in Localisation versus centralisation: all levels of care).
FIGURE 37.
Effect of centralisation on the number of combined IC and HDC cots required to meet demand without unplanned transfers. HDU, HDC unit.
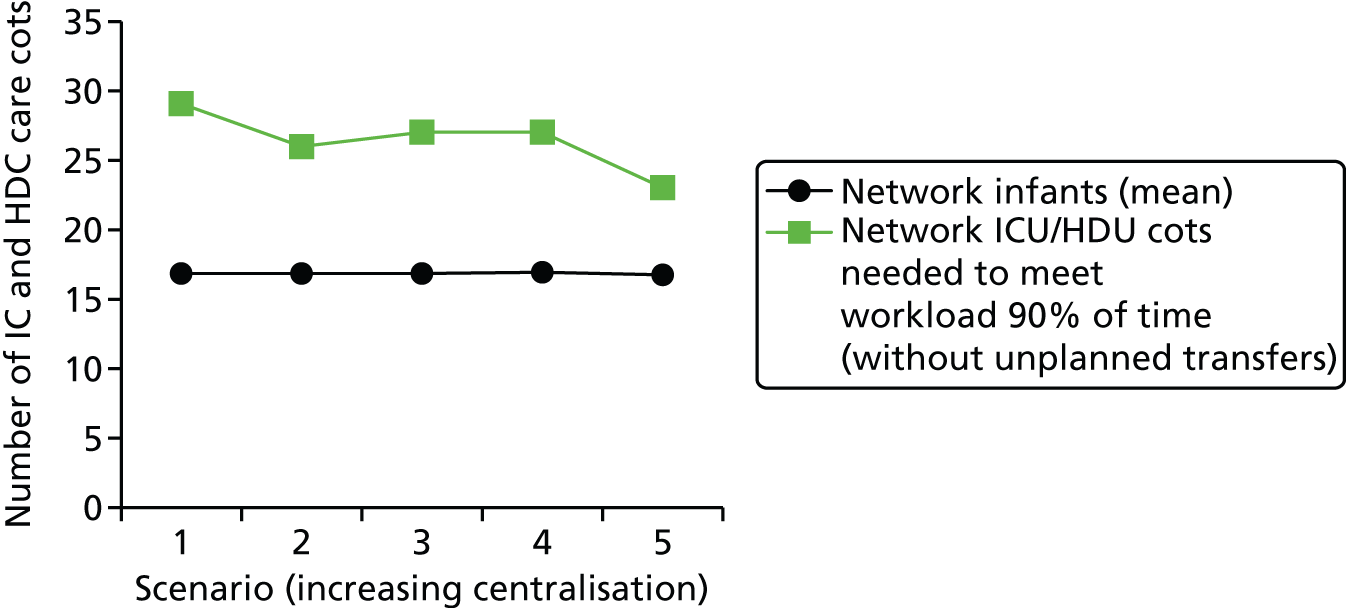
| Measure | Scenario | ||||
|---|---|---|---|---|---|
| 1 | 2 | 3 | 4 | 5 | |
| Hospital type | |||||
| Plymouth Derriford | ICU | ICU | ICU | ICU | ICU |
| Royal Devon and Exeter | ICU | ICU | LNU+ | LNU | – |
| Torbay Hospital | ICU | – | – | – | – |
| Royal Truro | ICU | ICU | LNU+ | LNU | – |
| Northern Devon (Barnstaple) | ICU | – | – | – | – |
| Workload (mean) | |||||
| Plymouth Derriford | 4.3 | 4.5 | 5.5 | 7.1 | 11.3 |
| Royal Devon and Exeter | 2.2 | 4.3 | 3.7 | 2.7 | 0.0 |
| Torbay Hospital | 1.4 | 0.0 | 0.0 | 0.0 | 0.0 |
| Royal Truro | 2.5 | 2.5 | 2.1 | 1.6 | 0.0 |
| Northern Devon (Barnstaple) | 1.0 | 0.0 | 0.0 | 0.0 | 0.0 |
| Workload (90th percentile) | |||||
| Plymouth Derriford | 7.0 | 7.0 | 9.0 | 11.0 | 16.0 |
| Royal Devon and Exeter | 4.0 | 7.0 | 6.0 | 5.0 | 0.0 |
| Torbay Hospital | 3.0 | 0.0 | 0.0 | 0.0 | 0.0 |
| Royal Truro | 4.5 | 5.0 | 4.0 | 3.0 | 0.0 |
| Northern Devon (Barnstaple) | 2.0 | 0.0 | 0.0 | 0.0 | 0.0 |
| Infants (mean) | |||||
| Plymouth Derriford | 6.3 | 6.7 | 7.7 | 9.4 | 16.8 |
| Royal Devon and Exeter | 3.3 | 6.5 | 5.8 | 4.8 | 0.0 |
| Torbay Hospital | 2.1 | 0.0 | 0.0 | 0.0 | 0.0 |
| Royal Truro | 3.7 | 3.7 | 3.3 | 2.8 | 0.0 |
| Northern Devon (Barnstaple) | 1.4 | 0.0 | 0.0 | 0.0 | 0.0 |
| Infants (90th percentile) | |||||
| Plymouth Derriford | 10.0 | 10.0 | 12.0 | 14.0 | 23.0 |
| Royal Devon and Exeter | 6.0 | 10.0 | 9.0 | 8.0 | 0.0 |
| Torbay Hospital | 4.0 | 0.0 | 0.0 | 0.0 | 0.0 |
| Royal Truro | 6.0 | 6.0 | 6.0 | 5.0 | 0.0 |
| Northern Devon (Barnstaple) | 3.0 | 0.0 | 0.0 | 0.0 | 0.0 |
| IC infants (mean) | |||||
| Plymouth Derriford | 2.2 | 2.3 | 3.4 | 4.8 | 5.8 |
| Royal Devon and Exeter | 1.1 | 2.2 | 1.6 | 0.7 | 0.0 |
| Torbay Hospital | 0.7 | 0.0 | 0.0 | 0.0 | 0.0 |
| Royal Truro | 1.3 | 1.3 | 0.9 | 0.4 | 0.0 |
| Northern Devon (Barnstaple) | 0.5 | 0.0 | 0.0 | 0.0 | 0.0 |
| IC infants (90th percentile) | |||||
| Plymouth Derriford | 4.0 | 5.0 | 6.0 | 8.0 | 9.0 |
| Royal Devon and Exeter | 3.0 | 4.0 | 3.0 | 2.0 | 0.0 |
| Torbay Hospital | 2.0 | 0.0 | 0.0 | 0.0 | 0.0 |
| Royal Truro | 3.0 | 3.0 | 2.0 | 1.0 | 0.0 |
| Northern Devon (Barnstaple) | 1.0 | 0.0 | 0.0 | 0.0 | 0.0 |
| HDC infants (mean) | |||||
| Plymouth Derriford | 4.1 | 4.4 | 4.4 | 4.5 | 11.0 |
| Royal Devon and Exeter | 2.2 | 4.3 | 4.3 | 4.1 | 0.0 |
| Torbay Hospital | 1.3 | 0.0 | 0.0 | 0.0 | 0.0 |
| Royal Truro | 2.4 | 2.4 | 2.4 | 2.4 | 0.0 |
| Northern Devon (Barnstaple) | 1.0 | 0.0 | 0.0 | 0.0 | 0.0 |
| HDC infants (90th percentile) | |||||
| Plymouth Derriford | 7.0 | 7.0 | 7.0 | 7.0 | 16.0 |
| Royal Devon and Exeter | 4.0 | 7.0 | 7.0 | 7.0 | 0.0 |
| Torbay Hospital | 3.0 | 0.0 | 0.0 | 0.0 | 0.0 |
| Royal Truro | 4.0 | 4.0 | 4.0 | 5.0 | 0.0 |
| Northern Devon (Barnstaple) | 2.0 | 0.0 | 0.0 | 0.0 | 0.0 |
| General network statistics | |||||
| Network infants (mean) | 16.8 | 16.8 | 16.8 | 17.0 | 16.8 |
| Network ICU infants (mean) | 5.8 | 5.8 | 5.8 | 5.9 | 5.8 |
| Network HDU infants (mean) | 11.1 | 11.1 | 11.1 | 11.1 | 11.0 |
| Network ICU cots needed to meet workload 90% of time (without unplanned transfers) | 13.0 | 12.0 | 11.0 | 11.0 | 9.0 |
| Network HDU cots needed to meet workload 90% of time (without unplanned transfers) | 20.0 | 18.0 | 18.0 | 19.0 | 16.0 |
| Network ICU/HDU cots needed to meet workload 90% of time (without unplanned transfers) | 29.0 | 26.0 | 27.0 | 27.0 | 23.0 |
| Network workload (mean) | 11.3 | 11.3 | 11.3 | 11.4 | 11.3 |
| Network on-duty staff to meet BAPM standards 90% of time | 20.5 | 19.0 | 19.0 | 19.0 | 16.0 |
| Distances | |||||
| Mean distance from patient node to point of care (km) | 16.1 | 24.4 | 27.5 | 32.5 | 54.1 |
| % infants over 50 km from parents’ home | 1 | 10 | 15 | 23 | 58 |
In the above results, it is assumed there is flexibility in cot use between IC and HDC. Without this flexibility the cot requirements increase. For example, in scenario 1 (fully localised), 33 cots (13 IC, 20 HDC) are required if infants must be cared for in distinct IC cots. This compares with 29 cots if cots may be used flexibly. In scenario 5 (fully centralised) 25 cots (9 IC, 16 HDC) are required if infants must be cared for in distinct IC and HDC cots. This compares with 23 cots if cots may be used flexibly.
Centralisation also affects the number of IC and HDC staff required to care for infants, if unplanned transfers are to be avoided (Figure 38, Table 27) and units do not co-opt staff primarily working in SC. The average IC and HDC network workload was 11.3 nurse equivalents. With full localisation, 21 nurses are required at any time, which is the equivalent to IC and HDC having to run at 55% nurse utilisation to meet BAPM standards and/or avoid unplanned transfers for 90% of IC and HDC infants. Having IC and HDC at only three hospitals (as currently) reduces the required nurses to 19, or 60% of target utilisation, to meet BAPM standards and/or avoid unplanned transfers 90% of the time. Again, the designation of Exeter and Truro as ICU, LNU+ or LNU has little effect on this number. If all IC and HDC is centralised in Plymouth then the number of nurses required is 16, equivalent to IC and HDC having to run at 70% of nurse utilisation to meet BAPM standards and/or avoid unplanned transfers 90% of the time. This is also the total number of nurses required to cope with network IC and HDC workload 90% of the time if transfers are allowed to smooth demand across the network. These figures assume an isolated pool of IC and HDC nurses, with no flexibility of work between IC, HDC and SC. Where flexibility of work with SC is possible, the fuller system results in Localisation versus centralisation: all levels of care are more relevant.
FIGURE 38.
Effect of centralisation on the number of on-duty nursing staff needed to support IC and HDC.

As with the full network simulation, centralisation had a significant effect on travel distances for parents with infants in IC or HDC (Figure 39). With IC provided locally, the average distance from the parents’ home location and the location of care is 16 km (road distance), with 99% cared for within 50 km of the home location. With three ICUs, the average distance from the parents’ home location and the location of care is 24 km (road distance), with 90% cared for within 50 km of the home location. In contrast to results on cot and nurse requirements, the type of designation of Exeter and Truro did affect travel distances. If these two hospitals are designated as LNU+ (approximates current configuration) then the average distance is 28 km, with 85% within 50 km. If these units become LNUs then the average distance is 33 km, with 77% within 50 km. If all IC and HDC is centralised in Plymouth then the average distance is 54 km, with 42% within 50 km.
FIGURE 39.
Effect of centralisation on distance from parents’ home to location of care (IC/HDC infants only). The black circles show the average distance from the point of care to the parents’ home, and the green squares show the percentage of infants cared for more than 50 km away from the parents’ home.
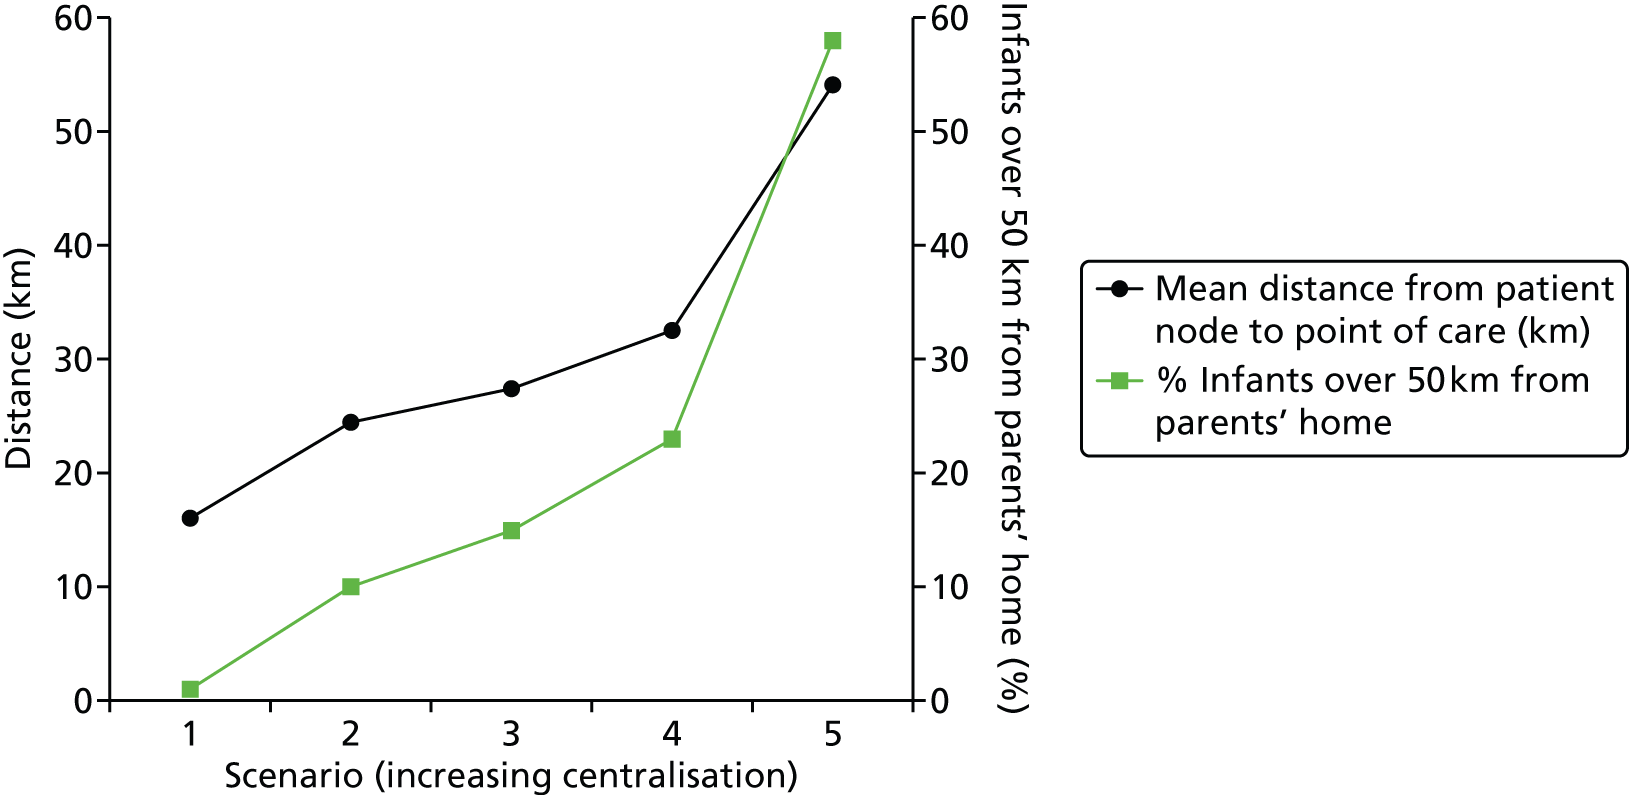
Variability in workload, the effect of altering the threshold of closure to new admissions and the effect of altering staffing levels
As observed in Chapter 7, Daily variation in case mix, workload and nursing numbers, there is considerable variability in workloads, with 21–48% CV in workload and 17%–45% CV in the number of infants present. We compared variability in our model with the observed variability (Figure 40, Table 28).
FIGURE 40.
A 2-year run-chart comparison of the number of infants present in each hospital. Light green, IC; dark blue, HDC; dark green, SC; black, TC; light blue, total.


| Measure | Actual (2011/12) | Model: resource-constrained | Model: resource-unconstrained | ||||||
|---|---|---|---|---|---|---|---|---|---|
| Mean | SD | CV (%) | Mean | SD | CV (%) | Mean | SD | CV (%) | |
| Workload | |||||||||
| Plymouth | 9.1 | 1.9 | 21 | 10.4 | 2.5 | 24 | 10.3 | 2.5 | 24 |
| Exeter | 6.7 | 1.5 | 22 | 5.8 | 1.8 | 31 | 5.8 | 1.8 | 31 |
| Torbay | 1.6 | 0.7 | 43 | 1.6 | 0.7 | 43 | 1.6 | 0.7 | 43 |
| Truro | 5.5 | 1.3 | 24 | 4.7 | 1.5 | 32 | 4.7 | 1.5 | 33 |
| Barnstaple | 1.3 | 0.6 | 48 | 1.1 | 0.6 | 50 | 1.2 | 0.6 | 51 |
| Infants | |||||||||
| Plymouth | 24.5 | 4.1 | 17 | 28.3 | 5.5 | 20 | 28.1 | 5.6 | 20 |
| Exeter | 20.5 | 3.8 | 19 | 15.8 | 4.2 | 26 | 15.9 | 4.2 | 27 |
| Torbay | 6.5 | 2.6 | 40 | 6.7 | 2.7 | 40 | 6.7 | 2.6 | 40 |
| Truro | 15.5 | 3.5 | 22 | 14.6 | 4.0 | 27 | 14.8 | 4.1 | 28 |
| Barnstaple | 4.9 | 2.2 | 45 | 4.8 | 2.2 | 46 | 4.8 | 2.2 | 47 |
We ran the model with capacity constrained by resource (as in the validation model, Demand based on raw Badger data, Plymouth working at up to 200% BAPM guidelines, and other hospitals working at up to 150% BAPM guidelines) and in a model where resource was unlimited. Interday variation was calculated from a once-daily audit count of the number of infants present in either the observed or the modelled data. In the model we see similar, if slightly higher, variability to the observed data; in the resource-constrained model there was 24–50% CV in workload and 20–46% CV in the number of infants present, and in the resource-unconstrained model there was 24–51% CV in workload and 20–47% CV in the number of infants present. As in the observed data, the model predicts higher variability of workload in the smaller units.
Effect of altering threshold of closure to new admissions
We went on to examine how this variability of workload potentially affects the number of transfers, and the distance that infants are from their parents’ home. Unit designations were as scenario 2, Table 25. The resources in the model were set to be the average workload for each hospital in the unconstrained model (i.e. each hospital has on average sufficient resource to cope with average predicted workload if there are no unplanned transfers). The threshold for closure to new admissions was then set at 100–200% BAPM guidelines.
When units may work at up to 200% BAPM workload, and when resources are set at average workload, the average travel distance from the location of care is 22 km (road distance), with 94% of homes within 50 km. As thresholds for closure to new admissions are brought down, average travel distances and the proportion of infants over 50 km from their parents’ home increase (Figure 41). When units close to new infants at 100% BAPM workload, with resources sufficient for average workload, the average travel distance from the location of care is 34 km (road distance), with 81% of homes within 50 km.
FIGURE 41.
Effect of altering closure threshold on distance of infants from parents’ home. The black circles show the average distance from the point of care to the parents’ home, and the green squares show the percentage of infants cared for more than 50 km away from the parents’ home.
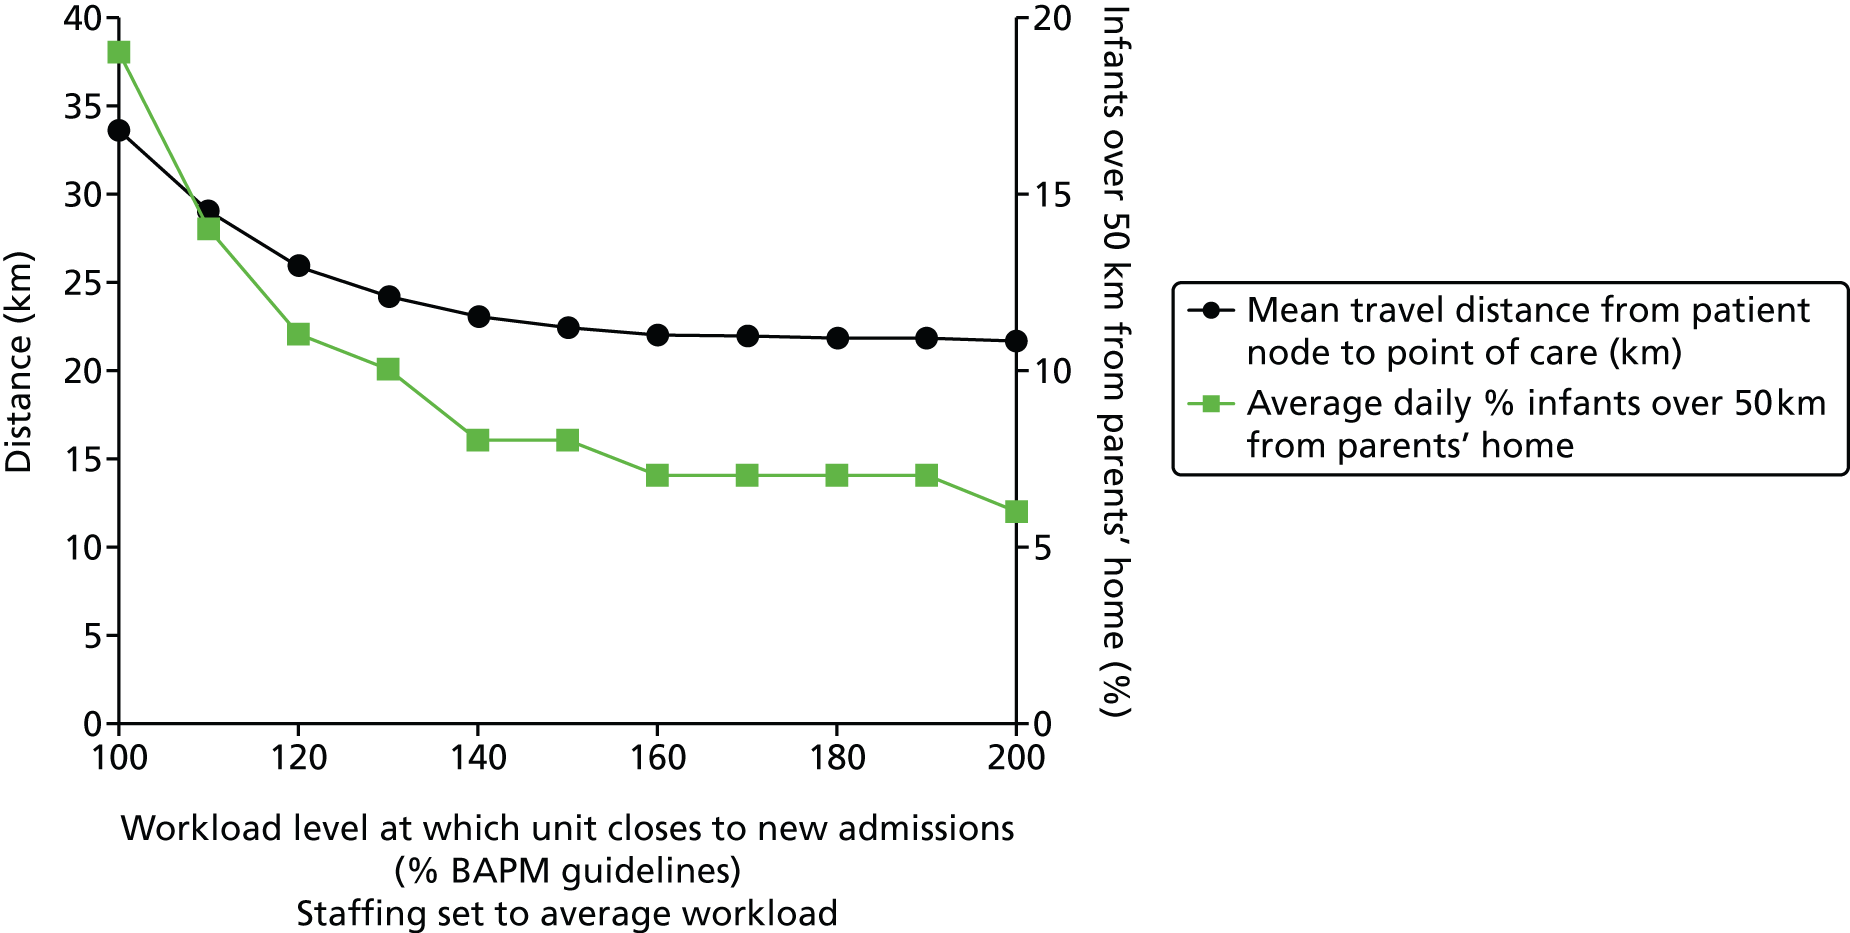
When units may work up to 200% BAPM workload, and when resources are set at average workload, there are ≈ 350 transfers per year, covering ≈ 75,000 km. As thresholds for closure to new admission are brought down, the number and total distance of transfers increase (Figure 42). When units close to new infants at 100% BAPM workload, with resources sufficient for average workload, there are ≈ 2400 transfers per year, covering ≈ 500,000 km.
FIGURE 42.
Effect of altering closure threshold on number and distances of neonatal transfers. The black circles show the expected neonatal transfers per year, and the green squares the total travel distance (assuming a return journey between the two transfer hospitals).
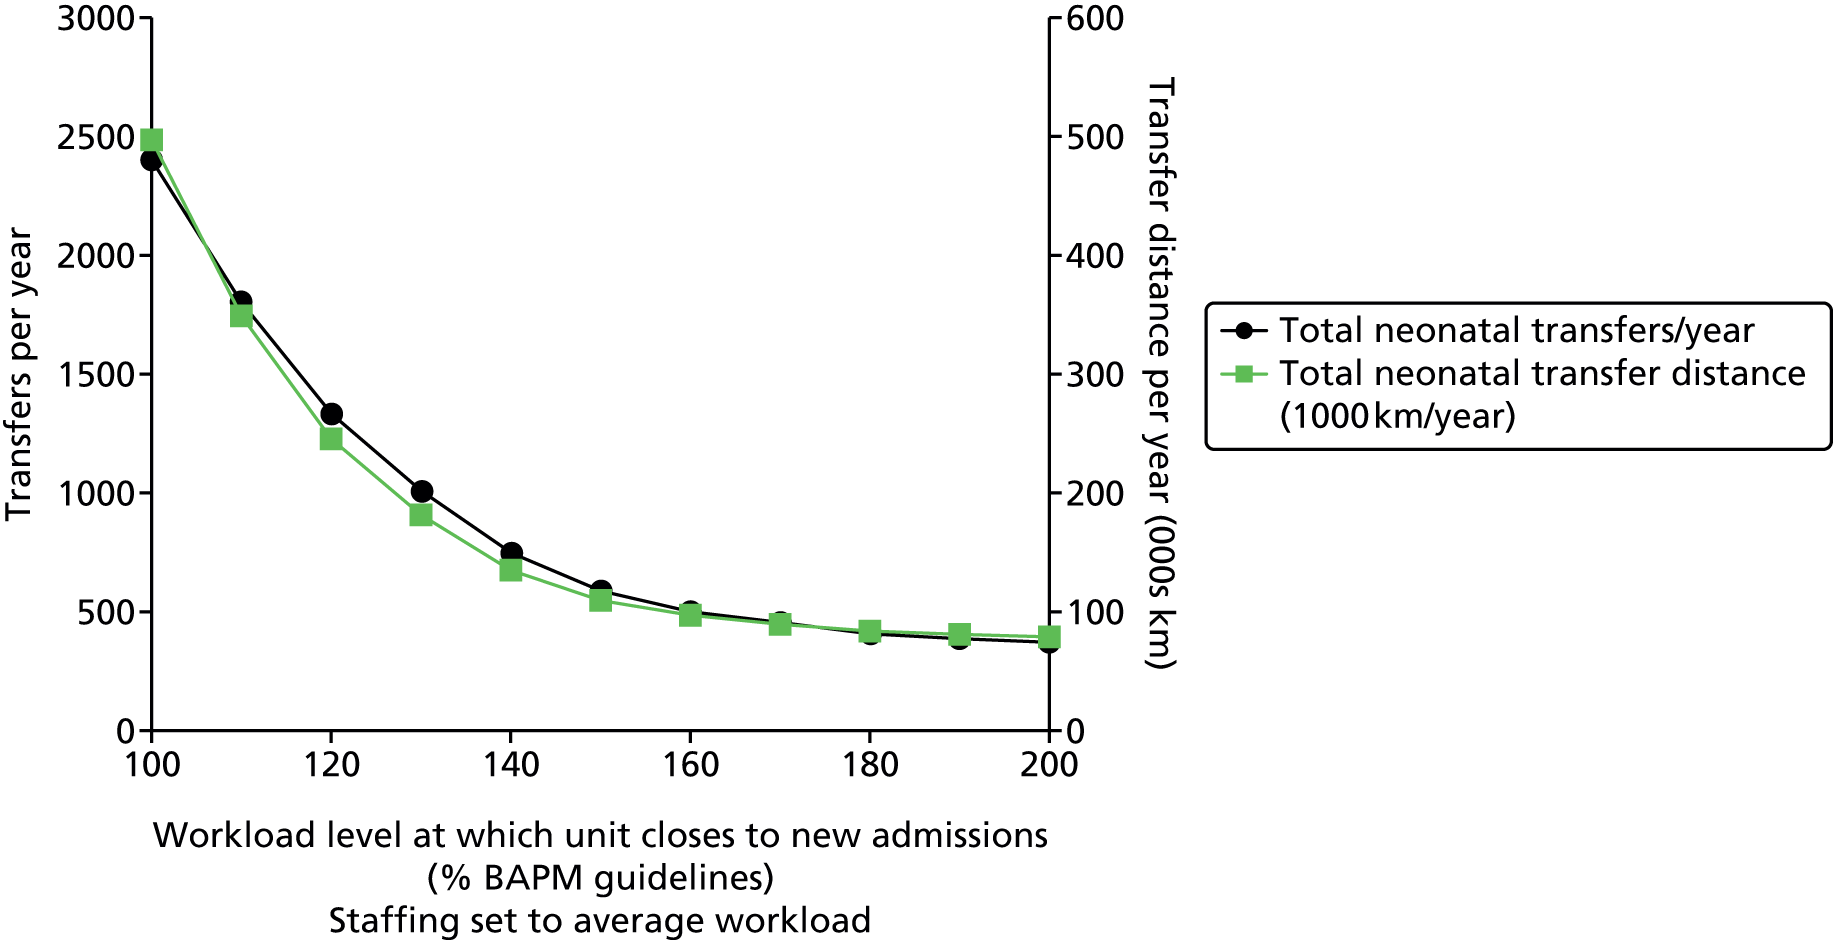
Using networks allows work to move to where there is spare capacity. This enables the network to run within guidelines without having to have enough spare resource in every unit to cope with local peaks in demand. However, as this flexibility is used more, the number and distances of transfers increase, and infants become located further from their parents’ home.
Effect of altering staffing to workload ratios
An alternative method of investigating the relationship between BAPM workload and system performance is to maintain a fixed BAPM workload at which the unit closes to new admissions and then adjusts resource levels so that the units are working, on average, at different workload levels relative to BAPM guidelines. Average workload is constant in these scenarios, but the number of nurses are changed so that average capacity utilisation (measured against staffing levels) varies.
In these models, units are closed to new admissions at 150% BAPM guideline workload levels. This level was chosen as being the typical maximum workload level we saw across the hospitals (see Chapter 7, Daily variation in case mix, workload and nursing numbers, for more details). Workload is then expressed as either percentage of BAPM guideline (with values of greater than 100% representing workloads in excess of BAPM guidelines given the nursing resources present) or percentage of maximum permitted workload (with 100% representing the maximum workload permitted before closure to new admissions, equivalent to 150% BAPM guidelines).
When average workload is low (50% BAPM guidelines, 33% maximum permitted workload) the average distance parents are from the location of care is 22 km, with 94% being within 50 km. As resource levels are reduced, increasing the workload relative to BAPM guidelines, the distance parents are from the location of care increases, with significant rises occurring above 70% maximum permitted workload (Figure 43). As average workload approaches the maximum permitted workload (150% BAPM recommendations), the average distance parents are from the location of care rises to 34 km, with 81% being within 50 km.
FIGURE 43.
The relationship between travel distance for parents and unit workload (workload expressed as percentage of maximum permitted workload before closure to new admissions when workload exceeds 150% BAPM guidelines). The black circles show the average distance from the point of care to the parents’ home, and the green squares show the percentage of infants cared for more than 50 km away from the parents’ home.
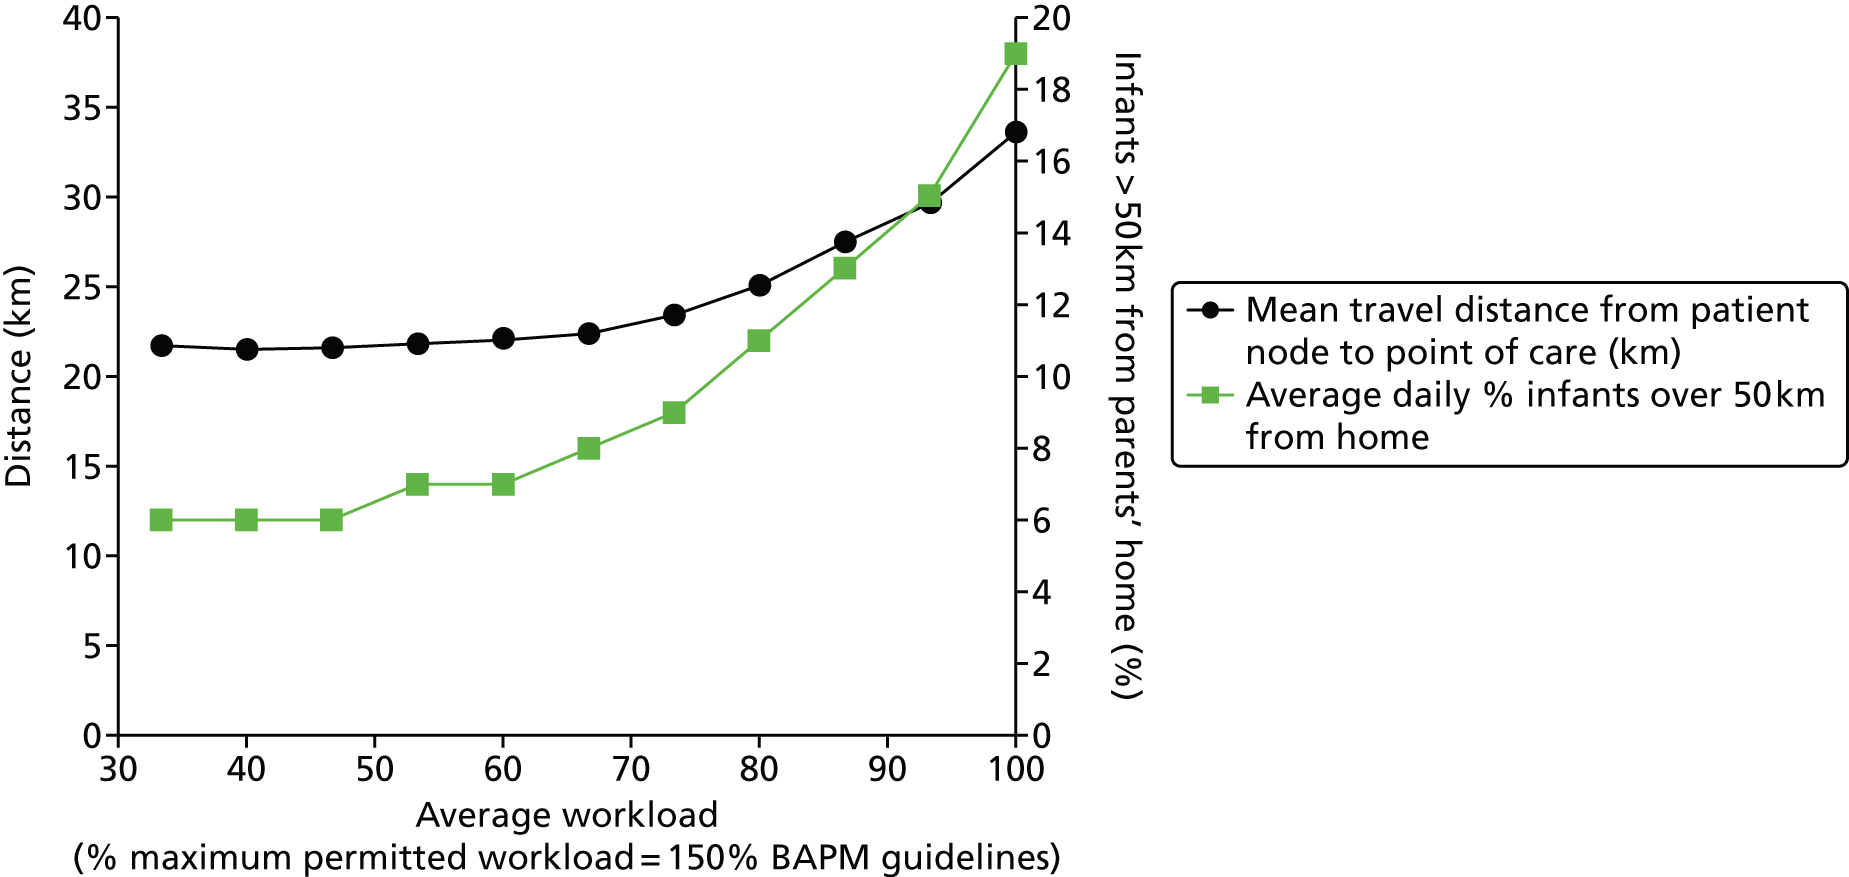
Average workload levels have a profound effect on the number and total distance of transfers (Figure 44). When average workload is low (50% BAPM guidelines, 33% maximum permitted workload) there are ≈ 350 transfers per year, covering ≈ 75,000 km. Transfers begin to increase significantly above 70% maximum permitted workload. As average workload approaches the maximum permitted workload (150% BAPM recommendations), the number of transfers reaches ≈ 2500 per year, covering 500,000 km.
FIGURE 44.
The relationship between transfers and unit workload (workload expressed as percentage of maximum permitted workload, which is 150% BAPM guidelines). The black circles show the expected neonatal transfers per year, and the green squares the total travel distance (assuming a return journey between the two transfer hospitals).
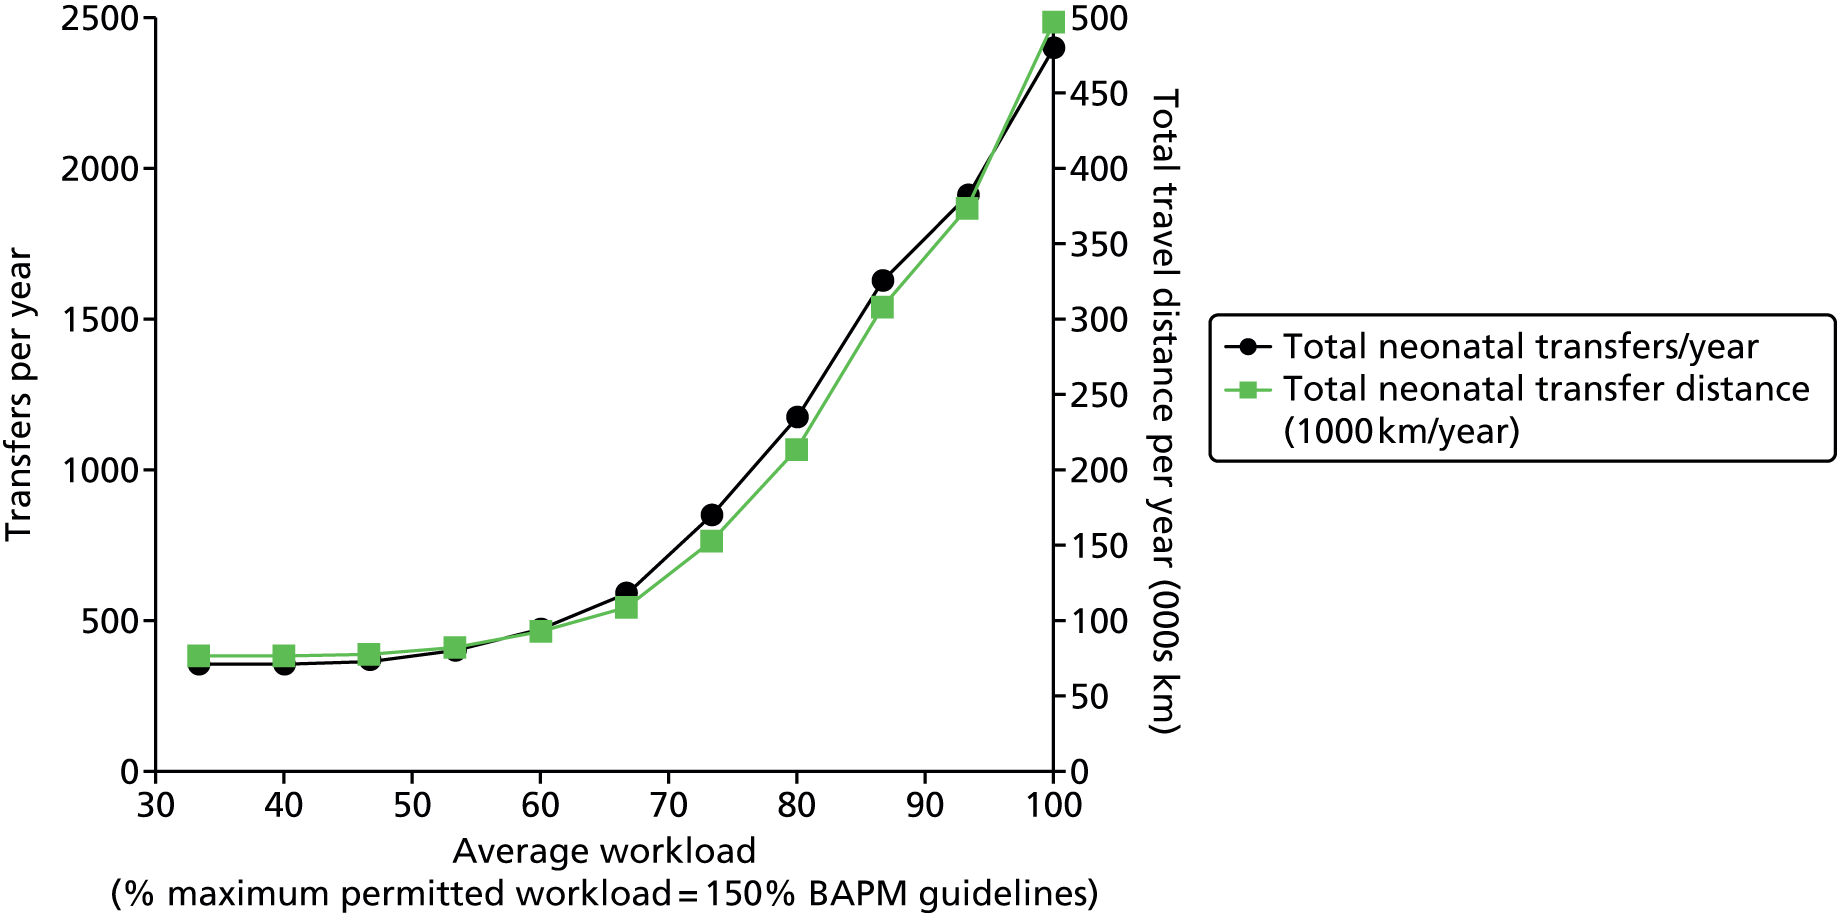
Nurse requirements to meet British Association of Perinatal Medicine standards
Both observed and modelled data were analysed to evaluate how many on-duty nurses (excluding managerial and transport nurses) are required to meet BAPM standards 80%, 90% and 95% of the time (Table 29).
| Measure | Average staffing (2011) | Workload | Nurses required | ||||||
|---|---|---|---|---|---|---|---|---|---|
| Mean | 80% | 90% | 95% | Mean | 80% | 90% | 95% | ||
| Observed (2011/12) | |||||||||
| Plymouth | 8.1 | 9.1 | 10.7 | 11.3 | 11.8 | 10 | 11 | 12 | 12 |
| Exeter | 8.4 | 6.6 | 7.7 | 8.5 | 8.9 | 7 | 8 | 9 | 9 |
| Torbay | 3.0 | 1.5 | 2.1 | 2.4 | 2.6 | 2 | 2 | 3 | 3 |
| Truro | 6.2 | 5.4 | 6.7 | 7.3 | 7.6 | 6 | 7 | 8 | 8 |
| Barnstaple | 2.1 | 1.2 | 1.8 | 2.0 | 2.3 | 2 | 2 | 2 | 3 |
| Total | 27.7 | 24.0 | 28.9 | 31.5 | 33.2 | 27 | 30 | 34 | 35 |
| Modelled with all work handled in planned unit (no transfers due to capacity shortfall) | |||||||||
| Plymouth | NA | 10.3 | 12.4 | 13.6 | 14.6 | 11 | 13 | 14 | 15 |
| Exeter | NA | 5.8 | 7.4 | 8.3 | 9.0 | 6 | 8 | 9 | 9 |
| Torbay | NA | 1.6 | 2.1 | 2.5 | 2.9 | 2 | 3 | 3 | 3 |
| Truro] | NA | 4.7 | 5.9 | 6.8 | 7.5 | 5 | 6 | 7 | 8 |
| Barnstaple | NA | 1.2 | 1.6 | 1.9 | 2.3 | 2 | 2 | 2 | 3 |
| Total | NA | 23.6 | 29.4 | 33.0 | 36.3 | 26 | 32 | 35 | 38 |
During the data collection period there were ≈ 28 on-duty nurses on average (excluding managerial and transport nurses).
These nurse requirements are for any one time. For each on-duty nurse it may be assumed that ≈ 5.8 whole-time equivalent (WTE) nurses are needed (based on 168 hours in a week, 37.5 hours per nurse week, 17.3% allowance for holiday and sickness and 5% for admin; from midwife staffing calculation described by Ball and Washbrook36).
Mortality modelling
As described in Mortality model, we have sought to investigate incorporating outcome measures into this operational model, and have used published models of mortality to link mortality in the model to (1) infant characteristics and (2) percentage unit occupancy. In these models we have used a workload level of 150% BAPM guidelines workload levels as equivalent to maximum occupancy. This level was chosen as being the typical maximum workload level we saw across the hospitals (see Chapter 7, Daily variation in case mix, workload and nursing numbers, for more details).
None of the model results elsewhere in this report use this mortality predictor unless specified. In the validation model (see Demand based on raw Badger data), when the mortality predictor was used, the model predicted mortality in the region of 1.03%. This compared with an actual mortality (January 2011 to December 2012) of 1.02%.
It must be reinforced, however, that these results are experimental.
We used this model to predict the impact of altering staffing levels in the network. For this experiment there were no closures of units to new admissions; workload was allowed to increase as staffing was reduced. When workload is expressed as a percentage of maximum workload (150% BAPM guidelines), mortality increases from 0.86% at 33% maximum workload to 1.21% at 100% maximum workload (Figure 45).
FIGURE 45.
Effect of altering staffing to workload ratio on predicted mortality (actual workload remains constant, but staffing is altered so workload relative to BAPM guidelines varies). Maximum permitted workload occurs when workload is 150% of BAPM guideline workload for the number of nurses present.
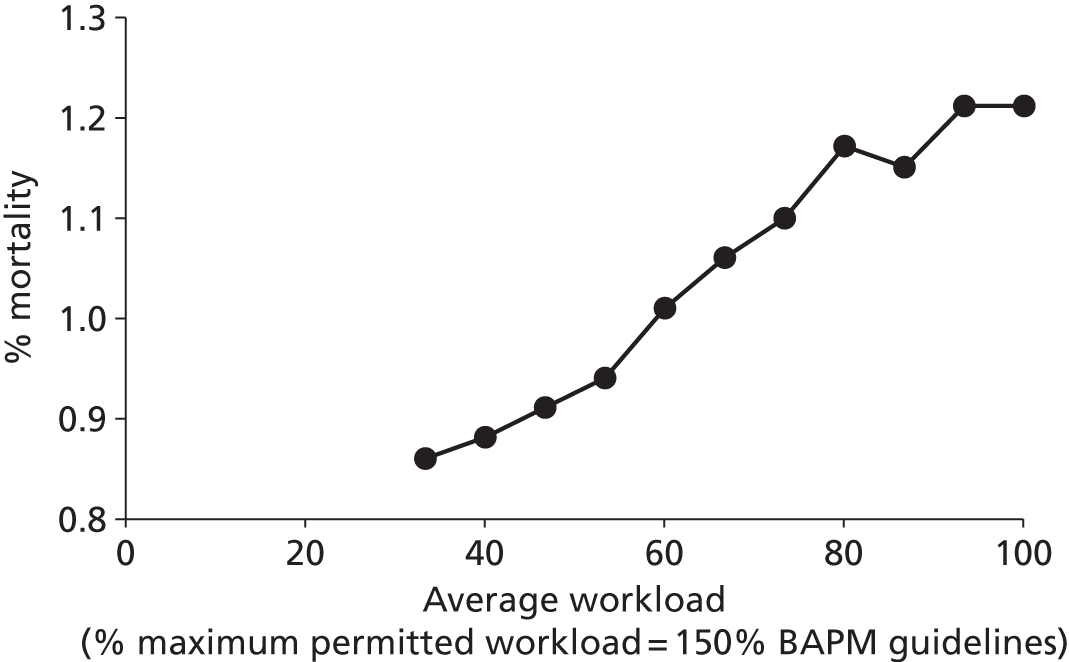
Extension to Western network
By basing demand on births (see Chapter 7, Comparison of demand with births) we modelled the expected performance of the combined Peninsula/Western network. For these scenarios we assumed that use of neonatal care and lengths of stay in the wider region were the same as the Peninsula region. We again looked at the expected impact of progressive centralisation, but this time in the larger network (Table 30). (See Table 14 for description of unit types.) These scenarios generally change all units to different levels at the same time, with the following exceptions:
| Hospital | Scenario (increasing centralisation) | |||||||
|---|---|---|---|---|---|---|---|---|
| 1 | 2 | 3 | 4 | 5 | 6 | 7 | 8 | |
| Royal United Hospital, Bath | Surgical | NICU | LNU+ | LNU | LNU | SCU | Births only | Closed |
| Yeovil District Hospital | Surgical | NICU | LNU+ | LNU | SCU | SCU | Births only | Closed |
| Southmead Hospital, Bristol | Surgical | NICU | LNU+ | LNU | LNU | SCU | Births only | Closed |
| St Michael’s Hospital, Bristol (UHB) | Surgical | Surgical | Surgical | Surgical | Surgical | Surgical | Surgical | Surgical |
| Royal Devon and Exeter Hospital, Exeter | Surgical | NICU | LNU+ | LNU | LNU | SCU | Births only | Closed |
| North Devon District Hospital, Barnstaple | Surgical | NICU | LNU+ | LNU | SCU | SCU | Births only | Closed |
| Gloucester Royal Hospital | Surgical | NICU | LNU+ | LNU | LNU | SCU | Births only | Closed |
| Cheltenham Hospital | Surgical | NICU | LNU+ | LNU | SCU | SCU | Births only | Closed |
| Derriford Hospital, Plymouth | Surgical | Surgical | LNU+ | LNU | LNU | SCU | Births only | Closed |
| Great Western Hospital, Swindon | Surgical | NICU | LNU+ | LNU | LNU | SCU | Births only | Closed |
| Musgrove Park Hospital, Taunton | Surgical | NICU | LNU+ | LNU | LNU | SCU | Births only | Closed |
| Torbay Hospital, Torquay | Surgical | NICU | LNU+ | LNU | SCU | SCU | Births only | Closed |
| Royal Cornwall Hospital, Truro | Surgical | NICU | LNU+ | LNU | LNU | SCU | Births only | Closed |
-
One surgical hospital is always maintained.
-
One option (scenario 2) allows for two surgical units, with the second unit being the current network ICU in the Peninsula network (Plymouth).
-
One option (scenario 5) has a mix of LNU and SCU; the allocation of hospitals is based on current differentials.
With increasing centralisation, we again observe that the number of nurses required to meet BAPM guidelines 90% of the time reduces, with a maximum 21% reduction between the extremes of localisation and centralisation (Figure 46). At the same time, average travel distances for parents increase from 15 km to 94 km with the number of parents over 50 km from the hospital increasing from 1% to 66% (Figure 47). Transfers increase from none to 4700 per year covering ≈ 1 million km per year (Figure 48).
FIGURE 46.
Effect of centralisation on network workload and nursing requirements. The graph shows the average workload (the number of nurses required to care for infants in care, black triangles), and 80th (dark green square), 90th (blue triangle) and 95th percentile (light green circle) workload. The light green circles, for example, show the number of nurses required to meet BAPM standards (without neonatal transfers) 95% of the time.
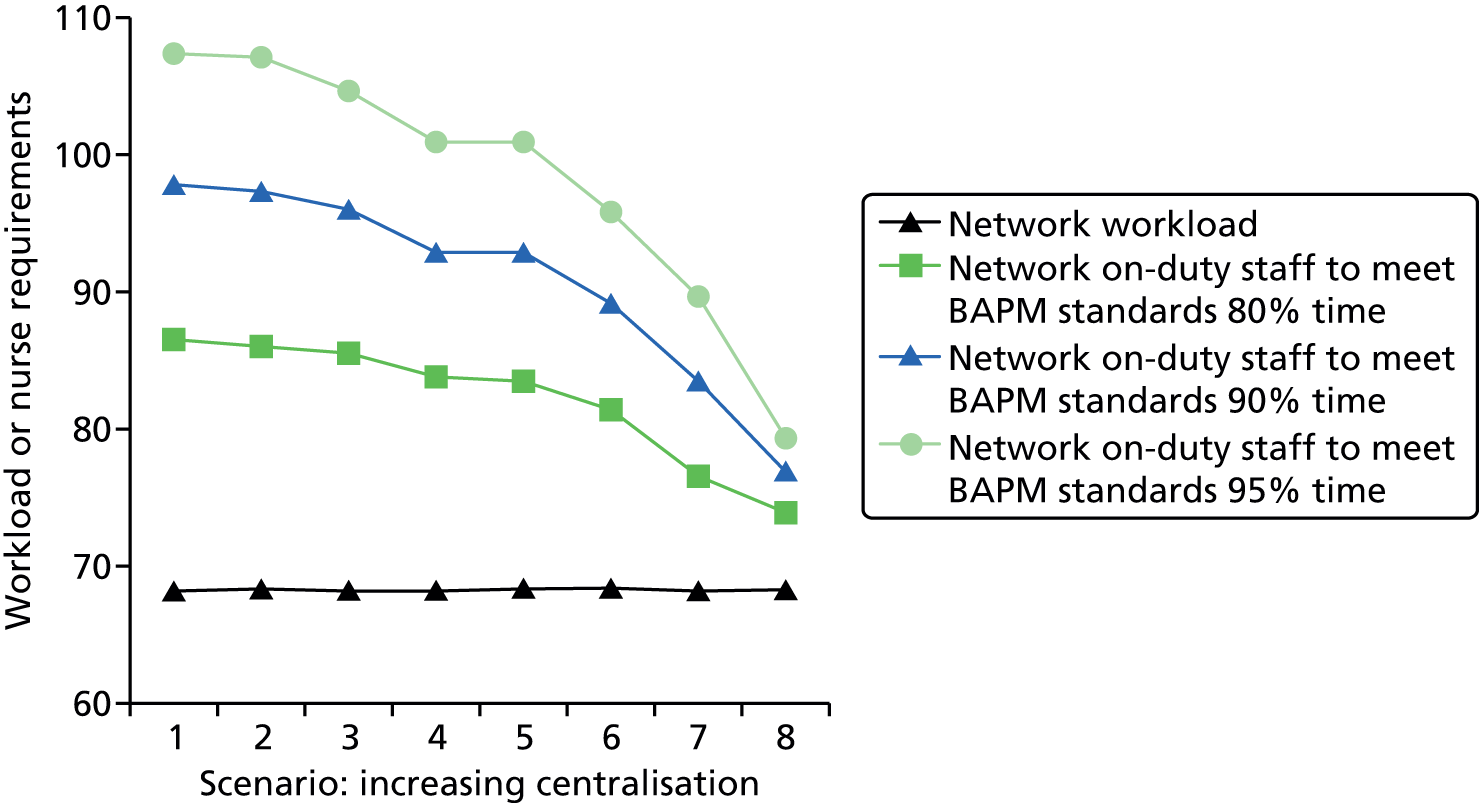
FIGURE 47.
Effect of centralisation on distance from parents’ home to location of care. The black triangles show the average distance from the point of care to the parents’ home, and the green squares show the percentage of infants cared for more than 50 km away from the parents’ home.
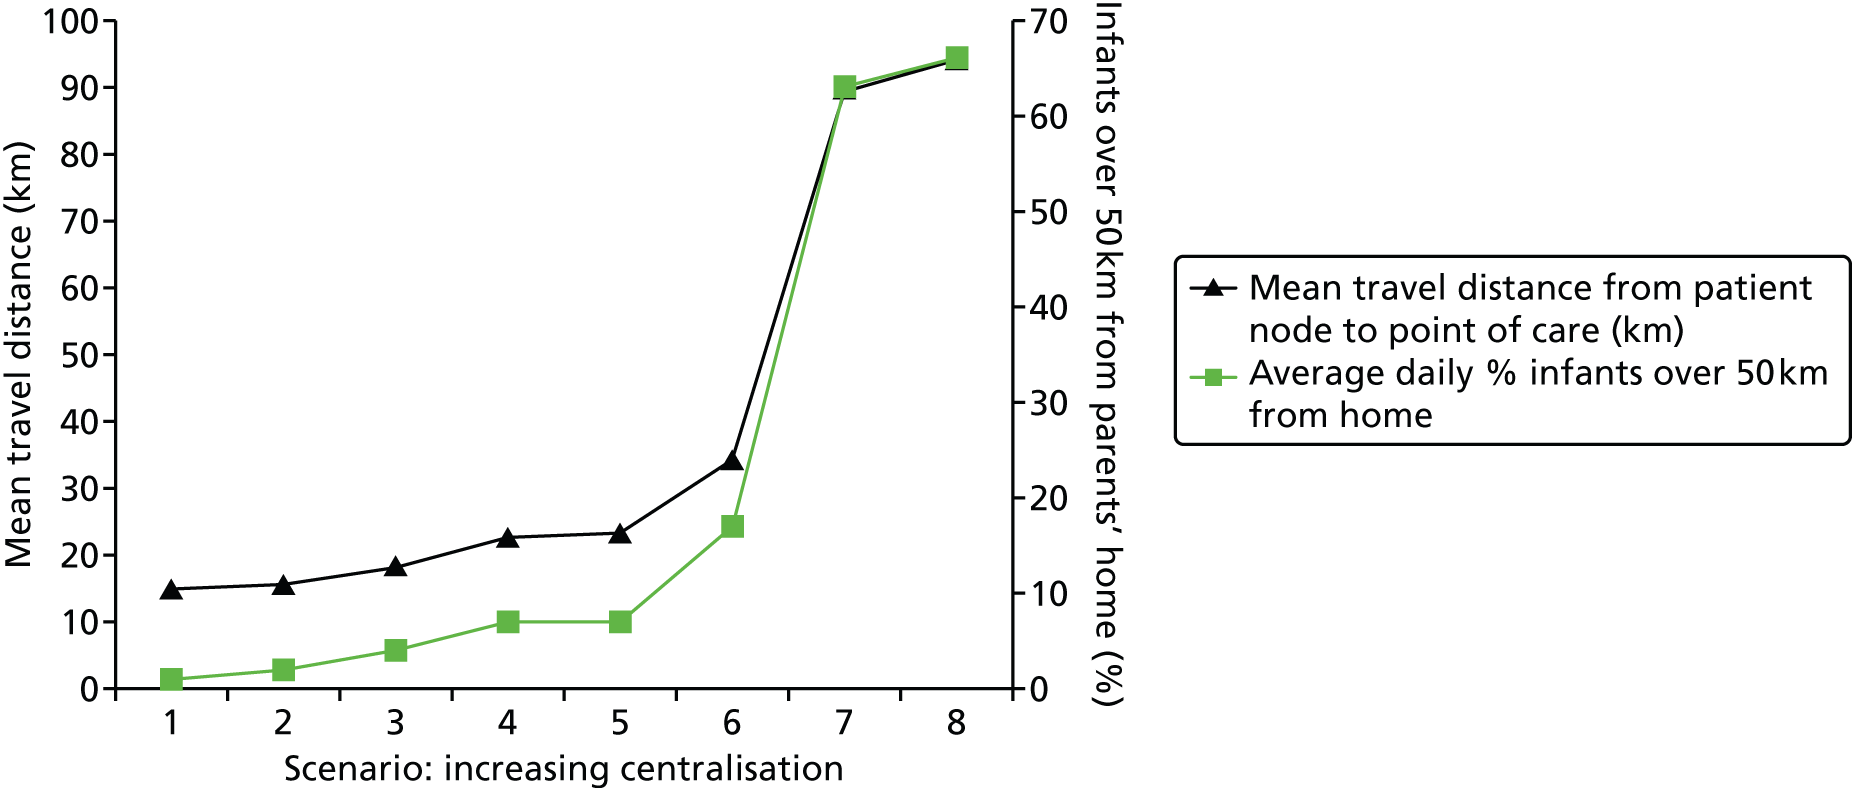
FIGURE 48.
Effect of centralisation on number and total distance of transfers. The black triangles show the expected neonatal transfers per year, and the green squares the total travel distance (assuming a return journey between the two transfer hospitals).
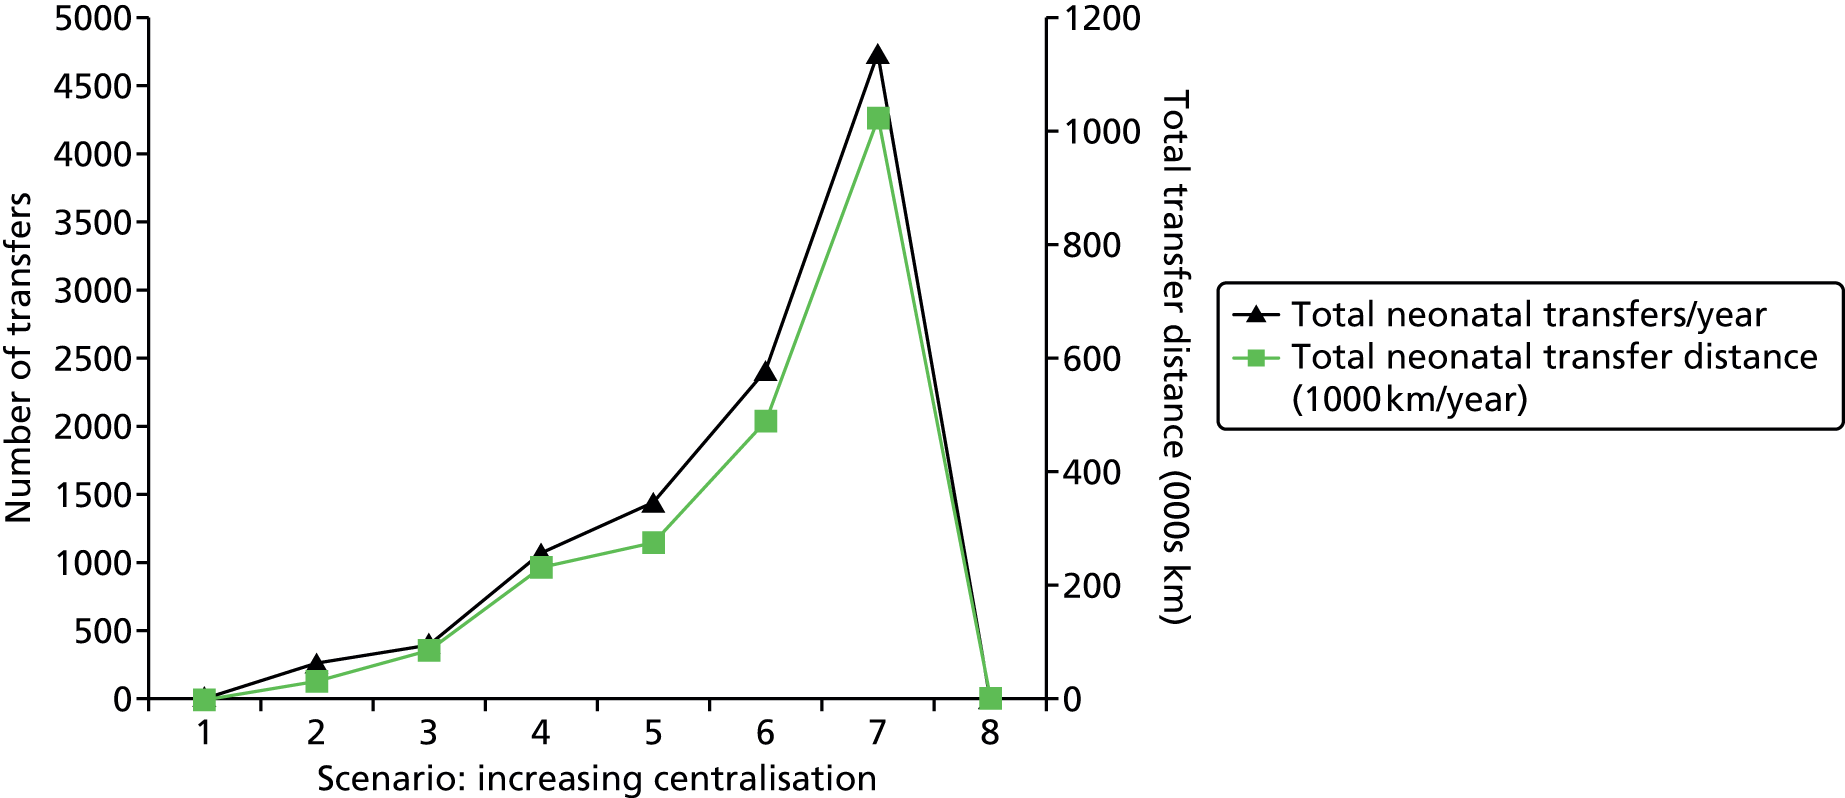
Performance difference between one and two networks
We investigated the effect of the network operating as either a single network or two networks (with the Peninsula being a separate region from the rest of the hospitals). In these scenarios the number of nurses was set to be equal to the average workload, and hospitals closed at 125% BAPM levels (units were therefore working, on average, at 80% capacity). In the model, a cot is first looked for within the home network; only on failing to find a cot in the home network is the second network searched. It is possible, when operating as two networks, that parents living close to the boundary between the networks may have to travel further to a hospital in their own network than if they could simply travel to the closest hospital. We found in the model only a very small effect on travel distances, which were an average of 20.1 km for a single network and 20.3 km for two networks (with the proportion within 50 km being 6.4% for a single network and 6.6% for two networks).
National modelling (England)
Distance between units
In order to better understand the geographic differences between networks we looked at the distance of each neonatal unit to its nearest neighbouring unit (Table 31). On average, units are separated by 23 km (road distance, fastest route, Microsoft MapPoint using MPMileCharter add-in). This statistic varied very significantly around the country. The London networks had average interunit distances of 7–9 km. The Peninsula region had the greatest interunit distance of 60 km.
| Network | Average distance to next nearest hospital (km by road) | Hospitals in network |
|---|---|---|
| Beds and Herts | 22 | 5 |
| Cheshire and Merseyside | 17 | 9 |
| Essex | 28 | 5 |
| Greater Manchester | 13 | 11 |
| Kent | 30 | 6 |
| Lancashire and South Cumbria | 36 | 5 |
| London: North Central | 7 | 5 |
| London: North East | 8 | 7 |
| London: North West | 7 | 7 |
| London: South East | 9 | 6 |
| London: South West | 9 | 5 |
| Midlands Central | 17 | 8 |
| Midlands North | 26 | 6 |
| Midlands South West | 17 | 9 |
| Norfolk, Suffolk and Cambridgeshire | 43 | 8 |
| North Trent | 23 | 9 |
| Northern | 25 | 12 |
| Peninsula | 60 | 5 |
| Surrey and Sussex | 26 | 9 |
| Thames Valley and Wessex: North | 28 | 9 |
| Thames Valley and Wessex: South | 29 | 6 |
| Trent | 26 | 6 |
| Western | 24 | 8 |
| Yorkshire | 25 | 11 |
| All | 23 | 177 |
Effect of changing the number of units on distance from home location to point of care
Methods
In some pilot work, we have used a simple algorithm to look at the impact of changing the number of neonatal units on the distance from the mother’s home location to the nearest neonatal unit. Location and numbers of infants is based on the number of births for each GP in England.
In this type of modelling, each solution is scored according to a weighted function based on the average distance to a unit, the percentage of parents within a given target distance and the maximum distance any parent has to travel (Table 32). The algorithm places the first unit (from a list of all current units) where the highest score is achieved. The first unit is then ‘locked’ in place and the algorithm repeated to find the second unit that increases the score by the most. The process repeats through all the locations available.
| Variable | Scoring | Weight | |
|---|---|---|---|
| 0 | 1 | ||
| Average distance (km) | 200 | 0 | 50 |
| % within target distance | 0 | 100 | 50 |
| Maximum distance travelled | 500 | 0 | 10 |
This analysis should not be seen in isolation. There may be other reasons for having more or fewer units than simply considering travel distances and there may be other reasons for choosing the location of units other than travel distances. This analysis uses straight-line distance; a fuller model would include estimated road distance and travel times.
Results
There are clearly diminishing returns in the number of units in terms of both average distance from home and the proportion of patients living within a target distance (Figure 49). There were diminishing returns in adding more units. With 10 units, the average travel distance is 35 km and 50% of parents are within 25 km (straight line) of their closest unit. With 20 units, the average travel distance is 24 km and 69% of parents are within 25 km of their closest unit. With 50 units, the average travel distance is 14 km and 90% of parents are within 25 km of their closest unit. With 100 units, the average travel distance is 10 km and 97% of parents are within 25 km of the closest unit. With 150 units, the average travel distance is 7 km and 97% of parents are within 25 km of the closest unit.
FIGURE 49.
Relationship between the number of units and the distance parents are from their closest unit. The solid line shows the average distance (straight line) and the dashed line the percentage of patients within 10 miles (straight line) of the location of care.
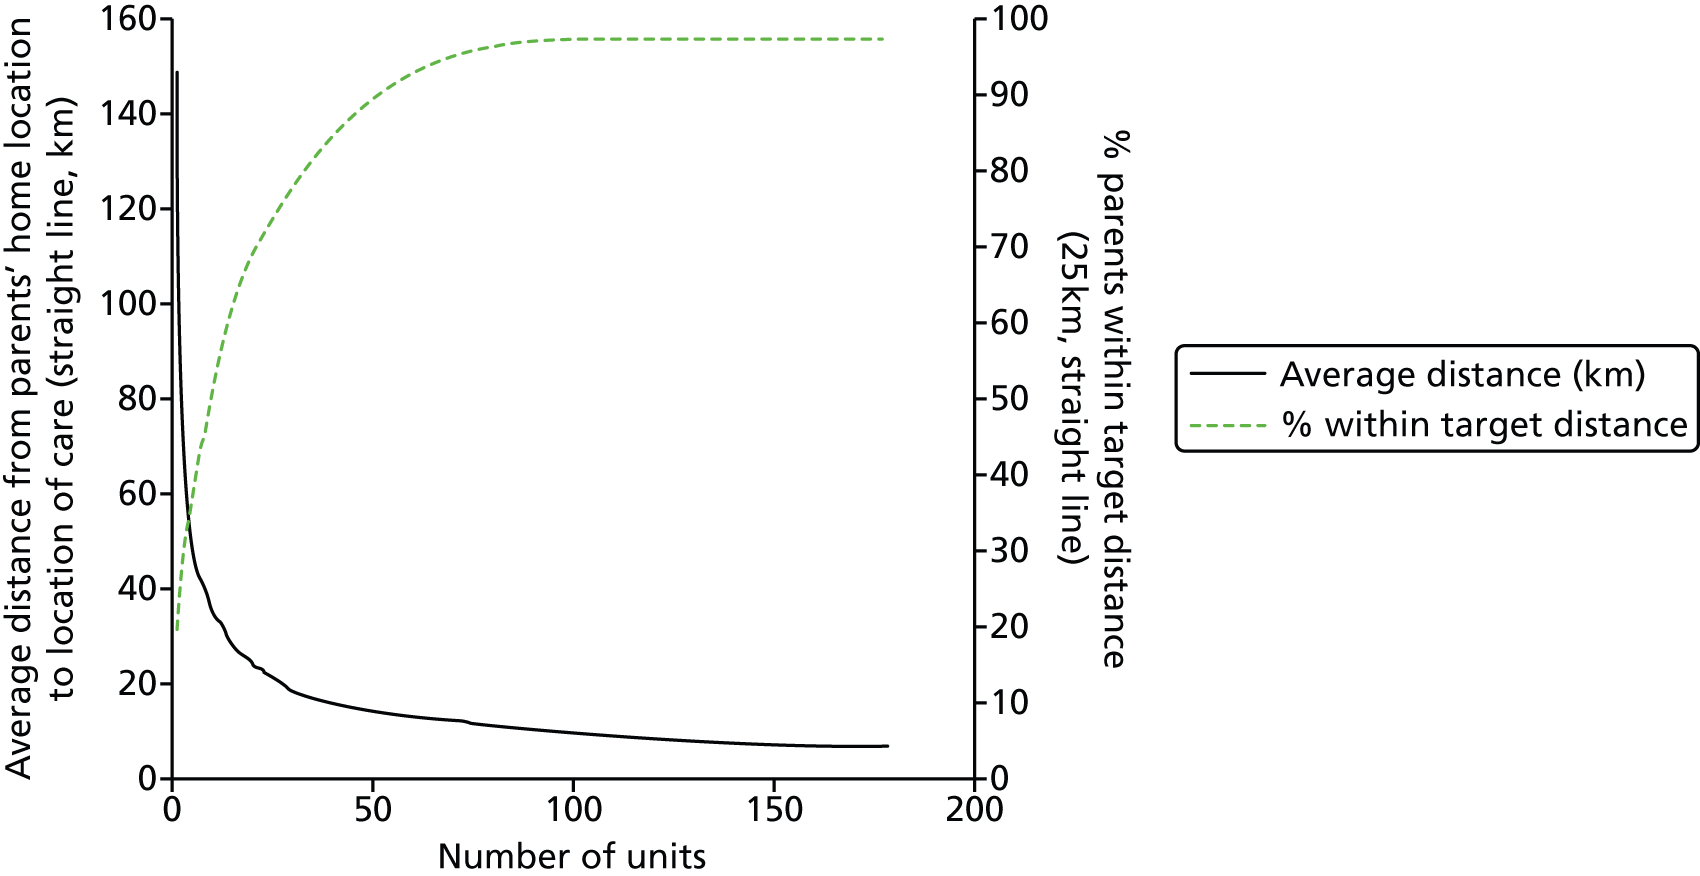
Chapter 9 Economic model
The health economics analysis evaluated the referral patterns that arise from the neonatal model and explored the impact these referral patterns have on costs and survival.
The aim of the economic evaluation was to move beyond service level objectives to consider both family and NHS costs, as well as the impact on mortality. The simulation was used to estimate the costs and outcomes of stepwise moves towards greater compliance with workload guidelines. The simulation also explored the extent to which these results changed when referrals became more centralised, the prediction being that centralisation would reduce workload variation, and so reduce the number of staff needed to meet BAPM standards 80%, 90% and 95% of the time.
Methods
The NHS costs were based on the level of care received and compared with micro-costing based on nurse grade. The costs to families included travel time, vehicle operating costs and overnight stays. Preliminary predictions of infant survival were based on infant characteristics (gestation, gender and birth weight) and workload of the neonatal units29,37 (methods are reported in Chapter 8, Mortality model).
The economic evaluation was based on a fixed cohort of pre-term infants and their referral pathway in the Peninsula network and beyond. The model was run over a 60-year period to increase precision (i.e. reduce the confidence intervals around the means) (see Chapter 8, Model run time, for more details on precision) and there was a short run-in time of 100 days before data were recorded. The referral pathway of infants outside the network, including time spent in IC, HDC and SC, and transfers were based on the observations of the Peninsula network and matched to similar hospitals outside the network (ones that have similar hospital characteristics).
To investigate the impact of centralisation and unit closures, a total of seven scenarios were modelled (Table 33). Under these scenarios we were able to look at the impact of moving infants from localised to centralised care in the Peninsula network using network on-duty staff (the number of infants seen outside the network is constant across scenarios). Scenarios 1–7 moved progressively from localised (all facilities exist locally) to centralised. In scenario 7, where all network neonatal units apart from the network ICU have been closed, we have made the realistic assumption that hospitals still provide interim care to stabilise infants born locally, even when they no longer have a neonatal unit (assumed to be half a day of care). We also estimated the costs and outcomes of stepwise moves towards greater compliance with BAPM workload guidelines based on the current system (scenario 4). As previously explained in the report, a unit may no longer admit new infants when the workload exceeds a given proportion above BAPM recommended workload. At a threshold of 100%, hospital workload may never exceed the BAPM recommendations. We also investigated the impact of greater compliance with workload guidelines, moving from restricting workloads to an upper limit, for example 200% of BAPM guidelines.
| Location of care | Scenario (increasing centralisation) | ||||||
|---|---|---|---|---|---|---|---|
| 1 | 2 | 3 | 4 | 5 | 6 | 7 | |
| Plymouth Derriford | ICU | ICU | ICU | ICU | ICU | ICU | ICU |
| Royal Devon and Exeter | ICU | LNU+ | LNU+ | LNU+ | LNU | SCU | – |
| Torbay Hospital | ICU | LNU+ | LNU | SCU | SCU | SCU | – |
| Royal Truro | ICU | LNU+ | LNU+ | LNU+ | LNU | SCU | – |
| Northern Devon (Barnstaple) | ICU | LNU+ | LNU | SCU | SCU | SCU | – |
| St Michael’s Hospital, Bristol | Surgical | Surgical | Surgical | Surgical | Surgical | Surgical | Surgical |
Predictions of NHS costs were based on two sources: the level of care received and a micro-costing based on WTE nurses. Unit costs for the level of care received were based on national reference costs 2011/12 and unit costs of WTE nurses are based on Curtis 2012. 38 Although each band of nurses has a range of salaries attached to it, Curtis bases the cost on the medium salary within each band (i.e. the median full-time equivalent basic salary for Agenda for Change Bands of April–June 2012 NHS Staff earnings estimates for Qualified Nurses). Table 34 summarises the unit costs applied in the economic evaluation.
| Cost components | Cost |
|---|---|
| Micro-costing by number of nurses on wards | |
| Nurse band 5 | £35 (£41) per hour |
| Unit costs (costs including qualifications in brackets) | £85 (£100) per hour patient contact. Annual £54,711 (£64,411) |
| Nurse trained in speciality band 6 | £43 (£50) per hour |
| Unit costs (costs including qualifications in brackets) | £105 (£121) per hour patient contact. Annual £68,005 (£77,705) |
| Costing by national reference costs per day | |
| Neonatal critical care, IC | £1117 |
| Neonatal critical care, HDC | £795 |
| Neonatal critical care, SC, without external carer | £480 |
| Neonatal critical care, SC, with external carer | £387 |
| Neonatal critical care, normal care | £440 |
| Neonatal critical care, transportation | £1253 |
| Costs of travel (parent) | |
| Cost of travel per mile | £0.45 |
| Cost of travel time per hour in non-work time (by base year 2011). Mothers likely to be passengers, because of caesarean, so need to multiply this by 2 | £4.68 per hour per person travelling |
| Cost of travel time per hour in work time (by base year 2011) | £26.93 per hour car driver and £19.80 per hour passenger |
The costs to families that we included were travel time and vehicle-operating costs. The unit costs applied to travel time were based on the Department of Transport non-business travel costs. 39 Travel for non-business was based on a study estimating the willingness to pay of travellers for shorter travel times. 40 This study found that travellers gave the same value to time in all modes of transport. The Department of Transport cost business travel at a higher rate, which varies between modes of transport based on lost workplace productivity and the wages of employees. We did not apply these higher costs here, although it is recognised that travel may also take place in work time for partners of women who have undergone a caesarean section (and are recommended to not drive in the first 6 weeks), as the partners may take time off to drive mothers to the hospitals. The unit cost of vehicle-operating costs was based on the AA motoring costs41 and included an allowance for car parking.
Results
When the model was run for 60 years this produced a cohort of 168,782 pre-term infants, and we used this cohort to look more systematically at changes in the referral pathway.
Most units in the Peninsula region are working at thresholds of closure above the BAPM recommended ratio of nursing staff to infants. In Tables 35 and 36 we modelled the impact of restricting workloads to a maximum of 200%, 190%, etc., so that the hospitals became increasingly compliant with the BAPM. Table 35 shows that transfers between hospitals and parental travel increased as the threshold to closure was lowered, and Table 36 shows that the mean NHS and family costs increased. We also explored the impact on mortality, and found that, as the threshold is lowered, mortality falls. For example, movements from 140% to 110% and 100% reduced the probability of mortality from 1.07 to 1.02 to 1.01, based on a preliminary mortality model outlined earlier (see Chapter 8, Mortality model). A key driver of mortality in this model was adherence to the BAPM, so in this case lowering BAPM thresholds increased costs but also reduced mortality. This result raised the question of whether or not the increasing costs are worth the improved outcome, to which we return in the discussion. However, this situation may no longer arise if we also take into account the positive effect that centralisation may have on mortality. 33
| Affected party | Parameter | BAPM threshold | ||||||||||
|---|---|---|---|---|---|---|---|---|---|---|---|---|
| 100% | 110% | 120% | 130% | 140% | 150% | 160% | 170% | 180% | 190% | 200% | ||
| NHS | Mean LoS (days) in ICU | 6.5 | 6.6 | 6.5 | 6.5 | 6.5 | 6.5 | 6.5 | 6.5 | 6.4 | 6.5 | 6.4 |
| Mean LoS (days) in HDU | 6.3 | 6.3 | 6.3 | 6.3 | 6.2 | 6.3 | 6.2 | 6.3 | 6.3 | 6.3 | 6.3 | |
| Mean LoS (days) in SCU | 6.4 | 6.4 | 6.4 | 6.4 | 6.4 | 6.4 | 6.4 | 6.4 | 6.4 | 6.4 | 6.4 | |
| Mean LoS (days) in TC | 1.9 | 1.9 | 1.9 | 1.9 | 1.9 | 1.9 | 1.9 | 1.9 | 1.9 | 1.9 | 1.9 | |
| Total transfers (thousands) | 167.5 | 126.1 | 93.3 | 70.4 | 52.3 | 41.2 | 35.0 | 31.5 | 28.7 | 27.3 | 26.2 | |
| Family | Mean distance travelled by parents (km)b | 692 | 588 | 523 | 483 | 456 | 444 | 436 | 434 | 429 | 430 | 427 |
| Mean travel time by parents (hours)b | 10.7 | 9.4 | 8.6 | 8.1 | 7.8 | 7.6 | 7.6 | 7.5 | 7.5 | 7.5 | 7.4 | |
| Affected party | Mean cost (£/infant) | BAPM threshold | ||||||||||
|---|---|---|---|---|---|---|---|---|---|---|---|---|
| 100% | 110% | 120% | 130% | 140% | 150% | 160% | 170% | 180% | 190% | 200% | ||
| NHS | Bed-days | 5419 | 5408 | 5416 | 5430 | 5391 | 5399 | 5395 | 5419 | 5387 | 5421 | 5411 |
| Transfers | 1244 | 936 | 693 | 523 | 388 | 305 | 260 | 234 | 213 | 203 | 194 | |
| Family | Distance travelledb | 311 | 265 | 235 | 217 | 205 | 200 | 196 | 195 | 193 | 194 | 192 |
| Travel timeb | 50 | 44 | 40 | 38 | 37 | 36 | 35 | 35 | 35 | 35 | 35 | |
| Mean total NHS and family costs | 7024 | 6653 | 6384 | 6208 | 6021 | 5940 | 5886 | 5883 | 5828 | 5853 | 5832 | |
We looked at the impact of moving from localisation (scenario 1) to centralisation (scenario 7). We considered the impact of centralisation under two situations: (1) removing the BAPM closure threshold, so that units never close to new admissions, and (2) setting the BAPM threshold at 200%, the level typically found in one of the central referral hospitals in the network. For this analysis, we looked at the cost implications only. Table 37 reports the impact of centralisation when the BAPM threshold is removed, and shows that movement to centralisation increased the mean distance and time travelled by parents. Table 38 shows the costs. Unit closures also increased mean distance and time travelled by parents. Table 39 reports the impact of centralisation when the BAPM threshold is 200% and shows similar findings.
| Measure | Scenario (increasing centralisation) | ||||||
|---|---|---|---|---|---|---|---|
| 1 | 2 | 3 | 4 | 5 | 6 | 7 | |
| Hospital type | |||||||
| Plymouth Derriford | ICU | ICU | ICU | ICU | ICU | ICU | ICU |
| Royal Devon and Exeter | ICU | LNU+ | LNU+ | LNU+ | LNU | SCU | Births only |
| Torbay Hospital | ICU | LNU+ | LNU | SCU | SCU | SCU | Births only |
| Royal Truro | ICU | LNU+ | LNU+ | LNU+ | LNU | SCU | Births only |
| Northern Devon (Barnstaple) | ICU | LNU+ | LNU | SCU | SCU | SCU | Births only |
| St Michael’s Hospital, Bristol | Surgical | Surgical | Surgical | Surgical | Surgical | Surgical | Surgical |
| NHS | |||||||
| Mean LoS (days) ICU | 6.6 | 6.6 | 6.5 | 6.6 | 6.5 | 6.5 | 6.5 |
| Mean LoS (days) HDU | 6.3 | 6.2 | 6.3 | 6.3 | 6.4 | 6.3 | 6.2 |
| Mean LoS (days) SCU | 6.3 | 6.4 | 6.4 | 6.4 | 6.4 | 6.4 | 6.4 |
| Mean LoS (days) TC | 1.9 | 1.9 | 1.9 | 1.9 | 1.9 | 1.9 | 1.9 |
| Total number of transfers | 8957 | 11,421 | 16,048 | 24,298 | 34,811 | 49,072 | 110,722 |
| Family | |||||||
| Mean distance travelled by parents (km)a | 373 | 394 | 400 | 428 | 458 | 544 | 1078 |
| Mean travel time by parents (hours)a | 6.8 | 7.0 | 7.1 | 7.5 | 7.8 | 8.9 | 15.7 |
| Network staff | |||||||
| Network on-duty staff to meet BAPM standards 80% of time | 30 | 30 | 30 | 30 | 29 | 29 | 27 |
| Network on-duty staff to meet BAPM standards 90% of time | 34 | 34 | 34 | 33 | 33 | 32 | 30 |
| Network on-duty staff to meet BAPM standards 95% of time | 38 | 37 | 37 | 36 | 36 | 35 | 33 |
| Measure | Scenario (increasing centralisation) | ||||||
|---|---|---|---|---|---|---|---|
| 1 | 2 | 3 | 4 | 5 | 6 | 7 | |
| Hospital type | |||||||
| Plymouth Derriford | ICU | ICU | ICU | ICU | ICU | ICU | ICU |
| Royal Devon and Exeter | ICU | LNU+ | LNU+ | LNU+ | LNU | SCU | Births only |
| Torbay Hospital | ICU | LNU+ | LNU | SCU | SCU | SCU | Births only |
| Royal Truro | ICU | LNU+ | LNU+ | LNU+ | LNU | SCU | Births only |
| Northern Devon (Barnstaple) | ICU | LNU+ | LNU | SCU | SCU | SCU | Births only |
| St Michael’s Hospital, Bristol | Surgical | Surgical | Surgical | Surgical | Surgical | Surgical | Surgical |
| NHS costs (£/infant) | |||||||
| Mean cost bed-days | 5407 | 5418 | 5422 | 5412 | 5421 | 5403 | 5388 |
| Mean cost of transfers | 66 | 85 | 119 | 180 | 258 | 364 | 822 |
| Family costs (£/infant) | |||||||
| Mean cost distance travelleda | 168 | 177 | 180 | 192 | 206 | 245 | 485 |
| Mean cost travel timea | 32 | 33 | 33 | 35 | 37 | 42 | 73 |
| Mean total NHS and family costs | 5673 | 5713 | 5754 | 5819 | 5922 | 6054 | 6768 |
| Measure | Scenario (increasing centralisation) | ||||||
|---|---|---|---|---|---|---|---|
| 1 | 2 | 3 | 4 | 5 | 6 | 7 | |
| Hospital type | |||||||
| Plymouth Derriford | ICU | ICU | ICU | ICU | ICU | ICU | ICU |
| Royal Devon and Exeter | ICU | LNU+ | LNU+ | LNU+ | LNU | SCU | Births only |
| Torbay Hospital | ICU | LNU+ | LNU | SCU | SCU | SCU | Births only |
| Royal Truro | ICU | LNU+ | LNU+ | LNU+ | LNU | SCU | Births only |
| Northern Devon (Barnstaple) | ICU | LNU+ | LNU | SCU | SCU | SCU | Births only |
| St Michael’s Hospital, Bristol | Surgical | Surgical | Surgical | Surgical | Surgical | Surgical | Surgical |
| NHS costs (£/infant) | |||||||
| Mean cost bed-days | 5406 | 5404 | 5391 | 5401 | 5419 | 5420 | 5388 |
| Mean cost of transfers | 83 | 102 | 132 | 194 | 320 | 591 | 822 |
| Family costs (£/infant) | |||||||
| Mean cost distance travelleda | 168 | 177 | 180 | 192 | 212 | 280 | 485 |
| Mean cost travel timea | 32 | 33 | 33 | 35 | 37 | 46 | 73 |
| Mean total NHS and family costs | 5689 | 5716 | 5736 | 5822 | 5988 | 6337 | 6768 |
A more accurate reflection of cost variation, as the system moves towards greater centralisation or unit closures, is found by looking at the network on-duty staff, a figure which is more able to reflect the changing cost structure that arises from changing the referral pathway. The analysis assumed that infants are not transferred because of cot or nurse shortages and that all transfers are in line with expected location of care. Table 37 shows the numbers of network on-duty staff to meet BAPM standards 80%, 90% and 95% of the time. Table 40 shows WTE staff costs per admitted infant based on the assumption that 70% of registered nurses are qualified in specialty (following markers for good practice3). In Table 40, mean staff costs per infant fell with greater centralisation and unit closures.
| Measure | Scenario (increasing centralisation) | ||||||
|---|---|---|---|---|---|---|---|
| 1 | 2 | 3 | 4 | 5 | 6 | 7 | |
| Hospital type | |||||||
| Plymouth Derriford | ICU | ICU | ICU | ICU | ICU | ICU | ICU |
| Royal Devon and Exeter | ICU | LNU+ | LNU+ | LNU+ | LNU | SCU | Births only |
| Torbay Hospital | ICU | LNU+ | LNU | SCU | SCU | SCU | Births only |
| Royal Truro | ICU | LNU+ | LNU+ | LNU+ | LNU | SCU | Births only |
| Northern Devon (Barnstaple) | ICU | LNU+ | LNU | SCU | SCU | SCU | Births only |
| St Michael’s Hospital, Bristol | Surgical | Surgical | Surgical | Surgical | Surgical | Surgical | Surgical |
| Costs (£/infant) | |||||||
| Mean cost of network staff to meet BAPM standards 80% of time | 4536 | 4517 | 4498 | 4479 | 4442 | 4328 | 4083 |
| Mean cost of network staff to meet BAPM standards 90% of time | 5122 | 5122 | 5065 | 4990 | 4933 | 4801 | 4574 |
| Mean cost of network staff to meet BAPM standards 95% of time | 5389 | 5596 | 5557 | 5481 | 5406 | 5217 | 4971 |
Chapter 10 Parent involvement
During the course of the project, two meetings with parents were held (with six parents in total, including one husband and wife). These meetings began with an introduction to simulation based on models of a restaurant and an accident and emergency department. These highly visual models allowed the parents to understand the basis of DES. The neonatal model was then demonstrated and some of the key outputs presented for discussion. The discussion focused on ‘What is most important here?’ and ‘What, if anything, have we left out?’. Parents were extremely well engaged. Model building in health care rarely involves the public, and these sessions helped to demonstrate the value of engaging the public in simulation modelling. Below are the key points that came out of the meetings.
-
Parents were enthusiastic about the potential use of modelling; they could see that the model was examining the issue from the perspective of both the service providers and the parents. They were impressed with how powerfully a simulation model could demonstrate the impact of any change, and there was a real sense of interest. This highlighted how modelling could be used more broadly in public engagement.
-
Parents were nervous about some of the model scenarios, particularly the most centralised options. Although we stressed that some model scenarios were there to explore the extremes of possibilities, parents were clearly concerned that if these scenarios were modelled then they might be considered. Being aware of this concern after the first meeting, we were able to prepare the parents more thoroughly in the second meeting. This was a learning experience for the modellers, who are very used to exploring the extremes in modelling exercises.
-
Parents highlighted that the only travel analysis at the time of presentation was travel by private car. They pointed out that not all parents have access to a car (or the shared car may be being used by a working parent), or that the mother may not be able to drive, for example after a birth by caesarean section. This stimulated the team to locate a method to analyse public transport travel times, and perform additional analysis comparing private and public transport.
-
There were mixed views on the significance of distance of care from home. All agreed that they wanted the best care for their children, but the disruptive element of care away from the parents’ home appeared to be dependent on individual circumstances. For one set of parents it was their first child. They did not have any other children to look after and so the mother was ready and willing to travel to be where the best care was available for her child. In this case her frustration was not due to the travel distance itself but because there was no assistance in providing, or helping to find, accommodation. An important aspect of the model, therefore, may be not just the travel distances, but estimating the number of parents who are likely to require local accommodation. If neonatal care, especially at IC level, becomes more centralised then it is probably important to have good estimates of the likely number (including peaks and troughs) of parents who are beyond reasonable daily travel distance. Our model helps to provide these data. The parents said that some hospitals were very good at providing for the needs of parents, including access to washing and cooking facilities. Access to Wi-Fi was also appreciated (one parent carried on working from the hospital). Following feedback from parents, we shall modify the output summary to give estimated ranges for each hospital. Another parent, however, highlighted how for her the travel distance was more significant, as she was already caring for another child at home. Having to move, even temporarily, away from her home location would be significantly more disruptive. These complex social issues are beyond the scope of our modelling, but the discussions with the parents show there are important questions to be addressed if further centralisation is considered.
-
An additional concern from parents was on the safety of transfer between hospitals. If more centralised models of service provision are adopted then having up-to-date data on the safety of transfers will be important to help inform and reassure parents.
-
There was a concern that units saw displaced infants as a lower priority than infants from the home hospital or network.
-
Transfers were sometimes repeatedly delayed. One parent reported that they packed up four times for a transfer to another hospital, but the first three times were cancelled because something had fallen through. Parents were interested in how the transfer of infants might be delayed after they were clinically suitable for transferring back to a cot closer to home.
-
Our modelling assumes that infants are relocated back to a hospital closer to home when possible (such as when moving to a lower care level). One parent said that this may not always be the parent’s wish. She related that they had built up a lot of trust and confidence in one hospital and found the move to another quite traumatic. She thought that they had probably used much more nurse and doctor time after the move, as they needed much more reassurance. She also said that it could be hard to know what a new hospital expected the parents to do or not to do; each had its own culture with relation to the role of the parents, and hospitals could sometimes assume that parents from another hospital would know how their own hospital worked in this regard. The parents want to do what is right; they may already have a sense of failure having given birth to a child who needs extra care, and ‘getting things wrong in the new unit’ added to a sense of failure. It was suggested that the mother (and/or father) could perhaps have a greater role in the transfer.
-
A possible gap in after-death support was highlighted. Support is generally offered from the hospital where death occurred, but this may be distant from the parents’ home. A question was raised about whether or not after-death support was reduced for those parents whose child had died in a hospital distant from home.
These discussions called attention to the need to estimate the number of parents outside reasonable travel distance (and therefore requiring local accommodation) and also to build in some analysis of public versus private transport. Based on feedback we shall also add additional statistics to the model to report how long infants might be delayed in transfer after they are clinically suitable for transfer back to a cot closer to home.
Specific suggestions for modelling that have been incorporated into the model, or are planned for the next refinement, are:
-
making the number of infants cared for in the hospital of birth (or the closest hospital to home) a key performance indicator
-
measuring the delay in waiting for a local cot after transfer to another unit for higher-level care (once the infant is ready to return)
-
measuring travel time by public transport as well as by car from the parents’ home to the nearest appropriate neonatal unit
-
calculating how many transfers occur where mother and baby are separated, and for what duration.
Chapter 11 Summary of main findings
-
The simulation model produces very good estimates of unit workload, transfers, and distances from parents’ home to location of care.
-
The models predicted network demand (expressed as either total infants or total nurse workload) to within 3% of the observed demand.
-
The mean absolute difference between the predicted and observed number of infants in each care level in the network was 0.5.
-
The number of transfers predicted was within 2%.
-
The average distance from parents’ home to location of care was predicted to within 2 km or 8%.
-
When comparing total number of infants and workload at each hospital between the models and the observed data, the average absolute error in the number for infants in each unit was 1.5. The average absolute error in the nurse workload in each unit was 0.4.
-
The coefficient of determination (R2) between the observed number and modelled number of infants or the nurse workload was greater than 0.85. When results were examined at each care level at each hospital, a coefficient of determination of 0.87 was achieved. The average absolute error in the number for infants in each care level in each hospital was 0.8.
-
Some discrepancies between observed and modelled data could be explained by differences in lengths of stay between different hospitals. The model allows for these differences to be incorporated, but the results described here are for a general model that assumes that LoS is dependent only on infant characteristics.
-
-
Demand for neonatal care in the Peninsula region, at 15% of all births, was higher than the national average (reported to be ≈ 10%). This may partly reflect deprivation in the region being higher than the national average. Demand had a geographical pattern: 30% or more infants from inner-city Plymouth GPs required neonatal care. Rural areas generally had lower admission rates.
-
Smaller units have higher relative variability in both the number of infants and the nurse workload present. The two smallest units had peak to trough (90th to 10th percentile) nurse workload ratios of 3–4, whereas the larger hospitals had peak to trough workload ratios of 1.5–2.
-
The nurse workload to nurse availability ratio varied significantly between hospitals, from working at an average of 51% of BAPM-recommended workload for the nursing staff present through to working at an average of 127% of BAPM guideline capacity. Similarly, hospitals ranged from 1% to 85% of days over BAPM guidelines. The highest utilisation was at the network ICU, the unit that arguably should work at the lowest utilisation. The network ICU should be most resilient to workload fluctuation, as it is receiving infants who cannot be cared for elsewhere in the network. This unit, caring for the sickest infants, is also where risk of mortality is highest, and this risk has previously been found to be related to the average occupancy of the unit.
-
From modelling we estimate that there is approximately a 20% shortfall in the number of nurses required across the network if unplanned transfers are to be avoided, and if units are to work to BAPM guidelines 90% of the time. The shortfall is focused especially on the network ICU, which has the lowest resilience to workload fluctuations.
-
Neonatal networks have the option to move infants between hospitals as an alternative to each unit having the spare capacity to meet its own fluctuation of workload. Modelling showed that this strategy comes with a price: transfers start to increase rapidly above 70% network maximum permitted workload. Each time local capacity is breached, two transfers are required: one to the hospital absorbing the breached capacity and then a return from that hospital when possible. As the number of transfers increases, the average distance that parents have to travel also increases (and the number of parents requiring temporary accommodation increases). The model predicted, for example, that the number of transfers doubles between 60% and 80% maximum permitted workload (assuming a maximum workload of 150% BAPM guidelines for the number of nurses for each infant), and doubles again as workload rises from 80% to approaching 100% maximum permitted workload. At the same time the average distance parents have to travel rises from 22 km to 25 km and then 34 km at 60%, 80% and 100% maximum permitted workload, with 7%, 11% and 19% of infants over 50 km away from their parents’ home location.
-
Centralisation of provision of services can reduce the degree of workload variation and can thus reduce the number of nurses required to meet BAPM standards 90% of the time. Achieving these savings is difficult, however, if some local neonatal care capacity must be maintained at every major birthing centre. Savings are likely to require a co-ordinated consolidation of maternity services.
-
With the geography of the Peninsula region, centralisation of services would lead to a significant increase in the average travel distances for parents and an increase in the number of parents more than 50 km away from the location of care. For example, if all intensive and high-dependency care were consolidated into a single site the number of IC and HDC cots and nurses could be reduced by ≈ 15% (compared with each of the three units currently offering IC and HDC cots having sufficient spare capacity to deal with local fluctuation in workload). However, the average distance for parents whose children were in intensive and high-dependency care increased from 28 km to 55 km, and the proportion of parents over 50 km away from the location of care increased from 15% to 60%.
-
The expected travel cost to parents rises from ≈ £200 per infant in a localised system to ≈ £550 per infant in a centralised system. At the same time ambulance transport costs rise from an average of about £83 per infant in a localised system to about £820 per infant in a centralised system.
-
The cost of nursing depends on the target for meeting BAPM standards. If there is a target of meeting BAPM standards (i.e. the nurse workload calculated by BAPM recommendations does not exceed the number of nurses available) 80% of the time, then predicted nursing costs per infant are ≈ £4500. To meet BAPM standards 95% of the time, the expected nursing costs per infant increase to £5500.
-
The effect of consolidation/centralisation on parent travel distances and costs may be significantly greater in the Peninsula region than in other networks. We noted large differences in the distances between hospitals in different regions. The Peninsula region had the greatest distance between each neonatal unit and its nearest neighbour, of 60 km. Nationally the average distance between a neonatal unit and its nearest neighbour is 23 km, and in the London networks 8 km. It may be possible that the economies of centralisation may be achieved in other networks without such a large effect on parents.
-
Calculating nurse requirements using BAPM 2011 produced requirements of 10–15% fewer nurses than using BAPM 2001 guidelines.
-
An algorithm was used to investigate the relationship between the number of units (of any particular type) across all of England and the travel distances for parents. The location of those units was identified using a ‘greedy algorithm’, which minimises average and maximum travel distances (units were chosen from a list of existing units). There were diminishing returns in adding more units. With 10 units, the average travel distance is 35 km, and 50% of parents are within 25 km (straight line) of their closest unit. With 20 units, the average travel distance is 24 km, and 69% of parents are within 25 km of their closest unit. With 50 units, the average travel distance is 14 km, and 90% of parents are within 25 km of their closest unit. With 100 units, the average travel distance is 10 km, and 97% of parents are within 25 km of their closest unit. With 150 units, the average travel distance is 7 km, and 97% of parents are within 25 km of their closest unit.
-
The modelling surpassed the intended specifications in two major ways. Firstly, during an extension to the project, we were able to formulate the model to work fully with any number of networks (rather than a single network model). This opens up the possibility of using the model at a national level. Secondly, the model, rather than using straight-line distances as originally specified, uses road distances. We were also able to perform some pilot analysis of national location of units and the relationship between the number of units and the expected travel distances for parents.
-
Following parent involvement, we performed additional analysis on public versus private travel times. We found that, on average, public transport times were twice as long as private transport. This may be significant when considering how many parents may need temporary accommodation because care is distant from their home location.
-
Using DES we were able to model the behaviour of a local neonatal network. This type of network model has significant advantages over single-hospital models, and we believe opens up the possibility of using this type of model on a national level to help inform decisions on the national provision of neonatal care.
Chapter 12 General discussion
Model challenges and validation
Location of parents
When modelling demand, there must be a compromise between precision of location of demand, on one hand, and feasibility and scalability of modelling, on the other. There are various options possible for locating centres, or nodes, of demand, such as postcode areas, or Super Output Areas (the geographic areas used by the ONS). We decided on using GP practices as demand nodes. Using GP practices offered us reasonable precision (the median distance between GP practices was 1 km in a straight line), offered a scalable number of demand nodes (220 in our region, and 7800 nationally) and allowed us to use other data available for GP practices, such as the number of women of child-bearing age and the fertility rate of those women. We believe this provided a reasonable guide to location of parents, although it is important to bear in mind that some people may not choose to attend their closest GP and a small proportion of people may not have a GP close by.
Travel distances and times
The original project aims specified that we would use straight-line (‘crow flight’) distances in the model. In talking to stakeholders, however, it became clear that using road distances and/or travel times would give the model a higher degree of credibility. The specification of the model was therefore changed and we incorporated fastest route distances (obtained from Microsoft MapPoint with the MPMileCharter add-in to allow large numbers of route distances and times to be assessed).
Using road distances and times becomes an issue for large-scale modelling. If the modelling were extrapolated to national level there would be over 1.3 million routes to be calculated, assuming that we used GP locations as patient nodes and all current neonatal units were incorporated into the model. This number of routes is potentially beyond that which can reasonably be assessed with commercially available route-planning software. We therefore undertook an analysis of straight-line versus road distances. Twenty thousand routes (between GPs and neonatal units) were selected randomly and the straight-line distances and road distances (fastest route) compared. The correlation was extremely high (R2 > 0.98), suggesting that straight-line distances (which are very rapid to calculate), adjusted for average ratio of road to straight-line distance, would be a reasonable basis for a national model. What is reasonable from a modelling perspective may, however, still be seen as unreasonable from a model user’s perspective. It is possible, therefore, that some compromise solution could be used. For example, road distances and times might be calculated within, but not between, each network. Alternatively, road distances may be calculated for all routes of less than a given distance (such as 100 km) and an adjusted straight-line distance used for more distant travel. This would ensure that road distances were used for the large majority of infants, while allowing straight-line distances (with adjustment between straight-line and road distances) to be used to enable a much larger geographic scope for the model.
During discussion with parents it became clear that private transport is not always used, or possible to use. In response to that, some additional analysis was performed on the differences between public and private transport. Analysis of public transport times will always be more limited than calculating road distances; using a publicly available database we are limited, practically, to being able to look at several thousand routes by public transport. It might be possible to perform analysis for up to ≈ 20,000 routes, but this would clearly be well short of the total number of routes, especially nationally, that would need to be analysed. In considering how this analysis could be performed at a wider level, some sampling and forecasting technique would probably be required, or the analysis may be performed as a stand-alone analysis as described in this report.
Capacity
The most significant model challenge came in defining the capacity of units. The model allowed capacity to be limited by number of nurses or by number of cots (with each cot being allowed to care for infants up to a specified care level; e.g. a HDC cot could be used for HDC, SC or TC, but not IC, infants). When we spoke to units we found that there was more flexibility than saying that there were a certain number of high-intensity care cots, etc. Cots could be used more flexibly as required and even the total number of cots could be flexed so long as there was the required equipment for the infants in care. Sometimes it could be specific equipment that limited capacity. Informal feedback received was that capacity was generally limited by nursing staff. For these reasons we chose to run the model with unlimited cot capacity, but with capacity limited by the number of nurses. There were two further considerations: should we include variability in nurse numbers, and what capacity should we set relative to the number of nurses?
In the model we chose to keep nurse numbers constant. The lengths of stay of infants were usually significantly longer than the period of fluctuation of nurse numbers. Making a decision based on the number of nurses at any given time was therefore often likely to be inappropriate. In the real world it is likely that decisions will be based on knowing what current and upcoming staffing levels are likely to be. Fortunately we saw relatively little variation in the recorded number of on-duty nurses, and so we saw this as an acceptable and preferable simplification.
When choosing levels at which the units shut to new admissions, we examined historic ratios of peak (90th percentile) workload to staff levels. We noted that hospitals other than Plymouth rarely had workload above 150% BAPM guidelines. Plymouth (the network ICU), however, worked up to 200% BAPM guidelines. For the validation model we therefore set limits for closure to new admissions at 150% BAPM guidelines for all hospitals apart from Plymouth, which was set at 200%. For exploratory scenarios we generally set the closure limit at 150% for all hospitals.
Types of unit and level of care offered
The NHS standard contract lists four types of unit. 42 We have aligned our model units with the NHS contract. Our model used necessary simplifications, and was based on gestational age, type of care required and length of care required. The NHS contract rules allow for some flexibility that can be difficult to model. For example, in a LNU ‘Short periods of intubated ventilator support will be provided, however the clinical condition of any baby requiring this care must be discussed with a consultant in the Network NICU [neonatal intensive care unit] by 48 hours and every 24 hours thereafter if intubated ventilator support continues’ (p. 6). In the model we simplified this to IC being delivered for up to 48 hours in a standard LNU. There were two LNUs in our network, Exeter and Truro. When we examined lengths of stay in these hospitals we found periods of IC up to ≈ 28 days (95th percentile lengths of stay). We therefore created an additional category of care just for use in modelling, the ‘LNU+’, which was as the LNU, but had an upper limit of IC of 28 days (gestational age limits were maintained). For LNUs, we set a maximum IC LoS of 2 days.
The model uses BAPM 2011 guidelines for care unless otherwise indicated. In these guidelines there is a category, ‘Transitional Care’, which does not come with any recommended nursing level of support. These infants have their mother caring for them. In the model we used a nominal nursing support ratio of one nurse to eight infants/mothers, half the level of nursing support of infants in SC (required nursing support per infant halves between IC and HDC, and halves between HDC and IC; we therefore continued that geometric progression into TC).
Non-Badger data sources
In the original objectives of this project we planned to assess sources of neonatal LoS data apart from Badger; we specifically planned to look at the Trent Neonatal Data Survey (www2.le.ac.uk/departments/health-sciences/research/timms/projects/tns). However, on inspection of this data set we concluded that it had insufficient data to reliably assign infants to levels of care as per BAPM guidelines. It was also not a comprehensive data set, not collecting data on later gestational age infants who did not require IC. During this time, however, Badger had been adopted by all neonatal units, so there was no longer a need to look for a secondary source of data to model other networks should the need or desire arise.
Length of stay distributions
Simulation allows the flexibility to apply different LoS distributions for each category of infant and for each care level. In our model this amounted to 29 different LoS distributions. To maintain consistency, we chose to use one distribution family, but allowed the parameters be adjusted. The log-normal distribution offered a high degree of generality across the gestational age and care type, and offered simplicity (two parameters describing mean and standard variation), so this distribution was selected for use for all lengths of stay.
Sensitivity analysis
A challenge with this model was the large number of parameters: there are 222 home locations (with the demand from that location), 29 LoS distributions (each with mean and standard deviation), 10 descriptive parameters for each hospital, 70 interdependent variables describing the routing of infants through the system, and 14 variables describing the numbers of births at each gestational age category and the incidence of twins. Each run of the model takes about 2 minutes. It is therefore challenging to perform any extensive sensitivity analysis on this model. Following validation of the model, changes in model parameters were focused on those issues of most interest.
NHS reorganisation
During the course of this project, the neonatal network regions underwent some reorganisation; this led to the merger of the Western and Peninsula regions into a single region. During a zero-cost extension to the project we used this reorganisation as an opportunity to increase the scope of the model. The bulk of our analysis was based on the original Peninsula network, for which we had most data, but we have performed some additional analysis on the larger network. Additionally, this opportunity allowed us to develop the model beyond the original specification so that the model can now model any number of hospitals in any number of networks; this paves the way for a full national modelling project. In a proof-of-concept study (results not reported) we ran the model with 7890 patient nodes and 178 hospitals organised in 24 networks. The model could run for 5 simulated years [limited by memory handling in Windows 7 (Microsoft Corporation, Redmond, WA, USA)]. This extension was also the stimulus for examining whether or not admissions could be predicted based on the birth rates for each GP practice.
In addition to modelling from GP practice birth rates in the extended region, we sought to access the full Badger data for the extended region. This proved slow, as the South Western network did not have a single point of data access as we had in the Peninsula region. When considering how best to extend the model beyond this network we have, therefore, started working with the NDAU at Imperial College London. All national Badger data are sent to the NDAU, which now acts as a national repository for neonatal data. If we are successful in securing funding for a national model we shall access data for all networks from the NDAU.
Flow of infants through care levels
In this model we have made a simplifying assumption that infants progress from worse to better. We therefore avoid, in the model, infants moving repeatedly between units because of fluctuating care needs. This, we believe, is a reasonable assumption to make based on the observations that (1) only about 1% of IC episodes at the network ICU are for infants returning after staying in a lower-level unit and (2) reversing the assumption (so that all infants progress from better to worse) makes no difference to unit occupancy and workload and no difference to average parent travel distances, although there is a small difference in the number of transfers when the progression is reversed for all infants.
Another simplifying assumption we made was that care was continuous, without discharge and readmission. In our observed data for 2011/12 we found that 98.3% of infants had no apparent readmission after discharge, and only 0.3% of infants had a total break of more than 7 days in their care record (the difference between accounted-for lengths of stay and the period between first admission and last discharge).
Model validation
The model was built using 2 years of data from January 2011 to December 2012. After the model was built, a further 6-month set of data was obtained for January 2013 to June 2013. The model results were compared with observed data for that 6-month period that were not used to train the model. Two models were validated against observed data: one model based on demand derived from Badger admissions per GP practice, and the other based on demand derived from births per GP practice.
Both models predicted demand well; the models predicted demand (expressed as either total infants or total nurse workload) to within 3% of the observed demand. The small discrepancy might be explained by demand falling slightly between the training and test periods of the observed data. The mean absolute difference between the predicted and observed number of infants in each care level in the network was 0.5. The number of transfers predicted was within 2% for the model based on demand derived from Badger admissions and 15% for the model based on births per GP practice. It is possible that the variability in demand per GP may be the major contributor to this difference. The average distance from the parents’ home to location of care was within 2 km or 10% for both models, although, interestingly, the margin of error was smaller this time when the model was based on demand derived from births (< 1% error) than when it was based on Badger admissions (≈ 8% error).
When comparing total number of infants and workload at each hospital between the models and the observed data, the average absolute error in the number for infants was 1.5 for the model based on Badger admissions and 2.0 for the model based on GP births; the average absolute error in the nurse workload was 0.4 for both models. The coefficients of determination (R2) between the observed number and modelled number of infants or the nurse workload were all greater than 0.94 for both models. When results were examined at the level of each care level at each hospital, coefficients of determination of 0.87 and 0.91 were achieved for the models based on Badger admission and GP births respectively. The average absolute error in the number for infants in each care level in each hospital was 0.8 for both models.
There was one notable difference between modelled and observed data, and that was in the average number of infants in SC in Exeter and Plymouth in the model based on Badger demand. The model had, on average, five more infants in SC in Plymouth than observed and ≈ 3.5 fewer infants in Exeter than observed. These results are just outside the ± 3 standard deviation limits that indicate the expected variation between 6-month periods. One factor in this may be that Exeter was observed to keep infants, on average, to a slightly older gestational age: we observed that the LoS in SC in Exeter was 29% longer than the network average whereas in Plymouth it was 22% shorter. That SC lengths of stay are 66% longer in Exeter than in Plymouth may explain a large proportion of the difference between predicted and observed SC occupancies. The model allows adjustment for local LoS differences, but this has not been used in any of the results in this report because of a concern that this leads to overfitting of model data and to a less generalisable model. Another potential difference, not included in our model, is parent choice, especially when a parent lives somewhere close to midway between two hospitals. It is possible that more women living within reasonable reach of both Exeter and Plymouth may choose to attend Exeter to give birth, as it has a more modern maternity unit. Our model assumed that people attend their closest unit, and this was not always the case (≈ 95% of births in the Peninsula network were in the most local hospital). Another potential explanation for the longer LoS in Exeter is that support, such as for breastfeeding, is performed primarily as part of the inpatient stay rather than by community teams. We should note, however, that the data do not indicate whether it is good or bad to have a longer or shorter LoS; a judgement on which is better would also need to take into account an assessment of quality of care, outcomes and impact on other parts of the health service.
Demand levels and geography
In 2007, the DH reported that 68,000 infants were admitted into neonatal units,3 19,500 of whom required IC. According to the ONS there were 655,357 live births in that year. 22 This equates to an admission rate into neonatal units of 10.4%, and an admission rate into IC of 3.0%. In our study area we found that total use of neonatal units (≈ 15% of births) was higher. Using the BAPM 2001 guidelines (which are the ones appropriate for the year of the DH report) we also found that admission into IC, at ≈ 4% of births, was higher than the national average.
There is no direct indicator in the data about why demand in the Peninsula region should be higher than the national average. One possible contributing cause may be the demographic characteristics of the region. As the majority of the Peninsula network has a deprivation index score higher than the national average, it is possible that the economic characteristics of the region contribute to the higher than average admission rate into neonatal units, because the risk of pre-term or low-birthweight infants has been linked to deprivation. 43–45 The highest admission rates (> 20% of births requiring neonatal care) were focused around the cities, especially Plymouth, where admission rates of 30% of births or higher were found in more than half the city centre GP practices. The inner-city Plymouth area is also in the highest quartile of deprivation scores. However, from our data we cannot say that the link between higher admission rates and the local deprivation score is causative, and there may be other contributing factors.
In our analysis, we compared a model based on births per GP with a model based on admissions into neonatal units. We found, when comparing them with observed data, both models to have similar predictive power. The observed variation in admission rate in and around the inner-city areas did not seem to affect the model adversely, possibly because these differences become averaged out over the wider catchment areas for those hospitals. We considered that using Badger admissions had the sounder theoretical basis, despite not actually improving model fit, and therefore continued to use neonatal admissions (rather than births) per GP as the basis for all other analysis within the Peninsula network. Using GP practice births as an indicator of demand does, however, appear to be reasonable when direct demand data are not available.
Workload under British Association of Perinatal Medicine 2001 and 2011 guidelines
In 2011 the BAPM updated its 2001 standards for classification of neonatal care into four levels. 7 We have used the 2011 standards throughout our modelling. When considering the number of nurses required, the use of BAPM 2001 or 2011 standards can make a significant difference. The difference between 2001 and 2011 categorisation is complicated a little by the introduction of a new category of care, namely ‘Transitional Care’, in the 2011 categorisation. The main characteristic of TC is that ‘the mother must be resident with her baby and providing care’. There are no guidelines for staffing of these infants and we have used a nominal eight infants to one nurse when calculating workload including TC (using this level of nursing, TC infants contribute ≈ 4% towards total workload).
Overall we found that calculating required staff levels using BAPM 2011 standards led to a reduction of 10–15% compared with using BAPM 2001 standards (the greater reduction is where TC infants are removed from the calculation). The effect appeared to be greater on the two SCUs than the LNUs or the network ICU. This might be significant if the change from BAPM 2011 to BAPM 2001 affects remuneration; the income would be rebalanced a little differently when using the two different sets of guidelines.
Variation in workload and staffing levels
A key issue when planning required health-care resources is recognising and planning for variation in unscheduled demand. Bagust et al. 5 suggested that in a 200-bed hospital an average bed occupancy of 85% would be an appropriate planning target to allow for normal variation in emergency bed requirements, with bed occupancies above 90% leading to frequent bed crises. Queuing theory predicts that as the number of arrivals increases the relative variability reduces. 46 This is reflected in the Poisson distribution, which models the variability of arrivals in any given unit of time. The Poisson distribution predicts that the standard deviation of the mean arrivals in any given unit of time is equal to the square root of the mean. Thus, if a unit experiences 100 arrivals a month, on average, the standard deviation in arrivals is expected to be 10, or 10% of the mean. However, a smaller unit, experiencing 25 arrivals a month, on average, will be expected to have a standard deviation of arrivals of five, or 20% of the mean.
When examining the variability of workload in this system we did indeed see the higher variability expected of low-throughput systems. For example, the typical trough and peak (10th and 90th percentile) number of IC infants in Plymouth ranged from one to six, with an average of three. Even across the network there is significant variation, with trough and peak infants in IC ranging from 3 to 10 (average 6). Variability reduces with the higher-throughput care levels, with a trough of seven infants in HDC and a peak of 16, a trough of 36 infants in SC and a peak of 53, and trough of all infants of 61 and a peak of 80. Peak occupancy and workload (90th percentile) were more than three times the trough (10th percentile) in the two SCUs, and 1.5–2 times the trough in the larger units.
Across the network as a whole, workload ranged from 20 (trough) to 28 (peak) nurse equivalents (average 24). This compared with an average number of on-duty staff of ≈ 28 nurses (excluding managerial and transport nurses). The network as a whole was working at 85% occupancy if maximum occupancy was set according to BAPM guidelines. The challenge in this system is balancing demand with staffing across a wide area. Although the system theoretically had sufficient nurses to meet BAPM standards 90% of the time across the network as a whole, in reality the system was stressed: Plymouth ran on average at 30% more workload for the nurses available than the BAPM standards recommend, and was above BAPM guideline workload for 85% of days. Being the unit in the network providing the highest level of care, Plymouth has the least flexibility; there are infants who can be cared for only at Plymouth. It might be argued that the units providing the highest levels of care therefore need the most spare capacity, as when they can no longer take in the sickest infants then the network as a whole closes to new admissions for these infants. If all units were resourced to cope with 90th percentile peak workloads (with unplanned transfers), as experienced in the observed data, then ≈ 34 on-duty nurses (excluding management and transport nurses) would be required at any one time. The model therefore predicted that, to meet BAPM standards 90% of the time, 35 on-duty nurses would be required if each unit were staffed to cope with local variation in workload. The model aligned with observed data and predicted that there is currently ≈ 20% shortfall in network nursing to cope with the local variation in workload. The nursing shortfall is currently most severe in the network ICU, Plymouth, which as highlighted above should arguably be where the highest spare capacity is available.
In the face of a local shortfall in resources, a key advantage of the neonatal network system is that infants can move to where capacity is available. There is a price to be paid for this flexibility, however. As the network capacity is increasingly filled, more infants become displaced from the location of first choice. The model predicted, for example, that the number of transfers would double between 60% and 80% maximum permitted workload (assuming maximum capacity is 150% BAPM workload) and would double again as workload rose from 80% to approaching 100% maximum permitted workload. At the same time, the average distance parents would have to travel would rise from 22 km to 25 km and then 34 km at 60%, 80% and 100% maximum permitted workload, with 7%, 11% and 19% of infants over 50 km away from their parents’ home location.
Another key factor influencing the number of transfers and the travel distances for parents is the workload level at which units close to new admissions. If the network is resourced to meet average workload according to BAPM guidelines and units could work up to 150% BAPM workload (workload 50% above BAPM guidelines) then ≈ 600 transfers would be expected per year. If, however, units were to close to new admissions when workload is 20% above BAPM guidelines, then the number of transfers would increase threefold to ≈ 1800.
Localisation versus centralisation
One of the key aims of the model was to examine the effects of altering configuration of services. We were especially interested in exploring the effect of moving between localised and centralised services.
There are clinical reasons why centralisation of services may be beneficial. Studies in both the USA32 and the UK33 have shown that units with more admissions have reduced mortality rates for their given gestational age intake. In the UK study the largest contributor to reduced mortality was considered to be the more aggressive use of prenatal corticosteroids. In this modelling study, though, we focused on investigating the operational effects of centralisation.
The potential operational gain of centralisation is in reducing the spare capacity needed across the network. Queuing theory suggests that lower admission numbers lead to greater relative variability in infant number and workload. 46 As work becomes centralised there should be a reduction in relative variation (peak to average workload ratio becomes reduced). This is indeed what we observed in the modelled scenarios. The effect, however, is expected to be relatively modest in the Peninsula region when looking at likely possible options of reconfiguration. For example, downgrading the care offered at Exeter and Truro to a maximum of 2 days in IC, and closing the two smaller units, leads to a maximum 10% reduction in the staff required to meet BAPM standards 90% of the time. This model, however, assumed that no care at all was supplied in the two smaller units. If these were still centres for childbirth then, in practice, some neonatal care would likely be needed to be retained in these units, and this would reduce the potential savings to only about 4% of nurse establishment if neonatal staff must be maintained to care for those infants who need stabilisation or who are waiting for transfer. Alternatively workload could be absorbed by the maternity postnatal services. The model highlighted that neonatal unit planning needs to be performed alongside planning for where women give birth.
As closure of units is an unlikely option, we examined the effect of centralisation on IC and HDC services in more detail. It may be argued that SC, as it is available in all district hospitals, is not truly a specialised service.
There are currently three hospitals in the Peninsula region offering IC and HDC. We classified Exeter and Truro, from Badger data, as LNU+; they generally follow the guidelines for LNUs, but have cared for infants in IC for up to 28 days (see Chapter 8, Hospital types, for more details). We found that downgrading Exeter and Truro to LNUs (providing a maximum of 2 days’ IC) did not reduce the expected total number of IC or HDC cots or nurses needed. An improvement in efficiency was achieved in the model only if Exeter and Truro were downgraded to SCUs; in this case the total number of IC and HDC cots required to meet BAPM standards 90% of the time (without the requirement for unplanned transfers) could be reduced from 26 to 23 (12% saving) and the number of on-duty nurses required to care for infants in IC or HDC could be reduced from 19 to 16 (16% saving). Increasing the capacity of Exeter and Truro to network ICU status would, however, require an increase in network resources from 26 to 29 IC and HDC cots (an increase of 12%) and an increase in the number of on-duty nurses from 19 to 21 (an 11% increase). The distinction between LNU and LNU+ therefore appears to make little difference, but the network becomes more efficient as it moves from three hospitals having full IC (without surgery) to one network ICU and two LNU(+)s, and finally to one network ICU with the other units becoming SCUs. Although downgrading Exeter and Truro to SC level might reduce the required network resources, there would be a significant impact on parents. With the current configuration, the model predicted that 85% of parents are within 50 km (road distance) and the average travel distance is 28 km. If Exeter and Truro were downgraded to SCUs then only ≈ 40% of parents with children requiring IC and HDC would be within 50 km of the location of care, and average travel distances would be ≈ 55 km. The number of planned transfers would also double from ≈ 350 to ≈ 700 per year. Cot and staff savings would therefore be offset by increased transport costs and the effect on the parents.
It should be noted, however, that the Peninsula region has a very high average distance between neighbouring units. In this region the average distance between neighbouring units is 60 km by road, which compares with a national average of 22 km, and an average in London of ≈ 8 km (although travel speeds will probably be lower in London). In the whole of England, Truro is the neonatal unit that has the greatest distance (90 km) to the next nearest neonatal unit. It is likely that in other regions consolidation might be used to achieve some gains in efficiency without as great an effect on the distance from the parents’ home to location of care.
Consolidation of units, as noted above, potentially requires significantly more transfers (unless births are also relocated). Data from the mid-2000s showed that transferring infants could be inherently dangerous, with critical incidents occurring in about 15% of transfers. 47 Over a 10-year period in the former Trent Health Region, 23% of transfers were found to be unplanned. 48 In a more recent study, however, circumstantial evidence suggests that transfer risks are quite small. 33 The potential risk of transfers should be considered when planning configuration of networks (although it may be that the risk has been reduced in recent years).
An alternative to providing capacity at each hospital to cope with peaks and troughs is to use transfers to relocate an infant to a hospital where there is capacity. This is an advantage of a network-based infrastructure as exists in neonatal care. The modelling indicated, however, that this approach can come at a significant cost: network transfers rose from a minimum of ≈ 350 per year up to about 2000 per year when the network was operating at 95% capacity. As the network capacity approached 100%, the chance that the right cot was available in the right place diminished. Not only is there the cost of transferring the infant to the hospital with spare capacity, but that infant is likely to be later transferred back to the hospital of choice; two additional transfers are frequently required each time local capacity is saturated. Transfers started to rise significantly when workload rose above ≈ 70% network maximum permitted.
When considering the benefits of centralisation, much focus has, understandably, been given to the physical health outcome for the child (e.g. see Marlow et al. 33). The organisation of neonatal provision, however, may also affect the health of the mother. Mothers whose children are placed in neonatal care units experience stress and anxiety. 49 If centralisation leads to a physical separation of mother and infant then the mother may experience increased anxiety or depression. 50 In addition, there are many examples of potential benefits to the infant in keeping mother and infant close together, especially through skin-to-skin contact. 51–55
Extended model
During an extension to the project we were able to modify the model to work with any number of networks. We ran the model for the combined Peninsula South West network with or without dividing the network in two. The centralised/localised scenarios in the extended network showed the same pattern of reducing nurse requirements coupled with increasing parent travel distances and infants transfers as with the Peninsula network, although the average parent distances were notably reduced in the wider region (68% of the workload of the combined network comes from the non-Peninsula region). There was about a 20% reduction in required nurses between fully localised and fully centralised services, although the practical range (likely possible reconfiguration scenarios) within this is significantly smaller.
It is possible that, operating as two networks, parents living close to the boundary between the networks might have to travel further to a hospital in their own network than if they could simply travel to the closest hospital. We were interested, therefore, in looking at the effect of removing this artificial boundary. The modelled results, however, showed very little impact overall of removing the boundary. It could be that we underestimated the effect by looking at a single network boundary; there were relatively few births close to the boundary in the model. It would be more interesting to examine this effect at a national level, as for a complete model a higher proportion of patients might live close to a network boundary and so might be displaced further than they need be if the closest available suitable cot is in a network other than their own.
Public transport
The model was based on fastest-route road distances from a parents’ home location to the different hospitals in the network. During discussion with parents the point was raised that parents might use public transport in place of private car travel. Although this is unlikely to significantly affect which hospital is the closest, there is a significant difference in time taken. Public transport travel times overall were about twice that of private car travel (these times reflect the travel time and waiting time within the travel only; they do not reflect parking time, for example). The most likely significant effect of the longer public transport time is in estimating the number of patients who are above a reasonable travel distance each day. In this report we have reported the proportion of parents above 50 km (road distance) away from the point of care; this represents approximately 1 hour’s travel time each way in our study region. By assuming private car travel for all parents we may therefore be underestimating the proportion of parents beyond a reasonable travel time. When planning accommodation for distant parents it may be prudent to conduct some more research into the use of public transport by parents.
Mortality modelling
The mortality module was an exploratory addition to the main model, looking to link an operational model to outcomes, and was not generally used. The predicted mortality (1.03%) was very close to the observed mortality (1.02%). We believe, however, that caution is required for this module. The mortality was based on infant characteristics30 and also unit occupancy29 as a percentage of a nominal maximum level. Infant characteristics are relatively easy to quantity whereas unit utilisation is more complex; utilisation may be expressed as a percentage of a nominal number of infants, as Tucker et al. 29 used in their paper, or as a percentage relative to a maximum workload for any given number of nurses. We have used the latter in our model, with a maximum workload of 150% BAPM guidelines being a nominal maximum from observation across the network. Changing the level that is considered 100% would, however, alter the predicted mortality. In addition, studies in both the USA31 and the UK33 have shown that units with greater numbers of admissions have lower mortality rates for their given gestational age intake. This effect may be due to greater specialist skills, equipment or knowledge, or to a more aggressive approach (such as greater use of prenatal corticosteroids). Our mortality module did not include this component. Mortality might also be influenced by differences in treatment between units. However, it was not within the scope of this module to predict treatment-dependent mortality rates; we were limited to understanding how unit operational characteristics might affect mortality.
With those caveats emphasised, the mortality module did demonstrate how changing workload within the network might lead to altered mortality levels. Between 50% and 100% utilisation, the model predicted mortality rates of 0.9–1.2% for the Peninsula network. Mortality occurs among the sickest infants and it was notable that Plymouth, the unit that takes the sickest infants, also ran with the highest nurse utilisation. There might, therefore, be potential for reduced mortality by reallocation of resourses so that the network ICU runs with the same or lower utilisation than the other units.
Single hospital versus network modelling
One of the aims of the project was to compare network modelling with single hospital workload modelling. It was clear from the modelling here, such as the localisation versus centralisation, that a network model offers key advantages over a single hospital workload model. Examples where a network model are essential include:
-
Closure or downgrading of one or more hospitals: In these scenarios workload may be distributed between two or more other hospitals with the balance of workload depending on the geographical location of the population. In the Peninsula network, for example, hypothetical closure of the SCU at Torbay leads to increased workloads in both Exeter and Plymouth.
-
Altering capacity at a hospital: Reducing capacity at one hospital may lead to changes in workload at two or more other hospitals, as the unit may close more often to new admissions and the work must be transferred elsewhere.
-
Parent travel distances, and transfer numbers and distances: To understand likely parent travel distances (and the number of parents who are beyond reasonable daily travel distances) it is essential to know both the location of parents and hospitals in a network. Without all regional hospitals present it is not possible to work out which suitable cot is closest to the parent. Likewise, transfer numbers and distances depend on an understanding of how infants must move about the network for different levels of care (or because of capacity shortages).
Health economics
We present preliminary work on the economic evaluation of referral patterns arising from a network model of neonatal care. Preliminary analysis showed that greater centralisation achieves cost savings from more efficient managerial structures, but imposes greater costs on families. Greater achievement of BAPM guidelines reduces mortality, under the model of mortality that we have used, but at a higher financial cost.
In these preliminary analyses we have been conservative in our estimates of family costs. For example, our estimate of family travel costs is well below those estimated by BLISS for families of neonatal care (BLISS estimated £400 for travel and £125 for car parking in 200656). BLISS based costs on all forms of transport, including public transport. In our model we estimate that basing travel on public transport would approximately double travel times. There are also other costs that are not yet incorporated into the model, including accommodation, child care and lost earnings. In February 2014, BLISS completed a nationwide survey of family costs, which gives additional disaggregated data on mode of travel and lost earnings, and which we will aim to include in further analysis. For example, there is also the possibility of including overnight stays for those in the early stages of care, or who live far from the hospital, with knock-on effects on child-care costs. Future work is needed on the major cost drivers for families and how they vary by urban/rural setting, family size, mode of transport and socioeconomic groups. The aim here would be to develop an algorithm to determine family costs of increased journey time, child-care costs, lost earnings and overnight stays due to neonatal care.
The preliminary analyses have raised some questions about the best approach to evaluate changes in referral patterns. Changes in service configuration affect the unit cost of bed-days, so applying a standard cost per IC infant seems oversimplistic. This suggests a need for greater clarity in the components that make up national reference costs for neonatal care bed-days, in order that we can adjust these figures accordingly to reflect changing unit costs and then apply these costs to episodes of care.
We are also concerned that the effects of closing units are likely to be non-negligible and the expected saving from disinvestment is not always achieved. 57 Moreover, in hospitals, services are provided jointly and closing one service has potential knock-on effects for other services. For example, hospital maternity and paediatric services in the South West currently use neonatal units for infants requiring stabilisation. If a hospital no longer provides neonatal care it will be necessary still to provide this service, for example through a practice nurse (band 8). But is it that simple? There are clear cross-subsidies of other staff across the maternity and neonatal services, including midwives, which would suggest the need for a model that captures both maternal and neonatal care jointly. In addition, when considering changes to configuration we have also not considered the capital costs of establishing units; our costing is for ongoing operational costs only.
There is a potential mismatch with our model and the secondary data sources of mortality. We assume that mortality occurs to infants in IC only, which we see in the Badger data set. In contrast, Manktelow et al. ’s estimates of mortality are for infants entering NICUs before 33 weeks and where there may have been mortality among the older of these infants in HDC. 30 Similarly, for the relationship between occupancy and mortality, it is not clear to which levels of care the Tucker et al. 29 occupancy measure should be applied.
Finally, there is the overriding problem that there is no clear decision rule for whether or not the additional costs justify the additional benefits using mortality estimates. Changes in service provision will affect more than one outcome: centralising services may reduce the risks of mortality for the very premature, but the costs to families can be disproportionate. Moreover, there are knock-on effects for the longer-term development of the infant, with associated uncertainties over morbidity. More work is needed to explore the factors that policy-makers and families would like to see taken into consideration in determining service reconfiguration. We need to explore how we might weight these competing outcomes, based on the views of families and/or members of the general population.
There are some limitations to the analysis. The relationship between occupancy and mortality was taken from Tucker et al. 29 but the definitions of levels of care and BAPM guidelines have changed since the time of their study. Little is reported about how best to combine the workload measure into a model of infant mortality. For example, Tarnow-Mordi et al. did not report on whether or not the coefficients applied to the infant characteristics change when the workload measure was added.
National modelling
Although it was not within the original scope of the project, we undertook some high-level analysis of the location of units at a national (England) level.
There was a significant difference in the distances between neonatal units. The average distance (by road) between neonatal units was highest in the Peninsula region. The average distance between closest units was 60 km in the Peninsula region, compared with 23 km nationally and about 8 km in the London networks. As noted in the discussion of centralisation versus localisation, the differences in geography are likely to affect how feasible consolidation of care is, without adversely affecting parent travel distances unacceptably.
A ‘greedy algorithm’ was used to investigate the relationship between the number of units (of any particular type) and the travel distances for parents. There were, as expected, diminishing returns in adding more units. Average travel distances and the number of people within 25 km of a unit improve rapidly up to about 50 units. Some moderate improvement is made between 50 and 100 units, and then only little improvement is made between 100 and 150 units.
It should be noted that there may be other good reasons for having more units than this algorithm suggests. For example, capacity limitations may prevent full consolidation; many hospitals are limited in how much they may expand and take on work currently performed elsewhere.
We have not listed here the order in which the algorithm picks locations, for two main reasons. Firstly, this algorithm does not use the current level of specialism within a unit; it does not differentiate between current IC and SC units when deciding where the next best location would be. This is unlikely to be simply an ‘academic’ problem with the algorithm; ICUs are likely to be best placed in hospitals that are well equipped with other specialist services. It is more likely, for example, that laboratory tests are available for more of the 24/7 period in a major hospital. The second reason we have not listed the order of the units is that the order in a greedy algorithm is very dependent on which locations have previously been picked. As an example, two hospitals may be very close together, such as Southmead and St Michael’s in Bristol. The advantage of choosing one over the other, if neither has been previously picked, may be very small and the algorithm will pick one by a potentially very small margin. The other hospital then can have little effect on the overall score, as placing a second hospital within Bristol is not going to significantly affect average distances nationally or the number of people within 25 km. The second hospital may then be pushed very much lower in the preferred list of locations, making it appear a poor location for placing a hospital. A better way of interpreting these results would be to see Bristol’s location in the list; the choice between two hospitals (if consolidation is wanted) should then be made on a much wider range of decision inputs, which would include position relative to local population as just one input.
Notwithstanding these caveats on the naming of hospitals in the preferred order, the value of this algorithm is in helping inform decisions on how many units of each type are desirable, and their general geographical locations. We see this algorithm as the basis of a more sophisticated algorithm which could take other factors into consideration, such as estimated travel times (rather than distance), predicted demographic changes and the ability of the hospital infrastructure to sustain a 24/7 ICU.
Comparison with previous neonatal models
A number of neonatal care models have been published in recent years. Ours, we believe, is the most detailed model to date, reporting on how the system behaves from the perspectives of the network, each unit, the transfer team and the parents. It should be noted, however, that ‘most detailed’ does not necessarily mean ‘better’. A model should be as simple as the question being addressed allows. The different models described in the literature are each answering specific questions, and the ‘best’ model depends on the question being addressed.
Asaduzzaman and co-authors have published a series of queuing models of either a neonatal unit or a network. 12–16 Compared with simulation models, queuing models generally use more simplifications and run much faster. The higher degree of simplification has benefits and drawbacks. The major benefit, apart from computational speed, is that, because the model avoids fine detail, the model user is forced to focus more on the high-level ‘big picture’ behaviour of the system without being drawn into what may often be minor or pedantic questions. This may, however, also be a drawback, as the mathematic models described do not, for example, allow surgical/cardiac infants to be separated out, admission rules to be based on gestational age of infants, or capacity to be limited by a combination of cots and nurses. In addition, resources are not shared between levels of care. The investigation of distances between the parents’ home and the location of care was also outside the scope of these queuing models. The simplified queuing model was, however, sufficient to estimate the probability of rejection of new admissions or changing infant state, a key performance indicator for neonatal units.
During the course of our work, Fournier and Zaric published a DES study of neonatal IC in British Columbia. 17 The neonatal care aspect of their model was similar to ours; the infant moved through a series of levels of care, and the closest suitable cot, if one was not present in the home hospital, was found. Distances were based on distances between hospitals. The model had two levels of units: those providing ‘Ordinary Care’, and those also providing IC. The authors then investigated how changing the number of cots at each care level affected both cot utilisation and the number of transfers out of the region. The basis of the model was, therefore, similar to ours. There were, however, some differences. Length of stay, rather than being sampled from a distribution as in our model, was based on a Markov chain, with the probability of requiring another day of care being assessed daily. In our model we generally calculated capacity depending on nurse workload rather than specific cots being occupied. Given the nature of different types of units in the UK, it was important to separate infants by gestational age; this was not a requirement in the Canadian model. We also incorporated surgical procedures and stay as a distinct phase that could be carried out at only a limited number of hospitals (more limited than the number offering IC). These differences might or might not have had a significant effect on the model, and some of the differences simply reflected differences between the Canadian and UK models of care. The major difference between our model and the British Columbia model was in the objective of our model to analyse transfer and parent travel distances in detail.
In 2014, Demir et al. 18 published some modelling studies using techniques that had not previously been applied to neonatal care. They demonstrated a Coxian phase-type distribution based on a three-phase continuous-time Markov chain matrix. Rather than using data describing lengths of stay in specific levels of care, the number of phases and the probability of transfer between the phases are found by ‘best fit’. This technique has the advantage of fitting complex LoS distributions without the need for data describing known phases within the LoS; the phases are derived from data giving just the total LoS. The disadvantage of this approach is that the phases do not map to specific levels of care. In a study where it is important to distinguish between levels of care, this type of analysis has limited use. The authors went on to apply a multinomial random-effects model as detailed by Adeyemia et al. 58 In this model infants were assigned to various routes through three care levels. As with our modelling, the authors assume that infants progress from worse to better, although they may die and exit the system at any care level. Total lengths of stay were then assigned to each of the possible paths through the system. As with the Coxian phase-type distribution model, this model did not describe LoS at each care level, so this method would again be limited where spells at each care level needed to be distinguished. Finally, the authors described a systems dynamics model. This had the potential to examine flow through different levels of care, and the authors introduced an interesting concept of a component of LoS that is resource dependent, and a separate component that is resource independent and is dependent only on the infant (assuming no limiting resources). The authors used this type of modelling to better understand how reducing lengths of stay at different care levels might affect other parameters such as the number of infants refused entry to the unit, and they uncovered some counterintuitive results such as reducing lengths of stay leading to increasing rates of rejection of admission of new infants. A final limitation of the study, the authors acknowledged, was that the analysis was limited to a single site and did not capture the complexity of infants moving between hospitals in a network. That paper, however, helps to illustrate how different modelling techniques may be of use in answering different questions regarding neonatal care provision.
Chapter 13 Conclusions
Our simulation model was able to replicate the current network configuration and performance, and could be used to explore alternative configurations of services.
There was significant fluctuation in workloads within the units. Workloads could vary by twofold in the larger units and three- to fourfold in the smaller units. This variation causes a challenge when trying to both (1) meet BAPM guidelines for nurse to infant ratios and (2) maximise resource utilisation.
Increasing centralisation pools variability and reduces the extent of peaks and troughs, thus reducing the amount of spare capacity needed to cope with peaks. The model predicted that costs to hospitals could be reduced by centralisation of services, but that this must be offset against the increased transfers required and increased parent travel distances and costs. As parent travel distances increase, the number beyond a reasonable daily travel distance increases, which opens up the question of how best to accommodate these parents, and what local hotel capacity, if any, should be planned for. The maximum cost reduction of services was achieved in the model only with unit closures. As neonatal care is frequently tied up with maternity and childbirth services this raises the question of how joint planning of neonatal and maternity services is best achieved.
Neonatal networks have the ability to move infants to other hospitals when local capacity is exhausted. Our modelling showed that, while this may reduce the number of nurses required to cope with local fluctuations in workload, the number of transfers and the travel distance for parents start to rise significantly above ≈ 70% network capacity utilisation.
The model raises the question of where spare capacity should best be located. Spare capacity is most needed at network ICUs because (1) these units have restricted ability to send the sickest infants elsewhere, and so need the capacity to cope with peaks in demand from the sickest infants, and (2) these units are where the majority of mortality will occur because they handle the sickest infants. A link between capacity utilisation and mortality has previously been established, so increasing the resilience, by allowing spare capacity, of the network ICUs would be expected to have the most significant positive effect on mortality.
The BAPM and DH provide guidelines on the number of infants that nurses may care for at each level. The model demonstrated the increasing costs associated with complying with these guidelines either 80% or 95% of the time.
Opportunities for further work
National analysis
The most obvious development of our model is to expand its application to the national level.
Currently there is significant cost-reduction pressure throughout the NHS. A recent NHS ‘call to action’ report59 says that ‘NHS England’s analysis suggests that the overall efficiency challenge could be as high as 5–6% in 2015/16 compared to the current 4% required efficiency in 2013/14’. NHS England is currently responding to this call to action by developing a 5-year specialised service strategy. Part of this strategy is to consider consolidation of some neonatal services, as Julia Grace from the Neonatal Clinical Reference Group (CRG) has communicated in a recent letter of support for a bid to perform follow-on national work.
As we have discussed, NHS England is currently developing its Five Year Specialised Service Strategy in response to the ‘Call to Action’ policy initiative. One of the areas which the Neonatal CRG is considering as part of the strategy development is consolidation of units. The thinking on this is at a very early stage and will consider a wide range of options including fewer level 3 units or a Prime Contractor model. In conjunction with this work, Specialised Services has a significant financial challenge over the next two years and the Neonatal CRG are considering how they can achieve their Productivity and Efficiency target by using the current resource more effectively.
Therefore the proposal you have developed is timely in terms of assisting the CRG with the development of the Strategy and considering implementation options for future configuration, with a clear focus on improving outcomes for babies and their families.
Julia Grace, Accountable Commissioner, Neonatal Clinical Reference Group, 2014
A national model would provide the research and information that would lead to a more informed reorganisation of neonatal services. We would also like to develop further the economic evaluation that underlies the cost aspects in the model.
We have also received agreement to support this project from the charity BLISS, which has already facilitated parent involvement in reviewing our plans:
Thank you for sharing the details of your proposed study that aims to build a computer simulation model of neonatal care provision in England. BLISS represents the families of the 80,000 babies born preterm or sick each year in the UK. We think that this research will help provide some useful analysis, which in turn has the potential to add key value to planners, commissioners, service providers and parents. We would like to support this project and would be happy to help identify and recruit parents to provide a parental perspective. Additionally, we would be willing to review and disseminate the results using a variety of communication channels that we have at our disposal.
Jane Abbott, Head of Programmes, BLISS, 2014
Aims and objectives of a national model
The aim of this proposed research is to understand national demand for neonatal care by location, acuity and cost, and to use modelling to investigate configurations of service (location, size, type of units and nursing numbers) that best meet the needs or preferences of service providers and parents.
What is the nature of the trade-off between throughput and parent travel distances?
Centralisation of services has potential benefits. Examples of these benefits are (1) increased throughput of infants leading to increased specialism and expertise, and (2) reduction in the ‘spare capacity’ needed to deal with peaks and troughs in workload (relative variation reduces as throughput increases). Centralisation of services will, however, increase average distances that parents must travel to the point of care. We propose to investigate that trade-off in the following ways:
-
What is the geographical pattern of demand? What is the average and maximum planned distance and travel time from the parents’ home location to the point of care? How does this vary across the country? How does this compare with actual distances and travel times (when infants travel further than to the closest unit of an appropriate level)?
-
What effect do network boundaries have on travel distances and times? What happens to travel distances if network boundaries are removed (infant goes to closest suitable and available cot, regardless of network affiliation)?
-
How would service reconfiguration (e.g. greater centralisation of services) affect the trade-off between unit throughput and parent travel distances? How would the number and distance of transfers be affected?
-
How may conflicting objectives be balanced against each other? How might a discrete choice experiment be constructed?
-
What effect does network size (by population or by area) have on travel distances and times?
-
What number of cots (IC, HDC, SC) and nurses nationwide are required for hospitals to work within BAPM guidelines 80–95% of the time, and for networks to avoid unplanned transfers out of their network 99% of the time?
-
What are the expected average and peak workloads at unit, network and national level under different configurations?
-
What is the effect of changing the number or type of neonatal units on travel distances for parents, distances and number of transfers, and required resources?
-
What is the relationship between the number of units and the expected travel times and throughputs?
-
Given any fixed number of units, which locations would minimise travel times?
-
What is the expected impact regionally of applying population projections?
How will costs per infant and outcome change with reconfiguration of services?
During our regional project, we found that use of health resource group reference costs had limited use for modelling, as they assume a fixed infant cost regardless of size of unit. In the regional model, we allowed for variation in nursing costs depending on configuration, but we would like to understand neonatal costs in significantly more detail so that we may better predict the likely relationship between service configuration and costs. Having access to the individual responses to a recent BLISS survey on costs to parents, we also seek to understand better the relationship between network configuration and costs to parents.
Questions to be addressed are:
-
What components, and in what proportion, contribute to the costs of the different types of neonatal unit?
-
How would changes in the degree of centralisation of services affect the ‘spare capacity’ needed to deal with peaks and troughs in workload?
-
How would changes in the degree of centralisation of services affect parent travel distances and costs?
-
How does the degree of centralisation affect the requirement for local accommodation for parents?
Other objectives include:
-
Develop associated visualising tools as communication tools (for commissioners, for service providers and for public and parents).
-
Involve parents in the research, especially in the development of visualisation tools.
-
Extend model to include incidence of triplet and quadruplet births.
Data availability for a national model
The NDAU based at Imperial College London receives a national extract of Badger data covering all 165 neonatal units in England (the data set also covers all 13 units in Wales). All the required data are available from a single source and any national modelling will be based on a collaboration between the University of Exeter and Imperial College London. Geographical location of patient nodes in the NDAU data set is finer than we have so far used, locating parents to Lower Layer Super Output Areas, which are on average 2 km across and contain ≈ 1500 people. These areas may be clustered together into large Middle Layer Super Output Areas. Super Output Areas form the foundation for demographic statistics published by the government so there is a wealth of statistics to support further analysis of the data.
Extension to maternity services
A second opportunity is to expand the maternity services aspect of the model. In our scenarios we explored some options where large numbers of births occurred in hospitals without neonatal services. This drove up the number and distances of transfers and left open the question of how short-term neonatal care is provided, and by whom, in those hospitals. There is potential to develop the link between labour ward and neonatal care further in the model, for example by inclusion of midwife-led birthing centres that are separate from hospitals with neonatal care facilities. This extended model would build on both this model and previous work by one of the present authors modelling labour wards. 60 We hope such an extension might provide a useful shared framework to inform discussion of how maternity services and neonatal care strategies influence each other.
Refinements to model
Hospital-level statistics on parental distance: The model currently reports the average travel distance and the proportion of all parents over a given distance away from the unit. In a subsequent model we would summarise these results for each hospital.
Neonatal transfer services: In the current model, neonatal transfer was not a limiting resource. We modelled in a fixed delay for transfer, but this was not a limiting factor in movement of infants. We modelled the number of transfers and the total transfer distance between hospitals (assuming a return journey from the higher-level hospital). There is potential to add further detail, for example having a certain number of neonatal transfer hub services (which might or might not be colocated with specific hospitals). Transfers would then be dependent on the availability of the transfer services, and the model could report the utilisation of these services along with the average wait time for transfer.
Delays in transfer: The raw data output from the model contains information on how long an infant was in a distant hospital when he or she was clinically suitable for transport back to a hospital closer to home. We shall add a refinement to the model to summarise this information.
Chapter 14 Communication strategy
Key preliminary results from this project have been communicated at a BAPM/CRG-sponsored Workshop on National Neonatal Data in London (January 2014) and at a regular CRG meeting (May 2014). Key results were presented at ‘What Next? New Beginnings!’, the sixth annual national neonatal conference for clinical matrons and their senior nursing teams, in June 2014. We are also looking at other opportunities to present to the major stakeholders, such as at a neonatal network managers’ meeting, at the British Maternal and Fetal Medicine Society, BAPM and The Neonatal Society Joint Meeting (2015), the 12th World Congress of Perinatal Medicine (2015), the Annual International Neonatal Conference (2015) or the Annual Meeting of the European Society of Paediatric and Neonatal Intensive Care (2015).
In addition to meetings and conferences we plan to publish at least two papers, one for the neonatal care audience (e.g. in Archives of Disease in Childhood: Fetal and Neonatal Edition) and the other for the operational research audience (e.g. in the Journal of the Operational Research Society).
Availability of model
As part of the project we intend to make the model available to any network. Preparing data for the model is not, however, a trivial process. Our preferred route is for a national modelling project in which we shall prepare data for the whole of England simultaneously, so all networks will be represented and results may be segregated by network. This also has the advantage that likely internetwork transfers will be represented in the model and that network affiliation may easily be changed.
Acknowledgements
Contribution of authors
Dr Michael Allen (senior modeller, healthcare modelling) was the technical lead, built the simulation model and was the primary author of the report.
Professor Anne Spencer (associate research professor, health economics) conducted the health economics analysis.
Dr Andy Gibson (senior research fellow, public and patient involvement) was responsible for parent involvement.
Mr Justin Matthews (associate research fellow, healthcare modelling) conducted the analysis of Badger and associated data, provided necessary parameters for the model, tested the model and performed scenario analyses using the model.
Dr Alex Allwood (consultant neonatologist, Derriford Hospital) assisted with the conceptual framework of the model and reviewed model outputs.
Mrs Sue Prosser (senior neonatal nurse, Royal Devon and Exeter Hospital) advised on neonatal unit working practices and assisted in parent involvement.
Professor Martin Pitt (associate research professor, healthcare modelling) was Principal Investigator and reviewed/amended the report.
Additional assistance
With thanks to the Peninsula and South Western neonatal network team for steering and guidance, especially:
-
Heather Burden.
-
Diana Cargill.
-
Rebecca Lemin.
-
Dr Vaughan Lewis.
-
Dr David Mabin.
-
Dr John Madar.
-
Dr Rebecca Mann.
Dr Brad Manktelow (statistician for the Trent Neonatal Data Set, Leicester University) assisted with access to data from the Trent Neonatal Data Set (although, ultimately, this was not used in the modelling).
Disclaimers
This report presents independent research funded by the National Institute for Health Research (NIHR). The views and opinions expressed by authors in this publication are those of the authors and do not necessarily reflect those of the NHS, the NIHR, NETSCC, the HS&DR programme or the Department of Health. If there are verbatim quotations included in this publication the views and opinions expressed by the interviewees are those of the interviewees and do not necessarily reflect those of the authors, those of the NHS, the NIHR, NETSCC, the HS&DR programme or the Department of Health.
References
- Are We Failing Special Care Babies in the UK?. London: Bliss; 2007.
- Pillay T, Nightingale P, Owen S, Kirby D, Spencer A. Neonatal nurse staffing and delivery of clinical care in the SSBC Newborn Network. Arch Dis Child 2012;97:F174-9. http://dx.doi.org/10.1136/adc.2011.300224.
- Toolkit for High Quality Neonatal Services. London: DH; 2009.
- National Institute for Health and Clinical Excellence . QS4 Specialist Neonatal Care: Cost Impact and Commissioning Assessment 2010. www.nice.org.uk/nicemedia/live/13822/60167/60167.pdf (accessed March 2013).
- Bagust A, Place M, Posnet JW. Dynamics of bed use in accommodating emergency admissions: stochastic simulation model. BMJ 1999;319:155-8. http://dx.doi.org/10.1136/bmj.319.7203.155.
- Tucker J, Parry G, Fowlie PW, McGuire W. Organisation and delivery of perinatal services. BMJ 2004;329:730-2. http://dx.doi.org/10.1136/bmj.329.7468.730.
- British Association of Perinatal Care . Categories of Care 2011 n.d. www.bapm.org/publications/documents/guidelines/CatsofcarereportAug11.pdf (accessed May 2013).
- NHS England . Service Specification E08 S A: Neonatal Critical Care 2013. www.england.nhs.uk/wp-content/uploads/2013/06/e08-neonatal-critical.pdf (accessed February 2014).
- Marlow N, Bryan Gill A. Establishing neonatal networks: the reality. Arch Dis Child Fetal Neonatal Ed 2007;92:F137-42. http://dx.doi.org/10.1136/adc.2005.086413.
- Department of Health . Report to the Department of Health Children’s Taskforce from the Maternity and Neonatal Workforce Group 2003. www.dh.gov.uk/prod_consum_dh/groups/dh_digitalassets/@dh/@en/documents/digitalasset/dh_4060948.pdf (accessed March 2014).
- It’s Not a Game: The Very Real Costs of Having a Premature or Sick Baby. London: BLISS; 2014.
- Asaduzzaman M, Chaussalet TJ, Puuronen S, Pechenizkiy M, Tsymbal A, Lee D-J. Twenty-First IEEE International Symposium on Computer-Based Medical Systems. Proceedings. June 17–19, 2008. Jyväskylä, Finland. Los Alamitos, CA: IEEE Computer Society; 2008.
- Asaduzzaman M, Chaussalet TJ, Robertson NJ. A loss network model with overflow for capacity planning of a neonatal unit. Ann Operations Res 2009;178:67-76. http://dx.doi.org/10.1007/s10479-009-0548-x.
- Asaduzzaman M, Chaussalet TJ, Adeyemi S, Chahed S, Hawdon J, Wood D, et al. Towards effective capacity planning in a perinatal network centre. Arch Dis Child Fetal Neonatal Ed 2010;95:F283-7. http://dx.doi.org/10.1136/adc.2009.161661.
- Assaduzzaman M, Chaussalet TJ. An overflow loss network model for capacity planning for a perinatal network. J R Stat Soc A 2010;174:403-17. http://dx.doi.org/10.1111/j.1467-985X.2010.00669.x.
- Asaduzzaman M, Chaussalet T. A Generalized Loss Network Model With Overflow for Capacity Planning of a Perinatal Network n.d. http://arxiv.org/pdf/1110.6544.pdf (accessed June 2014).
- Fournier DL, Zaric GS. Simulating neonatal intensive care capacity in British Columbia. Socio-Econ Plann Sci 2013;47:131-41. http://dx.doi.org/10.1016/j.seps.2013.01.001.
- Demir E, Lebcir R, Adeyami S. Modelling length of stay and patient flows: methodological case studies from the UK neonatal care services. J Operational Res Soc 2014;65:532-45.
- Neonatal Data Analysis Unit . BAPM Mapping Exercise 2010. www1.imperial.ac.uk/resources/74FF1159-00FF-4D58-B9EE-8D112AE36DED/bapmmappingexerciseversionfinalversion.pdf (accessed July 2014).
- Office for National Statistics . Atlas of Deprivation 2010 2011. www.ons.gov.uk/ons/rel/regional-trends/atlas-of-deprivation--england/2010/atlas-of-deprivation-2010.html (accessed May 2014).
- Public Health England . National General Practice Profiles 2014. http://fingertips.phe.org.uk/profile/general-practice (accessed February 2014).
- Office for National Statistics . Birth Statistics, England and Wales (Series FM1), No. 36, 2007 2008. www.ons.gov.uk/ons/rel/vsob1/birth-statistics--england-and-wales--series-fm1-/no--36--2007/birth-statistics-series-fm1.pdf (accessed January 2014).
- Office for National Statistics . Statistical Bulletin: Births in England and Wales, 2012 n.d. www.ons.gov.uk/ons/rel/vsob1/birth-summary-tables--england-and-wales/2012/stb-births-in-england-and-wales-2012.html (accessed April 2014).
- Katsaliaki K, Mustafee N. Applications of simulation within the healthcare context. J Operational Res Soc 2011;62:1431-51. http://dx.doi.org/10.1057/jors.2010.20.
- Mustafee N, Katsaliaki K, Taylor SJE. Profiling literature in healthcare simulation. Simulation: Trans Soc Model Simulation Int 2010;86:543-58. http://dx.doi.org/10.1177/0037549709359090.
- Fone D, Hollinghurst S, Temple M, Round A, Lester N, Weightman A, et al. Systematic review of the use and value of computer simulation modelling in population health and health care delivery. J Public Health Med 2003;25:325-35. http://dx.doi.org/10.1093/pubmed/fdg075.
- Jordan H, Roderick P, Martin D, Barnett S. Distance, rurality and the need for care: access to health services in South West England. Int J Health Geographics 2004;3. http://dx.doi.org/10.1186/1476-072X-3-21.
- Burge D, Drewett M. Workload and costs associated with providing a neonatal surgery service. Arch Dis Child Fetal Neonatal Ed 2012;97:F179-81. http://dx.doi.org/10.1136/archdischild-2011-300094.
- Tucker J. UK Neonatal Staffing Study Group . Patient volume, staffing, and workload in relation to risk-adjusted outcomes in a random stratified sample of UK neonatal intensive care units: a prospective evaluation. Lancet 2002;359:99-107. http://dx.doi.org/10.1016/S0140-6736(02)07366-X.
- Manktelow BN, Seaton SE, Field DJ, Draper ES. Population based estimates of in-unit survival for very preterm babies. Pediatrics 2013;131:e425-e432. http://dx.doi.org/10.1542/peds.2012-2189.
- Medlock S, Ravelli AC, Tamminga P, Mol BW, Abu-Hanna A. Prediction of mortality in very premature infants: a systematic review of prediction models. PLOS ONE 2011;6:1-9. http://dx.doi.org/10.1371/journal.pone.0023441.
- Phibbs CS, Baker LC, Caughey AB, Danielsen B, Schmitt SK, Phibbs RH. Level and volume of neonatal intensive care and mortality in very-low-birth-weight infants. N Engl J Med 2007;356:2165-75. http://dx.doi.org/10.1056/NEJMsa065029.
- Marlow N, Bennett C, Draper ES, Hennessy EM, Morgan AS, Costeloe KL. Perinatal outcomes for extremely preterm babies in relation to place of birth in England: the EPICure 2 study. Arch Dis Child Fetal Neonatal Ed 2014;99:F181-8. http://dx.doi.org/10.1136/archdischild-2013-305555.
- Alexopoulos C, Goldsman D, Chick S, Sánchez PJ, Ferrin D, Morrice DJ. To batch or not to batch. ACM Trans Model Comput Simulation 2003;14:76-114. http://dx.doi.org/10.1145/974734.974738.
- Keller PA, Pyzdek T. The Six Sigma Handbook. New York, NY: McGraw-Hill Professional; 2009.
- Ball JA, Washbrook M. Birthrate Plus: A Framework for Workforce Planning and Decision Making for Midwifery Services. London: Elsevier; 1996.
- Manktelow BN, Draper ES, Field DJ. Predicting neonatal mortality among very preterm infants: a comparison of three versions of the CRIB score. Arch Dis Child Fetal Neonatal Ed 2010;95:F9-F13. http://dx.doi.org/10.1136/adc.2008.148015.
- Curtis L. Unit Costs of Health and Social Care 2012 2012. www.pssru.ac.uk/project-information.php?id=354 (accessed March 2014).
- Department for Transport . Transport Analysis Guidance: WebTAG 2013. www.gov.uk/transport-analysis-guidance-webtag (accessed September 2013).
- Mackie PJ, Wardman M, Fowkes AS, Whelan G, Nellthorp J, Bates J. Values of Travel Time Savings UK. Leeds: Institute of Transport Studies, University of Leeds; 2003.
- Automobile Association . AA Motoring Costs 2013 n.d. www.theaa.com/motoring_advice/running_costs/index.html (accessed March 2014).
- NHS England . 2013/14/NHS/Standard/Contract/for/Neonatal/Critical/Care/E08/S/a n.d. www.england.nhs.uk/commissioning/wp-content/uploads/sites/12/2015/01/e08-serv-spec-neonatal-critical.pdf (accessed April 2014).
- Bonet M, Smith LK, Pilkington H, Draper ES, Zeitlin J. Neighbourhood deprivation and very preterm birth in an English and French cohort. BMC Pregnancy Childbirth 2013;13:97-105. http://dx.doi.org/10.1186/1471-2393-13-97.
- Blumenshine P, Egerter S, Barclay CJ, Cubbin C, Braveman PA. Socioeconomic disparities in adverse birth outcomes: a systematic review. Am J Prev Med 2010;39:263-72. http://dx.doi.org/10.1016/j.amepre.2010.05.012.
- Metcalfe A, Lail P, Ghali WA, Sauve RS. The association between neighbourhoods and adverse birth outcomes: a systematic review and meta-analysis of multi-level studies. Paediatr Perinat Epidemiol 2011;25:236-45. http://dx.doi.org/10.1111/j.1365-3016.2011.01192.x.
- Cooper RB. Introduction to Queueing Theory. Amsterdam: North Holland; 1981.
- Moss SJ, Embleton ND, Fenton AC. Towards safer neonatal transfer: the importance of critical incident revier. Arch Dis Child 2005;2005:729-32. http://dx.doi.org/10.1136/adc.2004.066639.
- Cusack J, Field D, Manktelow B. Impact of service changes on neonatal transfer patterns over 10 years. Arch Dis Child Fetal Neonatal Ed 2007;92:F181-4. http://dx.doi.org/10.1136/adc.2006.105098.
- Nyström K, Axelsson K. Mothers’ experience of being separated from their newborns. J Obstet Gynecol Neonatal Nurs 2002;31:275-82. http://dx.doi.org/10.1111/j.1552-6909.2002.tb00049.x.
- Feldman R, Weller A, Leckman JF, Kuin J, Eidelman AI. The nature of the mother’s tie to her infant: maternal bonding under conditions of proximity, separation, and potential loss. J Child Psychol Psychiatry 1999;40:929-39. http://dx.doi.org/10.1017/S0021963099004308.
- Bier J-AB, Ferguson AE, Morales Y, Liebling JA, Archer D, Oh W, et al. Comparison of skin-to-skin contact with standard contact in low-birth-weight infants who are breast-fed. Arch Pediatr Adolesc Med 1996;150:1265-9. http://dx.doi.org/10.1001/archpedi.1996.02170370043006.
- Feldman R, Weller A, Sirota L, Eidelman IA. Skin-to-skin contact (kangaroo care) promotes self-regulation in premature infants. Dev Psychol 2002;38:194-207. http://dx.doi.org/10.1037/0012-1649.38.2.194.
- Feldman R, Eidelman AI, Sirota L, Weller A. Comparison of skin-to-skin (kangaroo) and traditional care: parenting outcomes and preterm infant development. Pediatrics 2002;110:16-2. http://dx.doi.org/10.1542/peds.110.1.16.
- Crenshaw J. Care practice #6: no separation of mother and baby, with unlimited opportunities for breastfeeding. J Perinat Educ 2007;16:39-43. http://dx.doi.org/10.1624/105812407X217147.
- Whitelaw A, Heisterkamp G, Sleath K, Acolet D, Richards M. Skin to skin contact for very low birthweight infants and their mothers. Arch Dis Child 1988;63:1377-81. http://dx.doi.org/10.1136/adc.63.11.1377.
- BLISS – The national charity for the newborn. London; 2010.
- Mortimer D. Rorientating programme budgeting and marginal analysis (PBMA) towards disinvestment. BMC Health Serv Res 2010;10. http://dx.doi.org/10.1186/1472-6963-10-288.
- Adeyemia S, Chaussaleta TJ, Xiea H, Asaduzamana M. Random effects models for operational patient pathways. J Appl Statist 2010;37:691-70. http://dx.doi.org/10.1080/02664760902873951.
- NHS England . The NHS Belongs to the People: A Call to Action 2013. www.england.nhs.uk/wp-content/uploads/2013/07/nhs_belongs.pdf (accessed April 2014).
- Allen M, Thornton S. Providing one-to-one care in labour: analysis of ‘Birthrate Plus’ labour ward staffing in real and simulated labour ward environments. BJOG 2013;120:100-7. http://dx.doi.org/10.1111/j.1471-0528.2012.03483.x.
- Pay for Nurses n.d. www.nhscareers.nhs.uk/explore-by-career/nursing/pay-for-nurses/ (accessed 3 October 2013).
Appendix 1 Example of Badger data used
Example of Badger data for three patient spells
| Data filed | Patient 1 | Patient 2 | Patient 3 |
|---|---|---|---|
| Gender | F | F | M |
| Unique Badger ID | [removed] | [removed] | [removed] |
| Booked place of delivery | Royal Devon and Exeter | Royal Devon and Exeter | Royal Devon and Exeter |
| Booked place of delivery NHS code | RH801 | RH801 | RH801 |
| Place of birth | Royal Devon and Exeter | Royal Devon and Exeter | Royal Devon and Exeter |
| Birth time | 02/01/2011 08:08 | 27/12/2010 07:47 | 03/01/2011 10:29 |
| Gestation | 33 | 38 | 40 |
| Gestation days | 0 | 5 | |
| Birthweight | 1900 | 3098 | 3850 |
| GP PCT code | 5QQ | 5QQ | 5QQ |
| GP PCT name | Devon PCT | Devon PCT | Devon PCT |
| GP practice code | Y02633 | L83040 | L83655 |
| Mum PCT name | Devon PCT | Devon PCT | Devon PCT |
| Mum PCT code | 5QQ | 5QQ | 5QQ |
| Baby CCG code | 99P | 99P | 99P |
| Baby CCG name | NHS NORTH EAST WEST DEVON CCG | NHS NORTH EAST WEST DEVON CCG | NHS NORTH EAST WEST DEVON CCG |
| Episode | 1 | 2 | 1 |
| Reason for admit | Medical intensive care | Medical high dependency care | Transitional care |
| Primary clinical reason for admission | Preterm | Infection | Hypoglycaemia |
| Location of care | Royal Devon and Exeter | Royal Devon and Exeter | Royal Devon and Exeter |
| Admit time | 02/01/2011 08:30 | 02/01/2011 15:30 | 03/01/2011 19:30 |
| Admit temp | 36.6 | 36.6 | 36.7 |
| Admit from hospital name | Royal Devon And Exeter | Home | Royal Devon And Exeter |
| Admit from hospital NHS code | RH801 | ZZ201 | RH801 |
| Admit from hospital detail | |||
| Discharge destination | Home | Home | Ward |
| Discharge destination hospital name | Royal Devon and Exeter | ||
| Discharge destination hospital NHS code | RH801 | ||
| Discharge time | 25/01/2011 12:00 | 05/01/2011 11:55 | 04/01/2011 15:30 |
| Episode in unit | 1 | 2 | 1 |
| Episode in network | 1 | 2 | 1 |
| Network name admit from | Peninsula – South West | Peninsula – South West | |
| Network name booking hospital | Peninsula – South West | Peninsula – South West | Peninsula – South West |
| Network name discharge to | Peninsula – South West | ||
| Network name this episode | Peninsula – South West | Peninsula – South West | Peninsula – South West |
| Referral type | Inborn – booked | Readmission | Inborn – booked |
| CPAP days | 1 | 0 | 0 |
| Level 1 days 2001 | 1 | 0 | 0 |
| Level 2 days 2001 | 0 | 0 | 0 |
| Level 3 days 2001 | 23 | 4 | 2 |
| Level 1 days 2011 | 0 | 0 | 0 |
| Level 2 days 2011 | 1 | 0 | 0 |
| Level 3 days 2011 | 16 | 2 | 2 |
| Level 4 days 2011 | 7 | 2 | 0 |
| Location of care – NICU | 24 | 4 | 0 |
| Location of care – TCDays | 0 | 0 | 2 |
| Location of care – postnatal ward | 0 | 0 | 0 |
| HRG – 1 | 1 | 0 | 0 |
| HRG – 2 | 0 | 0 | 0 |
| HRG – 3 | 16 | 0 | 1 |
| HRG – 4 | 0 | 2 | 1 |
| HRG – 5 | 7 | 2 | 0 |
Appendix 2 Impact of reversing clinical progression on model results
The ordinary progression of infants is from worse to better in the model (Surgery → IC → HDC → SC → TC). It is possible that some infants progress, at least at times, in the opposite direction, but the Badger data we used do not distinguish the progression order within a hospital spell. In order to test the impact of this uncertainty in the model, we reversed the clinical progression so that infants enter at the lowest level of care they would receive and exit after the highest level of care they receive. There are no notable differences in occupancy levels of units (Figure 50), or average distance of care from parents’ home (Table 41). There was, however, about a 20% reduction in the number of transfers (and 10% reduction in travel distance) when reversing the clinical progression (see Table 41). This may be because an infant born in a hospital with only SC may have an additional transfer when IC is required first (Figure 51). These results therefore suggest that occupancy and parent distance levels are unaffected by clinical progression order, but that the number and distance of transfers may be somewhat affected if normal clinical progression order is not from worse to better.
FIGURE 50.
Impact of reversing clinical progression order on hospital and level of care occupancy. The graph shows the numbers of infants present in each unit at each care level modelled with improving condition (x-axis) and deteriorating condition (y-axis).
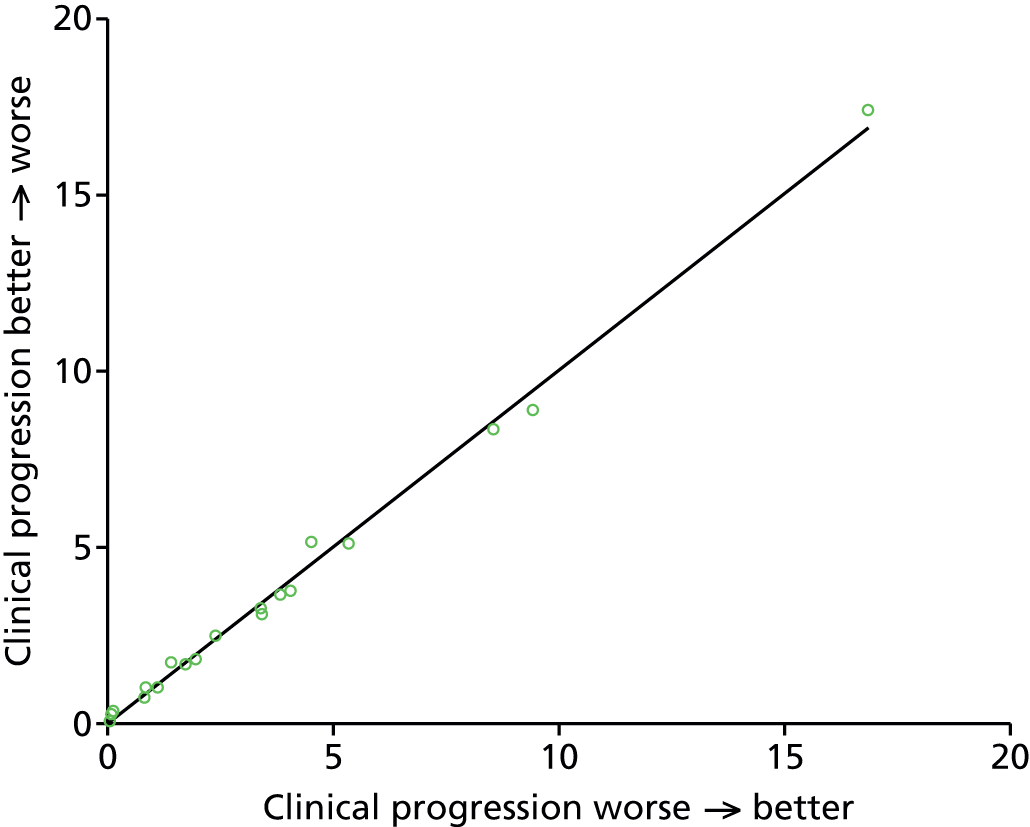
| Modelled result | Worse → better | Better → worse |
|---|---|---|
| Infants per year | 2799 | 2800 |
| Mean travel distance from patient node to point of care (km) | 21.8 | 22.4 |
| % patients in hospital closest to home | 92 | 91 |
| Average daily % parents over distance limit | 7 | 8 |
| In utero transfers/year | 29 | 17 |
| In utero transfer km/year | 6073 | 4634 |
| Total neonatal transfers/year | 384 | 305 |
| Total neonatal transfer km/year | 79,934 | 71,029 |
FIGURE 51.
Example of how reversing clinical order may reduce the number of transfers (birth in a hospital which offers SC only).
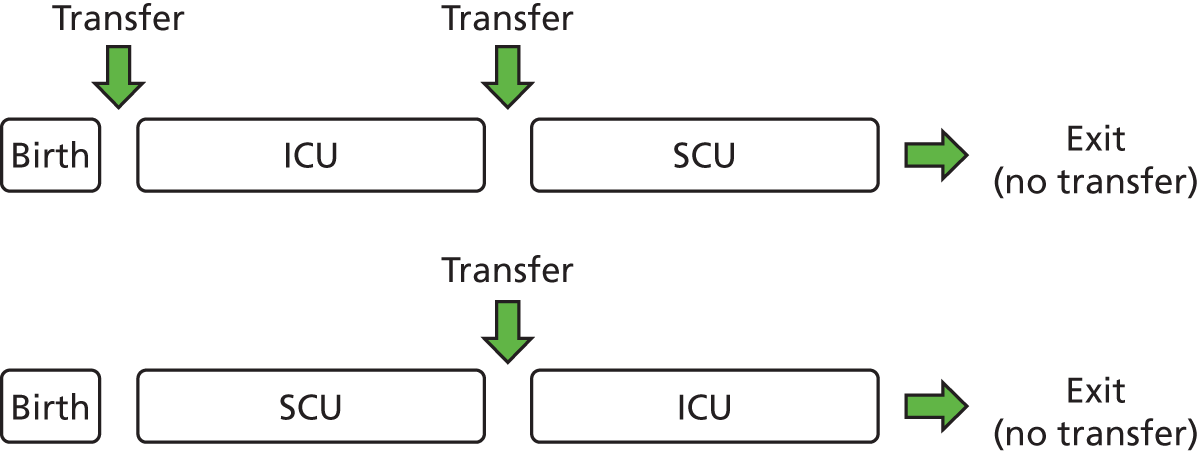
Appendix 3 Model selection for length of stay distributions
To model LoS, we used a family of statistical distributions, chosen from four candidates (log-normal, Weibull, gamma and exponential) all appropriate for non-negative variables.
The candidate families were fitted to the data in every stratum, where the strata were defined by level of care (four levels) and birth category (six levels). As an example, the LoS distributions for age category 5 (33 to < 36 weeks) are shown in the top row of Figure 52.
FIGURE 52.
Example distribution plots for age category 5 (33 to < 36 weeks) infants.
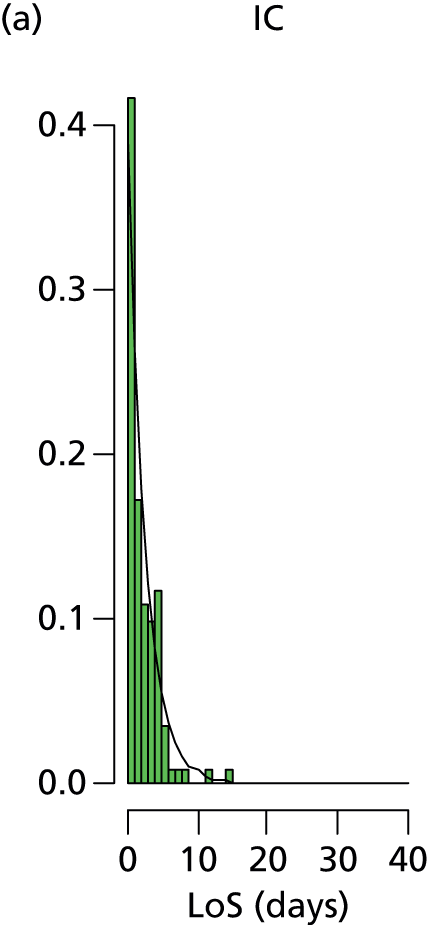
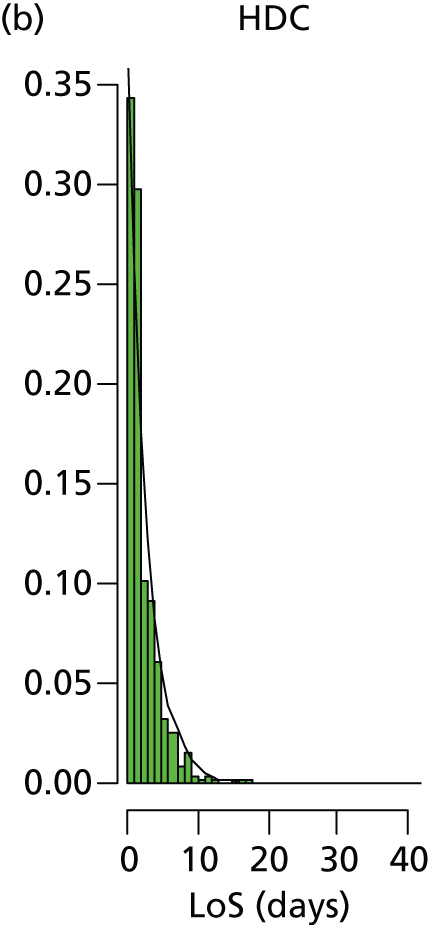

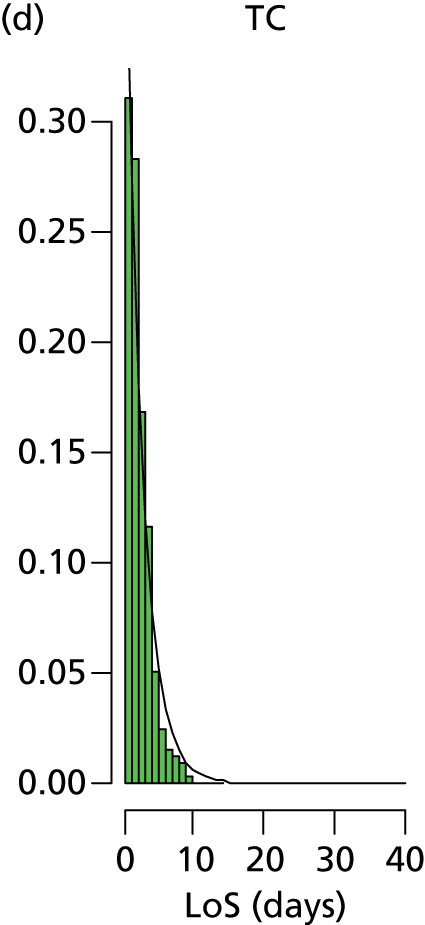
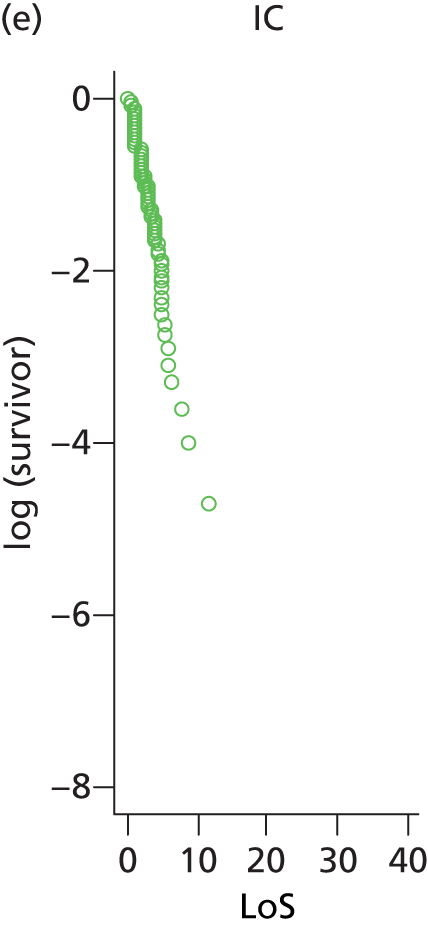
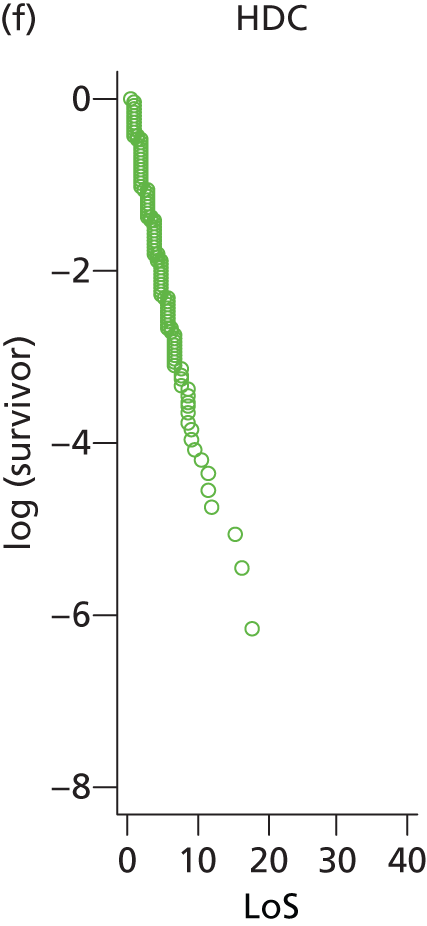
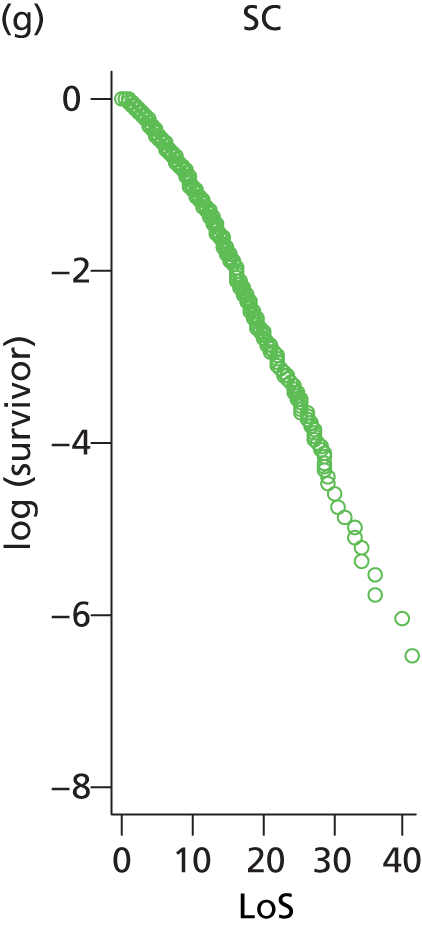
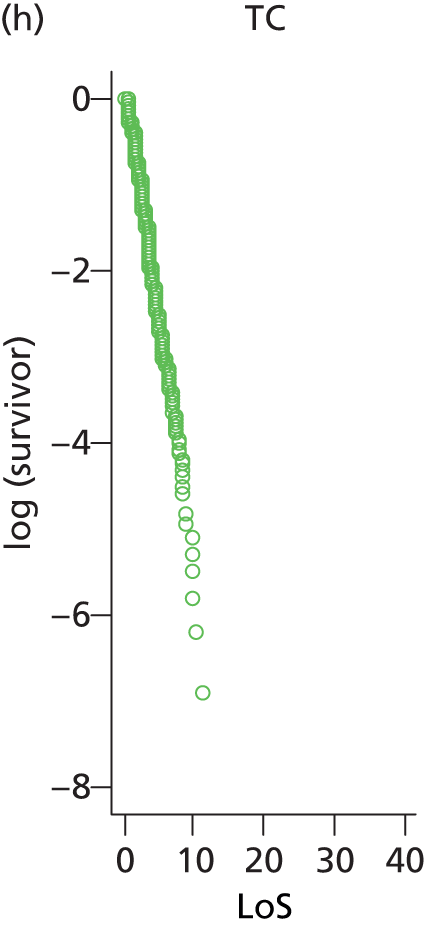
To demonstrate a graphical approach we also show the log-survivor curves in the bottom row of the figure above. If an exponential distribution were appropriate for these data then the log-survivor curve would be a straight line. Non-linearity in the SC category illustrates that the exponential fit is inappropriate.
We used a more formal and flexible method to choose between the distribution families for the data set as a whole. For each family we calculated the Akaike information criterion (AIC) (Table 42):
The AIC includes a penalty for the number of parameters in a model, so that more complex models are not necessarily better fitting, and the model with the lowest AIC value is then chosen.
For any particular distribution family we calculated the AIC for every stratum of the LoS distributions, where there are 4 levels of care × 6 age categories = 24 strata. We eliminated one stratum (TC in age category 1), which as expected did not contain any reliable data, giving 23 strata. We assumed the data sets were independent between the strata, so the overall AIC is the sum of the stratum-specific AIC values.
Only individuals present in the local network throughout the study period were included, as those leaving the network would have had incomplete LoS data. Fitted distribution families included two-parameter (log-normal, Weibull and gamma) and single-parameter (exponential) families.
| Family | Total number of parametersa | Log-likelihood | AIC |
|---|---|---|---|
| Log-normal | 46 | –28,244.2 | 56,580.3 |
| Exponential | 23 | –29,686.8 | 59,419.6 |
| Weibull | 46 | –28,731.9 | 57,555.7 |
| Gamma | 46 | –28,483.3 | 57,058.6 |
Based on the minimum AIC, we selected the log-normal family.
Appendix 4 Mortality model
We estimate the probability of survival to be:
where:
p = probability of survival
X1 = gestation
X2 = birthweight
X3 = gender (male)
X4 = gestation < 24 weeks
X5 = occupancy (relative to a nominal workload; 100% occupancy is reached at 150% BAPM workload guidelines in our model).
Manktelow et al. 30 estimated the impact of infant variables on survival (variables X1 to X4), and the UK neonatal staffing study group29 looked at the impact of workload on mortality (variable X5) and reported that for every 10% increase in percentage of maximum occupancy at admission the odds of mortality increased by 1.09 (range 1.01–1.18). So, in a logistic regression predicting the probability of mortality, the regression coefficient is log(1.09) = 0.0861.
We can convert a regression that is in terms of mortality to survival probability, by the following rearrangement:
So, the impact of occupancy on survival will be found by taking the negative of the coefficient in a regression looking at the impact of occupancy on mortality, and so an estimated impact of –0.086.
Appendix 5 Economic micro-costing
The micro-costing of nurses was based on two main types of nurses included in the model: qualified in specialty or not. Those nurses qualified in specialty were assumed to be nursing band 6, and others were assumed to be nursing band 5. 61 The unit costs that were applied to these nursing bands were taken from a report by Curtis, and these units costs include administrative on-costs and training costs. 38 The calculations were based on the assumption that 70% of registered nurses were qualified in specialty (following markers for good practice3). The mean costs were based on a cohort of 2813 infants (i.e. 168,782/60 in the simulation runs). It was assumed that for each on-duty nurse 5.77 WTE nurses are needed36 (based on 168 hours in a week, 37.5 hours per nurse week, 17.3% allowance for holiday and sickness and 5% for admin).
Glossary
- Badger
- The electronic patient record system used by all neonatal units.
- British Association of Perinatal Medicine guidelines
- Guidelines for the number of infants one nurse should care for, with one nurse caring for one infant in intensive care, two infants in high-dependency care or four infants in special care. No guidelines for transitional care are given. We have assumed one nurse may care for eight infants in transitional care.
- Coefficient of variation
- This equals standard deviation divided by mean.
- Discrete event simulation
- A method of simulating the behaviour and performance of a real-life process, facility or system. Discrete event simulation models the system as a series of ‘events’ (e.g. a birth, a stay in an intensive care unit, a transfer or a discharge) that occur over time.
- High-dependency care
- The care level between intensive care and special care.
- Intensive care
- The highest care level.
- Neonatal network
- A group of hospitals that, together, provides neonatal care for a region.
- Per cent coefficient of variation
- Refers to this figure expressed as a percentage, that is standard deviation/mean × 100.
- Special care
- The lowest level of care with specified nursing needs.
- Transitional care
- The care level below special care. Will usually have the mother as the primary carer.
- Whole-time equivalent
- Staff working 37.5 hours per week.
- Workload (or nurse workload)
- The number of nurses required by British Association of Perinatal Medicine guidelines to care for the number of infants present in a unit at any given time. This figure takes into account both the number and acuity of infants present in a unit.
List of abbreviations
- AIC
- Akaike information criterion
- BAPM
- British Association of Perinatal Medicine
- CRG
- Clinical Reference Group
- CV
- coefficient of variation
- DES
- discrete event simulation
- DH
- Department of Health
- GP
- general practitioner
- HDC
- high-dependency care
- HES
- Hospital Episode Statistics
- IC
- intensive care
- ICU
- intensive care unit
- IMD
- Index of Multiple Deprivation
- IQR
- interquartile range
- LNU
- local neonatal unit
- LoS
- length of stay
- NDAU
- neonatal data analysis unit
- NICU
- neonatal intensive care unit
- ONS
- Office for National Statistics
- SC
- special care
- SCU
- special care unit
- TC
- transitional care
- WTE
- whole-time equivalent