Notes
Article history
The research reported in this issue of the journal was funded by the HS&DR programme or one of its preceding programmes as project number 10/1008/43. The contractual start date was in August 2012. The final report began editorial review in August 2014 and was accepted for publication in December 2014. The authors have been wholly responsible for all data collection, analysis and interpretation, and for writing up their work. The HS&DR editors and production house have tried to ensure the accuracy of the authors’ report and would like to thank the reviewers for their constructive comments on the final report document. However, they do not accept liability for damages or losses arising from material published in this report.
Declared competing interests of authors
Peter Brocklehurst has received non-financial support and personal fees as a member of Department of Health and Medical Research Council commissioning and funding panels unrelated to this project. Neil Marlow has received personal consultancy fees from Novartis and Shire for work unrelated to this project.
Permissions
Copyright statement
© Queen’s Printer and Controller of HMSO 2015. This work was produced by Hollowell et al. under the terms of a commissioning contract issued by the Secretary of State for Health. This issue may be freely reproduced for the purposes of private research and study and extracts (or indeed, the full report) may be included in professional journals provided that suitable acknowledgement is made and the reproduction is not associated with any form of advertising. Applications for commercial reproduction should be addressed to: NIHR Journals Library, National Institute for Health Research, Evaluation, Trials and Studies Coordinating Centre, Alpha House, University of Southampton Science Park, Southampton SO16 7NS, UK.
Chapter 1 Introduction
Background
Since the early 1990s, government maternity care policy has moved away from consultant-led care for women with straightforward pregnancies towards policies designed to give women a choice of settings for birth. 1–4 Other initiatives that have also driven changes in the organisation and delivery of maternity care include the introduction of support workers, changed roles and professional boundaries for midwifery and medical staff, and expansion in the number of midwifery units (MUs).
Against this policy and organisational background, the Birthplace Research Programme, which ran from 2006 to 2011, aimed to fill a number of important gaps in the evidence supporting the provision of high-quality intrapartum maternity care in England. 5 At the time Birthplace was commissioned there was little reliable evidence about the nature, geographical location and distribution of MUs. Evidence was also lacking about the number and characteristics of women planning birth in each setting, the staffing structures within MUs and their position within and relationship with the wider organisation and provision of maternity care, including obstetric and home birth services. Furthermore, the risk of adverse perinatal outcomes associated with births planned in these settings was not accurately quantified and there was no reliable information about their comparative costs and cost-effectiveness.
The findings of the Birthplace Research Programme raised further questions about the organisation and delivery of maternity services. These questions were the subject of the ‘follow-on’ analyses presented here. In this introductory chapter we summarise the key findings of the Birthplace Research Programme, set out the rationale for and aims and objectives of these ‘follow-on’ analyses and outline the structure of this report.
Findings of the Birthplace Research Programme
The Birthplace Research Programme was an integrated programme of research using a range of methodological approaches in six component studies. 5 The key findings of Birthplace are published in detail elsewhere and are summarised below. 6–10
Birthplace mapping study
This mapping study aimed to describe the configuration of maternity care in England and used data collected as part of the Maternity Services Review carried out by the Healthcare Commission in 200711 and a follow-up survey of units and NHS trusts carried out by the Birthplace team in late 2010. 6 The evidence from this study showed that in 2010 there were 53 alongside midwifery units (AMUs) and 59 freestanding midwifery units (FMUs) in operation in England, representing around 39% of all available maternity units. 6 Of the 152 trusts providing maternity care, around half did not offer MU care of any kind and the geographical distribution of MUs in England was uneven. MUs varied considerably in size, and within unit type the numbers of beds or bed spaces, throughput (births per bed/bed space), staffing levels and skill mix varied considerably. While, overall, births planned in MUs and at home made up fewer than 10% of all births, there was notable geographical variation in this figure. 11
Birthplace national cohort study
The Birthplace national cohort study was designed to provide robust estimates of the safety and potential benefits of births planned at home, in FMUs and in AMUs compared with births planned in obstetric units (OUs), with a particular focus on women known to be at ‘low risk’ of complications prior to the onset of labour. 7,8 For ‘low risk’ women, the incidence of adverse perinatal outcomes was low in all settings. For all settings, adverse perinatal outcome, adverse maternal outcomes and intervention during labour were more common in nulliparous (see Glossary) women compared with multiparous (see Glossary) women. After adjusting for differences in the characteristics of women planning birth in each setting, there were no differences between birth settings in adverse perinatal outcome for multiparous women. For nulliparous women, there was no difference between outcomes in MUs and those in OUs, but adverse perinatal outcomes were more likely for nulliparous women who planned birth at home. The benefits of planned birth at home or in a MU included fewer interventions, a substantially reduced incidence of intrapartum caesarean section and a higher likelihood of ‘normal birth’ (see Glossary). 12
Birth outcomes in ‘higher risk’ women
Overall, 5% of women in the three planned non-OU groups were ‘higher risk’, that is with known medical, obstetric or fetal risk factors at the start of labour, and, therefore, according to national guidelines on intrapartum care, should have been ‘advised to give birth in an obstetric unit’. 13 The highest proportion of ‘higher risk’ women was in planned home births (7%), and the lowest was in planned FMU births (2.5%). 7 Findings suggested a possible increased incidence of an adverse perinatal outcome for ‘higher risk’ women planning birth at home compared with women planning OU birth, but the number of events was small and it was not possible to adjust for maternal characteristics or other potential confounders. Findings for other outcomes in ‘higher risk’ women – ‘normal birth’, interventions during labour, maternal morbidities and initiation of breastfeeding – were broadly consistent with ‘better’ outcomes for planned non-OU births relative to the planned OU group. However, reported findings for ‘higher risk’ women were not easy to interpret because the groups planning birth in each setting were not homogeneous in terms of risk. For example, planned induction of labour was recorded as a risk factor in almost half of the ‘higher risk’ women in the planned OU group, and nearly 7% of ‘higher risk’ women in the OU group had multiple risk factors, compared with 1–1.3% in the non-OU groups.
Transfers
Transfers during labour or immediately after birth occurred in over 20% of births in the three non-OU groups: more than two-thirds of transfers took place before the birth. 7 Failure to progress, fetal distress and meconium staining were the most common reasons for transfer during labour; epidural request was more common as a reason for transfer in the AMU group. Transfers immediately after birth were predominantly for repair of perineal trauma or for retained placenta.
Transfer rates in the three non-OU groups were markedly higher for nulliparous women than for multiparous women: for nulliparous ‘low risk’ women, transfer rates ranged from 36% (FMU) to 45% (planned home births), compared with 9–13% for multiparous ‘low risk’ women.
Birthplace cost-effectiveness study
The Birthplace cost-effectiveness study provided estimates of the cost to the NHS and the cost-effectiveness of planned births in MUs and at home compared with birth in an OU. 9,14 For ‘low risk’ women, the cost to the NHS of intrapartum and related postnatal care, including costs associated with transfer and any clinical complications, was lower for births planned at home, in a FMU and in an AMU than for planned birth in an OU. Planned birth at home, in a FMU or in an AMU generated cost savings per additional ‘normal birth’ and per adverse maternal morbidity avoided in comparison with planned birth in an OU. Data on longer-term outcomes and costs were not available at the time of the study, and this continues to be the case. 15
Birthplace qualitative organisational case studies
The Birthplace organisational case studies aimed to describe and explore the features of maternity care systems which may affect the provision of high-quality, safe care in different birth settings and were carried out in four ‘best’ or ‘better performing’ NHS trusts, as identified in the 2007 Healthcare Commission Maternity Services Review. 10,11 Key findings included considerable variation in the provision of maternity services between and within the case study sites, partly due to geography, and variation in the organisation of community midwifery services. Women’s choices about planned place of birth were influenced, and often limited, by geographical, organisational, service culture and provider factors. The presence of an AMU could highlight contrasts in birth philosophies between units and create issues around competition for birth rooms and staffing, and appeared to intensify the perceived workload in the associated OU, where midwives reported struggling to support normal birth. All sites were committed to multidisciplinary training, including attention to emergency skills and escalation of care, but more attention was given in this regard to the needs of midwives working in FMUs and less to the needs of midwives working in AMUs or those in the community supporting home birth.
Rationale for ‘follow-on’ analyses
The findings of the Birthplace national cohort study were broadly supportive of a policy of offering ‘low risk’ women a choice of birth setting. Given the geographical variation and documented gaps in the provision of MUs and home birth services, it was anticipated that confirmation of the safety of midwifery-led care might lead to an expansion of non-OU settings and services and possibly a reconfiguration of maternity services. The data collected in the Birthplace research programme had the potential to provide further evidence in answer to a number of questions relating to the safety, quality and organisation of maternity services.
The results of the Birthplace mapping study indicated that the number of MUs was increasing and that more expansion was planned. 6 This study also revealed significant variation in the characteristics of maternity units, including size, throughput and staffing, and in the way in which intrapartum care was organised and configured within NHS trusts. 6 The Birthplace case studies also showed that configuration of care had the potential to impact on effective team working and quality of care. 10 The extent to which these unit- and trust-level characteristics impacted on the care received by women, for example in terms of interventions and maternal outcomes, was not clear. Furthermore, other factors potentially associated with variation in interventions and outcomes, including maternal characteristics, staffing and time of the day/day of the week, were not well understood.
The Birthplace cohort study also revealed that substantial numbers of women planning birth at home or in a MU were transferred to an OU during labour or immediately after giving birth. 7,16 In order to provide evidence-based information to women considering place of birth, more information was required on the maternal characteristics associated with transfer from different settings and on the potential duration of transfer. Information on the possible ways in which the organisation and delivery of services might affect transfer rates was also needed by service providers and by those commissioning maternity services.
Finally, the Birthplace cohort study also identified that a non-negligible proportion (5%) of births planned in MUs or at home were to women at ‘higher risk’ of complications who, according to national guidelines at the time, should have been ‘advised to give birth in an obstetric unit’. 7 Little was known about the maternal demographic and clinical characteristics of these women. Furthermore, findings from the cohort study suggested that the babies of ‘higher risk’ women planning birth at home had poorer perinatal outcomes than those of ‘higher risk’ women planning OU birth, but the extent to which this was attributable to the birth setting or to differences in the clinical characteristics of the two groups was not clear. There was also a need to understand how labour care and transfer were managed in non-OU settings in ‘higher risk’ women and in ‘low risk’ women for whom ‘complicating conditions’ were identified at the start of labour care.
Aims and objectives
Aims
The aim of this ‘follow-on’ project was to support the development and delivery of safe, equitable and effective maternity services by strengthening the evidence base relating to planned place of birth. In particular it aimed to:
-
describe and explore the impact of service configuration and other variations in the organisation and delivery of services on birth outcomes, with a particular focus on maternal outcomes which impact on future pregnancies, such as caesarean section or complicated vaginal delivery
-
further describe intrapartum transfer rates and explore the possible impact of factors relating to the organisation and delivery of services on transfers
-
explore the clinical characteristics, management and outcomes of ‘higher risk’ women who opt for a non-OU birth.
Objectives
The objectives of the research were posed as a series of questions grouped as follows:
The impact of service configuration and organisation on interventions and maternal outcomes in ‘low risk’ women
-
What is the variation between individual units and NHS trusts (for home births) in rates of intervention and maternal outcome?
-
Is there evidence to suggest that rates of intervention and maternal outcome in planned OU births are affected by known characteristics of the OUs or configuration characteristics?
-
Is there evidence to suggest that rates of intervention and maternal outcome in planned AMU births are affected by known characteristics of the AMU?
-
Is there evidence to suggest that rates of intervention and maternal outcome in planned FMU births are affected by known characteristics of the FMU?
-
Is there evidence to suggest that rates of intervention and outcome in planned home births differ in NHS trusts with a high/low volume of planned home births?
Does the effect of planned place of birth on interventions and maternal outcomes vary for different groups of women?
-
Are the relative differences in maternal intervention and outcome rates between birth settings affected by ethnicity, area deprivation or maternal age?
Factors affecting intrapartum transfer of ‘low risk’ women and the transfer process
-
What maternal characteristics known at the start of care in labour are most strongly associated with intrapartum transfer?
-
For women planning birth outside an OU, what is the variation between units and NHS trusts (for home births) in the proportion of women who are transferred from their planned place of birth during or immediately after labour?
-
To what extent can any differences in transfer rates between units and NHS trusts (for home births) be explained by known characteristics of the unit or other aspects of the organisation and delivery of services?
-
Do intrapartum transfer rates vary by time of the day or day of the week in ‘low risk’ women planning birth in each setting?
-
What is the timing and duration of transfer in planned home and FMU births?
-
In planned home and FMU births, does the duration of transfer differ for women transferred for reasons likely to require more urgent transfer compared with women transferred for potentially non-urgent reasons?
Effects of time of day or day of the week on interventions and maternal outcomes in different settings
-
Do interventions and maternal outcomes vary by time of day or day of the week in births planned in each setting?
The characteristics and management of ‘higher risk’ women in non-obstetric unit settings
-
What are the sociodemographic and clinical characteristics of women known to be at ‘higher risk’ of complications prior to the onset of labour who plan to give birth in non-OU settings?
-
How are ‘higher risk’ women who present for planned birth in a non-OU setting managed with respect to transfer? For example, for women who are transferred, what is the distribution of time from start of labour care to the decision to transfer? Do the decision to transfer and timing of transfer depend on maternal characteristics or the presence of other medical/obstetric risk factors?
-
How are ‘low risk’ women managed with respect to transfer from non-OU settings when they are found to have ‘complicating conditions’ at the start of care in labour?
-
Is there any evidence that, in ‘higher risk’ women, the increased risk of adverse perinatal outcomes in planned home births relative to planned OU births is attributable to the planned delivery setting as opposed to differences in the clinical characteristics of the two groups?
This report
This project was conducted as a series of component studies primarily using data from the Birthplace national cohort study, but also incorporating data from a number of additional sources. A detailed description of the cohort study methods, a summary of the other data sources, a description of the statistical methods commonly used across the component studies and the characteristics of the sample of ‘low risk’ women in the Birthplace cohort are presented in Chapter 2. Chapters 3–7 describe each component study in detail, with relevant background literature and rationale, methods, results, discussion and conclusions presented in each chapter. Chapters 3–6 focus on ‘low risk’ women. Chapter 3 covers exploration of variation in maternal intervention and outcome rates between units, in different settings, and considers the extent to which unit- and trust-level characteristics might explain this variation. In Chapter 4 we present analyses exploring associations between planned place of birth, maternal characteristics and interventions during labour and birth, and investigate whether associations between planned place of birth and interventions are modified by ethnicity, area deprivation or maternal age. Chapter 5 considers a number of questions relating to the issue of transfer during labour and the transfer process. In Chapter 6 we explore the extent to which time of day or day of the week are associated with variation in maternal interventions in different settings. Chapter 7 is the only chapter to focus on women with known medical, obstetric or fetal risk factors (‘higher risk’ women); in it we describe the demographic and clinical characteristics of ‘higher risk’ women planning birth in different settings, consider a number of questions relating to the management of ‘higher risk’ women planning birth in non-OU settings and compare outcomes in ‘higher risk’ women planning birth at home with those in women planning OU birth and with those in ‘low risk’ women planning home birth. Finally, in Chapter 8 we provide an overview of the key findings, summarise the main discussion points raised in earlier chapters, present implications for policy and practice and list recommendations for further research.
Acknowledgement of other publications
During the course of this project, several of the analyses described in this report have been published elsewhere. At the end of each chapter in which we have reproduced sections of published papers, under terms of copyright, we include a section acknowledging and citing those publications.
Chapter 2 Methods
Introduction
This project used data from the Birthplace national cohort study, other Birthplace studies and a number of additional sources. This chapter summarises the data sources used, including a detailed description of the Birthplace cohort study methods, describes the characteristics of the Birthplace cohort of ‘low risk’ women used for the analyses presented in Chapters 3–6 and outlines the statistical methods commonly used across the component studies of this project. Methods that are specific to a single component study are described in the relevant chapter.
Data sources
Birthplace national prospective cohort study
The Birthplace cohort study comprised 79,774 women meeting the study eligibility criteria (see Eligibility). Data were collected from the vast majority of NHS trusts providing intrapartum care in England, including 142 (97%) of the 147 NHS trusts supporting home birth, 53 (95%) of FMUs, 43 (84%) of AMUs, and a stratified random sample of 36 OUs. The random sample of OUs was stratified by unit size (< 2600 births, 2600–4850 births and > 4850 births per year) and geographic location (northern or southern England) and was sampled so that each OU in England had approximately the same probability of selection. The cohort included 18,269 births planned at home, 11,666 planned in FMUs, 17,582 planned in AMUs, and 32,257 planned in OUs. Each unit and NHS trust (for home births) collected data for a different length of time within the overall study period of 1 April 2008 to 30 April 2010.
Midwives attending the births collected data using a specially designed site-specific data collection form (see Appendix 1). Data collected include maternal characteristics, risk factors known prior to the onset of labour, labour care, intrapartum transfer details, and maternal and neonatal outcomes by planned place of birth at the start of care in labour. 5,7 In order to validate outcome events and collect more detailed resource use and other information relating to adverse outcome, more detailed follow-up data were collected on a neonatal morbidity form (see Appendix 2).
The cohort study methods are described in full elsewhere7,8 and more detailed information on study design, eligibility, classification of ‘risk status’ and the characteristics of the samples used in the analyses carried out for this ‘follow-on’ project are presented in Birthplace cohort study and data.
Birthplace staffing logs
Staffing and organisational data were collected alongside the Birthplace cohort study in the form of daily staffing and workload logs completed at around 09.00 and 21.00 by midwives in OUs and MUs. The data collected using these logs (see Appendix 3) included the number of women in the unit, the number of midwives and maternity support workers on duty and obstetric cover during the previous 12 hours. Useable staffing data were collected in 30 OUs, 32 AMUs and 29 FMUs participating in the Birthplace cohort study during each unit’s data collection period for the cohort study.
Initial inspection of the data revealed that the level of missing data relating to medical staffing in OUs was too high for the data to be useable. Data on the number of women recorded as being in the unit and the number of midwives recorded as being on duty at 09.00 hours and 21.00 hours were cleaned. Checks were applied to identify any incorrect unit codes, internal inconsistencies or unexpected or implausible values and any missing data that could be derived from other information on the forms. Records containing errors where the correct codes or values could not be inferred were excluded from the analyses.
In total, 19,686 staffing and workload logs were completed. Of these, 17,359 (88%) remained after cleaning (3431 from OUs, 9019 from FMUs and 4909 from AMUs).
Birthplace mapping study
Data from the Birthplace mapping study were collected as part of the Healthcare Commission Maternity Services Review in 200711 and in a follow-up Birthplace mapping survey carried out in 2010. 6 The Healthcare Commission survey was mandatory and included all NHS trusts providing maternity care in England at the time of the survey, covering all aspects of service provision. The 2010 Birthplace mapping survey was not mandatory and addressed a small subset of topics covered in the 2007 survey, aiming to document any changes in configuration and the organisation of care since 2007 (see Appendix 4). Responses to the 2010 survey were received from 63% of the NHS trusts providing maternity care in England at the time of the survey.
Data from the Birthplace mapping study used for the purposes of this follow-on project included NHS trust-level data on the total number of births and the number of home births in the trust, the number of delivery beds or ‘bed spaces’ in units and whether or not FMUs were staffed 24 hours per day.
Office for National Statistics data
We used data from the Office for National Statistics (ONS) on registered maternities in the financial year 2009–10 by establishment and unit type to derive the numbers of women giving birth in each OU (including births in any associated AMU) and each FMU. These were used in conjunction with Birthplace data to derive the number of births per year in each OU and to estimate the proportion of births that were planned outside an OU and ‘out of hospital’ in each NHS trust. These ONS data were licensed under the Open Government Licence v1.0 and derived by BirthChoiceUK. 17
Geographical data
We used postcode data and Google Maps (maps.google.co.uk; Mountain View, CA, USA) to calculate the distance and estimated travel time by road from each FMU to the nearest OU.
Birthplace cohort study and data
Study design
The Birthplace cohort study was a prospective cohort study with planned place of birth at the start of care in labour as the exposure and a composite measure of intrapartum and early neonatal mortality and specific neonatal morbidities as the primary outcome. Four groups of women were defined based on their planned place of birth at the start of care in labour (see Glossary for definitions):
-
planned home birth
-
planned birth in a FMU, that is, a MU not on the same site as an OU
-
planned birth in an AMU, that is, a MU on the same site as an OU
-
planned birth in an OU.
In these ‘follow-on’ analyses the same four groups are compared. Throughout this report we refer to births planned in units or in trusts. We use ‘units’ to refer to births planned in MUs or in OUs and ‘trusts’ to describe births planned at home because home birth services are delivered within NHS trusts.
Eligibility
We used data on women who were eligible for inclusion in the Birthplace cohort study, that is ‘women who were attended by a NHS midwife during labour in their planned place of birth, for any amount of time’,7 excluding the following groups:
-
women who had a caesarean section before labour
-
women who presented in preterm labour (< 37 weeks’ gestation)
-
women with a multiple pregnancy
-
women who received no antenatal care
-
women who had a stillbirth before the start of care in labour.
Samples used for analyses
The sample for the analyses reported in Chapters 3–6 was Birthplace eligible ‘low risk’ women with a term pregnancy (37 to 42 + 0 weeks’ gestation). Women were classified as ‘low risk’ if, before the start of labour, they were not known to have any of the medical, obstetric or fetal risk factors listed in national intrapartum care guidelines in England and Wales as ‘indicating increased risk suggesting planned birth in an obstetric unit’. 13 These risk factors are presented in the sample data collection form in Appendix 1. The maternal sociodemographic and clinical characteristics of the ‘low risk’ sample by parity and planned place of birth are presented in Characteristics of the ‘low risk’ sample.
Women whose pregnancy was post-term (42 + 1 to 44 weeks’ gestation) or who had at least one risk factor identified before the start of labour were classified as ‘higher risk’; analyses relating to these women are presented in Chapter 7, where their characteristics are also described.
‘Complicating conditions’ at the start of labour care
In the Birthplace cohort study attending midwives assessed women for the following risk factors present at the start of care in labour:
-
prolonged rupture of membranes (> 18 hours)
-
meconium-stained liquor
-
proteinuria (1 + or more)
-
hypertension with either:
-
diastolic blood pressure of ≥ 90 mmHg on more than one occasion 20 minutes apart or ≥ 100 mmHg on one occasion
-
systolic blood pressure ≥ 160 mmHg on at least one occasion
-
-
abnormal vaginal bleeding
-
non-cephalic presentation
-
abnormal fetal heart rate
-
other complications not previously identified.
New risk factors identified at the start of care in labour could not affect the woman’s planned place of birth and so these ‘complicating conditions’ did not affect the woman’s ‘risk status’ as defined in Samples used for analyses. However, differences in the prevalence of these ‘complicating conditions’ in different settings could affect the homogeneity and, therefore, comparability of the ‘low risk’ groups. The Birthplace cohort study identified a higher prevalence of women with ‘complicating conditions’ at the start of labour care in ‘low risk’ women planning OU birth than in ‘low risk’ women planning birth elsewhere. 7 For this reason we describe the ‘complicating conditions’ identified in the ‘low risk’ sample by planned place of birth in Characteristics of the ‘low risk’ sample and, for the ‘higher risk’ sample, in Chapter 7. As in the original Birthplace analysis, for some of the analyses reported here we carried out further analyses restricted to women without ‘complicating conditions’ in order to compare groups which were more homogeneous with regard to risk. In other analyses, as appropriate, we adjusted for the presence of ‘complicating conditions’.
Characteristics of the ‘low risk’ sample
The ‘low risk’ Birthplace cohort used for the analyses reported here comprised 19,739 women planning OU birth, 16,753 planning birth in an AMU, 11,210 planning birth in a FMU and 16,632 planning birth at home. The sociodemographic and clinical characteristics of these women are summarised by parity and planned place of birth in Tables 1 and 2. As almost all analyses were carried out stratified by parity, those women in the cohort for whom parity was unknown are not included in these tables.
| Characteristic | OU | Home | FMU | AMU | ||||
|---|---|---|---|---|---|---|---|---|
| n | Weighted %a | n | Weighted %a | n | Weighted %a | n | Weighted %a | |
| Maternal age (years) | ||||||||
| Mean (SD) | 26.8 | 5.9 | 30.2 | 5.0 | 27 | 5.7 | 26.9 | 5.6 |
| < 20 | 1296 | 11.8 | 130 | 3.0 | 574 | 11.1 | 894 | 10.1 |
| 20–24 | 2620 | 24.3 | 446 | 9.8 | 1235 | 24.4 | 2040 | 23.7 |
| 25–29 | 3043 | 29.3 | 1329 | 29.5 | 1531 | 30.2 | 2535 | 30.2 |
| 30–34 | 2351 | 23.3 | 1670 | 37.4 | 1302 | 24.9 | 1984 | 25.3 |
| 35–39 | 968 | 9.9 | 813 | 18.2 | 456 | 8.5 | 752 | 9.8 |
| ≥ 40 | 149 | 1.4 | 94 | 2.0 | 47 | 0.9 | 56 | 0.9 |
| Missing | 12 | 7 | 7 | 15 | ||||
| Ethnicity | ||||||||
| White | 8669 | 81.7 | 4252 | 94.8 | 4745 | 92.3 | 6865 | 80.9 |
| Indian or Bangladeshi | 384 | 3.8 | 22 | 0.5 | 87 | 1.7 | 309 | 4.2 |
| Pakistani | 254 | 2.4 | 6 | 0.1 | 57 | 1.0 | 179 | 2.3 |
| Black Caribbean | 140 | 1.7 | 23 | 0.5 | 24 | 0.4 | 104 | 1.6 |
| Black African | 306 | 3.3 | 23 | 0.6 | 38 | 0.8 | 190 | 2.8 |
| Mixed | 168 | 1.8 | 84 | 1.8 | 61 | 1.2 | 142 | 2.0 |
| Other | 503 | 5.4 | 73 | 1.6 | 138 | 2.6 | 466 | 6.4 |
| Missing | 15 | 6 | 2 | 21 | ||||
| Understanding of English | ||||||||
| Fluent | 9573 | 92.1 | 4459 | 99.5 | 4979 | 96.8 | 7567 | 91.3 |
| Some or none | 783 | 7.9 | 25 | 0.5 | 164 | 3.2 | 679 | 8.7 |
| Missing | 83 | 5 | 9 | 30 | ||||
| Marital/partner status | ||||||||
| Married/living together | 8737 | 85.1 | 4256 | 95.1 | 4578 | 88.9 | 7181 | 87.6 |
| Single/unsupported | 1525 | 14.9 | 208 | 4.9 | 514 | 11.1 | 974 | 12.4 |
| Missing | 177 | 25 | 60 | 121 | ||||
| BMI (kg/m2) | ||||||||
| Mean (SD) | 24.1 | 4.0 | 23.6 | 3.5 | 23.7 | 3.5 | 23.6 | 3.7 |
| Not recorded | 1926 | 19.1 | 884 | 20.1 | 880 | 14.9 | 1410 | 16.7 |
| < 18.5 | 336 | 3.2 | 80 | 1.7 | 120 | 2.5 | 242 | 3.0 |
| 18.5–24.9 | 4879 | 46.9 | 2344 | 53.0 | 2723 | 54.3 | 4385 | 54.3 |
| 25–29.9 | 2356 | 22.3 | 902 | 19.9 | 1091 | 21.5 | 1699 | 20.1 |
| 30–35.0 | 916 | 8.5 | 252 | 5.4 | 333 | 6.8 | 518 | 5.8 |
| Missing | 26 | 27 | 5 | 22 | ||||
| Deprivation quintile | ||||||||
| First (least deprived) | 1608 | 15.0 | 947 | 21.6 | 1081 | 20.1 | 1231 | 12.6 |
| Second | 1974 | 18.6 | 929 | 21.1 | 1173 | 23.5 | 1345 | 15.1 |
| Third | 2041 | 19.3 | 1015 | 23.0 | 1088 | 21.8 | 1668 | 20.5 |
| Fourth | 2240 | 22.2 | 941 | 20.6 | 960 | 19.6 | 1969 | 25.3 |
| Fifth (most deprived) | 2505 | 24.9 | 633 | 13.8 | 835 | 15.0 | 2040 | 26.4 |
| Missing | 71 | 24 | 15 | 23 | ||||
| Gestation (completed weeks) | ||||||||
| Mean (SD) | 39.8 | 1.1 | 39.8 | 1.0 | 39.8 | 1.0 | 39.7 | 1.1 |
| 37 | 390 | 3.7 | 106 | 2.2 | 149 | 3.3 | 257 | 3.2 |
| 38 | 1035 | 9.9 | 434 | 9.6 | 473 | 9.1 | 798 | 9.9 |
| 39 | 2367 | 22.8 | 1035 | 22.9 | 1155 | 22.5 | 1995 | 24.9 |
| 40 | 3646 | 35.2 | 1711 | 38.4 | 1965 | 38.0 | 3178 | 37.8 |
| 41 to 42 + 0 | 3001 | 28.4 | 1203 | 26.9 | 1410 | 27.2 | 2048 | 24.1 |
| Missing | 0 | 0 | 0 | 0 | ||||
| Characteristic | OU | Home | FMU | AMU | ||||
|---|---|---|---|---|---|---|---|---|
| n | Weighted %a | n | Weighted %a | n | Weighted %a | n | Weighted %a | |
| Maternal age (years) | ||||||||
| Mean (SD) | 29.9 | 5.6 | 31.4 | 5.2 | 30.3 | 5.4 | 29.7 | 5.4 |
| < 20 | 180 | 2.0 | 87 | 0.8 | 98 | 1.5 | 157 | 1.8 |
| 20–24 | 1535 | 16.8 | 1242 | 10.5 | 881 | 14.9 | 1405 | 16.1 |
| 25–29 | 2573 | 28.3 | 2970 | 24.7 | 1714 | 28.9 | 2429 | 29.3 |
| 30–34 | 2634 | 29.9 | 4100 | 33.8 | 1918 | 31.4 | 2559 | 31.2 |
| 35–39 | 1627 | 18.8 | 3145 | 25.5 | 1222 | 20.0 | 1463 | 18.3 |
| ≥ 40 | 363 | 4.1 | 562 | 4.6 | 205 | 3.2 | 239 | 3.4 |
| Missing | 11 | 24 | 7 | 23 | ||||
| Ethnicity | ||||||||
| White | 7116 | 78.7 | 11476 | 94.7 | 5504 | 91.6 | 6484 | 76.0 |
| Indian or Bangladeshi | 383 | 4.2 | 57 | 0.5 | 145 | 2.1 | 327 | 4.6 |
| Pakistani | 372 | 4.1 | 34 | 0.3 | 106 | 1.6 | 364 | 4.5 |
| Black Caribbean | 124 | 1.7 | 103 | 0.8 | 23 | 0.4 | 93 | 1.4 |
| Black African | 347 | 4.3 | 87 | 0.7 | 56 | 0.9 | 326 | 4.7 |
| Mixed | 150 | 1.7 | 193 | 1.7 | 63 | 0.9 | 149 | 2.0 |
| Other | 420 | 5.3 | 165 | 1.4 | 145 | 2.5 | 518 | 6.9 |
| Missing | 11 | 15 | 3 | 14 | ||||
| Understanding of English | ||||||||
| Fluent | 8154 | 91.6 | 12047 | 99.4 | 5864 | 97.2 | 7485 | 90.1 |
| Some or none | 709 | 8.4 | 63 | 0.6 | 163 | 2.8 | 758 | 9.9 |
| Missing | 60 | 20 | 18 | 32 | ||||
| Marital/partner status | ||||||||
| Married/living together | 8073 | 91.6 | 11591 | 96.1 | 5788 | 96.2 | 7700 | 94.0 |
| Single/unsupported | 717 | 8.4 | 454 | 3.9 | 199 | 3.8 | 459 | 6.0 |
| Missing | 133 | 85 | 58 | 116 | ||||
| BMI (kg/m2) | ||||||||
| Mean (SD) | 24.7 | 4.1 | 24.2 | 3.8 | 24.4 | 3.8 | 24.4 | 3.8 |
| Not recorded | 1558 | 18.1 | 2345 | 19.3 | 967 | 13.7 | 1475 | 17.5 |
| < 18.5 | 225 | 2.5 | 237 | 2.0 | 112 | 2.0 | 194 | 2.5 |
| 18.5–24.9 | 3846 | 43.3 | 5702 | 47.2 | 2842 | 48.3 | 3765 | 46.5 |
| 25–29.9 | 2295 | 25.4 | 2833 | 23.4 | 1542 | 26.4 | 2053 | 24.7 |
| 30–35.0 | 975 | 10.6 | 955 | 8.1 | 572 | 9.7 | 745 | 8.8 |
| Missing | 24 | 58 | 10 | 43 | ||||
| Deprivation quintile | ||||||||
| First (least deprived) | 1494 | 16.5 | 2695 | 22.4 | 1401 | 21.2 | 1289 | 13.5 |
| Second | 1594 | 17.8 | 2501 | 20.7 | 1394 | 23.9 | 1275 | 14.6 |
| Third | 1596 | 18.0 | 2588 | 21.5 | 1196 | 21.6 | 1538 | 18.6 |
| Fourth | 1767 | 20.1 | 2344 | 19.6 | 1102 | 19.4 | 1850 | 23.9 |
| Fifth (most deprived) | 2420 | 27.7 | 1911 | 15.8 | 936 | 13.9 | 2298 | 29.3 |
| Missing | 52 | 91 | 16 | 25 | ||||
| Gestation (completed weeks) | ||||||||
| Mean (SD) | 39.7 | 1.1 | 39.7 | 1.0 | 39.7 | 1.0 | 39.7 | 1.0 |
| 37 | 326 | 3.7 | 270 | 2.2 | 165 | 2.7 | 216 | 2.7 |
| 38 | 930 | 10.6 | 1130 | 9.2 | 505 | 8.4 | 766 | 9.8 |
| 39 | 2186 | 24.7 | 3052 | 25.0 | 1512 | 24.6 | 2130 | 25.9 |
| 40 | 3325 | 37.0 | 4882 | 40.5 | 2392 | 39.5 | 3302 | 39.6 |
| 41 to 42 + 0 | 2156 | 24.0 | 2796 | 23.2 | 1471 | 24.8 | 1861 | 22.0 |
| Missing | 0 | 0 | 0 | 0 | ||||
| Previous pregnancies ≥ 24 completed weeks | ||||||||
| 1 previous | 5677 | 64.0 | 6457 | 53.1 | 3894 | 65.0 | 5586 | 67.6 |
| 2 previous | 2002 | 22.1 | 3630 | 30.2 | 1503 | 24.4 | 1924 | 23.2 |
| ≥ 3 previous | 1244 | 13.9 | 2043 | 16.7 | 648 | 10.6 | 765 | 9.2 |
| Missing | 0 | 0 | 0 | 0 | ||||
Compared with women planning birth in an OU, women planning birth at home tended to be older; 20.2% of nulliparous women and 30.1% of multiparous women planning birth at home were aged ≥ 35 years vs. 11.3% and 22.9%, respectively, of those planning birth in OUs. Women planning home birth were also more likely to be white, have fluent understanding of English, be married or living with a partner and be living in a more socioeconomically advantaged area than were the OU group. There was little difference between the two settings in the distribution of gestational age and body mass index (BMI). The characteristics of women planning FMU or AMU birth tended to fall between the planned OU and planned home birth groups; the AMU group tended to have similar characteristics to the OU group, while the FMU group tended to be more similar to the home birth group. The planned home birth group had the lowest proportion of multiparous women who had only one previous pregnancy (≥ 24 weeks’ gestation) and the highest proportion with three or more previous pregnancies.
In all settings, the proportion of women with one or more ‘complicating condition’ identified at the start of labour care was higher in nulliparous women than in multiparous women (Tables 3 and 4). A higher proportion of women in the planned OU group had one or more ‘complicating condition’ identified than did women planning birth in the other settings (nulliparous 23.9% vs. 7.5–9.0%; multiparous 14.7% vs. 4.1–5.2%). Prolonged rupture of membranes (> 18 hours) was the most commonly recorded ‘complicating condition’ in all settings in nulliparous women and in planned home and FMU births in multiparous women. In multiparous women planning OU birth, meconium-stained liquor was also common.
| Condition | OU | Home | FMU | AMU | ||||
|---|---|---|---|---|---|---|---|---|
| n | Weighted %a | n | Weighted %a | n | Weighted %a | n | Weighted %a | |
| Prolonged rupture of membranes > 18 hours | 1003 | 9.9 | 189 | 4.3 | 141 | 2.9 | 258 | 3.3 |
| Meconium-stained liquor | 746 | 7.2 | 93 | 2.1 | 76 | 1.6 | 133 | 1.7 |
| Proteinuria (1+ or more) | 234 | 2.3 | 35 | 0.8 | 75 | 1.8 | 226 | 2.6 |
| Hypertension | 361 | 3.4 | 38 | 0.9 | 46 | 1.1 | 76 | 1.0 |
| Abnormal vaginal bleeding | 162 | 1.7 | 20 | 0.5 | 12 | 0.2 | 29 | 0.4 |
| Non-cephalic presentation | 62 | 0.6 | 17 | 0.4 | 14 | 0.2 | 18 | 0.2 |
| Abnormal fetal heart rate | 249 | 2.4 | 31 | 0.7 | 36 | 0.6 | 40 | 0.6 |
| Other ‘complicating condition’ | 37 | 0.3 | 10 | 0.3 | 9 | 0.2 | 8 | 0.1 |
| Any ‘complicating conditions’ | 2467 | 23.9 | 394 | 9.0 | 364 | 7.5 | 719 | 8.9 |
| Number of ‘complicating conditions’ per woman | ||||||||
| 0 | 7933 | 76.1 | 4047 | 91.0 | 4779 | 92.5 | 7536 | 91.1 |
| 1 | 2123 | 20.5 | 360 | 8.2 | 322 | 6.4 | 663 | 8.1 |
| ≥ 2 | 344 | 3.4 | 34 | 0.8 | 42 | 1.1 | 56 | 0.7 |
| Condition | OU | Home | FMU | AMU | ||||
|---|---|---|---|---|---|---|---|---|
| n | Weighted %a | n | Weighted %a | n | Weighted %a | n | Weighted %a | |
| Prolonged rupture of membranes > 18 hours | 440 | 4.9 | 202 | 1.7 | 87 | 1.6 | 120 | 1.4 |
| Meconium-stained liquor | 478 | 5.4 | 145 | 1.3 | 62 | 1.0 | 98 | 1.2 |
| Proteinuria (1+ or more) | 111 | 1.2 | 44 | 0.4 | 35 | 0.8 | 142 | 1.7 |
| Hypertension | 136 | 1.5 | 52 | 0.5 | 31 | 0.6 | 36 | 0.5 |
| Abnormal vaginal bleeding | 107 | 1.2 | 20 | 0.2 | 10 | 0.1 | 8 | 0.1 |
| Non-cephalic presentation | 45 | 0.6 | 20 | 0.2 | 10 | 0.2 | 11 | 0.1 |
| Abnormal fetal heart rate | 134 | 1.5 | 34 | 0.3 | 15 | 0.3 | 24 | 0.3 |
| Other ‘complicating condition’ | 17 | 0.2 | 4 | 0.0 | 8 | 0.2 | 9 | 0.1 |
| Any ‘complicating conditions’ | 1305 | 14.7 | 490 | 4.1 | 250 | 4.6 | 428 | 5.2 |
| Number of ‘complicating conditions’ per woman | ||||||||
| 0 | 7582 | 85.3 | 11509 | 95.9 | 5788 | 95.4 | 7826 | 94.8 |
| 1 | 1168 | 13.2 | 474 | 3.9 | 242 | 4.4 | 408 | 4.8 |
| ≥ 2 | 137 | 1.5 | 16 | 0.2 | 8 | 0.2 | 20 | 0.3 |
Characteristics of the ‘higher risk’ sample
The sociodemographic and clinical characteristics of ‘higher risk’ women in the Birthplace cohort are described in Chapter 7.
Statistical methods
In this section we describe the most commonly used statistical methods in this report. Additional methods used for specific parts of each component study are described in the relevant chapters. All statistical analyses were carried out using Stata v13.1 (StataCorp LP, College Station, TX, USA) except for decision tree analysis [chi-squared automatic interaction detection (CHAID)], which was carried out using SPSS v20 (IBM Corporation, Armonk, NY USA). Many analyses were exploratory in nature and involved multiple testing. As specified in the protocol, two-sided p-values < 0.05 were taken to indicate statistical significance, but multiple testing was considered when interpreting the results.
Outcome measures
We used a number of main outcome measures in these analyses. While many of these are described as ‘maternal’ outcomes, it should be noted that several, for example, instrumental delivery and caesarean section, may also have implications for outcomes for the baby.
Maternal outcomes
Two measures of intervention during labour and birth:
-
instrumental delivery (ventouse or forceps)
-
intrapartum caesarean section.
A measure indicating birth without complications that might affect future births:
-
‘straightforward birth’, defined as birth without caesarean section, forceps or ventouse, third-/fourth-degree perineal trauma, or blood transfusion.
A measure indicating ‘low intervention’ during labour and birth:
-
‘normal birth’, defined as birth without induction of labour, epidural or spinal analgesia, general anaesthetic, forceps or ventouse, caesarean section, or episiotomy. 12
In addition, as a secondary outcome, we used a measure capturing intrapartum interventions and adverse maternal outcomes requiring obstetric care:
-
‘maternal composite’, defined as one or more of augmentation, forceps or ventouse, intrapartum caesarean section, general anaesthetic, blood transfusion, third-/fourth-degree perineal trauma, and maternal admission to higher-level care.
Transfers
-
Intrapartum transfer during labour or immediately after birth.
-
Duration of transfer.
Perinatal outcomes
As our main perinatal outcome we used a composite encompassing the Birthplace primary outcome and admission to a neonatal unit within 48 hours of birth for > 48 hours. Including neonatal admission in this way increased statistical power but avoided the inclusion of transient admissions for observation where the threshold for admission might be affected by birth setting.
As a secondary perinatal outcome we used the original Birthplace primary outcome. 7 This reflected adverse perinatal outcomes that may be related to the quality of intrapartum care, and comprised stillbirth after the start of care in labour; early neonatal death; neonatal encephalopathy; meconium aspiration syndrome; brachial plexus injury; and fractured humerus or clavicle.
Maternal characteristics
Several analyses in this report examine associations after adjustment for maternal characteristics. Unless otherwise stated we adjusted for the following maternal characteristics using the categories shown in brackets:
-
parity (nulliparous vs. multiparous)
-
maternal age (< 20, 20–24, 25–29, 30–34 and ≥ 35 years)
-
ethnicity (white vs. non-white)
-
Index of Multiple Deprivation (IMD) quintile [first (least deprived), second, third, fourth and fifth (most deprived)]
-
completed weeks of gestation (37, 38, 39, 40, and 41 to 42 + 0 completed weeks)
-
BMI (not recorded, < 18.5, 18.5–24.9, 25–29.9 and ≥ 30 kg/m2)
-
marital/partner status (married/living together vs. single/unsupported)
-
understanding of English (fluent vs. some or none)
-
presence of ‘complicating conditions’ identified at the start of care in labour (≥ 1 vs. 0).
For some analyses categories were combined (as described in individual chapters) for ease of interpretation or to avoid having very small numbers in some groups.
Almost all analyses were carried out separately for nulliparous and multiparous women. Where nulliparous and multiparous women were included in the same analysis parity was included as an adjustment variable. For some analyses relating to multiparous women the number of previous pregnancies of at least 24 weeks’ gestation (1, 2 or ≥ 3) was also included as an adjustment variable.
Poisson regression models
Most of the analyses estimating associations between maternal characteristics and perinatal or maternal outcomes or interventions were carried out using Poisson regression (generalised linear models with a Poisson distribution for the response and a log link). This allowed us to estimate the relative risks (RRs) of different outcomes while adjusting for the effects of other maternal factors which might differ between the groups of interest. For factors with several categories (e.g. BMI), the overall effect of each factor was determined using a Wald test, and p-values for these tests are presented in the relevant tables.
Weighting
All AMUs, FMUs and NHS trusts (for home births) in England were invited to participate in the Birthplace study; nearly all participated, but each unit and trust participated for a different length of time. OUs were selected from the population of OUs in England using stratified random sampling. As a consequence of these design features, the probability of a woman being selected to take part in the study varied. Probability weights inversely proportional to the duration of data collection in the unit/trust and the probability of selection of the unit were incorporated to adjust for this. Using probability weights, in effect, allowed us to make estimates of rates, proportions and the effects of various factors in the population of England rather than just in the sample.
Unless otherwise stated, all Poisson regression models and funnel plots used probability weighting. Where noted in the results tables, ‘weighted percentages’ were used in the same way to provide population estimates.
Robust standard errors
Standard regression models assume independence of observations. The design of the Birthplace cohort study was such that women were grouped by the unit or trust in which they planned to give birth, and it might be expected that outcomes would be more similar among women in the same unit or trust than for a random sample of women from the population as a whole. To allow for this, robust standard errors were used in all regression analyses unless otherwise stated. It should be noted that using robust standard errors does not affect the estimated RRs, only the confidence intervals (CIs), which are generally widened, and therefore gives more conservative estimates of effect by correctly taking account of the clustered (i.e. non-independent) nature of the data.
Calculation of adjusted rates for individual units or trusts
In the analyses reported in Chapters 3 and 5 we aimed to compare unit or trust ‘rates’ of intervention, maternal outcome and transfer. We use the word ‘rate’ as a synonym for proportion or ratio, that is, to express the proportion of women planning birth in the unit who experienced the specified intervention or outcome. While we appreciate that the use of the word ‘rate’ in this context is incorrect in strict epidemiological terms, it is commonly used and understood in these circumstances. 18
We calculated unadjusted (observed) event rates for the various outcome measures in each unit or trust separately for nulliparous and multiparous women by dividing the number of women with a given intervention or outcome by the total number of women in the Birthplace dataset in that unit or trust. We then calculated adjusted unit- and trust-level event rates using an indirect standardisation procedure to allow units or trusts to be compared as if each had the same ‘typical’ case mix of women in the sample. 18,19 Briefly, for each outcome measure, a multiple logistic regression model was used to estimate the probability of a woman having had the intervention or outcome on the basis of her demographic and clinical characteristics (see Maternal characteristics). These probabilities were then summed to give the unit’s predicted rate for each outcome. Adjusted rates for births planned in each unit or trust were calculated by dividing the unit or trust’s (observed) unadjusted rate by its predicted (or ‘expected’) rate, and multiplying this by the average rate across all units or trusts of that type in the sample.
Funnel plots
Funnel plots were used for some of the analyses reported in Chapters 3 and 5 to assess whether our data showed variation in adjusted intervention, outcome or transfer rates between individual units or trusts that was greater than we might expect to observe by chance. 19 These funnel plots show adjusted intervention or outcome rates for different units plotted against the sample size (number of women) (Figure 1).
FIGURE 1.
Example of a funnel plot.

The range of values that are likely to occur by chance for samples of that size if in reality all units have the same underlying rate are shown as ‘control limits’ on these plots. As the range of values attributable to chance becomes smaller with increasing sample size the upper and lower control limits become closer together as sample size increases along the horizontal axis, giving rise to the funnel plot’s name. We used conventional control limits at two and three standard deviations from the mean which identify the range of values in which approximately 95% and 99.8% of observed rates would be likely to fall if there was no variation in the underlying rates. The most useful interpretation of these funnel plots is, therefore, that if appreciably more than 5% (or 0.2%) of units fall outside the control limits on the graph this suggests there was more variation in the rates than could be explained by chance and that some cause(s) other than chance may, therefore, have accounted for at least some of the variation.
Linear regression
In Chapters 3 and 5 we used simple linear regression to examine associations between unit or trust characteristics and adjusted intervention, outcome and transfer rates. The adjusted intervention, outcome or transfer rate was calculated for each unit or trust, and these were regressed on selected unit/trust characteristics in turn to examine whether or not some of the variation could be explained by the unit characteristic. Individual units’ data were weighted according to the number of women in the sample for that unit and robust standard errors were used to allow for non-uniformity in the variance of unit rates with changes in some of the unit characteristics. A statistically significant result indicated that at least part of the variation in the outcome rates could be explained by that unit characteristic, with the R2 statistic giving the proportion of variance explained and the sign of the coefficient giving the direction of the relationship (positive or negative). Significant relationships were also plotted graphically and, where the graph suggested the relationships might have been heavily dependent on a small number of outliers, sensitivity analyses were carried out by repeating the regressions while excluding the outliers identified on the graphs.
Patient and public involvement
The views of users of maternity services were represented throughout the Birthplace research programme through the presence of a co-investigator from NCT (formerly the National Childbirth Trust) and several service user representatives in the Birthplace Advisory Group. Users of maternity services have had input to this ‘follow-on’ project through the continuing involvement of NCT. The National Perinatal Epidemiology Unit (NPEU) Advisory Committee, which includes representatives from a number of maternity service users groups, has also discussed and commented on this project as it has progressed.
During the Birthplace research programme, patient and public involvement as part of the research team influenced the design and conduct of the research, for example, leading to the inclusion of positive measures of outcome, such as ‘normal birth’, and careful consideration of the language and terminology used in dissemination of the results. This formal patient and public involvement has continued during this ‘follow-on’ project and has been complemented by active engagement with users of the research through ongoing Birthplace dissemination activities. This has included lectures, workshops and conferences involving midwives, antenatal teachers and other groups working with users of maternity services and collaborations with local clinical midwifery teams to develop information materials for women based on the Birthplace evidence. These activities have ensured that the research team maintains a focus on issues that are important to the users of maternity services and those working with them.
Chapter 3 Variation between units in interventions and maternal outcomes in ‘low risk’ women and the impact of unit characteristics, service configuration and trust-level characteristics
Introduction
Overall rates of medical intervention during labour and childbirth are increasing in many countries, although they are levelling off in some where rates are highest. 20–22 Information about intervention rates in individual maternity units in the UK is available online to inform women’s decision-making about place of birth,17,23 and has also been proposed as a basis for quality indicators, with the recognition that it is important to understand the potential sources of variation in these rates. 18,24
Maternal characteristics and clinical risk factors of women planning birth differ between hospitals and can affect intervention rates, but studies of OU intrapartum intervention rates in England indicate that these factors alone explain only a small part of the wide variation seen. 18,25,26 These studies have focused on births occurring in OUs, rather than planned in OUs, and may also include births occurring in associated AMUs as staffing and routine data collection in OUs and AMUs are not always separated and distinct. We are not aware of any previous study exploring variation in intervention rates in births planned in OUs or in births planned in other settings. Analyses presented in this chapter explore variation in unit intervention rates in ‘low risk’ women planning birth in each institutional setting (OU, AMU and FMU) and in NHS trusts providing home birth services and, first, investigate the extent to which this variation can be explained by maternal characteristics.
Studies have also explored the impact of organisational factors, including obstetric and midwifery staffing,27 unit size and the level of specialist care available,28–30 on intervention rates during labour and birth. These have also focused on intervention rates in births occurring in OUs, rather than in other settings for birth, and have shown inconclusive or mixed results and that there is little evidence from the UK. In recent years there has been a move towards fewer, larger OUs in England,31 with the assumption that the increased consultant presence that is possible in larger units will improve quality and safety. 32 Midwifery staffing levels (midwives per birth) have been increasing since 2008, but in 2012 there were fewer midwives per birth than in 2002. 32 A recent national survey found that 63% of trusts had fewer midwives per birth than the recommended minimum level, and only 78% of maternity units reported that they were achieving one-to-one care in labour 90% of the time. 32 Higher midwifery staffing levels are believed to improve outcomes and possibly reduce interventions, but the existing evidence on this is limited. 33 The extent to which variation in intervention rates can be understood by considering differences in characteristics of the unit or NHS trust, including the number of births, staffing and, for FMUs, the distance to the nearest OU, is also considered in this chapter.
Finally, recent years have also seen changes in the configuration of maternity services. In 2007, in England, two-thirds of NHS trusts providing maternity care did so in OUs only. 6 The proportion of OUs in England with an attached AMU has increased, from less than 20% in 2007 to 30% in 2010 and 53% in 2013,6,32 and there has been an increase in the proportion of births in MUs, from 4% in 2006–7 to 11% in 2012. 32 Little appears to be known about the possible effects of the configuration of care on intervention rates, either at a trust level or in individual units. It is plausible, for example, that more women opting for non-OU births might change the case mix of women giving birth in OUs, possibly resulting in a ‘higher risk culture’ developing in OUs. Alternatively, the NHS trusts offering more midwifery-led birth options could be those with a culture of promoting ‘normal birth’ in all maternity settings. We therefore also aimed to explore the extent to which specified aspects of service configuration might explain variation in intervention rates in planned births in OUs.
The results of some of the analyses relating to OUs described and discussed below have also been published elsewhere. 34
Methods
Study population
The main study population for these analyses was ‘low risk’ women with a term pregnancy (37 to 42 + 0 weeks’ gestation) planning a vaginal birth in any of the 43 AMUs, 53 FMUs, or 142 NHS trusts providing home birth services, and a stratified random sample of 36 OUs in which data collection for the Birthplace cohort study took place.
Unit or NHS trust characteristics
Using the methods described in Derivation of unit or NHS trust characteristics we derived the variables summarised in Table 5 to describe units or NHS trusts and configuration of care and considered these as factors which might be associated with the study outcomes.
| Unit or trust characteristic | OU | AMU | FMU | Home |
|---|---|---|---|---|
| Size (number of births) | ✓ | ✓ | ✓ | ✓ |
| Number of delivery beds or bed spaces | ✓ | ✓ | ✓ | ✗ |
| Presence of an AMU | ✓ | ✗ | ✗ | ✗ |
| % of births in the trust taking place at home | ✗ | ✗ | ✗ | ✓ |
| % of births in the trust planned outside the OU | ✓ | ✗ | ✗ | ✗ |
| % of births in the trust planned ‘out of hospital’ | ✓ | ✗ | ✗ | ✗ |
| Midwifery ‘understaffing’ | ✓ | ✓ | ✓ | ✗ |
| Mean number of midwives on duty | ✗ | ✓ | ✓ | ✗ |
| Mean number of midwives on duty per woman in labour | ✗ | ✓ | ✓ | ✗ |
| Distance to nearest OU | ✗ | ✗ | ✓ | ✗ |
| Estimated travel time to nearest OU | ✗ | ✗ | ✓ | ✗ |
| Median transfer time to nearest OU | ✗ | ✗ | ✓ | ✗ |
| 24-hour staffing | ✗ | ✗ | ✓ | ✗ |
| Size index | ✗ | ✓ | ✓ | ✗ |
| Midwifery staffing index | ✗ | ✓ | ✓ | ✗ |
| Distance index | ✗ | ✗ | ✓ | ✗ |
Derivation of unit or NHS trust characteristics
Size (number of births)
For OUs we used ONS data on births in 2009–10 to derive the number of births per year in each hospital. Where there was an AMU in the same hospital as the OU, these data included births in both settings. Using Birthplace monthly logs of planned births in each unit and cohort study data on transfers before birth, we estimated the annual number of births in each AMU and subtracted this from the total number of births in the hospital to estimate the numbers of births in the OU.
For AMUs and FMUs: we used Birthplace monthly logs of planned births to estimate the annual number of women planning birth in each unit by dividing the number of planned births by the duration of data collection for that unit in years.
For home births: for each NHS trust we used data from the 2007 Healthcare Commission Maternity Services Review on the number of home births in the trust. 11
Number of delivery beds or bed spaces
As another indication of the size of a unit, we used data from the 2010 mapping survey on the number of delivery beds or ‘bed spaces’ in the unit on 31 March 2010. 6 For units that did not reply to the 2010 survey, we used data from the 2007 Healthcare Commission Maternity Services Review. 11
Presence of an alongside midwifery unit
An OU was defined as having an AMU if the associated AMU was open for the whole of the period when cohort study data for the OU were being collected.
Percentage of births in each NHS trust taking place at home
For each NHS trust we used data from the 2007 Healthcare Commission Maternity Services Review on the number of home births and the total number of births in the trust to calculate the percentage of births for which intrapartum care was provided by the trust, but took place at home. 11
Percentage of births in each NHS trust planned outside an obstetric unit and ‘out of hospital’
We used Birthplace monthly logs of planned births in units and at home to calculate the number of births planned to take place outside an OU (i.e. in an AMU, in a FMU or at home) and ‘out of hospital’ (i.e. in a FMU or at home) in each NHS trust. The total number of births in the NHS trust was calculated by summing ONS data on maternities in 2009–10 for each of the OUs and MUs in the trust (OU, AMU and FMU) and adding to this the estimated annual number of home births in the trust (planned minus transferred) from Birthplace data. Unplanned home births were excluded from both the numerator and the denominator.
Midwifery staffing levels and ‘understaffing’
For OUs we used data from the Birthplace staffing logs to estimate the proportion of shifts with at least one woman in the unit where the total number of women in the delivery suite or labour ward exceeded the number of midwives on duty as a measure of midwifery ‘understaffing’.
For AMUs and FMUs: we calculated the mean number of midwives on duty and the mean number of midwives on duty per woman in labour for shifts when there was at least one woman in labour for each of the AMUs and FMUs. We also estimated midwifery ‘understaffing’ in AMUs and FMUs using the proportion of shifts with at least one woman in labour where the number of women in labour exceeded the number of midwives on duty.
The Birthplace staffing log sheets from each unit included data recorded for two shifts, with data points at 09.00 and 21.00. Proportions of shifts ‘understaffed’ included all morning and evening shifts at each unit for which data were available.
Distance to nearest obstetric unit
For each FMU we used postcode data and Google Maps to calculate the distance and estimated travel time by road to the nearest OU in the same trust. We used Birthplace data on transfer times to calculate the median time from the start of transfer to the start of care in an OU for women transferred from each FMU.
Twenty-four-hour staffing
We used data from the 2010 Birthplace mapping survey6 (see Appendix 4) or, if no data were available, the 2007 Healthcare Commission Maternity Services Review11 to identify whether or not each FMU was staffed 24 hours per day.
Size, staffing and distance indices
Because several variables in our data set may have been interpreted as indicators of the same underlying characteristics of the units we combined these into single indices for size, staffing and, for FMUs only, distance from the nearest OU, using methods described in Statistical methods, Size, staffing and distance indices. The size index used data on the number of delivery beds, the number of women planning birth in the unit per year and the mean number of midwives on duty when there was at least one woman in labour. The staffing index used the mean number of midwives on duty per woman in labour and the percentage of shifts ‘understaffed’. The distance index (for FMUs) was based on distance and travel time to the nearest OU measured using Google Maps and the median transfer time for that unit from the Birthplace cohort study. Larger indices indicate larger units, higher staffing levels and units further away from the nearest OU.
Outcome measures
We used the following four main ‘outcome measures’, two capturing interventions during labour and birth, one indicating birth without complications that might affect future births and one indicating birth with low intervention:
-
intrapartum caesarean section
-
instrumental delivery (forceps or ventouse)
-
‘straightforward birth’, defined as birth without forceps or ventouse, intrapartum caesarean section, third- or fourth-degree perineal trauma or blood transfusion
-
‘normal birth’, defined as birth without induction of labour, epidural or spinal analgesia, general anaesthetic, forceps or ventouse, caesarean section or episiotomy. 12
For each we calculated adjusted unit or trust (for home birth) rates. For analyses of OU intervention rates we also used the following additional ‘outcome measures’, not included in the original planned analyses, to help to explain observations from the analyses of our main outcome measures:
-
epidural or spinal analgesia
-
augmentation with oxytocin.
Unit/trust rates of each intervention or outcome were adjusted for the maternal characteristics listed in Chapter 2 (see Maternal characteristics) and for the presence of one or more ‘complicating conditions’ identified at the start of care in labour, as described in Chapter 2 (see ‘Complicating conditions’ at the start of labour care).
Statistical methods
Calculation of intervention and outcome rates
We calculated unadjusted (observed) event rates in each unit or NHS trust (for home births) separately for nulliparous and multiparous women by dividing the number of women with a given intervention or outcome by the total number of women in the Birthplace data set in that unit. Adjusted unit-level event rates were calculated using an indirect standardisation procedure (see Chapter 2, Calculation of adjusted rates for individual units or trusts). 18,19
Variation between units/trusts in rates of maternal interventions or outcomes
We plotted the adjusted event rates against the numbers of women in the Birthplace sample on funnel plots with 95% and 99.8% control limits as described in Chapter 2 (see Funnel plots). 19 The control limits, which represent approximately two and three standard deviations, respectively, around the overall mean event rate, were used to assess whether or not there was more variation than might be expected by chance after allowing for differences in maternal characteristics between units. 19
Size, staffing and distance indices
Indices of size, staffing and distance from the nearest OU were created by combining several variables indicative of each of these characteristics as described in Derivation of unit or NHS trust characteristics, Size, staffing and distance indices. Principal components analysis was used to combine the measurements in each index, with the score on the first principal component being taken as the measurement for that unit’s size, staffing or distance from an OU. These ‘measurements’ have no units, but indicate which units are bigger, better staffed or further from an OU than other units in the data set.
Effects of unit or configuration characteristics on intervention and outcome rates
Simple linear regression was used to investigate whether unit or configuration characteristics were associated with variations in the study outcomes (the adjusted event rates). The adjusted event rates were regressed on each of the unit characteristics in turn. Robust standard errors were used to take account of non-constant variance among the outcome rates with increases in some of the unit characteristics (heteroscedasticity). The regressions were also weighted to take account of the number of observations used to calculate each unit’s event rate.
Further exploratory analyses
We carried out a series of post-hoc analyses to further explore some of the associations found in the analyses relating to OUs. First, because of their possible association with other interventions we carried out additional analyses of rates of augmentation and epidural or spinal analgesia use. Second, we explored whether or not the proportion of planned births in an OU that were ‘higher risk’ (estimated from the Birthplace cohort) had an impact on intervention rates in planned ‘low risk’ births in OUs. Third, we investigated whether or not intervention rates were correlated in ‘low risk’ and ‘higher risk’ women within the same OU. Pearson’s correlation coefficients were used to describe the strength of association between rates and p-values were calculated after verifying approximate Gaussian distributions of the variables. Finally, we examined whether or not OUs situated in trusts with a higher percentage of non-OU births tended to be those with an associated AMU.
Sensitivity analyses
We plotted significant relationships between unit or configuration characteristics and outcome measures on scatter graphs; where these suggested that the relationships might have been heavily dependent on a small number of outliers, sensitivity analyses were carried out by repeating the regressions while excluding the outliers identified on the graphs.
Results
Characteristics of obstetric units in the study sample
For 1 of the 36 OUs included in the study we had insufficient data on the associated AMU to enable us to estimate the number of births in the OU. The remaining OUs varied in size, as measured by number of births per year, and in the number of delivery beds (Table 6). Data on midwifery staffing were available for only 30 OUs, but a relatively high proportion (median 30%) of shifts in those OUs were ‘understaffed’, with less than one midwife for each woman in labour. For six OUs it was not possible to calculate the proportion of non-OU and ‘out-of-hospital’ births because insufficient data were available to estimate the annual number of planned FMU births (four trusts) or home births (two trusts). In line with national figures, a relatively small proportion of births were planned to take place outside OUs and ‘out of hospital’, but with some variation between trusts. Nine OUs had an associated AMU in the same hospital.
| Unit or configuration characteristic | n | Median (IQR) | Min. | Max. |
|---|---|---|---|---|
| Sizea | 35 | 2919 (2361–3849) | 1380 | 6490 |
| Number of delivery bedsb | 36 | 10 (8–12) | 5 | 19 |
| % midwifery ‘understaffing’c | 30 | 29.6 (20.5–41.8) | 4.4 | 83.6 |
| % of planned non-OU birthsd | 30 | 3.0 (2.3–7.9) | 0.4 | 37.2 |
| % of planned ‘out-of-hospital’ birthse | 30 | 2.4 (1.4–4.1) | 0.4 | 10.2 |
Variation in intervention rates between obstetric units
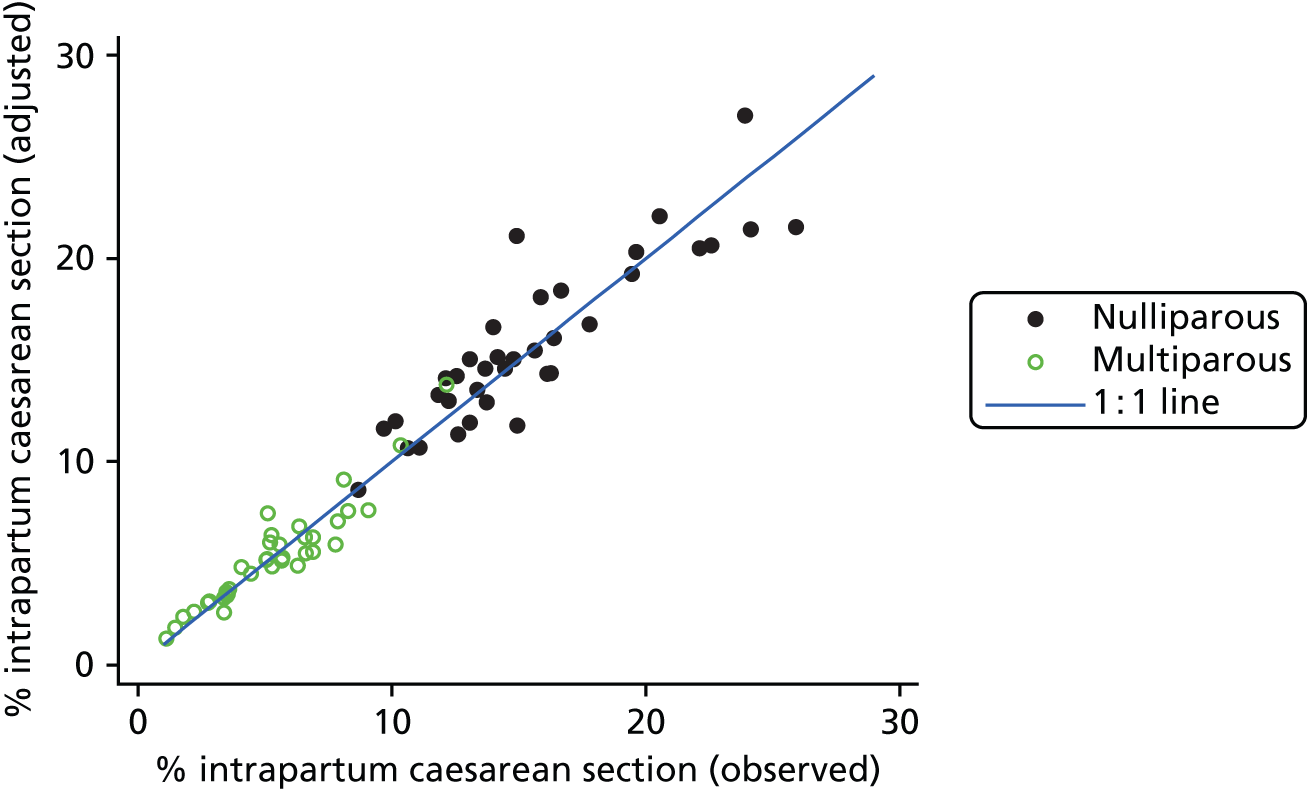
We examined intervention rates, both unadjusted and adjusted for differences in maternal characteristics between OUs, to study the variation between OUs. Adjustment generally had little effect on the rates (see example in Figure 2) and so subsequent figures and tables all use adjusted rates.
FIGURE 2.
Adjusted vs. unadjusted intrapartum caesarean section rates in OUs.
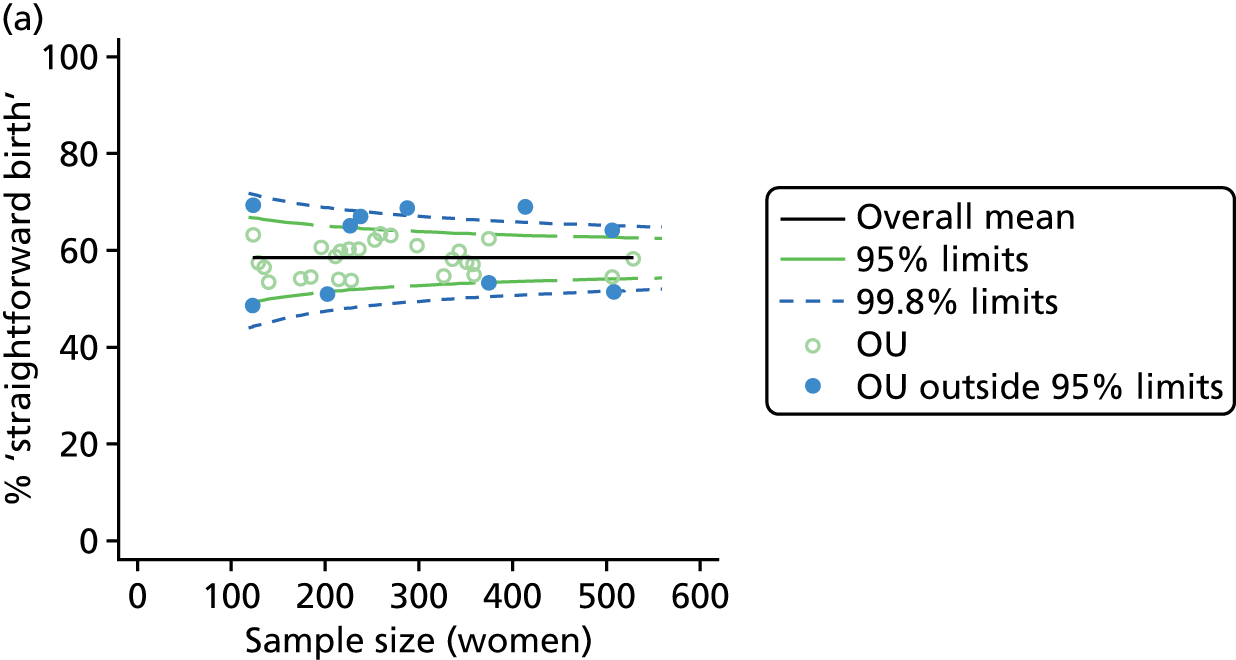
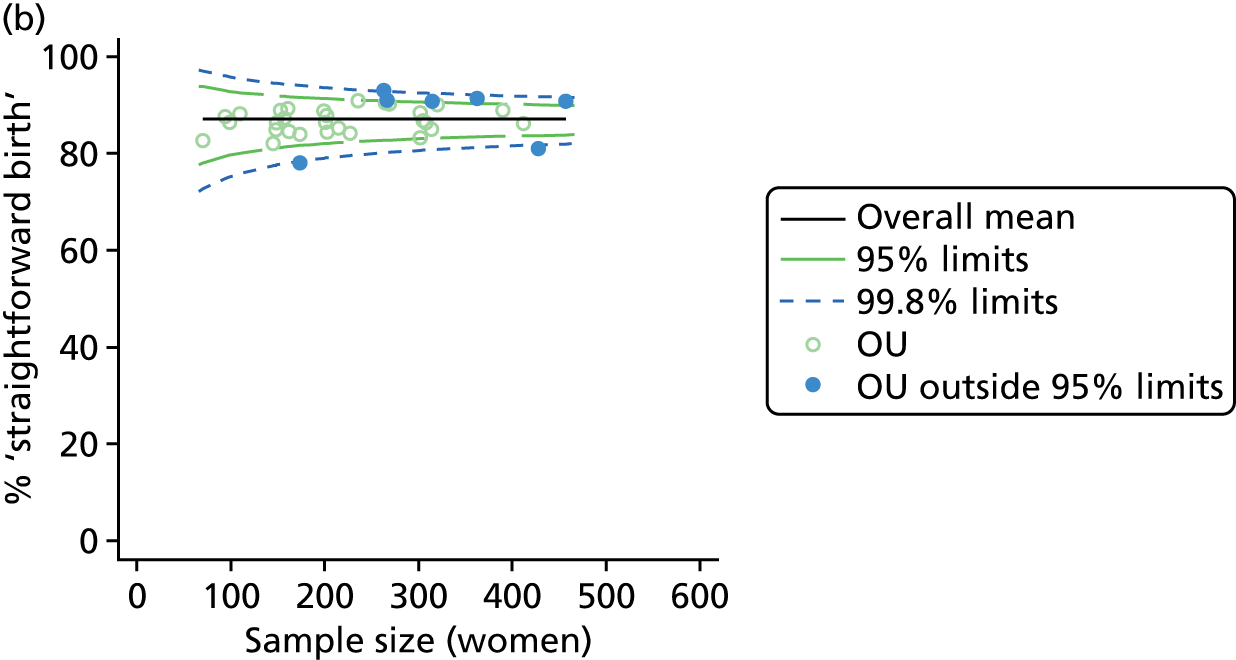
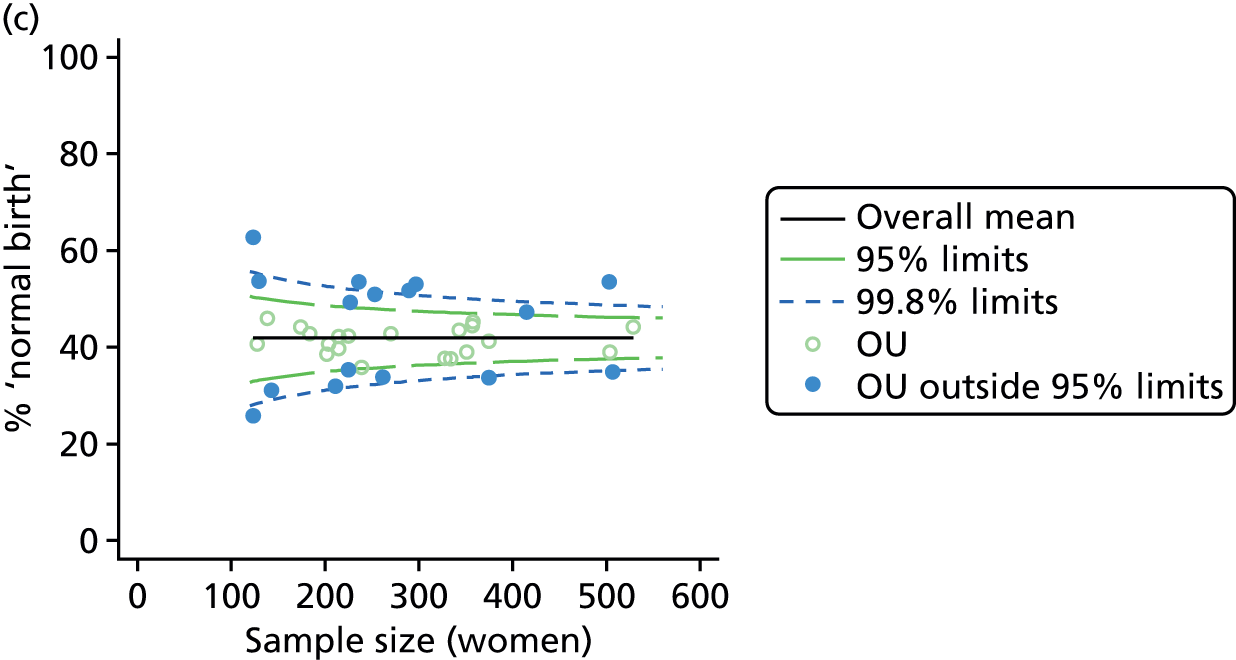
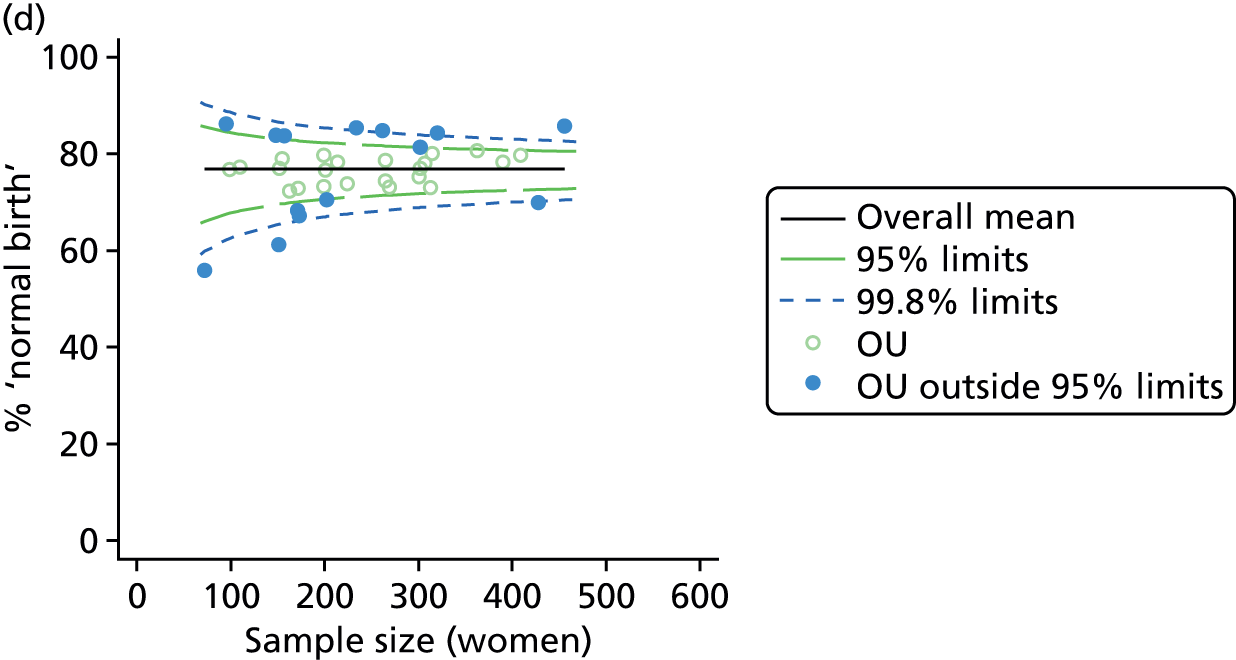
For all study outcomes, funnel plots showed that there was more variation in adjusted intervention rates in nulliparous and multiparous women planning birth in OUs than would be expected by chance alone (Figures 3 and 4). There was more variation in intervention rates in nulliparous women than in multiparous women for all outcomes except ‘normal birth’, where the variation in rates in nulliparous and multiparous women was similar (Table 7). There was more variation in rates of ‘normal birth’ than for our other maternal outcome, ‘straightforward birth’. For most outcomes the number of OUs with intervention rates that were higher or lower than would be expected by chance was broadly similar (see Figures 3 and 4).
FIGURE 3.
Funnel plots showing adjusted instrumental delivery and intrapartum caesarean section rates in OUs. (a) Percentage of instrumental delivery in nulliparous women; (b) percentage of instrumental delivery in multiparous women; (c) percentage of caesarean section in nulliparous women; and (d) percentage of caesarean section in multiparous women.
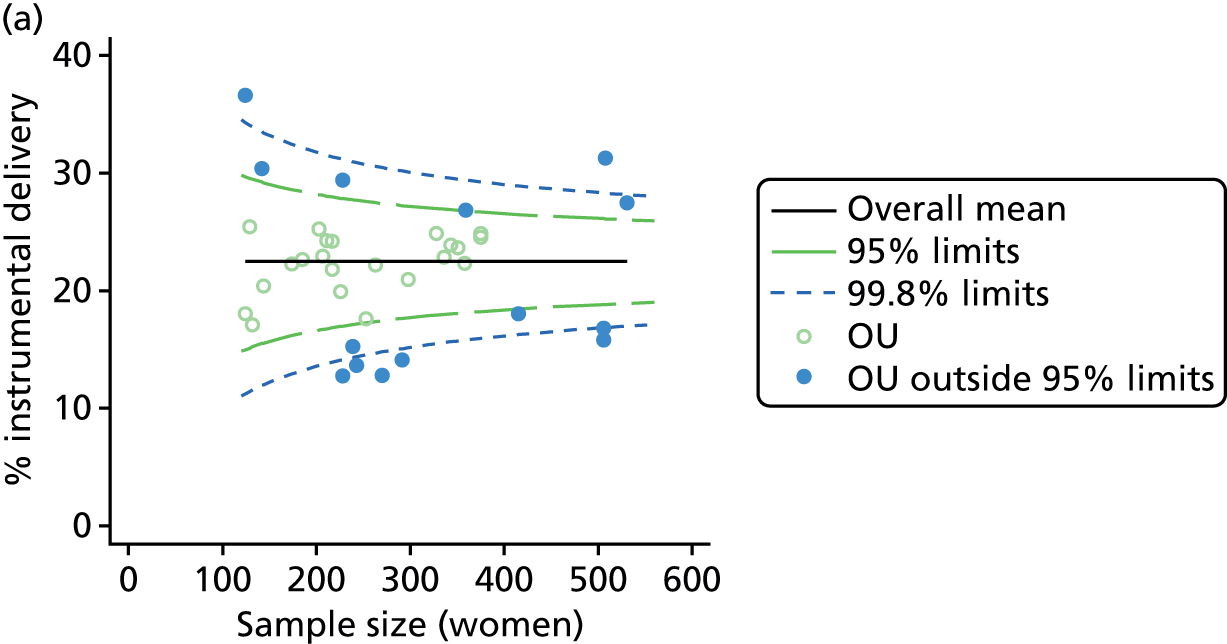
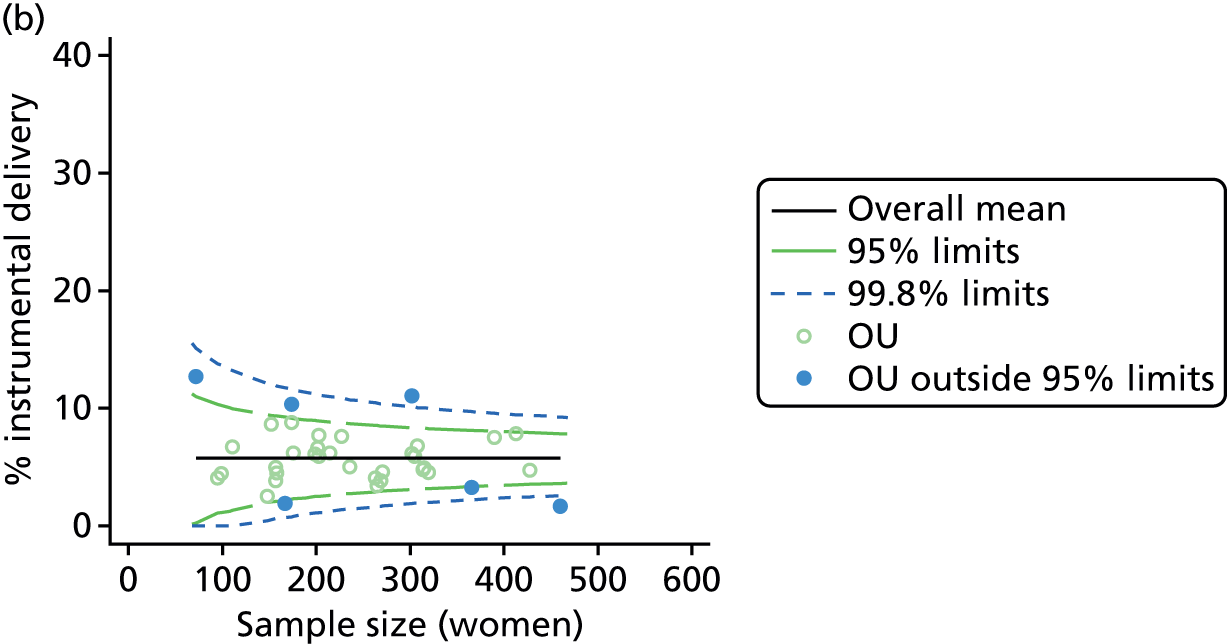
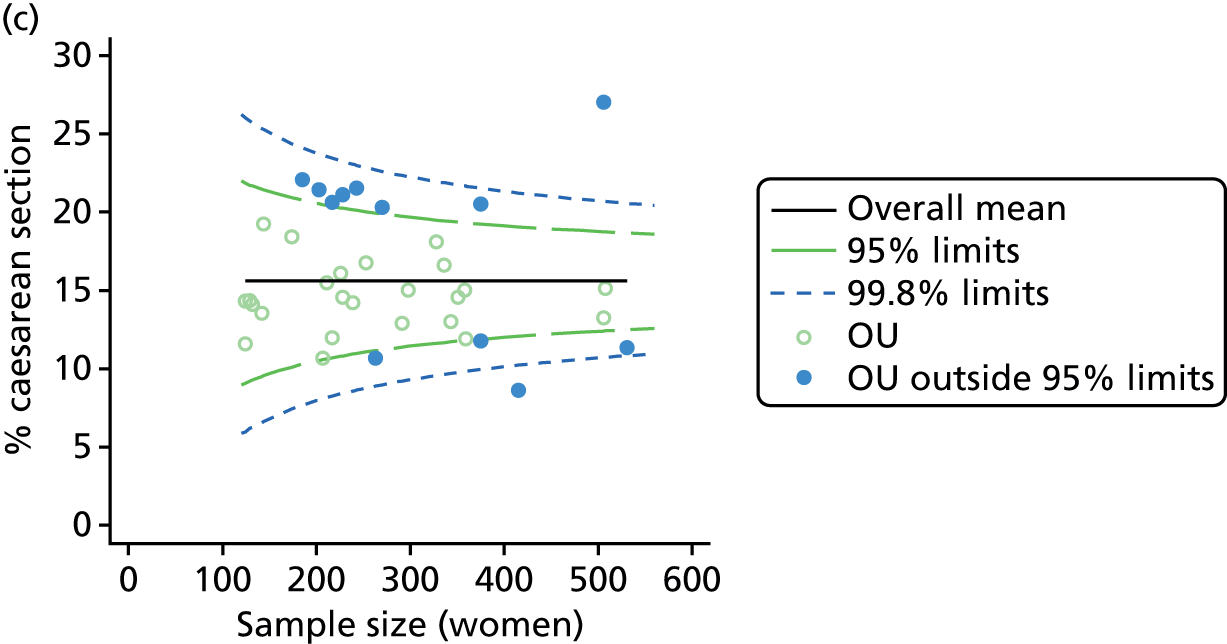
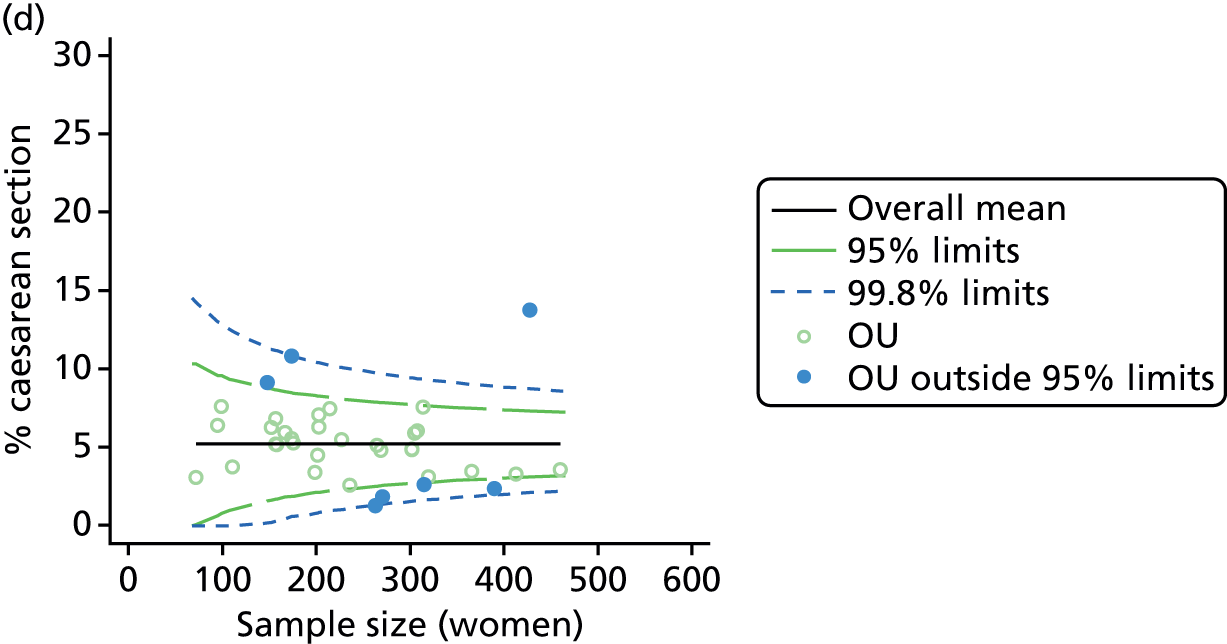
FIGURE 4.
Funnel plots showing adjusted ‘straightforward birth’ and ‘normal birth’ rates in OUs. (a) Percentage of ‘straightforward birth’ in nulliparous women; (b) percentage of ‘straightforward birth’ in multiparous women; (c) percentage of ‘normal birth’ in nulliparous women; and (d) percentage of ‘normal birth’ in multiparous women.
| Outcome measure | Nulliparous women | Multiparous women | ||
|---|---|---|---|---|
| Units | ‘Outliers’, n (%) | Units | ‘Outliers’, n (%) | |
| Instrumental delivery | 36 | 14 (39) | 36 | 6 (17) |
| Intrapartum caesarean section | 36 | 12 (33) | 36 | 7 (19) |
| ‘Straightforward birth’ | 36 | 10 (28) | 36 | 7 (19) |
| ‘Normal birth’ | 36 | 16 (44) | 36 | 14 (39) |
Configuration, unit characteristics and intervention rates in obstetric units
There was no significant association between the number of OU delivery beds or the percentage of births in the trust that were planned ‘out of hospital’ and any of the main outcome measures studied (Table 8).
| Unit or configuration characteristic (number of OUs) and outcome measure | Nulliparous women | Multiparous women | ||||
|---|---|---|---|---|---|---|
| R2 (%)a | Coefficientb | p-value | R2 (%)a | Coefficientb | p-value | |
| Sizec (n = 35) | ||||||
| Instrumental delivery | 5.0 | 0.09 | 0.325 | 2.3 | –0.03 | 0.529 |
| Intrapartum caesarean section | 5.8 | –0.08 | 0.045 | 10.6 | –0.07 | 0.008 |
| ‘Straightforward birth’ | 0.1 | –0.01 | 0.882 | 8.8 | 0.08 | 0.047 |
| ‘Normal birth’ | 1.0 | –0.05 | 0.640 | 4.4 | 0.09 | 0.184 |
| Number of delivery bedsd (n = 36) | ||||||
| Instrumental delivery | 1.8 | 0.25 | 0.532 | 2.3 | –0.13 | 0.442 |
| Intrapartum caesarean section | 0.0 | 0.03 | 0.938 | 0.0 | –0.02 | 0.957 |
| ‘Straightforward birth’ | 1.6 | –0.23 | 0.503 | 1.2 | 0.14 | 0.613 |
| ‘Normal birth’ | 6.3 | –0.63 | 0.122 | 0.1 | 0.06 | 0.895 |
| % midwifery ‘understaffing’e (n = 30) | ||||||
| Instrumental delivery | 0.2 | 0.02 | 0.798 | 5.6 | –0.04 | 0.068 |
| Intrapartum caesarean section | 17.6 | –0.10 | 0.025 | 12.6 | –0.05 | 0.106 |
| ‘Straightforward birth’ | 3.5 | 0.06 | 0.307 | 15.1 | 0.08 | 0.011 |
| ‘Normal birth’ | 0.1 | –0.01 | 0.889 | 1.7 | 0.05 | 0.482 |
| Presence of AMUf (n = 35) | ||||||
| Instrumental delivery | 3.8 | –2.40 | 0.335 | 0.0 | 0.09 | 0.916 |
| Intrapartum caesarean section | 22.8 | 4.99 | 0.030 | 23.1 | 3.23 | 0.061 |
| ‘Straightforward birth’ | 1.4 | –1.40 | 0.552 | 14.8 | –3.14 | 0.039 |
| ‘Normal birth’ | 10.1 | –5.16 | 0.077 | 21.1 | –6.35 | 0.015 |
| % of planned non-OU birthsg (n = 30) | ||||||
| Instrumental delivery | 1.9 | –0.08 | 0.505 | 0.0 | 0.00 | 0.900 |
| Intrapartum caesarean section | 31.8 | 0.31 | 0.022 | 43.2 | 0.23 | 0.014 |
| ‘Straightforward birth’ | 8.2 | –0.17 | 0.057 | 26.3 | –0.22 | 0.006 |
| ‘Normal birth’ | 6.1 | –0.20 | 0.079 | 17.4 | –0.25 | 0.008 |
| % of planned ‘out of hospital’ birthsh (n = 30) | ||||||
| Instrumental delivery | 8.6 | –0.49 | 0.223 | 0.1 | 0.02 | 0.896 |
| Intrapartum caesarean section | 11.2 | 0.52 | 0.284 | 17.3 | 0.41 | 0.221 |
| ‘Straightforward birth’ | 0.2 | –0.08 | 0.810 | 11.0 | –0.39 | 0.151 |
| ‘Normal birth’ | 0.4 | 0.15 | 0.673 | 2.7 | –0.28 | 0.429 |
There was a significant association between the OU size (number of births) and the intrapartum caesarean section rate in planned OU births; larger OUs had lower intrapartum caesarean section rates in both nulliparous and multiparous women. Larger OUs also had a significantly higher ‘straightforward birth’ rate in multiparous women.
For nulliparous women there was a significant association between our measure of midwifery staffing and the intrapartum caesarean rate in planned OU births, with lower caesarean section rates observed in planned ‘low risk’ births in OUs with lower staffing levels. For multiparous women, rates of ‘straightforward birth’ were significantly higher in units with lower levels of staffing.
There were significant associations between the proportion of births that were planned outside the OU and three of the four main outcome measures. A higher proportion of non-OU births in the trust was associated with significantly higher intrapartum caesarean section rates for nulliparous and multiparous women planning OU birth, and significantly lower rates of ‘straightforward birth’ and ‘normal birth’ in multiparous women. For nulliparous women, the proportion of non-OU births was not significantly associated with rates of ‘straightforward birth’ and ‘normal birth’ (p = 0.06 and p = 0.08, respectively), but the direction of effect was the same as that seen for multiparous women.
For ‘low risk’ women planning OU birth, having an AMU in the hospital was also associated with a significantly higher intrapartum caesarean section rate in nulliparous women and significantly lower rates of ‘normal birth’ and ‘straightforward birth’ in multiparous women. These analyses were based on planned ‘low risk’ births in the OU and so women who gave birth in the unit following an intrapartum transfer from an attached AMU or elsewhere did not contribute to the rates.
None of the configuration or unit characteristics studied showed any association with rates of instrumental delivery in planned OU births.
Visual examination of scatterplots for the predictor and outcome variables that were significantly associated (see Appendix 5) did not suggest that the associations were driven by regression outliers.
Further exploratory analyses of obstetric unit intervention rates
In order to explore potential explanations for the association between the proportion of non-OU births in a trust and higher intervention rates in OUs, we carried out a number of further analyses. First, we explored whether or not epidural and augmentation rates followed the same pattern of associations as the main outcomes. Second, we explored whether or not a higher proportion of planned non-OU births in a trust was associated with a higher proportion of ‘higher risk’ births in the OU. Third, we explored whether or not the proportion of planned births that were ‘higher risk’ in an OU was associated with our main outcomes in ‘low risk’ women. Fourth, we explored whether or not intervention rates in ‘low risk’ and ‘higher risk’ women within the same OU were correlated. Finally, we examined whether or not OUs situated in trusts with a higher percentage of non-OU births tended to be those with an associated AMU.
None of the configuration or unit characteristic variables was significantly associated with the adjusted epidural rate (Table 9). For ‘low risk’ nulliparous women planning birth in an OU, a higher proportion of ‘out-of-hospital’ births in the trust was associated with significantly lower augmentation rates. In hospitals with an AMU, augmentation rates appeared to be higher, although this association was not statistically significant (p = 0.05). For multiparous women, there was a significant association between midwifery staffing and the augmentation rate; lower staffing levels were associated with higher augmentation rates.
| Unit or configuration characteristic (number of OUs) and outcome measure | Nulliparous women | Multiparous women | ||||
|---|---|---|---|---|---|---|
| R2 (%)a | Coefficientb | p-value | R2 (%)a | Coefficientb | p-value | |
| Sizec (n = 35) | ||||||
| Epidural | 7.6 | 0.16 | 0.128 | 1.7 | –0.05 | 0.366 |
| Augmentation | 0.8 | –0.04 | 0.677 | 6.7 | –0.07 | 0.191 |
| Number of delivery bedsd (n = 36) | ||||||
| Epidural | 8.4 | 0.81 | 0.097 | 0.5 | –0.14 | 0.737 |
| Augmentation | 0.8 | 0.20 | 0.644 | 1.9 | –0.19 | 0.404 |
| % midwifery ‘understaffing’e (n = 30) | ||||||
| Epidural | 0.9 | 0.05 | 0.594 | 0.0 | 0.00 | 0.942 |
| Augmentation | 5.6 | –0.10 | 0.156 | 11.1 | –0.09 | 0.048 |
| Presence of AMUf (n = 35) | ||||||
| Epidural | 8.3 | 5.29 | 0.074 | 7.4 | 3.51 | 0.169 |
| Augmentation | 14.0 | 5.59 | 0.050 | 9.6 | 2.73 | 0.066 |
| % of planned non-OU birthsg (n = 30) | ||||||
| Epidural | 6.4 | 0.23 | 0.073 | 6.7 | 0.14 | 0.121 |
| Augmentation | 0.7 | 0.06 | 0.651 | 4.7 | 0.09 | 0.178 |
| % of ‘out-of-hospital’ birthsh (n = 30) | ||||||
| Epidural | 1.7 | 0.33 | 0.424 | 4.5 | 0.32 | 0.214 |
| Augmentation | 13.7 | –0.73 | 0.018 | 1.3 | –0.13 | 0.430 |
We found no significant association between the proportion of planned non-OU births in each trust and the proportion of planned OU births that were classified as ‘higher risk’ according to National Institute for Health and Care Excellence (NICE) criteria (data not shown). Furthermore, there was no consistent relationship between the proportion of women planning OU birth who were ‘higher risk’ and our four main outcome measures in ‘low risk’ women. Exploration of intervention rates in ‘low risk’ and ‘higher risk’ women planning birth in the same OU revealed significant positive correlations for most interventions and strong positive correlations for epidural analgesia, instrumental delivery (nulliparous women) and ‘straightforward birth’ (nulliparous women); intrapartum caesarean section rates in ‘low risk’ and ‘higher risk’ women were less strongly correlated, particularly for nulliparous women [Pearson’s correlation (r) = 0.327, p = 0.05 in nulliparous women; r = 0.515, p = 0.001 in multiparous women].
There were 29 OUs for which we had data on both the percentage of non-OU births in the trust and the presence of an AMU, and, of these, five had an associated AMU. Three OUs were situated in trusts where > 20% of births were planned in a non-OU setting and all three of these had an attached AMU. The numbers of OUs with and without an AMU were too small to enable us to carry out a meaningful sensitivity analysis stratified by the presence of an AMU.
Characteristics of alongside midwifery units in the study sample
The 38 AMUs for which we could derive data on the number of planned births varied in size, but were, on average, much smaller than the OUs, with around half as many delivery beds (Table 10). On average there were two midwives on duty per shift (1.5 midwives per woman in labour) with a median of 5.4% of shifts with less than one midwife for each woman in labour.
| Unit characteristic | n | Median (IQR) | Min. | Max. |
|---|---|---|---|---|
| Sizea | 38 | 754 (585–1012) | 139 | 2922 |
| Number of delivery bedsb | 28 | 5 (3–6) | 1 | 13 |
| Women per year per bed | 25 | 165 (115–209) | 69 | 347 |
| Midwives on duty (mean for AMU)c | 32 | 2 (1.6–2.4) | 1 | 9.5 |
| Midwives per woman (mean for AMU)c | 32 | 1.5 (1.1–1.7) | 0.9 | 4.7 |
| % midwifery ‘understaffing’d | 32 | 5.4 (2.1–8.2) | 0 | 17.5 |
| Size indexe | 19 | 0.7 (–0.1–1.2) | –1.4 | 6.3 |
| Staffing indexf | 32 | –0.2 (–1.1–0.5) | –2.8 | 4.5 |
Variation in intervention rates between alongside midwifery units
Funnel plots showed more variation between AMUs in adjusted rates of all outcomes in ‘low risk’ planned AMU births than would be expected by chance, particularly for nulliparous women. There was less variation in intervention rates for multiparous women, particularly for instrumental delivery and intrapartum caesarean section (Figures 5 and 6 and Table 11). For ‘straightforward birth’ and ‘normal birth’, most of the ‘outlier’ units had rates that were higher, rather than lower, than would be expected by chance (see Figure 6).
FIGURE 5.
Funnel plots showing adjusted instrumental delivery and intrapartum caesarean section rates in AMUs. (a) Percentage of instrumental delivery in nulliparous women; (b) percentage of instrumental delivery in multiparous women; (c) percentage of caesarean section in nulliparous women; and (d) percentage of caesarean section in multiparous women.
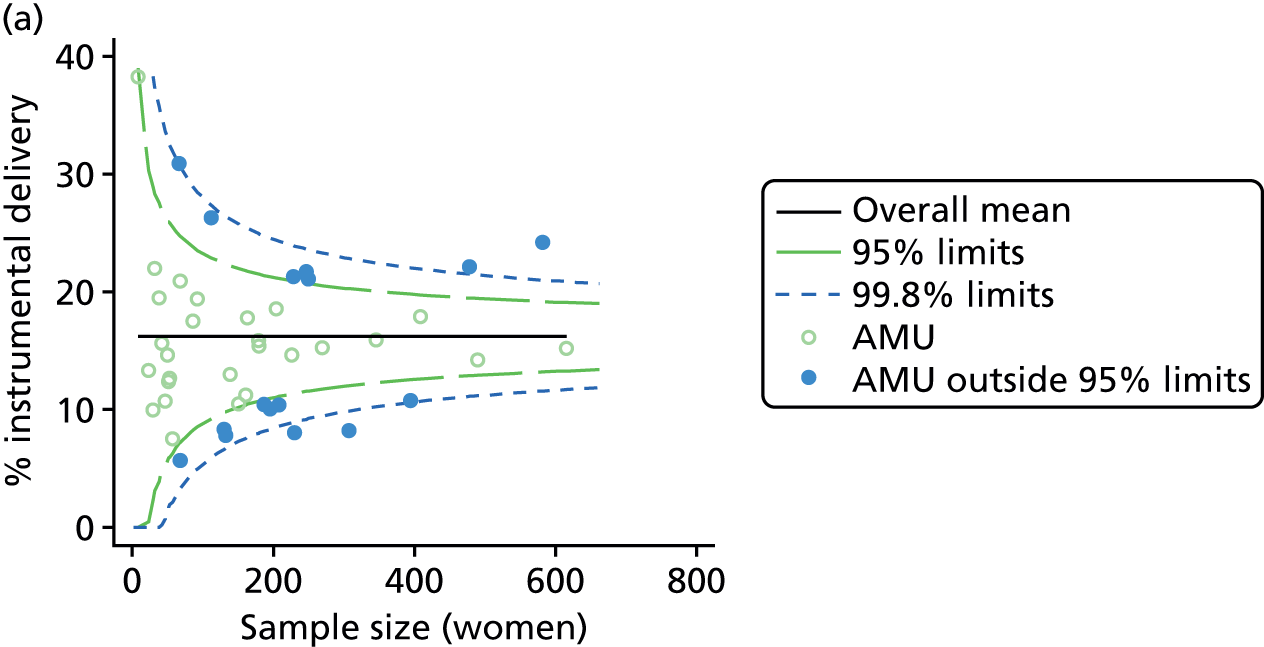

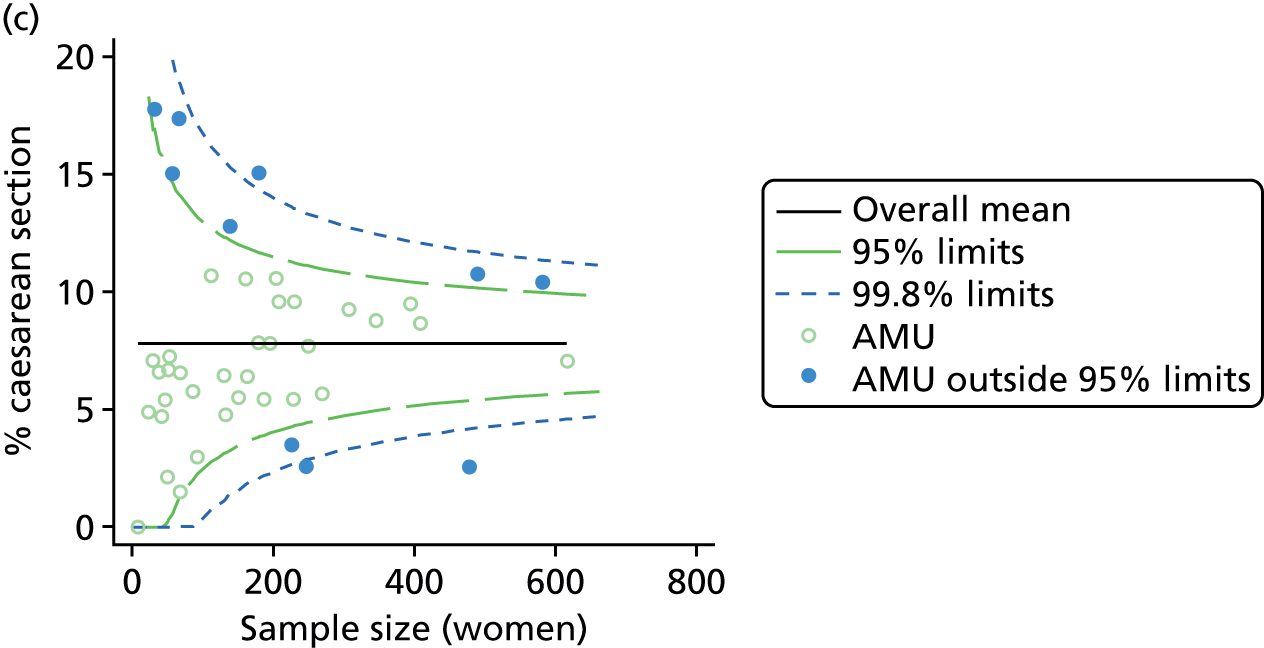
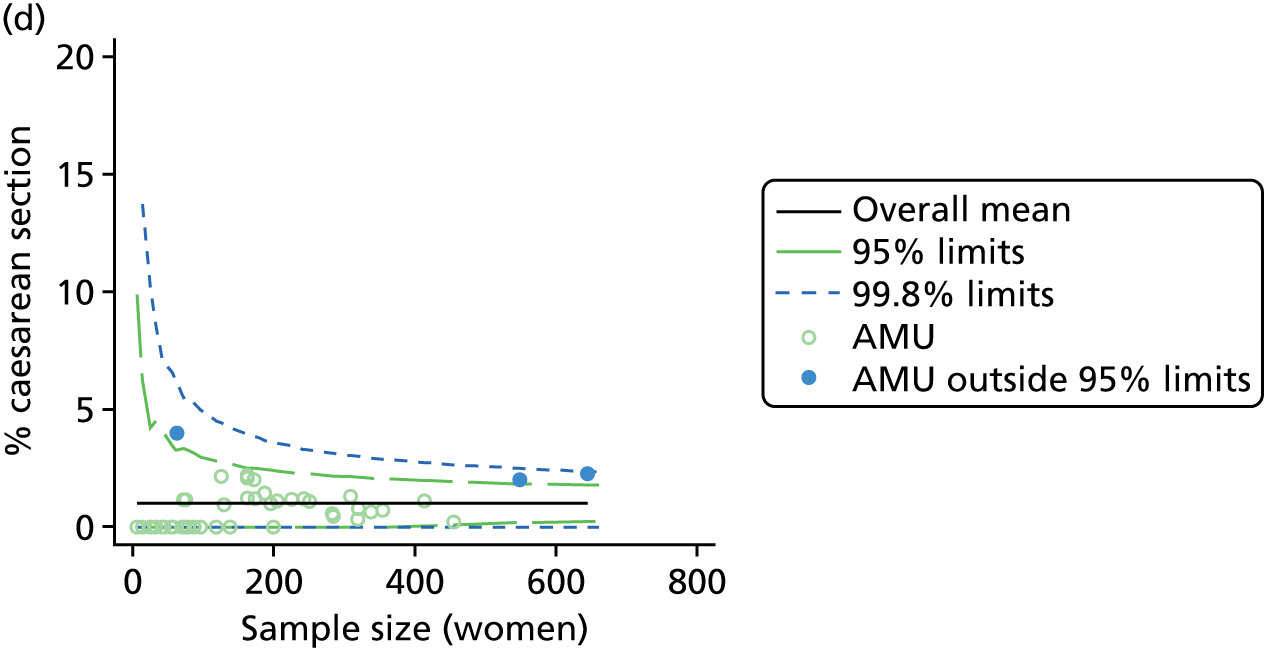
FIGURE 6.
Funnel plots showing adjusted ‘straightforward birth’ and ‘normal birth’ rates in AMUs. (a) Percentage of ‘straightforward birth’ in nulliparous women; (b) percentage of ‘straightforward birth’ in multiparous women; (c) percentage of ‘normal birth’ in nulliparous women; and (d) percentage of ‘normal birth’ in multiparous women.
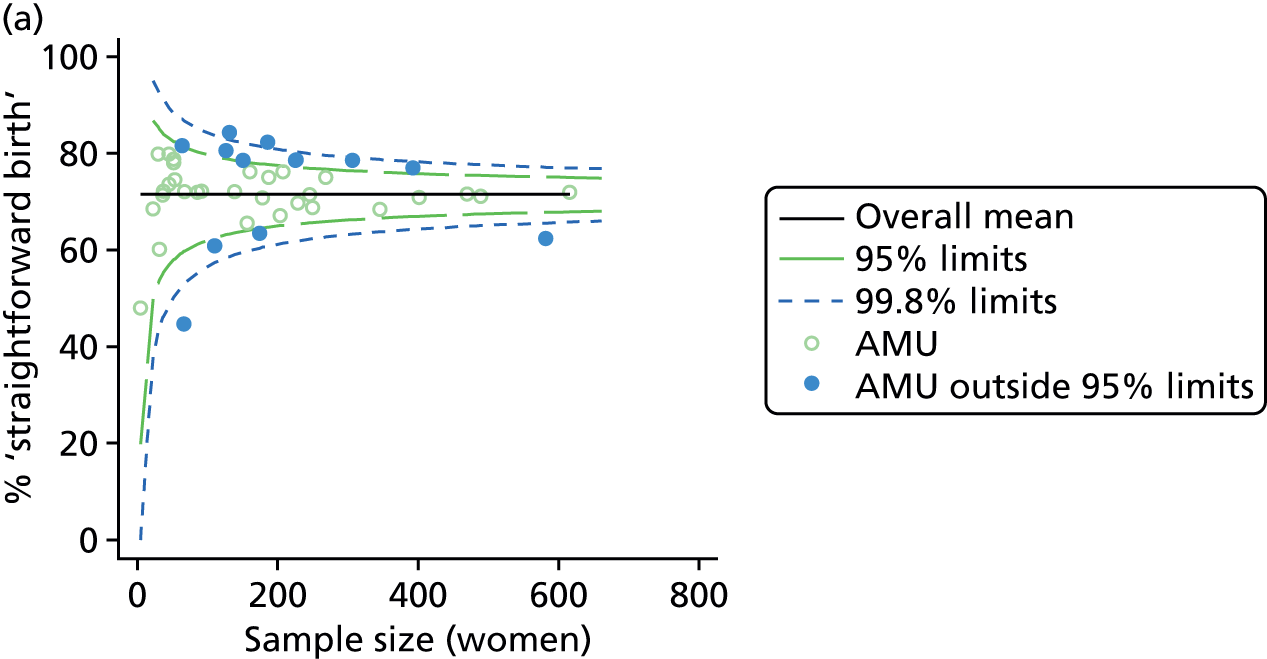
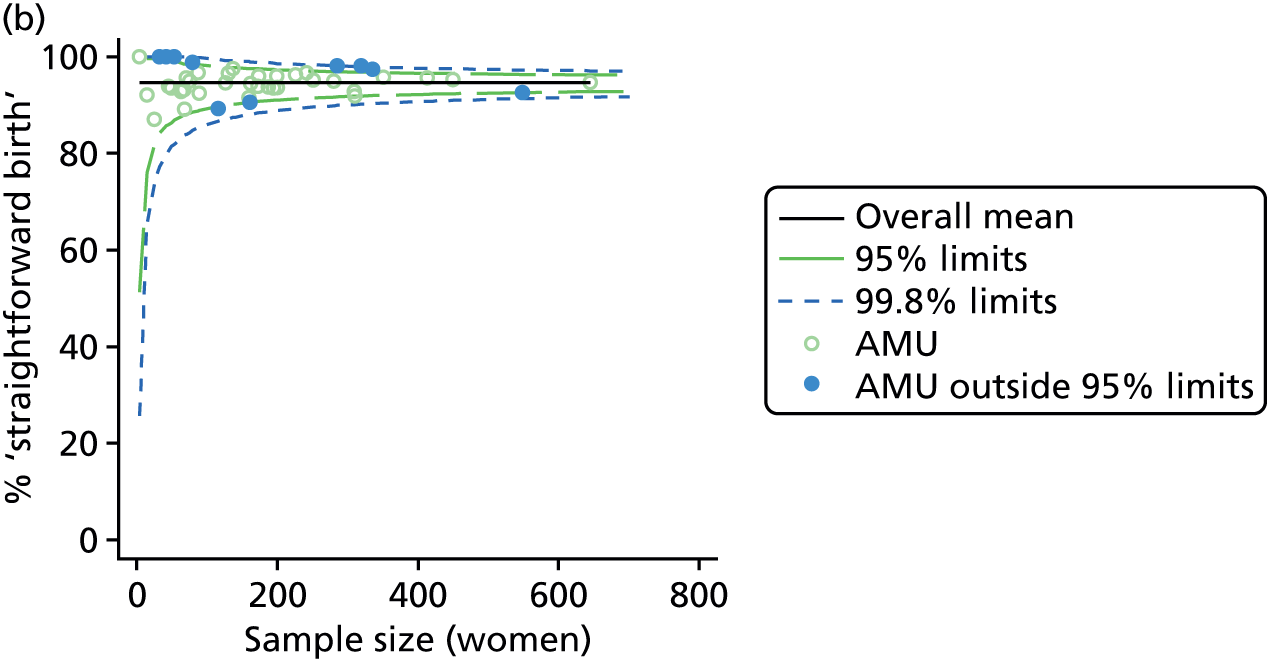


| Outcome measure | Nulliparous women | Multiparous women | ||
|---|---|---|---|---|
| Units | ‘Outliers’, n (%) | Units | ‘Outliers’, n (%) | |
| Instrumental delivery | 43 | 16 (37) | 43 | 4 (9) |
| Intrapartum caesarean section | 43 | 10 (23) | 43 | 3 (7) |
| ‘Straightforward birth’ | 43 | 13 (30) | 43 | 11 (26) |
| ‘Normal birth’ | 43 | 14 (33) | 43 | 6 (14) |
Unit characteristics and intervention rates in alongside midwifery units
There was no significant association between the number of women per year per bed, our measure of midwifery ‘understaffing’ or the ‘staffing index’ and any of the outcome measures studied in AMUs (Table 12). For all outcome measures apart from intrapartum caesarean section in nulliparous women and instrumental delivery in multiparous women, there was a significant association between the size of the AMU (as measured by our ‘size index’) and intervention rates; in larger AMUs (with more births, more beds and more midwives) adjusted rates of ‘straightforward birth’ and ‘normal birth’ were significantly lower for nulliparous and multiparous women and adjusted rates of instrumental delivery and caesarean section appeared to be higher, but not all associations were statistically significant.
| Unit characteristic (number of AMUs) and outcome measure | Nulliparous women | Multiparous women | ||||
|---|---|---|---|---|---|---|
| R2 (%)a | Coefficientb | p-value | R2 (%)a | Coefficientb | p-value | |
| Sizec (n = 38) | ||||||
| Instrumental delivery | 23.8 | 0.41 | < 0.001 | 7.2 | 0.06 | 0.040 |
| Intrapartum caesarean section | 1.8 | 0.07 | 0.318 | 10.9 | 0.04 | 0.003 |
| ‘Straightforward birth’ | 21.0 | –0.45 | < 0.001 | 7.1 | –0.09 | 0.038 |
| ‘Normal birth’ | 22.3 | –0.56 | < 0.001 | 5.5 | –0.11 | 0.024 |
| Number of delivery bedsd (n = 28) | ||||||
| Instrumental delivery | 17.1 | 0.59 | 0.098 | 6.8 | 0.10 | 0.284 |
| Intrapartum caesarean section | 5.0 | 0.18 | 0.292 | 34.7 | 0.12 | 0.004 |
| ‘Straightforward birth’ | 24.0 | –0.75 | 0.033 | 22.6 | –0.27 | 0.006 |
| ‘Normal birth’ | 25.5 | –0.98 | 0.015 | 14.4 | –0.29 | 0.012 |
| Women per year per bed (n = 25) | ||||||
| Instrumental delivery | 0.9 | 0.01 | 0.719 | 0.0 | 0.00 | 0.944 |
| Intrapartum caesarean section | 1.4 | 0.00 | 0.686 | 2.2 | 0.00 | 0.577 |
| ‘Straightforward birth’ | 1.2 | –0.01 | 0.619 | 4.0 | 0.01 | 0.382 |
| ‘Normal birth’ | 0.1 | 0.00 | 0.895 | 0.9 | 0.00 | 0.695 |
| Mean number of midwives on duty (n = 32) | ||||||
| Instrumental delivery | 8.1 | 0.94 | 0.136 | 11.0 | 0.27 | 0.269 |
| Intrapartum caesarean section | 0.3 | 0.11 | 0.609 | 5.1 | 0.11 | 0.277 |
| ‘Straightforward birth’ | 6.4 | –0.95 | 0.130 | 12.7 | –0.48 | 0.045 |
| ‘Normal birth’ | 12.3 | –1.59 | 0.005 | 27.2 | –0.87 | < 0.001 |
| Mean number of midwives on duty per woman in labour (n = 32) | ||||||
| Instrumental delivery | 0.1 | 0.31 | 0.724 | 0.3 | –0.11 | 0.703 |
| Intrapartum caesarean section | 0.5 | –0.35 | 0.380 | 10.8 | 0.41 | 0.049 |
| ‘Straightforward birth’ | 0.0 | –0.05 | 0.957 | 0.7 | –0.28 | 0.466 |
| ‘Normal birth’ | 3.3 | –2.06 | 0.090 | 12.0 | –1.47 | 0.008 |
| % midwifery ‘understaffing’e (n = 32) | ||||||
| Instrumental delivery | 2.4 | 0.17 | 0.483 | 1.8 | 0.04 | 0.471 |
| Intrapartum caesarean section | 0.7 | 0.05 | 0.511 | 0.0 | 0.00 | 0.956 |
| ‘Straightforward birth’ | 4.9 | –0.28 | 0.255 | 1.7 | –0.06 | 0.496 |
| ‘Normal birth’ | 5.0 | –0.34 | 0.254 | 0.4 | 0.03 | 0.735 |
| Size indexf (n = 19) | ||||||
| Instrumental delivery | 27.5 | 1.27 | 0.017 | 14.8 | 0.20 | 0.114 |
| Intrapartum caesarean section | 8.4 | 0.37 | 0.155 | 35.6 | 0.21 | 0.003 |
| ‘Straightforward birth’ | 34.9 | –1.54 | 0.006 | 26.8 | –0.46 | 0.005 |
| ‘Normal birth’ | 35.8 | –2.00 | 0.001 | 20.6 | –0.57 | 0.007 |
| Staffing indexg (n = 32) | ||||||
| Instrumental delivery | 0.4 | –0.25 | 0.718 | 1.1 | –0.10 | 0.537 |
| Intrapartum caesarean section | 0.8 | –0.21 | 0.347 | 3.4 | 0.11 | 0.391 |
| ‘Straightforward birth’ | 1.4 | 0.53 | 0.494 | 0.0 | 0.04 | 0.898 |
| ‘Normal birth’ | 0.0 | 0.09 | 0.935 | 5.5 | –0.47 | 0.194 |
When we repeated the analysis after excluding one large AMU that appeared to be an outlier, none of the associations between AMU size and our outcome measures was significant (data not shown).
Characteristics of freestanding midwifery units in the study sample
The 48 FMUs for which we had data on the number of planned births were relatively small, with a median of two delivery beds in each unit and a smaller number of women per year per bed compared with AMUs (Table 13). Average numbers of midwives on duty per shift and per woman in labour were similar to those in AMUs, but the average proportion of shifts with less than one midwife per woman was lower than in AMUs. Most FMUs were located within 30 km of the nearest OU, with an average travel or transfer time of around 30 minutes. Forty FMUs had 24-hour staffing; this information was not available for three of the FMUs.
| Unit characteristic | n | Median (IQR) | Min. | Max. |
|---|---|---|---|---|
| Sizea | 48 | 241 (107 to 361) | 5 | 702 |
| Number of delivery bedsb | 50 | 2 (1 to 3) | 1 | 7 |
| Women per year per bed | 45 | 96 (56 to 136) | 5 | 317 |
| Midwives on duty (mean for FMU)c | 29 | 1.7 (1.4 to 2.0) | 1.0 | 3.2 |
| Midwives per woman (mean for FMU)c | 29 | 1.5 (1.3 to 1.8) | 1.0 | 2.8 |
| % midwifery ‘understaffing’d | 29 | 1.3 (0.0 to 3.7) | 0.0 | 19.2 |
| Transfer distance (km)e | 52 | 26 (20 to 32) | 4 | 85 |
| Estimated transfer duration (minutes)e | 52 | 31 (25 to 35) | 10 | 79 |
| Actual transfer duration (minutes)f | 50 | 35 (30 to 40) | 15 | 70 |
| Size indexg | 25 | –0.9 (–1.2 to –0.3) | –1.7 | 0.8 |
| Staffing indexh | 29 | 0.3 (–0.2 to 0.9) | –2.9 | 2.2 |
| Distance indexi | 50 | 0.0 (–0.8 to 0.8) | –2.9 | 7.2 |
Variation in intervention rates between freestanding midwifery units
Funnel plots showed more variation between FMUs in adjusted rates of instrumental delivery, ‘straightforward birth’ and ‘normal birth’ in ‘low risk’ planned FMU births than would be expected by chance (Figures 7 and 8 and Table 14). There was little variation in adjusted rates of intrapartum caesarean section in nulliparous or multiparous women planning FMU birth. For instrumental delivery more ‘outlier’ units had rates that were higher than would be expected by chance (see Figure 7). For ‘straightforward birth’ and ‘normal birth’, particularly for multiparous women, more ‘outlier’ units had rates that were higher than would be expected by chance (see Figure 8).
FIGURE 7.
Funnel plots showing adjusted instrumental delivery and intrapartum caesarean section rates in FMUs. (a) Percentage of instrumental delivery in nulliparous women; (b) percentage of instrumental delivery in multiparous women; (c) percentage of caesarean section in nulliparous women; and (d) percentage of caesarean section in multiparous women.
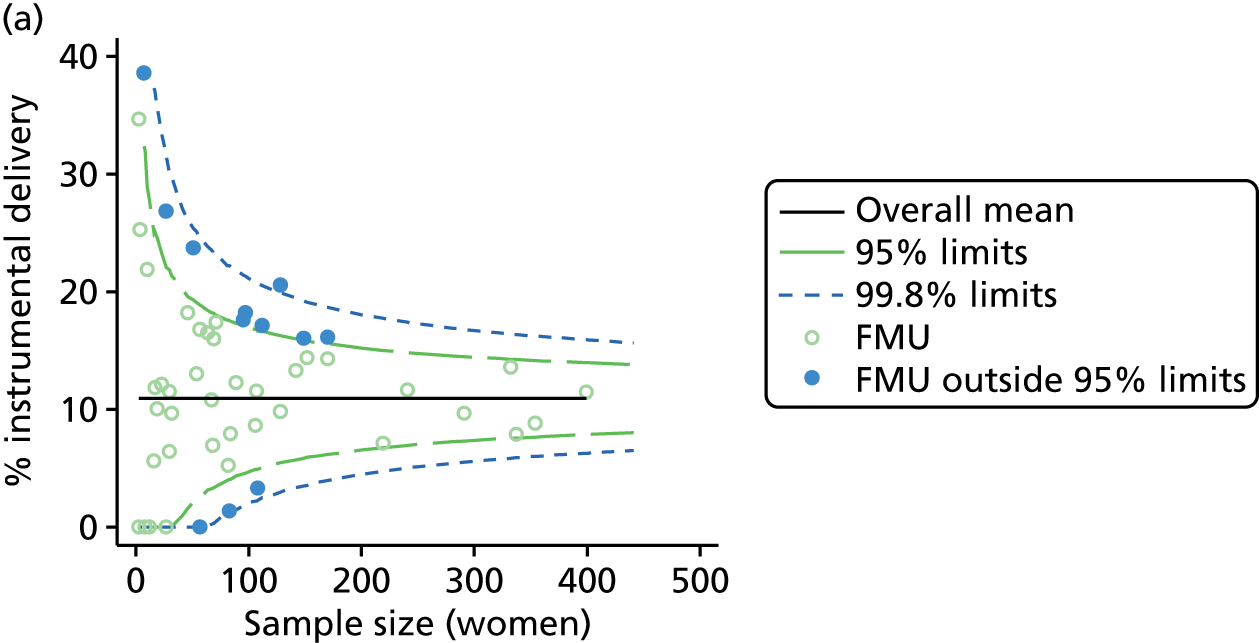

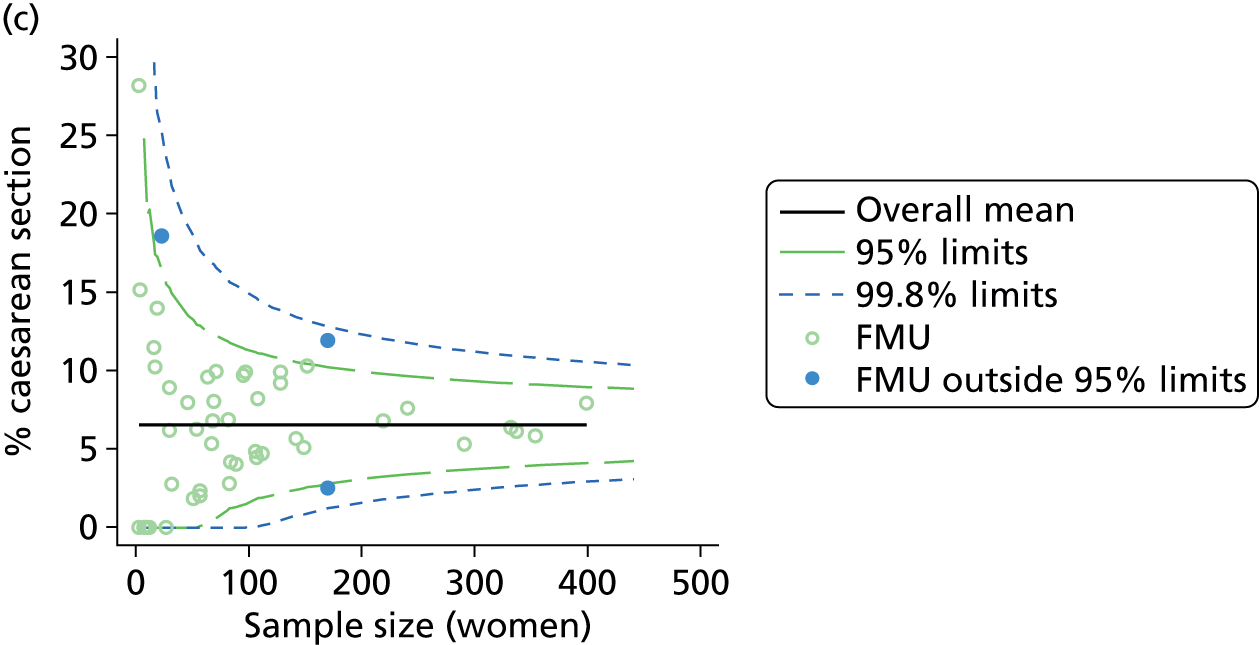

FIGURE 8.
Funnel plots showing adjusted ‘straightforward birth’ and ‘normal birth’ rates in FMUs. (a) Percentage of ‘straightforward birth’ in nulliparous women; (b) percentage of ‘straightforward birth’ in multiparous women; (c) percentage of ‘normal birth’ in nulliparous women; and (d) percentage of ‘normal birth’ in multiparous women.
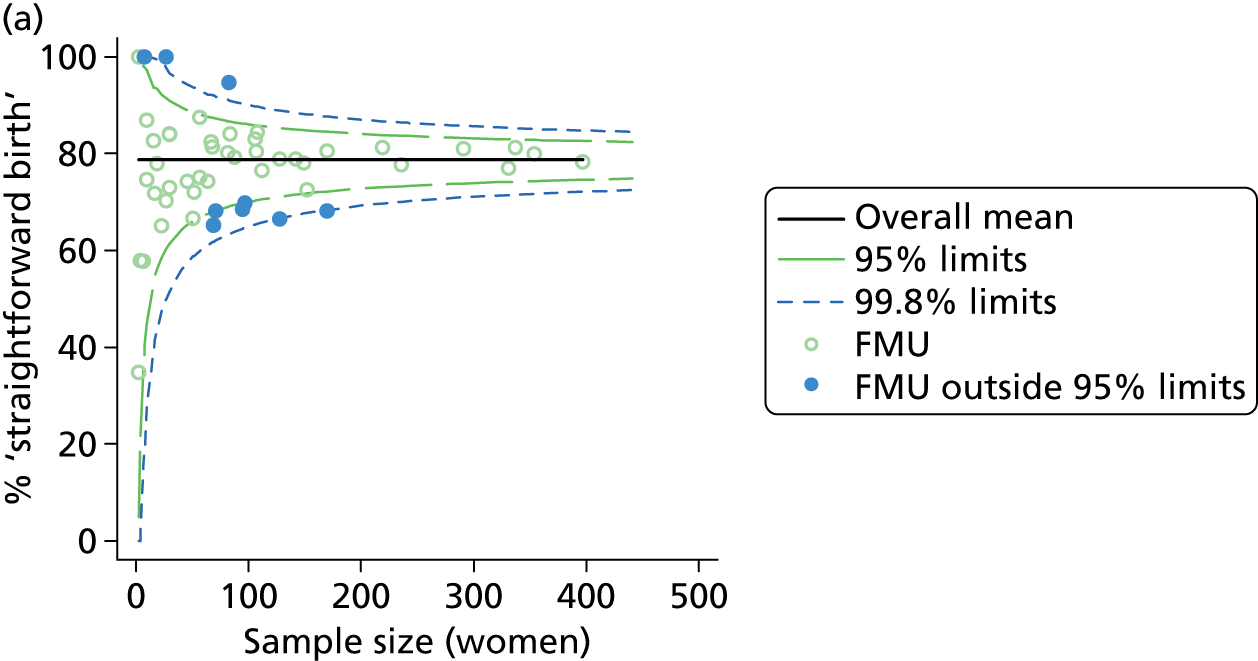
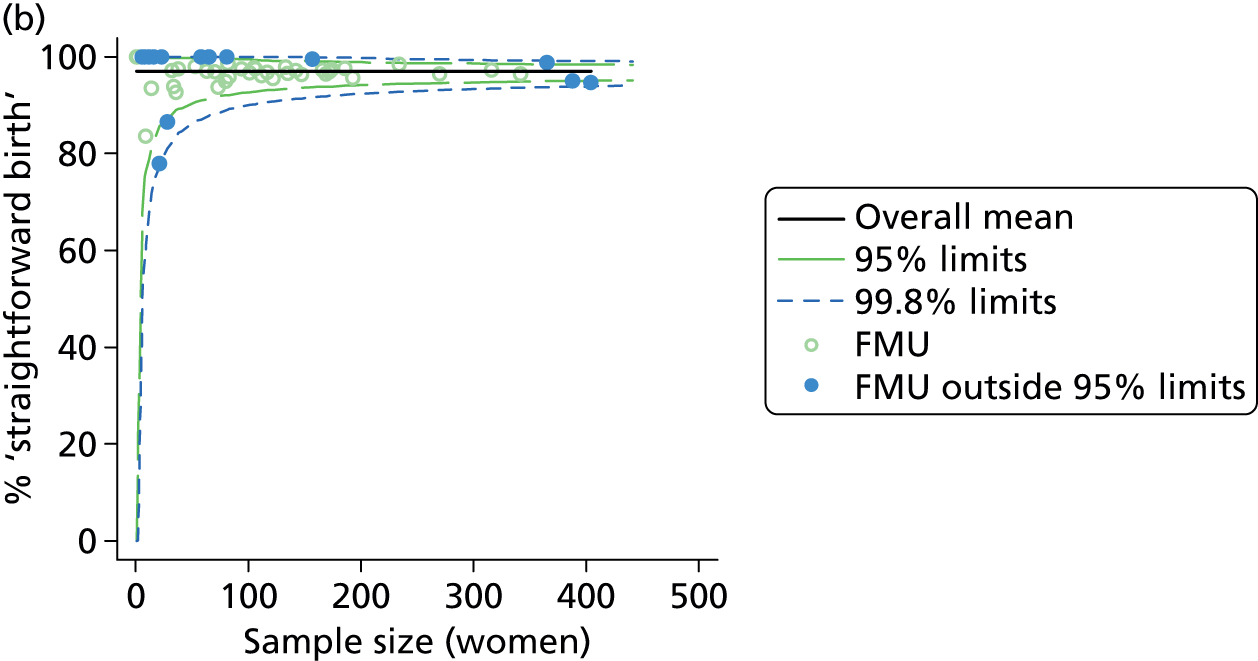


| Outcome measure | Nulliparous women | Multiparous women | ||
|---|---|---|---|---|
| Units | ‘Outliers’, n (%) | Units | ‘Outliers’, n (%) | |
| Instrumental delivery | 50 | 12 (24) | 53 | 6 (11) |
| Intrapartum caesarean section | 50 | 3 (6) | 53 | 4 (8) |
| ‘Straightforward birth’ | 50 | 10 (20) | 53 | 19 (36) |
| ‘Normal birth’ | 50 | 12 (24) | 53 | 10 (19) |
Unit characteristics and intervention rates in freestanding midwifery units
In multiparous women, in whom for most outcome measures there was less variation in intervention rates between FMUs, there was no significant association between any of the unit characteristics and the outcome measures studied (Table 15). In nulliparous women there was a significant association between the size of the FMU (as measured by our ‘size index’) and adjusted rates of instrumental delivery, ‘straightforward birth’ and ‘normal birth’; in larger FMUs instrumental delivery rates were lower and rates of ‘straightforward birth’ and ‘normal birth’ were higher. Additionally, in nulliparous women there was a significant association between our ‘distance index’ and intervention rates; FMUs that were further away, with longer travel time to the nearest OU, had higher instrumental delivery rates and lower ‘straightforward birth’ and ‘normal birth’ rates.
| Unit characteristic (number of FMUs) and outcome measure | Nulliparous women | Multiparous women | ||||
|---|---|---|---|---|---|---|
| R2 (%)a | Coefficientb | p-value | R2 (%)a | Coefficientb | p-value | |
| Sizec (nulliparous, n = 46; multiparous, n = 48) | ||||||
| Instrumental delivery | 22.7 | –1.28 | < 0.001 | 0.1 | 0.03 | 0.831 |
| Intrapartum caesarean section | 0.8 | –0.14 | 0.447 | 0.0 | 0.00 | 0.956 |
| ‘Straightforward birth’ | 13.4 | 1.16 | 0.003 | 0.3 | 0.07 | 0.741 |
| ‘Normal birth’ | 16.1 | 1.56 | 0.005 | 0.1 | 0.05 | 0.790 |
| Number of delivery bedsd (nulliparous, n = 47; multiparous, n = 50) | ||||||
| Instrumental delivery | 5.8 | –0.67 | 0.042 | 0.2 | 0.04 | 0.808 |
| Intrapartum caesarean section | 0.7 | 0.14 | 0.479 | 0.2 | 0.03 | 0.708 |
| ‘Straightforward birth’ | 3.5 | 0.64 | 0.087 | 0.1 | 0.04 | 0.898 |
| ‘Normal birth’ | 6.3 | 1.05 | 0.007 | 0.2 | 0.07 | 0.691 |
| Women per year per bed (nulliparous, n = 43; multiparous, n = 45) | ||||||
| Instrumental delivery | 7.0 | –0.02 | 0.059 | 0.0 | 0.00 | 0.926 |
| Intrapartum caesarean section | 1.7 | –0.01 | 0.446 | 0.3 | 0.00 | 0.686 |
| ‘Straightforward birth’ | 4.8 | 0.02 | 0.196 | 0.0 | 0.00 | 0.902 |
| ‘Normal birth’ | 2.7 | 0.02 | 0.311 | 0.2 | 0.00 | 0.691 |
| Mean number of midwives on duty (nulliparous, n = 29; multiparous, n = 29) | ||||||
| Instrumental delivery | 4.2 | –2.32 | 0.306 | 0.0 | –0.02 | 0.966 |
| Intrapartum caesarean section | 0.1 | –0.13 | 0.909 | 0.4 | 0.13 | 0.610 |
| ‘Straightforward birth’ | 3.4 | 2.29 | 0.401 | 0.3 | –0.23 | 0.700 |
| ‘Normal birth’ | 10.4 | 5.07 | 0.118 | 0.5 | –0.35 | 0.634 |
| Mean number of midwives on duty per woman in labour (nulliparous, n = 29; multiparous, n = 29) | ||||||
| Instrumental delivery | 1.1 | –1.38 | 0.611 | 0.0 | –0.04 | 0.930 |
| Intrapartum caesarean section | 0.0 | –0.06 | 0.965 | 0.6 | 0.20 | 0.467 |
| ‘Straightforward birth’ | 1.5 | 1.80 | 0.594 | 0.8 | –0.48 | 0.475 |
| ‘Normal birth’ | 6.9 | 4.95 | 0.213 | 0.5 | –0.42 | 0.602 |
| % midwifery ‘understaffing’e (nulliparous, n = 29; multiparous, n = 29) | ||||||
| Instrumental delivery | 1.5 | –0.17 | 0.455 | 0.1 | –0.01 | 0.847 |
| Intrapartum caesarean section | 0.6 | 0.05 | 0.670 | 2.9 | –0.05 | 0.046 |
| ‘Straightforward birth’ | 0.5 | 0.11 | 0.685 | 1.3 | 0.07 | 0.462 |
| ‘Normal birth’ | 2.7 | –0.33 | 0.222 | 3.9 | 0.13 | 0.119 |
| 24-hour staffing (nulliparous, n = 47; multiparous, n = 50) | ||||||
| Instrumental delivery | 2.9 | –3.21 | 0.043 | 0.0 | –0.03 | 0.960 |
| Intrapartum caesarean section | 1.2 | 1.19 | 0.265 | 0.7 | 0.28 | 0.477 |
| ‘Straightforward birth’ | 1.5 | 2.80 | 0.323 | 0.9 | 0.70 | 0.477 |
| ‘Normal birth’ | 1.1 | 3.01 | 0.416 | 0.5 | 0.59 | 0.519 |
| Transfer distance (km)f (nulliparous, n = 50; multiparous, n = 52) | ||||||
| Instrumental delivery | 8.7 | 0.13 | 0.013 | 2.9 | 0.02 | 0.247 |
| Intrapartum caesarean section | 1.0 | –0.03 | 0.387 | 1.0 | –0.01 | 0.296 |
| ‘Straightforward birth’ | 1.8 | –0.08 | 0.232 | 1.6 | –0.02 | 0.376 |
| ‘Normal birth’ | 2.6 | –0.11 | 0.233 | 0.2 | 0.01 | 0.764 |
| Transfer duration (minutes)f (nulliparous, n = 50; multiparous, n = 52) | ||||||
| Instrumental delivery | 11.3 | 0.18 | 0.004 | 2.4 | 0.02 | 0.319 |
| Intrapartum caesarean section | 0.1 | –0.01 | 0.788 | 0.0 | 0.00 | 0.839 |
| ‘Straightforward birth’ | 3.5 | –0.12 | 0.051 | 1.9 | –0.03 | 0.349 |
| ‘Normal birth’ | 4.4 | –0.17 | 0.088 | 0.1 | 0.01 | 0.850 |
| Median time from start of transfer to start of care in OU (minutes)g (nulliparous, n = 49; multiparous, n = 50) | ||||||
| Instrumental delivery | 22.0 | 0.35 | < 0.001 | 3.5 | 0.04 | 0.202 |
| Intrapartum caesarean section | 0.6 | 0.03 | 0.634 | 0.2 | 0.01 | 0.710 |
| ‘Straightforward birth’ | 14.4 | –0.35 | 0.001 | 3.1 | –0.06 | 0.241 |
| ‘Normal birth’ | 13.5 | –0.41 | 0.002 | 0.0 | 0.00 | 0.980 |
| Size indexh (nulliparous, n = 25; multiparous, n = 25) | ||||||
| Instrumental delivery | 13.7 | –2.31 | 0.005 | 2.1 | 0.24 | 0.559 |
| Intrapartum caesarean section | 0.2 | 0.12 | 0.847 | 1.7 | 0.17 | 0.416 |
| ‘Straightforward birth’ | 11.6 | 2.20 | 0.026 | 1.1 | –0.29 | 0.676 |
| ‘Normal birth’ | 21.9 | 3.66 | 0.001 | 0.5 | –0.22 | 0.703 |
| Staffing indexi (nulliparous, n = 29; multiparous, n = 29) | ||||||
| Instrumental delivery | 0.0 | 0.11 | 0.913 | 0.0 | 0.01 | 0.947 |
| Intrapartum caesarean section | 0.3 | –0.13 | 0.801 | 2.0 | 0.16 | 0.086 |
| ‘Straightforward birth’ | 0.0 | 0.12 | 0.921 | 1.3 | –0.26 | 0.430 |
| ‘Normal birth’ | 5.5 | 1.84 | 0.173 | 2.3 | –0.40 | 0.263 |
| Distance indexj (nulliparous, n = 49; multiparous, n = 50) | ||||||
| Instrumental delivery | 15.0 | 1.49 | < 0.001 | 3.4 | 0.20 | 0.227 |
| Intrapartum caesarean section | 0.1 | –0.05 | 0.840 | 0.1 | –0.02 | 0.781 |
| ‘Straightforward birth’ | 6.0 | –1.16 | 0.009 | 2.5 | –0.26 | 0.295 |
| ‘Normal birth’ | 6.7 | –1.51 | 0.025 | 0.1 | 0.05 | 0.875 |
When we repeated the analysis after removing one very distant FMU that appeared to be an outlier, the associations between distance and intervention rates were unchanged (data not shown). Scatterplots showed that size and distance were correlated, with FMUs located further away from the nearest OU tending to be smaller (data not shown).
Characteristics of NHS trusts providing home birth services in the study sample
In most NHS trusts the number and percentage of births taking place at home was relatively small (Table 16). For three primary care trusts providing home birth services it was not possible to calculate an appropriate denominator for the percentage of births in the trust that took place at home.
Variation in intervention rates between NHS trusts providing home birth services
Funnel plots showed more variation between NHS trusts providing home birth services in adjusted rates of ‘straightforward birth’ and ‘normal birth’ in ‘low risk’ planned home births than would be expected by chance (Figures 9 and 10 and Table 17). There was little variation in adjusted rates of instrumental delivery or intrapartum caesarean section in nulliparous or multiparous women planning home birth. Almost all ‘outlier’ trusts had higher, rather than lower, rates of intervention than would be expected by chance (see Figures 9 and 10). In most trusts there were very small numbers of nulliparous women planning home birth in the study sample.
FIGURE 9.
Funnel plots showing adjusted instrumental delivery and intrapartum caesarean section rates in women planning birth at home in different NHS trusts. (a) Percentage of instrumental delivery in nulliparous women; (b) percentage of instrumental delivery in multiparous women; (c) percentage of caesarean section in nulliparous women; and (d) percentage of caesarean section in multiparous women.
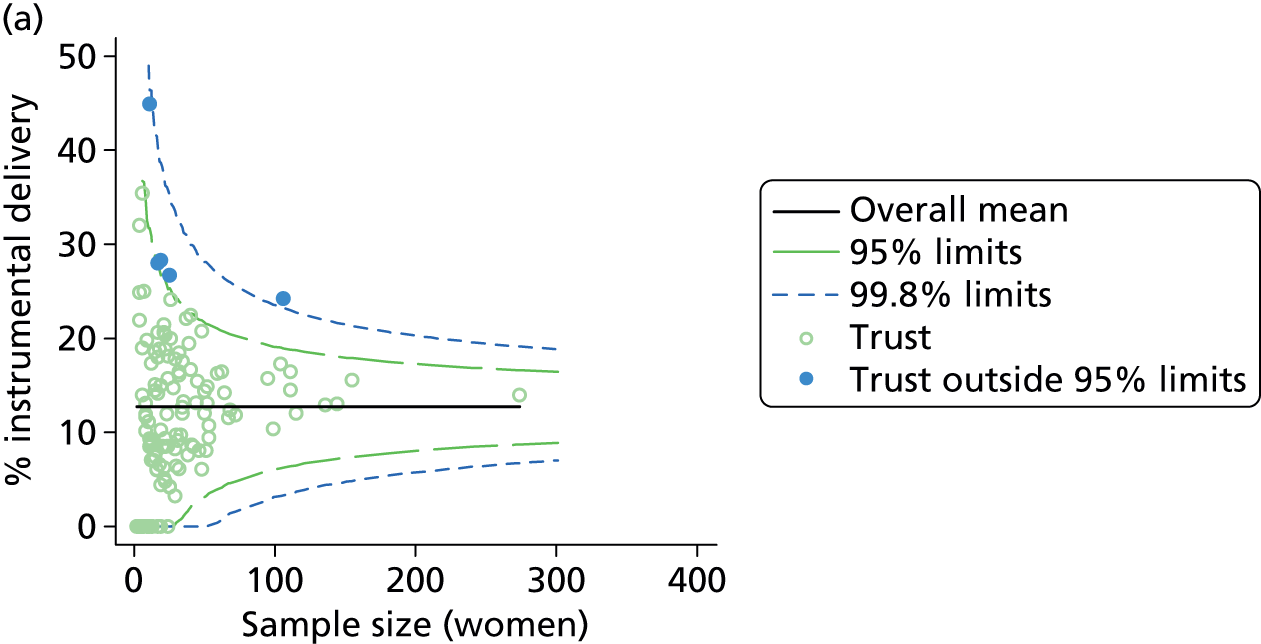
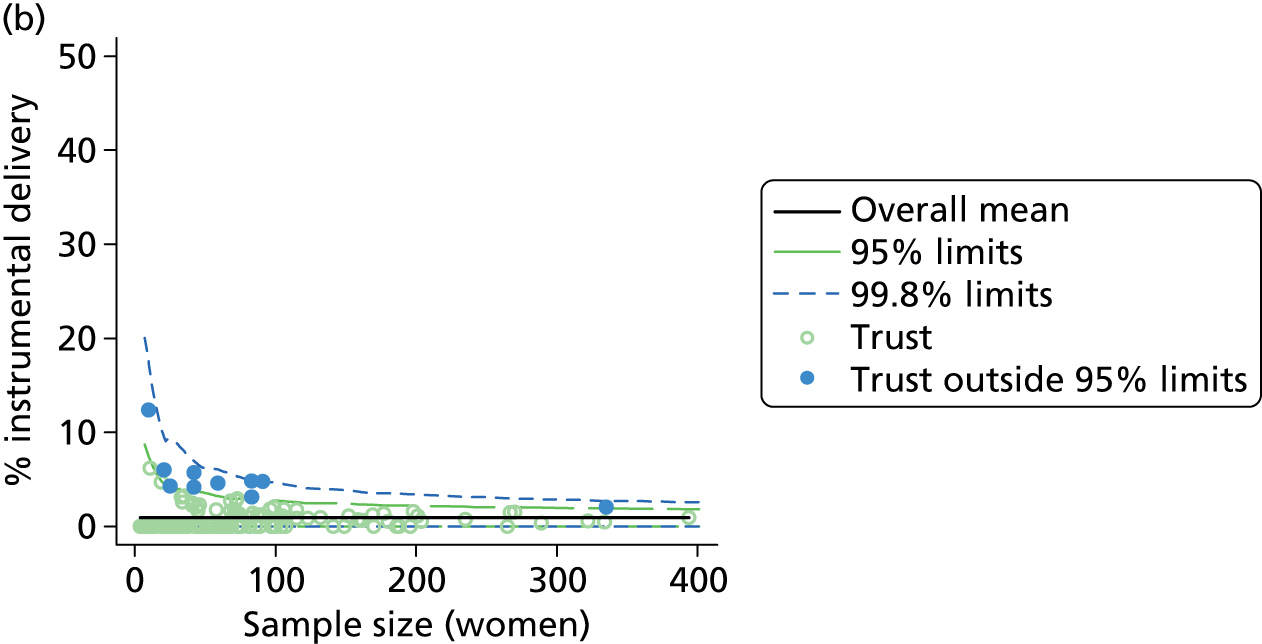
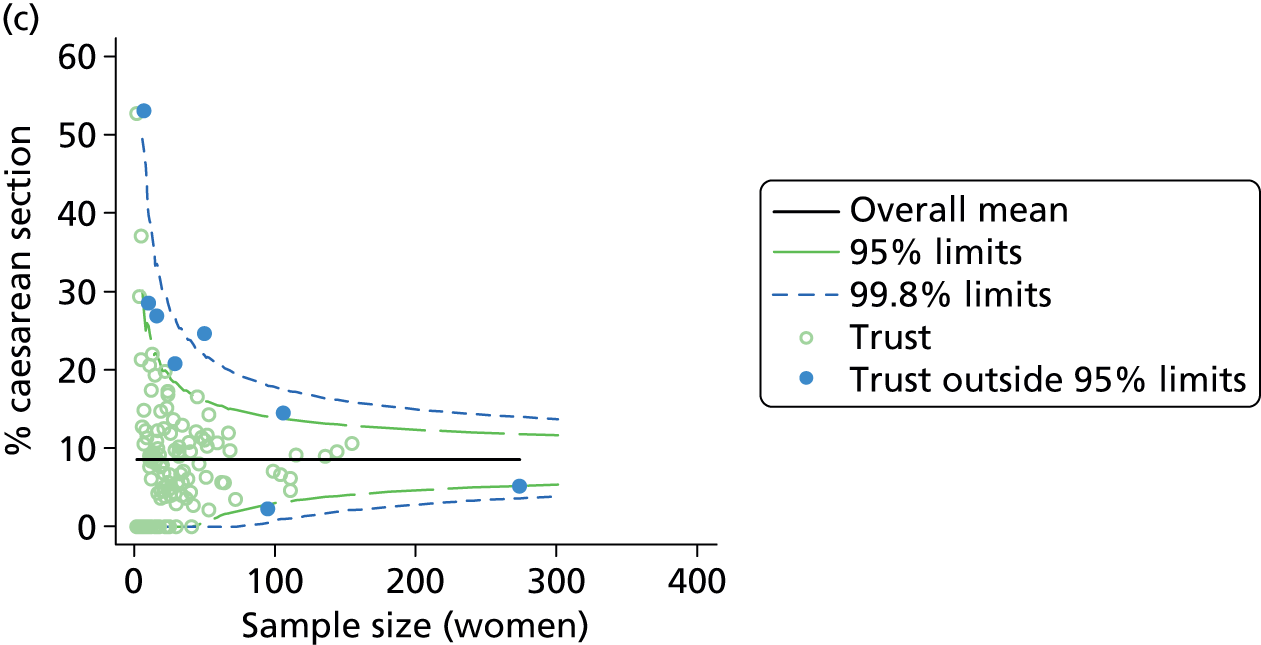
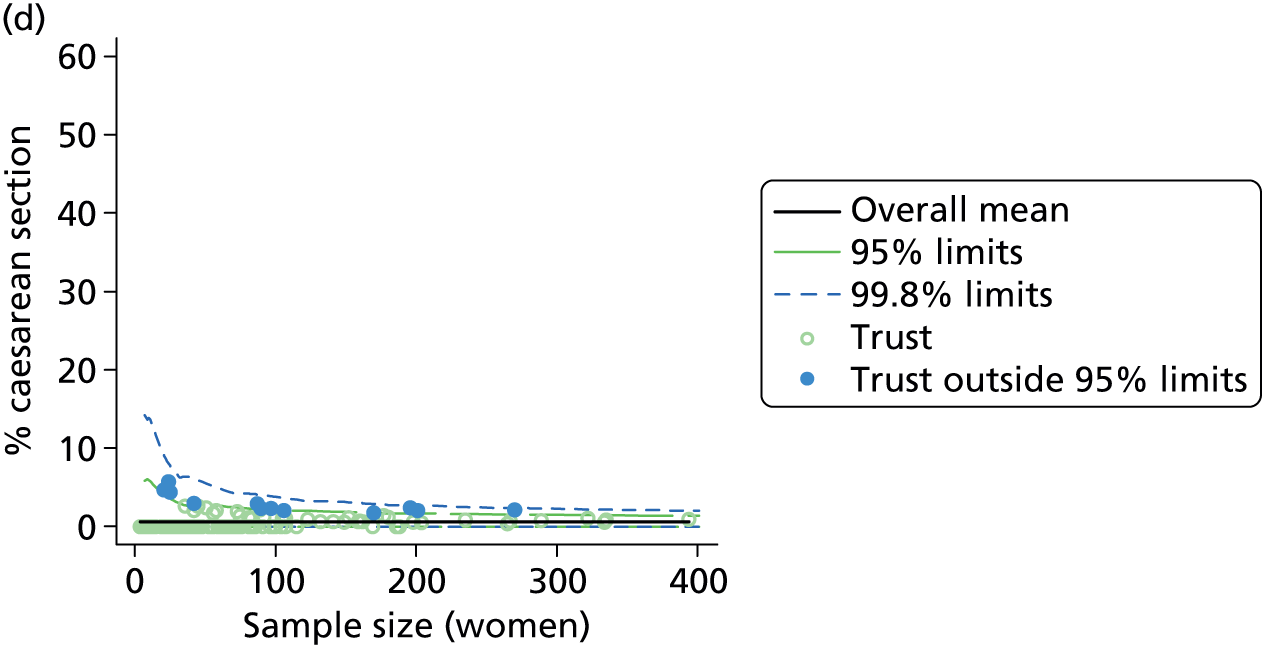
FIGURE 10.
Funnel plots showing adjusted ‘straightforward birth’ and ‘normal birth’ rates in women planning birth at home in different NHS trusts. (a) Percentage of ‘straightforward birth’ in nulliparous women; (b) percentage of ‘straightforward birth’ in multiparous women; (c) percentage of ‘normal birth’ in nulliparous women; and (d) percentage of ‘normal birth’ in multiparous women.
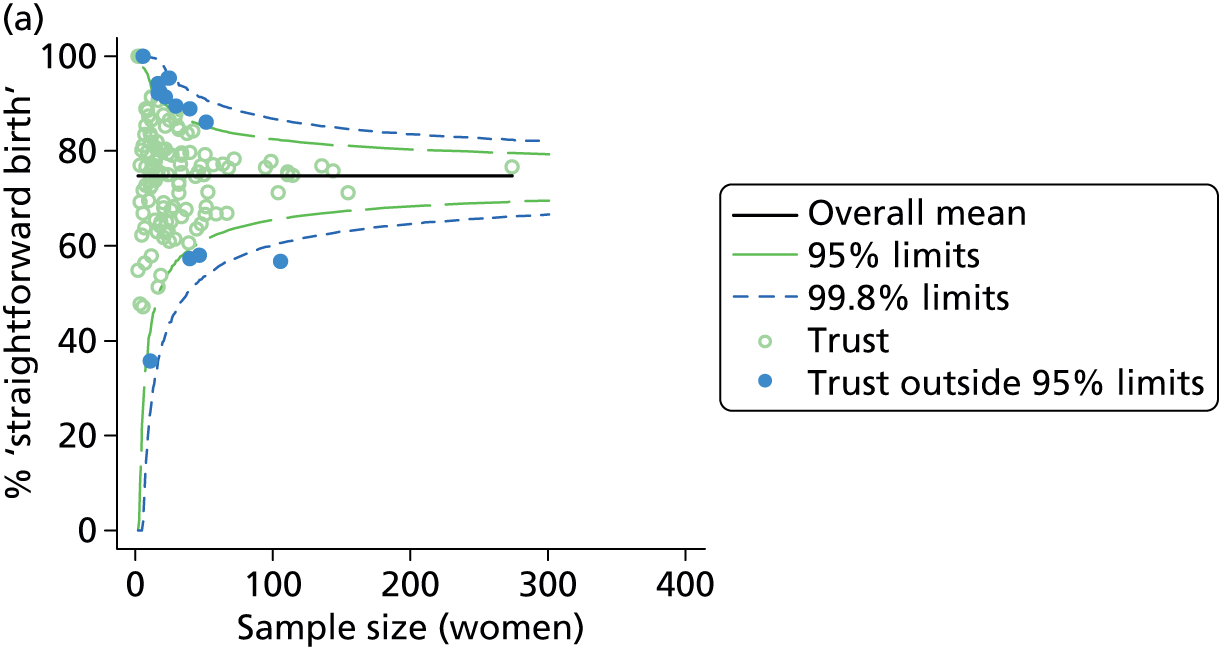
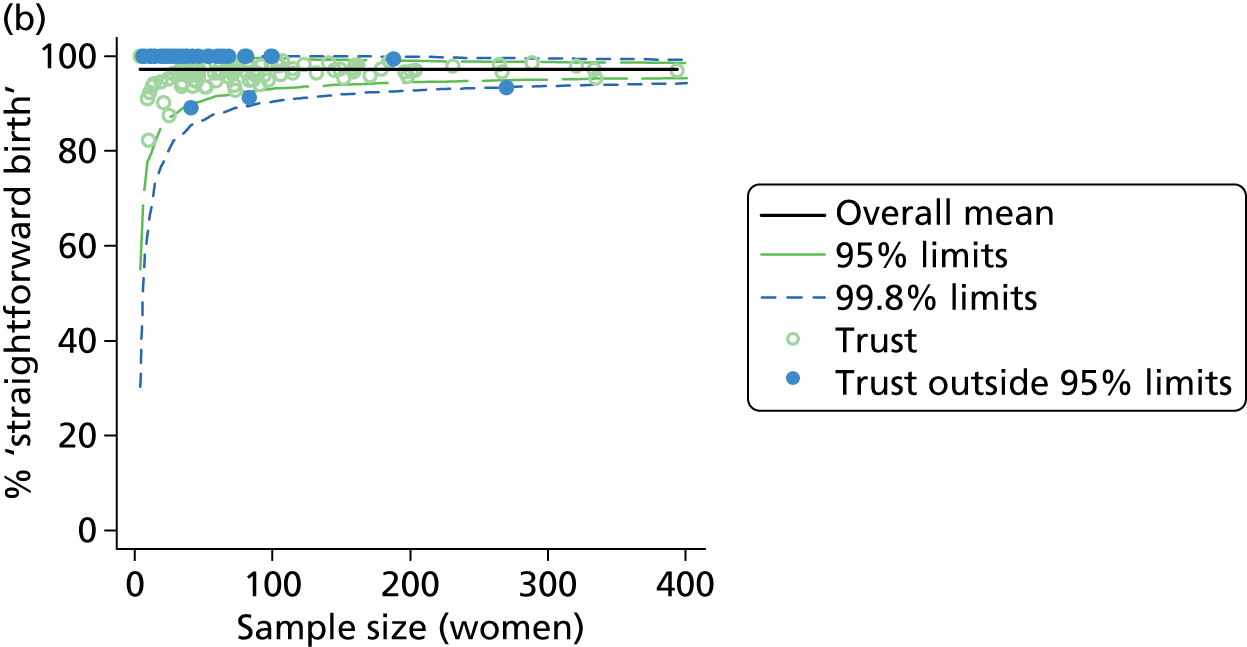
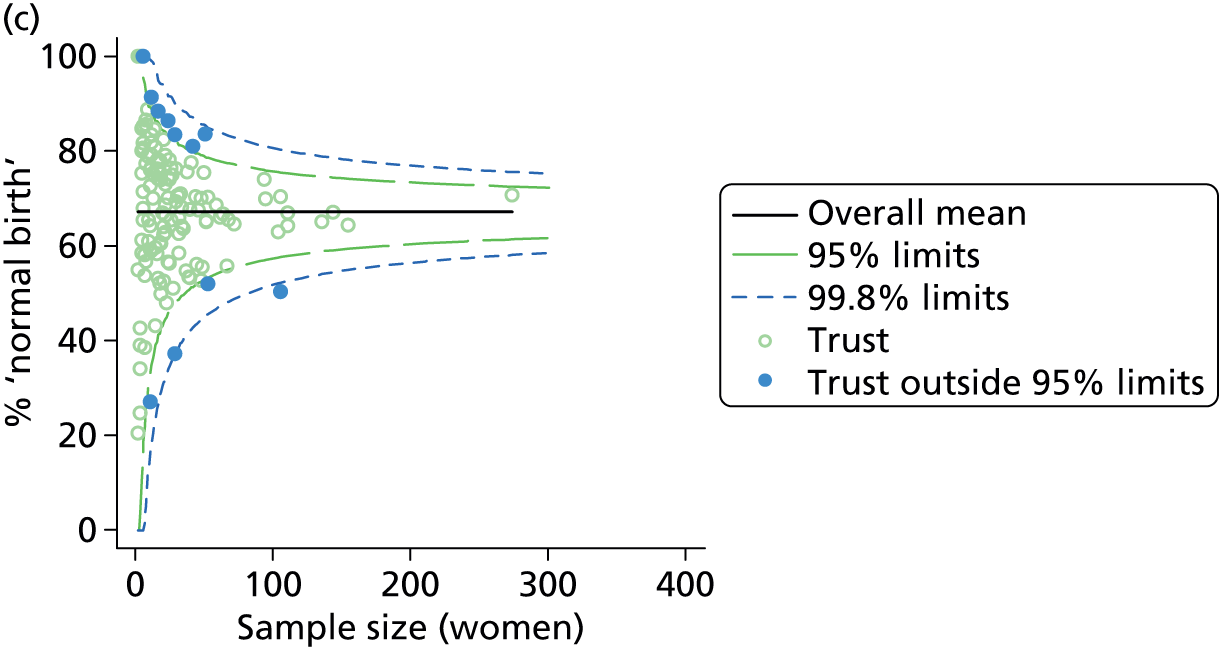
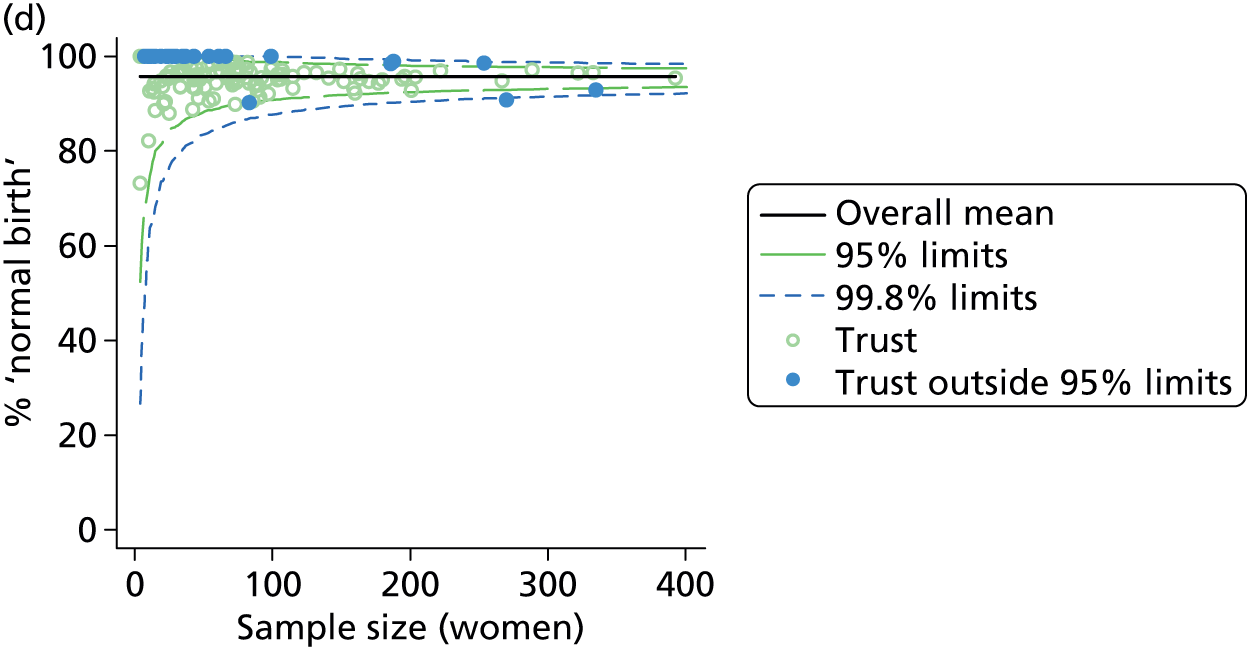
| Outcome measure | Nulliparous women | Multiparous women | ||
|---|---|---|---|---|
| Units | Outliers, n (%) | Units | Outliers, n (%) | |
| Instrumental delivery | 141 | 5 (4) | 142 | 10 (7) |
| Intrapartum caesarean section | 141 | 10 (7) | 142 | 12 (9) |
| ‘Straightforward birth’ | 141 | 29 (21) | 142 | 47 (33) |
| ‘Normal birth’ | 141 | 19 (14) | 142 | 31 (22) |
Trust characteristics and intervention rates in NHS trusts providing home birth services
In nulliparous women neither the absolute number of home births in the NHS trust nor the percentage of births that took place at home was associated with rates of any of the outcome measures studied (Table 18). In NHS trusts where the absolute number and the percentage of births at home was higher, the ‘normal birth’ rate in multiparous women was statistically significantly higher, and in trusts where the percentage of births at home was higher the ‘straightforward birth’ rate was also higher and the instrumental delivery rate lower, but these characteristics explained very little of the variation observed.
| Trust characteristic (number of trusts) and outcome measure | Nulliparous women | Multiparous women | ||||
|---|---|---|---|---|---|---|
| R2 (%)a | Coefficientb | p-value | R2 (%)a | Coefficientb | p-value | |
| Sizec (nulliparous, n = 141; multiparous, n = 142) | ||||||
| Instrumental delivery | 0.6 | 0.47 | 0.171 | 2.0 | –0.18 | 0.058 |
| Intrapartum caesarean section | 1.4 | –0.66 | 0.136 | 0.0 | –0.01 | 0.932 |
| ‘Straightforward birth’ | 0.0 | –0.07 | 0.917 | 0.6 | 0.18 | 0.342 |
| ‘Normal birth’ | 0.8 | 0.87 | 0.199 | 2.7 | 0.46 | 0.033 |
| Percentage of births in the trust at homed (nulliparous, n = 138; multiparous, n = 139) | ||||||
| Instrumental delivery | 0.1 | 0.08 | 0.578 | 3.1 | –0.09 | 0.004 |
| Intrapartum caesarean section | 0.2 | –0.10 | 0.608 | 0.0 | 0.01 | 0.839 |
| ‘Straightforward birth’ | 0.1 | 0.09 | 0.739 | 2.3 | 0.13 | 0.027 |
| ‘Normal birth’ | 0.4 | 0.25 | 0.409 | 3.4 | 0.19 | 0.004 |
Discussion
Summary of main findings
Obstetric units
In ‘low risk’ women planning birth in OUs, we found considerably greater variation in intervention rates than would be expected by chance and this was not explained by known differences in maternal characteristics. The proportion of births in the trust that were planned outside an OU (i.e. in an AMU, in a FMU or at home) was significantly associated with higher intervention rates in planned OU births in ‘low risk’ women and in particular with higher rates of intrapartum caesarean section in both nulliparous and multiparous women. Maternal intervention rates in planned OU births were not significantly associated with the percentage of planned ‘out-of-hospital’ births (planned at home or in a FMU). Having an AMU in the hospital was associated with significantly higher intrapartum caesarean section rates in nulliparous ‘low risk’ women planning an OU birth and significantly lower rates of ‘normal birth’ and ‘straightforward birth’ in multiparous ‘low risk’ women planning an OU birth.
The size of the OU (number of births) and midwifery ‘understaffing’ (the proportion of shifts where there were more women than midwives) were also associated with significant variation in rates of some interventions in planned OU births in ‘low risk’ women, but the lack of a consistent significant effect across multiple outcomes means that we cannot rule out the possibility that these were chance findings.
Alongside midwifery units
In ‘low risk’ women planning birth in AMUs there was greater variation in adjusted intervention rates, particularly in nulliparous women, than would be expected by chance. In larger AMUs (those with more births, more beds and more midwives) adjusted intervention rates were higher, with lower rates of ‘straightforward birth’ and ‘normal birth’ in both nulliparous and multiparous women. However, in a sensitivity analysis in which data relating to one large AMU that appeared to be an outlier were removed, none of the associations with size was significant. Midwifery staffing was not consistently associated with rates of any of the interventions studied.
Freestanding midwifery units
In ‘low risk’ planned FMU births, there was more variation in adjusted rates of instrumental delivery and ‘straightforward birth’ and ‘normal birth’ than would be expected by chance, but little variation in rates of intrapartum caesarean section. In larger FMUs (those with more beds, more births and more midwives) adjusted intervention rates were lower in nulliparous women only. In FMUs which were further away from the nearest OU (based on map distance and travel duration and on transfer duration) adjusted intervention rates were higher, again only in nulliparous women. However, as more distant units tended to be smaller it was not possible to clearly separate out the independent effects of size and distance. Midwifery staffing was not consistently associated with rates of any of the interventions studied. With the exception of one significant association (which may be a chance finding), none of the FMU characteristics considered was significantly associated with variations in rates of intrapartum caesarean section for either nulliparous or multiparous women. With the exception of one significant association (which may be a chance finding), none of the FMU characteristics considered was associated with variations in intervention rates for multiparous women.
Planned home births
In ‘low risk’ planned home births there was little variation between NHS trusts in adjusted rates of instrumental delivery and intrapartum caesarean section, but more variation in adjusted rates of ‘straightforward birth’ and ‘normal birth’. Multiparous ‘low risk’ women who planned home birth in a trust where more home births took place were significantly more likely to have a ‘normal birth’, and multiparous women who planned birth in a trust with a higher proportion of home births tended to have lower instrumental delivery rates and higher rates of ‘normal birth’ and ‘straightforward birth’. No significant associations with either measure of ‘volume’ of planned home births was observed for nulliparous women, but this may be due to the limited number of nulliparous women in the home birth sample. The magnitude of the ‘volume of home births effect’ was modest and very little of the variability in intervention rates was explained by the two measures of ‘volume’ considered.
Strengths and limitations
General strengths and limitations of the Birthplace cohort study dataset are discussed in Chapter 8. For the analyses presented in this chapter, we were constrained by the extremely limited availability of data on the characteristics of maternity units and NHS trusts providing home birth services in England. The data we used, assembled from a variety of sources, were sometimes of uncertain quality and validity and enabled us to evaluate a relatively limited range of unit characteristics, particularly for home births. To provide more robust measures of some unit characteristics for FMUs and AMUs, we combined several variables together to produce indices of size, staffing and distance to the nearest OU. Missing or incomplete data for some unit characteristics reduced the sample size for several analyses; we had only a small number of OUs in our sample, and so many of our findings need to be replicated in a larger sample of units.
We initially explored using multilevel modelling to investigate the extent to which unit characteristics explained variation in intervention rates, with the rationale that this method would enable us to model potentially complex inter-relationships between variables. However, because of missing data for some unit characteristics a relatively large proportion of units dropped out of these analyses and some models failed to converge. The linear regression models used could be fitted in all cases and had the advantage of allowing visual inspection of the fit of the model (see Appendix 5). We chose not to adjust for other unit characteristics in these models, as many unit characteristics were correlated with each other, making interpretation difficult.
Our analyses involved multiple testing, and should be considered exploratory in nature; our interpretation, therefore, focuses on factors which showed consistency of effect across a number of outcomes or where a number of variables measuring different aspects of the same fundamental characteristic, for example size, showed consistent associations with outcomes in the same direction.
Interpretation
Our findings confirm that there is significant variation in intervention rates in OUs and that this variation is not fully explained by the sociodemographic or clinical characteristics of women planning to give birth there. 18,25,26 We also found similar unexplained variation in intervention rates in planned AMU births, but less variation in intervention rates in FMUs and in NHS trusts providing home birth services, particularly for rates of intrapartum caesarean section.
In general, the institutional factors affecting intervention rates are poorly understood and previous studies have largely focused on intervention rates in births taking place in OUs. These have found some association between junior doctor staffing levels and intervention rates in OUs,27 and mixed or inconclusive results on the relationship between unit size or the level of neonatal care available and intervention rates. 28–30 Studies in France and Australia suggest that smaller units may have lower rates of some interventions, but in these studies smaller units differed from larger units in other ways, including, for example, the level of obstetric and neonatal care available and rurality. 28,35 There is little or no evidence on unit or NHS trust characteristics and their association with variation in intervention rates in women planning birth in non-OU settings.
In OUs we explored the effect of unit size and midwifery staffing on intervention rates and, while we observed some significant associations, these showed no consistent pattern, suggesting that there is no straightforward or clear relationship between the size of the unit or midwifery staffing and OU intervention rates, at least within the ranges observed within our samples. 36 We also found that having an AMU in the hospital was associated with significant variation in some of our outcome measures, but with no consistent pattern. AMUs vary considerably in their characteristics, for example size, number of midwives, whether midwifery staff work only in the AMU or work on rotation in the AMU and the OU, and the extent to which they are physically separate from the OU. 36 Some operate an ‘opt-in’ admissions policy, whereby women have to actively choose to plan birth in the AMU rather than in the OU, while others operate a policy whereby the default option for ‘low risk’ women is the AMU and these women have to actively ‘opt-out’ in order to plan birth in the OU. 36 We were not able to explore the effect of these varied AMU characteristics on OU intervention rates. We cannot, therefore, rule out the possibility that the presence of an AMU may have an impact on intervention rates in planned births in the associated OU.
We did find that some variation in OU intervention rates may be explained by another aspect of configuration of care: specifically, that intervention rates in planned ‘low risk’ OU births tend to be higher in OUs situated in trusts where a higher proportion of women planned birth in a non-OU setting (home, FMU or AMU). It is possible that this apparent association was confounded by the presence of a large AMU. It was notable that in our sample the three OUs situated in trusts with the highest proportions of non-OU births were also those with attached AMUs. We also observed an association between the presence of an AMU and higher rates of some interventions in planned OU births. Because of the small number of OUs in our sample with an attached AMU, we were not able to assess the independent effects of these two factors (percentage of non-OU births and presence of an AMU). The Birthplace organisational case studies found that the presence of an AMU appeared to intensify perceptions of the workload in the adjoining OU, where service providers reported struggling to support ‘normal birth’, suggesting one possible explanation for the findings relating to OU intervention rates. 10
There are also a number of possible alternative explanations for this finding. Unit intervention rates are readily available online17 and it is possible that, in NHS trusts where the OU is known to have a high intervention rate, a higher proportion of ‘low risk’ women may choose to plan birth in a non-OU setting in order to avoid unwanted interventions. However, we lack the evidence to confirm or refute this. Another possibility is that a higher proportion of ‘low risk’ births being planned in non-OU settings might result in a higher proportion of the women planning birth in the OU being, or being perceived to be,36 ‘higher risk’, possibly resulting in a more ‘medicalised’ approach to birth for women in the unit. However, we found no significant association between the proportion of planned non-OU births in the trust and the proportion of planned OU births that were classified as ‘higher risk’. Nor did we find a consistent relationship between the proportion of women planning OU birth who were ‘higher risk’ and intervention rates, suggesting that OUs with more ‘higher risk’ births did not necessarily exhibit an ‘interventionist culture’. Another possible explanation is selection bias, whereby the women opting for a non-OU birth might be those most keen to have a ‘normal birth’ without medical intervention, resulting in the planned OU group being less ‘intervention averse’. Other studies provide some support for this hypothesis. Women who opt for a hospital birth rather than a home birth in the Netherlands have been found to be more receptive to intervention,37 and one UK study found that willingness to accept intervention was a significant predictor of operative or instrumental birth. 38 Finally, there is evidence to suggest that midwives working in units with high intervention rates tend to have a higher perception of risk. 39
The vast majority of births take place in OUs,8,32 and in our sample of OUs only six (19%) were situated in trusts where > 10% of births were planned in a non-OU setting, with considerably lower levels of non-OU births in most trusts. The risk of interventions is substantially reduced in births planned in non-OU settings. 7,8,40 We lacked the data to examine intervention rates at a trust level, but the increase in interventions observed in ‘low risk’ planned OU births in trusts with more non-OU births was relatively small in comparison, suggesting that any increase would be more than offset by the reduction in interventions in the ‘low risk’ planned non-OU births. This needs to be verified using data on trust-level variations in intervention rates.
In AMUs, FMUs and NHS trusts providing home birth services we found some different patterns of association between unit or trust characteristics and intervention rates. In all these settings the interventions we considered as outcome measures can only take place after transfer to an OU. Consideration therefore needs to be given to the extent to which the associations seen are a function of measured or unmeasured characteristics of the MU or the NHS trust itself or of the OU(s) to which women are transferred, most of which were not included in our analyses because the Birthplace cohort study included only a stratified sample of 36 OUs (out of 180 OUs in England at the time).
For AMUs we found considerable variation in intervention rates, particularly in nulliparous women, and our main analysis suggested that intervention rates tended to increase with the AMU’s size. However, our sensitivity analyses revealed that these associations appeared to be driven by higher intervention rates in a single large AMU in our sample. Within the size range of the vast majority of AMUs in our sample (< ≈1500 planned births per year), AMU size did not, therefore, appear to be associated with variation in intervention rates. The observed wide variation in intervention rates between AMUs may be explained by other important unmeasured differences in the characteristics of AMUs,36 such as, for example, whether they operate an opt-in or an opt-out admission policy, whether or not they are physically separate from the OU and/or whether or not they share midwifery staff with the OU. The characteristics and intervention patterns of the associated OU may also be influential, but given the available data we were unable to investigate this. Since the Birthplace cohort study took place, the number of AMUs has increased by 71% from 51 to 87,32 and so further research on the characteristics of AMUs and intervention rates in women planning birth there is merited.
In FMUs we explored associations between unit characteristics, measuring size, midwifery staffing levels and distance to the nearest OU and intervention rates, and found that larger FMUs had lower intervention rates and that FMUs located further away from the nearest OU had higher intervention rates, both in nulliparous women. However, as more distant units, many of which serve small rural communities,41 were also more likely to be smaller, it was not possible to clearly separate out the independent effects of size and distance. None of the FMU characteristics considered, including size and distance, was associated with variation in intrapartum caesarean section rates. For planned home births, we also found indications that NHS trusts with higher absolute numbers or proportions of births that took place at home might have lower rates of intervention. The observed associations for both FMUs and home births are consistent with other analyses reported in Chapter 5, which showed similar associations between the size and location of FMUs and number of home births in a trust and transfer rates. Possible explanations for these findings on transfer, which may explain the results reported in this chapter, are considered in Chapter 5.
Conclusions
These exploratory analyses of ‘low risk’ births planned in different settings suggest that some unit or NHS trust characteristics may be associated with variation in intervention rates. In particular, in relation to planned OU births, our findings suggest that the level of provision of midwifery-led intrapartum care within a trust, and possibly the size of the OU and OU midwifery staffing levels, may explain some of the variation in OU intervention rates. Trusts with greater provision of non-OU intrapartum care may be more likely to have higher intervention rates in their planned ‘low risk’ OU births, but it is possible that this association is confounded by trusts with a high proportion of planned non-OU births being more likely to have an AMU. Furthermore, the magnitude of this effect is likely to be small and, at a trust level, more than offset by the lower levels of intervention in the births planned in AMUs, in FMUs and at home.
In relation to planned births in MUs, we found considerable variation in intervention rates in planned AMU births, but no consistent associations with any of the unit characteristics on which we had data. Our results on FMU characteristics and intervention rates, indicating lower intervention rates in nulliparous women planning birth in larger FMUs and higher intervention rates in nulliparous women in FMUs located further away from the nearest OU, were broadly consistent with other analyses on variation in FMU transfer rates (see Chapter 5).
Further research using high-quality data on service configuration, unit characteristics and interventions and other outcomes in ‘low risk’ women in a larger sample of units and trusts is required to confirm these findings. Qualitative research may also be required to explore the mechanisms involved. In addition, further research is required on the consequences of opt-in and opt-out admission policies and other characteristics of AMUs; on the possible effects of unit ‘culture’, policies, staff behaviour and women’s attitudes and expectations on intervention rates; and to explore the impact of working in different birth settings on midwives’ attitudes, skills and confidence in relation to ‘normal birth’.
Acknowledgement of material published under Creative Commons licence
Some of the analyses relating to OUs described and discussed above have also been published elsewhere. 34 Sections of text in this chapter, including substantial parts of the following sections, are reproduced from, or closely based on, the original article,34 and are covered by the terms of the Creative Commons Attribution Non-Commercial (CC BY-NC 4.0) license that applies to the original publication:
-
Introduction.
-
Methods.
-
Characteristics of obstetric units in the study sample.
-
Variation in intervention rates between obstetric units.
-
Configuration, unit characteristics and intervention rates in obstetric units.
-
Further exploratory analyses of obstetric unit intervention rates.
-
Discussion.
Chapter 4 The effect of planned place of birth on interventions and maternal outcomes for different groups of ‘low risk’ women
Introduction
For ‘low risk’ women, planned birth in a MU or at home is associated with benefits for the mother in terms of fewer interventions, including instrumental delivery and intrapartum caesarean section. 7,8,13,40,42–44 Where there is no evidence of an associated increase in poor outcomes, fewer interventions are desirable because of the associated benefits for women and for the NHS in terms of reduced length of stay, post-delivery complications avoided and reduced need for intervention in a future birth. 2
A number of studies have explored ethnic and sociodemographic variations in the likelihood of intervention during labour. These studies suggest that women from some ethnic minority backgrounds are more likely to have a caesarean section,45 particularly during labour;26,46 suggest that women from more deprived areas may be more likely to have an emergency caesarean section, although this study showed changes in this association over time;47 and have found consistent associations between advanced maternal age and increased risk of interventions, including caesarean section. 48–52 Most of these studies have been carried out using population- or area-level data, in which the overwhelming majority of women would have been planning birth in an OU setting. Relatively little is known, therefore, about the risk of intervention in women in these groups who plan birth in other settings. The women planning birth in some non-OU settings, most notably in FMUs and at home, are less varied in terms of sociodemographic background than those planning birth in OUs or AMUs. 7,8 However, given that the overall number of women planning birth outside an OU is increasing,32 it is important to identify whether or not the beneficial effect of planning non-OU birth, in terms of reduced chance of intervention, is experienced equally by women in different sociodemographic groups.
We aimed to explore associations between planned place of birth, maternal characteristics and interventions during labour and birth, and investigate whether associations between planned place of birth and interventions were modified by ethnicity, area deprivation or maternal age.
Methods
Study population
The main study population for these analyses was ‘low risk’ women in the Birthplace cohort with a term pregnancy (37 to 42 + 0 weeks’ gestation) planning a vaginal birth in an OU, in an AMU, in a FMU or at home. Women with unknown parity were excluded.
Outcome measures
We used four main outcome measures, two capturing interventions during labour and birth, one indicating birth without complications that might affect future births and one indicating birth with low intervention:
-
instrumental delivery (forceps or ventouse)
-
intrapartum caesarean section
-
‘straightforward birth’, defined as birth without forceps or ventouse, intrapartum caesarean section, third- or fourth-degree perineal trauma or blood transfusion
-
‘normal birth’, defined as birth without induction of labour, epidural or spinal analgesia, general anaesthetic, forceps or ventouse, caesarean section or episiotomy. 12
Statistical methods
We used multivariable Poisson regression to study associations between the following and each outcome in turn:
-
planned place of birth (OU, AMU, FMU, home)
-
ethnicity (white, non-white)
-
IMD (less deprived: IMD quintiles 1, 2 and 3; more deprived: IMD quintiles 4 and 5)
-
maternal age in years (< 20, 20–24, 25–29, 30–34; ≥ 35).
Ethnicity and IMD were dichotomised to ensure that all groups had large enough numbers for statistical testing.
Relative risks were adjusted for these and other maternal characteristics and the presence of ‘complicating conditions’ identified at the start of labour care as described in Chapter 2 (see Poisson regression models).
Initially, the absolute and adjusted RRs for each maternal characteristic and for AMUs, FMUs and home births compared with OUs were estimated with adjustment for the variables listed in Chapter 2 (see Maternal characteristics) using Poisson models (main effects models). We then investigated whether the effect of planned place of birth (OU, AMU, FMU and home) on each outcome measure was modified by ethnicity (white vs. non-white), area deprivation score (less deprived vs. more deprived) or maternal age (< 35 years vs. ≥ 35 years) by carrying out tests for interaction using Wald tests. To interpret these we also calculated unadjusted and adjusted absolute and RRs of each outcome in each setting for each category of ethnicity, deprivation or maternal age also using Poisson models. When modelling interactions, we adjusted for other maternal characteristics using the variables and categories listed in Chapter 2 (see Maternal characteristics).
Results
Characteristics of the sample
The study group consisted of 61,820 ‘low risk’ women with a ‘term’ pregnancy (37 to 42 + 0 weeks’ gestation), of whom 27,497 were nulliparous and 34,323 were multiparous; their characteristics are presented in Tables 1–4.
Association between planned place of birth, maternal characteristics and interventions during labour or birth
The following tables show the associations between planned place of birth, maternal characteristics and the outcomes studied: instrumental delivery (Table 19), intrapartum caesarean section (Table 20), ‘straightforward birth’ (Table 21) and ‘normal birth’ (Table 22), by parity. While the tables include results for all maternal characteristics included in the models, in order to show the effect of potential confounders, the commentary focuses on the explanatory variables of interest in this chapter; that is, ethnicity, area deprivation and maternal age.
| Birth setting and characteristic | Nulliparous women (n = 27,477) | Multiparous women (n = 34,305) | ||||||
|---|---|---|---|---|---|---|---|---|
| Events | Births | Weighted % | Adjusted RR (95% CI) | Events | Births | Weighted % | Adjusted RR (95% CI) | |
| Planned place of birth | ||||||||
| OU | 2201 | 10,039 | 22.5 | 1 | 482 | 8616 | 5.7 | 1 |
| Home | 575 | 4359 | 12.7 | 0.51 (0.44 to 0.59) | 107 | 11,733 | 0.9 | 0.15 (0.12 to 0.20) |
| FMU | 604 | 5047 | 10.9 | 0.49 (0.41 to 0.60) | 69 | 5934 | 1.1 | 0.19 (0.13 to 0.27) |
| AMU | 1275 | 8032 | 16.2 | 0.73 (0.62 to 0.86) | 185 | 8022 | 2.5 | 0.46 (0.35 to 0.60) |
| p-valuea | p < 0.001 | p < 0.001 | ||||||
| Ethnicity | ||||||||
| White | 4097 | 23,836 | 21.8 | 1 | 723 | 29,722 | 5.2 | 1 |
| Non-white | 558 | 3641 | 19.3 | 0.87 (0.74 to 1.03) | 120 | 4583 | 3.9 | 0.80 (0.57 to 1.11) |
| p-valuea | p = 0.116 | p = 0.176 | ||||||
| Deprivation | ||||||||
| Less deprivedb | 2798 | 15,696 | 21.9 | 1 | 480 | 20,102 | 5.4 | 1 |
| More deprivedc | 1857 | 11,781 | 20.7 | 1.06 (0.95 to 1.17) | 363 | 14,203 | 4.4 | 0.92 (0.76 to 1.13) |
| p-valuea | p = 0.301 | p = 0.429 | ||||||
| Maternal age (years) | ||||||||
| < 20 | 284 | 2799 | 14.2 | 0.60 (0.48 to 0.75) | 19 | 501 | 7.1 | 1.30 (0.68 to 2.48) |
| 20–24 | 839 | 6135 | 17.1 | 0.70 (0.58 to 0.84) | 91 | 4927 | 3.3 | 0.65 (0.46 to 0.90) |
| 25–29 | 1440 | 8210 | 22.1 | 0.90 (0.77 to 1.04) | 235 | 9392 | 4.8 | 0.95 (0.81 to 1.12) |
| 30–34 | 1355 | 7096 | 24.9 | 1 | 275 | 10,903 | 5.1 | 1 |
| ≥ 35 | 737 | 3237 | 27.9 | 1.10 (0.98 to 1.24) | 223 | 8582 | 5.7 | 1.08 (0.88 to 1.33) |
| p-valuea | p < 0.001 | p = 0.001 | ||||||
| Understanding of English | ||||||||
| Fluent | 4373 | 25,870 | 21.4 | 1 | 797 | 32,656 | 5.0 | 1 |
| Some or none | 282 | 1607 | 20.2 | 0.98 (0.85 to 1.12) | 46 | 1649 | 3.6 | 0.81 (0.59 to 1.12) |
| p-valuea | p = 0.737 | p = 0.207 | ||||||
| Marital/partner status | ||||||||
| Marriedd | 4256 | 24,298 | 22.3 | 1 | 791 | 32,511 | 4.9 | 1 |
| Singlee | 399 | 3179 | 15.6 | 0.83 (0.73 to 0.95) | 52 | 1794 | 4.7 | 0.97 (0.71 to 1.31) |
| p-valuea | p = 0.006 | p = 0.821 | ||||||
| BMI (kg/m2) | ||||||||
| Not recorded | 829 | 4922 | 19.8 | 0.87 (0.78 to 0.98) | 160 | 6123 | 5.4 | 0.97 (0.78 to 1.21) |
| < 18.5 | 123 | 759 | 20.3 | 1.02 (0.85 to 1.22) | 21 | 753 | 3.9 | 0.78 (0.42 to 1.46) |
| 18.5–24.9 | 2390 | 13,949 | 22.4 | 1 | 402 | 15,779 | 5.4 | 1 |
| 25–29.9 | 987 | 5887 | 20.9 | 0.90 (0.82 to 0.98) | 196 | 8497 | 4.1 | 0.75 (0.61 to 0.93) |
| 30–35.0 | 326 | 1960 | 20.6 | 0.86 (0.76 to 0.97) | 64 | 3153 | 4.3 | 0.76 (0.53 to 1.10) |
| p-valuea | p = 0.022 | p = 0.118 | ||||||
| Gestation (completed weeks) | ||||||||
| 37 | 101 | 868 | 14.3 | 0.62 (0.50 to 0.78) | 29 | 928 | 5.9 | 1.14 (0.82 to 1.58) |
| 38 | 320 | 2660 | 15.2 | 0.69 (0.59 to 0.80) | 71 | 3241 | 4.5 | 0.93 (0.68 to 1.28) |
| 39 | 912 | 6348 | 18.8 | 0.85 (0.77 to 0.93) | 183 | 8619 | 4.6 | 0.96 (0.80 to 1.17) |
| 40 | 1772 | 10,168 | 22.4 | 1 | 314 | 13,491 | 4.7 | 1 |
| 41 to 42 + 0 | 1550 | 7433 | 25.2 | 1.11 (1.01 to 1.23) | 246 | 8026 | 5.6 | 1.17 (0.99 to 1.39) |
| p-valuea | p < 0.001 | p = 0.218 | ||||||
| Number of ‘complicating conditions’ identified at the start of labour care | ||||||||
| None | 3766 | 23,654 | 20.0 | 1 | 711 | 31,896 | 4.4 | 1 |
| ≥ 1 | 889 | 3823 | 26.3 | 1.24 (1.14 to 1.36) | 132 | 2409 | 8.2 | 1.64 (1.32 to 2.04) |
| p-valuea | p < 0.001 | p < 0.001 | ||||||
| Birth setting and characteristic | Nulliparous women (n = 27,477) | Multiparous women (n = 34,305) | ||||||
|---|---|---|---|---|---|---|---|---|
| Events | Births | Weighted % | Adjusted RR (95% CI) | Events | Births | Weighted % | Adjusted RR (95% CI) | |
| Planned place of birth | ||||||||
| OU | 1545 | 10,039 | 15.6 | 1 | 446 | 8616 | 5.2 | 1 |
| Home | 356 | 4359 | 8.5 | 0.57 (0.47 to 0.70) | 78 | 11,733 | 0.6 | 0.15 (0.10 to 0.21) |
| FMU | 342 | 5047 | 6.5 | 0.51 (0.42 to 0.61) | 44 | 5934 | 0.7 | 0.18 (0.12 to 0.26) |
| AMU | 618 | 8032 | 7.8 | 0.59 (0.48 to 0.71) | 85 | 8022 | 1.0 | 0.24 (0.17 to 0.36) |
| p-valuea | p < 0.001 | p < 0.001 | ||||||
| Ethnicity | ||||||||
| White | 2380 | 23,836 | 13.8 | 1 | 526 | 29,722 | 4.1 | 1 |
| Non-white | 481 | 3641 | 17.5 | 1.29 (1.09 to 1.52) | 127 | 4583 | 5.2 | 1.31 (1.03 to 1.66) |
| p-valuea | p = 0.004 | p = 0.027 | ||||||
| Deprivation | ||||||||
| Less deprivedb | 1695 | 15,696 | 15.2 | 1 | 379 | 20,102 | 4.6 | 1 |
| More deprivedc | 1166 | 11,781 | 13.6 | 0.95 (0.85 to 1.08) | 274 | 14,203 | 4.0 | 0.83 (0.66 to 1.06) |
| p-valuea | p = 0.448 | p = 0.132 | ||||||
| Maternal age (years) | ||||||||
| < 20 | 153 | 2799 | 7.7 | 0.46 (0.39 to 0.54) | 8 | 501 | 2.6 | 0.56 (0.22 to 1.45) |
| 20–24 | 483 | 6135 | 11.1 | 0.63 (0.56 to 0.71) | 82 | 4927 | 3.5 | 0.84 (0.60 to 1.16) |
| 25–29 | 841 | 8210 | 14.0 | 0.78 (0.69 to 0.88) | 167 | 9392 | 4.0 | 0.97 (0.80 to 1.17) |
| 30–34 | 895 | 7096 | 18.0 | 1 | 202 | 10,903 | 4.3 | 1 |
| ≥ 35 | 489 | 3237 | 21.9 | 1.19 (1.05 to 1.34) | 194 | 8582 | 5.4 | 1.16 (0.88 to 1.54) |
| p-valuea | p < 0.001 | p = 0.161 | ||||||
| Understanding of English | ||||||||
| Fluent | 2676 | 25,870 | 14.2 | 1 | 610 | 32,656 | 4.3 | 1 |
| Some or none | 185 | 1607 | 16.8 | 1.16 (0.95 to 1.41) | 43 | 1649 | 4.8 | 0.99 (0.64 to 1.53) |
| p-valuea | p = 0.139 | p = 0.967 | ||||||
| Marital/partner status | ||||||||
| Marriedd | 2591 | 24,298 | 14.9 | 1 | 600 | 32,511 | 4.3 | 1 |
| Singlee | 270 | 3179 | 11.7 | 1.05 (0.91 to 1.22) | 53 | 1794 | 5.1 | 1.26 (0.94 to 1.68) |
| p-valuea | p = 0.465 | p = 0.125 | ||||||
| BMI (kg/m2) | ||||||||
| Not recorded | 543 | 4922 | 16.2 | 1.28 (1.12 to 1.46) | 133 | 6123 | 5.0 | 1.26 (0.92 to 1.73) |
| < 18.5 | 46 | 759 | 8.1 | 0.75 (0.55 to 1.02) | 11 | 753 | 3.7 | 1.16 (0.71 to 1.90) |
| 18.5–24.9 | 1281 | 13,949 | 12.3 | 1 | 253 | 15,779 | 3.5 | 1 |
| 25–29.9 | 739 | 5887 | 16.7 | 1.28 (1.16 to 1.42) | 177 | 8497 | 4.9 | 1.25 (1.00 to 1.56) |
| 30–35.0 | 252 | 1960 | 19.1 | 1.41 (1.21 to 1.65) | 79 | 3153 | 5.5 | 1.29 (0.99 to 1.69) |
| p-valuea | p < 0.001 | p = 0.234 | ||||||
| Gestation (completed weeks) | ||||||||
| 37 | 59 | 868 | 9.8 | 0.69 (0.50 to 0.94) | 19 | 928 | 3.6 | 0.84 (0.49 to 1.44) |
| 38 | 177 | 2660 | 11.3 | 0.81 (0.67 to 0.97) | 75 | 3241 | 5.1 | 1.35 (1.04 to 1.74) |
| 39 | 497 | 6348 | 11.3 | 0.83 (0.73 to 0.94) | 110 | 8619 | 3.1 | 0.87 (0.65 to 1.17) |
| 40 | 1026 | 10,168 | 13.6 | 1 | 213 | 13,491 | 3.5 | 1 |
| 41 to 42 + 0 | 1102 | 7433 | 19.8 | 1.44 (1.32 to 1.56) | 236 | 8026 | 6.7 | 1.89 (1.49 to 2.39) |
| p-valuea | p < 0.001 | p < 0.001 | ||||||
| Number of ‘complicating conditions’ identified at the start of labour care | ||||||||
| None | 2056 | 23,654 | 11.6 | 1 | 453 | 31,896 | 3.2 | 1 |
| ≥ 1 | 805 | 3823 | 24.7 | 1.92 (1.68 to 2.18) | 200 | 2409 | 12.4 | 3.38 (2.67 to 4.29) |
| p-valuea | p < 0.001 | p < 0.001 | ||||||
| Birth setting and characteristic | Nulliparous women (n = 27,312) | Multiparous women (n = 34,023) | ||||||
|---|---|---|---|---|---|---|---|---|
| Events | Births | Weighted % | Adjusted RR (95% CI) | Events | Births | Weighted % | Adjusted RR (95% CI) | |
| Planned place of birth | ||||||||
| OU | 5916 | 9986 | 58.5 | 1 | 7475 | 8559 | 87.1 | 1 |
| Home | 3237 | 4332 | 74.7 | 1.32 (1.26 to 1.39) | 11,301 | 11,632 | 97.2 | 1.10 (1.09 to 1.12) |
| FMU | 3909 | 5032 | 78.8 | 1.28 (1.23 to 1.34) | 5704 | 5890 | 97.0 | 1.10 (1.08 to 1.12) |
| AMU | 5747 | 7962 | 71.6 | 1.18 (1.12 to 1.23) | 7529 | 7942 | 94.6 | 1.07 (1.05 to 1.09) |
| p-valuea | p < 0.001 | p < 0.001 | ||||||
| Ethnicity | ||||||||
| White | 16,413 | 23,706 | 61.2 | 1 | 27,800 | 29,482 | 89.0 | 1 |
| Non-white | 2396 | 3606 | 58.4 | 0.95 (0.89 to 1.02) | 4209 | 4541 | 88.6 | 0.99 (0.97 to 1.02) |
| p-valuea | p = 0.184 | p = 0.511 | ||||||
| Deprivation | ||||||||
| Less deprivedb | 10,522 | 15,611 | 59.2 | 1 | 18,739 | 19,929 | 87.9 | 1 |
| More deprivedc | 8287 | 11,701 | 62.5 | 1.00 (0.97 to 1.03) | 13,270 | 14,094 | 90.1 | 1.02 (1.00 to 1.04) |
| p-valuea | p = 0.984 | p = 0.016 | ||||||
| Maternal age (years) | ||||||||
| < 20 | 2293 | 2782 | 76.3 | 1.40 (1.30 to 1.50) | 460 | 500 | 86.1 | 0.97 (0.91 to 1.04) |
| 20–24 | 4595 | 6096 | 68.4 | 1.28 (1.19 to 1.37) | 4666 | 4894 | 92.0 | 1.03 (1.02 to 1.05) |
| 25–29 | 5559 | 8169 | 60.3 | 1.13 (1.07 to 1.20) | 8780 | 9306 | 89.3 | 1.00 (0.99 to 1.02) |
| 30–34 | 4495 | 7054 | 52.9 | 1 | 10,150 | 10,812 | 88.7 | 1 |
| ≥ 35 | 1867 | 3211 | 46.6 | 0.89 (0.85 to 0.94) | 7953 | 8511 | 86.7 | 0.98 (0.97 to 1.00) |
| p-valuea | p < 0.001 | p < 0.001 | ||||||
| Understanding of English | ||||||||
| Fluent | 17,729 | 25,720 | 60.8 | 1 | 30,502 | 32,389 | 88.9 | 1 |
| Some or none | 1080 | 1592 | 59.8 | 0.99 (0.93 to 1.05) | 1507 | 1634 | 88.5 | 1.00 (0.97 to 1.03) |
| p-valuea | p = 0.712 | p = 0.789 | ||||||
| Marital/partner status | ||||||||
| Marriedd | 16,392 | 24,146 | 59.1 | 1 | 30,357 | 32,240 | 88.9 | 1 |
| Singlee | 2417 | 3166 | 70.4 | 1.05 (1.01 to 1.09) | 1652 | 1783 | 88.9 | 1.00 (0.97 to 1.02) |
| p-valuea | p = 0.017 | p = 0.799 | ||||||
| BMI (kg/m2) | ||||||||
| Not recorded | 3328 | 4891 | 60.0 | 0.98 (0.94 to 1.02) | 5653 | 6072 | 87.4 | 0.98 (0.97 to 1.00) |
| < 18.5 | 543 | 748 | 66.2 | 1.00 (0.94 to 1.06) | 706 | 747 | 91.7 | 1.02 (0.98 to 1.06) |
| 18.5–24.9 | 9710 | 13,880 | 61.8 | 1 | 14,772 | 15,644 | 89.4 | 1 |
| 25–29.9 | 3919 | 5844 | 59.4 | 0.99 (0.96 to 1.02) | 7930 | 8432 | 88.8 | 1.00 (0.98 to 1.01) |
| 30–35.0 | 1309 | 1949 | 57.2 | 0.97 (0.93 to 1.02) | 2948 | 3128 | 88.9 | 1.00 (0.98 to 1.03) |
| p-valuea | p = 0.658 | p = 0.439 | ||||||
| Gestation (completed weeks) | ||||||||
| 37 | 688 | 864 | 74.1 | 1.26 (1.19 to 1.34) | 858 | 921 | 88.8 | 1.00 (0.97 to 1.04) |
| 38 | 2061 | 2636 | 70.6 | 1.18 (1.12 to 1.24) | 3040 | 3228 | 88.7 | 0.99 (0.97 to 1.02) |
| 39 | 4662 | 6311 | 66.3 | 1.10 (1.06 to 1.15) | 8143 | 8547 | 90.5 | 1.01 (0.99 to 1.03) |
| 40 | 6917 | 10,097 | 60.3 | 1 | 12,642 | 13,365 | 89.9 | 1 |
| 41 to 42 + 0 | 4481 | 7404 | 51.5 | 0.86 (0.82 to 0.89) | 7326 | 7962 | 85.8 | 0.96 (0.94 to 0.97) |
| p-valuea | p < 0.001 | p < 0.001 | ||||||
| Number of ‘complicating conditions’ identified at the start of labour care | ||||||||
| None | 16,809 | 23,510 | 64.7 | 1 | 29,978 | 31,625 | 90.5 | 1 |
| ≥ 1 | 2000 | 3802 | 46.1 | 0.74 (0.70 to 0.78) | 2031 | 2398 | 77.8 | 0.87 (0.84 to 0.90) |
| p-valuea | p < 0.001 | p < 0.001 | ||||||
| Birth setting and characteristic | Nulliparous women (n = 27,394) | Multiparous women (n = 34,174) | ||||||
|---|---|---|---|---|---|---|---|---|
| Events | Births | Weighted % | Adjusted RR (95% CI) | Events | Births | Weighted % | Adjusted RR (95% CI) | |
| Planned place of birth | ||||||||
| OU | 4266 | 9996 | 42.0 | 1 | 6609 | 8558 | 76.8 | 1 |
| Home | 2892 | 4336 | 67.2 | 1.62 (1.50 to 1.76) | 11,171 | 11,686 | 95.7 | 1.24 (1.20 to 1.27) |
| FMU | 3500 | 5039 | 70.0 | 1.55 (1.44 to 1.66) | 5600 | 5923 | 94.6 | 1.22 (1.18 to 1.26) |
| AMU | 4992 | 8023 | 61.6 | 1.37 (1.27 to 1.48) | 7308 | 8007 | 90.8 | 1.16 (1.12 to 1.19) |
| p-valuea | p < 0.001 | p < 0.001 | ||||||
| Ethnicity | ||||||||
| White | 13,621 | 23,771 | 45.3 | 1 | 26,660 | 29,617 | 79.9 | 1 |
| Non-white | 2029 | 3623 | 45.1 | 1.02 (0.94 to 1.12) | 4028 | 4557 | 81.0 | 1.01 (0.97 to 1.04) |
| p-valuea | p = 0.616 | p = 0.715 | ||||||
| Deprivation | ||||||||
| Less deprivedb | 8736 | 15,655 | 44.1 | 1 | 17,983 | 20,030 | 78.8 | 1 |
| More deprivedc | 6914 | 11,739 | 46.6 | 0.99 (0.95 to 1.05) | 12,705 | 14,144 | 81.6 | 1.02 (1.00 to 1.05) |
| p-valuea | p = 0.845 | p = 0.068 | ||||||
| Maternal age (years) | ||||||||
| < 20 | 1879 | 2788 | 57.2 | 1.43 (1.28 to 1.59) | 437 | 499 | 81.6 | 1.03 (0.96 to 1.10) |
| 20–24 | 3845 | 6121 | 51.5 | 1.28 (1.19 to 1.39) | 4473 | 4912 | 84.0 | 1.06 (1.03 to 1.08) |
| 25–29 | 4635 | 8189 | 44.4 | 1.10 (1.03 to 1.19) | 8403 | 9349 | 80.8 | 1.02 (0.99 to 1.04) |
| 30–34 | 3736 | 7065 | 40.0 | 1 | 9740 | 10,867 | 79.1 | 1 |
| ≥ 35 | 1555 | 3231 | 33.6 | 0.85 (0.81 to 0.90) | 7635 | 8547 | 77.9 | 0.99 (0.97 to 1.02) |
| p-valuea | p < 0.001 | p < 0.001 | ||||||
| Understanding of English | ||||||||
| Fluent | 14,790 | 25,798 | 45.5 | 1 | 29,250 | 32,535 | 80.0 | 1 |
| Some or none | 860 | 1596 | 42.2 | 0.91 (0.82 to 1.00) | 1438 | 1639 | 82.1 | 1.03 (0.98 to 1.07) |
| p-valuea | p = 0.057 | p = 0.267 | ||||||
| Marital/partner status | ||||||||
| Marriedd | 13,687 | 24,221 | 44.3 | 1 | 29,122 | 32,388 | 80.0 | 1 |
| Singlee | 1963 | 3173 | 51.2 | 1.00 (0.95 to 1.06) | 1566 | 1786 | 82.1 | 1.02 (0.98 to 1.07) |
| p-valuea | p = 0.890 | p = 0.283 | ||||||
| BMI (kg/m2) | ||||||||
| Not recorded | 2779 | 4895 | 45.3 | 1.00 (0.95 to 1.05) | 5421 | 6089 | 79.6 | 1.00 (0.98 to 1.03) |
| < 18.5 | 440 | 756 | 49.3 | 0.99 (0.90 to 1.10) | 679 | 753 | 84.3 | 1.04 (0.99 to 1.09) |
| 18.5–24.9 | 8072 | 13,919 | 46.0 | 1 | 14,170 | 15,728 | 80.2 | 1 |
| 25–29.9 | 3269 | 5869 | 44.2 | 1.00 (0.96 to 1.05) | 7593 | 8467 | 79.6 | 1.00 (0.98 to 1.03) |
| 30–35.0 | 1090 | 1955 | 42.2 | 0.99 (0.92 to 1.07) | 2825 | 3137 | 81.0 | 1.03 (0.99 to 1.07) |
| p-valuea | p = 0.995 | p = 0.240 | ||||||
| Gestation (completed weeks) | ||||||||
| 37 | 572 | 863 | 54.8 | 1.26 (1.15 to 1.38) | 822 | 923 | 80.1 | 1.02 (0.97 to 1.07) |
| 38 | 1779 | 2654 | 55.4 | 1.23 (1.15 to 1.31) | 2925 | 3227 | 80.6 | 1.00 (0.96 to 1.05) |
| 39 | 3972 | 6334 | 50.6 | 1.12 (1.06 to 1.18) | 7881 | 8581 | 83.5 | 1.03 (1.01 to 1.06) |
| 40 | 5790 | 10,134 | 45.5 | 1 | 12,122 | 13,451 | 80.8 | 1 |
| 41 to 42 + 0 | 3537 | 7409 | 35.9 | 0.80 (0.76 to 0.84) | 6938 | 7992 | 75.4 | 0.94 (0.92 to 0.96) |
| p-valuea | p < 0.001 | p < 0.001 | ||||||
| Number of ‘complicating conditions’ identified at the start of labour care | ||||||||
| None | 14,278 | 23,590 | 50.1 | 1 | 28,884 | 31,786 | 82.3 | 1 |
| ≥ 1 | 1372 | 3804 | 27.8 | 0.59 (0.55 to 0.63) | 1804 | 2388 | 65.1 | 0.81 (0.78 to 0.85) |
| p-valuea | p < 0.001 | p < 0.001 | ||||||
Planned place of birth
As has previously been shown, the risk of intervention differed significantly according to planned birth setting after adjusting for maternal characteristics and ‘complicating conditions’ identified at the start of labour care. Compared with planned OU birth, the risk of instrumental delivery (see Table 19) and intrapartum caesarean section (see Table 20) was significantly lower and the chances of a ‘straightforward birth’ (see Table 21) and of a ‘normal birth’ (see Table 22) were significantly higher in nulliparous and multiparous women planning birth in all non-OU settings.
Ethnicity
Non-white ethnicity was associated with a significantly higher risk of intrapartum caesarean section in both nulliparous and multiparous women after adjusting for planned place of birth, maternal characteristics and ‘complicating conditions’ identified at the start of labour care (adjusted RR 1.29, 95% CI 1.09 to 1.52 nulliparous; adjusted RR 1.32, 95% CI 1.03 to 1.66 multiparous) (see Table 20). Ethnicity was not significantly associated with risk of instrumental delivery (see Table 19), ‘straightforward birth’ (see Table 21) or ‘normal birth’ (see Table 22).
Area deprivation
The risk of instrumental delivery (see Table 19) and intrapartum caesarean section (see Table 20), and the chances of ‘straightforward birth’ (see Table 21) and ‘normal birth’ (see Table 22) did not vary significantly with level of area deprivation (more deprived vs. less deprived) in nulliparous or multiparous women.
Maternal age
In nulliparous women the risk of instrumental delivery (see Table 19) and intrapartum caesarean section (see Table 20) tended to increase with increasing maternal age, while the chances of having a ‘straightforward birth’ (see Table 21) or a ‘normal birth’ (see Table 22) decreased with increasing age. In multiparous women there was no clear trend in intervention rates across maternal age categories.
Is the association between planned place of birth and intervention modified by ethnicity, area deprivation or maternal age?
Ethnicity
We found no significant interactions between planned place of birth and ethnicity for any of our outcome measures (Table 23). Women from non-white ethnic groups planning birth in a non-OU setting experienced the same reduced risk of instrumental delivery and intrapartum caesarean section and increased chance of ‘straightforward birth’ and ‘normal birth’, compared with planned OU birth, as white women.
Area deprivation
We found significant interactions between planned place of birth and area deprivation for instrumental delivery (p = 0.013), intrapartum caesarean section (p = 0.002) and ‘straightforward birth’ (p = 0.028) in nulliparous women and for ‘normal birth’ (p = 0.023) in multiparous women, indicating that the association between planned place of birth and these outcomes was different in more deprived areas compared with less deprived areas (Table 24).
| Outcome | Nulliparous, p-valuea | Multiparous, p-valuea |
|---|---|---|
| Instrumental delivery | 0.013 | 0.306 |
| Intrapartum caesarean section | 0.002 | 0.552 |
| ‘Straightforward birth’ | 0.028 | 0.051 |
| ‘Normal birth’ | 0.466 | 0.023 |
Tables 25–28 present absolute and RRs (unadjusted and adjusted) for the outcomes where we found significant interactions. Absolute risks for each of these outcomes by planned place of birth and area deprivation, adjusted for other maternal characteristics and ‘complicating conditions’, are also shown in Figures 11–14. In OUs the level of area deprivation did not modify the risk of any of the outcomes considered (instrumental delivery, intrapartum caesarean section, ‘straightforward birth’ and ‘normal birth’). Examination of the absolute and RRs of each outcome stratified by level of area deprivation revealed that although there were statistically significant interactions between planned place of birth and area deprivation for these outcomes, the pattern of association did not differ markedly between the more and less deprived groups. Irrespective of level of area deprivation, women who planned birth in a non-OU setting experienced a significant reduction in interventions, compared with women who planned birth in an OU.
| Area deprivation and birth setting | Unadjusted | Adjusted | |||
|---|---|---|---|---|---|
| Absolute risk (%)a | RRa (95% CI) | Absolute risk (%) | Adjusted RR (95% CI) | p-value | |
| In OUs only | |||||
| Less deprivedb | 23.0 | 1 | 21.8 | 1 | |
| More deprivedc | 21.9 | 0.95 (0.86 to 1.06) | 23.5 | 1.08 (0.97 to 1.21) | 0.179 |
| Less deprived | |||||
| OU | 23.0 | 1 | 21.8 | 1 | |
| Home | 12.7 | 0.55 (0.47 to 0.65) | 11.2 | 0.51 (0.44 to 0.60) | < 0.001 |
| FMU | 12.1 | 0.52 (0.43 to 0.64) | 11.8 | 0.54 (0.45 to 0.66) | < 0.001 |
| AMU | 18.3 | 0.79 (0.67 to 0.94) | 17.7 | 0.81 (0.69 to 0.96) | 0.015 |
| More deprived | |||||
| OU | 21.9 | 1 | 23.5 | 1 | |
| Home | 12.7 | 0.58 (0.47 to 0.72) | 11.9 | 0.51 (0.41 to 0.63) | < 0.001 |
| FMU | 8.8 | 0.40 (0.32 to 0.51) | 9.5 | 0.40 (0.32 to 0.51) | < 0.001 |
| AMU | 14.2 | 0.65 (0.52 to 0.81) | 15.3 | 0.65 (0.52 to 0.81) | < 0.001 |
FIGURE 11.
Adjusted absolute risks (%) of instrumental delivery in ‘low risk’ nulliparous women by planned place of birth and area deprivation.

| Area deprivation and birth setting | Unadjusted | Adjusted | |||
|---|---|---|---|---|---|
| Absolute risk (%)a | RRa (95% CI) | Absolute risk (%) | Adjusted RR (95% CI) | p-value | |
| In OUs only | |||||
| Less deprivedb | 16.4 | 1 | 15.6 | 1 | |
| More deprivedc | 14.7 | 0.90 (0.78 to 1.03) | 14.9 | 0.96 (0.84 to 1.09) | 0.513 |
| Less deprived | |||||
| OU | 16.4 | 1 | 15.6 | 1 | |
| Home | 9.3 | 0.57 (0.46 to 0.69) | 9.6 | 0.62 (0.50 to 0.76) | < 0.001 |
| FMU | 5.8 | 0.35 (0.29 to 0.43) | 6.7 | 0.43 (0.35 to 0.53) | < 0.001 |
| AMU | 8.8 | 0.54 (0.43 to 0.67) | 9.8 | 0.63 (0.49 to 0.80) | < 0.001 |
| More deprived | |||||
| OU | 14.7 | 1 | 14.9 | 1 | |
| Home | 7.1 | 0.48 (0.36 to 0.64) | 7.4 | 0.49 (0.37 to 0.66) | < 0.001 |
| FMU | 8.0 | 0.54 (0.41 to 0.71) | 10.1 | 0.67 (0.52 to 0.87) | 0.002 |
| AMU | 6.8 | 0.47 (0.37 to 0.59) | 8.1 | 0.54 (0.42 to 0.70) | < 0.001 |
FIGURE 12.
Adjusted absolute risks (%) of intrapartum caesarean section in ‘low risk’ nulliparous women by planned place of birth and area deprivation.

| Area deprivation and birth setting | Unadjusted | Adjusted | |||
|---|---|---|---|---|---|
| Absolute risk (%)a | RRa (95% CI) | Absolute risk (%) | Adjusted RR (95% CI) | p-value | |
| In OUs only | |||||
| Less deprivedb | 57.0 | 1 | 58.9 | 1 | |
| More deprivedc | 60.2 | 1.06 (1.02 to 1.10) | 58.6 | 1.00 (0.96 to 1.03) | 0.808 |
| Less deprived | |||||
| OU | 57.0 | 1 | 58.9 | 1 | |
| Home | 73.6 | 1.29 (1.22 to 1.36) | 77.5 | 1.32 (1.25 to 1.39) | < 0.001 |
| FMU | 78.4 | 1.38 (1.31 to 1.45) | 76.6 | 1.30 (1.24 to 1.36) | < 0.001 |
| AMU | 68.0 | 1.19 (1.13 to 1.27) | 67.5 | 1.15 (1.09 to 1.21) | < 0.001 |
| More deprived | |||||
| OU | 60.2 | 1 | 58.6 | 1 | |
| Home | 76.8 | 1.28 (1.20 to 1.35) | 78.4 | 1.34 (1.26 to 1.42) | < 0.001 |
| FMU | 79.6 | 1.32 (1.24 to 1.40) | 73.2 | 1.25 (1.19 to 1.31) | < 0.001 |
| AMU | 74.9 | 1.24 (1.17 to 1.32) | 70.6 | 1.20 (1.14 to 1.27) | < 0.001 |
FIGURE 13.
Adjusted absolute risks (%) of ‘straightforward birth’ in ‘low risk’ nulliparous women by planned place of birth and area deprivation.
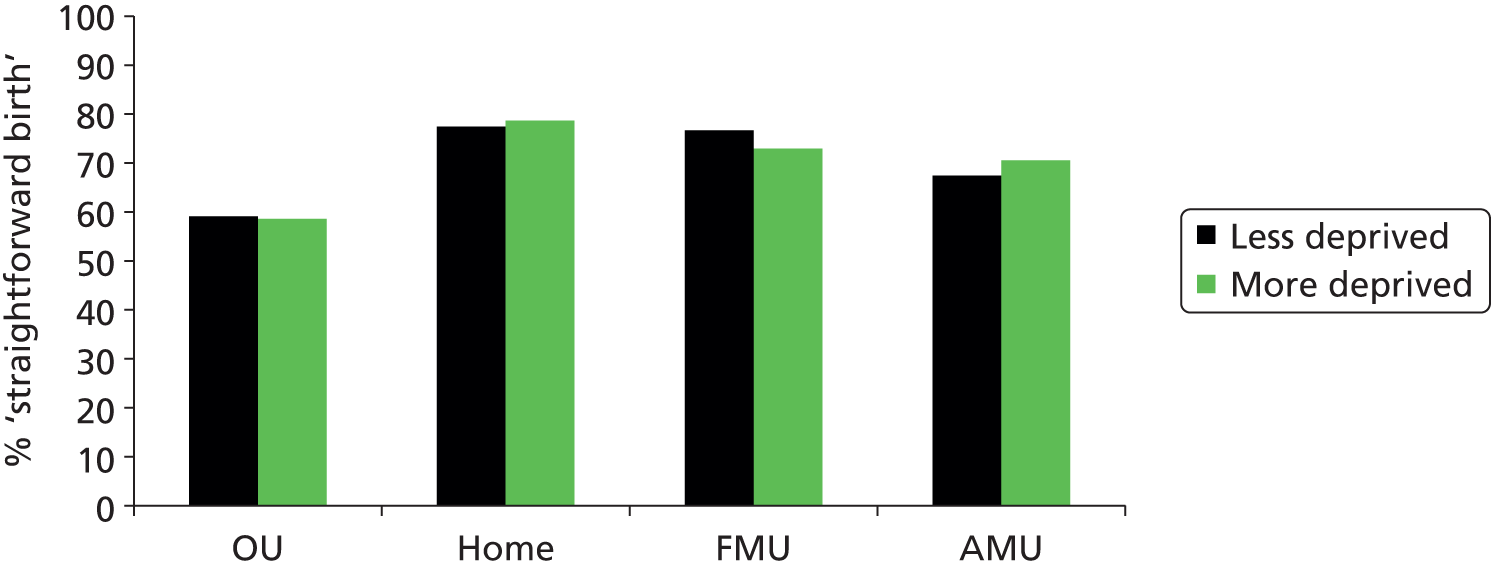
| Area deprivation and birth setting | Unadjusted | Adjusted | |||
|---|---|---|---|---|---|
| Absolute risk (%)a | RRa (95% CI) | Absolute risk (%) | Adjusted RR (95% CI) | p-value | |
| In OUs only | |||||
| Less deprivedb | 74.9 | 1 | 75.9 | 1 | |
| More deprivedc | 78.9 | 1.05 (1.02 to 1.09) | 78.3 | 1.03 (1.00 to 1.07) | 0.051 |
| Least deprived | |||||
| OU | 74.9 | 1 | 75.9 | 1 | |
| Home | 95.5 | 1.27 (1.23 to 1.32) | 95.1 | 1.25 (1.21 to 1.30) | < 0.001 |
| FMU | 94.7 | 1.26 (1.22 to 1.31) | 94.2 | 1.24 (1.19 to 1.29) | < 0.001 |
| AMU | 90.1 | 1.20 (1.15 to 1.25) | 89.4 | 1.18 (1.13 to 1.23) | < 0.001 |
| More deprived | |||||
| OU | 78.9 | 1 | 78.3 | 1 | |
| Home | 96.1 | 1.22 (1.18 to 1.26) | 94.8 | 1.21 (1.18 to 1.24) | < 0.001 |
| FMU | 94.2 | 1.19 (1.16 to 1.23) | 92.3 | 1.18 (1.15 to 1.21) | < 0.001 |
| AMU | 91.4 | 1.16 (1.12 to 1.20) | 89.3 | 1.14 (1.11 to 1.17) | < 0.001 |
FIGURE 14.
Adjusted absolute risks (%) of ‘normal birth’ in ‘low risk’ multiparous women by planned place of birth and area deprivation.
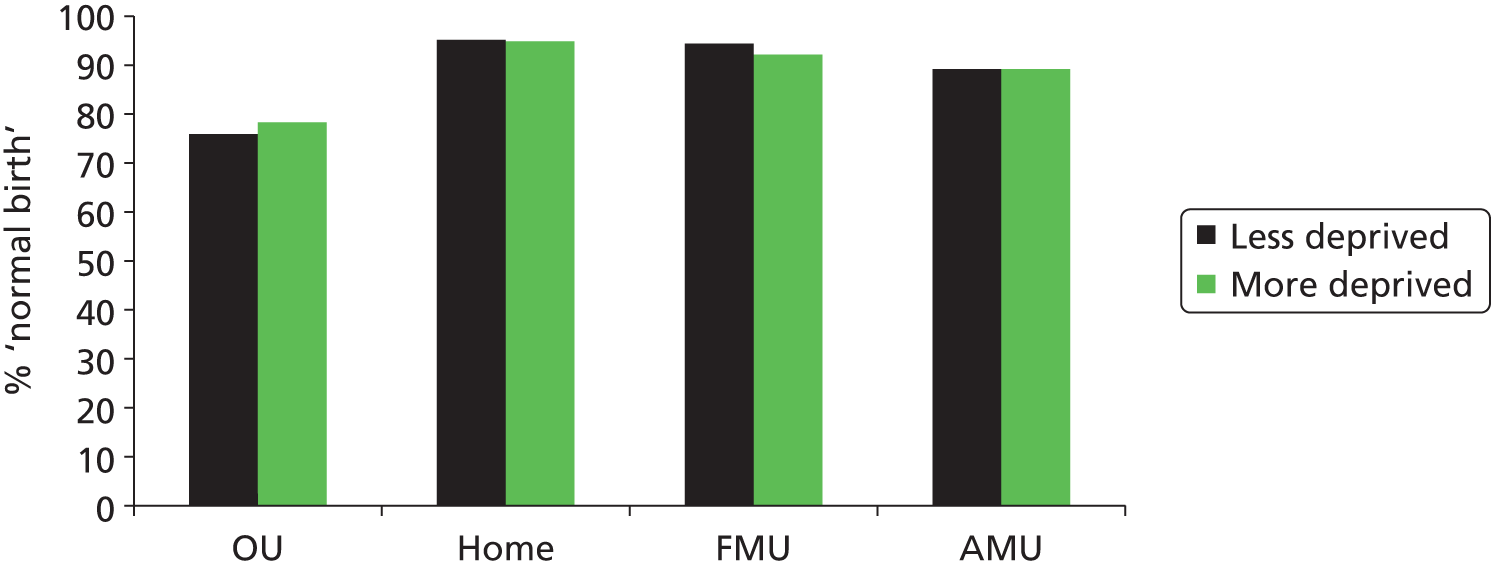
Maternal age
We found significant interactions between planned place of birth and maternal age for ‘straightforward birth’ in nulliparous (p < 0.001) and multiparous (p = 0.009) women and for ‘normal birth’ (p < 0.001) in nulliparous women, indicating that the association between planned place of birth and these outcomes was different in older and younger women (Table 29).
| Outcome | Nulliparous, p-value | Multiparous, p-value |
|---|---|---|
| Instrumental delivery | 0.194 | 0.762 |
| Intrapartum caesarean section | 0.469 | 0.420 |
| ‘Straightforward birth’ | < 0.001 | 0.009 |
| ‘Normal birth’ | < 0.001 | 0.214 |
Tables 30–32 present absolute and RRs (unadjusted and adjusted) for the outcomes where we found significant interactions. Absolute risks for each of these outcomes by planned place of birth and maternal age, adjusted for other maternal characteristics and ‘complicating conditions’, are also shown in Figures 15–17. In OUs the absolute and relative chances of ‘straightforward birth’ and ‘normal birth’ were significantly reduced in older nulliparous women; the chances of ‘straightforward birth’ were also significantly reduced in older multiparous women, although the difference was small (around 3%). In nulliparous women, the association between planned place of birth and these two outcomes was significantly modified by maternal age. Older nulliparous women were less likely than younger women to have a ‘straightforward birth’ or ‘normal birth’ but, irrespective of age, those who planned birth in a non-OU setting experienced a significant increase in the chances of ‘straightforward birth’ and ‘normal birth’, compared with women who planned birth in an OU. The relative increase in the chances of a ‘straightforward birth’ or ‘normal birth’ was greater in older women. In multiparous women, the association between planned place of birth and ‘straightforward birth’ differed significantly with maternal age, but the size of the differences was small.
| Maternal age and birth setting | Unadjusted | Adjusted | |||
|---|---|---|---|---|---|
| Absolute risk (%)a | RRa (95% CI) | Absolute risk (%) | Adjusted RR (95% CI) | p-value | |
| In OUs only | |||||
| < 35 years | 60.4 | 1 | 60.5 | 1 | |
| ≥ 35 years | 43.6 | 0.72 (0.67 to 0.77) | 45.6 | 0.75 (0.70 to 0.81) | < 0.001 |
| < 35 years | |||||
| OU | 60.4 | 1 | 60.5 | 1 | |
| Home | 76.1 | 1.26 (1.21 to 1.32) | 74.2 | 1.23 (1.17 to 1.28) | < 0.001 |
| FMU | 79.9 | 1.32 (1.27 to 1.38) | 76.9 | 1.27 (1.22 to 1.32) | < 0.001 |
| AMU | 72.9 | 1.21 (1.15 to 1.27) | 69.9 | 1.15 (1.10 to 1.21) | < 0.001 |
| ≥ 35 years | |||||
| OU | 43.6 | 1 | 45.6 | 1 | |
| Home | 69.2 | 1.59 (1.43 to 1.76) | 68.4 | 1.50 (1.35 to 1.67) | < 0.001 |
| FMU | 67.9 | 1.56 (1.39 to 1.75) | 66.6 | 1.46 (1.30 to 1.64) | < 0.001 |
| AMU | 60.6 | 1.39 (1.24 to 1.56) | 59.7 | 1.31 (1.17 to 1.47) | < 0.001 |
FIGURE 15.
Adjusted absolute risks (%) of ‘straightforward birth’ in ‘low risk’ nulliparous women by planned place of birth and maternal age.
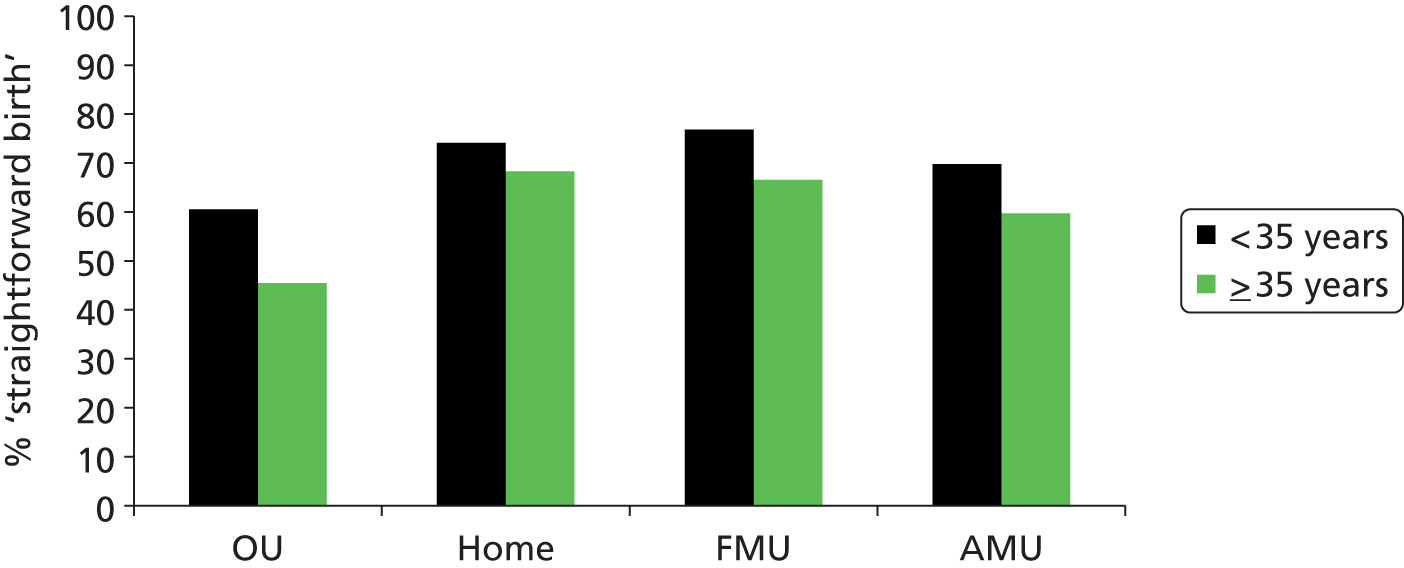
| Maternal age and birth setting | Unadjusted | Adjusted | |||
|---|---|---|---|---|---|
| Absolute risk (%)a | RRa (95% CI) | Absolute risk (%) | Adjusted RR (95% CI) | p-value | |
| In OUs only | |||||
| < 35 years | 87.9 | 1 | 88.0 | 1 | |
| ≥ 35 years | 84.4 | 0.96 (0.94 to 0.98) | 85.3 | 0.97 (0.95 to 0.99) | 0.002 |
| < 35 years | |||||
| OU | 87.9 | 1 | 88.0 | 1 | |
| Home | 97.4 | 1.11 (1.09 to 1.12) | 96.2 | 1.09 (1.08 to 1.11) | < 0.001 |
| FMU | 97.1 | 1.10 (1.09 to 1.12) | 96.2 | 1.09 (1.08 to 1.11) | < 0.001 |
| AMU | 95.1 | 1.08 (1.06 to 1.10) | 93.8 | 1.07 (1.05 to 1.08) | < 0.001 |
| ≥ 35 years | |||||
| OU | 84.4 | 1 | 85.3 | 1 | |
| Home | 97.0 | 1.15 (1.12 to 1.18) | 96.3 | 1.13 (1.10 to 1.16) | < 0.001 |
| FMU | 96.6 | 1.14 (1.11 to 1.17) | 96.1 | 1.13 (1.10 to 1.16) | < 0.001 |
| AMU | 93.1 | 1.10 (1.07 to 1.13) | 92.5 | 1.08 (1.06 to 1.11) | < 0.001 |
FIGURE 16.
Adjusted absolute risks (%) of ‘straightforward birth’ in ‘low risk’ multiparous women by planned place of birth and maternal age.
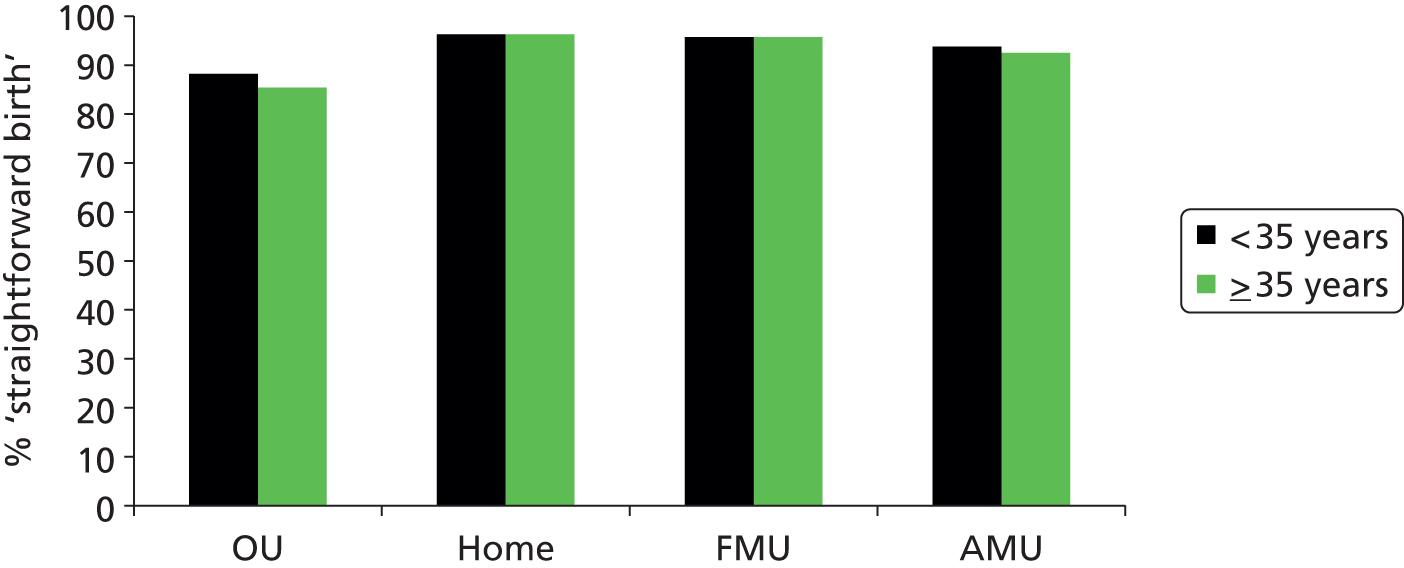
| Maternal age and birth setting | Unadjusted | Adjusted | |||
|---|---|---|---|---|---|
| Absolute risk (%)a | RRa (95% CI) | Absolute risk (%) | Adjusted RR (95% CI) | p-value | |
| In OUs only | |||||
| < 35 years | 43.6 | 1 | 43.8 | 1 | |
| ≥ 35 years | 29.8 | 0.68 (0.63 to 0.74) | 31.4 | 0.72 (0.66 to 0.78) | < 0.001 |
| < 35 years | |||||
| OU | 43.6 | 1 | 43.8 | 1 | |
| Home | 68.6 | 1.57 (1.47 to 1.69) | 65.3 | 1.49 (1.38 to 1.60) | < 0.001 |
| FMU | 70.9 | 1.63 (1.51 to 1.75) | 66.7 | 1.52 (1.41 to 1.64) | < 0.001 |
| AMU | 62.9 | 1.44 (1.33 to 1.57) | 58.9 | 1.35 (1.24 to 1.46) | < 0.001 |
| ≥ 35 years | |||||
| OU | 29.8 | 1 | 31.4 | 1 | |
| Home | 61.6 | 2.07 (1.82 to 2.35) | 59.6 | 1.90 (1.66 to 2.17) | < 0.001 |
| FMU | 61.9 | 2.08 (1.80 to 2.41) | 59.1 | 1.88 (1.62 to 2.18) | < 0.001 |
| AMU | 50.5 | 1.70 (1.47 to 1.96) | 48.3 | 1.54 (1.32 to 1.79) | < 0.001 |
FIGURE 17.
Adjusted absolute risks (%) of ‘normal birth’ in ‘low risk’ nulliparous women by planned place of birth and maternal age.
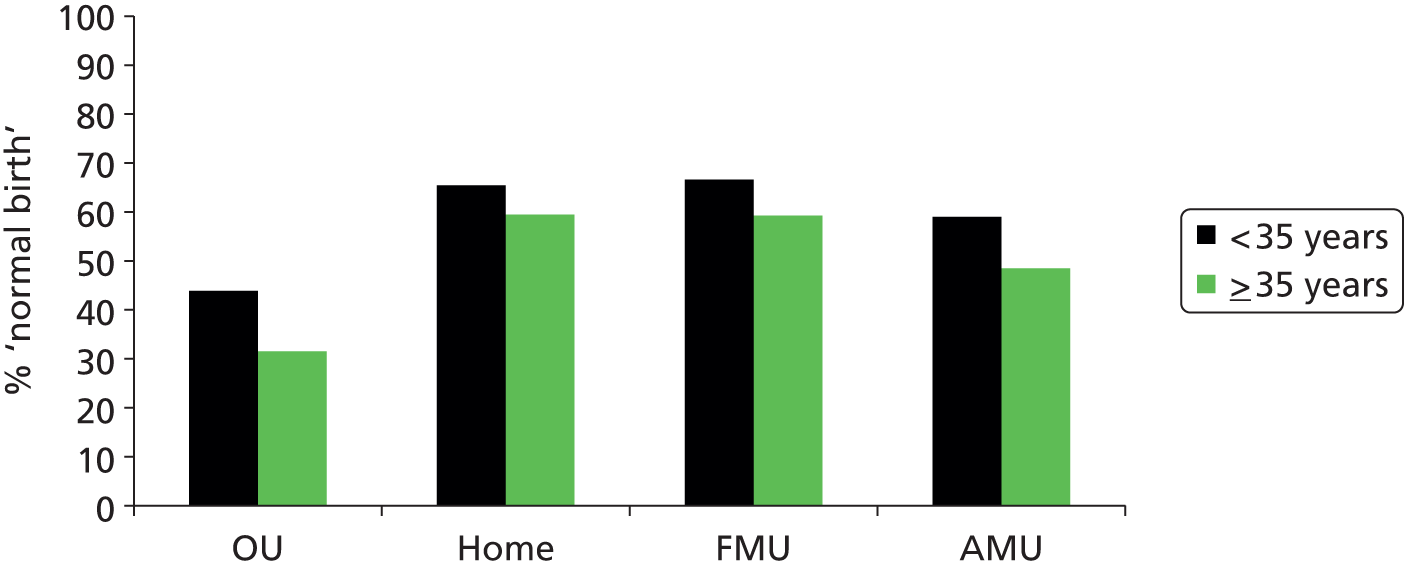
Discussion
Summary of main findings
These results confirm that ‘low risk’ women who plan birth in a non-OU setting are more likely to labour and give birth without intervention than comparable women planning birth in an OU.
Compared with white women, women from non-white ethnic groups were more likely to experience an intrapartum caesarean section, but, overall, if non-white women planned birth in a non-OU setting they experienced the same reduced risk of intervention as white women.
Women living in more socioeconomically disadvantaged areas were no more or less likely to experience an intervention than women living in relatively advantaged areas. We found statistically significant differences between more and less disadvantaged areas in the reduction in the risk of intervention associated with planning non-OU birth. However, the magnitude of these differences was small and, irrespective of area deprivation, women who planned birth in a non-OU setting experienced a reduction in interventions, compared with women who planned birth in an OU.
In ‘low risk’ nulliparous women the risk of interventions during labour and birth increased with increasing age, while in multiparous women there was no consistent pattern across age groups in any of the interventions considered. In nulliparous women the association between planned place of birth and ‘normal birth’ and ‘straightforward birth’ was different for younger and older women. Older nulliparous women who planned a non-OU birth had a greater relative increase in ‘normal birth’ and ‘straightforward birth’ than younger women. This greater relative increase at older ages partly reflects the comparatively low proportion of older nulliparous women who plan birth in an OU and have a ‘straightforward birth ‘ or ‘normal birth’ (45.6% and 31.4%, respectively); this ‘magnifies’ the relative effect of any given absolute improvement in rates in older women. For example, an absolute increase of 10 percentage points in the ‘normal birth’ rate from 31.4% (the rate observed in planned OU births in older nulliparous women) to 41.4% corresponds to a relative increase of 40%; a 10 percentage-point increase in the rates from 43.8% (the rate observed in planned OU births in younger nulliparous women) represents a 23% relative increase.
Strengths and limitations
The large national data set provided by the Birthplace cohort has enabled us to compare the risk of intervention across birth settings and within different groups of women in a relatively homogeneous population of ‘low risk’ women, while controlling for important potential confounders such as BMI. Previous analyses have shown that a higher proportion of women planning birth in an OU had ‘complicating conditions’ at the start of care in labour than did women planning birth in other settings, and these could potentially have affected intervention rates. In these analyses we additionally controlled for the presence of ‘complicating conditions’ at the start of care in labour. There remains the potential for confounding by unmeasured maternal characteristics, but it seems unlikely that the significant reductions in risk observed for women planning non-OU birth could be explained by differences in the clinical characteristics of the women planning birth in the different settings.
Despite the large overall size of the cohort, the number of women in some groups defined by ethnicity, area deprivation and maternal age was relatively small in some non-OU settings. For this reason, and additionally for ease of interpretation, when testing interactions between planned place of birth and these maternal characteristics we therefore combined groups. Our non-white ethnic group comprised women from many different ethnic backgrounds; by combining these groups, differences in outcomes between women from different ethnic backgrounds might have been concealed. Similarly, by combining the least disadvantaged three quintiles and the most disadvantaged two quintiles in our measure of area deprivation we will also have combined groups of women living in very different areas and with very varied individual socioeconomic status. 53 In the case of maternal age, we dichotomised maternal age into two groups (< 35 years and ≥ 35 years) for the purposes of analysing age interactions. Because intervention rates are strongly affected by age, analyses based on this crude dichotomisation may be affected by differences in the age structures of women planning birth in different settings. For example, the younger age distribution of nulliparous women aged < 35 years in the OU group is likely to have led to the relative difference in intervention rates between planned OU and non-OU births being underestimated in women aged < 35 years in analyses where age was dichotomised.
We tested for interactions using a common approach for all three variables. However, analyses reported elsewhere54 indicate that the association between maternal age and many interventions is broadly linear within the age range 16–40 years, so that we could have modelled age as a continuous variable for the purposes of testing interactions. Results from these alternative analyses are discussed below.
Interpretation
Other large studies conducted in the UK have found that women from some black and minority ethnic (BME) groups are at increased risk of an intrapartum caesarean section,26,46 although it is difficult to assess which specific groups are at increased risk because of differences in study design and in classification of ethnicity. Studies in other countries similarly show increased risk of intrapartum caesareans section in some, but not all, BME groups. 55 Our findings relating specifically to ‘low risk’ women add to the evidence that women from a BME background may be at increased risk of intrapartum caesarean section, but it seems probable that risks differ for different ethnic groups. None of the other outcomes considered showed a significant difference between white and non-white women, although we cannot rule out the possibility that risks may differ for some specific ethnic groups. Our findings suggest that planned birth in a non-OU setting appears to confer equal benefits on white and BME women in terms of reduced risk of intervention.
We did not find that the risk of intervention varied significantly with the level of disadvantage of the area in which the woman lived. This appears to be consistent with other UK studies that have examined the effect of area and individual level socioeconomic status on caesarean section rates. 25,47 For example, analysis of trends in emergency caesarean section rates in women from different socioeconomic backgrounds in Scotland showed that a social gradient (with higher rates among women from more disadvantaged areas) disappeared over the period 1980 to 2000. 47 Our findings did suggest that the association between planned place of birth and risk of intervention might be different for more and less advantaged areas, but the differences were small and did not appear to consistently ‘favour’ more or less advantaged areas.
Our finding that intervention rates increased with increasing age in ‘low risk’ women, particularly in those having a first baby, even after adjustment for maternal characteristics and the presence of ‘complicating conditions’ is generally consistent with previous studies56 and is also consistent with the age related pattern of intrapartum transfer reported in Chapter 5. Our findings also confirm that planning birth in a non-OU setting has a ‘protective effect’ in terms of a reduction in the risk of intervention in both older and younger women, although our findings do suggest that the ‘effect’ may vary with age. For reasons discussed above, in the analyses reported here we considered maternal age as a binary variable, with the age of 35 years as the cut-off point. In a more detailed analysis of the Birthplace cohort relating to maternal age, planned place of birth and intrapartum outcomes, published elsewhere, we considered age as a continuous variable. 54 This showed that up to the age of 40 years the risk of maternal interventions and adverse outcomes requiring obstetric care increased in a broadly linear way, with no step-change in risk below the age of 40 years and, furthermore, that there was no significant increase with maternal age in adverse neonatal outcome within the age range 16–40 years. That analysis similarly showed that the relative reduction in risk of instrumental delivery and intrapartum caesarean section associated with planned birth in a non-OU setting was not significantly affected by age.
Conclusions
For ‘low risk’ women, irrespective of their ethnic background, age or the relative socioeconomic disadvantage of the area in which they live, planning birth in a non-OU setting is associated with a reduction in the risk of intervention during labour and birth.
Chapter 5 Factors affecting intrapartum transfer and the transfer process
Introduction
Transfer during labour or immediately after birth affects over 20% of women planning birth in the three non-OU settings; transfer rates in nulliparous women are substantially higher (36–45%) and overall more than two-thirds of transfers take place before birth. 7,8,16 Transfer is also an issue which can influence women’s decision-making about place of birth. 10,57 Given recent increases in the number of women planning birth in non-OU settings,32 and revised national guidance on intrapartum care that recommends advising ‘low risk’ women to plan birth at home or in a MU,58 it is likely that the overall number of women experiencing transfer will increase. With this in mind, this chapter explores a number of unanswered questions relating to transfer.
Previous analyses have explored and reported the maternal characteristics associated with transfer from midwifery units. 16 Analyses presented in this chapter extend this work to consider the maternal characteristics associated with transfer in all non-OU settings, with a view to providing evidence-based information for women and their carers to inform women’s choices about planned place of birth.
Previous work has also identified substantial variation in unit transfer rates between MUs. 16 Variation in unit or hospital intervention rates and the contribution of maternal or institutional characteristics to explaining this variation has been the subject of previous research18,25–30 and has been explored in Chapter 3. The extent to which variation in transfer rates can be explained by differences in maternal characteristics in different units or can be further understood by considering differences in service and organisational factors, including the size of the unit, staffing and distance to the nearest OU, has not previously been investigated is of interest to those commissioning and planning midwifery-led services and is considered in this chapter.
For reasons discussed more fully in Chapter 6, there may be a concern that clinical decision-making may be influenced by non-clinical factors or in response to factors such as reduced staffing levels or obstetrician cover at certain times of the day or days of the week, or to shift changes. 59,60 Whether or not there is any evidence to suggest that decision-making about transfer may be influenced by non-clinical factors in this way is also considered here.
Finally, the transfer process itself is of concern and interest to women and their carers, particularly in transfers from home or FMUs, where a journey by ambulance or car is involved. 10,57 Because the Birthplace study evaluated the safety of planned place of birth with an ‘intention-to-treat’ approach, the reported comparative risks of adverse perinatal outcomes7,8 implicitly take account of any risks associated with transfer or with giving birth in a setting without immediate access to obstetric or neonatal services. Nevertheless, transfer from planned home births and FMUs raises concerns about safety, in part because of the potential for delay or logistical problems. 4,61–65 Some women describe choosing birth in an AMU to avoid the possibility of transfer by car or ambulance. 57 Those planning birth at home or in a FMU want information about transfer, may be concerned or ill-informed about journey time and may find longer journeys more difficult. 57 We therefore aimed to estimate the overall duration of transfer from planned births at home and in FMUs and to explore and describe the association between urgency and transfer duration from both settings. The results of some of these analyses have also been published elsewhere, with further information relating to transfer distance and duration. 66
Methods
Study population
The study population for the analyses reported in this chapter was ‘low risk’ women in the Birthplace cohort with a ‘term’ pregnancy (37 to 42 + 0 weeks’ gestation) planning birth in an AMU, in a FMU or at home (see Chapter 2, Characteristics of the ‘low risk’ sample).
Objective 1: maternal characteristics associated with transfer
Maternal characteristics
The maternal characteristics described in Chapter 2 (see Maternal characteristics) were considered as factors that might be associated with transfer.
Outcome measure
The primary outcome for these analyses was transfer from the planned birth setting to an OU during labour or within 24 hours after birth.
Statistical methods
We used multivariable Poisson regression to investigate the association between each maternal characteristic and transfer from each birth setting separately in nulliparous and multiparous women, while adjusting for other maternal characteristics (see Chapter 2, Poisson regression models).
Objective 2: variation in transfer rates and the impact of unit or trust characteristics
Unit or NHS trust characteristics
Using the methods described in Chapter 3 (see Derivation of unit or NHS trust characteristics) we derived the following variables to describe units and trusts and considered these as factors that might be associated with transfer rates.
For AMUs, FMUs and NHS trusts providing home birth services:
-
size (number of births).
For AMUs and FMUS:
-
number of delivery beds
-
number of women per year per bed
-
midwifery ‘understaffing’
-
mean number of midwives on duty
-
mean number of midwives on duty per woman in labour
-
indices of size and staffing (see Chapter 3, Derivation of unit or NHS trust characteristics, Size, staffing and distance indices).
For FMUs:
-
distance and travel time to nearest OU
-
distance index (see Chapter 3, Derivation of unit or NHS trust characteristics, Size, staffing and distance indices)
-
24-hour staffing.
For NHS trusts providing home births:
-
the percentage of births in the NHS trust that took place at home.
Outcome measure
The outcome measure for these analyses was the unit or NHS trust (for home births) transfer rate during or immediately after labour, adjusted for the maternal characteristics described in Objective 1: maternal characteristics associated with transfer.
Statistical methods
We calculated adjusted transfer rates in each unit or NHS trust (for home births) separately for nulliparous and multiparous women, as described in Chapter 2 (see Calculation of adjusted rates for individual units or trusts).
Using the methods described in Chapter 2 (see Funnel plots) we used funnel plots to explore variation in adjusted transfer rates in different units and NHS trusts (for home births) and used simple linear regression (see Chapter 2, Linear regression) to investigate whether unit or trust characteristics were associated with variation.
Objective 3: variation in transfer by time of the day and day of the week
For women who were transferred to an OU, data on the date and time of the following events were available: start of care in labour (data for all women), decision to transfer, start of transfer, first assessment by a midwife or an obstetrician in the OU and birth (data for all women). If these times did not follow a logical sequence then women were excluded from the analysis of transfer timings.
Statistical methods
With available data there was no ‘denominator’ from which to calculate transfer rates at different times or on different days. We therefore used histograms and chi-squared tests to explore and compare the distributions of the timing of the decision to transfer by time of the day and day of the week.
Objective 4: urgency and duration of transfer from freestanding midwifery units and planned home births
Outcome measure
The primary outcome for these analyses was the duration of transfer. The timing and duration of transfer was described using five measures, broadly based on those used in an audit of community maternity units in Scotland. 67
-
time to decision: the time from the start of care in labour to the decision to transfer
-
arranging transfer: the time from the decision to transfer to the start of transfer (when the woman left her planned place of birth)
-
departure to first OU assessment: the time from when the woman left her planned place of birth to when she was first seen by a midwife or obstetrician in the receiving OU
-
overall transfer time: the time from the decision to transfer to when the woman was first seen by a midwife or obstetrician in the receiving OU
-
time to birth after transfer: the time from when the woman was first seen by a midwife or obstetrician in the receiving OU to when she gave birth (for transfers before birth only).
Urgency of transfer
Data on the primary reason for transfer were collected for each woman, but there were no explicit data on the urgency of transfer. In order to explore the association between urgency and the duration of transfer, we grouped the recorded primary reasons for transfer according to their likely urgency, based on clinical judgement, deriving the following three categories:
-
‘potentially urgent’ transfers before birth (antepartum haemorrhage, failure to progress in the second stage and fetal distress in the first or second stage)
-
‘non-urgent’ transfers before birth (failure to progress in the first stage, epidural request)
-
‘potentially urgent’ transfers after birth (postpartum haemorrhage).
Data checking and cleaning
For analyses relating to transfer duration, records were checked to ensure that the recorded times for the transfer process followed a logical sequence. Where they did not, and could not be corrected, records were excluded from analyses of transfer duration [205 (5.9%) from the home birth group and 112 (4.6%) from the FMU group].
We manually reviewed the study records relating to all transfers for ‘potentially urgent’ reasons where the overall transfer time was longer than 90 minutes, together with a sample of similar records of transfers for ‘non-urgent’ reasons, to establish whether reasons for delay could be ascertained or inferred or obvious errors detected. While some longer transfer times seemed implausible, given the available data it was not possible to verify or discount these. Given the small number of these cases and the non-parametric methods used, it is not likely that these outliers will have had a measurable effect on the overall conclusions, and so they were retained in the data set.
Statistical methods
We tabulated overall transfer rates, reasons for transfer and the timing of transfer by parity for planned home and FMU births as a proportion of all planned births in each setting. We calculated the median and interquartile range (IQR) for each measure of transfer duration by parity and urgency and compared medians using Wilcoxon’s rank-sum test. Cumulative distribution plots were used to compare the overall transfer time (from decision to transfer to first OU assessment) for ‘potentially urgent’ versus ‘non-urgent’ transfers before birth from home or from a FMU.
Weighting and clustering
For all analyses apart from histograms we adjusted for the varying duration of participation of units and NHS trusts and for the ‘clustering’ of women within units/NHS trusts, as described in Chapter 2 (see Probability weights and Robust standard errors).
Results
Characteristics of the sample
The study population consisted of 16,632 ‘low risk’ eligible women with a ‘term’ pregnancy (37 to 42 + 0 weeks’ gestation) planning birth at home, 11,210 planning a FMU birth and 16,573 planning an AMU birth; their characteristics are summarised in Table 33. As has previously been reported, women planning birth in an AMU tended to be more ethnically and socially diverse than women planning birth at home or in a FMU. 7,8 More women planning birth at home, and more women transferred from planned home births, were aged > 30 years and were having a second or subsequent baby, compared with women planning birth in, and transferred from, FMUs or AMUs.
| Characteristic | Home | FMU | AMU | |||||||||
|---|---|---|---|---|---|---|---|---|---|---|---|---|
| Not transferred (N = 13,175) | Transferred (N = 3457) | Not transferred (N = 8766) | Transferred (N = 2444) | Not transferred (N = 12,214) | Transferred (N = 4359) | |||||||
| n | Weighted % | n | Weighted % | n | Weighted % | n | Weighted % | n | Weighted % | n | Weighted % | |
| Maternal age (years) | ||||||||||||
| Mean (SD) | 31.2 | (5.2) | 30.9 | (5.1) | 28.8 | (5.8) | 28.5 | (5.7) | 28.3 | (5.7) | 28.4 | (5.5) |
| < 20 | 152 | 1.2 | 65 | 2.0 | 515 | 5.6 | 158 | 6.9 | 775 | 6.0 | 279 | 6.1 |
| 20–24 | 1346 | 10.4 | 344 | 9.9 | 1634 | 18.9 | 483 | 20.3 | 2644 | 20.7 | 808 | 18.0 |
| 25–29 | 3400 | 26.1 | 905 | 25.6 | 2527 | 29.4 | 725 | 30.1 | 3597 | 29.2 | 1372 | 31.2 |
| 30–34 | 4483 | 34.2 | 1290 | 37.0 | 2512 | 28.5 | 712 | 28.4 | 3301 | 27.8 | 1245 | 29.2 |
| 35–39 | 3222 | 23.9 | 738 | 22.2 | 1360 | 15.3 | 318 | 12.6 | 1639 | 14.1 | 579 | 13.6 |
| ≥ 40 | 542 | 4.1 | 114 | 3.3 | 207 | 2.2 | 45 | 1.7 | 231 | 2.2 | 65 | 1.9 |
| Missing | 30 | 1 | 11 | 3 | 27 | 11 | ||||||
| Ethnicity | ||||||||||||
| White | 12,461 | 94.7 | 3280 | 94.8 | 8016 | 92 | 2246 | 91.8 | 9745 | 77.5 | 3623 | 81 |
| Indian or Bangladeshi | 61 | 0.5 | 18 | 0.6 | 182 | 1.9 | 50 | 2.2 | 452 | 4.3 | 184 | 4.7 |
| Pakistani | 33 | 0.2 | 7 | 0.2 | 134 | 1.4 | 29 | 1.1 | 453 | 3.8 | 91 | 2.3 |
| Black Caribbean | 107 | 0.8 | 19 | 0.6 | 38 | 0.4 | 9 | 0.4 | 160 | 1.6 | 37 | 1.2 |
| Black African | 90 | 0.7 | 20 | 0.6 | 74 | 0.8 | 20 | 0.9 | 414 | 4.1 | 103 | 2.5 |
| Mixed | 212 | 1.7 | 65 | 1.9 | 103 | 1.1 | 21 | 0.8 | 229 | 2 | 62 | 2 |
| Other | 194 | 1.5 | 44 | 1.3 | 215 | 2.5 | 68 | 2.8 | 737 | 6.7 | 247 | 6.3 |
| Missing | 17 | 4 | 4 | 1 | 24 | 12 | ||||||
| Understanding of English | ||||||||||||
| Fluent | 13,090 | 99.4 | 3429 | 99.5 | 8503 | 97.2 | 2353 | 96.3 | 11,082 | 90.4 | 3990 | 91.7 |
| Some or none | 69 | 0.6 | 19 | 0.5 | 241 | 2.8 | 86 | 3.7 | 1082 | 9.6 | 356 | 8.3 |
| Missing | 16 | 9 | 22 | 5 | 50 | 13 | ||||||
| Marital/partner status | ||||||||||||
| Marrieda | 12,572 | 95.9 | 3287 | 95.6 | 8102 | 92.7 | 2277 | 93.6 | 10,991 | 90.9 | 3906 | 90.2 |
| Singleb | 511 | 4.1 | 152 | 4.4 | 566 | 7.3 | 147 | 6.4 | 1041 | 9.1 | 396 | 9.8 |
| Missing | 92 | 18 | 98 | 20 | 182 | 57 | ||||||
| BMI (kg/m2) | ||||||||||||
| Mean (SD) | 24 | (3.7) | 24.1 | (3.7) | 24.1 | (3.8) | 23.9 | (3.5) | 24.1 | (3.8) | 23.9 | (3.7) |
| Not recorded | 2533 | 19.3 | 698 | 20.5 | 1331 | 13.1 | 516 | 18.5 | 2166 | 17.5 | 728 | 16.2 |
| < 18.5 | 261 | 2 | 56 | 1.6 | 185 | 2.2 | 47 | 2.2 | 322 | 2.8 | 115 | 2.8 |
| 18.5–24.9 | 6421 | 48.9 | 1629 | 48.1 | 4393 | 51.6 | 1180 | 49 | 5933 | 49.6 | 2225 | 52.8 |
| 25–29.9 | 2943 | 22.5 | 799 | 22.5 | 2088 | 24.2 | 549 | 23.8 | 2790 | 22.6 | 964 | 21.8 |
| 30–35.0 | 954 | 7.3 | 253 | 7.3 | 758 | 8.9 | 147 | 6.5 | 958 | 7.6 | 307 | 6.4 |
| Missing | 63 | 22 | 11 | 5 | 45 | 20 | ||||||
| Deprivation quintile | ||||||||||||
| First (least deprived) | 2904 | 22.2 | 739 | 22.1 | 1931 | 20.7 | 552 | 20.5 | 1803 | 12.7 | 717 | 13.9 |
| Second | 2739 | 20.9 | 697 | 20.6 | 2005 | 23.7 | 565 | 24 | 1866 | 14.3 | 760 | 16.5 |
| Third | 2816 | 21.5 | 789 | 23.2 | 1768 | 21.5 | 520 | 22.3 | 2335 | 19 | 877 | 21.2 |
| Fourth | 2617 | 20.2 | 672 | 18.8 | 1624 | 19.6 | 441 | 19 | 2795 | 24.5 | 1028 | 25 |
| Fifth (most deprived) | 2008 | 15.2 | 536 | 15.2 | 1411 | 14.4 | 362 | 14.2 | 3383 | 29.5 | 961 | 23.4 |
| Missing | 91 | 24 | 27 | 4 | 32 | 16 | ||||||
| Parity | ||||||||||||
| 0 (nulliparous) | 2481 | 19 | 2008 | 58.5 | 3284 | 37.8 | 1868 | 75.9 | 4955 | 41.3 | 3321 | 76.1 |
| 1 previous | 5587 | 42.3 | 870 | 24.7 | 3489 | 40.1 | 405 | 17.3 | 4814 | 39.1 | 772 | 17.6 |
| 2 previous | 3269 | 25 | 361 | 10.5 | 1385 | 15.4 | 118 | 4.9 | 1742 | 14.1 | 182 | 4.3 |
| ≥ 3 previous | 1826 | 13.7 | 217 | 6.3 | 604 | 6.7 | 44 | 2 | 684 | 5.5 | 81 | 2 |
| Missing | 12 | 1 | 4 | 9 | 19 | 3 | ||||||
| Gestation (completed weeks) | ||||||||||||
| Mean (SD) | 39.7 | (1.0) | 39.9 | (1.0) | 39.7 | (1.0) | 39.9 | (1.0) | 39.7 | (1.0) | 39.9 | (1.0) |
| 37 | 306 | 2.2 | 72 | 2 | 255 | 3 | 60 | 2.8 | 376 | 3.1 | 98 | 2.4 |
| 38 | 1293 | 9.6 | 275 | 8.2 | 795 | 9.0 | 183 | 7.4 | 1275 | 10.9 | 290 | 6.9 |
| 39 | 3443 | 25.9 | 646 | 18.7 | 2196 | 24.9 | 473 | 18.9 | 3224 | 26.8 | 908 | 21.8 |
| 40 | 5214 | 40.0 | 1382 | 39.7 | 3421 | 38.9 | 943 | 38.5 | 4743 | 38.6 | 1749 | 39.1 |
| 41 to 42 + 0 | 2919 | 22.3 | 1082 | 31.3 | 2099 | 24.1 | 785 | 32.4 | 2596 | 20.6 | 1314 | 29.9 |
| Missing | 0 | 0 | 0 | 0 | 0 | 0 | ||||||
| Number of ‘complicating conditions’ identified at the start of labour care | ||||||||||||
| 0 | 12,616 | 96.8 | 2952 | 85.8 | 8425 | 95.8 | 2154 | 87.9 | 11,580 | 95 | 3803 | 87.4 |
| 1 | 393 | 3.0 | 441 | 13.0 | 319 | 4.1 | 246 | 10.0 | 579 | 4.8 | 493 | 11.3 |
| ≥ 2 | 13 | 0.1 | 37 | 1.2 | 9 | 0.2 | 41 | 2.2 | 26 | 0.3 | 50 | 1.3 |
| Missing | 153 | 27 | 13 | 3 | 29 | 13 | ||||||
Maternal characteristics associated with transfer
Transfer from alongside midwifery units
In nulliparous women, maternal age, gestation and the presence of ‘complicating conditions’ at the start of labour care were all significantly associated with the risk of transfer from an AMU after adjustment for maternal characteristics (Table 34). The risk of transfer increased with increasing maternal age. Compared with the reference group of nulliparous women whose pregnancy lasted 40 weeks, those who started labour care at < 40 weeks had a lower risk of transfer and those whose pregnancy lasted longer had a higher risk of transfer (adjusted RR 1.18, 95% CI 1.10 to 1.28). Nulliparous women who had one or more ‘complicating conditions’ identified at the start of labour care had a 56% higher risk of transfer (adjusted RR 1.56, 95% CI 1.42 to 1.73). No other maternal characteristics were significantly associated with transfer.
| Characteristic | Transfers | Births | Weighted % | Unadjusteda RR (95% CI) (n = 8276) | Adjustedb RR (95% CI) (n = 8045) |
|---|---|---|---|---|---|
| Maternal age (years) | |||||
| < 20 | 261 | 894 | 29.9 | 0.65 (0.58 to 0.73) | 0.65 (0.58 to 0.74) |
| 20–24 | 660 | 2040 | 32.6 | 0.71 (0.65 to 0.79) | 0.73 (0.66 to 0.81) |
| 25–29 | 1069 | 2535 | 42.0 | 0.92 (0.85 to 0.99) | 0.92 (0.85 to 0.99) |
| 30–34 | 916 | 1984 | 45.7 | 1 | 1 |
| ≥ 35 | 409 | 808 | 48.7 | 1.07 (0.97 to 1.17) | 1.06 (0.97 to 1.16) |
| p-valuec | p < 0.001 | p < 0.001 | |||
| Gestation (completed weeks) | |||||
| 37 | 74 | 257 | 29.3 | 0.71 (0.55 to 0.91) | 0.72 (0.56 to 0.93) |
| 38 | 214 | 798 | 26.3 | 0.64 (0.57 to 0.71) | 0.64 (0.57 to 0.72) |
| 39 | 692 | 1995 | 35.8 | 0.87 (0.78 to 0.96) | 0.86 (0.78 to 0.96) |
| 40 | 1331 | 3178 | 41.3 | 1 | 1 |
| 41 to 42 + 0 | 1010 | 2048 | 50.1 | 1.21 (1.12 to 1.32) | 1.18 (1.10 to 1.28) |
| p-valuec | p < 0.001 | p < 0.001 | |||
| BMI (kg/m2) | |||||
| Not recorded | 539 | 1410 | 37.7 | 0.92 (0.79 to 1.09) | 0.94 (0.82 to 1.08) |
| < 18.5 | 90 | 242 | 37.4 | 0.92 (0.68 to 1.23) | 1.02 (0.78 to 1.34) |
| 18.5–24.9 | 1764 | 4385 | 40.7 | 1 | 1 |
| 25–29.9 | 707 | 1699 | 41.8 | 1.03 (0.93 to 1.14) | 1.02 (0.92 to 1.12) |
| 30–35.0 | 211 | 518 | 39.6 | 0.97 (0.81 to 1.17) | 1.01 (0.84 to 1.20) |
| p-valuec | p = 0.702 | p = 0.887 | |||
| Ethnicity | |||||
| White | 2788 | 6865 | 40.8 | 1 | 1 |
| Non-white | 527 | 1390 | 37.9 | 0.93 (0.84 to 1.04) | 0.99 (0.93 to 1.06) |
| p-valuec | p = 0.180 | p = 0.858 | |||
| Marital/partner status | |||||
| Married/living together | 2955 | 7181 | 41.1 | 1 | 1 |
| Single/unsupported | 323 | 974 | 34.0 | 0.83 (0.71 to 0.96) | 1.03 (0.88 to 1.21) |
| p-valuec | p = 0.013 | p = 0.715 | |||
| Understanding of English | |||||
| Fluent | 3053 | 7567 | 40.6 | 1 | 1 |
| Some or none | 259 | 679 | 37.4 | 0.92 (0.80 to 1.06) | 1.00 (0.89 to 1.11) |
| p-valuec | p = 0.232 | p = 0.941 | |||
| Deprivation quintile | |||||
| First (least deprived) | 548 | 1231 | 44.8 | 1 | 1 |
| Second | 589 | 1345 | 44.2 | 0.99 (0.90 to 1.08) | 1.01 (0.91 to 1.12) |
| Third | 686 | 1668 | 42.3 | 0.95 (0.86 to 1.04) | 0.99 (0.89 to 1.09) |
| Fourth | 782 | 1969 | 39.4 | 0.88 (0.78 to 0.99) | 0.95 (0.83 to 1.08) |
| Fifth (most deprived) | 707 | 2040 | 34.7 | 0.78 (0.67 to 0.90) | 0.87 (0.76 to 1.00) |
| p-valuec | p = 0.015 | p = 0.154 | |||
| Number of ‘complicating conditions’ identified at start of labour care | |||||
| None | 2887 | 7536 | 38.3 | 1 | 1 |
| ≥ 1 | 424 | 719 | 59.3 | 1.55 (1.41 to 1.70) | 1.56 (1.42 to 1.73) |
| p-valuec | p < 0.001 | p < 0.001 | |||
In multiparous women planning AMU birth, gestational age and the presence of ‘complicating conditions’ at the start of labour care were significantly associated with the risk of transfer; maternal age was not significantly associated with transfer (Table 35). The effect of gestational age was evident only in women whose pregnancy lasted > 40 weeks, who had a higher risk of transfer (adjusted RR 1.28, 95% CI 1.07 to 1.53). Multiparous women with one or more ‘complicating conditions’ identified at the start of labour care had a significantly increased risk of transfer (adjusted RR 2.35, 95% CI 1.86 to 2.97).
| Characteristic | Transfers | Births | Weighted % | Unadjusteda RR (95% CI) (n = 8275) | Adjustedb RR (95% CI) (n = 8028) |
|---|---|---|---|---|---|
| Maternal age (years) | |||||
| < 20 | 18 | 157 | 12.1 | 0.95 (0.59 to 1.54) | 0.87 (0.51 to 1.48) |
| 20–24 | 147 | 1405 | 11.1 | 0.87 (0.71 to 1.08) | 0.90 (0.72 to 1.13) |
| 25–29 | 302 | 2429 | 13.1 | 1.04 (0.91 to 1.19) | 1.09 (0.94 to 1.25) |
| 30–34 | 328 | 2559 | 12.7 | 1 | 1 |
| ≥ 35 | 235 | 1702 | 14.2 | 1.12 (0.96 to 1.32) | 1.13 (0.97 to 1.32) |
| p-value | p = 0.186 | p = 0.122 | |||
| Gestation (completed weeks) | |||||
| 37 | 24 | 216 | 12.5 | 0.96 (0.60 to 1.53) | 0.99 (0.62 to 1.59) |
| 38 | 76 | 766 | 10.7 | 0.82 (0.62 to 1.10) | 0.84 (0.63 to 1.13) |
| 39 | 215 | 2130 | 10.1 | 0.78 (0.64 to 0.94) | 0.79 (0.65 to 0.96) |
| 40 | 416 | 3302 | 13.0 | 1 | 1 |
| 41 to 42 + 0 | 304 | 1861 | 17.1 | 1.32 (1.11 to 1.56) | 1.28 (1.07 to 1.53) |
| p-valuec | p < 0.001 | p < 0.001 | |||
| BMI (kg/m2) | |||||
| Not recorded | 188 | 1475 | 13.1 | 1.03 (0.75 to 1.43) | 1.05 (0.79 to 1.40) |
| < 18.5 | 25 | 194 | 14.8 | 1.17 (0.73 to 1.87) | 1.21 (0.77 to 1.91) |
| 18.5–24.9 | 460 | 3765 | 12.7 | 1 | 1 |
| 25–29.9 | 256 | 2053 | 12.9 | 1.01 (0.87 to 1.18) | 1.00 (0.86 to 1.16) |
| 30–35.0 | 96 | 745 | 12.8 | 1.01 (0.80 to 1.28) | 0.89 (0.68 to 1.17) |
| p-valuec | p = 0.978 | p = 0.837 | |||
| Ethnicity | |||||
| White | 832 | 6484 | 13.2 | 1 | 1 |
| Non-white | 197 | 1777 | 11.8 | 0.89 (0.67 to 1.19) | 0.99 (0.72 to 1.35) |
| p-valuec | p = 0.434 | p = 0.932 | |||
| Marital/partner status | |||||
| Married/living together | 949 | 7700 | 12.7 | 1 | 1 |
| Single/unsupported | 73 | 459 | 16.4 | 1.29 (0.93 to 1.77) | 1.44 (1.02 to 2.04) |
| p-valuec | p = 0.124 | p = 0.039 | |||
| Understanding of English | |||||
| Fluent | 934 | 7485 | 13.0 | 1 | 1 |
| Some or none | 97 | 758 | 12.1 | 0.93 (0.72 to 1.20) | 1.04 (0.78 to 1.38) |
| p-valuec | p = 0.569 | p = 0.786 | |||
| Deprivation quintile | |||||
| First (least deprived) | 169 | 1289 | 12.8 | 1 | 1 |
| Second | 169 | 1275 | 14.0 | 1.09 (0.85 to 1.41) | 1.09 (0.84 to 1.42) |
| Third | 191 | 1538 | 13.8 | 1.08 (0.85 to 1.36) | 1.09 (0.85 to 1.39) |
| Fourth | 245 | 1850 | 13.7 | 1.07 (0.87 to 1.32) | 1.10 (0.89 to 1.36) |
| Fifth (most deprived) | 254 | 2298 | 11.0 | 0.86 (0.68 to 1.10) | 0.85 (0.67 to 1.08) |
| p-valuec | p = 0.218 | p = 0.089 | |||
| Number of ‘complicating conditions’ identified at start of labour care | |||||
| None | 913 | 7826 | 12.1 | 1 | 1 |
| ≥ 1 | 119 | 428 | 27.7 | 2.28 (1.81 to 2.88) | 2.35 (1.86 to 2.97) |
| p-valuec | p < 0.001 | p < 0.001 | |||
Explaining less variation, marital status was also significantly associated with the risk of transfer; single or unsupported multiparous women had a higher risk of transfer than women who were married or living with a partner (adjusted RR 1.4, 95% CI 1.02 to 2.04).
Transfer from freestanding midwifery units
In nulliparous women planning FMU birth, maternal age, gestational age and the presence of ‘complicating conditions’ at the start of labour care explained significant variation in the risk of transfer (Table 36). As with nulliparous women in AMUs, the risk of transfer increased with increasing maternal age, women whose pregnancy lasted > 40 weeks (adjusted RR 1.19, 95% CI 1.09 to 1.31) and those with ‘complicating conditions’ identified at the start of labour care (adjusted RR 1.70, 95% CI 1.42 to 2.03) had a higher risk of transfer.
| Characteristic | Transfers | Births | Weighted % | Unadjusteda RR (95% CI) (n = 5152) | Adjustedb RR (95% CI) (n = 5048) |
|---|---|---|---|---|---|
| Maternal age (years) | |||||
| < 20 | 148 | 574 | 26.6 | 0.69 (0.59 to 0.81) | 0.77 (0.64 to 0.94) |
| 20–24 | 391 | 1235 | 29.7 | 0.77 (0.68 to 0.87) | 0.78 (0.68 to 0.89) |
| 25–29 | 567 | 1531 | 35.5 | 0.92 (0.82 to 1.03) | 0.92 (0.83 to 1.02) |
| 30–34 | 530 | 1302 | 38.6 | 1 | 1 |
| ≥ 35 | 230 | 503 | 42.5 | 1.10 (0.95 to 1.28) | 1.08 (0.93 to 1.25) |
| p-valuec | p < 0.001 | p = 0.001 | |||
| Gestation (completed weeks) | |||||
| 37 | 41 | 149 | 28.9 | 0.84 (0.63 to 1.12) | 0.81 (0.63 to 1.06) |
| 38 | 133 | 473 | 25.9 | 0.75 (0.61 to 0.93) | 0.76 (0.62 to 0.93) |
| 39 | 368 | 1155 | 29.6 | 0.86 (0.74 to 1.00) | 0.86 (0.74 to 0.99) |
| 40 | 709 | 1965 | 34.5 | 1 | 1 |
| 41 to 42 + 0 | 617 | 1410 | 42.0 | 1.22 (1.10 to 1.35) | 1.19 (1.09 to 1.31) |
| p-valuec | p < 0.001 | p < 0.001 | |||
| BMI (kg/m2) | |||||
| Not recorded | 390 | 880 | 42.8 | 1.34 (1.12 to 1.60) | 1.28 (1.09 to 1.51) |
| < 18.5 | 36 | 120 | 31.4 | 0.98 (0.70 to 1.38) | 1.12 (0.80 to 1.57) |
| 18.5–24.9 | 931 | 2723 | 32.0 | 1 | 1 |
| 25–29.9 | 404 | 1091 | 36.5 | 1.14 (1.02 to 1.28) | 1.11 (1.00 to 1.25) |
| 30–35.0 | 105 | 333 | 30.8 | 0.97 (0.81 to 1.15) | 0.92 (0.77 to 1.10) |
| p-valuec | p = 0.018 | p = 0.020 | |||
| Ethnicity | |||||
| White | 1728 | 4745 | 34.5 | 1 | 1 |
| Non-white | 139 | 405 | 33.5 | 0.97 (0.87 to 1.09) | 0.94 (0.83 to 1.06) |
| p-valuec | p = 0.594 | p = 0.287 | |||
| Marital/partner status | |||||
| Married/living together | 1722 | 4578 | 36.0 | 1 | 1 |
| Single/unsupported | 131 | 514 | 23.3 | 0.65 (0.50 to 0.83) | 0.74 (0.57 to 0.96) |
| p-valuec | p = 0.001 | p = 0.022 | |||
| Understanding of English | |||||
| Fluent | 1800 | 4979 | 34.3 | 1 | 1 |
| Some or none | 65 | 164 | 40.6 | 1.18 (0.95 to 1.47) | 1.16 (0.93 to 1.46) |
| p-valuec | p = 0.124 | p = 0.191 | |||
| Deprivation quintile | |||||
| 1st (least deprived) | 423 | 1081 | 36.0 | 1 | 1 |
| 2nd | 439 | 1173 | 35.2 | 0.98 (0.83 to 1.15) | 0.98 (0.85 to 1.14) |
| 3rd | 408 | 1088 | 36.2 | 1.01 (0.88 to 1.16) | 1.07 (0.94 to 1.21) |
| 4th | 323 | 960 | 31.5 | 0.88 (0.72 to 1.06) | 0.96 (0.80 to 1.14) |
| 5th (most deprived) | 272 | 835 | 32.6 | 0.91 (0.76 to 1.08) | 1.01 (0.85 to 1.22) |
| p-valuec | p = 0.463 | p = 0.547 | |||
| Number of ‘complicating conditions’ identified at start of labour care | |||||
| None | 1647 | 4779 | 32.7 | 1 | 1 |
| ≥ 1 | 218 | 364 | 57.1 | 1.74 (1.46 to 2.09) | 1.70 (1.42 to 2.03) |
| p-valuec | p < 0.001 | p < 0.001 | |||
Also significantly associated with the risk of transfer, but explaining less variation, BMI (and, in particular, not having BMI recorded in the woman’s notes) was associated with an increased risk of transfer and being single or unsupported was associated with a lower risk of transfer in nulliparous women planning FMU birth.
In multiparous women planning birth in a FMU the pattern of associations was similar to that for multiparous women planning AMU birth; gestational age and ‘complicating conditions’ explained significant variation in the risk of transfer (Table 37). Maternal age was not associated with the risk of transfer. Women whose pregnancy lasted 41–42 weeks had an increased risk of transfer compared with those who started labour care at 40 weeks’ gestation (adjusted RR 1.28, 95% CI 1.06 to 1.56). Multiparous women with one or more ‘complicating conditions’ identified at the start of labour care also had a significantly increased risk of transfer (adjusted RR 2.87, 95% CI 2.02 to 4.08).
| Characteristic | Transfers | Births | Weighted % | Unadjusteda RR (95% CI) (n = 6045) | Adjustedb RR (95% CI) (n = 5934) |
|---|---|---|---|---|---|
| Maternal age (years) | |||||
| < 20 | 9 | 98 | 9.1 | 1.04 (0.50 to 2.20) | 1.18 (0.56 to 2.49) |
| 20–24 | 91 | 881 | 11.4 | 1.30 (0.93 to 1.83) | 1.36 (0.96 to 1.91) |
| 25–29 | 155 | 1714 | 8.6 | 0.98 (0.77 to 1.26) | 0.98 (0.75 to 1.27) |
| 30–34 | 178 | 1918 | 8.7 | 1 | 1 |
| ≥ 35 | 133 | 1427 | 9.3 | 1.06 (0.87 to 1.30) | 1.09 (0.89 to 1.33) |
| p-valuec | p = 0.523 | p = 0.363 | |||
| Gestation (completed weeks) | |||||
| 37 | 18 | 165 | 9.9 | 1.08 (0.70 to 1.68) | 1.02 (0.66 to 1.59) |
| 38 | 50 | 505 | 10.4 | 1.14 (0.79 to 1.65) | 1.13 (0.80 to 1.59) |
| 39 | 104 | 1512 | 6.6 | 0.72 (0.60 to 0.87) | 0.72 (0.60 to 0.86) |
| 40 | 228 | 2392 | 9.1 | 1 | 1 |
| 41 to 42 + 0 | 167 | 1471 | 11.5 | 1.26 (1.02 to 1.54) | 1.28 (1.06 to 1.56) |
| p-valuec | p < 0.001 | p < 0.001 | |||
| BMI (kg/m2) | |||||
| Not recorded | 126 | 967 | 12.8 | 1.52 (1.12 to 2.05) | 1.54 (1.12 to 2.12) |
| < 18.5 | 11 | 112 | 9.4 | 1.11 (0.62 to 2.01) | 0.97 (0.51 to 1.87) |
| 18.5–24.9 | 243 | 2842 | 8.4 | 1 | 1 |
| 25–29.9 | 143 | 1542 | 9.5 | 1.12 (0.89 to 1.41) | 1.10 (0.88 to 1.39) |
| 30–35.0 | 42 | 572 | 7.3 | 0.87 (0.64 to 1.18) | 0.83 (0.62 to 1.12) |
| p-valuec | p = 0.038 | p = 0.056 | |||
| Ethnicity | |||||
| White | 509 | 5504 | 9.0 | 1 | 1 |
| Non-white | 58 | 538 | 11.8 | 1.31 (0.89 to 1.92) | 1.33 (0.89 to 1.99) |
| p-valuec | p = 0.162 | p = 0.159 | |||
| Marital/partner status | |||||
| Married/living together | 546 | 5788 | 9.3 | 1 | 1 |
| Single/unsupported | 16 | 199 | 7.3 | 0.79 (0.50 to 1.24) | 0.67 (0.40 to 1.13) |
| p-valuec | p = 0.299 | p = 0.128 | |||
| Understanding of English | |||||
| Fluent | 544 | 5864 | 9.1 | 1 | 1 |
| Some or none | 21 | 163 | 12.2 | 1.33 (0.91 to 1.95) | 1.10 (0.71 to 1.71) |
| p-valuec | p = 0.132 | p = 0.669 | |||
| Deprivation quintile | |||||
| First (least deprived) | 128 | 1401 | 8.4 | 1 | 1 |
| Second | 123 | 1394 | 9.1 | 1.08 (0.78 to 1.51) | 1.10 (0.80 to 1.52) |
| Third | 109 | 1196 | 8.6 | 1.03 (0.76 to 1.39) | 1.05 (0.78 to 1.40) |
| Fourth | 116 | 1102 | 10.7 | 1.28 (0.94 to 1.73) | 1.27 (0.93 to 1.74) |
| Fifth (most deprived) | 90 | 936 | 9.8 | 1.17 (0.88 to 1.57) | 1.14 (0.85 to 1.55) |
| p-valuec | p = 0.351 | p = 0.439 | |||
| Number of ‘complicating conditions’ identified at start of labour care | |||||
| None | 499 | 5788 | 8.6 | 1 | 1 |
| ≥ 1 | 68 | 250 | 23.4 | 2.74 (1.88 to 3.98) | 2.87 (2.02 to 4.08) |
| p-valuec | p < 0.001 | p < 0.001 | |||
Transfer from planned home births
As in the other settings for birth, in nulliparous women planning birth at home, gestational age and ‘complicating conditions’ at the start of labour care showed a significant association with transfer (Table 38). In contrast, in nulliparous women planning home birth maternal age was not significantly associated with transfer. The risk of transfer increased with increasing gestational age. Nulliparous women with one or more ‘complicating conditions’ identified at the start of labour care were more likely to be transferred (adjusted RR 1.79, 95% CI 1.66 to 1.93).
| Characteristic | Transfers | Births | Weighted % | Unadjusteda RR (95% CI) (n = 4489) | Adjustedb RR (95% CI) (n = 4360) |
|---|---|---|---|---|---|
| Maternal age (years) | |||||
| < 20 | 53 | 130 | 42.6 | 0.93 (0.74 to 1.17) | 0.98 (0.80 to 1.20) |
| 20–24 | 182 | 446 | 40.3 | 0.88 (0.76 to 1.01) | 0.90 (0.79 to 1.03) |
| 25–29 | 573 | 1329 | 41.6 | 0.90 (0.81 to 1.01) | 0.92 (0.83 to 1.02) |
| 30–34 | 785 | 1670 | 46.0 | 1 | 1 |
| ≥ 35 | 414 | 907 | 46.7 | 1.01 (0.89 to 1.15) | 1.00 (0.89 to 1.13) |
| p-valuec | p = 0.063 | p = 0.170 | |||
| Gestation (completed weeks) | |||||
| 37 | 35 | 106 | 32.2 | 0.74 (0.54 to 1.00) | 0.69 (0.51 to 0.94) |
| 38 | 150 | 434 | 34.9 | 0.80 (0.69 to 0.92) | 0.80 (0.70 to 0.93) |
| 39 | 373 | 1035 | 35.7 | 0.82 (0.73 to 0.91) | 0.82 (0.74 to 0.91) |
| 40 | 770 | 1711 | 43.7 | 1 | 1 |
| 41 to 42 + 0 | 680 | 1203 | 56.2 | 1.28 (1.19 to 1.39) | 1.29 (1.20 to 1.40) |
| p-valuec | p < 0.001 | p < 0.001 | |||
| BMI (kg/m2) | |||||
| Not recorded | 365 | 884 | 39.8 | 0.89 (0.78 to 1.02) | 0.88 (0.78 to 1.00) |
| < 18.5 | 28 | 80 | 32.9 | 0.74 (0.54 to 1.01) | 0.79 (0.58 to 1.07) |
| 18.5–24.9 | 1050 | 2344 | 44.5 | 1 | 1 |
| 25–29.9 | 438 | 902 | 47.4 | 1.07 (0.97 to 1.17) | 1.05 (0.96 to 1.15) |
| 30–35.0 | 115 | 252 | 47.7 | 1.07 (0.90 to 1.28) | 1.03 (0.88 to 1.22) |
| p-valuec | p = 0.035 | p = 0.063 | |||
| Ethnicity | |||||
| White | 1912 | 4252 | 44.2 | 1 | 1 |
| Non-white | 94 | 231 | 42.8 | 0.97 (0.80 to 1.17) | 1.01 (0.85 to 1.21) |
| p-valuec | p = 0.730 | p = 0.895 | |||
| Marital/partner status | |||||
| Married/living together | 1918 | 4256 | 44.5 | 1 | 1 |
| Single/unsupported | 81 | 208 | 40.1 | 0.90 (0.73 to 1.12) | 0.90 (0.74 to 1.09) |
| p-valuec | p = 0.341 | p = 0.269 | |||
| Understanding of English | |||||
| Fluent | 1992 | 4459 | 44.1 | 1 | 1 |
| Some or none | 12 | 25 | 48.2 | 1.09 (0.72 to 1.65) | 1.12 (0.68 to 1.85) |
| p-valuec | p = 0.668 | p = 0.650 | |||
| Deprivation quintile | |||||
| First (least deprived) | 446 | 947 | 46.9 | 1 | 1 |
| Second | 416 | 929 | 44.1 | 0.94 (0.85 to 1.04) | 0.96 (0.88 to 1.06) |
| Third | 462 | 1015 | 45.3 | 0.97 (0.85 to 1.09) | 0.97 (0.87 to 1.10) |
| Fourth | 384 | 941 | 39.4 | 0.84 (0.74 to 0.95) | 0.86 (0.76 to 0.97) |
| Fifth (most deprived) | 288 | 633 | 44.7 | 0.95 (0.83 to 1.09) | 0.98 (0.87 to 1.11) |
| p-valuec | p = 0.022 | p = 0.029 | |||
| Number of ‘complicating conditions’ identified at start of labour care | |||||
| None | 1706 | 4047 | 41.2 | 1 | 1 |
| ≥ 1 | 287 | 394 | 74.5 | 1.81 (1.67 to 1.96) | 1.79 (1.66 to 1.93) |
| p-valuec | p < 0.001 | p < 0.001 | |||
Index of Multiple Deprivation was also statistically significantly associated with transfer, but with no clear pattern across the quintiles.
In multiparous women planning home birth, gestational age, ‘complicating conditions’ and BMI were associated with transfer (Table 39). For gestational age the pattern of association was less clear than in other settings. The presence of ‘complicating conditions’ at the start of labour care was associated with an increased risk of transfer (adjusted RR 3.3, 95% CI 2.92 to 2.92). Women with BMI not recorded in their maternity notes and those with BMI ≥ 25 kg/m2 had an increased risk of transfer compared with women whose BMI was in the normal range, although absolute differences in the risk of transfer were small.
| Characteristic | Transfers | Births | Weighted % | Unadjusteda RR (95% CI) (n = 12,130) | Adjustedb RR (95% CI) (n = 11,740) |
|---|---|---|---|---|---|
| Maternal age (years) | |||||
| < 20 | 12 | 87 | 12.1 | 1.03 (0.54 to 1.96) | 0.84 (0.38 to 1.84) |
| 20–24 | 162 | 1242 | 12.5 | 1.06 (0.86 to 1.31) | 1.02 (0.84 to 1.25) |
| 25–29 | 332 | 2970 | 10.6 | 0.90 (0.79 to 1.02) | 0.88 (0.77 to 1.00) |
| 30–34 | 505 | 4100 | 11.8 | 1 | 1 |
| ≥ 35 | 437 | 3707 | 12.0 | 1.02 (0.88 to 1.18) | 1.02 (0.88 to 1.19) |
| p-valuec | p = 0.315 | p = 0.199 | |||
| Gestation (completed weeks) | |||||
| 37 | 37 | 270 | 14.5 | 1.20 (0.86 to 1.67) | 1.07 (0.75 to 1.53) |
| 38 | 125 | 1130 | 11.5 | 0.96 (0.78 to 1.19) | 0.93 (0.76 to 1.14) |
| 39 | 273 | 3052 | 8.8 | 0.73 (0.62 to 0.86) | 0.71 (0.61 to 0.82) |
| 40 | 611 | 4882 | 12.0 | 1 | 1 |
| 41 to 42 + 0 | 402 | 2796 | 13.6 | 1.13 (0.98 to 1.31) | 1.11 (0.97 to 1.27) |
| p-valuec | p < 0.001 | p < 0.001 | |||
| BMI (kg/m2) | |||||
| Not recorded | 332 | 2345 | 14.3 | 1.43 (1.24 to 1.66) | 1.38 (1.19 to 1.60) |
| < 18.5 | 28 | 237 | 12.2 | 1.23 (0.82 to 1.84) | 1.27 (0.84 to 1.92) |
| 18.5–24.9 | 579 | 5702 | 10.0 | 1 | 1 |
| 25–29.9 | 361 | 2833 | 11.9 | 1.20 (1.05 to 1.36) | 1.17 (1.03 to 1.32) |
| 30–35.0 | 138 | 955 | 13.6 | 1.37 (1.15 to 1.62) | 1.29 (1.08 to1.54) |
| p-valuec | p < 0.001 | p < 0.001 | |||
| Ethnicity | |||||
| White | 1367 | 11,476 | 11.6 | 1 | 1 |
| Non-white | 79 | 639 | 11.8 | 1.01 (0.78 to 1.33) | 1.08 (0.83 to 1.41) |
| p-valuec | p = 0.913 | p = 0.571 | |||
| Marital/partner status | |||||
| Married/living together | 1368 | 11,591 | 11.6 | 1 | 1 |
| Single/unsupported | 71 | 454 | 12.7 | 1.09 (0.83 to 1.45) | 1.10 (0.85 to 1.43) |
| p-valuec | p = 0.525 | p = 0.462 | |||
| Understanding of English | |||||
| Fluent | 1436 | 12,047 | 11.6 | 1 | 1 |
| Some or none | 7 | 63 | 10.0 | 0.86 (0.38 to 1.99) | 0.87 (0.37 to 2.06) |
| p-valuec | p = 0.731 | p = 0.747 | |||
| Deprivation quintile | |||||
| First (least deprived) | 293 | 2695 | 10.9 | 1 | 1 |
| Second | 280 | 2501 | 11.1 | 1.02 (0.86 to 1.21) | 1.03 (0.87 to 1.23) |
| Third | 327 | 2588 | 12.2 | 1.12 (0.94 to 1.35) | 1.15 (0.96 to 1.36) |
| Fourth | 288 | 2344 | 11.5 | 1.06 (0.89 to 1.27) | 1.05 (0.88 to 1.25) |
| Fifth (most deprived) | 248 | 1911 | 12.5 | 1.15 (0.94 to 1.40) | 1.10 (0.91 to 1.33) |
| p-valuec | p = 0.587 | p = 0.557 | |||
| Number of ‘complicating conditions’ identified at start of labour care | |||||
| None | 1245 | 11,509 | 10.6 | 1 | 1 |
| ≥ 1 | 191 | 490 | 36.5 | 3.44 (2.95 to 4.03) | 3.38 (2.92 to 3.92) |
| p-valuec | p < 0.001 | p < 0.001 | |||
Variation in transfer rates between alongside midwifery units, freestanding midwifery units and NHS trusts providing home birth services
The characteristics of the AMUs, FMUs and NHS trusts providing home birth services in the study sample are presented in Chapter 3 (see Characteristics of alongside midwifery units in the study sample, Characteristics of freestanding midwifery units in the study sample and Characteristics of NHS trusts providing home birth services in the study sample, respectively. The funnel plots in Figures 18–20 show that in all settings, for both nulliparous and multiparous women, there was significantly more variation in unit/NHS trust transfer rates than would be expected by chance alone, even after adjusting for maternal characteristics. There was most variation in transfer rates in AMUs and least variation in NHS trusts providing home birth services (Table 40).
FIGURE 18.
Funnel plots showing adjusted transfer rates for AMUs in (a) nulliparous; and (b) multiparous women.
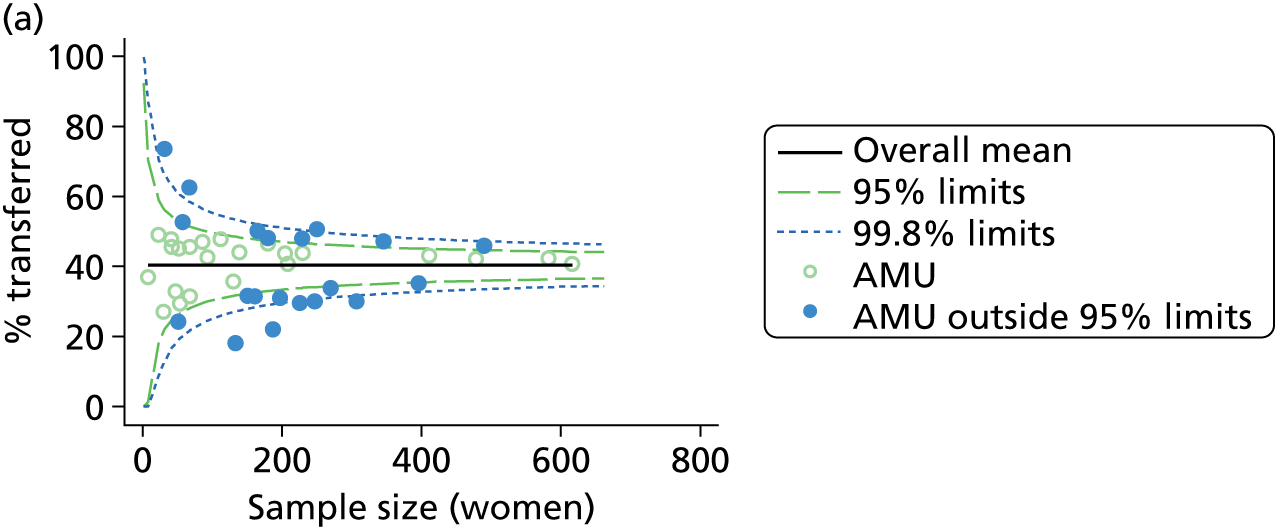
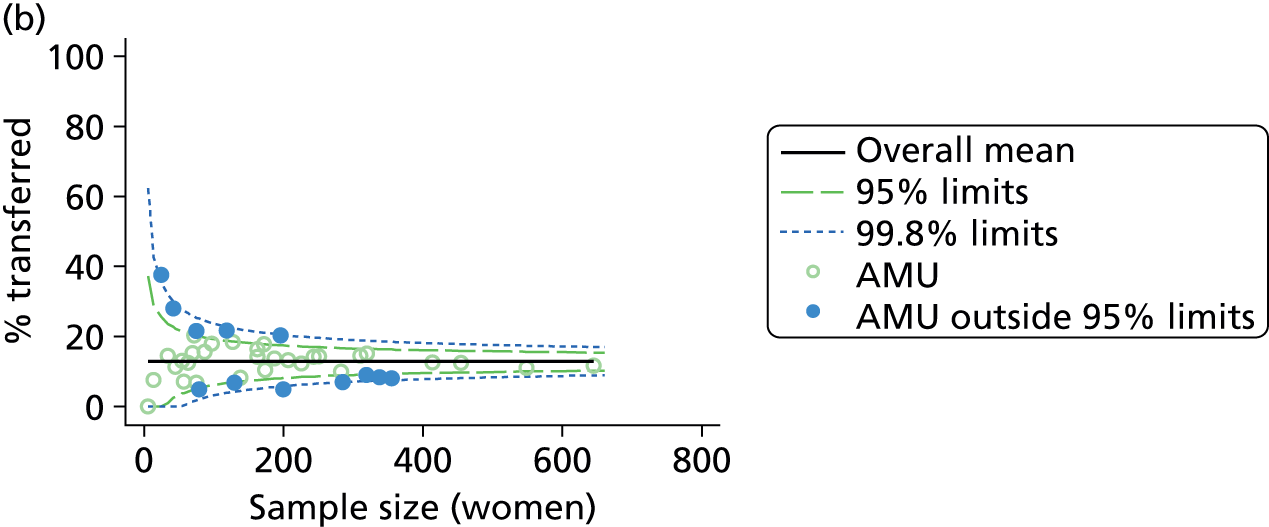
FIGURE 19.
Funnel plots showing adjusted transfer rates for FMUs in (a) nulliparous; and (b) multiparous women.
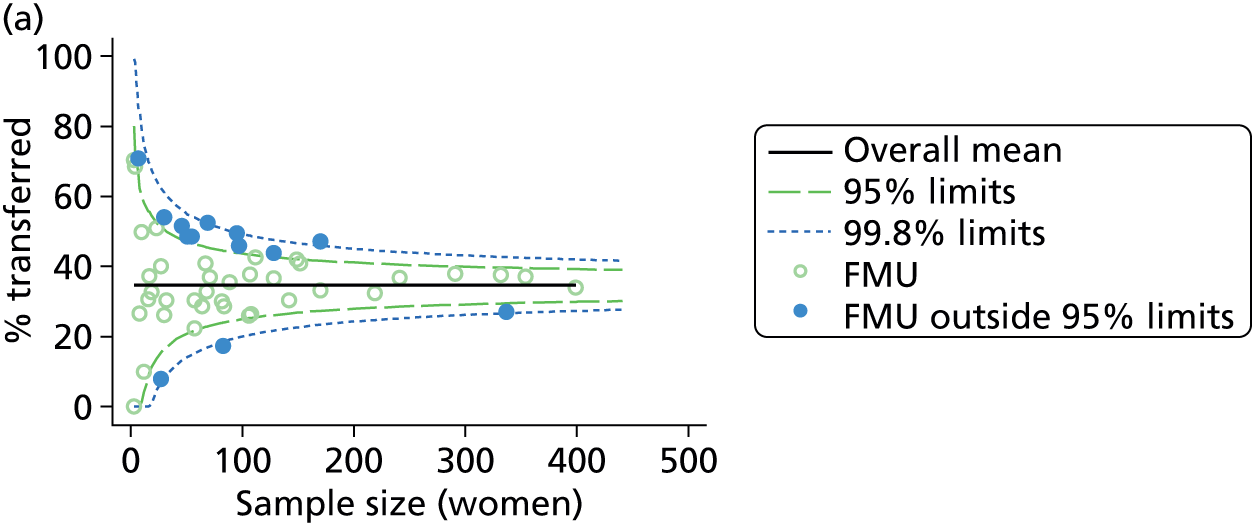
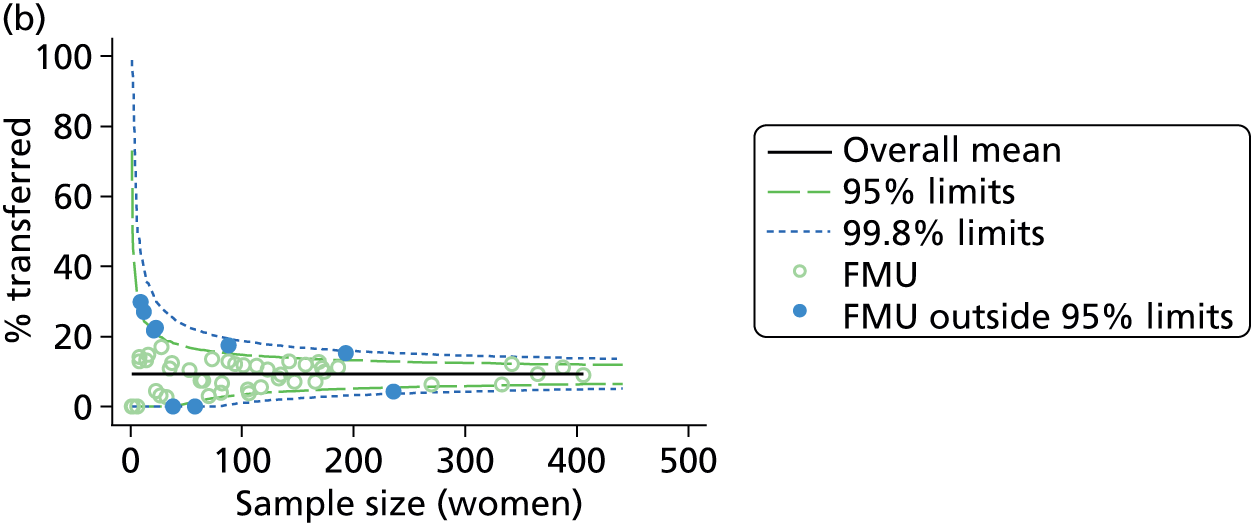
FIGURE 20.
Funnel plots showing adjusted transfer rates for NHS trusts providing home birth services in (a) nulliparous; and (b) multiparous women.
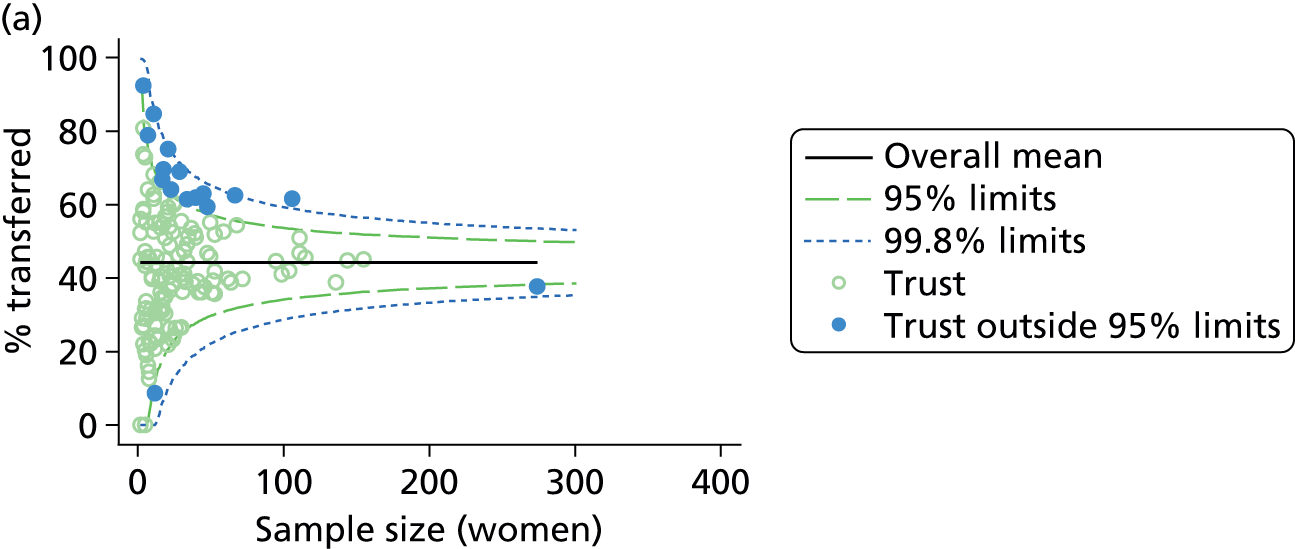
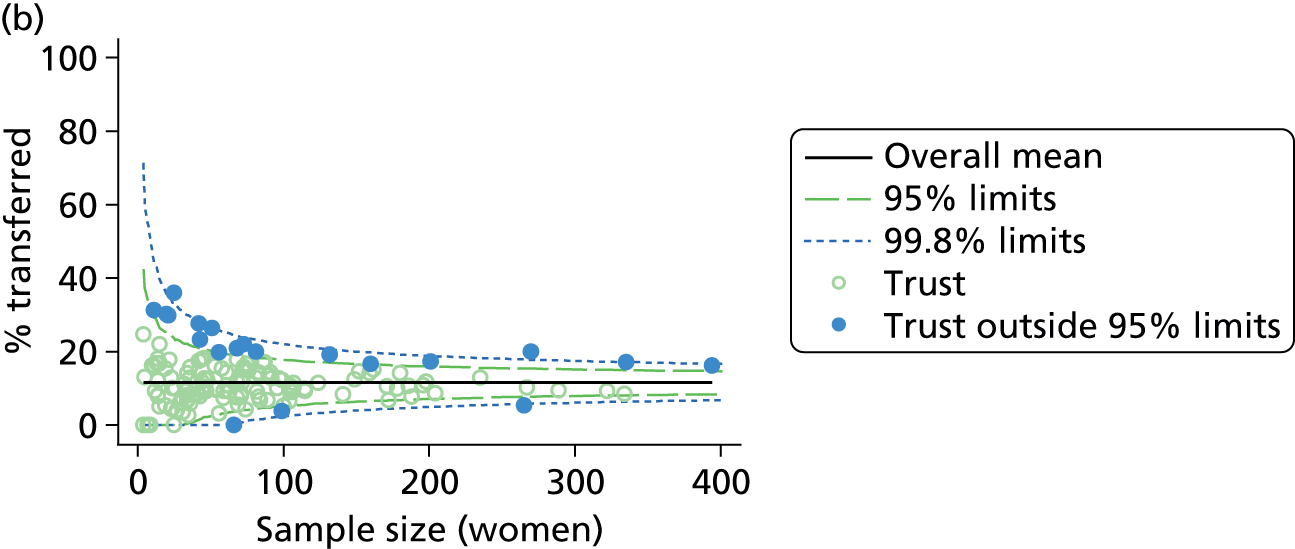
| Planned birth setting | Nulliparous women | Multiparous women | ||
|---|---|---|---|---|
| Units/trusts | Outliers, n (%) | Units/trusts | Outliers, n (%) | |
| AMU | 43 | 20 (47) | 43 | 12 (28) |
| FMU | 50 | 13 (26) | 53 | 9 (17) |
| Home | 141 | 16 (11) | 142 | 20 (14) |
Unit or NHS trust characteristics and transfer rates
In AMUs, although higher midwifery staffing, as measured by the number of midwives on duty and the number of midwives per woman in labour, was significantly associated with higher transfer rates in multiparous women, there was no consistent relationship between any of the unit characteristics studied and transfer rates (Table 41).
| Unit characteristic | Nulliparous women | Multiparous women | ||||||
|---|---|---|---|---|---|---|---|---|
| n a | R2 (%)b | Coefficientc | p-value | n a | R2 (%)b | Coefficientc | p-value | |
| Sized | 38 | 0.3 | 0.1 | 0.567 | 38 | 3.4 | –0.1 | 0.124 |
| Number of delivery bedse | 28 | 3.0 | 0.4 | 0.145 | 28 | 0.2 | –0.1 | 0.758 |
| Women per year per bed | 25 | 0.1 | 0.0 | 0.895 | 25 | 1.6 | 0.0 | 0.479 |
| Mean number of midwives on duty | 32 | 1.2 | 0.5 | 0.216 | 32 | 9.7 | 0.7 | 0.016 |
| Mean number of midwives on duty per woman in labour | 32 | 0.3 | 0.6 | 0.639 | 32 | 5.9 | 1.4 | 0.043 |
| Percentage of midwifery ‘understaffing’f | 32 | 1.3 | 0.2 | 0.415 | 32 | 0.8 | –0.1 | 0.569 |
| Size indexg | 19 | 2.5 | 0.5 | 0.243 | 19 | 0.1 | 0.0 | 0.878 |
| Staffing indexh | 32 | 0.1 | –0.2 | 0.839 | 32 | 3.7 | 0.5 | 0.235 |
In FMUs, where there was less variation in transfer rates, particularly for multiparous women, none of the unit characteristics studied was consistently associated with transfer rates in multiparous women (Table 42). In nulliparous women, the number of delivery beds was negatively associated with transfer rates. Other indicators of the size of the unit (number of births per year, number of midwives and our index combining all three ‘size’ characteristics) were not significantly associated with transfer rates in nulliparous women, but effects were all in the same direction, suggesting lower transfer rates in larger units. Two characteristics relating to the distance of the FMU to the nearest OU (distance based on postcode and median transfer time), and our distance index combining these characteristics with estimated travel duration, were significantly positively associated with transfer rates in nulliparous women; FMUs located further away from the nearest OU may have higher transfer rates for women having a first baby. Scatterplots for the predictor and outcome variables that were significantly associated are shown in Appendix 6.
| Unit characteristic | Nulliparous women | Multiparous women | ||||||
|---|---|---|---|---|---|---|---|---|
| n a | R2 (%)b | Coefficientc | p-value | n a | R2 (%)b | Coefficientc | p-value | |
| Sized | 46 | 11.9 | –1.5 | 0.051 | 48 | 0.0 | 0.0 | 0.889 |
| Number of delivery bedse | 47 | 3.9 | –0.9 | 0.048 | 50 | 0.0 | 0.0 | 0.856 |
| Women per year per bed | 43 | 2.5 | 0.0 | 0.385 | 45 | 0.0 | 0.0 | 0.978 |
| Mean number of midwives on duty | 29 | 8.7 | –4.8 | 0.092 | 29 | 0.3 | 0.4 | 0.752 |
| Mean number of midwives on duty per woman in labour | 29 | 7.0 | –5.2 | 0.140 | 29 | 0.0 | –0.1 | 0.968 |
| Percentage of midwifery ‘understaffing’f | 29 | 0.1 | 0.1 | 0.801 | 29 | 0.3 | –0.1 | 0.758 |
| 24-hour staffingg | 47 | 2.8 | –4.9 | 0.154 | 50 | 1.3 | –1.5 | 0.152 |
| Transfer distance (km) | 50 | 7.4 | 0.2 | 0.049 | 52 | 0.4 | 0.0 | 0.682 |
| Estimated transfer duration (minutes) | 50 | 5.1 | 0.2 | 0.108 | 52 | 1.8 | –0.1 | 0.401 |
| Actual transfer duration (minutes)h | 49 | 12.9 | 0.4 | 0.010 | 50 | 1.0 | –0.1 | 0.537 |
| Size indexi | 25 | 8.4 | –2.3 | 0.103 | 25 | 5.0 | 0.9 | 0.217 |
| Staffing indexj | 29 | 2.5 | –1.3 | 0.361 | 29 | 0.1 | 0.1 | 0.866 |
| Distance indexk | 49 | 9.2 | 1.9 | 0.024 | 50 | 1.1 | –0.3 | 0.505 |
As described in Chapter 3, size and distance were correlated, with FMUs located further away from the nearest OU tending to be smaller (data not shown).
For planned home births the number of births in a NHS trust that took place at home was negatively associated with transfer rates in nulliparous and multiparous women (Table 43), indicating that NHS trusts with a higher number of births at home may have lower transfer rates.
| Trust characteristic | Nulliparous women | Multiparous women | ||||||
|---|---|---|---|---|---|---|---|---|
| n a | R2 (%)b | Coefficientc | p-value | n a | R2 (%)b | Coefficientc | p-value | |
| Sized | 141 | 4.4 | –2.4 | 0.001 | 142 | 9.8 | –1.7 | < 0.001 |
| Percentage of births in the trust at home | 138 | 2.1 | –0.6 | 0.116 | 139 | 1.4 | –0.2 | 0.230 |
Transfer and time of day or day of the week
In order to explore whether the timing of transfer might be influenced by non-clinical factors such as shift patterns or staffing levels/cover at certain times of the day or on particular days of the week, we compared distributions for the timing of the decision to transfer by time of the day and day of the week.
Timing of the decision to transfer
The percentage of transfers from each birth setting where the decision was taken on each day of the week is shown in Figure 21. The distribution of the day of the decision to transfer was not significantly different from a uniform distribution in any of the settings, indicating that there were no day or days of the week when decisions to transfer a woman were more likely to be taken.
FIGURE 21.
The percentage of women transferred where the decision to transfer was taken on each day of the week in each birth setting. p-values for chi-squared test for a uniform distribution are shown. (a) At home; (b) in a FMU; and (c) in an AMU.
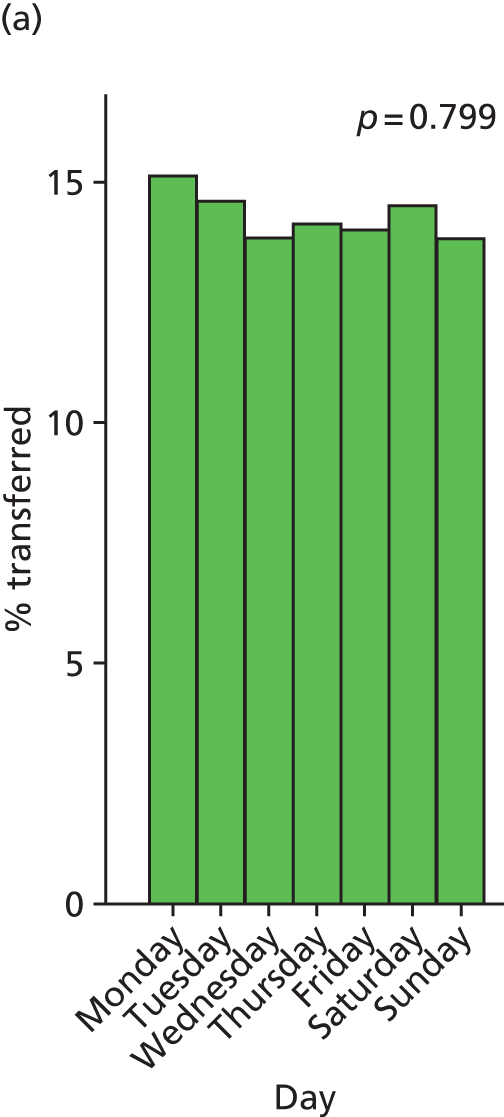
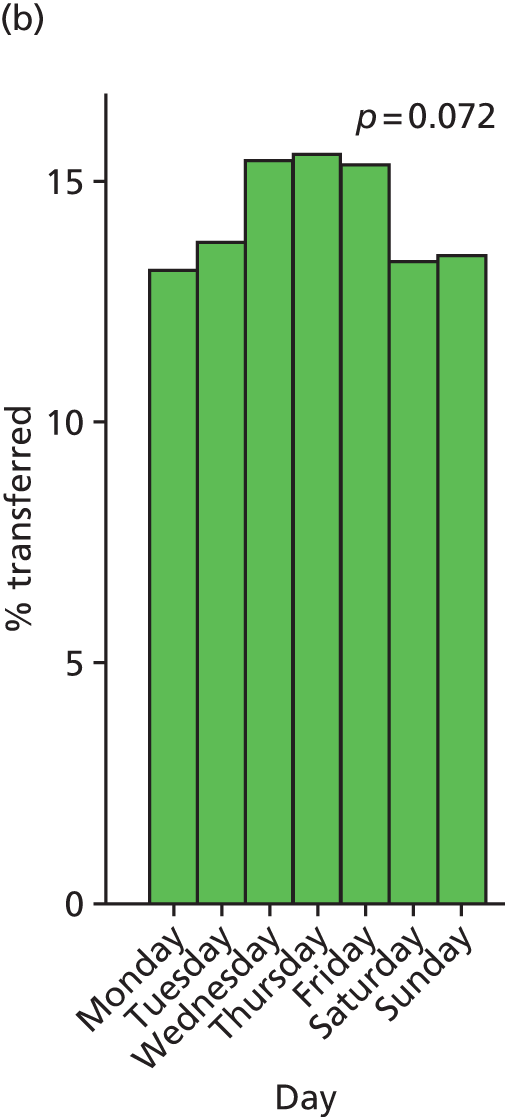
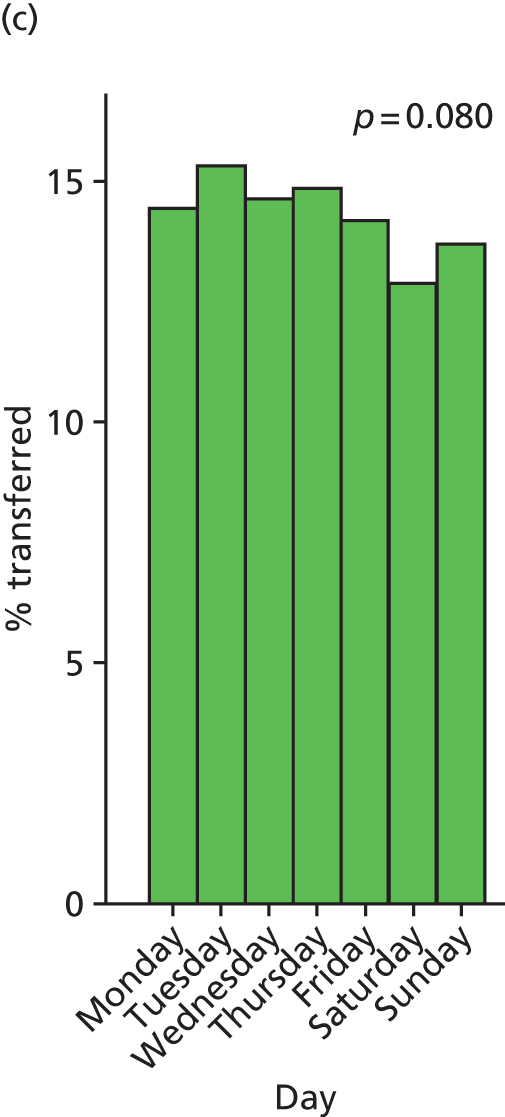
Variation in the percentage of women transferred where the decision was taken at different times of day is shown in Figure 22. While there was some statistically significant variation in FMUs and AMUs, this did not follow any obvious trend and there was no clear time of day when transfers were more common. For home births the distribution showed an apparent excess of transfers in the early hours of the morning, but this was not statistically significant.
FIGURE 22.
The percentage of women transferred where the decision was taken during each hour of a 24-hour period in each birth setting. p-values for chi-squared test for a uniform distribution are shown. (a) At home; (b) in a FMU; and (c) in an AMU.
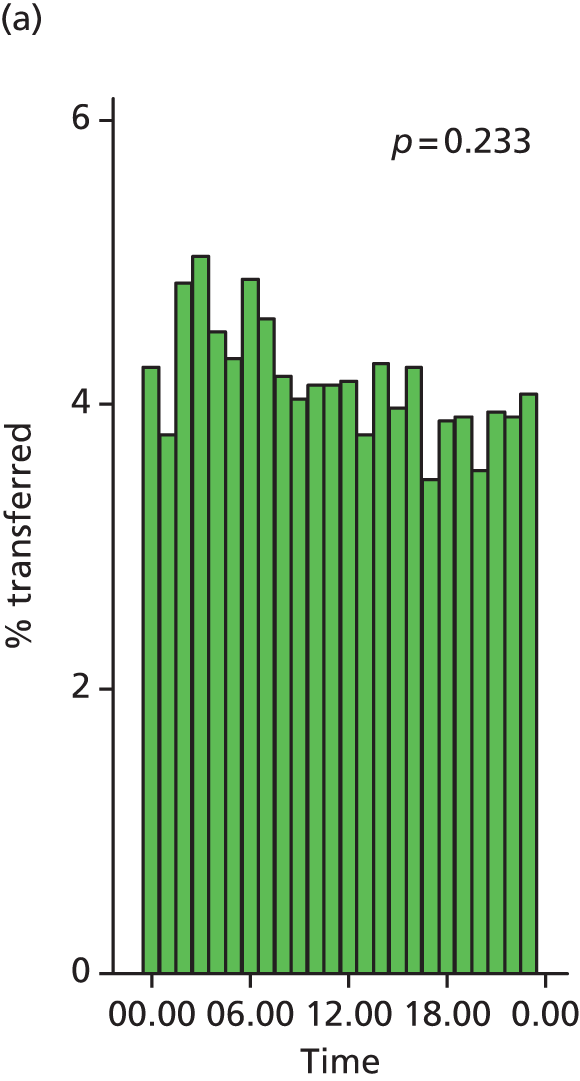
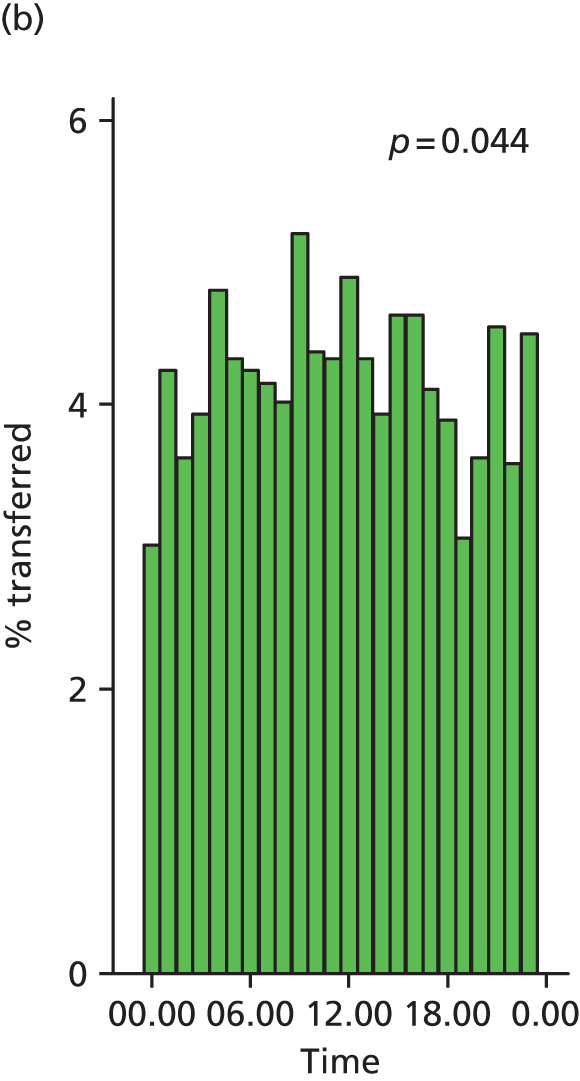
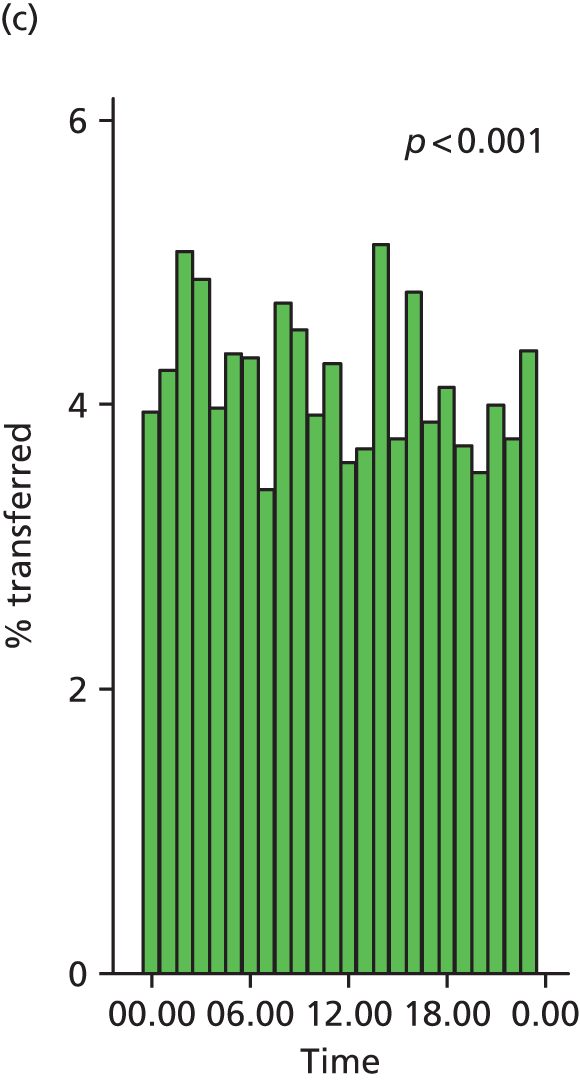
Further exploration of the timing of the decision to transfer by hour of the day on different days of the week (Monday to Thursday, Friday, weekend) did not reveal any clear patterns (Figure 23). For transfers that took place before birth a very similar picture was seen, with some variation between times of day but with no clear trends emerging (data not shown).
FIGURE 23.
The percentage of women transferred where the decision was taken during each hour of a 24-hour period on different days of the week in each birth setting. p-values for chi-squared test for a uniform distribution are shown. (a) Monday to Thursday at home; (b) Monday to Thursday in FMU; (c) Monday to Thursday in AMU; (d) Friday at home; (e) Friday in FMU; (f) Friday in AMU; (g) Saturday to Sunday at home; (h) Saturday to Sunday in FMU; and (i) Saturday to Sunday in AMU.

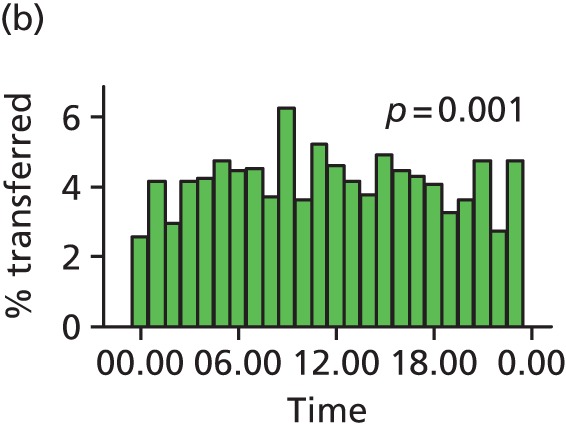

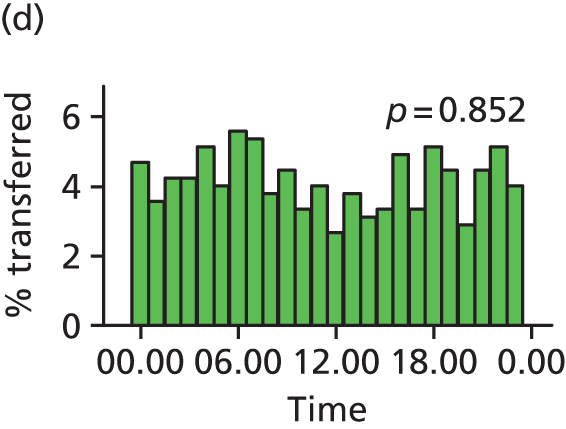


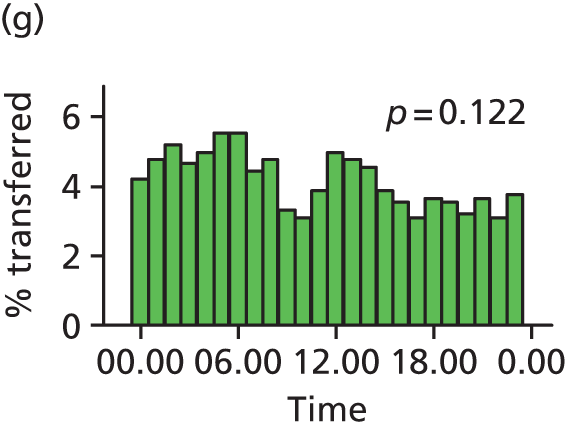
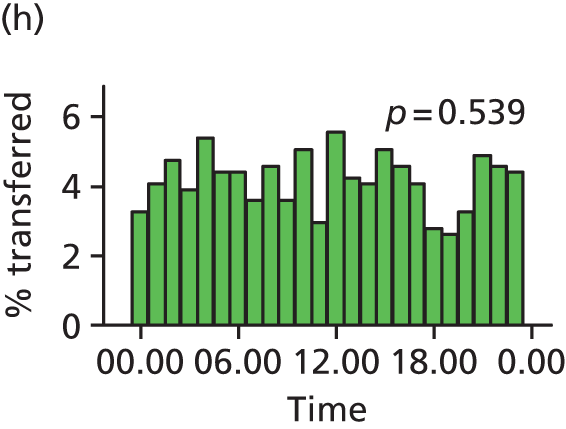
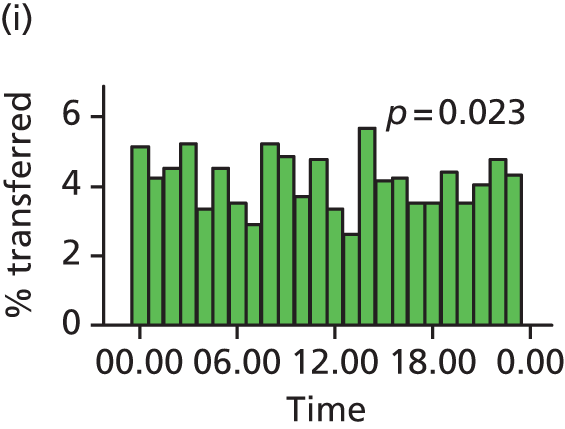
The duration and urgency of transfer from freestanding midwifery units and from planned home births
Reasons for transfer
The most common reason for transfer, in both settings and irrespective of parity, was failure to progress (Table 44). In nulliparous women, 18% of those planning birth at home and 13% of those planning FMU birth were transferred for failure to progress in either the first or the second stage. In multiparous women, failure to progress was the single most common reason for transfer, but almost half of all transfers took place after birth for reasons such as repair of perineal trauma, retained placenta, postpartum haemorrhage and concerns about the baby.
| Home (N = 16,619) | FMU (N = 11,197) | |||||||
|---|---|---|---|---|---|---|---|---|
| Nulliparous | Multiparous | Nulliparous | Multiparous | |||||
| n | Weighted % | n | Weighted % | n | Weighted % | n | Weighted % | |
| Women not transferred | 2481 | 55.9 | 10,682 | 88.4 | 3284 | 65.5 | 5478 | 90.8 |
| Women transferred | 2008 | 44.1 | 1448 | 11.6 | 1868 | 34.5 | 567 | 9.2 |
| Primary reason for transferb | ||||||||
| Malposition | 11 | 0.3 | 15 | 0.1 | 8 | 0.1 | 3 | < 0.1 |
| Malpresentation | 34 | 0.8 | 35 | 0.3 | 28 | 0.5 | 13 | 0.2 |
| Failure to progress first stage | 521 | 11.2 | 206 | 1.7 | 457 | 8.0 | 76 | 1.2 |
| Fetal distress first stage | 95 | 2.2 | 85 | 0.7 | 165 | 3.2 | 36 | 0.6 |
| Meconium staining | 246 | 5.4 | 178 | 1.4 | 247 | 4.5 | 53 | 0.8 |
| Epidural request | 131 | 2.8 | 44 | 0.4 | 139 | 2.4 | 23 | 0.3 |
| Hypertension | 41 | 0.9 | 32 | 0.2 | 48 | 1.0 | 16 | 0.2 |
| Antepartum haemorrhage | 34 | 0.8 | 26 | 0.2 | 32 | 0.6 | 14 | 0.2 |
| Failure to progress second stage | 300 | 6.7 | 78 | 0.6 | 316 | 5.3 | 48 | 0.7 |
| Fetal distress second stage | 30 | 0.6 | 11 | 0.1 | 29 | 0.5 | 6 | 0.1 |
| Postpartum haemorrhage | 53 | 1.2 | 88 | 0.7 | 37 | 0.7 | 53 | 0.9 |
| Retained placenta | 85 | 1.8 | 161 | 1.2 | 81 | 1.7 | 96 | 1.5 |
| Repair of perineal trauma | 203 | 4.4 | 180 | 1.4 | 144 | 2.9 | 37 | 0.6 |
| Other before birthc | 149 | 3.4 | 110 | 0.9 | 58 | 1.3 | 33 | 0.5 |
| Other after birth, maternal reasons | 9 | 0.2 | 18 | 0.1 | 9 | 0.1 | 11 | 0.2 |
| Other after birth, neonatal reasons | 42 | 0.9 | 141 | 1.1 | 33 | 0.6 | 32 | 0.6 |
| Not known | 24 | 0.6 | 40 | 0.4 | 37 | 1.0 | 17 | 0.5 |
| Timing of transferb | ||||||||
| During labour (before birth) | 1563 | 34.2 | 764 | 6.0 | 1521 | 26.9 | 316 | 4.9 |
| Immediately after birth | 401 | 8.6 | 633 | 5.0 | 304 | 6.0 | 237 | 3.9 |
| Not known | 44 | 1.3 | 51 | 0.6 | 43 | 1.5 | 14 | 0.5 |
| Urgency of reason for transferb | ||||||||
| ‘Potentially urgent’ (before birth)d | 462 | 10.3 | 206 | 1.6 | 540 | 9.5 | 102 | 1.5 |
| ‘Non-urgent’ (before birth)e | 640 | 13.6 | 244 | 2.0 | 589 | 10.3 | 98 | 1.5 |
| ‘Potentially urgent’ (after birth)f | 53 | 1.2 | 88 | 0.7 | 37 | 0.7 | 53 | 0.9 |
| Not classifiedg | 853 | 19.1 | 910 | 7.3 | 702 | 14.0 | 314 | 5.3 |
Timing, duration and urgency of transfer
We explored the timing and duration of transfer from planned births at home and in FMUs in transfers for ‘potentially urgent’ and ‘non-urgent’ reasons. On average, decisions to transfer were taken slightly sooner after the start of care in labour for women transferred from home than for women transferred from a FMU (Table 45). This difference between settings was not apparent for ‘potentially urgent’ transfers (before birth).
| Home | FMU | |||
|---|---|---|---|---|
| n | Median (IQR) | n | Median (IQR) | |
| Before transferb (hours) | ||||
| All transfers | 3176 | 4.7 (2.3–7.7) | 2274 | 5.3 (2.9–8.7) |
| Transfers during labour (before birth) | 2164 | 5.0 (2.3–8.0) | 1744 | 5.4 (2.8–8.8) |
| ‘Potentially urgent’c transfers (before birth) | 630 | 5.4 (2.8–8.0) | 610 | 5.2 (2.7–8.2) |
| ‘Non-urgent’d transfers (before birth) | 839 | 6.6 (4.3–9.5) | 654 | 7.5 (4.8–10.2) |
| Transfers after birth | 973 | 4.0 (2.3–6.0) | 509 | 5.2 (3.2–8.1) |
| Arranging transfere (minutes) | ||||
| All transfers | 3159 | 20 (10–30) | 2272 | 24 (15–35) |
| Transfers during labour (before birth) | 2173 | 19 (10–30) | 1754 | 20 (14–32) |
| ‘Potentially urgent’ transfers (before birth) | 632 | 15 (10–25) | 613 | 20 (10–30) |
| ‘Non-urgent’ transfers (before birth) | 842 | 20 (13–30) | 657 | 25 (15–38) |
| Transfers after birth | 974 | 25 (15–40) | 511 | 30 (15–45) |
| ‘Potentially urgent’ transfers (after birth)f | 135 | 20 (14–30) | 84 | 25 (15–39) |
| Travel timeg (minutes) | ||||
| All transfers | 3141 | 25 (16–35) | 2244 | 31 (25–42) |
| Transfers during labour (before birth) | 2162 | 25 (17–35) | 1731 | 30 (25–40) |
| ‘Potentially urgent’ transfers (before birth) | 628 | 24 (15–30) | 605 | 30 (24–40) |
| ‘Non-urgent’ transfers (before birth) | 838 | 27 (20–36) | 646 | 35 (25–45) |
| Transfers after birth | 967 | 28 (15–38) | 506 | 33 (25–45) |
| ‘Potentially urgent’ transfers (after birth) | 135 | 30 (20–44) | 83 | 30 (20–40) |
| Overall transfer timeh (minutes) | ||||
| All transfers | 3161 | 49 (35–65) | 2252 | 60 (45–75) |
| Transfers during labour (before birth) | 2162 | 45 (35–60) | 1731 | 55 (45–70) |
| ‘Potentially urgent’ transfers (before birth) | 627 | 42 (30–55) | 605 | 50 (40–65) |
| ‘Non-urgent’ transfers (before birth) | 839 | 50 (37–65) | 646 | 60 (50–75) |
| Transfers after birth | 965 | 55 (40–77) | 505 | 65 (50–89) |
| ‘Potentially urgent’ transfers (after birth) | 135 | 54 (40–70) | 83 | 60 (45–75) |
| After transferi (hours) | ||||
| Transfers during labour (before birth) | 2162 | 3.0 (1.2–7.0) | 1733 | 3.3 (1.4–7.4) |
| ‘Potentially urgent’ transfers (before birth) | 628 | 1.6 (0.8–3.0) | 606 | 1.6 (0.8–3.1) |
| ‘Non-urgent’ transfers (before birth) | 839 | 5.4 (2.6–8.8) | 646 | 6.3 (3.5–9.3) |
The median overall transfer time, from the decision to transfer to the first OU assessment, was significantly shorter for transfers from home (49 minutes) than for transfers from FMUs (60 minutes) (p < 0.001). For women transferred before birth, the median time between the woman’s first assessment in the OU and giving birth was around 3 hours in both settings.
Using our classification of urgency, 668 transfers before birth from home and 642 from FMUs were for ‘potentially urgent’ reasons; 884 transfers before birth from home and 687 from FMUs were classified as ‘non-urgent’. In both settings the overall transfer time was shorter for women transferred before birth for ‘potentially urgent’ reasons than for women transferred before birth for ‘non-urgent’ reasons (home median 42 vs. 50 minutes, p < 0.001; FMU median 50 vs. 60 minutes, p < 0.001) (see Table 45). The shorter transfer times for transfers from home were such that women transferred from home for ‘non-urgent’ reasons had the same transfer time as women transferred from a FMU for ‘potentially urgent’ reasons (Figure 24 and see Table 45).
FIGURE 24.
Overall transfer time by urgency in transfers before birth from home and FMUs.
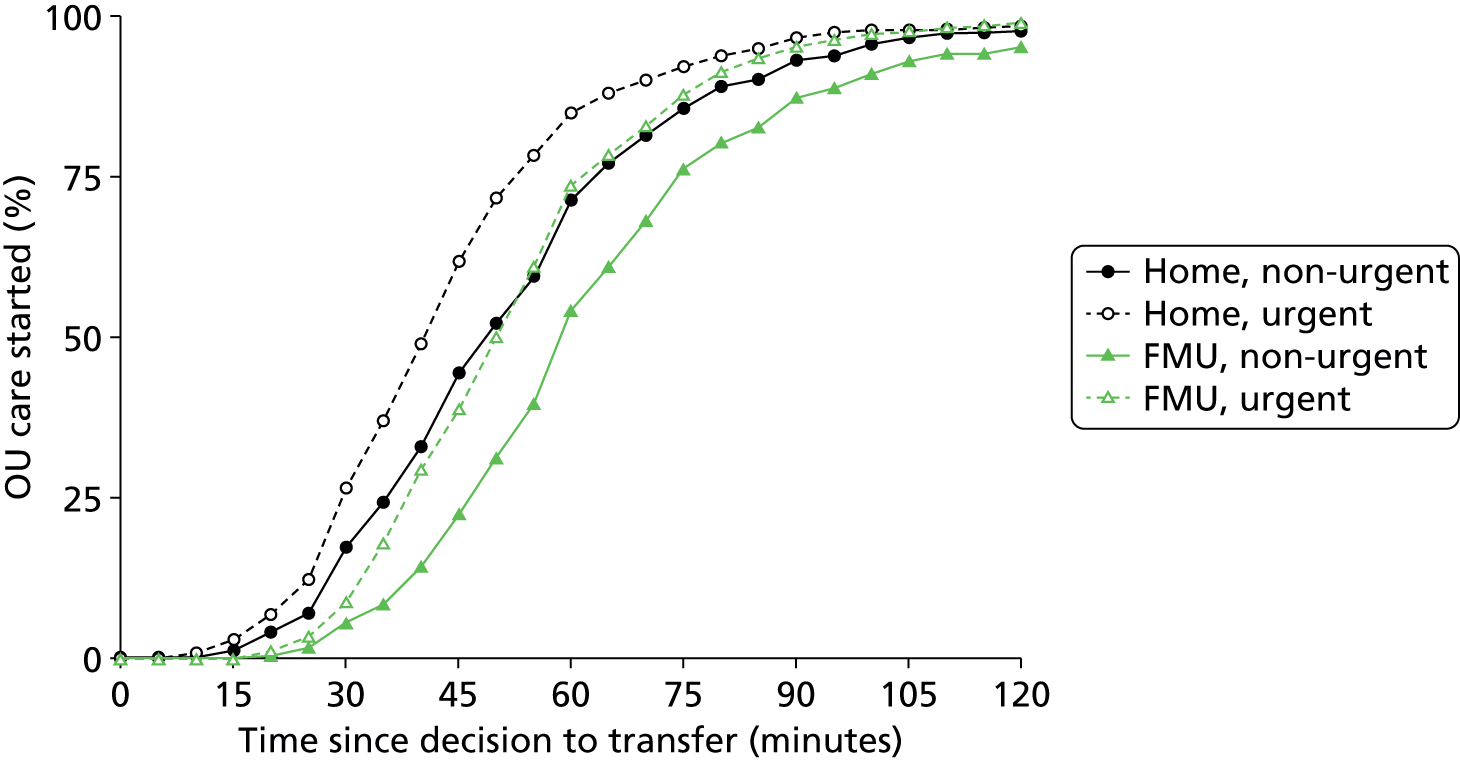
For women transferred before birth for ‘potentially urgent’ reasons, the median time from their first assessment in the OU to giving birth was just over 90 minutes in both settings (see Table 45).
Transfers after birth for postpartum haemorrhage are also ‘potentially urgent’. In these transfers (141 from home and 90 from FMUs) the median overall transfer time was 54 minutes from planned home births and 60 minutes from FMUs (see Table 45).
Discussion
Summary of main findings
Maternal characteristics associated with transfer
Across all three non-OU birth settings, and after adjustment for other maternal characteristics, gestational age was associated with transfer, with the general pattern that women who started labour care later in their pregnancy were more likely to be transferred, although the strength of effect varied in different settings and by parity. In nulliparous women planning birth in AMUs or FMUs, increasing maternal age was associated with an increased risk of transfer. Maternal age was not significantly associated with transfer in women planning home birth or in multiparous women planning birth in a MU. In all settings, for both nulliparous and multiparous women, the presence of one or more ‘complicating condition’ identified at the start of labour care significantly increased the risk of transfer.
Variation in alongside midwifery unit, freestanding midwifery unit and NHS trust transfer rates
In all three settings we found greater variation in unit and NHS trust transfer rates than would be expected by chance alone, even after adjusting for maternal characteristics. Only a small proportion of that variation was explained by the unit and NHS trust characteristics we studied.
In AMUs higher levels of midwifery staffing were associated with higher transfer rates in multiparous women, but there was no consistent effect across all measures of staffing or for nulliparous women and so we cannot rule out the possibility that these were chance findings.
In FMUs we found no consistent association between any of the unit characteristics we studied and transfer rates in multiparous women. However, in nulliparous women, where transfer rates were higher and more varied, we found lower transfer rates in larger FMUs and higher transfer rates in FMUs located further away from the nearest OU.
In NHS trusts providing home birth services we found that transfer rates in nulliparous and multiparous women were lower in trusts where more women in the trust planned birth at home.
Transfer and time of day or day of the week
We found no evidence that transfer was more likely to occur at any particular time of day or on any given day of the week.
Duration and urgency of transfer from freestanding midwifery units and planned home births
The median overall transfer time, including time spent arranging transfer, waiting for the ambulance to arrive, travel time and any wait before first assessment in the OU, was 60 minutes for transfers from FMUs and 49 minutes for transfers from home. In both settings, the overall transfer time was slightly shorter for transfers before birth for ‘potentially urgent’ reasons (median 50 minutes from FMUs, 42 minutes from home).
Strengths and limitations
General strengths and limitations of the Birthplace cohort study data set are discussed in Chapter 8. For our analyses using unit and NHS trust characteristics, as outlined in Chapter 3 (see Strengths and limitations), the availability of relevant data was extremely limited and the quality and validity of the data available to us was sometimes uncertain. We used simple linear regression to explore associations between unit and NHS trust characteristics and transfer rates, because initial exploration using multilevel modelling revealed that for some variables models failed to converge. Simple linear regression models could be fitted in all cases and had the advantage of ease of interpretation and enabling visual checking of the fit of the model. We chose not to adjust for other unit characteristics as many were correlated with each other so these models were difficult to interpret.
As in Chapter 3, because these analyses involved multiple testing and were exploratory, in interpreting our findings we have considered the consistency of effect across a number of variables measuring the same characteristic.
Only a relatively limited number of data items about transfer were collected in the cohort study. For our analyses on variations in transfer rates by time of day and day of the week, there was no appropriate ‘denominator’ with which to calculate ‘transfer rates’ for any given time or day and so we were limited to exploration of distributions of transfer times. When we considered the duration of transfer, we were able to evaluate the time taken to arrange transfer in each setting and the overall time from decision to transfer to time of first assessment by a midwife or obstetrician in an OU. However, because data were not collected on the time of arrival at the OU, we were unable to determine the extent to which delays occurred once the woman had arrived in the OU. In the absence of data on the urgency of transfers, we operationalised a classification for transfers which used the primary reason for transfer to infer ‘potential urgency’ or ‘non-urgency’. Within the ‘potentially urgent’ category some transfers will have been more urgent than others, some might have been emergencies, and some transfers for reasons that we did not classify as ‘potentially urgent’ might also have been urgent. Transfers defined by us as ‘potentially urgent’ should not be considered as emergencies.
Finally, data on the timing of the transfer process were recorded by attending midwives. The data were checked for obvious time or date sequence errors; where these could not be corrected the record was excluded from analyses of duration. Some implausibly short and long transfers remained; in some cases likely explanations could be inferred, but some are likely to reflect data recording errors or rounding. Given the methods used, using the median and IQR to describe transfer durations, this is not likely to have made a substantial difference to the results.
Interpretation
Our findings on the maternal characteristics associated with transfer build on previously reported analyses on transfers from MUs. 16 Evidence suggests that the risk of complications and adverse outcomes increases with increasing gestational age68 and with increasing maternal age54,56,69–71 and that the risk of complications and adverse outcomes may be higher in women who become pregnant for the first time at a later age. 54,72 The increased risk of transfer seen in women with advanced gestational age and in older nulliparous women planning birth in MUs may, therefore, simply reflect higher rates of complications during labour requiring medical supervision or treatment in these groups. It is also possible, however, that midwives’ decision-making around transfer may be influenced by perceptions of risk, particularly in older nulliparous women, resulting in a more ‘cautious’ approach with regard to transfer. Midwives clearly interpret guidelines on transfer flexibly, exercising their clinical judgement. While the presence of a ‘complicating condition’ at the start of labour care significantly increased the risk of transfer in all settings and irrespective of parity, many of these conditions were listed in national guidance at the time as ‘indications for intrapartum transfer’,13 and large proportions of women with a ‘complicating condition’ identified were not transferred.
Individual maternal characteristics are likely to be a factor contributing to the average transfer rate for any given MU or NHS trust providing home birth services, and previous work has identified variation in these unit or trust transfer rates. 16 The further analyses reported here confirm that maternal characteristics alone do not explain this variation, and have explored the extent to which characteristics of the units or NHS trusts themselves might be contributing factors. Given the limitations already described about the quality of data and lack of adjustment for multiple unit-level characteristics, our findings should be considered as hypothesis-generating for future research, but raise some interesting questions particularly with regard to FMUs and NHS trusts providing home birth services. It has been suggested that increased experience and skill in supporting women to give birth ‘normally’ without intervention results in lower transfer rates. 73,74 The size of FMUs and the number of births planned at home in NHS trusts vary dramatically (see Chapter 3, Characteristics of freestanding midwifery units in the study sample and Characteristics of NHS trusts providing home birth services in the study sample) and larger FMUs and NHS trusts where more women plan birth at home may provide more opportunity for midwives to develop their skills and experience, which may contribute to the associations between size and lower transfer rates in nulliparous women seen in our analyses. Evidence from studies in Scotland, where some MUs are very remote,67 indicates that midwives working in more remote units take account of distance to the OU in their decision-making around transfer and may be more cautious as a consequence;75,76 this could provide one explanation for the higher transfer rates in nulliparous women we found in more distant FMUs. Both of these findings on transfer rates in nulliparous women planning birth in FMUs also fit with the results of our analyses of intervention rates in women planning birth in FMUs reported in Chapter 3. Further work is required to explore whether or not there are measurable characteristics of AMUs that may be associated with the significant variation seen in AMU transfer rates.
‘Culture’ or other unit-level characteristics may influence transfer rates, but at an individual level decisions about transfer should largely be based on clinical considerations. There may also be a concern, however, that individual transfer decisions might be influenced by non-clinical factors, including awareness and consideration of staffing levels or obstetric cover in the OUs to which women are transferred. We found no evidence of any such association, but given the available data we could carry out only straightforward exploratory analyses.
Finally, we explored the transfer process and, in particular, the duration of transfer from home or FMUs in relation to urgency. There is no national policy or guidance on what is an acceptable duration for transfer and local NHS guidelines on transfer are of variable quality. 77 While transfer times of 40–50 minutes for ‘potentially urgent’ reasons may raise concerns that women planning birth in a community setting are exposed to unnecessary risk, our more detailed analyses published elsewhere indicate that our categorisation of transfer for ‘potentially urgent’ reasons should not be equated with transfer for an obstetric emergency. 66
Given the transfer times described in this study, all members of the multidisciplinary team caring for women who are transferred have a responsibility to manage any attendant risk appropriately to maximise safety and to consider the woman’s experience. The benefits of good communication and teamwork in cases of transfer were evident in the Birthplace case studies. 10 Communication of urgency has been noted as an important factor in the variability of decision-to-delivery intervals for urgent caesarean sections;78 appropriate communication of urgency is also likely to be key to the successful transfer of a woman from a planned home or MU birth and timely assessment and intervention if required on her arrival at the OU. Effective communication at the handover of care is also important from the point of view of women’s experience,57 but requires OU staff to be informed and available.
Our findings show that it typically takes around 15–20 minutes to arrange a ‘potentially urgent’ transfer, that is from decision to transfer to departure from home or the FMU, with transfers from home arranged more quickly on average than those from a FMU. Although it is reassuring that transfers can generally be arranged quickly for ‘potentially urgent’ transfers from home, the difference between the settings suggest that action may be required to ensure that avoidable delays do not occur when a woman requires urgent transfer from a FMU.
Conclusions
Our findings on the maternal characteristics associated with transfer add to the evidence base that may be used by midwives and others when talking with women about planned place of birth.
Our exploratory analyses of transfer rates in different units and NHS trusts suggests that some unit or trust characteristics may be associated with transfer rates, particularly in FMUs and NHS trusts providing home birth services. In particular, our findings suggest that the number of women planning birth in FMUs and at home in NHS trusts may explain some of the variation in transfer rates for nulliparous women. Larger FMUs and NHS trusts where more women plan birth at home may have lower transfer rates in nulliparous women. Furthermore, our findings suggest that in FMUs located further away from the nearest OU, transfer rates in nulliparous women may be higher. Both of these findings are consistent with our analyses of unit intervention rates reported in Chapter 3, but further research may be required to explore the mechanisms involved and the extent to which measurable characteristics of AMUs may be associated with AMU transfer rates.
We found no evidence that non-clinical factors, such as the time of day or the day of the week, are associated with decision-making around transfer.
Transfers from home or FMU commonly take up to 60 minutes from decision to transfer to first assessment in an OU, even for transfers for ‘potentially urgent’ reasons. However, the possible impact of these transfer times on outcomes is unclear, as the Birthplace primary analysis found similar rates of adverse perinatal outcomes in planned FMU and AMU births, even though urgent transfers can potentially be achieved within minutes in the latter setting. We do not know if transfer delays contribute to the higher perinatal risks already observed in nulliparous women planning a home birth, but transfers from home are typically achieved more rapidly than transfers from FMUs, indicating that in general access to obstetric or neonatal care is not worse for planned home births. Most transfers from home or FMU are not urgent and emergencies are uncommon, but urgent transfer is more likely for nulliparous women. All women planning birth at home or in a FMU, but particularly women having a first baby, need to be prepared for the possibility of transfer and should be given straightforward information about the potential duration of transfer, including the time taken to arrange the transfer and wait for transport.
Acknowledgement of material published under Creative Commons licence
Some of the analyses relating to duration and urgency of transfer described and discussed above have been published elsewhere. 66 Sections of text in this chapter, including substantial parts of the following sections, are reproduced from, or closely based on, the original article66 and are covered by the terms of the Creative Commons Attribution Non-Commercial (CC BY-NC 4.0) licence that applies to the original publication:
Chapter 6 Time of day and day of the week variations in interventions and maternal outcomes in ‘low risk’ women planning birth in different settings
Introduction
Numerous studies show that the onset of labour and hour of spontaneous birth exhibit a circadian pattern,79–82 and there is some evidence of diurnal variation in labour duration. 83 Spontaneous onset of labour and shorter labour appear to be more common during night-time hours, while circadian patterns of ‘normal birth’, without obstetric intervention, are more variable and influenced by parity,82,84,85 season85 and possibly other factors including birth setting. 82 One large study in the Netherlands, for example, found a marked difference in the circadian patterns of ‘normal birth’ between births in primary, midwife-led care and secondary care led by an obstetrician, with the peak timing of birth delayed in women under obstetric care. 82
‘Natural’ circadian patterns of labour and birth could potentially result in time of day variation in intervention. However, there may also be a concern that clinical decision-making or the quality of care may be influenced by factors such as midwifery staffing levels or obstetric cover at certain times of the day or days of the week, or associated with shift changes,27,60 and that this may lead to avoidable intervention with potential adverse consequences for women, for their babies and to the NHS in terms of cost. Reduced availability of senior and/or experienced staff out of hours has also been posited as an explanation for apparent associations between adverse outcomes and time of day, but the findings of studies investigating these associations are inconsistent. 86 Others have suggested that the evident circadian variation in the spontaneous onset of labour is mirrored in similar variation in the duration and progress of labour,83 and the pain associated with labour and birth,87 and that this may explain differences seen in interventions and outcomes at different times of day. The aim of the analyses reported in this chapter was to explore the extent to which interventions during labour and birth varied by time of day or day of the week in different planned settings for birth.
Methods
Study population
The study population for the analyses reported in this chapter was ‘low risk’ women in the Birthplace cohort with a ‘term’ pregnancy (37 to 42 + 0 weeks’ gestation) planning birth in an OU, in an AMU, in a FMU or at home.
Timing of birth
In order to test whether or not interventions and outcomes varied by time of day or day of the week we used pre-specified categories for the time of birth, broadly based on those used in a Scottish study of neonatal mortality and time of birth,86 with an additional category for weekend births. The time of day/day of the week categories we used for the time of birth were:
-
weekday night: Monday to Thursday, 17.00–08.59
-
weekday day (‘office hours’): Monday to Friday, 09.00–16.59
-
weekend: Friday 17.00 to Monday 08.59.
Outcome measures
We used the following four main outcome measures, two capturing interventions during labour and birth, one indicating birth without complications that might affect future birth and one indicating birth with low intervention:
-
intrapartum caesarean section
-
instrumental delivery (forceps or ventouse)
-
‘straightforward birth’, defined as birth without forceps or ventouse, intrapartum caesarean section, third- or fourth-degree perineal trauma or blood transfusion
-
‘normal birth’, defined as birth without induction of labour, epidural or spinal analgesia, general anaesthetic, forceps or ventouse, caesarean section or episiotomy. 12
We also used the following secondary outcome measures:
-
birth after epidural or spinal analgesia
-
birth after augmentation of labour with oxytocin.
Statistical methods
We used logistic regression to investigate associations between day and time of birth and maternal interventions and outcomes, separately in nulliparous and multiparous women, adjusted for the maternal characteristics described in Chapter 2 (see Statistical methods, Maternal characteristics).
These analyses were then repeated in the restricted population of ‘low risk’ women without ‘complicating conditions’ identified at the start of labour care. ‘Weekday nights’ was used as the reference category in each case for reasons of statistical efficiency.
Tests for an overall association between time of day/day of the week and each outcome (i.e. comparing outcome rates in all three time categories with each other) were carried out using Wald tests.
Sensitivity analysis
Our main analyses used pre-specified time cut-offs to test whether intervention and outcome rates were different during ‘office hours’ during the week or at weekends, compared with weekday nights. In order to explore whether or not our findings might have been influenced by the cut-offs used, for example if there was any variation which spanned our time cut-offs, we used kernel-weighted local polynomial regression using a bandwidth of 1.0 to provide estimates of the percentage of births in which each of our outcome measures was observed at half-hourly intervals throughout the day. We calculated these separately for nulliparous and multiparous women and plotted them on line graphs in women with and without ‘complicating conditions’ identified at the start of labour care in order to explore whether or not the pattern of variation was different in these two groups. Before fitting the regression models all of the data were replicated three times as if from three consecutive days and the estimated percentages for the middle 24-hour period were shown on the smoothed plots. This ensured that the estimated percentages for the beginning (00.00) and end (24.00) of the day were the same and that the smoothing process correctly took into account data from shortly before midnight or shortly after midnight, respectively, when calculating these percentages.
Results
Characteristics of the sample
The sociodemographic and clinical characteristics of the ‘low risk’ Birthplace cohort are summarised by parity and planned place of birth in Chapter 2 (see Birthplace study cohort and data, Characteristics of the ‘low risk’ sample). In line with the definition of ‘low risk’ used in the Birthplace programme, none of these women had their labour induced.
In all settings, the proportion of women with one or more ‘complicating condition’ identified at the start of labour care was higher in nulliparous women than in multiparous women (see Tables 3 and 4). A higher proportion of women in the planned OU group had one or more ‘complicating condition’ identified than did women planning birth in the other settings (nulliparous: 23.9% vs. 7.5–9.0%; multiparous: 14.7% vs. 4.1–5.2%). Prolonged rupture of membranes (> 18 hours) was the most commonly recorded ‘complicating condition’ in all settings in nulliparous women and in planned home and FMU births in multiparous women. In multiparous women planning OU birth meconium-stained liquor was also common.
Time of day/day of the week of birth and interventions in births planned in obstetric units
Time of day/day of the week of birth was significantly associated with the likelihood of having an instrumental delivery in nulliparous women planning OU birth; those whose babies were born during weekday ‘office hours’ were more likely to have an instrumental delivery than women whose babies were born at night [odds ratio (OR) 1.25, 95% CI 1.10 to 1.42; p = 0.005] (Table 46). When we restricted the population by excluding ‘low risk’ women with ‘complicating conditions’ identified at the start of labour care, the strength of this association increased (OR 1.36, 95% CI 1.20 to 1.56; p < 0.001). In this restricted population we also found a significant association between time of day/day of the week and the likelihood of having an intrapartum caesarean section; nulliparous women who gave birth during weekday ‘office hours’ were less likely to have an intrapartum caesarean than women who gave birth at night, although the absolute difference was relatively small (12% vs. 13.8%).
| Outcome and time of week | All ‘low risk’ nulliparous women | ‘Low risk’ nulliparous women without ‘complicating conditions’ | ||||||
|---|---|---|---|---|---|---|---|---|
| Events | Births | Weighted % | Adjusted OR (95% CI) | Events | Births | Weighted % | Adjusted OR (95% CI) | |
| Instrumental delivery | ||||||||
| Weekday night | 828 | 4033 | 21.0 | 1 | 589 | 3035 | 19.6 | 1 |
| Weekday daytime | 589 | 2422 | 24.7 | 1.25 (1.10 to 1.42) | 452 | 1861 | 24.7 | 1.36 (1.20 to 1.56) |
| Weekend | 862 | 3957 | 22.7 | 1.12 (1.01 to 1.26) | 598 | 3020 | 20.7 | 1.09 (0.94 to 1.25) |
| p-valuea | p = 0.005 | p < 0.001 | ||||||
| Intrapartum caesarean | ||||||||
| Weekday night | 652 | 4033 | 16.5 | 1 | 408 | 3035 | 13.8 | 1 |
| Weekday daytime | 368 | 2422 | 15.5 | 0.93 (0.79 to 1.10) | 217 | 1861 | 12.0 | 0.84 (0.71 to 0.99) |
| Weekend | 595 | 3957 | 15.0 | 0.87 (0.75 to 1.02) | 363 | 3020 | 11.8 | 0.83 (0.67 to 1.03) |
| p-valuea | p = 0.238 | p = 0.049 | ||||||
| ‘Straightforward birth’ | ||||||||
| Weekday night | 2392 | 4008 | 58.9 | 1 | 1915 | 3017 | 62.9 | 1 |
| Weekday daytime | 1382 | 2413 | 56.7 | 0.90 (0.79 to 1.02) | 1128 | 1855 | 60.2 | 0.89 (0.78 to 1.01) |
| Weekend | 2349 | 3932 | 59.0 | 1.00 (0.91 to 1.10) | 1939 | 3006 | 63.9 | 1.04 (0.96 to 1.14) |
| p-valuea | p = 0.165 | p = 0.039 | ||||||
| ‘Normal birth’ | ||||||||
| Weekday night | 1721 | 4015 | 42.3 | 1 | 1444 | 3022 | 47.4 | 1 |
| Weekday daytime | 992 | 2410 | 40.6 | 0.91 (0.83 to 1.00) | 839 | 1850 | 44.8 | 0.89 (0.79 to 0.99) |
| Weekend | 1699 | 3943 | 42.2 | 0.98 (0.89 to 1.07) | 1451 | 3011 | 47.3 | 0.98 (0.89 to 1.09) |
| p-valuea | p = 0.145 | p = 0.114 | ||||||
| Epidural | ||||||||
| Weekday night | 1618 | 4006 | 41.5 | 1 | 1071 | 3016 | 36.4 | 1 |
| Weekday daytime | 1024 | 2407 | 43.8 | 1.12 (1.00 to 1.25) | 712 | 1851 | 40.0 | 1.16 (1.03 to 1.32) |
| Weekend | 1576 | 3938 | 41.6 | 1.02 (0.92 to 1.15) | 1058 | 3008 | 36.6 | 1.03 (0.90 to 1.16) |
| p-valuea | p = 0.097 | p = 0.036 | ||||||
| Augmentation | ||||||||
| Weekday night | 1390 | 3989 | 35.4 | 1 | 872 | 3001 | 29.1 | 1 |
| Weekday daytime | 845 | 2390 | 35.5 | 1.02 (0.92 to 1.14) | 559 | 1836 | 30.7 | 1.09 (0.96 to 1.24) |
| Weekend | 1295 | 3910 | 33.1 | 0.91 (0.81 to 1.03) | 828 | 2980 | 27.6 | 0.94 (0.83 to 1.07) |
| p-valuea | p = 0.181 | p = 0.103 | ||||||
In multiparous women planning OU birth, as in all settings, intervention rates were lower overall than in nulliparous women. Time of day/day of the week of birth was more clearly significantly associated with the chance of having an intervention (Table 47). Compared with women whose babies were born at night, those whose babies were born during weekday ‘office hours’ were more likely to have an instrumental delivery (OR 1.49, 95% CI 1.21 to 1.83; p < 0.001) and less likely to have a ‘straightforward birth’ (OR 0.69, 95% CI 0.57 to 0.83; p = 0.001) or a ‘normal birth’ (OR 0.74, 95% CI 0.65 to 0.85; p < 0.001). In women without ‘complicating conditions’ similar or stronger associations were seen.
| Outcome and time of week | All ‘low risk’ multiparous women | ‘Low risk’ multiparous women without ‘complicating conditions’ | ||||||
|---|---|---|---|---|---|---|---|---|
| Events | Births | Weighted % | Adjusted OR (95% CI) | Events | Births | Weighted % | Adjusted OR (95% CI) | |
| Instrumental delivery | ||||||||
| Weekday night | 182 | 3545 | 5.1 | 1 | 134 | 3002 | 4.4 | 1 |
| Weekday daytime | 141 | 1983 | 7.3 | 1.49 (1.21 to 1.83) | 121 | 1709 | 7.3 | 1.71 (1.37 to 2.13) |
| Weekend | 178 | 3373 | 5.5 | 1.12 (0.87 to 1.44) | 135 | 2852 | 4.9 | 1.17 (0.89 to 1.53) |
| p-valuea | p = 0.001 | p < 0.001 | ||||||
| Intrapartum caesarean | ||||||||
| Weekday night | 169 | 3545 | 4.8 | 1 | 113 | 3002 | 3.8 | 1 |
| Weekday daytime | 120 | 1983 | 6.2 | 1.35 (1.01 to 1.81) | 82 | 1709 | 4.8 | 1.31 (0.93 to 1.86) |
| Weekend | 167 | 3373 | 4.9 | 1.00 (0.78 to 1.29) | 93 | 2852 | 3.2 | 0.89 (0.65 to 1.22) |
| p-valuea | p = 0.093 | p = 0.114 | ||||||
| ‘Straightforward birth’ | ||||||||
| Weekday night | 3109 | 3524 | 88.2 | 1 | 2680 | 2985 | 89.9 | 1 |
| Weekday daytime | 1669 | 1972 | 84.2 | 0.69 (0.57 to 0.83) | 1459 | 1699 | 85.5 | 0.66 (0.53 to 0.81) |
| Weekend | 2946 | 3344 | 87.9 | 0.97 (0.83 to 1.13) | 2553 | 2827 | 90.2 | 1.01 (0.85 to 1.20) |
| p-valuea | p = 0.001 | p = 0.001 | ||||||
| ‘Normal birth’ | ||||||||
| Weekday night | 2775 | 3520 | 78.6 | 1 | 2413 | 2981 | 80.8 | 1 |
| Weekday daytime | 1459 | 1969 | 73.6 | 0.74 (0.65 to 0.85) | 1286 | 1699 | 75.2 | 0.72 (0.62 to 0.83) |
| Weekend | 2594 | 3351 | 76.9 | 0.89 (0.79 to 0.99) | 2277 | 2835 | 79.9 | 0.92 (0.81 to 1.03) |
| p-valuea | p < 0.001 | p < 0.001 | ||||||
| Epidural | ||||||||
| Weekday night | 530 | 3531 | 15.3 | 1 | 393 | 2991 | 13.4 | 1 |
| Weekday daytime | 369 | 1974 | 19.5 | 1.37 (1.17 to 1.61) | 292 | 1703 | 17.9 | 1.41 (1.19 to 1.66) |
| Weekend | 538 | 3355 | 16.7 | 1.12 (0.96 to 1.29) | 385 | 2840 | 14.1 | 1.08 (0.93 to 1.25) |
| p-valuea | p = 0.001 | p = 0.001 | ||||||
| Augmentation | ||||||||
| Weekday night | 335 | 3516 | 9.3 | 1 | 212 | 2976 | 7.1 | 1 |
| Weekday daytime | 200 | 1967 | 10.2 | 1.10 (0.92 to 1.32) | 128 | 1695 | 7.5 | 1.05 (0.82 to 1.35) |
| Weekend | 336 | 3344 | 10.1 | 1.10 (0.92 to 1.31) | 211 | 2826 | 7.4 | 1.09 (0.85 to 1.39) |
| p-valuea | p = 0.428 | p = 0.795 | ||||||
Looking at our secondary outcomes, in nulliparous women we found a significant association between time of day/day of the week of birth and epidural only in the restricted population excluding women with ‘complicating conditions’ (see Table 46); in multiparous women we found a similar but stronger association (see Table 47). In both groups women were more likely to have had an epidural if they gave birth during weekday ‘office hours’ compared with weekday nights. Time of day/day of the week of birth was not significantly associated with the likelihood of having had augmentation.
Time of day/day of the week of birth and interventions in births planned in alongside midwifery units
In nulliparous and multiparous women planning birth in an AMU, time of day/day of the week of birth was not significantly associated with any of our main outcomes (Tables 48 and 49).
| Outcome and time of week | All ‘low risk’ nulliparous women | ‘Low risk’ nulliparous women without ‘complicating conditions’ | ||||||
|---|---|---|---|---|---|---|---|---|
| Events | Births | Weighted % | Adjusted OR (95% CI) | Events | Births | Weighted % | Adjusted OR (95% CI) | |
| Instrumental delivery | ||||||||
| Weekday night | 493 | 3246 | 15.8 | 1 | 439 | 2943 | 15.4 | 1 |
| Weekday daytime | 317 | 1968 | 15.9 | 0.99 (0.81 to 1.21) | 280 | 1775 | 15.4 | 1.00 (0.81 to 1.23) |
| Weekend | 485 | 3002 | 16.6 | 1.03 (0.90 to 1.19) | 440 | 2768 | 16.2 | 1.02 (0.88 to 1.18) |
| p-valuea | p = 0.861 | p = 0.961 | ||||||
| Intrapartum caesarean | ||||||||
| Weekday night | 239 | 3246 | 7.4 | 1 | 199 | 2943 | 6.9 | 1 |
| Weekday daytime | 157 | 1968 | 8.1 | 1.06 (0.86 to 1.31) | 129 | 1775 | 7.4 | 1.05 (0.83 to 1.33) |
| Weekend | 230 | 3002 | 7.8 | 1.01 (0.81 to 1.27) | 195 | 2768 | 6.9 | 0.95 (0.73 to 1.24) |
| p-valuea | p = 0.826 | p = 0.700 | ||||||
| ‘Straightforward birth’ | ||||||||
| Weekday night | 2339 | 3210 | 71.7 | 1 | 2142 | 2909 | 72.6 | 1 |
| Weekday daytime | 1394 | 1947 | 71.2 | 0.99 (0.86 to 1.14) | 1275 | 1756 | 72.5 | 1.00 (0.87 to 1.16) |
| Weekend | 2143 | 2972 | 71.7 | 1.04 (0.90 to 1.19) | 2001 | 2742 | 73.1 | 1.08 (0.93 to 1.25) |
| p-valuea | p = 0.750 | p = 0.530 | ||||||
| ‘Normal birth’ | ||||||||
| Weekday night | 2032 | 3243 | 61.3 | 1 | 1876 | 2942 | 62.6 | 1 |
| Weekday daytime | 1216 | 1965 | 62.0 | 1.04 (0.87 to 1.25) | 1113 | 1773 | 63.2 | 1.03 (0.85 to 1.25) |
| Weekend | 1878 | 2995 | 62.2 | 1.07 (0.93 to 1.24) | 1764 | 2762 | 63.8 | 1.10 (0.93 to 1.29) |
| p-valuea | p = 0.637 | p = 0.476 | ||||||
| Epidural | ||||||||
| Weekday night | 757 | 3243 | 24.8 | 1 | 664 | 2942 | 23.9 | 1 |
| Weekday daytime | 477 | 1967 | 24.4 | 0.97 (0.79 to 1.19) | 420 | 1774 | 23.6 | 0.98 (0.79 to 1.22) |
| Weekend | 713 | 2989 | 24.0 | 0.94 (0.79 to 1.12) | 629 | 2755 | 22.9 | 0.92 (0.77 to 1.10) |
| p-valuea | p = 0.789 | p = 0.554 | ||||||
| Augmentation | ||||||||
| Weekday night | 551 | 3243 | 17.2 | 1 | 470 | 2941 | 16.3 | 1 |
| Weekday daytime | 354 | 1968 | 17.4 | 1.00 (0.83 to 1.20) | 292 | 1774 | 15.8 | 0.97 (0.80 to 1.18) |
| Weekend | 569 | 2988 | 19.1 | 1.12 (0.98 to 1.28) | 501 | 2753 | 17.9 | 1.09 (0.93 to 1.28) |
| p-valuea | p = 0.193 | p = 0.419 | ||||||
| Outcome and time of week | All ‘low risk’ multiparous women | ‘Low risk’ multiparous women without ‘complicating conditions’ | ||||||
|---|---|---|---|---|---|---|---|---|
| Events | Births | Weighted % | Adjusted OR (95% CI) | Events | Births | Weighted % | Adjusted OR (95% CI) | |
| Instrumental delivery | ||||||||
| Weekday night | 63 | 3411 | 1.9 | 1 | 58 | 3222 | 1.8 | 1 |
| Weekday daytime | 54 | 1886 | 3.0 | 1.62 (1.05 to 2.49) | 51 | 1769 | 3.1 | 1.75 (1.11 to 2.75) |
| Weekend | 72 | 2937 | 2.7 | 1.43 (0.96 to 2.13) | 64 | 2796 | 2.6 | 1.42 (0.89 to 2.26) |
| p-valuea | p = 0.075 | p = 0.061 | ||||||
| Intrapartum caesarean | ||||||||
| Weekday night | 34 | 3411 | 1.0 | 1 | 28 | 3222 | 0.9 | 1 |
| Weekday daytime | 21 | 1886 | 1.2 | 1.21 (0.68 to 2.15) | 18 | 1769 | 1.1 | 1.38 (0.75 to 2.55) |
| Weekend | 33 | 2937 | 1.0 | 1.07 (0.59 to 1.95) | 26 | 2796 | 0.8 | 1.03 (0.51 to 2.09) |
| p-valuea | p = 0.794 | p = 0.549 | ||||||
| ‘Straightforward birth’ | ||||||||
| Weekday night | 3210 | 3377 | 94.8 | 1 | 3041 | 3191 | 95.1 | 1 |
| Weekday daytime | 1758 | 1860 | 94.2 | 0.89 (0.69 to 1.15) | 1650 | 1744 | 94.2 | 0.82 (0.60 to 1.10) |
| Weekend | 2746 | 2905 | 94.6 | 0.96 (0.72 to 1.27) | 2621 | 2765 | 94.8 | 0.94 (0.69 to 1.28) |
| p-valuea | p = 0.653 | p = 0.385 | ||||||
| ‘Normal birth’ | ||||||||
| Weekday night | 3131 | 3403 | 91.1 | 1 | 2971 | 3214 | 91.5 | 1 |
| Weekday daytime | 1707 | 1885 | 90.1 | 0.90 (0.67 to 1.20) | 1602 | 1768 | 90.1 | 0.83 (0.60 to 1.13) |
| Weekend | 2659 | 2927 | 90.7 | 0.97 (0.73 to 1.29) | 2543 | 2787 | 91.1 | 0.96 (0.71 to 1.30) |
| p-valuea | p = 0.748 | p = 0.412 | ||||||
| Epidural | ||||||||
| Weekday night | 180 | 3404 | 5.8 | 1 | 162 | 3215 | 5.5 | 1 |
| Weekday daytime | 116 | 1886 | 6.5 | 1.15 (0.89 to 1.49) | 108 | 1770 | 6.5 | 1.24 (0.92 to 1.67) |
| Weekend | 171 | 2931 | 5.6 | 0.99 (0.74 to 1.32) | 155 | 2791 | 5.4 | 1.00 (0.72 to 1.39) |
| p-valuea | p = 0.480 | p = 0.257 | ||||||
| Augmentation | ||||||||
| Weekday night | 69 | 3401 | 2.0 | 1 | 58 | 3212 | 1.7 | 1 |
| Weekday daytime | 54 | 1887 | 2.8 | 1.45 (1.03 to 2.03) | 46 | 1771 | 2.6 | 1.57 (1.04 to 2.39) |
| Weekend | 72 | 2933 | 2.6 | 1.36 (1.02 to 1.82) | 64 | 2792 | 2.4 | 1.46 (1.04 to 2.05) |
| p-valuea | p = 0.031 | p = 0.036 | ||||||
In multiparous women we found that those who gave birth during weekday ‘office hours’ or at the weekend were more likely to have had their labour augmented than those who gave birth during the night, but only a small percentage of these women received augmentation and absolute differences in percentages were small (0.6–0.9%) (see Table 49).
Time of day/day of the week of birth and interventions in births planned in freestanding midwifery units
In nulliparous women planning birth in a FMU, women who gave birth during weekday ‘office hours’ were less likely to have an intrapartum caesarean section than women who gave birth during the night (Table 50); in nulliparous women without ‘complicating conditions’ the direction of the association was the same, but the time of day variation was no longer statistically significant.
| Outcome and time of week | All ‘low risk’ nulliparous women | ‘Low risk’ nulliparous women without ‘complicating conditions’ | ||||||
|---|---|---|---|---|---|---|---|---|
| Events | Births | Weighted % | Adjusted OR (95% CI) | Events | Births | Weighted % | Adjusted OR (95% CI) | |
| Instrumental delivery | ||||||||
| Weekday night | 236 | 2001 | 10.6 | 1 | 213 | 1861 | 10.4 | 1 |
| Weekday daytime | 161 | 1254 | 11.9 | 1.16 (0.84 to 1.60) | 145 | 1153 | 11.7 | 1.17 (0.83 to 1.63) |
| Weekend | 211 | 1887 | 10.1 | 0.94 (0.72 to 1.22) | 188 | 1756 | 9.7 | 0.92 (0.69 to 1.23) |
| p-valuea | p = 0.361 | p = 0.301 | ||||||
| Intrapartum caesarean | ||||||||
| Weekday night | 155 | 2001 | 7.7 | 1 | 135 | 1861 | 6.8 | 1 |
| Weekday daytime | 68 | 1254 | 5.2 | 0.65 (0.47 to 0.91) | 57 | 1153 | 4.6 | 0.66 (0.44 to 1.01) |
| Weekend | 128 | 1887 | 6.5 | 0.86 (0.71 to 1.04) | 107 | 1756 | 5.9 | 0.87 (0.70 to 1.08) |
| p-valuea | p = 0.030 | p = 0.131 | ||||||
| ‘Straightforward birth’ | ||||||||
| Weekday night | 1545 | 1994 | 78.5 | 1 | 1453 | 1854 | 79.8 | 1 |
| Weekday daytime | 978 | 1252 | 79.4 | 1.04 (0.80 to 1.36) | 906 | 1151 | 79.9 | 0.99 (0.73 to 1.35) |
| Weekend | 1462 | 1879 | 79.0 | 1.01 (0.84 to 1.22) | 1381 | 1749 | 79.9 | 0.99 (0.80 to 1.23) |
| p-valuea | p = 0.958 | p = 0.997 | ||||||
| ‘Normal birth’ | ||||||||
| Weekday night | 1389 | 1996 | 69.7 | 1 | 1311 | 1856 | 71.2 | 1 |
| Weekday daytime | 866 | 1252 | 70.2 | 1.01 (0.84 to 1.23) | 809 | 1152 | 71.4 | 1.01 (0.81 to 1.25) |
| Weekend | 1314 | 1884 | 70.3 | 1.01 (0.88 to 1.17) | 1243 | 1753 | 71.4 | 1.01 (0.86 to 1.19) |
| p-valuea | p = 0.982 | p = 0.992 | ||||||
| Epidural | ||||||||
| Weekday night | 396 | 1993 | 19.0 | 1 | 353 | 1853 | 17.8 | 1 |
| Weekday daytime | 239 | 1248 | 17.8 | 0.91 (0.77 to 1.09) | 210 | 1148 | 16.7 | 0.93 (0.76 to 1.13) |
| Weekend | 375 | 1883 | 19.4 | 1.03 (0.86 to 1.23) | 331 | 1752 | 18.6 | 1.05 (0.85 to 1.30) |
| p-valuea | p = 0.548 | p = 0.619 | ||||||
| Augmentation | ||||||||
| Weekday night | 312 | 1988 | 14.5 | 1 | 273 | 1849 | 13.3 | 1 |
| Weekday daytime | 179 | 1244 | 13.7 | 0.91 (0.73 to 1.13) | 152 | 1144 | 12.4 | 0.91 (0.72 to 1.17) |
| Weekend | 278 | 1882 | 13.2 | 0.89 (0.76 to 1.04) | 249 | 1751 | 12.7 | 0.94 (0.79 to 1.11) |
| p-valuea | p = 0.254 | p = 0.622 | ||||||
In multiparous women planning FMU birth, those who gave birth during weekday ‘office hours’ or at weekends were less likely to have a ‘normal birth’ than women who gave birth at night, and a similar or stronger association was seen in multiparous women without ‘complicating conditions’ identified at the start of labour care (Table 51).
| Outcome and time of week | All ‘low risk’ multiparous women | ‘Low risk’ multiparous women without ‘complicating conditions’ | ||||||
|---|---|---|---|---|---|---|---|---|
| Events | Births | Weighted % | Adjusted OR (95% CI) | Events | Births | Weighted % | Adjusted OR (95% CI) | |
| Instrumental delivery | ||||||||
| Weekday night | 19 | 2417 | 0.8 | 1 | 17 | 2316 | 0.8 | 1 |
| Weekday daytime | 20 | 1332 | 1.2 | 1.44 (0.79 to 2.63) | 20 | 1278 | 1.2 | 1.58 (0.80 to 3.13) |
| Weekend | 32 | 2277 | 1.4 | 1.66 (0.83 to 3.32) | 31 | 2177 | 1.3 | 1.68 (0.81 to 3.49) |
| p-valuea | p = 0.265 | p = 0.261 | ||||||
| Intrapartum caesarean | ||||||||
| Weekday night | 16 | 2417 | 0.6 | 1 | 13 | 2316 | 0.5 | 1 |
| Weekday daytime | 9 | 1332 | 0.7 | 1.24 (0.46 to 3.34) | 7 | 1278 | 0.6 | 1.16 (0.41 to 3.30) |
| Weekend | 18 | 2277 | 0.7 | 1.19 (0.54 to 2.61) | 16 | 2177 | 0.7 | 1.40 (0.61 to 3.21) |
| p-valuea | p = 0.889 | p = 0.710 | ||||||
| ‘Straightforward birth’ | ||||||||
| Weekday night | 2338 | 2400 | 97.5 | 1 | 2243 | 2299 | 97.7 | 1 |
| Weekday daytime | 1276 | 1320 | 97.0 | 0.81 (0.52 to 1.25) | 1225 | 1266 | 97.1 | 0.78 (0.50 to 1.21) |
| Weekend | 2180 | 2261 | 96.8 | 0.76 (0.55 to 1.04) | 2083 | 2161 | 96.8 | 0.70 (0.51 to 0.97) |
| p-valuea | p = 0.211 | p = 0.089 | ||||||
| ‘Normal birth’ | ||||||||
| Weekday night | 2309 | 2412 | 95.9 | 1 | 2217 | 2311 | 96.0 | 1 |
| Weekday daytime | 1240 | 1332 | 93.1 | 0.57 (0.42 to 0.78) | 1194 | 1278 | 93.4 | 0.58 (0.40 to 0.83) |
| Weekend | 2133 | 2271 | 94.0 | 0.67 (0.50 to 0.89) | 2041 | 2171 | 94.1 | 0.66 (0.49 to 0.88) |
| p-valuea | p = 0.002 | p = 0.007 | ||||||
| Epidural | ||||||||
| Weekday night | 70 | 2412 | 2.6 | 1 | 63 | 2311 | 2.4 | 1 |
| Weekday daytime | 55 | 1332 | 4.2 | 1.77 (1.15 to 2.71) | 49 | 1278 | 3.8 | 1.69 (1.01 to 2.82) |
| Weekend | 96 | 2272 | 4.2 | 1.71 (1.22 to 2.40) | 92 | 2172 | 4.2 | 1.83 (1.28 to 2.62) |
| p-valuea | p = 0.007 | p = 0.006 | ||||||
| Augmentation | ||||||||
| Weekday night | 25 | 2411 | 0.8 | 1 | 20 | 2310 | 0.7 | 1 |
| Weekday daytime | 30 | 1331 | 2.1 | 2.80 (1.50 to 5.23) | 28 | 1277 | 1.9 | 3.35 (1.75 to 6.43) |
| Weekend | 39 | 2271 | 1.6 | 2.07 (1.12 to 3.83) | 34 | 2171 | 1.4 | 2.35 (1.23 to 4.47) |
| p-valuea | p = 0.006 | p = 0.002 | ||||||
Multiparous women giving birth during weekday ‘office hours’ and at weekends were also more likely to have an epidural and more likely to have had their labour augmented than those who gave birth at night during the week, but percentages and absolute differences were small (see Table 51).
Time of day/day of the week of birth and interventions in births planned at home
In women planning birth at home there were no significant associations between time of day/day of the week of birth and any of our main or secondary outcome measures in nulliparous (Table 52) or multiparous women (Table 53).
| Outcome and time of week | All ‘low risk’ nulliparous women | ‘Low risk’ nulliparous women without ‘complicating conditions’ | ||||||
|---|---|---|---|---|---|---|---|---|
| Events | Births | Weighted % | Adjusted OR (95% CI) | Events | Births | Weighted % | Adjusted OR (95% CI) | |
| Instrumental delivery | ||||||||
| Weekday night | 206 | 1728 | 11.6 | 1 | 176 | 1554 | 10.8 | 1 |
| Weekday daytime | 146 | 1077 | 12.0 | 1.07 (0.81 to 1.42) | 127 | 981 | 11.3 | 1.09 (0.80 to 1.48) |
| Weekend | 229 | 1668 | 13.5 | 1.20 (0.97 to 1.49) | 193 | 1498 | 12.8 | 1.24 (0.96 to 1.60) |
| p-valuea | p = 0.250 | p = 0.230 | ||||||
| Intrapartum caesarean | ||||||||
| Weekday night | 149 | 1728 | 9.4 | 1 | 123 | 1554 | 8.6 | 1 |
| Weekday daytime | 85 | 1077 | 8.0 | 0.84 (0.54 to 1.29) | 68 | 981 | 6.9 | 0.77 (0.49 to 1.22) |
| Weekend | 129 | 1668 | 7.9 | 0.81 (0.60 to 1.08) | 106 | 1498 | 7.1 | 0.82 (0.60 to 1.14) |
| p-valuea | p = 0.355 | p = 0.424 | ||||||
| ‘Straightforward birth’ | ||||||||
| Weekday night | 1295 | 1720 | 74.6 | 1 | 1180 | 1546 | 76.0 | 1 |
| Weekday daytime | 793 | 1069 | 75.6 | 1.04 (0.81 to 1.33) | 736 | 974 | 77.1 | 1.06 (0.82 to 1.37) |
| Weekend | 1244 | 1658 | 74.9 | 1.00 (0.83 to 1.21) | 1144 | 1490 | 76.7 | 1.01 (0.82 to 1.23) |
| p-valuea | p = 0.942 | p = 0.907 | ||||||
| ‘Normal birth’ | ||||||||
| Weekday night | 1139 | 1702 | 67.1 | 1 | 1065 | 1547 | 69.1 | 1 |
| Weekday daytime | 708 | 1066 | 68.3 | 1.05 (0.84 to 1.30) | 671 | 978 | 70.6 | 1.08 (0.87 to 1.34) |
| Weekend | 1106 | 1652 | 67.3 | 1.02 (0.86 to 1.22) | 1034 | 1490 | 69.9 | 1.02 (0.85 to 1.24) |
| p-valuea | p = 0.909 | p = 0.804 | ||||||
| Epidural | ||||||||
| Weekday night | 388 | 1719 | 22.6 | 1 | 326 | 1548 | 21.0 | 1 |
| Weekday daytime | 246 | 1073 | 22.2 | 0.99 (0.78 to 1.26) | 210 | 979 | 20.4 | 0.97 (0.76 to 1.25) |
| Weekend | 379 | 1661 | 22.5 | 0.99 (0.82 to 1.20) | 316 | 1492 | 20.8 | 1.02 (0.81 to 1.26) |
| p-valuea | p = 0.996 | p = 0.928 | ||||||
| Augmentation | ||||||||
| Weekday night | 294 | 1719 | 16.9 | 1 | 239 | 1548 | 14.9 | 1 |
| Weekday daytime | 198 | 1073 | 17.3 | 1.08 (0.84 to 1.38) | 173 | 979 | 16.4 | 1.16 (0.90 to 1.50) |
| Weekend | 284 | 1658 | 16.6 | 1.00 (0.82 to 1.21) | 235 | 1489 | 15.2 | 1.06 (0.86 to 1.30) |
| p-valuea | p = 0.771 | p = 0.521 | ||||||
| Outcome and time of week | All ‘low risk’ multiparous women | ‘Low risk’ multiparous women without ‘complicating conditions’ | ||||||
|---|---|---|---|---|---|---|---|---|
| Events | Births | Weighted % | Adjusted OR (95% CI) | Events | Births | Weighted % | Adjusted OR (95% CI) | |
| Instrumental delivery | ||||||||
| Weekday night | 46 | 4966 | 0.8 | 1 | 41 | 4719 | 0.8 | 1 |
| Weekday daytime | 32 | 2708 | 1.2 | 1.44 (0.81 to 2.58) | 30 | 2576 | 1.2 | 1.52 (0.84 to 2.74) |
| Weekend | 32 | 4410 | 0.8 | 0.99 (0.55 to 1.79) | 29 | 4173 | 0.8 | 1.02 (0.55 to 1.88) |
| p-valuea | p = 0.362 | p = 0.308 | ||||||
| Intrapartum caesarean | ||||||||
| Weekday night | 38 | 4966 | 0.8 | 1 | 29 | 4719 | 0.6 | 1 |
| Weekday daytime | 17 | 2708 | 0.5 | 0.68 (0.36 to 1.29) | 14 | 2576 | 0.4 | 0.77 (0.37 to 1.60) |
| Weekend | 25 | 4410 | 0.5 | 0.67 (0.36 to 1.22) | 21 | 4173 | 0.5 | 0.79 (0.40 to 1.57) |
| p-valuea | p = 0.310 | p = 0.707 | ||||||
| ‘Straightforward birth’ | ||||||||
| Weekday night | 4743 | 4897 | 97.0 | 1 | 4517 | 4653 | 97.2 | 1 |
| Weekday daytime | 2600 | 2682 | 97.0 | 1.00 (0.76 to 1.31) | 2476 | 2550 | 97.1 | 0.95 (0.71 to 1.27) |
| Weekend | 4267 | 4371 | 97.6 | 1.25 (0.93 to 1.68) | 4045 | 4138 | 97.7 | 1.19 (0.88 to 1.61) |
| p-valuea | p = 0.229 | p = 0.298 | ||||||
| ‘Normal birth’ | ||||||||
| Weekday night | 4680 | 4895 | 95.7 | 1 | 4507 | 4700 | 95.9 | 1 |
| Weekday daytime | 2554 | 2679 | 95.5 | 0.96 (0.76 to 1.21) | 2446 | 2563 | 95.6 | 0.90 (0.71 to 1.16) |
| Weekend | 4184 | 4365 | 96.0 | 1.04 (0.83 to 1.31) | 3995 | 4158 | 96.2 | 1.02 (0.80 to 1.30) |
| p-valuea | p = 0.781 | p = 0.630 | ||||||
| Epidural | ||||||||
| Weekday night | 143 | 4963 | 2.8 | 1 | 124 | 4716 | 2.6 | 1 |
| Weekday daytime | 87 | 2704 | 3.0 | 1.10 (0.83 to 1.45) | 80 | 2572 | 3.0 | 1.19 (0.88 to 1.61) |
| Weekend | 126 | 4409 | 2.8 | 1.00 (0.75 to 1.34) | 113 | 4173 | 2.7 | 1.07 (0.79 to 1.45) |
| p-valuea | p = 0.750 | p = 0.522 | ||||||
| Augmentation | ||||||||
| Weekday night | 47 | 4964 | 0.9 | 1 | 39 | 4717 | 0.8 | 1 |
| Weekday daytime | 40 | 2703 | 1.5 | 1.56 (0.98 to 2.46) | 33 | 2571 | 1.3 | 1.57 (0.96 to 2.57) |
| Weekend | 43 | 4407 | 0.9 | 0.98 (0.63 to 1.54) | 35 | 4171 | 0.8 | 1.01 (0.64 to 1.57) |
| p-valuea | p = 0.110 | p = 0.169 | ||||||
Sensitivity analysis of time of birth as a continuous variable and interventions
In order to investigate whether or not our results may have been influenced by our categorisation of time of day/day of the week and to highlight any apparent variation which spanned our time cut-offs, we plotted the risk of intervention in women with and without ‘complicating conditions’ by time of birth as a continuous variable combining weekdays and weekends.
Inspection of these plots did not show any apparent variation in our main outcome measures which would have been likely to markedly change the pattern of associations seen in our main analyses (see Appendix 7). For our secondary outcome measures, in all settings, but most clearly in the planned OU birth group, there was an apparent peak in augmentation in births occurring at the end of the day/in early evening in nulliparous women, overlapping our cut-off between ‘office hours’ and night-time, with a similar pattern for the risk of epidural (see Appendix 7). In multiparous women planning OU birth, similar variation over time was seen in the risk of augmentation and epidural, but in other settings there was very little evidence of variation in the risk of these interventions by time of day.
Discussion
Summary of main findings
Main outcomes
In women planning OU birth, instrumental delivery was more likely, and ‘straightforward birth‘ and ‘normal birth’ less likely, in births that occurred on weekdays during ‘office hours’ (09.00–16.59) than in births that occurred at night, after adjustment for any differences in maternal characteristics. In nulliparous women without ‘complicating conditions’ at the start of labour care we found that those who gave birth during weekday ‘office hours’ were less likely to have an intrapartum caesarean section than those who gave birth at night.
In women who planned birth in non-OU settings rates of intervention were generally low overall, particularly in multiparous women, and lowest overall in planned FMU births.
In births planned in AMUs and at home no clear association was detected between time of day/day of the week and any of our main outcome measures.
In nulliparous women who planned FMU birth, those who gave birth during weekday ‘office hours’ were less likely to have an intrapartum caesarean section than women who gave birth at night. In multiparous women, those who gave birth on weekdays during ‘office hours’ or at weekends were less likely to have a normal birth than those who gave birth on a weekday at night.
Secondary outcomes
In women planning OU birth we found that epidural analgesia was more common in births that occurred during weekday ‘office hours’ than those that occurred during weekday nights, particularly in multiparous women. Further sensitivity analyses indicated an apparent ‘peak’ in augmentation and epidural in births that occurred at the end of the day and in the early evening.
In planned AMU births, multiparous women who gave birth on weekdays during ‘office hours’ or at weekends were more likely to have had their labour augmented than those who gave birth on a weekday at night.
In planned FMU births, multiparous women giving birth during weekday ‘office hours’ and at weekends were also more likely to have an epidural and more likely to have had their labour augmented than those who gave birth on a weekday night, but percentages and absolute differences were small.
We found no associations between time of day/day of the week and our secondary outcome measures in women who planned birth at home.
Strengths and limitations
General strengths and limitations of the Birthplace cohort are described in Chapter 8. In these analyses, we were unable to explore possible associations between time of day/day of the week and perinatal outcomes because of the very small number of adverse outcomes in this ‘low risk’ population. We were also limited by having data on only the timing of the start of care in labour and of birth itself; we lacked other relevant data on the timing of interventions such as augmentation or epidural or on the timing of the decision to intervene. While we observed some apparent variation in the timing of interventions during labour and birth, we also lacked other contextual data, for example on obstetric cover or on the urgency of the need for intervention, which might have informed our understanding of why this variation occurs.
Other studies in this area have used a range of different ways to categorise the time of day/day of the week. Ideally, the time cut-offs used would have corresponded to the timing of relevant organisational ‘events’, such as hours of staffing cover or shift changes. These data were not available and, furthermore, are likely to vary from unit to unit. We therefore took the decision to set pre-specified time cut-offs, broadly based on those used for a study of time of birth and risk of neonatal death,86 and to conduct sensitivity analyses to explore whether or not the cut-offs used might have influenced our findings. These sensitivity analyses, exploring the risk of intervention and time of day as a continuous variable, suggested that our cut-offs were broadly appropriate for our main outcome measures. They also revealed, however, that using this categorisation may have concealed some variation in our secondary outcomes, most notably an apparent ‘peak’ in augmentation and epidural in births which occurred towards the end of the day and in the early evening, overlapping our cut-off between weekday ‘office hours’ and weekday night.
As discussed in Chapter 3, research on the possible impact of different staffing levels is hampered by the lack of good-quality data on staffing. While we collected some data on midwifery and obstetric staffing during the Birthplace study period, using a staffing log completed twice daily by participating units (see Appendix 3), these suffered from non-negligible levels of missing data, and data relating to obstetrician cover in particular were of poor quality.
Interpretation
Our findings on apparent variation in the timing of interventions during labour and birth, particularly in births planned in OU settings, add to a body of evidence in this area which is consistent with higher rates of some interventions in births which take place during weekday ‘office hours’. It is possible that this reflects higher obstetric staffing levels during these periods, which may lead to an increased likelihood of intervention,59 but the presence of consultant obstetric cover may also impact in other ways. In OUs we found that instrumental delivery was less common in births that occurred at night and a suggestion that intrapartum caesarean section might be more common at night, particularly in women without ‘complicating conditions’ identified at the start of labour care, although absolute differences were small. A study of intrapartum caesarean sections in one UK hospital found no time of day difference in the decision to carry out a grade 1 caesarean (where there is immediate threat to the life of the woman or the fetus), but found that grade 2 caesareans, those carried out when there is maternal or fetal compromise which is not immediately life-threatening, were more common at night. 88 The authors of this paper speculate that the lack of on-site consultant obstetrician cover at night may have contributed to this apparent change in clinical decision-making.
Our findings can be interpreted as consistent with a possible effect of non-clinical factors on intervention. However, there are other potential explanations, including the hypothesis that, because of the circadian rhythm of normal labour and birth,79,81 the labour of women who give birth during the day or early evening is less effective, progresses more slowly83 and may be more painful87 than that of women who give birth at night, leading to more intervention in the form of augmentation and/or epidural as a consequence. Augmentation is itself associated with an increased risk of epidural, which in turn is associated with an increased risk of having an instrumental delivery. 89 As discussed above, we lacked data on the timing of decisions to intervene and of interventions such as epidural and augmentation, and so consideration of these questions and further exploration of factors such as length of labour were beyond the scope of our analyses.
Conclusions
These exploratory analyses suggest that in women who plan OU birth, some interventions, including instrumental delivery, augmentation and epidural analgesia, may be more likely in births that take place during weekday ‘office hours’, and that intrapartum caesarean section may be more common at night. Our evidence also suggests that time of day or day of the week is less strongly associated with intervention in births planned in other settings. The extent to which the apparent differences are caused by different staffing models or levels at different times of day or by normal circadian rhythms of labour and birth is unclear. Further research, using good-quality data on midwifery and obstetric staffing, is warranted to tease out the potential impact of non-clinical factors on clinical decision-making; this could be informed by qualitative research to explore the factors that midwives and obstetricians perceive to be affecting their decision-making. Further investigation of possible diurnal variations in the clinical threshold for augmentation might also be of benefit.
Chapter 7 The characteristics, management and outcomes of women at ‘higher risk’ of complications planning birth in midwifery units or at home
Introduction
National guidance on intrapartum care in England and Wales recommends that women with certain pre-existing medical or obstetric conditions should be advised that these conditions are associated with an increased risk to the mother or baby during labour or shortly after birth and that care in an OU would be expected to reduce the risk. 58
Most ‘higher risk’ women plan birth in an OU, but the Birthplace study found that around 7% of women who planned home birth, 4% of those who planned birth in an AMU, and 3% planning birth in a FMU had known risk factors. 7
Previous analyses exploring the maternal characteristics associated with transfer have given some indication of the ‘risk’ characteristics of women planning birth in MUs and the extent to which ‘risk status’ might be associated with transfer. 16,90 Beyond this, there is very little evidence about the sociodemographic or clinical characteristics of ‘higher risk’ women who plan birth in non-OU settings or how these women are managed, particularly with respect to transfer and the timing of transfer. This information is important to inform women’s choices and the provision of services for women with risk factors who may want to plan birth in a non-OU setting. Analyses describing the characteristics of ‘higher risk’ women planning non-OU birth and exploring the reasons for and timing of transfer and the risk of transfer in women with different ‘risk’ characteristics are presented in this chapter.
Available evidence on outcomes for ‘low risk’ women indicates that women who plan birth at home or in a MU have a higher likelihood of a ‘normal birth’ with less intervention and that, apart from nulliparous women planning birth at home, outcomes for their babies are comparable with those for women planning OU birth. 7,8 For some groups of ‘higher risk’ women, such as those with diabetes, there is good evidence that maternal or neonatal outcomes can be improved through monitoring, treatment or other interventions not normally provided outside an OU. 91 However, national guidance on conditions indicating that birth should be planned in an OU was based on consensus rather than on high-quality evidence,13 and for many ‘higher risk’ conditions the risks and benefits of planning birth in a non-OU setting are not well documented. The number of ‘higher risk’ women planning birth in MUs in the Birthplace cohort was relatively small; we therefore aimed to evaluate perinatal and maternal outcomes in ‘higher risk’ women planning birth at home compared with ‘higher risk’ women planning birth in an OU. In addition, we compared perinatal outcomes for ‘higher risk’ and ‘low risk’ women planning home birth.
Methods
Study population
The study population for the analyses reported in this chapter was ‘higher risk’ women (as defined in Chapter 2, Birthplace cohort study and data, Samples used for analyses) in the Birthplace cohort planning birth in an AMU, in a FMU or at home. Where we compared with ‘higher risk’ women planning OU birth, we excluded women in this group with planned induction of labour as, at the time of the Birthplace study, induction of labour was almost exclusively carried out in OUs and so there were no comparable ‘higher risk’ women in the other settings. For specific analyses, detailed below, we used ‘higher risk’ women planning OU birth and ‘low risk’ women planning birth in each non-OU setting as reference groups.
Objective 1: characteristics of ‘higher risk’ women planning birth in non-obstetric unit settings
We described the sociodemographic and clinical risk characteristics of ‘higher risk’ women planning birth in the three non-OU settings, compared with ‘higher risk’ women planning OU birth.
Objective 2: management and risk of transfer in ‘higher risk’ women
We calculated the overall weighted percentage of ‘higher risk’ women transferred in each non-OU setting and described the reasons for and timing of transfer (before or after birth). We also explored the association between ‘risk status’ (‘higher risk’ vs. ‘low risk’), the presence of ‘complicating conditions’ at the start of labour care and transfer and the timing of transfer in relation to the start of labour care in each setting. For analyses comparing ‘higher risk’ and ‘low risk’ women in each planned birth setting, we used ‘low risk’ women as the reference group.
Outcome measures
The main outcome for these analyses was transfer from the planned birth setting to an OU during labour or immediately after birth. We also considered the timing and management of transfer using the time from the start of care in labour to the decision to transfer (‘time to decision’).
Statistical methods
In each non-OU setting we calculated the weighted percentage, with 95% CIs, of ‘higher risk’ and ‘low risk’ women transferred by parity. We used log Poisson regression with robust standard errors to calculate RRs of transfer in ‘higher risk’ women compared with ‘low risk’ women planning birth in the same setting, unadjusted and adjusted for all the maternal characteristics described in Chapter 2, Maternal Characteristics apart from the presence of ‘complicating conditions’.
We then repeated these analyses in the restricted population of women without ‘complicating conditions’ identified at the start of labour care.
We used cumulative distribution plots to compare the time from the start of labour care to the decision to transfer and the percentage of before birth transfers for each non-OU setting, looking at the following groups:
-
‘low risk’ women without ‘complicating conditions’
-
‘low risk’ women with ‘complicating conditions’
-
‘higher risk’ women without ‘complicating conditions’
-
‘higher risk’ women with ‘complicating conditions’.
Objective 3: outcomes in ‘higher risk’ women planning birth at home
The sample of ‘higher risk’ women planning birth in a MU was small, and so when considering outcomes in ‘higher risk’ women planning non-OU birth we focused on planned home births. We compared perinatal outcomes in ‘higher risk’ and ‘low risk’ women planning home birth and compared perinatal and maternal outcomes in ‘higher risk’ women planning home birth with ‘higher risk’ women planning OU births.
Reference groups and study populations
We used two reference groups:
-
‘low risk’ women planning home birth
-
‘higher risk’ women planning birth in an OU, excluding women with planned induction of labour, as there were no comparable ‘higher risk’ women in the planned home birth group.
For analyses comparing outcomes in ‘higher risk’ women planning home birth with those planning OU birth we used a series of ‘restricted’ populations, as follows, to control for potential differences in risk between women planning birth in the two settings:
-
population 1: whole study population of ‘higher risk’ women
-
population 2: ‘higher risk’ women without ‘complicating conditions’ identified at the start of labour care
-
population 3: ‘higher risk’ women without ‘complicating conditions’, with only one risk factor and excluding women with ‘other’ medical or obstetric risk factors, which included diverse conditions that were not necessarily comparable in both settings (see Statistical methods).
Data on neonatal unit admission
For comparing perinatal outcomes we used data on neonatal admission shortly after birth. In order to exclude short admissions for relatively minor problems, for example transient respiratory problems associated with caesarean section, and those where a lower threshold of admission might apply owing to onsite availability of neonatal care, we used a minimum length of stay of 48 hours. Duration of neonatal unit admission was not directly recorded in Birthplace and had to be derived from a number of variables that included date of admission and discharge, number of days at ‘intensive’, ‘high dependency’, ‘special’ and ‘normal’ level care and free-text notes. In most cases, the duration of admission was unambiguously classifiable as more or less than 48 hours. In borderline cases two reviewers blinded to planned place of birth independently reviewed all available data (including free text) to determine whether or not the admission was for more than 48 hours.
Outcome measures
Our main perinatal outcome was a composite (referred to as the ‘main composite’), encompassing both intrapartum-related mortality or morbidity, as captured in the original Birthplace primary outcome, and admission to a neonatal unit within 48 hours of birth for > 48 hours. The original Birthplace primary outcome (referred to here as the ‘intrapartum composite’) comprised:
-
stillbirth after the start of care in labour
-
early neonatal death
-
neonatal encephalopathy
-
meconium aspiration syndrome
-
brachial plexus injury
-
fractured humerus or clavicle.
In our ‘main composite’ outcome, to increase statistical power, we also included:
-
admission to a neonatal unit within 48 hours of birth for > 48 hours.
As a secondary perinatal outcome, for comparability with previous analyses,7,8 we considered the original Birthplace primary outcome (‘intrapartum composite’ defined above), designed to capture the adverse perinatal outcomes that may be related to the quality of intrapartum care.
In addition, we considered two composite maternal outcomes. The first, designed to capture intrapartum interventions and adverse maternal outcomes requiring obstetric care (‘maternal composite’), was defined as one or more of:
-
augmentation
-
instrumental delivery
-
intrapartum caesarean section
-
general anaesthesia
-
maternal blood transfusion
-
third- or fourth-degree perineal trauma
-
maternal admission to higher-level care.
Our second maternal outcome was:
-
‘straightforward birth’, defined as birth without forceps or ventouse, intrapartum caesarean section, third- or fourth- degree perineal trauma or blood transfusion.
Statistical methods
For all outcomes we calculated the weighted event rate with 95% CIs and used log Poisson regression with robust standard errors to calculate RRs unadjusted and adjusted for maternal characteristics as described in the Statistical methods section for objective 2, above, except where the number of events was too small to perform a reliable adjusted analysis.
Analyses comparing perinatal outcomes in ‘higher risk’ versus ‘low risk’ women planning home birth were conducted in the whole study population (‘population 1’) and repeated in the restricted population of women without ‘complicating conditions’ at the start of care in labour (‘population 2’).
Our main analyses comparing perinatal and maternal outcomes in ‘higher risk’ planned home births with ‘higher risk’ planned OU births were carried out in the same way, in the whole study population (‘population 1’) and then repeated in the restricted ‘population 2’. Because these main analyses controlled only for differences in maternal characteristics and not for possible differences in risk, we then conducted sensitivity analyses of the ‘main composite’ outcome in which we frequency ‘matched’ women in the OU and home groups on individual risk factor. Matching was feasible only on a single ‘risk’ variable and so the sensitivity analyses were conducted in women without ‘complicating conditions’ at the start of care in labour and with only one risk factor and excluding women with ‘other’ medical or obstetric risk factors (‘population 3’). Women with ‘other’ risk factors were excluded, as these categories included diverse conditions that were not necessarily comparable in the two settings.
Sensitivity analyses were conducted as follows. First, we repeated the analysis of the ‘main composite’ in ‘population 3’ and compared the findings with the main analyses to see to what extent progressively restricting the populations had an effect on the estimated RRs. Second, we used logistic regression to conduct a risk-adjusted analysis in ‘population 3’. Prior to conducting the risk-adjusted analyses, we used CHAID (StatSoft Inc., Tulsa, OK, USA: www.statsoft.com/textbook/stathome.html) to explore whether or not there were significant interactions between maternal characteristics (age, parity, BMI) and risk factors that needed to be incorporated in the matching. This identified that parity and level of obesity varied by setting in multiparous women with a BMI> 35 kg/m2 and that parity varied by setting in multiparous women with a previous caesarean section. We therefore created more detailed matching criteria for multiparous women with either of these two risk factors to reflect these interactions. In these risk-adjusted analyses women were, therefore, matched using individual risk factors and the following categories:
-
BMI at booking > 35 kg/m2, parity = 0
-
BMI at booking 35–40 kg/m2 (exclusive), parity = 1
-
BMI at booking 35–40 kg/m2 (exclusive), parity ≥ 2
-
BMI at booking ≥ 40 kg/m2, parity = 1
-
BMI at booking ≥ 40 kg/m2, parity ≥ 2
-
previous caesarean section, parity = 1
-
previous caesarean section, parity ≥ 2.
We planned to use conditional logistic regression to carry out the matched analysis, but found that this method did not enable us to apply weights. However, exploratory analyses comparing unconditional and conditional models indicated that conditional and unconditional models yielded similar results. For comparability with the main weighted analyses we therefore used weighted unconditional logistic regression for the risk-adjusted sensitivity analysis. Because the outcome of interest is uncommon, ORs and RRs are similar.
Finally, we conducted an additional post-hoc sensitivity analysis to explore whether or not the cut-off of more than 48-hour length of stay used in our main composite outcome measure affected the findings. Specifically, we were concerned that the original 48-hour cut-off might have included babies admitted for observation or minor conditions, rather than only those with serious morbidity, as intended. We therefore derived a ‘modified composite’ outcome encompassing the ‘intrapartum composite’ (as before) and admission to a neonatal unit within 48 hours of birth for > 4 days and repeated our primary analysis using this outcome.
All analyses were conducted separately by parity, excluding women for whom parity was unknown. We tested for interactions between planned place of birth (and risk status) and parity using the Wald test and, where we did not find a significant interaction, we carried out a pooled analysis using data on all women and adjusted for parity.
Results
Objective 1: characteristics of ‘higher risk’ women planning birth in non-obstetric unit settings
The study population consisted of 9319 eligible ‘higher risk’ women: 6691 planning OU birth, 1489 planning birth at home, 329 planning a FMU birth and 810 planning an AMU birth. Their sociodemographic characteristics are summarised by parity in Tables 54 and 55 and by clinical risk characteristics in Tables 56–59.
| Characteristic | OU (N = 2524) | Home (N = 288) | FMU (N = 104) | AMU (N = 308) | ||||
|---|---|---|---|---|---|---|---|---|
| n | Weighted % | n | Weighted % | n | Weighted % | n | Weighted % | |
| Maternal age (years) | ||||||||
| Mean (SD) | 27.1 | (6.0) | 30.5 | (5.4) | 28.2 | (6.0) | 27.4 | (5.8) |
| < 20 | 279 | 11.0 | 7 | 3.1 | 10 | 8.3 | 32 | 9.2 |
| 20–24 | 645 | 25.2 | 33 | 11.4 | 20 | 19.3 | 78 | 24.4 |
| 25–29 | 694 | 27.4 | 75 | 26.3 | 31 | 32.7 | 72 | 23.6 |
| 30–34 | 588 | 23.7 | 106 | 37.2 | 24 | 22.0 | 94 | 30.9 |
| 35–39 | 262 | 10.6 | 58 | 19.3 | 18 | 16.9 | 28 | 10.7 |
| ≥ 40 | 51 | 2.0 | 9 | 2.7 | 1 | 0.8 | 4 | 1.2 |
| Missing | 5 | 0 | 0 | 0 | ||||
| Ethnic group | ||||||||
| White | 2099 | 81.7 | 275 | 93.2 | 94 | 92.1 | 242 | 77.9 |
| Indian | 59 | 2.4 | 2 | 0.9 | 1 | 0.8 | 11 | 3.6 |
| Pakistani | 65 | 2.6 | 0 | – | 1 | 0.9 | 10 | 3.4 |
| Bangladeshi | 15 | 0.6 | 0 | – | 1 | 0.8 | 2 | 0.9 |
| Black Caribbean | 42 | 2.2 | 2 | 0.7 | 1 | 0.8 | 5 | 2.0 |
| Black African | 87 | 3.9 | 0 | – | 1 | 0.9 | 10 | 3.2 |
| Mixed | 48 | 2.0 | 3 | 2.8 | 3 | 2.5 | 8 | 2.6 |
| Other | 107 | 4.7 | 6 | 2.4 | 2 | 1.3 | 20 | 6.5 |
| Missing | 2 | 0 | 0 | 0 | ||||
| Understanding of English | ||||||||
| Fluent | 2323 | 92.2 | 286 | 99.6 | 100 | 98.0 | 280 | 90.9 |
| Some | 142 | 5.8 | 1 | 0.4 | 3 | 2.0 | 20 | 6.7 |
| None | 47 | 2.0 | 0 | – | 0 | – | 7 | 2.4 |
| Missing | 12 | 1 | 1 | 1 | ||||
| Marital/partner status | ||||||||
| Married/living together | 2077 | 82.7 | 270 | 95.0 | 87 | 84.9 | 261 | 86.3 |
| Single/unsupported by partner | 413 | 17.3 | 16 | 5.0 | 16 | 15.1 | 43 | 13.7 |
| Missing | 34 | 2 | 1 | 4 | ||||
| BMI (kg/m2) | ||||||||
| Mean (SD) | 28.5 | (7.9) | 28.3 | (8.7) | 27.7 | (7.7) | 26.7 | (7.6) |
| Not recorded | 325 | 13.3 | 43 | 13.9 | 17 | 14.0 | 57 | 19.5 |
| < 18.5 | 74 | 2.9 | 3 | 0.8 | 1 | 0.5 | 9 | 3.1 |
| 18.5–24.9 | 847 | 33.9 | 114 | 39.3 | 37 | 38.0 | 127 | 40.7 |
| 25.0–29.9 | 485 | 18.7 | 43 | 14.9 | 23 | 23.3 | 50 | 17.3 |
| 30.0–34.9 | 213 | 8.3 | 13 | 6.1 | 5 | 6.0 | 12 | 3.9 |
| 35.0–39.9 | 368 | 14.7 | 51 | 18.5 | 18 | 14.6 | 41 | 11.7 |
| ≥ 40.0 | 204 | 8.2 | 20 | 6.6 | 3 | 3.7 | 12 | 3.8 |
| Missing | 8 | 1 | 0 | 0 | ||||
| IMD quintiles | ||||||||
| First (least deprived) | 383 | 15.0 | 54 | 21.5 | 21 | 17.6 | 47 | 12.9 |
| Second | 425 | 16.5 | 64 | 21.8 | 27 | 30.8 | 43 | 14.5 |
| Third | 465 | 18.1 | 65 | 21.2 | 21 | 20.8 | 74 | 21.0 |
| Fourth | 574 | 22.9 | 63 | 23.5 | 17 | 14.9 | 56 | 19.5 |
| Fifth (most deprived) | 651 | 27.5 | 37 | 12.1 | 18 | 16.0 | 88 | 32.1 |
| Missing | 26 | 5 | 0 | 0 | ||||
| Gestation (completed weeks) | ||||||||
| Mean (SD) | 39.7 | (1.4) | 40.4 | (1.4) | 40.3 | (1.4) | 40.2 | (1.3) |
| 37 | 159 | 6.4 | 5 | 1.7 | 3 | 2.4 | 6 | 1.9 |
| 38 | 352 | 14.0 | 20 | 6.3 | 8 | 5.5 | 27 | 9.1 |
| 39 | 553 | 21.8 | 59 | 20.3 | 19 | 19.1 | 54 | 17.3 |
| 40 | 715 | 28.3 | 73 | 25.6 | 29 | 27.6 | 101 | 34.2 |
| 41 | 516 | 20.2 | 47 | 17.7 | 24 | 25.6 | 63 | 22.2 |
| 42 | 211 | 8.7 | 80 | 27.5 | 16 | 14.5 | 47 | 13.2 |
| 43 to 44 + 0 | 14 | 0.6 | 3 | 0.9 | 5 | 5.3 | 8 | 2.2 |
| Missing | 4 | 1 | 0 | 2 | ||||
| Birthweight (g) | ||||||||
| Mean (SD) | 3390.2 | (506.2) | 3524.1 | (458.7) | 3395.9 | (478.9) | 3412.6 | (447.2) |
| < 2500 | 96 | 3.9 | 3 | 1.1 | 2 | 1.8 | 6 | 1.9 |
| 2500–2999 | 449 | 17.5 | 32 | 9.7 | 16 | 18.2 | 48 | 16.5 |
| 3000–3499 | 936 | 37.8 | 101 | 34.8 | 43 | 37.8 | 121 | 38.8 |
| 3500–3999 | 757 | 29.8 | 106 | 40.0 | 33 | 30.7 | 105 | 34.6 |
| 4000–4499 | 239 | 9.6 | 43 | 13.5 | 7 | 8.5 | 21 | 6.9 |
| ≥ 4500 | 42 | 1.5 | 3 | 0.9 | 3 | 3.0 | 4 | 1.4 |
| Missing | 5 | 0 | 0 | 3 | ||||
| Characteristic | OU (N = 4167) | Home (N = 1201) | FMU (N = 225) | AMU (N = 502) | ||||
|---|---|---|---|---|---|---|---|---|
| n | Weighted % | n | Weighted % | n | Weighted % | n | Weighted % | |
| Maternal age | ||||||||
| Mean (SD) | 30.4 | (5.7) | 32.2 | (5.5) | 30.7 | (5.3) | 30.5 | (5.4) |
| < 20 | 78 | 1.7 | 6 | 0.5 | 2 | 1.8 | 6 | 1.1 |
| 20–24 | 650 | 15.1 | 105 | 8.7 | 33 | 12.5 | 71 | 13.8 |
| 25–29 | 1146 | 27.2 | 270 | 22.2 | 56 | 28.2 | 144 | 30.5 |
| 30–34 | 1220 | 29.5 | 374 | 31.5 | 81 | 33.6 | 162 | 31.8 |
| 35–39 | 856 | 21.1 | 346 | 28.8 | 44 | 17.8 | 102 | 19.6 |
| ≥ 40 | 211 | 5.4 | 100 | 8.2 | 9 | 6.2 | 17 | 3.1 |
| Missing | 6 | 0 | 0 | 0 | ||||
| Ethnic group | ||||||||
| White | 3205 | 74.9 | 1124 | 93.4 | 203 | 89.8 | 389 | 77.2 |
| Indian | 95 | 2.4 | 6 | 0.6 | 2 | 1.0 | 6 | 1.3 |
| Pakistani | 211 | 4.9 | 3 | 0.3 | 5 | 2.0 | 11 | 2.7 |
| Bangladeshi | 85 | 2.0 | 1 | 0.1 | 2 | 0.7 | 4 | 0.8 |
| Black Caribbean | 72 | 2.2 | 19 | 1.6 | 1 | 0.8 | 9 | 2.0 |
| Black African | 255 | 7.3 | 12 | 0.9 | 4 | 2.0 | 42 | 8.6 |
| Mixed | 63 | 1.6 | 19 | 1.6 | 4 | 1.5 | 9 | 1.6 |
| Other | 175 | 4.8 | 16 | 1.5 | 4 | 2.2 | 30 | 5.8 |
| Missing | 6 | 1 | 0 | 2 | ||||
| Understanding of English | ||||||||
| Fluent | 3764 | 90.3 | 1194 | 99.4 | 219 | 97.5 | 465 | 91.7 |
| Some | 275 | 7.5 | 7 | 0.6 | 5 | 2.1 | 27 | 6.0 |
| None | 83 | 2.2 | 0 | – | 1 | 0.4 | 9 | 2.3 |
| Missing | 45 | 0 | 0 | 1 | ||||
| Marital/partner status | ||||||||
| Married/living together | 3731 | 90.1 | 1139 | 95.6 | 217 | 96.3 | 461 | 92.9 |
| Single/unsupported by partner | 376 | 9.9 | 53 | 4.4 | 8 | 3.7 | 35 | 7.1 |
| Missing | 60 | 9 | 0 | 6 | ||||
| BMI (kg/m2) | ||||||||
| Mean (SD) | 28.5 | (7.4) | 28.9 | (7.8) | 28.4 | (7.5) | 28.4 | (7.5) |
| Not recorded | 540 | 13.6 | 161 | 12.8 | 22 | 8.9 | 60 | 11.6 |
| < 18.5 | 80 | 1.9 | 26 | 2.0 | 5 | 2.1 | 13 | 2.9 |
| 18.5–24.9 | 1335 | 31.8 | 387 | 32.8 | 83 | 36.8 | 158 | 30.4 |
| 25.0–29.9 | 896 | 21.8 | 217 | 17.5 | 45 | 21.6 | 107 | 23.2 |
| 30.0–34.9 | 442 | 10.6 | 84 | 7.9 | 14 | 5.0 | 44 | 9.9 |
| 35.0–39.9 | 542 | 13.0 | 242 | 20.3 | 43 | 17.8 | 94 | 16.9 |
| ≥ 40.0 | 324 | 7.4 | 81 | 6.7 | 13 | 7.7 | 25 | 5.1 |
| Missing | 8 | 3 | 0 | 1 | ||||
| IMD quintiles | ||||||||
| First (least deprived) | 663 | 14.9 | 253 | 21.5 | 53 | 18.7 | 72 | 12.7 |
| Second | 680 | 16.0 | 246 | 20.1 | 40 | 21.8 | 67 | 11.8 |
| Third | 718 | 16.9 | 220 | 18.2 | 49 | 22.3 | 84 | 15.4 |
| Fourth | 830 | 19.7 | 243 | 20.4 | 54 | 26.0 | 96 | 21.3 |
| Fifth (most deprived) | 1266 | 32.6 | 231 | 19.8 | 29 | 11.2 | 182 | 38.9 |
| Missing | 40 | 8 | 0 | 1 | ||||
| Previous pregnancies ≥ 24 completed weeks | ||||||||
| 1 previous | 2384 | 56.8 | 562 | 45.8 | 128 | 57.2 | 294 | 58.9 |
| 2 previous | 1032 | 24.8 | 349 | 29.4 | 58 | 27.1 | 123 | 23.4 |
| ≥ 3 previous | 751 | 18.4 | 290 | 24.8 | 39 | 15.7 | 85 | 17.7 |
| Missing | 0 | 0 | 0 | 0 | ||||
| Gestation (completed weeks) | ||||||||
| Mean (SD) | 39.5 | (1.2) | 39.9 | (1.3) | 40.0 | (1.3) | 39.8 | (1.2) |
| 37 | 265 | 6.5 | 37 | 2.9 | 10 | 3.9 | 20 | 3.9 |
| 38 | 614 | 14.4 | 124 | 10.9 | 15 | 4.7 | 41 | 7.4 |
| 39 | 1012 | 24.6 | 247 | 19.6 | 53 | 21.5 | 124 | 26.1 |
| 40 | 1337 | 32.3 | 436 | 37.1 | 73 | 33.6 | 189 | 37.2 |
| 41 | 761 | 18.4 | 225 | 19.5 | 45 | 23.2 | 92 | 19.1 |
| 42 | 155 | 3.6 | 113 | 8.7 | 28 | 12.4 | 31 | 5.8 |
| 43 to 44 + 0 | 8 | 0.2 | 15 | 1.3 | 1 | 0.8 | 3 | 0.6 |
| Missing | 15 | 4 | 0 | 2 | ||||
| Birthweight (g) | ||||||||
| Mean (SD) | 3455.6 | (501.1) | 3629.8 | (493.7) | 3572.7 | (474.1) | 3528.8 | (446.0) |
| < 2500 | 88 | 2.2 | 13 | 1.0 | 1 | 0.3 | 4 | 1.8 |
| 2500–2999 | 628 | 15.0 | 97 | 8.5 | 21 | 7.8 | 56 | 10.4 |
| 3000–3499 | 1548 | 37.3 | 362 | 30.9 | 82 | 40.6 | 180 | 35.4 |
| 3500–3999 | 1306 | 31.2 | 431 | 35.2 | 80 | 36.4 | 186 | 39.1 |
| 4000–4499 | 490 | 11.8 | 243 | 20.2 | 34 | 12.6 | 57 | 10.4 |
| ≥ 4500 | 103 | 2.5 | 49 | 4.2 | 7 | 2.3 | 17 | 2.9 |
| Missing | 4 | 6 | 0 | 2 | ||||
| Risk factor | OU (N = 2524) | Home (N = 288) | FMU (N = 104) | AMU (N = 308) | ||||
|---|---|---|---|---|---|---|---|---|
| n | Weighted % | n | Weighted % | n | Weighted % | n | Weighted % | |
| Cardiovascular | ||||||||
| Confirmed cardiac disease | 49 | 2.00 | 5 | 1.54 | 2 | 2.29 | 3 | 1.05 |
| Hypertensive disorders | 225 | 8.59 | 7 | 2.17 | 3 | 2.59 | 8 | 2.64 |
| Respiratory | ||||||||
| Asthmaa | 64 | 2.40 | 9 | 3.55 | 4 | 5.19 | 8 | 2.13 |
| Cystic fibrosis | 2 | 0.11 | 0 | – | 0 | – | 0 | – |
| Haematological | ||||||||
| Haemoglobinopathiesa | 8 | 0.31 | 1 | 0.40 | 1 | 0.52 | 2 | 0.87 |
| Thromboembolic disorders | 41 | 1.60 | 6 | 1.91 | 2 | 2.33 | 5 | 1.09 |
| Thrombocytopeniaa | 27 | 1.02 | 4 | 1.28 | 3 | 2.73 | 3 | 0.75 |
| von Willebrand’s disease | 10 | 0.43 | 0 | – | 0 | – | 0 | – |
| Bleeding disordera | 6 | 0.24 | 2 | 0.60 | 0 | – | 0 | – |
| Atypical antibodiesa | 17 | 0.71 | 1 | 0.26 | 0 | – | 2 | 1.06 |
| Infective | ||||||||
| GBSa | 337 | 13.07 | 22 | 7.43 | 5 | 4.02 | 68 | 26.69 |
| Hepatitis B/C/with abnormal LFT | 25 | 1.06 | 4 | 1.70 | 1 | 0.78 | 11 | 3.75 |
| HIV | 6 | 0.25 | 0 | – | 0 | – | 1 | 0.26 |
| Current chicken pox/rubella/genital herpes | 18 | 0.91 | 1 | 0.80 | 1 | 1.02 | 1 | 0.52 |
| Immune | ||||||||
| Systemic lupus erythematosus | 6 | 0.28 | 2 | 0.64 | 0 | – | 0 | – |
| Endocrine | ||||||||
| Hyperthyroidism | 45 | 1.72 | 12 | 4.14 | 8 | 7.05 | 20 | 6.36 |
| Diabetes | 89 | 3.62 | 1 | 0.27 | 0 | – | 1 | 0.21 |
| Renal | ||||||||
| Abnormal renal function | 8 | 0.31 | 2 | 0.59 | 1 | 2.49 | 2 | 0.50 |
| Renal diseasea | 9 | 0.33 | 3 | 1.03 | 1 | 0.91 | 5 | 1.48 |
| Neurological | ||||||||
| Epilepsy | 60 | 2.27 | 3 | 0.67 | 2 | 2.65 | 4 | 1.03 |
| Myasthenia gravis | 2 | 0.09 | 0 | – | 0 | – | 0 | – |
| Previous cerebrovascular accident | 2 | 0.07 | 1 | 0.33 | 0 | – | 1 | 0.14 |
| Gastrointestinal | ||||||||
| Liver diseasea | 11 | 0.40 | 1 | 0.64 | 2 | 1.64 | 0 | – |
| Psychiatric | ||||||||
| Current inpatient care | 14 | 0.51 | 2 | 0.57 | 0 | – | 2 | 0.51 |
| ‘Other’ medical risk factorb | 78 | 3.10 | 20 | 7.84 | 6 | 5.62 | 15 | 5.98 |
| Any medical risk factor | 1102 | 43.29 | 108 | 37.93 | 40 | 40.00 | 156 | 55.23 |
| Number of medical risk factors per woman | ||||||||
| 0 | 1422 | 56.8 | 180 | 62.1 | 64 | 60.0 | 152 | 44.8 |
| 1 | 1049 | 41.2 | 107 | 37.5 | 38 | 38.2 | 150 | 53.4 |
| ≥ 2 | 53 | 2.0 | 1 | 0.4 | 2 | 1.8 | 6 | 1.8 |
| Risk factor | OU (N = 4167) | Home (N = 1201) | FMU (N = 225) | AMU (N = 502) | ||||
|---|---|---|---|---|---|---|---|---|
| n | Weighted % | n | Weighted % | n | Weighted % | n | Weighted % | |
| Cardiovascular | ||||||||
| Confirmed cardiac disease | 44 | 1.05 | 10 | 0.75 | 3 | 1.47 | 7 | 1.35 |
| Hypertensive disorders | 150 | 3.50 | 16 | 1.26 | 4 | 1.29 | 7 | 1.23 |
| Respiratory | ||||||||
| Asthmaa | 50 | 1.19 | 26 | 2.40 | 5 | 3.25 | 8 | 1.36 |
| Cystic fibrosis | 2 | 0.05 | 0 | – | 0 | – | 0 | – |
| Haematological | ||||||||
| Haemoglobinopathiesa | 13 | 0.29 | 1 | 0.14 | 0 | – | 0 | – |
| Thromboembolic disorders | 71 | 1.73 | 16 | 1.29 | 3 | 0.93 | 11 | 3.17 |
| Thrombocytopeniaa | 33 | 0.73 | 8 | 0.57 | 1 | 0.25 | 2 | 0.47 |
| von Willebrand’s disease | 3 | 0.08 | 1 | 0.06 | 0 | – | 1 | 0.23 |
| Bleeding disordera | 4 | 0.10 | 6 | 0.38 | 1 | 0.40 | 0 | – |
| Atypical antibodiesa | 45 | 1.20 | 17 | 1.40 | 4 | 2.85 | 8 | 2.32 |
| Infective | ||||||||
| GBSa | 495 | 11.95 | 81 | 6.17 | 11 | 3.17 | 93 | 19.88 |
| Hepatitis B/C/with abnormal LFT | 39 | 0.94 | 1 | 0.42 | 2 | 0.62 | 7 | 1.51 |
| HIV | 9 | 0.23 | 0 | – | 0 | – | 1 | 0.16 |
| Current chicken pox/rubella/genital herpes | 6 | 0.15 | 1 | 0.08 | 0 | – | 1 | 0.09 |
| Tuberculosis under treatment | 1 | 0.03 | 0 | – | 0 | – | 0 | – |
| Immune | ||||||||
| Systemic lupus erythematosus | 8 | 0.17 | 1 | 0.07 | 0 | – | 2 | 0.32 |
| Scleroderma | 3 | 0.08 | 0 | – | 0 | – | 0 | – |
| Endocrine | ||||||||
| Hyperthyroidism | 69 | 1.63 | 35 | 2.87 | 9 | 3.95 | 14 | 2.38 |
| Diabetes | 95 | 2.19 | 4 | 0.32 | 1 | 0.76 | 1 | 0.22 |
| Renal | ||||||||
| Abnormal renal function | 10 | 0.23 | 2 | 0.13 | 1 | 0.71 | 0 | – |
| Renal diseasea | 11 | 0.26 | 4 | 0.29 | 0 | – | 2 | 0.35 |
| Neurological | ||||||||
| Epilepsy | 81 | 1.80 | 24 | 1.96 | 3 | 1.84 | 8 | 1.62 |
| Previous cerebrovascular accident | 6 | 0.15 | 7 | 0.50 | 0 | – | 1 | 0.22 |
| Gastrointestinal | ||||||||
| Liver diseasea | 17 | 0.39 | 1 | 0.08 | 0 | – | 0 | – |
| Psychiatric | ||||||||
| Current inpatient care | 10 | 0.22 | 3 | 0.19 | 1 | 0.40 | 2 | 0.25 |
| ‘Other’ medical risk factorb | 76 | 1.73 | 55 | 4.30 | 10 | 4.01 | 16 | 3.81 |
| Any medical risk factor | 1273 | 30.21 | 310 | 24.81 | 58 | 25.67 | 192 | 41.09 |
| Number of medical risk factors per woman | ||||||||
| 0 | 2894 | 69.8 | 891 | 75.3 | 167 | 74.3 | 310 | 59.1 |
| 1 | 1200 | 28.5 | 300 | 23.9 | 57 | 25.4 | 192 | 40.9 |
| ≥ 2 | 73 | 1.8 | 10 | 0.9 | 1 | 0.2 | 0 | – |
| Risk factor | OU (N = 2524) | Home (N = 288) | FMU (N = 104) | AMU (N = 205) | ||||
|---|---|---|---|---|---|---|---|---|
| n | Weighted % | n | Weighted % | n | Weighted % | n | Weighted % | |
| Current pregnancy | ||||||||
| Placenta praevia | 7 | 0.24 | 1 | 0.30 | 0 | – | 1 | 0.19 |
| Pre-eclampsia or pregnancy induced hypertension | 369 | 14.60 | 6 | 2.37 | 6 | 5.39 | 8 | 2.25 |
| Preterm labour or preterm PROM | 31 | 1.22 | 2 | 0.53 | 2 | 1.26 | 1 | 0.21 |
| Placental abruption | 5 | 0.20 | 0 | – | 1 | 2.55 | 0 | – |
| Anaemiaa | 8 | 0.32 | 0 | – | 0 | – | 0 | – |
| Substance misuse | 42 | 1.56 | 2 | 0.63 | 2 | 1.18 | 1 | 0.15 |
| Alcohol dependencya | 6 | 0.22 | 0 | – | 0 | – | 0 | – |
| Gestational diabetes | 119 | 4.68 | 8 | 2.63 | 2 | 2.16 | 2 | 0.48 |
| Malpresentation | 28 | 1.17 | 0 | – | 1 | 1.05 | 3 | 0.80 |
| BMI > 35 kg/m2 | 557 | 22.24 | 70 | 24.60 | 20 | 17.75 | 54 | 16.06 |
| Recurrent antepartum haemorrhage | 18 | 0.82 | 1 | 0.34 | 1 | 0.74 | 1 | 0.35 |
| Post term (42 + 1 to 44 weeks) | 198 | 8.20 | 78 | 26.80 | 21 | 19.82 | 53 | 14.60 |
| Fetal | ||||||||
| Small for gestational agea | 107 | 4.11 | 5 | 1.67 | 3 | 3.58 | 6 | 2.38 |
| Abnormal fetal heart ratea | 19 | 0.75 | 2 | 0.49 | 1 | 0.78 | 2 | 0.61 |
| Oligo/polyhydramniosa | 63 | 2.39 | 5 | 1.75 | 1 | 1.57 | 5 | 1.48 |
| Previous gynaecological history | ||||||||
| Myomectomy | 5 | 0.20 | 0 | – | 0 | – | 0 | – |
| ‘Other’ obstetric or fetal risk factorb | 120 | 4.84 | 15 | 4.62 | 5 | 3.73 | 16 | 5.66 |
| Any obstetric or fetal risk factor | 1570 | 62.64 | 187 | 64.36 | 64 | 60.00 | 153 | 45.24 |
| Number of obstetric/fetal risk factors per woman | ||||||||
| 0 | 954 | 37.4 | 101 | 35.9 | 40 | 40.0 | 155 | 54.9 |
| 1 | 1447 | 57.8 | 179 | 61.6 | 62 | 58.4 | 153 | 45.1 |
| ≥ 2 | 123 | 4.8 | 8 | 2.5 | 2 | 1.6 | 0 | – |
| Risk factor | OU (N = 4167) | Home (N = 1201) | FMU (N = 225) | AMU (N = 502) | ||||
|---|---|---|---|---|---|---|---|---|
| n | Weighted % | n | Weighted % | n | Weighted % | n | Weighted % | |
| Complications in previous pregnancy | ||||||||
| Unexplained stillbirth/neonatal deatha | 111 | 2.66 | 17 | 1.33 | 6 | 2.66 | 8 | 1.68 |
| Neonatal encephalopathy | 2 | 0.04 | 0 | – | 1 | 0.28 | 1 | 0.22 |
| Pre-eclampsia requiring preterm birth | 65 | 1.63 | 20 | 1.60 | 3 | 1.38 | 9 | 1.75 |
| Placental abruptiona | 14 | 0.34 | 4 | 0.30 | 1 | 0.23 | 1 | 0.13 |
| Eclampsia | 18 | 0.39 | 2 | 0.13 | 1 | 0.35 | 1 | 0.22 |
| Uterine rupture | 2 | 0.05 | 0 | – | 0 | – | 0 | – |
| PPH with treatment/transfusion | 179 | 4.43 | 61 | 4.86 | 15 | 6.04 | 39 | 8.32 |
| Retained placentaa | 123 | 3.14 | 66 | 5.87 | 18 | 10.77 | 34 | 6.02 |
| Caesarean section | 1227 | 30.35 | 209 | 18.21 | 9 | 2.98 | 18 | 3.15 |
| Shoulder dystocia | 55 | 1.24 | 20 | 1.67 | 4 | 1.85 | 9 | 2.45 |
| Current pregnancy | ||||||||
| Placenta praevia | 6 | 0.16 | 0 | – | 0 | – | 0 | – |
| Pre-eclampsia or pregnancy-induced hypertension | 176 | 4.13 | 16 | 1.20 | 2 | 0.56 | 5 | 0.97 |
| Preterm labour or preterm PROM | 31 | 0.70 | 9 | 0.74 | 4 | 1.38 | 6 | 1.11 |
| Placental abruption | 12 | 0.29 | 0 | – | 0 | – | 0 | – |
| Anaemiaa | 28 | 0.68 | 6 | 0.51 | 1 | 0.41 | 6 | 1.26 |
| Substance misuse | 75 | 1.73 | 6 | 0.48 | 4 | 1.30 | 3 | 0.65 |
| Alcohol dependencya | 9 | 0.21 | 3 | 0.21 | 1 | 0.28 | 2 | 0.44 |
| Gestational diabetes | 175 | 4.33 | 33 | 3.14 | 3 | 1.07 | 4 | 0.96 |
| Malpresentation | 39 | 0.94 | 6 | 0.45 | 0 | – | 4 | 0.78 |
| BMI > 35 kg/m2 | 828 | 19.48 | 314 | 26.23 | 55 | 25.27 | 118 | 21.78 |
| Recurrent antepartum haemorrhage | 16 | 0.40 | 0 | – | 0 | – | 1 | 0.22 |
| Post term (42 + 1 to 44 weeks) | 132 | 3.11 | 114 | 8.92 | 27 | 12.62 | 33 | 6.27 |
| Fetal | ||||||||
| Small for gestational agea | 136 | 2.96 | 18 | 1.58 | 5 | 2.48 | 4 | 0.72 |
| Abnormal fetal heart ratea | 18 | 0.35 | 3 | 0.20 | 0 | – | 3 | 0.57 |
| Oligo/polyhydramniosa | 94 | 2.26 | 13 | 1.14 | 2 | 1.52 | 7 | 1.32 |
| Previous gynaecological history | ||||||||
| Myomectomy | 1 | 0.02 | 0 | – | 0 | – | 0 | – |
| ‘Other’ obstetric or fetal risk factorb | 143 | 3.55 | 78 | 6.56 | 17 | 6.46 | 21 | 4.40 |
| Any obstetric or fetal risk factor | 3213 | 77.44 | 936 | 78.93 | 175 | 78.32 | 320 | 61.78 |
| Number of obstetric/fetal risk factors per woman | ||||||||
| 0 | 954 | 22.6 | 265 | 21.2 | 50 | 21.7 | 182 | 38.2 |
| 1 | 2769 | 66.6 | 864 | 73.1 | 171 | 76.8 | 303 | 58.2 |
| ≥ 2 | 444 | 10.8 | 72 | 5.7 | 4 | 1.6 | 17 | 3.6 |
Maternal sociodemographic characteristics
Compared with ‘higher risk’ women planning OU birth, ‘higher risk’ women in the planned home birth group were more likely to be older, white, married/living with partner and living in less deprived areas. Those in the planned home birth group were also more likely to be multiparous (81.0% vs. 62.5%) and to have had more than one previous pregnancy. The proportion of women who gave birth at 42 weeks’ gestation or more was higher in the planned home birth group (see Tables 54 and 55). The maternal characteristics of women planning FMU or AMU birth tended to fall between the planned OU and planned home birth group, with the characteristics of women in the planned FMU group generally closer to that of the planned home group and the characteristics of women in the planned AMU group generally closer to that of the planned OU group (see Tables 54 and 55).
Risk factors
Overall, the proportion of ‘higher risk’ women with multiple risk factors was lower in women planning birth in non-OU settings (home 8.9%, FMU 5.1%, AMU 4.6%) than in women planning OU birth (15.7%). Medical risk factors are presented in Tables 56 and 57, obstetric/fetal risk factors in Tables 58 and 59, and ‘complicating conditions’ identified at the start of care in labour in Tables 60 and 61.
| Condition | OU (N = 2524) | Home (N = 288) | FMU (N = 104) | AMU (N = 308) | ||||
|---|---|---|---|---|---|---|---|---|
| n | Weighted % | n | Weighted % | n | Weighted % | n | Weighted % | |
| Prolonged rupture of membranes > 18 hours | 251 | 9.62 | 15 | 6.52 | 3 | 3.30 | 12 | 4.13 |
| Meconium-stained liquor | 207 | 7.98 | 3 | 1.02 | 1 | 0.78 | 4 | 1.41 |
| Proteinuria (1+ or more) | 236 | 9.32 | 4 | 1.34 | 3 | 1.96 | 13 | 4.02 |
| Hypertensiona | 432 | 17.05 | 11 | 3.97 | 6 | 5.04 | 7 | 2.10 |
| Abnormal vaginal bleeding | 28 | 1.20 | 4 | 1.05 | 1 | 0.91 | 2 | 0.71 |
| Non-cephalic presentation | 30 | 1.30 | 0 | – | 0 | – | 4 | 1.25 |
| Abnormal fetal heart rate | 102 | 4.07 | 4 | 1.47 | 1 | 0.91 | 4 | 1.18 |
| Other ‘complicating condition’ | 4 | 0.16 | 2 | 0.80 | 0 | – | 0 | – |
| Any ‘complicating condition’ | 981 | 38.36 | 34 | 13.03 | 14 | 12.39 | 39 | 12.70 |
| Number of ‘complicating conditions’ per woman | ||||||||
| 0 | 1535 | 61.6 | 251 | 87.0 | 90 | 87.6 | 268 | 87.3 |
| 1 | 709 | 27.5 | 26 | 10.1 | 13 | 11.9 | 32 | 10.6 |
| ≥ 2 | 272 | 10.8 | 8 | 2.9 | 1 | 0.5 | 7 | 2.1 |
| Condition | OU (N = 4167) | Home (N = 1201) | FMU (N = 225) | AMU (N = 502) | ||||
|---|---|---|---|---|---|---|---|---|
| n | Weighted % | n | Weighted % | n | Weighted % | n | Weighted % | |
| Prolonged rupture of membranes > 18 hours | 224 | 5.32 | 37 | 3.05 | 4 | 1.20 | 12 | 2.11 |
| Meconium-stained liquor | 266 | 6.29 | 33 | 2.90 | 6 | 2.23 | 13 | 3.02 |
| Proteinuria (1+ or more) | 145 | 3.45 | 8 | 0.59 | 0 | – | 16 | 2.82 |
| Hypertensiona | 262 | 6.11 | 18 | 1.27 | 4 | 1.98 | 7 | 1.39 |
| Abnormal vaginal bleeding | 59 | 1.42 | 6 | 0.46 | 0 | – | 1 | 0.16 |
| Non-cephalic presentation | 49 | 1.26 | 5 | 0.39 | 0 | – | 3 | 0.67 |
| Abnormal fetal heart rate | 100 | 2.37 | 6 | 0.45 | 2 | 0.76 | 4 | 0.79 |
| Other ‘complicating condition’ | 11 | 0.29 | 0 | – | 0 | – | 0 | – |
| Any ‘complicating conditions’ | 947 | 22.63 | 107 | 8.65 | 14 | 5.41 | 52 | 10.33 |
| Number of ‘complicating conditions’ per woman | ||||||||
| 0 | 3203 | 77.4 | 1074 | 91.4 | 210 | 94.6 | 448 | 89.7 |
| 1 | 795 | 19.1 | 101 | 8.2 | 12 | 4.7 | 48 | 9.7 |
| ≥ 2 | 152 | 3.5 | 6 | 0.5 | 2 | 0.8 | 4 | 0.6 |
Medical and obstetric/fetal risk factors
The proportion of women with at least one medical risk factor was broadly similar in women planning OU, home and FMU birth (37.9–43.2% nulliparous, 24.8–30.3% multiparous) and higher in women planning AMU birth (55.2% nulliparous, 40.9% multiparous) (see Tables 56 and 57). The prevalence of obstetric or fetal risk factors was, again, broadly similar in the planned OU, home and FMU groups (60.0–64.1% nulliparous, 77.4–78.8% multiparous) and lower in the planned AMU group (45.1% nulliparous, 61.8% multiparous) (see Tables 58 and 59).
The distribution of individual risk factors differed between birth settings and by parity (see Tables 56–59). In nulliparous women, BMI > 35 kg/m2 was a common risk factor in all four planned birth settings; post-term pregnancy was most prevalent in the planned home birth group (26.8%), followed by planned FMU and AMU groups; pre-eclampsia or pregnancy-induced hypertension in the current pregnancy was more common in the planned OU group than in the non-OU groups; known carriage of group B streptococcus (GBS) was a common risk factor in the planned AMU (26.7%) and planned OU (13.1%) groups (see Tables 56 and 58). In multiparous women, more common risk factors included BMI > 35/m2, previous caesarean section, post-term pregnancy and known carriage of GBS; BMI > 35 kg/m2 and post-term pregnancy were more common in the planned home and FMU birth group, previous caesarean section was most common in the planned OU group (30.4%), and known carriage of GBS was more common in the planned AMU (19.9%) and OU (12.0%) groups (see Table 57 and 59).
‘Complicating conditions’ identified at the start of labour care
The proportion of ‘higher risk’ women who had one or more ‘complicating condition’ noted at the start of care in labour was lower in women planning birth in all non-OU settings than in women planning OU birth (12.4–13.0% vs. 38.4% nulliparous, 5.4–10.3% vs. 22.6% multiparous) (see Tables 60 and 61). Compared with ‘higher risk’ women in the planned OU group, a lower proportion of ‘higher risk’ women planning birth in non-OU settings had multiple ‘complicating conditions’ identified (0.5–2.9% vs. 10.8% nulliparous, 0.5–0.8% vs. 3.5% multiparous).
Objective 2: management and risk of transfer in ‘higher risk’ women
Timing and reason for transfer
Overall, the proportion of ‘higher risk’ women who were transferred during labour or after birth was similar in all three non-OU settings (Table 62). In total, 18.4%, 21.6% and 25.0% of ‘higher risk’ women were transferred before birth from the planned home, FMU and AMU groups, respectively. The proportion of ‘higher risk’ women transferred before birth was higher in nulliparous women (37.6–45.0%) than in multiparous women (11.2–13.9%). A lower proportion of ‘higher risk’ women planning AMU birth (3.6%) were transferred after the birth than of women planning birth in FMUs (7.8%) or at home (8.5%). The proportion of women transferred after birth was broadly similar in nulliparous and multiparous women in the planned home and AMU groups, but in the planned FMU group relatively more nulliparous women were transferred after birth (10.4% vs. 6.6% in multiparous women).
| Home (N = 1489) | FMU (N = 329) | AMU (N = 810) | ||||
|---|---|---|---|---|---|---|
| n | Weighted % | n | Weighted % | n | Weighted % | |
| Overall | ||||||
| Not transferred | 1077 | 73.1 | 235 | 70.6 | 588 | 71.4 |
| Before birth | 284 | 18.4 | 75 | 21.6 | 191 | 25.0 |
| After birth | 126 | 8.5 | 19 | 7.8 | 30 | 3.6 |
| Missing | 2 | – | 0 | – | 1 | – |
| Nulliparous | ||||||
| Not transferred | 145 | 53.9 | 47 | 44.5 | 168 | 53.5 |
| Before birth | 120 | 37.6 | 47 | 45.0 | 129 | 42.9 |
| After birth | 23 | 8.6 | 10 | 10.4 | 11 | 3.7 |
| Missing | 0 | – | 0 | – | 0 | – |
| Multiparous | ||||||
| Not transferred | 932 | 77.6 | 188 | 82.3 | 420 | 82.7 |
| Before birth | 164 | 13.9 | 28 | 11.2 | 62 | 13.7 |
| After birth | 103 | 8.5 | 9 | 6.6 | 19 | 3.6 |
| Missing | 2 | – | 0 | – | 1 | – |
The reasons for transfer in ‘higher risk’ women are summarised in Table 63. Compared with the planned home birth group, a higher proportion of ‘higher risk’ women planning birth in a FMU or AMU were transferred, primarily because they had risk factors that made them ineligible for non-OU birth. Compared with the other two settings, a smaller proportion of women planning AMU birth were transferred because of a retained placenta and no women were transferred because of neonatal concerns, possibly reflecting the fact that the mother did not need to be transferred if the baby needed admission to higher-level care.
| Home (N = 1489) | FMU (N = 329) | AMU (N = 810) | ||||
|---|---|---|---|---|---|---|
| n | Weighted % | n | Weighted % | n | Weighted % | |
| Not transferred | 1077 | 73.1 | 235 | 70.6 | 588 | 71.4 |
| Transfers before birtha | ||||||
| Failure to progress (first stage) | 87 | 5.5 | 25 | 7.6 | 42 | 4.9 |
| Fetal distress (first stage) | 20 | 1.3 | 7 | 2.2 | 15 | 2.5 |
| Meconium staining | 32 | 2.1 | 6 | 1.4 | 15 | 2.1 |
| Epidural request | 26 | 1.8 | 3 | 0.7 | 20 | 2.9 |
| Hypertension | 19 | 1.2 | 5 | 1.5 | 15 | 1.7 |
| Malposition | 4 | 0.2 | 0 | 0 | 0 | 0 |
| Malpresentation | 9 | 0.6 | 0 | 0 | 10 | 1.2 |
| Antepartum haemorrhage | 10 | 0.8 | 2 | 0.5 | 3 | 0.4 |
| Failure to progress (second stage) | 31 | 1.9 | 9 | 2.1 | 27 | 3.5 |
| Fetal distress (second stage) | 4 | 0.2 | 1 | 0.2 | 9 | 1.2 |
| Pain relief | 6 | 0.4 | 0 | 0 | 0 | 0 |
| Risk factors and eligibility criteria | 8 | 0.6 | 8 | 2.6 | 24 | 3.3 |
| Other maternal (before birth) | 15 | 0.9 | 3 | 1.0 | 4 | 0.4 |
| Other fetal (before birth) | 9 | 0.6 | 5 | 1.4 | 3 | 0.4 |
| Other (before birth) | 3 | 0.2 | 0 | 0 | 1 | 0.2 |
| Missing (before birth) | 1 | 0.1 | 1 | 0.5 | 3 | 0.4 |
| Total (before birth) | 284 | 18.4 | 75 | 21.6 | 191 | 25.0 |
| Transfers after birthb | ||||||
| Postpartum haemorrhage | 23 | 1.5 | 3 | 1.1 | 8 | 1.2 |
| Retained placenta | 31 | 2.2 | 2 | 2.6 | 7 | 0.9 |
| Repair of perineal trauma | 32 | 2.1 | 6 | 1.9 | 15 | 1.6 |
| Other maternal (after birth) | 5 | 0.3 | 2 | 0.4 | 0 | 0 |
| Neonatal concerns | 33 | 2.4 | 5 | 1.5 | 0 | 0 |
| Other (after birth) | 1 | 0.1 | 1 | 0.3 | 0 | 0 |
| Missing (after birth) | 1 | 0.1 | 0 | 0 | 0 | 0 |
| Total (after birth) | 126 | 8.5 | 19 | 7.8 | 30 | 3.6 |
| Reason and timing missing | 2 | – | 0 | – | 1 | – |
The risk of transfer in women with different ‘risk status’
Table 64 shows transfer rates in ‘low risk’ and ‘higher risk’ women with and without ‘complicating conditions’ identified at the start of labour care in all three non-OU settings. As previously shown in Chapter 5, in nulliparous and multiparous ‘low risk’ women, those with ‘complicating conditions’ had a higher risk of transfer. The pattern of risk of transfer in ‘higher risk’ women with and without ‘complicating conditions’ compared with ‘low risk’ women was different in the different settings.
| ‘Low risk’ women: ‘complicating conditions’ | ‘Higher risk’ women: ‘complicating conditions’ | |||||||||||
|---|---|---|---|---|---|---|---|---|---|---|---|---|
| No | Yes | No | Yes | |||||||||
| Events/total | Weighted % | (95% CI) | Events/total | Weighted % | (95% CI) | Events/total | Weighted % | (95% CI) | Events/total | Weighted % | (95% CI) | |
| Overall | ||||||||||||
| Home | 2951/15,556 | 18.6 | (17.5 to 19.8) | 478/884 | 53.5 | (48.8 to 58.2) | 334/1325 | 24.4 | (21.7 to 27.2) | 75/141 | 55.4 | (46.1 to 64.3) |
| FMU | 2146/10,567 | 19.4 | (17.8 to 21.1) | 286/614 | 42.9 | (34.6 to 51.6) | 78/300 | 27.5 | (21.0 to 35.2) | 16/28 | 56.6 | (37.0 to 74.3) |
| AMU | 3800/15,362 | 25.1 | (22.9 to 27.4) | 543/1147 | 47.9 | (42.3 to 53.4) | 175/716 | 25.8 | (23.1 to 28.7) | 47/91 | 53.1 | (42.1 to 63.9) |
| Nulliparous | ||||||||||||
| Home | 1706/4047 | 41.2 | (39.0 to 43.5) | 287/394 | 74.5 | (68.5 to 79.7) | 117/251 | 42.6 | (36.2 to 49.2) | 24/34 | 70.6 | (48.7 to 85.8) |
| FMU | 1647/4779 | 32.7 | (30.0 to 35.6) | 218/364 | 57.1 | (47.4 to 66.2) | 44/90 | 50.3 | (37.3 to 63.2) | 13/14 | 92.5 | (58.4 to 99.1) |
| AMU | 2887/7536 | 38.3 | (35.3 to 41.4) | 424/719 | 59.3 | (53.8 to 64.7) | 112/268 | 43.4 | (36.7 to 50.4) | 28/39 | 70.1 | (59.0 to 79.3) |
| Multiparous | ||||||||||||
| Home | 1245/11,509 | 10.6 | (9.8 to 11.4) | 191/490 | 36.5 | (30.9 to 42.5) | 217/1074 | 20.3 | (17.7 to 23.1) | 51/107 | 50.0 | (40.7 to 59.4) |
| FMU | 499/5788 | 8.6 | (7.6 to 9.7) | 68/250 | 23.4 | (16.1 to 32.8) | 34/210 | 18.0 | (11.9 to 26.2) | 3/14 | 19.4 | (4.9 to 52.6) |
| AMU | 913/7826 | 12.1 | (10.7 to 13.6) | 119/428 | 27.7 | (22.0 to 34.1) | 63/448 | 15.0 | (11.8 to 19.0) | 19/52 | 40.0 | (24.2 to 58.2) |
‘Risk status’ and transfers from alongside midwifery units
In the planned AMU group ‘higher risk’ women without ‘complicating conditions’ had similar transfer rates to ‘low risk’ women without ‘complicating conditions’, in both nulliparous and multiparous women (see Table 64). ‘higher risk’ women with ‘complicating conditions’ had higher transfer rates than ‘low risk’ women with ‘complicating conditions’.
Absolute risks of transfer were slightly higher in ‘higher risk’ women planning AMU birth compared with ‘low risk’ women in the same setting; after adjustment for maternal characteristics ‘higher risk’ women had a small but statistically significant increased risk of transfer compared with ‘low risk’ women (Table 65). This association was the same in the restricted population of women without ‘complicating conditions’ at the start of labour care.
| Transfers | Births | Weighted % (95% CI) | Unadjusted RR (95% CI) | Adjusted RRa (95% CI) | |
|---|---|---|---|---|---|
| All planned AMU births | |||||
| Overall (Wald test for interaction, p = 0.23b) | |||||
| ‘Low risk’ | 4356 | 16,551 | 26.7 (24.4 to 29.1) | 1 | 1 |
| ‘Higher risk’ | 222 | 810 | 28.7 (24.8 to 33.0) | 1.07 (0.92 to 1.25) | 1.27 (1.04 to 1.55) |
| Nulliparous | |||||
| ‘Low risk’ | 3321 | 8276 | 40.2 (37.1 to 43.4) | 1 | 1 |
| ‘Higher risk’ | 140 | 308 | 46.5 (38.9 to 54.3) | 1.16 (0.96 to 1.39) | 1.18 (0.91 to 1.54) |
| Multiparous | |||||
| ‘Low risk’ | 1035 | 8275 | 12.9 (11.5 to 14.5) | 1 | 1 |
| ‘Higher risk’ | 82 | 502 | 17.5 (13.8 to 22.0) | 1.36 (1.05 to 1.75) | 1.45 (1.08 to 1.94) |
| Planned AMU births in women without ‘complicating conditions’ | |||||
| Overall (Wald test for interaction, p = 0.52b) | |||||
| ‘Low risk’ | 3800 | 15,362 | 25.1 (22.9 to 27.5) | 1 | 1 |
| ‘Higher risk’ | 175 | 716 | 25.8 (23.0 to 28.8) | 1.03 (0.91 to 1.17) | 1.24 (1.02 to 1.50) |
| Nulliparous | |||||
| ‘Low risk’ | 2887 | 7536 | 38.3 (35.2 to 41.5) | 1 | 1 |
| ‘Higher risk’ | 112 | 268 | 43.4 (36.5 to 50.6) | 1.13 (0.94 to 1.37) | 1.16 (0.88 to 1.52) |
| Multiparous | |||||
| ‘Low risk’ | 913 | 7826 | 12.1 (10.7 to 13.7) | 1 | 1 |
| ‘Higher risk’ | 63 | 448 | 15.0 (11.7 to 19.1) | 1.24 (0.96 to 1.61) | 1.40 (1.03 to 1.92) |
‘Risk status’ and transfers from freestanding midwifery units
In the planned FMU group the numbers of ‘higher risk’ nulliparous women and ‘higher risk’ women with ‘complicating conditions’ were small (see Table 64). ‘higher risk’ women planning FMU birth had higher absolute and RRs of transfer than ‘low risk’ women (Table 66 and see Table 64). ‘higher risk’ women planning FMU birth had about twice the risk of transfer as ‘low risk’ women in the same setting after adjusting for maternal sociodemographic characteristics (adjusted RR 1.99, 95% CI 1.58 to 2.51) and this association was the same in the restricted population of women without ‘complicating conditions’ at the start of labour care. There was no statistically significant interaction between parity and risk status, indicating that the association between risk status and transfer was the same in nulliparous and multiparous women.
| Transfers | Births | Weighted % (95% CI) | Unadjusted RR (95% CI) | Adjusted RRa (95% CI) | |
|---|---|---|---|---|---|
| All planned FMU births | |||||
| Overall (Wald test for interaction, p = 0.26b) | |||||
| ‘Low risk’ | 2435 | 11,197 | 20.8 (19.0 to 22.7) | 1 | 1 |
| ‘Higher risk’ | 94 | 329 | 29.4 (23.0 to 36.7) | 1.42 (1.17 to 1.71) | 1.99 (1.58 to 2.51) |
| Nulliparous | |||||
| ‘Low risk’ | 1868 | 5152 | 34.5 (31.6 to 37.4) | 1 | 1 |
| ‘Higher risk’ | 57 | 104 | 55.5 (43.5 to 66.9) | 1.61 (1.34 to 1.93) | 1.62 (1.25 to 2.10) |
| Multiparous | |||||
| ‘Low risk’ | 567 | 6045 | 9.2 (8.1 to 10.5) | 1 | 1 |
| ‘Higher risk’ | 37 | 225 | 17.7 (12.0 to 25.5) | 1.93 (1.37 to 2.70) | 2.68 (1.88 to 3.82) |
| Planned FMU births in women without ‘complicating conditions’ | |||||
| Overall (Wald test for interaction, p = 0.11b) | |||||
| ‘Low risk’ | 2146 | 10,567 | 19.4 (17.7 to 21.2) | 1 | 1 |
| ‘Higher risk’ | 78 | 300 | 27.5 (20.8 to 35.4) | 1.42 (1.13 to 1.78) | 2.03 (1.56 to 2.64) |
| Nulliparous | |||||
| ‘Low risk’ | 1647 | 4779 | 32.7 (29.9 to 35.7) | 1 | 1 |
| ‘Higher risk’ | 44 | 90 | 50.3 (37.0 to 63.5) | 1.54 (1.20 to 1.97) | 1.55 (1.13 to 2.14) |
| Multiparous | |||||
| ‘Low risk’ | 499 | 5788 | 8.6 (7.5 to 9.7) | 1 | 1 |
| ‘Higher risk’ | 34 | 210 | 18.0 (11.8 to 26.4) | 2.10 (1.45 to 3.05) | 2.83 (1.95 to 4.12) |
‘Risk status’ and transfers from home
In the planned home birth group, transfer rates in ‘higher risk’ nulliparous women were similar to those in ‘low risk’ nulliparous women, both in women with and without ‘complicating conditions’ (see Table 64). In the larger group of multiparous women planning home birth, ‘higher risk’ women had higher transfer rates compared with ‘low risk’ women.
Comparing all ‘higher risk’ women planning home birth with ‘low risk’ women, ‘higher risk’ nulliparous women had the same risk of transfer as ‘low risk’ women planning birth in the same setting after adjustment for maternal characteristics (adjusted RR 0.93, 95% CI 0.78 to 1.10) (Table 67). In multiparous women planning home birth, ‘higher risk’ women had a significantly higher risk of transfer compared with ‘low risk’ women (adjusted RR 2.16 95% CI 1.89 to 2.47). The association between risk status and risk of transfer remained the same when the analysis was restricted to women without ‘complicating conditions’ at the start of care in labour (see Table 67).
| Transfers | Births | Weighted % (95% CI) | Unadjusted RR (95% CI) | Adjusted RRa (95% CI) | |
|---|---|---|---|---|---|
| All planned home births (Wald test for interaction, p < 0.001b) | |||||
| Nulliparous | |||||
| ‘Low risk’ | 2008 | 4489 | 44.1 (41.8 to 46.5) | 1 | 1 |
| ‘Higher risk’ | 143 | 288 | 46.1 (40.5 to 51.9) | 1.04 (0.93 to 1.18) | 0.93 (0.78 to 1.10) |
| Multiparous | |||||
| ‘Low risk’ | 1448 | 12,130 | 11.6 (10.8 to 12.5) | 1 | 1 |
| ‘Higher risk’ | 269 | 1201 | 22.7 (20.1 to 25.4) | 1.95 (1.72 to 2.21) | 2.16 (1.89 to 2.47) |
| Planned home births in women without ‘complicating conditions’ (Wald test for interaction, p < 0.001b) | |||||
| Nulliparous | |||||
| ‘Low risk’ | 1706 | 4047 | 41.2 (39.0 to 43.5) | 1 | 1 |
| ‘Higher risk’ | 117 | 251 | 42.6 (36.2 to 49.2) | 1.03 (0.89 to 1.20) | 0.90 (0.71 to 1.13) |
| Multiparous | |||||
| ‘Low risk’ | 1245 | 11,509 | 10.6 (9.8 to 11.4) | 1 | 1 |
| ‘Higher risk’ | 217 | 1074 | 20.3 (17.7 to 23.1) | 1.92 (1.67 to 2.20) | 2.17 (1.87 to 2.51) |
‘Risk status’ and the timing of the decision to transfer
In ‘higher risk’ women who were transferred before birth from non-OU settings we explored time from the start of care in labour to when the decision to transfer was made; this varied, largely according to whether or not the women had ‘complicating conditions’ identified at the start of labour care (Figures 25–27). In all three settings decisions to transfer were taken earlier, on average, in ‘low risk’ women who had ‘complicating conditions’ identified than in ‘higher risk’ women without ‘complicating conditions’.
FIGURE 25.
Time from start of labour care to decision to transfer in ‘higher risk’ and ‘low risk’ women transferred from a planned home birth.
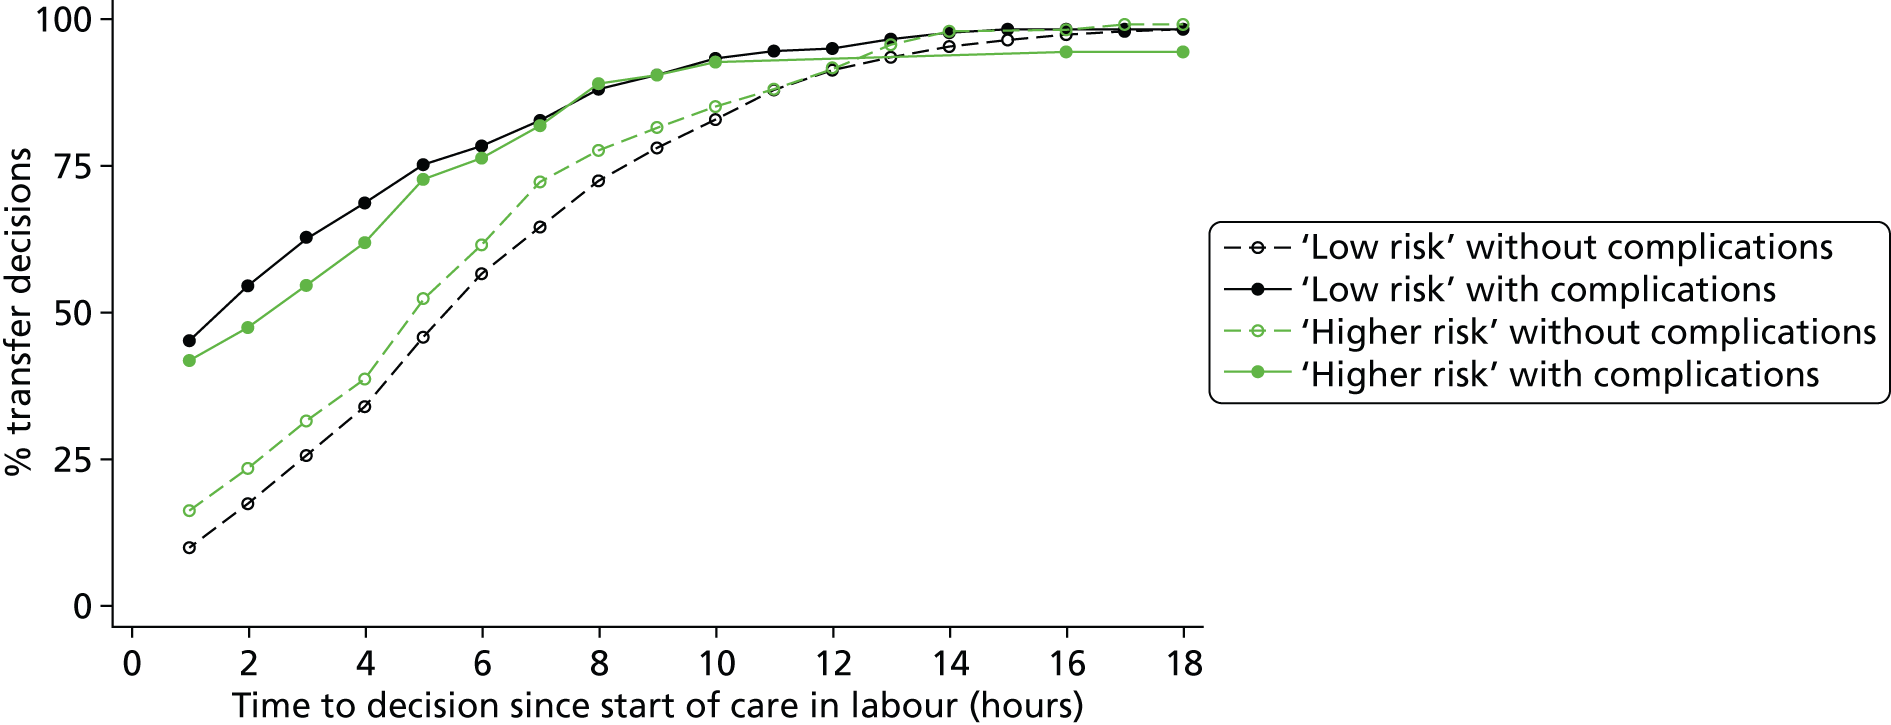
FIGURE 26.
Time from start of labour care to decision to transfer in ‘higher risk’ and ‘low risk’ women transferred from a planned FMU birth.
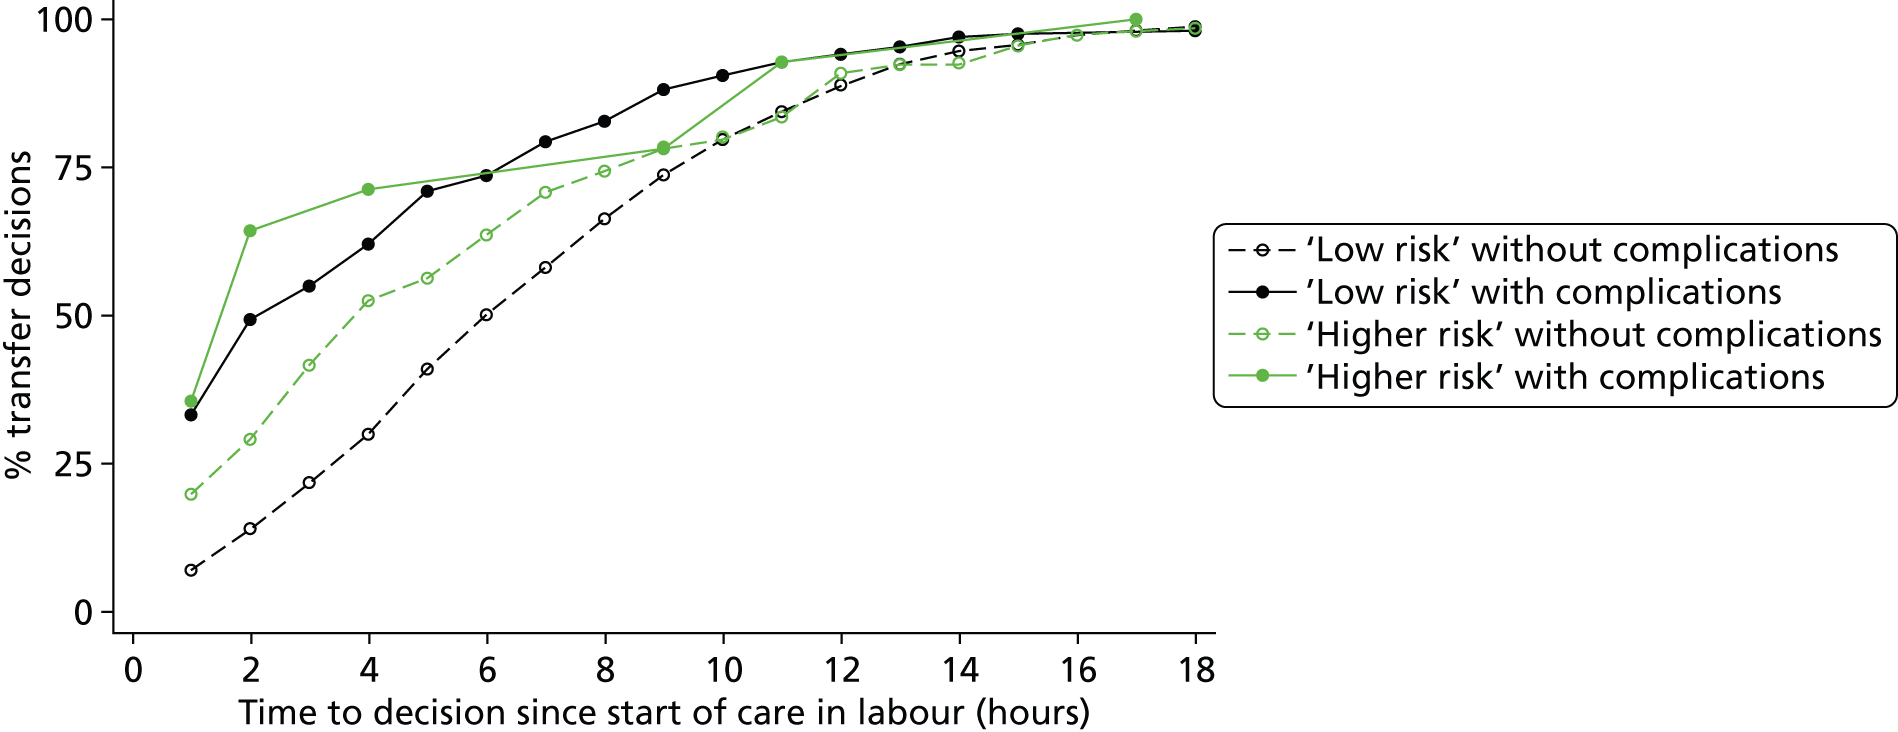
FIGURE 27.
Time from start of labour care to decision to transfer in ‘higher risk’ and ‘low risk’ women transferred from a planned AMU birth.
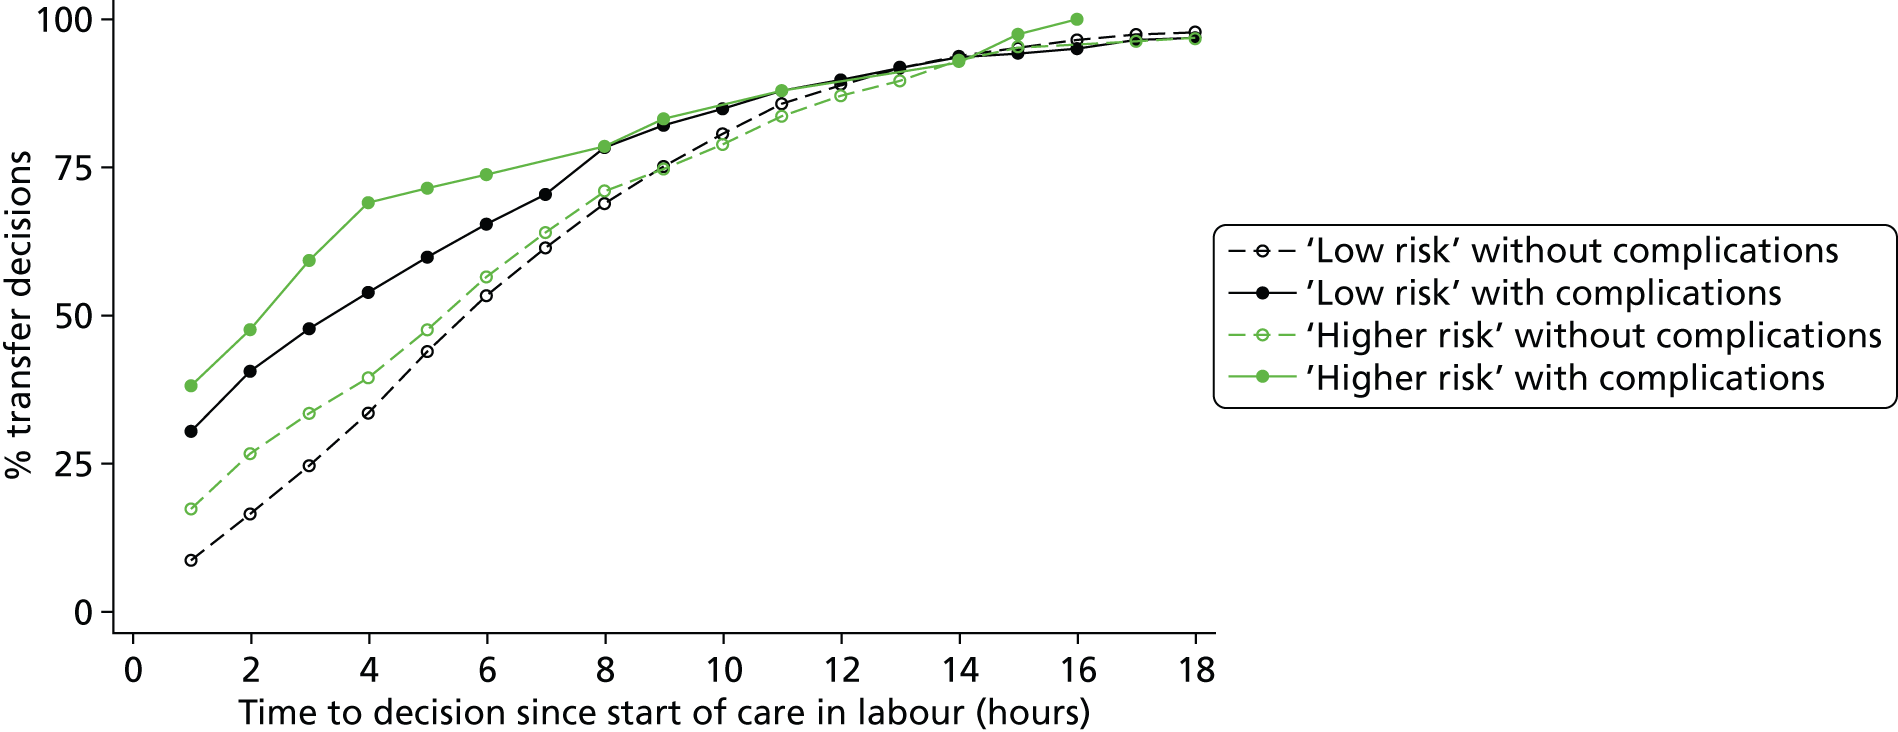
In ‘higher risk’ women planning home birth who had ‘complicating conditions’ identified at the start of labour care and were transferred, the decision to transfer was made within 2 hours of the start of labour care in around 50% of cases; the proportion of transfers where the decision was taken within the first 2 hours of labour care was similar in ‘low risk’ women with ‘complicating conditions’ planning home birth (see Figure 25). In contrast, in ‘higher risk’ women who did not have any ‘complicating condition’ identified, around 25% of transfer decisions were made within the first 2 hours.
In the planned FMU group the timing of transfer showed a similar pattern, but in women without ‘complicating conditions’ the decision to transfer appeared to be made earlier for ‘higher risk’ women transferred than for ‘low risk’ women, although numbers were small (see Figure 26).
In women transferred from AMUs, the timing of the decision to transfer followed a broadly similar pattern to the planned home birth group (see Figure 27).
Perinatal and maternal outcomes in ‘higher risk’ women planning home birth
When considering perinatal and maternal outcomes in ‘higher risk’ women planning non-OU birth we focused on planned home births because the number of ‘higher risk’ women planning birth in the two MU settings was relatively small. We compared perinatal outcomes in ‘higher risk’ and ‘low risk’ women planning home birth, and compared perinatal and maternal outcomes in ‘higher risk’ women planning home birth with ‘higher risk’ women planning OU birth (excluding women with planned induction of labour).
Perinatal outcomes in ‘higher risk’ versus ‘low risk’ women planning home birth
In planned home births, the absolute risk of an adverse perinatal outcome (‘main composite’ encompassing intrapartum-related mortality and morbidity and admission to a neonatal unit within 48 hours of birth for > 48 hours) was significantly higher in ‘higher risk’ women than ‘low risk’ women planning birth in the same setting (adjusted RR 1.89, 95% CI 1.23 to 2.90) (Table 68). Adjusted RRs did not differ significantly by parity. The excess risk in ‘higher risk’ versus ‘low risk’ planned home births was not statistically significant when the analysis was restricted to women without ‘complicating conditions’ at the start of care in labour (adjusted RR 1.66, 95% CI 0.95 to 2.91).
| Events | Births | Weighted n/1000 (95% CI) | Unadjusted RR (95% CI) | Adjusted RRb (95% CI) | |
|---|---|---|---|---|---|
| All planned home births (‘population 1’) | |||||
| Overall (Wald test for interaction, p = 0.93c) | |||||
| ‘Low risk’ | 177 | 16,309 | 10.7 (9.0 to 12.8) | 1 | 1 |
| ‘Higher risk’ | 25 | 1469 | 15.2 (9.9 to 23.2) | 1.42 (0.94 to 2.14) | 1.89 (1.23 to 2.90) |
| Nulliparous | |||||
| ‘Low risk’ | 84 | 4399 | 19.3 (15.2 to 24.4) | 1 | 1 |
| ‘Higher risk’ | 9 | 283 | 27.7 (12.5 to 60.2) | 1.44 (0.61 to 3.37) | 1.82 (0.89 to 3.72) |
| Multiparous | |||||
| ‘Low risk’ | 93 | 11,910 | 7.5 (6.1 to 9.3) | 1 | 1 |
| ‘Higher risk’ | 16 | 1186 | 12.3 (6.8 to 22.2) | 1.63 (0.88 to 3.03) | 1.92 (1.02 to 3.64) |
| Planned home births in women without ‘complicating conditions’ (‘population 2’) | |||||
| Overall (Wald test for interaction, p = 0.83c) | |||||
| ‘Low risk’ | 151 | 15,318 | 9.9 (8.1 to 12.0) | 1 | 1 |
| ‘Higher risk’ | 18 | 1310 | 12.4 (7.3 to 21.3) | 1.26 (0.75 to 2.13) | 1.66 (0.95 to 2.91) |
| Nulliparous | |||||
| ‘Low risk’ | 69 | 3983 | 17.8 (13.5 to 23.5) | 1 | 1 |
| ‘Higher risk’ | 6 | 248 | 21.1 (8.5 to 51.0) | 1.18 (0.45 to 3.13) | 1.69 (0.73 to 3.89) |
| Multiparous | |||||
| ‘Low risk’ | 82 | 11,335 | 7.1 (5.6 to 8.8) | 1 | 1 |
| ‘Higher risk’ | 12 | 1062 | 10.5 (5.0 to 21.9) | 1.49 (0.71 to 3.12) | 1.69 (0.79 to 3.61) |
Perinatal outcomes in ‘higher risk’ women planning home birth versus ‘higher risk’ women planning obstetric unit birth
In both nulliparous and multiparous ‘higher risk’ women, the proportion of births with an adverse perinatal outcome as measured by the more restrictive of our two perinatal outcome measures (the ‘intrapartum composite’) was higher in planned home births (Table 69) than in planned OU births, but the number of events was small (n = 41) and the difference was not statistically significant (RR adjusted for parity 1.92, 95% CI 0.97 to 3.80). Findings were similar when the analysis was restricted to women without ‘complicating conditions’ at the start of care in labour (see Table 69).
| Events | Births | Weighted n/1000 (95% CI) | Unadjusted RR (95% CI) | Adjusted RRb (95% CI) | |
|---|---|---|---|---|---|
| All ‘higher risk’ women (‘population 1’) | |||||
| Overall (Wald test for interaction, p = 0.88c) | |||||
| OU | 29 | 6648 | 4.2 (2.9 to 6.1) | 1 | 1 |
| Home | 12 | 1471 | 7.1 (4.1 to 12.2) | 1.68 (0.87 to 3.25) | 1.92 (0.97 to 3.80) |
| Nulliparous | |||||
| OU | 15 | 2508 | 6.0 (3.7 to 9.7) | 1 | N/A |
| Home | 4 | 284 | 10.6 (4.2 to 26.8) | 1.77 (0.62 to 5.05) | N/A |
| Multiparous | |||||
| OU | 14 | 4140 | 3.1 (1.8 to 5.5) | 1 | N/A |
| Home | 8 | 1187 | 6.2 (3.0 to 12.9) | 1.99 (0.79 to 5.00) | N/A |
| ‘Higher risk’ women without ‘complicating conditions’ (‘population 2’) | |||||
| Overall (Wald test for interaction, p = 0.53c) | |||||
| OU | 18 | 4715 | 3.8 (2.6 to 5.6) | 1 | 1 |
| Home | 10 | 1312 | 6.7 (3.6 to 12.4) | 1.75 (0.84 to 3.62) | 2.05 (0.98 to 4.29) |
| Nulliparous | |||||
| OU | 10 | 1528 | 6.5 (3.7 to 11.5) | 1 | N/A |
| Home | 3 | 249 | 9.2 (3.0 to 27.6) | 1.41 (0.41 to 4.87) | N/A |
| Multiparous | |||||
| OU | 8 | 3187 | 2.5 (1.3 to 4.8) | 1 | N/A |
| Home | 7 | 1063 | 6.1 (2.8 to 13.4) | 2.43 (0.88 to 6.71) | N/A |
When the measure of adverse perinatal outcome was extended by including neonatal unit admissions for > 48 hours (‘main composite’), the number of adverse outcomes increased to 240: 41 of these were events included in the ‘intrapartum composite’ and 199 involved neonatal unit admissions for > 48 hours for other reasons. In the latter group, hypoglycaemia and/or sepsis or suspected sepsis were mentioned as reasons for admission in 50% of admissions where a reason was available (n = 188, data not shown). The composition of adverse outcomes differed by setting. In planned OU births, events included in the ‘intrapartum composite’ comprised 12.4% of the ‘main composite’ outcomes, with neonatal unit admissions for > 48 hours for other reasons accounting for the vast majority (87.6%) of events (Table 70). In contrast, among planned home births the ‘intrapartum composite’ outcomes comprised 46.7% of the ‘main composite’ outcomes, and neonatal unit admissions for > 48 hours for other reasons accounted for only 53.3% of events.
| OU | Home | |||
|---|---|---|---|---|
| n | Weighted % | n | Weighted % | |
| Stillbirth | 3 | 1.1 | 3 | 10.8 |
| Early neonatal death (within 7 days) | 3 | 1.4 | 2 | 8.3 |
| Neonatal encephalopathy (clinical diagnosis) | 9 | 4.0 | 3 | 10.8 |
| Neonatal encephalopathy (signs) | 4 | 1.9 | 0 | – |
| Meconium aspiration syndrome | 6 | 2.4 | 3 | 12.5 |
| Brachial plexus | 4 | 1.6 | 1 | 4.3 |
| Fractured humerus | 0 | – | 0 | – |
| Fractured clavicle | 0 | – | 0 | – |
| Admission to neonatal unit within 48 hours for > 48 hours | 186 | 87.6 | 13 | 53.3 |
| Total | 215 | 100.0 | 25 | 100.0 |
In both nulliparous and multiparous ‘higher risk’ women, the risk of an adverse perinatal outcome (‘main composite’) was lower in planned home births than in planned OU births (nulliparous women: 27.7 per 1000 planned home births vs. 46.0 per 1000 planned OU births; multiparous women: 12.3 per 1000 planned home births vs. 26.8 per 1000 planned OU births) (Table 71). Absolute event rates were higher in nulliparous women, but there was no evidence that the relative decrease in the risk of an adverse event (‘main composite’) in planned home births differed by parity. Overall, the risk of the ‘main composite’ outcome was significantly lower in planned home births than in planned OU births (adjusted RR 0.50, 95% CI 0.31 to 0.81). A similar pattern was observed when the analysis was restricted to ‘higher risk’ women without ‘complicating conditions’, indicating that the risk of neonatal unit admission was higher in planned OU births even in the absence of complications such as prolonged rupture of membranes and meconium staining (see Table 18).
| Events | Births | Weighted n/1000 (95% CI) | Unadjusted RR (95% CI) | Adjusted RRa (95% CI) | |
|---|---|---|---|---|---|
| All ‘higher risk’ women (‘population 1’) | |||||
| Overall (Wald test for interaction, p = 0.64b) | |||||
| OU | 215 | 6636 | 34.0 (26.7 to 43.2) | 1 | 1 |
| Home | 25 | 1469 | 15.2 (9.9 to 23.2) | 0.45 (0.27 to 0.73) | 0.50 (0.31 to 0.81) |
| Nulliparous | |||||
| OU | 107 | 2503 | 46.0 (33.2 to 63.4) | 1 | 1 |
| Home | 9 | 283 | 27.7 (12.5 to 60.3) | 0.60 (0.26 to 1.41) | 0.60 (0.25 to 1.43) |
| Multiparous | |||||
| OU | 108 | 4133 | 26.8 (21.6 to 33.1) | 1 | 1 |
| Home | 16 | 1186 | 12.3 (6.8 to 22.2) | 0.46 (0.24 to 0.86) | 0.47 (0.25 to 0.88) |
| ‘Higher risk’ women without ‘complicating conditions’ (‘population 2’) | |||||
| Overall (Wald test for interaction, p = 0.91b) | |||||
| OU | 139 | 4711 | 31.1 (24.3 to 39.7) | 1 | 1 |
| Home | 18 | 1310 | 12.4 (7.3 to 21.2) | 0.40 (0.22 to 0.72) | 0.42 (0.23 to 0.76) |
| Nulliparous | |||||
| OU | 64 | 1528 | 44.7 (31.1 to 63.9) | 1 | 1 |
| Home | 6 | 248 | 21.1 (8.5 to 51.1) | 0.47 (0.18 to 1.24) | 0.43 (0.16 to 1.16) |
| Multiparous | |||||
| OU | 75 | 3183 | 24.6 (19.4 to 31.0) | 1 | 1 |
| Home | 12 | 1062 | 10.5 (5.1 to 21.9) | 0.43 (0.20 to 0.93) | 0.41 (0.18 to 0.89) |
Maternal interventions and adverse maternal outcomes
Compared with planned OU birth, planned home birth was associated with a significantly lower risk of intrapartum interventions and adverse maternal outcomes requiring obstetric care in both nulliparous and multiparous ‘higher risk’ women and a significantly higher probability of ‘straightforward birth’ in both nulliparous and multiparous ‘higher risk’ women (Table 72).
| Events | Births | Weighted % (95% CI) | Unadjusted RR (95% CI) | Adjusted RRa (95% CI) | |
|---|---|---|---|---|---|
| All ‘higher risk’ women (‘population 1’) | |||||
| Interventions and adverse maternal outcomes requiring obstetric care (‘maternal composite’b) | |||||
| Nulliparous | |||||
| OU | 1599 | 2491 | 64.6 (61.5 to 67.6) | 1 | 1 |
| Home | 103 | 282 | 33.8 (27.7 to 40.4) | 0.52 (0.43 to 0.64) | 0.48 (0.40 to 0.58) |
| Multiparous | |||||
| OU | 1463 | 4102 | 35.7 (33.6 to 38.0) | 1 | 1 |
| Home | 108 | 1186 | 8.9 (7.3 to 10.9) | 0.25 (0.20 to 0.31) | 0.26 (0.21 to 0.32) |
| Wald test for interaction, p < 0.001c | |||||
| ‘Straightforward birth’ d | |||||
| Nulliparous | |||||
| OU | 1305 | 2504 | 51.7 (48.9 to 54.4) | 1 | 1 |
| Home | 201 | 284 | 73.5 (66.8 to 79.2) | 1.42 (1.29 to 1.57) | 1.63 (1.47 to 1.81) |
| Multiparous | |||||
| OU | 3109 | 4138 | 74.7 (72.9 to 76.4) | 1 | 1 |
| Home | 1101 | 1189 | 92.7 (91.1 to 94.1) | 1.24 (1.21 to 1.28) | 1.20 (1.16 to 1.23) |
| Wald test for interaction, p < 0.001c | |||||
| ‘Higher risk’ women without ‘complicating conditions’ (‘population 2’) | |||||
| Interventions and adverse maternal outcomes requiring obstetric care (‘maternal composite’b) | |||||
| Nulliparous | |||||
| OU | 841 | 1510 | 56.6 (52.8 to 60.3) | 1 | 1 |
| Home | 85 | 247 | 31.4 (24.7 to 39.0) | 0.55 (0.44 to 0.70) | 0.50 (0.40 to 0.63) |
| Multiparous | |||||
| OU | 969 | 3154 | 30.7 (28.7 to 32.8) | 1 | 1 |
| Home | 86 | 1064 | 7.9 (6.3 to 9.8) | 0.26 (0.20 to 0.32) | 0.26 (0.21 to 0.34) |
| Wald test for interaction, p < 0.001c | |||||
| ‘Straightforward birth’d | |||||
| Nulliparous | |||||
| OU | 906 | 1523 | 59.0 (55.9 to 62.0) | 1 | 1 |
| Home | 180 | 247 | 75.9 (68.8 to 81.8) | 1.29 (1.17 to 1.42) | 1.43 (1.29 to 1.58) |
| Multiparous | |||||
| OU | 2484 | 3181 | 77.7 (76.0 to 79.4) | 1 | 1 |
| Home | 992 | 1065 | 93.4 (91.5 to 94.8) | 1.20 (1.17 to 1.24) | 1.17 (1.13 to 1.20) |
| Wald test for interaction, p < 0.001c | |||||
Sensitivity analyses
Restricting the analyses of the ‘main composite’ perinatal outcome to women without ‘complicating conditions’ (‘population 2’) (see Table 71) and to women without ‘complicating conditions’ and with only one specified risk factor (‘population 3’) (Table 73) did not show any clear differences from the unrestricted analysis (adjusted RR 0.50, 0.42 and 0.48 in populations 1–3, respectively).
| Events | Births | Weighted n/1000 or % (95% CI) | Unadjusted RR (95% CI) | Adjusted RRa (95% CI) | |
|---|---|---|---|---|---|
| Adverse perinatal outcomes (‘main composite’) | n/1000 | ||||
| Overall (Wald test for interaction, p = 0.98b) | |||||
| OU | 94 | 3827 | 26.2 (19.9 to 34.4) | 1 | 1 |
| Home | 15 | 1072 | 12.7 (7.3 to 22.1) | 0.49 (0.26 to 0.90) | 0.48 (0.26 to 0.90) |
| Nulliparous | |||||
| OU | 43 | 1262 | 36.9 (24.7 to 54.7) | 1 | 1 |
| Home | 5 | 205 | 21.4 (7.7 to 57.7) | 0.58 (0.20 to 1.71) | 0.52 (0.17 to 1.58) |
| Multiparous | |||||
| OU | 51 | 2565 | 21.0 (15.3 to 28.8) | 1 | 1 |
| Home | 10 | 867 | 10.8 (5.2 to 22.3) | 0.52 (0.23 to 1.14) | 0.45 (0.20 to 1.03) |
| Maternal composite outcome | % | ||||
| Nulliparous | |||||
| OU | 673 | 1244 | 55.3 (51.4 to 59.1) | 1 | 1 |
| Home | 70 | 205 | 31.3 (24.1 to 39.5) | 0.57 (0.44 to 0.73) | 0.50 (0.39 to 0.64) |
| Multiparous | |||||
| OU | 754 | 2539 | 29.7 (27.2 to 32.2) | 1 | 1 |
| Home | 68 | 868 | 7.4 (5.8 to 9.5) | 0.25 (0.19 to 0.33) | 0.27 (0.21 to 0.35) |
| Wald test for interaction, p < 0.001b | |||||
| ‘Straightforward birth’ | % | ||||
| Nulliparous | |||||
| OU | 765 | 1256 | 60.3 (56.6 to 63.8) | 1 | 1 |
| Home | 151 | 205 | 76.6 (69.2 to 82.7) | 1.27 (1.14 to 1.41) | 1.41 (1.25 to 1.59) |
| Multiparous | |||||
| OU | 2003 | 2562 | 77.9 (76.0 to 79.8) | 1 | 1 |
| Home | 809 | 869 | 93.6 (91.5 to 95.1) | 1.20 (1.16 to 1.24) | 1.15 (1.11 to 1.19) |
| Wald test for interaction, p < 0.001b | |||||
Adjustment for maternal characteristics and controlling for differences in risk did not materially affect the risk of the ‘main composite’ outcome (Table 74). The unadjusted and adjusted ORs in the top half of Table 74 are comparable with the unadjusted and adjusted RRs for the ‘main composite’ outcome presented in Table 73. The difference between the OR adjusted for maternal characteristics and the OR additionally adjusted for risk arises in part because the fully adjusted analysis is based on a smaller subset of women. This smaller subset is used for the analyses reported in the lower half of the table. The purpose of restricting the analysis population to women included in the fully adjusted model is to enable the effect of adjusting for risk factors to be seen. However, this analysis population is smaller than ‘population 3’ (n = 3824 vs. n = 4897) because it excludes risk categories where there are no adverse events in one or other of the groups, and risk categories where there are no women with the risk factor in one or other of the groups.
| Events | Births | Weighted n/1000 (95% CI) | Unadjusted OR (95% CI) | Adjusteda OR (95% CI) | Fully adjusteda,b OR (95% CI) | |
|---|---|---|---|---|---|---|
| Nulliparous | ||||||
| OU | 43 | 1262 | 36.9 (24.7 to 54.7) | 1 | 1 | 1 |
| Home | 5 | 205 | 21.4 (7.7 to 57.7) | 0.57 (0.19 to 1.73) | 0.50 (0.15 to 1.64) | 0.63 (0.16 to 2.52) |
| Multiparous | ||||||
| OU | 51 | 2564 | 21.0 (15.3 to 28.8) | 1 | 1 | 1 |
| Home | 10 | 866 | 10.8 (5.2 to 22.3) | 0.51 (0.23 to 1.14) | 0.44 (0.19 to 1.03) | 0.38 (0.14 to 1.02) |
| ‘Population 3’ restricted to women included in the fully adjusted model above | ||||||
| Nulliparous | ||||||
| OU | 41 | 996 | 44.4 (29.6 to 66.1) | 1 | 1 | 1 |
| Home | 5 | 161 | 27.5 (9.9 to 73.9) | 0.61 (0.20 to 1.87) | 0.62 (0.18 to 2.14) | 0.63 (0.16 to 2.52) |
| Multiparous | ||||||
| OU | 51 | 1995 | 26.8 (19.6 to 36.6) | 1 | 1 | 1 |
| Home | 10 | 672 | 14.0 (6.8 to 28.7) | 0.51 (0.23 to 1.15) | 0.47 (0.20 to 1.08) | 0.38 (0.14 to 1.02) |
In a further post-hoc sensitivity analysis, in which we explored the effect of changing the cut-off for length of stay in the ‘main composite’ from 48 hours to 4 days, we found that the proportion of births with an adverse outcome decreased from 34.0 per 1000 births (95% CI 26.7 to 43.2) to 20.4 per 1000 births (95% CI 15.8 to 26.3) in the planned OU group and from 15.2 per 1000 births (95% CI 9.9 to 23.2) to 12.3 per 1000 births (95% CI 7.4 to 20.4) in the planned home birth group (Table 75). Overall, the difference in outcomes between settings was no longer statistically significant (adjusted RR 0.63, 95% CI 0.35 to 1.12), although the ‘direction of effect’ was unchanged.
| Events | Births | Weighted n/1000 (95% CI) | Unadjusted RR (95% CI) | Adjusted RRb (95% CI) | |
|---|---|---|---|---|---|
| All ‘higher risk’ women (‘population 1’) | |||||
| Overall (Wald test for interaction, p = 0.29c) | |||||
| OU | 130 | 6633 | 20.4 (15.8 to 26.3) | 1 | 1 |
| Home | 20 | 1469 | 12.3 (7.4 to 20.4) | 0.60 (0.34 to 1.07) | 0.63 (0.35 to 1.12) |
| Nulliparous | |||||
| OU | 62 | 2500 | 26.3 (18.9 to 36.6) | 1 | 1 |
| Home | 9 | 284 | 27.6 (12.4 to 60.1) | 1.05 (0.55 to 2.47) | 0.96 (0.40 to 2.30) |
| Multiparous | |||||
| OU | 68 | 4133 | 16.8 (13.1 to 21.4) | 1 | 1 |
| Home | 11 | 1185 | 8.7 (4.0 to 19.1) | 0.52 (0.23 to 1.18) | 0.51 (0.21 to 1.21) |
| ‘Higher risk’ women without ‘complicating conditions’ (‘population 2’) | |||||
| Overall (Wald test for interaction, p = 0.65c) | |||||
| OU | 86 | 4710 | 19.1 (14.8 to 24.5) | 1 | 1 |
| Home | 15 | 1310 | 10.3 (5.5 to 19.1) | 0.54 (0.28 to 1.06) | 0.51 (0.26 to 1.01) |
| Nulliparous | |||||
| OU | 39 | 1528 | 26.9 (18.6 to 38.7) | 1 | 1 |
| Home | 6 | 249 | 21.0 (8.5 to 51.0) | 0.78 (0.30 to 2.06) | 0.62 (0.23 to 1.67) |
| Multiparous | |||||
| OU | 47 | 3182 | 15.3 (11.9 to 19.7) | 1 | 1 |
| Home | 9 | 1061 | 7.9 (3.1 to 19.9) | 0.52 (0.20 to 1.35) | 0.46 (0.17 to 1.27) |
Discussion
Summary of main findings
Characteristics of ‘higher risk’ women planning birth in non-obstetric unit settings
‘Higher risk’ women who planned home birth were more likely to be older, white, multiparous, married/living with partner and living in less deprived areas than ‘higher risk’ women who planned OU birth. The sociodemographic characteristics of ‘higher risk’ women planning FMU birth were similar to those of the ‘higher risk’ planned home birth group, while the planned AMU group were more similar to the planned OU group.
Compared with ‘higher risk’ women planning OU birth, those planning birth in a non-OU setting were less likely to have multiple risk factors and had a different distribution of risk factors. Having a BMI > 35kg/m2 was common in all four planned birth settings. Pre-eclampsia or pregnancy-induced hypertension was less common in ‘higher risk’ women planning non-OU birth, while other risk factors, for example post-term pregnancy, were more common. Fewer ‘higher risk’ women planning birth in the non-OU settings had ‘complicating conditions’ noted at the start of care in labour than did ‘higher risk’ women planning OU birth.
Management and risk of transfer in ‘higher risk’ women
The proportion of ‘higher risk’ women who were transferred to an OU during labour or after birth was similar in all three non-OU settings, at 27–29%. Compared with the other two groups, more women planning birth in an AMU were transferred during labour and fewer after birth. Compared with the planned home birth group, more ‘higher risk’ women planning birth in a MU were transferred, primarily because they had risk factors which made them ineligible for non-OU birth.
In the planned home birth group, after adjustment for maternal characteristics, ‘higher risk’ multiparous women were more likely to be transferred than ‘low risk’ multiparous women, but there was no difference in the risk of transfer between ‘higher risk’ and ‘low risk’ nulliparous women.
In the planned FMU group, in both nulliparous and multiparous women, ‘higher risk’ women were more likely to be transferred than ‘low risk’ women. In women planning AMU birth, ‘higher risk’ women had a higher RR of transfer than ‘low risk’ women, but differences in the absolute risk of transfer were small.
In all three non-OU settings decisions to transfer were made sooner in women who had ‘complicating conditions’ identified at the start of labour care than in those who did not. ‘low risk’ women with ‘complicating conditions’ were transferred sooner after the start of labour care than ‘higher risk’ women without ‘complicating conditions’.
Perinatal and maternal outcomes in ‘higher risk’ women planning home birth
Compared with ‘low risk’ women planning home birth, ‘higher risk’ women who planned a home birth had a significantly higher risk of an adverse perinatal outcome (adjusted RR 1.89, 95% CI 1.23 to 2.90).
In ‘higher risk’ women, compared with planned OU birth, planned home birth was associated with a significantly reduced risk of ‘intrapartum-related mortality and morbidity’ or neonatal admission within 48 hours for > 48 hours (adjusted RR 0.50, 95% CI 0.31 to 0.81). The difference reflected a higher neonatal admission rate in planned OU births. This finding was not materially altered by adjusting for maternal characteristics or risk factors, and remained of the same order when the definition of the neonatal admission component of the outcome measure was changed to admission for > 4 days.
When the measure of adverse perinatal outcome was restricted to include only ‘intrapartum-related mortality and morbidity’, a measure that encompassed intrapartum stillbirth, early neonatal death and specific intrapartum-related morbidities, planned home birth was not associated with a significant difference in risk compared with planned OU birth (RR adjusted for parity 1.92, 95% CI 0.97 to 3.80), but the direction of effect was reversed with a higher proportion of adverse outcomes in planned home births. Because of the small sample size it was not possible to adjust for maternal characteristics other than parity.
Planned home birth was associated with lower intervention rates than and an increased probability of having a ‘straightforward birth’ compared with planned OU birth.
Strengths and limitations
The general strengths and limitations of the Birthplace cohort are discussed in Chapter 8.
The number of ‘higher risk’ women planning birth in non-OU settings was relatively small, particularly for the MU settings. When evaluating outcomes we could consider outcomes only in planned home births, and because the home birth sample was small we had limited statistical power to detect clinically important differences in uncommon adverse outcomes between birth settings and were unable to adjust for maternal characteristics other than parity in our analysis of the ‘intrapartum composite’. To increase statistical power, we used a composite measure of perinatal mortality and morbidity that included admission to a neonatal unit within 48 hours for > 48 hours. This will have excluded short admissions for observation or for transient problems, but neonatal unit admissions may potentially be influenced by access or other factors unrelated to the severity of neonatal morbidity. 92 Neonatal unit admission for > 48 hours was substantially more common in planned OU births and we have no means of determining if this reflects a real difference in morbidity as opposed to a difference in admission criteria and/or admission threshold.
Interpretation
There is very little evidence on the clinical characteristics, management and outcomes of ‘higher risk’ women who plan birth outside an OU. Our analyses describing clinical characteristics in this group suggest that they have fewer risk factors and different combinations of risk factors and are less likely to have ‘complicating conditions’ identified at the start of labour care than ‘higher risk’ women who plan OU birth. We carried out a more detailed exploration of the risk characteristics of our sample of ‘higher risk’ women planning home birth (Rowe R, Li Y, Townend J, Linsell L, Brocklehurst P, Knight M, et al. ; unpublished data), but the simple descriptive statistics reported here show that non-negligible numbers of women with commonly occurring risk factors, including post-term pregnancy, obesity and previous caesarean section, plan birth in non-OU settings, and particularly at home. The evidence on women’s decision-making in planning birth at home suggests that they are motivated by the desire to avoid the perceived ‘risks’ of intervention associated with birth in an OU, in part because of previous negative experiences, as well as valuing greater control and wanting a relaxing and comfortable environment. 93–96 The limited qualitative evidence on the decision-making of ‘higher risk’ women planning home birth in Australia suggests similar preferences. 97 MU admission criteria typically exclude women with ‘risk factors’,6 and so many ‘higher risk’ women who want to avoid OU birth may be able to opt only for home birth. Further research is required to examine the motivation of these women and influences on their decision-making, and to consider what service changes might be required to better meet their needs. This may include evaluation of whether or not some groups of ‘higher risk’ women might be safely looked after in other midwifery-led settings. For example, recent research using the Birthplace data suggests that otherwise healthy multiparous women with a BMI of 35–40 kg/m2 may have relatively low intrapartum risks,98 and a Dutch study found that extremely obese women achieved good outcomes in midwifery-led care. 99
Once attended by a midwife during labour in a non-OU setting, around 50% of nulliparous ‘higher risk’ women and 20% of multiparous ‘higher risk’ women were transferred from their chosen setting during or after birth. Our results suggest that midwives may be more ‘cautious’ in their management of ‘higher risk’ women who plan birth outside an OU, but compared with ‘low risk’ women the risk of transfer was not higher for all ‘higher risk’ women in all settings and the presence of ‘complicating conditions’ was a bigger factor in determining how soon after the start of labour care decisions to transfer were made. As in ‘low risk’ women (see Chapter 5), we saw higher transfer rates in ‘higher risk’ women who had ‘complicating conditions’ identified at the start of labour care than in those who did not. In around 10% of transfers before birth from FMUs and AMUs the stated primary reason for transfer was related to the presence of a risk factor or ineligibility for birth in a MU; relatively few transfers from home took place primarily because of the presence of a risk factor or because of ineligibility for home birth.
The few studies which have evaluated perinatal outcomes in women with known risk factors planning home birth have identified poorer outcomes in this group than in ‘low risk’ women planning birth at home, but have not compared outcomes with comparable women planning OU birth. 100–102 A UK study comparing outcomes in women attended by independent midwives with a matched group in NHS care, in which 66% of the independent midwives group planned home birth, found higher perinatal mortality rates for ‘higher risk’ women in the independent midwives group, but their ‘higher risk’ group included preterm births and twin pregnancies. 103
While our descriptive analyses reported here, and in further, more detailed unpublished analyses (Rowe R, Li Y, Townend J, Linsell L, Brocklehurst P, Knight M, et al. ; unpublished data), identified differences in the risk characteristics of our sample of ‘higher risk’ women planning home and OU birth, our sensitivity analyses did not suggest these differences explained the observed differences in perinatal outcomes between birth settings. It remains possible, however, that the severity of the recorded risk factors or other unmeasured factors affecting risk may have differed in the two settings.
Admission to a neonatal unit involves separation of mother and baby which may have negative consequences and it is, therefore, an important outcome to consider. 104 However, we cannot determine whether the higher admission rate we found in planned OU births represents a true difference in neonatal morbidity, increased precautionary treatment or extended observation of babies born in an OU, or ‘undertreatment’ of babies born (or planned to be born) at home. We do not know to what extent the babies of ‘higher risk’ women born at home are monitored for early signs of complications requiring treatment or whether or not some conditions resulting in admission of OU-born babies are safely managed at home. It is possible that there is increased medical and midwifery monitoring of babies born in hospital, leading to more screening for conditions such as hypoglycaemia and infection. Once a baby is admitted, intervention and monitoring may be continued until uncertainty about the baby’s condition has been resolved.
The higher rate of adverse perinatal outcomes seen in ‘higher risk’ women who planned a home birth than in ‘low risk’ women in the same setting indicates that the recommended criteria for defining ‘higher risk’13 do identify women whose babies are at increased risk, but our sample size was too small even in this national study to assess the risks associated with most individual risk factors.
Conclusions
‘higher risk’ women who plan birth in non-OU settings appear to have fewer risk factors than and different combinations of risk factors from ‘higher risk’ women planning OU birth. Further research is required to determine why a small, but important, group of women with commonly occurring risk factors (e.g. post-term pregnancy, BMI > 35 kg/m2, previous caesarean section) choose to plan birth in non-OU settings, and in particular at home, and to consider what service, environmental or behavioural changes might enable OUs, or some MUs, to adequately meet the clinical needs, values and preferences of these women.
In planned home births, the babies of women classified as ‘higher risk’ according to current guidelines are at increased risk of an adverse intrapartum related outcome or neonatal unit admission for > 48 hours compared with ‘low risk’ women who plan birth at home. Guidelines state that it may be safer for this group of women to plan birth in an OU, but the risk of an adverse perinatal outcome associated with planned home birth versus planned OU birth appears to depend on the measure used. The babies of ‘higher risk’ women who plan birth in an OU are more likely to be admitted to a neonatal unit for > 48 hours than the babies of ‘higher risk’ women who plan birth at home, but it is uncertain if this reflects a real difference in morbidity. Obstetric intervention rates were lower in ‘higher risk’ women who planned home birth than in those who planned OU birth.
No change in the guidelines on planned place of birth for ‘higher risk’ women can be recommended on the basis of the results reported here, but further evaluation of outcomes in some groups of ‘higher risk’ women who plan birth in a non-OU setting would be merited to strengthen the evidence informing guidelines on planned place of birth.
Acknowledgement of material published under Creative Commons licence
Some of the analyses described and discussed above have been published elsewhere. Sections of text in this chapter, including substantial parts of the following sections are reproduced from, or closely based on, the original article105 and are covered by the terms of the Creative Commons Attribution Non-Commercial (CC BY-NC 4.0) licences that apply to these publications:
-
Introduction
-
Methods, Objective 3: outcomes in ‘higher risk’ women planning birth at home
-
Results, Objective 1: characteristics of ‘higher risk’ women planning birth in non-obstetric unit settings
-
Results, Perinatal and maternal outcomes in ‘higher risk’ women planning home birth
-
Discussion
Chapter 8 Discussion, conclusions and implications for practice
Introduction
The Birthplace in England research programme was an integrated programme of research, using a range of methodological approaches, designed to address gaps in the evidence relating to processes, outcomes and costs associated with different settings for birth in the NHS in England. The Birthplace mapping study described the characteristics of intrapartum care services and documented current configuration of services and future plans; the Birthplace cohort study answered key questions relating to perinatal safety and maternal outcomes in each setting; the Birthplace cost-effectiveness study, conducted alongside the cohort study, documented the short-term costs and cost-effectiveness of planned birth in each setting; and the Birthplace organisational case studies highlighted both good practice and issues affecting the quality and safety of intrapartum care.
The ‘follow-on’ analyses described in this report were designed to provide further evidence both to support the development and delivery of safe, equitable and effective maternity services and to provide information that might be used by women and their health-care providers to inform choice of birth setting.
This chapter provides an overview of the key findings and summarises the main discussion points raised earlier in the report. Readers are referred to the individual chapters for a more in depth discussion of the interpretation of findings. Implications for policy and practice and recommendations for further research are presented below.
Overview of strengths and limitations
A key strength of these follow-on analyses is that they are based on a large, nationally representative sample of births with high-quality data on interventions and outcomes in both ‘low risk’ and ‘higher risk’ women planning birth in different settings. High response rates were achieved so that the study had a low risk of non-response bias. We were also able to control for many important potential confounders, including maternal age, gestational age, BMI and parity. However, some general limitations apply to the findings discussed below. First, while Birthplace collected data from the vast majority of AMUs, FMUs and home birth services, data were collected only from a stratified, random sample of 36 OUs, and thus the number of OUs, and in particular the number of OUs with an AMU on site, was limited. This, combined with limitations on the availability, completeness and quality of data on unit characteristics and staffing, means that analyses relating to unit characteristics and associations with interventions and outcomes need to be regarded as exploratory. Second, maternity services have undergone substantial changes over the past few years: the number of AMUs has increased since the time of the Birthplace data collection (2008–10) and currently around half of all OUs have an AMU on site. 32 Third, the analyses relating to ‘low risk’ women focus on maternal interventions and outcomes such as ‘normal birth’ and transfer. The sample was not of sufficient size to investigate uncommon adverse maternal or perinatal outcomes and, in the absence of this information, we have no means of determining which intervention rate or transfer rate is ‘right’. Fourth, this ‘follow-on’ study involved secondary analyses of existing data, and in some instances variables that would have been useful for specific analyses were lacking. For example, we lacked data on the urgency of interventions and transfer or on the timing of many events during labour other than those relating to transfer.
Summary and discussion of findings
The impact of service configuration and organisation on interventions and maternal outcomes in ‘low risk’ women
Rationale
Previous Birthplace analyses focused on differences in interventions and outcomes between planned birth settings (OU vs. AMU, FMU or home), but did not examine the extent to which intervention rates vary between units of the same type or between NHS trusts (for home births). The analyses discussed in this section were designed to describe unit-level variation in intervention rates in ‘low risk’ women, and to explore whether or not organisational factors such as unit size or staffing levels may ‘explain’ some of this variation. The overall purpose of these exploratory analyses was to provide service providers and commissioners with some insight into the possible effects of current or planned service reconfiguration or development, such as the ongoing expansion in the provision of AMUs. 32
Summary of findings
What is the variation between individual units and NHS trusts (for home births) in rates of intervention and maternal outcome?
We considered the variation in adjusted rates of instrumental delivery, intrapartum caesarean section, and rates of two composite measures, one capturing birth without complications that might affect future births (‘straightforward birth’) and one indicating birth with low intervention (‘normal birth’), in ‘low risk’ women planning birth in OUs, in AMUs, in FMUs and at home.
There was greater variation in intervention rates than would be expected by chance in planned births in all settings and this variation was not explained by maternal characteristics.
For planned OU and AMU births, there was considerably greater variation than would be expected by chance for all four intervention and outcome measures, particularly for nulliparous women.
For planned FMU and home births there was considerably greater variation in interventions and outcomes than would be expected by chance for some of the measures considered, but relatively little unexplained variation in intrapartum caesarean section rates. For planned home births there was also relatively little unexplained variation in rates of instrumental delivery.
Is there evidence to suggest that rates of intervention and maternal outcome in planned obstetric unit births are affected by known characteristics of the obstetric units or configuration characteristics?
As summarised above, there was more variation in OUs’ adjusted rates of instrumental delivery, intrapartum caesarean section, ‘straightforward birth’ and ‘normal birth’ in ‘low risk’ women planning birth in OUs than could be explained by maternal characteristics (see Chapter 2, Statistical methods, Maternal characteristics) or by chance. We explored whether or not any of this unexplained variation in rates could be explained by the following OU characteristics: unit size (annual number of births, number of delivery beds), presence of an AMU on site, midwifery ‘understaffing’ (the proportion of shifts where the number of women exceeded the number of midwives), the percentage of births in the trust that were planned in a non-OU setting and the percentage of planned ‘out of hospital’ births (planned at home or in a FMU).
The proportion of births in the trust that were planned outside an OU was significantly associated with higher intervention rates in planned OU births in ‘low risk’ women, and in particular with higher rates of intrapartum caesarean section in both nulliparous and multiparous women. Maternal intervention rates in planned OU births were not significantly associated with the percentage of planned ‘out of hospital’ births (planned at home or in a FMU).
Having an AMU in the hospital was associated with significantly higher intrapartum caesarean section rates in nulliparous ‘low risk’ women planning an OU birth and significantly lower rates of ‘normal birth’ and ‘straightforward birth’ in multiparous ‘low risk’ women planning an OU birth.
Isolated significant associations were found for the size of the OU and midwifery ‘understaffing’, but no consistent pattern was observed.
The magnitude of the observed significant associations was small. In particular, the higher rates of intervention observed in planned OU births in trusts with a higher proportion of non-OU births is likely to be more than offset by the lower intervention rates in the non-OU settings. It is notable that the three OUs situated in trusts with the highest proportions of non-OU births were also those with attached AMUs. Given that we also observed an association between the presence of an AMU and higher intervention rates in planned OU births, it is possible that this association may be confounded. Because only 9 of the 36 OUs in our sample had an AMU on site, we could not assess the independent effects of these two factors (percentage of non-OU births and presence of an AMU).
Is there evidence to suggest that rates of intervention and maternal outcome in planned alongside midwifery unit births are affected by known characteristics of the alongside midwifery unit?
We considered whether or not AMU size (number of births, number of delivery beds) and midwifery staffing levels (mean number of midwives on duty per woman in labour, midwifery ‘understaffing’) were associated with variations in adjusted rates of instrumental delivery, intrapartum caesarean section, ‘straightforward birth’ and ‘normal birth’ in ‘low risk’ women planning birth in an AMU.
With the exception of intrapartum caesarean section in nulliparous women and instrumental delivery in multiparous women, where associations were not significant, we found a significant association between the size of the unit and intervention rates. In our main analyses, ‘low risk’ women who planned birth in larger AMUs tended to have higher intervention rates and lower rates of ‘normal birth’ and ‘straightforward birth’, but when we conducted a sensitivity analysis in which we repeated the analysis after excluding one large AMU which appeared to be an outlier, none of the associations with AMU size was significant.
Is there evidence to suggest that rates of intervention and maternal outcome in planned freestanding midwifery unit births are affected by known characteristics of the freestanding midwifery unit?
We considered whether or not FMU size, midwifery staffing levels, and transfer distance/transfer time to the nearest OU were associated with variations in rates of instrumental delivery, intrapartum caesarean section, ‘straightforward birth’ and ‘normal birth’.
In nulliparous women, we found a significant association between the size of the FMU and rates of instrumental delivery, ‘straightforward birth’ and ‘normal birth’, with larger FMUs having lower intervention rates. In nulliparous women we also found a significant association between the distance of the FMU from the nearest OU and rates of instrumental delivery, ‘straightforward birth’ and ‘normal birth’; intervention rates tended to be higher in more distant FMUs. However, as more distant units tended to be smaller, it was not possible to clearly separate out the independent effects of size and distance.
None of the FMU characteristics considered was significantly associated with variations in rates of intrapartum caesarean section for either nulliparous or multiparous women.
With the exception of one significant association (which may be a chance finding), none of the FMU characteristics considered was associated with variations in intervention rates for multiparous women.
Overall, our findings suggest that nulliparous ‘low risk’ women who plan birth in larger FMUs that are not too distant from an OU may tend to have lower intervention rates than similar women planning birth in smaller or more distant FMUs. None of the FMU characteristics that we considered, including size and distance, appear be associated with intrapartum caesarean section rates in women planning FMU birth. These findings are broadly consistent with the pattern of transfer discussed in Factors affecting intrapartum transfer of ‘low risk’ women and the transfer process, below.
Is there evidence to suggest that rates of intervention and maternal outcome in planned home births differ in NHS trusts with a high/low volume of planned home births?
Multiparous ‘low risk’ women who planned home birth in a trust where numerically more home births took place were significantly more likely to have a ‘normal birth’, and multiparous women who planned birth in a trust with a higher proportion of home births tended to have lower instrumental delivery rates and higher rates of ‘normal birth’ and ‘straightforward birth’. No significant associations with either measure of ‘volume’ of planned home births was observed for nulliparous women, but this may be due to the limited number of nulliparous women in the home birth sample. The magnitude of the association with the ‘volume’ of home births was modest and very little of the variation in intervention rates was explained by the two measures of ‘volume’ considered. Because of the lack of relevant data, we were unable to explore whether or not other potentially important aspects of the organisation and delivery of home birth services, such as staffing models, were associated with variations in interventions or outcomes.
Discussion and interpretation of findings
These are exploratory findings based on maternity services and practice patterns at the time of the Birthplace study (2008–10). Service changes since the Birthplace study, such as increased midwifery staffing levels and the rapid expansion of provision of AMUs,32 could have affected some of the observed associations. Nevertheless, some of our findings have potentially important implications for service planning and commissioning and would merit further studies using high-quality data relevant to current services and practice patterns both to confirm the findings and to investigate further.
Our findings suggest that in ‘low risk’ women, planned birth in an OU situated in a trust with a high proportion of non-OU births may be associated with higher intervention rates. Having an attached AMU was also associated with an increased risk of some interventions. Because NHS trusts with a high volume of non-OU births tend to be those with a large AMU, we cannot rule out the possibility that the relationship between non-OU births and OU intervention rates may actually reflect the effects of having a larger AMU. The Birthplace organisational case studies found that the presence of an AMU appeared to intensify staff perceptions of the acuity and workload in the adjoining OU, where staff reported that they struggled to support normal birth, suggesting a possible explanation for the findings relating to OU intervention rates. 10
Our main analysis suggested that intervention rates in planned AMU births tended to increase with AMU size but sensitivity analyses revealed that these associations were driven by higher intervention rates in a single, large AMU in our sample. Within the size range of the vast majority of AMUs in our sample (< ≈1500 planned births per year) AMU size did not, therefore, appear to be associated with variation in intervention rates. Further research is required to determine whether or not intervention rates systematically differ with size above the range that we were able to investigate. This, and research into issues related to other characteristics of AMUs and OUs, will be particularly important if there is a move towards maternity services based around fewer, larger, more centralised OUs with large AMUs.
Another notable finding was the substantial variation in maternal intervention rates between AMUs, suggesting that important differences may exist between AMUs. AMUs can differ in many, generally undocumented, ways, such as whether they operate an opt-in or opt-out admission policy, whether or not they are physically separate from the OU, and whether they share midwifery staff with the OU or are managed separately. The characteristics and intervention patterns of the associated OU may also be important, but given the available data we were unable to investigate this. Further research is required to determine whether these or other AMU characteristics affect outcomes in any way.
With regard to FMUs, our data suggest that larger FMUs may tend to have lower intervention rates; however, at the time of the Birthplace study, larger FMUs tended to be situated closer to an OU. We cannot determine whether or not FMU size and distance have independent effects. The higher transfer rate observed in more distant FMUs (discussed below) would be consistent with staff in more distant FMUs adopting a precautionary approach to transfer (taking account of transfer time). 75,76 We found that intervention and transfer rates tended to be lower in planned home births in trusts with a higher volume of home births, suggesting that an increase in the numbers of planned home births (as recommended by NICE for multiparous women)58 might be associated with a corresponding reduction in interventions and transfers in planned home births. In relation to planning service reconfigurations, it should be noted that the findings of the Birthplace organisational case studies suggest that careful consideration needs to be given to the training and preparation of midwives supporting home birth. 10,106
Does the effect of planned place of birth on interventions and maternal outcomes vary for specific subgroups of ‘low risk’ women, particularly those defined by parity, age, ethnicity and the level of deprivation of their area of residence?
Rationale
Previously reported Birthplace findings showed that ‘low risk’ women who planned birth in a non-OU setting generally had a significantly reduced risk of intervention,7 but did not establish whether or not all groups of women benefit equally from this reduction. The purpose of the analyses discussed in this section was to explore whether BME women, women living in disadvantaged areas and older women (particularly older nulliparous women) who plan birth in non-OU settings experienced the same benefits of planned non-OU birth as white women, those living in less disadvantaged areas or younger women.
Summary of findings
Ethnicity
Across all settings, we observed an increased risk of intrapartum caesarean section in ‘low risk’ non-white women compared with ‘low risk’ white women, which is broadly consistent with the findings of previous studies. 26,46 However, our findings did not suggest that the benefits of planned birth in a non-OU setting differed for white and non-white women: planned birth in an AMU, in a FMU or at home was associated with a similar reduction in caesarean section in both white and non-white women, and there was no evidence that the pattern was different for instrumental delivery, ‘normal birth’ or ‘straightforward birth’.
Women living in areas with higher levels of deprivation
After adjustment for other maternal characteristics, we did not observe any difference in the risk of intervention (instrumental delivery, intrapartum caesarean section, ‘normal birth’ and ‘straightforward birth’) between women living in more and less disadvantaged areas. Analysis of transfer rates (see Factors affecting intrapartum transfer of ‘low risk’ women and the transfer process) also did not show that the risk of transfer varied significantly with the level of disadvantage of the area in which the woman lived.
We did find that the association between planned place of birth and some interventions was significantly modified by the level of deprivation of the area in which the women lived, but the differences were small. Planned birth in a non-OU setting was significantly associated with a reduced risk of instrumental delivery and intrapartum caesarean section and a significantly increased chance of ‘straightforward birth’ and ‘normal birth’ irrespective of whether the woman lived in a more or a less advantaged area.
Maternal age
In nulliparous women, the risk of instrumental delivery and intrapartum caesarean section increased with increasing maternal age and the chances of having a ‘straightforward birth’ or ‘normal birth’ decreased with maternal age. There were no clear trends with maternal age in multiparous women.
The association between planned place of birth and risk of instrumental delivery and intrapartum caesarean section was not significantly different for women aged ≥ 35 years compared with women aged < 35 years. However, in some analyses the relationship between planned place of birth and chances of a ‘straightforward birth’ or ‘normal birth’ was modified by maternal age. In particular, older nulliparous women who planned birth in a non-OU setting had a significantly increased chance of a ‘straightforward birth’ or ‘normal birth’.
Discussion and interpretation of findings
The benefits of planned birth in non-OU settings in terms of reduced interventions appear to apply to nulliparous and multiparous women, to women in more and less disadvantaged areas, to non-white and white women and to younger and older women. However, for nulliparous women, the benefits of planned birth in a non-OU setting appear to vary with maternal age.
Our findings relating to maternal age, including those of a more detailed investigation reported elsewhere,54 indicate that both younger and older nulliparous women who plan birth in a non-OU setting have a reduced risk of intervention and an increased chance of ‘normal birth’ and ‘straightforward birth’, compared with women of the same age who plan birth in an OU. For many interventions, including instrumental delivery and intrapartum caesarean section, absolute rates increase steadily with age, particularly in nulliparous women. 54 There appear to be some age-related differences in the relative reduction in the risk of intervention associated with planned non-OU birth, specifically a smaller relative reduction in the risk of intervention at older ages. However, because intervention rates are higher at older ages, the absolute reduction in risk across age groups is generally similar or even greater at older ages. The converse is true for measures of low intervention, such as the ‘normal birth’ rate.
In summary, both younger and older nulliparous women who plan birth in a non-OU setting have a reduced risk of intervention compared with women who plan birth in an OU but, irrespective of setting, intervention rates are higher at older ages and older nulliparous women have a substantial probability of transfer (43–49% depending on setting).
Factors affecting intrapartum transfer of ‘low risk’ women and the transfer process
Rationale
The Birthplace primary analysis showed that intrapartum transfer affected around 20% of ‘low risk’ women planning birth in a non-OU setting, with nulliparous women having substantially higher rates. 7,8 The analyses discussed in this section were designed with three aims in mind. The first was to provide women with more information about transfer that might be important when choosing their planned birth setting: this includes information about how transfer rates vary with maternal characteristics and birth setting and information about how long transfers take. The second was to provide service providers and commissioners with information about possible ways in which the organisation and delivery of services may affect transfer rates. This includes, for example, information about whether or not FMU characteristics such as size and distance appear to influence transfer rates and whether or not there are time of day/day of the week variations in transfer that might point to non-clinical influences on transfer, such as variations in staffing or shift changes. The third was to provide descriptive information about the transfer process, particularly in planned home and FMU births, that might provide further insight into the primary Birthplace findings relating to the safety of planned birth settings.
Summary of findings
What maternal characteristics known at the start of care in labour are most strongly associated with intrapartum transfer?
Parity, maternal age, gestational age and the presence of ‘complicating conditions’ identified at the start of care in labour were all independently associated with variation in the risk of transfer.
Parity: nulliparous women had consistently higher rates of transfer than multiparous women.
Gestational age: ‘low risk’ women who gave birth at 37–39 weeks’ gestational age generally had a lower risk of transfer relative to women who gave birth at 40 weeks, and women who gave birth at 41 to 42 + 0 weeks generally had a significantly higher risk of transfer.
Maternal age: in nulliparous women, the risk of transfer increased with maternal age in planned AMU and FMU births; no age-related pattern was evident in multiparous women or in nulliparous women planning home birth, but the number of nulliparous women was small in the home birth group.
‘Complicating conditions’: the presence of ‘complicating conditions’ identified at the start of care in labour (see Chapter 2, Birthplace cohort study and data, ‘Complicating conditions’ at the start of labour) was associated with a significantly increased risk of transfer in all three settings, with the risk doubling or tripling in planned FMU and home births.
We did not find any significant variation in the risk of transfer associated with ethnicity (white vs. non-white) or understanding of English. Transfer rates differed significantly by marital status in some analyses, but the associations were not consistent across settings suggesting that this may be a chance finding.
In planned FMU and home births, transfer rates showed some significant variation with BMI. For planned FMU births and planned home births (multiparous women only), the absence of a BMI record in the woman’s notes was associated with a significantly increased risk of transfer.
Variation in transfer rates and the association between unit or trust characteristics and transfer rates
We considered the following questions:
-
For women planning a birth outside an OU, what is the variation between units and NHS trusts (for home births) in the proportion of women who are transferred from their planned place of birth during or immediately after labour?
-
To what extent can any differences in transfer rates between units and NHS trusts (for home births) be explained by known characteristics of the unit or other aspects of the organisation and delivery of services?
There was greater variation in transfer rates than would be expected by chance in planned births in all non-OU settings and this variation was not explained by maternal characteristics.
For AMUs, we considered whether size or midwifery staffing levels were associated with variations in transfer rates. For multiparous women, higher staffing levels were associated with higher transfer rates, but we cannot rule out the possibility that this association may reflect some unmeasured characteristic of AMUs with higher staffing levels.
For FMUs, we considered whether or not size, midwifery staffing levels and measures of transfer distance/time were associated with variations in transfer rates. For nulliparous women, larger FMUs tended to have lower transfer rates, although not all associations tested were significant, and FMUs situated further from the nearest OU tended to have higher transfer rates. However, FMU size and distance were correlated (more distant FMUs tended to be smaller) and it was not possible to determine if FMU size and distance had independent effects. Additionally, these two characteristics explained only a small proportion of the variation in transfer rates.
For home births, we considered whether or not transfer rates were associated with the ‘volume’ of home births; that is, did trusts with more home births have higher or lower transfer rates? For both nulliparous and multiparous women we found a significant, but modest, downwards trend in transfer rates with increasing number of home births; trusts with more home births tended to have lower transfer rates.
Do intrapartum transfers vary by time of day or day of the week in ‘low risk’ women planning birth in each setting?
Transfers did not occur uniformly throughout the day (24 hours) in FMUs and AMUs, but descriptive plots did not suggest a ‘meaningful’ pattern of peaks or troughs in these settings or in home births.
Diurnal variations in the onset of labour mean that women may be more likely to present for labour care during the evening, at night and in the early morning. Our analysis did not take account of probable diurnal variations in the number of women in labour at any given time in a unit.
Urgency and duration of transfer from freestanding midwifery units and planned home births
We considered the following questions:
-
What is the timing and duration of transfer in planned home and FMU births?
-
In planned home and FMU births, does the duration of transfer differ for women transferred for reasons likely to require more urgent transfer compared with women transferred for potentially non-urgent reasons?
The median total transfer duration (from the decision to transfer through to first assessment in the OU) was 60 minutes for FMU transfers and 49 minutes for home birth transfers. Median transfer duration was around 7–10 minutes shorter for transfers for potentially urgent reasons.
For transfers before birth (which constitute the majority of transfers), the median time from start of care in labour to decision to transfer was just over 5 hours. Transfers for potentially non-urgent reasons, for example failure to progress in the first stage, tended to occur slightly later.
Our analyses indicated that transfers from home tended to take less time to arrange than transfers from FMUs, although the difference was only a few minutes, and the median ‘travel time’ also tended to be slightly shorter for home birth transfers.
Discussion and interpretation of findings
The increased risk of transfer in older nulliparous women and the increased risk of transfer associated with greater gestational age and the presence of ‘complicating conditions’ appears to be broadly similar to the pattern of risk observed for interventions such as instrumental delivery and intrapartum caesarean section reported in Chapter 4 and discussed in The impact of service configuration and organisation on interventions and maternal outcomes in ‘low risk’ women, above. Despite the higher risk of transfer, findings reported here and elsewhere54 suggest that older ‘low risk’ nulliparous women who plan birth in a midwifery-led setting still benefit from a reduced risk of intervention. Further research into the clinical thresholds for transfer and intervention in older nulliparous women may be merited.
Alongside midwifery unit transfer rates were highly variable and none of the unit characteristics that we considered explained this variation. As discussed in The impact of service configuration and organisation on interventions and maternal outcomes in ‘low risk’ women, intervention rates in planned AMU births also exhibited marked variation, which we were unable to explain. It seems possible that transfer and intervention rates are influenced by other AMU characteristics for which we lacked data, possibly including the characteristics (and intervention patterns) of the associated OU.
We found that, in nulliparous women, larger FMUs tended to have lower transfer rates and more distant FMUs tended to have higher transfer rates, but more distant FMUs tended to be smaller and it was not possible to determine whether or not size and distance had independent effects. This pattern has some similarities with the pattern of risk of instrumental delivery, ‘normal birth’ and ‘straightforward birth’ reported in Chapter 3. We have no means of determining which transfer and intervention rates are ‘right’.
Transfers from home or FMU commonly took up to 60 minutes from decision to transfer to first assessment in an OU. The vast majority of transfers, even those for potentially urgent reasons, did not appear to be medical or obstetric emergencies. At the time of the Birthplace study, most women did not expect to be transferred90 despite this being a relatively frequent occurrence. Information about the chances of transfer and the benefits and risk of each birth setting now appears to be more readily available to women;17,107 the inclusion of the additional information from this study might be helpful to women.
Do interventions and maternal outcomes vary by time of day or day of the week in births planned in each setting?
Rationale
There are known circadian patterns in the spontaneous onset of labour, and in the duration of labour and timing of birth, although it appears that the latter may be substantially modified by obstetric intervention. 80–83 While it is possible that naturally occurring circadian patterns may influence the pattern of intervention, there is some evidence to suggest that interventions and outcomes may also be influenced by time of day variations in decision-making or quality of care, possibly related to variations in staffing or to other non-clinical factors such as the staff’s own circadian patterns or shift changes. 59,60 The aim of the analyses described and discussed in this section was to describe and explore the extent to which interventions during labour and birth varied by time of day and day of the week in births planned in different birth settings.
Summary of findings
We considered time of day/day of the week variations in four main outcomes (instrumental delivery, intrapartum caesarean section, ‘normal birth’ and ‘straightforward birth’), and also two secondary outcomes (augmentation and epidural use).
In planned OU births, instrumental delivery was more likely, and ‘straightforward birth’ and ‘normal birth’ less likely, in births that occurred on weekdays during ‘office hours’ than in births that occurred at night. In nulliparous women without ‘complicating conditions’ at the start of labour care we found that those who gave birth during weekday ‘office hours’ were less likely to have an intrapartum caesarean section than those who gave birth at night. Epidural analgesia was more common in births that occurred during weekday ‘office hours’ than in those that occurred during weekday nights, particularly in multiparous women. Descriptive plots revealed an apparent ‘peak’ in augmentation and epidural in births that occurred at the end of the day and in the early evening.
In births planned in AMUs and at home there was no clear association between time of day/day of the week and any of our main outcome measures. In planned AMU births, multiparous women who gave birth on weekdays during ‘office hours’ or at weekends were more likely to have had their labour augmented than those who gave birth on a weekday at night.
In nulliparous women who planned FMU birth, those who gave birth during weekday ‘office hours’ were less likely to have an intrapartum caesarean section than women who gave birth at night. In multiparous women, those who gave birth on weekdays during ‘office hours’ or at weekends were less likely to have a ‘normal birth’ than those who gave birth on a weekday at night. This may be partly attributable to epidural use being more common during weekday ‘office hours’ in this group.
Discussion and interpretation of findings
These exploratory analyses suggest that in women who plan OU birth, some interventions, including instrumental delivery, augmentation and epidural analgesia, may be more likely in births which take place during weekday ‘office hours’ and that intrapartum caesarean section may be more common at night. Less variation was observed in births planned in other settings.
Although it is plausible that ‘natural’ circadian patterns of labour might contribute to diurnal variation in augmentation and epidural use, the patterns observed are consistent with other limited evidence from the UK suggesting that the daytime excess of epidural and augmentation may reflect non-clinical factors. 88 We have no means of determining what these might be, but the pattern could suggest factors relating to the availability of obstetric or anaesthetic staff; it is possible that the higher occurrence of elective procedures during the day may have influenced OU routines or staffing in ways that could have affected the threshold for intervention.
We cannot explain the excess of intrapartum caesarean sections at night in planned OU births and in planned FMU births in nulliparous women, but differences in clinical decision-making at night, possibly related to the skills and experience of staff on duty, are a possible explanation. 88
Further exploration of the causes and consequences of the daytime excess of augmentation and the night-time excess of intrapartum caesarean section is required.
The characteristics and management of ‘higher risk’ women in non-obstetric unit settings
Rationale
Most women with pre-existing medical or obstetric ‘risk factors’ plan birth in an OU, as recommended by clinical guidelines,13 but the Birthplace cohort study found that around 7% of women who planned birth at home and 3–4% of women who planned birth in a MU had known risk factors. 7 Previous Birthplace analyses of outcomes in ‘higher risk’ women showed that the incidence of the Birthplace primary outcome (‘intrapartum-related perinatal mortality and morbidity’) was highest in the babies of ‘higher risk’ women who planned home birth. 7 The risk was not significantly increased compared with planned OU birth but the number of events was small and CIs were wide. Additionally, the OU group included a substantial proportion of women with planned induction of labour, creating a potential difference in the ‘risk profiles’ of the study groups.
The analyses discussed in this section were designed to describe the characteristics and patterns of transfer of ‘higher risk’ women planning birth in a non-OU setting, and to compare perinatal and maternal outcomes in ‘higher risk’ women planning a vaginal birth at home versus in an OU. Women with planned induction of labour were excluded from all analyses.
Findings
What are the sociodemographic and clinical characteristics of women known to be at ‘higher risk’ of complications prior to the onset of labour who plan to give birth in non-obstetric unit settings?
‘higher risk’ women who planned birth at home or in a FMU were more likely to be older, white, multiparous, married or living with a partner and living in less deprived areas than ‘higher risk’ women who planned OU birth. ‘higher risk’ women who planned birth in an AMU were more similar to the OU group.
Compared with ‘higher risk’ women planning OU birth, those planning birth in a non-OU setting were less likely to have multiple risk factors and had a different distribution of risk factors. Having a BMI > 35 kg/m2 was common in all planned birth settings. Previous caesarean section was the most common risk factor in multiparous ‘higher risk’ women planning OU birth, but was also a common risk factor in ‘higher risk’ women planning home birth. Pre-eclampsia or pregnancy-induced hypertension was less common in ‘higher risk’ women planning non-OU birth, while other risk factors, for example post-term pregnancy, were more common. Fewer ‘higher risk’ women planning birth in the non-OU settings had ‘complicating conditions’ noted at the start of care in labour than did ‘higher risk’ women planning OU birth.
Pattern of transfer in ‘higher risk’ women and ‘low risk’ women with ‘complicating conditions’ who plan birth in a non-obstetric unit setting
-
How are ‘higher risk’ women who present for planned birth in a non-OU setting managed with respect to transfer? For example, for women who are transferred, what is the distribution of time from the start of labour care to the decision to transfer? Does the decision to transfer and timing of transfer depend on maternal characteristics or the presence of other medical/obstetric risk factors?
-
How are ‘low risk’ women managed with respect to transfer from non-OU settings when they are found to have ‘complicating conditions’ at the start of care in labour?
‘Higher risk’ women
The proportion of ‘higher risk’ women who were transferred to an OU during labour or after the birth was broadly similar in all three non-OU settings (46–56% in nulliparous women and 18–23% in multiparous women). Compared with the other two groups, more women planning birth in an AMU were transferred during labour and fewer after birth. Compared with the planned home birth group, more ‘higher risk’ women planning birth in a MU were transferred primarily because they had risk factors which made them ineligible for non-OU birth.
In the planned home birth group, after adjustment for maternal characteristics, ‘higher risk’ multiparous women were more likely to be transferred than ‘low risk’ multiparous women, but there was no difference in the risk of transfer between ‘higher risk’ and ‘low risk’ nulliparous women.
In the planned FMU and AMU groups, ‘higher risk’ women were more likely to be transferred than ‘low risk’ women.
In all three non-OU settings, decisions to transfer were made sooner in ‘higher risk’ women who had ‘complicating conditions’ noted at the start of labour care than in those who did not.
‘Higher risk’ women compared with ‘low risk’ women with ‘complicating conditions’ noted at the start of care in labour
Women without known pre-existing risk factors who were found to have ‘complicating conditions’ (see Chapter 2, Birthplace cohort study and data, ‘Complicating conditions’ at the start of labour care) at the start of labour care consistently had higher transfer rates than ‘higher risk’ women without ‘complicating conditions’ and appeared to be transferred sooner after the start of labour care than both ‘low risk’ and ‘higher risk’ women without ‘complicating conditions’.
Is there any evidence that, in ‘higher risk’ women, the increased risk of adverse perinatal outcomes observed in planned home births relative to planned obstetric unit births is attributable to the planned delivery setting as opposed to differences in the clinical characteristics of the two groups?
The following findings are based on analyses conducted in ‘higher risk’ women planning a vaginal birth, excluding women having induction of labour. We addressed two questions:
-
What is the risk of an adverse perinatal outcome in ‘higher risk’ women planning birth at home compared with (i) ‘low risk’ women who plan birth at home and (ii) ‘higher risk’ women who plan birth in an OU?
-
What is the risk of intervention or adverse outcome requiring obstetric care in ‘higher risk’ women who plan home birth, compared with ‘higher risk’ women who plan birth in an OU?
The main adverse perinatal outcome considered was a composite combining ‘intrapartum-related perinatal mortality and morbidity’ (the original Birthplace primary outcome) and neonatal unit admission within 48 hours for > 48 hours. For comparability with previous analyses, we also considered the original Birthplace primary outcome on its own; we also conducted a sensitivity analysis in which we changed the length of stay criteria for the neonatal admission component of the outcome measure to admission within 48 hours for > 4 days.
Compared with ‘low risk’ women planning home birth, ‘higher risk’ women planning home birth had a significantly higher risk of our main perinatal outcome (‘intrapartum-related mortality and morbidity’ or neonatal admission within 48 hours for > 48 hours).
In ‘higher risk’ women, compared with planned OU birth, planned home birth was associated with a significantly reduced risk of an adverse perinatal outcome (defined as above). The difference reflected a higher neonatal admission rate in planned OU births. This finding was not materially altered by adjusting for maternal characteristics or risk factors, and remained of the same order when the definition of the neonatal admission component of the outcome measure was changed to admission for > 4 days.
When the measure of adverse perinatal outcome was restricted to include only ‘intrapartum-related mortality and morbidity’, a measure that encompassed intrapartum stillbirth, early neonatal death and specific intrapartum-related morbidities (the original Birthplace primary outcome), planned home birth was not associated with a significant difference in risk compared with planned OU birth, but the direction of effect was reversed, with a higher proportion of adverse outcomes in planned home births. Because of the small sample size, the analysis had limited power to detect a difference in risk, and it was not possible to adjust for maternal characteristics other than parity.
Planned home birth was associated with a reduced risk of maternal intervention or adverse outcome requiring obstetric care and an increased probability of having a ‘straightforward birth’ compared with planned OU birth.
Discussion and interpretation of findings
There is very little evidence on the clinical characteristics, management and outcomes of ‘higher risk’ women who plan birth outside an OU. Our findings, and related unpublished analyses, suggest that these ‘higher risk’ women have fewer risk factors and different combinations of risk factors and were less likely to have ‘complicating conditions’ identified at the start of labour care than ‘higher risk’ women who planned OU birth.
Once attended by a midwife during labour in a non-OU setting, around 50% of nulliparous ‘higher risk’ women and 20% of multiparous ‘higher risk’ women were transferred from their chosen setting during or after birth. Our results suggest that midwives may be more ‘cautious’ in their management of ‘higher risk’ women who plan birth outside an OU but, compared with ‘low risk’ women, the risk of transfer was not higher for all ‘higher risk’ women in all settings and the presence of ‘complicating conditions’ was a bigger factor in determining how soon after the start of labour care decisions to transfer were made.
Our findings suggest that the widely used NICE criteria13,58 for defining women as being at ‘higher risk’ of complications do indeed identify women who are at increased risk, relative to women without ‘risk factors’. However, when we compared adverse perinatal outcomes associated with planned home birth versus planned OU birth in ‘higher risk’ women, we found that the pattern of risk associated with the two birth settings depended on the measure used. The risk of intrapartum-related perinatal mortality and morbidity (the original Birthplace primary outcome) was not significantly different in ‘higher risk’ women who planned birth at home or in an OU, but neonatal unit admissions were substantially more common in planned OU births. It is unclear if this reflects a real difference in neonatal morbidity, increased precautionary treatment or extended observation of babies born in an OU, or the possibility that babies born (or planned to be born) at home may not be getting treatment in accordance with guidelines.
The results reported here do not suggest a change in the guidelines is warranted on planned place of birth for ‘higher risk’ women,58 but it seems possible that there may be some groups of women currently classified as ‘higher risk’ who might be safely looked after in midwifery-led settings, particularly in AMUs where obstetric and neonatal care is available on site if needed. For example, recent research using the Birthplace data suggests that otherwise healthy multiparous women with a BMI of 35–40 kg/m2 may have relatively low intrapartum risks. 98
We do not know why ‘higher risk’ women in our sample opted to plan a non-OU birth. MUs have locally determined admission criteria which may be more or less restrictive than the criteria for recommending birth in an OU set out in the NICE guideline;58 these guidelines also apply to home births, but ‘higher risk’ women may still request a home birth. Further research is required to determine why a small, but important, group of women with commonly occurring risk factors (e.g. post-term pregnancy, BMI > 35 kg/m2, previous caesarean section) choose to plan birth in non-OU settings, and in particular at home, and to consider what service, environmental or behavioural changes might enable OUs, or some MUs, to adequately meet the clinical needs, values and preferences of these women.
Summary of main findings: what this project adds
-
Differences between units’ intervention rates are not explained by the characteristics of the women planning birth in them. Our findings suggest that some aspects of configuration of care may be associated with higher intervention rates in ‘low risk’ women planning OU birth and that FMUs and home birth services with a higher ‘volume’ of births may have lower rates of some interventions; however, the magnitude of these significant associations is small.
-
‘Low risk’ women who plan birth in a non-OU setting have a lower risk of intervention during labour and birth, irrespective of ethnic background, age or relative socioeconomic disadvantage, than women who plan birth in an OU.
-
Nulliparous women aged ≥ 35 years or whose pregnancy is prolonged (41–42 + 0 weeks’ gestation) have a 40–50% chance of transfer if they plan birth in a non-OU setting. ‘Complicating conditions’ identified at the start of labour care, for example prolonged rupture of membranes, significantly increase the chance of transfer in both nulliparous and multiparous women.
-
Transfer from a FMU or a planned home birth takes, on average, around 50–60 minutes from the decision to transfer to first assessment in the OU.
-
Some interventions in planned OU births may be more likely in births occurring during weekday ‘office hours’, and intrapartum caesarean section may be more common at night.
-
‘Higher risk’ women who plan birth at home have fewer risk factors than and a different distribution of risk factors from ‘higher risk’ women planning OU birth.
-
Compared with ‘low risk’ women planning home birth, ‘higher risk’ women planning home birth have an increased risk of an adverse perinatal outcome.
-
The babies of ‘higher risk’ women who plan birth in an OU are more likely to be admitted to a neonatal unit for > 48 hours than the babies of ‘higher risk’ women who plan birth at home, but it is uncertain if this reflects a real difference in morbidity.
Implications for practice and policy
Expansion and reconfiguration of midwifery-led intrapartum care
-
The expansion in the capacity of non-OU intrapartum care could potentially reduce intervention rates in ‘low risk’ women who opt for birth in these settings. However, intervention and transfer rates vary considerably between units, particularly OUs and AMUs, for reasons that are not well understood. Our exploratory analyses suggest that OUs situated in trusts with more planned ‘non-OU’ births tended to have higher intervention rates. Major changes in service provision need to be accompanied by appropriate monitoring and evaluation. Data capture systems need to be put in place to enable changes in the provision of services, equity of access to midwifery-led settings and changes in the characteristics of women using those services to be better monitored and to enable outcomes by planned place of birth (including planned home births) to be routinely evaluated.
-
Moves to centralise obstetric services could potentially lead to fewer, larger OUs, possibly with an increase in the number of larger AMUs and possibly an increase in the number of FMUs which commonly open on sites where an OU has closed. 41 Birthplace findings relating to outcomes in planned AMU births primarily relate to units with < 1500 births per year. The possible expansion of provision in large AMUs and changes in admission criteria or other fundamental characteristics, including staffing, should be accompanied by appropriate evaluation to confirm that such units safely achieve the reduction in intervention rates observed in the Birthplace study.
-
Findings relating to FMUs can cautiously be interpreted as suggesting that larger FMUs that are not too distant from an OU may achieve the lowest maternal intervention rates and lowest transfer rates. However, the degree of variation in intervention rates associated with size and distance in FMUs was small relative to the substantial difference in intervention rates between FMUs and OUs. This suggests that the provision of smaller FMUs may be a reasonable approach to providing accessible maternity services to more remote areas, although women should be informed of potential transfer times: the median ‘total transfer time’ for FMUs situated > 40 km from an OU was 61 minutes. 66
-
The primary Birthplace analysis showed that for multiparous women planned home birth was safe for the baby and reduced the risk of interventions for the mother. The evidence from the present study indicates that NHS trusts with more home births achieve lower transfer and intervention rates in planned home births. Taken together, these findings support a policy of increasing provision of home birth services to support multiparous women who wish to plan birth at home. Consideration needs to be given to the training and preparation of midwives supporting home birth and to the organisation of home birth services. It will be important to monitor the characteristics of women opting for home birth, particularly parity and risk status, and future re-evaluation of outcomes in planned home births should be intended, ideally using routinely collected maternity data. Changes that would be required to routine data systems are discussed in Data systems for monitoring and evaluation, below.
-
The accumulated evidence from Birthplace supports a policy of offering ‘low risk’ women a choice of birth setting. Recent data suggest that choice of birth setting has increased in the last few years, with more AMUs and a small increase in the number of FMUs, with the new FMUs predominantly replacing OUs that have closed. 41 However, while these changes are consistent with a policy of offering women a choice of birth setting, and may improve equity of access to non-OU care, is unclear what aspects of choice women value: it is not known, for example, to what extent women have a preference for AMUs versus FMUs in different geographical locations, how women value proximity of services versus choice of birth setting, and whether or not women feel that AMUs with opt-out policies deny them choice.
-
Although the association between socioeconomic disadvantage and morbidity means that the proportion of women with risk factors may be higher in disadvantaged areas, our findings suggest that the maternal benefits of midwifery-led settings in terms of reduced intervention apply to ‘low risk’ women living in both advantaged and disadvantaged areas.
Clinical thresholds for intervention and transfer
-
Time of day variations in interventions in planned OU births suggest that non-clinical factors may be leading to an ‘excess’ use of epidurals and augmentation in women labouring during ‘office hours’, with a corresponding dip in women having a ‘normal birth’. OUs need to examine whether their delivery ward practices and procedures, or staffing levels and skill mix, contribute to this and implement strategies to promote ‘normal birth’ and reduce unnecessary interventions, particularly for women who express a preference for minimal intervention. The night-time excess of intrapartum caesarean sections also requires investigation.
-
Our findings add to the evidence of a marked age-related increase in interventions, including augmentation, instrumental delivery and intrapartum caesarean section, in nulliparous women. This age-related trend was seen in births planned in both OU and non-OU settings. There is evidence that nulliparous women may labour less effectively at older ages; evidence from elsewhere (summarised by Li et al. 54) suggests that non-clinical factors, such as the labelling of older women as ‘higher risk’ and possibly older women’s expectations and preferences, may also be contributory factors. Given the upwards trend in maternal age at first birth, there is a pressing need for further investigation of factors contributing to higher intervention rates at older ages, with a possible view to randomised controlled trials evaluating the safety and effectiveness of strategies to reduce interventions in this group of women.
-
The high neonatal admission rate in planned OU births at term (which was observed in both ‘low risk’ and ‘higher risk’ births) is costly, and the separation of mother and baby may have negative consequences. Prolonged admission of term babies with suspected sepsis or hypoglycaemia might be a suitable topic for local audit.
Informing women’s choices
-
Analyses relating to maternal characteristics associated with both transfer and subsequent obstetric intervention identify groups of women with a high probability of transfer, including nulliparous older women and women who are more than a week past their due date. It may be appropriate to consider whether or not the information and advice given to older nulliparous women and women who have reached 41 weeks’ gestation, and possibly other groups, should be modified to make women aware of their chances of transfer. Planned birth in an AMU might be recommended for women in these groups who are concerned about their chances of transfer and who may wish to avoid transfer in an ambulance.
-
Regular publication of data on unit-level intervention rates, ideally presenting rates by planned place of birth at start of labour care, by parity and separating ‘low risk’ and ‘higher risk’ women, would help women make informed decisions and would also be of value to commissioners and service managers.
Data systems for monitoring and evaluation
Birthplace findings reflect outcomes applicable to the models of service provision and clinical practice patterns in place over the years 2008–10, when data were collected for the study. As there have been changes to maternity services provision since that time, systems need to be put in place to monitor the impact of these changes and evaluate outcomes by planned place of birth over time. High-quality maternity data systems are needed to routinely capture the data required to update the key Birthplace analyses of perinatal and maternal outcomes by planned place of birth without the need for a major prospective cohort study. Although the data collected in the Birthplace cohort study were largely of the type that would be appropriate to collect in routine data collection systems, they were neither available nationally nor recorded consistently in the wide range of systems used locally. This section summarises some of the issues that would need to be addressed to enable the main Birthplace analyses to be repeated routinely and to facilitate monitoring of outcomes by planned place of birth.
Problems with routine data systems
-
A major problem, already apparent in the early 1980s when the Maternity Hospital Episode Statistics (HES) system was designed, is that planned place of birth at the start of labour care has not been specified as a data item in HES. Instead, only the items ‘delivery place intended’, ‘delivery place actual’ and ‘delivery place change reason’ are recorded. In addition to this problem, the definitions of settings for birth are now very dated and were designed for an era when general practitioners still acted as lead professionals. Although a new data item, ‘type of midwifery unit’, has been added, this still bears little resemblance either to the definitions developed in Birthplace or to common parlance.
-
In recent years, considerable investment has been put into a more complex maternity services data set. 108 It is yet to be implemented and so it is too early to judge whether or not it will successfully capture all the data items specified, but some problems are apparent from the outset. It is based on using restricted checklists for clinical diagnoses and procedures rather than the full range of conditions found in the International Classification of Diseases-Fourth Edition109 and the procedures found in the OPCS-4 (Office of Population, Censuses and Surveys Classification of Surgical Operations and Procedures) operation codes110 and other classifications. At an earlier stage it was proposed that it collected data on planned place of birth at the start of labour care, but this has now been replaced by the same unsatisfactory data items as the Maternity HES. The reason given for this is the requirement to maintain consistency with the NHS Data Dictionary. 111
-
The other major problem is that data on home births in general and planned home births in particular are not captured. The Maternity HES captures only a minority of births occurring at home and a small number of women who intended to deliver at home at some point, but transferred to hospital. The original plans specified that Maternity HES should capture all registrable births in England, both NHS and private, but it has never done so, probably because some hospital systems are not designed to capture information about events outside their remit. The specification for the maternity data set is that it should capture NHS-funded births, but it remains to be seen to what extent it can capture planned home births.
This project has also highlighted the lack of relevant, high-quality data on the characteristics of maternity services, including staffing, that can be used to investigate outcomes associated with aspects of the organisation and delivery of services.
Recommended changes to data systems
Two major changes are needed to enable outcomes by planned place of birth to be routinely monitored and evaluated in relation to changes in service provision:
-
The definitions relating to place of delivery in the NHS Data Dictionary need to be amended to include planned place of birth at the start of labour care, and categories relating to actual place of birth need to be updated. Alignment with questions relating to ‘intended place of delivery’ collected by MBRRACE-UK (Mothers and Babies: Reducing Risk through Audits and Confidential Enquiries across the UK) in their perinatal death notification system might facilitate evaluation of perinatal outcomes by planned place of birth. 112
-
Local maternity information systems need to be able to record data about maternity care in the community as well as on hospital premises, both for local use and audit and to enable national collection of data about planned and unplanned home births. The inclusion of births attended by independent midwives and private hospitals in the Maternity HES would be desirable.
Additionally:
-
Greater use should be made of data linkage to other routine systems.
-
To complement data collected routinely, there is a need for periodic services reviews, including surveys of maternity provision at both a trust and an unit level, such as those conducted by the Healthcare Commission in 2007 and the National Audit Office in 2013. These can provide data on the characteristics of services that can be used for both monitoring and research and can be used to generate local and national reports. 11,32
Unanswered questions and recommendations for further research
-
Intervention rates in planned OU births: as has previously been suggested by the Birthplace investigators,7 there is a need to address the higher frequency of major interventions and the relatively low frequency of ‘normal births’ in ‘low risk’ women planning birth in OUs compared with other settings. Research to identify ways of safely reducing OU intervention is a priority. This might include further observational studies comparing aspects of labour care in different settings, as well as further exploration of the factors underlying the time of day variations in intervention rates in OUs as a means of identifying factors associated with variations in intervention threshold.
-
Understanding factors leading to lower intervention rates in midwifery-led care: the key mechanisms that lead to lower intervention rates in midwifery-led care are poorly understood. These may directly relate to aspects of intrapartum care that may promote normal physiologic birth, such as non-pharmacological methods of pain relief, a reassuring birth environment and high levels of one-to-one care, but may also include factors such as women’s beliefs and expectations regarding birth, which may in turn be influenced by the quality of information and care received during the antenatal period. Mixed-methods research exploring differences between MUs with high and low intervention rates might be one possible approach in this area.
-
Understanding women’s preferences and choices: the organisation and configuration of maternity services needs to be informed by an understanding of women’s preferences and the factors that underpin these preferences. Mixed-methods research is required to explore what aspects of choice women value (see Implications for practice and policy, Expansion and reconfiguration of midwifery-led intrapartum care, above). This should build on and further explore what is already known about some of the factors that influence women’s preferences and their beliefs about the ‘best’ place to give birth. 95,113–115 Methodological work to develop a tool that could be used by commissioners and service planners to evaluate local women’s preferences might be worthwhile.
-
‘Higher risk’ women who opt for non-OU birth: further research is required to determine why some women with commonly occurring risk factors choose to plan birth in non-OU settings and in particular at home. More generally, research is required to identify how services can meet the needs of ‘higher risk’ women who require continuous fetal monitoring or other interventions such as induction of labour, but who wish to minimise other interventions as far as possible.
-
Increasing options for some women with ‘risk factors’: MU admission criteria are known to vary from unit to unit6 and, anecdotally, some AMUs currently admit women with risk factors such as a BMI > 35 kg/m2. For some risk factors the NICE guideline acknowledges that there is limited evidence on whether or not planned birth in an OU improves outcomes compared with planned birth in another setting. 15 Research into outcomes for women with common risk factors, such as BMI > 35 kg/m2 and post-term pregnancy, who plan birth in an AMU may be merited.
-
High neonatal unit admission rates in planned OU births: the higher neonatal admission rate following planned OU births at term (which was observed in both ‘low risk’ and ‘higher risk’ women) is costly and the separation of mothers and babies may have negative consequences. Conversely, the lower neonatal admission rate in planned home births at term (also observed in both ‘low risk’ and ‘higher risk’ women) could mean that babies at risk of serious, but uncommon, morbidity may be missed or have their diagnosis delayed. Research exploring the reasons for admission to a neonatal unit and the reasons for continuing to receive specialist neonatal care is required in order to understand the high admission rate in planned OU births. Such research might focus on term babies admitted for > 48 hours for investigation or observation following a query diagnosis of sepsis or hypoglycaemia. Findings of such a study might potentially be used to determine whether or not neonatal observation could be carried out safely in a lower-dependency setting such as the postnatal ward.
Conclusions
Birthplace findings support a policy of offering healthy women with low risk pregnancies a choice of birth setting. The findings from this project provide additional evidence that may be used to inform the development of safe, effective and equitable intrapartum care services that offer women a choice of birth setting. Our findings also provide information that will be helpful to women choosing their planned birth setting. Additionally, we suggest areas where routine data systems might be strengthened to enable outcomes to be routinely monitored and evaluated as services develop and identify areas where further research is merited. In particular, we identify research that might contribute to strategies to reduce interventions and develop services that are more closely aligned with women’s preferences, and that might further our understanding of ways in which services could be developed to better meet the needs and preferences of ‘higher risk’ women and their babies.
Acknowledgements
We would like to thank:
Miranda Dodwell from BirthChoiceUK, who shared ONS data on the number of women giving birth per year in maternity units.
Dharmintra Pasupathy, consultant obstetrician and senior lecturer in maternal and fetal medicine and perinatal epidemiology at King’s College London, who contributed to the design and interpretation of the study on ‘higher risk’ women reported in Chapter 7.
Kirstie Coxon, Research Associate at King’s College London, who attended co-investigator meetings as an observer and gave insightful comments on several aspects of the project.
Pamela White, who provided administrative support to the project.
Contributions of authors
Jennifer Hollowell (Associate Professor, Senior Epidemiologist) conceived and developed the research questions and protocol, led the project, advised on analysis and interpretation of results and codrafted and revised the final report.
Rachel Rowe (University Research Lecturer, Senior Health Services Researcher) developed the research questions and protocol, managed the project, advised on analysis and interpretation of results and codrafted and revised the final report.
John Townend (Senior Medical Statistician) developed analysis plans, carried out analyses, advised on analysis and interpretation of results, drafted sections of and commented on the final report.
Marian Knight (Professor, Maternal and Child Population Health) contributed to the development of the research questions and protocol, advised on analysis and interpretation of results and commented on the final report.
Yangmei Li (Epidemiologist/Health Services Researcher) developed the analysis plan and carried out the analysis for the study on ‘higher risk’ women, contributed to the drafting of Chapter 7 and commented on other sections of the final report.
Louise Linsell (Senior Medical Statistician) contributed to the development of the protocol, advised on statistical methods, analysis and interpretation of results and commented on sections of the final report.
Maggie Redshaw (Senior Social Scientist) contributed to the development of the research questions and protocol, advised on analysis and interpretation of results and commented on the final report.
Peter Brocklehurst (Professor, Perinatal Epidemiology) contributed to the development of the research questions and protocol, advised on analysis and interpretation of results and commented on the final report.
Alison Macfarlane (Professor, Perinatal Health) contributed to the development of the research questions and protocol, advised on analysis and interpretation of results and commented on the final report.
Neil Marlow (Professor, Neonatology) contributed to the development of the research questions and protocol, advised on analysis and interpretation of results in Chapter 7 and commented on sections of the final report.
Christine McCourt (Professor, Maternal and Child Health) contributed to the development of the research questions and protocol, advised on analysis and interpretation of results and commented on the final report.
Mary Newburn (Head of Research & Quality, National Childbirth Trust) contributed to the development of the research questions and protocol, advised on analysis and interpretation of results and commented on the final report.
Jane Sandall (Professor, Social Science and Women’s Health) contributed to the development of the research questions and protocol, advised on analysis and interpretation of results and commented on the final report.
Louise Silverton (Director for Midwifery, Royal College of Midwives) contributed to the development of the research questions and protocol, advised on analysis and interpretation of results and commented on the final report.
Publications
Rowe RE, Townend J, Brocklehurst P, Knight M, Macfarlane A, McCourt C, et al. Duration and urgency of transfer in births planned at home and in freestanding midwifery units in England: secondary analysis of the Birthplace national prospective cohort study. BMC Pregnancy Childbirth 2013;13:224.
Rowe RE, Townend J, Brocklehurst P, Knight M, Macfarlane A, McCourt C, et al. Service configuration, unit characteristics and variation in intervention rates in a national sample of obstetric units in England: an exploratory analysis. BMJ Open 2014;4:e005551.
Li Y, Townend J, Rowe R, Brocklehurst P, Knight M, Linsell L, et al. Perinatal and maternal outcomes in planned home and obstetric unit births in women at ‘higher risk’ of complications: secondary analysis of the Birthplace national prospective cohort study. BJOG 2015;122:741–53.
Data sharing statement
Requests for access to data should be addressed to the corresponding author or to the data custodian, the NPEU Director.
Disclaimers
This report presents independent research funded by the National Institute for Health Research (NIHR). The views and opinions expressed by authors in this publication are those of the authors and do not necessarily reflect those of the NHS, the NIHR, NETSCC, the HS&DR programme or the Department of Health. If there are verbatim quotations included in this publication the views and opinions expressed by the interviewees are those of the interviewees and do not necessarily reflect those of the authors, those of the NHS, the NIHR, NETSCC, the HS&DR programme or the Department of Health.
References
- Changing Childbirth, Part 1: Report of the Expert Maternity Group. London: HMSO; 1993.
- National Service Framework for Children, Young People and Maternity Services. Standard 11: Maternity Services. London: Department of Health; 2004.
- Maternity Matters: Choice, Access and Continuity of Care in a Safe Service. London: Department of Health; 2007.
- Campbell R, Macfarlane A. Where to be Born? The Debate and the Evidence. Oxford: National Perinatal Epidemiology Unit; 1994.
- Hollowell J. Birthplace Programme Overview: Background, Component Studies and Summary of Findings. Birthplace in England Research Programme. London: NIHR Service Delivery and Organisation programme; 2011.
- Redshaw M, Rowe R, Schroeder L, Puddicombe D, Macfarlane A, Newburn M, et al. Mapping Maternity Care. The Configuration of Maternity Care in England. Birthplace in England Research Programme. London: NIHR Service Delivery and Organisation programme; 2011.
- Hollowell J, Puddicombe D, Rowe R, Linsell L, Hardy P, Stewart M, et al. The Birthplace National Prospective Cohort Study: Perinatal and Maternal Outcomes by Planned Place Of Birth. Birthplace in England Research Programme. London: NIHR Service Delivery and Organisation programme; 2011.
- Birthplace in England Collaborative Group . Perinatal and maternal outcomes by planned place of birth for healthy women with low risk pregnancies: the Birthplace in England national prospective cohort study. BMJ 2011;343. http://dx.doi.org/10.1136/bmj.d7400.
- Schroeder L, Petrou S, Patel N, Hollowell J, Puddicombe D, Redshaw M, et al. Birthplace Cost-Effectiveness Analysis of Planned Place of Birth: Individual Level Analysis. Birthplace in England Research Programme. London: NIHR Service Delivery and Organisation programme; 2011.
- McCourt C, Rance S, Rayment J, Sandall J. Birthplace Qualitative Organisational Case Studies: How Maternity Care Systems May Affect the Provision of Care in Different Settings. Birthplace in England Research Programme. London: NIHR Service Delivery and Organisation programme; 2011.
- Towards Better Births: A Review of Maternity Services in England. London: Commission for Healthcare Audit and Inspection; 2008.
- Making Normal Birth a Reality. London: National Childbirth Trust and Royal College of Midwives & Royal College of Obstetricians and Gynaecologists; 2007.
- Intrapartum Care: Care of Healthy Women and their Babies During Childbirth. London: NICE; 2007.
- Schroeder E, Petrou S, Patel N, Hollowell J, Puddicombe D, Redshaw M, et al. Cost effectiveness of alternative planned places of birth in woman at low risk of complications: evidence from the Birthplace in England national prospective cohort study. BMJ 2012;344. http://dx.doi.org/10.1136/bmj.e2292.
- Intrapartum Care: Care of Healthy Women and their Babies During Childbirth. London: National Collaborating Centre for Women’s and Children’s Health; 2014.
- Rowe RE, Fitzpatrick R, Hollowell J, Kurinczuk JJ. Transfers of women planning birth in midwifery units: data from the Birthplace prospective cohort study. BJOG 2012;119:1081-90. http://dx.doi.org/10.1111/j.1471-0528.2012.03414.x.
- Which? in partnership with BirthChoiceUK . Which? BirthChoice n.d. www.which.co.uk/birth-choice (accessed May 2014).
- Patterns of Maternity Care in English NHS Hospitals. London: Royal College of Obstetricians and Gynaecologists; 2013.
- Spiegelhalter DJ. Funnel plots for comparing institutional performance. Stat Med 2005;24:1185-202. http://dx.doi.org/10.1002/sim.1970.
- Declercq E, Young R, Cabral H, Ecker J. Is a rising cesarean delivery rate inevitable? Trends in industrialized countries, 1987 to 2007. Birth 2011;38:99-104. http://dx.doi.org/10.1111/j.1523-536X.2010.00459.x.
- Wildman K, Blondel B, Nijhuis J, Defoort P, Bakoula C. European indicators of health care during pregnancy, delivery and the postpartum period. Eur J Obstet Gynecol Reprod Biol 2003;111:53-65. http://dx.doi.org/10.1016/j.ejogrb.2003.09.006.
- EURO-PERISTAT Project with SCPE and EUROCAT . European Perinatal Health Report. The Health and Care of Pregnant Women and Babies in Europe in 2010 2013. www.europeristat.com/ (accessed 10 June 2015).
- Health and Social Care Information Centre . NHS Maternity Statistics: England, April 2011–March 2012: Provider Level Analysis n.d. www.hscic.gov.uk/catalogue/PUB09202 (accessed 11 December 2013).
- Dodwell M, Newburn M. Normal Birth as a Measure of Quality of Care. London: National Childbirth Trust; 2010.
- Bragg F, Cromwell DA, Edozien LC, Gurol-Urganci I, Mahmood TA, Templeton A, et al. Variation in rates of caesarean section among English NHS trusts after accounting for maternal and clinical risk: cross sectional study. BMJ 2010;341. http://dx.doi.org/10.1136/bmj.c5065.
- Paranjothy S, Frost C, Thomas J. How much variation in CS rates can be explained by case mix differences?. BJOG 2005;112:658-66. http://dx.doi.org/10.1111/j.1471-0528.2005.00501.x.
- Joyce R, Webb R, Peacock J. Predictors of obstetric intervention rates: case-mix, staffing levels and organisational factors of hospital of birth. J Obstet Gynaecol 2002;22:618-25. http://dx.doi.org/10.1080/0144361021000020385.
- Coulm B, Le Ray C, Lelong N, Drewniak N, Zeitlin J, Blondel B. Obstetric interventions for low-risk pregnant women in France: do maternity unit characteristics make a difference?. Birth 2012;39:183-91. http://dx.doi.org/10.1111/j.1523-536X.2012.00547.x.
- Coonrod DV, Drachman D, Hobson P, Manriquez M. Nulliparous term singleton vertex cesarean delivery rates: institutional and individual level predictors. Am J Obstet Gynecol 2008;198. http://dx.doi.org/10.1016/j.ajog.2008.03.026.
- Le Ray C, Carayol M, Zeitlin J, Bréart G, Goffinet F. PREMODA Study Group . Level of perinatal care of the maternity unit and rate of cesarean in low-risk nulliparas. Obstet Gynecol 2006;107:1269-77. http://dx.doi.org/10.1097/01.AOG.0000218098.70942.a2.
- High Quality Women’s Health Care: A Proposal for Change. London: Royal College of Obstetricians and Gynaecologists; 2011.
- Maternity Services in England. Report by the Comptroller and Auditor General. London: The Stationery Office; 2013.
- Gerova V, Griffiths P, Jones S, Bick D. The Association between Midwifery Staffing and Outcomes in Maternity Units in England: Observational Study using Routinely Collected Data. London: National Nursing Research Unit, King’s College London; 2010.
- Rowe RE, Townend J, Brocklehurst P, Knight M, Macfarlane A, McCourt C, et al. Service configuration, unit characteristics and variation in intervention rates in a national sample of obstetric units in England: an exploratory analysis. BMJ Open 2014;4. http://dx.doi.org/10.1136/bmjopen-2014-005551.
- Tracy S, Sullivan E, Dahlen H, Black D, Wang YA, Tracy MB. Does size matter? A population-based study of birth in lower volume maternity hospitals for low risk women. BJOG 2006;113:86-9. http://dx.doi.org/10.1111/j.1471-0528.2005.00794.x.
- McCourt C, Rayment J, Rance S, Sandall J. An ethnographic organisational study of alongside midwifery units: a follow-on study from the Birthplace in England programme. Health Serv Deliv Res 2014;2.
- Van Der Hulst LA, Van Teijlingen ER, Bonsel GJ, Eskes M, Bleker OP. Does a pregnant woman’s intended place of birth influence her attitudes toward and occurrence of obstetric interventions?. Birth 2004;31:28-33. http://dx.doi.org/10.1111/j.0730-7659.2004.0271.x.
- Green JM, Baston HA. Have women become more willing to accept obstetric interventions and does this relate to mode of birth? Data from a prospective study. Birth 2007;34:6-13. http://dx.doi.org/10.1111/j.1523-536X.2006.00140.x.
- Mead MM, Kornbrot D. The influence of maternity units’ intrapartum intervention rates and midwives’ risk perception for women suitable for midwifery-led care. Midwifery 2004;20:61-7. http://dx.doi.org/10.1016/S0266-6138(03)00054-8.
- Hodnett ED, Downe S, Walsh D. Alternative versus conventional institutional settings for birth. Cochrane Database Syst Rev 2012;8. http://dx.doi.org/10.1002/14651858.cd000012.pub4.
- Dodwell M. Trends in Freestanding Midwife-led Units in England and Wales 2001–2013. London: BirthChoiceUK for the Royal College of Midwives; 2013.
- Walsh D, Downe SM. Outcomes of free-standing, midwife-led birth centers: a structured review. Birth 2004;31:222-9. http://dx.doi.org/10.1111/j.0730-7659.2004.00309.x.
- Lindgren HE, Radestad IJ, Christensson K, Hildingsson IM. Outcome of planned home births compared to hospital births in Sweden between 1992 and 2004. A population-based register study. Acta Obstet Gynecol Scand 2008;87:751-9. http://dx.doi.org/10.1080/00016340802199903.
- Janssen PA, Saxell L, Page LA, Klein MC, Liston RM, Lee SK. Outcomes of planned home birth with registered midwife versus planned hospital birth with midwife or physician. Can Med Assoc J 2009;181:377-83. http://dx.doi.org/10.1503/cmaj.081869.
- Ibison JM. Ethnicity and mode of delivery in ‘low risk’ first-time mothers, East London, 1988–1997. Eur J Obstet Gynecol Reprod Biol 2005;118:199-205. http://dx.doi.org/10.1016/j.ejogrb.2004.05.002.
- Essex HN, Green J, Baston H, Pickett KE. Which women are at an increased risk of a caesarean section or an instrumental vaginal birth in the UK: an exploration within the Millennium Cohort Study. BJOG 2013;120:732-43. http://dx.doi.org/10.1111/1471-0528.12177.
- Fairley L, Dundas R, Leyland AH. The influence of both individual and area based socioeconomic status on temporal trends in Caesarean sections in Scotland 1980–2000. BMC Public Health 2011;11. http://dx.doi.org/10.1186/1471-2458-11-330.
- Ezra Y, McParland P, Farine D. High delivery intervention rates in nulliparous women over age 35. Eur J Obstet Gynecol Reprod Biol 1995;62:203-7. http://dx.doi.org/10.1016/0301-2115(95)02201-H.
- Gordon D, Milberg J, Daling J, Hickok D. Advanced maternal age as a risk factor for cesarean delivery. Obstet Gynecol 1991;77:493-7.
- Heffner LJ, Elkin E, Fretts RC. Impact of labor induction, gestational age, and maternal age on cesarean delivery rates. Obstet Gynecol 2003;102:287-93. http://dx.doi.org/10.1016/S0029-7844(03)00531-3.
- Patel RR, Peters TJ, Murphy DJ. AST. Prenatal risk factors for Caesarean section . Analyses of the ALSPAC cohort of 12,944 women in England. Int J Epidemiol 2005;34:353-67. http://dx.doi.org/10.1093/ije/dyh401.
- Peipert JF, Bracken MB. Maternal age: an independent risk factor for cesarean delivery. Obstet Gynecol 1993;81:200-5.
- Dibben C, Sigala M, Macfarlane A. Area deprivation, individual factors and low birth weight in England: is there evidence of an area effect?. J Epidemiol Commun Health 2006;60:1053-9. http://dx.doi.org/10.1136/jech.2005.042853.
- Li Y, Townend J, Rowe R, Knight M, Brocklehurst P, Hollowell J. The effect of maternal age and planned place of birth on intrapartum outcomes in healthy women with straightforward pregnancies: secondary analysis of the Birthplace national prospective cohort study. BMJ Open 2014;4. http://dx.doi.org/10.1136/bmjopen-2013-004026.
- Anderson NH, Sadler LC, Stewart AW, Fyfe EM, McCowan LME. Ethnicity and risk of caesarean section in a term, nulliparous New Zealand obstetric cohort. Aust N Z J Obstet Gynaecol 2013;53:258-64. http://dx.doi.org/10.1111/ajo.12036.
- Bell JS, Campbell DM, Graham WJ, Penney GC, Ryan M, Hall MH. Can obstetric complications explain the high levels of obstetric interventions and maternity service use among older women? A retrospective analysis of routinely collected data. BJOG 2001;108:910-18. http://dx.doi.org/10.1111/j.1471-0528.2001.00214.x.
- Rowe RE, Kurinczuk JJ, Locock L, Fitzpatrick R. Women’s experience of transfer from midwifery unit to hospital obstetric unit during labour: a qualitative interview study. BMC Pregnancy Childbirth 2012;12. http://dx.doi.org/10.1186/1471-2393-12-129.
- Intrapartum Care: Care of Healthy Women and their Babies During Childbirth. London: NICE; 2014.
- Webb DA, Culhane J. Time of day variation in rates of obstetric intervention to assist in vaginal delivery. J Epidemiol Commun Health 2002;56:577-8. http://dx.doi.org/10.1136/jech.56.8.577.
- Fraser W, Usher RH, McLean FH, Bossenberry C, Thomson ME, Kramer MS, et al. Temporal variation in rates of cesarean section for dystocia: does ‘convenience’ play a role?. Am J Obstet Gynecol 1987;156:300-4. http://dx.doi.org/10.1016/0002-9378(87)90272-9.
- Argent VP. Pre-hospital risks of the reconfiguration of obstetric services. Clin Risk 2010;16:52-5. http://dx.doi.org/10.1258/cr.2009.090060.
- Fell G, Haroon S. Learning from a Rapid Health Impact Assessment of a proposed maternity service reconfiguration in the English NHS. BMC Public Health 2008;8. http://dx.doi.org/10.1186/1471-2458-8-138.
- Advice on Proposals for Changes to Maternity Services in Scarborough and North East Yorkshire. London: Independent Reconfiguration Panel; 2008.
- Norfolk A. Baby dies after drive to hospital. There was a lack of facilities at new hospital and no ambulance for the mother. The Times 2004.
- RCOG Statement on the Results of the NPEU Birthplace Study. London: Royal College of Obstetricians and Gynaecologists; 2011.
- Rowe RE, Townend J, Brocklehurst P, Knight M, Macfarlane A, McCourt C, et al. Duration and urgency of transfer in births planned at home and in freestanding midwifery units in England: secondary analysis of the birthplace national prospective cohort study. BMC Pregnancy Childbirth 2013;13. http://dx.doi.org/10.1186/1471-2393-13-224.
- Hogg M, Penney G, Carmichael J. Audit of Care Provided and Outcomes Achieved by Community Maternity Units in Scotland 2005. Aberdeen: Scottish Programme for Clinical Effectiveness in Reproductive Health; 2007.
- Induction of Labour. London: NICE; 2008.
- Berkowitz GS, Skovron ML, Lapinski RH, Berkowitz RL. Delayed childbearing and the outcome of pregnancy. New Engl J Med 1990;322:659-64. http://dx.doi.org/10.1056/NEJM199003083221004.
- Carolan M. Maternal age ≥ 45 years and maternal and perinatal outcomes: a review of the evidence. Midwifery 2013;29:479-89. http://dx.doi.org/10.1016/j.midw.2012.04.001.
- Jolly M, Sebire N, Harris J, Robinson S, Regan L. The risks associated with pregnancy in women aged 35 years or older. Human Reproduction 2000;15:2433-7. http://dx.doi.org/10.1093/humrep/15.11.2433.
- Delpisheh A, Brabin L, Attia E, Brabin BJ. Pregnancy late in life: a hospital-based study of birth outcomes. J Women’s Health 2008;17:965-70. http://dx.doi.org/10.1089/jwh.2007.0511.
- Walsh D. Improving Maternity Services. Small is Beautiful – Lessons from a Birth Centre. Oxford: Radcliffe Publishing; 2007.
- Walsh DJ. A birth centre’s encounters with discourses of childbirth: how resistance led to innovation. Sociol Health Illn 2007;29:216-32. http://dx.doi.org/10.1111/j.1467-9566.2007.00545.x.
- Cheyne H, Dalgleish L, Tucker J, Kane F, Shetty A, McLeod S, et al. Risk assessment and decision making about in-labour transfer from rural maternity care: a social judgment and signal detection analysis. BMC Med Inform Decis Making 2012;12. http://dx.doi.org/10.1186/1472-6947-12-122.
- Harris FM, van Teijlingen E, Hundley V, Farmer J, Bryers H, Caldow J, et al. The buck stops here: midwives and maternity care in rural Scotland. Midwifery 2011;27:301-7. http://dx.doi.org/10.1016/j.midw.2010.10.007.
- Rowe RE. Local guidelines for the transfer of women from midwifery unit to obstetric unit during labour in England: a systematic appraisal of their quality. Qual Saf Health Care 2010;19:90-4. http://dx.doi.org/10.1136/qshc.2008.030239.
- Caesarean Section. London: NICE; 2011.
- Kaiser IH, Halberg F. Circadian periodic aspects of birth. Ann New York Acad Sci 1962;98:1056-68. http://dx.doi.org/10.1111/j.1749-6632.1962.tb30618.x.
- Glattre E, Bjerkedal T. The 24-hour rhythmicity of birth: a populational study. Acta Obstet Gynecol Scand 1983;62:31-6. http://dx.doi.org/10.3109/00016348309155754.
- Jolly A. Hour of birth in primates and man. Folia Primatologica 1972;18:108-21. http://dx.doi.org/10.1159/000155472.
- Heres MHB, Pel M, Borkent-Polet M, Treffers PE, Mirmiran M. The hour of birth: comparisons of circadian pattern between women cared for by midwives and obstetricians. Midwifery 2000;16:173-6. http://dx.doi.org/10.1054/midw.1999.0210.
- Backe B. A circadian variation in the observed duration of labor. Acta Obstet Gynecol Scand 1991;70:465-8. http://dx.doi.org/10.3109/00016349109007161.
- Anderka M, Declercq ER, Smith W. A time to be born. Am J Public Health 2000;90. http://dx.doi.org/10.2105/AJPH.90.1.124.
- Cagnacci A, Soldani R, Melis GB, Volpe A. Diurnal rhythms of labor and delivery in women: modulation by parity and seasons. Am J Obstet Gynecol 1998;178:140-5. http://dx.doi.org/10.1016/S0002-9378(98)70641-6.
- Pasupathy D, Wood AM, Pell JP, Fleming M, Smith GCS. Time of birth and risk of neonatal death at term: retrospective cohort study. BMJ 2010;341. http://dx.doi.org/10.1136/bmj.c3498.
- Harkness J, Gijsbers K. Pain and stress during childbirth and time of day. Ethol Sociobiol 1989;10:255-61. http://dx.doi.org/10.1016/0162-3095(89)90003-4.
- Cerbinskaite A, Malone S, McDermott J, Loughney AD. Emergency caesarean section: influences on the decision-to-delivery interval. J Pregnancy 2011;2011. http://dx.doi.org/10.1155/2011/640379.
- Anim-Somuah M, Smyth RM, Jones L. Epidural versus non-epidural or no analgesia in labour. Cochrane Database Syst Rev 2011;12. http://dx.doi.org/10.1002/14651858.cd000331.pub3.
- Rowe R. Transfer from Midwifery Unit to Obstetric Unit During Labour: Rates, Process and Women’s Experience. Oxford: University of Oxford; 2011.
- Diabetes in Pregnancy. Management of Diabetes and its Complications from Preconception to the Postnatal Period. London: Royal College of Obstetricians and Gynaecologists; 2008.
- Rohininath T, O’Connell L, Sheehan K, Corcoran D, Matthews T, Clarke T. Workload and short-term outcome of babies weighing 2,500?grams or more at birth admitted to the paediatric unit of the Rotunda Hospital. J Matern Fetal Neonatal Med 2005;17:139-43.
- Boucher D, Bennett C, McFarlin B, Freeze R. Staying home to give birth: why women in the United States choose home birth. J Midwifery Womens Health 2009;54:119-26. http://dx.doi.org/10.1016/j.jmwh.2008.09.006.
- Viisainen K. Negotiating control and meaning: home birth as a self-constructed choice in Finland. Soc Sci Med 2001;52:1109-21. http://dx.doi.org/10.1016/S0277-9536(00)00206-9.
- Coxon K, Sandall J, Fulop NJ. To what extent are women free to choose where to give birth? How discourses of risk, blame and responsibility influence birth place decisions. Health Risk Soc 2014;16:51-67. http://dx.doi.org/10.1080/13698575.2013.859231.
- Redshaw M, Rowe R, Hockley C, Brocklehurst P. Recorded Delivery: A National Survey of Women’s Experience of Maternity Care 2006. Oxford: National Perinatal Epidemiology Unit; 2007.
- Jackson M, Dahlen H, Schmied V. Birthing outside the system: perceptions of risk amongst Australian women who have freebirths and high risk homebirths. Midwifery 2012;28:561-67. http://dx.doi.org/10.1016/j.midw.2011.11.002.
- Hollowell J, Pillas D, Rowe R, Linsell L, Knight M, Brocklehurst P. The impact of maternal obesity on intrapartum outcomes in otherwise low risk women: secondary analysis of the Birthplace national prospective cohort study. BJOG 2014;121:343-55. http://dx.doi.org/10.1111/1471-0528.12437.
- Daemers DO, Wijnen HA, van Limbeek EB, Budé LM, Nieuwenhuijze MJ, Spaanderman ME, et al. The impact of obesity on outcomes of midwife-led pregnancy and childbirth in a primary care population: a prospective cohort study. BJOG 2014;121:1403-13. http://dx.doi.org/10.1111/1471-0528.12684.
- Bastian H, Keirse MJ, Lancaster PA. Perinatal death associated with planned home birth in Australia: population based study. BMJ 1998;317:384-8. http://dx.doi.org/10.1136/bmj.317.7155.384.
- Cheyney M, Bovbjerg M, Everson C, Gordon W, Hannibal D, Vedam S. Outcomes of care for 16,924 planned home births in the United States: the Midwives Alliance of North America Statistics Project, 2004 to 2009. J Midwifery Womens Health 2014;59:17-2. http://dx.doi.org/10.1111/jmwh.12172.
- Mehl-Madrona L, Madrona MM. Physician- and midwife- attended home births: effects of breech, twin, and post-dates outcome data on mortality rates. J Nurse Midwifery 1997;42:91-8. http://dx.doi.org/10.1016/S0091-2182(96)00153-X.
- Symon A, Winter C, Inkster M, Donnan PT. Outcomes for births booked under an independent midwife and births in NHS maternity units: matched comparison study. BMJ 2009;338. http://dx.doi.org/10.1136/bmj.b2060.
- Bystrova K, Ivanova V, Edhborg M, Matthiesen A-S, Ransjö-Arvidson A-B, Mukhamedrakhimov R, et al. Early contact versus separation: effects on mother–infant interaction one year later. Birth 2009;36:97-109. http://dx.doi.org/10.1111/j.1523-536X.2009.00307.x.
- Li Y, Townend J, Rowe R, Brocklehurst P, Knight M, Linsell L, et al. Perinatal and maternal outcomes in planned home and obstetric unit births in women at ‘higher risk’ of complications: secondary analysis of the Birthplace national prospective cohort study. BJOG 2015;122:741-53. http://dx.doi.org/10.1111/1471-0528.13283.
- McCourt C, Rayment J, Rance S, Sandall J. Organisational strategies and midwives’ readiness to provide care for out of hospital births: an analysis from the Birthplace organisational case studies. Midwifery 2012;28:636-45. http://dx.doi.org/10.1016/j.midw.2012.07.004.
- NHS Choices . Where to Give Birth: The Options 2013. www.nhs.uk/conditions/pregnancy-and-baby/pages/where-can-i-give-birth.aspx?tabname = Labour%20and%20birth (accessed 16 July 2014).
- Maternity Services Data Set. Leeds: Health and Social Care Information Centre; 2014.
- The ICD-10 International Statistical Classification of Diseases and Related Health Problems. Geneva: World Health Organization; 2010.
- OPCS-4 Classification. Leeds: Health and Social Care Information Centre; 2015.
- NHS Data Dictionary. Leeds: Health and Social Care Information Centre; 2013.
- MBRRACE-UK Perinatal Death Data Collection Form. Oxford: National Perinatal Epidemiology Unit; 2014.
- Grigg C, Tracy S, Daellenbach R, Kensington M, Schmied V. An exploration of influences on women’s birthplace decision-making in New Zealand: a mixed methods prospective cohort within the Evaluating Maternity Units study. BMC Pregnancy Childbirth 2014;14. http://dx.doi.org/10.1186/1471-2393-14-210.
- Scotland GS, McNamee P, Cheyne H, Hundley V, Barnett C. Women’s preferences for aspects of labor management: results from a discrete choice experiment. Birth 2011;38:36-4. http://dx.doi.org/10.1111/j.1523-536X.2010.00447.x.
- Rogers J, Barber T, Marsh S, Henty D, McCandlish R, Alexander J, et al. Birth Place Choices Project: Final Report 2005. www.uhs.nhs.uk/Media/SUHTInternet/Services/ObsMidwiferyGynae/BirthPlaceChoice/BirthChoiceProjectFinalReport.pdf (accessed 10 June 2015).
Appendix 1 Birthplace data collection forms
The planned home birth and OU data collection forms used in the Birthplace cohort study are reproduced here. The planned home birth, FMU and AMU data collection forms were almost identical. The planned home birth form included one extra question: D1 – Did this woman make her final decision about place of birth during labour? The planned home birth form also had an extra option for question E3, which was about the date and time of maternal discharge: not applicable, delivered at home.
Birthplace planned home birth data collection form
Birthplace planned obstetric unit data collection form
The OU data collection form had four extra eligibility questions, A1–A4, which were used to exclude women with a caesarean section before the onset of labour, a multiple pregnancy, a gestation of < 37 weeks and 0 days, and unbooked women (i.e. women who did not have any antenatal care). In addition, the OU form did not have a section to collect detailed information about transfers during labour or immediately after the birth.
Both data collection forms have previously been published7,8 and are reproduced here with the permission of the Birthplace co-investigator group and under the terms of the Creative Commons Attribution Non Commercial (CC BY-NC 4.0) licence that applies to the published paper.
Appendix 2 Birthplace neonatal morbidity data collection form
This data collection form was used to confirm neonatal morbidities and to collect more detailed information about adverse neonatal outcomes. It has been previously published7,8 and is reproduced here with the permission of the original Birthplace co-investigator group and under the terms of the Creative Commons Attribution Non Commercial (CC BY-NC 4.0) licence that applies to the published paper.
Birthplace neonatal morbidity form
Appendix 3 Birthplace staffing log data collection forms
These staffing log data collection forms were used to record staffing and organisational data in the MUs and OUs participating in the Birthplace cohort study. These logs were completed at around 09.00 hours and 21.00 hours by midwives in the participating units. The form used in AMUs (and in FMUs) is shown in Figure 31 and the OU form is shown in Figure 32. Both forms are reproduced here with the permission of the original Birthplace co-investigator group.
Alongside midwifery unit staffing log data collection form (also used in freestanding midwifery units)
Obstetric unit staffing log data collection form
Appendix 4 2010 Birthplace mapping survey
The 2010 Birthplace mapping survey was a follow-up to the 2007 survey carried out in collaboration with the Healthcare Commission Maternity Services Review11 and aimed to document any changes in the configuration and organisation of care since 2007. Two data collection forms were used: Figure 33 shows the form used for NHS trust-level data collection and Figure 34 shows the unit-level form. Both forms are reproduced here with the permission of the original Birthplace co-investigator group.
2010 Birthplace mapping survey NHS trust data collection form
2010 Birthplace mapping survey unit data collection form
Appendix 5 Graphs of associations between unit/NHS trust characteristics and interventions and outcomes
This appendix shows scatterplots for associations between unit/NHS trust characteristics and interventions and outcomes reported in Chapter 3. Scatterplots shown are those where there was a significant association in either nulliparous or multiparous women or in both groups. As explained in Chapter 3, given the exploratory nature of these analyses and taking into consideration multiple testing, some of these significant associations are likely to be chance findings. All scatterplots where a significant association was found are shown in order to illustrate visually the magnitude of the associations seen and any apparent outliers. All intervention and outcome rates shown are adjusted for maternal characteristics as described in Chapter 2.
Obstetric units
FIGURE 28.
Association between OU size and the intrapartum caesarean section rate in ‘low risk’ (a) nulliparous (p = 0.045); and (b) multiparous (p = 0.008) women planning OU birth.
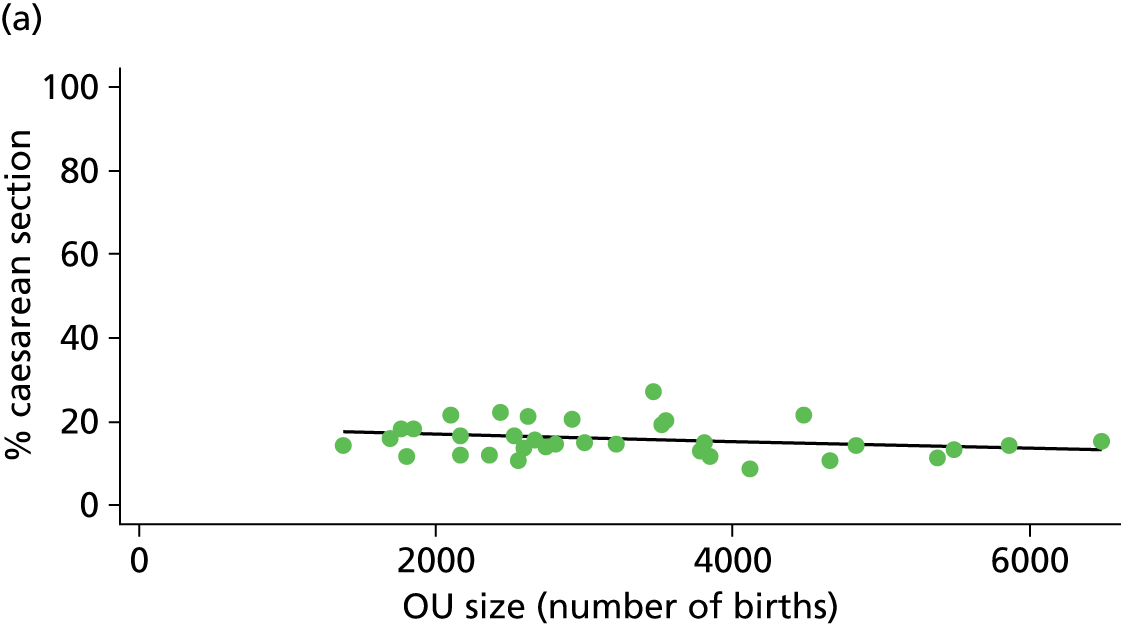
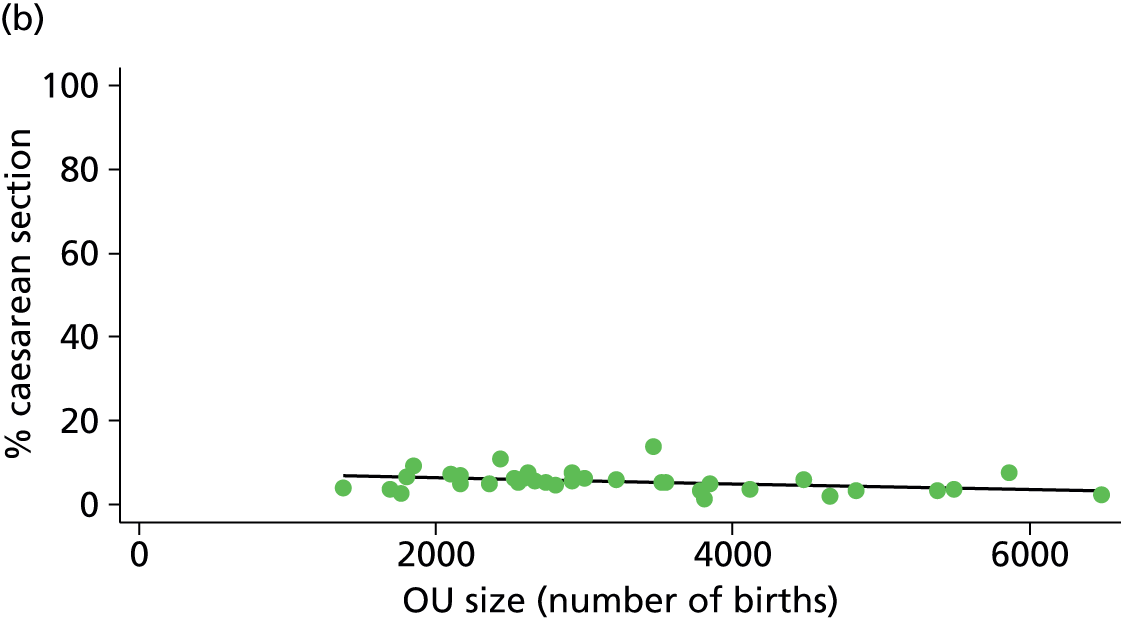
FIGURE 29.
Association between OU size and the ‘straightforward birth’ rate in ‘low risk’ (a) nulliparous (p = 0.882); and (b) multiparous women (p = 0.047) planning OU birth.


FIGURE 30.
Association between midwifery ‘understaffing’ (% of shifts understaffed) in OUs and the intrapartum caesarean section rate in ‘low risk’ (a) nulliparous (p = 0.025); and (b) multiparous women (p = 0.106) planning OU birth.
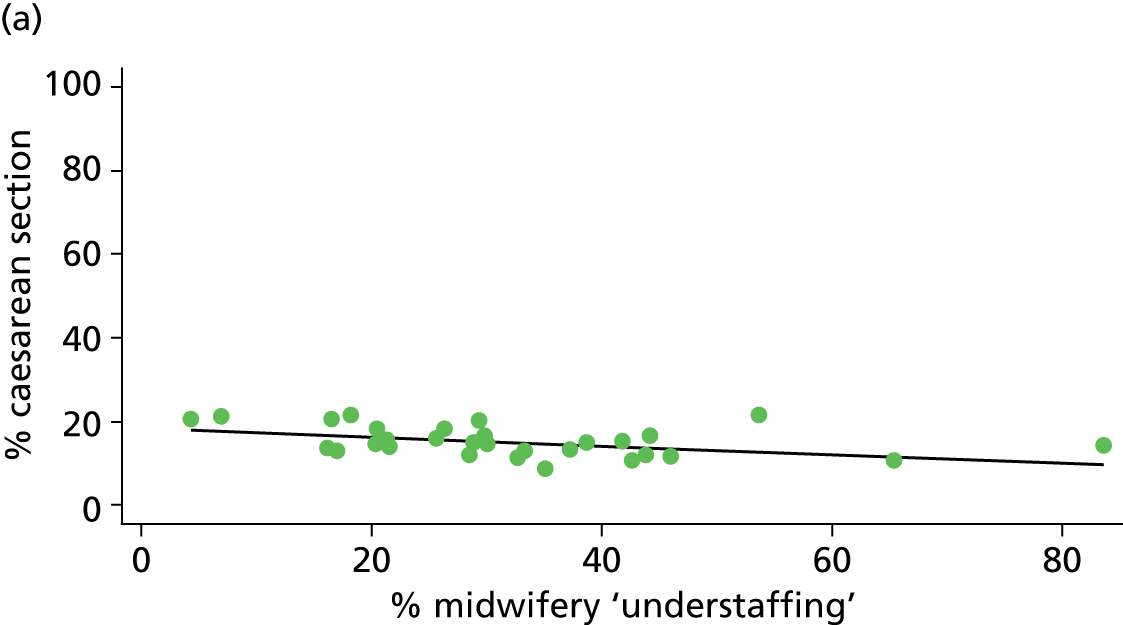
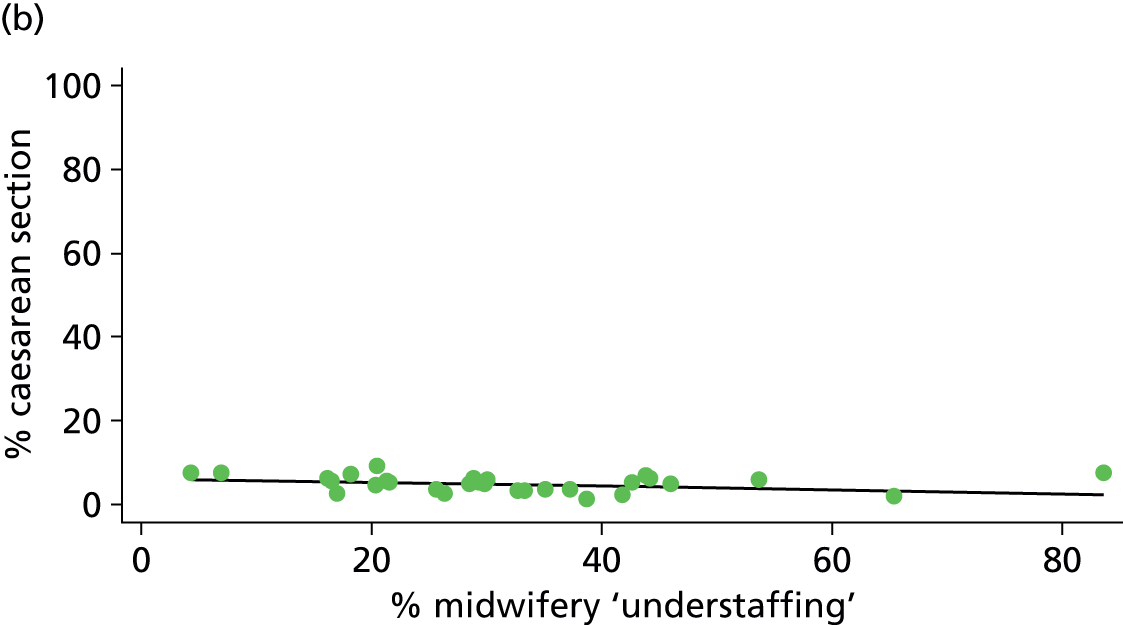
FIGURE 31.
Association between midwifery ‘understaffing’ (% of shifts understaffed) in OUs and the ‘straightforward birth’ rate in ‘low risk’ (a) nulliparous (p = 0.307); and (b) multiparous women (p = 0.011) planning OU birth.
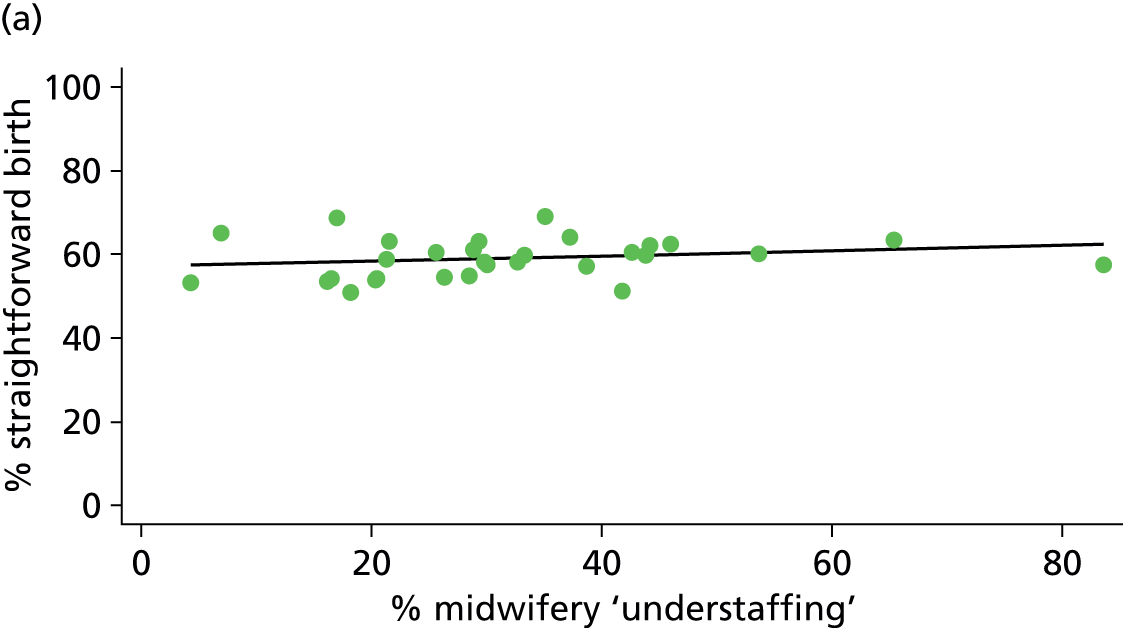
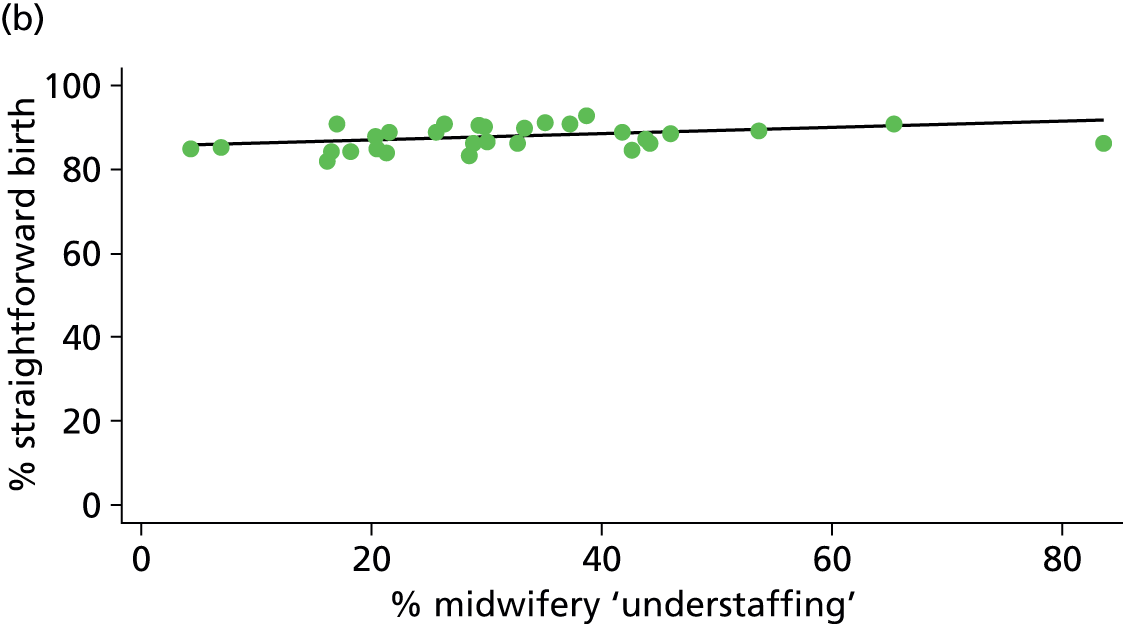
FIGURE 32.
Association between the presence of an AMU and the intrapartum caesarean section rate in ‘low risk’ (a) nulliparous (p = 0.030); and (b) multiparous women (p = 0.061) planning OU birth.
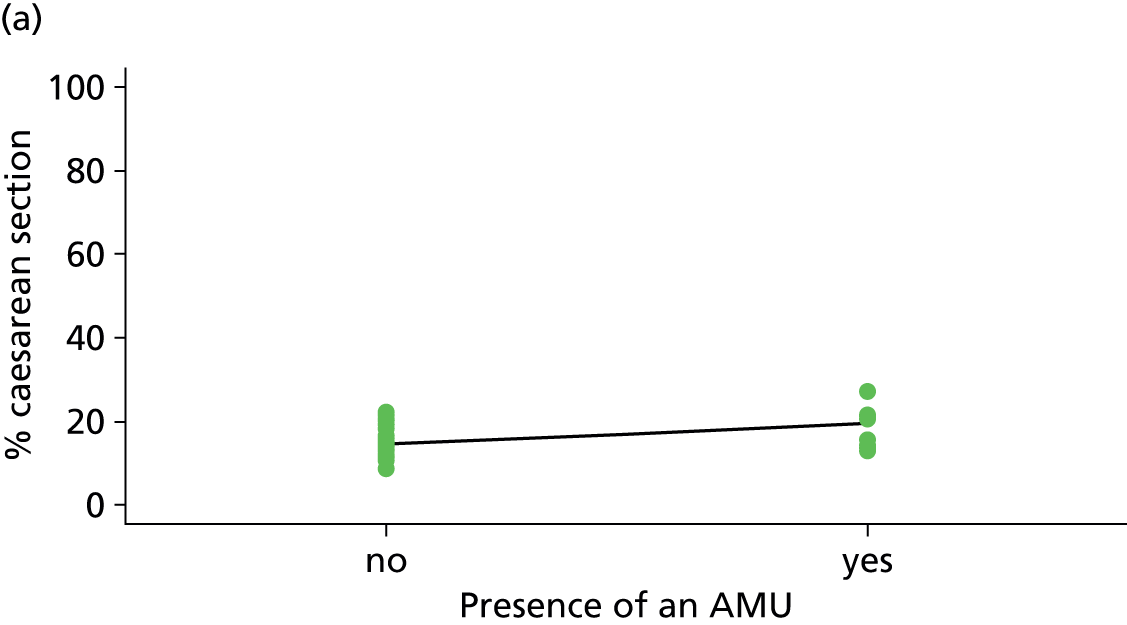
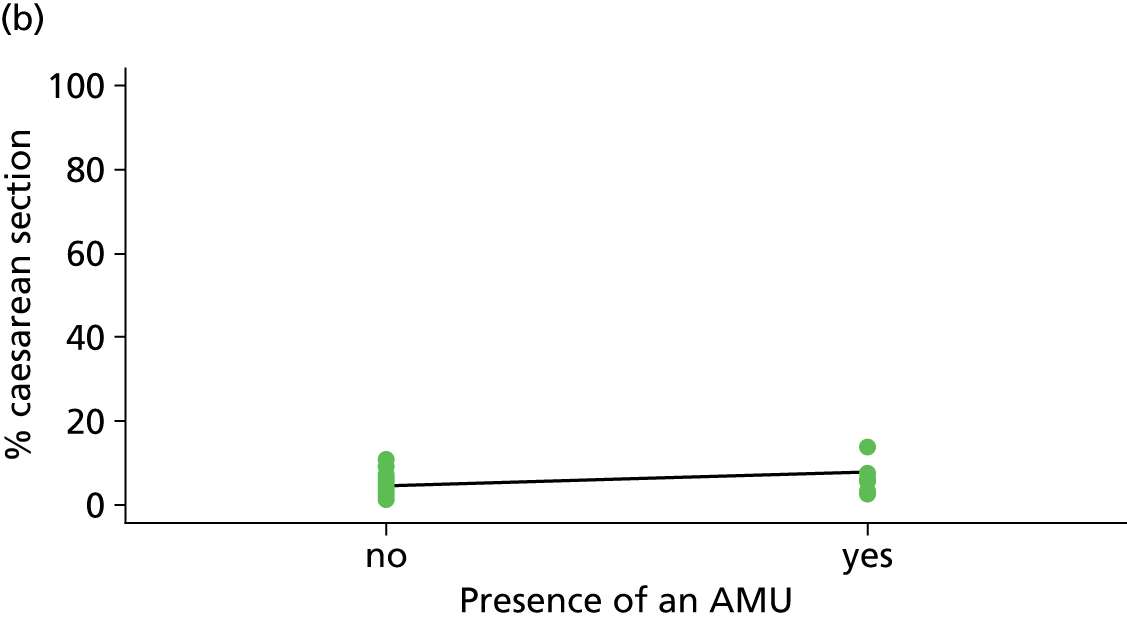
FIGURE 33.
Association between the presence of an AMU and the ‘straightforward birth’ rate in ‘low risk’ (a) nulliparous (p = 0.552); and (b) multiparous women (p = 0.039) planning OU birth.


FIGURE 34.
Association between the presence of an AMU and the ‘normal birth’ rate in ‘low risk’ (a) nulliparous (p = 0.077); and (b) multiparous women (p = 0.015) planning OU birth.
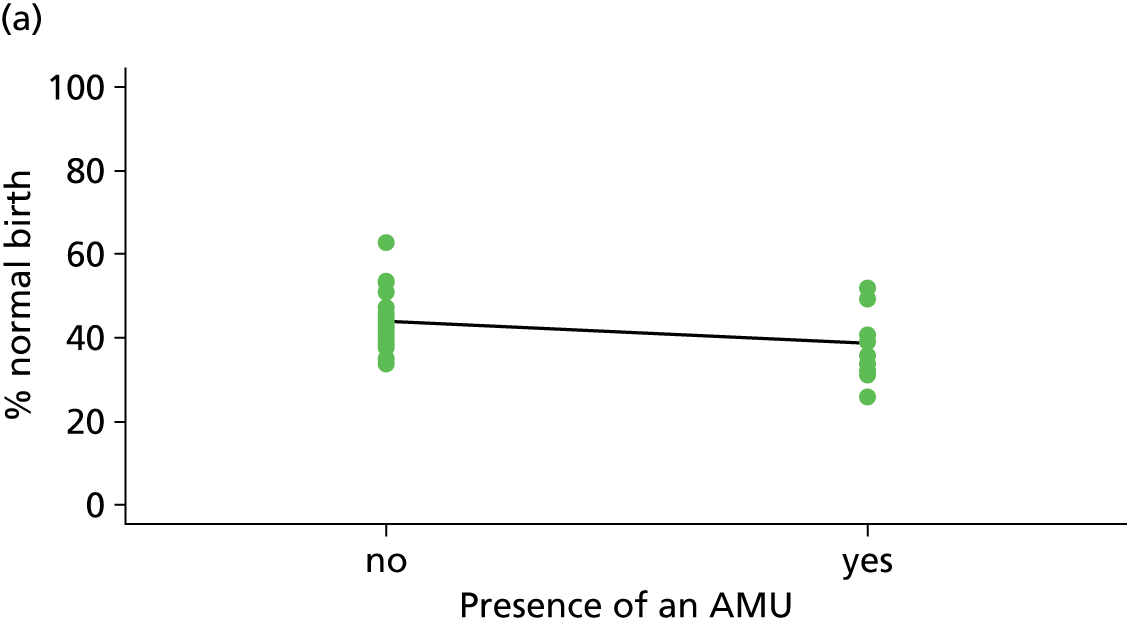
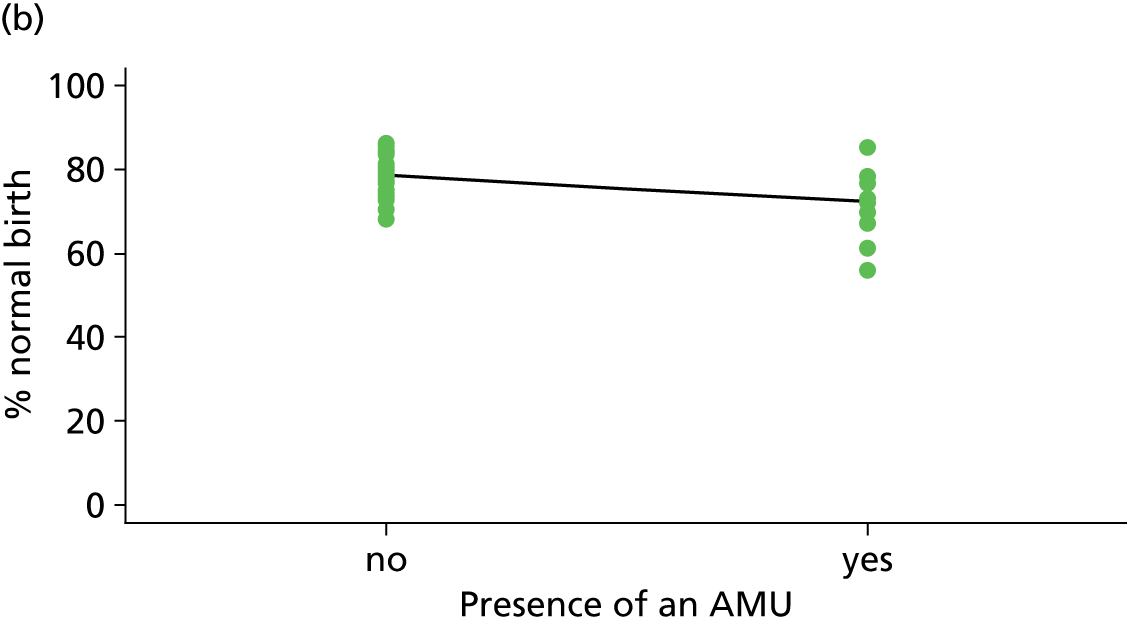
FIGURE 35.
Association between the proportion of births in the NHS trust planned outside the OU and the intrapartum caesarean section rate in ‘low risk’ (a) nulliparous (p = 0.022); and (b) multiparous women (p = 0.014) planning OU birth.
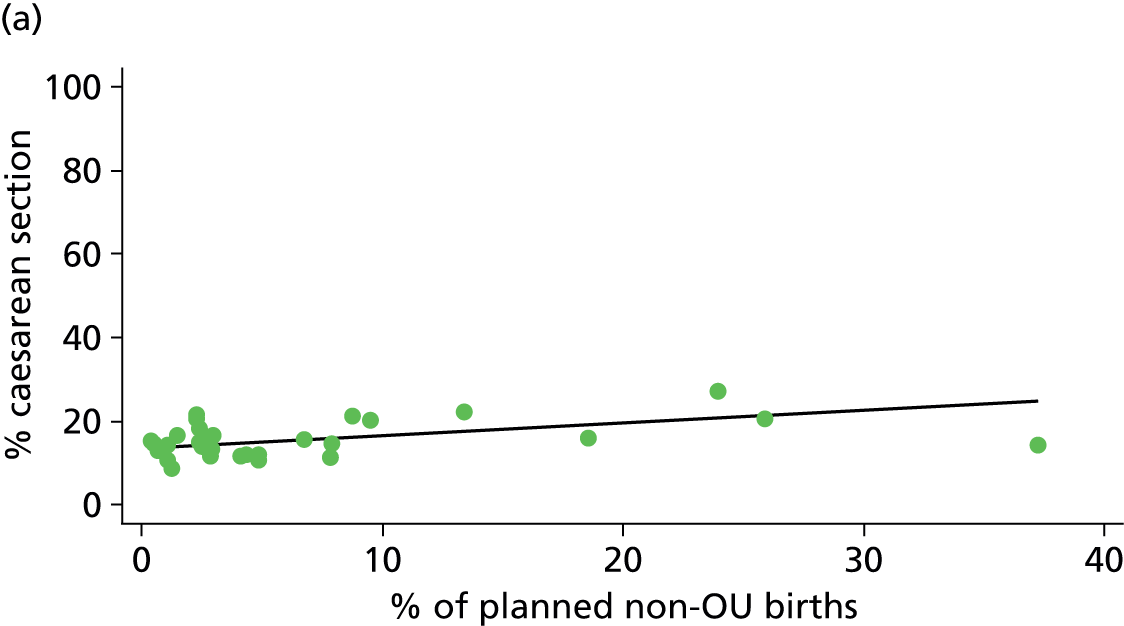

FIGURE 36.
Association between the proportion of births in the NHS trust planned outside the OU and the ‘straightforward birth’ rate in ‘low risk’ (a) nulliparous (p = 0.057); and (b) multiparous women (p = 0.006) planning OU birth.
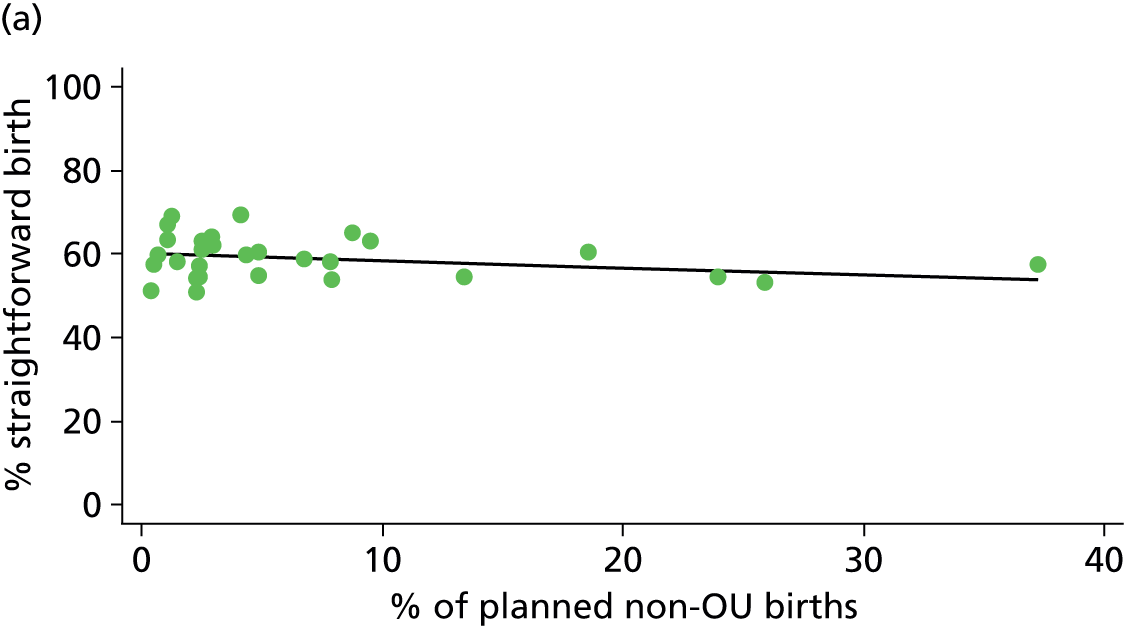

FIGURE 37.
Association between the proportion of births in the NHS trust planned outside the OU and the ‘normal birth’ rate in ‘low risk’ (a) nulliparous (p = 0.079); and (b) multiparous women (p = 0.008) planning OU birth.


Alongside midwifery units
FIGURE 38.
Association between the number of births planned in the AMU per year and the instrumental delivery rate in ‘low risk’ (a) nulliparous (p = 0.000); and (b) multiparous women (p = 0.040) planning AMU birth.
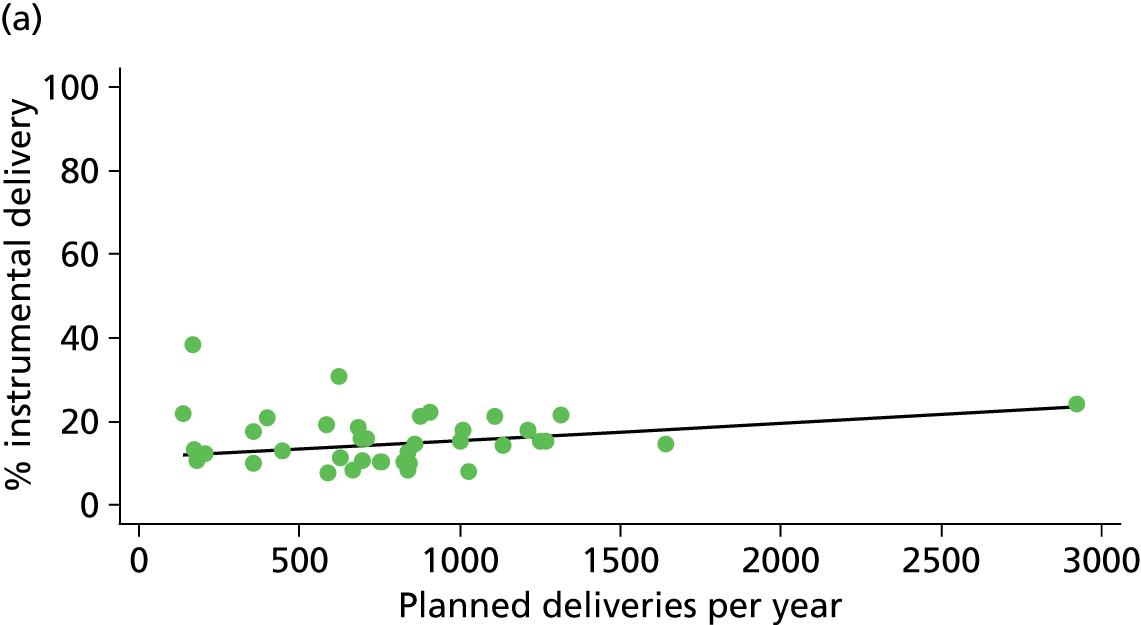
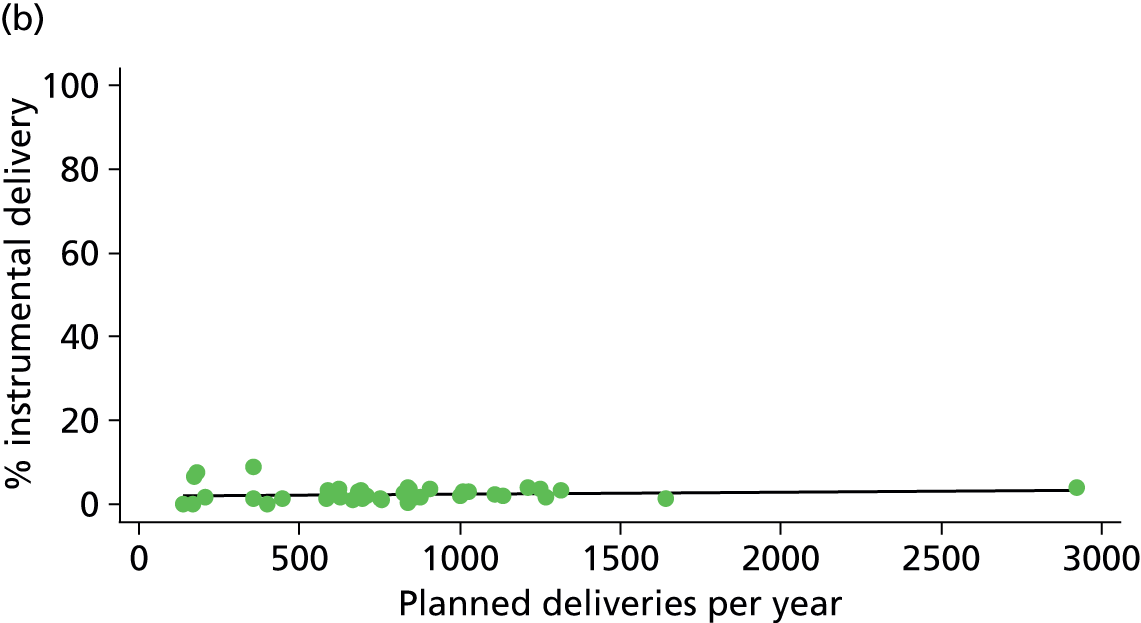
FIGURE 39.
Association between the number of births planned in the AMU per year and the intrapartum caesarean section rate in ‘low risk’ (a) nulliparous (p = 0.318); and (b) multiparous women (p = 0.003) planning AMU birth.
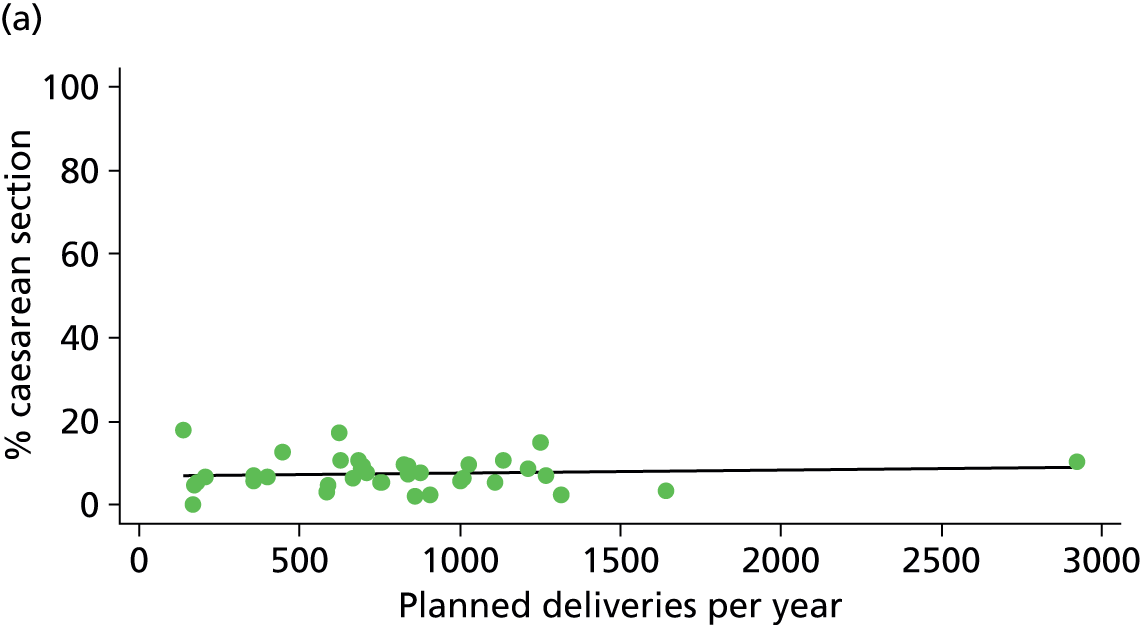
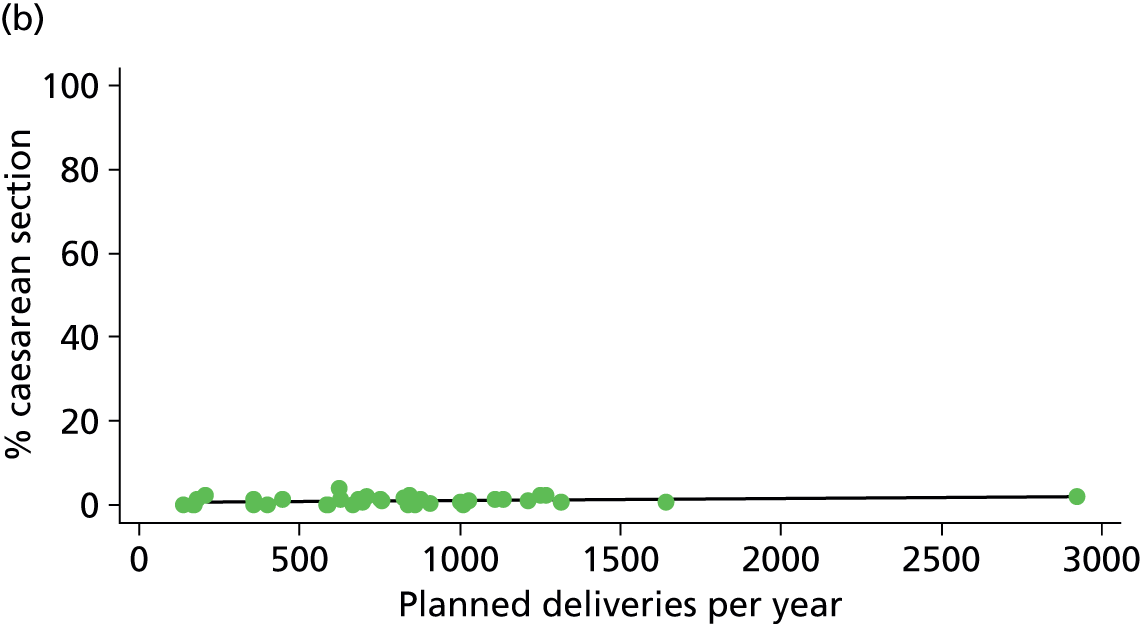
FIGURE 40.
Association between the number of births planned in the AMU per year and the ‘straightforward birth’ rate in ‘low risk’ (a) nulliparous (p = 0.000); and (b) multiparous women (p = 0.038) planning AMU birth.
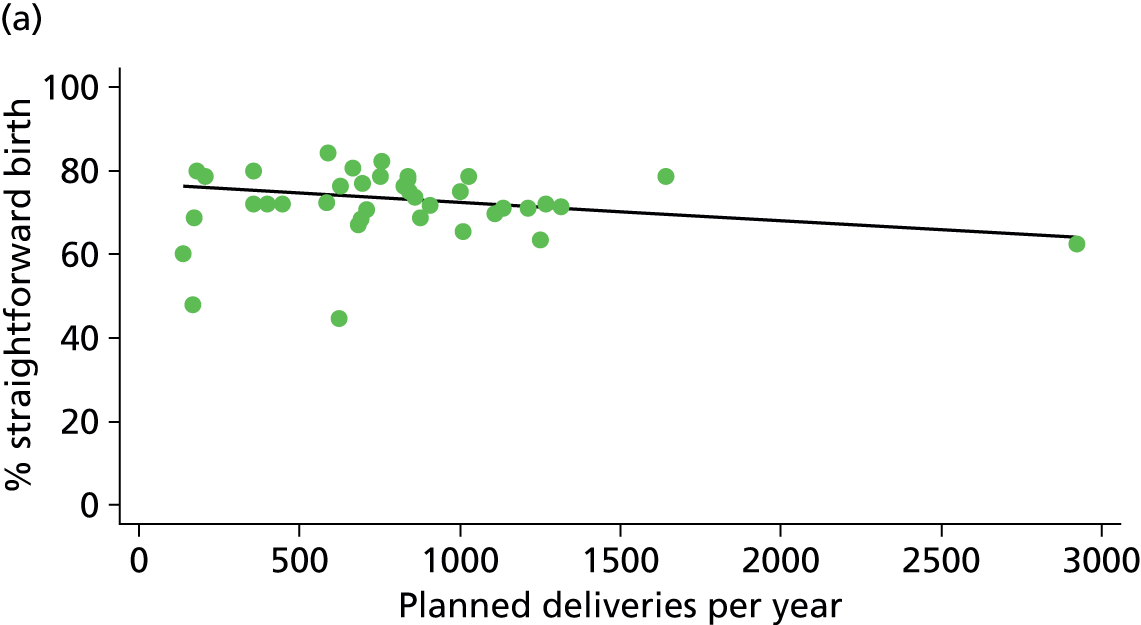
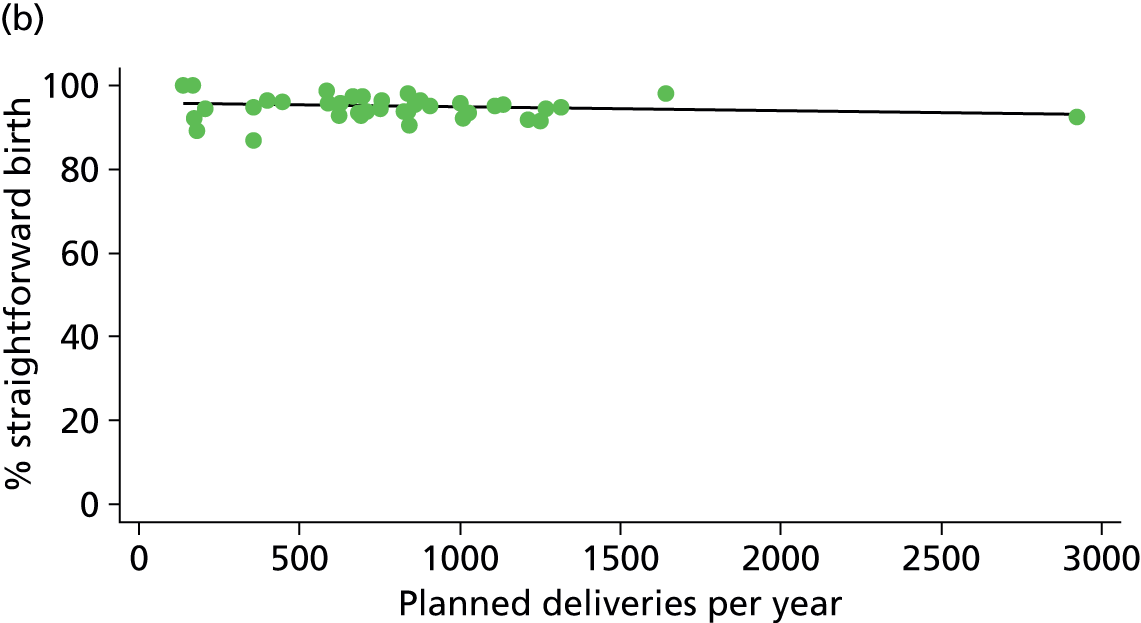
FIGURE 41.
Association between the number of births planned in the AMU per year and the ‘normal birth’ rate in ‘low risk’ (a) nulliparous (p = 000); and (b) multiparous women (p = 0.024) planning AMU birth.

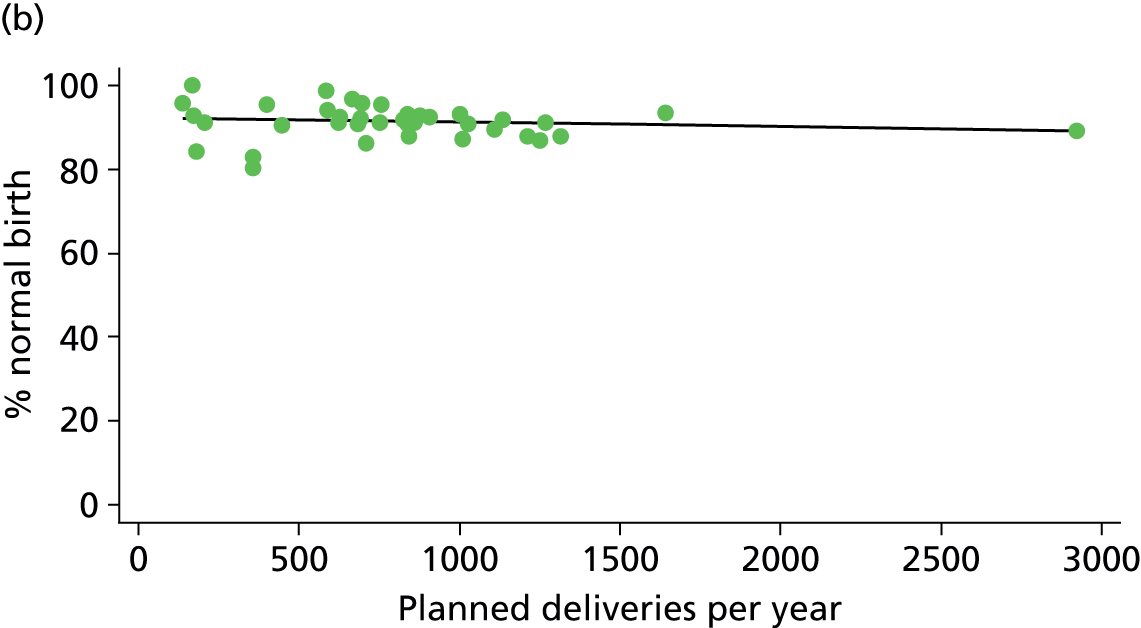
FIGURE 42.
Association between the number of delivery beds in the AMU and the intrapartum caesarean section rate in ‘low risk’ (a) nulliparous (p = 0.292); and (b) multiparous women (p = 0.004) planning AMU birth.
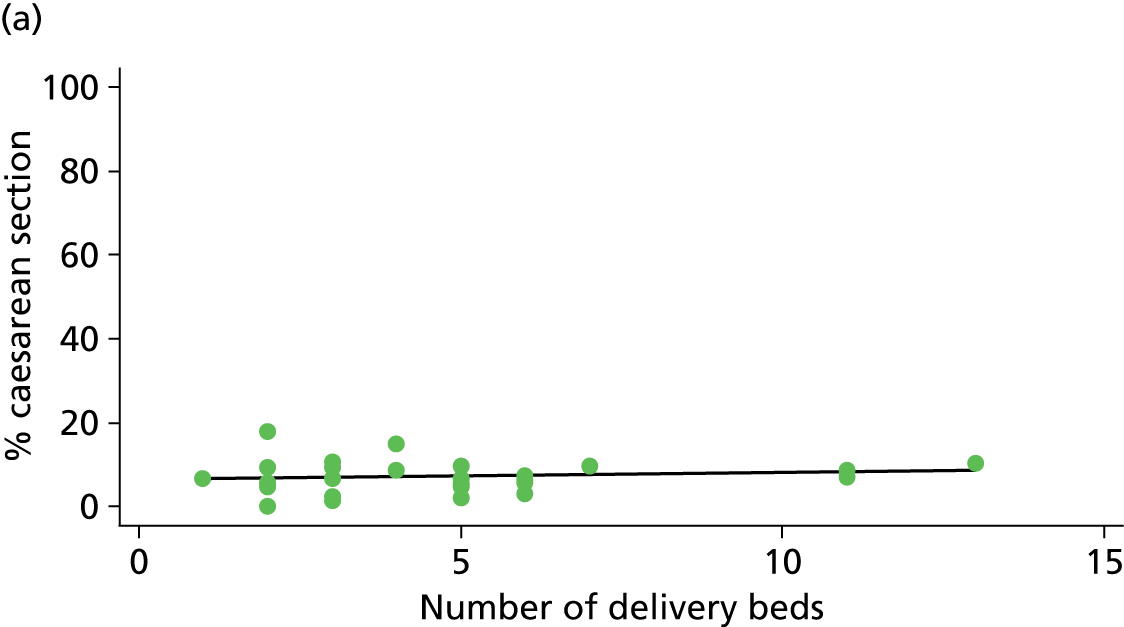
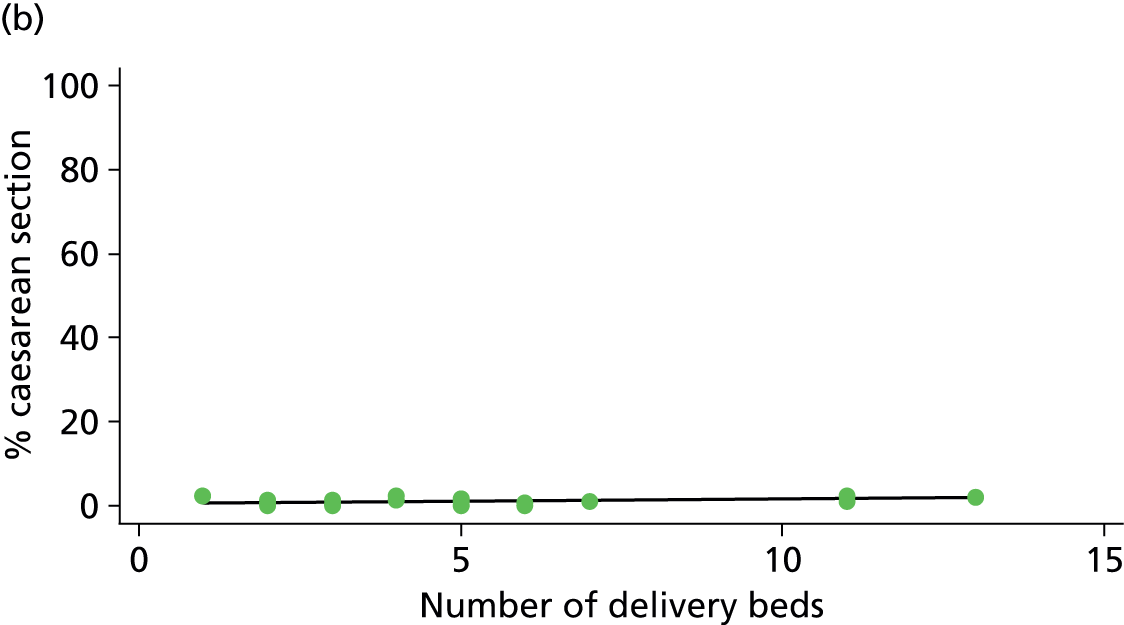
FIGURE 43.
Association between the number of delivery beds in the AMU and the ‘straightforward birth’ rate in ‘low risk’ (a) nulliparous (p = 0.033); and (b) multiparous women (p = 0.006) planning AMU birth.

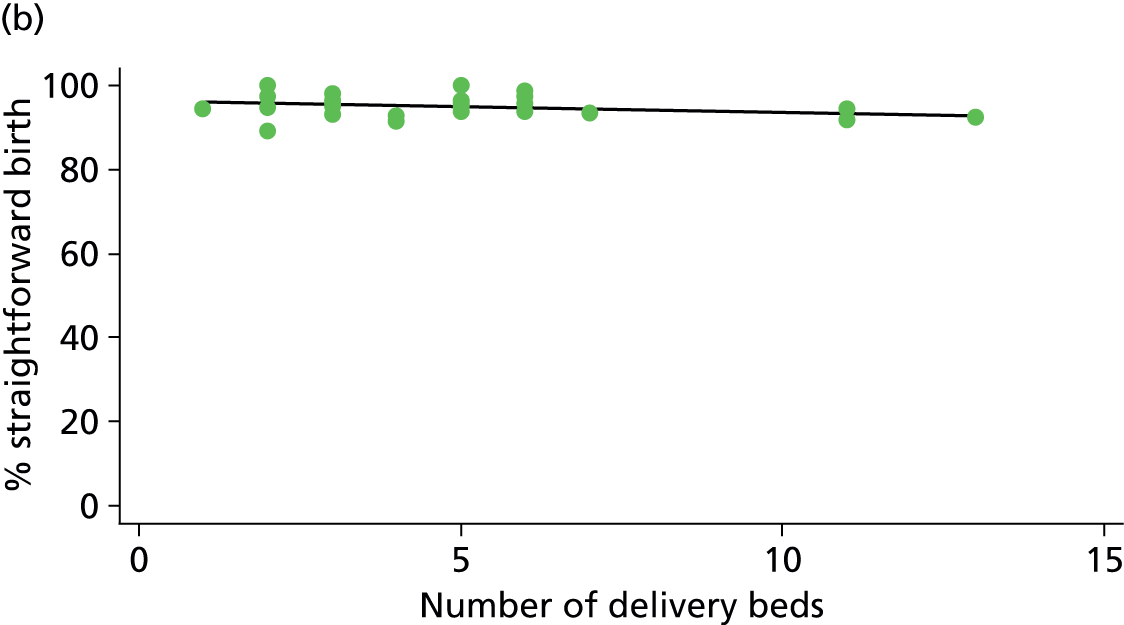
FIGURE 44.
Association between the number of delivery beds in the AMU and the ‘normal birth’ rate in ‘low risk’ (a) nulliparous (p = 0.015); and (b) multiparous women (p = 0.012) planning AMU birth.
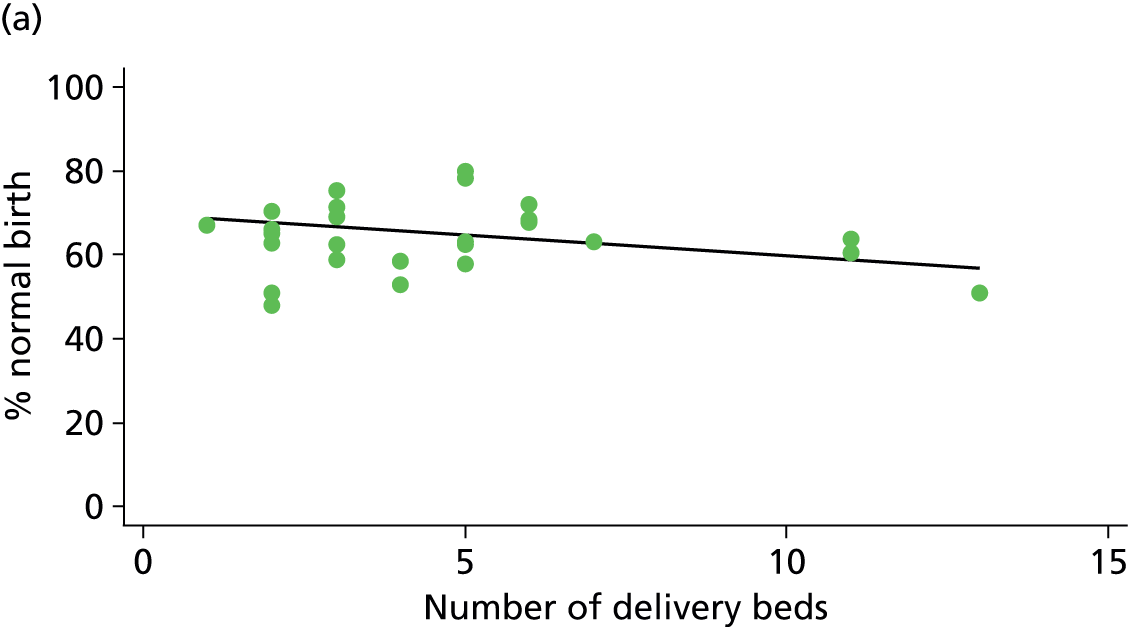
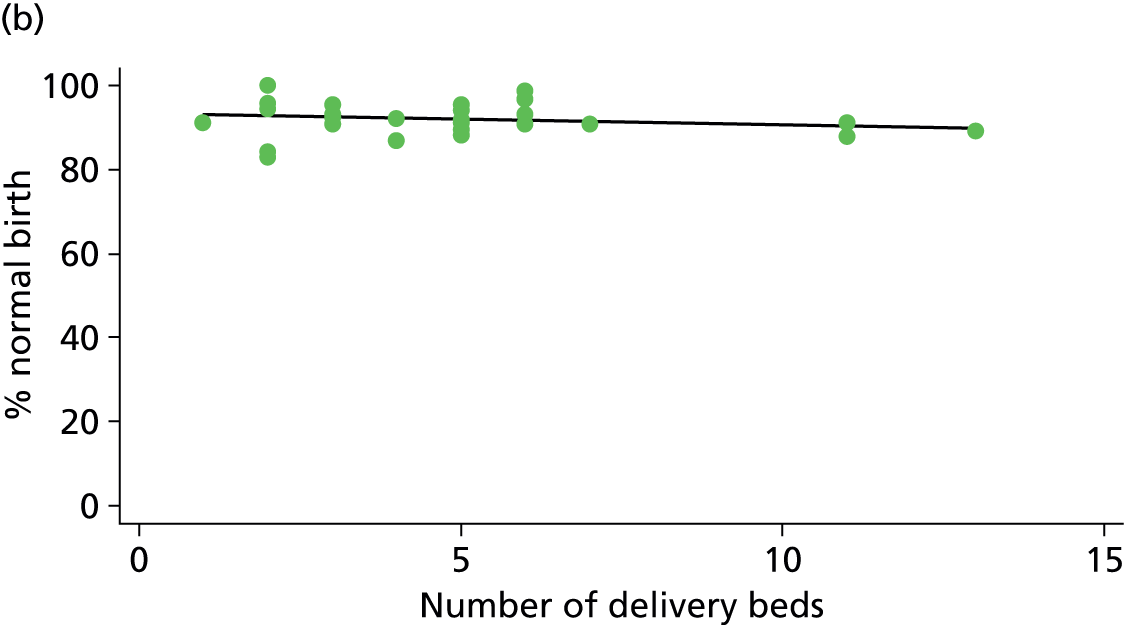
FIGURE 45.
Association between the mean number of midwives on duty in the AMU and the ‘straightforward birth’ rate in ‘low risk’ (a) nulliparous (p = 0.130); and (b) multiparous women (p = 0.045) planning AMU birth.
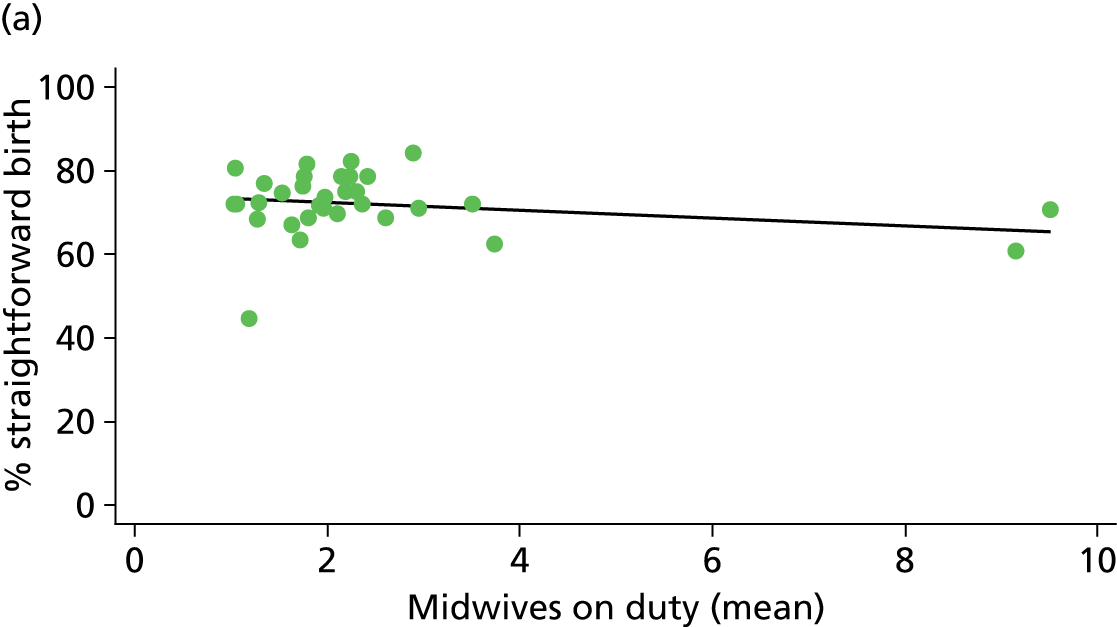
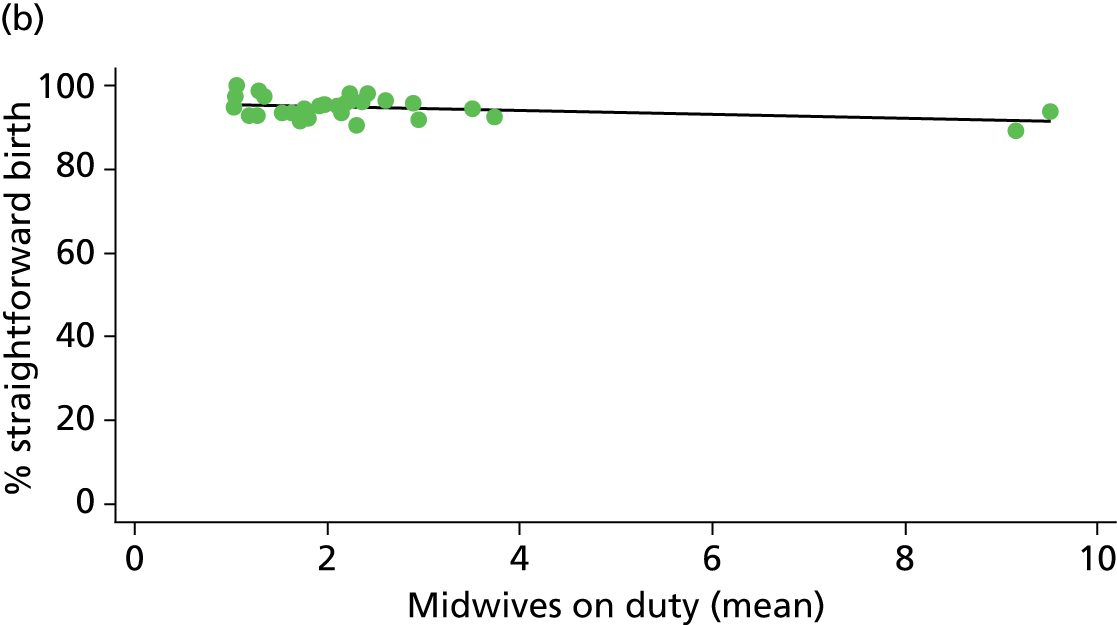
FIGURE 46.
Association between the mean number of midwives on duty in the AMU and the ‘normal birth’ rate in ‘low risk’ (a) nulliparous (p = 0.005); and (b) multiparous women (p = 0.000) planning AMU birth.
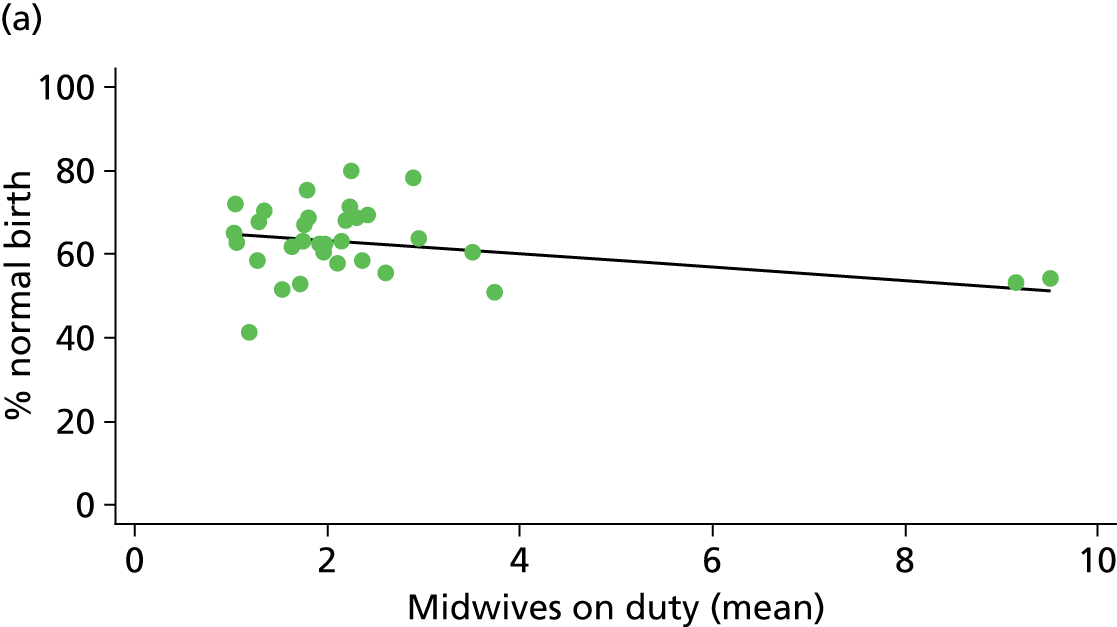
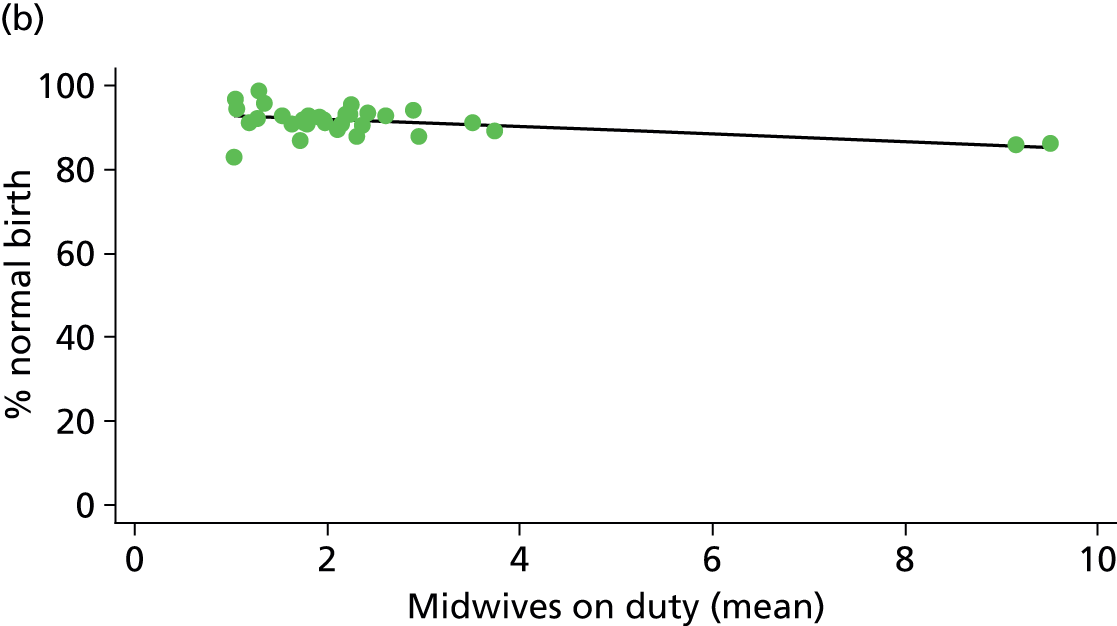
FIGURE 47.
Association between the mean number of midwives on duty per woman in labour in the AMU and the intrapartum caesarean section rate in ‘low risk’ (a) nulliparous (p = 0.380); and (b) multiparous women (p = 0.049) planning AMU birth.

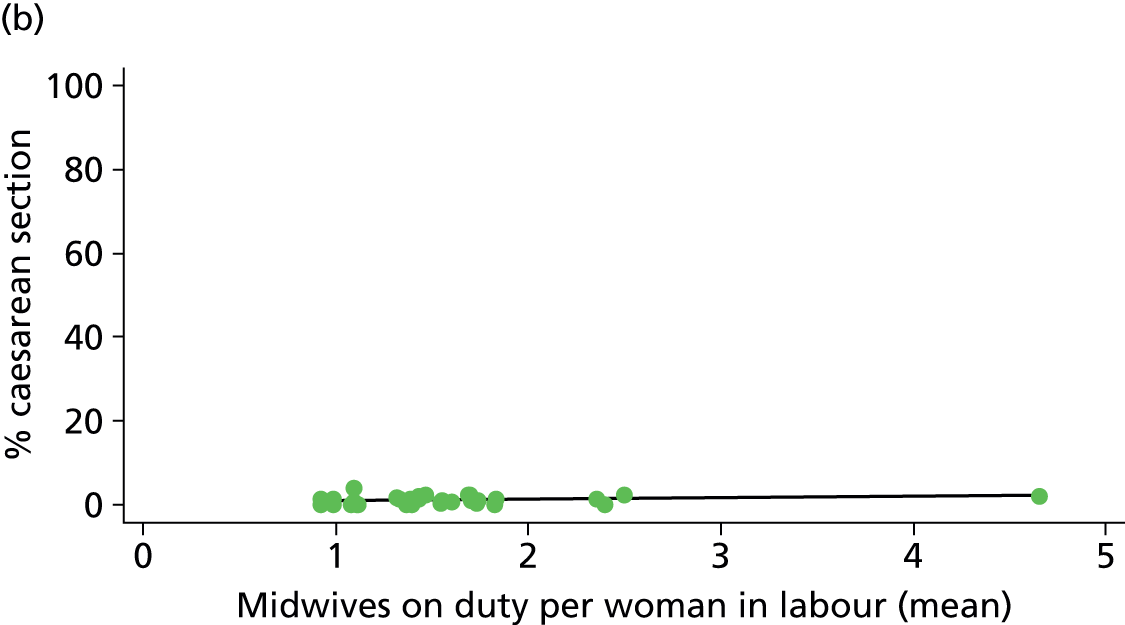
FIGURE 48.
Association between the mean number of midwives on duty per woman in labour in the AMU and the ‘normal birth’ rate in ‘low risk’ (a) nulliparous (p = 0.090); and (b) multiparous women (p = 0.008) planning AMU birth.
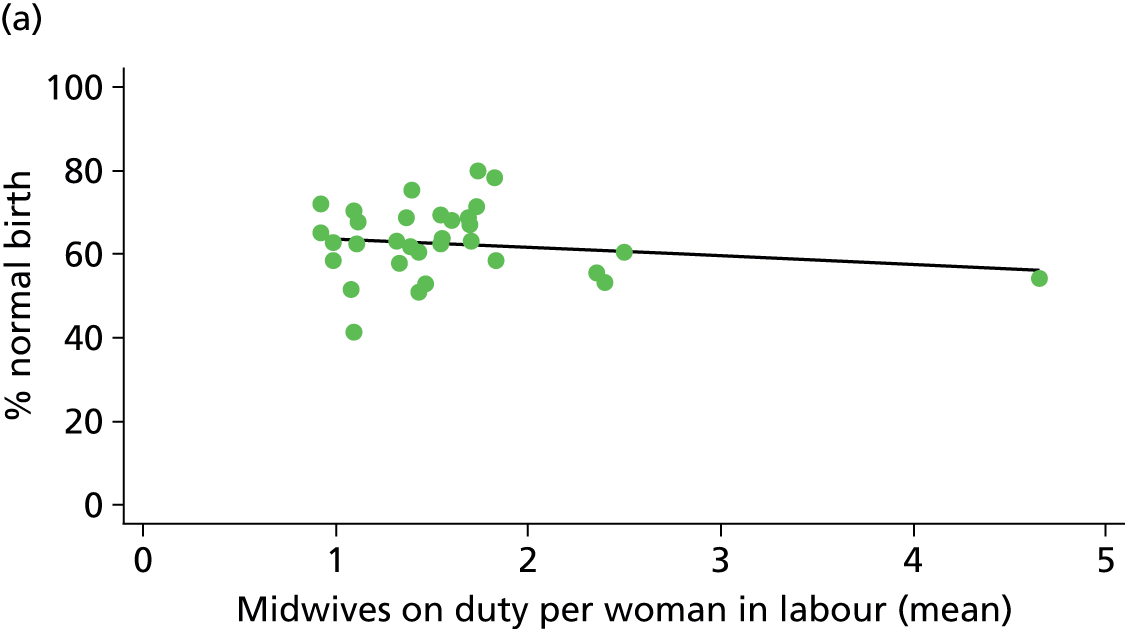
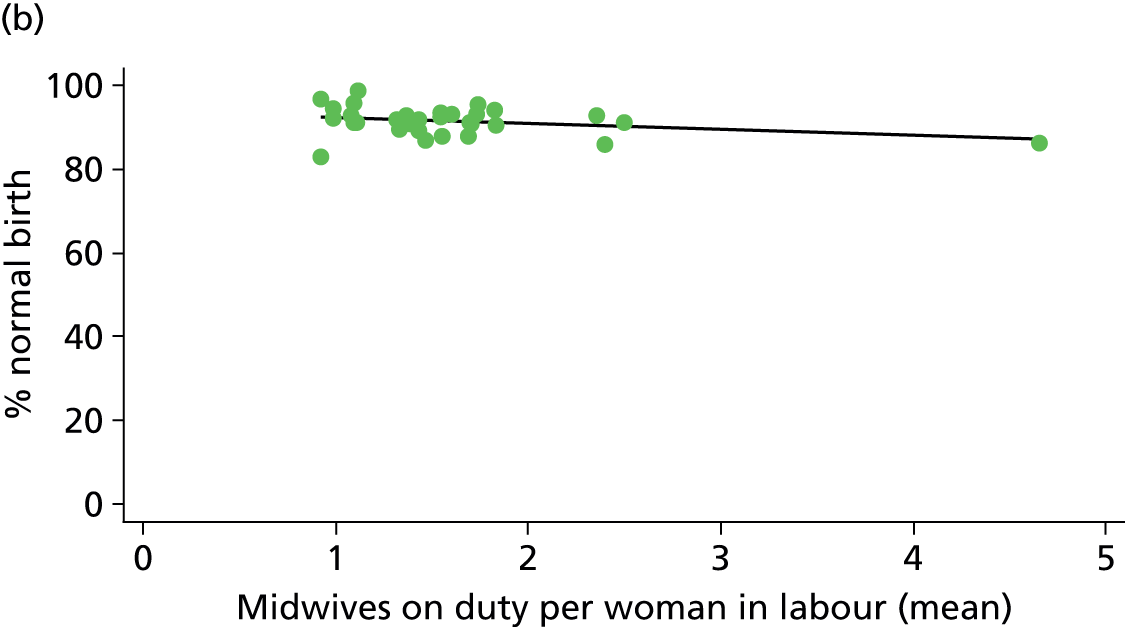
FIGURE 49.
Association between the AMU ‘size index’ and the instrumental delivery rate in ‘low risk’ (a) nulliparous (p = 0.017); and (b) multiparous women planning AMU birth.
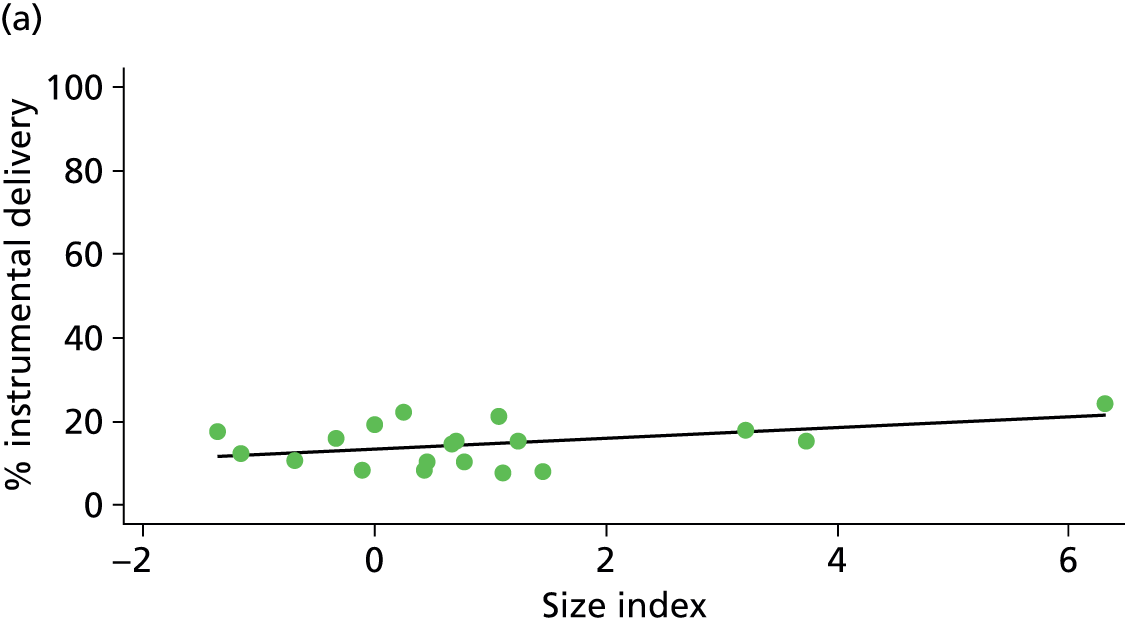
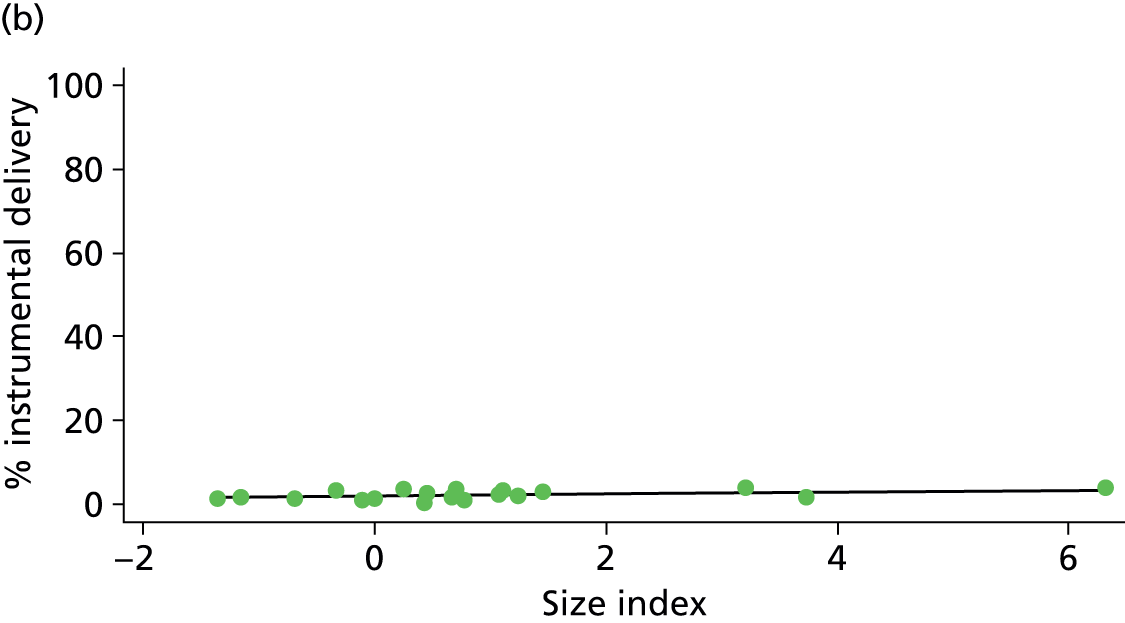
FIGURE 50.
Association between the AMU ‘size index’ and the intrapartum caesarean section rate in ‘low risk’ (a) nulliparous (p = 0.155); and (b) multiparous women (p = 0.003) planning AMU birth.


FIGURE 51.
Association between the AMU ‘size index’ and the ‘straightforward birth’ rate in ‘low risk’ (a) nulliparous (p = 0.006); and (b) multiparous women (p = 0.005) planning AMU birth.
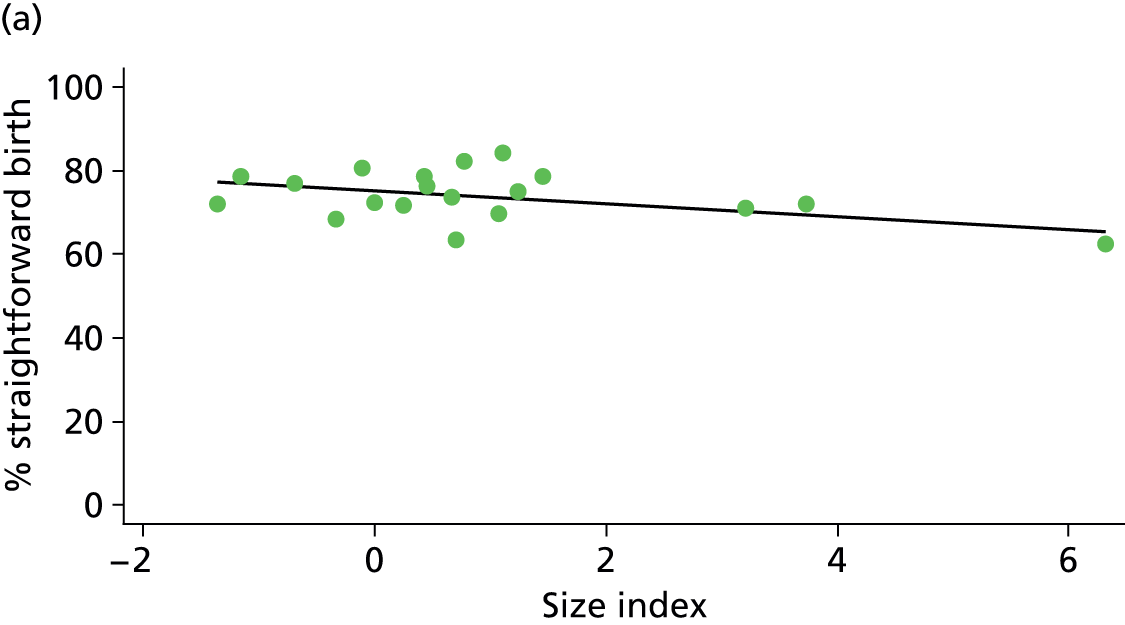
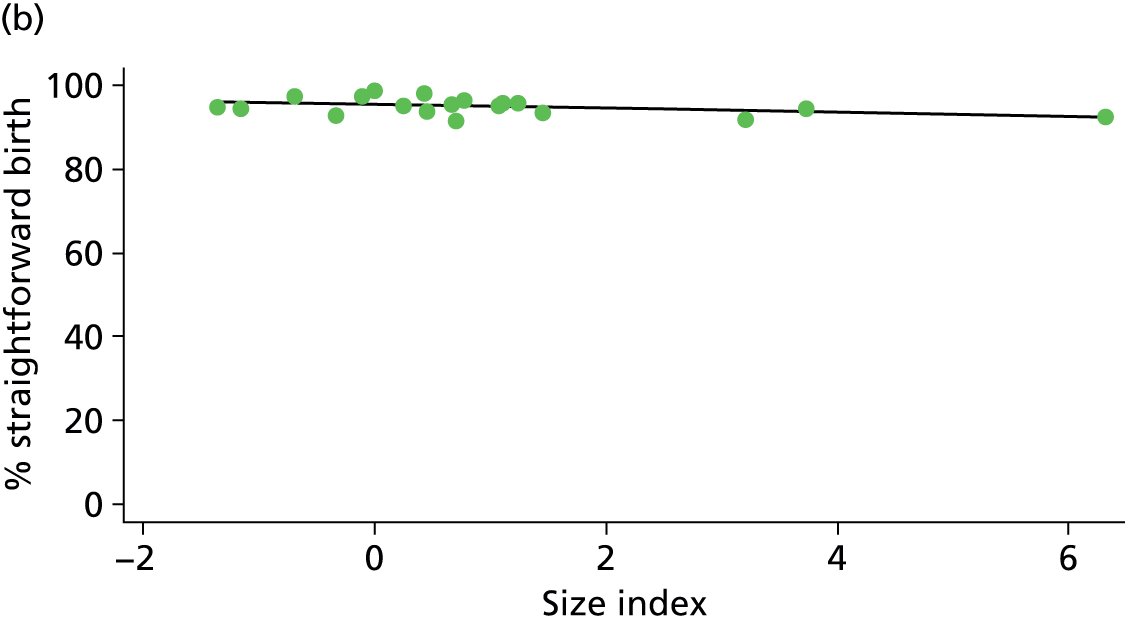
FIGURE 52.
Association between the AMU ‘size index’ and the ‘normal birth’ rate in ‘low risk’ (a) nulliparous (p = 0.001); and (b) multiparous (p = 0.007) women planning AMU birth.
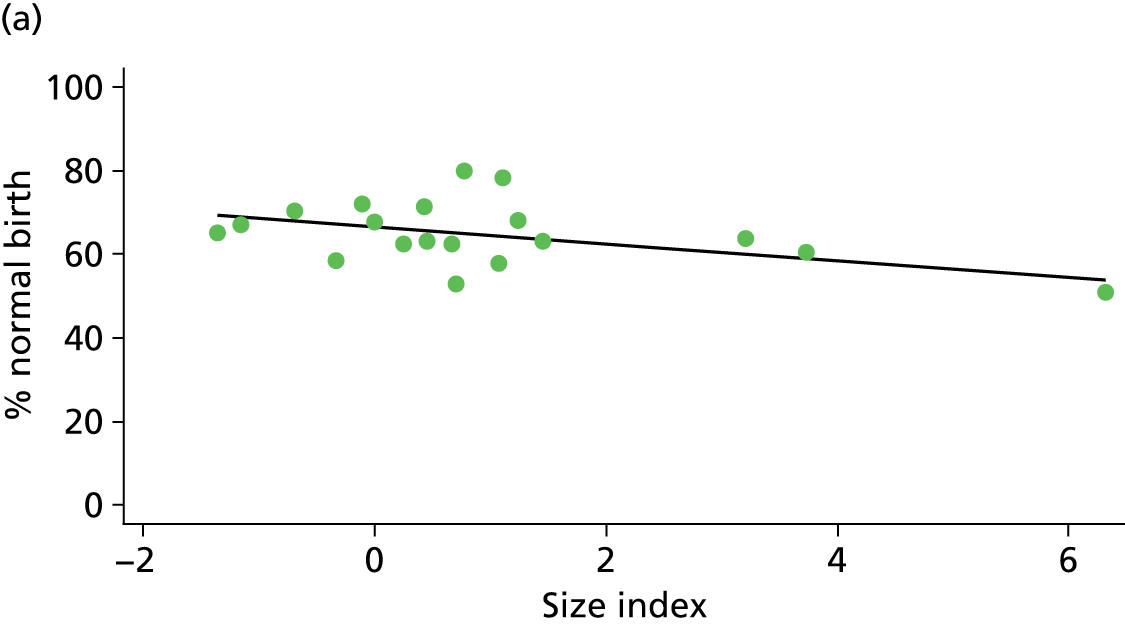
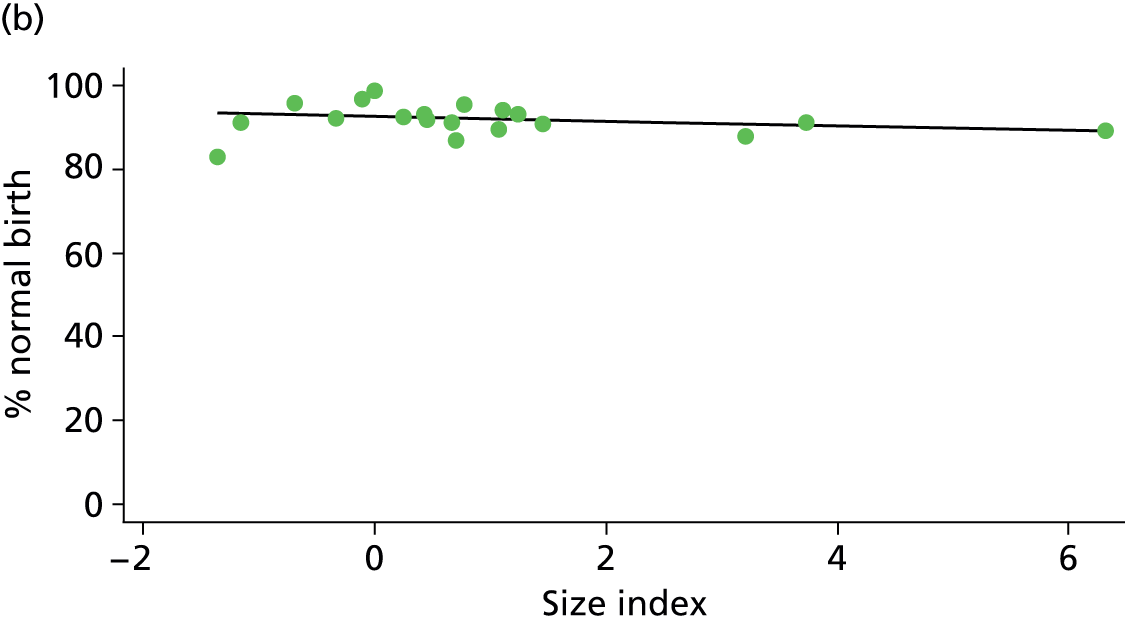
Freestanding midwifery units
FIGURE 53.
Association between the number of planned births per year in the FMU and the instrumental delivery rate in ‘low risk’ (a) nulliparous (p = 0.000); and (b) multiparous women (p = 0.831) planning FMU birth.
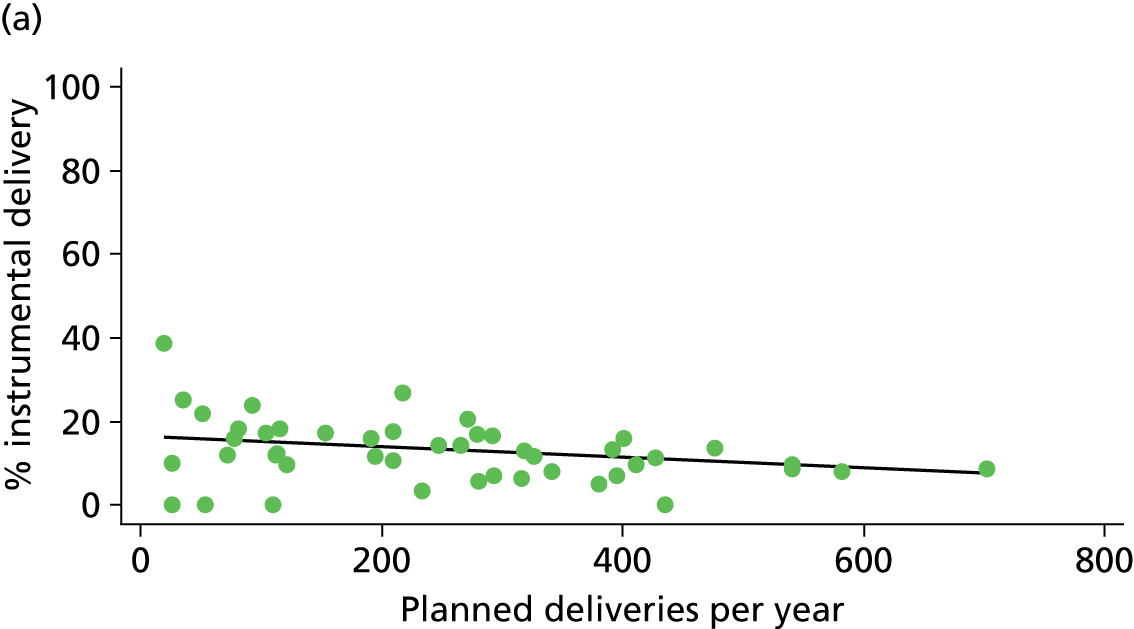
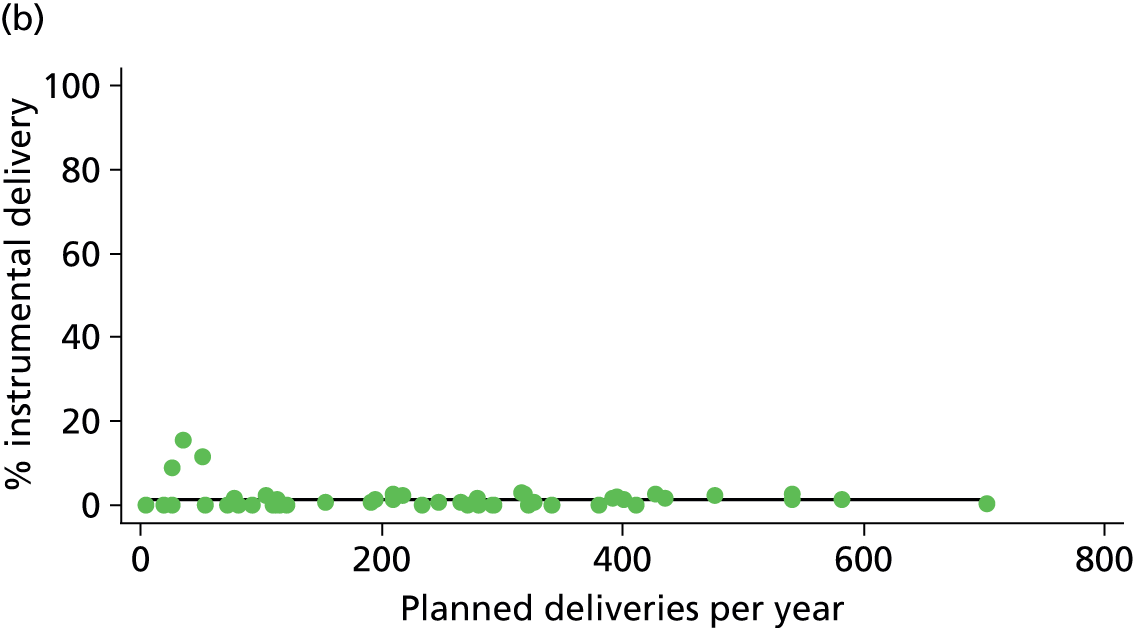
FIGURE 54.
Association between the number of planned births per year in the FMU and the ‘straightforward birth’ rate in ‘low risk’ (a) nulliparous (p = 0.003); and (b) multiparous women (p = 0.741) planning FMU birth.
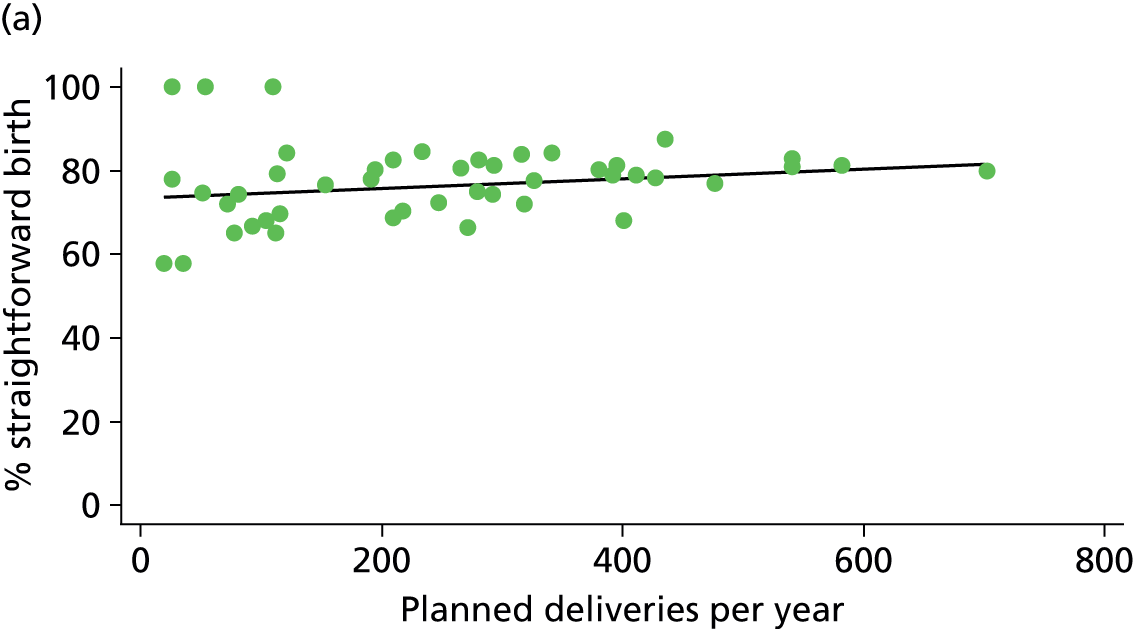
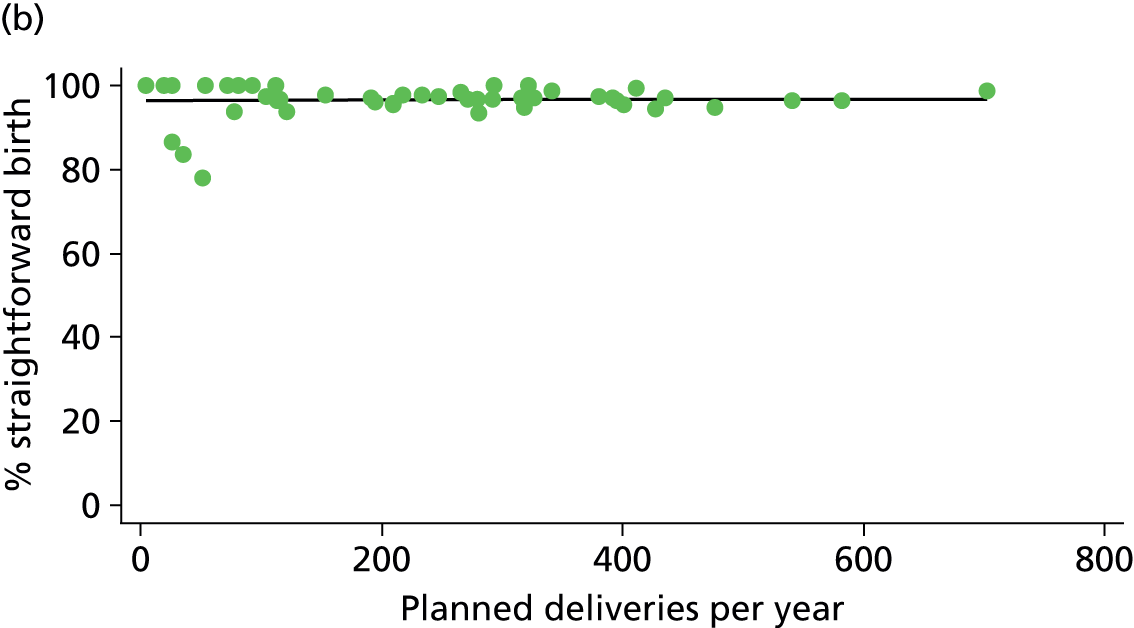
FIGURE 55.
Association between the number of planned births per year in the FMU and the ‘normal birth’ rate in ‘low risk’ (a) nulliparous (p = 0.005); and (b) multiparous women (p = 0.790) planning FMU birth.
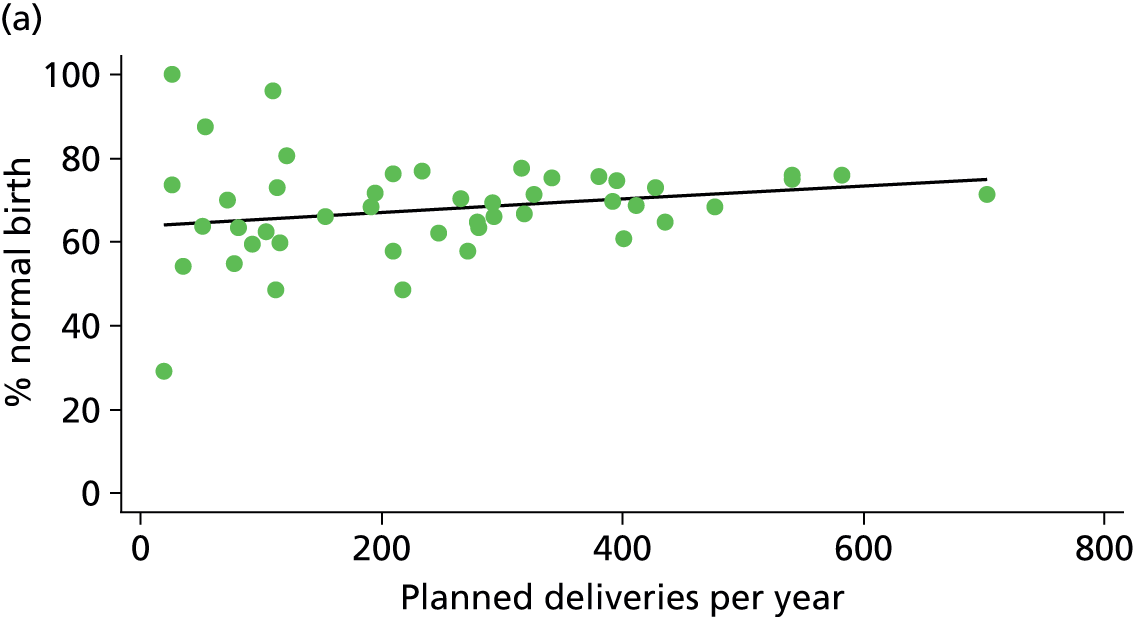
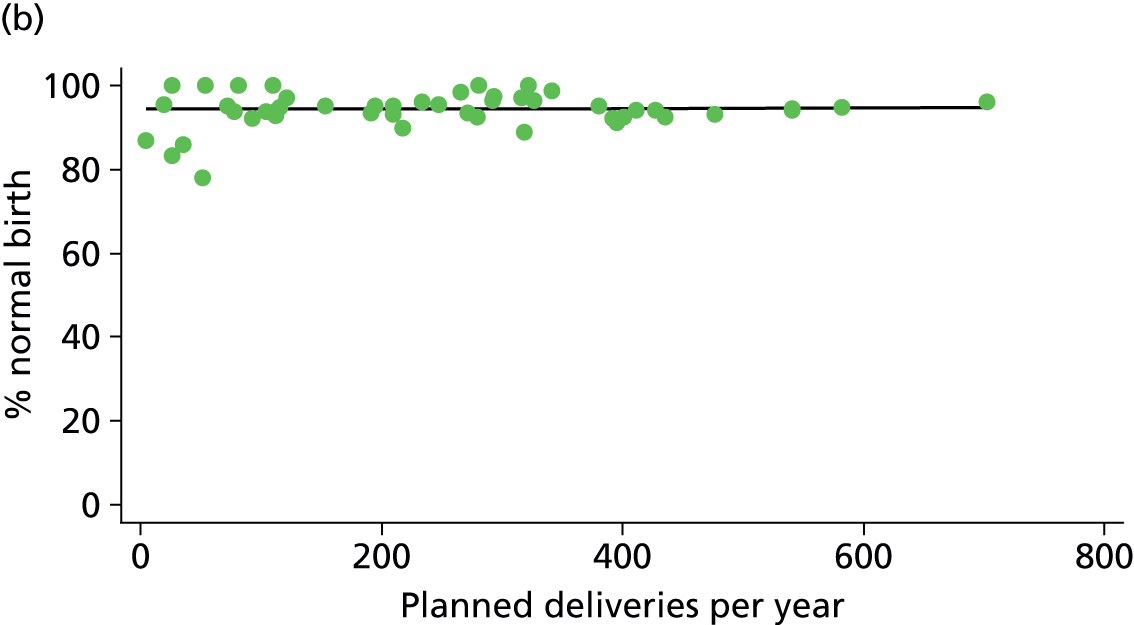
FIGURE 56.
Association between the number of delivery beds in the FMU and the instrumental delivery rate in ‘low risk’ (a) nulliparous (p = 0.042); and (b) multiparous women (p = 0.808) planning FMU birth.
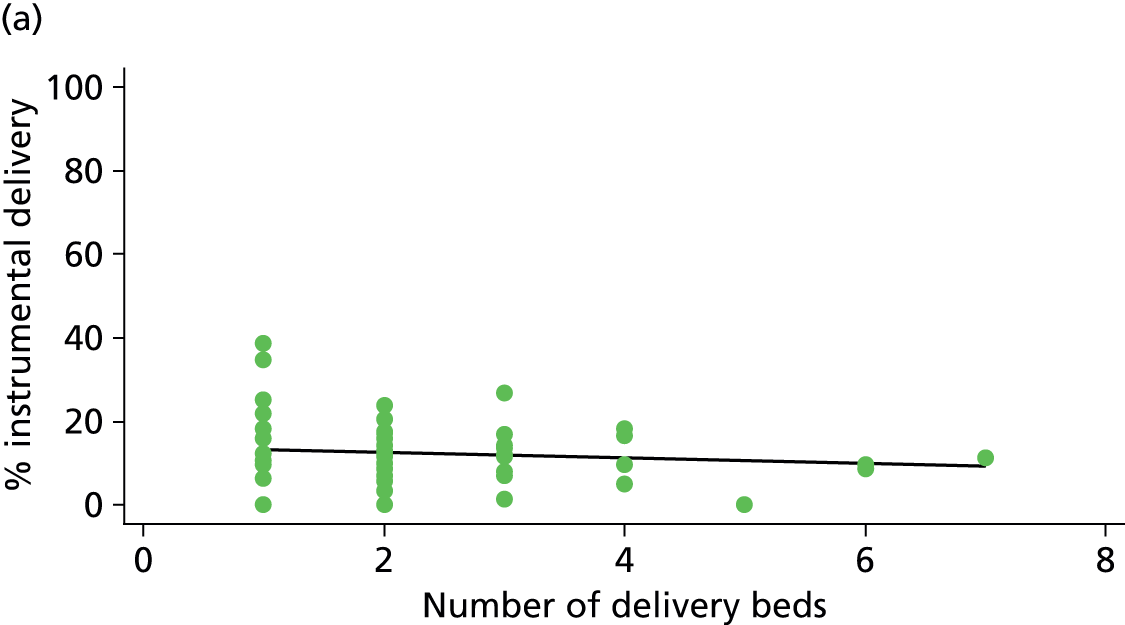

FIGURE 57.
Association between the number of delivery beds in the FMU and the ‘normal birth’ rate in ‘low risk’ (a) nulliparous (p = 0.007); and (b) multiparous women (p = 0.691) planning FMU birth.
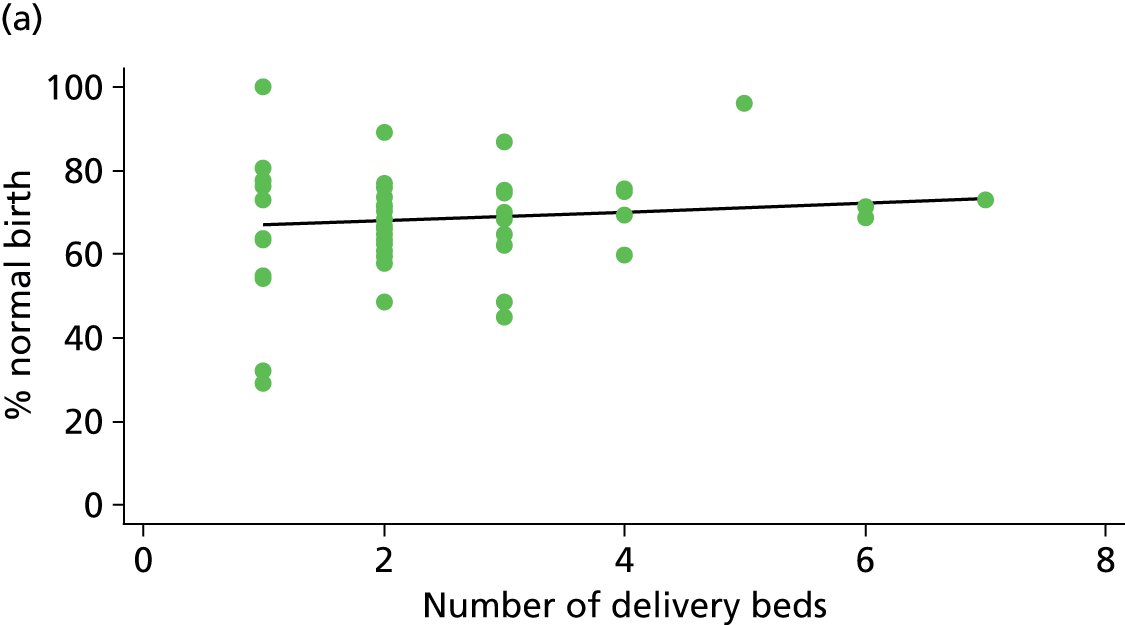
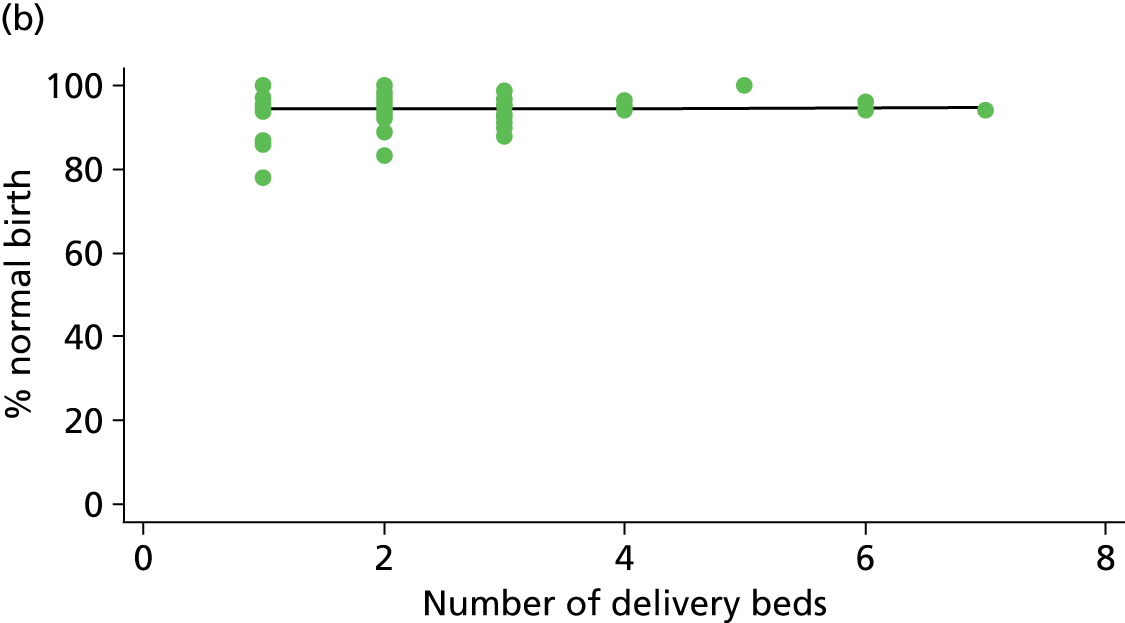
FIGURE 58.
Association between midwifery ‘understaffing’ (% of shifts understaffed) in the FMU and the intrapartum caesarean section rate in ‘low risk’ (a) nulliparous (p = 0.670); and (b) multiparous women (p = 0.046) planning FMU birth.

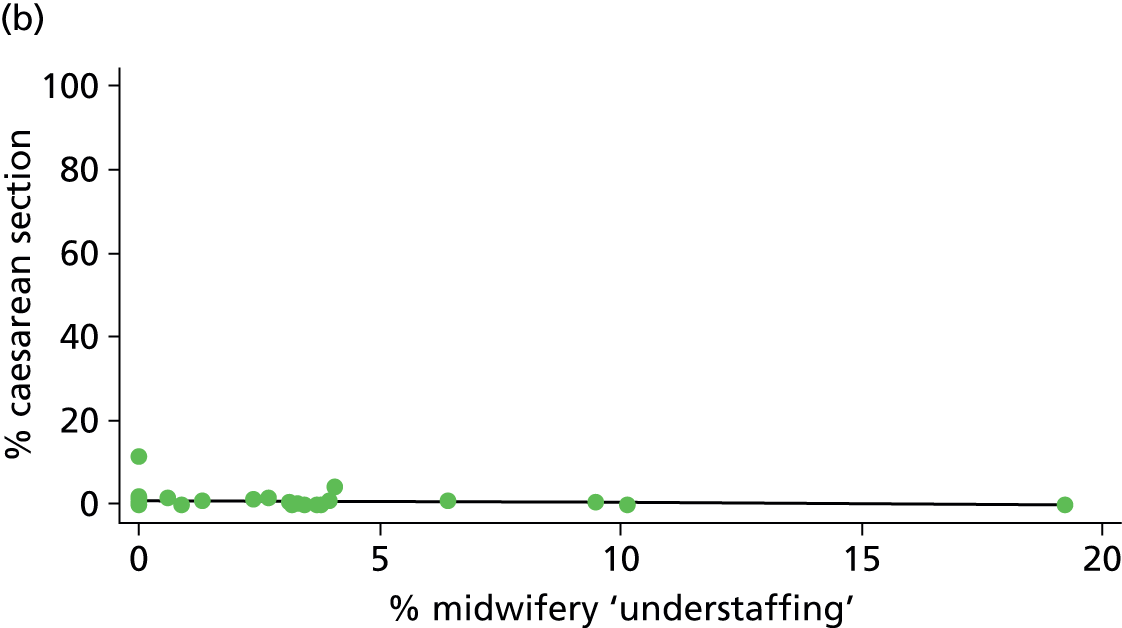
FIGURE 59.
Association between whether or not the FMU was staffed 24 hours per day and the instrumental delivery rate in ‘low risk’ (a) nulliparous (p = 0.043); and (b) multiparous women (p = 0.960) planning FMU birth.
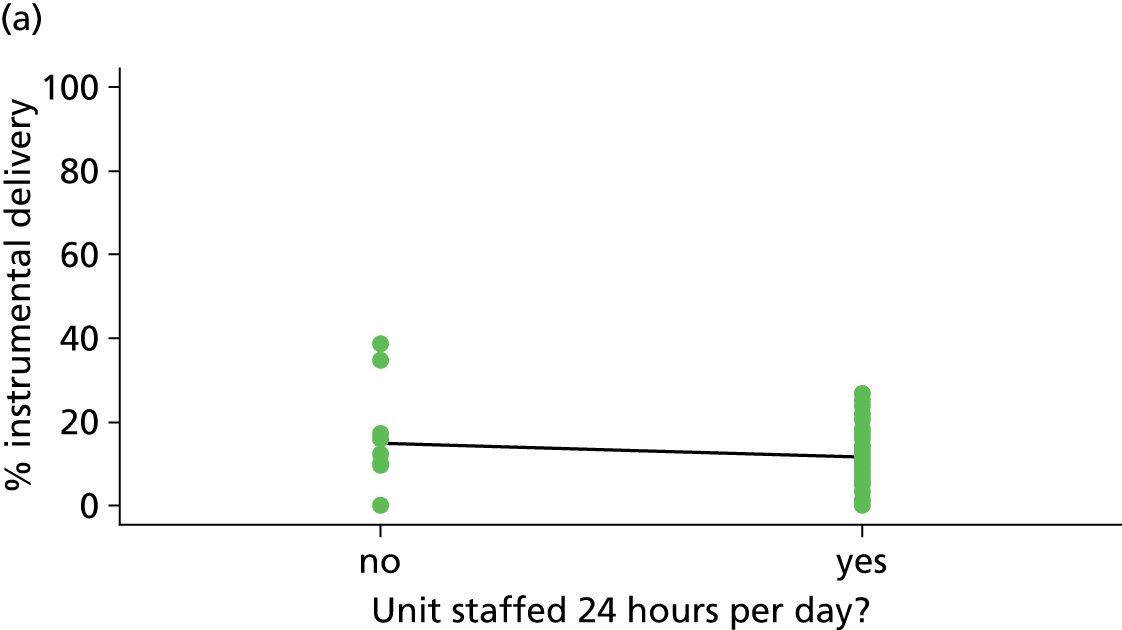
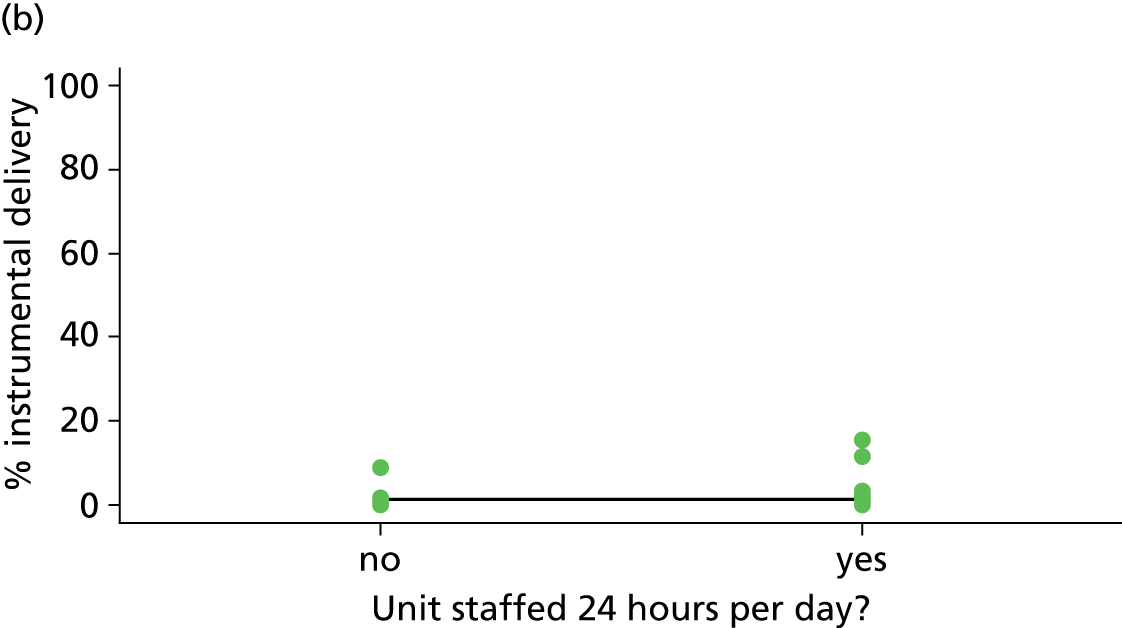
FIGURE 60.
Association between the transfer distance from the FMU to the nearest OU and the instrumental delivery rate in ‘low risk’ (a) nulliparous (p = 0.013); and (b) multiparous women (p = 0.247) planning FMU birth.
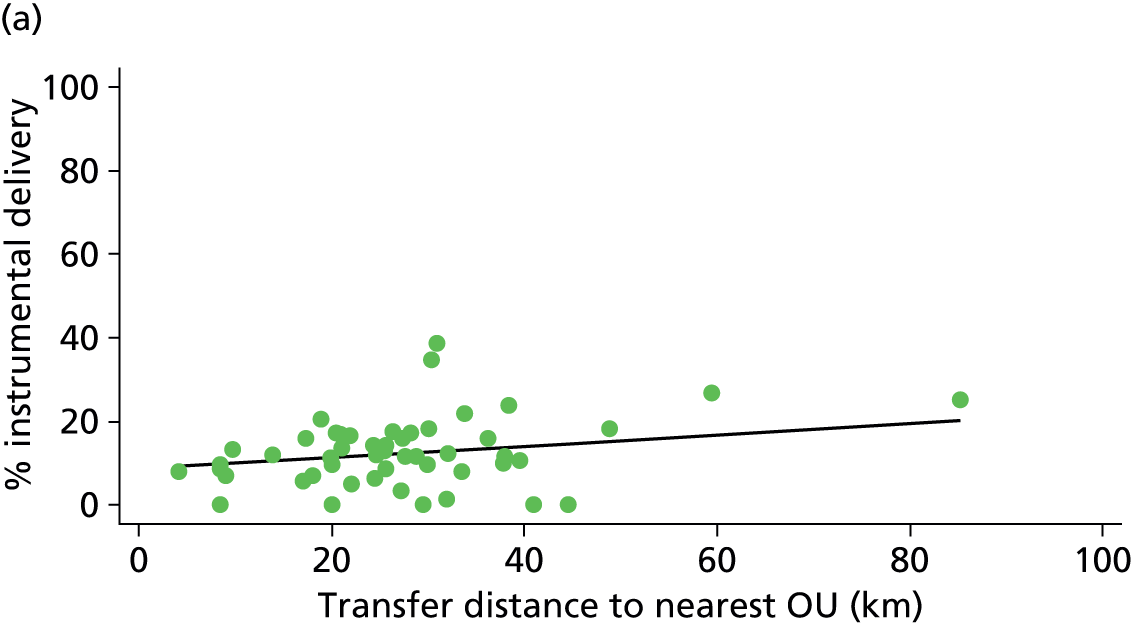
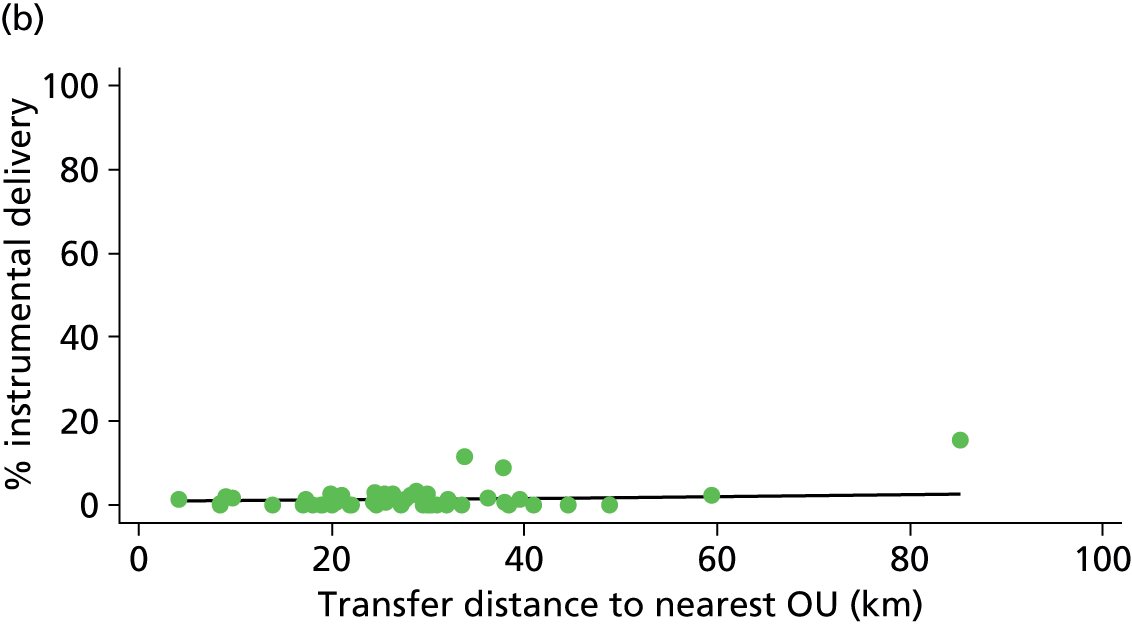
FIGURE 61.
Association between the transfer time from the FMU to the nearest OU and the instrumental delivery rate in ‘low risk’ (a) nulliparous (p = 0.004); and (b) multiparous women (p = 0.319) planning FMU birth.
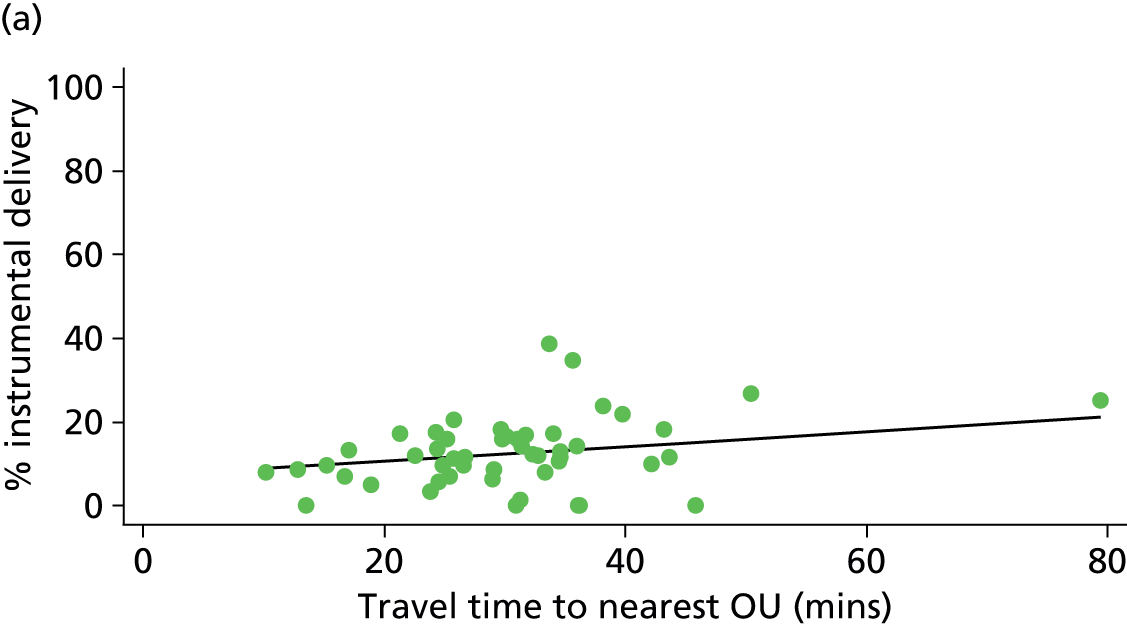
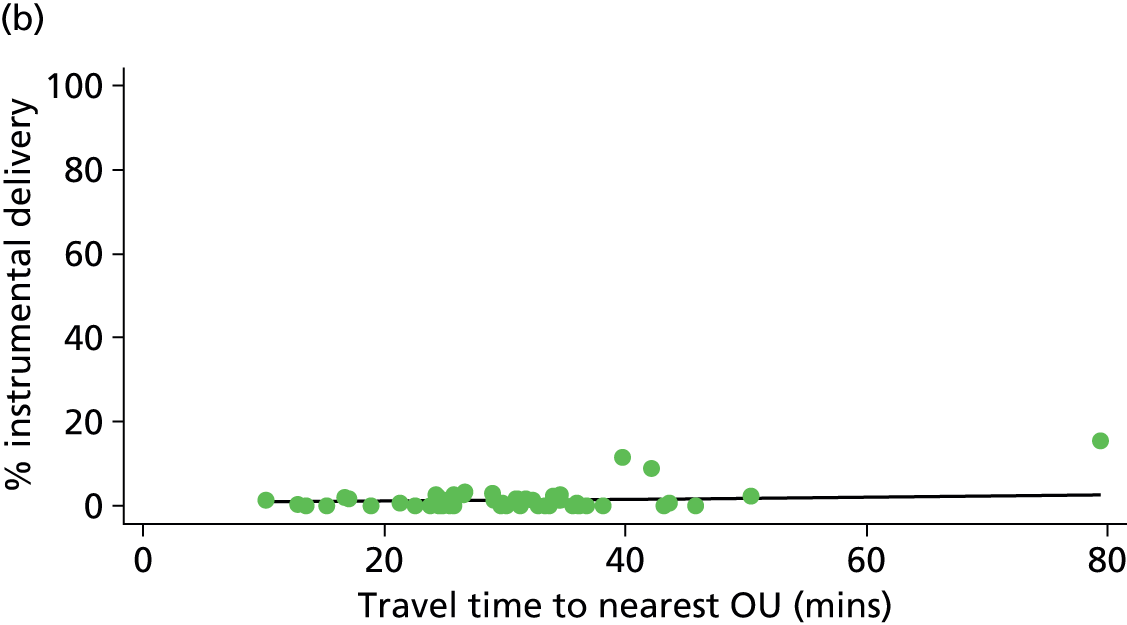
FIGURE 62.
Association between the median transfer time from the FMU to the nearest OU and the instrumental delivery rate in ‘low risk’ (a) nulliparous (p = 0.000); and (b) multiparous women (p = 0.202) planning FMU birth.
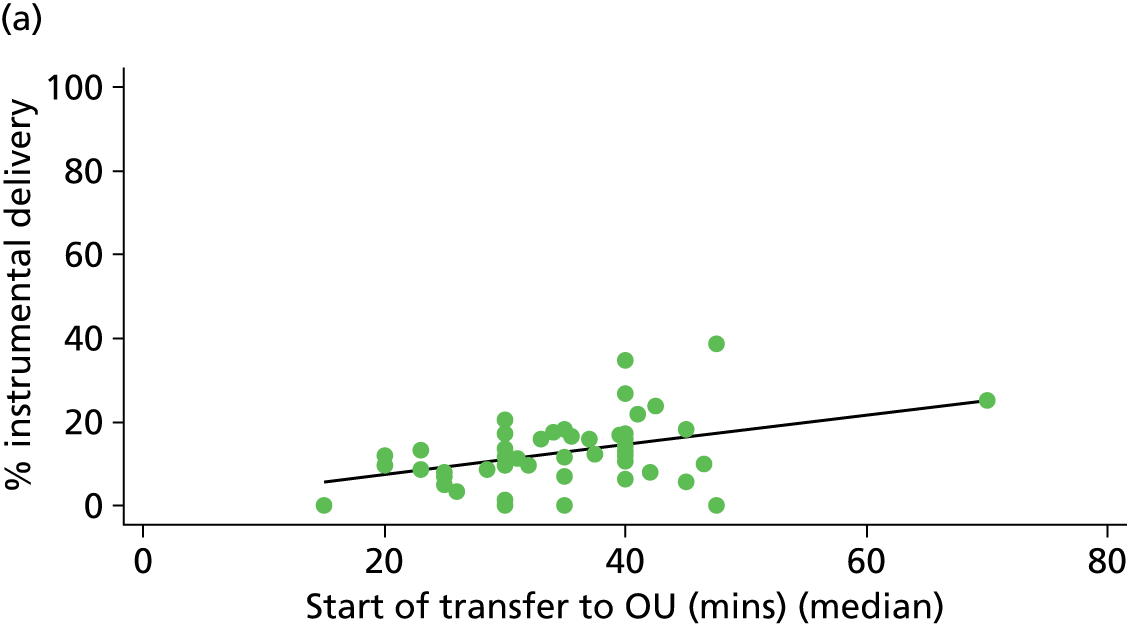
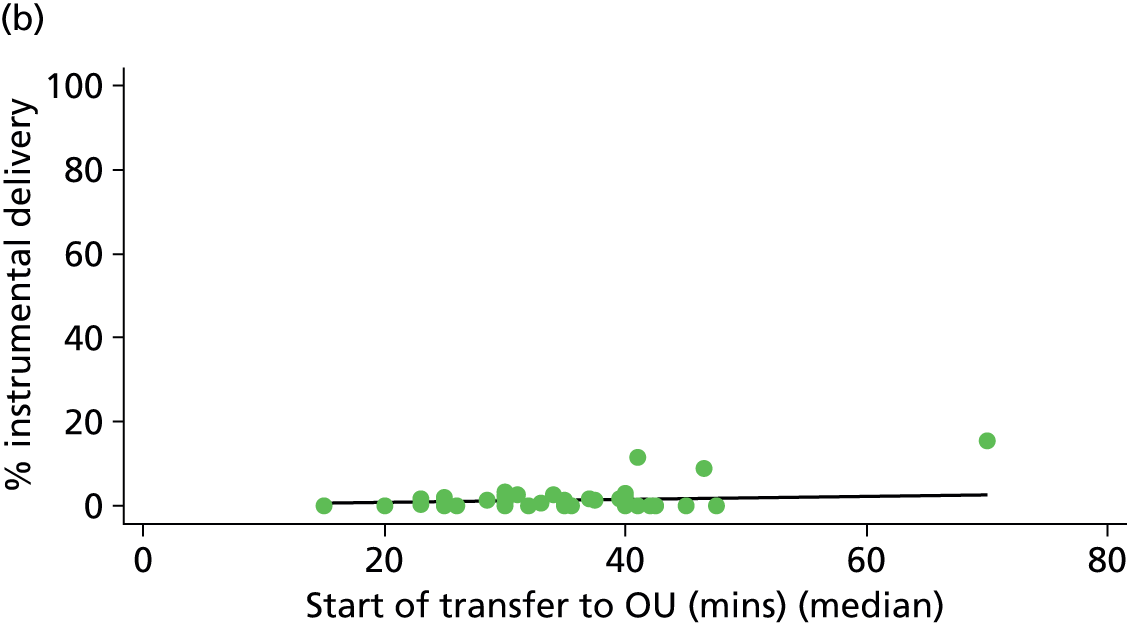
FIGURE 63.
Association between the median transfer time from the FMU to the nearest OU and the ‘straightforward birth’ rate in ‘low risk’ (a) nulliparous (p = 0.001); and (b) multiparous women (p = 0.241) planning FMU birth.
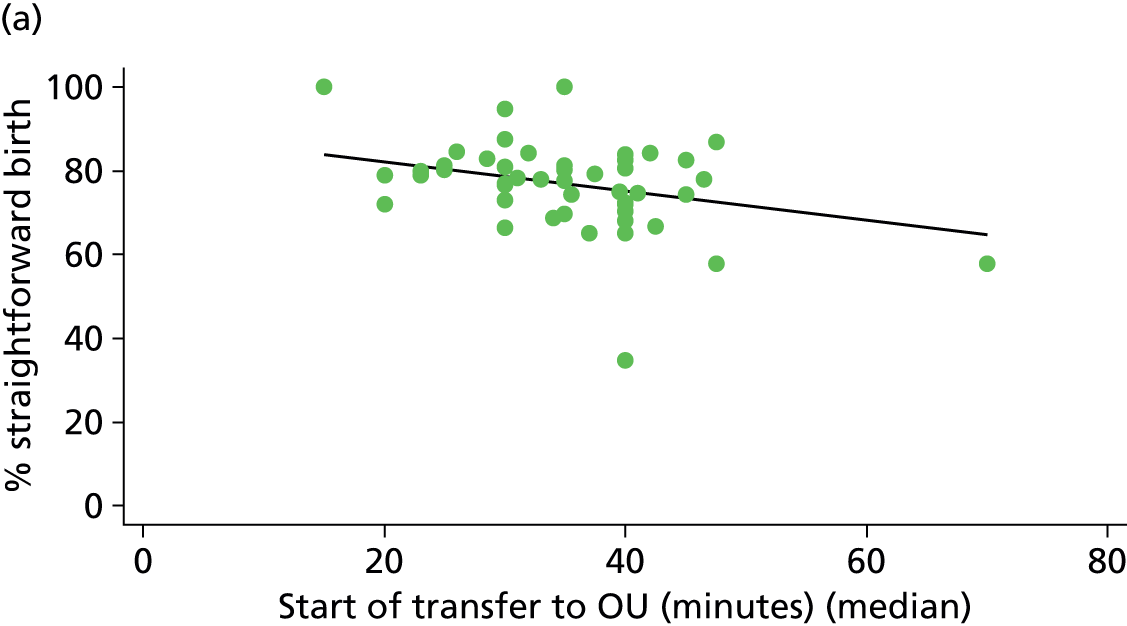
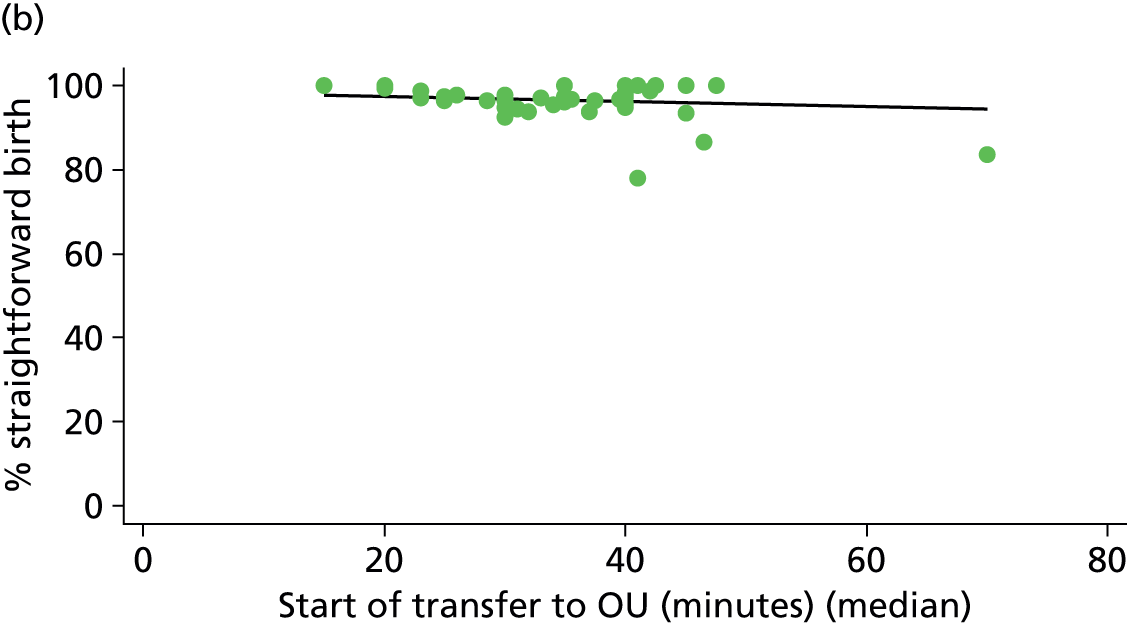
FIGURE 64.
Association between the median transfer time from the FMU to the nearest OU and the ‘normal birth’ rate in ‘low risk’ (a) nulliparous (p = 0.002); and (b) multiparous women (p = 0.980) planning FMU birth.
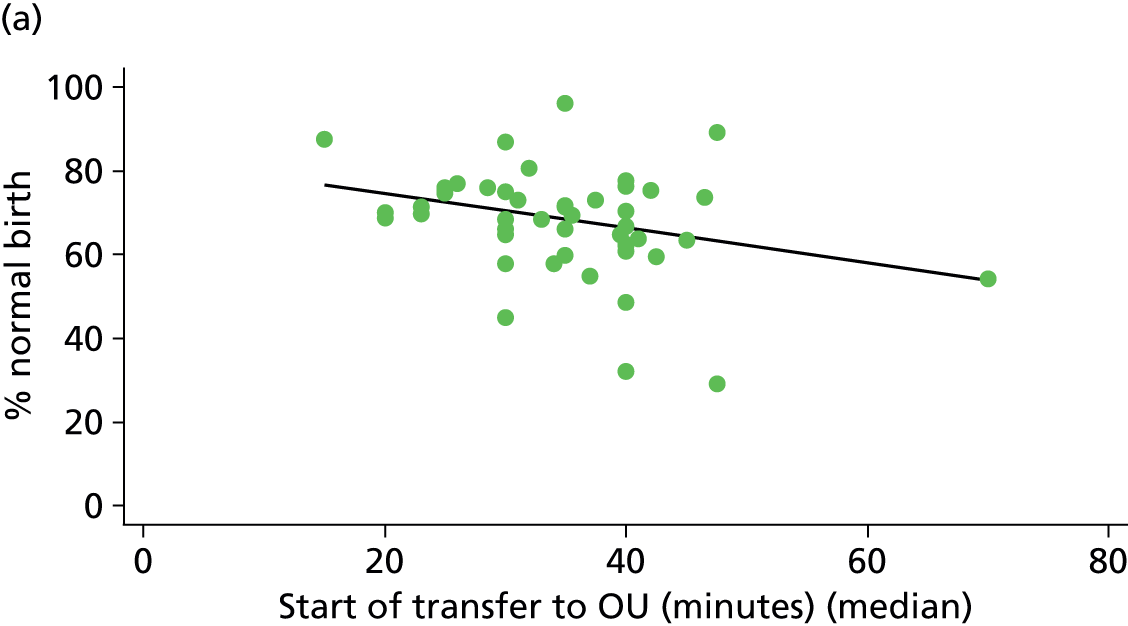
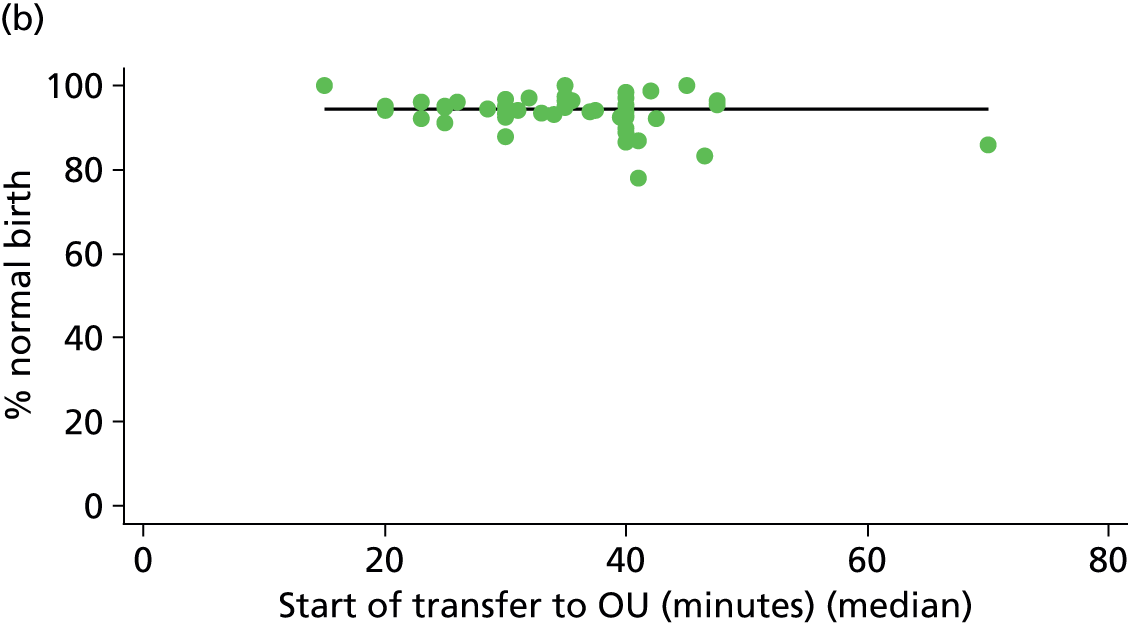
FIGURE 65.
Association between the FMU ‘size index’ and the instrumental delivery rate in ‘low risk’ (a) nulliparous (p = 0.005); and (b) multiparous women (p = 0.559) planning FMU birth.


FIGURE 66.
Association between the FMU ‘size index’ and the ‘straightforward birth’ rate in ‘low risk’ (a) nulliparous (p = 0.026); and (b) multiparous women (p = 0.676) planning FMU birth.
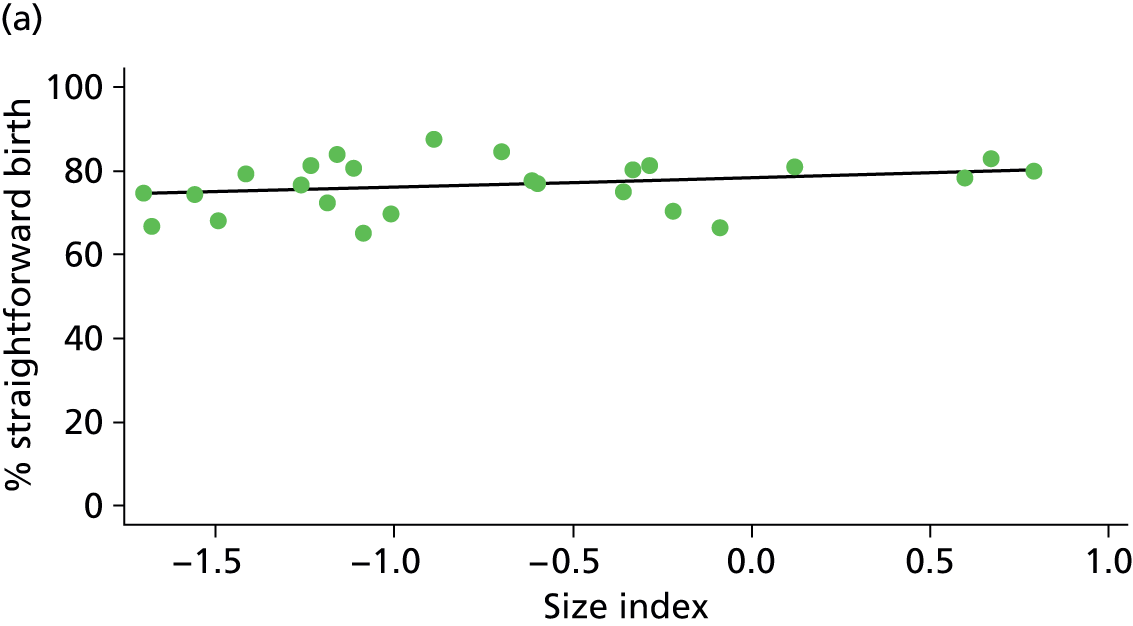
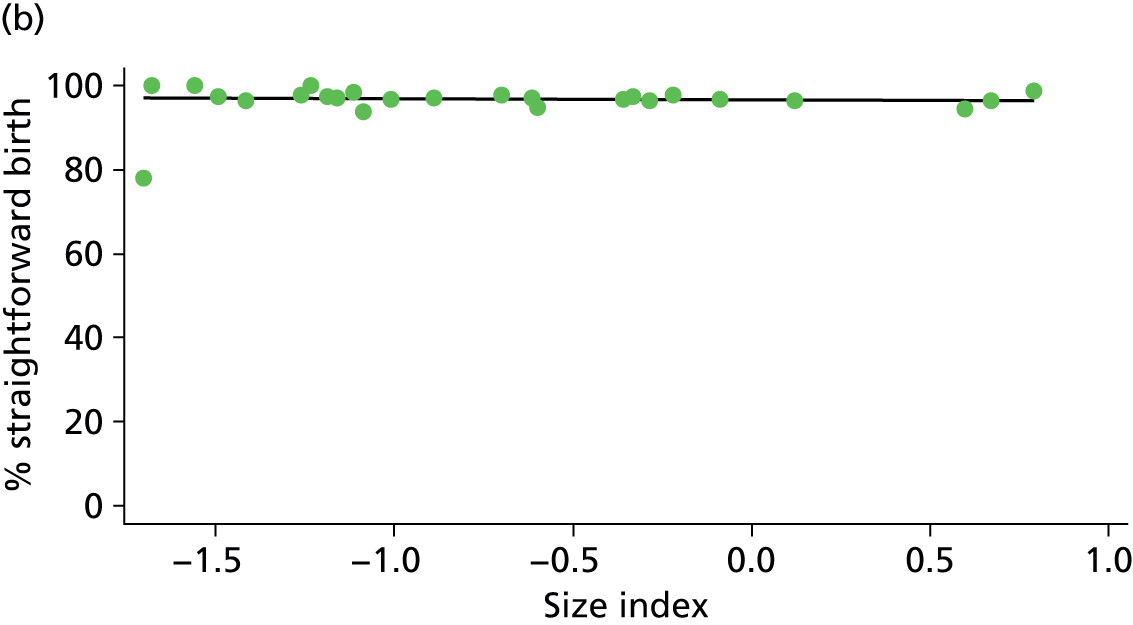
FIGURE 67.
Association between the FMU ‘size index’ and the ‘normal birth’ rate in ‘low risk’ (a) nulliparous (p = 0.001); and (b) multiparous women (p = 0.703) planning FMU birth.
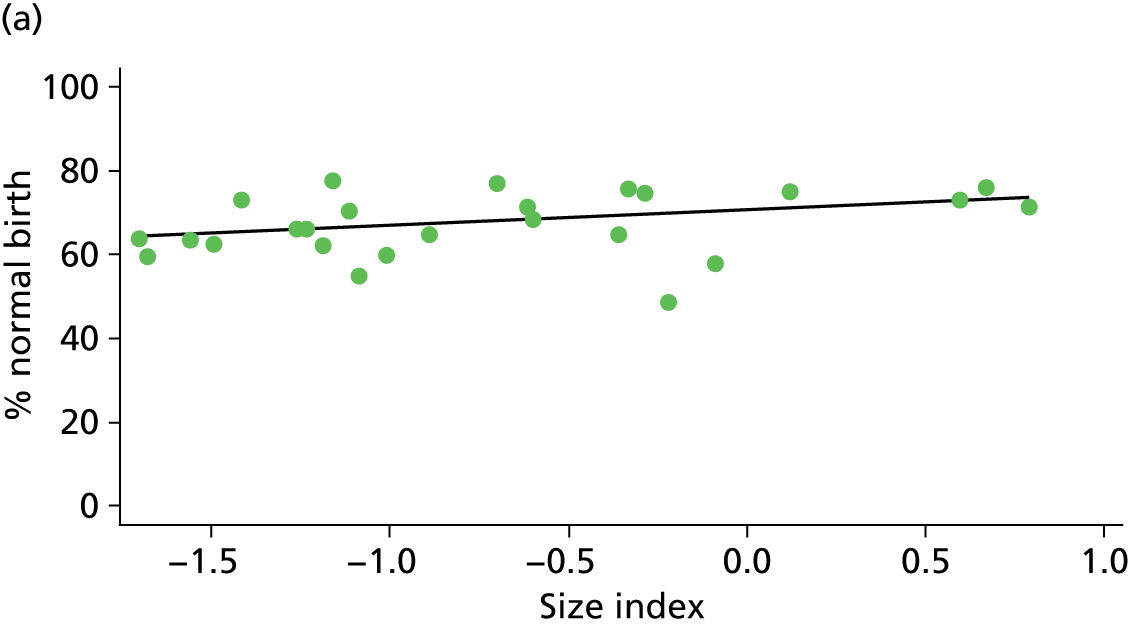
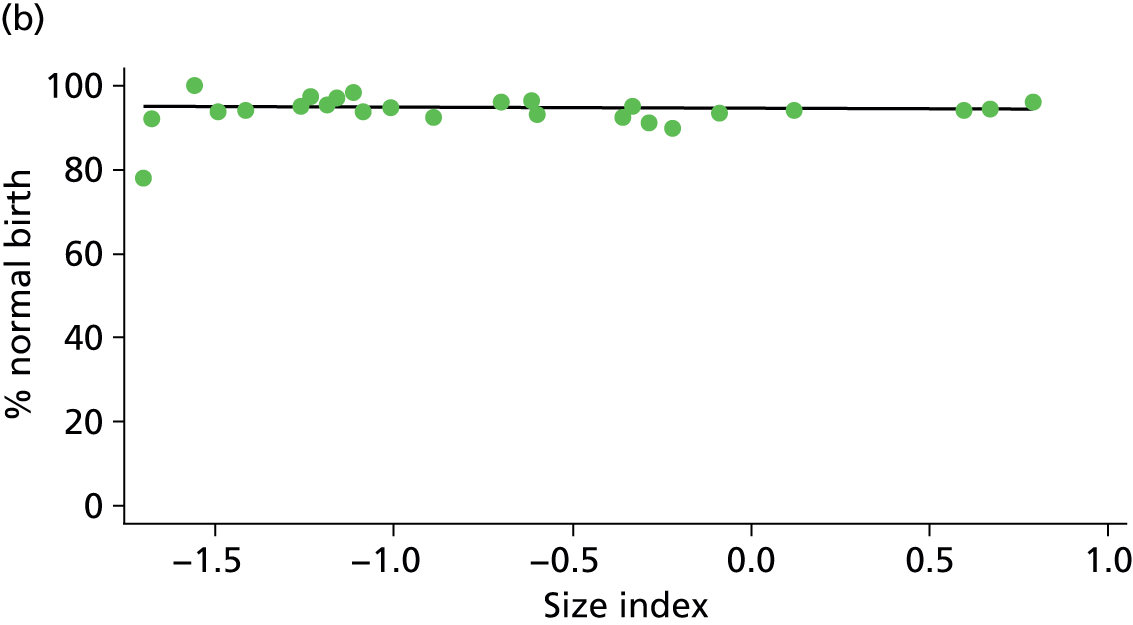
FIGURE 68.
Association between the FMU ‘distance index’ and the instrumental delivery rate in ‘low risk’ (a) nulliparous (p = 0.000); and (b) multiparous women (p = 0.227) planning FMU birth.
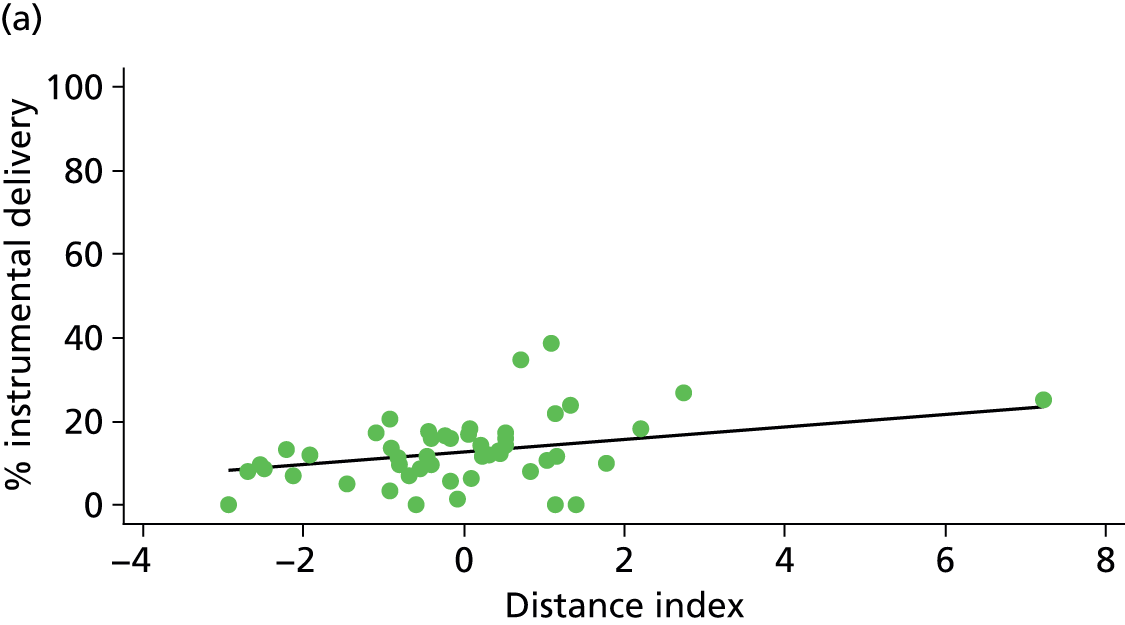
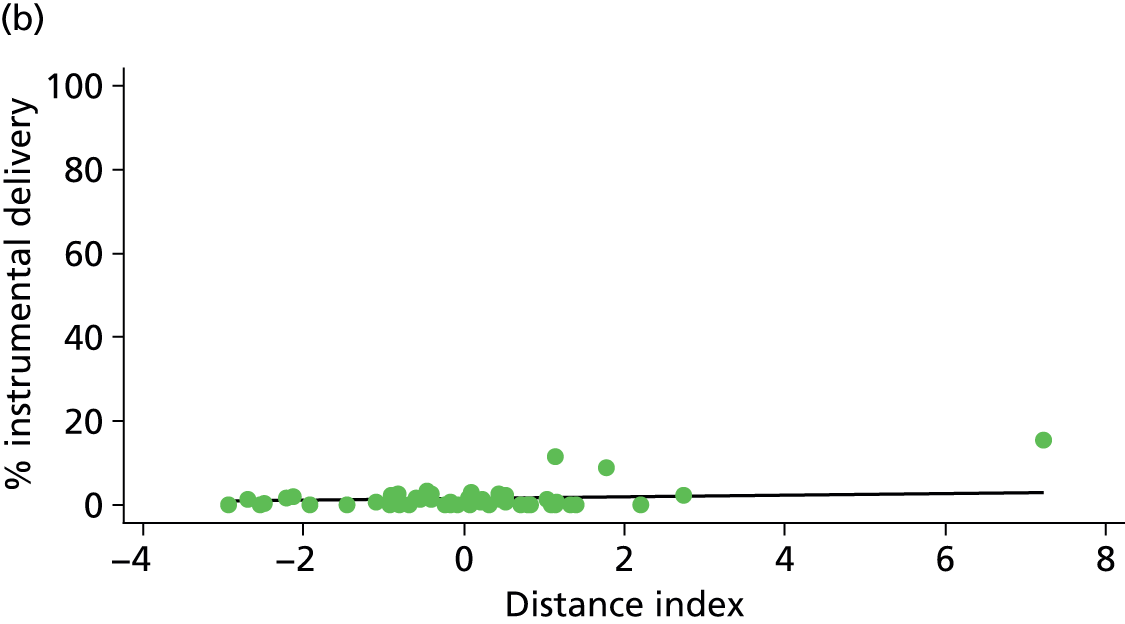
FIGURE 69.
Association between the FMU ‘distance index’ and the ‘straightforward birth’ rate in ‘low risk’ (a) nulliparous (p = 0.009); and (b) multiparous women (p = 0.295) planning FMU birth.
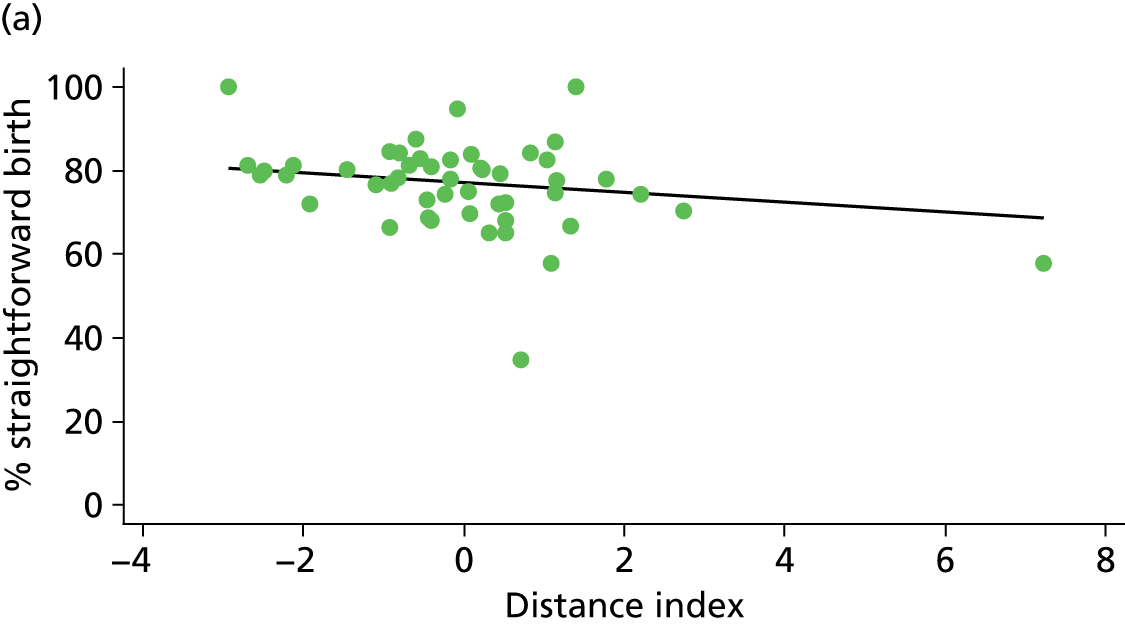
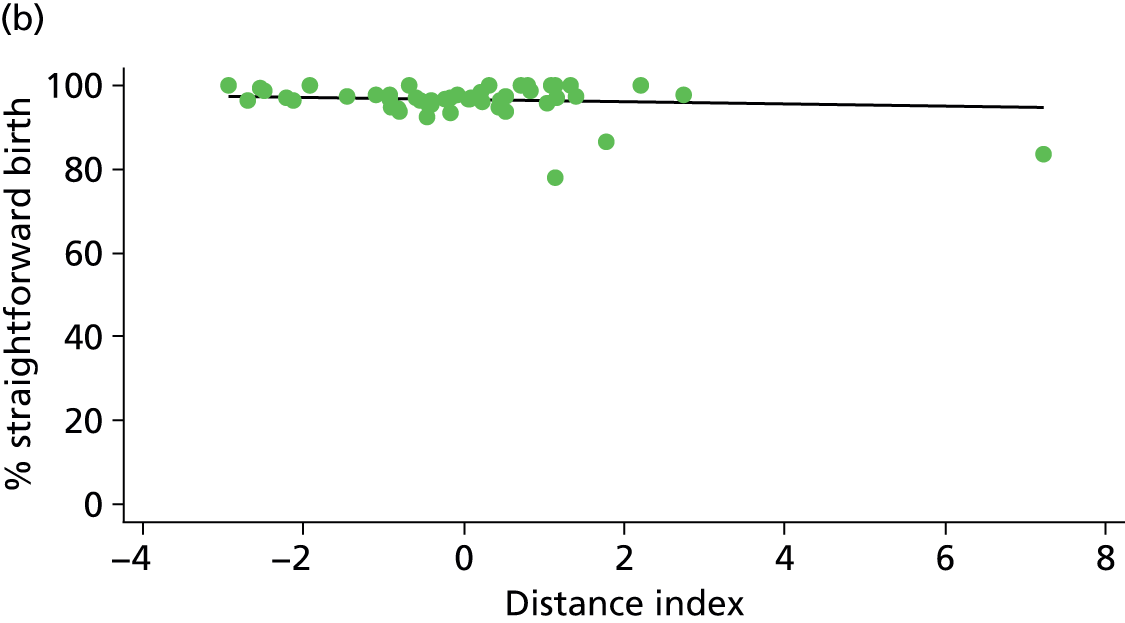
FIGURE 70.
Association between the FMU ‘distance index’ and the ‘normal birth’ rate in ‘low risk’ (a) nulliparous (p = 0.025); and (b) multiparous women (p = 0.875) planning FMU birth.
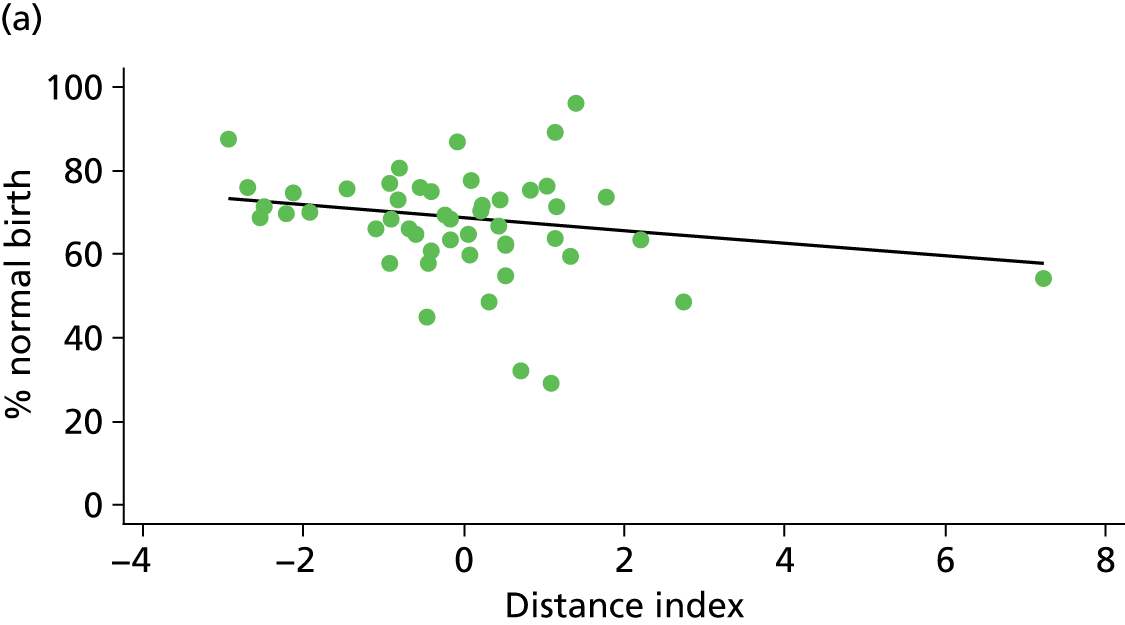
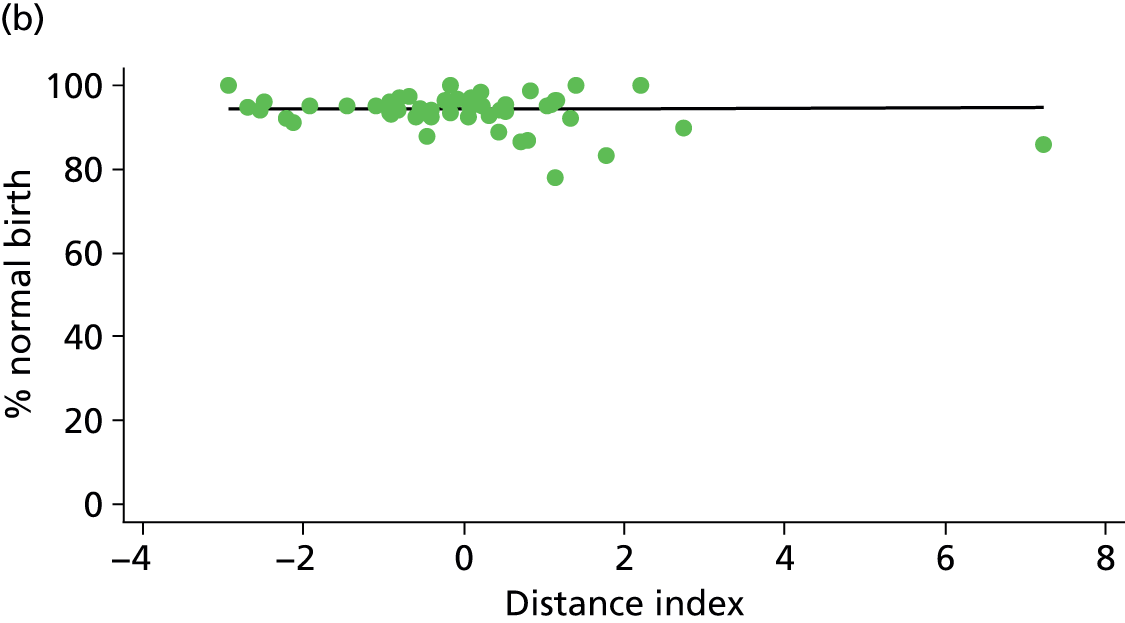
NHS trusts providing home birth services
FIGURE 71.
Association between the number of home births per year in the NHS trust and the ‘normal birth’ rate in (a) nulliparous (p = 0.199); and (b) multiparous women (p = 0.033) planning home birth.
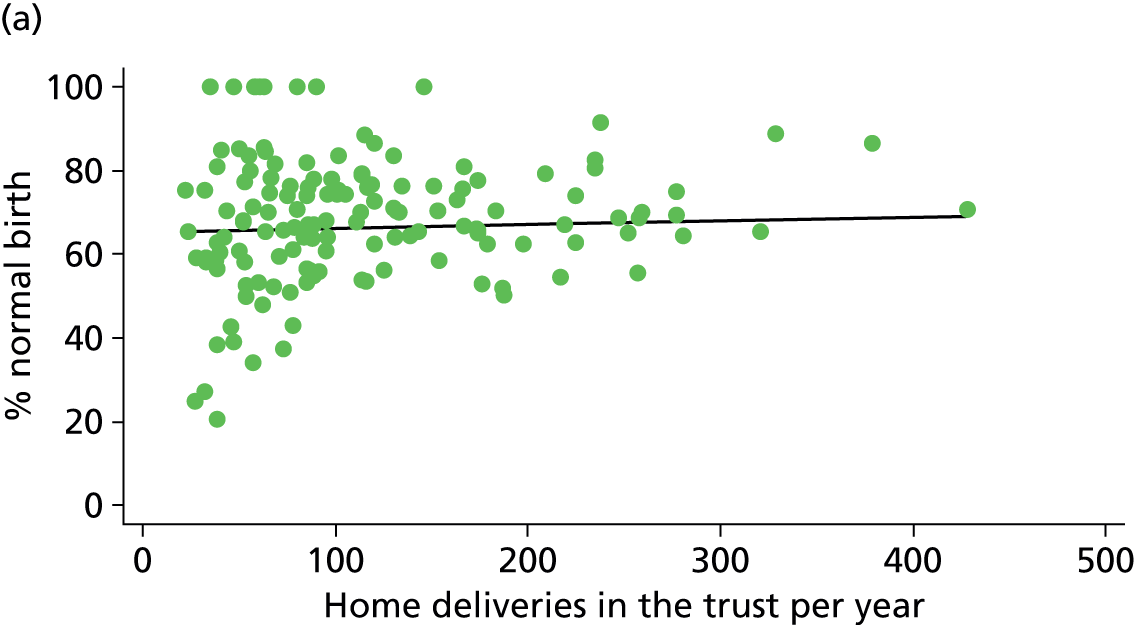
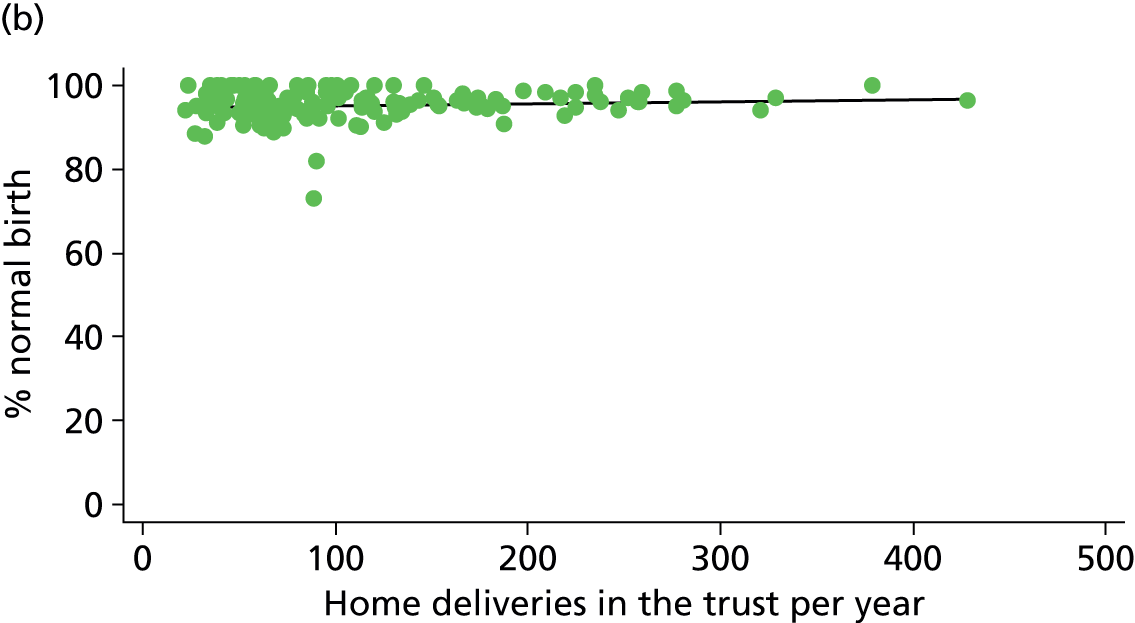
FIGURE 72.
Association between the percentage of births in the NHS trust that took place at home and the ‘normal birth’ rate in (a) nulliparous (p = 0.409); and (b) multiparous women (p = 0.004) planning home birth.
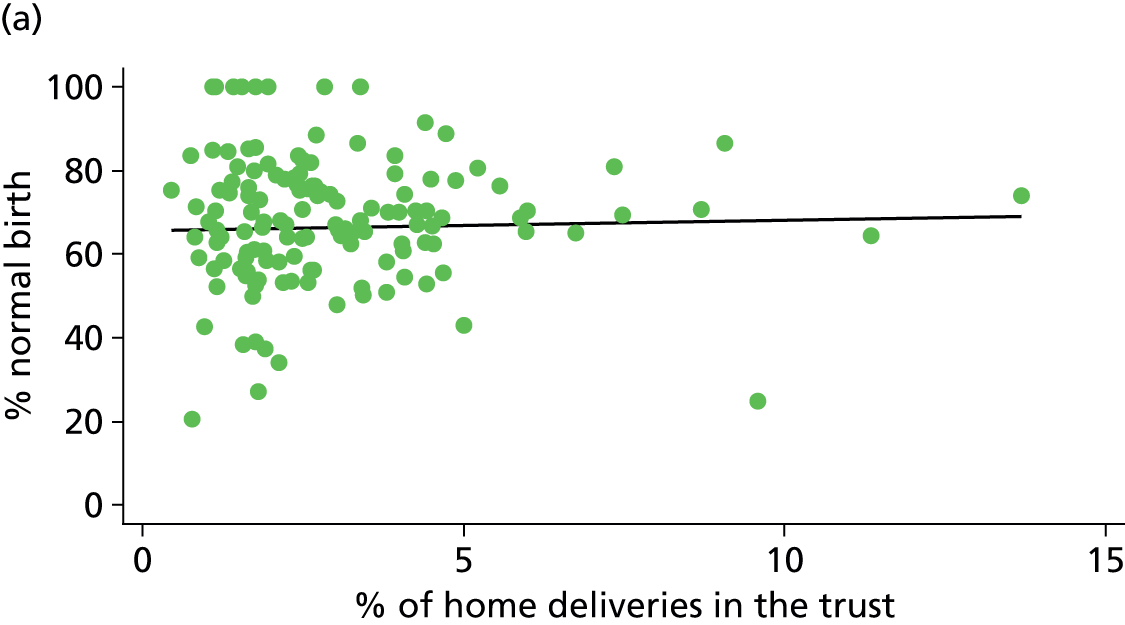
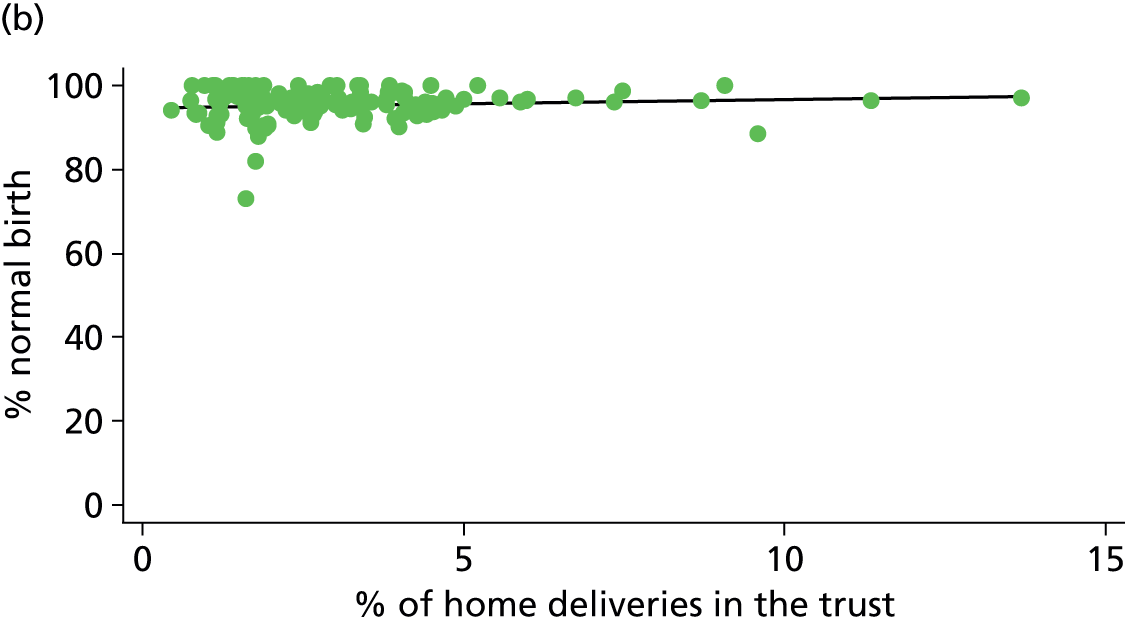
Appendix 6 Graphs of associations between unit/NHS trust characteristics and transfer rates in midwifery units and NHS trusts providing home birth services
This appendix shows scatterplots for associations between unit/NHS trust characteristics and transfer rates as reported in Chapter 5. Scatterplots shown are those where there was a significant association in either nulliparous or multiparous women or in both groups. As explained in Chapter 5, given the exploratory nature of these analyses and taking into consideration multiple testing, some of these significant associations are likely to be chance findings. All scatter plots where a significant association was found are shown in order to illustrate visually the magnitude of the associations seen and any outliers. All transfer rates shown are adjusted for maternal characteristics as described in Chapter 2.
Alongside midwifery units
FIGURE 73.
Association between the mean number of midwives on duty in the AMU and the transfer rate in ‘low risk’ (a) nulliparous (p = 0.216); and (b) multiparous women (p = 0.016) planning AMU birth.
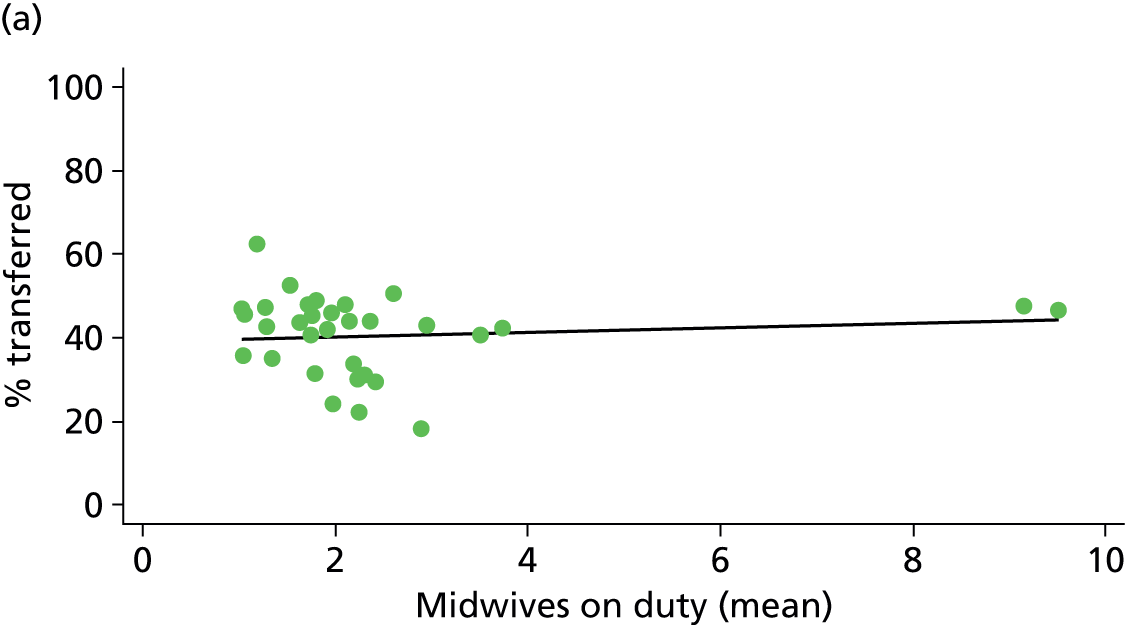
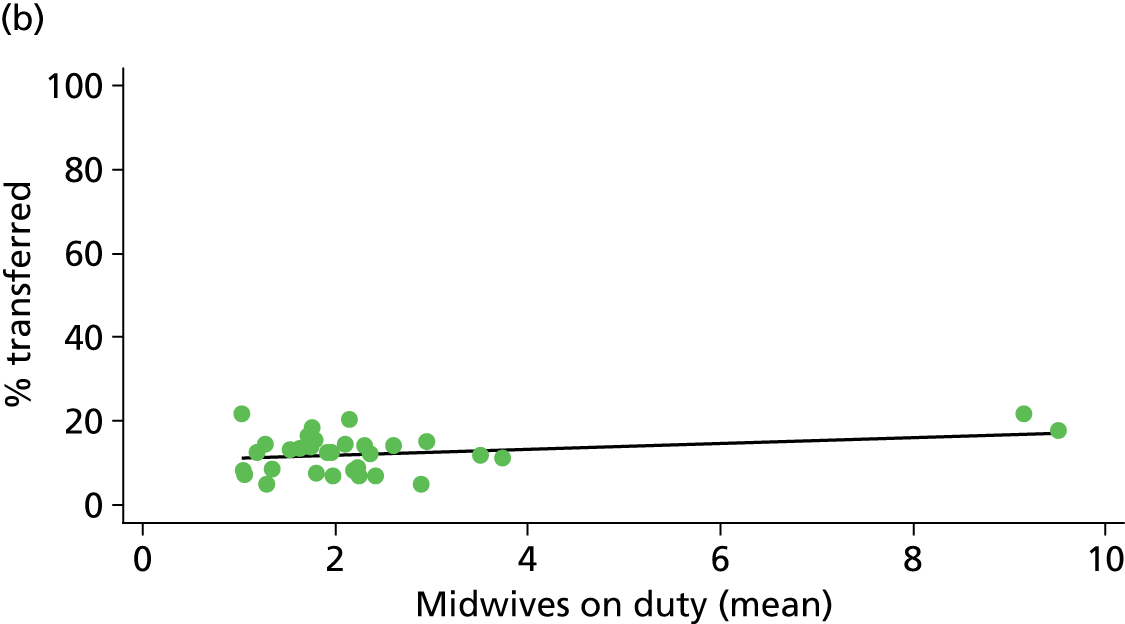
FIGURE 74.
Association between the mean number of midwives on duty per woman in labour in the AMU and the transfer rate in ‘low risk’ (a) nulliparous (p = 0.639); and (b) multiparous women (p = 0.043) planning AMU birth.


Freestanding midwifery units
FIGURE 75.
Association between the number of delivery beds in the FMU and the transfer rate in ‘low risk’ (a) nulliparous (p = 0.048); and (b) multiparous women (p = 0.856) planning FMU birth.
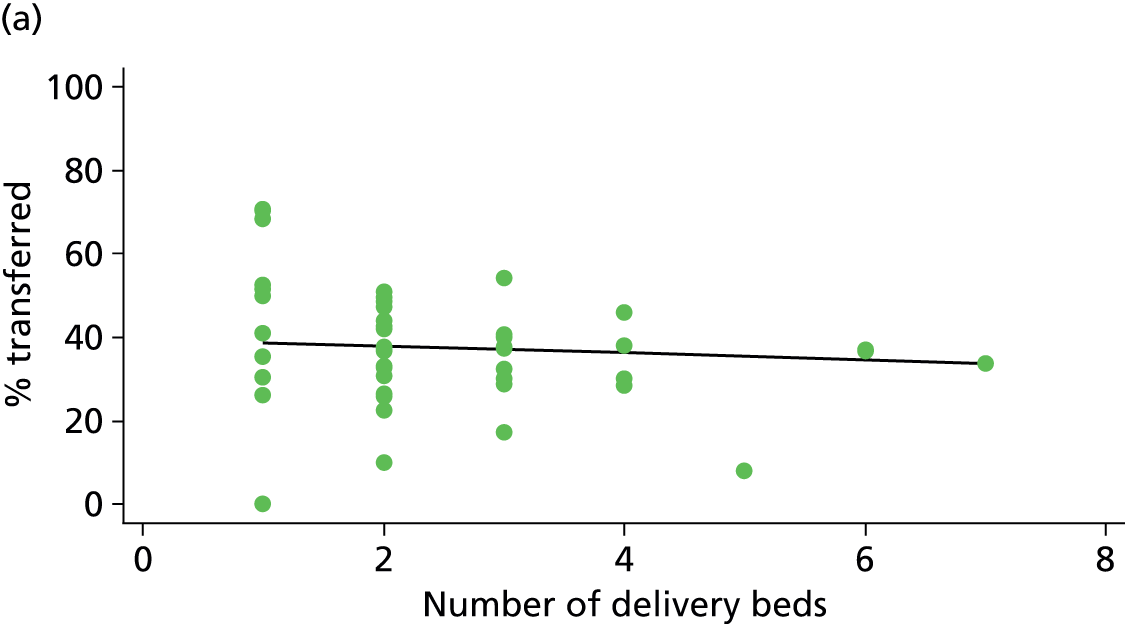
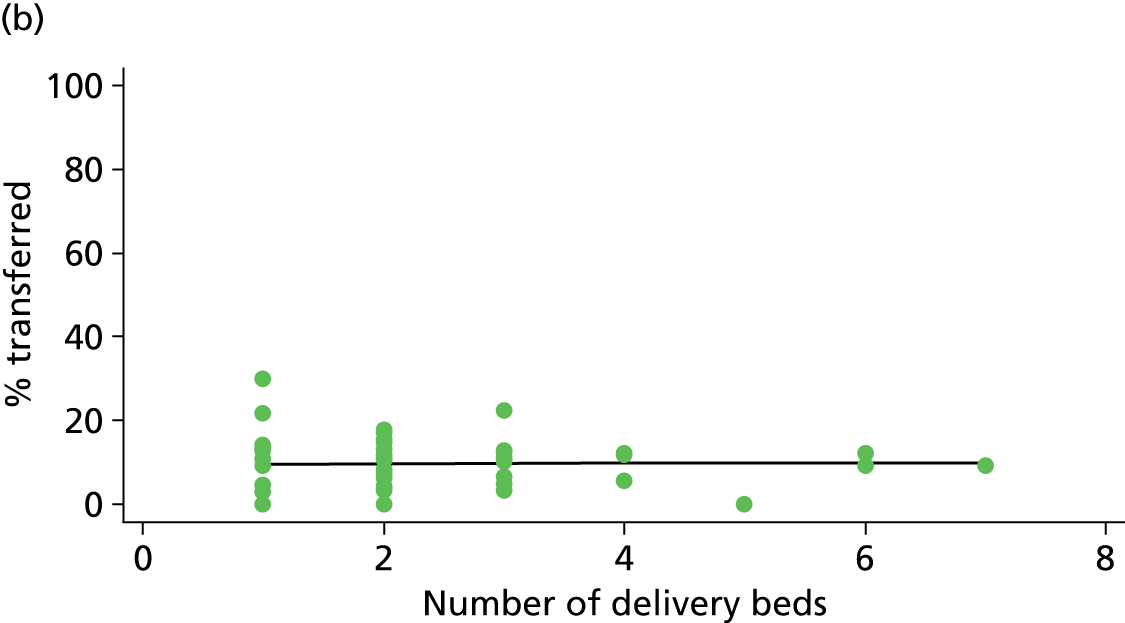
FIGURE 76.
Association between the transfer distance from the FMU to the nearest OU and the transfer rate in ‘low risk’ (a) nulliparous (p = 0.049); and (b) multiparous women (p = 0.682) planning FMU birth.

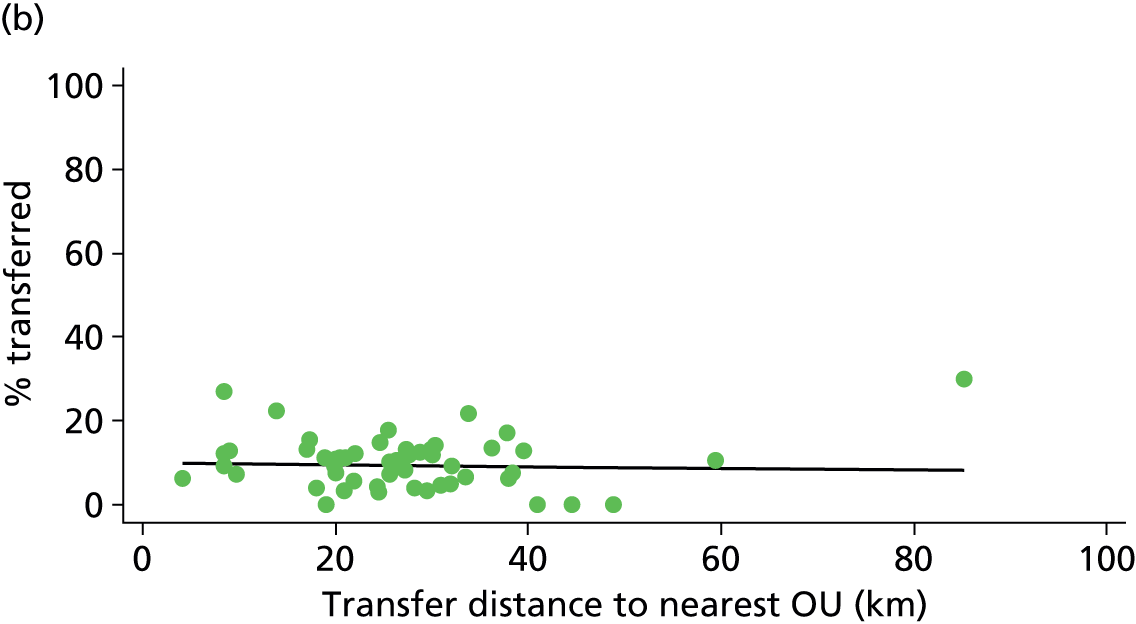
FIGURE 77.
Association between the median transfer time from the FMU to the nearest OU and the transfer rate in ‘low risk’ (a) nulliparous (p = 0.010); and (b) multiparous women (p = 0.537) planning FMU birth.
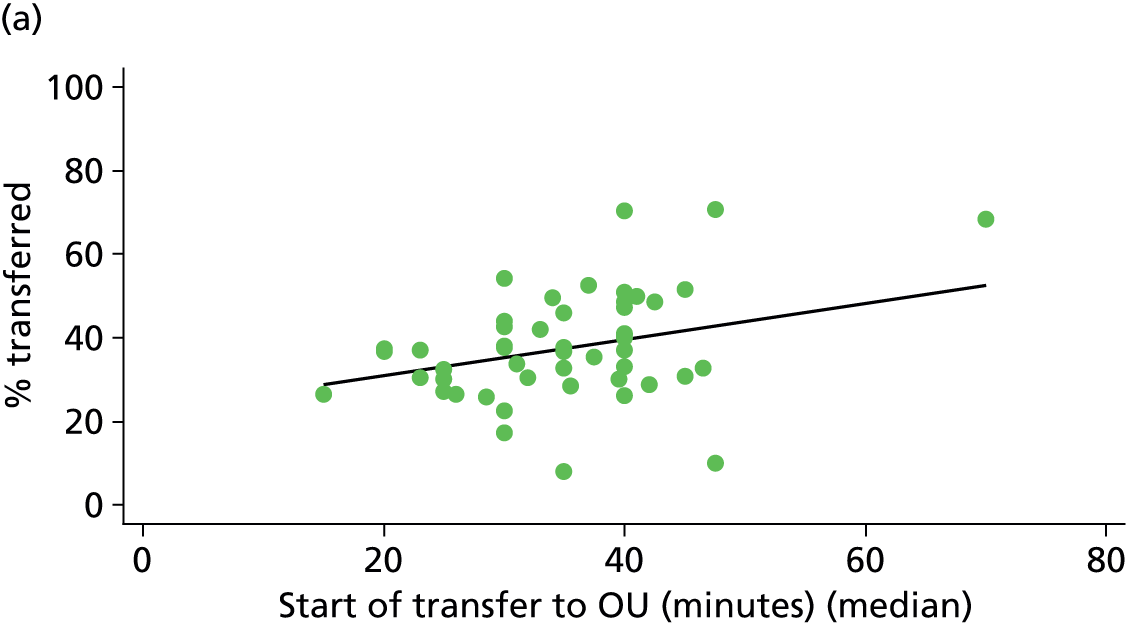
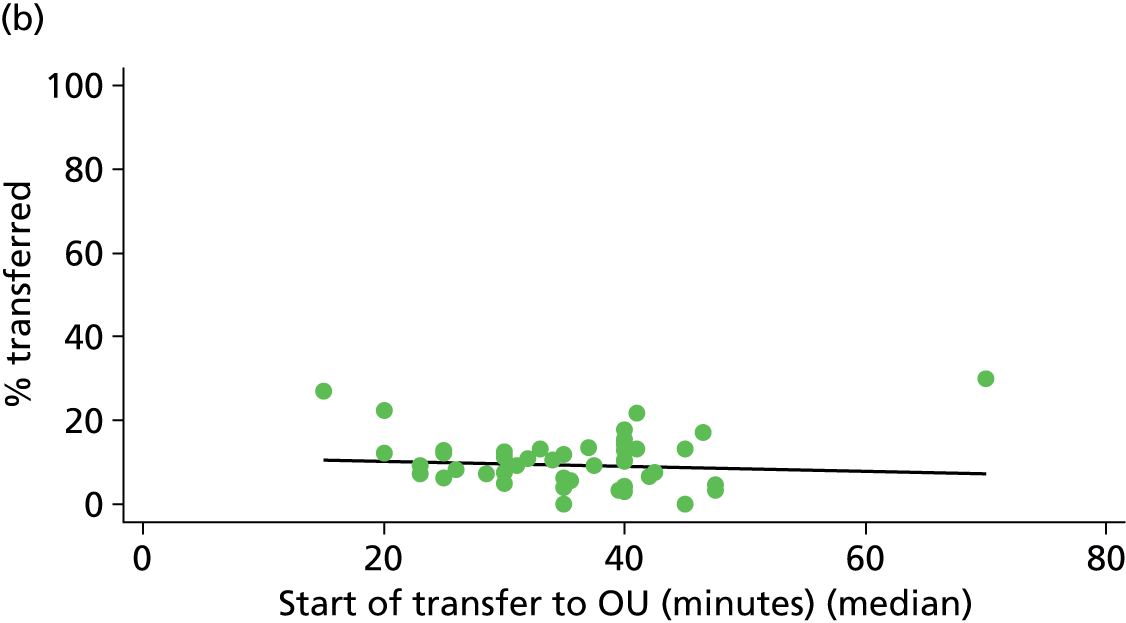
FIGURE 78.
Association between the FMU ‘distance index’ and the transfer rate in ‘low risk’ (a) nulliparous (p = 0.024); and (b) multiparous women (p = 0.505) planning FMU birth.
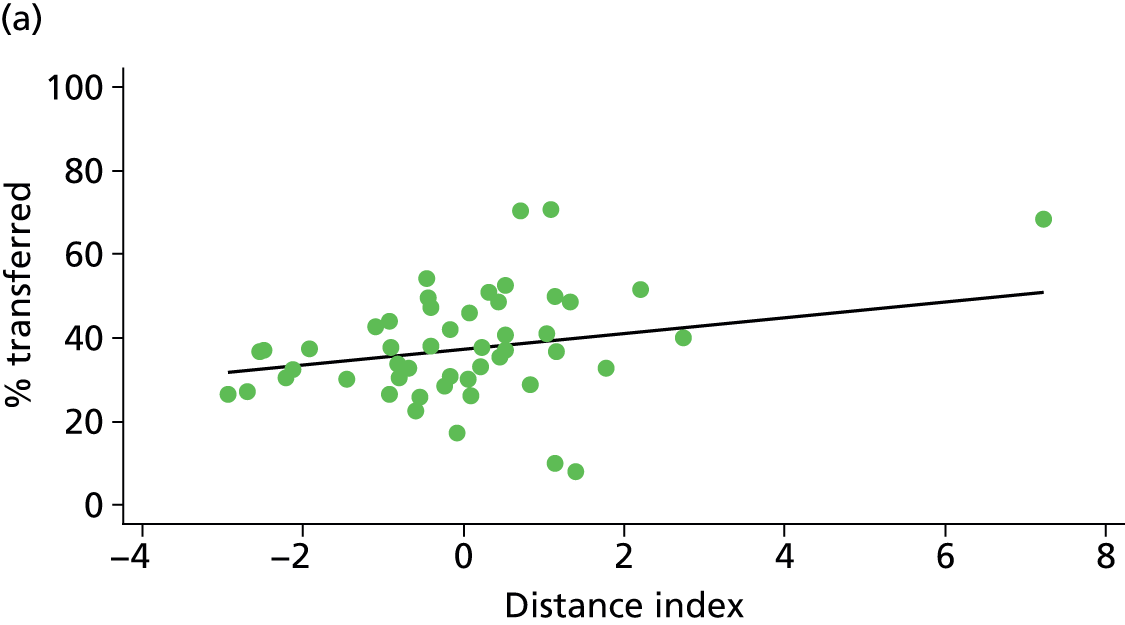
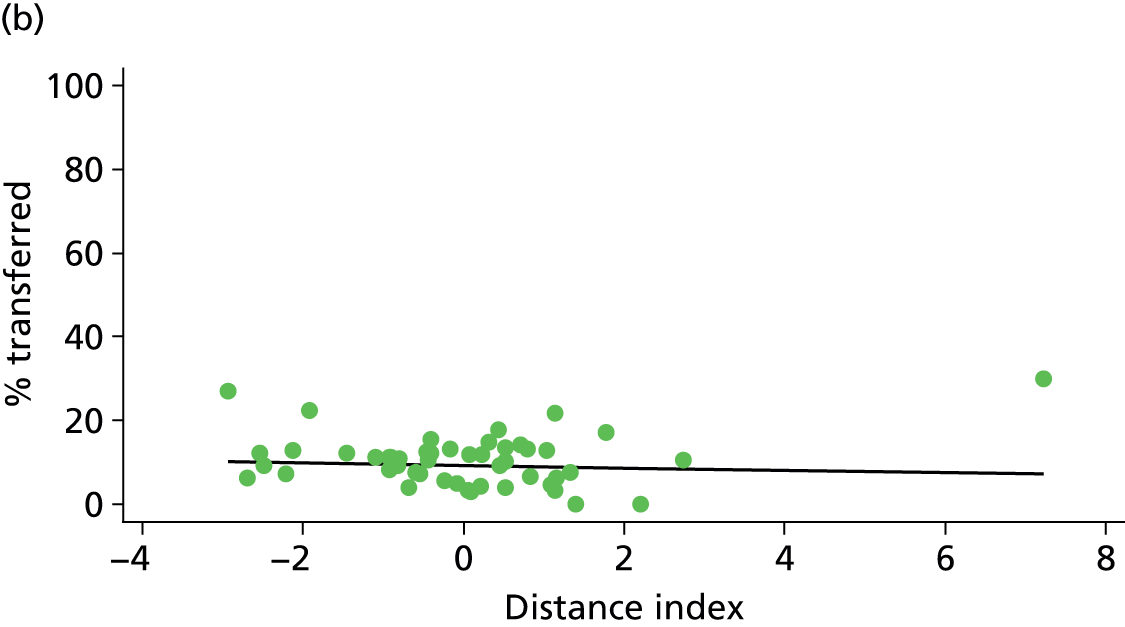
NHS trusts providing home birth services
FIGURE 79.
Association between the number of home births per year in the NHS trust and the transfer rate in (a) nulliparous (p = 0.001); and (b) multiparous women (p = 0.000) planning home birth.
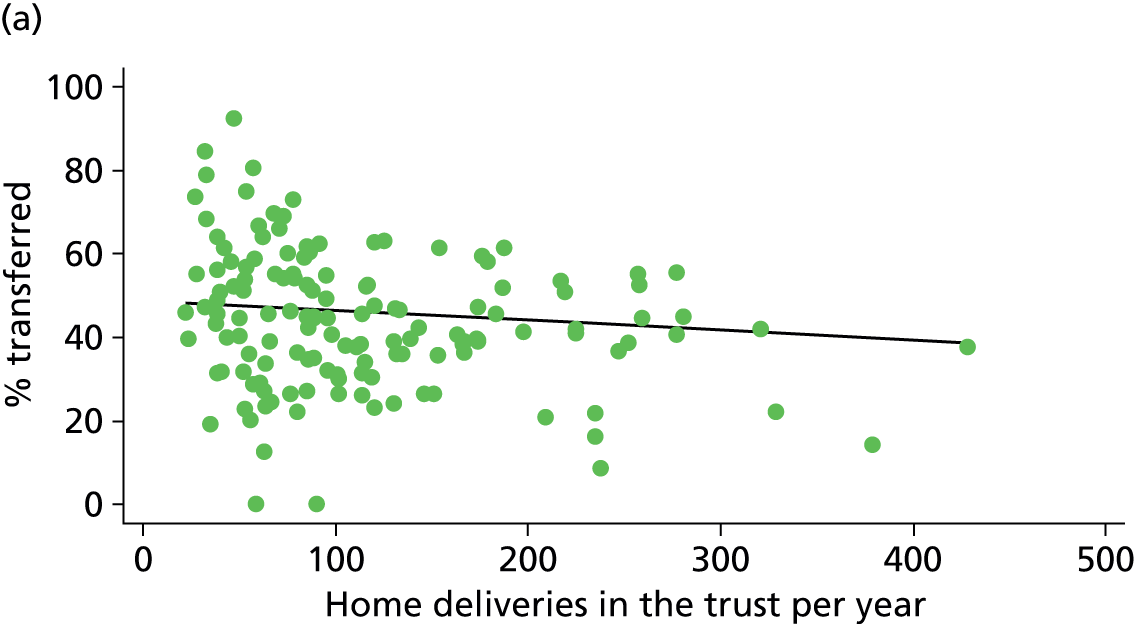
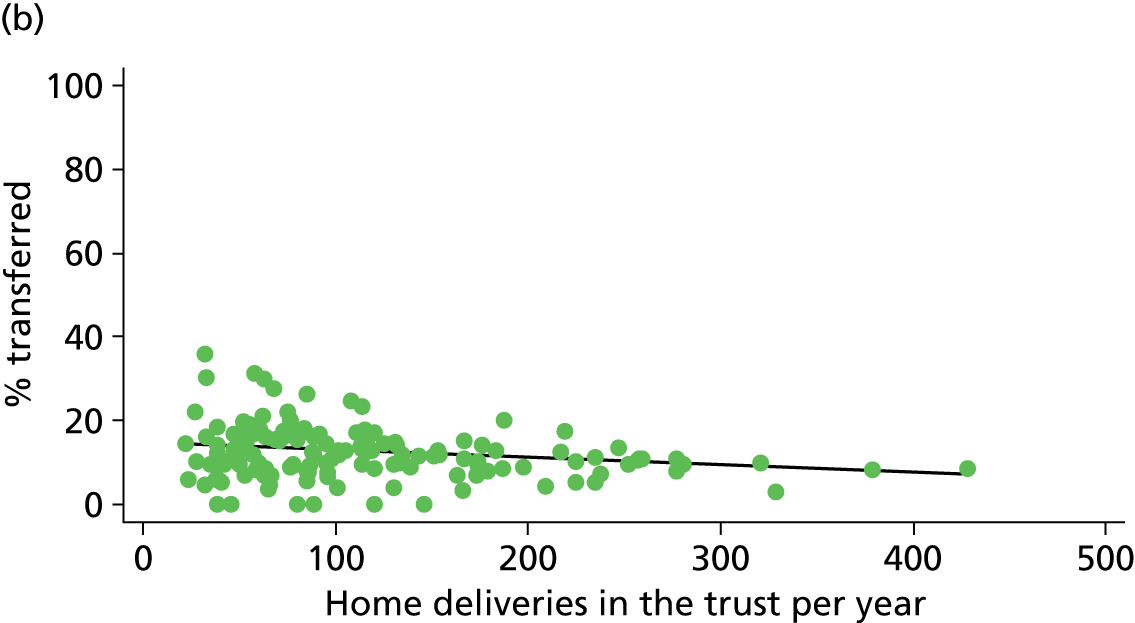
Appendix 7 Graphs of intervention and outcome rates by time of day
This appendix shows graphs plotting intervention and outcome rates in OUs by time of day as described in Chapter 6. These were calculated separately for nulliparous and multiparous women in women with and without ‘complicating conditions’ identified at the start of labour care.
FIGURE 80.
Plot of risk of instrumental delivery by time of birth in women planning OU birth: (a) nulliparous; and (b) multiparous women with and without ‘complicating conditions’.
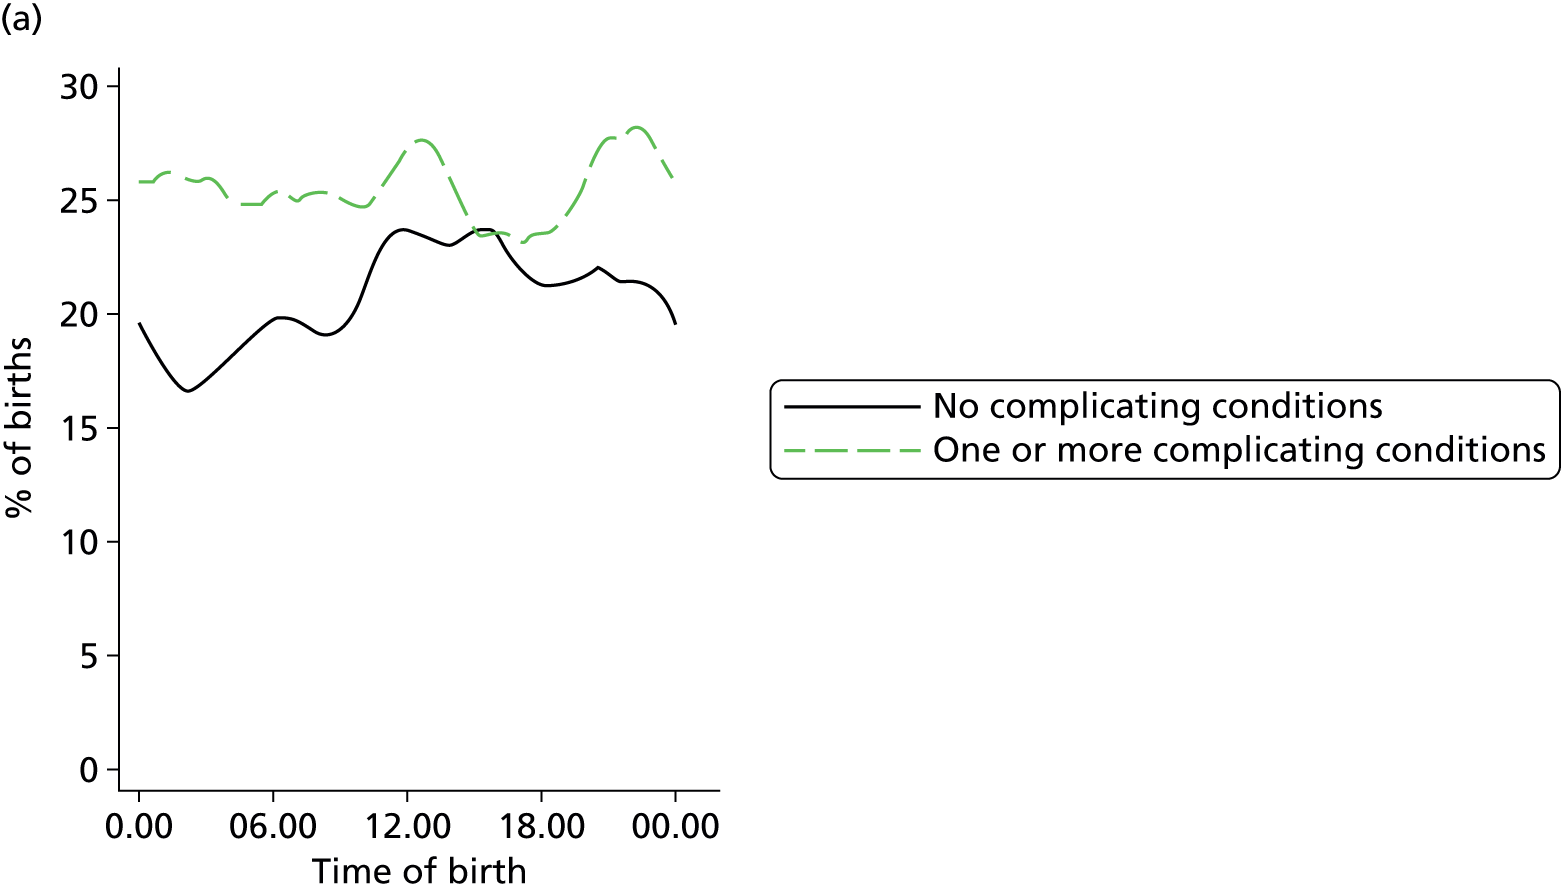
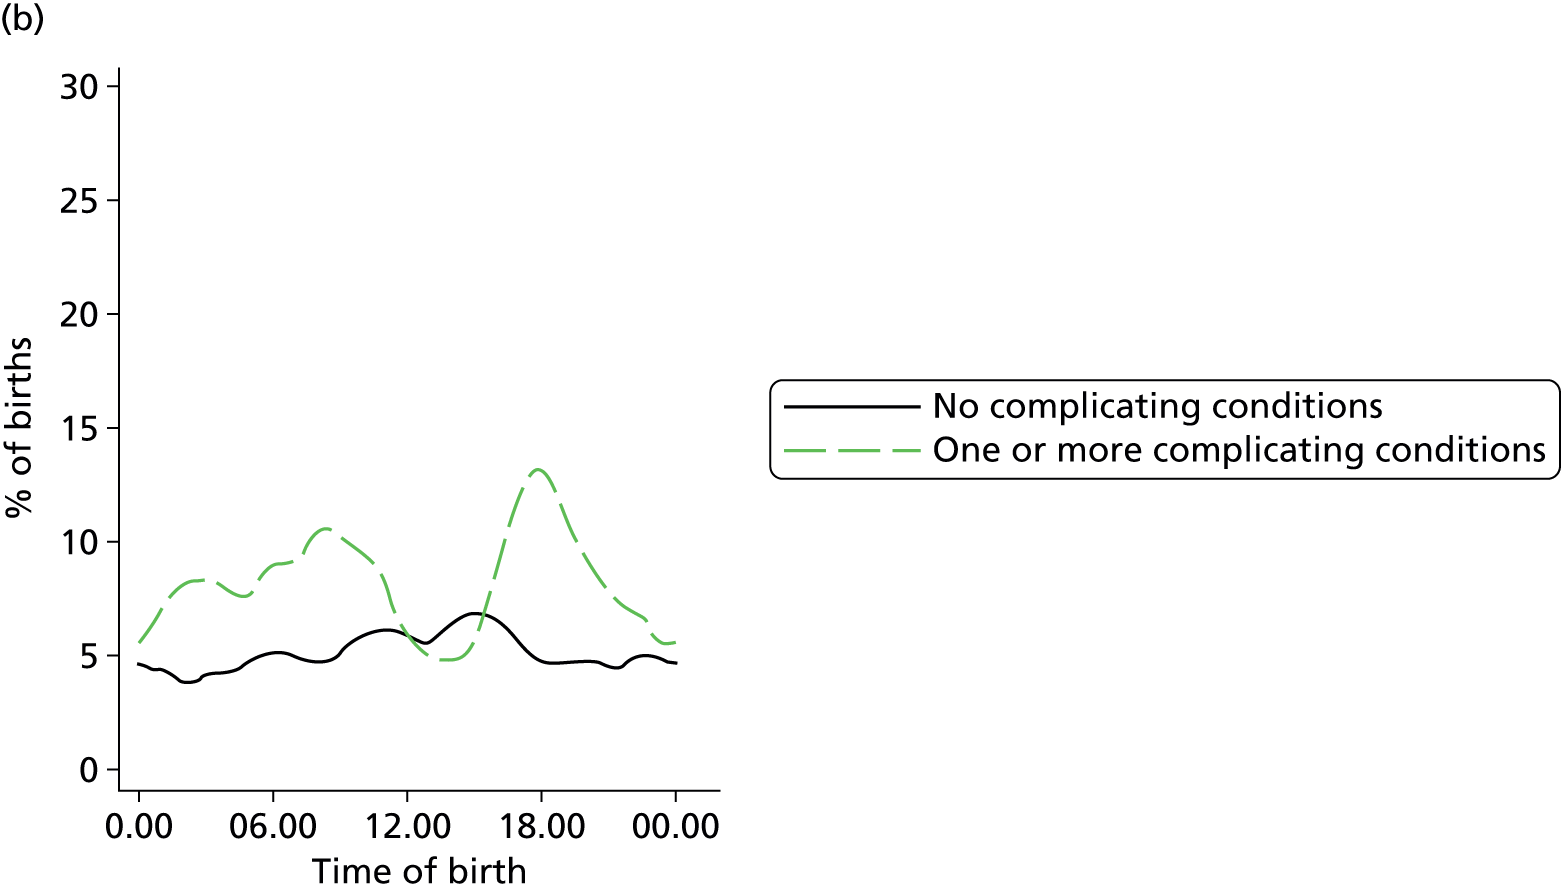
FIGURE 81.
Plot of risk of intrapartum caeserean section by time of birth in women planning OU birth: (a) nulliparous; and (b) multiparous women with and without ‘complicating conditions’.
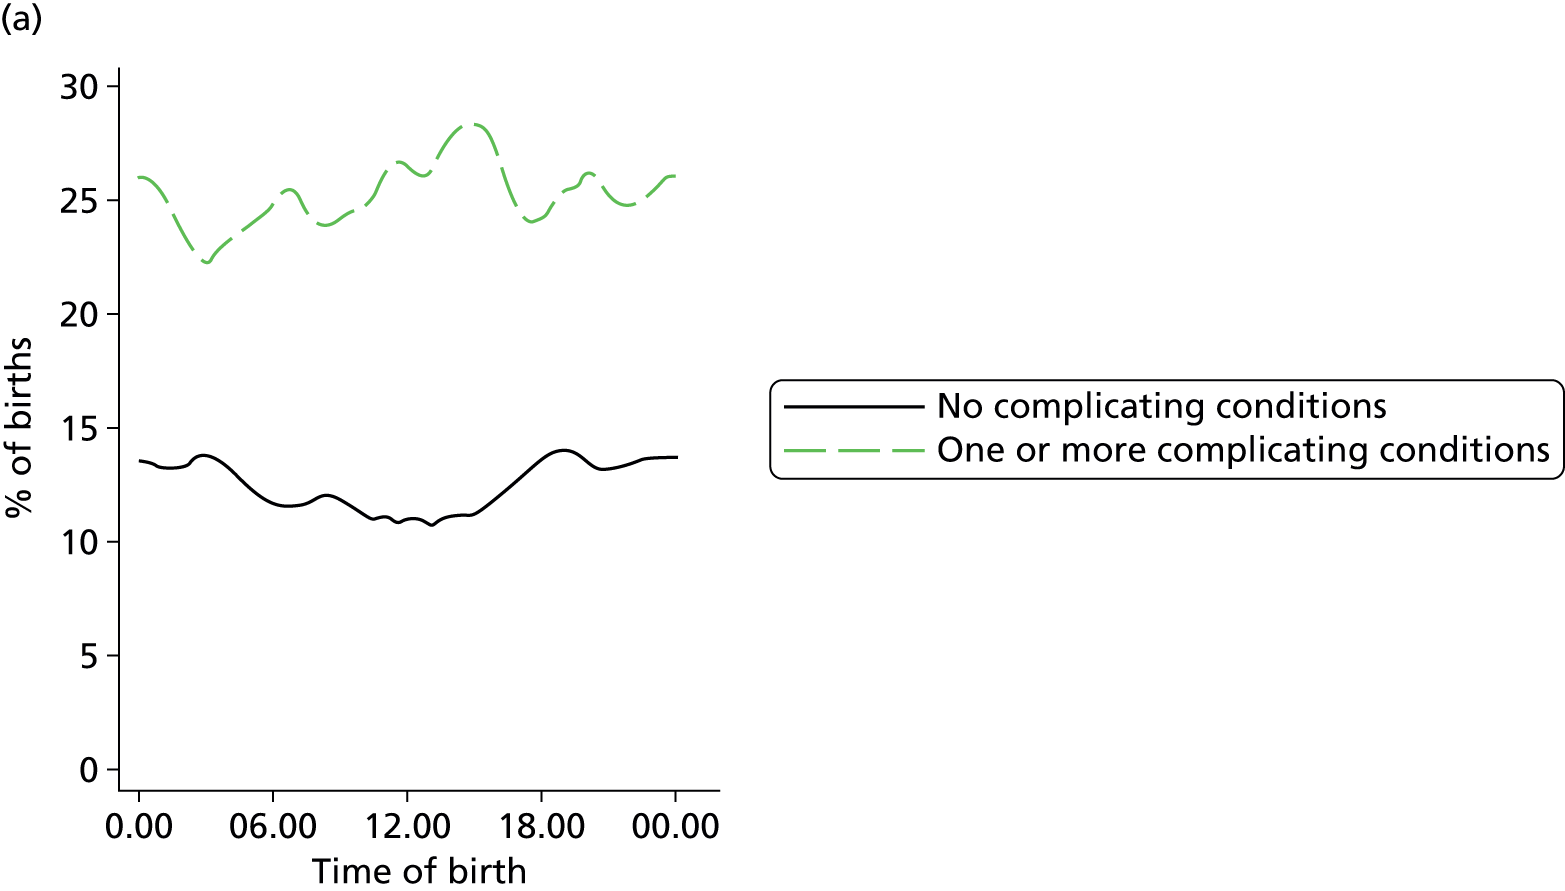

FIGURE 82.
Plot of probability of ‘normal birth’ by time of birth in women planning OU birth: (a) nulliparous; and (b) multiparous women with and without ‘complicating conditions’.
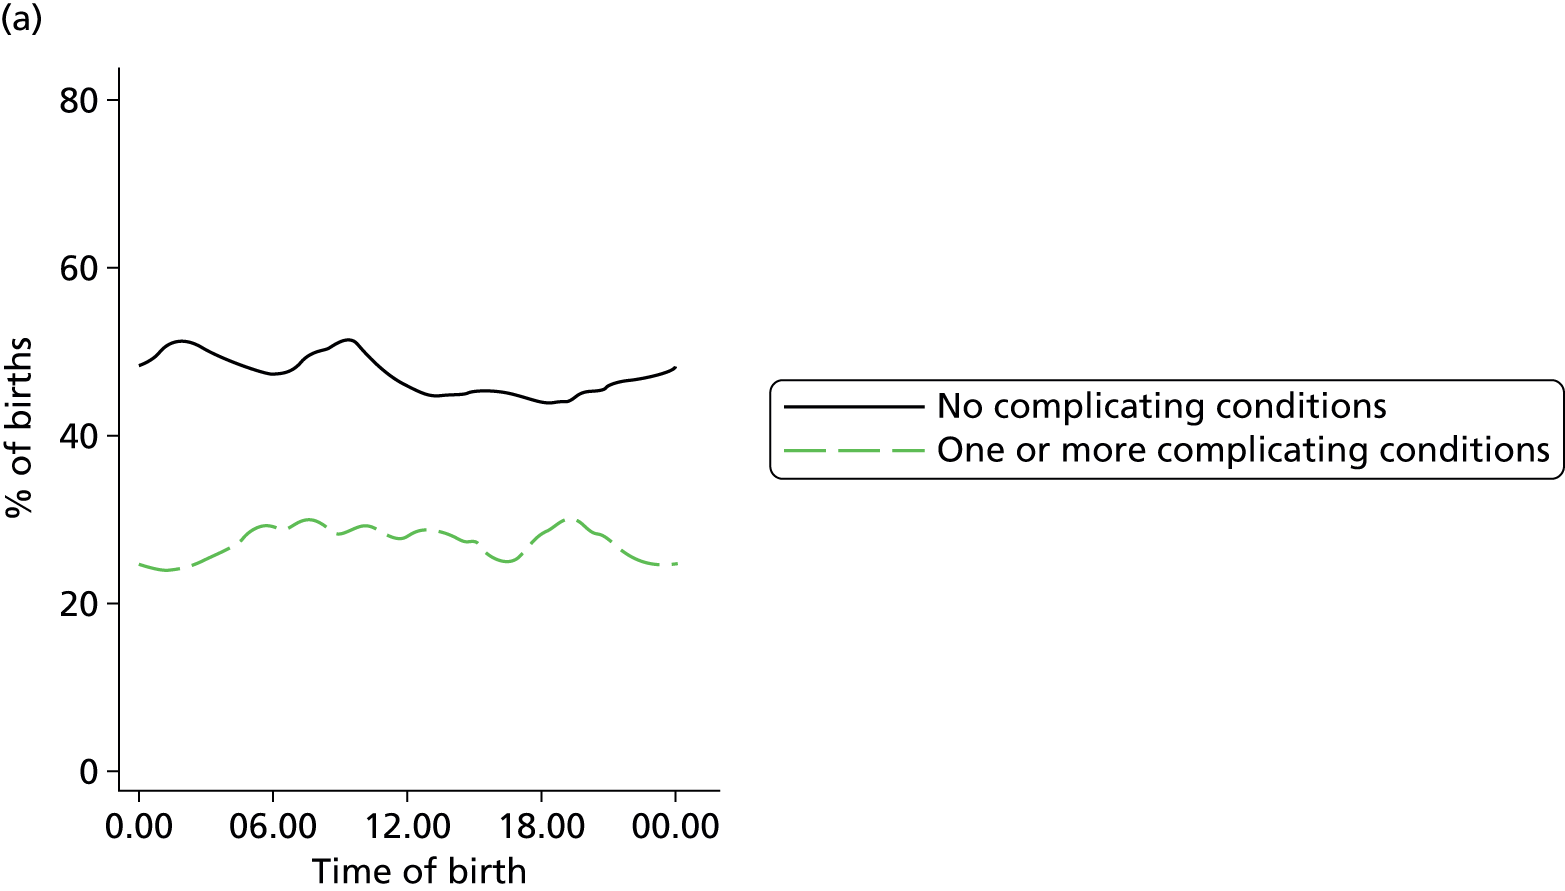
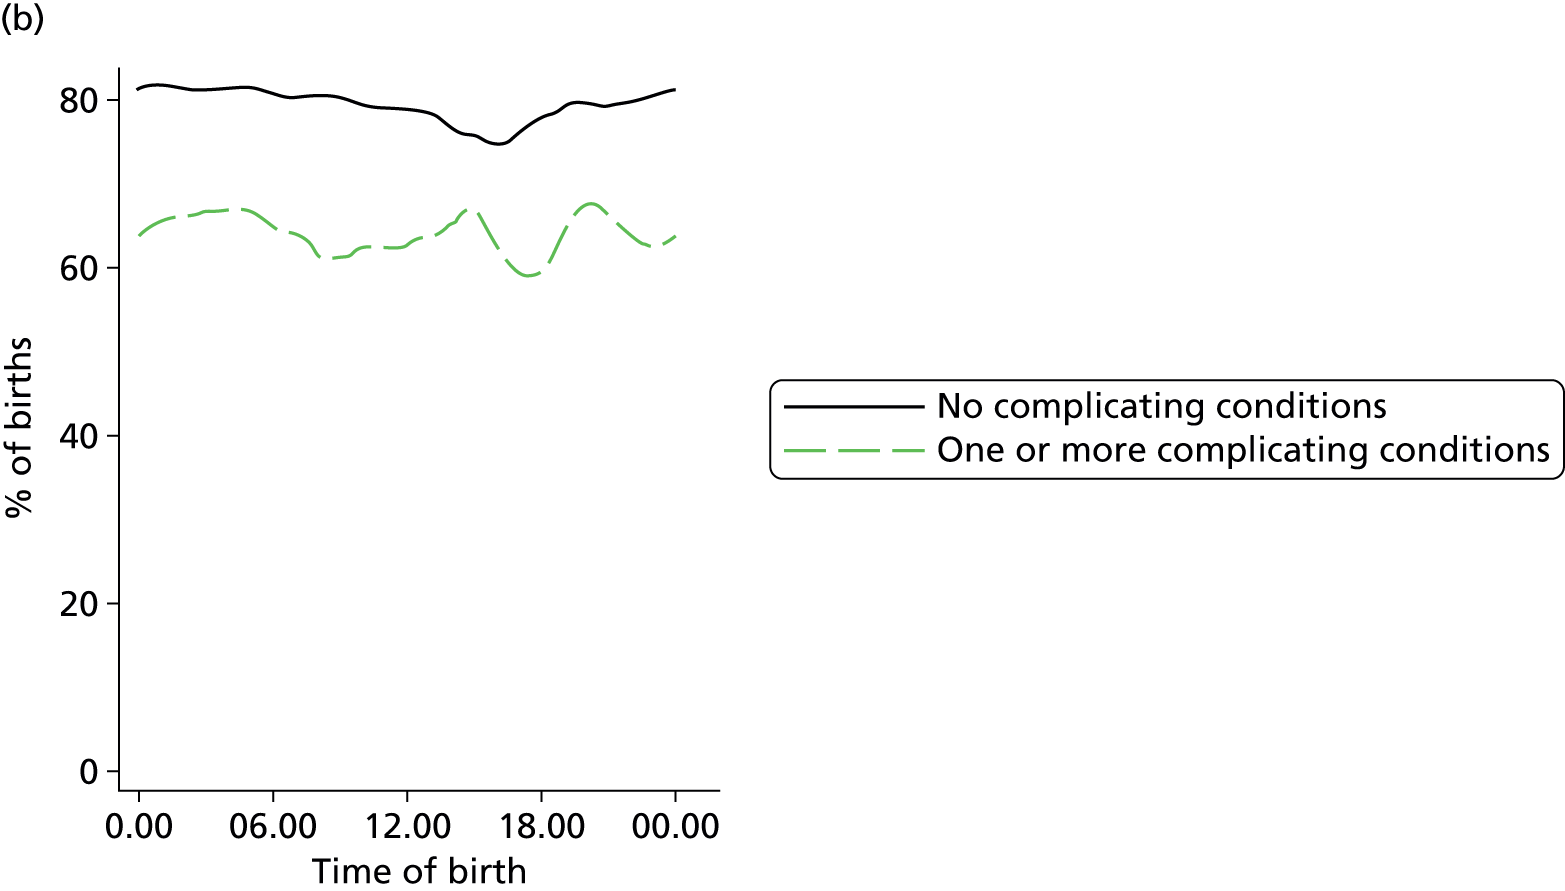
FIGURE 83.
Plot of probability of ‘straightforward birth’ by time of birth in women planning OU birth: (a) nulliparous; and (b) multiparous women with and without ‘complicating conditions’.
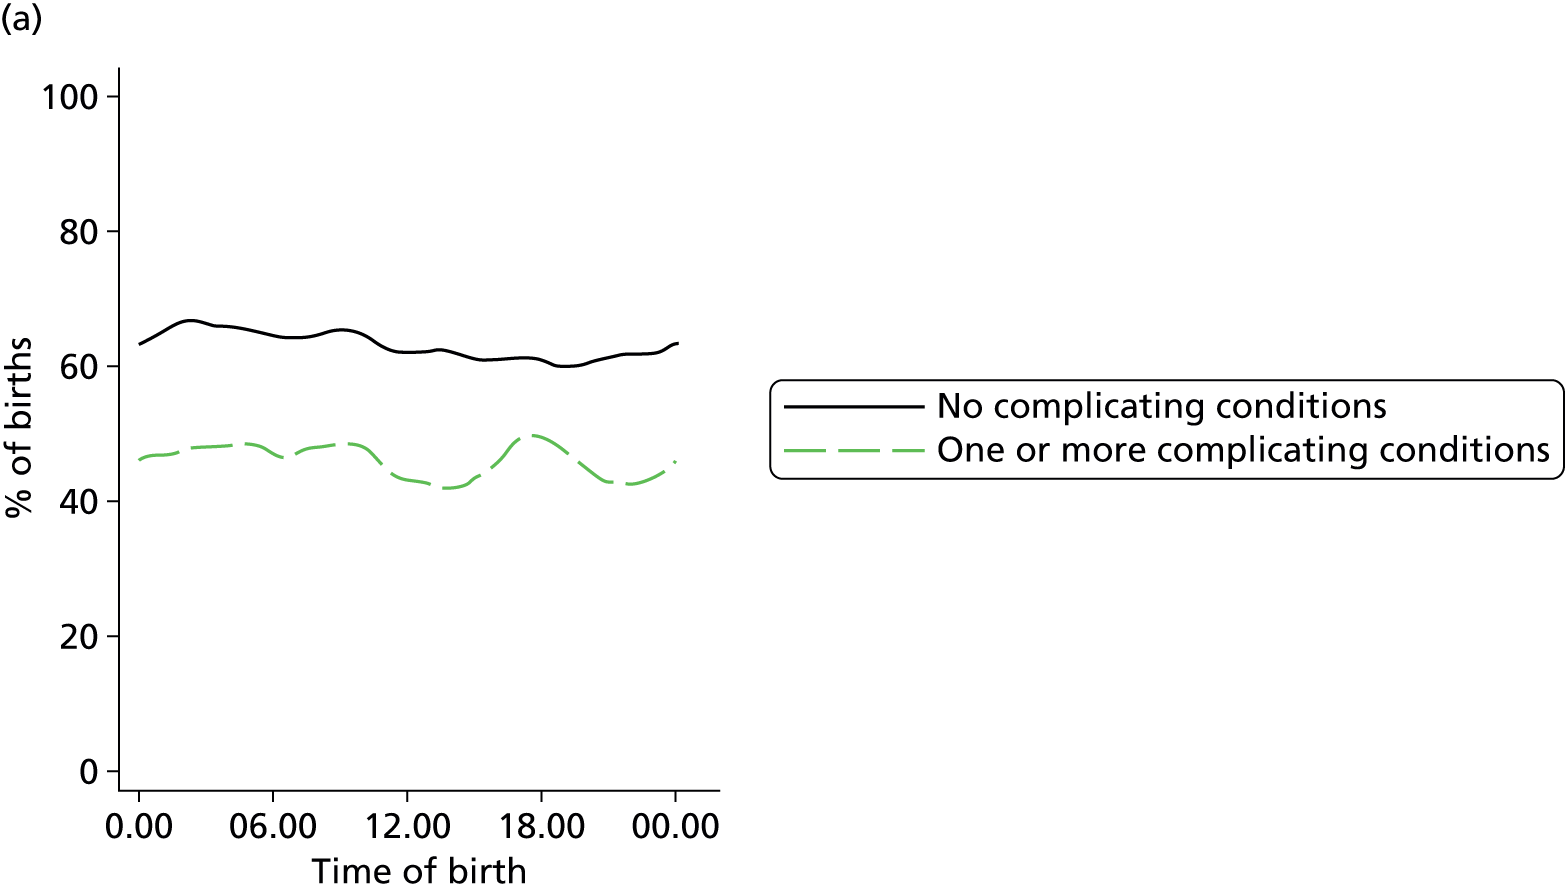

FIGURE 84.
Plot of probability of epidural analegesia by time of birth in women planning OU birth: (a) nulliparous; and (b) multiparous women with and without ‘complicating conditions’.
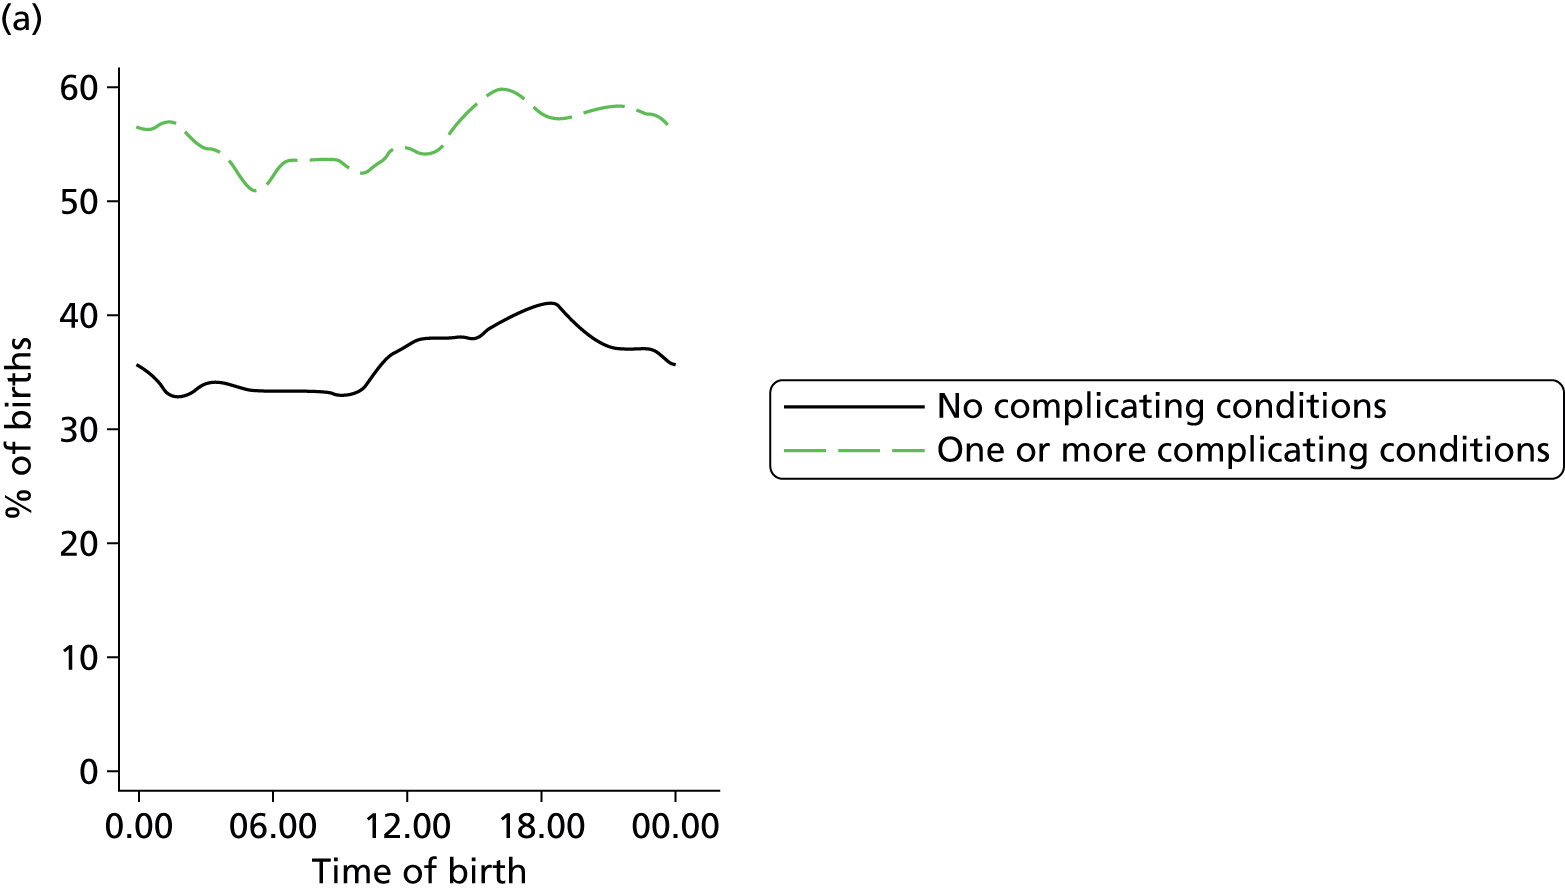
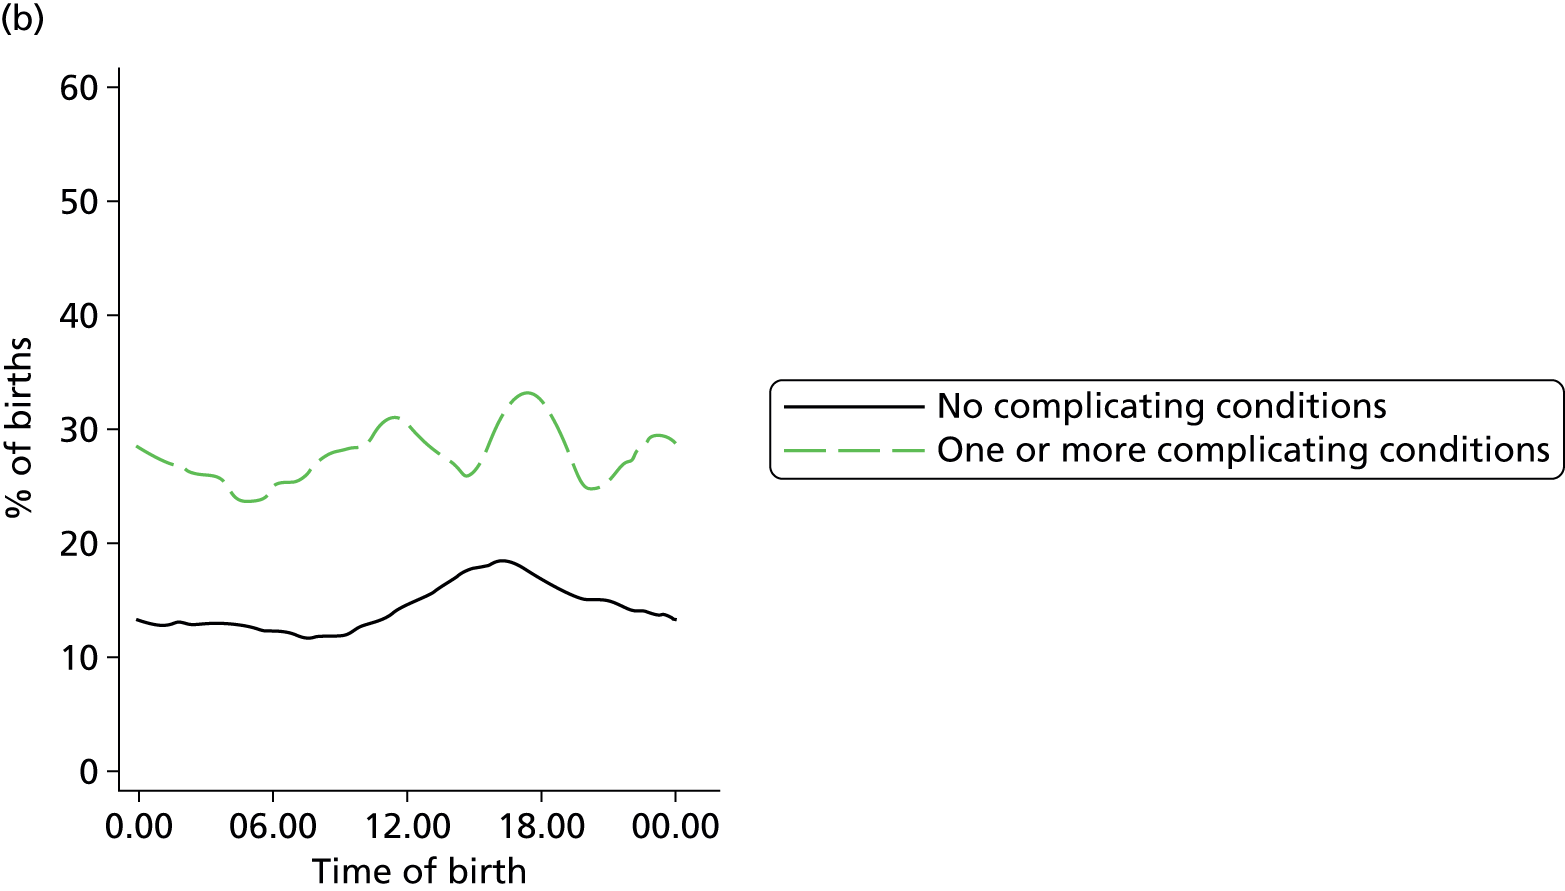
FIGURE 85.
Plot of probability of augmentation by time of birth in women planning OU birth: (a) nulliparous; and (b) multiparous women with and without ‘complicating conditions’.
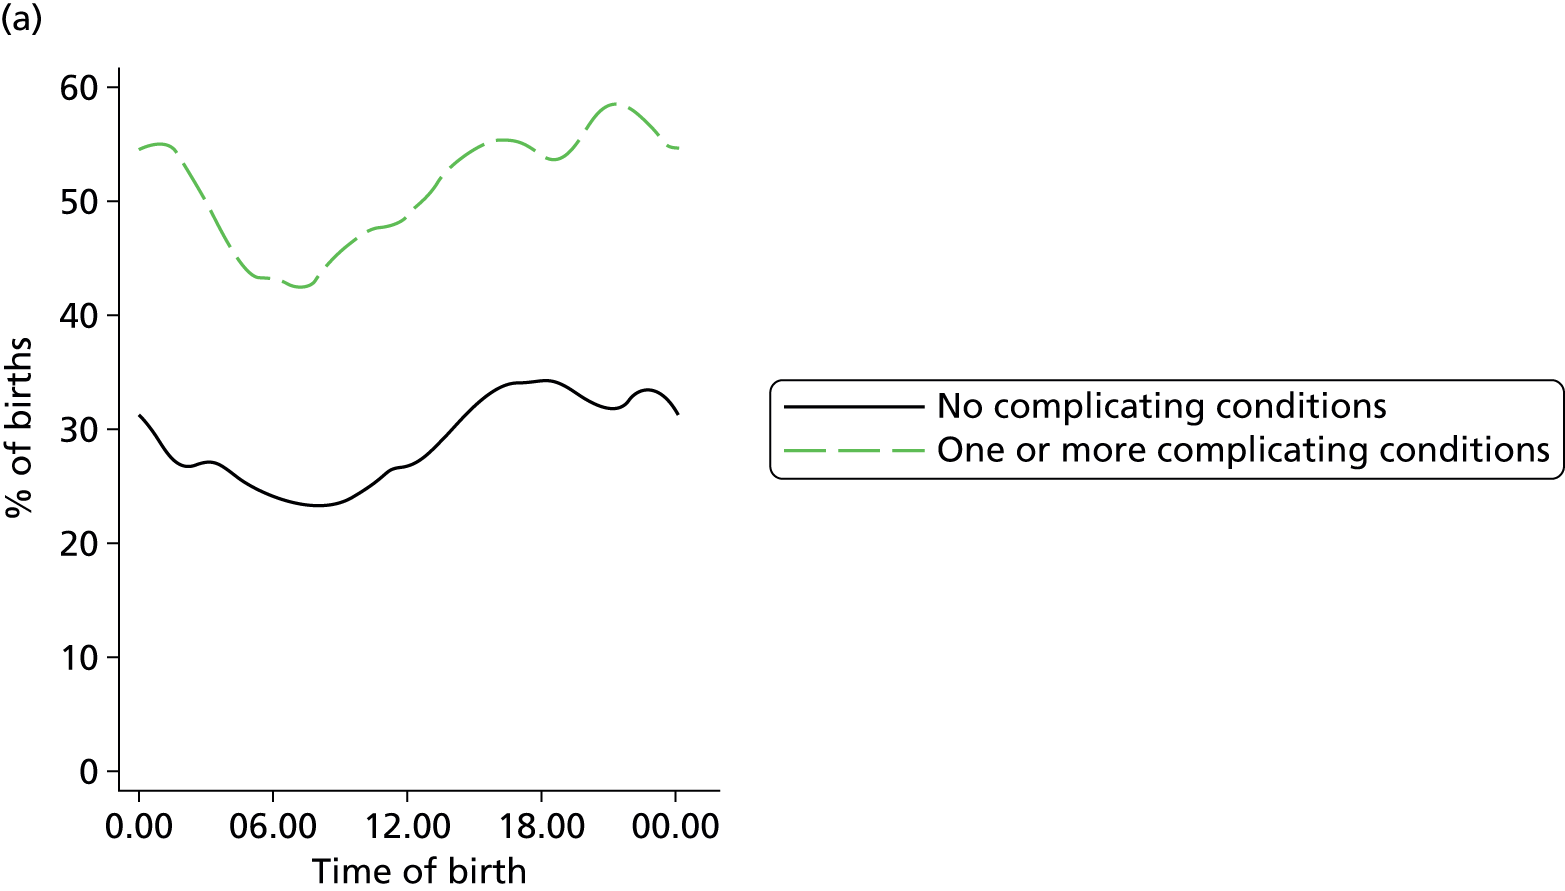
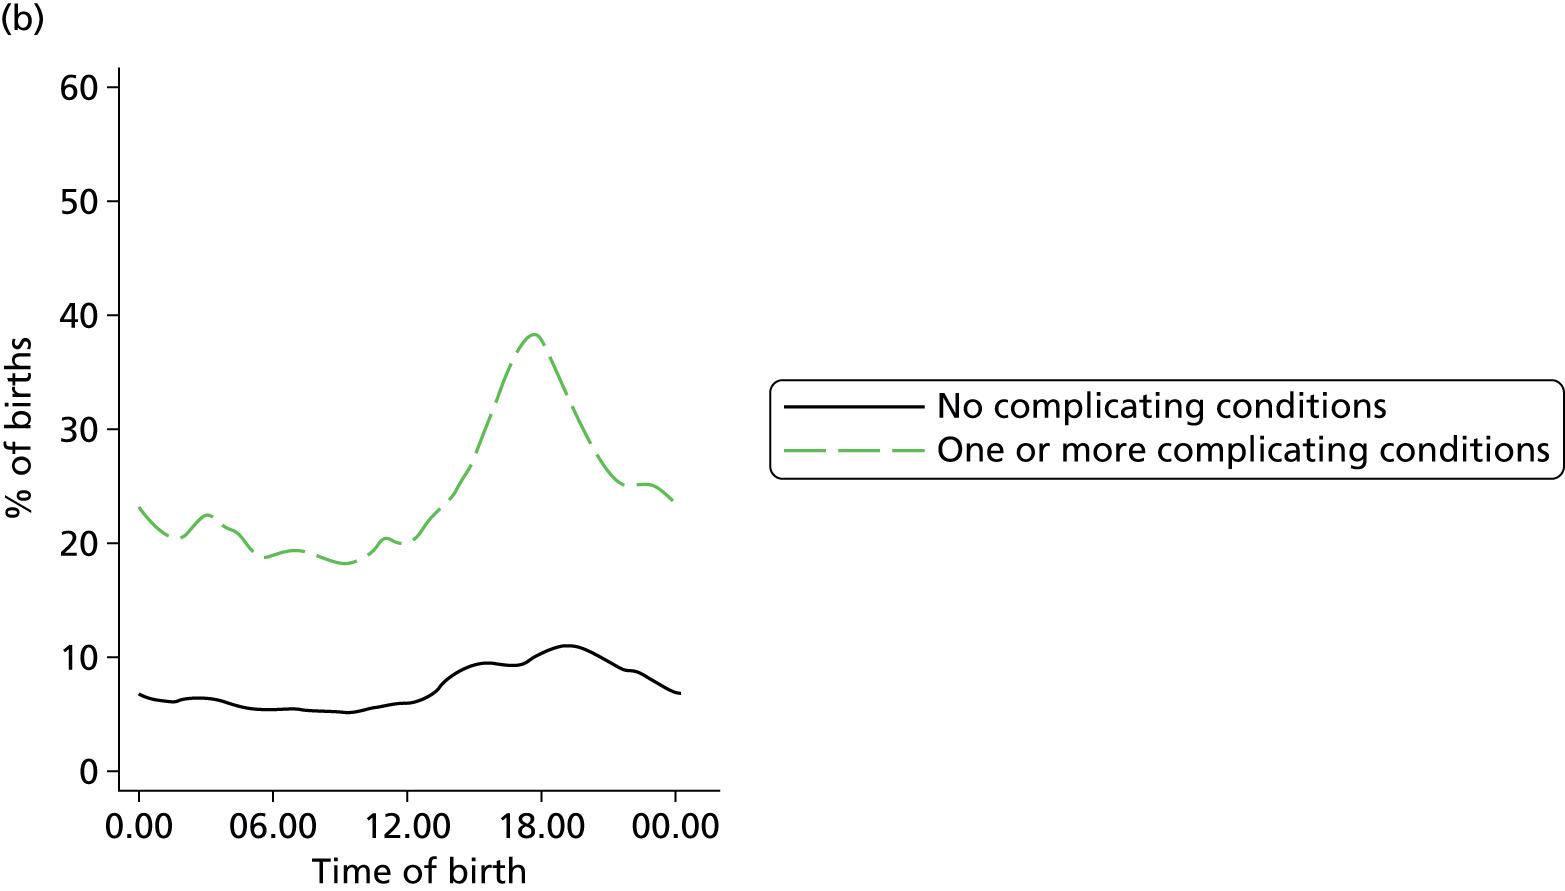
Glossary
- Alongside midwifery unit
- A NHS clinical location offering care to women with straightforward pregnancies during labour and birth in which midwives take primary professional responsibility for care. During labour and birth diagnostic and treatment medical services, including obstetric, neonatal and anaesthetic care, are available, should they be needed, in the same building or in a separate building on the same site. Transfer will normally be by trolley, bed or wheelchair.
- ‘Complicating conditions’ identified at the start of care in labour
- The following conditions when identified at the start of care in labour by midwives attending women in the Birthplace cohort study: prolonged rupture of membranes (> 18 hours); meconium-stained liquor; proteinuria (1+ or more); hypertension with either diastolic blood pressure of ≥ 90 mmHg on more than one occasion 20 minutes apart or ≥ 100 mmHg on one occasion; systolic blood pressure ≥ 160 mmHg on at least one occasion; abnormal vaginal bleeding; non-cephalic presentation; abnormal fetal heart rate; and other complications not previously identified.
- Freestanding midwifery unit
- A NHS clinical location offering care to women with straightforward pregnancies during labour and birth in which midwives take primary professional responsibility for care. General practitioners may also be involved in care. During labour and birth diagnostic and treatment medical services, including obstetric, neonatal and anaesthetic care, are not immediately available but are located on a separate site should they be needed. Transfer will normally involve a car or an ambulance.
- Multiparous
- Having had a least one previous pregnancy of ≥ 24 weeks’ gestation.
- Normal birth
- Birth without induction of labour, epidural or spinal analgesia, general anaesthetic, forceps or ventouse, caesarean section, or episiotomy.
- Nulliparous
- Having had no previous pregnancies of ≥ 24 weeks’ gestation.
- Obstetric unit
- A NHS clinical location in which care is provided by a team, with obstetricians taking primary professional responsibility for women at high risk of complications during labour and birth. Midwives offer care to all women in an obstetric unit, whether they are considered at high or low risk, and take primary responsibility for women with straightforward pregnancies during labour and birth. Diagnostic and treatment medical services, including obstetric, neonatal and anaesthetic care, are available on site, 24 hours per day.
- Post-term pregnancy
- Pregnancy with gestational age 42–44 weeks.
List of abbreviations
- AMU
- alongside midwifery unit
- BME
- black and minority ethnic
- BMI
- body mass index
- CHAID
- chi-squared automatic interaction detector
- CI
- confidence interval
- FMU
- freestanding midwifery unit
- GBS
- group B streptococcus
- HES
- Hospital Episode Statistics
- IMD
- Index of Multiple Deprivation
- IQR
- interquartile range
- MU
- midwifery unit
- NICE
- National Institute for Health and Care Excellence
- ONS
- Office for National Statistics
- OR
- odds ratio
- OU
- obstetric unit
- RR
- relative risk