Notes
Article history
The research reported in this issue of the journal was funded by the HS&DR programme or one of its preceding programmes as project number 10/2000/29. The contractual start date was in October 2011. The final report began editorial review in May 2014 and was accepted for publication in October 2014. The authors have been wholly responsible for all data collection, analysis and interpretation, and for writing up their work. The HS&DR editors and production house have tried to ensure the accuracy of the authors’ report and would like to thank the reviewers for their constructive comments on the final report document. However, they do not accept liability for damages or losses arising from material published in this report.
Declared competing interests of authors
Professor Peter Donnan is a member of the New Drugs Committee of the Scottish Medicines Consortium and reports grants from GSK, grants from Lundbeck, grants from Gilead and grants from Otsuka outside the submitted work.
Permissions
Copyright statement
© Queen’s Printer and Controller of HMSO 2015. This work was produced by Guthrie et al. under the terms of a commissioning contract issued by the Secretary of State for Health. This issue may be freely reproduced for the purposes of private research and study and extracts (or indeed, the full report) may be included in professional journals provided that suitable acknowledgement is made and the reproduction is not associated with any form of advertising. Applications for commercial reproduction should be addressed to: NIHR Journals Library, National Institute for Health Research, Evaluation, Trials and Studies Coordinating Centre, Alpha House, University of Southampton Science Park, Southampton SO16 7NS, UK.
Chapter 1 Introduction
Prescribing safety and harm
Prescribing is the commonest health-care intervention, and the number of prescriptions issued in the UK has steadily risen for many years, driven by the availability of more drugs with proven benefits, evidence for the more intensive management of cardiovascular risk in particular and an ageing population. There is a 30-year history of widespread primary care prescribing improvement in the UK, although the focus has largely been on costs, reflecting both that prescribing represents a significant proportion of NHS costs and that data on the cost and volume of drugs dispensed generated from the pharmacy payment process are easily available to UK primary care organisations (variously, family health service authorities, health boards, primary care trusts, Clinical Commissioning Groups, etc., depending on country and year). 1–3 In the last 15 years, there have been a number of initiatives targeting the quality of prescribing, largely framed in terms of whether or not patients receive indicated drugs (e.g. aspirin after myocardial infarction). 4 This reflects that national clinical guidelines focus on effective prescribing, identifying broad groups of patients in whom particular drugs are clearly indicated. These recommendations are relatively easy to translate into quality measures, some of which are embedded in the Quality and Outcomes Framework (QOF), both explicitly [e.g. use of angiotensin-converting enzyme (ACE) inhibitors after myocardial infarction] and implicitly (measures of and incentives to achieve blood pressure, cholesterol and glycated haemoglobin control – all of which usually require drug treatment). More recently still, there has been growing interest in the safety of prescribing,5–8 in parallel with the recognition that health care is often unsafe and commonly harms patients. 9–11
Prescribed drugs have many benefits, but are also a common cause of harm, ranging from relatively minor and transient adverse effects to serious harm causing hospital admission and death. A UK study12 showed that 6.5% of hospital admissions were caused by an adverse drug event (ADE), and in 80% of such admissions the ADE was the primary cause of admission. Antiplatelet drugs and non-steroidal anti-inflammatory drugs (NSAIDs) were the drugs most commonly associated with death after admission. A systematic review of studies of drug-related hospitalisation found that 3.7% of admissions were related to drugs and preventable, with over 50% of such admissions due to four drug groups (aspirin, NSAIDs, diuretics and anticoagulants). 13 Historically, antiplatelet drugs such as aspirin and NSAIDs were the drug groups most likely to cause death, although antipsychotics prescribed to older people with dementia have emerged as a major cause of drug-related death. 14 All drugs have inherent risks, and the harm caused has to be balanced against benefit. High-risk prescribing is therefore not always inappropriate because it will sometimes be the least bad option in patients with complex interacting problems. 5,15
Measuring potentially inappropriate and high-risk prescribing
The safety of medication use can generally be assessed using implicit or explicit approaches. Implicit criteria are based on a judgement made by an expert assessor on whether or not an individual patient’s prescriptions are appropriate for that patient, either in general or at a particular point in time, whereas explicit methods assess medication use against prespecified rules. Explicit criteria define specific situations in which certain prescribing should usually be used or avoided, and therefore can highlight only prescribing that is high-risk or potentially inappropriate. 16,17 As an example, an antipsychotic drug prescribed to an older person with dementia would trigger an explicit criterion because the risk of serious harm usually outweighs any potential benefit, but such prescribing may be judged appropriate during the application of implicit criteria to an individual patient because the risk/benefit balance in that patient may be reversed owing to circumstances beyond age and a diagnosis of dementia.
With appropriate training and expertise, implicit criteria provide a much more detailed and balanced measure of the appropriateness of prescribing because they cover multiple aspects of prescribing. The Medications Appropriateness Index, for example, assesses 10 domains of prescribing quality including indication, effectiveness, dosing directions and interactions with other drugs. 18 Although they require the application of clinical judgement to an individual’s circumstances, they are difficult and expensive to implement at scale, which limits their use. 17 By contrast, explicit criteria are relatively easy to use at very large scales using electronic data of various kinds, and unsurprisingly they dominate both the research literature and health service improvement work.
The study reported here is using routine electronic data, and therefore, by definition, the measures used will be explicit criteria. However, it is important to recognise that the value of explicit criteria significantly depends on how likely an identified prescription is to be inappropriate and/or the degree of harm involved relative to the likelihood of benefit. In the case of antipsychotics in older people with dementia, harm is very high (causing an estimated 1800 deaths per year in the UK in 2009), benefit is known to be small at best, based on high-quality trial evidence, and it is estimated that at least two-thirds of prescribing in 2009 could and should be stopped. 14 There is therefore strong face validity for including this indicator of high-risk prescribing in sets of explicit prescribing safety measures (although, in practice, few explicit tools yet do so).
Commonly used explicit criteria
The Beers Criteria are the most commonly used explicit set of measures. The original Beers Criteria were a list of drugs which were judged by a Delphi panel to be potentially inappropriate for use in adults aged 65 years and over in the USA, and has since been updated on two occasions. 7,8,19 Included criteria cover both drugs which are judged to always be potentially inappropriate (e.g. amphetamines) and those which are inappropriate if patients have particular conditions (e.g. NSAIDs in people with a history of peptic ulceration). 7 The prevalence of potentially inappropriate prescribing (PIP) has been measured in multiple routine data sets in many different countries, and it is straightforward to show that PIP is common, although estimated prevalence varies widely depending on the exact subset of Beers Criteria applied and the setting. 20–26
However, the Beers Criteria have been criticised on a number of grounds. Many of the drugs being measured are only rarely prescribed, particularly those that are defined as potentially inappropriate in all older adults. In practice, therefore, the prevalence of PIP as assessed by Beers Criteria is driven by a small number of drugs, such as benzodiazepines. In addition, there is little evidence of an association between Beers ‘drugs to avoid’ and ADEs in clinical practice,27–31 where most serious ADEs (including those causing emergency hospital admission) are a result of drugs which are in fact recommended by guidelines12,13 such as aspirin, anticoagulants and antihypertensives (although there is some evidence that some individual measures within the Beers Criteria are associated with harm25,32). In addition, the focus solely on potentially inappropriate use of drugs that may be harmful (a sin of commission) has been criticised when as much or more harm (in terms of forgone benefit) may be caused by indicated drugs not being used (a sin of omission). 28,33,34
Screening Tool of Older Persons’ potentially inappropriate Prescriptions and Screening Tool to Alert doctors to Right Treatment
More recent explicit criteria sets have addressed this critique of the Beers Criteria by including both drugs that should usually be avoided and drugs that are often beneficial to use, notably the Screening Tool of Older Persons’ potentially inappropriate Prescriptions (STOPP) and Screening Tool to Alert doctors to Right Treatment (START) criteria. 28 STOPP is focused on drugs to be avoided in older people, usually with particular conditions or coprescribing, where the assumption is that drugs should not be used without a clearly stated good reason. START identifies drugs with demonstrable high benefit in older people, again usually defined by the presence of particular conditions, where the assumption is that drugs should be used unless there is a clear reason not to. STOPP and START were originally designed to be used during professional review of prescribing, for example at hospital admission, but a subset of these criteria have since been applied to electronic data. There is evidence that STOPP is better associated with harm in older people than the Beers Criteria,35 and that using STOPP and/or START as screening tools is associated with improvements in appropriateness of prescribing as measured with the implicit criteria Medication Appropriateness Index. 36 Overall, STOPP and START in combination provide a more nuanced set of measures in that they usually are focused on drug prescribing in people particularly vulnerable to drug adverse effects (where vulnerability is defined by age, comorbidity and coprescribing), and are more explicitly designed to focus on drugs commonly causing harm.
Criteria sets developed in the UK
There have been several consensus studies that aimed to identify UK prescribing indicators with face validity. In 2000, Campbell et al. 37 used a Delphi study of UK prescribing advisers to identify a set of prescribing indicators suitable for use with practice-level data on the aggregate cost and volume of prescribing. They identified 12 indicators as valid, seven focused on cost and five on quality, although these were all narrowly focused, and the paper concluded that better quality indicators would require individual patient data with information on comorbidity and coprescribing. 37 Two studies have since identified sets of prescribing indicators for use in UK general practice using individual patient data. Both used a literature review to identify plausible indicators and then validated them in consensus studies with professionals. 38,39
A study carried out by our group focused on developing indicators of prescribing quality and safety, concentrating on prescribing that was likely to be associated with significant harm, including both underuse (not prescribing drugs with significant benefit) and overuse (prescribing drugs in situations where harm was common and/or likely to be greater than benefit). A RAND Appropriateness Method process was used to identify indicators where there was consensus that the stated prescribing should be avoided. An e-Delphi study38 was subsequently used to prioritise which of these indicators were most important for implementation in the UK NHS. The prevalence of a subset of 15 of these measures which focused on high-risk prescribing was subsequently examined using multilevel modelling of routine clinical data extracted from 314 Scottish general practices. 5 This demonstrated wide variation in high-risk prescribing between practices, varying approximately fourfold after adjustment for case mix,5 and is the precursor to the study of variation between practices and between general practitioners (GPs) reported in Chapters 3 and 4.
Subsequently, a study commissioned by the Royal College of General Practitioners (RCGP) used the RAND Appropriateness Method to ‘identify a set of potential prescribing-safety indicators for the purposes of revalidation of individual GPs in the UK’. 39 By implication, the RCGP indicators were all suitable for measuring prescribing safety at GP level (although, as discussed in Chapter 2, this is not straightforward using electronic data), and we drew on both our own and the RCGP indicator set to examine changes in prescribing over time as reported in Chapter 5.
Prevalence of high-risk prescribing and change over time
A number of studies conducted in a variety of settings have investigated how commonly high-risk or otherwise potentially problematic prescribing occurs, with fewer studies reporting time trends. The focus here is on larger scale primary care studies, the majority of which were conducted in the USA, the UK and Sweden, with the remainder reporting data from the Netherlands, Ireland and Finland. 22,23,25,40–45
Beers Criteria and Screening Tool of Older Persons’ potentially inappropriate Prescriptions/Screening Tool to Alert doctors to Right Treatment
We identified nine (three USA, three UK, one Netherlands, one Finland, one Ireland) studies using various versions of the Beers Criteria, analysing data from 1987 through to 2008. The majority of studies used claims data, and all included studies included patients aged 65 years or older. Across all studies, the reported point prevalence among study populations ranged from approximately 15% to 30%. The prevalence estimates were consistently higher in US and UK studies (21.3% to 32.2%) than in studies conducted in continental Europe (14.7% to 20%), which is likely to be, at least partly, a result of the variable availability of Beers drugs in different countries. Three of the identified Beers Criteria studies (two UK, one Netherlands) reported time trends. In one UK study, the prevalence of people using one or more Beers drugs (‘high-risk’ Beers drugs) fell slightly between 1994 and 2003, from 32.9% (21.4%) to 32.2% (20.5%). 23 The other UK study46 found a more pronounced reduction in the use of Beers drugs, from 32.2% in 1996 to 28.3% in 2005, which was largely driven by reductions in co-proxamol prescribing following national guidance. In contrast, the Dutch study43 found a slight increase in Beers drug prescribing, from 19.1% in 1997 to 20.0% in 2002. The prevalence of high-risk prescribing according to STOPP criteria was found to be 22% among 1329 patients from three GP practices in Ireland, which was similar to Beers list prescribing prevalence (18.3%). In the same study, 22.7% of patients were not prescribed a potentially beneficial drug according to START criteria. 22
Polypharmacy and drug–drug interactions
Three (one from the USA and two from Sweden) of the large-scale studies identified provided prevalence and time trend data on polypharmacy. In the US study, the number of practice visits involving polypharmacy (estimated from national surveys) almost quadrupled, from 10.1 million in 1990 to 37.5 million in 2000. 47 Over a similar time period, surveys of the Swedish population aged 77 years or older in 1992 and 2002 showed a 2.5-fold increase in the prevalence of polypharmacy (more than five drugs), from 18% to 42%. 48 The second Swedish study used a prescription claims database containing data for the entire Swedish population and found that between 2005 and 2008 the proportion of people using more than five drugs increased from 10.2% to 11.1% and the proportion using more than 10 drugs increased from 2.1% to 2.4%. 49 These studies clearly demonstrate that polypharmacy is becoming more frequent; the use of more than five drugs in the elderly is becoming the rule rather than an exception.
Although polypharmacy is not inappropriate per se, it is associated with an increased risk of drug–drug interactions and with higher levels of ADEs. One US study found that, in nationally representative probability samples of the US population, the annual incidence of people consulting outpatient clinics or accident and emergency departments for ADEs approximately doubled between 1995 and 2000, from 9 out of 1000 persons to 17 out of 1000 persons. Polypharmacy (defined as five or more drugs) was associated with an 88% higher risk of experiencing an ADE compared with the use of fewer than five drugs. 50 One study of 8000 people included in a cohort study in Jämtland, Sweden, found that between 1983/4 and 2003/4 the risk of receiving drugs with type C interactions (defined as ‘the interaction may modify the effect of the drug, however this can be mastered by individual dose adjustment, and/or by determination of the plasma concentration of the drug’51) increased by 18%, but fell by 29% for type D interactions (‘the interaction may have serious clinical consequences, such as severe adverse effects, no effects, or the modified effects may be difficult to control by individual dose adjustment’51). In both time periods, there was a positive exponential correlation between the number of drugs used and the risk of being exposed to a type D drug interaction. 51
Studies of change in single indicators
As well as research examining sets of explicit criteria, there is also a literature on change in single indicators. Examples of such studies of change in potentially problematic (although not always clearly high-risk) prescribing have focused on anticholinergic burden, antidepressant use and opiate use. 52–54 Again, similar to the findings of the studies discussed previously, such prescribing typically either increases or remains stable. High-risk prescribing is remarkably resistant to change even in the context of prescribers receiving specific regulatory warnings. Dusetzina et al. 55 systematically reviewed studies of the impact of US Food and Drug Administration risk communications, identifying 49 papers relating to 16 drugs or drug classes. They found that risk communications did have an impact on prescribing, but that this was inconsistent and typically small. There are several similar studies in the UK, which again find relatively small changes in prescribing associated with regulatory warnings, although (not unexpectedly) much larger changes associated with drug withdrawal. 56–59
High-risk and potentially inappropriate prescribing summary
In summary, numerous studies using a range of indicator sets show that high-risk and PIP remains common in primary care. Notwithstanding its regular critique, most large-scale prevalence studies have applied the Beers list in patients 65 years and older and found that between 15% and 30% are affected, although a smaller study using START/STOPP criteria found a similar prevalence. Despite the growing emphasis on health-care safety in the last 15 years,9,10 and the current ubiquity of electronic prescribing with automatic interaction checkers in primary care, the majority of studies demonstrate little change in the prevalence of high-risk prescribing over time, irrespective of the specific measures used. The small reported changes in Beers drug prescribing in the three identified studies examining time trends may partly reflect a lack of evidence that the Beers list prescribing is associated with worse outcomes,21 although it is possible that prescribers have become more aware of high-risk prescribing over time, but that a parallel rise in the prevalence of polypharmacy and the associated increased risk of drug–drug interactions overburdens prescribers. Others have highlighted that physicians’ clinical practice styles in terms of referral, test ordering and resource use are relatively consistent over time,60 so the lack of change over time may also indicate scope for improving current mechanisms of translating prescribing safety guidance into clinical practice.
Nevertheless, there is evidence of statistically and clinically significant variation in practices’ prescribing patterns, even after adjustment for patient-level variables including polypharmacy, which suggests that some practices are more successful in avoiding high-risk prescribing than others. It is currently unclear, however, whether such variation is mainly because of individual prescribers (a ‘bad apple’ problem) or practices’ prescribing culture (a ‘spoiled barrel’ problem). The next section discusses the literature on variation between physicians and between the institutions or setting in which they work.
Examining variation between practices and between practitioners
Variation in health-care process and outcome was originally described in terms of variation between areas in the USA in the 1970s,61 and has since grown to examine variation between institutions, professional groups and individuals. A feature of this literature is the increasing problem of accounting for chance variation as the unit of measurement gets smaller. In particular, simply ranking institutions or professionals in a league table (whether case-mix adjusted or not) is known to be problematic in that rankings and the implied identification of an institution or individual as having a high or low performance are unreliable. 62–65 The importance of reliability depends on the use to which a performance measure is intended to be put. Arguably, if a measure is for low-stakes prompting of reflection on their practice by practitioners, then reliability is less important than if it is intended for high-stakes evaluation for payment or regulatory action such as revalidation of fitness to practice. For high-stakes evaluation, much greater certainty about the quality of the data and case-mix adjustment is required. 63,66 In addition, interpretation of why an institution or an individual is an outlier is not straightforward, as individuals may be outliers because of the institutional or wider context in which they work. 66,67
The interaction between individuals and the systems they work in (which has parallels in institutions and the wider contexts in which they operate) is one which is of concern to those seeking to improve the quality and safety of health care. Historically, the response to safety problems was most commonly to blame the individual closest to the incident, but in recent years it has been increasingly recognised that errors are common and harm occurs when a series of errors are made and not mitigated by other individuals or defences at different levels of a system (often described with a ‘Swiss cheese’ analogy). 68,69 From this perspective, the focus should predominantly be on proactively managing the latent conditions which allow errors to cause harm, rather than reactively punishing the individuals who happen to be present at the final event. 9,10 Reason cogently argues this case:
To use another analogy: active failures are like mosquitoes. They can be swatted one by one, but they still keep coming. The best remedies are to create more effective defences and to drain the swamps in which they breed. The swamps, in this case, are the ever present latent conditions.
p. 79669
In safety improvement this has led to a focus on systems and is in contrast to the way in which health-care professional regulation typically works, where the focus is almost exclusively on the individual and the application of individual sanctions70 (although high-profile individual cases also often lead to system-wide regulatory changes which go far beyond individual sanction71). However, more recently, several authors have argued that too much of a focus on systems risks obscuring that there are individuals who truly are ‘bad apples’ and who cannot or will not be improved by system approaches. At the extreme, this is incontestable, in the sense that there are malign or dishonest or incompetent individuals who are beyond improvement (in the UK, Harold Shipman72 and Rodney Ledward73 are examples). However, even within more normal practice, individual choice and action remains important. We should not be surprised if individuals do not wash their hands between patients if there are no facilities for doing so, and fixing such system problems is critical. However, even with intervention to create better systems, hand-washing remains variable between individuals, and both those with system responsibility and individual professionals must, therefore, jointly be accountable for lack of hand-washing. 67
More strikingly, an Australian nationwide study of complaints against doctors that were escalated to regional or federal ombudsmen found that 3% of doctors accounted for 49% of escalated complaints, highlighting that individuals can play an important part in determining system performance. 74 This will never be an either/or situation, as the way in which a potential bad apple professional is responded to or managed is a system issue;75 individual action can reduce the effectiveness or safety of the system or team in which the individual works,76 and individual professionals need to take responsibility not just for their own actions but also for the actions of other team members. 77 The appropriate balance between system and individual intervention is likely to vary depending on the extent to which systems influence individual action or on the extent to which variation in process or outcome is determined at system or individual level.
Variation at different levels of the health-care system
Since Wennberg published his seminal study of small-area variation in health services volume in 1973,61 there have been a large number of studies examining variation in health care. A recent systematic review of 836 such studies in Organisation for Economic Co-operation and Development countries that were published between 2000 and 2011 concluded that there was overwhelming evidence that practice varied between areas and institutions but relatively few data on the causes and consequences of such variation. 78 However, the studies cited primarily examine variation in hospital care or procedures, reflecting the fact that data on these are relatively more readily available, and most did not examine variation in ways which appropriately account for the effects of chance.
Fung et al. 79 carried out a systematic review of English-language literature identified from MEDLINE using multilevel modelling or similar techniques to examine variation between regions, institutions or providers in health service performance or which examined reliability of measurement at a higher/aggregated level (e.g. hospital) for an outcome measured at patient level. Such studies are not well indexed and the search strategy used combined broad medical subject heading (MeSH) terms with title or abstract keyword searches, for example Quality Assurance, Health Care (MeSH) and (hierarchical OR intraclass correlation coefficient OR Bayes) [title or abstract]. They identified 39 studies that explicitly partitioned variance in terms of the relevant importance of between-patient and between-region/institution/provider variation, with 30 studies explicitly using multilevel modelling approaches to do so. Thirty-two of the studies adjusted for patient age and sex, with smaller numbers adjusting for other sociodemographic variables such as socioeconomic status or ethnicity, or for clinical characteristics such as comorbidity. Few studies included explanatory variables at higher levels.
The most common form of reporting was to express variation between higher levels in terms of intraclass correlation coefficient (ICC), defined as the variance at a level divided by the total variance, and interpretable as the proportion of variation in patient outcome attributable to that level. Estimated variation attributable to higher levels varied considerably, from 0–19% in studies of physician-level variation and 0–10% at provider group level, to 0–51% at facility level and 0–3% at health plan level. Only a minority of studies presented data on absolute differences between higher levels, either in terms of crude and/or case-mix-adjusted variation or in terms of estimated residual variation at higher levels based on the multilevel model. The authors argue that, although ICCs are useful in examining variation, their clinical significance cannot be easily judged without understanding the magnitude of absolute differences.
Variation at higher levels above the patient was examined at different levels of aggregation, including physician, physician-group, facility (medical centre, hospital, nursing home), health plan and other levels (hospital ward, clinical team, geographical area). Most studies examined variation at only a single higher level, but seven examined two levels, three examined three levels and two examined four levels of care. The 12 studies examining variation at multiple levels are particularly relevant to our study, although none examined prescribing outcomes. Five examined satisfaction,80–84 three diabetes care processes,85–87 and one each preventative care,88 inpatient psychiatry length of stay,89 the number of physical therapy sessions for back pain90 and dialysis resource use. 91
The findings of these studies do not show consistently greater variation at one level over another, although a majority find greater variation at lower levels of aggregation (physician and facility) than higher (health plan and region). For example, two of three diabetes studies86,87 found greater variation in most process and intermediate outcome measures at physician than facility or hospital level (the exceptions being processes which are likely to be more under the control of the institution than the physician, such as eye screening, in which Dijkstra et al. 87 found greater variation at hospital level than physician level), as did the third85 for process measures although greater variation in costs and intermediate outcome achievement at facility level. In contrast, the number of physical therapy sessions for low back pain showed greater variation at practice (7.2%) than practitioner (4.4%) level,90 and there is much more variation in dialysis costs at facility than physician level. 91 Such inconsistency is not surprising, in that the processes and outcomes being measured vary in terms of the relative control over them exerted by individual clinicians versus organisations; dialysis costs, for example, are more likely to vary with decisions made at organisational level.
Twelve studies examined reliability, in the sense of the ability of the examined performance measures to distinguish true variation between higher level units from chance variation, usually focusing on variation between physicians, as, for a given ICC, reliability improves as the number of patients that a physician or other higher-level unit treats increases. Reliability is, therefore, usually more of a problem when measuring individual physicians rather than larger organisational units. Seven of the 12 studies used the Spearman–Brown prophecy formula for this purpose, in which it was most commonly suggested that a reliability of 0.8 was the minimum required for a measure to be used for physician or other higher level unit profiling (reliability measures vary between 0 and 1, where 1 is perfectly reliable). Using the Spearman–Brown prophecy formula, the authors estimated that, if the ICC was 0.20, then a physician would need 16 of their patients to be included in a performance indicator to have their performance measured with a reliability > 0.8, compared with 396 patients if the ICC was 0.01 (i.e. 1% of variation in patient outcome attributable to differences between physicians).
Only 2 of the 39 identified studies used a prescribing outcome. Normand et al. 92 combined observed and simulated data to estimate the minimum number of discharges with myocardial infarction a hospital would need to be reliably measured using four prescribing indicators, but did not report ICCs. Cowen and Strawderman93 examined variation in pharmacy costs using a range of models, concluding that multilevel regression models provided better estimates for physicians with smaller numbers of patients in particular than did single-level regression models. They examined multiple sets of aggregated pharmacy costs, but, for all costs, the estimated ICC was between 0.0009 and 0.04 depending on the population of physicians being examined. 93
Variation in primary care prescribing
As this systematic review did not include relevant primary care prescribing studies that we had already identified, we carried out an additional search for primary care studies of variation combining the MeSH term ‘Physician’s Practice Patterns’ and a set of terms to limit to primary care/family practice/general practice. This yielded 11,290 titles which were screened to identify papers explicitly examining variation in high-risk or PIP between settings and/or physicians using an appropriate method (i.e. not simply using a league table approach or using a crude comparison of the highest and lowest prescribers).
Variation at different levels
In an early study, the ICC for the binary outcome of a New Zealand GP issuing any prescription during a consultation was 9.5% and little affected by including patient or GP characteristics. 94 Two UK studies examining variation between practices in PIP have found ICCs of 1.2% for strong opioid prescribing and 7.5% for antipsychotic use in older people with dementia. 54,95 Neither of the UK studies examined variation between GPs as well as between practices, but a Swedish study examining variation in use of guideline-recommended statins found that there was equal variation between physicians and between health-care centres (median odds ratios 1.89 and 1.88 respectively), which reduced over the 3 years studied as guideline compliance generally increased. 96
Four studies (two USA and two Sweden) examined the impact of geographical area on prescribing patterns. Zhang et al. 97 showed that antibiotic use among older adults varies considerable between geographical regions in the USA (ratios of the 75th percentile to the 25th percentile of adjusted annual antibiotic spending were 1.31 across states and 1.32 across regions) after adjusting for population characteristics. 97 Similarly, the same group has shown that prescribing safety, measured using indicators from the Healthcare Effectiveness Data and Information Set quality assurance programme, varied to a similar degree, although neither analyses examined variation between practices or settings within geographical areas. 98 In contrast, Ohlsson et al. 99 examined variation in five prescribing indicators at both county and health-care unit levels. Variation at county level was relatively small (ICC ranged from 2% to 7%) compared with variation at the level of health-care unit (ICC ranged from 20% to 40%). In an earlier study, Ohlsson et al. 100 also found that the health-care centres in which prescribers work are more important in understanding the physicians’ propensity to prescribe a recommended statin (median odds ratio = 1.96) than the municipality (median odds ratio = 1.41).
Therapeutic traditions and practice culture
Landon et al. 101 investigated how decisions regarding use of oral lipid-lowering agents for primary prevention and four other non-prescribing health-care scenarios were associated with individual prescriber characteristics, practice setting and organisational characteristics, attributes of the patient population under care and the market environment. The authors found no evidence of an overall style of practice (such as a higher propensity to intervene across the five scenarios studied). The organisational setting of practice was the most consistent predictor of behaviour across all but one clinical scenario, including prescribing of lipid-lowering agents. 101
However, vignette studies do not always reflect actual practice. Ohlsson and Merlo102 examined whether or not adherence to prescription guidelines is a common trait of health-care practices or dependent on the drug type (statin, renin–angiotensin system inhibitors, proton pump inhibitor). Multilevel modelling revealed that practices with the highest level of adherence for any two guideline-recommended drugs were also more likely to adhere to guideline recommendations for the third drug type than were practices with low guideline adherence for the other drug types. The authors concluded that prescribers’ decisions to follow prescription guidelines seem to be influenced by therapeutic traditions in the practice they work in. 102 Brookhart et al. 103 investigated variation in prescribing for osteoporosis as measured by five indicators. They found that the combination of patient, physician and clinic factors explained 20% of variation in adherence to osteoporosis guidelines, where individual physician effects explained 14% of the variation, although more than half of this explained variation could have also been attributed to the individual clinic effect. The authors conclude that, before instigating quality improvement initiatives, the clustering at practice level requires further investigation because it is equally likely to be a result of culture or tradition as because of the structure of the practice environment. 103
Brookhart’s conclusion emphasises that, although clustering at practice level is commonly observed, the reasons for it are not usually clear. Although culture or tradition (often described as the way things are done around here) may be the explanation,104,105 it is also possible that there are variations in case mix, structural factors or incentives which explain the clustering. In this regard, Ohlsson et al. 106 investigated associations between both patient and contextual factors on early adoption of rosuvastatin (Crestor®, AstraZeneca) prescribing. They found that private practices were four times more likely to be early rosuvastatin prescribers than public practices, a finding mirrored by a US study which found that both insurance status and whether or not the patient was enrolled in a Health Maintenance Organisation were associated with antibiotic use. 107
In this sense, culture or tradition are likely to be at least partly influenced by the type of patient seen (a case-mix or compositional effect) and the context in which the practice operates. However, there is some limited qualitative evidence that practice organisational culture is associated with differences in how practices manage safety critical practice processes such as prescribing108 and results handling. 109 However, from the perspective of the analysis which follows, at least some of these issues are less relevant, in the sense that UK general practices operate under a fairly consistent set of financial and non-financial incentives and, although patients vary in socioeconomic status, there are fewer financial incentives for patients to seek or avoid seeking care.
Summary
There are a large number of proposed indicators of high-risk or PIP which have been validated in consensus studies. However, the evidence that the prescribing identified is associated with actual harm is somewhat variable, and it is notable that most serious harm is caused by commonly prescribed drugs, many of which are recommended by clinical guidelines, rather than by drugs with limited benefit. Most studies of the prevalence of high-risk prescribing or PIP are cross-sectional and show that such prescribing is common. The longitudinal studies that exist do not show large changes in high-risk prescribing over time. Few of these studies examine variation between practices or physicians.
Nevertheless, there is an extensive literature on variation in medical care more generally, much of it focused on small-area variation and examining use of hospital care, procedures and preventative care (reflecting the fact that data on these have historically been more easily available at large scales than data on high-risk prescribing). Most studies examine variation at only a single level of the health-care system, and typically show large variation. Where variation at multiple levels has been examined, most commonly, variation between physicians is greater than variation between the institutions or areas that those physicians work in, although this depends on the outcome in relation to the extent to which it is under the direct control of an individual (an example from diabetes care being that between-physician variation in blood pressure measurement is larger than between-hospital variation, whereas between-hospital variation in eye screening is larger than between-physician variation87).
There are relatively few studies that focus on primary care prescribing, but these usually find that between-physician variation is larger than between-practice or between-area variation. There is also evidence that there are ‘therapeutic traditions’ at both individual level and practice level which are consistent across different types of care and persistent over time. With the partial exception of antibiotic usage (where overuse is assumed to the norm and potentially harmful), none of the studies identified examined prescribing safety.
Aims and objectives
As stated in the original protocol:
The aim of this study is to define a set of prescribing safety indicators that can be operationalised in existing electronic clinical data, and to examine how high-risk prescribing varies between patients, GPs and practices in order to determine the validity of these indicators for safety improvement, clinical governance and appraisal/revalidation purposes.
Objective 1: to define and operationalise prescribing safety indicators that can be applied at individual prescriber level and practice level.
Objective 2: to examine the prevalence of individual indicators and appropriate composites, associations with patient, prescriber and practice variables and the relative importance of variation at prescriber level and practice level before and after adjustment for patient-level variables.
Objective 3: to measure the reliability of individual and composite indicators at prescriber level and practice level.
Objective 4 (additional in revised protocol): to examine changes in rates of high-risk prescribing over time (2004–9) and variation between practices, using a basket of indicators with consensus validation.
The detailed methods used are described for each analysis separately in the chapters that follow. We convened a study advisory committee with an independent chairperson (Professor Tony Avery, University of Nottingham) and a public representative (Susan Kinsey) to provide advice and for wider study governance. Given the nature of the study (a statistically complex secondary analysis of a large, routine data set) the main purpose of our public involvement was to ensure that the findings were reasonably comprehensible to a broader audience.
Chapter 2 Data sources and feasibility
Data source and extraction
The data set used was provided by the Primary Care Clinical Informatics Unit (PCCIU) at University of Aberdeen. Until the replacement of the General Practice Administration System for Scotland (GPASS) clinical information technology (IT) system in 2010, PCCIU ran the Scottish Programme for Implementing Clinical Effectiveness in Primary Care (SPICE-PC) on behalf of NHS Scotland. In SPICE-PC, a near complete copy of data held in clinical IT systems was extracted from participating practices using GPASS and used for feeding back comparative quality data. Data were anonymised at source by removing names and unique patient identifiers (IDs) and extracting other IDs with a degree of fuzziness (e.g. rather than extracting full postcode, only postcode sector was extracted to allow allocation of Carstairs deprivation score). With practices’ consent, the data were available in fully anonymised form for research purposes, and the NHS Grampian Research Ethics Committee had agreed that individual studies using the data did not require specific review, provided that data management and analysis followed PCCIU standard operating procedures, which this study has.
At its peak, approximately one-third of Scottish practices participated in SPICE-PC and agreed to research use of their data. The data available are nearly identical to those in other GP-derived data sets and include patient demography (anonymised where required), diagnoses and procedures (recorded as Read Codes), values such as blood pressures and laboratory values, and prescribing. Somewhat differently from other GP-derived data sets, information was also available about which GP or other clinician had provided care in the form of anonymised clinician codes, with some characteristics of GPs and practices (e.g. GP sex, practice list size) available for use in analysis. However, clinician IDs had not previously been used for either NHS or research purposes, so there was no experience of their use to draw on. The planned project was potentially sensitive, and data from relatively far in the past were, therefore, used (GPASS was replaced in Scotland in a phased withdrawal from 2008, which was complete by 2011; the data used for examining variation in high-risk prescribing in this analysis is from before 31 March 2007).
For this project, much initial data management was done by PCCIU, drawing on its expertise of defining conditions with comprehensive Read Code sets and comprehensively identifying drugs using British National Formulary (BNF) codes where available and free text matching where not. We used PCCIU-defined code sets where these had already been developed and used for SPICE-PC other NHS purposes and worked with PCCIU to define new code sets where necessary. Data extraction was planned to be done in stages, with the initial data extraction to explore feasibility being for practices participating in SPICE-PC that additionally were part of the NHS Scotland Practice Team Information (PTI) programme. PTI is a national morbidity-recording data set, supported by NHS Scotland Information Services Division, where practices record one or more Read Codes for the morbidities managed in all face-to-face encounters with GPs or nurses in ≈ 50 (5%) practices. These Read Codes are distinguished from other Read Codes (e.g. diagnoses based on hospital letters) by having a coded modifier associated with them, with GPs and nurses using different modifiers, making it possible to further distinguish the type of clinician the patients is having a face-to-face consultation with. PTI practices are typically more IT-literate than average and receive additional training in, and financial support for, coding, and the quality and completeness of coding is audited.
For the initial feasibility analysis, data were extracted for 39 PTI practices (although one had ceased to contribute to PTI during 2006 and was subsequently excluded). Data extracted included patient demography (age, sex, postcode-defined Carstairs Score), selected morbidities [including Read Codes ever recorded for peptic ulceration, heart failure, chronic kidney disease (CKD)] and selected prescribing (including oral anticoagulants, antiplatelet drugs, renal toxic drugs). Additional data extracted included the table recording all ‘encounters’ with the practice, anonymised clinician IDs and clinician demography and practice structural data (list size, rurality/remoteness, type of contract held with the NHS, whether or not the practice was accredited for post-graduate GP training and whether or not the practice dispensed its own medicines). The detailed contents of the encounter and clinician tables are described in later sections.
If the analysis of variation between GPs was shown to be feasible, then the intention was to extend the data extraction to all 314 practices with data available on 31 March 2007. In the event, analysis of variation between GPs was found to be feasible in only a subset of practices, and so the second round of data extraction was reconfigured to examine change in high-risk prescribing over time, using data complete up to 31 March 2009, the date chosen being a balance between the length of time over which change could be examined and the number of practices available as the switch away from GPASS gathered pace. Data for the longitudinal analysis was available for 190 practices providing care to just under 20% of the Scottish population.
Defining measures of high-risk prescribing
Our previous analysis examined cross-sectional variation between practices. 5 This is relatively straightforward, as it is easy to define a population of patients who are registered with the practice and at risk from a particular pattern of prescribing on a particular date. The high-risk prescription is attributable to the practice, because someone in the practice has authorised the prescription in the past and someone in the practice has issued it now. When examining variation between GPs, attribution is more complicated because the majority of prescriptions are ‘repeats’, which are usually reauthorised once a year but issued repeatedly between authorisations with variable but typically weak clinical oversight. This is because GPs often sign repeat prescriptions for tens of patients for hundreds of separate drugs every working day with little explicit review, effectively trusting the decision of whichever colleague authorised the prescription as a repeat and giving greater thought to the quality and safety of prescribing only if the patient presents with a problem or when the IT system flags that the prescription needs a review (typically annually). 110,111 In addition, although GPs remain legally liable for all the prescriptions they create and sign and are not required to follow specialist advice, a large proportion of repeat drugs for chronic conditions are initiated or recommended by specialists, and the authorising GP may, therefore, not be the sole decision-maker.
It was, therefore, decided to focus on prescriptions where the decision was strongly attributable to an individual GP and where the decision to prescribe was reasonably widely known to be significantly risky (but not absolutely contraindicated) at the time of prescription. The original intention was to examine two kinds of decision by GPs (text taken from the original application):
-
The decision to stop a high-risk drug at medication review, which is relatively strongly attributable to individual GPs and can be analysed using a simpler, strictly hierarchical multilevel model.
-
Acute prescribing of high-risk medication, which is relatively strongly attributable to individual GPs but where analysis is more complicated and will require fitting cross-classified multilevel models.
Stopping high-risk drugs at medication review
Medication review in the previous 15 months for people prescribed repeat medication was incentivised under the QOF via the Medicines 5 and Medicines 9 indicators, worth approximately £2000 to an average-sized practice. 112 In principle, the stopping of a high-risk drug was a decision which would be attributable to the reviewing GP. The intention was, therefore, to examine repeat drugs inactivated on the day that a medication review was done. In GPASS, medication review was recorded by ticking a box in the repeat prescribing screen which inserted a medication review code which was visible in the patient record, and our assumption was that this was stored in the ReadCodeEvents table in the GPASS database. However, the data extracted by PCCIU from GPASS did not include this medication review code; therefore, this analysis was not feasible.
Acute prescribing of high-risk medications
We considered a number of possible indicators of high-risk prescribing, and chose to focus on high-risk prescribing of NSAIDs for a number of reasons, including being commonly prescribed, that prescriptions are usually initiated in general practice (which increases confidence in attributing the decision to an individual GP) and that the high-risk prescribing being measured was both known about in the period being examined and not absolutely contraindicated. Five indicators of high-risk NSAID prescribing and a single composite indicator were defined based on clear advice about risk in the March 2005 edition of the BNF 49. 113 We chose to define indicators based on BNF statements of risk, as the BNF is the main source of day-to-day drug information in the UK and is distributed free to all UK prescribers; therefore, it has much greater dissemination than drug safety bulletins or guidelines (the bold and italic text used is as stated in the BNF). There is, therefore, a reasonable expectation that prescribers would be aware that the prescribing being measured carried risk.
-
Prescription of a NSAID to a person with previous peptic ulcer disease [significant risk of gastrointestinal (GI) bleeding: BNF 49 states in a specifically highlighted Committee for Safety of Medicines (CSM) warning ‘All NSAIDs are associated with serious gastro-intestinal toxicity . . . all NSAIDS are contra-indicated in patients with active peptic ulceration. The CSM also contra-indicates non-selective NSAIDs in patients with a history of peptic ulceration’113 (p. 495)].
-
Prescription of a NSAID to a person aged 75 years or over [significant risk of GI bleeding: BNF 49 states ‘should be used with caution in the elderly (risk of serious side-effects and fatalities)’ and in the blue box CSM warning ‘All NSAIDs are associated with serious gastro-intestinal toxicity; the risk is higher in the elderly’113 (p. 495)].
-
Prescription of a NSAID to a person with heart failure [significant risk of worsening heart failure: BNF 49 states ‘In patient with renal, cardiac, or hepatic impairment caution is required’113 (p. 495)]
-
Prescription of a NSAID to a person also prescribed an oral anticoagulant [significant risk of GI bleeding: BNF 49 identifies this as an interaction that is ‘potentially hazardous and where combined administration of the drugs involved should be avoided’113 (p. 638)].
-
Prescription of a NSAID to a person aged 65 years or over also prescribed aspirin or clopidogrel [significant risk of GI bleeding: BNF 49 states in a specifically highlighted CSM warning ‘The combination of a NSAID and low-dose aspirin may increase the risk of gastro-intestinal side-effects; this combination should only be used if absolutely necessary’ (p. 495) and identifies as an interaction ‘increased risk of bleeding when NSAIDs given with clopidogrel’113 (p. 638)].
-
A composite indicator was defined as prescription of a NSAID to a person with any of peptic ulcer, aged 75 years or over, heart failure, coprescribed warfarin or coprescribed aspirin or clopidogrel.
More technical definitions are provided in Table 19 in Appendix 2. Additional NSAID indicators were considered but excluded either because it was unclear how widely known the risks involved were at the time the prescriptions were issued [prescription of a NSAID to a person also prescribed a diuretic and an ACE inhibitor or angiotensin receptor blocker (ARB) (the ‘triple whammy’); prescription of a NSAID in people at high risk of cardiovascular disease] or because data were inconsistently recorded in the period studied (prescription of a NSAID to a person with CKD stage 3–5 because CKD coding improved after its inclusion in QOF from April 2006). In our previous work, we have also often accounted for whether or not patients receiving drugs with a high risk of GI bleeding are also being prescribed a gastroprotective drug. This reduces but does not abolish the excess GI bleeding risk of NSAIDs, and it can be argued such mitigation shows evidence that the prescriber has considered the risk. More recent guidance clearly recommends use of gastroprotection in various patients prescribed NSAIDs,114,115 but in the period examined this was not the case. Rather the recommendation was to avoid NSAIDs in people at high risk of peptic ulceration, and prophylaxis recommendations were focused on people who developed a NSAID-associated ulcer but who had to continue the NSAID (the example given being people with active rheumatoid arthritis). 113
Examining types of non-steroidal anti-inflammatory drug prescription
Background
A feature of the previous analysis is that it does not account for variation within practices in terms of who prescribes a high-risk NSAID. Linked to this, it ignores how individual prescriptions are created and issued, in that the outcome happens when a NSAID prescription is issued to a patient vulnerable to adverse drug effects (strictly speaking, the outcome happens if such a patient receives one or more NSAID prescriptions during the final quarter of 2006, as some patients receive more than one in that time period). A crucial distinction in GP IT systems is between acute and repeat prescriptions, because this determines who is allowed to issue a prescription, and the degree of oversight exerted by the clinician who signs the prescription.
Understanding how prescriptions are created and issued in the General Practice Administration System for Scotland
As part of the feasibility testing, we used a demonstration version of GPASS to explore the relationship between the way in which a prescription was created and the name printed on the paper prescription, on the one hand, and the name recorded in GPASS electronically, on the other.
Understanding how prescriptions can be created and issued/printed
An ‘acute’ prescription could be generated in GPASS in one of two ways. First, an individual with a clinical user account can create and issue a new acute prescription. In this case, the prescription prints with the name of the clinical user creating the prescription at the bottom. Second, any user can copy and issue a prescription that has already been issued as either an acute or a repeat. In this case, the prescription can print with a variety of names on the bottom, depending on how the prescription has been created, either the name of the clinical user creating the prescription or, if a non-clinical user creates the prescription, the name of the ‘duty doctor’ or the ‘registered doctor’. Practices set a general preference for duty or registered doctor daily.
A repeat prescription could be generated in the same two ways. Clinical users can create one and, if they issue it as part of the creation process, the name printed on the prescription is theirs. Non-clinical users can also create repeat prescriptions either by copying existing acute or repeat prescription, or de novo. If a non-clinical user issues the prescription as part of the creation process, then the duty or registered doctor’s name is printed on the bottom. Subsequent issuing of repeats can be done by both clinical and non-clinical users, with the same printing rules.
Understanding how prescriptions are electronically recorded
Apart from hand-written prescriptions, issuing a prescription requires opening the patient’s electronic record. GPASS records any file opening as an encounter, distinguishing between the following types:
-
‘encounter encounters’, which are face-to-face consultations in the practice premises (encounter encounters is what GPASS calls them, although, for clarity, in this report we refer to them as normal surgery encounters from now on)
-
out-of-hours encounters, telephone encounters, home visit encounters and clinic encounters, which are other patient consultations
-
data entry encounters, which are file openings to read or update the record without any actual patient contact.
For all encounter types except data entry, prescriptions created by clinicians will automatically have the clinician ID linked to the prescription. For data entry encounters, the clinician ID is linked electronically only if the clinician manually adds his or her name from a drop-down box on the encounter screen (although there will always be a clinician’s name printed on the paper prescription). Data entry encounters also do not have to be saved if there are no data actually entered, in which case the file opening leaves no record in GPASS (there is a separate audit trail which does record the file opening but these data are not accessible for research use).
Based on this, our expectations were that:
-
Not all prescriptions would have user IDs and that this would vary by the type of prescription.
-
It would be necessary to distinguish between clinical and non-clinical users, and to specifically identify GPs.
-
It would be necessary to distinguish different types of encounter. Although all data entry encounters in which a prescription was issued should be saved, clinicians vary in terms of whether or not they save data entry encounters where they have only looked at the record (e.g. to check that a diagnosis on a hospital letter had been coded). This is relevant for measuring a rate of high-risk prescribing if the measure denominator is the number of encounters, as variation in data entry encounter saving between GPs will affect their estimated rate of high-risk prescribing.
The aim of the analysis that follows was therefore to explore the feasibility of implementing our planned analysis of variation between GPs in high-risk prescribing given the data available. The next section, therefore, describes the data available in some detail, and the rationale for the design and data used in the analysis in the next chapter.
Data sources and methods
The data tables supplied to us had already had a substantial amount of management and merging done to them by the PCCIU. There were four types of table supplied:
-
A demography table with one row per patient for every patient with any data extracted. This table included data about individual patients including age, sex, socioeconomic deprivation, the presence of various morbidities and the total number of active repeat drugs at the start of each year. Each row (patient) had a patient ID and a practice ID allowing linkage to other tables.
-
A set of prescribing tables for selected drugs, defined as being drugs of interest, for example an oral NSAID table (drugs in BNF section 10.1.1), an antiplatelet table (drugs in BNF 2.9) and so on. Each table contained one row per prescription issue, identifying the drug issued by name (a mixture of coded and free text) and BNF code (only for coded drug names), dosing instructions and quantities and whether or not the drug was an acute or repeat prescription. Each row (prescription) had a patient ID (linkable to the demography table), and some rows had an encounter ID (linkable to the encounter table).
-
An encounter table with one row per encounter with the practice. Each row (encounter) had an encounter ID (linkable to the prescribing table) and a patient ID (linkable to the demography table). Information provided for each encounter included the encounter date, the encounter type (e.g. whether a normal face-to-face surgery encounter or by telephone), the user who had created the encounter, clinician type and clinician sex (both misnamed, as they include non-clinical users), and the morbidities dealt with in face-to-face consultations (a PTI-modified Read Code which PTI practices record for every face-to-face consultation with a GP or a nurse).
-
A practice table with one row per practice. This table had data on routinely available practice structural characteristics including list size (in quartiles to reduce identifiability), urban/rural/remote location, the type of NHS contract held by the practice [General Medical Services or one of the two locally modified alternatives called section 2c and section 17c (broadly equivalent to an English Personal Medical Services contract)], whether or not the practice was accredited for post-graduate training of GPs and whether or not the practice dispensed its own prescriptions. Each row (patient) had a practice ID (linkable to the demography table).
The feasibility analysis examined a number of different areas:
-
how common different types of NSAID prescription were in terms of whether they were acute or repeat prescriptions, and within that whether they were new or not
-
the completeness of linkage across the different tables, in terms of how often high-risk NSAID prescriptions of different types could be linked to the encounter table or had a linkable clinician ID which could be identified as a GP
-
how often high-risk NSAID prescriptions of different types could be linked to a clinician ID and how often linked clinicians could be identified as GPs
-
whether or not it was possible to define a set of encounters to provide a comparable denominator for the analysis of variation between GPs.
For this analysis we identified all oral NSAID prescriptions in calendar year 2006, and for each one calculated if it was high risk in terms of whether or not it had been issued at a time when the patient was particularly vulnerable to NSAID prescribing, as defined by the five measures listed in Acute prescribing of high-risk medications. We then linked these high-risk NSAID prescriptions to the encounter file to examine the extent to which encounter data and clinician ID were available for these prescriptions, and whether or not it was possible to identify an appropriate set of GPs and encounters to use in the modelling.
Results
Type of non-steroidal anti-inflammatory drug prescription
We defined four types of NSAID prescription according to whether they were acute or repeat, and new or subsequent. Acute and repeat prescriptions are defined by a field in the data supplied and are a key element in the way that the clinical system is set up and used. An acute prescription is a one-off issue from an encounter screen which can be reissued only in an encounter screen, and acute prescriptions are typically issued by clinicians. A repeat prescription is set up so that it can be reissued from the repeat prescribing screen, and this is typically done by administrative staff rather than clinicians. Each type of prescription is separately displayed/clearly distinguished in GPASS.
Based on the data, we then defined the following types of high-risk NSAID prescriptions:
-
‘new acute’: an acute NSAID prescription without a NSAID prescription of any kind issued in the previous 365 days
-
‘subsequent acute’: an acute NSAID prescription that was preceded by either an acute or a repeat NSAID prescription in the previous 365 days
-
‘new repeat’: a repeat NSAID prescription where there had not been a repeat NSAID prescription issued in the previous 365 days
-
‘subsequent repeat’: all other repeat NSAID prescriptions.
The distinction being made is between new decisions to create a particular type of prescription for the first time that year (new acute and new repeat NSAIDs) and a decision to reissue a recently issued drug (subsequent acute and subsequent repeat NSAIDs). Based on our knowledge of how practices organise this prescribing, subsequent decisions are subject to less scrutiny and clinical consideration than new ones. Creating new prescriptions is therefore a key decision point that partly determines future care.
Table 1 shows how common each type of prescription was in calendar year 2006, for each individual indicator and for the composite. For the composite indicator, acute prescribing accounted for 26.2% of all high-risk NSAID prescriptions issued, with new acute NSAIDs representing 10.6%. The creation of new repeat NSAIDs was relatively uncommon (1.2%) but subsequent issues of repeat NSAIDs represented nearly three-quarters (72.7%) of all NSAID prescriptions issued. There was some variation by indicator, where people with previous peptic ulceration and those with heart failure were somewhat less likely to be issued a repeat prescription, although overall the patterns were similar for all five individual indicators.
| Type of high-risk NSAID prescription | Peptic ulcer, no. (%) of all prescriptions (n = 4691) | Heart failure, no. (%) of all prescriptions (n = 2535) | Aged ≥ 75 years, no. (%) of all prescriptions (n = 9887) | Oral anticoagulants, no. (%) of all prescriptions (n = 702) | Aspirin or clopidogrel, no. (%) of all prescriptions (n = 10,870) | Composite, no. (%) of all prescriptions (n = 20,759) |
|---|---|---|---|---|---|---|
| New acute NSAID | 705 (15.0) | 268 (10.6) | 923 (9.3) | 61 (8.7) | 1034 (9.5) | 2199 (10.6) |
| Subsequent acute NSAID | 920 (19.6) | 445 (17.6) | 1382 (14.0) | 85 (12.1) | 1594 (14.7) | 3236 (15.6) |
| New repeat NSAID | 59 (1.3) | 36 (1.4) | 109 (1.1) | 8 (1.1) | 122 (1.1) | 241 (1.2) |
| Subsequent repeat NSAID | 3007 (64.1) | 1786 (70.5) | 7473 (75.6) | 548 (78.1) | 8120 (74.7) | 15,083 (72.7) |
Linkage of high-risk non-steroidal anti-inflammatory drug prescription data to the encounter table and clinician data
The encounter data supplied to us contained a field called ‘encounter type’ with five values [C = ‘Co-op’ (i.e. out of hours), D = ‘data entry’, E = ‘encounter’ (i.e. a normal surgery encounter), P = ‘telephone’, U = ‘unknown’ (but actually a catch-all for other encounter types which includes a variety of values including ‘clinic’, ‘other practice’ and ‘home visit’)]. The encounter table also has a field for the user who recorded the encounter, which we received as an anonymised ‘clinician ID’ (although not all users are clinicians).
Table 2 examines the extent to which high-risk NSAID prescriptions for each indicator and the composite were linkable to the encounter table, and the proportion of linkable prescriptions for which encounter type and clinician ID were recorded. It shows that, of 20,759 high-risk NSAID prescriptions, 4543 (21.9%) did not have an encounter ID and so could not be linked to the encounter table. Of the 16,216 (78.1%) prescriptions that were linkable to the encounter table, only 64.9% had an encounter type recorded and only 52.4% had a clinician ID recorded, as these are not compulsory fields depending on how the record is opened. Linkage was similar for the five individual indicators, although somewhat better for peptic ulcer and somewhat worse for oral anticoagulants.
| Linkage to other tables and fields | Peptic ulcer, no. (%) of all prescriptions (n = 4691) | Heart failure, no. (%) of all prescriptions (n = 2535) | Aged ≥ 75 years, no. (%) of all prescriptions (n = 9887) | Oral anticoagulants, no. (%) of all prescriptions (n = 702) | Aspirin or clopidogrel, no. (%) of all prescriptions (n = 10,870) | Composite, no. (%) of all prescriptions (n = 20,759) |
|---|---|---|---|---|---|---|
| Linkable to encounter table | 3768 (80.3) | 1947 (76.8) | 7394 (74.8) | 517 (73.6) | 8597 (79.1) | 16,216 (78.1) |
| Encounter type | 3352 (71.5) | 1657 (65.4) | 6006 (60.7) | 407 (57.7) | 7062 (65.0) | 13,481 (64.9) |
| Normal surgery | 2300 (49.0) | 962 (37.9) | 3650 (36.9) | 253 (36.0) | 4609 (42.4) | 8740 (42.1) |
| Data entry | 874 (18.6) | 618 (24.4) | 1816 (18.4) | 127 (18.1) | 206 (18.5) | 3885 (18.7) |
| Co-op (out of hours) | 0 | 3 (0.1) | 0 | 1 (0.1) | 3 (0.03) | 4 (0.02) |
| Telephone | 93 (2.0) | 36 (1.4) | 216 (2.2) | 5 (0.7) | 184 (1.7) | 380 (1.8) |
| Unknown/other | 85 (1.8) | 38 (1.4) | 324 (3.3) | 19 (2.7) | 260 (2.4) | 472 (2.3) |
| Clinician ID present | 2744 (58.5) | 1657 (65.4) | 4713 (52.3) | 336 (47.9) | 5745 (52.9) | 10,869 (52.4) |
Table 3 examines linkage by type of high-risk NSAID prescription in terms of whether it was acute or repeat, and new or subsequent (as defined in Type of non-steroidal anti-inflammatory drug prescription). Acute high-risk NSAID prescribing was almost always linkable, and almost always had an encounter type recorded (> 99%). Of new acute prescriptions, 95.4% had a clinician ID recoded, versus 67.1% of subsequent acute prescriptions. By contrast, new repeat prescriptions were linked in only 76.3% and subsequent repeat prescriptions in 70.3% of cases overall, with over half not having a linked clinician ID. This reflects the fact that repeat prescribing can be managed either through encounter screens (which generate an encounter ID) or through the repeat prescribing screen (which does not).
| Linkage to other tables and fields | New acute NSAID, no. (%) of all prescriptions (n = 2199) | Subsequent acute NSAID, no. (%) of all prescriptions (n = 3236) | New repeat NSAID, no. (%) of all prescriptions (n = 241) | Subsequent repeat NSAID, no. (%) of all prescriptions (n = 15,083) |
|---|---|---|---|---|
| Linkable to encounter table | 2198 (99.95) | 3236 (100) | 184 (76.3) | 10,598 (70.3) |
| Encounter type | 2198 (99.95) | 3236 (100) | 182 (75.5) | 7865 (52.1) |
| Normal surgery | 1848 (84.0) | 1674 (51.7) | 100 (41.5) | 5118 (33.9) |
| Data entry | 167 (7.6) | 1230 (38.0) | 71 (29.5) | 2417 (16.0) |
| Co-op (out of hours) | 1 (0.05) | 0 | 0 | 3 (0.02) |
| Telephone | 63 (2.9) | 95 (2.9) | 6 (2.5) | 216 (1.4) |
| Unknown/other | 119 (5.4) | 237 (7.3) | 5 (2.1) | 111 (0.7) |
| Clinician ID present | 2098 (95.4) | 2172 (67.1) | 154 (63.9) | 6445 (42.7) |
On further exploration, it was clear that the encounter ID (and therefore clinician ID) for subsequent repeat prescriptions defaulted to the encounter and clinician who had initiated the repeat prescription, with all subsequent issues having the same encounter and clinician IDs. This reflects the data structure, where the first repeat prescription is recorded in the prescription table, which has encounter ID for linkage, but subsequent issues are recorded in a separate table, which records only the date of reissue. In practice, therefore, subsequent repeat prescribing has only the initiating GP’s identity recorded, but this is missing anyway more often than not.
We concluded that it was potentially feasible to examine acute but not repeat NSAID prescribing in a GP-level analysis, and the next section examines acute prescribing further.
Defining eligible encounters and eligible general practitioners
Table 4 shows the extent to which clinician IDs were missing for new and subsequent acute high-risk NSAID prescriptions by encounter type. Clinician ID recording was high (> 95%) when issued in normal surgery encounters (i.e. face to face in a normal GP surgery) or telephone encounters as well as for new acute high-risk NSAID prescriptions that were issued in other/unknown types of encounters. However, for data entry encounters, clinician ID recording was poor (< 50%) for both types of prescriptions, and especially for ‘subsequent acute’ prescriptions (28.1%).
| Encounter type | New acute NSAID, no. (%) of prescriptions with a clinician ID (n = 2198) | Encounter type | Subsequent acute NSAID, no. (%) of prescriptions with a clinician ID (n = 3236) |
|---|---|---|---|
| Normal surgery (n = 1848) | 1847 (99.9) | Normal surgery (n = 1674) | 1669 (98.9) |
| Data entry (n = 167) | 73 (43.7) | Data entry (n = 1230) | 346 (28.1) |
| Co-op (out of hours) (n = 1) | 1 (100) | Co-op (n = 0) | – |
| Telephone (n = 63) | 63 (100) | Telephone (n = 95) | 94 (99.7) |
| Unknown/other (n = 119) | 114 (95.8) | Unknown/other (n = 237) | 63 (26.6) |
For the planned analysis, it was also necessary to distinguish between clinical and non-clinical users, and between GPs and nurses. The data supplied to us contained a field called ‘clinician type’ with two values (G and X) which we were told was believed to distinguish GPs from other users, although there was ambiguity about whether or not ‘G’ clinicians also sometimes included nurses. We additionally extracted data about whether or not an encounter had an associated Read Code with a PTI modifier. All the practices contributed data to the NHS Scotland PTI data set, where face-to-face encounters with patients all have one or more Read Codes attached to identify the morbidity being dealt with, and these Read Codes have a specific modifier attached which identifies if they are a GP or a nurse consultation (the modifier allows data entry Read Codes, e.g. following a hospital admission, to be excluded from primary care workload analyses). Using this data, we identified clinician IDs who were GPs and nurses based on their recording of PTI-modified Read Codes.
During 2006, there were a total of 478 GPs who had a total of 181,263 encounters (normal surgery, telephone or unknown/other) with a patient at risk (i.e. vulnerable to adverse effects of NSAIDs by virtue of comorbidity or coprescription) at the time of the encounter, during which 2024 new acute NSAID prescriptions were issued. Of these, 1961 (96.9%) of new acute prescriptions had a GP ID. However, 80 GPs (who prescribed a total of eight new acute NSAIDs in 2006) had fewer than 10 encounters with at-risk patients, which is a problem when estimating variation in the prevalence of relatively rare events.
We concluded that it was potentially feasible to examine new but not subsequent acute NSAID prescribing in a GP-level analysis, and to examine new acute NSAID prescribing in normal surgery, telephone and unknown/other encounter types for GPASS users identified as GPs using analysis of PTI-modified Read Codes.
Do new acute prescriptions matter given that they are not the bulk of prescribing?
It was feasible to examine variation only in new acute NSAID prescribing in the analysis to examine variation between both practices and GPs but these prescriptions accounted for only 10.6% of high-risk prescriptions issued in 2006, raising the question of whether or not this was a important enough outcome to examine. Total high-risk prescribing in a practice will be determined by a number of processes including:
-
New acute NSAID prescribing. Our expectation is that this would be the most frequent initiation event.
-
New repeat NSAID prescribing without a preceding acute prescription. This will be rarer, but once set up is the gateway to regular issuing without much clinical oversight (although this is rare in this data set, with only one of 241 new repeat prescriptions in 2006 not being preceded by an acute prescription in the previous year, the exception having previously had a active repeat prescription issued just under 2 years earlier but subsequently cancelled).
-
For those issued a new acute prescription, transition in some patients to receiving subsequent acute prescriptions.
-
For those issued a new acute or subsequent acute prescription, transition in some patients to receiving new and then subsequent repeat prescriptions.
-
Cessation of either multiple acute or repeat prescribing, either because patients’ symptoms resolve or because of review and active withdrawal by a clinician.
To examine the relative importance of high-risk new acute NSAID prescribing, we identified 441 patients eligible for one of our five measures who received a new acute NSAID prescription in Q4 2005, and examined high-risk NSAID prescribing to these patients in 2006. Five patients received a further new acute NSAID in 2006 (i.e. an acute prescription more than 1 year after the one issued in Q4 2005), 135 patients received a total of 279 subsequent acute NSAID prescriptions in 2006, and 21 received a new repeat NSAID with 203 subsequent repeat issues. In total, 143 (31.8%) patients prescribed a new acute NSAID in Q4 2005 received one or more NSAIDs in 2006, with a total of 513 prescriptions issued, representing 2.6% of all high-risk NSAID prescribing in 2006. As well as carrying risk in its own right, new acute NSAID prescribing is, therefore, an important initiation event for chronic prescribing.
Discussion
Summary
For analysis of variation between GPs, attribution of a particular prescription to a GP is critical but is complicated for two reasons:
-
The decision to prescribe being made by more than one clinician, notably with regard to specialist recommended prescriptions issued by GPs. In this situation, GPs clearly have the legal responsibility for the prescription because they create and sign it but attribution is not as simple as one where the GP alone decides to prescribe.
We therefore defined a set of measures relating to high-risk NSAID prescribing where the first problem was relatively unlikely to arise, because almost all decisions to prescribe NSAIDs are made by GPs.
-
Not all prescriptions include a clinician ID, and, even if they do, the clinician ID may not be the correct ID for the clinician actually signing the prescription.
General practitioner systems distinguish between repeat and acute prescriptions. Repeat prescriptions are those for which a prescription is set up so that the patient can reorder the medication from reception staff, who print it off and pass it to a GP for signing, typically in a large pile of other repeat prescriptions. Acute prescriptions are one-offs which cannot be straightforwardly reissued by reception staff, and for which reissue is usually done by a clinician, meaning there is greater clinical oversight.
Unsurprisingly, repeat prescribing did not reliably have a clinician ID, and, where an ID was present, it related to the encounter where a new repeat prescription was originally created rather than to the signing of a repeat issue. In addition, we know that in many practices repeat prescriptions are often not signed by the GP whose name is on the prescription because the printed name is often automatically set to be the ‘duty doctor’ or the ‘registered doctor’. Hence, attribution of repeat prescriptions even in the presence of an electronically recorded clinician ID is problematic. Our planned analysis in this context was to examine cessation of high-risk prescribing after a medication review, but the data set did not have reliable recording of the person doing medication review so this was not possible. It was therefore not feasible to examine repeat prescribing at GP level.
For acute prescribing, we distinguished ‘new’ and ‘subsequent’ prescriptions (an acute prescription is a ‘one-off’ which cannot be straightforwardly reissued by reception staff and for which there is, therefore, greater clinical oversight). A new acute NSAID prescription was defined as an acute prescription where there has been no NSAID prescribed in the previous year. This is the prescription with the greatest clinical oversight, in that almost all this prescribing happens in face-to-face clinical encounters and is the key initiation event for subsequent prescribing, which is typically subject to less clinical oversight. One-third of new acute prescriptions were associated with additional high-risk NSAID prescribing in the subsequent year. Over 95% of new acute NSAIDs had a clinician ID associated with them, with most missing clinician IDs being in data entry encounters, where a clinician ID is not required. In contrast, only 67.1% of subsequent acute prescriptions had a clinician ID, reflecting the fact that they were much more commonly issued in data entry encounters, probably because they were telephone requests via reception rather than clinical encounters (reflecting the reduced clinical oversight involved, although oversight is still higher than for repeat prescribing because acute prescribing will typically be flagged as a special request to distinguish it from repeat prescribing).
Interpretation and implications for subsequent analyses
The feasibility analysis showed that we could reasonably robustly analyse new acute NSAID prescriptions in non-data entry encounters for GPs identified using PTI-modified Read Codes. The data set for analysis of variation between practices and between GPs, given the constraints described above, therefore included 181,010 (99.9%) encounters by 26,539 (99.97%) patients at risk in 2006 who consulted at least once, during which 1953 new acute NSAIDs were issued (96.5% of those with a clinician ID, 88.9% of all new acute NSAIDs).
However, problems of attribution limited the extension of this to other types of high-risk prescribing. First, the need to identify GPs using PTI modifiers means that extension to analyse new acute NSAIDs in non-PTI practices was not feasible. Second, repeat prescribing and to a lesser extent subsequent acute NSAIDs could not be reliably linked to a clinician ID. Although other clinical systems may always attach a clinician ID to a prescription issue, this in itself would not address the problem that receptionist-generated repeat prescriptions will not necessarily be signed by the GP whose name is on the prescription, which is likely to restrict analysis of prescribing at GP level to acute prescribing. In addition, many high-risk drugs were judged often to be initiated by both GPs and by specialists making recommendations to GPs. Feasible types of prescribing that could be examined are those where a large proportion of prescribing is acute rather than repeat and where the decision-maker is clearly the GP. However, in terms of high-volume drugs, this restricts the scope of analysis to drugs which are usually or often acute prescribed and initiated by GPs, such as analgesics, antibiotics and some psychotropic drugs including antidepressants and possibly hypnotics/anxiolytics (but not antipsychotics). To try to get round this problem of attributing the initiation decision to the GP who starts a repeat medication, we had intended to also examine drug cessation after medication review, which is more clearly attributable to the GP, but in GPASS medication reviews could not be reliably linked to clinician ID so this was not feasible (it might or might not be feasible in other clinical IT systems).
After discussion with the National Institute for Health Research (NIHR) Health Services and Delivery Research (HSDR) programme, it was agreed that we would complete the original study using the data on new acute NSAID prescribing from the 38 PTI practices and in addition examine change in high-risk prescribing over the period 2004–9 in 190 practices.
Chapter 3 Variation in high-risk non-steroidal anti-inflammatory drug prescribing in quarter 4 2006: two-level model of patients within practices
Introduction
Prescribing is typically done by an individual clinician for an individual patient in a particular setting (a practice, a hospital, a clinic) in a particular region or local health economy in a particular health-care system. All of these are potentially sources of variation which may be of interest to researchers and practitioners. Similar to most analyses of this nature, not all sources of variation are of primary interest or feasible to model. From this perspective, all such models ignore some sources of variation either because they are not relevant (all practices in this analysis come from the same health-care system – NHS Scotland) or because they cannot be measured (in this data set we have no information about region or local health economy). The focus of the analyses described in this chapter is on variation between practices and models for two outcomes are presented.
Methods
Data sources
Data were extracted by PCCIU for 38 practices participating in NHS Scotland PTI in 2006 (i.e. practices with higher than average coding quality, and where it is more straightforward to identify what kind of clinicians IT system users are and whether or not an ‘encounter’ is a clinical encounter as opposed to another kind of record opening). Data were complete up to 31 March 2007.
Outcome measures
As described above, we defined the five measures of high-risk NSAID prescribing in a way suitable for implementation in a cross-sectional analysis. Peptic ulceration (PCCIU supplied code-set) and heart failure (QOF-defined code set116) were defined as the presence of any relevant Read Code ever, and the date of the first Read Code was taken as the date of first diagnosis. Oral NSAIDs were defined as all drugs in BNF section 10.1.1. Oral anticoagulants were defined as relevant oral drugs in BNF section 2.8.2. Aspirin and clopidogrel were defined as relevant drugs in BNF section 2.9. 113
Patients were eligible for analysis if they were permanently registered with the practice continuously between 1 October and 31 December 2006, and if they were defined as being vulnerable to adverse effects of a NSAID on the basis of age, existing disease or coprescription. For age and existing disease, patients had to be aged 75 years or over or have a diagnosis of peptic ulcer or heart failure before 1 October 2006. For coprescription, patients had to have been prescribed an anticoagulant or antiplatelet drug either on the same day as a NSAID during the final quarter of 2006, or to have received an anticoagulant and antiplatelet drug both before and after the final quarter of 2006 (data for 1 January 2007 to 31 March 2007 were used to define coprescription to ensure that patients were on a coprescribed drug at the time of any NSAID prescription in Q4 2006). For the coprescription measures, NSAID prescription only triggered the outcome if the relevant coprescribed drug had been issued on the same day as the NSAID or in the 84 days before and the 84 days after the NSAID.
The outcome variable examined was a binary variable defined as the receipt of any oral NSAID between 1 October and 31 December 2006 inclusive. This replicates the methods used in our previous analysis of a broader basket of high-risk prescribing. 5
Additional data were extracted to examine how high-risk NSAID prescribing was associated with patient and practice characteristics:
-
At patient level: sex, age, socioeconomic status (measured by quintiles of postcode derived Carstairs Score117), number of active repeat drugs (a measure of overall morbidity and resource use118–120) and the number of indicators that an individual was eligible for (a partial measure of how risky a NSAID might be for them).
-
At practice level: list size (in quartiles), practice rurality/remoteness (three aggregated categories of the Scottish Executive Urban Rural Classification), whether or not the practice is accredited for post-graduate training of GPs, whether or not the practice is a dispensing practice, whether or not the practice holds a General Medical Services contract (the standard national contract) or a locally specified contract.
-
At practice level: two practice-level variables were created by aggregating from patient-level data, namely the rate at which practices prescribed new acute NSAIDs to patient at risk in 2006 and the rate at which practices prescribed new repeat NSAIDs in 2006. Both variables were analysed by quartile of practice rate. The rationale for these is that three-quarters of high-risk NSAID prescribing in Q4 is a result of repeat prescribing, and first initiation of an acute NSAID and first initiation of a repeat NSAID are key transition points that lead to repeat prescribing, which is subject to less oversight than acute prescribing. These two variables therefore are measures of recent rates of such transitions at practice level.
Descriptive analysis and multilevel modelling
For each indicator and the composite we calculated the percentage [and exact confidence intervals (CIs)] of eligible patients with high-risk prescribing and how prevalence varied at practice level. Figure 1 illustrates the model structure, with the outcome measured at patient level (a light-green circle indicating that a patient did not receive a high-risk prescription and dark-green circle with a cross indicating that they did), and with patients clustered within practices in a many-to-one relationship (each practice has many patients, but all patients only have one practice).
FIGURE 1.
Two-level model of patients within practices. A light-green circle indicates that a patient did not receive a high-risk prescription and a dark-green circle with a cross indicates that they did.

As the outcome is binary at patient level (a patient particularly vulnerable to NSAID ADEs receives a NSAID either in Q4 2006 or now), we fitted a two-level hierarchical multilevel model of patients clustered within practices using the xtmelogit command in Stata Intercooled version 11 (StataCorp LP, College Station, TX, USA). 121–123 The empty model is defined as:
B1j is the intercept which has an overall fixed component (B1) but is allowed to vary randomly by GP (u1j). u1j is assumed to be normally distributed with mean zero and variance σ2u1 which is estimated. e0ij is the encounter-level residual and is assumed to have mean zero with a variance of π2/3. Fixed effects at either level are straightforwardly fitted as in single-level regression models.
The ICC at practice level is defined as the proportion of total variance that is at practice level:
The ICC was initially calculated in the empty model with no fixed effects fitted, defined as the level 2 (practice-level) variance divided by the total variance [the sum of the level 2 variance and the level 1 (patient-level) variance which in a logistic model is fixed at π2/3]. For each of the patient and practice characteristics described above, we calculated univariate odds ratios (ORs) and 95% CIs using the xtmelogit command to account for clustering, and then fitted an ‘adjusted’ model retaining only those variables which were statistically significant. Two adjusted models were fitted, one with only patient characteristics (a case-mix adjusted model) and one with both patient and practice characteristics. Selection of variables to include was based on testing the significance of individual variables, and on the overall fit of the model assessed using the Akaike information criterion (AIC) with a smaller is better criterion. Model assumptions were checked, including checking that the number of integration points used in the estimation was appropriate using the quadchk command (the Stata default of seven integration points were shown to produce stable estimates) and by examining graphically whether level 2 residuals were normally distributed. 122,123 Example plots for the main outcomes can be found in Figure 17 in Appendix 6. Variation between practices after accounting for patient characteristics was examined by estimating the ICC, calculating median odds ratios124 and by creating caterpillar plots of shrunken practice-level residuals with 95% CIs from the adjusted model including patient characteristics. 125,123 Initial data management and descriptive analysis was carried out in IBM Statistical Product and Service Solutions (SPSS) Statistics version 21 (IBM Corporation, Armonk, NY, USA) and regression modelling in Stata Intercooled version 11.
Reliability analysis
In this context, reliability is the extent to which the mean score of a patient-level outcome accurately measures an individual practice’s performance in terms of how well it differentiates between practices in terms of our confidence that observed differences between practices are a result of true differences in prescribing safety. 62,79,126–128 Reliability increases as variation between practices increases (measured by the ICC) and as the number of patients being measured in the practice increases. The ICC is estimated from all the data and does not vary by practice, but the number of patients being measured in each practice varies widely and an indicator may therefore be reliable for a large practice but not for a small one. Reliability varies between 0 (completely unreliable) and 1 (completely reliable). Values greater than 0.7 are generally considered to indicate acceptable reliability in the sense that observed differences between practices can be attributed reasonably confidently to true differences in quality or safety but for high-stakes evaluation such as for governance purposes, reliabilities of > 0.8 are generally believed to be required and > 0.9 may be preferable. In a two-level model, reliability can be estimated with the Spearman–Brown prophecy formula, which is commonly used in this context both to estimate the reliability of a measure for a given number of patients and to estimate the minimum number of patients that a practice must have being measured to achieve a prespecified level of reliability. 79,126
where n = the number of patients and ρ = the ICC.
The same formula can be rearranged so that for an observed ICC ρ, the required number of patients, n, to measure with a desired reliability, λ, is given by:
For the two-level models examined in this chapter, we used the estimated ICC to calculate the reliability for a practice with the median number of patients and to calculate the number of practices in the study for which the proportion of their patients with high-risk prescribing had reliability > 0.7, > 0.8 and > 0.9.
Results
Analysis was for 31,646 patients particularly vulnerable to NSAID adverse drug effects throughout Q4 2006, registered with 38 practices.
Prevalence of high-risk prescribing for all five indicators and the composite
Table 5 shows the prevalence of high-risk prescribing in the last quarter of 2006 for the five individual indicators and for the composite and the variation between practices. Between 4.3% and 11.1% of those patients particularly vulnerable to NSAID adverse drug effects as defined by the individual indicators received one or more NSAIDs, with 9.5% (95% CI 8.2% to 10.7%) of patients in any indicator receiving a NSAID. The highest prevalence was found for coprescription of a NSAID with aspirin or clopidogrel, and the lowest for coprescription of a NSAID with an oral anticoagulant.
| Indicator | No. of patients prescribed a NSAID/no. of patients at risk | % (95% CI)a | Practice mean (range) | Practice median (interquartile range) | ICC (95% CI) |
|---|---|---|---|---|---|
| 1. NSAID prescribed to person with diagnosis of previous peptic ulcer | 788/8268 | 9.5 (8.3 to 10.7) | 9.5 (0–18.2) | 9.1 (6.8–12.1) | 0.035 (0.017 to 0.072) |
| 2. NSAID prescribed to person aged 75 years and over | 1375/16,578 | 8.3 (7.0 to 9.6) | 8.6 (3.1–22.4) | 8.1 (6.1–10.2) | 0.043 (0.025 to 0.074) |
| 3. NSAID prescribed to person with diagnosis of heart failure | 352/4035 | 8.7 (6.9 to 10.5) | 8.6 (0–16.7) | 8.1 (5.5–11.9) | 0.026 (0.010 to 0.068) |
| 4. NSAID prescribed to person also prescribed oral anticoagulant | 96/2255 | 4.3 (2.6 to 5.9) | 4.3 (0–18.4) | 2.9 (0–5.6) | 0.184 (0.086 to 0.351) |
| 5. NSAID prescribed to person also prescribed aspirin or clopidogrel | 1423/12,773 | 11.1 (9.7 to 12.6) | 10.9 (4.2–21.0) | 11.0 (7.7–13.1) | 0.035 (0.019 to 0.063) |
| Composite for main analysis | 2997/31,646 | 9.5 (8.2 to 10.7) | 9.5 (4.2–21.0) | 9.3 (7.3–11.2) | 0.034 (0.020 to 0.056) |
There was evidence of quite considerable variation between practices, with a wide range in the prevalence of high-risk NSAID prescribing between practices, with the composite range being 4.2–21.0%, with an interquartile range of 7.3–11.2%. As is commonly found,79 ICC were relatively small, being < 0.05 for all indicators except for the NSAID and oral anticoagulation measure, where the ICC was 0.184 (95% CI 0.086 to 0.351). The interpretation of the ICC is that it shows the proportion of variation in patient outcome attributable to variation between practices. For example, the ICC for the composite indicator is 0.034 (95% CI 0.020 to 0.056), indicating that 3.4% of variation in outcome between patients is attributable to the practice. The remaining 96.6% of variation is either between patients or is random, but in a multilevel logistic regression model it is not possible to disentangle patient and random variation. 79,121,129
Composite indicator univariate associations
Univariate associations between high-risk NSAID prescribing measured by the composite indicator and patient characteristics are shown in Appendix 3, Table 22. Men were less likely than women to receive a NSAID (8.9% vs. 10.0%, OR 0.88, 95% CI 0.82 to 0.95), as were people aged under 50 years compared with older people. There was no association with socioeconomic deprivation but NSAID prescribing was less likely in people who had more than one risk factor (6.8% in those eligible for three or more of the five individual indicators vs. 9.8% in those eligible for one, OR 0.66, 95% CI 0.55 to 0.79). There was a strong association between high-risk NSAID prescribing and the number of repeat drugs that a patient is being currently prescribed, with the prevalence of high-risk NSAIDs increasing from 4.4% in those with no active repeats to 17.9% in those with 11 or more active repeats (OR 4.53, 95% CI 3.73 to 5.49).
Associations with practice-level characteristics were generally weaker (see Appendix 3, Table 23). None of the practice structural characteristics was associated with high-risk prescribing (list size, urban/rural location, type of contract, training or dispensing status). A practice’s rate of new acute NSAID prescribing earlier in 2006 was associated with any NSAID use in Q4 2006 [prevalence 12.2% in practices in the highest quartile of new acute NSAID prescribing compared with 7.1% in the lowest quartile, OR 1.83 (95% CI 1.37 to 2.43), and a consistent gradient]. There was a weaker association with practice rates of new repeat NSAID prescribing although this is a rarer event [prevalence 12.0% in practices in the highest quartile of new repeat NSAID prescribing compared with 7.9% in the lowest quartile, OR 1.42 (95% CI 1.03 to 1.96), but a less clear gradient across quartiles].
Composite indicator adjusted analysis
In multivariate analysis, only four variables were significantly associated with high-risk NSAID prescribing (Table 6) – patient age, the number of indicators patients were eligible for, the number of active repeat drugs and practice new acute NSAID prescribing earlier in 2006. After adjustment, there were significant differences only between the under-50-year-olds (reference category) and people aged 80 years and over, who were less likely to be prescribed a high-risk NSAID (OR 0.71, 95% CI 0.73 to 0.85, compared with the under-50-year-olds). The association with the number of indicators that a patient was eligible was strengthened somewhat (OR 0.49, 95% CI 0.41 to 0.59, in those with three or more risk factors vs. those with one), as was the association with the number of active repeat drugs a patient was prescribed (OR 5.62, 95% CI 4.59 to 6.89, in those with 11 or more active repeats vs. those with none). Practice rates of new acute NSAID prescribing earlier in 2006 remained significantly associated with any high-risk NSAID use in Q4 2006 (OR 1.80, 95% CI 1.41 to 2.30, in practices in the highest quartile compared with the lowest quartile).
| Patient and practice characteristics | Empty model, % (95% CI) with high-risk NSAID | Adjusted multilevel OR (95% CI), patient characteristics only | Adjusted multilevel OR (95% CI), patient and practice characteristics |
|---|---|---|---|
| Patient level | |||
| Age group | |||
| < 50 years (n = 2406) | 7.4 (5.8 to 9.0) | 1 | 1 |
| 50–59 (n = 2354) | 9.4 (7.6 to 11.3) | 1.01 (0.81 to 1.24) | 1.01 (0.82 to 1.25) |
| 60–69 (n = 5571) | 12.9 (11.4 to 14.3) | 1.03 (0.86 to 1.24) | 1.04 (0.86 to 1.25) |
| 70–79 (n = 10,818) | 10.3 (8.8 to 11.8) | 0.87 (0.73 to 1.04) | 0.87 (0.73 to 1.04) |
| 80 > years (n = 4330) | 7.3 (6.0 to 8.6) | 0.71 (0.59 to 0.85) | 0.71 (0.73 to 0.85) |
| No. of indicators eligible for | |||
| 1 (n = 21,553) | 9.8 (8.5 to 11.1) | 1 | 1 |
| 2 (n = 8104) | 9.3 (7.9 to 10.8) | 0.75 (0.68 to 0.82) | 0.74 (0.68 to 0.82) |
| ≥ 3 (n = 1989) | 6.8 (5.5 to 8.2) | 0.49 (0.41 to 0.60) | 0.49 (0.41 to 0.59) |
| No. of repeat drugs | |||
| 0 (n = 7598) | 4.4 (3.5 to 5.3) | 1 | 1 |
| 1–2 (n = 5901) | 8.8 (7.7 to 9.8) | 2.11 (1.82 to 2.44) | 2.11 (1.82 to 2.44) |
| 3–4 (n = 6976) | 10.0 (8.4 to 11.7) | 2.65 (2.29 to 3.06) | 2.65 (2.30 to 3.07) |
| 5–6 (n = 5380) | 11.0 (9.7 to 12.4) | 3.04 (2.62 to 3.54) | 3.05 (2.62 to 3.54) |
| 7–8 (n = 3182) | 13.3 (11.2 to 15.4) | 3.91 (3.32 to 4.60) | 3.91 (3.32 to 4.60) |
| 9–10 (n = 1517) | 15.3 (12.4 to 18.2) | 4.62 (3.81 to 5.59) | 4.63 (3.82 to 5.60) |
| > 11 (n = 1092) | 17.9 (14.6 to 21.3) | 5.60 (4.57 to 6.87) | 5.62 (4.59 to 6.89) |
| Practice level | |||
| 2006 new acute quartile | |||
| Q1 (lowest) (n = 9) | 7.1 (5.9 to 8.3) | – | 1 |
| Q2 (n = 10) | 9.6 (6.9 to 12.2) | – | 1.47 (1.16 to 1.85) |
| Q3 (n = 10) | 9.5 (8.3 to 10.8) | – | 1.52 (1.20 to 1.92) |
| Q4 (highest) (n = 9) | 12.2 (9.9 to 14.4) | – | 1.80 (1.41 to 2.30) |
| Random effects | |||
| Variance (95% CI) | 0.116 (0.068 to 0.196) | 0.088 (0.051 to 0.151) | 0.049 (0.027 to 0.088) |
| ICC (95% CI) | 0.034 (0.020 to 0.056) | 0.026 (0.015 to 0.044) | 0.015 (0.008 to 0.026) |
| Median odds ratio (95% CI) | 1.38 (1.28 to 1.53) | 1.33 (1.24 to 1.45) | 1.23 (1.17 to 1.33) |
The ICC in the empty model was 0.034 (95% CI 0.020 to 0.056), compared with 0.026 (95% CI 0.015 to 0.044) in the adjusted model with only patient-level fixed effects and 0.015 (95% CI 0.008 to 0.026) in the adjusted model with both patient-level and practice-level fixed effects. An alternative way of expressing variation between practices is the median odds ratio, which is on the same scale as the fixed effects and is the median odds ratio between a patient randomly selected from one practice and another randomly selected from another practice. 124 The median odds ratio in the empty model was 1.38 (95% CI 1.28 to 1.53) and in the fully adjusted model 1.23 (95% CI 1.17 to 1.33), indicating that variation because of differences in patient characteristics is much greater than variation owing to differences in the practice that a patient is registered with. Figure 2 shows variation by practice based on estimated shrunken residuals for each practice from the model adjusted for patient characteristics only. Six of the 38 practices had statistically significantly higher rates of high-risk NSAID prescribing compared with the population average, and nine had significantly lower rates.
FIGURE 2.
Residual variation between practices after accounting for patient characteristics significantly associated with any high-risk NSAID prescribing in Q4 2006 (practice-level shrunken residuals estimated from the ‘patient characteristics only’ adjusted model in Table 6).
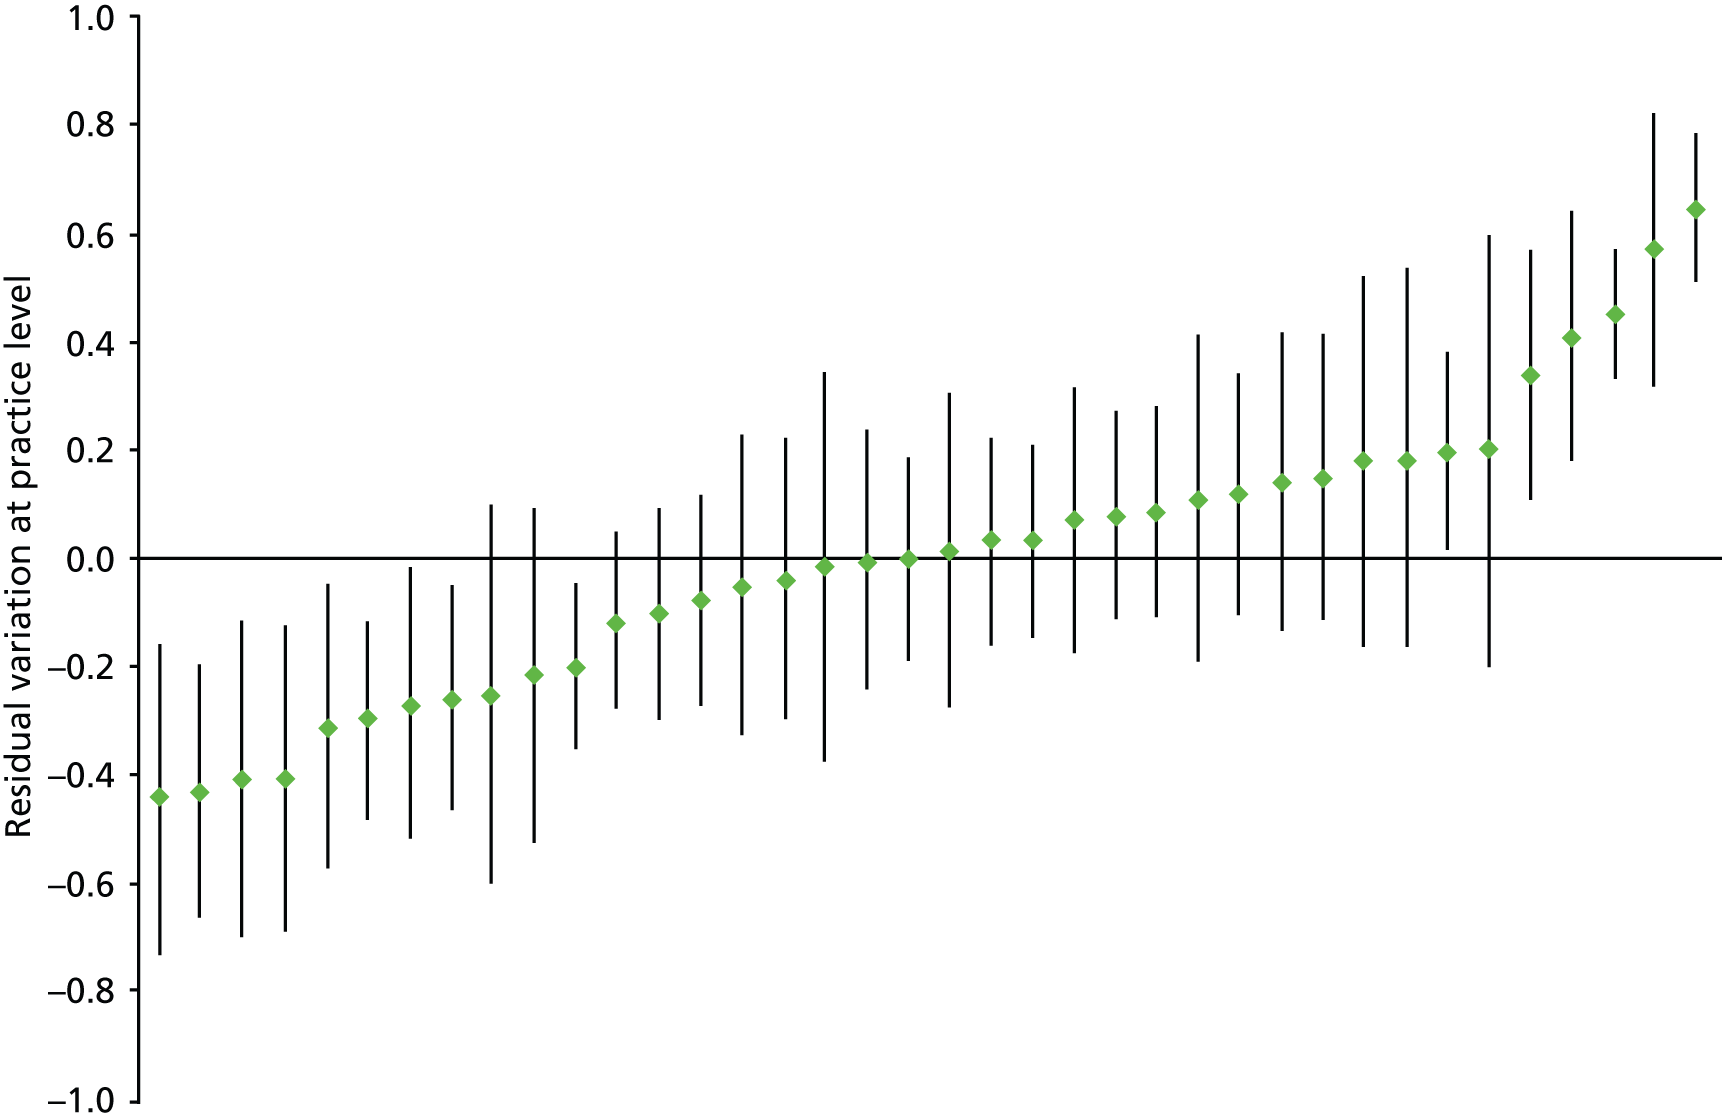
Individual and composite indicator reliability
Table 7 shows the estimated reliability of the five individual indicators and the composite, both before and after accounting for patient characteristics. Reliability varies with both the ICC and the number of patients being measured in each practice. Reliability for a practice with the median number of patients was 0.9 or above for all indicators except for NSAID prescribing in heart failure where it was 0.67. All included practices could be measured with reliability > 0.7 for three of the individual indicators and the composite, but the majority of practices could not be reliably measured at this level for the NSAID in heart failure measure. All included practices could be measured with reliability > 0.8 for the composite indicator, and all but one for NSAIDs prescribed to older people and to people prescribed an oral anticoagulant. None of the individual indicators was reliable in more than three-quarters of included practices, but the composite had reliability > 0.9 in 35 of the 38. Adjusting for patient characteristics made no meaningful difference to the reliability of the composite indicator.
| Indicator | Reliability for practice with median number of patients at risk | Percentage of practices with reliability > 0.7 | Percentage of practices with reliability > 0.8 | Percentage of practices with reliability > 0.9 | No. of patients for reliability > 0.7 | No. of patients for reliability > 0.8 | No. of patients for reliability > 0.9 |
|---|---|---|---|---|---|---|---|
| 1. NSAID prescribed to person with diagnosis of previous peptic ulcer | 0.97 | 92.1 | 79.0 | 31.6 | 65 | 111 | 249 |
| 2. NSAID prescribed to person aged 75 years and over | 0.94 | 100 | 97.4 | 76.3 | 52 | 90 | 201 |
| 3. NSAID prescribed to person with diagnosis of heart failure | 0.67 | 42.1 | 21.0 | 2.6 | 88 | 150 | 338 |
| 4. NSAID prescribed to person also prescribed oral anticoagulant | 0.91 | 100 | 97.4 | 57.9 | 11 | 18 | 40 |
| 5. NSAID prescribed to person also prescribed aspirin or clopidogrel | 0.90 | 100 | 89.5 | 50.0 | 65 | 111 | 249 |
| Composite – empty model | 0.96 | 100 | 100 | 92.1 | 67 | 114 | 256 |
| Composite – patient-adjusted model | 0.96 | 100 | 100 | 97.4 | 61 | 105 | 235 |
Discussion
Summary of findings
Prescription of NSAIDs to patients at particularly high risk of adverse drug effects was relatively common, with just under 1 in 10 such patients receiving a NSAID in Q4 2006. In the full multilevel model, high-risk NSAID prescribing was associated with patient age (over-80-year-olds being less likely to receive a NSAID), the number of indicators that a patient was eligible for (those with more risk factors being less likely to receive a NSAID), and the number of repeat drugs a patient was taking (with a progressive increase in NSAID prescribing as the number of repeat drugs increased). At practice level, the only significantly associated variable was the practice rate of new acute NSAID prescribing earlier in 2006 (practices with higher rates of such prescribing had higher rates of total prescribing in Q4 2006).
Variation between practices was fairly large in absolute terms (varying from 4.1% to 21.0% for the composite) but fairly small when measured using the ICC, where less than 5% of variation in patient outcome was attributable to variation between practices. This applied to the composite (ICC in the empty model 0.035) and four of the five individual measures (ICCs varying from 0.026 to 0.043), although for NSAID prescription to people already prescribed oral anticoagulants the ICC was much larger (0.184). Of note is that when variation between practices is expressed as a median odds ratio (the difference in odds of receiving a high-risk NSAID between two patients randomly selected from different practices), then the fixed effects in the model generally had larger associations with high-risk prescribing than the practice the patient happened to be in (median odds ratio in the empty model was 1.38 and 1.23 in the fully adjusted model both smaller than the most weakly associated patient or practice characteristic). Our overall interpretation is that for total high-risk NSAID prescribing, there is small but statistically and clinically significant variation between practices.
Despite the relatively low ICC, four of the five individual indicators were reasonably reliable (the exception being NSAIDs in heart failure which was not) in their ability to distinguish practices from each other, at least to the level where the indicators could be used in more formative ways (reliability > 0.7), although only for NSAIDs in older people and NSAIDs coprescribed with oral anticoagulants was reliability considered adequate for higher-stakes evaluation (reliability > 0.8) in nearly all included practices. Reflecting the large numbers of patients eligible for the measure (i.e. particularly vulnerable to NSAID adverse drug effects), the composite indicator had reliability > 0.8 in all included practices and > 0.9 in 35 of the 38 practices.
Strengths and limitations
The analysis uses routinely collected data from GP electronic medical records, which has a number of strengths and a number of matching weaknesses. Key strengths are that GP records are generally near complete for prescribing and have reasonable accuracy for common diagnostic coding such as heart failure and peptic ulcer. Key weaknesses are that some prescriptions are hand-written and so will not be recorded electronically (particularly prescriptions written during home visits which are most commonly for frailer patients who are most at risk of ADEs), and that the practices being studied are relatively unusual in that they contribute to a national morbidity recording data set (although this does mean that their diagnostic coding will likely be of higher quality than average). However, the findings are similar to our previous work in a representative one-third of Scottish practices, in terms of the prevalence of high-risk prescribing measured by the indicators examined, the amount of variation between practices and the reliability of the indicators. 5 It is also important to note that the practice characteristics data that are available predominantly relate to practice structural characteristics rather than to indicators of how practices organise their prescribing systems or how practitioners within them conceive the risk of the measured prescribing. The partial exception to that is the measure of new acute NSAID prescribing in the previous year, which is associated with total prescribing in Q4 2006.
In addition, composite indicators have a number of potential disadvantages, including that they may combine indicators with very different implications and prevalences. In this case, the composite consists of people prescribed a single drug class where each indicator is clearly associated with risk, although given the numbers of people affected it will be little influenced by NSAID prescribing to people taking oral anticoagulation and to lesser extent NSAID prescribing to people with heart failure. Finally, we do not know the specific indication for the NSAID, which will of course be critical for understanding the risk–benefit balance, as the benefits in people with inflammatory arthritis are likely to be greater (and harder to achieve with other drugs) than in people with mild to moderate osteoarthritis.
Interpretation and comparison with existing literature
This analysis replicates our previously applied methods for the set of indicators and practices used in this study. Of note is that the lower rates of NSAID use in the oldest patients and those with more than one risk factor (i.e. included in more than one indicator) is consistent with there being a general recognition by prescribing GPs that NSAIDs are risky. Rising rates of NSAID use as the number of repeat drugs increases likely reflects greater need for analgesics in sicker people, although of course the risks also increase. The association between prior new acute NSAID use and total NSAID use in Q4 2006 is not unexpected, but reinforces the belief that new acute NSAID use is a reasonable outcome to use in the analysis which follows. Ideally, data would be available on how practices organise their prescribing systems and their knowledge of and attitudes to prescribing risk, although such data are unlikely to ever be routinely available.
The observed absolute variation between practices and the ICCs are similar to our previous study of high-risk prescribing,5 the exception being the NSAIDs coprescribed with oral anticoagulants measure, for which the ICC was 0.184 (95% CI 0.086 to 0.351) which is at the upper end of observed inter-practice variation in other studies, consistent with practices (or GPs within practices) varying considerably in their perception of the risk of this prescribing. 79 Small ICCs of the kind observed for the other indicators and the composite are the norm in studies of variation in quality, particularly for binary outcomes where the level 1 variance combines both variation between patients and chance variation. ICCs of this magnitude are not infrequently assumed to mean that there is little or only trivial variation in technical quality between practices or other higher-level organisations or areas. 62,85–87,130 However, as others have pointed out, small ICCs at practice or other higher level are quite compatible with large absolute variation between practices if total variation is also large,79,131,132 and the absolute variation in high-risk NSAID use between practices was large for all indicators including those where there were large numbers of patients being measured.
The reliability of an indicator is a measure of how well it distinguishes between practices, or more formally it is the proportion of the observed variation between practices which is because of true differences between practices. 62,79,126,128 Reliability varies between 0 (completely unreliable) and 1 (completely reliable) and it is an arbitrary decision as to how reliable a measure must be to be useful. Commonly applied rules of thumb are that reliability > 0.7 is adequate for formative evaluation, but values > 0.8 and ideally > 0.9 are required for summative or high-stakes evaluation, with Streiner and Norman128 suggesting that > 0.75 is the minimum requirement under most circumstances but also noting that few instruments have reliability > 0.9. In part, this depends on the context and in particular the use that a measure will be put to. For example, the reliability required for feeding data back to practices for reflection as part of a formative appraisal process is less than that required for a high-stakes evaluation such as identification of practices for clinical governance investigation or intervention or tournament-based pay-for-performance schemes where there are both winners and losers. 62,126
From this perspective, four of the five individual measures examined here would be suitable for formative assessment (the exception being NSAIDs in heart failure) with reliabilities > 0.7 in almost all practices, and the composite indicator would be suitable for high stakes evaluation with reliability > 0.8 in all practices and > 0.9 in all but the smallest practices. These high reliabilities are despite a relatively small ICC, reflecting that at practice level there are a large number of patients particularly vulnerable to NSAID ADEs, with reliability varying with both the ICC (the same in all practices) and the number of patients being measured (varying between practices). Adjusting for the available patient characteristics made little difference to the reliability, which would simplify implementation in NHS or other health-care settings.
Chapter 4 Variation in new acute high-risk non-steroidal anti-inflammatory drug prescribing in 2006: three-level model of encounters within general practitioners within practices
Introduction
As discussed above, there are multiple potential sources of variation at various levels of aggregation, but not all are of primary interest or feasible to model. All models are therefore likely to ignore some sources of variation either because they are not relevant (all practices in this analysis come from the same health-care system – NHS Scotland) or because they cannot be measured (in this data set we have no information about region or local health economy). The focus of the analyses described in this chapter is on variation between practices and variation between GPs. The data structure can be conceptualised in several ways, illustrated in Figures 3–5.
FIGURE 3.
Two-level model of patients within practices. A light-green circle indicates that a patient did not receive a high-risk prescription and a dark-green circle with a cross indicates that they did.

FIGURE 4.
Three-level model of encounters within GPs within practices. A light-green circle indicates that a patient did not receive a high-risk prescription and a dark-green circle with a cross indicates that they did.
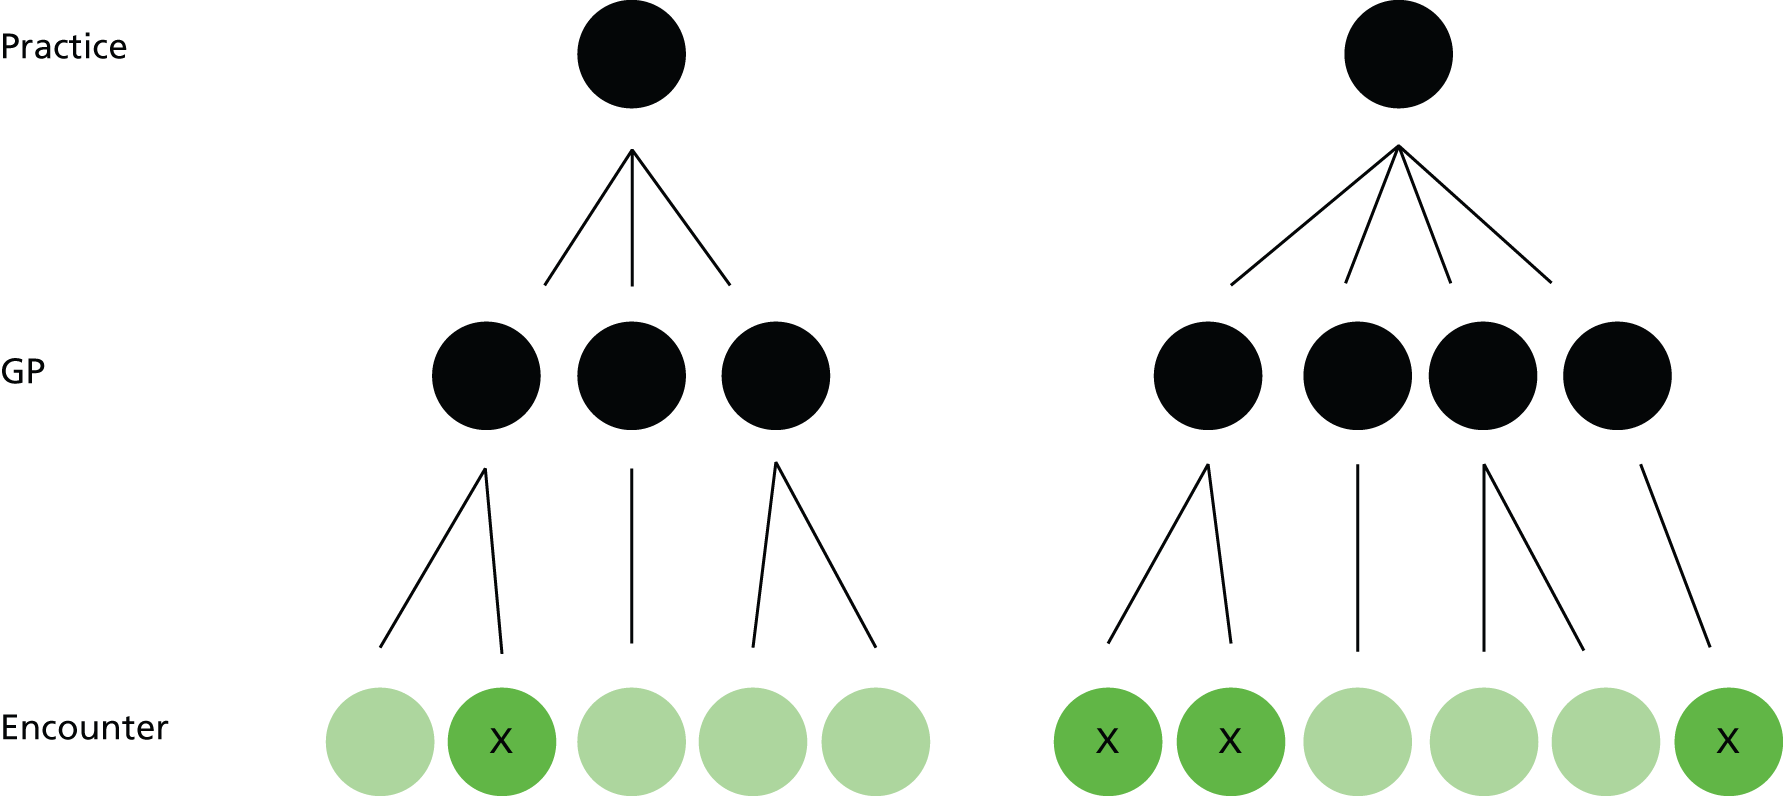
FIGURE 5.
Cross-classified model of encounters cross-classified between GPs and patients, clustered within practices. A light-green circle indicates that a patient did not receive a high-risk prescription and a dark-green circle with a cross indicates that they did.
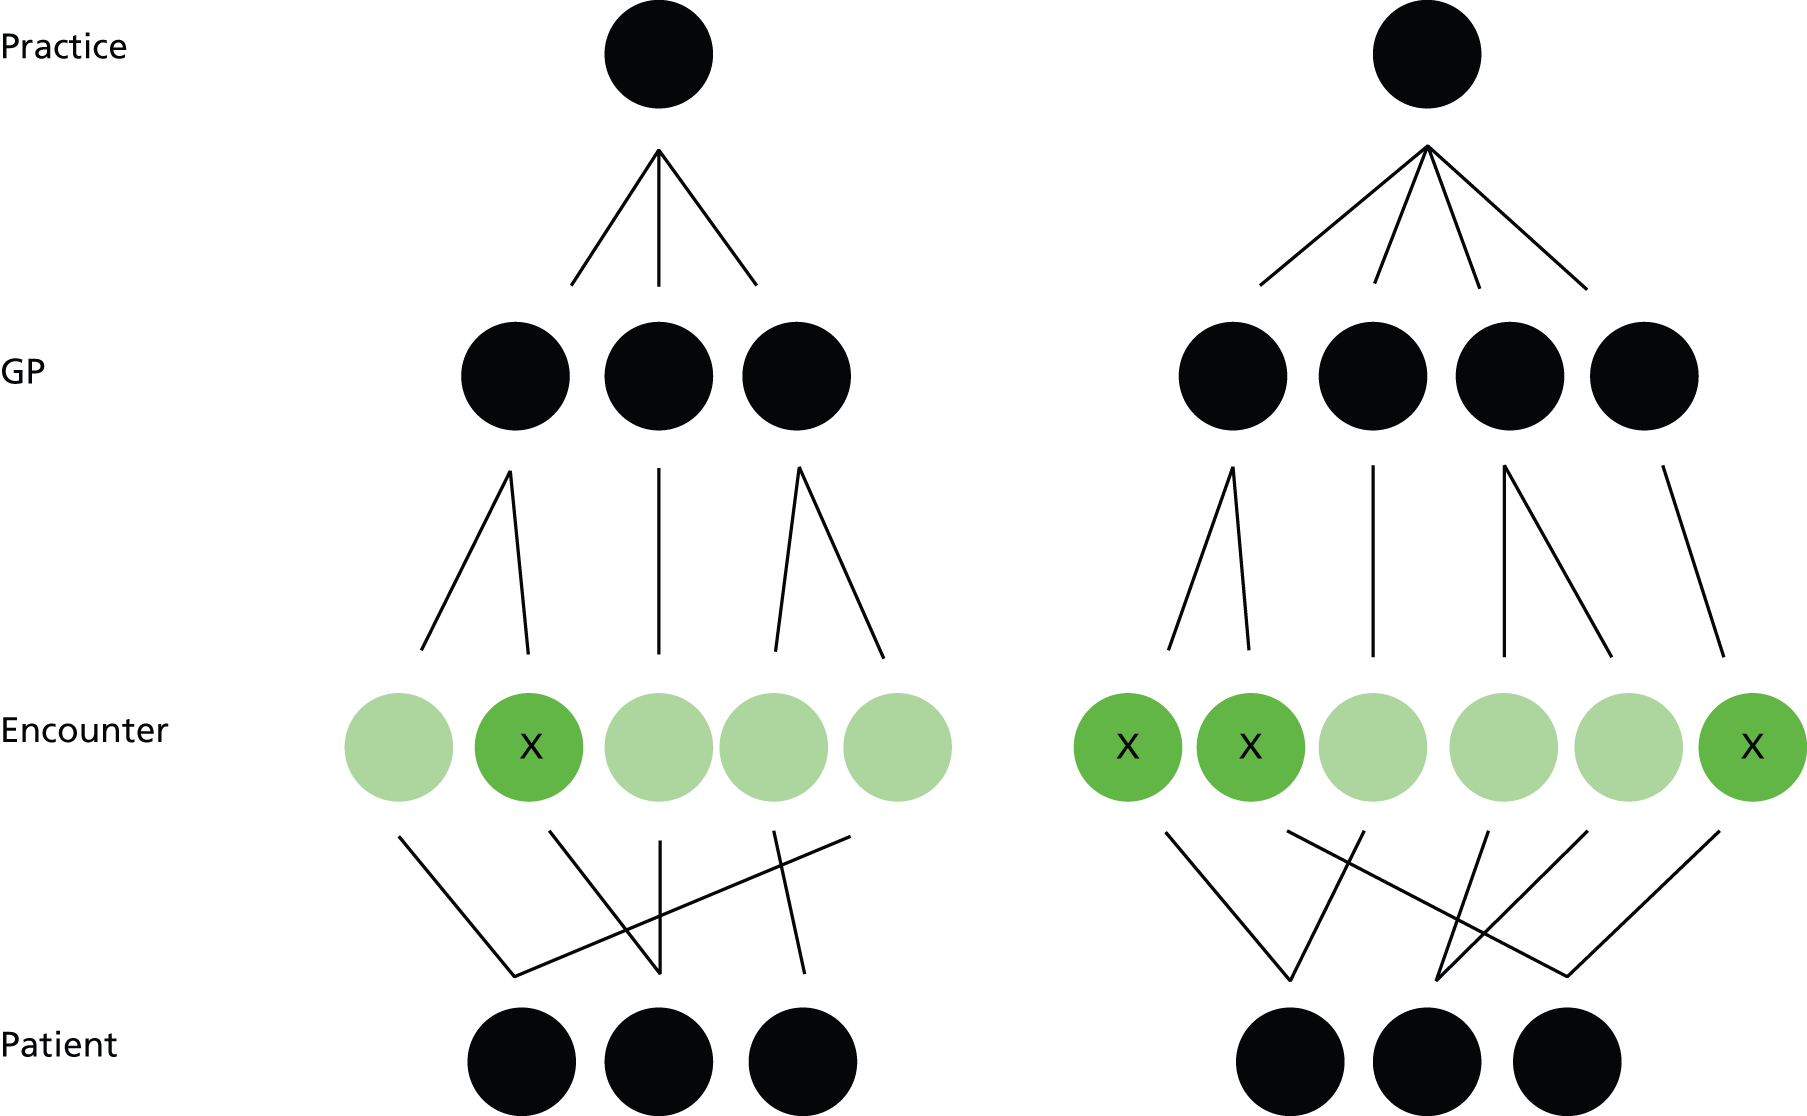
The simplest conceptualisation is the one modelled in the previous chapter and shown in Figure 3. Here the outcome is measured at patient level (a light-green circle indicating that a patient did not receive a high-risk prescription and a dark-green circle with a cross indicating that they did), and patients are clustered within practices in a many-to-one relationship (each practice has many patients but all patients only have one practice).
The two-level model does not account for GPs, who are plausibly an important source of variation in outcome. 79 Figure 4 shows a three-level model which does account for GPs, in which each practice contains many GPs and each GP has many encounters with patients. The outcome is measured at encounter level, in that the GP may or may not issue a high-risk prescription during that encounter. Such models are straightforward to fit with current software. This is the model described below (the same three-level structure could also be used to model encounters within patients within practices, as patients receive prescriptions during encounters of various kinds, but this is not further considered).
The three-level model shown in Figure 4 does not account for patients. Figure 5 shows the structure of the data to do this. The complication is that, although each GP has a set of encounters with various patients, and each patient has a set of encounters with various GPs, patients can see many GPs. The data are therefore in a many-to-many relationship and are cross-classified rather than strictly hierarchical (encounters are cross-classified within both GPs and patients, and all are clustered within practices). Such models can be fitted with current software but do not always converge or may take unfeasibly large amounts of time to converge. 123 We explored fitting this kind of model but were unable to get even an empty model with no fixed effects to converge using Laplace approximation on our server optimised for such analyses after more than a week. Laplace approximation is the simplest and fastest estimation method available in Stata, although it can be biased in its estimation of variance components which are of key interest in this analysis. 123 The time required for less biased estimation methods increases with the number of integration points according to a power law (by default Stata uses seven integration points), and we concluded that cross-classified modelling was therefore not feasible.
Methods
Data sources
As previously described, data were extracted by PCCIU for 38 practices participating in NHS Scotland PTI in 2006 (i.e. practices with higher than average coding quality who routinely record Read Code diagnostic data during clinical encounters as part of contributing to a national data set). Data were complete up to 31 March 2007.
Outcome measures
We defined the same five measures of high-risk NSAID prescribing described above in a way suitable for implementation in an encounter level analysis over one calendar year (see Table 20 in Appendix 2). Peptic ulceration (PCCIU supplied code set) and heart failure (QOF code set116) were defined as the presence of any relevant Read Code ever, and the date of the first Read Code was taken as the date of first diagnosis. Oral NSAIDs were defined as all drugs in BNF section 10.1.1. Oral anticoagulants were defined as relevant oral drugs in BNF section 2.8.2. Aspirin and clopidogrel were defined as relevant drugs in BNF section 2.9. 113
An encounter with a patient was eligible for analysis if it occurred between 1 January 2006 and 31 December 2007 inclusive, if it was at a time when the patient was permanently registered and at a time when the patient was defined as being vulnerable to adverse effects of a NSAID on the basis of age, existing disease or coprescription at the time of the encounter and the patient had not had a NSAID prescribed in the year before the encounter (as it is then not possible for them to be prescribed a new acute NSAID according to the way we defined this type of prescription) and if the GP being encountered had at least 10 encounters with patients at risk during 2006. The data set for analysis of variation between practices and between GPs given the constraints described above included 181,010 (99.9%) potentially eligible encounters by 26,539 (99.97%) eligible patients at risk in 2006 who consulted at least once. During these encounters 1953 new acute NSAIDs were issued (96.5% of all NSAIDs prescribed to these patients in 2006 where there was a clinician ID recorded).
For age and existing disease, patients had to be aged 75 years or over, or have a diagnosis of peptic ulcer or heart failure recorded before the encounter date. For coprescription, patients had to have been prescribed an anticoagulant or antiplatelet drug in both the 84 days before and the 84 days after the encounter. One binary variable composite outcome was defined – receipt of a new acute NSAID during an encounter.
Additional data were extracted to examine how high-risk NSAID prescribing was associated with encounter, GP and practice characteristics:
-
At encounter level: the encounter type, the number of indicators a patient was eligible for at the time of the encounter, and whether or not the patient had a ‘relevant diagnosis’ recorded at the time of the encounter (defined as a Read Code from chapter N musculoskeletal conditions, chapter R ill-defined conditions/working diagnoses, chapter S injuries and poisoning, and chapter 1 history/symptoms). 133 We additionally fitted variables which were ‘characteristics of the patient having the encounter’ including sex, age, socioeconomic status (measured by quintiles of postcode derived Carstairs Score117), and number of active repeat drugs at the start of 2006 (a measure of overall morbidity and resource use118–120). Such characteristics would be more appropriately fitted at patient level in a cross-classified model, but such a model was feasible. The main implication is that although the estimated association is likely to be unbiased, the standard errors and, therefore, the CIs estimated for these variables will be falsely narrow because the model is assuming that they are being measured more often than they actually are being (e.g. a patient who consults six times has only had their socioeconomic status measured once, but the model assumes it has been measured six times).
-
At GP level, GP sex (recorded in the original data) and the number of encounters each GP had with patients at risk during the year (calculated from the encounter data and categorised into quartiles). There were no other data on GP characteristics available.
-
At practice level for use in both analyses: list size (in quartiles), practice rurality/remoteness (three aggregated categories of the Scottish Executive Urban Rural Classification), whether or not the practice is accredited for post-graduate training of GPs, whether or not the practice is a dispensing practice, whether or not the practice holds a General Medical Services contract (the standard national contract) or a locally specified contract.
Descriptive analysis and multilevel modelling
For each indicator and the composite, we calculated the percentage (and exact CIs) of eligible encounters in which a new acute NSAID was prescribed and how prevalence varied at GP level and practice level. Figure 6 illustrates the model structure, with the outcome measured at encounter level (a light-green circle indicating that a patient did not receive a high-risk prescription and a dark-green circle indicating that they did), and with encounters clustered within GPs within practices in many-to-one relationships (each practice has many GPs, but all GPs only have one practice; each GP has many encounters, but all encounters only have one GP).
FIGURE 6.
Three-level model of encounters within GPs within practices. A light-green circle indicates that a patient did not receive a high-risk prescription and a dark-green circle with a cross indicates that they did.

As the outcome is binary at encounter level (a new acute NSAID is either prescribed in an eligible encounter or not), we fitted a three-level hierarchical multilevel model of encounters clustered within GPs clustered within practices using the xtmelogit command in Stata. 121–123 The empty model is defined as:
B1jk is the intercept which has an overall fixed component (B1) but is allowed to vary randomly by GP (u1jk) and by practice (v1k). u1jk and v1k are assumed to be normally distributed with mean zero and variances σ2v1 and σ2u1 which are estimated. e0ijk is the encounter level residual and is assumed to have mean zero with a variance of π2/3. Fixed effects at any level are straightforwardly fitted as in single level regression models.
The ICC was initially calculated in the empty model with no fixed effects fitted. The ICC at practice and at GP level are defined as the proportion of total variance that is at each level:
For each of the encounter, GP and practice characteristics described above, we calculated univariate ORs and 95% CIs using xtmelogit to account for clustering, and then fitted an ‘adjusted’ model retaining only those variables which were statistically significant. Two adjusted models were fitted, one with only encounter characteristics (a case-mix adjusted model) and one with all of encounter, GP and practice characteristics. Selection of variables to include was based on testing the significance of individual variables and on the overall fit of the model assessed using the AIC. Model assumptions were checked, including by checking that the number of integration points used in the estimation was appropriate using the quadchk command (the Stata default of seven integration points were shown to produce stable estimates) and by examining graphically whether or not level 2 (GP) and level 3 (practice) residuals were normally distributed. 122,123 Example plots for the main outcomes can be found in Figure 17 in Appendix 6. Variation between practices and between GPs after accounting for encounter characteristics was examined by calculating median odds ratios124 and by creating caterpillar plots of shrunken practice- and GP-level residuals with 95% CIs from the adjusted model including encounter characteristics. 123,125
How GPs with statistically significantly higher than average high-risk new acute NSAID prescribing were distributed across practices which themselves had higher than average, average or lower than average high-risk new acute NSAID prescribing was then examined. We then repeated this to examine the distribution of the same GPs across practices with higher, average or lower high-risk prescribing of any NSAIDs in Q4 2006 as identified in the two-level multilevel model reported in the previous chapter.
Initial data management and descriptive analysis was carried out in IBM SPSS Statistics version 21 and regression modelling in Stata Intercooled version 11.
Reliability
Estimating reliability in a three-level model is somewhat more complex than a two-level model because the Spearman–Brown prophecy formula does not straightforwardly extend to this situation (although it has been used to estimate reliability for physician level measurement using ICCs estimated in three or more level models). We, therefore, examined reliability using generalizability theory (G-theory), which is an approach to partitioning variance developed in the context of educational assessment. 128 Classical test theory assumes that a test score is composed of a true score plus an error score because the instrument is imperfect. Reliability is then defined as the ratio of variance in the true score to the observed variance which is composed of both true and error variance. In practice, there are many different kinds of reliability depending on what is being measured, including scores made by one observer at two time points (intraobserver or intrarater reliability), scores made by different observers at the same time point (interobserver reliability), different items on a multi-item scale (internal consistency) and so on. In practice, there will often be multiple sources of error, and G-theory allows measured error to be partitioned in a G-study based on the actual data, and then to be modelled in a decision study which examines how reliability would change by altering the number of observations or other parameters. 128 The aim of D-studies is to inform consideration of the feasibility of implementing a reliable system to differentiate practices and doctors in terms of high-risk prescribing.
From this perspective, we can conceive of each encounter a GP has with a patient at risk as being a binary outcome (prescribed or not prescribed) test of their likelihood of prescribing a NSAID to a patient particularly vulnerable to NSAID adverse drug effects. We used urGENOVA programme and associated software (G_String_IV; The Program for Educational Research and Development, faculty of Health Sciences, McMaster University, Hamilton ON, Canada. Available from: http://fhspend.mcmaster.ca/g_string/) to conduct G-studies and associated D-studies. However, G_String_IV could not analyse the full data set, and we, therefore, used data for GPs with at least one hundred encounters to carry out a G-study, with the focus then being on the D-studies based on this analysis. These studies allowed the calculation of the different reliabilities achieved when discriminating between practices across a range of different possible numbers of encounters and GPs, and the reliabilities achieved when discriminating between GPs across a range of different possible numbers of encounters. 128,134 Only the results of the D-studies are presented.
Results
The analysis is of 181,010 encounters in 2006 between 26,539 patients particularly vulnerable to NSAID ADEs and 398 GPs in 38 practices. Of note is that the number of patients included is fewer than the Q4 2006 analysis reported in the previous chapter, because a proportion of patients at risk do not consult and so do not have an opportunity to be prescribed a new acute NSAID.
Prevalence of high-risk new acute non-steroidal anti-inflammatory drug prescribing for all five indicators and the composite
Table 8 shows the prevalence of high-risk new acute prescribing in 2006 for the five individual indicators and for the composite, and variation between practices and between GPs. Between 0.20% and 1.59% of encounters with those particularly vulnerable to NSAID ADEs as defined by the individual indicators involved the prescription of a new acute NSAID, with 1.08% (95% CI 1.03% to 1.13%) of encounters with any patient at risk involving a new acute NSAID prescription. The highest rate of new acute NSAID prescribing was to people with a history of peptic ulcer disease and the lowest for coprescription of a NSAID with an oral anticoagulant.
| Indicator (no. of encounters) | % (95% CI)a | Practice mean (range) | Practice median (interquartile range) | GP mean (range) | GP median (interquartile range) |
|---|---|---|---|---|---|
| 1. NSAID prescribed to person with diagnosis of previous peptic ulcer (n = 40,414) | 1.59 (1.46 to 1.71) | 1.67 (0.24–3.93) | 1.37 (1.06–21.52) | 1.62 (0–33.33) | 0 (0–19.82) |
| 2. NSAID prescribed to person aged 75 years and over (n = 99,306) | 0.80 (0.74 to 0.85) | 0.89 (0.11–2.75) | 0.76 (0.50–1.23) | 0.86 (0–15.38) | 0.17 (0–1.22) |
| 3. NSAID prescribed to person with diagnosis of heart failure (n = 31,009) | 0.75 (0.65 to 0.85) | 0.81 (0–5.13) | 0.58 (0.32–1.01) | 0.72 (0–25.00) | 0 (0–0.68) |
| 4. NSAID prescribed to person also prescribed oral anticoagulant (n = 25,773) | 0.20 (0.15 to 0.26) | 0.25 (0–1.12) | 0.15 (0–0.41) | 0.25 (0–10.00) | 0 (0–0) |
| 5. NSAID prescribed to person also prescribed aspirin or clopidogrel (n = 88,364) | 1.04 (0.97 to 1.11) | 1.23 (0.30–6.00) | 0.93 (0.56–1.56) | 1.11 (0–22.22) | 0.46 (0–1.41) |
| Composite for main analysis (n = 181,010) | 1.09 (1.03 to 1.13) | 1.21 (0.37–3.50) | 1.01 (0.76–1.51) | 1.21 (0–20.00) | 0.68 (0–1.50) |
There was evidence of variation between practices, with the minimum to maximum range of prevalence for the composite being 0.37–3.50%, and the interquartile range 0.76–1.51%. For two indicators, the minimum at practice level was zero (NSAIDs and heart failure; NSAIDs coprescribed with an oral anticoagulant), and for one the lowest quartile was zero (NSAIDs coprescribed with an oral anticoagulant). Variation at GP level was greater, with the minimum to maximum range of prevalence for the composite being 0–20.0%, and the interquartile range 0–1.50%. For all indicators, the minimum at GP level was zero, and for three individual indicators and the composite, the lowest quartile was zero (NSAIDs with peptic ulcer; NSAIDs and heart failure; NSAIDs coprescribed with an oral anticoagulant).
Figure 7 shows variation between GPs within practices. GPs are grouped within practices, and GP rates of new acute NSAID prescribing are plotted in ascending order of practice rate, and then ascending order of GP rate within practice. Visually, there is a reasonable amount of within practice variation across the entire range of practice variation. On the face of it, there is much more variation between GPs than between practices, but this would be expected to be at least partly driven by there being fewer encounters per GP than per practice. One hundred and thirty-three (33.4%) GPs had no high-risk NSAID prescribing and, not unexpectedly, the GPs with the highest and the lowest (zero) rates of prescribing are most commonly those with relatively few encounters, with, for example, the GP with the ‘highest’ prescribing (20%) having 15 encounters with eligible patients and prescribing three of them a new acute NSAID (Figure 8).
FIGURE 7.
League table of frequency of new acute NSAID prescribing in encounters with patients at risk by GPs within practices (in ascending order of practice rates, then ascending order of GP rates).
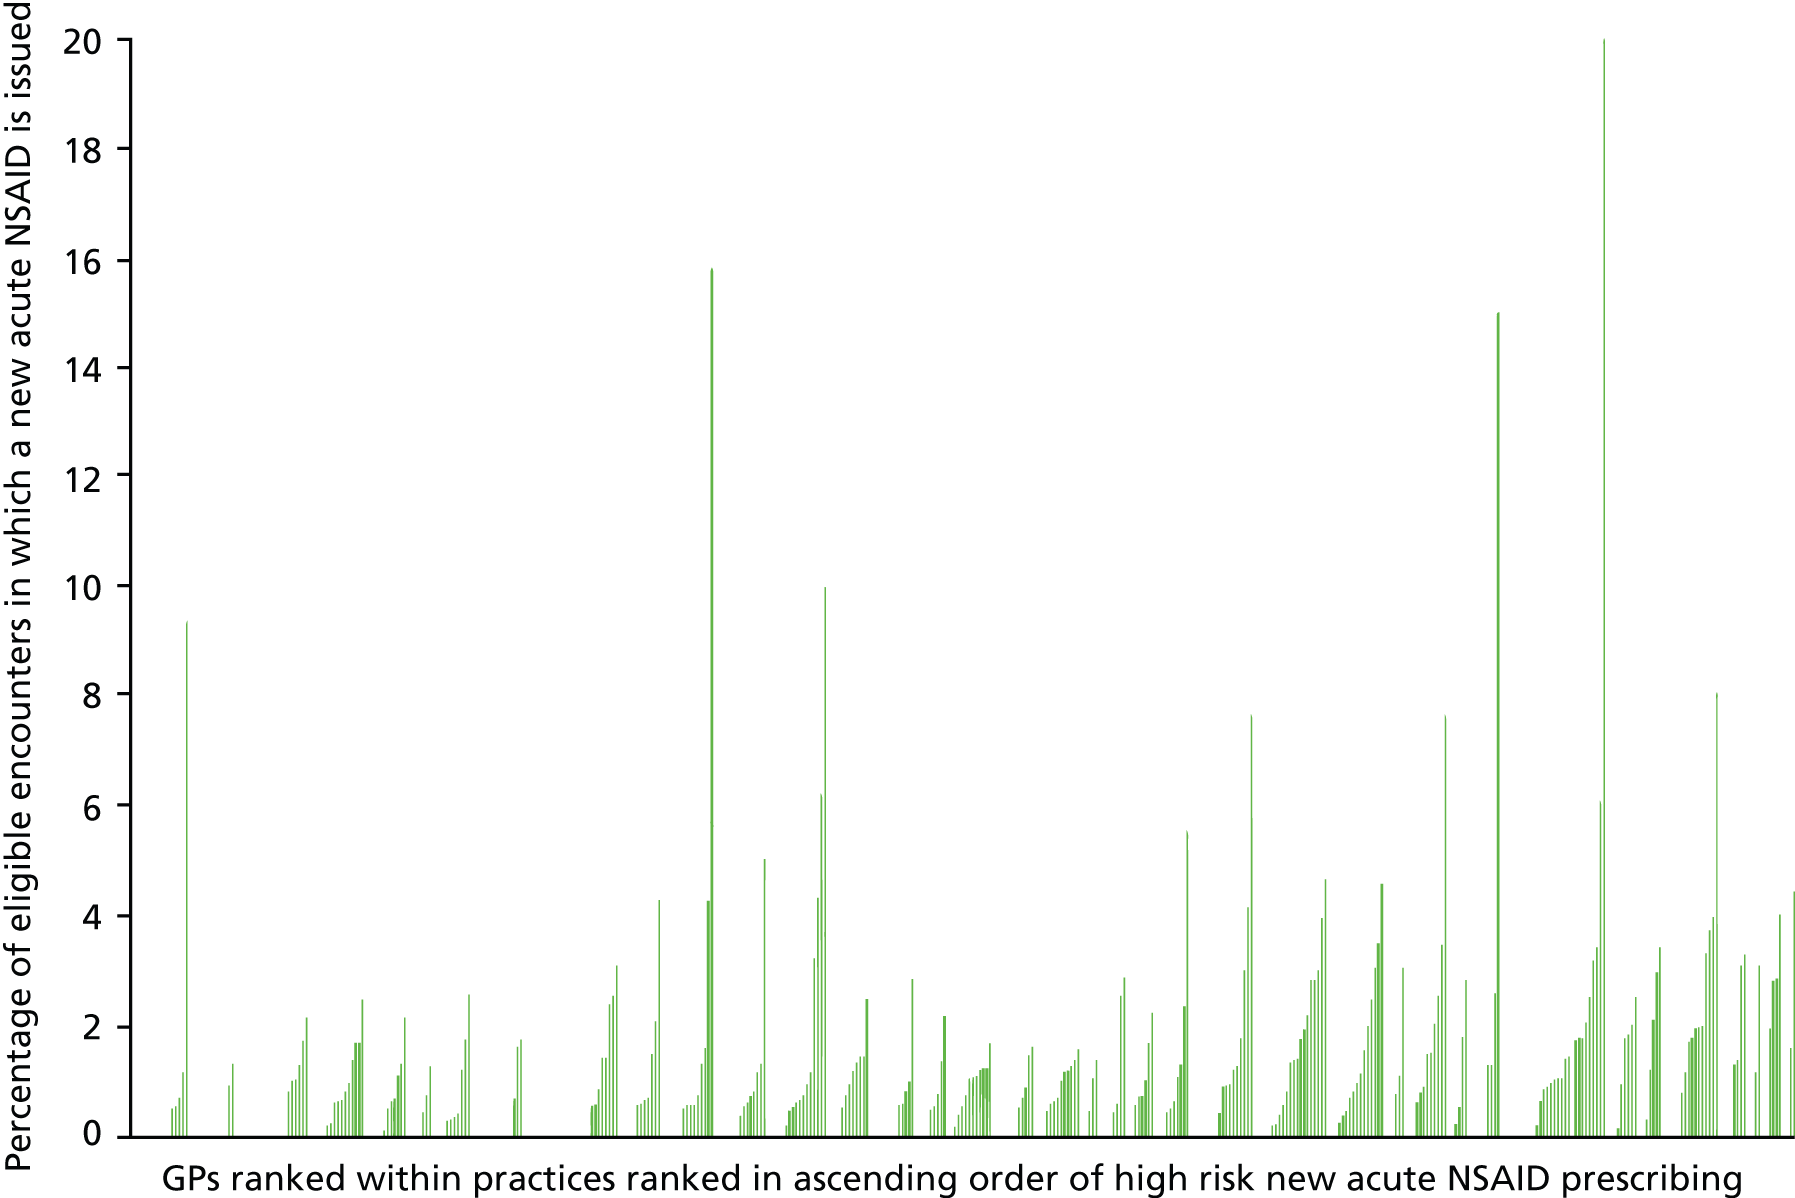
FIGURE 8.
Scatterplot of frequency at GP level of new acute NSAID prescribing in encounters with patient at risk and number of encounters with patients at risk each GP has.
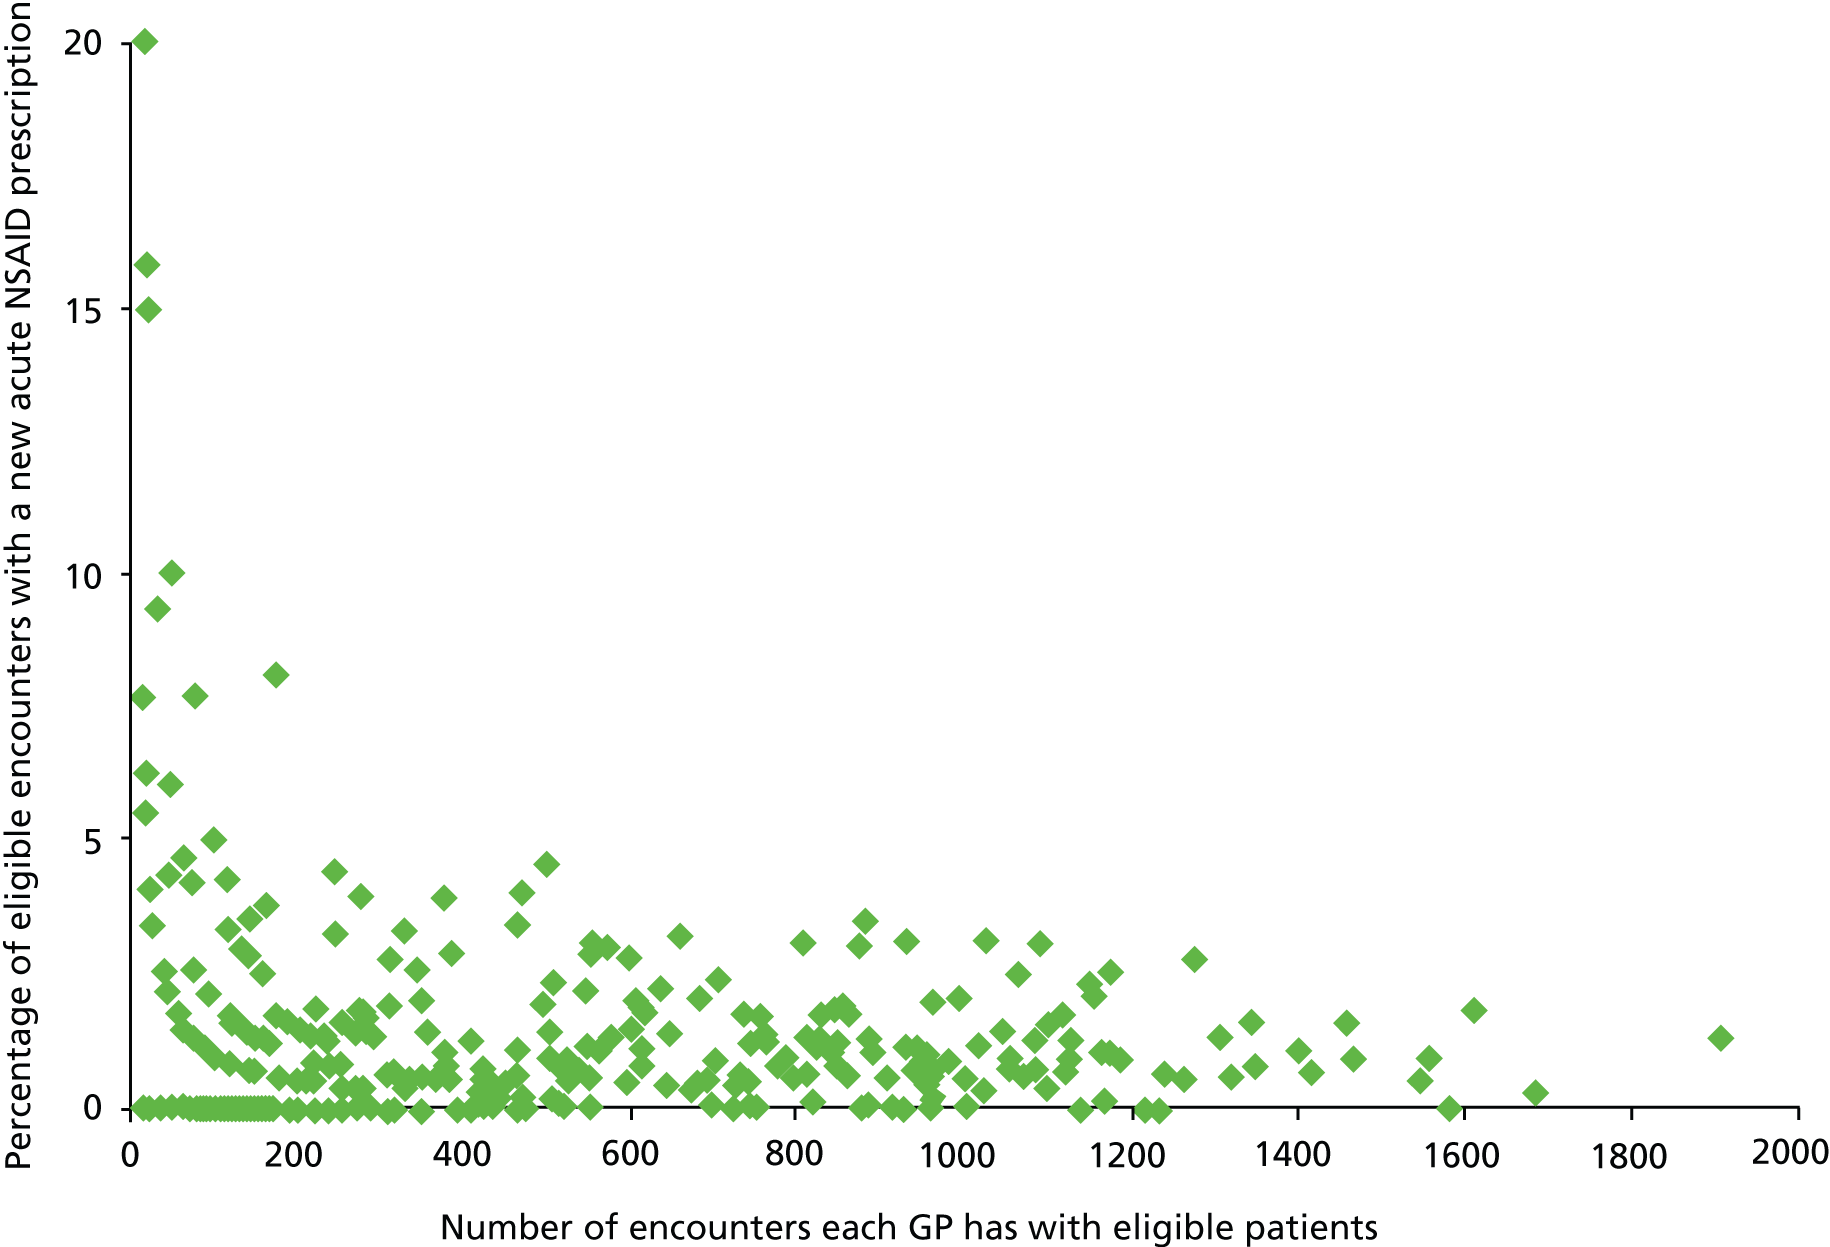
Intraclass correlation coefficients estimated from the three-level empty model are shown in Table 9. These can be interpreted as showing the proportion of variation in encounter outcomes that is attributable to either practice or clinician. The proportion of variation attributable to variation between practices ranged from 1.9% (NSAIDs coprescribed with anticoagulants) to 8.7% (NSAIDs and heart failure), and was 5.5% for the composite. The proportion of variation attributable to variation between GPs ranged from 12.2% (NSAIDs and heart failure) to 17.1% (NSAIDs coprescribed with oral anticoagulants) and was 16.6% for the composite. The proportion of variation attributable to either practices or GPs ranged from 14.6% (NSAIDs and peptic ulcer) to 25.0% (NSAIDs coprescribed with anticoagulants), and was 20.5% for the composite. For every indicator, a higher proportion of the variation was attributable to GPs than to practices, ranging from 1.4 times more at GP level for NSAIDs in heart failure to 6.7 times for NSAIDs in peptic ulcer and 3.0 times more at GP level for the composite. Remaining variation is a mixture of variation between encounters and random variation but cannot be further partitioned. 123,125,129 At practice level, the estimated ICCs are similar to that found in other studies and at GP level the ICCs are at the upper end of observed ranges. 79
| Indicator (no. of encounters) | % (95% CI)a | Practice-level ICC (95% CI) | GP-level ICC (95% CI) | Practice-level median odds ratio (95% CI) | GP-level median odds ratio (95% CI) |
|---|---|---|---|---|---|
| 1. NSAID prescribed to person with diagnosis of previous peptic ulcer (n = 40,414) | 1.59 (1.46 to 1.71) | 0.019 (0.005 to 0.073) | 0.127 (0.087 to 0.173) | 2.04 (1.73 to 2.69) | 1.95 (1.71 to 2.29) |
| 2. NSAID prescribed to person aged 75 years and over (n = 99,306) | 0.80 (0.74 to 0.85) | 0.060 (0.029 to 0.119) | 0.167 (0.127 to 0.209) | 2.56 (2.11 to 3.34) | 2.24 (1.96 to 2.62) |
| 3. NSAID prescribed to person with diagnosis of heart failure (n = 31,009) | 0.75 (0.65 to 0.85) | 0.087 (0.040 to 0.173) | 0.122 (0.072 to 0.189) | 2.44 (1.85 to 3.69) | 1.97 (1.63 to 2.57) |
| 4. NSAID prescribed to person also prescribed oral anticoagulant (n = 25,773) | 0.20 (0.15 to 0.26) | 0.079 (0.017 to 0.228) | 0.171 (0.045 to 0.403) | 2.71 (1.56 to 9.60) | 2.29 (1.46 to 6.09) |
| 5. NSAID prescribed to person also prescribed aspirin or clopidogrel (n = 88,364) | 1.04 (0.97 to 1.11) | 0.060 (0.030 to 0.114) | 0.132 (0.100 to 0.168) | 2.33 (1.96 to 3.09) | 2.01 (1.80 to 2.31) |
| Composite for main analysis (n = 181,010) | 1.08 (1.03 to 1.13) | 0.055 (0.029 to 0.102) | 0.166 (0.135 to 0.197) | 2.52 (2.15 to 3.09) | 2.22 (2.00 to 2.50) |
The median odds ratio is an alternative way of examining variation between GPs and between practices, although it is most useful in models with fixed effects fitted, as it allows comparison of the magnitude of fixed and random effects on the same scale. 124 Two median odds ratios in the various empty models are shown in Table 10. The GP-level median odds ratio is the median odds ratio between two randomly selected eligible encounters with the different GPs in the same practice. The practice-level median odds ratio is the median odds ratio between two randomly selected eligible encounters with different GPs in different practices. The practice-level median odds ratio should therefore be interpreted in terms of its difference from the GP-level median odds ratio, as it represents the additional variation in outcome from seeing a different GP in a different practice, compared with a different GP in the same practice. The median odds ratio at GP level varied between 1.95 and 2.29 for the individual indicators, and was 2.22 for the composite. At practice level, median odds ratios only increased in size by a small amount, varying between 2.04 and 2.71 for the individual indicators and 2.52 for the composite.
Composite indicator univariate associations
Table 24 in Appendix 4 shows how the percentage of high-risk new acute NSAID prescribing varies by encounter characteristics and the characteristics of the patient in the encounter, with the same for GP and practice characteristics shown in Table 25, Appendix 4. The equivalent multilevel univariate ORs are shown in Tables 26 and 28, Appendix 4, and the univariate findings are briefly summarised here.
Compared with normal surgery encounters (face-to-face in a normal surgery), high-risk new acute NSAID prescribing was less common in telephone or other/unknown encounter types [0.46% for telephone, 0.36% for other vs. 1.33% for normal surgery, OR 0.26 (95% CI 0.20 to 0.33) for telephone, OR 0.31 (95% CI 0.25 to 0.37) for unknown/other]. As in the previous analysis, the more risk factors for NSAID ADEs that a patient had, the less likely they were to receive a NSAID (0.48% in those eligible for three or more of the five individual indicators vs. 1.38% in those eligible for one, OR 0.35, 95% CI 0.28 to 0.42). Encounters where a ‘relevant diagnosis’ had been recorded were much more likely to have a NSAID prescribed (2.72% vs. 0.40% in those without a relevant diagnosis recorded, OR 7.12, 95% CI 6.48 to 7.97). Encounters with older people were much less likely to result in a NSAID prescription (2.18% in those under 50 years vs. 0.66% in those aged 80 years and over, OR 0.31, 95% CI 0.26 to 0.37), as were encounters with patients taking more repeat medication (1.76% in those on no repeat drugs vs. 0.62% in those taking 11 or more, OR 0.32, 95% CI 0.24 to 0.42). Encounters with a male patient were slightly more likely to result in a NSAID prescription (1.20% vs. 0.98% in women, OR 1.18, 95% CI 1.08 to 1.29), but there was no association with socioeconomic status.
Male GPs were more likely than women to prescribe a high-risk new acute NSAID (1.32% vs. 0.68%, OR 1.82, 95% CI 1.44 to 2.31), but there was no association with the number of encounters GPs had. None of the practice characteristics examined was associated with new acute NSAID prescribing.
Composite indicator adjusted analysis
In multivariate analysis, six variables were statistically significantly associated with high-risk NSAID prescribing (see Table 10) – three encounter characteristics (encounter type, the number of indicators the patient was eligible for at the time of the encounter and the presence of a relevant diagnosis code for the encounter), two characteristics of patients being encountered (patient age and the number of active repeat drugs the patient was on), and one GP characteristic (GP sex). Two models were fitted, one without GP sex and one with. Associations with encounter level variables did not meaningfully change with the inclusion of GP sex, so the text that follows refers to the ORs in the final model.
| Encounter, patient and GP characteristics | Empty model, % (95% CI) of encounters with a high-risk new acute NSAID | Encounter and patient in encounter variables only OR (95% CI) | All variables OR (95% CI) |
|---|---|---|---|
| Encounter characteristics | |||
| Encounter type | |||
| Normal surgery (n = 133,614) | 1.33 (1.27 to 1.40) | 1 | 1 |
| Telephone (n = 16,855) | 0.46 (0.27 to 0.45) | 0.68 (0.52 to 0.89) | 0.68 (0.52 to 0.89) |
| Unknown/other (n = 30,541) | 0.36 (0.30 to 0.44) | 0.34 (0.28 to 0.42) | 0.34 (0.29 to 0.42) |
| Indicators triggered at encounter date | |||
| 1 (n = 99,389) | 1.38 (1.30 to 1.46) | 1 | 1 |
| 2 (n = 61,404) | 0.79 (0.72 to 0.86) | 0.81 (0.73 to 0.91) | 0.81 (0.73 to 0.91) |
| ≥ 3 (n = 20,217) | 0.48 (0.38 to 0.58) | 0.62 (0.49 to 0.77) | 0.61 (0.49 to 0.76) |
| Relevant diagnosis at encounter | |||
| No (n = 127,984) | 0.40 (0.37 to 0.44) | 1 | 1 |
| Yes (n = 53,026) | 2.72 (2.56 to 2.86) | 7.03 (6.33 to 7.82) | 7.03 (6.32 to 7.82) |
| Characteristics of patients in encounter | |||
| Age | |||
| < 50 years (n = 1767 patients, 8893 encounters) | 2.18 (1.85 to 2.51) | 1 | 1 |
| 50–59 years (n = 1779 patients, 10,600 encounters) | 1.98 (1.70 to 2.26) | 1.07 (0.87 to 1.32) | 1.07 (0.87 to 1.32) |
| 60–69 years (n = 4929 patients, 30,991 encounters) | 1.41 (1.28 to 1.55) | 0.94 (0.78 to 1.13) | 0.93 (0.77 to 1.12) |
| 70–79 years (n = 9342 patients, 64,502 encounters) | 1.05 (0.96 to 1.13) | 0.74 (0.62 to 0.89) | 0.74 (0.62 to 0.89) |
| > 80 years (n = 8722 patients, 66,024 encounters) | 0.66 (0.60 to 0.72) | 0.59 (0.49 to 0.72) | 0.59 (0.49 to 0.72) |
| No. of repeat drugs | |||
| 0 (n = 4874 patients, 24,051 encounters) | 1.76 (1.58 to 1.94) | 1 | 1 |
| 1–2 (n = 5225 patients, 31,435 encounters) | 1.39 (1.25 to 1.52) | 0.86 (0.4 to 0.99) | 0.86 (0.74 to 0.99) |
| 3–4 (n = 6183 patients, 42,589 encounters) | 0.85 (0.75 to 0.95) | 0.73 (0.63 to 0.84) | 0.73 (0.63 to 0.84) |
| 5–6 (n = 4893 patients, 36,075 encounters) | 0.77 (0.65 to 0.88) | 0.61 (0.52 to 0.72) | 0.61 (0.52 to 0.72) |
| 7–8 (n = 2922 patients, 23,926 encounters) | 0.77 (0.65 to 0.88) | 0.55 (0.43 to 0.70) | 0.61 (0.50 to 0.73) |
| 9–10 (n = 1409 patients, 12,897 encounters) | 0.70 (0.55 to 0.85) | 0.55 (0.43 to 0.70) | 0.55 (0.43 to 0.71) |
| >11 (n = 1033 patients, 10,037 encounters) | 0.62 (0.46 to 0.78) | 0.51 (0.38 to 0.68) | 0.51 (0.39 to 0.68) |
| GP characteristics | |||
| GP sex | |||
| Women (n = 159 GPs, 67,615 encounters) | 0.68 (0.53 to 0.83) | – | 1 |
| Men (n = 239 GPs, 113,395 encounters) | 1.32 (1.17 to 1.46) | – | 1.73 (1.39 to 2.16) |
| Random effects | |||
| Practice level variance (95% CI) | 0.177 (0.083 to 0.379) | 0.171 (0.080 to 0.368) | 0.123 (0.052 to 0.291) |
| Clinician level variance (95% CI) | 0.599 (0.452 to 0.792) | 0.574 (0.432 to 0.763) | 0.514 (0.383 to 0.690) |
| Practice level ICC (95% CI) | 0.055 (0.029 to 0.102) | 0.042 (0.021 to 0.083) | 0.031 (0.014 to 0.068) |
| Clinician level ICC (95% CI) | 0.166 (0.135 to 0.197) | 0.142 (0.114 to 0.173) | 0.131 (0.103 to 0.161) |
| Median odds ratio (95% CI) different GP different practice | 2.52 (2.15 to 3.09) | 2.28 (1.98 to 2.76) | 2.14 (1.88 to 2.57) |
| Median odds ratio (95% CI) different GP same practice | 2.22 (2.00 to 2.50) | 2.06 (1.87 to 2.30) | 1.98 (1.80 to 2.21) |
The most strongly associated variable was whether or not a relevant diagnosis had been recorded for the encounter (OR 7.03, 95% CI 6.32 to 7.82), which is not surprising (the variable was included primarily to account for case-mix variation between GPs94). Most of the other observed univariate associations weakened somewhat after adjustment, although all remained statistically significant. Compared with normal surgery encounters, the association between new acute NSAID prescribing and telephone encounters weakened somewhat after adjustment but remained statistically significant (OR 0.68, 95% CI 0.52 to 0.89) and the association with other/unknown encounters remained the same (OR 0.34, 95% CI 0.29 to 0.42). Associations with the number of risk factors a patient had also weakened but remained statistically significant (OR 0.61. 95% CI 0.49 to 0.76, in those eligible for three or more of the five individual indicators vs. those eligible for one). There were no statistically significant differences between encounters with those aged 50–59 years or 60–69 years compared with the under-50-year-olds, but encounters with people aged 70–79 years (OR 0.74, 95% CI 0.62 to 0.89, compared with the under-50-year-olds) and with those 80 years and over (OR 0.59, 95% CI 0.49 to 0.72) were less likely to result in a high-risk new acute NSAID. Encounters with people taking 11 or more repeats had half the odds of resulting in a new acute NSAID than those with people with no active repeat drugs (OR 0.51, 95% CI 0.39 to 0.68). GP sex remained statistically significantly associated with high-risk new acute NSAID prescribing (OR 1.73, 95% CI 1.39 to 2.16, for male GPs compared with female).
The practice-level ICC in the empty model was 0.055 (95% CI 0.029 to 0.102), compared with 0.042 (95% CI 0.021 to 0.083) in the adjusted model with only encounter-level fixed effects and 0.031 (95% CI 0.014 to 0.068) in the adjusted model with both encounter-level and GP-level fixed effects. Including the encounter-level fixed effects therefore slightly increased the estimated variation between practices, whereas accounting for GP sex slightly reduced it. The GP level ICC in the empty model was 0.166 (95% CI 0.135 to 0.197), compared with 0.142 (95% CI 0.114 to 0.173) in the adjusted model with only patient-level fixed effects and 0.131 (95% CI 0.103 to 0.161) in the adjusted model with both patient- and GP-level fixed effects.
The median odds ratio is an alternative way of examining variation between GPs and between practices, and expresses random variation on the same OR scale as the estimates of associations with fixed effects. 124 Two median odds ratios were calculated. The GP-level median odds ratio is the median odds ratio between two randomly selected eligible encounters with the different GPs in the same practice. The practice-level median odds ratio is the median odds ratio between two randomly selected eligible encounters with different GPs in different practices. The practice-level median odds ratio should therefore be interpreted in terms of its difference from the GP-level median odds ratio, as it represents the additional variation in outcome from encountering a different GP in a different practice, compared with encountering a different GP in the same practice. The median odds ratio at GP level was 2.22 (95% CI 2.00 to 2.50) in the empty model, 2.06 (95% CI 1.87 to 2.30) in the model with only encounter-level fixed effects and 1.98 (95% CI 1.80 to 2.21) in the adjusted model with both encounter and GP fixed effects. The median odds ratio at practice level was 2.52 (95% CI 2.15 to 3.09) in the empty model, 2.28 (95% CI 1.98 to 2.76) in the model with only encounter-level fixed effects, and 2.14 (95% CI 1.88 to 2.57) in the adjusted model with both encounter and GP fixed effects. Put another way, encountering a different GP in the same practice has a similar magnitude of association with outcome as the adjusted association between high-risk prescribing and age or the number of repeat drugs. Encountering a different GP in a different practice has slightly higher ORs but a very similar magnitude.
Figure 9 shows variation by practice based on estimated shrunken residuals for each practice from the model adjusted for patient characteristics only. Three of the 38 practices had statistically significantly higher rates of high-risk new acute NSAID prescribing than the population average, and two had statistically significantly lower rates. At GP level, 55 out of 398 GPs had statistically significantly higher rates of new acute NSAID, and 10 had statistically significantly lower rates (Figure 10). The majority of GPs in practices which had statistically significantly higher new acute NSAID prescribing did not themselves have statistically significantly higher rates of such prescribing. Of the 46 GPs in the three practices with statistically significantly higher new acute NSAID prescribing, eight had statistically significantly higher new acute NSAID prescribing, two had statistically significantly lower and 36 were not statistically different from average (Figure 11). Overall, therefore, of the 55 GPs with statistically significantly higher than average new acute NSAID prescribing, eight (15.7%) were in the three practices with statistically significantly higher than average prescribing (7.9% of practices with 15.3% of GPs), three (5.9%) were in the two practices with statistically significantly lower than average prescribing (5.3% of practices with 11.6% of GPs), and 40 (78.4%) were in the remaining 33 practices (78.4% of practices with 73.1% of GPs).
FIGURE 9.
Residual variation between practices after accounting for patient characteristics statistically significantly associated with high-risk new acute NSAID prescribing (practice-level shrunken residuals estimated from the adjusted model in Table 10).
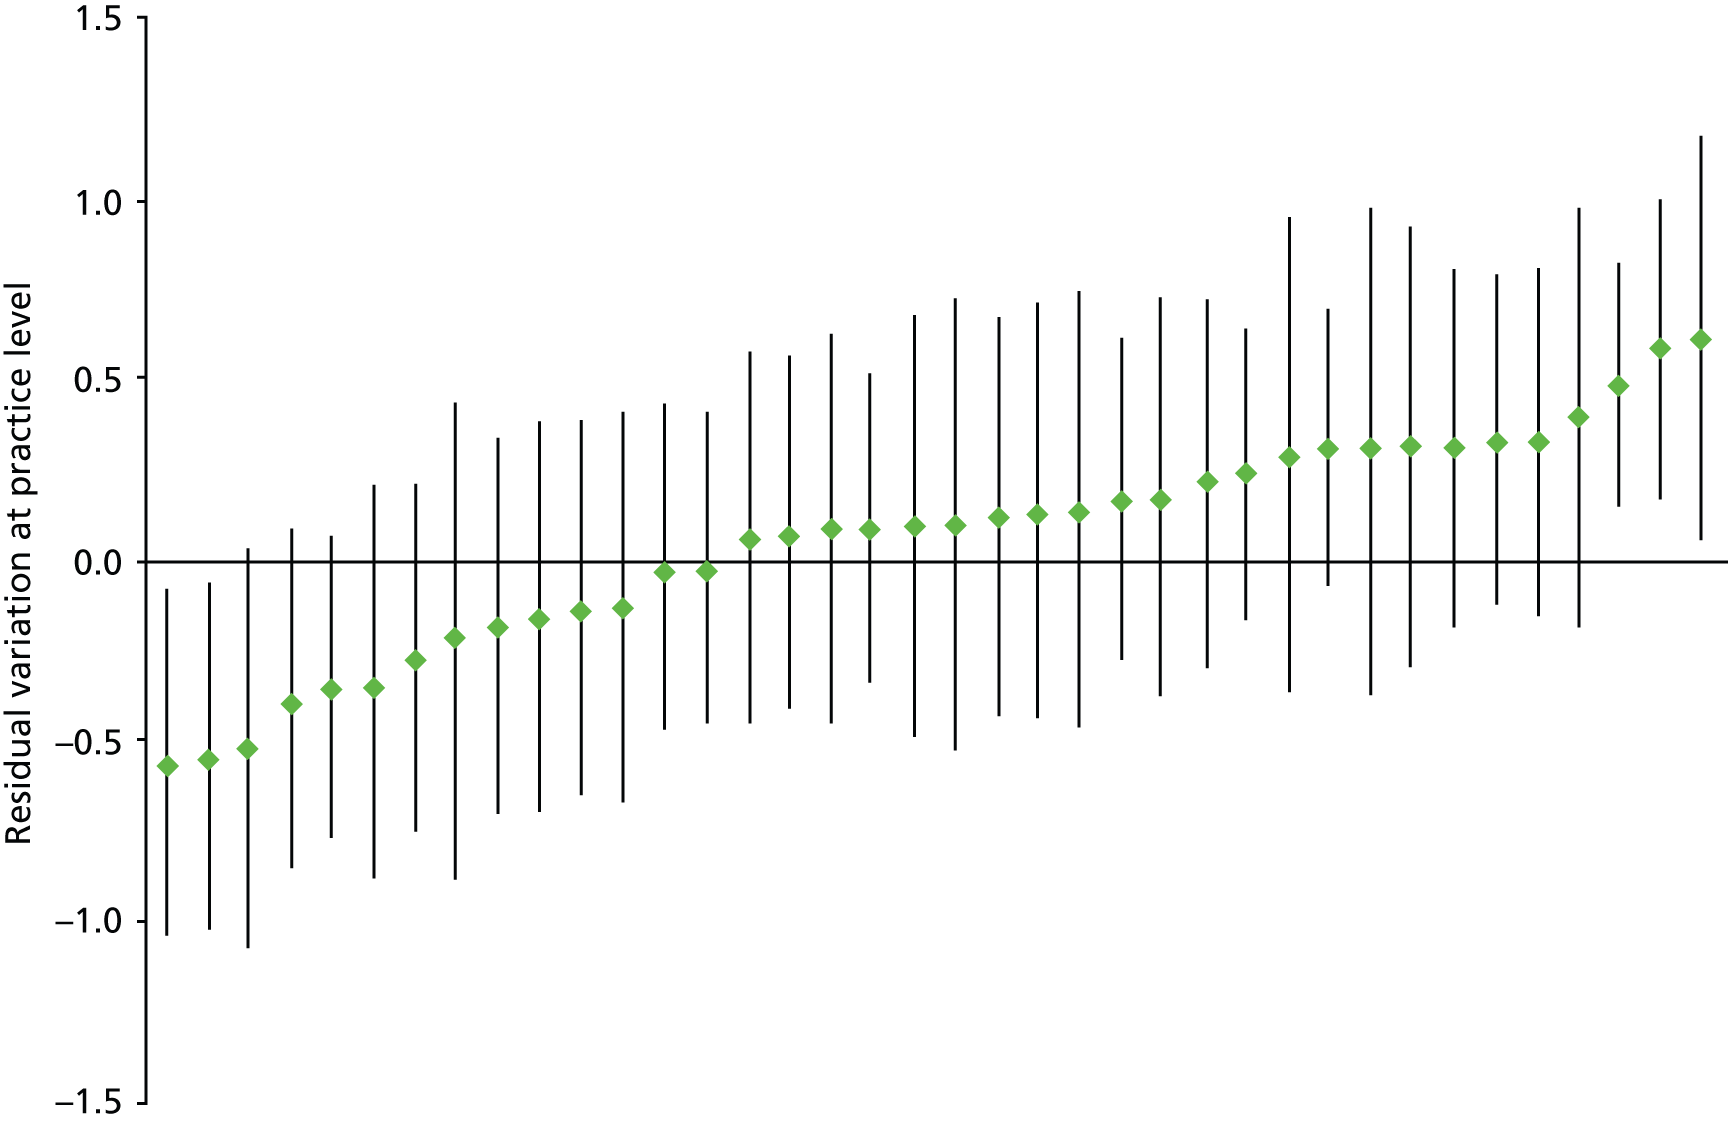
FIGURE 10.
Residual variation between GPs after accounting for patient characteristics statistically significantly associated with high-risk new acute NSAID prescribing (practice-level shrunken residuals estimated from the adjusted model in Table 10).
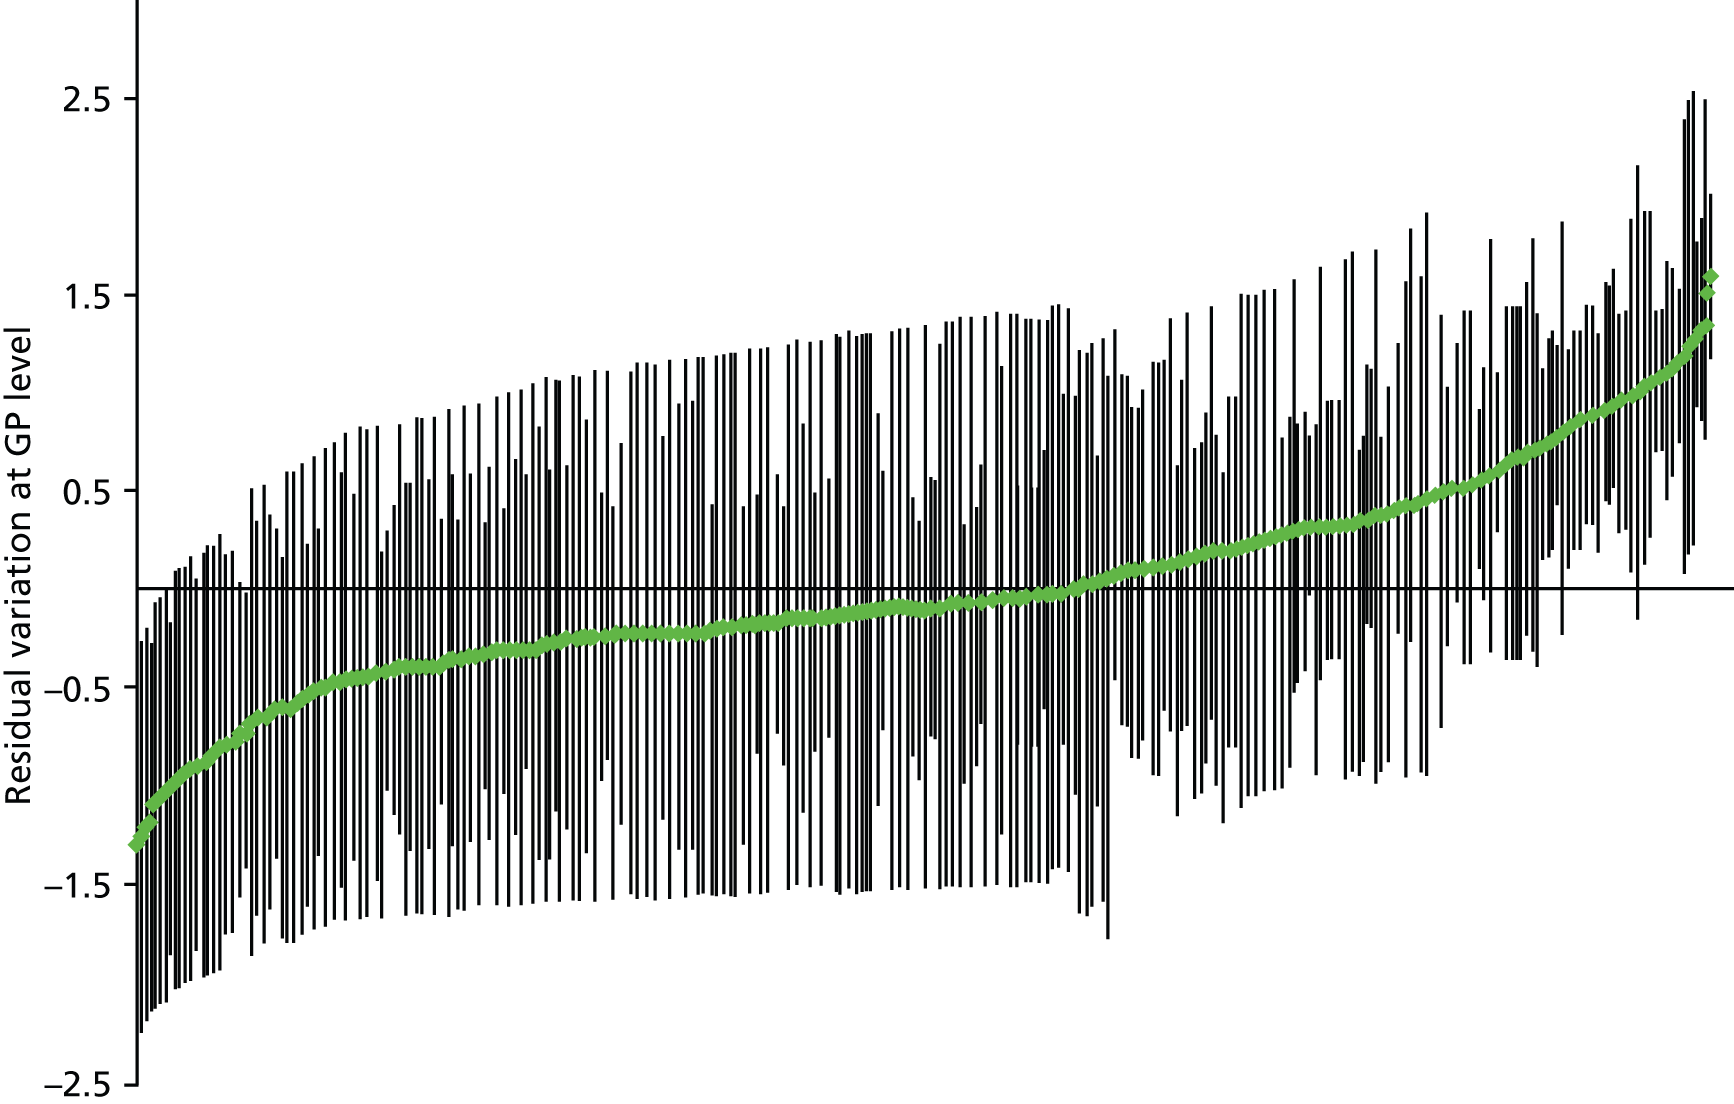
FIGURE 11.
Variation in high-risk new acute NSAID prescribing between GPs in practices with higher than average high-risk new acute prescribing (practice-level shrunken residuals estimated from the adjusted model in Table 10).
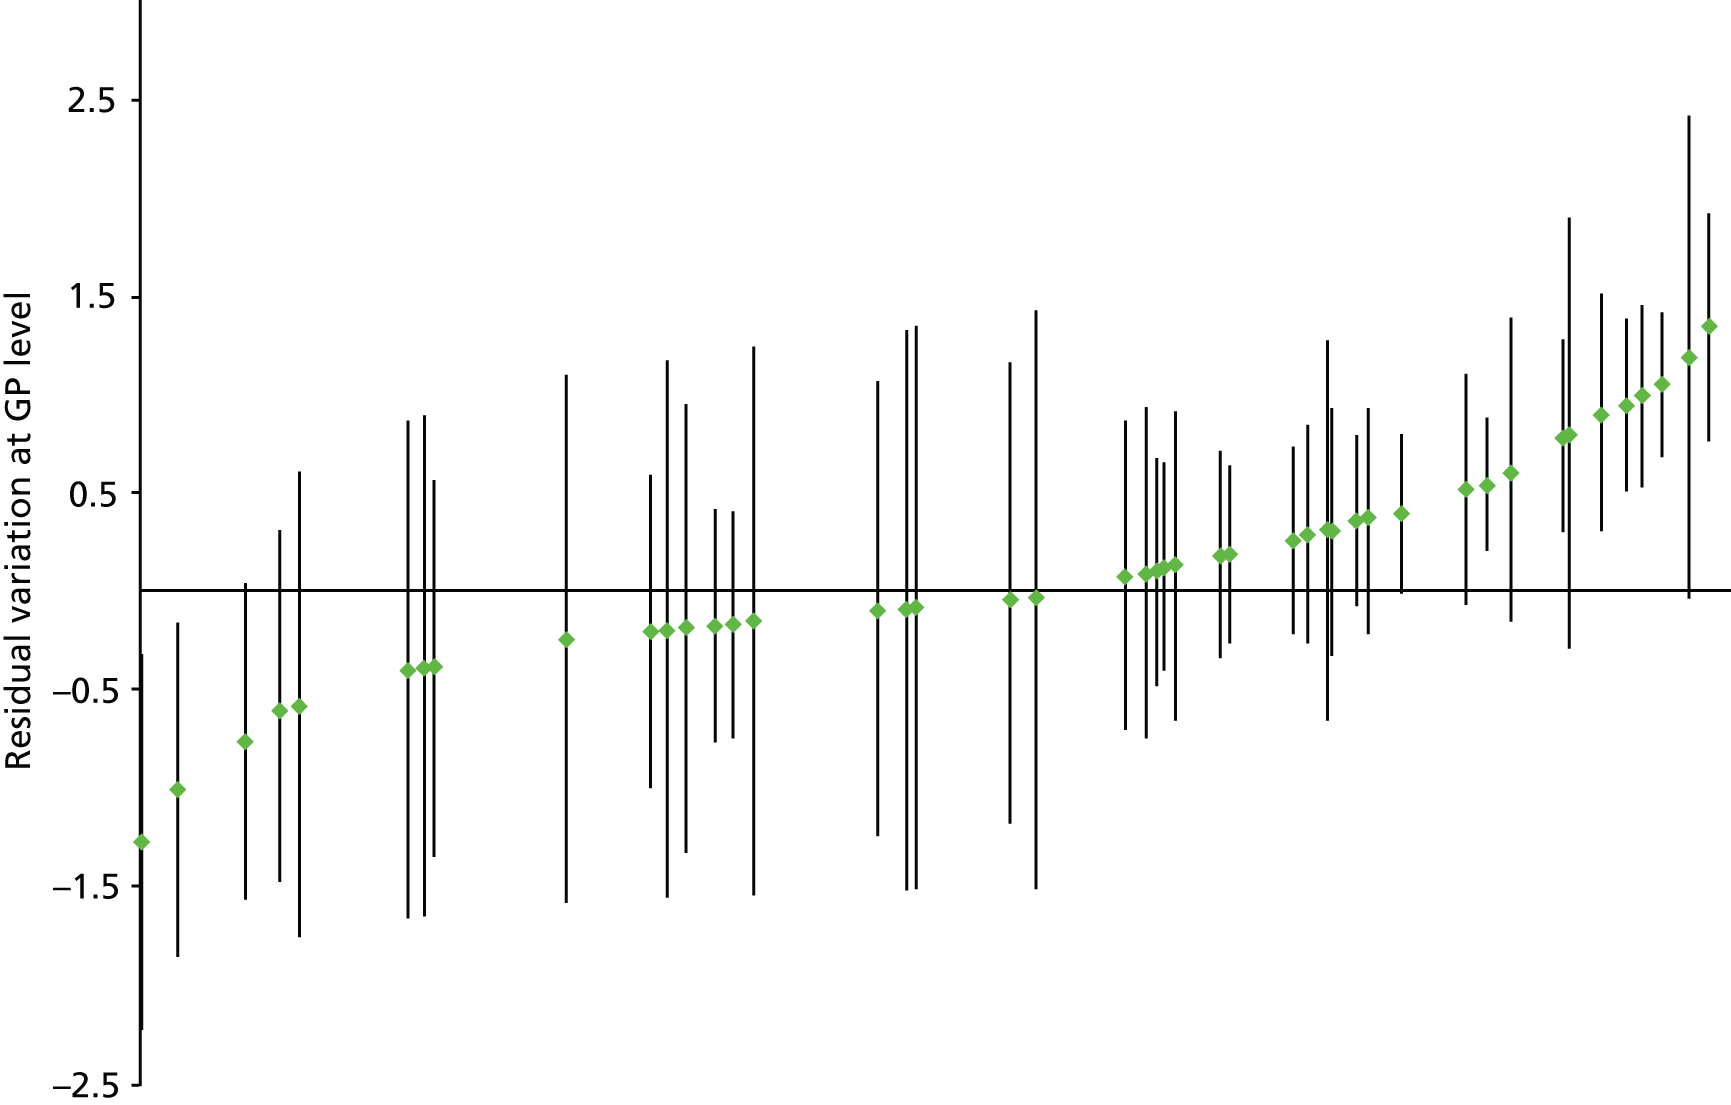
Generalizability theory reliability studies
Table 11 gives the reliabilities achieved for the ability to differentiate between practices’ prescribing safety for different numbers of combinations of observation (encounters per doctor and number of doctors within practices). As expected, the ability to differentiate between practices increased with the number of encounters and the number of GPs. Reliability was good (G = 0.713) for practices with 15 GPs each having 200 encounters, which is adequate for quality improvement purposes, but it was only moderate for practices with five GPs and 500 encounters per GP (G = 0.526). Of note is that in the study data set, the interquartile range for the number of GPs per practice is 6–14, and for encounters per GP 90–766. Reliability at practice level is therefore relatively poor for the majority of practices.
| Reliability | Number of encounters | Number of doctors (within practices) | Reliability, G coefficient |
|---|---|---|---|
| Facets of generalisation: GP, encounter, question treated as random variables | 100 | 5 | 0.387 |
| 200 | 5 | 0.464 | |
| 300 | 5 | 0.496 | |
| 500 | 5 | 0.526 | |
| 1000 | 5 | 0.550 | |
| 100 | 10 | 0.550 | |
| 200 | 10 | 0.628 | |
| 300 | 10 | 0.659 | |
| 500 | 10 | 0.686 | |
| 1000 | 10 | 0.708 | |
| 100 | 15 | 0.640 | |
| 200 | 15 | 0.713 | |
| 300 | 15 | 0.740 | |
| 500 | 15 | 0.765 | |
| 1000 | 15 | 0.784 |
Table 12 shows the reliabilities (ability to differentiate between individual doctors’ prescribing safety) for a given number of encounters for each doctor independent of practice. High variance between doctors (which contributed to the relatively poor reliability in differentiating between practices) resulted in moderate reliability (G = 0.699) for 200 encounters per GP and high reliability (G = 0.823) for 400 encounters per GP. In total, 61% of GPs in this data set had ≥ 200 encounters with patients particularly vulnerable to high-risk NSAID prescribing in 2006 and 44.7% had ≥ 400 encounters, indicating that in practice only GPs with relatively heavy clinical workloads could be reliably measured.
| Reliability | Number of encounters | Reliability, G coefficient |
|---|---|---|
| Facets of generalisation: encounter, question treated as random variables | 100 | 0.537 |
| 200 | 0.699 | |
| 300 | 0.777 | |
| 400 | 0.823 | |
| 500 | 0.853 |
Discussion
Summary of findings
New acute NSAID prescribing to patients at particularly high risk of NSAID-related ADEs occurred in 1.1% of eligible encounters in 2006, varying by individual indicator from 0.20% of encounters with people also prescribed an oral anticoagulant to 1.59% of people with a history of peptic ulceration. In the full multilevel model, high-risk NSAID prescribing was unsurprisingly much more common in encounters with a recorded diagnosis of a musculoskeletal or pain-related symptom (OR 7.03, 95% CI 6.32 to 7.82), and less likely to occur in telephone (OR 0.68, 95% CI 0.52 to 0.89) or other/unknown (OR 0.34, 95% CI 0.29 to 0.42) encounter types compared with normal surgery encounters (i.e. face to face in a normal surgery). Encounters with patients with more risk factors for NSAID ADEs were less likely to end with a new acute NSAID prescription, as were encounters with patients aged 70–79 years (OR vs. the under-50-year-olds 0.74, 95% CI 0.62 to 0.89) and aged 80 years and over (OR 0.59, 95% CI 0.49 to 0.72), and those prescribed more repeat drugs. Male GPs were more likely than female GPs to prescribe a high-risk new acute NSAID (OR 1.73, 95% CI 1.39 to 2.16).
There was evidence of variation between GPs and between practices, with the minimum to maximum range of prevalence for the composite being 0–20% at GP level (interquartile range 0–1.5%) and 0.37–3.50% at practice level (interquartile range 0.76–1.51%). One-third of GPs had no high-risk NSAID prescribing, although the extremes of the distribution at GP level were dominated by those with small numbers of encounters with eligible patients. Graphical examination of rates of high-risk NSAID prescribing was consistent with there being considerable variation between GPs within practices, as well as between GPs more generally. Using empty model estimates of the ICC, the proportion of variation in outcome attributable to variation between practices ranged from 1.9% (NSAIDs and peptic ulcer) to 8.7% (NSAIDs and heart failure), and was 5.5% for the composite. The proportion of variation in outcome attributable to variation between GPs ranged from 12.2% (NSAIDs and heart failure) to 17.1% (NSAIDs coprescribed with oral anticoagulants), and was 16.6% for the composite. For every indicator, there was greater variation at GP level than at practice level. At practice level, the estimated ICCs are similar to that found in other studies, and at GP level the ICCs are at the upper end of observed ranges in other studies. 79
The median odds ratio expresses variation between practices on the same scale as the fixed effects such as patient age or GP sex. The median odds ratio at GP level can be interpreted as the median difference in the odds of receiving a new acute NSAID if the same patient were to randomly encounter two different GPs in the same practice. The median odds ratio at GP level was 2.22 (95% CI 2.00 to 2.50) in the empty model, 2.06 (95% CI 1.87 to 2.30) in the model with only encounter-level fixed effects and 1.98 (95% CI 1.80 to 2.21) in the adjusted model with both encounter and GP fixed effects. The median odds ratio at practice level can be interpreted as the median difference in the odds of receiving a new acute NSAID if the patient were to randomly encounter two different GPs from different practices (but should be interpreted in terms of how different it is from the median odds ratio at GP level, as it includes variation between GPs as well as between practices). The median odds ratio at practice level was 2.52 (95% CI 2.15 to 3.09) in the empty model, 2.28 (95% CI 1.98 to 2.76) in the model with only encounter-level fixed effects and 2.14 (95% CI 1.88 to 2.57) in the adjusted model with both encounter and GP fixed effects. Variation between GPs is, therefore, of a similar magnitude as all of the encounter and GP characteristics included as fixed effects apart from an encounter for a relevant diagnosis.
Three practices and 51 GPs had statistically significantly higher than average high-risk new acute NSAID prescribing after accounting for encounter characteristics. However, most GPs in practices with higher than average new acute NSAID prescribing were not themselves higher than average, and 43 GPs with higher than average prescribing were in practices which were average or statistically significantly lower than average.
Reliability of measurement of high-risk prescribing was poor at practice level, with only the minority of practices with 15 or more GPs being able to be measured with reliability ≥ 0.7. As expected given the higher ICC at GP level, reliability of measurement was better for GPs with just over 60% having enough encounters to be measured with reliability ≥ 0.7 (which is adequate for comparative feedback for improvement purposes) but only 45% having enough to be measured with reliability ≥ 0.8 (which is required for higher-stakes evaluation).
Strengths and limitations
This analysis has the same general strengths and limitations as the analysis described in Chapter 3. It additionally has some important other limitations relating to the relative lack of data about GPs and about practices and to only being able to examine new acute NSAID prescribing.
As noted in Chapter 3, the practice-level data largely describe structural characteristics of the practice and lack information on how practices organise prescribing. Even more so, there are virtually no data available for GP characteristics beyond GP sex and the number of encounters that GPs have with eligible patients (which is a marker for part-time and/or temporary GPs). In particular, we cannot distinguish locum or temporary GPs from GPs in training or from more permanent salaried or partner/principal GPs. There are also no data available on GPs’ knowledge of risk or their attitudes to it, including their more general risk tolerance. This reflects both that routine data do not record such characteristics and the concerns of the data provider to ensure confidentiality, but is a major limitation when it comes to trying to explain why GPs vary. Finally, whereas we can be reasonably confident that a particular prescription was issued to a particular patient, because clinicians take care to ensure this, the attribution of that prescription to a particular GP relies on GPs not sharing user accounts. In general, this will not happen because GPs usually need to log in simultaneously with multiple colleagues working the same day, but it is likely that some locums log in either using a single locum user account or using the log-in of the GP for whom they are covering. Practices are likely to vary in how they organise this, but, without knowing more about the GPs being measured in this study, it is not possible to explore this further. In general, this would most likely cause a bias if locums had a different rate of high-risk prescribing than other GPs (although there was no association with the number of encounters each GP had which might have been expected to occur if this was the case).
It is also important to recognise that, while we believe that new acute NSAID prescribing is a key initiation event for all subsequent NSAID prescribing, most people exposed to high-risk NSAID prescribing at any one time have more chronic prescribing. As explained in Chapter 2, it is not possible with current data systems to attribute repeat prescriptions to individual prescribers. Our belief is that GPs will also vary in the degree to which they review the repeat prescriptions they sign (which in total will amount to hundreds of prescriptions per day in most practices), although whether or not GPs with lower rates of new acute high-risk NSAID prescribing also detect and avoid more chronic high-risk NSAID prescribing is unknown.
Interpretation and comparison with existing literature
Just over 1% of encounters with patients particularly vulnerable to a NSAID-related ADE led to a NSAID prescription, more commonly when there was a recorded diagnosis consistent with a musculoskeletal symptom or pain, in those prescribed more repeat drugs, in younger compared with older patients, and in those with fewer risk factors for NSAID ADEs. The first of these two characteristics is markers of need for prescribing, either directly (consulting with a particular diagnosis) or indirectly (number of drugs is a proxy for multimorbidity)119,135 and the second of the two is markers of risk of ADEs. The only non-encounter characteristic associated with high-risk NSAID prescribing was GP sex, with men more likely to prescribe than women, which is at least partially consistent with known gender-related differences in practice. 136
This analysis found that there was considerable variation between GPs in issuing new acute high-risk NSAID prescriptions, and that this variation was considerably higher than variation between practices. High-risk new acute NSAID prescribing is therefore more a characteristic of individual GPs than of practices. This is consistent with the literature that actions which are under the direct control of individual physicians vary more at individual than at institution or area level. 79,96,99,100,103,131 In contrast, it might be expected that repeat prescribing might be more associated with practice-level rather than GP-level variation, as it is organised as a single system for the practice albeit still subject to GP discretion whether to sign a prescription or not, although the data do not allow this to be examined. Reliability at practice level was poor, reflecting the considerable variation between GPs within practices and at GP level was only moderate with the majority of GPs only being able to be measured with reliability of more than ≈ 70%, which is suitable for formative but not high-stakes evaluation. Although the model fitted identified three practices and 51 GPs as being statistically significantly more likely to prescribed new acute high-risk NSAIDs, it would not be possible to identify high-risk prescribing GPs by examining high-risk prescribing practices because most GPs in high-risk prescribing practices are not themselves high-risk prescribers, and most GPs with high levels of high-risk prescribing work in average or lower than average practices.
It is worth reiterating that the analysis done could not be easily extended to most other high-risk prescribing because of problems of attribution (knowing whether the GP issuing the prescription is the primary decision-maker or is acting on the recommendation of a specialist) and of identification (having a GP ID clearly attached to the prescription). Variation in high-risk prescribing between GPs is therefore important in its magnitude, difficult to measure in general and difficult to measure reliably enough for high-stakes evaluation even if it can be measured.
Chapter 5 Change over time in a broad basket of high-risk prescribing indicators
Introduction
Potentially inappropriate prescribing and high-risk prescribing are remarkably stable over time, at least in the absence of specific interventions such as regulatory risk communication55,56 or focused improvement work. 137 However, there are relatively few longitudinal studies, and fewer still that were not based on the Beers Criteria, making an examination of change in high-risk prescribing over time of considerable interest. The initial feasibility work in this study showed that it was not possible to extend the GP-level analysis to a broader set of high-risk prescribing indicators. However, this largely related to difficulties in attributing a particular prescription to a particular GP, and analysis at practice level is more straightforward. In agreement with NIHR HSDR, we amended the protocol to add a fourth objective:
To examine changes in rates of high-risk prescribing over time (2004–9) and variation between practices, using a basket of indicators with consensus validation (from the amended protocol).
We proposed examining up to 20 candidate indicators for which there was evidence of harm, which had been recently validated in one or more RAND/University of California Los Angeles consensus studies38,39 (including one specifically intended to create indicators for use in GP appraisal and revalidation39) and which were likely feasible to implement in GP electronic data. 5
Methods
Data sources
Data were available for 190 Scottish practices providing care to almost one million patients from the start of Q2 2004 to the end of Q1 2009.
Outcome measures
Individual indicators
We proposed examining up to 20 measures based on plausibly feasible indicators which had been validated in one or both of the recent UK consensus studies. 38,39 Nineteen indicators were implemented (Box 1). For some of the indicators, there were differences in definition between the two consensus studies. For example, both consensus studies included an indicator relating to NSAID prescription in patients already prescribed oral anticoagulation, but one study judged this inappropriate without further restriction,39 whereas the other judged it inappropriate only if the patient was additionally not prescribed gastroprotection (indicator 13). 38 As gastroprotection mitigates but does not abolish NSAID-related GI bleeding risk, both are reasonable measures.
-
Specified drug to avoid prescribed to person with history of heart failure [oral NSAID, tricyclic antidepressant, class I or III antiarrhthymics excluding amiodarone, glitazone, minoxidil (Loniteri®, Pharmacia), tadalafil (Cialis®, Adcirca®, Lilly) verapamil, diltiazem, oral azole antifungal]. 38,39
-
Beta blocker prescribed to person with asthma in the absence of CHD and COPD. 38,39
-
LABA prescribed to person with asthma without COPD without coprescription of an ICS. 38,39
-
NSAID prescribed to person with history of peptic ulcer, without coprescription of gastroprotection. 38,39
-
NSAID prescribed to person aged 75 years and over, without coprescription of gastroprotection. 38
-
Methotrexate prescribed in mixed doses (2.5 mg and 10 mg tablets). 38
-
Combined oral contraceptive prescribed to woman with history of arterial or venous thromboembolism. 39
-
Oral or transdermal oestrogen prescribed to woman with a history of breast cancer. 39
-
Antipsychotic drug prescribed to person aged 65 years and over with dementia but no psychosis. 38
-
Metoclopramide or prochlorperazine prescribed to person with Parkinson’s disease. 39
-
Specified contraindicated drug prescribed to person with CKD stage 4 or worse (digoxin ≥ 250 mcg daily, metformin, sulphonylurea [excluding gliclazide or tolbutamide], aldosterone antagonist, thiazide). 38,39
-
NSAID prescribed to person prescribed an oral anticoagulant, without coprescription of gastroprotection. 38,39
-
NSAID prescribed to person prescribed an antiplatelet drug, without coprescription of gastroprotection. 38
-
NSAID prescribed to person aged 65 year and over prescribed an ACE inhibitor/ARB and a diuretic (the ‘triple whammy’). 38
-
Aspirin or clopidogrel prescribed to person prescribed an oral anticoagulant, without coprescription of gastroprotection. 38
-
Clopidogrel prescribed to person prescribed aspirin, without coprescription of gastroprotection. 38
-
Specified drug known to significantly impact on International Normalized Ratio prescribed to person prescribed a coumarin oral anticoagulant (quinolone, macrolide, metronidazole, oral azole antifungal). 38
-
PPDE-5 inhibitor prescribed to person prescribed oral nitrates or nicorandil. 39
CHD, coronary heart disease; COPD, chronic obstructive pulmonary disease; ICS, inhaled corticosteroids; LABA, long-acting beta-agonist; PPDE-5, phosphodiesterase-5.
However, observed change over time in measures of NSAID GI bleeding risk might occur because of falling use of NSAIDs, increasing use of gastroprotection, or mixtures of both. In principle at least, a falling rate of NSAID use without gastroprotection in people prescribed oral anticoagulants could be due to rising NSAID use but even faster rising gastroprotection use, in which case the apparent improvement in safety, shown by a falling rate in this indicator, would actually represent less safe practice. A variant of this phenomenon was observed in Canada when the introduction of safer COX-2 inhibitors was associated with increasing rates of admission to hospital with GI bleeding, because the marketing of COX-2 inhibitors as safer NSAIDs led to a marked expansion in the proportion of the population exposed to any NSAID. 138 As most of the NSAID indicators related to GI bleeding were derived from the consensus study which included gastroprotection in the definition,38 we chose to construct all of these measures in terms of ‘NSAID prescribed without gastroprotection’ but to additionally examine all NSAID prescribing to better interpret the findings. Full definitions of the implemented measures are provided in the appendix (see Table 21, Appendix 2).
For indicators relating to CKD, there was an additional issue in that CKD coding changed significantly during the period of study because of the routine reporting of estimated glomerular filtration rate (eGFR) by laboratories from the end of 2005 (which makes stage 3 CKD considerably easier to diagnose) and the inclusion of CKD as a disease domain in the QOF pay-for-performance programme from April 2006. This leads to a large increase in the number of people with recorded CKD over the course of 2006. Examination of these measures was, therefore, restricted to the period from Q1 2007 to Q1 2009, inclusive.
Composite indicators
We additionally defined six composite indicators. For each, patients were eligible to be included if they were eligible or one or more of the underlying individual indicators. Patients were defined as receiving a high-risk prescription if they triggered on any of the individual indicators.
Five composites were prespecified which consisted of indicators grouped because of being congruent in one of several ways, namely in terms of only involving one drug class (composite 1: NSAIDs); or two closely related drug classes (composite 2: NSAIDs and antiplatelets); or the underlying indicators measuring a drug–disease interaction which would not be signalled by GP interaction checkers for newly prescribed drugs (composite 3); or the underlying indicators measuring a drug–drug interaction which would be signalled by GP interaction checkers (composite 4); or the underlying indicators being related to renal risk (composite 5). Our expectation was that drug–drug interactions would be more likely to show reductions than drug–disease interactions because new prescribing involving drug–drug interactions would be highlighted as being risky throughout the period studied, whereas drug–disease interactions do not prompt warnings.
Finally, a prespecified composite was created for 17 indicators, excluding the two indicators relating to CKDs, as these could not be measured for the entire period. For all indicators involving risk of GI bleeding, the measure used was receipt of any NSAID or antiplatelet ignoring whether or not gastroprotection was prescribed.
-
Composite 1 (NSAIDs) consisted of indicators 4 (NSAID and peptic ulcer), 5 (NSAID aged > 75 years), 13 (NSAID and oral anticoagulants), 14 (NSAID and antiplatelet) and 15 (NSAID and ACE inhibitor/ARB and diuretic) and the NSAID element of indicator 1 (heart failure).
-
Composite 2 (NSAIDs and antiplatelets) consisted of the same indicators as composite 1 plus 16 (antiplatelet and oral anticoagulant) and 17 (clopidogrel and aspirin).
-
Composite 3 (drug–disease interactions) consisted of indicators 1 (drugs to avoid in heart failure), 2 (beta-blockers and asthma), 4 (NSAID and peptic ulcer), 7 (combined oral contraceptive pill and previous thromboembolism), 8 (oestrogens in breast cancer), 9 (antipsychotics and dementia) and 10 (metoclopramide/prochlorperazine and Parkinson’s disease).
-
Composite 4 (drug–drug interactions) consisted of indicators 3 [long-acting beta-agonist (LABA) but no inhaled corticosteroids (ICSs) in asthma], 6 (methotrexate mixed strengths), 13 (NSAIDs and oral anticoagulants), 14 (NSAIDs and antiplatelets), 15 (NSAIDs and ACE inhibitors/ARB and diuretic), 16 (antiplatelets and oral anticoagulants), 17 (clopidogrel and aspirin), 18 (high-risk drugs with coumarin oral anticoagulant) and 19 [phosphodiesterase-5 (PPDE-5) antagonists and oral nitrates].
-
Composite 5 (renal adverse effects) consisted of indicators 11 (NSAID and CKD 3–5), 12 (various drugs and CKD 4 and 5) and 15 (NSAID and ACE inhibitors/ARB and diuretic).
-
Composite 6 (all indicators) consisted of all indicators except indicators 11 (NSAID and CKD 3–5) and 12 (various drugs and CKD 4 and 5), which were excluded because they could not be reliably measured over the entire period.
Statistical methods
For each indicator and for each composite, the prevalence of high-risk prescribing in Q1 2009 was calculated, and variation between practices in that quarter examined by calculating the mean, minimum, maximum, median and interquartile range of prevalence at practice level. The ICC at practice level was estimated using a two-level model of patients nested within practices using xtmelogit in Stata version 11, with normality of level 2 (practice-level) residuals checked graphically.
The prevalence of high-risk prescribing over time was then plotted for each indicator and each composite. For indicators where gastroprotection was included in the numerator definition, then prevalence of high-risk prescribing was plotted both accounting for and ignoring gastroprotection to check whether or not any observed change in the indicator was a result of less NSAID or antiplatelet prescribing or more gastroprotection prescribing. For each indicator and for each composite, we then used linear regression to estimate the slope of the trend over time. As the data is a time-series, we initially examined it for the presence of autocorrelation using relevant graphical plots of the autocorrelation and partial autocorrelation functions, and if necessary fitting lag terms for first order autocorrelation (which was present in some models). To estimate trends, we initially fitted linear models then explored whether or not the inclusion higher order quadratic and cubic terms improved model fit. Model fit was assessed using AIC, and the best-fitting model used to estimate change over time. In this context, autocorrelation is a nuisance term requiring adjustment and only main effects are reported.
Finally, changes in the variation between practices over time was examined using box plots of prevalence at practice level across the whole time series, and estimating ICCs for Q1 in each year using the same two-level model structure described in Chapter 3, Descriptive analysis and multilevel modelling. After checking for normality of the level 2 (practice-level) residuals, differences in variance at practice level was examined using an F-test comparing the variance in Q1 2009 with the earliest available variance in Q1 in a previous year (Q1 2005, except for the CKD indicators 11 and 12 and the renal composite, when Q1 2007 was used).
Results
Prevalence of high-risk prescribing and variation between practices in quarter 1 2009
The prevalence of high-risk prescribing in those particularly vulnerable to ADEs varied from 0.17% (indicator 7: combined oral contraceptive pill in women with previous thromboembolism) to 20.2% (indicator 1: drugs to avoid in heart failure), with an overall prevalence for the composite of all indicators except CKD of 5.2% (95% CI 5.1% to 5.3%) (Tables 13 and 14). The range of high-risk prescribing across practices was typically large, although, as is common in a practice-based analysis, extreme values were usually found in small practices. Of note is that the minimum for every indicator is zero, which is invariably a single very small practice with few patients eligible for any measure. For the four indicators (7, 8, 10, 19) with the lowest prevalence, less than 20% of practices had any recorded high-risk prescribing (6.3% for indicator 7, 7.4% for indicator 8, 17.9% for indicator 9 and 16.8% for indicator 10). However, it was not the case that this generally zero prescribing occurred in the same practices, with 38.4% of practices having at least one patient triggering one of the four indicators, and no statistically significant correlation between the practice prevalences. For all four of these indicators, it was either not possible to fit a multilevel model to estimate the ICC or fitted models were unstable and had very non-normal distribution of level 2 (practice-level) residuals, violating a key model assumption (an example plot is shown in Appendix 6, Figure 17).
| Indicator | No. of patients prescribed a NSAID/no. of patients at risk | % (95% CI) | Practice mean (range) | Practice median (interquartile range) | ICC (95% CI) |
|---|---|---|---|---|---|
| 1: Drugs to avoid in heart failure | 1958/9682 | 20.2 (19.4 to 21.0) | 19.7 (0–50.0) | 20.0 (14.6–23.5) | 0.008 (0.003 to 0.022) |
| 2: Beta blockers in asthma | 1400/106,932 | 1.31 (1.2 to 1.4) | 1.4 (0–7.1) | 1.2 (0.8–1.8) | 0.036 (0.023 to 0.056) |
| 3: LABA use without ICS use | 443/17,408 | 2.54 (2.3 to 2.8) | 2.9 (0–22.6) | 1.7 (0–4.0) | 0.202 (0.149 to 0.268) |
| 4: NSAID in peptic ulcer | 873/32,833 | 2.66 (2.5 to 2.8) | 2.7 (0–11.7) | 1.6 (1.5–3.8) | 0.041 (0.024 to 0.069) |
| 5: NSAID in over-75-year-olds | 2597/84,983 | 3.06 (2.9 to 3.2) | 3.2 (0–13.8) | 2.8 (1.7–4.3) | 0.087 (0.067 to 0.114) |
| 6: Methotrexate in mixed strengths | 326/2954 | 11.0 (9.9 to 12.2) | 12.7 (0–75.0) | 6.5 (0–22.0) | 0.320 (0.239 to 0.415) |
| 7: COCP in previous thromboembolisma | 12/7225 | 0.17 (0.07 to 0.26) | 0.2 (0–5.3) | 0 (0–0) | – |
| 8: Oestrogens in previous breast cancera | 17/8951 | 0.19 (0.10 to 0.28) | 0.2 (0–11.1) | 0 (0–0) | – |
| 9: Antipsychotics in dementia | 929/6178 | 15.0 (14.2 to 15.9) | 14.6 (0–66.7) | 13.3 (6.9–19.0) | 0.064 (0.041 to 0.100) |
| 10: Parkinson’s diseasea | 21/1689 | 1.24 (0.71 to 1.77) | 1.2 (0–33.3) | 0 (0–0) | – |
| 11: NSAID in CKD 3–5 | 2405/34,011 | 7.4 (7.1 to 7.7) | 8.0 (0–41.2) | 7.0 (4.5–10.0) | 0.068 (0.050 to 0.091) |
| 12: Drugs to avoid in CKD 4 and 5 | 563/2803 | 20.1 (18.6 to 21.6) | 18.4 (0–66.7) | 18.2 (9.8–16.4) | 0.009 (0.001 to 0.104) |
| 13: NSAID with OAC | 106/10,821 | 1.0 (0.8 to 1.2) | 1.1 (0–16.7) | 0 (0–1.6) | 0.167 (0.086 to 0.300) |
| 14: NSAID with aspirin or clopidogrel | 3489/88,631 | 3.9 (3.8 to 4.1) | 4.0 (0–13.2) | 3.7 (2.3–5.2) | 0.071 (0.055 to 0.092) |
| 15: NSAID with ACE inhibitors/ARB and diuretic | 2608/31,904 | 8.2 (7.9 to 8.5) | 8.7 (0–27.0) | 8.1 (5.6–10.8) | 0.069 (0.052 to 0.091) |
| 16: Aspirin/clopidogrel with OAC | 646/10,821 | 6.0 (5.5 to 6.4) | 5.8 (0–21.4) | 5.3 (2.5–8.0) | 0.052 (0.030 to 0.089) |
| 17: Aspirin and clopidogrel | 1242/81,704 | 1.5 (1.4 to 1.6) | 1.5 (0–7.5) | 1.4 (0.8–2.0) | 0.038 (0.024 to 0.061) |
| 18: High-risk drugs with coumarin OAC | 497/10,821 | 4.6 (4.2 to 5.0) | 4.8 (0–25.0) | 3.9 (2.1–6.7) | 0.023 (0.006 to 0.077) |
| 19: PPDE-5 inhibitor with oral nitratea | 48/15,844 | 0.3 (0.2 to 0.4) | 0.3 (0–5.6) | 0 (0–0) | – |
| Indicator | No. of patients prescribed a NSAID/no. of patients at risk | % (95% CI) | Practice mean (range) | Practice median (interquartile range) | ICC (95% CI) |
|---|---|---|---|---|---|
| Composite 1: NSAIDs | 7923/171,927 | 4.6 (4.5 to 4.7) | 4.8 (0–14.1) | 4.3 (3.1–6.0) | 0.058 (0.046 to 0.073) |
| Composite 2: NSAIDs and antiplatelets | 9731/171,927 | 5.7 (5.6 to 5.8) | 5.8 (0–14.9) | 5.4 (4.1–7.2) | 0.043 (0.034 to 0.054) |
| Composite 3: drug–disease interactions | 5161/165,027 | 3.1 (3.0 to 3.2) | 3.2 (0–7.1) | 3.1 (2.4–4.1) | 0.025 (0.018 to 0.054) |
| Composite 4: drug–drug interactions | 8661/128,752 | 6.7 (6.6 to 6.9) | 6.9 (0–16.7) | 6.4 (5.2–8.3) | 0.030 (0.023 to 0.039) |
| Composite 5: renal adverse effects | 4827/53,597 | 9.0 (8.7 to 9.2) | 9.3 (0–25.6) | 8.5 (6.2–11.3) | 0.051 (0.039 to 0.066) |
| Composite 6: all indicators except CKD | 14,635/280,461 | 5.2 (5.1 to 5.3) | 5.3 (0–10.1) | 5.2 (4.1–6.3) | 0.025 (0.020 to 0.033) |
Intraclass correlation coefficients were estimated for the remaining 15 individual measures and the composite measures (see Tables 13 and 14). For the two indicators with the highest prevalence, the estimated ICC was statistically significantly different from zero but trivial in absolute terms, indicating minimal variation beyond chance between practices (indicator 1: drugs to avoid in heart failure; and indicator 12: drugs to avoid in CKD 4 and 5, both with prevalence > 20%). For three indicators, the ICC was large, indicating that a large proportion of the variation in outcome was attributable to variation between practices, being 0.320 (95% CI 0.239 to 0.415) for indicator 6 (methotrexate in mixed doses), 0.202 (95% CI 0.149 to 0.268) for indicator 3 (LABA use without ICS use) and 0.167 (95% CI 0.086 to 0.300) for indicator 13 (NSAID use without gastroprotection in people prescribed an oral anticoagulant). For all other individual indicators, the ICCs were in the range 0.023–0.087, which is similar to other primary care studies of between-practice variation and usually interpreted as indicating small to moderate variation between practices. ICCs for the composite indicators were in a similar range, varying from 0.025 to 0.058.
Change in high-risk prescribing and variation between practices over time
Figures 12 and 13 show time trends in high-risk prescribing for the individual indicators and the composites respectively. Tables 15 and 16 summarise analysis of change over time in prevalence and in variation between practices, with detailed analysis provided in Appendix 5. Overall, there was evidence that high-risk prescribing reduced between 2004 and 2009, with 8.5% of those patients particularly vulnerable to adverse events (measured by composite 6, which included all indicators except for the CKD indicators) receiving a high-risk drug in Q2 2004, compared with 5.2% in Q1 2009 (difference 3.3%, 95% CI 3.1% to 3.4%). However, this change was not linear, with an initial more rapid reduction and then subsequent partial flattening off. No reduction in variation between practices was observed for composite 6 (all indicators except for the CKD indicators). All of the other five composites showed reductions in high-risk prescribing, with composite 1 (NSAIDs), composite 2 (NSAIDs and antiplatelets) and composite 4 (drug–drug interactions) having the same pattern of initial more rapid reduction with subsequent partial flattening off, whereas the remaining two composites showed a linear reducing trend.
FIGURE 12.
Time series of changes in high-risk prescribing 2004–9. (a) Indicator 1: drugs to avoid in heart failure; (b) indicator 2: beta blockers in asthma; (c) indicator 3: LABA use without ICS use; (d) indicator 4: NSAID in peptic ulcer; (e) indicator 5: NSAID in over-75-year-olds; (f) indicator 6: methotrexate in mixed strengths; (g) indicator 7: COCP in previous thromboembolism; (h) indicator 8: oestrogens in previous breast cancer; (i) indicator 9: antipsychotics in dementia; (j) indicator 10: Parkinson’s disease; (k) indicator 11: NSAID in CKD 3–5; (l) indicator 12: drugs to avoid in CKD 4–5; (m) indicator 13: NSAID with OAC; (n) indicator 14: NSAID with aspirin or clopidogrel; (o) indicator 15: NSAID with ACE inhibitors/ARB and diuretic; (p) indicator 16: aspirin/clopidogrel with OAC; (q) indicator 17: aspirin and clopidogrel; (r) indicator 18: high-risk drugs with coumarin OAC; and (s) indicator 19: PPDE-5 inhibitor with oral nitrate. COCP, combined oral contraceptive pill; OAC, oral anticoagulant.
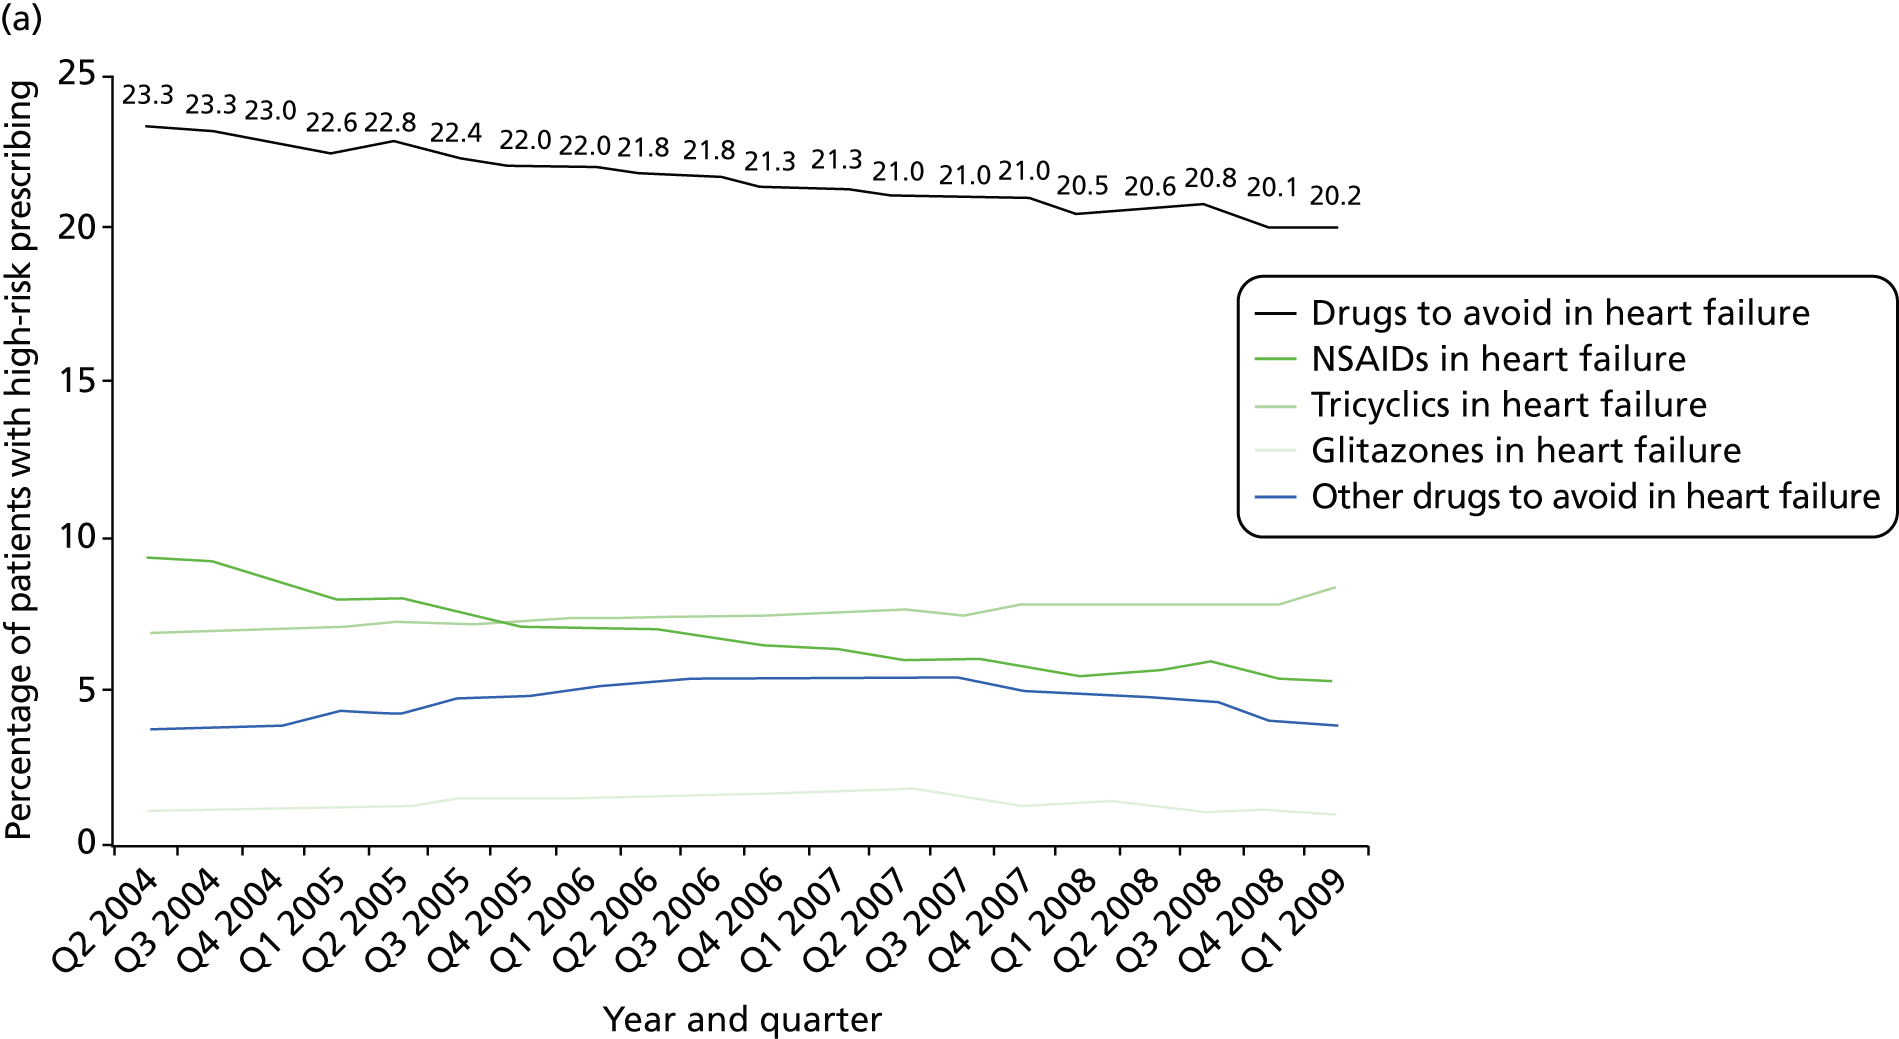
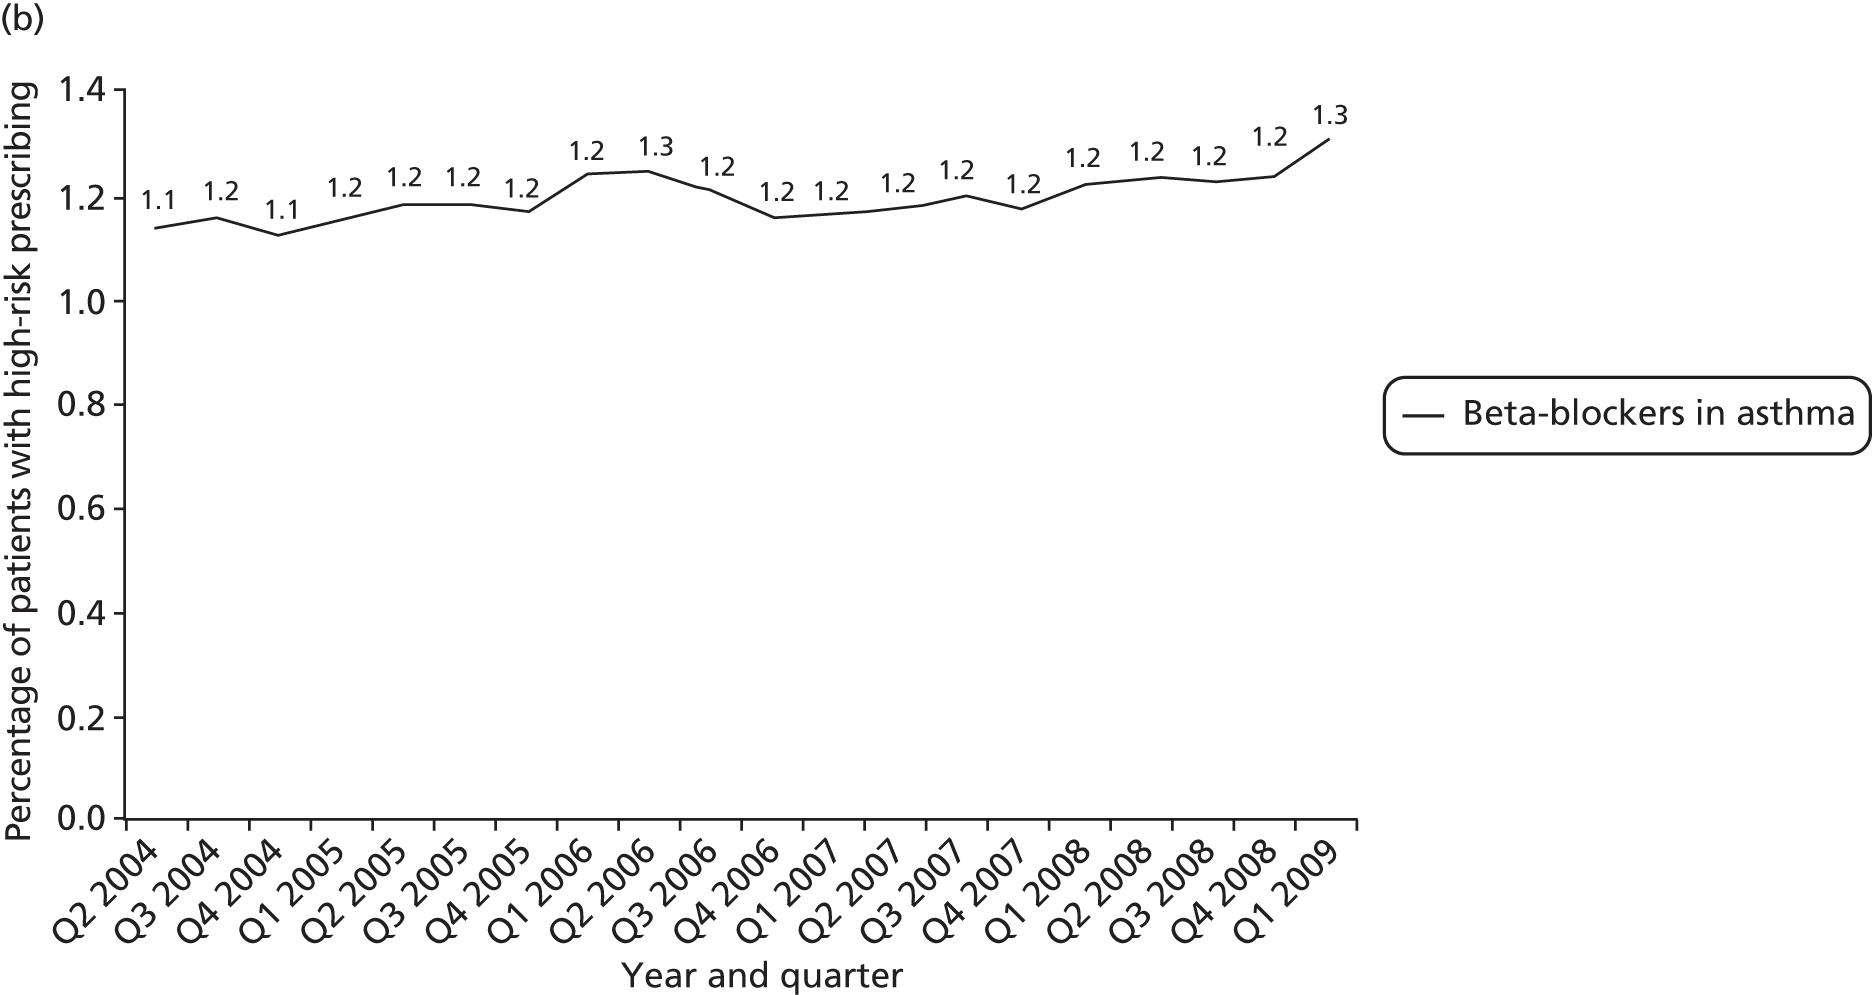
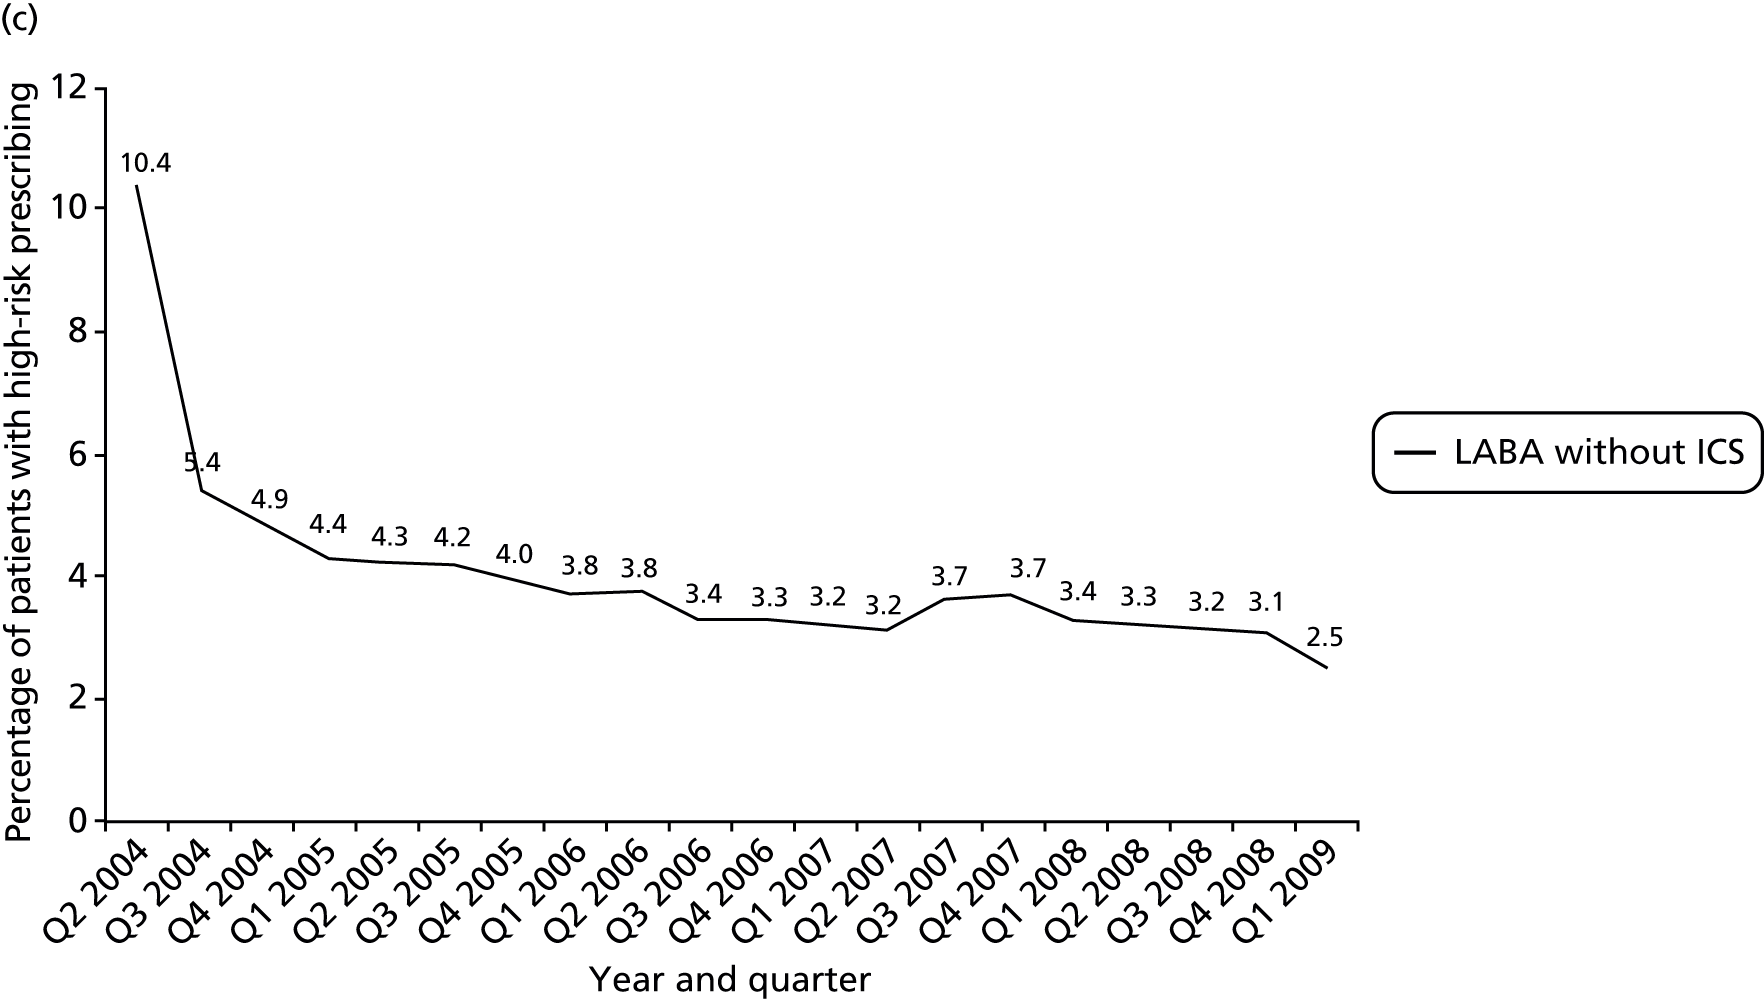
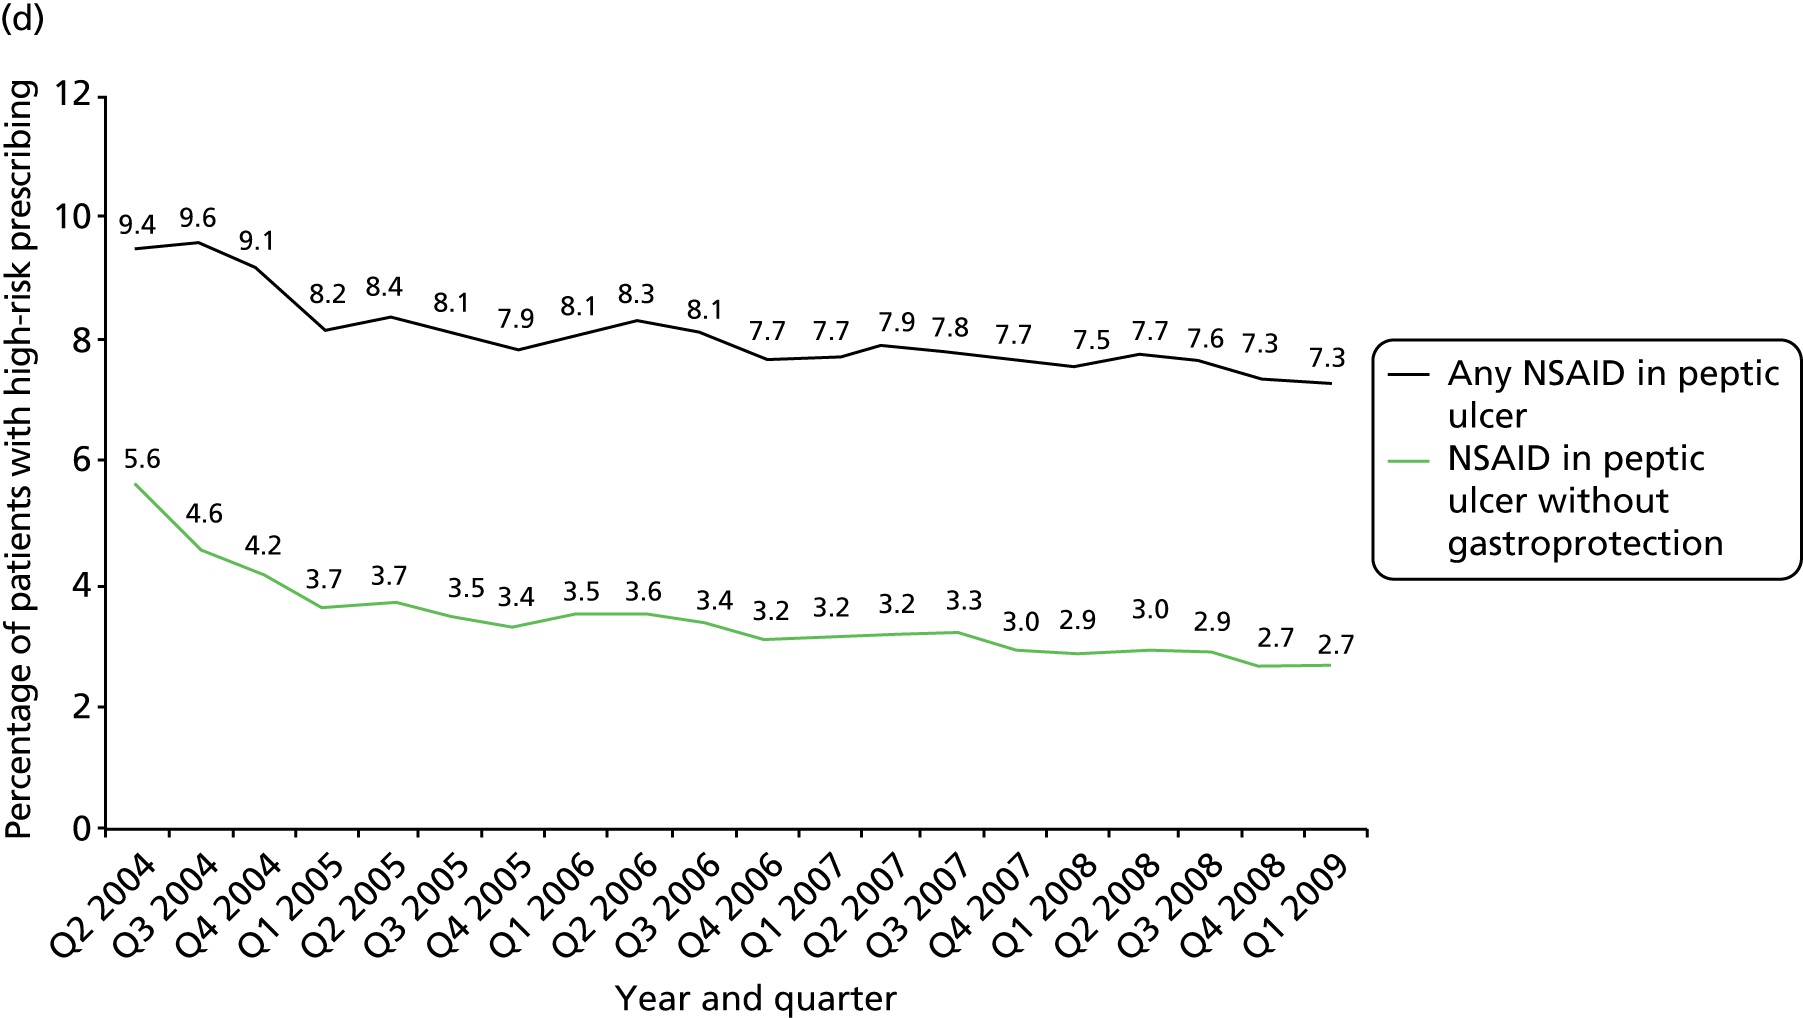
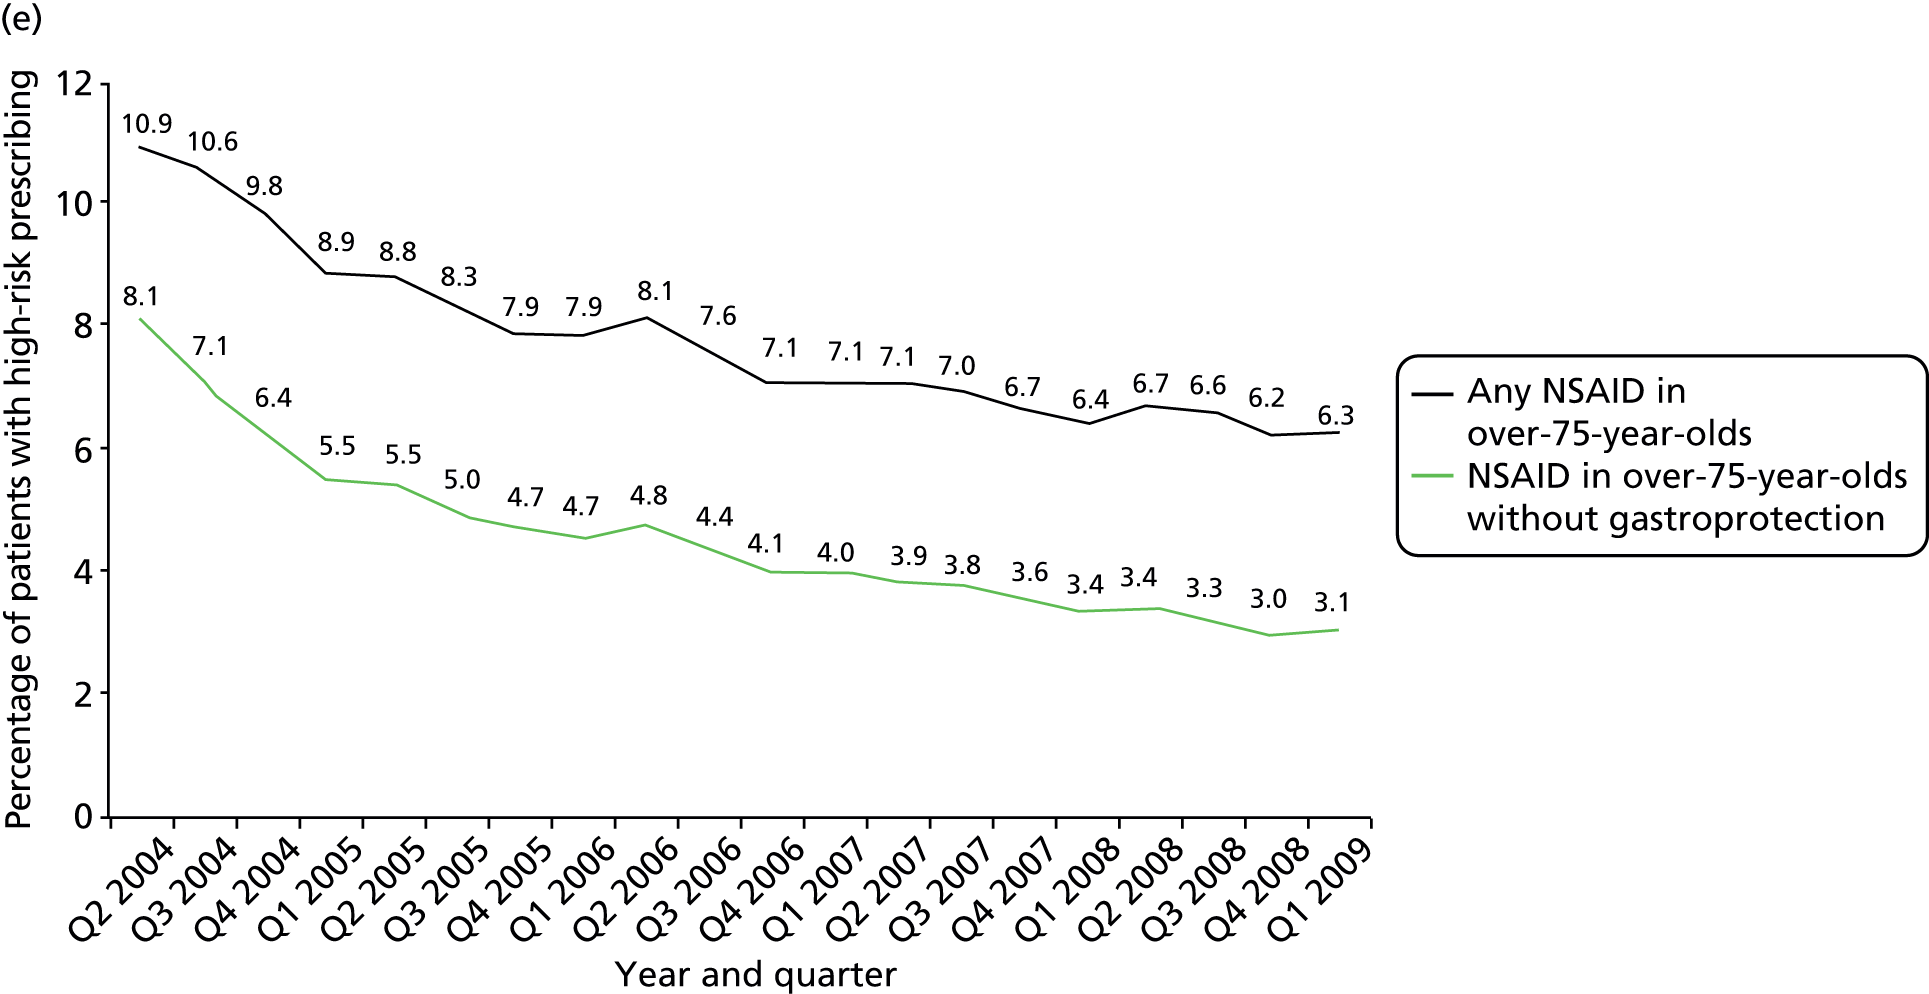


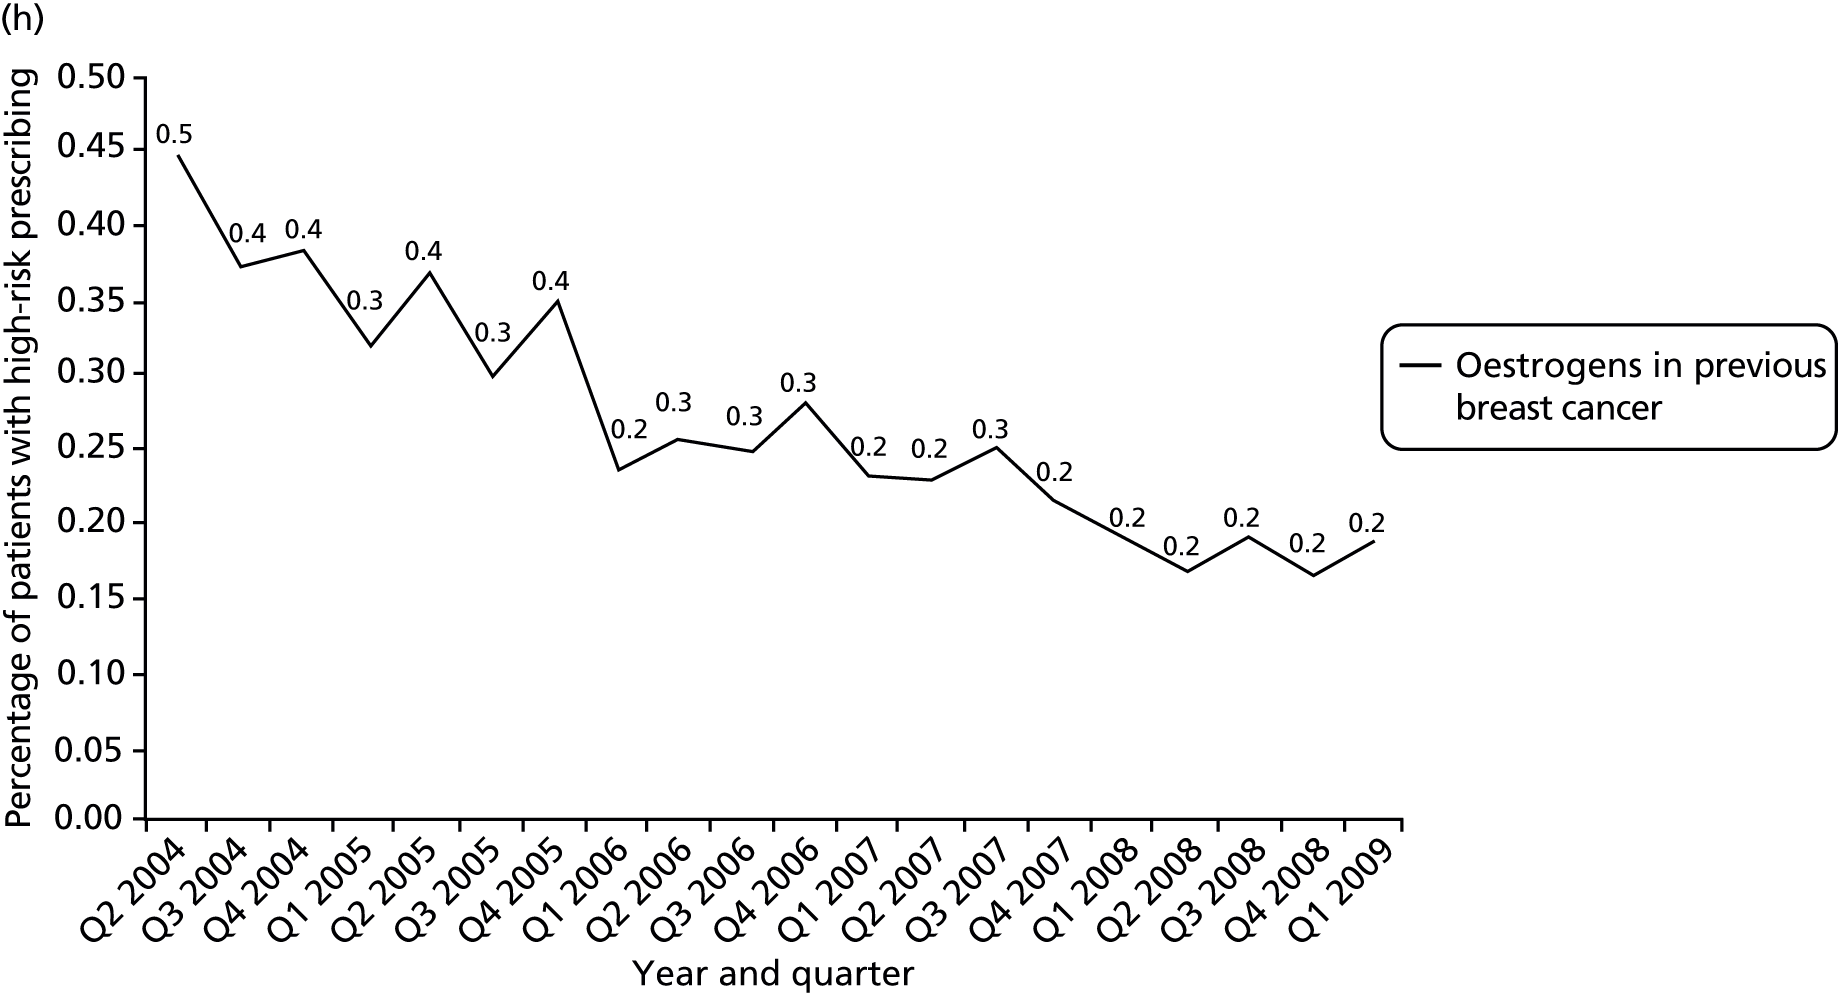
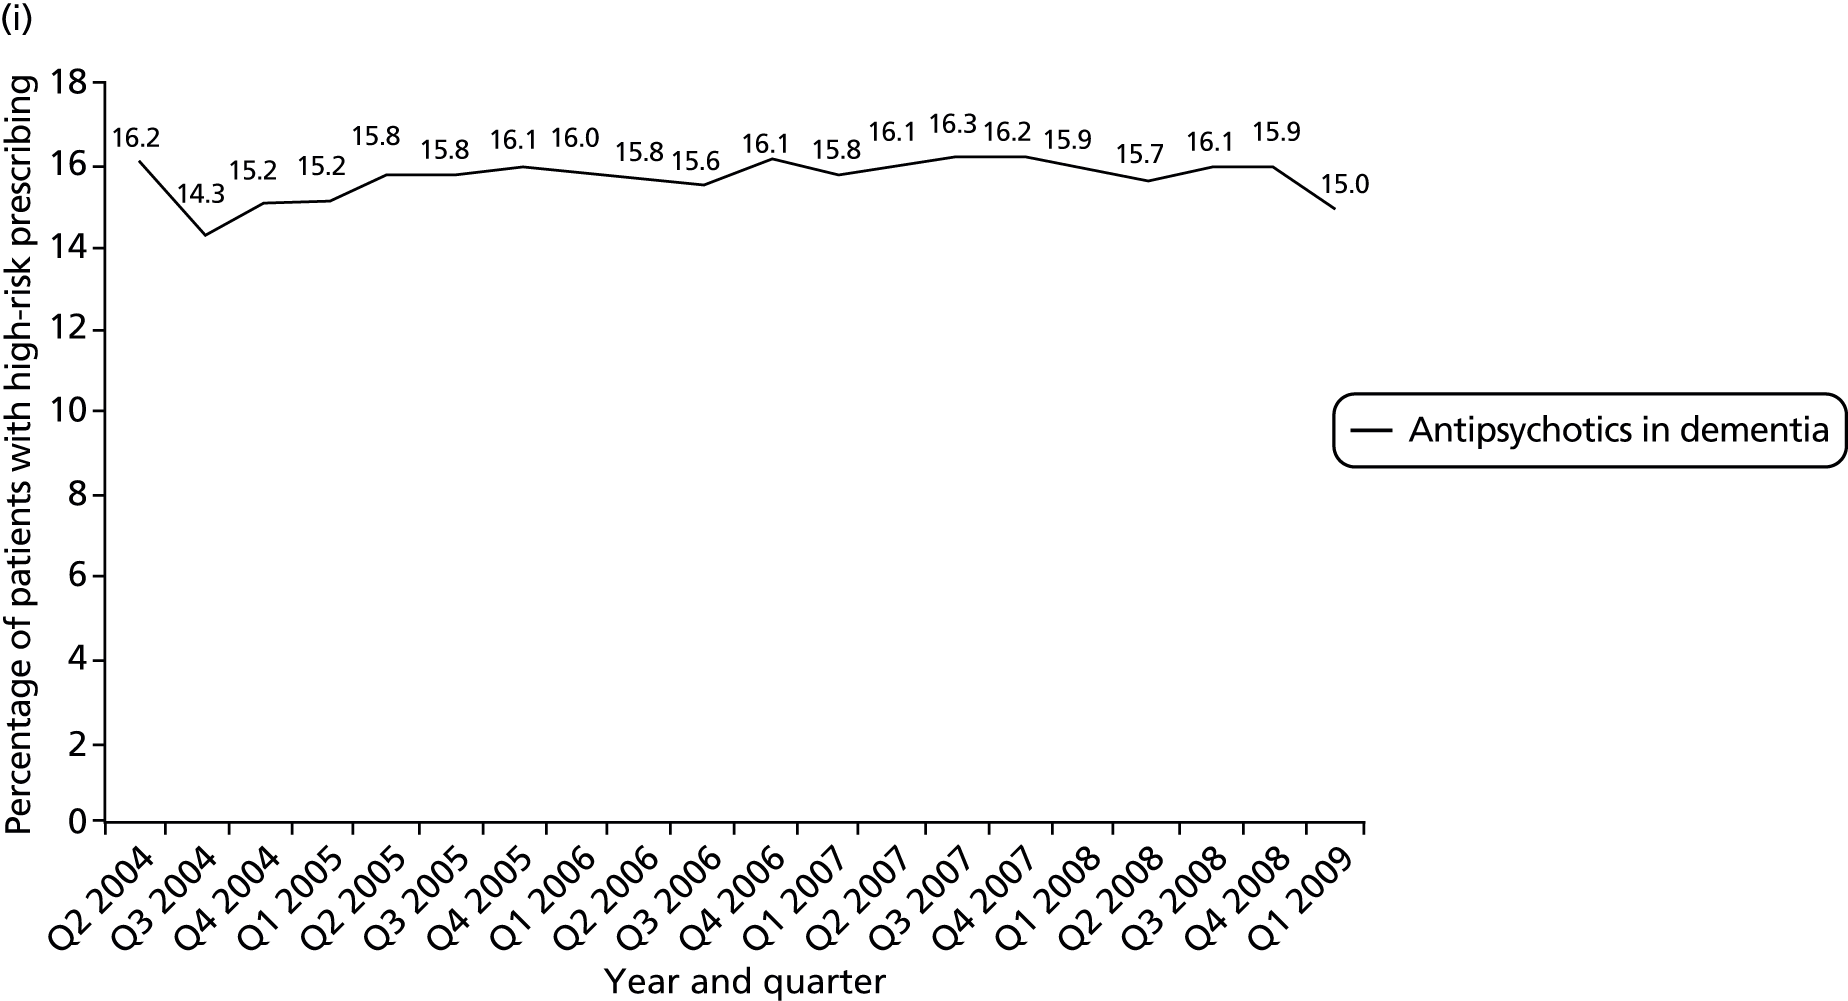
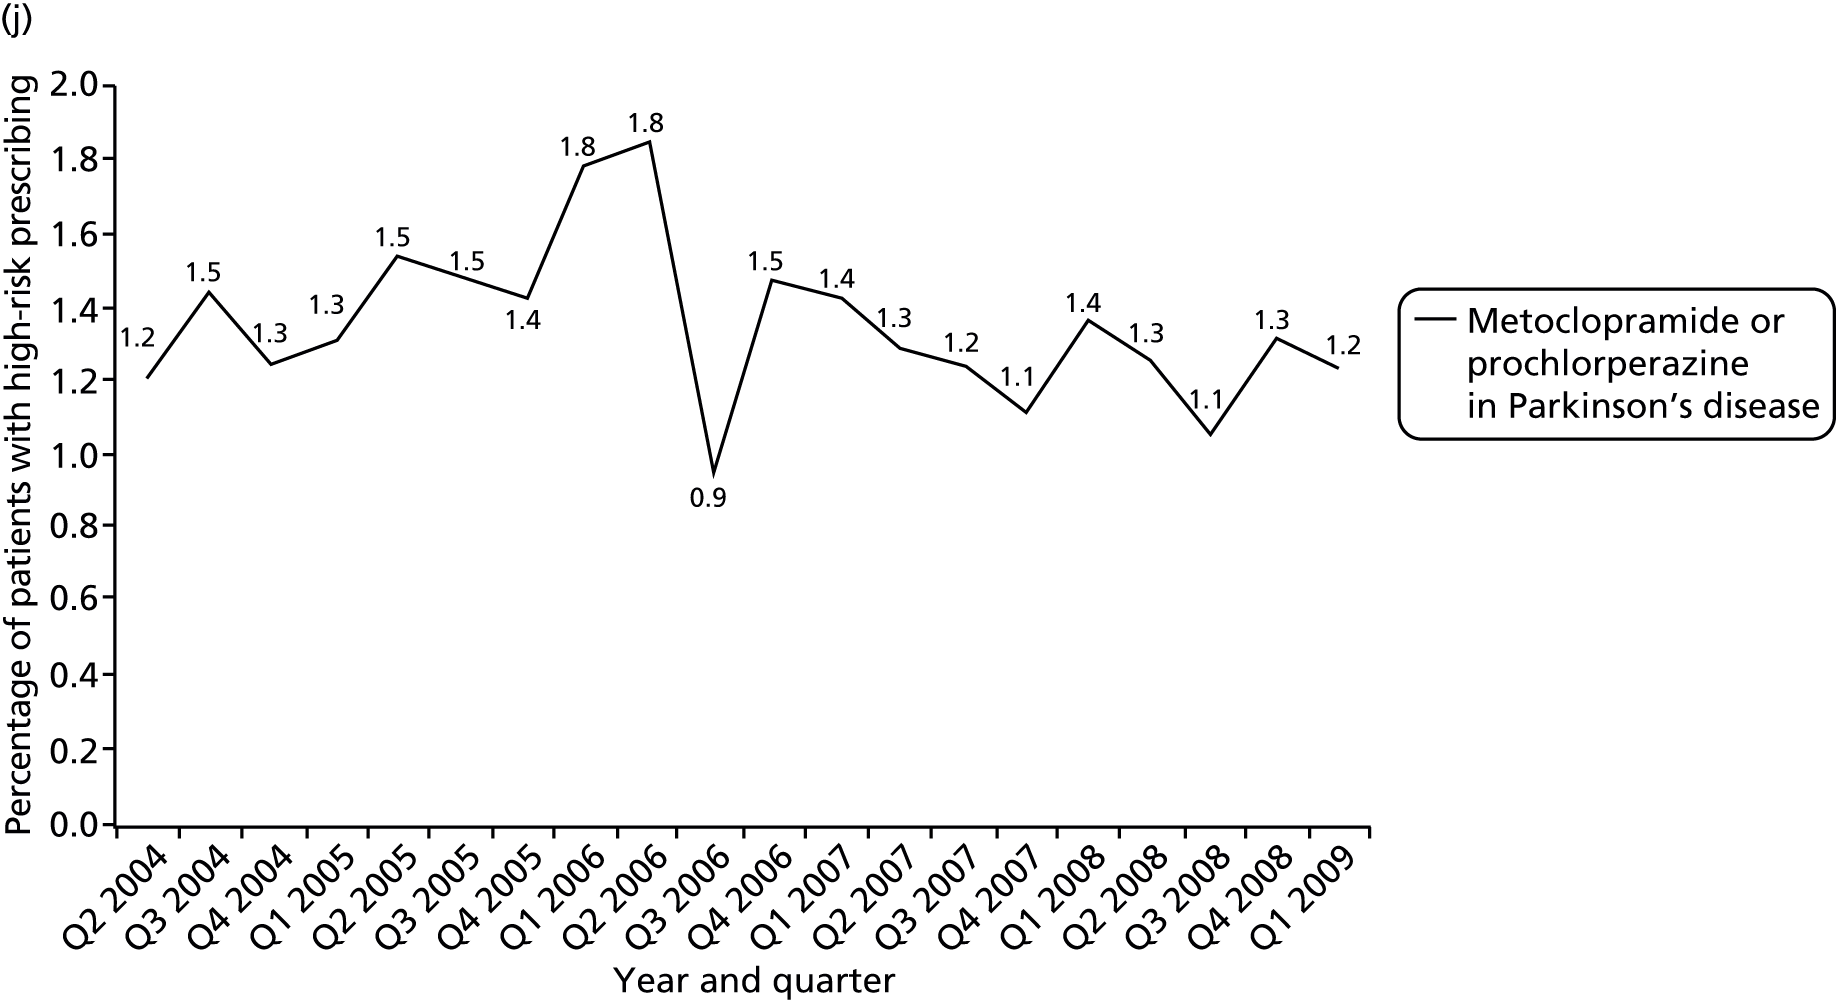
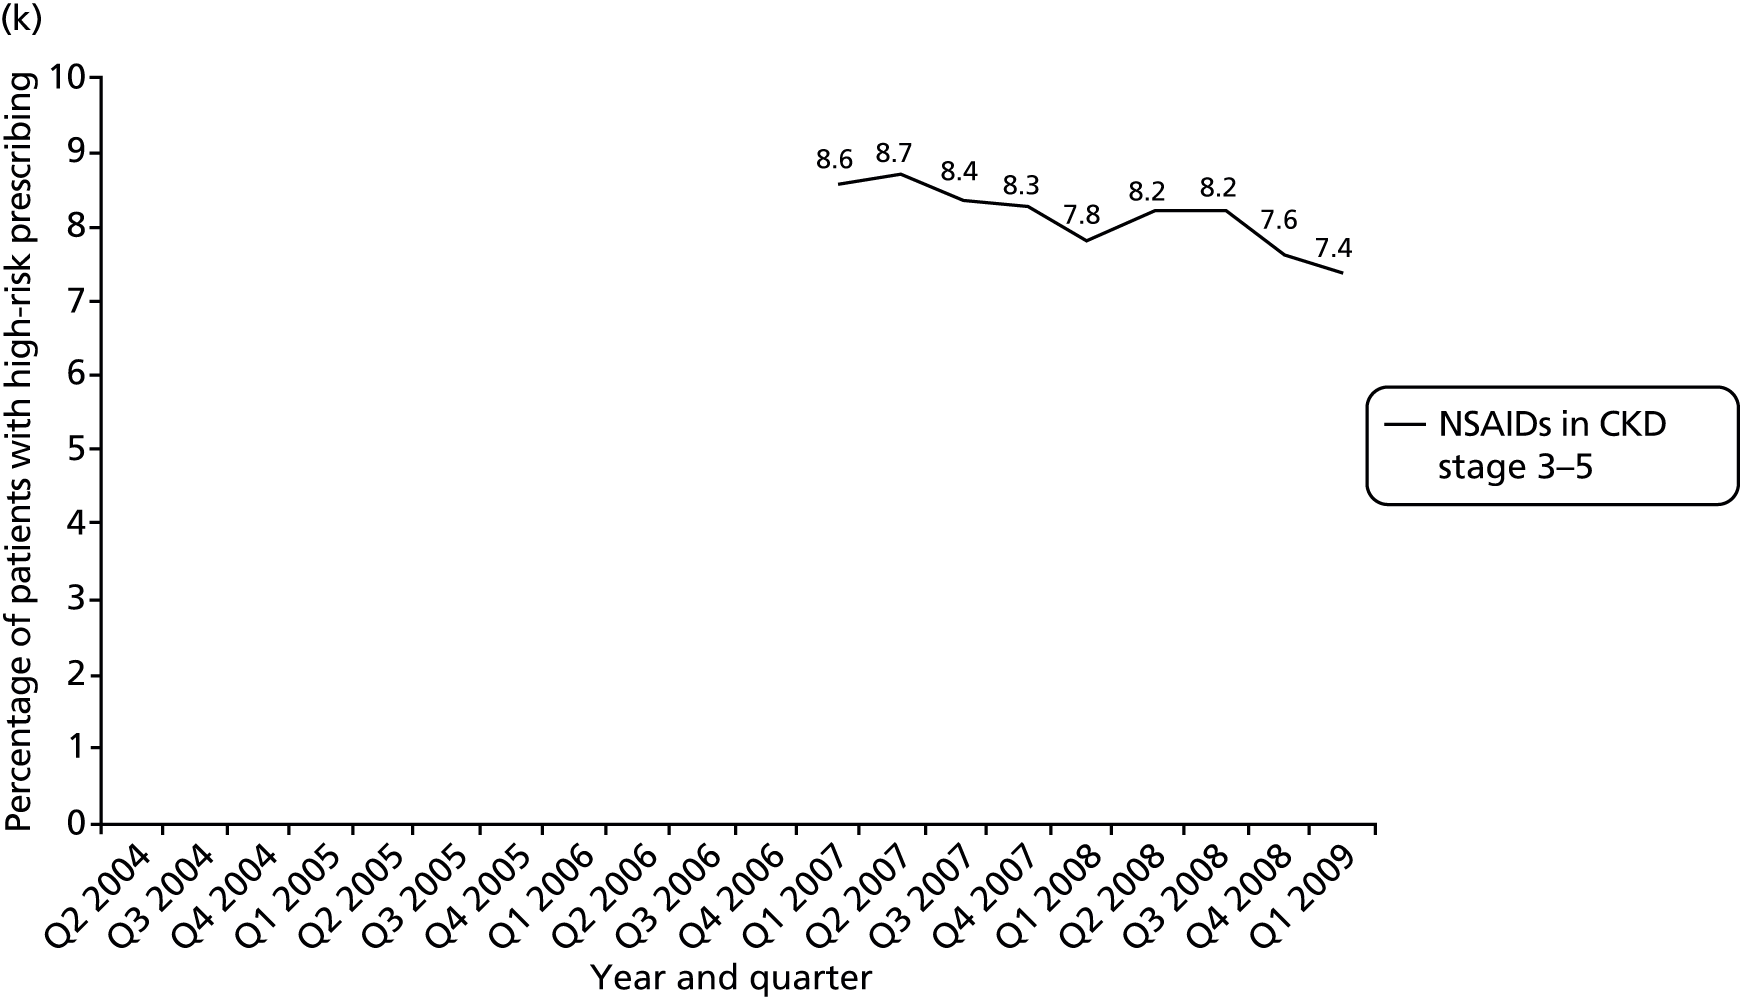
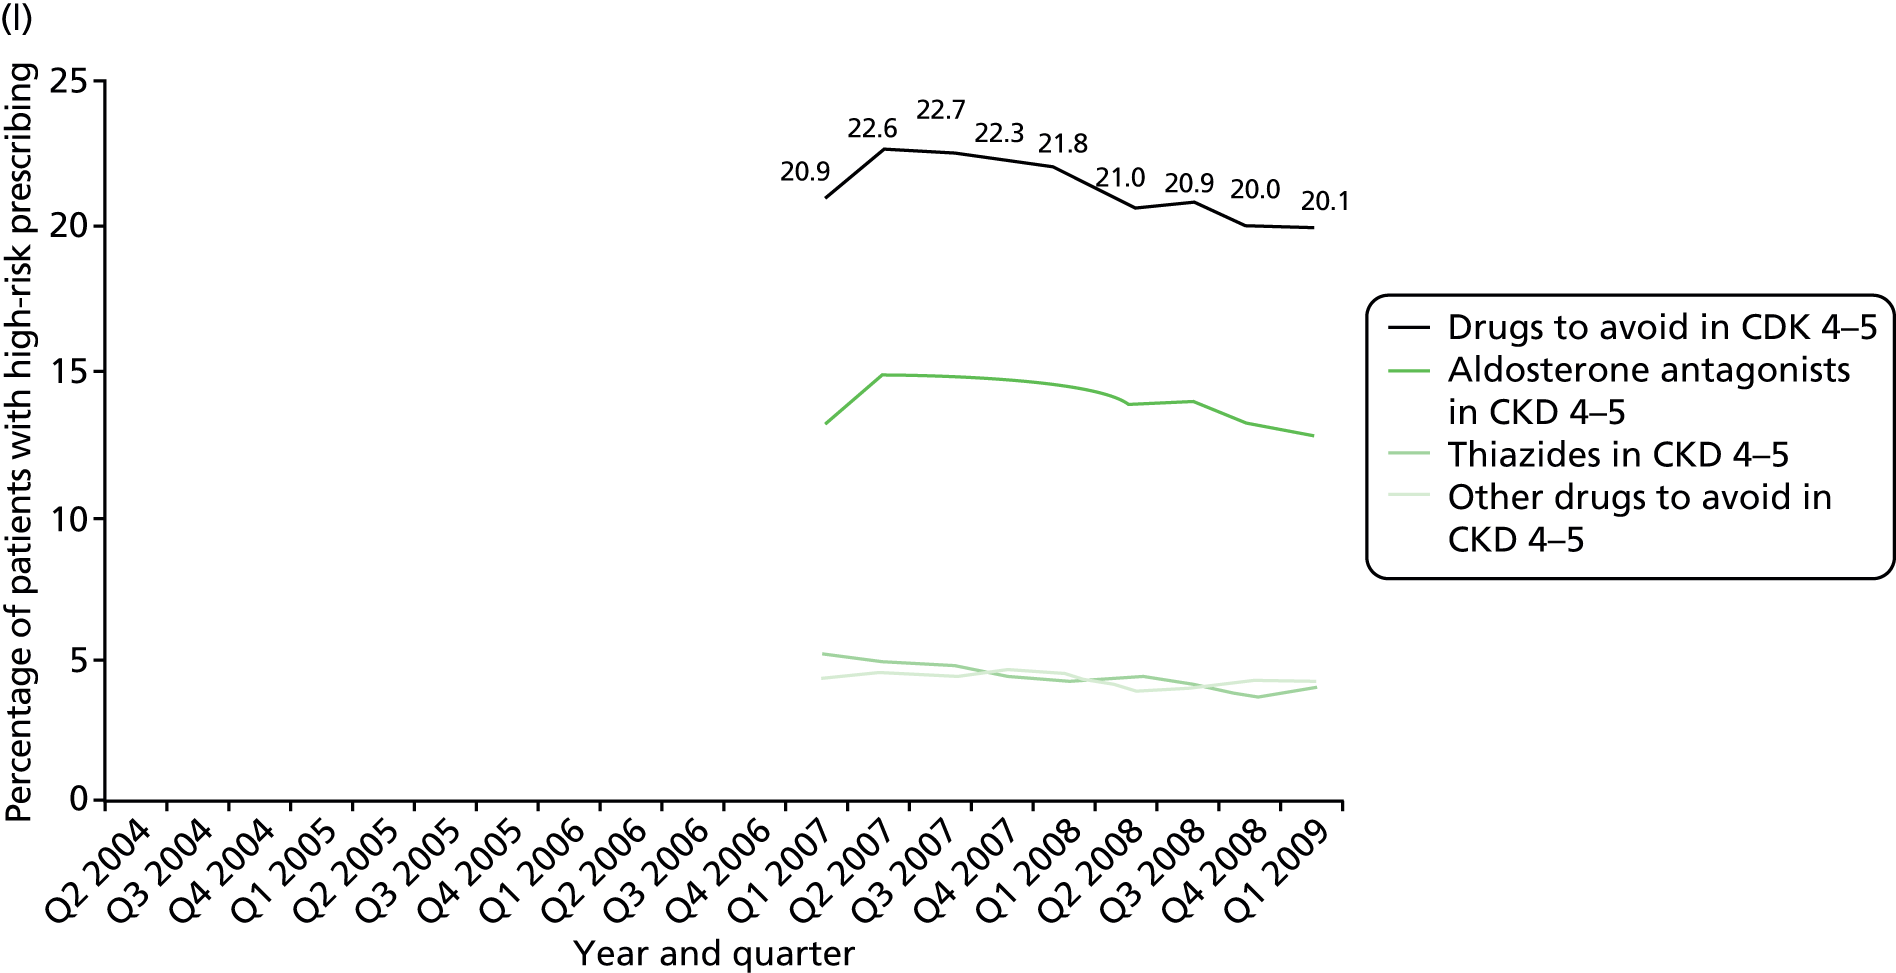
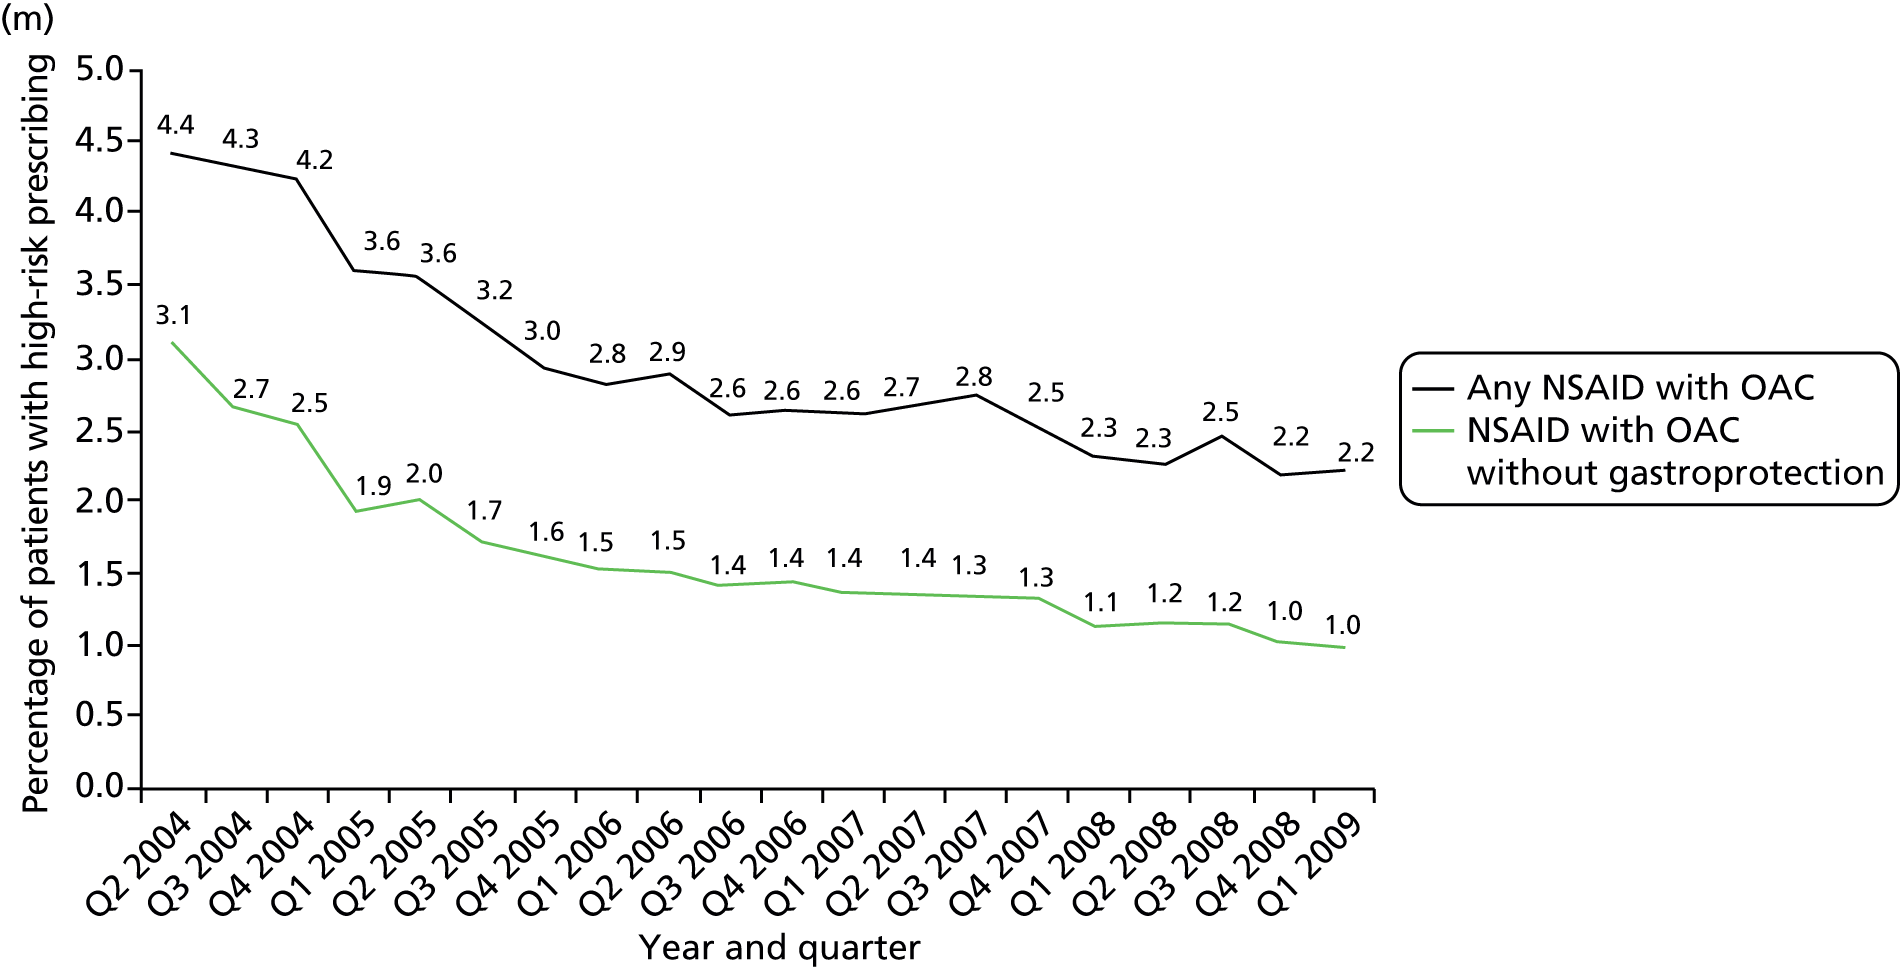
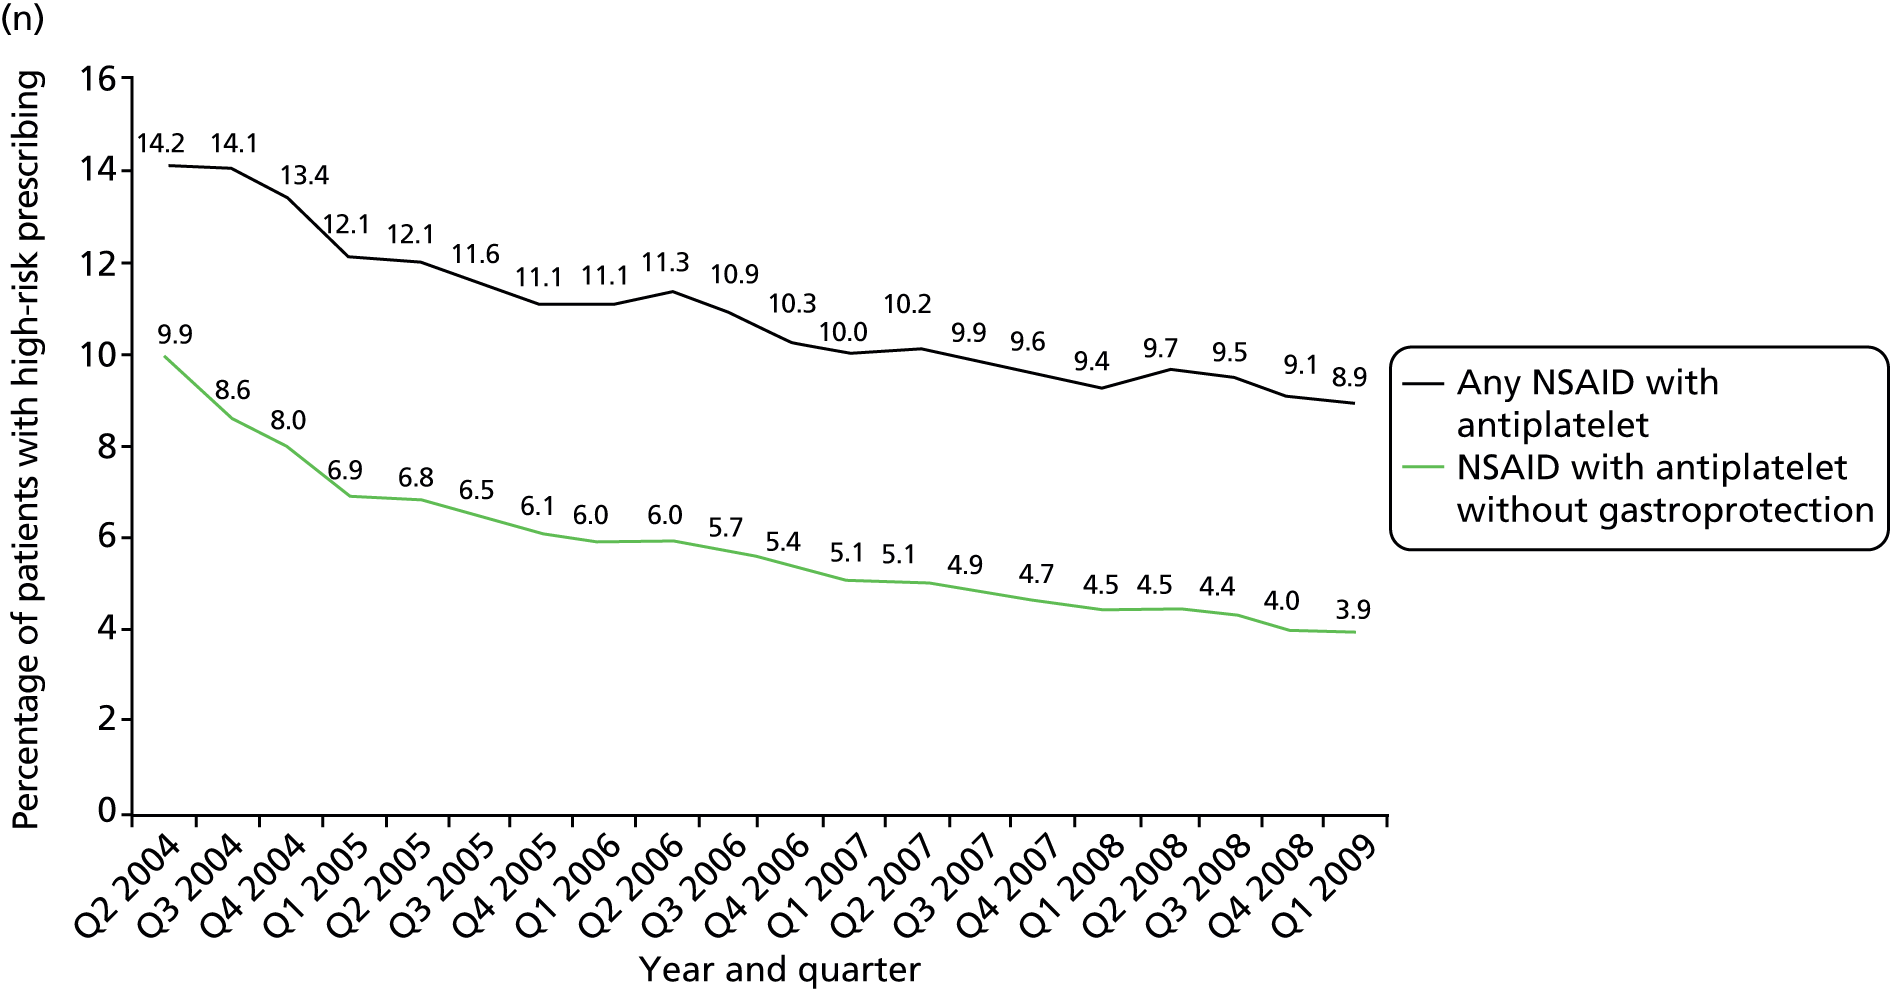

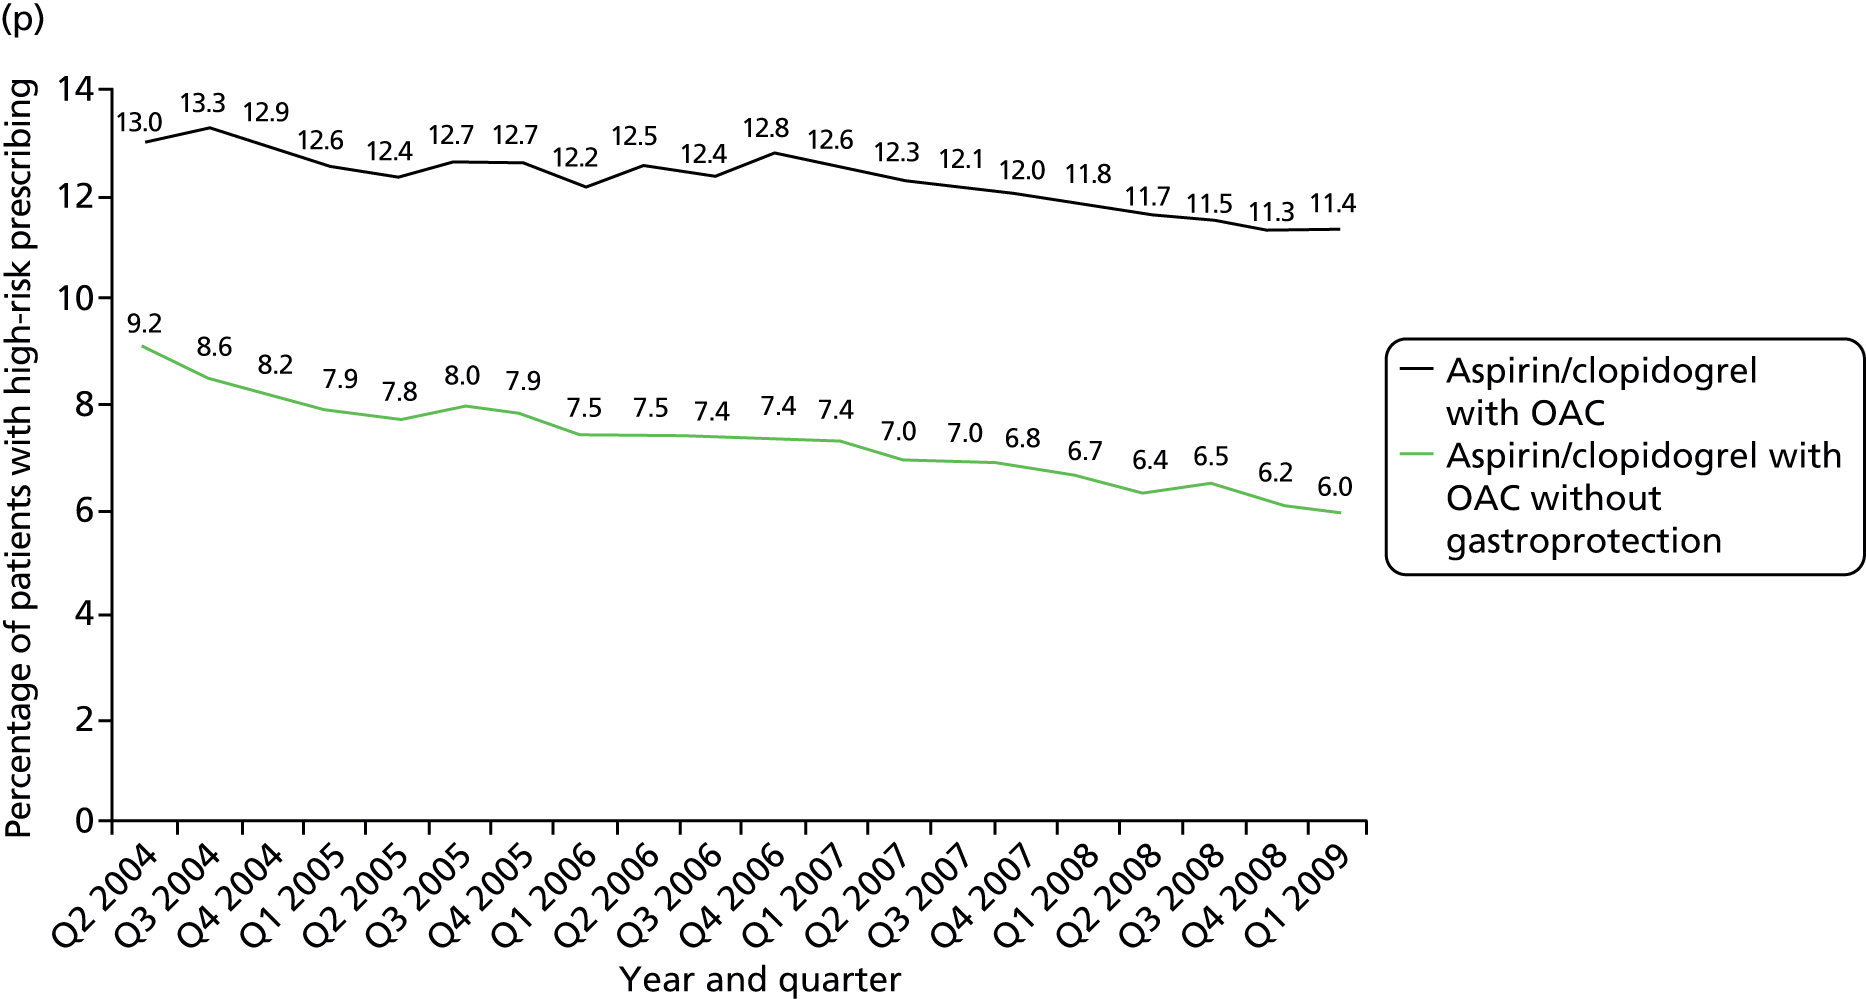
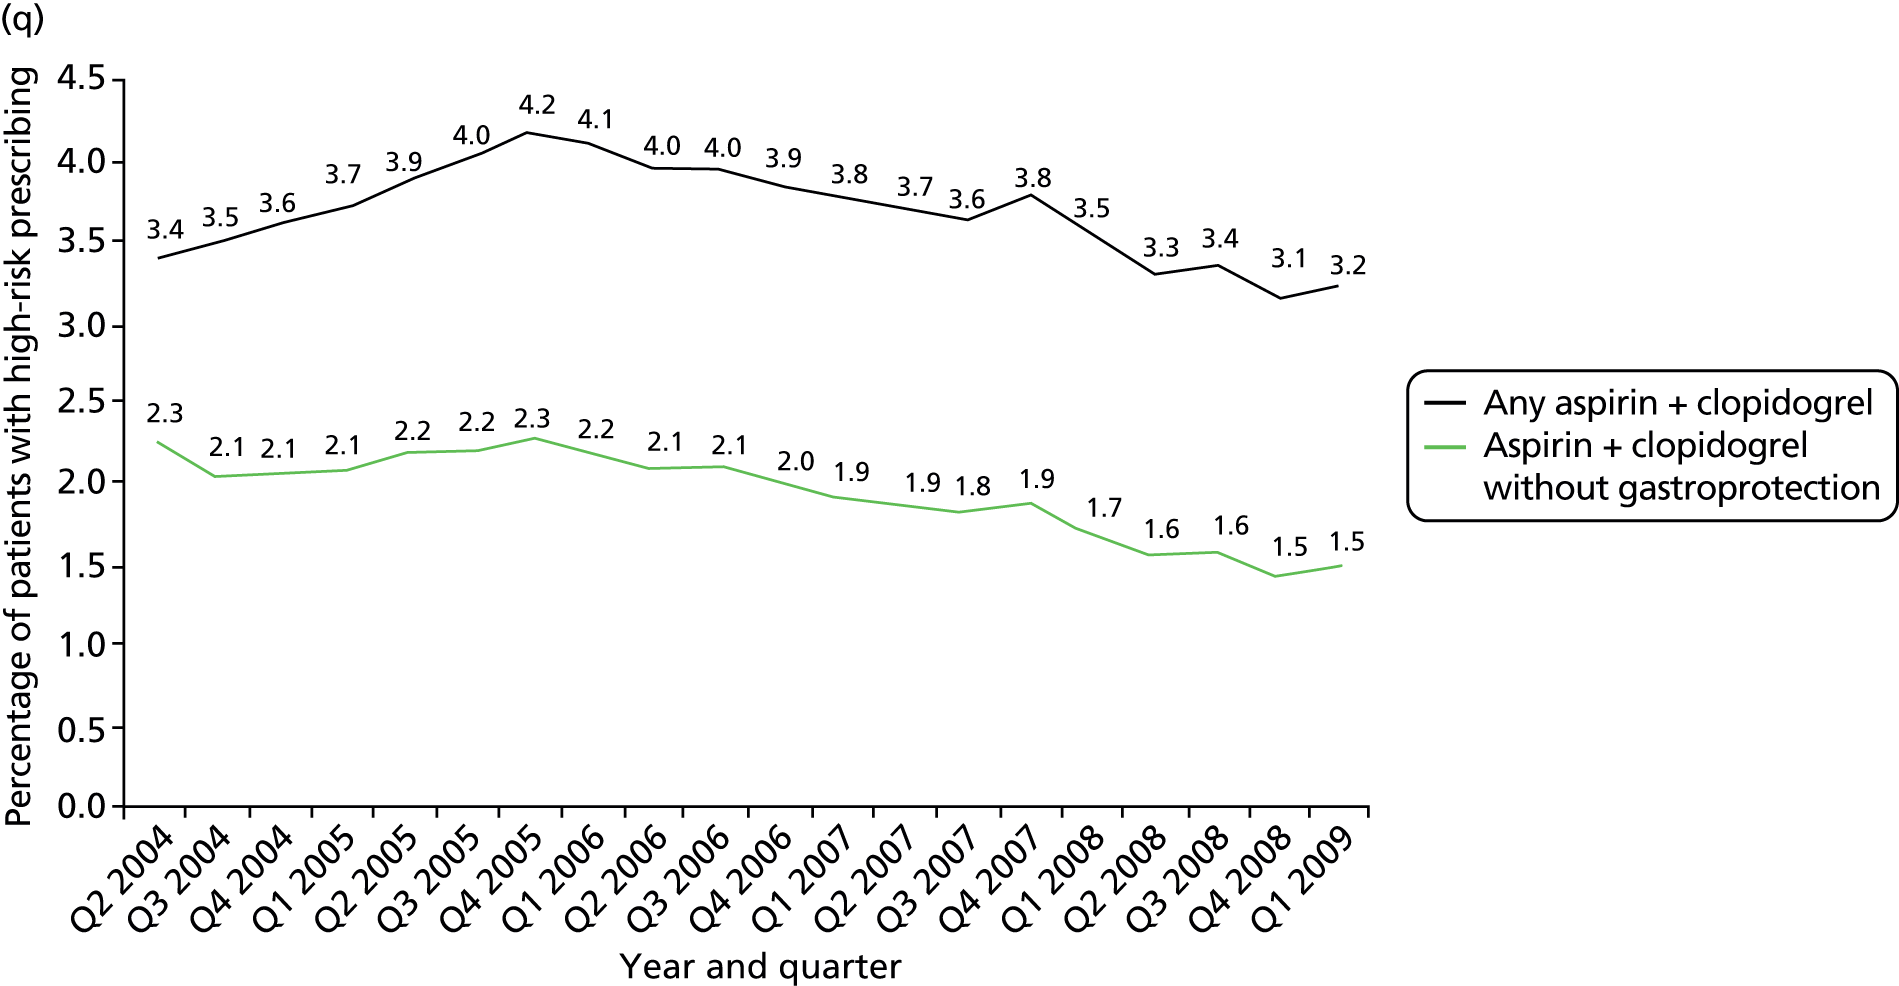

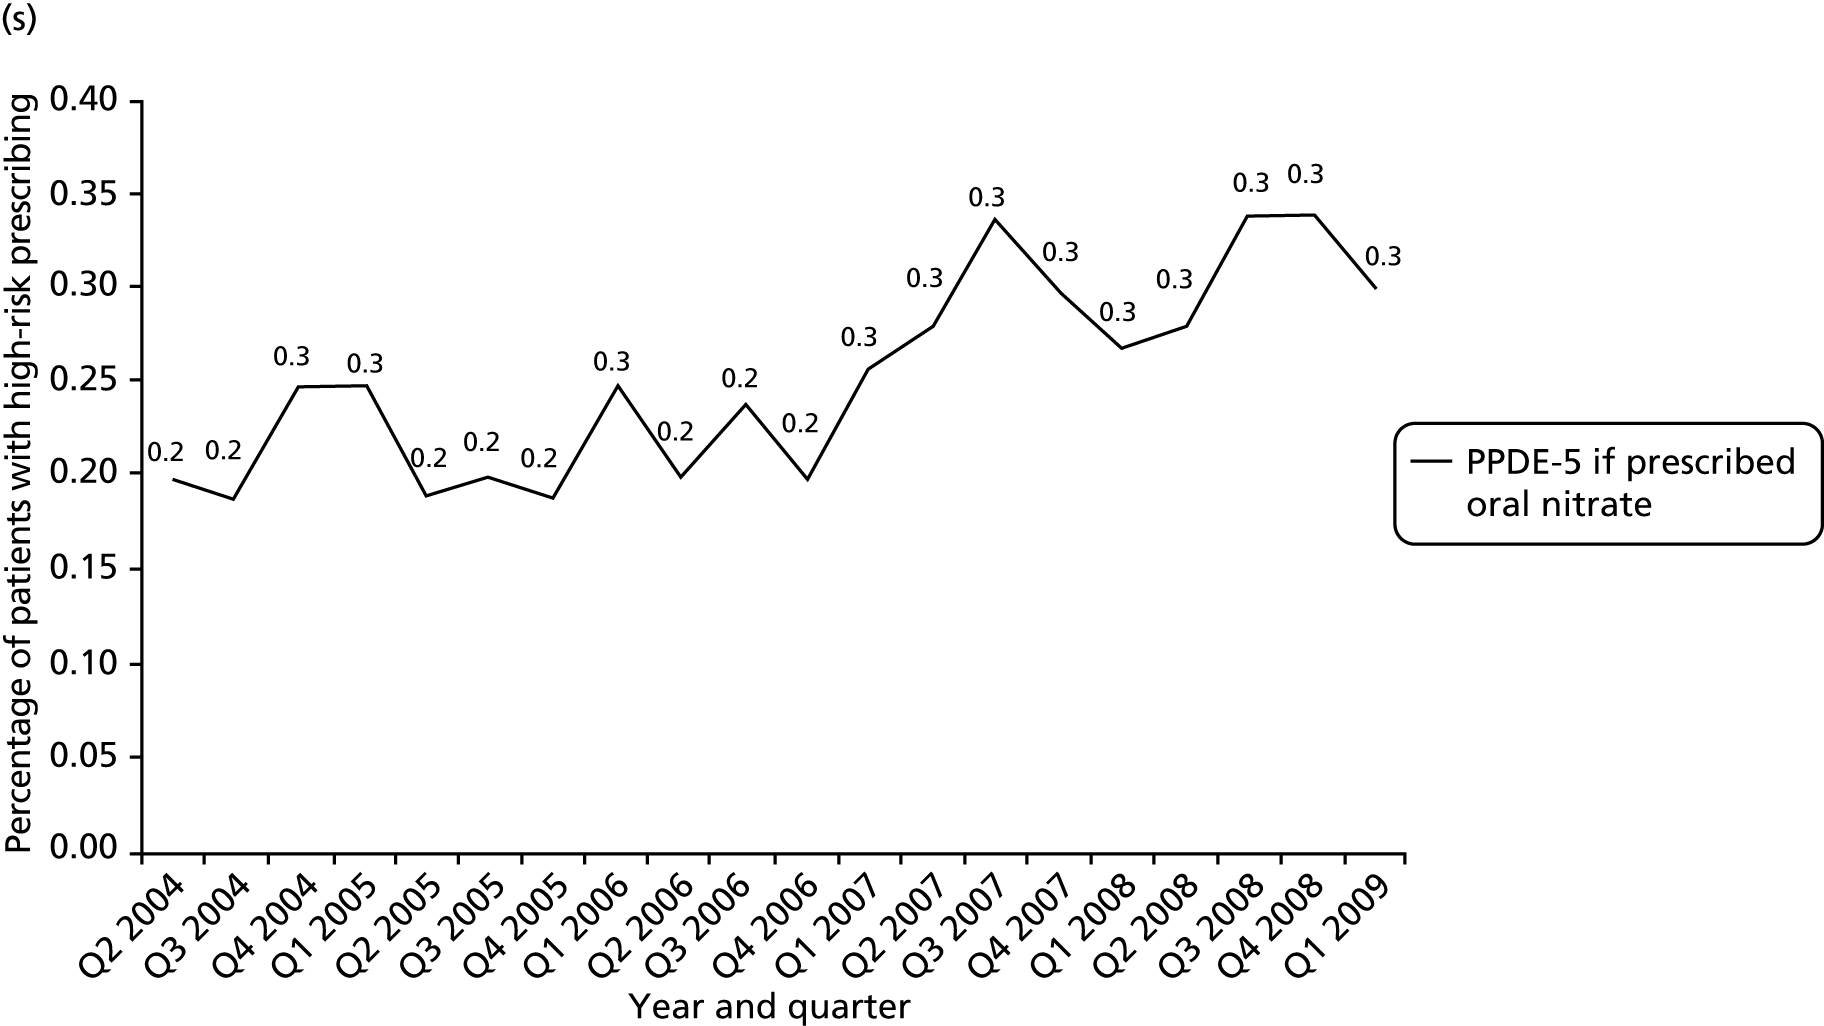
FIGURE 13.
Time series of changes in high-risk prescribing 2004–9 for composite indicators. (a) Composite 1: NSAIDs; (b) composite 2: NSAIDs and antiplatelets; (c) composite 3: drug–disease interactions; (d) composite 4: drug–drug interactions; (e) composite 5: renal adverse effects; and (f) composite 6: all indicators except CKD.
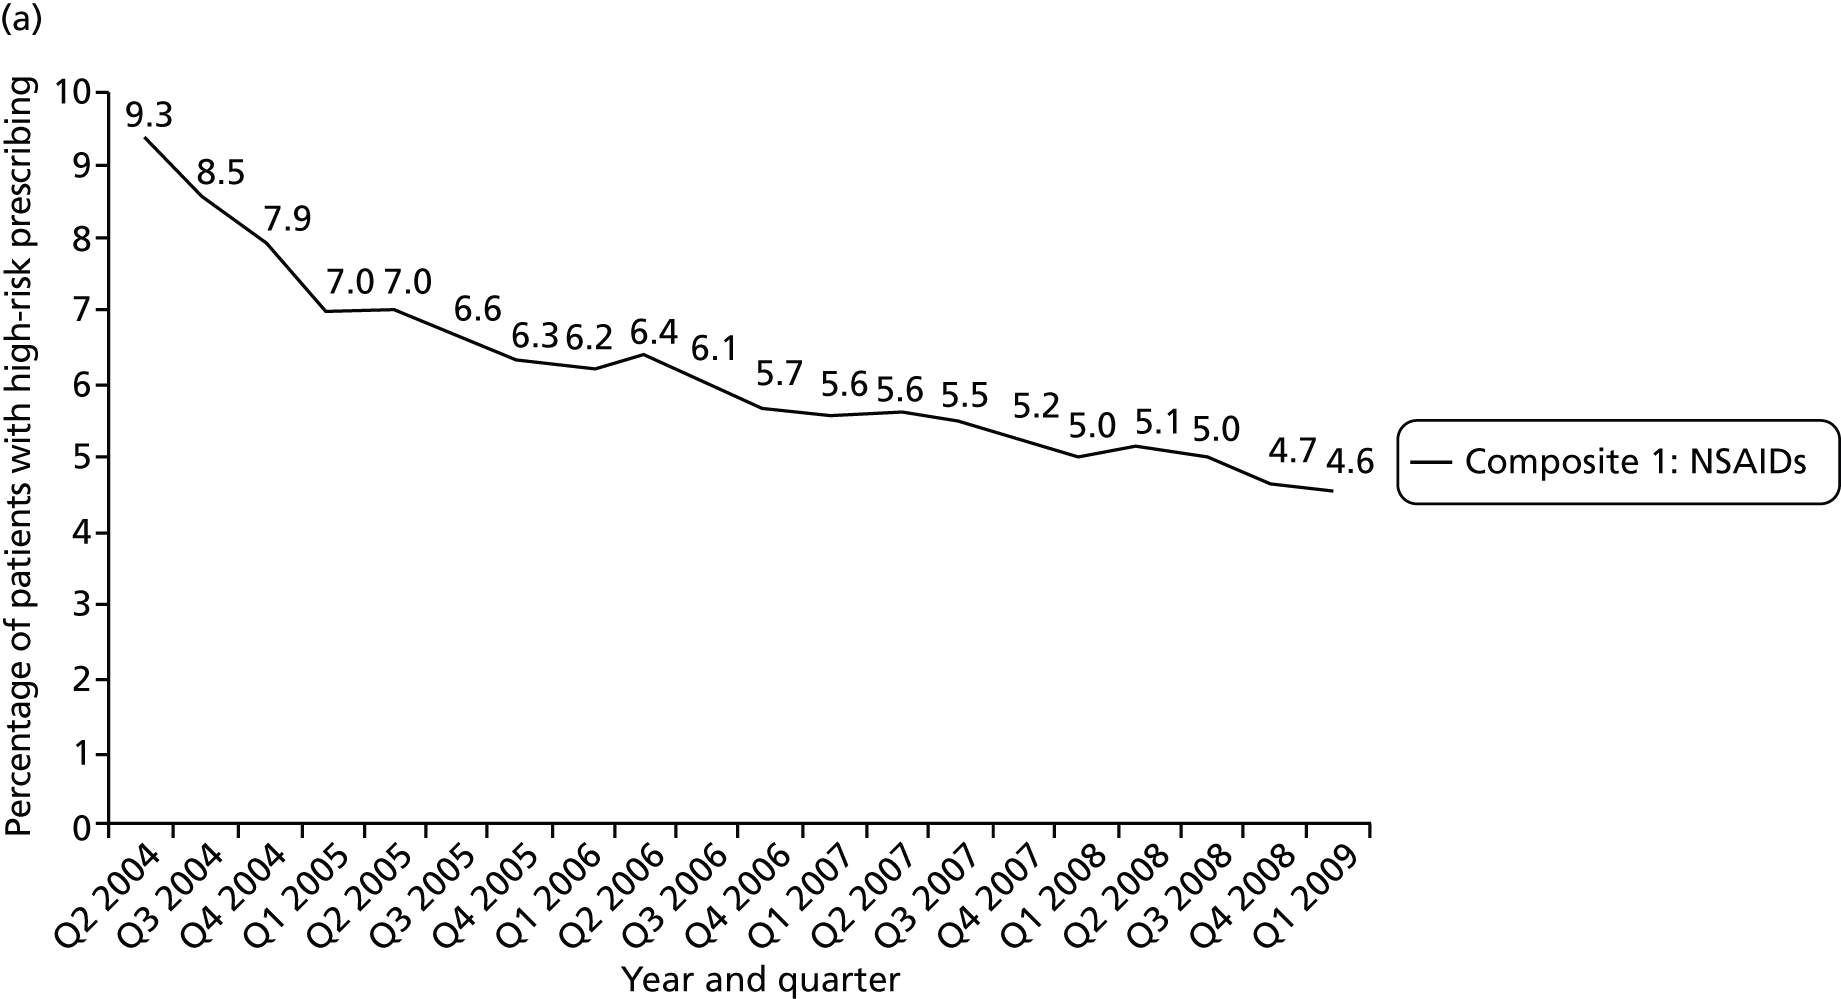
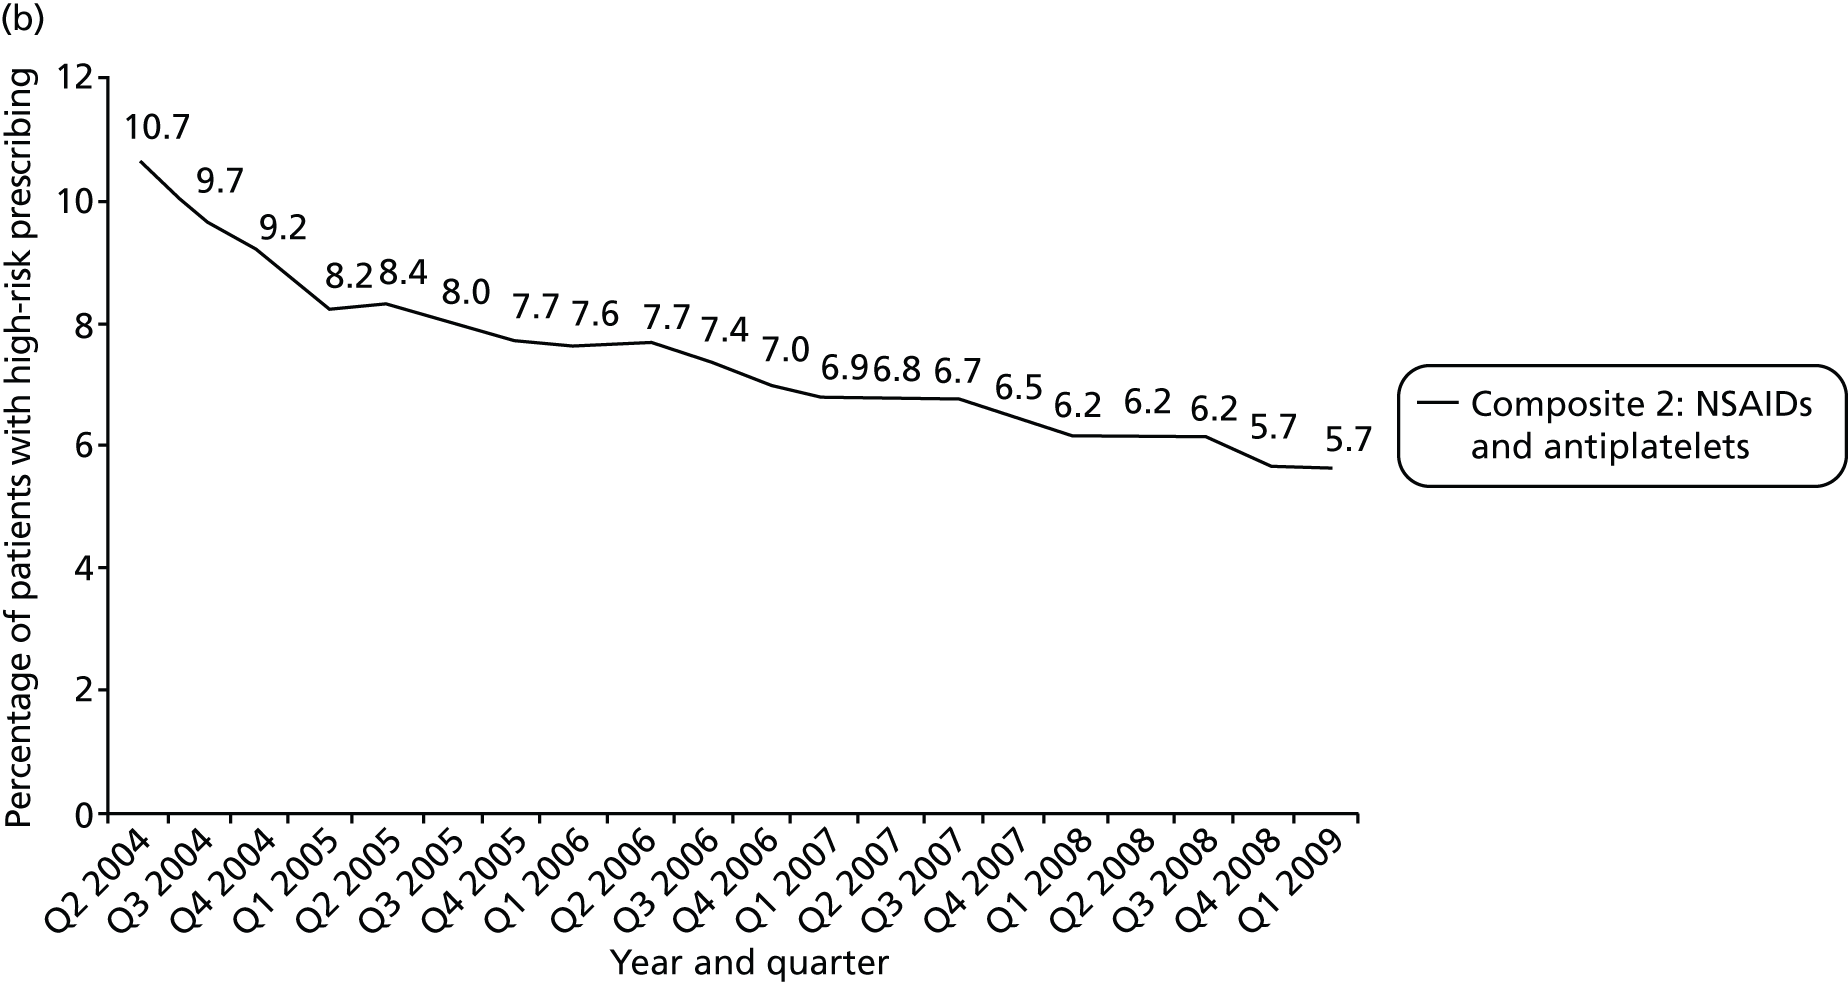
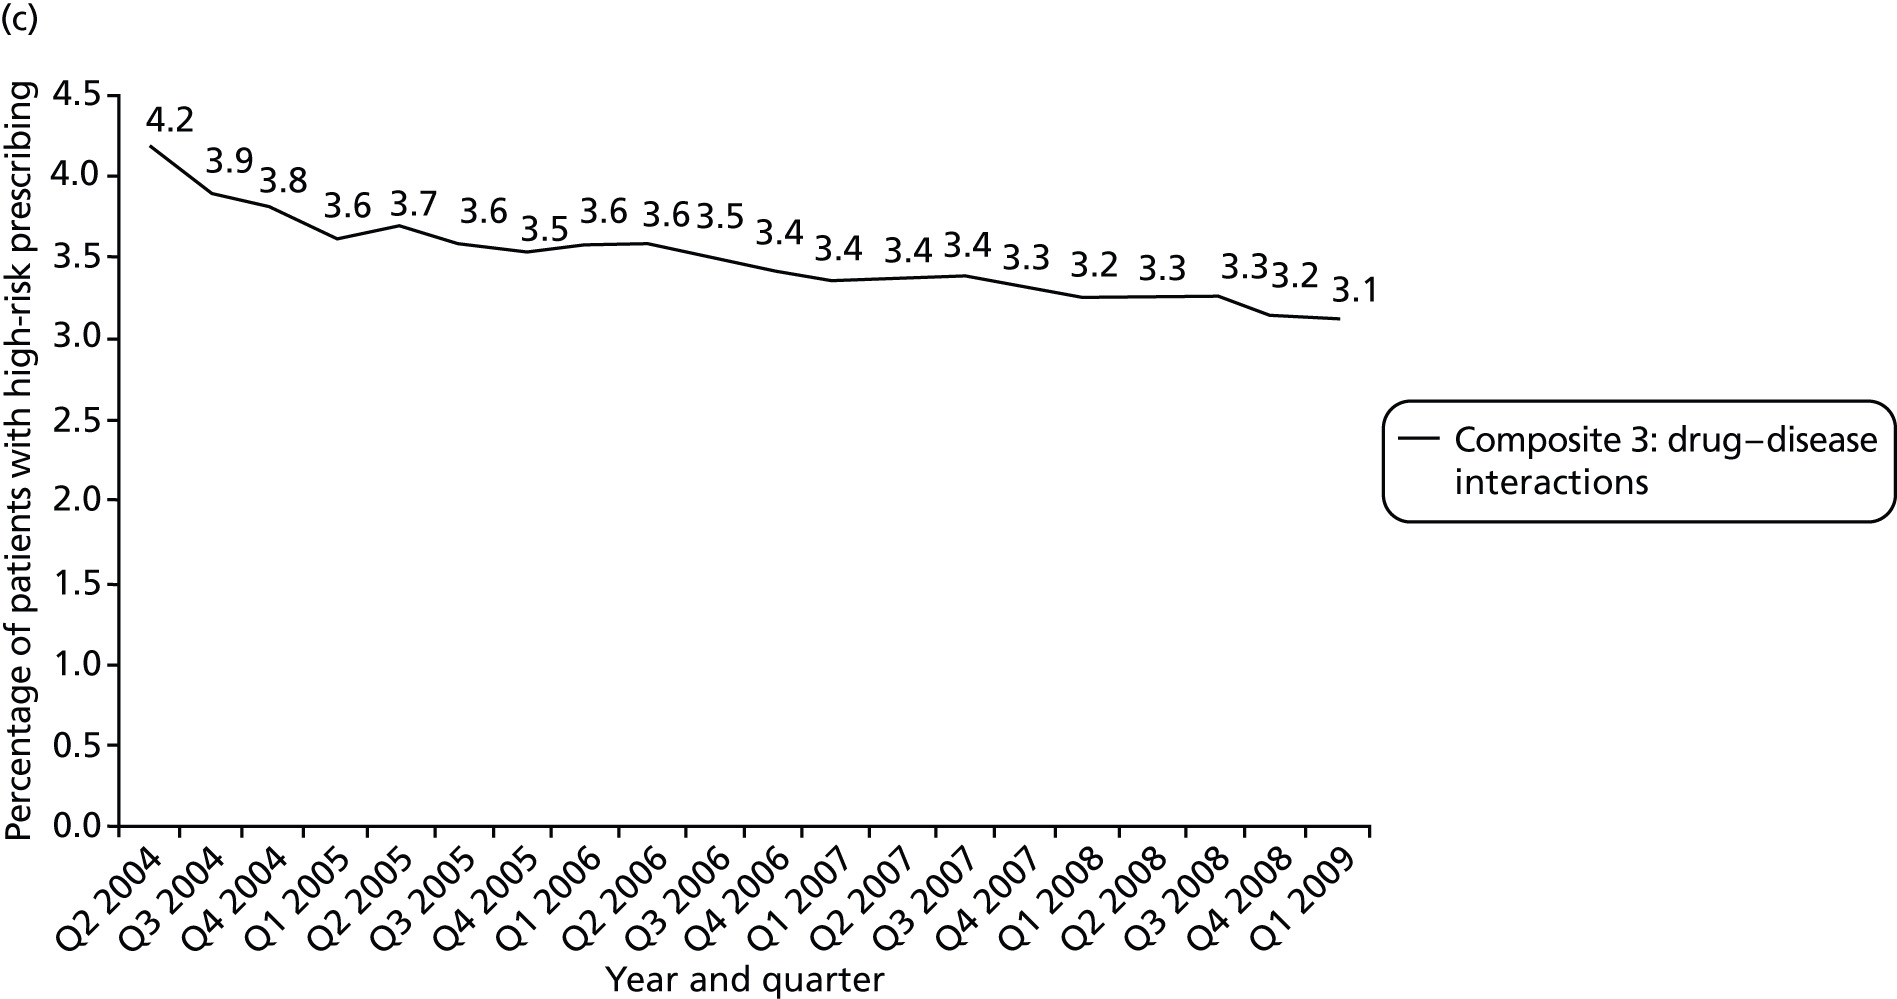
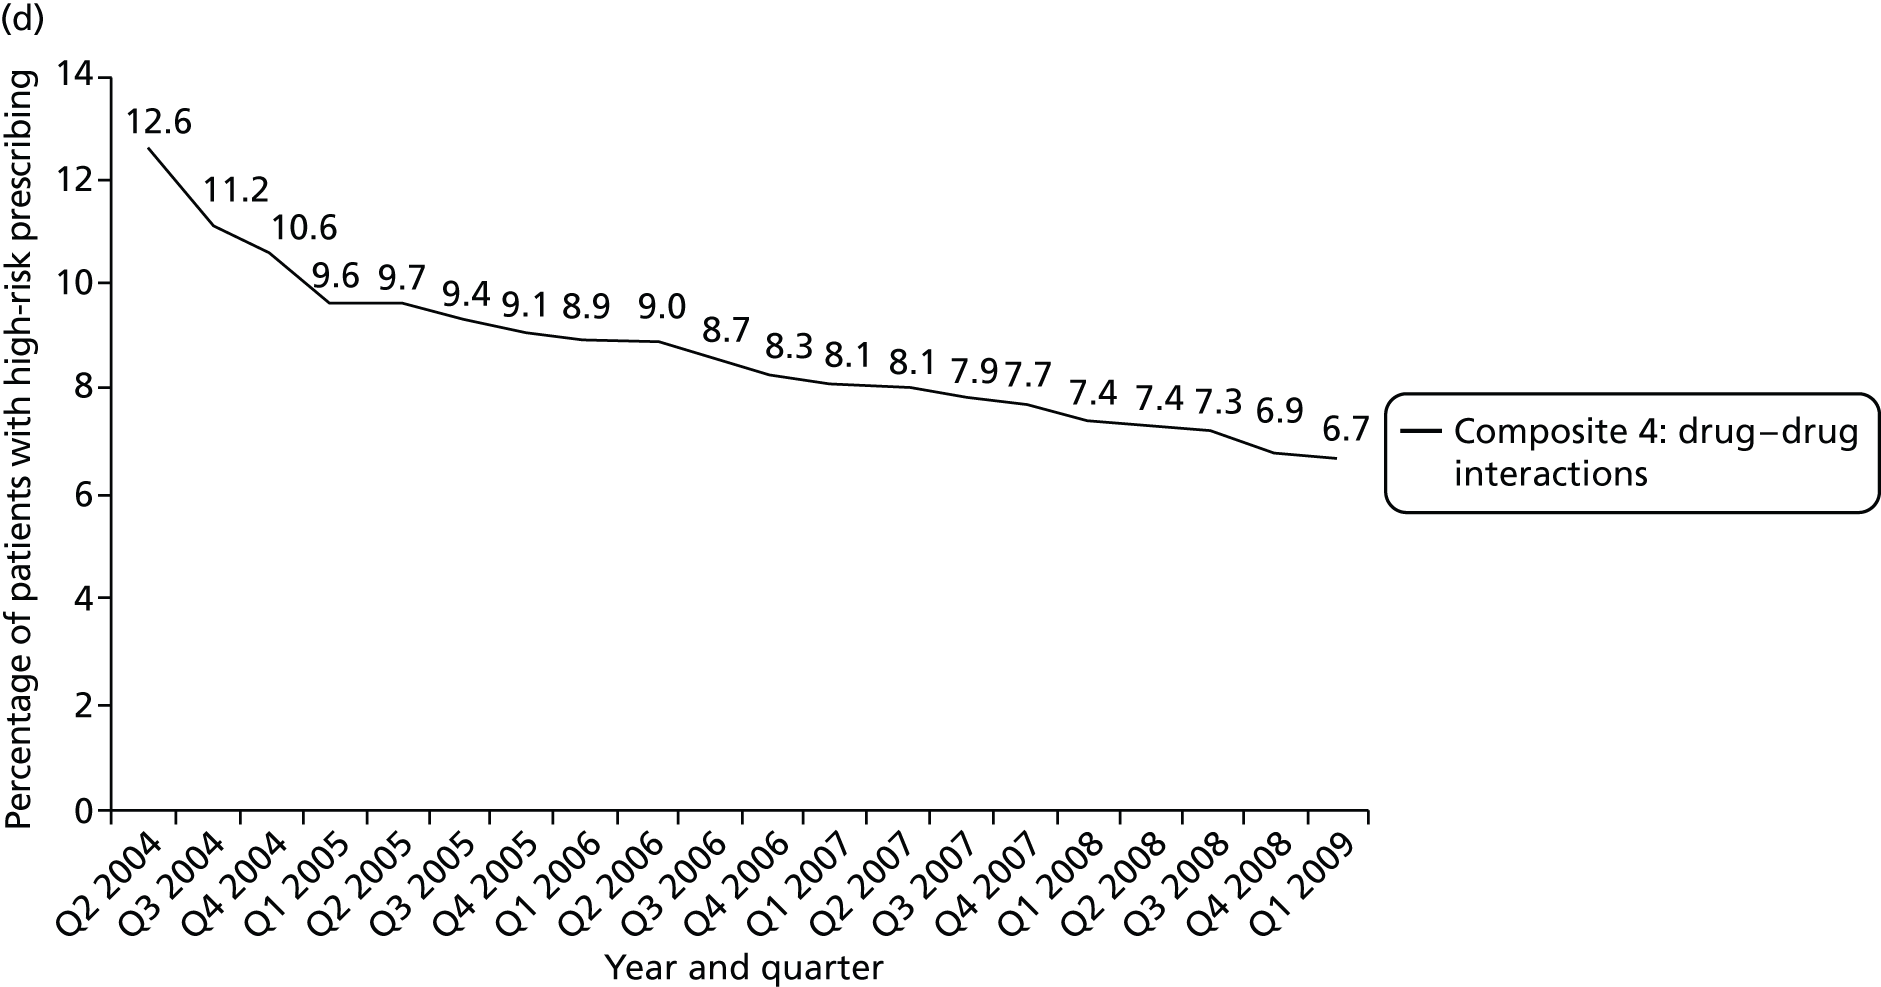
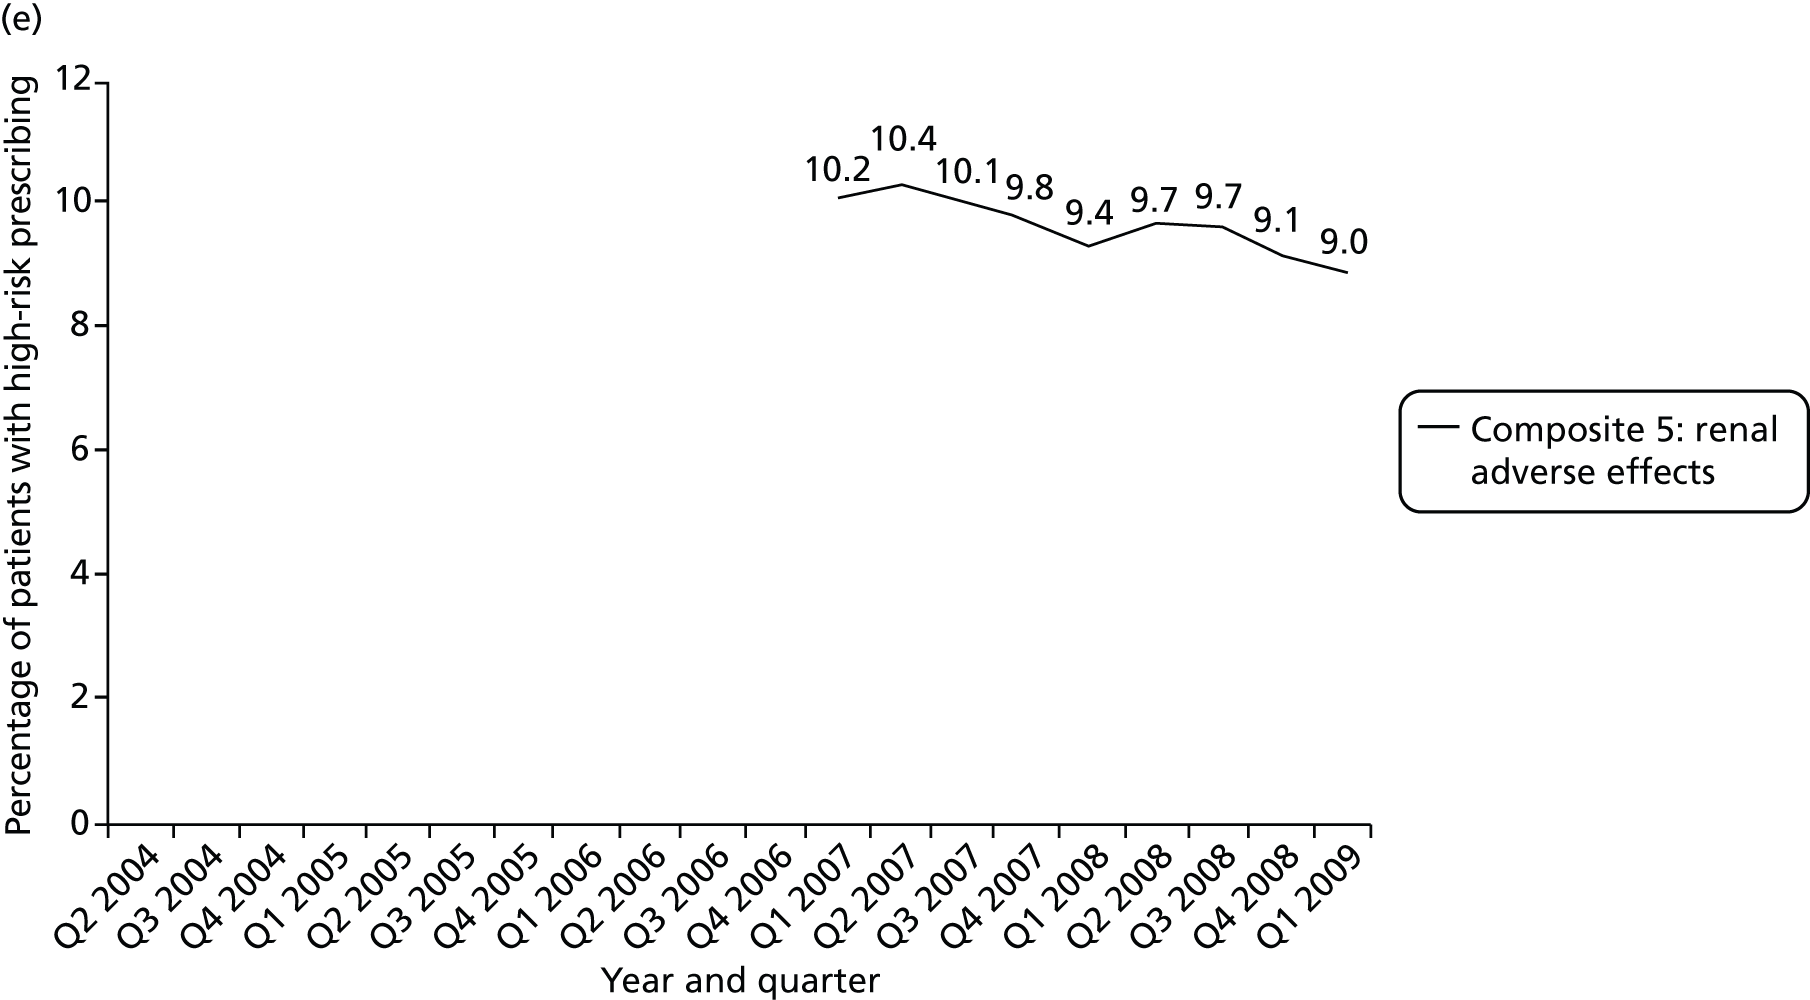
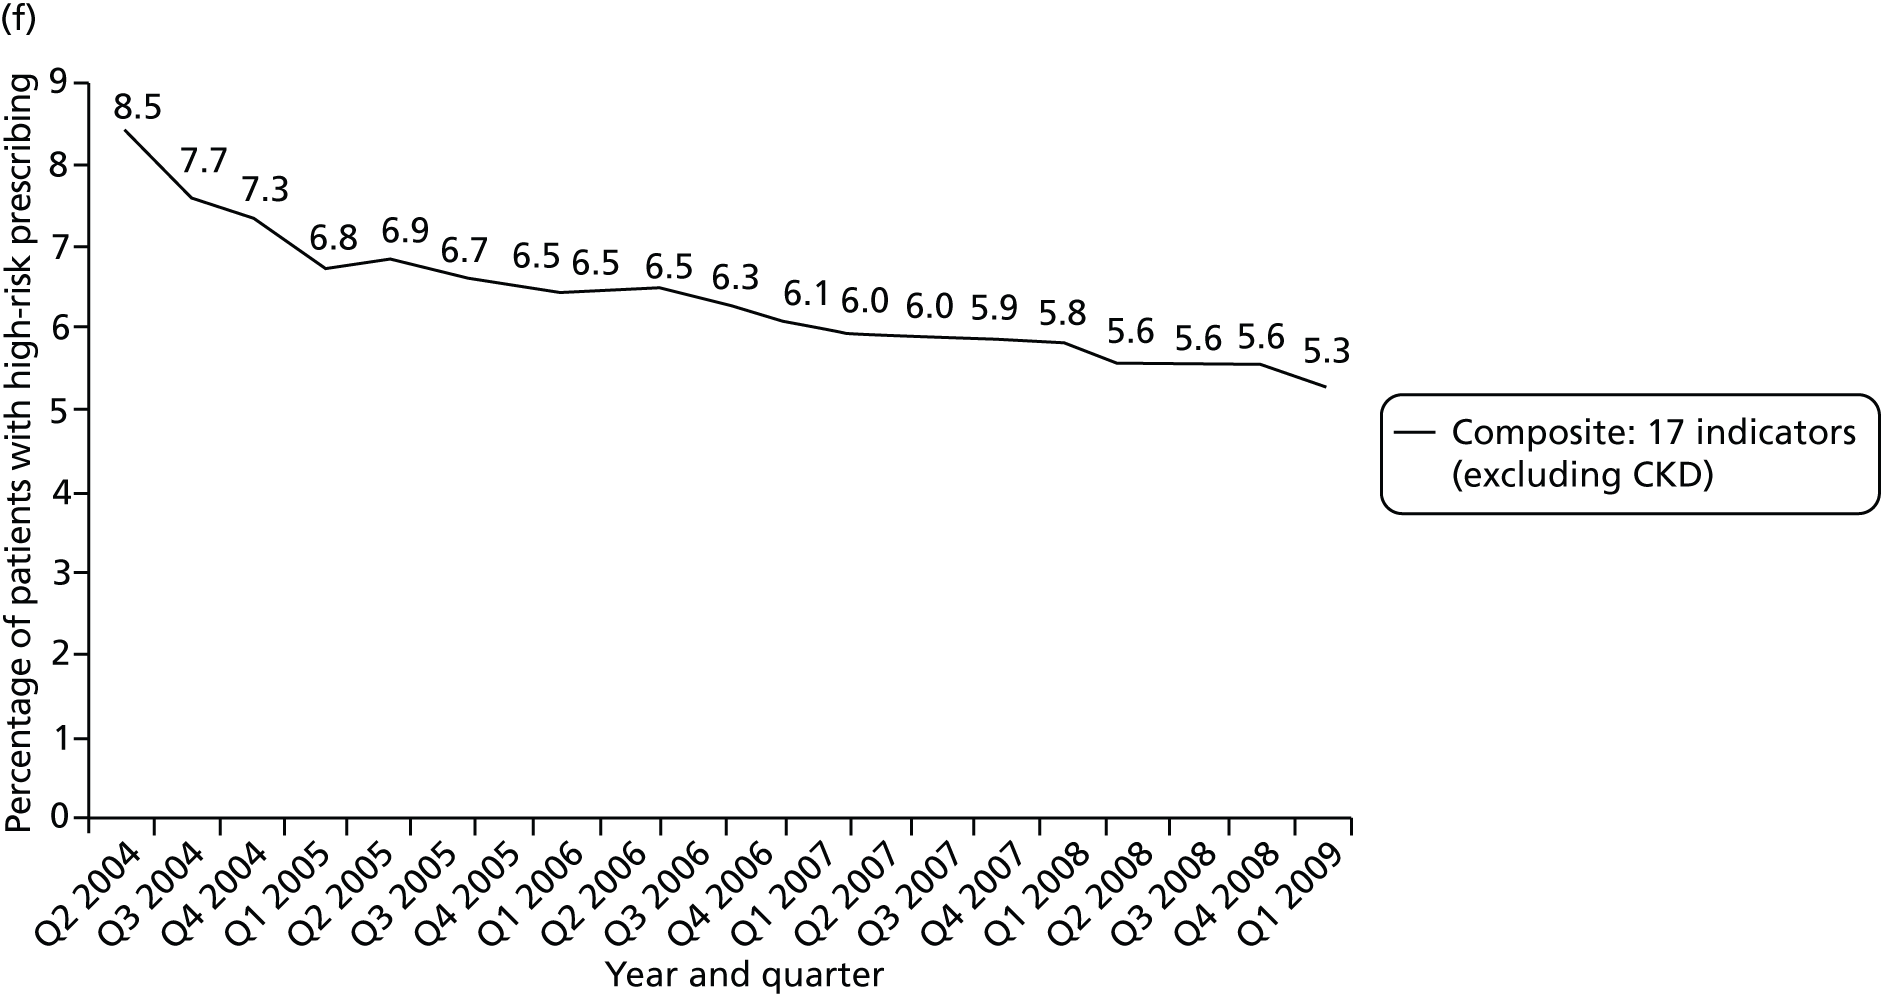
| Indicator | Change in prevalence | Change in variation between practices | ||||
|---|---|---|---|---|---|---|
| Prevalence (%), Q2 2004 vs. Q1 2009a,b | Pattern of any change | Interpretation | ICC, Q1 2005 vs. Q1 2009a | F-test p-value | Interpretation | |
| 1: Drugs to avoid in heart failure | 23.3 → 20.2 | Linear fall in high-risk prescribing | Small but clinically significant decrease | 0.016 → 0.008 | p < 0.0001 | Significant reduction in variation between practices |
| 2: Beta blockers in asthma | 1.1 → 1.3 | Linear rise in high-risk prescribing | Not clinically significant | 0.051 → 0.036 | p = 0.004 | Significant reduction in variation between practices |
| 3: LABA use without ICS use | 5.4 → 2.5b | Linear fall in high-risk prescribing | Clinically significant decrease | 0.125 → 0.202 | p < 0.0001 | Significant increase in variation between practices |
| 4: NSAID in peptic ulcer | 5.6 → 2.7 | Initially more rapid reduction, partially flattening off | Clinically significant decrease | 0.041 → 0.041 | p = 0.142 | No significant change in variation between practices |
| 5: NSAID in over-75-year-olds | 8.1 → 3.1 | Initially more rapid reduction, partially flattening off | Clinically significant decrease | 0.053 → 0.087 | p = 0.0004 | Significant increase in variation between practices |
| 6: Methotrexate in mixed strengths | 14.5 → 11.0 | Linear fall in high-risk prescribing | Clinically significant decrease | 0.151 → 0.320 | p < 0.00001 | Significant increase in variation between practices |
| 7: COCP in previous thromboembolismc | 0.25 → 0.17 | Linear fall in high-risk prescribing | Very small numbers, not clinically significant | – | – | – |
| 8: Oestrogens in previous breast cancerc | 0.45 → 0.19 | Linear fall in high-risk prescribing | Very small numbers, not clinically significant | – | – | – |
| 9: Antipsychotics in dementia | 14.3 → 15.0 | Initial small rise then flattening off | Not clinically significant | 0.074 → 0.064 | p = 0.313 | No significant change in variation between practices |
| 10: Parkinson’s disease | 1.2 → 0.7 | Linear fall in high-risk prescribing | Very small numbers, not clinically significant | – | – | – |
| 11: NSAID in CKD 3–5 | 8.6 → 7.4a | Initially more rapid reduction, partially flattening off | Small clinically significant decrease, short time series | 0.051 → 0.068a | p < 0.00001 | Significant increase in variation between practices |
| 12: Drugs to avoid in CKD 4 and 5 | 20.9 → 20.1a | Initial small rise then flattening off | Not clinically significant, short time series | 0.053 → 0.009a | p < 0.00001 | Significant reduction in variation between practices |
| 13: NSAID with (OAC) | 3.1 → 0.98 | Initially more rapid reduction, partially flattening off | Clinically significant decrease | 0.109 → 0.167 | p = 0.0016 | Significant increase in variation between practices |
| 14: NSAID with aspirin or clopidogrel | 9.9 → 3.8 | Initially more rapid reduction, partially flattening off | Clinically significant decrease | 0.057 → 0.071 | p = 0.180 | No significant change in variation between practices |
| 15: NSAID with ACE inhibitors/ARB and diuretic | 13.6 → 8.2 | Initially more rapid reduction, partially flattening off | Clinically significant decrease | 0.057 → 0.069 | p = 0.063 | No significant change in variation between practices |
| 16: Aspirin/clopidogrel with OAC | 9.2 → 6.0 | Linear fall in high-risk prescribing | Clinically significant decrease | 0.062 → 0.052 | p = 0.019 | Significant reduction in variation between practices |
| 17: Aspirin and clopidogrel | 2.3 → 1.5 | Linear fall | Clinically significant decrease | 0.036 → 0.038 | p = 0.997 | No significant change in variation between practices |
| 18: High-risk drugs with coumarin OAC | 2.9 → 4.6 | Linear rise in high-risk prescribing | Clinically significant increase | 0.056 → 0.023 | p < 0.00001 | Significant reduction in variation between practices |
| 19: PPDE-5 inhibitor with oral nitratec | 0.20 → 0.30 | Linear rise in high-risk prescribing | Very small numbers, not clinically significant | – | – | – |
| Indicator | Change in prevalence | Change in variation between practices | ||||
|---|---|---|---|---|---|---|
| Prevalence, Q2 2004 vs. Q1 2009a,b | Pattern of any change | Interpretation | ICC, Q1 2005 vs. Q1 2009a | F-test p-value | Interpretation | |
| Composite 1: NSAIDs | 9.3 → 4.6 | Initially more rapid reduction, partially flattening off | Clinically significant decrease | 0.049 → 0.058 | p = 0.305 | No significant change in variation between practices |
| Composite 2: NSAIDs and antiplatelets | 10.7 → 5.7 | Initially more rapid reduction, partially flattening off | Clinically significant decrease | 0.038 → 0.043 | p = 0.465 | No significant change in variation between practices |
| Composite 3: drug–disease interactions | 4.2 → 3.1 | Linear fall | Clinically significant decrease | 0.032 → 0.025 | p = 0.018 | Significant reduction in variation between practices |
| Composite 4: drug–drug interactions | 12.6 → 6.7 | Initially more rapid reduction, partially flattening off | Clinically significant decrease | 0.028 → 0.030 | p = 0.730 | No significant change in variation between practices |
| Composite 5: Renal adverse effects | 10.2 → 9.0a | Linear fall | Small clinically significant decrease, short time series | 0.042 → 0.051b | p = 0.040 | Significant increase in variation between practices |
| Composite 6: all indicators except CKD | 8.5 → 5.2 | Initially more rapid reduction, partially flattening off | Clinically significant decrease | 0.027 → 0.025 | p = 0.470 | No significant change in variation between practices |
In total, 11 of the 19 indicators showed statistically significant decreases in prevalence (the seven NSAID indicators; the two antiplatelet indicators; indicator 1: drugs to avoid in heart failure; and indicator 3: LABA use without ICSs), seven showed no change and one showed a statistically significant increase (indicator 18: high-risk drugs with coumarin oral anticoagulant) increasing from 2.9% to 4.6%. All of the NSAID indicators had an initial more rapid reduction with subsequent partial flattening off, apart from indicator 11 (NSAIDs in CKD 3–5), although this indicator covers only the later part of the time series from Q1 2007 so is not directly comparable. For NSAID and antiplatelet indicators related to GI bleeding risk, reductions in high-risk prescribing could, in principle, be because of reduced rates of NSAID prescribing or increased use of gastroprotective drugs, but the same pattern of change was seen irrespective of whether or not gastroprotection was accounted for (see relevant panels of Figure 12), consistent with reductions being primarily driven by reduced NSAID prescribing.
Two indicators showed reductions between Q2 and Q3 2004, which did not fit the otherwise observed trend (indicator 3: LABA use without ICSs in asthma; and indicator 9: antipsychotic use in dementia). For antipsychotic use in people with dementia, we know from an analysis using this data set over a longer period of time that this is the tail end of a very large change in this prescribing associated with a regulatory warning in early 2004. 56 The large change in LABA use without ICSs is potentially the result of regulatory warnings and new guidance about avoiding LABA monotherapy issued in 2003. 139 However, the prior trend is unobservable in this data set, and, to our knowledge, there are no published studies that extend over a longer period, and so the first data point was excluded from regression models fitting a trend line.
In terms of change in variation between practices, of the 15 indicators for which an ICC could be estimated, variation between practices increased for five indicators, remained the same for five, and reduced for five. There was no clear relationship between change in prevalence and change in variation between practices (Table 17), although it was notable that 5 of the 11 indicators with a falling prevalence had an increase in variation between practices.
| Summary of change | Increase in variation | No change in variation | Decrease in variation | Row totals |
|---|---|---|---|---|
| Increase in prevalence | 0 | 0 | 1 | 1 |
| No change in prevalence | 0 | 1 (+ 4a) | 2 | 3 (+ 4a) |
| Decrease in prevalence | 5 | 4 | 2 | 11 |
| Column totals | 5 | 5 (+ 4a) | 5 | 19 |
As we observed that changes in the overall composite appeared to be largely driven by reductions in high-risk NSAID and antiplatelet prescribing, we defined post-hoc a composite of all indicators which were not NSAID or antiplatelet related and examined change in prevalence and variation between practices. This composite was not prespecified but was defined in the same way as the other composite measures and consisted of indicators 1 (drugs to avoid in heart failure excluding NSAIDs), 2 (beta-blockers and asthma), 3 (LABA but no ICS in asthma), 6 (methotrexate mixed strengths), 7 (combined oral contraceptive pill and previous thromboembolism), 8 (oestrogens in breast cancer), 9 (antipsychotics and dementia), 10 (metoclopramide/prochlorperazine and Parkinson’s disease), 18 (high-risk drugs with coumarin oral anticoagulant) and 19 (PPDE-5 antagonists and oral nitrates). Consistent with overall changes in high-risk prescribing being NSAID and, to a lesser extent, antiplatelet related, there was no change in the prevalence of this composite indicator (Q3 2004 prevalence 3.3% vs. 3.3% in Q1 2009) or in variation between practices (ICC 0.023 in Q1 2005 vs. 0.021 in Q1 2009; F-test for difference in variances, p = 0.219).
Discussion
Summary of findings
The prevalence of high-risk prescribing in Q1 2009 measured by composite 6 (all indicators except CKD) was 5.2% (95% CI 5.1% to 5.3%) and by composite 5 (renal adverse effects) was 9.0% (95% CI 8.7% to 9.2%). There was clinically important variation between practices in the absolute prevalence of high-risk prescribing, with the composite 6 range being 0–10.1% and the interquartile range being 4.1–6.3%. ICCs for the composite measures ranged from 0.025 (95% CI 0.020 to 0.033) for composite 6 to 0.058 (95% CI 0.046 to 0.073) for composite 1 (NSAID indicators), consistent with variation between practices being a small to at best moderate proportion of total variation.
Four of the indicators had low absolute numbers of patients receiving a high-risk prescription, and low overall prevalence, with no prescribing at all in > 80% of practices in Q1 2009 (and earlier). These were indicator 7 (combined oral contraceptive prescribed to a woman with a history of arterial or venous thromboembolism), indicator 8 (oral or transdermal oestrogen prescribed to a woman with a history of breast cancer), indicator 10 (metoclopramide or prochlorperazine prescribed to a person with Parkinson’s disease) and indicator 19 (PPDE-5 inhibitor prescribed to a person prescribed oral nitrates or nicorandil). For these indicators, it was not possible to calculate an ICC, but this prescribing seemed to be a result of rare and sporadic error rather than systematic differences, as most practices had no such prescribing, few practices had more than one patient with such prescribing and practices with any patient triggering one of these measures did not usually have any triggering other measures. Although still important to review from an individual patient perspective,38,39,140 the prescribing measured by these indicators will therefore not be a common cause of harm, and variation between practices in them is unlikely to be important.
Excluding these four indicators, the prevalence of high-risk prescribing in Q1 2009 varied from 1.0% (indicator 13: NSAID prescribed to person prescribed an oral anticoagulant) to 20.2% (indicator 1: drugs to avoid in heart failure). There was trivial variation between practices for two indicators (indicators 1 and 12), large variation between practices for three (ICC 0.167 to 0.320 for indicators 3, 6 and 13), and ICCs in the range seen in most other studies for the remainder (range in this study 0.023 to 0.087).
Overall, high-risk prescribing declined between 2004 and 2009, with 11 of the 19 indicators showing clinically significant reductions, eight of which were indicators involving NSAIDs and/or antiplatelet drugs, which were almost entirely responsible for the observed reduction in overall high-risk prescribing. Only indicator 18 (high-risk drugs with coumarin oral anticoagulants) increased in prevalence. The percentage of patients receiving any high-risk prescription in composite 6 (all indicators except for the CKD indicators) fell from 8.5% in Q2 2004 to 5.2% in Q1 2009, reflecting 7213 fewer patients receiving any high-risk prescription (21,848 out of 257,656 vs. 14,635 out of 280,461). Over the same period, variation between practices increased for five indicators, did not change for five and decreased for five (and could not be estimated for indicators 7, 8, 10 and 19; see Table 15). There was no clear relationship between change in prevalence and change in variation between practices.
Strengths and limitations
The analysis uses routinely collected data from GP electronic medical records for approximately 20% of the Scottish population. Such data have a number of strengths and a number of matching weaknesses. Important strengths are the size and scope of the data set and that GP records are generally near complete for prescribing and have reasonable accuracy for diagnostic coding for the common conditions included here. The partial exception to this is CKD, for which there were major changes to practice, with the routine reporting of eGFR being implemented across the UK in late 2005 and CKD becoming a domain the QOF from April 2006. This led to major changes in CKD coding during 2006, and analysis of the two CKD-related indicators (indicators 11 and 12) therefore only starts in Q1 2007.
Key limitations are that some prescriptions are hand-written and therefore will not be recorded electronically (particularly prescriptions written during home visits, which are most commonly given to frailer patients who are most at risk of ADEs), and some patients may obtain NSAIDs or aspirin over the counter from a pharmacy, although prescriptions are free to all over-65-year-olds and some younger people with chronic disease, making this less likely for many of the measures which predominantly target older people. As discussed in Chapter 3, composite indicators can be problematic to interpret if they combine individual indicators with different levels of risk or associated harm, or with different prevalence meaning that the composite is effectively dominated by a small number of the underlying individual indicators. In this case, the composites are less similar than in previous chapters, where they related to a single drug class (NSAIDs), and the underlying prevalence varies more widely. For this reason, interpretation of the composites should be cautious and made with reference to changes in the underlying individual indicators.
Interpretation and comparison with existing literature
There have been a number of studies of change in high-risk prescribing over time, although these typically examine the impact of specific interventions targeting one particular kind of prescribing, most commonly the impact of regulatory or other risk communications. 55–59,141,142 Such studies find typically small and somewhat variable impact of risk communication interventions with impact associated with clear recommendations for action, repeated warnings and larger reductions in new prescribing than prevalent prescribing (i.e. in people being prescribed the drug before the warning). 55,56 For the indicators examined here, there were Medicines and Healthcare products Regulatory Agency (MHRA) risk communications in relation to antipsychotics in older people with dementia in Q1 2004143 in relation to NSAID GI toxicity (focusing on the risks in older people and when coprescribed with aspirin) in 2002 and 2003,144,145 and COX-2 NSAIDs and cardiovascular risk in 2004146 and 2005147 (but which also reminded prescribers to use all NSAIDs at the lowest possible dose) and updated advice about cardiovascular risk of all NSAIDs in 2006, including that non-selective NSAIDs might carry cardiovascular risk. 148 In addition, the National Patient Safety Agency issued a risk communication and best practice advice in relation to methotrexate, including avoiding prescribing both 2.5 mg and 10 mg strengths in 2006. 149
We have previously shown that a very large change in prescribing of antipsychotics to older people with dementia happened in Q1 2004 (i.e. immediately before the start of observation in this study), and it is likely that the small out-of-trend fall in prescribing between Q2 and Q3 2004 is the tail end of this change. 56 Although the fitted trend in mixed-dose methotrexate prescribing across the whole period was linear, there is a visual indication of a possible change in trend in 2006 consistent with a small change in practice at the time of the National Patient Safety Agency risk communication, although formally testing this would require fitting a segmented regression or other appropriate model. 150,151 Using joinpoint regression, others have shown that NSAID prescribing (and particularly COX-2 NSAID prescribing) reduced after the MHRA warnings in 2004 and 2005, although high-risk NSAID prescribing in this study was falling from the start of observation period, which coincided with the first of these risk communications. It seems likely that the observed decline in high-risk NSAID prescribing from 2004 is at least partly because of MHRA warnings about GI risk in 2002144 and 2003145 and partly because of a spillover effect from risk communications about cardiovascular risk between 2004 and 2006. 146–148 Figure 14 shows the number of oral NSAID prescriptions dispensed by NHS Scotland from 2001 to 2013, distinguishing traditional NSAIDs from COX-2 NSAIDs. 152 This shows that the number of NSAID scripts dispensed rose steadily between 2001 and 2004 because of an increase in COX-2 prescribing which was only partly in substitution for traditional NSAIDs. Dispensing fell slightly in 2005, with a large fall in 2006 driven by large reductions in COX-2 dispensing with only partial substitution of traditional NSAIDs. There was then a smaller decline in total NSAID dispensing until 2008, at which point dispensing slowly increased.
Few previous studies have examined change in variation between practices. In two studies in Sweden and the Netherlands examining health-care centre adherence to guideline recommendations to prescribe simvastatin for cardiovascular prevention, increasing mean adherence over time was associated with large decreases in between-practice variation. 96,153 However, similar to this study, an analysis of change in four indicators over 7 years in variation between physicians and variation between facilities found that quality improved and variation decreased for two indicators, quality improved and variation increased for one, and there was no change for the fourth. 131 This rather contradicts an assumption in some of the literature that variation between physicians or institutions is likely to be large when quality is low and consistently reduce as quality improves. 132,154 Although this must be generally true in the sense that as mean performance approaches 100% then variation must reduce, quality improvement is likely to have differential effects on different physicians or institutions, which very plausibly might increase variation when first implemented. Victora et al. 155 propose such a situation with their ‘inverse equity hypothesis’, which is that improved preventative care initially benefits the more affluent and so will initially widen health inequalities even if longer-term inequalities eventually narrow. The implication is that, although large variation between physicians or institutions is likely to indicate that the quality or safety of care being measured is improvable, decisions to try to improve should not be made solely on the basis of the absence or presence of variation. 131,132 However, quality or safety improvers should pay attention to variation and, if necessary, intervene to minimise it if improvement is widening inequalities.
Chapter 6 Discussion and conclusions
This section summarises the findings of the study, objective by objective, and then discusses their implications for practice and research.
Summary of findings
The aim of this study was to define a set of prescribing safety indicators that can be operationalised in existing electronic clinical data and to examine how high-risk prescribing varied between patients, GPs and practices in order to determine the validity of these indicators for safety improvement, clinical governance and appraisal/revalidation purposes.
Summary for objective 1 (original protocol): Chapter 2
Objective 1 was to define and operationalise prescribing safety indicators that can be applied at individual prescriber level and practice level. We concluded that it was only narrowly feasible to create prescribing safety indicators that could be applied at individual prescriber level because of the difficulty of attributing prescribing decisions to individuals. There were two main reasons for this. First, it is not possible in current data to identify who actually makes the decision to initiate many drugs, with GPs not infrequently prescribing on the recommendation or instruction of a hospital specialist (although the GP has no obligation to follow such a recommendation and retains legal responsibility for the prescription). Second, GP electronic data commonly do not have a clinician ID attached to them. After exploration of the data, we considered that new acute NSAID prescribing (the issue of an acute NSAID prescription when there had been no NSAID prescribing in the previous year) could be attributed to an individual in that almost all such prescriptions will be initiated by GPs, have a clinician ID attached and are likely to be issued and signed by the clinician identified because they are largely created in clinical encounters rather than through administrative processes. This method could be applied to some other high-risk prescribing but is neither generally applicable nor straightforward to implement.
The analysis additionally identified that the most high-risk NSAID prescriptions were issued as repeats, for which clinical oversight is often limited. New acute NSAID prescribing is an important initiating event as it is often associated with subsequent prescribing, with the shift from repeated acute prescribing to repeat being another likely key transition point that will influence practice high-risk prescribing rates.
Summary for objectives 2 and 3 (original protocol): Chapters 3 and 4
Objective 2 was to examine the prevalence of individual indicators and appropriate composites, associations with patient, prescriber and practice variables, and the relative importance of variation at prescriber level and practice level before and after adjustment for patient-level variables. Objective 3 was to measure the reliability of individual and composite indicators at prescriber level and practice level. Two multilevel modelling analyses are reported.
Two-level model reported in Chapter 3
The two-level (patients clustered within practices) model was used to analyse the most recent high-risk NSAID prescription in Q4 2006. This initial analysis examined between-practice variation in total high-risk NSAID prescribing and found that 9.5% of patients particularly vulnerable to NSAID ADEs received a NSAID in Q4 2006. High-risk NSAID use was lower in people with multiple reasons to be vulnerable to ADEs and in the oldest patients, consistent with the risks of NSAID prescribing in these patients being generally recognised. Total high-risk NSAID use was associated with prior rates of new acute NSAID prescribing, reinforcing our belief that the latter is an important decision point and that it is a reasonable outcome to model in the three-level analysis. Variation between practices was statistically fairly small (empty model: ICC 0.034, 95% CI 0.020 to 0.056; median odds ratio 1.38, 95% CI 1.28 to 1.53) but persisted after adjustment for patient characteristics (adjusted model: ICC 0.026, 95% CI 0.015 to 0.044; median odds ratio 1.33, 95% CI 1.24 to 1.45). The observed ICC is in the range typically seen in this kind of analysis, but the large numbers of patients vulnerable to NSAID ADEs meant that the composite indicator was reliable in distinguishing practices as having higher or lower high-risk NSAID prescribing.
Three-level model reported in Chapter 4
The three-level (encounters clustered within GPs clustered within practices) model was used to analyse new acute high-risk NSAID prescription in 2006. In 2006, new acute NSAID prescribing occurred in 1.1% of eligible encounters with people particularly vulnerable to NSAID ADEs. Male GPs were more likely than female GPs to issue a high-risk new acute NSAID (adjusted OR 1.73, 95% CI 1.39 to 2.16), but none of the available practice characteristics was associated with high-risk new acute NSAID prescribing. Of note is that routine data include information only about practice structural characteristics and GP sex, meaning that it was not possible to examine characteristics of practices such as organisation of prescribing systems or characteristics of GPs, such as risk tolerance, which might better explain variation in high-risk prescribing.
There was moderate variation in high-risk new NSAID prescribing at practice level (empty model: ICC 0.055, 95% CI 0.029 to 0.102) and large variation in high-risk new NSAID prescribing at GP level (empty model: ICC 0.166, 95% CI 0.135 to 0.197), that is 5.5% of the variation was attributable to variation between practices and 16.6% to variation between GPs. There was relatively little change after accounting for encounter characteristics [adjusted model: ICC 0.042 (95% CI 0.021 to 0.083) at practice level and 0.142 (95% CI 0.114 to 0.173) at GP level]. The median odds ratio at GP level can be interpreted as the median difference in the odds of receiving a new acute NSAID if the patient were to randomly encounter two different GPs from the same practice. The median odds ratio at GP level was 2.22 (95% CI 2.0 to 2.5) and 2.06 (95% CI 1.87 to 2.30) in the model adjusted for encounter characteristics. The median odds ratio at practice level can be interpreted as the median difference in the odds of receiving a new acute NSAID if the patient were to randomly encounter two different GPs from different practices (but should be interpreted in terms of how different it is from the median odds ratio at GP level, as it includes variation between GPs as well as between practices). The median odds ratio at practice level was 2.52 (95% CI 2.15 to 3.09) in the empty model and 2.28 (95% CI 1.98 to 2.76) in the model adjusted for encounter characteristics. Variation between GPs is, therefore, of a similar magnitude as almost all of the associations with encounter and GP characteristics included as fixed effects.
In total, 3 out of 38 practices and 51 out of 398 GPs had statistically significantly higher than average high-risk new acute NSAID prescribing after accounting for encounter characteristics. However, most GPs in practices with higher than average new acute NSAID prescribing were not themselves higher than average, and 43 GPs with higher than average prescribing were in practices which were average or statistically significantly lower than average. It was not possible to reliably discriminate between practices in terms of their high-risk new acute NSAID prescribing, with measurement only having reliability ≥ 0.7 in a minority of larger practices. Reflecting the larger ICC, measurement was more reliable at GP level, although only 62% of GPs in this study could be measured with reliability ≥ 0.7, which is adequate for comparative feedback for improvement purposes, and only 45% with reliability ≥ 0.8, which is required for high-stakes evaluation.
Summary for objective 4 (additional in revised protocol): Chapter 5
Objective 4 was to examine changes in rates of high-risk prescribing over time (2004–9) and variation between practices, using a basket of indicators with consensus validation. Nineteen indicators derived from UK-based consensus studies identifying valid indicators of high-risk prescribing were chosen as likely to be feasible to implement in routine GP data. 38,39 Changes in the prevalence of, and variation between practices in, each of these indicators were estimated. For the overall composite composed of the 17 indicators that could be consistently measured over the entire period, the percentage of patients receiving any high-risk prescription fell from 8.5% in Q2 2004 to 5.2% in Q1 2009, which was largely driven by reductions in high-risk NSAID and to a lesser extent antiplatelet prescribing. Only one type of high-risk prescribing statistically significantly increased in prevalence – high-risk coprescribing to people prescribed coumarin anticoagulants (which relates to antibiotic and antifungal coprescription). Change in variation between practices could be assessed for only 15 indicators, and it increased for five indicators, did not change for five and decreased for five, with no clear relationship between change in prevalence and change in variation between practices.
Implications for practice
Measurement at general practitioner level is not routinely feasible for either governance or improvement activity
Although variation between GPs was estimated to be approximately three times greater than variation between practices, there is no feasible way of routinely measuring high-risk prescribing at GP level with current data because of attribution problems. These problems reflect both the difficulty of attributing the decision to initiate to the GP who issues the first prescription and the difficulty of identifying which GP actually issued a particular prescription using existing electronic data. The latter is potentially remediable, although is likely to require wholesale electronic prescribing where clinicians are identified by a unique ID used in all clinical data such as their General Medical Council registration number. The parallel is with the shift in patients having IDs that vary across settings (multiple hospital numbers, GP IDs that are only unique within one practice and so on) to having a single NHS number used across all settings. However, the problem of attributing the decision to initiate a high-risk prescription to a particular individual is more problematic, reflecting that similar to much of health care, prescribing is often a shared endeavour with several clinicians involved in decision-making (although legal responsibility primarily lies with the individual who signs the prescription). High-risk prescribing indicators at GP level are therefore unlikely to be usable for governance or wide-scale improvement purposes in the near future.
Measurement at practice level for governance purposes
It is feasible to measure total high-risk prescribing at practice level using the NSAID indicators examined in this study (and a wider basket of indicators in our previous work5), and these indicators distinguish between practices with high-reliability making them suitable for high-stakes evaluation as part of governance activity. In principle, therefore, prescribing safety indicators could be used to identify practices with high rates of high-risk prescribing to investigate for clinical governance purposes. However, it remains unclear why practices vary in their prescribing and such an approach would not intervene on the majority of GPs with high-risk prescribing (as most work in practices which would not be targeted) nor the majority of patients exposed to high-risk prescribing (as for all indicators for which high-risk prescribing is common, it happens in all or most practices).
Measurement at practice level for improvement purposes
An improvement approach could focus on higher-risk practices but, as indicated above, the majority of people with high-risk prescribing would not benefit. The alternative is to deploy improvement activity in all practices, on the basis that high-risk prescribing will sometimes or often be appropriate but needs regular review because appropriateness will change over time. These approaches could still use practice-level measurement as part of an intervention, for example for feedback of practice performance, which could include comparison against other practices or a benchmark. There are examples of such interventions being evaluated in trials, with a small number of feedback trials156–161 being based on prescribing safety outcomes,162 one large completed UK-based trial of a pharmacist-led intervention which did reduce targeted high-risk prescribing137 and two other UK trials (which have completed but not reported as of autumn 2014) using feedback163 or feedback combined with educational outreach and financial incentives. 164
The implications of this study is that research and service interventions targeting NSAID prescribing should carefully consider whether or not and how to combine review of existing prescribing (as repeat prescribing is the bulk of prevalent high-risk NSAID use), and understanding and intervention to influence the initiation of new prescribing and transitions from intended short-term treatment to long-term use of high-risk drugs. In terms of new prescribing initiation, variation between GPs was found to be large in this study. Although measurement of this variation using routine coded data is not feasible, as part of an improvement intervention practices could be encouraged to internally examine who initiates high-risk prescribing (both specialist and GP initiation) and the appropriateness of transitions from short-term to longer term treatment. In addition, improvement programmes should consider not only whether or not overall quality and safety is increasing, but also whether or not improvement happens across the board or is more piecemeal and therefore associated with increasing inequalities and consider whether or not more intensive intervention is required in some settings to reduce variation. 155
Implications for research
There are several areas that cannot be addressed using routine electronically recorded data where further research would be useful.
Causes of variation between practices
There is relatively little known about why practices vary in their high-risk prescribing, with only a limited range of practice structural characteristics examined in this and previous analyses of variation. It is likely that practice variation is driven by wider contextual factors (including variation between specialists and areas) and how practices organise their repeat prescribing systems. Although there are some examples of such work, there is a need for research to better understand how the organisation of high-volume, safety-critical systems influences safety and patient outcomes and how this organisation reflects wider practice culture. 108,109,111,165 In particular, research is needed to better understand how and why high-risk prescribing is initiated, how prescribing systems facilitate or hinder clinical oversight and how and when repeat high-risk prescribing is reviewed and managed.
Causes of variation between general practitioners
Although variation between individual clinicians is usually found to be larger than variation between the institutions or areas they work in, research is needed to better understand why this variation occurs. 79,96,102,153,166 There is some evidence from other contexts, including test ordering, that individual risk preference and risk tolerance are associated with differences in practice, but the extent to which this matters compared with differences in knowledge, for example, is uncertain. However, although the extent of variation seen is large, it is unclear whether or not and how to intervene to reduce variation between GPs without understanding what causes it.
Quantifying the risk of commonly used drugs
The type of variation occurring is what others have described as variation in preference-centred care where the evidence of benefit or harm is ambiguous or absent where physicians’ preferences play a large part in decision-making, at least partly because of a failure to allow patients themselves to make informed choices. 78 The risks and harm of prescribed drugs are often poorly quantified, with, for example, the risk of coprescribing with coumarin anticoagulants such as warfarin being remarkably uncertain for most drugs despite the length of time coumarins have been used and it being clear that drug–drug interactions are common and important causes of harm for the increasing number of people taking coumarins long term. 167 Although the indicators used in this study had all been validated in consensus studies based on existing evidence, there is a need to more systematically quantify the risk of commonly used drugs using robust pharmacoepidemiological methods.
Understanding high-risk versus inappropriate prescribing
The prescribing being measured is high risk but is not clearly inappropriate, and it is possible that variation in patient preference for risk plays a part in the observed variation between GPs and between practices. From this perspective, high-risk prescribing could easily be judged appropriate if patients make informed choices about the risks and benefits involved and choose to take a drug even if their risk of adverse events is higher than average (although, as noted below, the actual risks of some of this prescribing are remarkably poorly quantified; therefore, informed choices will not always be that easy to make). There is evidence from other contexts that prescribing decisions are often made without much active patient involvement and that doctors fairly commonly do not elicit or actively misunderstand patient perspectives. 168,169 Research to better understand patient perspectives on the risks and benefits of high-risk prescribing is needed, and how patient perspectives could be better elicited in consultations and incorporated into decision-making.
Interventions to manage and reduce high-risk prescribing
There is evidence from studies in the UK and elsewhere that high-risk prescribing in primary care can be improved, but it remains unclear what the most effective approach is. The completed PINCER study demonstrated the effectiveness of a 12-week pharmacist-led intervention combining single-round feedback of rates, educational outreach and facilitation of review by the pharmacist, but it is notable that there was evidence that reductions in high-risk prescribing at 6 months were only partially sustained at 12 months. 6,137 It is, therefore, unclear how to ensure longer-term prescribing safety, or how pharmacist-led interventions compare in effectiveness to simpler interventions using regular feedback alone163 or to other complex interventions prompting and facilitating GP review of high-risk prescribing164 and interventions that target patients with polypharmacy rather than focusing on particular indicators. 170,171 Computerised point-of-care reminders are also under-researched in the UK and may be an efficient way of improving prescribing safety, although ensuring that they are tailored to individual patient characteristics and avoid overloading prescribers with unnecessary alerts is challenging.
Research is also needed to examine the extent to which interventions which improve prescribing safety actually improve patient outcomes. Finally, it seems likely that the reductions in high-risk NSAID prescribing observed in this study were associated with a series of risk communications relating to NSAIDs in 2004–6. Of note is that these risk communications were about cardiovascular safety and largely related to COX-2 NSAIDs in the period examined, highlighting that although regulatory risk communications do sometimes impact on targeted prescribing, their effect is variable and often extends beyond targeted prescribing. 55,172 Given the importance of regulatory risk communications in disseminating knowledge of newly discovered drug risks and in recommending appropriate action, research to more systematically evaluate the impact of regulatory risk communications and improve their design to maximise effectiveness is needed.
Acknowledgements
We would like to thank Professor Tony Avery (an expert in the field) and Sue Kinsey (public representative), who provided external advice via the project advisory group, Dr Boikanyo Makubate, who carried out the initial data management and analysis, and all the practices that submitted data to the PCCIU at the University of Aberdeen, which provided the data used in the analysis to us. The views in this publication are not necessarily the views of the University of Aberdeen, its agents or employees. We thank Katie Wilde and Fiona Chaloner of the University of Aberdeen, who did the initial data extraction and management. This report presents independent research commissioned by the NIHR. The views and opinions expressed by authors in this publication are those of the authors and do not necessarily reflect those of the NHS, the NIHR, NIHR Evaluation, Trials and Studies Coordinating Centre, the HSDR programme or the Department of Health.
Contributions of authors
Bruce Guthrie (Professor of Primary Care Medicine, GP and Health Services Researcher) contributed to the original conception and design of the project, and was responsible for the overall project management, completing the multilevel modelling and drafting the final report.
Ning Yu (Research Fellow, Statistician) was responsible for the additional analysis of change in the prevalence of and variation between practices in high-risk prescribing.
Douglas Murphy (Research Fellow, GP and Health Services Researcher) contributed to the original conception and design of the project and the G-theory analysis of reliability.
Peter T Donnan (Professor of Biostatistics, Statistician) contributed to the original conception and design of the project, interpretation of the findings and provided statistical expertise and support.
Tobias Dreischulte (Research Pharmacist, Health Services Researcher) contributed to the original conception and design of the project, the literature review and the interpretation of the findings.
Publications
Guthrie B, Donnan PT, Murphy D, Makubate B, Dreischulte T. Bad apples or spoiled barrels? Multilevel modelling analysis of variation in high-risk prescribing between general practitioners and between the practices they work in. BMJ Open 2015; in press.
Disclaimers
This report presents independent research funded by the National Institute for Health Research (NIHR). The views and opinions expressed by authors in this publication are those of the authors and do not necessarily reflect those of the NHS, the NIHR, NETSCC, the HS&DR programme or the Department of Health. If there are verbatim quotations included in this publication the views and opinions expressed by the interviewees are those of the interviewees and do not necessarily reflect those of the authors, those of the NHS, the NIHR, NETSCC, the HS&DR programme or the Department of Health.
References
- Primary Care Prescribing: A Bulletin for Primary Care Trusts. London: Audit Commission; 2003.
- Supporting Prescribing in General Practice: A Progress Report. Edinburgh: Audit Scotland; 2003.
- Primary Care Prescribing. Edinburgh: Audit Scotland; 2013.
- Crossing the Quality Chasm: A New Health System for the 21st Century. Washington, DC: Institute of Medicine; 2001.
- Guthrie B, McCowan C, Davey P, Simpson CR, Dreischulte T, Barnett K. High-risk prescribing in primary care patients particularly vulnerable to adverse drug events: cross sectional population database analysis in Scottish general practice. BMJ 2011;342. http://dx.doi.org/10.1136/bmj.d3514.
- Avery A, Rodgers S, Cantrill J, Armstrong S, Boyd M, Cresswell K, et al. Effectiveness, Costs/Benefits and Acceptability of a Pharmacist-Led, IT-Based Intervention Compared with Simple Feedback in Reducing Rates of Clinically Important Instances of Potentially Hazardous Prescribing and Medicines Management in General Practice. Birmingham: National Patient Safety Agency; 2010.
- Fick DM, Cooper JW, Wade WE, Waller JL, Maclean JR, Beers MH. Updating the Beers Criteria for potentially inappropriate medication use in older adults. Arch Intern Med 2003;163:2716-24. http://dx.doi.org/10.1001/archinte.163.22.2716.
- The American Geriatrics Society Beers Criteria Update Expert Panel . American Geriatrics Society updated Beers Criteria for potentially inappropriate medication use in older adults. J Am Geriatr Soc 2012;60:616-31. http://dx.doi.org/10.1111/j.1532-5415.2012.03923.x.
- To Err is Human: Building a Safer Health System. Washington, DC: Institute of Medicine; 1999.
- An Organisation with a Memory. Report of an Expert Group on Learning from Adverse Events in the NHS. London: The Stationery Office; 2000.
- Healthcare Improvement Scotland 2009. www.patientsafetyalliance.scot.nhs.uk (accessed 28 March 2011).
- Pirmohamed M, James S, Meakin S, Green C, Scott AK, Walley TJ, et al. Adverse drug reactions as cause of admission to hospital: prospective analysis of 18 820 patients. BMJ 2004;329:15-9. http://dx.doi.org/10.1136/bmj.329.7456.15.
- Howard R, Avery A, Slavenburg S, Royal S, Pipe G, Lucassen P, et al. Which drugs cause preventable admissions to hospital? A systematic review. Br J Clin Pharmacol 2007;63:136-47. http://dx.doi.org/10.1111/j.1365-2125.2006.02698.x.
- Banerjee S. The Use of Antipsychotic Medication for People With Dementia: Time for Action. London: Department of Health; 2009.
- Barnett K, Mercer SW, Norbury M, Watt G, Wyke S, Guthrie B. Epidemiology of multimorbidity and implications for health care, research, and medical education: a cross-sectional study. Lancet 2012;380:37-43. http://dx.doi.org/10.1016/S0140-6736(12)60240-2.
- Spinewine A, Schmader KE, Barber N, Hughes C, Lapane KL, Swine C, et al. Prescribing in elderly people 2 – appropriate prescribing in elderly people: how well can it be measured and optimised?. Lancet 2007;370:173-84. http://dx.doi.org/10.1016/S0140-6736(07)61091-5.
- Dimitrow MS, Airaksinen MSA, Kivelä S-L, Lyles A, Leikola SNS. Comparison of prescribing criteria to evaluate the appropriateness of drug treatment in individuals aged 65 and older: a systematic review. J Am Geriatr Soc 2011;59:1521-30. http://dx.doi.org/10.1111/j.1532-5415.2011.03497.x.
- Hanlon J, Schmader K, Samsa G, Weinberger M, Uttech K, Lewis I, et al. A method for assessing drug therapy appropriateness. J Clin Epidemiol 1992;45:1045-51. http://dx.doi.org/10.1016/0895-4356(92)90144-C.
- Beers MH. Explicit criteria for determining potentially inappropriate medication use by the elderly: an update. Arch Intern Med 1997;157:1531-6. http://dx.doi.org/10.1001/archinte.1997.00440350031003.
- Holmes HM, Luo R, Kuo Y-F, Baillargeon J, Goodwin JS. Association of potentially inappropriate medication use with patient and prescriber characteristics in Medicare Part D. Pharmacoepidemiol Drug Saf 2013;22:728-34. http://dx.doi.org/10.1002/pds.3431.
- Barnett K, McCowan C, Evans JMM, Gillespie ND, Davey PG, Fahey T. Prevalence and outcomes of use of potentially inappropriate medicines in older people: cohort study stratified by residence in nursing home or in the community. BMJ Qual Saf 2011;20:275-81. http://dx.doi.org/10.1136/bmjqs.2009.039818.
- Ryan C, O’Mahony D, Kennedy J, Weedle P, Byrne S. Potentially inappropriate prescribing in an Irish elderly population in primary care. Br J Clin Pharmacol 2009;68:936-47. http://dx.doi.org/10.1111/j.1365-2125.2009.03531.x.
- De Wilde S, Carey IM, Harris T, Richards N, Victor C, Hilton SR, et al. Trends in potentially inappropriate prescribing amongst older UK primary care patients. Pharmacoepidemiol Drug Saf 2007;16:658-67. http://dx.doi.org/10.1002/pds.1306.
- Goulding MR. Inappropriate medication prescribing for elderly ambulatory care patients. Arch Intern Med 2004;164:305-12. http://dx.doi.org/10.1001/archinte.164.3.305.
- Zhan C, Sangl J, Bierman AS, Miller MR, Friedman B, Wickizer SW, et al. Potentially inappropriate medication use in the community-dwelling elderly: findings from the 1996 medical expenditure panel survey. JAMA 2001;286:2823-9. http://dx.doi.org/10.1001/jama.286.22.2823.
- Onder G, Bonassi S, Abbatecola AM, Folino-Gallo P, Lapi F, Marchionni N, et al. High prevalence of poor quality drug prescribing in older individuals: a nationwide report from the Italian Medicines Agency (AIFA). J Gerontol A Biol Sci Med Sci 2013;69:430-7. http://dx.doi.org/10.1093/gerona/glt118.
- Laroche ML, Charmes JP, Nouaille Y, Picard N, Merle L. Is inappropriate medication use a major cause of adverse drug reactions in the elderly?. Br J Clin Pharmacol 2007;63:177-86. http://dx.doi.org/10.1111/j.1365-2125.2006.02831.x.
- Gallagher P, Ryan C, Byrne S, Kennedy J, O’Mahony D. STOPP (Screening Tool of Older Person’s Prescriptions) and START (Screening Tool to Alert doctors to Right Treatment). Consensus validation. Int J Clin Pharmacol Ther 2008;46:72-83. http://dx.doi.org/10.5414/CPP46072.
- Budnitz DS, Lovegrove MC, Shehab N, Richards CL. Emergency hospitalizations for adverse drug events in older Americans. N Engl J Med 2011;365:2002-12. http://dx.doi.org/10.1056/NEJMsa1103053.
- Budnitz DS, Shehab N, Kegler SR, Richards CL. Medication use leading to emergency department visits for adverse drug events in older adults. Ann Intern Med 2007;147:755-65. http://dx.doi.org/10.7326/0003-4819-147-11-200712040-00006.
- Page RL, Ruscin JM. The risk of adverse drug events and hospital-related morbidity and mortality among older adults with potentially inappropriate medication use. Am J Geriatr Pharmacother 2006;4:297-305. http://dx.doi.org/10.1016/j.amjopharm.2006.12.008.
- Stockl K, Le L, Zhang S, Harada S. Clinical and economic outcomes associated with potentially inappropriate prescribing in the elderly. Am J Manag Care 2010;16:e1-10.
- Steinman M, Hanlon J. Managing medications in clinically complex elders: ‘there’s got to be a happy medium’. JAMA 2010;304:1592-601. http://dx.doi.org/10.1001/jama.2010.1482.
- Steinman MA, Landefeld CS, Rosenthal GE, Berthenthal D, Sen S, Kaboli PJ. Polypharmacy and Prescribing Quality in Older People. J Am Geriatr Soc 2006;54:1516-23. http://dx.doi.org/10.1111/j.1532-5415.2006.00889.x.
- Gallagher P, O’Mahony D. STOPP (Screening Tool of Older Persons’ potentially inappropriate Prescriptions): application to acutely ill elderly patients and comparison with Beers’ criteria. Age Ageing 2008;37:673-9. http://dx.doi.org/10.1093/ageing/afn197.
- Gallagher P, O’Connor M, O’Mahony D. Prevention of potentially inappropriate prescribing for elderly patients: a randomized controlled trial using STOPP/START criteria. Clin Pharmacol Ther 2011;89:845-54. http://dx.doi.org/10.1038/clpt.2011.44.
- Campbell SM, Cantrill JA, Roberts D. Prescribing indicators for UK general practice: Delphi consultation study. BMJ 2000;321. http://dx.doi.org/10.1136/bmj.321.7258.425.
- Dreischulte T, Grant A, McCowan C, McAnaw J, Guthrie B. Quality and safety of medication use in primary care: consensus validation of a new set of explicit medication assessment criteria and prioritisation of topics for improvement. BMC Clin Pharmacol 2012;12. http://dx.doi.org/10.1186/1472-6904-12-5.
- Avery AJ, Dex GM, Mulvaney C, Serumaga B, Spencer R, Lester HE, et al. Development of prescribing-safety indicators for GPs using the RAND Appropriateness Method. Br J Gen Pract 2011;61:e526-e36. http://dx.doi.org/10.3399/bjgp11X588501.
- Leikola S, Dimitrow M, Lyles A, Pitkala K, Airaksinen M. Potentially inappropriate medication use among Finnish non-institutionalized people aged ≥ 65 years: a register-based, cross-sectional, national study. Drugs Aging 2011;28:227-36. http://dx.doi.org/10.2165/11586890-000000000-00000.
- Ay P, Akici A, Harmanc H. Drug utilization and potentially inappropriate drug use in elderly residents of a community in Istanbul, Turkey. Int J Clin Pharmacol Ther 2005;43:195-202. http://dx.doi.org/10.5414/CPP43000.
- Rajska-Neumann A, Wieczorowska-Tobis K. Polypharmacy and potential inappropriateness of pharmaco-logical treatment among community-dwelling elderly patients. Arch Gerontol Geriatr 2007;44:303-9. http://dx.doi.org/10.1016/j.archger.2007.01.040.
- van der Hooft CS, Jong GW, Dieleman JP, Verhamme KM, van der Cammen TJ, Stricker BH, et al. Inappropriate drug prescribing in older adults: the updated 2002 Beers criteria – a population-based cohort study. Br J Clin Pharmacol 2005;60:137-44. http://dx.doi.org/10.1111/j.1365-2125.2005.02391.x.
- Simon SR, Chan KA, Soumerai SB, Wagner AK, Andrade SE, Feldstein AC, et al. Potentially inappropriate medication use by elderly persons in U.S. health maintenance organizations, 2000–2001. J Am Geriatr Soc 2005;53:227-32. http://dx.doi.org/10.1111/j.1532-5415.2005.53107.x.
- Willcox S, Himmelstein D, Woolhandler S. Inappropriate drug prescribing for the community-dwelling elderly. JAMA 1994;272:292-6. http://dx.doi.org/10.1001/jama.1994.03520040054040.
- Carey I, Wilde S, Harris T, Victor C, Richards N, Hilton S, et al. What factors predict potentially inappropriate primary care prescribing in older people?. Drugs Aging 2008;25:693-706. http://dx.doi.org/10.2165/00002512-200825080-00006.
- Aparasu R, Mort J, Brandt H. Polypharmacy trends in office visits by the elderly in the United States, 1990 and 2000. Res Social Adm Pharm 2005;1:446-59. http://dx.doi.org/10.1016/j.sapharm.2005.06.004.
- Haider S, Johnell K, Thorslund M, Fastbom J. Trends in polypharmacy and potential drug–drug interactions across educational groups in elderly patients in Sweden for the period 1992–2002. Int J Clin Pharmacol Ther 2007;45:643-53. http://dx.doi.org/10.5414/CPP45643.
- Hovstadius B, Hovstadius K, Astrand B, Petersson G. Increasing polypharmacy – an individual-based study of the Swedish population 2005–2008. BMC Clin Pharmacol 2010;10. http://dx.doi.org/10.1186/1472-6904-10-16.
- Bourgeois FT, Shannon MW, Valim C, Mandl KD. Adverse drug events in the outpatient setting: an 11-year national analysis. Pharmacoepidemiol Drug Saf 2010;19:901-10. http://dx.doi.org/10.1002/pds.1984.
- Åstrand E, Åstrand B, Antonov K, Petersson G. Potential drug interactions during a three-decade study period: a cross-sectional study of a prescription register. Eur J Clin Pharmacol 2007;63:851-9. http://dx.doi.org/10.1007/s00228-007-0326-0.
- Sumukadas D, McMurdo MET, Mangoni AA, Guthrie B. Temporal trends in anticholinergic medication prescription in older people: repeated cross-sectional analysis of population prescribing data. Age Ageing 2014;43:515-21. http://dx.doi.org/10.1093/ageing/aft199.
- Lockhart P, Guthrie B. Trends in primary care antidepressant prescribing 1995–2007: a longitudinal population database analysis. Br J Gen Pract 2011;61. http://dx.doi.org/10.3399/bjgp11X593848.
- Ruscitto A, Smith BH, Guthrie B. Changes in opioid and other analgesic use 1995–2010: repeated cross-sectional analysis of dispensed prescribing for a large geographical population in Scotland. Eur J Pain 2015;19:59-66. http://dx.doi.org/10.1002/ejp.520.
- Dusetzina S, Higashi A, Dorsey E, Conti R, Huskamp H, Zhu S, et al. Impact of FDA drug risk communications on health care utilization and health behaviors: a systematic review. Med Care 2012;50:466-78. http://dx.doi.org/10.1097/MLR.0b013e318245a160.
- Guthrie B, Clark SA, Reynish EL, McCowan C, Morales DR. Differential impact of two risk communications on antipsychotic prescribing to people with dementia in Scotland: segmented regression time series analysis 2001–2011. PLOS ONE 2013;8. http://dx.doi.org/10.1371/journal.pone.0068976.
- Hawton K, Bergen H, Simkin S, Brock A, Griffiths C, Romeri E, et al. Effect of withdrawal of co-proxamol on prescribing and deaths from drug poisoning in England and Wales: time series analysis. BMJ 2009;338. http://dx.doi.org/10.1136/bmj.b2270.
- Bedson J, Belcher J, Martino OI, Ndlovu M, Rathod T, Walters K, et al. The effectiveness of national guidance in changing analgesic prescribing in primary care from 2002 to 2009: an observational database study. Eur J Pain 2012;17:434-43. http://dx.doi.org/10.1002/j.1532-2149.2012.00189.x.
- Wheeler BW, Metcalfe C, Gunnell D, Stephens P, Martin RM. Population impact of regulatory activity restricting prescribing of COX-2 inhibitors: ecological study. Br J Clin Pharmacol 2009;68:752-64. http://dx.doi.org/10.1111/j.1365-2125.2009.03500.x.
- Davis P, Gribben B, Scott A, Lay-Yee R. Do physician practice styles persist over time? Continuities in patterns of clinical decision-making among general practitioners. J Health Serv Res Policy 2000;5:200-7.
- Wennberg J, Gittelsohn A. Small area variations in health care delivery: a population-based health information system can guide planning and regulatory decision-making. Science 1973;182:1102-8. http://dx.doi.org/10.1126/science.182.4117.1102.
- Hofer TP, Hayward RA, Greenfield S, Wagner EH, Kaplan SH, Manning WG. The unreliability of individual physician ‘report cards’ for assessing the costs and quality of care of a chronic disease. JAMA 1999;281:2098-105. http://dx.doi.org/10.1001/jama.281.22.2098.
- Bird S, Cox D, Farewell H, Holt T, Smith PC. Performance Indicators: Good, Bad and Ugly. London: Royal Statistical Society Working Party on Performance Monitoring in the Public Services; 2003.
- Spiegelhalter D. Funnel plots for comparing institutional performance. Stat Med 2005;24:1185-202. http://dx.doi.org/10.1002/sim.1970.
- Spiegelhalter DJ. Understanding uncertainty. Ann Fam Med 2008;6:196-7. http://dx.doi.org/10.1370/afm.848.
- Lilford R, Mohammed AM, Spiegelhalter D, Thomson R. Uses and misuses of outcome data in managing performance of acute medical care: avoiding institutional stigma. Lancet 2004;363:1147-54. http://dx.doi.org/10.1016/S0140-6736(04)15901-1.
- Goldmann D. System failure versus personal accountability – the case for clean hands. N Engl J Med 2006;355:121-3. http://dx.doi.org/10.1056/NEJMp068118.
- Reason J. Human Error. Cambridge, UK: Cambridge University Press; 1990.
- Reason J. Human error: models and management. BMJ 2000;320:768-70. http://dx.doi.org/10.1136/bmj.320.7237.768.
- Traynor M, Stone K, Cook H, Gould D, Maben J. Disciplinary processes and the management of poor performance among UK nurses: bad apple or systemic failure? A scoping study. Nurs Inq 2013;21:51-8. http://dx.doi.org/10.1111/nin.12025.
- Dixon-Woods M, Yeung K, Bosk C. Why is UK medicine no longer a self-regulating profession? The role of scandals involving ‘bad apple’ doctors. Soc Sci Med 2011;73:1452-9. http://dx.doi.org/10.1016/j.socscimed.2011.08.031.
- Shipman I. The Shipman inquiry first report: death disguised. Norwich: HMSO; 2002.
- Harley M, Mohammed MA, Hussain S, Yates J, Almasri A. Was Rodney Ledward a statistical outlier? Retrospective analysis using routine hospital data to identify gynaecologists’ performance. BMJ 2005;330. http://dx.doi.org/10.1136/bmj.38377.675440.8F.
- Bismark MM, Spittal MJ, Gurrin LC, Ward M, Studdert DM. Identification of doctors at risk of recurrent complaints: a national study of healthcare complaints in Australia. BMJ Qual Saf 2013;22:532-40. http://dx.doi.org/10.1136/bmjqs-2012-001691.
- Shojania KG, Dixon-Woods M. ‘Bad apples’: time to redefine as a type of systems problem?. BMJ Qual Saf 2013;22:528-31. http://dx.doi.org/10.1136/bmjqs-2013-002138.
- Felps W, Mitchell T, Byington E. How, when, and why bad apples spoil the barrel: negative group members and dysfunctional groups. Res Organ Behav 2006;27:175-222. http://dx.doi.org/10.1016/S0191-3085(06)27005-9.
- Gallagher TH, Levinson W. Physicians with multiple patient complaints: ending our silence. BMJ Qual Saf 2013;22:521-4. http://dx.doi.org/10.1136/bmjqs-2013-001880.
- Corallo AN, Croxford R, Goodman DC, Bryan EL, Srivastava D, Stukel TA. A systematic review of medical practice variation in OECD countries. Health Policy 2014;114:5-14. http://dx.doi.org/10.1016/j.healthpol.2013.08.002.
- Fung V, Schmittdiel JA, Fireman B, Meer A, Thomas S, Smider N, et al. Meaningful variation in performance: a systematic literature review. Med Care 2010;48:140-8. http://dx.doi.org/10.1097/MLR.0b013e3181bd4dc3.
- Aiello A, Garman A, Morris S. Patient satisfaction with nursing care: a multilevel analysis. Qual Manag Health Care 2003;12:187-90. http://dx.doi.org/10.1097/00019514-200307000-00009.
- Bjorngaard J, Ruud T, Garratt A, Hatling T. Patients’ experiences and clinicians’ ratings of the quality of outpatient teams in psychiatric care units in Norway. Psychiatr Serv 2007;58:1102-7. http://dx.doi.org/10.1176/ps.2007.58.8.1102.
- Safran D, Karp M, Coltin KL, Chang H, Li A, Ogren J, et al. Measuring patients’ experiences with individual primary care physicians. J Gen Intern Med 2006;21:13-21. http://dx.doi.org/10.1111/j.1525-1497.2005.00311.x.
- Brook RH, Chassin MR, Fink A, Solomon DH, Kosecoff J, Park RE. A method for the detailed assessment of the appropriateness of medical technologies. Int J Technol Assess Health Care 1986;2:53-6. http://dx.doi.org/10.1017/S0266462300002774.
- Zaslavsky AM, Zaborski L, Cleary PD. Plan, geographical, and temporal variation of consumer assessments of ambulatory health care. Health Serv Res 2004;39:1467-85. http://dx.doi.org/10.1111/j.1475-6773.2004.00299.x.
- Krein SL, Hofer TP, Kerr EA, Hayward R. Whom should we profile? Examining diabetes care practice variation among primary care providers, provider groups, and health care facilities. Health Serv Res 2002;37:1159-80. http://dx.doi.org/10.1111/1475-6773.01102.
- O’Connor P, Rush W, Davidson G, Louis T, Solberg L, Crain A, et al. Variation in quality of diabetes care at the levels of patient, physician, and clinic. Prev Chronic Dis 2008;5:1-9.
- Dijkstra RF, Braspenning JCC, Huijsmans Z, Peters S, Van Ballegooie E, Ten Have P, et al. Patients and nurses determine variation in adherence to guidelines at Dutch hospitals more than internists or settings. Diabet Med 2004;21:586-91. http://dx.doi.org/10.1111/j.1464-5491.2004.01195.x.
- Baker LC, Hopkins D, Dixon R, Rideout J, Geppert J. Do health plans influence quality of care?. Int J Qual Health Care 2004;16:19-30. http://dx.doi.org/10.1093/intqhc/mzh003.
- Harman J, Cuffel B, Kelleher K. Profiling hospitals for length of stay for treatment of psychiatric disorders. J Behav Health Serv Res 2004;31:66-74. http://dx.doi.org/10.1007/BF02287339.
- Swinkels I, Wimmers R, Groenewegen P, van den Bosch W, Dekker J, van den Ende C. What factors explain the number of physical therapy treatment sessions in patients referred with low back pain; a multilevel analysis. BMC Health Serv Res 2005;5. http://dx.doi.org/10.1186/1472-6963-5-74.
- Hirth RA, Turenne MN, Wheeler JRC, Pan Q, Ma Y, Messana JM. Provider monitoring and pay-for-performance when multiple providers affect outcomes: an application to renal dialysis. Health Serv Res 2009;44:1585-602. http://dx.doi.org/10.1111/j.1475-6773.2009.00990.x.
- Normand S-LT, Wolf RE, Ayanian JZ, McNeil BJ. Assessing the accuracy of hospital clinical performance measures. Med Decis Making 2007;27:9-20. http://dx.doi.org/10.1177/0272989X06298028.
- Cowen ME, Strawderman RL. Quantifying the physician contribution to managed care pharmacy expenses: a random effects approach. Med Care 2002;40:650-61. http://dx.doi.org/10.1097/00005650-200208000-00004.
- Davis P, Gribben B. Rational prescribing and interpractitioner variation: a multilevel approach. Int J Technol Assess Health Care 1995;11:428-42. http://dx.doi.org/10.1017/S0266462300008655.
- Guthrie B, Clark SA, McCowan C. The burden of psychotropic drug prescribing in people with dementia: a population database study. Age Ageing 2010;39:637-42. http://dx.doi.org/10.1093/ageing/afq090.
- Hjerpe P, Ohlsson H, Lindblad U, Bengtsson Bostrom K, Merlo J. Understanding adherence to therapeutic guidelines: a multilevel analysis of statin prescription in the Skaraborg Primary Care Database. Eur J Clin Pharmacol 2011;67:415-23. http://dx.doi.org/10.1007/s00228-010-0973-4.
- Zhang Y, Steinman MA, Kaplan CM. Geographic variation in outpatient antibiotic prescribing among older adults. Arch Intern Med 2012;172:1465-71. http://dx.doi.org/10.1001/archinternmed.2012.3717.
- Zhang Y, Baicker K, Newhouse J. Geographic variation in the quality of prescribing. N Engl J Med 2010;363:1985-8. http://dx.doi.org/10.1056/NEJMp1010220.
- Ohlsson H, Librero J, Sundquist J, Sundquist K, Merlo J. Performance evaluations and league tables: do they capture variation between organizational units? An analysis of 5 Swedish pharmacological performance indicators. Med Care 2011;49:327-31. http://dx.doi.org/10.1097/MLR.0b013e31820325c5.
- Ohlsson H, Merlo J. Understanding the effects of a decentralized budget on physicians’ compliance with guidelines for statin prescription – a multilevel methodological approach. BMC Health Serv Res 2007;7. http://dx.doi.org/10.1186/1472-6963-7-68.
- Landon BE, Reschovsky J, Reed M, Blumenthal D. Personal, organizational, and market level influences on physicians’ practice patterns: results of a national survey of primary care physicians. Med Care 2001;39:889-905. http://dx.doi.org/10.1097/00005650-200108000-00014.
- Ohlsson H, Merlo J. Is physician adherence to prescription guidelines a general trait of health care practices or dependent on drug type? – A multilevel logistic regression analysis in South Sweden. Pharmacoepidemiol Drug Saf 2009;18:682-90. http://dx.doi.org/10.1002/pds.1767.
- Brookhart MA, Solomon DH, Wang P, Glynn RJ, Avorn J, Schneeweiss S. Explained variation in a model of therapeutic decision making is partitioned across patient, physician, and clinic factors. J Clin Epidemiol 2006;59:18-25. http://dx.doi.org/10.1016/j.jclinepi.2005.07.005.
- Speroff T, Nwosu S, Weinger M, Talbot T, Wall R, Deshpande J, et al. Organisational culture: variation across hospitals and connection to patient safety climate. Qual Saf Health Care 2010;19:592-6. http://dx.doi.org/10.1136/qshc.2009.039511.
- Kirk S, Parker D, Claridge T, Esmail A, Marshall M. Patient safety culture in primary care: developing a theoretical framework for practical use. Qual Saf Health Care 2007;16:313-20. http://dx.doi.org/10.1136/qshc.2006.018366.
- Ohlsson H, Chaix B, Merlo J. Therapeutic traditions, patient socioeconomic characteristics and physicians’ early new drug prescribing – a multilevel analysis of rosuvastatin prescription in south Sweden. Eur J Clin Pharmacol 2009;65:141-50. http://dx.doi.org/10.1007/s00228-008-0569-4.
- Steinman MA, Landefeld C, Gonzales R. Predictors of broad-spectrum antibiotic prescribing for acute respiratory tract infections in adult primary care. JAMA 2003;289:719-25. http://dx.doi.org/10.1001/jama.289.6.719.
- Grant A, Sullivan F, Dowell J. An ethnographic exploration of influences on prescribing in general practice: why is there variation in prescribing practices?. Implement Sci 2013;8. http://dx.doi.org/10.1186/1748-5908-8-72.
- Grant S. An Ethnographic Study of Primary Care Results Handling: Research Findings. Glasgow: NHS Education for Scotland; 2013.
- Zermansky AG. Who controls repeats. Br J Gen Pract 1996;46:643-7.
- Swinglehurst D, Greenhalgh T, Russell J, Myall M. Receptionist input to quality and safety in repeat prescribing in UK general practice: ethnographic case study. BMJ 2011;343. http://dx.doi.org/10.1136/bmj.d6788.
- Delivering investment in General Practice: Implementing the New GMS Contract. London: Department of Health; 2003.
- British National Formulary. 49 ed. London: BMJ Group and Pharmaceutical Press; 2005.
- NHS National Prescribing Centre . Cardiovascular and Gastrointestinal Safety of NSAIDS. MeReC 2007;30:1-6.
- NHS National Prescribing Centre . Update on the prescribing of NSAIDs. MeReC Monthly No. 2 2008.
- NHS England Primary Care Commissioning . QOF Implementation: Business Rules 2009. www.pcc-cic.org.uk/article/qof-business-rules-v210 (accessed 7 February 2015).
- Carstairs V, Morris R. Deprivation and Health in Scotland. Aberdeen: Aberdeen University Press; 1991.
- Brilleman S, Gravelle H, Hollinghurst S, Purdy S, Salisbury C, Windmeijer F. Keep it simple? Predicting Primary Health Care Costs with Measures of Morbidity and Multimorbidity. York: Centre for Health Economics; 2012.
- Brilleman S, Salisbury C. Comparing measures of multimorbidity to predict outcomes in primary care: a cross sectional study. Fam Pract 2013;30:172-8. http://dx.doi.org/10.1093/fampra/cms060.
- Brilleman SL, Purdy S, Salisbury C, Windmeijer F, Gravelle H, Hollinghurst S. Implications of comorbidity for primary care costs in the UK: a retrospective observational study. Br J Gen Pract 2013;63:e274-e82. http://dx.doi.org/10.3399/bjgp13X665242.
- Leyland A, Goldstein H. Multilevel Modelling of Health Statistics. Chichester: John Wiley & Sons Ltd; 2001.
- Snijders T, Bosker R. Multilevel Analysis: An Introduction to Basic and Advanced Multilevel Modeling. London: Sage; 1999.
- Rabe-Hesketh S, Skrondal A. Multilevel and Longitudinal Modelling Using Stata. College Station, TX: Stata Press; 2008.
- Larsen K, Merlo J. Appropriate assessment of neighbourhood effects on individual health: integrating random and fixed effects in multilevel logistic regression. Am J Epidemiol 2007;161:81-8. http://dx.doi.org/10.1093/aje/kwi017.
- Rasbash J, Browne W, Goldstein H, Yang M, Plewis I, Healy M, et al. A User’s Guide to MLwin. London: Multilevel models project, Institute of Education; 2001.
- Adams J. The Reliability of Provider Profiling: A Tutorial. Santa Monica, CA: RAND Corporation; 2009.
- Roland M, Elliott M, Lyratzopoulos G, Barbiere J, Parker RA, Smith P, et al. Reliability of patient responses in pay for performance schemes: analysis of national General Practitioner Patient Survey data in England. BMJ 2009;339. http://dx.doi.org/10.1136/bmj.b3851.
- Streiner D, Norman G. Health Measurement Scales: A Practical Guide to their Development and Use. Oxford: Oxford University Press; 2008.
- Snijders T, Bosker R. An Introduction to Basic and Advanced Multilevel Modelling. London: Sage; 2012.
- Davis P, Gribben B, Lay-Yee R, Scott A. How much variation in clinical activity is there between general practitioners? A multi-level analysis of decision-making in primary care. J Health Serv Res Policy 2002;7:202-8. http://dx.doi.org/10.1258/135581902320432723.
- Selby JV, Schmittdiel JA, Lee J, Fung V, Thomas S, Smider N, et al. Meaningful variation in performance: what does variation in quality tell us about improving quality?. Med Care 2010;48:133-9. http://dx.doi.org/10.1097/MLR.0b013e3181c15a6e.
- Young GJ. Can multi-level research help us design pay-for-performance programs?. Med Care 2008;46:109-11. http://dx.doi.org/10.1097/MLR.0b013e318165b987.
- Health and Social Care Information Centre (HSCIC) . Read Codes n.d. http://systems.hscic.gov.uk/data/uktc/readcodes (accessed 7 February 2015).
- Bloch R. G_String: A Windows Wrapper for urGENOVA. Hamilton, Canada: The Program for Educational Research and Development: McMaster University; 2014.
- Huntley AL, Johnson R, Purdy S, Valderas JM, Salisbury C. Measures of multimorbidity and morbidity burden for use in primary care and community settings: a systematic review and guide. Ann Fam Med 2012;10:134-41. http://dx.doi.org/10.1370/afm.1363.
- Watkins C, Harvey I, Carthy P, Moore L, Robinson E, Brawn R. Attitudes and behaviour of general practitioners and their prescribing costs: a national cross sectional survey. Qual Saf Health Care 2003;12:29-34. http://dx.doi.org/10.1136/qhc.12.1.29.
- Avery AJ, Rodgers S, Cantrill JA, Armstrong S, Cresswell K, Eden M, et al. A pharmacist-led information technology intervention for medication errors (PINCER): a multicentre, cluster randomised, controlled trial and cost-effectiveness analysis. Lancet 2012;379:1310-19. http://dx.doi.org/10.1016/S0140-6736(11)61817-5.
- Mamdani M, Juurlink DN, Kopp A, Naglie G, Austin PC, Laupacis A. Gastrointestinal bleeding after the introduction of COX 2 inhibitors: ecological study. BMJ 2004;328:1415-16. http://dx.doi.org/10.1136/bmj.38068.716262.F7.
- MHRA . Salmeterol (Serevent) and formoterol (Oxis) in asthma management. Curr Probl Pharmacovigilance 2003;29.
- Spencer R, Bell B, Avery AJ, Gookey G, Campbell SM. Identification of an updated set of prescribing-safety indicators for GPs. Br J Gen Pract 2014;64:e181-90. http://dx.doi.org/10.3399/bjgp14X677806.
- Wheeler BW, Gunnell D, Metcalfe C, Stephens P, Martin RM. The population impact on incidence of suicide and non-fatal self harm of regulatory action against the use of selective serotonin reuptake inhibitors in under 18s in the United Kingdom: ecological study. BMJ 2008;336:542-5. http://dx.doi.org/10.1136/bmj.39462.375613.BE.
- Wheeler BW, Metcalfe C, Martin RM, Gunnell D. International impacts of regulatory action to limit antidepressant prescribing on rates of suicide in young people. Pharmacoepidemiol Drug Saf 2009;18:579-88. http://dx.doi.org/10.1002/pds.1753.
- Summary of Clinical Trial Data on Cerebrovascular Adverse Events (CVAEs) in Randomized Clinical Trials of Risperidone Conducted in Patients with Dementia. London: Committee on Safety of Medicines; 2004.
- MHRA . Non-steroidal anti-inflammatory drugs (NSAIDs) and gastrointestinal (GI) safety. Curr Probl Pharmacovigilance 2002;28.
- MHRA . Reminder: gastrointestinal toxicity of NSAIDs. Curr Probl Pharmacovigilance 2003;29.
- MHRA . Advice on the Use of Celecoxib and Other Selective Cox-2 Inhibitors In Light of Concerns About Cardiovascular Safety 2004. http://webarchive.nationalarchives.gov.uk/20141205150130/http://www.mhra.gov.uk/Safetyinformation/Safetywarningsalertsandrecalls/Safetywarningsandmessagesformedicines/CON1004257 (accessed 7 February 2015).
- MHRA . MHRA Issues Updated Advice on the Safety of Selective Cox-2 Inhibitors 2005. http://webarchive.nationalarchives.gov.uk/20141205150130/http://www.mhra.gov.uk/Safetyinformation/Safetywarningsalertsandrecalls/Safetywarningsandmessagesformedicines/CON1004250 (accessed 7 February 2015).
- MHRA . Review of the Cardiovascular Safety of Non-Steroidal Anti-Inflammatory Drugs 2006. http://webarchive.nationalarchives.gov.uk/20141205150130/http://www.mhra.gov.uk/Safetyinformation/Safetywarningsalertsandrecalls/Safetywarningsandmessagesformedicines/CON1004301 (accessed 7 February 2015).
- National Patient Safety Agency . Improving Compliance With Oral Methotrexate Guidelines 2006. www.npsa.nhs.uk/nrls/alerts-and-directives/alerts/oral-methotrexate/ (accessed 7 February 2015).
- Wagner A, Soumerai S, Zhang F, Ross-Degnan D. Segmented regression analysis of interrupted time series studies in medication use research. J Clin Pharm Ther 2002;27:299-30. http://dx.doi.org/10.1046/j.1365-2710.2002.00430.x.
- Briesacher BA, Soumerai SB, Zhang F, Toh S, Andrade SE, Wagner JL, et al. A critical review of methods to evaluate the impact of FDA regulatory actions. Pharmacoepidemiol Drug Saf 2013;22:986-94. http://dx.doi.org/10.1002/pds.3480.
- Information Services Division NHS Scotland . Community Dispensing 2014. www.isdscotland.org/Health-Topics/Prescribing-and-Medicines/Community-Dispensing/Prescription-Cost-Analysis (accessed 6 April 2014).
- Ohlsson H, Vervloet M, van Dijk L. Practice variation in a longitudinal perspective: a multilevel analysis of the prescription of simvastatin in general practices between 2003 and 2009. Eur J Clin Pharmacol 2011;67:1205-11. http://dx.doi.org/10.1007/s00228-011-1082-8.
- Turenne MN, Hirth RA, Pan Q, Wolfe RA, Messana JM, Wheeler JRC. Using knowledge of multiple levels of variation in care to target performance incentives to providers. Med Care 2008;46:120-6. http://dx.doi.org/10.1097/MLR.0b013e31815b9d7a.
- Victora CG, Vaughan JP, Barros FC, Silva AC, Tomasi E. Explaining trends in inequities: evidence from Brazilian child health studies. Lancet 2000;356:1093-8. http://dx.doi.org/10.1016/S0140-6736(00)02741-0.
- Balas E, Boren SA, Hicks LL, Chonko AM, Stephenson K. Effect of linking practice data to published evidence: a randomized controlled trial of clinical direct reports. Med Care 1998;36:79-87.
- Bregnhøj L, Thirstrup S, Kristensen MB, Bjerrum L, Sonne J. Combined intervention programme reduces inappropriate prescribing in elderly patients exposed to polypharmacy in primary care. Eur J Clin Pharmacol 2009;65:199-207.
- Curtis JR, Olivieri J, Allison JJ, Gaffo A, Juarez L, Kovac SH, et al. A group randomized trial to improve safe use of nonsteroidal anti-inflammatory drugs. Am J Manag Care 2005;11:537-43.
- Holm M. Intervention against long-term use if hypnotics/sedatives in general practice. Scand J Prim Health Care 1990;8:113-17.
- Pimlott NJG, Hux JE, Wilson LM, Kahan M, Li C, Rosser WW. Educating physicians to reduce benzodiazepine use by elderly patients: a randomized controlled trial. Can Med Assoc J 2003;168:835-9.
- Smith D, Christensen DB, Stergachis A, Holmes G. A randomized controlled trial of a drug use review intervention for sedative hypnotic medications. Prenat Diagn 1998;15:1013-21.
- Ivers N, Jamtvedt G, Flottorp S, Young J, Odgaard-Jensen J, French S, et al. Audit and feedback: effects on professional practice and healthcare outcomes. Cochrane Database Syst Rev 2012;6. http://dx.doi.org/10.1002/14651858.CD000259.pub3.
- Guthrie B, Treweek S, Petrie D, Barnett K, Ritchie LD, Robertson C, et al. Protocol for the Effective Feedback to Improve Primary Care Prescribing Safety (EFIPPS) study: a cluster randomised controlled trial using ePrescribing data. BMJ Open 2012;2. http://dx.doi.org/10.1136/bmjopen-2012-002359.
- Dreischulte T, Grant A, Donnan P, McCowan C, Davey P, Petrie D, et al. A cluster randomised stepped wedge trial to evaluate the effectiveness of a multifaceted information technology-based intervention in reducing high-risk prescribing of non-steroidal anti-inflammatory drugs and antiplatelets in primary medical care: the DQIP study protocol. Implement Sci 2012;7. http://dx.doi.org/10.1186/1748-5908-7-24.
- Grant S, Guthrie B, Entwistle VA, Williams B. A meta-ethnography of organisational culture in primary care medical practice. J Health Organ Manage 2014;28:21-40. http://dx.doi.org/10.1108/JHOM-07-2012-0125.
- Ohlsson H, Merlo J. Is there important variation among health care institutions?. Med Care 2010;48:757-8. http://dx.doi.org/10.1097/MLR.0b013e3181e80861.
- Holbrook AM, Pereira JA, Labiris R, McDonald H, Douketis JD, Crowther M, et al. Systematic overview of warfarin and its drug and food interactions. Arch Intern Med 2005;165:1095-106. http://dx.doi.org/10.1001/archinte.165.10.1095.
- Britten N, Stevenson FA, Barry CA, Barber N, Bradley CP. Misunderstandings in prescribing decisions in general practice: qualitative study. BMJ n.d.;320:484-8. http://dx.doi.org/10.1136/bmj.320.7233.484.
- Barry CA, Bradley CP, Britten N, Stevenson FA, Barber N. BMJ 2000;320:1246-50. http://dx.doi.org/10.1136/bmj.320.7244.1246.
- Leendertse A, de Koning F, Goudswaard A, Jonkhoff A, van den Bogert S, de Gier H, et al. Preventing hospital admissions by reviewing medication (PHARM) in primary care: design of the cluster randomised, controlled, multi-centre PHARM-study. BMC Health Serv Res 2011;11. http://dx.doi.org/10.1186/1472-6963-11-4.
- Desborough J, Houghton J, Wood J, Wright D, Holland R, Sach T, et al. Multi-professional clinical medication reviews in care homes for the elderly: study protocol for a randomised controlled trial with cost-effectiveness analysis. Trials 2011;12. http://dx.doi.org/10.1186/1745-6215-12-218.
- Dusetzina S, Alexander G. Drug vs. class-specific black box warnings: does one bad drug spoil the bunch?. J Gen Intern Med 2011;26:570-2. http://dx.doi.org/10.1007/s11606-011-1714-9.
Appendix 1 Numbers of practices patients, general practitioners and encounters included in each analysis of variation
| Variable | 2006/07 prescribing analysis | Current prescribing analysis | Encounter-based analyses |
|---|---|---|---|
| Outcome | All NSAIDs prescribed 1 January 2006/31 December 2006 | Any NSAID prescribed 1 January 2006/31 December 2006 | New acute NSAIDs prescribed 1 January 2006/31 December 2006 |
| Practices | 38 | 38 | 38 |
| Patientsa | Not applicable (prescription-level analysis) | 31,646 patients at risk on 1 October 2006 | 26,539 patients at risk at any point between 1 January 2006/31 December 2006 and with one or more eligible encounters with an eligible GP |
| GPs | – | – | 398 |
| Encounters | – | – | 181,010 |
| Type of NSAID prescription | |||
| Any NSAID in Q4 2006 | – | 2997 | – |
| New acute 2006/07 | 2199 | 479 | 1953 |
| Subsequent acute 2006/07 | 3236 | – | – |
| New repeat 2006/07 | 241 | – | – |
| Subsequent repeat 2006/07 | 15,083 | – | – |
| Structure of file | One row per NSAID prescription for NSAIDs prescribed to a patient at risk on that date | One row per patient | One row per eligible encounter with an eligible GP |
Appendix 2 Indicator definitions
| Indicator | Patient is included in the indicator if they fulfil the following denominator definition | Patient is counted as having a high-risk NSAID if they fulfil the following numerator definition |
|---|---|---|
| 1. NSAID prescribed to person with diagnosis of previous peptic ulcer | Diagnosed with peptic ulcer before 1 October 2006 and registered with the practice throughout 1 October 2006 to 31 December 2006. Peptic ulcer defined by PCCIU supplied code set | Prescribed any oral NSAID between 1 October 2006 and 31 December 2006. Oral NSAIDs defined as selected drugs in BNF chapter 10.1.1.113 |
| 2. NSAID prescribed to person aged 75 years and over | Aged 75 years before 1 October 2006 and registered with the practice throughout 1 October 2006 to 31 December 2006 | Prescribed any oral NSAID between 1 October 2006 and 31 December 2006 |
| 3. NSAID prescribed to person with diagnosis of heart failure | Diagnosed with heart failure before 1 October 2006 and registered with the practice throughout 1 October 2006 to 31 December 2006. Heart failure defined by QOF code set116 | Prescribed any oral NSAID between 1 October 2006 and 31 December 2006 |
| 4. NSAID prescribed to person also prescribed oral anticoagulant | Oral anticoagulant prescribed between 1 October 2006 and 31 December 2006 and oral anticoagulant prescribed between 1 July 2006 and 30 September 2006 and oral anticoagulant prescribed between 1 January 2007 and 31 March 2007 and registered with the practice throughout 1 October 2006 to 31 December 2006. Oral anticoagulants defined as oral drugs in BNF chapter 2.8.2.113 | Prescribed any oral NSAID between 1 October 2006 and 31 December 2006 |
| 5. NSAID prescribed to person also prescribed aspirin or clopidogrel | Aspirin or clopidogrel prescribed between 1 October 2006 and 31 December 2006 and aspiring or clopidogrel prescribed between 1 July 2006 and 30 September 2006 and aspirin or clopidogrel prescribed between 1 January 2007 and 31 March 2007 and registered with the practice throughout 1 October 2006 to 31 December 2006. Aspirin and clopidogrel defined as selected drugs in BNF chapter 2.9.113 | Prescribed any oral NSAID between 1 October 2006 and 31 December 2006 |
| Composite for main analysis | In any denominator | In any numerator |
| Indicator | Patient is included in the indicator if they fulfil the following denominator definition | Patient is counted as having a high-risk NSAID if they fulfil the following numerator definition |
|---|---|---|
| 1. NSAID prescribed in an encounter with a person with diagnosis of previous peptic ulcer | Diagnosed with peptic ulcer before the encounter | Prescribed any oral NSAID in the encounter |
| 2. NSAID prescribed in an encounter with a person aged 75 years and over | Aged 75 years before the encounter | Prescribed any oral NSAID in the encounter |
| 3. NSAID prescribed in an encounter with a person with diagnosis of heart failure | Diagnosed with heart failure before the encounter | Prescribed any oral NSAID in the encounter |
| 4. NSAID prescribed in an encounter with a person also prescribed oral anticoagulant | Either prescribed an oral anticoagulant on the day of the encounter or (prescribed an oral anticoagulant in the 84 days before the encounter and prescribed an oral anticoagulant in the 84 days after the encounter) | Prescribed any oral NSAID in the encounter |
| 5. NSAID prescribed in an encounter with a person also prescribed aspirin or clopidogrel | Either prescribed aspirin or clopidogrel on the day of the encounter or prescribed aspirin or clopidogrel in the 84 days before the encounter and prescribed aspirin or clopidogrel in the 84 days after the encounter | Prescribed any oral NSAID in the encounter |
| Composite for main analysis | In any denominator | In any numerator |
| Indicator | Patient is included in the indicator if they fulfil the following denominator definitiona | Patient is counted as having a high-risk drug if they fulfil the following numerator definition |
|---|---|---|
| 1. Specified ‘drug to avoid’ prescribed to person with history of heart failure (oral NSAID, tricyclic antidepressant, class I or class III antiarrhthymics excluding amiodarone, glitazone, minoxidil, tadalafil, verapamil, diltiazem, oral azole antifungal) | Diagnosed with heart failure before the start of the quarter | Prescribed any listed drugs during the quarter |
| 2. Beta blocker prescribed to person with asthma in the absence of CHD and COPD | Diagnosed with asthma before the start of the quarter and not diagnosed with CHD or COPD diagnosis before the end of the quarter | Prescribed any beta blocker during the quarter |
| 3. LABA prescribed to person with asthma without COPD without coprescription of an ICS | Diagnosed with asthma before the start of the quarter and not diagnosed with COPD diagnosis before the end of the quarter and prescribed a LABA during the quarter | Not prescribed ICS in the 12 weeks (84 days) before LABA prescriptionb |
| 4. NSAID prescribed to person with history of peptic ulcer, without coprescription of gastroprotection | Diagnosed with peptic ulcer before the start of the quarter | Prescribed an oral NSAID during the quarter and not prescribed a gastroprotective drug in the 12 weeks (84 days) before NSAID prescriptionb |
| 5. NSAID prescribed to person aged 75 years and over, without coprescription of gastroprotection | Aged 75 years and over before the start of the quarter | Prescribed an oral NSAID during the quarter and not prescribed a gastroprotective drug in the 12 weeks (84 days) before NSAID prescriptionb |
| 6. Methotrexate prescribed in mixed doses (2.5-mg and 10-mg tablets) | Prescribed methotrexate during the quarter | Prescribed both 2.5-mg and 10-mg methotrexate tablets in the same quarter |
| 7. Combined oral contraceptive prescribed to woman with history of arterial or venous thromboembolism | Woman diagnosed with arterial or venous thrombosis before the start of the quarter | Prescribed any combined oral contraceptive during the quarter |
| 8. Oral or transdermal oestrogen prescribed to woman with a history of breast cancer | Woman diagnosed with breast cancer before the start of the quarter | Prescribed any oral or transdermal oestrogen during the quarter |
| 9. Antipsychotic drug prescribed to person aged ≥ 65 years with dementia but no psychosis | Aged 65 years and over and diagnosed with dementia before the start of the quarter and not diagnosed with psychosis before the end of the quarter | Prescribed any oral antipsychotic drug during the quarter |
| 10. Metoclopramide or prochlorperazine prescribed to person with Parkinson’s disease | Diagnosed with Parkinson’s disease before the start of the quarter | Prescribed any listed drug during the quarter |
| 11. NSAID prescribed to person with CKD stage 3 or worse | Diagnosed with CKD stage 3 or worse before the start of the quarter | Prescribed any oral NSAID during the quarter |
| 12. Specified contraindicated drug prescribed to person with CKD stage 4 or worse [digoxin ≥ 250 mcg daily, metformin, sulphonylurea (excluding gliclazide or tolbutamide), aldosterone antagonist, thiazide] | Diagnosed with CKD stage 4 or worse before the start of the quarter | Prescribed any of the listed drugs during the quarter |
| 13. NSAID prescribed to person prescribed an OAC, without coprescription of gastroprotection | Prescribed an OAC during the quarter | Prescribed an oral NSAID during the quarter and not prescribed a gastroprotective drug in the 12 weeks (84 days) before NSAID prescriptionb |
| 14. NSAID prescribed to person prescribed an antiplatelet drug, without coprescription of gastroprotection | Prescribed an antiplatelet drug during the quarter | Prescribed an oral NSAID during the quarter and not prescribed a gastroprotective drug in the 12 weeks (84 days) before NSAID prescriptionb |
| 15. NSAID prescribed to person aged 65 years and over prescribed an ACE inhibitor/ARB and a diuretic (the ‘triple whammy’) | Aged 65 years and over before the start of the quarter and prescribed an ACE inhibitor/ARB and a diuretic during the quarter | Prescribed an oral NSAID in the same quarter |
| 16. Aspirin or clopidogrel prescribed to person prescribed an oral anticoagulant, without coprescription of gastroprotection | Prescribed an OAC during the quarter | Prescribed aspirin or clopidogrel during the quarter and not prescribed a gastroprotective drug in the 12 weeks (84 days) before aspirin or clopidogrel prescriptionb |
| 17. Clopidogrel prescribed to person prescribed aspirin, without coprescription of gastroprotection | Prescribed aspirin during the quarter | Prescribed clopidogrel during the quarter and not prescribed a gastroprotective drug in the 12 weeks (84 days) before clopidogrel prescriptionb |
| 18. Specified drug known to significantly impact on INR prescribed to person prescribed a coumarin OAC (quinolone, macrolide, metronidazole, oral azole antifungal) | Prescribed a coumarin OAC during the quarter | Prescribed any of the listed drugs in the same quarter |
| 19. PPDE-5 inhibitor prescribed to person prescribed oral nitrates or nicorandil | Prescribed an oral nitrates or nicorandil during the quarter | Prescribed any PPDE-5 inhibitor in the same quarter |
Appendix 3 Additional tables for Chapter 3 two-level model of total high-risk non-steroidal anti-inflammatory drug prescribing in quarter 4 2006
| Patient characteristics | % (95% CI) with high-risk NSAID | Univariate mulitilevel OR (95% CI) |
|---|---|---|
| Female (n = 14,980) | 10.0 (8.6 to 11.3) | 1 |
| Male (n = 16,666) | 8.9 (7.7 to 10.1) | 0.88 (0.82 to 0.95) |
| Age group (years) | ||
| < 50 (n = 2406) | 7.4 (5.8 to 9.0) | 1 |
| 50–59 (n = 2354) | 9.4 (7.6 to 11.3) | 1.29 (1.05 to 1.59) |
| 60–69 (n = 5571) | 12.9 (11.4 to 14.3) | 1.78 (1.50 to 2.12) |
| 70–79 (n = 10,818) | 10.3 (8.8 to 11.8) | 1.38 (1.17 to 1.63) |
| ≥ 80 (n = 4330) | 7.3 (6.0 to 8.6) | 0.97 (0.81 to 1.14) |
| Carstairs quintile | ||
| Q1 (affluent) (n = 5080) | 8.0 (6.0 to 10.1) | 1 |
| Q2 (n = 7335) | 8.3 (6.3 to 10.3) | 0.76 (0.65 to 0.91) |
| Q3 (n = 9161) | 10.1 (8.2 to 12.0) | 0.80 (0.67 to 0.97) |
| Q4 (n = 5740) | 9.3 (7.9 to 10.8) | 0.93 (0.77 to 1.12) |
| Q5 (deprived) (n = 4330) | 12.0 (9.7 to 14.3) | 0.93 (0.75 to 1.15) |
| No. of indicators eligible for | ||
| 1 (n = 21,553) | 9.8 (8.5 to 11.1) | 1 |
| 2 (n = 8104) | 9.3 (7.9 to 10.8) | 0.93 (0.85 to 1.01) |
| ≥ 3 (n = 1989) | 6.8 (5.5 to 8.2) | 0.66 (0.55 to 0.79) |
| No. of repeat drugs | ||
| 0 (n = 7598) | 4.4 (3.5 to 5.3) | 1 |
| 1–2 (n = 5901) | 8.8 (7.7 to 9.8) | 2.02 (1.75 to 2.32) |
| 3–4 (n = 6976) | 10.0 (8.4 to 11.7) | 2.36 (2.06 to 2.71) |
| 5–6 (n = 5380) | 11.0 (9.7 to 12.4) | 2.60 (2.26 to 3.00) |
| 7–8 (n = 3182) | 13.3 (11.2 to 15.4) | 3.22 (2.77 to 3.76) |
| 9–10 (n = 1517) | 15.3 (12.4 to 18.2) | 3.76 (3.14 to 4.50) |
| ≥ 11 (n = 1092) | 17.9 (14.6 to 21.3) | 4.53 (3.73 to 5.49) |
| Practice characteristics | % (95% CI) with high-risk NSAID | Univariate mulitilevel OR (95% CI) |
|---|---|---|
| 2006 new acute quartile | ||
| Q1 (lowest) (n = 9) | 7.1 (5.9 to 8.3) | 1 |
| Q2 (n = 10) | 9.6 (6.9 to 12.2) | 1.38 (1.05 to 1.81) |
| Q3 (n = 10) | 9.5 (8.3 to 10.8) | 1.50 (1.14 to 1.98) |
| Q4 (highest) (n = 9) | 12.2 (9.9 to 14.4) | 1.83 (1.37 to 2.43) |
| 2006 new repeat quartile | ||
| Q1 (lowest) (n = 9) | 7.9 (6.6 to 9.2) | 1 |
| Q2 (n = 10) | 9.3 (6.3 to 12.3) | 1.10 (0.81 to 1.51) |
| Q3 (n = 10) | 9.3 (8.2 to 10.3) | 1.14 (0.83 to 1.55) |
| Q4 (highest) (n = 9) | 12.0 (9.4 to 14.6) | 1.42 (1.03 to 1.96) |
| List size quartile | ||
| Q1 (small) (n = 10) | 10.2 (8.3–12.0) | 1 |
| Q2 (n = 9) | 9.2 (6.7–11.7) | 0.95 (0.68–1.32) |
| Q3 (n = 10) | 8.2 (6.7–9.6) | 0.78 (0.57–1.07) |
| Q4 (large) (n = 9) | 10.4 (8.0–12.7) | 0.99 (0.72–1.37) |
| Urban/remote location | ||
| Urban area (n = 24) | 9.5 (8.0–11.0) | 1 |
| Accessible area (n = 8) | 8.3 (6.9–9.6) | 0.93 (0.69–1.23) |
| Remote area (n = 6) | 11.9 (7.8–16.1) | 1.18 (0.85–1.65) |
| Type of NHS contract | ||
| General Medical Services contract (n = 29) | 8.2 (6.8–9.7) | 1 |
| Other contract (n = 9) | 9.8 (8.3–11.3) | 0.87 (0.66–1.15) |
| Accredited for post-graduate training | ||
| Not training (n = 23) | 9.9 (8.4–11.4) | 1 |
| Training (n = 15) | 8.9 (6.8–11.0) | 0.82 (0.64–1.02) |
| Dispenses own prescriptions | ||
| Not dispensing (n = 35) | 9.4 (8.2–10.7) | 1 |
| Dispensing (n = 3) | 10.4 (8.2–12.6) | 1.17 (0.72–1.90) |
Appendix 4 Additional tables for Chapter 4 three-level model of new acute high-risk non-steroidal anti-inflammatory drug prescribing
| Encounter and patient characteristics | No. (% with new acute NSAID; 95% CI) |
|---|---|
| Encounter characteristics (n = 181,010) | 1953 (1.09; 1.03 to 1.13) |
| Encounter type | |
| Normal surgery (n = 133,614) | 1781 (1.33; 1.27 to 1.40) |
| Telephone (n = 16,855) | 60 (0.36; 0.27 to 0.45) |
| Unknown/other (n = 30,541) | 112 (0.36; 0.30 to 0.44) |
| Indicators triggered at encounter date | |
| 1 (n = 99,389) | 1371 (1.38; 1.30 to 1.46) |
| 2 (n = 61,404) | 485 (0.79; 0.72 to 0.86) |
| ≥ 3 (n = 20,217) | 97 (0.48; 0.38 to 0.58) |
| Relevant diagnosis at encounter | |
| No (n = 127,984) | 513 (0.40; 0.37 to 0.44) |
| Yes (n = 53,026) | 1440 (2.72; 2.56 to 2.86) |
| Characteristics of patients in encounter | |
| Sex | |
| Women (n = 14,062 patients, 100,603 encounters) | 988 (0.98; 0.92 to 1.05) |
| Men (n = 12,477 patients, 80,407 encounters) | 965 (1.20; 1.12 to 1.28) |
| Age (years) | |
| < 50 (n = 1767 patients, 8893 encounters) | 194 (2.18; 1.85 to 2.51) |
| 50–59 (n = 1779 patients, 10,600 encounters) | 210 (1.98; 1.70 to 2.26) |
| 60–69 (n = 4929 patients, 30,991 encounters) | 438 (1.41; 1.28 to 1.55) |
| 70–79 (n = 9342 patients, 64,502 encounters) | 675 (1.05; 0.96 to 1.13) |
| ≥ 80 (n = 8722 patients, 66,024 encounters) | 436 (0.66; 0.60 to 0.72) |
| Carstairs deprivation quintile | |
| Q1 affluent (n = 4443 patients, 29,440 encounters) | 302 (1.03; 0.91 to 1.15) |
| Q2 (n = 5774 patients, 41,317 encounters) | 365 (0.88; 0.79 to 0.98) |
| Q3 (n = 7666 patients, 50,282 encounters) | 615 (1.22; 1.12 to 1.32) |
| Q4 (n = 4939 patients, 34,054 encounters) | 340 (1.00; 0.89 to 0.11) |
| Q5 (deprived) (n = 3717 patients, 25,917 encounters) | 331 (1.28; 1.13 to 1.42) |
| No. of repeat drugs | |
| 0 (n = 4874 patients, 24,051 encounters) | 424 (1.76; 1.58 to 1.94) |
| 1–2 (n = 5225 patients, 31,435 encounters) | 436 (1.39; 1.25 to 1.52) |
| 3–4 (n = 6183 patients, 42,589 encounters) | 451 (0.85; 0.75 to 0.95) |
| 5–6 (n = 4893 patients, 36,075 encounters) | 306 (0.77; 0.65 to 0.88) |
| 7–8 (n = 2922 patients, 23,926 encounters) | 184 (0.77; 0.65 to 0.88) |
| 9–10 (n = 1409 patients, 12,897 encounters) | 90 (0.70; 0.55 to 0.85) |
| ≥ 11 (n = 1033 patients, 10,037 encounters) | 62 (0.62; 0.46 to 0.78) |
| GP and practice characteristics | No. (% with new acute NSAID; 95% CI) |
|---|---|
| GP characteristics | |
| GP sex | |
| Women (n = 159 GPs, 67,615 encounters) | 460 (0.68; 0.53 to 0.83) |
| Men (n = 239 GPs, 113,395 encounters) | 1493 (1.32; 1.17 to 1.46) |
| Quartile of number of encounters with at risk patients | |
| Q1 (10–89) (n = 99 GPs, 3972 encounters) | 493 (1.07; 0.87 to 1.26) |
| Q2 (90–316) (n = 100 GPs, 18,887 encounters) | 536 (1.14; 0.94 to 1.34) |
| Q3 (317–765) (n = 100 GPs, 52,957 encounters) | 542 (1.09; 0.84 to 1.32) |
| Q4 (766–1908) (n = 99 GPs, 105,194 encounters) | 382 (1.01; 0.74 to 1.27) |
| Practice characteristics | |
| List size quartile | |
| Q1 (small) (n = 10 practices, 21,095 encounters) | 232 (1.10; 0.79 to 1.41) |
| Q2 (n = 9 practices, 37,537 encounters) | 337 (0.90; 0.53 to 1.27) |
| Q3 (n = 10 practices, 55,337 encounters) | 612 (1.11; 0.72 to 1.49) |
| Q4 (large) (n = 9 practices, 67,041 encounters) | 772 (1.15; 0.91 to 1.39) |
| Urban/remote location | |
| Urban area (n = 24 practices, 126,696 encounters) | 1269 (1.00; 0.78 to 1.23) |
| Accessible area (n = 8 practices, 33,416 encounters) | 424 (1.27; 0.91 to 1.62) |
| Remote area (n = 6 practices, 20,898 encounters) | 260 (1.24; 0.94 to 1.55) |
| Type of NHS contract | |
| General Medical Services contract (n = 29 practices, 14,281 encounters) | 1514 (1.06; 0.87 to 1.25) |
| Other contract (n = 9 practices, 38,129 encounters) | 439 (1.15; 0.73 to 1.57) |
| Accredited for post-graduate training | |
| Not training (n = 23 practices, 105,704 encounters) | 1240 (1.17; 0.93 to 1.42) |
| Training (n = 15 practices, 75,306 encounters) | 713 (0.95; 0.71 to 0.12) |
| Dispenses own prescriptions | |
| Not dispensing (n = 35 practices, 176,787 encounters) | 1897 (1.07; 0.89 to 1.26) |
| Dispensing (n = 3 practices, 4223 encounters) | 56 (1.33; 1.02 to 1.74) |
| Encounter and patient characteristics | Multilevel univariate OR (95% CI) |
|---|---|
| Encounter characteristics | 1 |
| Encounter type | |
| Normal surgery (n = 133,614) | |
| Telephone (n = 16,855) | 0.26 (0.20 to 0.33) |
| Unknown/other (n = 30,541) | 0.31 (0.25 to 0.37) |
| Indicators triggered at encounter date | |
| 1 (n = 99,389) | 1 |
| 2 (n = 61,404) | 0.58 (0.52 to 0.64) |
| ≥ 3 (n = 20,217) | 0.35 (0.28 to 0.42) |
| Relevant diagnosis at encounter | |
| No (n = 127,984) | 1 |
| Yes (n = 53,026) | 7.12 (6.48 to 7.97) |
| Characteristics of patients in encounter | |
| Sex | |
| Women (n = 14,062 patients, 100,603 encounters) | 1 |
| Men (n = 12,477 patients, 80,407 encounters) | 1.18 (1.08 to 1.29) |
| Age (years) | |
| < 50 (n = 1767 patients, 8893 encounters) | 1 |
| 50–59 (n = 1779 patients, 10,600 encounters) | 0.97 (0.79 to 1.18) |
| 60–69 (n = 4929 patients, 30,991 encounters) | 0.68 (0.57 to 0.81) |
| 70–79 (n = 9342 patients, 64,502 encounters) | 0.49 (0.42 to 0.58) |
| ≥ 80 (n = 8722 patients, 66,024 encounters) | 0.31 (0.26 to 0.37) |
| Carstairs deprivation quintile | |
| Q1 affluent (n = 4443 patients, 29,440 encounters) | 1 |
| Q2 (n = 5774 patients, 41,317 encounters) | 0.86 (0.70 to 1.05) |
| Q3 (n = 7666 patients, 50,282 encounters) | 0.95 (0.76 to 1.18) |
| Q4 (n = 4939 patients, 34,054 encounters) | 0.94 (0.76 to 1.16) |
| Q5 (deprived) (n = 3717 patients, 25,917 encounters) | 1.04 (0.81 to 1.34) |
| No. of repeat drugs | |
| 0 (n = 4874 patients, 24,051 encounters) | 1 |
| 1–2 (n = 5225 patients, 31,435 encounters) | 0.74 (0.64 to 0.85) |
| 3–4 (n = 6183 patients, 42,589 encounters) | 0.58 (0.50 to 0.66) |
| 5–6 (n = 4893 patients, 36,075 encounters) | 0.46 (0.40 to 0.54) |
| 7–8 (n = 2922 patients, 23,926 encounters) | 0.38 (0.35 to 0.50) |
| 9–10 (n = 1409 patients, 12,897 encounters) | 0.38 (0.30 to 0.48) |
| ≥ 11 (n = 1033 patients, 10,037 encounters) | 0.32 (0.24 to 0.42) |
| GP and practice characteristics | Multilevel univariate OR (95% CI) |
|---|---|
| GP characteristics | |
| GP sex | |
| Women (n = 159 GPs, 67,615 encounters) | 1 |
| Men (n = 239 GPs, 113,395 encounters) | 1.82 (1.44 to 2.31) |
| Quartile of number of encounters with at risk patients | |
| Q1 (10–89) (n = 99 GPs, 3972 encounters) | 1 |
| Q2 (90–316) (n = 100 GPs, 18,887 encounters) | 1.21 (0.90 to 1.63) |
| Q3 (317–765) (n = 100 GPs, 52,957 encounters) | 1.16 (0.83 to 1.62) |
| Q4 (766–1908) (n = 99 GPs, 105,194 encounters) | 1.07 (0.72 to 1.60) |
| Practice characteristics | |
| List size quartile | |
| Q1 (small) (n = 10 practices, 21,095 encounters) | 1 |
| Q2 (n = 9 practices, 37,537 encounters) | 0.81 (0.46 to 1.45) |
| Q3 (n = 10 practices, 55,337 encounters) | 0.96 (0.55 to 1.65) |
| Q4 (large) (n = 9 practices, 67,041 encounters) | 1.15 (0.67 to 1.99) |
| Urban/remote location | |
| Urban area (n = 24 practices, 126,696 encounters) | 1 |
| Accessible area (n = 8 practices, 33,416 encounters) | 1.31 (0.82 to 2.11) |
| Remote area (n = 6 practices, 20,898 encounters) | 1.31 (0.75 to 2.29) |
| Type of NHS contract | |
| General Medical Services contract (n = 29 practices, 14,281 encounters) | 1 |
| Other contract (n = 9 practices, 38,129 encounters) | 1.11 (0.70 to 1.77) |
| Accredited for post-graduate training | |
| Not training (n = 23 practices, 105,704 encounters) | 1 |
| Training (n = 15 practices, 75,306 encounters) | 0.88 (0.59 to 1.30) |
| Dispenses own prescriptions | |
| Not dispensing (n = 35 practices, 176,787 encounters) | 1 |
| Dispensing (n = 3 practices, 4223 encounters) | 1.52 (0.66 to 3.50) |
Appendix 5 Change over time in high-risk prescribing prevalence and variation between practices: detailed tables and figures
| Indicator | Baseline % | Trend, % change per quarter (95% CI) (if present second line is quadratic term) |
|---|---|---|
| 1: Drugs to avoid in heart failure | 23.3 | –0.17 (–0.18 to 0.16) |
| 2: Beta blockers in asthma | 1.15 | 0.005 (0.003 to 0.007) |
| 3: LABA use without ICS usea | 4.81 | –0.11 (–0.14 to –0.08) |
| 4: NSAID in peptic ulcer | 4.85 | –0.24 (–0.32 to –0.16) |
| 0.007 (0.002 to 0.012) | ||
| 5: NSAID in over-75-year-olds | 7.40 | –0.47 (–0.56 to –0.39) |
| 0.013 (0.09 to 0.018) | ||
| 6: Methotrexate in mixed strengths | 15.1 | 0.045 (–0.153 to 0.243) |
| –0.16 (–0.026 to –0.006) | ||
| 7: COCP in previous thromboembolism | 0.26 | –0.004 (–0.006 to –0.001) |
| 8: Oestrogens in previous breast cancer | 0.39 | –0.013 (–0.015 to –0.010) |
| 9: Antipsychotics in dementiaa | 14.72 | 0.28 (0.19 to 0.39) |
| –0.013 (–0.023 to –0.009) | ||
| 10: Parkinson’s disease | 1.46 | –0.11 (–0.13 to 0.004) |
| 11: NSAID in CKD 3–5 | 8.71 | –0.14 (–0.19 to –0.10) |
| 12: Drugs to avoid in CKD 4 and 5 | 21.30 | 0.50 (–0.06 to 1.06) |
| –0.077 (–0.131 to –0.022) | ||
| 13: NSAID with OAC | 2.83 | –0.22 (–0.26 to –0.17) |
| 0.007 (0.005 to 0.009) | ||
| 14: NSAID with aspirin or clopidogrel | 9.06 | –0.52 (–0.62 to –0.43) |
| 0.014 (0.009 to 0.019) | ||
| 15: NSAID with ACE inhibitors/ARB and diuretic | 13.38 | –0.52 (–0.61 to –0.42) |
| 0.014 (0.009 to 0.018) | ||
| 16: Aspirin/clopidogrel with OAC | 8.63 | –0.13 (–0.15 to –0.12) |
| 17: Aspirin and clopidogrel | 2.16 | 0.017 (–0.004 to 0.039) |
| –0.003 (–0.004 to –0.002) | ||
| 18: High-risk drugs with coumarin OAC | 3.16 | 0.10 (0.07 to 0.12) |
| 19: PPDE-5 inhibitor with oral nitrate | 0.19 | 0.007 (0.005 to 0.009) |
| Indicator | Baseline % | Trend, % change per quarter (95% CI) (if present second line is quadratic term) |
|---|---|---|
| Composite 1: NSAIDs | 8.30 | –0.39 (–0.46 to –0.32) |
| 0.011 (0.007 to 0.015) | ||
| Composite 2: NSAIDs and antiplatelets | 9.62 | –0.37 (–0.45 to –0.30) |
| 0.009 (0.005 to 0.013) | ||
| Composite 3: drug–disease interactions | 3.85 | –0.042 (–0.049 to –0.036) |
| Composite 4: drug–drug interactions | 11.21 | –0.43 (–0.52 to –0.34) |
| 0.011 (0.0026 to 0.016) | ||
| Composite 5: renal adverse effects | 10.18 | –0.16 (–0.21 to –0.11) |
| Composite 6: all indicators except CKD | 7.68 | –0.23 (–0.28 to –0.18) |
| 0.006 (0.003 to 0.009) |
FIGURE 15.
Time series of variation between practices in high-risk prescribing 2004–9 for individual indicators (note varying scales on y-axis). Indicators involving gastroprotection, indicators 4, 5, 13, 14, 16 and 17, are shown for the numerator ‘prescribed a NSAID without prescription of gastroprotection’. (a) indicator 1: drugs to avoid in heart failure; (b) indicator 2: beta blockers in asthma; (c) indicator 3: LABA use without ICS use; (d) indicator 4: NSAID in peptic ulcer; (e) indicator 5: NSAID in over-75-year-olds; (f) indicator 6: methotrexate in mixed strengths; (g) indicator 7: COCP in previous thromboembolism; (h) indicator 8: oestrogens in previous breast cancer; (i) indicator 9: antipsychotics in dementia; (j) indicator 10: Parkinson’s disease; (k) indicator 11: NSAID in CKD 3–5; (l) indicator 12: drugs to avoid in CKD 4 and 5; (m) indicator 13: NSAID with oral anticoagulant (OAC); (n) indicator 14: NSAID with aspirin or clopidogrel; (o) indicator 15: NSAID with ACE inhibitors/ARB and diuretic; (p) indicator 16: aspirin/clopidogrel with OAC; (q) indicator 17: aspirin and clopidogrel; (r) indicator 18: high-risk drugs with coumarin OAC; and (s) indicator 19: PPDE-5 inhibitor with oral nitrate. COCP, combined oral contraceptive pill.
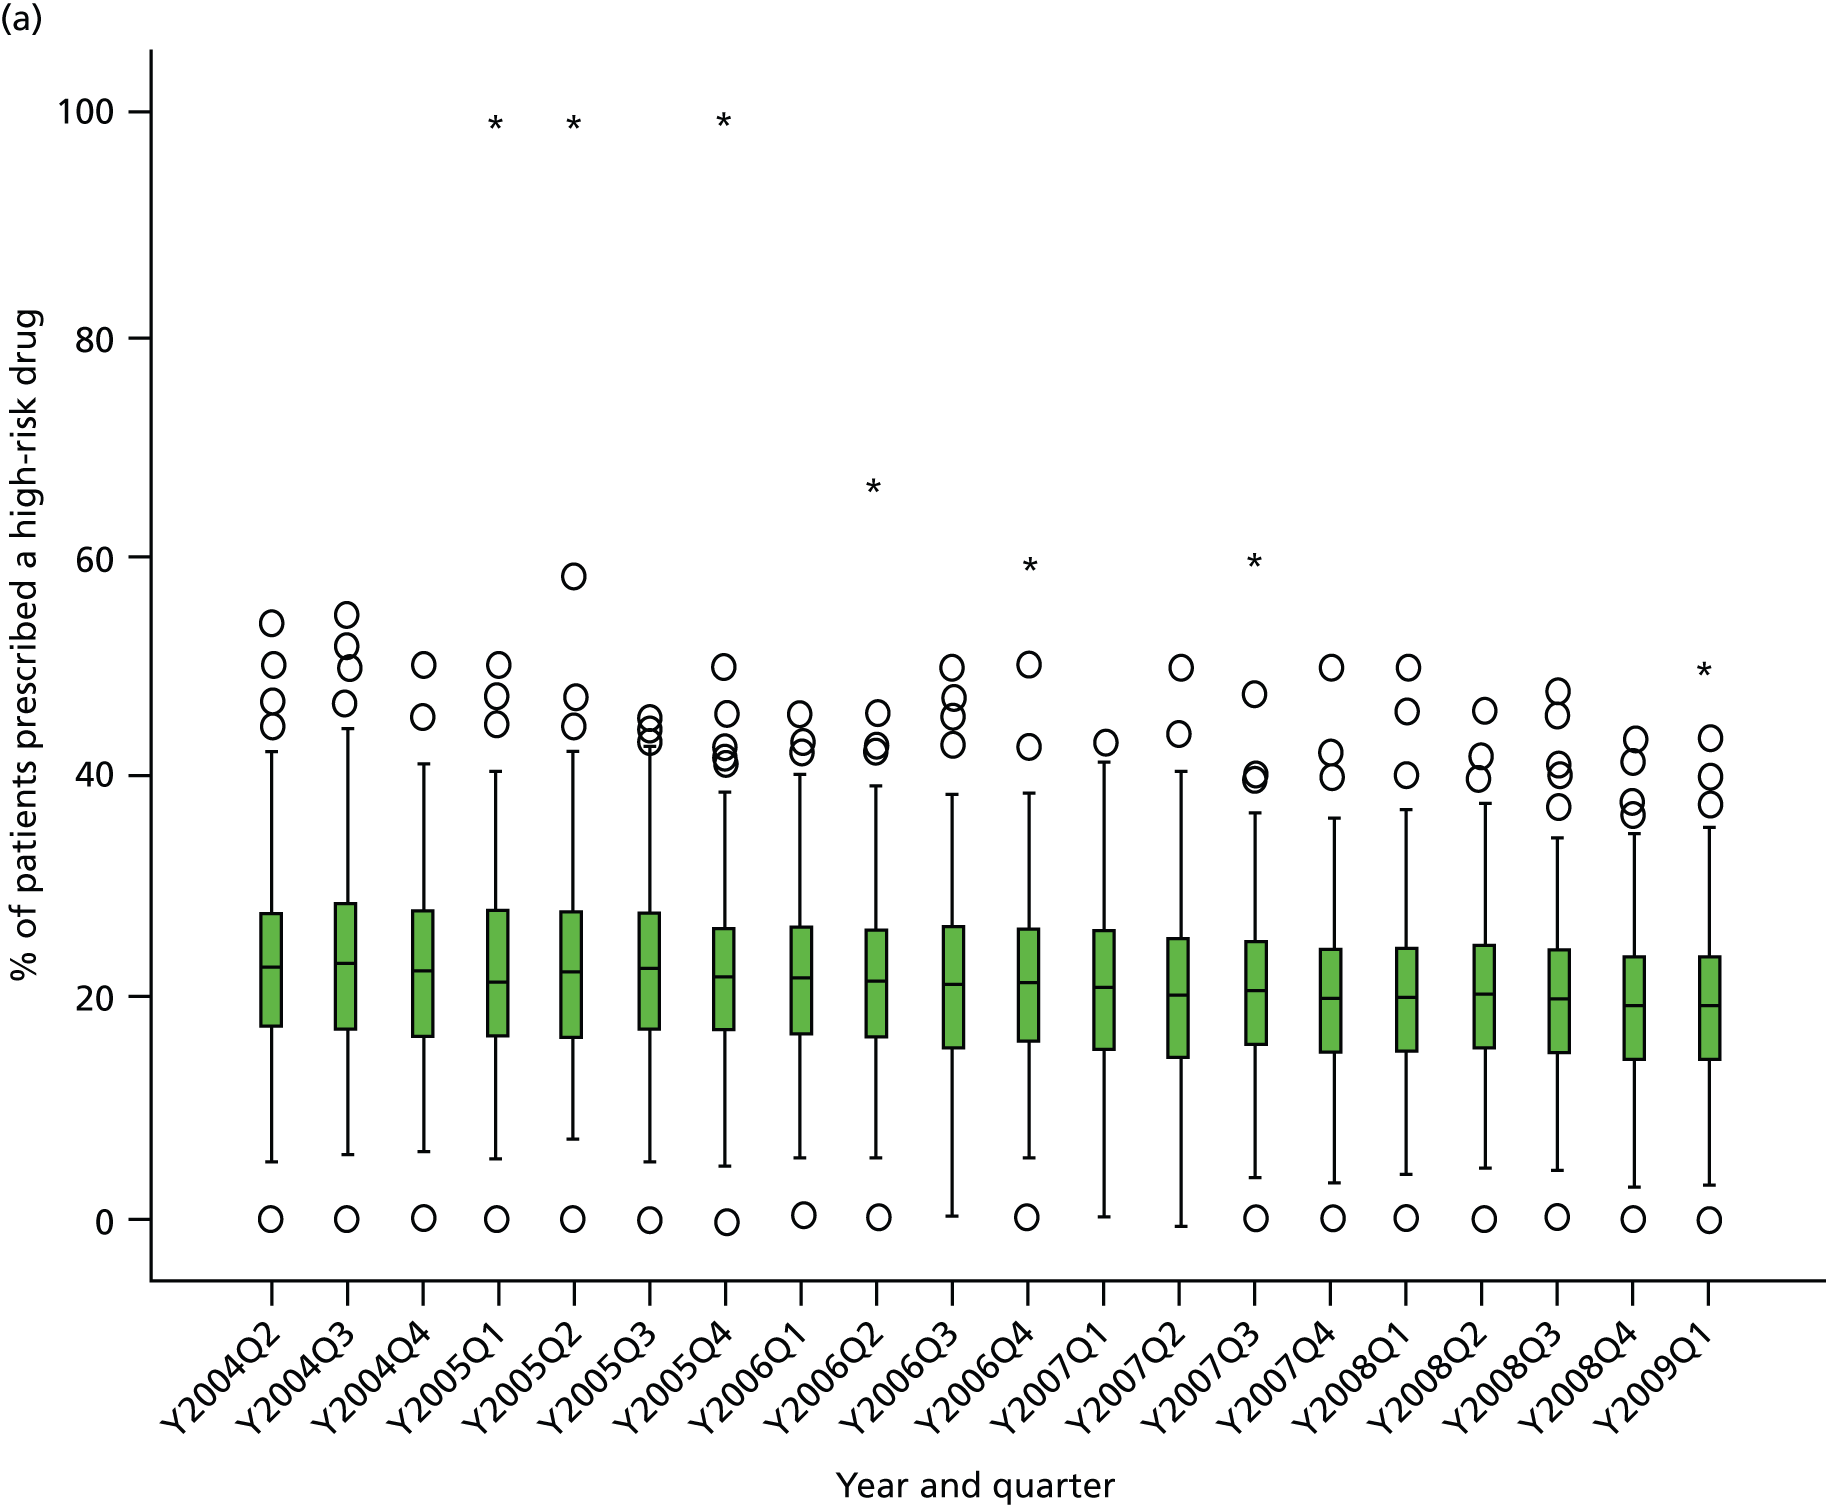

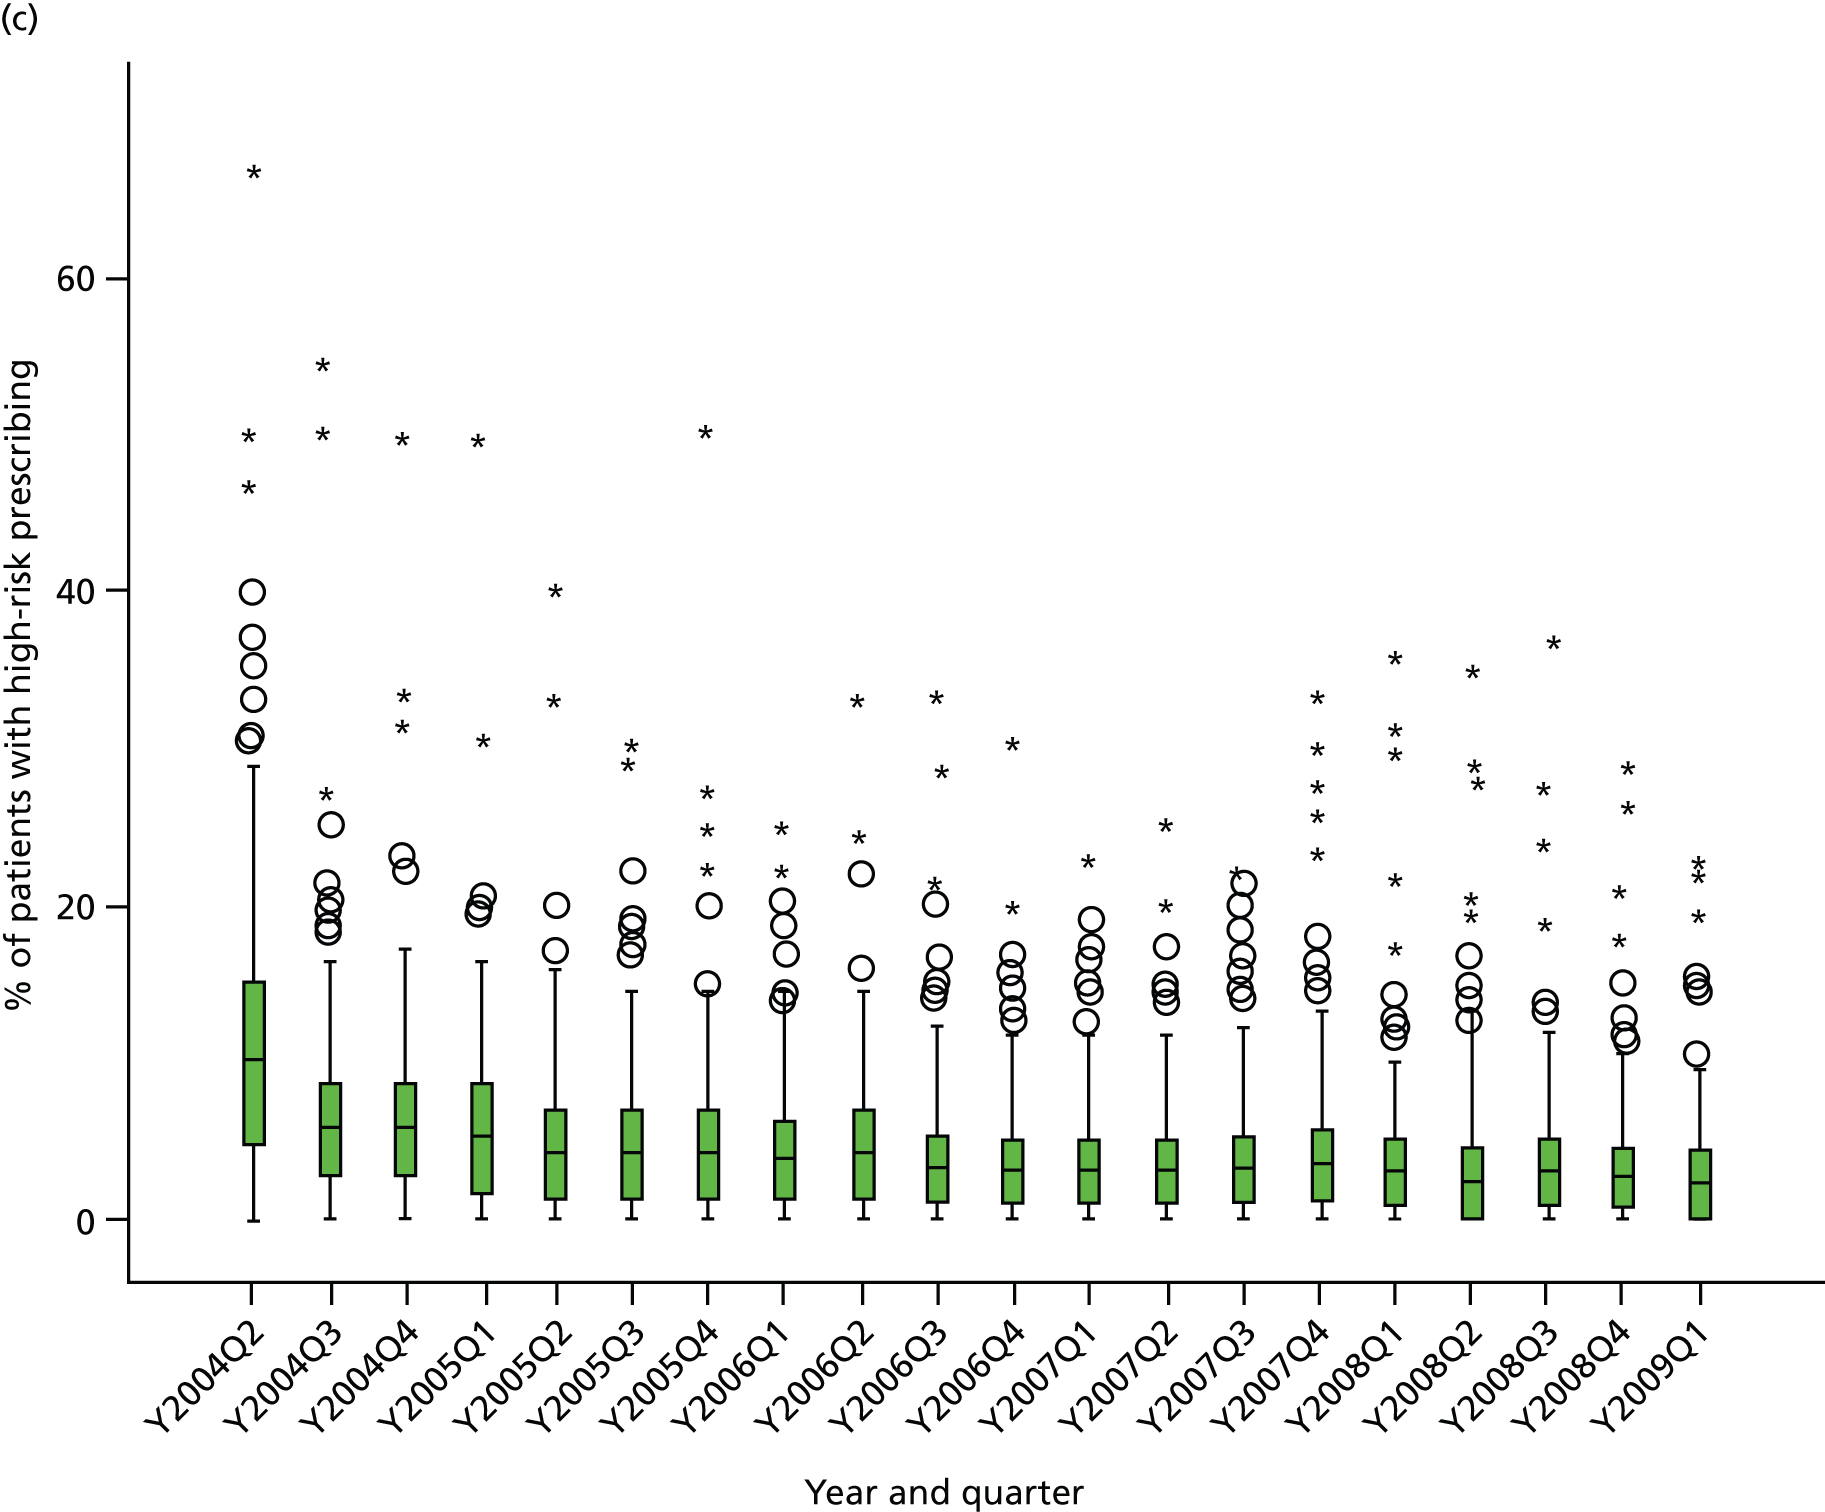
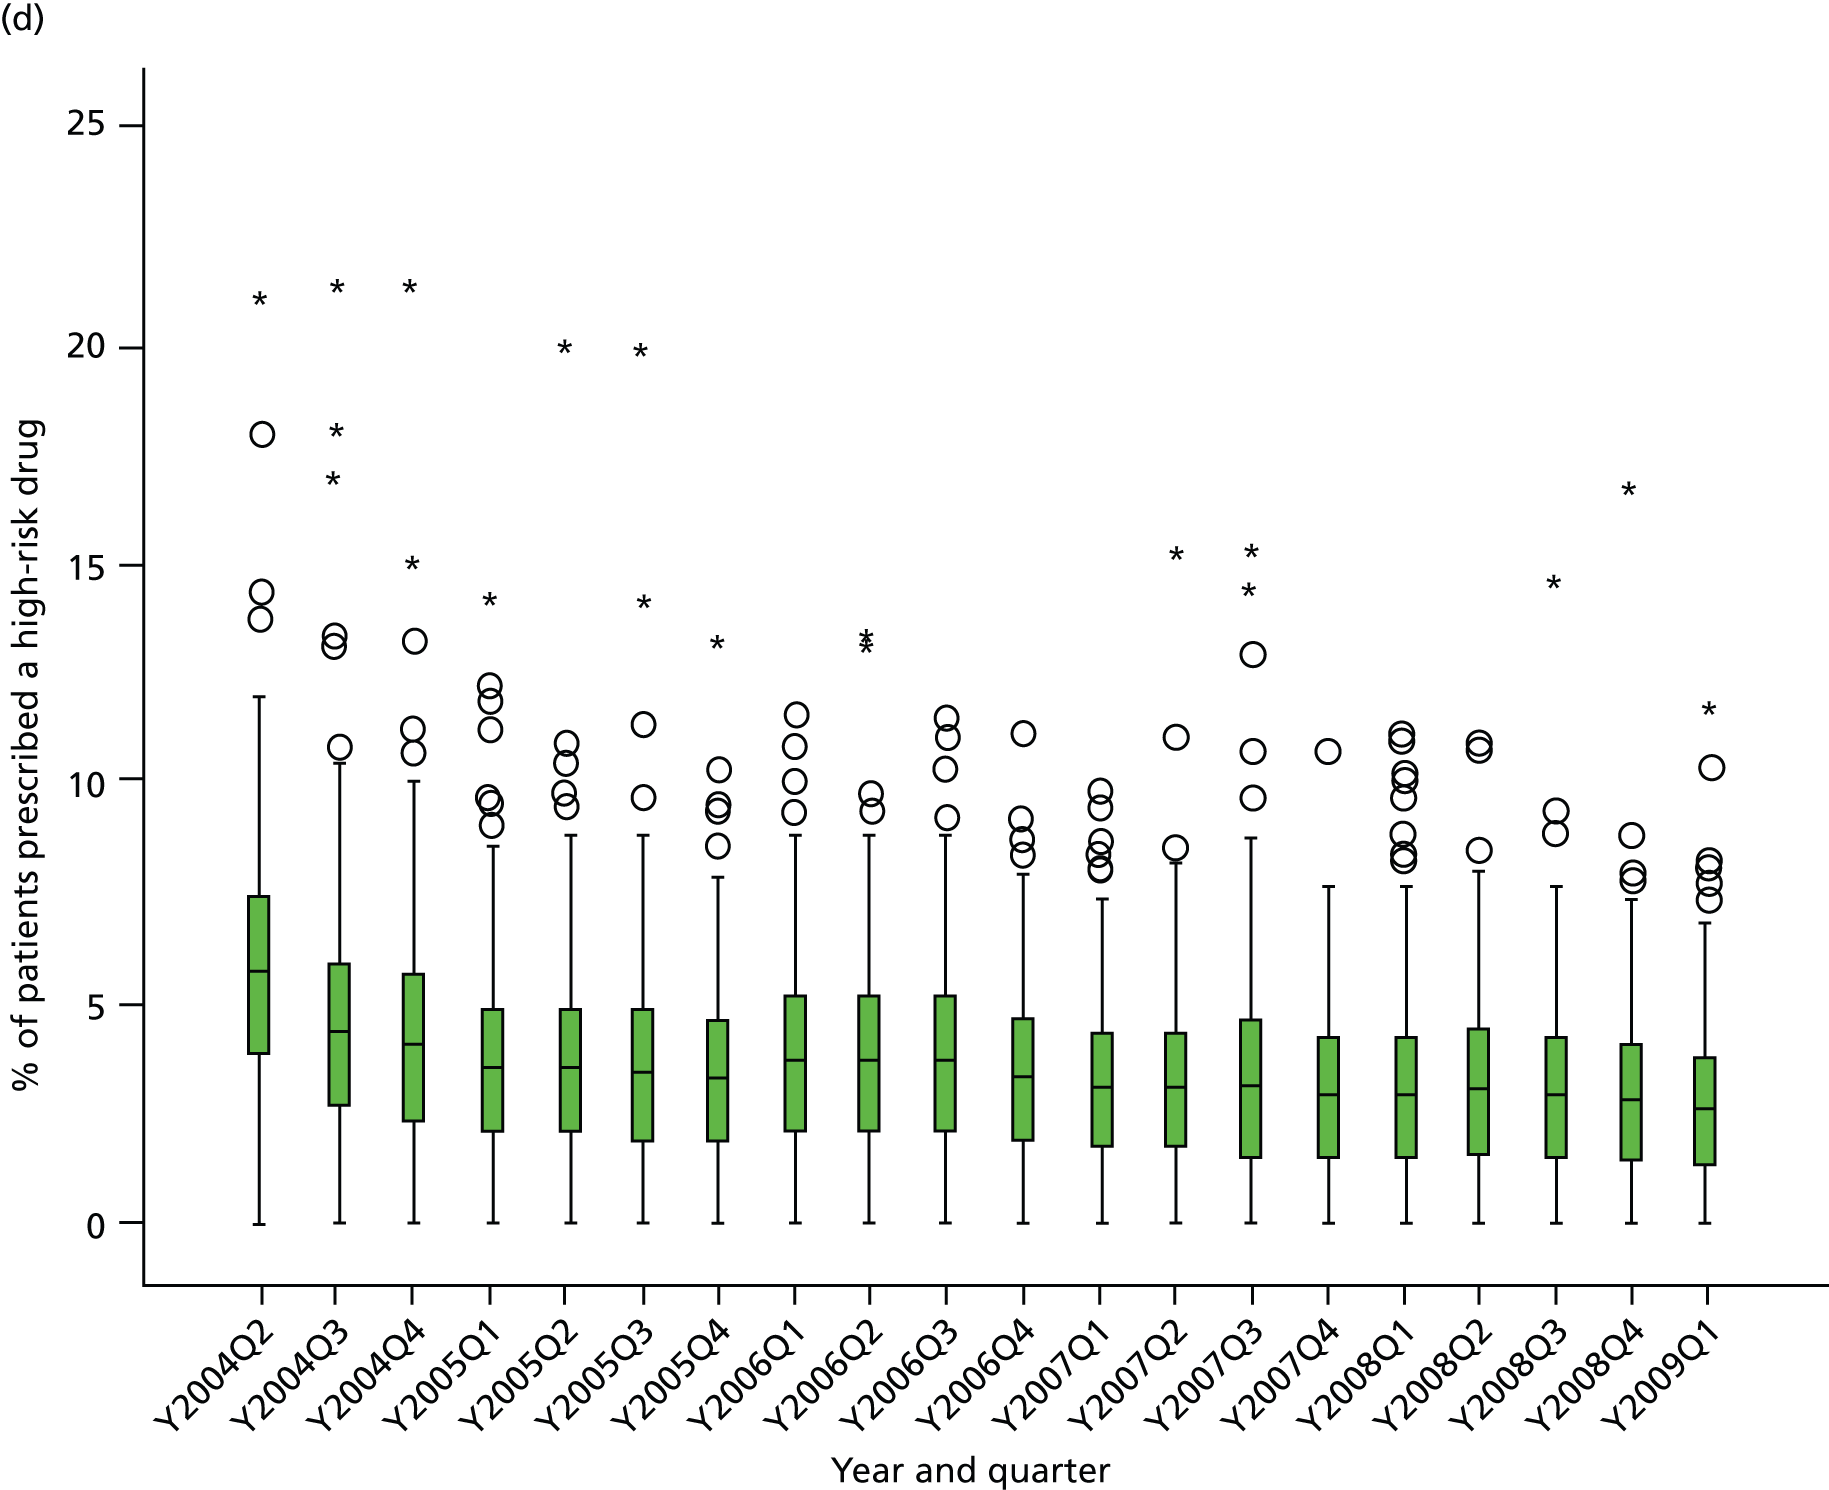
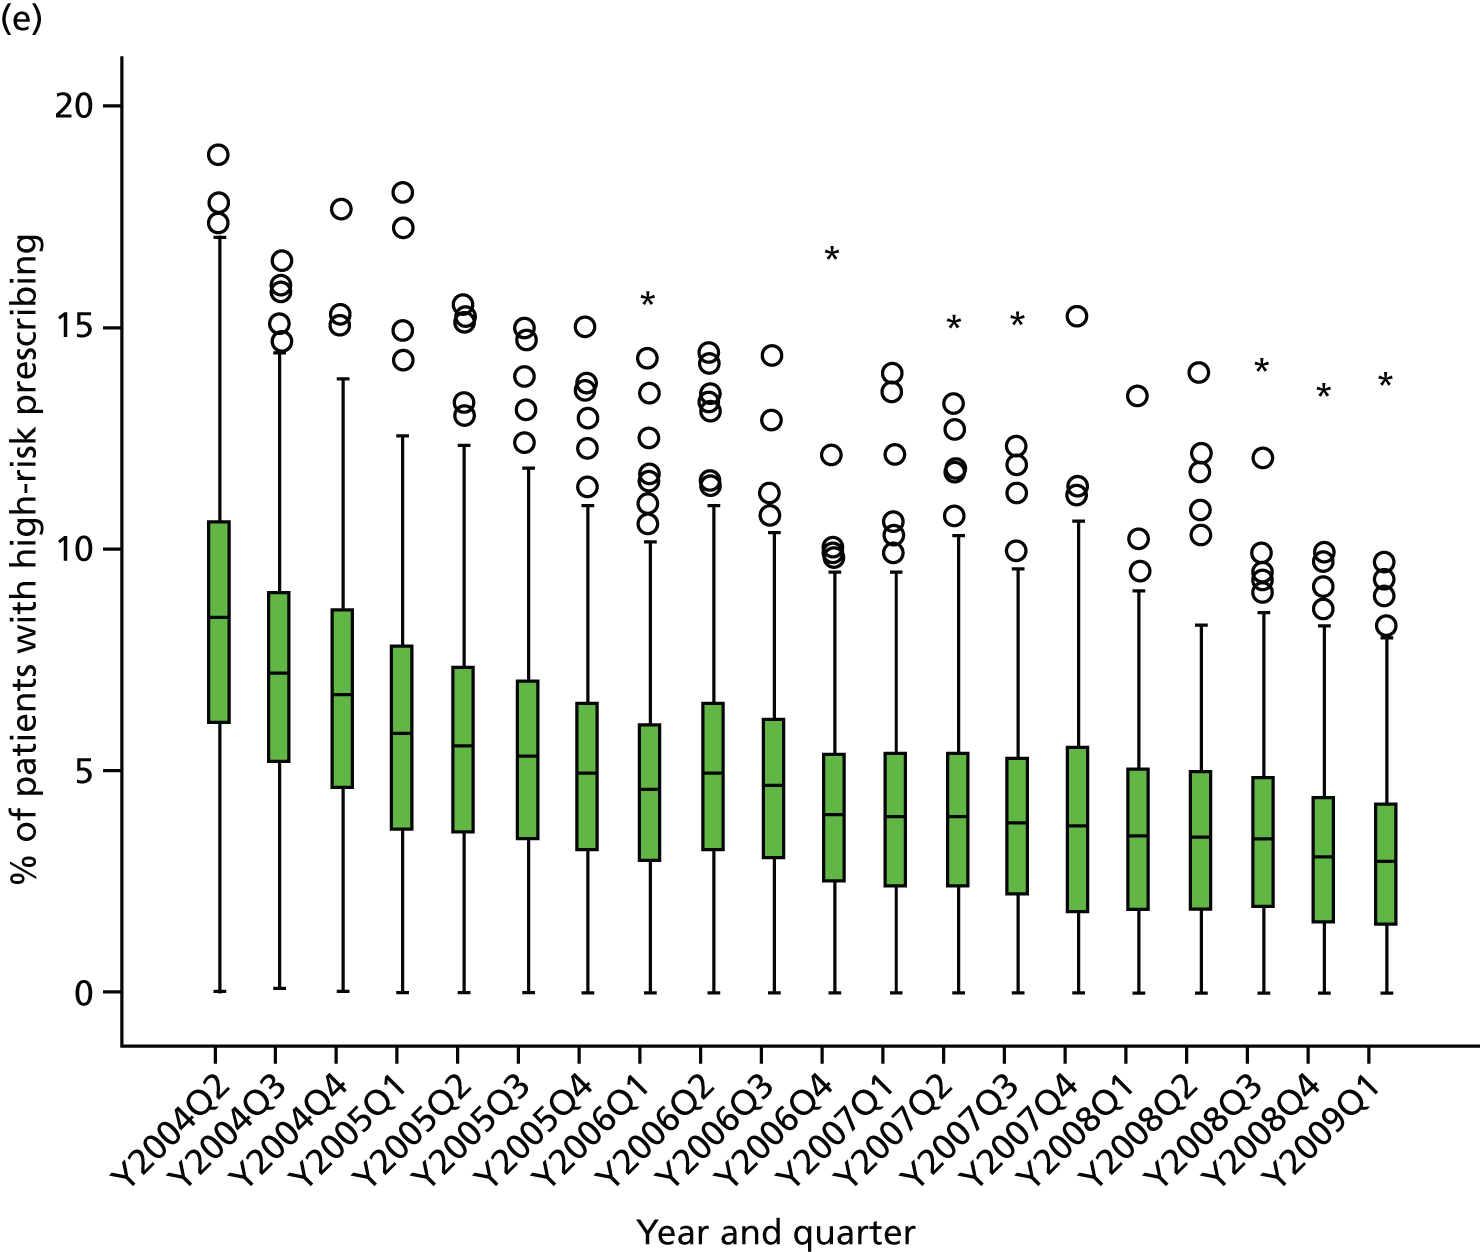
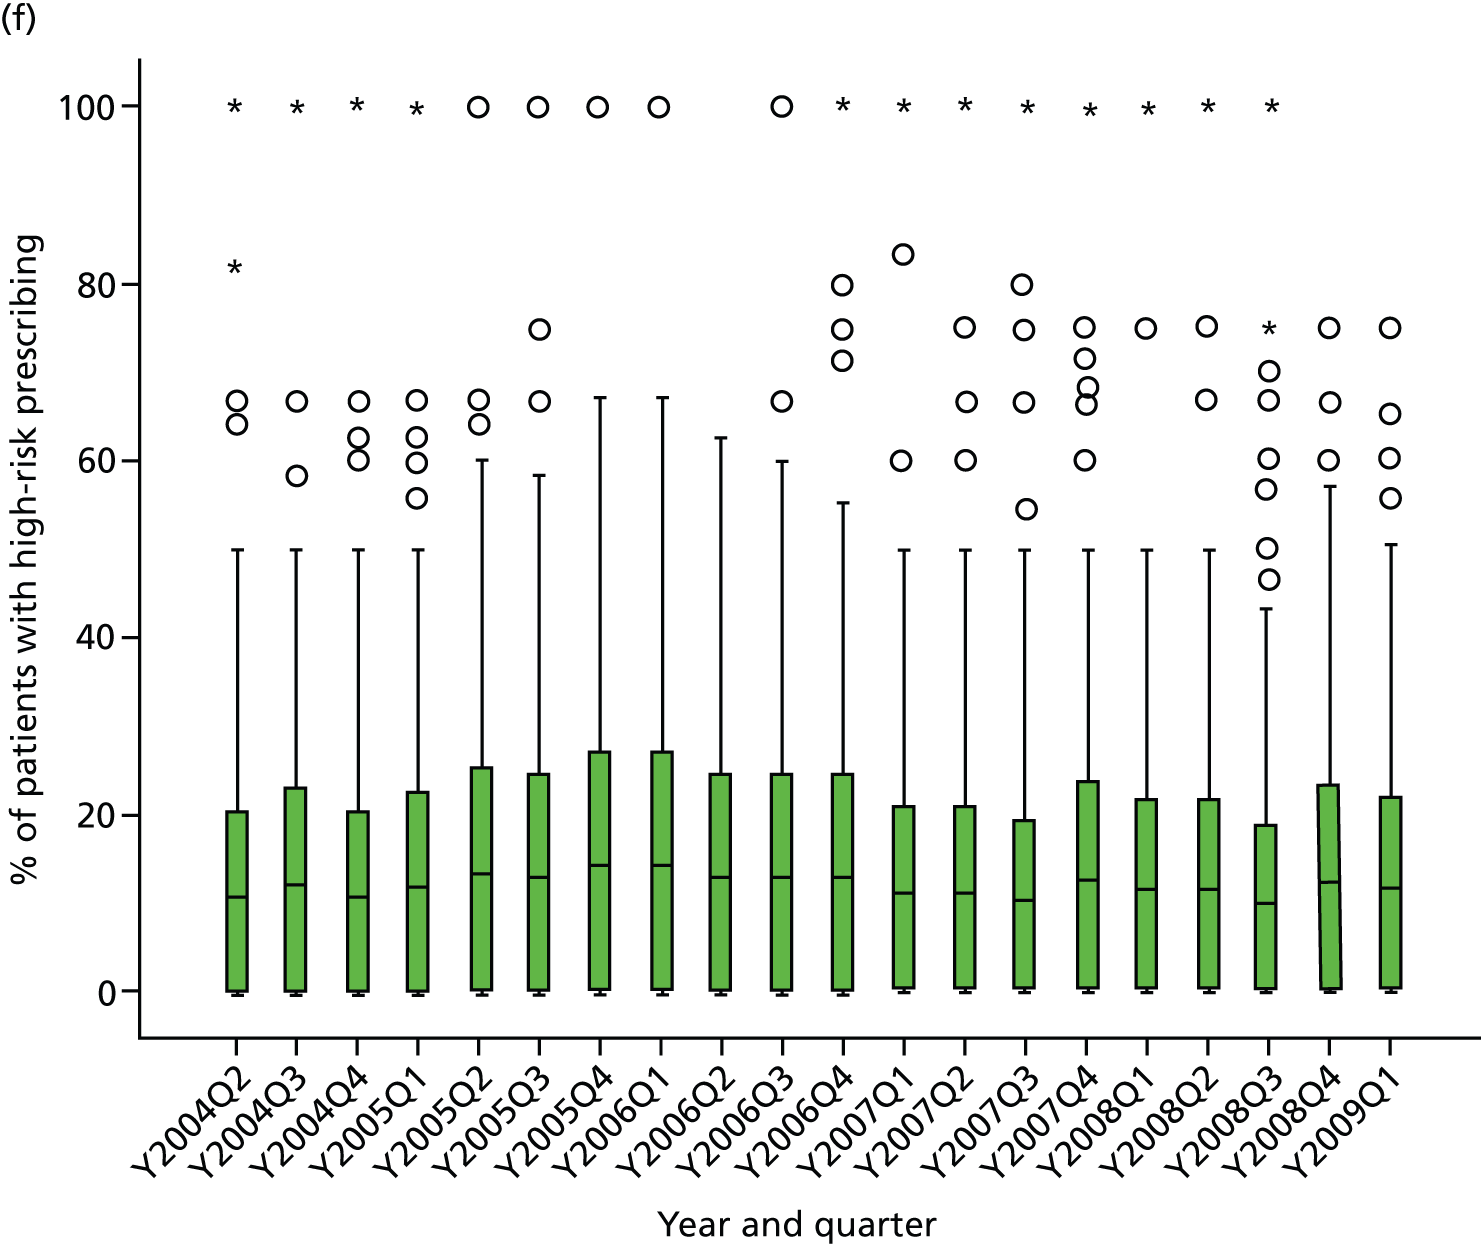

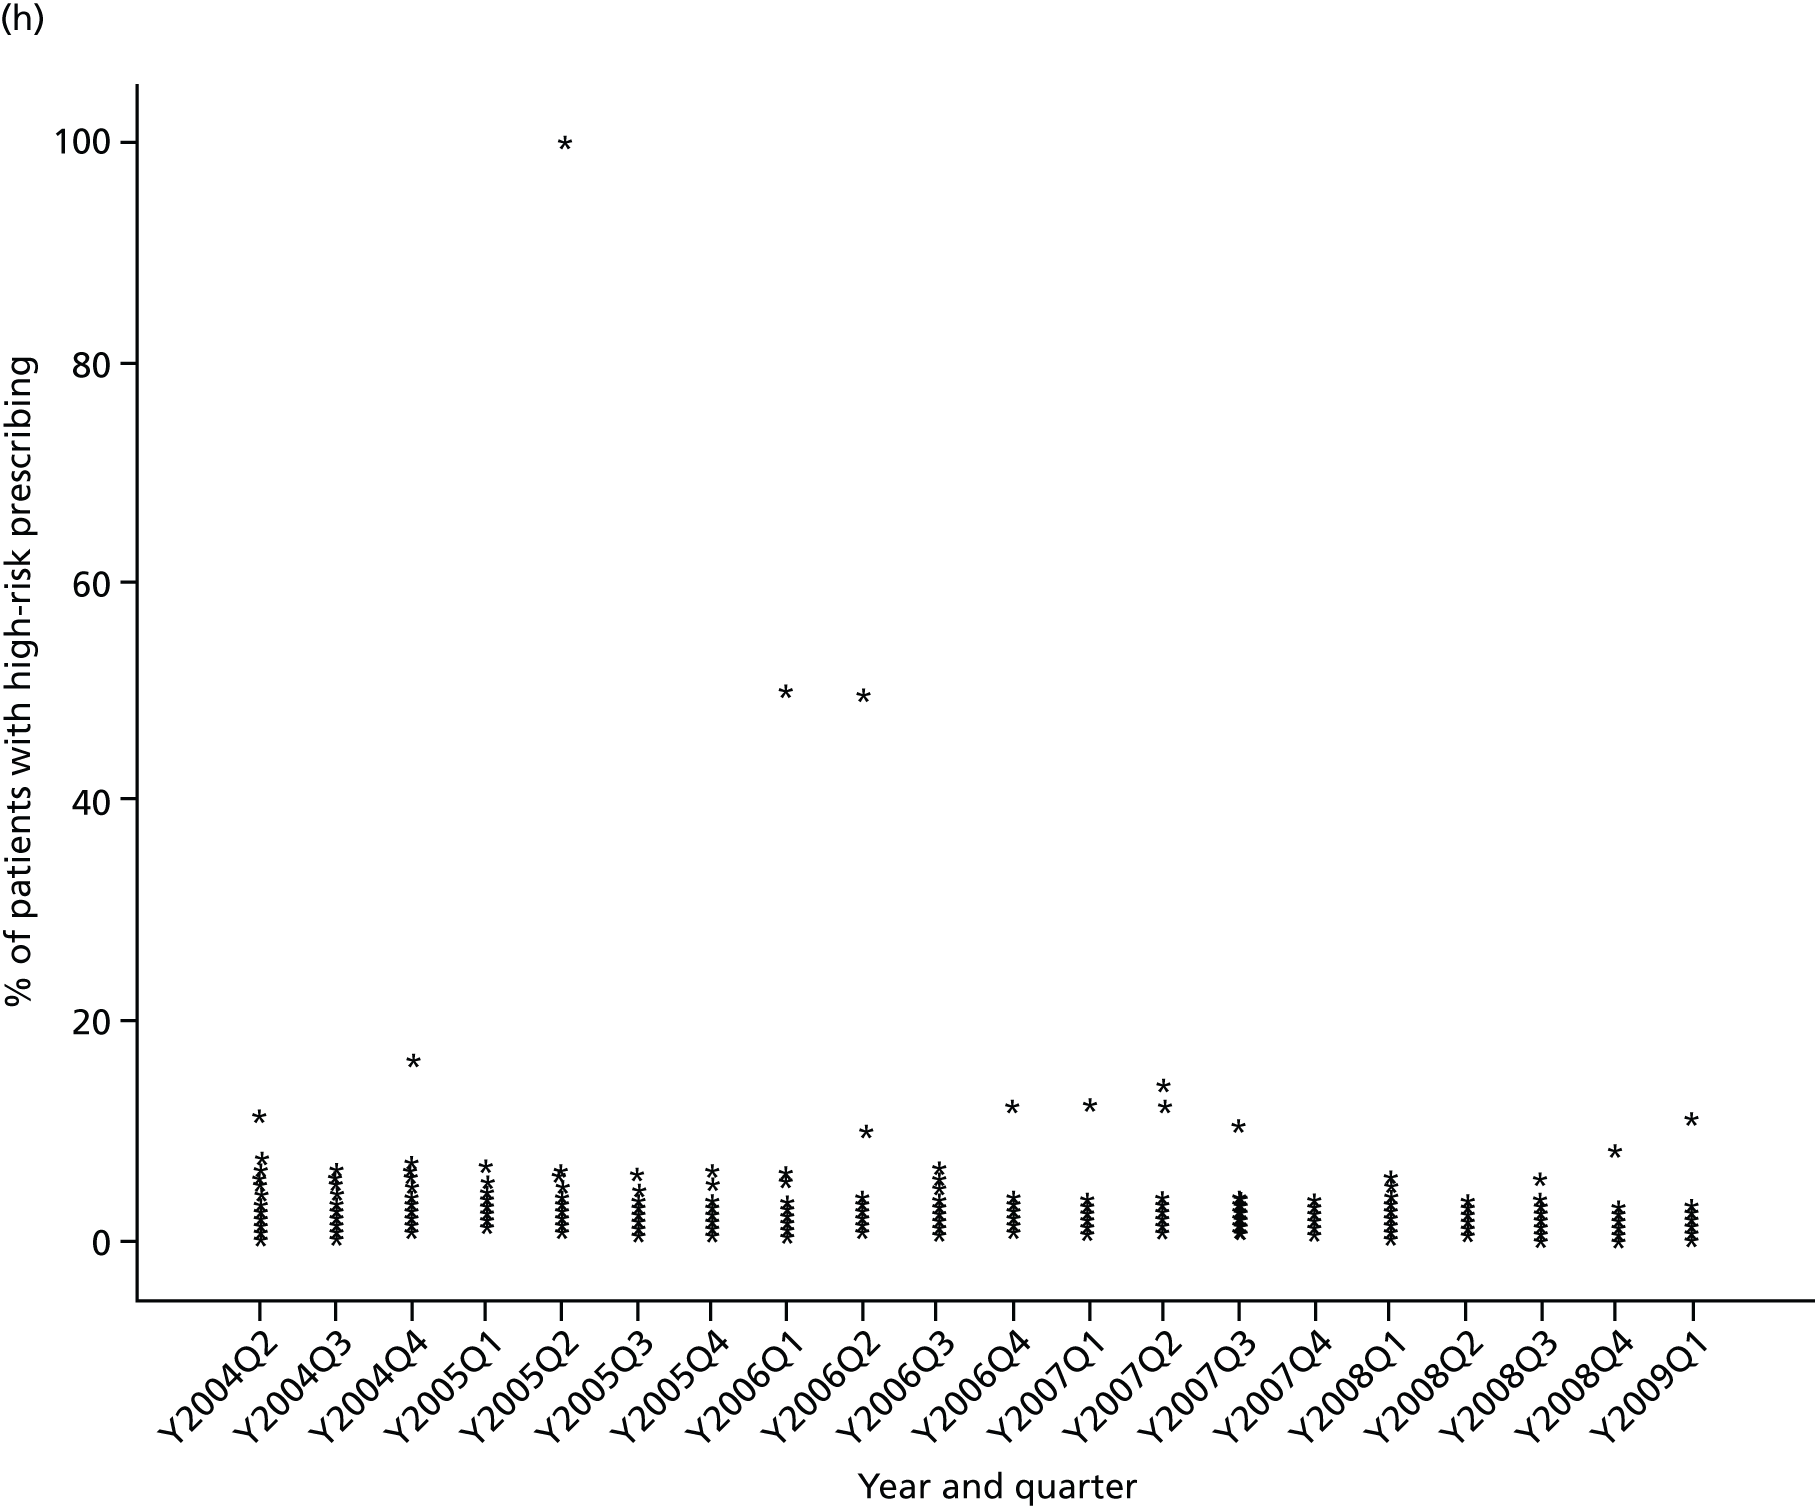
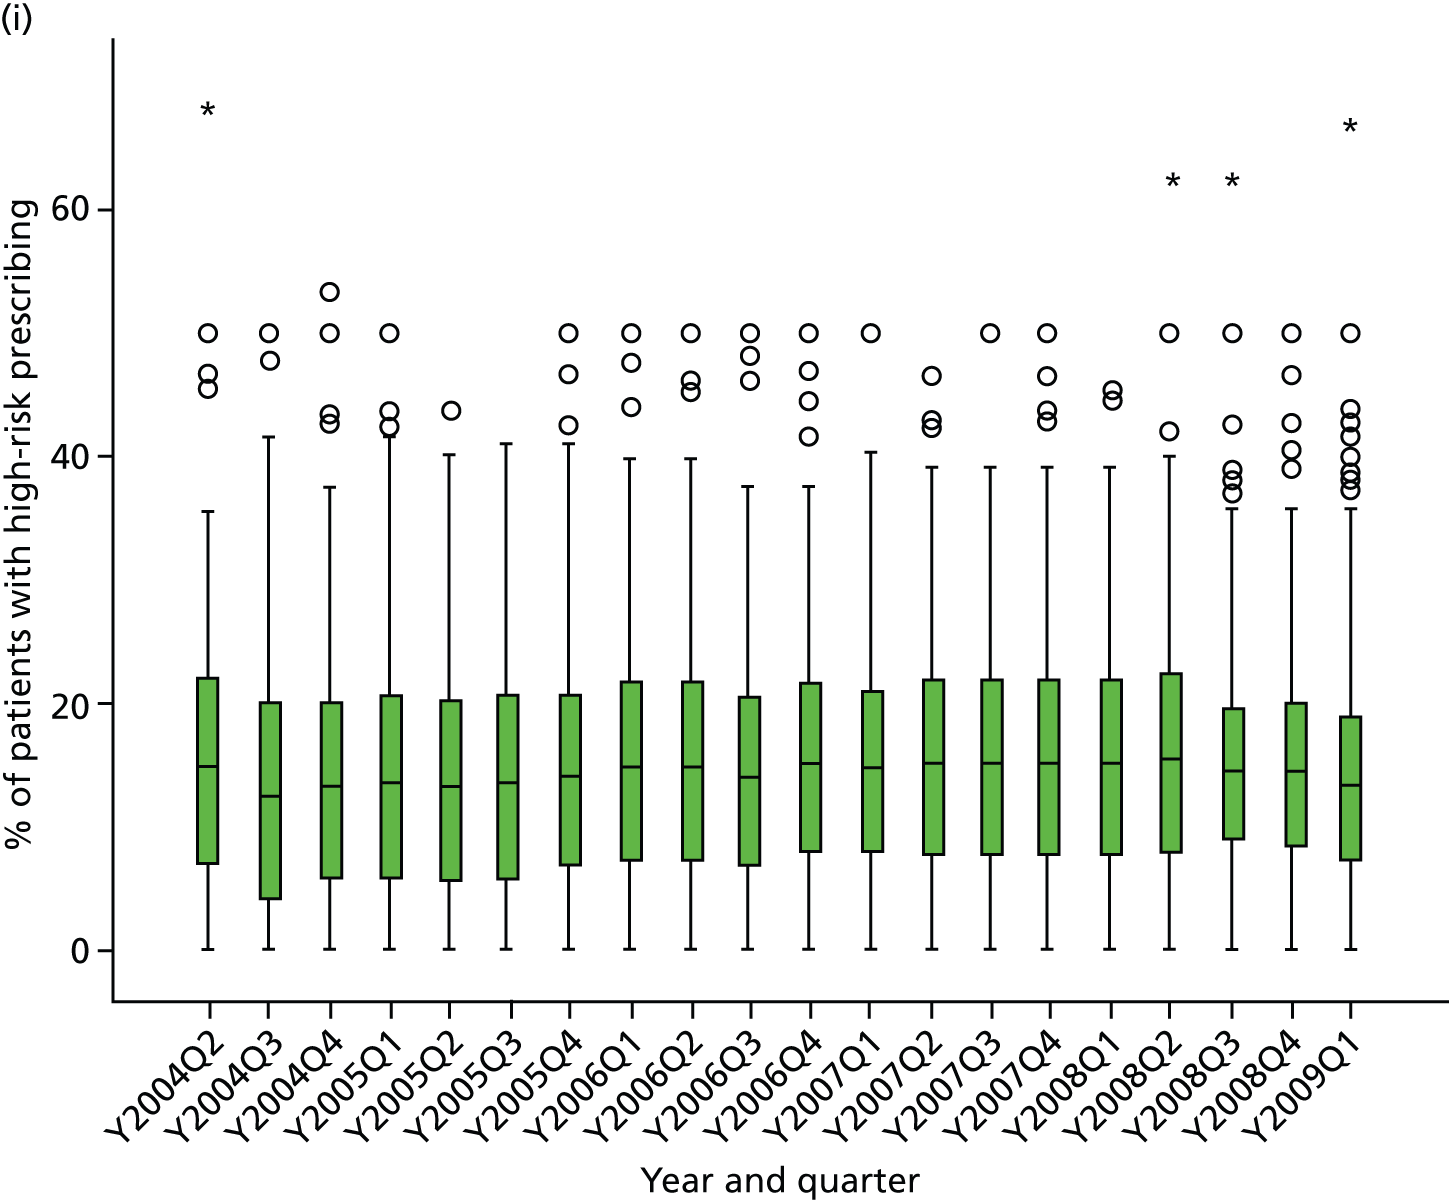
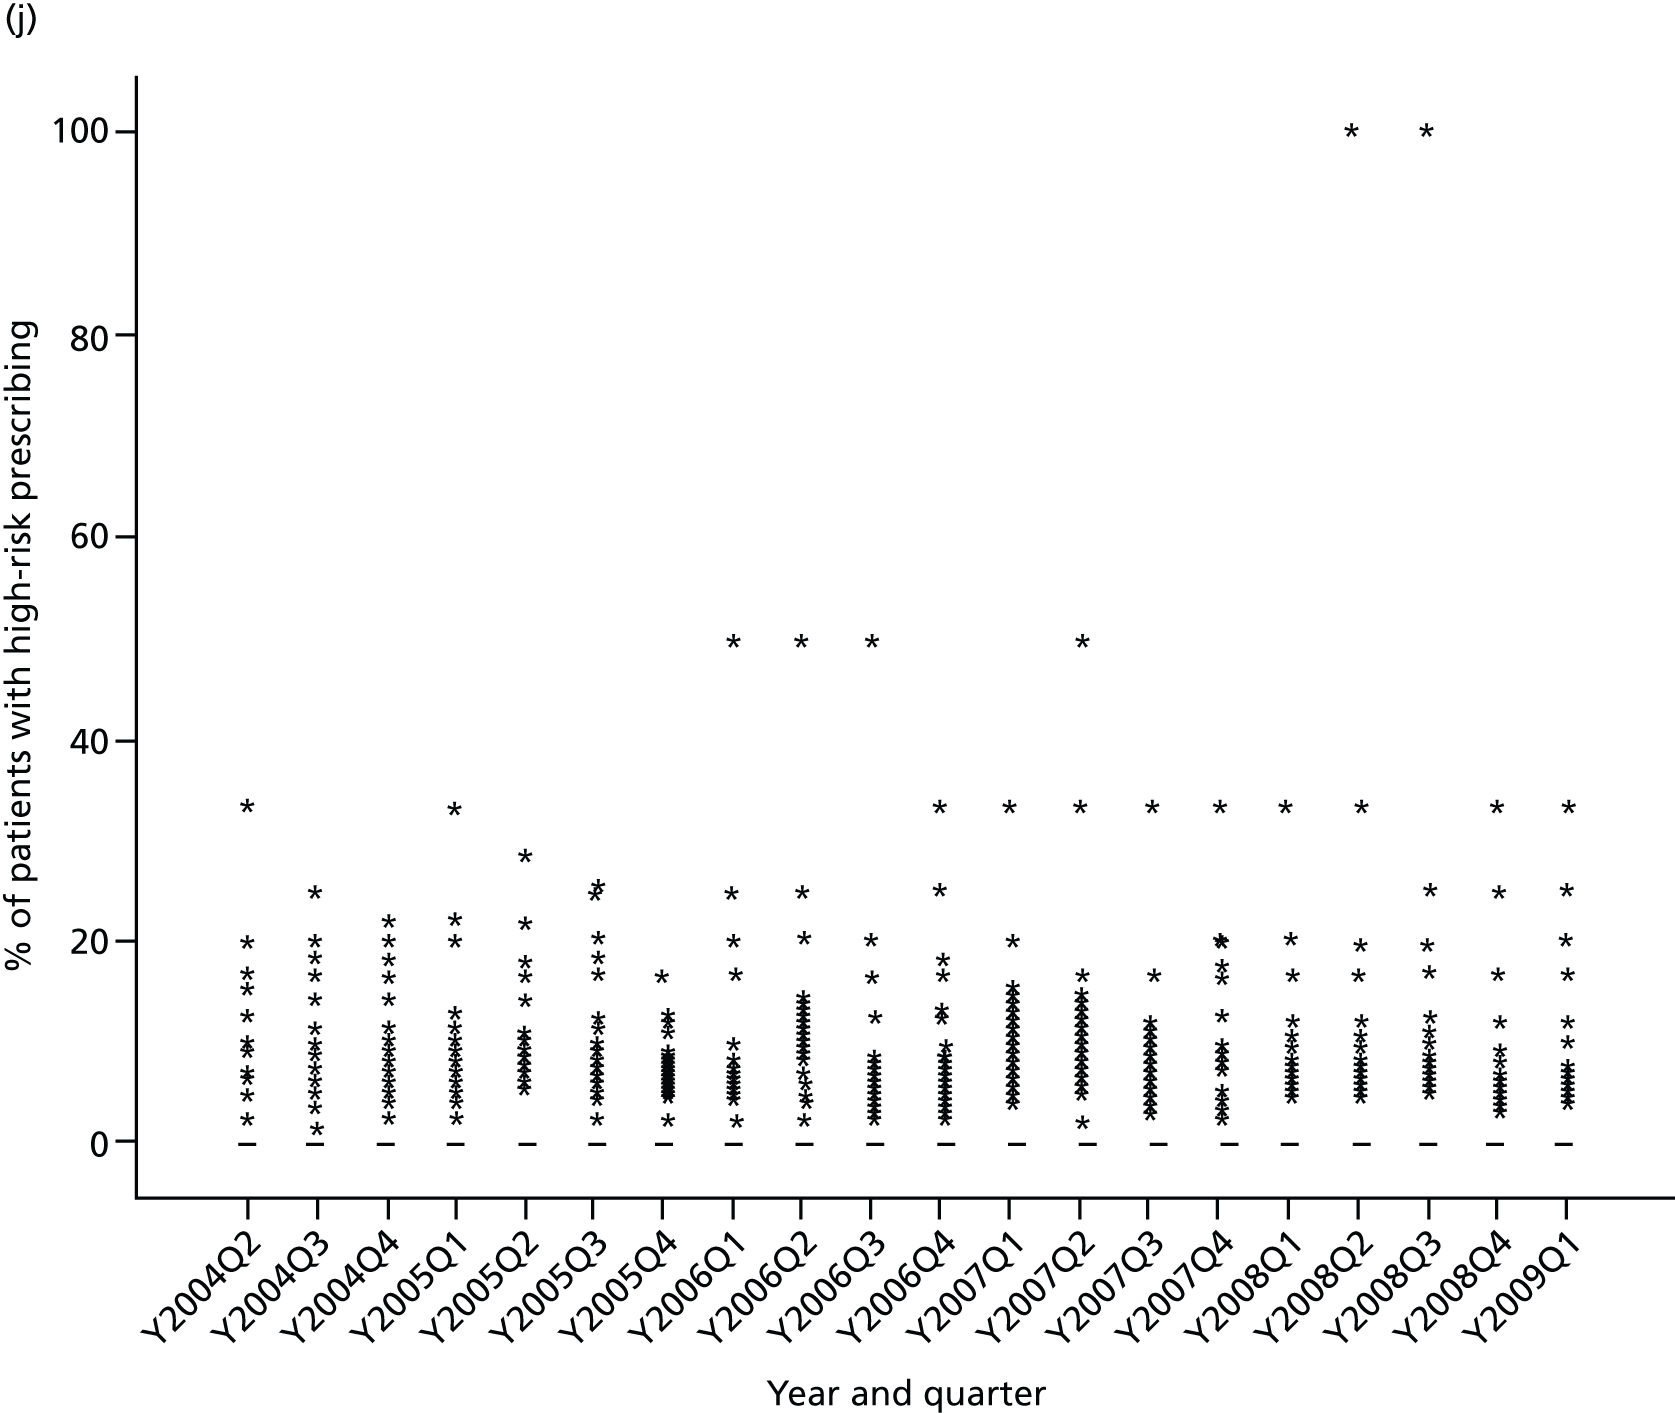
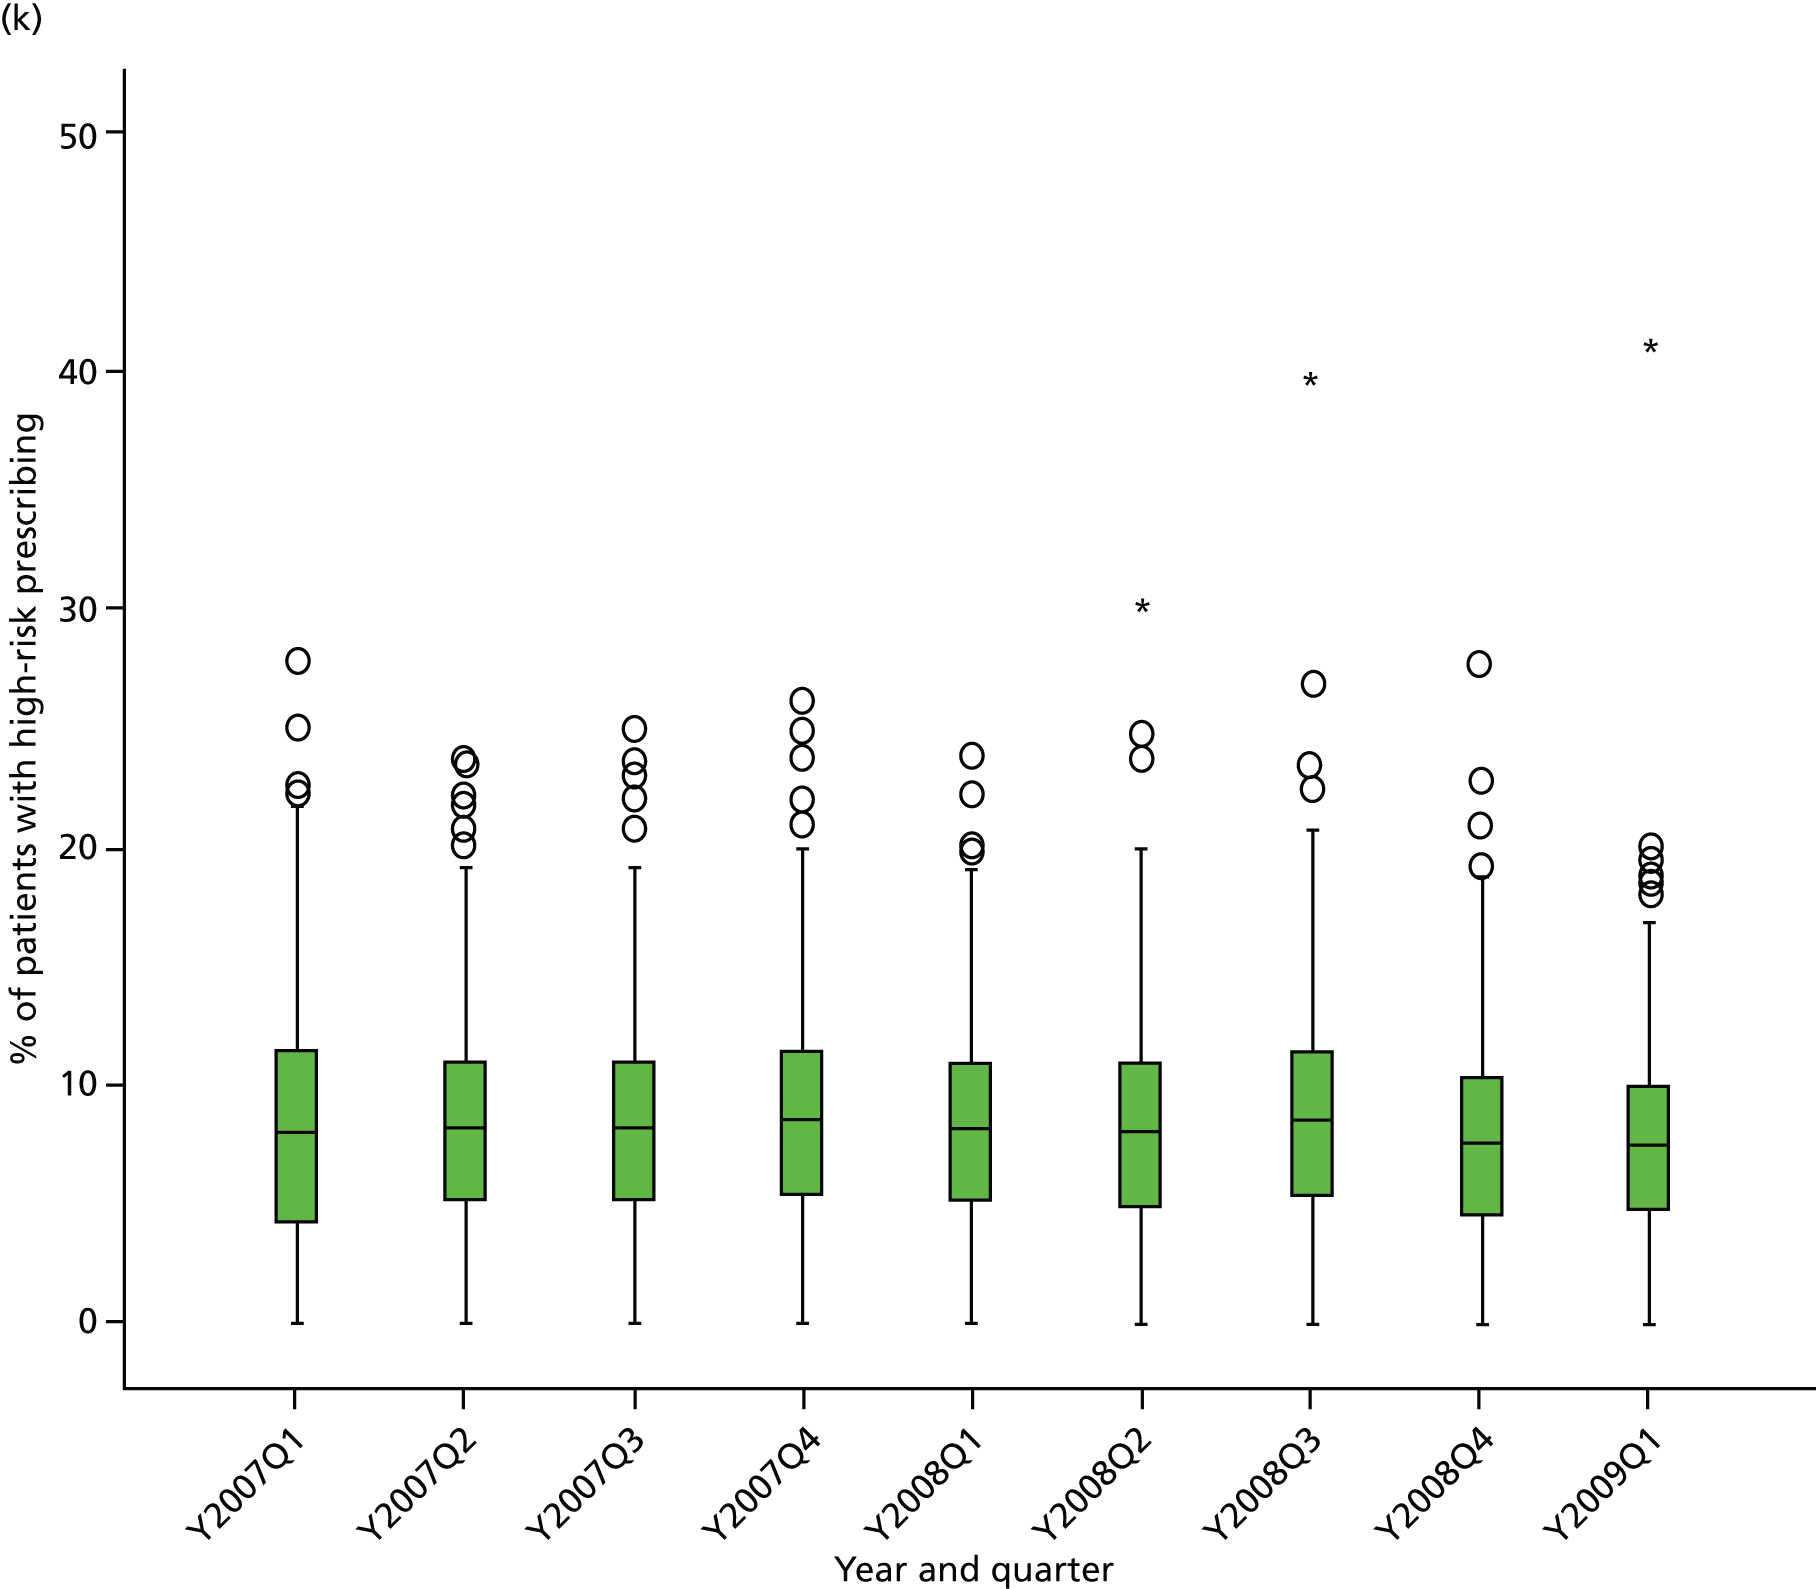
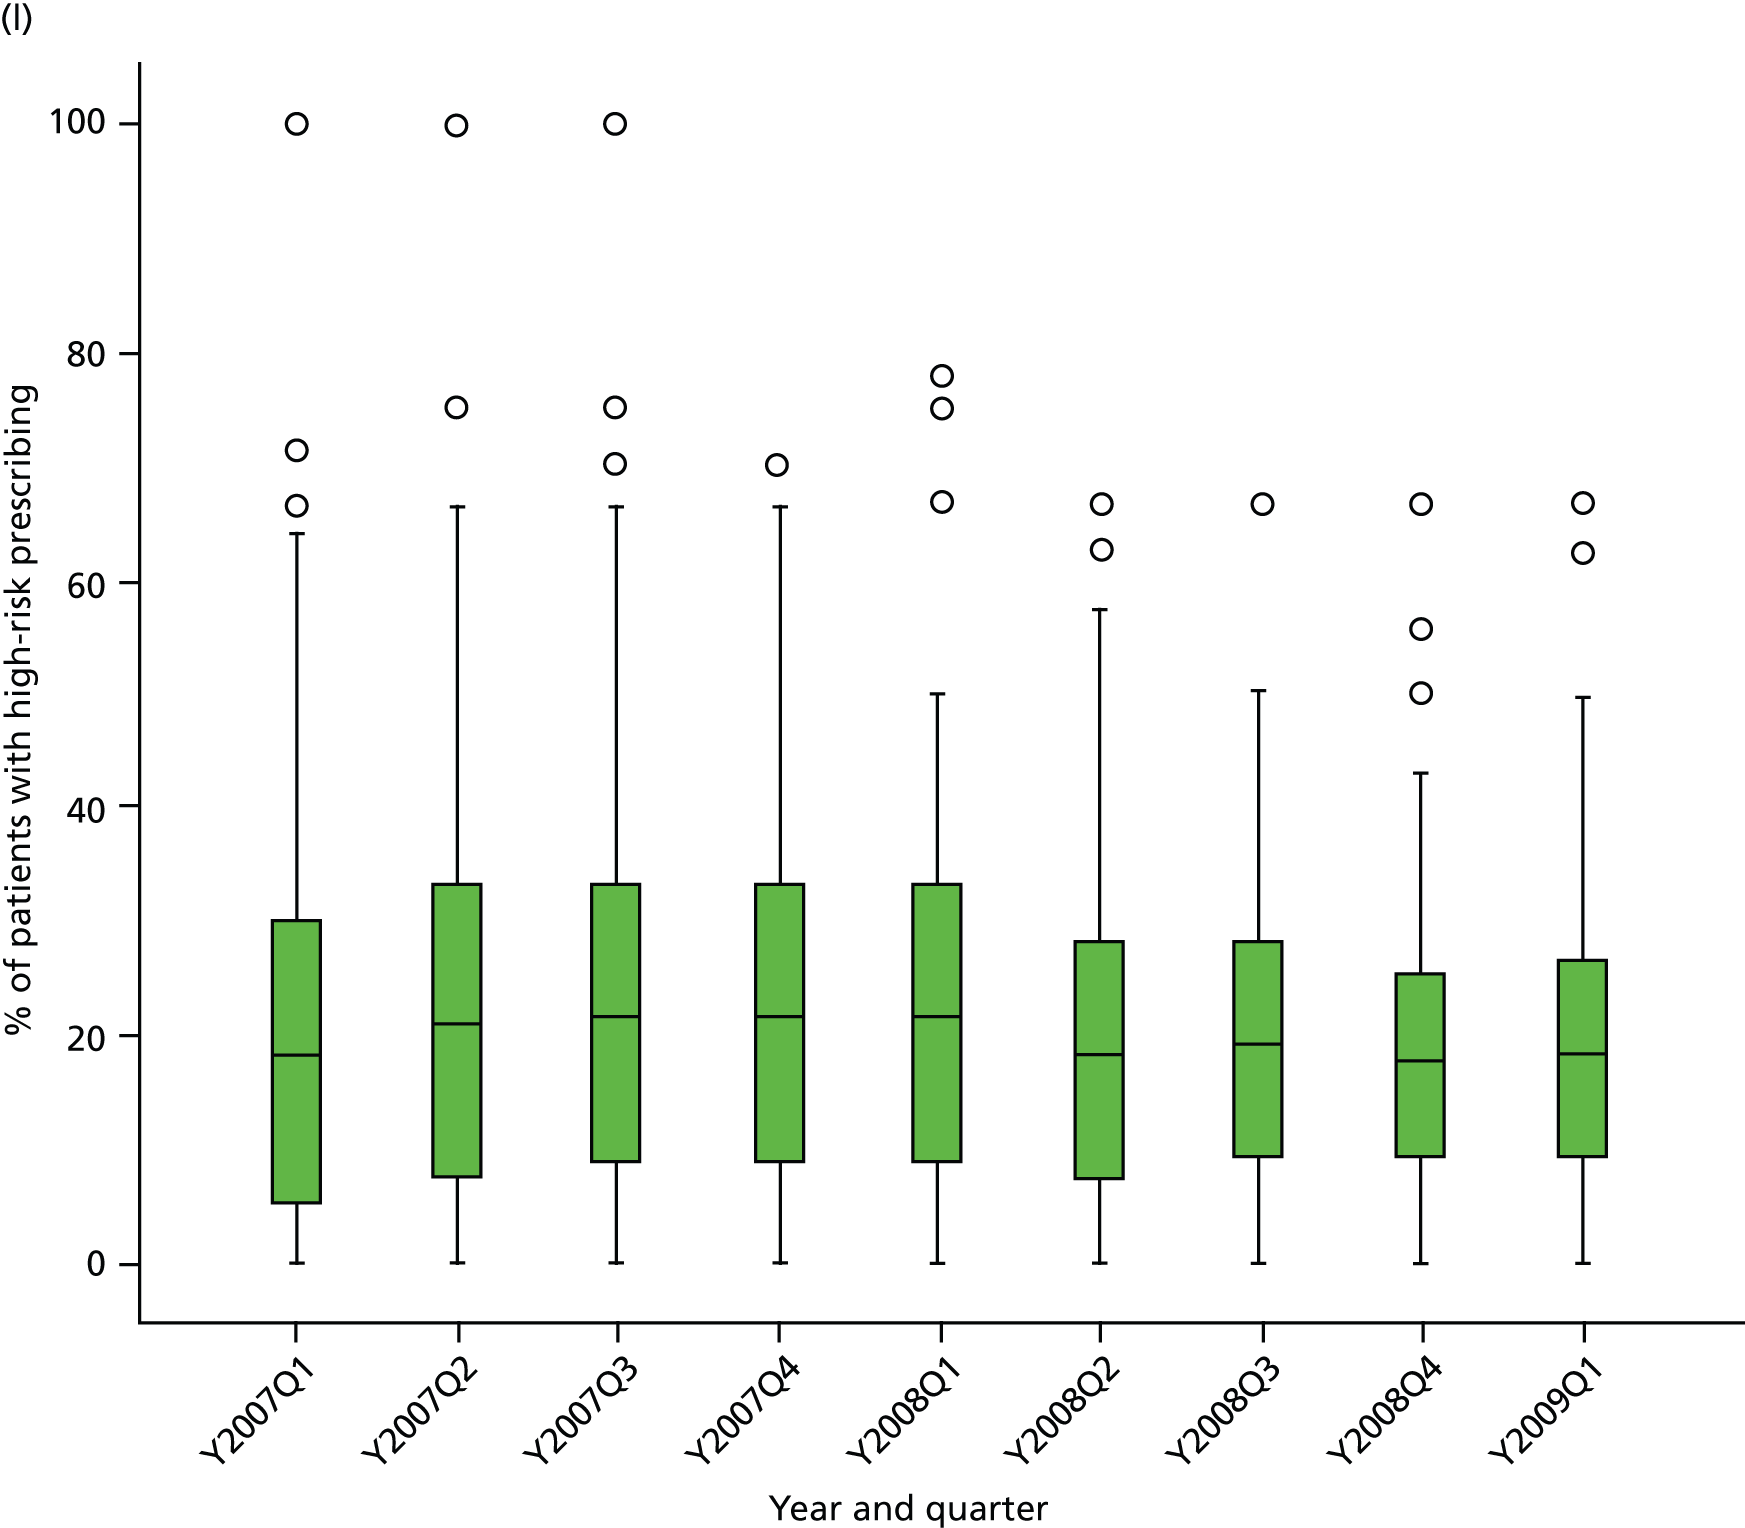
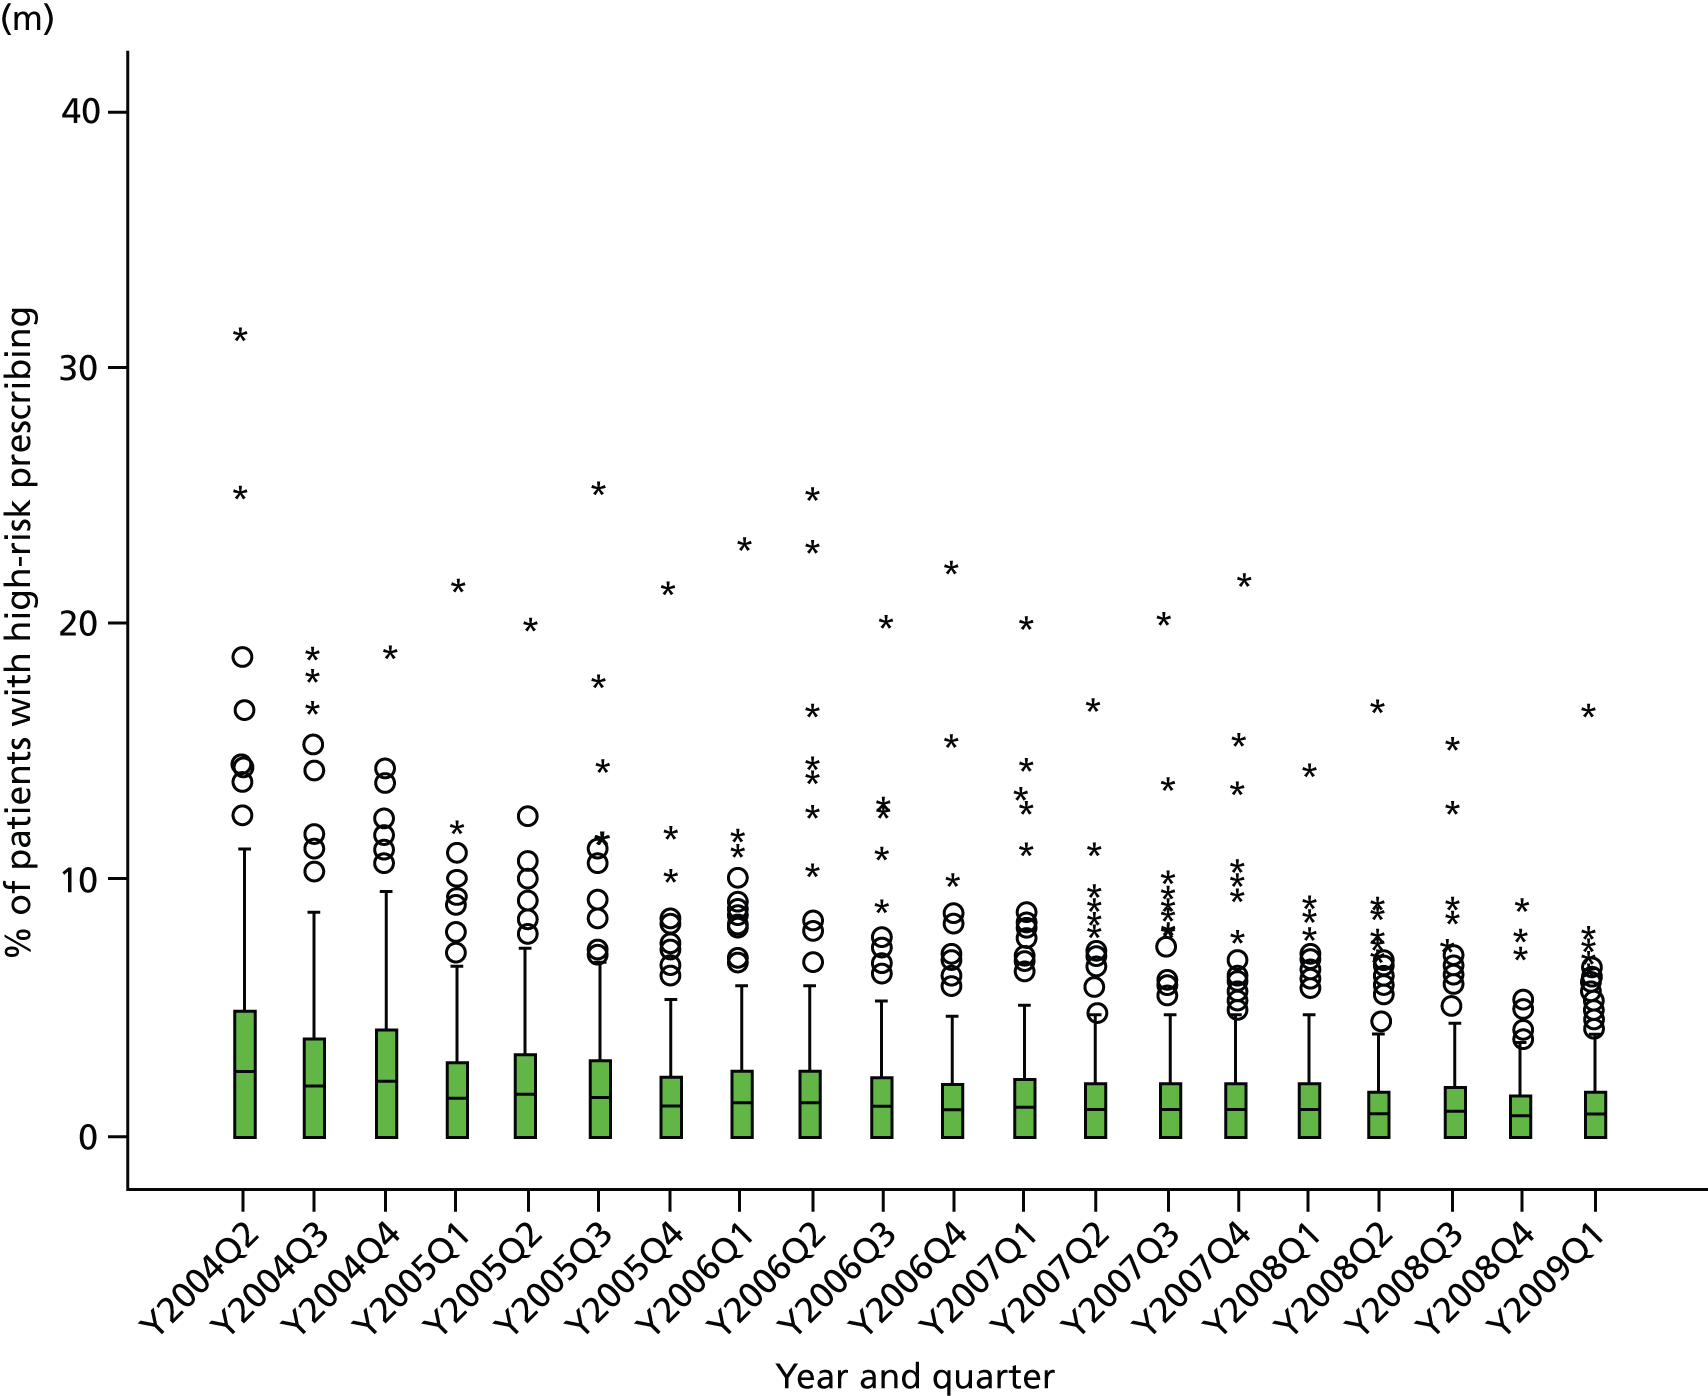
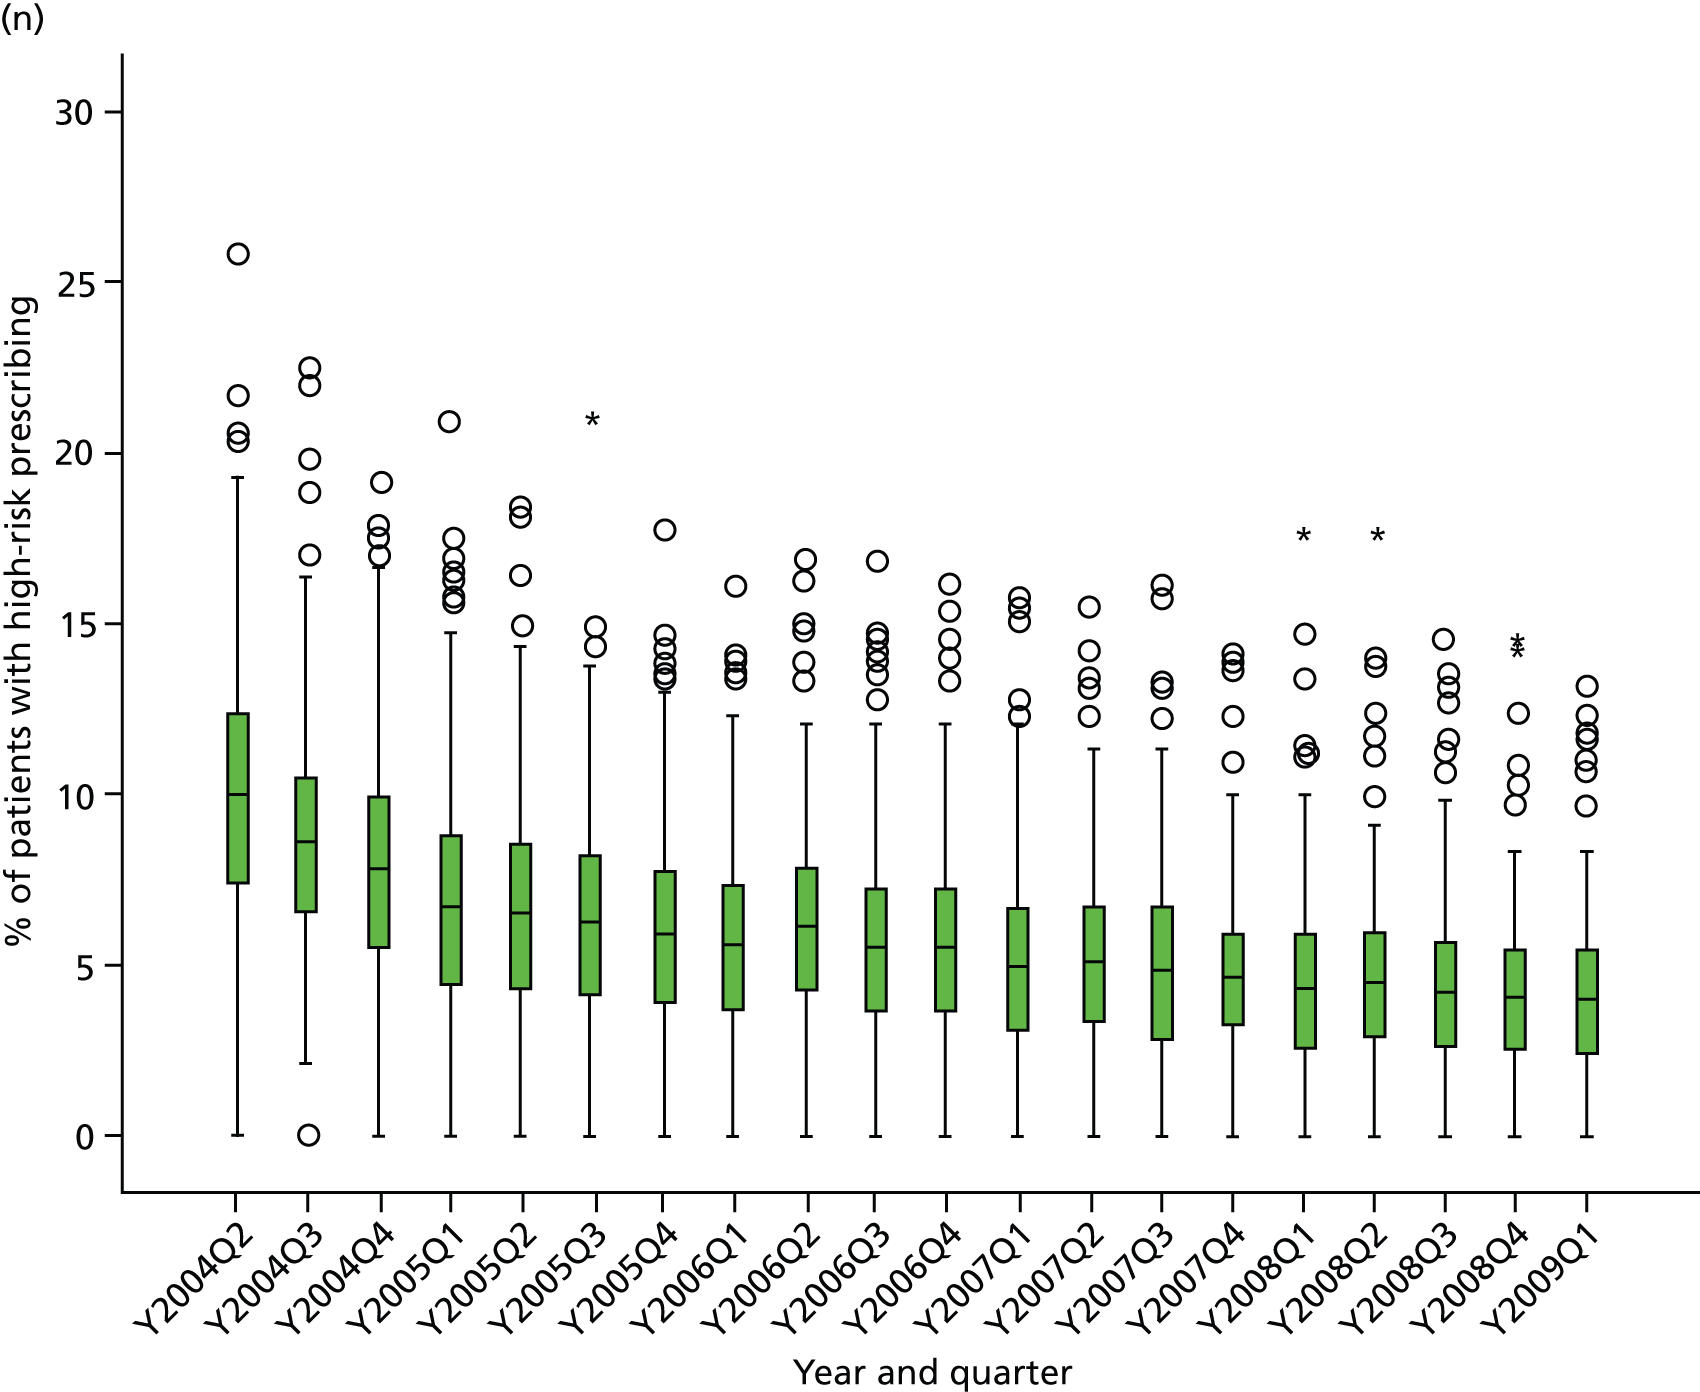
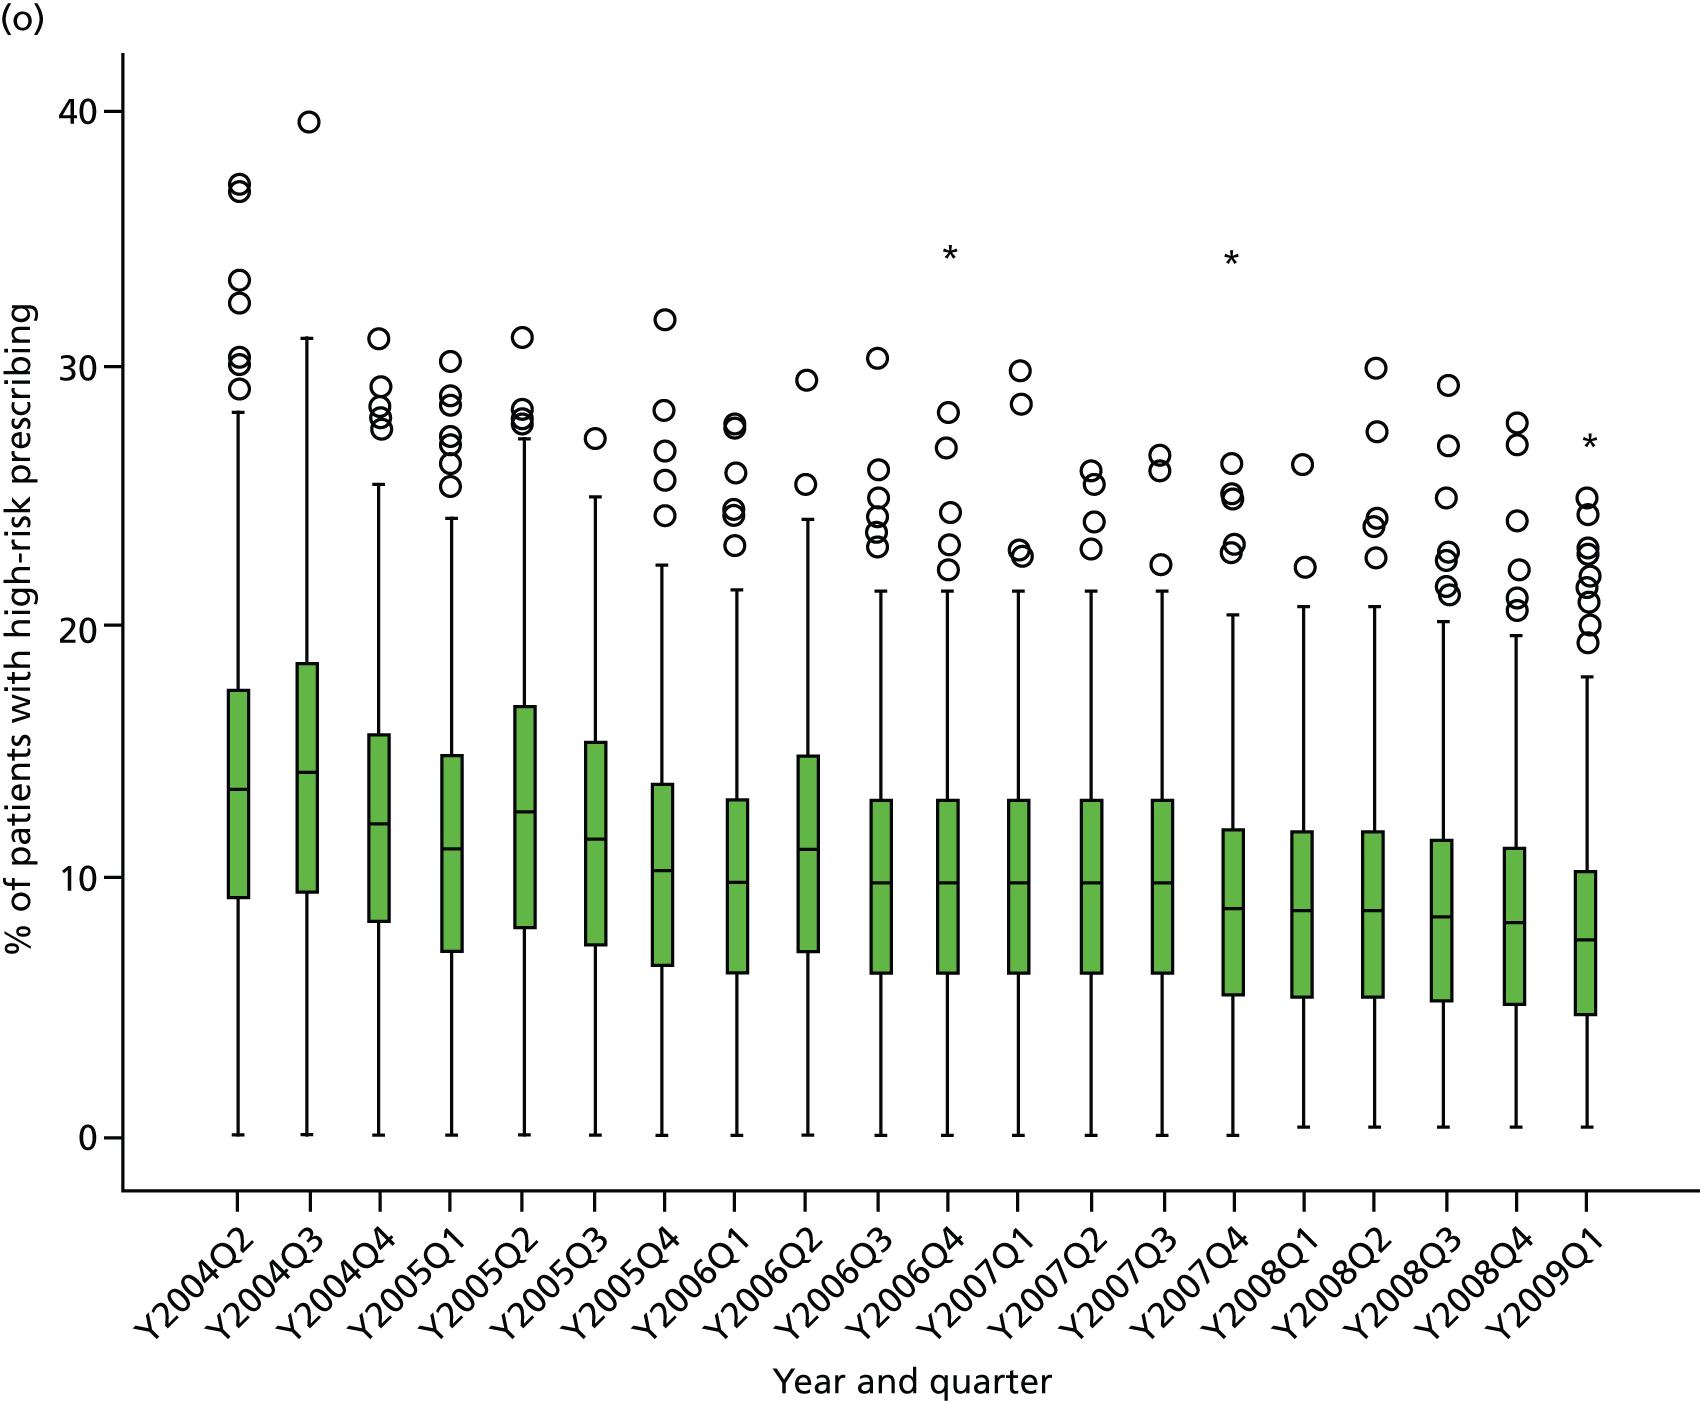
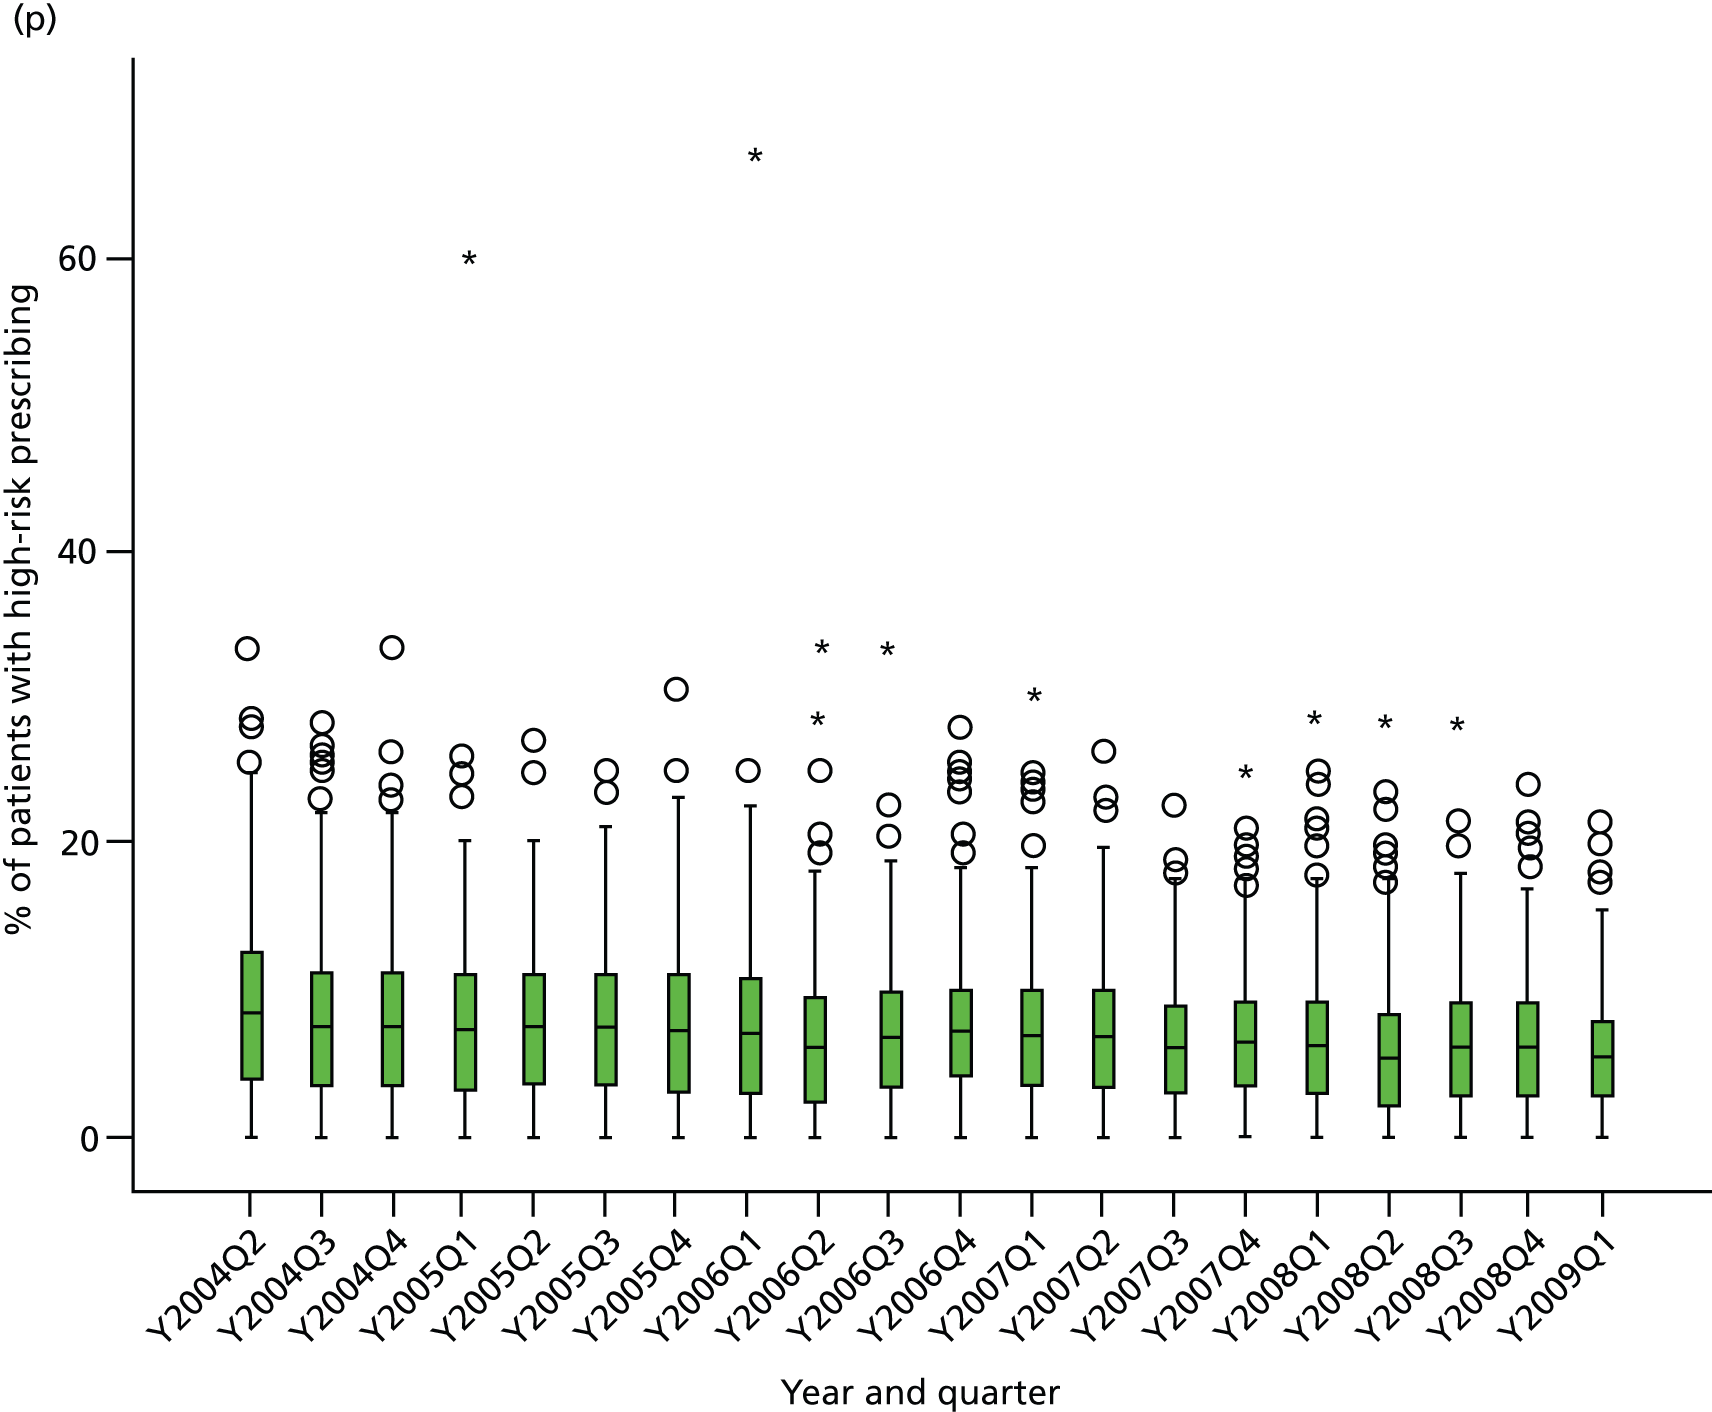
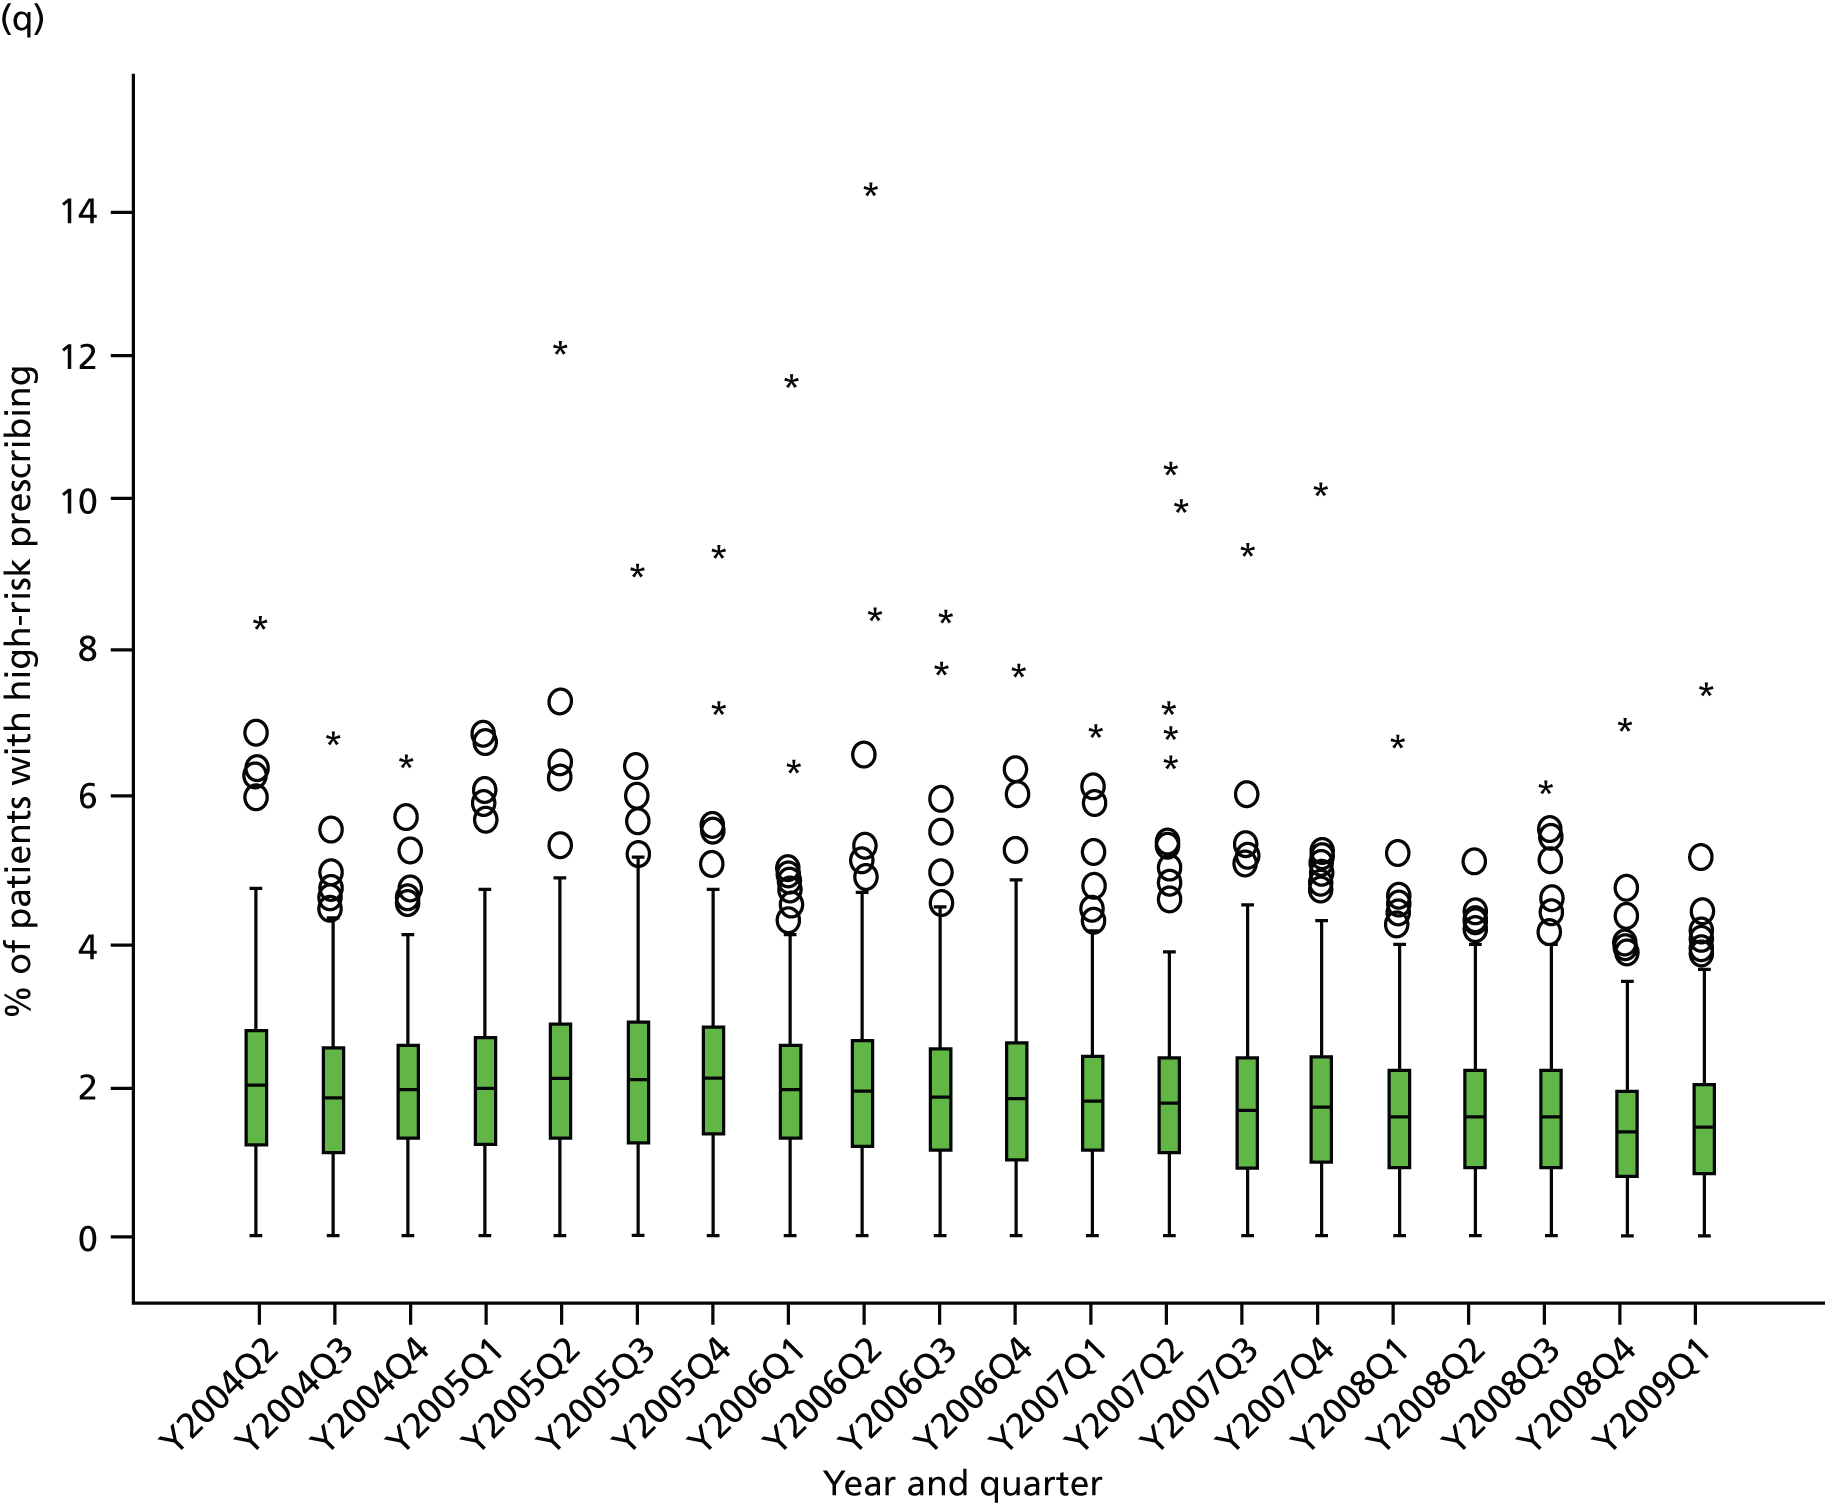
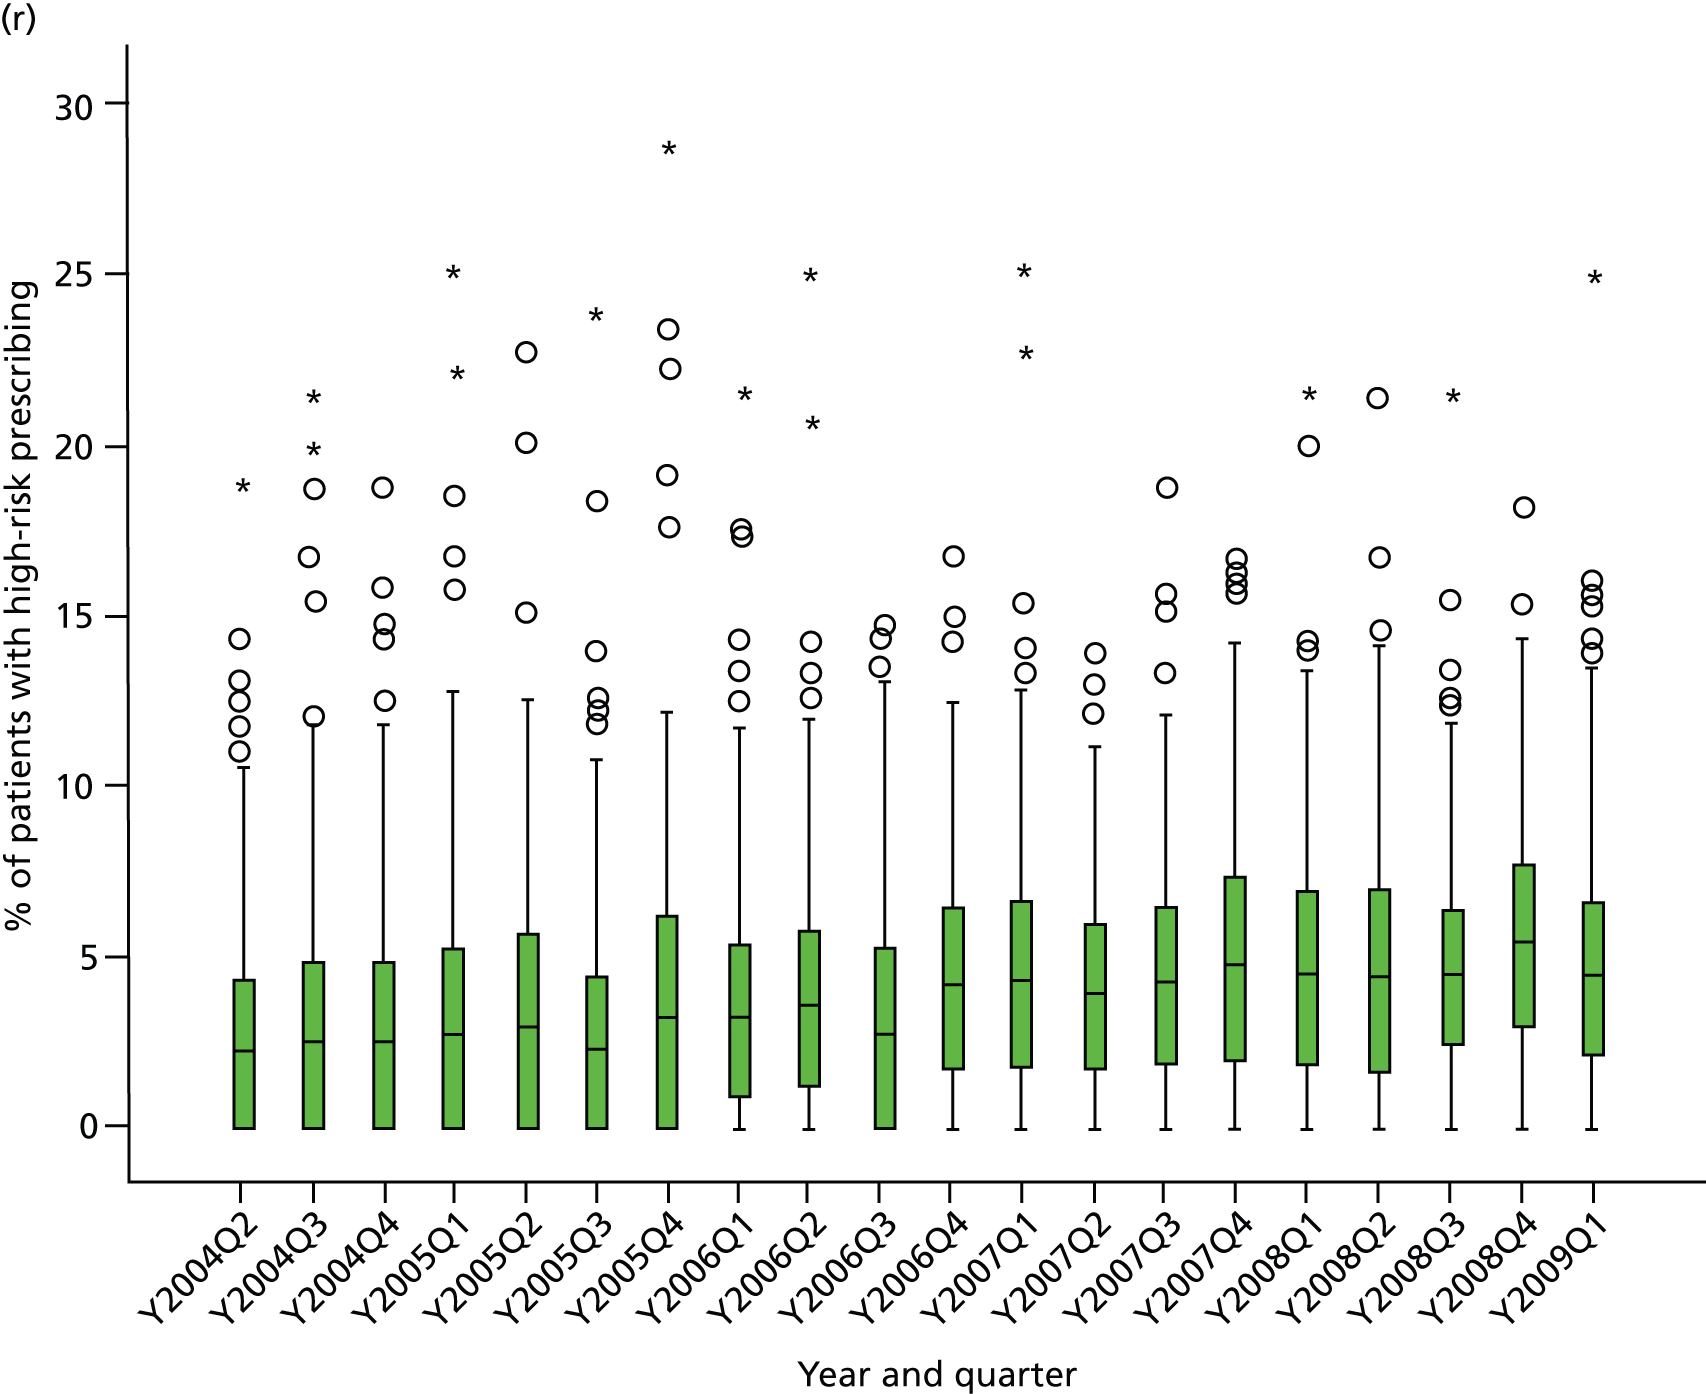
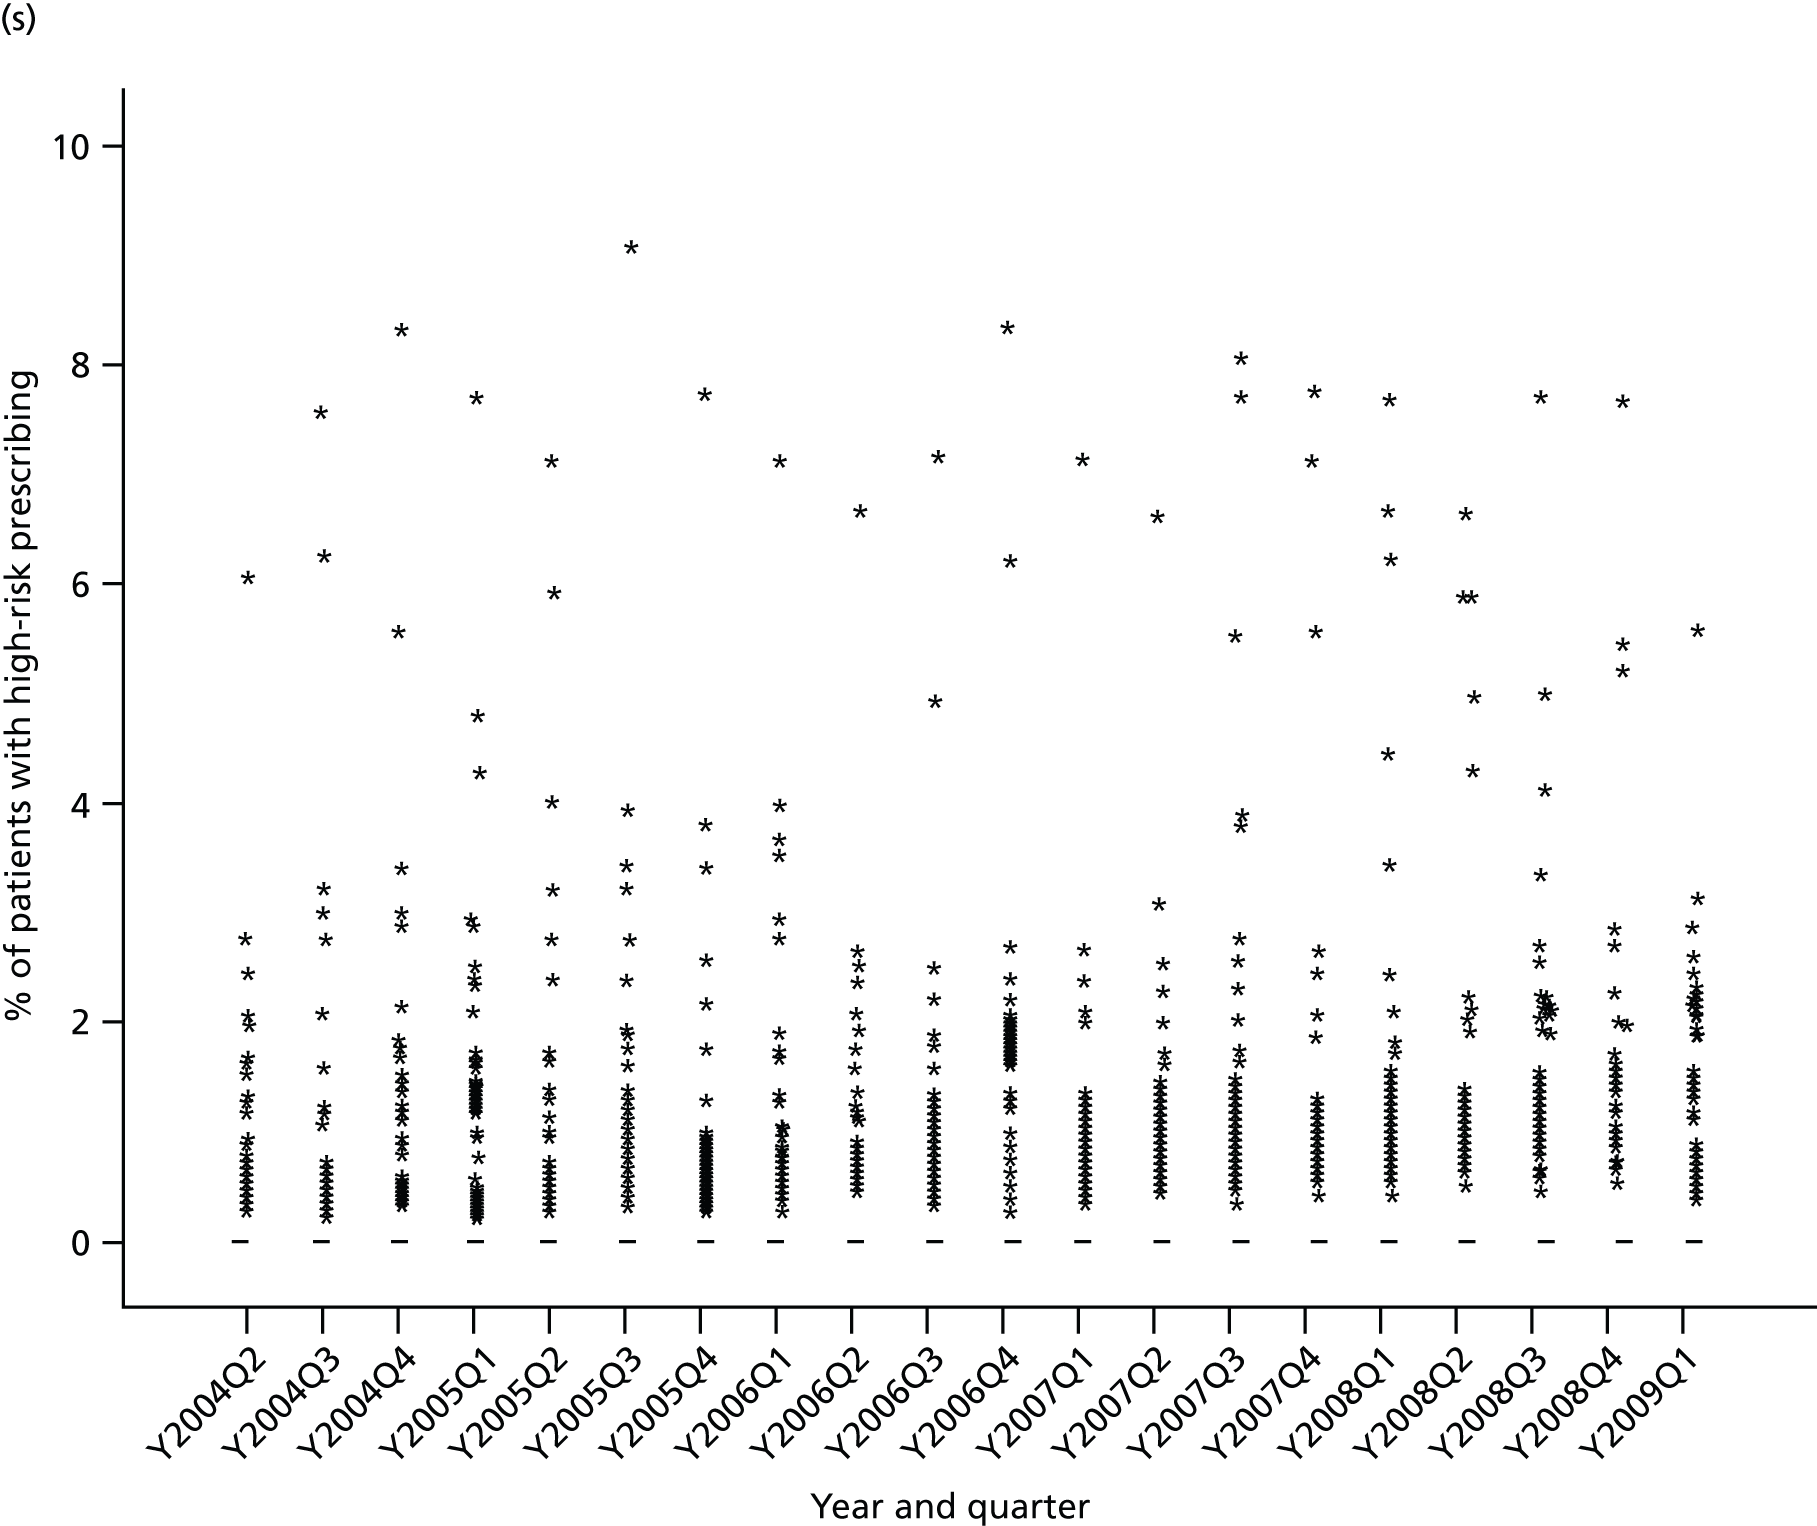
FIGURE 16.
Time series of variation between practices in high-risk prescribing 2004–9 for composite indicators. (a) Composite 1: NSAIDs; (b) composite 2: NSAIDs and antiplatelets; (c) composite 3: drug–disease interactions; (d) composite 4: drug–drug interactions; (e) composite 5: renal adverse effects; and (f) composite 6: all indicators except CKD.
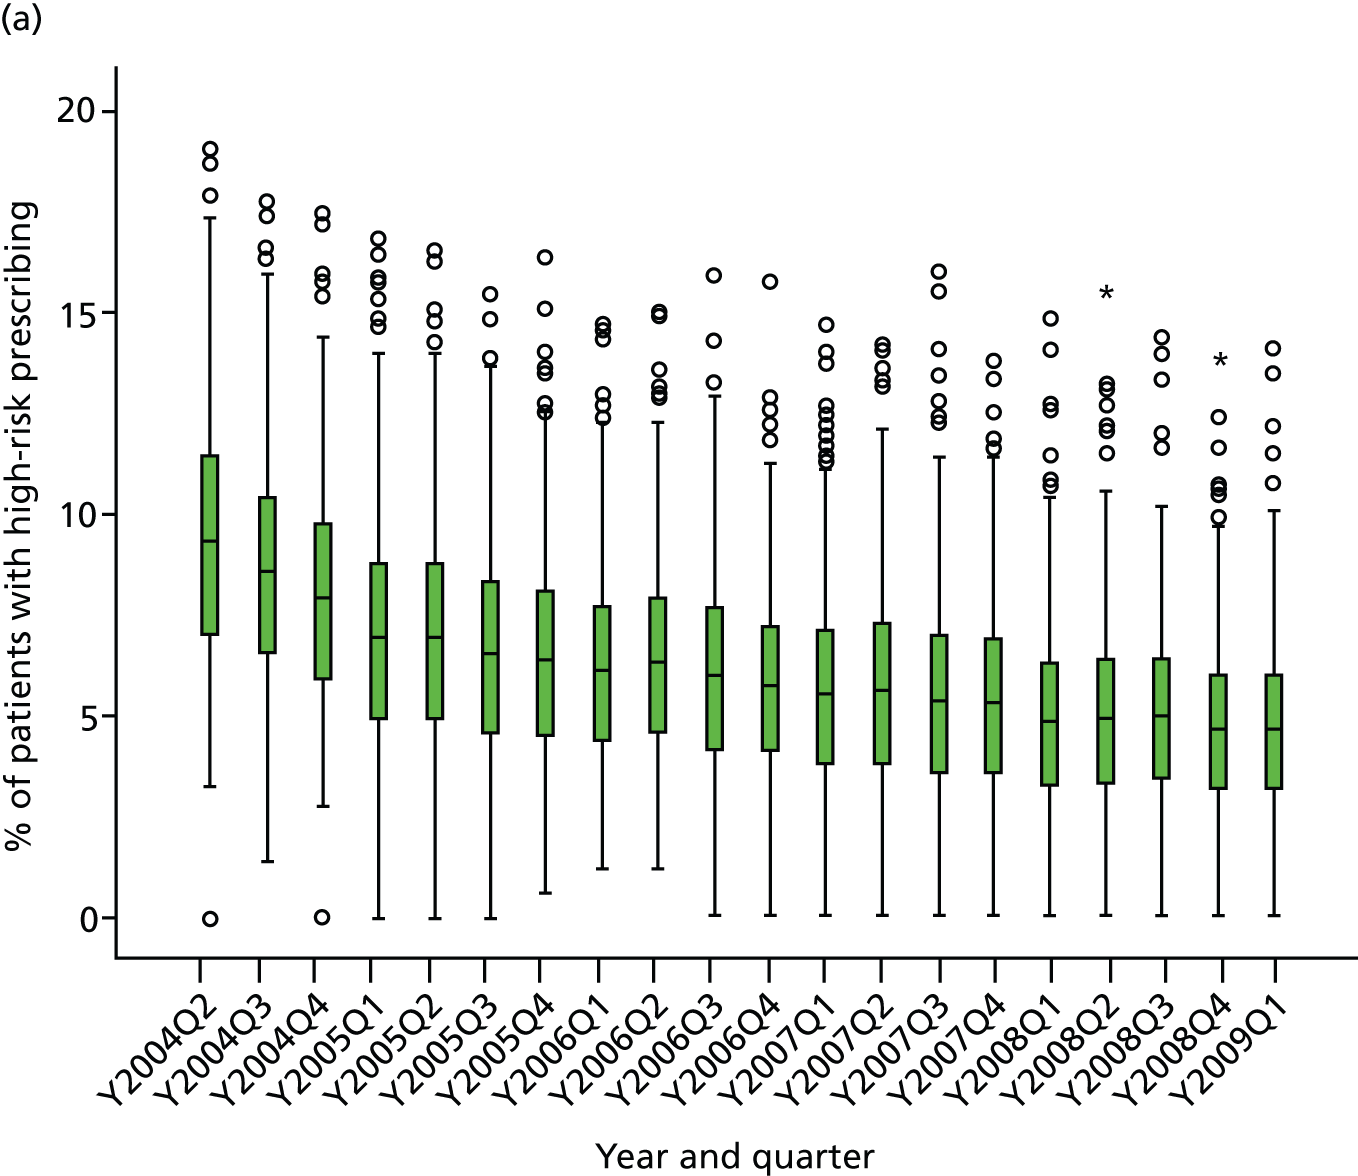
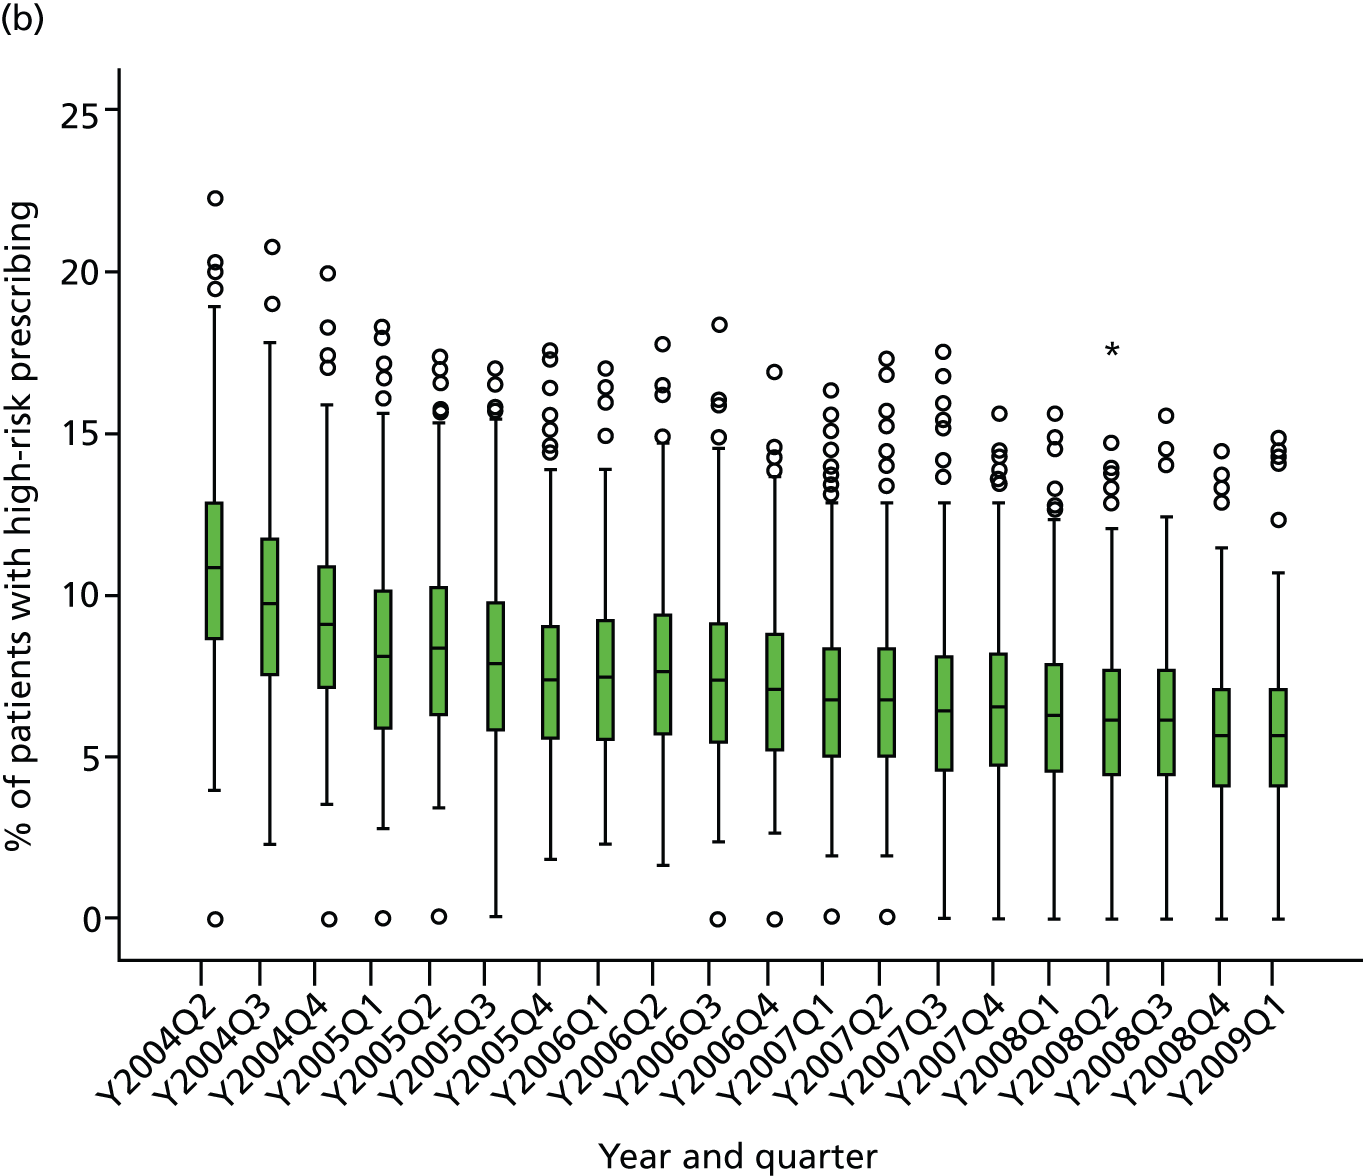
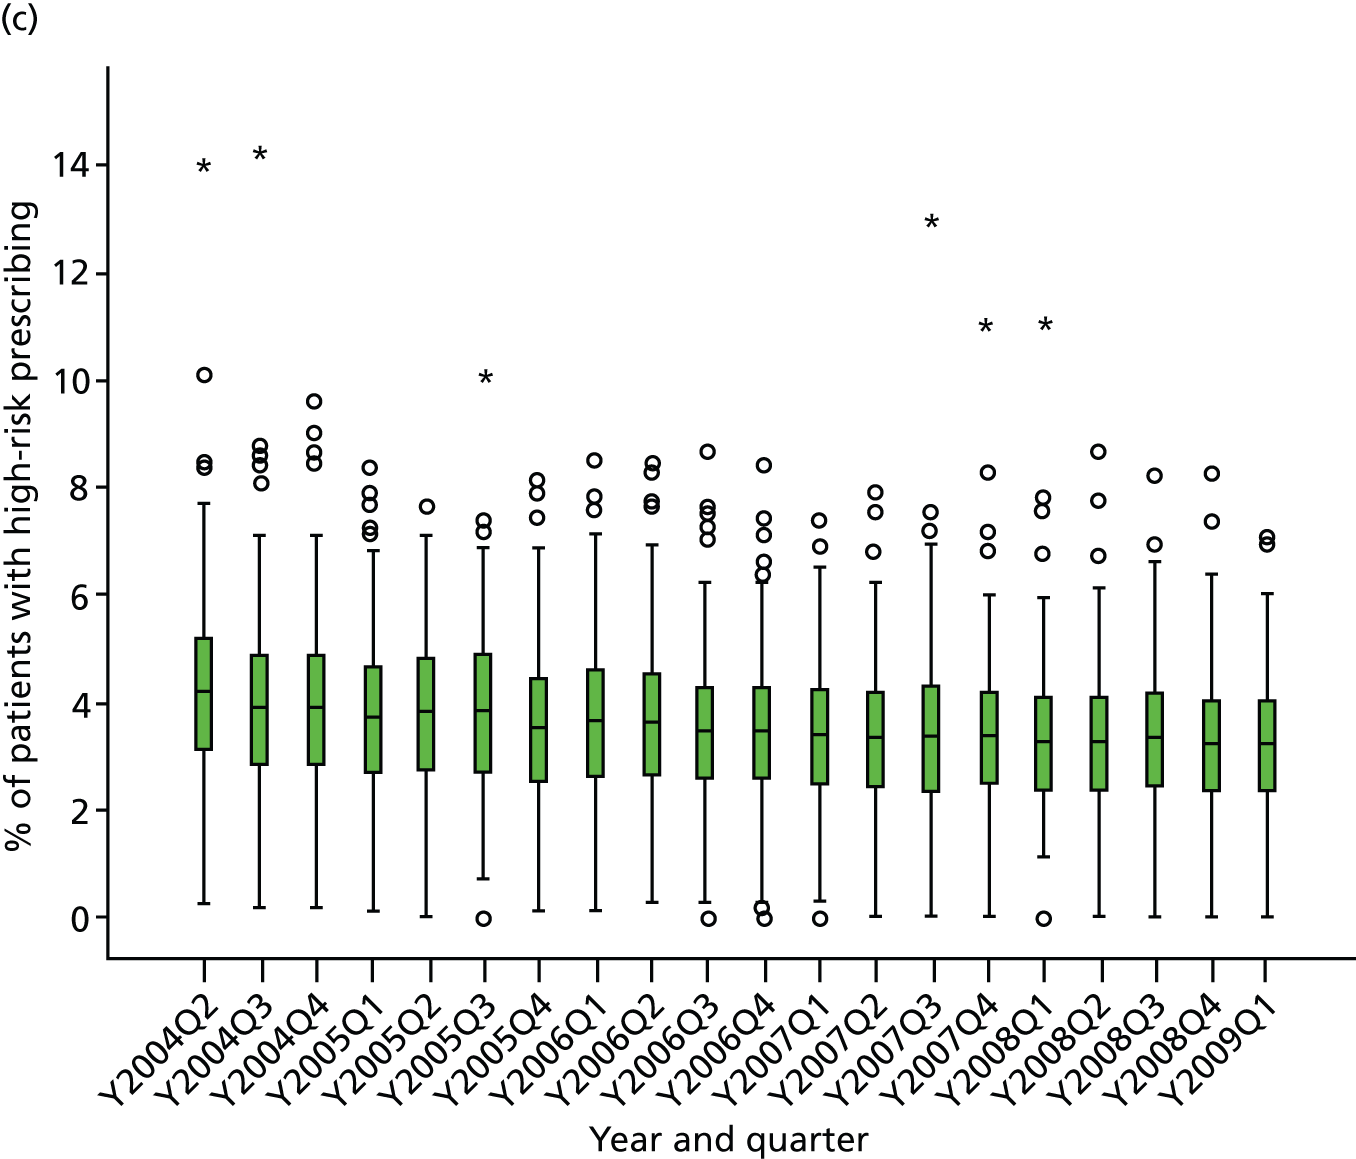
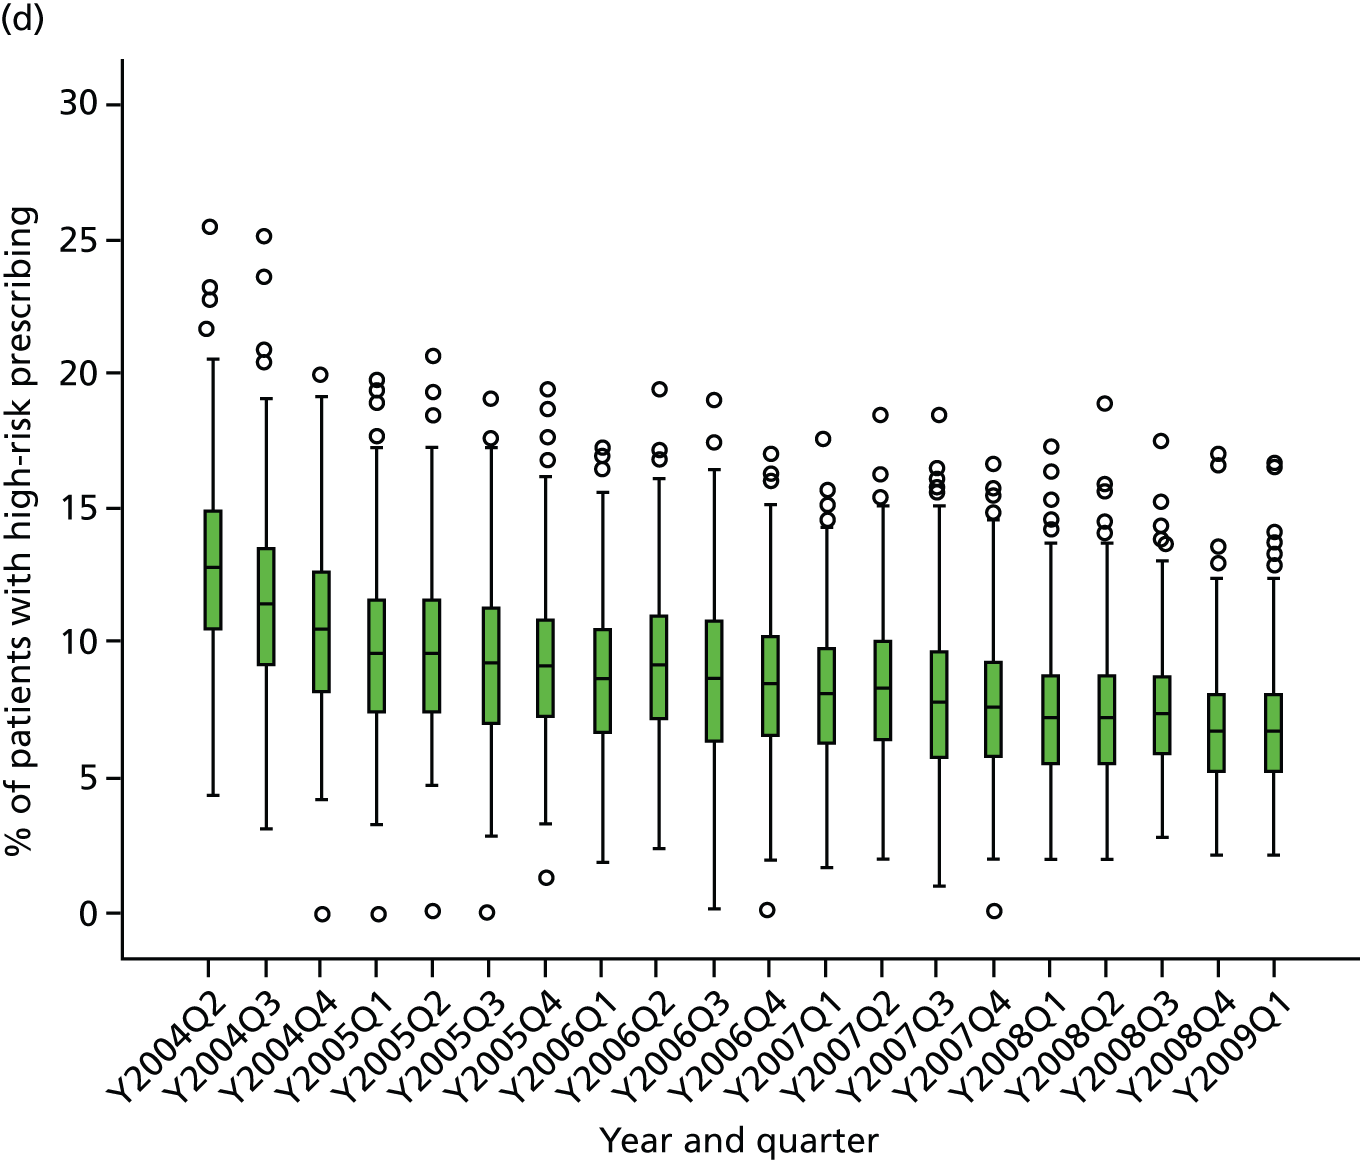
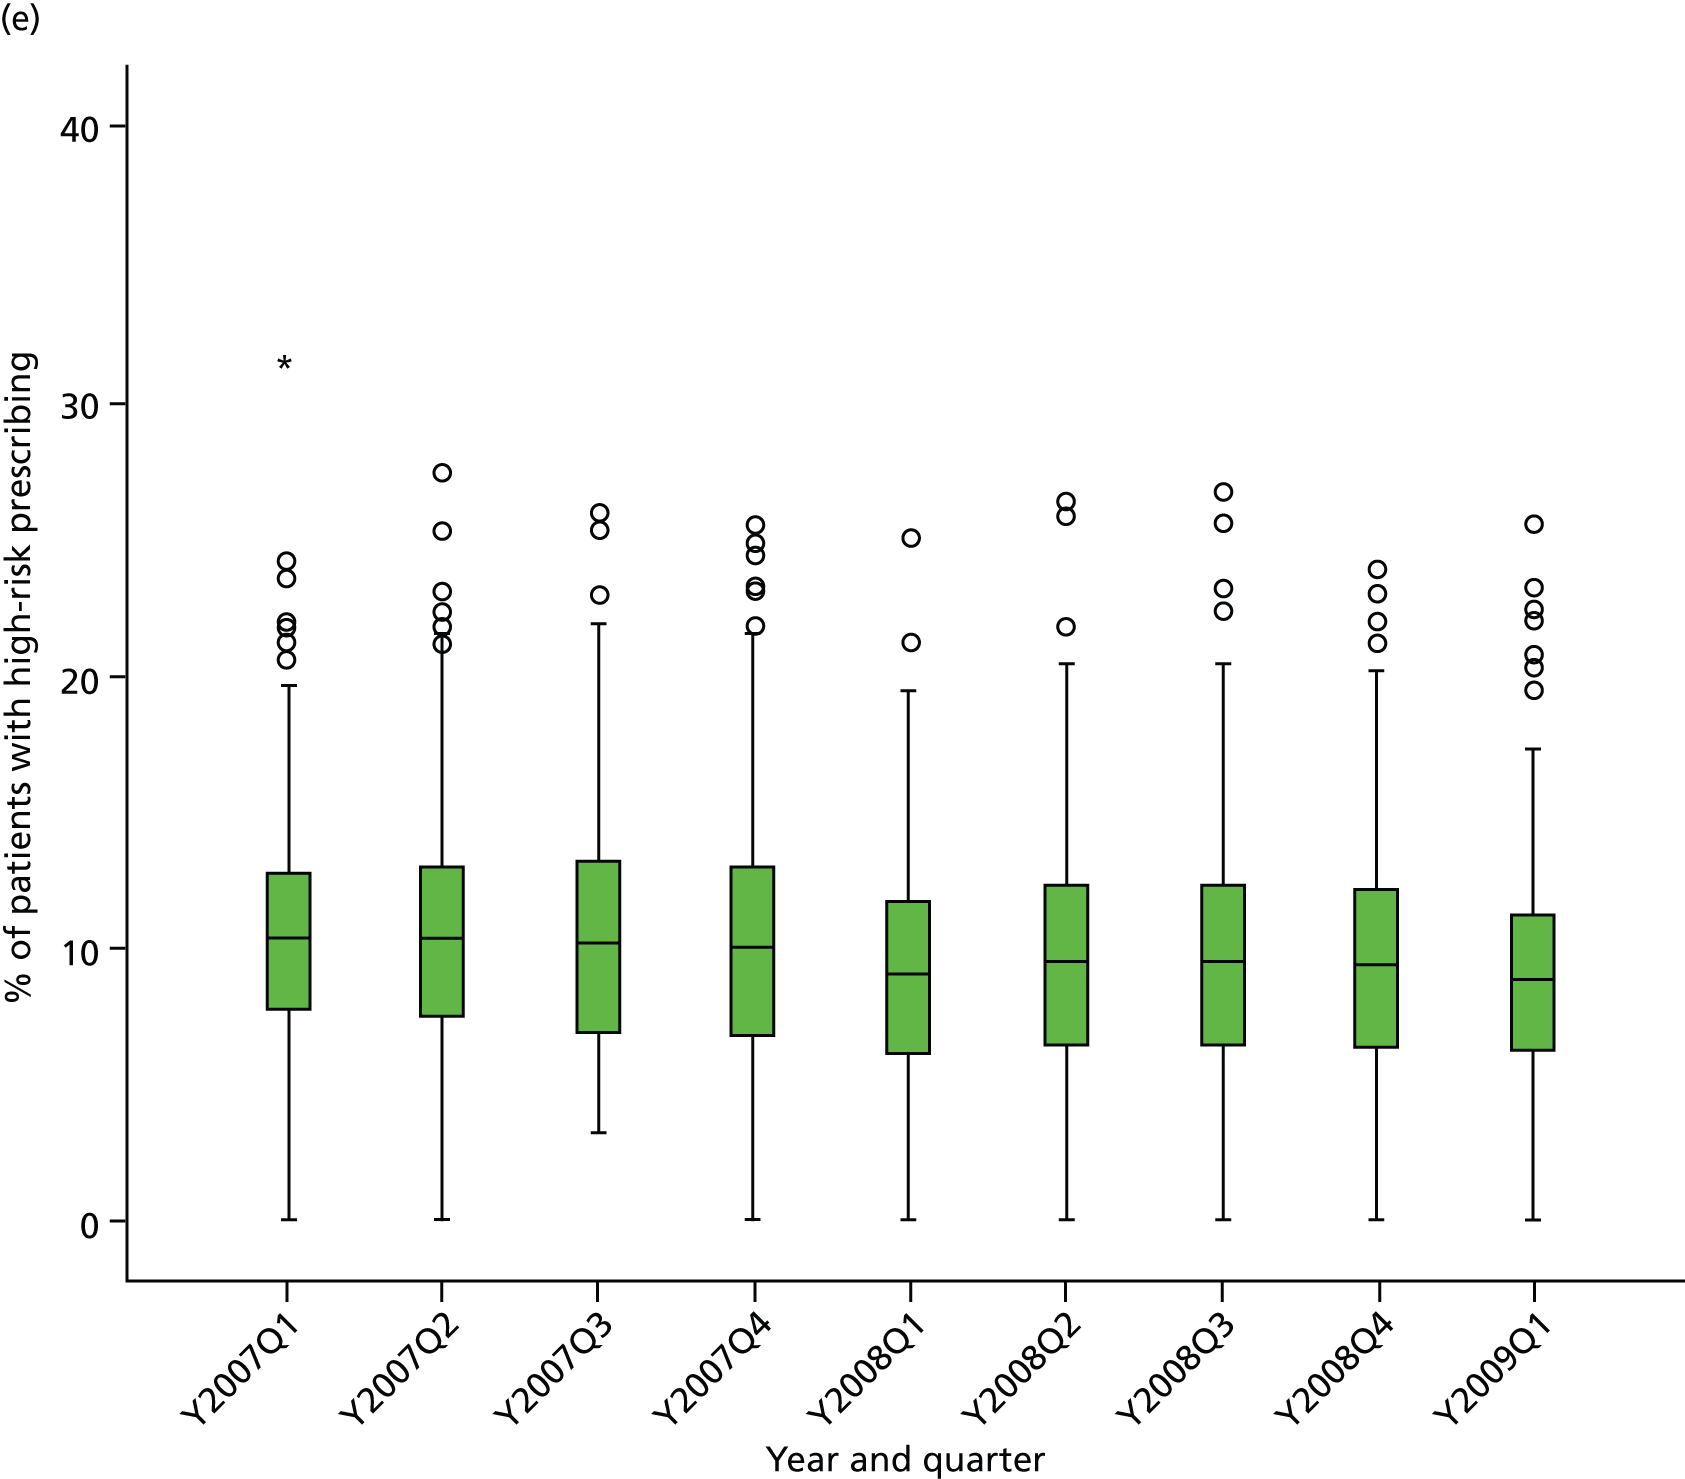
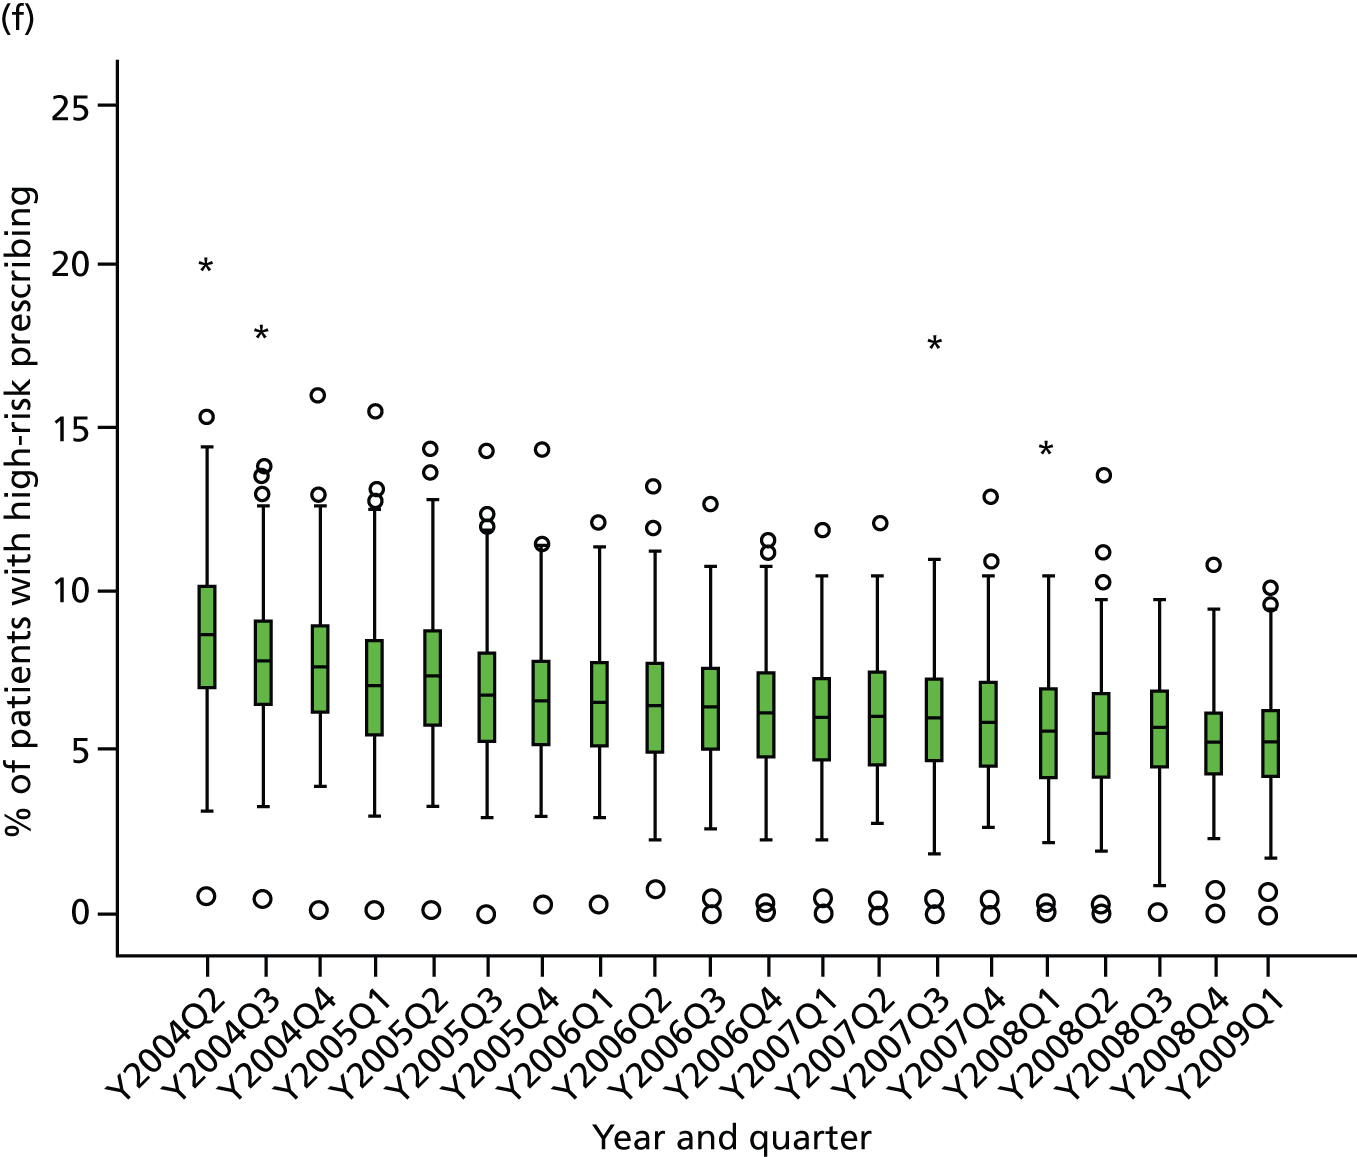
| Indicator | ICC (95% CI), Q1 2005 | ICC (95% CI), Q1 2006 | ICC (95% CI), Q1 2007 | ICC (95% CI), Q1 2008 | ICC (95% CI), Q1 2009 | F-test for difference in variances, Q1 2009 vs. Q1 2005a |
|---|---|---|---|---|---|---|
| 1: Drugs to avoid in heart failure | 0.016 (0.009 to 0.029) | 0.013 (0.006 to 0.025) | 0.013 (0.006 to 0.027) | 0.012 (0.005 to 0.025) | 0.008 (0.003 to 0.022) | p-value < 0.0001 |
| 2: Beta blockers in asthma | 0.051 (0.034 to 0.075) | 0.048 (0.032 to 0.071) | 0.047 (0.031 to 0.071) | 0.039 (0.025 to 0.061) | 0.036 (0.023 to 0.056) | p-value < 0.004 |
| 3: LABA use without ICS usea | 0.125 (0.085 to 0.180) | 0.131 (0.091 to 0.184) | 0.151 (0.107 to 0.210) | 0.200 (0.153 to 0.259) | 0.202 (0.149 to 0.268) | p-value < 0.0001 |
| 4: NSAID in peptic ulcer | 0.041 (0.027 to 0.063) | 0.036 (0.022 to 0.057) | 0.049 (0.032 to 0.075) | 0.062 (0.040 to 0.095) | 0.041 (0.024 to 0.069) | p-value = 0.142 |
| 5: NSAID in over-75-year-olds | 0.053 (0.041 to 0.069) | 0.065 (0.050 to 0.084) | 0.082 (0.063 to 0.106) | 0.079 (0.060 to 0.103) | 0.087 (0.067 to 0.114) | p-value = 0.0004 |
| 6: Methotrexate in mixed strengths | 0.151 (0.085 to 0.254) | 0.139 (0.083 to 0.224) | 0.185 (0.118 to 0.278) | 0.227 (0.151 to 0.326) | 0.320 (0.239 to 0.415) | p-value < 0.0001 |
| 7: COCP in previous thromboembolismb | – | – | – | – | – | – |
| 8: Oestrogens in previous breast cancerb | – | – | – | – | – | – |
| 9: Antipsychotics in dementia | 0.074 (0.048 to 0.113) | 0.065 (0.042 to 0.101) | 0.056 (0.034 to 0.089) | 0.069 (0.046 to 0.103) | 0.064 (0.041 to 0.100) | p-value = 0.313 |
| 10: Parkinson’s diseaseb | – | – | – | – | – | – |
| 11: NSAID in CKD 3–5a | – | – | 0.051 (0.033 to 0.076) | 0.049 (0.035 to 0.069) | 0.068 (0.050 to 0.091) | p-value < 0.0001 |
| 12: Drugs to avoid in CKD 4 and 5a | – | – | 0.053 (0.023 to 0.117) | 0.048 (0.023 to 0.098) | 0.009 (0.001 to 0.104) | p-value < 0.0001 |
| 13: NSAID and OAC | 0.109 (0.053 to 0.213) | 0.132 (0.064 to 0.253) | 0.215 (0.131 to 0.334) | 0.211 (0.122 to 0.340) | 0.167 (0.086 to 0.300) | p-value = 0.0016 |
| 14: NSAID with aspirin or clopidogrel | 0.057 (0.044 to 0.072) | 0.064 (0.050 to 0.082) | 0.069 (0.054 to 0.088) | 0.077 (0.060 to 0.098) | 0.071 (0.055 to 0.092) | p-value = 0.180 |
| 15: NSAID with ACE inhibitor/ARB and diuretic | 0.057 (0.042 to 0.075) | 0.054 (0.040 to 0.072) | 0.054 (0.040 to 0.072) | 0.063 (0.048 to 0.083) | 0.069 (0.052 to 0.091) | p-value = 0.063 |
| 16: Aspirin/clopidogrel with OAC | 0.062 (0.038 to 0.101) | 0.067 (0.041 to 0.106) | 0.046 (0.026 to 0.081) | 0.063 (0.039 to 0.102) | 0.052 (0.030 to 0.089) | p-value = 0.019 |
| 17: Aspirin and clopidogrel | 0.036 (0.022 to 0.056) | 0.023 (0.013 to 0.038) | 0.048 (0.033 to 0.070) | 0.053 (0.036 to 0.078) | 0.038 (0.024 to 0.061) | p-value = 0.997 |
| 18: High-risk drug and coumarin OAC | 0.056 (0.025 to 0.121) | 0.027 (0.007 to 0.097) | 0.033 (0.012 to 0.086) | 0.033 (0.013 to 0.081) | 0.023 (0.006 to 0.077) | p-value < 0.0001 |
| 19: PPDE-5 inhibitor and oral nitrateb | – | – | – | – | – | – |
| Indicator | ICC (95% CI), Q1 2005 | ICC (95% CI), Q1 2006 | ICC (95% CI), Q1 2007 | ICC (95% CI), Q1 2008 | ICC (95% CI), Q1 2009 | F-test for difference in variances, Q1 2009 vs. Q1 2005a |
|---|---|---|---|---|---|---|
| Composite 1: NSAIDs | 0.049 (0.039 to 0.061) | 0.050 (0.040 to 0.063) | 0.055 (0.044 to 0.069) | 0.058 (0.046 to 0.073) | 0.058 (0.046 to 0.073) | p-value = 0.305 |
| Composite 2: NSAIDs and antiplatelets | 0.038 (0.030 to 0.047) | 0.037 (0.029 to 0.046) | 0.042 (0.033 to 0.053) | 0.045 (0.036 to 0.057) | 0.043 (0.034 to 0.054) | p-value = 0.465 |
| Composite 3: drug–disease interactions | 0.032 (0.024 to 0.035) | 0.032 (0.024 to 0.043) | 0.026 (0.019 to 0.035) | 0.027 (0.020 to 0.036) | 0.025 (0.018 to 0.054) | p-value = 0.018 |
| Composite 4: drug–drug interactions | 0.028 (0.022 to 0.036) | 0.027 (0.021 to 0.035) | 0.029 (0.022 to 0.037) | 0.034 (0.027 to 0.045) | 0.030 (0.023 to 0.039) | p-value = 0.730 |
| Composite 5: Renal adverse effects | – | – | 0.042 (0.032 to 0.056) | 0.044 (0.034 to 0.058) | 0.051 (0.039 to 0.066) | p-value = 0.040 |
| Composite 6: all indicators except CKD | 0.027 (0.021 to 0.035) | 0.027 (0.021 to 0.034) | 0.028 (0.022 to 0.035) | 0.029 (0.022 to 0.037) | 0.025 (0.020 to 0.033) | p-value = 0.470 |
Appendix 6 Example normal plots for multilevel models
FIGURE 17.
Normal plots for graphically checking the assumption that higher-level residuals are normally distributed. (a) Two-level any NSAID model (see Chapter 2): practice-level residuals; (b) three-level new acute NSAID model (Chapter 3): practice-level residuals; (c) three-level new acute NSAID model (see Chapter 3): GP-level residuals; (d) two-level composite 6 model (see Chapter 4) (ICC estimate for Q1 2009): practice-level residuals; (e) two-level indicator 7 model (see Chapter 4) (ICC estimate for Q1 2009): practice-level residuals; and (f) example of a model that was not used because assumption of normality of level 2 residuals not valid.
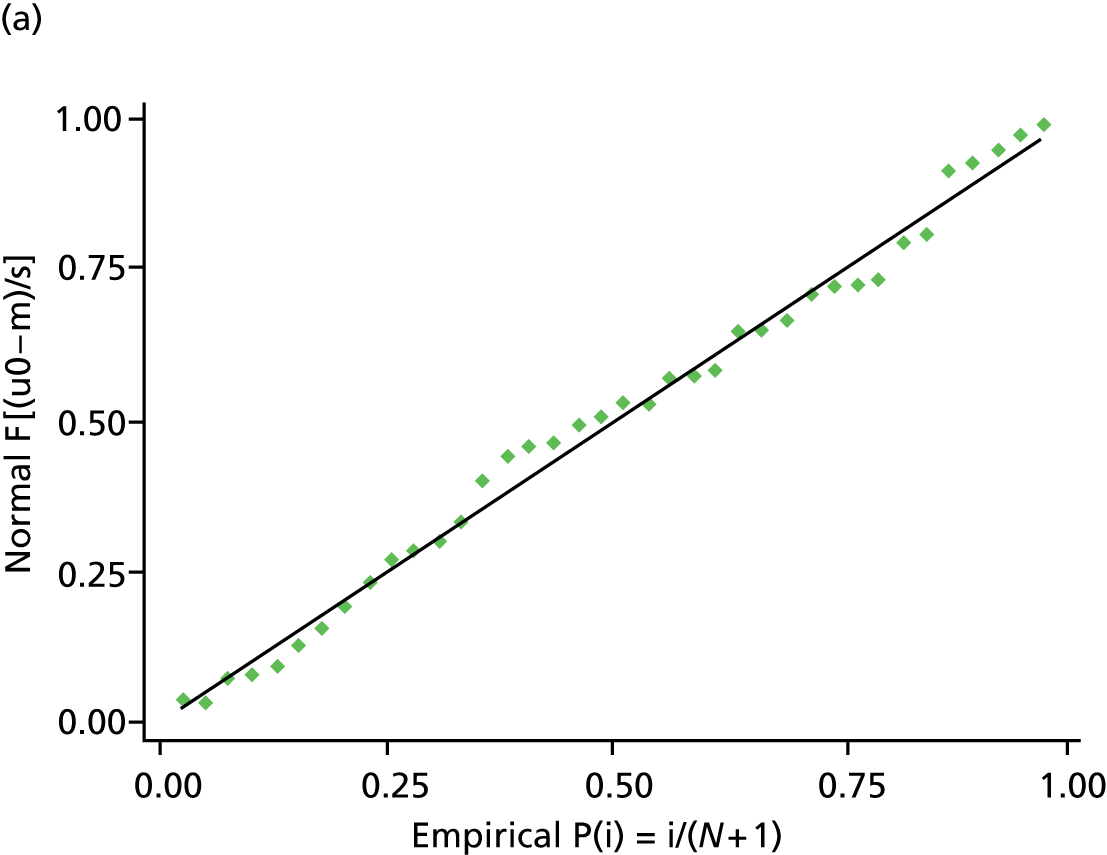
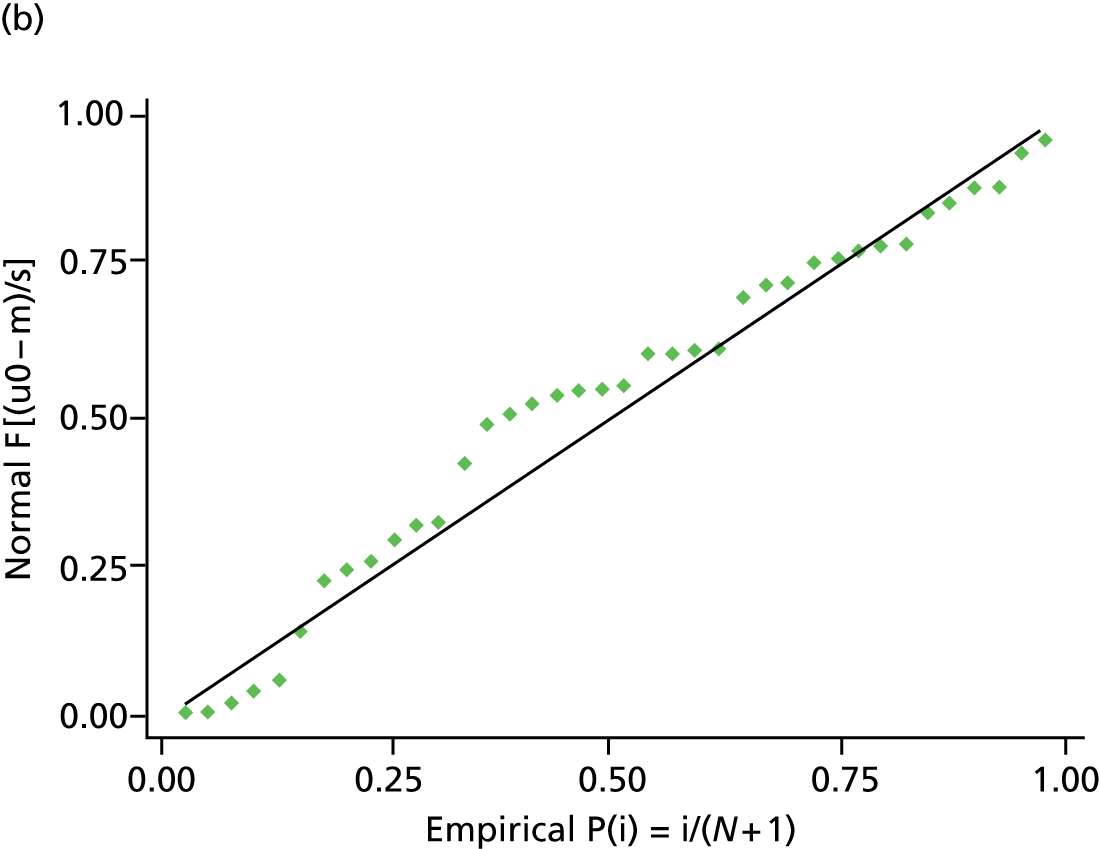
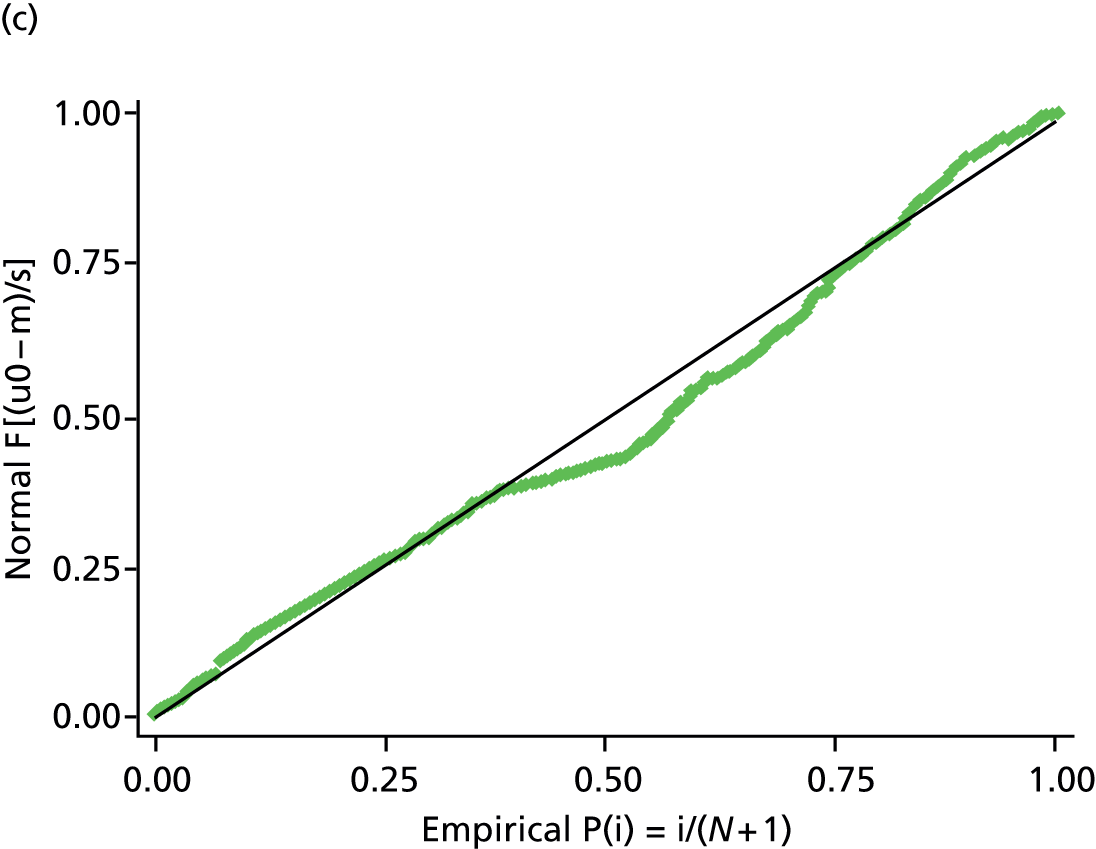
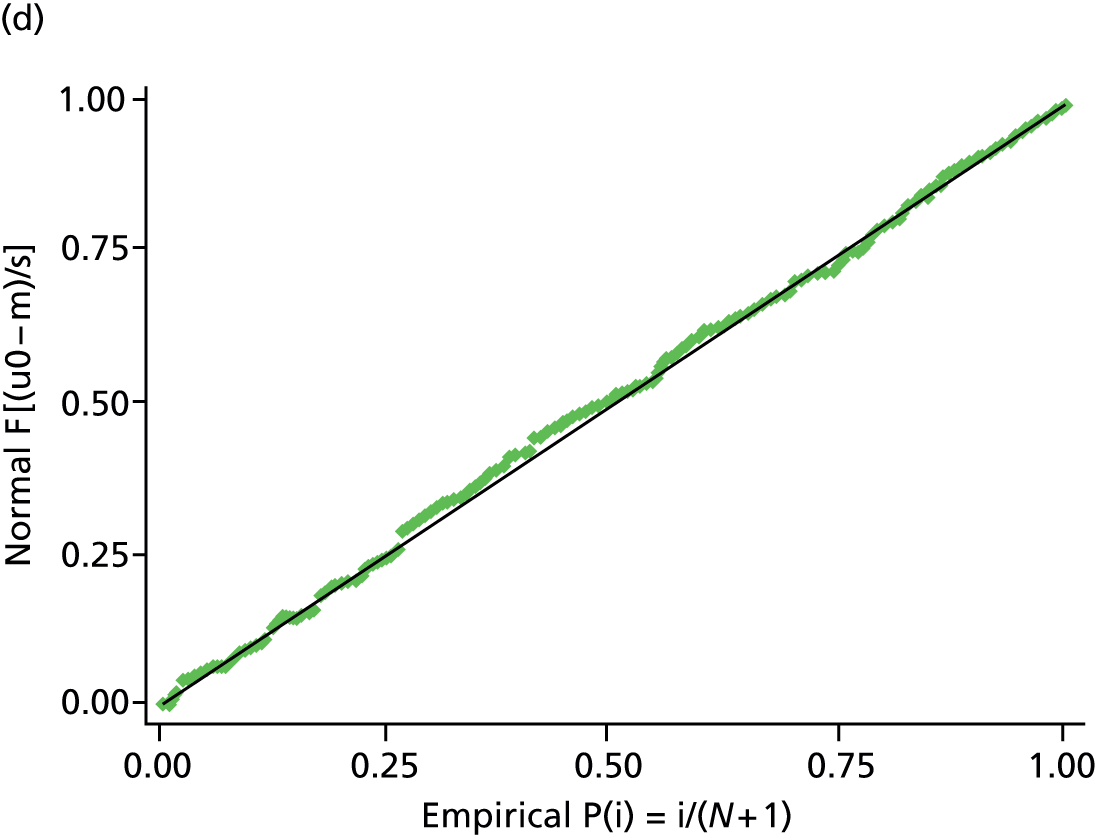
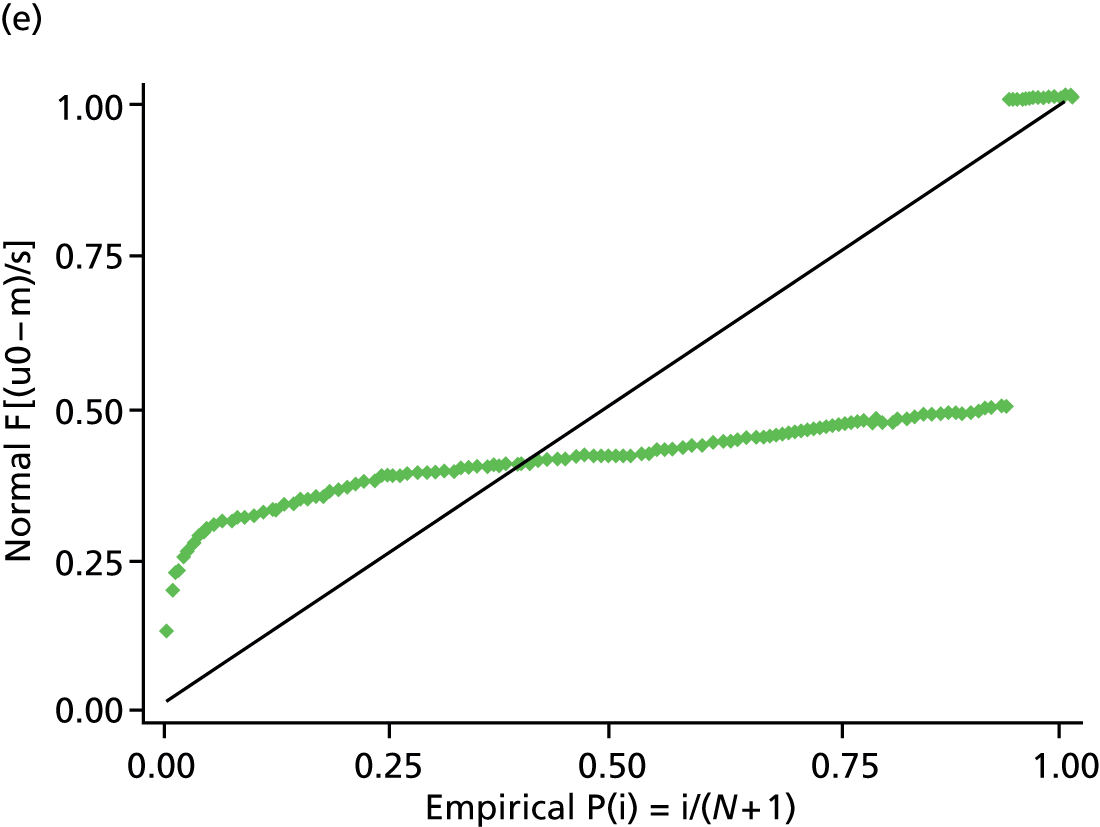
List of abbreviations
- ACE
- angiotensin-converting enzyme
- ADE
- adverse drug event
- AIC
- Akaike information criterion
- ARB
- angiotensin receptor blocker
- BNF
- British National Formulary
- CI
- confidence interval
- CKD
- chronic kidney disease
- CSM
- Committee for Safety of Medicines
- D-study
- decision study
- eGFR
- estimated glomerular filtration rate
- G-theory
- generalizability theory
- GI
- gastrointestinal
- GP
- general practitioner
- GPASS
- General Practice Administration System for Scotland
- HSDR
- Health Services and Delivery Research
- ICC
- intraclass correlation coefficient
- ICS
- inhaled corticosteroid
- ID
- identifier
- IT
- information technology
- LABA
- long-acting beta-agonist
- MeSH
- medical subject heading
- MHRA
- Medicines and Healthcare products Regulatory Agency
- NIHR
- National Institute for Health Research
- NSAID
- non-steroidal anti-inflammatory drug
- OR
- odds ratio
- PCCIU
- (University of Aberdeen) Primary Care Clinical Informatics Unit
- PIP
- potentially inappropriate prescribing
- PPDE-5
- phosphodiesterase-5
- PTI
- Practice Team Information
- Q
- quarter
- QOF
- Quality and Outcomes Framework
- RCGP
- Royal College of General Practitioners
- SPICE-PC
- Scottish Programme to Improve Clinical Effectiveness in Primary Care
- SPSS
- Statistical Product and Service Solutions
- START
- Screening Tool to Alert doctors to Right Treatment
- STOPP
- Screening Tool of Older Persons’ potentially inappropriate Prescriptions
