Notes
Article history
The research reported in this issue of the journal was funded by the HS&DR programme or one of its preceding programmes as project number 12/5001/43. The contractual start date was in June 2013. The final report began editorial review in February 2017 and was accepted for publication in January 2018. The authors have been wholly responsible for all data collection, analysis and interpretation, and for writing up their work. The HS&DR editors and production house have tried to ensure the accuracy of the authors’ report and would like to thank the reviewers for their constructive comments on the final report document. However, they do not accept liability for damages or losses arising from material published in this report.
Declared competing interests of authors
Caroline Elston reports personal fees from Chiesi Farmaceutici S.p.A. (Parma, Italy) advisory board and Raptor Pharmaceuticals (Novato, CA, USA) advisory board, outside the submitted work. Martin Wildman reports funding from Philips [(Amsterdam, the Netherlands) for research to create posters encouraging adherence to preventative inhaled therapies in cystic fibrosis (CF) and for support to Sheffield University to fund statistician time for data analysis about nebuliser use in relation to exacerbations and spirometry devices and weighing scales to understand home monitoring in CF]; travel expenses from Pari Pharma GmbH (Starnberg, Germany) to attend Pari in Munich to discuss the CFHealthHub programme; speaker fees and travel expenses from Vertex Pharmaceuticals (Boston, MA, USA) to deliver talks; funding from Smiths Medical (Minneapolis, MN, USA) to support the development of a chipped Acapella device; grants from the Burdett Trust for Nursing; grants from the National Institute for Health Research (NIHR) Programme Grants for Applied Research (PGfAR) programme; and funding from NHS England to support a programme to develop interventions to encourage self-management in people with CF from NHS England, outside the submitted work. In addition, Martin Wildman has a patent pending for Chipped Acapella. Siobhán B Carr reports personal fees (advisory board, steering committee and lecture) to her institution from Vertex Pharmaceuticals, advisory board fees from Chiesi Farmaceutici S.p.A. and speaker fees from Teva Pharmaceutical Industries Ltd. (Petah Tikva, Israel), outside the submitted work.
Permissions
Copyright statement
© Queen’s Printer and Controller of HMSO 2019. This work was produced by MacNeill et al. under the terms of a commissioning contract issued by the Secretary of State for Health and Social Care. This issue may be freely reproduced for the purposes of private research and study and extracts (or indeed, the full report) may be included in professional journals provided that suitable acknowledgement is made and the reproduction is not associated with any form of advertising. Applications for commercial reproduction should be addressed to: NIHR Journals Library, National Institute for Health Research, Evaluation, Trials and Studies Coordinating Centre, Alpha House, University of Southampton Science Park, Southampton SO16 7NS, UK.
2019 Queen’s Printer and Controller of HMSO
Chapter 1 Introduction
Background and rationale
Cystic fibrosis
Cystic fibrosis (CF) is a common genetic disease, affecting approximately 9000 people in the UK. 1 The genetic mutation leads to mucus obstruction and infection in the lungs. 2 Other organs, such as the liver, intestines and pancreas, are also affected, which, in turn, leads to poor nutrient absorption and malnutrition. 3 The prognosis for patients with CF has improved dramatically over the years, and it was recently shown that there has been a clear increase in the median age at death since the early 1970s. 4 In 2009, the median predicted survival for UK patients was 38 years. 1
People with CF are treated at specialist centres that offer dedicated paediatric or adult care; transition to adult care usually occurs after a person’s 16th birthday. Care involves daily treatments that can include drugs to clear mucus and prevent lung infections, pancreatic enzymes to aid digestion, and physiotherapy.
The CF Trust – the national UK charity for CF – maintains a national registry database (the UK CF Registry) of detailed clinical and demographic information on all patients attending these specialist centres. Patients are invited to attend annual reviews at their specialist centre and, based on these review data, the Trust produces annual reports describing the health of patients. The reports are available on the CF Trust website to be accessed by patients and clinicians alike [www.cysticfibrosis.org.uk/uk-cf-registry/reporting-and-resources (accessed 6 July 2018)].
Centre comparisons
From 2008 to 2014, the annual reports published by the CF Trust included comparisons between centres in terms of key clinical outcomes using simple rankings. Although these comparisons give a sense of the distribution of outcomes between centres, they encourage the reader to assume, for example, that centres with the highest values of lung function measure are ‘better’ than those with lower values. This is misleading on two grounds:
-
The rankings make no allowances for the differences in patient intakes. It could be argued, for example, that centres with younger patients would have higher age- and sex-adjusted lung function measures than centres with older patients, because lung function declines with age in people with CF. As such, between-centre comparisons that do not account for the age of patients risk not detecting good outcomes in centres where patients are older. Similarly, poor outcomes in centres with younger patients may not be detected.
-
The rankings include no formal tests comparing centres. Without formal comparisons, we cannot say that there is evidence that outcomes are better at one centre than another, let alone conclude that any observed differences are related to the processes of care.
Such shortcomings are important if the reader interprets the CF Trust graphs as league tables. Marshall and Spiegelhalter5 showed that league tables – even after adjustment for patient intake – are unreliable in identifying poor performance. Furthermore, Lilford et al. 6 suggest that league tables – in which a centre’s position could be caused by a host of reasons, such as differences in definitions and data quality between providers, chance or inadequate case-mix adjustment to differences in institutional management – can generate undue tension as blame is attributed without identification of the reason. After all, the very nature of a league table is that one provider is ranked bottom, whether or not care is poor, and ranking may simply be due to chance. 7 Without providing any explanation for observed differences, we are no further forward in knowing how to improve care, which should be the ultimate aim of any institutional comparisons.
Quality improvement in cystic fibrosis
Quality improvement programmes of varying sorts are not new in CF: there is a long history of such programmes in the USA8,9 and they have been described in Germany. 10 In the USA, the national CF Patient Registry performs centre comparisons in its routine reporting and this has also encouraged local units to undertake their own within-centre quality improvement work, making use of the national registry data. 11,12 However, in the UK there has been no work testing the hypothesis that there are key differences in the delivery of care that affect outcomes. We therefore adopted a ‘quality improvement’ approach to understanding whether or not differences between centres are related to the processes of care, which builds upon and improves on existing methodologies in CF centre comparisons. In this study, we considered all centres in our analyses and used statistical process control (SPC) charts to determine whether or not there are statistically meaningful differences. These charts were developed as a means of studying the variability of ‘processes’ over time13 and have been shown to be useful when comparing health-care providers (whether hospitals, clinics or primary care practices) as well as the outcomes of single providers (e.g. Harold Shipman) over time. 14
For the SPC charts, summary outcome measures for individual units were plotted against time or the size of the unit, with control limits [either at 2 or 3 standard deviations (SDs)]. It is anticipated that there will be some variability between units, which is intrinsic to the process itself and referred to as ‘common-cause variation’. 13 SPC charts are designed to highlight variability caused by factors outside the process, referred to as ‘special-cause variation’. Centres that have summary measures outside the control limits (either higher or lower) are said to exhibit special-cause variation.
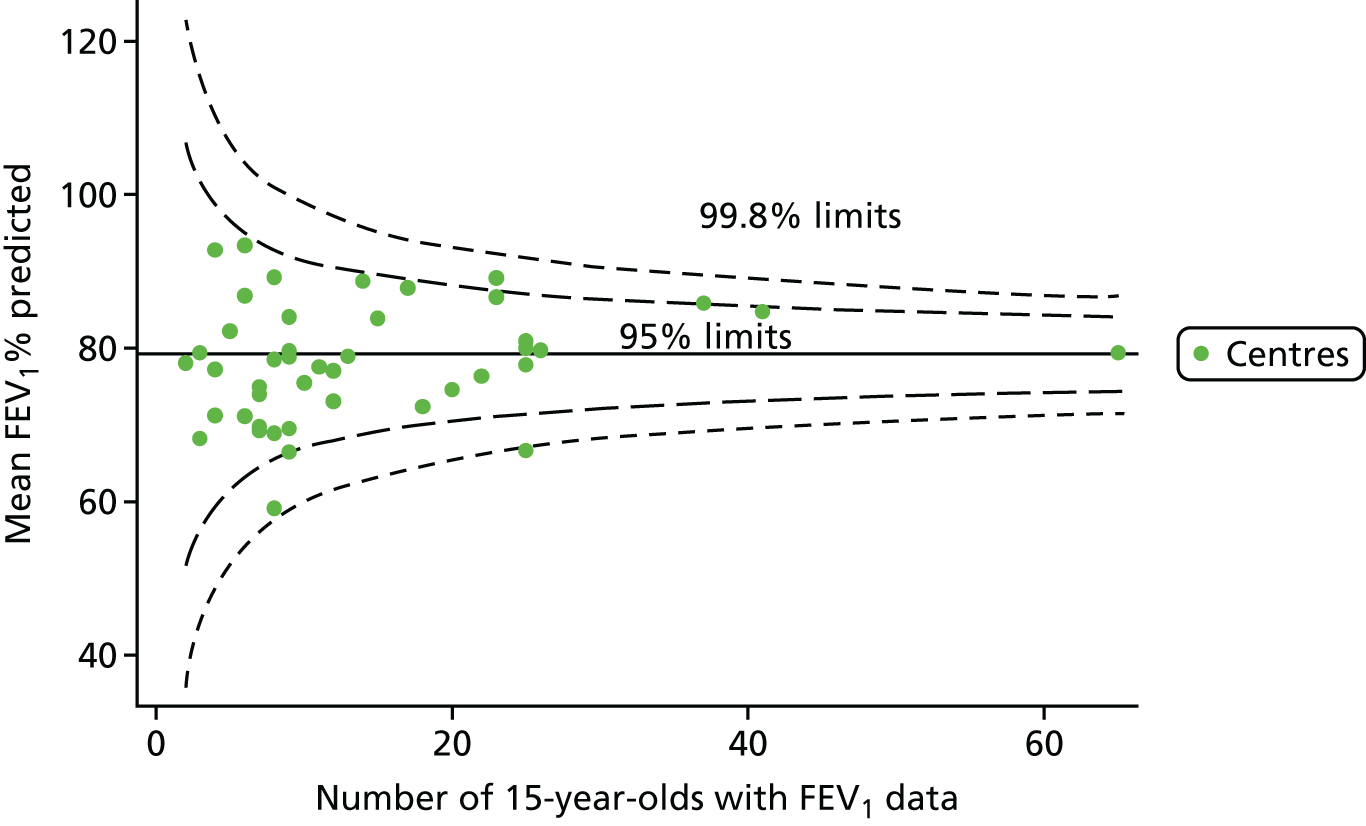
An example of a SPC chart is presented in Figure 1. Each dot represents a different CF unit and these CF units are being compared in terms of the mean forced expiratory volume in 1 second (FEV1) in children aged 15 years, with the size of the unit on the x-axis, given by the number of 15 year olds with FEV1 data. The dashed lines represent the control limits. Units located between the limits show ‘common-cause variation’ and those outside the limits show ‘special-cause variation’. Limits of 95% are equivalent to 2 SDs and limits of 99.8% are equivalent to 3 SDs.
FIGURE 1.
Example of funnel plot. FEV1, forced expiratory volume in 1 second.
Use of clinical audits in improving care
The vast wealth of health information collected from patients in both primary and secondary care is increasingly seen as a valuable resource, with the potential to help understand health outcomes as well as how care is delivered. By understanding how care is delivered and how care relates to autcomes, it is hoped that patient outcomes can be improved. The nature of registries and clinical audits varies: some, like the UK CF Registry, require centres to manually input specified data onto secure systems, whereas others, like the UK Renal Registry, take regular, automatic downloads from centre information technology systems. Both of these registries are run by national charities. NHS Digital has been commissioned to run a range of clinical audits for organisations such as NHS England and the Healthcare Quality Improvement Partnership (HQIP). These audits are designed to allow for performance to be compared with defined standards, and HQIP has published guidance on how to detect and manage outliers in such audits, which includes reference to the importance of case-mix adjustment. 15
The importance of adjustment in centre comparisons is reflected in recent National Institute for Health Research (NIHR)-funded work by Pagel et al. 16 They sought to improve their risk adjustment model for 30-day mortality after heart surgery and to improve how information was communicated back to patients. Given that the impact of identifying outliers can be dramatic for centres – surgery at one paediatric centre was halted under the original risk model – appropriate risk modelling was identified as important. Careful attention was given to developing the model, which involved an iterative process of clinical discussions to identify risk factors, statistical modelling and assessments of model performance of cross-validation.
Aims and objectives
The aims of this project were to determine whether or not there are statistically meaningful differences in key health outcomes between CF centres in the UK and to determine the processes of care driving such differences.
Our objectives were to:
-
establish a framework to allow future comparisons of key measures of quality in terms of care structures and processes
-
develop statistical models using data from the national CF Registry database that allow us to adjust clinical outcomes at centres for the patient case mix
-
compare centres using SPC charts to determine whether or not important differences in key clinical outcomes exist between centres
-
consult with experts in CF care to turn existing care guidelines17 into maps of the structures, policies and processes (SPPs) required to deliver good outcomes and to identify factors that could facilitate or hinder such SPPs being successful
-
consult with people with CF to ascertain what they believe are the factors that could facilitate or hinder these SPPs from being successful
-
collect data from individual centres and describe the structures and processes of care at these centres based on the SPP-mapping exercise
-
explore how the SPPs of care differ between centres with exceptional outcomes and the remaining centres.
Structure of this report
Chapter 2 outlines our methodologies for all components of the study. Our statistical analysis of the CF Registry data is described in Chapter 3. The workshops and focus groups with clinicians and people with CF to understand the SPPs that can help or hinder good care are described in Chapter 4. In Chapter 5 we describe the results of our questionnaire to clinicians across all centres. In Chapter 6 we discuss and summarise our results.
Chapter 2 Methodology
Introduction
In order to address our research objectives, we structured our work around centre comparisons and consultations with clinicians and patients to identify factors that would help to understand variability, describe care structures and identify differing processes.
Centre comparisons
We used data from the CF Registry to compare CF centres in the UK in terms of key clinical outcomes.
Data source
Annual review data (2007–15 inclusively) from the CF Registry database were used for all analyses. Centres are allocated an identification (ID) number by the CF Trust, which is used in the CF Trust’s reporting. We generated new, anonymised, IDs to ensure that, while conducting our analyses, we were blind to the identity of centres. This means that the IDs used in this report will not match those used by the CF Trust.
Outcomes
Consultation with members of the CF Registry steering committee and with centre directors identified a number of respiratory and nutrition outcomes deemed clinically meaningful for measuring the performance of both paediatric and adult centres. For paediatric centres we considered:
-
FEV1 at 12 years of age
-
FEV1 at 15 years of age
-
FEV1 change from 13 to 15 years of age
-
body mass index (BMI) percentile at 15 years of age.
For adult centres we considered:
-
FEV1 change from 18 to 21 years of age
-
BMI change from 18 to 21 years of age as described above.
In the first instance, we performed our analyses using data from 2007–12, as stated in our original protocol. We subsequently amended the protocol to use data from 2013–15, when the data became available. With these additional data, we repeated the analyses of FEV1 at 12 and 15 years of age.
To inform our analyses of these age groups and confirm any trends observed, we also conducted single-year analyses (for 2007–15 inclusive) using the CF Registry data of patients of all ages. The outcome considered for these was FEV1% predicted. We also considered trends in intravenous (i.v.) antibiotic treatment.
The CF Registry provides FEV1% predicted, calculated using the Knudson reference equations18 based on a patient’s age, and these values were used for our analyses. We also studied our outcomes using the more recently developed Global Lung Function Initiative (GLI) reference equations,19 which have been shown to be superior in modelling FEV1 during the adolescent period. Researchers found that transitioning from one set of reference equations to another when moving into adulthood can lead to disproportionate step changes in FEV1% predicted, which GLI eliminates. 20 Predictions of FEV1 using the GLI reference equations require more detailed information on ethnicity; therefore, there were some missing data using this method compared with the other method. From 2016 onwards, the UK CF Registry adopted the GLI reference equations for their reporting, although they continue to record absolute FEV1 in litres so that any changes to the GLI reference equations can be accommodated.
Candidate variables for case-mix adjustment
Case-mix adjustment involved adjusting outcomes for non-modifiable factors that are known to be associated with health-care outcomes and to differ between centres. By adjusting outcomes for the patient case mix, we eliminated factors that the centre has no control over from our between-centre comparison. In the case of this study, candidate variables were the patient’s CF genotype, sex, whether or not they have sufficient pancreatic function to digest food without supplements, socioeconomic status [(SES) based on Townsend deprivation scores)21], age (measured in months) and age at diagnosis (measured in months).
Inclusion criteria
We considered all centres and all patients with annual review data during the relevant time periods. At the individual level, all patients who were within the age ranges stated above (see Chapter 2, Outcomes) at the time of their annual review were considered eligible for the analysis. For outcomes relating to changes in FEV1 and BMI over time, we required that patients have at least two annual reviews at the same centre.
Data analysis
For each outcome we analysed, we began by identifying the patient population in terms of their demographic characteristics and the completeness of the data they provided. As the case-mix variables were not expected to change over time, we made use of a patient’s full history of annual reviews, when possible, to estimate missing values in any given year. For example, if a patient’s genotype was not available in the 2007 annual review data, we carried it over from later years when it was available. Minimising missing case-mix data is important, as only those patients without missing data were included in our case-mix adjustment models, and rates and patterns of ‘missingness’ have the potential to bias our results. Centre variation in rates of ‘missingness’ for these variables was described using descriptive statistics and funnel plots.
Following these explorations of data completeness and case mix, the means of the observed (i.e. not case-mix adjusted) outcomes for each outcome were analysed using funnel plots, which allowed us to look at the differences in outcomes between centres. For outcomes relating to change in FEV1 or BMI, we performed linear regression analyses for each patient, calculating the annual decline in the outcome during the period of interest. These individual changes in FEV1 or BMI were then pooled by centre to generate funnel plots of mean change in FEV1 or BMI by centre.
As the control limits were influenced by the rare occurrence of extremely small centres, which made interpretation of the plots illegible, we restricted many of our plots to centres providing data on at least five patients.
Next, to understand the impact of case mix, we adjusted our outcomes for case mix using multilevel linear regression models, fitting centres as a random effect. The random intercept model allowed the outcome to vary between centres and the unstructured covariance option was used to allow all variance–covariance parameters to vary. Having fitted a random intercept model, we used the likelihood ratio test to check for cluster-level variation. We generated funnel plots of the level 2 residuals of our case-mix adjustment models using the funnelcompar command in Stata® version 14 (StataCorp LP, College Station, TX, USA). If a centre was outside the upper 3-SD limits of these plots, it indicated that the mean of the outcome for that centre was greater than the overall mean; similarly, a centre outside the lower limits had a mean smaller than the overall mean.
In single-year analyses that considered wide age ranges and in which it was unlikely that there would be a linear association between age and FEV1, we considered different methods for the adjustment of age in children and in adults.
-
Children (aged 6–15 years): in each year of analysis, we ran a generalised linear model (GLM) of FEV1% predicted across age as a categorical variable (with 6 years as the referent group) and from this model we obtained predicted values. Our age-adjusted FEV1% predicted values were then calculated using the ratio of the original FEV1% predicted to the values predicted by the regression model multiplied by 100. Centre-level means of this age-adjusted FEV1% predicted were generated and funnel plots produced to assess how this adjustment affected centre comparisons. These age-adjusted outcomes were then used as outcomes in multilevel models that further adjusted for other case-mix variables.
To contrast with the above approach, we also considered age adjustment by fitting a single linear term for age in our multilevel models. The results for both approaches are presented.
-
Adults (aged ≥ 16 years): in each year of analysis, we ran a GLM of FEV1% predicted across age deciles and from this model obtained predicted values. Our age-adjusted FEV1% predicted was then calculated using the ratio of the original FEV1% predicted to the values predicted by the regression model multiplied by 100. Centre-level means of this age-adjusted FEV1% predicted was generated and funnel plots produced to assess how this adjustment affected centre comparisons. These age-adjusted outcomes were then used as outcomes in multilevel models that further adjusted for other case-mix variables.
Another approach to dealing with potential non-linearity is to use beta-splines, as has been done in other studies of FEV1 in CF. 22 Knots were placed at 18, 28 and 40 years for each year’s analysis. The splines were incorporated into multilevel models and from these we used the random intercept predictions in our funnel plots.
To complement these analyses, we described our case-mix variables using means or medians for continuous measures and frequencies and proportions for categorical variables. We also generated funnel plots of the proportion of patients taking i.v. antibiotics, assuming a binomial distribution.
A number of sensitivity analyses were performed to assess the robustness of our results. These included the following:
-
We compared the FEV1 results that we obtained using the Knudson reference equations18 with those obtained when using the GLI reference equations. 19
-
In our year-by-year analysis of FEV1, we re-ran our models for 2013–15, this time excluding patients with the milder G551D mutation, as a large proportion of these patients would have been taking a new CF treatment, called Ivacaftor (Kalydeco ©, Vertex), that has been shown to be highly successful.
-
In our year-by-year analysis of paediatric centres, we re-ran our models, this time excluding those patients receiving shared care. We were interested to see if the outcomes of the main centre changed when these patients – who can have varying levels of contact with the main centre – are excluded. There has been some evidence that the model of care can affect clinical outcomes. 23
-
In some cases in which multilevel models are used for case-mix adjustment, the resulting centre-level means are drawn towards the overall mean, thus potentially masking true differences. 15 This is referred to as ‘shrinkage’. We explored whether or not the interpretation of our case-mix adjusted funnel plots would differ if we used fixed-effect GLMs rather than multilevel models to adjust for case mix. From our GLMs, we compared the predicted outcome with the observed outcome to obtain a measure of what ‘proportion’ of the outcome is explained by case mix. The centre-level mean ‘proportions’ were then presented in funnel plots.
All funnel plots were generated using the funnelcompar command in Stata® and all analyses were conducted in Stata®.
Consultations to identify factors that would help to understand variability
Consultation with clinicians
Focus groups to understand key determinants of quality of CF care were held in October 2013. Clinicians from adult centres attended on day 1 and clinicians from paediatric centres attended on day 2. The meeting started with an introduction that highlighted the purpose of the day, which was to explore the factors that contributed to high-quality care, with the intention of developing a questionnaire that could be sent to CF centres so the researchers could understand local patterns of care. Determinants of care were explored in three general categories:
-
Structures – clinicians were asked to explore the resources that they considered to be important in delivering high-quality care in terms of buildings, staff and equipment.
-
Policies – clinicians were asked to explore the policies that they considered to be important in delivering high-quality care in terms of approaches to care, for example the approach taken to detecting new isolates of Pseudomonas.
-
Processes – clinicians were asked to explore the processes that they considered to be important in delivering high-quality care, for example the processes employed within clinics to monitor adherence or carry out quality improvement.
The analysis of the focus group data was guided by the principles of interpretative thematic analysis, whereby the transcripts were thoroughly read by the researcher and codes and categories were assigned to sections of the text to highlight key thematic areas with regard to factors that hinder or facilitate SPPs. 24 In addition, a form of content analysis – an assertions analysis25 – was undertaken of each transcript to examine the frequency with which particular barriers or facilitators are characterised in a particular way.
Following the workshops, the outcomes of each workshop were shared with participants to provide the opportunity to comment on the synthesis of the data collected and to suggest any final refinements.
Questionnaire
The topics discussed in the focus groups were used to develop a questionnaire for paediatric centre teams and a questionnaire for adult centre teams. The development of the questionnaire is described in more detail in Chapter 5.
Consultation with patients
In consulting with patients we aimed to develop a questionnaire to be issued to patients.
The process also allowed us to investigate the patients’ views on the key SPPs that were identified in the consultation with clinicians (described in Consultation with clinicians) to assess if these were important to them as well as to clinicians. To do this, we conducted a focus group with the team of seven clinical care patient advisors who are tasked by the CF Trust with promoting high-quality care. The focus group was conducted by teleconference and comprised two components. The first focused on participants’ own experiences of CF care. The second asked participants to consider, from their own experiences, factors that could facilitate or hinder the SPPs identified in the consultation with clinicians as being successful and their views on the importance of these clinician-defined SPPs.
The focus group schedule of questions was developed with input from the study management group as well as patient clinical care advisor Dominic Kavanagh, who was involved in the development of this project.
The results of the patient focus groups will be analysed using the same techniques of thematic analysis and assertions analysis as described in Consultation with clinicians.
Describing care structures
We administered the online questionnaires developed from our consultation with clinicians (Consultation with clinicians) to centre directors of all specialist CF centres in the UK – who cascaded the questionnaire to their multidisciplinary teams (MDTs). The results of the survey were tabulated and presented using descriptive statistics.
Patient and public involvement
A patient and a CF Trust representative were members of the study management group that developed and refined the research approach adopted as the study progressed.
Chapter 3 Centre comparisons
This chapter considers the centre comparisons performed using different clinical outcomes as part of work package 1. This work is presented separately for paediatric and adult centres.
Owing to the large number of figures and tables referred to in these analyses, many are presented in Appendix 2 (figures) and Appendix 3 (tables).
Paediatric analyses
Analyses of children attending paediatric centres focus first on young adolescents whose outcomes, we hypothesised, would be most strongly affected by specialist clinical care. Based on our original project plan, we considered data from 2007–12 (see Analyses in young adolescents: 2007–12) and pooled data across the study period to maximise our sample size. We then updated some of these analyses using more recently available data from 2013–15 (see Analyses in young adolescents: 2007–15).
This work is complemented by single-year analyses of data from 2007 to 2015 inclusive for all children between the ages of 6 and 15 years [see Analyses in all children aged 6–15 years by year (2007–15)]. The aim of this separate analysis was to explore whether or not there were patterns in outcomes over multiple years.
Analyses in young adolescents: 2007–12
Between 2007 and 2012, 9914 unique patients had at least one annual review recorded on the UK CF Registry. This includes 2112 patients aged 12–15 years who attended paediatric centres; 31 paediatric centres contributed data to the CF Registry during this period.
Our prespecified outcomes in children each relate to different age groups:
-
12 years – FEV1
-
15 years – FEV1 and BMI percentile
-
13–15 years – FEV1 change from ages 13 to 15 years.
Given that these outcomes differ in nature (some focus on an outcome at a single age and others focus on changes in outcomes over time), different eligibility criteria are applied to each, as described in Chapter 2.
For each outcome, we described the identified patient population in terms of their demographic characteristics and the completeness of the outcome and case-mix data that they provided (Table 1). In the analysis of each outcome, there was an approximately equal split of boys and girls and most of the patients were taking pancreatic enzyme supplements for pancreatic insufficiency. Just over half of patients were homozygous DF508, whereas < 10% of genotyped patients had no DF508 mutations. Using home postcode data to determine area-level SES, we note that those in the most deprived quintile were under-represented for each outcome analysis.
| Characteristic | Outcomes, n (%) | ||
|---|---|---|---|
| 12 years of age (patients eligible for analysis, N = 1193) | 15 years of age (patients eligible for analysis, N = 1151) | 13–15 years of age (patients eligible for analysis, N = 1180) | |
| Sex | |||
| Male | 614 (54.5) | 566 (49.2) | 578 (49.0) |
| Female | 579 (48.5) | 585 (50.8) | 602 (51.0) |
| Number of missing observations (% based on those eligible) | 0 (0) | 0 (0) | 0 (0) |
| Pancreatic enzyme | |||
| Yes | 1067 (91.7) | 1054 (92.1) | 1105 (93.9) |
| No | 97 (8.3) | 91 (8.0) | 72 (6.1) |
| Number of missing observations (% based on those eligible) | 29 (2.4) | 6 (0.5) | 3 (0.3) |
| SES | |||
| 1 (least deprived) | 254 (21.8) | 237 (21.2) | 258 (22.6) |
| 2 | 242 (20.7) | 225 (20.1) | 216 (19.0) |
| 3 | 233 (20.0) | 218 (19.5) | 239 (21.0) |
| 4 | 240 (20.6) | 254 (22.7) | 244 (21.4) |
| 5 (most deprived) | 198 (17.0) | 185 (16.5) | 183 (16.1) |
| Number of missing observations (% based on those eligible) | 26 (2.2) | 32 (2.8) | 40 (3.4) |
| Genotype | |||
| Homozygous | 653 (55.4) | 632 (55.5) | 635 (54.3) |
| Heterozygous | 434 (36.8) | 413 (36.3) | 437 (37.4) |
| No DF508 | 92 (7.8) | 94 (8.3) | 98 (8.4) |
| Number of missing observations (% based on those eligible) | 14 (1.2) | 12 (1.0) | 10 (0.1) |
As these variables were to be used in case-mix adjustment, and only those patients with non-missing data for these variables would be included in case-mix adjustment models, rates and patterns of ‘missingness’ had the potential to bias our results. We therefore sought to quantify and explore variations between centres in rates of ‘missingness’ for these variables. For the variables considered, there were few missing data (< 5%) in any of the analysis populations (inclusion in an analysis population depended in part on having non-missing outcome data).
Outcome: FEV1 in children aged 12 years
Data were available for a total of 1193 12-year-olds across the 31 paediatric centres. Estimates of the predicted FEV1 can be obtained using the Knudson reference equations,18 but, more recently, it has become common to use the GLI reference equations. 19 We considered both methods and analysed the data first using the Knudson reference equations. 18
Of the 1193 12-year-olds studied, 87 did not have FEV1% predicted data available. A funnel plot illustrated the proportion of patients at each centre with non-missing data and showed that, although the vast majority of centres had good levels of non-missingness (≥ 85%), centres 39 and 43 exhibited low levels of non-missingness and were outside the lower 3-SD limits (see Appendix 2, Figure 18a).
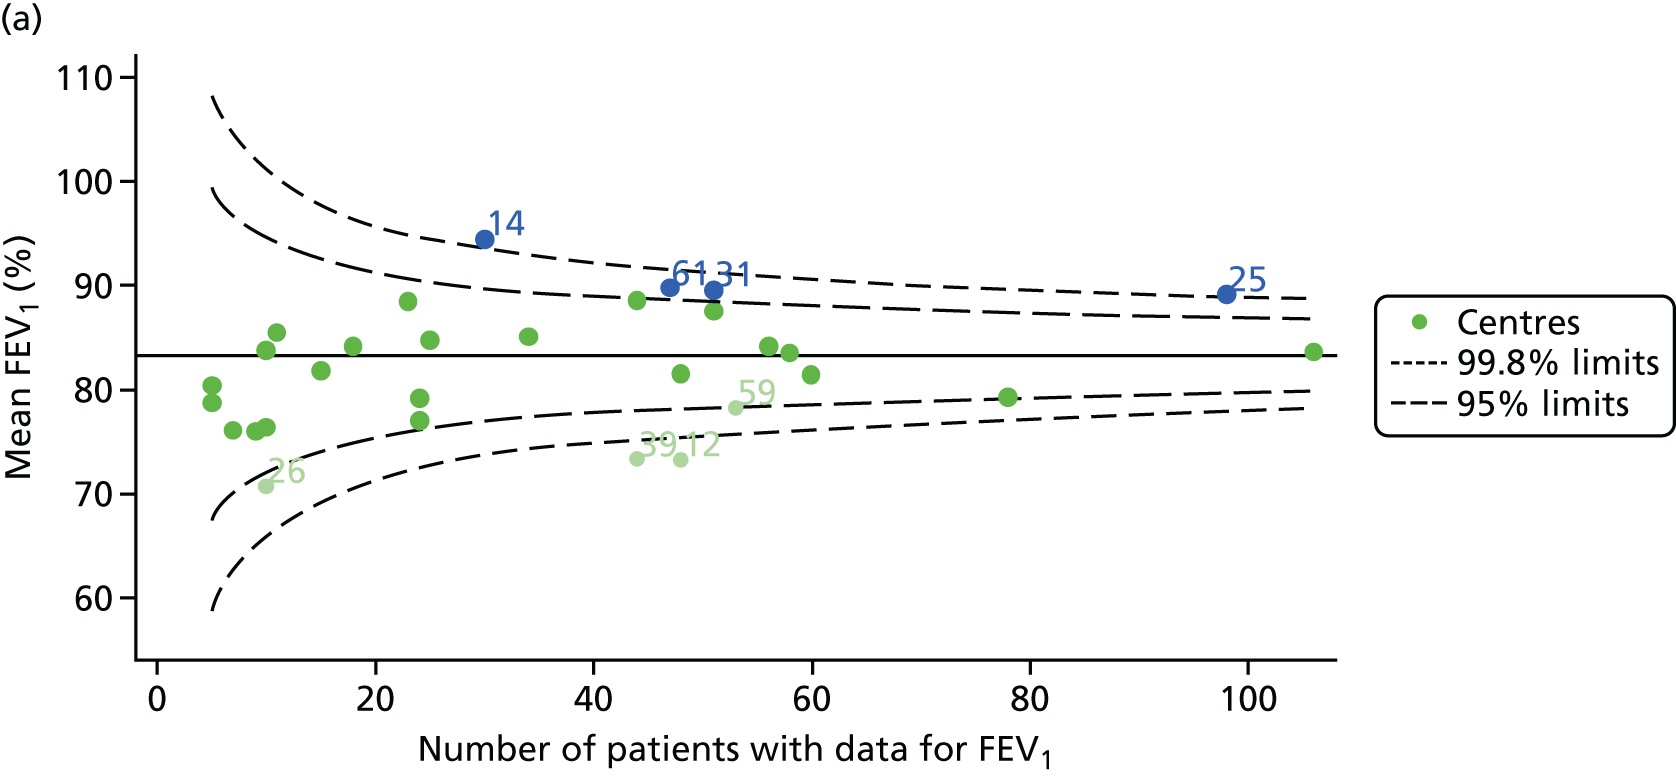
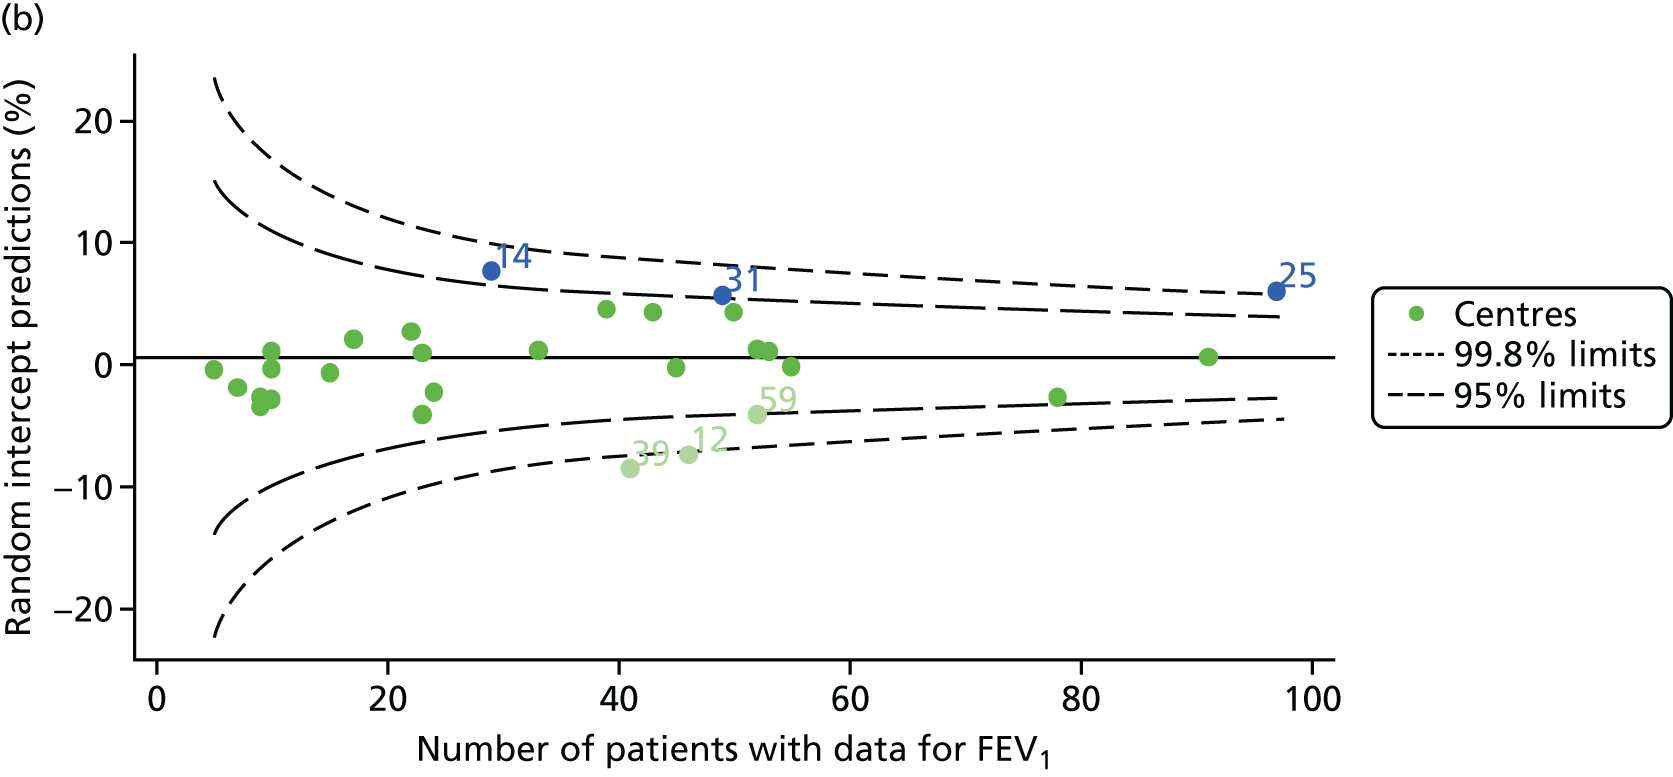
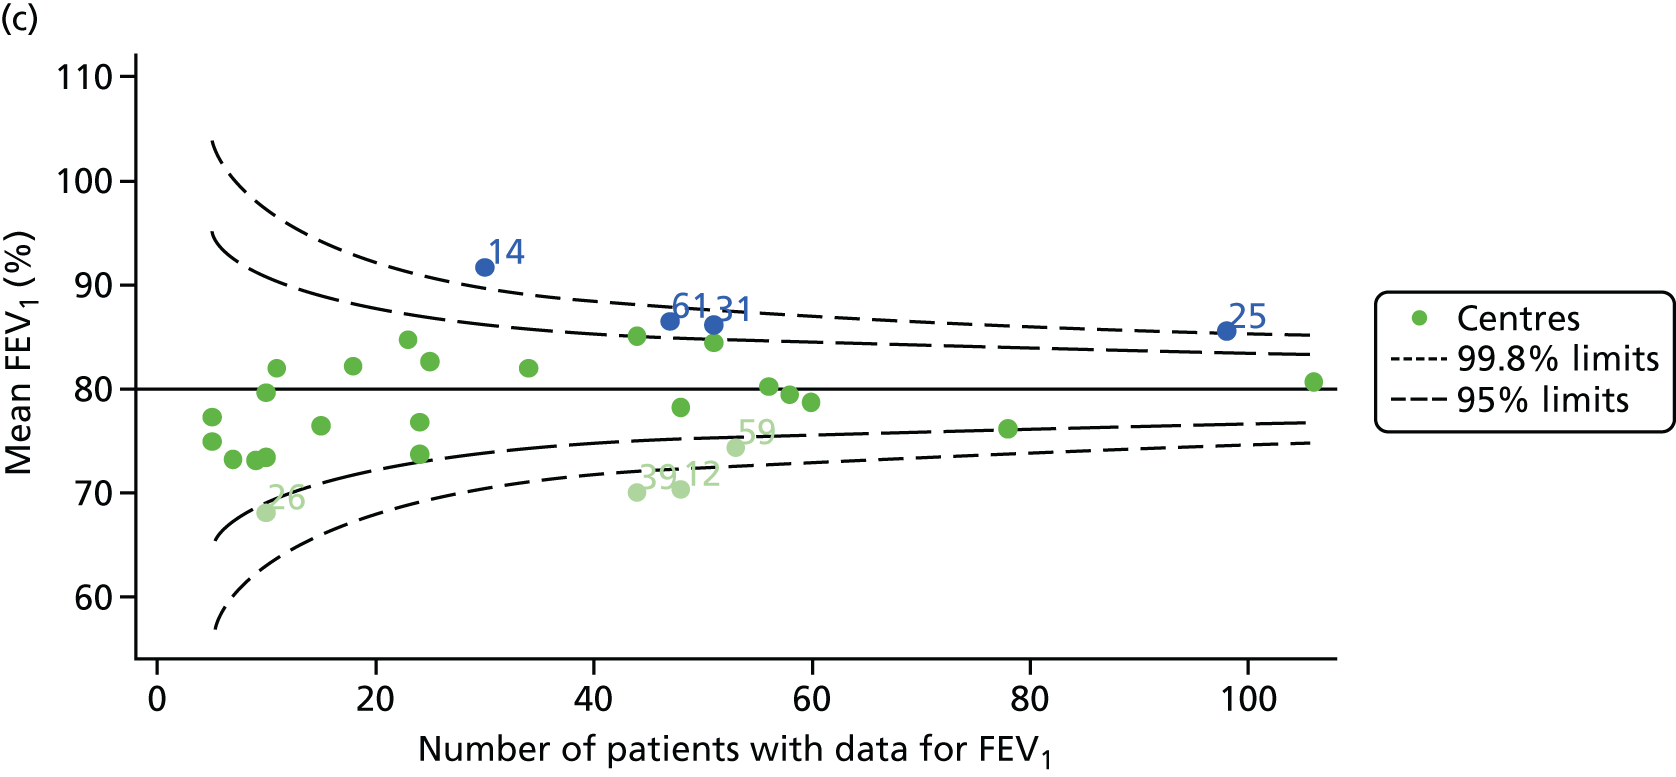
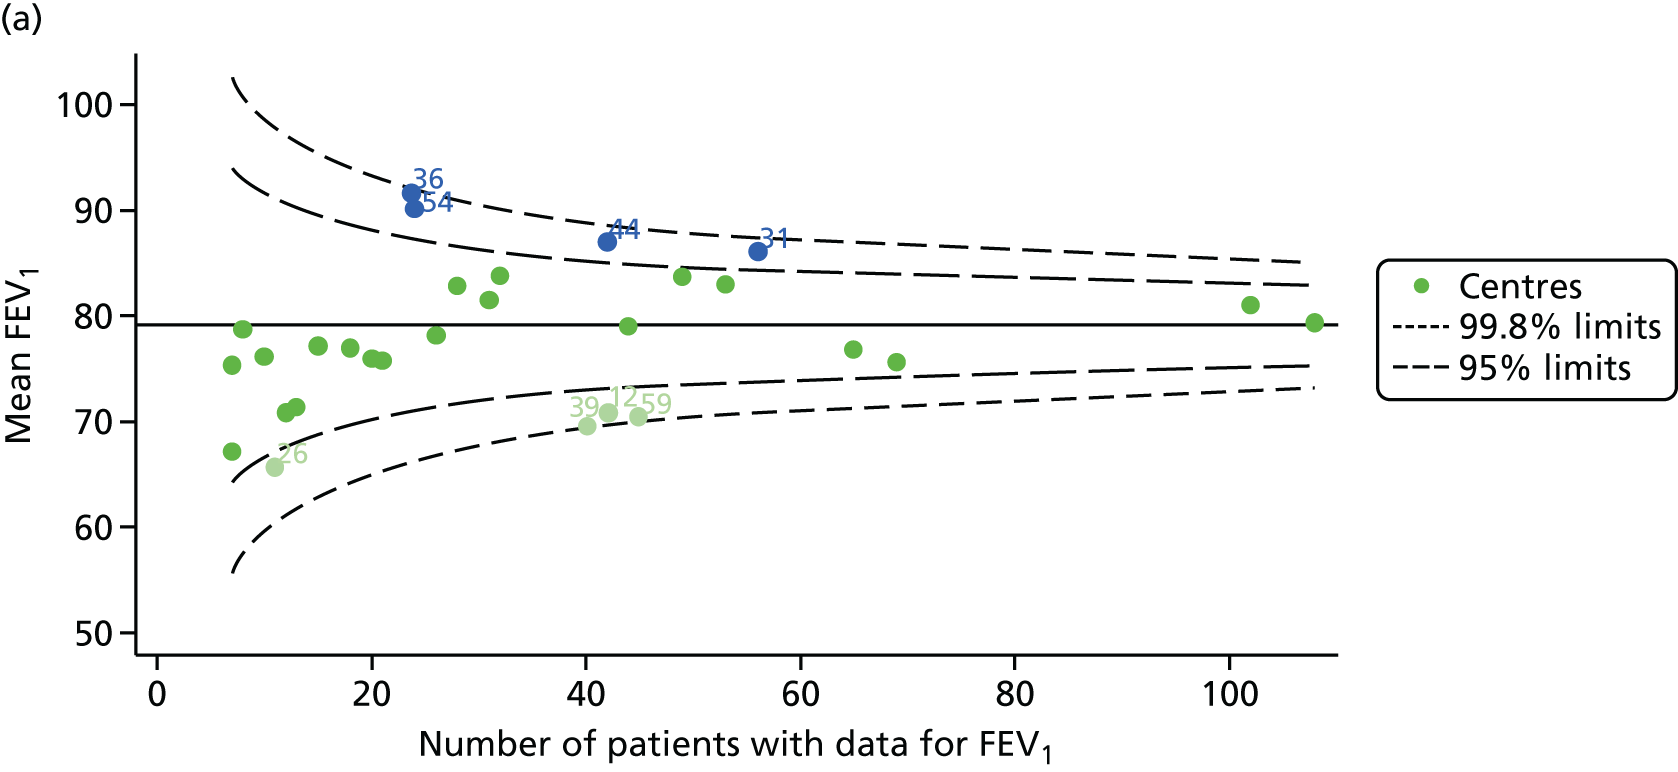
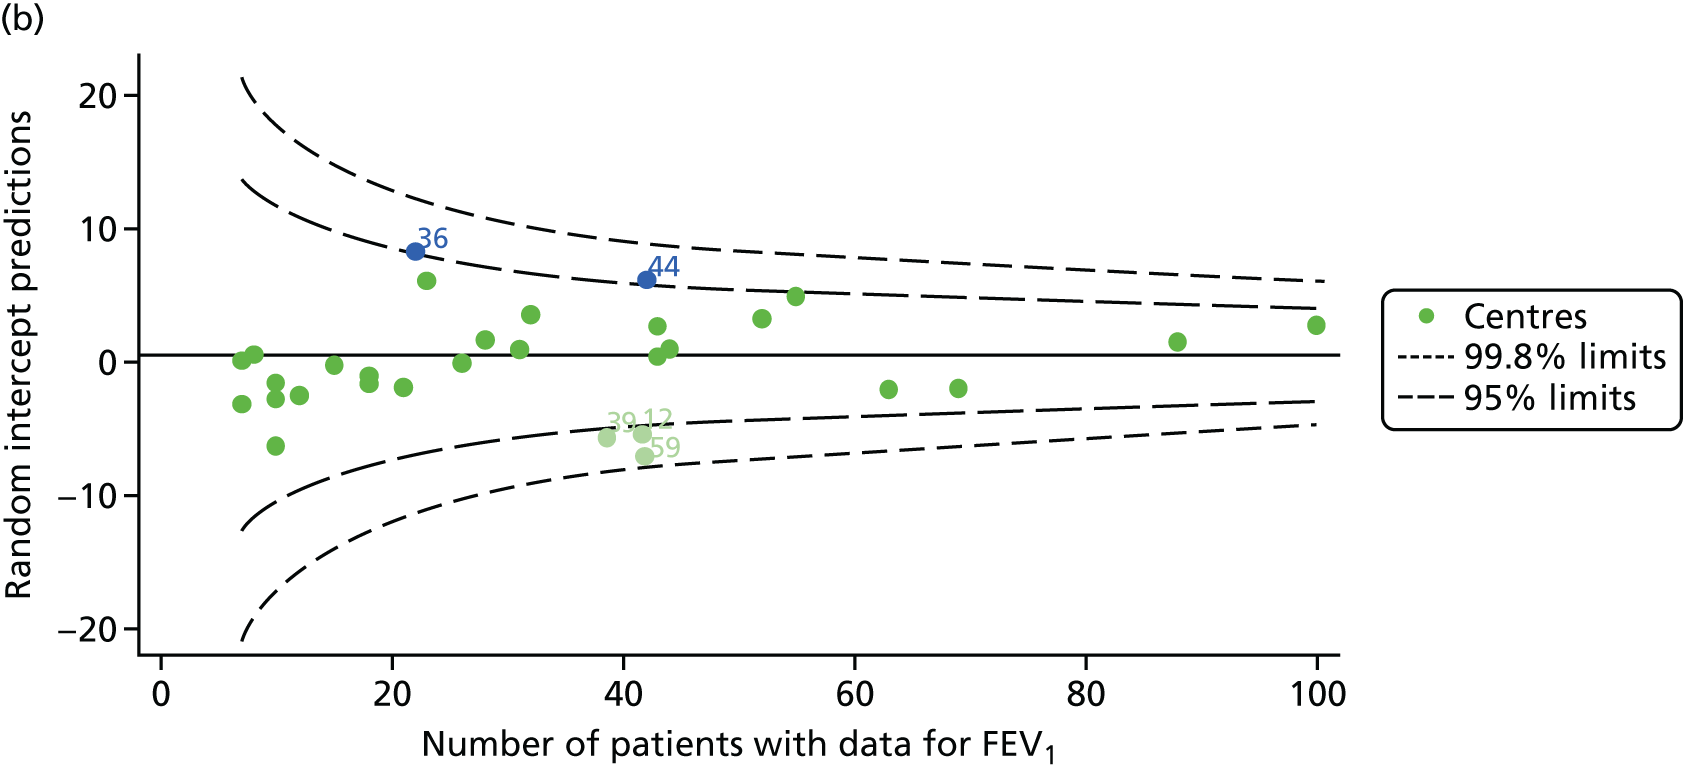
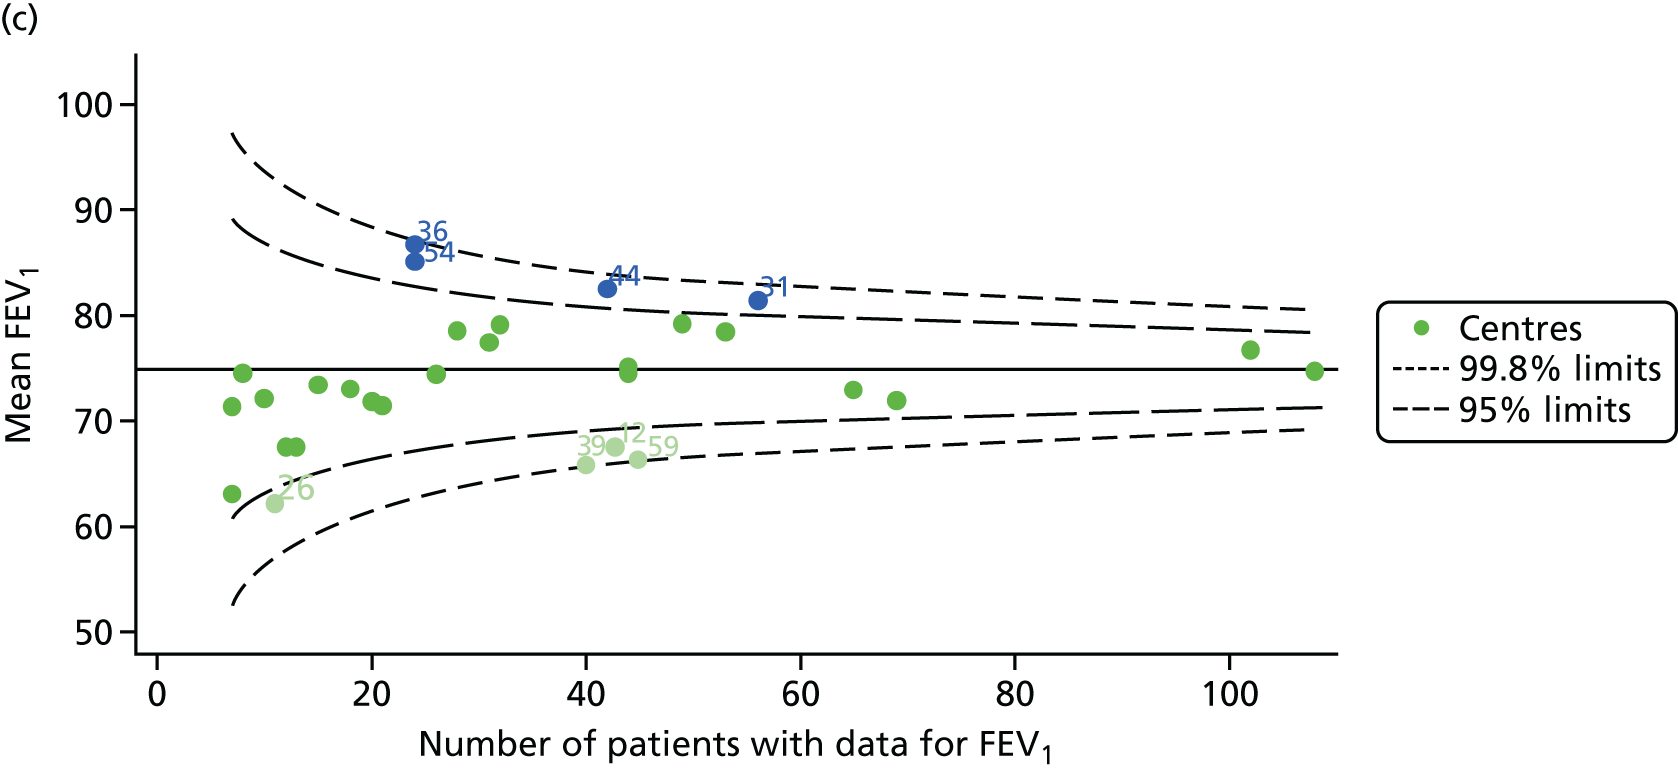
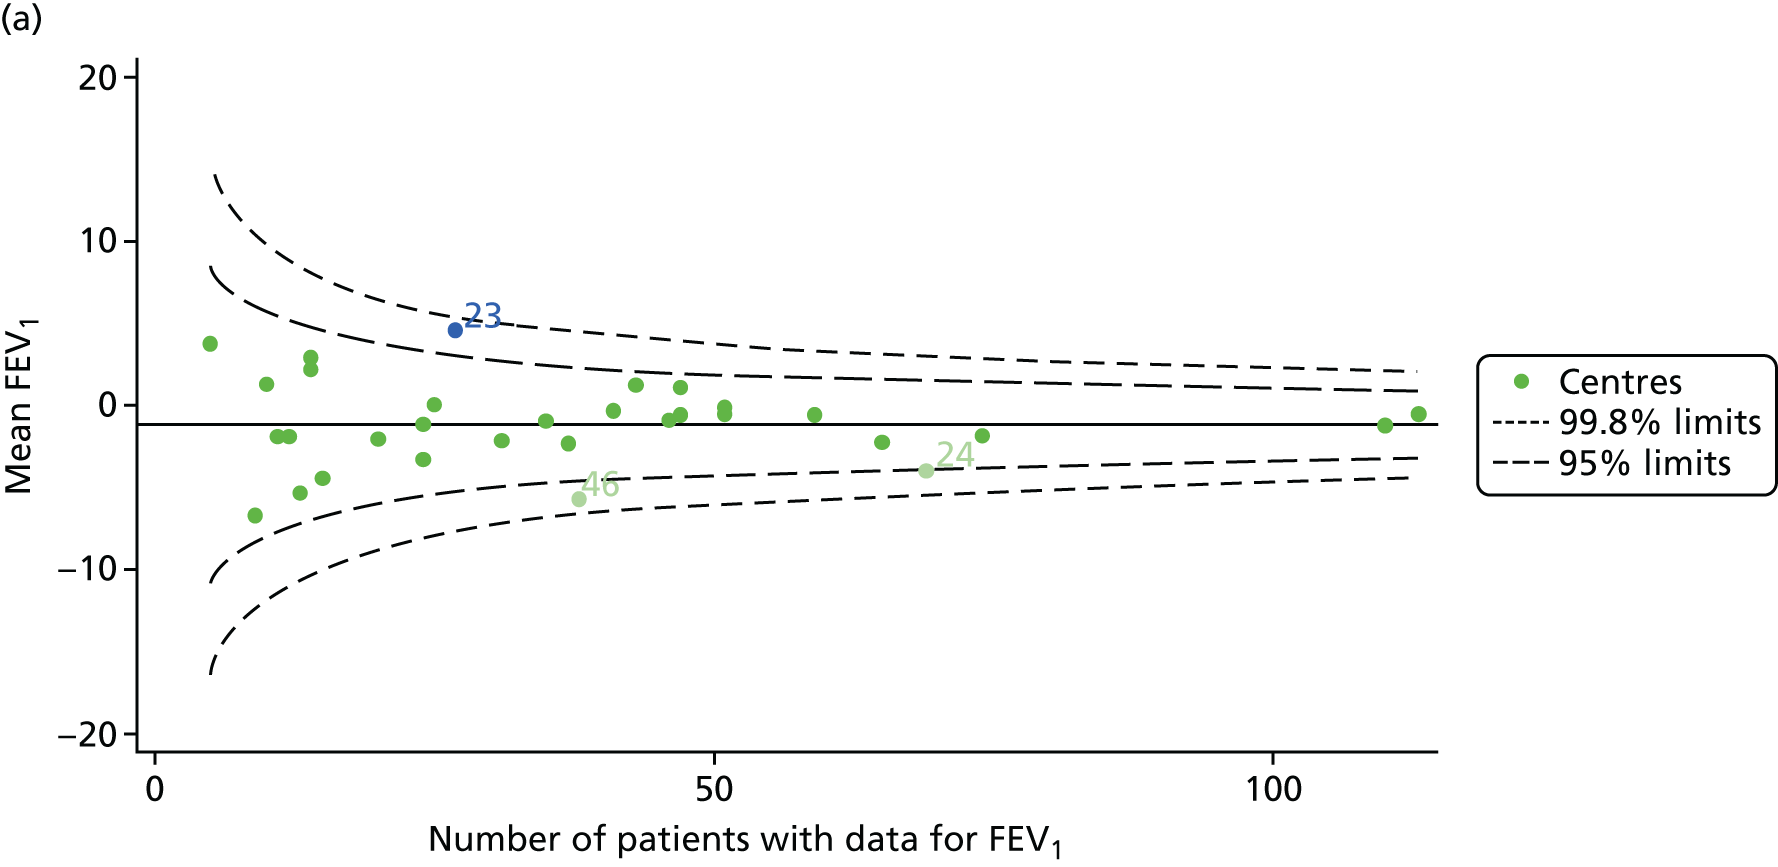
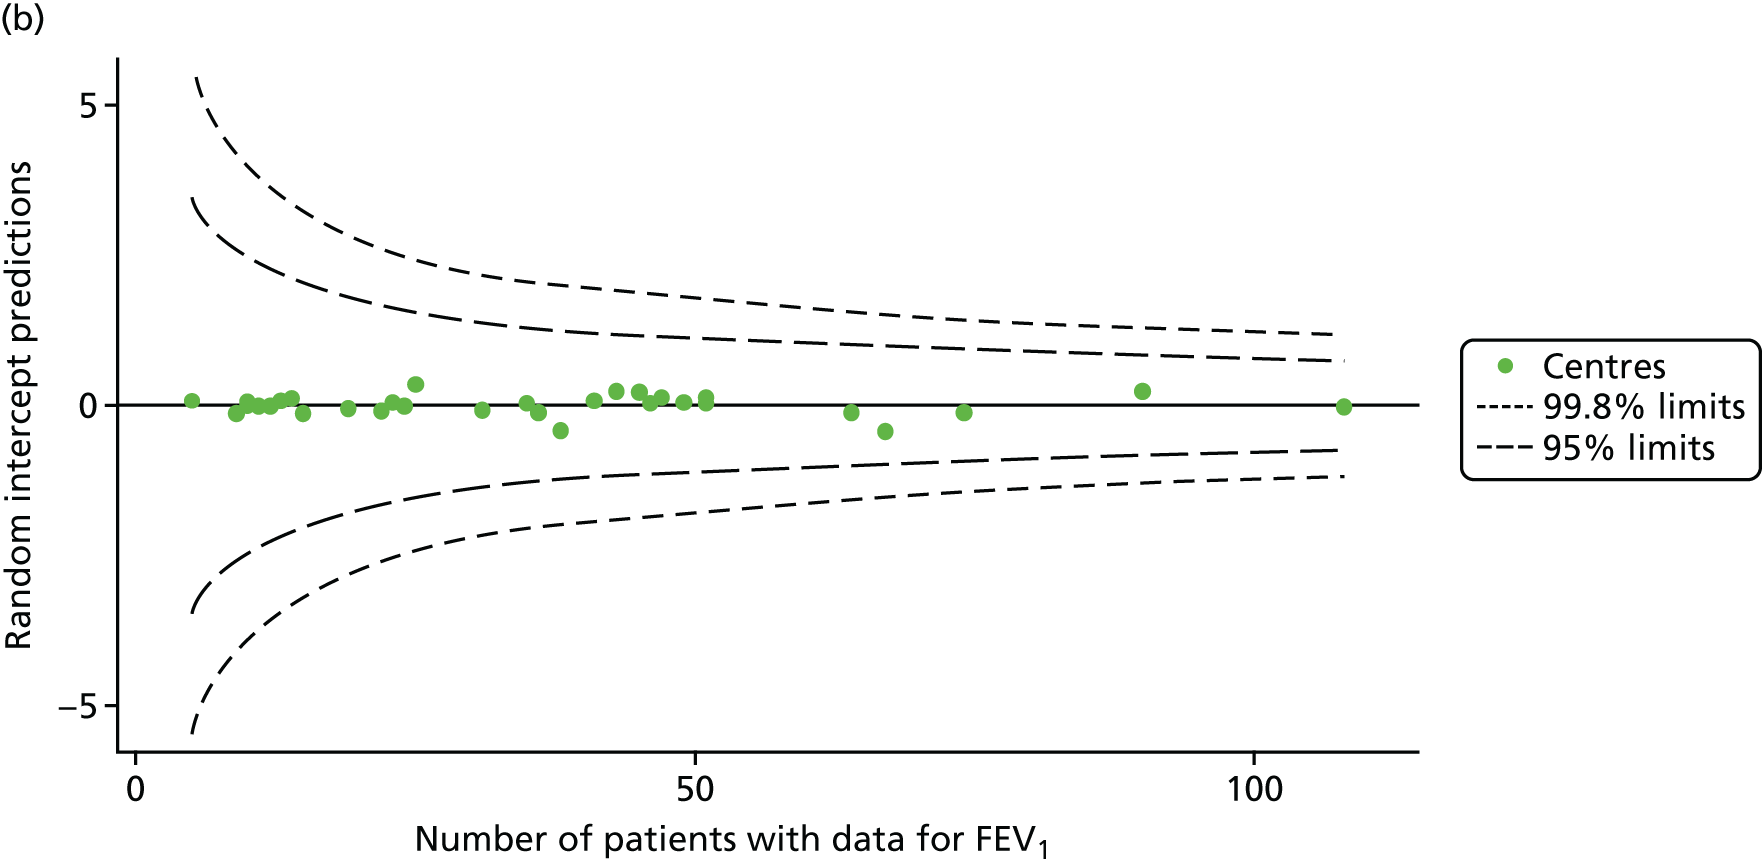
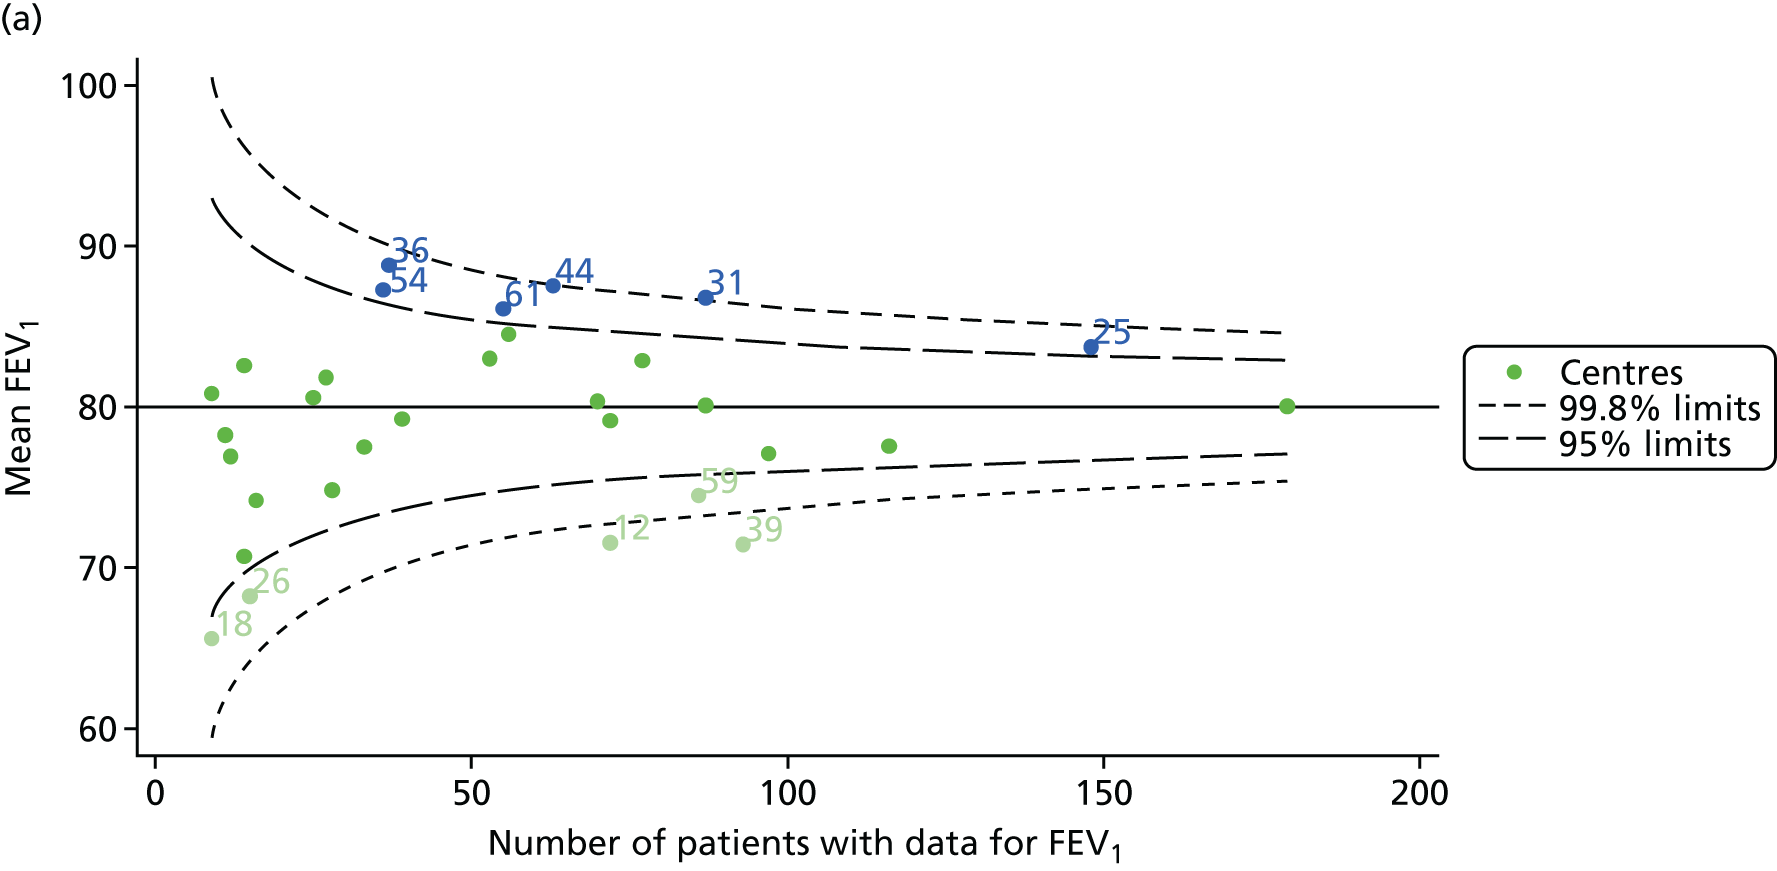
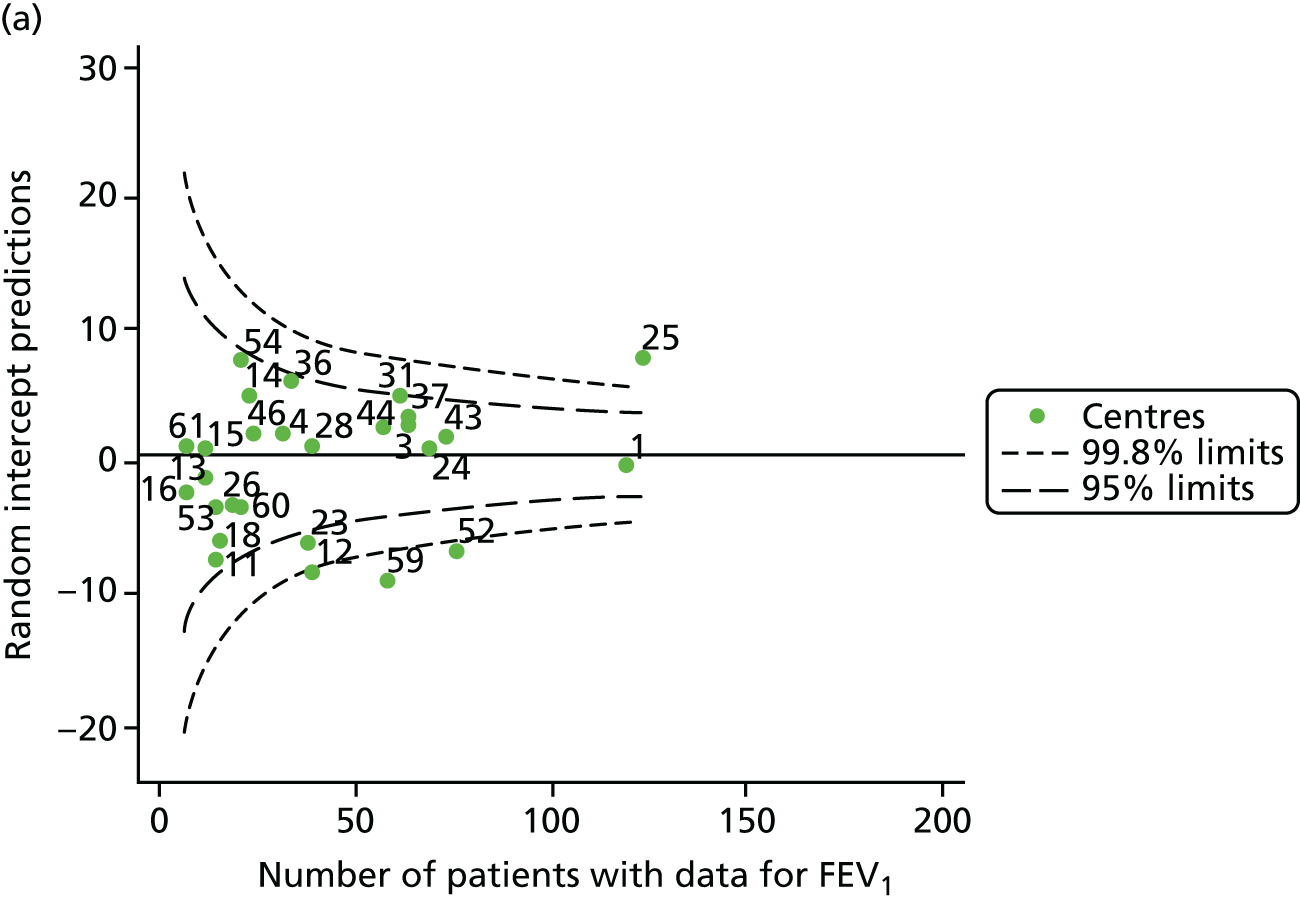
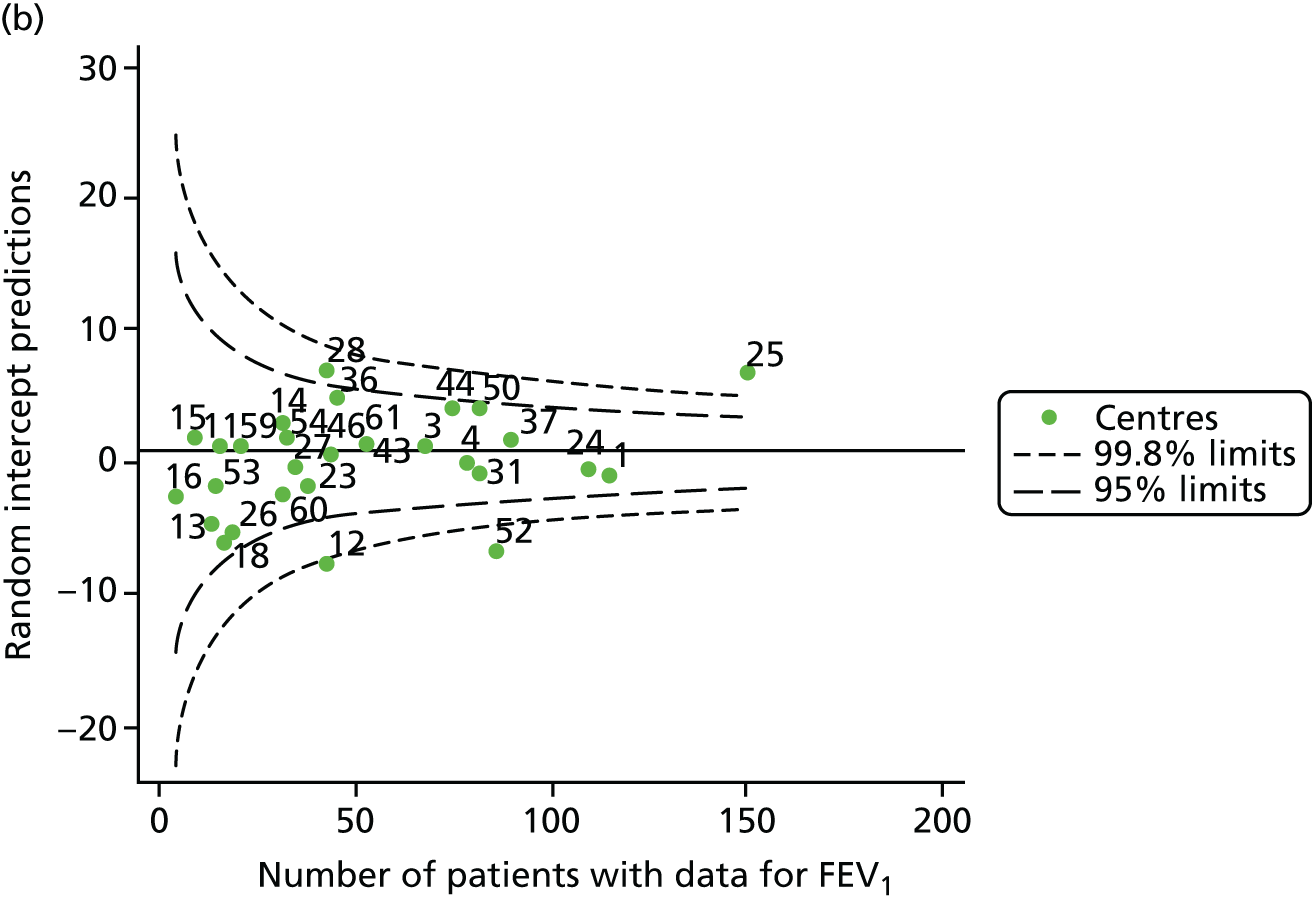
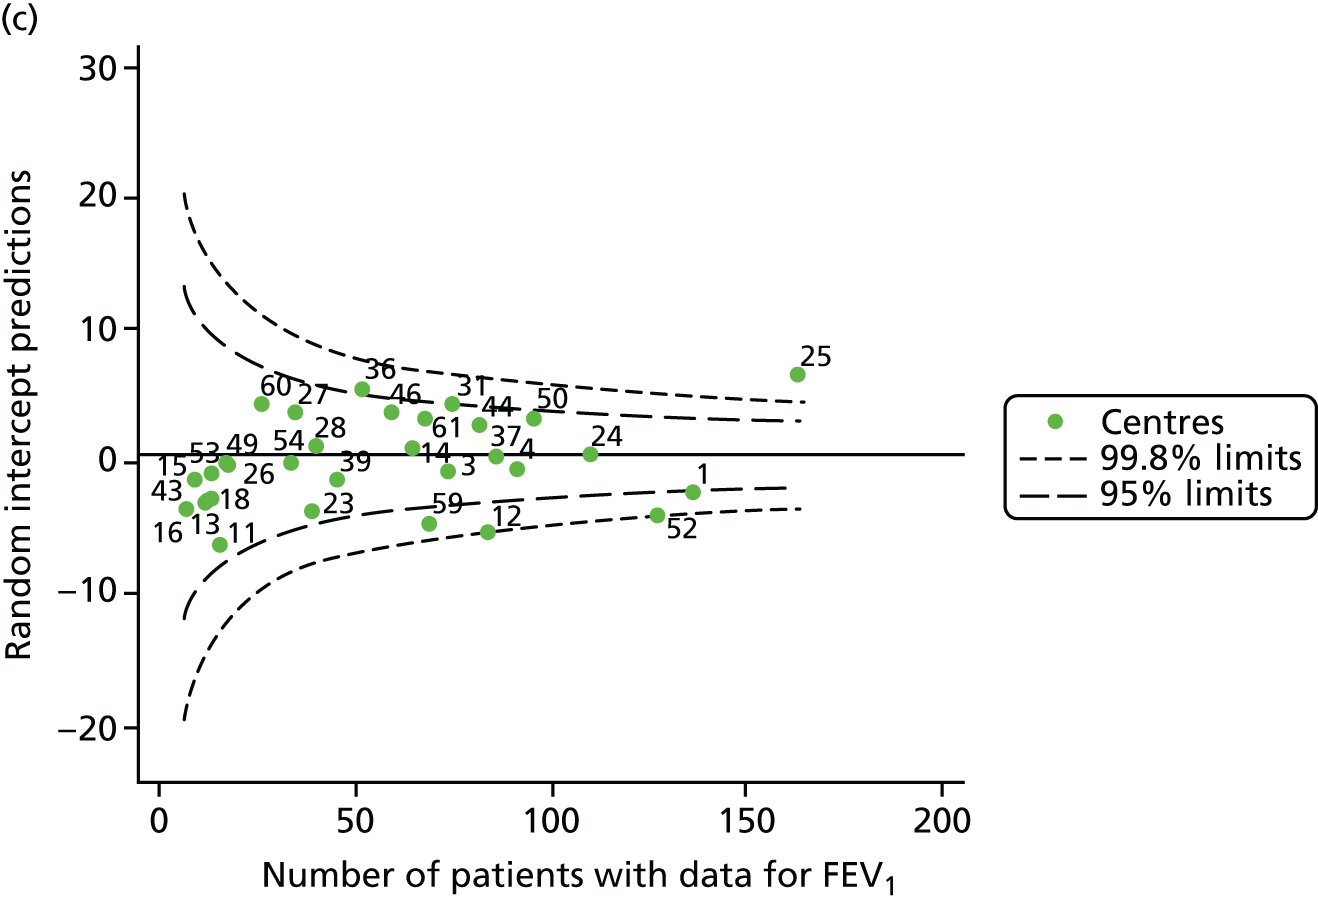
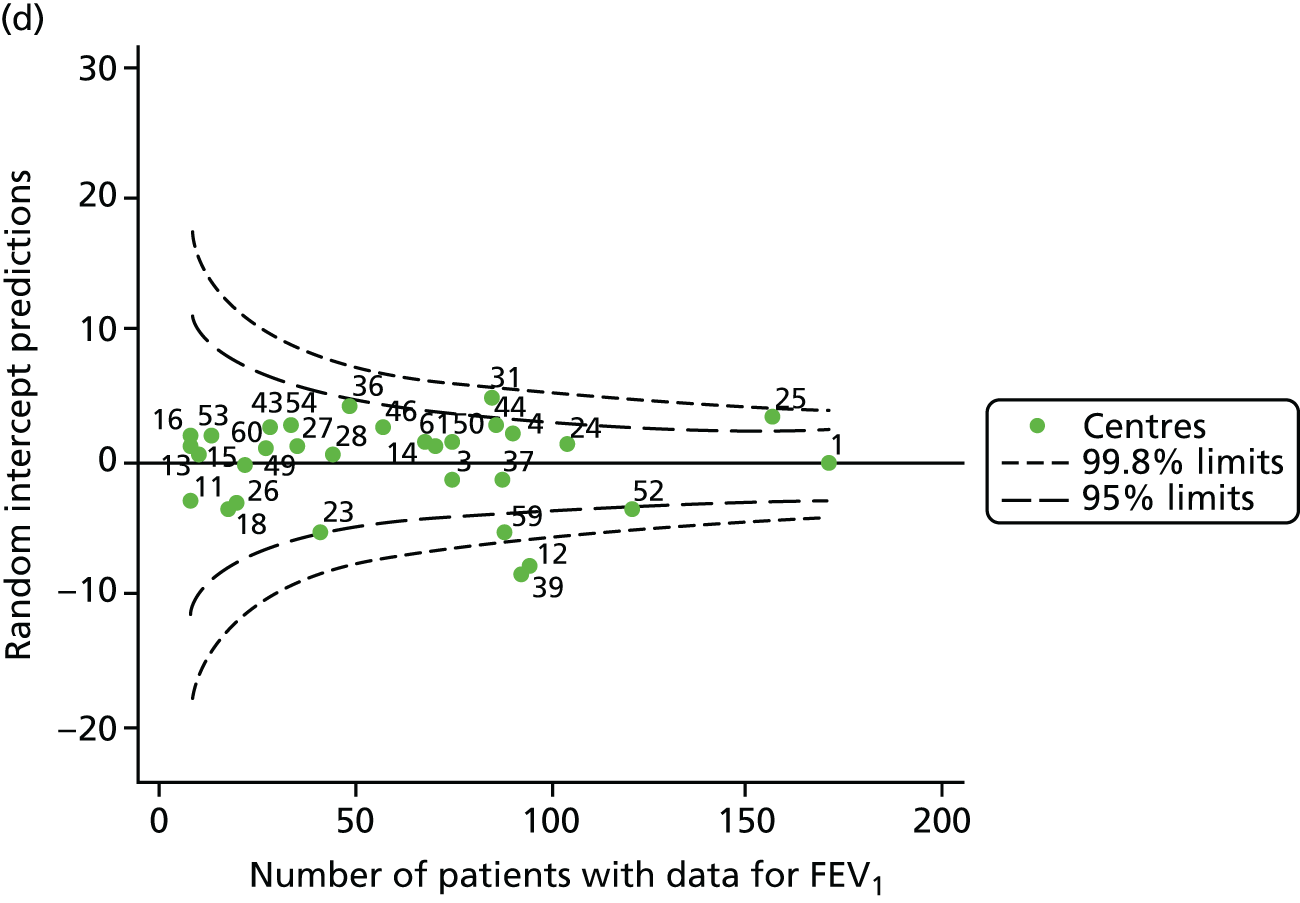
The means of the observed (i.e. not case-mix adjusted) FEV1% predicted of 12-year-olds at each of the 31 CF paediatric centres were plotted into a funnel plot (Figure 2a). This allowed us to look at the differentiation between the centres in terms of their observed FEV1% predicted. The plot shows eight centres outside the 2-SD control limits, although only four were outside the 3-SD limits. The results suggest that some centres have higher mean FEV1 values than the average, whereas others have lower mean FEV1 values than the average. Centres with fewer patients tended to have slightly lower than average FEV1 values and the two largest centres had slightly higher mean FEV1 values. The same pattern was observed when we calculated the FEV1% predicted using the GLI reference equations (Figure 2c).
We explored whether or not there were between-centre differences in the case-mix variables (see Appendix 2, Figure 19) using funnel plots. Although there was some variability between centres, this rarely exceeded the 3-SD control limits. The exception to this is centre 43, which had a larger proportion of patients in the most deprived quintile than the other centres (see Appendix 2, Figure 19c).
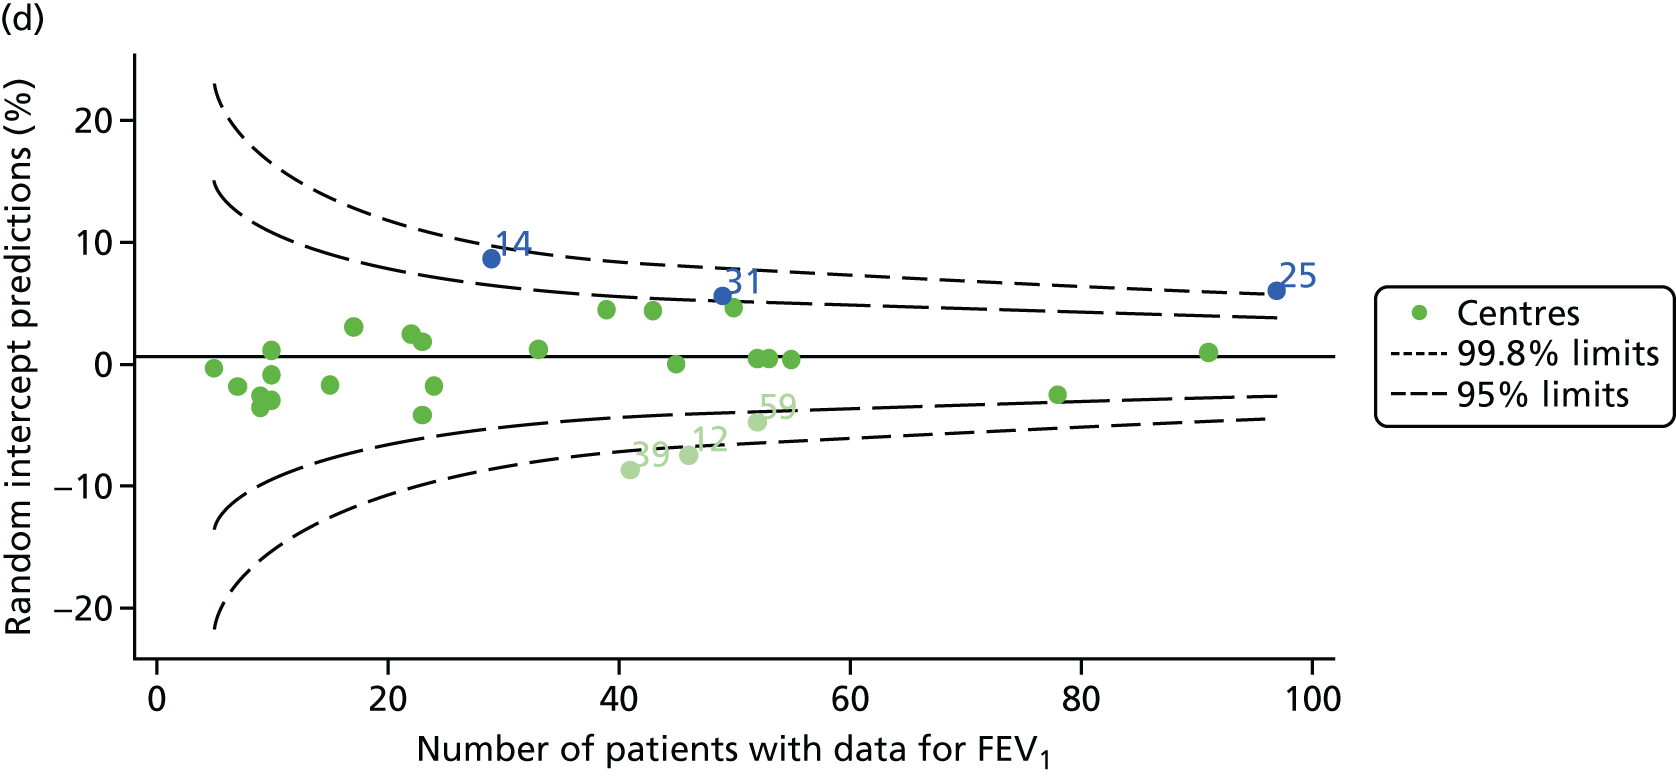
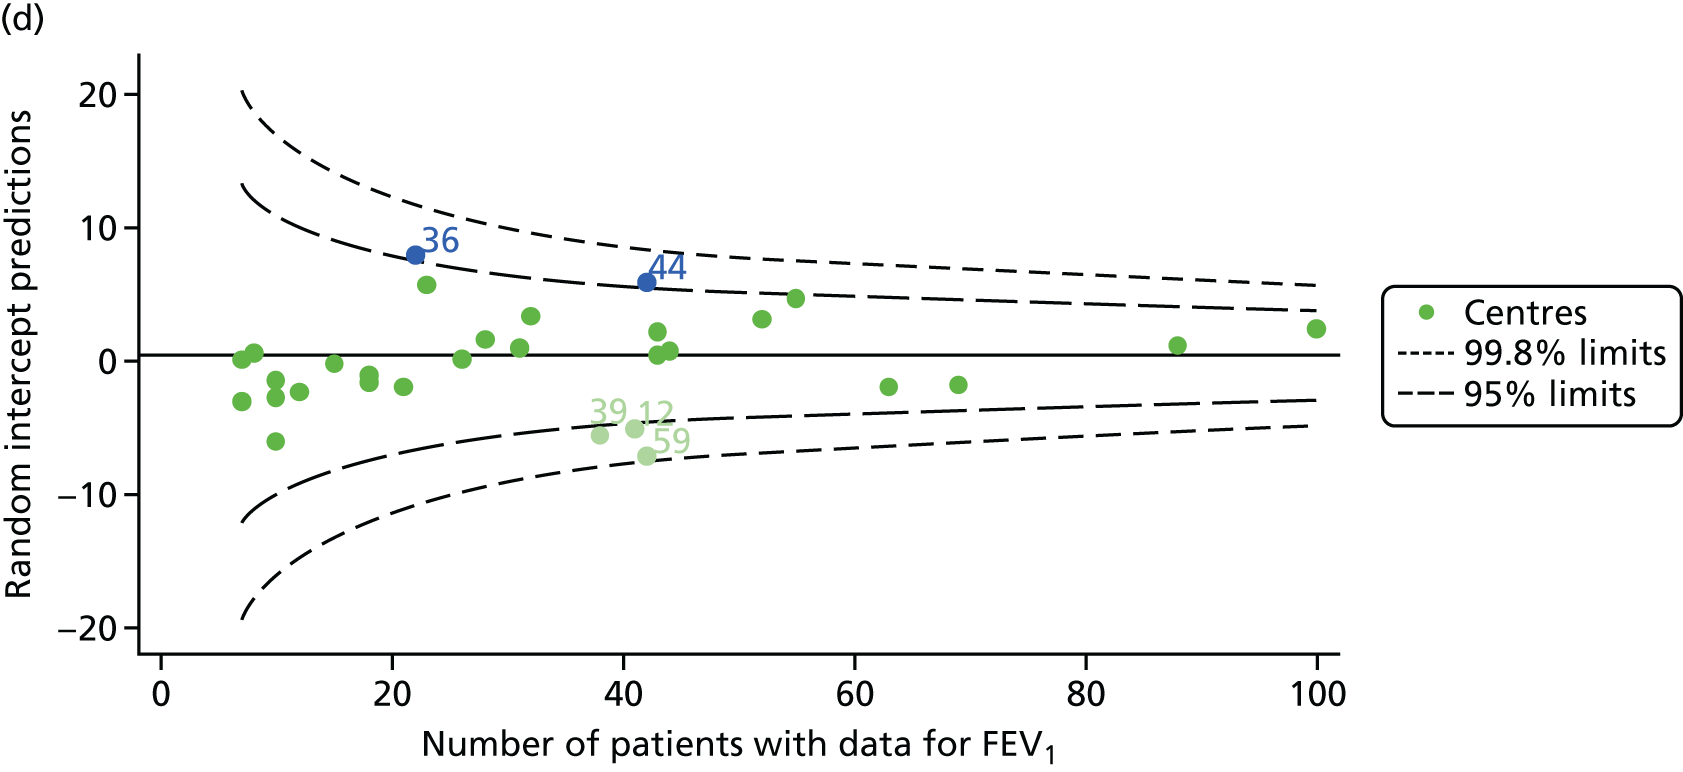
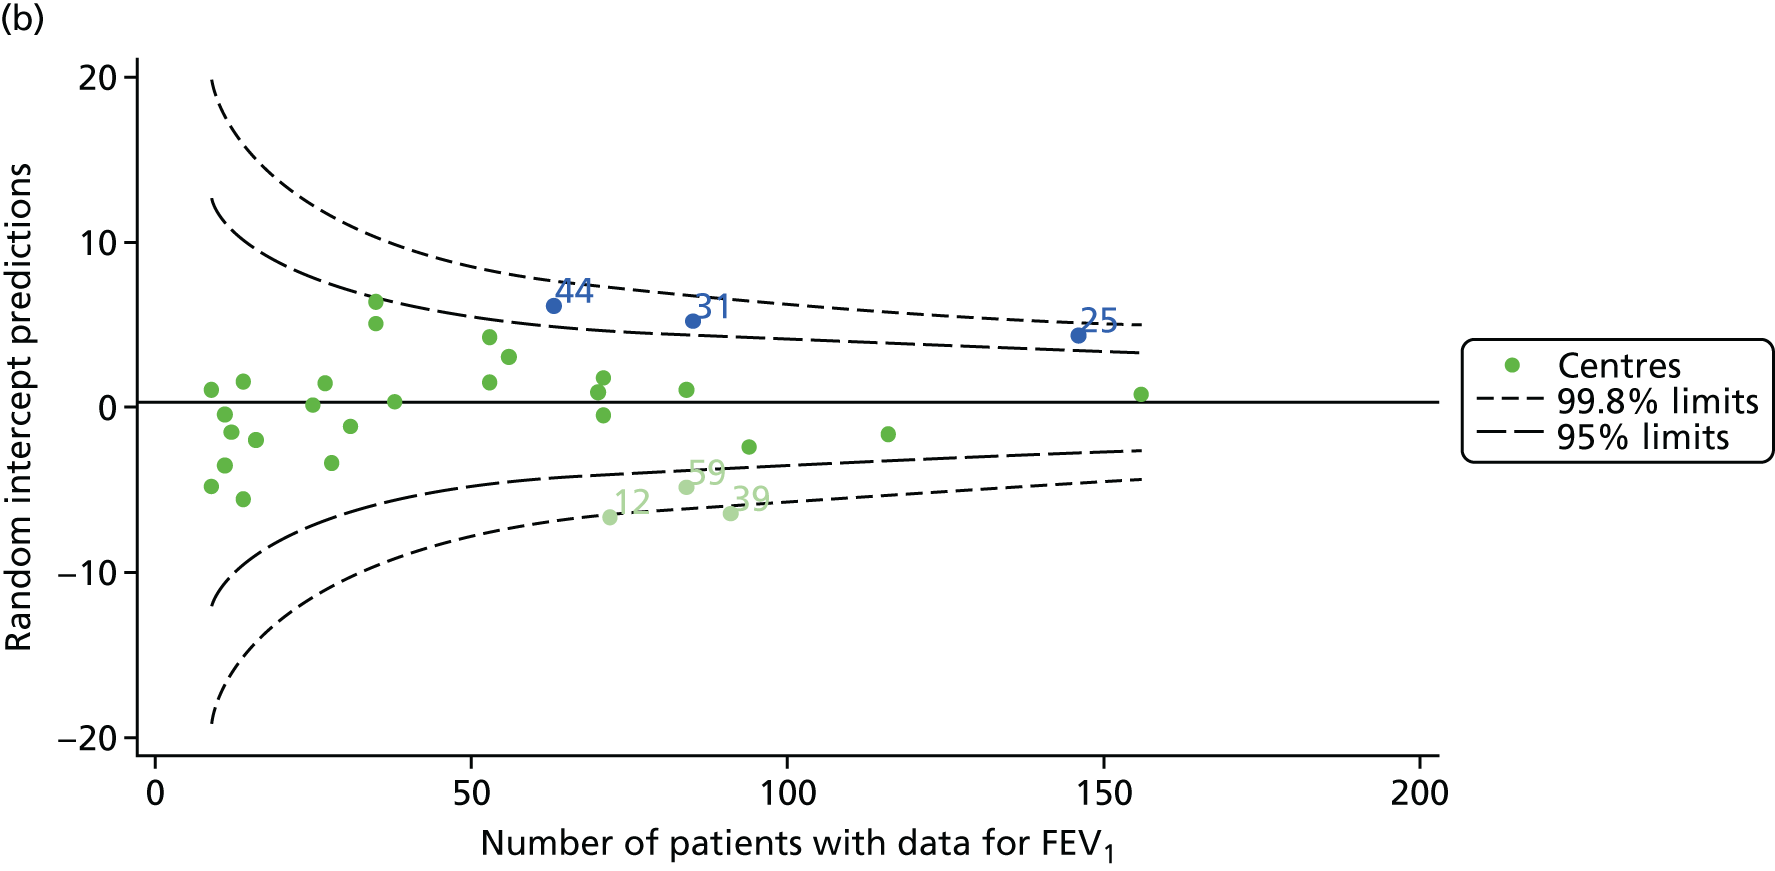
To assess whether or not the observed between-centre variation was attributable to differences in the distribution of case-mix variables, we generated multilevel models of our outcome adjusted for these factors (see Appendix 3, Table 17). The results of our model suggest, as expected, that males have higher FEV1 values than females and that patients taking pancreatic enzyme supplements have lower FEV1 than those not requiring this treatment. There was also some evidence that patients in more socioeconomically deprived areas had lower FEV1 values than those in the most affluent quintiles. A funnel plot of the random effect variation (see Figure 2b) after case-mix adjustment reveals that, although many of the same centres remain outside the 2-SD control limits as in the unadjusted analysis, centre 39 remains outside the 3-SD limits. These results suggest that differences in case mix between centres may be responsible for some – although not all – of the differences in FEV1. Similar results were obtained when FEV1% predicted was calculated using the GLI reference equations (see Figure 2d).
Outcome: FEV1 in children aged 15 years
Data were available for a total of 1151 15-year-olds across the 31 paediatric centres. Of these, only 85 did not have FEV1% predicted values.
Funnel plots illustrated the proportion of patients at each centre with non-missing FEV1% predicted and it was observed that, although the vast majority of centres had good levels of non-missingness (≥ 85%), as was observed with 12-year-olds, centres 43 and 39 exhibited low levels of non-missingness (see Appendix 2, Figure 20a).
The means of the observed FEV1 of 15-year-olds at each of the 31 paediatric centres were plotted into a funnel plot (Figure 3a). Eight centres were outside the 2-SD limits and many (centres 12, 26, 31, 39 and 59) were also outside these limits in the analysis of 12-year-olds. In contrast to the plots of 12-year-olds, however, none of the centres was outside the 3-SD limits.
As was observed in 12-year-olds, case-mix factors differed between centres (see Appendix 2, Figure 21); none of the centres was outside the 3-SD limits.
Our case-mix adjustment model (see Appendix 3, Table 18) showed similar patterns of association for 15-year-olds as was observed for 12-year-olds, in that FEV1 was lower among females, lower for those with a more deprived SES and lower for those taking pancreatic enzyme supplements. The SD of the between-centre variation of the random effect is comparable between the two models. Inspection of the funnel plots of the predicted random intercepts showed no centres outside the 3-SD control limits and showed that larger centres tended to have FEV1 values that were slightly greater than the mean (see Figure 3b).
Analyses were repeated using the GLI reference equations19 and the results were very much the same for the unadjusted funnel plot (see Figure 3c) and the funnel plot adjusted for case mix (see Figure 3d).
Outcome: body mass index percentile in children aged 15 years
In total, BMI percentile data were available for 1117 15-year-olds across the 31 paediatric centres. Funnel plots illustrated the proportion of patients at each centre with non-missing BMI (percentile) and it was observed that, although the vast majority of centres had good levels of non-missingness (≥ 85%) (see Appendix 2, Figure 22), one centre (39) had a lower proportion of missingness than the average.
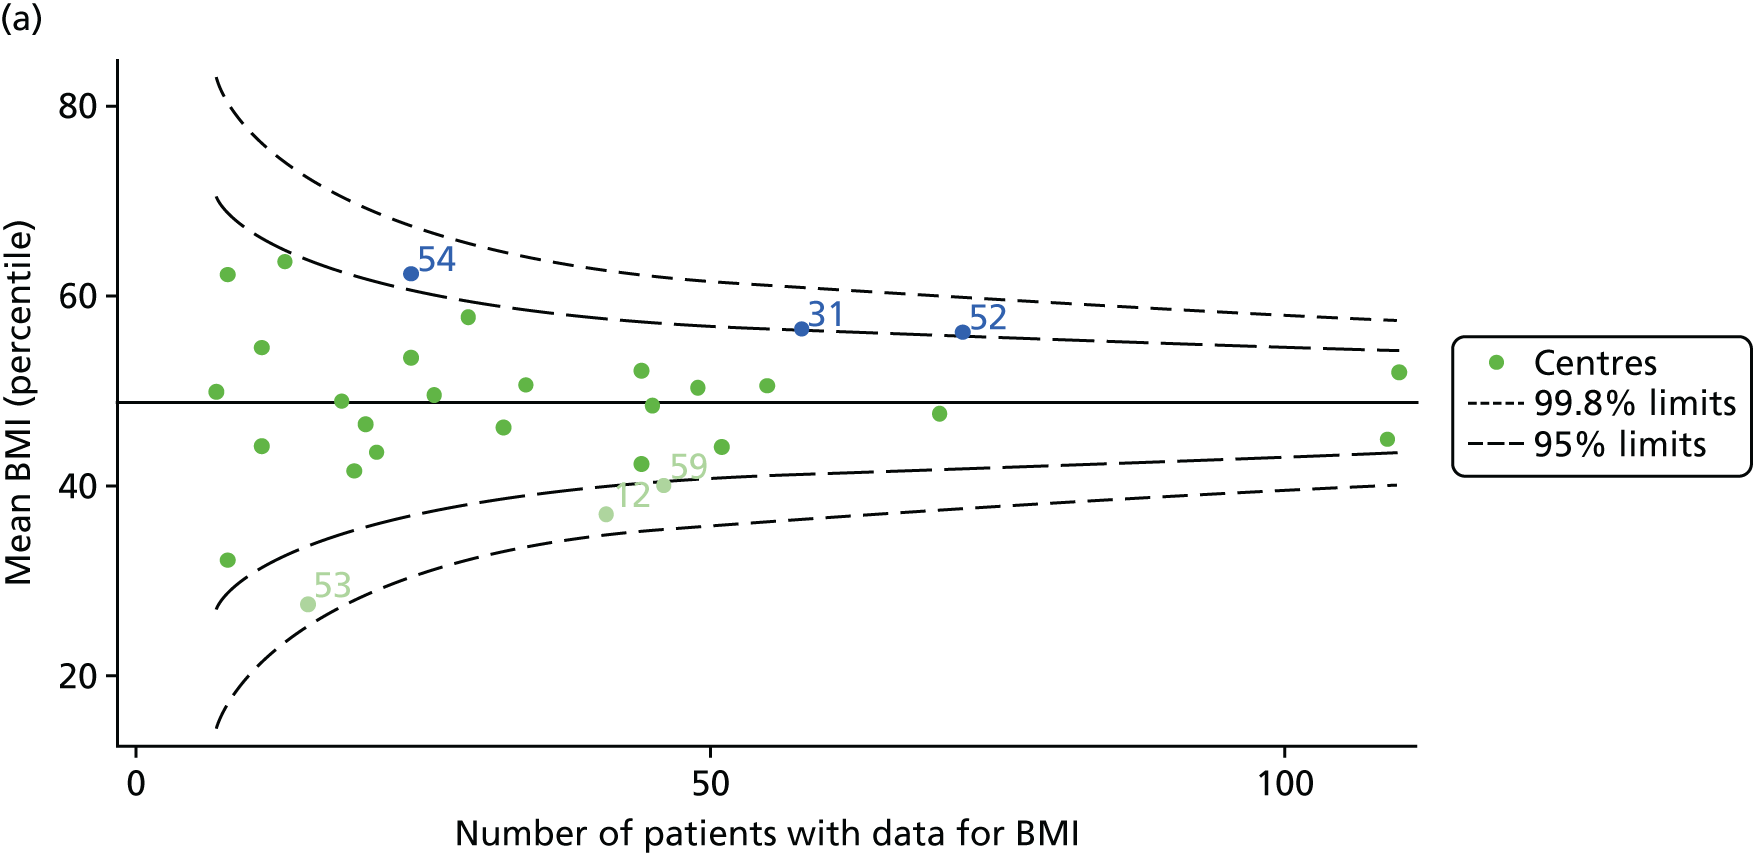
The means of the observed BMI of 15-year-olds at each of the 31 paediatric centres were plotted into a funnel plot (Figure 4a). No centres were outside the 3-SD control limits, but a few were outside the 2-SD limits: centres 31, 52 and 54 had a higher than average BMI percentile and centres 12, 53 and 59 had a lower than average BMI percentile.
FIGURE 4.
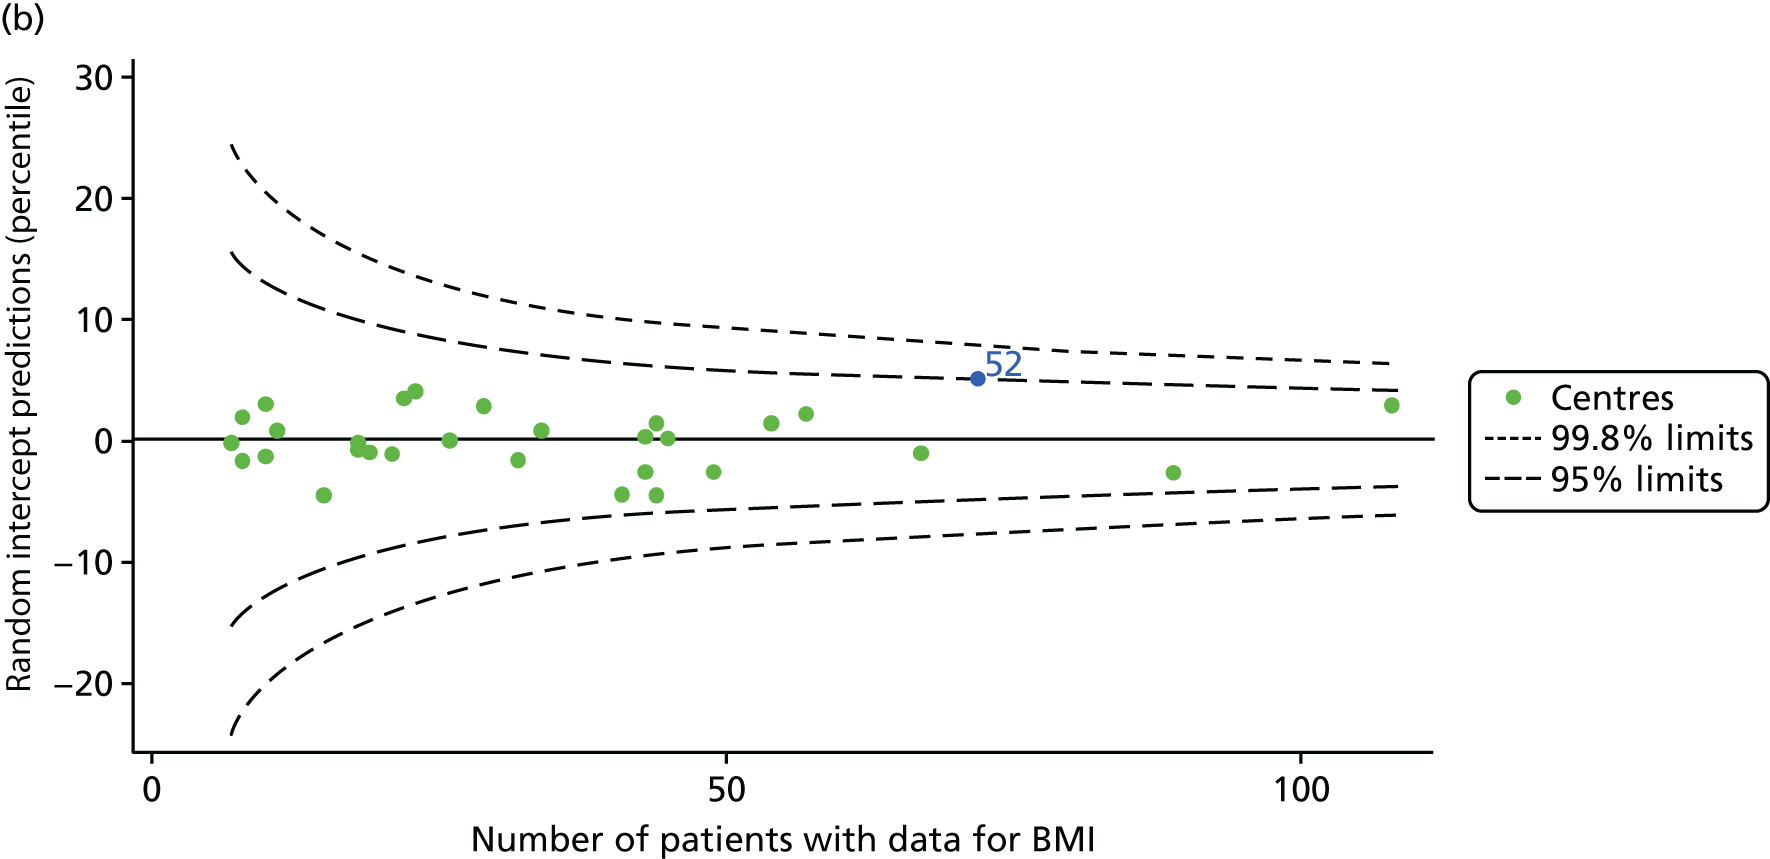
BMI percentile at 15 years of age. (a) Mean of the observed BMI percentile for each of the centres; and (b) predicted random intercepts for BMI percentile for each of the centres.
We considered the same case-mix variables as with our FEV1 analyses and, in case-mix adjusted models, we showed that gender, pancreatic enzyme use and living in the most deprived quintile had a significant effect on lowering a patient’s BMI percentile (see Appendix 3, Table 19).
Inspection of the funnel plots of the predicted random intercepts from the case-mix adjusted model showed no centres outside the 3-SD control limits and only centre 52 near the upper 2-SD limit (Figure 4b).
Outcome: change in FEV1 in children aged 13–15 years
As one of the aims of CF care is to maintain good lung function, we sought to assess whether or not there were statistically meaningful differences between centres in the rate of change of FEV1 during the early teenage years (age 13–15). We identified 1180 patients who had had at least two annual reviews with FEV1% predicted recorded between the ages of 13 and 15 years during the study period. Although most centres contributed data for the vast majority of their patients (see Appendix 2, Figure 23a), centres 39 and 43 had sufficient FEV1 data to calculate decline for < 60% of their eligible patients. These same centres also had poor completeness of FEV1 data for 12- and 15-year-olds, as described in earlier sections.
We performed linear regression analyses for each patient, calculating the annual decline in FEV1 in those aged between 13 and 15 years. These individual changes in FEV1 were then pooled by centre to generate funnel plots of mean change in FEV1 by centre. The mean FEV1 decline across centres was a decline of 1.2% predicted per year (SD = 11.1) and there was equal variability between centres above and below this mean. Although three centres were outside the 2-SD control limits, none was outside the 3-SD limits (Figure 5a).
A multilevel model, using the estimated change in FEV1 as the outcome, was generated to explore the impact of case-mix variables (see Appendix 3, Table 20). Unlike earlier models for FEV1 at ages 12 and 15 years, none of the case-mix variables was statistically significant. Furthermore, the between-centre SD was 0.58, suggesting minimal difference between centres. This was confirmed in a funnel plot of the predicted random intercepts (Figure 5b), in which all centres were very close to the mean.
As described in Chapter 2, when using multilevel modelling for case-mix adjustment it is possible that the model draws centre estimates to the overall mean in a process known as ‘shrinkage’. This can give the false impression that it is the case-mix variables that are responsible for differences between centres.
To explore the potential role of shrinkage in our case-mix adjusted analysis, we re-ran the adjustment using fixed-effects GLMs. This analysis showed one centre to be outside the 3-SD limits (centre 54; see Appendix 2, Figure 24). The fixed-effects case-mix adjustment model explained very little of the variability in the outcome (R2 = 0.0071), however, making it difficult to infer what the centre-level estimate means.
Analyses in young adolescents: 2007–15
Our analyses of children aged 12 and 15 years – described in the previous three sections – were repeated with the addition of annual review data from 2013 to 2015. When these data became available to researchers, we used them to see if our previous findings were altered by the inclusion of the new data. We did not explore lung function decline between 13 and 15 years of age as there was no evidence of special-cause variation in the case-mix adjusted results using multilevel modelling; we felt that it was highly unlikely that this would change with the addition of further data.
Outcome: FEV1 in children aged 12 years (2007–15)
With the addition of the 2013–15 data, we had annual review data on 1853 12-year-olds attending paediatric CF centres. Of these, 1737 (93.7%) had non-missing FEV1% predicted data. These patients came from the same centres as studied previously, but now each centre contributed the data of more patients to the analysis.
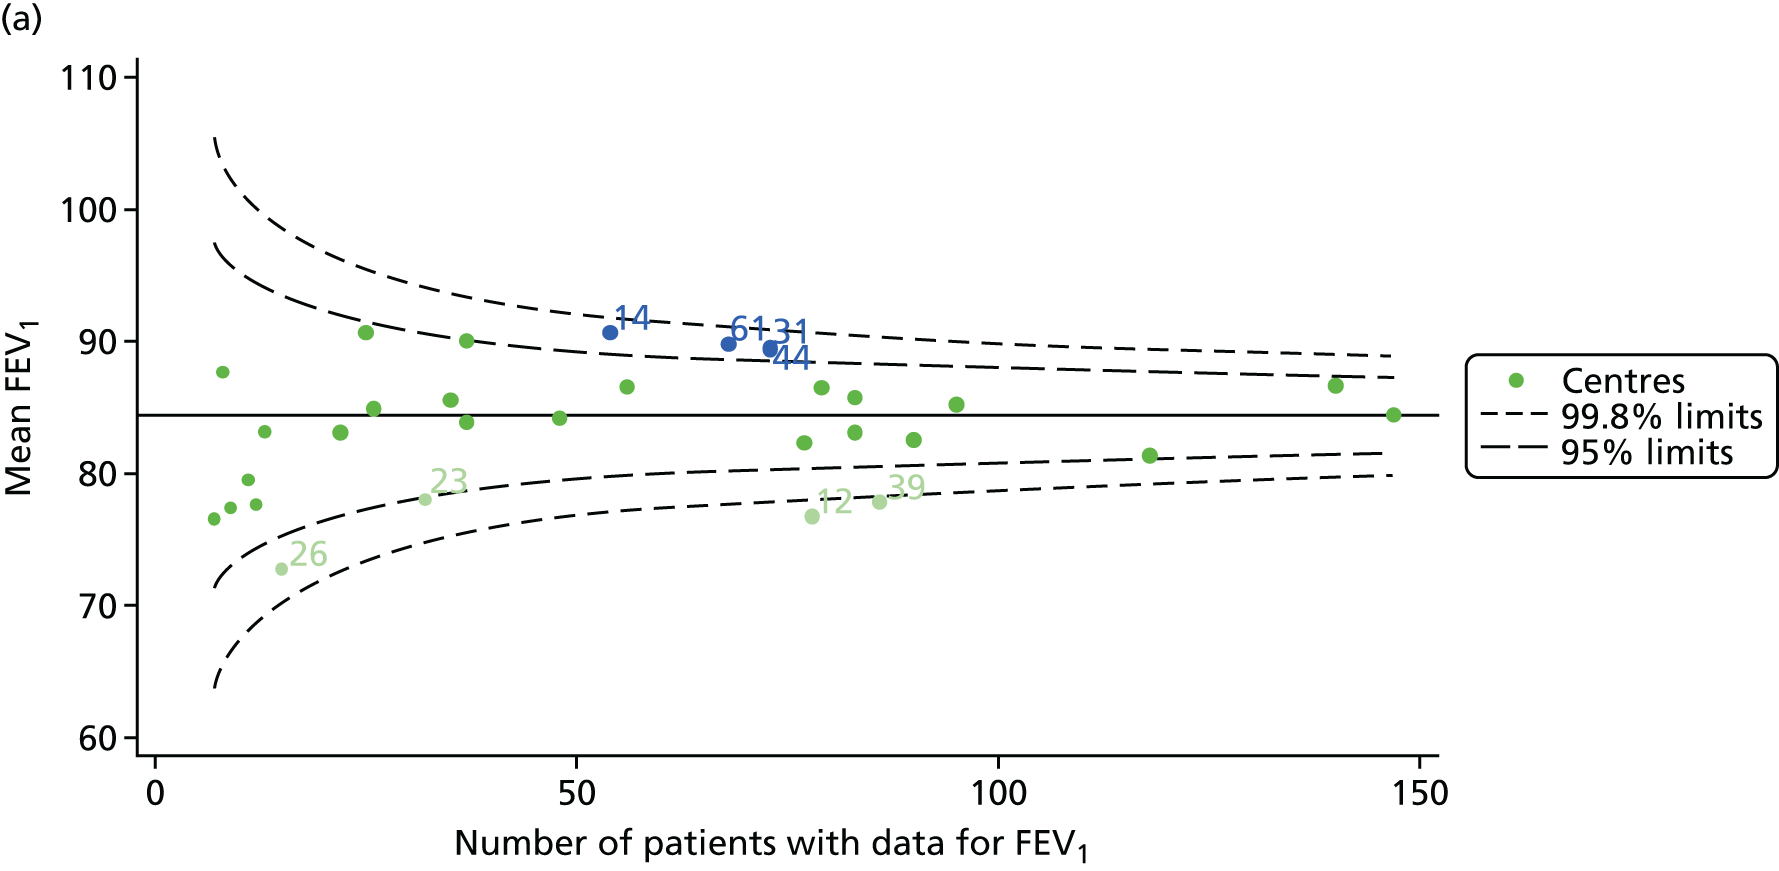
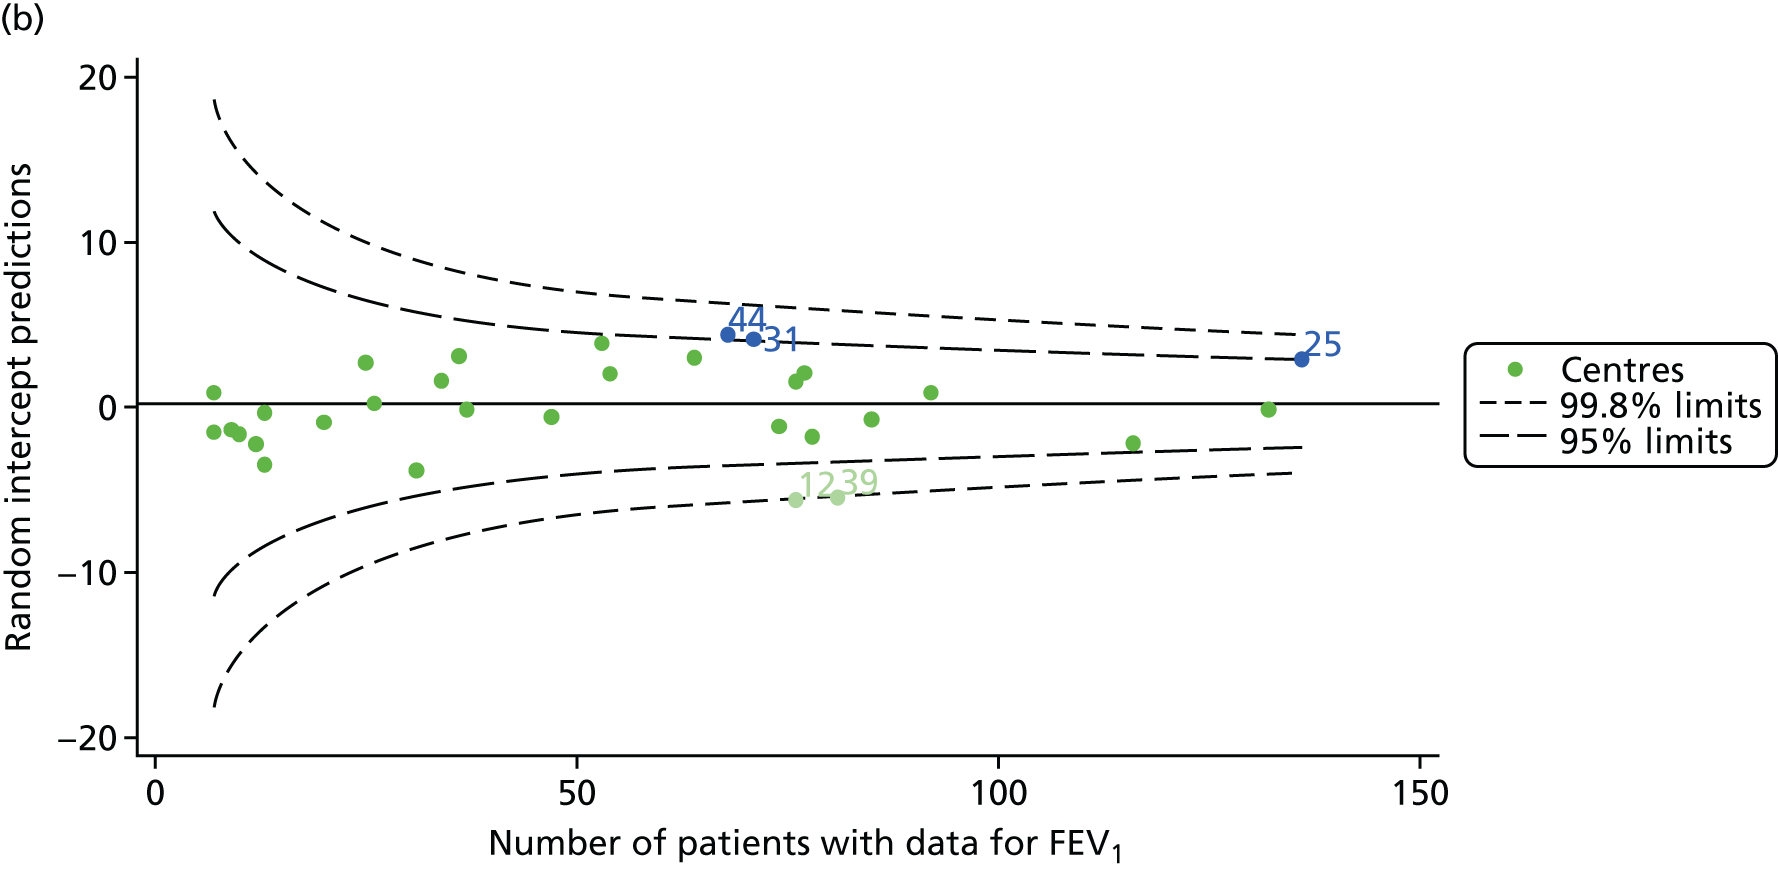
The means of the observed (i.e. not case-mix adjusted) FEV1% predicted were plotted into a funnel plot (Figure 6a). As with the analysis of the 2007–12 data, the plots showed eight centres to be outside the 2-SD control limits, although these were not the same centres as before (see Figure 2a). Only two of the centres (12 and 39) were outside the 3-SD limits, and these remained outside after case-mix adjustment (Figure 6b). In our original analysis, centre 25 was on the upper 3-SD control limit after case-mix adjustment (see Figure 2b), but, when the later data were added, this centre was drawn closer to the overall mean.
As in the analysis of change in FEV1, we explored the role of shrinkage by generating a funnel plot of the ‘percentage predicted’; the outcome is presented in Appendix 2, Figure 25. This model shows some consistency with Figure 6b, in which, after case-mix adjustment, centres 12 and 39 remained outside the 3-SD control limits. Interestingly, smaller centres such as 23 and 26 – which, when using multilevel models for case-mix adjustment, moved from between the lower 2- and 3-SD control limits to well within the 2-SD limits – remained outside the 2-SD limits when the role of shrinkage was explored, but they were never outside the 3-SD control limits. Our results suggest, however, that case mix was not necessarily the driver in moving these centres closer to the overall mean.
Outcome: FEV1 in children aged 15 years (2007–15)
With the addition of the 2013–15 data, we had annual review data on 1844 15-year-olds attending paediatric CF centres. Of these, 1736 (94.1%) had non-missing FEV1% predicted data.
The means of the observed FEV1 of 15-year-olds at each of the 31 paediatric centres were plotted into a funnel plot (Figure 7a). Eleven centres were outside the 2-SD limits, including all of those identified in the earlier analysis using data from 2007–12 (see Figure 3a). Using the more recent data, however, moved three of the centres outside the 3-SD control limits (centres 12, 31 and 39), in addition to bringing three centres outside the 2-SD limits for the first time (centres 18, 25 and 61). After case-mix adjustment, many of these centres were brought within the 2-SD limits, but centres 12 and 39 remained outside the lower 3-SD limit.
We explored the effect of shrinkage on our results (see Appendix 2, Figure 26). As seen in the earlier case-mix adjusted analysis in Figure 7, centres 12 and 39 had FEV1 values outside the lower 3-SD control limit. Centre 31, however, shifted slightly to within the 3-SD limits.
Outcome: body mass index percentile in children aged 15 years (2007–15)
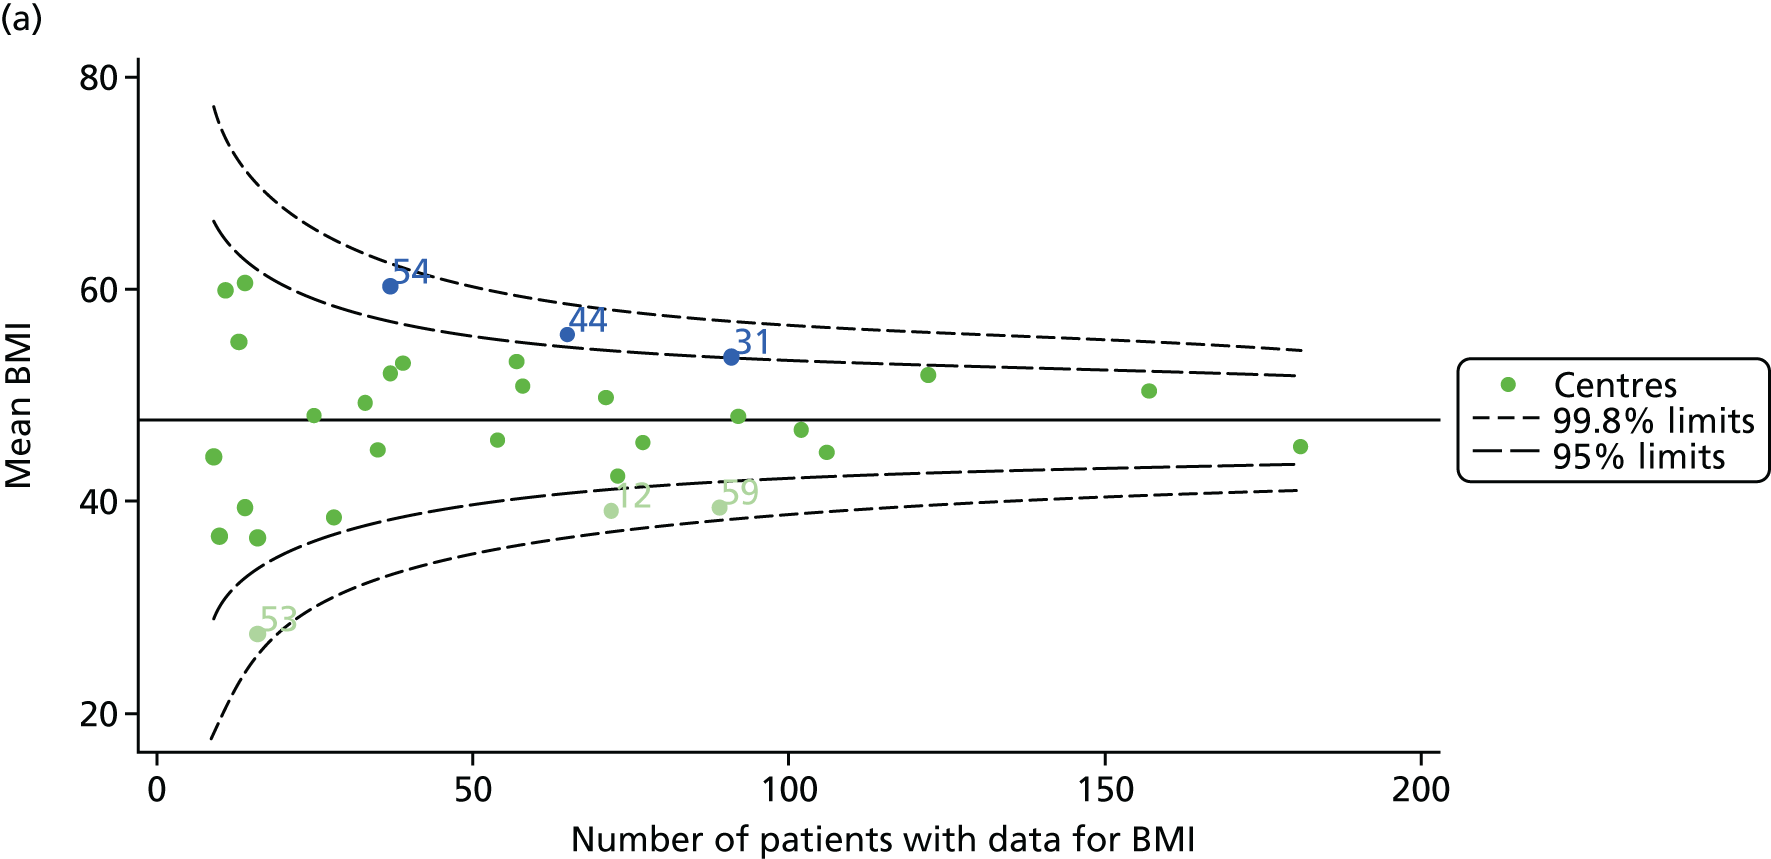
Incorporating data from 2013–15 increased the number of 15-year-olds with non-missing BMI percentile data to 1804. As in the original analysis, there were no centres outside the 3-SD control limits (Figure 8a) and the same centres tended to be outside the 2-SD limits as in the original analysis (see Figure 4). The only differences were centre 52, which was no longer outside the upper 2-SD limit, and centre 44, which moved outside the upper 2-SD limit. Case-mix adjustment largely brought centres closer to the mean and in the updated analysis only centre 59 was outside the 2-SD control limits after case-mix adjustment.
FIGURE 8.
BMI percentile at 15 years of age. (a) Mean of the observed BMI percentile for each of the centres; and (b) predicted random intercepts for BMI percentile for each of the centres.
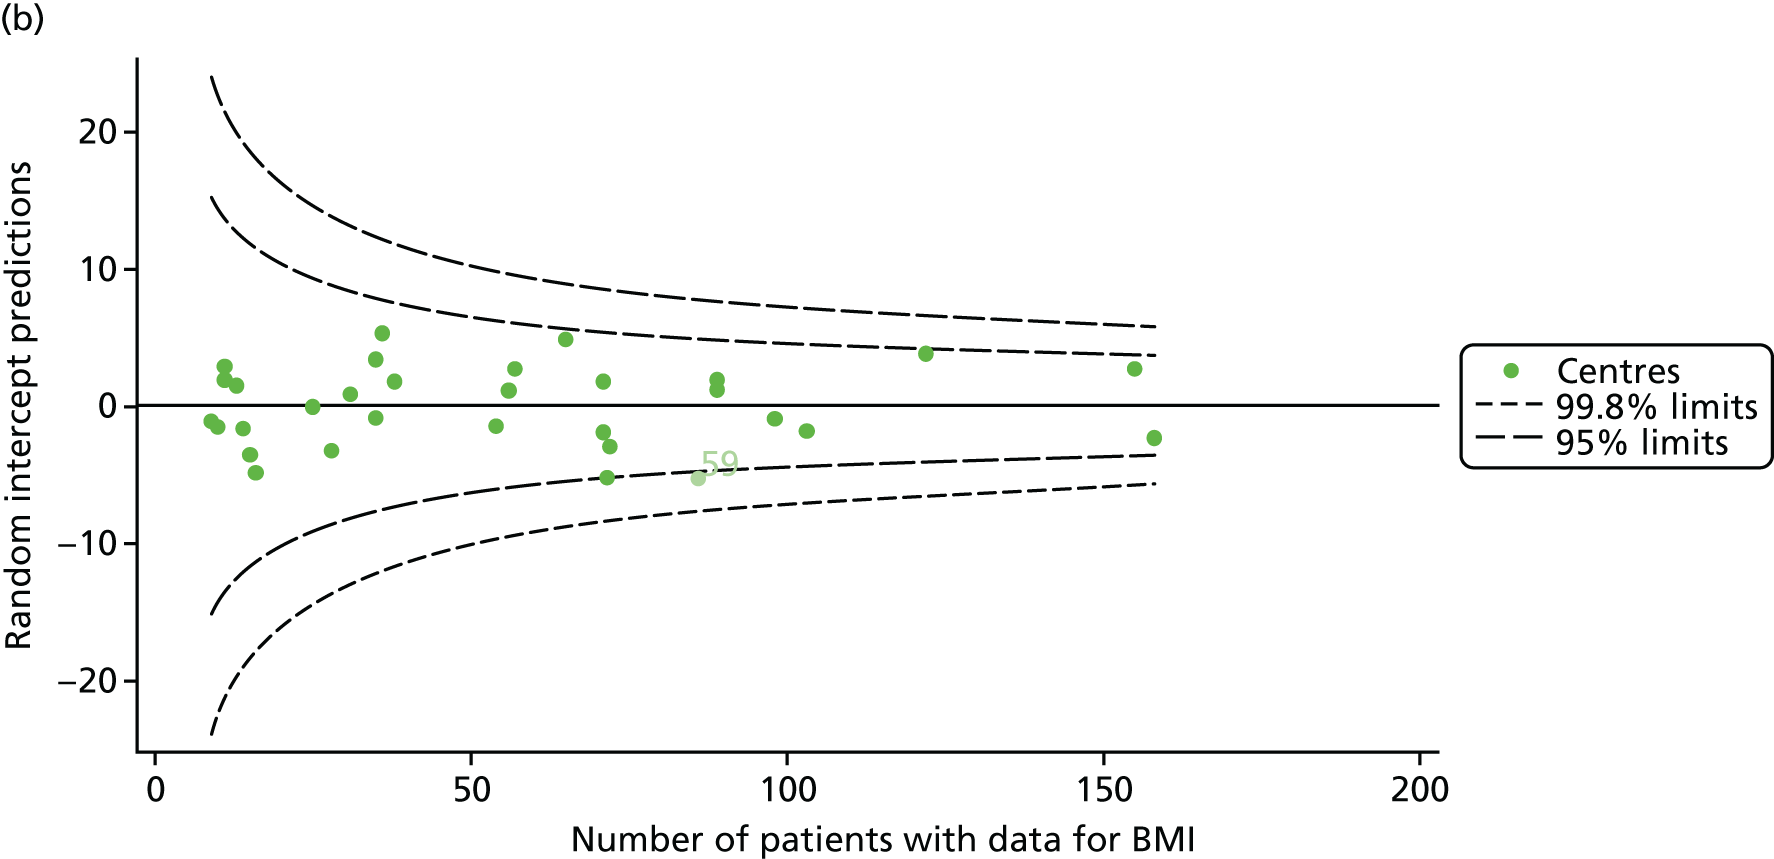
As seen in Figure 8, when we used fixed-effects modelling to explore the role of shrinkage, we found that none of the centres was outside the 3-SD control limits (see Appendix 2, Figure 27).
Analyses in all children aged 6–15 years, by year (2007–15)
To complement the analyses of outcomes in targeted age groups that were carried out by pooling data across multiple years, we conducted all-age analyses by year. By exploring outcomes in all ages year by year, we can see whether or not there are trends in clinical outcomes.
For the analyses of paediatric centres we focused on FEV1% predicted in all patients aged 6–15 years, excluding those patients who had previously had a lung transplant as these patients are likely to have much better lung function. First, we used FEV1, measured using the Knudson reference equations18 as reported in the UK CF Registry, and, second, sensitivity analyses were performed (see Global Lung Function Initiative reference equations) using the GLI reference equations. 19
We considered data from 2007 to 2015 inclusive; the number of patients having annual reviews, and those providing FEV1 data at these reviews, had changed over that period, reflecting overall improvements in the completeness of the UK CF Registry, as highlighted in Table 2.
| Contributing data | 2007 | 2008 | 2009 | 2010 | 2011 | 2012 | 2013 | 2014 | 2015 |
|---|---|---|---|---|---|---|---|---|---|
| Number of centres | 28 | 30 | 31 | 31 | 31 | 31 | 31 | 31 | 31 |
| Total number of annual reviews | 1315 | 1742 | 2111 | 2201 | 2290 | 2271 | 2339 | 2321 | 2376 |
| Total number of FEV1% predicted measures | 1230 | 1586 | 1834 | 1958 | 2104 | 2121 | 2074 | 2078 | 2149 |
Unadjusted analyses
Centre-level analyses unadjusted for any case-mix factors illustrated that centres varied widely in size and that outcomes varied between centres (Figure 9a and b).
FIGURE 9.
Funnel plots of FEV1 unadjusted for case mix, by year. (a) 2007; (b) 2008; (c) 2009; (d) 2010; (e) 2011; (f) 2012; (g) 2013; (h) 2014; and (i) 2015.

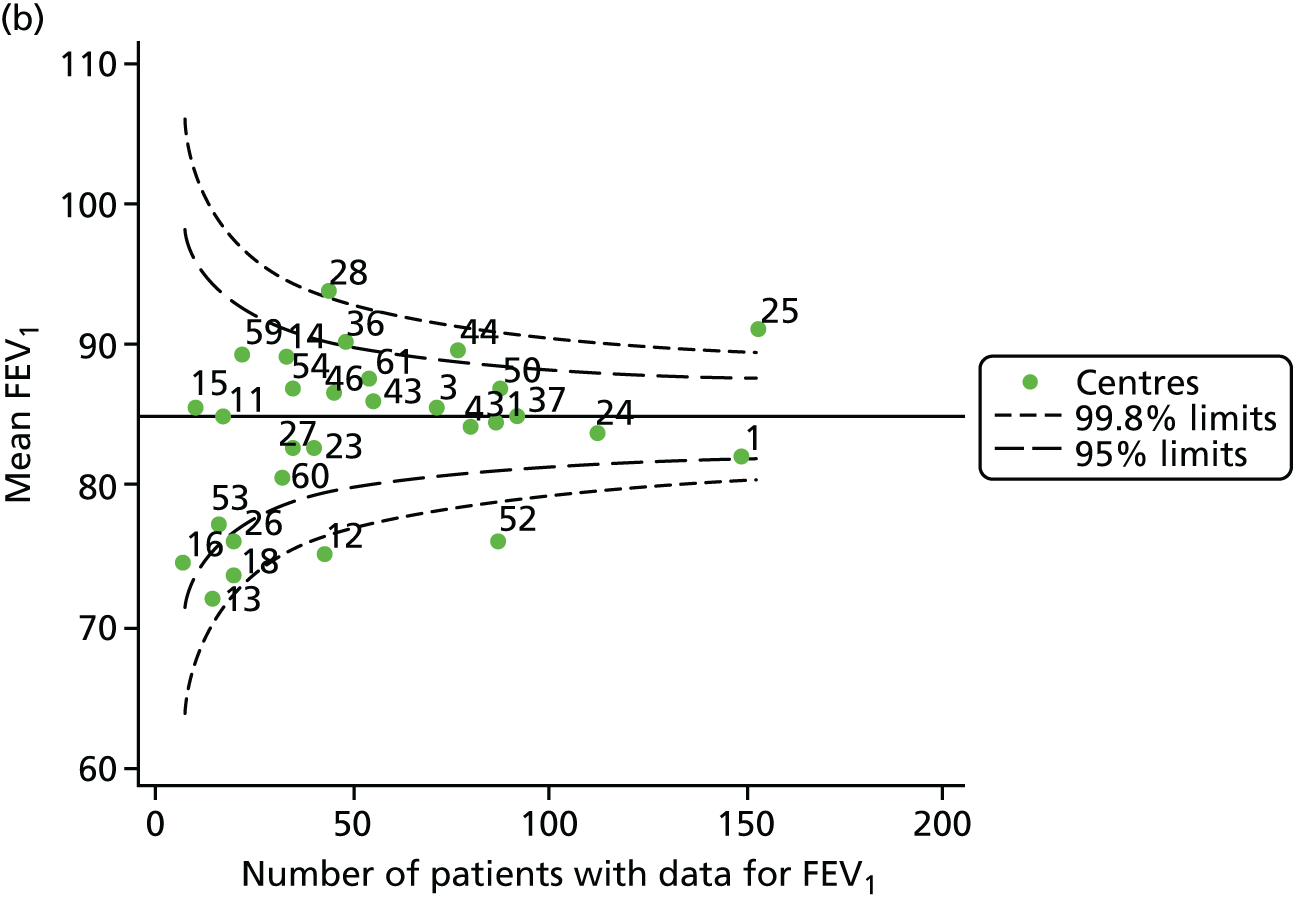
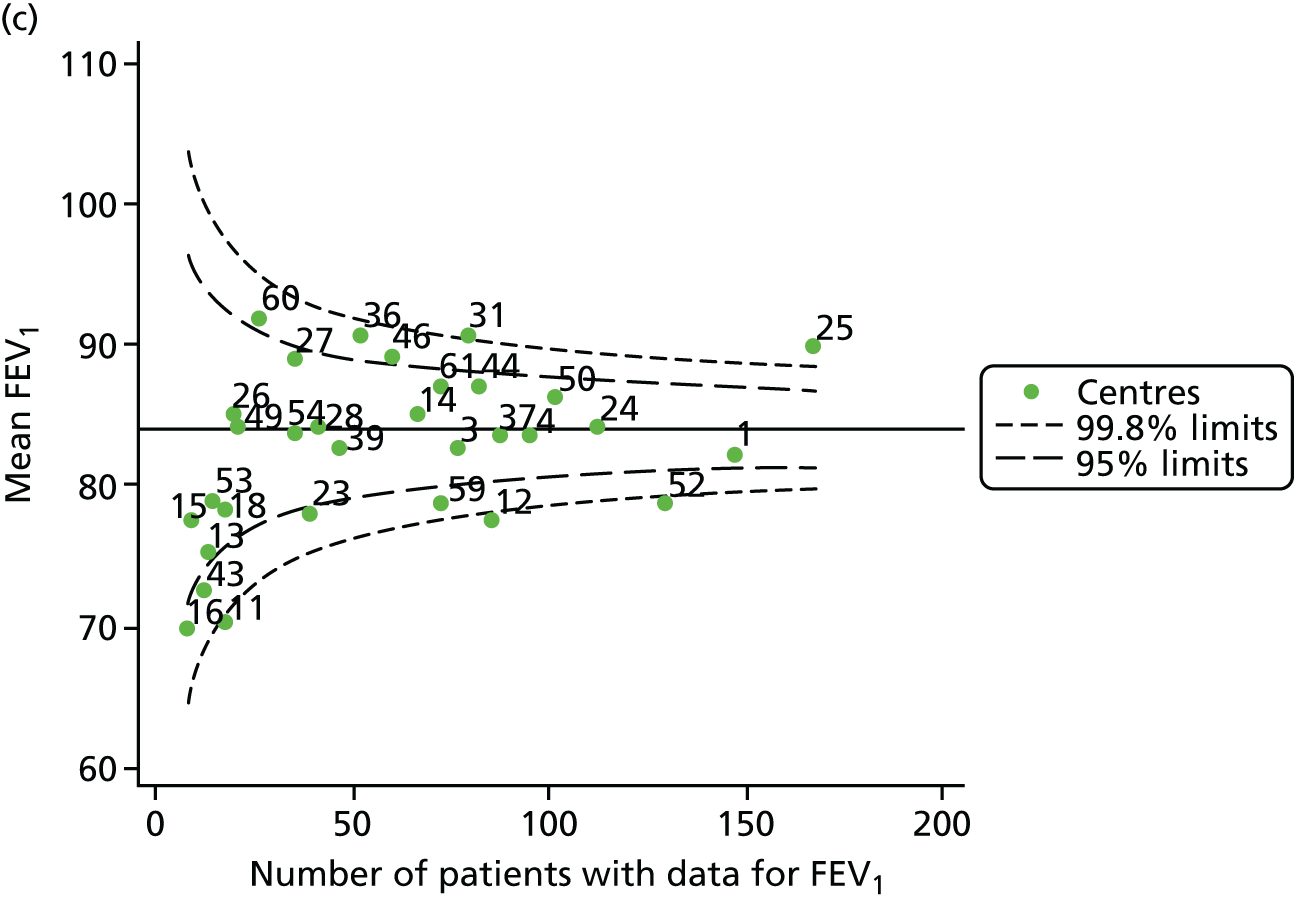

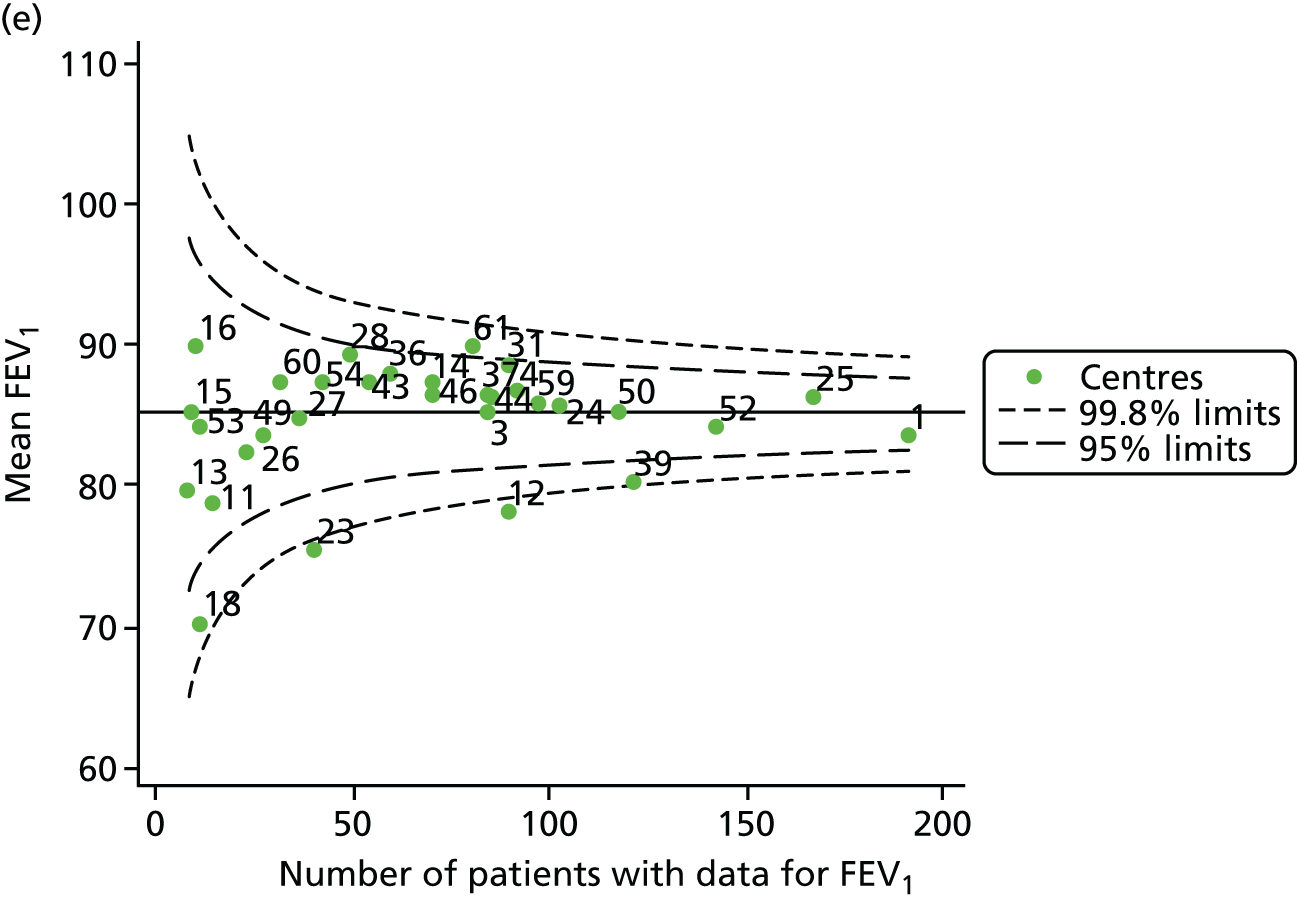
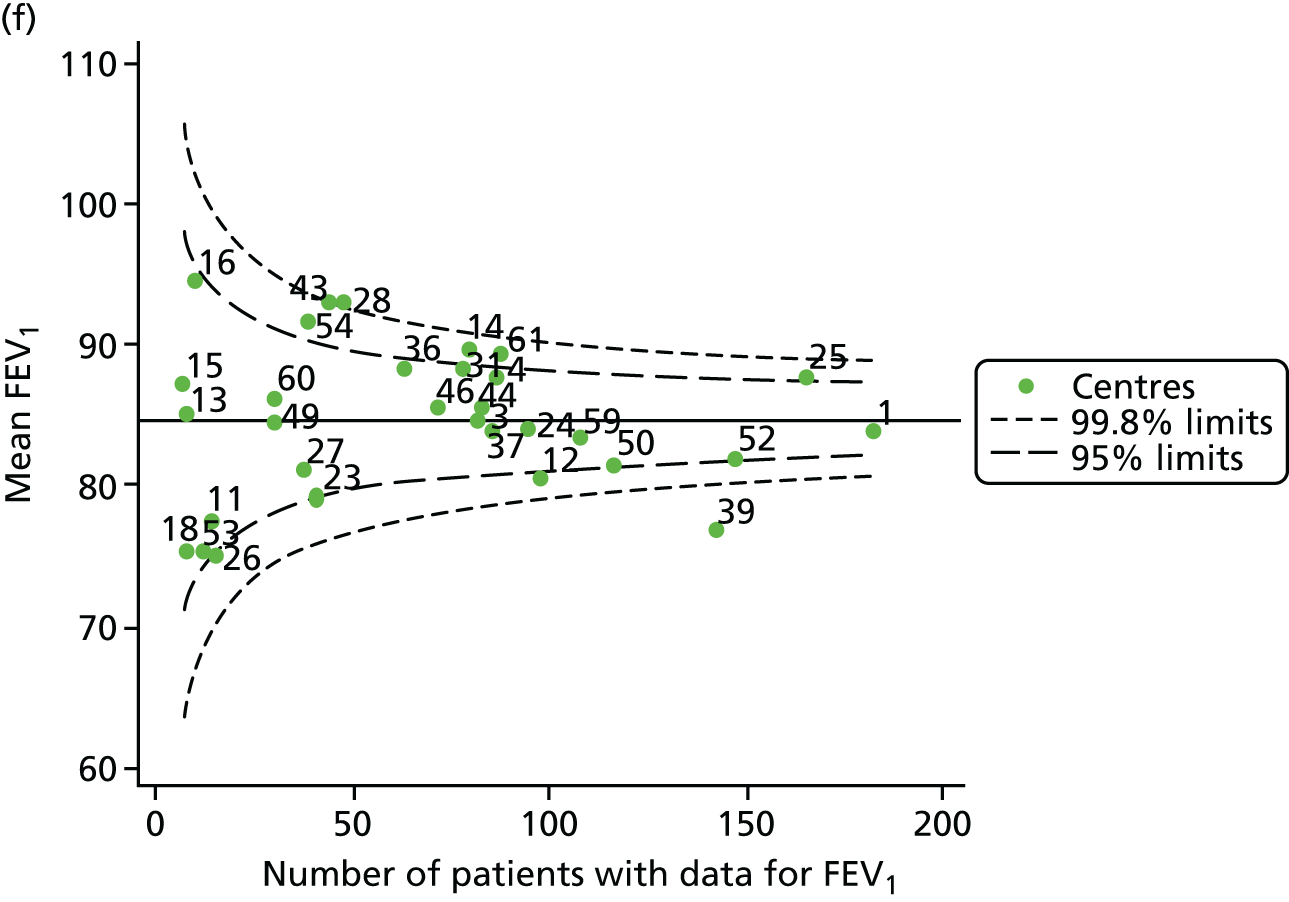
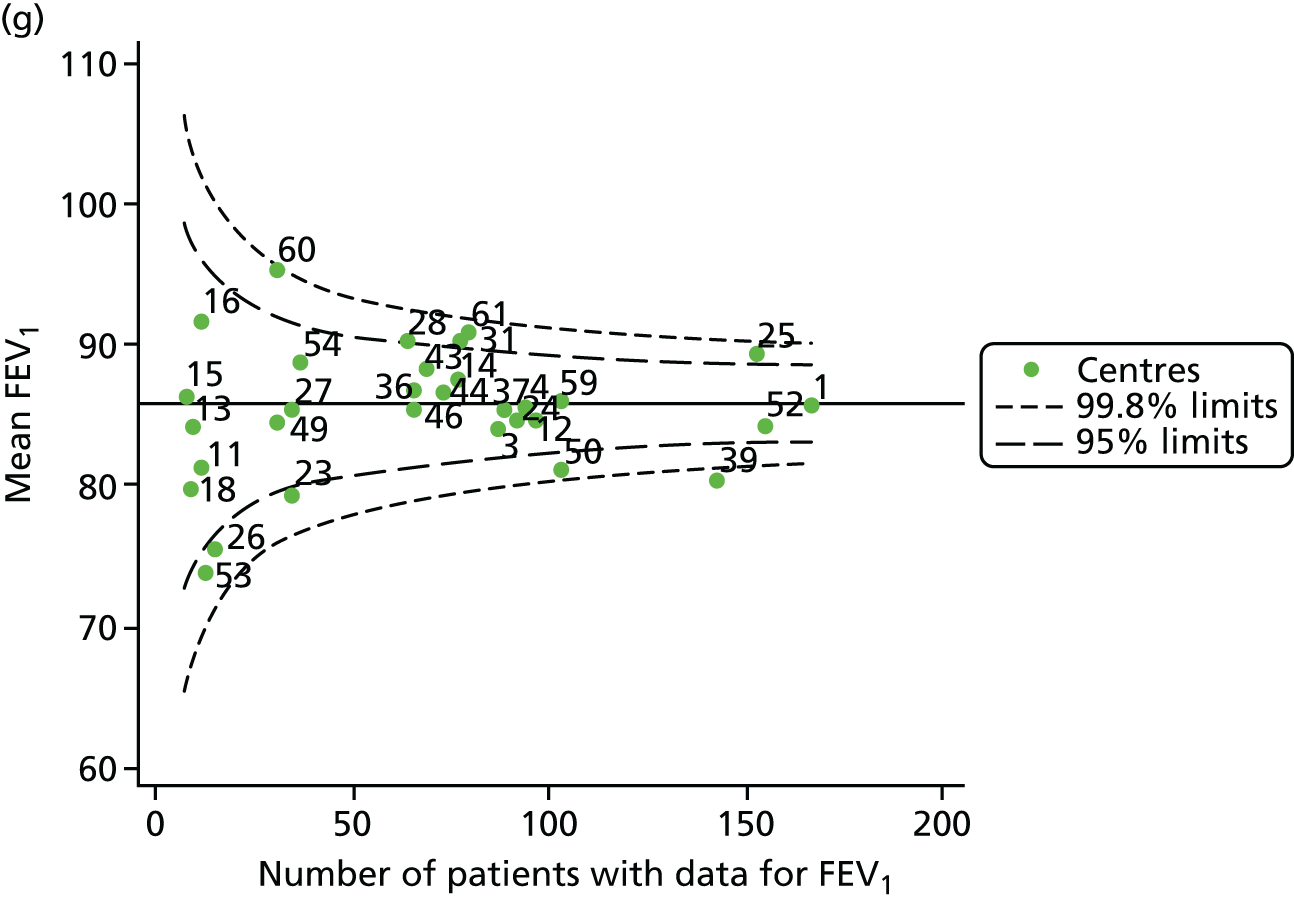
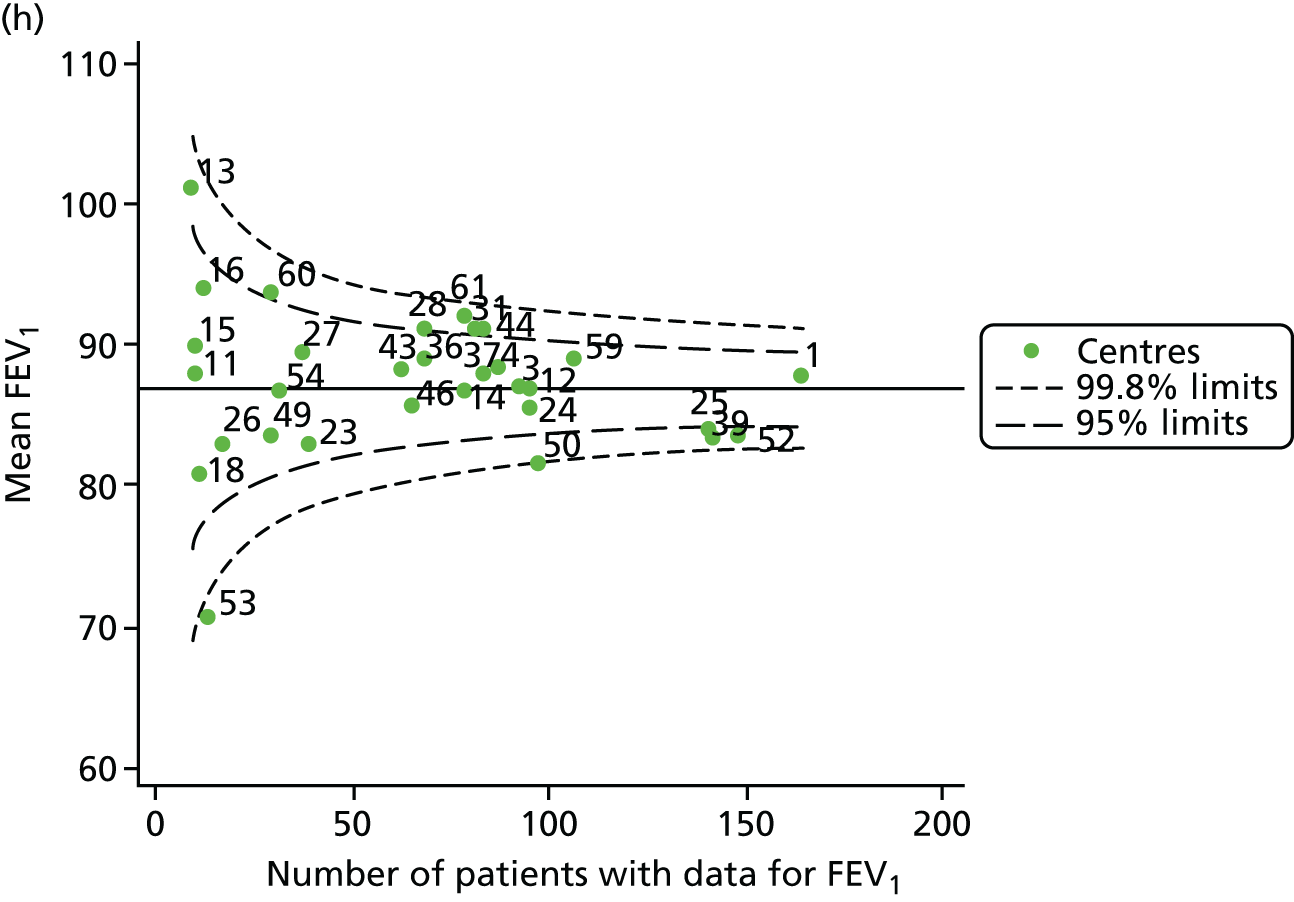
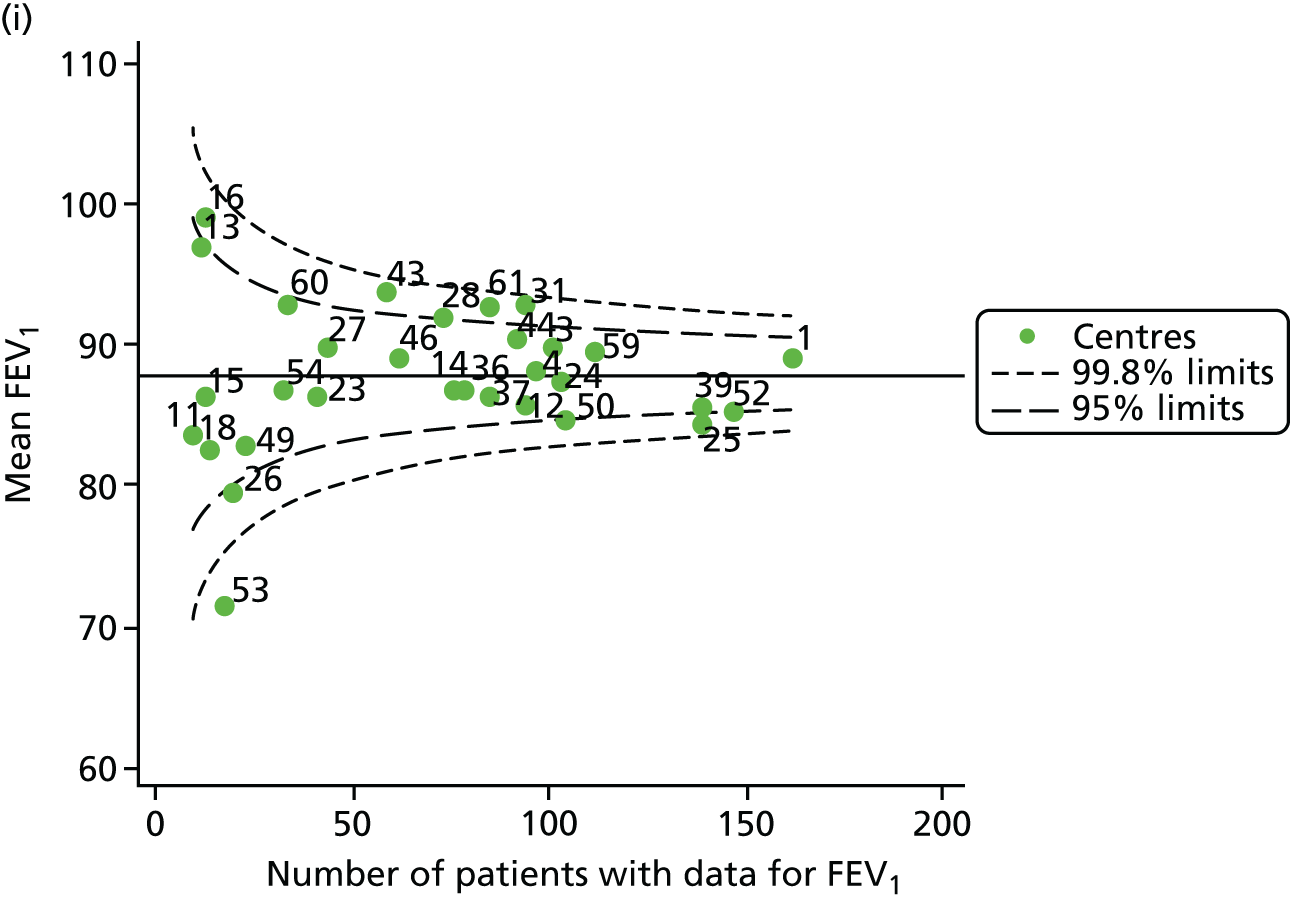
Each year’s plot was investigated to see whether or not centres appeared inside or outside the 2- or 3-SD control limits. We also took note of centres that ‘hovered’ near control limits without being outside those limits, so that we could monitor whether or not they had crossed the control limits previously or in subsequent years. These results are summarised in Table 3.
| Year | Centres with lower than average FEV1 values | Centres with higher than average FEV1 values | ||
|---|---|---|---|---|
| Outside lower 3-SD limit | Outside lower 2-SD limit | Outside upper 2-SD limit | Outside upper 3-SD limit | |
| 2007 | 12, 52 and 59 | 11, 16,a 23 and 53a | 14, 31, 36, 37 and 54 | 25 |
| 2008 | 12 and 52 | 1, 13, 18 and 26 | 36 and 44 | 25 and 28 |
| 2009 | 11, 12 and 52 | 16, 23, 43 and 59 | 36, 46 and 60 | 25 and 31 |
| 2010 | 12 and 39 | 23, 52 and 59 | 36, 46a and 54a | 31 |
| 2011 | 12 and 23 | 18 and 39 | 31a and 61 | – |
| 2012 | 39 | 23,a 26, 50a and 52a | 25, 31,a 43 and 54 | 28 |
| 2013 | 39 | 23, 26, 50 and 53 | 25, 28, 31 and 61 | 60 |
| 2014 | 53 | 25, 39, 50 and 52 | 13, 28, 31, 44, 60 and 61 | – |
| 2015 | 53 | 25, 26, 39,a 50 and 52a | 16, 28, 31, 43, 60a and 61 | – |
We note that a large number of centres appear between the 2- and 3-SD limits and few appear to be outside the upper 3-SD limit, which indicates higher than average FEV1 values. The patterns in the data suggest that some centres appear outside (or near) the 3-SD control limits repeatedly, and we focused our attention on these.
-
Centres with lower than average FEV1 values: the centres appearing outside the lower 3-SD limit most frequently were centres 12, 39 and 52. Centres 12 and 52 were outside the limits in the early years (2007–11) but subsequently moved to within the limits and sometimes within the 2-SD limits. Centre 39, in contrast, was outside the 3-SD limits in the later years (2010, 2012 and 2013) and similarly moved within the 2-SD limits outside these years.
-
Centres with higher than average FEV1 values: the centres appearing outside the upper 2- or 3-SD limits most frequently are centres 25, 28 and 31. From 2013, however, they were generally between the 2- and 3-SD limits.
As was done with the earlier age-specific analyses, we conducted a pyramid of investigation approach to understanding the data.
Pyramid of investigation: data
The UK CF Registry was re-established in 2007 and since then has grown progressively. In 2012, data from the annual reviews on the CF Registry were used for banding centres for funding. Although funding is linked to other features in addition to severity of FEV1 impairment, it has encouraged centres to provide complete data. The growing number of patients providing annual review data therefore reflects, in part, this push for greater data completeness. To explore whether or not the patterns observed in Figure 9 are related to the changing centre size, and changing proportions of data completeness for FEV1, we present the frequencies and proportions by centre and year in Table 4.
| Centre | 2007 | 2008 | 2009 | 2010 | 2011 | 2012 | 2013 | 2014 | 2015 | ||||||||||||||||||
|---|---|---|---|---|---|---|---|---|---|---|---|---|---|---|---|---|---|---|---|---|---|---|---|---|---|---|---|
| AR | FEV1 | % NM | AR | FEV1 | % NM | AR | FEV1 | % NM | AR | FEV1 | % NM | AR | FEV1 | % NM | AR | FEV1 | % NM | AR | FEV1 | % NM | AR | FEV1 | % NM | AR | FEV1 | % NM | |
| Centres with lower than average FEV1 values | |||||||||||||||||||||||||||
| 12 | 41 | 40 | 98 | 49 | 43 | 88 | 92 | 85 | 92 | 98 | 95 | 97 | 94 | 89 | 95 | 102 | 98 | 96 | 104 | 96 | 92 | 103 | 95 | 92 | 98 | 93 | 95 |
| 39 | – | – | – | 1 | 1 | 100 | 126 | 46 | 37 | 169 | 97 | 57 | 179 | 121 | 68 | 178 | 143 | 80 | 170 | 142 | 84 | 168 | 141 | 84 | 157 | 138 | 88 |
| 52 | 79 | 78 | 99 | 89 | 87 | 98 | 136 | 129 | 95 | 131 | 121 | 92 | 149 | 142 | 95 | 155 | 148 | 95 | 168 | 154 | 92 | 157 | 148 | 94 | 164 | 146 | 89 |
| Centres with higher than average FEV1 values | |||||||||||||||||||||||||||
| 25 | 144 | 126 | 88 | 165 | 153 | 93 | 181 | 167 | 92 | 175 | 162 | 93 | 178 | 167 | 94 | 175 | 166 | 95 | 168 | 152 | 90 | 156 | 140 | 90 | 155 | 138 | 89 |
| 28 | 42 | 40 | 95 | 45 | 44 | 98 | 43 | 41 | 95 | 50 | 47 | 94 | 51 | 49 | 96 | 51 | 48 | 94 | 68 | 63 | 93 | 76 | 68 | 89 | 74 | 72 | 97 |
| 31 | 65 | 63 | 97 | 93 | 86 | 92 | 86 | 79 | 92 | 95 | 89 | 94 | 96 | 89 | 93 | 85 | 78 | 92 | 91 | 77 | 85 | 99 | 81 | 82 | 104 | 93 | 89 |
For many centres there was an increase in the number of annual reviews at each centre over time, with lower numbers of annual reviews in 2007 and 2008.
As well as considering the number of annual reviews submitted, we also considered what percentage of these annual reviews included non-missing FEV1 data. This should be near 100%, as FEV1 constitutes an important component of annual reviews for CF, and this result was observed for the majority of centres. Non-missingness was generally > 80%, although of notable exception is centre 39, which had a period between 2009 and 2011 during which non-missingness ranged from 37% to 68%. The centre was outside at least the 2-SD limits from 2010 to 2013, covering both this period of poor data completeness and the period in which rates of non-missingness improved.
Prior to being disseminated, UK CF Registry data undergo quality checks by those preparing the CF Registry’s annual report, during which time outlier values are queried with the centres that are able to compare CF Registry data with their own records. Since centre-level summary statistics started to be published in these annual reports, centre directors have been given the opportunity to query results that do not seem to align with their own clinical experience. For this reason, we did not explore the quality of the FEV1 values further in this work.
After considering possible discrepancies in the data, the next step in the pyramid of investigation is to consider case mix. This is particularly relevant in the year-by-year analyses in which all patients aged 6–15 years are included in the analyses.
Pyramid of investigation: case mix
Age
Earlier analyses of FEV1 in select, narrow age groups did not account for age, but FEV1 declines with age and – as the mean age of patients varies slightly between centres (see Appendix 3, Table 21) – it is essential to adjust FEV1 accordingly.
Statistical adjustment should account for the documented non-linear association between FEV1 and age. To do this, for each year of analysis we ran a GLM of FEV1% predicted across age as a categorical variable (with 6 years as the referent group) and from this obtained model-predicted values. Our age-adjusted FEV1% predicted was then calculated using the ratio of the original FEV1% predicted to the values predicted by the regression model multiplied by 100. The results are described in Appendix 2, Figure 28, and Appendix 3, Table 22, and show very similar patterns to the unadjusted analysis, with some centres moving from outside to inside the 3-SD limits. Notably, centre 28, which had previously been outside the upper 3-SD limits, was now consistently within these limits and, thus, closer to the mean.
We also ran a separate analysis simply incorporating age as a linear term into multilevel models and we used the random intercept predictions, which estimate the difference between the overall mean and the centre-level mean, after adjustment for age. As a result, the y-axes for this graph (see Appendix 2, Figure 29) will be different from those in earlier funnel plots (see Appendix 2, Figure 28). In both cases, however, we are looking at differences from the mean. The results from this analysis are broadly similar to those of the other adjustment (for age), but in various years brought some centres outside the 3-SD limits to either within these or within the 2-SD limits (see Appendix 2, Figure 29, and Appendix 3, Table 23). The centres affected by this were centres 12, 23, 31, 50, 53, 54 and 60.
Additional case-mix variables
Beyond age, a number of other factors that may influence FEV1, which are not influenced by care and which are collected on the UK CF Registry, as outlined below.
A number of studies have shown that females have poorer CF outcomes than males. We explored whether or not centres with better outcomes have a lower proportion of female patients. We observed that approximately 50% of patients were female in most centres.
As CF is a recessive genetic disease, every effort is made to have all patients genotyped, and this information is recorded on the UK CF Registry. The most common genotype in the UK is DF508, and it has been shown in many studies that those who have two of these mutations (i.e. are homozygous for DF508) have poorer outcomes. In those centres with lower than average FEV1 values, the proportion of patients who have homozygous DF508 was generally ≥ 50%. There appeared to be less variability between the centres with higher than average FEV1 values. If we look uniquely at 2015, half of the centres had just under 50% homozygous DF508 patients and half had slightly more.
In 2012, a new CF therapy called Ivacaftor became available in the UK for patients with a G551D mutation. Clinical trials showed promising results and uptake of the drug was swift in those patients who were eligible to receive it. There is also some evidence26 suggesting that patients with at least one G551D mutation have less severe CF than those who are homozygous DF508. The mutation was not very common in the centres selected for analysis here: in 2015, the centres with the highest prevalence of the mutation were centre 31 (10.6%) and centre 39 (8.2%). The former had higher FEV1 than the average and the latter had lower FEV1 than the average.
A marker of CF severity is pancreatic sufficiency (i.e. pancreatic enzymes are not required to digest food). Here we considered the proportion of patients who were pancreatic sufficient. We noted that in centres with higher than average FEV1 values, the proportions of patients who are pancreatic sufficient varied widely. For example, there was a near twofold difference in the proportion of patients who are pancreatic sufficient between centres 25 and 31, although both report higher than average FEV1 values. In centres with lower than average FEV1 values, there was variability between centres, but pancreatic sufficiency was rarely as common as in centre 31.
As with many conditions, there is evidence that individuals from more disadvantaged backgrounds have poorer outcomes. Here, SES was summarised in quintiles: we explored what proportion of patients were in the fifth (most deprived) quintile. All other things being equal, we would expect that 20% of patients in a given centre would be in any given quintile. Although this was observed in some centres (such as centres 39 and 52, which had lower than average FEV1 values, and centre 28, which had higher than average FEV1 values), patients in the most deprived quartile were under-represented in other centres reporting lower than average FEV1 values (centre 12) and higher than average FEV1 values (centre 31). Contrary to expectation, centre 36, which reported higher than average FEV1 values, had a consistently high proportion of patients (> 30%) from the most deprived quintile.
All of these results suggest that case-mix factors shown in the literature to be associated with FEV1 differ between centres, although not in entirely consistent ways. Adjustment for these factors may be helpful in explaining some of the associations seen in our earlier funnel plot.
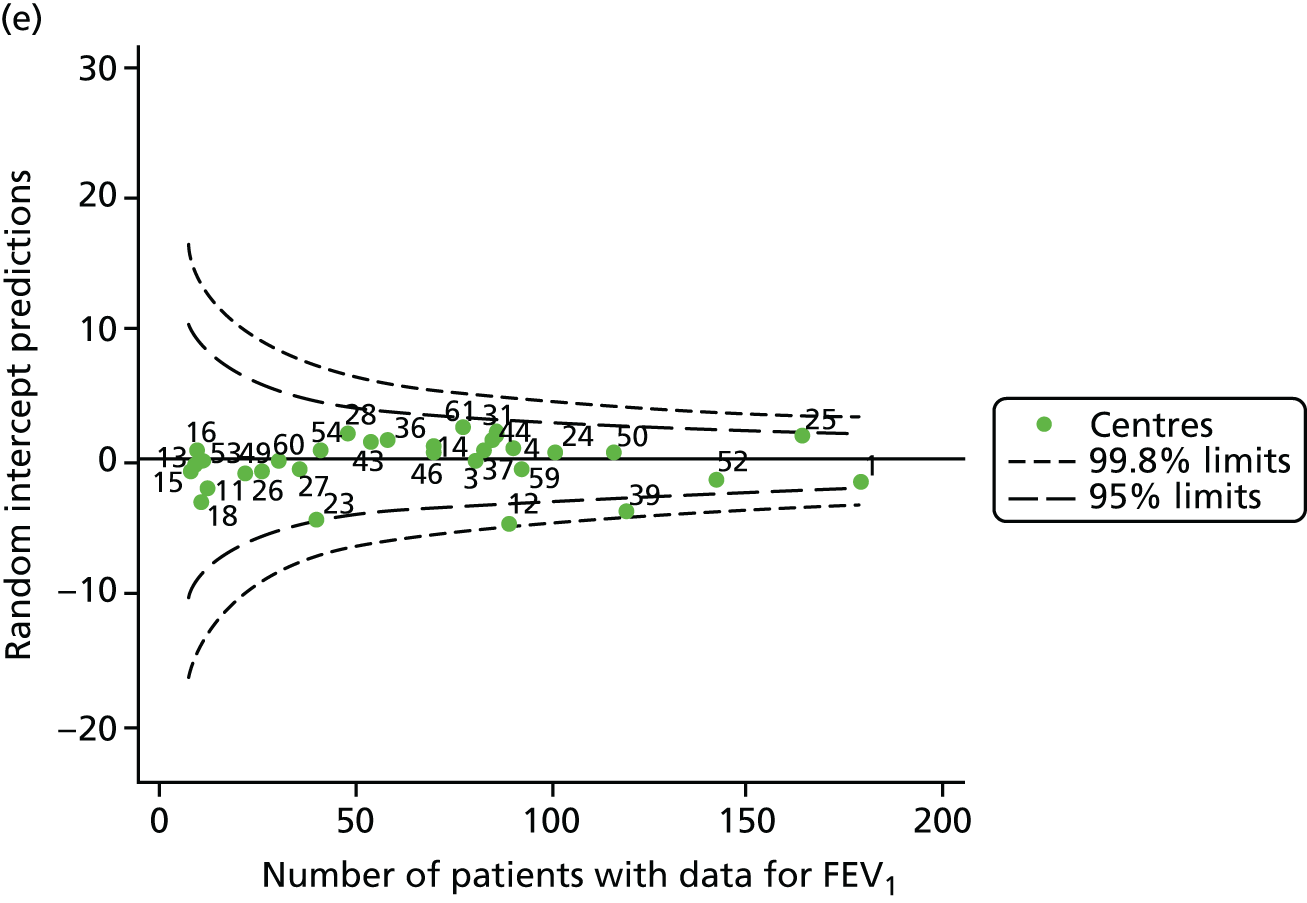
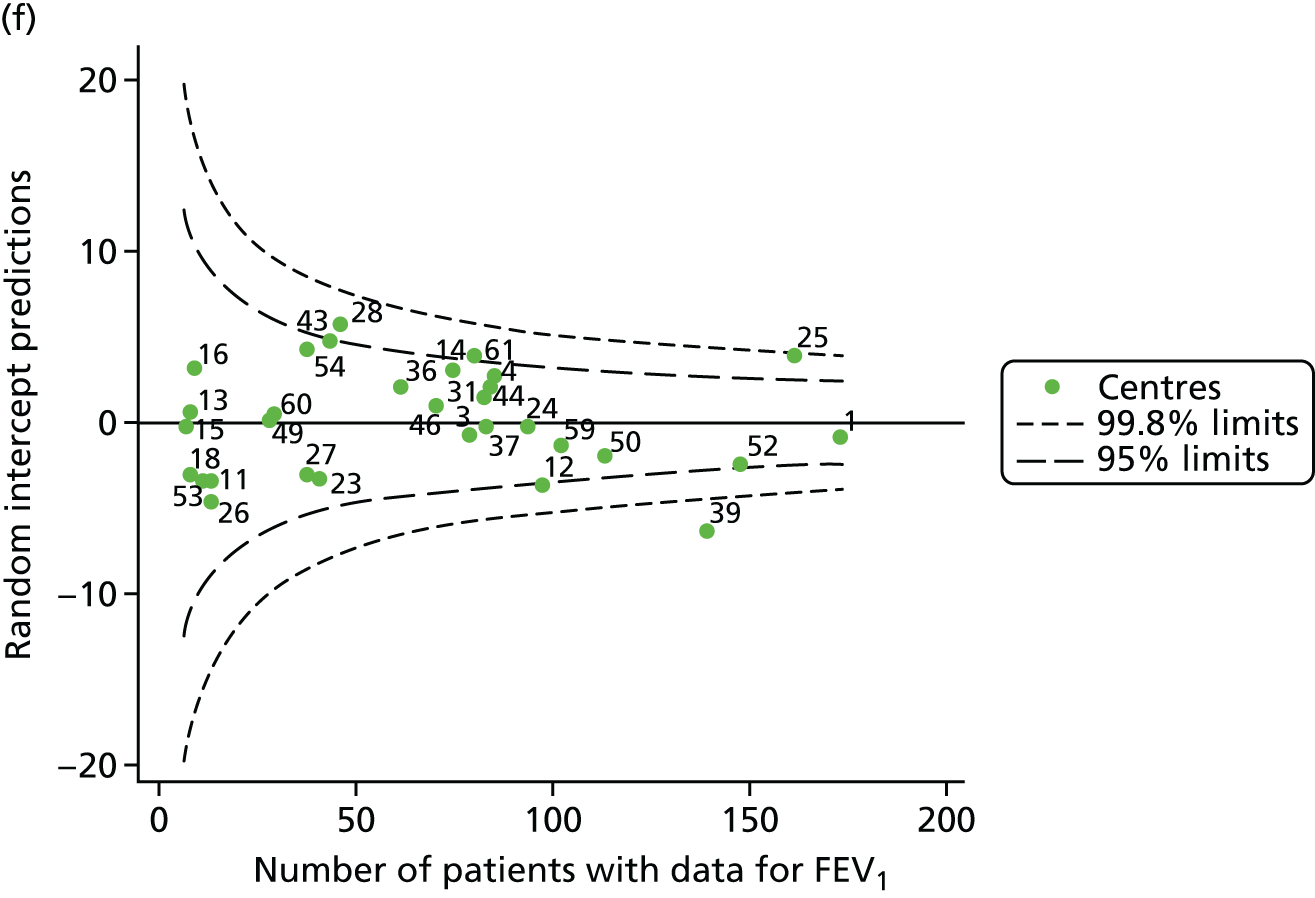
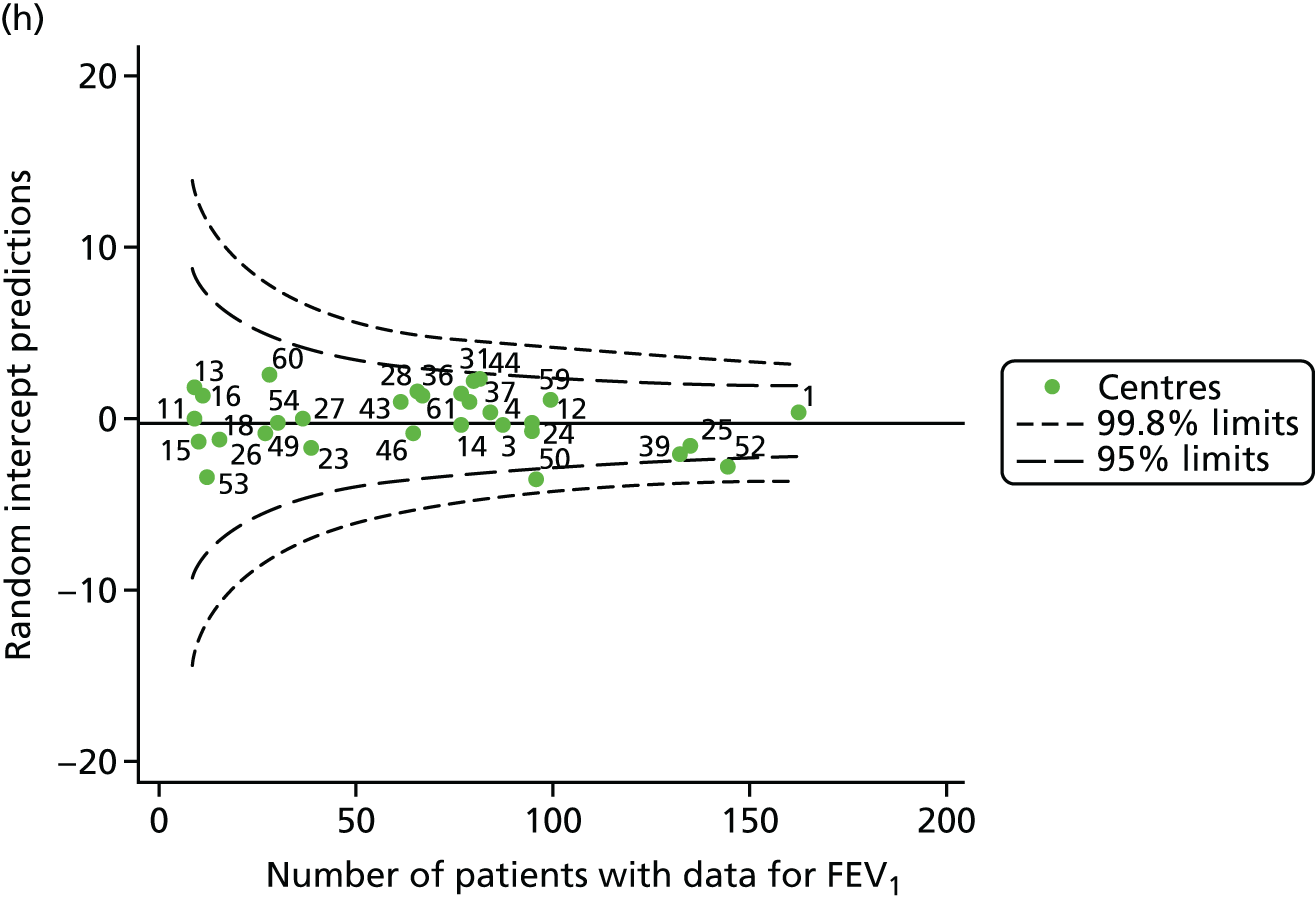
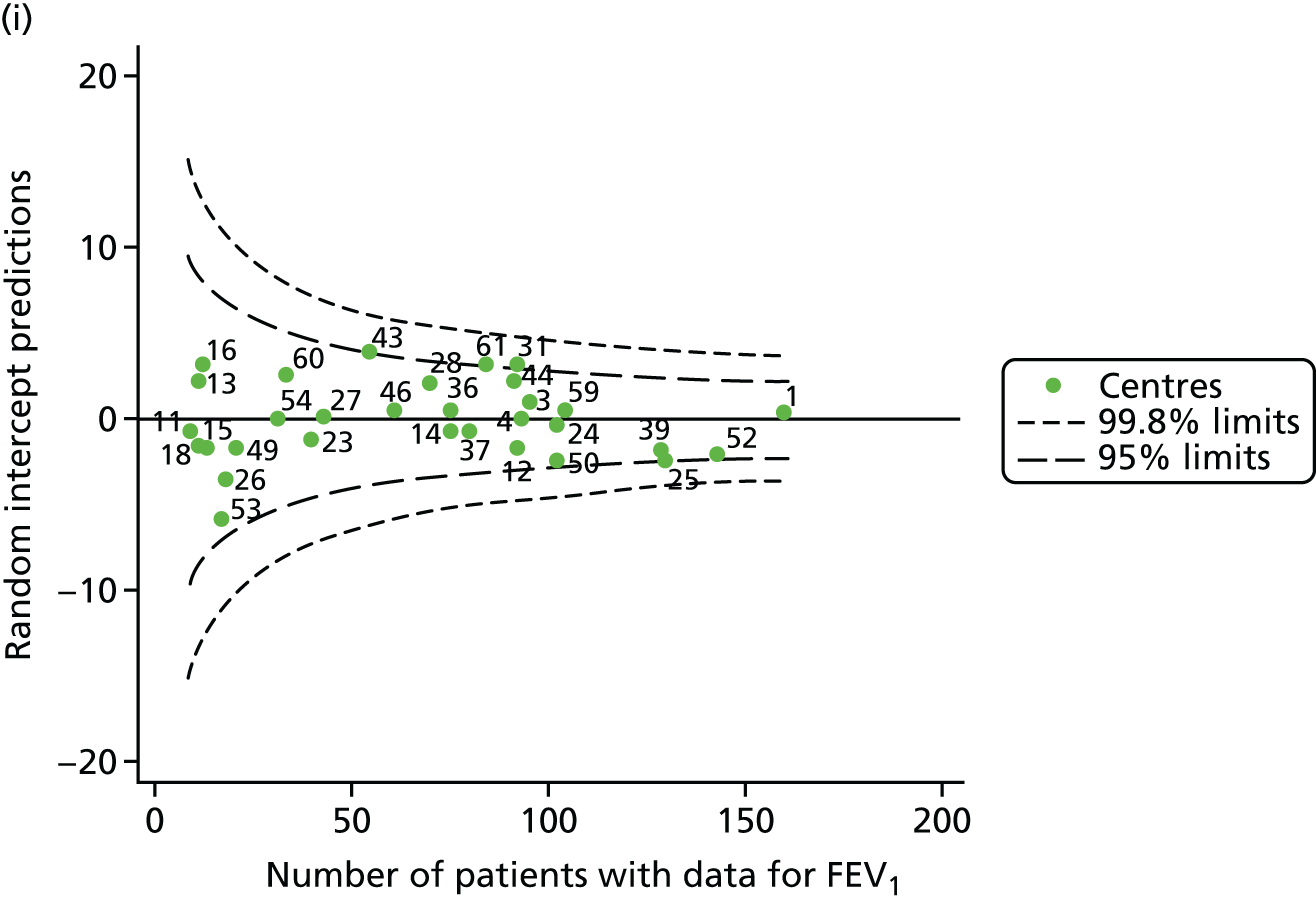
All case-mix variables were included in multilevel models and adjustment for age was undertaken, adopting the approaches described earlier in this section. Both approaches gave largely similar results, as described in Tables 5 and 6 and Figures 10 and 11. Centre 31 moved from outside the upper 3-SD limits to within these limits in 2010 and centre 28 moved within the upper 3-SD limits in 2012. Conversely, centre 25 moved outside the 3-SD limits in 2013, although this was seen only in the analysis that adjusts for age using a GLM.
| Year | Centres with lower than average FEV1 values | Centres with higher than average FEV1 values | ||
|---|---|---|---|---|
| Outside 3-SD limit | Outside 2-SD limit | Outside 2-SD limit | Outside 3-SD limit | |
| 2007 | 52 and 59 | 12 and 23 | 31 and 54a | 25 |
| 2008 | 12 and 52 | – | 28, 44 and 50a | 25 |
| 2009 | 12 and 52 | 1 and 59 | 31, 36, 46a and 50a | 25 |
| 2010 | 12 and 39 | 23, 52a and 59 | 25, 31, 36a and 44a | – |
| 2011 | – | 1,a 12, 23a and 39 | 25a | – |
| 2012 | 39 | 12 and 52a | 14,a 25, 28 and 43a | – |
| 2013 | 39 | 50 | 31 | 25 |
| 2014 | – | 39,a 50 and 52 | – | – |
| 2015 | – | 25,a 50a and 52a | 31,a 61 and 43 | – |
| Year | Centres with lower than average FEV1 values | Centres with higher than average FEV1 values | ||
|---|---|---|---|---|
| Outside 3-SD limit | Outside 2-SD limit | Outside 2-SD limit | Outside 3-SD limit | |
| 2007 | 12, 52 and 59 | 23 | 31, 36a and 54a | 25 |
| 2008 | 12 and 52 | – | 28, 44a and 50a | 25 |
| 2009 | 12 and 52 | 1 and 59 | 31 and 36 | 25 |
| 2010 | 12 and 39 | 23, 52 and 59 | 25, 31, 36a and 44a | – |
| 2011 | – | 12, 23a and 39 | 25a | – |
| 2012 | 39 | 12 and 52a | 14, 25, 28 and 43a | – |
| 2013 | – | 39 and 50 | 31 | 25 |
| 2014 | – | 39,a 50 and 52 | 44a | – |
| 2015 | – | 25,a 50a and 52a | 31, 43 and 61 | – |
FIGURE 10.
Funnel plots of FEV1 adjusted for age using GLMs, then further adjusted for case mix using multilevel models, by year. (a) 2007; (b) 2008; (c) 2009; (d) 2010; (e) 2011; (f) 2012; (g) 2013; (h) 2014; and (i) 2015.
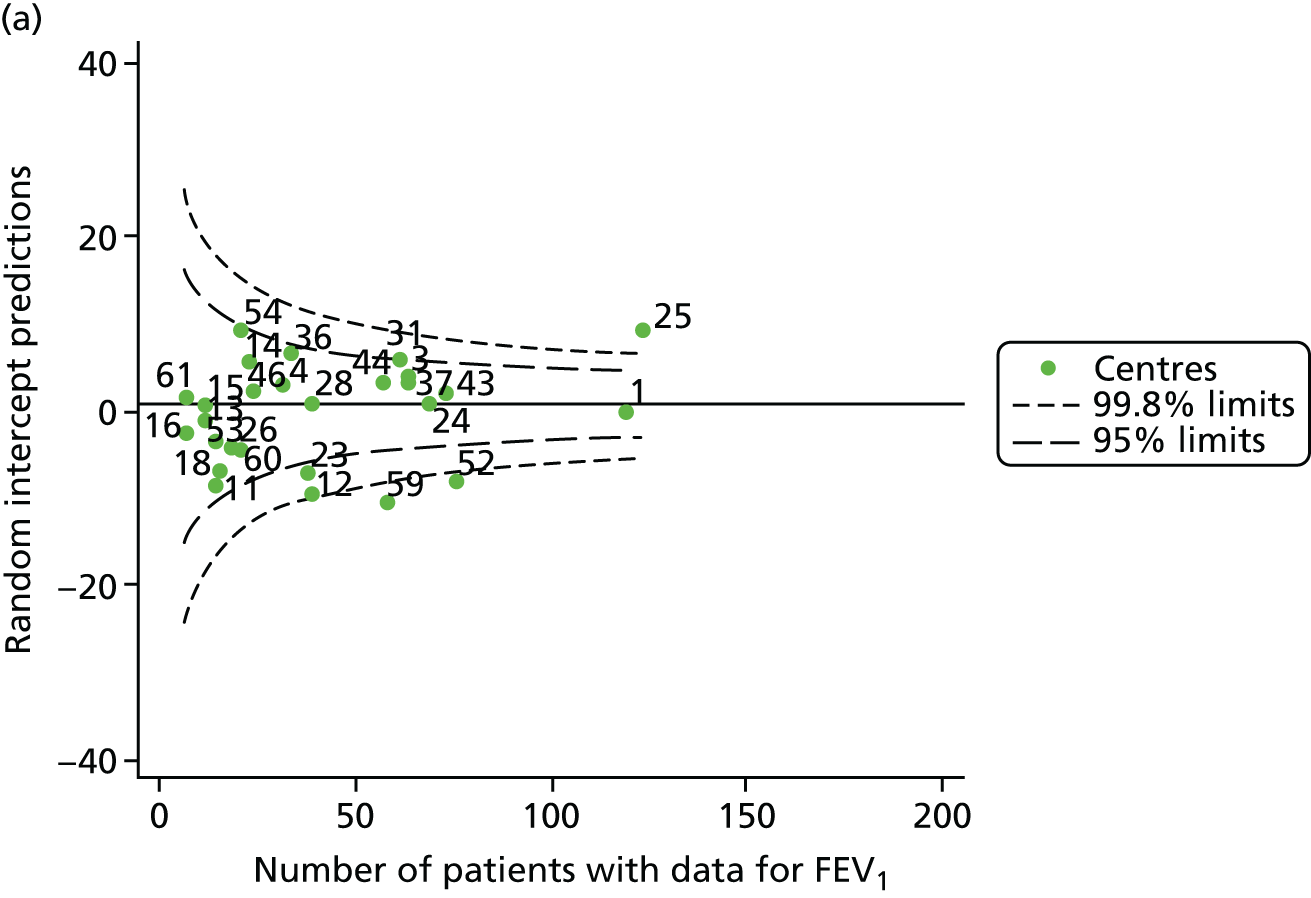
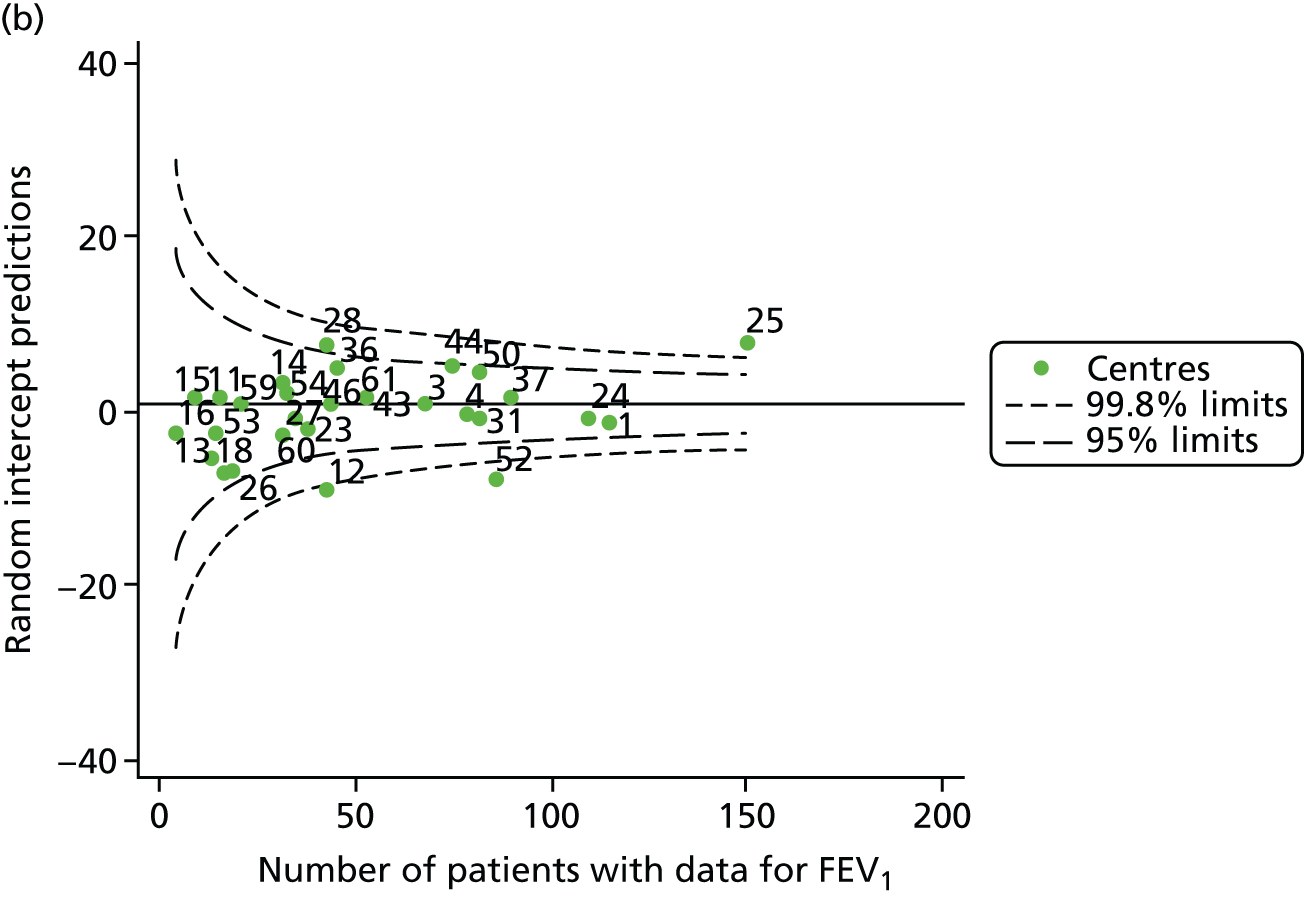
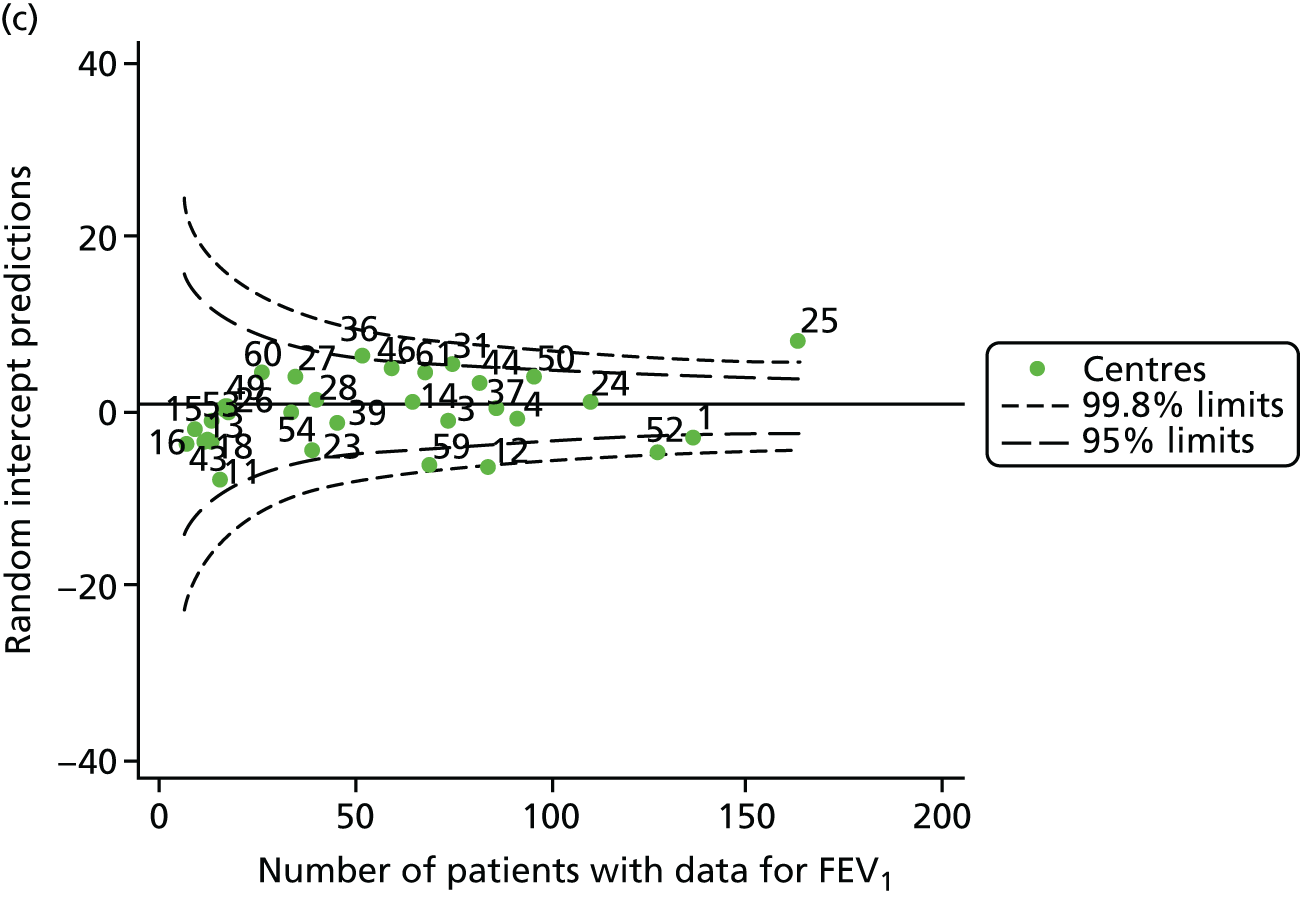
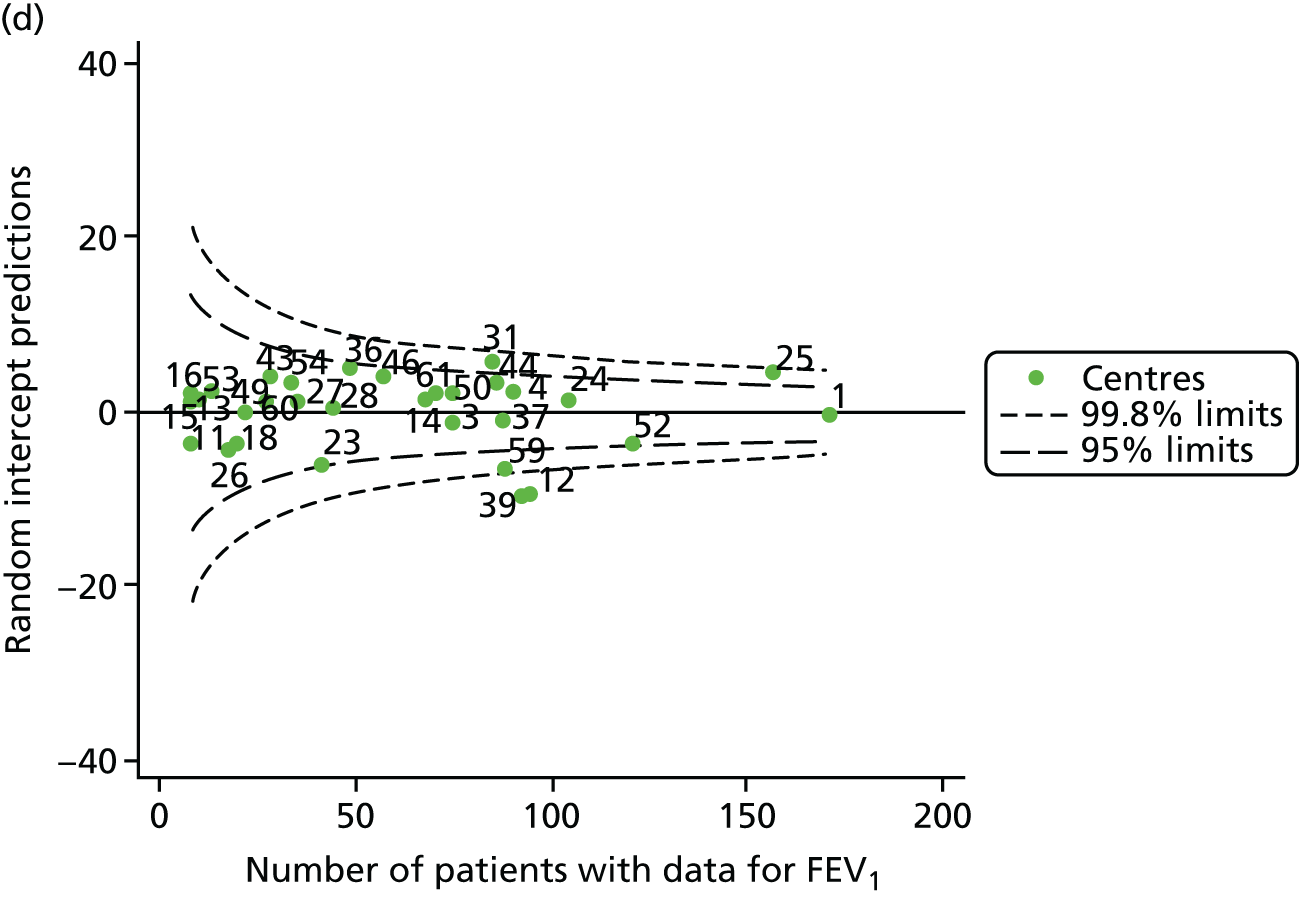
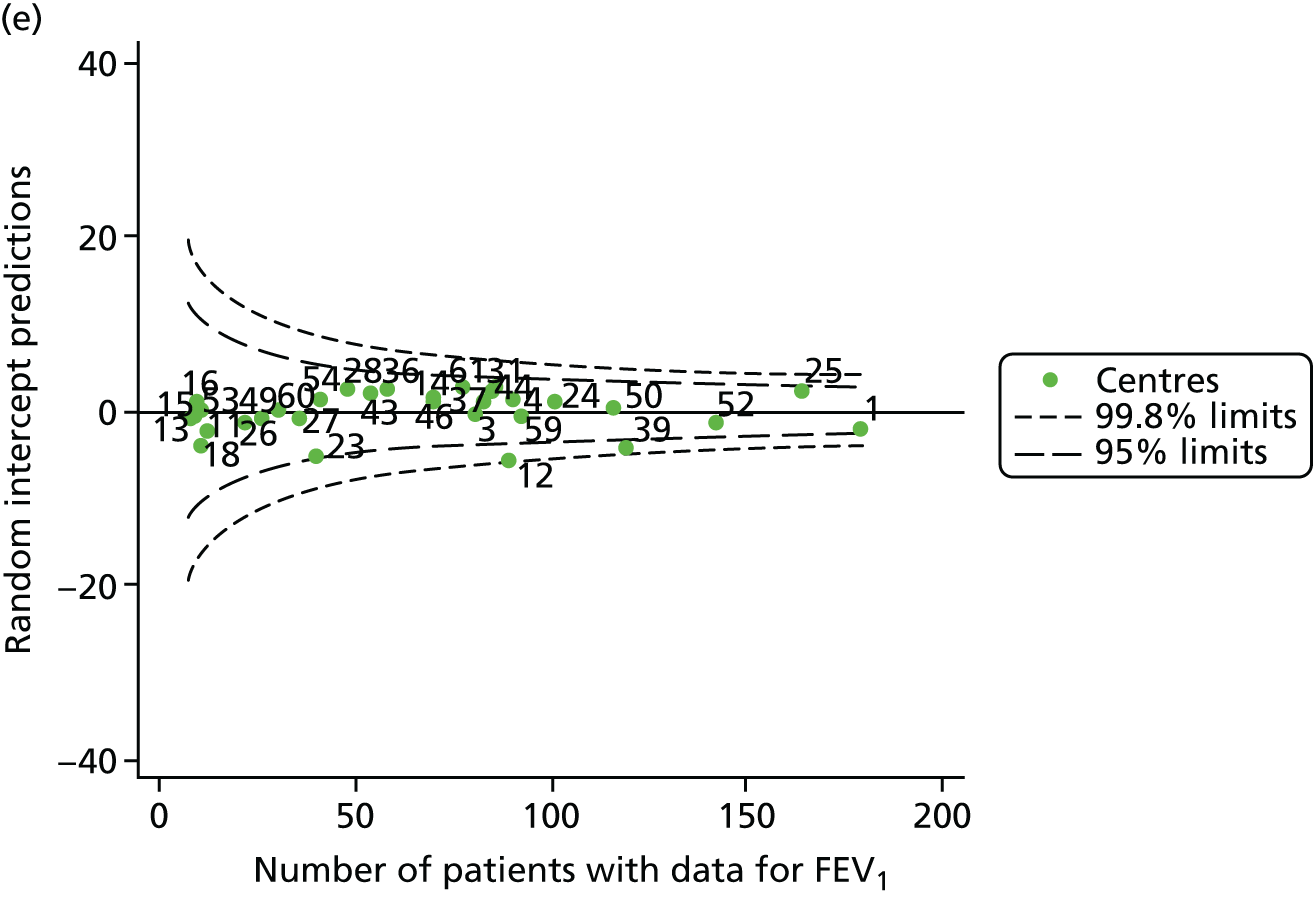
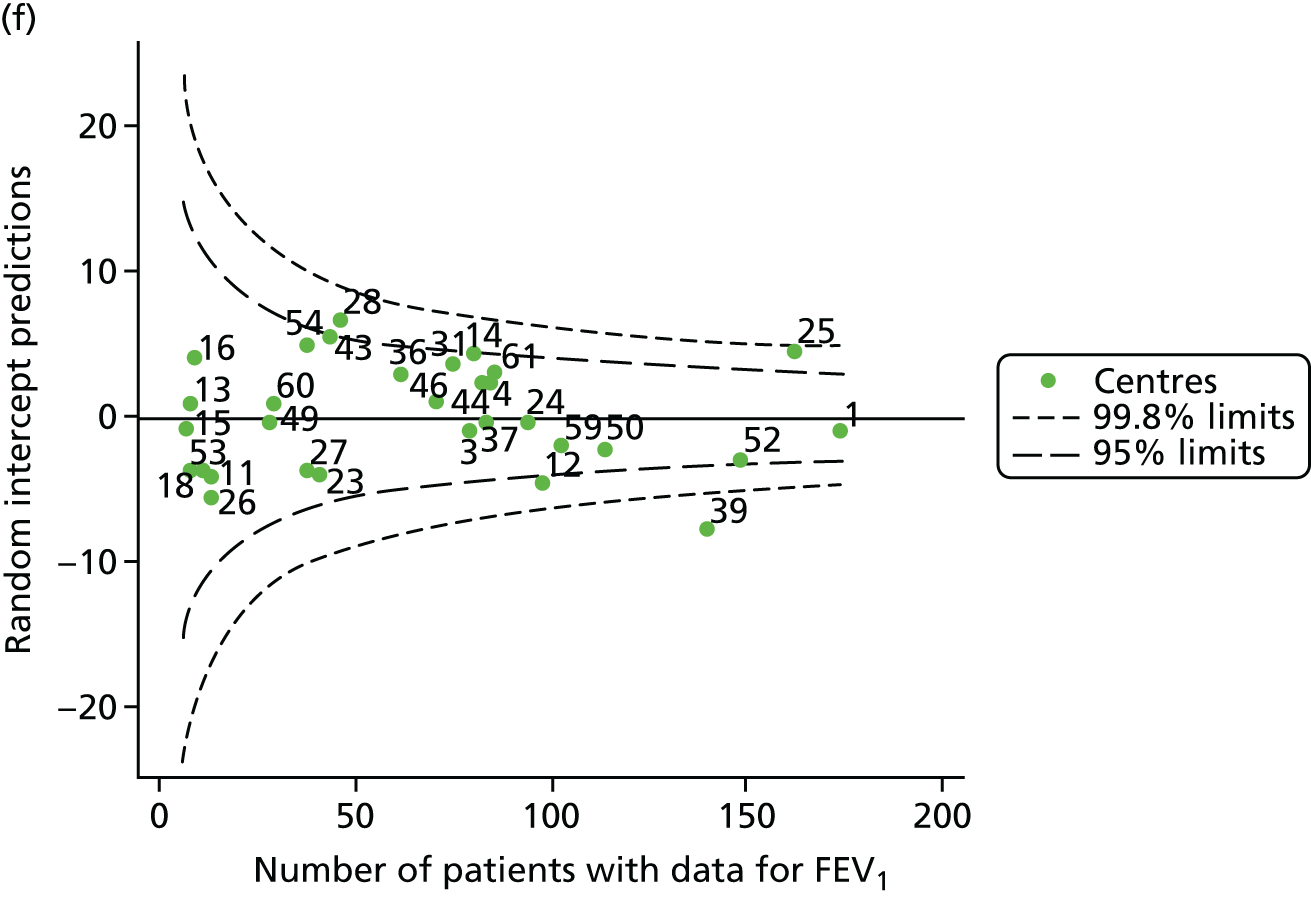
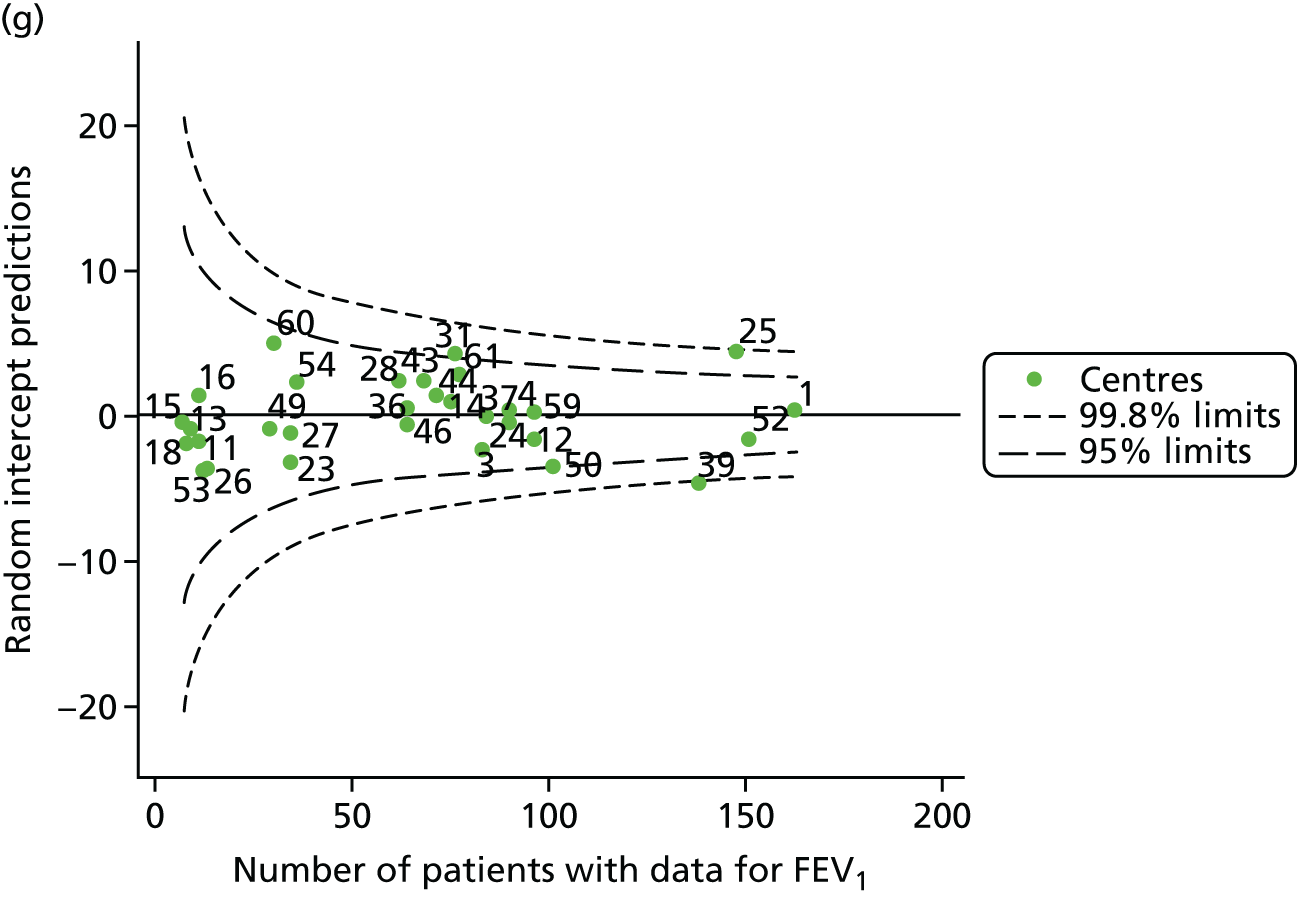

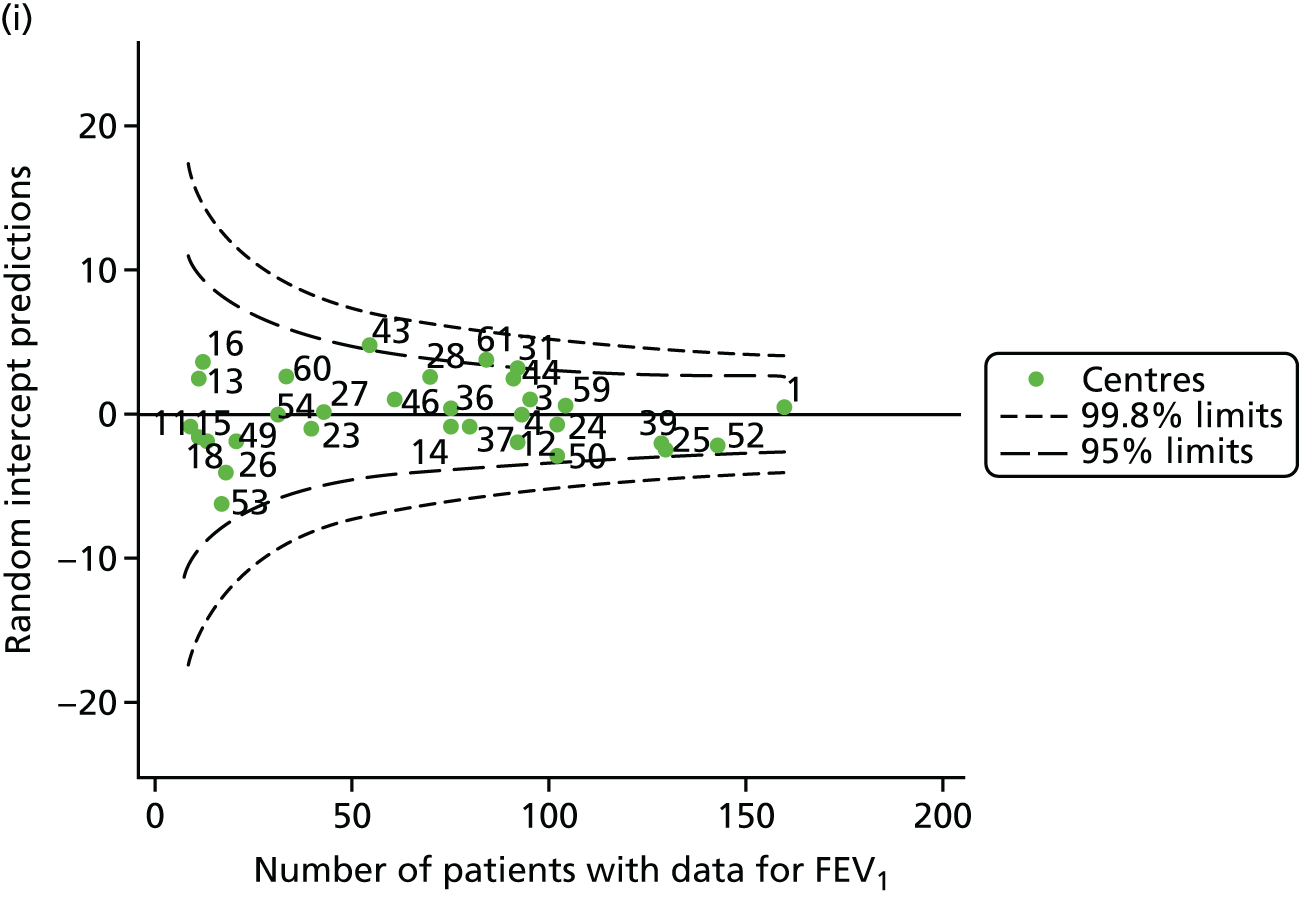
FIGURE 11.
Funnel plots of FEV1 adjusted for age (linear term) and other case mix using multilevel models, by year. (a) 2007; (b) 2008; (c) 2009; (d) 2010; (e) 2011; (f) 2012; (g) 2013; (h) 2014; and (i) 2015.

As with the other analyses, we ran a sensitivity analysis to assess the role of ‘shrinkage’. Our findings were broadly similar to those obtained using the multilevel model approach. A summary of contrasting approaches is presented in Appendix 3, Table 29, and the funnel plots are presented in Appendix 2, Figure 30. Occasionally, however, centres that had been brought inside the 3-SD limits using the multilevel modelling approach stayed outside those limits when adopting the GLM approach (centre 28 in 2008, centres 12 and 23 in 2011, centre 28 in 2012, centre 39 in 2013 and centre 53 in 2015). In these instances, concluding that case mix was solely responsible for special-cause variation in the unadjusted models would be inappropriate.
Pyramid of investigation: care
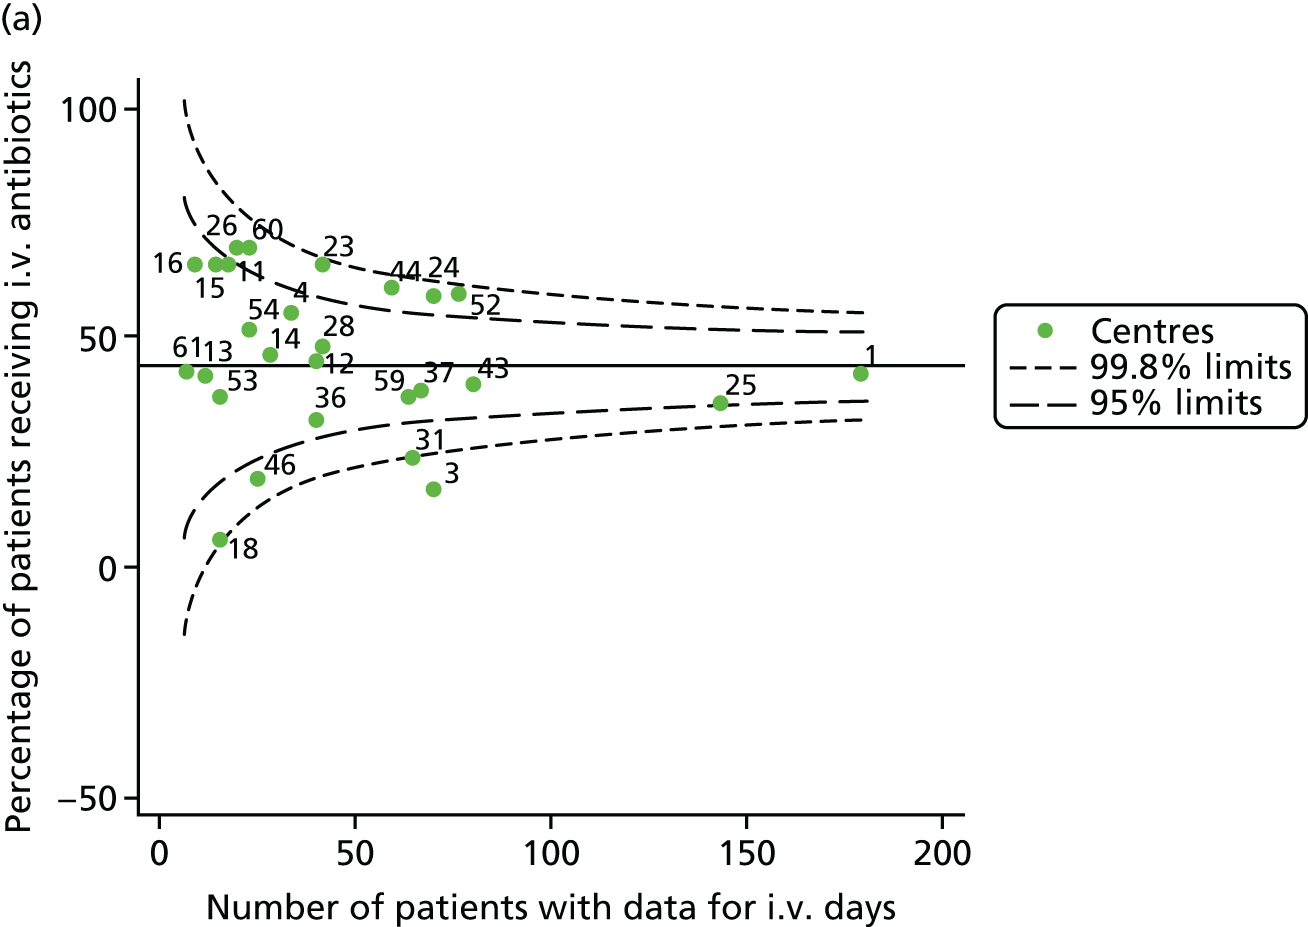
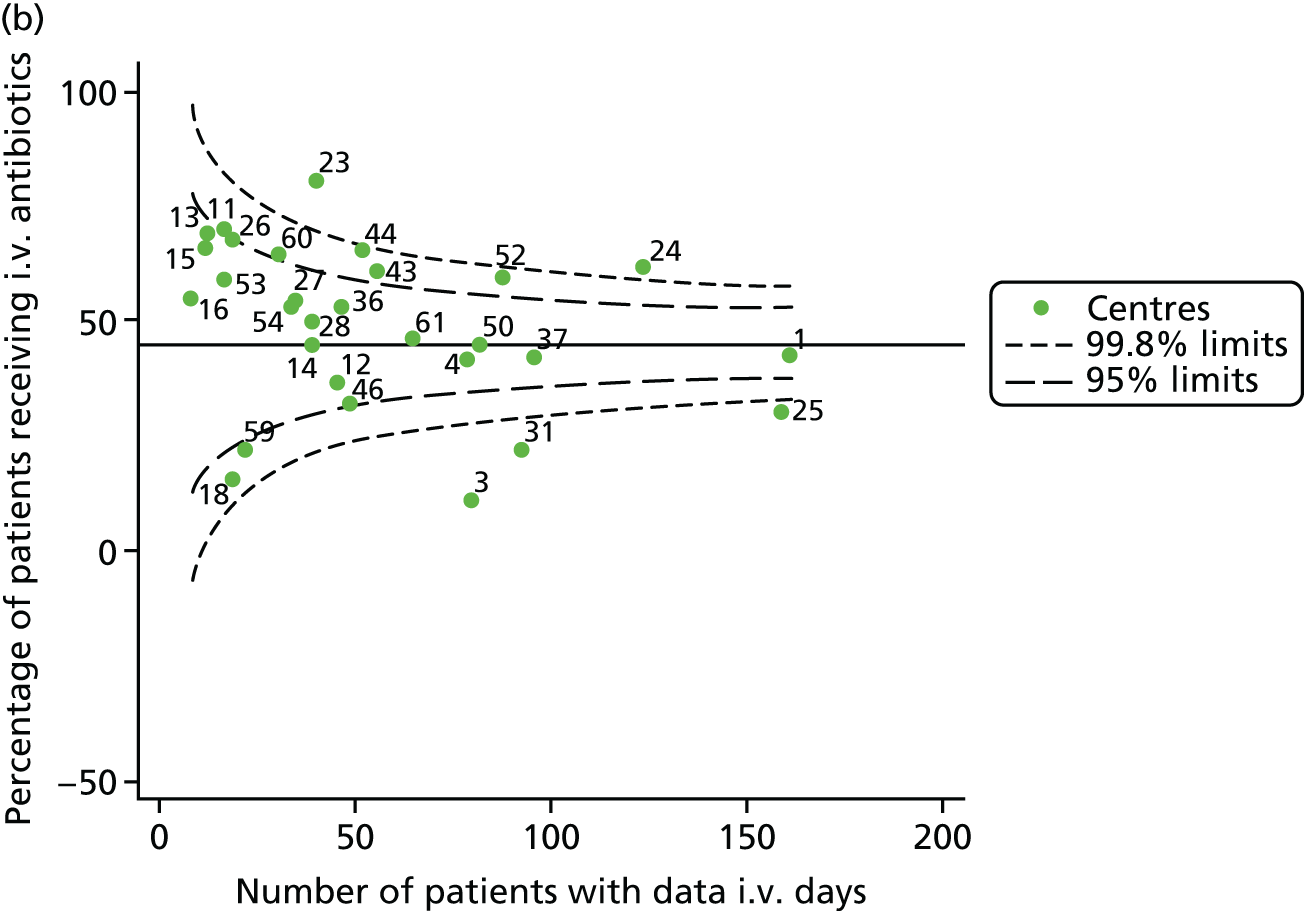
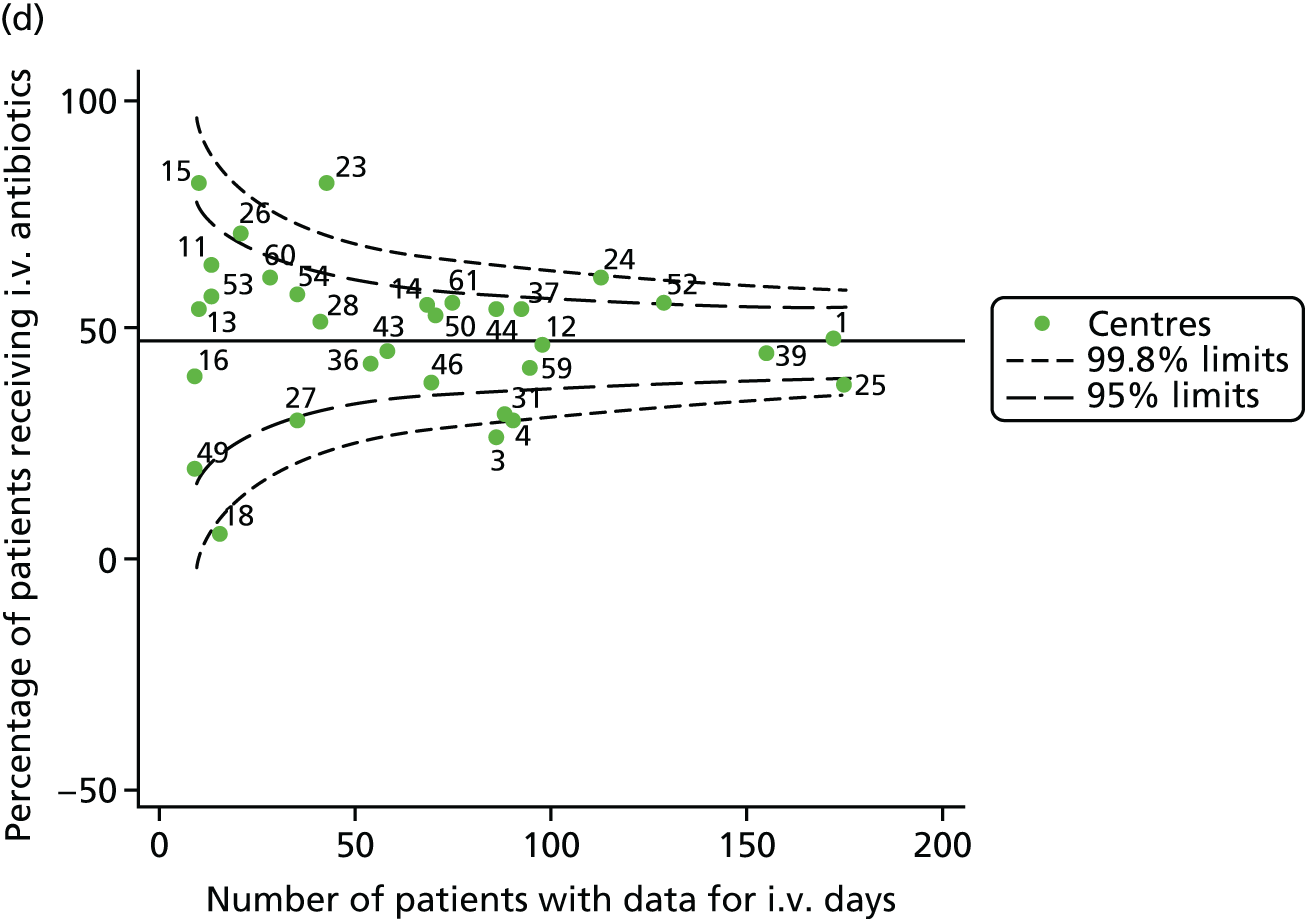
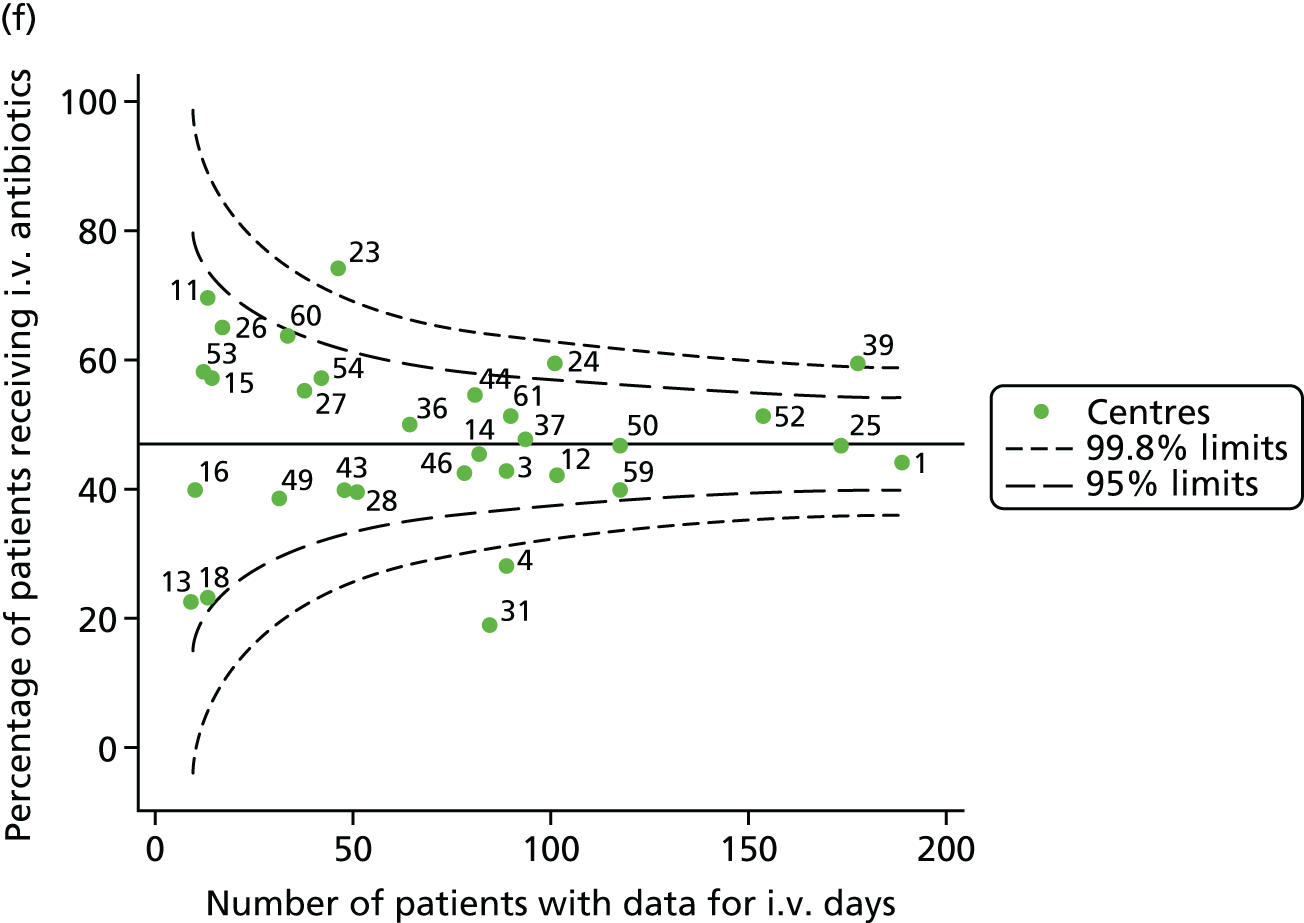
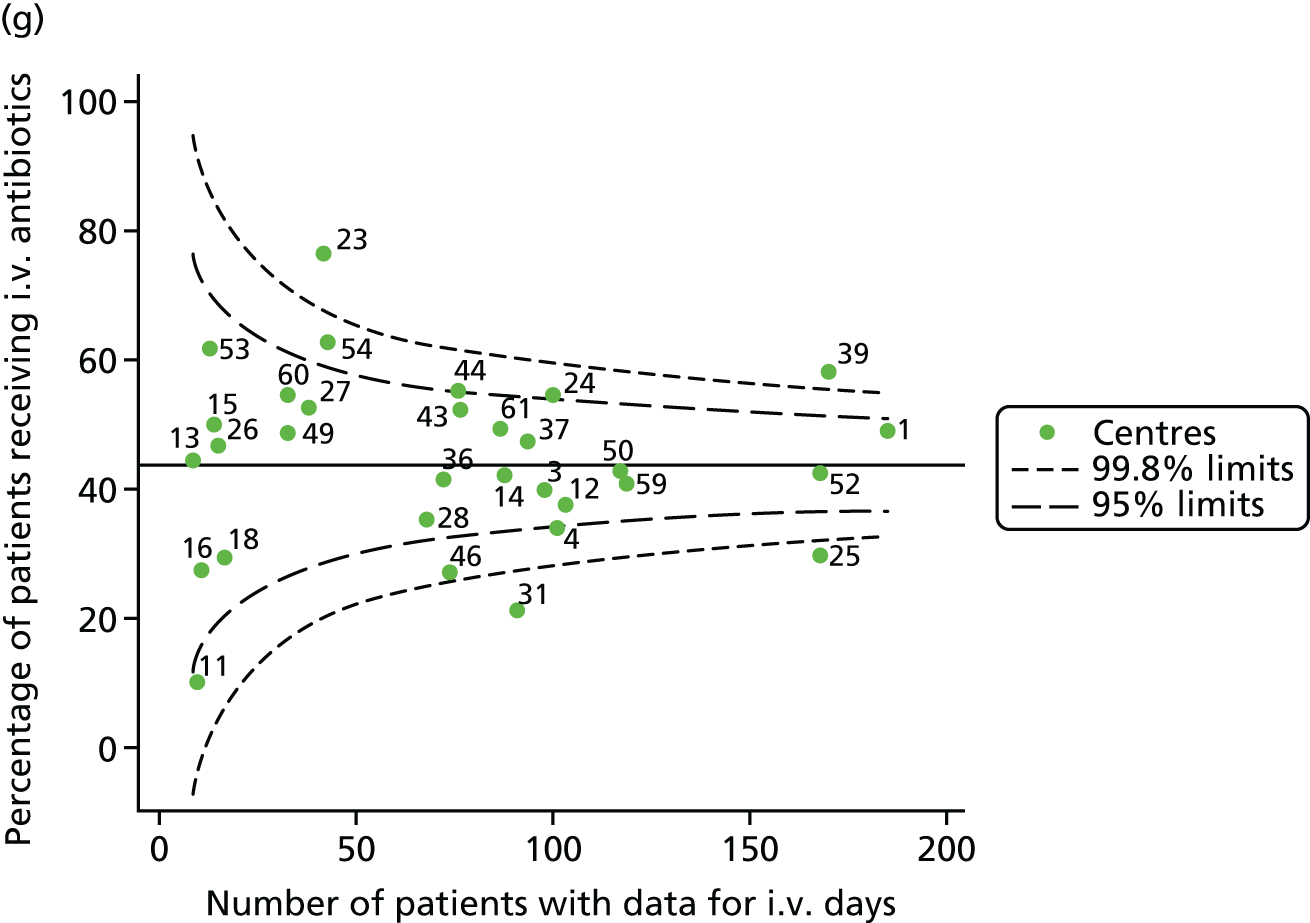
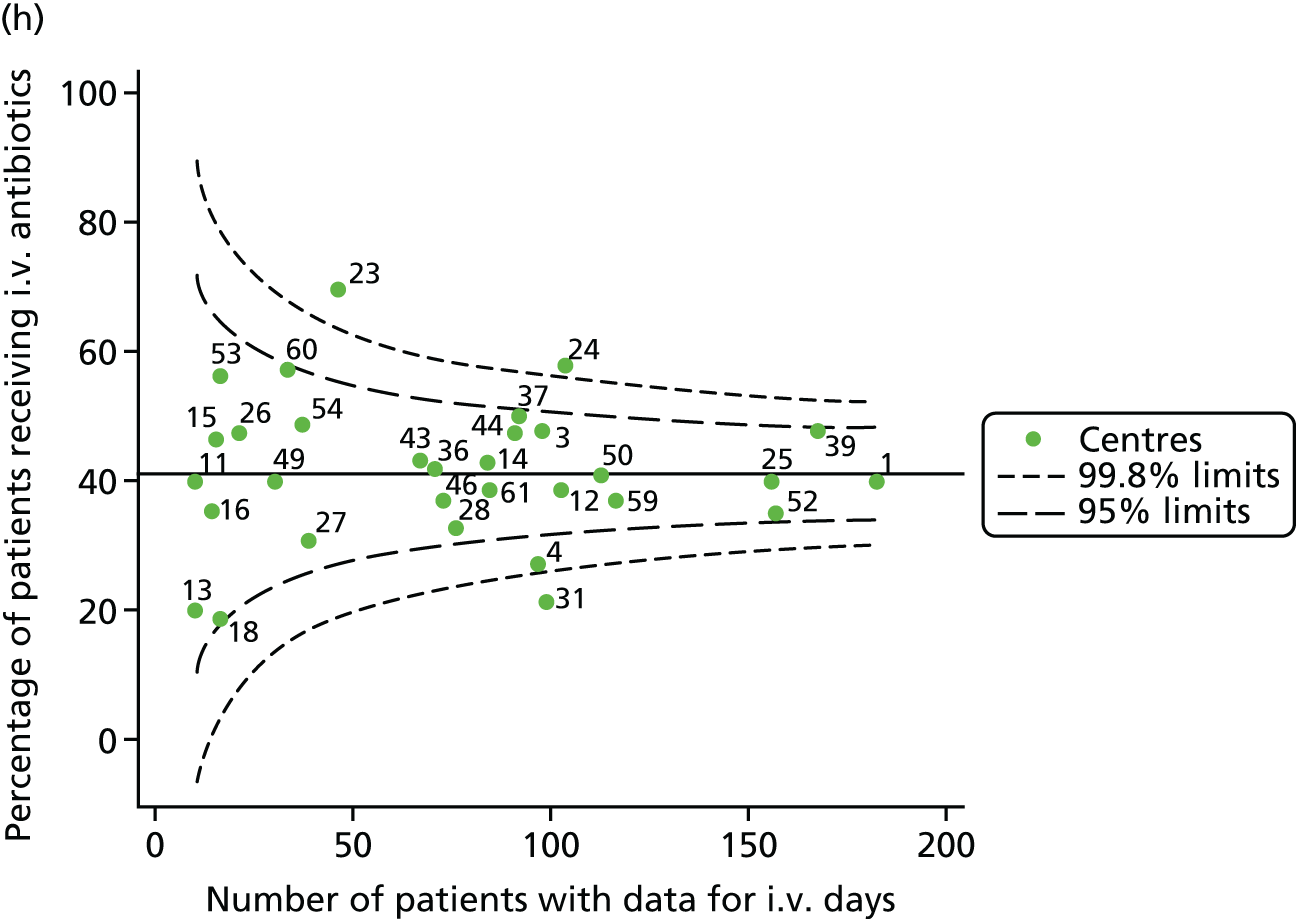
Given that we saw more consistent signals of special-cause variation in these year-by-year analyses, we explored measures of clinical care to see if these are associated with the trends observed in FEV1. It has been shown in the USA that centres that use more i.v. antibiotics have better FEV1 outcomes. 27 One way of exploring whether or not that trend exists in the UK is to look at the proportion of patients receiving i.v. antibiotics and at the total number of days on i.v. antibiotics for those patients receiving any antibiotics (see Appendix 3, Table 30). There was no consistent trend showing that centres with lower than average FEV1 values have systematically different rates and durations of i.v. antibiotic treatment than those centres with higher FEV1. The most consistent trend among these centres was that centre 31 tended to have a lower proportion of patients taking i.v. antibiotics (2008–11) and a shorter duration of treatment among those patients receiving them (2012). This trend of lower than average proportions of patients on i.v. antibiotics at centre 31 was also in evidence in the funnel plots presented in Figure 12, in which centre 31 frequently shows special-cause variation, being outside the lower 3-SD limit.
FIGURE 12.
Funnel plots of the proportion of patients receiving i.v. antibiotics, by year. (a) 2007; (b) 2008; (c) 2009; (d) 2010; (e) 2011; (f) 2012; (g) 2013; (h) 2014; and (i) 2015.



Sensitivity analyses
Global Lung Function Initiative reference equations
In recent years there has been a move to adopt the GLI reference equations for calculating FEV1% predicted, as they more effectively model FEV1 during the teenage years. We replicated the unadjusted analyses presented in Unadjusted analyses using the new reference equations to explore whether or not – given differences in case mix – centre-level mean FEV1 may be affected by the change in reference equations. We noted (see Appendix 2, Figure 31, and Appendix 3, Table 31) that the same general trends emerged. Occasionally, a centre crossed the 3-SD limit (in either direction) but remained outside the 2-SD limit. On other occasions, centres crossed the 2-SD limits when they had hovered below the limit previously (and vice versa). Some centres moved within the 2-SD limits in the GLI analyses, including centre 25, which no longer showed special-cause variation in 2012 and 2014. Centre 12 was the only centre to show special-cause variation (2-SD) in the GLI analysis in 2012 when it was within the control limits in the original analysis.
Excluding patients with a G551D mutation from 2012 onwards
As described in Pyramid of investigation: case mix, in 2012 a new CF treatment was launched, targeting patients with the G551D mutation. Uptake was swift on the basis that the treatment had been shown to be very successful in improving lung function. We re-ran the unadjusted analyses for 2012 onwards to explore whether or not patients with the G551D mutation influenced the centre comparisons in these years, as it is suggested that the G551D mutation has a milder phenotype and there is effective new treatment available for patients with this mutation. The results of the original analysis – with sensitivity analysis in italics – are presented in Table 7. We can see that there is some shifting of single centres between the 2- and 3-SD control limits, but the results do not change drastically. The most consistent shift among centres outside the control limits (rather than borderline centres) was for centre 31, which had a relatively high proportion of G551D patients (10%) and no longer showed special-cause variation in 2013 and 2014 at 2SD when these patients were excluded; this suggests that part of the reason for this centre’s high FEV1 levels is its cohort of these patients.
| Year | Centres with lower than average FEV1 values | Centres with higher than average FEV1 values | |||
|---|---|---|---|---|---|
| Outside 3-SD limit | Outside 2-SD limit | Outside 2-SD limit | Outside 3-SD limit | ||
| 2007 | 12, 52 and 59 | 11, 16,a 23 and 53a | 14, 31, 36, 37 and 54 | 25 | |
| 2008 | 12 and 52 | 1, 13, 18 and 26 | 36 and 44 | 25 and 28 | |
| 2009 | 11, 12 and 52 | 16, 23, 43 and 59 | 36, 46 and 60 | 25 and 31 | |
| 2010 | 12 and 39 | 23, 52 and 59 | 36, 46a and 54 | 31 | |
| 2011 | 12 and 23 | 18 and 39 | 31a and 61 | – | |
| 2012 | 39 | 23,a 26, 50a and 52a | 25, 31,a 43 and 54 | 28 | |
| 2013 | All patients | 39 | 23, 26, 50 and 53 | 25, 28, 31 and 61 | 60 |
| Excluding G551D | 39 | 23, 26, 50 and 53 | 25, 28, 31,a 60 and 61 | – | |
| 2014 | All patients | 53 | 25, 39, 50 and 52 | 13, 28, 31, 44, 60 and 61 | – |
| Excluding G551D | 53 | 25, 39, 50 and 52 a | 13, 28, 44, 59,a 60a and 61 | – | |
| 2015 | All patients | 53 | 25, 26, 39,a 50 and 52a | 16, 28, 31, 43, 60a and 61 | – |
| Excluding G551D | 53 | 25, 26, 50 and 52 a | 16, 28,a 31, 43 and 61 | – | |
Excluding identified network clinics from centre analyses
The way in which specialist paediatric care in CF is delivered is different from the way in which adult CF care is delivered. In paediatrics there is a model of care that involves main centres sharing care with smaller ‘network’ clinics. This model is devised, in part, to allow patients to receive CF care close to home, with input from a larger centre; how this is delivered differs by network.
Many of these network clinics input their data to the UK CF Registry in such a manner that the patients attending the network clinics are clearly identified; to ensure sufficiently large centre sizes, we pooled the network clinics with the main centres in all of our analyses. To assess, however, whether or not a centre’s outcomes would differ if only those patients attending the main centre were studied, we conducted a sensitivity analysis removing identified network patients from the centres. As these network clinics are small, we did not study them separately but rather excluded them from the analysis entirely.
Comparing the results of the original analysis with those excluding the network clinics yields comparable results, as seen in Table 8. In the analysis unadjusted for case mix, excluding network patients resulted in largely identical trends to the original analysis. Occasionally, however, centres moved closer to the overall mean (excluding network clinics); in some cases, the centre moved further away. For example, centre 12 was outside the lower 3-SD limits in 2009 and 2011, but moved within those limits and, thus, closer to the overall mean, when its network patients were excluded. Centres 25 and 52 also moved to within the lower 2-SD limits in 2014 and centre 28 moved within the upper 2-SD limits in 2015. Conversely, centre 23 moved outside the 3-SD limits when it had previously only been outside the 2-SD limits in 2010, as did centre 50 in 2014.
| Year | Centres with lower than average FEV1 values | Centres with higher than average FEV1 values | |||
|---|---|---|---|---|---|
| Outside 3-SD limit | Outside 2-SD limit | Outside 2-SD limit | Outside 3-SD limit | ||
| 2007 | All patients | 12, 52 and 59 | 11, 16,a 23 and 53a | 14, 31, 36, 37 and 54 | 25 |
| Excluding shared care | 12, 52 and 59 | 11, 16a and 23 | 14, 31, 36, 37 and 54 | 25 | |
| 2008 | All patients | 12 and 52 | 1, 13, 18 and 26 | 36 and 44 | 25 and 28 |
| Excluding shared care | 12 and 52 | 1,a 13, 18 and 26 | 36, 44a and 46a | 25 and 28 | |
| 2009 | All patients | 11, 12 and 52 | 16, 23, 43 and 59 | 36, 46 and 60 | 25 and 31 |
| Excluding shared care | 11 and 52 | 12, 16, 23, 43 and 59 | 36, 46 and 60 | 25 and 31 | |
| 2010 | All patients | 12 and 39 | 23, 52 and 59 | 36, 46a and 54a | 31 |
| Excluding shared care | 12, 23 and 39 | 3a and 59 | 36, 50a and 54 | 31 | |
| 2011 | All patients | 12 and 23 | 18 and 39 | 31a and 61 | – |
| Excluding shared care | 23 | 12, 18 and 39 | 31a and 61 | – | |
| 2012 | All patients | 39 | 23,a 26,a 50a and 52a | 25, 31,a 43 and 54 | 28 |
| Excluding shared care | 39 | 12,a 26 and 53a | 14, 31,a 43, 54 and 61 | 28 | |
| 2013 | All patients | 39 | 23, 26, 50 and 53 | 25, 28, 31 and 61 | 60 |
| Excluding shared care | 39 | 3, 26, 50 and 53 | 25, 28, 31, 60 and 61 | – | |
| 2014 | All patients | 53 | 25, 39, 50 and 52 | 13, 28, 31, 44, 60 and 61 | – |
| Excluding shared care | 50 and 53 | 39a | 13, 28,a 31,a 44 and 61 | – | |
| 2015 | All patients | 53 | 25, 26, 39,a 50 and 52a | 16, 28, 31, 43, 60a and 61 | – |
| Excluding shared care | 53 | 25,a 26 and 50a | 16, 31, 43a and 61 | – | |
Adult analyses
Analyses of patients attending adult centres focus first on young adults in the early years after transitioning to adult care, whose outcomes we hypothesised would be most strongly affected by specialist clinical care. Later analyses consider all patients aged ≥ 16 years attending adult centres. Based on our original project plan, we considered data from 2007–12 (see Analyses in young adults: 2007–12) and pooled data across the study period to maximise our sample size. Given the trends observed in the analysis of patients in this age group using 2007–12 data, we did not further expand on these analyses using 2013–15 data.
This work is, however, complemented by single-year analyses of all adults aged ≥ 16 years using data from 2007–15, inclusive (see Analyses of all patients attending adult centres: 2007–15). The aim of these separate analyses is to explore whether or not there are patterns in outcomes over multiple years in the wider adult patient population.
Analyses in young adults: 2007–12
There were 1439 unique patients aged 18–21 years attending adult CF centres during the study period who fulfilled the study inclusion criteria and had non-missing outcome data. There were 28 adult centres contributing data to the UK CF Registry during this period.
Our two prespecified outcomes in adults were changes in FEV1 and BMI between 18 and 21 years of age. To be eligible for the analysis, patients required at least two annual review encounters at the same centre between 2007 and 2012. Table 9 shows the identified patient population in terms of their demographic characteristics and the completeness of the outcome and case-mix data that they provided. We considered using measures of patient health at the time of transition to adult care as case-mix variables, as this would allow us to account, in part, for the care delivered in paediatric centres. However, this information was infrequently available for older adults, who were less likely to have data from when they were 16 years old, as UK CF Registry records go back as far as 2007 only.
| Characteristic | Patients aged 18–21 years (patients eligible for analysis, N = 1439), n (%) |
|---|---|
| Sex | |
| Male | 784 (54.5) |
| Female | 655 (45.5) |
| Number of missing observations (% of eligible) | 0 |
| Pancreatic enzyme | |
| Yes | 1337 (92.9) |
| No | 98 (6.8) |
| Number of missing observations (% of eligible) | 4 (0.3) |
| SES | |
| 1 (least deprived) | 302 (21.0) |
| 2 | 273 (19.0) |
| 3 | 260 (18.1) |
| 4 | 300 (20.8) |
| 5 (most deprived) | 285 (19.8) |
| Number of missing observations (% of eligible) | 19 (1.3) |
| Genotype | |
| Homozygous | 795 (55.2) |
| Heterozygous | 499 (34.7) |
| No DF508 | 117 (8.1) |
| Number of missing observations (% of eligible) | 28 (1.9) |
Outcome: change in FEV1 in adults aged 18–21 years
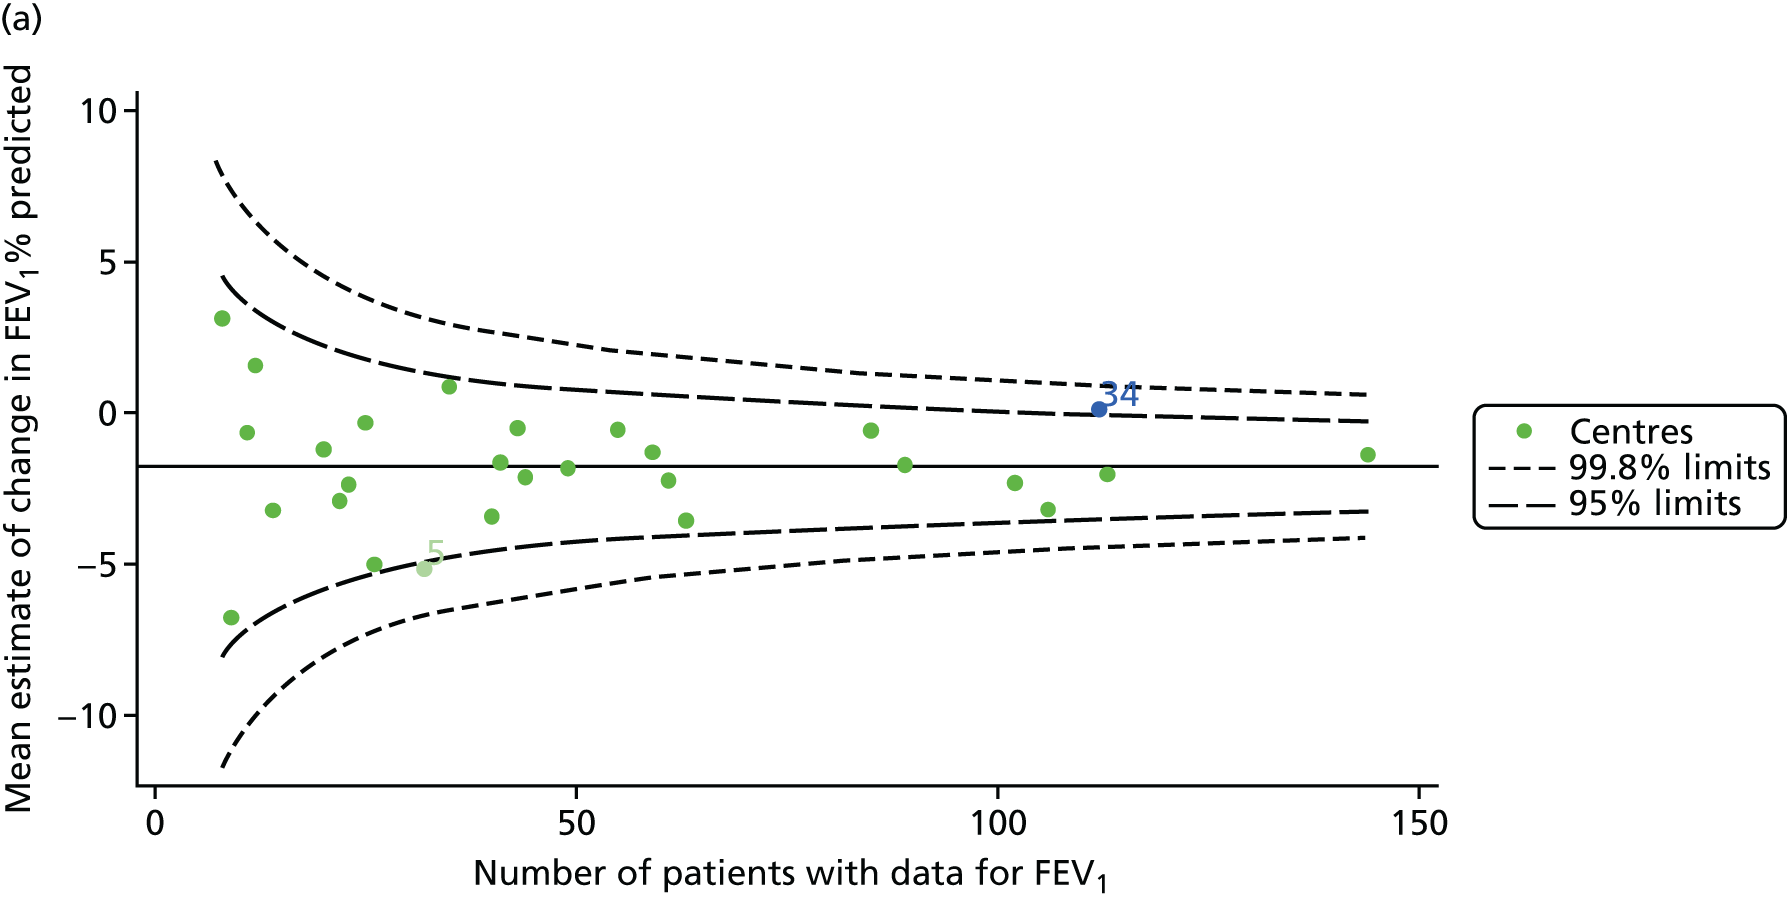
We identified 1439 patients with non-missing FEV1 data who fulfilled the inclusion criteria for this analysis. As was carried out in the paediatric analyses, we performed linear regression analyses for each patient, calculating the annual decline in FEV1 between 18 and 21 years of age. These individual changes in FEV1 were then pooled by centre to generate funnel plots of mean change in FEV1 by centre. The mean decline across centres was 1.78%. Although two centres were outside the 2-SD control limits, none was outside the 3-SD limits (Figure 13a).
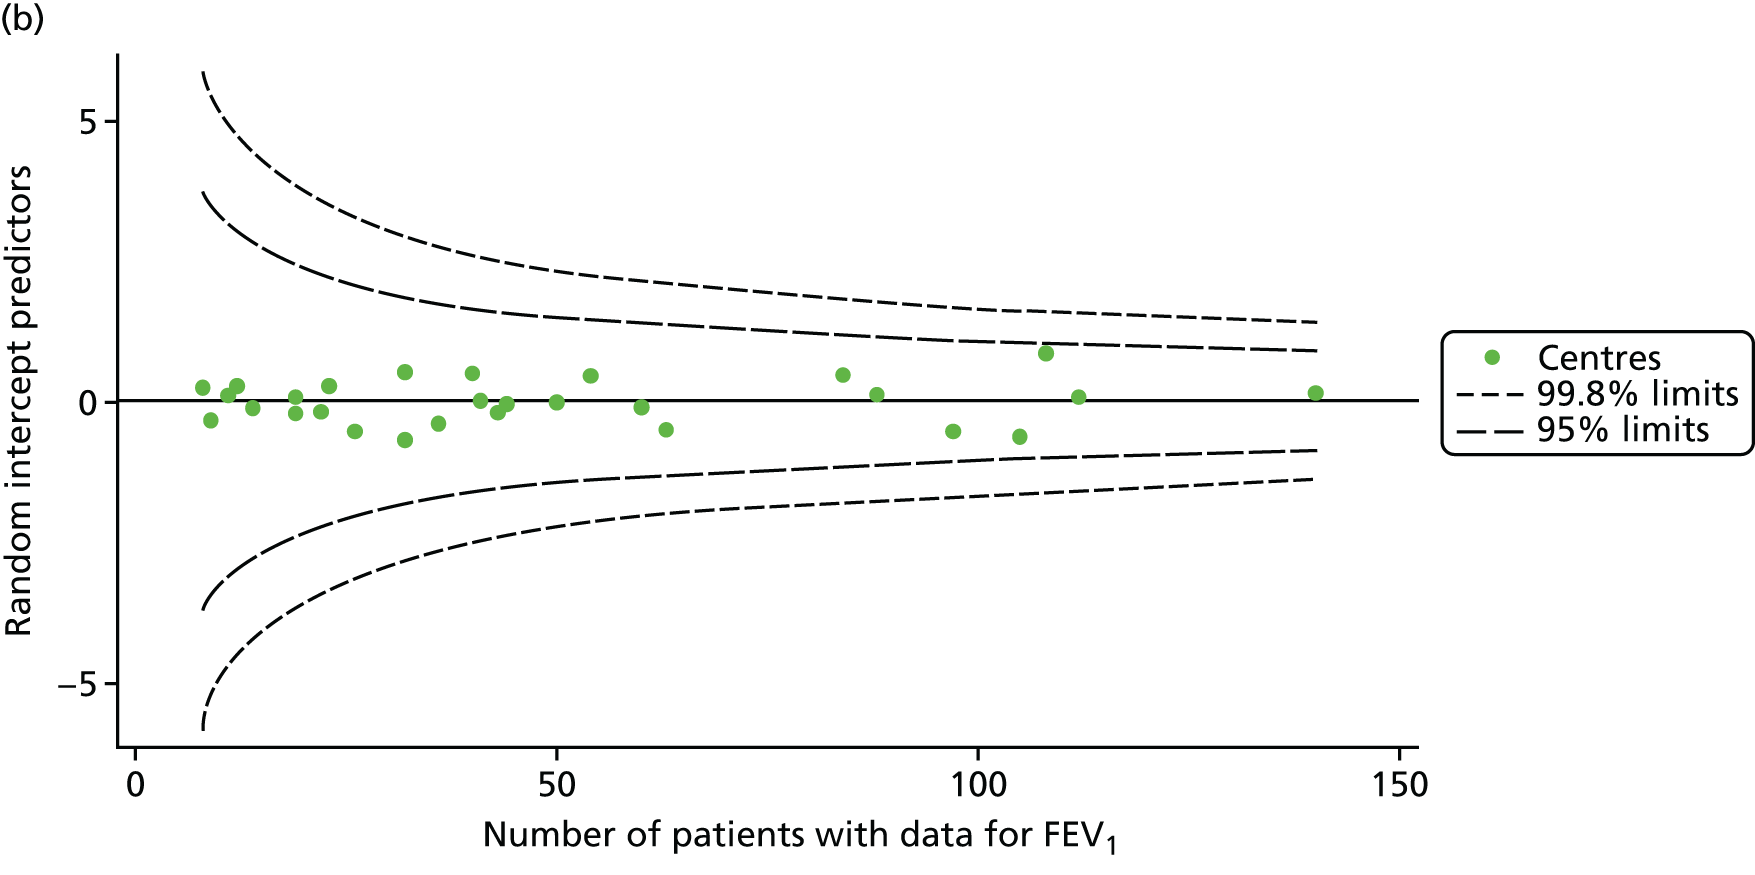
A multilevel model, using the estimated change in FEV1 as the outcome, was generated to explore the impact of case-mix variables with the addition of age at the first visit in this analysis (Table 10). Only sex proved statistically significant in this analysis. A funnel plot adjusted for case mix shows that intercepts (Figure 13b) for all centres were very close to the mean.
| Fixed effect | Estimate (95% CI) | p-value |
|---|---|---|
| Constant | 0.09 (–2.28 to 2.47) | 0.939 |
| Sex (male) | –1.56 (–2.49 to –0.62) | 0.001 |
| Genotype | ||
| Homozygous DF508 | – | 0.643 |
| Heterozygous DF508 | 0.23 (–0.79 to 1.25) | |
| No DF508 | 0.87 (–0.98 to 2.72) | |
| Pancreatic enzyme supplement use | –0.88 (–2.88 to 1.21) | 0.389 |
| SES | ||
| 1 (least deprived) | – | 0.764 |
| 2 | –0.89 (–2.35 to 0.57) | |
| 3 | –0.59 (–2.07 to 0.90) | |
| 4 | –0.81 (–2.24 to 0.63) | |
| 5 (most deprived) | –0.41 (–1.91 to 1.09) | |
| Age at first visit | 0.29 (–0.86 to 0.28) | 0.325 |
| Random effect | ||
| Between-centre SD | 0.78 (0.29 to 2.11) | |
| Within-centre SD | 8.81 (8.48 to 9.14) | |
As with other outcomes, we considered the possible role of shrinkage and used a fixed-effects model to adjust for case mix. The results are shown in Appendix 2, Figure 32, and no centres are outside the 3-SD limits.
Outcome: change in body mass index in adults aged 18–21 years
We identified 1432 patients with non-missing BMI data who fulfilled the inclusion criteria for this analysis.
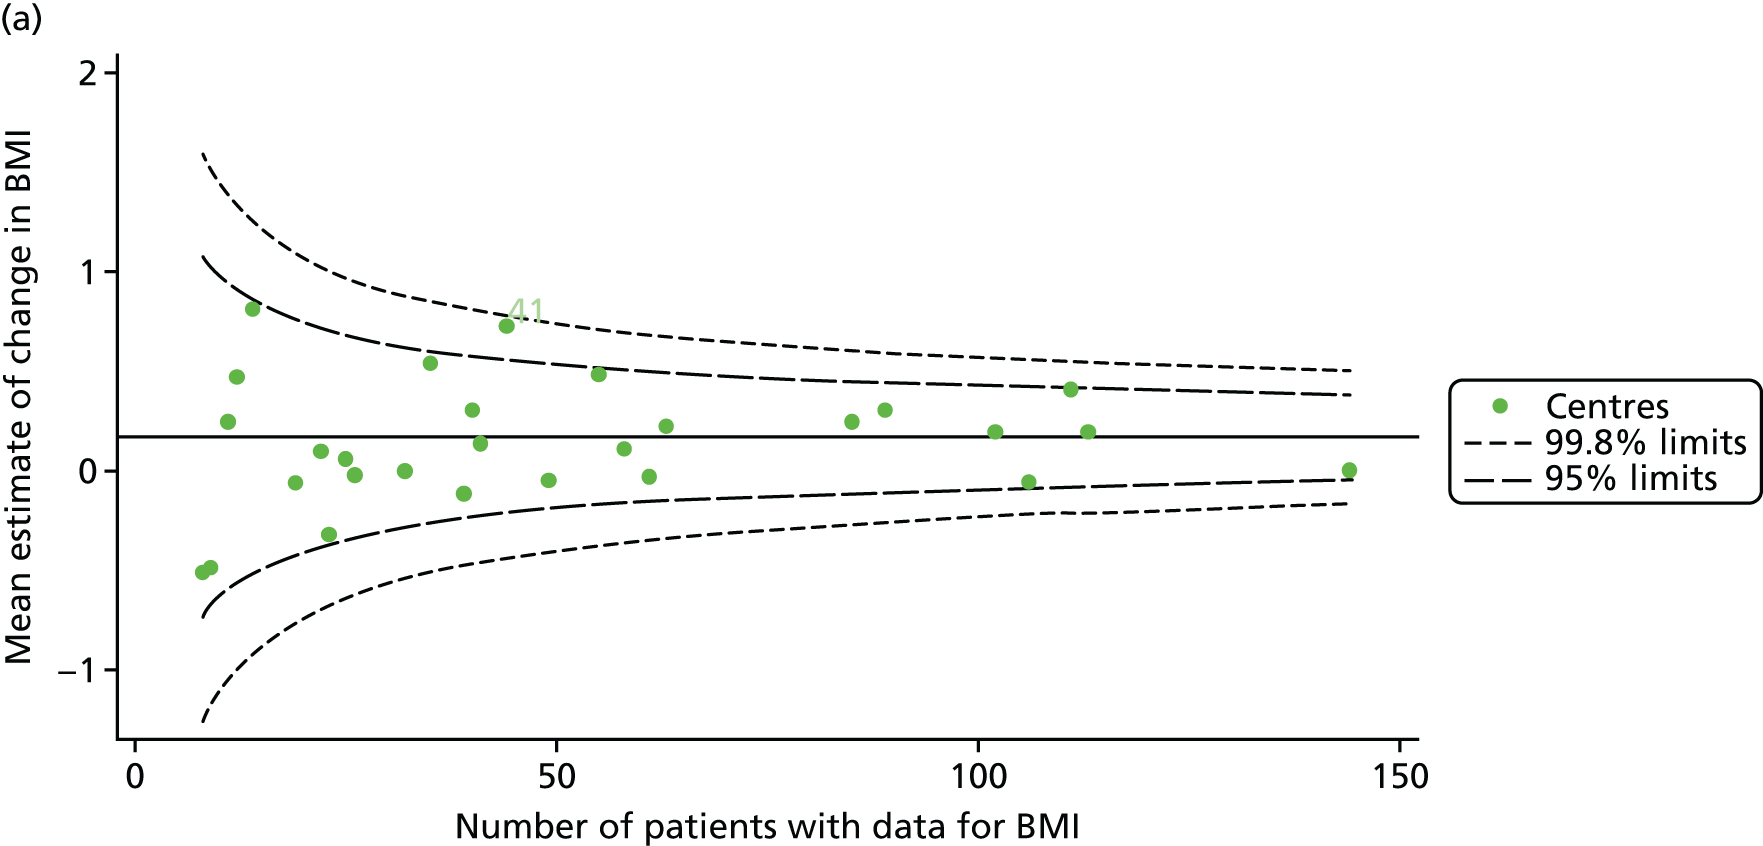
As for the earlier adult analyses, we performed linear regression analyses for each patient, calculating the annual decline in BMI between the ages of 18 and 21 years. These individual changes in BMI were then pooled by centre to generate funnel plots of mean change in BMI by centre. The mean change across centres was a 0.17 unit increase. Only one centre was outside the 2-SD control limits; it was within the 3-SD limits, however (Figure 14a).
FIGURE 14.
Change in BMI between ages 18 and 21 years. (a) Mean of the unadjusted BMI; and (b) predicted random intercepts of BMI.
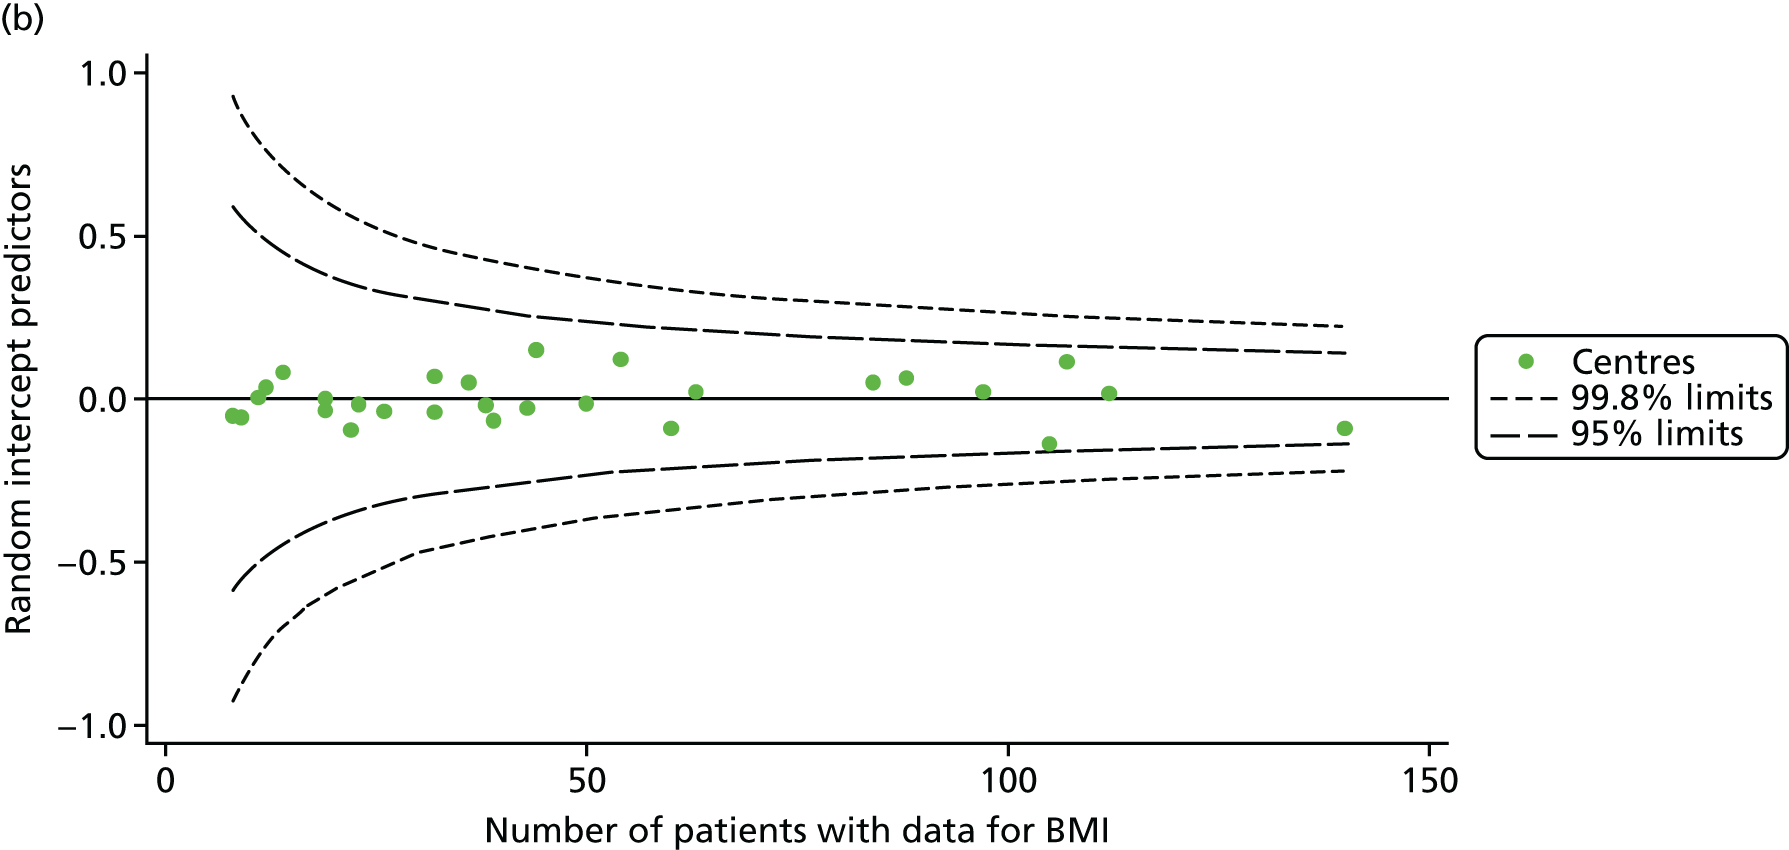
A multilevel model, using the estimated change in BMI as the outcome, was generated to explore the impact of case-mix variables (Table 11). None of the case-mix variables proved statistically significant in this analysis. A funnel plot adjusted for case mix shows that intercepts (Figure 14b) for all centres were very close to the mean.
| Fixed effect | Estimate (95% CI) | p-value |
|---|---|---|
| Constant | –0.05 (–0.40 to 0.30) | 0.778 |
| Sex (male) | 0.13 (–0.01 to 0.27) | 0.068 |
| Genotype | ||
| Homozygous DF508 | – | 0.7450 |
| Heterozygous DF508 | 0.04 (–0.11 to 0.19) | |
| No DF508 | 0.10 (–0.17 to 0.37) | |
| Pancreatic enzyme supplement use | 0.05 (–0.25 to 0.34) | 0.755 |
| SES | ||
| 1 (least deprived) | – | 0.295 |
| 2 | 0.10 (–0.11 to 0.32) | |
| 3 | 0.01 (–0.21 to 0.23) | |
| 4 | 0.10 (–0.11 to 0.31) | |
| 5 (most deprived) | 0.22 (0.002 to 0.44) | |
| Age at first visit | –0.03 (–0.11 to 0.05) | 0.485 |
| Random effect | ||
| Between-centre SD | 0.13 (0.06 to 0.30) | |
| Within-centre SD | 1.29 (1.25 to 1.34) | |
To assess the impact of shrinkage we conducted sensitivity analyses, as we had done for other outcomes. As observed in the analysis of change in FEV1 in children, we observed some outliers in this analysis that were not evident in the unadjusted or multilevel model-adjusted analysis (see Appendix 2, Figure 33). As before, however, the case-mix adjustment model explains very little of the outcome variability (R2 = 0.007) and it is difficult to interpret what these results mean.
Analyses of all patients attending adult centres: 2007–15
To complement the analyses of outcomes in targeted age groups pooling data across multiple years, we conducted all-age analyses by year, as was done for the paediatric sample.
For the analyses of adult centres, we focused on FEV1% predicted in all patients aged ≥ 16 years, excluding those patients who had previously had a lung transplant. We used FEV1 measured using the Knudson reference equations,18 as reported in the UK CF Registry, and sensitivity analyses were performed using the GLI reference equations. 19
We considered data from 2007 to 2015 inclusive; the number of patients having annual reviews and those providing FEV1 data at these reviews changed over that period, reflecting improvements in the completeness of the UK CF Registry (Table 12).
| Contributing data | 2007 | 2008 | 2009 | 2010 | 2011 | 2012 | 2013 | 2014 | 2015 |
|---|---|---|---|---|---|---|---|---|---|
| Number of centres | 26 | 27 | 29 | 29 | 28 | 28 | 27 | 28 | 28 |
| Total number of annual reviews | 2263 | 3060 | 3588 | 3924 | 4349 | 4440 | 4569 | 4945 | 5079 |
| Total number of FEV1% predicted measures | 2163 | 2889 | 3355 | 3732 | 4234 | 4220 | 4387 | 4742 | 4872 |
Unadjusted analyses
Centre-level analyses unadjusted for any case-mix factors illustrated that centres varied widely in size and that FEV1 varied between centres (Figure 15).
FIGURE 15.
Funnel plots of FEV1 unadjusted for case mix, by year. (a) 2007; (b) 2008; (c) 2009; (d) 2010; (e) 2011; (f) 2012; (g) 2013; (h) 2014; and (i) 2015.
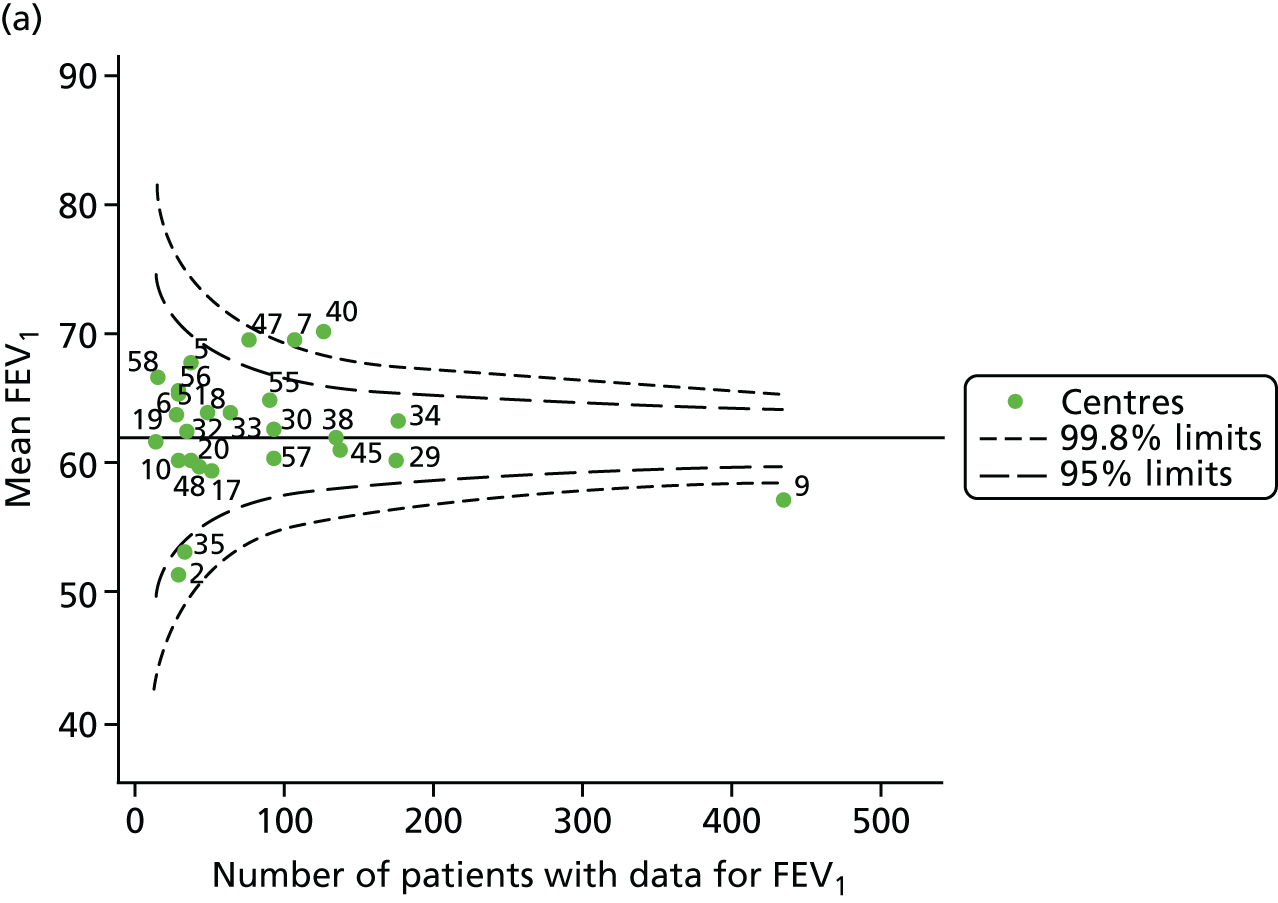

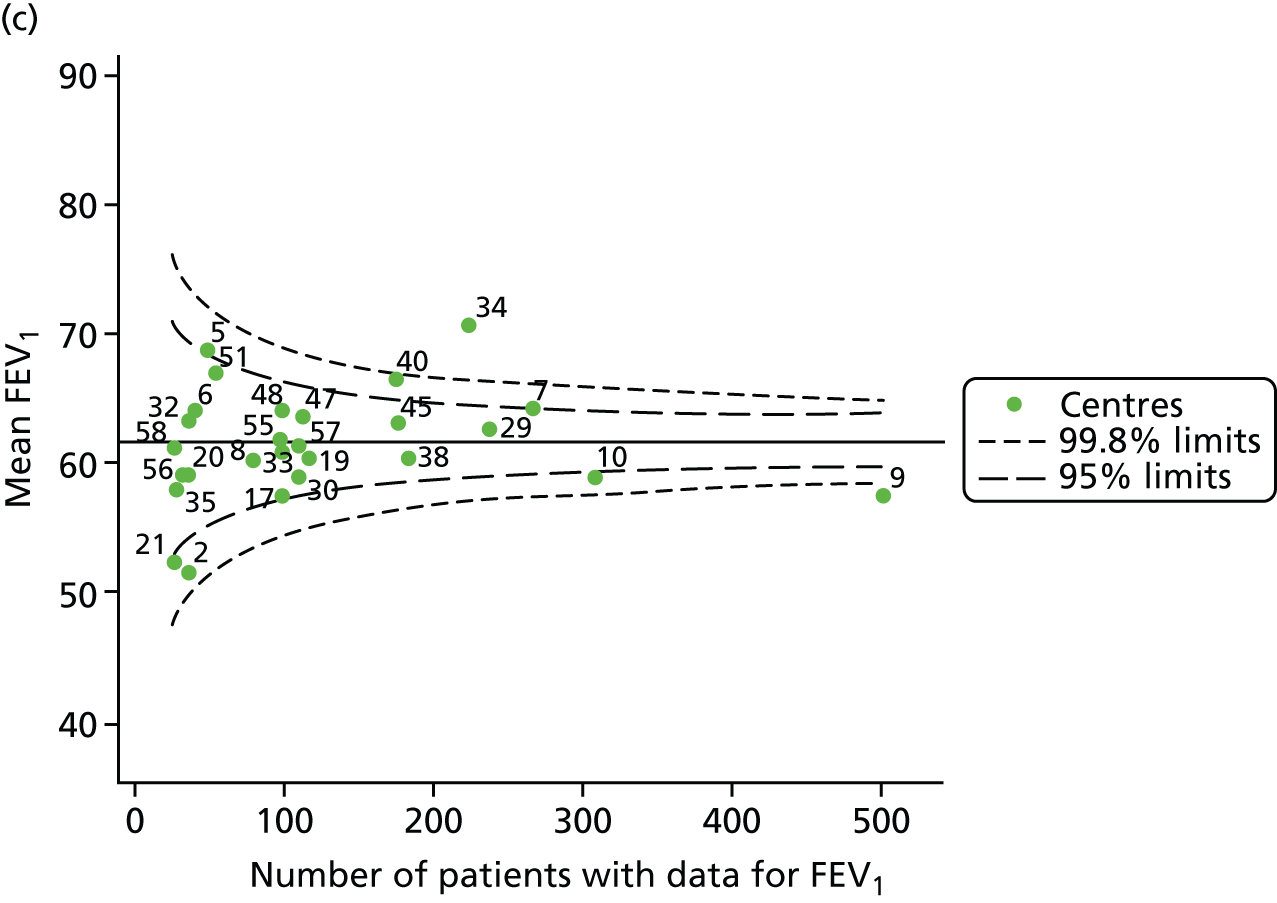
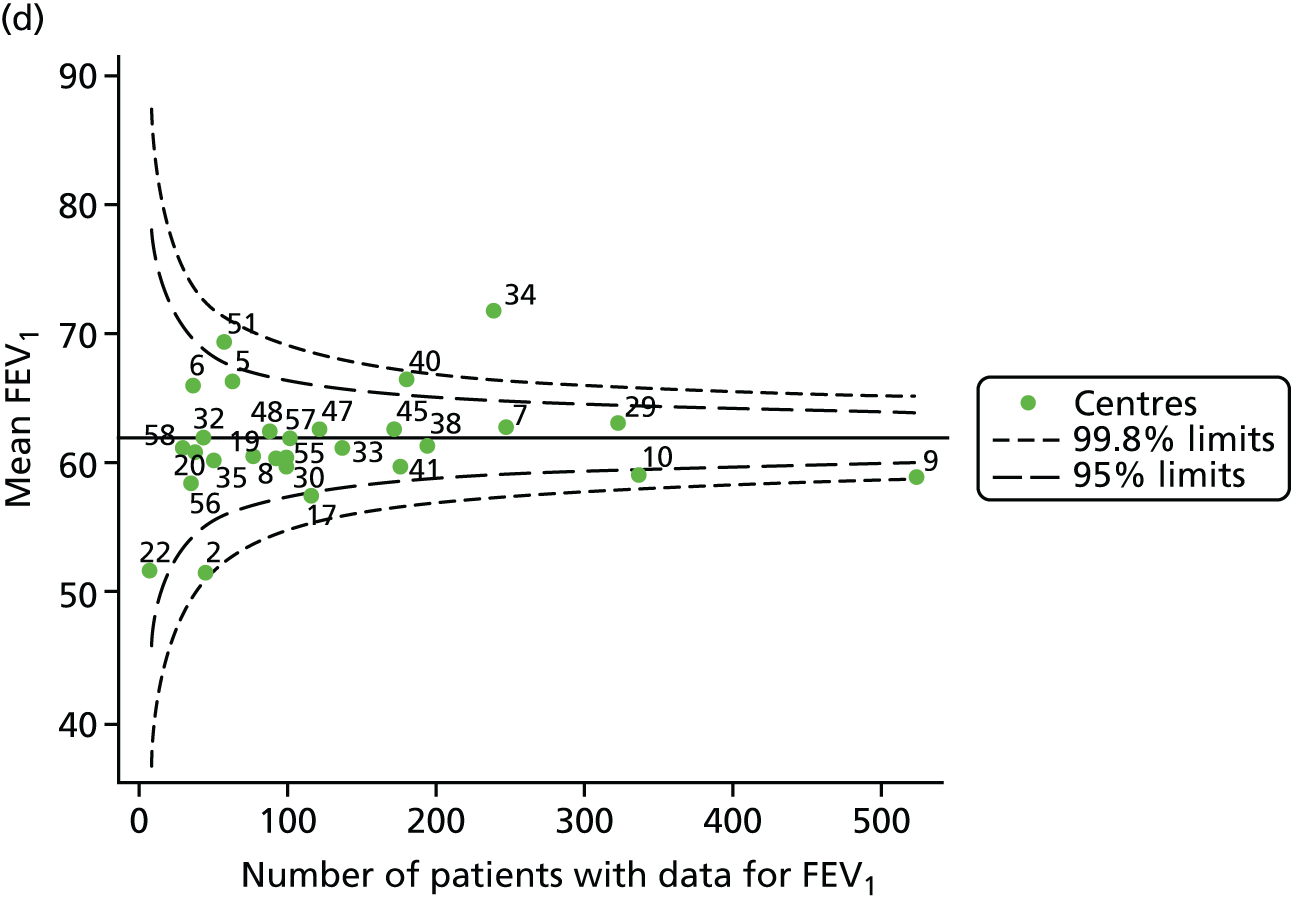
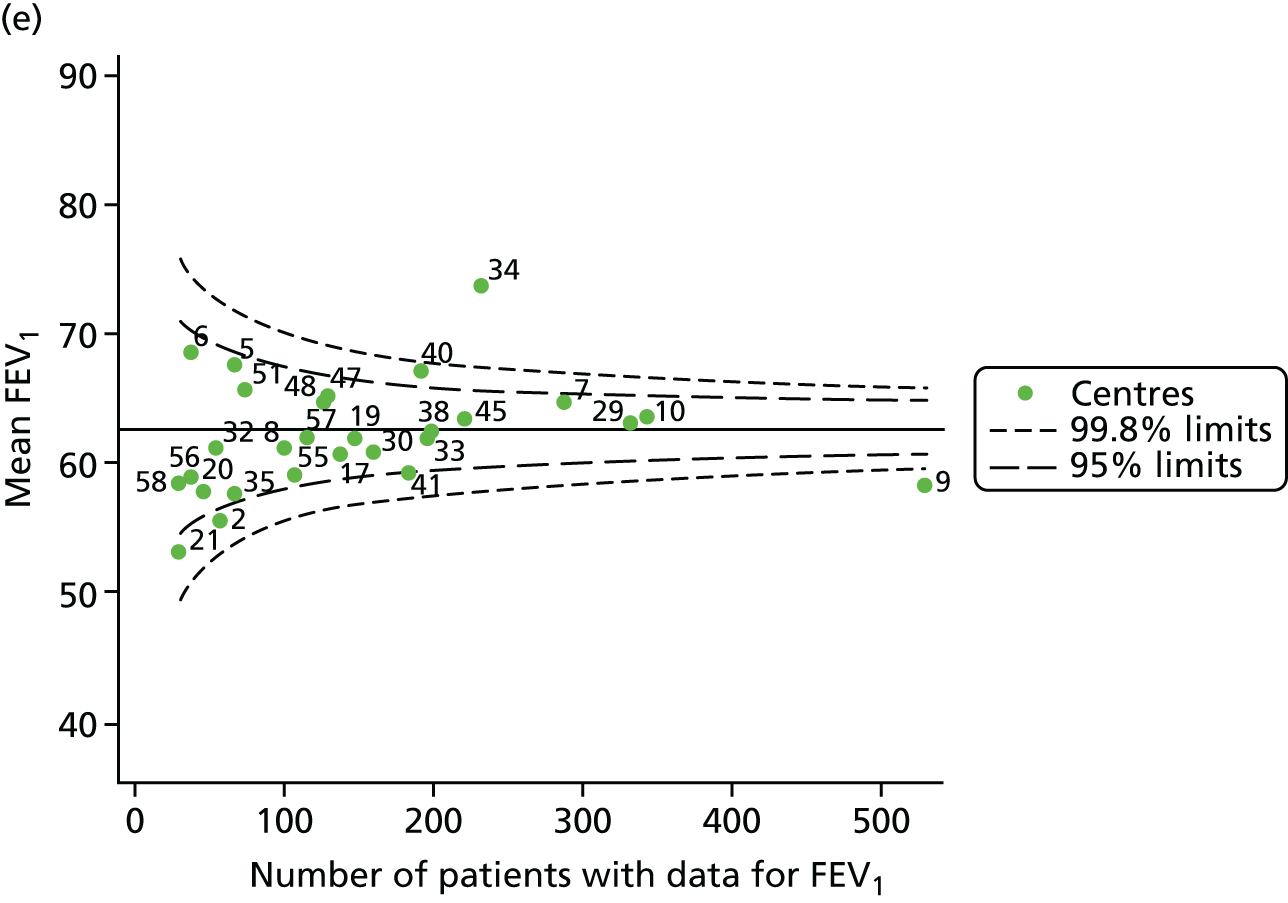
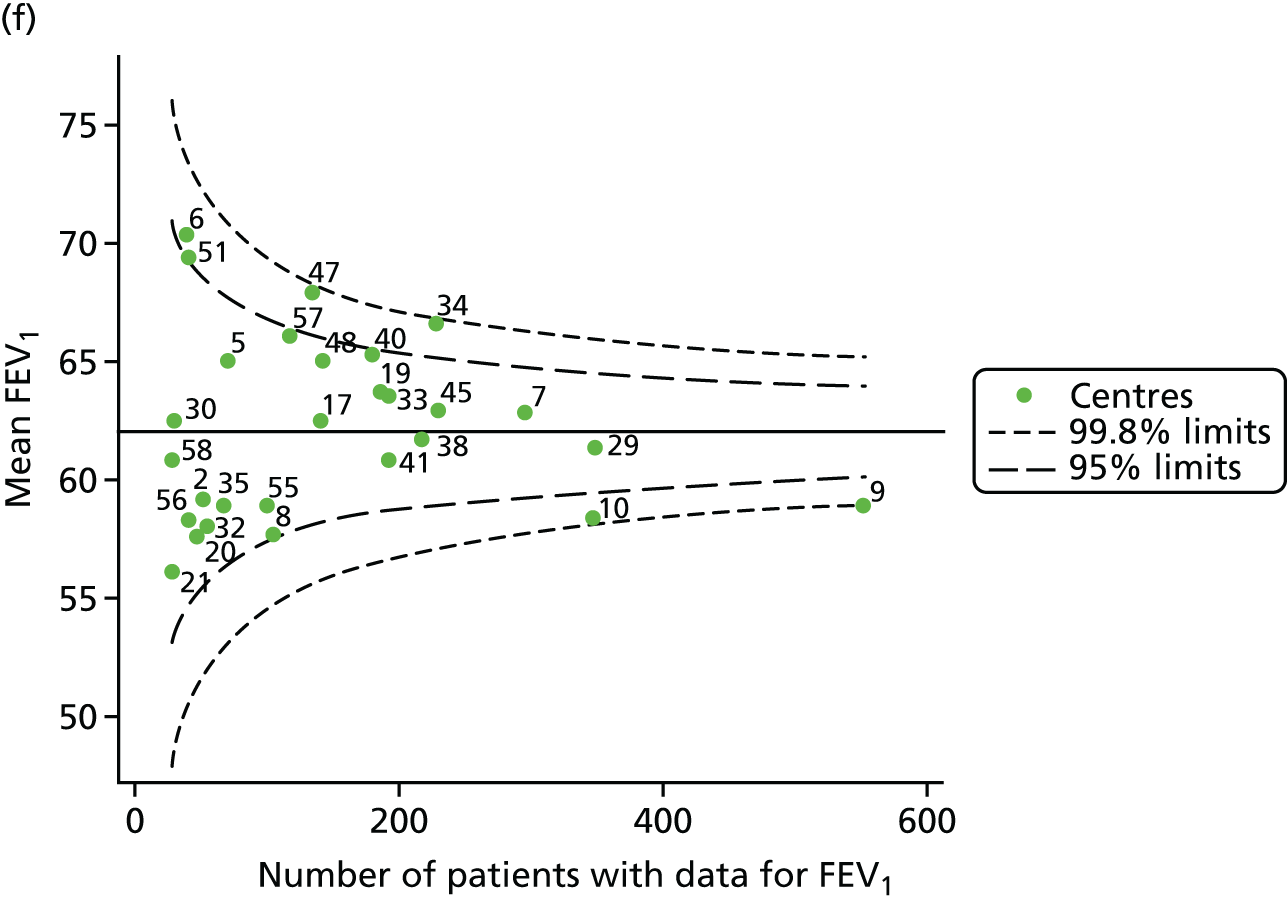

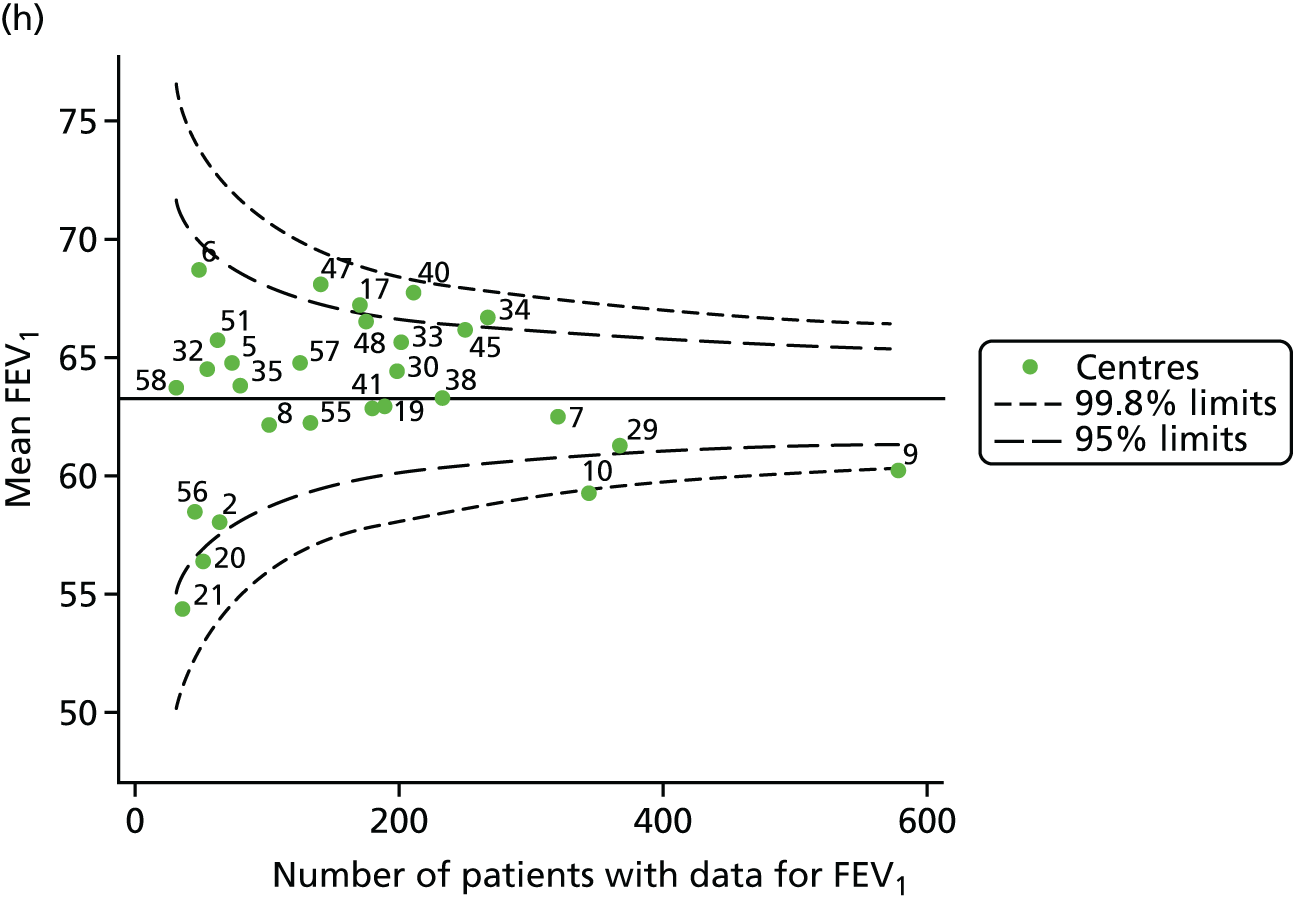

Each year’s plot was investigated to see if centres appeared inside or outside the 2- or 3-SD control limits. We also took note of centres that ‘hovered’ near control limits without being outside them. These results are summarised in Table 13.
| Year | Centres with lower than average FEV1 values | Centres with higher than average FEV1 values | ||
|---|---|---|---|---|
| Outside 3-SD limit | Outside 2-SD limit | Outside 2-SD limit | Outside 3-SD limit | |
| 2007 | 9 | 2 and 35 | 47 | 7 and 40 |
| 2008 | 9 | 35a | 5 and 48a | 7 |
| 2009 | 9 | 2, 10, 17a and 21 | 5, 7a and 40 | 34 |
| 2010 | 9 | 2, 10 and 17 | 40 and 51 | 34 |
| 2011 | 9 | 2, 21, 35a and 41 | 5a and 40 | 34 |
| 2012 | 9 | 8a and 10 | 6, 40, 47 and 51a | 34 |
| 2013 | – | 9, 10, 20,a 21 and 56 | 34, 40 and 47 | – |
| 2014 | 9 and 10 | 20, 21 and 29a | 17, 34, 40, 45 and 47 | – |
| 2015 | – | 9, 10, 20, 29 and 56 | 34, 40, 45 and 48 | 47 |
There are some patterns in the data that suggest that some centres are outside the control limits consistently.
-
Centres with lower than average FEV1 values: centre 9 is outside the 3-SD limits for most years, although – as the largest centre by a large margin and located where the control limits are at their narrowest – it is generally close to those limits. Centre 10 was frequently outside the 2-SD limits from 2010 (and outside the 3-SD limits in 2014). In the early years of the study period (2007–11), centre 2 was frequently outside the limits, as was centre 21 from 2011 onwards.
-
Centres with higher than average FEV1 values: centres 34 and 40 were frequently outside the control limits and, between 2009 and 2012, centre 34 was outside the 3-SD limits. In the later years of the analysis, centre 47 was also frequently outside the 2-SD limits and was outside the 3-SD limits in 2015. In 2007 and 2008, centre 7 was outside the 3-SD control limits and from 2009 was either borderline on the 2-SD limits or within the 2-SD limits. Similarly, centre 5 was often outside the 2-SD limits in the early years, but moved to a borderline position within the control limits after this.
We will explore the patterns seen at those centres appearing outside the 3-SD limits (centres 7, 9 and 34) in more detail, adopting the pyramid of investigation approach, and will consider whether or not issues in the data have led to these trends.
Pyramid of investigation: data
To explore whether or not the patterns observed in Figure 14 are related to the variations in the number of annual reviews submitted – and to explore variations in the proportion of patients with poor FEV1 (< 40% predicted) – we stratified patients by FEV1 and we present the frequencies by centre and year in Appendix 3, Table 32. There was a general increase in the number of annual reviews at each centre over time. As discussed in relation to the paediatric data, we did no further validation of the adult data, given the data validation already performed by the CF Trust.
After considering possible discrepancies in the data, the next step in the pyramid of investigation was to consider case mix. This was particularly relevant in the year-by-year analyses in which all patients aged ≥ 16 years were included.
Pyramid of investigation: case mix
Age
It is known that FEV1 declines with age; therefore, as the mean age of patients varies between centres (see Appendix 3, Table 33), it is essential to adjust FEV1 accordingly.
Statistical adjustment should account for the documented non-linear association between FEV1 and age. To do this we adopted two approaches:
-
For each year of analysis we ran a GLM of FEV1% predicted across age deciles and from this obtained model-predicted values. Our age-adjusted FEV1% predicted was then calculated using the ratio of the original FEV1% predicted to the values predicted by the regression model multiplied by 100. When considering those centres identified as exhibiting special-cause variation in the unadjusted analysis, we saw that adjustment for age resulted in some shifting across the control limits. Centre 9 moved to within the 3-SD limits in 2008, 2012–15. The results are described in Appendix 2, Figure 34, and Appendix 3, Table 34.
-
We used beta-splines for age with knots chosen at 18, 28 and 40 years based on visual inspection of the 2012 data. This was done to accommodate possible non-linear associations between age and FEV1, as has been seen in a number of studies. 22 These splines were incorporated into multilevel models and we used the random intercept predictions in our funnel plots. With this adjustment, some of the centres that showed evidence of special-cause variation in unadjusted analyses were now within the 2-SD control limits (centres 2, 5, 7 and 21). Centre 9 continued to show evidence of special-cause variation, but in 2008, 2010 and 2012 moved to within the 3-SD limits. However, some ‘positions’ remained unchanged, such as that of centre 34, which remained outside the 3-SD limits in 2009–11 and outside the 2-SD limits in 2012–15. The results of these analyses are presented in Appendix 2, Figure 35, and Appendix 3, Table 35.
-
This analysis was repeated using a simple linear adjustment for age and similar results were obtained (results not shown).
These results suggest that age may have accounted for some of the differences between centres, but not in all cases. In addition, regardless of the method used to account for age, consistent signals are detected in centres exhibiting the greatest difference from the mean.
Additional case-mix variables
In addition to age, there are a number of other factors that may influence FEV1, which are not influenced by care and which are collected on the UK CF Registry.
A number of studies have shown that women have poorer CF outcomes than men. For this reason, we explored whether or not centres with better outcomes have a lower proportion of female patients. We observed that, except for a few outliers, at most centres and at most times the proportion of females ranged from 40% to 55%.
As CF is a recessive genetic disease, every effort is made to have all patients genotyped, and this information is recorded on the UK CF Registry. The most common genotype in the UK is DF508, and it has been shown in many studies that those who have two of these mutations (i.e. are homozygous DF508) have poorer outcomes. We considered this and noted that in most centres approximately 50% of patients are homozygous DF508. It is also of note that centre 40, which consistently had higher than average FEV1 results, reports < 35% of its patients being homozygous DF508. This suggests that patients at centre 40 have a different CF genotype profile from patients at other centres.
In 2012, a new CF therapy called Ivacaftor became available in the UK for patients with a G551D mutation. Clinical trials showed promising results and uptake of the drug was swift in those patients who were eligible to receive it. We explored what proportion of patients had at least one G551D mutation and found that the mutation was not very common, but was more common at centre 34, which showed higher than average FEV1 values, in line with our hypothesis.
A marker of CF severity is pancreatic sufficiency (i.e. pancreatic enzymes are not required to digest food). Here we considered what proportion of patients were pancreatic sufficient. We noted that there was variability between centres and that the centre with the highest proportion of pancreatic-sufficient patients was centre 34, which had higher than average FEV1 values. Centre 7, which had higher than average FEV1 values, had the lowest proportion of pancreatic-sufficient patients.
As with many conditions, there is evidence that individuals from more disadvantaged backgrounds have poorer outcomes. Here, SES was summarised in quintiles: we explored what proportion of patients were in the fifth (most deprived) quintile. All other things being equal, we would expect that 20% of patients in a given centre would be in any given quintile. This was the pattern observed in some of the centres, but we noted that centre 7 (which had better FEV1 outcomes) had far fewer patients in the fifth quintile. In the later years of the analysis, centre 40 (better FEV1 outcome) also had fewer patients in this quintile. Contrary to this trend, however, centre 34 – which consistently had better FEV1 outcomes – had > 25% of its patients in the fifth quintile.
All of these results suggest that some case-mix characteristics may explain some of the FEV1 patterns we observed and, therefore, adjusting for these in our analyses would be worthwhile. There are, of course, many other variables unrelated to care at an adult CF centre that could influence clinical outcomes but we are limited to those available on the UK CF Registry and those that have good data completeness.
Case-mix variables were included in multilevel models and adjustment for age was carried out using the approaches described earlier. Both approaches gave very similar results, as described in Tables 14 and 15 and Figures 16 and 17. This additional adjustment generally reduced the number of centres between the 2-SD and 3-SD limits in the case of centres with lower than average FEV1 values. In the case of those centres with higher than average FEV1 values, in later years this adjustment seemed to bring centres that were once outside the 3-SD limits to between the 2- and 3-SD limits.
| Year | Centres with lower than average FEV1 values | Centres with higher than average FEV1 values | ||
|---|---|---|---|---|
| Outside 3-SD limit | Outside 2-SD limit | Outside 2-SD limit | Outside 3-SD limit | |
| 2007 | 9 | – | 7 and 40 | – |
| 2008 | 9 | – | – | 7 |
| 2009 | 9 | 10 | 7,a 29a and 40a | 34 |
| 2010 | 9 | 10 | 40 | 34 |
| 2011 | 9 | 41a | – | 34 |
| 2012 | – | 9 and 10 | 34 | – |
| 2013 | – | 9 | 34 and 40 | – |
| 2014 | – | 9 and 10 | 34 and 40 | – |
| 2015 | – | 9 and 10a | 34, 47a and 48 | – |
| Year | Centres with lower than average FEV1 values | Centres with higher than average FEV1 values | ||
|---|---|---|---|---|
| Outside 3-SD limit | Outside 2-SD limit | Outside 2-SD limit | Outside 3-SD limit | |
| 2007 | 9 | – | 7 and 40 | – |
| 2008 | 9 | – | – | 7 |
| 2009 | 9 | 10 | 7a and 29 | 34 |
| 2010 | – | 9 and 10 | 40a | 34 |
| 2011 | 9 | 41a | 7a | 34 |
| 2012 | – | 9 and 10 | 34 | – |
| 2013 | – | 9 | 34 and 40 | – |
| 2014 | – | 9 and 10 | 34 and 40 | – |
| 2015 | – | – | 34, 40,a 47a and 48 | – |
FIGURE 16.
Funnel plots of FEV1 adjusted for age using GLM then further adjusted for case mix using multilevel models, by year. (a) 2007; (b) 2008; (c) 2009; (d) 2010; (e) 2011; (f) 2012; (g) 2013; (h) 2014; and (i) 2015.

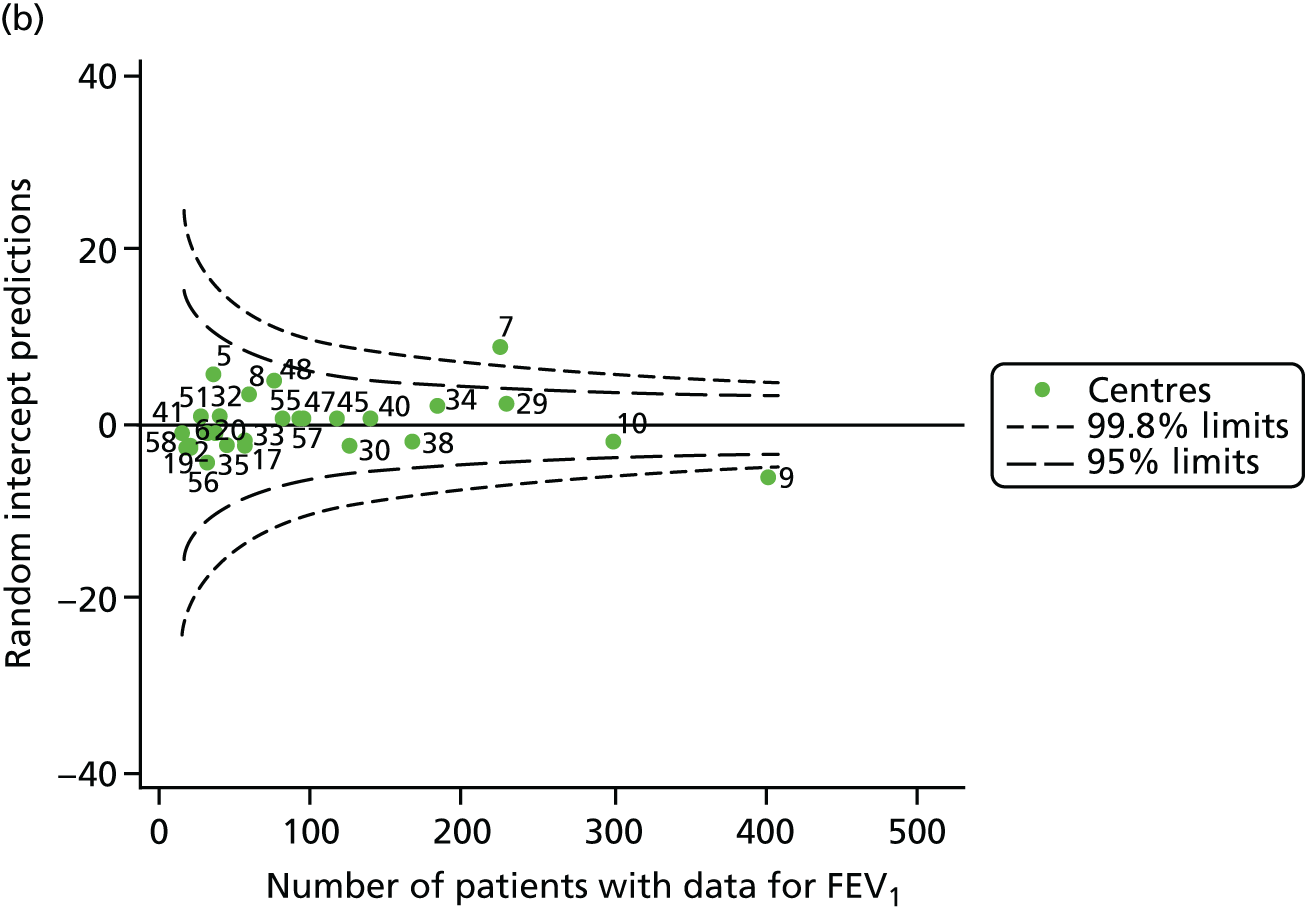
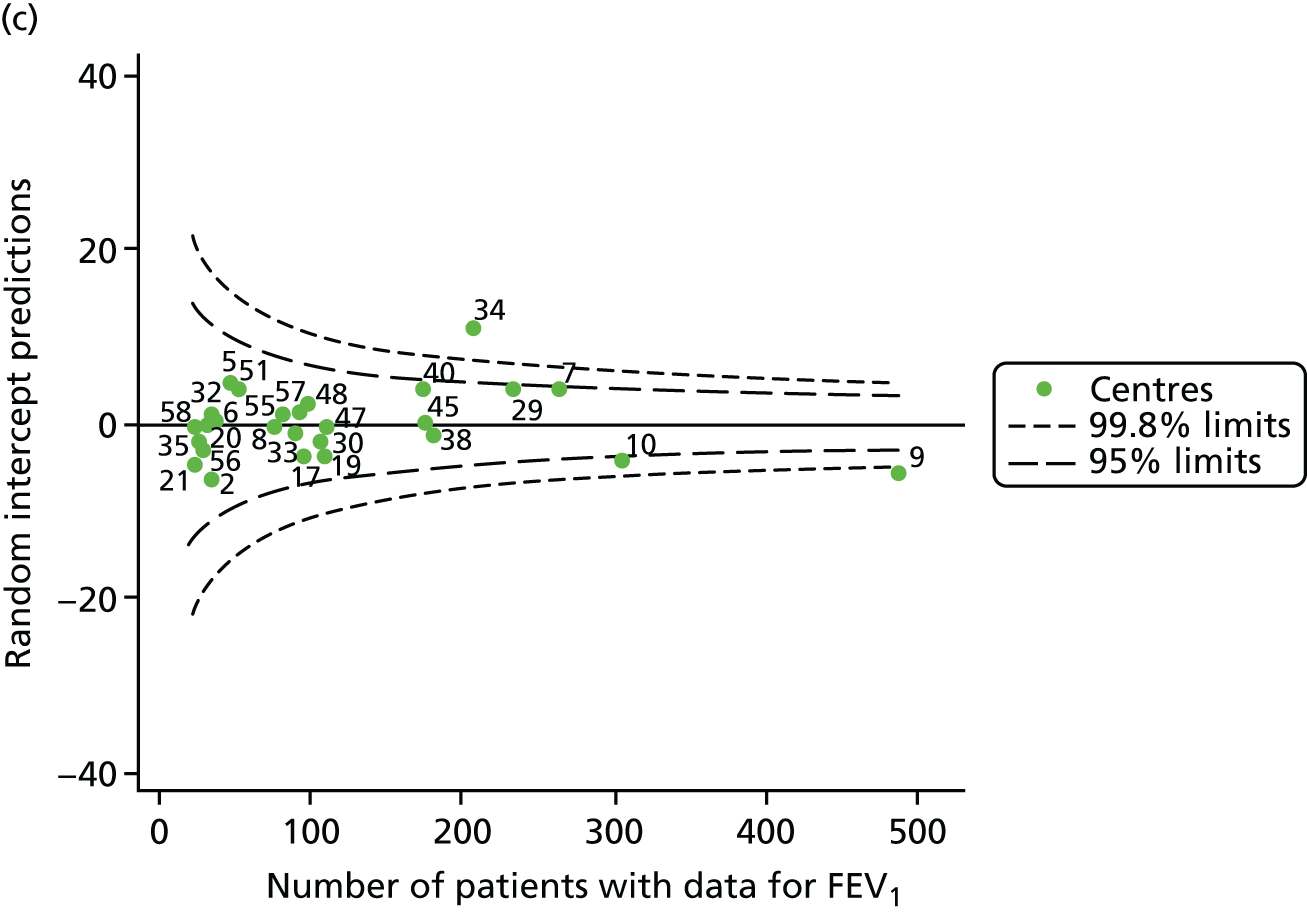
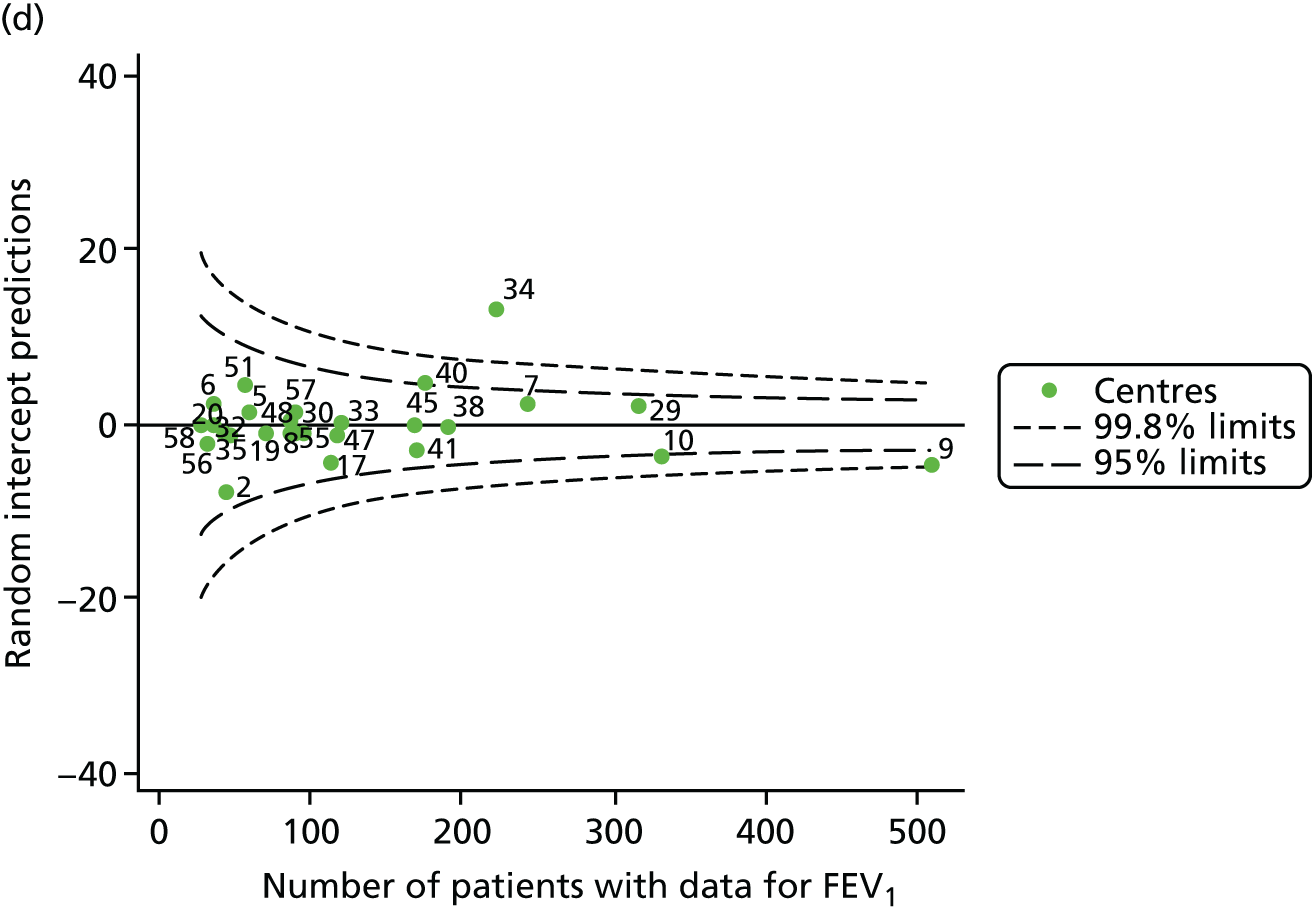
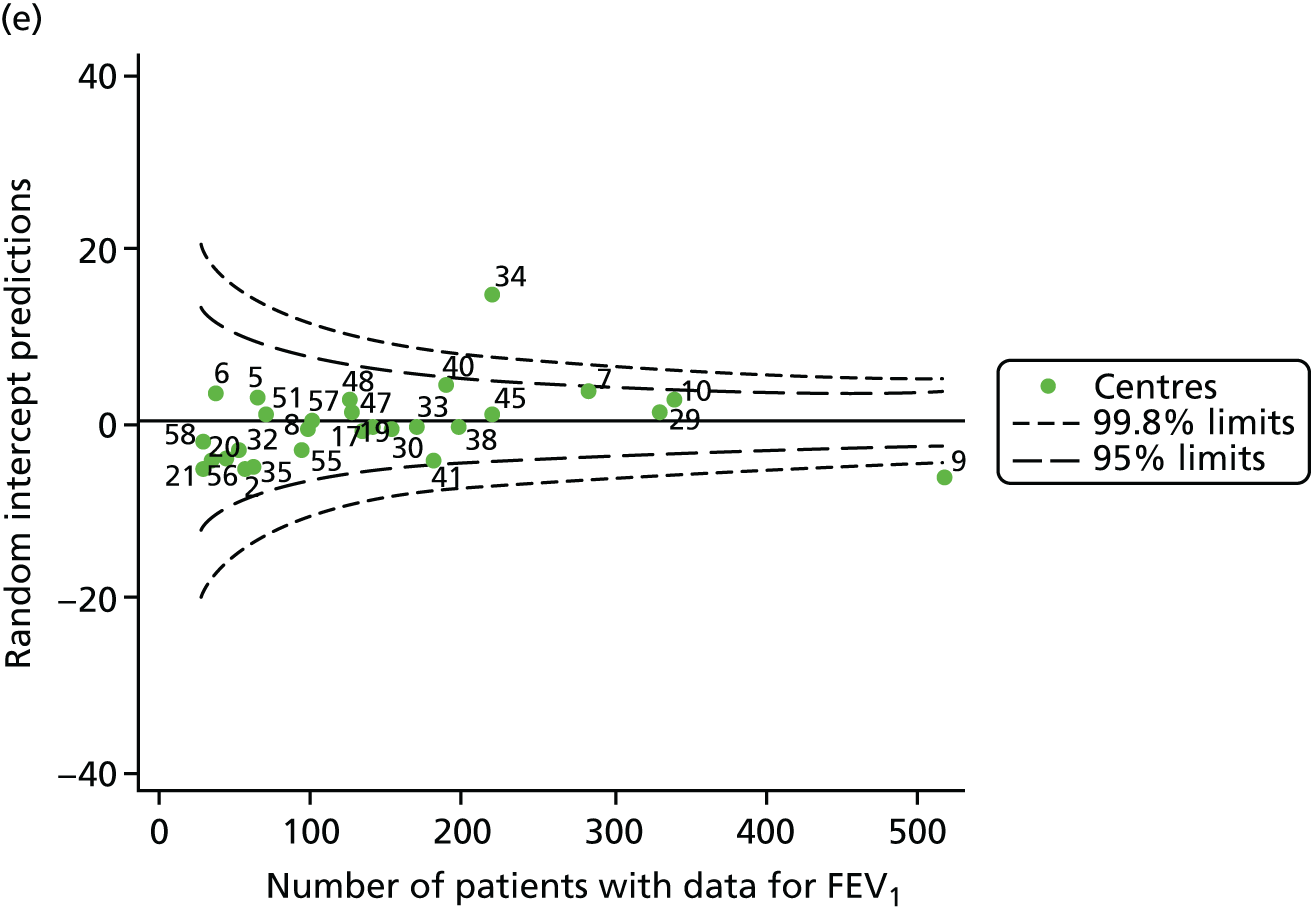
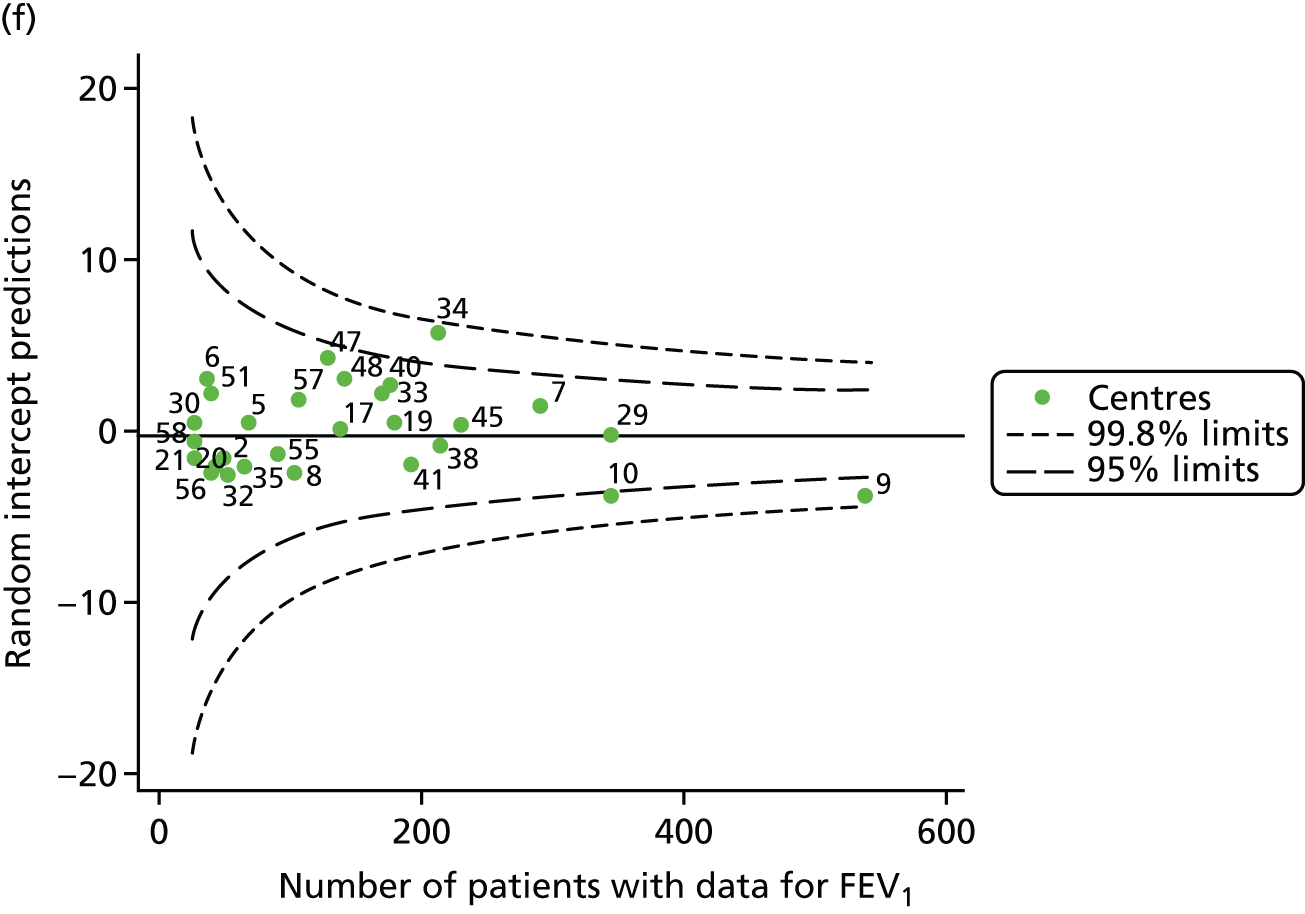
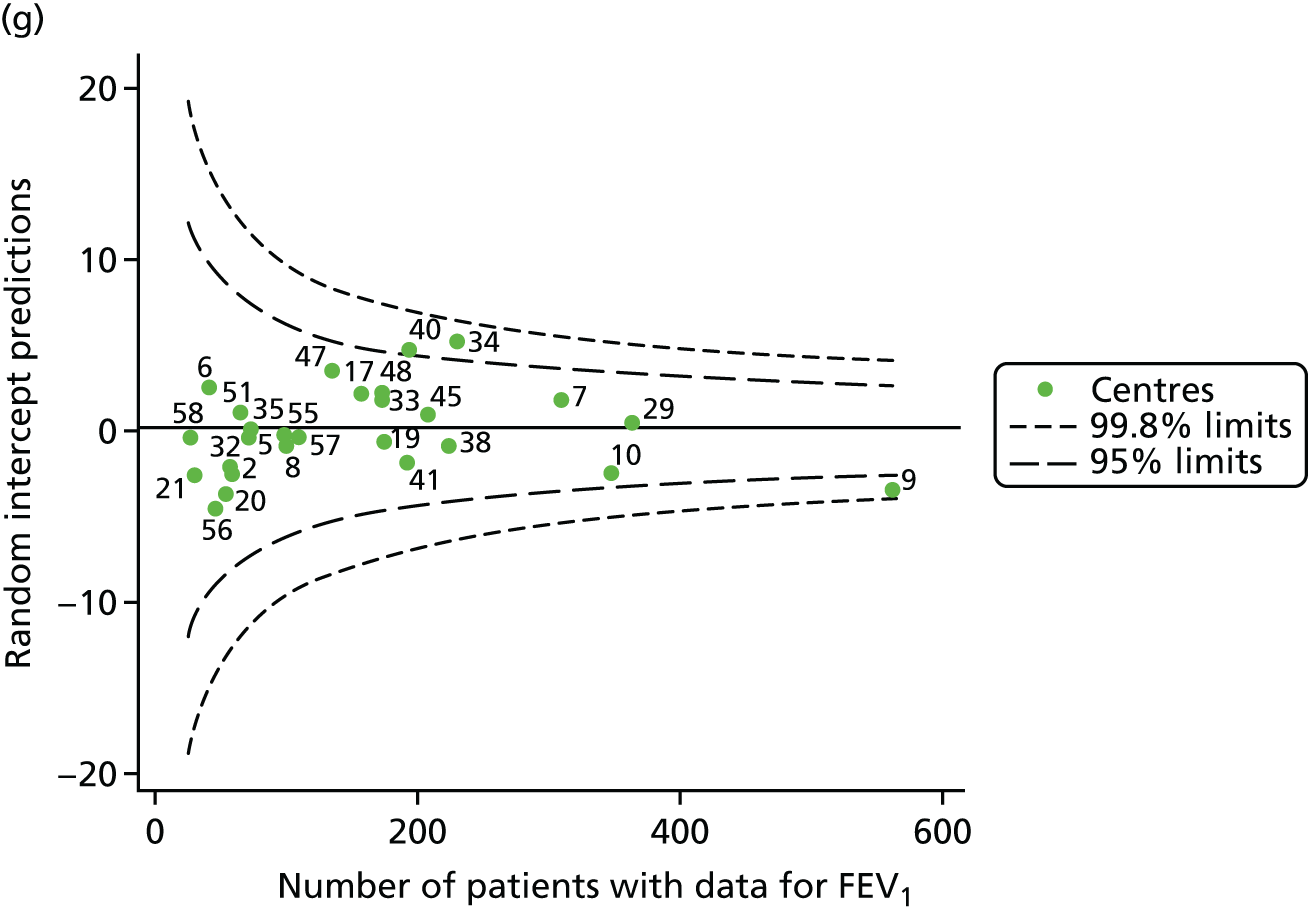
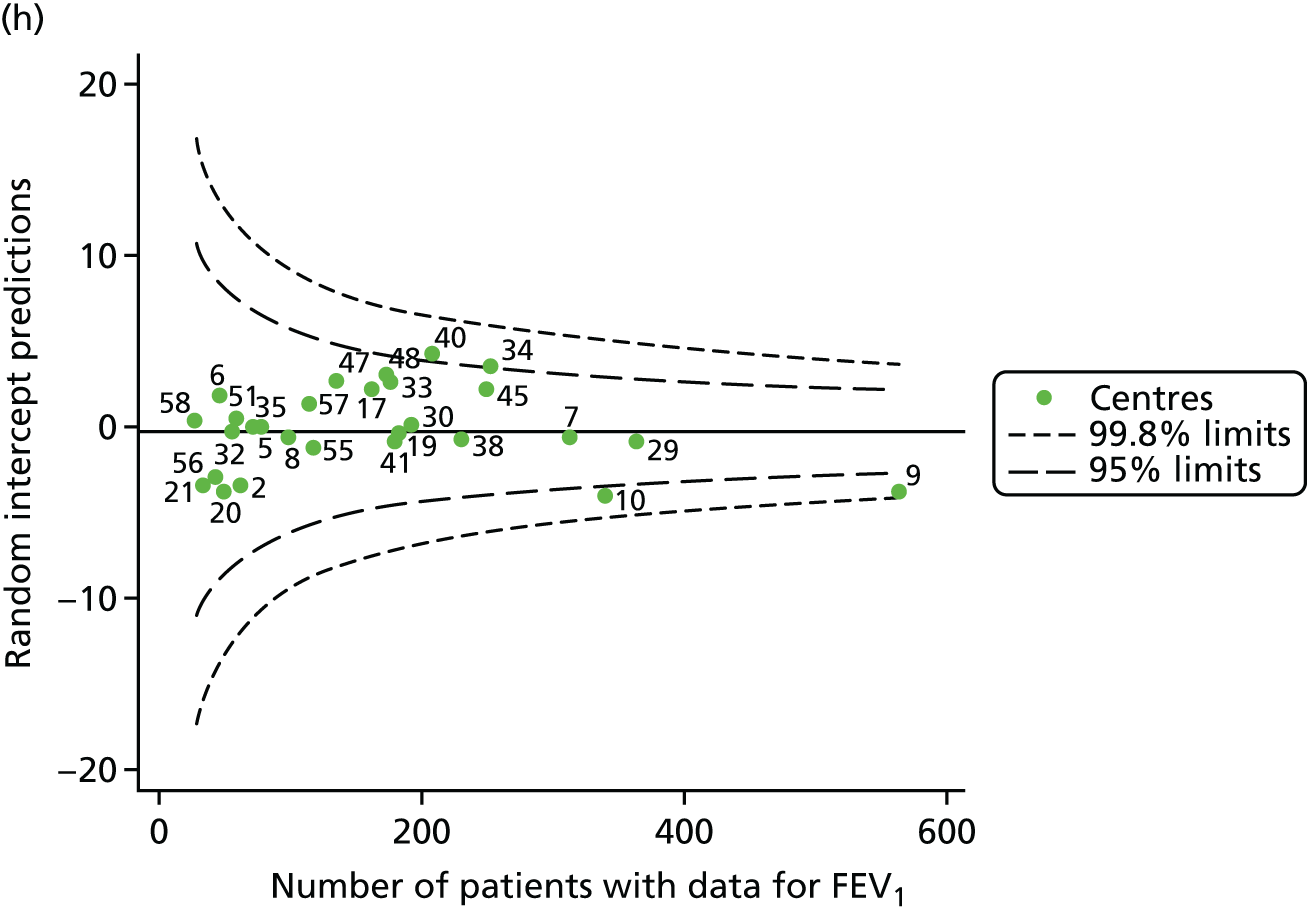
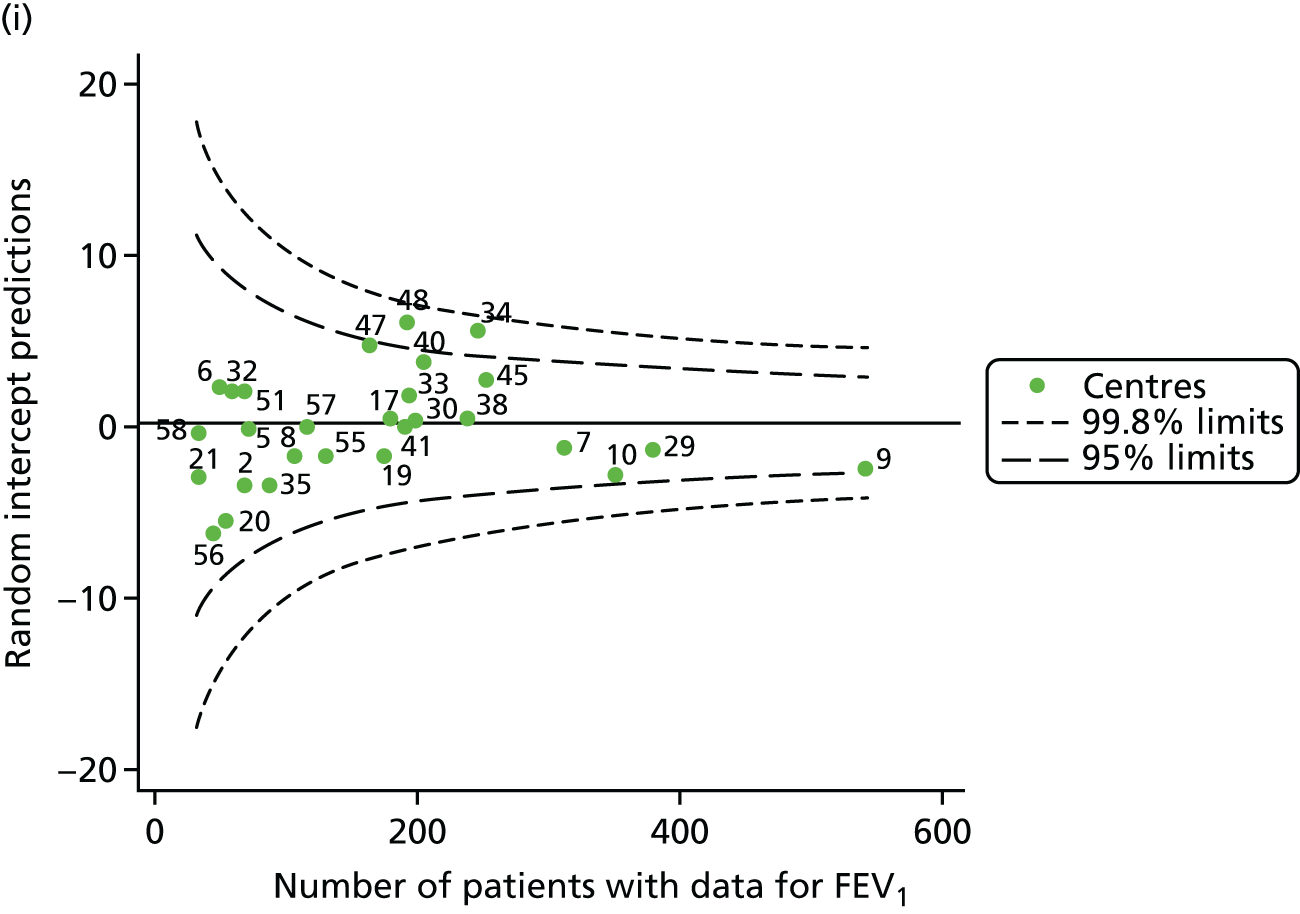
FIGURE 17.
Funnel plots of FEV1 adjusted for age (splines) and other case-mix factors using multilevel modelling, by year. (a) 2007; (b) 2008; (c) 2009; (d) 2010; (e) 2011; (f) 2012; (g) 2013; (h) 2014; and (i) 2015.
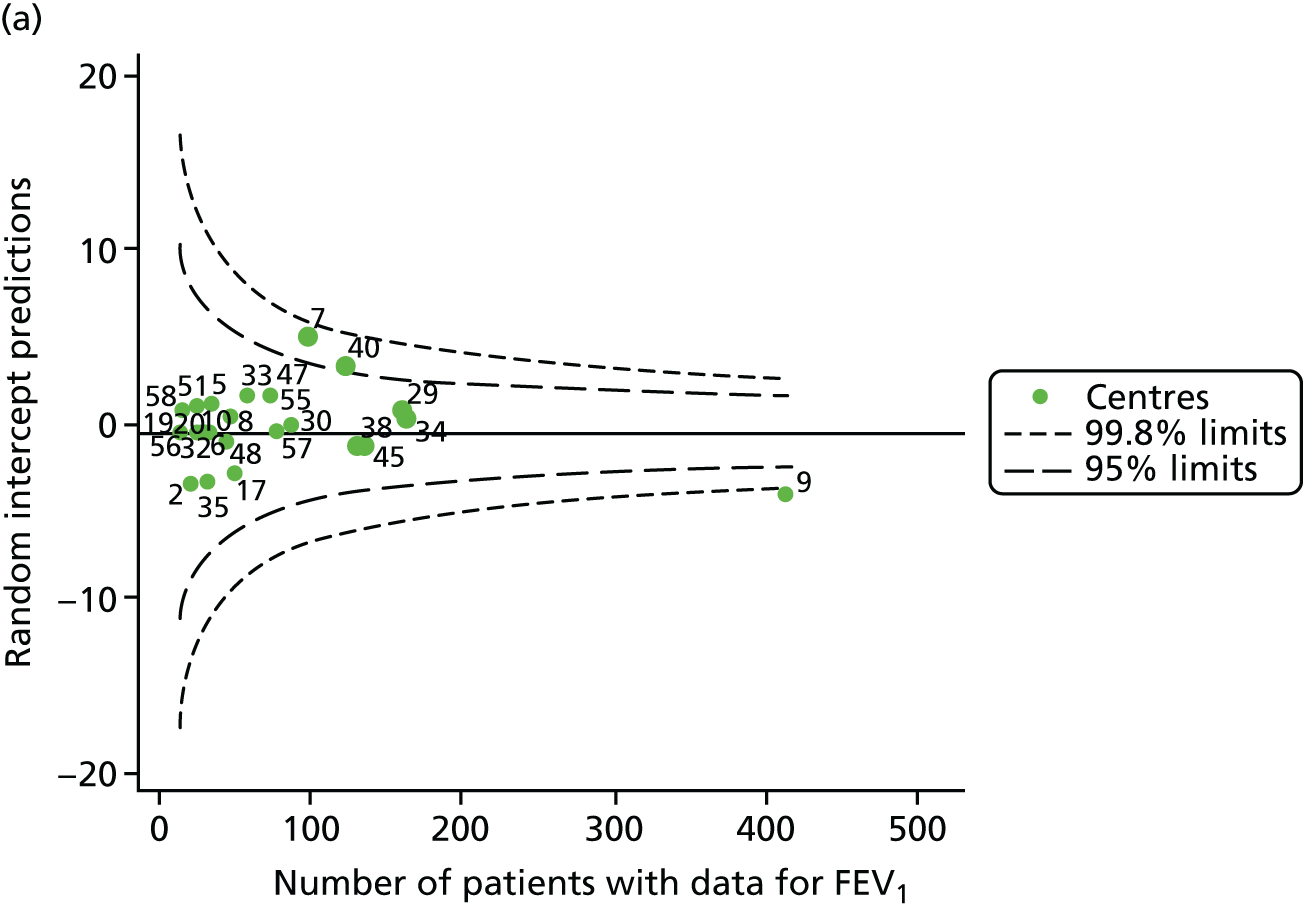

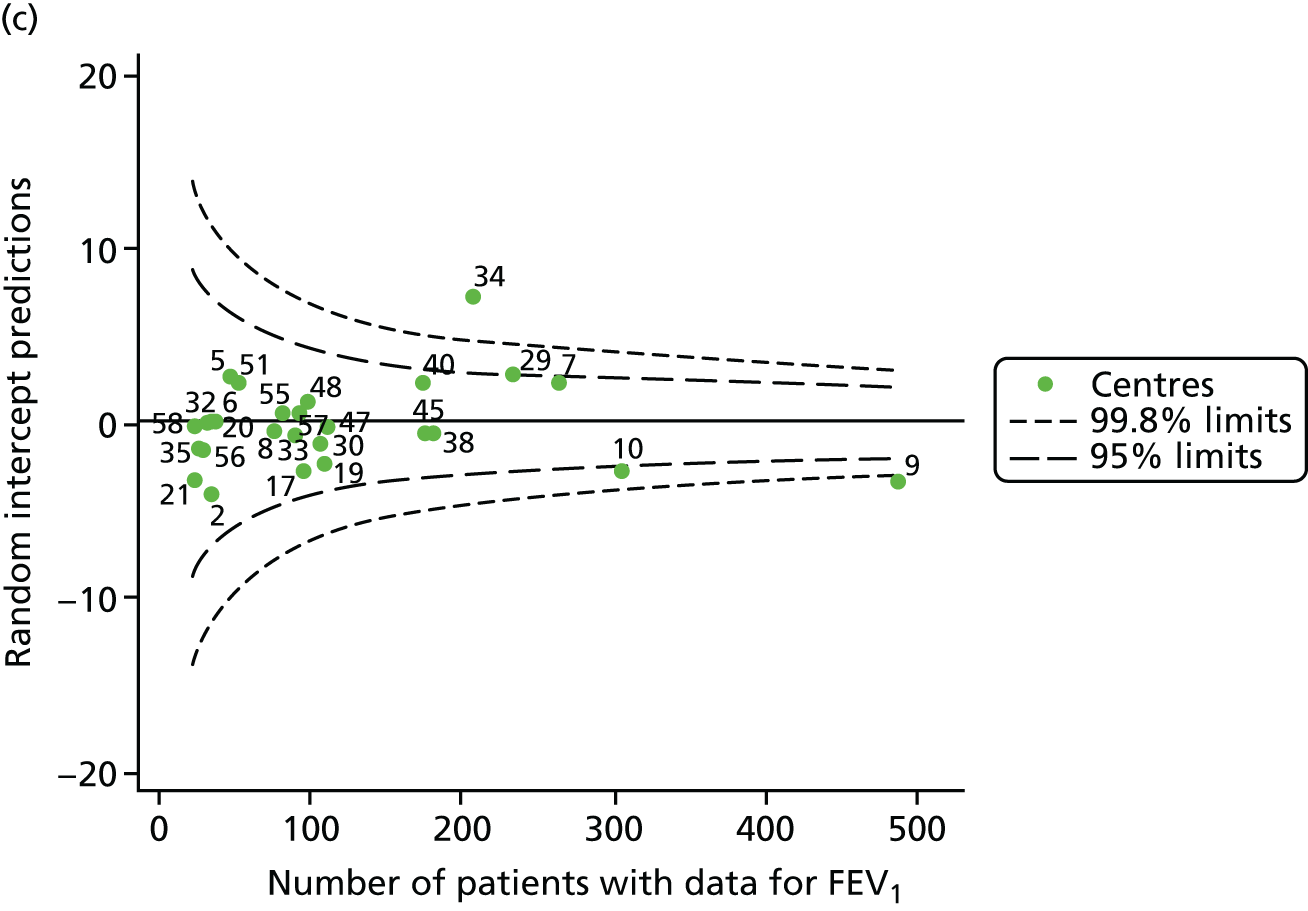
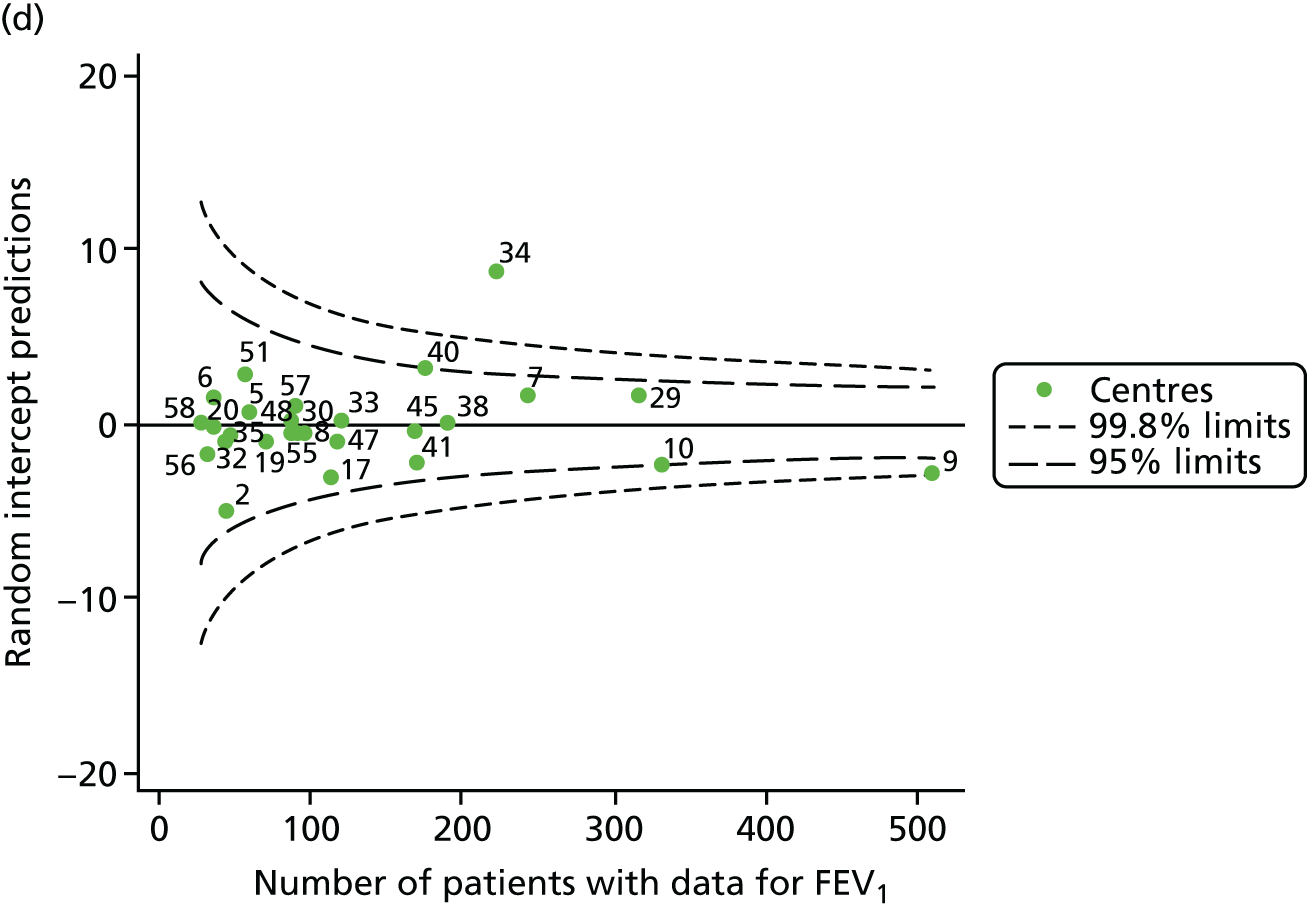
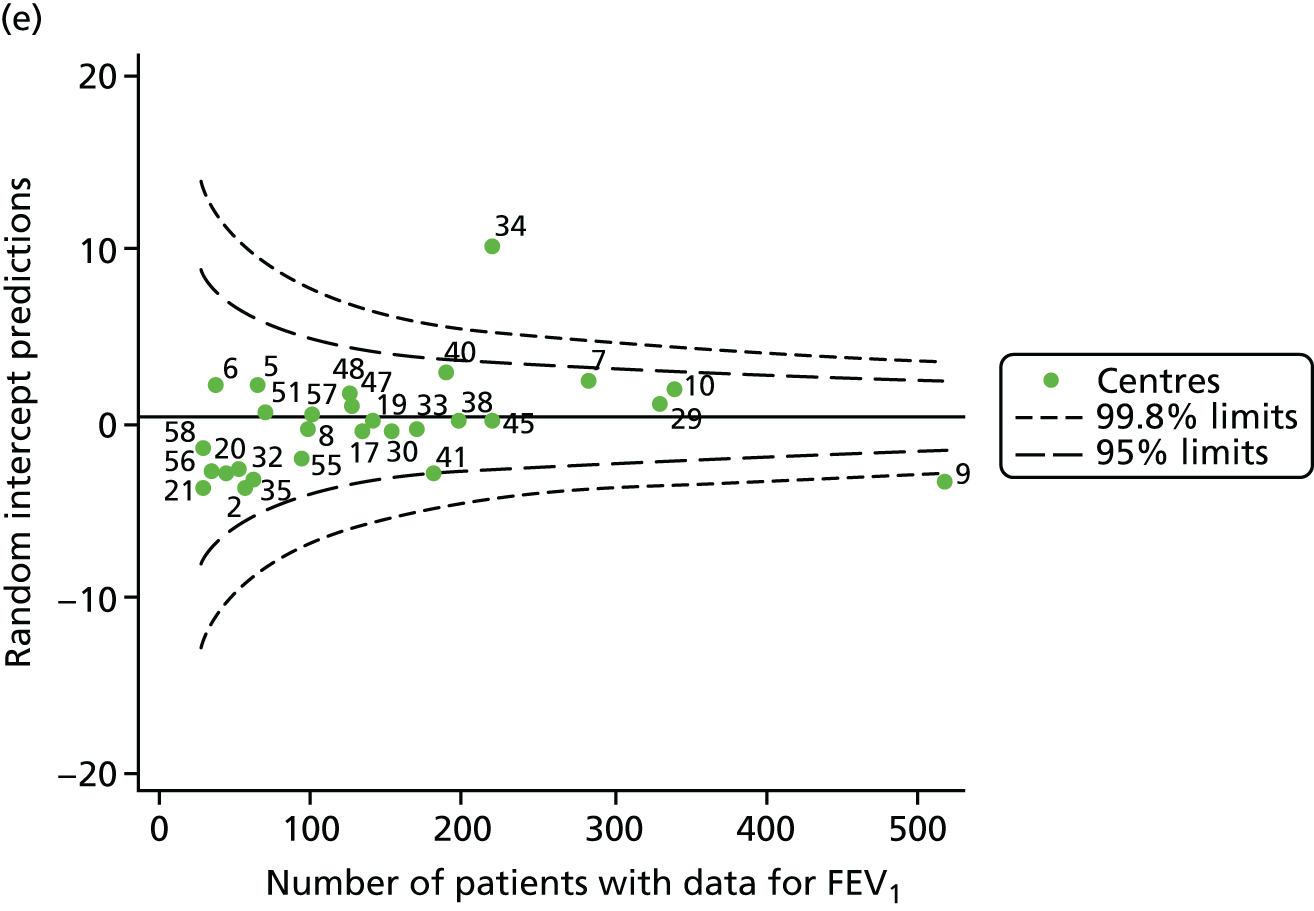
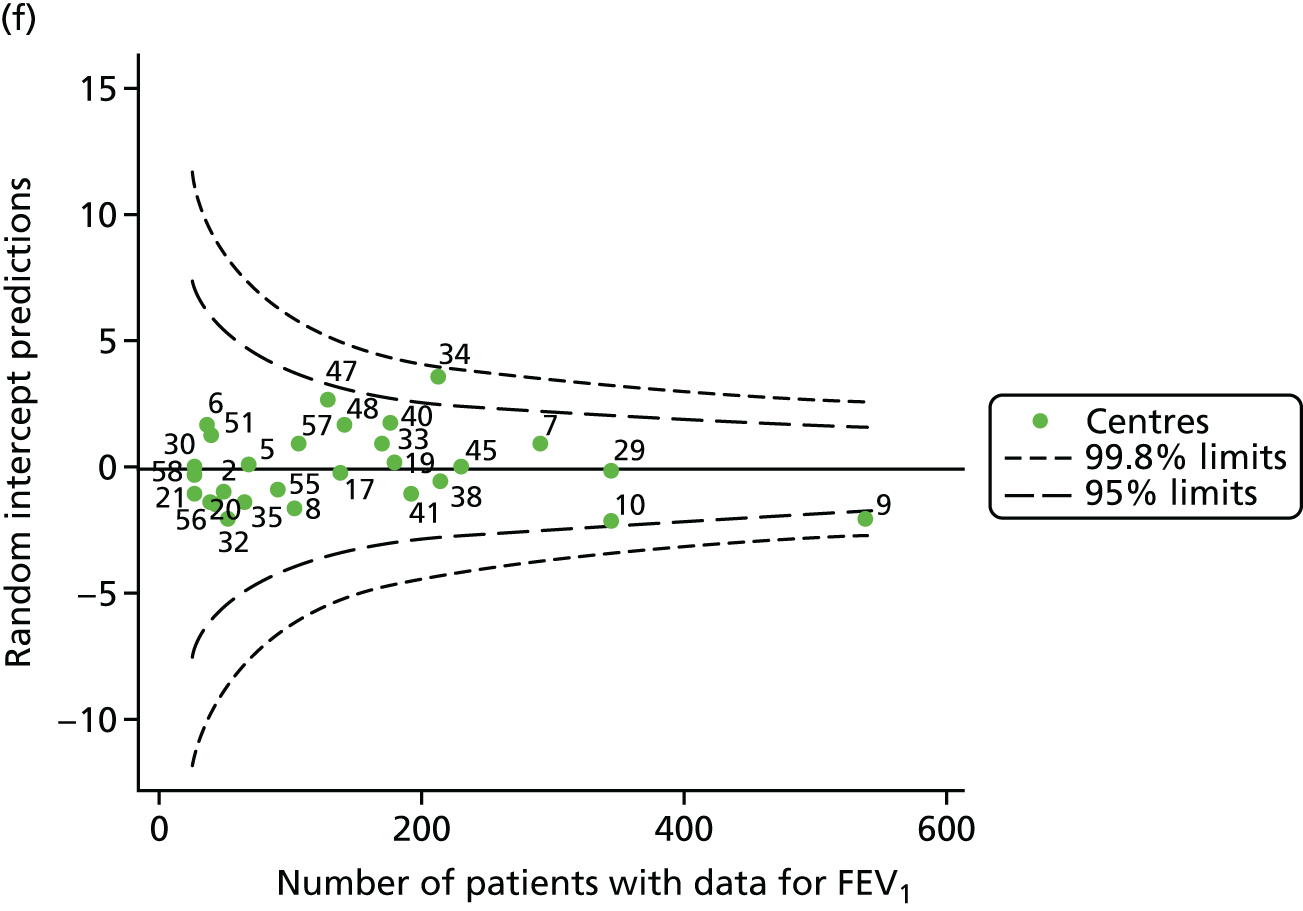
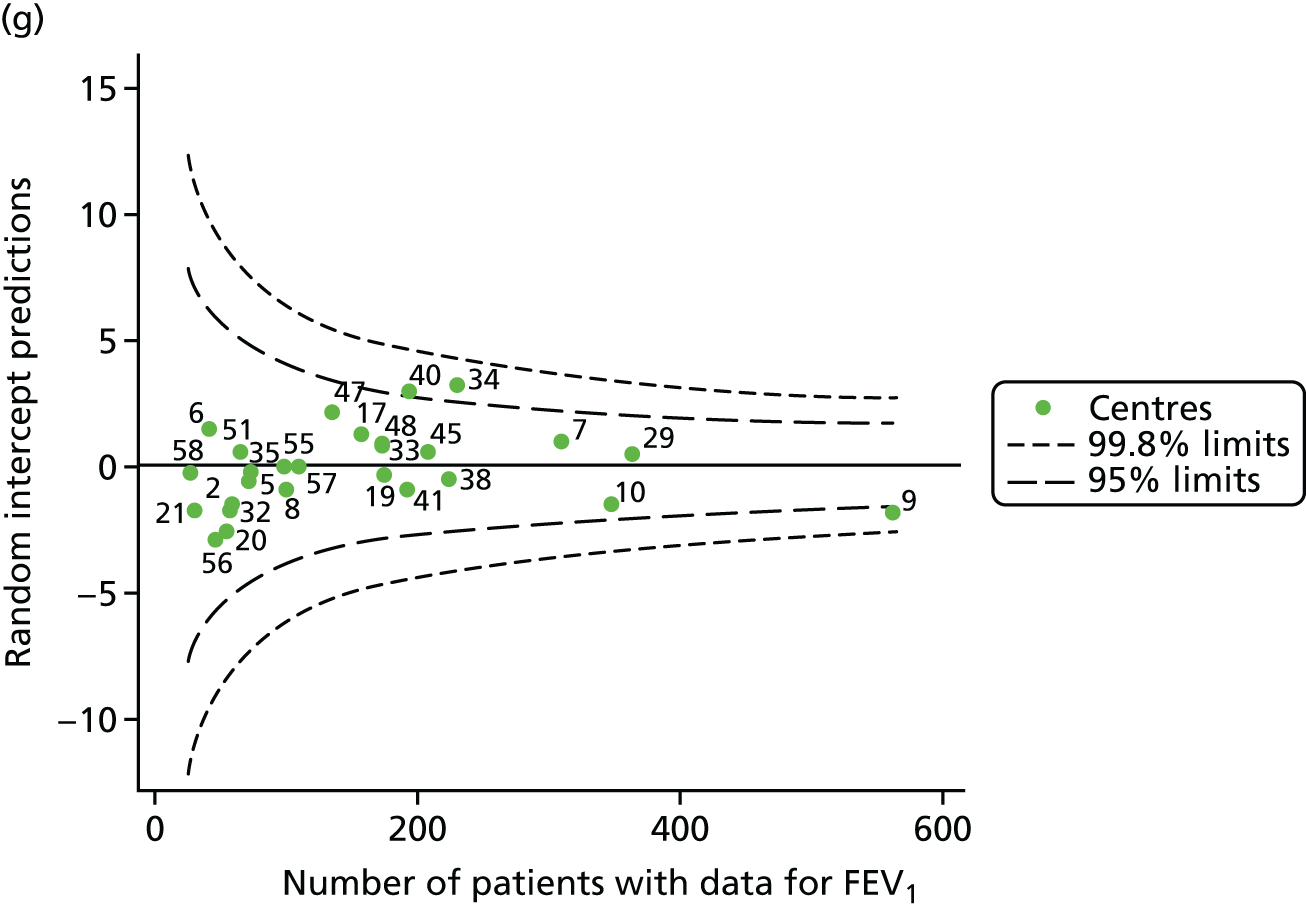
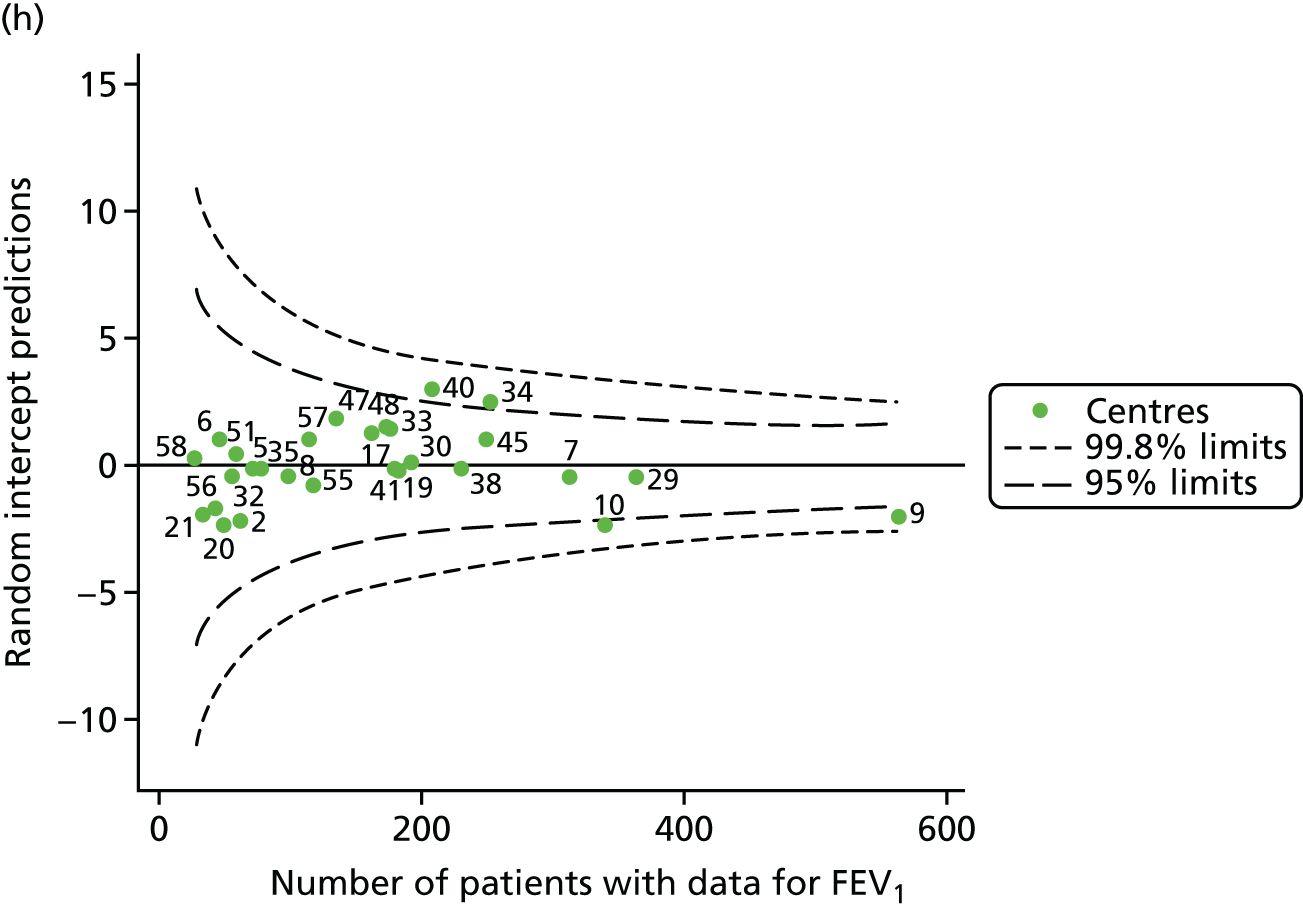
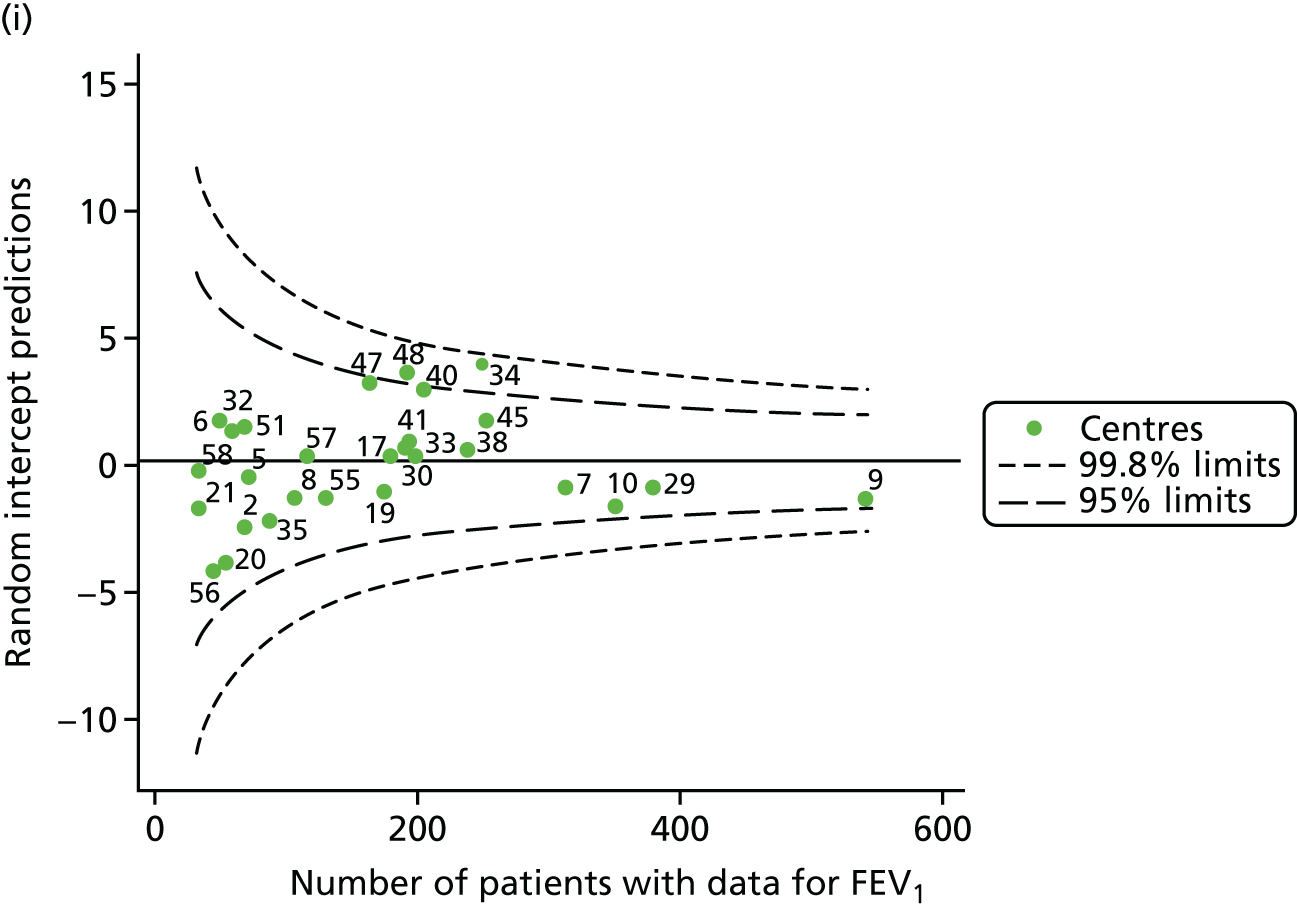
Recognising the possible role of shrinkage in moving centres from outside the 3-SD control limits to within these limits after case-mix adjustment, we conducted sensitivity analyses as described above; in this case, splines were used to adjust for age. The resulting funnel plots are presented in Appendix 2, Figure 36, and, to compare this method of case-mix adjustment with that using multilevel modelling and unadjusted results, a summary of centres outside the 2- and 3-SD control limits using all three methods is presented in Appendix 3, Table 41. In focusing on the centres outside the 3-SD limits, there were only occasional years in which the case-mix adjusted results using multilevel modelling drew centres within the control limits, whereas the method using GLM resulted in them being outside the limits. Often, centre 40 was outside the 3-SD limits in the fixed model-adjusted analysis but was between the 2- and 3-SD control limits in the multilevel modelling approach.
Pyramid of investigation: care
As was done in our analysis of outcomes in paediatric centres, we explored the use of i.v. antibiotics (see Appendix 3, Table 42).
Focusing first on those centres that, after case-mix adjustment, showed consistent signs of special-cause variation (lower than average FEV1 values: centre 9; higher than average FEV1 values: centre 34), the patterns were not entirely clear or consistent. In some of the years under study, patients at centre 9 seemed to have the lowest number of days on i.v. antibiotics (15.5 days in 2008, compared with 21.5 days and 25 days at sites 40 and 34, respectively, in the same year). In other years, the number of days on i.v. antibiotics was similar between sites with lower and higher than average FEV1 values, but the proportion of patients actually receiving i.v. antibiotics differed (in 2009, 50% of patients at centre 9 received i.v. antibiotics, whereas 62% received them at centre 34). Similar tendencies were noted in analyses restricted to patients with FEV1 < 40% predicted.
To explore graphically whether or not there were differences between centres in the proportion of patients receiving i.v. antibiotics, we generated funnel plots of these by year (see Appendix 2, Figure 37). Here we noted that centre 9 consistently had a smaller proportion of its patients on i.v. antibiotics than the average, as did centre 40, which had better FEV1 outcomes. Centre 10, which had poorer FEV1 outcomes, had more patients on i.v. antibiotics than the average.
Sensitivity analyses
Global Lung Function Initiative reference equations
We replicated the unadjusted analyses (presented in Unadjusted analyses) using the new GLI reference equations19 and noted very similar trends (see Appendix 2, Figure 38, and Appendix 3, Table 43).
Excluding patients with a G551D mutation from 2013 onwards
As described earlier, we re-ran the unadjusted analyses for 2013 onwards to explore whether or not patients with the G551D mutation influenced the centre comparisons in these years, as it is suggested that the G551D mutation has a milder phenotype and there is effective new treatment available for patients with this mutation. The results of the original analysis – with sensitivity analysis in italics – are presented in Appendix 3, Table 44. We can see that there is some shifting of single centres between the 2- and 3-SD control limits, but the results do not change drastically. The biggest difference is for 2015, in which centre 48 hovers near the upper 2-SD limit in the full analysis and moves outside the 3-SD limits in the sensitivity analysis.
Chapter 4 Consultation with clinicians and people with cystic fibrosis to identify factors that would help in understanding variability
Introduction
Cystic fibrosis clinicians and people with CF were consulted to explore the CF issues that are important to them, which may explain variability in quality of care between CF units. These consultations were undertaken to inform the development of questionnaires for completion by CF centre staff and patients. Three focus groups were held to inform questionnaire development: (1) a focus group of CF clinicians from adult centres, (2) a focus group of CF clinicians from paediatric centres and (3) a focus group of adults with CF. The focus groups were facilitated by research team member Jonathan Boote; focus groups with clinicians were supported by research team members Stephanie J MacNeill, Martin Wildman and Steve Harrison, all of whom took field notes. The focus group discussions were transcribed and a copy of the transcript was made available to participants to view if they wished, in order to correct any factual inaccuracies.
The analysis of the focus group data was guided by the principles of interpretative thematic analysis. The transcripts were thoroughly read by the researcher, and codes and categories were assigned to sections of the text to highlight key thematic areas with regard to factors that hinder or facilitate SPPs. 24 In addition, a form of content analysis – an assertions analysis25 – was undertaken of each transcript to examine the frequency with which particular barriers to, or facilitators of, the development of SPPs are characterised in a particular way.
Focus groups with clinicians
The clinician focus groups formed the second part of the 1-day workshops, which were held for the clinicians from adult and paediatric CF centres as part of this research study. In the first part of the workshop, the clinicians explored the SPPs that they consider important to enable the best outcomes for CF patients. In the second part of the workshop, the focus group explored in more detail the characteristics of a well-performing CF unit, with respect to the SPPs identified as being important.
The focus group of clinicians from adult centres was attended by two consultants, two dietitians, a psychologist, a social worker and two physiotherapists. The focus group of clinicians from paediatric centres was attended by a consultant physician (plus a paediatric consultant physician from the research team), two nurses, a psychologist and a dietitian.
No key differences in the issues raised were found between the two clinician focus groups. A summary of the focus group discussions is provided below, in terms of key SPPs that participants thought should be in place within a high-performing CF unit. Illustrative quotations from the focus group transcripts are provided to support the analysis.
In terms of structures, focus group participants associated a high-performing CF unit with the following:
-
a well-qualified MDT including dietitians, diabetologists, physiotherapists, pharmacists and gastroenterologists, as well as administrative support, with sufficient time to spend with the patient –Participant 1, adult CF focus group
The CF team moves away from that medical model and is much more holistic and multidisciplinary than the average medical setting.
-
sufficient resources to provide high-quality CF care –Participant 3, adult CF focus groupParticipant 3, paediatric CF focus group
In terms of resources, I think that food is always an issue with patients and I think whenever the CF Trust do a satisfaction survey, like they do with the peer review, the food always comes out rated as poor. And I think part of that is that a lot of patients when they are in hospital actually have not got good appetites, so their enjoyment of food is impaired. But I think we are still, in most units, not meeting their needs even if their needs are very high. I think we are not meeting them and that is because we have restrictions of funding.
Negative pressure rooms [are often lacking in CF units]. That means that the patients with different bugs can be in closer geographical proximity and have better use of the facilities because that, to some extent, enables infection control. And at the moment I think with the new bugs that are coming in, the worry is that any new facilities or quality facilities that you have got might not be accessible to all patients because those with unusual bugs have got infection control.
-
strong clinical leadership –Participant 5, paediatric CF focus group
What helps is leadership, isn’t it? Somebody who is creative about where they are going to go to get resources and committed in getting them, I think that helps.
-
provision of education and training for CF centre staff –Participant 6, adult CF focus group
As a team you have education once a month, where we are supposed to come up with external topics. External people come in and deal with relevant MDT topics, I think that means that sometimes it is more psychosocial. Sometimes it is more medical. The whole team go with the idea that it [education] is all relevant to everybody.
In terms of processes, focus group participants associated a high-performing CF unit with the following:
-
the existence of clear processes for the measurement and monitoring of key outcomes, such as lung function over time, weight and BMI, and Pseudomonas aeruginosa –Participant 4, adult CF focus groupParticipant 3, paediatric CF focus groupParticipant 6, adult CF focus group
What are the metrics that matter to us? Well, your gold standard is the client’s lung function absolutely, BMI and weight.
A unit should measure its mean adherence rate.
I think measuring quality of life versus treatment is an increasing issue.
-
strong MDT processes, such as written treatment plans and pre- and post-clinic MDT meetings –Participant 5, adult CF focus groupParticipant 1, adult CF focus group
Good team processes as well so that we know what is being said to the patient and that sort of group, joint team approach, as in a double consultation with, say, a doctor and physio[therapist], or physio and dietitian saying almost the same thing.
If you have a good relationship within your team, good interdisciplinary working, if you know another member of the team discusses something that is not strictly their area because it has come up, or the patient has a good rapport with that person and they bring it up, say, like with the physio and they bring up breastfeeding and then that works well.
-
support for the team to engage in process improvement –Participant 4, adult CF focus groupParticipant 5, paediatric CF focus group
I mean we do regular audits and look at our data and look at improving that, whether it be patients, like for dietitians we do an annual vitamin D audit. And we have changed our practice with vitamin D supplementation with regard to that. We also do an annual food survey to try and improve the food service and look at our BMI data.
I suppose a team that is supported to reflect on what their needs are. You know, being able to see if there is a glaring hole on how we manage this, or we are not very good at doing that.
In terms of policies, focus group participants associated a high-performing CF unit with having the following policies in place:
-
clear expectations of what patients can expect of the unit, and the expectations that the unit has of each patient –Participant 6, adult CF focus groupParticipant 3, paediatric CF focus group
A good unit should have high expectations of its patients. But staff should be encouraged to communicate . . . in a non-judgemental way when patients are struggling.
Particularly important that we communicate our expectations effectively where patients should be on the growth and lung function charts.
-
patient education about key aspects of their treatment and care –Participant 2, adult CF focus groupParticipant 5, adult CF focus group
We produce a lot of information leaflets on, well, for nutrition, on every aspect that we deal with really. And we have got a website as well which we do and a newsletter which we put in patient information and hot topics and other bits of information.
It is a challenge providing the education without giving them false hope or guarantees. We cannot give a guarantee, so you want to educate that if you take nebulisers more often, they want a guarantee that they will live till they are 50 or they will not have IVs [i.v. antibiotics] for another six months. You always have to build in that guarantee so it then reinforces them.
-
patient-centred care, such as tailored support to those patients struggling to self-medicate, and patient involvement in decision-making about their care and treatment –Participant 1, paediatric CF focus groupParticipant 2, adult CF focus group
And I think visual tools can really help [to explain issues to patients struggling with their treatment]. Like the BMI chart when you show them where they are and the difference in relation to the healthy range visually I think is quite powerful.
I think communication skills of the team are the bottom line with helping [patients consider treatment options]. I think often real experience, real skills, communicative skills of the teams because they are so used to adapting to different situations and difficult situations and different groups. I think that really helps.
-
standardisation of key aspects of CF care, such as protocols for newly diagnosed patients, policies for dealing with declines in lung function and BMI, eradicating Pseudomonas aeruginosa infections, general infection control and managing diabetes –Participant 6, paediatric CF focus groupParticipant 7, adult CF focus group
Clinic protocol adhesion is what you are expecting from clinic – who are you going to see in clinic should be standard for everyone. And inpatient admission should be standard.
I mean we do have standards for our nutrition therapy. So we have standards for interventions, vitamin targets. What else have we got? Diabetes, yeah we do have written standards for diabetes and for annual review. So if someone turns up for an annual review, they all have the same standard annual review and you individualise it, but they are all going to have the same things and the same tests. That is definitely how it should be.
Information obtained from the clinician focus groups was used to guide the development of the questionnaires for CF centre directors and their teams on the SPPs affecting CF care quality. The questionnaires were reviewed and refined by the wider research team and the questionnaire was piloted in two centres. The results of the survey are described in Chapter 5.
Patient focus group
The focus group with CF expert patients considered those factors that, from a patient perspective, may help a CF unit to perform well. Five expert patients attended the focus group. To minimise the risk of cross-infection, this focus group was run as a teleconference. As the group consisted of CF expert patients, participants were invited to reflect on their own personal experiences of care and treatment within their own CF unit, as well as the care and treatment experiences of other CF patients known to them.
A topic guide was developed to structure the expert patient focus group (see Appendix 1). The focus group topic guide was based around the key factors that CF unit staff had previously identified as helping a CF unit to perform well, although the CF expert patients were invited to consider other issues of importance to them. Issues identified in the expert patient focus group were subsequently used to construct a patient questionnaire for distribution within both adult and paediatric CF units.
For the first part of the focus group, participants were asked to describe factors affecting the quality of inpatient stays in, and outpatient visits to, their CF units. Characteristics of a good-quality inpatient stay included:
-
a clear action plan for the stay and patient input in the content of the action plan –Participant 3
I suppose a good inpatient stay, obviously you have your initial consultation, work out a plan of action for your stay. And then you have a plan with the nurses about if you take your own medication and I suppose it is being informed about what is going to happen during your stay, and having a little bit of – I want to say control. A bit of a say of what goes on within your treatment as well. That would be a good place for me is to know what’s going on every day and what plans there are for me.
-
timely admittance and timely commencement of treatment on admittance –Participant 2
I would like to say right from the outset, soon after admission, that the treatment was started as early as possible without unnecessary delays due to very inexperienced ward staff who were unable to stick cannulas for instance.
-
a clean and tidy inpatient room –Participant 5
Basically for me it is sensible that there is actually a room and I am not waiting days. And I know a good experience of mine, I think the longest I’ve waited is maybe 7 hours for my bed. Not weeks like other patients wait. And that room is actually cleaned to a standard that I want. A bad experience is that it is not cleaned and it is disgusting. So for me it would be a case that the bed is actually available and done.
-
access to all appropriate MDT members –Participant 1
It’s just having that access to and input from all the team, including the physiotherapist.
-
self-management of medication during the inpatient stay –Participant 3
One of the things that is a really great advantage at my unit is that we are actually able to take our own medications and manage our own medications on the ward. So that is quite a positive aspect, which is good because it gives you back that control and that normality.
-
appropriate food and food portion sizes –Participant 2Participant 4
The food and the portions of food, and the food’s of good quality, is important to me.
Also obviously food or nutrition is an important part of an inpatient stay, and subsequently nice food during the stay, albeit it proper meals or snacks from the trolley, that sort of thing.
-
consistent quality of care between that provided at weekends and that provided on working weekdays –Participant 2
And I would say it is more the communication and maybe it’s when it’s weekends. Things tend to go wrong on a weekend, I don’t know why. And as long as your CF team are contactable, then that’s OK, but if they are not, then that can cause trouble if the ward actually don’t know what they are doing. And I have had it where we have actually stopped treatment before because obviously they haven’t known what to do.
-
sufficient numbers of trained staff on the unit to perform key procedures –Participant 5
One bad experience would be when the ward staff are under-resourced. And in the evenings when they are trying to deal with quite a few poorly patients, that means your last dose of IVs don’t start till the early hours of the morning. You know, as late as two in the morning sometimes. And the knock-on effects of that. Sometimes where staff haven’t got the competency to be able to perform certain procedures, which again results in delays of treatments and the knock-on effects of that.
Characteristics of a good-quality outpatient experience included the following:
-
sufficient time to see all the relevant members of the MDT within the allocated appointment time –Participant 1
I think for me mainly it’s the time factor. And because you obviously spend a long time at outpatient and regularly you can spend anywhere up to 2 to 3 hours depending on who you see and obviously you need to take into consideration there may be other CF patients needing longer or whatever.
-
access to an outpatient pharmacy –Participant 2Participant 3
I am really jealous of the clinics that have outpatient pharmacies, separate pharmacies for outpatients.
I think not only do you have the outpatient appointment, but you do have prescriptions to wait for was well, and it just adds so much time on to the appointment. And obviously you have got the risk of bumping into other people with CF and quite often risk cross-infection and things like that as well.
-
seeing an experienced consultant with detailed knowledge of the patient –Participant 1
For me, a good experience or better experience is having a consultation with a doctor that knows you well, or one of the more experienced consultants. When things get more complex, it is important that they are able to make the right decisions and obviously negotiated with myself, and it is really good to be able to go to a patient appointment and come out with a solution to something that has been sort of nagging.
-
well-organised segregation of patients –Participant 5
Good segregation, arriving at the outpatients clinic and being directed straight to a room always makes me feel better.
-
timely explanations if there are to be delays in seeing any member of the MDT –Participant 4
I just wanted to add really and going back to the time thing, actually I don’t mind waiting, just as long as someone tells me why I’m waiting. So if there has been a reason why the CF team has been held up for any reason. That has happened before and they have just, I have been sat an hour before I’ve seen anyone. I would actually like to know why, because then I might not be so cross about it.
For the second part of the focus group, participants identified and discussed a number of key issues that are considered important for a CF unit to perform well from a patient perspective. These are outlined as follows.
-
Education of patients about the condition: participants felt that the CF unit had a very important educational role to play, from providing information following a patient’s CF diagnosis as a child, through to further education of the patient in adulthood –Participant 5Participant 2
And obviously when you are first diagnosed, the information will be straight from the CF team. That team is obviously your first port of call . . . some sites will give them the information that they need.
I think also the importance of educating patients is very important further down the line as well. And well in advance of when the patients come across more complex aspects of their CF and more critical aspects, because it often means there is a seriousness of CF. You can pick up that information beyond our CF centres if we want to and particularly in the subcontext of teenagers where they often need encouragement and incentivisation to take their CF seriously and take treatments that are suggested to them for the moment until they can think ahead and encouraging them to carry on doing the things they want to do in their lives. And linking that to the importance of their treatment and understanding their CF. I think education could be used in a sort of encouraging way as well as just a means to an end.
-
Developing a constructive dialogue between patients and CF unit staff – this was seen as particularly important in providing ongoing motivation to patients to self-care and self-medicate, especially around their transition from a paediatric to an adult CF unit –Participant 3Participant 4
. . . because going back to the sort of teenage years where we were reliant on our parents quite a bit and reliant on the CF team to make decisions and take the lead. There comes a time in all of our lives when we are going to become more independent and have to make those decisions ourselves. Be it if we’ve left home, or if we’ve lost parents. And so to prepare ourselves, I think it needs the taking of responsibility from early days, and at the right time obviously.
The CF centre highlighting that point in all its literature and some other information platforms that patients need to take responsibility for their treatment as much as being led by the CF team. Because it’s a two-way process, isn’t it? It’s not just absorbing everything the CF team says. It’s also explained about taking your own responsibility as well, as a patient.
However, it was acknowledged that such constructive dialogue will be dependent on the following:
-
The amount of time that units have to develop such dialogue during inpatient and outpatient visits.
-
The attitude of the individual patient. It was thought that a well-performing CF unit would be able to be creative in the methods/platforms that it uses to develop a constructive dialogue with patients –Participant 1Participant 4
I think time is the factor for staff to be able to have those discussions. The importance of taking responsibilities, those discussions with patients, or the lack of this done during inpatient treatment. And also the attitude of patients, because not everyone wants to take responsibility. They’re not all model patients.
I think a unit that has sufficient resources both in terms of staffing and time, and sufficient funding and facilities I suppose to be able to provide a variety of platforms for engaging with patients with constructive engagement. Be it to developing a CF centre website or a newsletter where they haven’t got a newsletter, and perhaps even offering sort of twilight teleconference sessions. Again it might be a bit unrealistic given the funding and staff and resources that currently we have to contend with.
-
Patient involvement in the measurement and management of key aspects of CF. Participants discussed a range of CF outcomes that they are either actively involved in measuring and managing (such as lung function) or that they would like to be more involved in measuring and monitoring (such as exercise tolerance) –Participant 1Participant 4
I do think some people get a bit obsessed by what their lung function is, you know. You see them talking on the internet and chat rooms and stuff. ‘Well mine’s this and last week it was this and . . .’ I think sometimes it is good to know and have as a benchmark, but some people can sort of obsess over them a bit, which I think is unhealthy.
I think exercise tolerance should be measured perhaps more routinely, or more frequently. And then there is annual review. And even at annual review, there isn’t always an exercise tolerance there; and what about adherence feedback? In terms of the I-neb [I-neb AAD System; Philips, Amsterdam, the Netherlands], I-neb downloads of how much treatment is being taken. I did a brief study where I could see it for about a month. And actually I was really shocked because I thought I was doing it a lot more than I was. So it actually made me realise. So I think seeing that sort of thing could be useful, because sometimes I think you sort of delude yourself to think you are doing something. And it’s not until someone actually points out some kind of hard-core data that this is actually what you are doing. Or not doing, as it turned out, that made me really sort of think.
-
Access to a consistent MDT on the CF unit. Participants felt that it is important for patients to try to see a consistent MDT during inpatient stays and outpatient visits, although it was acknowledged that this is not always possible. It was also considered important that teams communicate a consistent message to patients with regard to key aspects of their care –Participant 5
I think, at my centre, the communication is very good and the messages consistent. Occasionally, I think inevitably, there are some differences in opinion on some treatments. One example I can give you is inducing tamsulosin infusion. Sometimes it’s been down from a high dosage and sometimes it’s just stopped immediately and there are implications of the latter, complications from the latter.
Patients reported that, during visits to their unit, it was not always possible to see certain members of the MDT:
I think a common, well, two common people that . . . probably are quite difficult to see across all the centres, is usually psychologists and social workers. Sometimes even the clinics don’t have access to them and they don’t have them necessarily on the team. So usually they are not available to see as generally as most patients would like. And I think, I used to find it hard in paediatrics to get hold of a dietitian and they weren’t always available during clinic time. And you had to make a separate appointment when obviously you are going to the hospital for appointments anyway which are generally quite long, having to come back in for a dietitian appointment is actually not very ideal. Obviously there’s been change since I’ve been there, but I know they were without a dietitian quite a while in the centre I went to. But yeah, in general the idea from patients is that psychologists and social workers which is not great because they are part of a very important part of the team.
Participant 1
[Participant name] has mentioned about the inconsistency and psychosocial coverage and dietetic coverage of some centres and I would add to that also physiotherapy, because having spoken to some of the paediatric teams and parents, and also from my own experience in adults, it is not always consistent that we get sufficient physiotherapy support, particularly at weekends. Although things have improved considerably at my centre.
Participant 4
A patient questionnaire was developed, informed by the issues raised at the patient focus group; this was then discussed and refined by the wider research team and included input from the study’s patient advisor. The resulting questionnaire included questions relating to:
-
whether or not the patient has adequate time with their CF team
-
facilities at the unit
-
access to support
-
how CF is measured and monitored by the CF team
-
how treatments are discussed between the CF team and patients
-
how changes in lung function are communicated to patients
-
communication with the CF team
-
CF team expectations of patients
-
leadership at the centre.
We aimed to disseminate the questionnaire online via the CF Trust’s social media connections, targeting adult patients and the parents of paediatric patients. REC and NHS approvals were obtained for the questionnaire, but we were unable to co-ordinate the dissemination of the questionnaire in time for analysis and synthesis prior to the end of the study.
Chapter 5 Understanding the structures, processes and policies of care
In parallel with the use of CF Registry data to explore whether or not outcome data could identify CF centres that were high performing and those that were low performing, work was undertaken to understand whether or not high- and low-performing centres differed in the SPPs that underpinned care.
Four stages to identify structures, processes and policies
Stage 1: understanding structures, processes and policies associated with high-performing centres
Two 1-day workshops were held with clinicians (1 day for clinicians from adult centres and 1 day for clinicians from paediatric centres). The aim of these was to understand from clinicians the SPPs that were considered to be associated with high-quality care. Details of how the focus groups were run and how the data were analysed are described in Chapter 4.
Stage 2: generating a questionnaire to gather data about structure, process and policy in cystic fibrosis centres
The data collected in the focus groups, as described in Chapter 4, confirmed that there were commonalities in the way in which care was delivered, as identified in previous investigations of quality improvement in US centres. 27,28 An important issue in quality improvement is paying attention to important aspects of care. It was intended that the design of the questionnaires would elicit the extent to which clinicians in individual centres concentrated on the structures, processes and policies that were thought to be associated with high-quality care. Two questionnaires were developed – one for use in adult units and one for use in paediatric units.
Stage 3: collecting and analysing questionnaire data from UK cystic fibrosis centres
The questionnaires were sent out to adult and paediatric centres by e-mail using SurveyMonkey® (Palo Alto, CA, USA). The initial aim was to analyse the data by centre to understand the SPPs by centre. However, the response rate was too low to allow this; instead, the responses were aggregated and analysed in two groups: (1) across all adult units and (2) across all paediatric units.
Stage 4: comparing structures, processes and policies in centres by outcome
The aim of stage 4 was to compare the SPPs in the centres with the best outcomes with those with the worst outcomes. The within-centre response rates did not allow for the definition of SPPs at centre level, so this part of the work could not be completed and, hence, this aspect of our work is unable to give a perspective on SPPs across the centres that might provide an insight into areas in which challenges arise.
Adult questionnaire
Response rate and respondents
The questionnaire was sent by e-mail using SurveyMonkey to the centre directors at all 29 adult centres. A total of 136 responses from 16 centres were obtained, with a median of six responses per responding centre [interquartile range (IQR) 4–16 responses]. Appendix 3, Table 45, shows the distribution of responses by centre and clinical role; it is observed that the majority of responses came from only five adult centres. Respondents had worked in CF for a median of 7 years (IQR 4–10 years), with nine respondents having ≥ 20 years of CF experience. Thirty-three doctors (of whom 25 were consultants), 25 nurses, 24 physiotherapists and 17 dietitians made up the majority of respondents.
To explore how centres that participated in the survey compared with those that did not, we examined annual review data from all centres in 2015, as this was the year of the survey. We considered the size of the centre to be the number of annual reviews conducted that year and found that the centres responding (regardless of the number of responses within the centre) were slightly larger than the centres that did not respond (median number of annual reviews: 194 vs. 169). The mean FEV1% predicted of all patients at annual review was also compared, and only minimal differences were observed between participating and non-participating centres (mean 65.9% predicted vs. 66.2% predicted, respectively). Participating centres included sites in England and Scotland; non-participating centres included the only adult centre in Northern Ireland and six of the eight adult centres in Scotland. It is noteworthy that the participating centres that returned the most questionnaires included the sites of collaborators (King’s College Hospital and Northern General Hospital, which also helped to pilot the questionnaire). It is impossible to know how widely the questionnaire was disseminated within teams, as centre directors were asked to cascade the weblink to the survey to their teams. As such, we are unable to comment on the composition of the MDTs of non-participating centres.
Facilities, staffing and resources
Respondents were asked about the facilities, staffing and resources in their centres by seeking their agreement or disagreement with statements describing attributes that were deemed to be desirable by the focus groups. The responses are shown in Appendix 2, Figure 39, with the proportion on the x-axis indicating the proportion of respondents agreeing with the statements. Less than half of the respondents felt that their centre had adequate administrative staffing, access to a gastroenterologist as required, a dedicated CF-related diabetes clinic or a dedicated diabetologist who has a high level of expertise in CF-related diabetes. More common than this were responses relating to access to CF outpatient facilities, allowing the team to meet the CF Trust standards of care and having a strong co-ordinator (> 80%; see Appendix 2, Figure 39).
Capacity and demand
Respondents were asked about capacity and demand; Appendix 2, Figure 40, shows that, although < 50% of respondents could provide appropriate home visit support, > 90% could review patients of concern within 48–72 hours.
Leadership
Respondents were asked about the leadership within the hospitals and centres where they worked; Appendix 2, Figure 41, shows the proportion of respondents agreeing with the statements. Although < 50% of respondents felt valued by hospital management, > 90% of respondents felt that their teams had skilled clinical leadership.
Measurement and monitoring
Respondents were asked about the monitoring systems to support CF care that are available within their centres; Appendix 2, Figure 42, shows the proportion of respondents agreeing with the statements. Less than one-third of respondents felt that their centre had an excellent system specifically to support CF, but > 80% felt that they were able to promptly identify patients with new Pseudomonas aeruginosa infections or declining lung function.
Multidisciplinary team processes
Respondents were asked about the organisational processes that support care delivery (see Appendix 2, Figure 43). Less than half of respondents reported that they had a ‘fool-proof’ system and never overlooked results or felt that their centre was known for running efficiently. Encouragingly, > 80% of respondents felt that all members of the MDT had their voices heard.
Quality improvement of care delivery processes
Respondents were asked about the quality improvement work occurring in their units (see Appendix 2, Figure 44). Less than one-third of respondents reported that their centre routinely uses quality improvement tools, whereas most reported that the team measures and shares outcome, satisfaction, clinical process and safety data with the MDT in order to make improvements.
Treatment policies
Respondents all showed high rates of agreement with policies regarding the use of i.v. antibiotics that might be considered to reflect prompt and proactive care (see Appendix 2, Figure 45).
Time lag to starting antibiotics for cough and cold
Appendix 2, Figure 46, shows that almost all respondents would start antibiotics in adults with cough and cold symptoms if symptoms persisted for 7 days.
Expectations
Respondents were asked about expectations of care to try to understand how determined teams were in their delivery of care and in not tolerating decline. Appendix 2, Figure 47, shows that > 40% of respondents have very high expectations of care, insofar as they expect no yearly decline in lung function.
Paediatric questionnaire
The paediatric questionnaire differed from the adult questionnaire because the clinicians from paediatric centres attending the workshop in which the questionnaire was developed had slightly different concerns when thinking about the determinants of care.
Response rate and respondents
As with the adult questionnaire, the questionnaire to paediatric centres was sent via e-mail using SurveyMonkey to the lead clinicians in 33 CF centres. A total of 95 responses were received from 24 (73%) of the 33 centres, but in half of these there were ≤ 3 individual respondents. Forty (42%) respondents were doctors, 16 (17%) were physiotherapists, 11 (12%) were nurses and 10 (11%) were dietitians. Respondents had worked in CF for a median of 12 years (IQR 7–20).
As was the case with the adult centres, we used 2015 annual review data to compare centres that did and did not respond to the survey, based on the number of patients attending annual review and the FEV1% predicted at these centres. As was observed for the adult centres, centres that participated tended to be slightly larger (median number of patients: 124 vs. 106). Mean FEV1% predicted at the centres participating was slightly higher than at the centres not participating (87.9% predicted vs. 83.8% predicted), and their patients tended to be slightly older (mean age 8.7 years for participating centres compared with 8.0 years for non-participating centres). It is noteworthy that some centres contacted the research team to indicate that the questionnaire could be difficult to complete in the case of network clinics with different facilities and resources.
Facilities, staffing and resources
Appendix 2, Figure 48, describes the responses to questions investigating resource issues. Only 20% of respondents felt that they had adequate social worker resources; however, 80% of respondents felt that they had adequate consultant time for patients.
Capacity and demand
Appendix 2, Figure 49, shows that centres were able to meet capacity and demand requirements with varying degrees of success. Whereas only 41% of respondents felt able to provide popular food for inpatients, 97% of respondents felt able to review patients of concern within 48–72 hours.
Leadership
Appendix 2, Figure 50, shows that participants generally felt more valued by the clinical leaders in their team (86%) than by hospital management (43%). More than 80% of participants felt that their teams were well organised and had skilled and experienced CF clinical leadership.
Measurement and monitoring
Appendix 2, Figure 51, shows the range of responses in the paediatric teams’ views about measuring and monitoring. Whereas only one-third of respondents thought that they had an excellent computerised system for monitoring patients, > 90% of respondents thought that they identified new Pseudomonas aeruginosa infections promptly.
Multidisciplinary team processes
Appendix 2, Figure 52, shows that just over 50% of teams thought that they had ‘foolproof’ systems, which ensured that they never overlooked important results. This means that almost 50% of respondents did not have such systems. Most respondents (> 80%) felt that their annual review processes were effective in delivering treatment plans that were followed through, that in their MDT meetings all voices were heard and that the post-clinic meetings were held with the appropriate people.
Quality improvement of care delivery processes
Appendix 2, Figure 53, shows the respondents’ answers to questions about the processes used to improve systems within the CF centre. It can be seen that, although < 10% of respondents were using formal tools for improvement, almost 60% were using data to improve team performance. The lack of use of formal quality improvement tools in paediatric centres is consistent with what was observed in adult centres.
Treatment policies
Appendix 2, Figure 54, shows that 78% of respondents believed that they could avoid rescue i.v. antibiotics by using preventative treatment, and 96% of respondents agreed that nutrition is important and interventions are expected.
Overview of the questionnaire data
The questionnaire was useful, as its preparation provided a cause to work with the focus groups to understand the factors that clinical teams felt were important in delivering high-quality CF care. Unfortunately, we were missing information from a number of sites and, because the number of respondents in any centre was also limited, it was difficult to be confident that the responses gave a representative description of the care in the centre. Nevertheless, the topics raised by the focus groups point towards areas of interest that might be explored in the future to understand why centres differ in their outcomes.
Chapter 6 Discussion
Summary of results from centre comparison work
The analyses of adult and paediatric CF centres show that using funnel plots on a clinically important and well-completed clinical outcome such as FEV1 allows us to identify some trends in special-cause variation. By analysing each year separately, we were able to compare results in any given year with those of other years, thus allowing us to disregard one-off departures from the mean.
Identifying special-cause variation allows us to engage in a scientific method to explore these differences;29 therefore, we adopted a pyramid of investigation approach. 6 Summaries of the main findings from our analyses are presented separately below for paediatric and adult specialist centres.
Paediatrics
We studied FEV1 in two different ways in children: (1) by pooling data across multiple years for adolescents and (2) by studying all children aged 6–15 years in repeated single-year analyses. We observed that centre 39 was frequently an outlier, with FEV1 levels outside the lower 3-SD limit in our unadjusted analyses of young adults. It also repeatedly showed special-cause variation in our year-by-year analyses of the wider paediatric patient population, along with centres 12 and 52 (outside the lower 3-SD limit) and centres 25, 28 and 31 (outside the upper 3-SD limit).
The first step in the pyramid of investigation model involves checking the data. Members of the study group had already contributed to annual processes of data validation of CF Registry data – through either conducting the validation themselves or providing a validation framework for others within the CF Trust to follow. As a result, the data analysed had already gone through lengthy validation checks involving querying outlier data with the centres, and so they were not verified again. We did, however, explore the completeness of the outcome data used in our analyses of young adults. We noted that data were relatively complete for the case-mix variables considered, but some centres (39 and 43) had lower than average rates of complete FEV1 data among those patients having annual review encounters. As lung function measurements form a key part of the annual review process, such data should be available.
Continuing with the pyramid of investigation approach, we explored differences in case mix and found some differences in the patient populations at those sites showing special-cause variation in FEV1. Adjustment for age, for example, brought centre 28 within the 3-SD control limits, despite patients at this centre being only slightly younger than the mean. Centres 12 and 31 were brought within the control limits after further adjustment for genotype, pancreatic sufficiency, sex and SES. Compared with the centres overall, centre 12 had more female patients and more patients who had the milder G551D mutation, in addition to having fewer patients living in the most deprived SES quintile. Centre 31 had fewer patients who were homozygous DF508 and more who were pancreatic sufficient than the overall paediatric patient population. For these two centres, we suggest that differences in FEV1 are a result of the patient case mix.
After adjustment for our case-mix variables, three of the original six centres continued to show patterns of special-cause variation in FEV1: centres 39 and 52 (lower than average FEV1 values) and centre 25 (higher than average FEV1 values). We next considered care; an objective and routinely collected measure of CF care is the use of i.v. antibiotics. In the USA, this has been shown to be associated with better clinical outcomes. 27 We reported the median number of days on i.v. antibiotics as well as the proportion of patients receiving these treatments. We noted that there was a tendency for centre 25 – which had better FEV1 outcomes – to be near or outside the lower control limits for the proportion of patients on i.v. antibiotics. Conversely, centres 39 and 52 – which had poorer FEV1 outcomes – tended to have higher than average proportions of patients on i.v. antibiotics. This, however, tells us about receiving treatment and not about needing treatment, as the CF Registry does not explicitly record pulmonary exacerbations for which i.v. antibiotics would be needed, nor does it record whether the course of antibiotics was planned or unplanned. A US study showed that there is variation in how pulmonary exacerbations are treated in paediatric CF care. 30
A summary of possible explanations for special-cause variation base on the pyramid of investigation is presented in Table 16.
| Centre | Primary explanation | Evidence |
|---|---|---|
| 12 | Case mix | There is a higher proportion of female patients and patients with the DF508 mutation at this centre than in the overall centre patient population. The centre also has a lower proportion of patients in the most deprived SES quintile. After adjustment for these and other factors, the centre moved to within the 3-SD control limits |
| 28 | Age of patients | After adjustment for age, this centre moved to within the 3-SD control limits. The difference in mean ages, however, was small |
| 31 | Case mix | This centre had fewer homozygous DF508 patients than the overall centre patient population and more pancreatic sufficient patients, suggesting less severe disease. After adjustment for these and other case-mix variables, the centre moved to within the 3-SD control limits |
Adults
As performed in the paediatric analysis, we studied FEV1 in different manners, from decline in early adulthood to studying all adults in repeated single-year analyses. In analyses unadjusted for case mix, we observed that centres 7, 9 and 34 were frequently outside the 3-SD control limits, and centre 40 appeared outside the limits in 2007. All centres except centre 9 showed evidence in these analyses of having mean FEV1 values that were higher than the overall average.
Following the pyramid of investigation we found that adjustment for case mix is essential to avoid misattributing differences in outcomes to care and to avoid missing important differences. Adjustment for age, for example, brought centre 40 from within the 3-SD control limits to outside these limits for 2009–11 and 2013–15.
We then considered other patient case-mix characteristics to see if these were responsible for our findings. In considering models adjusted for case mix, this adjustment substantially affected centre 40 only, which was brought within the 3-SD limits. This centre differed from the average in many ways: the centre had fewer patients who were DF508 homozygous, more patients with the milder G551D mutation and more patients who were pancreatic sufficient. Our findings at the other centres – 7, 9 and 34 – could not be attributed to case mix.
As discussed in our summary of results from paediatric centres, an objective measure of CF care is the use of i.v. antibiotics, which has been shown to be related to better clinical outcomes. 27 For this reason, we explored how the centres compared in terms of the proportion of patients receiving i.v. antibiotics. Centre 9 frequently exhibited special-cause variation in this variable and had a smaller proportion of patients on i.v. antibiotics. It is difficult to explore the number of days on i.v. antibiotics using funnel plots because of the skewed distribution of the data, but we observed that, among patients at this site receiving i.v. antibiotics, the median number of days on antibiotics in 1 year tended to be fewer than the median across all sites – a pattern observed both overall and when considering the subgroup of patients with lower lung function (FEV1 < 40% predicted).
Summary
These findings confirm that the annual review data from the UK CF Registry can be used to identify differences in clinical outcomes between centres and that case-mix characteristics might explain some of these differences. This adjustment does not, however, account for all differences; therefore, further work is needed to explore the results we obtained.
Summary of consultations with clinicians and patients
Focus groups with clinicians from adult and paediatric centres were conducted to identify what they felt were the important SPPs for delivering good CF care. There was a focus on adequate staffing and sufficient time with different members of the MDT, monitoring and measuring of clinical outcomes and treatment adherence, communication within the MDT and with patients, patient education and support, and standard policies on how to deal with infection control and eradication as well as changes in lung function and BMI. From the focus groups, questionnaires for CF centre directors (in both adult and paediatric centres) were developed and disseminated nationally. It was hoped that the results from these questionnaires could help to inform conversations with CF centres that had outcomes that were better or worse than the average. The response rate, however, was relatively poor, making it difficult to draw inferences or to use the information to start a dialogue with centres.
A focus group with the CF Trust’s team of expert patient advisors was conducted to identify what people with CF think is necessary for good CF care. Based on the outcomes of this, we devised a questionnaire to be disseminated to patients nationally. The focus group concentrated on three areas: (1) the characteristics of good inpatient stays, (2) the characteristics of good outpatient visits and (3) the characteristics of well-functioning CF centres. In relation to inpatient stays, the group highlighted a number of issues which included the importance of patient involvement in devising a clear action plan and self-management of medication during the stay. Access to appropriate and sufficient numbers of members of the MDT and consistent quality of care over the course of 1 week were also identified as important. In the outpatient setting, patients felt that it was important to have sufficient time to see all members of the MDT, to have access to an outpatient pharmacy and to speak to an experienced consultant who has detailed knowledge of the patient. It was felt that a well-functioning CF unit will educate patients about CF, develop a constructive dialogue between patients and CF unit staff, have patients involved in the measurement and management of key aspects of CF and provide consistent access to the unit’s MDT. We were unable to conduct the patient survey within the time frame of this study, but it will take place subsequently.
Although we cannot compare survey results between the clinician and patient questionnaires, we can compare the issues that were raised by both groups. Several overlapping themes emerged: the importance of written treatment plans, involvement of patients in decision-making, sufficient access to relevant members of the centres’ MDTs, policies regarding infection control and effective communication between the patient and MDT.
Patient and public involvement
The co-applicants on this study included a person with CF as well as the CF Trust. All co-applicants were involved in identifying research priorities and were members of the study management group.
The CF Trust helped make links with their team of expert patient advisors to enable us to conduct our patient focus group. Our patient member participated in the research itself by participating in the study focus group.
Our clinician survey benefited from feedback from our CF Trust member in its development, and the CF Trust gave us the opportunity to promote the study – and our clinician survey – at a national CF Registry meeting.
Moving forward, the CF Trust has shown a commitment to supporting us to address some of the outstanding elements of our work.
Strengths and limitations
Data
This study has many strengths and limitations. Its greatest strengths are the coverage and completeness of the data source. Virtually all CF patients consent to their annual review data being included in the CF Registry and data completeness has grown such that, by 2015, 89% of registered patients provided complete data. 31 Data from the CF Registry are used for clinical care commissioning and pharmacovigilance work in recent years, thus encouraging complete returns. When UK ethics approval for the new web-based system was granted in 2007, there was a big increase in centres being involved and there was a learning curve for data clerks.
However, despite the large number of data collected and satisfactory patient coverage, we were not always able to adjust for all relevant case-mix characteristics. For example, when studying adult care it would be helpful to adjust for clinical characteristics at the time of transition to adult care. Adults who transitioned to adult care before 2007, or in the early years of the CF Registry in which data completeness was not as good, will not necessarily have relevant data. We explored using characteristics data at transition in our analyses of 18- to 21-year-olds but did not pursue using these data as it would have meant losing a large proportion of our patients for centre comparisons because of missing case-mix variables.
The number of data collected is also related to the size of CF centres. Although we observed evidence of special-cause variation in large and medium-sized centres, we cannot exclude the possibility that in very small centres, for which the control limits are widest, we were unable to detect statistically meaningful departures from the mean. Absence of special-cause variation, therefore, does not exclude the possibility of true differences from the mean. Recent comparisons between adult centres indicate that for small absolute differences in FEV1 predicted of 5% to be reliably detected at the 95% significance level, a minimum of 273 patients per centre would be required. 32
In terms of the appropriateness of the outcomes under study, we met with CF centre directors and patient advisors early in the design stage of the study to discuss our intentions and proposals. This was done to ensure that the outcomes directly related to the issues raised by the clinical community and patients. There are new variables being collected that were not available at the time we began this study, so these may form a framework for the future analyses.
Analysis
Conclusions based on Shewhart’s13 SPC approach are subject to two types of error. The first is to treat an outcome resulting from a common cause as if it were a special cause. The second is to treat an outcome resulting from a special cause as if it were a common cause. Although we cannot entirely eliminate the possibility of making these errors, we can minimise it. For this reason, Shewhart13 argued that variation from stable processes lies within limits that – combining mathematical theory, empirical evidence and pragmatism – can be usefully set at 3-SD limits from the mean. For this reason, and in keeping with Shewhart’s original work in this field,13 other centre comparison studies using funnel plots and the pyramid of investigation approach,33 we focused much of our attention on identifying special-cause variation at 3-SD limits.
Our results were largely robust and replicated in sensitivity analyses, and we obtained very similar results regardless of whether we used the GLI reference equations19 or Knudson17 reference equations. We cannot exclude the possibility, however, that there were unmeasured case-mix variables that might have explained some of the differences we observed.
Analyses of changes in FEV1 over time failed to show much variability after case-mix adjustment analysis using multilevel models; this may be because we were not necessarily able to get a good measure of ‘change’, owing to the small number of data points available. The individual year analyses, however, afforded us the opportunity to explore whether or not centres showed special-cause variation multiple times over the study period, but this approach also meant that we risked observing regression to the mean. 34 As the CF Registry grows, there will be more opportunities for longitudinal analyses considering changes in lung function over time as well as patient characteristics at the time of transition.
An issue arising from the use of funnel plots for centre comparisons is one of overdispersion. 35 This can occur when there is insufficient risk adjustment and is exhibited by the presence of many outliers in the plots. Our research team benefited from the expertise of a group of clinicians with a great deal of knowledge of the outcomes being studied and of the quality of the data on the CF Registry; with them, we identified those clinically meaningful variables that were well recorded on the CF Registry and could affect outcomes. Invariably, however, there will be other factors, or better measures of the factors that we considered, that may be more appropriate. For example, we considered only current area-level measures of deprivation, but it may be more important to look at early-life exposures to second-hand tobacco smoke. However, these data were not available. Similarly, we are aware that our analyses of outcomes in adult centres could be improved with the addition of more information on the health of patients at the time at which they transitioned to adult care. We are, however, limited by the data available. One recommended method of dealing with overdispersion is the use of mixed-effects modelling, which is the approach we used. With this approach, we found few centres exhibiting special-cause variation.
A consequence of the use of multilevel modelling, however, is that ‘shrinkage’ can occur when the adjusted results are drawn to the overall mean, thus giving the false illusion that case mix explains variability. This can have the greatest effect for smaller centres. We attempted to address the impact of this in our analyses by running sensitivity analyses in which we used fixed-effects GLMs that did not account for centre to generate predicted outcomes. We compared the observed and predicted outcomes by generating the ‘% predicted’ outcomes and generated our funnel plots from these new outcomes. Comparing the results obtained using this method of analysis with the multilevel modelling approach generally yielded similar results. Occasionally, a centre that was within the 3-SD limits in the analysis using multilevel modelling stayed outside those limits when a fixed-effects modelling approach was used. This is of particular relevance to adult centre 40, the results of which were thought to be driven largely by case mix, but which remained an outlier in our fixed-effects modelling approach. Nonetheless, our results were generally consistent. When looking at change in FEV1 in children and change in BMI in adults, however, we observed some large outliers in the fixed-effects modelling approach that were not present in the multilevel modelling approach. Those centres outside the control limits were within the control limits in the unadjusted analysis. Predictions from our case-mix adjusted model were very poor, making interpretation of our modified outcome of ‘% predicted’ difficult.
Consultations with clinicians
We ran two successful workshops with clinicians – from adult and paediatric centres, separately – to gain insight into the SPPs needed to deliver good CF care. Participants in these discussions came from a variety of disciplines, thereby ensuring that we had insight covering all aspects of care delivered by MDTs. This approach uncovered broad areas that clinicians felt were important and from these consultations we devised questionnaires that were disseminated to all centre directors for them and their teams to complete.
The clinician survey alone would be insufficient to gain insight into the SPPs associated with good care, but it was designed to help inform the conversation with sites and provide a starting point for discussions regarding the causes of variations in clinical outcomes. Owing to the low response rate for this questionnaire, we were unable to get a clear sense of the structures and processes of care at all centres. We can obtain supplemental information from the CF Registry (such as days on i.v. antibiotics and use of chronic preventative therapies, which have been suggested as a reason for better lung function outcomes in the USA than in the UK36) but this does not cover the full picture of how care is structured and delivered at a centre.
Alternative approaches to understanding how sites deliver care – such as through observation – may have yielded more information than a questionnaire. Questionnaires about how care is delivered can be prone to the selective bias of recalling more incidences of desirable behaviours and fewer incidences of undesirable behaviours. However, we felt that responses to our questions might signpost areas of further inquiry. The response rate to our questionnaire reflects the intense pressure that clinicians are under. Our choice of a relatively unsophisticated approach was an attempt to pragmatically sample a population that we knew to be very busy.
As indicated, it was anticipated that these questionnaires would provide hypotheses of the reasons for the differences in clinical outcomes observed, which are discussed in Chapter 3. These would then be explored in site visits at a sample of adult and paediatric centres. Centres were to be chosen in such a way that some would have average outcomes, some would have below average outcomes and others would have above average outcomes. Our plan for these site visits was described in the protocol; it involved an iterative process whereby the centre comparisons on clinical outcomes would be shared with the centre directors, who would be invited to comment and provide their own hypotheses, which we could then investigate with the data collected. Based on these analyses, we would have further discussions and discuss hypotheses generated from the centre director survey. However, it was felt that conducting the site visits without clear hypotheses driven by the survey would not be helpful or informative, so these were not conducted.
Consultation with patients
Our consultation with patients yielded insight into what patients feel is important in the delivery of CF care. It is only because of time restrictions that we were unable to disseminate, analyse and present our results within the context of this study.
The questionnaire on its own was not designed to enable us to perform statistical hypothesis testing, but it can be best conceptualised as a qualitative survey tool; as such, we would be looking for data saturation as an indicator that the important themes had been uncovered. However, understanding differences between centres would be difficult.
Unanswered questions and future work
Questions raised by this project
There remain questions to be addressed. How does i.v. antibiotic treatment (and, potentially, other medications) affect outcomes in CF patients? We observed that centre 9 was frequently outside the 3-SD limits for FEV1, despite adjustment for case mix, and there was some evidence that this centre has a smaller than average proportion of patients receiving i.v. antibiotics. It has been suggested that CF centres with better FEV1 give more i.v. antibiotic treatments27,37 and analyses comparing FEV1 in US and UK CF patients suggested that the determined use of treatments in the USA may be a driver of differences between US and UK CF centres. 36 Future work could explore the role of antibiotic treatments through more detailed analysis of CF Registry data and discussions with sites.
Are there other measures that could be used for centre comparisons? The outcomes studied in this project were those that were felt to be important to clinicians and that have been shown to be associated with survival. Mant38 suggests, however, that process measures would be more sensitive to change in quality improvement than clinical outcomes. Therefore, future studies may involve exploring which process measures would be most reliable and relevant to studying CF care. We, and another research group,37 studied the number of days on i.v. antibiotics as process measures and found interesting results that encourage further exploration. We studied the number of days on i.v. antibiotics as it was the most reliable process measure routinely collected by the CF Registry at the time, but the exploration of other data sets may suggest other measures that, in future, could be incorporated into national comparisons. There is, for example, current work funded by the CF Registry that is exploring the potential of linkages between the CF Registry and other routine data sets such as Hospital Episode Statistics. Such linked data could potentially yield useful data in this regard.
If we are to concentrate centre comparisons on measures of lung function, are there other measures of lung function that might prove insightful? In recent years, the UK CF Registry has collected information on ‘best’ FEV1 as well as FEV1 at annual review. Future research could involve comparisons between centres on this ‘best’ measure and – if data become available in the future – an exploration of the care received by patients in the period leading up to their ‘best’ FEV1. There is evidence from those sites providing both measures of FEV1 in 2013 that ‘best’ FEV1 differs from FEV1 values at annual review (when patients are ‘stable’) and that differences are greater for larger and smaller centres (see appendix C37).
Are there better ways of adjusting for patient case mix? The case-mix adjustment models used in the current analyses were based on clinical feedback on important patient characteristics and the data available. A more detailed exploration of patient histories, using evolving CF Registry data, may allow for refinement of the case-mix adjustment models, which could be validated against data from other well-established CF Registries, such as those in Canada and the USA.
What is the role of SES on observed differences between centres on FEV1? The importance of SES in health outcomes in CF has been studied extensively. 39 There is evidence that disparities exist, at least from the earliest point (at age 6 years) at which lung function is routinely recorded. It is not obvious what the mediating factors are, but it has been proposed that exposure to tobacco smoke may play a role. Future work to understand how centres can address this might, for example, involve exploring more closely the SPPs of those centres that have good clinical outcomes as well as a mixed patient population in terms of SES.
Beyond the potential role of the use of i.v. antibiotics, we were unable to identify the SPPs related to good CF care. Our survey of clinicians did not yield sufficient data to inform discussions with the sites. Taking an ethnographic approach based on observation, however, may yield more useful information.
How do patients feel about the care that they receive? We developed a detailed questionnaire for patients, which we did not have time to disseminate and analyse within the context of this study. Relevant approvals for this project have been obtained and we hope to disseminate the questionnaire soon. Analyses here can consider different age groups, as the concerns of the parents of young children will potentially be different from the views of young adults and older adults who will have had a lifetime of CF care.
Aims from this project
Despite the unanswered questions and limitations encountered, we have developed part of the framework we intended to, which will support future centre comparison analysis of UK CF Registry data, thereby benefiting the CF community – both patients and clinicians. The framework, as currently developed, relates to having established models and processes for making centre-level comparisons on key clinical outcomes and routinely collected measures of care (such as i.v. antibiotic usage), although these are subject to a number of limitations, as described above. Our workshops and focus groups have elicited important information on what patients and clinicians feel is important in delivering good CF care and achieving good outcomes. These events have helped us to devise questionnaires to be distributed more widely to the clinical and patient community.
This forms the basis of future work linking care and clinical outcomes, which could complete our intended aims. To resolve the outstanding elements of our proposed work, the following is required:
-
Disseminate the patient questionnaire that was developed in this project.
-
Collect information on the SPPs at centres. We accept that our survey design was inadequate and are exploring other possibilities, including an ethnographic approach using observation.
-
Use the information gathered in the first two steps to inform conversations with sites identified in our centre comparison work to explore whether or not the differences observed relate to care.
Conclusions
This study has demonstrated that we can identify variation between centres and has raised some hypotheses regarding reasons for these differences. The hypotheses raised in this work – including the potential role of i.v. antibiotics – require further study and could provide valuable insights for the CF clinical community.
In fact, the CF Registry is already moving towards the use of funnel plots in making centre comparisons. 31 The learning from this work regarding the importance of case-mix adjustment, the limitations of such plots of detecting special-cause variation in small centres, the usefulness of making comparisons across years rather than using single-year analyses and the potential usefulness of incorporating available process measures can all be incorporated into future practice at the CF Registry. We also gleaned valuable information from select groups of clinicians and patients on what is important in delivering good CF care. Although we were unable to successfully investigate these issues at the national level, we have gained insight into how this might be done successfully in the future.
Our approach provides a framework for future centre comparisons in CF or other disease areas for which routine clinical data are available on well-defined patient populations. This can usefully form the basis of discussions with sites about outcomes – subject to the limitations described in this chapter – when following the pyramid of investigation approach.
Acknowledgements
We would like to acknowledge the contributions of Kathy Collins (NHS National Services Scotland), who was part of the study team and advised on the design of the study and interpretation of the early-stage results; Elaine Gunn (CF Trust), who provided data and advised on data-related issues; Dominic Kavanagh (CF Trust), who was involved in designing the study and participated in our focus group; Paul Norman, who provided data on SES; the CF Trust’s team of expert patient advisors; and CF clinicians who participated in focus groups and responded to our centre director questionnaire.
Contributions of authors
Stephanie J MacNeill (Medical Statistician) developed the analysis plan, extracted data, performed analyses, interpreted results and managed the study.
Livia Pierotti (Medical Statistician) extracted data, performed analyses and interpreted results.
Mohammed A Mohammed (Professor of Healthcare Quality and Effectiveness) advised on study design and the interpretation of results.
Martin Wildman (Consultant in Respiratory Medicine) advised on the design of the study, facilitated workshops with clinicians, developed the questionnaire for clinical teams, analysed data and advised on the interpretation of results.
Jonathan Boote (Honorary Research Fellow in Public Health) advised on the design of the study, conducted focus groups with patients and clinicians, analysed data and developed the patient questionnaire.
Steve Harrison (Head of Quality Improvement and Senior Microsystems Improvement Coach) facilitated workshops with clinicians, developed the questionnaire for clinical teams, analysed data and advised on the interpretation of results.
Siobhán B Carr (Consultant in Paediatric Respiratory Medicine) advised on the design of the study and the interpretation of the results.
Paul Cullinan (Professor of Occupational and Environmental Respiratory Disease) advised on the design of the study and the interpretation of the results.
Caroline Elston (Consultant in Respiratory Medicine) advised on the design of the study and the interpretation of the results.
Diana Bilton (Honorary Consultant in Respiratory Medicine) advised on the design of the study and the interpretation of the results.
Data-sharing statement
All data requests should be submitted to the corresponding author for consideration. Access to available anonymised data may be granted following review.
Patient data
This work uses data provided by patients and collected by the NHS as part of their care and support. Using patient data is vital to improve health and care for everyone. There is huge potential to make better use of information from people’s patient records, to understand more about disease, develop new treatments, monitor safety, and plan NHS services. Patient data should be kept safe and secure, to protect everyone’s privacy, and it’s important that there are safeguards to make sure that it is stored and used responsibly. Everyone should be able to find out about how patient data are used. #datasaveslives You can find out more about the background to this citation here: https://understandingpatientdata.org.uk/data-citation.
Disclaimers
This report presents independent research funded by the National Institute for Health Research (NIHR). The views and opinions expressed by authors in this publication are those of the authors and do not necessarily reflect those of the NHS, the NIHR, NETSCC, the HS&DR programme or the Department of Health and Social Care. If there are verbatim quotations included in this publication the views and opinions expressed by the interviewees are those of the interviewees and do not necessarily reflect those of the authors, those of the NHS, the NIHR, NETSCC, the HS&DR programme or the Department of Health and Social Care.
References
- UK CF Registry Annual Data Report 2009. London; 2011.
- Ratjen FA. Cystic fibrosis: pathogenesis and future treatment strategies. Respir Care 2009;54:595-60. https://doi.org/10.4187/aarc0427.
- Davis PB. Cystic fibrosis since 1938. Am J Respir Crit Care Med 2006;173:475-82. https://doi.org/10.1164/rccm.200505-840OE.
- Barr HL, Britton J, Smyth AR, Fogarty AW. Association between socioeconomic status, sex, and age at death from cystic fibrosis in England and Wales (1959 to 2008): cross sectional study. BMJ 2011;343. https://doi.org/10.1136/bmj.d4662.
- Marshall EC, Spiegelhalter DJ. Reliability of league tables of in vitro fertilisation clinics: retrospective analysis of live birth rates. BMJ 1998;316:1701-4. https://doi.org/10.1136/bmj.316.7146.1701.
- Lilford R, Mohammed MA, Spiegelhalter D, Thomson R. Use and misuse of process and outcome data in managing performance of acute medical care: avoiding institutional stigma. Lancet 2004;363:1147-54. https://doi.org/10.1016/S0140-6736(04)15901-1.
- Adab P, Rouse AM, Mohammed MA, Marshall T. Performance league tables: the NHS deserves better. BMJ 2002;324:95-8. https://doi.org/10.1136/bmj.324.7329.95.
- Quon BS, Goss CH. A story of success: continuous quality improvement in cystic fibrosis care in the USA. Thorax 2011;66:1106-8. https://doi.org/10.1136/thoraxjnl-2011-200611.
- Kraynack NC, McBride JT. Improving care at cystic fibrosis centers through quality improvement. Semin Respir Crit Care Med 2009;30:547-58. https://doi.org/10.1055/s-0029-1238913.
- Stern M, Niemann N, Wiedemann B, Wenzlaff P. German CFQA Group . Benchmarking improves quality in cystic fibrosis care: a pilot project involving 12 centres. Int J Qual Health Care 2011;23:349-56. https://doi.org/10.1093/intqhc/mzr017.
- Moore BM, Laguna TA, Liu M, McNamara JJ. Increased adherence to CFF practice guidelines for pulmonary medications correlates with improved FEV1. Pediatr Pulmonol 2013;48:747-53. https://doi.org/10.1002/ppul.22665.
- Siracusa CM, Weiland JL, Acton JD, Chima AK, Chini BA, Hoberman AJ, et al. The impact of transforming healthcare delivery on cystic fibrosis outcomes: a decade of quality improvement at Cincinnati Children’s Hospital. BMJ Qual Saf 2014;23:i56-i63. https://doi.org/10.1136/bmjqs-2013-002361.
- Shewhart WA. Economic Control of Quality of Manufactured Product. London: D. Van Nostrand Company Inc.; 1931.
- Mohammed MA, Cheng KK, Rouse A, Marshall T. Bristol, Shipman, and clinical governance: Shewhart’s forgotten lessons. Lancet 2001;357:463-7. https://doi.org/10.1016/S0140-6736(00)04019-8.
- Healthcare Quality Improvement Partnership/National Cardiac Arrest Audit Group . Detection and Management of Outliers for National Clinical Audits 2017. www.hqip.org.uk/resources/detection-and-management-outliers-national-clinical-audits/ (accessed 30 October 2017).
- Pagel C, Rogers L, Brown K, Ambler G, Anderson D, Barron D, et al. Improving risk adjustment in the PRAiS (Partial Risk Adjustment in Surgery) model for mortality after paediatric cardiac surgery and improving public understanding of its use in monitoring outcomes. Health Serv Deliv Res 2017;5.
- Standards for the Clinical Care of Children and Adults with Cystic Fibrosis. London: Cystic Fibrosis Trust; 2011.
- Knudson RJ, Lebowitz MD, Holberg CJ, Burrows B. Changes in the normal maximal expiratory flow-volume curve with growth and aging. Am Rev Respir Dis 1983;127:725-34. https://doi.org/10.1164/arrd.1983.127.6.725.
- Quanjer PH, Stanojevic S, Cole TJ, Baur X, Hall GL, Culver BH, et al. Multi-ethnic reference values for spirometry for the 3–95-yr age range: the global lung function 2012 equations. Eur Respir J 2012;40:1324-43. https://doi.org/10.1183/09031936.00080312.
- Stanojevic S, Stocks J, Bountziouka V, Aurora P, Kirkby J, Bourke S, et al. The impact of switching to the new global lung function initiative equations on spirometry results in the UK CF registry. J Cyst Fibros 2014;13:319-27. https://doi.org/10.1016/j.jcf.2013.11.006.
- Townsend P, Phillimore P, Beattie A. Health and Deprivation: Inequality and the North. London: Croom Helm; 1988.
- Kulich M, Rosenfeld M, Campbell J, Kronmal R, Gibson RL, Goss CH, et al. Disease-specific reference equations for lung function in patients with cystic fibrosis. Am J Respir Crit Care Med 2005;172:885-91. https://doi.org/10.1164/rccm.200410-1335OC.
- Doull I, Evans H. South and Mid Wales Paediatric Cystic Fibrosis Network . Full, shared and hybrid paediatric care for cystic fibrosis in South and Mid Wales. Arch Dis Child 2012;97:17-20. https://doi.org/10.1136/adc.2010.199380.
- Miles MB, Huberman AM. Qualitative Data Analysis: An Expanded Sourcebook. Thousand Oaks, CA: Sage Publications Inc.; 1994.
- Stewart DW, Shamdasani PN, Rook DW. Focus Groups. Thousand Oaks, CA: Sage Publications Inc.; 2007.
- Comer DM, Ennis M, McDowell C, Beattie D, Rendall J, Hall V, et al. Clinical phenotype of cystic fibrosis patients with the G551D mutation. QJM 2009;102:793-8. https://doi.org/10.1093/qjmed/hcp120.
- Johnson C, Butler SM, Konstan MW, Morgan W, Wohl ME. Factors influencing outcomes in cystic fibrosis: a center-based analysis. Chest 2003;123:20-7. https://doi.org/10.1378/chest.123.1.20.
- Quinton HB, O’Connor GT. Current issues in quality improvement in cystic fibrosis. Clin Chest Med 2007;28:459-72. https://doi.org/10.1016/j.ccm.2007.02.013.
- Woodall WH. Controversies and contradictions in statistical process control. J Qual Technol 2000;32:341-50. https://doi.org/10.1080/00224065.2000.11980013.
- Kraynack NC, Gothard MD, Falletta LM, McBride JT. Approach to treating cystic fibrosis pulmonary exacerbations varies widely across US CF care centers. Pediatr Pulmonol 2011;46:870-81. https://doi.org/10.1002/ppul.21442.
- Cystic Fibrosis Trust . 2015 Registry Annual Data Report 2016. www.cysticfibrosis.org.uk/the-work-we-do/uk-cf-registry/reporting-and-resources (accessed 30 October 2017).
- Nightingale JA, Osmond C. Does current reporting of lung function by the UK cystic fibrosis registry allow a fair comparison of adult centres?. J Cyst Fibros 2017;16:585-91. https://doi.org/10.1016/j.jcf.2017.04.007.
- Mohammed MA, Booth K, Marshall D, Brolly M, Marshall T, Cheng KK, et al. A practical method for monitoring general practice mortality in the UK: findings from a pilot study in a health board of Northern Ireland. Br J Gen Pract 2005;55:670-6.
- Barnett AG, van der Pols JC, Dobson AJ. Regression to the mean: what it is and how to deal with it. Int J Epidemiol 2005;34:215-20. https://doi.org/10.1093/ije/dyh299.
- Spiegelhalter DJ. Handling over-dispersion of performance indicators. Qual Saf Health Care 2005;14:347-51. https://doi.org/10.1136/qshc.2005.013755.
- Goss CH, MacNeill SJ, Quinton HB, Marshall BC, Elbert A, Knapp EA, et al. Children and young adults with CF in the USA have better lung function compared with the UK. Thorax 2015;70:229-36. https://doi.org/10.1136/thoraxjnl-2014-205718.
- Hoo ZH, Campbell MJ, Curley R, Walters SJ, Wildman MJ. Do cystic fibrosis centres with the lowest FEV1 still use the least amount of intravenous antibiotics? A registry-based comparison of intravenous antibiotic use among adult CF centres in the UK. J Cyst Fibros 2018;17:360-7. https://doi.org/10.1016/j.jcf.2017.10.005.
- Mant J. Process versus outcome indicators in the assessment of quality of health care. Int J Qual Health Care 2001;13:475-80. https://doi.org/10.1093/intqhc/13.6.475.
- Taylor-Robinson D, Whitehead M, Diderichsen F, Olesen HV, Pressler T, Smyth RL, et al. Understanding the natural progression in %FEV1 decline in patients with cystic fibrosis: a longitudinal study. Thorax 2012;67:860-6. https://doi.org/10.1136/thoraxjnl-2011-200953.
Appendix 1 Expert patient focus group topic guide
National Institute for Health Research Health Services and Delivery Research cystic fibrosis study: focus group schedule for expert patients
Preamble
Hello everyone, and thank you for joining this telephone-based focus group. During the next couple of hours, we are going to discuss some issues that we think help a CF unit to perform well. There are no right or wrong answers to the questions I am going to ask, so please feel free to agree or disagree with each other as we go along. Because this focus group is being tape recorded for later analysis, can I please ask you not to talk over each other? Please try to wait for whoever is speaking to finish before starting to speak yourself. Whilst we are keen to hear about your own personal experiences, you are welcome to also mention the experiences of other CF patients who you know about.
Schedule
-
Can we start by considering the level of information that CF units should provide to patients and carers?
-
Is it important in your view that CF units educate their patients about the condition? What benefits would this have?
-
What specific aspects of CF is it important for units to educate patients and carers about? And how is this achieved in your experience?
-
To your knowledge, what educational materials are routinely given to patients? Are there any gaps in your view?
-
Do you think units should have explicit policies and procedures in place around education of patients? Would this be valuable?
-
Would you find it helpful if members of the MDT asked questions to confirm your understanding of aspects of your treatment? What benefits would this have?
-
What helps or hinders CF units in educating their patients and carers in your view?
-
In an ideal world, what would a well-performing CF unit look like, with respect to patient education?
-
-
Can we turn next to consider the extent to which units encourage CF patients to have influence and control over their treatment and care?
-
So first of all, do you personally feel that you are encouraged to take control over your care and treatment? How/in what ways?
-
In your experience, do patients and carers want greater control and influence over their treatment and care? If so, what aspects of their treatment and care do they want more control over?
-
Is it important that CF units encourage patients to take greater control of the management of the their condition? What benefits would this have?
-
What helps or hinders CF units in encouraging their patients to have more influence and control over their treatment and care in your view?
-
In an ideal world, what would a well-performing CF unit look like, with respect to the degree of control and influence a CF patient has over their treatment and care?
-
-
The next issue for discussion is how CF units develop a constructive dialogue and relationship with patients. So, first of all, do you generally feel listened to when receiving care at your CF unit?
-
Does the MDT try to understand your lifestyle, and fit your treatment around your lifestyle? Could you provide an example of this?
-
How do you feel that CF professionals go about developing a constructive dialogue and relationship with yourself and other CF patients?
-
Do you think that CF patients are interested in developing a constructive dialogue with specific members of a unit?
-
What helps or hinders a CF unit from developing a constructive dialogue with patients in your view?
-
In an ideal world, what would a well-performing CF unit look like, with regards to how it develops a constructive dialogue with patients?
-
-
For the next part of the focus group, I’d like us to consider how units measure and manage CF within the MDT. So first of all, what in your view should units be measuring to know that they are treating patients effectively?
-
Do you feel that you understand your target lung function and weight and what these mean? Are there other aspects of your health that you feel it is important that CF units monitor and manage?
-
Are you given information about your own condition to help you evaluate how your treatment and care is progressing?
-
Have you experienced variation in the standard and quality of your care in visits to your unit?
-
Do you feel that the MDT in your unit communicates well and delivers a consistent message?
-
Do you feel that the MDT has a shared understanding of your treatment and care?
-
Are you confident that the MDT shares information well, so that they all know about your treatment and care?
-
Do you think it is important for patients and carers to be involved in monitoring and managing the performance of CF units? What benefits would this have?
-
Should CF patients know how their unit performs in relation to other units in the country? What benefits would this have?
-
In your view, what factors help or hinder CF units measuring and managing CF effectively?
-
In an ideal world, what would a well-performing CF unit look like, with respect to the measurement and management of CF?
-
-
The next part of the focus group relates to resources and multidisciplinary staffing in CF units. First of all, have you, or patients who you know, ever experienced difficulties in seeing certain members of the MDT as often as you would like?
-
Have you, or patients who you know, ever experienced difficulties in obtaining relevant treatments such as nebulisers?
-
Are you confident that all members of the MDT in your unit are equipped and trained to manage your CF effectively?
-
What, in your view, helps or hinders CF units to obtain the resources and staffing to ensure a good level of performance?
-
In an ideal world, what would a well-performing CF unit look like with regard to staffing and resources?
-
-
I’d like now to broaden the discussion out and for you to describe for me some good and bad experiences of the care that you have had both as an inpatient and an outpatient. If we could start with your experiences of being treated as an inpatient:
-
What is a good experience as an inpatient like?
-
What is a bad experience as an inpatient like?
-
What is a good experience as an outpatient like?
-
What is a bad experience as an outpatient like?
-
What does your CF unit do well?
-
What could your CF unit improve?
-
Closing remarks
We have come to the end of the focus group questions. Before we close, does anyone want to add anything to any of the issues that we have discussed?
Many thanks for your participation. The recording is going to be transcribed verbatim and a copy will be made available to you for your information.
Appendix 2 Additional figures
FIGURE 18.
Proportion of 12-year-old patients with data recorded at each of the 31 paediatric centres. (a) FEV1% predicted; (b) genotype; (c) SES; and (d) pancreatic enzyme use.
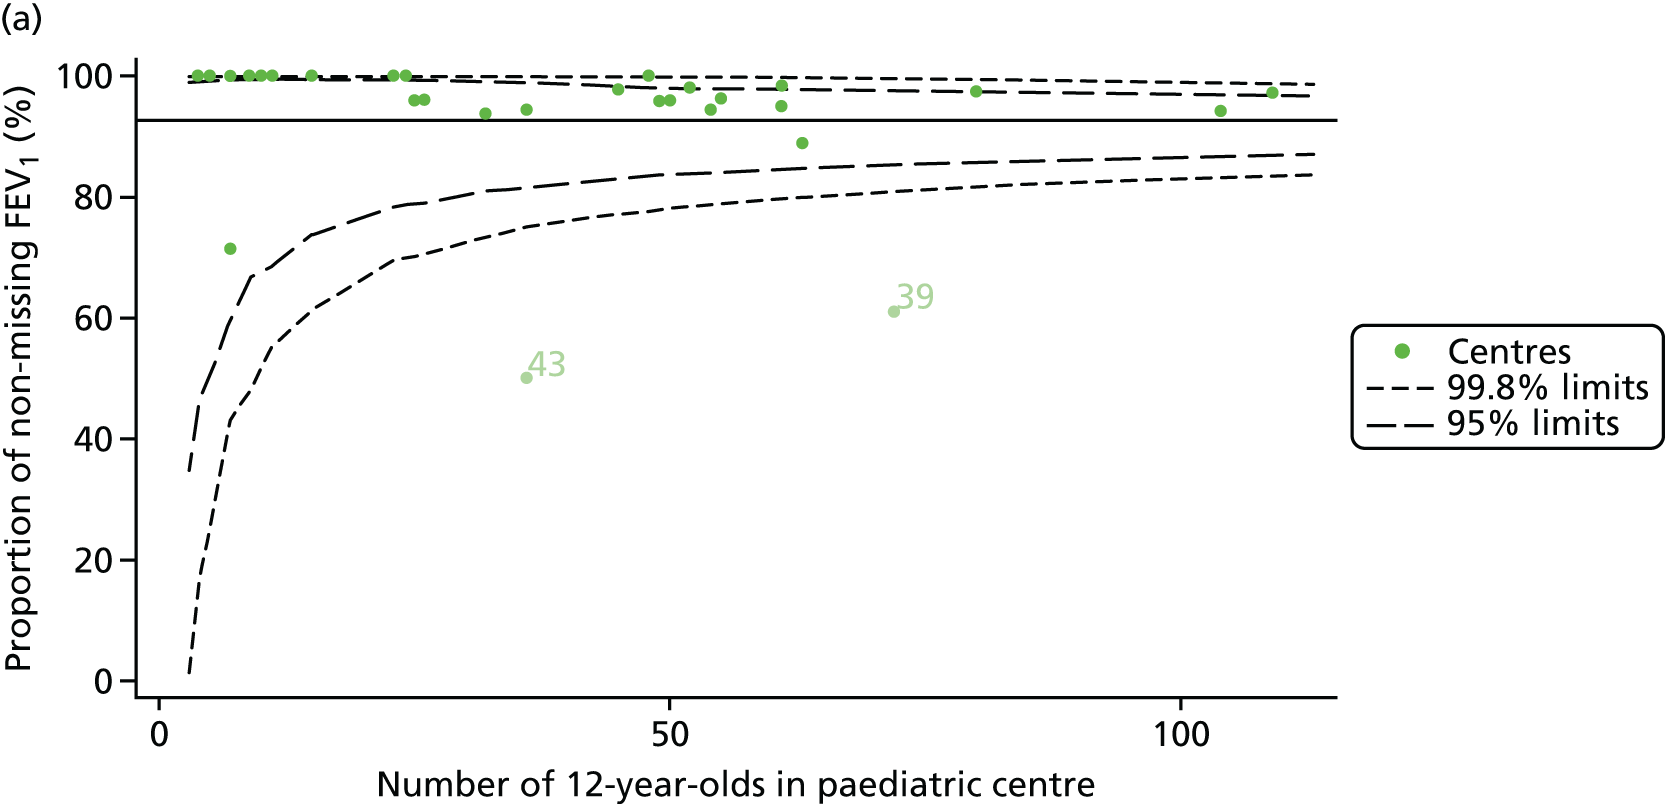
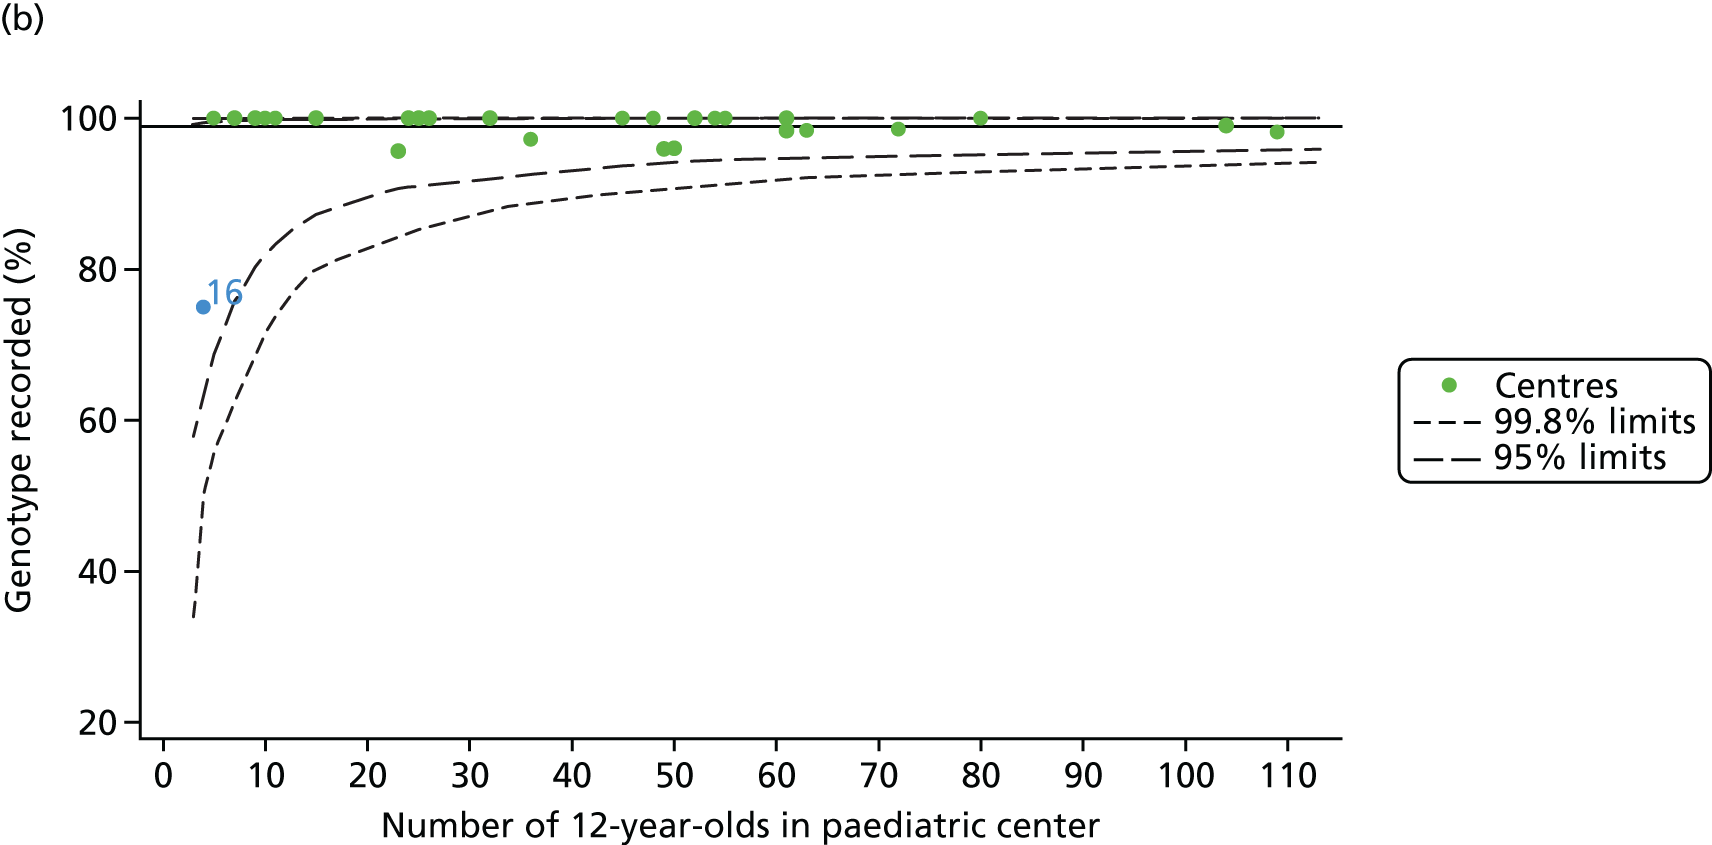
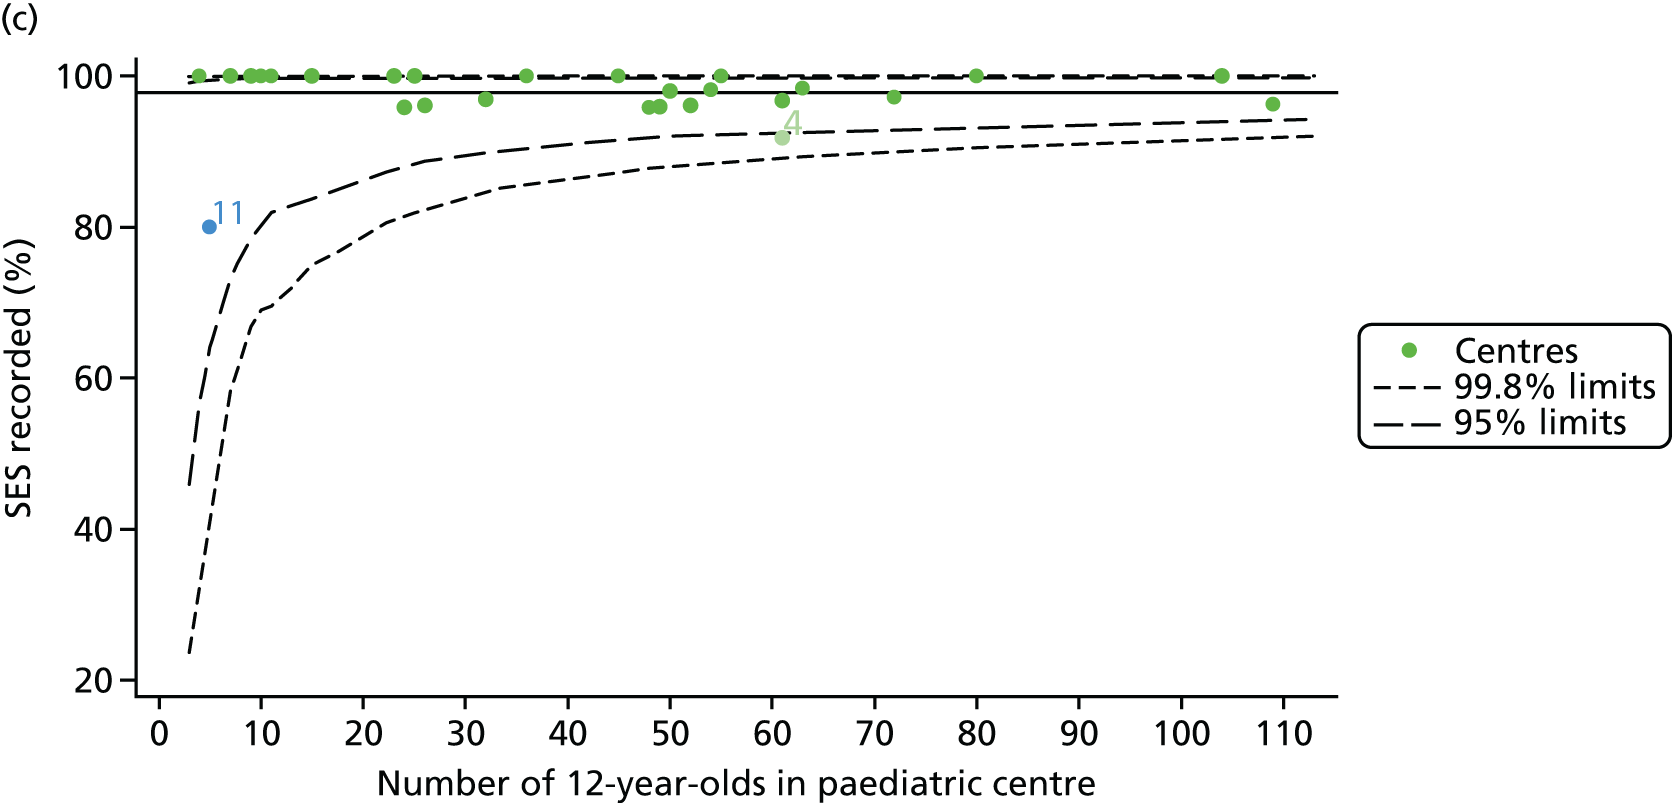
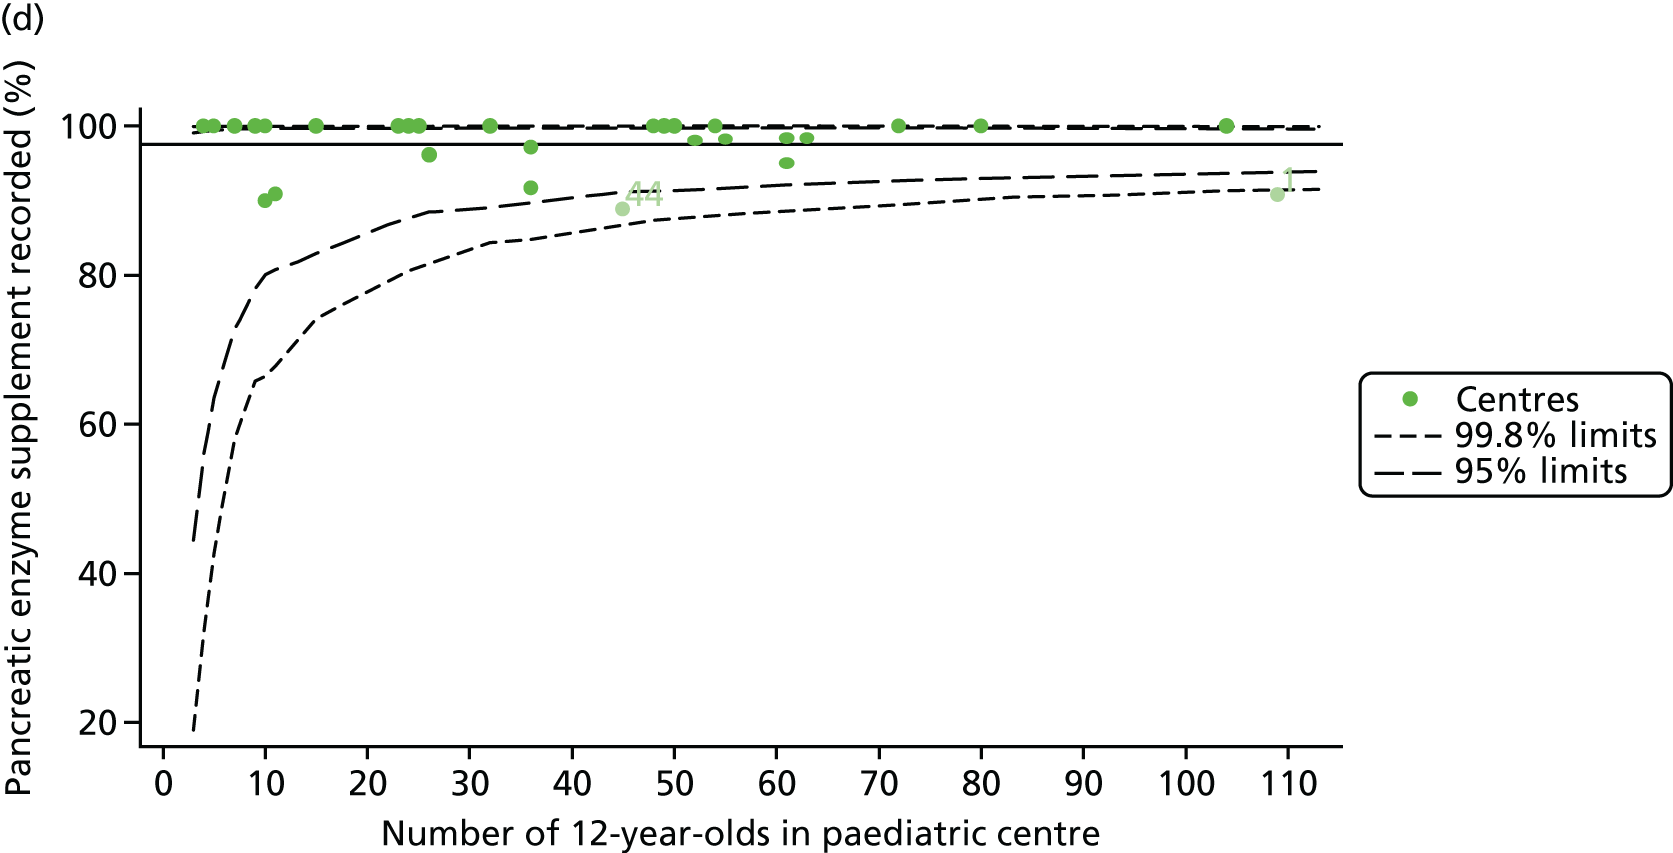
FIGURE 19.
Description of case-mix variables at each of the 31 paediatric centres (for 12-year-old patients). (a) Sex: female; (b) genotype: homozygous DF508; (c) SES; and (d) pancreatic enzyme use.
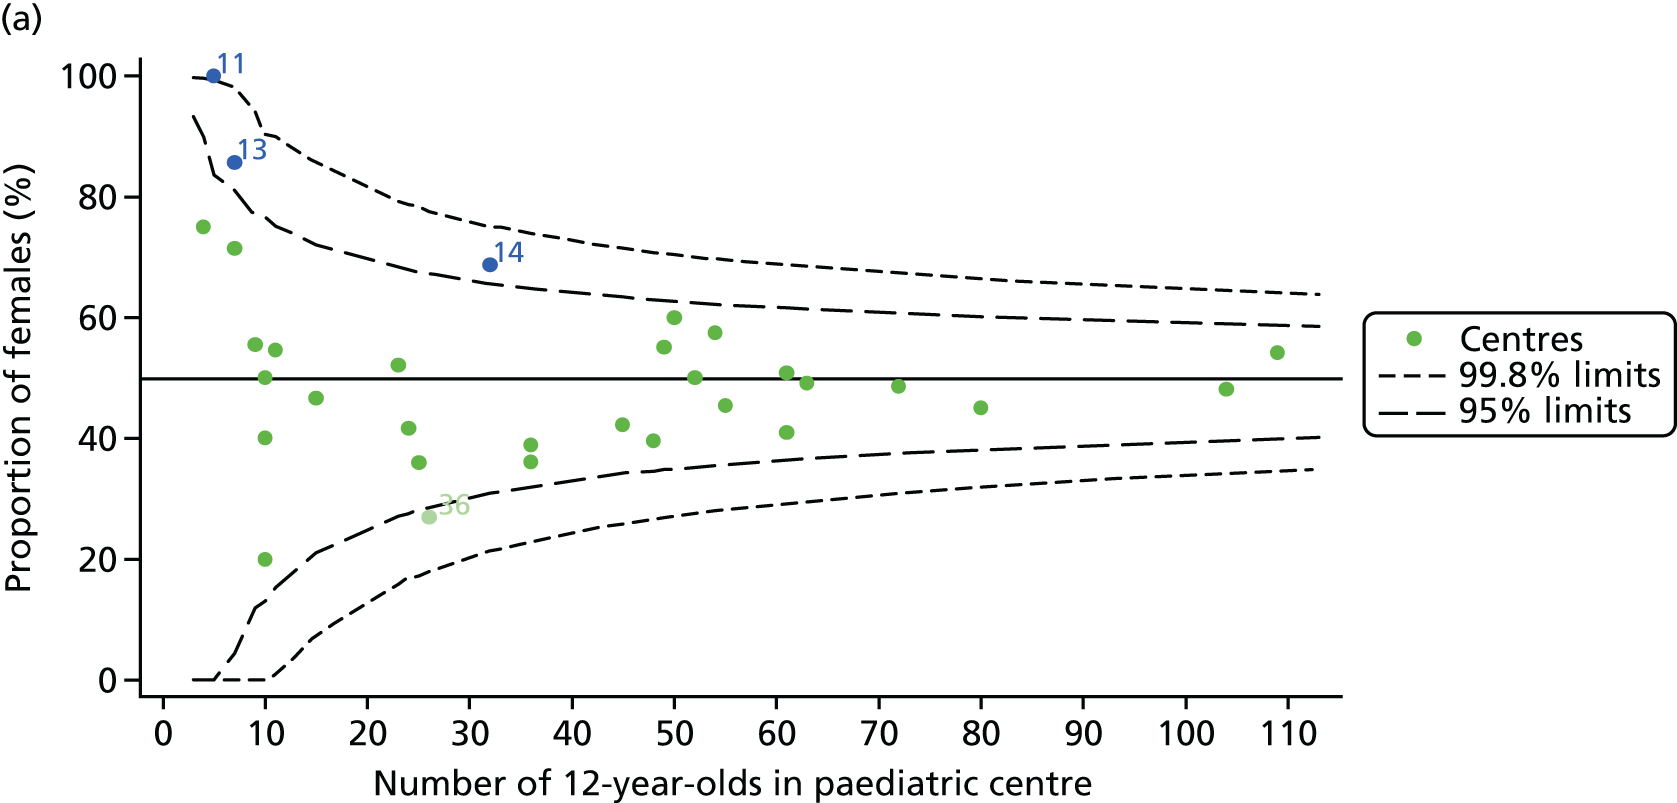
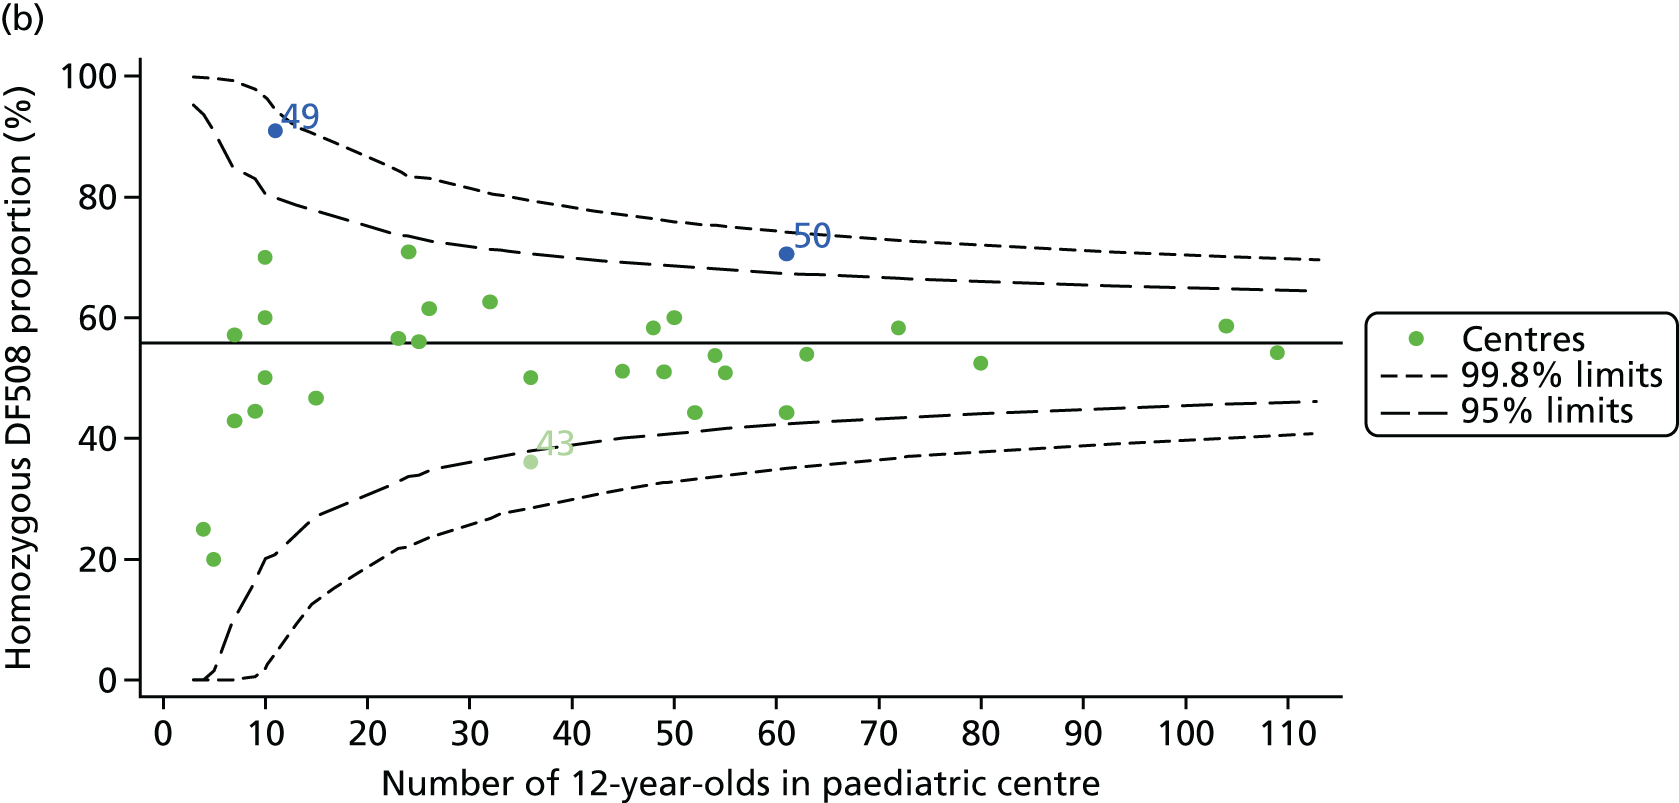
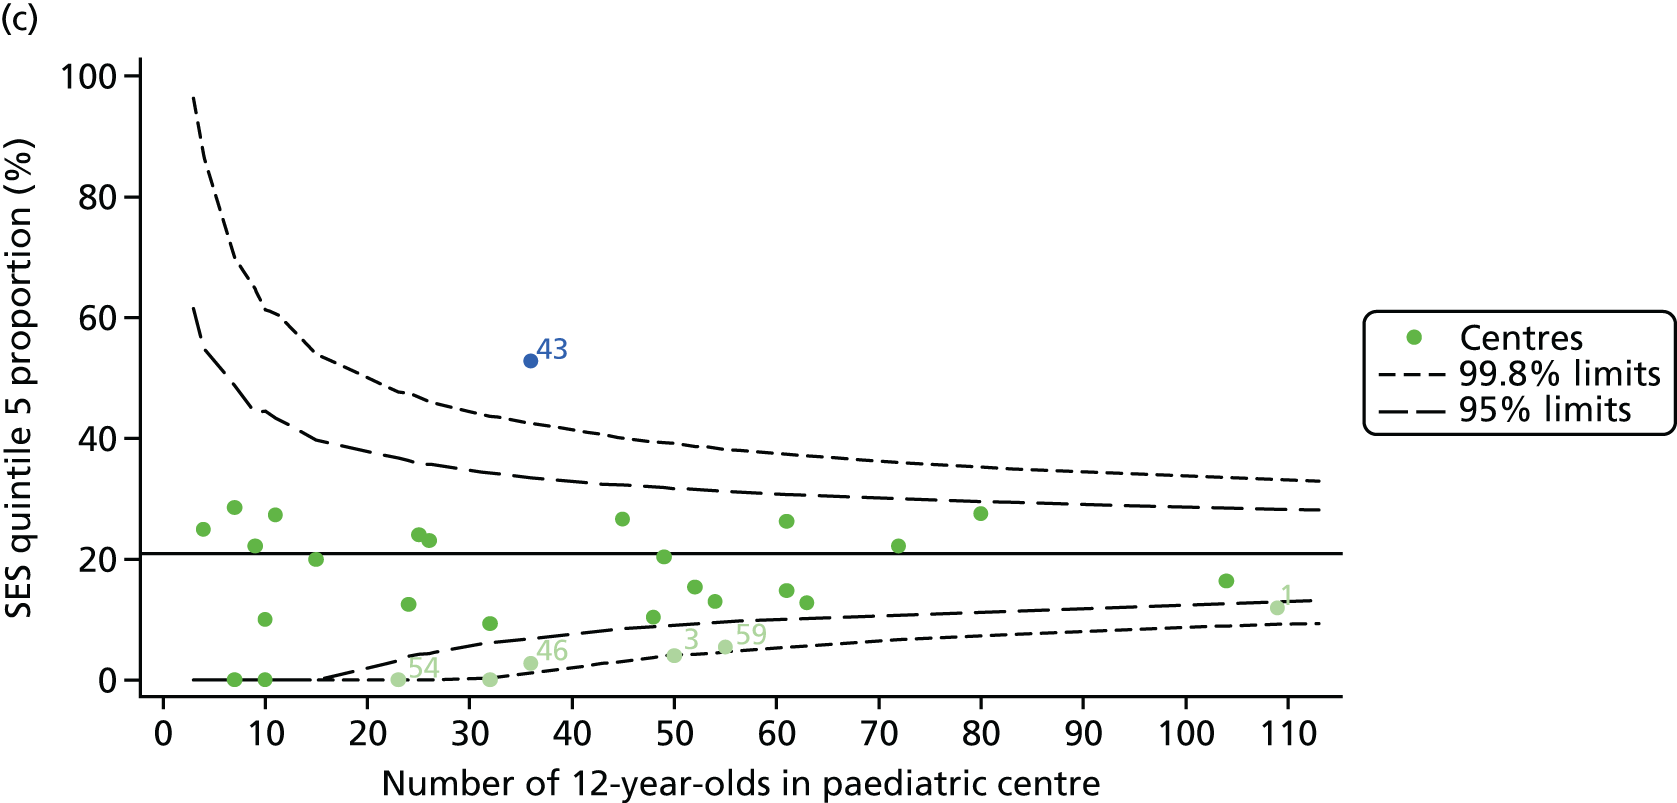
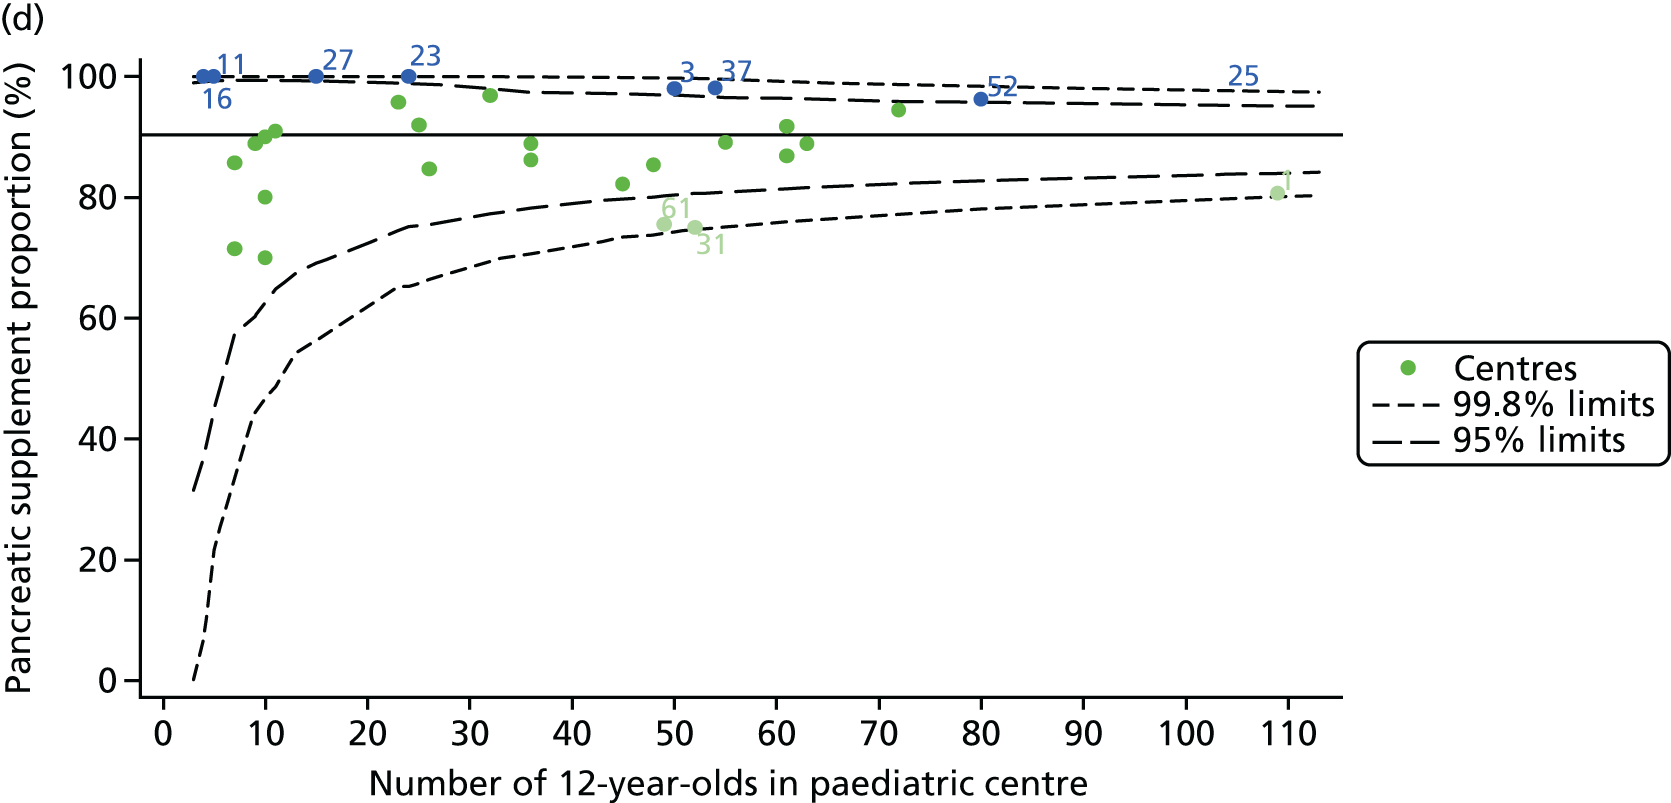
FIGURE 20.
Proportion of 15-year-old patients with data recorded at each of the 31 paediatric centres. (a) FEV1% predicted; (b) genotype; (c) SES; and (d) pancreatic enzyme use.
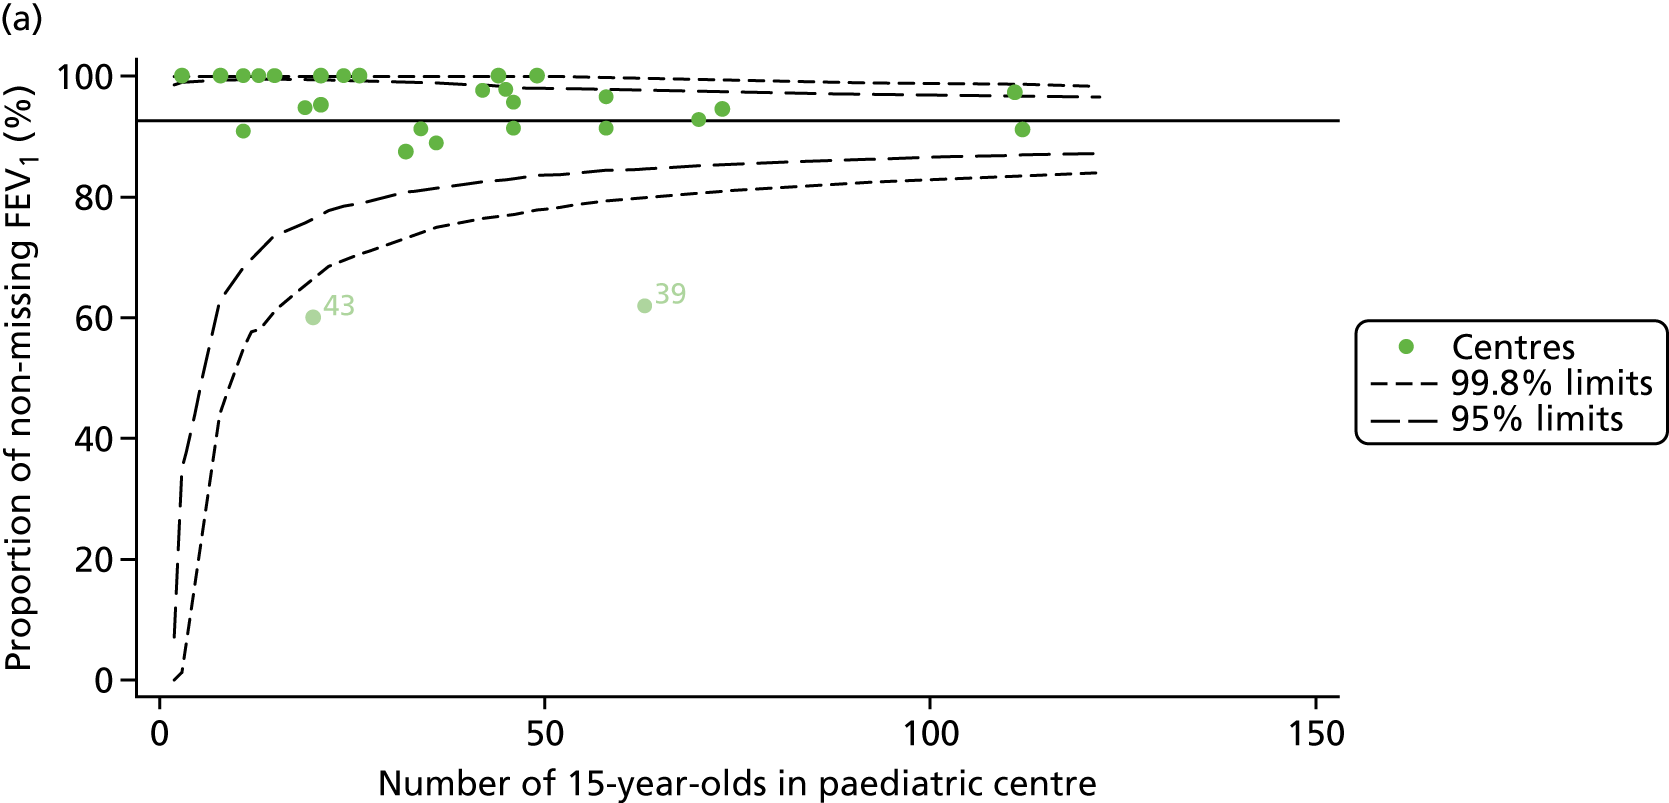
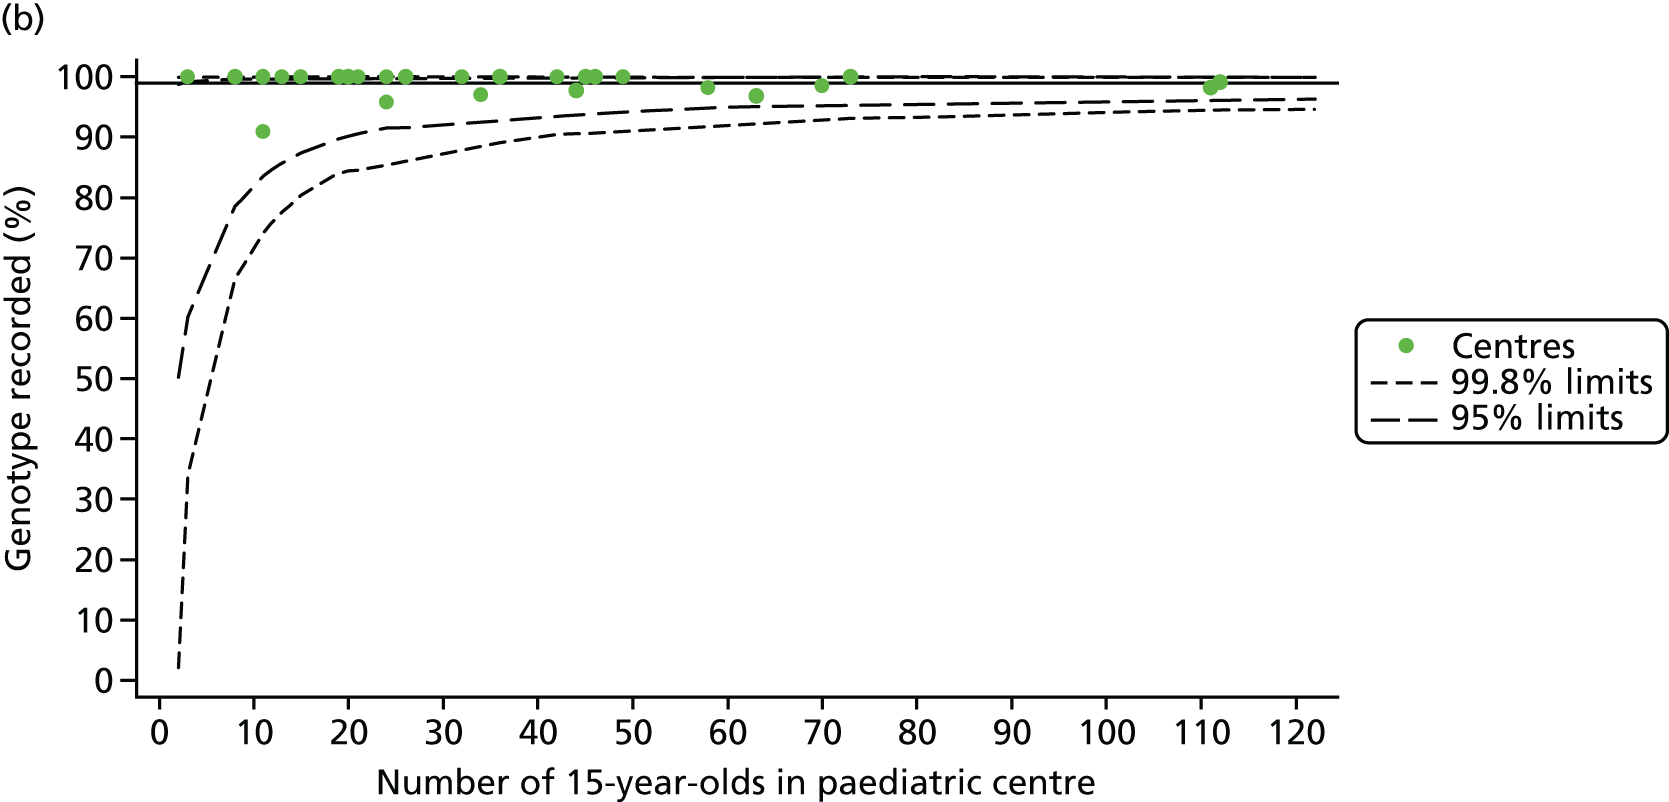
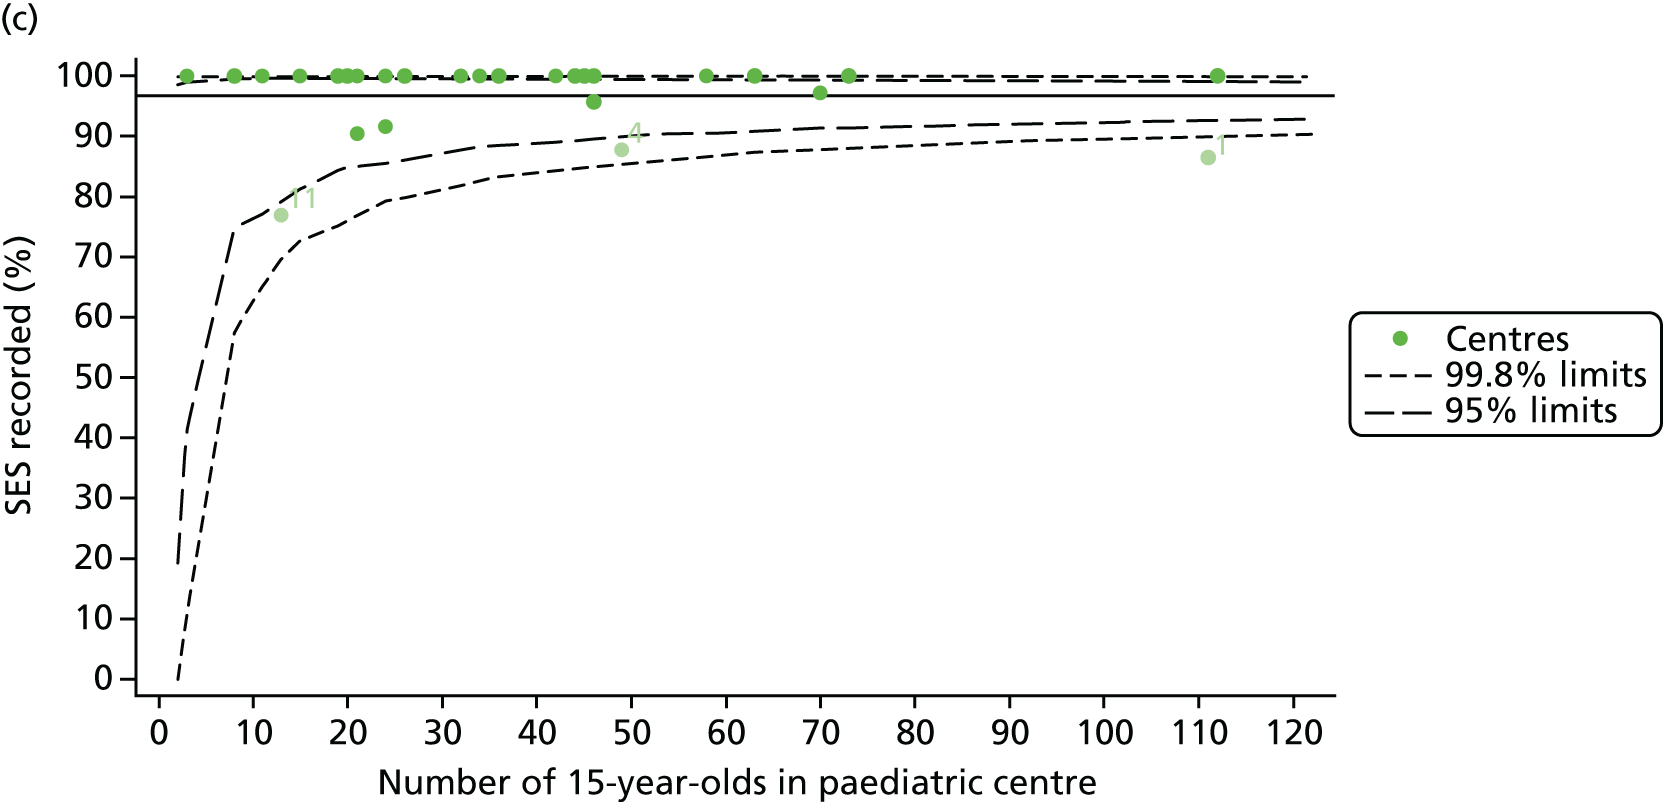
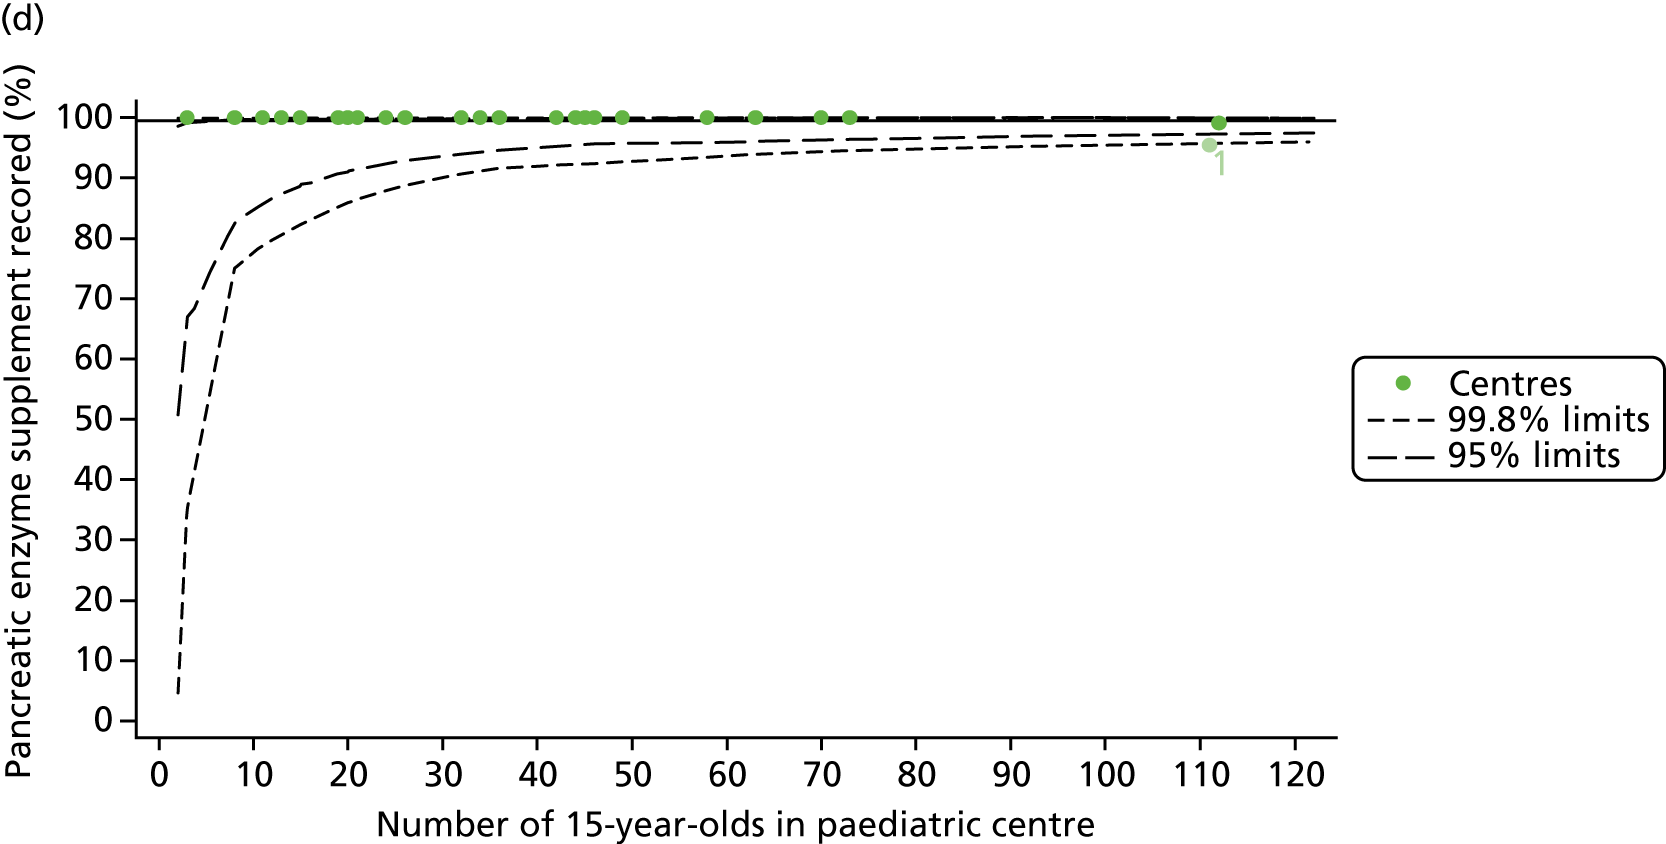
FIGURE 21.
Description of case-mix variables at each of the 31 paediatric centres (for 15-year-old patients). (a) Sex: female; (b) genotype: homozygous DF508; (c) SES; and (d) pancreatic enzyme use.
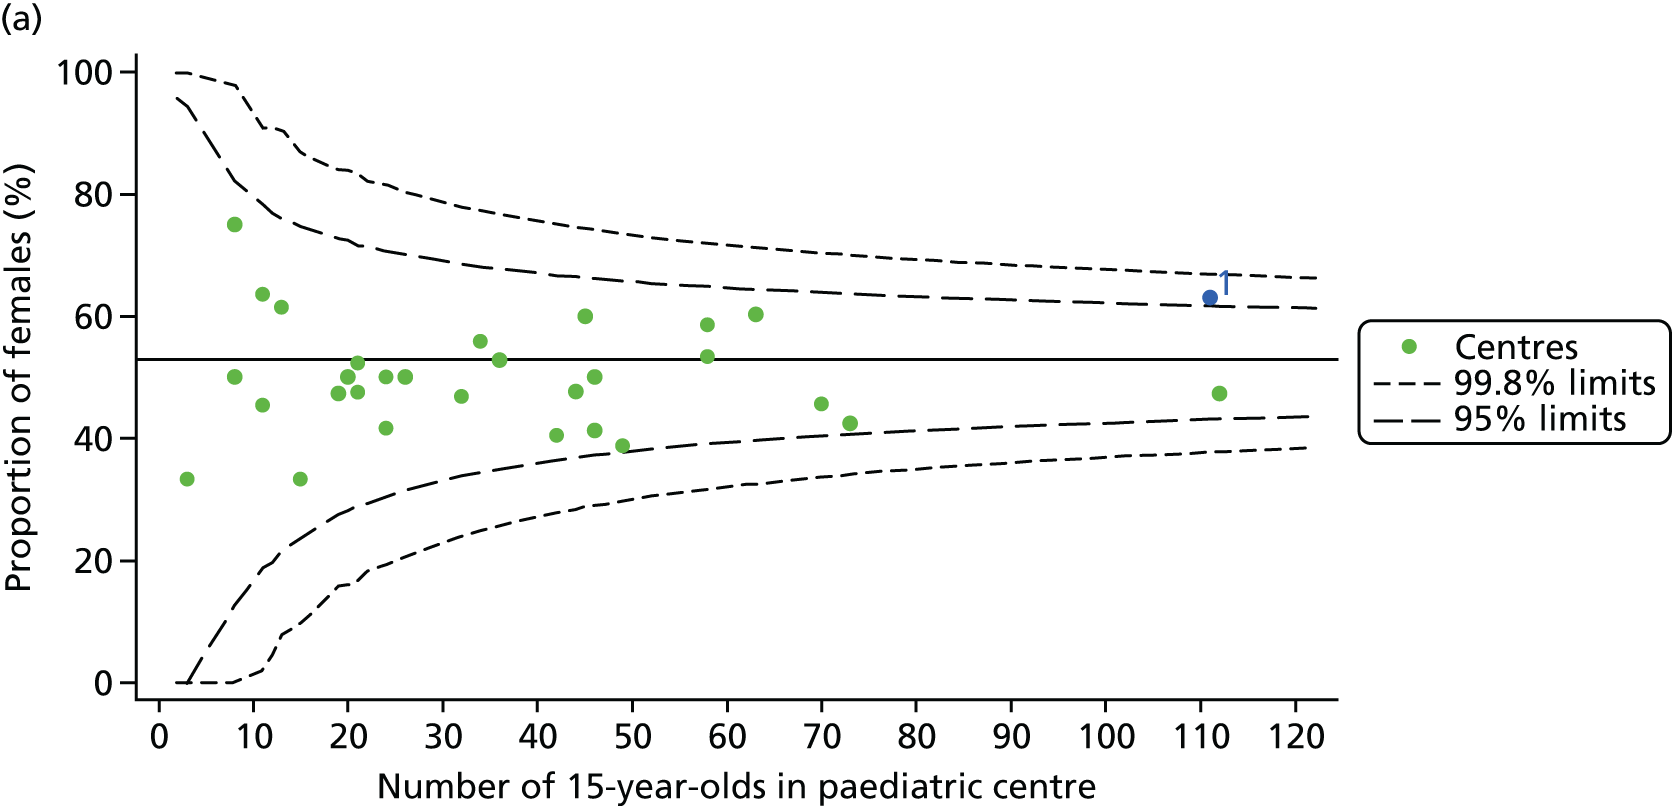
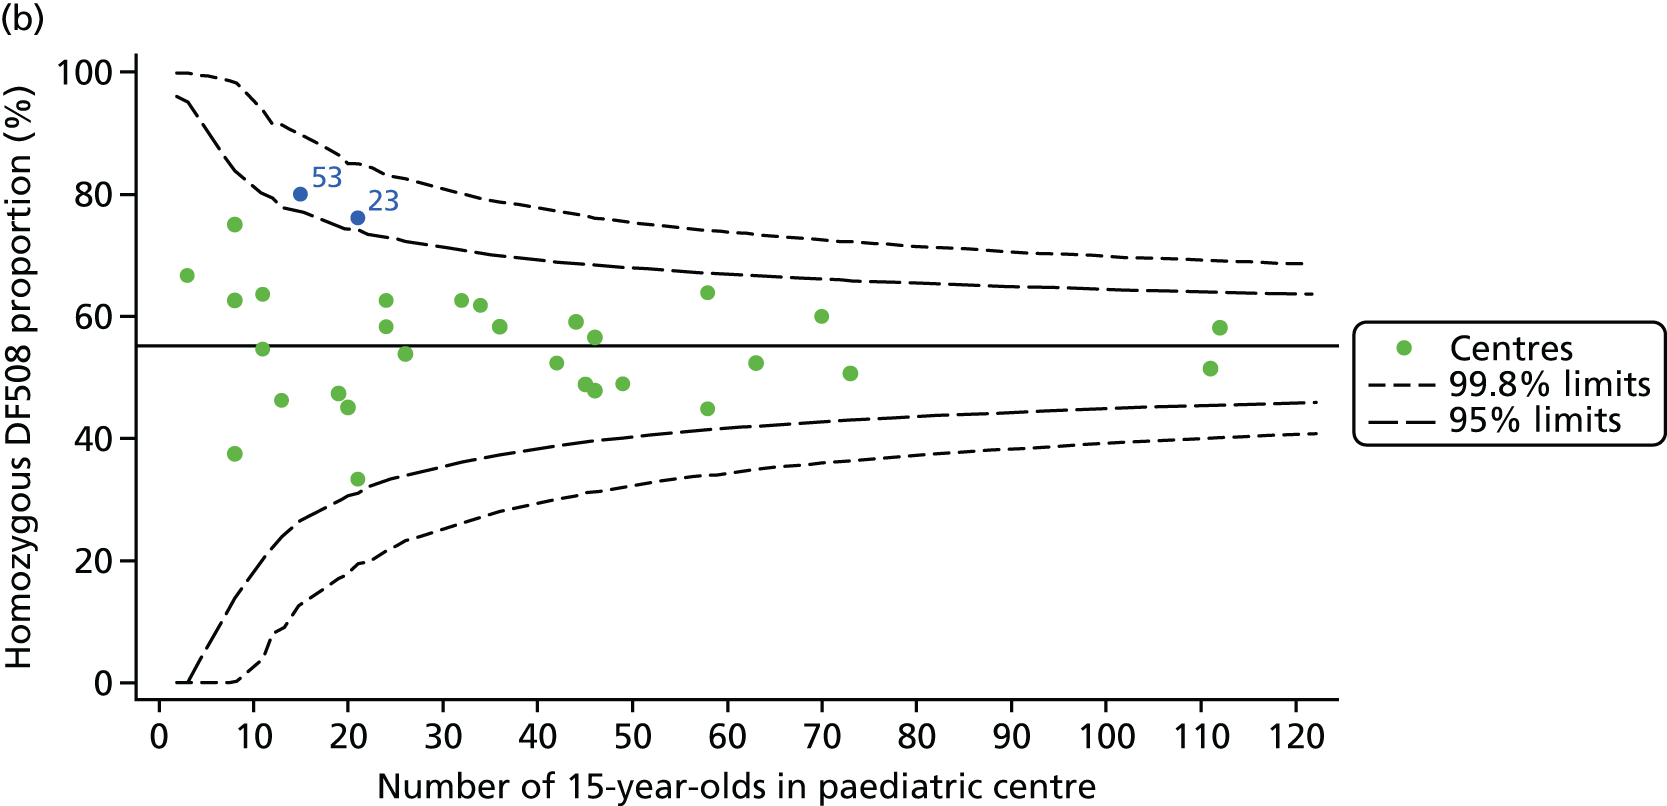
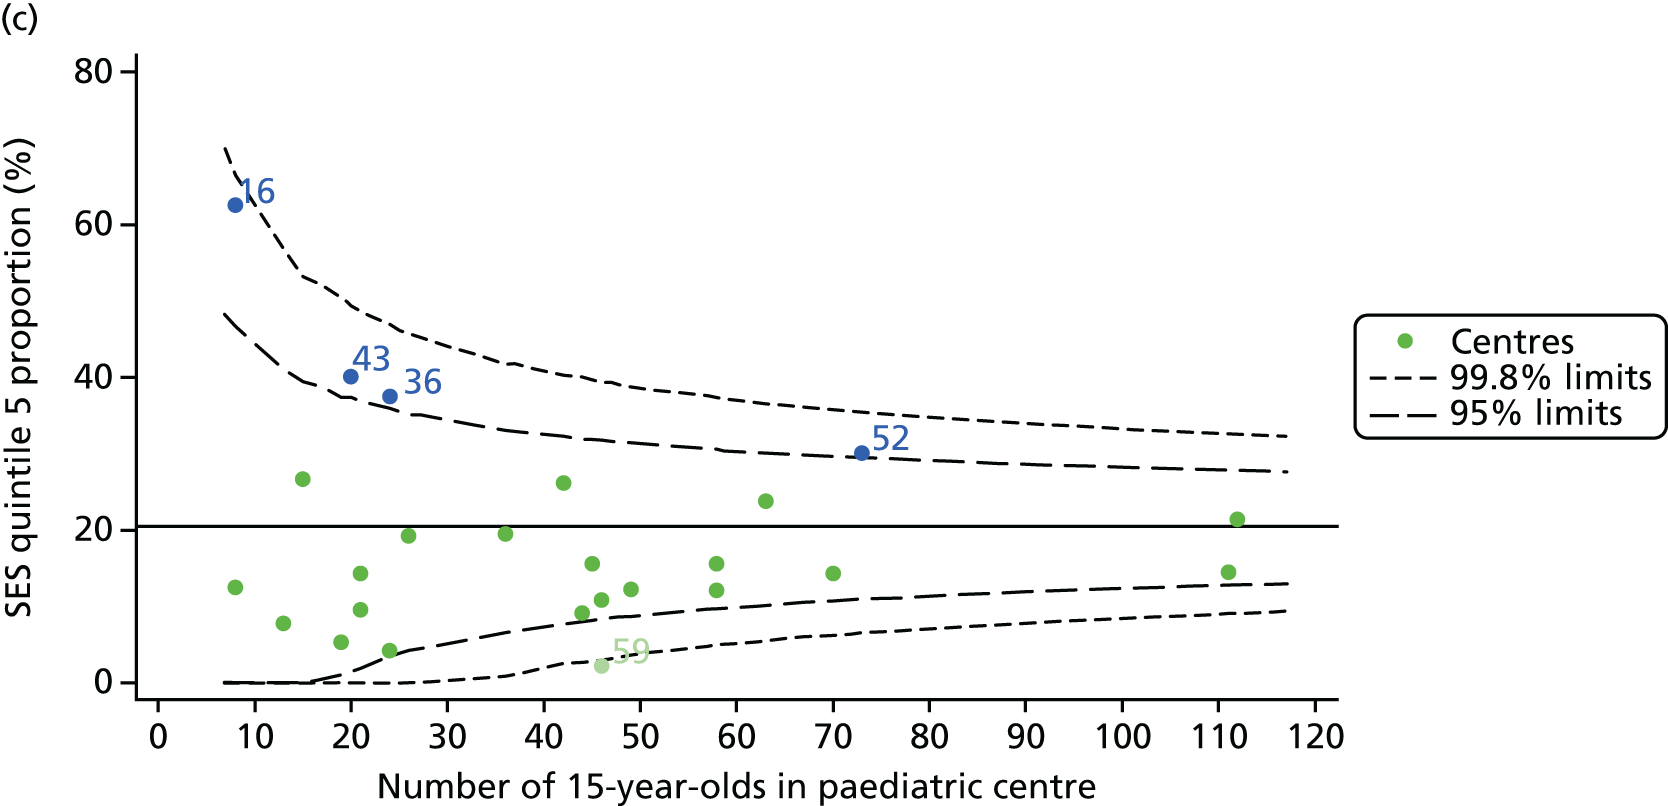
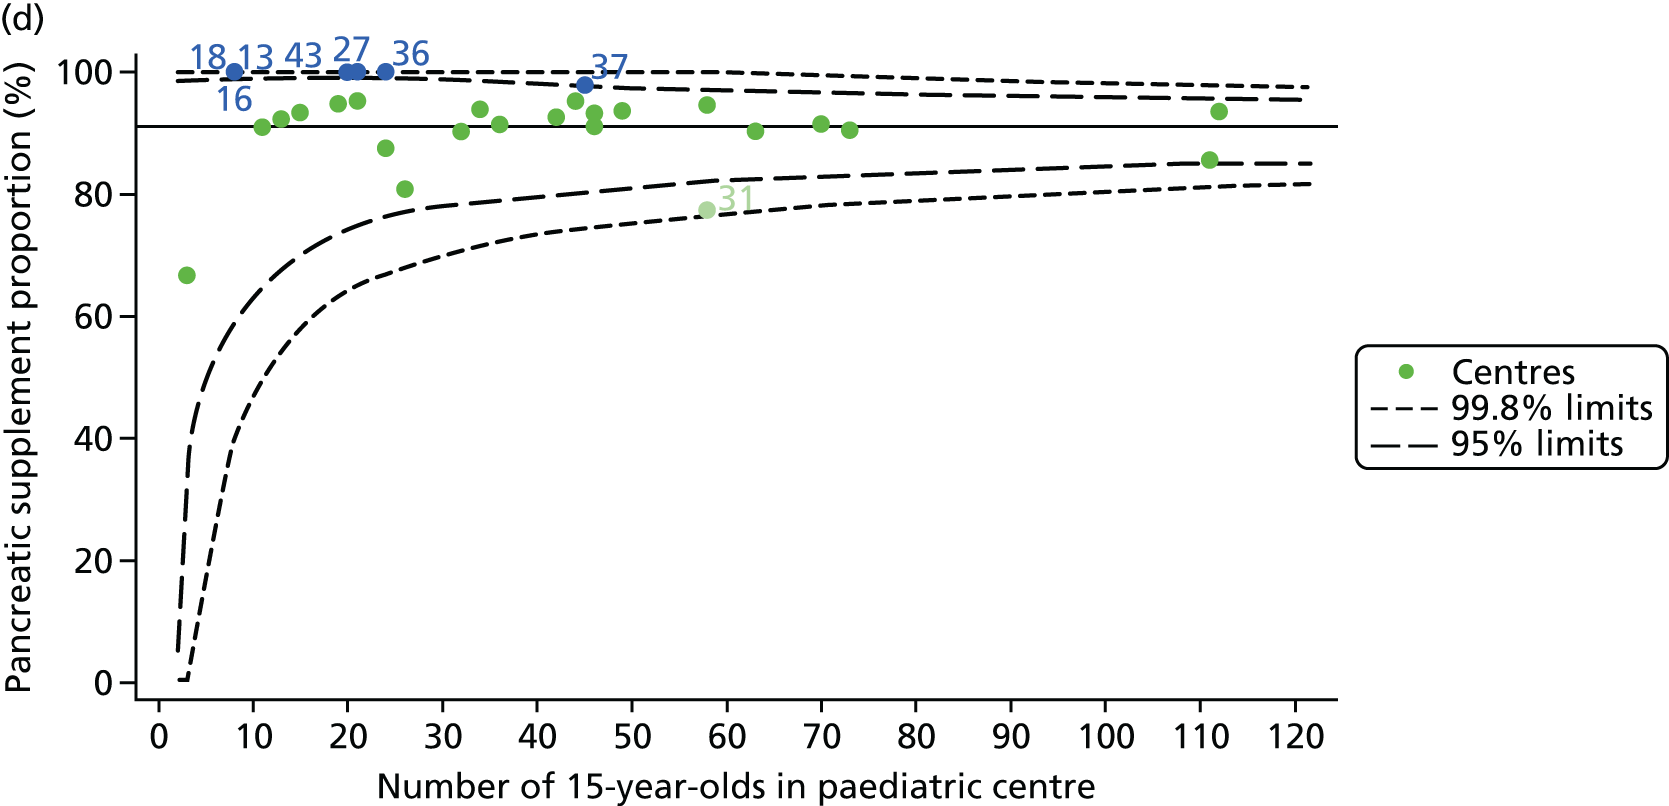
FIGURE 22.
Proportion of 15-year-old patients with data recorded for BMI percentile for each of the 31 paediatric centres.
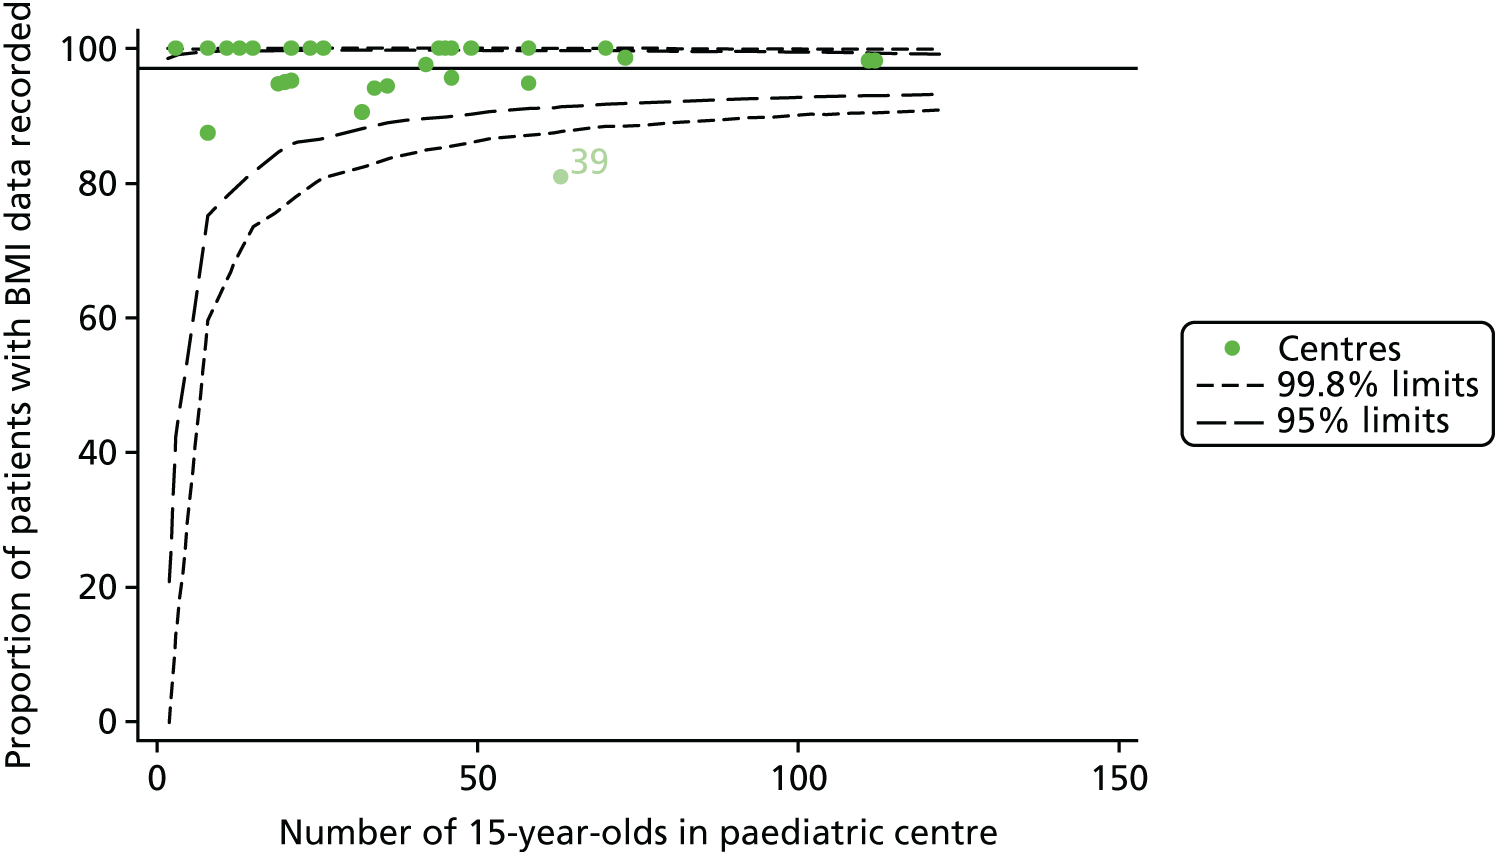
FIGURE 23.
Proportion of patients with non-missing data (at least two annual reviews between the ages of 13 and 15 years: 2007–12). (a) FEV1% predicted; (b) genotype; (c) SES; and (d) pancreatic enzyme use.
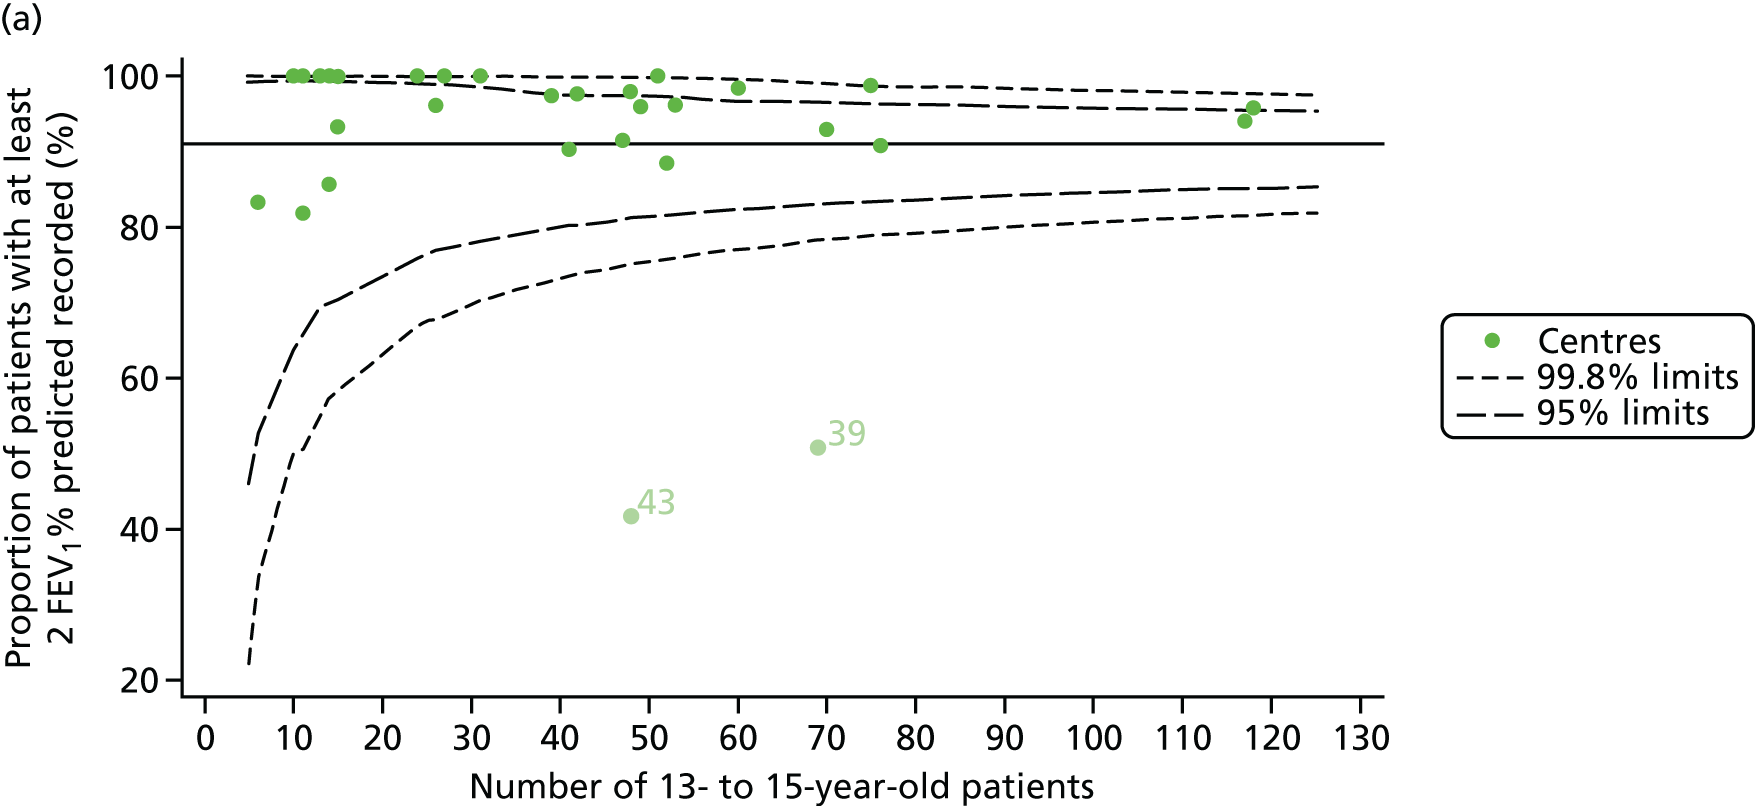
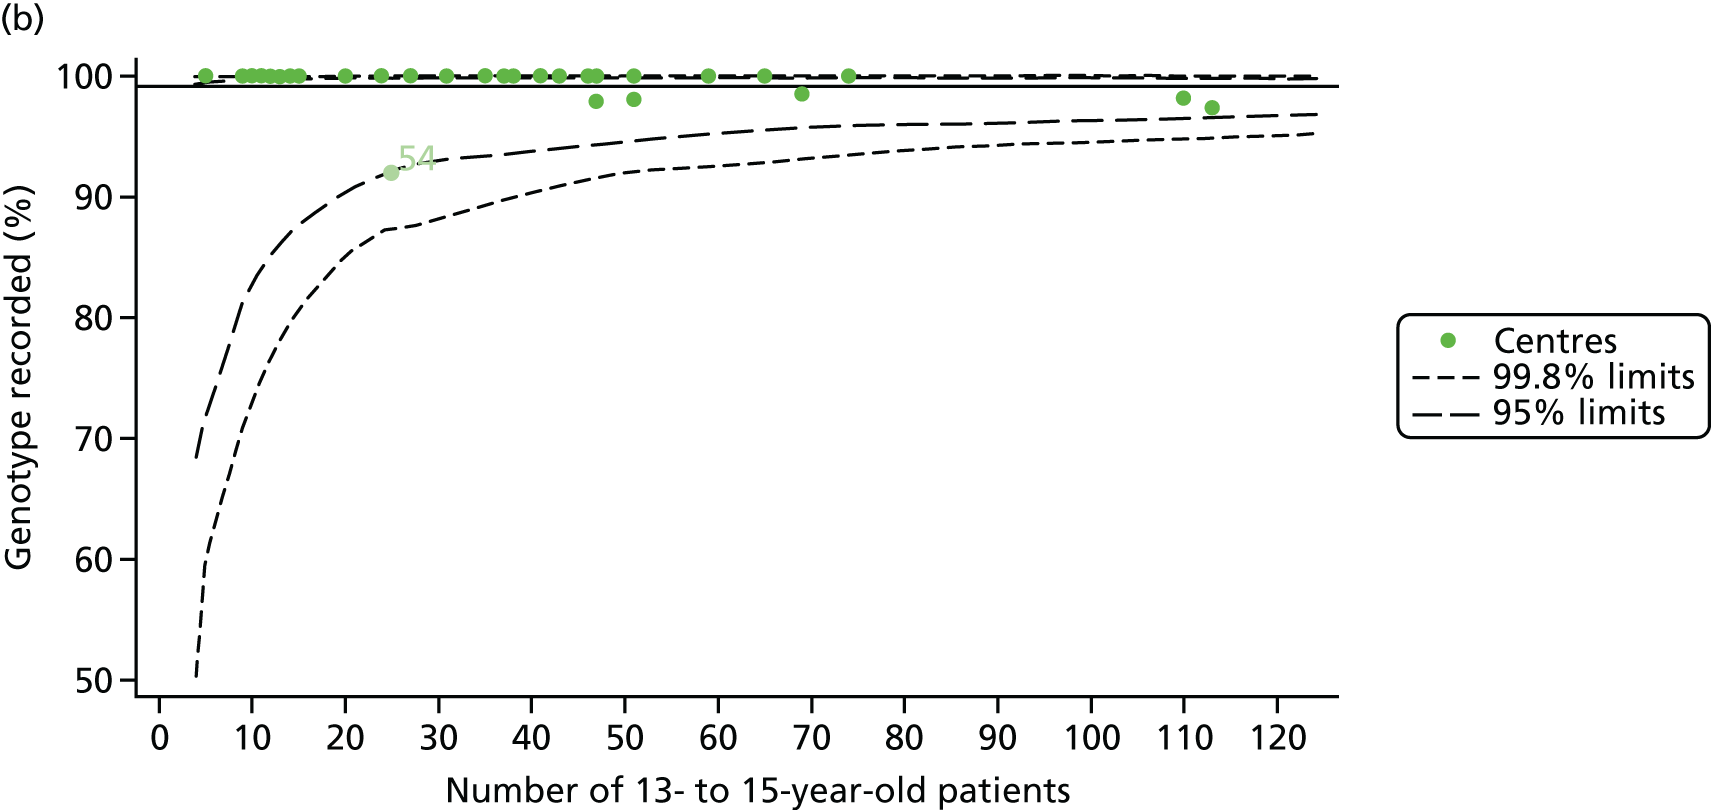
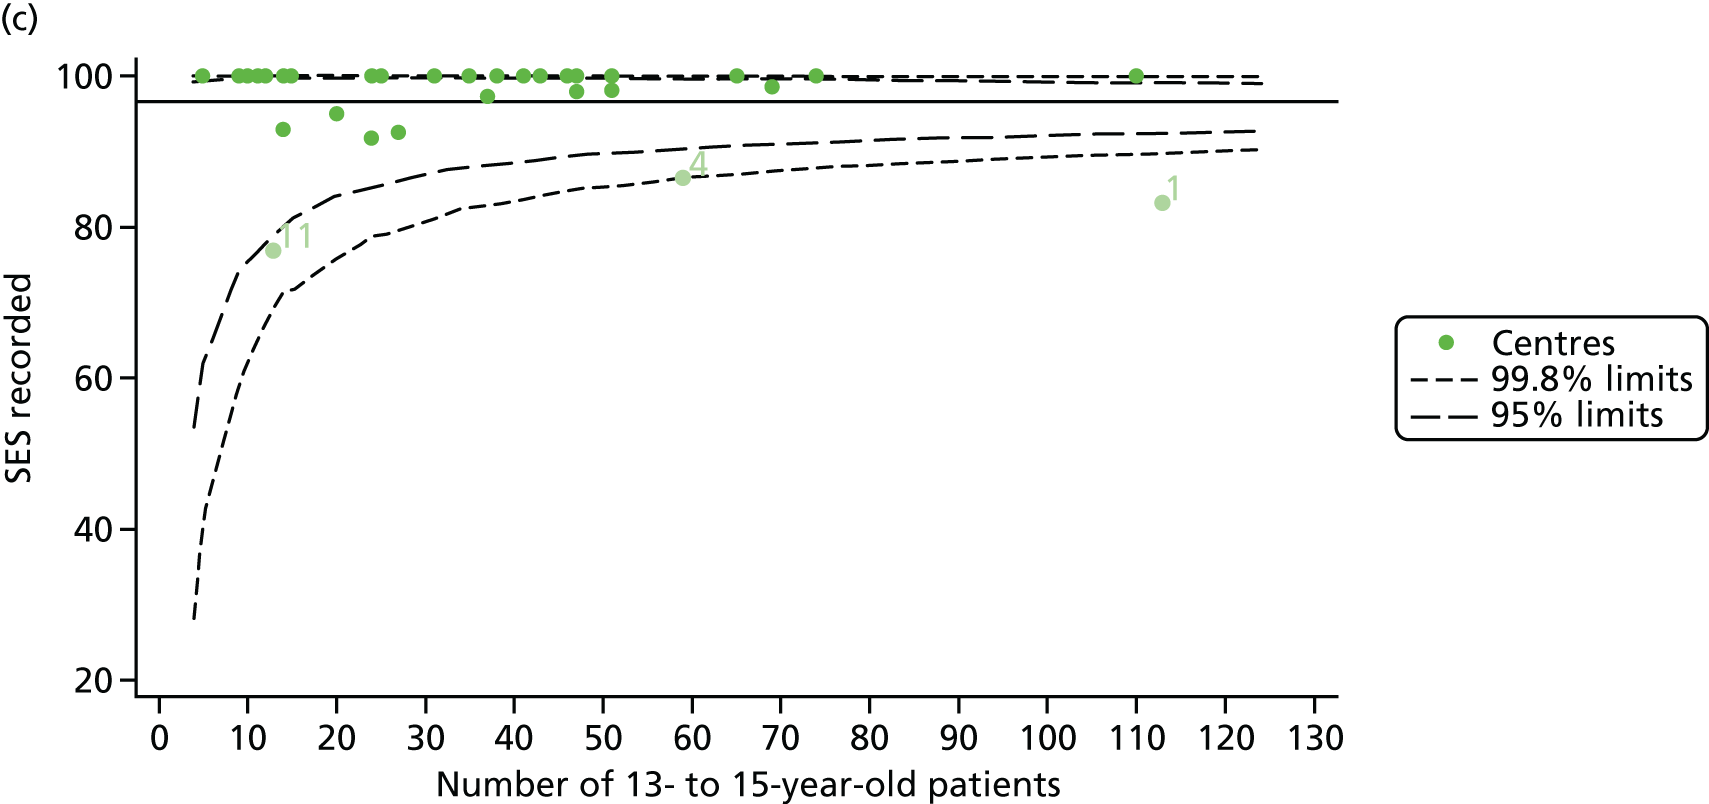
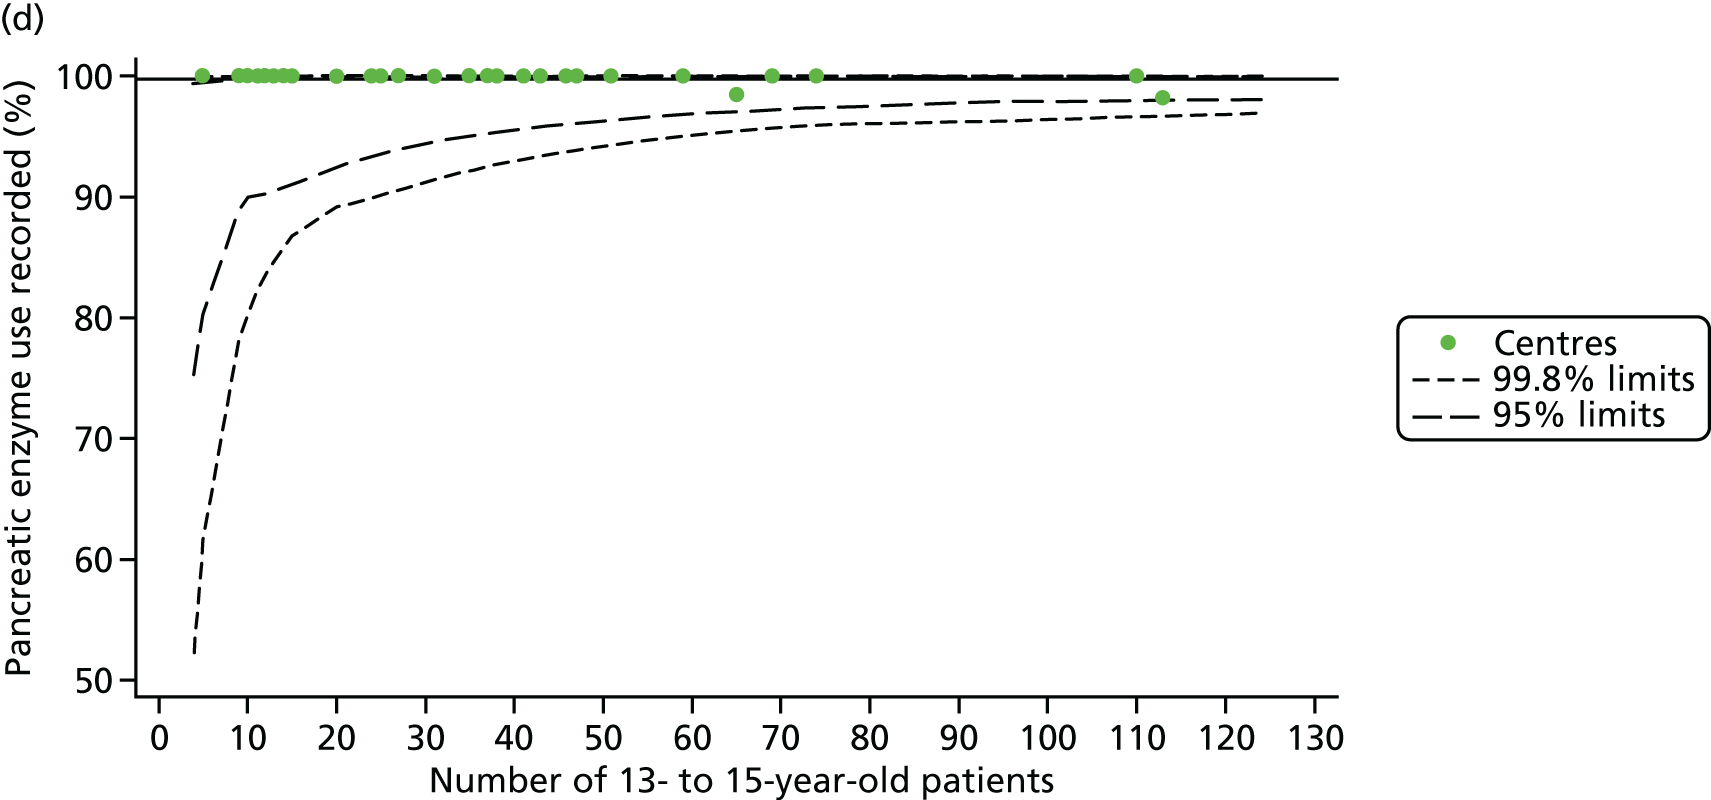
FIGURE 24.
Comparison of the unadjusted change in FEV1 between the ages of 13 and 15 years with case-mix adjusted predicted values (using data from 2007–12 and fixed-effect GLM to perform case-mix adjustment).

FIGURE 25.
Comparison of unadjusted FEV1% predicted (Knudson) with case-mix adjusted predicted values (at 12 years of age using data from 2007–15 and fixed-effect GLM to perform case-mix adjustment).
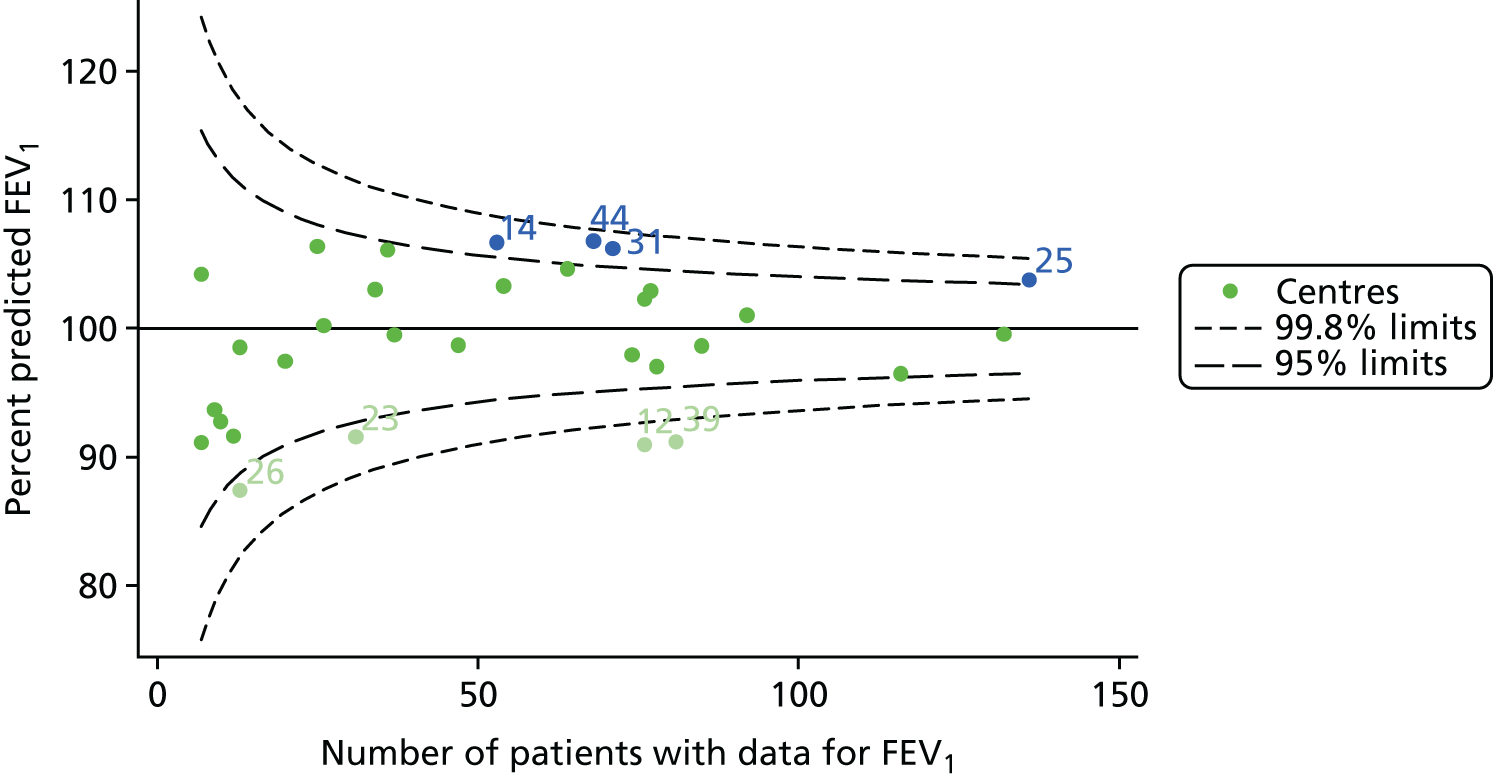
FIGURE 26.
Comparison of unadjusted FEV1% predicted (Knudson) with case-mix adjusted predicted values (at 15 years of age using data from 2007–15 and fixed-effect GLM to perform case-mix adjustment).
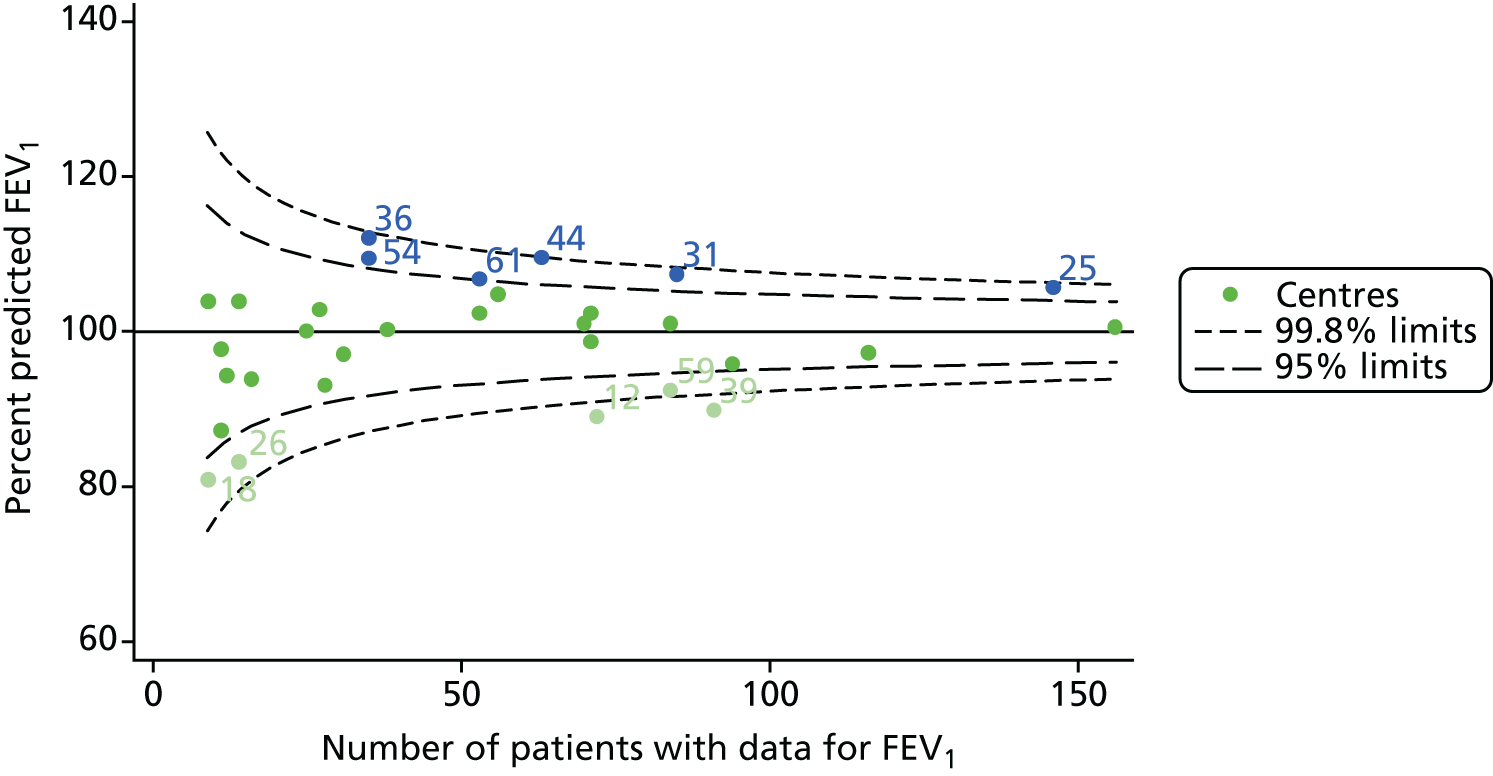
FIGURE 27.
Comparison of unadjusted BMI with case-mix adjusted predicted values (at 15 years of age using data from 2007–15 and GLM to perform case-mix adjustment).
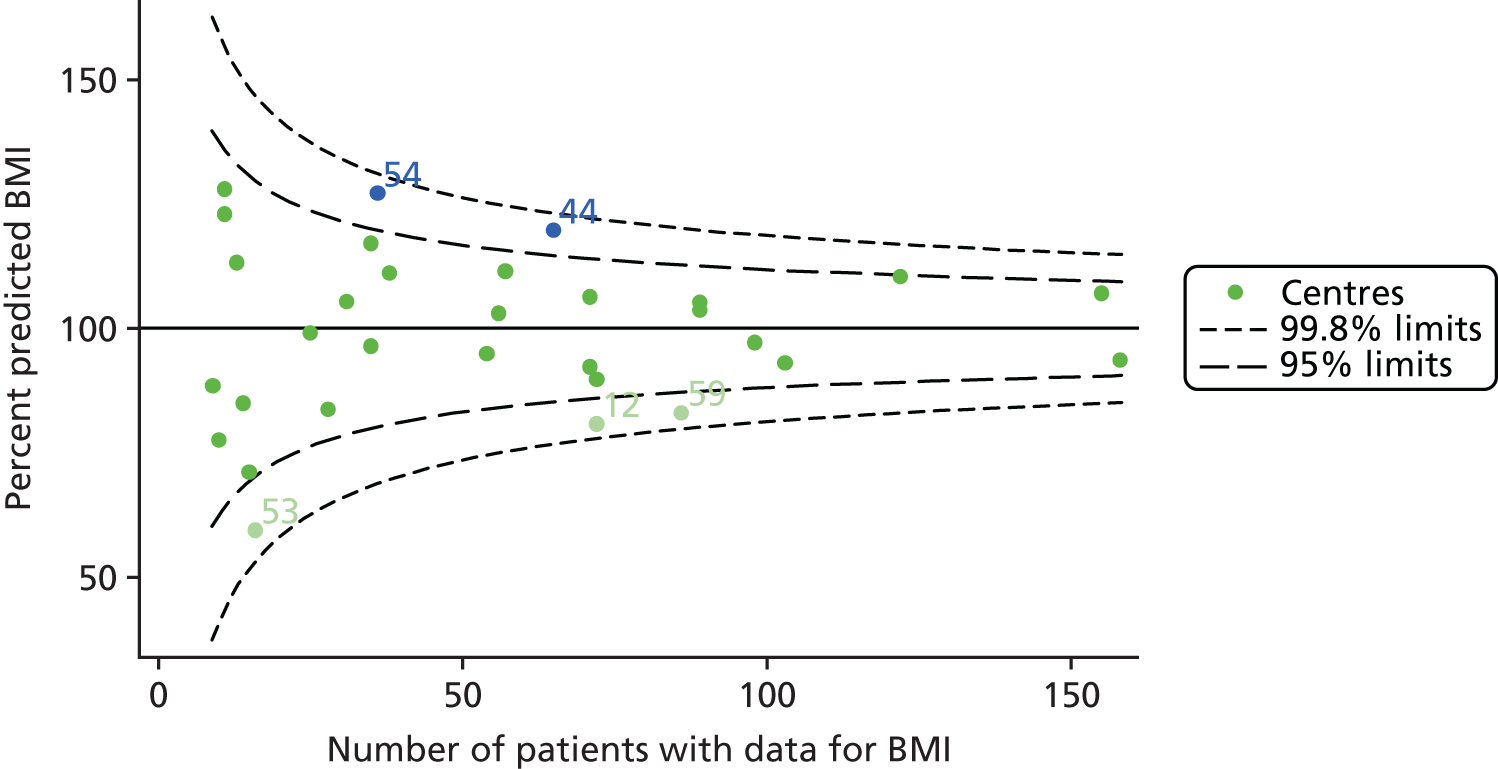
FIGURE 28.
Funnel plots of FEV1 adjusted for age using GLMs, by year. (a) 2007; (b) 2008; (c) 2009; (d) 2010; (e) 2011; (f) 2012; (g) 2013; (h) 2014; and (i) 2015.


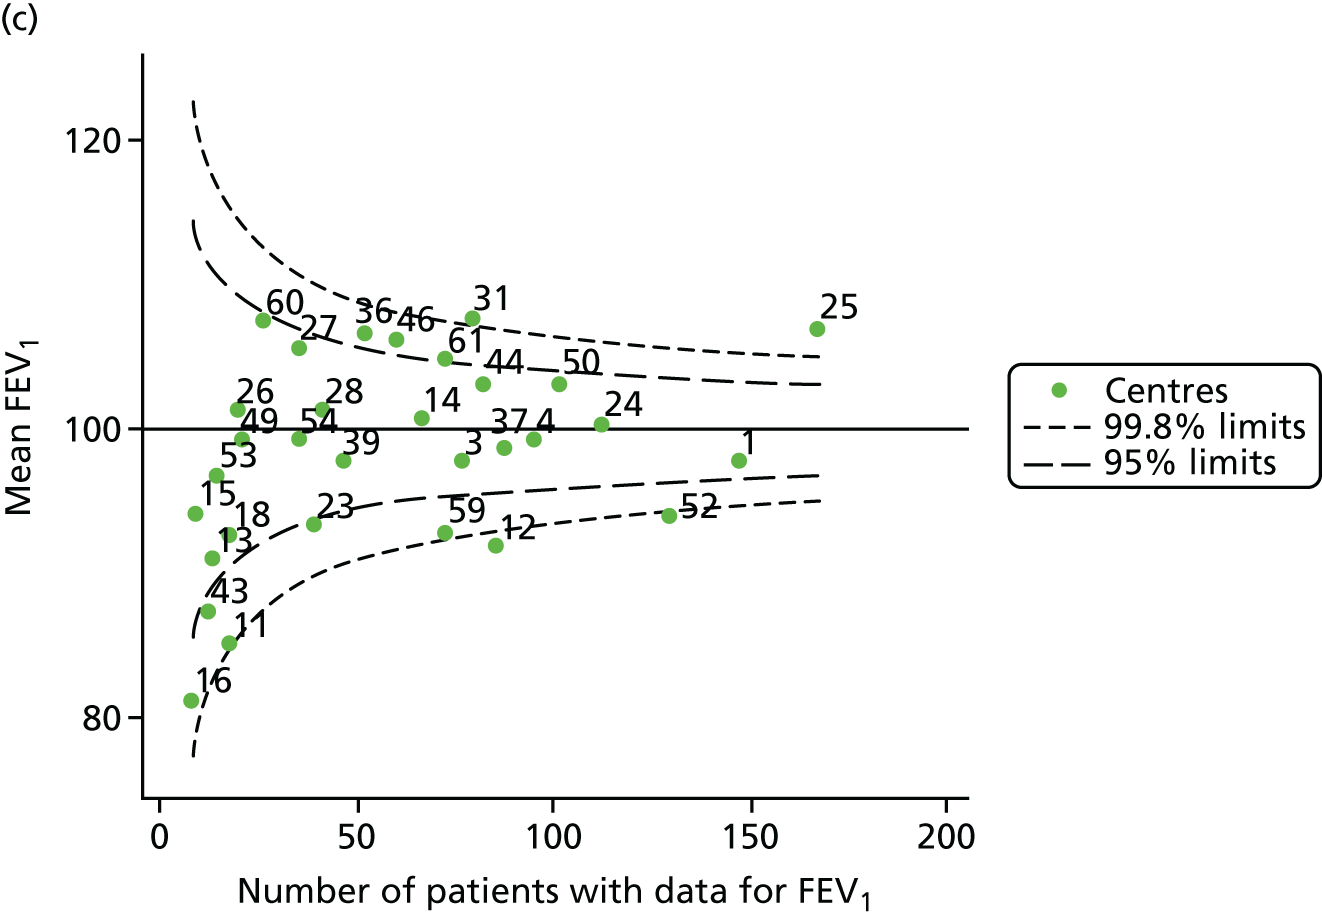
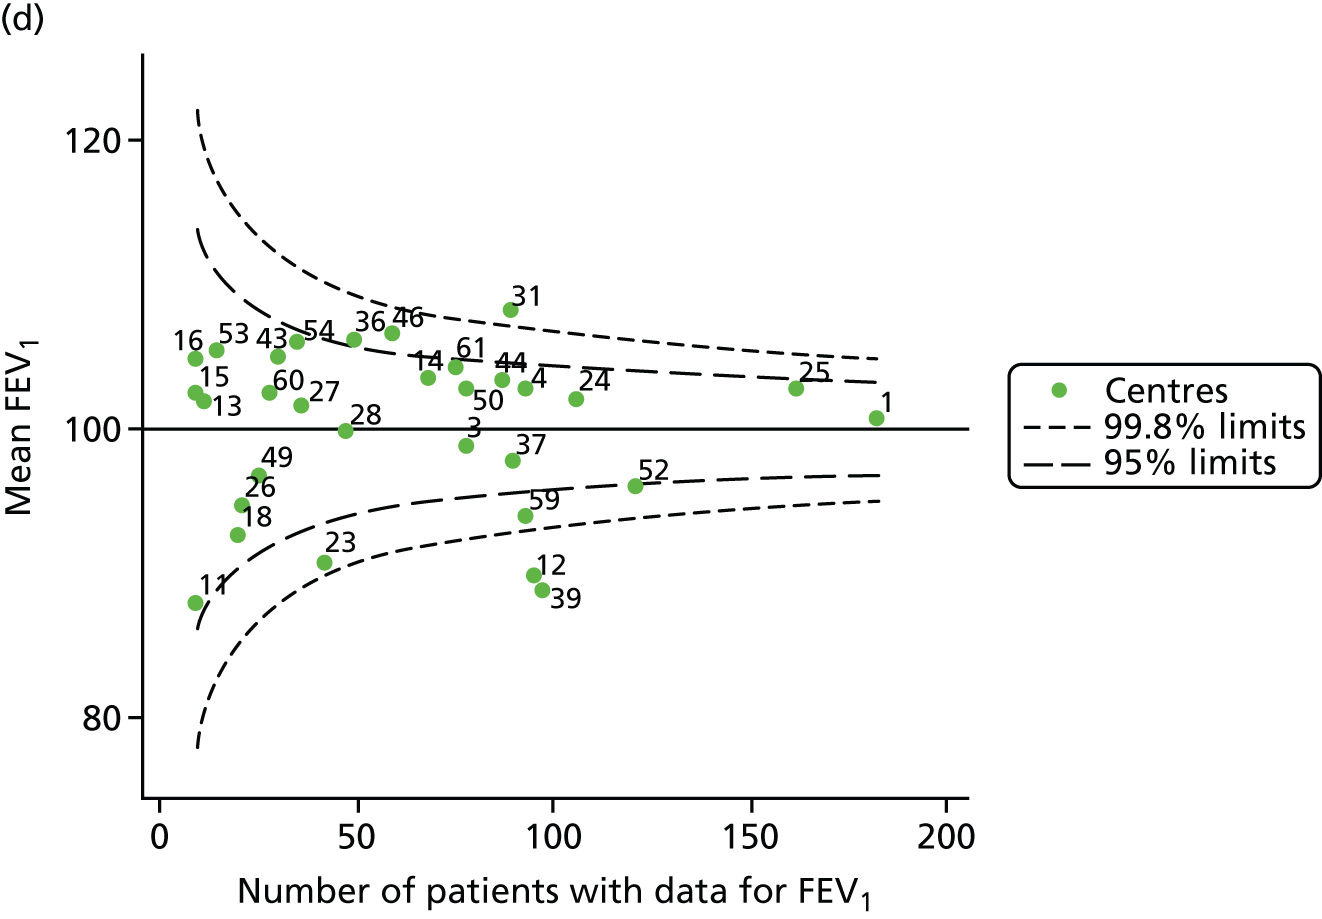
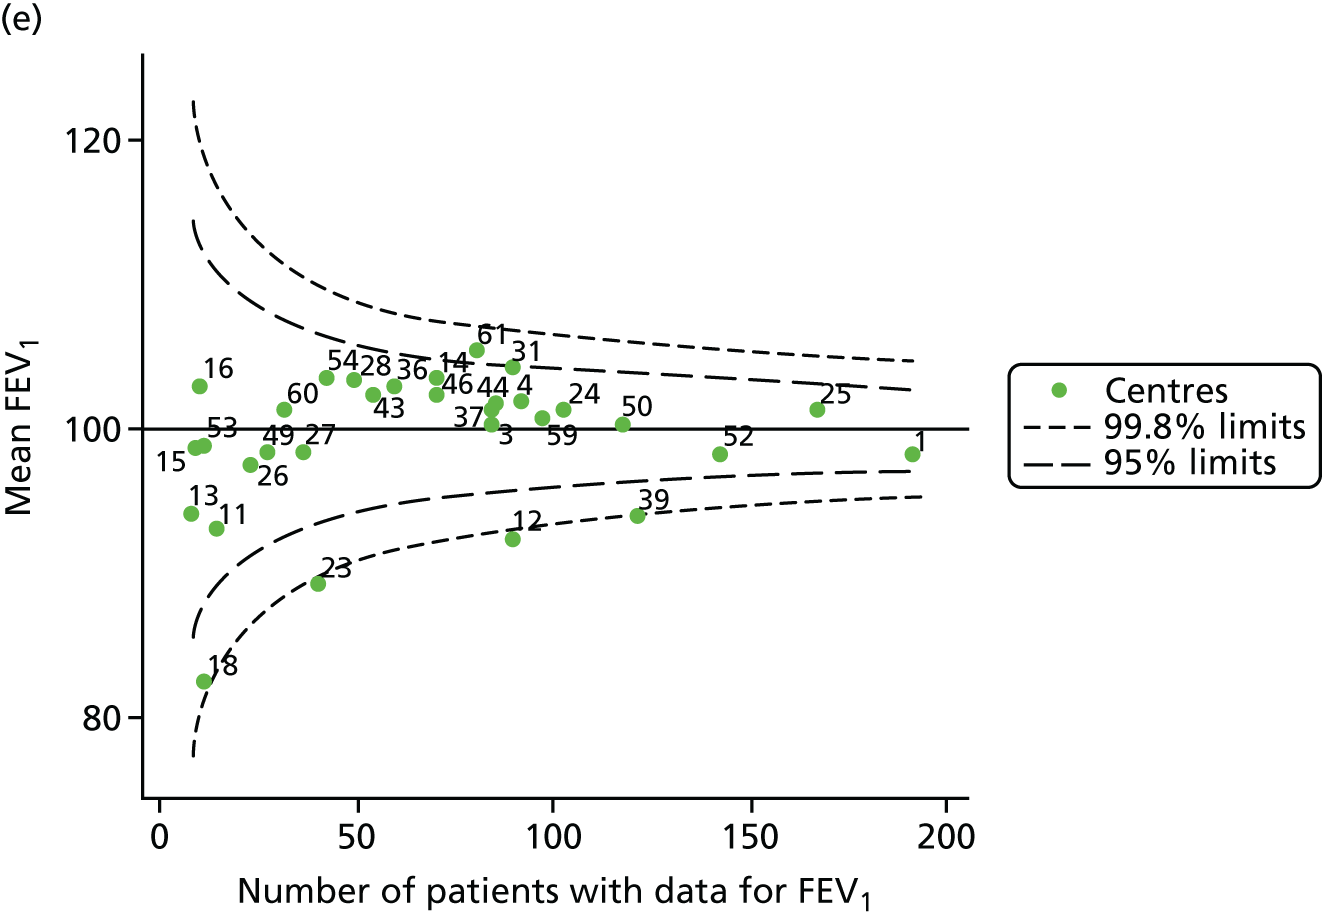
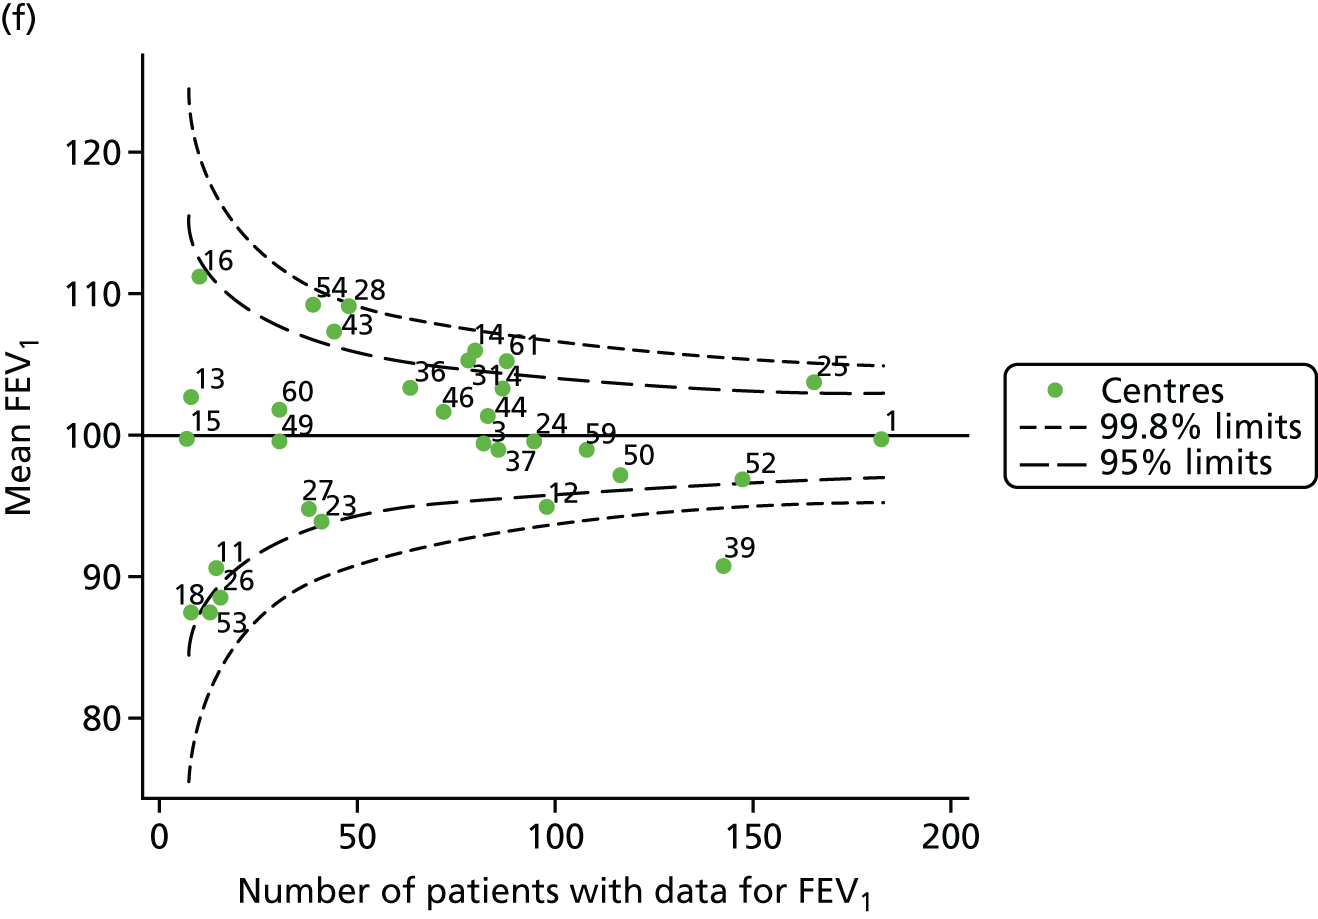
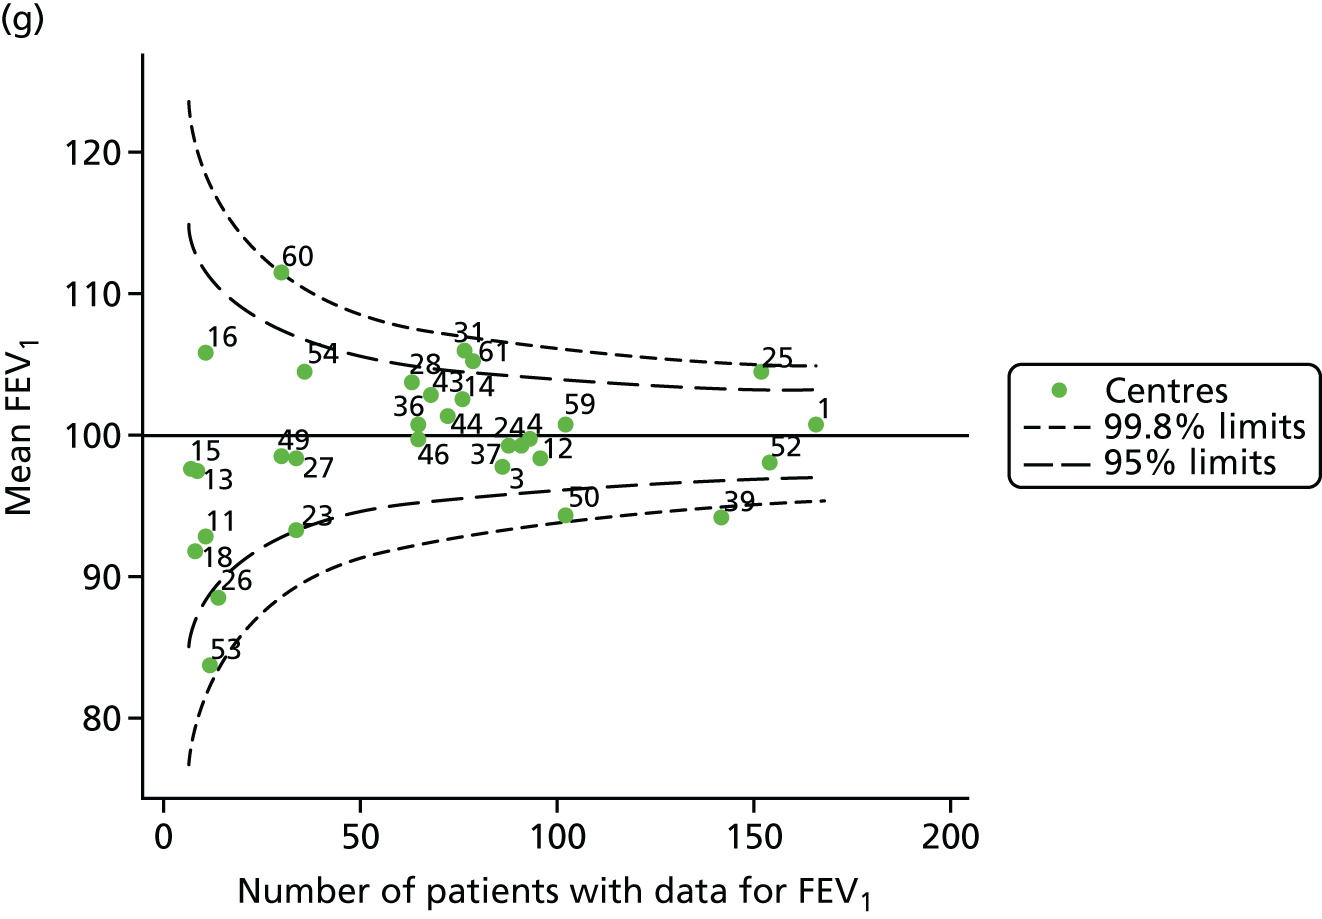
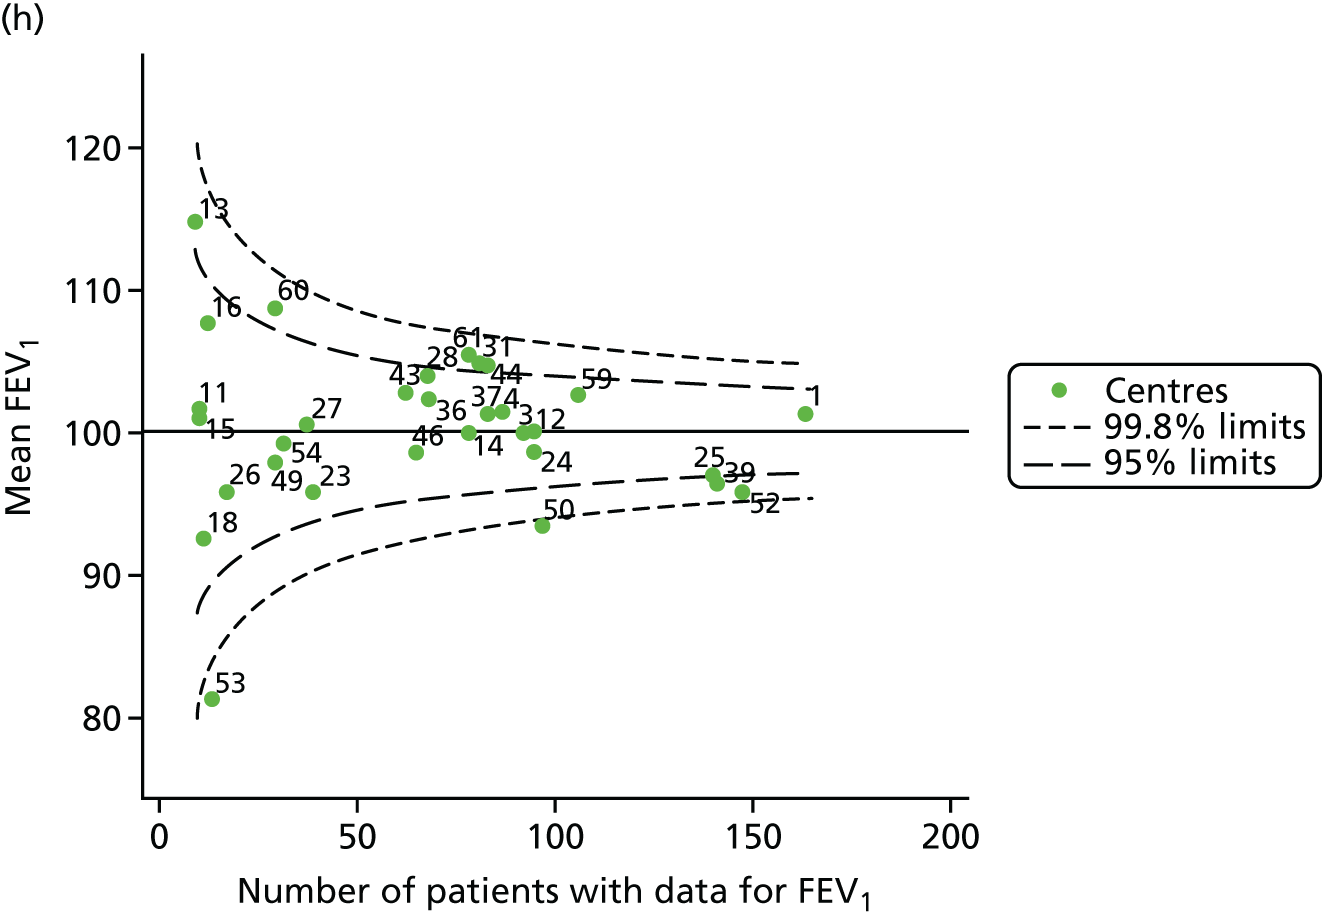
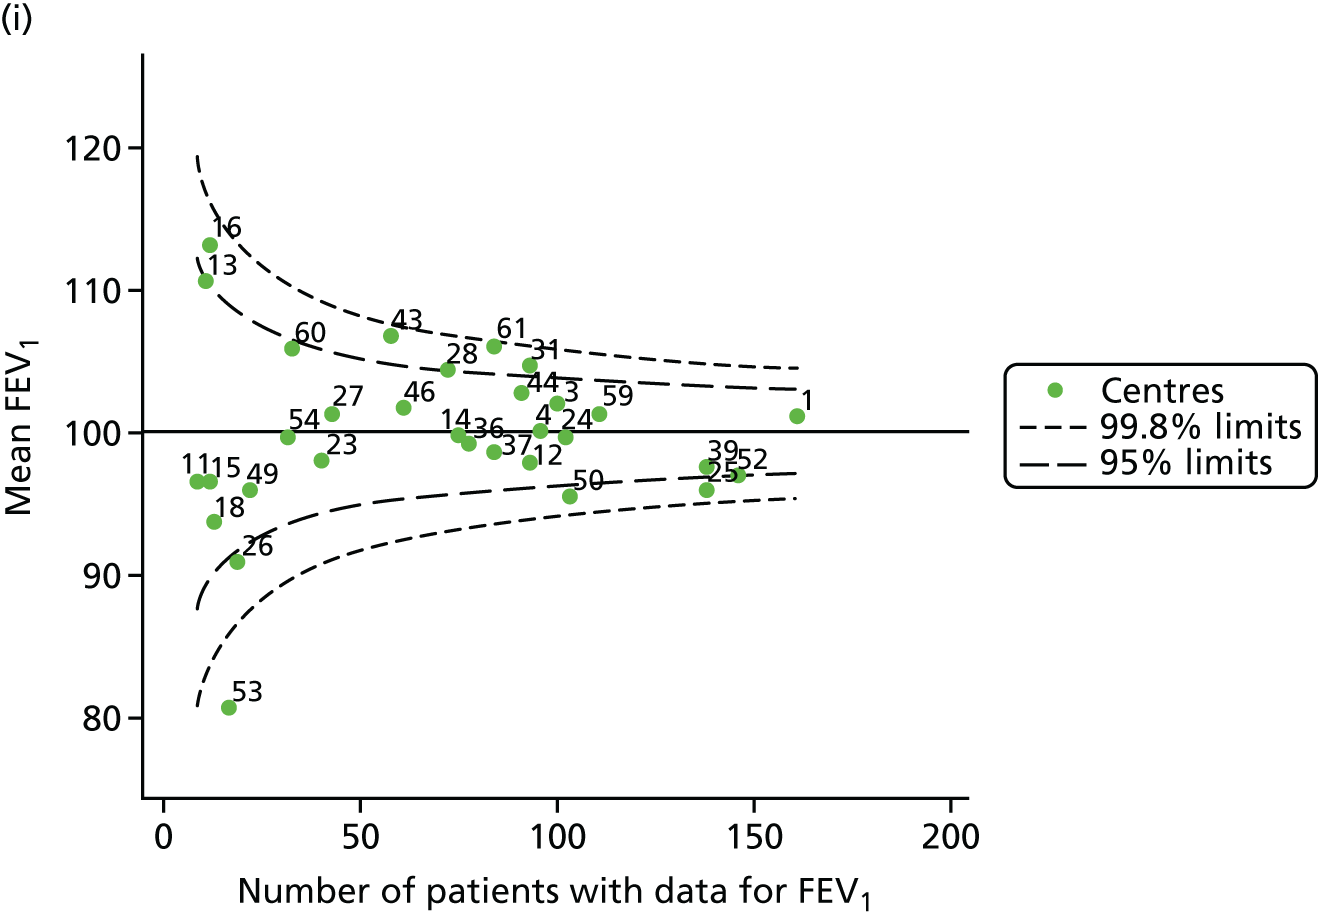
FIGURE 29.
Funnel plots of FEV1 adjusted for age using a linear term for age, by year. (a) 2007; (b) 2008; (c) 2009; (d) 2010; (e) 2011; (f) 2012; (g) 2013; (h) 2014; and (i) 2015.
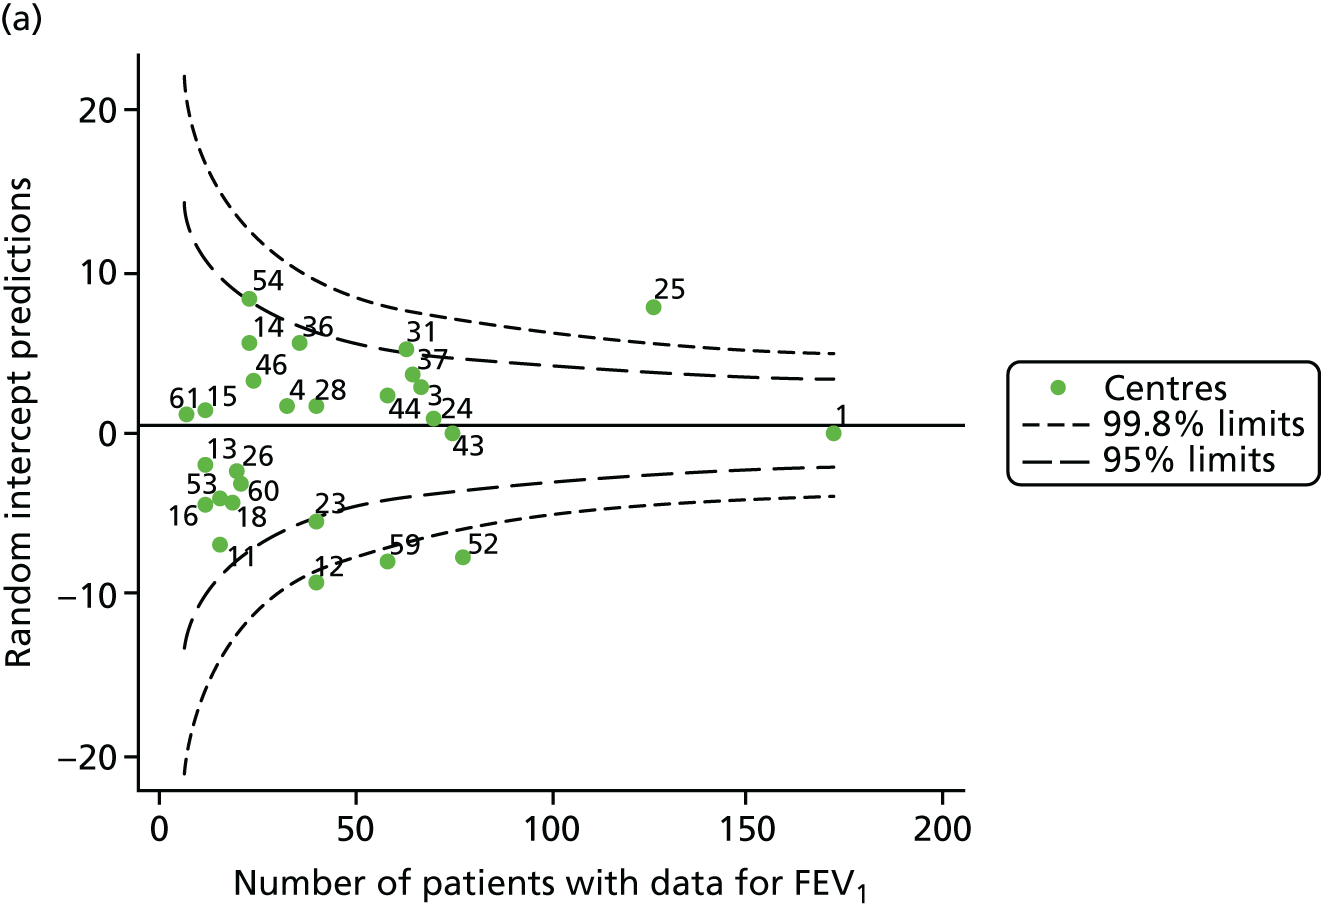


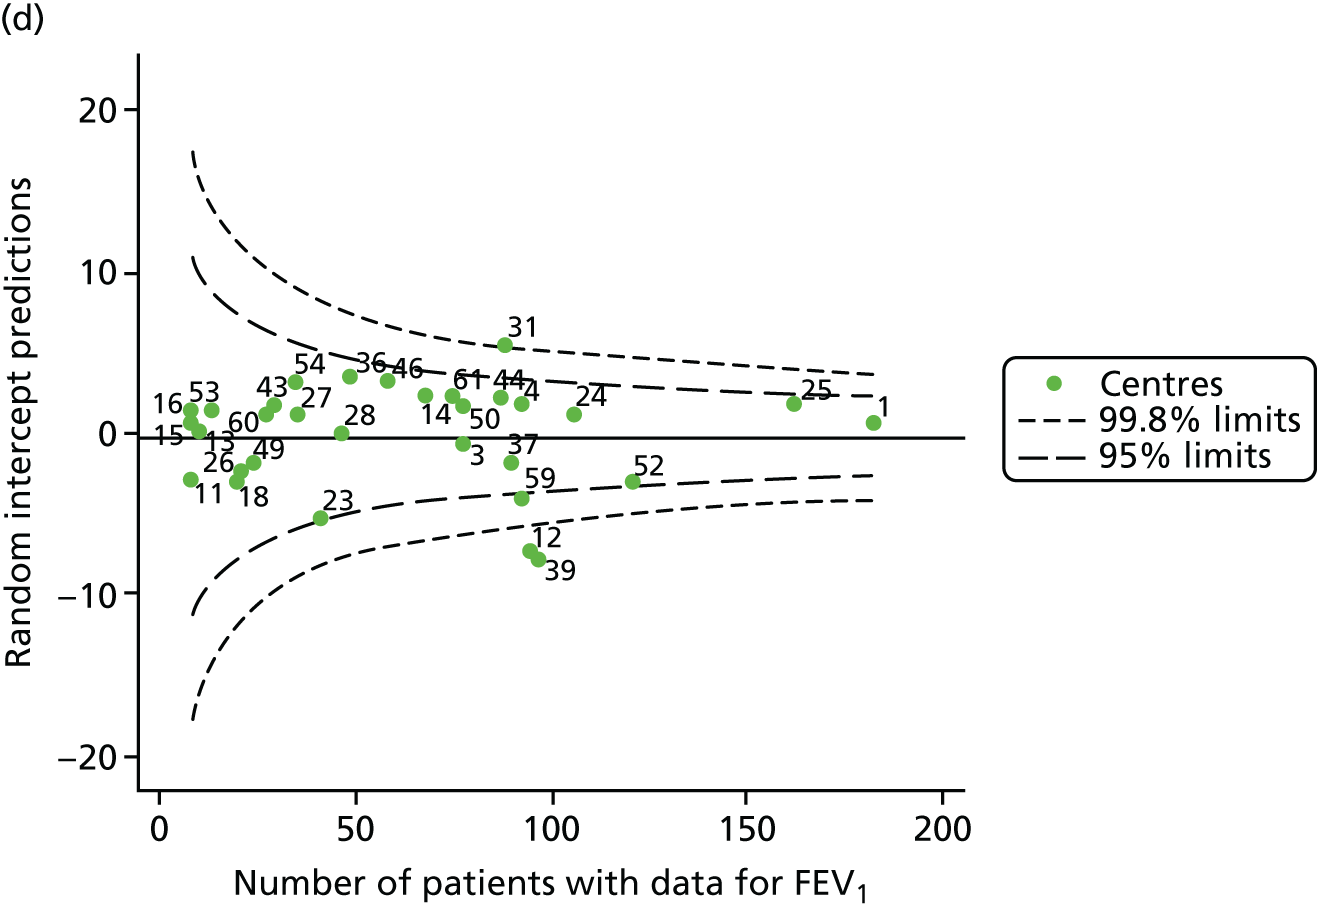
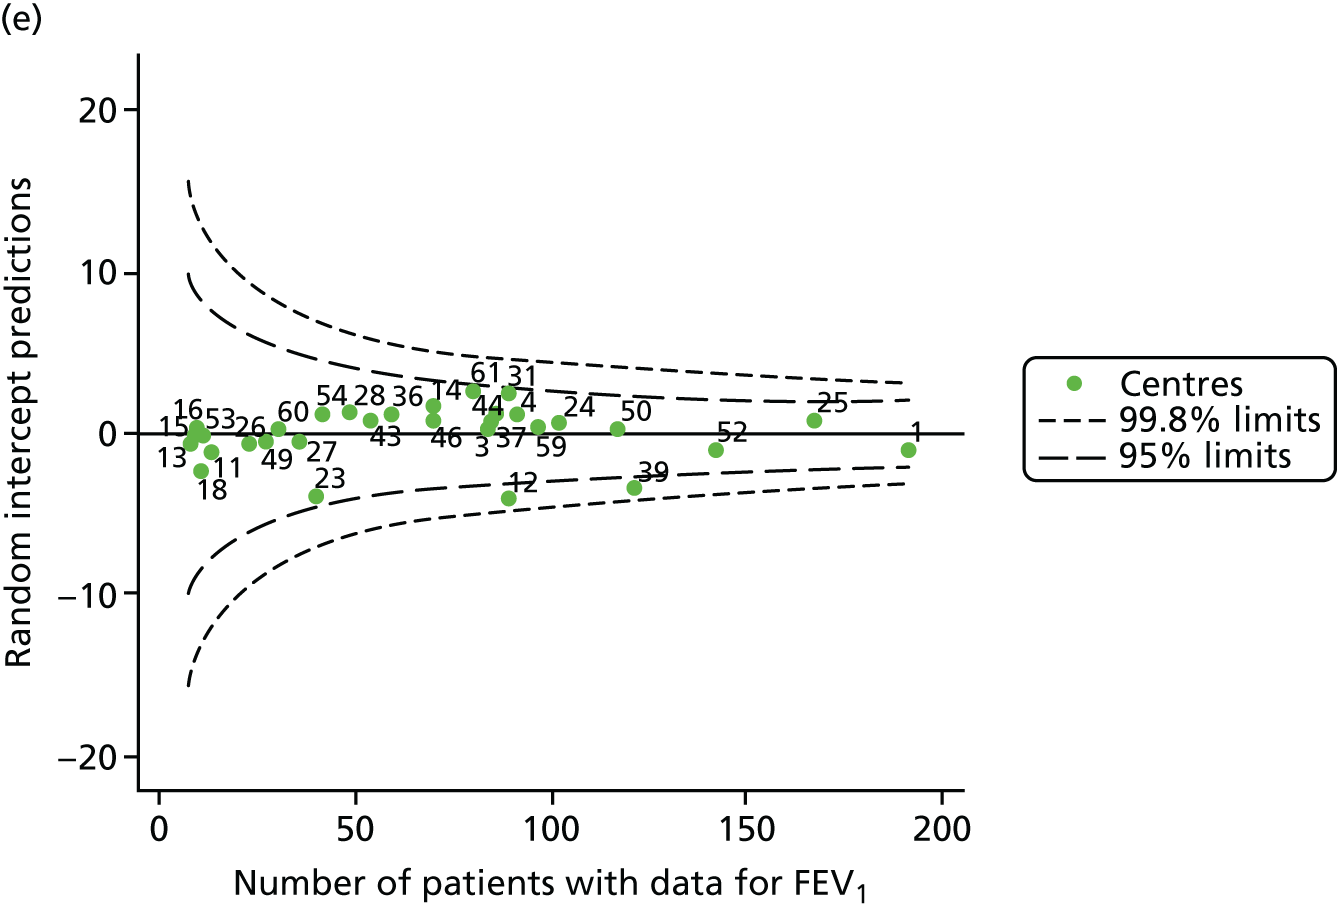
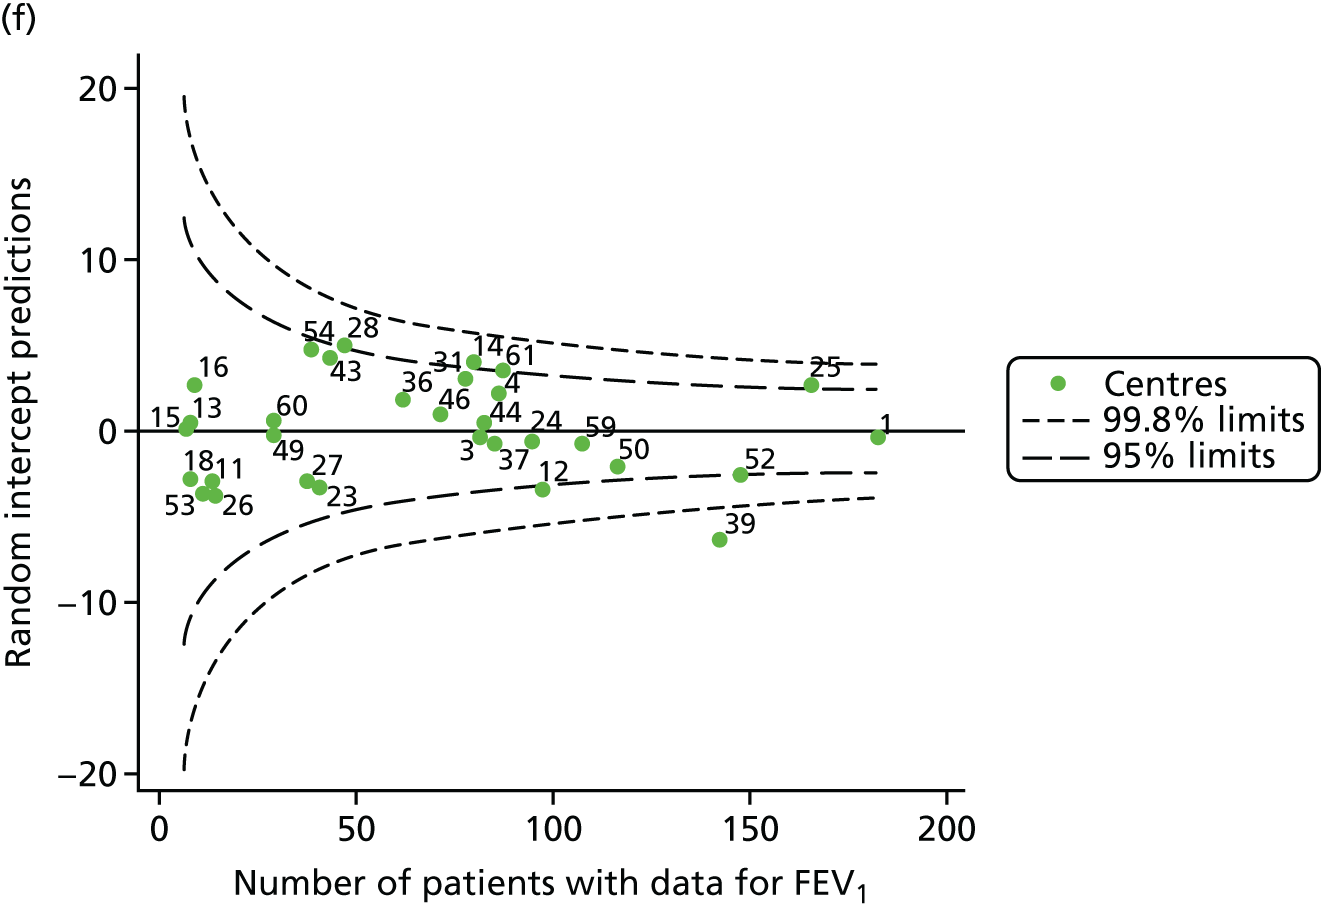
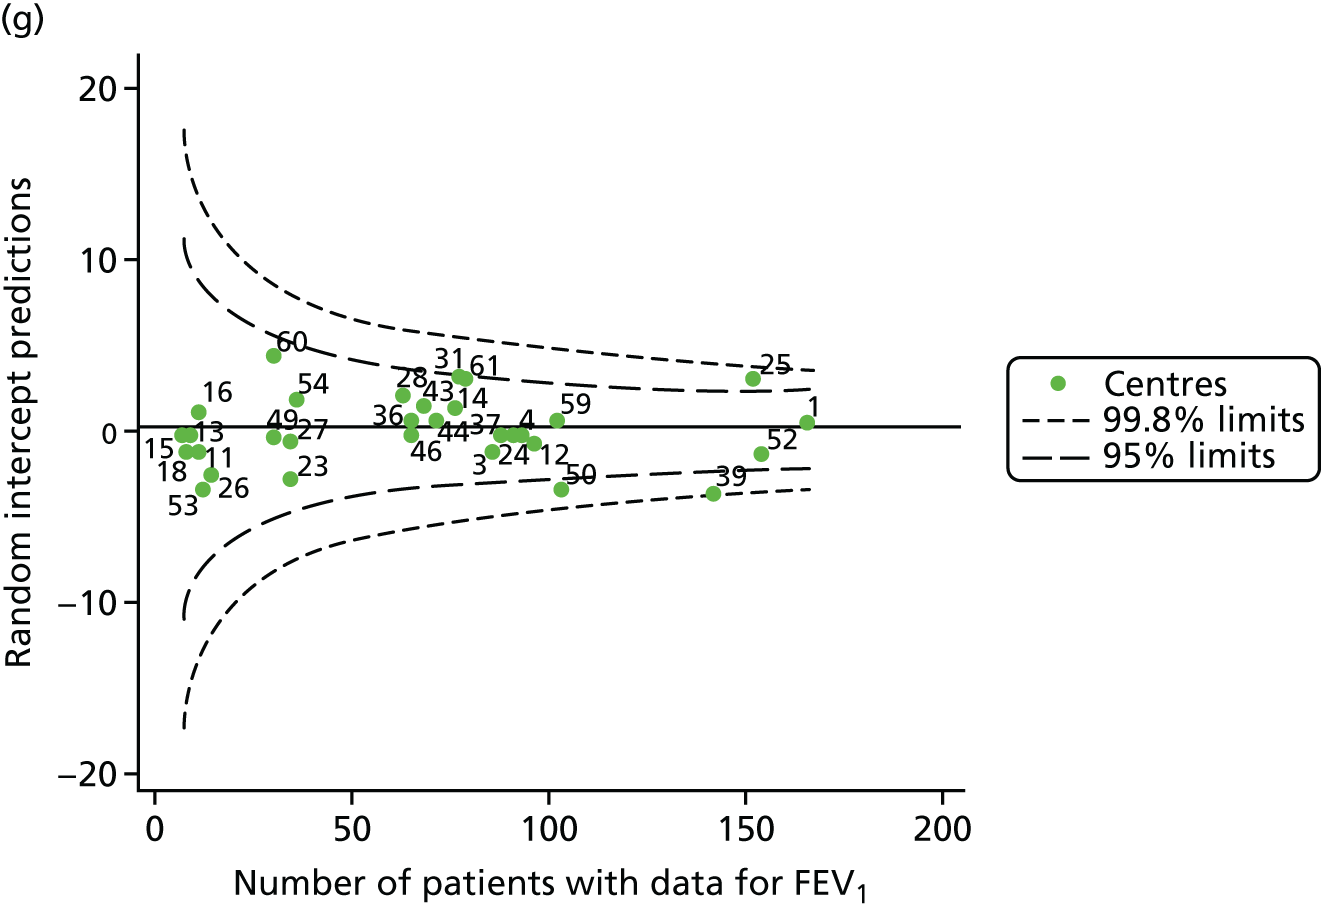
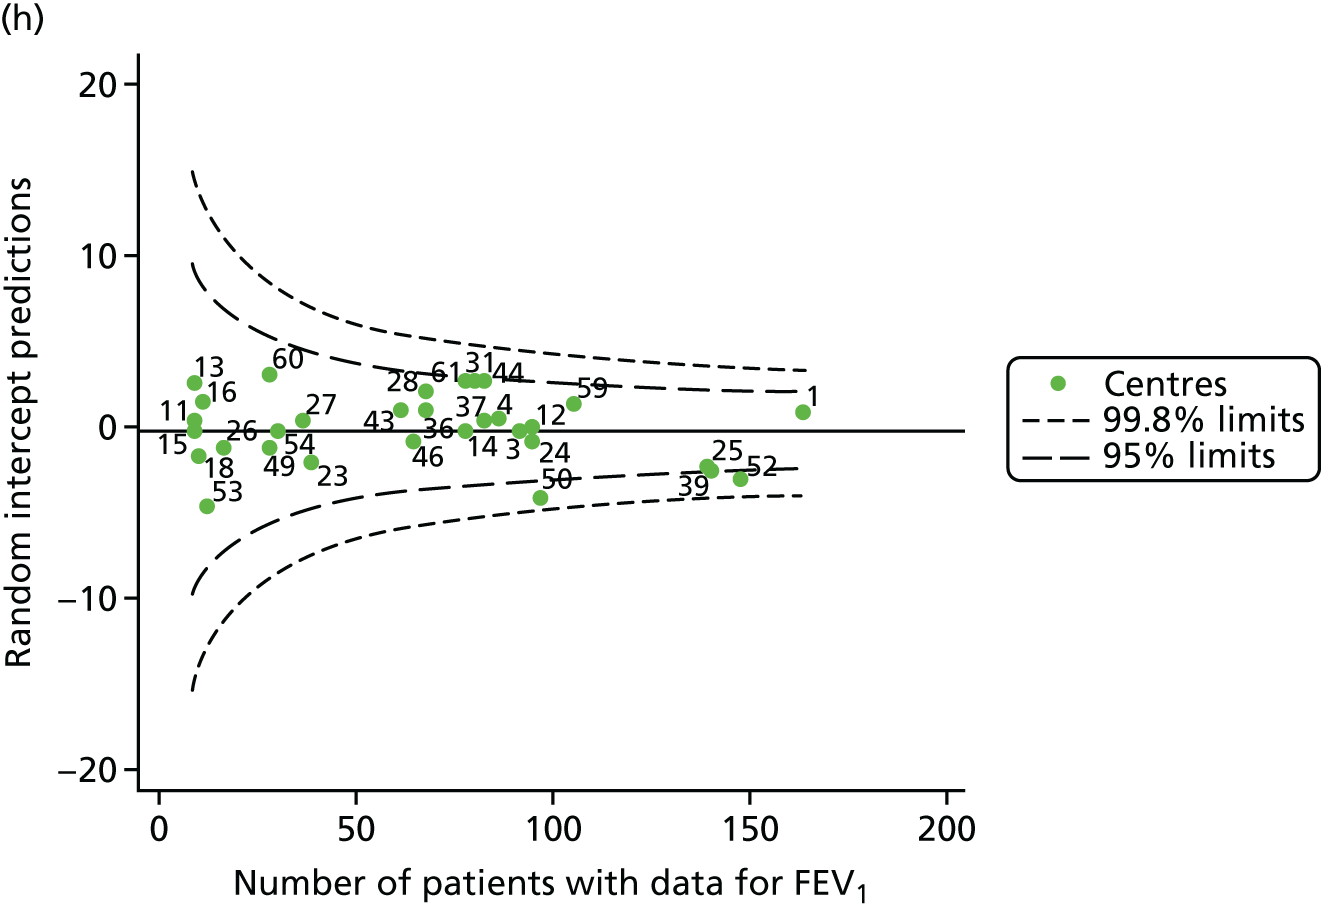
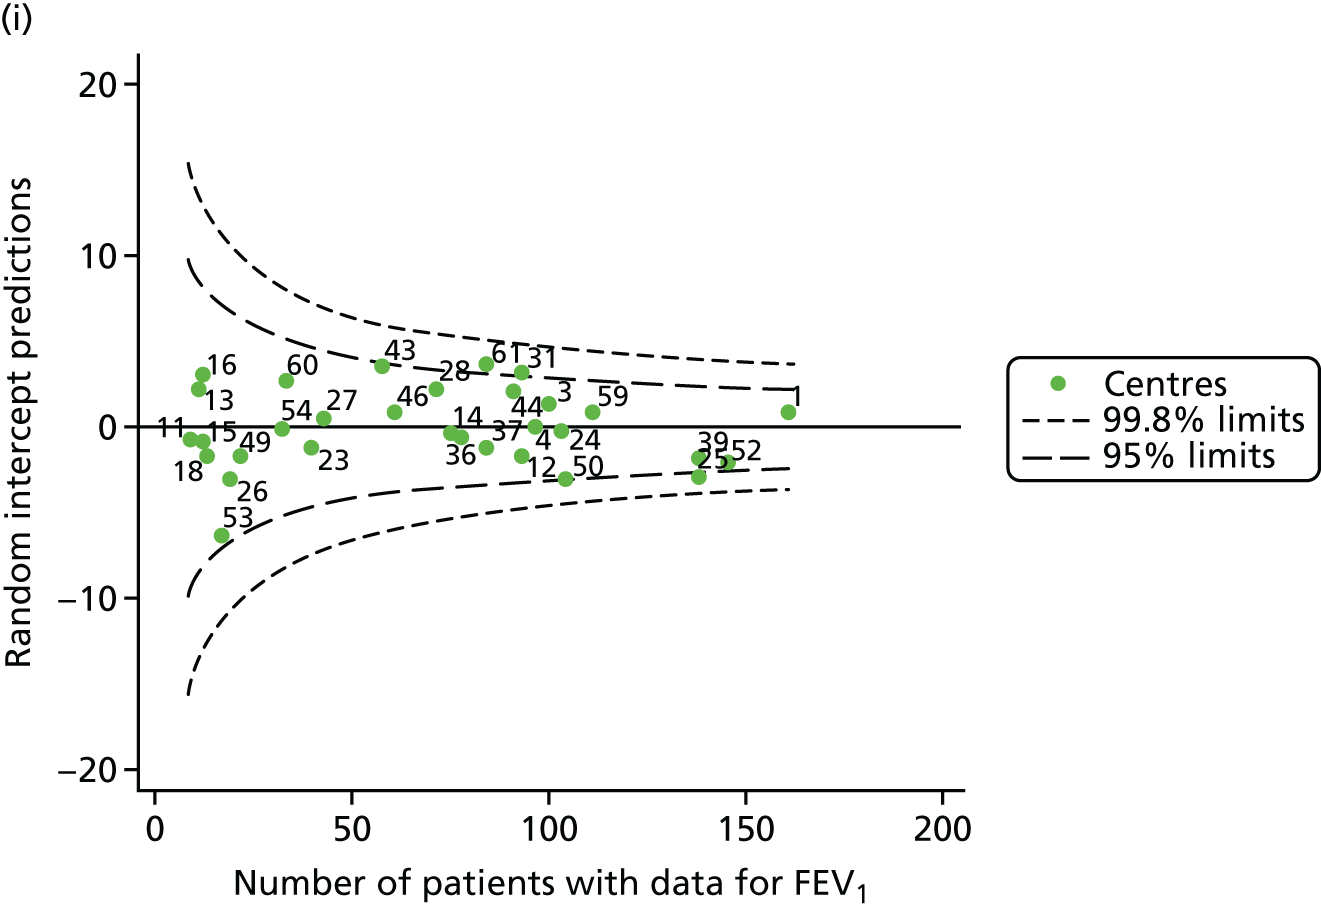
FIGURE 30.
Funnel plots of FEV1 adjusted for age and other case-mix variables using fixed-effect GLM models, by year. (a) 2007; (b) 2008; (c) 2009; (d) 2010; (e) 2011; (f) 2012; (g) 2013; (h) 2014; and (i) 2015.
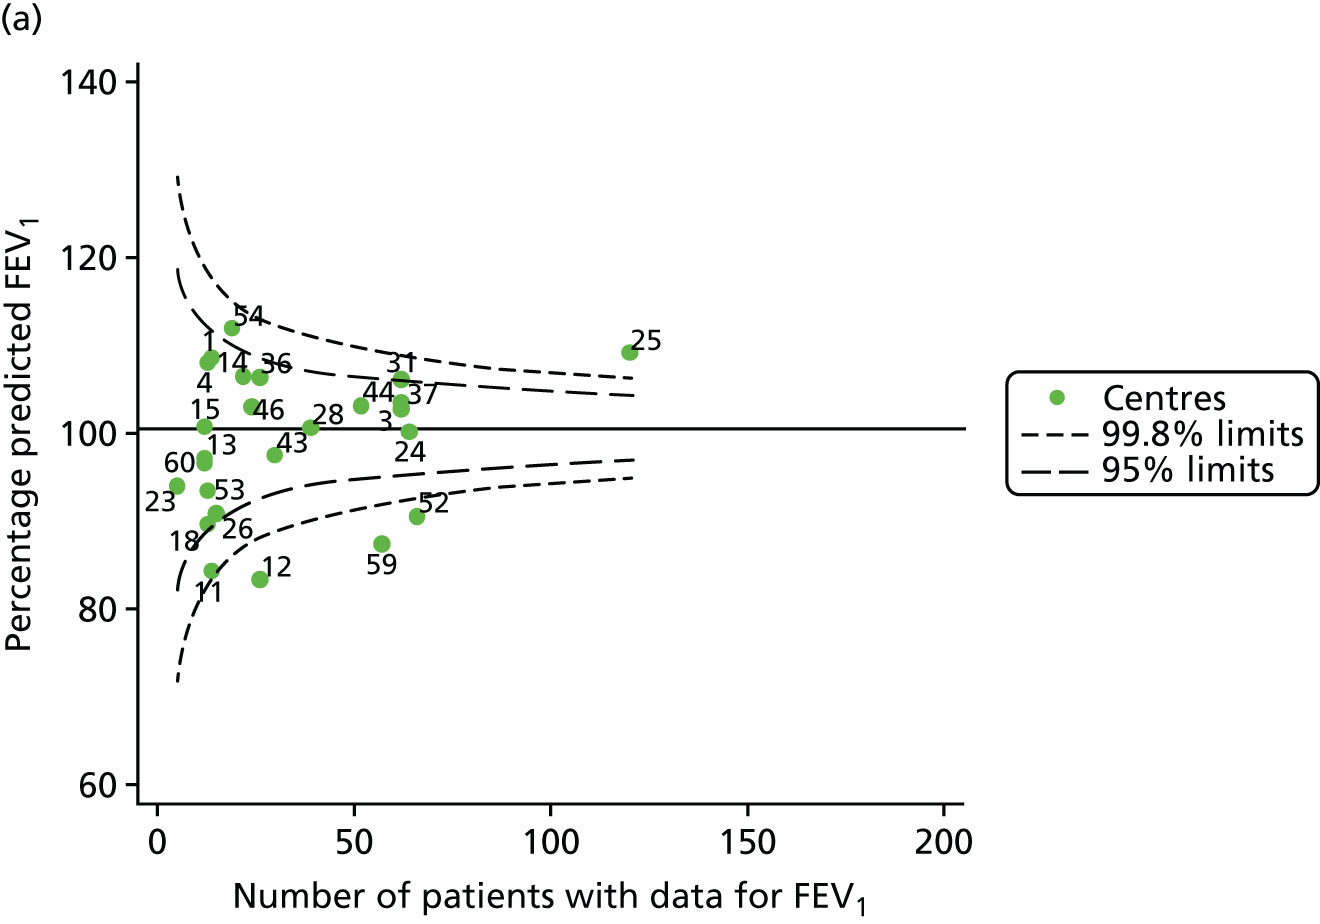
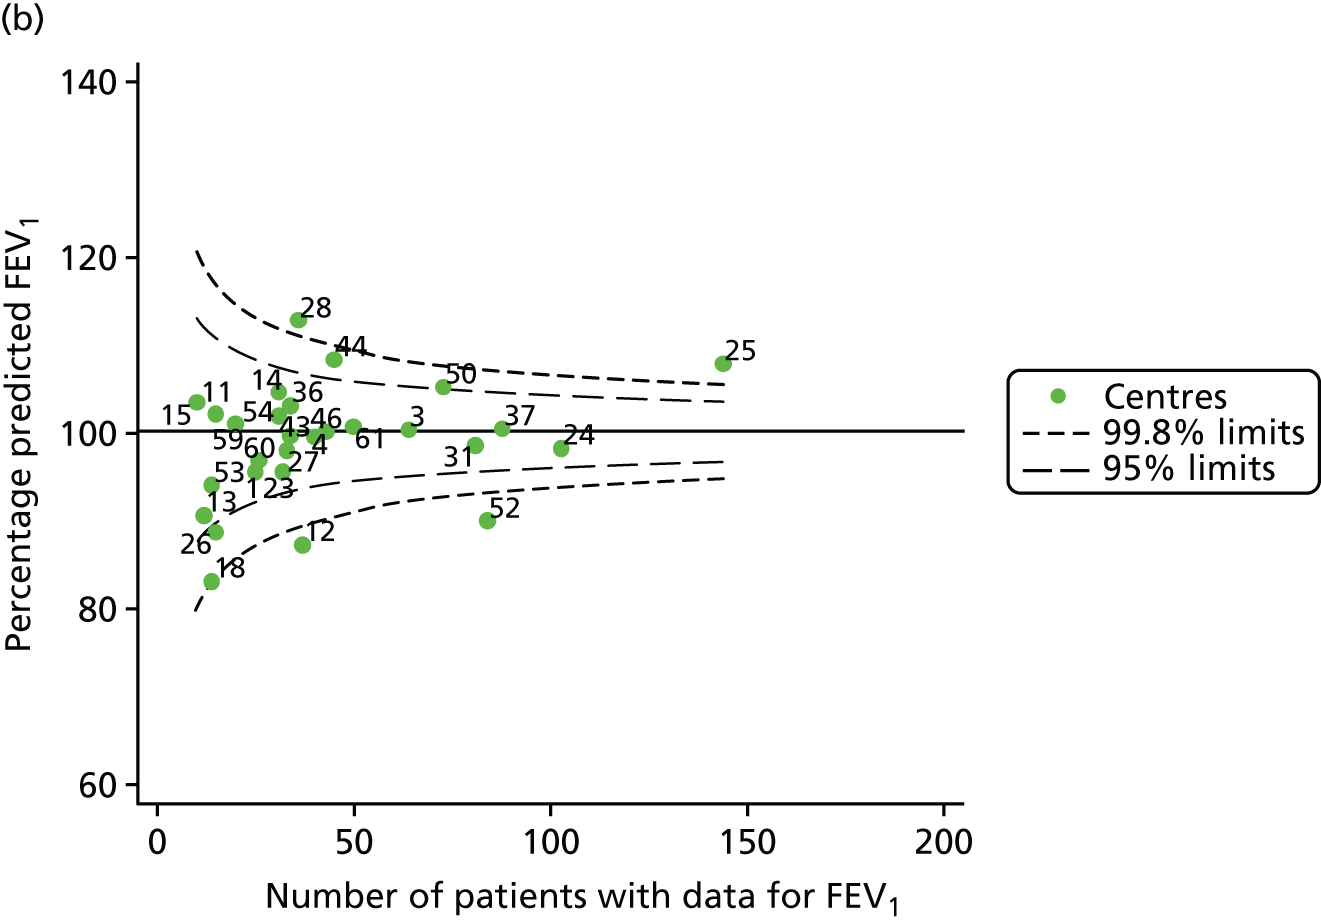
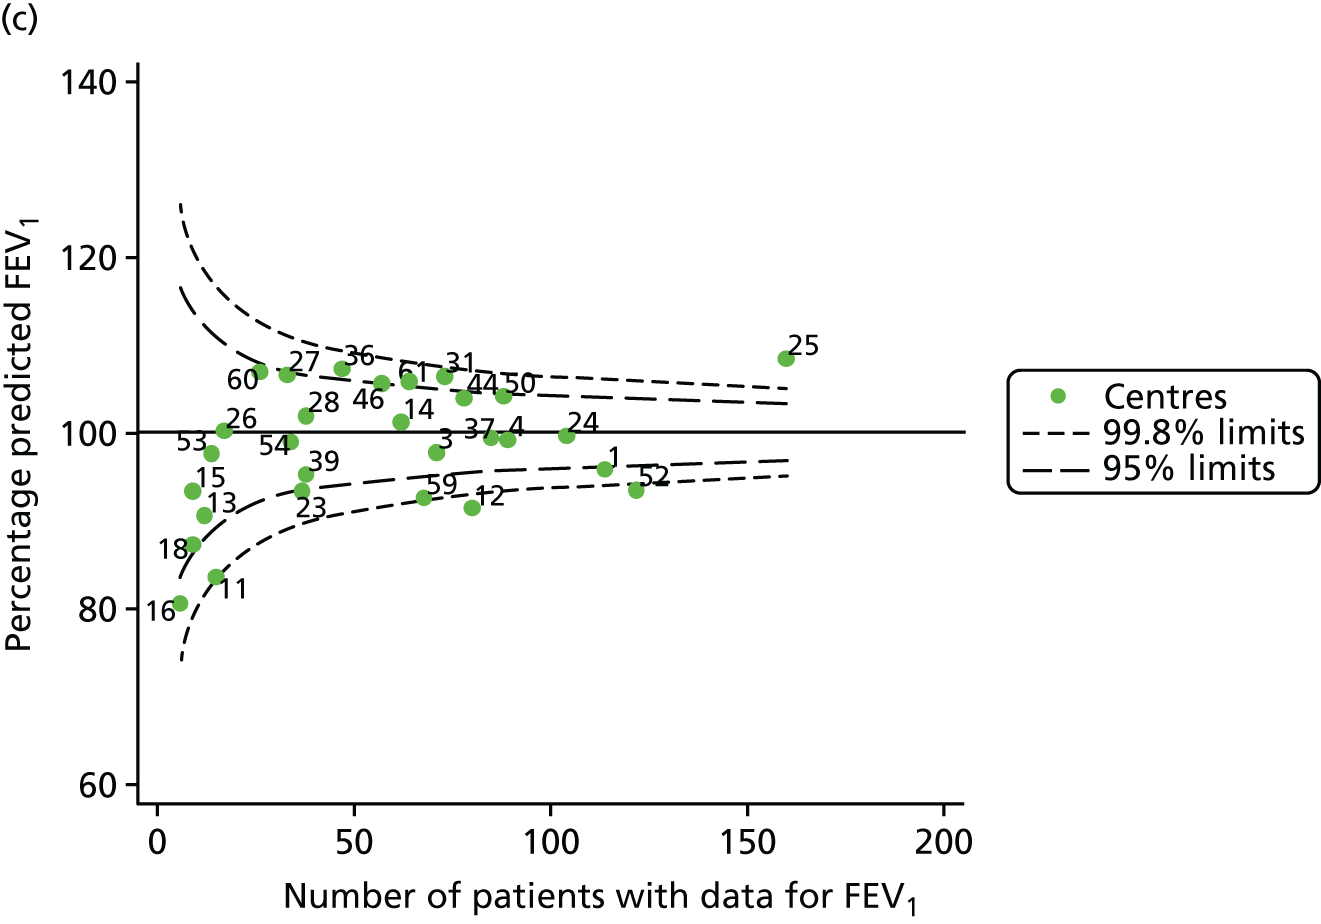
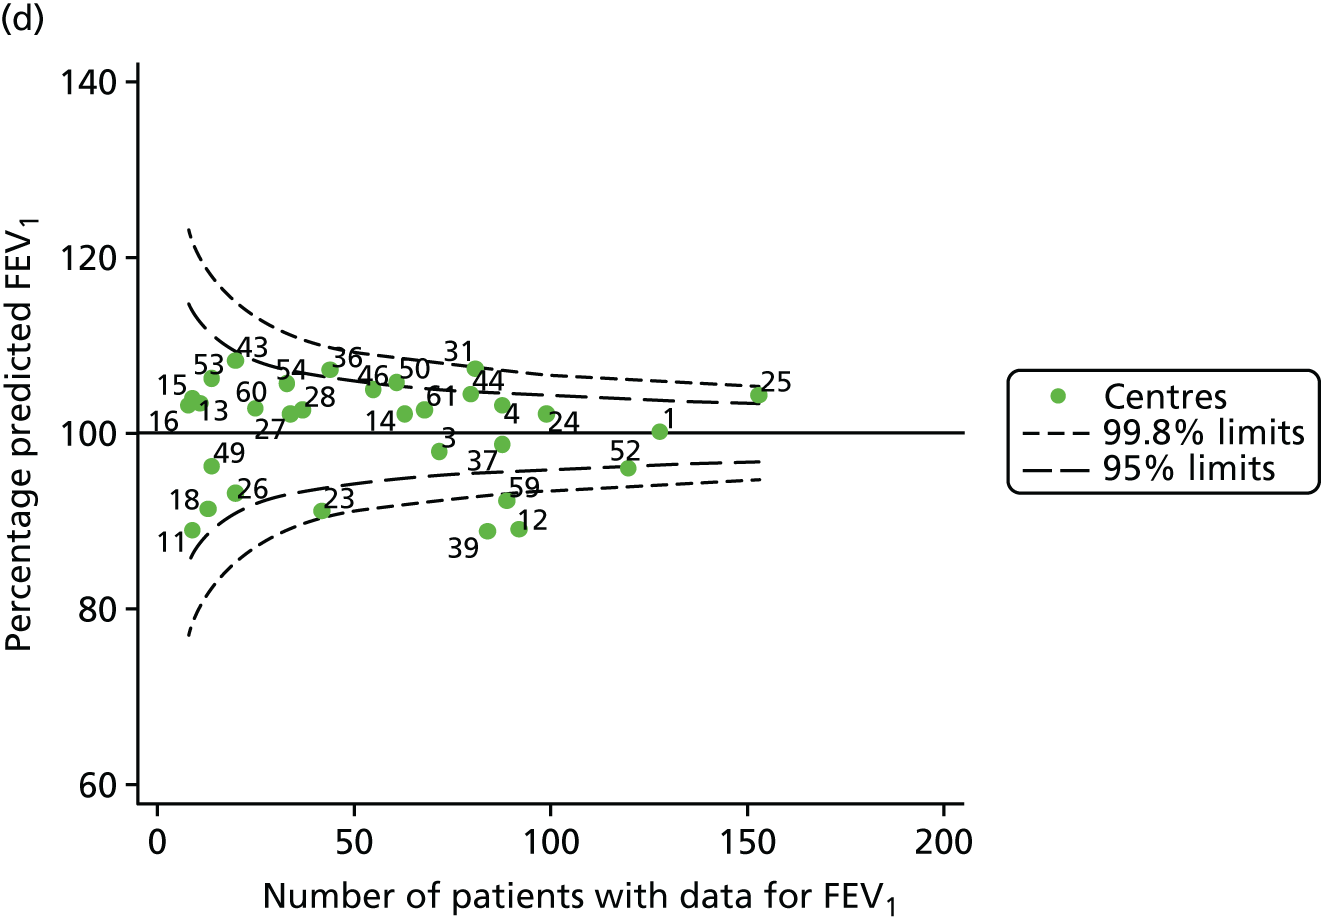
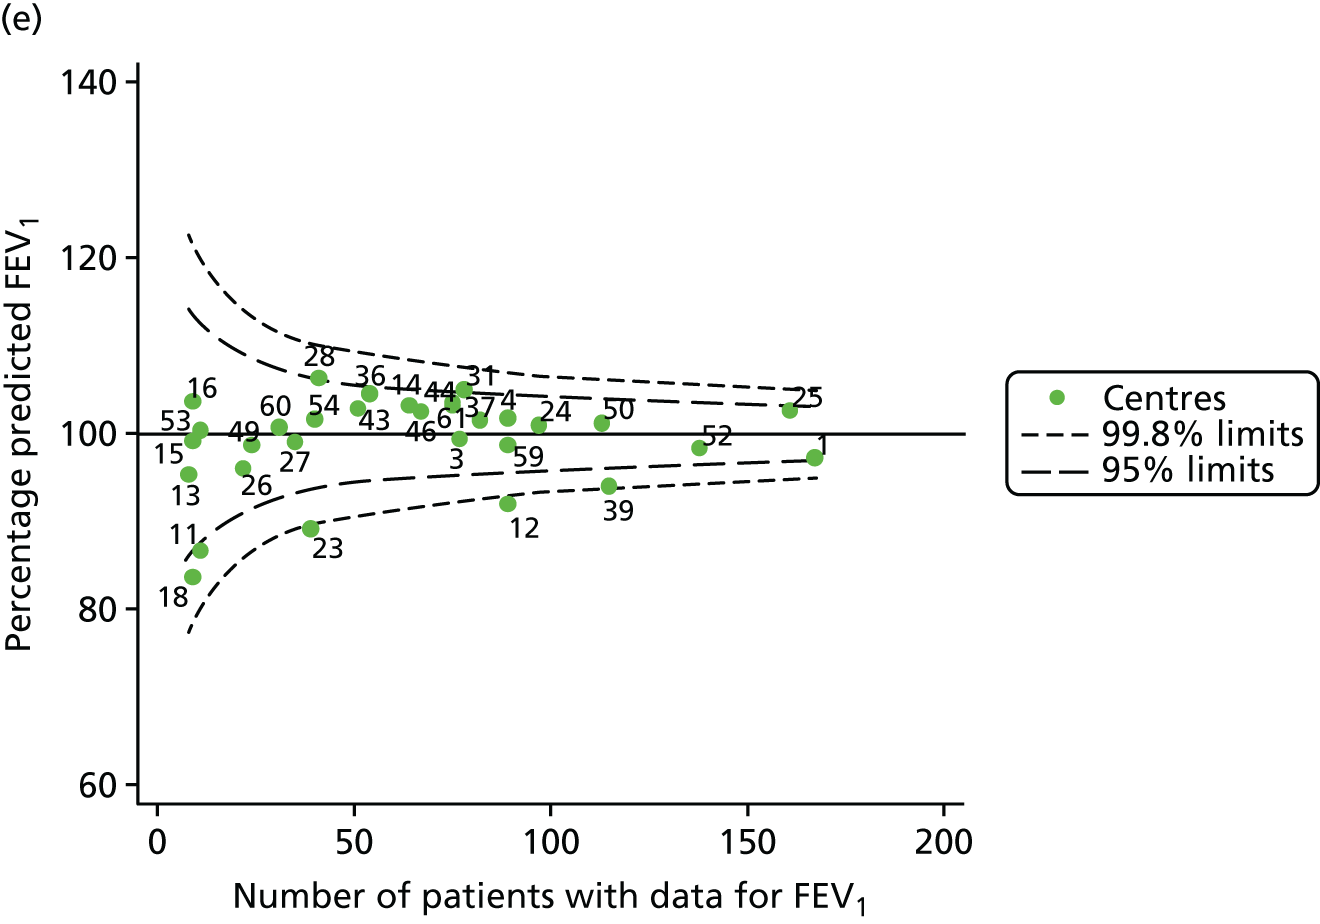
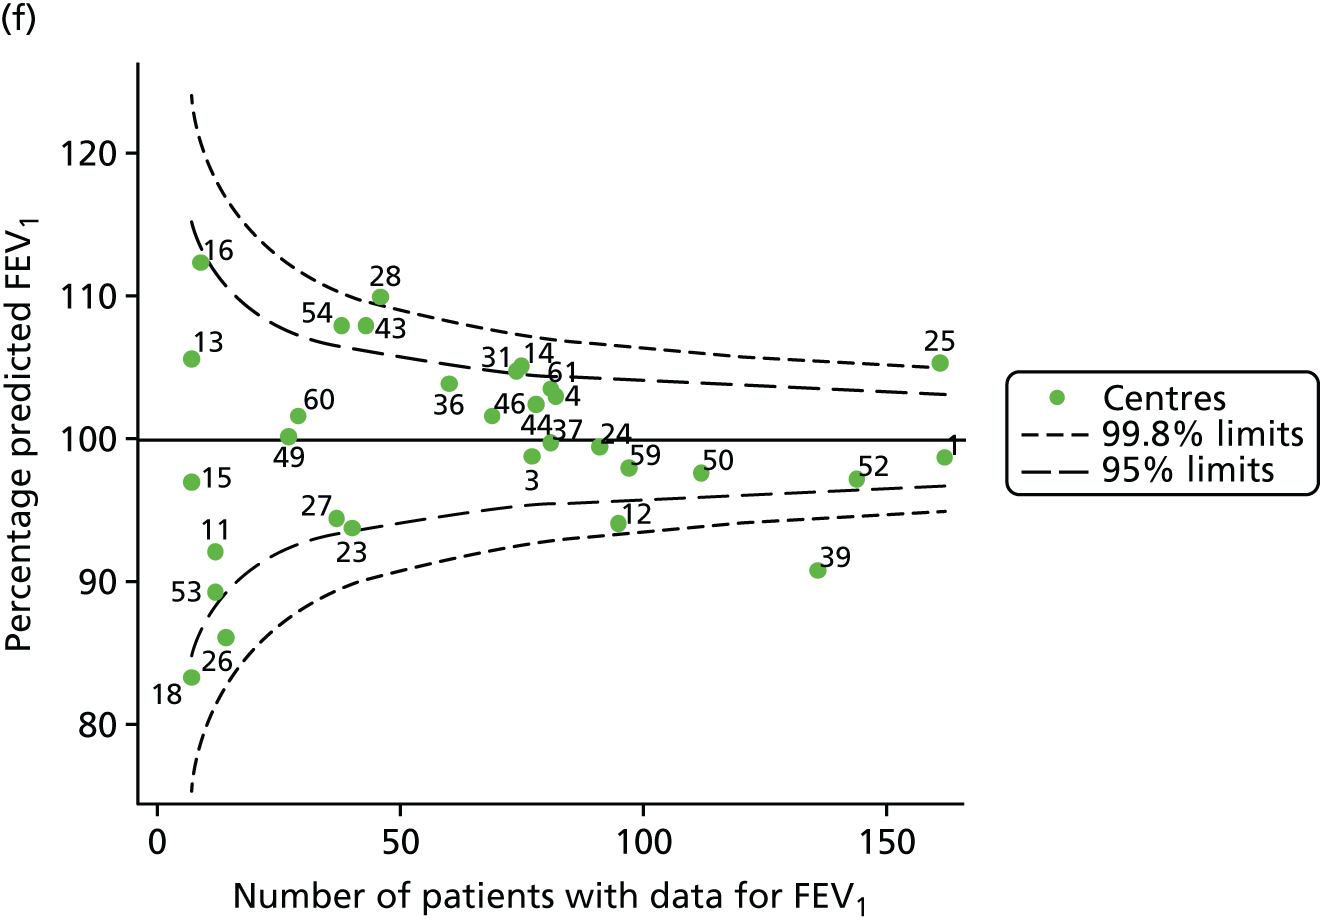
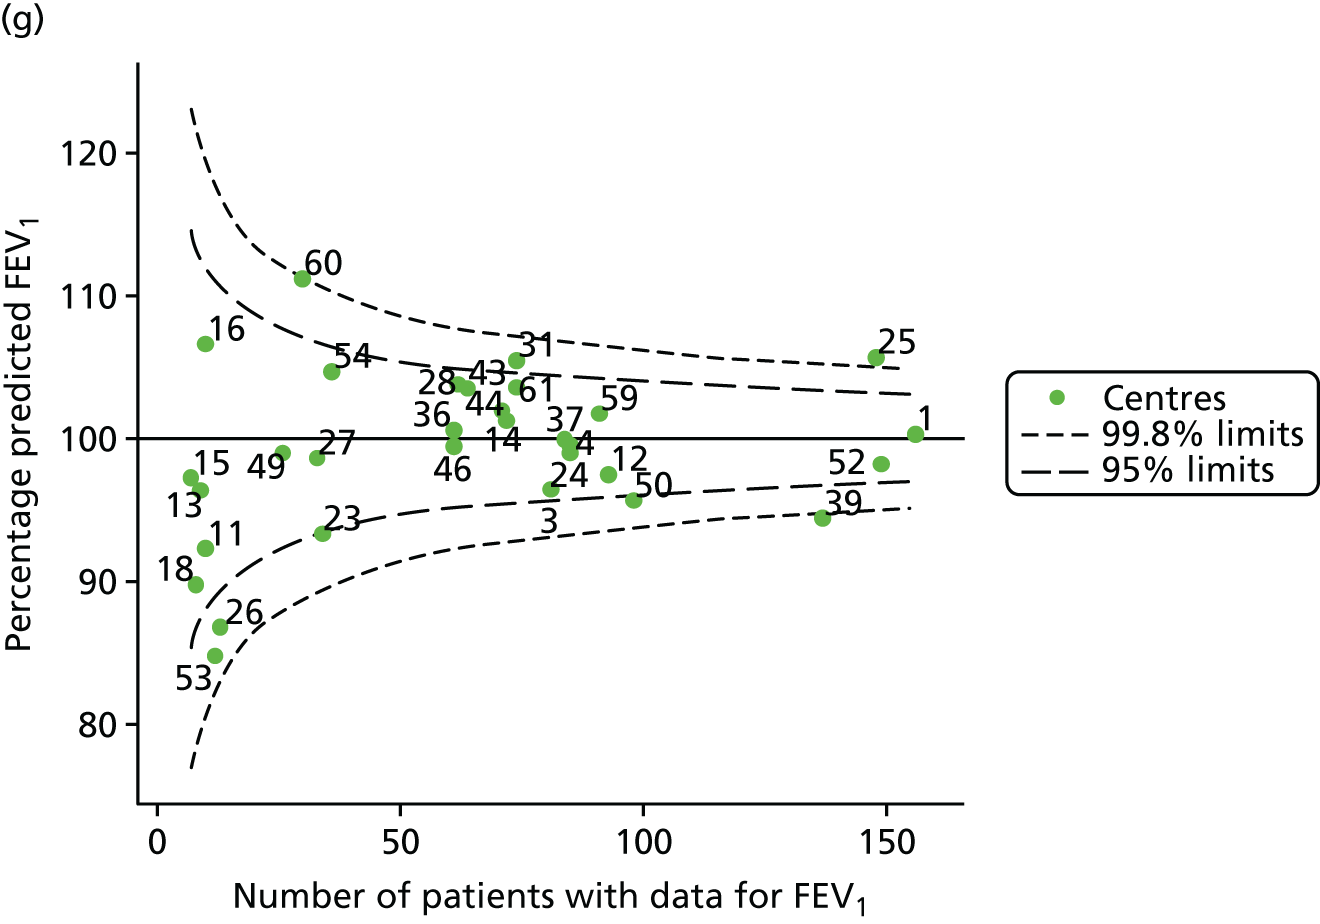
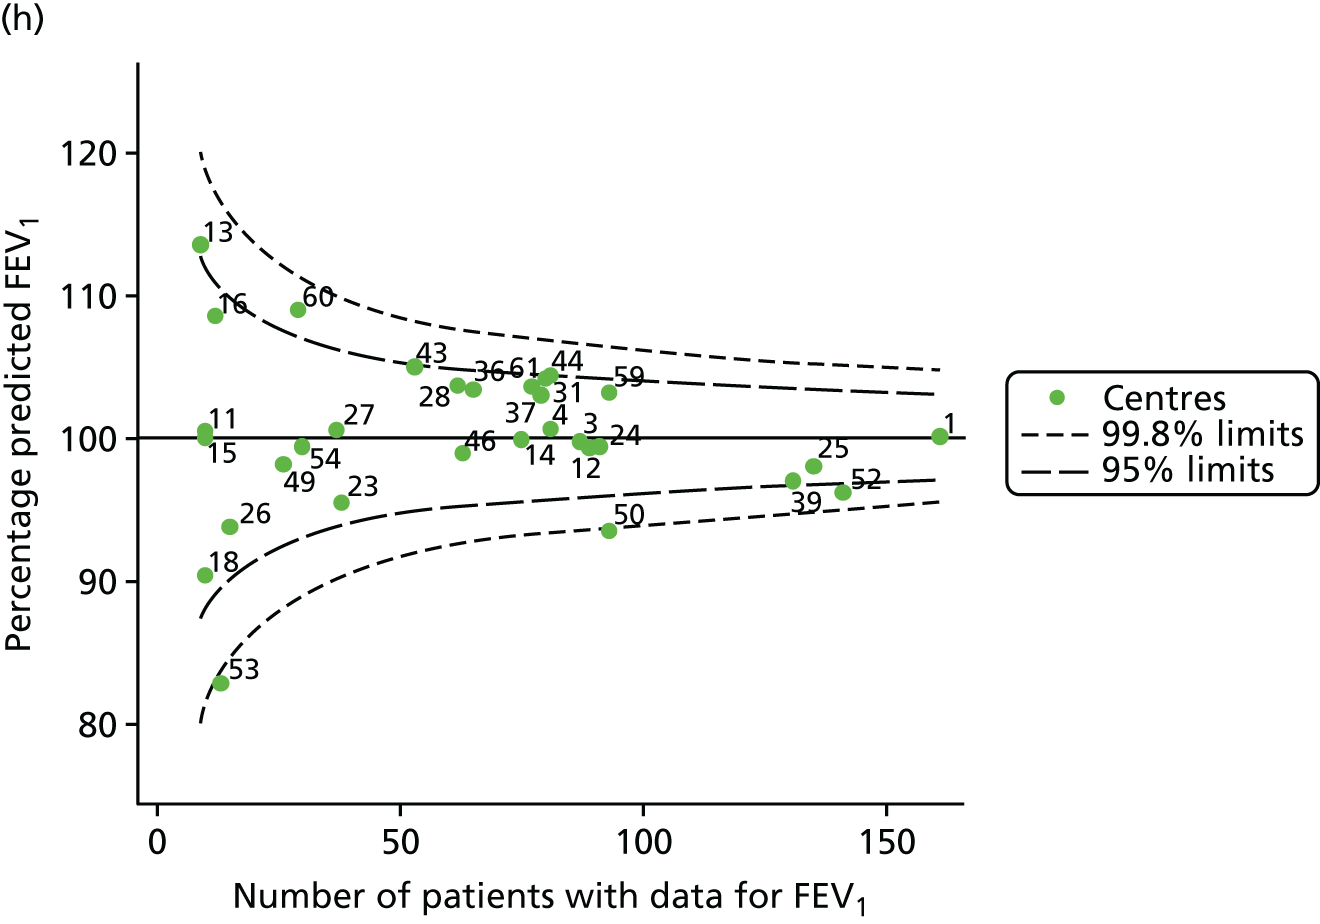
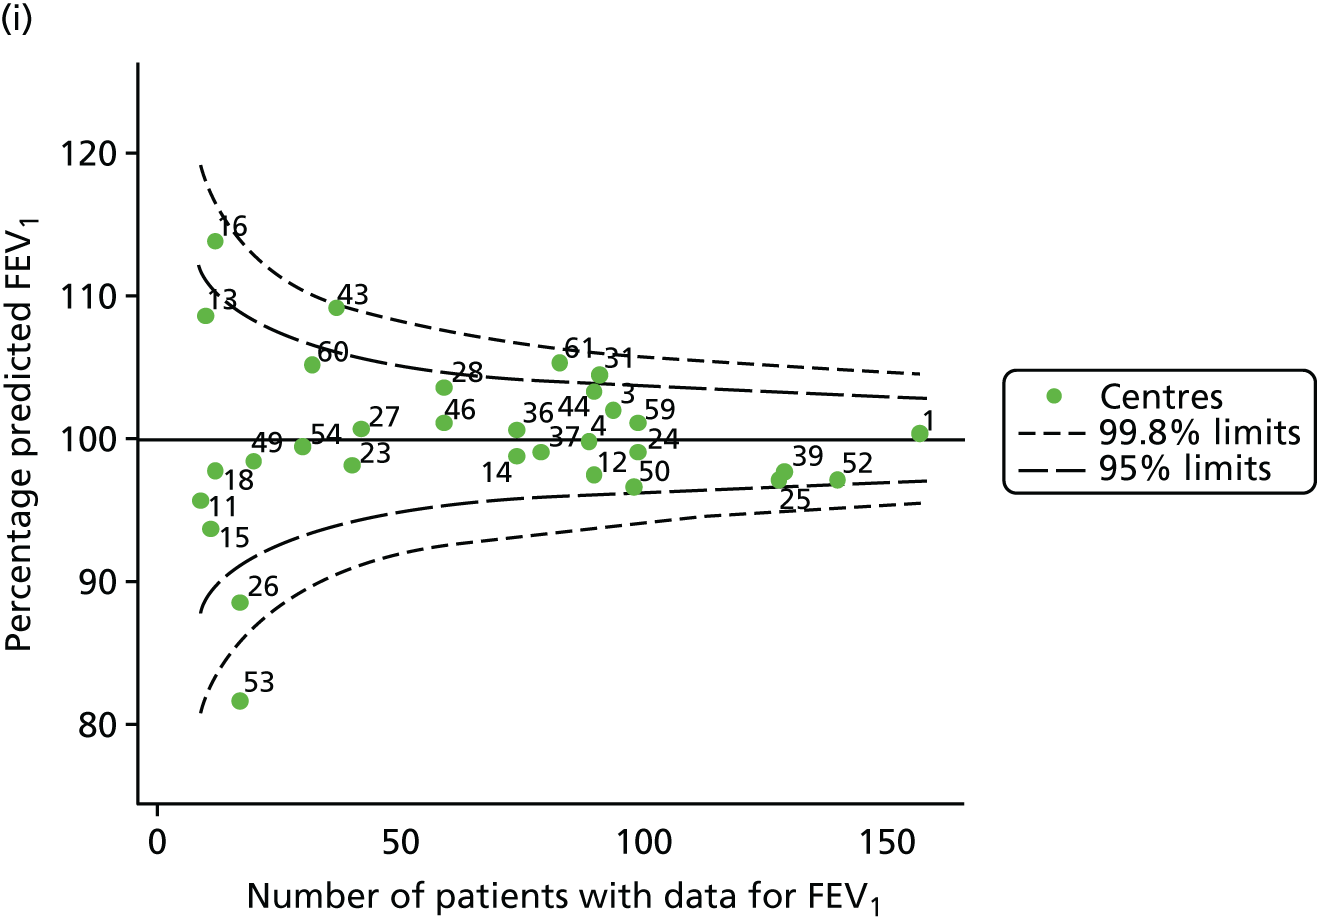
FIGURE 31.
Funnel plots of FEV1 unadjusted for case-mix estimated using GLI reference equations, by year. (a) 2007; (b) 2008; (c) 2009; (d) 2010; (e) 2011; (f) 2012; (g) 2013; (h) 2014; and (i) 2015.

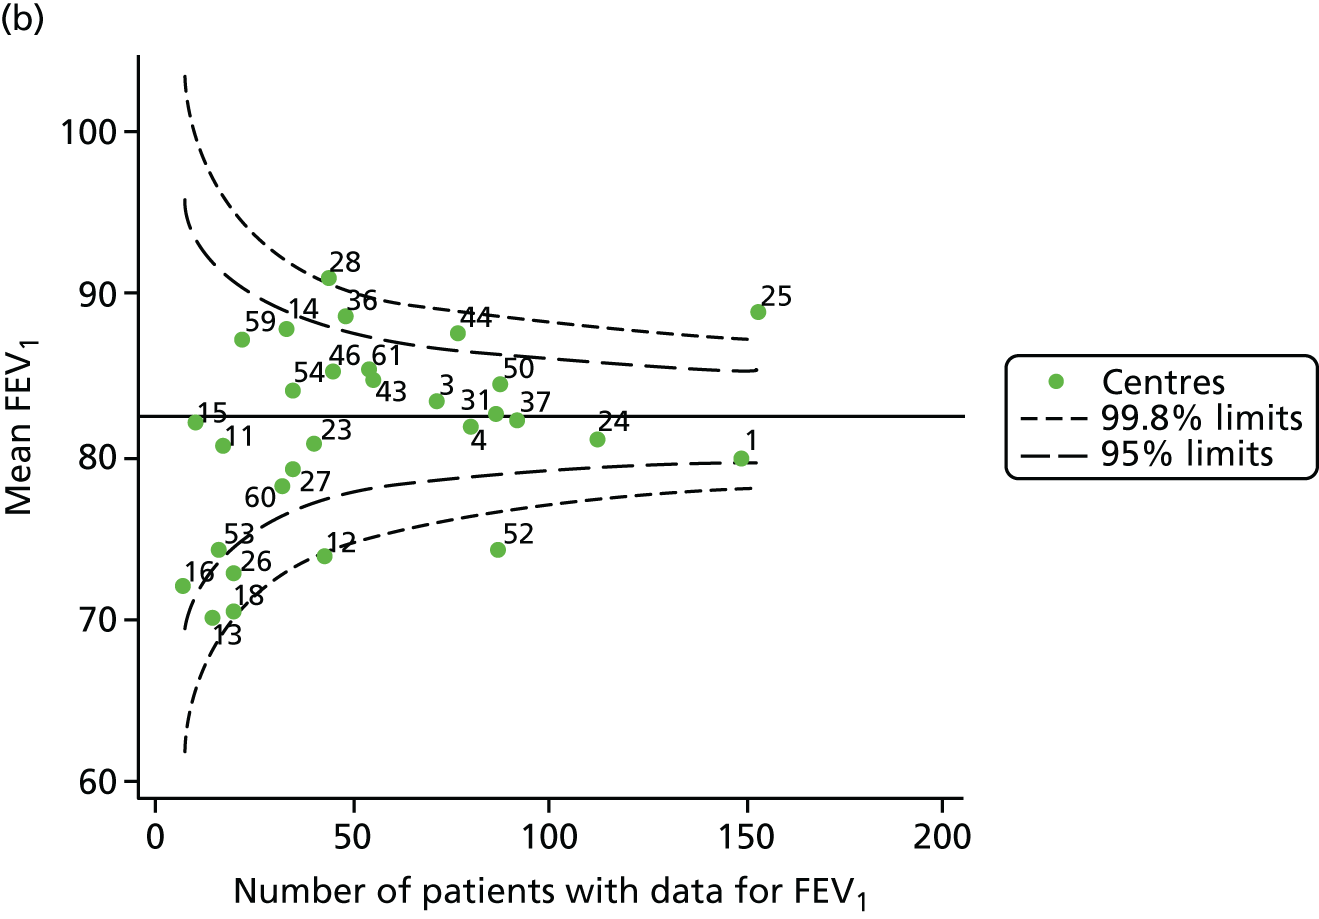
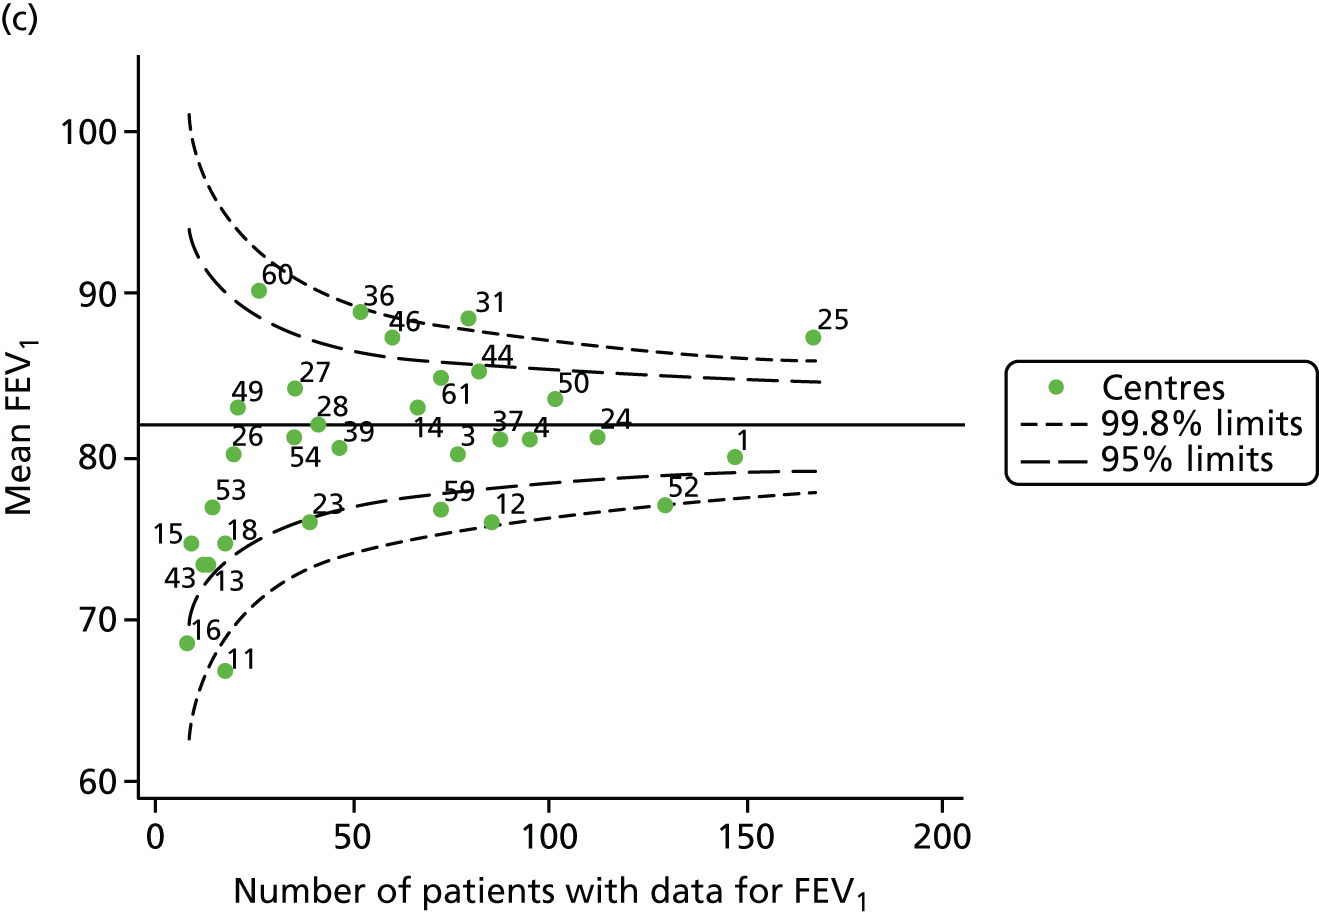
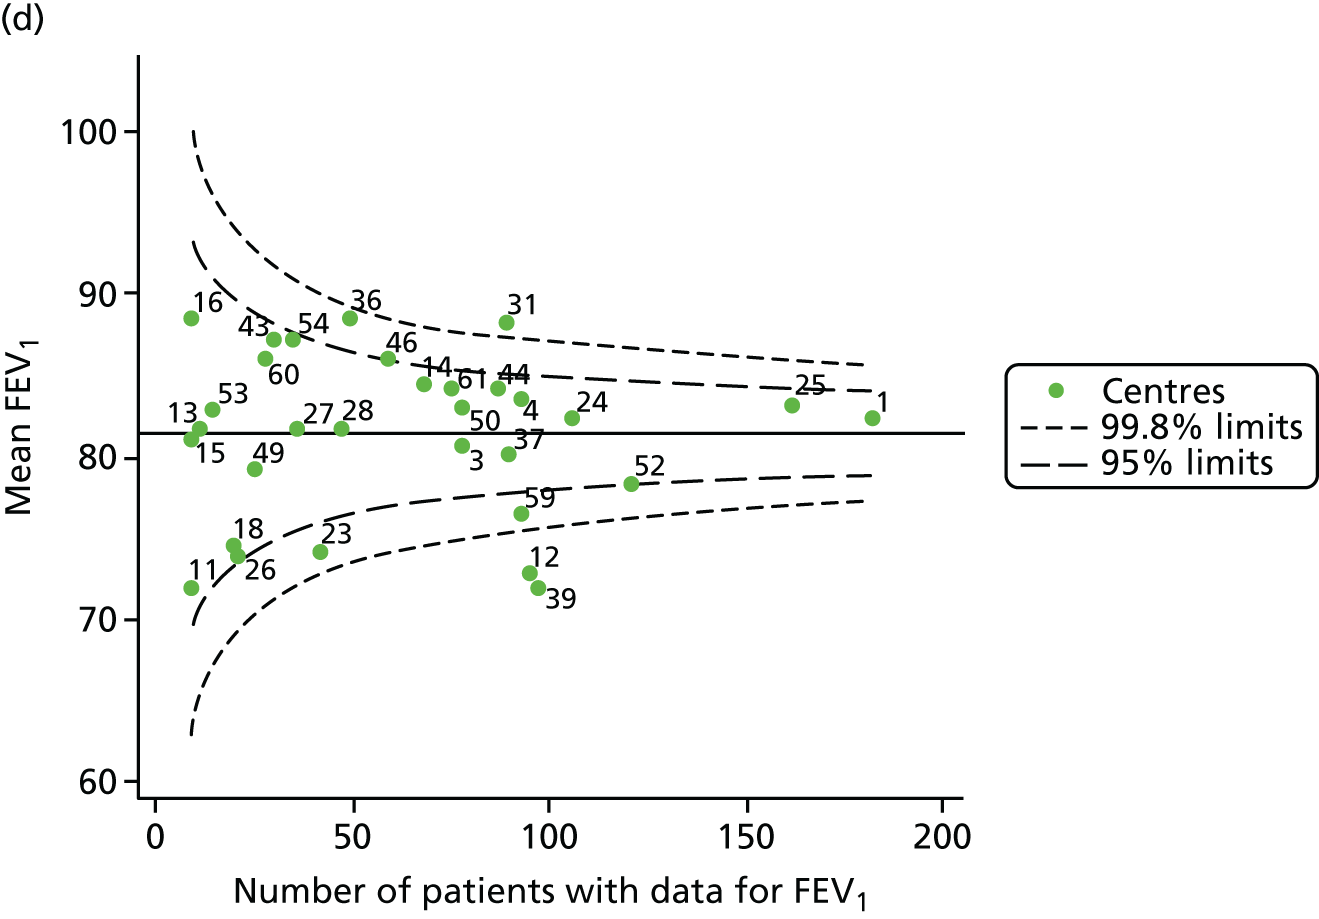
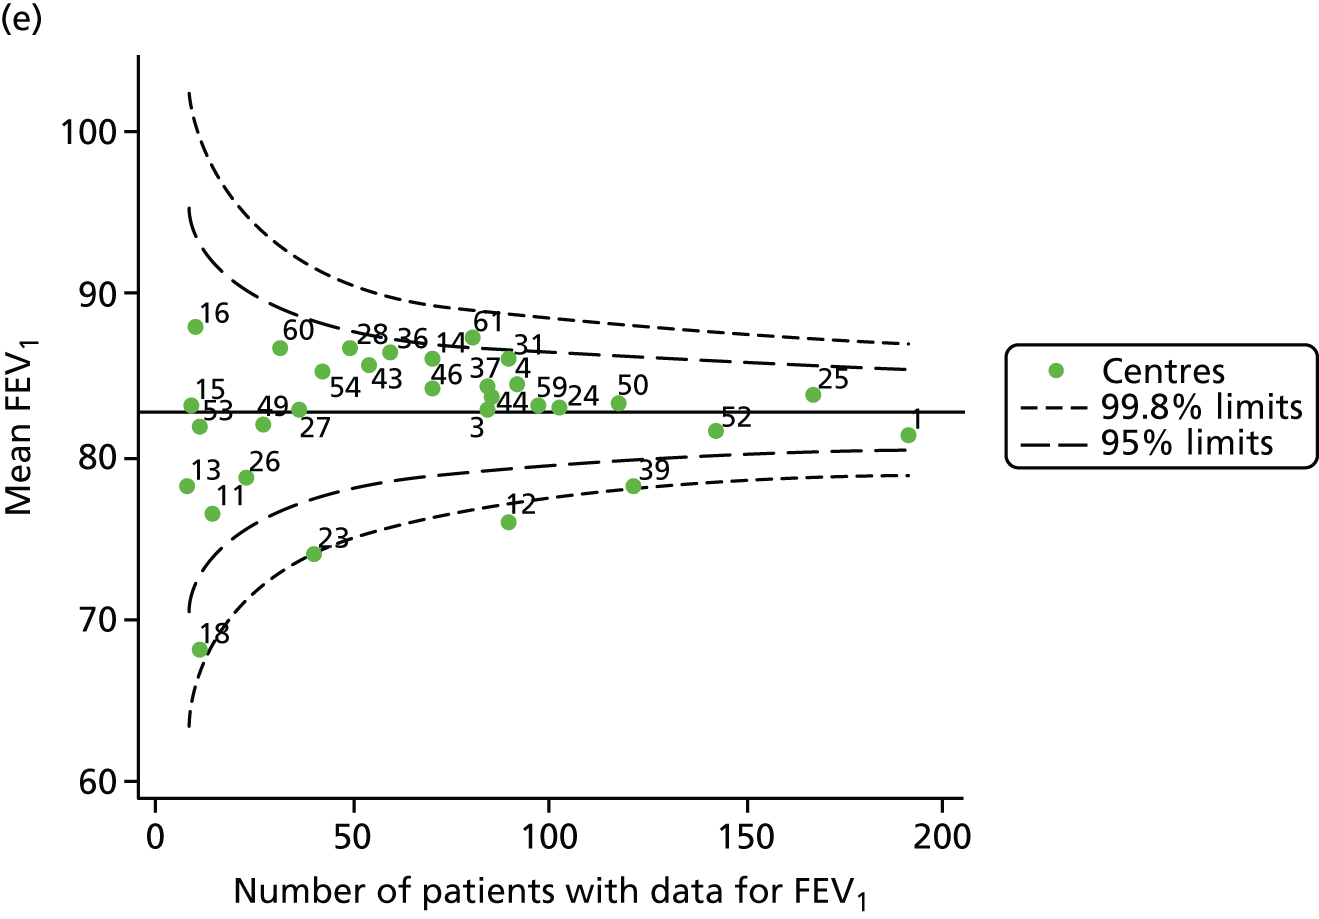
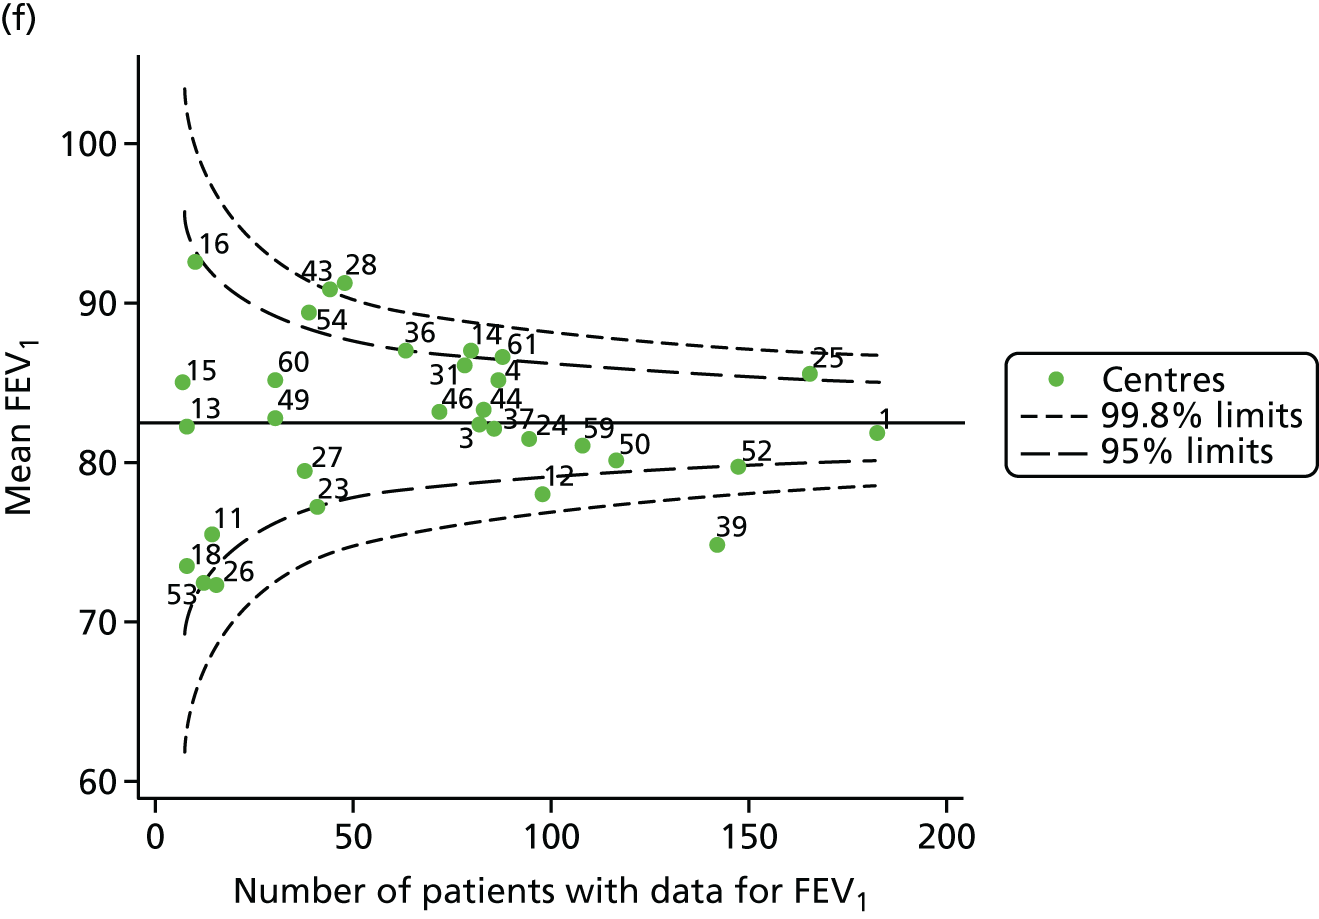

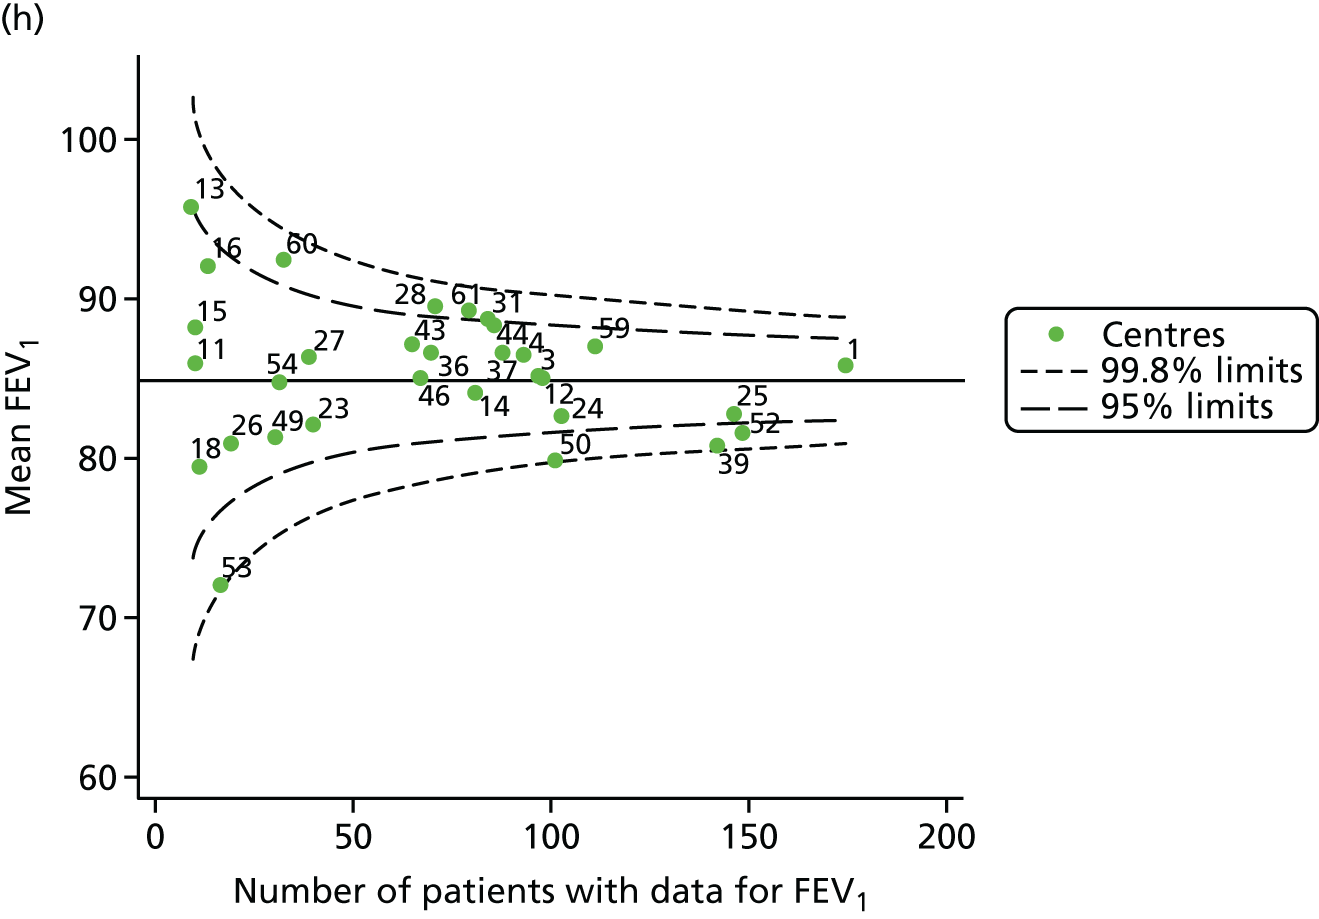
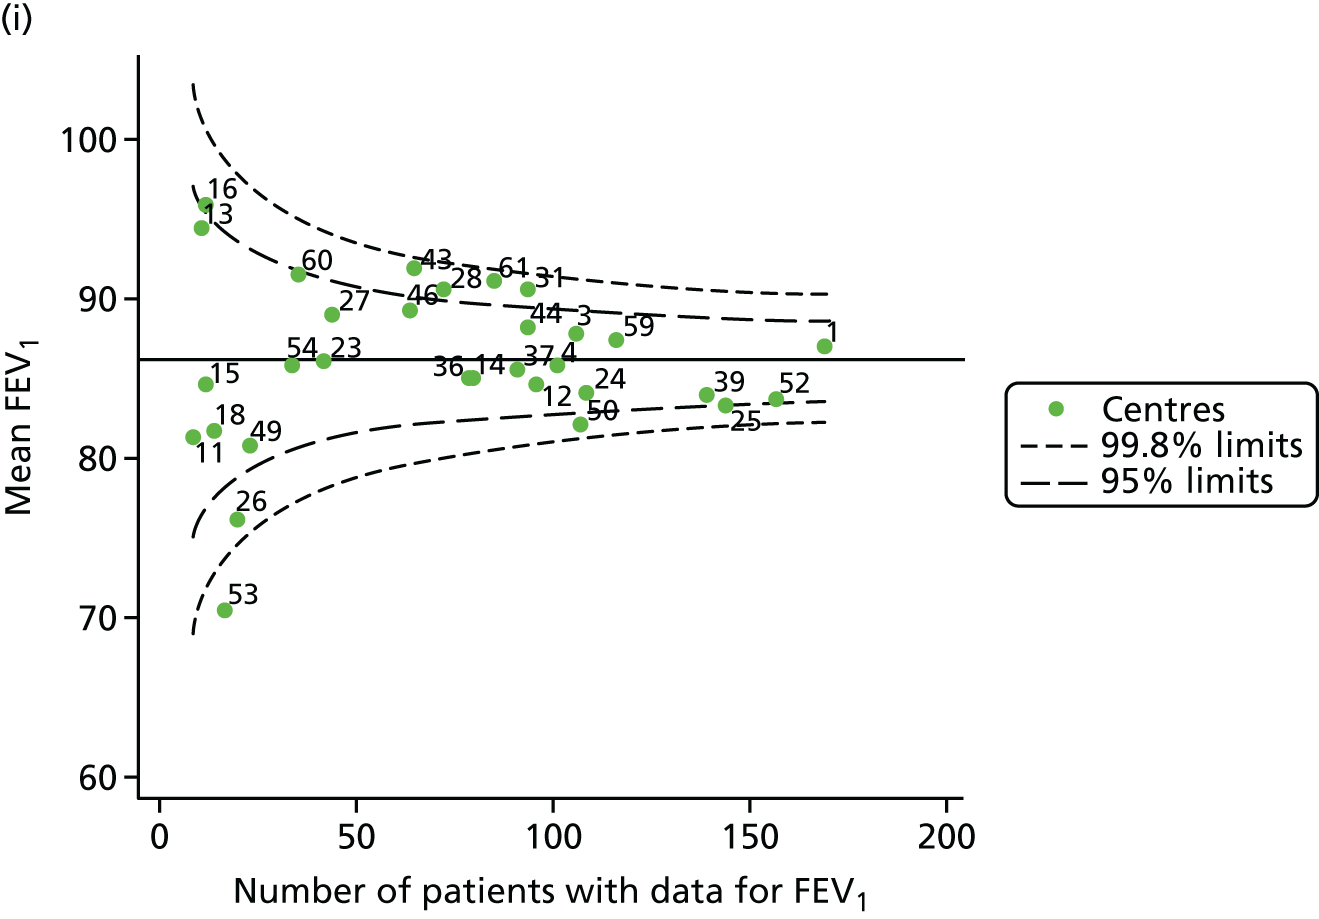
FIGURE 32.
Comparison of unadjusted change in FEV1% predicted (Knudson) with case-mix adjusted predicted values (between ages 18 and 21 years using data from 2007–12 and fixed-effect GLM to perform case-mix adjustment).
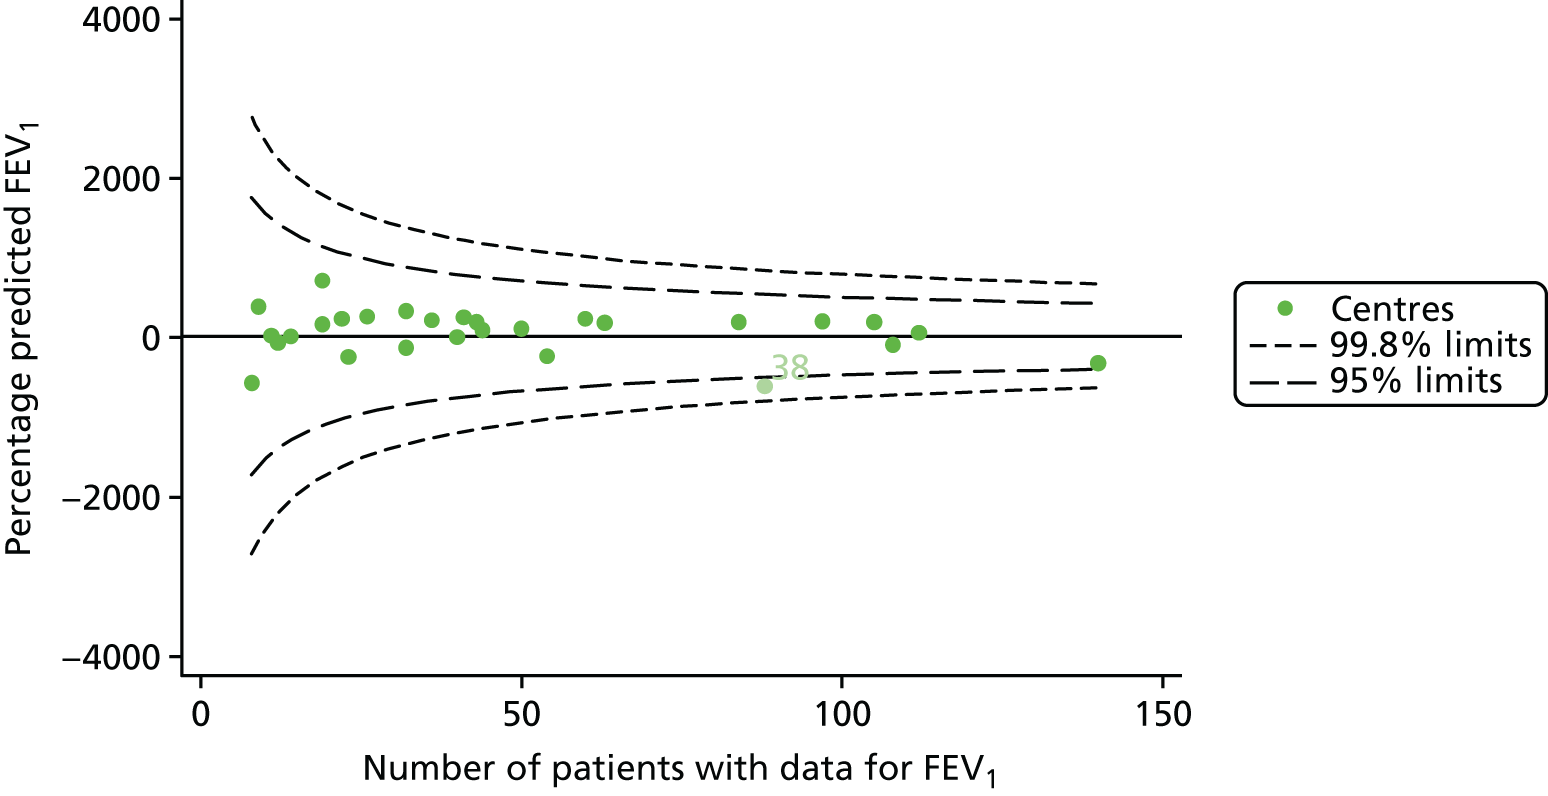
FIGURE 33.
Comparison of unadjusted change in BMI with case-mix adjusted predicted values (between ages 18 and 21 years using data from 2007–12 and fixed-effect GLM to perform case-mix adjustment).
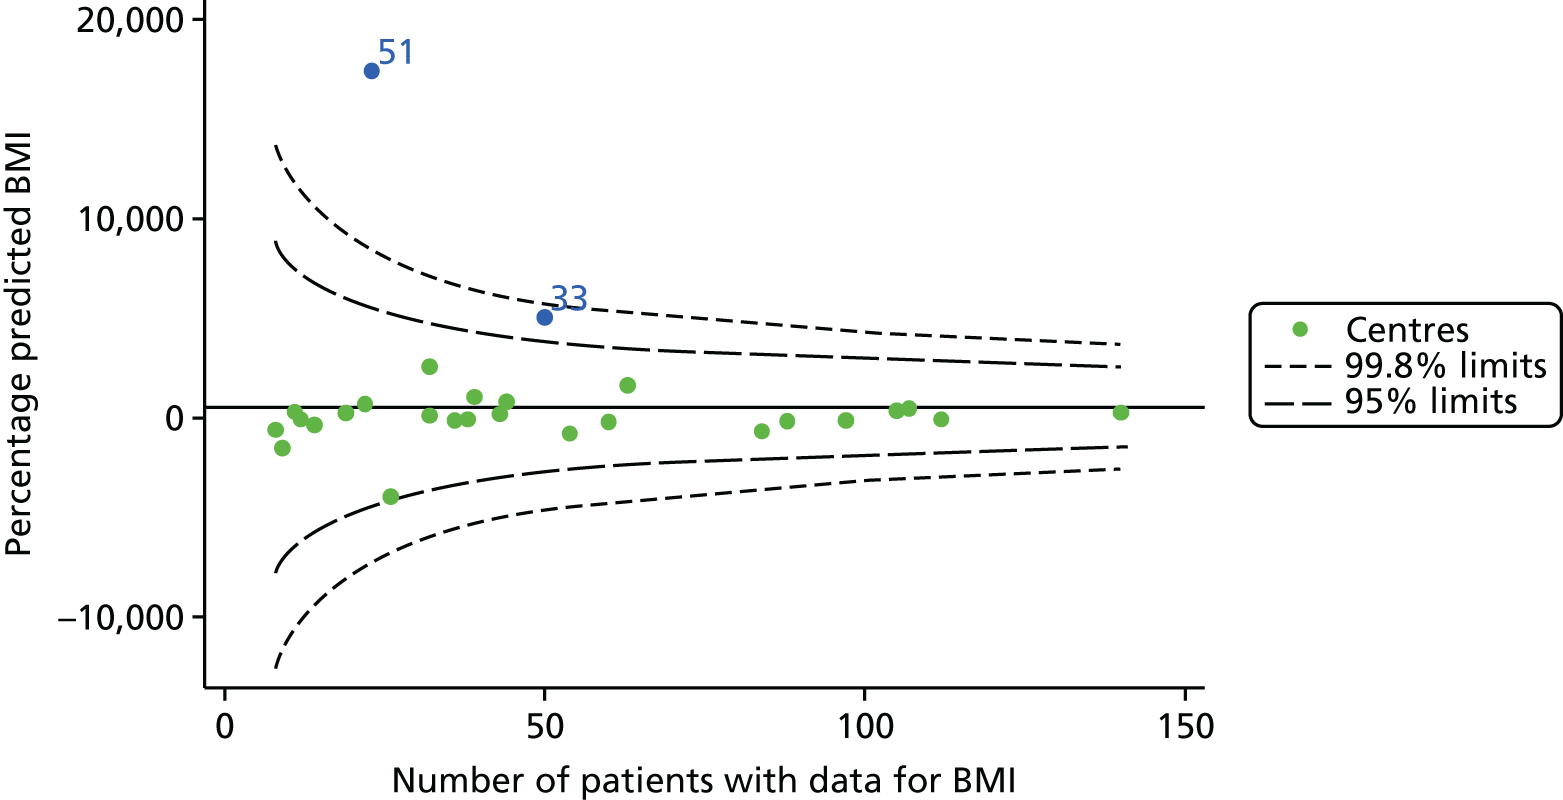
FIGURE 34.
Funnel plots of FEV1 adjusted for age using GLMs, by year. (a) 2007; (b) 2008; (c) 2009; (d) 2010; (e) 2011; (f) 2012; (g) 2013; (h) 2014; and (i) 2015.
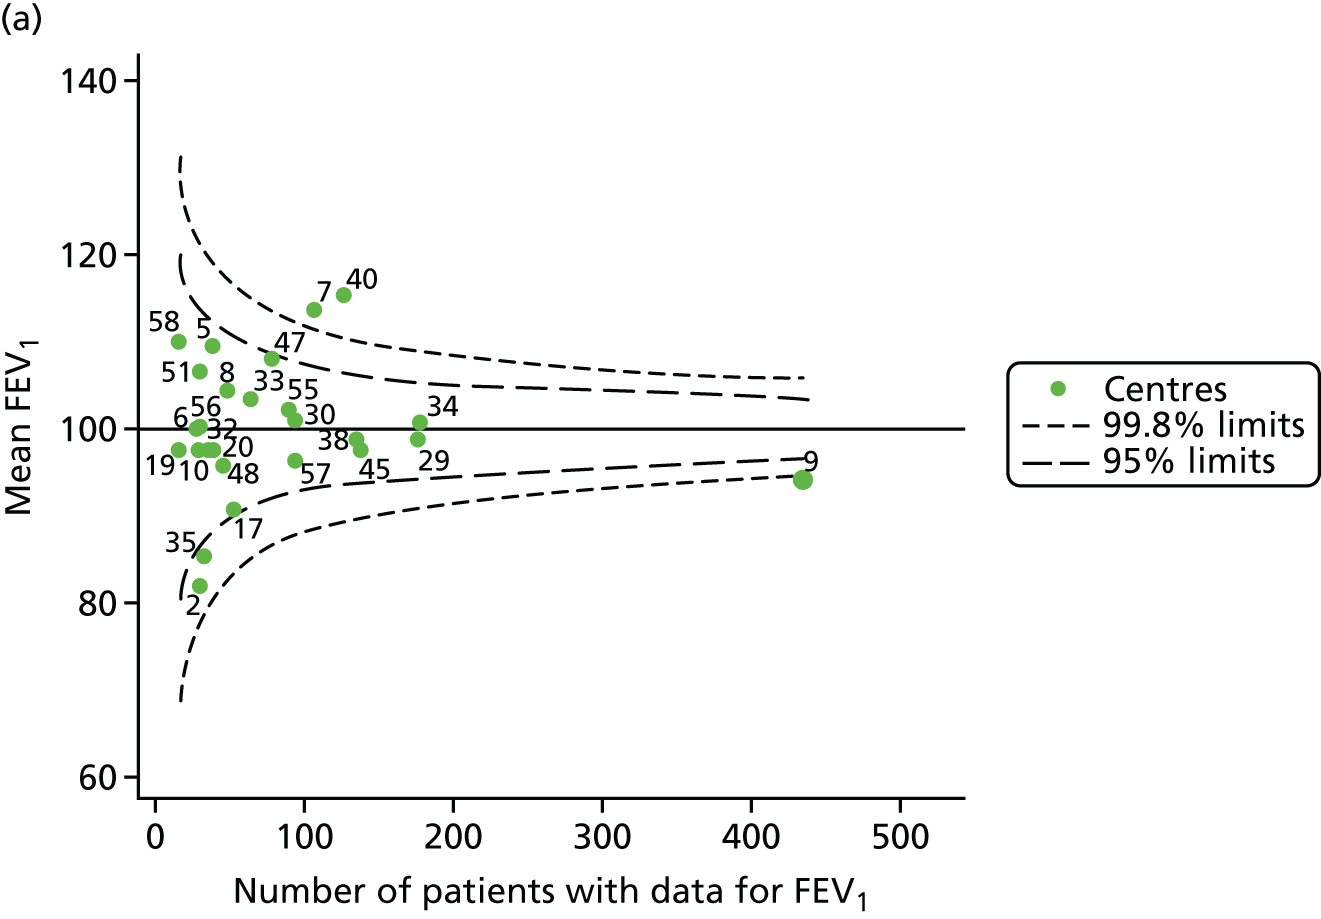
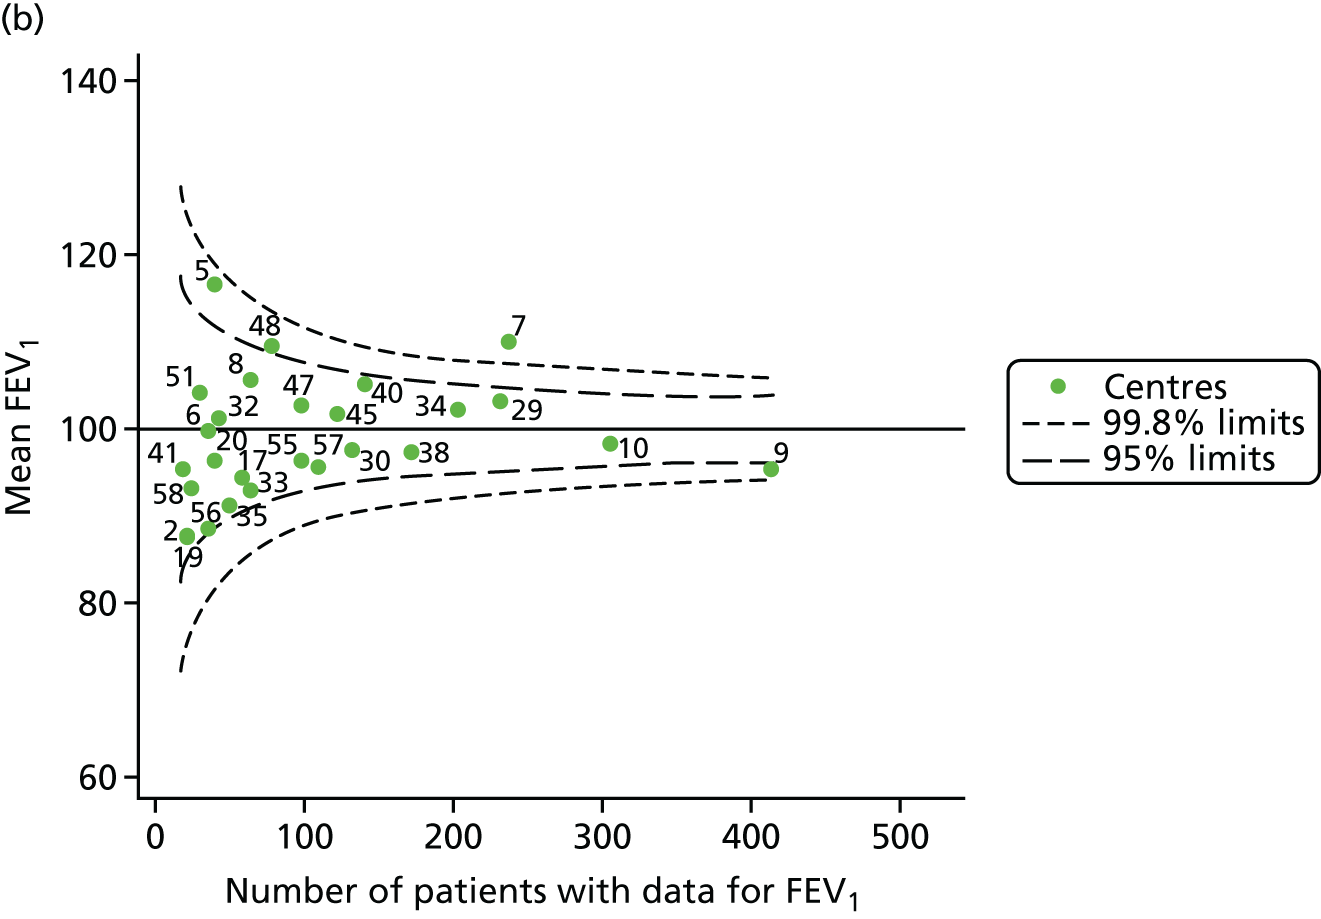
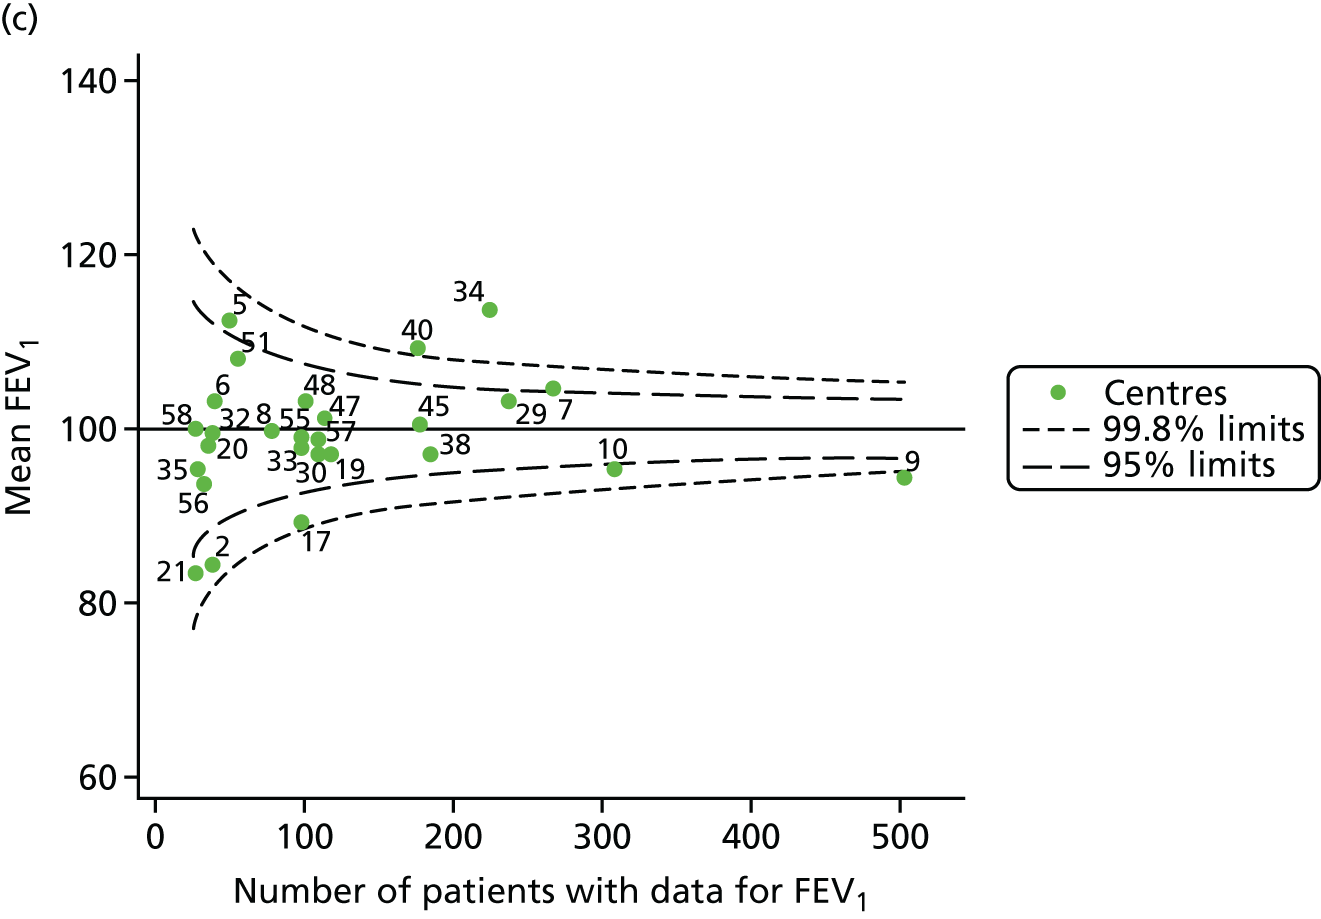
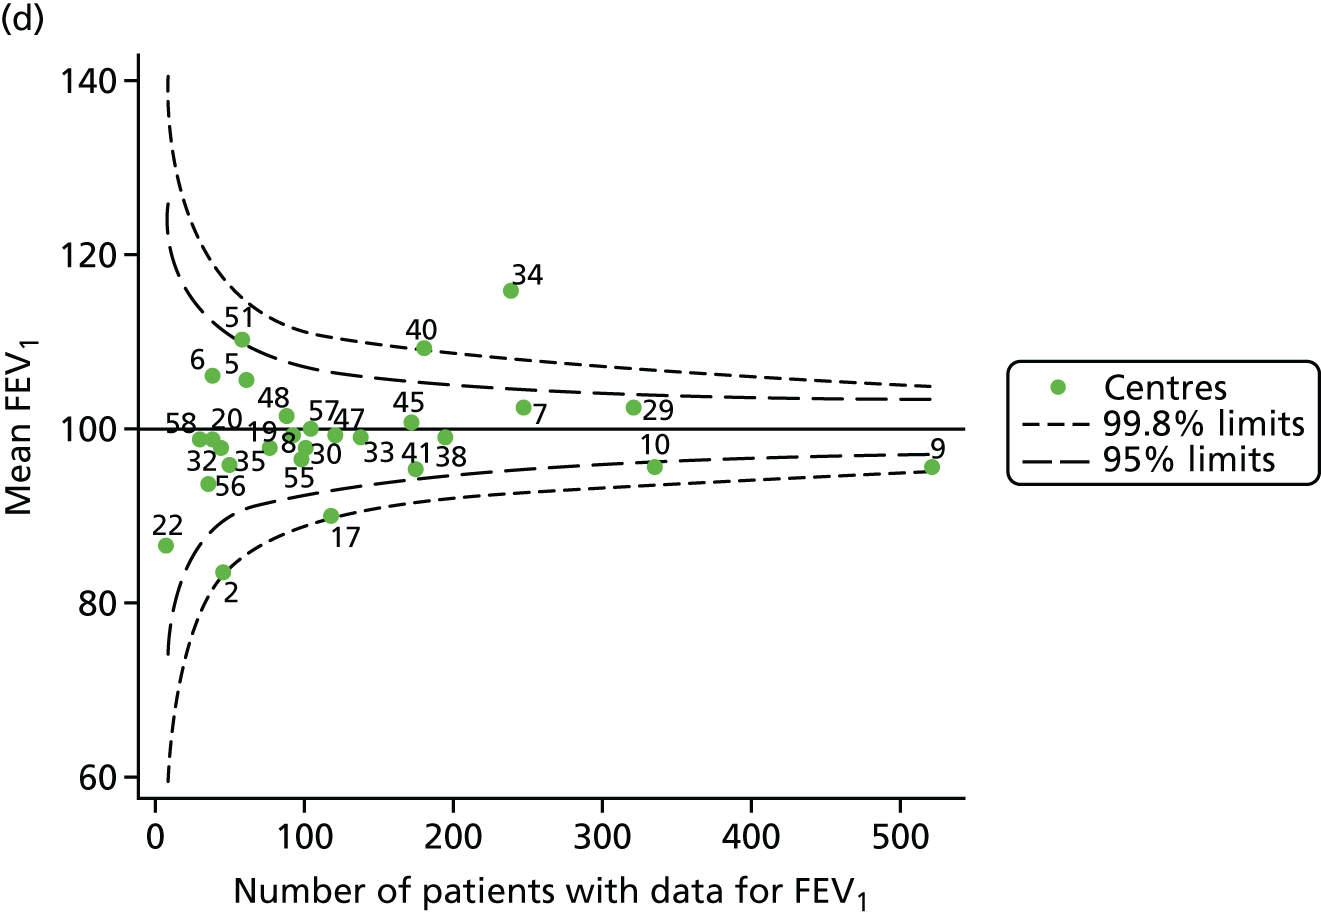
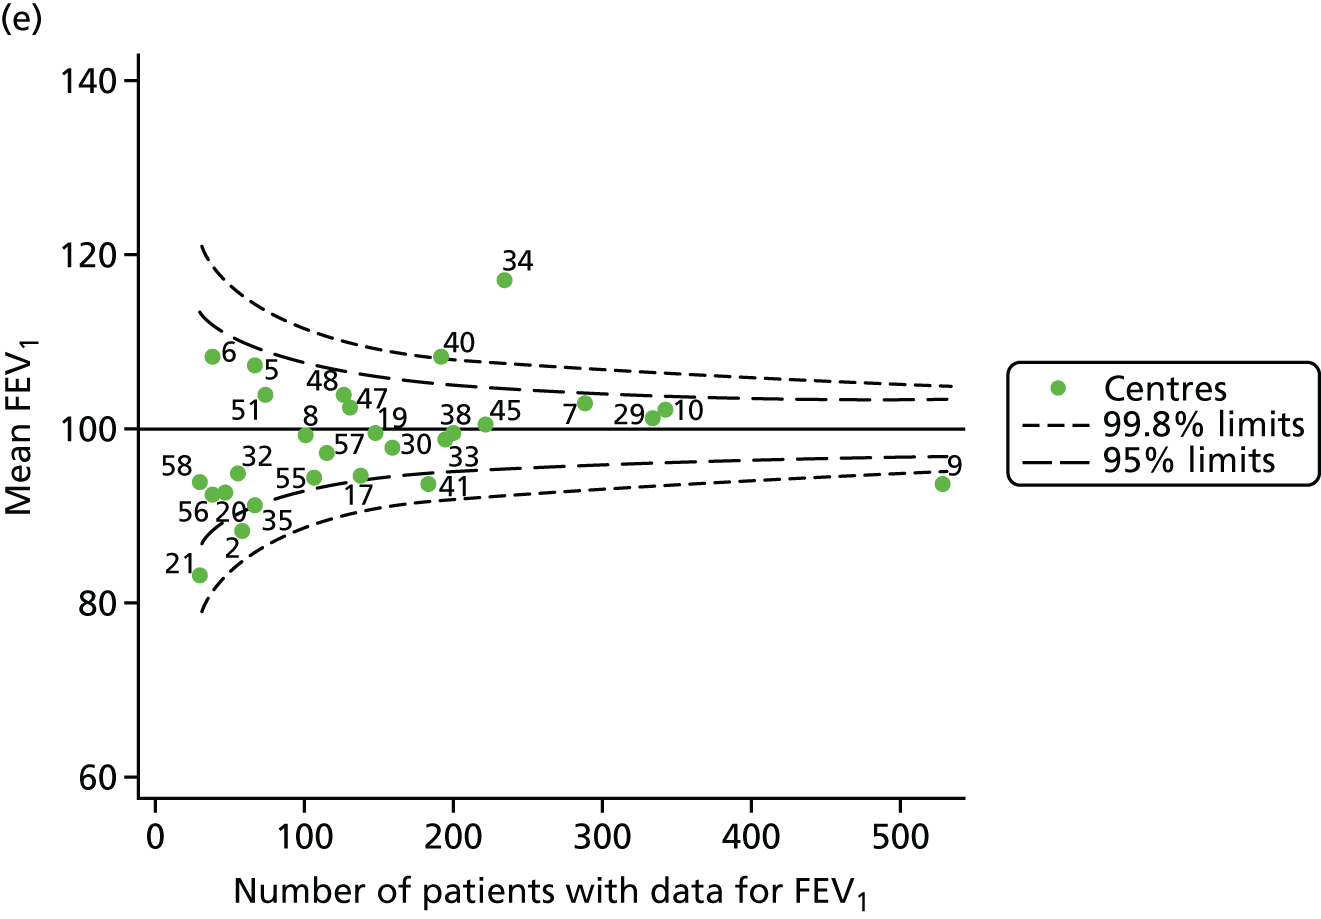
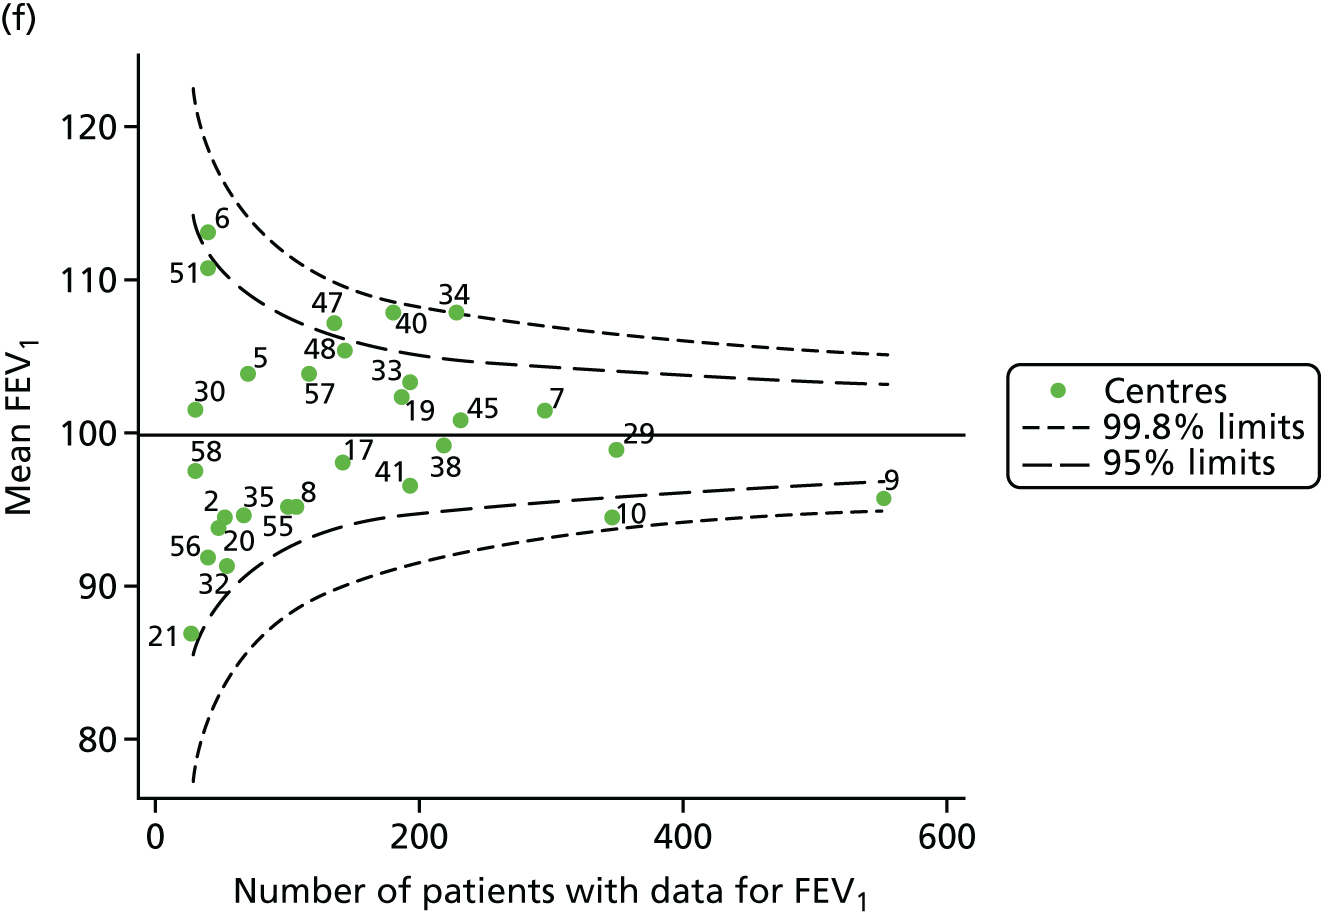

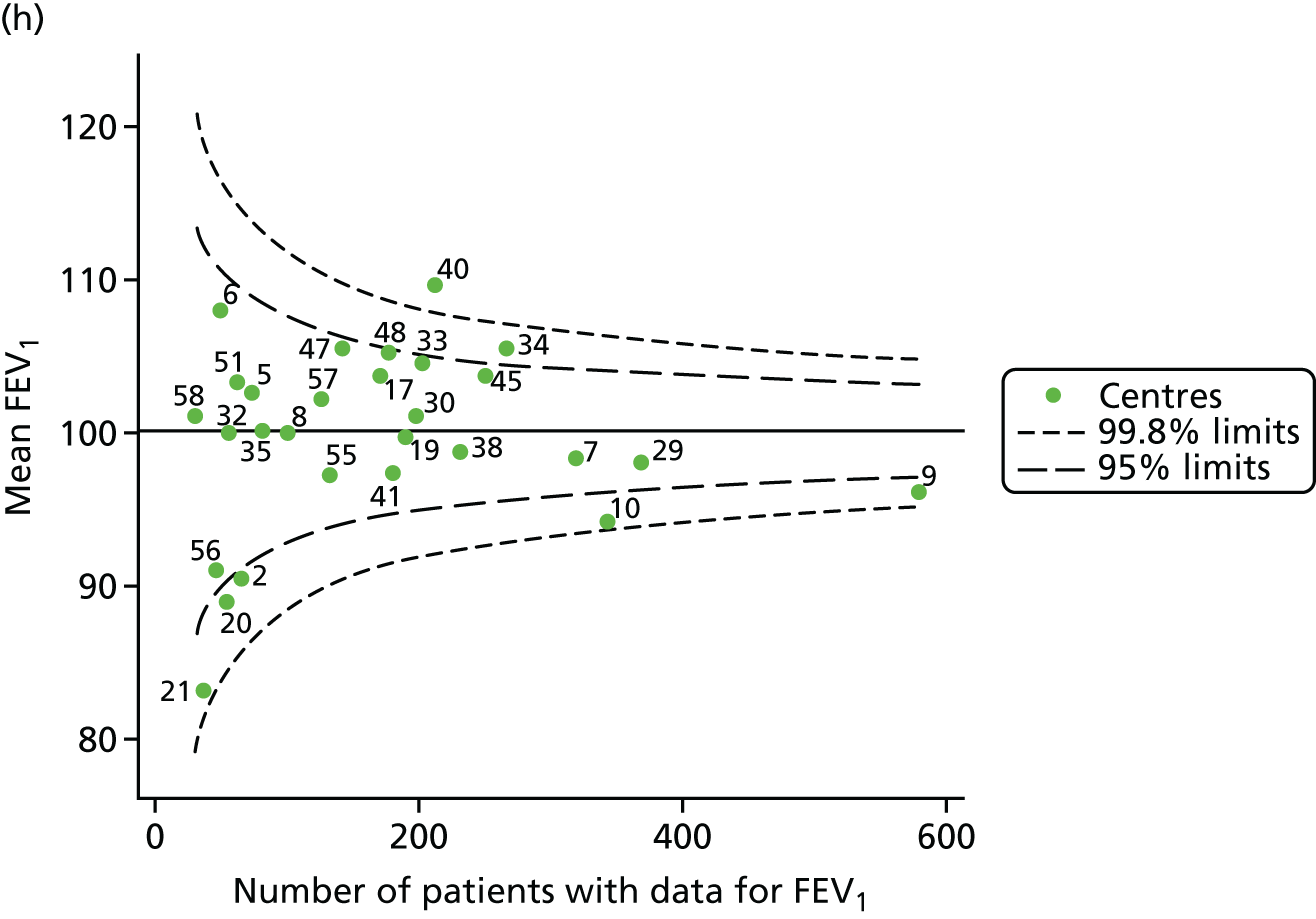
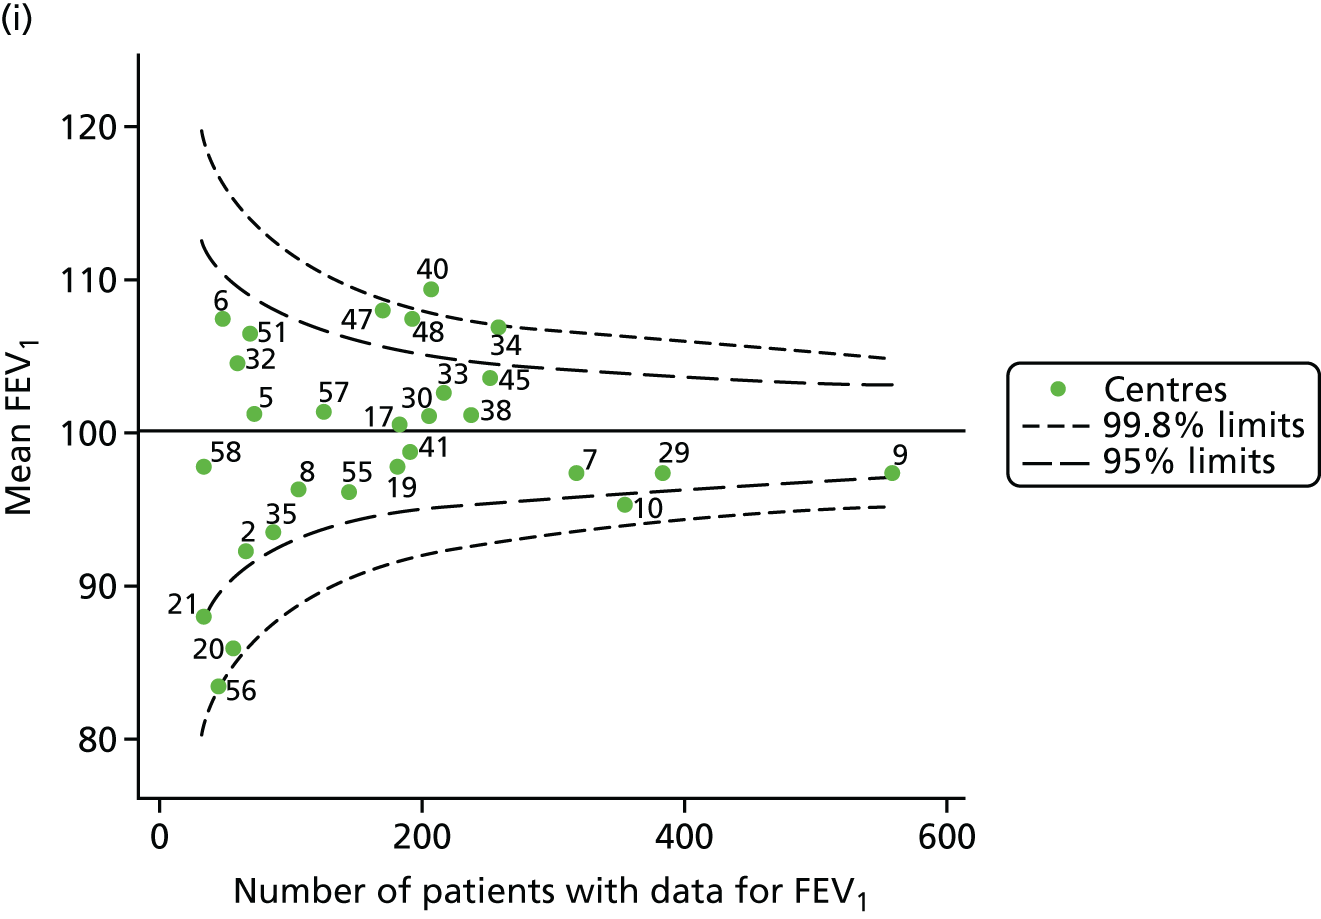
FIGURE 35.
Funnel plots of FEV1 adjusted for age using splines, by year. (a) 2007; (b) 2008; (c) 2009; (d) 2010; (e) 2011; (f) 2012; (g) 2013; (h) 2014; and (i) 2015.
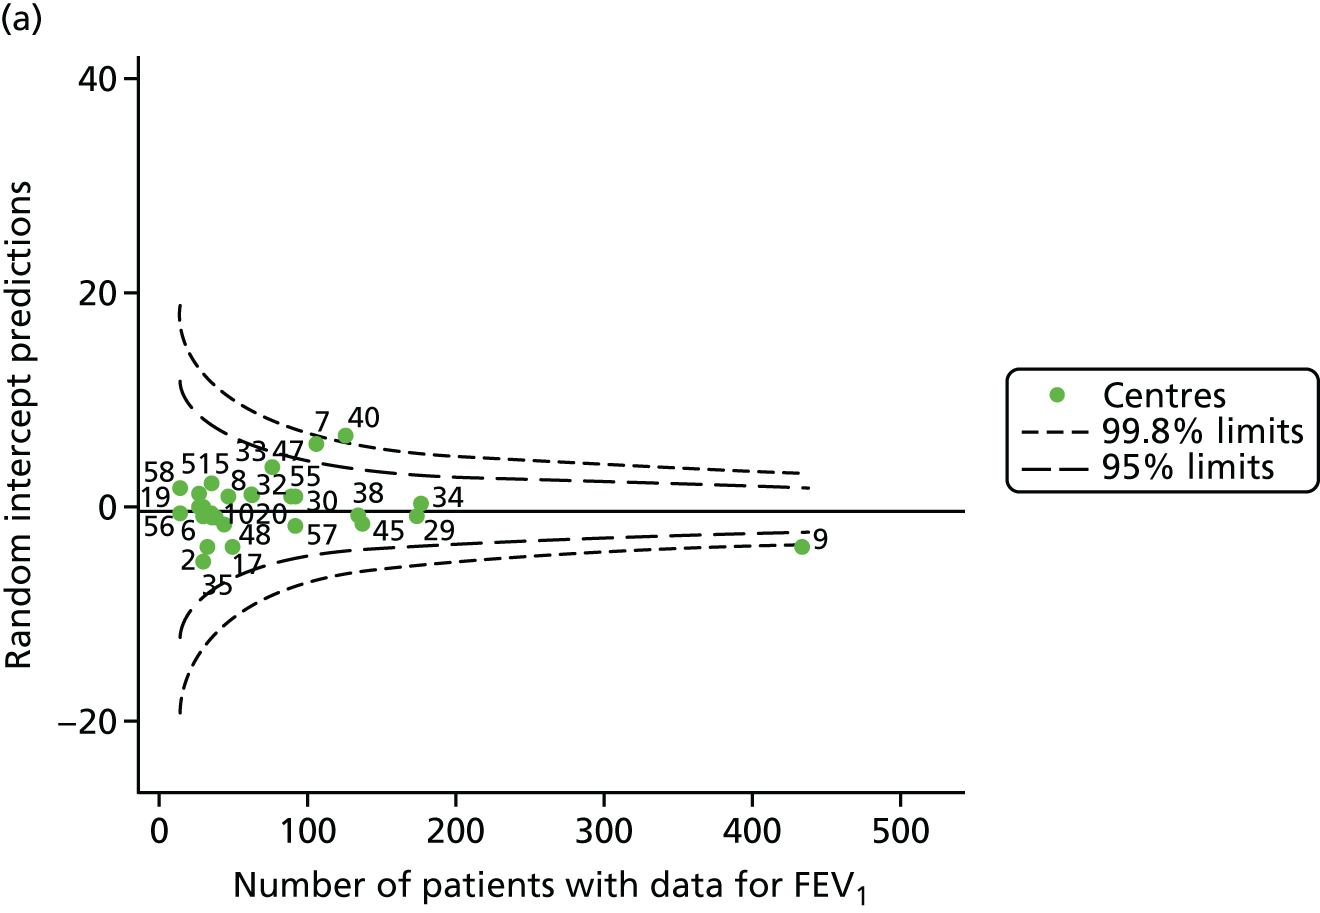
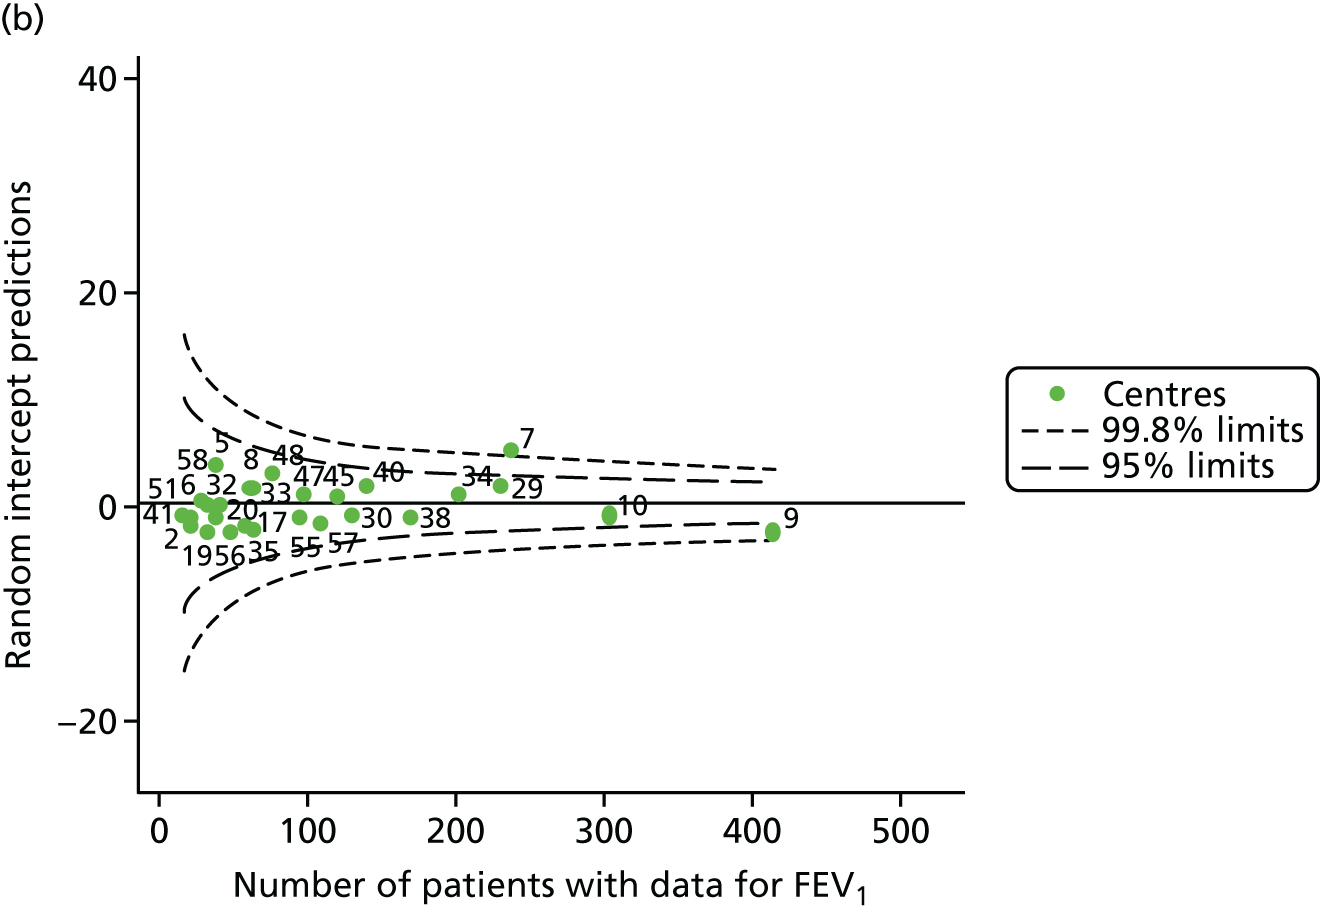
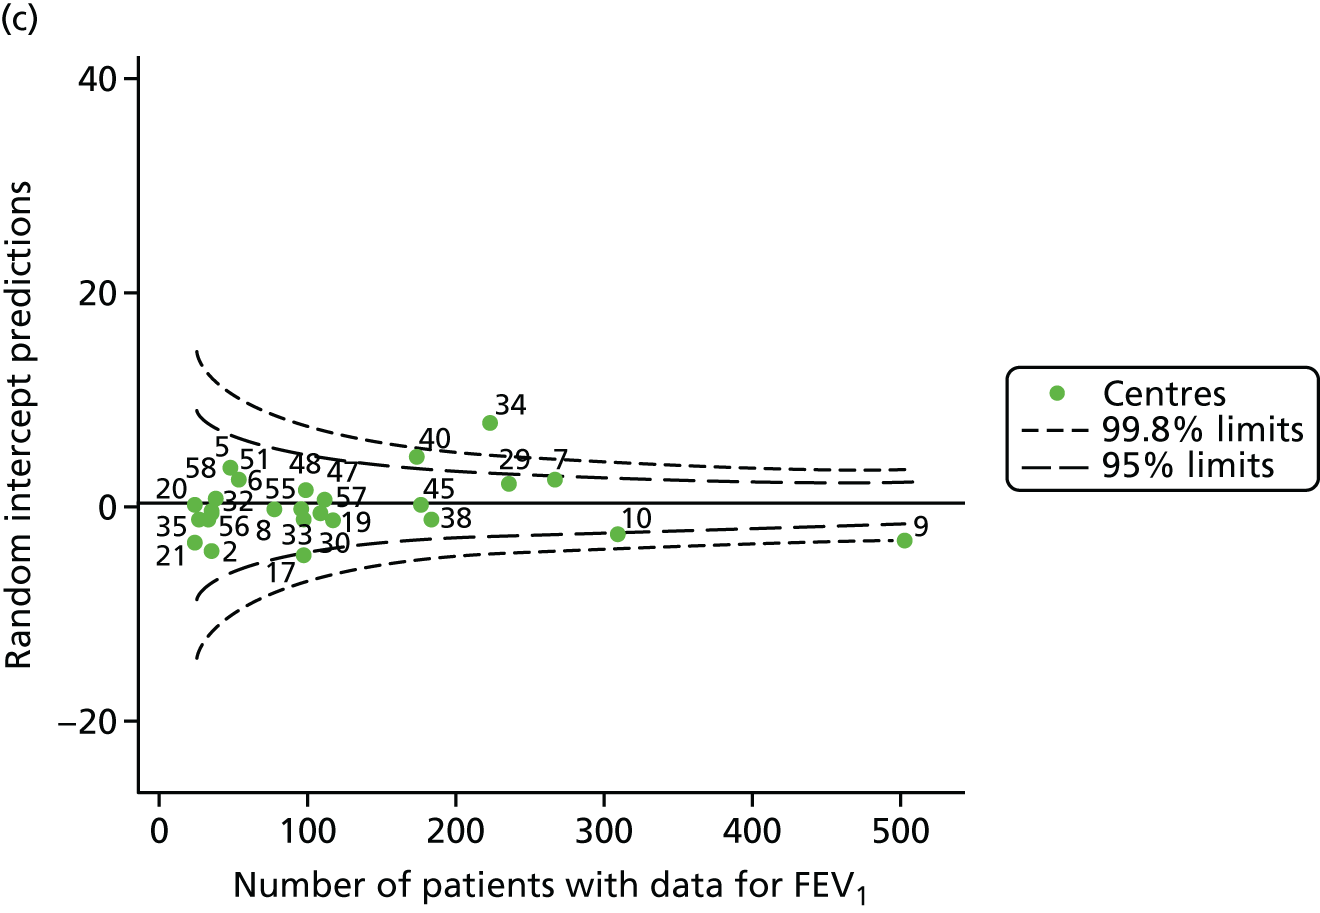
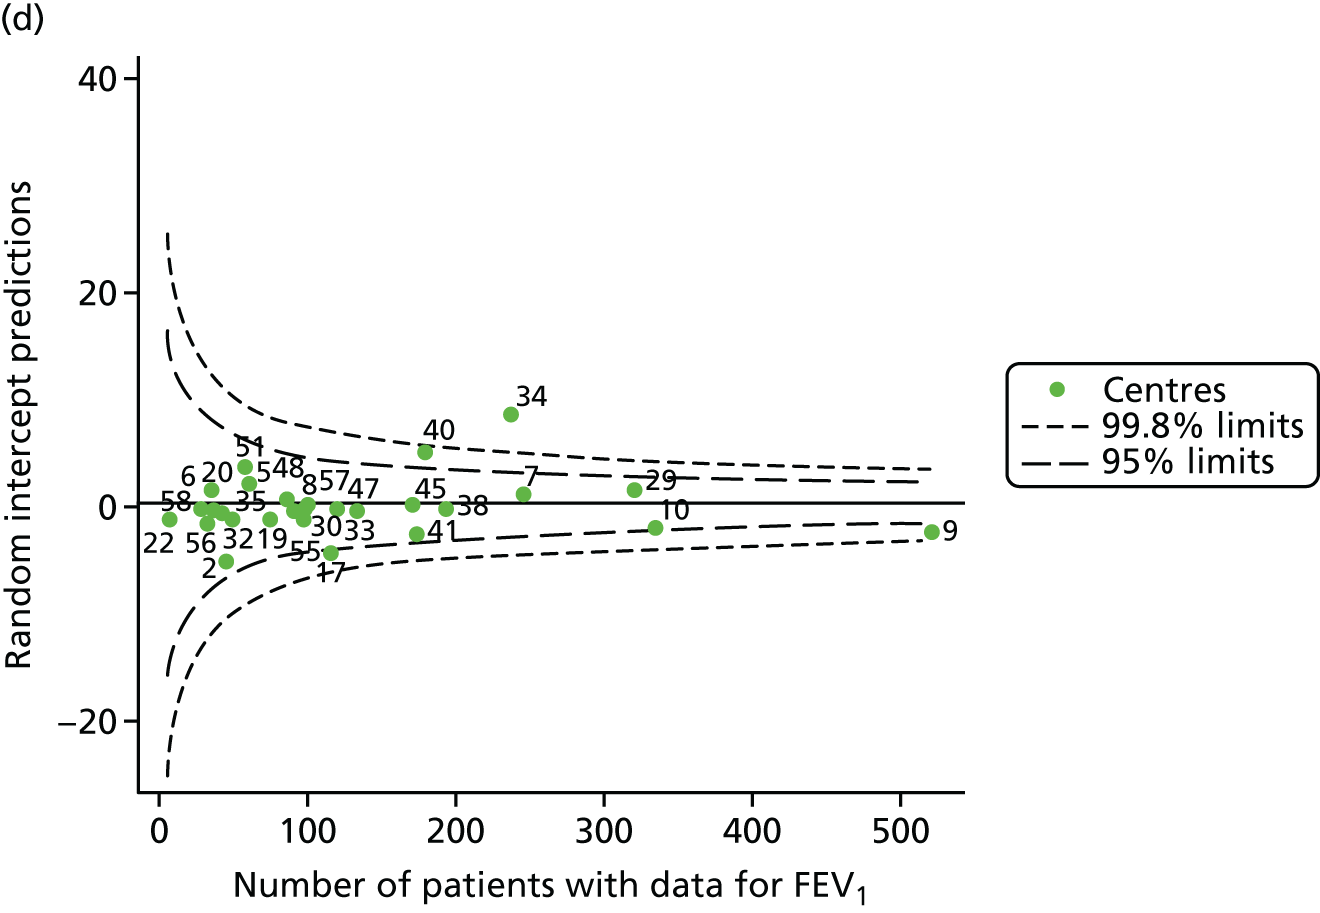
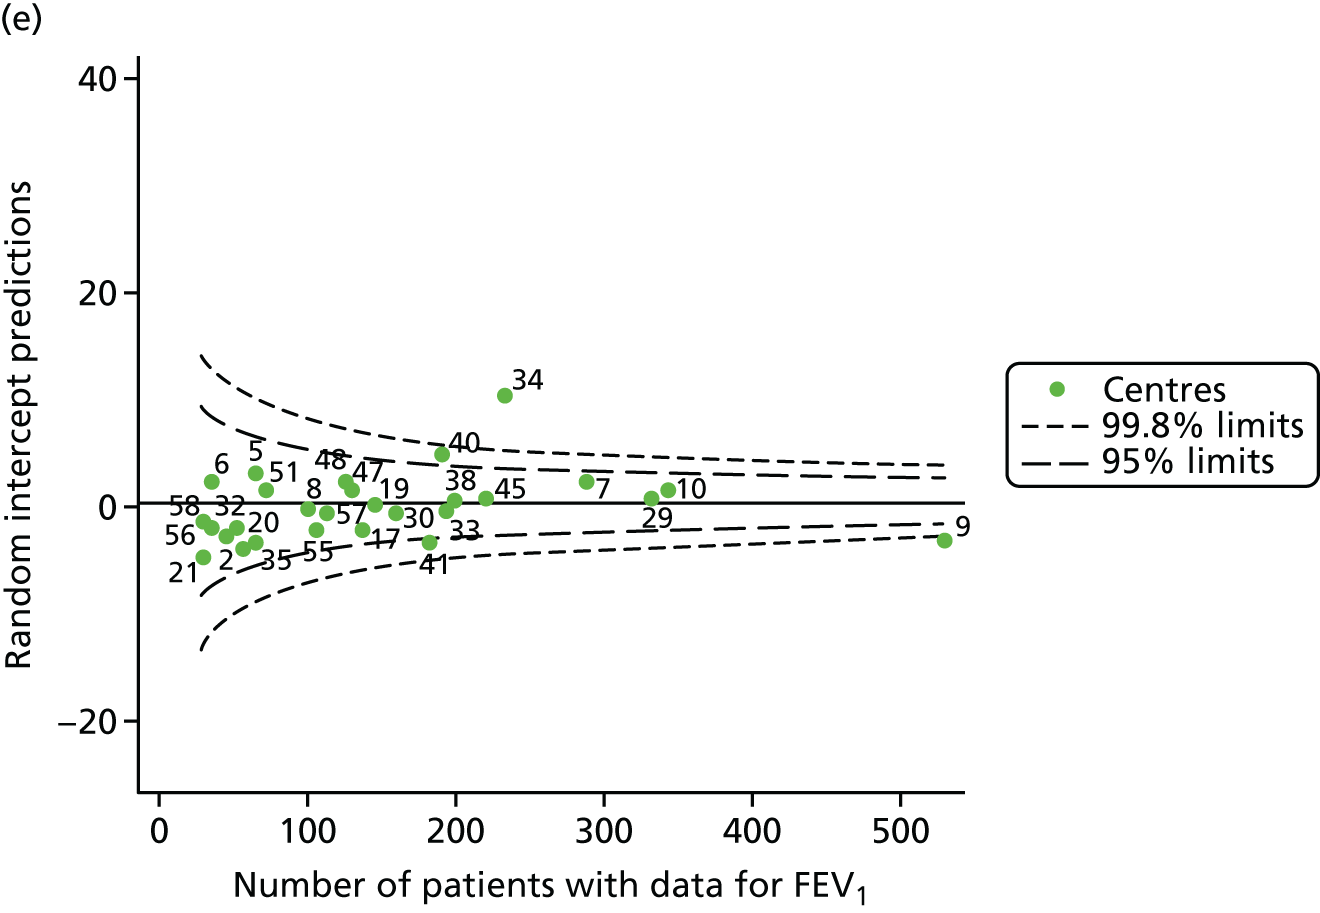

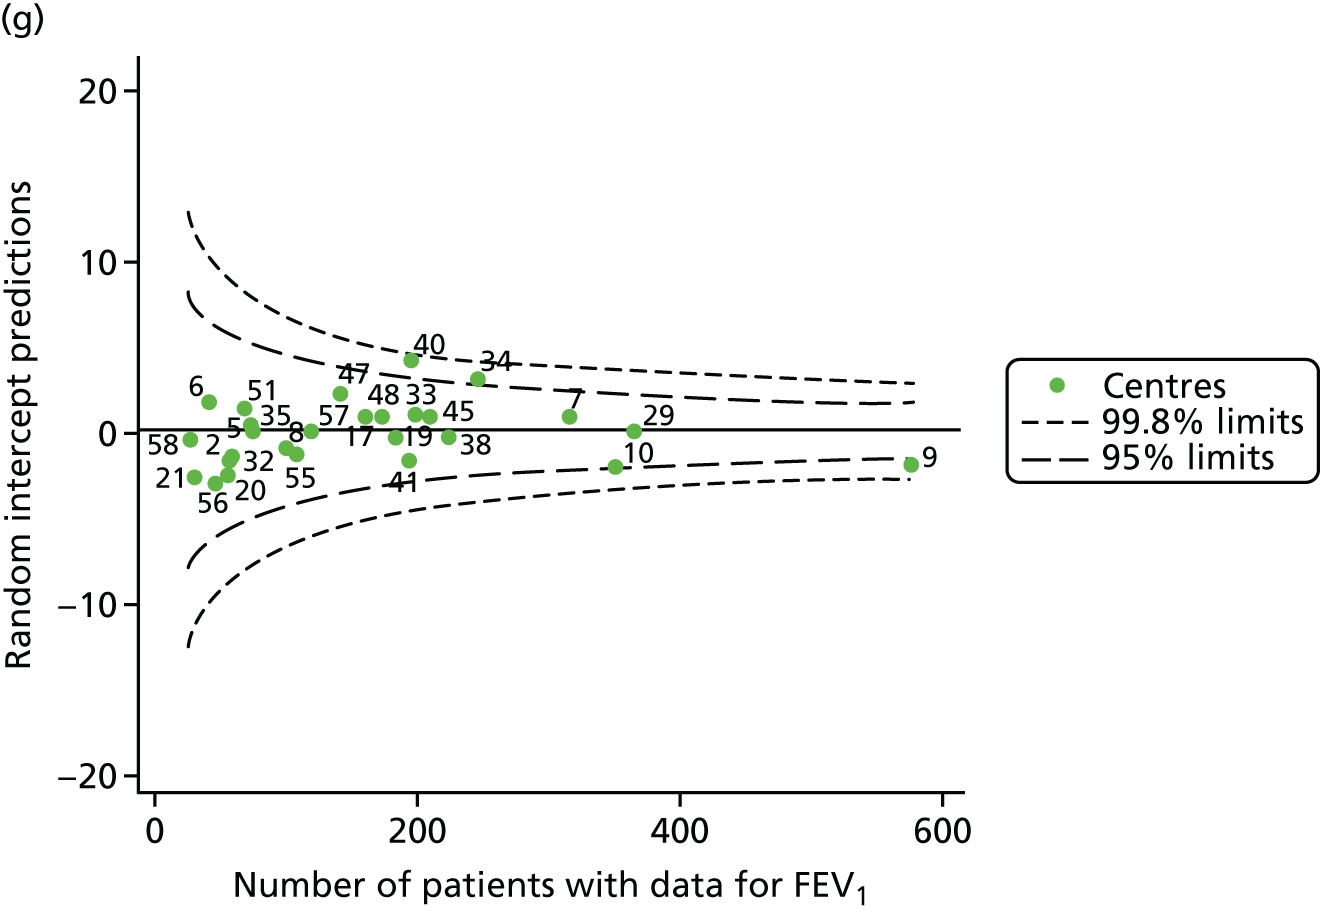
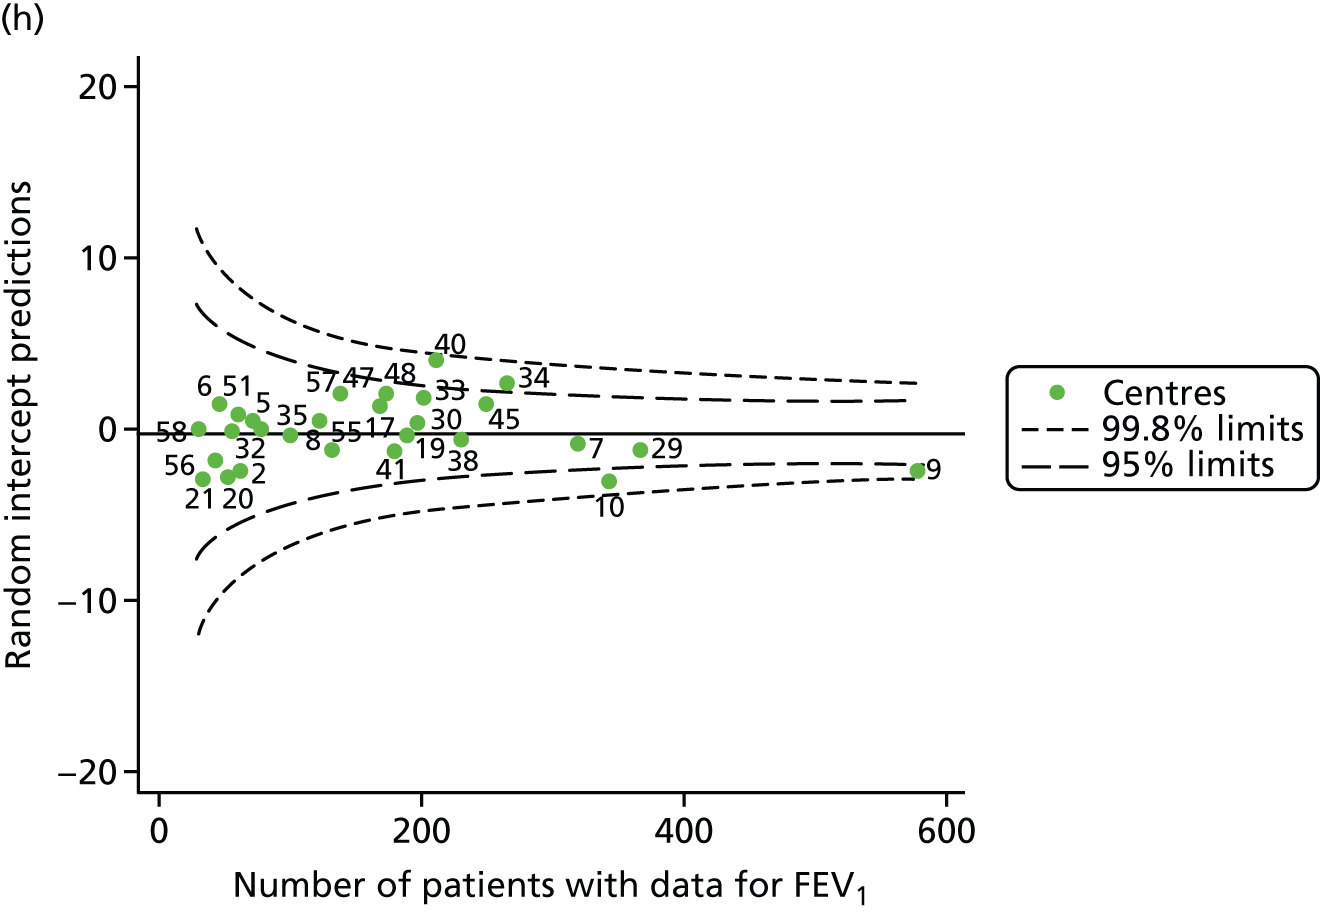
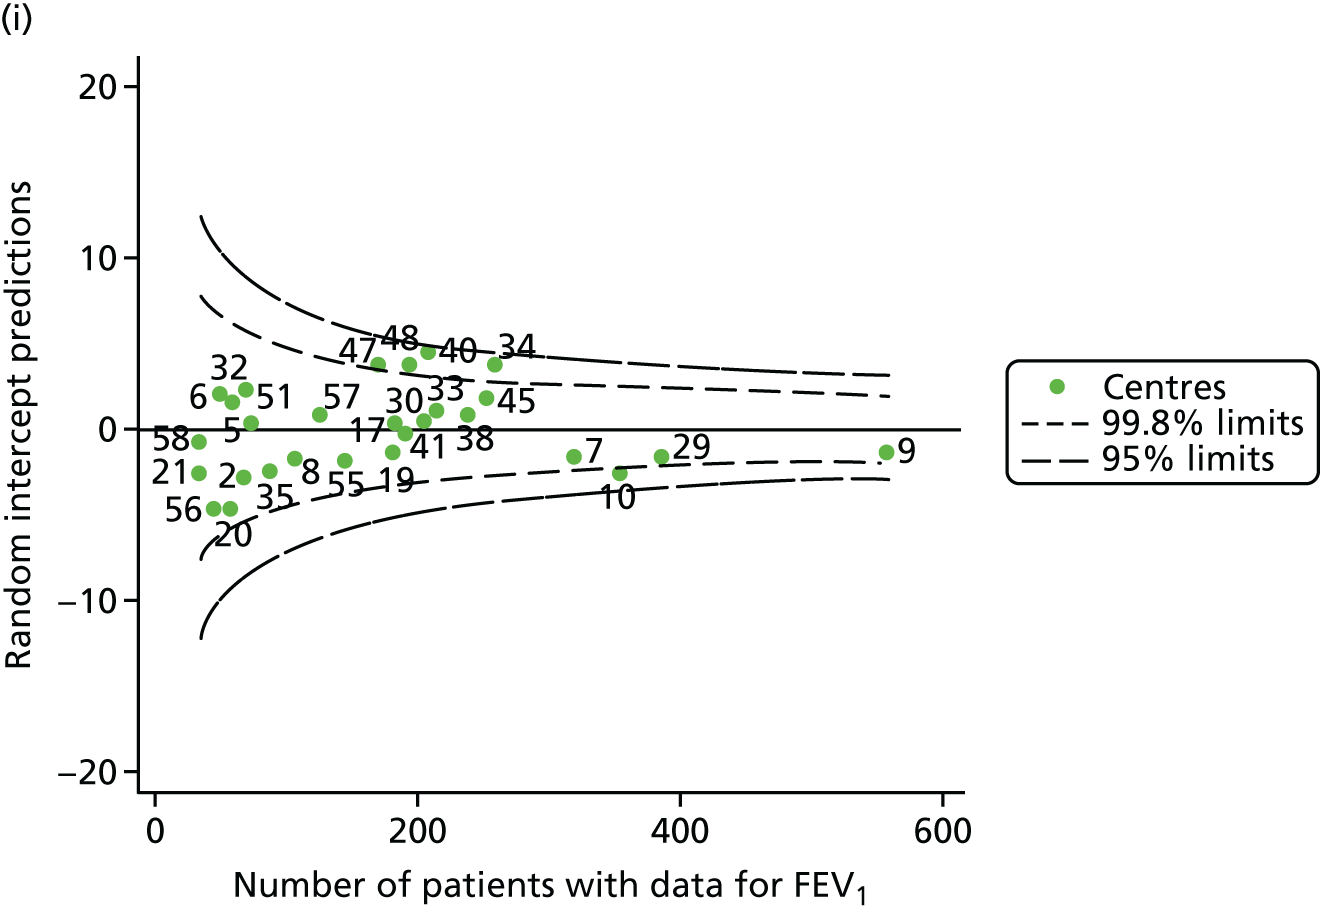
FIGURE 36.
Funnel plots of FEV1 adjusted for age using splines and other case-mix variables using fixed-effect GLM models, by year. (a) 2007; (b) 2008; (c) 2009; (d) 2010; (e) 2011; (f) 2012; (g) 2013; (h) 2014; and (i) 2015.
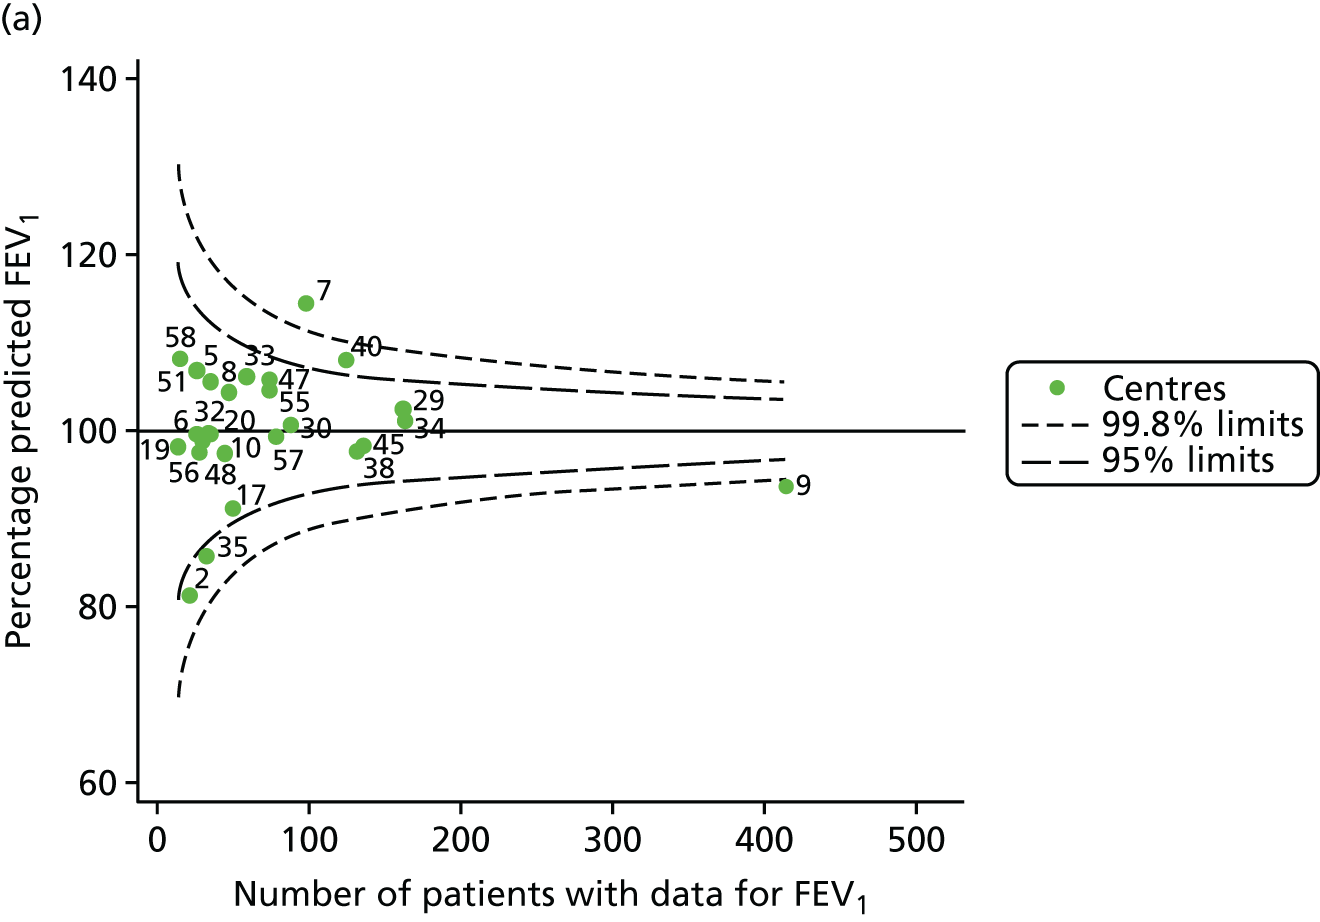
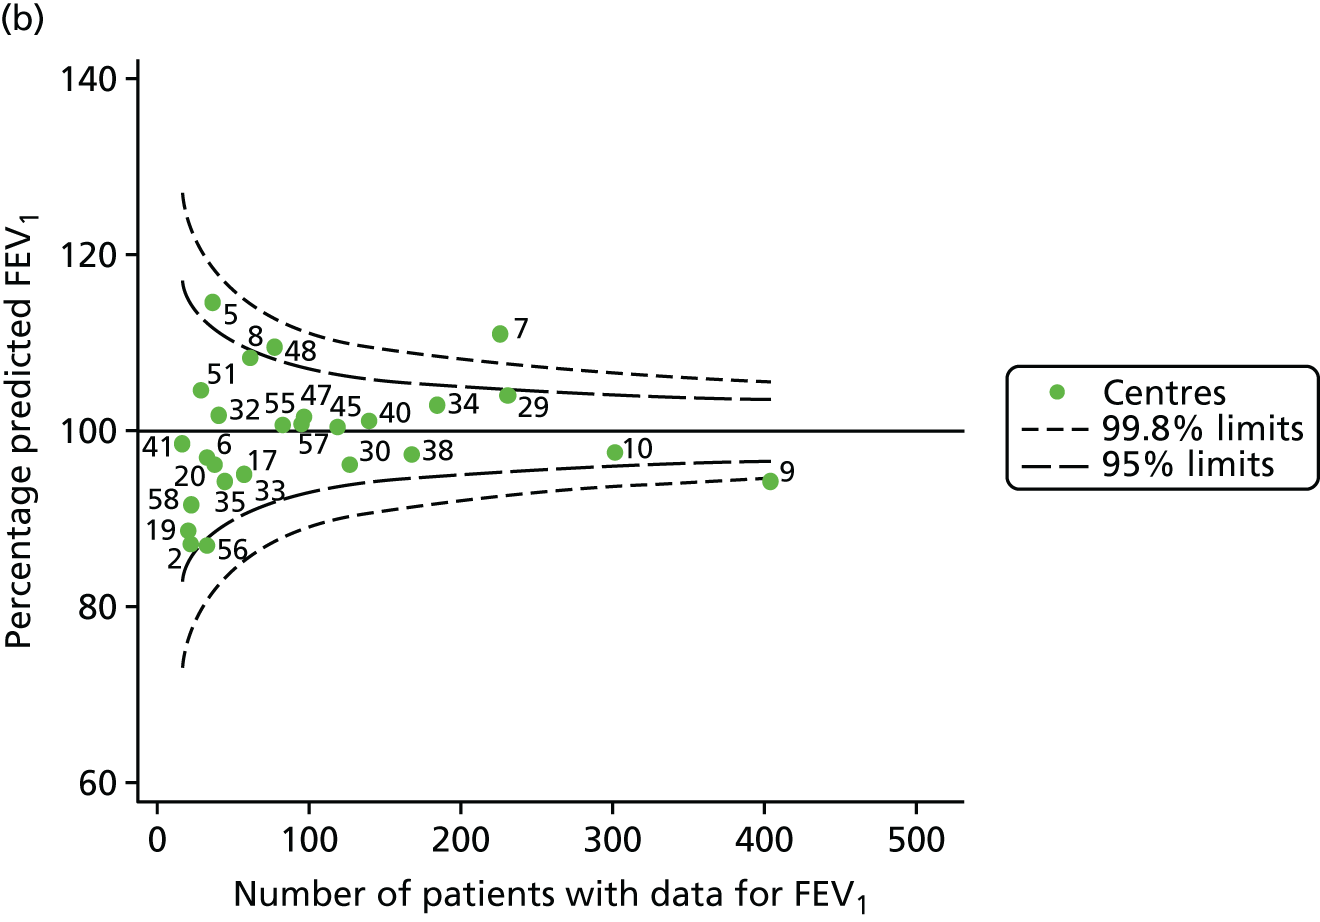
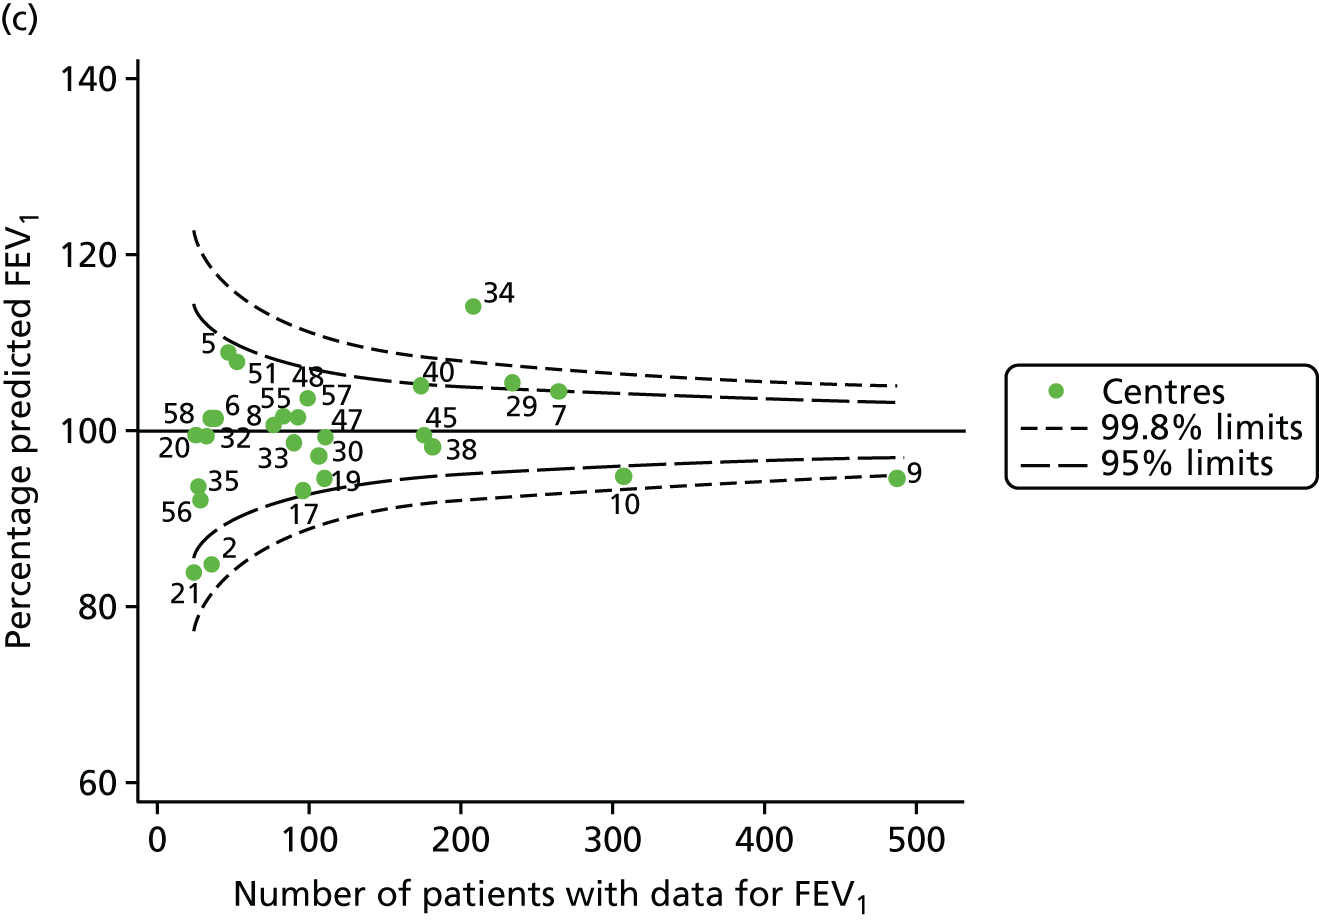
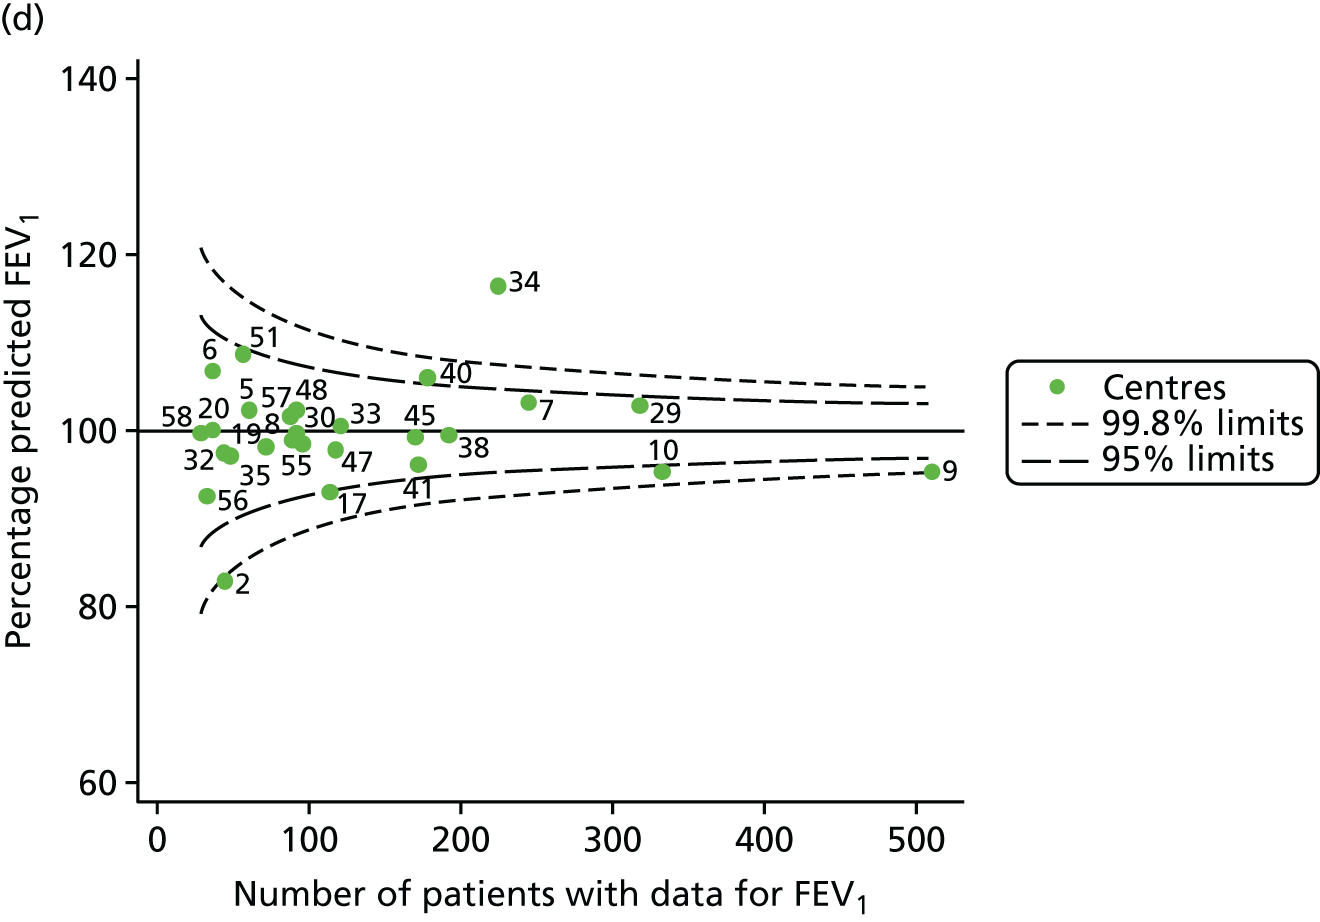
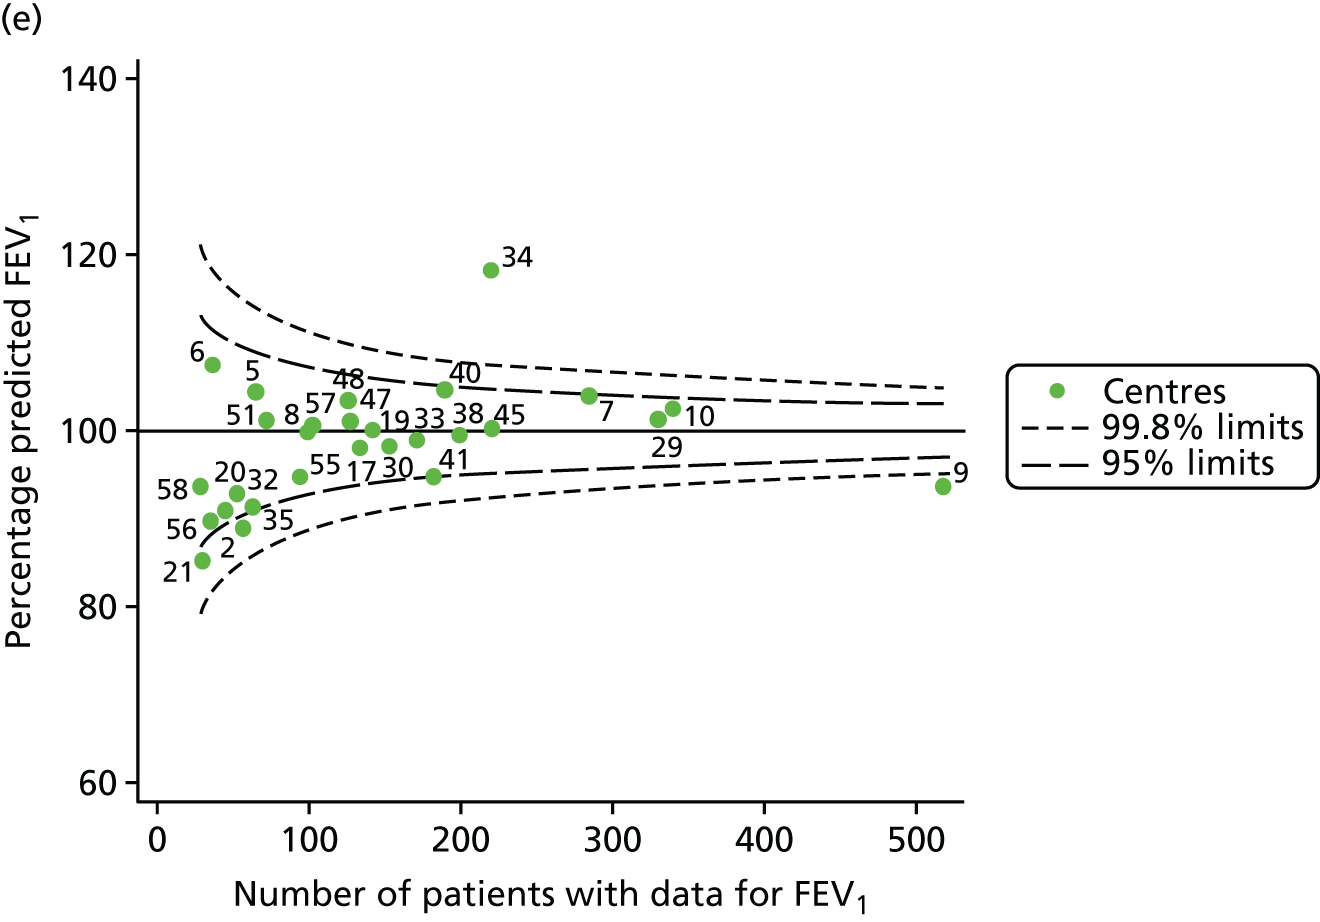
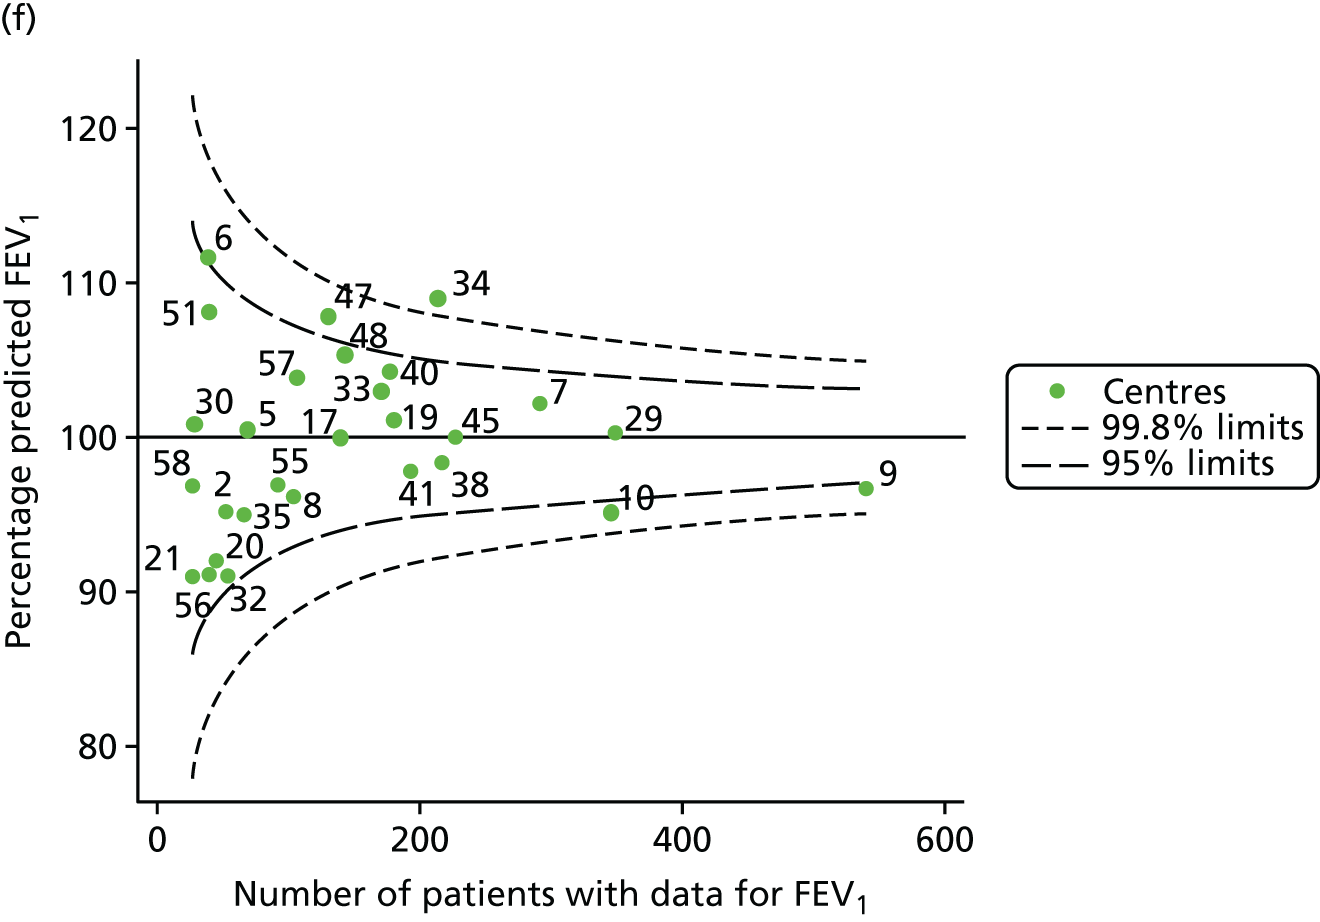
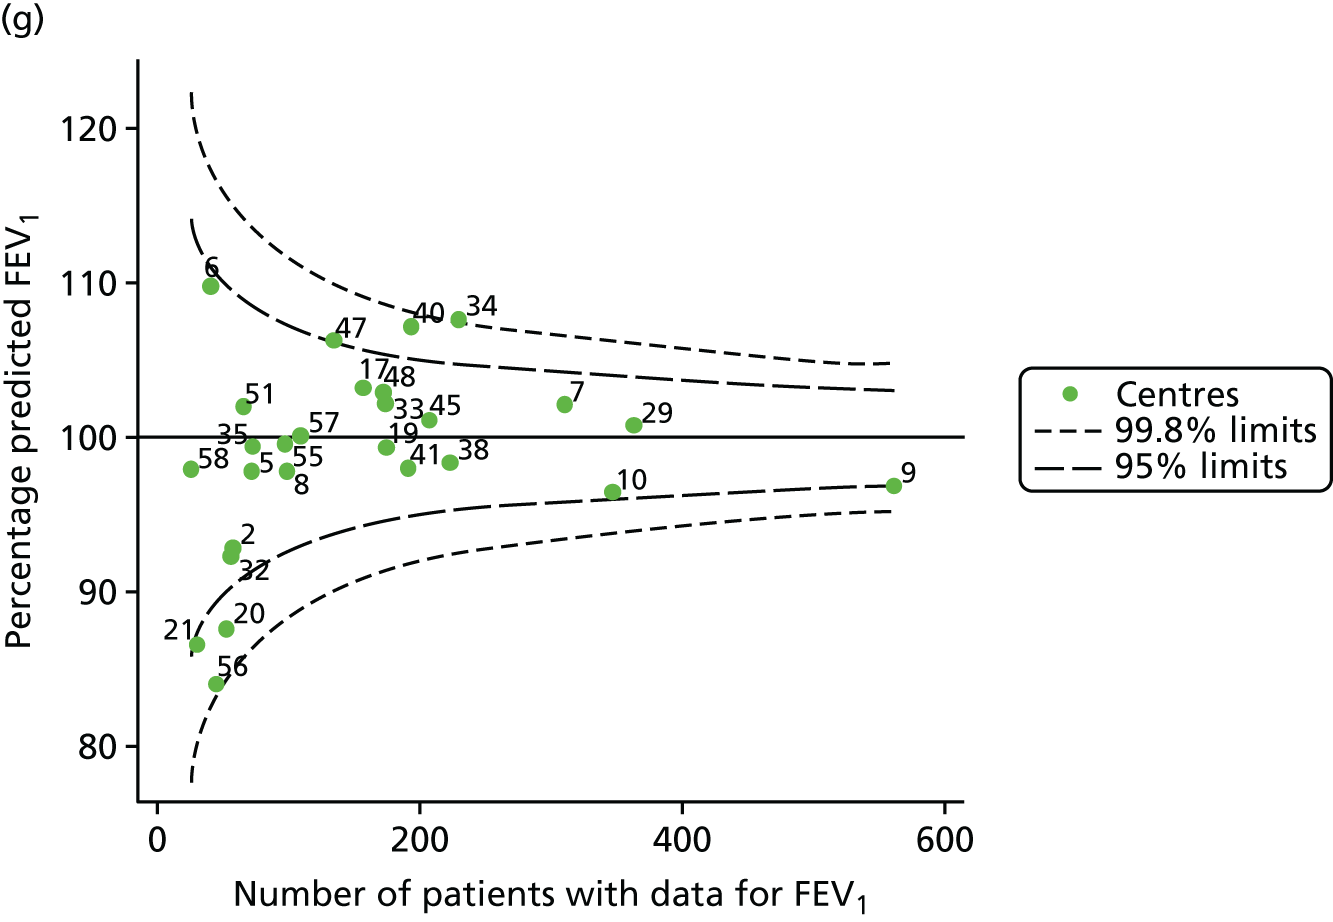
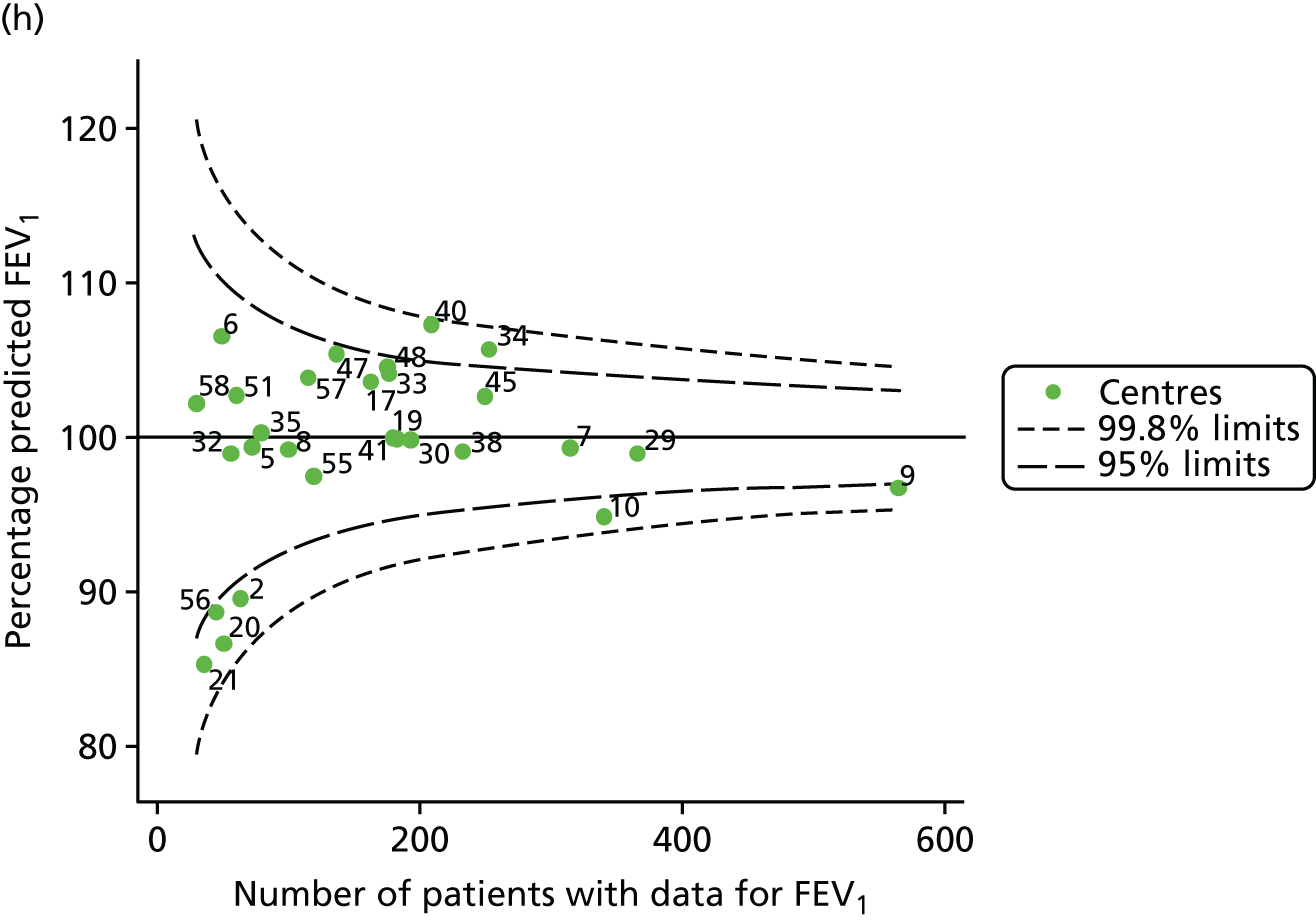
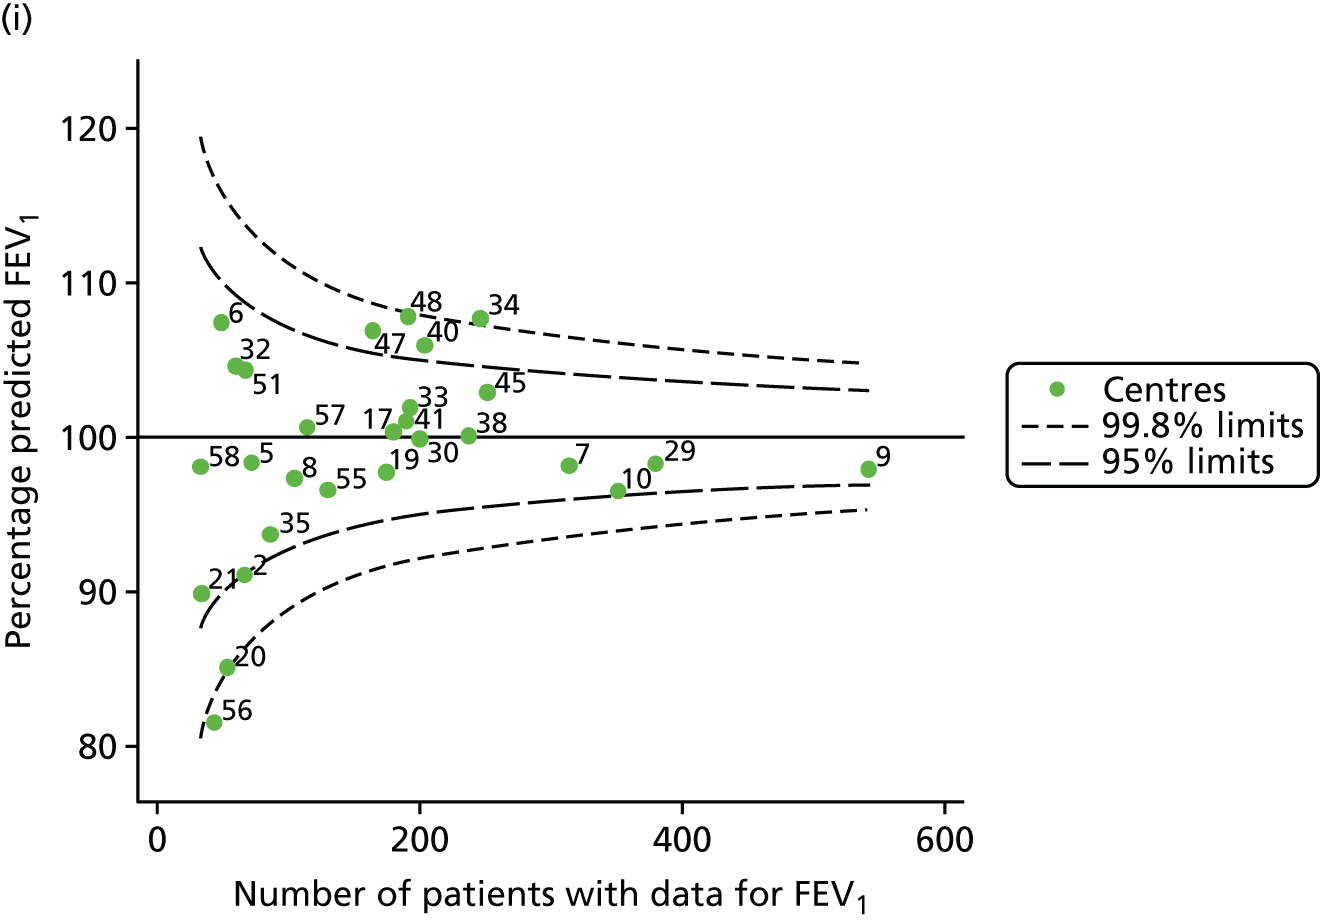
FIGURE 37.
Funnel plots of the proportion of patients receiving i.v. antibiotics, by year. (a) 2007; (b) 2008; (c) 2009; (d) 2010; (e) 2011; (f) 2012; (g) 2013; (h) 2014; and (i) 2015.
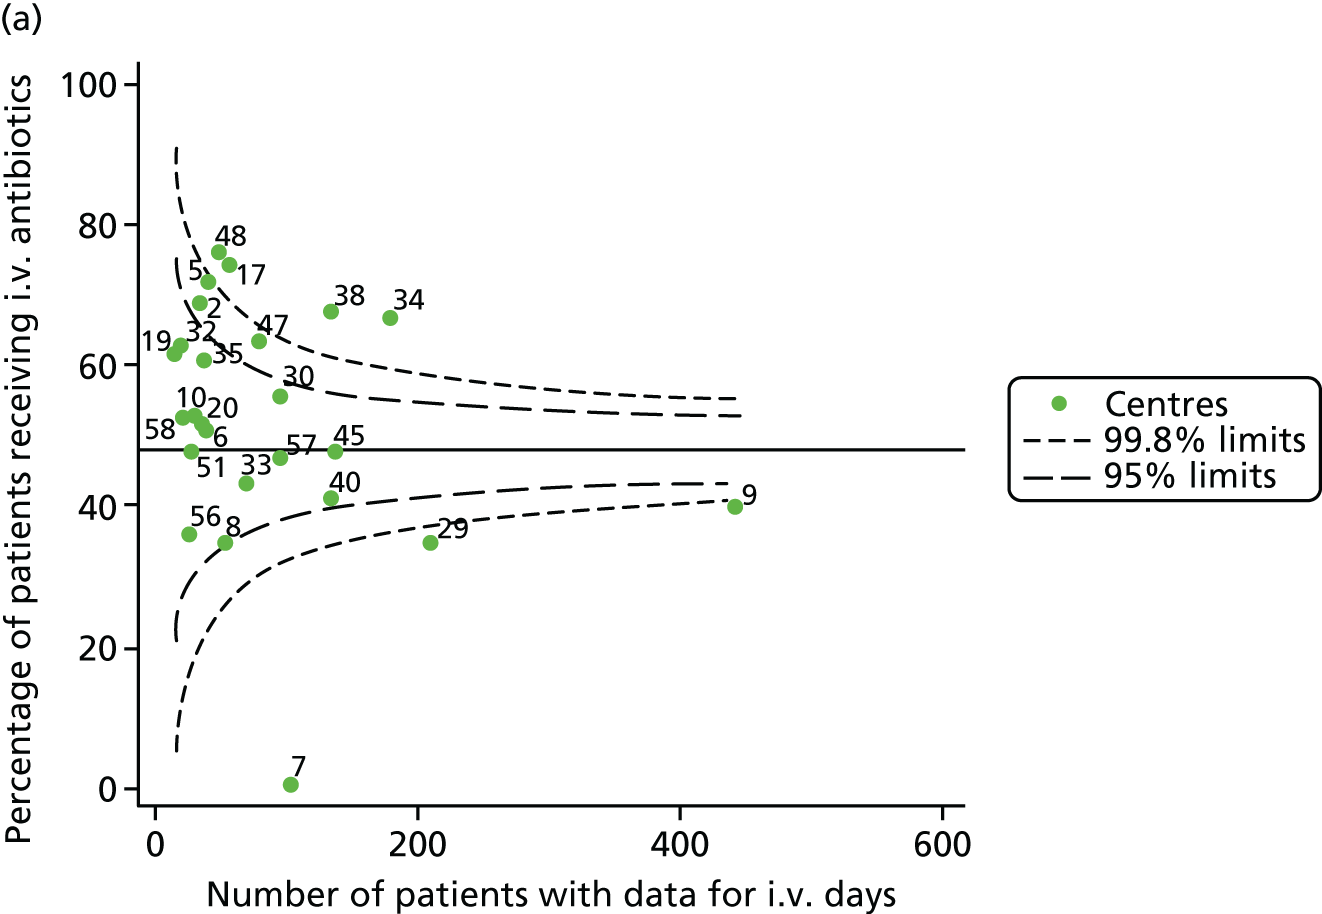
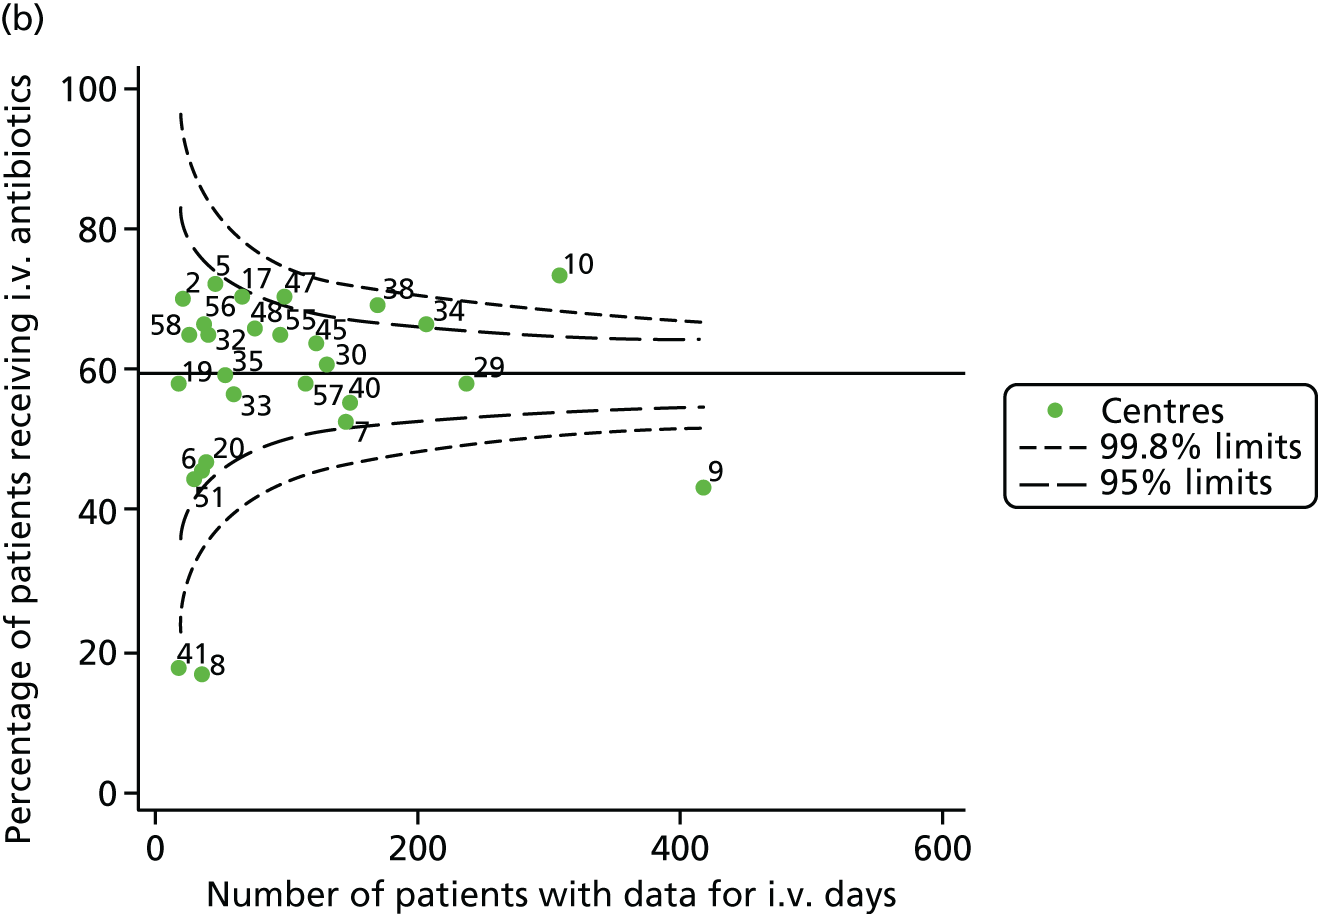
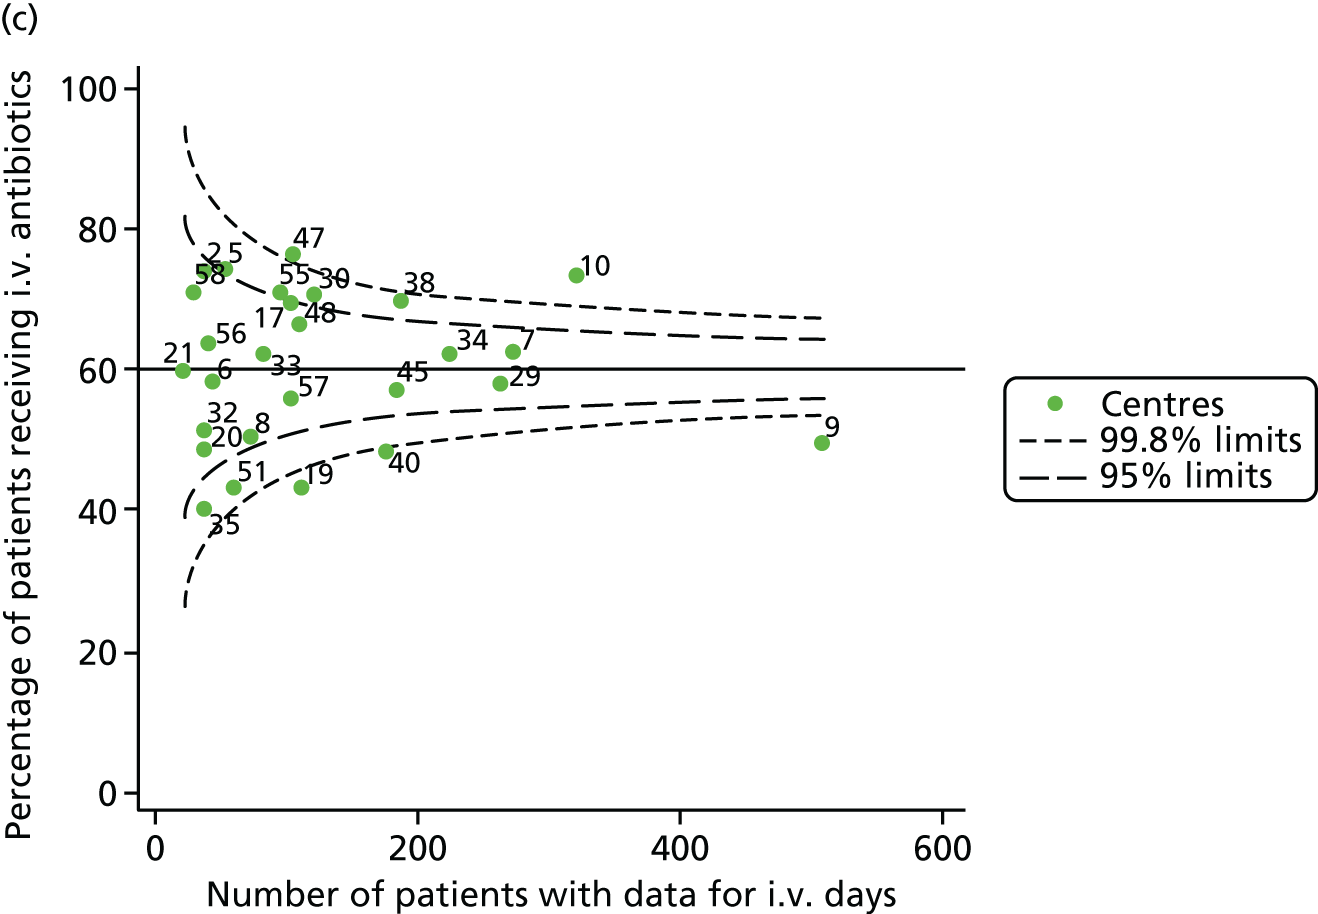
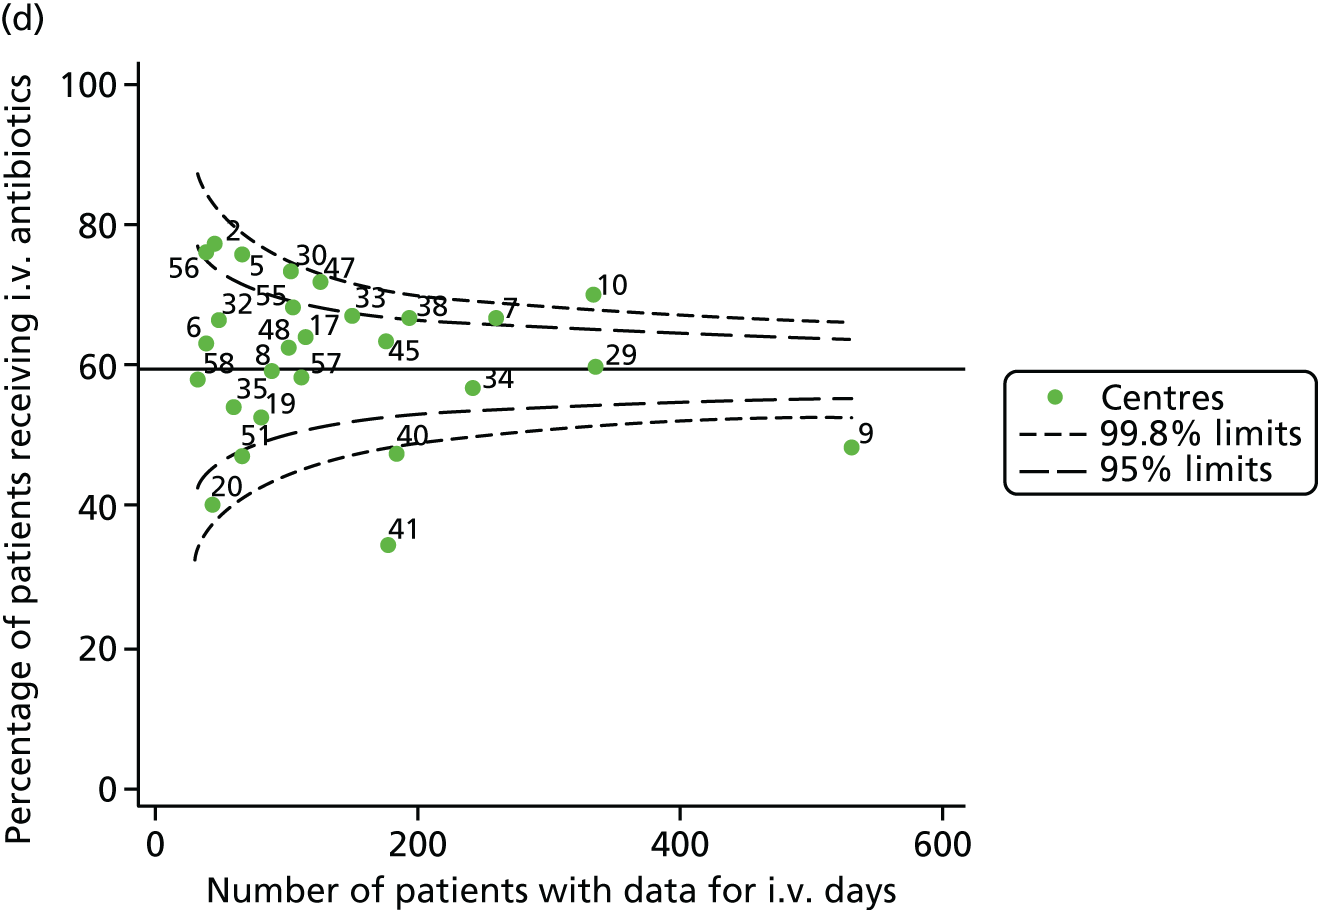
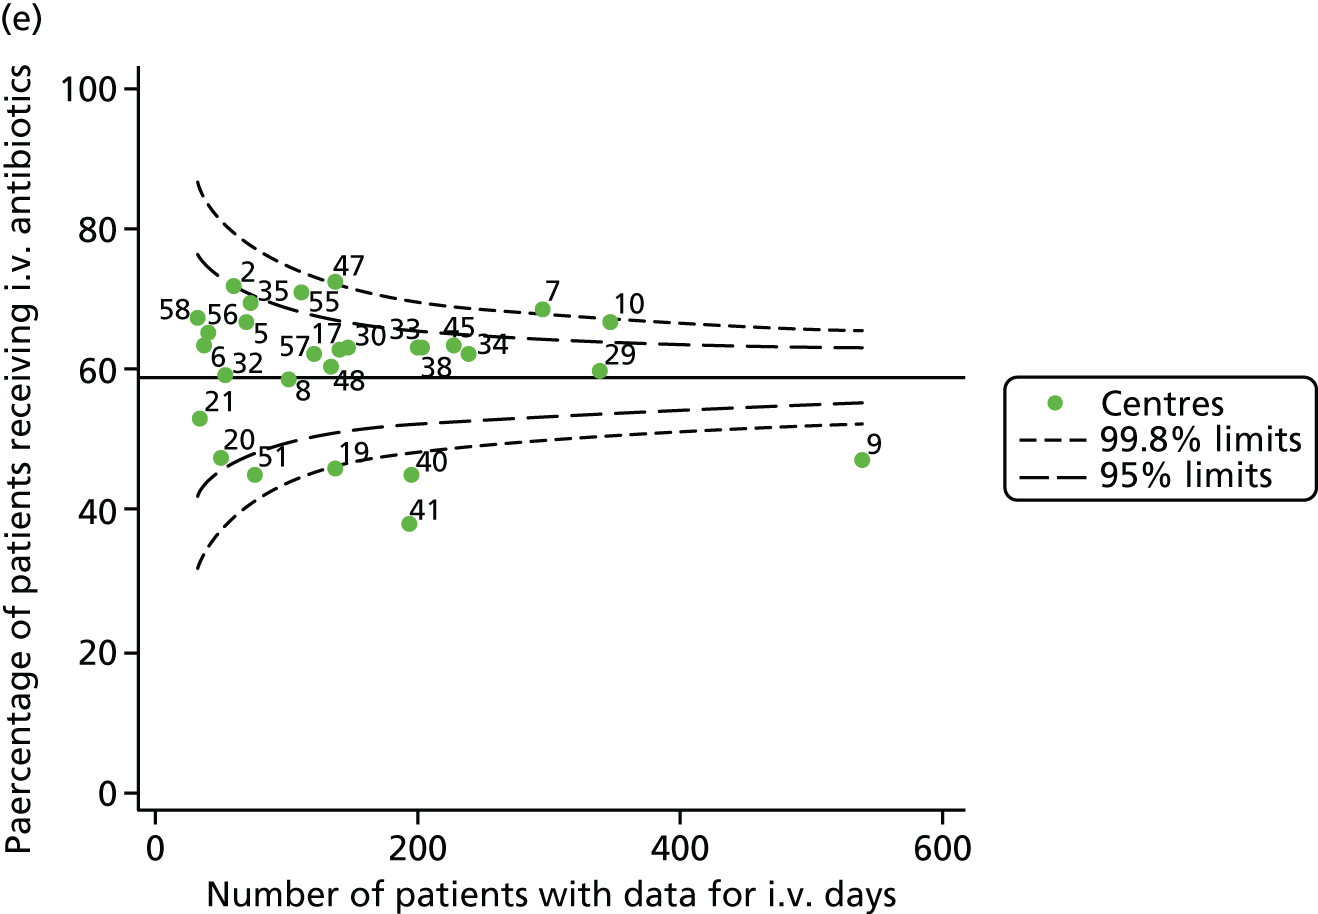
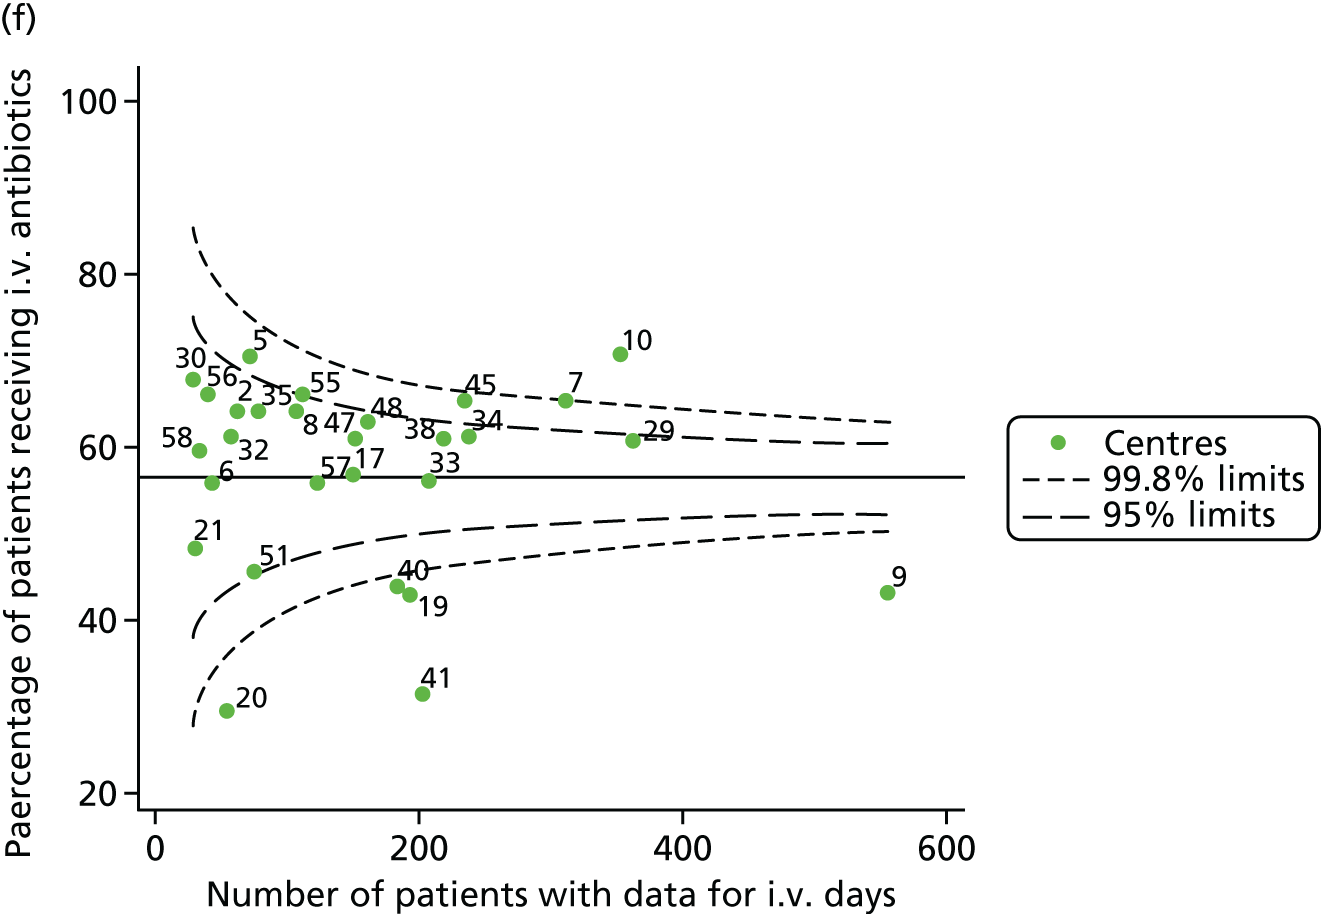
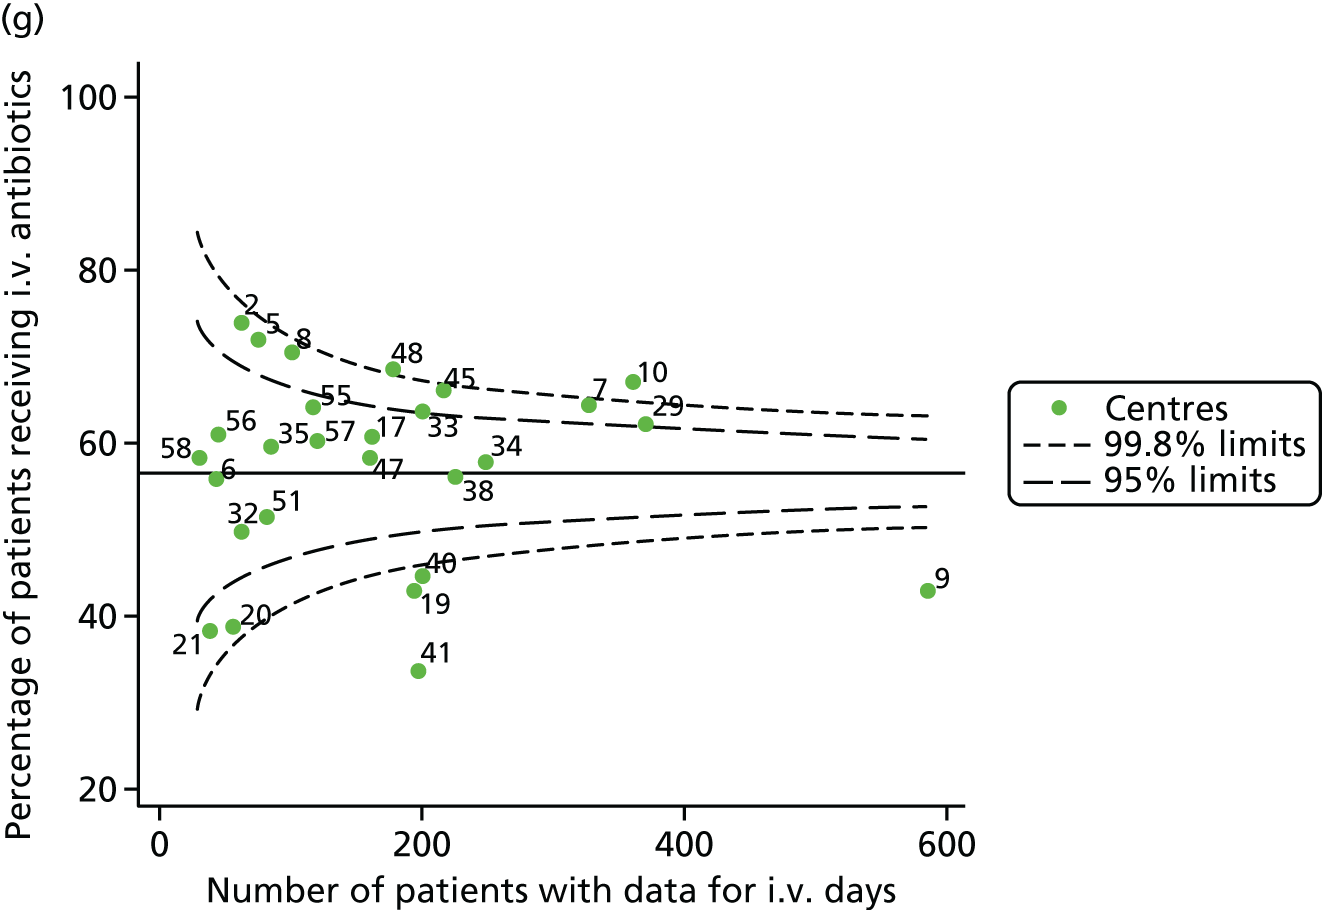

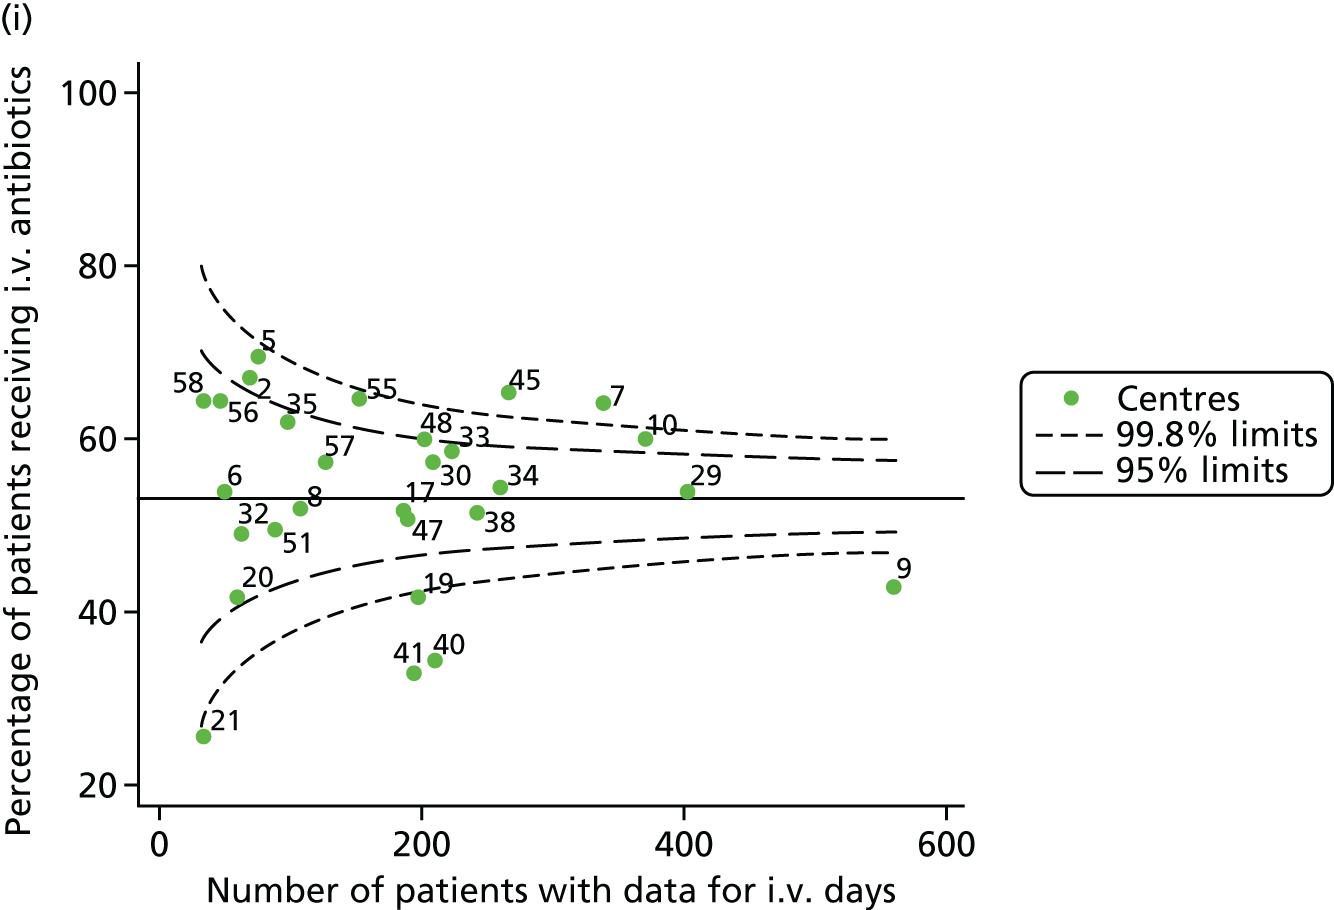
FIGURE 38.
Funnel plots of FEV1 unadjusted for case mix estimated using GLI reference equations, by year. (a) 2007; (b) 2008; (c) 2009; (d) 2010; (e) 2011; (f) 2012; (g) 2013; (h) 2014; and (i) 2015.
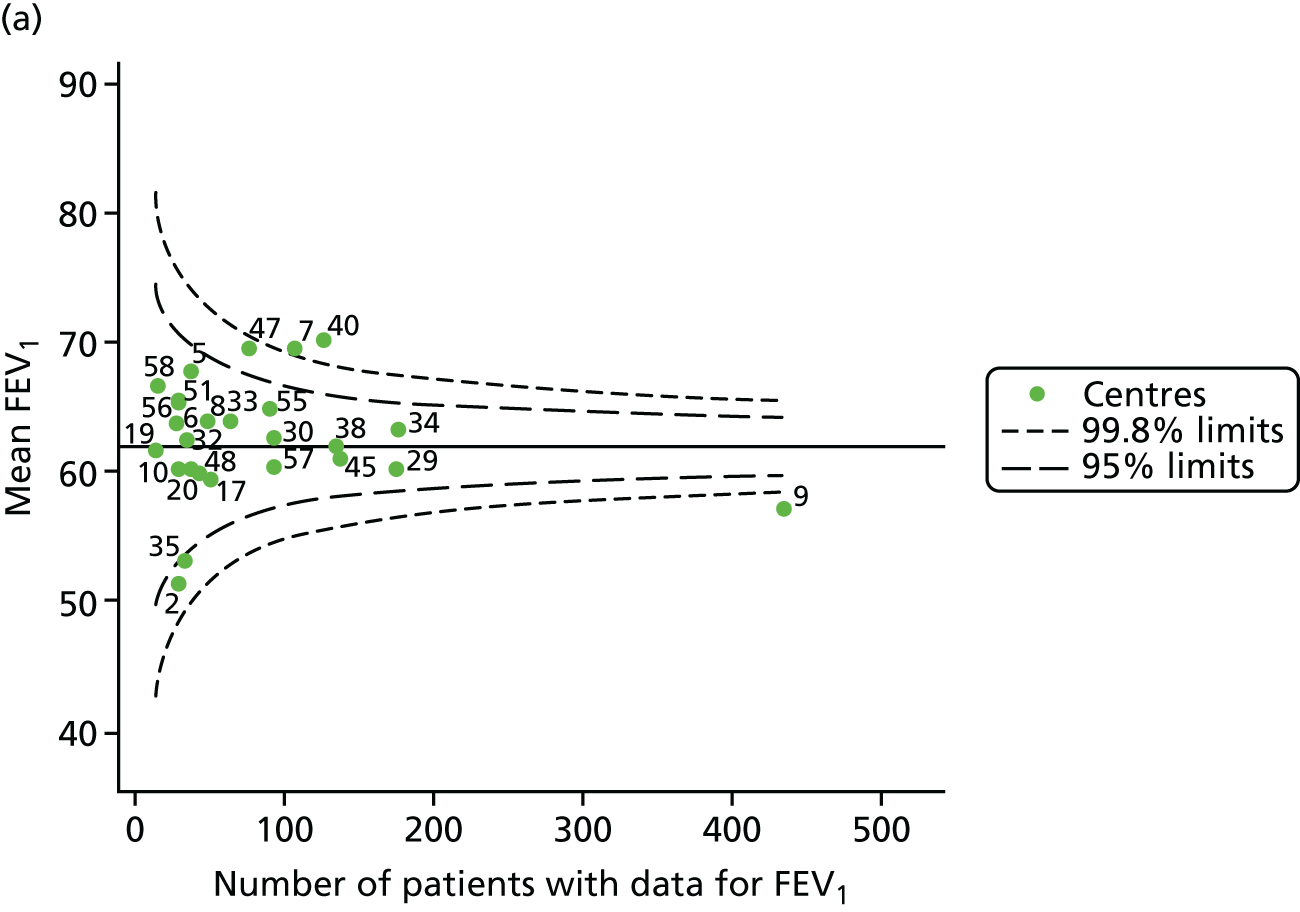
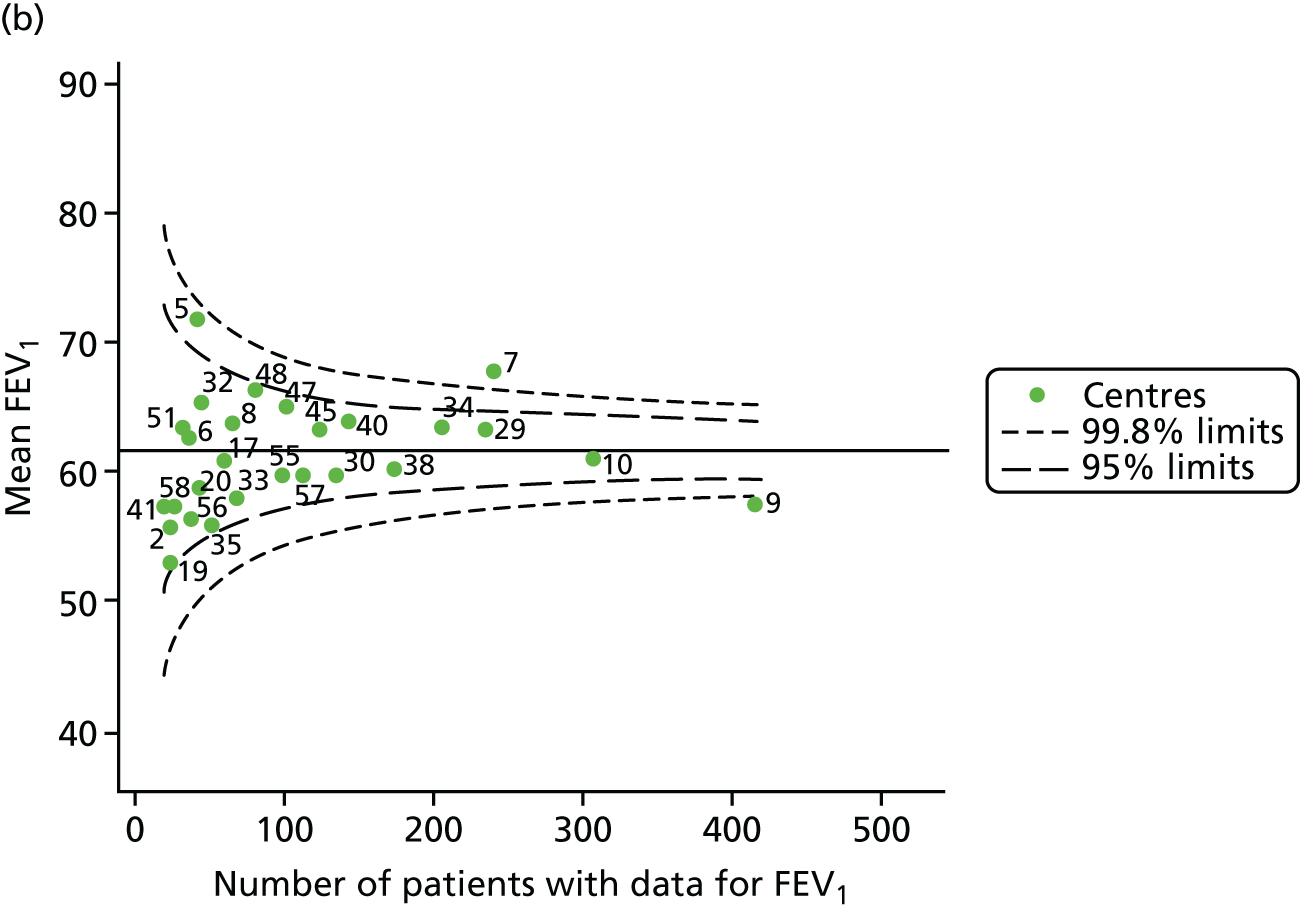
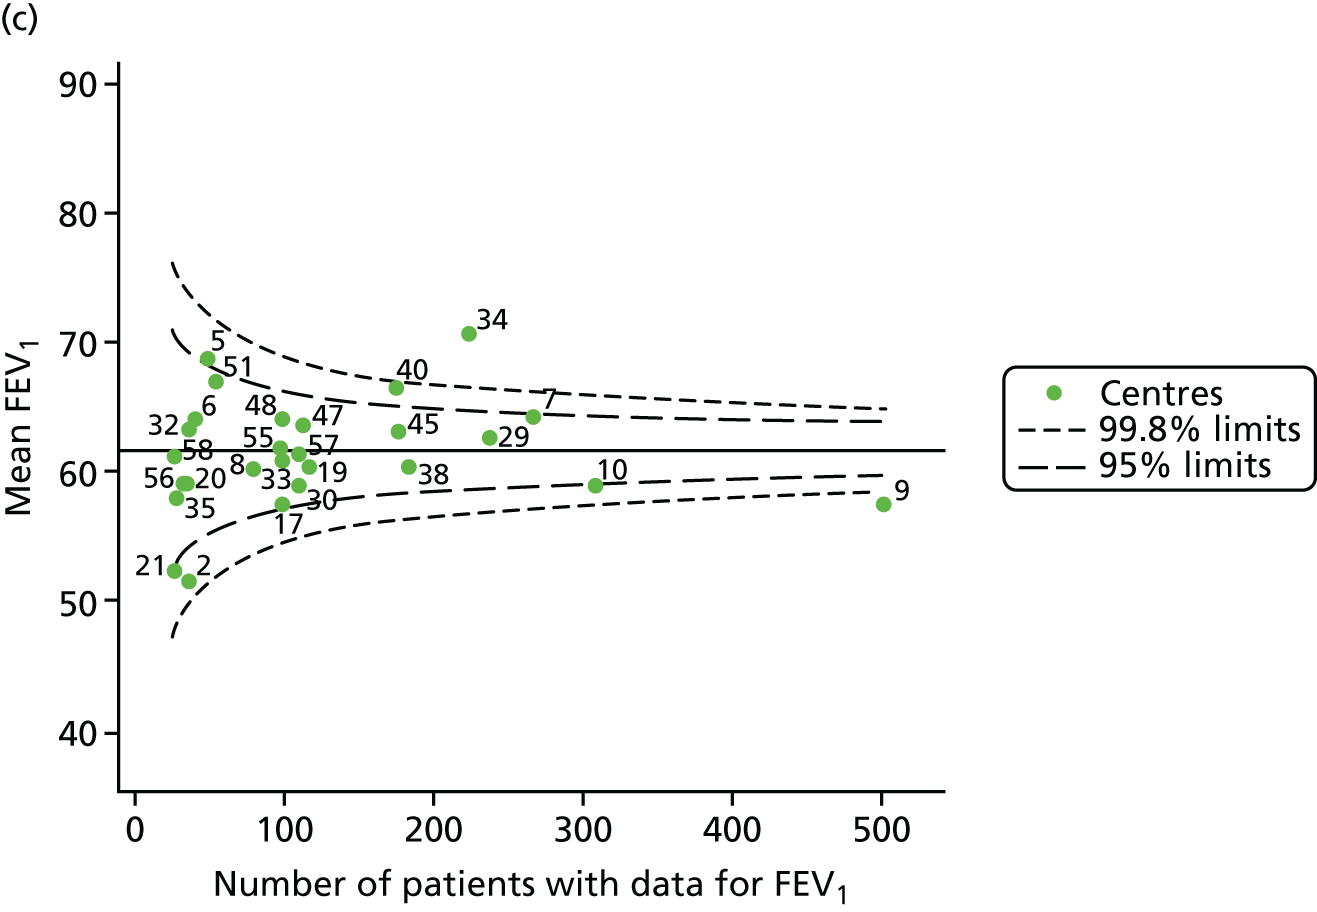
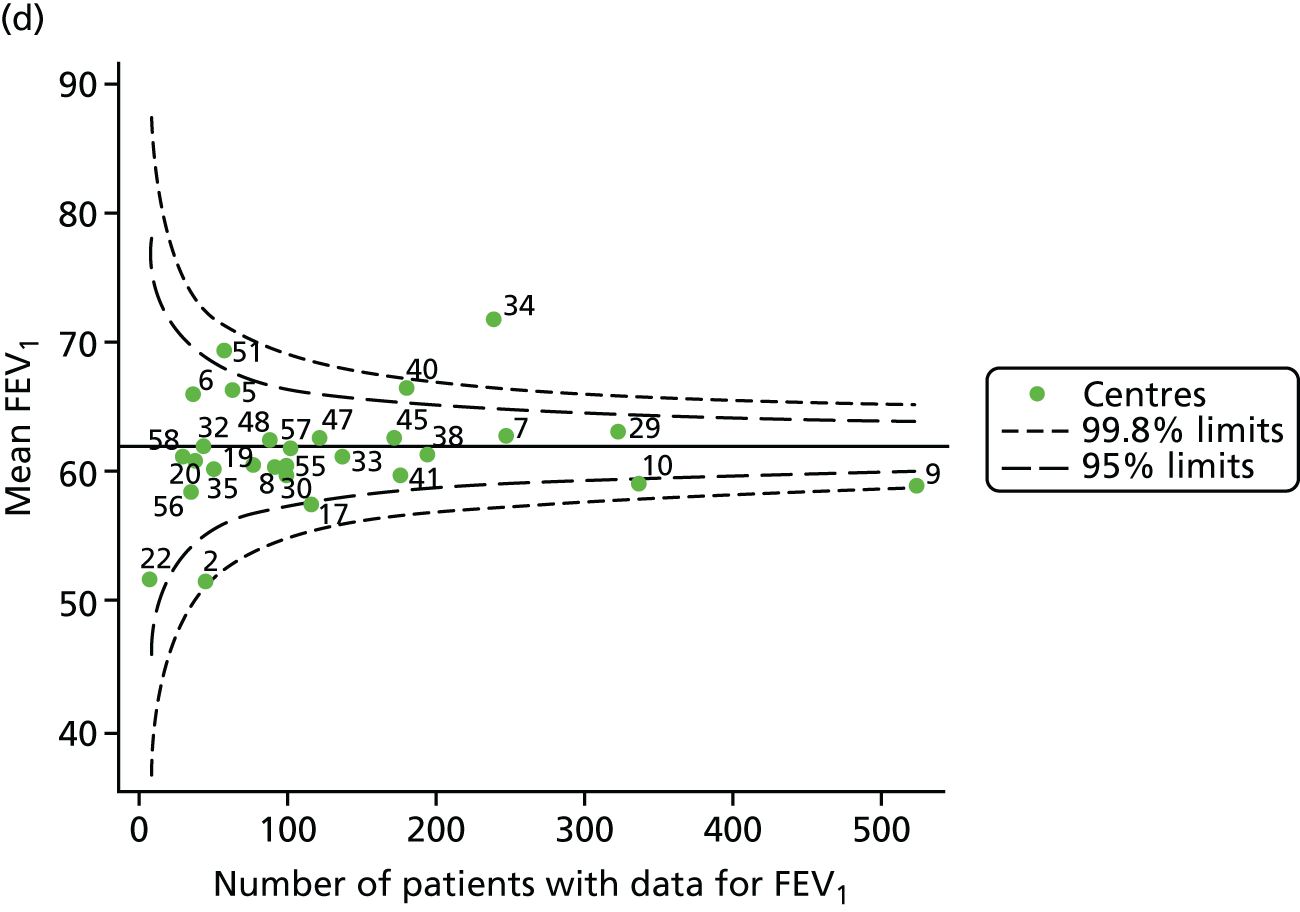
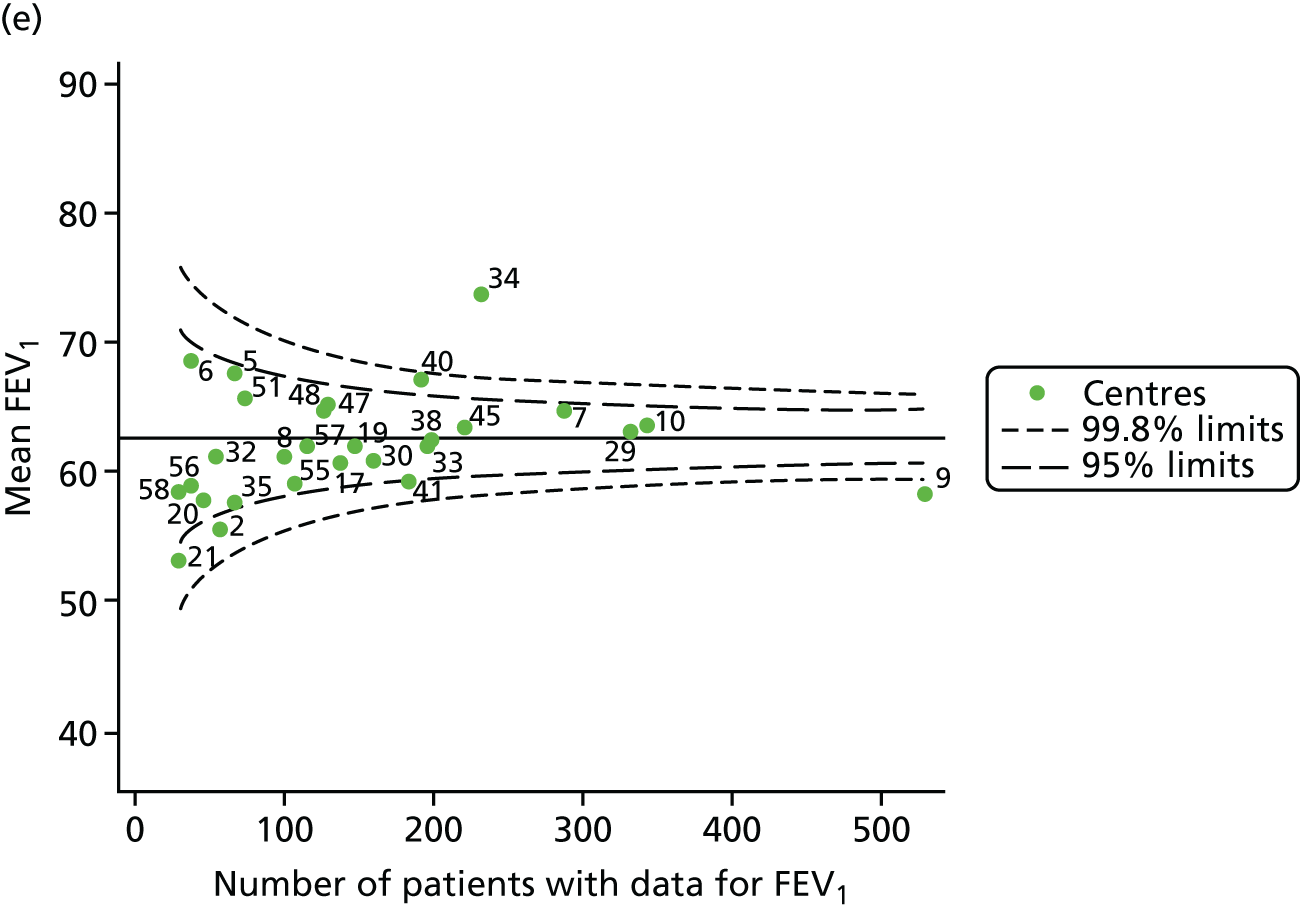
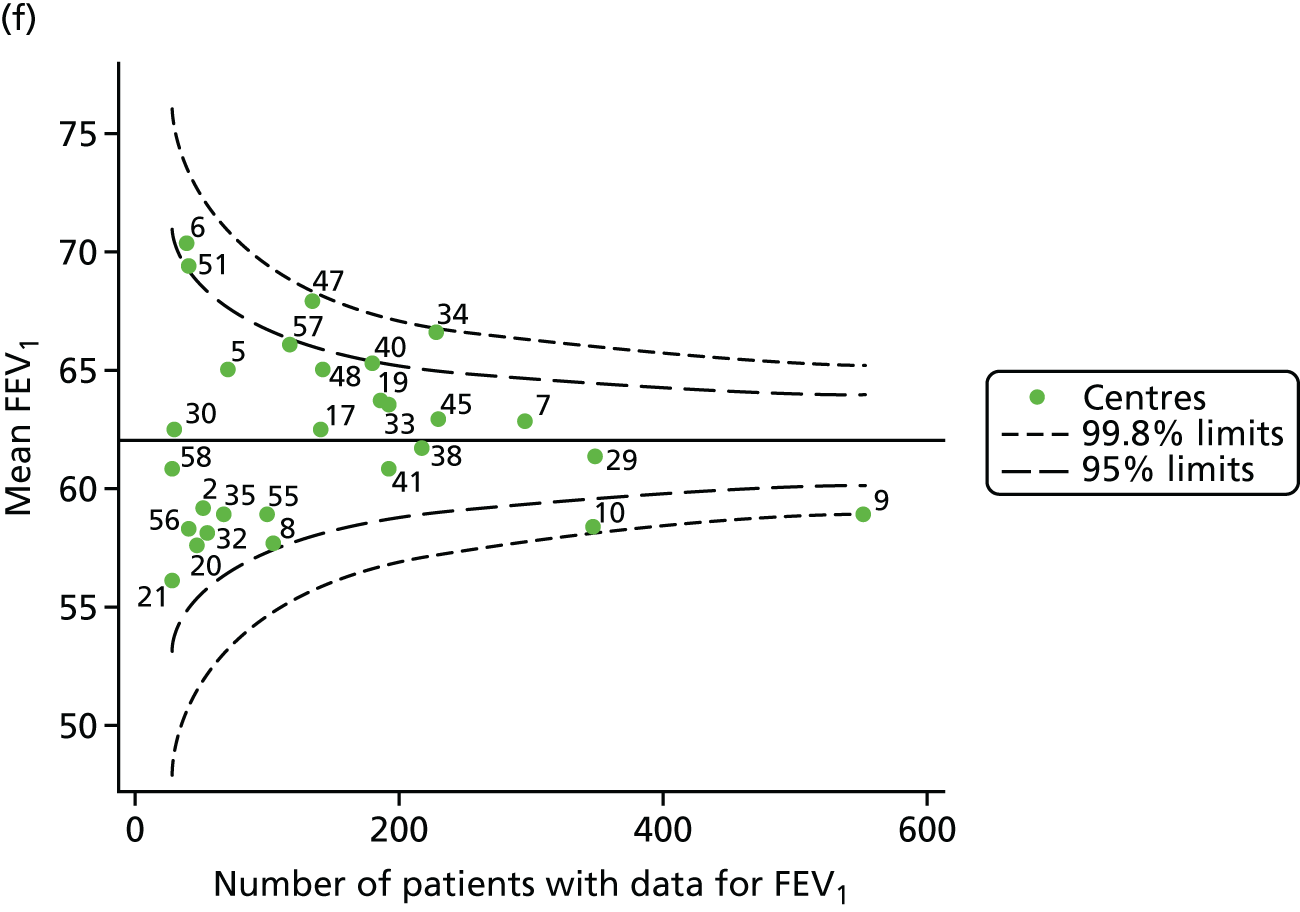
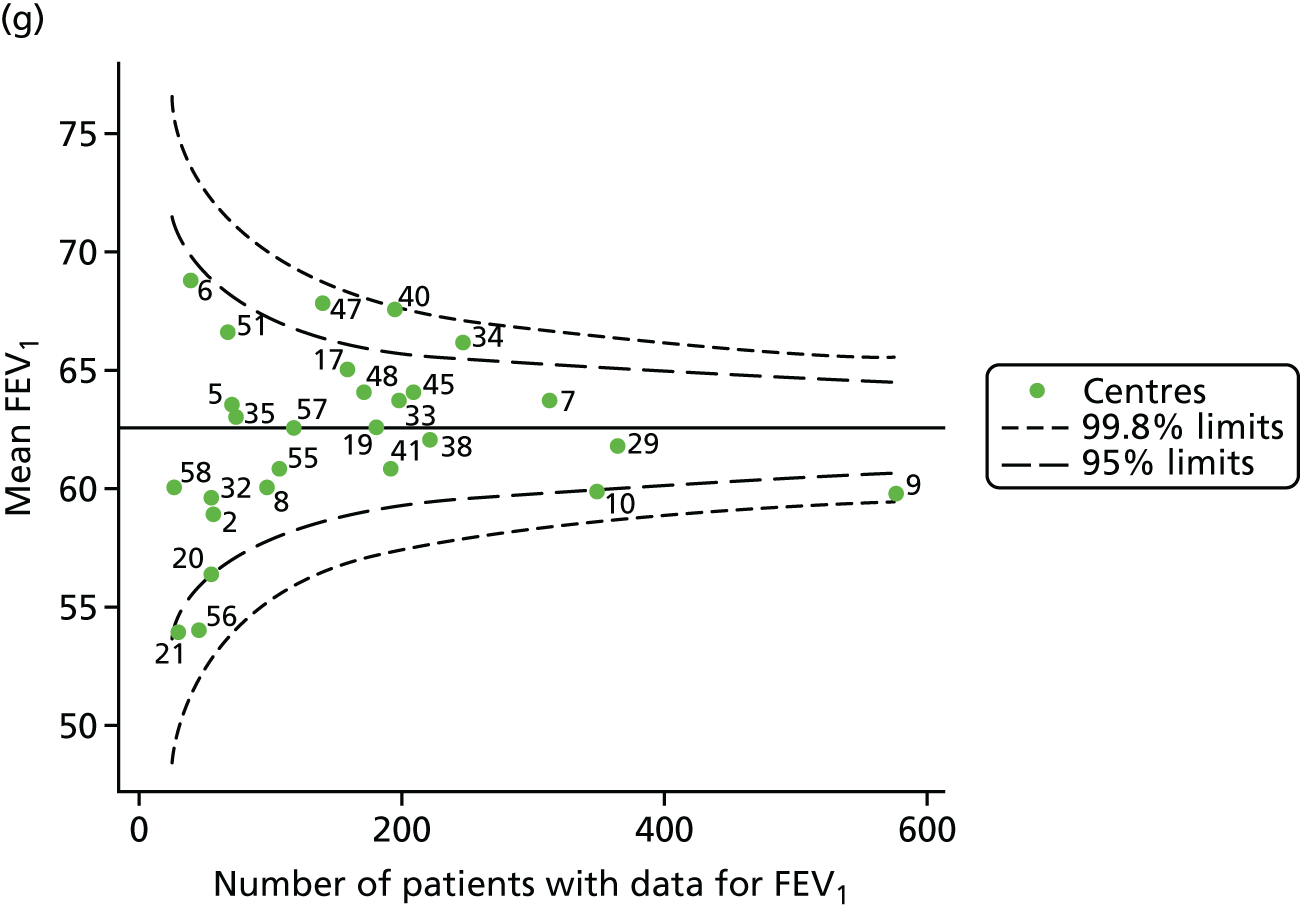

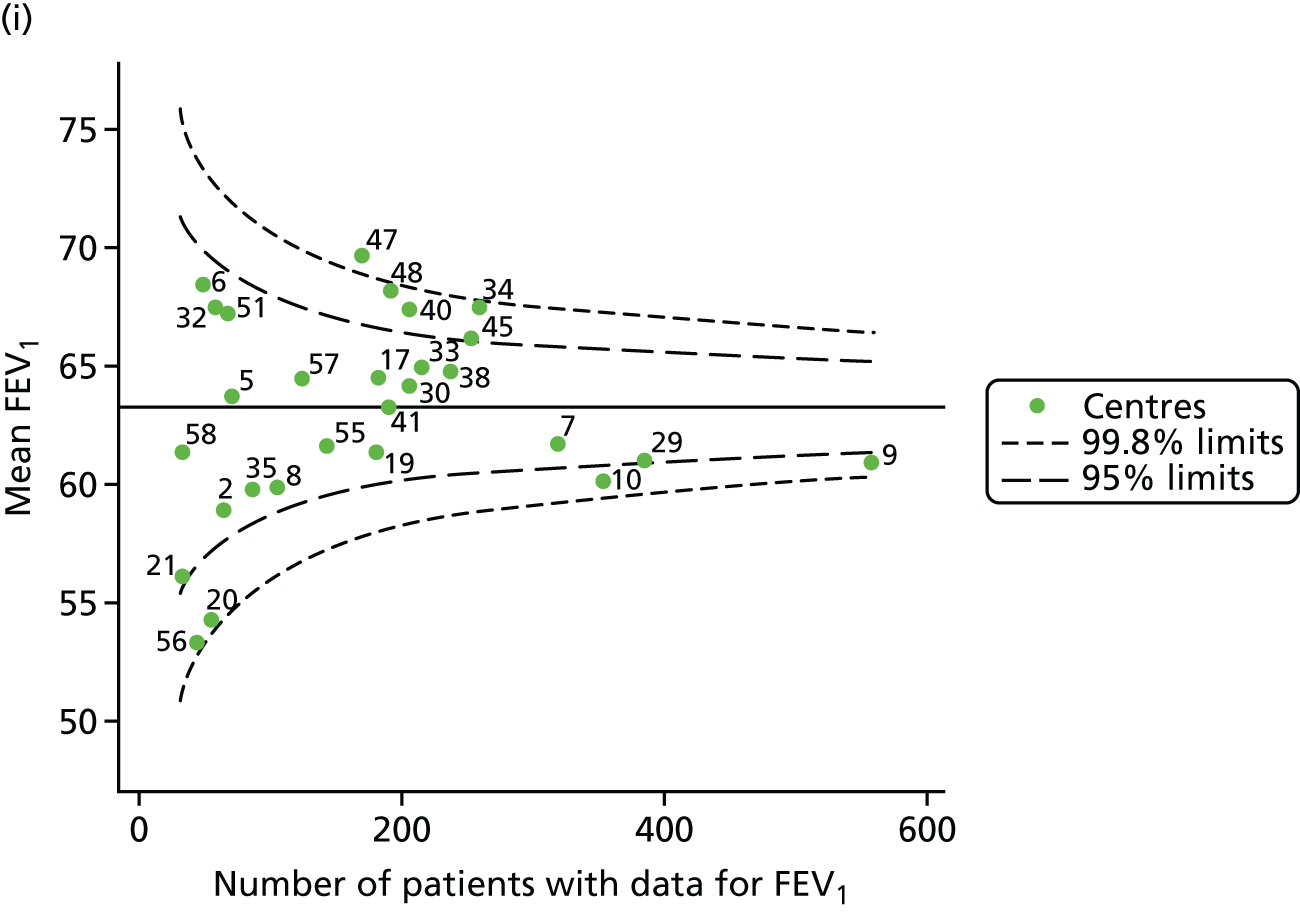
FIGURE 39.
Views on facilities, staffing and resources (adult centres). CFRD, cystic fibrosis-related diabetes.
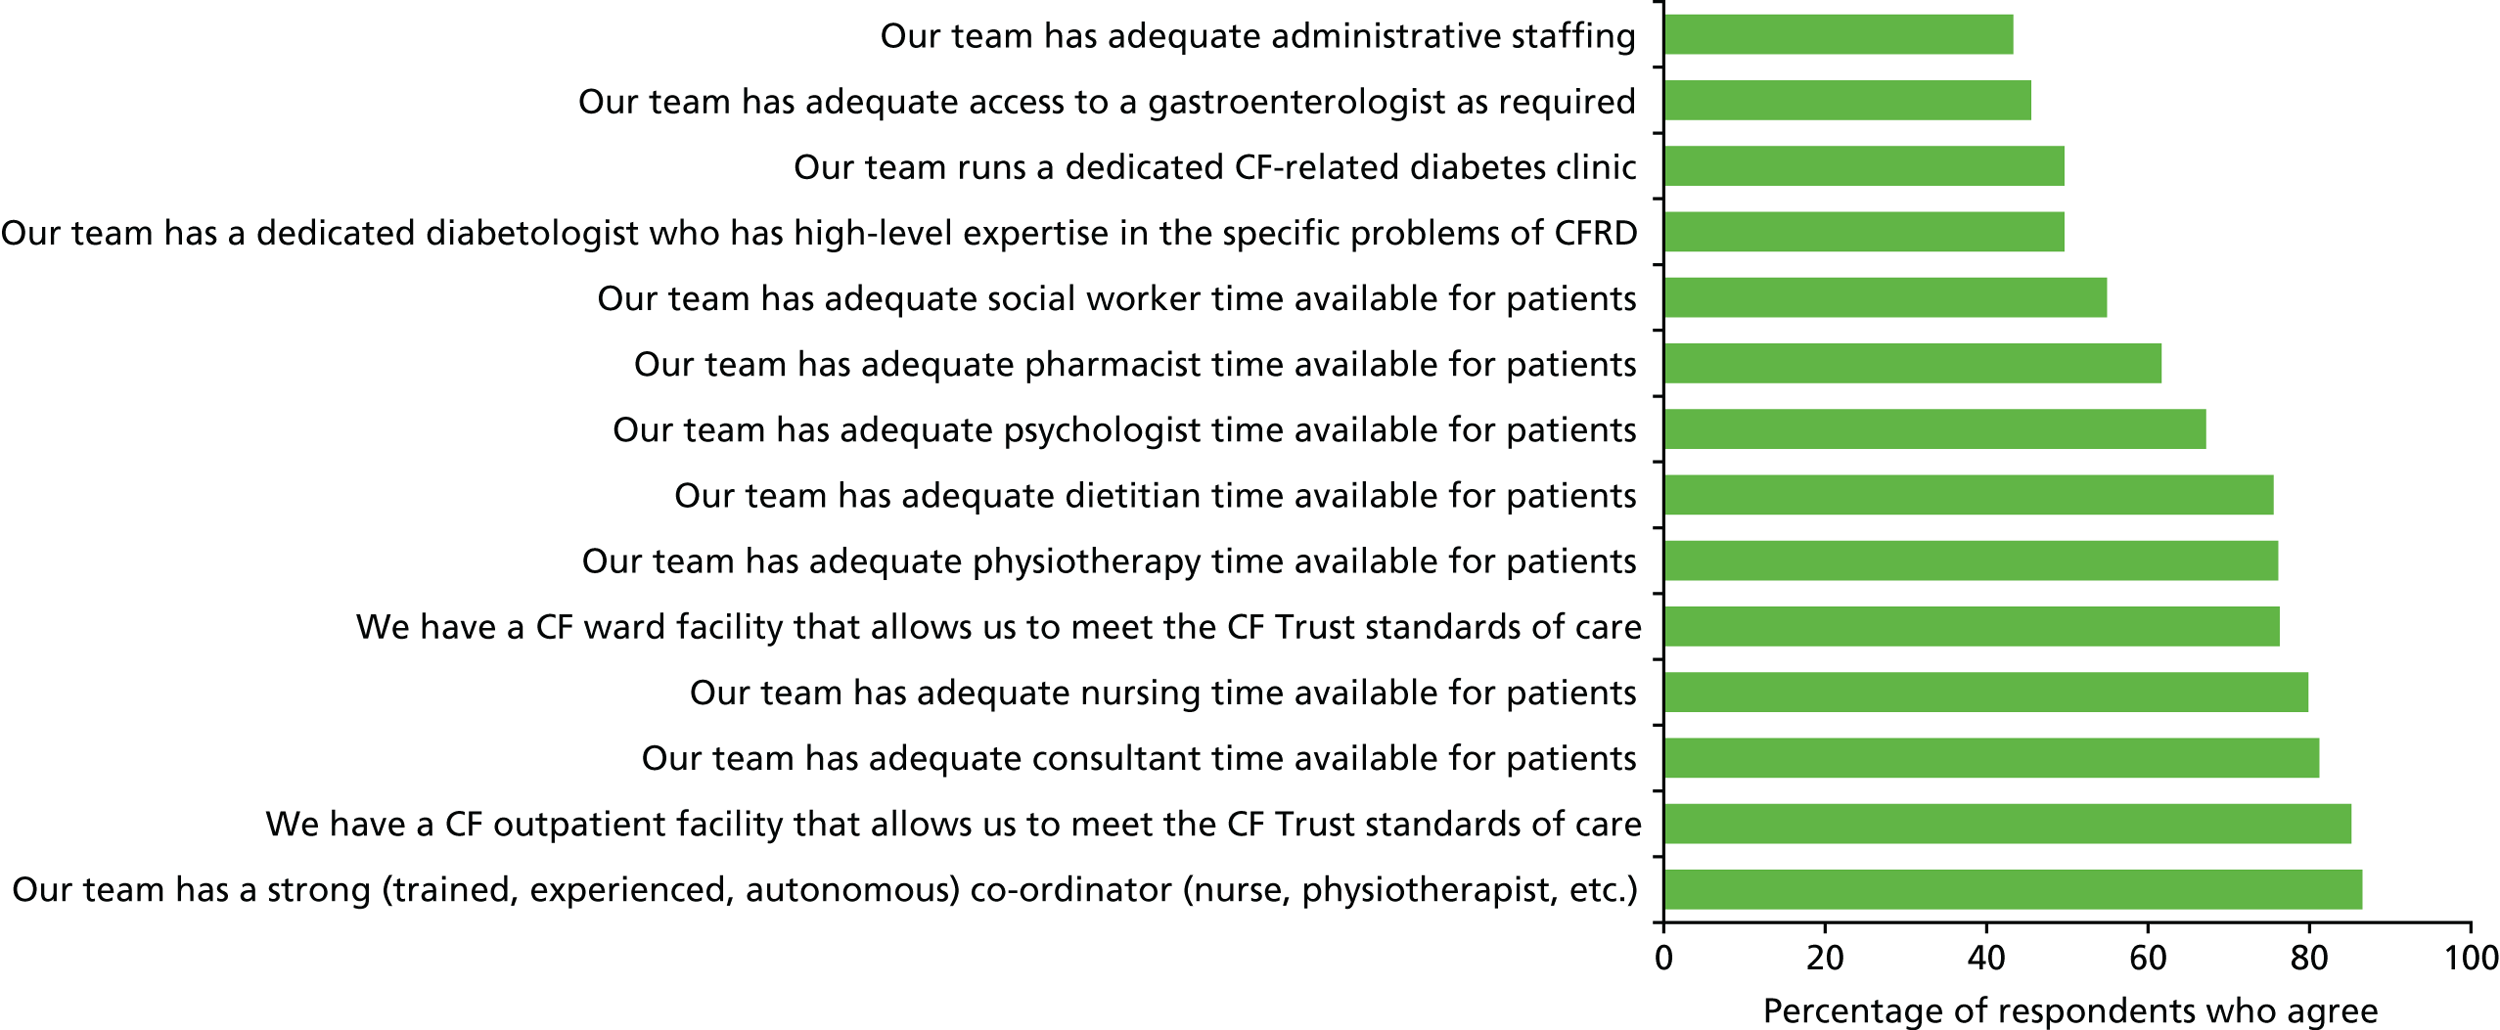
FIGURE 40.
Views on capacity and demand (adult centres).
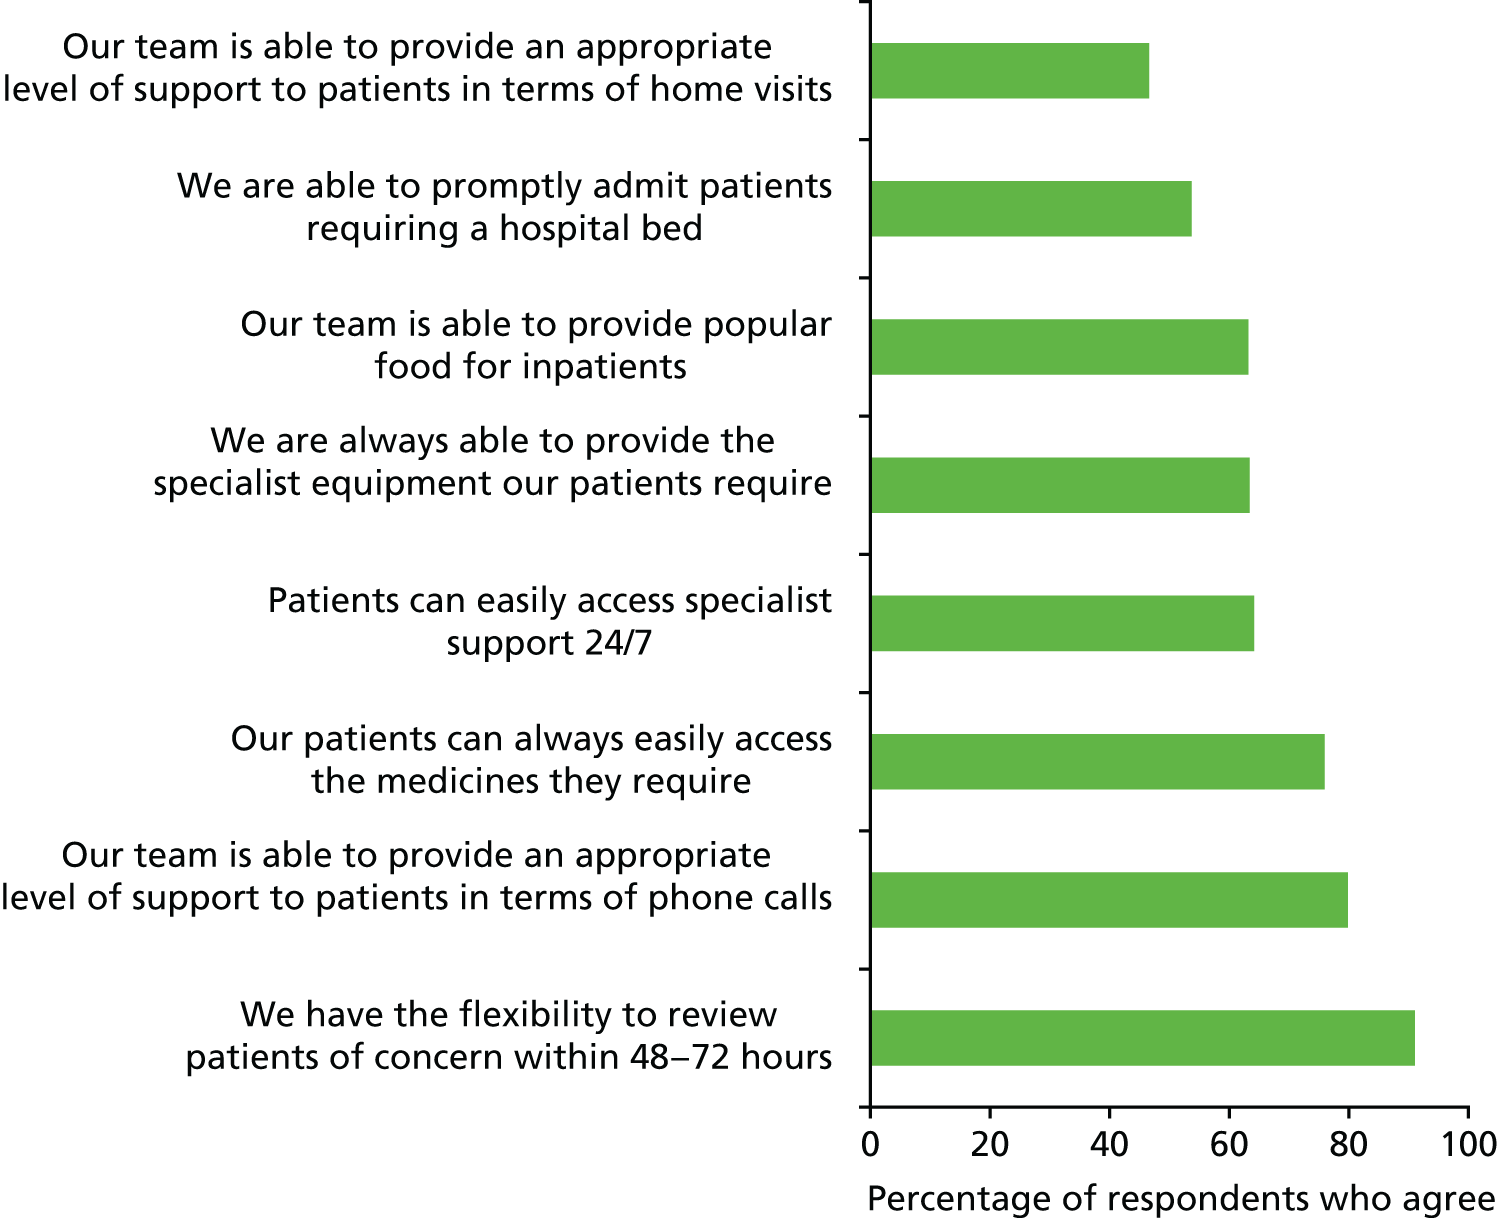
FIGURE 41.
Views on leadership (adult centres).
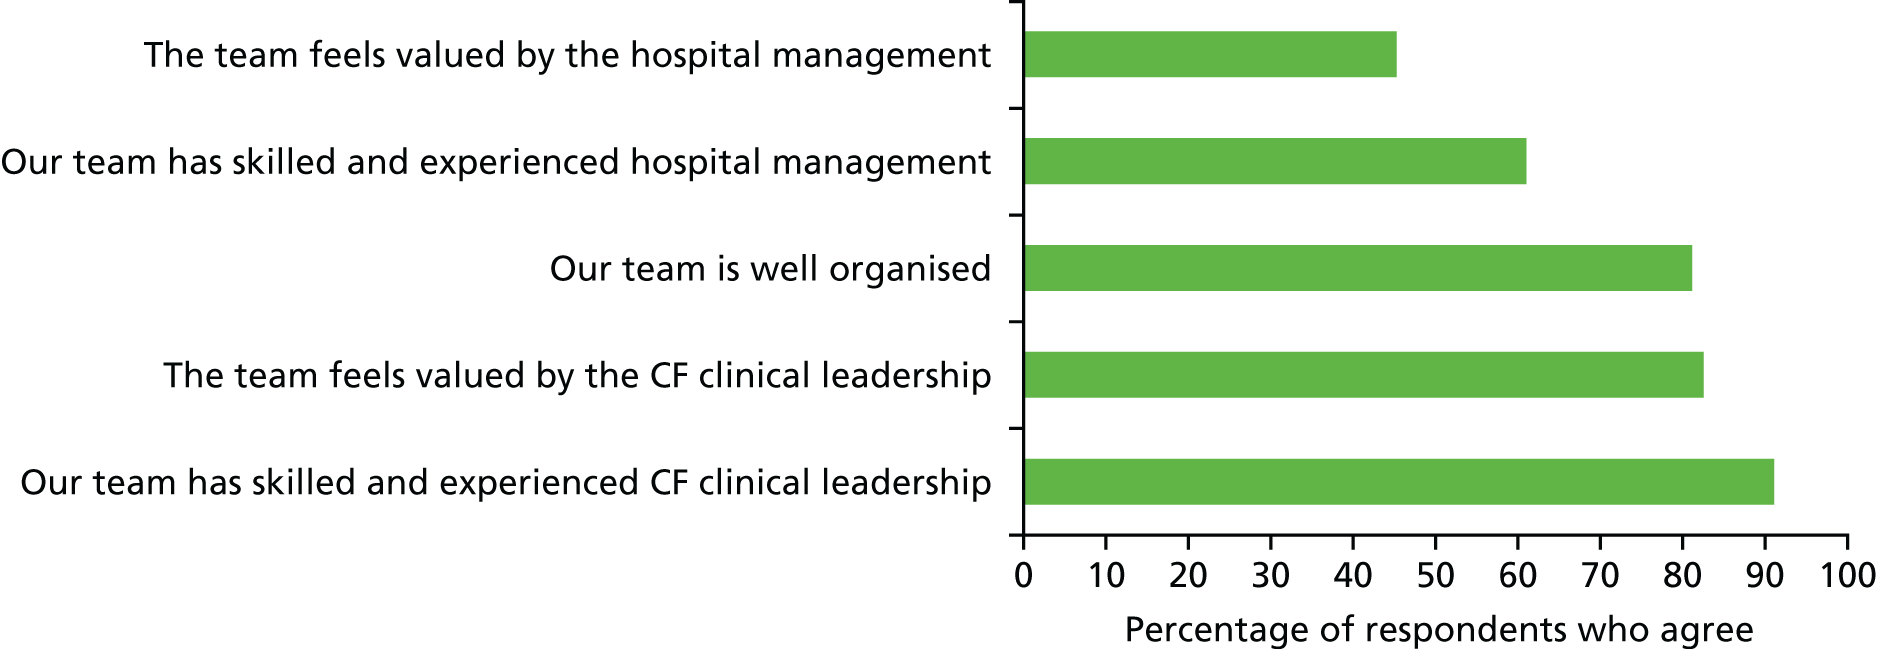
FIGURE 42.
Views on measurement and monitoring (adult centres).
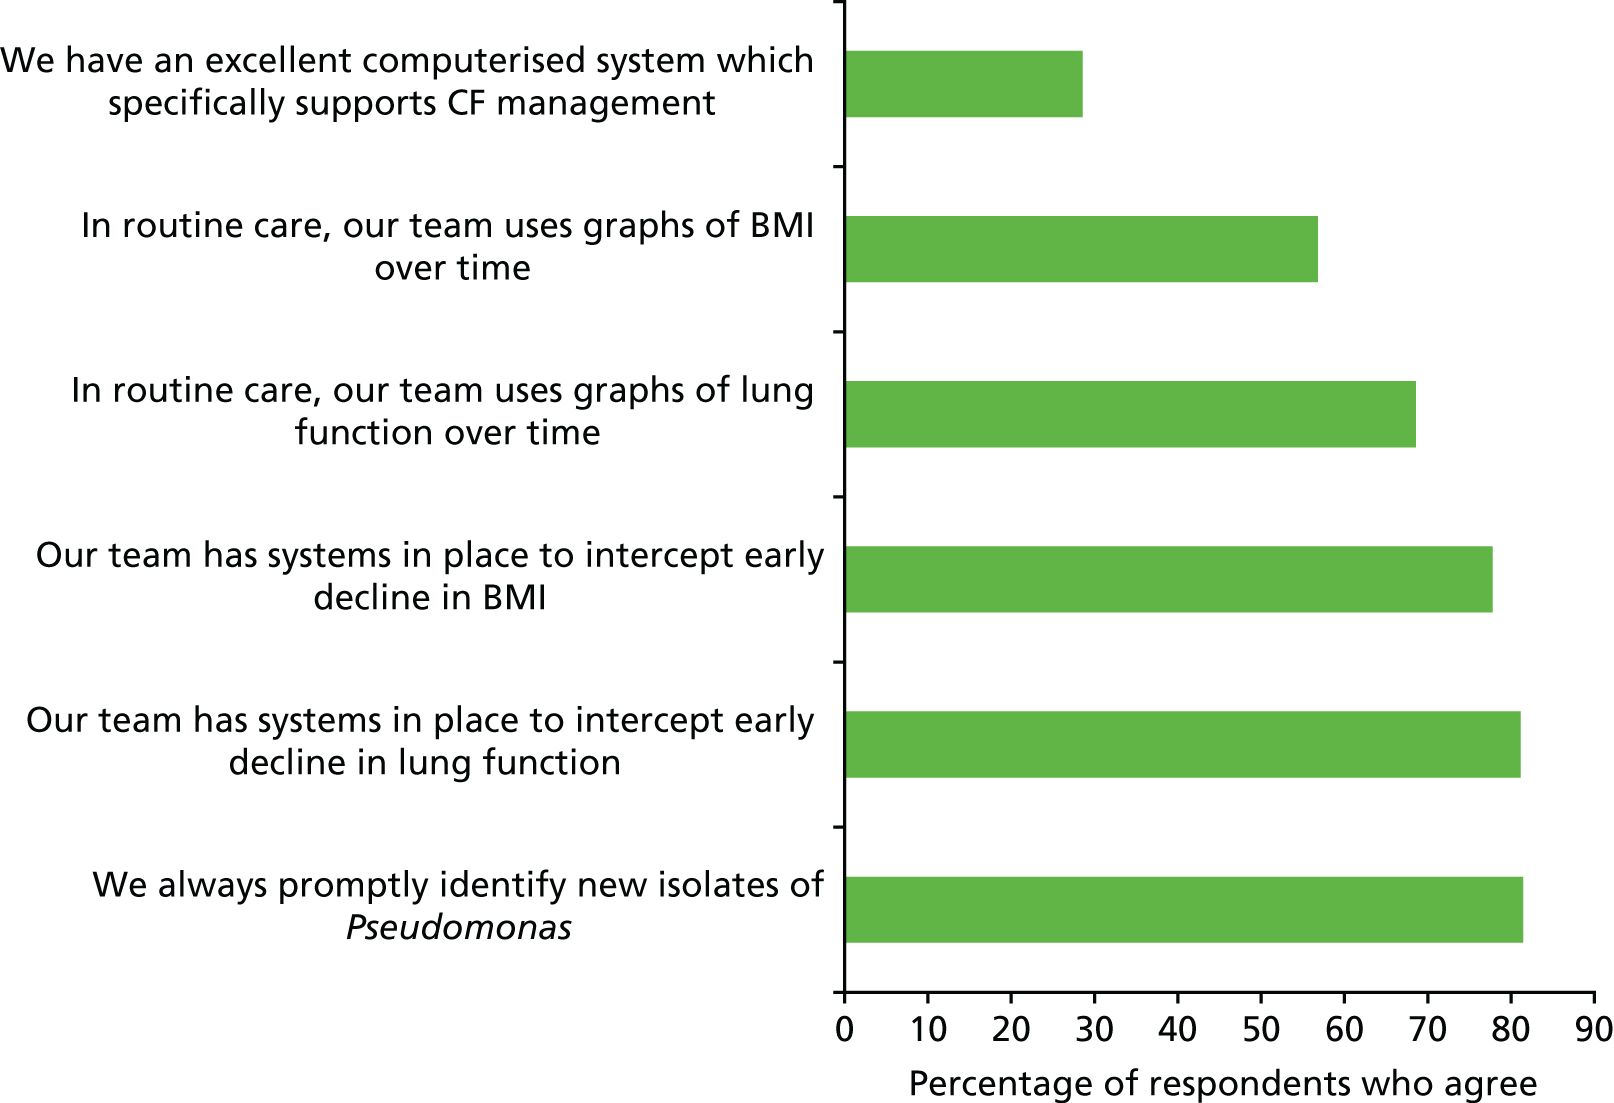
FIGURE 43.
Views on MDT processes (adult centres).

FIGURE 44.
Views on process improvement (adult centres). PDSA, Plan Do Study Act.
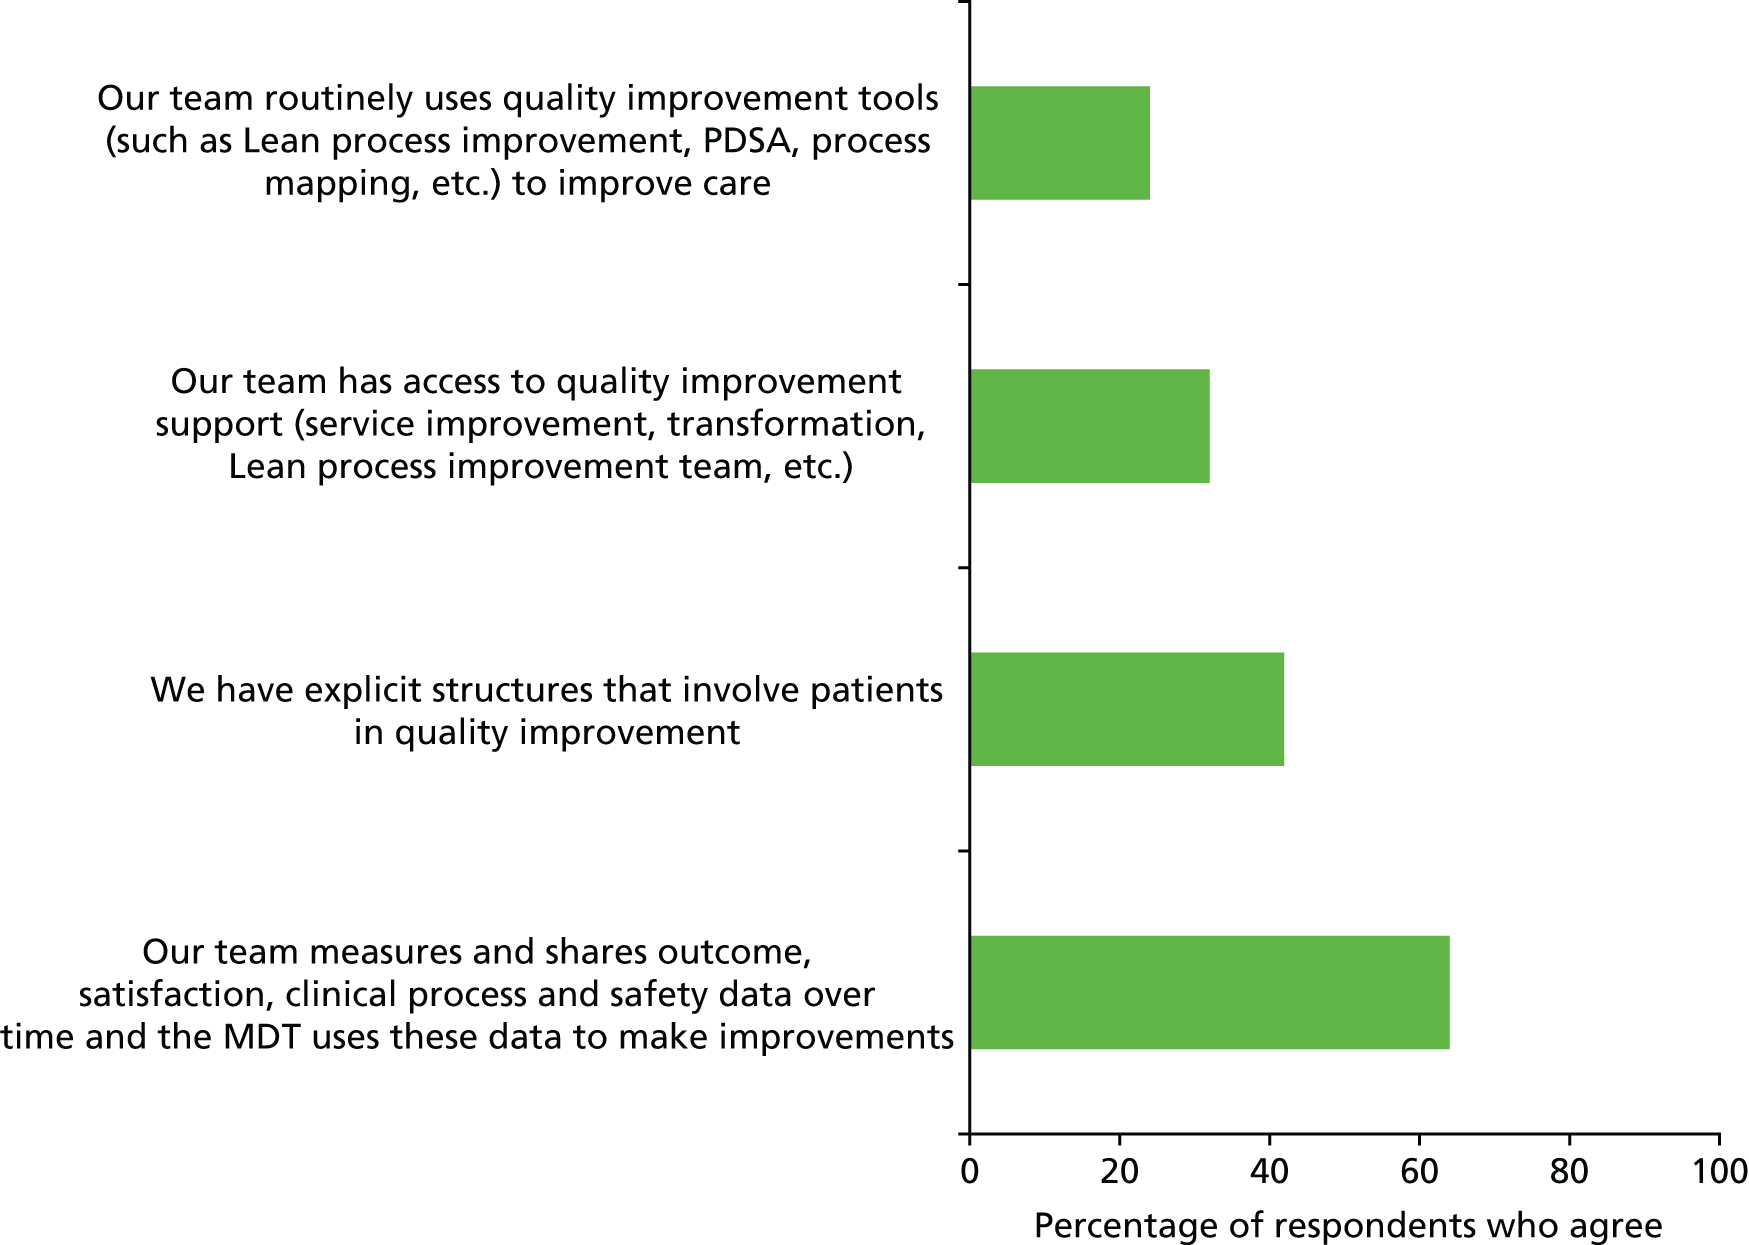
FIGURE 45.
Views on treatment policy (adult centres).
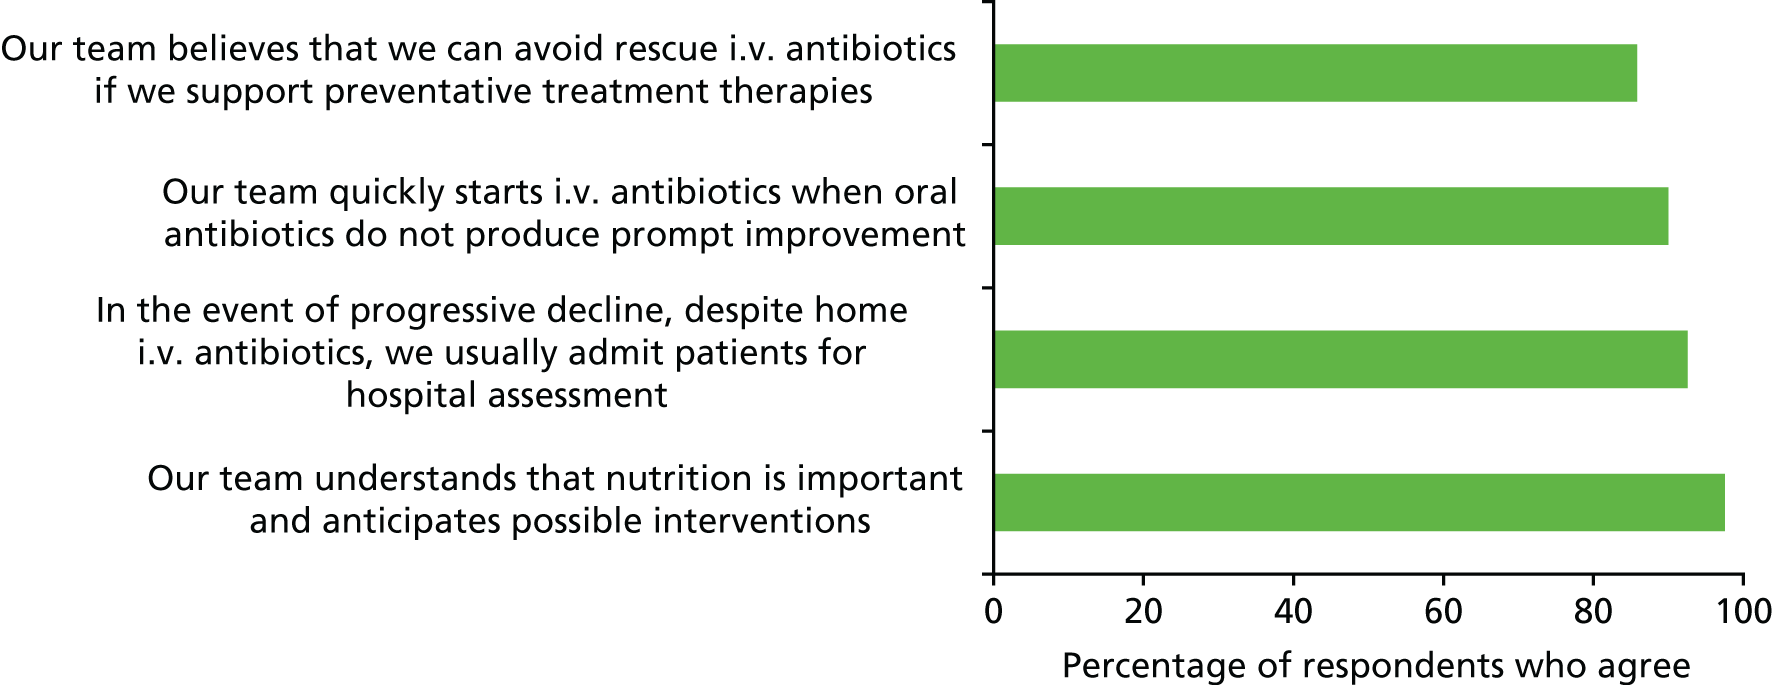
FIGURE 46.
Time lag to starting antibiotics for cough and cold (adult centres). For a CF patient who calls to report increased cough and cold but no other symptoms, we would consider treatment with antibiotics if symptoms persisted for _ days.
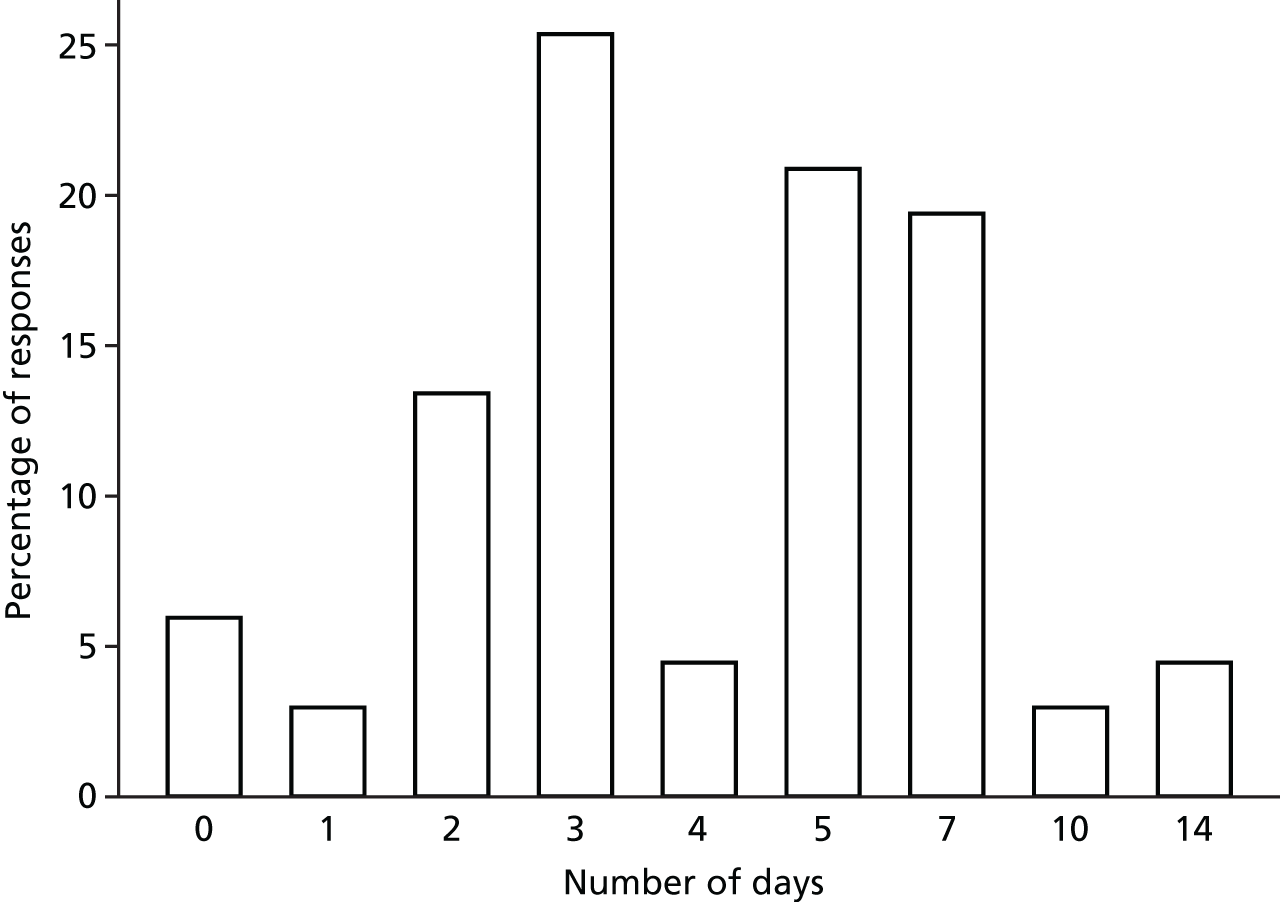
FIGURE 47.
Expectations of care (adult centres).
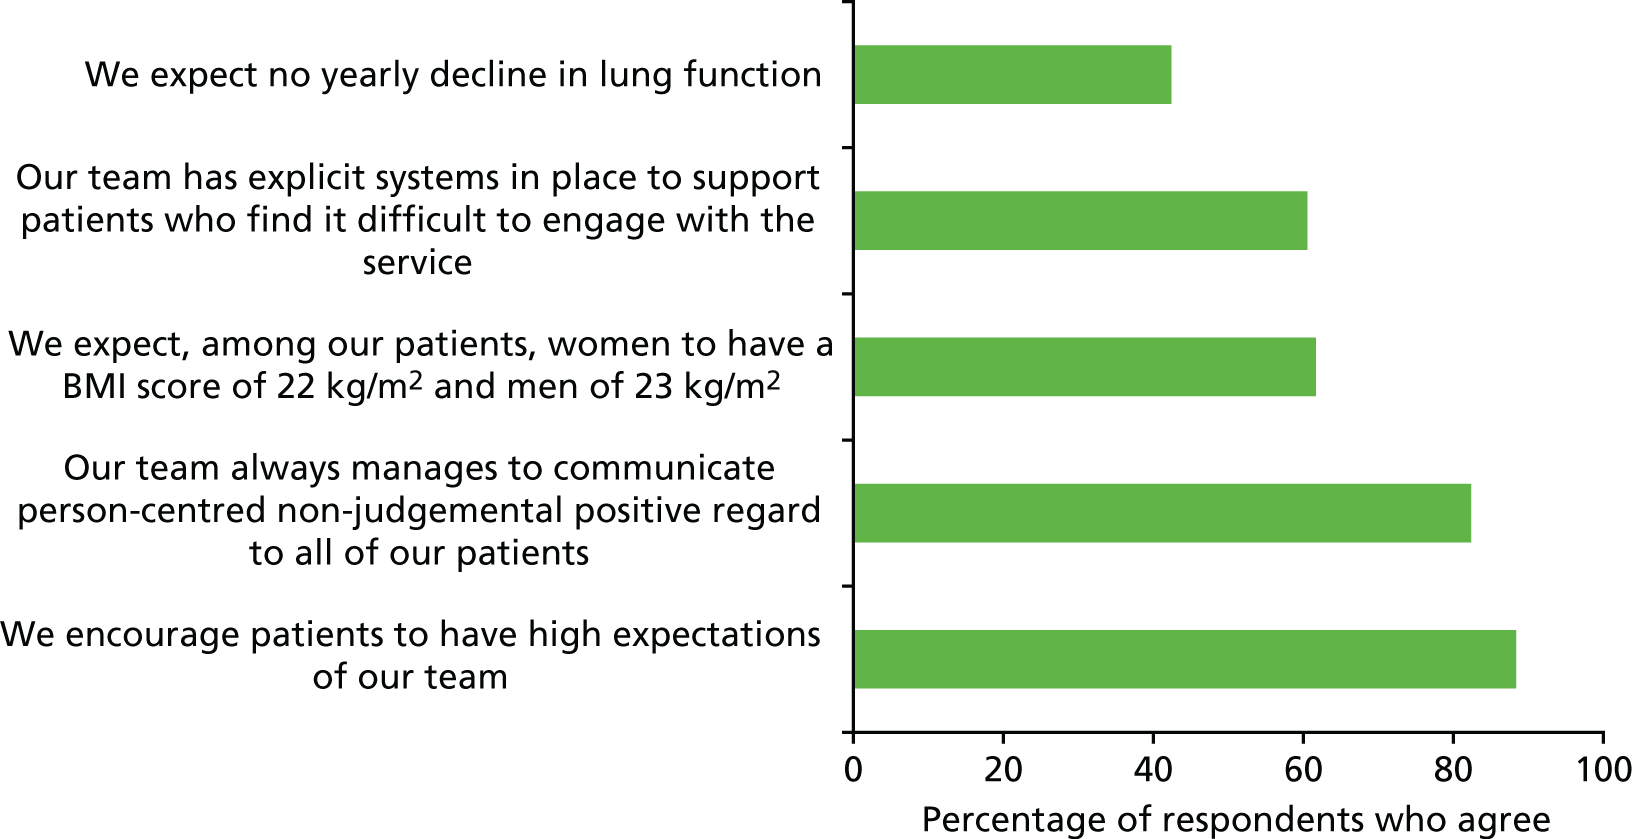
FIGURE 48.
Views on facilities, staffing and resources (paediatric centres). CFRD, cystic fibrosis-related diabetes.
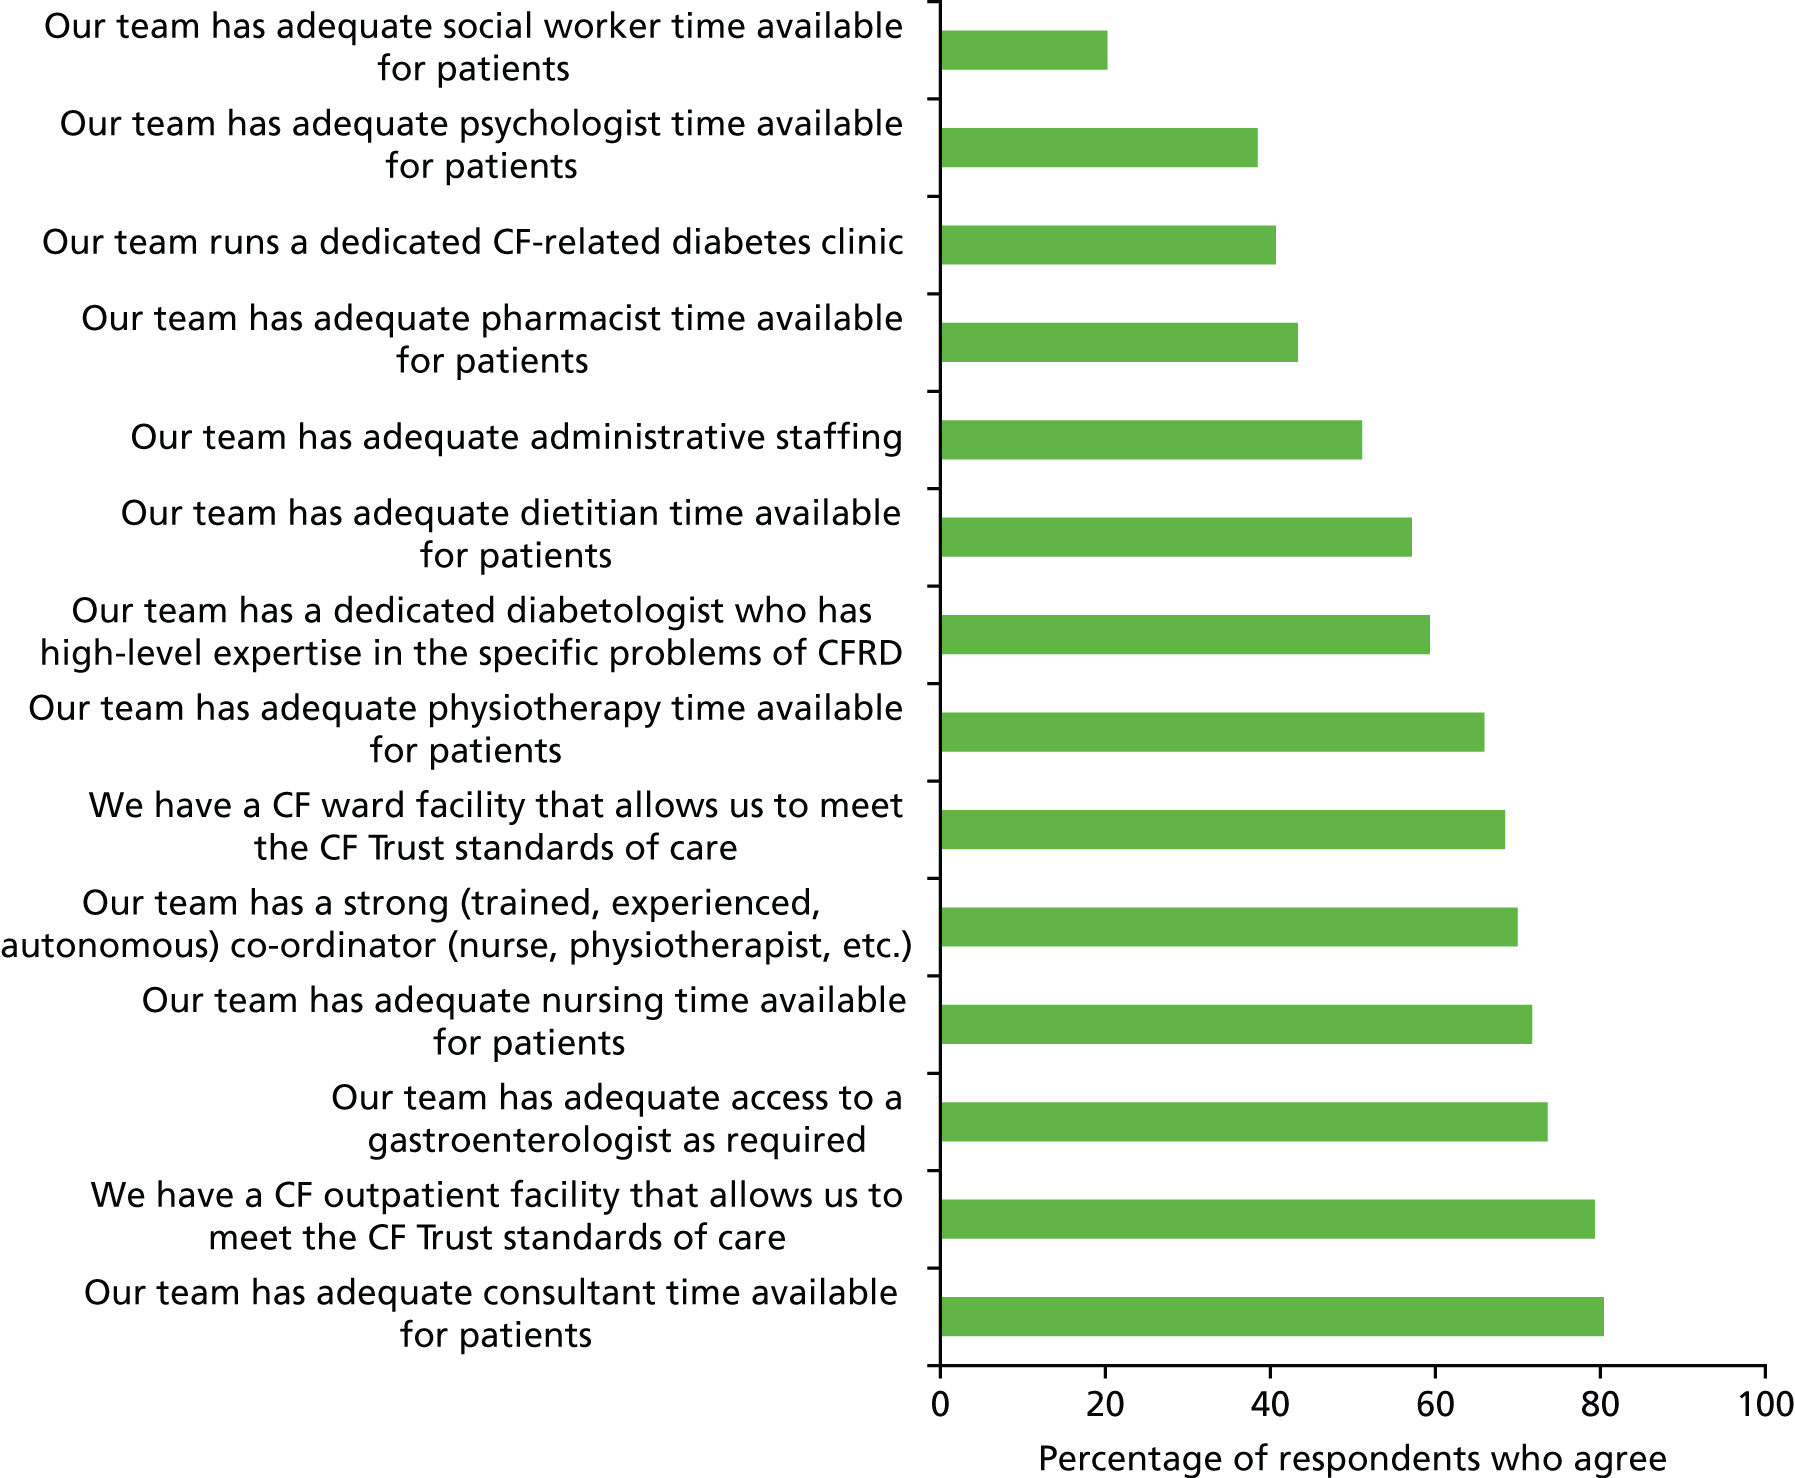
FIGURE 49.
Views on capacity and demand (paediatric centres).
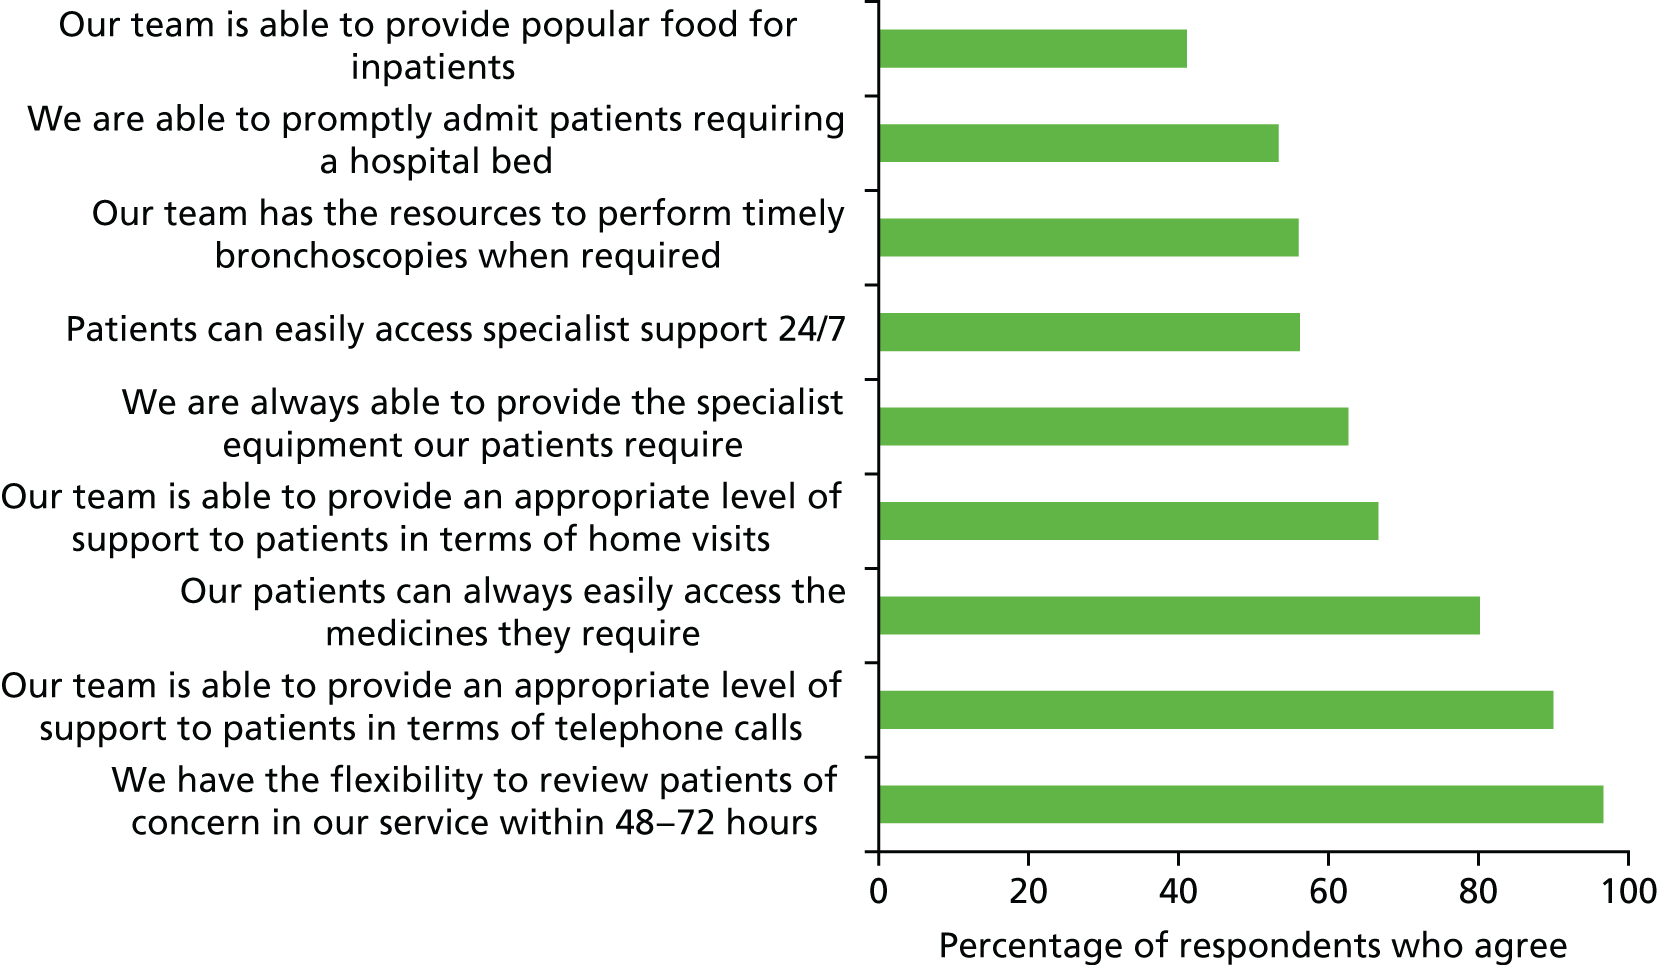
FIGURE 50.
Views on leadership (paediatric centres).
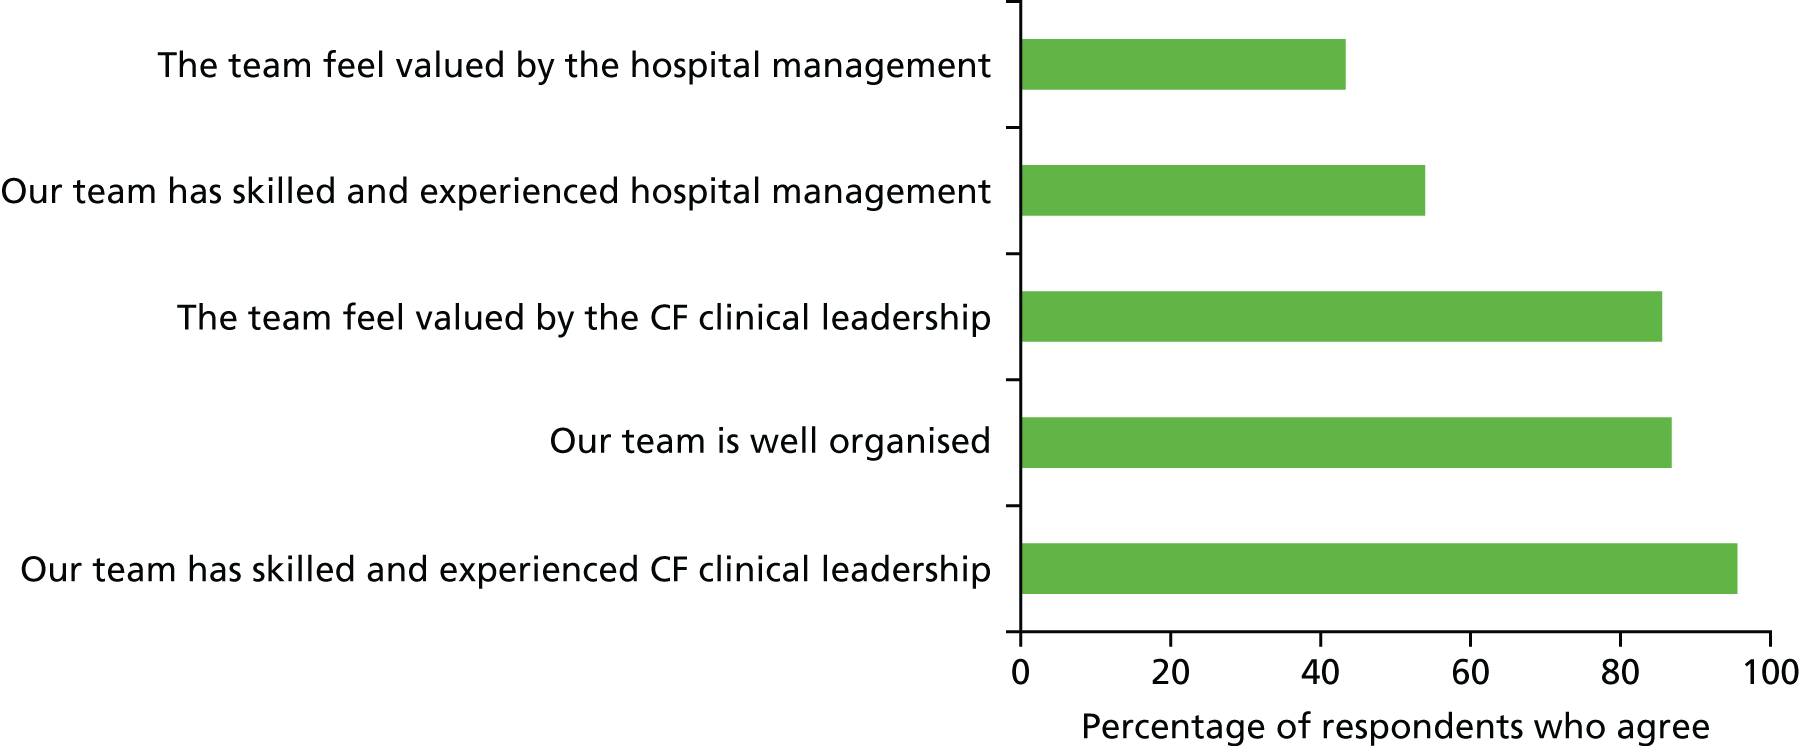
FIGURE 51.
Views on measurement and monitoring (paediatric centres).
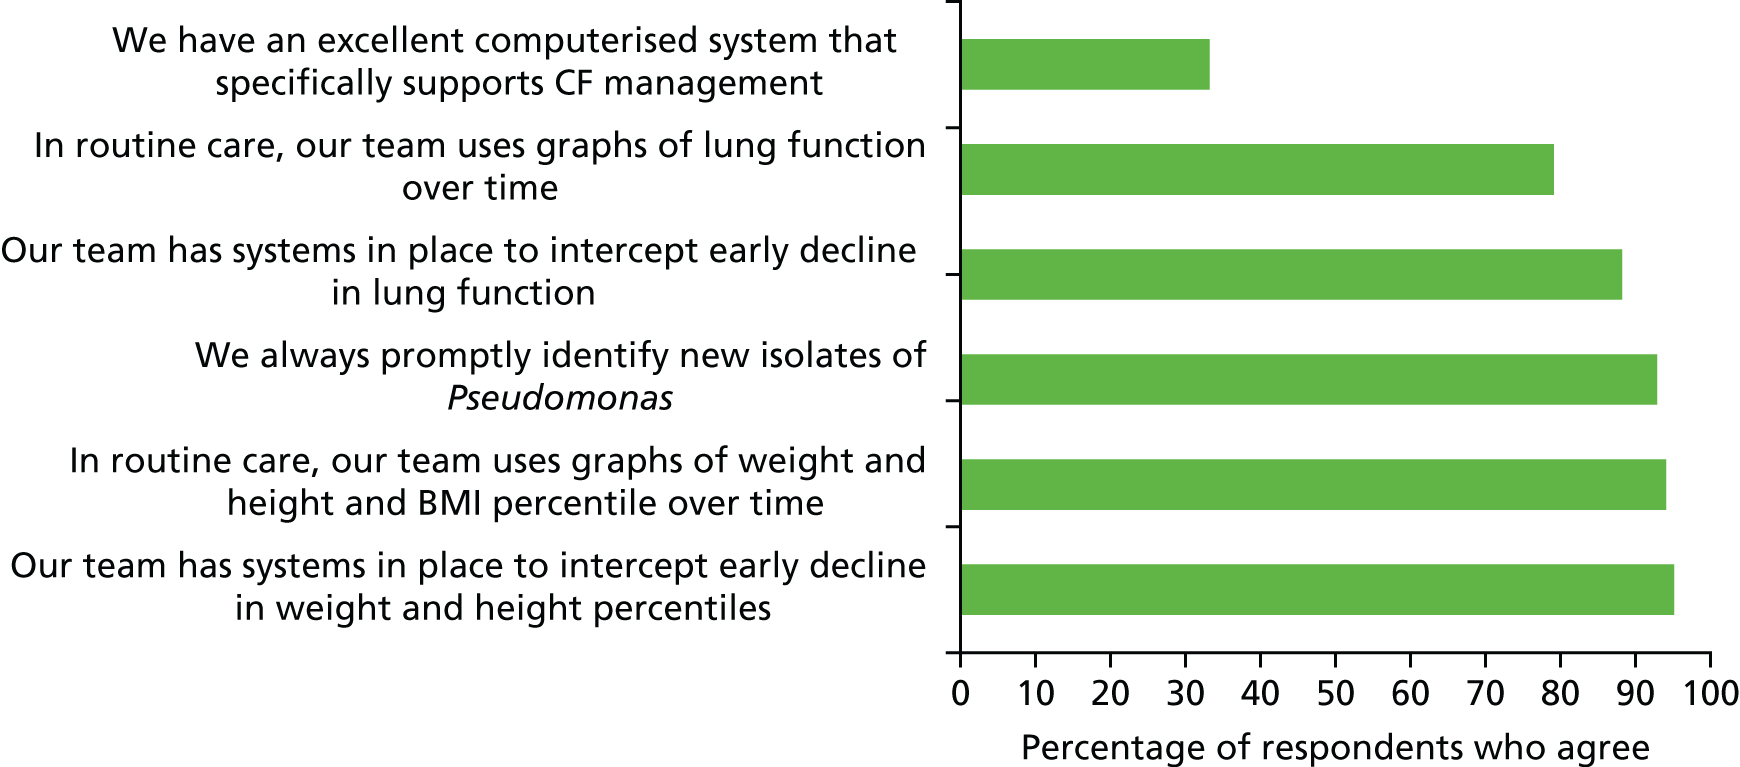
FIGURE 52.
Views on MDT processes (paediatric centres).
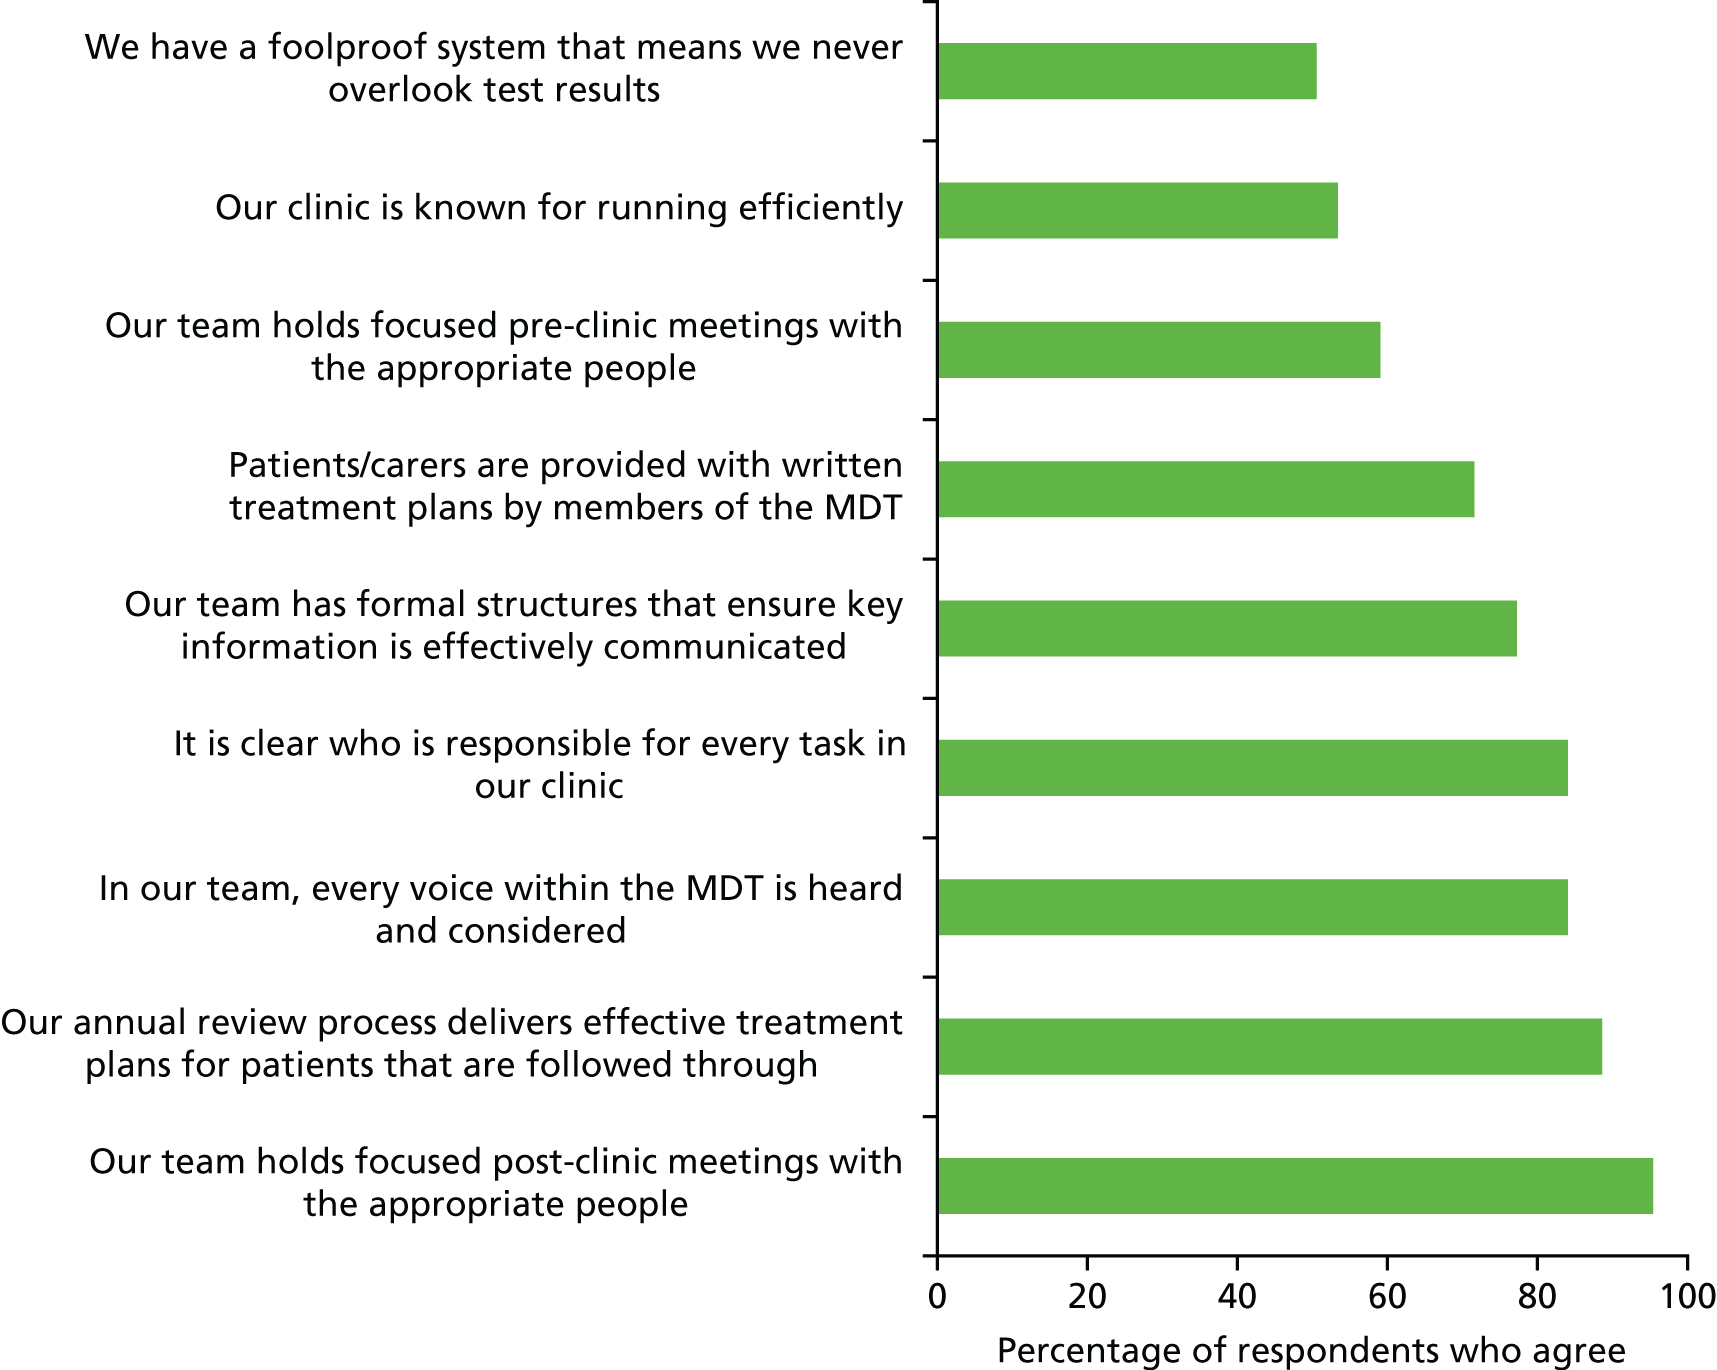
FIGURE 53.
Views on process improvement (paediatric centres). PDSA, Plan Do Study Act.
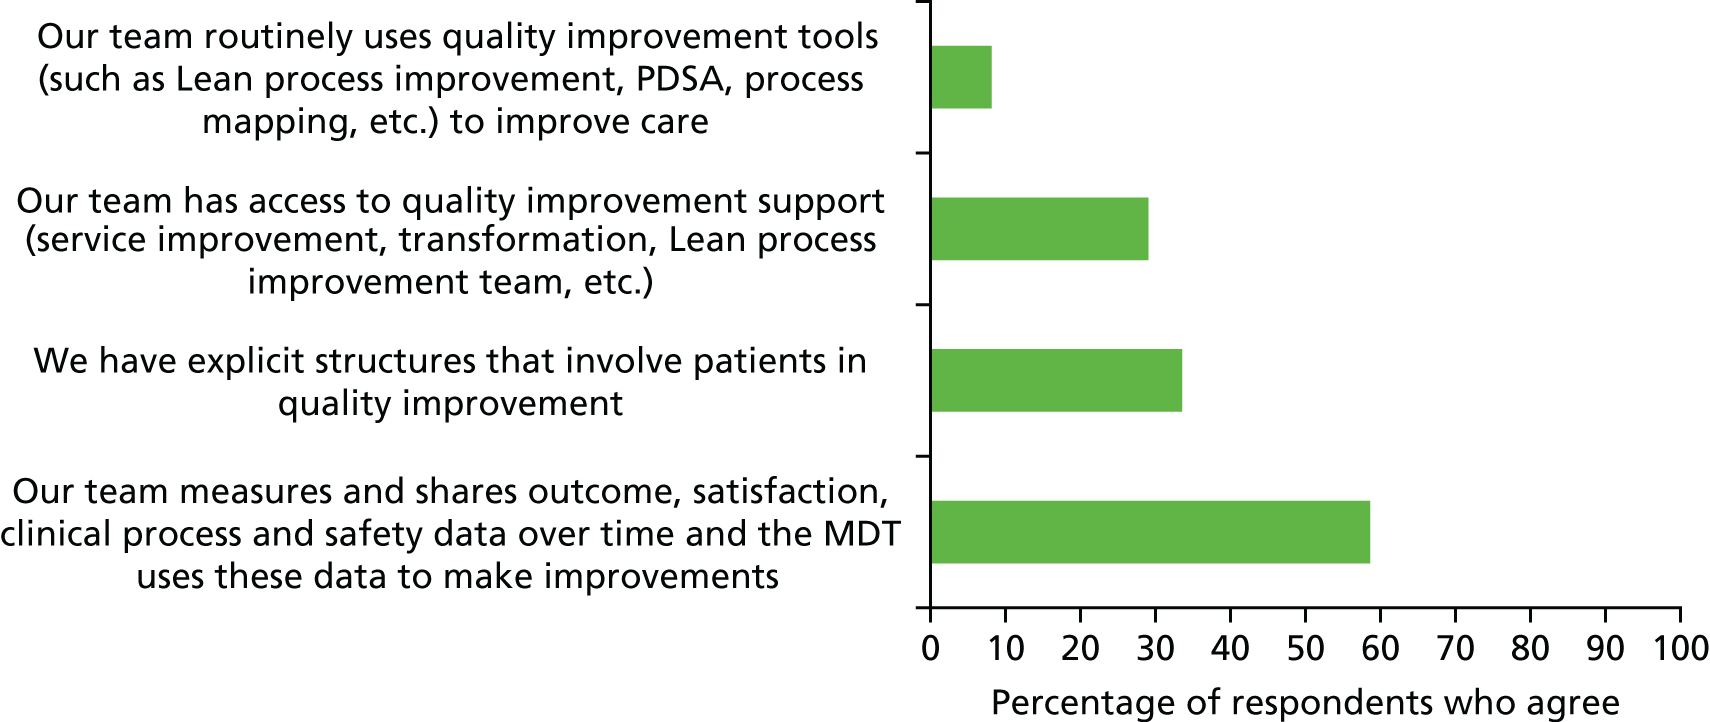
FIGURE 54.
Treatment policy (paediatric centres).
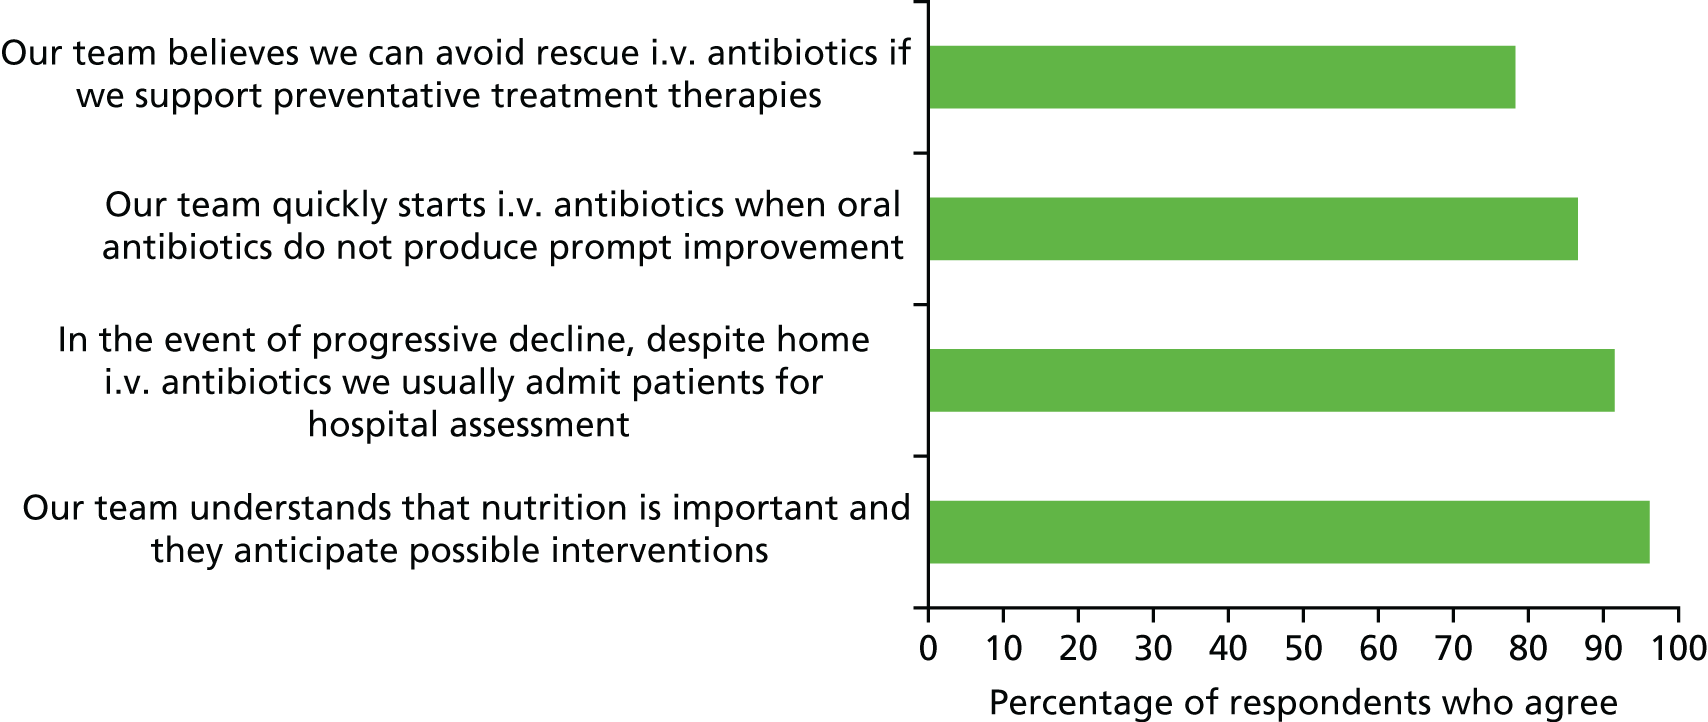
Appendix 3 Additional tables
| Fixed effect | Estimate (95% CI) (% predicted) | p-value |
|---|---|---|
| Constant | 87.24 (8.07 to 92.41) | < 0.001 |
| Sex (male) | 2.98 (0.80 to 5.16) | 0.007 |
| Genotype | ||
| Homozygous DF508 | – | 0.111 |
| Heterozygous DF508 | 1.41 (–0.95 to 3.78) | |
| No DF508 | –3.03 (–7.32 to 1.27) | |
| Pancreatic enzyme supplement use | –4.23 (–8.38 to –0.07) | 0.046 |
| SES quintile | ||
| 1 (least deprived) | – | 0.002 |
| 2 | –1.20 (–4.52 to 2.11) | |
| 3 | –2.76 (–6.11 to 0.60) | |
| 4 | –3.91 (–7.24 to –0.57) | |
| 5 (most deprived) | –5.50 (–9.08 to –1.92) | |
| Random effect | ||
| Between-centres SD | 4.74 (3.26 to 6.89) | |
| Within-centre SD | 17.65 (16.90 to 18.44) | |
| Fixed effect | Estimate (95% CI) (% predicted) | p-value |
|---|---|---|
| Constant | 84.50 (78.61 to 90.39) | < 0.001 |
| Sex (male) | 3.20 (0.73 to 5.68) | 0.011 |
| Genotype | ||
| Homozygous DF508 | – | 0.256 |
| Heterozygous DF508 | 1.58 (–1.11 to 4.28) | |
| No DF508 | –1.99 (–6.70 to 2.72) | |
| Pancreatic enzyme supplement use | –7.34 (–12.16 to –2.51) | 0.003 |
| SES quintile | ||
| 1 (least deprived) | – | < 0.001 |
| 2 | 2.81 (–1.04 to 6.66) | |
| 3 | –0.63 (–4.47 to 3.21) | |
| 4 | –3.27 (–6.99 to 0.46) | |
| 5 (most deprived) | –5.61 (–9.76 to –1.46) | |
| Random effect | ||
| Between-centres SD | 4.83 (3.13 to 7.44) | |
| Within-centre SD | 19.89 (19.03 to 20.79) | |
| Fixed effect | Estimate (95% CI) (% predicted) | p-value |
|---|---|---|
| Constant | 70.29 (62.15 to 78.43) | < 0.001 |
| Sex (male) | –4.49 (–8.01 to –0.97) | 0.012 |
| Genotype | ||
| Homozygous DF508 | – | 0.92 |
| Heterozygous DF508 | –0.64 (–4.49 to 3.21) | |
| No DF508 | –1.11 (–7.84 to 5.62) | |
| Pancreatic enzyme supplement use | –17.15 (–24.00 to –10.29) | < 0.001 |
| SES quintile | ||
| 1 (least deprived) | – | 0.021 |
| 2 | –3.51 (–8.98 to 1.97) | |
| 3 | –1.61 (–7.11 to 3.88) | |
| 4 | –3.71 (–9.02 to 1.60) | |
| 5 (most deprived) | –9.58 (–15.40 to –3.77) | |
| Random effect | ||
| Between-centres SD | 4.15 (2.13 to 8.11) | |
| Within-centre SD | 29.07 (27.85 to 30.35) | |
| Fixed effect | Estimate (95% CI) (% predicted) | p-value |
|---|---|---|
| Constant | 3.61 (–13.28 to 20.50) | 0.675 |
| Sex (male) | 0.76 (–0.53 to 2.06) | 0.248 |
| Genotype | ||
| Homozygous DF508 | – | 0.171 |
| Heterozygous DF508 | 0.35 (–1.07 to 1.77) | |
| No DF508 | –2.02 (–4.46 to 0.41) | |
| Pancreatic enzyme supplement use | –1.34 (–4.21 to 1.54) | 0.362 |
| SES quintile | ||
| 1 (least deprived) | – | 0.665 |
| 2 | 0.45 (–1.56 to 2.46) | |
| 3 | 1.09 (–0.86 to 3.05) | |
| 4 | –0.37 (–2.32 to 1.59) | |
| 5 (most deprived) | 0.52 (–1.60 to 2.63) | |
| Age at first visit | –0.31 (–1.51 to 0.90) | 0.620 |
| Random effect | ||
| Between-centres SD | 0.57 (0.03 to 9.41) | |
| Within-centre SD | 11.03 (10.58 to 11.50) | |
| Centre | 2007 | 2008 | 2009 | 2010 | 2011 | 2012 | 2013 | 2014 | 2015 |
|---|---|---|---|---|---|---|---|---|---|
| Centres with lower than average FEV1 values | |||||||||
| 12 | 10.2 | 9.9 | 10.5 | 10.6 | 10.8 | 10.6 | 10.5 | 10.6 | 10.4 |
| 39 | – | 9 | 10.4 | 10.8 | 10.8 | 10.9 | 10.8 | 10.7 | 10.5 |
| 52 | 10.5 | 10.8 | 10.8 | 10.8 | 10.4 | 10.4 | 10.4 | 10.3 | 10.2 |
| Across all centres | |||||||||
| All | 10.5 | 10.7 | 10.8 | 10.8 | 10.7 | 10.6 | 10.5 | 10.4 | 10.3 |
| Centres with higher than average FEV1 values | |||||||||
| 25 | 10.8 | 10.8 | 11 | 11.1 | 10.7 | 10.7 | 10.5 | 10.5 | 10.4 |
| 28 | 10.6 | 10.5 | 11.4 | 10.9 | 10.1 | 10.1 | 9.6 | 9.8 | 10 |
| 31 | 10.1 | 10.8 | 10.8 | 10.7 | 10.7 | 10.8 | 10.7 | 10.2 | 10 |
| Year | Centres with lower than average FEV1 values | Centres with higher than average FEV1 values | ||
|---|---|---|---|---|
| Outside 3-SD limit | Outside 2-SD limit | Outside 2-SD limit | Outside 3-SD limit | |
| 2007 | 12, 52 and 59 | 11, 16a and 23 | 14, 31, 36 and 37 | 25 and 54a |
| 2008 | 12 and 52 | 1,a 13, 18, 26 | 28 and 44 | 25 |
| 2009 | 12 and 52 | 11, 16, 23,a 43 and 59 | 36, 46, 60a and 61 | 25 and 31 |
| 2010 | 12 and 39 | 23, 52 and 59 | 25,a 36, 46 and 61a | 31 |
| 2011 | 12, 23 and 39 | 18 | 31 and 61 | – |
| 2012 | 39 | 12, 23,a 26, 52a and 53 | 14, 25, 28, 31, 43, 54 and 61 | – |
| 2013 | 39 | 23, 26, 50 and 53 | 25, 31 and 61 | 60 |
| 2014 | 50 and 53 | 25,a 39 and 52 | 13, 28,a 31, 44, 60 and 61 | – |
| 2015 | 53 | 25, 26, 50 and 52a | 13,a 16, 28,a 31, 43, 60a and 61 | – |
| Year | Centres with lower than average FEV1 values | Centres with higher than average FEV1 values | ||
|---|---|---|---|---|
| Outside 3-SD limit | Outside 2-SD limit | Outside 2-SD limit | Outside 3-SD limit | |
| 2007 | 12, 52 and 59 | 23a | 31 and 54 | 25 |
| 2008 | 52 | 1a and 12 | 28 and 44a | 25 |
| 2009 | 12 and 52 | 59 | 31 and 36a | 25 |
| 2010 | 39 and 12 | 23,a 52a and 59 | 25a | 31 |
| 2011 | 12 and 39 | – | 61a | – |
| 2012 | 39 | 12a and 52a | 14, 25, 28, 31,a 54a and 61 | – |
| 2013 | 39 | 50 | 25, 31a and 61a | – |
| 2014 | – | 25,a 39,a 50 and 52 | 31,a 44a and 61a | – |
| 2015 | – | 25, 50 and 52a | 31, 43a and 61 | – |
| Centre | 2007 | 2008 | 2009 | 2010 | 2011 | 2012 | 2013 | 2014 | 2015 |
|---|---|---|---|---|---|---|---|---|---|
| Centres with lower than average FEV1 values | |||||||||
| 12 | 19 (46.3) | 22 (44.9) | 46 (50.0) | 49 (50.0) | 50 (53.2) | 54 (52.9) | 55 (52.9) | 55 (53.4) | 53 (54.1) |
| 39 | – (–) | 0 (0.0) | 69 (54.8) | 89 (52.7) | 90 (50.3) | 86 (48.3) | 82 (48.2) | 84 (50.0) | 77 (49.0) |
| 52 | 32 (40.5) | 40 (44.9) | 63 (46.3) | 62 (47.3) | 70 (47.0) | 75 (48.4) | 84 (50.0) | 78 (49.7) | 84 (51.2) |
| Across all centres | |||||||||
| All | 640 (48.7) | 859 (49.3) | 1062 (50.3) | 1106 (50.2) | 1121 (49.0) | 1114 (49.1) | 1165 (49.8) | 1149 (49.5) | 1186 (49.9) |
| Centres with higher than average FEV1 values | |||||||||
| 25 | 59 (41.0) | 78 (47.3) | 83 (45.9) | 79 (45.1) | 75 (42.1) | 78 (44.6) | 71 (42.3) | 70 (44.9) | 67 (43.2) |
| 28 | 19 (45.2) | 20 (44.4) | 19 (44.2) | 20 (40.0) | 20 (39.2) | 18 (35.3) | 28 (41.2) | 32 (42.1) | 33 (44.6) |
| 31 | 34 (52.3) | 43 (46.2) | 43 (50.0) | 46 (48.4) | 44 (45.8) | 34 (40.0) | 43 (47.3) | 48 (48.5) | 54 (51.9) |
| Centre | 2007 | 2008 | 2009 | 2010 | 2011 | 2012 | 2013 | 2014 | 2015 |
|---|---|---|---|---|---|---|---|---|---|
| Centres with lower than average FEV1 values | |||||||||
| 12 | 24 (58.5) | 28 (57.1) | 49 (53.3) | 60 (61.2) | 52 (55.3) | 53 (52.0) | 55 (52.9) | 52 (50.5) | 48 (49.0) |
| 39 | – (–) | 0 (0.0) | 70 (57.4) | 93 (56.7) | 100 (56.8) | 101 (58.0) | 92 (55.8) | 89 (56.7) | 81 (55.1) |
| 52 | 45 (58.4) | 48 (54.5) | 69 (51.5) | 68 (51.9) | 81 (54.4) | 91 (58.7) | 96 (57.5) | 85 (54.5) | 91 (55.8) |
| Across all centres | |||||||||
| All | 723 (56.4) | 955 (56.1) | 1144 (55.4) | 1201 (55.6) | 1238 (54.9) | 1236 (55.3) | 1243 (53.9) | 1233 (54.0) | 1247 (53.5) |
| Centres with higher than average FEV1 values | |||||||||
| 25 | 88 (62.4) | 100 (61.7) | 105 (59.3) | 103 (60.6) | 105 (60.3) | 106 (62.0) | 96 (58.5) | 87 (57.2) | 85 (57.8) |
| 28 | 19 (46.3) | 21 (47.7) | 20 (47.6) | 23 (46.9) | 20 (40.0) | 19 (38.0) | 30 (44.8) | 33 (44.6) | 31 (42.5) |
| 31 | 28 (43.1) | 44 (48.4) | 41 (48.8) | 45 (48.4) | 43 (45.3) | 39 (46.4) | 40 (44.0) | 45 (45.5) | 48 (46.2) |
| Centre | 2007 | 2008 | 2009 | 2010 | 2011 | 2012 | 2013 | 2014 | 2015 |
|---|---|---|---|---|---|---|---|---|---|
| Centres with lower than average FEV1 values | |||||||||
| 12 | 2 (4.9) | 3 (6.1) | 8 (8.7) | 9 (9.2) | 9 (9.6) | 10 (9.8) | 9 (8.7) | 8 (7.8) | 6 (6.1) |
| 39 | – (–) | 0 (0.0) | 7 (5.7) | 12 (7.3) | 13 (7.4) | 12 (6.9) | 12 (7.3) | 12 (7.6) | 12 (8.2) |
| 52 | 7 (9.1) | 7 (8.0) | 7 (5.2) | 7 (5.3) | 5 (3.4) | 6 (3.9) | 5 (3.0) | 7 (4.5) | 7 (4.3) |
| Across all centres | |||||||||
| All | 92 (7.2) | 99 (5.8) | 122 (5.9) | 135 (6.2) | 139 (6.2) | 129 (5.8) | 131 (5.7) | 126 (5.5) | 123 (5.3) |
| Centres with higher than average FEV1 values | |||||||||
| 25 | 5 (3.5) | 8 (4.9) | 8 (4.5) | 7 (4.1) | 9 (5.2) | 6 (3.5) | 7 (4.3) | 6 (3.9) | 5 (3.4) |
| 28 | 3 (7.3) | 3 (6.8) | 3 (7.1) | 3 (6.1) | 5 (10.0) | 6 (12.0) | 7 (10.4) | 8 (10.8) | 6 (8.2) |
| 31 | 5 (7.7) | 6 (6.6) | 4 (4.8) | 6 (6.5) | 7 (7.4) | 6 (7.1) | 9 (9.9) | 11 (11.1) | 11 (10.6) |
| Centre | 2007 | 2008 | 2009 | 2010 | 2011 | 2012 | 2013 | 2014 | 2015 |
|---|---|---|---|---|---|---|---|---|---|
| Centres with lower than average FEV1 values | |||||||||
| 12 | 1 (2.4) | 6 (12.2) | 12 (13.2) | 8 (8.2) | 9 (9.6) | 12 (11.8) | 15 (14.4) | 12 (11.7) | 11 (11.3) |
| 39 | – | 0 (0.0) | 12 (9.5) | 12 (7.1) | 15 (8.4) | 13 (7.3) | 21 (12.4) | 23 (13.7) | 22 (14.0) |
| 52 | 6 (7.6) | 6 (6.7) | 12 (8.8) | 14 (10.7) | 16 (10.7) | 14 (9.0) | 20 (11.9) | 20 (12.7) | 25 (15.2) |
| Across all centres | |||||||||
| All | 85 (6.7) | 125 (7.3) | 176 (8.4) | 174 (7.9) | 226 (9.9) | 229 (10.1) | 283 (12.1) | 299 (12.9) | 315 (13.3) |
| Centres with higher than average FEV1 values | |||||||||
| 25 | 9 (6.3) | 8 (4.8) | 7 (3.9) | 5 (2.9) | 4 (2.2) | 6 (3.4) | 14 (8.3) | 17 (10.9) | 11 (7.3) |
| 28 | 5 (11.9) | 4 (8.9) | 4 (9.3) | 4 (8.2) | 6 (11.8) | 8 (15.7) | 13 (19.1) | 18 (24.0) | 20 (27.4) |
| 31 | 11 (16.9) | 18 (19.4) | 16 (18.6) | 17 (17.9) | 19 (19.8) | 15 (17.6) | 17 (18.7) | 20 (20.2) | 21 (20.2) |
| Centre | 2007 | 2008 | 2009 | 2010 | 2011 | 2012 | 2013 | 2014 | 2015 |
|---|---|---|---|---|---|---|---|---|---|
| Centres with lower than average FEV1 values | |||||||||
| 12 | 7 (17.5) | 6 (12.2) | 12 (13.0) | 12 (12.2) | 12 (12.8) | 15 (14.7) | 9 (8.7) | 9 (8.7) | 7 (7.1) |
| 39 | – (–) | 0 (0.0) | 23 (18.3) | 32 (18.9) | 35 (19.6) | 38 (21.3) | 34 (20.0) | 32 (19.0) | 32 (20.5) |
| 52 | 29 (36.7) | 33 (37.1) | 30 (22.1) | 27 (20.6) | 28 (18.8) | 33 (21.3) | 33 (19.9) | 27 (17.4) | 29 (17.9) |
| Across all centres | |||||||||
| All | 239 (18.4) | 325 (18.8) | 382 (18.2) | 376 (17.2) | 385 (16.9) | 402 (17.8) | 417 (17.9) | 420 (18.3) | 428 (18.2) |
| Centres with higher than average FEV1 values | |||||||||
| 25 | 28 (19.4) | 34 (20.6) | 47 (26.0) | 42 (24.0) | 41 (23.0) | 43 (24.6) | 38 (22.6) | 41 (26.5) | 40 (26.1) |
| 28 | 6 (14.3) | 9 (20.0) | 9 (20.9) | 13 (26.0) | 13 (25.5) | 11 (21.6) | 15 (22.1) | 18 (23.7) | 16 (21.6) |
| 31 | 10 (15.6) | 14 (15.4) | 13 (15.5) | 15 (16.1) | 15 (16.0) | 11 (13.3) | 11 (12.2) | 10 (10.3) | 13 (12.7) |
| Year and adjustment method | Centres with lower than average FEV1 values | Centres with higher than average FEV1 values | ||
|---|---|---|---|---|
| Outside 3-SD limit | Outside 2-SD limit | Outside 2-SD limit | Outside 3-SD limit | |
| 2007 | ||||
| Unadjusted | 12, 52 and 59 | 11, 16,a 23 and 53a | 14, 31, 36, 37 and 54 | 25 |
| Multilevel model | 12, 52 and 59 | 23 | 31, 36a and 54a | 25 |
| GLM | 12, 52 and 59 | 11 and 18a | 31a and 54 | 25 |
| 2008 | ||||
| Unadjusted | 12 and 52 | 1, 13, 18 and 26 | 36 and 44 | 25 and 28 |
| Multilevel model | 12 and 52 | – | 28, 44a and 50a | 25 |
| GLM | 12, 18a and 52 | 26 | 44 and 50 | 25 and 28 |
| 2009 | ||||
| Unadjusted | 11, 12 and 52 | 16, 23, 43 and 59 | 36, 46 and 60 | 25 and 31 |
| Multilevel model | 12 and 52 | 1 and 59 | 31 and 36 | 25 |
| GLM | 11,a 12 and 52 | 1, 16,18,a 23a and 59 | 27,a 31, 36, 60a and 61 | 25 |
| 2010 | ||||
| Unadjusted | 12 and 39 | 23, 52 and 59 | 36, 46a and 54a | 31 |
| Multilevel model | 12 and 39 | 23, 52 and 59 | 25, 31, 36a and 44a | – |
| GLM | 12, 39 and 59 | 23 and 52 | 25, 36 and 50 | 31a |
| 2011 | ||||
| Unadjusted | 12 and 23 | 18 and 39 | 31a and 61 | – |
| Multilevel model | – | 12, 23a and 39 | 25a | – |
| GLM | 12, 23 and 39a | 11 and 18 | 28 and 31 | – |
| 2012 | ||||
| Unadjusted | 39 | 23,a 26, 50a and 52a | 25, 31,a 43 and 54 | 28 |
| Multilevel model | 39 | 12 and 52a | 14, 25, 28 and 43a | – |
| GLM | 39 | 12, 18 and 26 | 14, 31, 43 and 54 | 25 and 28 |
| 2013 | ||||
| Unadjusted | 39 | 23, 26, 50 and 53 | 25, 28, 31 and 61 | 60 |
| Multilevel model | – | 39 and 50 | 31 | 25 |
| GLM | 39 | 23,a 26, 50 and 53 | 31 | 25 and 60a |
| 2014 | ||||
| Unadjusted | 53 | 25, 39, 50 and 52 | 13, 28, 31, 44, 60 and 61 | – |
| Multilevel model | – | 39,a 50 and 52 | 44a | – |
| GLM | 50a and 53 | 52 | 13, 43,a 44a and 60 | – |
| 2015 | ||||
| Unadjusted | 53 | 25, 26, 39,a 50 and 52a | 16, 28, 31, 43, 60a and 61 | – |
| Multilevel model | – | 25,a 50a and 52a | 31, 43 and 61 | – |
| GLM | 53 | 26 and 52a | 16, 31, 43 and 61 | – |
| Centre | Mean FEV1 | Any i.v. antibiotics, n (%) | Median number of days on i.v. antibiotics | FEV1 < 70% | FEV1 ≥ 70% | ||
|---|---|---|---|---|---|---|---|
| Any i.v. antibiotics, n (%) | Median number of days on i.v. antibiotics | Any i.v. antibiotics, n (%) | Median number of days on i.v. antibiotics | ||||
| 2007: centres with lower than average FEV1 values | |||||||
| 12 | 72.98 | 18 (43.9) | 27 | 8 (53.3) | 26 | 9 (36.0) | 26 |
| 39 | – | – (–) | – | – (–) | – | – (–) | – |
| 52 | 75.63 | 46 (58.2) | 50.5 | 17 (68.0) | 56 | 29 (54.7) | 42 |
| 2007: across all centres | |||||||
| All | 84.57 | 561 (42.7) | 28 | 170 (67.2) | 42 | 391 (36.8) | 28 |
| 2007: centres with higher than average FEV1 values | |||||||
| 25 | 92.2 | 51 (35.4) | 14 | 8 (53.3) | 24 | 36 (32.4) | 14 |
| 28 | 85.85 | 20 (47.6) | 28 | 6 (75.0) | 56 | 13 (40.6) | 28 |
| 31 | 90.61 | 16 (24.6) | 14 | 3 (33.3) | 39 | 12 (22.2) | 13.5 |
| 2008: centres with lower than average FEV1 values | |||||||
| 12 | 75.25 | 17 (37.0) | 16 | 10 (71.4) | 22 | 6 (22.2) | 21 |
| 39 | 57.64 | 1 (100.0) | 14 | 1 (100.0) | 14 | 0 (0.0) | |
| 52 | 76.21 | 53 (60.2) | 54 | 23 (82.1) | 56 | 29 (50.0) | 28 |
| 2008: across all centres | |||||||
| All | 84.88 | 738 (45.4) | 28 | 207 (72.6) | 50 | 531 (39.6) | 21 |
| 2008: centres with higher than average FEV1 values | |||||||
| 25 | 91.14 | 48 (30.2) | 28 | 11 (64.7) | 50 | 36 (27.7) | 14.5 |
| 28 | 93.86 | 20 (50.0) | 28 | 3 (100.0) | 42 | 16 (44.4) | 24.5 |
| 31 | 84.65 | 21 (22.6) | 13 | 7 (50.0) | 36 | 12 (16.7) | 12.5 |
| 2009: centres with lower than average FEV1 values | |||||||
| 12 | 77.7 | 33 (36.7) | 21 | 20 (71.4) | 28 | 9 (16.4) | 14 |
| 39 | 82.66 | 41 (34.5) | 56 | 8 (80.0) | 56 | 13 (43.3) | 28 |
| 52 | 78.85 | 78 (60.0) | 41.5 | 29 (78.4) | 56 | 43 (50.0) | 28 |
| 2009: across all centres | |||||||
| All | 84.17 | 900 (45.1) | 28 | 257 (73.2) | 43 | 643 (39.1) | 27 |
| 2009: centres with higher than average FEV1 values | |||||||
| 25 | 89.95 | 58 (32.2) | 17.5 | 14 (63.6) | 31.5 | 42 (29.2) | 14 |
| 28 | 84.22 | 26 (60.5) | 28 | 5 (100.0) | 42 | 19 (52.8) | 28 |
| 31 | 90.66 | 19 (22.4) | 14 | 5 (62.5) | 50 | 12 (17.1) | 12.5 |
| 2010: centres with lower than average FEV1 values | |||||||
| 12 | 75.08 | 46 (46.9) | 28 | 26 (74.3) | 34.5 | 18 (30.0) | 14 |
| 39 | 74.05 | 70 (45.2) | 43.5 | 24 (72.7) | 43.5 | 22 (40.0) | 32.5 |
| 52 | 80.32 | 72 (55.8) | 38.5 | 24 (88.9) | 56 | 41 (44.6) | 28 |
| 2010: across all centres | |||||||
| All | 83.75 | 979 (47.2) | 28 | 283 (77.3) | 49 | 696 (40.8) | 24 |
| 2010: centres with higher than average FEV1 values | |||||||
| 25 | 85.77 | 66 (37.7) | 28 | 20 (69.0) | 41.5 | 41 (30.8) | 14 |
| 28 | 83.79 | 22 (52.4) | 47 | 8 (80.0) | 59.5 | 14 (45.2) | 28 |
| 31 | 90.61 | 28 (31.5) | 14 | 6 (66.7) | 84 | 20 (26.7) | 11.5 |
| 2011: centres with lower than average FEV1 values | |||||||
| 12 | 78.21 | 45 (47.9) | 28 | 25 (86.2) | 42 | 18 (30.0) | 21.5 |
| 39 | 80.22 | 103 (59.2) | 45 | 28 (82.4) | 56 | 40 (46.5) | 36 |
| 52 | 84.2 | 73 (49.3) | 38 | 18 (75.0) | 54 | 51 (43.6) | 28 |
| 2011: across all centres | |||||||
| All | 85.16 | 1049 (46.8) | 28 | 310 (79.5) | 42 | 739 (39.9) | 27 |
| 2011: centres with higher than average FEV1 values | |||||||
| 25 | 86.32 | 74 (41.8) | 28 | 24 (77.4) | 42 | 44 (32.4) | 15 |
| 28 | 89.34 | 17 (38.6) | 49 | 4 (100.0) | 48 | 12 (31.6) | 45.5 |
| 31 | 88.62 | 20 (22.2) | 14 | 7 (70.0) | 60 | 12 (16.4) | 13.5 |
| 2012: centres with lower than average FEV1 values | |||||||
| 12 | 80.62 | 43 (42.2) | 31 | 24 (75.0) | 54 | 18 (27.3) | 25.5 |
| 39 | 76.87 | 106 (59.6) | 42 | 42 (79.2) | 56 | 45 (50.0) | 19 |
| 52 | 82.11 | 79 (51.3) | 28 | 28 (87.5) | 42 | 48 (41.7) | 15.5 |
| 2012: across all centres | |||||||
| All | 84.69 | 1065 (47.1) | 28 | 330 (77.6) | 45 | 735 (40.0) | 21 |
| 2012: centres with higher than average FEV1 values | |||||||
| 25 | 87.8 | 81 (46.6) | 24 | 22 (88.0) | 39 | 55 (39.3) | 14 |
| 28 | 93.01 | 20 (39.2) | 43.5 | 6 (100.0) | 37 | 14 (33.3) | 44 |
| 31 | 88.31 | 16 (18.8) | 13.5 | 8 (61.5) | 27.5 | 8 (12.3) | 9.5 |
| 2013: centres with lower than average FEV1 values | |||||||
| 12 | 84.66 | 39 (37.5) | 28 | 15 (78.9) | 56 | 21 (27.3) | 28 |
| 39 | 80.41 | 99 (58.2) | 42 | 39 (88.6) | 56 | 51 (52.0) | 42 |
| 52 | 84.36 | 71 (42.3) | 28 | 26 (74.3) | 28 | 40 (33.6) | 19 |
| 2013: across all centres | |||||||
| All | 85.78 | 1021 (43.7) | 28 | 284 (76.5) | 42 | 737 (37.5) | 21 |
| 2013: centres with higher than average FEV1 values | |||||||
| 25 | 89.44 | 50 (29.8) | 15.5 | 13 (65) | 27 | 32 (24.2) | 14 |
| 28 | 90.17 | 24 (35.3) | 36 | 5 (71.4) | 42 | 17 (30.4) | 27 |
| 31 | 90.37 | 19 (20.9) | 14 | 5 (55.6) | 14 | 13 (19.1) | 10 |
| 2014: centres with lower than average FEV1 values | |||||||
| 12 | 86.96 | 40 (38.8) | 24 | 14 (77.8) | 32.5 | 23 (29.9) | 17 |
| 39 | 83.36 | 81 (48.2) | 45 | 27 (84.4) | 56 | 42 (38.5) | 36.5 |
| 52 | 83.64 | 55 (35.0) | 28 | 21 (61.8) | 33 | 31 (27.2) | 14 |
| 2014: across all centres | |||||||
| All | 86.94 | 958 (41.3) | 25.5 | 262 (78.2) | 42 | 696 (35.0) | 15 |
| 2014: centres with higher than average FEV1 values | |||||||
| 25 | 83.94 | 63 (40.4) | 17 | 18 (66.7) | 43 | 37 (32.7) | 14 |
| 28 | 91.24 | 25 (32.9) | 42 | 7 (100.0) | 65 | 16 (26.2) | 30 |
| 31 | 91.18 | 21 (21.2) | 21 | 9 (75.0) | 27 | 10 (14.5) | 12.5 |
| 2015: centres with lower than average FEV1 values | |||||||
| 12 | 85.9 | 35 (35.7) | 28 | 9 (52.9) | 43 | 24 (31.6) | 16 |
| 39 | 85.42 | 69 (43.9) | 30 | 18 (85.7) | 53.5 | 43 (36.8) | 20 |
| 52 | 85.3 | 70 (42.7) | 14.5 | 19 (76.0) | 28 | 43 (35.5) | 14 |
| 2015: across all centres | |||||||
| All | 87.9 | 918 (38.6) | 23.5 | 221 (72.5) | 42 | 697 (33.7) | 15 |
| 2015: centres with higher than average FEV1 values | |||||||
| 25 | 84.46 | 62 (40.0) | 20.5 | 20 (83.3) | 43.5 | 37 (32.5) | 15 |
| 28 | 91.97 | 25 (33.8) | 28 | 3 (60.0) | 19 | 22 (32.8) | 28 |
| 31 | 92.98 | 22 (21.2) | 14 | 5 (62.5) | 32 | 15 (17.6) | 13 |
| Year | Centres with lower than average FEV1 values | Centres with higher than average FEV1 values | ||
|---|---|---|---|---|
| Outside 3-SD limit | Outside 2-SD limit | Outside 2-SD limit | Outside 3-SD limit | |
| 2007 | 11, 12, 52 and 59 | 16, 18,a 23 and 53a | 14, 31 and 36 | 25 |
| 2008 | 12 and 52 | 1,a 13, 18, 26 and 53a | 36 and 44 | 25 and 28 |
| 2009 | 11, 12 and 52 | 16 and 59 | 36, 44,a 46 and 60 | 25 and 31 |
| 2010 | 12 and 39 | 23, 26,a 52a and 59 | 36, 43,a 46 and 54 | 31 |
| 2011 | 12 and 23 | 18 and 39 | 31a and 61 | – |
| 2012 | 39 | 12, 23,a 26, 52a and 53a | 25, 31,a 36, 54 and 61 | 28 and 43 |
| 2013 | 39 | 23, 26, 50 and 53 | 25, 28, 31 and 61 | 60 |
| 2014 | – | 39, 50, 52 and 53 | 13,a 28, 31, 44, 60 and 61 | – |
| 2015 | 53 | 25, 26, 39,a 50 and 52 | 16, 28, 31, 43, 60a and 61 | – |
| Centre | 2007 | 2008 | 2009 | 2010 | 2011 | 2012 | 2013 | 2014 | 2015 | ||||||||||||||||||
|---|---|---|---|---|---|---|---|---|---|---|---|---|---|---|---|---|---|---|---|---|---|---|---|---|---|---|---|
| AR | FEV1 | < 40 (%) | AR | FEV1 | < 40 (%) | AR | FEV1 | < 40 (%) | AR | FEV1 | < 40 (%) | AR | FEV1 | < 40 (%) | AR | FEV1 | < 40 (%) | AR | FEV1 | < 40 (%) | AR | FEV1 | < 40 (%) | AR | FEV1 | < 40 (%) | |
| Centres with lower than average FEV1 values | |||||||||||||||||||||||||||
| 9 | 440 | 435 | 26 | 418 | 415 | 26 | 511 | 503 | 25 | 533 | 522 | 23 | 540 | 530 | 22 | 557 | 554 | 16 | 585 | 576 | 23 | 583 | 580 | 21 | 561 | 558 | 20 |
| Centres with higher than average FEV1 values | |||||||||||||||||||||||||||
| 7 | 109 | 106 | 21 | 248 | 238 | 17 | 271 | 267 | 14 | 259 | 247 | 17 | 294 | 289 | 13 | 312 | 296 | 18 | 328 | 315 | 15 | 330 | 320 | 17 | 339 | 319 | 18 |
| 34 | 178 | 177 | 12 | 206 | 204 | 13 | 225 | 224 | 5 | 241 | 239 | 5 | 237 | 233 | 6 | 239 | 229 | 13 | 251 | 247 | 16 | 268 | 268 | 14 | 262 | 260 | 12 |
| 40 | 133 | 126 | 95 | 148 | 142 | 96 | 178 | 175 | 98 | 184 | 180 | 98 | 194 | 192 | 99 | 185 | 181 | 98 | 200 | 196 | 98 | 216 | 212 | 98 | 211 | 208 | 99 |
| Centre | 2007 | 2008 | 2009 | 2010 | 2011 | 2012 | 2013 | 2014 | 2015 |
|---|---|---|---|---|---|---|---|---|---|
| Centres with lower than average FEV1 values | |||||||||
| 9 | 29.94 | 30.36 | 30.25 | 30.39 | 31.00 | 31.57 | 32.4 | 32.9 | 33.1 |
| Overall mean across all centres | |||||||||
| All | 27.5 | 27.8 | 28.1 | 28.2 | 28.7 | 29.1 | 30 | 30.4 | 30.6 |
| Centres with higher than average FEV1 values | |||||||||
| 7 | 29.17 | 27.96 | 27.90 | 28.41 | 28.77 | 29.29 | 30 | 30.2 | 30.2 |
| 34 | 25.92 | 26.44 | 26.75 | 27.15 | 28.22 | 28.64 | 29.7 | 29.8 | 30.3 |
| 40 | 29.3 | 29.5 | 29.2 | 30.2 | 31.2 | 32 | 33.5 | 34.2 | 35.3 |
| Year | Centres with lower than average FEV1 values | Centres with higher than average FEV1 values | ||
|---|---|---|---|---|
| Outside 3-SD limit | Outside 2-SD limit | Outside 2-SD limit | Outside 3-SD limit | |
| 2007 | 9 | 2, 17 and 35 | 47a | 7 and 40 |
| 2008 | – | 9 and 56a | 5 and 48 | 7 |
| 2009 | 9 | 2, 10, 17 and 21 | 5 and 7 | 34 and 40 |
| 2010 | – | 2, 9, 10, 17 and 41a | 51 | 34 and 40 |
| 2011 | 9 | 2, 17,a 21, 35 and 41 | 40 | 34 |
| 2012 | – | 9, 10 and 21a | 6, 40, 47, 48a and 51a | 34 |
| 2013 | – | 9, 10, 20, 21 and 56 | 34 and 47 | 40 |
| 2014 | – | 2,a 9, 10, 20 and 21 | 33,a 34 and 48a | 40 |
| 2015 | – | 9,a 10, 20, 21a and 56 | 34, 47 and 48 | 40 |
| Year | Centres with lower than average FEV1 values | Centres with higher than average FEV1 values | ||
|---|---|---|---|---|
| Outside 3-SD limit | Outside 2-SD limit | Outside 2-SD limit | Outside 3-SD limit | |
| 2007 | 9 | – | 7 | 40 |
| 2008 | – | 9 | – | 7 |
| 2009 | 9 | 10 and 17 | 7a and 40 | 34 |
| 2010 | – | 9, 10,a 17 and 41a | 40 | 34 |
| 2011 | 9 | 41 | 40 | 34 |
| 2012 | – | 9 and 10 | 34 and 40 | – |
| 2013 | – | 9 and 10* | 34 and 40 | – |
| 2014 | – | 9 and 10 | 34 and 40 | – |
| 2015 | – | 9a and 10 | 34, 40, 47 and 48 | – |
| Centre | 2007 | 2008 | 2009 | 2010 | 2011 | 2012 | 2013 | 2014 | 2015 |
|---|---|---|---|---|---|---|---|---|---|
| Centres with lower than average FEV1 values | |||||||||
| 9 | 182 (41.4) | 174 (41.6) | 225 (44.0) | 236 (44.3) | 239 (44.3) | 257 (46.1) | 268 (45.8) | 273 (46.8) | 265 (47.2) |
| Across all centres | |||||||||
| All | 989 (43.7) | 1355 (44.3) | 1596 (44.5) | 1753 (44.7) | 1934 (44.5) | 1989 (44.8) | 2071 (45.3) | 2233 (45.2) | 2308 (45.4) |
| Centres with higher than average FEV1 values | |||||||||
| 7 | 54 (49.5) | 102 (41.1) | 111 (41.0) | 108 (41.7) | 117 (39.8) | 125 (40.1) | 137 (41.8) | 138 (41.8) | 144 (42.5) |
| 34 | 84 (47.2) | 97 (47.1) | 102 (45.3) | 114 (47.3) | 109 (46.0) | 110 (46.0) | 112 (44.6) | 121 (45.1) | 116 (44.3) |
| 40 | 55 (41.4) | 70 (47.3) | 79 (44.4) | 84 (45.7) | 86 (44.3) | 81 (43.8) | 94 (47.0) | 107 (49.5) | 105 (49.8) |
| Centre | 2007 | 2008 | 2009 | 2010 | 2011 | 2012 | 2013 | 2014 | 2015 |
|---|---|---|---|---|---|---|---|---|---|
| Centres with lower than average FEV1 values | |||||||||
| 9 | 225 (52.2) | 199 (48.1) | 250 (49.8) | 263 (49.7) | 254 (47.7) | 261 (47.6) | 274 (47.6) | 276 (48.1) | 264 (47.8) |
| Across all centres | |||||||||
| All | 1131 (51.6) | 1546 (52.0) | 1780 (51.0) | 1918 (50.1) | 2090 (49.3) | 2143 (49.4) | 2198 (49.2) | 2347 (48.5) | 2391 (48.1) |
| Centres with higher than average FEV1 values | |||||||||
| 7 | 56 (51.4) | 131 (53.5) | 140 (52.2) | 137 (53.3) | 153 (52.9) | 164 (53.2) | 165 (51.1) | 164 (50.5) | 174 (52.1) |
| 34 | 93 (56.0) | 110 (57.6) | 118 (55.4) | 120 (52.2) | 114 (50.2) | 114 (50.0) | 120 (49.6) | 127 (48.7) | 128 (50.0) |
| 40 | 37 (28.2) | 56 (38.4) | 62 (35.0) | 61 (33.5) | 66 (34.6) | 64 (35.2) | 67 (33.8) | 72 (33.8) | 64 (30.8) |
| Centre | 2007 | 2008 | 2009 | 2010 | 2011 | 2012 | 2013 | 2014 | 2015 |
|---|---|---|---|---|---|---|---|---|---|
| Centres with lower than average FEV1 values | |||||||||
| 9 | 19 (4.4) | 13 (3.1) | 22 (4.4) | 24 (4.5) | 24 (4.5) | 23 (4.2) | 22 (3.8) | 23 (4.0) | 23 (4.2) |
| Across all centres | |||||||||
| All | 136 (6.2) | 163 (5.5) | 213 (6.1) | 237 (6.2) | 262 (6.2) | 268 (6.2) | 281 (6.3) | 299 (6.2) | 313 (6.3) |
| Centres with higher than average FEV1 values | |||||||||
| 7 | 6 (5.5) | 11 (4.5) | 12 (4.5) | 10 (3.9) | 11 (3.8) | 12 (3.9) | 14 (4.3) | 14 (4.3) | 16 (4.8) |
| 34 | 9 (5.4) | 11 (5.8) | 14 (6.6) | 13 (5.7) | 16 (7.0) | 16 (7.0) | 18 (7.4) | 19 (7.3) | 20 (7.8) |
| 40 | 15 (11.5) | 8 (5.5) | 16 (9.0) | 16 (8.8) | 16 (8.4) | 17 (9.3) | 19 (9.6) | 19 (8.9) | 18 (8.7) |
| Centre | 2007 | 2008 | 2009 | 2010 | 2011 | 2012 | 2013 | 2014 | 2015 |
|---|---|---|---|---|---|---|---|---|---|
| Centres with lower than average FEV1 values | |||||||||
| 9 | 69 (15.7) | 80 (19.1) | 92 (18.0) | 96 (18.0) | 95 (17.6) | 95 (17.1) | 110 (18.8) | 109 (18.7) | 103 (18.4) |
| Across all centres | |||||||||
| All | 281 (12.5) | 393 (12.9) | 494 (13.8) | 564 (14.4) | 648 (14.9) | 676 (15.2) | 737 (16.1) | 837 (16.9) | 854 (16.8) |
| Centres with higher than average FEV1 values | |||||||||
| 7 | 9 (8.9) | 29 (12.2) | 28 (10.3) | 23 (8.9) | 27 (9.2) | 35 (11.2) | 43 (13.1) | 37 (11.2) | 41 (12.1) |
| 34 | 25 (14.0) | 27 (13.2) | 32 (14.2) | 38 (15.8) | 38 (16.0) | 42 (17.6) | 40 (16) | 47 (17.6) | 42 (16.1) |
| 40 | 48 (36.1) | 43 (29.1) | 56 (31.5) | 56 (30.4) | 63 (32.5) | 56 (30.3) | 61 (30.5) | 71 (32.9) | 76 (36.0) |
| Centre | 2007 | 2008 | 2009 | 2010 | 2011 | 2012 | 2013 | 2014 | 2015 |
|---|---|---|---|---|---|---|---|---|---|
| Centres with lower than average FEV1 values | |||||||||
| 9 | 81 (19.0) | 76 (18.5) | 101 (20.0) | 104 (19.8) | 116 (21.7) | 121 (21.9) | 133 (23.0) | 125 (21.7) | 115 (20.7) |
| Across all centres | |||||||||
| All | 392 (17.7) | 541 (17.8) | 655 (18.4) | 752 (19.3) | 840 (19.4) | 851 (19.3) | 863 (19.0) | 913 (18.6) | 911 (18.1) |
| Centres with higher than average FEV1 values | |||||||||
| 7 | 18 (16.5) | 51 (20.6) | 45 (16.6) | 44 (17.0) | 50 (17.0) | 48 (15.4) | 49 (14.9) | 55 (16.7) | 59 (17.4) |
| 34 | 47 (26.9) | 61 (30.2) | 69 (31.4) | 71 (30.0) | 71 (30.6) | 65 (27.9) | 66 (27.0) | 69 (26.4) | 70 (27.5) |
| 40 | 27 (20.3) | 28 (18.9) | 35 (19.7) | 33 (17.9) | 30 (15.5) | 29 (15.7) | 28 (14.0) | 38 (17.6) | 30 (14.3) |
| Year | Centres with lower than average FEV1 values | Centres with higher than average FEV1 values | ||
|---|---|---|---|---|
| Outside 3-SD limit | Outside 2-SD limit | Outside 2-SD limit | Outside 3-SD limit | |
| 2007 | ||||
| Unadjusted | 9 | 2 and 35 | 47 | 7 and 40 |
| Multilevel model | 9 | – | 7 and 40 | – |
| GLM | 9 | 2 and 35 | 40 | 7 |
| 2008 | ||||
| Unadjusted | 9 | 35a | 5 and 48a | 7 |
| Multilevel model | 9 | – | – | 7 |
| GLM | 9 | 56 | 5 and 48 | 7 |
| 2009 | ||||
| Unadjusted | 9 | 2, 10, 17a and 21 | 5, 7a and 40 | 34 |
| Multilevel model | 9 | 10 | 7a and 29 | 34 |
| GLM | 9 | 2, 10, 17a and 21 | 7, 29 and 40a | 34 |
| 2010 | ||||
| Unadjusted | 9 | 2, 10 and 17 | 40 and 51 | 34 |
| Multilevel model | – | 9 and 10 | 40a | 34 |
| GLM | – | 2, 9, 10a and 17 | 40 | 34 |
| 2011 | ||||
| Unadjusted | 9 | 2, 21, 35a and 41 | 5a and 40 | 34 |
| Multilevel model | 9 | 41a | – | 34 |
| GLM | 9 | 2, 21, 35a and 41 | 7a and 40a | 34 |
| 2012 | ||||
| Unadjusted | 9 | 8a and 10 | 6, 40, 47 and 51a | 34 |
| Multilevel model | – | 9 and 10 | 34 | – |
| GLM | – | 9 and 10 | 6a and 47 | 34 |
| 2013 | ||||
| Unadjusted | – | 9, 10, 20,a 21 and 56 | 34, 40 and 47 | – |
| Multilevel model | – | 9 and 10 | 34 and 40 | – |
| GLM | – | 9, 10,a 20, 21 and 56 | 34, 40 and 47a | – |
| 2014 | ||||
| Unadjusted | 9 and 10 | 20, 21, and 29a | 17, 34, 40, 45 and 47 | – |
| Multilevel model | – | 9 and 10 | 34 and 40 | – |
| GLM | – | 2, 9, 10, 20, 21 and 56 | 34 and 40 | – |
| 2015 | ||||
| Unadjusted | – | 9, 10, 20, 29 and 56 | 34, 40, 45 and 48 | 47 |
| Multilevel model | – | – | 34, 40,a 47a and 48 | – |
| GLM | 56 | 2, 10a and 20 | 40, 47 and 48 | 34 |
| Centre | Mean FEV1 | Any i.v. antibiotics, n (%) | Median number of days on i.v. antibiotics | FEV1 < 40% | 40% ≤ FEV1 ≤ 70% | FEV1 > 70% | |||
|---|---|---|---|---|---|---|---|---|---|
| Any i.v. antibiotics, n (%) | Median number of days on i.v. antibiotics | Any i.v. antibiotics, n (%) | Median number of days on i.v. antibiotics | Any i.v. antibiotics, n (%) | Median number of days on i.v. antibiotics | ||||
| 2007: centres with lower than average FEV1 values | |||||||||
| 9 | 59.81 | 176 (40.0) | 15.5 | 80 (71.4) | 29.5 | 69 (40.6) | 14 | 27 (17.6) | 14 |
| 2007: across all centres | |||||||||
| All | 64.82 | 1016 (44.9) | 28 | 278 (69.7) | 42 | 443 (51.9) | 28 | 295 (29.2) | 21 |
| 2007: centres with higher than average FEV1 values | |||||||||
| 7 | 72.62 | 1 (0.9) | 14 | 0 (0.0) | – | 1 (2.7) | 14 | 0 (0.0) | – |
| 34 | 66.26 | 119 (66.9) | 24 | 20 (95.2) | 27 | 59 (76.6) | 28 | 40 (50.6) | 14 |
| 40 | 73.42 | 55 (41.4) | 28 | 11 (91.7) | 42 | 26 (59.1) | 21 | 15 (21.4) | 14 |
| 2008: centres with lower than average FEV1 values | |||||||||
| 9 | 60.09 | 182 (43.6) | 15.5 | 72 (67.3) | 28 | 74 (46.8) | 14 | 34 (22.8) | 14 |
| Across all centres | |||||||||
| All | 64.48 | 1656 (59.5) | 28 | 427 (82.9) | 48 | 702 (67.0) | 28 | 527 (43.2) | 21 |
| Centres with higher than average FEV1 values | |||||||||
| 7 | 71.11 | 76 (52.4) | 28 | 13 (72.2) | 57 | 30 (78.9) | 28 | 29 (35.8) | 24 |
| 34 | 66.39 | 137 (66.5) | 25 | 26 (96.3) | 52.5 | 70 (74.5) | 28 | 39 (47.0) | 14 |
| 40 | 66.73 | 82 (55.8) | 21.5 | 19 (95.0) | 33 | 35 (64.8) | 22 | 24 (35.8) | 13.5 |
| 2009: centres with lower than average FEV1 values | |||||||||
| 9 | 59.87 | 252 (49.6) | 21 | 97 (77.6) | 32 | 101 (50.8) | 20 | 49 (27.8) | 14 |
| 2009: across all centres | |||||||||
| All | 64.43 | 2055 (60.4) | 28 | 528 (87.6) | 49 | 851 (67.2) | 28 | 676 (44.1) | 23 |
| 2009: centres with higher than average FEV1 values | |||||||||
| 7 | 67.41 | 169 (62.6) | 38 | 37 (100.0) | 63 | 75 (72.1) | 41 | 53 (42.4) | 24 |
| 34 | 74.08 | 139 (62.1) | 21 | 9 (81.8) | 42 | 64 (73.6) | 28 | 65 (52.0) | 14 |
| 40 | 69.37 | 85 (48.6) | 24 | 20 (100.0) | 39 | 39 (60.9) | 20 | 24 (27.3) | 19.5 |
| 2010: centres with lower than average FEV1 values | |||||||||
| 9 | 61.26 | 255 (48.1) | 22 | 88 (73.9) | 28.5 | 110 (53.4) | 21 | 49 (25.3) | 14 |
| 2010: across all centres | |||||||||
| All | 64.62 | 2295 (59.8) | 28 | 600 (87.5) | 49 | 968 (68.6) | 28 | 727 (41.8) | 24 |
| 2010: centres with higher than average FEV1 values | |||||||||
| 7 | 65.78 | 173 (67.1) | 36 | 41 (95.3) | 56 | 69 (77.5) | 42 | 53 (46.5) | 15 |
| 34 | 75.22 | 137 (56.8) | 28 | 13 (100.0) | 29 | 61 (69.3) | 40 | 61 (44.2) | 17 |
| 40 | 69.51 | 87 (47.5) | 21 | 20 (83.3) | 51 | 35 (59.3) | 16 | 31 (32.0) | 15 |
| 2011: centres with lower than average FEV1 values | |||||||||
| 9 | 60.81 | 253 (47.1) | 24 | 90 (75.6) | 31.5 | 113 (51.4) | 24 | 45 (23.8) | 14 |
| 2011: across all centres | |||||||||
| All | 65.48 | 2538 (59.2) | 28 | 634 (86.3) | 45 | 1109 (68.5) | 31 | 795 (41.1) | 22 |
| 2011: centres with higher than average FEV1 values | |||||||||
| 7 | 67.57 | 202 (68.7) | 42 | 37 (100.0) | 65 | 91 (82.0) | 42 | 70 (49.6) | 28 |
| 34 | 76.94 | 147 (62.0) | 27 | 11 (78.6) | 34 | 56 (74.7) | 29 | 77 (53.5) | 23 |
| 40 | 69.88 | 88 (45.4) | 16 | 22 (81.5) | 37.5 | 40 (58.8) | 15 | 24 (24.7) | 15 |
| 2012: centres with lower than average FEV1 values | |||||||||
| 9 | 61.22 | 241 (43.3) | 25 | 94 (70.7) | 31.5 | 104 (48.1) | 26.5 | 41 (20.0) | 14 |
| 2012: across all centres | |||||||||
| All | 64.61 | 2506 (56.5) | 29 | 683 (83.3) | 50 | 1052 (65.3) | 28 | 771 (38.5) | 20 |
| 2012: centres with higher than average FEV1 values | |||||||||
| 7 | 65.56 | 205 (65.7) | 37 | 49 (94.2) | 56 | 88 (80.0) | 42 | 58 (43.3) | 22 |
| 34 | 69.6 | 146 (61.3) | 21.5 | 25 (86.2) | 76 | 67 (77.0) | 16 | 49 (43.4) | 14 |
| 40 | 68.17 | 81 (43.8) | 29 | 19 (76.0) | 37 | 40 (56.3) | 25 | 21 (24.7) | 16 |
| 2013: centres with lower than average FEV1 values | |||||||||
| 9 | 62.28 | 252 (43.1) | 26 | 91 (69.5) | 34 | 113 (50.4) | 26 | 45 (20.4) | 14 |
| 2013: across all centres | |||||||||
| All | 65.12 | 2585 (56.6) | 28 | 688 (83.8) | 54 | 1110 (67.0) | 28 | 787 (37.7) | 21 |
| 2013: centres with higher than average FEV1 values | |||||||||
| 7 | 66.36 | 211 (64.3) | 38 | 46 (100.0) | 64 | 90 (73.8) | 35 | 62 (42.2) | 26 |
| 34 | 68.92 | 144 (57.6) | 26 | 34 (85.0) | 52 | 60 (66.7) | 24 | 50 (42.7) | 15 |
| 40 | 70.33 | 89 (44.5) | 23 | 18 (78.3) | 49.5 | 37 (52.9) | 24 | 30 (29.1) | 14.5 |
| 2014: centres with lower than average FEV1 values | |||||||||
| 9 | 62.78 | 267 (45.8) | 21 | 84 (67.7) | 28 | 120 (54.1) | 25.5 | 63 (26.9) | 14 |
| 2014: across all centres | |||||||||
| All | 66.07 | 2738 (55.4) | 28 | 718 (83.6) | 49 | 1158 (66.3) | 28 | 862 (36.9) | 20.5 |
| 2014: centres with higher than average FEV1 values | |||||||||
| 7 | 65.01 | 202 (61.2) | 38.5 | 51 (92.7) | 53 | 88 (71.0) | 28.5 | 55 (39.0) | 25 |
| 34 | 69.65 | 137 (51.1) | 28 | 32 (84.2) | 68 | 68 (65.4) | 28 | 37 (29.4) | 14 |
| 40 | 70.81 | 83 (38.4) | 18 | 20 (74.1) | 29 | 40 (52.6) | 19.5 | 20 (18.3) | 12.5 |
| 2015: centres with lower than average FEV1 values | |||||||||
| 9 | 63.49 | 243 (43.3) | 24 | 70 (63.1) | 38.5 | 121 (51.7) | 21 | 52 (24.4) | 14 |
| 2015: across all centres | |||||||||
| All | 66.09 | 2714 (53.5) | 28 | 721 (82.7) | 49 | 1180 (64.4) | 28 | 813 (34.2) | 18 |
| 2015: centres with higher than average FEV1 values | |||||||||
| 7 | 64.26 | 217 (64.0) | 29 | 52 (92.9) | 59.5 | 94 (72.3) | 29 | 58 (43.6) | 15.5 |
| 34 | 70.35 | 143 (54.8) | 27 | 25 (80.6) | 68 | 75 (75.0) | 28 | 41 (32.0) | 14 |
| 40 | 70.39 | 73 (34.6) | 17 | 17 (70.8) | 29 | 40 (51.3) | 16.5 | 15 (14.2) | 14 |
| Year | Centres with lower than average FEV1 values | Centres with higher than average FEV1 values | ||
|---|---|---|---|---|
| Outside 3-SD limit | Outside 2-SD limit | Outside 2-SD limit | Outside 3-SD limit | |
| 2007 | 9 | 2 and 35 | 47 | 7 and 40 |
| 2008 | 9 | 35a | 5 and 48a | 7 |
| 2009 | 9 | 2, 10 and 21 | 5, 7a and 40 | 34 |
| 2010 | 9 | 2, 10 and 17 | 40 and 51 | 34 |
| 2011 | 9 | 2, 21 and 41 | 40 | 34 |
| 2012 | 9 | 8a and 10 | 6, 34, 40,a 47, 51 and 57a | – |
| 2013 | – | 9, 10, 20, 21 and 56 | 34, 40 and 47 | – |
| 2014 | 9 and 10 | 20, 21 and 29a | 17, 34, 40, 45,a 47 and 48a | – |
| 2015 | – | 9, 10, 20, 29a and 56 | 34, 40, 45a and 48 | 47 |
| Year | Centres with lower than average FEV1 values | Centres with higher than average FEV1 values | ||
|---|---|---|---|---|
| Outside 3-SD limit | Outside 2-SD limit | Outside 2-SD limit | Outside 3-SD limit | |
| 2007 | 9 | 2 and 35 | 47 | 7 and 40 |
| 2008 | 9 | 35a | 5 and 48a | 7 |
| 2009 | 9 | 2, 10, 17a and 21 | 5, 7a and 40 | 34 |
| 2010 | 9 | 2, 10 and 17 | 40 and 51 | 34 |
| 2011 | 9 | 2, 21, 35a and 41 | 5a and 40 | 34 |
| 2012 | 9 | 8a and 10 | 6, 40, 47 and 51a | 34 |
| 2013 | ||||
| All patients | – | 9, 10, 20,a 21 and 56 | 34, 40 and 47 | – |
| Excluding G551D | – | 9, 10, 21 and 56 | 34, 40 and 47 | – |
| 2014 | ||||
| All patients | 9 and 10 | 20, 21 and 29a | 17, 34, 40, 45 and 47 | – |
| Excluding G551D | 10 | 9, 20,a 21 and 29 | 17, 34, 40, 45, 47 and 48 a | |
| 2015 | ||||
| All patients | – | 9, 10, 20, 29 and 56 | 34, 40, 45 and 48 | 47a |
| Excluding G551D | – | 9, 10, 20, 29 and 56 | 34, 40 and 45 | 47 and 48 |
| Centre | Response (%) | Response count |
|---|---|---|
| King’s College Hospital, London | 14.0 | 19 |
| Southampton General Hospital | 13.2 | 18 |
| Northern General Hospital, Sheffield | 12.5 | 17 |
| Royal Papworth Hospital | 11.8 | 16 |
| University Hospital Llandough | 11.0 | 15 |
| Gartnavel General Hospital, Glasgow | 5.9 | 8 |
| Birmingham Heartlands Hospital | 4.4 | 6 |
| Nottingham City Hospital | 4.4 | 6 |
| Royal Brompton Hospital, London | 4.4 | 6 |
| Derriford Hospital, Plymouth | 3.7 | 5 |
| Royal Victoria Infirmary, Newcastle upon Tyne | 3.7 | 5 |
| Aberdeen Royal Infirmary | 2.9 | 4 |
| Royal Devon and Exeter Hospital, Exeter | 2.9 | 4 |
| University Hospital Lewisham, London | 2.9 | 4 |
| Frimley Park Hospital, Camberley | 1.5 | 2 |
| Castle Hill Hospital, Hull | 0.7 | 1 |
| Clinical role of respondents | ||
| Doctor – consultant | 18.4 | 25 |
| Nurse | 18.4 | 25 |
| Physiotherapist | 17.6 | 24 |
| Dietitian | 12.5 | 17 |
| Administrative and clerical | 8.1 | 11 |
| Pharmacist | 6.6 | 9 |
| Doctor – other | 5.9 | 8 |
| Psychologist | 5.9 | 8 |
| Social worker | 5.1 | 7 |
| Manager | 1.5 | 2 |
List of abbreviations
- BMI
- body mass index
- CF
- cystic fibrosis
- FEV1
- forced expiratory volume in 1 second
- GLI
- Global Lung Function Initiative
- GLM
- generalised linear model
- HQIP
- Healthcare Quality Improvement Partnership
- ID
- identification
- IQR
- interquartile range
- i.v.
- intravenous
- MDT
- multidisciplinary team
- SD
- standard deviation
- SES
- socioeconomic status
- SPC
- statistical process control
- SPP
- structure, process and policy

