Notes
Article history
The research reported in this issue of the journal was funded by the HS&DR programme or one of its preceding programmes as project number 14/19/22. The contractual start date was in March 2018. The final report began editorial review in April 2018 and was accepted for publication in October 2018. The authors have been wholly responsible for all data collection, analysis and interpretation, and for writing up their work. The HS&DR editors and production house have tried to ensure the accuracy of the authors’ report and would like to thank the reviewers for their constructive comments on the final report document. However, they do not accept liability for damages or losses arising from material published in this report.
Declared competing interests of authors
Wei Gao declares involvement in the National Institute for Health Research (NIHR) funding boards Health Technology Assessment (HTA) End of Life Care 2016 and Add on Studies 2016 during the period of the reported research. Irene J Higginson declares involvement in the NIHR funding boards Health Services and Delivery Research Commissioned Board Members 2009–15, HTA Efficient Study Designs 2015–16, HTA End of Life Care and Add on Studies 2015–16 and Service Delivery and Organisation Studies Panel Members 2009–12 during the period of the reported research.
Permissions
Copyright statement
© Queen’s Printer and Controller of HMSO 2019. This work was produced by Gao et al. under the terms of a commissioning contract issued by the Secretary of State for Health and Social Care. This issue may be freely reproduced for the purposes of private research and study and extracts (or indeed, the full report) may be included in professional journals provided that suitable acknowledgement is made and the reproduction is not associated with any form of advertising. Applications for commercial reproduction should be addressed to: NIHR Journals Library, National Institute for Health Research, Evaluation, Trials and Studies Coordinating Centre, Alpha House, University of Southampton Science Park, Southampton SO16 7NS, UK.
2019 Queen’s Printer and Controller of HMSO
Chapter 1 Background
Project context
By 2030, the number of deaths is projected to increase to > 70 million worldwide, with non-communicable diseases, such as cancers, respiratory and circulatory diseases, and neurological conditions the leading causes. 1 The increase in the number of deaths due to these chronic and life-limiting diseases would see a rise in palliative care needs globally, for which care would need to focus on improving the quality of life of patients and families of patients with these diseases. 2
In England and Wales, a similar mortality pattern is expected. Although the number of deaths per year in England and Wales has decreased overall since 2001, the number of deaths is projected to increase in the future due to a larger population, an ageing demographic and post-war baby boomers moving into old age. 3 Non-communicable diseases, often of the chronic and life-limiting types, have become the main cause of death. 4 By 2040, this projected increase in deaths due to chronic illnesses would see an increase in palliative care needs in England and Wales. 5 Like the rest of the world, a shift in focus to caring for patients and their families during and towards the end of their illness has become essential.
In 2008, the UK Department of Health and Social Care published the End of Life Care Strategy6 to raise the profile of end-of-life care in England. The policy highlighted the need for the provision of high-quality, person-centred end-of-life care; the challenges faced in achieving it and the respective recommendations. One of the key challenges that the strategy urged attention be paid to was helping people die in their preferred PoD. It emphasised that although most people would prefer not to die in a hospital, this was the most common PoD. There was also variation in where people die, with differences in PoD between regions, age and cause of death.
People’s preferred and actual PoD, including the variation in PoD, continued to be a key issue in What’s Important to Me: A Review of Choice in End of Life Care,7 a review of the quality and experiences of care for adults and those close to them at the end of life published by The Choice in End of Life Care Programme Board in 2015. A public engagement exercise conducted to inform the review found that being cared for and dying in one’s preferred place were the main concerns for many people. However, people continued to not be able to die in their preferred place and the hospital was still the most common PoD. 8–11
Ensuring that people have a choice in their preferred PoD, and subsequently ensuring that they die in their preferred place, is a crucial part of the person-centred approach that underlies high-quality palliative care. In view of the current landscape, it is vital that we investigate how we can help people to die in their preferred place by understanding the PoD trends and the factors affecting them. This understanding would also guide the planning of palliative and end-of-life care services in England and, therefore, has serious implications for the sustainability of the health and social care systems.
A systematic review involving 58 studies, with > 1.5 million patients from 13 countries, found that the PoD may be influenced by interactions between three main groups of factors – those related to the illness, the individual and the environment – of which the health-care input and social support in the environment group were found to be the most important. 12 The importance of the service factors in health-related outcomes has also been noted in other studies. 13–15 A recent study found that between 2004 and 2014 there was a decline in hospital deaths and an increase in home, care home and hospice deaths. 16 The authors projected that if this trend was to continue, hospital deaths would continue to decline, whereas home, care home and hospice deaths would almost double by 2040. However, this decline in hospital deaths would reverse by 2023 if health and social services were not built to sustain the current trend. The findings from this study suggest the importance of service capacity in affecting the PoD. Previously, in an analysis carried out on behalf of the GUIDE_Care project,17 we suggested that health-care factors might mediate the effect of underlying cause of death on the PoD. However, the main analysis was restricted to the effect of underlying cause of death on the PoD only; the role of health-care in PoD was not systematically evaluated, nor were their interactions with other factors considered.
In the GUIDE_Care project, we identified trends and patient factors associated with the variation in PoD. 18 Being younger, married and having certain cancers were associated with dying at home. However, this explained only one-quarter of the variation and even less so for cancer, dementia, chronic respiratory failure and long-term neurological conditions (≈10%), thereby prompting a need for further investigation of other determinants that could better explain where people die. GUIDE_Care Services [www.journalslibrary.nihr.ac.uk/programmes/hsdr/141922/#/ (accessed 13 April 2018)] is a follow-up study that builds on GUIDE_Care findings to investigate the potential role of health service factors in the PoD and provides information on both national and local levels to improve end-of-life care services. We hope that this will eventually help us to better meet people’s preferences on the PoD, ultimately enabling them to rest in a place of their choice.
Policy context
Palliative and end-of-life care have become a public health priority in England in recent years. This saw the roll-out of several national policies and initiatives in an attempt to restructure the health and social care system to meet the increased palliative and end-of-life care needs.
In 2004, the National End of Life Care Programme was established to improve end-of-life care for adults in England by raising awareness of palliative and end-of-life care, as well as to encourage best care practice. 19 This supported the implementation of the End of Life Care Strategy6 in 2008, which led to several changes and improvements in end-of-life care in England. One of the key changes was the phasing out of the Review of Liverpool Care Pathway for Dying Patients20 following an independent review in 2013, documented in More Care, Less Pathway: A Review of the Liverpool Care Pathway20 and the consequent establishment of the Leadership Alliance for the Care of Dying People, which is a group of organisations leading the way in improving palliative and end-of-life care in England. In the following year, the Alliance published the report One Chance to Get it Right: Improving People’s Experience of Care in the Last Few Days and Hours of Life,21 in which it set out the end-of-life care priorities and made recommendations for better care practice.
NHS England published a policy Actions for End of Life Care: 2014–1622 in 2014, in which it addressed concerns about the Liverpool Care Pathway that were raised in the independent review More Care, Less Pathway: A Review of the Liverpool Care Pathway20 and expanded on the End of Life Care Strategy. 6 The policy also highlighted NHS England’s commitments to end-of-life care provision and set out future plans and actions. In 2015, the National Palliative and End of Life Care Partnership published the framework Ambitions for Palliative and End of Life Care: A National Framework for Local Action 2015–2020,23 which was built on the End of Life Care Strategy6 and aligned with the NHS Five Year Forward View24 and NICE Quality Standard for End of Life Care. 25 The review What’s Important to Me: A Review of Choice in End of Life Care7 by the Choice in End of Life Care Programme Board, also published in 2015, reviews the end-of-life care landscape since the implementation of the End of Life Care Strategy. 6
It is evident that many national policies and programmes targeted at improving end-of-life care in England have been implemented since the End of Life Care Strategy,6 each one influencing the other. Their influence can also be seen on a larger scale in new laws that were enforced to address health and social care issues related to end-of-life care. The Health and Social Care Act 201226 mandated changes to achieve the integration and management of health and social care services, and the Care Act 201427 mandated changes to address adult care, support and health needs. It was expected that these changes would change the end-of-life care landscape.
The health and social care systems are constantly changing to meet the country’s needs. Palliative and end-of-life care, as a part of the health and social care systems, cannot be viewed in isolation; likewise, policies, programmes and laws relevant to health and social care that are not specific to palliative and end-of-life care need to be considered alongside specific ones to help obtain an accurate picture of the palliative and end-of-life care landscape in England.
The palliative and end-of-life care landscape in England has changed substantially over the years. Relevant to the current report, Gao et al. 9 reported a downwards trend in hospital deaths and increased home deaths from 2005 to 2010. A more recent study by Bone et al. 16 found the same trend from 2004 to 2014, with decreased hospital deaths and increased home, care home and hospice deaths. The change in the patterns in PoD coincided with the implementation of the National End of Life Care Programme in 2004 and the subsequent policies, programmes and laws. However, to our knowledge, this change has not been evaluated in the context of these policies, programmes and laws; their effectiveness, therefore, cannot be concluded. An understanding of the changes in the palliative and end-of-life care landscape in England, in relation to the relevant policies, programmes and laws, can shed light on what works or what does not. This is crucial to helping us design better, focused initiatives and/or reforms to sustain or advance current improvements, while ensuring that it is financially sustainable.
The GUIDE_Care Services project has begun work on this. A grey literature search was conducted to consolidate current and past policies, programmes and laws relevant to health and social care in England from 2004, including those specific and non-specific to palliative and end-of-life care. A database has been created for this purpose. While conducting the search, it was found that local palliative and end-of-life care initiatives have sprouted up across the country. These initiatives could shed light on the changes in palliative and end-of-life care quality and practices across localities, and potentially help to explain the regional variations in PoD in England.
Conceptual framework
As discussed, sociodemographic and disease-related variables explain only about a fraction of the substantial geographical variations in PoD. Health-care service factors may be responsible for some or much of the residual variations, but their effects have never been systematically evaluated as a result of the lack of a conceptual framework. Therefore, to guide the planning, analysis and interpretation of the findings, a conceptual framework was developed. 28 The development of this framework was built on a conceptual model of factors influencing death at home by Gomes and Higginson12 and relevant health service models that include the impact of a service component on either end-of-life care outcomes or service access/utilisation. 14,29–34 The service components that could potentially influence where people die and their organisation were identified from and guided by these models.
The graphical presentation of the framework is shown in Figure 1. Health-care services in this framework refer to all health and care services related to end-of-life care, which includes generic (e.g. hospital, general practice) and specialised (e.g. hospice) care services. The service characteristics were grouped into four categories: type, capacity of service facilities, location and workforce. Service characteristics initially depend on the end-of-life care policies and their implementation through health-care service commissioning, which, in turn, influences service utilisation and ultimately where people die. Individual sociodemographic and disease-related characteristics (patient factors), together with social care and family and community support (environmental factors), are not the focus of this framework. These characteristics are included as the variables to be controlled when evaluating the service impact on the PoD. Information on service utilisation and PoD creates loop feedback to inform end-of-life care policies and service commissioning. The arrows indicate the direction of the impact. The solid and dotted lines represent direct and indirect effects (or feedback loop), respectively.
FIGURE 1.
A population-based conceptual framework for the role of service factors in PoD. A&E, accident and emergency; GP, general practitioner. Reproduced with permission from Gao et al. 28 © 2018 by the authors. Licensee MDPI, Basel, Switzerland. This article is an open access article distributed under the terms and conditions of the Creative Commons Attribution (CC BY) license (http://creativecommons.org/licenses/by/4.0/).

Aims and objectives
Aims
To evaluate the role of service factors in PoD and to inform national and local end-of-life care improvement.
Objectives
-
To determine the relative contribution of service factors to geographical variation in PoD.
-
To produce geographical information system (GIS) maps to visualise the services and patient factors-adjusted variation in PoD.
-
To explore with statistical causal modelling how service variables interact with each other and with patient factors to influence PoD.
-
To engage with commissioners, NHS managers, service deliverers, patients and the public to consider the implications of the findings.
Chapter 2 Methods
Study design and setting
A national population-based observational study in NHS England, using death registry data linked to area-level service data.
Data sources
Data used in this study were at two levels: individual and service. The individual-level data set was extracted from the Office for National Statistics (ONS) death registry (ONS; 29 January 2015). Service-level data sets were primarily from the public domain [e.g. Care Quality Commission (CQC), NHS Digital, Hospice Aid UK websites] and other relevant sources [e.g. Hospice UK, National Online Manpower Information System (NOMIS) and UK data services]. We chose to focus on the data in 2014, as it was the first year that the data from the Clinical Commissioning Groups (CCG) became available following the change of the NHS health structure in April 2013. 35
Service data
Service data sets consist of the characteristics of health services. These include service commissioning (e.g. end-of-life care expenditures), service types [e.g. adult inpatient hospices, hospitals, general practitioners (GPs) and care homes], service capacity [e.g. ratio of service facilities to user population, counts of services types within CCGs and local authorities (LAs)], service location (e.g. geographical proximity to various services types), workforce data (e.g. counts of doctors and non-medical staff) and indicators of health services utilisation [e.g. attendances, admissions, finished consultant episodes (FCEs), waiting times and length of stay (LOS)].
Expenditures on end-of-life care were provided by NHS England. 36 Service utilisation data for adult inpatient hospices (i.e. number of admitted patients, LOS and information on bed counts) were supplied by Hospice UK. These were supplemented with data from the Hospice Aid UK website. 37 Care home data, consisting of care home beds and locations, was from the CQC website. 38 Services utilisation data for accident and emergency (A&E) comprised the number of attendances and LOS and, for hospitals, the information on bed availability, occupancy and inpatient and outpatient admission. Data for service proximity was derived by quantifying the level of geographical access from patients’ place of usual residence to their nearest health service facilities using GIS. Other data sets (e.g. shapefiles used for GIS mapping) were downloaded from the ONS (NOMIS official labour market statistics) website and the UK data service. 39,40
Individual level
The individual-level data set comprised all adult deaths (aged ≥ 25 years) from non-accidental causes in England in the year 2014. The data set contains clinical and sociodemographic characteristics of the deceased. In England, it is a mandatory requirement to register a death within 5 days of its occurrence according to the law. 9 Information recorded in the death registry includes PoD, place of usual residence of the deceased, date of death, age, marital status, sex, country of birth, informant’s relationship, postcode of usual residence, the main cause of death and the number of contributory causes of death. Information on cause of death was coded according to the International Classification of Diseases, Tenth Revision (ICD-10),41 cancer (C00–C97) and non-cancer (all non-accidental cause of death codes excluding C00–C97). 42 The Index of Multiple Deprivation (IMD) was used as a proxy indicator of patients’ socioeconomic status.
The IMD is a composite measure describing the relative deprivation for 32,844 lower layer super output areas (LSOAs) in England. 43 A LSOA is a census unit with an average population of 1500 persons. 44 IMD scores were derived from seven domains: income, employment, education, skills and training, health and disability, crime, and barriers to housing and services and living environment. These were grouped into quintiles ranging from one (most deprived) to five (least deprived). Patients’ place of settlement was grouped into rural and urban areas. Patients’ region of residence was recorded in the ONS death registry based on patients’ Government Office Regions. In England, there are currently nine Government Office Regions: North East, East Midlands, North West, Yorkshire and the Humber, West Midlands, South East, South West, East, and London.
Data processing, management and linkage
Data were checked for errors, completeness and consistency using a combination of visual exploratory techniques and structured query language. Exploratory data tools, such as a histogram, were used to check for unusual patterns in the data set (e.g. outliers). In cases for which data points were anomalous and did not conform to a normal distribution, further probing was done to ensure that values were consistent and error free. Structured query language was used to check for illogical data values [e.g. age of death > 150 years or –20 years, sex of deceased < 1, or year of death outside the study period (i.e. date of death not equal to 2014)].
Service- and individual-level data were processed to derive area-level estimates for CCGs and LAs. CCGs are planning regions for commissioning health and social service in England. 35 LAs are local government areas with health and well-being boards, mandated with responsibilities to improve the health of their local population. 45 In 2014, there were 211 CCGs and 152 LAs. CCG and LA estimates were derived from aggregated summaries of individual and service data, based on patients’ area or postcode of usual residence, by linking patient postcodes of usual residence to their corresponding CCGs and LAs through the geographical identifier. The link file was the November 2016 version of the ONS Postcode Directory, downloaded from the ONS geoportal. 46 The ONS Postcode Directory is a linked database comprising all postcodes in the UK that are linked to administrative (LAs), electoral (wards), health [CCGs, primary care trusts (PCTs)] and census geographies (LSOAs). 47
Outcome variable
The outcome variable is the PoD, divided into five categories: hospital, home, hospice, care home and other places. At the area level, the outcome was summarised as a proportion (e.g. proportion of deaths in hospitals). At the individual level, the outcome was a binary indicator where 1 = death in a specific type of place (i.e. hospital, care home and hospice) and 0 = death at home. We chose ‘home’ as the reference group because this is the only non-institutional care setting. The number of deaths ‘in other places’ was low and was not analysed as a PoD category of interest in modelling analyses.
Explanatory variables
Explanatory variables of services used in the analysis were grouped into five categories, in line with our conceptual framework (see Figure 1). These include services commissioning, service type and capacity, service location, workforce and service utilisation.
Service commissioning
Service commissioning variables comprised end-of-life care expenditures across CCGs in England. Expenditure on end-of-life care was quantified in Great British pounds. The data contains spending that was > £25,000 for the period 2014. The two variables used in the analysis were the expenditure spent on end-of-life care and the expenditure spent on end-of-life care per 10,000 adults.
Service provision: type and capacity
Service provision type and capacity (availability) comprised the number and types of health-care services (i.e. care homes, GPs, adult inpatient hospices and hospitals). Service capacity consisted of indicators quantifying area-level service availability. These included the number and ratio of services type weighted per thousand of the proportion of persons aged ≥ 25 years in CCGs and LAs. The variables generated for this category included the number of care homes, care home beds, care homes per 10,000 adults, care home beds per 10,000 adults, all types of hospices, adult hospices, hospices per 10,000 adults, adult hospices per 10,000 adults, GP practices, GP practices per 10,000 adults, hospitals per 10,000 adults and mean number of hospital beds.
Service location
Service location comprised indicators of the level of proximity to various health-care facilities. These include geographical access to adult inpatient hospices, GPs, care homes, hospices and hospitals. Geographical access was quantified by measuring the straight-line distance in metres from patients’ place of residence to the nearest health-care facility. 48,49 Area-level estimates of geographical access were derived by calculating the aggregate median patient-level straight-line distances to each facility for CCGs and LAs. The variables used in this category included median distance to the nearest hospice, to the nearest hospital, to the nearest care home and to the nearest GP practice.
Workforce
Workforce data comprised a headcount of doctors (excluding locums) and non-medical staff working in NHS hospitals and community health services and organisations from various specialty and staff groups. The data consisted of staff in full-time equivalent roles in December 2014. The two variables used in this analysis were the number of doctors and the number of non-medics.
Service utilisation
Variables of service utilisation used in the analysis comprised LOS (A&E, hospices, hospitals), number of attendances (A&E), admissions (A&E, hospitals, hospices) and FCEs in hospitals. LOS in A&E was quantified in minutes. LOS in hospices and hospitals were given as the mean number of days spent by admitted patients. Attendances in A&E and hospitals consisted of counts of admitted patients. Admissions in hospices comprised total inpatient admissions including re-admissions. Hospital inpatient FCEs consisted of the number of episodes, in terms of visits by a patient (an episode is interpreted as the period of care of a patient per consultant in a hospital). 50 The variables included in this category were the total number of hospice admissions, total number of patients admitted by hospices, median LOS in hospices, number of FCEs in hospitals, number of hospital admissions, median LOS in hospital, median LOS in A&E, number of A&E attendances, number of hospital outpatient consultations and mean number of occupied hospital beds.
Individual sociodemographic and disease-related characteristics (including age, sex, cause of death, number of contributory causes of death, marital status, rural/urban indicator and IMD) were treated as the potential confounding variables to be controlled for in modelling analysis.
Statistical analysis
Descriptive analysis and geographical mapping
Data were described by their characteristics using frequency and percentage. Continuous data were classed as categorical variables and, when appropriate, the mean, median, standard deviation and range were also estimated. The data were described for all causes of death, cancer and non-cancer.
Service data were stored and visualised using the GIS. Mapping and visualisation of service data at area level was completed in R statistical software (The R Foundation for Statistical Computing, Vienna, Austria) using functions from the GISTools and tmap library. Service data were displayed as choropleth maps using sequential colour schemes, ranging from shades of yellow (representing minimum values) to green (representing maximum values). Null or missing values were represented as a grey colour.
Modelling analysis
Area level
The relationship between a service variable and the proportion of deaths in a specific PoD was modelled using a beta regression, adjusting for proportions of deaths of those aged ≥ 75 years, male sex, married, decedents in the most deprived quintile, rural residents, the median number of contributory causes of death and total number of deaths. We chose beta regression as it is appropriate for an outcome variable in the range of 0 to 1, which is the case for this analysis. 51,52
The predicted area-level proportion of deaths in a specific PoD (i.e. hospital, care home, hospice and home) was derived from the model. The correlation between the actual and predicted proportion of deaths was estimated using Pearson’s correlation coefficient (r). The per cent of unexplained variation was estimated using the formula below:
The unexplained variations and their 99% confidence interval (CI) at CCG and LA level were estimated for all deaths, cancer and non-cancer. Models for all causes were also adjusted for the proportion of cancer deaths.
We developed area-based models to assess the relative contribution of individual service categories. The dependent variable was the proportion of deaths in a CCG or a LA. The independent variables were grouped into one of the five service categories: commissioning, type and capacity, location, workforce, and utilisation. Each variable in the individual service categories was first tested for its bivariate association with PoD. Variables within a service category that were statistically (p < 0.05) related to the proportion of deaths in a location of interest were then used to construct a beta-regression model. The predicted proportions of the PoD were estimated using the model and regressed on the actual proportions of the PoD. Pearson’s r2 was derived to quantify the relative contribution of a service category to the variations of the PoD. The R2 was interpreted as the percentage of the variation in the PoD attributed to the service variables. We calculated the R2 for deaths in hospital, care home, hospice and home, in all deaths and for cancer and non-cancer deaths.
Patient level
These analyses were performed at the patient level using individual data nested with area-level service data. The effect of individual area-level service variables on the PoD was evaluated using the generalised linear mixed model (GLMM)53 with binary distribution and logit link function. Such a model can account for the clustering effect, that is, patients living in the same geographical areas tend to have a similar PoD outcome. The dependent variable was a binary indicator of the PoD, where death at home was coded as 0 and death in a hospital, care home or a hospice was coded as 1. We developed separate models to compare the probability of patient death in hospital, care home or in a hospice with death at home. We used home death as the reference group as it was a major non-institutional care setting and the most preferred PoD. 10,11 The intercept was modelled as a random effect and all variables were modelled as a fixed effect.
Following the same procedure as those of area-level analyses, the service variable was first tested for its bivariate association with PoD. All variables significant at the 0.05 level were grouped by service categories assessing their total impact on the PoD. The performance of the individual models was evaluated using the area under the receiver operating characteristics curve (AUC) with 99% CI. An AUC of 0.5 indicates chance prediction (equivalent to flipping a coin), whereas an AUC value of 0.5–0.6 indicates poor, 0.6–0.7 indicates fair and > 0.7 indicates good discriminating ability. 54 An AUC value of 1 represents perfect classification accuracy.
The service variable within each individual service category that produced the largest and statistically significant AUC was used to build a multilevel regression model to evaluate its independent effect on PoD, accounting for the effects of sociodemographic variables. The effect was measured by the odds ratio (OR) and its 99% CI.
The mediating effect of service use on service characteristics and PoD was assessed with statistically significant service use variables only. We ran two models for all the possible combinations of the service use variables and the service characteristic variables: one with (larger model) and one without (reduced model) the service use variable. The difference in AUCs between the larger and reduced models was derived and if it was statistically significant, the indirect and direct effect of service characteristics was then estimated using the method proposed by Mackinnon et al. 55
Built on the independent effect models, we also evaluated the two-way interaction effects between statistically significant service variables and between those service variables and patient-level variables within the models, including sociodemographic and clinical variables. All analyses were based on complete cases only.
To control the family-wise error rate,56 the statistical significance level was set at 0.01. In the final analysis, the variables of interest fell into five categories according to our conceptual framework. We applied the Bonferroni correction to the typical significance level of 0.05.
The individual and service data sets were processed and managed using GIS software – ArcGIS Desktop 10.5 [Redlands, CA: Environmental Systems Research Institute (ESRI); 2011], GISTools and tmap from R statistical software and SAS® 9.4 (SAS Institute Inc., Cary, NC, USA). Descriptive analysis was conducted with R statistical software. Area- and individual-level modelling analyses were implemented using the GLIMMIX procedure in SAS 9.4. 53
The reporting of this report was guided by Strengthening the Reporting of Observational Studies in Epidemiology (STROBE)57 and REporting of studies Conducted using Observational Routinely-collected health Data (RECORD)58 checklists (see www.equator-network.org). 59
Ethics and permissions
Following ONS procedures, a Data Access Agreement was signed and all required forms were provided in a formal agreement of data management, protection and management. In addition, as required, all researchers accessing the data (WG, EC and PY) were individually assessed and approved by ONS. This study was based on anonymised records with postcode information provided by ONS and data from the public domain (ONS; 29 January 2015). The King’s College London Research Ethics Committee approved this study via the low-risk route (reference number BDM/14/15-5).
Chapter 3 Results
Sociodemographics and clinical characteristics of the decedents
Overall, 447,406 people died in England in the year 2014. After removing late registered deaths (< 1%), the final data set consisted of 431,735 adult deaths (aged ≥ 25 years) (Table 1). Hospital was the most common PoD (47.3%), followed by care home (23.1%), home (22.5%), hospice (6.1%) and other places (1.1%). The number of deaths increased progressively with increasing participant age, particularly for those patients who died in care homes and hospitals. Patients aged ≥ 85 years accounted for the largest proportion of deaths in both care homes (66.5%) and hospitals (37.3%).
| Variables | PoD, % | ||||
|---|---|---|---|---|---|
| Hospital | Care home | Home | Hospice | Other | |
| n (%) | 204,183 (47.3) | 99,611 (23.1) | 96,984 (22.5) | 26,136 (6.1) | 4821 (1.1) |
| Age (years) | |||||
| 25–54 | 5.3 | 0.6 | 7.0 | 11.4 | 14.6 |
| 55–64 | 8.0 | 1.6 | 11.3 | 16.3 | 15.1 |
| 65–74 | 17.5 | 6.2 | 22.1 | 29.3 | 20.8 |
| 75–84 | 31.9 | 25.1 | 31.3 | 29.0 | 25.9 |
| ≥ 85 | 37.3 | 66.5 | 28.2 | 14.0 | 23.6 |
| Sex | |||||
| Female | 49.4 | 64.9 | 45.6 | 50.2 | 43.6 |
| Male | 50.6 | 35.1 | 54.4 | 49.8 | 56.4 |
| Marital status | |||||
| Divorced | 9.9 | 7.2 | 11.0 | 13.0 | 17.9 |
| Married | 41.1 | 21.5 | 47.4 | 54.3 | 31.8 |
| Separated/dissolved | 0.1 | 0.0 | 0.1 | 0.3 | 0.1 |
| Single | 9.1 | 8.8 | 9.3 | 8.6 | 13.8 |
| Widowed | 39.3 | 61.9 | 31.5 | 23.3 | 35.9 |
| Unknown/not stated | 0.5 | 0.5 | 0.5 | 0.4 | 0.4 |
| Underlying cause of death | |||||
| Cancer | 23.4 | 18.6 | 41.1 | 88.4 | 35.5 |
| CBD | 9.2 | 9.0 | 3.1 | 0.7 | 2.1 |
| COPD | 7.7 | 3.4 | 5.8 | 1.4 | 3.8 |
| CVD | 22.4 | 13.3 | 30.0 | 2.8 | 44.1 |
| Neurological condition | 1.3 | 2.9 | 1.4 | 1.4 | 0.6 |
| Other diseases | 35.9 | 52.8 | 18.5 | 5.3 | 14.0 |
| Number of contributory causes of deaths | |||||
| 0 | 14.4 | 25.3 | 31.7 | 59.5 | 30.8 |
| 1 | 22.5 | 33.5 | 30.9 | 23.8 | 33.3 |
| 2 | 23.9 | 22.7 | 20.3 | 9.4 | 20.3 |
| 3 | 18.0 | 11.3 | 10.4 | 4.4 | 9.8 |
| 4 | 11.1 | 4.7 | 4.4 | 2.0 | 3.9 |
| ≥ 5 | 10.2 | 2.5 | 2.3 | 0.9 | 1.9 |
| Settlement | |||||
| Rural | 18.3 | 22.3 | 22.0 | 18.2 | 22.3 |
| Urban | 81.7 | 77.7 | 78.0 | 81.8 | 77.7 |
| IMD | |||||
| 1 (most deprived) | 21.7 | 16.0 | 20.7 | 17.2 | 22.7 |
| 2 | 20.6 | 19.0 | 19.3 | 18.3 | 20.3 |
| 3 | 20.3 | 21.9 | 20.3 | 20.1 | 19.6 |
| 4 | 19.2 | 22.1 | 19.9 | 22.1 | 19.8 |
| 5 (least deprived) | 18.2 | 21.0 | 19.8 | 22.3 | 17.6 |
| Regions | |||||
| East | 10.9 | 12.3 | 12.2 | 9.7 | 12.3 |
| East Midlands | 9.2 | 8.8 | 9.2 | 6.3 | 8.9 |
| London | 11.6 | 7.0 | 9.5 | 12.0 | 10.6 |
| North East | 5.9 | 5.3 | 6.1 | 3.5 | 5.7 |
| North West | 15.0 | 13.7 | 14.1 | 14.5 | 13.4 |
| South East | 15.2 | 18.8 | 15.5 | 21.4 | 16.7 |
| South West | 10.1 | 13.8 | 11.7 | 9.8 | 11.9 |
| West Midlands | 11.5 | 9.8 | 10.9 | 10.8 | 9.7 |
| Yorkshire and the Humber | 10.4 | 10.6 | 10.8 | 12.2 | 10.9 |
More women died in care homes (64.9% vs. 35.1%) and hospices (50.2% vs. 49.8%) than men, who were more likely to die at home (54.4%), in hospitals (50.6%) and in other places (54.6%). Patients who were married and widowed accounted for the largest proportion of deaths across settings. Hospice was the most common PoD for patients who were married (54.3%). Care home was the most frequent PoD among those who were widowed (61.9%).
Cancer was the leading cause of death for patients who died at home (41.1%) and in hospices (88.4%). Deaths from other diseases were common in care homes (52.8%) and hospitals (35.9%). Cardiovascular disease was the most common cause of death in other places. Hospitals (10.5%) were the most common PoD for patients who died from five or more causes.
The majority of those who died were urban dwellers (> 77%) and only ≤ 25% of decedents lived in rural settlements. Patients who lived in urban areas most often died in hospices (81.8%). Care home (77.7%) deaths and deaths in other places (77.7%) were fewer among urban residents. Care homes (22.3%), homes (22.0%) and other places (22.3%) were the most common PoD for rural dwellers.
In terms of deprivation, decedents living in the most deprived areas most often died in other places (22.7%) and died less often in care homes (16.0%). Patients who lived in least deprived areas most often died in hospices (22.3%) and less often in other places (17.6%). The proportions of hospice deaths vary according to the level of deprivation or socioeconomic status. An increasing level of socioeconomic status is associated with more hospice death, ranging from 17.2% in the most deprived quintile to 22.3% in the least deprived quintile. The reverse is the case for patients who died in other places, ranging from 22.7% in the most deprived quintile to 17.6% in the least deprived quintile.
There were significant variations in the proportions of deaths across regions. The South East had the largest proportion of deaths across settings. Hospice was the leading PoD for patients who lived in the South East (21.4%), London (12.0%), and Yorkshire and the Humber (12.2%). Care home deaths were common among residents of East (12.3%) and South West (13.8%). Hospital was the most common PoD among patients in the East Midlands (9.2%), North West (15.0%) and West Midlands (11.5%).
The characteristics of cancer deaths are shown in Table 2. Female cancer patients most often died in care homes (52.7% vs. 47.3%), hospices (50.5% vs. 49.5%) and other places (58.1% vs. 41.9%) than male cancer patients. Home (55.1%) and hospital (55.3%) were the most common PoD among male cancer patients. In terms of marital status, patients who were married and widowed accounted for the largest proportion of deaths across all PoDs. Married cancer patients most often died at home (61.6%; see Table 2). Cancer patients who were widowed most often died in other places (44.9%).
| Variable | PoD, % | ||||
|---|---|---|---|---|---|
| Hospital | Care home | Home | Hospice | Other | |
| n (%) | 47,748 (36.5) | 18,489 (14.1) | 39,827 (30.4) | 23,107 (17.7) | 1712 (1.3) |
| Age (years) | |||||
| 25–54 | 7.4 | 1.4 | 6.7 | 12.2 | 10.4 |
| 55–64 | 13.3 | 4.3 | 13.9 | 17.3 | 13.2 |
| 65–74 | 26.9 | 13.0 | 27.9 | 30.1 | 20.7 |
| 75–84 | 32.0 | 33.5 | 33.3 | 28.2 | 32.1 |
| ≥ 85 | 20.4 | 47.7 | 18.3 | 12.1 | 23.7 |
| Sex | |||||
| Female | 44.7 | 52.7 | 44.9 | 50.5 | 58.1 |
| Male | 55.3 | 47.3 | 55.1 | 49.5 | 41.9 |
| Marital status | |||||
| Divorced | 11.7 | 11.1 | 9.1 | 13.3 | 21.4 |
| Married | 51.1 | 26.2 | 61.6 | 55.0 | 21.0 |
| Separated/dissolved | 0.1 | 0.0 | 0.2 | 0.2 | 0.1 |
| Single | 9.2 | 11.1 | 5.3 | 8.8 | 12.4 |
| Widowed | 27.5 | 51.0 | 23.6 | 22.2 | 44.9 |
| Unknown/not stated | 0.5 | 0.6 | 0.3 | 0.4 | 0.2 |
| Number of contributory causes of deaths | |||||
| 0 | 30.6 | 40.7 | 50.1 | 63.4 | 52.0 |
| 1 | 27.4 | 31.5 | 29.9 | 23.5 | 31.3 |
| 2 | 19.7 | 16.6 | 12.6 | 8.1 | 11.1 |
| 3 | 11.7 | 7.3 | 4.8 | 3.3 | 3.2 |
| 4 | 6.0 | 2.7 | 1.8 | 1.2 | 2.0 |
| ≥ 5 | 4.6 | 1.3 | 0.8 | 0.5 | 0.4 |
| Settlement | |||||
| Rural | 19.0 | 20.7 | 23.5 | 18.5 | 18.8 |
| Urban | 81.0 | 79.3 | 76.5 | 81.5 | 81.2 |
| IMD | |||||
| 1 (most deprived) | 21.4 | 16.9 | 18.8 | 17.2 | 24.6 |
| 2 | 20.3 | 19.7 | 18.9 | 18.3 | 22.1 |
| 3 | 20.3 | 20.8 | 20.2 | 20.0 | 18.6 |
| 4 | 19.1 | 21.2 | 21.0 | 22.2 | 18.8 |
| 5 (least deprived) | 18.8 | 21.3 | 21.0 | 22.3 | 16.0 |
| Regions | |||||
| East | 11.1 | 12.5 | 12.5 | 9.7 | 10.8 |
| East Midlands | 9.6 | 8.8 | 9.8 | 6.4 | 9.1 |
| London | 12.1 | 7.9 | 8.0 | 11.7 | 11.3 |
| North East | 6.4 | 5.9 | 6.7 | 3.6 | 5.6 |
| North West | 14.1 | 13.7 | 14.9 | 14.5 | 16.1 |
| South East | 14.9 | 17.8 | 14.6 | 21.2 | 15.8 |
| South West | 10.1 | 13.3 | 11.9 | 10.1 | 11.9 |
| West Midlands | 11.5 | 10.1 | 11.1 | 11.1 | 9.5 |
| Yorkshire and the Humber | 10.2 | 10.0 | 10.5 | 11.8 | 9.9 |
Patients who died from cancers with at least five or more contributory causes died more often in hospitals. Most cancer patients lived in urban areas (> 75%), and hospice was the leading PoD for cancer patients who lived in urban areas (81.5%). Rural cancer patients more often died at home (23.5%).
Hospice was the leading PoD for cancer patients living in the least deprived quintile 22.3 (Table 2). Deaths in other places (24.6%) and in hospital (21.4%) were more prevalent among patients in the most socioeconomically deprived areas. There are regional heterogeneities in the proportion of cancer deaths across settings. Patients who lived in East England died most often in care homes (12.5%) and at home (12.5%). Hospital was the leading PoD for patients who lived in London (12.1%) and the West Midlands (11.5%). Most patients who lived in the East Midlands (9.8%) and the North East (6.7%) died at home. Hospice was the leading PoD for residents in the South East (21.2%) and Yorkshire and the Humber (11.8%).
Over half of those who died from non-cancers (Table 3) died in hospitals (52.0%). Care home (27.0%) was the second most common PoD, followed by home (19.0%), hospice (1%) and other places (1%).
| Variable | PoD, % | ||||
|---|---|---|---|---|---|
| Hospital | Care home | Home | Hospice | Other | |
| n (%) | 156,435 (52.0) | 81,122 (27.0) | 57,157 (19.0) | 3029 (1.0) | 3109 (1.0) |
| Age (years) | |||||
| 25–54 | 4.7 | 0.4 | 7.3 | 5.6 | 16.9 |
| 55–64 | 6.3 | 1.0 | 9.5 | 8.7 | 16.2 |
| 65–74 | 14.7 | 4.6 | 18.2 | 22.8 | 20.9 |
| 75–84 | 31.9 | 23.2 | 29.8 | 35.1 | 22.5 |
| ≥ 85 | 42.5 | 70.8 | 35.2 | 27.8 | 23.6 |
| Sex | |||||
| Female | 50.8 | 67.6 | 46.1 | 47.8 | 35.6 |
| Male | 49.2 | 32.4 | 53.9 | 52.2 | 64.4 |
| Marital status | |||||
| Divorced | 9.4 | 6.3 | 12.4 | 10.7 | 16.0 |
| Married | 38.1 | 20.5 | 37.6 | 49.4 | 37.8 |
| Separated/dissolved | 0.1 | 0.0 | 0.1 | 0.4 | 0.1 |
| Single | 9.0 | 8.3 | 12.1 | 7.2 | 14.6 |
| Widowed | 42.9 | 64.4 | 37.1 | 32.0 | 31.0 |
| Unknown/not stated | 0.5 | 0.5 | 0.7 | 0.4 | 0.5 |
| Number of contributory causes of deaths | |||||
| 0 | 9.4 | 21.8 | 19.0 | 30.1 | 19.1 |
| 1 | 20.9 | 34.0 | 31.6 | 26.0 | 34.5 |
| 2 | 25.1 | 24.1 | 25.7 | 19.2 | 25.4 |
| 3 | 19.9 | 12.2 | 14.2 | 12.3 | 13.4 |
| 4 | 12.7 | 5.1 | 6.2 | 7.9 | 4.9 |
| ≥ 5 | 11.9 | 2.7 | 3.3 | 4.5 | 2.7 |
| Settlement | |||||
| Rural | 18.1 | 22.6 | 20.9 | 16.5 | 24.2 |
| Urban | 81.9 | 77.4 | 79.1 | 83.5 | 75.8 |
| IMD | |||||
| 1 (most deprived) | 21.8 | 15.7 | 22.0 | 17.8 | 21.7 |
| 2 | 20.7 | 18.9 | 19.6 | 17.9 | 19.4 |
| 3 | 20.3 | 22.1 | 20.4 | 20.8 | 20.1 |
| 4 | 19.2 | 22.3 | 19.1 | 21.2 | 20.3 |
| 5 (least deprived) | 18.0 | 21.0 | 18.9 | 22.3 | 18.5 |
| Regions | |||||
| East | 10.8 | 12.2 | 11.9 | 9.4 | 13.1 |
| East Midlands | 9.1 | 8.8 | 8.8 | 5.7 | 8.8 |
| London | 11.5 | 6.7 | 10.6 | 14.0 | 10.2 |
| North East | 5.8 | 5.1 | 5.6 | 2.6 | 5.7 |
| North West | 15.3 | 13.7 | 13.5 | 14.2 | 11.9 |
| South East | 15.3 | 19.0 | 16.1 | 22.7 | 17.2 |
| South West | 10.1 | 13.9 | 11.6 | 7.9 | 12.0 |
| West Midlands | 11.6 | 9.8 | 10.7 | 8.5 | 9.8 |
| Yorkshire and the Humber | 10.5 | 10.7 | 11.0 | 15.2 | 11.4 |
Deaths increased with age for patients who died in care homes, home, hospitals and other places. Female deaths were common in care homes (67.6%). Male deaths were most frequent at in other places (64.4%).
In terms of marital status, patients who were married (ranging from 49.4% to 20.5%) and widowed (ranging from 64.4% to 31.0%) constituted the largest proportion of deaths across settings. Hospice was the leading PoD for married patients (49.4%). The majority of patients who died in care homes (64.4%) were widowed. Hospital (11.9%) was the most common PoD for patients who died with five or more contributory causes.
Over 75% of those who died from non-cancer lived in urban areas. Hospice was the leading PoD for patients who lived in urban areas (83.5%). Deaths in other places (24.2%) were more frequent among rural dwellers. Hospice was the most common PoD for patients who lived in the least deprived areas. Hospice deaths appear to vary by wealth, with the proportions of hospice deaths increasing with the level of socioeconomic status (ranging from 17.8% in the most deprived quintile or lowest socioeconomic status to 22.3% in the least deprived quintile or highest socioeconomic status).
There are significant regional differences in PoD. Hospice was the leading PoD for patients who lived in London (14.0%), South East (22.7%) and Yorkshire and the Humber (15.2%). Those who lived in the North West (15.3%), West Midlands (11.6%) and East Midlands (9.1%) more often died in hospital.
Area-level unexplained variations
Overall, the residual variations of the PoD were greater in hospice and home models than in hospital and care home models (Table 4). This was consistent at both CCG and LA levels. Between 85% and 90% of the area-level variations in hospice and home deaths were not explained by the differences in sociodemographics and clinical characteristics, but these figures ranged from 37.3% to 56.3% in hospital and care home models.
| Cause of death | PoD, % unexplained variations (95% CI) | |||
|---|---|---|---|---|
| Hospital | Care home | Hospice | Home | |
| CCG level | ||||
| All | 56.2 (46.7 to 65.7) | 37.3 (29.7 to 44.9) | 90.6 (83.4 to 97.7) | 84.9 (76.4 to 93.4) |
| Cancer | 88.6 (80.9 to 96.3) | 77.7 (68.2 to 87.1) | 93.7 (87.6 to 99.8) | 74.7 (65.1 to 84.4) |
| Non-cancer | 46.5 (37.7 to 55.3) | 35.5 (28.2 to 42.9) | 91.7 (84.8 to 98.5) | 77.9 (68.5 to 87.4) |
| LA level | ||||
| All | 56.3 (45.3 to 67.3) | 37.9 (29.1 to 46.8) | 85.0 (75.3 to 94.8) | 90.2 (81.8 to 98.5) |
| Cancer | 83.7 (73.6 to 93.8) | 86.3 (76.7 to 95.8) | 67.7 (56.2 to 79.2) | 67.5 (56.0 to 78.9) |
| Non-cancer | 62.9 (51.4 to 74.3) | 46.1 (36.0 to 56.2) | 65.2 (53.7 to 76.7) | 83.7 (73.7 to 93.8) |
At the CCG level, > 90% of the variation in hospice deaths remained unaccounted for by patient characteristics irrespective of what causes the patients died from. The unexplained variations in hospice deaths were lower for LA-level models and comparable between cancer and non-cancer deaths (65.2% vs. 67.7%). Although the unexplained variations in home deaths at the CCG level were similar between cancer and non-cancer deaths, there was more divergence in LA-level models (67.5% vs. 83.7%).
For PoD, variations in care home deaths were most explained by sociodemographic and clinical characteristics: residual 37.3% to 37.9% at CCG and LA level, respectively. However, they were mostly driven by non-cancer deaths. The unexplained CCG- (77.7% vs. 35.5%) and LA-level (86.3% vs. 46.1%) variations of cancer deaths in care homes nearly doubled that of non-cancer deaths.
Area-level profile of services
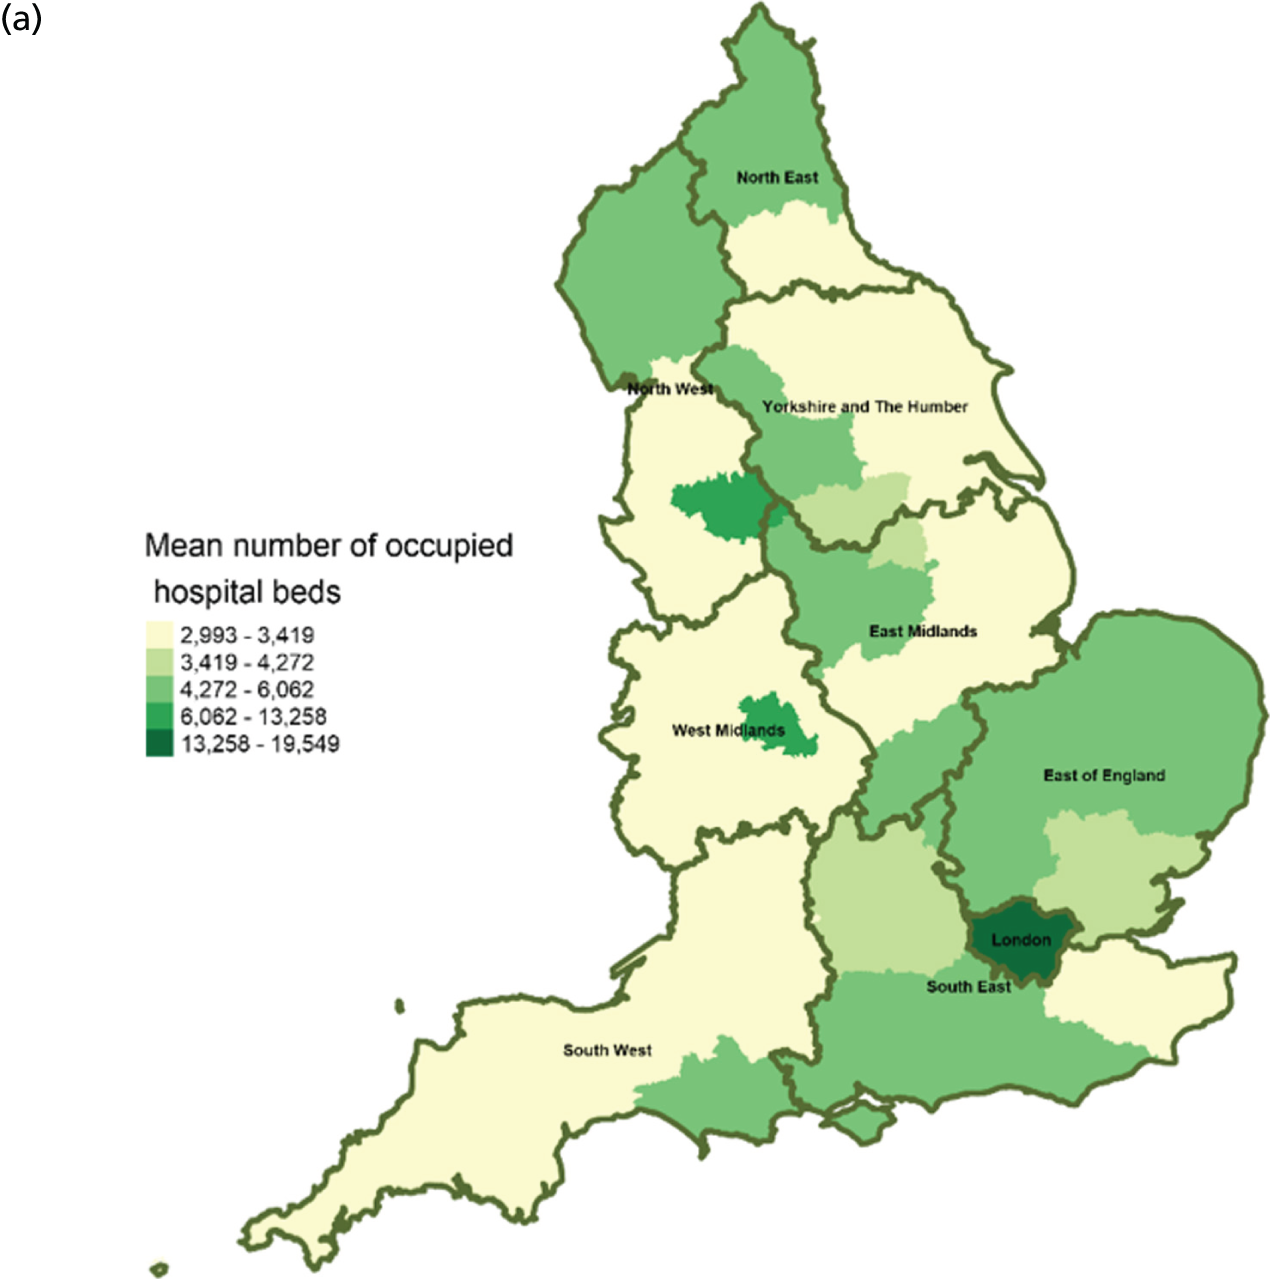
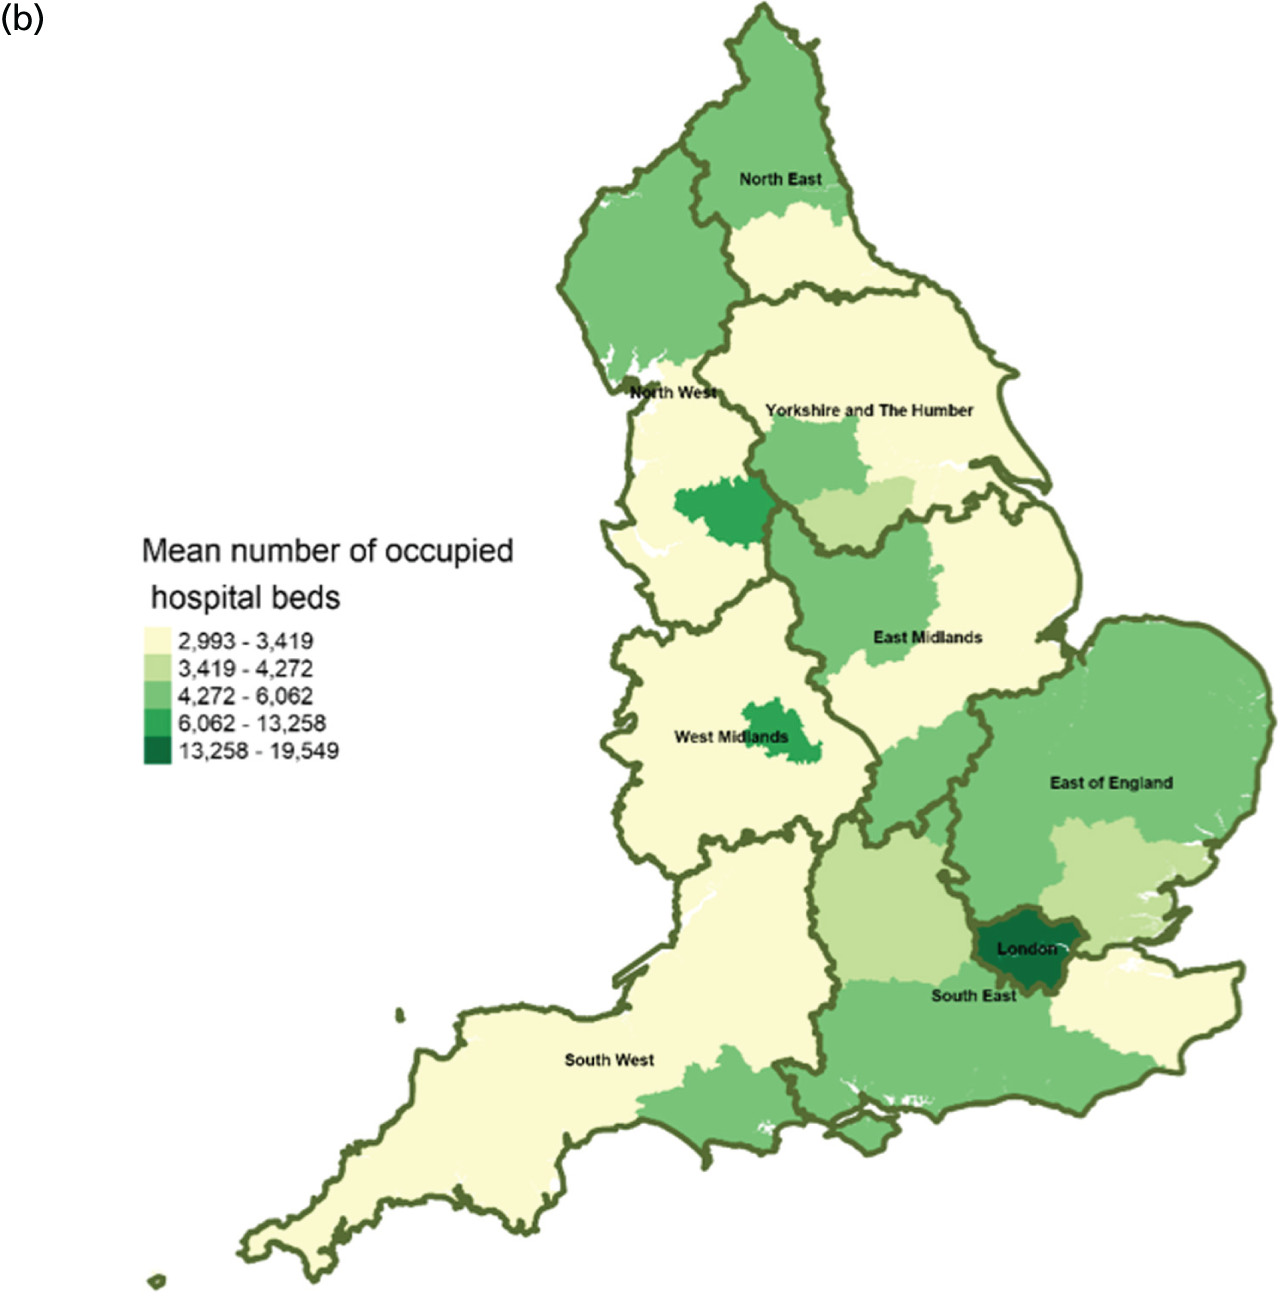
There were significant geographical variations in service factors across England (Figures 2–14) at CCG and LA levels of geography. However, these data should be interpreted with caution because of limited/missing data values for some CCGs and LAs (see Figures 3, 10 and 12). In addition, data for the following service variables: hospital beds (see Figure 5) and mean LOS (see Figure 13), were derived from area team geography – a larger geographical area than CCG. This means that variations shown on maps (see Figures 5, 13 and 14) reflect variations of the area team geography from which the data were derived.
FIGURE 2.
Area-level profile of expenditure on end-of-life care: (a) CCGs; and (b) LAs. Contains National Statistics data © Crown copyright and database right (2016) and contains Ordnance Survey data © Crown copyright and database right (2016). 60
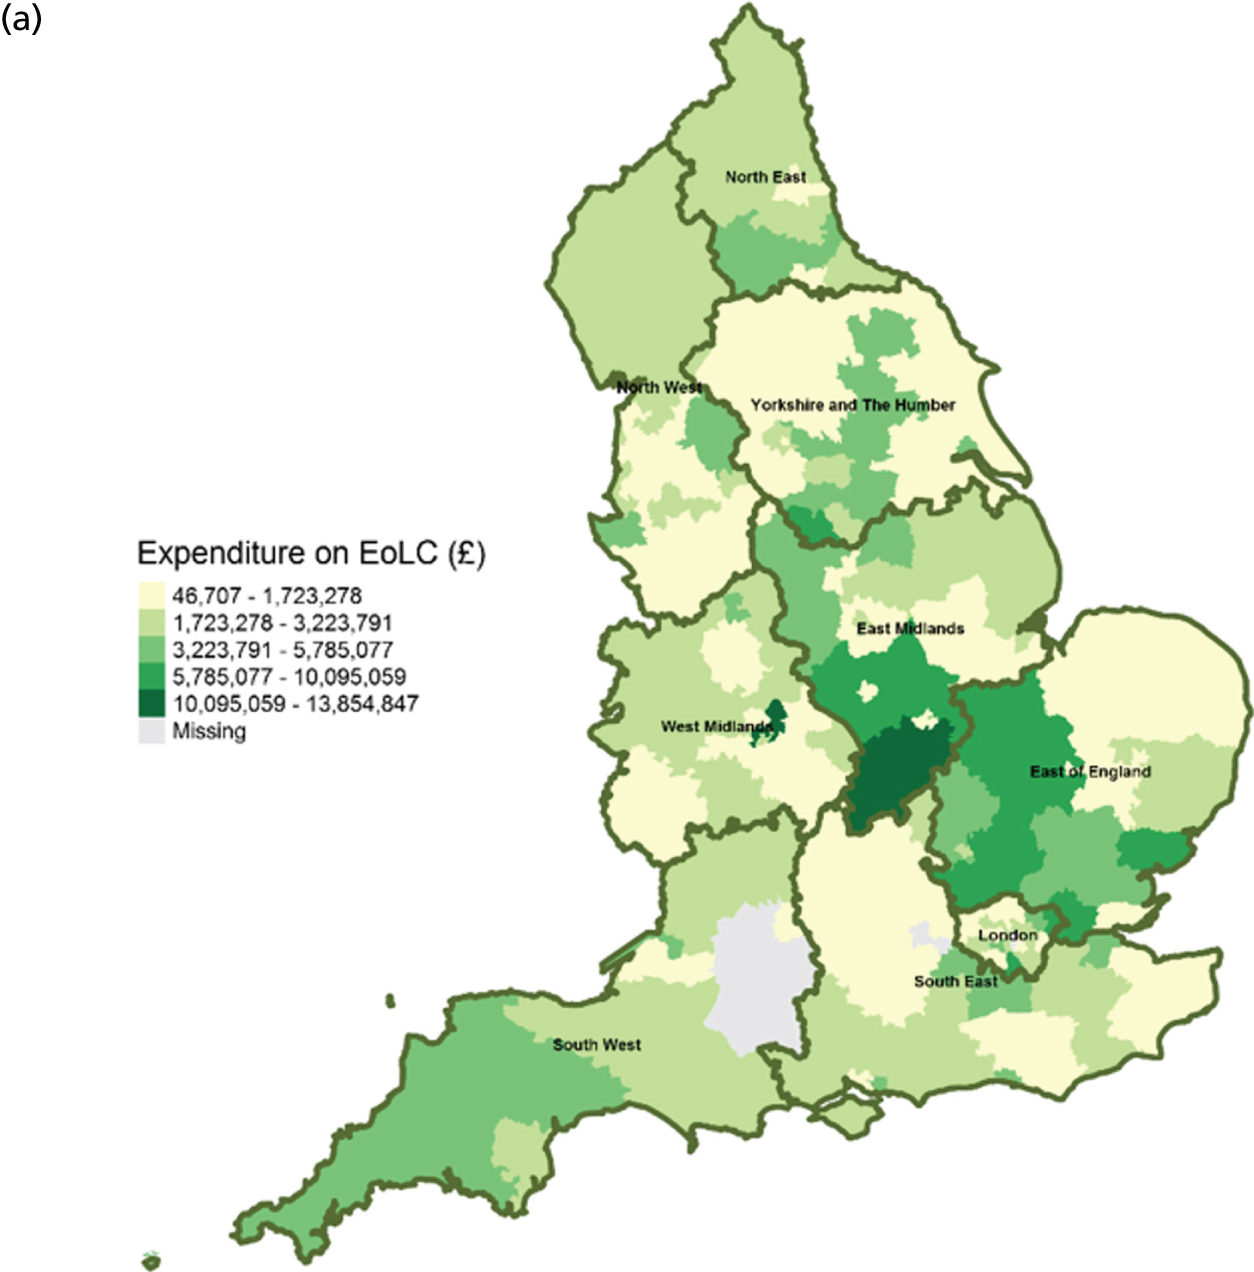
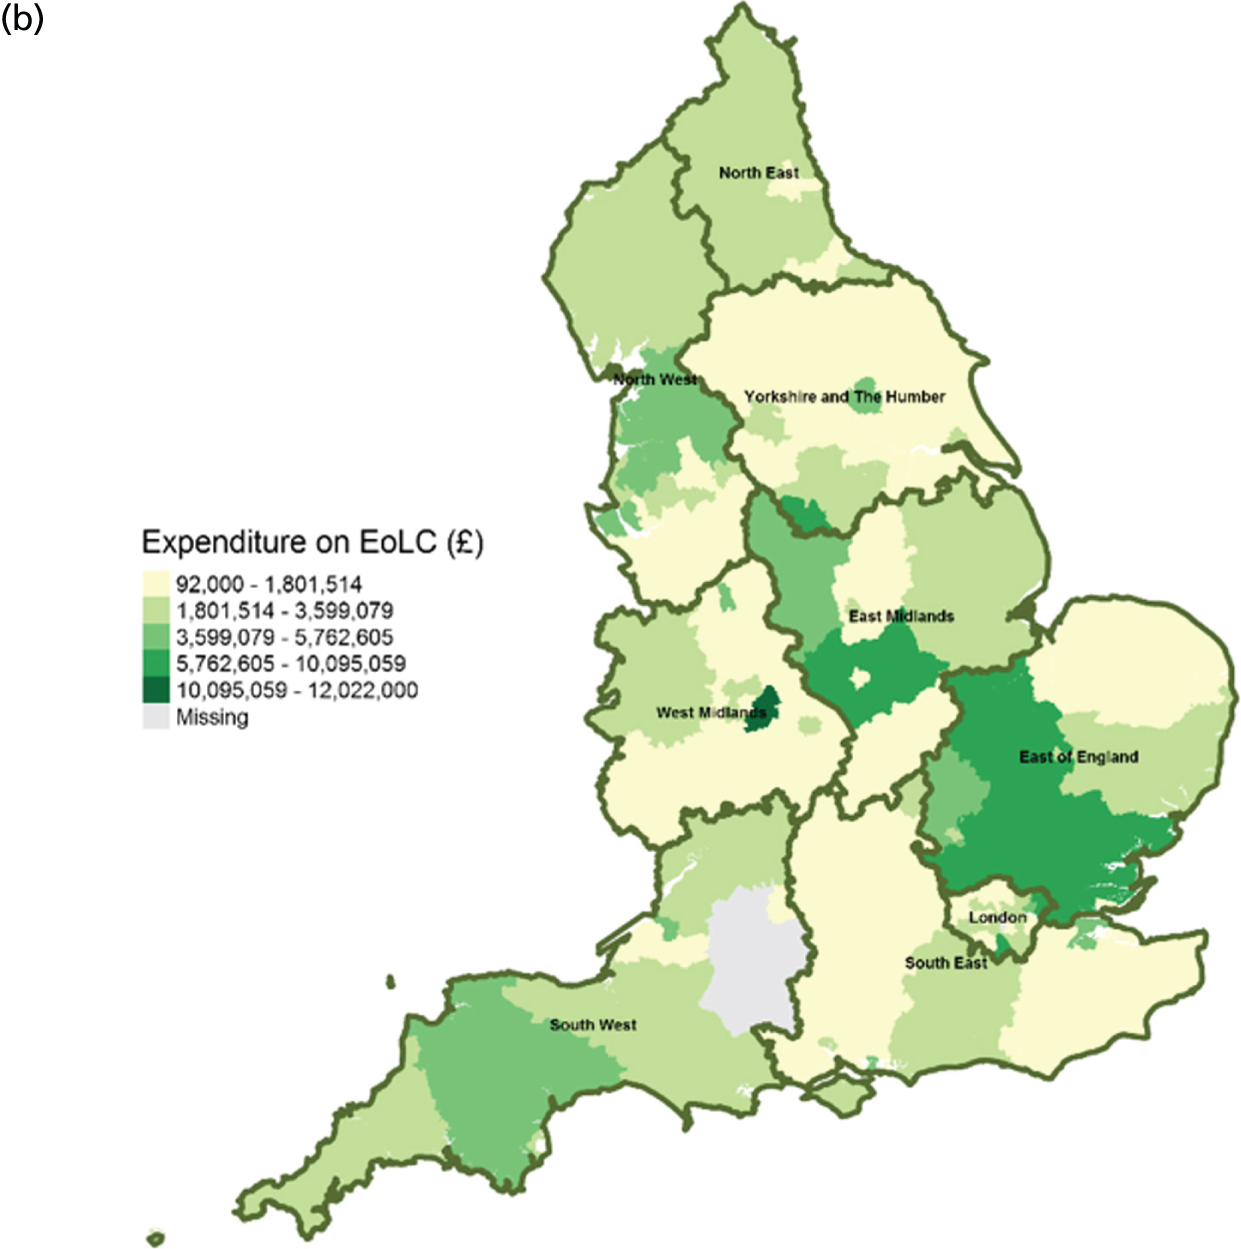
FIGURE 3.
Area-level profile of hospice beds per 10,000: (a) CCGs; and (b) LAs. Contains National Statistics data © Crown copyright and database right (2016) and contains Ordnance Survey data © Crown copyright and database right (2016). 60

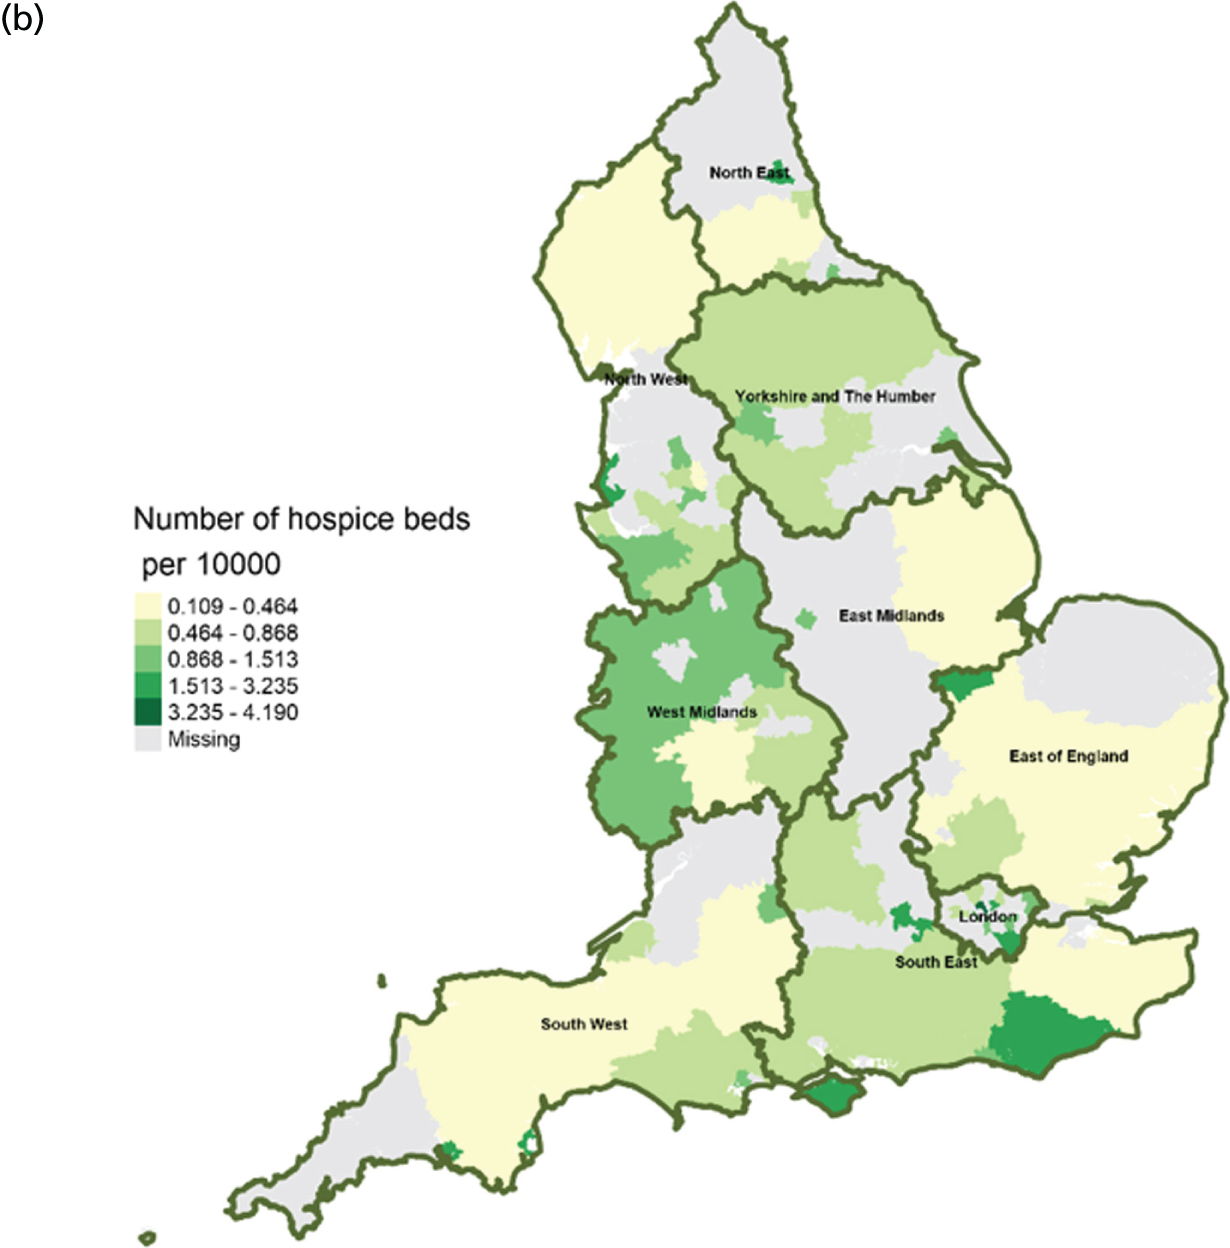
FIGURE 4.
Area-level profile of care home beds per 10,000: (a) CCGs; and (b) LAs. Contains National Statistics data © Crown copyright and database right (2016) and contains Ordnance Survey data © Crown copyright and database right (2016). 60
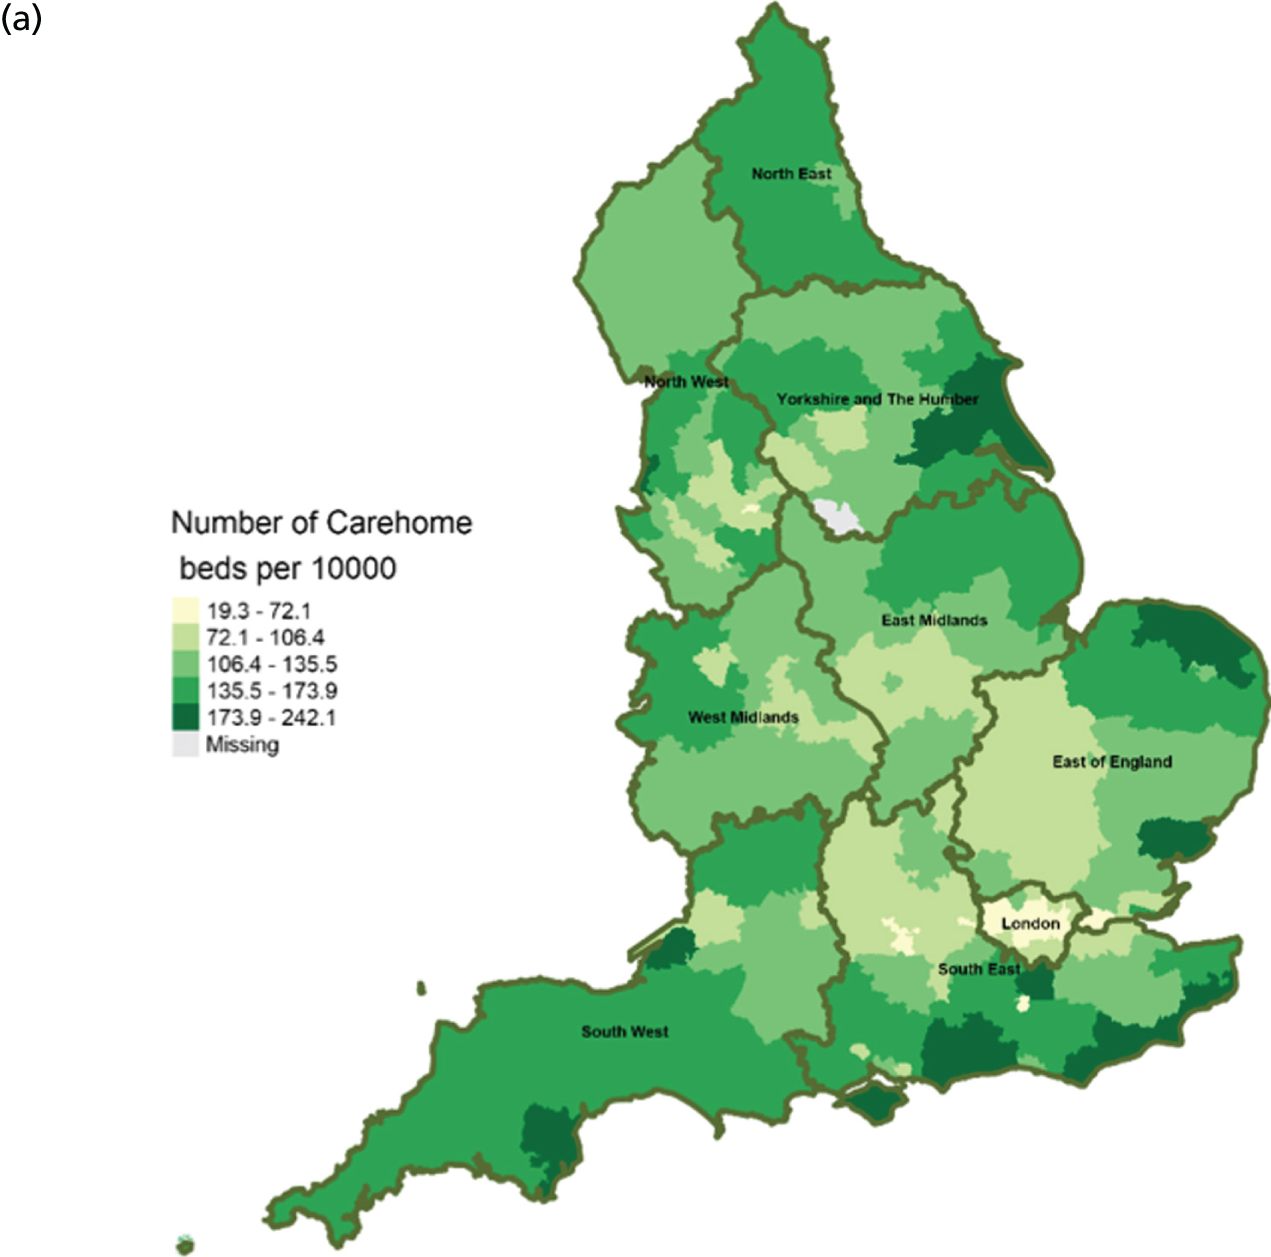
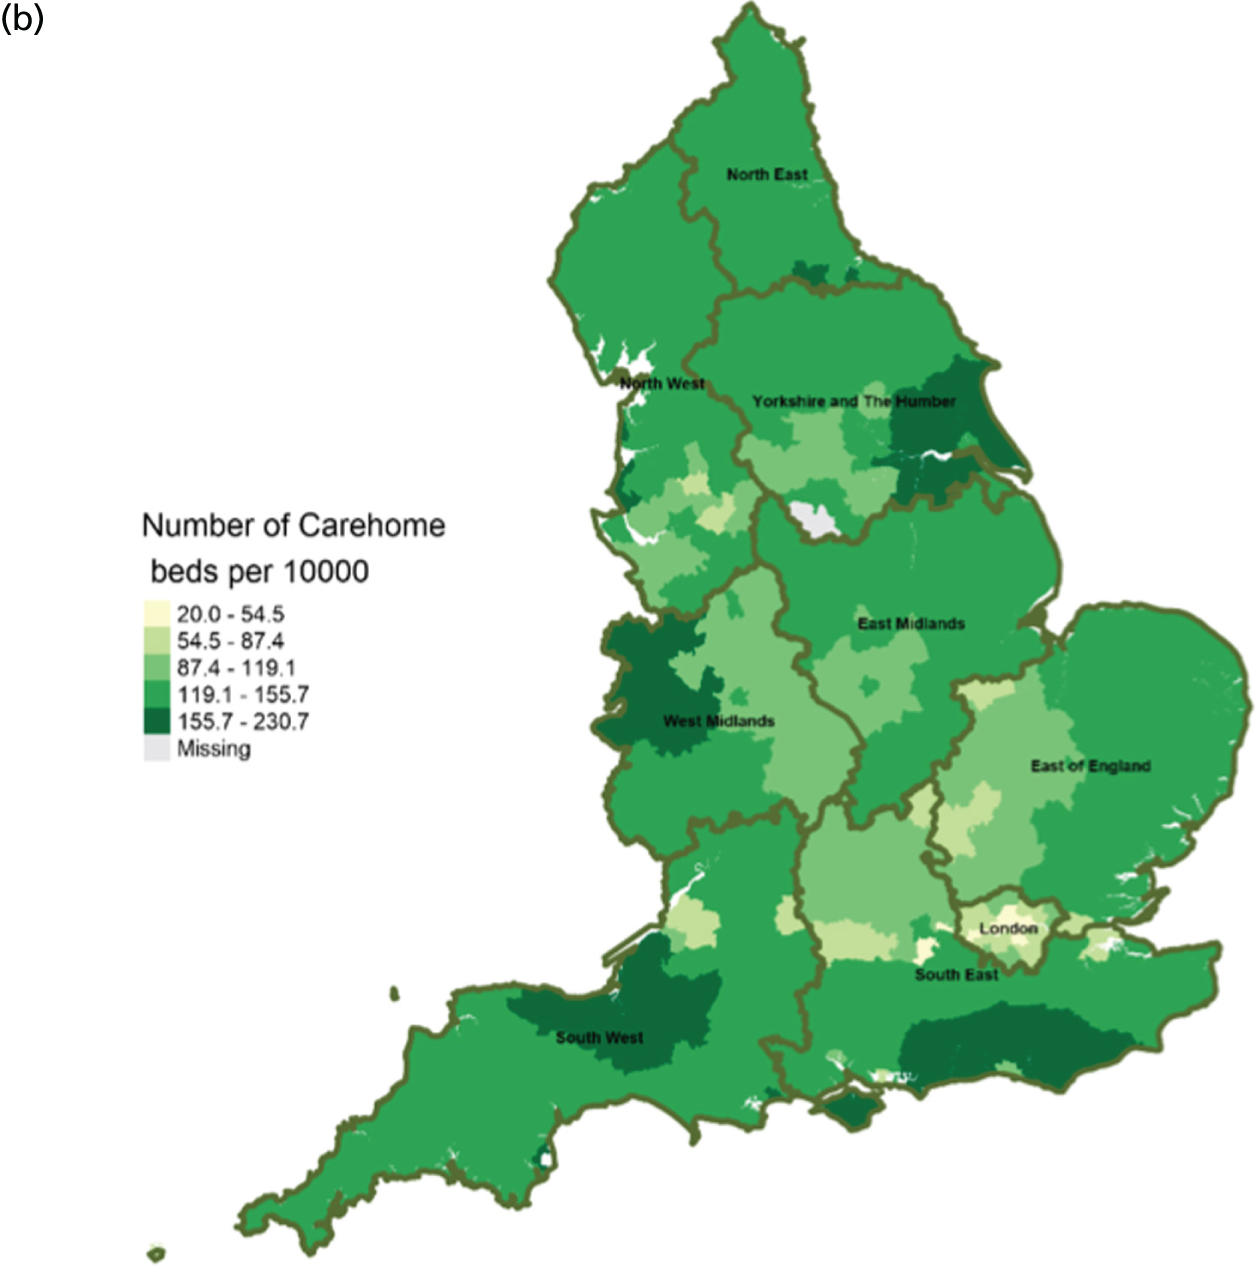
FIGURE 5.
Area-level profile of hospital bed availability: (a) CCGs; and (b) LAs. Contains National Statistics data © Crown copyright and database right (2016) and contains Ordnance Survey data © Crown copyright and database right (2016). 60
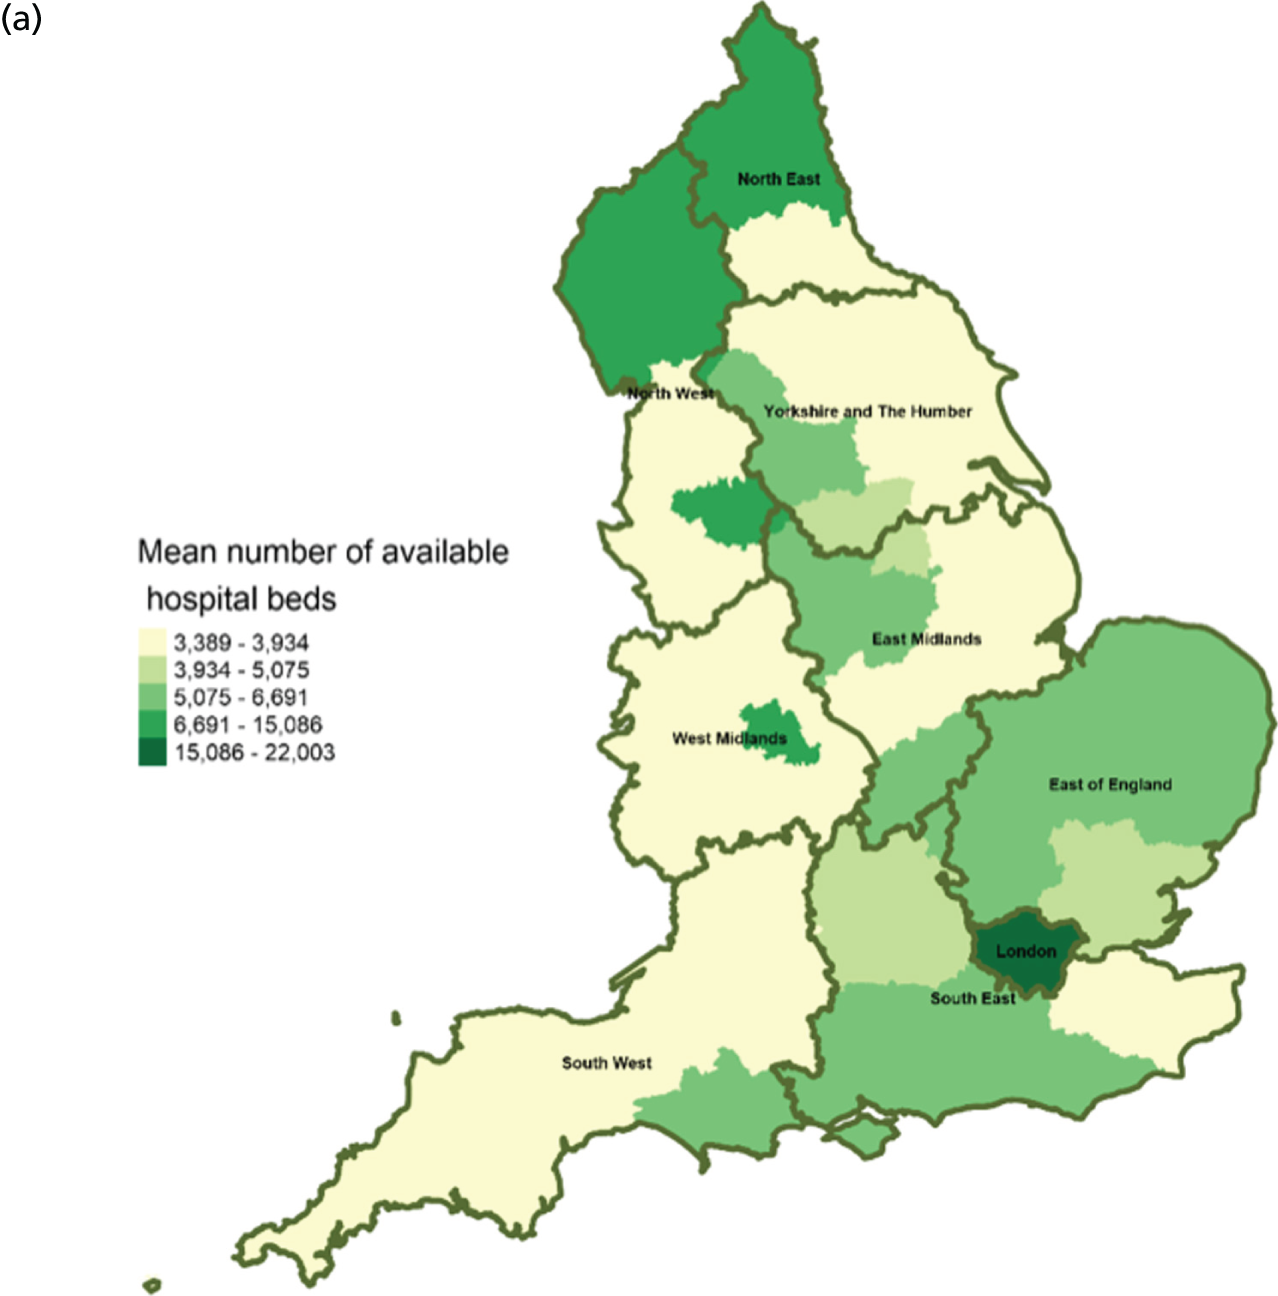
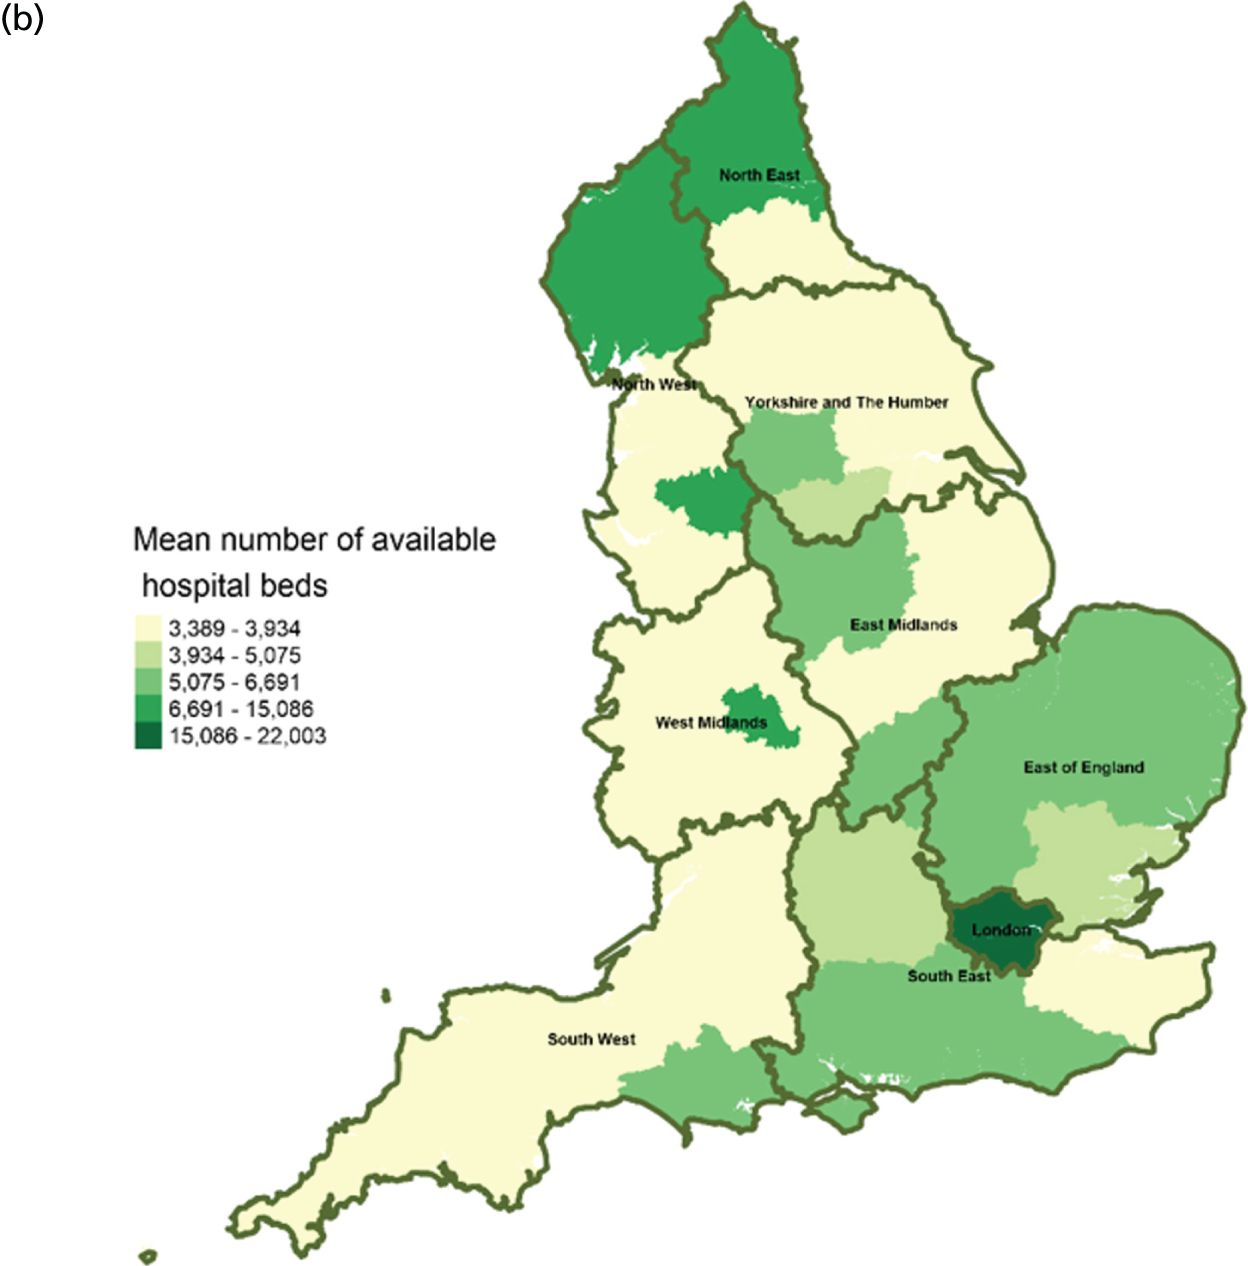
FIGURE 6.
Area-level profile of geographical access to inpatient hospice services: (a) CCGs; and (b) LAs. Contains National Statistics data © Crown copyright and database right (2016) and contains Ordnance Survey data © Crown copyright and database right (2016). 60

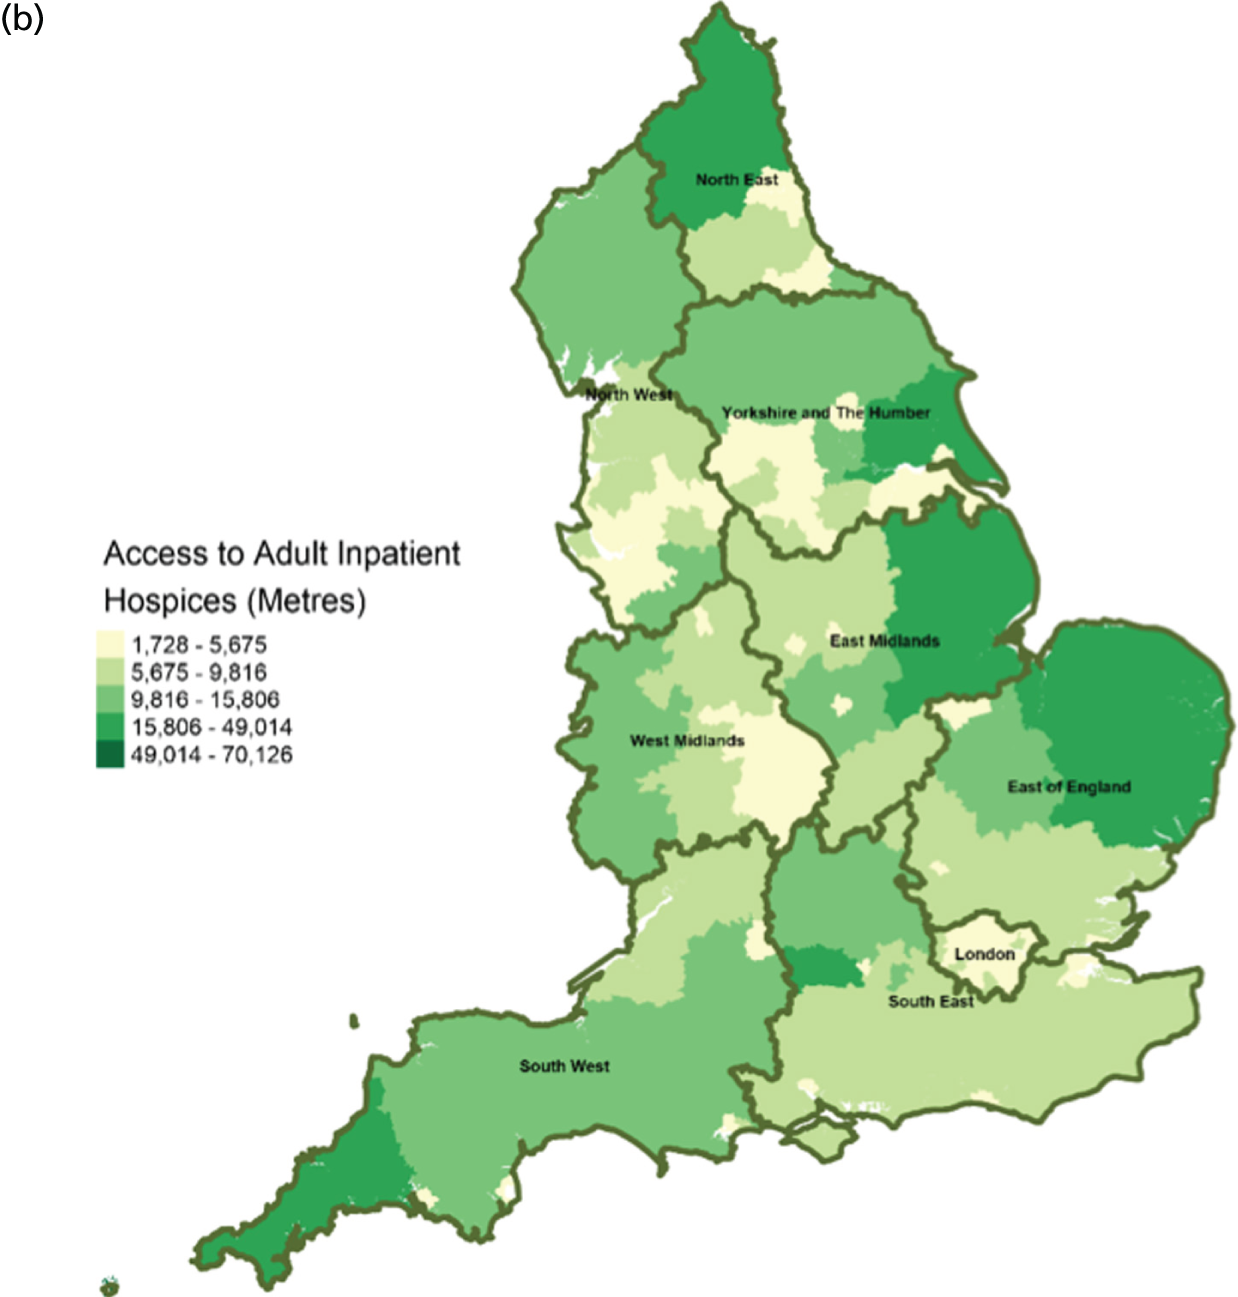
FIGURE 7.
Area-level profile of geographical access to care homes: (a) CCGs; and (b) LAs. Contains National Statistics data © Crown copyright and database right (2016) and contains Ordnance Survey data © Crown copyright and database right (2016). 60
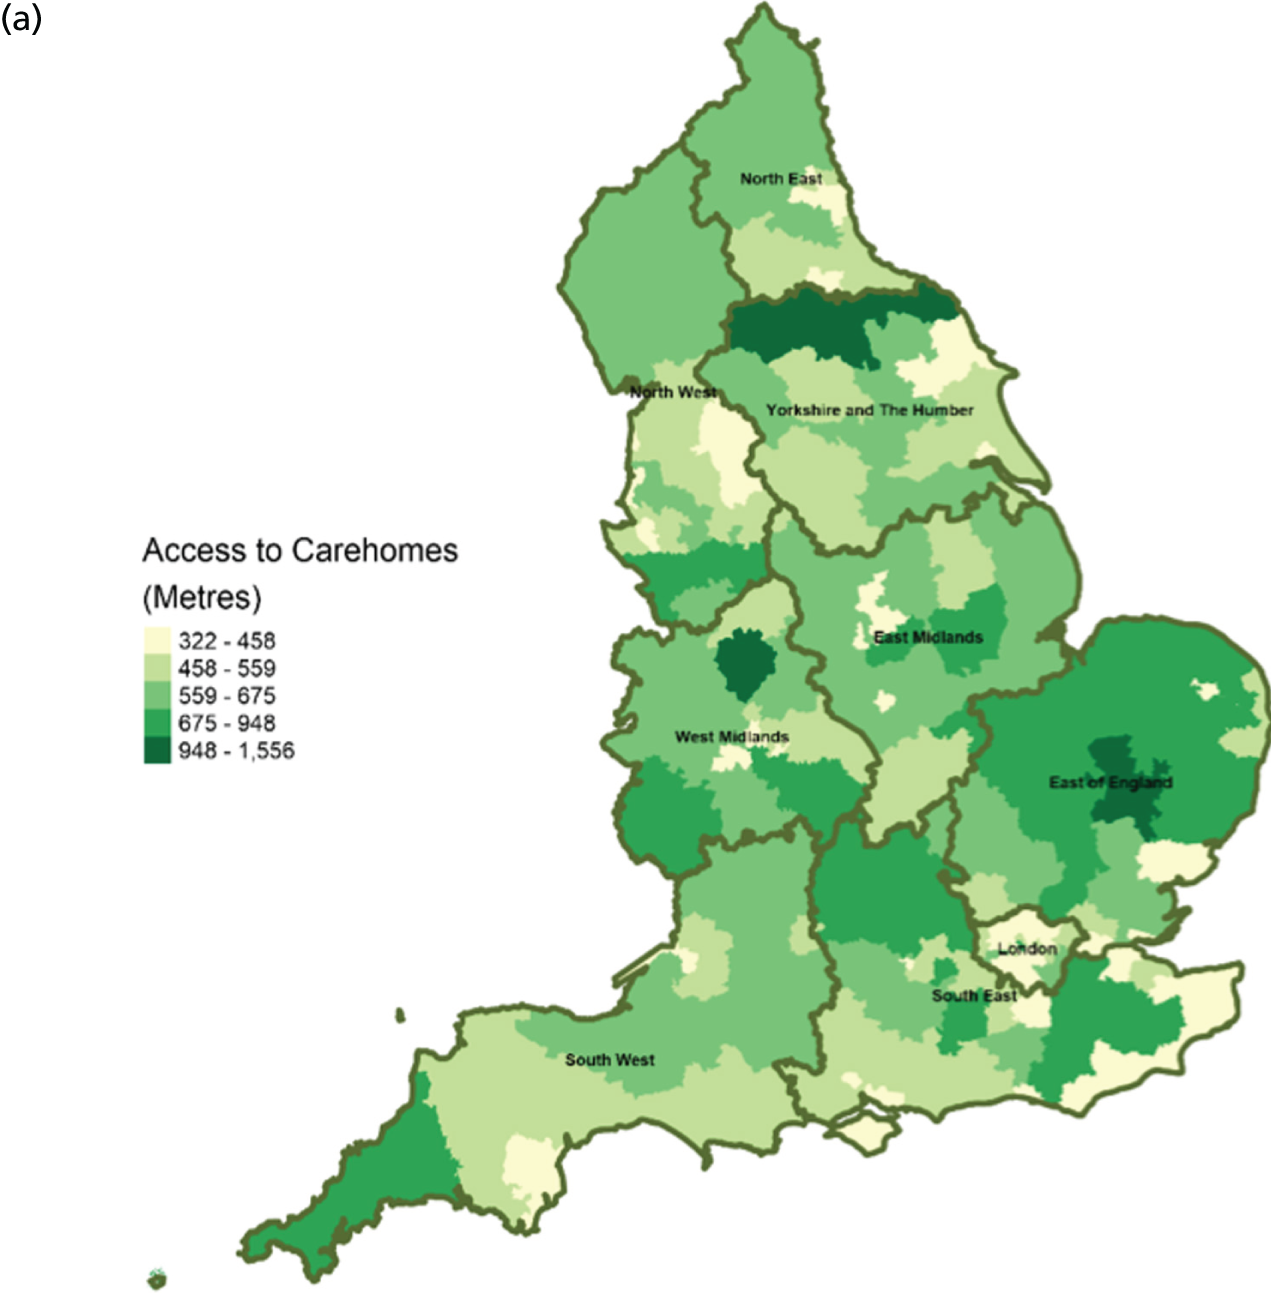
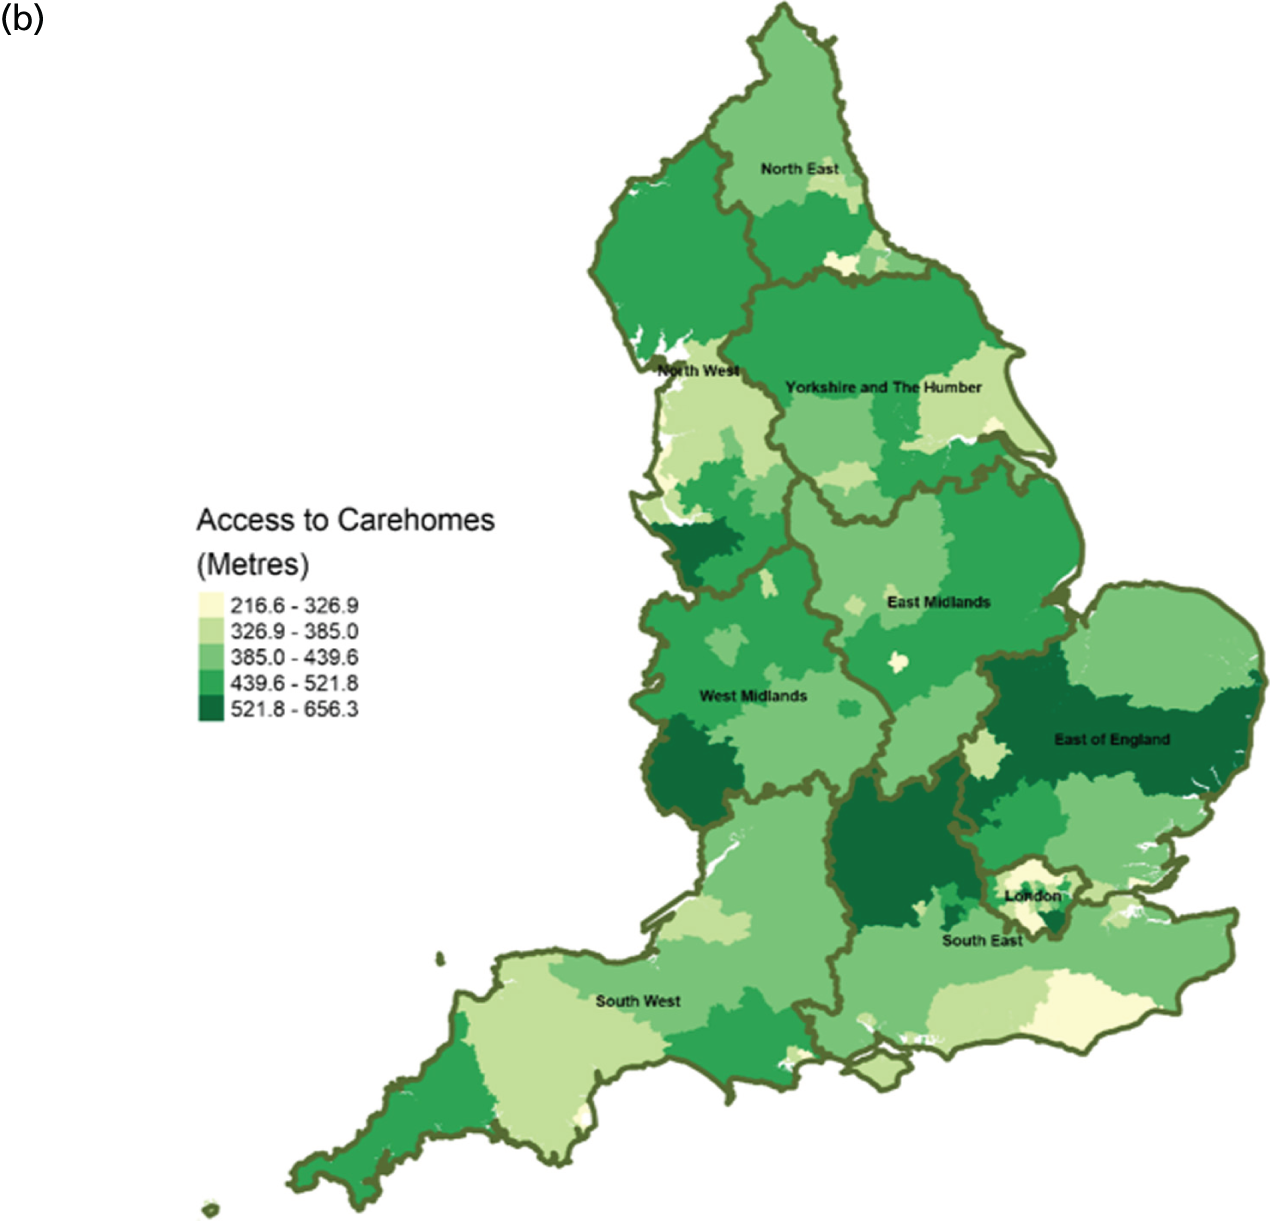
FIGURE 8.
Area-level profile of geographical access to general practices: (a) CCGs; and (b) LAs. Contains National Statistics data © Crown copyright and database right (2016) and contains Ordnance Survey data © Crown copyright and database right (2016). 60

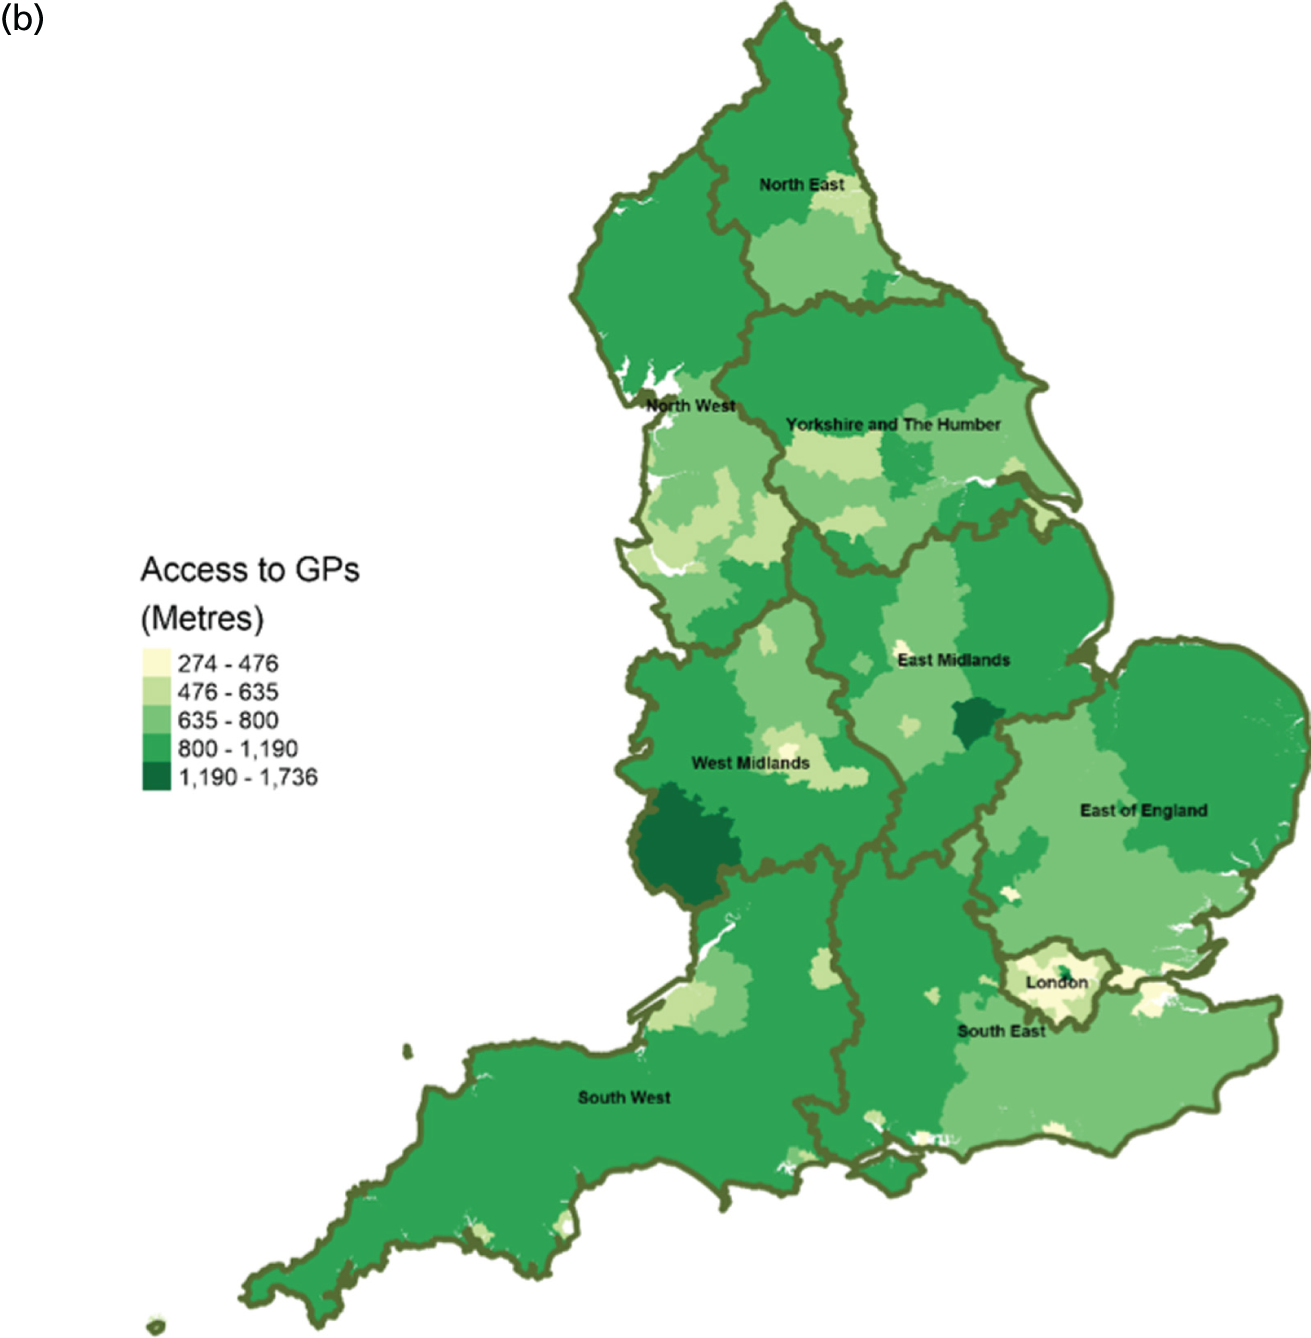
FIGURE 9.
Area-level profile of geographical access to hospitals: (a) CCGs; and (b) LAs. Contains National Statistics data © Crown copyright and database right (2016) and contains Ordnance Survey data © Crown copyright and database right (2016). 60
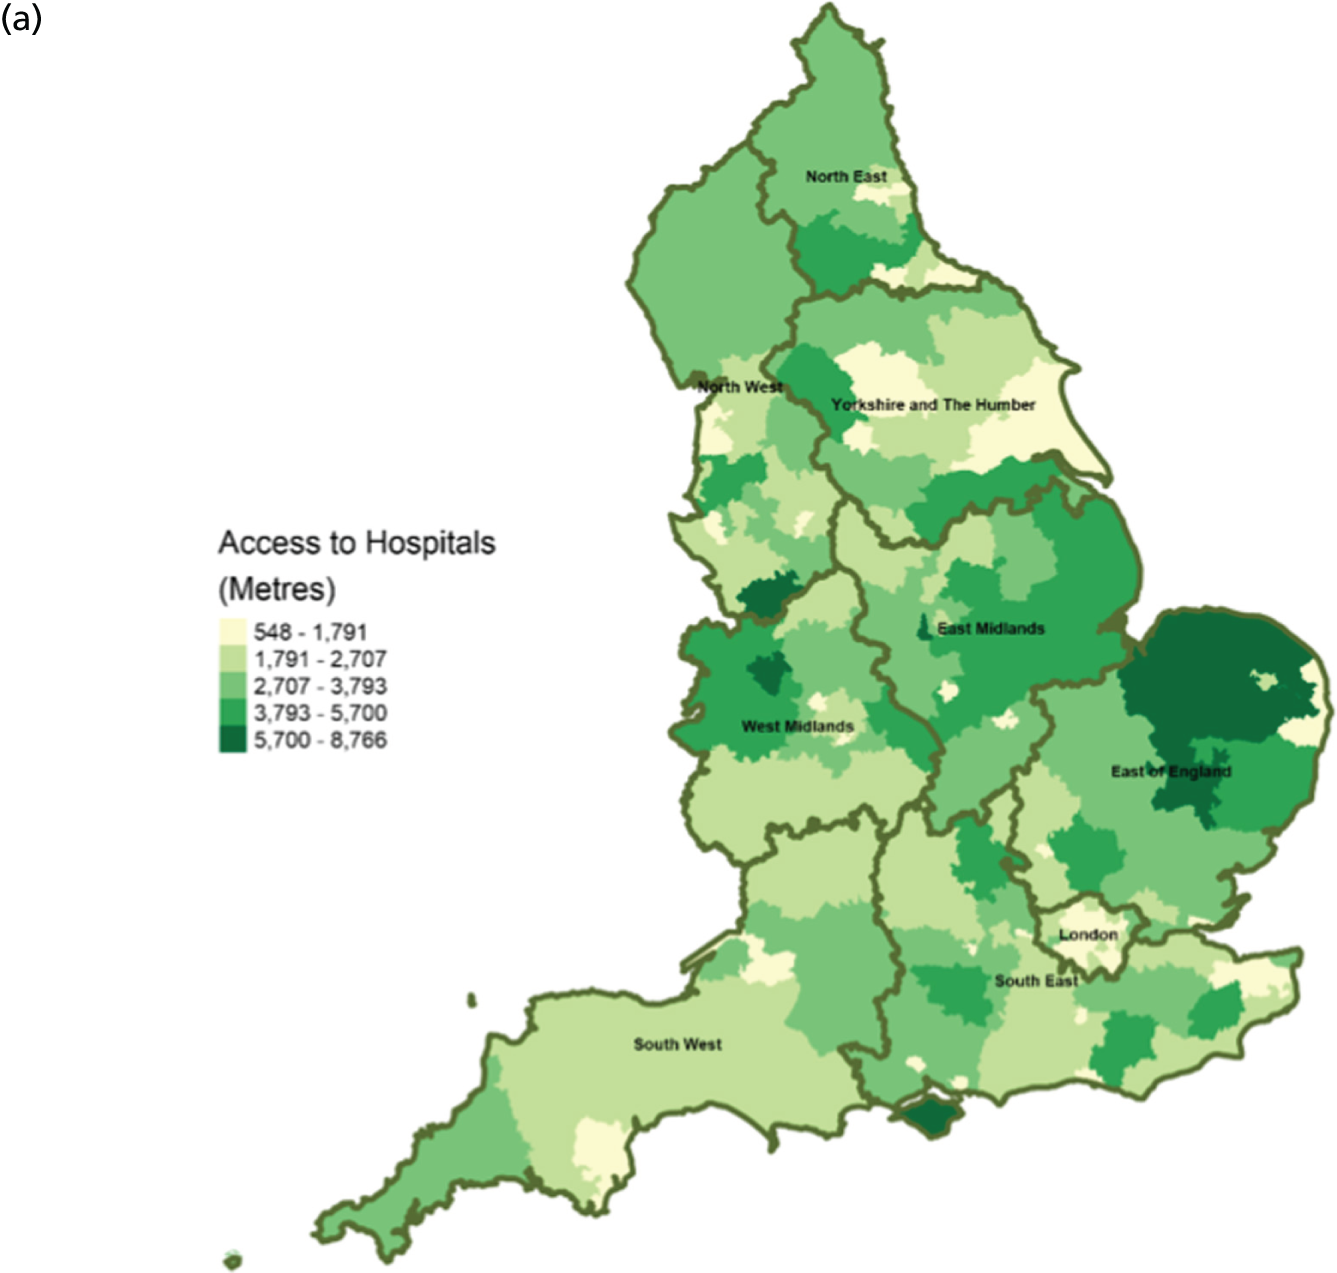
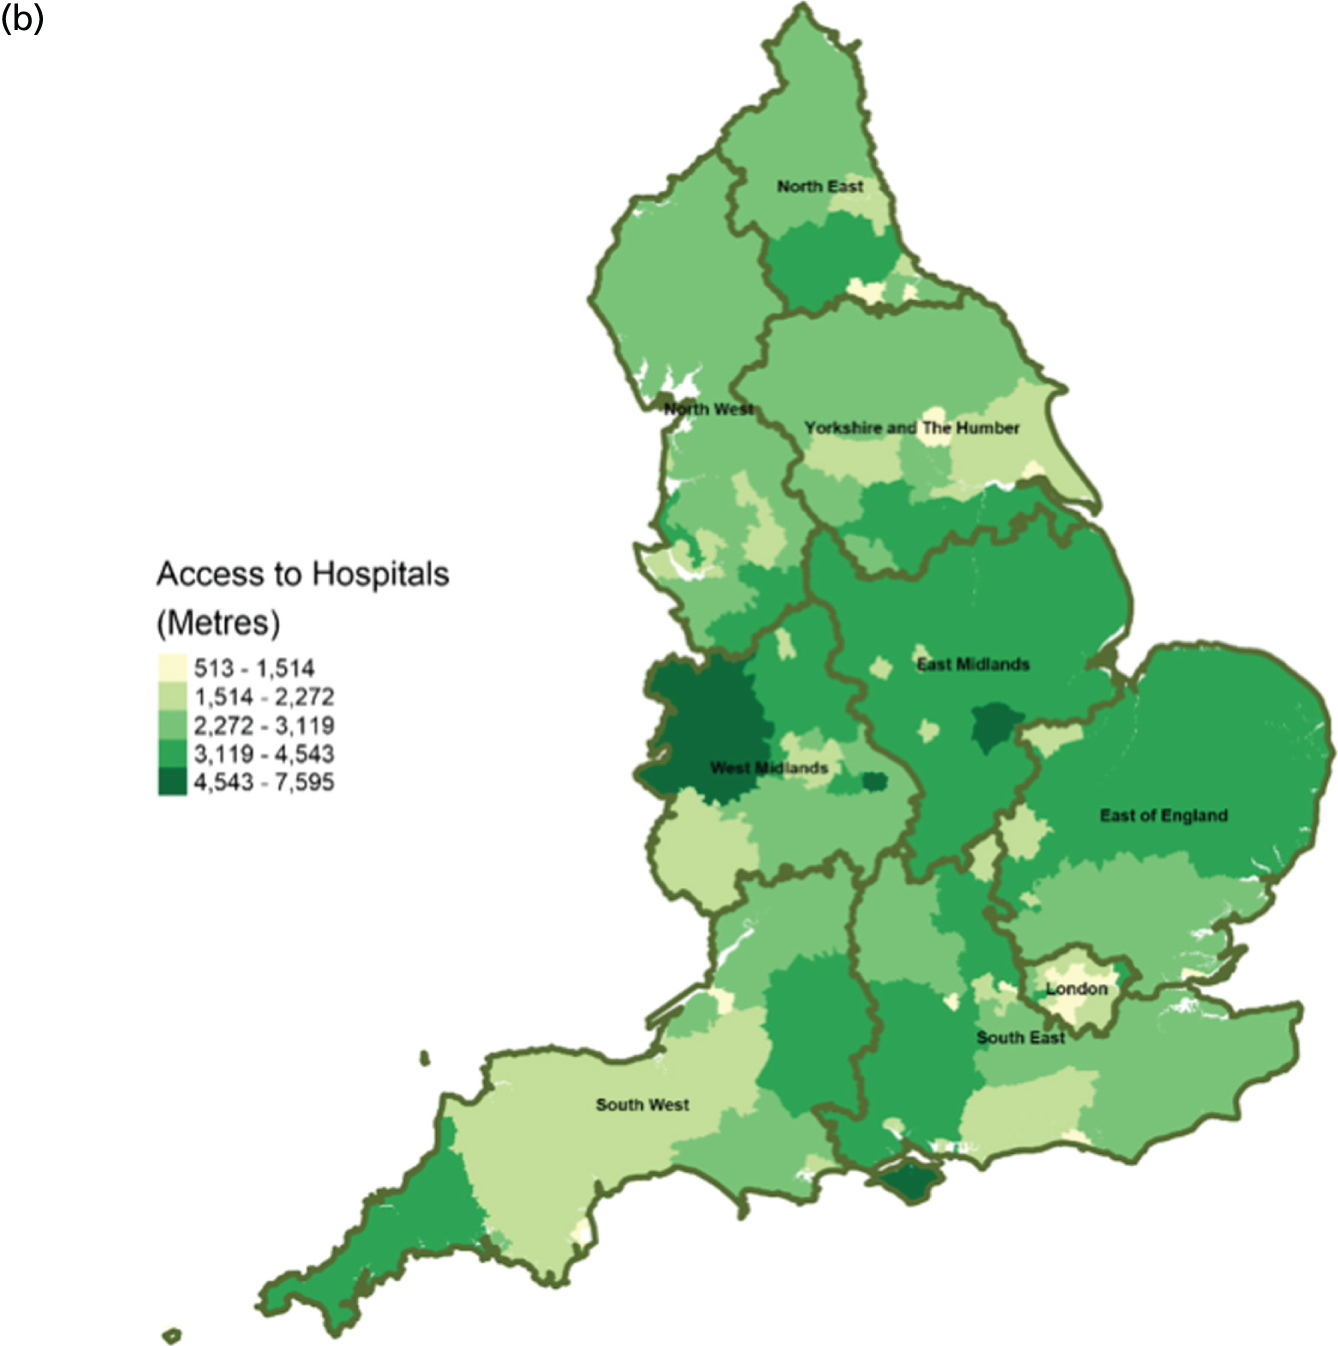
FIGURE 10.
Area-level profile of workforce (doctors): (a) CCGs; and (b) LAs. Contains National Statistics data © Crown copyright and database right (2016) and contains Ordnance Survey data © Crown copyright and database right (2016). 60

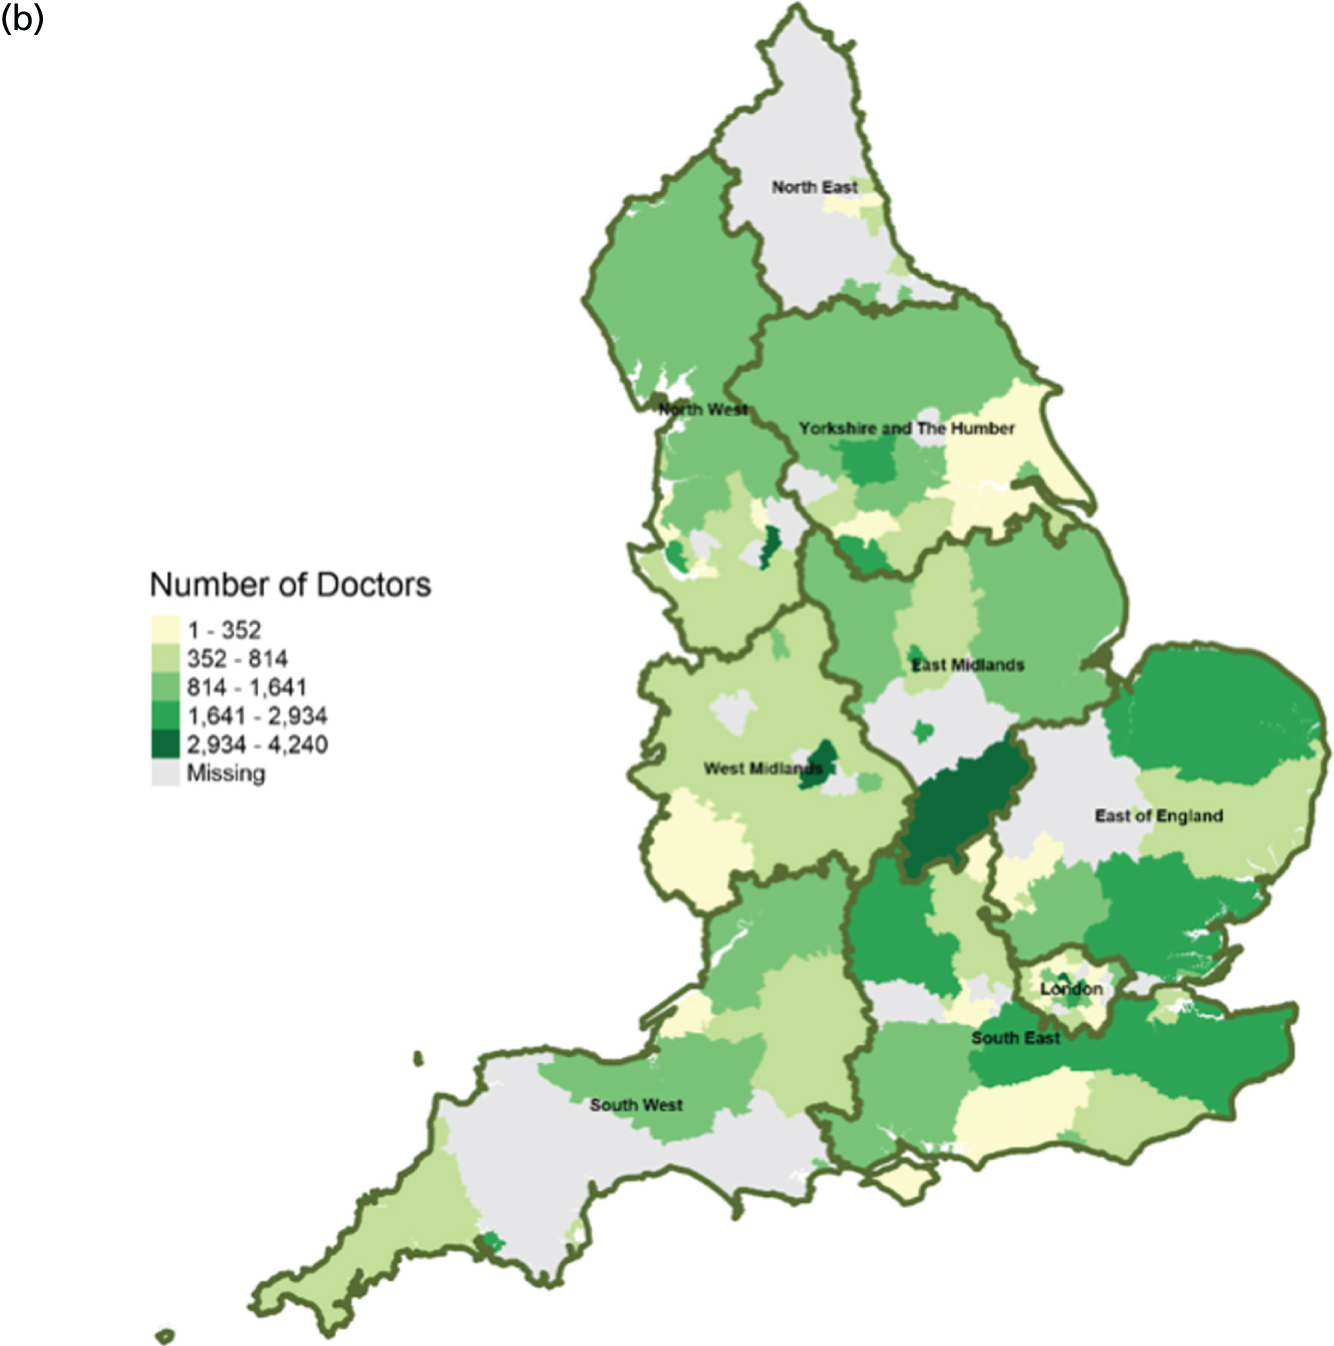
FIGURE 11.
Area-level profile of workforce (non-medical staff): (a) CCGs; and (b) LAs. Contains National Statistics data © Crown copyright and database right (2016) and contains Ordnance Survey data © Crown copyright and database right (2016). 60
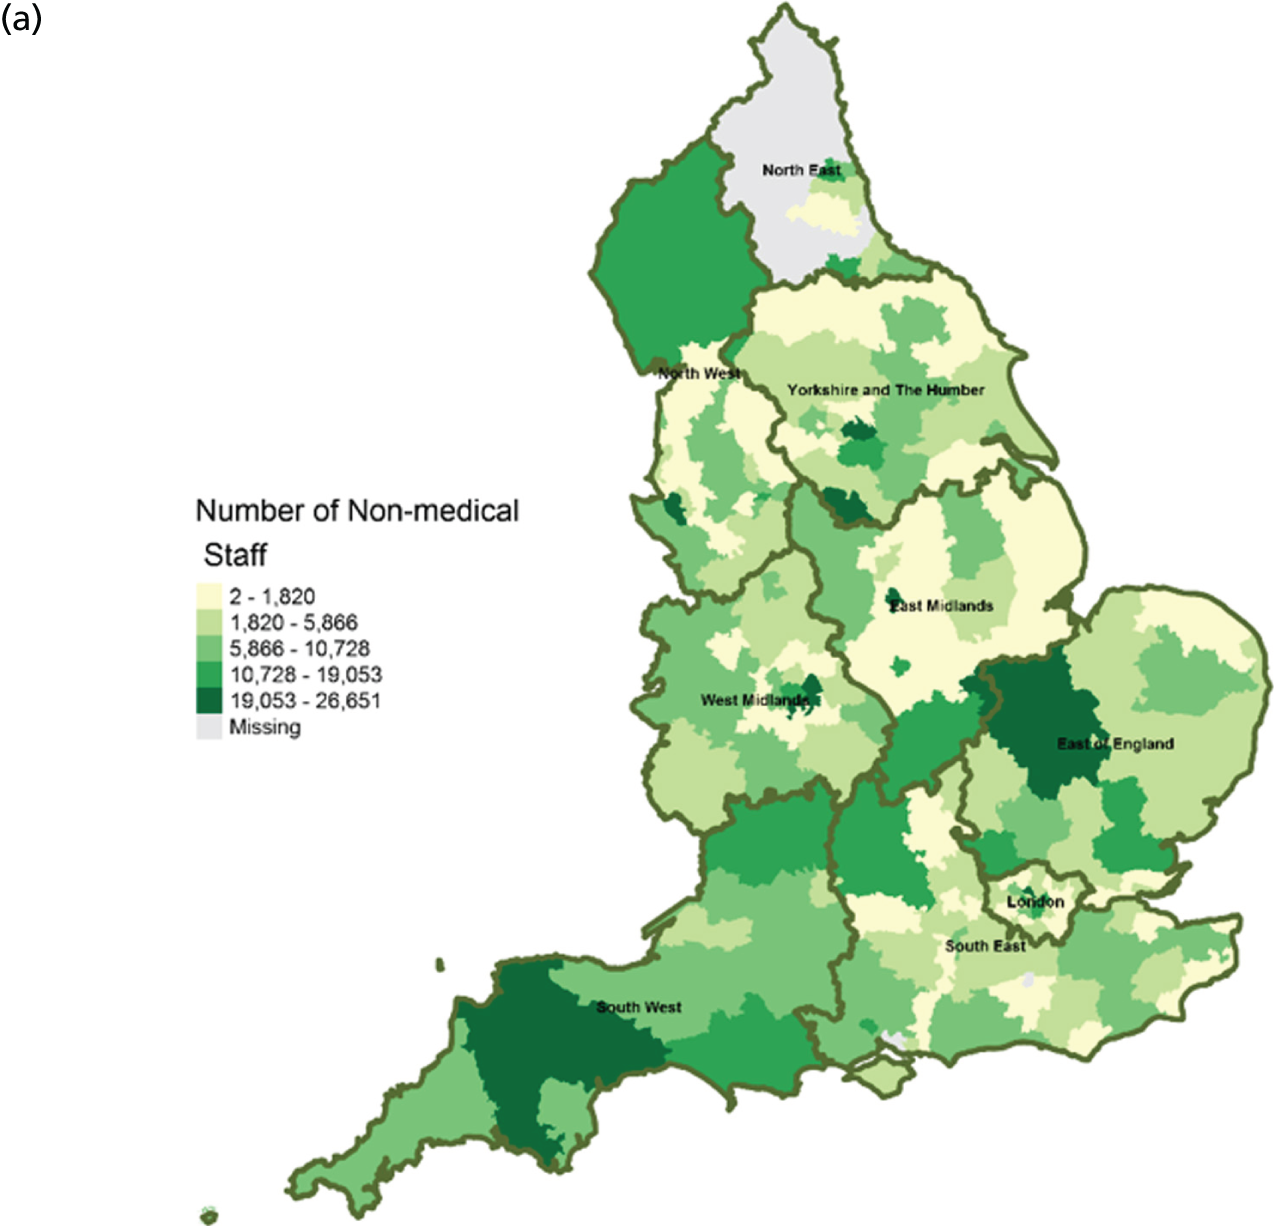
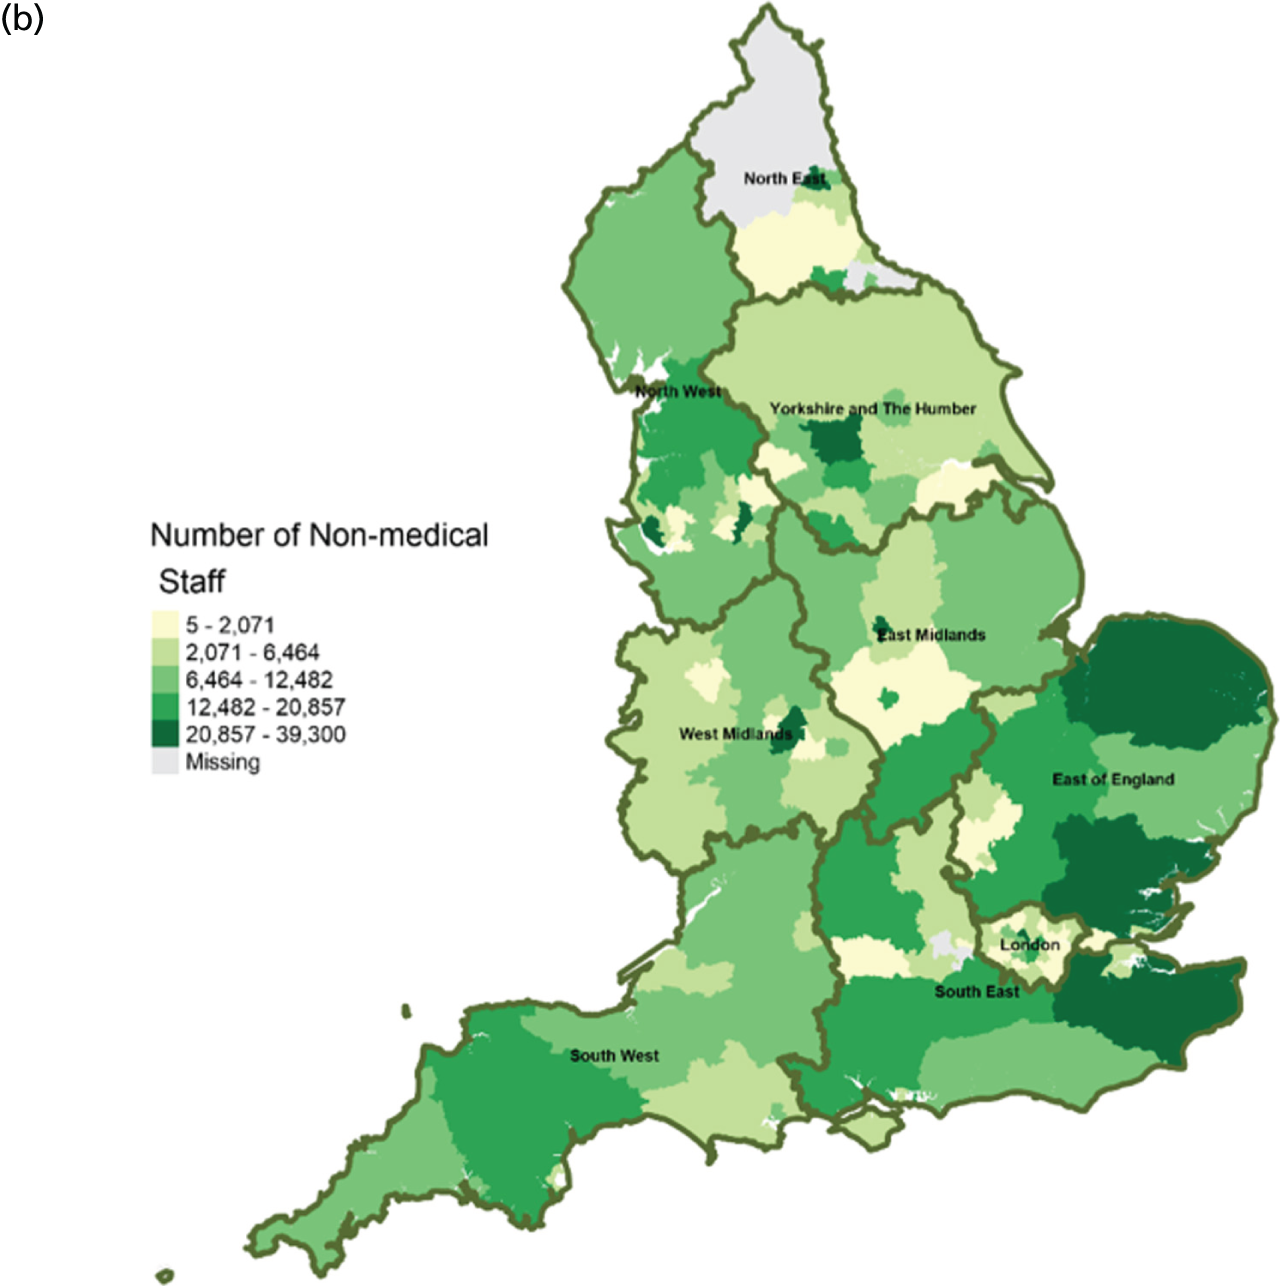
FIGURE 12.
Area-level profile of mean LOS in hospices: (a) CCGs; and (b) LAs. Contains National Statistics data © Crown copyright and database right (2016) and contains Ordnance Survey data © Crown copyright and database right (2016). 60
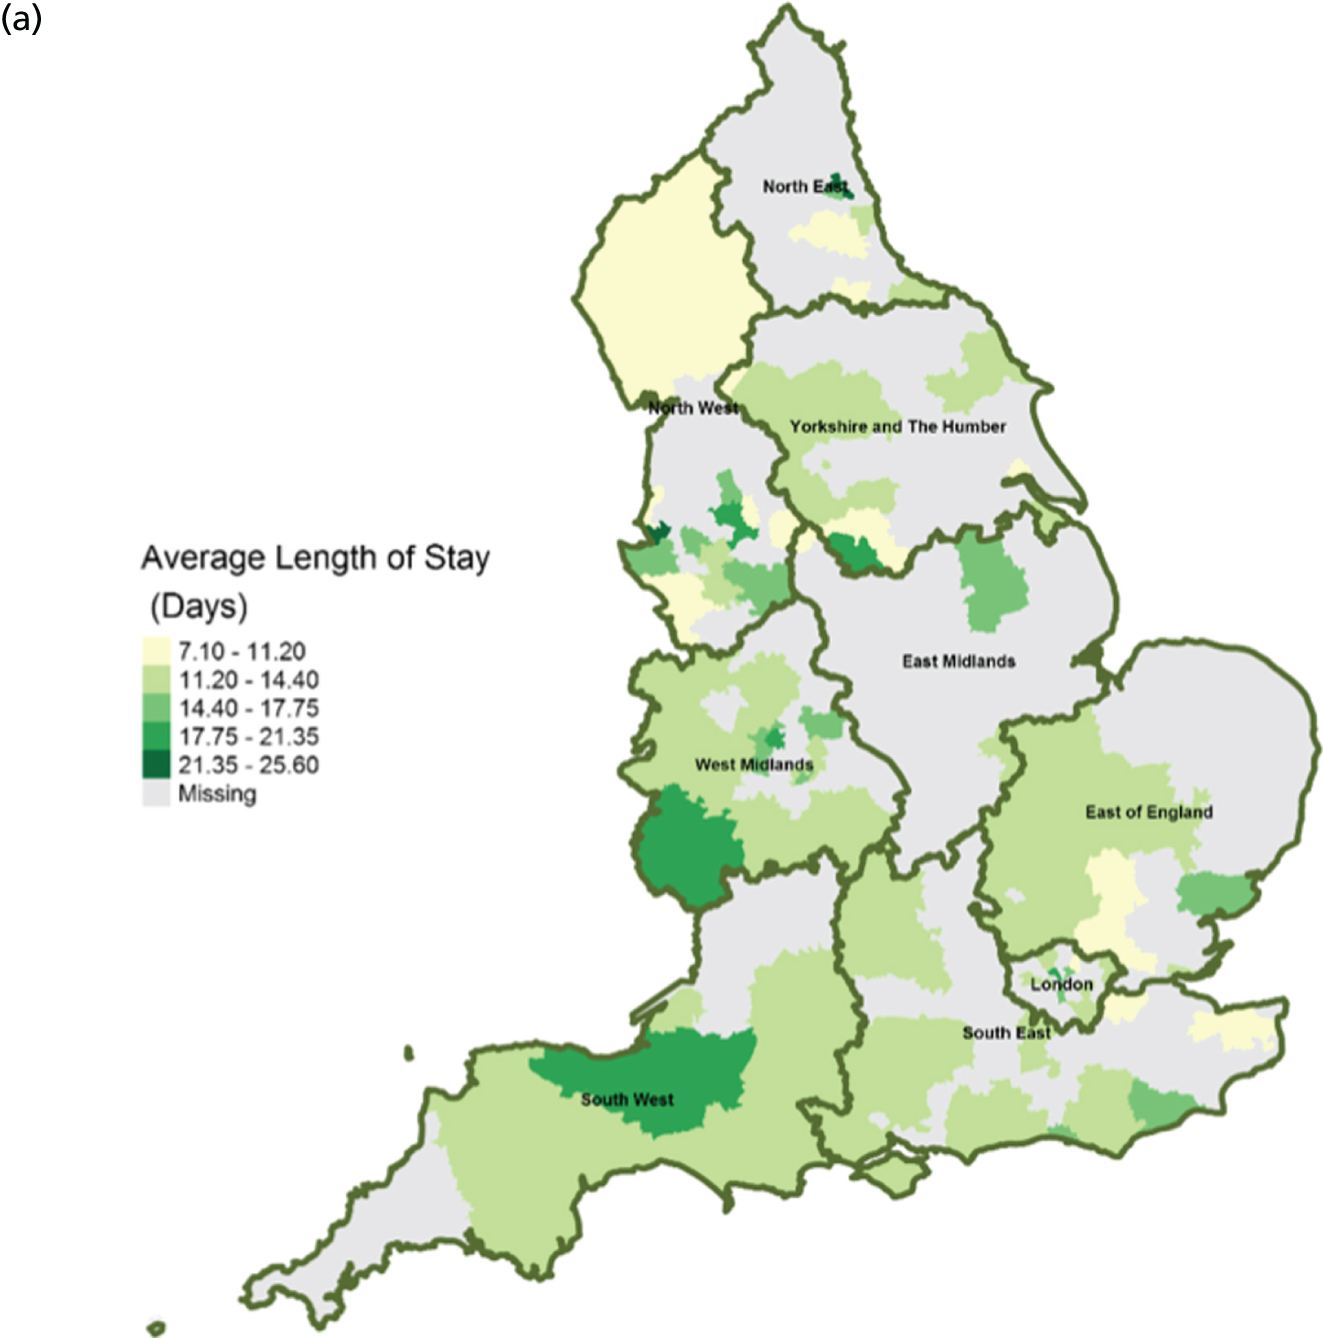
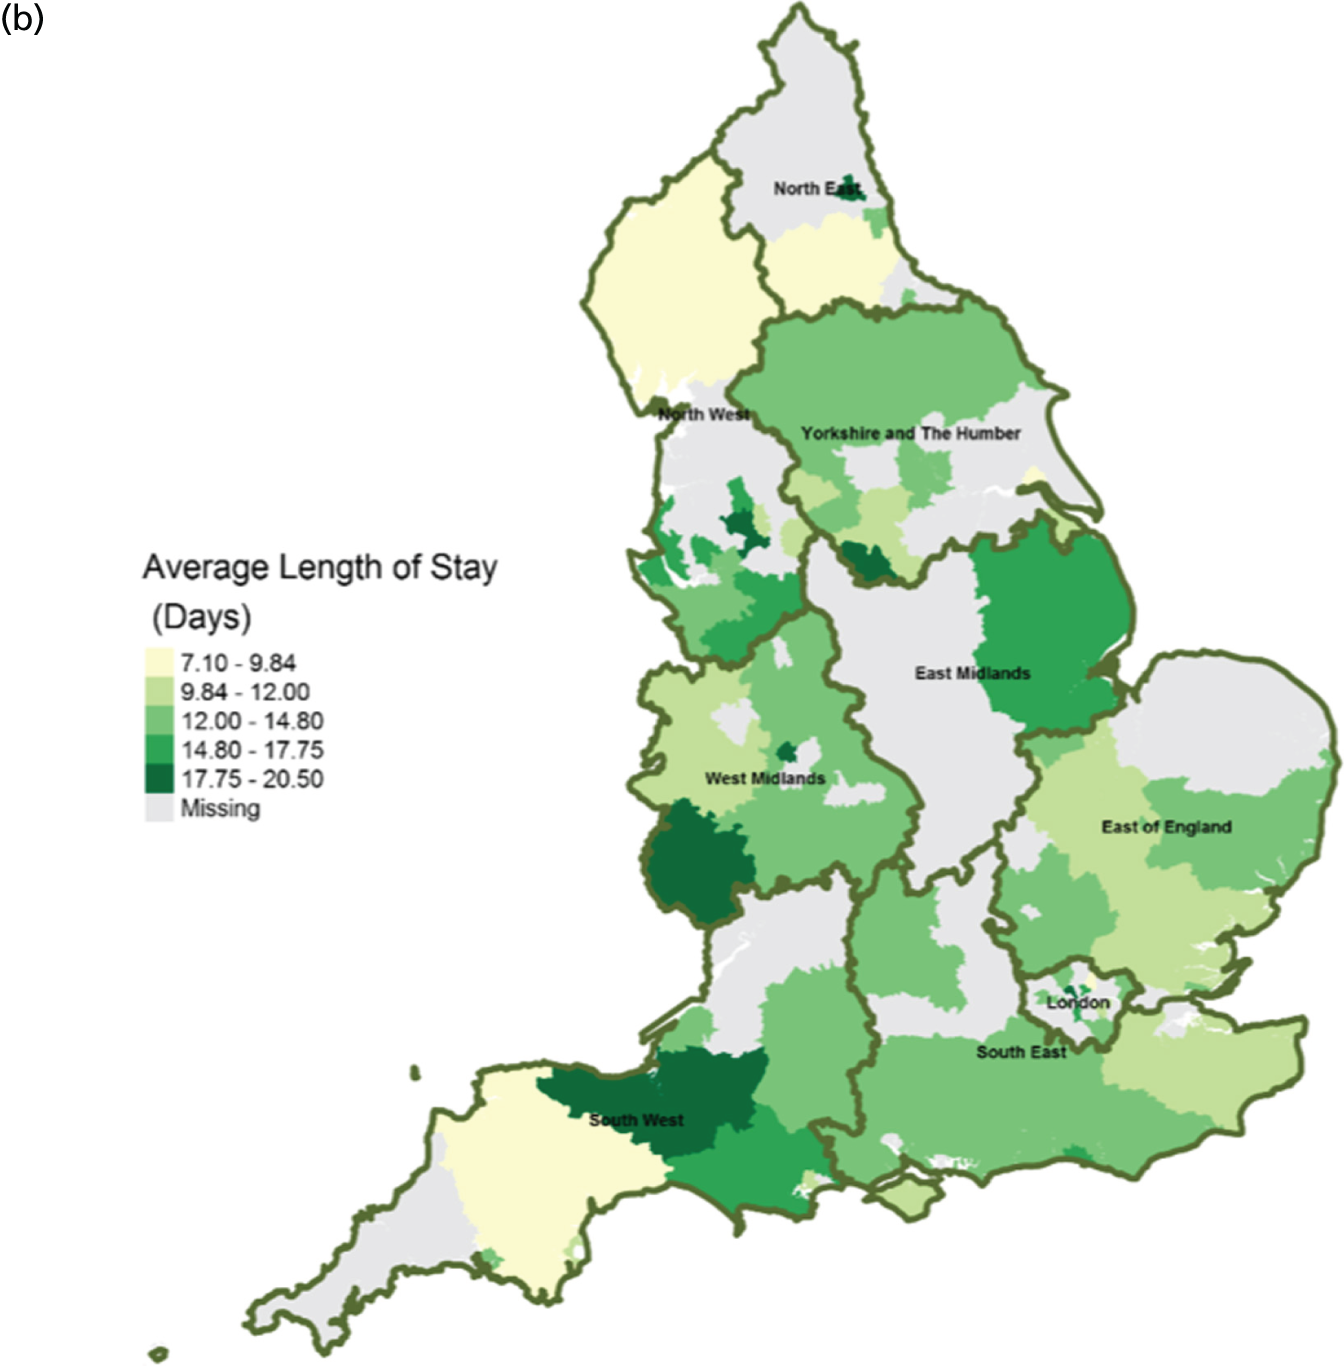
FIGURE 13.
Area-level profile of LOS in hospitals: (a) CCGs; and (b) LAs. Contains National Statistics data © Crown copyright and database right (2016) and contains Ordnance Survey data © Crown copyright and database right (2016). 60
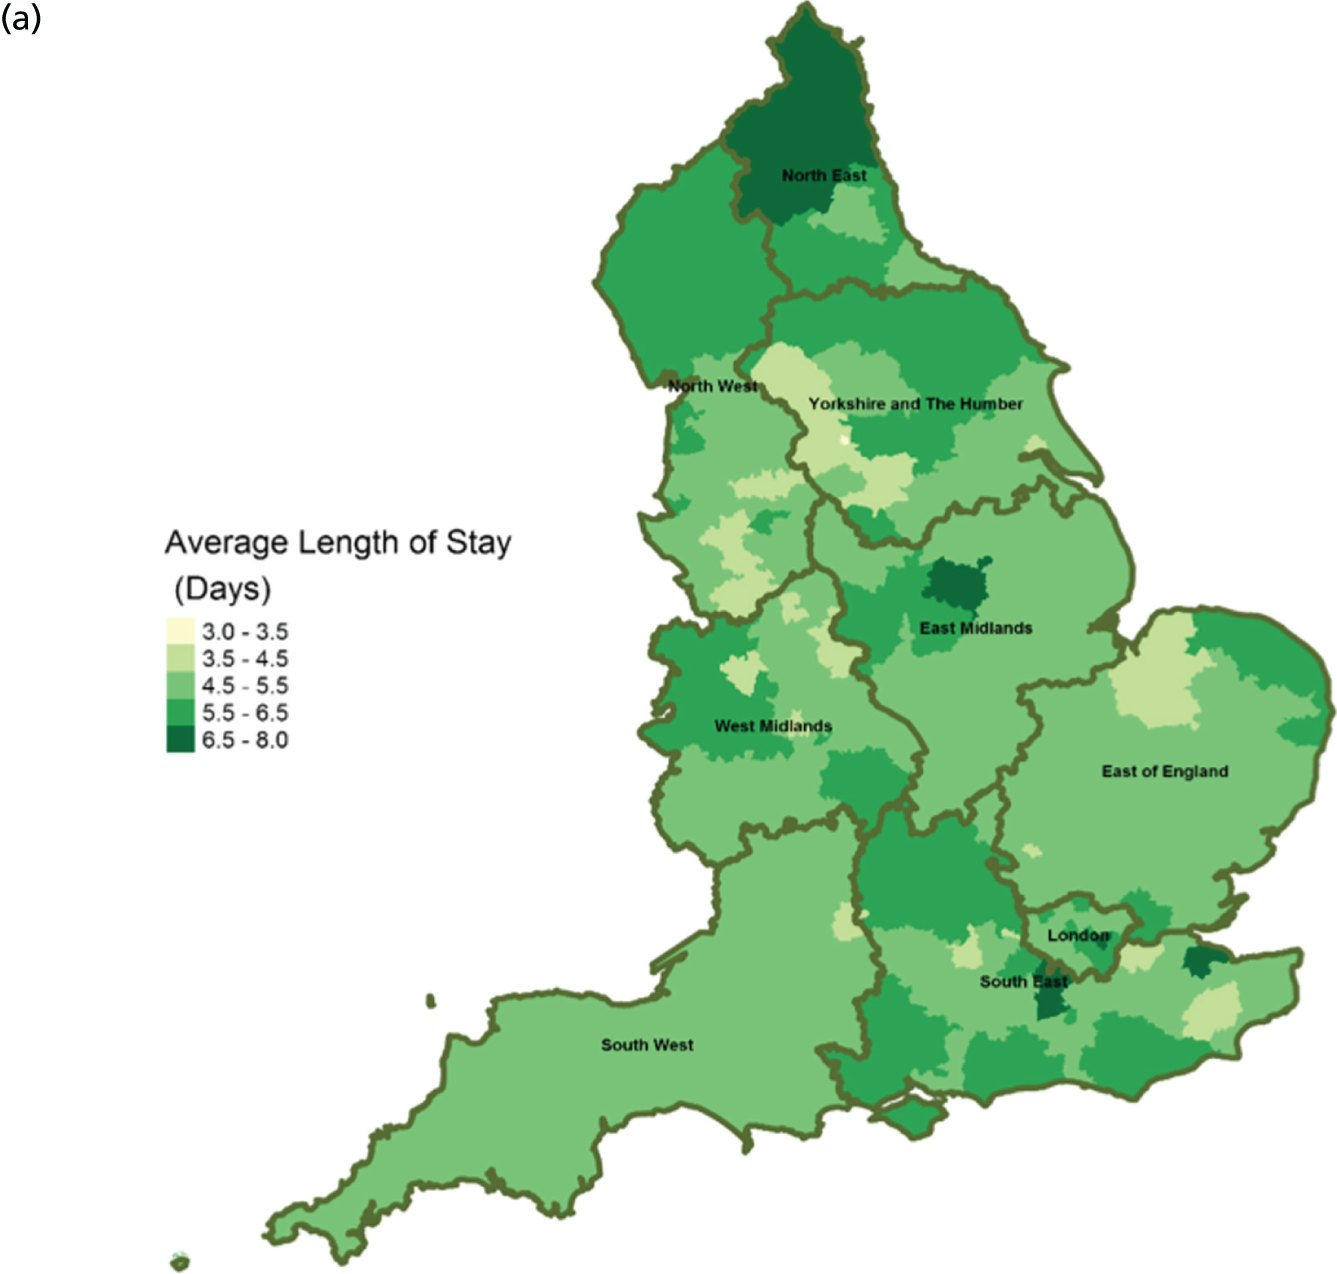
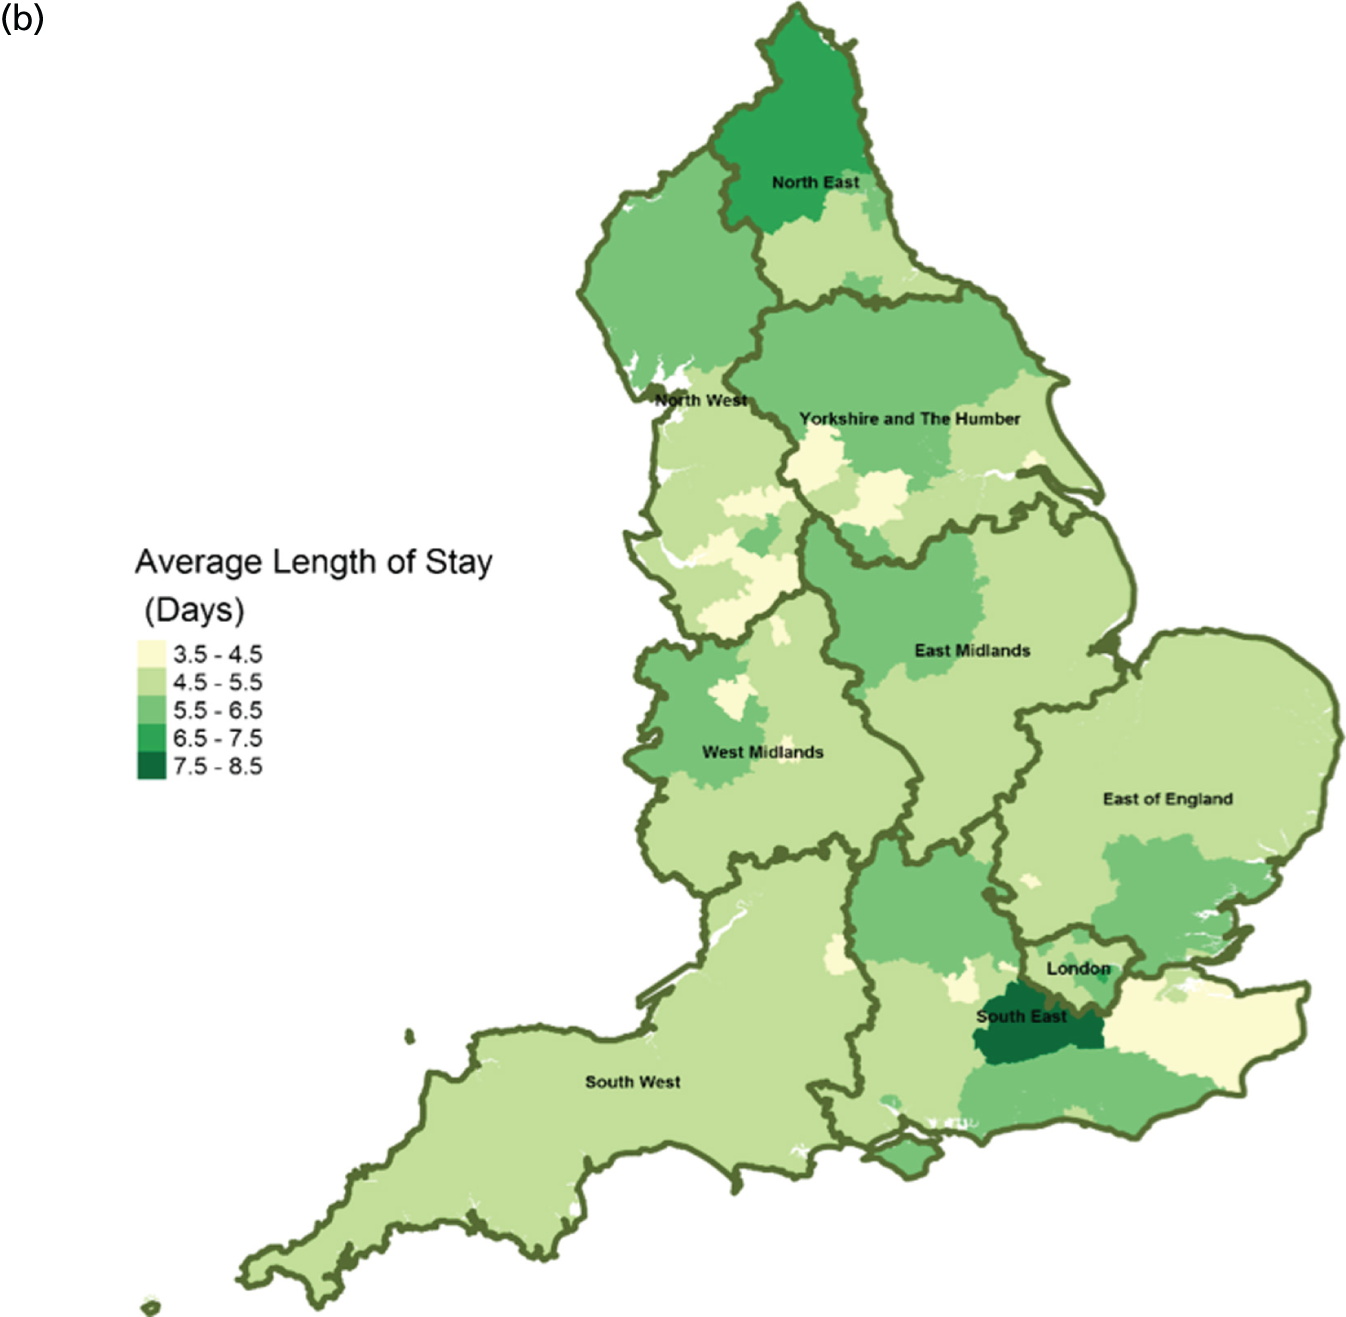
FIGURE 14.
Area-level profile of hospital bed occupancy: (a) CCGs; and (b) LAs. Overall association: service factors and PoD. Contains National Statistics data © Crown copyright and database right (2016) and contains Ordnance Survey data © Crown copyright and database right (2016). 60
Expenditure on end-of-life care
There are large geographical variations in expenditures on end-of-life care across (see Figure 2) CCGs (ranging from £46,707 to £13,854,847) and LAs (ranging from £92,000 to £12,022,000). High expenditures on end-of-life care seemed to cluster at the heart of England. This is particularly visible in parts of East Midlands and East England. Expenditure on end-of-life care is relatively low in London. One possible explanation for the observed variation may be due to the proportions of people who need palliative care.
Service type and capacity
In terms of service capacity, the average number of available hospital beds varied between 3389 and 22,003 across CCGs and LAs. London has the highest number of available beds (approximately > 15,000). Bed availability in hospices (see Figure 3) is particularly low in many areas of England, with values ranging from 0 to approximately 7.1 per 10,000 persons in CCGs (see Figure 3a) and 0.1 to 4.1 in LAs (see Figure 3b). There are more care home beds than hospice and hospital beds. The number of available care home beds ranged from 19.3 to 242.1 per 10,000 persons in CCGs and 20 to 230.7 per 10,000 persons in LAs (see Figure 4).
Service locations
There are distinct geographical variations in access to health-care facilities across England (see Figures 6–9). The pattern of geographical access reflects the number and distribution of health-care facilities. Access to adult inpatient hospices (see Figure 6) varies widely across CCGs (from 1742 m to 38,543 m) and LAs (from 1728 m to 70,126 m). Area-level median distance to hospices is comparatively longer in East England and East Midlands. Area-level median distance to hospices is much lower in central areas of England. Overall, the pattern of access appears to mirror the pattern of rural and urban areas. CCGs and LAs in London and other urban centres (e.g. Manchester) have relatively shorter distances to hospices than the more rural areas (e.g. South West). Geographical access to hospitals varies between 548 m and 8766 m in CCGs and between 513 m and 7595 m in LAs (see Figure 9). Similar to hospices, most CCGs in East England and East Midlands have a relatively long distance to hospitals (≈ > 2000 m). Geographical access to GPs (see Figure 8) is more uniform, with little variation at both CCGs (ranging from 286 m to 1596 m) and LAs (ranging from 274 m to 1736). Area-level median distance for LAs varies from 216.6 m to 656.3 m and from 322 m to 1556 m in CCG (see Figure 7).
Workforce
Distribution of doctors seems to be sporadic owing to missing records in many LAs and CCGs (see Figure 10). The distribution of non-medical staff appears to be more in the East and South East at LA geography (see Figure 11). Geographical distribution of non-medical staff at the CCG level is somewhat different from LAs. The difference in distribution is caused by the effect of scale.
Service use
The average number of days spent in inpatient hospices (see Figure 12) and hospitals (see Figure 13) varied markedly across England. Patients stayed longer in hospices (mean LOS for CCGs 7–25.6 days, and mean LOS for LAs 7–20.5 days) than in hospitals (mean LOS for CCGs 3–8 days, and mean LOS for LAs 3.5–8.5 days). The variation of LOS in hospitals reflects variations of underlying area team geography, which was aggregated to CCG and LA levels. There were more occupied hospital beds in CCGs and LAs within London than within the other areas of England (see Figure 14).
Area level
The per cent of area-level variations in PoD explained by categories of service variables only are shown in Table 5. Almost all service categories under study contributed to some of the area-level variations in PoD. Service type and capacity was the strongest predictor among all service categories, explaining 36.5–56.6% of the variation in hospital deaths, 47.8–73.8% of care home variations and, a lower level but still statistically significant, the variation of deaths in hospice (14.2–21.7%) and home (26.3–46.2%).
| Area | PoD, % explained variations (95% CI)a | |||
|---|---|---|---|---|
| Hospital | Care home | Hospice | Home | |
| CCG | ||||
| All | ||||
| Type and capacity | 52.6 (35.3 to 69.9) | 73.8 (62.5 to 85.1) | 25.8 (6.9 to 44.8) | 32.0 (12.6 to 51.3) |
| Location | 18.7 (6.8 to 30.7) | 23.7 (11.1 to 36.3) | 13.9 (3.0 to 24.9) | 7.7 (–1.0 to 16.4) |
| Workforce | – | 6.6 (–2.7 to 15.9) | – | 5.7 (–3.0 to 14.5) |
| Use | 35.8 (16.5 to 55.1) | 40.9 (21.9 to 59.9) | 20.2 (2.2 to 38.3) | 14.2 (–2.1 to 30.4) |
| Cancer | ||||
| Type and capacity | 38.4 (19.2 to 57.6) | 59.7 (44.1 to 75.4) | 27.1 (8.0 to 46.2) | 46.2 (27.8 to 64.6) |
| Location | 11.8 (1.5 to 22.1) | 10.8 (0.8 to 20.8) | 13.4 (2.6 to 24.1) | 14.6 (3.5 to 25.7) |
| Use | 34.8 (15.5 to 54.1) | 23.2 (4.6 to 41.8) | 22.7 (4.2 to 41.3) | 45.1 (26.6 to 63.6) |
| Non-cancer | ||||
| Type and capacity | 56.6 (40.2 to 73.0) | 73.4 (61.9 to 84.9) | 17.8 (0.4 to 35.3) | 44.4 (25.8 to 63.1) |
| Location | 21.0 (8.7 to 33.3) | 26.0 (13.2 to 38.9) | 12.9 (2.3 to 23.5) | 10.3 (0.5 to 20.2) |
| Workforce | – | 6.7 (–2.7 to 16.2) | – | 19.7 (5.8 to 33.5) |
| Use | 32.7 (13.4 to 52.1) | 44.4 (25.7 to 63.0) | 11.5 (–3.6 to 26.6) | 25.2 (6.3 to 44.1) |
| LA | ||||
| All | ||||
| Type and capacity | 49.5 (30.5 to 68.5) | 72.2 (59.5 to 84.8) | 19.4 (0.4 to 38.4) | 26.3 (6.1 to 46.5) |
| Location | 27.0 (12.0 to 41.9) | 34.3 (19.1 to 49.5) | 7.1 (–2.6 to 16.8) | 9.7 (–1.4 to 20.8) |
| Use | 40.2 (19.9 to 60.5) | 51.2 (32.5 to 69.9) | 17.6 (–0.9 to 36.1) | 12.8 (–3.9 to 29.5) |
| Cancer | ||||
| Type and capacity | 36.5 (15.9 to 57.0) | 47.8 (28.5 to 67.1) | 14.2 (–3.1 to 31.5) | 42.7 (22.7 to 62.7) |
| Location | 14.1 (1.4 to 26.8) | 3.7 (–3.6 to 11.0) | 4.1 (–3.6 to 11.7) | 13.0 (0.7 to 25.4) |
| Use | 30.8 (10.3 to 51.4) | 38.3 (17.9 to 58.7) | 17.1 (–1.2 to 35.5) | 47.2 (27.8 to 66.6) |
| Non-cancer | ||||
| Type and capacity | 53.0 (34.7 to 71.3) | 73.0 (60.7 to 85.3) | 24.2 (4.2 to 44.1) | 40.9 (20.6 to 61.1) |
| Location | 26.2 (11.4 to 41.1) | 34.1 (19.0 to 49.3) | 11.0 (–0.6 to 22.7) | – |
| Workforce | – | – | – | 7.5 (–3.6 to 18.6) |
| Use | 40.5 (20.3 to 60.8) | 51.9 (33.3 to 70.4) | 18.5 (–0.3 to 37.2) | 25.6 (5.4 to 45.7) |
Institutional death models demonstrated that the service location, measured by the distance to the nearest hospital, hospice, care home and GP practice, was a significant service category that contributed to the variations in hospital and care home deaths. This contribution was not as strong as type and capacity variables but was statistically significant (10.8–34.1%). Service location was also related to CCG-level variations of hospice death (12.9–13.9%) but showed no effect at LA level. Home deaths from cancer were associated with service location at both the CCG and LA levels, but none of the distance measures reached a statistically significant contribution to non-cancer home deaths.
The two workforce variables (i.e. number of medical/non-medical staff) were less useful in explaining the area-level variations in PoD. These variables either did not pass through the bivariate screening or did not reach the statistical significance of their contribution to explain the PoD variations. However, our modelling results did show that 19.7% (95% CI 5.8% to 33.5%) of CCG-level variations in non-cancer home deaths can be explained by the difference in the workforce.
Service use, conceptualised as a factor mediating the effect of service characteristics and PoD, altogether explained between 23.2% and 51.9% of the area-level variations of hospital or care home deaths. The service variables were collectively useful in accounting for the CCG-level but not LA-level variations of hospice deaths. Close to half of the variations in cancer home deaths were explained by the service use variables (CCG, 45.1%; LA, 47.2%); for non-cancer, one-quarter of the variations in home deaths was attributable to the variables in this category.
None of the service commissioning variables passed through the bivariate screening.
Individual level
The multilevel models developed using the service variables by individual service categories were mostly of poor performance in classifying hospital or care home death from home death (Table 6). Most AUCs were in the range of 0.5 to 0.6. Models built with service location variables for care home versus home death in cancer showed a fair predictive accuracy (0.684 to 0.687). For all deaths, the predictive performance provided by the service location was satisfactory (0.777, 95% CI 0.774 to 0.780) in the care home versus home model.
| Area | PoD, AUC (95% CI) | ||
|---|---|---|---|
| Hospital vs. home | Care home vs. home | Hospice vs. home | |
| CCG | |||
| All | |||
| Type and capacity | 0.540 (0.537 to 0.543) | 0.578 (0.574 to 0.583) | 0.634 (0.629 to 0.639) |
| Location | 0.568 (0.565 to 0.571) | DC | 0.643 (0.638 to 0.647) |
| Workforce | 0.539 (0.536 to 0.542) | 0.576 (0.572 to 0.580) | – |
| Use | 0.540 (0.537 to 0.543) | 0.576 (0.573 to 0.579) | 0.634 (0.629 to 0.639) |
| Cancer | |||
| Type and capacity | 0.561 (0.556 to 0.566) | 0.588 (0.581 to 0.594) | 0.613 (0.605 to 0.622) |
| Location | 0.570 (0.565 to 0.575) | 0.684 (0.677 to 0.690) | 0.656 (0.651 to 0.662) |
| Workforce | – | 0.587 (0.579 to 0.594) | – |
| Use | 0.562 (0.557 to 0.567) | 0.588 (0.581 to 0.594) | 0.647 (0.641 to 0.652) |
| Non-cancer | |||
| Type and capacity | 0.540 (0.535 to 0.545) | 0.582 (0.577 to 0.588) | 0.680 (0.668 to 0.692) |
| Location | 0.574 (0.570 to 0.577) | DC | 0.691 (0.679 to 0.703) |
| Workforce | 0.539 (0.535 to 0.543) | 0.582 (0.577 to 0.586) | – |
| Use | – | 0.581 (0.577 to 0.585) | 0.679 (0.667 to 0.691) |
| LA | |||
| All | |||
| Type and capacity | 0.541 (0.537 to 0.545) | 0.579 (0.573 to 0.586) | 0.596 (0.587 to 0.606) |
| Location | 0.569 (0.567 to 0.572) | 0.777 (0.774 to 0.780) | 0.648 (0.643 to 0.653) |
| Workforce | – | 0.580 (0.575 to 0.585) | – |
| Use | 0.541 (0.537 to 0.545) | 0.577 (0.570 to 0.583) | 0.596 (0.587 to 0.605) |
| Cancer | |||
| Type and capacity | 0.570 (0.563 to 0.577) | 0.576 (0.563 to 0.589) | 0.605 (0.594 to 0.616) |
| Location | 0.574 (0.569 to 0.579) | 0.687 (0.680 to 0.693) | 0.663 (0.657 to 0.668) |
| Use | 0.570 (0.564 to 0.577) | 0.575 (0.562 to 0.588) | 0.603 (0.592 to 0.614) |
| Non-cancer | |||
| Type and capacity | 0.540 (0.533 to 0.547) | 0.589 (0.581 to 0.597) | 0.667 (0.651 to 0.683) |
| Location | 0.575 (0.572 to 0.579) | DC | 0.704 (0.692 to 0.715) |
| Workforce | – | 0.589 (0.583 to 0.595) | – |
| Use | – | 0.585 (0.578 to 0.593) | 0.649 (0.626 to 0.671) |
The service variables appeared more useful in predicting death in hospice than in hospital or care home, with most AUCs in the fair performance range of 0.603 to 0.691. Again, the AUCs of service location models in hospice versus home ranged from 0.643 to 0.704.
Workforce variables did not pass through the bivariate screening in any of the hospice versus home models and in most of the hospital versus home models. The CCG-level workforce variables did get through the hospital versus home models for all deaths and for non-cancer deaths. However, the AUCs derived from both models were the smallest among all estimated AUCs (0.539). In the care home versus home models, the AUCs of the workforce variables ranged from 0.576 to 0.589, but the LA-level workforce variables did not add useful information to classify care home versus home death.
Effects of service variables on the place of death
The independent effect of service variables on the PoD was shown in Tables 7–9. After controlling the differences in the patient-level characteristics and each other’s effects, the area-level service factors did not show strong independent effects on PoD. However, the effect was consistent across the CCG- and LA-level service attributes and the direction of the effect was clear.
| Service variable by area | Hospital vs. home | Care home vs. home | Hospice vs. home |
|---|---|---|---|
| CCG | |||
| Number of hospices per 10,000 adults | – | – | 24.217977 (1.532988 to 382.592945) |
| Distance to nearest hospice | – | – | 0.999961 (0.999956 to 0.999966) |
| Number of attendances to A&E | – | – | 1.000000 (1.000000 to 1.000000) |
| Number of hospices per 10,000 adults | 0.621136 (0.328848 to 1.173217) | – | – |
| Distance to nearest hospital | 0.999986 (0.999981 to 0.999991) | – | – |
| Number of doctors | 0.999959 (0.999914 to 1.000004) | – | – |
| Mean A&E LOS | 1.001385 (0.999384 to 1.003390) | – | – |
| Number of hospices | – | 1.051167 (0.982569 to 1.124555) | – |
| Distance to nearest hospital | – | 0.999976 (0.999969 to 0.999982) | – |
| Number of doctors | – | 0.999804 (0.999702 to 0.999907) | – |
| Mean A&E LOS | – | 0.994498 (0.990212 to 0.998801) | – |
| LA | |||
| Number of hospices per 10,000 adults | – | – | 1.009539 (0.994853 to 1.024441) |
| Distance to nearest hospice | – | – | 0.999944 (0.999932 to 0.999956) |
| Number of attendances to A&E | – | – | 1.000000 (1.000000 to 1.000000) |
| Number of hospices | – | 1.077330 (0.957945 to 1.211593) | – |
| Distance to nearest hospital | – | 0.999966 (0.999954 to 0.999977) | – |
| Number of doctors | – | 0.999882 (0.999785 to 0.999978) | – |
| Mean occupancy of hospital beds | – | 0.999971 (0.999959 to 0.999983) | – |
| Distance to nearest hospital | 0.999990 (0.999982 to 0.999998) | – | – |
| Mean available hospital beds | 0.999958 (0.999727 to 1.000188) | – | – |
| Mean occupancy of hospital beds | 1.000055 (0.999798 to 1.000312) | – | – |
| Service variable by area | Hospital vs. home | Care home vs. home | Hospice vs. home |
|---|---|---|---|
| CCG | |||
| Number of hospices per 10,000 adults | – | – | 0.999961 (0.999955 to 0.999966) |
| Distance to nearest hospice | – | – | 1.121466 (0.965119 to 1.303142) |
| Median hospital LOS | – | – | 0.828207 (0.625363 to 1.096847) |
| Number of care home beds per 10,000 adults | 0.997915 (0.996783 to 0.999048) | – | – |
| Distance to nearest care home | 0.999946 (0.999927 to 0.999964) | – | – |
| Median hospital LOS | 1.090463 (1.026024 to 1.158950) | – | – |
| Number of care home beds per 10,000 adults | – | 1.004493 (1.002884 to 1.006105) | – |
| Distance to nearest care home | – | 0.999485 (0.999444 to 0.999526) | – |
| Number of non-medics | – | 0.999992 (0.999982 to 1.000003) | – |
| Median hospital LOS | – | 0.887089 (0.813366 to 0.967495) | – |
| LA | |||
| Number of care home beds per 10,000 adults | – | – | 0.999257 (0.994425 to 1.004113) |
| Distance to nearest hospice | – | – | 0.999956 (0.999947 to 0.999966) |
| Number of hospital outpatients | – | – | 1.000000 (1.000000 to 1.000000) |
| Number of care home beds | 1.000001 (0.999949 to 1.000053) | 1.000050 (0.999966 to 1.000134) | – |
| Distance to nearest care home | 0.999932 (0.999896 to 0.999969) | 0.999235 (0.999154 to 0.999315) | – |
| Number of hospital outpatients | 1.000000 (1.000000 to 1.000000) | 1.000000 (1.000000 to 1.000000) | – |
| Service variable by area | Hospital vs. home | Care home vs. home | Hospice vs. home |
|---|---|---|---|
| CCG | |||
| Number of hospices per 10,000 adults | – | – | 30.881030 (3.462192 to 275.443399) |
| Distance to nearest hospice | – | – | 0.999956 (0.999947 to 0.999966) |
| Number of attendances to A&E | – | – | 1.000000 (1.000000 to 1.000000) |
| Number of hospitals per 10,000 adults | 0.844329 (0.723414 to 0.985455) | – | – |
| Distance to nearest hospice | 0.999998 (0.999995 to 1.000000) | – | – |
| Number of doctors | 0.999941 (0.999902 to 0.999980) | – | – |
| Number of care home beds per 10,000 adults | – | 1.004468 (1.003321 to 1.005617) | – |
| Distance to nearest care home | – | 0.998979 (0.998954 to 0.999003) | – |
| Number of non-medics | – | 0.999994 (0.999988 to 1.000000) | – |
| Number of attendances to A&E | – | 1.000000 (1.000000 to 1.000000) | – |
| LA | |||
| Number of hospice beds per 10,000 adults | 0.995086 (0.989602 to 1.000599) | – | – |
| Distance to nearest hospice | 0.999999 (0.999991 to 1.000007) | – | – |
| Number of care home beds per 10,000 adults | – | – | 1.000378 (0.996445 to 1.004327) |
| Distance to nearest hospice | – | – | 0.999957 (0.999940 to 0.999973) |
| Number of hospital outpatient visits | – | – | 1.000000 (1.000000 to 1.000000) |
| Number of hospices | – | 0.999989 (0.991565 to 1.008484) | – |
| Distance to nearest care home | – | 0.998579 (0.998513 to 0.998646) | – |
| Number of doctors | – | 0.999802 (0.999692 to 0.999911) | – |
| Number of attendances to A&E | – | 1.000000 (1.000000 to 1.000000) | – |
Models constructed with all deaths (see Table 7) showed that the distance to the nearest hospital was negatively associated with hospital death, and it was consistent in both CCG- and LA-level models. The distance to the nearest hospital and the number of doctors both negatively affected the probability of care home death. The CCG-level number of hospices significantly increased the chance of hospice death (OR 24.22, 99% CI 1.53 to 382.59), but the effect was not significant at the LA level. The distance to the nearest hospital reduced the likelihood of care home death. The distance to nearest hospice was related to a lower chance of hospice death. Service use variables showed no effect on hospital or hospice deaths, but the increased use of acute care (i.e. the mean LOS at A&E and mean number of occupied hospital beds) was negatively associated with care home death.
Among those who died from cancer, the number of care home beds increased the chance of care home deaths and correspondingly reduced the chance of hospital death. The number of hospices was associated with the lower chance of hospice death in the CCG model but had no impact in the LA model. The distance to the nearest care home decreased the chance of hospital death and care home death (see Table 8). The care home bed capacity reduced the chance of hospital death and increased the likelihood of care home death. The distance to a hospice was related to a lower chance of hospice death. Median hospital LOS was associated with an increased chance of hospital death and a reduced chance of care home death.
In non-cancer deaths (see Table 9), the CCG-level number of hospitals per 10,000 adults and number of doctors were both inversely associated with hospital death, and no LA-level service measures were statistically related to hospital death. The distance to the nearest care home negatively affected the chance of care home death. The increase of care home capacity and the decrease of the number of LA-level doctors were associated with an increased chance of care home death. The distance to the nearest hospice reduced the likelihood of hospice death. The number of hospices per 10,000 adults significantly increased the chance of hospice death (OR 30.88, 99% CI 3.46 to 275.44) in CCG-level but not in LA-level measures, whereas both the CCG- and LA-based distance to the nearest hospice were negatively associated with death in hospice.
Mediating effect of service use on place of death
None of the service use variables offered a statistically significant value in improving the discriminatory power of the constructed models in classifying death at home and against the other places of death (i.e. hospital, care home and hospice). The p-values between the AUCs of the larger and the reduced models ranged from 0.16 to 0.92.
Interaction effects of service variables and sociodemographic variables on the place of death
Among all the examined interaction effects, only the LA-level service factors were interacting with each other and with sociodemographics to affect the chance of cancer patients dying in hospital. The distance to the nearest care home influenced the effect of care home beds, age and sex on hospital death; p-values ranged from 0.0002 to 0.0026.
Chapter 4 Discussions
Main findings
To our knowledge, this was the first and, to date, the largest empirical study using the nationwide population-based routine data in England to systematically evaluate the role of service factors in relation to the PoD. Service variables were evaluated in five categories: commission, type, capacity – facilities, location, workforce and service use. For every type of service variable included in this study, the accompanying capacity measures were acquired and, therefore, were used in the analyses as a combined category. There were the following main findings.
First, service factors, including service characteristics and service use, are not associated with where people die. Although the effect size was small overall, the effect of the service variables and the direction of their impact on the PoD outcome was clear and consistent. Among the service variables in five categories, service type and capacity tended to be more useful if the measures were derived at the CCG level. The CCG-level number of hospices was the strongest predictor of hospice death, and a higher number of hospices was associated with a significantly higher chance of hospice death. The effect was even stronger in non-cancer deaths. However, the association was reversed in cancer deaths, with the higher volume related to a lower chance of hospice death. A possible reason for this might be that in an area with a higher number of hospices, the home-based hospice care might be better developed than in other areas. 61 Cancer patients were more likely to use hospice care at home or were facilitated to die at home, resulting in a higher chance of home death. In previous studies, the care home bed provision was found to be associated with care home death. 62 To our knowledge, this is the first empirical evidence that the capacity of hospices (i.e. the number of hospices) is linked positively to hospice death.
Second, service location, as measured by the distance (or median if at area level) from the residential address of the deceased to the nearest care facility, was the one variable with consistent effects on PoD. Measures derived from either CCG or LA level were useful. Overall, the increased distance to a specific institutional care setting was associated with a reduced chance of dying in that care setting. It was particularly true for care home and hospice deaths. The distance to the nearest hospital was the only significant service factor independently associated with hospital death in models constructed with all deaths. The findings are in accordance with those of previous smaller sample studies and in studies from other care settings. 63–68 The effect size for the distance variables in this study was small overall (close to 1) compared with those reported in the other studies, probably because we adjusted for more potentially confounding variables and the interference of the other important service variables.
Third, a large data gap was identified through this project. More than 8 GB of service-level data have been collected from public domains and many of them can be accessed without the need to go through complex approval processes. Most of the data were geared towards acute care settings and often with regular updates; however, few were palliative and end-of-life care specific or even relevant. For example, we were seeking to obtain a master list of hospices in England from the public domain, which should be available as individual hospices are searchable freely on the internet. The data set was not available, and we had to resort to the relevant organisations and made a bespoke request. The project team encountered similar challenges to access the basic information of the children’s hospices. There was not a single central facility to collect national data on hospice capacity. The minimal data set (MDS) collected annually by the National Council for Palliative Care (now part of Hospice UK) had to be relied on to get some capacity information (National Council for Palliative Care; 1 December 2018). 69 It was far from ideal as the MDS was a sample survey of the national hospices and the extent of missing data was substantial [as high as 57% at the CCG level and 53% at the LA level (see Figure 3)]. This explains why, in theory, a better capacity measure (e.g. hospice beds per 10,000 adults) in this study did not show its superiority to the less refined measures (e.g. number of hospices). The MDS was stopped at the end of March 2017. 62 There has not yet been a plan in place to replace it.
The commissioning data were inadequate as well. CCGs were created following the Health and Social Care Act in 201226 and replaced PCTs on 1 April 2013. 35 They are responsible for the planning and commissioning of health-care services for their local area. The CCGs publish their annual spending, which is > £25,000, but not all CCGs upload their data and the uploaded files were in various non-unified formats, making the secondary use of these data unnecessarily difficult if not impossible.
Compared with sociodemographic and clinical factors, the effects of service factors were not strong, but we did find evidence of significant interactions between service variables and some of the sociodemographic variables. Although this data did not provide room for a more detailed analysis, it did suggest that a person-centred approach is essential to achieve the desired end-of-life care outcome in the context of service configurations. In our conceptual framework, the service use was conceptualised as the factors mediating the relationship between service characteristics and PoD. None of the service use variables in our analyses reached a statistically significant contribution that warrants the estimation of mediating effects. This may not indicate that service use was not important, but rather that the available service use variables were not overly relevant to the PoD outcomes. As was mentioned earlier, the service variables were primarily focused on data from acute care settings (e.g. occupied hospital beds) and were non-palliative and not end-of-life care specific.
Implications
The identified large data gap suggests that there is an urgent need to develop systems to collect robust national data on palliative and end-of-life care services to enable evidence-based service commission, planning, design and delivery. Service location showing consistent effects on PoD has practical implications. It highlights the importance of the strategic planning of the care facilities’ locations, a fact that has yet to receive enough attention in the palliative and end-of-life care field. Researchers in public health areas proposed a method to optimise the service location. The authors applied it to a real-life application of the breast cancer screening programme in AB, Canada. It showed an increase in the accessibility of breast cancer screening services in the province. 63 Whether or not the method will work in palliative and end-of-life care settings should be a topic of research for future studies. Another possible approach to address the inequality associated with geographical accessibility is through the application of modern technologies; for example, telemedicine/health has been used in a palliative care setting and shows promise to improve access to care. 64–66
Limitations
The results reported here were not from causal modelling, which should be an ideal solution for understanding the complex relationship as depicted in our conceptual framework. A key strength of this modelling strategy is that the service use variables can be modelled as variables mediating the relationship between variables of service characteristics and PoD, implemented through structural equation models (SEMs). We tried to fit the data with the SEM for the binary outcome, but the fit statistics were far from satisfactory. We also modelled the PoD as a multinomial outcome using the GLMM, but all tested models did not get converged.
One of the main reasons for this outcome might be that the service-level data were not fine-grained enough to reveal the complicated relationship among variables. Most of the service variables available in the public domains were aggregated at CCG or LA level. These variables integrated with individual-level variables from the death certificates and, although this offered an increased power, they did not provide sufficient details to reflect the service variabilities, particularly the service use at the individual level. A study using Monte Carlo simulation techniques demonstrated that the minimal sample size for the simplest SEM with a mediating variable is 460. 70 In the present study, the effective sample sizes for analyses involving service variables were 221 (CCGs) and 152 (LAs), both of which were smaller than that which is minimally required. Hence, we had to resort to the simpler GLMM to establish the association rather than the causal links between service characteristics and PoD. We also urge any future data provision to be offered in an area as small as possible (e.g. LSOA). 71
This study considers the service location from the perspective of geographical proximity only, which assumes that patients access services which are the closest or nearest to their place of residence. The straight-line distance was used as a proxy measure of access. This simplistic approach did not reflect patients’ actual access to a health-care facility. More rigorous techniques for quantifying service proximity exist in health GIS literature. 72–74 However, the computationally intensive nature of these approaches and the size of the data set meant that we could not implement them. Furthermore, access is a multidimensional construct,31,75,76 consisting of both geographical and non-geographical components (e.g. availability, affordability, accommodation, acceptability). Analysing access in the context of the geographical dimension only ignores the influence of non-geographical factors (e.g. the number of beds, workforce, patients’ preference and seasonality). Future studies should consider methods of calibrating access that account for both geographical and non-geographical factors.
Owing to reorganisation in the NHS, the new CCGs replaced the PCTs where the local services were organised and delivered. The organisational change led to the area-level service data provision changing accordingly to CCGs. Many of the PCT-level statistics discontinued. The ONS individual data delivery had a 1-year lag and, hence, we had to work with 1-year data only. This limited the capability of investigating how variations in PoD changed with the service configuration and provision. If resources are allowed, it might be helpful to repeat the analyses using the latest data sets, to compare and contrast findings and to gain a better understanding of the links between service factors and PoD. We controlled the confounding effects of main sociodemographics and clinical variables, but we did not consider the potential impact of other factors (e.g. social care, seasonality, community support).
Nevertheless, this project does provide useful data for further exploration into how service factors interact with each other, as well as how they interact with patients and other environmental factors that affect where people die.
Chapter 5 Conclusions
This is, to date, the largest national population-based evaluation study of the relationship between health-care services and PoD.
It was found that area-level service factors, including commissioning, type and capacity, location, workforce and service use, do play a role in the PoD. Hospice capacity was associated with a significantly higher chance of hospice death in non-cancer deaths but a slightly lower chance of hospice death in cancer deaths. The distance to the nearest care facility was negatively related to the probability of a patient dying in that care facility.
The strength of the association of the service factors with PoD was small overall and there was a significant interactive effect between the service factors and sociodemographic and clinical variables, suggesting that high-quality end-of-life care needs to be built on a service-level configuration that is tailored to the individual’s circumstances.
A large data gap was identified, which means that more national data collection is required on services relevant to palliative and end-of-life care. Owing to the limitation of the data, these findings need to be further explored in future investigations.
Chapter 6 Recommendations
Based on the findings, we make the following recommendations:
-
To develop a core set of national data, collected using standardised approach and format, on services relevant to palliative and end-of-life care, particularly those that may facilitate/prohibit patients achieving their preferred PoD.
-
To support further research to validate the link between the capacity of care facilities and the PoD, and to understand why they have different impacts on cancer and non-cancer deaths, including how care facilities interact with various contextual and other service factors.
-
To support further research to validate the link between distance to health-care facilities as well as other geographical access measures (e.g. travel time, network measures) and the PoD, and how to address the inequality caused by the limited geographical access.
-
To support research on the application of the research evidence in practices to improve palliative and end-of-life care, particularly in reducing inequality in care.
-
To support more evaluation research that helps to identify both health and social care services that contribute to the high quality of care at the end of life, in particular the studies involving routine data sources (e.g. HES, CPRD, other underused health and social care data) that can be used to investigate time trends, the trajectories of care outcomes, and social care and associated contextual factors.
-
To support research in expanding the evidence base on how health and social care service factors affect care outcomes beyond PoD (e.g. satisfaction, place of care, preference).
Acknowledgements
Investigators of the GUIDE_Care Services project: Wei Gao (principal investigator), Irene J Higginson (co-principal investigator), Julia Verne, Emma Gordon and Giovanna Polato.
Members of the Project Advisory Group: Tony Bonser, Nicola Bowtell, Kate Heaps, Claire Henry, Jamie Jenkins, Katie Lindsey, Catherine Millington-Sanders, Rajiv Mitra, Myfanwy Morgan, Carolyn Morris, Robert Mulliss, Andy Pring, Sarah Russell, Jane Smith, Ros Taylor, Claudia Wells and Paula Young.
GUIDE_Care Services [National Institute for Health Research (NIHR) Health Services and Delivery Research (HSDR) 14/19/22] is a follow-on project of the GUIDE_Care (NIHR HSDR 09/2000/58). 18
GUIDE_Care Services investigators: Wei Gao (principal investigator), Irene J Higginson (co-principal investigator), Julia Verne, Emma Gordon and Giovanna Polato.
GUIDE_Care Services researchers: Emeka Chukwusa (project manager), Peihan Yu, Rebecca Wilson, Clare Pearson and Sumaya Huque.
Administrative support: Halle Johnson, Daniel Gulliford, Sophie Watson and Zaynah Sheikh.
This work is independent research supported by the NIHR Collaboration for Leadership in Applied Health Research and Care (CLAHRC) South London. CLAHRC South London is part of the NIHR and is a partnership between King’s Health Partners, St. George’s, University London and St George’s Healthcare NHS Trust.
Patient and public involvement
Service users were involved through the membership of the Project Advisory Group and linked through the patient and public involvement reference group at the Cicely Saunders Institute. Patients and service users have been involved in the project in the following ways: (1) provided lay feedback and comments, (2) monitored progress of the research as members of the Project Advisory Group, (3) helped to develop and implement dissemination plans, (4) contributed/commented on reports/publications/findings and (5) established links with wider user groups.
Contributions of authors
Dr Wei Gao (Reader in Statistics and Epidemiology, King’s College London), Principal Investigator, led the conception and design of the study, organisation of the conduct of the study, statistical analysis plan, data analysis, interpretation of the data and writing of the report.
Dr Emeka Chukwusa (Research Associate, King’s College London), Project Manager, managed and maintained the database, prepared and linked the data, produced the GIS graphs, and contributed to the data analysis, interpretation of the data and writing of the report.
Professor Julia Verne [Director for Knowledge and Intelligence (South West) and Clinical Lead – National End of Life Care Intelligence Network], Co-Investigator, provided senior support to the organisation of the conduct of the study, and contributed to the conception and design of the study and interpretation of the data.
Miss Peihan Yu (Research Assistant, King’s College London), contributed to the data collection, processing and writing of the report.
Ms Giovanna Polato (Team Leader – Intelligence, Monitoring Analytics – Mental Health and Learning Disability, CQC), Co-Investigator, contributed to the conception and design of the study and interpretation of the data.
Professor Irene J Higginson (Professor of Palliative Care, King’s College London) Co-Principal Investigator, co-led the conception and design of the study, provided senior support to the organisation of the conduct of the study and contributed to the interpretation of the data.
All authors approved the final version of this report.
Publications
Pearson C, Verne J, Wells C, Polato G, Higginson IJ, Gao W. Distance Between Usual Place of Residence of Cancer Patients and the Hospitals in Which They Died: A Comparison in South London. Poster at National Cancer Research Institute (NCRI) conference, Liverpool, November 2015.
Pearson C, Verne J, Wells C, Polato G, Higginson IJ, Gao W. Geographical Accessibility to Hospice for Non-hospice Deaths: A Comparison in South London. Poster at the Hospices UK conference, Liverpool, November 2015.
Davies JM, Gao W, Sleeman KE, Lindsey K, Murtagh FE, Teno JM, et al. Using routine data to improve palliative and end of life care. BMJ 2016;6:257–62.
Sleeman KE, Davies JM, Verne J, Gao W, Higginson IJ. The changing demographics of inpatient hospice death: population-based cross-sectional study in England, 1993–2012. Palliative Med 2016;30:45–53.
Chukwusa E, Gao W. Geographical Accessibility and Variations in Place of Death: Does Geographical Accessibility Play a Role? Poster at the Health Service Research Symposium, Nottingham, 6–7 July 2017.
Higginson IJ, Reilly CC, Bajwah S, Maddocks M, Costantini M, Gao W. Which patients with advanced respiratory disease die in hospital? A 14-year population-based study of trends and associated factors. BMC Med 2017;15:19.
Pearson C, Verne J, Wells C, Polato GM, Higginson IJ, Gao W. Measuring geographical accessibility to palliative and end of life (PEoLC) related facilities: a comparative study in an area with well-developed specialist palliative care (SPC) provision. BMC Palliat Care 2017;16:14.
Chukwusa E, Verne J, Polato G, Higginson IJ, Taylor R, Gao W. Does Distance Matter? Rural and Urban Patterns of Place of Death in Relation to Distance from Hospital and Hospice. Poster at EAPC conference, Bern, 24–26 May 2018.
Chukwusa E, Yu P, Verne J, Polato G, Taylor R, Higginson I, Gao W. Regional Variations in the Association Between Geographical Access to Hospice Inpatient Unit and Place of Death – A National Population-based Study in England. Poster at EAPC conference, Bern, 24–26 May 2018.
Gao W, Huque S, Morgan M, Higginson IJ. A population-based conceptual framework for evaluating the role of healthcare services in place of death. Healthcare (Basel) 2018;6:E107.
Peng JK, Higginson IJ, Gao W. Place of death and factors associated with hospital death in patients who have died from liver disease in England: a national population-based study. Lancet Gastroenterol Hepatol 2019:4;52–62.
Data-sharing statement
The data analysed in this study were obtained from the ONS (www.ons.gov.uk) under licence. The agreements in place for these data do not permit further distribution or sharing. Further information can be obtained from the corresponding author.
Disclaimers
This report presents independent research funded by the National Institute for Health Research (NIHR). The views and opinions expressed by authors in this publication are those of the authors and do not necessarily reflect those of the NHS, the NIHR, NETSCC, the HS&DR programme or the Department of Health and Social Care. If there are verbatim quotations included in this publication the views and opinions expressed by the interviewees are those of the interviewees and do not necessarily reflect those of the authors, those of the NHS, the NIHR, NETSCC, the HS&DR programme or the Department of Health and Social Care.
References
- World Health Organization . Projections of Mortality and Causes of Death, 2015 and 2030 2018. www.who.int/healthinfo/global_burden_disease/projections/en/ (accessed 9 April 2018).
- World Palliative Care Alliance, World Health Organization . Global Atlas of Palliative Care at the End of Life 2014. www.who.int/cancer/publications/palliative-care-atlas/en/ (accessed 9 April 2018).
- Office for National Statistics . Deaths Registered in England and Wales: 2016 2017. www.ons.gov.uk/peoplepopulationandcommunity/birthsdeathsandmarriages/deaths/bulletins/deathsregistrationsummarytables/2016 (accessed 9 April 2018).
- Public Health England . Chapter 2: Major Causes of Death and How They Have Changed 2017. www.gov.uk/government/publications/health-profile-for-england/chapter-2-major-causes-of-death-and-how-they-have-changed (accessed 9 April 2018).
- Etkind SN, Bone AE, Gomes B, Lovell N, Evans CJ, Higginson IJ, et al. How many people will need palliative care in 2040? Past trends, future projections and implications for services. BMC Med 2017;15. https://doi.org/10.1186/s12916-017-0860-2.
- End of Life Care Strategy: Promoting High-Quality Care for Adults at the End of their Life. London: Department of Health and Social Care; 2008.
- What’s Important to Me: A Review of Choice in End of Life Care. London: Department of Health and Social Care; 2015.
- Hunt KJ, Shlomo N, Addington-Hall J. End-of-life care and achieving preferences for place of death in England: results of a population-based survey using the VOICES-SF questionnaire. Palliat Med 2014;28:412-21. https://doi.org/10.1177/0269216313512012.
- Gao W, Ho YK, Verne J, Glickman M, Higginson IJ. GUIDE_Care project . Changing patterns in place of cancer death in England: a population-based study. PLOS Med 2013;10. https://doi.org/10.1371/journal.pmed.1001410.
- Gomes B, Calanzani N, Higginson I. Local Preferences and Place of Death in Regions Within England 2010. London: Cicely Saunders International; 2011.
- Gomes B, Higginson IJ, Calanzani N, Cohen J, Deliens L, Daveson BA, et al. Preferences for place of death if faced with advanced cancer: a population survey in England, Flanders, Germany, Italy, the Netherlands, Portugal and Spain. Ann Oncol 2012;23:2006-15. https://doi.org/10.1093/annonc/mdr602.
- Gomes B, Higginson IJ. Factors influencing death at home in terminally ill patients with cancer: systematic review. BMJ 2006;332:515-21. https://doi.org/10.1136/bmj.38740.614954.55.
- Bucagu M, Kagubare JM, Basinga P, Ngabo F, Timmons BK, Lee AC. Impact of health systems strengthening on coverage of maternal health services in Rwanda, 2000–2010: a systematic review. Reprod Health Matters 2012;20:50-61. https://doi.org/10.1016/S0968-8080(12)39611-0.
- Kindig DA, Asada Y, Booske B. A population health framework for setting national and state health goals. JAMA 2008;299:2081-3. https://doi.org/10.1001/jama.299.17.2081.
- Van Citters AD, Bartels SJ. A systematic review of the effectiveness of community-based mental health outreach services for older adults. Psychiatr Serv 2004;55:12-23.
- Bone AE, Gomes B, Etkind SN, Verne J, Murtagh FE, Evans CJ, et al. What is the impact of population ageing on the future provision of end-of-life care? Population-based projections of place of death. Palliat Med 2018;32:329-36. https://doi.org/10.1177/0269216317734435.
- Sleeman KE, Ho YK, Verne J, Glickman M, Silber E, Gao W, et al. GUIDE_Care Project . Place of death, and its relation with underlying cause of death, in Parkinson’s disease, motor neurone disease, and multiple sclerosis: a population-based study. Palliat Med 2013;27:840-6. https://doi.org/10.1177/0269216313490436.
- Gao W, Ho YK, Verne J, Gordon E, Higginson IJ. Geographical and temporal Understanding In place of Death in England (1984–2010): analysis of trends and associated factors to improve end-of-life Care (GUIDE_Care) – primary research. Health Serv Deliv Res 2014;2. https://doi.org/10.3310/hsdr02420.
- Kennedy S, Seymour J, Almack K, Cox K. Key stakeholders’ experiences and views of the NHS End of Life Care Programme: findings from a national evaluation. Palliat Med 2009;23:283-94. https://doi.org/10.1177/0269216309104861.
- Review of the Liverpool Care Pathway for Dying Patients. London: Department of Health and Social Care; 2013.
- One Chance to Get it Right: Improving People’s Experience of Care in the Last Few Days and Hours of Life. London: NHS England; 2014.
- NHS England’s Actions for End of Life Care: 2014–16. Leeds: NHS England; 2014.
- National Palliative and End of Life Care Partnership . Ambitions for Palliative and End of Life Care: A National Framework for Local Action 2015–20 2016. http://endoflifecareambitions.org.uk/wp-content/uploads/2015/09/Ambitions-for-Palliative-and-End-of-Life-Care.pdf (accessed February 2019).
- NHS Five Year Forward View. London: NHS England; 2014.
- End of Life Care for Adults [QS13]. London: NICE; 2011.
- Health and Social Care Act 2012. London: The Stationery Office; 2012.
- Care Act 2014. London: The Stationery Office; 2014.
- Gao W, Huque S, Morgan M, Higginson IJ. A population-based conceptual framework for evaluating the role of healthcare services in place of death. Healthcare 2018;6. https://doi.org/10.3390/healthcare6030107.
- Phillips KA, Morrison KR, Andersen R, Aday LA. Understanding the context of healthcare utilization: assessing environmental and provider-related variables in the behavioral model of utilization. Health Serv Res 1998;33:571-96.
- Andersen R, Newman JF. Societal and individual determinants of medical care utilization in the United States. Milbank Q 2005;83:1-28. https://doi.org/10.2307/3349613.
- Levesque JF, Harris MF, Russell G. Patient-centred access to health care: conceptualising access at the interface of health systems and populations. Int J Equity Health 2013;12. https://doi.org/10.1186/1475-9276-12-18.
- Donabedian A. The quality of care. How can it be assessed?. JAMA 1988;260:1743-8. https://doi.org/10.1001/jama.1988.03410120089033.
- Laguna J, Enguídanos S, Siciliano M, Coulourides-Kogan A. Racial/ethnic minority access to end-of-life care: a conceptual framework. Home Health Care Serv Q 2012;31:60-83. https://doi.org/10.1080/01621424.2011.641922.
- Access to Health Care in America. Washington (DC): National Academies Press (US); 1993.
- Naylor C, Curry N, Holder H, Ross S, Marshall L, Tait E. Clinical Commissioning Groups: Supporting Improvement in General Practice?. London: The King’s Fund and Nuffield Trust; 2013.
- Data.gov.uk . NHS Spendings n.d. https://data.gov.uk/search?q=NHS+spendings (accessed 6 June 2017).
- Hospice Aid UK . Directory of UK Hospices, by County 2015. www.hospiceaid.org.uk/images/guide_to_hospice_aid/hospicedirectorybycounty.pdf (accessed 22 November 2016).
- Datasheet. Newcastle upon Tyne: Care Quality Commission; 2016.
- Office for National Statistics Official Labour Market Statistics, NOMIS . Census Statistics 2016. www.nomisweb.co.uk/ (accessed 2 November 2016).
- UK Data Services . Census Boundary Data 2016. www.ukdataservice.ac.uk/ (accessed 2 November 2016).
- World Health Organization . International Statistical Classification of Diseases and Related Health Problems 10th Revision (ICD-10) n.d. http://apps.who.int/classifications/icd10/browse/2010/en (accessed 6 June 2017).
- Quan H, Sundararajan V, Halfon P, Fong A, Burnand B, Luthi JC, et al. Coding algorithms for defining comorbidities in ICD-9-CM and ICD-10 administrative data. Med Care 2005;43:1130-9. https://doi.org/10.1097/01.mlr.0000182534.19832.83.
- Official Statistics. The English Indices of Deprivation 2010. London: Department for Communities and Local Government; 2011.
- Cockings S, Harfoot A, Martin D, Hornby D. Maintaining existing zoning systems using automated zone-design techniques: methods for creating the 2011 census output geographies for England and Wales. Environ Plan A 2011;43:2399-418. https://doi.org/10.1068/a43601.
- Murphie A, Wilcox C. Local Government. London: National Audit Office; 2016.
- Postcode Directory 2016. Newport: Office for National Statistics; n.d.
- Office for National Statistics . Postcode Directory User Guide ONSPD 2016. https://data.gov.uk/dataset/ac0f335f-ff09-4945-a913-e91b23b1fdb0/ons-postcode-directory-november-2016-user-guide (accessed 31 November 2016).
- Delamater PL, Messina JP, Shortridge AM, Grady SC. Measuring geographic access to health care: raster and network-based methods. Int J Health Geogr 2012;11. https://doi.org/10.1186/1476-072X-11-15.
- Pearson C, Verne J, Wells C, Polato GM, Higginson IJ, Gao W. Measuring geographical accessibility to palliative and end of life (PEoLC) related facilities: a comparative study in an area with well-developed specialist palliative care (SPC) provision. BMC Palliat Care 2017;16. https://doi.org/10.1186/s12904-017-0185-0.
- Hospital Episode Statistics, Admitted Patient Care, England: 2013–14. Leeds: NHS Digital; 2015.
- Ferrari SLP, Cribari-Neto F. Beta regression for modelling rates and proportions. J Appl Stat 2004;31:799-815. https://doi.org/10.1080/0266476042000214501.
- Ghosh A. Robust inference under the beta regression model with application to health care studies [published online ahead of print January 01 2017]. Stat Methods Med Res 2017. https://doi.org/10.1177/0962280217738142.
- Zhu M. Analyzing multilevel models with the GLIMMIX procedure. Cary, NC: Proceedings of the SAS® Global Forum 2014 Conference; n.d.
- Fawcett T. An introduction to ROC analysis. Pattern Recognit Lett 2006;27:861-74. https://doi.org/10.1016/J.PATREC.2005.10.010.
- Mackinnon DP, Dwyer JH. Estimating mediated effects in prevention studies. Evaluation Review 1993;17:144-58. https://doi.org/10.1177/0193841X9301700202.
- Hochberg Y. A sharper Bonferroni procedure for multiple tests of significance. Biometrika 1988;75:800-2. https://doi.org/10.1093/biomet/75.4.800.
- von Elm E, Altman DG, Egger M, Pocock SJ, Gøtzsche PC, Vandenbroucke JP, et al. Strengthening the reporting of observational studies in epidemiology (STROBE) statement: guidelines for reporting observational studies. BMJ 2007;335. https://doi.org/10.1136/bmj.39335.541782.AD.
- Benchimol EI, Smeeth L, Guttmann A, Harron K, Moher D, Petersen I, et al. The REporting of studies Conducted using Observational Routinely-collected health Data (RECORD) Statement. PLoS Med 2015;12. https://doi.org/10.1371/journal.pmed.1001885.
- The Equator Network . Enhancing the QUAlity and Transparency Of Health Research n.d. www.equator-network.org/reporting-guidelines/ (accessed 29 August 2018).
- Office for National Statistics (2016) . 2016 Census: Boundary Data (England and Wales) [Data Collection]. UK Data Service. SN:5819 UKBORDERS: Digitised Boundary Data, 1840– and Postcode Directories, 1980– n.d. http://census.ukdataservice.ac.uk/get-data/boundary-data.aspx.
- Buck J, Webb L, Moth L, Morgan L, Barclay S. Persistent inequalities in Hospice at Home provision [published online ahead of print February 14 2018]. BMJ Support Palliat Care 2018. https://doi.org/10.1136/bmjspcare-2017-001367.
- Sleeman KE, Ho YK, Verne J, Gao W, Higginson IJ. GUIDE_Care project . Reversal of English trend towards hospital death in dementia: a population-based study of place of death and associated individual and regional factors, 2001–10. BMC Neurol 2014;14. https://doi.org/10.1186/1471-2377-14-59.
- Hare TS, Barcus HR. Geographical accessibility and Kentucky’s heart-related hospital services. Appl Geogr 2007;27:181-205. https://doi.org/10.1016/j.apgeog.2007.07.004.
- Aoun N, Matsuda H, Sekiyama M. Geographical accessibility to healthcare and malnutrition in Rwanda. Soc Sci Med 2015;130:135-45. https://doi.org/10.1016/j.socscimed.2015.02.004.
- Gatrell AC, Harman JC, Francis BJ, Thomas C, Morris SM, McIllmurray M. Place of death: analysis of cancer deaths in part of North West England. J Public Health Med 2003;25:53-8. https://doi.org/10.1093/pubmed/fdg011.
- Dejardin O, Jones AP, Rachet B, Morris E, Bouvier V, Jooste V, et al. The influence of geographical access to health care and material deprivation on colorectal cancer survival: evidence from France and England. Health Place 2014;30:36-44. https://doi.org/10.1016/j.healthplace.2014.08.002.
- Harada K, Lee S, Shimada H, Lee S, Bae S, Anan Y, et al. Distance to screening site and older adults’ participation in cognitive impairment screening. Geriatr Gerontol Int 2018;18:146-53.
- Clifton A, Burgess C, Clement S, Ohlsen R, Ramluggun P, Sturt J, et al. Influences on uptake of cancer screening in mental health service users: a qualitative study. BMC Health Serv Res 2016;16. https://doi.org/10.1186/s12913-016-1505-4.
- The National Council for Palliative Care . National Survey of Patient Activity Data for Specialist Palliative Care Services MDS Full Report for the Year 2013–14 n.d. www.ncpc.org.uk/sites/default/files/MDS_Full_Report_2013-14.pdf (accessed December 2018).
- Wolf EJ, Harrington KM, Clark SL, Miller MW. Sample size requirements for structural equation models: an evaluation of power, bias, and solution propriety. Educ Psychol Meas 2013;76:913-34. https://doi.org/10.1177/0013164413495237.
- A Beginner's Guide to UK Geography (2017) v1.3. Newport: Office for National Statistics; 2017.
- Lian M, Struthers J, Schootman M. Comparing GIS-based measures in access to mammography and their validity in predicting neighborhood risk of late-stage breast cancer. PLOS ONE 2012;7. https://doi.org/10.1371/journal.pone.0043000.
- Luo W, Qi Y. An enhanced two-step floating catchment area (E2SFCA) method for measuring spatial accessibility to primary care physicians. Health Place 2009;15:1100-7. https://doi.org/10.1016/j.healthplace.2009.06.002.
- Langford M, Fry R, Higgs G. Measuring transit system accessibility using a modified two-step floating catchment technique. Int J Geogr Inf Sci 2012;26:193-214. https://doi.org/10.1080/13658816.2011.574140.
- Comber AJ, Brunsdon C, Radburn R. A spatial analysis of variations in health access: linking geography, socio-economic status and access perceptions. Int J Health Geogr 2011;10. https://doi.org/10.1186/1476-072X-10-44.
- Penchansky R, Thomas JW. The concept of access: definition and relationship to consumer satisfaction. Med Care 1981;19:127-40. https://doi.org/10.1097/00005650-198102000-00001.
List of abbreviations
- A&E
- accident and emergency
- AUC
- area under the receiver operating characteristics curve
- CCG
- Clinical Commissioning Group
- CI
- confidence interval
- CQC
- Care Quality Commission
- FCE
- finished consultant episode
- GIS
- geographical information system
- GLMM
- generalised linear mixed model
- GP
- general practitioner
- HSDR
- Health Services and Delivery Research
- HTA
- Health Technology Assessment
- IMD
- Index of Multiple Deprivation
- LA
- local authority
- LOS
- length of stay
- LSOA
- lower layer super output area
- MDS
- minimal data set
- NIHR
- National Institute for Health Research
- ONS
- Office for National Statistics
- OR
- odds ratio
- PCT
- primary care trust
- PoD
- place of death
- SEM
- structural equation model
