Notes
Article history
The research reported in this issue of the journal was funded by the HS&DR programme or one of its preceding programmes as project number 14/46/02. The contractual start date was in December 2015. The final report began editorial review in December 2018 and was accepted for publication in August 2019. The authors have been wholly responsible for all data collection, analysis and interpretation, and for writing up their work. The HS&DR editors and production house have tried to ensure the accuracy of the authors’ report and would like to thank the reviewers for their constructive comments on the final report document. However, they do not accept liability for damages or losses arising from material published in this report.
Declared competing interests of authors
Andrew Judge reports grants from the National Institute for Health Research (NIHR) Health Services and Delivery Research (HSDR) programme, during the conduct of the study; that he is a subpanel member of the NIHR Programme Grants for Applied Research programme (1 September 2015 to present); that he has received personal fees from Freshfields Bruckhaus Deringer (London, UK); and that he is a member of the Data Safety and Monitoring Board (which involved receipt of fees) from Anthera Pharmaceuticals (Hayward, CA, USA). Andrew Price reports personal fees from Zimmer Biomet (Warsaw, IN, USA), DePuy (Raynham, MA, USA) and Smith & Nephew (London, UK); and grants from NIHR and Versus Arthritis (Chesterfield, UK), outside the submitted work. Cyrus Cooper reports personal fees from Alliance for Better Bone Health [Proctor & Gamble Pharmaceuticals, Inc. (Cincinnati, OH, USA) and Sanofi S.A. (Paris, France)], Amgen Inc. (Thousand Oaks, CA, USA), Eli Lilly and Company (Indianapolis, IN, USA), GlaxoSmithKline (Brentford, UK), Medtronic plc (Dublin, Ireland), Merck Sharp & Dohme (Kenilworth, NJ, USA), Novartis International AG (Basel, Switzerland), Pfizer Inc. (New York, NY, USA), F. Hoffmann-La Roche AG (Basel, Switzerland), Servier Laboratories (Suresnes, France), Takeda Pharmaceutical Company (Tokyo, Japan) and UCB Biopharma (Brussels, Belgium). Daniel Prieto-Alhambra is a member of the NIHR Health Technology Assessment Clinical Trials Committee (1 March 2018 to present); he reports grants from Amgen Inc., UCB Biopharma and Servier Laboratories and other from Janssen (Beerse, Belgium), outside the submitted work. George Peat holds an honorary public health academic contract with Public Health England (London, UK). Nigel Arden reports grants from the NIHR HSDR programme during the conduct of the study; grants from Bioiberica (Barcelona, Spain) and Merck Sharp & Dohme; and personal fees from Flexion Therapeutics (Burlington, MA, USA), Regeneron Pharmaceuticals (Tarrytown, NY, USA), Freshfields Bruckhaus Deringer, Eli Lilly and Company and Pfizer Inc., outside the submitted work.
Permissions
Copyright statement
© Queen’s Printer and Controller of HMSO 2020. This work was produced by Judge et al. under the terms of a commissioning contract issued by the Secretary of State for Health and Social Care. This issue may be freely reproduced for the purposes of private research and study and extracts (or indeed, the full report) may be included in professional journals provided that suitable acknowledgement is made and the reproduction is not associated with any form of advertising. Applications for commercial reproduction should be addressed to: NIHR Journals Library, National Institute for Health Research, Evaluation, Trials and Studies Coordinating Centre, Alpha House, University of Southampton Science Park, Southampton SO16 7NS, UK.
2020 Queen’s Printer and Controller of HMSO
Chapter 1 Introduction
Hospital Episode Statistics1 and patient-reported outcome measures2 data were made available by NHS Digital, and re-used with the permission of NHS Digital. All rights reserved.
Background
Osteoarthritis presents an important health burden as the population becomes older and increasingly obese. 3 Almost half of those aged > 75 years seek medical care for osteoarthritis, with a large impact on health-care costs and health-related quality of life. 4 It is a leading cause of worldwide disability, with an estimated annual loss of productivity cost of £3.2B in the UK,5 with pain being the primary symptom that causes people to seek out pharmacological (e.g. prescription analgesia) and non-pharmacological (e.g. exercise programmes supervised by physiotherapists) treatment and, in severe cases, joint replacement surgery. Over 200,000 people with severe hip or knee pain caused by osteoarthritis have joint replacement surgery each year in the NHS, and this number is expected to increase. 6
A 2010 White Paper7 outlined the future of the NHS, making it more accountable to patients through greater choice and information, with a strong focus on clinical outcomes. To shift decision-making as close as possible to individual patients, the government has devolved power and responsibility for commissioning services to general practitioners (GPs) and their practice teams working in consortia. The NHS Act 2006,8 as amended by the Health and Social Care Act 2012,9 places duties on the NHS Commissioning Board and Clinical Commissioning Groups (CCGs) to have regard to the need to reduce variations in access to, and outcomes from, health-care services for patients, and to assess and report on how well they have fulfilled this duty.
There are well-known geographical variations in the uptake of common surgical procedures, including total hip replacement (THR) and total knee replacement (TKR),10,11 as publicised through The NHS Atlas of Variation in Healthcare. 12 A recent study found evidence of significant unexplained variation among hospitals in both health outcomes and resource use following THR or TKR,13 but little is known about factors that can explain why such variation exists. In the NHS, as part of the Patient Choice Agenda,14 patients can choose which hospital they want to have their surgery in. Information on the outcomes of surgery between different hospitals would help patients in making their decision. Geographical variation in outcomes of surgery may be explained by a hospital treating more complex, sick patients. However, differences in patient outcomes could also be explained by how hospitals organise their services,10 such as bed availability, numbers of operating theatres and specialist surgeons, using new surgical techniques, such as minimally invasive surgery,10 or centralising care into specialist high-volume hospitals. 15,16
Between April 2009 and March 2011, the Department of Health and Social Care established an Enhanced Recovery Partnership Programme17 to support the NHS to implement and realise the benefits of enhanced recovery in colorectal, musculoskeletal, gynaecological and urological major elective surgical pathways. Through this programme, a new ‘enhanced recovery’ patient pathway for THR and TKR has now been introduced across all NHS hospitals. 18 Enhanced recovery is a complex intervention19,20 that focuses on key areas of care across the pathway: preoperatively (for the patient to be in the best possible condition for surgery), perioperatively (the patient has the best possible management during and after their operation) and postoperatively (the patient experiences the best rehabilitation). It is hoped that this will benefit patients through patient education before and after surgery, which includes making changes around the home, doing exercises to strengthen the joint and changing diet to help reduce the risk of complications and speed up recovery. Patients for whom it is suitable will benefit further by being able to return home earlier to continue their recuperation at home with appropriate support. This in turn will benefit the hospital by freeing up space for other patients on the waiting list. A greater number of frail older people with complex comorbid conditions now receive THR or TKR. The new enhanced recovery pathway (ERP) could specifically benefit these patient groups. 21
There is limited evidence concerning the clinical effectiveness and cost-effectiveness of enhanced recovery programmes in TKR and THR. 22 There is a need for information on what the core active ingredients are and how they are exerting their effect. 20 This is important because, when implemented nationwide in diverse hospital settings, the intervention may be adapted to local circumstances that inhibit its effectiveness. 23 A recent synthesis of evidence about effectiveness and implementation of enhanced recovery programmes highlights ‘barriers’ to and ‘facilitators’ of implementation. 22 Barriers include resistance to change, inadequate funding, lack of support from management, high staff turnover, poor documentation and shortness of time. Facilitators include a dedicated enhanced recovery lead, the presence of multidisciplinary team working, and ongoing education for staff and patients. Studies of patients’ experiences of enhanced recovery following colorectal surgery have been carried out,24–26 but we know little about experiences for TKR and THR, or the elements of pathway-driven care that patients like most and least. Organisational processes and collaboration between professionals are crucial to the delivery of safe and satisfactory care,27 but the organisational contexts that can support or inhibit delivery of enhanced recovery have not been explored.
Aims
To determine the effect of hospital organisation, surgical factors and the ERP on patient outcomes and NHS costs of hip and knee replacement.
Objectives
-
Identification of hospital organisation, surgical factors and the ERP as determinants of geographical variation in patient outcomes and NHS costs.
-
Natural experiment to determine the clinical effectiveness and cost-effectiveness of the enhanced recovery treatment pathway.
-
Qualitative study (process evaluation) on implementation of ERPs in four hospital settings.
Design and methodology
The project comprises a patient forum and two main work packages. The project began with a patient forum to identify the outcomes that matter most to THR and TKR patients (patient-identified outcomes). Findings from the forum inform the primary and secondary outcomes of the study.
Work package 1
Work package 1 aims to explore geographical variation in patient outcomes of surgery. Using Hospital and Community Health Service (HCHS), KH03 and Supporting Facilities data sets linked to the National Joint Registry (NJR), Hospital Episode Statistics (HES) and patient-reported outcome measures (PROMs), we explore how hospital organisational factors (e.g. staff, beds, operating theatres) and surgical factors (e.g. minimally invasive technique, surgeon volume, operative time, implant fixation, thromboprophylaxis) explain geographical variation in patient outcomes, adjusting for patient case mix. The results are displayed as maps, highlighting the level of variation in patient outcomes across CCGs.
Work package 2
Work package 2 focuses specifically on the enhanced recovery care pathway.
Process evaluation
Here we characterise the enhanced recovery intervention as used in practice in different hospital settings (tertiary care centre of excellence, teaching hospital, district general hospital, private hospital) and understand organisational processes that enable or impede implementation of the ERP. The qualitative work uses an ethnographic approach.
Natural experiment
We evaluate the impact that the ERP has had on NHS costs and patient outcomes [PROMs, length of stay (LOS), complications, revision]. We used interrupted time series analysis to examine changes in secular trends in outcomes and NHS costs before and after the introduction of the new treatment pathway.
Economic evaluation
This describes the hospital and non-hospital NHS costs for THR and TKR, and the cost-effectiveness of the ERP.
Chapter 2 Data sources
National Joint Registry
Starting in 2003, the NJR6 has collected information on all hip and knee replacements performed each year in both public and private hospitals in England, Wales and, since 2012, Northern Ireland. Data are entered into the NJR using forms completed by surgeons at the time of surgery and revision operations are linked using unique patient identifiers.
Hospital Episode Statistics
The HES database holds information on all patients admitted to NHS hospitals in England, including diagnostic International Classification of Diseases codes, providing information about a patient’s illness or condition, and Operating Procedure Codes Classification of Interventions and Procedures (OPCS-4) procedural codes for surgery. It covers a smaller geographical area than the NJR and does not include privately funded operations. Data for all-cause mortality are provided by the Office for National Statistics (ONS) and linked to the HES database.
Patient-reported outcome measures
Since April 2009, PROM28 data have been collected on hip and knee replacements performed in public hospitals in England. Preoperative and 6-month quality-of-life questionnaires [the EuroQol-5 Dimensions (EQ-5D)29] and joint-specific PROMs [the Oxford Hip Score (OHS)30 and Oxford Knee Score (OKS)31] are collected.
Clinical Practice Research Datalink
The Clinical Practice Research Datalink (CPRD),32 formerly the General Practice Research Database, was established in 1987 and contains anonymised individual patient data from electronic primary health-care records from practices across the UK. Data cover clinical and referral events in primary and secondary care, and comprehensive demographic information, medication prescription data, clinical events, specialist referrals, hospital admissions and their major outcomes. As of June 2017, 693 general practices contributed data to the CPRD. In total, data from an estimated 14.2 million patients are available within the CPRD, of whom 2.8 million were active in 2017.
Hospital organisational characteristics
The NHS HCHS Workforce Statistics in England provide details on the workforce within NHS organisations, including numbers of consultants and specialties (e.g. trauma and orthopaedic, anaesthetists), registrars and other doctors in training. The NHS quarterly Bed Availability and Occupancy data set has data on the number of available beds and occupied beds, whereas the Supporting Facilities data set provides information on operating theatres and dedicated day-case theatres. The data are published quarterly and can be linked to HES data through the hospital provider code. 10
Data applications
National Joint Registry, Hospital Episode Statistics and patient-reported outcome measures
Approval for NJR data was received on 8 July 2016 (NJR internal reference RSC2016/11). Confidentiality Advisory Group section 251 approval was received on 20 September 2016 (Confidentiality Advisory Group reference 16/CAG/0111). A Data Access Request Service application was made to NHS Digital for HES and PROMs data to be linked to data from the NJR. This was approved, with the data-sharing agreement signed on 23 January 2016. Data from the NJR were received on 14 March 2017. HES and PROM data were made available to download on 7 April 2017.
Clinical Practice Research Datalink, Hospital Episode Statistics and patient-reported outcome measures
Independent Scientific Advisory Committee approval was received on 5 July 2016 (protocol number 11_050AMnA2R). The CPRD subsequently announced a new linkage to PROMs, so a further Independent Scientific Advisory Committee amendment was submitted and approval was obtained on 10 January 2017 (protocol number 11_050 AMnA2RA2). CPRD data linked to inpatient and outpatient HES were received on 9 May 2017 and linked PROMs data were received on 25 July 2017.
Data summary
Data were available on 746,822 primary THRs from the NJR (2003–17). HES data were obtained for years 2008–17, of which 445,611 could be linked to NJR data. PROMs data (2009–16) were available for 229,025 patients with complete preoperative and 6-month postoperative OHSs (Figure 1). There were 841,139 primary TKRs and unicompartmental knee replacements (UKRs) in the NJR (2003–17), with HES data (2008–17) linked for 531,790 patients and PROM data (2009–17) linked for 258,297 patients, with preoperative and 6-month postoperative OKSs (Figure 2).
FIGURE 1.
Flow diagram on selection of primary THR patients. Navy shows inclusion; light blue shows exclusion.

FIGURE 2.
Flow diagram on selection of primary TKR patients. Navy shows inclusion; light blue shows exclusion.
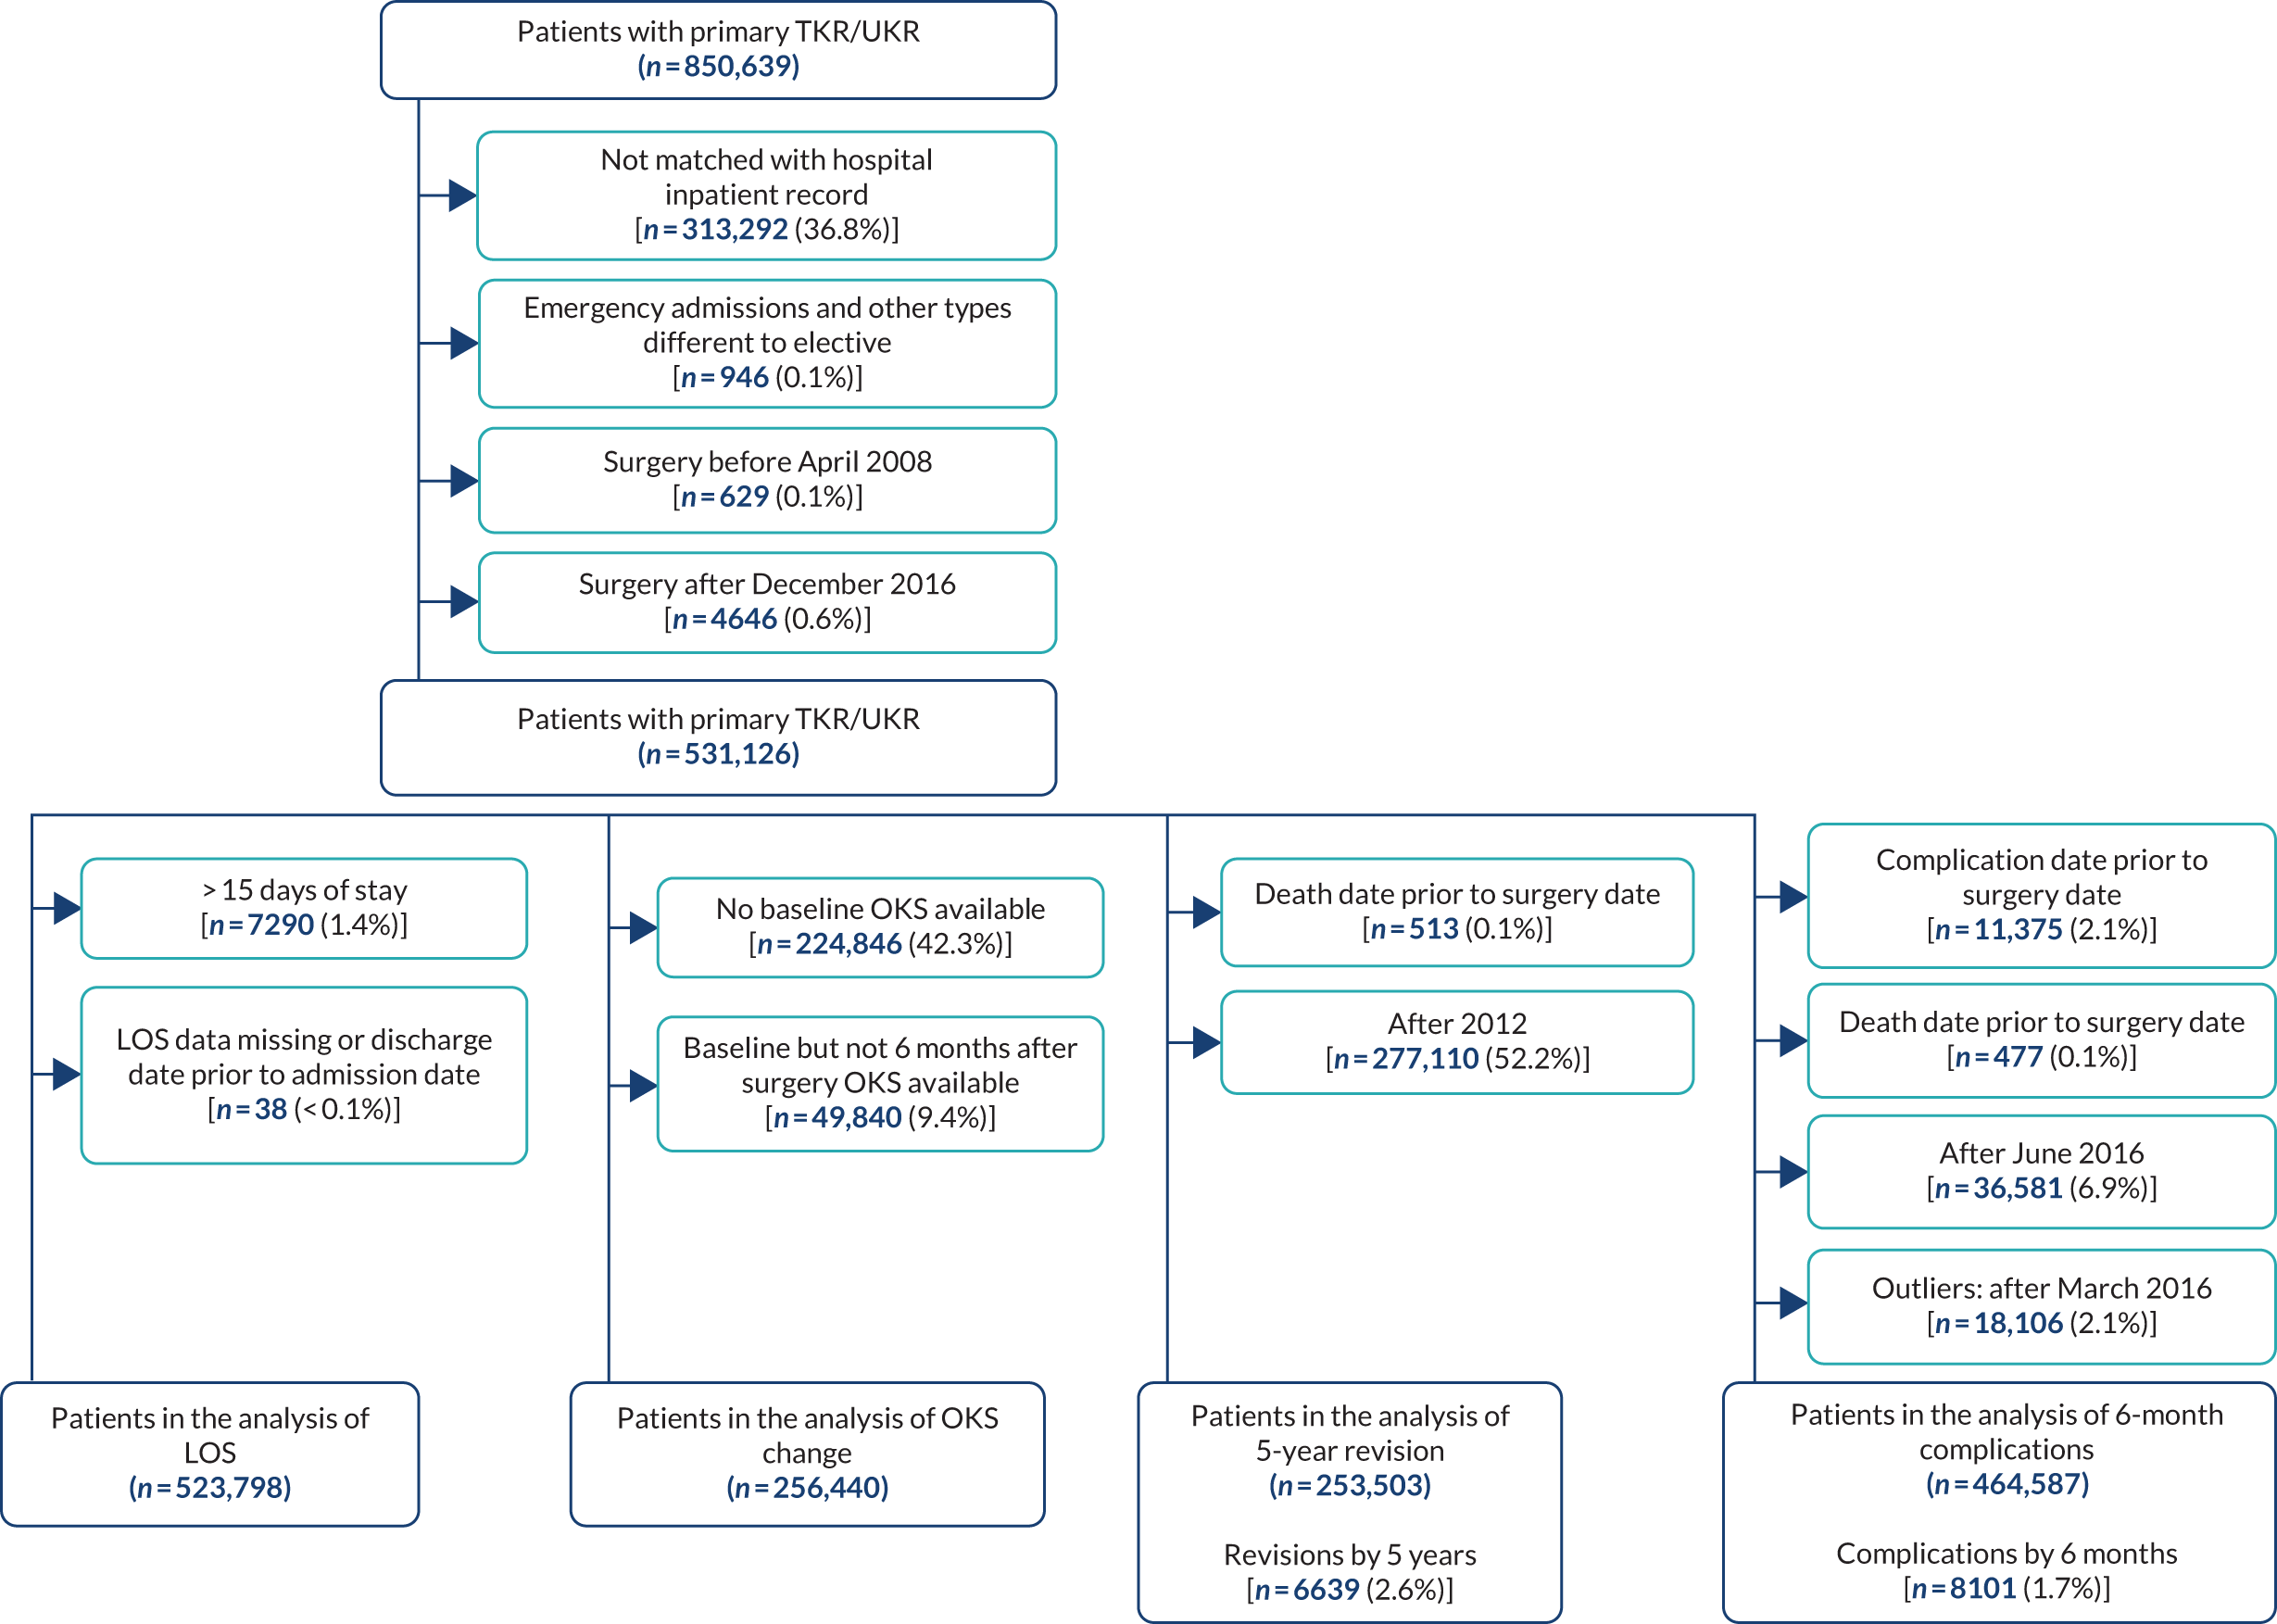
In the CPRD data, we have 72,339 primary THRs and 64,071 primary TKRs from 1995 to 2017. Linked HES data were available for 42,204 hips and 38,606 knees. PROM data from 2009 onwards were linked to 5184 hips and 5352 knees.
Descriptive summary statistics of the variables available for analysis from the NJR (Table 1), HES (Table 2), hospital organisational factor (Table 3) and PROMs (Table 4) linked data sets are described below.
| Category | Unilateral primary hip replacements | Unilateral primary knee replacements |
|---|---|---|
| Total (n) | 440,640 | 531,524 |
| Age (years) at operation | ||
| Mean (SD) | 69.1 (10.8) | 69.6 (9.5) |
| Range | 18–117 | 18–102 |
| Age categories (years), n (%) | ||
| < 50 | 21,045 (4.8) | 12,205 (2.3) |
| 50–59 | 57,333 (13.0) | 65,771 (12.4) |
| 60–69 | 131,691 (29.9) | 175,354 (33.0) |
| 70–79 | 158,015 (35.9) | 197,931 (37.2) |
| 80–84 | 48,300 (11.0) | 55,868 (10.5) |
| ≥ 85 | 24,256 (5.5) | 24,395 (4.6) |
| Sex, n (%) | ||
| Female | 263,961 (59.9) | 302,295 (56.9) |
| Male | 176,679 (40.1) | 229,229 (43.1) |
| Side, n (%) | ||
| Right | 196,585 (44.6) | 252,958 (47.6) |
| Left | 244,055 (55.4) | 278,566 (52.4) |
| BMI (kg/m2) | ||
| Mean (SD) | 28.9 (5.2) | 31.0 (5.4) |
| Range | 16–60 | 16–60 |
| Missing, n (%) | 124,706 (28.3) | 150,496 (28.3) |
| ASA grade, n (%) | ||
| P1 | 59,934 (13.6) | 52,158 (9.8) |
| P2 | 310,596 (70.5) | 391,903 (73.7) |
| P3 | 68,326 (15.5) | 85,949 (16.2) |
| P4 | 1769 (0.4) | 1494 (0.3) |
| P5 | 15 (0.0) | 20 (0.0) |
| Year of primary hip replacement, n (%) | ||
| 2007 | 1 (0.0) | |
| 2008 | 29,070 (6.6) | 34,130 (6.4) |
| 2009 | 39,279 (8.9) | 46,892 (8.8) |
| 2010 | 44,717 (10.2) | 53,130 (10.0) |
| 2011 | 47,312 (10.7) | 57,285 (10.8) |
| 2012 | 50,793 (11.5) | 60,679 (11.4) |
| 2013 | 52,836 (12.0) | 62,168 (11.7) |
| 2014 | 57,156 (13.0) | 69,600 (13.1) |
| 2015 | 57,536 (13.1) | 70,686 (13.3) |
| 2016 | 58,416 (13.3) | 72,350 (13.6) |
| 2017 | 3525 (0.8) | 4603 (0.9) |
| Type of surgeon, n (%) | ||
| Other | 84,646 (19.2) | 110,724 (20.8) |
| Consultant | 355,994 (80.8) | 420,800 (79.2) |
| Type of approach, n (%) | ||
| Other | 166,376 (37.8) | |
| Posterior | 274,264 (62.2) | |
| Lateral parapatellar | 4911 (0.9) | |
| Medial parapatellar | 495,866 (93.3) | |
| Mid-vastus | 16,015 (3.0) | |
| Subvastus | 6094 (1.2) | |
| Other | 8638 (1.6) | |
| Primary indication, n (%) | ||
| Osteoarthritis | 426,826 (96.9) | 525,652 (98.9) |
| Osteoarthritis and other | 13,814 (3.1) | 5872 (1.1) |
| Primary thromboprophylaxis, n (%) | ||
| None | 13,373 (3.0) | 18,967 (3.6) |
| Aspirin only | 21,716 (4.9) | 28,905 (5.4) |
| LMWH (± other) | 289,732 (65.8) | 384,276 (72.3) |
| Other (no LMWH) | 115,819 (26.3) | 99,376 (18.7) |
| Primary mechanical prophylaxis, n (%) | ||
| None | 26,306 (6.0) | 29,036 (5.5) |
| Any | 414,334 (94.0) | 502,488 (94.5) |
| Primary graft femur, n (%) | ||
| None | 437,943 (99.4) | 526,675 (99.1) |
| Any | 2697 (0.6) | 4849 (0.9) |
| Primary graft tibia, n (%) | ||
| None | 529,515 (99.6) | |
| Any | 2009 (0.4) | |
| Primary complication, n (%) | ||
| None | 433,428 (99.0) | 528,917 (99.5) |
| One or more | 4438 (1.0) | 2607 (0.5) |
| Missing | 2774 (0.6) | 0 (0.0) |
| Primary cup fixation, n (%) | ||
| Uncemented cup | 275,877 (63.3) | |
| Cemented cup | 160,131 (36.7) | |
| Missing | 4632 (1.1) | |
| Primary fixation, n (%) | ||
| Cementless | 22,865 (4.3) | |
| Cemented | 504,910 (95.1) | |
| Hybrid | 3359 (0.6) | |
| Missing | 390 (0.1) | |
| Type of primary implant, n (%) | ||
| MoM resurfacing | 7803 (1.8) | |
| THR (any bearing) | 423,499 (98.2) | |
| Missing | 9338 (2.1) | |
| Type of resurfacing stem fix, n (%) | ||
| Cemented HR stem | 7097 (91.0) | |
| Uncemented HR stem | 706 (9.1) | |
| THR or missing | 432,837 (98.2) | |
| Femoral fixation, n (%) | ||
| Cementless | 25,219 (4.8) | |
| Cemented | 499,559 (95.2) | |
| Missing | 6746 (1.3) | |
| Tibial fixation, n (%) | ||
| Cementless | 23,158 (4.4) | |
| Cemented | 498,538 (95.6) | |
| Missing | 9828 (1.8) | |
| Type of primary stem fixation, n (%) | ||
| Uncemented THR stem | 193,118 (45.4) | |
| Cemented THR stem | 232,520 (54.6) | |
| Resurfacing or missing | 15,002 (3.4) | |
| Type of primary bearing, n (%) | ||
| MoM | 16,175 (3.8) | |
| Non-MoM | 412,223 (96.2) | |
| Missing | 12,242 (2.8) | |
| Details of primary bearing, n (%) | ||
| MoM | 16,175 (3.8) | |
| MoP | 263,520 (61.5) | |
| CoC | 68,487 (16.0) | |
| CoP | 78,878 (18.4) | |
| CoM | 1245 (0.3) | |
| MoC | 93 (0.0) | |
| Missing | 12,242 (2.8) | |
| Primary implant type, n (%) | ||
| MoM THR | 8372 (2.0) | |
| HR | 7803 (1.8) | |
| Non-MoM THR | 412,223 (96.2) | |
| Unicondylar/hinged/linked/custom/preassembled | 40,471 (7.7) | |
| Bicondylar | 484,529 (92.3) | |
| Missing | 12,242 (2.8) | 6524 (1.2) |
| Primary head size (mm), n (%) | ||
| ≤ 28 | 172,885 (40.1) | |
| 32 | 145,693 (33.8) | |
| 36–42 | 101,341 (23.5) | |
| 44–48 | 5346 (1.2) | |
| 50–52 | 4510 (1.1) | |
| ≥ 54 | 1527 (0.4) | |
| Missing | 9338 (2.1) | |
| Minimally invasive, n (%) | ||
| Yes | 17,911 (4.1) | 27,999 (5.3) |
| No | 422,729 (95.9) | 503,525 (94.7) |
| Unit type, n (%) | ||
| Public hospital | 336,285 (76.3) | 403,302 (75.9) |
| Independent hospital | 82,109 (18.6) | 100,399 (18.9) |
| Independent treatment centre | 22,246 (5.1) | 27,823 (5.2) |
| Surgical volume per consultant | ||
| Mean (SD) | 98.0 (80.5) | 88.4 (60.4) |
| Range | 1–693 | 1–434 |
| Resurfacing volume per consultant | ||
| Mean (SD) | 2.3 (8.7) | |
| Range | 0–160 | |
| Missing, n (%) | 12,242 (2.8) | |
| THR volume per consultant | ||
| Mean (SD) | 94.7 (78.3) | |
| Range | 0–687 | |
| Missing, n (%) | 12,242 (2.8) | |
| TKR volume per consultant | ||
| Mean (SD) | 79.3 (54.3) | |
| Range | 0–409 | |
| Missing, n (%) | 0 (0.0) | |
| UKR volume per consultant | ||
| Mean (SD) | 8.0 (16.7) | |
| Range | 0–218 | |
| Missing, n (%) | 0 (0.0) | |
| PFJR volume per consultant | ||
| Mean (SD) | 1.1 (2.7) | |
| Range | 0–56 | |
| Missing, n (%) | 0 (0.0) | |
| Surgical volume per unit | ||
| Mean (SD) | 341.3 (253.0) | 383.5 (266.2) |
| Range | 1–1286 | 1–1633 |
| Resurfacing surgical volume per unit | ||
| Mean (SD) | 6.8 (17.9) | |
| Range | 0–192 | |
| Missing, n (%) | 12,242 (2.8) | |
| THR surgical volume per unit | ||
| Mean (SD) | 328.0 (243.9) | |
| Range | 0–1272 | |
| Missing, n (%) | 12,242 (2.8) | |
| TKR surgical volume per unit | ||
| Mean (SD) | 348.0 (243.0) | |
| Range | 0–1429 | |
| Missing, n (%) | 0 (0.0) | |
| UKR surgical volume per unit | ||
| Mean (SD) | 30.9 (43.8) | |
| Range | 0–384 | |
| Missing, n (%) | 0 (0.0) | |
| PFJR surgical volume per unit | ||
| Mean (SD) | 4.6 (6.1) | |
| Range | 0–67 | |
| Outcome, n (%) | ||
| Death | 33,473 (7.6) | 36,921 (7.0) |
| Revised | 7600 (1.7) | 10,293 (1.9) |
| Unrevised | 399,179 (90.7) | 484,308 (91.1) |
| Missing | 388 (0.1) | 2 (0.0) |
| Time to revision (years) | ||
| Mean (SD) | 2.2 (2.2) | 2.4 (1.7) |
| Range | 0–9 | 0–9 |
| Not revised or missing, n (%) | 433,040 (98.3) | 521,231 (98.1) |
| Time to death (years) | ||
| Mean (SD) | 3.6 (2.1) | 3.7 (2.1) |
| Range | 0–9 | 0–9 |
| Alive or missing, n (%) | 406,535 (92.3) | 494,603 (93.1) |
| Category | Unilateral primary hip replacements | Unilateral primary knee replacements |
|---|---|---|
| Total (n) | 440,640 | 531,524 |
| IMD quintiles at primary surgery, n (%) | ||
| Least deprived (20%) | 106,613 (24.2) | 115,670 (21.8) |
| Less deprived (20–40%) | 108,818 (24.7) | 122,769 (23.1) |
| Less deprived (40–60%) | 79,678 (18.1) | 101,703 (19.1) |
| More deprived (20–40%) | 74,417 (16.9) | 97,473 (18.3) |
| Most deprived (20%) | 71,114 (16.1) | 93,909 (17.7) |
| Rurality at primary surgery, n (%) | ||
| Urban ≥ 10,000 population | 315,071 (71.5) | 398,650 (75.0) |
| Town and fringe | 56,321 (12.8) | 62,623 (11.8) |
| Village/isolated | 69,248 (15.7) | 70,251 (13.2) |
| Ethnicity, n (%) | ||
| White | 386,149 (97.3) | 451,169 (93.4) |
| Non-white | 10,806 (2.7) | 32,103 (6.6) |
| Missing | 43,685 (9.9) | 48,252 (9.1) |
| Comorbidities at primary surgery, n (%) | ||
| None | 326,661 (74.1) | 374,092 (70.4) |
| Mild | 80,211 (18.2) | 113,913 (21.4) |
| Moderate | 22,785 (5.2) | 30,315 (5.7) |
| Severe | 10,983 (2.5) | 13,204 (2.5) |
| Charlson Comorbidity Index, n (%) | ||
| AIDS | 0 (0.0) | 0 (0.0) |
| Metastatic solid tumour | 628 (0.1) | 323 (0.1) |
| Severe liver disease | 1072 (0.2) | 1135 (0.2) |
| Lymphoma | 389 (0.1) | 384 (0.1) |
| Leukaemia | 610 (0.1) | 666 (0.1) |
| Non-metastatic tumour | 4784 (1.1) | 4979 (0.9) |
| Diabetes mellitus with end organ damage | 1090 (0.3) | 1711 (0.3) |
| Moderate–severe renal disease | 18,249 (4.1) | 22,028 (4.1) |
| Hemiplegia | 505 (0.1) | 709 (0.1) |
| Dementia | 1380 (0.3) | 1224 (0.2) |
| Chronic pulmonary disease | 56,225 (12.8) | 74,930 (14.1) |
| Mild diabetes mellitus (without end organ damage – includes ketoacidosis and coma) | 40,035 (9.1) | 67,315 (12.7) |
| Mild liver disease | 525 (0.1) | 806 (0.2) |
| Peptic ulcer disease | 610 (0.1) | 872 (0.2) |
| Peripheral vascular disease | 4048 (0.9) | 4235 (0.8) |
| Stroke/cerebrovascular disease | 1623 (0.4) | 1926 (0.4) |
| Congestive heart failure | 1643 (0.4) | 1624 (0.3) |
| Myocardial infarction | 481 (0.1) | 375 (0.1) |
| Complication within 6 months, n (%) | ||
| Stroke | 839 (0.2) | 999 (0.2) |
| Respiratory infection | 2977 (0.7) | 3124 (0.6) |
| Acute myocardial infarction | 941 (0.2) | 1099 (0.2) |
| Pulmonary embolism/deep-vein thrombosis | 1865 (0.4) | 2193 (0.4) |
| Urinary tract infection | 3258 (0.7) | 3676 (0.7) |
| Wound disruption | 786 (0.2) | 1609 (0.3) |
| Surgical site infection | 2028 (0.5) | 3136 (0.6) |
| Fracture after implant | 455 (0.1) | 179 (0.0) |
| Complication of prosthesis | 4590 (1.0) | 4250 (0.8) |
| Neurovascular injury | 70 (0.0) | 128 (0.0) |
| Acute renal failure | 2031 (0.5) | 2537 (0.5) |
| Blood transfusion | 526 (0.1) | 414 (0.1) |
| Revision NJR + HES, n (%) | 8622 (2.0) | 13,626 (2.6) |
| Reoperations only, n (%) | 1616 (0.4) | 2722 (0.5) |
| LOS (days) | ||
| Mean (SD) | 4.8 (3.8) | 4.7 (3.6) |
| Range | 0–378 | 0–737 |
| Missing, n (%) | 35 (0.0) | 36 (0.0) |
| Readmission within 6 months, n (%) | 87,675 (19.9) | 120,034 (22.6) |
| Category | Unilateral primary hip replacements | Unilateral primary knee replacements |
|---|---|---|
| FTE (n) | 440,640 | 531,524 |
| Specialty group | ||
| Trauma and orthopaedic surgery | ||
| Median (IQR) | 41.1 (29.9–56.9) | 40.9 (29.9–56.6) |
| Range | 0.1–115.5 | 10.4–115.5 |
| Missing, n (%) | 167,434 (38.0) | 202,251 (38.1) |
| Rehabilitation medicine | ||
| Median (IQR) | 3.3 (1.5–6.7) | 3.0 (1.0–6.6) |
| Range | 0.2–21.0 | 0.2–21.0 |
| Missing, n (%) | 330,039 (74.9) | 401,909 (75.6) |
| Grade | ||
| Consultant | ||
| Median (IQR) | 34.5 (23.8–50.4) | 34.9 (24.0–51.3) |
| Range | 1.0–143.3 | 1.0–143.3 |
| Missing, n (%) | 167,916 (38.1) | 202,682 (38.1) |
| Middle-grade doctor | ||
| Median (IQR) | 20.8 (13.1–31.8) | 21.1 (13.3–32.5) |
| Range | 1.0–116.2 | 1.0–116.2 |
| Missing, n (%) | 173,421 (39.4) | 208,469 (39.2) |
| Trainee doctor | ||
| Median (IQR) | 9.0 (5.0–13.0) | 9.0 (6.0–14.0) |
| Range | 0.6–37.0 | 0.6–37.0 |
| Missing, n (%) | 200,001 (45.4) | 237,983 (44.8) |
| Beds: specialty group | ||
| Trauma and orthopaedic surgery (overnight) | ||
| Median (IQR) | 69.0 (50.5–91.9) | 68.2 (50.4–92.2) |
| Range | 0.0–167.2 | 0.0–167.2 |
| Missing, n (%) | 163,889 (37.2) | 197,443 (37.1) |
| Rehabilitation (overnight) | ||
| Median (IQR) | 0.0 (0.0–16.8) | 0.0 (0.0–16.7) |
| Range | 0.0–164.1 | 0.0–164.1 |
| Missing, n (%) | 163,889 (37.2) | 197,443 (37.1) |
| Anaesthetics (overnight) | ||
| Median (IQR) | 0.0 (0.0–16.8) | 0.0 (0.0–16.7) |
| Range | –0.1 to 40.1 | –0.1 to 40.1 |
| Missing, n (%) | 163,889 (37.2) | 197,443 (37.1) |
| Beds: total available | ||
| Overnight | ||
| Median (IQR) | 764.2 (541.8–1024.9) | 778.8 (557.6–1040.2) |
| Range | 0.0–2195.8 | 0.0–2195.8 |
| Missing, n (%) | 147,090 (33.4) | 177,083 (33.3) |
| Number of operating theatres | ||
| Median (IQR) | 20 (14–29) | 21 (14–30) |
| Range | 2–63 | 2–63 |
| Missing, n (%) | 93,737 (21.3) | 113,194 (21.3) |
| Number of dedicated day-case theatres | ||
| Median (IQR) | 4 (2–6) | 4 (2–6) |
| Range | 0–17 | 0–17 |
| Missing, n (%) | 93,737 (21.3) | 113,194 (21.3) |
| Category | Unilateral primary hip replacements | Unilateral primary knee replacements |
|---|---|---|
| Total (n) | 440,640 | 531,524 |
| OHS: follow-up at 6 months | ||
| Median (IQR) | 42 (34–46) | |
| Range | 0–48 | |
| Missing, n (%) | 214,080 (48.6) | |
| OHS: preoperative | ||
| Median (IQR) | 17 (11–23) | |
| Range | 0–48 | |
| Missing, n (%) | 173,399 (39.4) | |
| OKS: follow-up at 6 months | ||
| Median (IQR) | 36 (28–42) | |
| Range | 0–48 | |
| Missing, n (%) | 275,089 (51.8) | |
| OKS: preoperative | ||
| Median (IQR) | 18 (12–23) | |
| Range | 0–48 | |
| Missing, n (%) | 227,822 (42.9) | |
| EQ-5D: follow-up at 6 months | ||
| Median (IQR) | 0.80 (0.69–1.00) | 0.73 (0.62–0.88) |
| Range | –0.59 to 1.00 | –0.59 to 1.00 |
| Missing, n (%) | 214,787 (48.7) | 274,554 (51.7) |
| EQ-5D: preoperative | ||
| Median (IQR) | 0.26 (0.00–0.62) | 0.52 (0.06–0.69) |
| Range | –0.59 to 1.00 | –0.59 to 1.00 |
| Missing, n (%) | 176,497 (40.1) | 231,053 (43.5) |
| EQ-5D health scale change | ||
| Mean (SD) | 8.9 (22.8) | 3.4 (20.9) |
| Median (IQR) | 6 (–5 to 20) | 1 (–9 to 15) |
| Range | –100 to 100 | –100 to 100 |
| Missing, n (%) | 233,271 (52.9) | 296,581 (55.8) |
Chapter 3 Patient forum
Introduction
Among the priorities identified through the work of the James Lind Alliance Priority Setting Partnership for Hip/Knee Replacement was the need to involve patients to identify the outcomes that matter most to them (patient-identified outcomes). 33 We utilised the University of Bristol Musculoskeletal Research Unit’s patient involvement group: the Patient Experience Partnership in Research (PEP-R). 34 The PEP-R comprises 12 patients with musculoskeletal conditions, most of whom have had joint replacement and all of whom have experience of long-term pain.
Methodology
The session was organised and facilitated by Amanda Burston (patient and public involvement co-ordinator based at the University of Bristol’s Musculoskeletal Research Unit). At the forum session, patients were provided with a plain English description of the project and the outcome measures available in the data sets, sent out in advance, along with information on patient and public involvement in research. In the session, the patient and public involvement co-ordinator fostered discussion about the different outcome variables and, using consensus techniques, captured patients’ views about the outcomes that matter most to them. Views were linked to service users’ own individual experiences, which they were encouraged to share with others.
At the end of the meeting, the group’s views were collated and drafted into a brief report that was sent out to group members after the meeting. The meetings lasted around 2.5 hours, and included a comfort break, refreshments and opportunity for discussion. Patients were reimbursed for their time and expenses.
Results
Prior to the meeting, the group was given a list of eight outcomes for consideration and discussion: LOS, readmission, reoperation, revision surgery, complications, mortality, OHS and OKS on pain and function, and EQ-5D quality-of-life scores. The meeting began by refreshing the group on what the research project was about in relation to work package 1 (variation in patient outcomes of surgery) and work package 2 (ERP). The group was then asked to evaluate which patient outcomes are most important to them.
Top outcomes
Pain and function
It was suggested that when presenting geographic variation in outcomes of surgery, we should consider stratifying according to preoperative pain and function. The group agreed that stability and mobility are important.
Complications
Infection was the main issue. Everyone thought that infection was important. However, this was in the context of hospital-acquired infection, such as meticillin-resistant Staphylococcus aureus (S. aureus) (MRSA), rather than an infection in the hip or knee joint related to the operation itself. From earlier consultations with surgeon co-applicants, it was found that surgeons worry about different complications to patients. Surgeons are more worried about deep-vein thrombosis, rather than infection.
Mid-outcomes
Length of stay
It was agreed that the right LOS was not one size fits all, as there is no point in being sent home early if the support is not in place. The group agreed that LOS was an important outcome, but very dependent on the level of support at home.
Revision/reoperation/readmission
The group felt that revision, reoperation and readmission should be evaluated as one outcome. It was thought that if reoperation was 5 years later, rather than 10–20 years later, it would have a very different sentiment for the patient.
Mortality
Rate of mortality was ranked low by the group but it was thought that patients’ families may rank the outcome higher.
Other important outcomes and areas of discussion
-
Choice of pain relief.
-
Patient education on both pain relief and physiotherapy.
-
Continuity of care.
-
Length of time between discovery of problem and operation. This fed into the need to stratify according to preoperative pain and function when looking at patient outcomes, as the time taken to get to surgery can have an effect.
-
Managing expectations. A group member explained that a friend who had recently had a knee operation was disappointed with the results, as she expected to be able to go back to line dancing club two or three times a week without pain or difficulty with her knee.
-
The group agreed that patient satisfaction and overall outcomes are dependent on the patient’s overall outlook and positivity. It was also thought that, if there is a long time between diagnosis and surgery, then the patient becomes that much older, but the operation is not going to wind the clock back.
The group felt that the maps describing geographical variation in outcome need to be clear to patients about what hospitals include (e.g. some hospitals do not take more complex patients). Some group members explained that they chose certain hospitals because of reputation and ‘word of mouth’. One group member said that they found it difficult to find any information on outcomes when choosing a hospital, but that they made a final choice of hospital on infection rate. It was explained to the group that, for all outcomes, patient data will be adjusted for patient situation and comorbidities.
Chapter 4 Identification of hospital organisation and surgical factors as determinants of geographical variation in patient outcomes and NHS costs
Aims
Use the NJR, HES and PROMs linked data sets to identify patient, surgical and hospital organisational factors that can explain geographical variation in patient outcomes.
Methodology
Data source and sample size
Hospital organisational factors from the HCHS Workforce Statistics, the Bed Availability and Occupancy data set and the Supporting Facilities data set were linked to the NJR, HES and PROMs data via the hospital provider code. Details of the NJR, HES and PROMs linked data have been previously described in Chapter 2. For this analysis, we use the most recent 3 years of data, from 2014 to 2016.
Main outcome measures
The primary outcomes of interest are informed by the findings of the patient forum (as described in Chapter 3). As a measure of patient-reported pain and function, we used the absolute change in OHSs and OKSs. 30,31 Each question is scored between 0 (meaning worse symptoms) and 4 (denoting least symptoms). Scores from these 12 questions are added, getting a total score spanning from 0 (the worst possible score) to 48 (the best possible score). We calculated the difference between the total scores 6 months after the operation and at baseline to obtain a measure of change associated with the surgery.
Further outcomes included the proportion of complications at 6 months after surgery. For a list of the International Statistical Classification of Diseases and Related Health Problems, Tenth Revision (ICD-10),35 codes used to identify complications of surgery, see Report Supplementary Material 1. We defined complications as one or more from the following list: stroke (excluding transient ischaemic attack), respiratory infection, acute myocardial infarction, pulmonary embolism/deep-vein thrombosis, urinary tract infection, wound disruption, surgical site infection, fracture after implant, complication of prosthesis, neurovascular injury, acute renal failure and blood transfusion. For a list of the OPCS-4 codes used to identify blood transfusion complication, see Report Supplementary Material 2. LOS was calculated as the number of days between the hospital admission and discharge date. We estimated the inpatient cost relating to the index episode using NHS Reference Costs from 2015–16. 36 We estimated the mean cost per bed-day based on the health-care resource use [Healthcare Resource Group (HRG)] for each patient and their LOS. For methods to support the estimation of bed-day cost, see Report Supplementary Material 3.
Predictor variables
Patient-level characteristics (case mix)
Age, sex, body mass index (BMI), area deprivation, rurality, ethnicity, Charlson Comorbidity Index, American Society of Anesthesiologists (ASA) grade, baseline OHS/OKS, baseline EQ-5D, calendar year of primary THR/TKR, primary indication.
Surgical factors
Whether or not a minimally invasive technique was used, annual surgeon volume/caseload, grade of operating surgeon, surgical approach, patient position, implant fixation, type of mechanical or chemical thromboprophylaxis, anaesthetic type, type of bone graft if used.
Hospital organisational factors
Unit type (public, private, independent-sector treatment centre). As a measure of centralisation of services, we calculated the annual volume of procedures performed in each hospital trust. From the quarterly hospital surveys, we have information on hospital staffing according to the full-time equivalent (FTE) of specialty groups (trauma and orthopaedic surgery, rehabilitation medicine) and staff grades (consultants, middle-grade doctors, trainee doctors). Data on bed availability within specialty groups (trauma and orthopaedics, rehabilitation). We further obtained data on numbers of available operating theatres, including the number of dedicated day-case theatres.
Exclusion criteria
We included only patients receiving planned surgery (Figure 3) between 2014 and 2016. We excluded patients without information for the 2001 census lower-layer super output area. Patients with missing data for LOS were also excluded. We excluded patients without information on baseline and/or 6-month follow-up OHS/OKS scores for the analysis of change in OHS and OKS.
FIGURE 3.
Flow diagram showing selection of patients for inclusion in this study (navy shows inclusion and light blue shows exclusion). Reproduced from Garriga et al. 37 © 2019 Garriga C et al. This is an Open Access article distributed in accordance with the terms of the Creative Commons Attribution (CC BY 4.0) license, which permits others to distribute, remix, adapt and build upon this work, for commercial use, provided the original work is properly cited. See: http://creativecommons.org/licenses/by/4.0/.
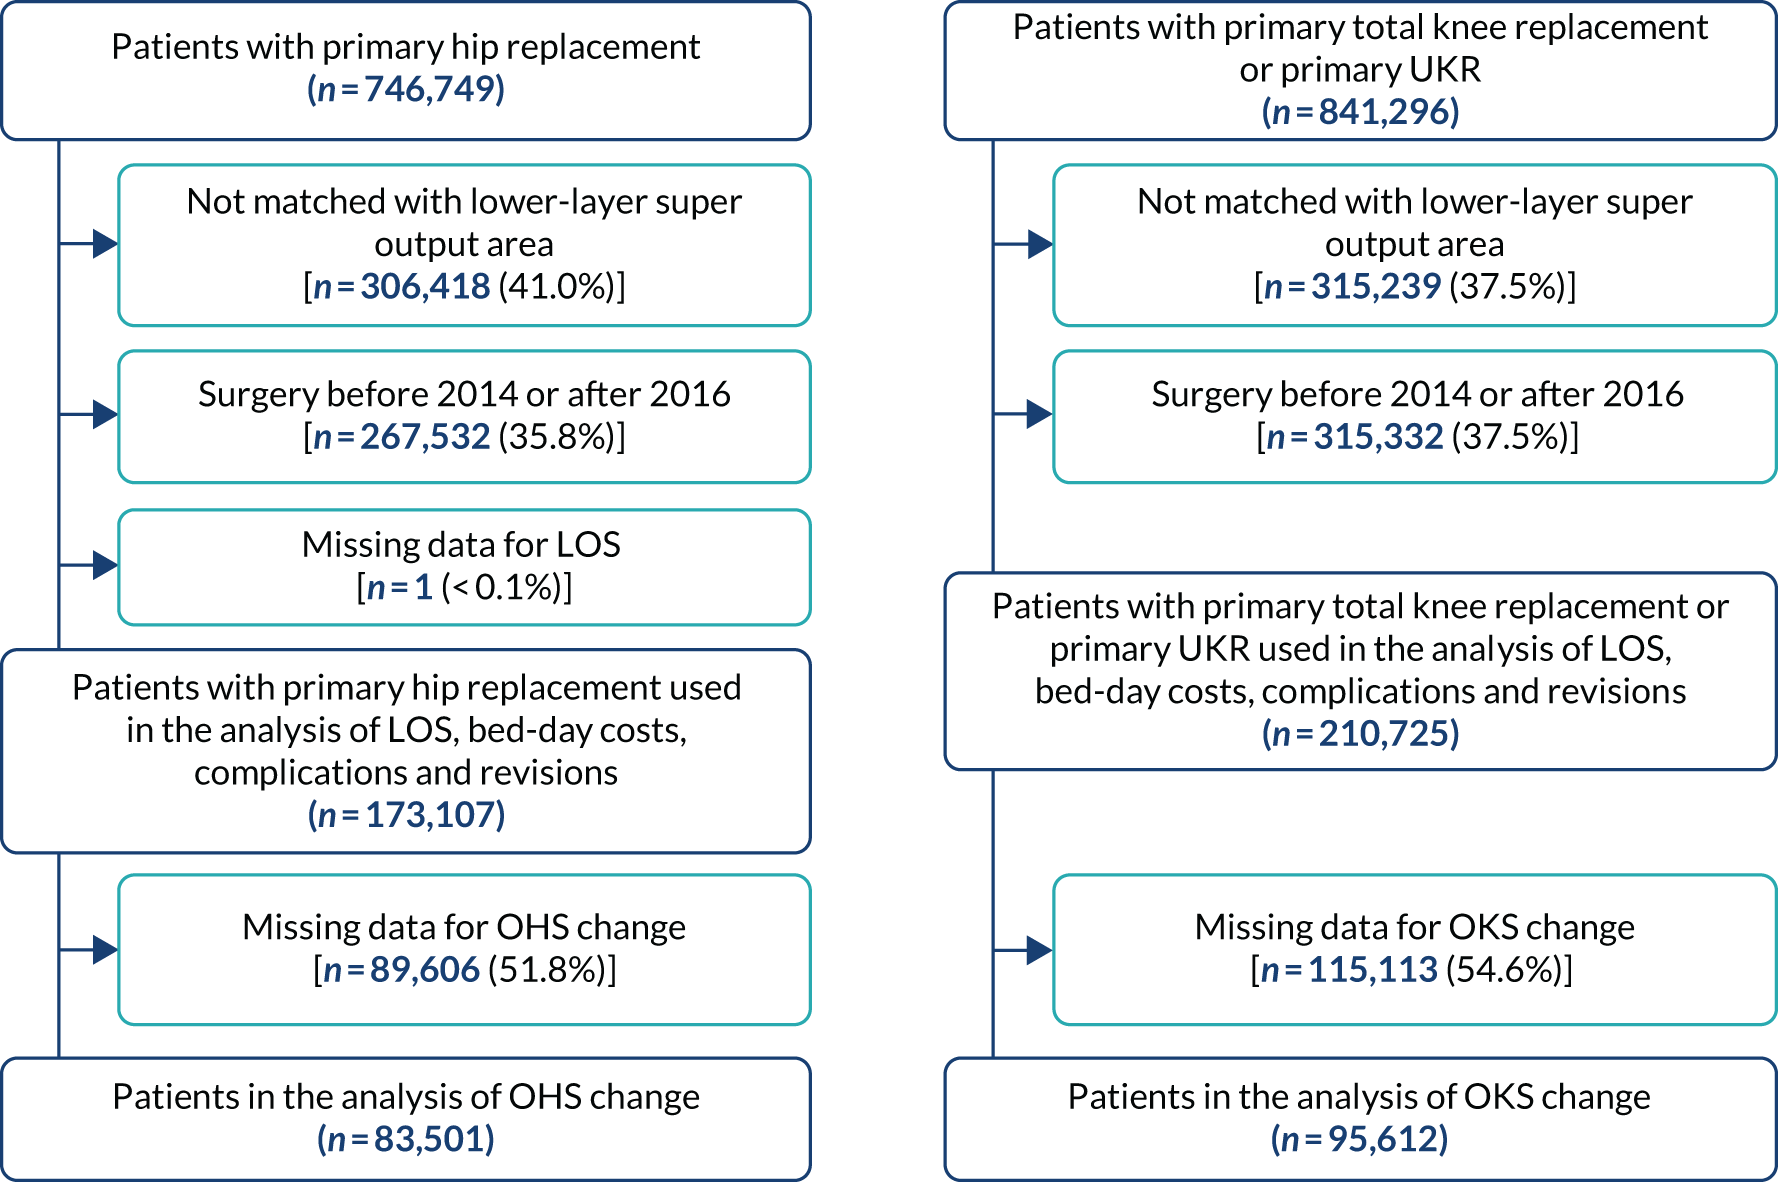
Sample size
To account for clustering within the data (patients nested within CCGs), we need to inflate the required sample size by the design effect [1 + (n – 1)p], where p is the intracluster correlation and n the mean cluster size. From our previous work, the intracluster correlation was 0.0135 for hip and 0.014 for knee replacement. 38 There are 207 CCGs in England and the CCG is the cluster. If we expect to have 100 patients from each CCG group, the design effect is (1 + 99 × 0.014) = 2.4.
For OHS and OKS outcomes, the minimally important difference between groups39,40 has been estimated to be 5, with a standard deviation (SD) of 10. Using a two-sided, two-sample t-test, with 90% power, at a 5% level of significance, to detect a difference in mean OHS and OKS of 5 requires a sample size of 85 in each exposure group. Assuming a 50% response rate to the 6-month follow-up OHS and OKS questionnaires inflates the sample size to 170 per exposure group. The required sample size per exposure group adjusted for clustering is 2.4 × 170 = 408. Several exposure variables will be considered in the model. Including up to 50 degrees of freedom would require a sample size of around 20,000 patients, assuming equal-sized exposure groups. Hence, this is more than adequately powered. We note that this does not account for multiple testing.
For the other binary outcomes, for complications of both THR and TKR, within 6 months of operation, rates of stroke and myocardial infarction were < 0.5%, and of anaemia, urinary tract infection, wound infection and pulmonary embolism/deep-vein thrombosis were < 3%. 41 The NJR annual report shows 90-day mortality of 0.5% and 1-year mortality of 1.5%. Rates of revision are around 5% at 10 years and rates of revision/reoperation are higher, at up to 20%. 42 For the rarest outcomes, to detect a difference in proportions of 0.5% compared with 1%, using a two-sided, two-sample chi-squared test, with 90% power at a 5% level of significance, requires 6650 patients per exposure group. As HES encompasses elective admissions to all English hospitals, we expect no loss to follow-up, as this information would be captured. For the design effect of 2.4 (for which we assume the same intracluster correlation as above), the sample size increases to 15,960 per degree of freedom. Hence, even for these rarest outcomes, with an actual sample size of > 350,000, we can still include over 20 degrees of freedom in the model.
Geographical variables
Within our HES data set, the smallest level of geography available to us is the lower-layer super output area (LLSOA) that a patient lives in. LLSOAs have a population between 1000 and 3000, and between 400 and 1200 households. There are 32,482 LLSOAs in England as of 2001. For the multilevel analysis, we use this as an intermediate level between the patient level and the CCG level. From the ONS Open Geography Portal, we obtained a polygon shapefile for the 2017 CCG areas in England. Maps were produced using these boundaries.
We start by looking at the structure of the geographical data (CCG areas) for a hospital that a patient is treated in. To do this, we use the ArcGIS 10.5 software (ESRI, Redlands, CA, USA) to do a point-in-polygon overlay, providing a spatial join of the hospital points with the CCG areas. This shows us that there are CCG areas that do not have any hospitals within them. For knee replacement, there are 173 CCGs that have a hospital contained within their boundary (175 CCGs for hips). Hence, out of the 207 CCG areas, there are 34 that do not have a hospital in their boundary for hips and 32 for knees. For this analysis, we want a ‘nested data set’; currently, if our data structure is to have patients within hospitals within CCGs, it does not work as there are CCG areas with no hospitals, which, therefore, would appear blank on a CCG map of England when displaying outcomes of surgery.
To have a nested data structure, we instead will base this on the CCG area for a LLSOA that a patient lives in. By doing a spatial join of the LLSOA points with the 2017 CCG polygon file, this provides us with a nested data set of patients (level 1) within LLSOA (level 2) within CCG (level 3) (Table 5).
| Classification number | Classification | Number of units | |
|---|---|---|---|
| TKR/UKR | THR | ||
| 3 | NHS CCGs | 207 | 207 |
| 2 | 2001 Census LLSOA code for England | 31,715 | 30,850 |
| 1 | Patients | 210,725 | 173,107 |
However, with this structure to the data, we now need to allocate a hospital organisational characteristic according to the LLSOA areas. This is done by using a spatial join based on the distance between two points (hospital and LLSOA). For each LLSOA, we can then identify the nearest hospital and attribute the hospital’s characteristics to that LLSOA area.
Statistical analysis
The hierarchical structure of the data consists of patients (level 1), nested within LLSOA (level 2), within CCGs (level 3). Multilevel regression models are used to describe the association of patient, hospital organisation and surgical factors and patient outcomes of surgery. This controls for evidence of clustering in the data, by allowing outcomes to vary across LLSOAs and CCGs. Failure to control for evidence of clustering can lead to estimates of standard errors that are spuriously precise and a potential source of bias. Analyses are conducted separately for THR and TKR.
The general form of the multilevel model is given as:
where Yijk is the outcome variable in patient i, in LLSOA j, in CCG k. CONS is the constant term, the vector of explanatory variables, Uj is the LLSOA residual error term distributed N(0,σj2), Vk is the CCG residual error term distributed N(0,σk2), and eijk is the individual-level residual error distributed N(0,σe2).
It is assumed that the set of random effects explains the clustering in the data, such that different observations in the same cluster are independent. We examine continuous outcomes (e.g. LOS, OHS, OKS) using linear regression, and binary outcomes (complications at 6 months) using logistic regression. Normal distributional assumptions are assumed for both linear and logistic multilevel regression models. We use normal probability plots that plot the ranked residuals against corresponding points on a normal distribution curve, to assess our assumption that level 2 and 3 residuals are normally distributed.
In order to generate the predicted outcomes across the 207 CCGs, we first estimate the linear predictor, which is the sum of the betas for each patient i in the data set. The overall predicted outcome in each CCG is then just the mean of the linear predictor for each CCG:
To incorporate evidence of clustering, the multilevel regression model has an estimate of the residual CCG variation. This is additional CCG-level variation in outcomes that is not explained by the variables in the regression model. So, for each of the 207 CCGs, k, we add the mean of the linear predictor to the CCG-level residual:
We fit the following models: (1) null model of the actual observed outcomes; (2) model that adjusts for patient case-mix variables; (3) model further adjusting for surgical variable; and (4) model adjusting for hospital organisational variables. Analyses were conducted using Stata version 15.1 statistical software (StataCorp LP, College Station, TX, USA). Multilevel analyses were imported to Stata from MLwiN version 3.00 (MLwiN Centre for Multilevel Modelling, Bristol, UK), using the Stata command runmlwin.
Results
Between 2014 and 2016, there were 173,107 primary THRs and 210,275 TKRs (see Figure 3). Almost 60% of patients were women and the average age was ≈69 years. The mean BMI at primary surgery was in the obese range (≈30 kg/m2). The ASA grade of 83% of patients was ‘mild’ or ‘fit’. Additional patient, surgical and hospital organisation factors are summarised for hip replacement and TKRs/UKRs in Appendix 1, Table 25.
Predictive variables
Length of stay
Patients aged ≥ 80 years, in ASA grades 3 and 4, and with two or more comorbidities had longer LOS (see Appendix 1, Tables 26 and 27). Shorter LOS was seen in private hospitals or private treatment centres and with better quality-of-life scores (EQ-5D). Hospitals with ≥ 100 beds available overnight for trauma and orthopaedics had longer LOS for THR than hospitals with < 35 beds. Knee implants other than bicondylar (unicondylar, hinged, linked, custom or preassembled) were associated with shorter LOS for patients undergoing knee surgery.
Oxford Hip Score and Oxford Knee Score change
Greater absolute change in OHS and OKS was associated with better preoperative EQ-5D score (see Appendix 1, Tables 28 and 29). Greater change in OHS was associated with bigger femoral head size (≥ 44 mm) and less deprived areas. Patients aged ≥ 60 years had greater change in OKS. Smaller improvements were associated with worse condition for operation (ASA grades 3 and 4), and patients with comorbidities for both OHS and OKS outcomes.
Complications at 6 months
Older patients (aged 80–84 or ≥ 85 years) with comorbidities and worse ASA grades had higher probabilities of developing a complication in the following 6 months (see Appendix 1, Tables 30 and 31). Thromboprophylaxis based on aspirin and < 200 hip replacements per year in the hospital were also related to complications at 6 months. Fewer complications were associated with minimally invasive hip replacement surgery. For TKR, private treatment centres and unicondylar, hinged, linked, custom or preassembled implants had a lower percentage of complications at 6 months.
Variation in outcomes
Length of stay
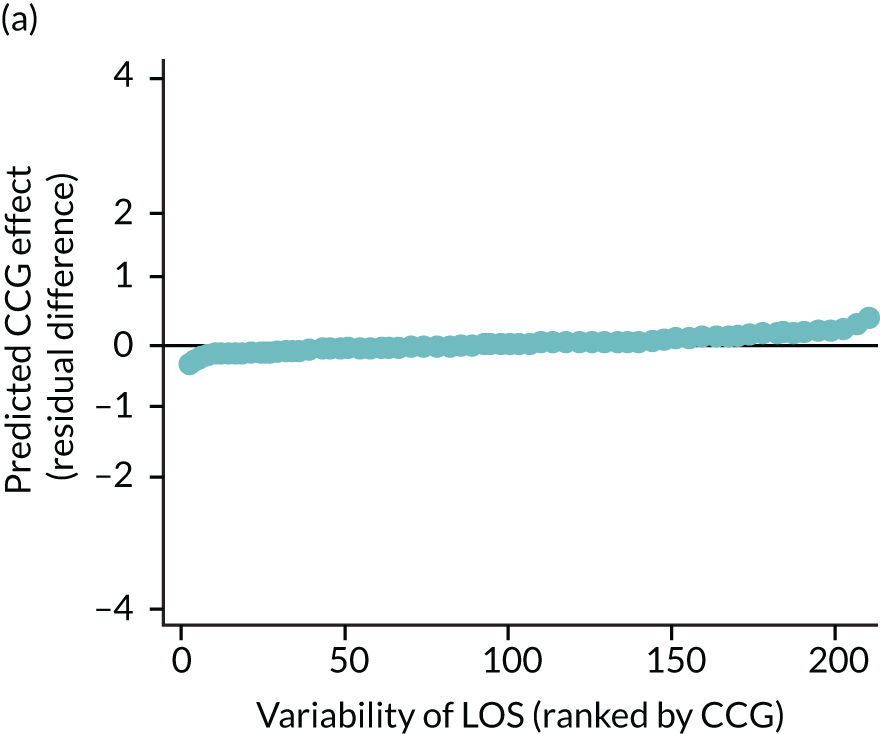
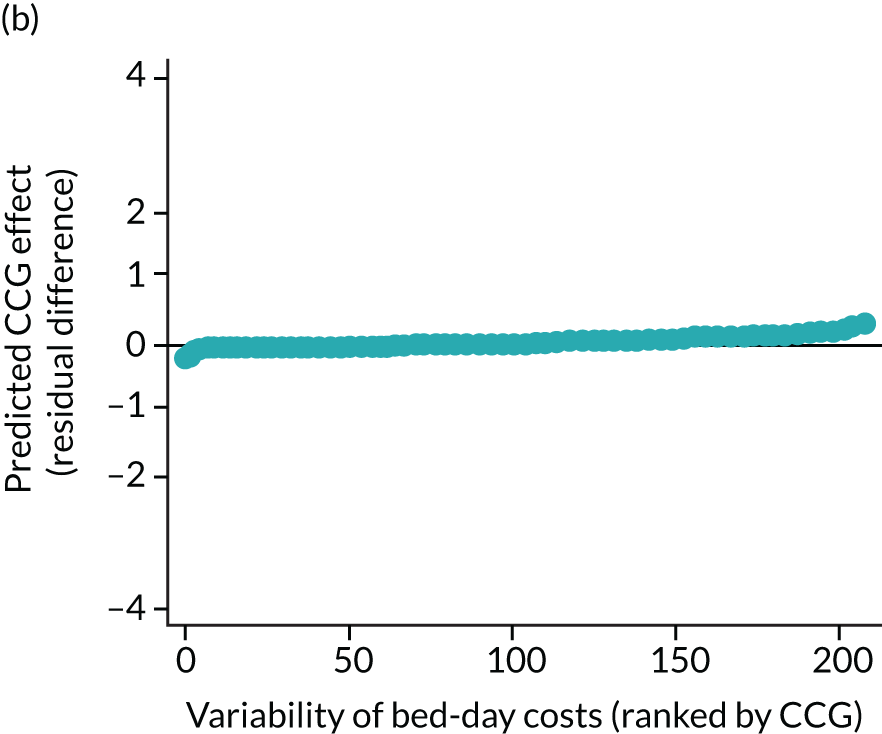
The observed mean LOS by CCG ranged between 2.5 and 6.2 days for THRs, and between 2.7 and 6.6 days for TKRs. Variability across CCGs was high, with 54 out of 207 CCGs having significantly shorter mean LOS and 58 CCGs having longer mean LOS for THR (Figure 4). Variability between CCGs was even more marked for patients undergoing TKR, with 72 CCGs with significantly shorter mean LOS and 62 CCGs with longer mean LOS (Figure 5). Table 6 shows the five CCGs with the lowest estimates of mean LOS (≈3 days) and the five CCGs with the highest mean estimates (≈6–7 days) for THR and TKR patients, respectively. Maps of England with CCG boundaries show that the London region had longer mean LOS, whereas North England and the East Coast have shorter mean LOS for both THR and TKR (Figures 6 and 7). The mean bed-day costs ranged between £4727 (SD £1026) in the NHS Scarborough and Ryedale CCG (within Yorkshire and the Humber region) and £8800 (SD £1572) in the NHS Hillingdon CCG (within London region) for THR. The mean bed-day costs for TKR oscillated between £4758 (SD £1096) in the NHS Scarborough and Ryedale CCG and £8692 (SD £1507) in the NHS Central London CCG.
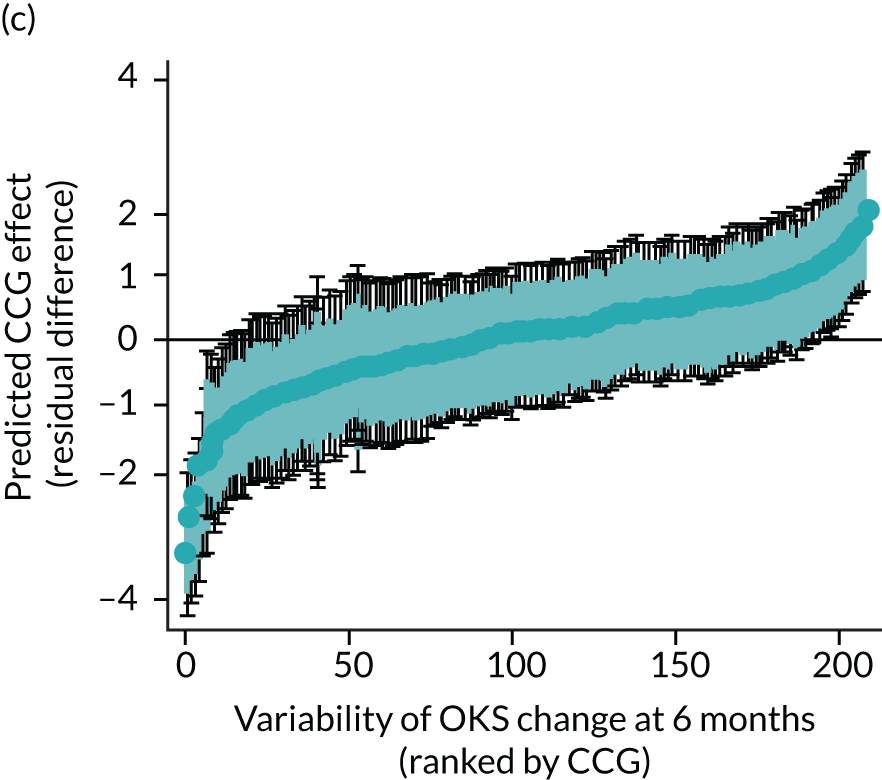
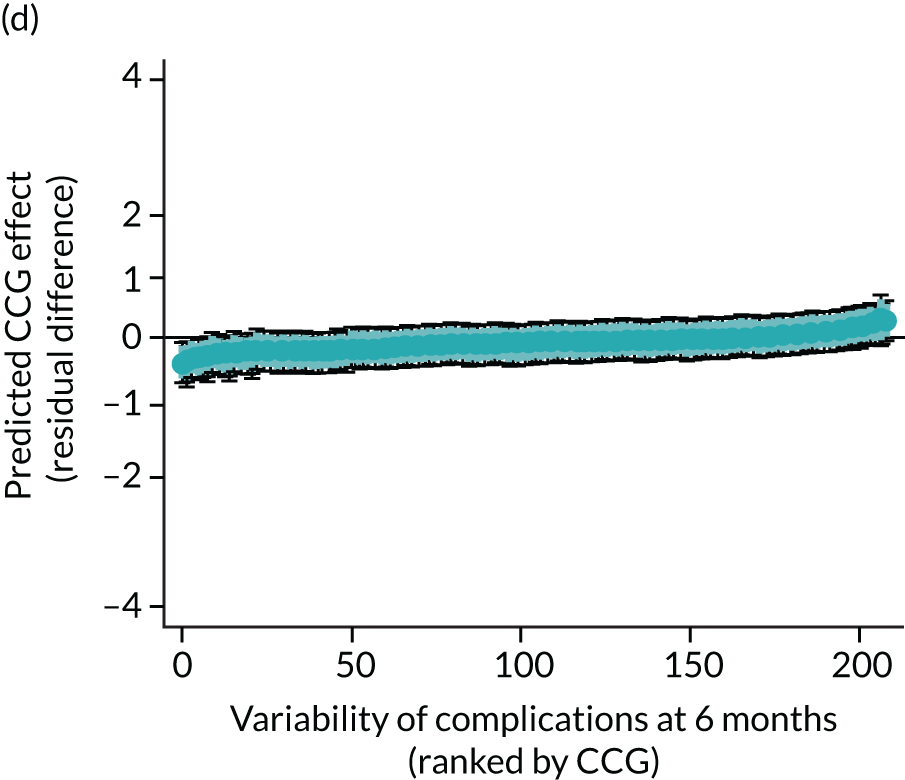
FIGURE 4.
Caterpillar plots showing variation in outcomes across CCGs (THR). (a) LOS (54/207 CCGs have significantly shorter LOS than average, whereas 54 CCGs have longer LOS); (b) bed-day costs (56/207 CCGs have significantly lower costs than average, whereas 53 have higher costs); (c) OHS change at 6 months (13/207 CCGs have significantly less change at 6 months, whereas 11 have more change); and (d) complications at 6 months (4/207 CCGs have significantly higher percentages of complications at 6 months than average).
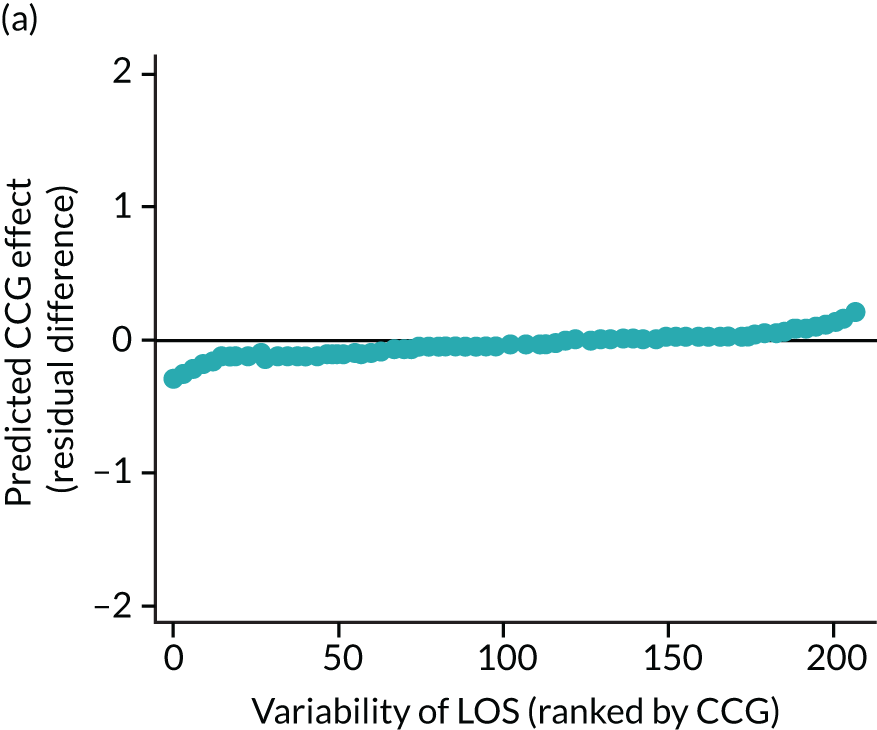
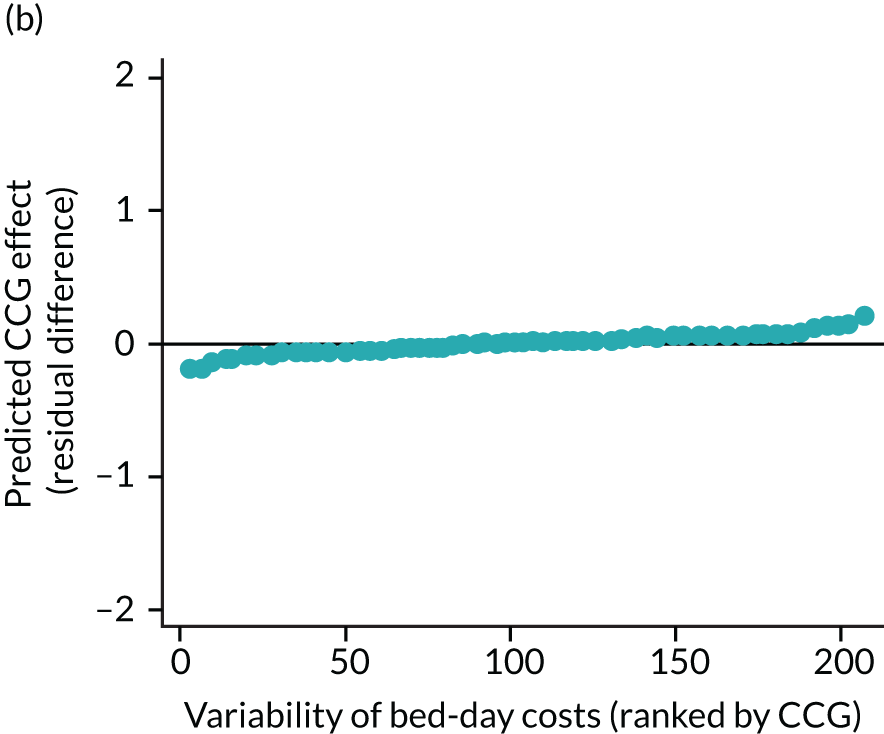
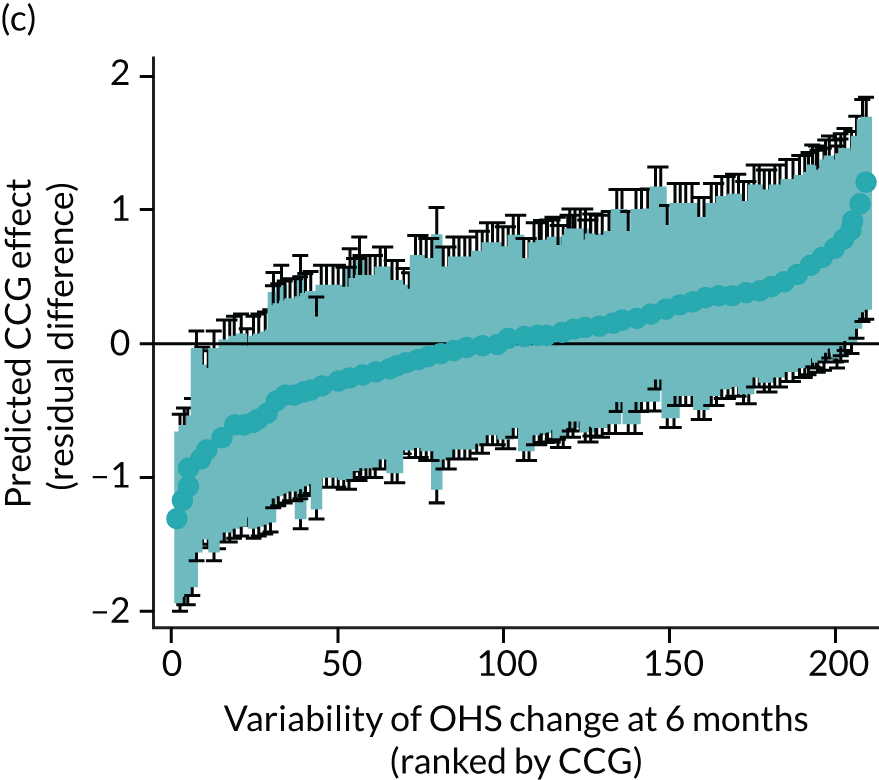
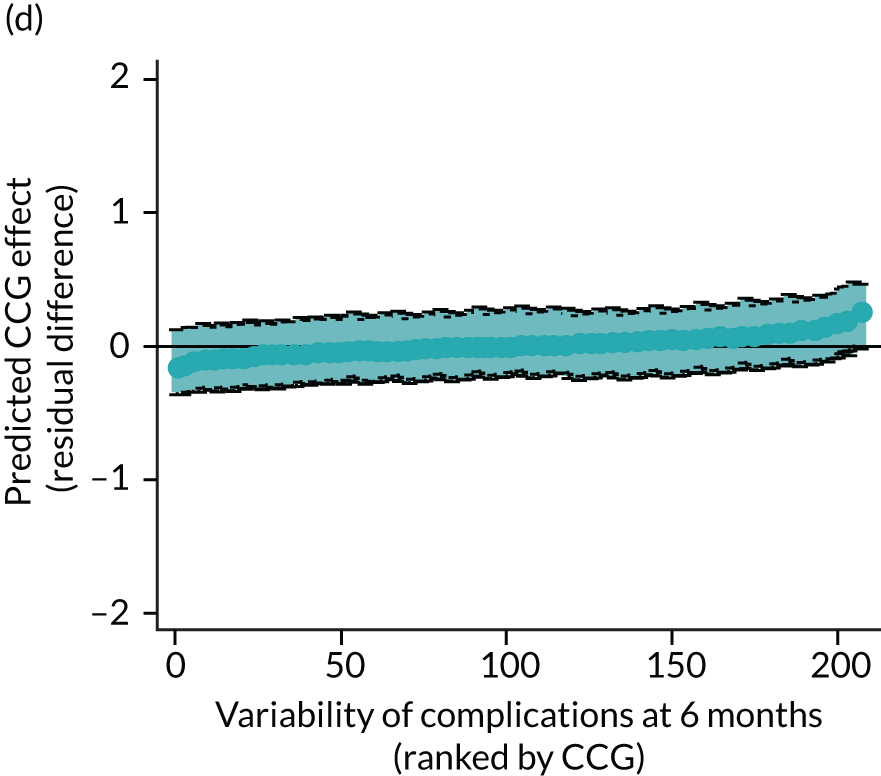
FIGURE 5.
Caterpillar plots showing variation in outcomes across CCGs (TKR). (a) LOS (72/207 CCGs have significantly shorter LOS than average, whereas 62 have longer LOS); (b) bed-day costs (65/207 CCGs have significantly lower costs than average, whereas 56 have higher costs); (c) OKS change at 6 months (25/207 CCGs have significantly less change at 6 months, whereas 26 have more change); and (d) complications at 6 months (7/207 CCGs have significantly lower percentages of complications at 6 months than average, whereas eight have higher percentages).
| THRs | TKRs/UKRs | ||||||
|---|---|---|---|---|---|---|---|
| Five lowest | Five highest | Five lowest | Five highest | ||||
| CCG | Predicted (SD) | CCG | Predicted (SD) | CCG | Predicted (SD) | CCG | Predicted (SD) |
| Mean LOS (days) | |||||||
| Scarborough and Ryedale | 2.7 (1.0) | Hillingdon | 6.1 (1.8) | Scarborough and Ryedale | 2.9 (1.0) | West London | 6.6 (1.7) |
| Hastings and Rother | 2.9 (1.0) | Harrow | 6.1 (2.1) | Northumberland | 3.2 (0.7) | Hammersmith and Fulham | 6.6 (1.8) |
| Hambleton, Richmondshire and Whitby | 3.1 (0.8) | Camden | 6.1 (1.9) | Bassetlaw | 3.3 (1.4) | Camden | 6.5 (1.8) |
| Northumberland | 3.1 (0.9) | Barnet | 5.8 (2.0) | Hastings and Rother | 3.4 (1.0) | Central London (Westminster) | 6.1 (1.6) |
| High Weald Lewes Havens | 3.3 (1.4) | Central London (Westminster) | 5.7 (2.0) | Salford | 3.4 (1.0) | Barnet | 6.1 (1.6) |
| Mean bed-day cost (£) | |||||||
| Scarborough and Ryedale | 4727 (1026) | Hillingdon | 8800 (1572) | Scarborough and Ryedale | 4758 (1096) | Central London (Westminster) | 8692 (1507) |
| Hastings and Rother | 4880 (1051) | Harrow | 8647 (1881) | Northumberland | 4930 (720) | City and Hackney | 8686 (1247) |
| Northumberland | 4998 (867) | Camden | 8250 (1561) | Bassetlaw | 4960 (1329) | Lewisham | 8676 (1585) |
| Hambleton, Richmondshire and Whitby | 5187 (908) | Barnet | 8132 (1788) | Hastings and Rother | 5294 (1050) | West London | 8639 (1438) |
| High Weald Lewes Havens | 5219 (1305) | Waltham Forest | 8060 (1710) | Salford | 5344 (1008) | Camden | 8600 (1493) |
| Mean OHS change (points) | Mean OKS change (points) | ||||||
| Mid Essex | 24.6 (5.3) | Brent | 18.7 (6.2) | Ipswich and East Suffolk | 18.8 (4.2) | City and Hackney | 13.1 (4.3) |
| Ipswich and East Suffolk | 24.1 (4.9) | Islington | 19.1 (6.4) | Eastern Cheshire | 18.5 (4.2) | Newham | 13.4 (4.3) |
| Stoke on Trent | 24.1 (5.0) | Harrow | 19.2 (6.6) | Castle Point and Rochford | 18.5 (4.0) | Islington | 13.6 (5.4) |
| Scarborough and Ryedale | 23.7 (5.4) | Kingston | 19.4 (6.6) | Warrington | 18.5 (4.2) | Brighton and Hove | 13.7 (4.5) |
| Nene | 23.6 (5.3) | Croydon | 19.4 (5.9) | Nene | 18.5 (4.2) | Barnet | 13.8 (4.7) |
| Mean complications at 6 months (%) | |||||||
| High Weald Lewes Havens | 3.0 (2.4) | Tower Hamlets | 5.4 (4.1) | Hull | 2.9 (1.4) | Herts Valleys | 5.8 (2.7) |
| Leeds West | 3.1 (1.9) | Newham | 5.3 (3.2) | Dartford, Gravesham and Swanley | 2.9 (1.4) | South Devon and Torbay | 5.7 (3.1) |
| Solihull | 3.2 (2.0) | Camden | 5.2 (3.4) | Calderdale | 2.9 (1.5) | Tower Hamlets | 5.5 (2.4) |
| Herefordshire | 3.2 (2.0) | Enfield | 5.1 (3.0) | Hambleton, Richmondshire and Whitby | 3.1 (1.4) | Camden | 5.4 (2.8) |
| West Leicestershire | 3.2 (2.1) | Hillingdon | 5.0 (3.3) | Erewash | 3.1 (1.6) | Newham | 5.4 (2.7) |
FIGURE 6.
Map of patient outcomes across 2017 CCGs (THR). (a) LOS (days); (b) bed-day costs (£); (c) complications at 6 months (%); and (d) OHS change at 6 months (points). Ultrageneralised clipped boundaries in England V4. Reproduced with permission. 43 Source: Office for National Statistics licensed under the Open Government Licence v.3.0. Contains OS data © Crown copyright and database right 2019.
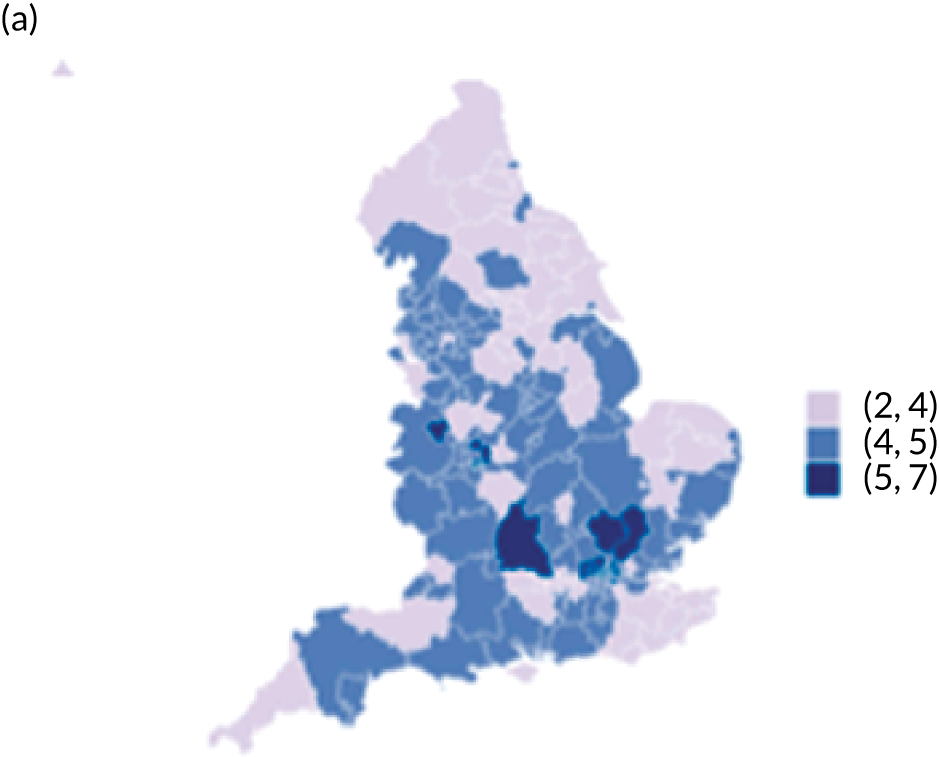
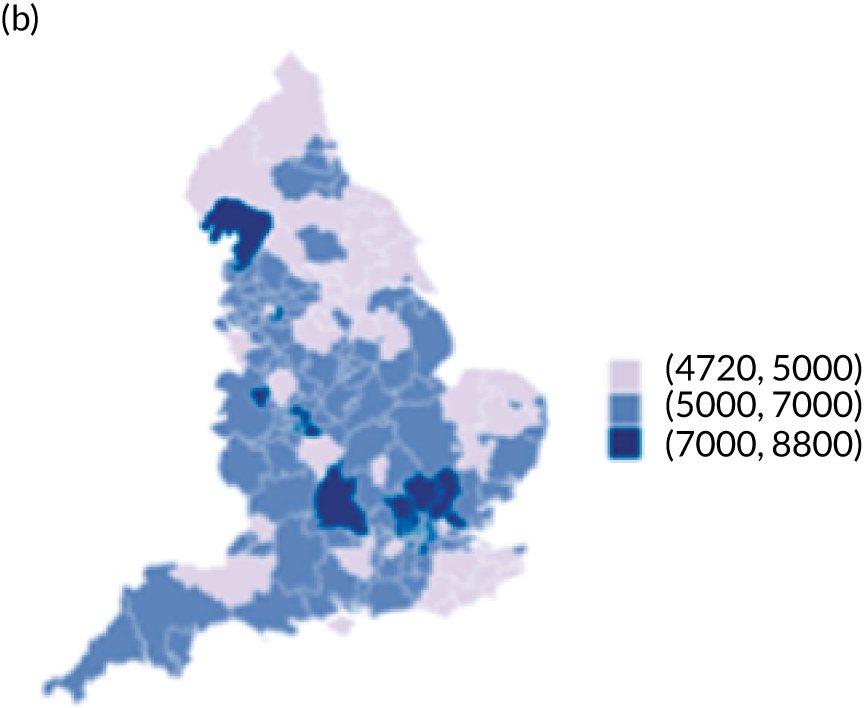


FIGURE 7.
Map of patient outcomes across 2017 CCGs (TKR). (a) LOS (days); (b) bed-day costs (£); (c) complications at 6 months (%); and (d) OHS change at 6 months (points). Ultrageneralised clipped boundaries in England V4. Reproduced with permission. 43 Source: Office for National Statistics licensed under the Open Government Licence v.3.0. Contains OS data © Crown copyright and database right 2019.
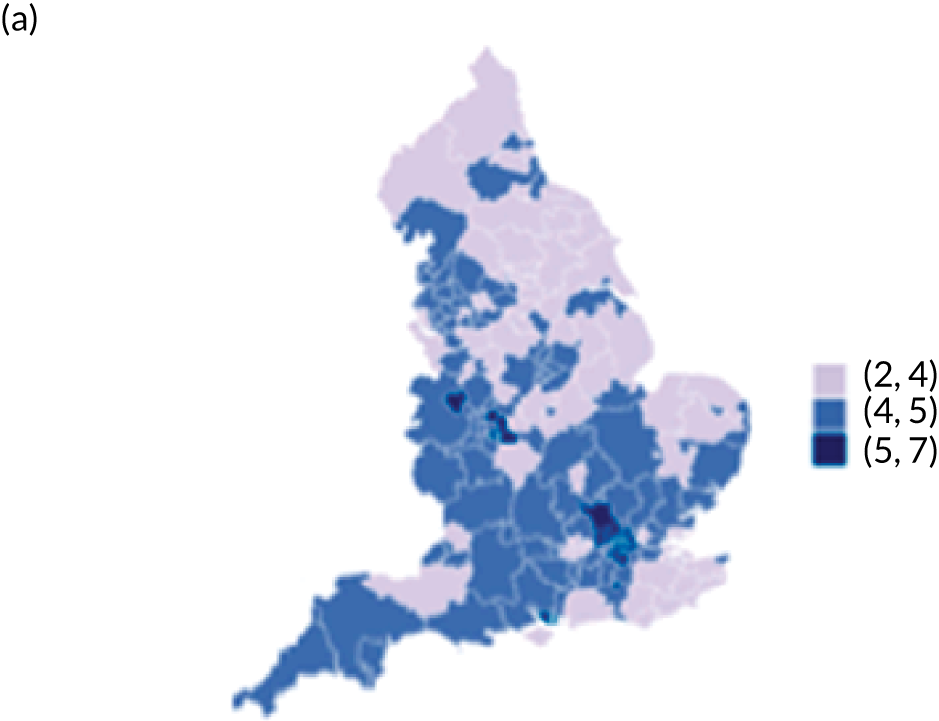
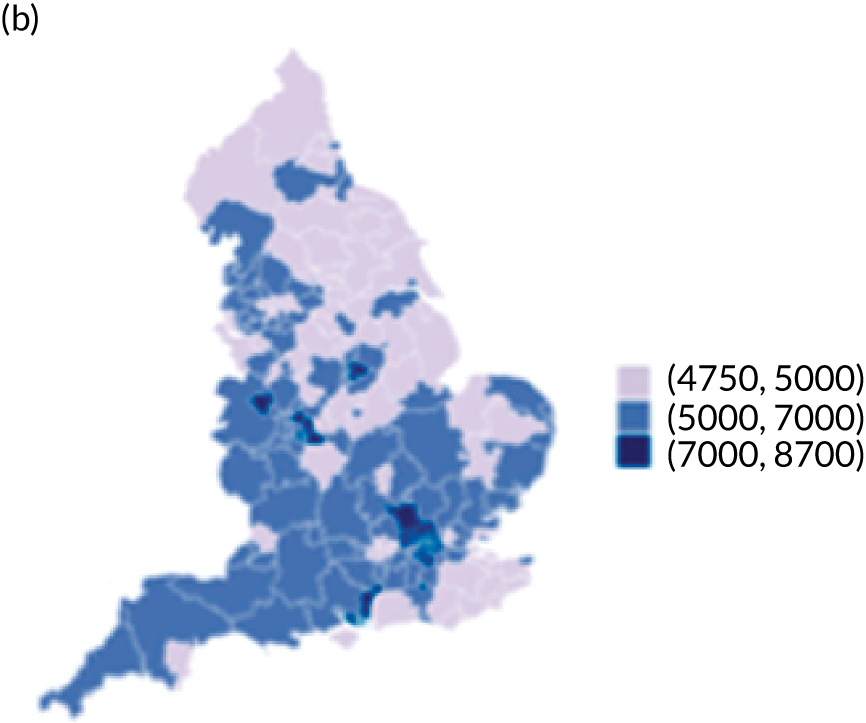
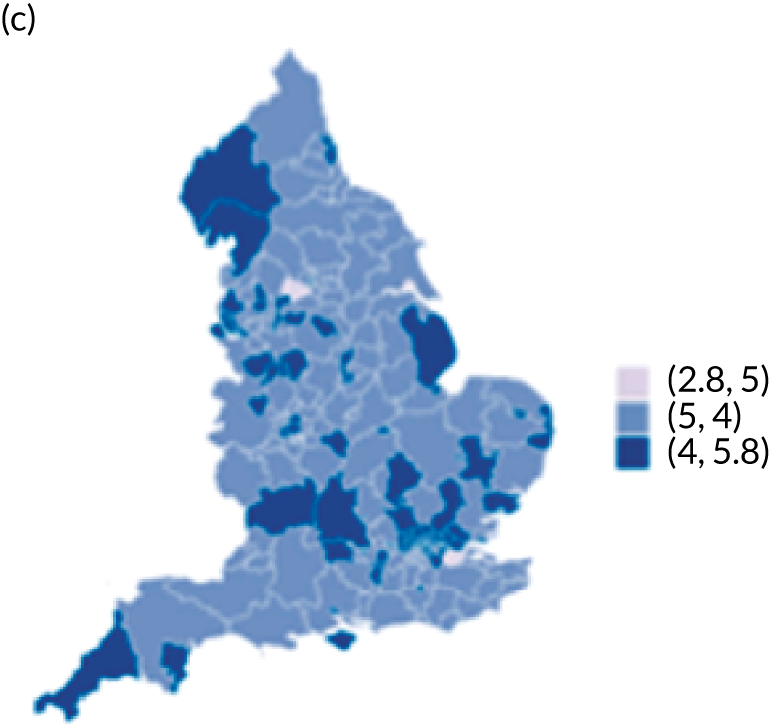
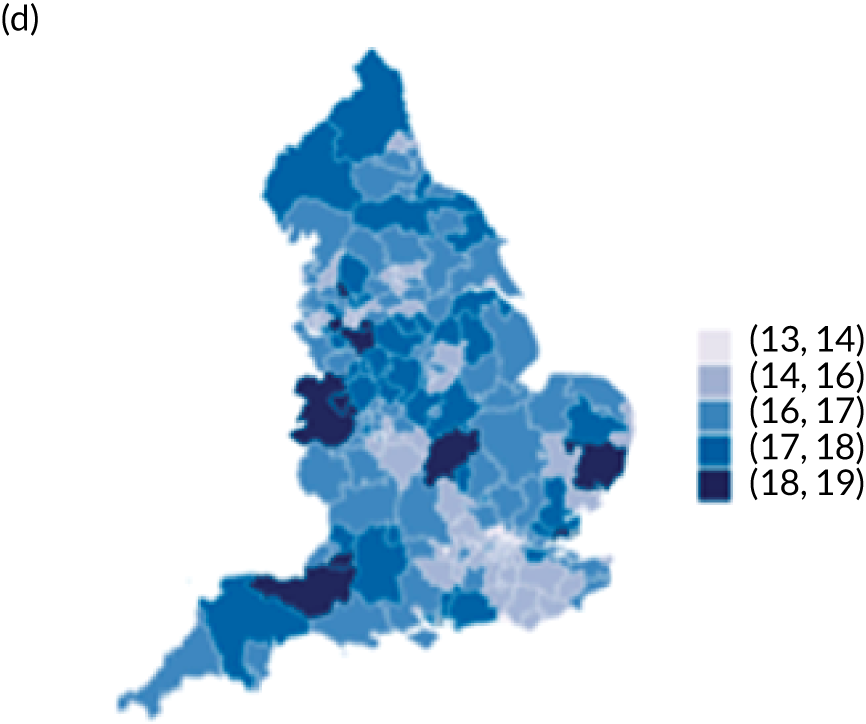
Oxford Hip Score and Oxford Knee Score change
Observed mean OHS change by CCG ranged between 17.5 and 24.9 points, and mean OKS change ranged between 11.2 and 19.1 points. The estimated percentage of variation in OHS and OKS scores lying between CCGs was 1.0% and 1.3%, respectively. In turn, 4.0% and 5.7% of the variation in OHS and OKS scores, respectively, was attributed to differences at the level of LLSOAs. Caterpillar plots exploring the variability for OHS change (see Figure 4) and OKS change (see Figure 5) show little variability between CCGs. However, they presented wide confidence intervals (CIs), representing high variability within each CCG. The mean OHS improvement ranged between 24.6 points (SD 5.3 points) in the Mid Essex CCG (within East England) and 18.7 points (SD 6.2 points) in NHS Brent CCG (within London region). The mean OKS improvement oscillated between 18.8 points (SD 4.2 points) in NHS Ipswich and East Suffolk CCG (within East England) and 13.1 points (SD 4.3 points) in NHS City and Hackney CCG (within London region).
Complications at 6 months
Observed complications at 6 months by CCG ranged between 2.0% and 8.6% for THR, and between 1.5% to 8.4% for TKR. Complications at 6 months showed low variability between CCGs for patients undergoing THR (see Figure 4) and TKR (see Figure 5). Complications at 6 months ranged between 3% and 5–6% for patients with THR and patients with TKR. CCG maps show that the London region was associated with a higher percentage of complications.
Discussion
Main findings
There is substantial variation in patient outcomes of THR and TKR across CCG areas. This variation remained after adjusting for patient case mix and surgical factors. Hospital organisational factors had little to no influence on explaining this variation.
Strengths/limitations
Strengths of the study include use of the NJR data set, which, to the best of our knowledge, is the largest arthroplasty data set in the world, allowing us to generalise the results to the UK. The NJR has near complete coverage of all operations, particularly in the most recent years of data. Linkage to HES allowed us to examine a wide range of confounding factors and enabled us to link in hospital organisational factors; however, the limitation of this is that analysis was restricted to England only and private operations are not included in the HES data set. The large sample size has allowed us to explore geographical variation in rare complications. The main limitation of the study is missing data, which was particularly prevalent for the hospital organisation factors. To overcome this, we used multiple imputation methods, but only single imputation was possible given the complexity of the multilevel regression models fitted.
What is already known
A large number of studies within the literature have identified factors predictive of patient outcomes of THR and TKR. In respect of patient case-mix variables, it has been shown that baseline levels of pain and functional disease severity,44–51 age,46,49,52,53 sex,46,48,54 obesity,48,52,55 comorbidities46,48,51 and social deprivation50 are all related to patient-reported outcomes of pain and function. Less is known about predictors of complications of surgery, although we have previously shown that such complications are rare, with obesity associated with small but clinically insignificant effects. 41 Predictors of LOS are less commonly studied, with literature mostly relating to enhanced recovery interventions, although our work in Chapter 5 shows that age and comorbidity are associated with longer LOS. Much of this work on predictors of outcomes of THR and TKR is formally synthesised within large systematic reviews56 and in the published National Institute for Health Research (NIHR) Programme Grants for Applied Research report [Clinical Outcomes in Arthroplasty study (COASt)57].
We have previously demonstrated evidence of geographical variation and inequity in access to THR and TKR for patients operated on in 2002 (between 12 and 14 years before the patients in our study were operated on). 10 However, in those patients who navigate through the care pathway and obtain access to joint replacement surgery, there has been little research exploring geographical variations in outcomes of surgery. A previous NIHR Health Services and Delivery Research study by Street et al. 13 used HES data to explore variation in PROMs for THR and TKR across hospitals in England. Using multilevel regression modelling, they looked at whether or not patient factors (age, sex, comorbidity, deprivation) and hospital factors (volume, teaching hospital) predicted (1) health outcomes (EQ-5D, OHS, OKS) or (2) resource use (LOS, hospital costs). The key findings were significant unexplained variation among hospitals in both health outcomes and resource use. This is consistent with the findings of our study; however, our research takes this forward by looking at variation in other relevant outcomes (complications, LOS) and looking at a broader range of patient, surgical and hospital organisational factors as predictors of geographical variation in outcomes. Our findings suggest that such factors do not explain this variation. Hence, there are probably other unmeasured historical organisational factors and processes specific to individual local hospitals that may explain why such variation exists. Specifically, we have shown that it cannot be explained by ‘our population is different’, as we have well accounted for patient case-mix factors.
Conclusions
We have identified potentially unwarranted variations in patient outcomes of THR and TKR. This variation cannot be explained by differences in patient case mix, surgical factors or hospital organisational factors. This information is informative to patients in deciding where to have their surgery and to commissioners in monitoring variations in outcomes of surgery.
Chapter 5 Natural experiment to determine the clinical effectiveness and cost-effectiveness of the enhanced recovery treatment pathway
Aims
To assess whether or not implementation of the UK Department of Health and Social Care national enhanced recovery after surgery (ERAS) programme in THR and TKR has had an impact on trends in LOS, bed-day costs, PROMs, complications and revision surgery.
Methodology
Data sources
The NJR, HES and PROMs linked data sets (see Chapter 2).
Outcomes
Length of stay, cost per bed-day, absolute change in OHS and OKS, and complications at 6 months after surgery (see Chapter 4 for details). The rate of revision up to 5 years after primary THR and TKR was also evaluated. This included revisions declared to the NJR by the surgeons and revisions reported to HES. We specified our analysis time in years, reporting the rate as number of revisions per 1000 implant-years. For a list of the OPCS-4 codes used to identify hip revision, see Report Supplementary Material 4; for knee revision, see Report Supplementary Material 5.
Intervention
The primary exposure (‘intervention’) is the period when the new ERP was introduced (between April 2009 and March 2011).
There is likely to be variation in the dates when individual hospitals introduced ERAS and variation in the type of ERAS service a hospital has adopted. Hence, in addition to looking at the national picture, we have looked at individual trusts in a region of England. In this region, adoption of enhanced recovery in orthopaedics was monitored by the Musculoskeletal Clinical Leaders Network when the pathway was being introduced to hospitals in 2009 and 2010. For this reason, information is available on the dates when individual hospitals in the region introduced their programmes. As outcomes of revision surgery and complications are rare, we focus just on outcomes of LOS and PROMs for the analysis of individual hospitals.
Potential modifiers
We evaluated whether or not trends in LOS and OHS and OKS over time differed by age (18–59, 60–69, 70–79, 80–84, ≥ 85 years) and evaluated the presence of comorbidities (yes/no). For a list of the ICD-1035 codes used to identify comorbidities, see Report Supplementary Material 6.
Statistical analysis
We used a natural experimental study design. 58 We evaluated the ERAS impact on trends before, during and after the implementation of the intervention. 59,60 The timing of implementation of ERP varied by trust and was assumed to span the 2 years of the implementation period (April 2009–March 2011). To do so, we described the trends by calculating monthly outcomes, being means (LOS, bed costs, OHS, OKS), proportions (complications) and rates (revision), together with their 95% CIs. We estimated a fractional polynomial over the study period and plotted the resulting curve along with the CI.
In interrupted times series studies, sample size calculations are related to the estimation of the number of observations or time points at which data will be collected. 61 According to the quality criteria of Ramsey et al. ,62 at least 10 pre and 10 post data points would be needed to reach at least 80% power to detect a change (if the autocorrelation is > 0.4). Our outcomes will be estimated at monthly intervals and, as autocorrelation is unknown, we will allow at least 2 years either side of the date of interest (24 pre and 24 post data points).
We used an interrupted time series approach to estimate changes in outcomes during and immediately following the intervention period, while controlling for baseline levels and trends. We modelled aggregated data points of each outcome of interest by month using segmented linear regression:59
The equation used on trusts in the South Central region excluded the intervention period because this was assumed to be a date point:
Here, Yt is the mean LOS, mean OHS/OKS change, mean proportion of 6-month complications and mean 5-year revision rate (taking place in month t). ‘Time’ is a continuous variable representing number of months from the start of observation period (i.e. April 2008) at time t. β0 estimates the baseline level of the outcome at the beginning of the time series (i.e. April 2008). β1 estimates the trend before ERAS implementation. β2 is the change in level immediately following the intervention. β3 estimates the change in the trend in the monthly mean after ERAS started (i.e. ERAS implementation trend). β4 is the change in level immediately following the end of the intervention. β5 estimates the change in the trend in the mean monthly number or rate (depending of outcome) after ERAS ended (i.e. ERAS post-implementation trend). We checked the autocorrelation with the previous month, 2 months, etc., until the previous 12 months, using Durbin’s alternative test. 63 Autocorrelation would invalidate the interpretation of the model. For this reason, we estimated the linear regression models with Newey–West standard errors. 64 Parsimonious models were generated using the variables selected through backward regression.
Separate models are fitted for THR and TKR. All analyses were conducted using Stata.
National results
Length of stay
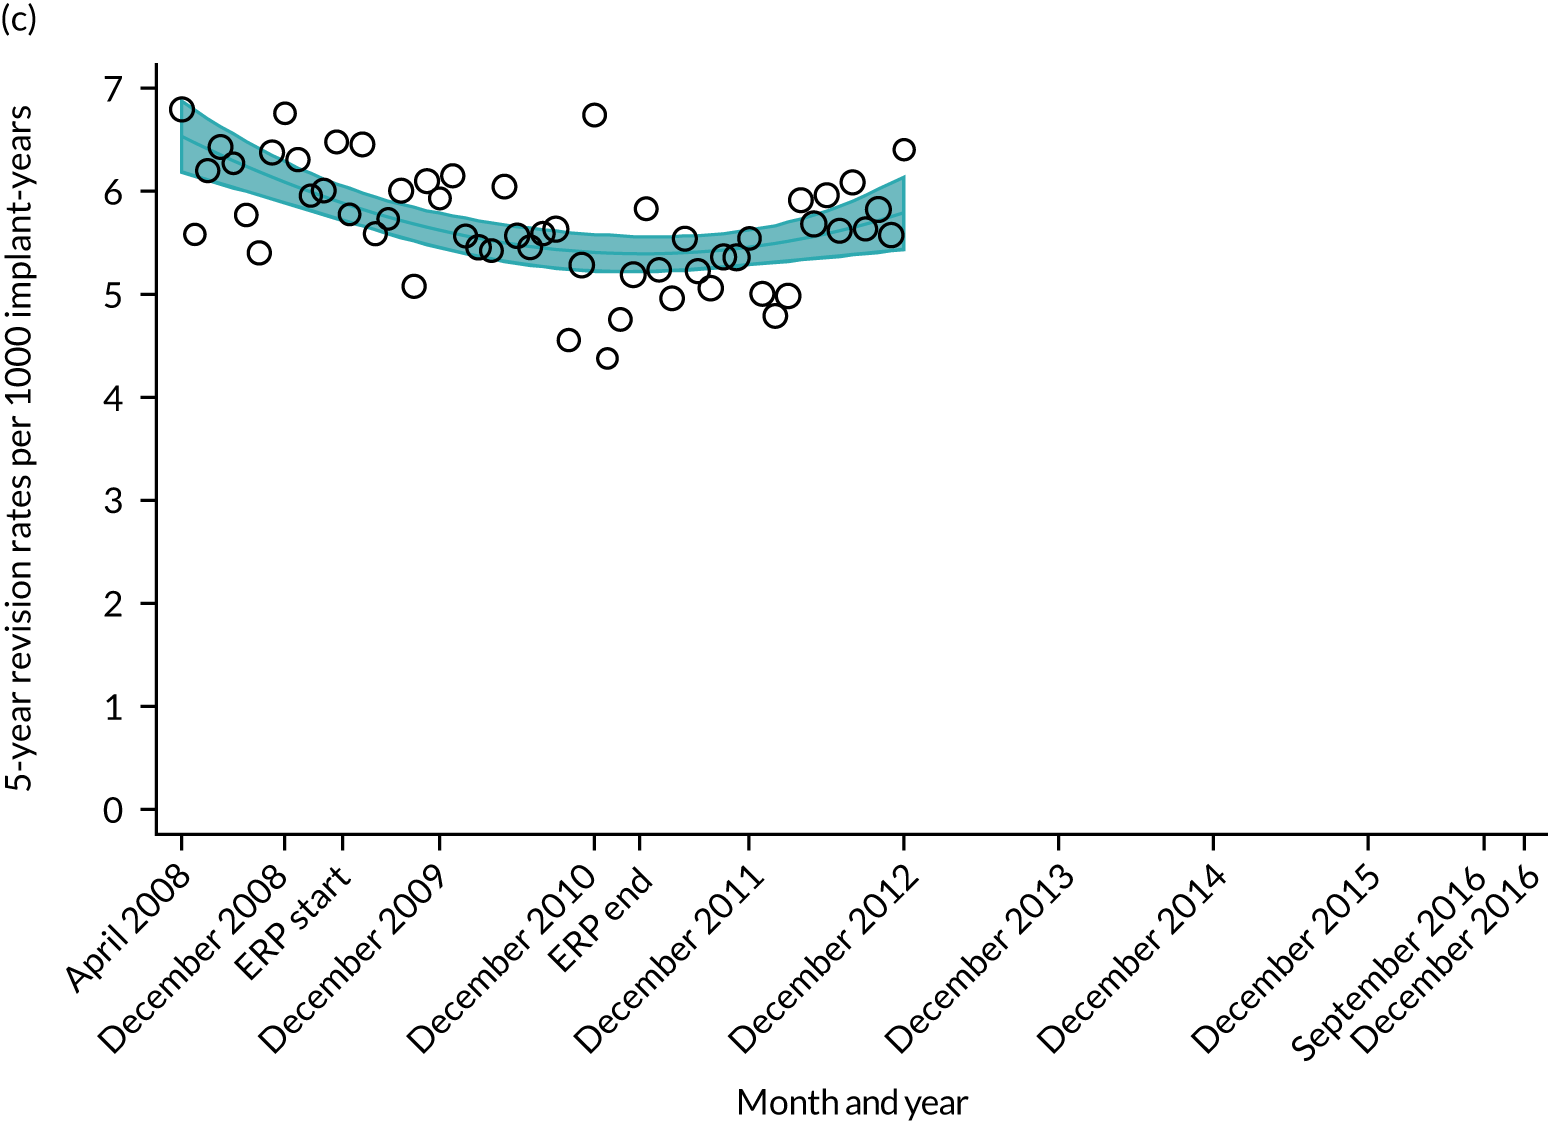
For THR, the mean LOS decreased from 5.6 days in April 2008 to 3.6 days in December 2016 (Figure 8), For TKR, the mean LOS decreased from 5.7 days in April 2008 to 3.6 days in December 2016 (Figure 9). Prior to ERAS, LOS was already decreasing significantly (Table 7). The rate of reduction in mean LOS was higher during the implementation period (April 2009–March 2011), and slowed afterwards (April 2011–December 2016).
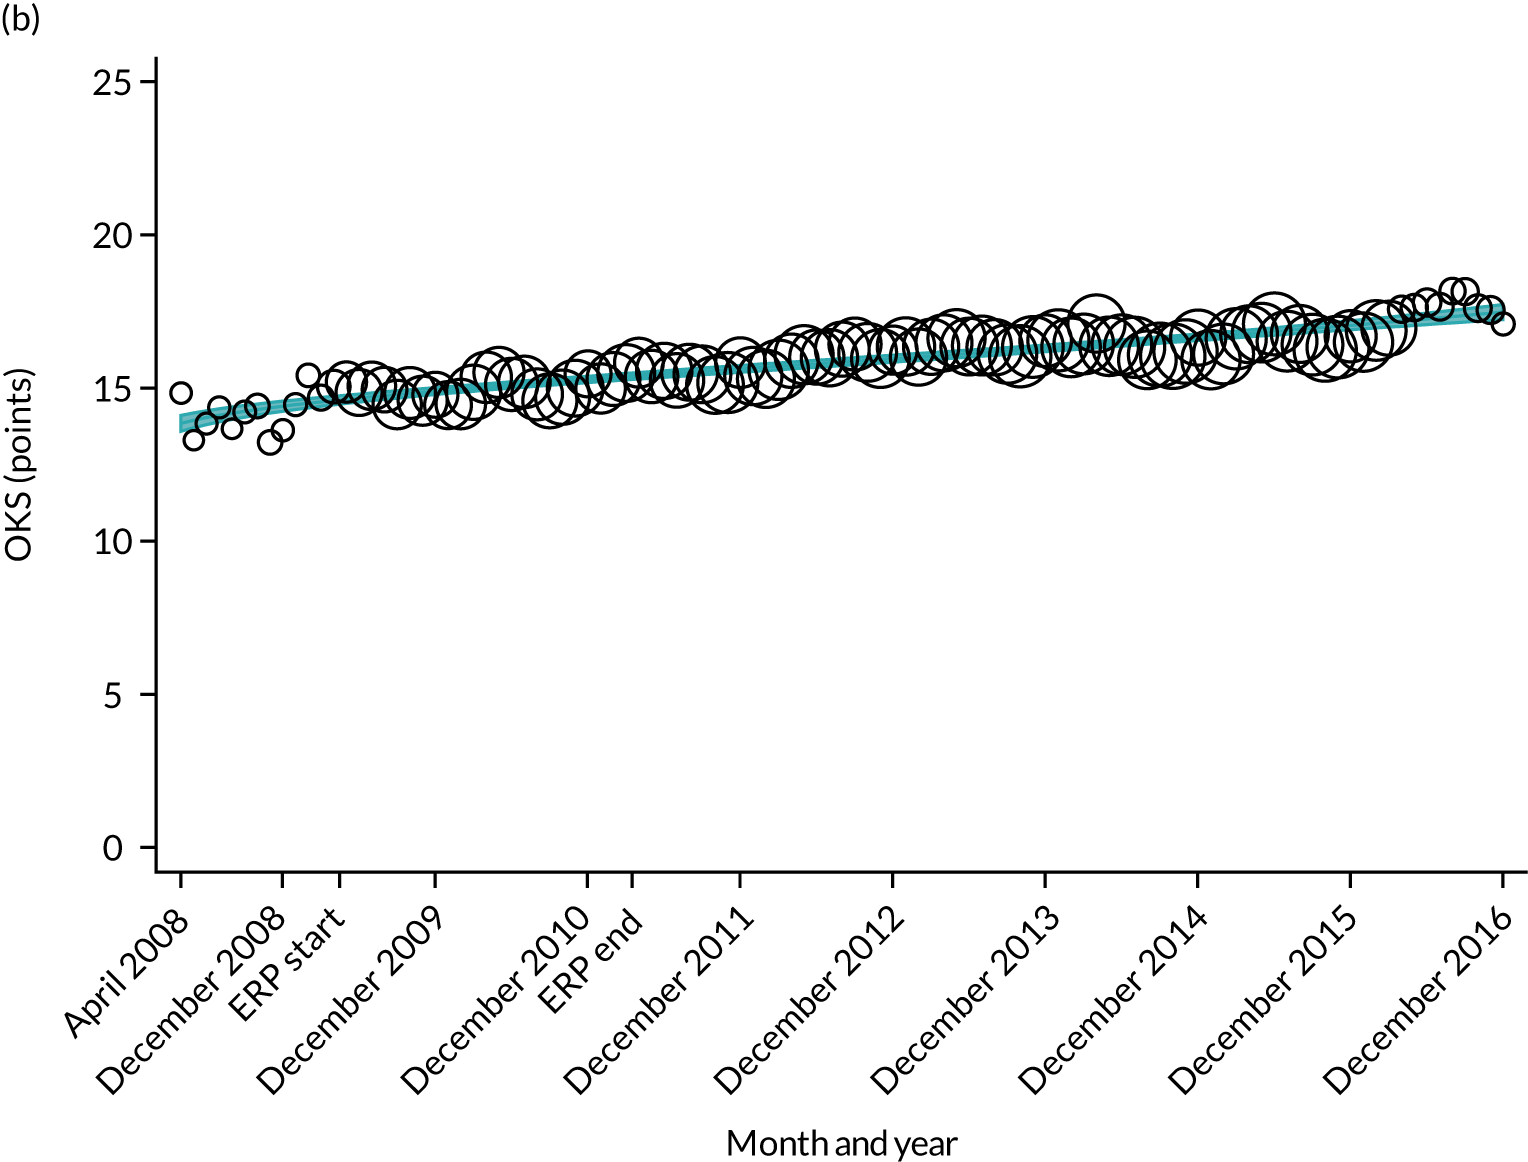
FIGURE 8.
Trends in outcomes following primary hip replacement in England, 2008–16, by month. (a) LOS (days); (b) OHS 6 months – OHS baseline; (c) primary hip replacements with a complication in the following 6 months; and (d) primary hip replacements with a revision in the following 5 years. Reproduced from Garriga et al. 65 © Author(s) (or their employer(s)) 2019. Re-use permitted under CC BY. Published by BMJ. This is an open access article distributed in accordance with the Creative Commons Attribution 4.0 Unported (CC BY 4.0) license, which permits others to copy, redistribute, remix, transform and build upon this work for any purpose, provided the original work is properly cited, a link to the licence is given, and indication of whether changes were made. See: https://creativecommons.org/licenses/by/4.0/. Minor changes have been made to the formatting.
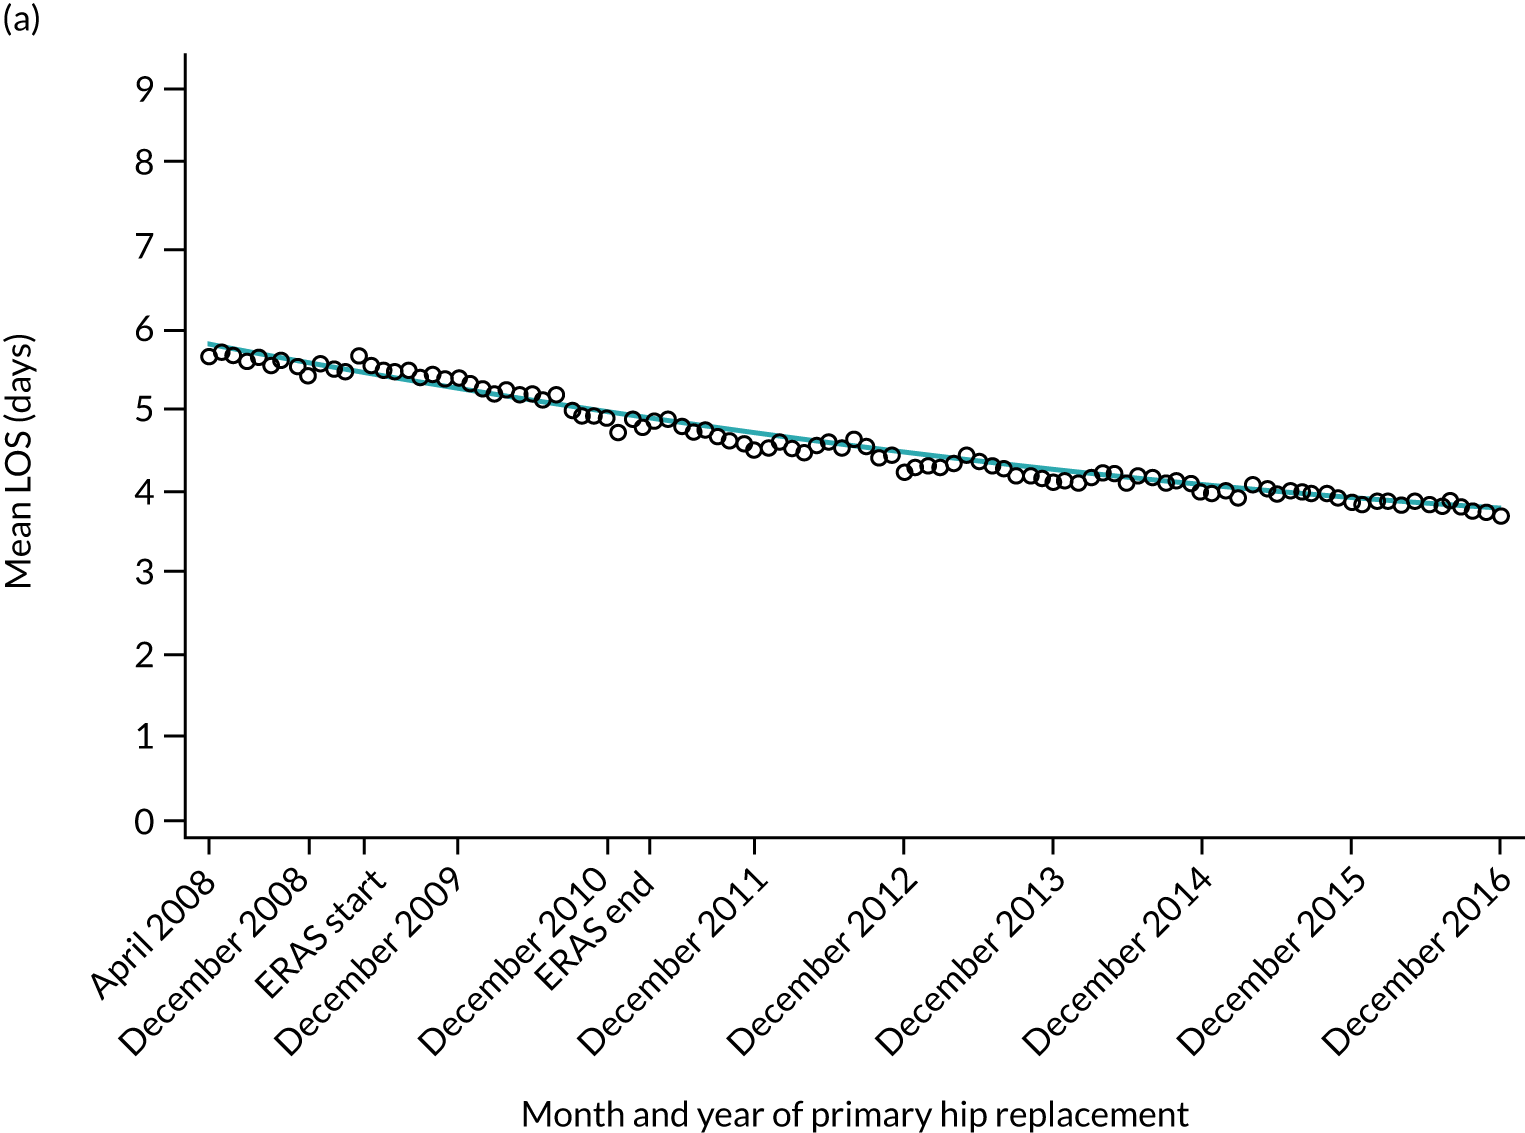

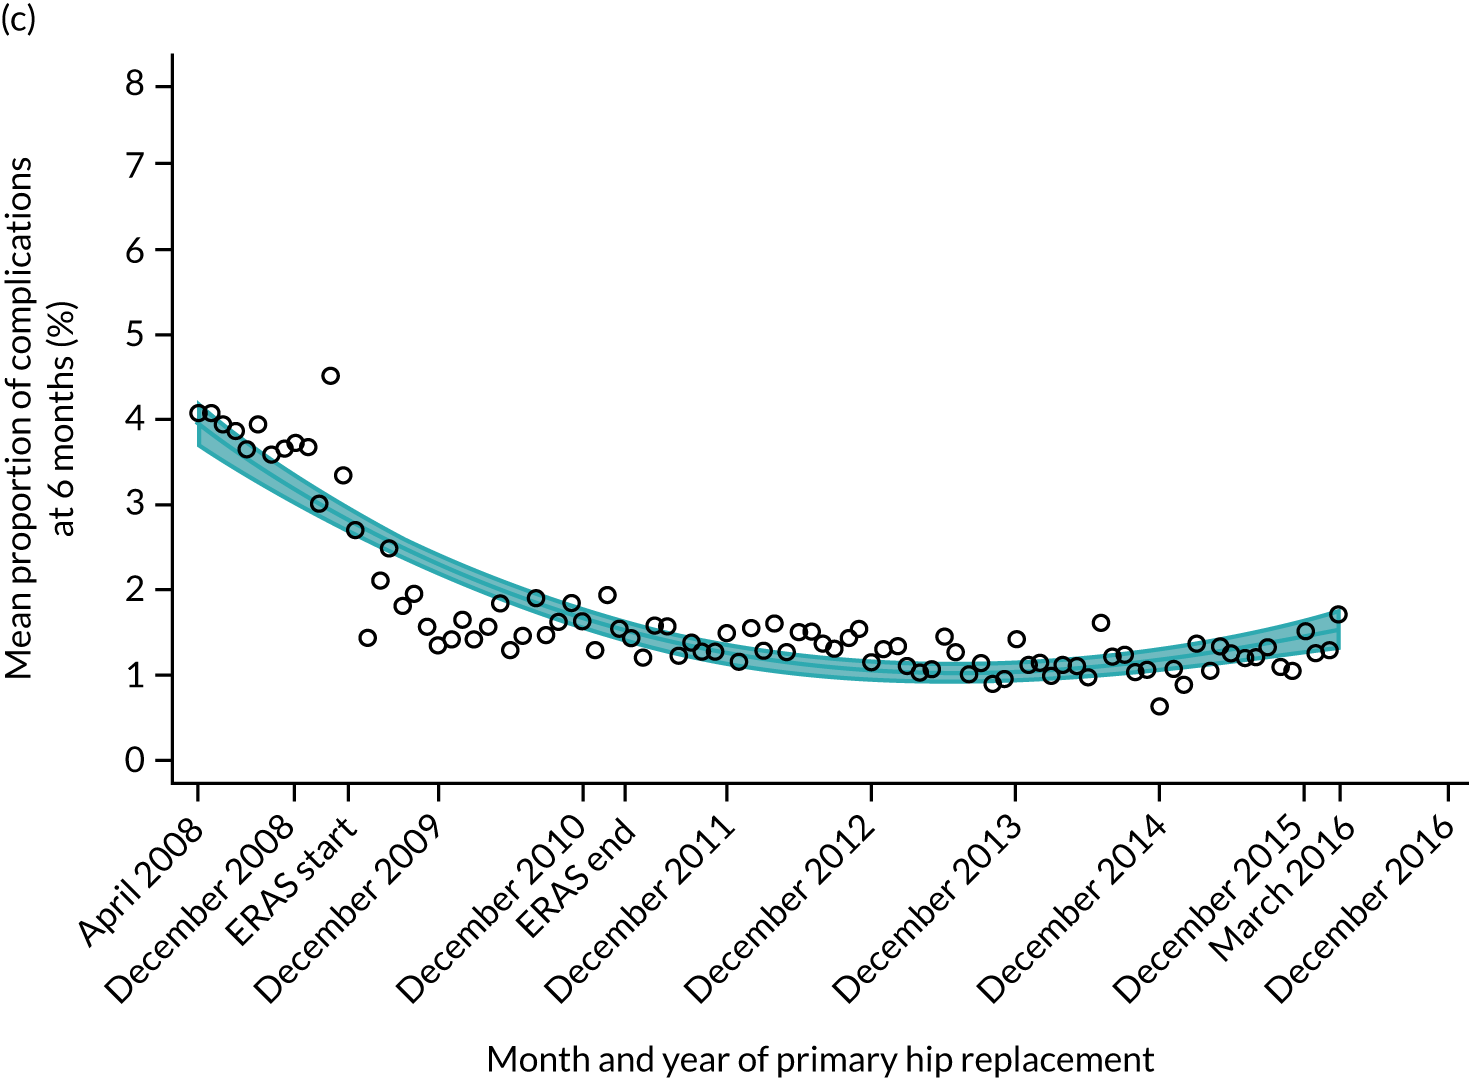
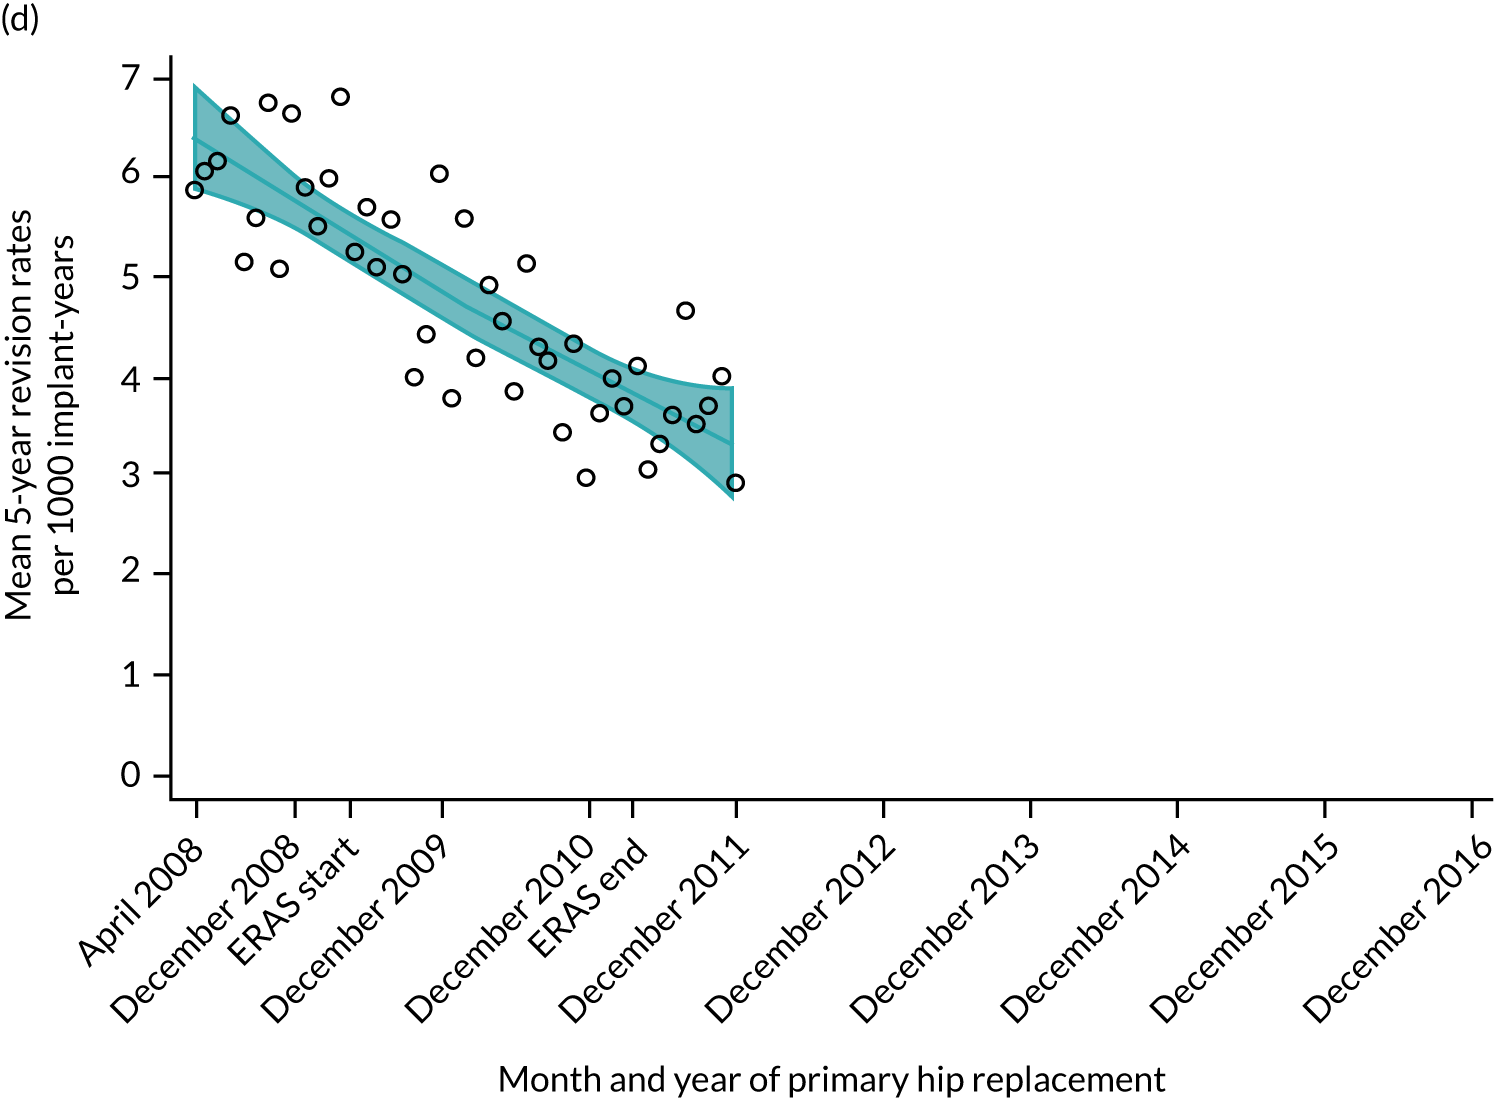
FIGURE 9.
Trends in outcomes following primary TKR/UKR in England, 2008–16, by month. (a) LOS (days); (b) OKS 6 months – OKS baseline; (c) primary knee surgeries with a revision in the following 5 years; and (d) primary TKR/UKR with a complication in the following 6 months. Reproduced from Garriga et al. 66 © The Author(s). This is an Open Access article distributed in accordance with the terms of the Creative Commons Attribution (CC BY-NC-ND 4.0) license, which permits others to share this work, provided the original work is properly cited. See: https://creativecommons.org/licenses/by-nc-nd/4.0/.


| Parameter | Coefficient | 95% CI | p-value |
|---|---|---|---|
| LOS | |||
| Intercept | 5.674 | 5.655 to 5.693 | < 0.001 |
| Monthly trend | –0.020 | –0.023 to –0.017 | < 0.001 |
| Level change ERAS0 | 0.176 | 0.120 to 0.232 | < 0.001 |
| Trend change after ERAS0 | –0.013 | –0.017 to –0.009 | < 0.001 |
| Level change ERASend | –0.102 | –0.203 to –0.001 | 0.049 |
| Trend change after ERASend | 0.019 | 0.015 to 0.022 | < 0.001 |
| OHS 6 months – OHS baseline | |||
| Intercept | 17.063 | 16.896 to 17.230 | < 0.001 |
| Monthly trend | 0.158 | 0.130 to 0.186 | < 0.001 |
| Level change ERAS0 | 0.772 | 0.538 to 1.006 | < 0.001 |
| Trend change after ERAS0 | –0.131 | –0.161 to –0.101 | < 0.001 |
| Level change ERASend | 0.564 | 0.208 to 0.920 | 0.002 |
| Trend change after ERASend | –0.013 | –0.025 to –0.001 | 0.039 |
| Complication by 6 months | |||
| Intercept | 4.044 | 3.465 to 4.624 | < 0.001 |
| Monthly trend | –0.078 | –0.096 to –0.061 | < 0.001 |
| Level change ERAS0 | – | – | – |
| Trend change after ERAS0 | – | – | – |
| Level change ERASend | – | – | – |
| Trend change after ERASend | 0.078 | 0.056 to 0.100 | < 0.001 |
| Revision rates by 5 years | |||
| Intercept | 5.940 | 5.820 to 6.060 | < 0.001 |
| Monthly trend | – | – | – |
| Level change ERAS0 | – | – | – |
| Trend change after ERAS0 | –0.098 | –0.105 to –0.090 | < 0.001 |
| Level change ERASend | – | – | – |
| Trend change after ERASend | 0.103 | 0.068 to 0.139 | < 0.001 |
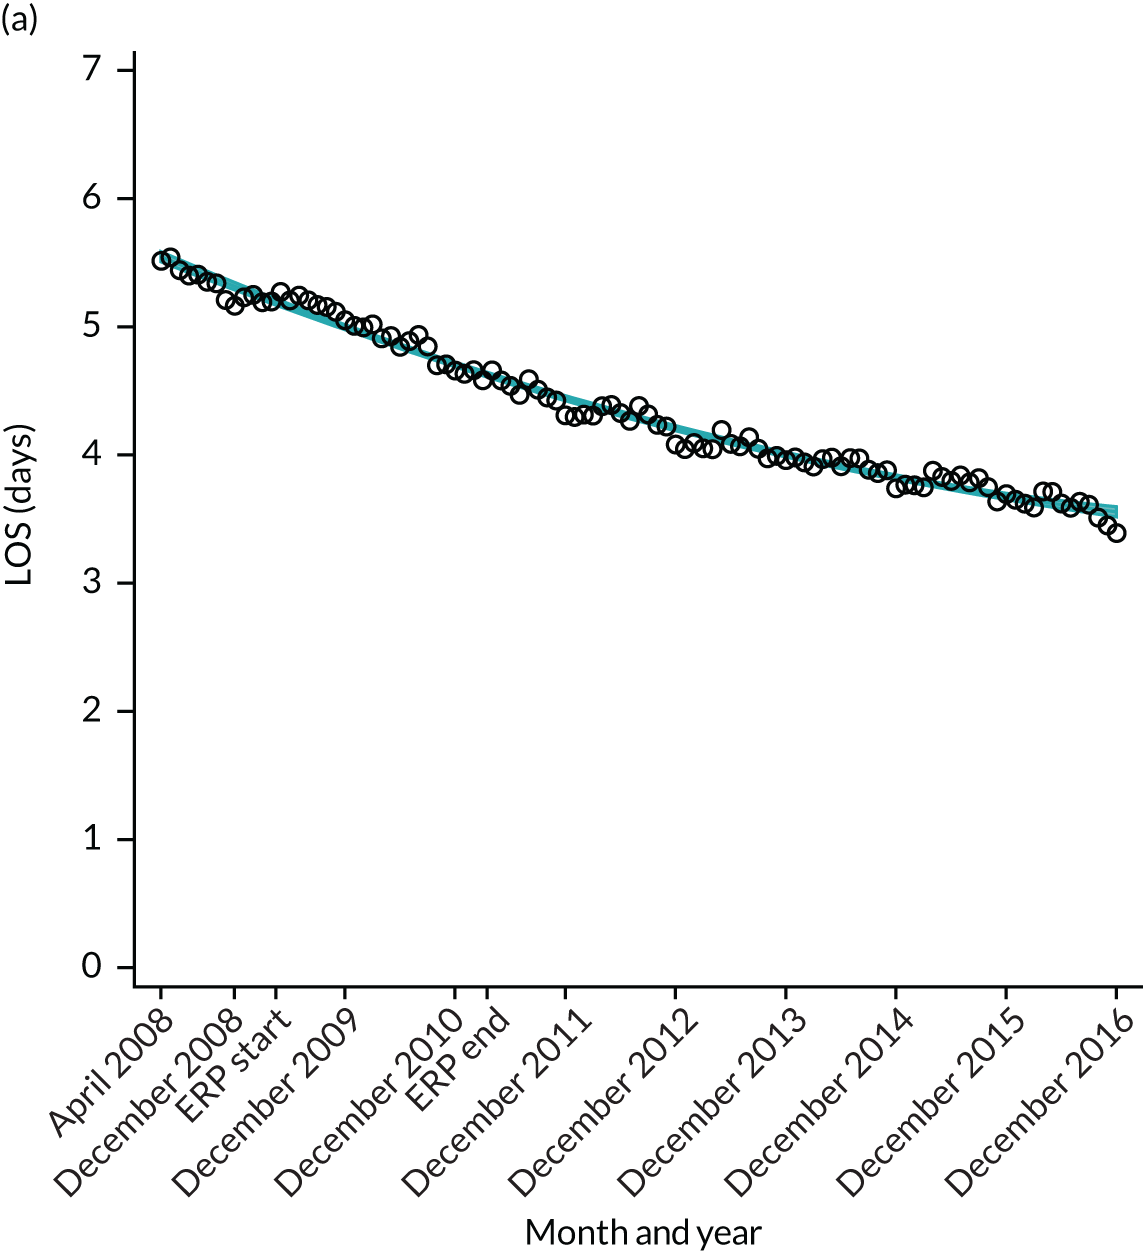
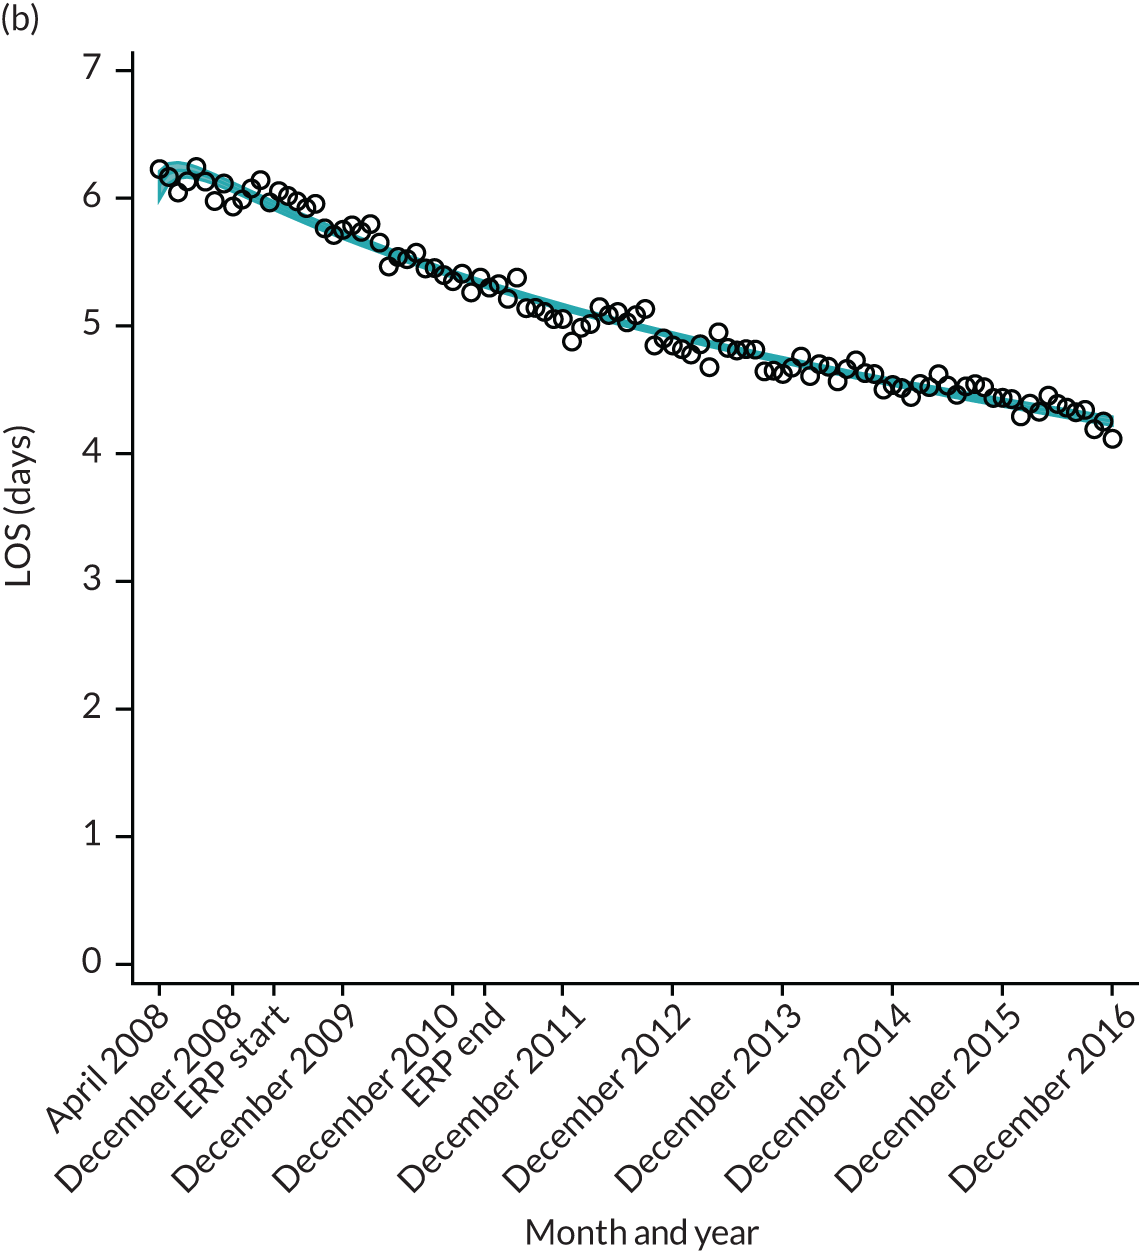
Although older patients had a longer LOS, the secular trends in decreasing LOS were observed across all age groups (e.g. for THR, 4.7 days to 3.0 days in those aged 18–59 years; and 8.1 days to 5.3 days in those aged ≥ 85) (Figures 10 and 11). Secular trends also decreased in patients with and without pre-existing comorbidity (Figures 12 and 13).
FIGURE 10.
Trends of LOS at hospital following primary hip replacement according to age categories in England, 2008–16, by month. (a) All ages; (b) 18–59 years; (c) 60–69 years; (d) 70–79 years; (e) 80–84 years; and (f) ≥ 85 years. ERP implemented in England from April 2009 to March 2011. Reproduced from Garriga et al. 65 © Author(s) (or their employer(s)) 2019. Re-use permitted under CC BY. Published by BMJ. This is an open access article distributed in accordance with the Creative Commons Attribution 4.0 Unported (CC BY 4.0) license, which permits others to copy, redistribute, remix, transform and build upon this work for any purpose, provided the original work is properly cited, a link to the licence is given, and indication of whether changes were made. See: https://creativecommons.org/licenses/by/4.0/. Minor changes have been made to the formatting.
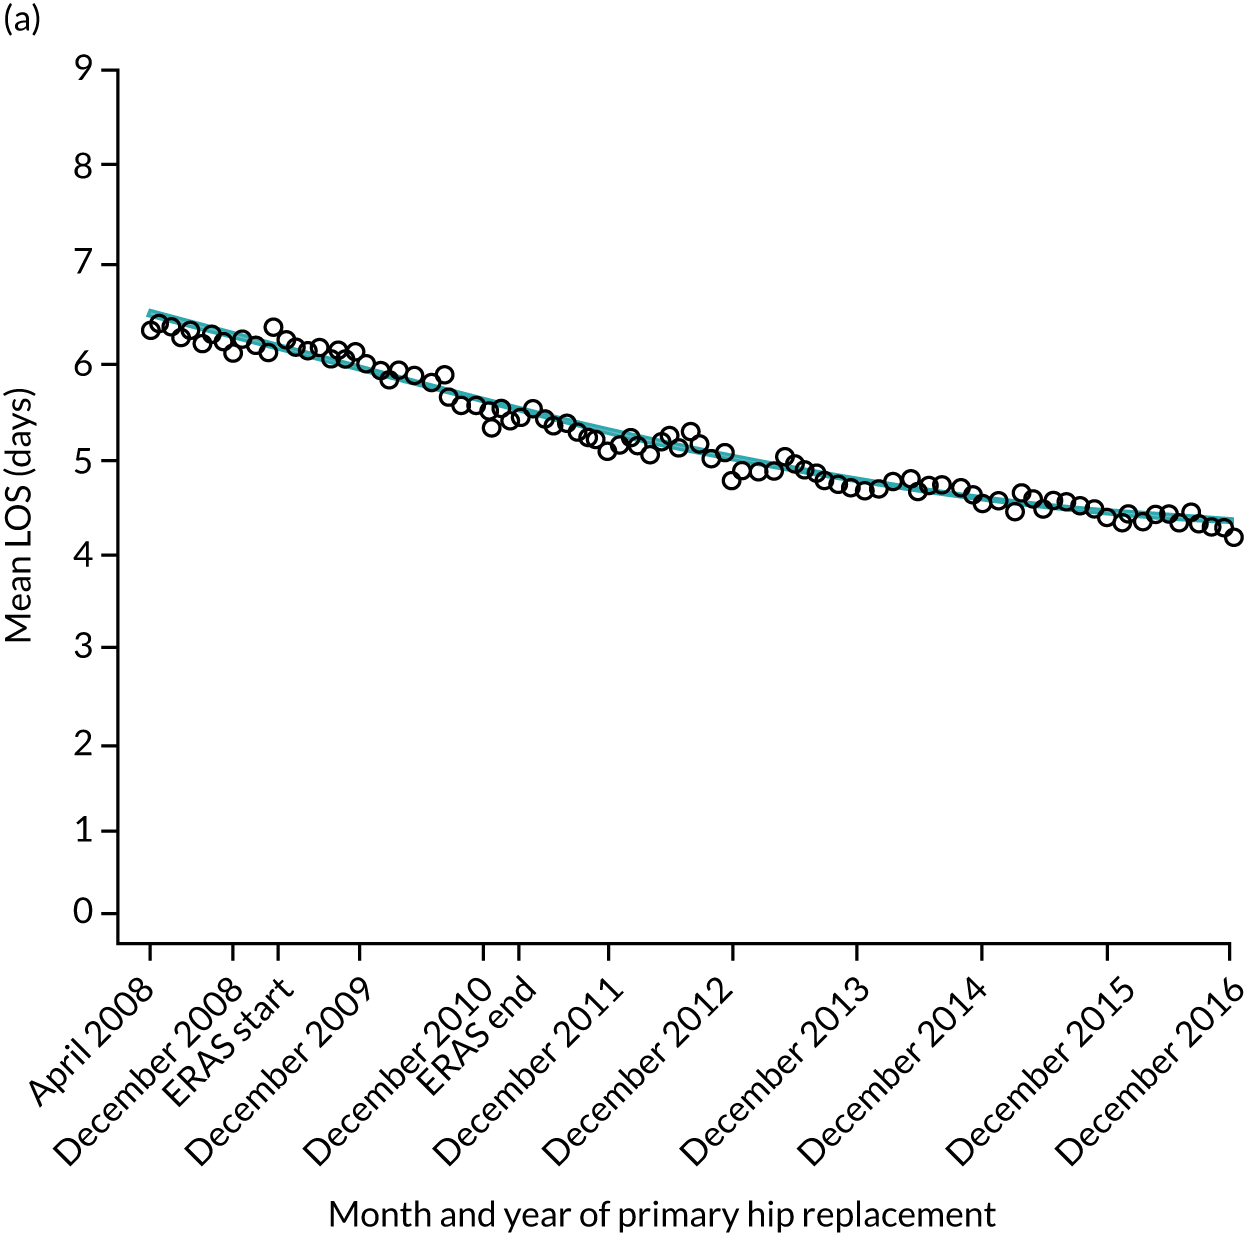

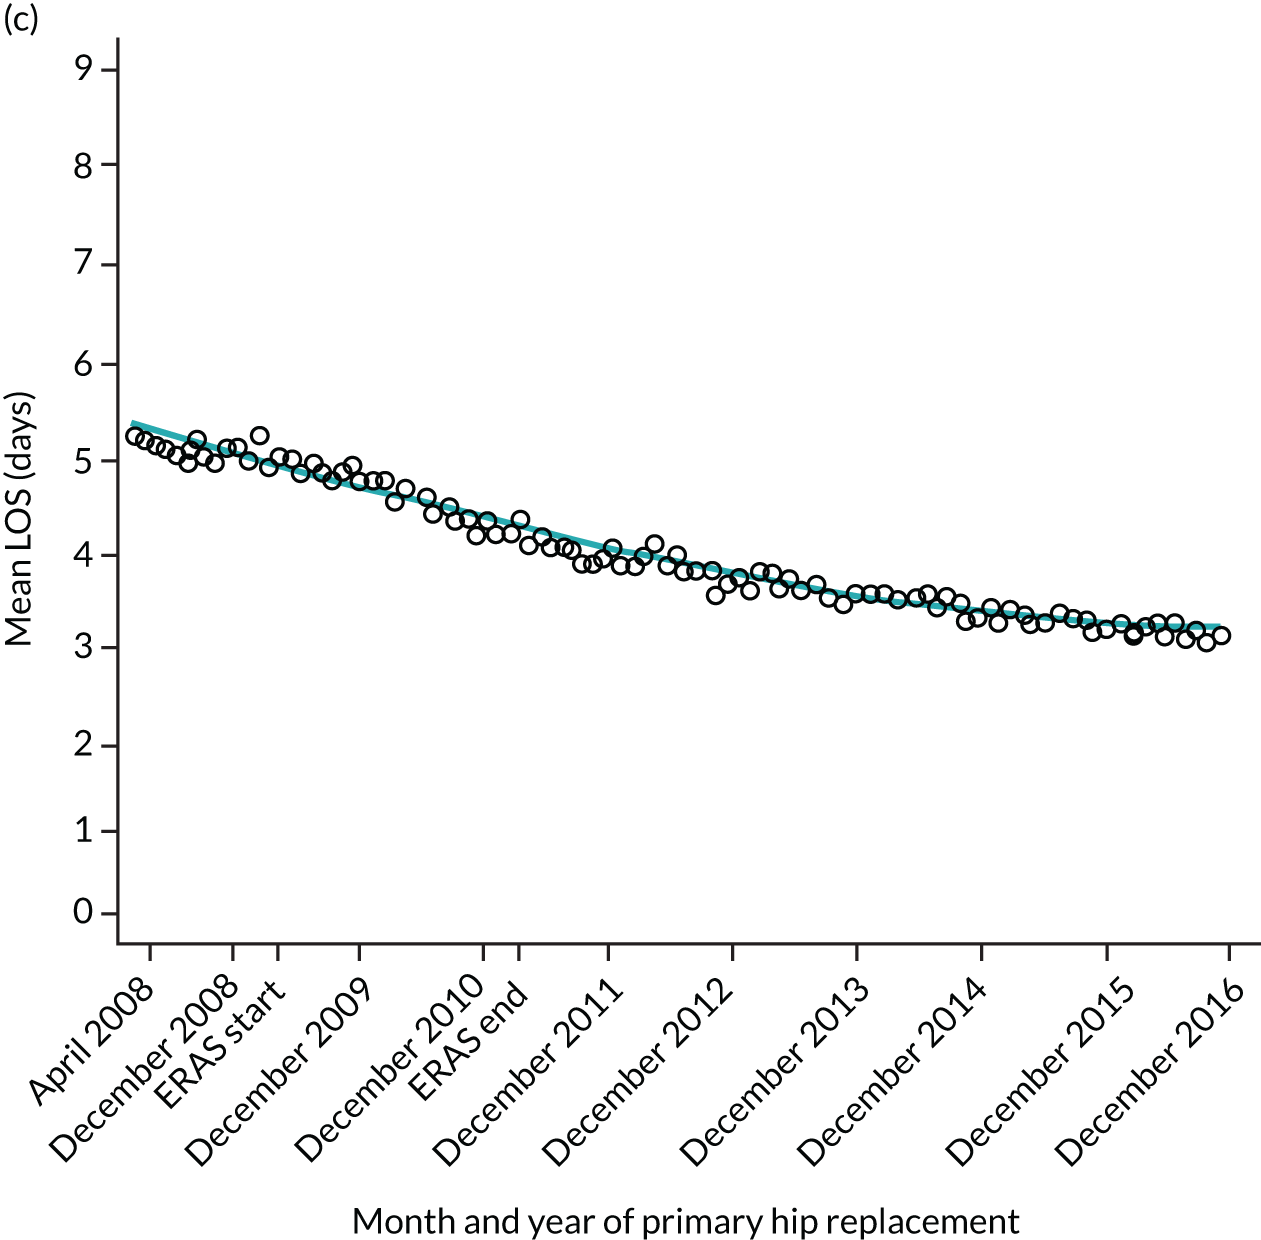
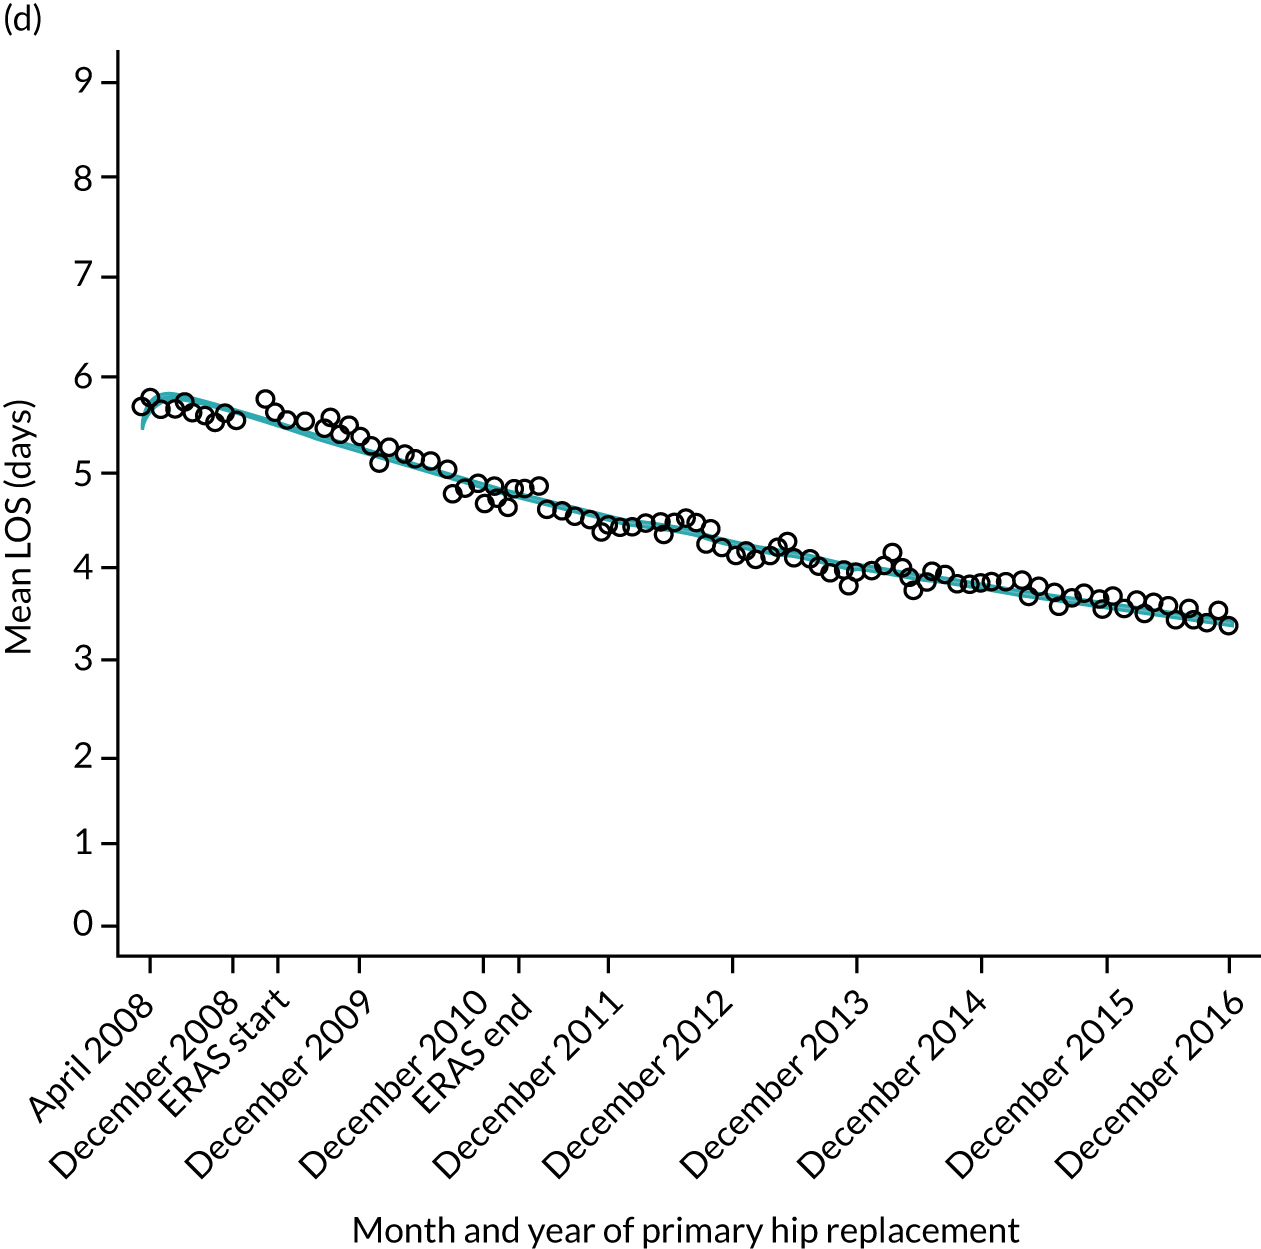
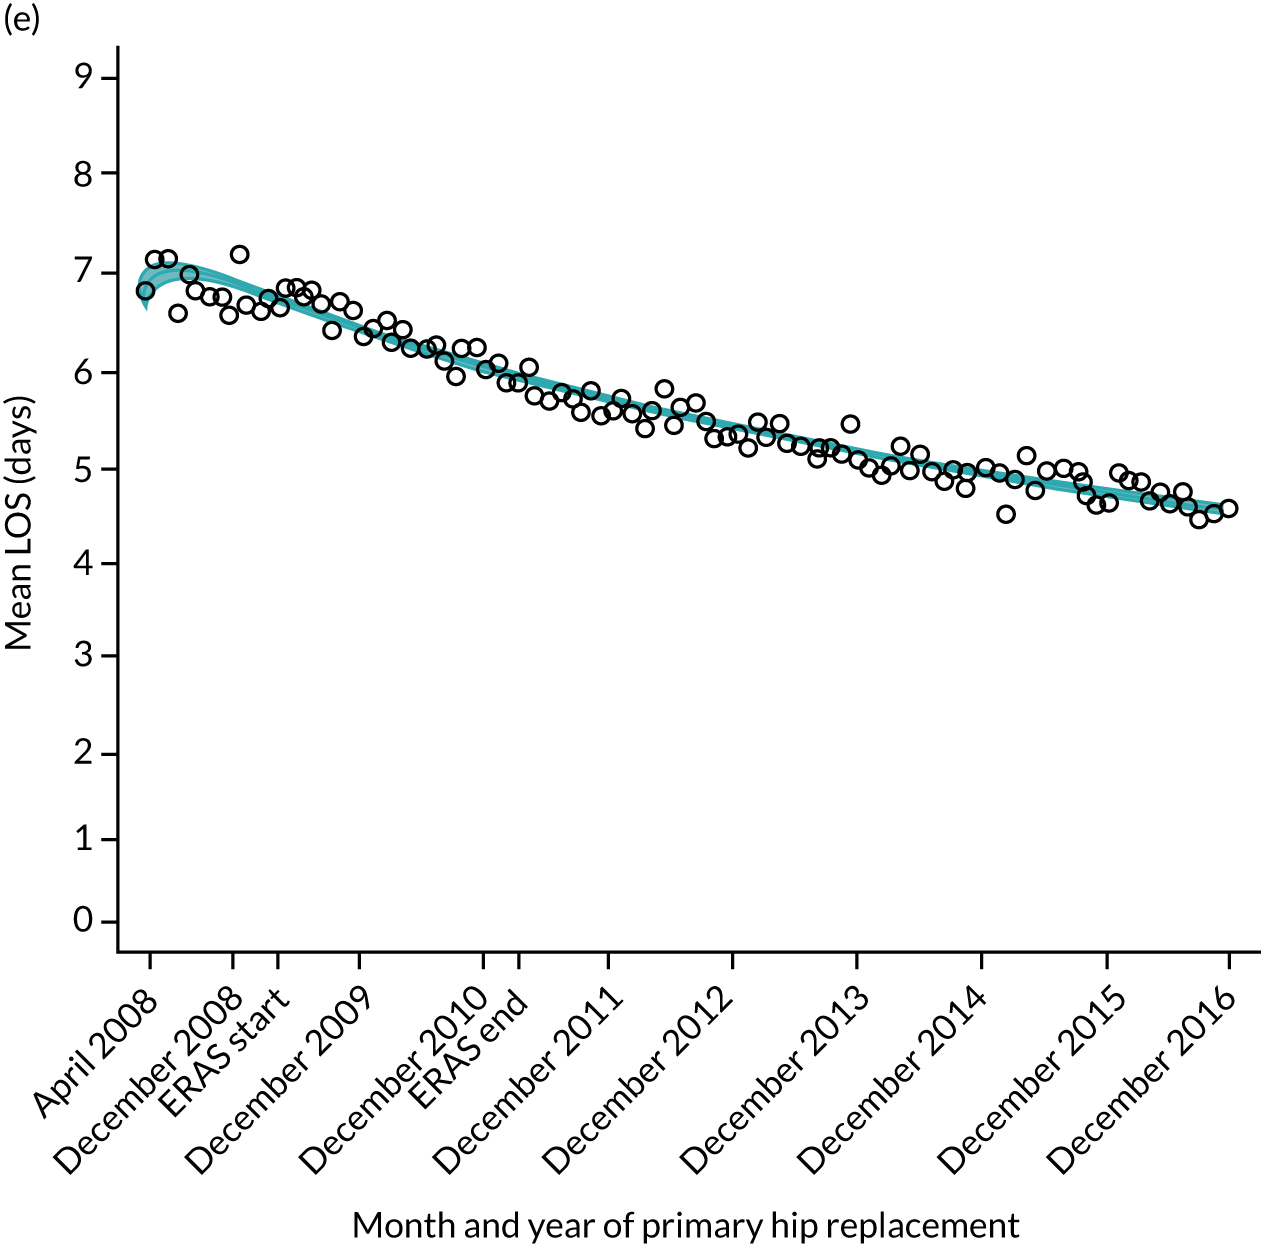
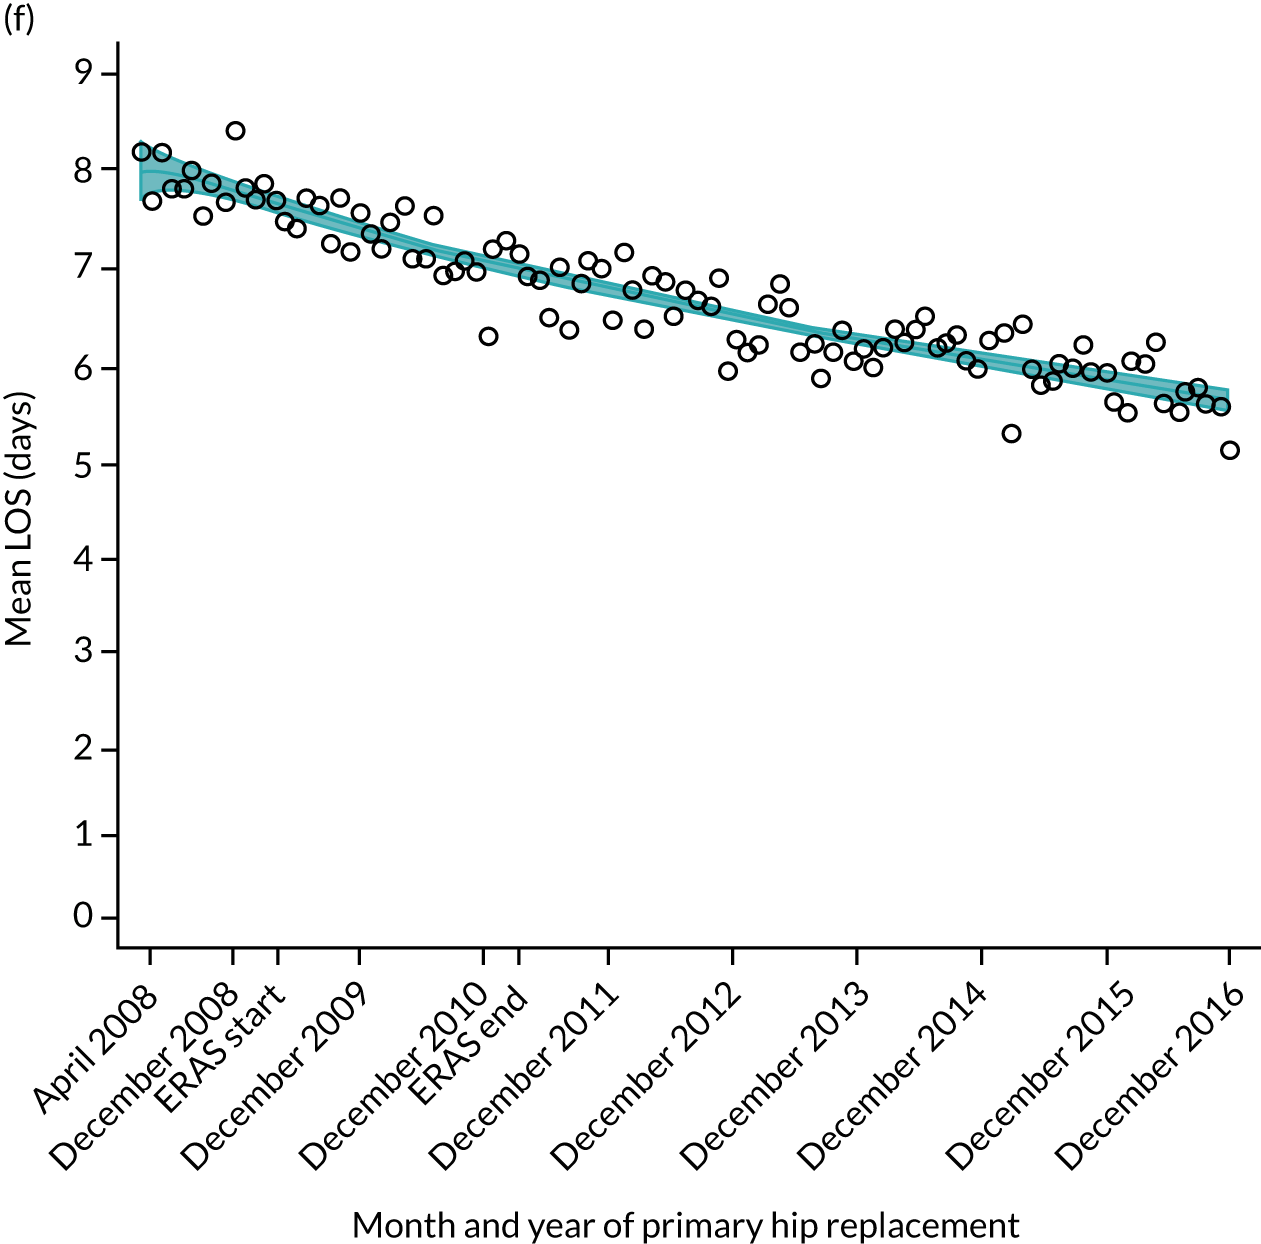
FIGURE 11.
Trends of LOS at hospital after primary TKR/UKR according to age categories in England, 2008–16. (a) All ages; (b) 18–59 years; (c) 60–69 years; (d) 70–79 years; (e) 80–84 years; and (f) ≥ 85 years. ERAS programme implemented in England from April 2009 to March 2011. Reproduced from Garriga et al. 66 © The Author(s). This is an Open Access article distributed in accordance with the terms of the Creative Commons Attribution (CC BY-NC-ND 4.0) license, which permits others to share this work, provided the original work is properly cited. See: https://creativecommons.org/licenses/by-nc-nd/4.0/.
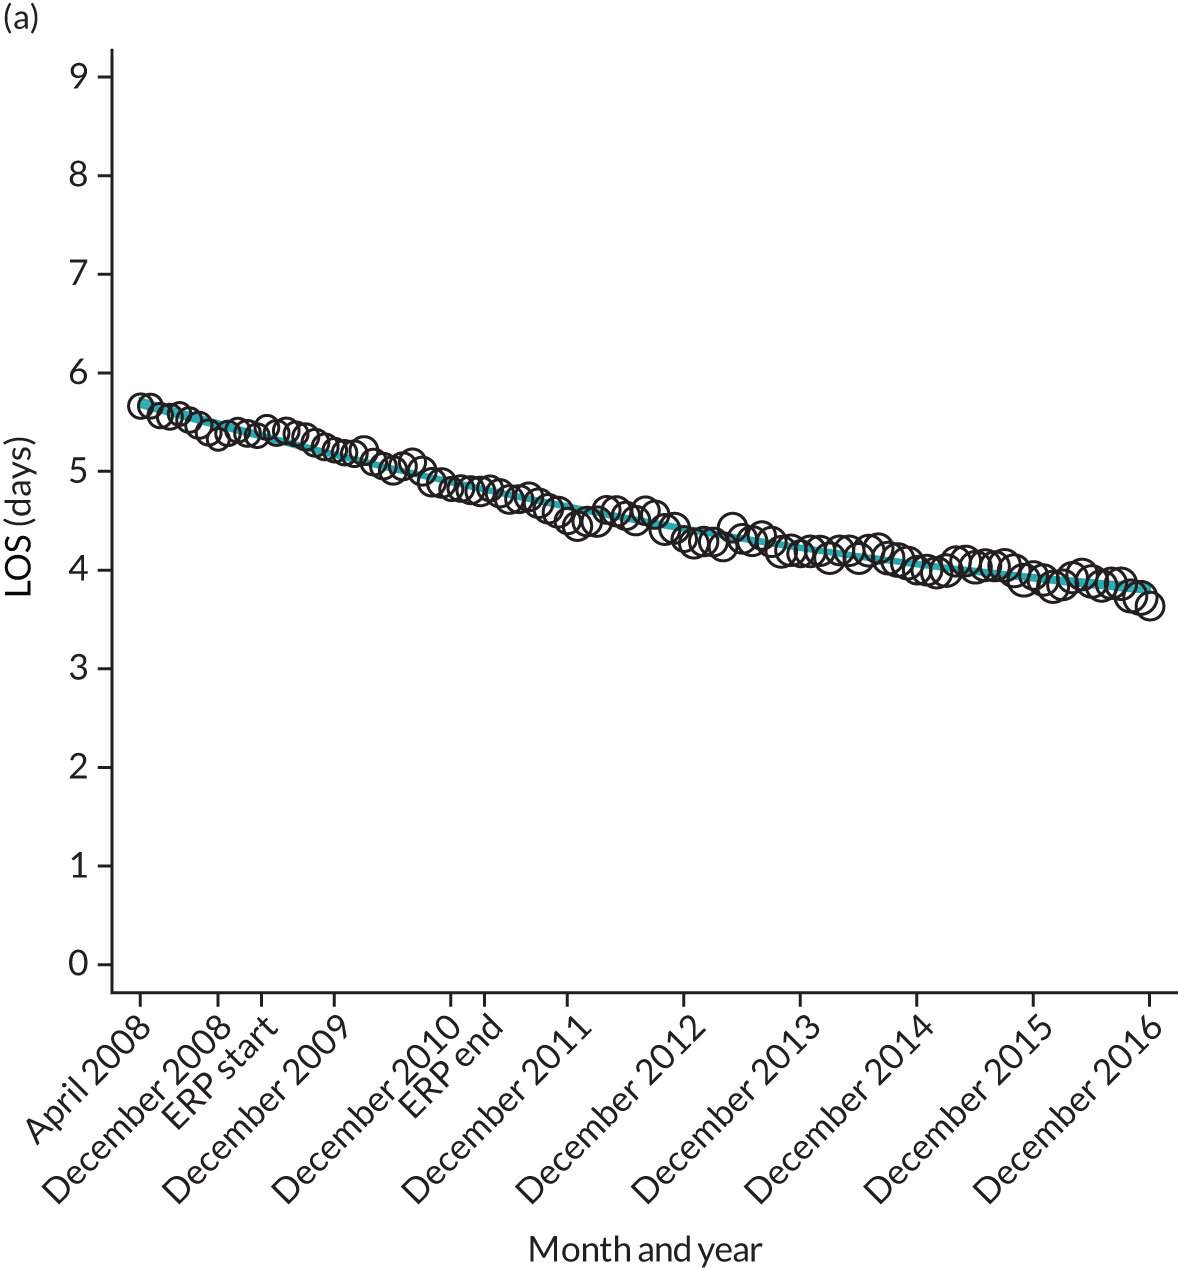
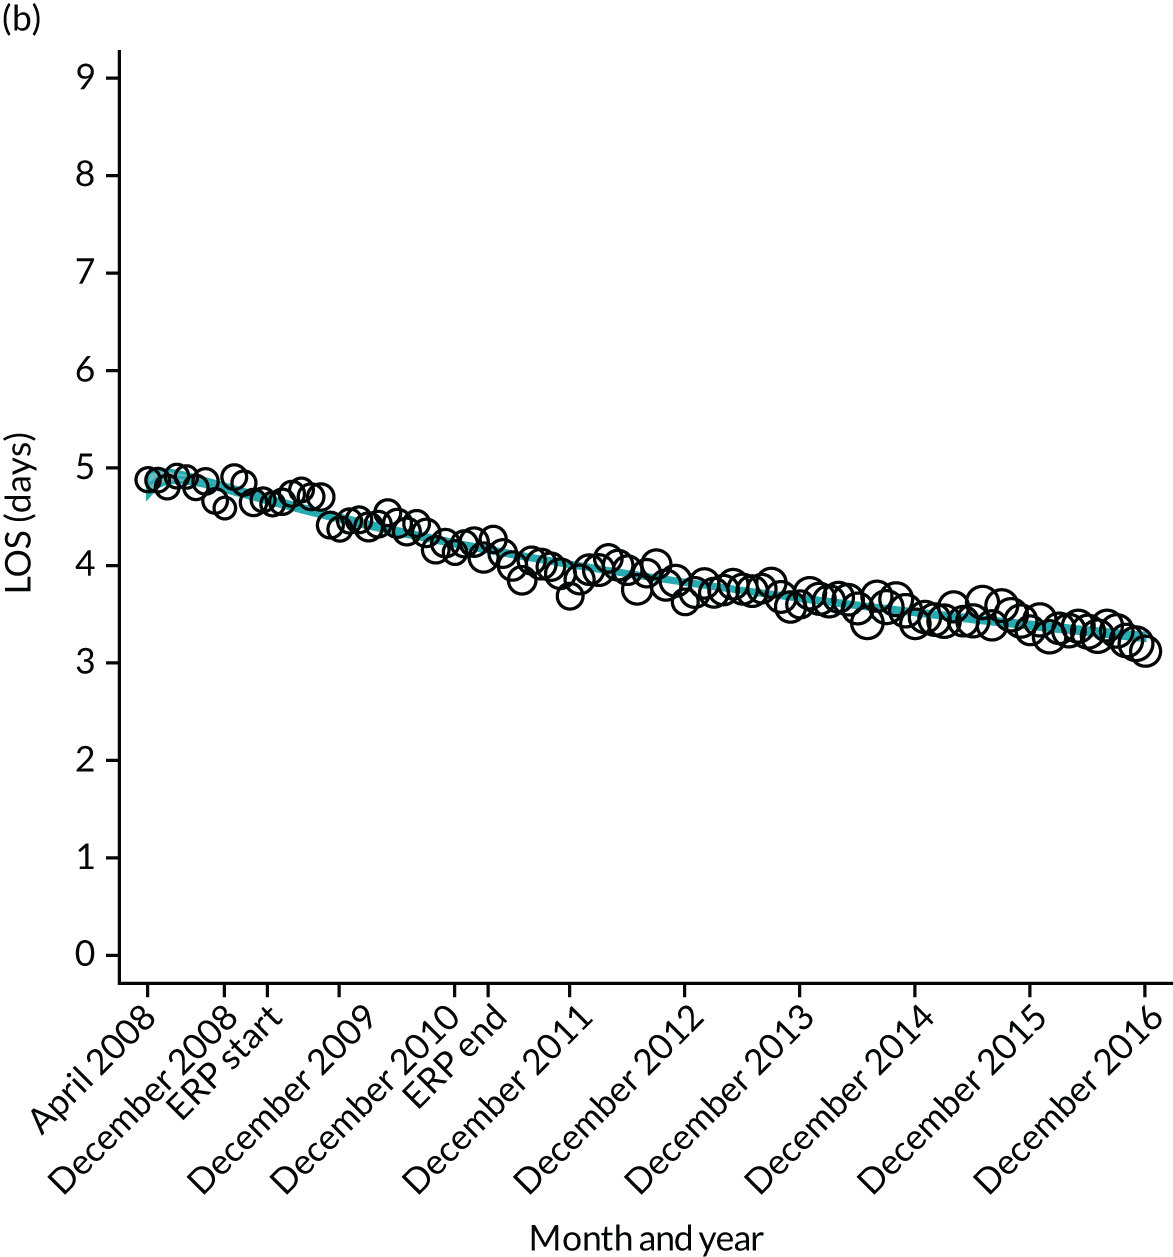
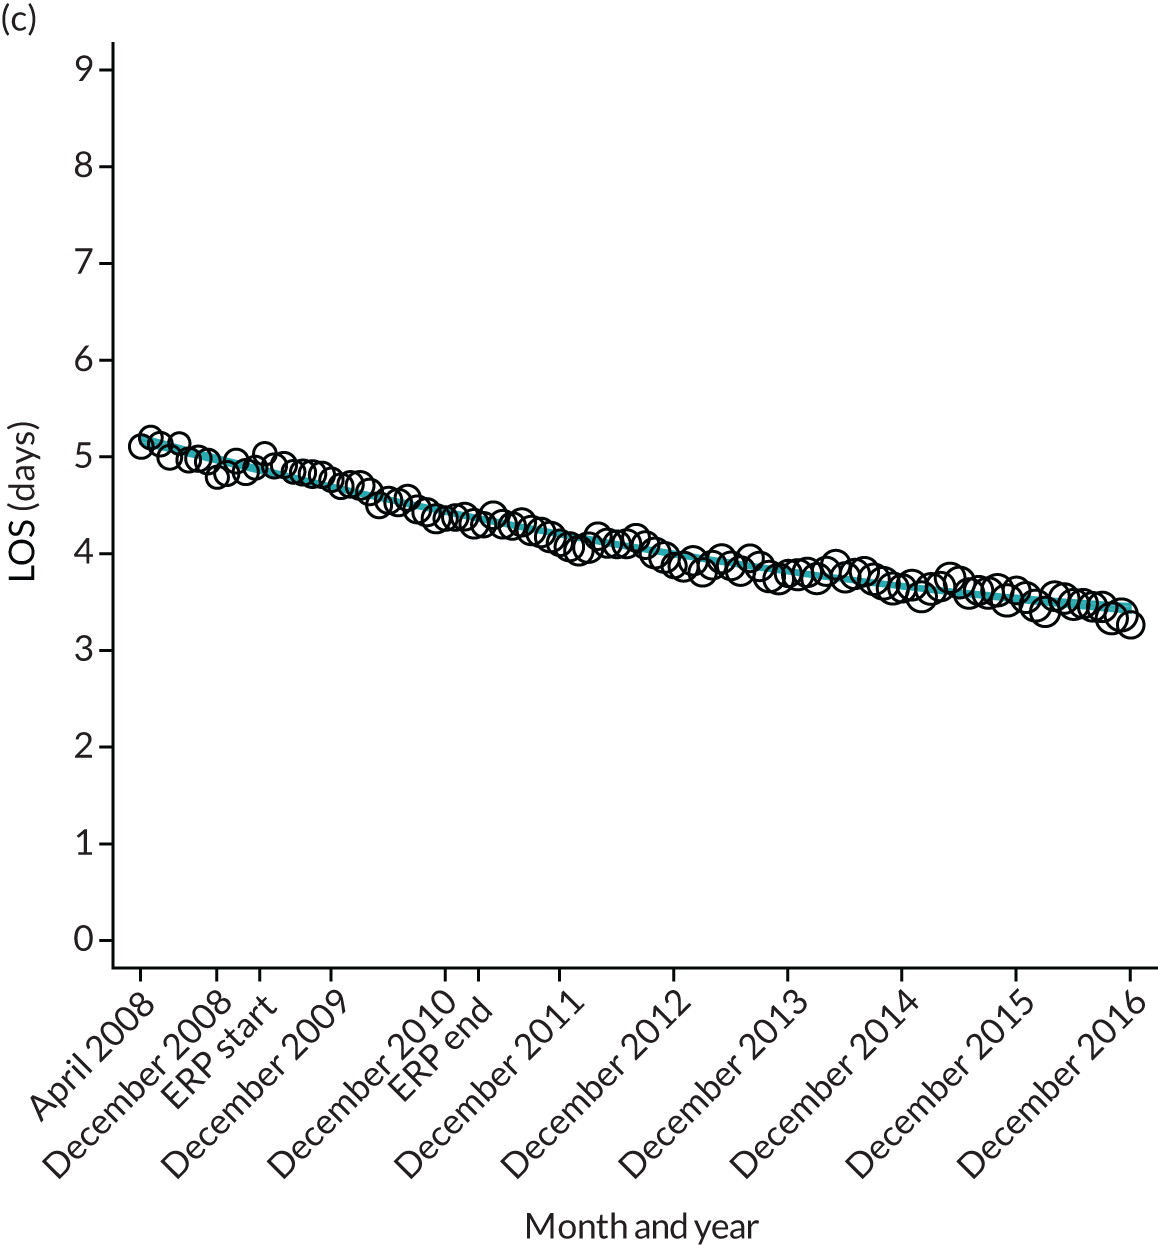
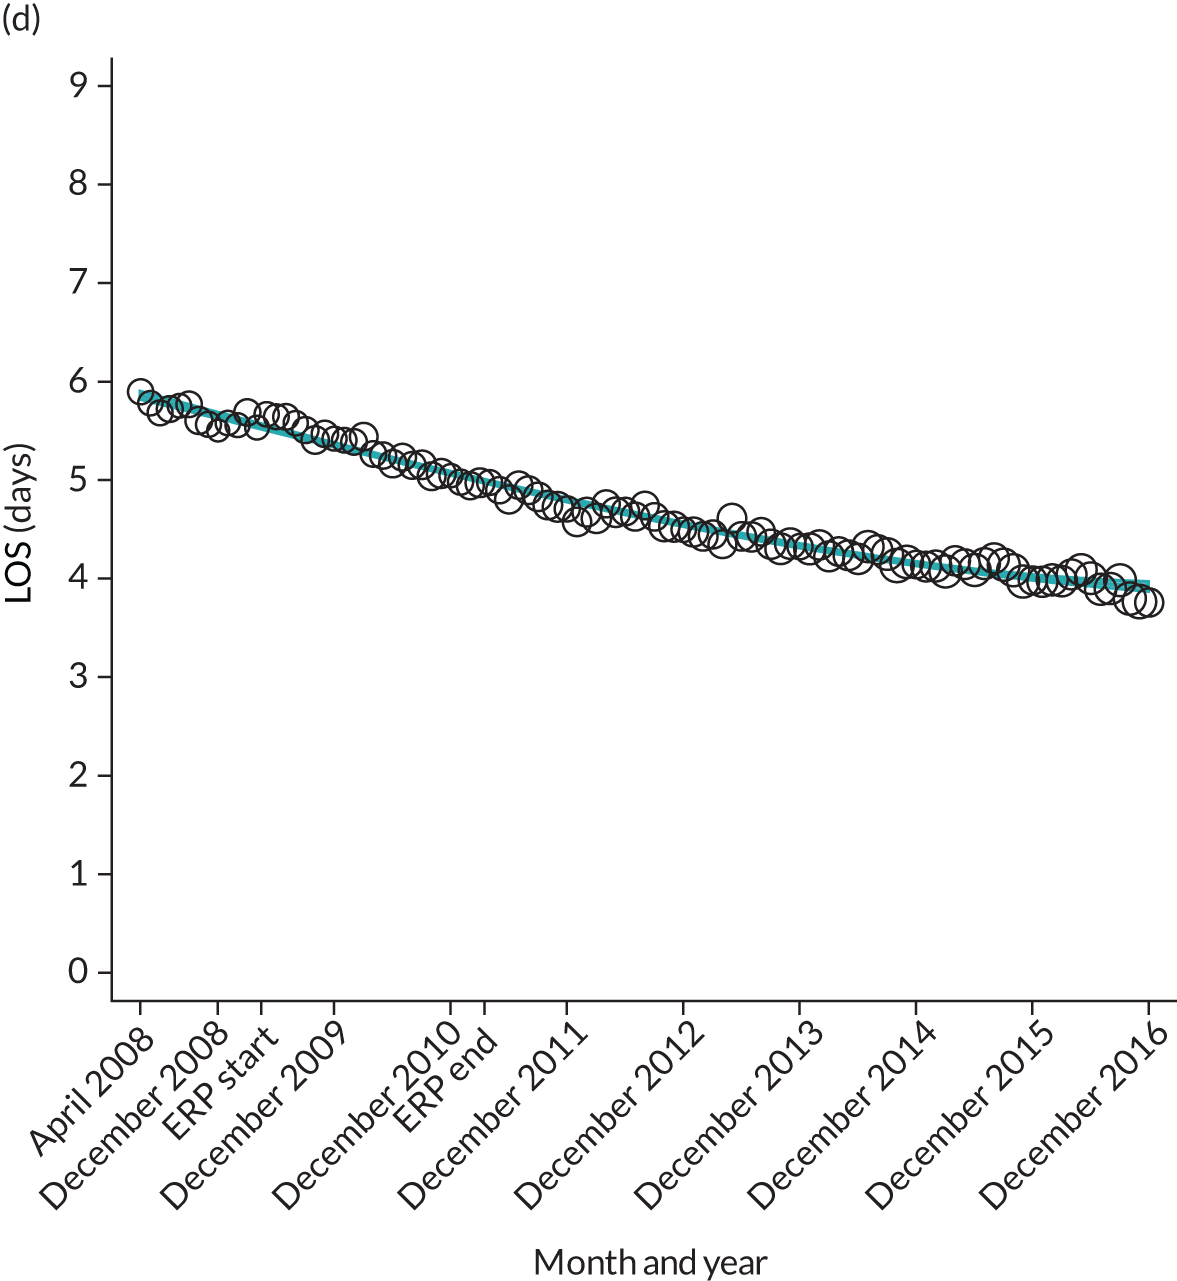
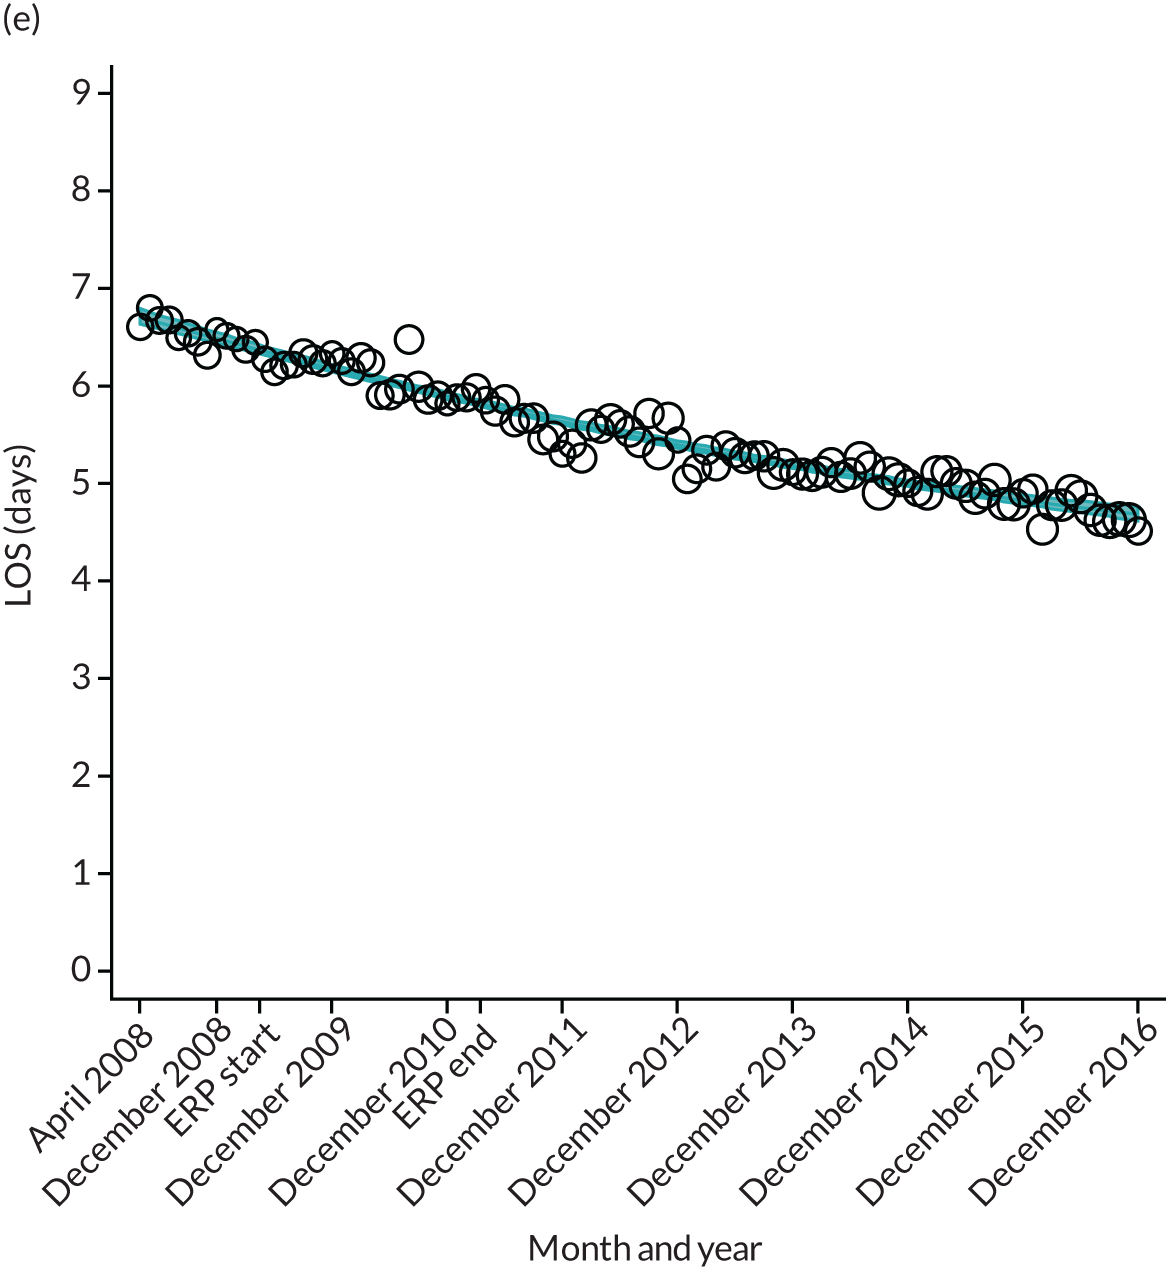

FIGURE 12.
Trends of LOS at hospital following primary hip replacement by patients with/without comorbidities in England, 2008–16, by month. (a) Without comorbidities; and (b) one or more comorbidities. ERP implemented in England from April 2009 to March 2011. Reproduced from Garriga et al. 65 © Author(s) (or their employer(s)) 2019. Re-use permitted under CC BY. Published by BMJ. This is an open access article distributed in accordance with the Creative Commons Attribution 4.0 Unported (CC BY 4.0) license, which permits others to copy, redistribute, remix, transform and build upon this work for any purpose, provided the original work is properly cited, a link to the licence is given, and indication of whether changes were made. See: https://creativecommons.org/licenses/by/4.0/. Minor changes have been made to the formatting.
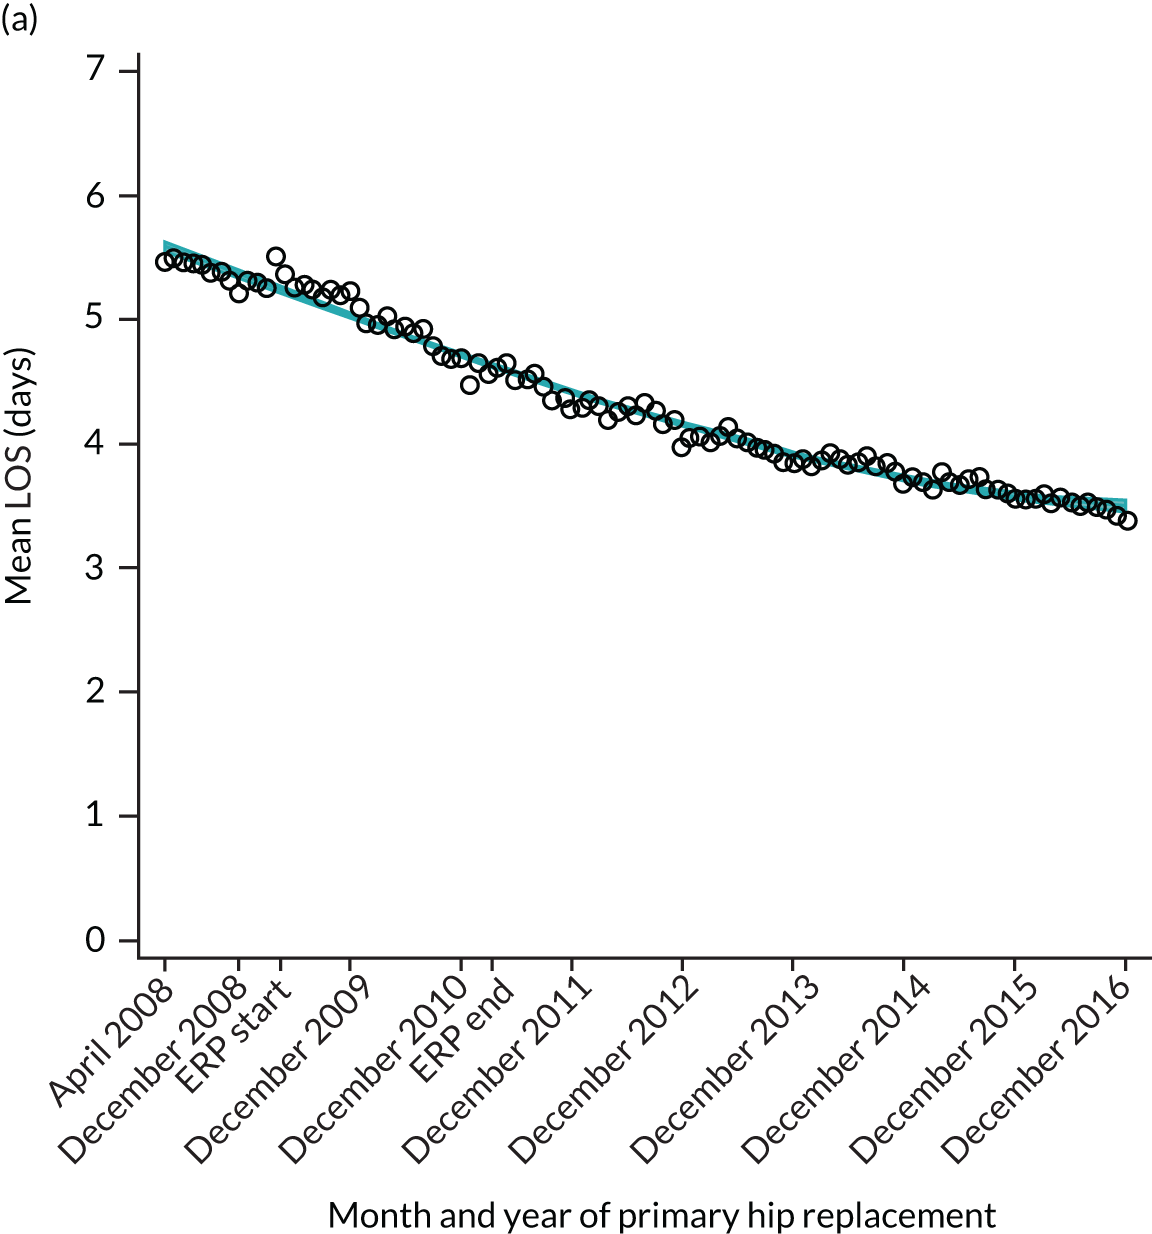
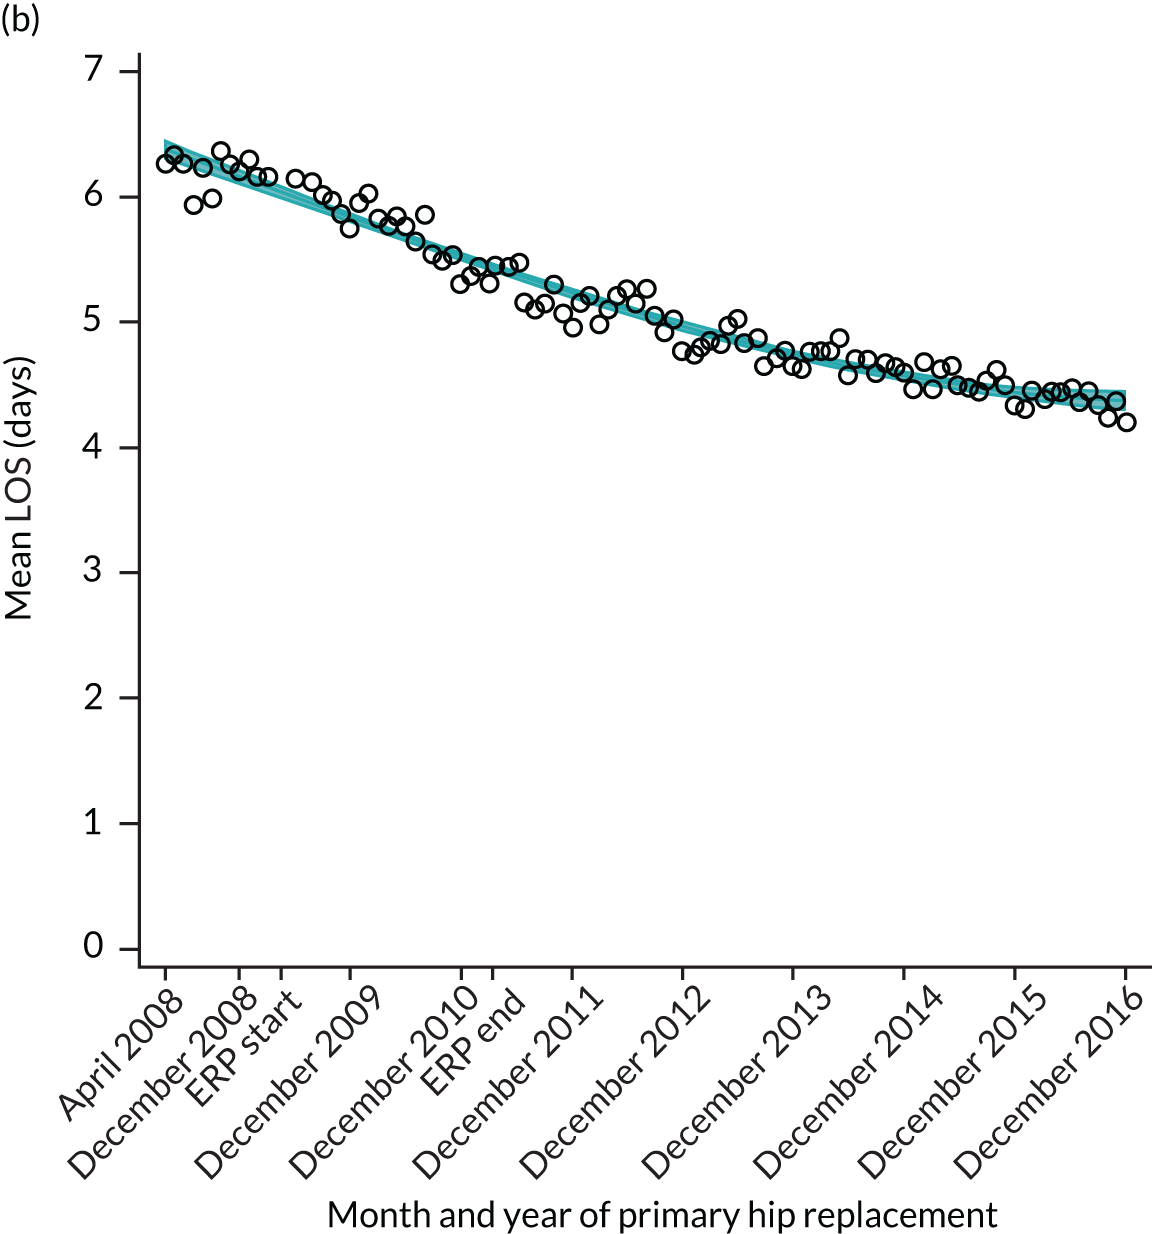
FIGURE 13.
Trends of LOS at hospital after primary TKR/UKR by patients with/without comorbidities in England, 2008–16. (a) Without comorbidities; and (b) one or more comorbidities. Reproduced from Garriga et al. 66 © The Author(s). This is an Open Access article distributed in accordance with the terms of the Creative Commons Attribution (CC BY-NC-ND 4.0) license, which permits others to share this work, provided the original work is properly cited. See: https://creativecommons.org/licenses/by-nc-nd/4.0/.
Oxford Hip Score and Oxford Knee Score change
Over the study period, there was an improvement in PROMs, with an increment in OHS 6 months after surgery of 17.7 points in April 2008 to 22.9 points in December 2016 for THR (see Figure 8). For TKR, there was an increment in OHS 6 months after surgery of 15.0 points in April 2008 to 17.1 points in December 2016 (see Figure 9). This secular trend was seen in patients with and without comorbidities, and in all age groups except in those aged ≥ 85 years, for whom the change in OHS and OKS was stable over the time period (Figures 14–17).
FIGURE 14.
Trends of OHS change following primary hip replacement according to age categories in England, 2008–16, by month. (a) All ages; (b) 18–59 years; (c) 60–69 years; (d) 70–79 years; (e) 80–84 years; and (f) ≥ 85 years. Reproduced from Garriga et al. 65 © Author(s) (or their employer(s)) 2019. Re-use permitted under CC BY. Published by BMJ. This is an open access article distributed in accordance with the Creative Commons Attribution 4.0 Unported (CC BY 4.0) license, which permits others to copy, redistribute, remix, transform and build upon this work for any purpose, provided the original work is properly cited, a link to the licence is given, and indication of whether changes were made. See: https://creativecommons.org/licenses/by/4.0/. Minor changes have been made to the formatting.
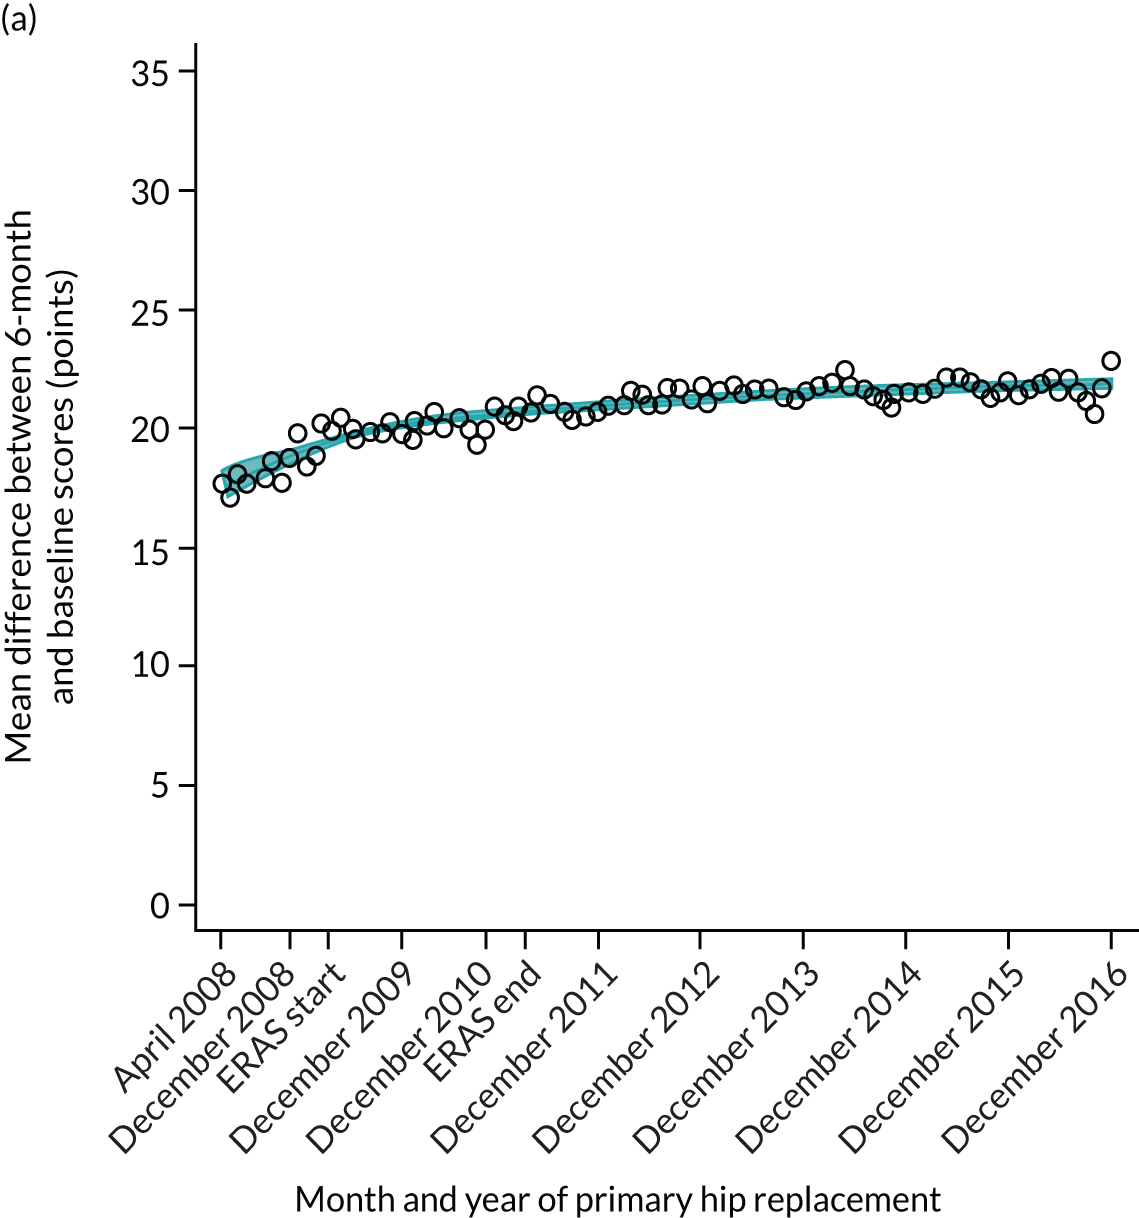
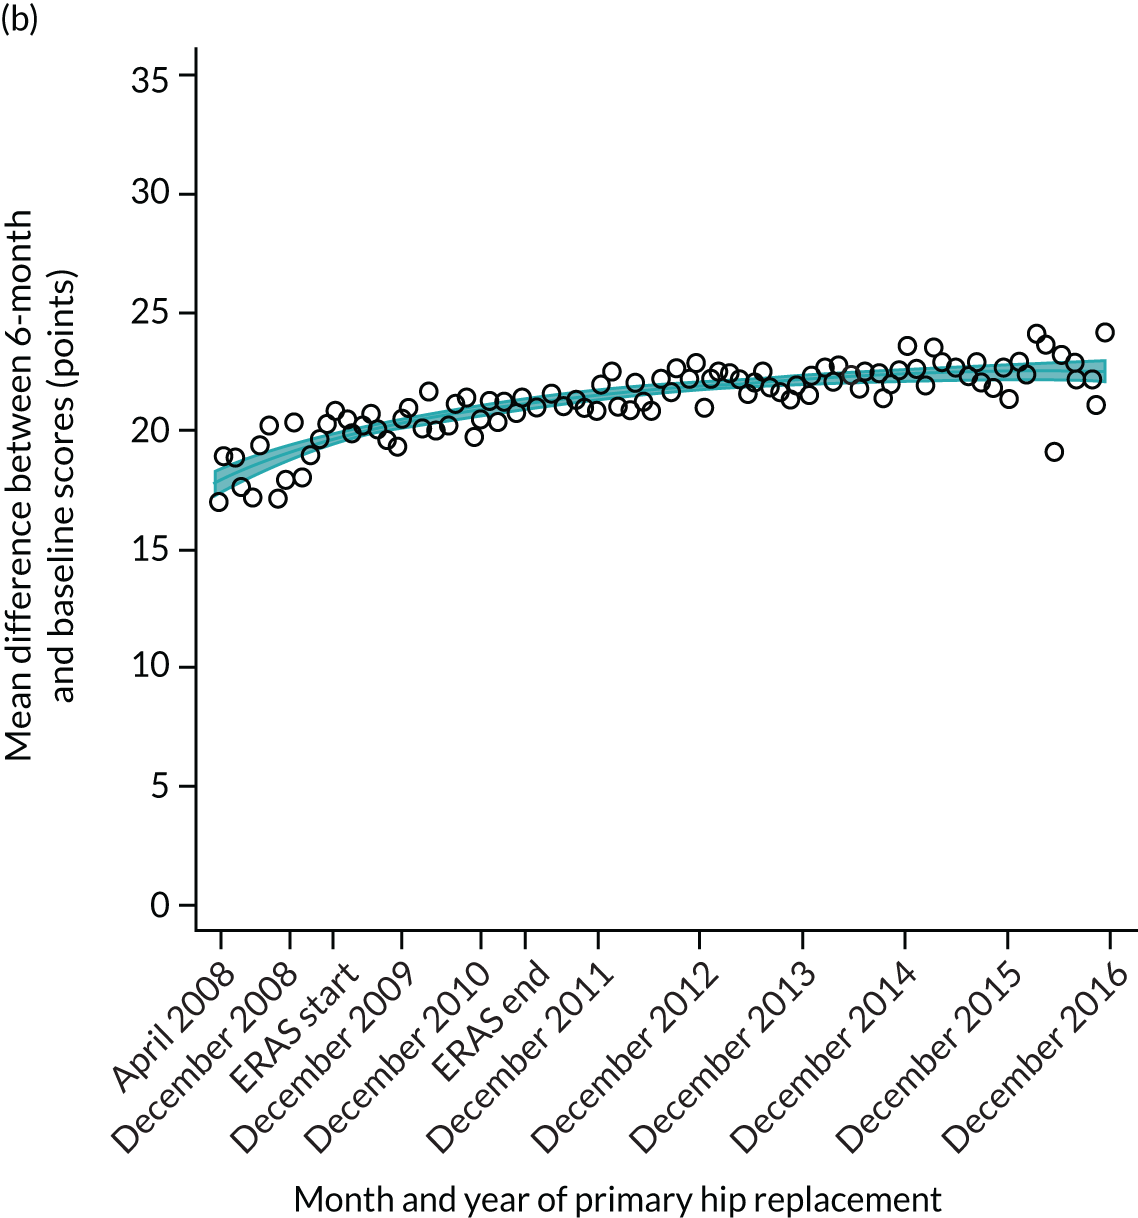
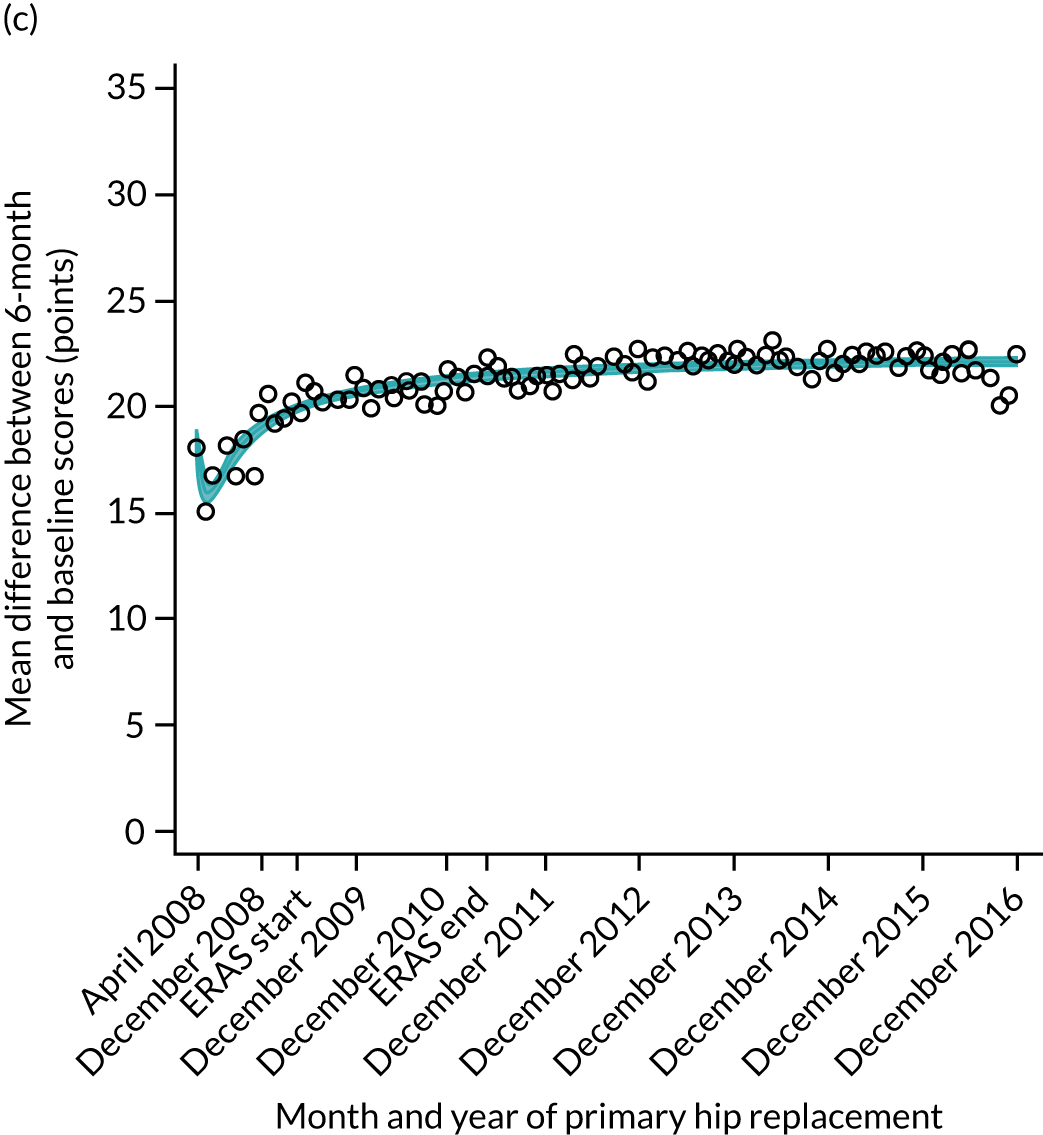
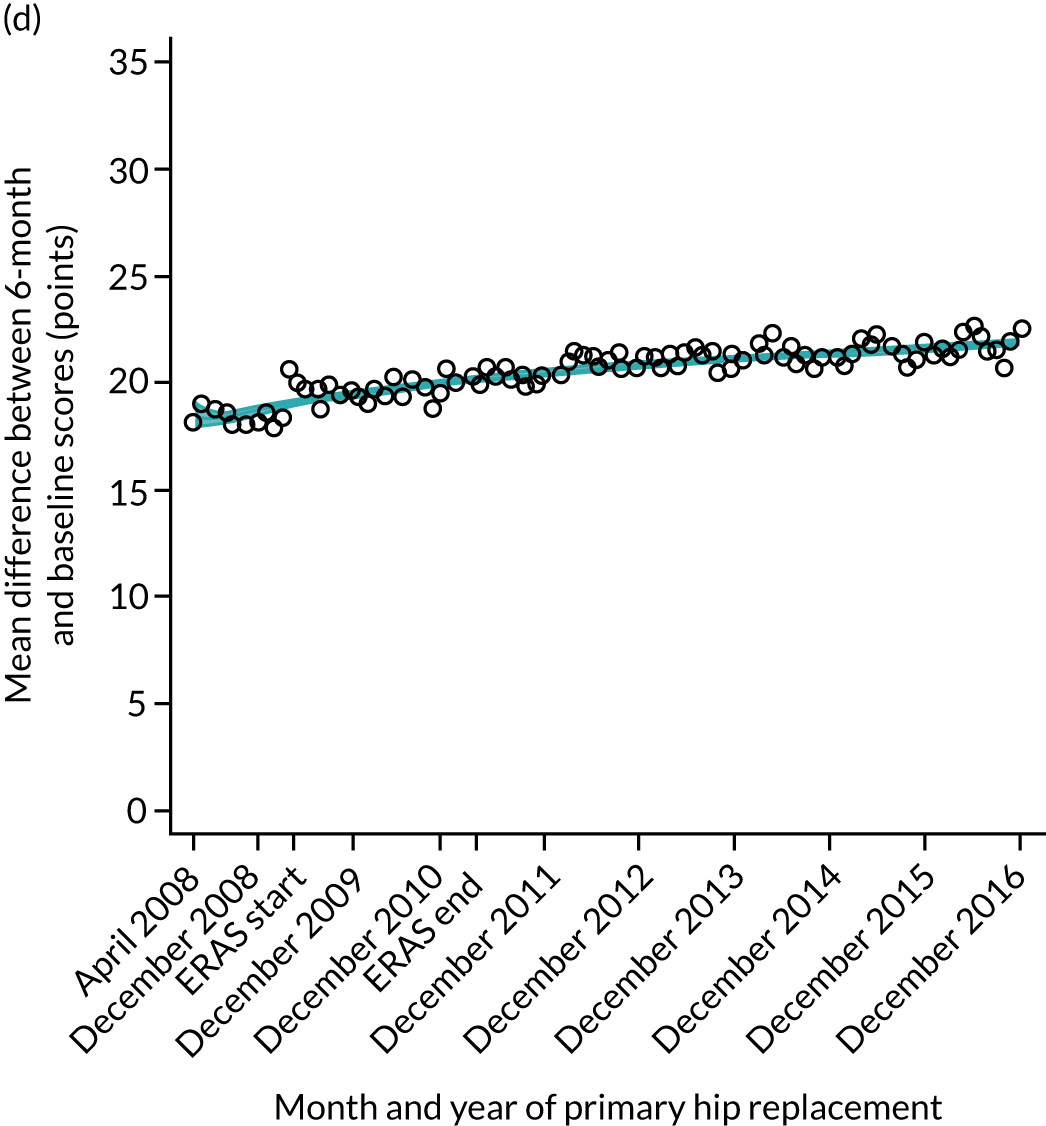
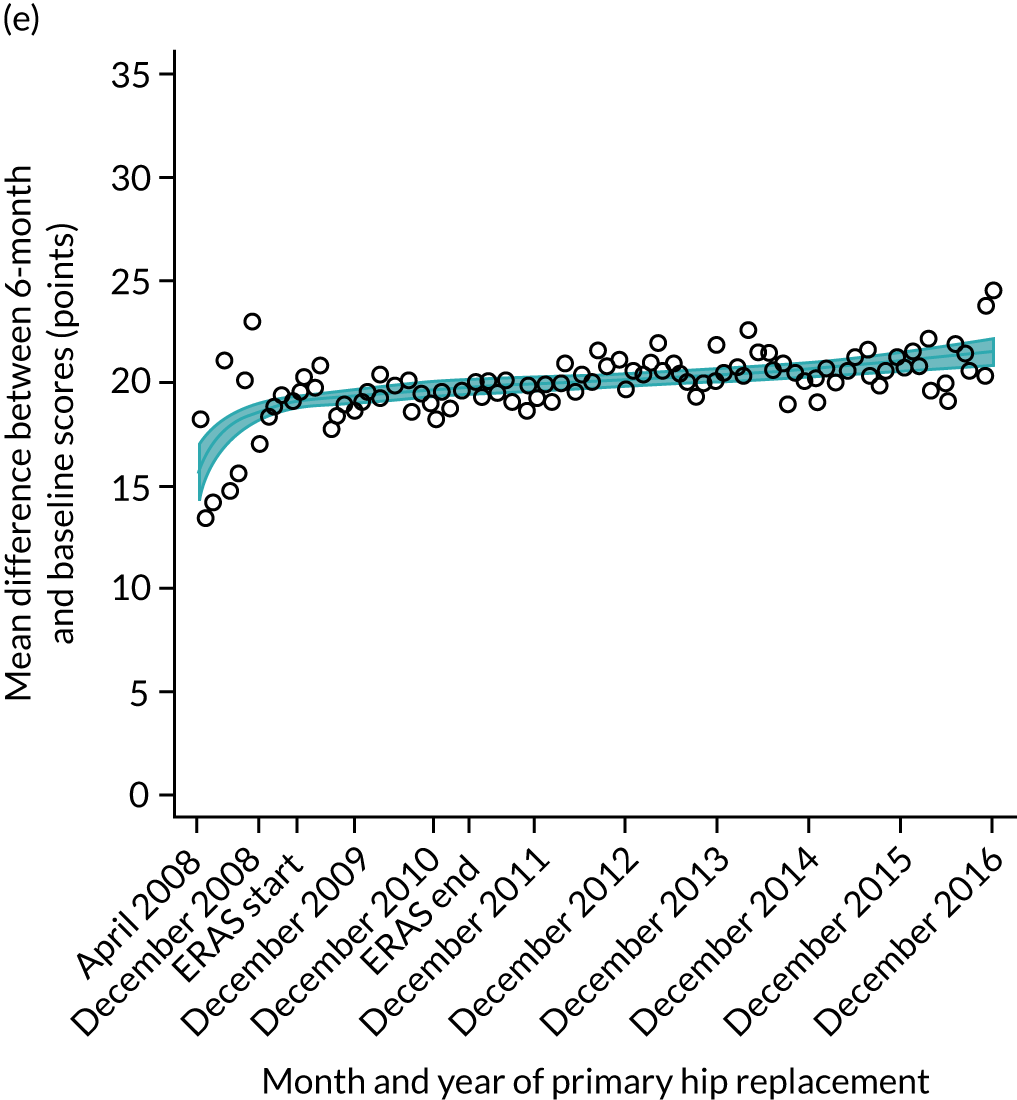
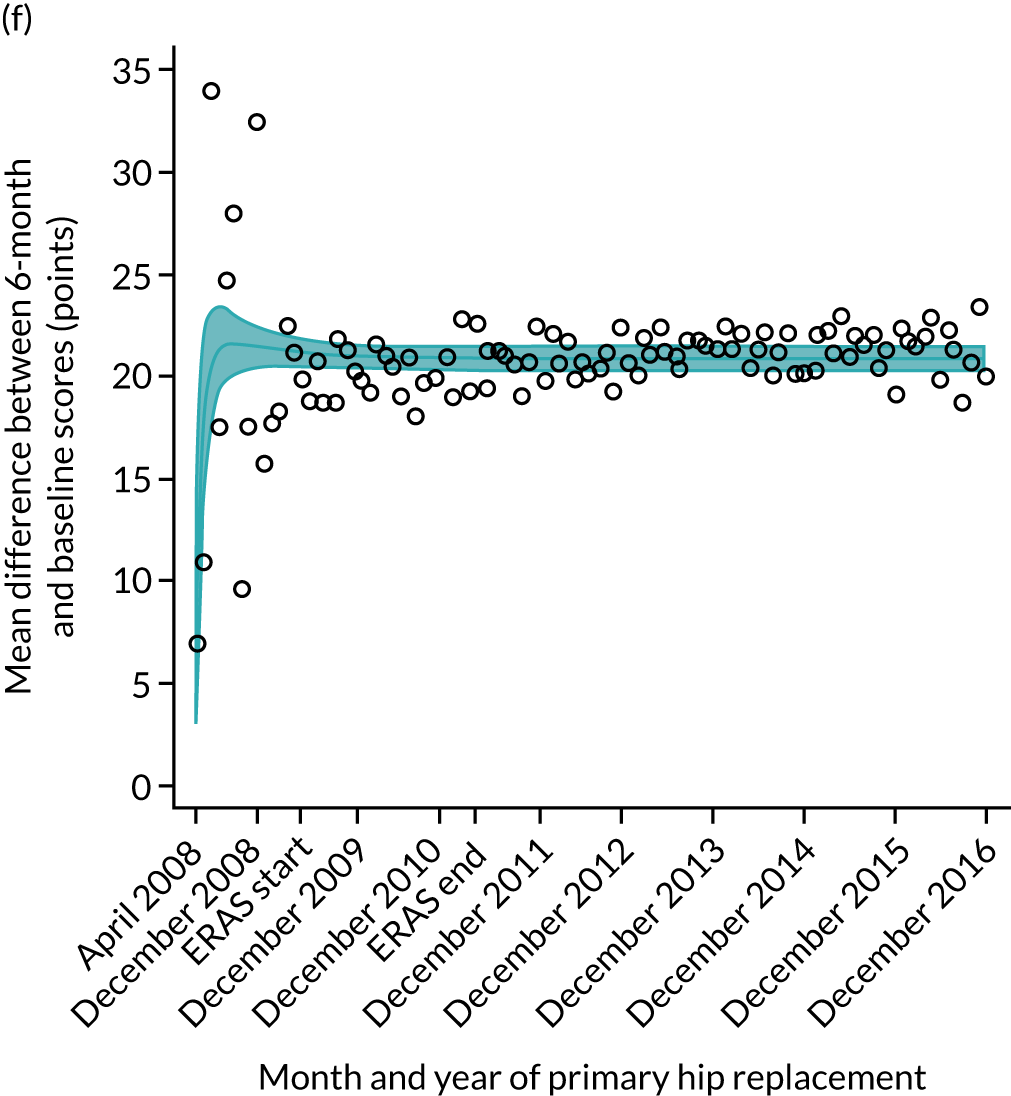
FIGURE 15.
Trends of OKS change (OKS 6 months – OKS baseline) after primary TKR/UKR according to age categories in England, 2008–16. (a) All ages; (b) 18–59 years; (c) 60–69 years; (d) 70–79 years; (e) 80–84 years; and (f) ≥ 85 years. Reproduced from Garriga et al. 66 © The Author(s). This is an Open Access article distributed in accordance with the terms of the Creative Commons Attribution (CC BY-NC-ND 4.0) license, which permits others to share this work, provided the original work is properly cited. See: https://creativecommons.org/licenses/by-nc-nd/4.0/.
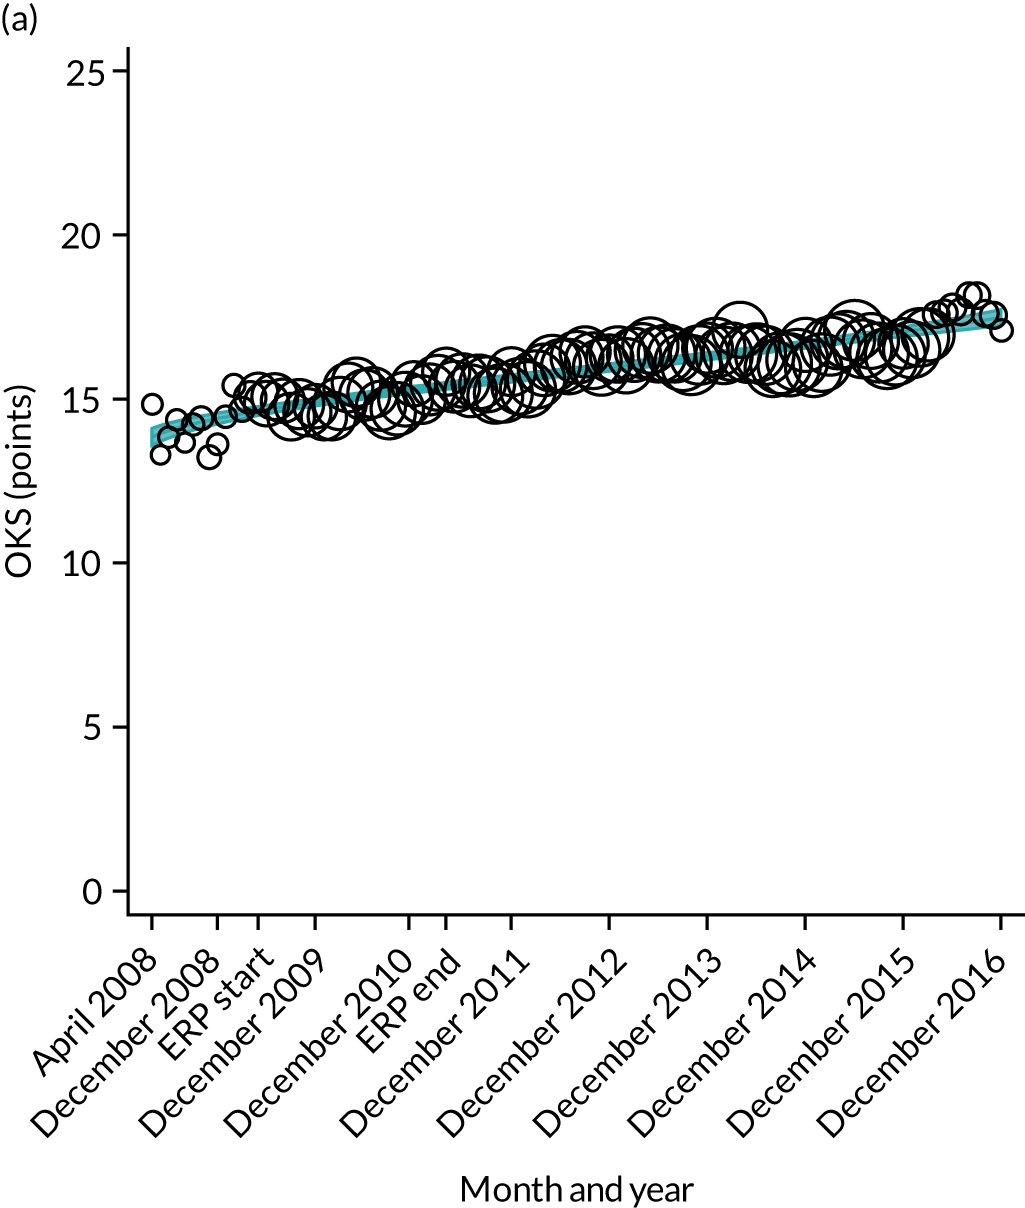
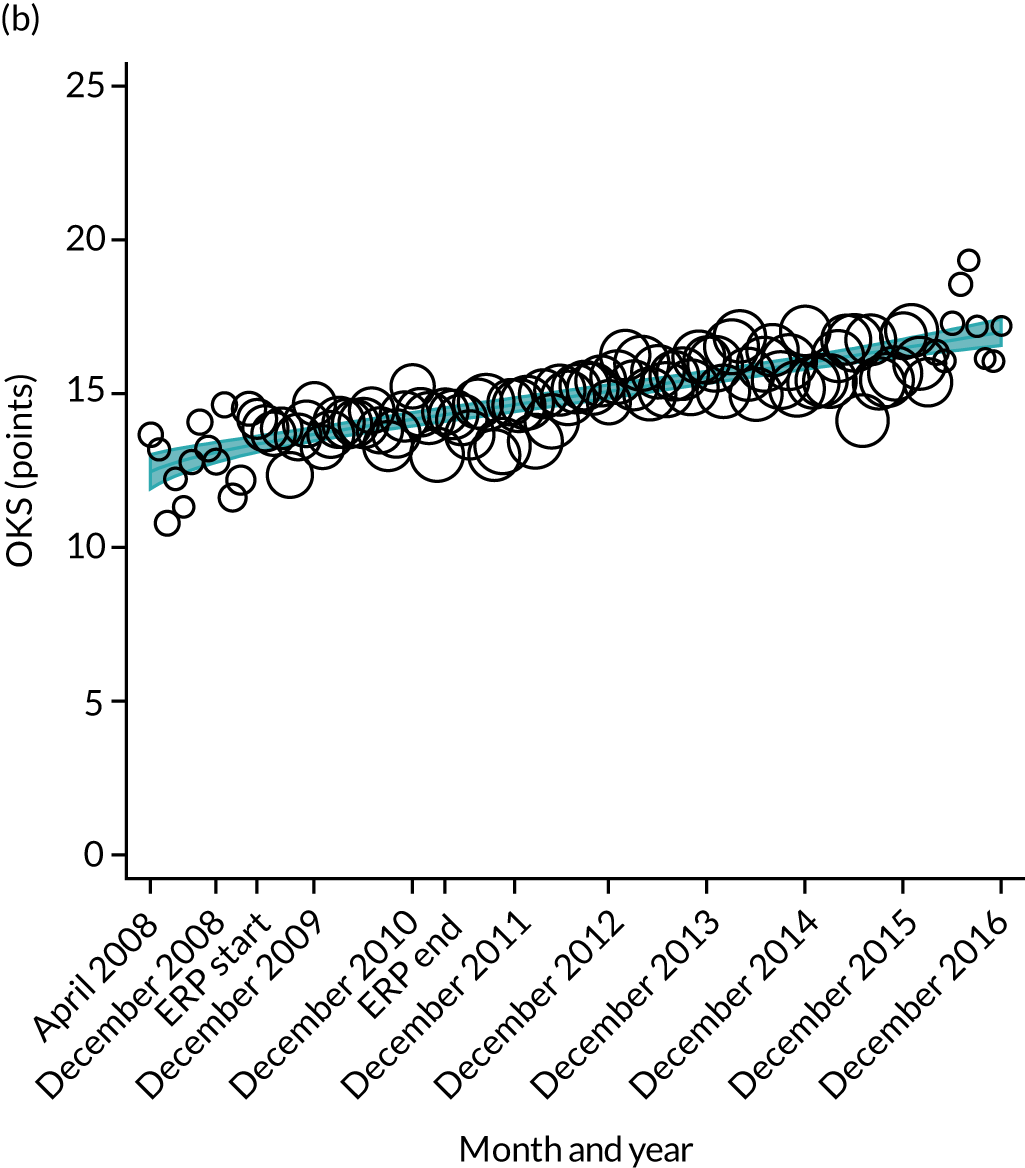
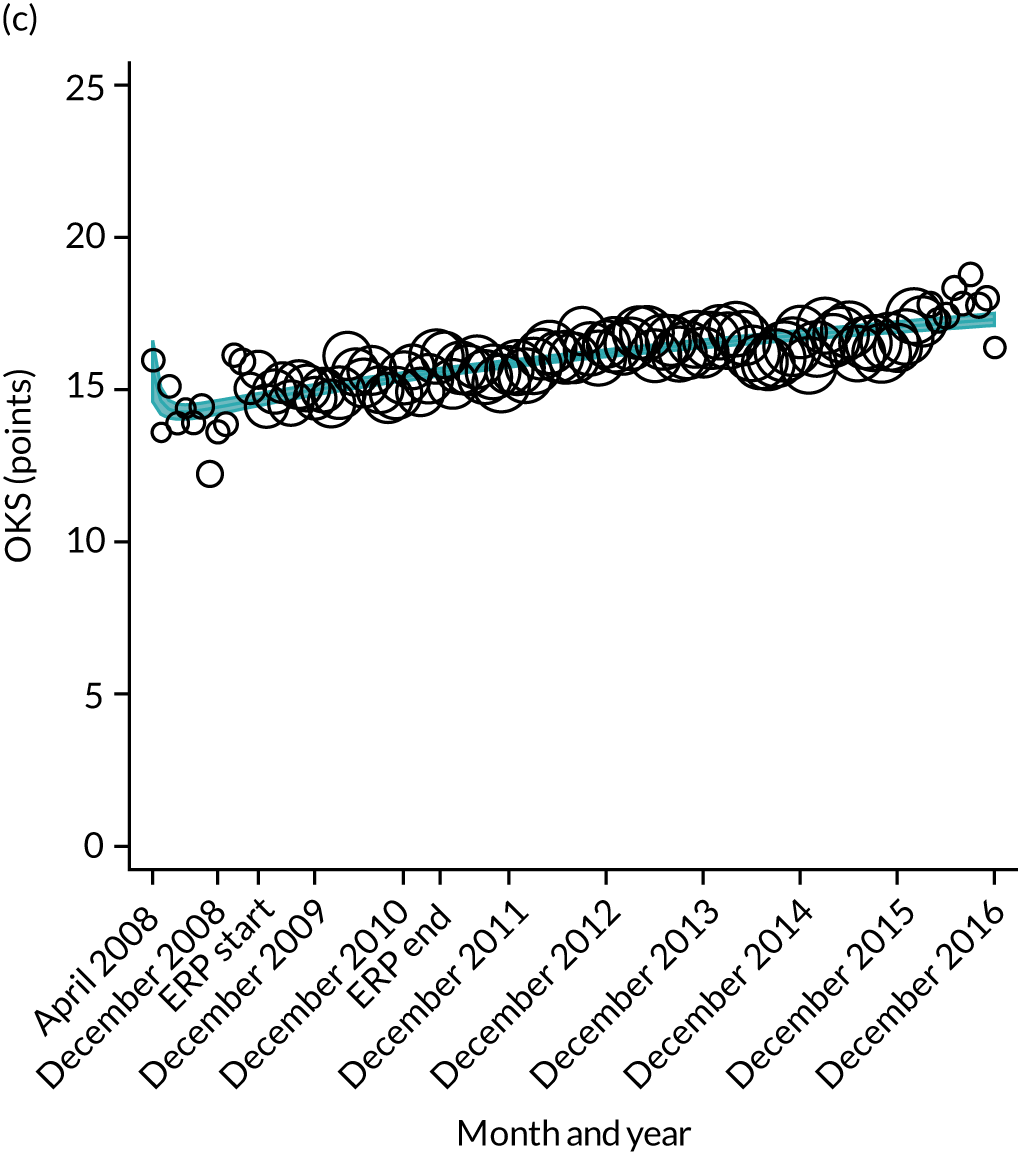
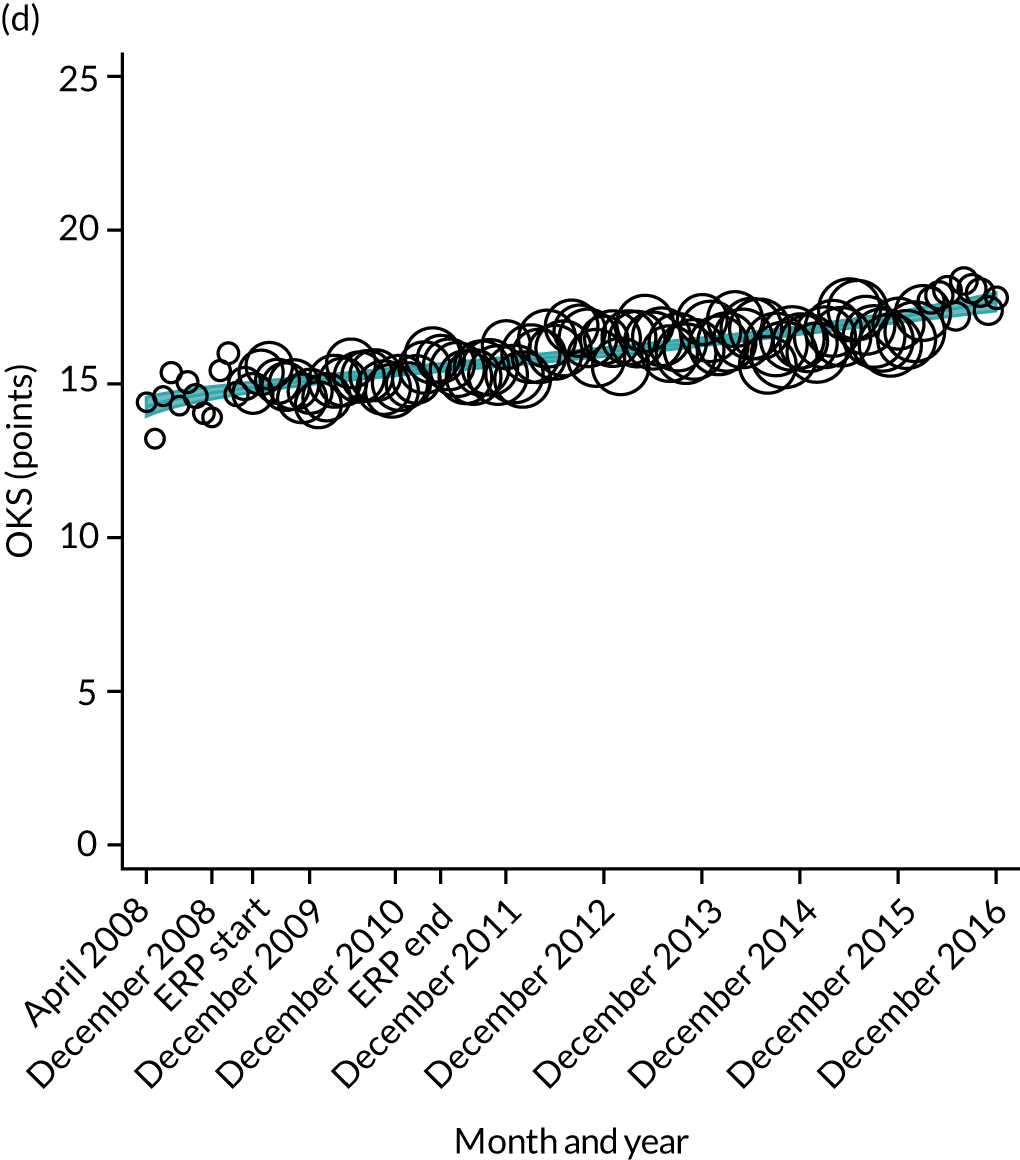
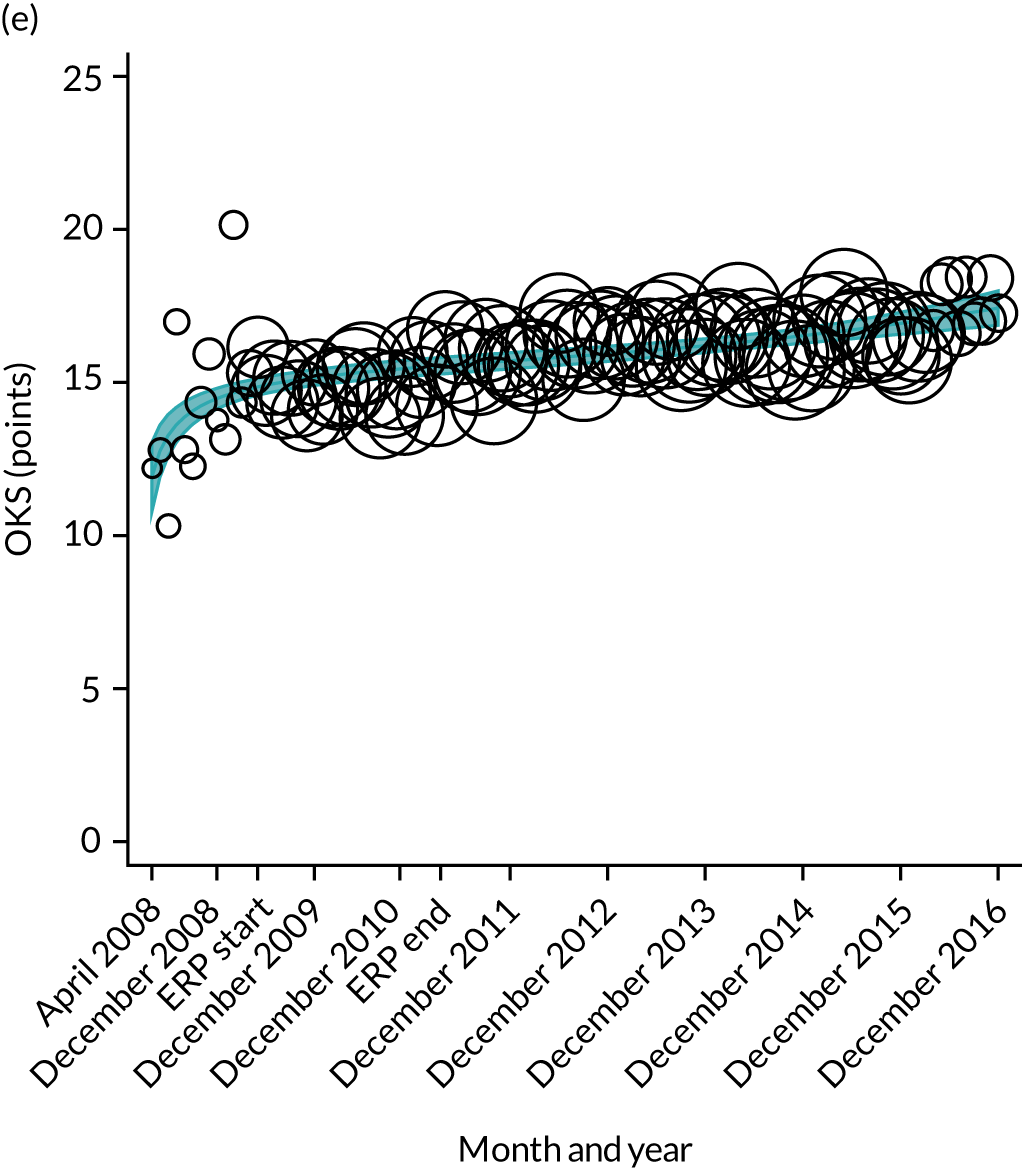

FIGURE 16.
Trends of OHS change following primary hip replacement by patients with/without comorbidities in England, 2008–16, by month. (a) Without comorbidities; and (b) one or more comorbidities. Reproduced from Garriga et al. 65 © Author(s) (or their employer(s)) 2019. Re-use permitted under CC BY. Published by BMJ. This is an open access article distributed in accordance with the Creative Commons Attribution 4.0 Unported (CC BY 4.0) license, which permits others to copy, redistribute, remix, transform and build upon this work for any purpose, provided the original work is properly cited, a link to the licence is given, and indication of whether changes were made. See: https://creativecommons.org/licenses/by/4.0/. Minor changes have been made to the formatting.
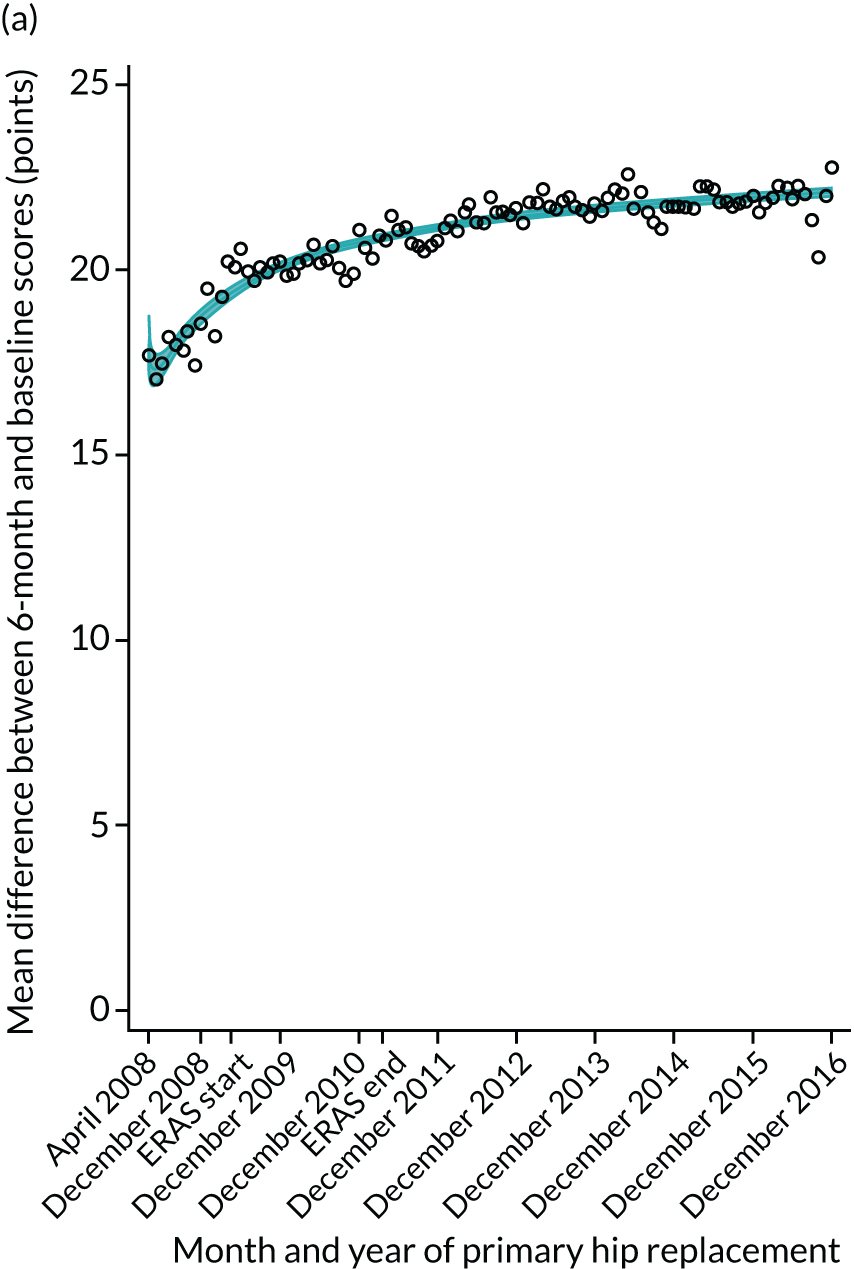
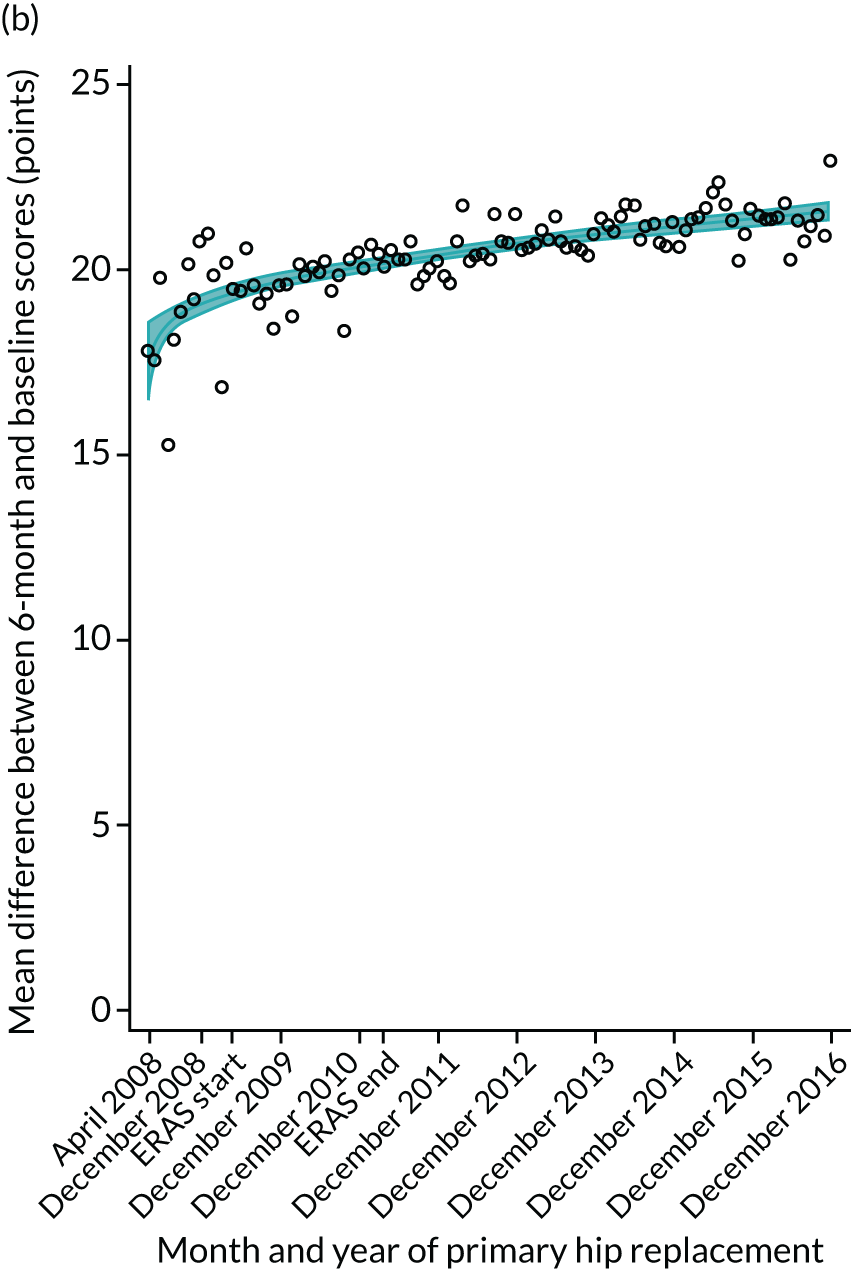
FIGURE 17.
Trends of OKS change (OKS 6 months – OKS baseline) after primary TKR/UKR by patients with/without comorbidities in England, 2008–16. (a) Without comorbidities; and (b) one or more comorbidities. Reproduced from Garriga et al. 66 © The Author(s). This is an Open Access article distributed in accordance with the terms of the Creative Commons Attribution (CC BY-NC-ND 4.0) license, which permits others to share this work, provided the original work is properly cited. See: https://creativecommons.org/licenses/by-nc-nd/4.0/.
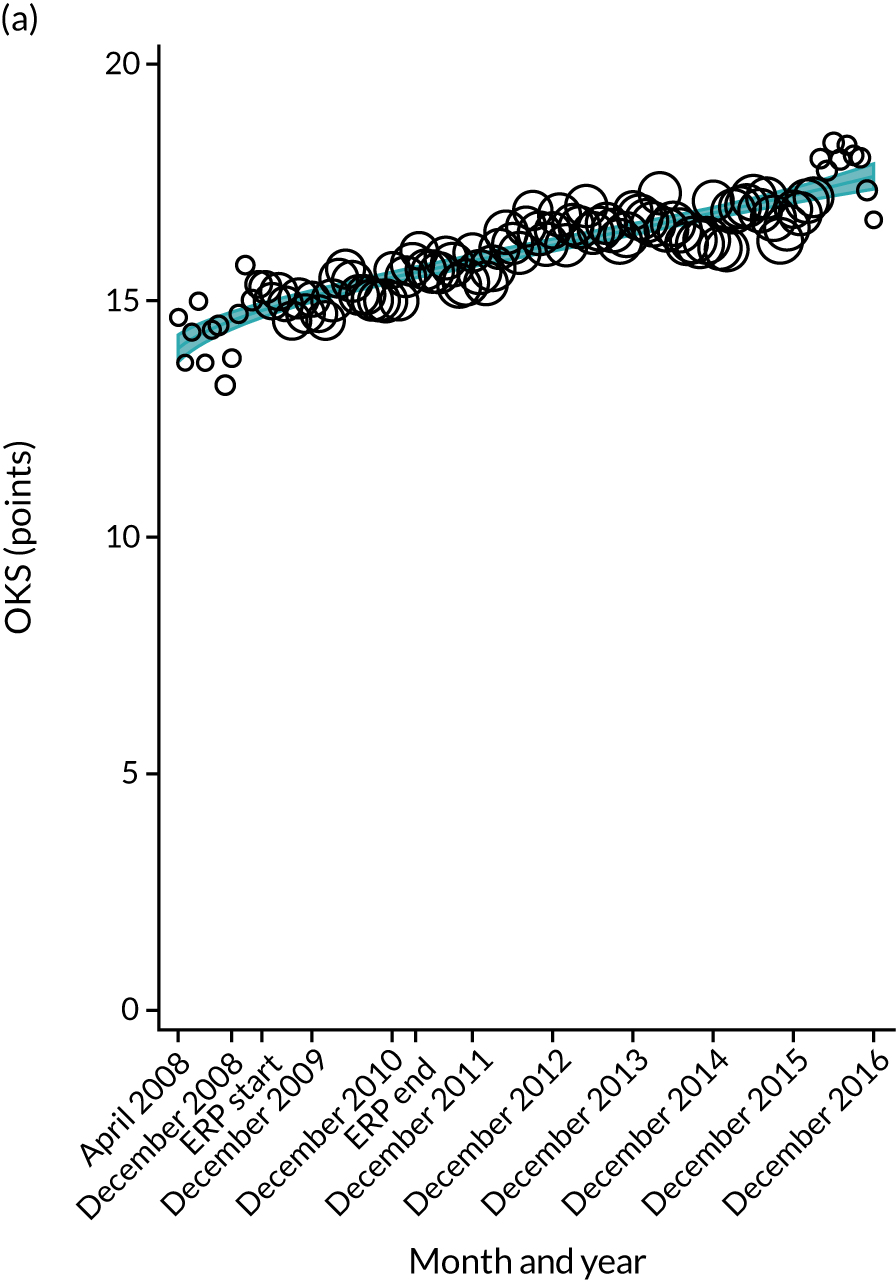
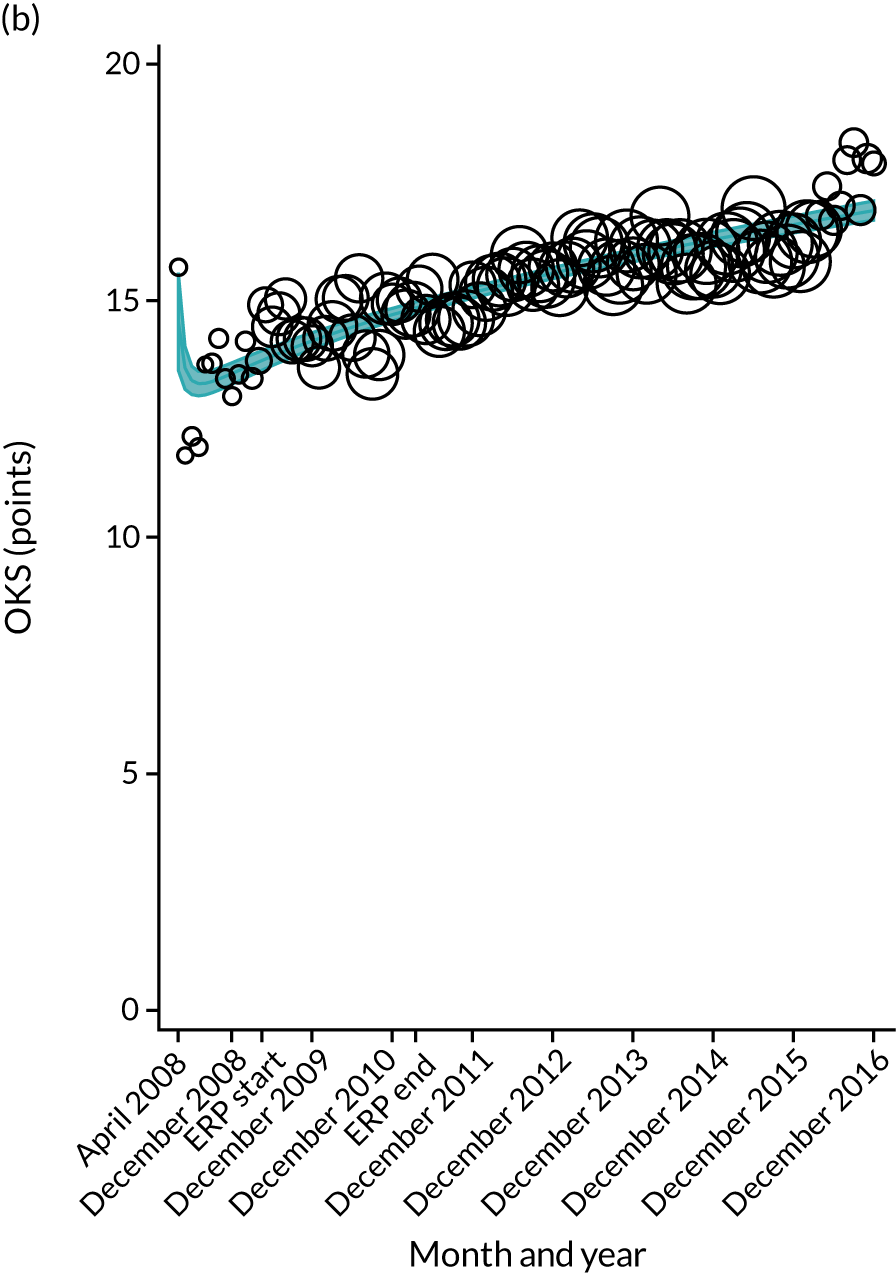
The interrupted time series model shows that, prior to ERAS, OHS change significantly increased, by 0.158%, every month (see Table 7). During the ERAS implementation (April 2009–March 2011), the secular trend slowed down and continued to increase by just 0.027%. The subsequent period after the ERAS implementation (April 2011–December 2016) remained stable. For the OKS model, there is no impact of the intervention in the secular trend of OKS change (Table 8), although post-intervention trends improved in the 60–69 years and the 70–79 years age groups, by 0.025% and 0.024%, respectively.
| Parameter | Coefficient | 95% CI | p-value |
|---|---|---|---|
| LOS | |||
| Intercept | 5.713 | 5.688 to 5.738 | < 0.001 |
| Monthly trend | –0.029 | –0.031 to –0.026 | < 0.001 |
| Level change ERAS0 | 0.151 | 0.100 to 0.202 | < 0.001 |
| Trend change after ERAS0 | – | – | – |
| Level change ERASend | –0.088 | –0.160 to –0.016 | 0.017 |
| Trend change after ERASend | 0.015 | 0.012 to 0.017 | < 0.001 |
| OKS 6 months – OKS baseline | |||
| Intercept | 14.004 | 13.842 to 14.166 | < 0.001 |
| Monthly trend | 0.029 | 0.024 to 0.034 | < 0.001 |
| Level change ERAS0 | 0.301 | 0.029 to 0.573 | 0.030 |
| Trend change after ERAS0 | – | – | – |
| Level change ERASend | – | – | – |
| Trend change after ERASend | – | – | – |
| Complication by 6 months | |||
| Intercept | 3.928 | 3.727 to 4.128 | < 0.001 |
| Monthly trend | –0.056 | –0.084 to –0.029 | < 0.001 |
| Level change ERAS0 | –0.766 | –1.345 to –0.187 | 0.010 |
| Trend change after ERAS0 | – | – | – |
| Level change ERASend | 0.293 | 0.003 to 0.584 | 0.048 |
| Trend change after ERASend | 0.054 | 0.026 to 0.082 | < 0.001 |
| Revision rates by 5 years | |||
| Intercept | 5.986 | 5.908 to 6.063 | < 0.001 |
| Monthly trend | – | – | – |
| Level change ERAS0 | – | – | – |
| Trend change after ERAS0 | –0.038 | –0.045 to –0.030 | < 0.001 |
| Level change ERASend | – | – | – |
| Trend change after ERASend | 0.050 | 0.022 to 0.079 | 0.001 |
A total of 6232 (1.6%) THR patients between April 2008 and March 2016 had one or more complication in the following 6 months. The proportion of complications at 6 months decreased from 4.1% to 1.7% (see Figure 8). The interrupted time series model shows that prior to ERAS, complication proportions decreased by 0.078% every month (see Table 7). During the ERAS, the secular trend increased by just 0.078%. The period after the ERAS intervention was stable.
For TKR patients, the proportion of complications at 6 months decreased between the first and the last month of the study period, from 4.1% in April 2008 to 1.7% in May 2016. The trend significantly declined before intervention (April 2008–March 2009), by 0.056% (see Table 8). The trend of 6-month complications slightly increased after the ERAS implementation (April 2011–December 2016), by 0.054%.
Five-year revision rates
A total of 3392 (2.1%) THR patients between April 2008 and December 2011 had a hip revision in the following 5 years. Rates of 5-year hip revision per 1000 implant-years decreased from 5.9 in April 2008 to 2.9 in December 2011 (see Figure 8). The 5-year hip revision rates show a significant downwards trend of –0.098 per 1000 implant-years during ERAS implementation (April 2009–March 2011). The trend changed direction by increasing during the post-intervention period (April 2011–December 2016) by 0.103 per 1000 implant-years.
A total of 4964 (2.6%) patients with a primary TKR between April 2008 and December 2012 had a knee revision in the following 5 years. Rates of 5-year knee revision per 1000 implant-years slightly decreased, from 6.6 in April 2008 to 5.4 in December 2011 (see Figure 8). There was a significant downwards trend of –0.038 per 1000 implant-years during ERP implementation (April 2009–March 2011). However, the trend significantly increased during the post-intervention period by 0.050 per 1000 implant-years.
Results for individual hospitals in the South Central region
Information was available from the Musculoskeletal Clinical Leaders Network on the dates of ERAS implementation for the trusts listed in Table 9. These trusts were identified in the HES data set through the hospital provider code.
| Trust | Frequency | Date of ERAS | |
|---|---|---|---|
| THR | TKR | ||
| Hampshire Hospitals NHS Foundation Trust | 4186 | 5134 | 2009 |
| University Hospital Southampton NHS Foundation Trust | 2022 | 2445 | September 2010 |
| Oxford University Hospitals NHS Foundation Trust | 5770 | 5616 | October 2011 |
| Royal Berkshire NHS Foundation Trust | 2910 | 2977 | August 2010 |
| Buckinghamshire Hospitals NHS Trust | 2450 | 3094 | June 2011 |
| Heatherwood and Wexham Park Foundation Trust | 5671 | 7243 | September 2010 |
| Portsmouth Hospitals NHS Trust | 4133 | 4950 | October 2010 |
| Isle of Wight NHS Primary Care Trust | 1845 | 2151 | 2011 |
Length of stay
Reductions in LOS were observed across all the individual hospitals for both THR and TKR (Figures 18 and 19). However, there was notable variation between the individual trusts. For example, at the start of the study period in April 2008, LOS was higher in some trusts than in others. For example, Southampton had a mean LOS of around 7 days, compared with 5 days in Buckinghamshire, reflecting that these hospitals may have already implemented ERAS-type pathways ahead of the national programme. The greatest impact of ERAS was seen at Southampton and the Isle of Wight, where, prior to implementing ERAS, LOS was stable and not changing, and after ERAS implementation LOS declined substantially. In many hospitals, formalising ERAS implementation resulted in no improvements in LOS, predominantly as mean LOS had already been declining, with little further reductions in LOS once ERAS was formally implemented.
FIGURE 18.
Length of stay after primary THR for hospitals in the South Central region. (a) Hampshire Hospitals NHS Foundation Trust; (b) University Hospital Southampton NHS Foundation Trust; (c) Oxford University Hospitals NHS Foundation Trust; (d) Royal Berkshire NHS Foundation Trust; (e) Buckinghamshire Hospitals NHS Trust; (f) Heatherwood and Wexham Park Hospitals NHS Foundation Trust; (g) Portsmouth Hospitals NHS Trust; and (h) Isle of Wight NHS Primary Care Trust.
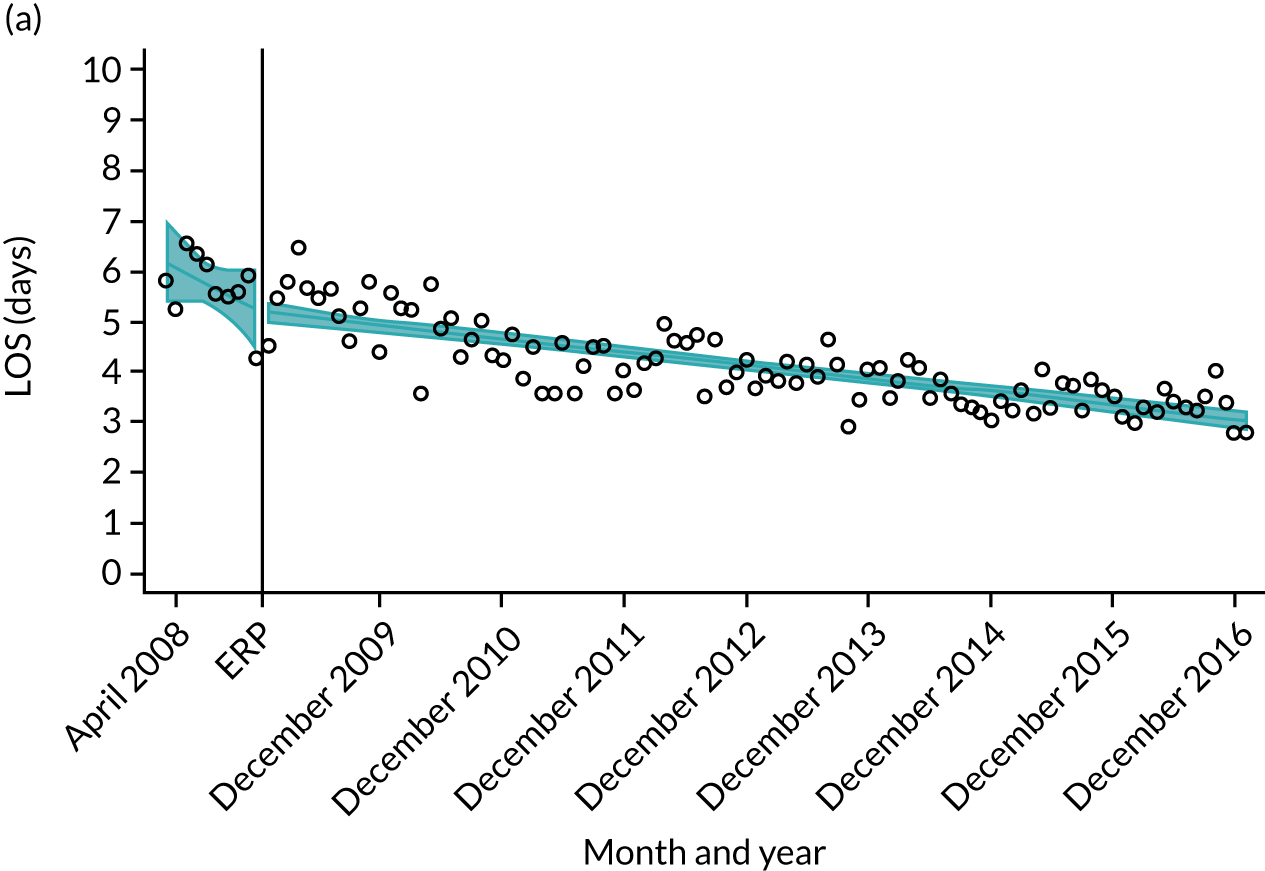
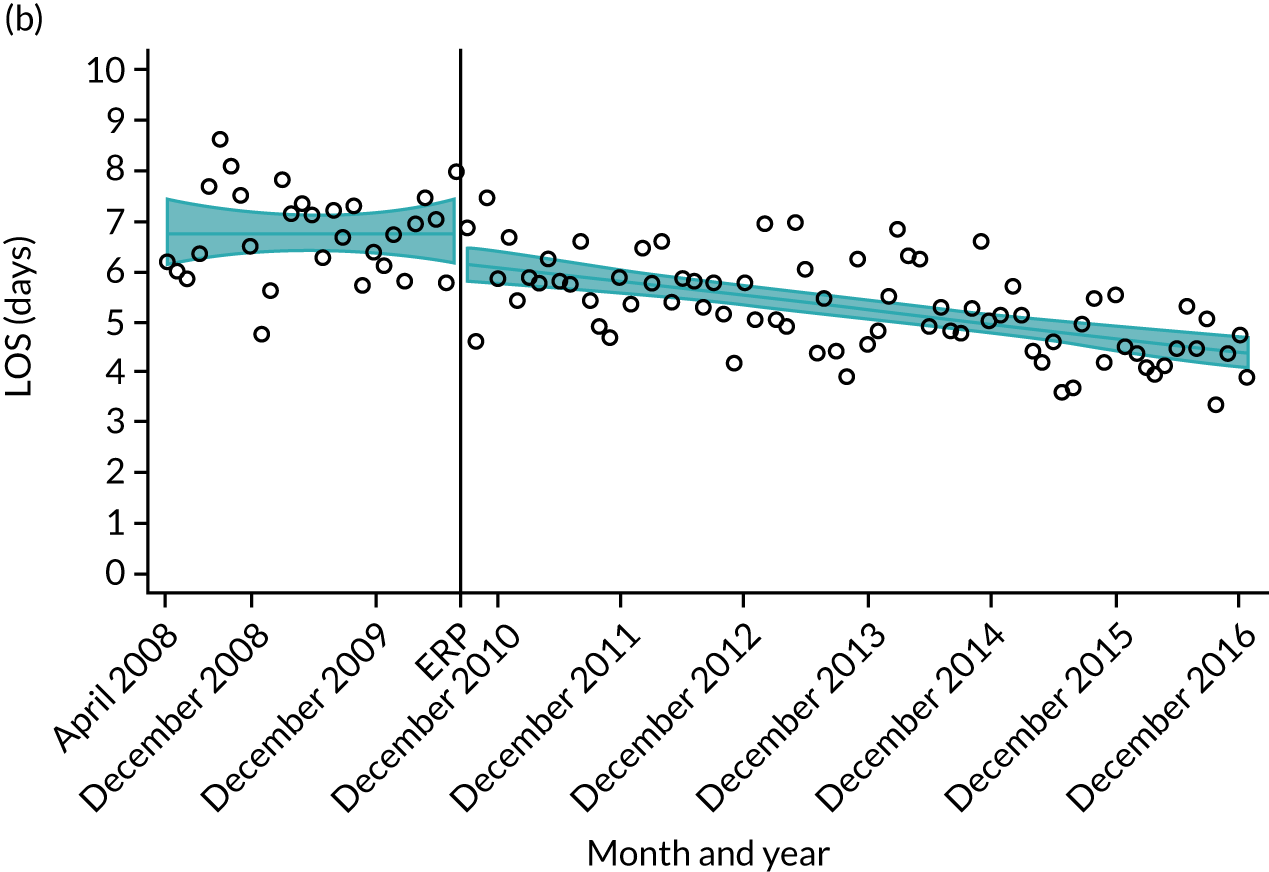

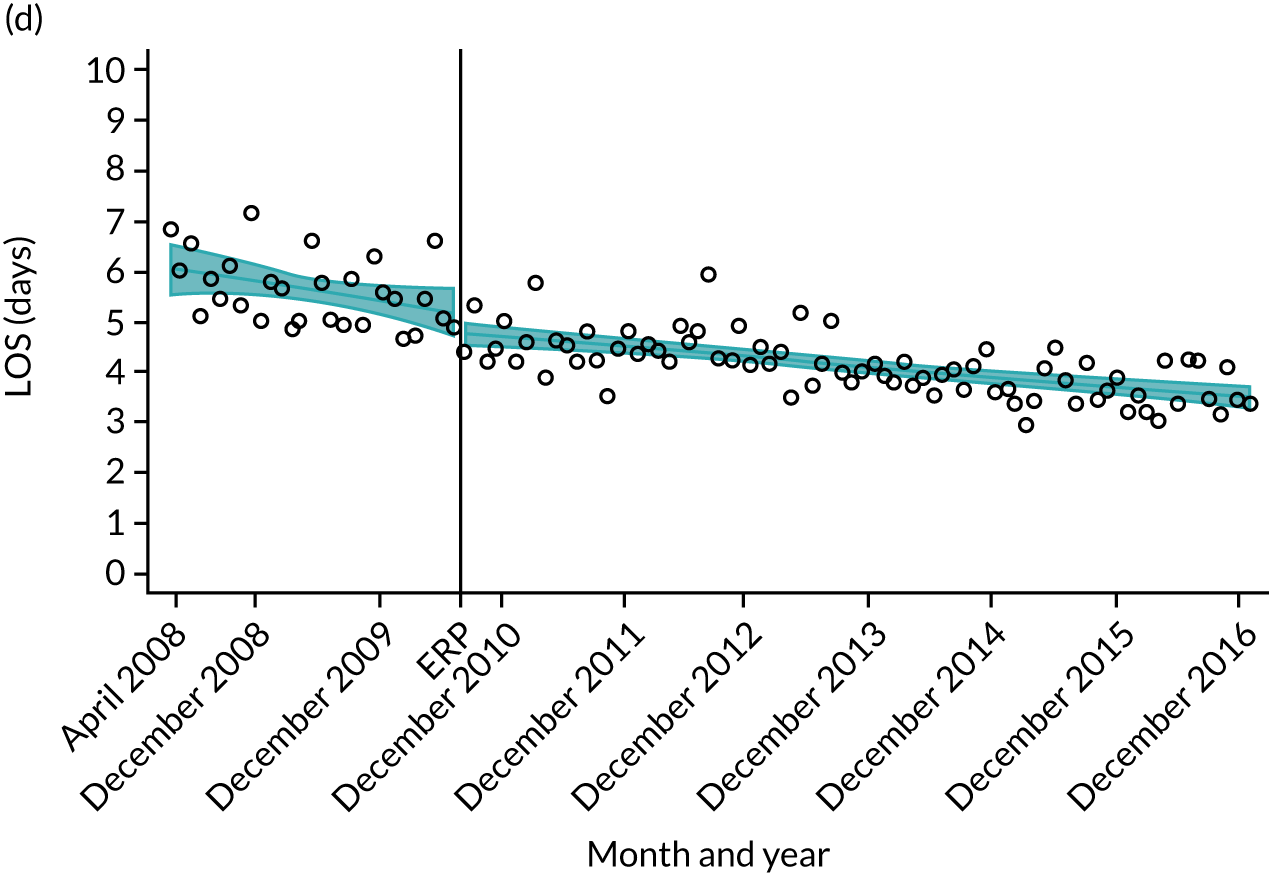
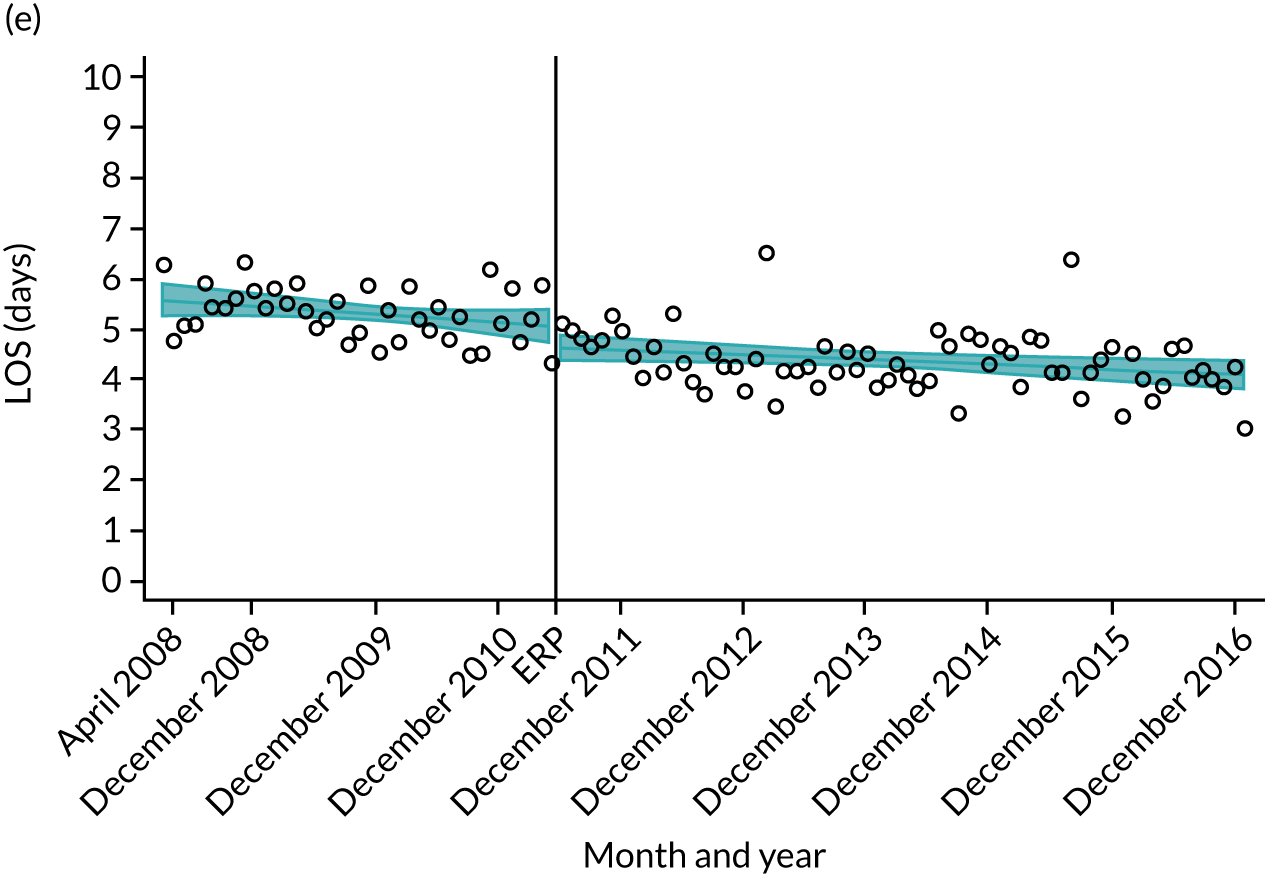
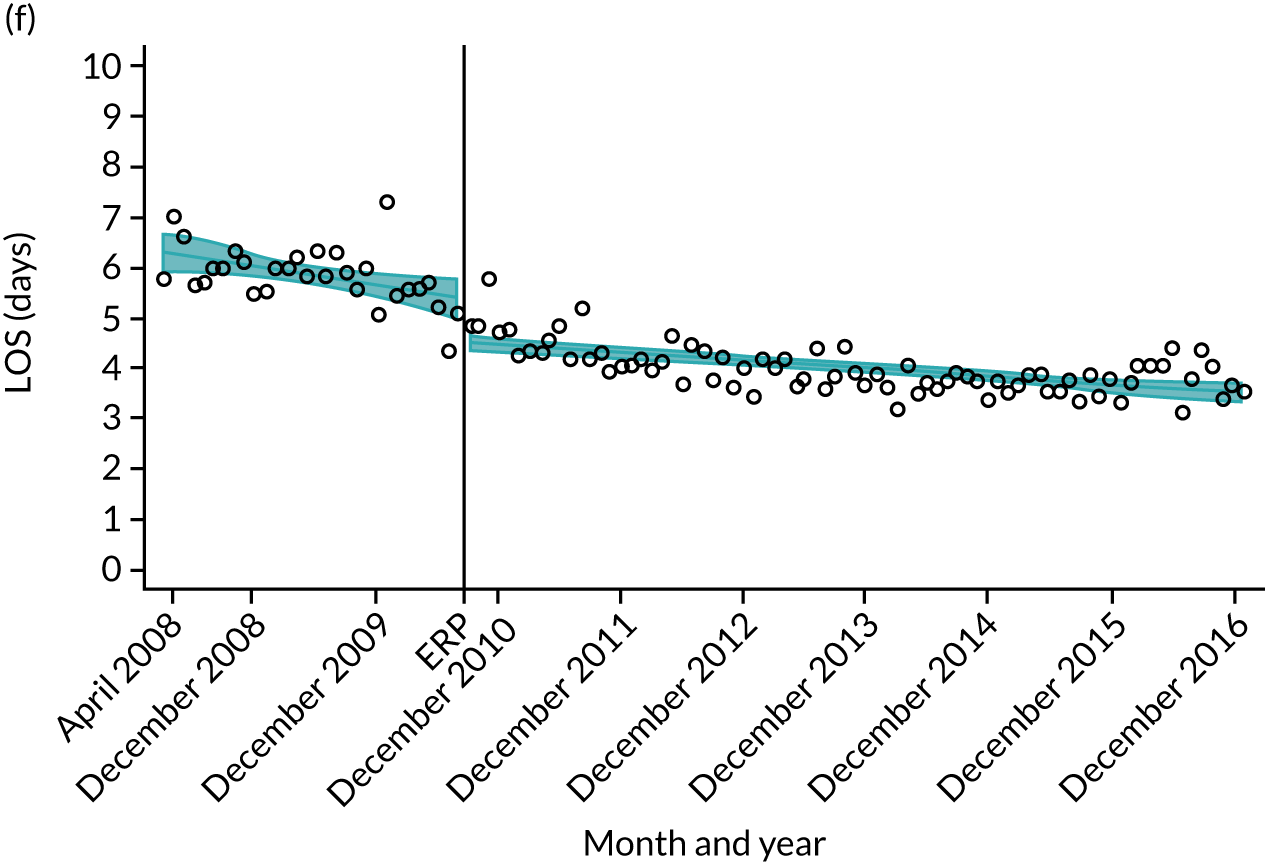
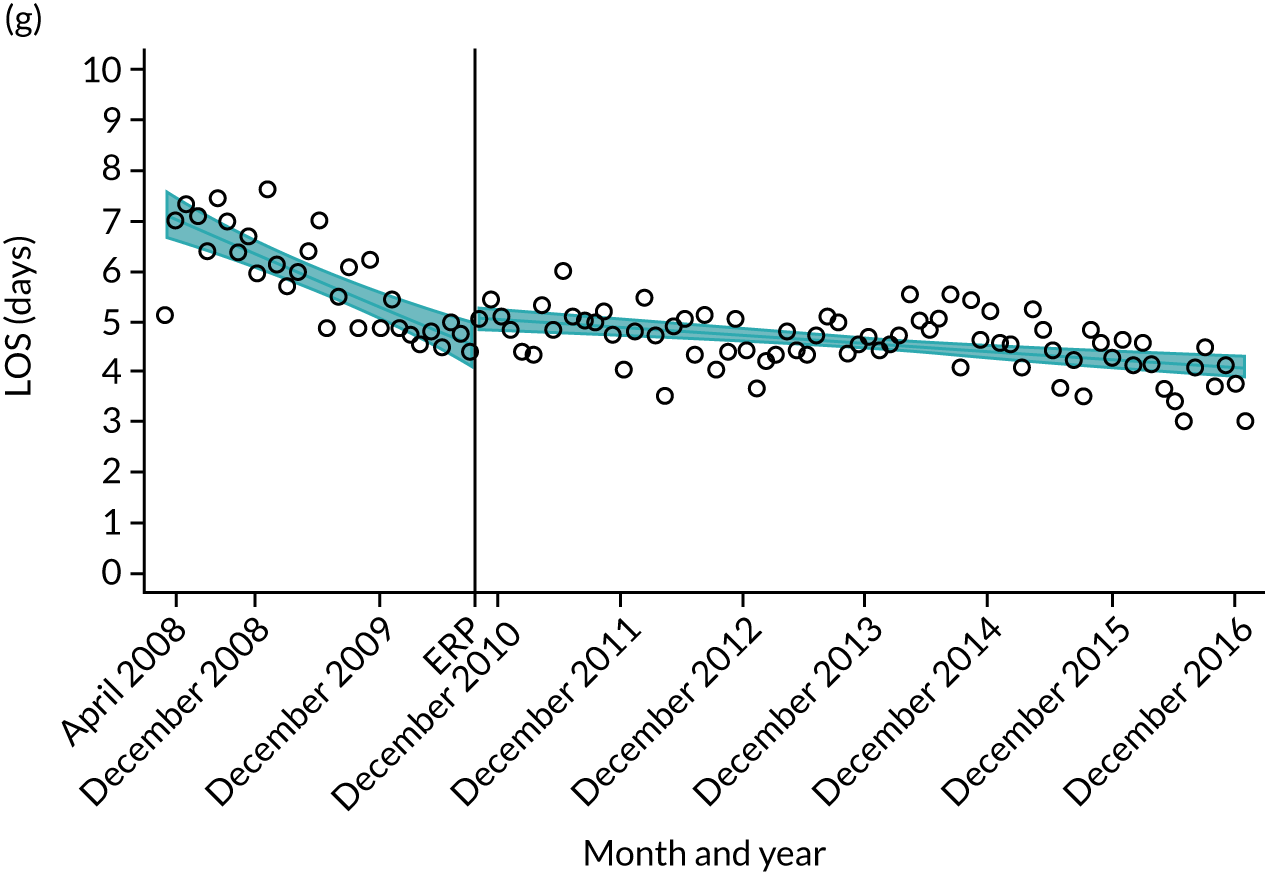
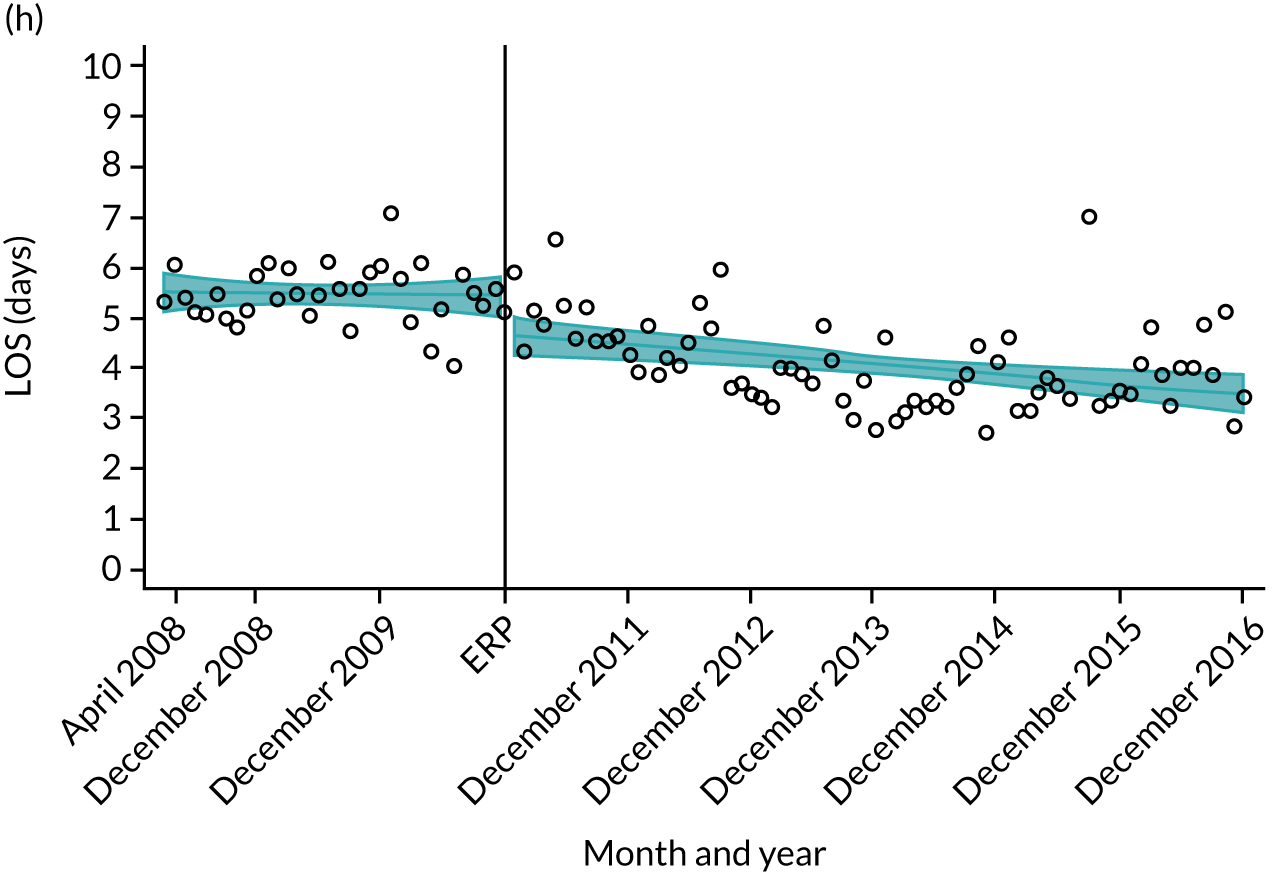
FIGURE 19.
Length of stay after primary TKR for hospitals in the South Central region. (a) Hampshire Hospitals NHS Foundation Trust; (b) University Hospital Southampton NHS Foundation Trust; (c) Oxford University Hospitals NHS Foundation Trust; (d) Royal Berkshire NHS Foundation Trust; (e) Buckinghamshire Hospitals NHS Trust; (f) Heatherwood and Wexham Park Hospitals NHS Foundation Trust; (g) Portsmouth Hospitals NHS Trust; and (h) Isle of Wight NHS Primary Care Trust.

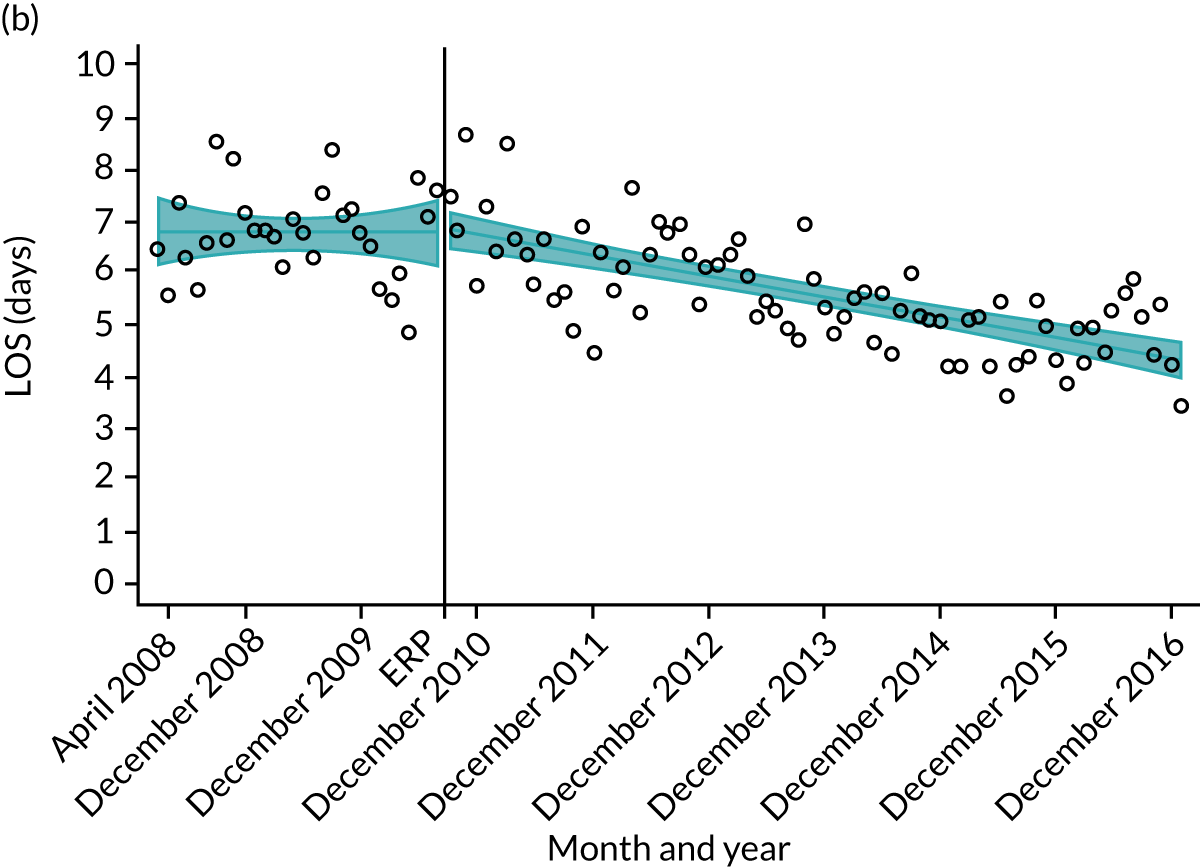
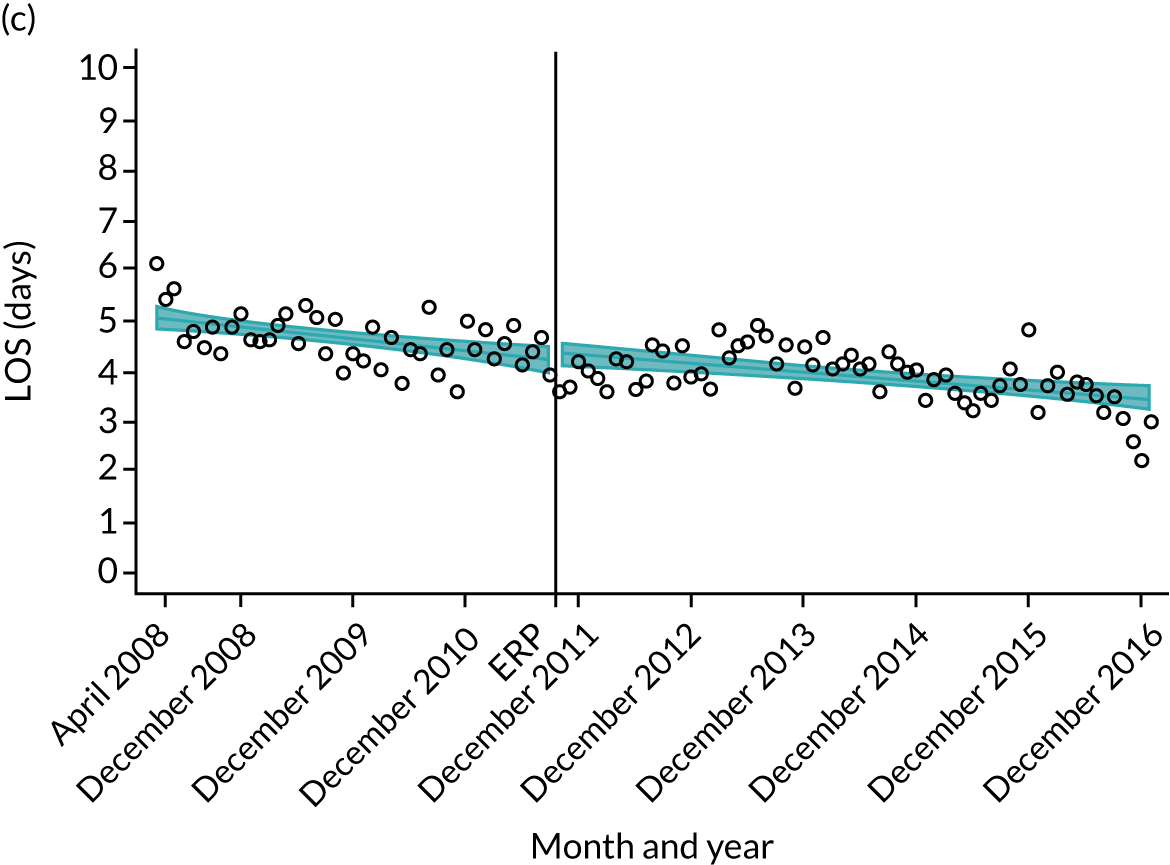
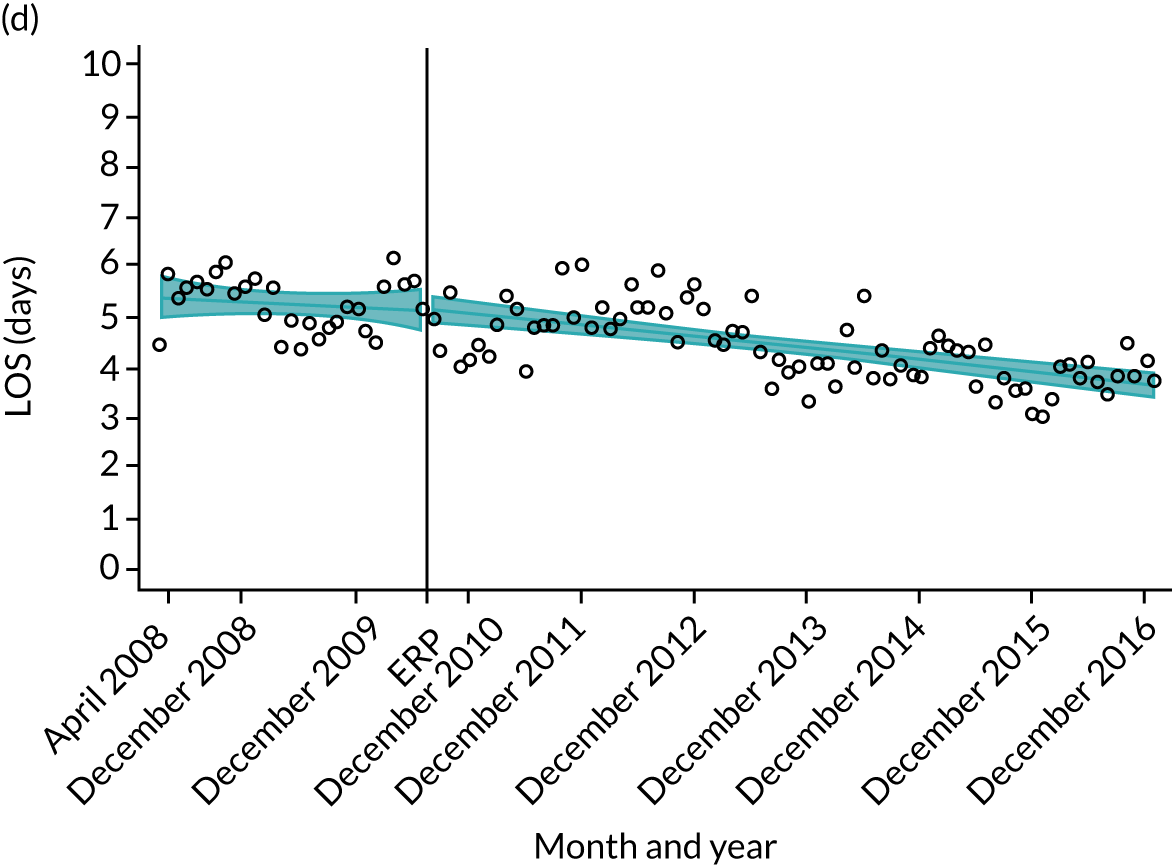

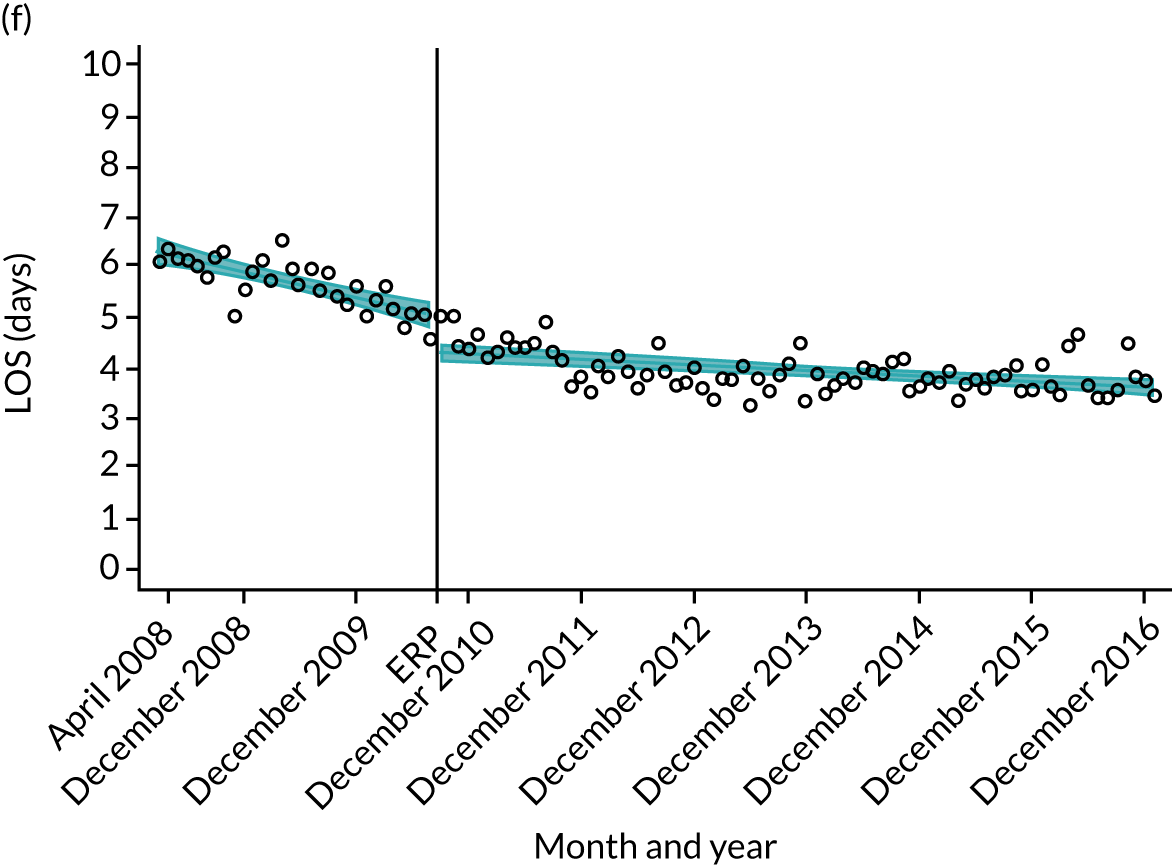
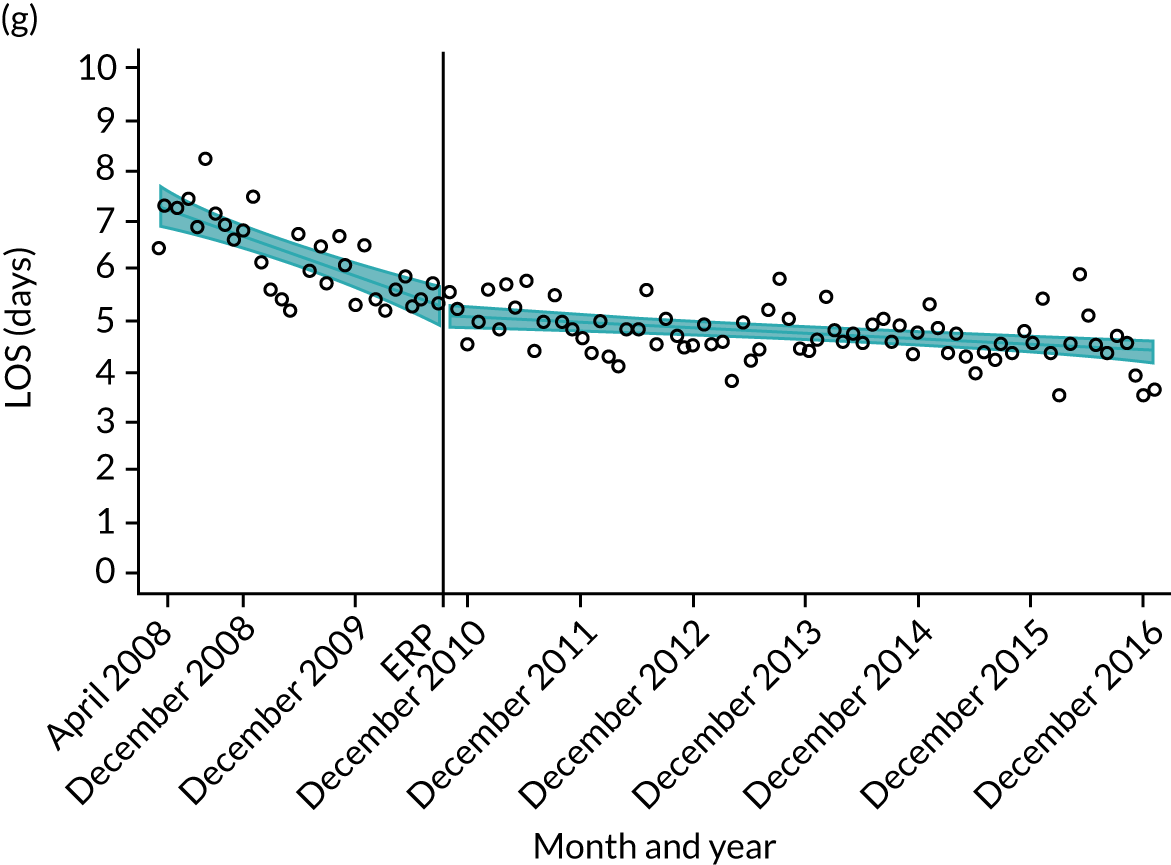
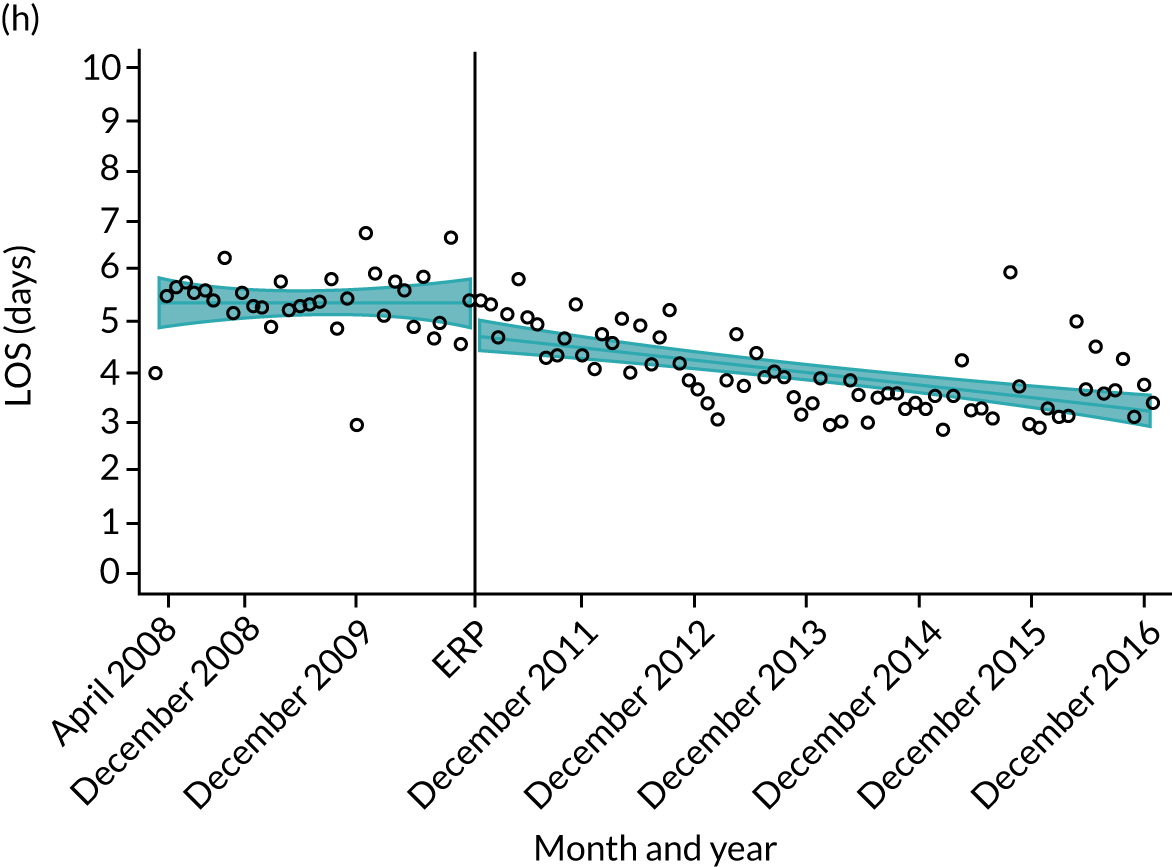
Oxford Hip Score and Oxford Knee Score outcomes
There does not seem to be any ecological correlation between hospitals’ trends in LOS and PROM outcomes (Figures 20 and 21). The overall trends tend to mirror that of the national picture.
FIGURE 20.
Change in OHS at 6 months after primary THR for hospitals in the South Central region. (a) Hampshire Hospitals NHS Foundation Trust; (b) University Hospital Southampton NHS Foundation Trust; (c) Oxford University Hospitals NHS Foundation Trust; (d) Royal Berkshire NHS Foundation Trust; (e) Buckinghamshire Hospitals NHS Trust; (f) Heatherwood and Wexham Park Hospitals NHS Foundation Trust; (g) Portsmouth Hospitals NHS Trust; and (h) Isle of Wight NHS Primary Care Trust.

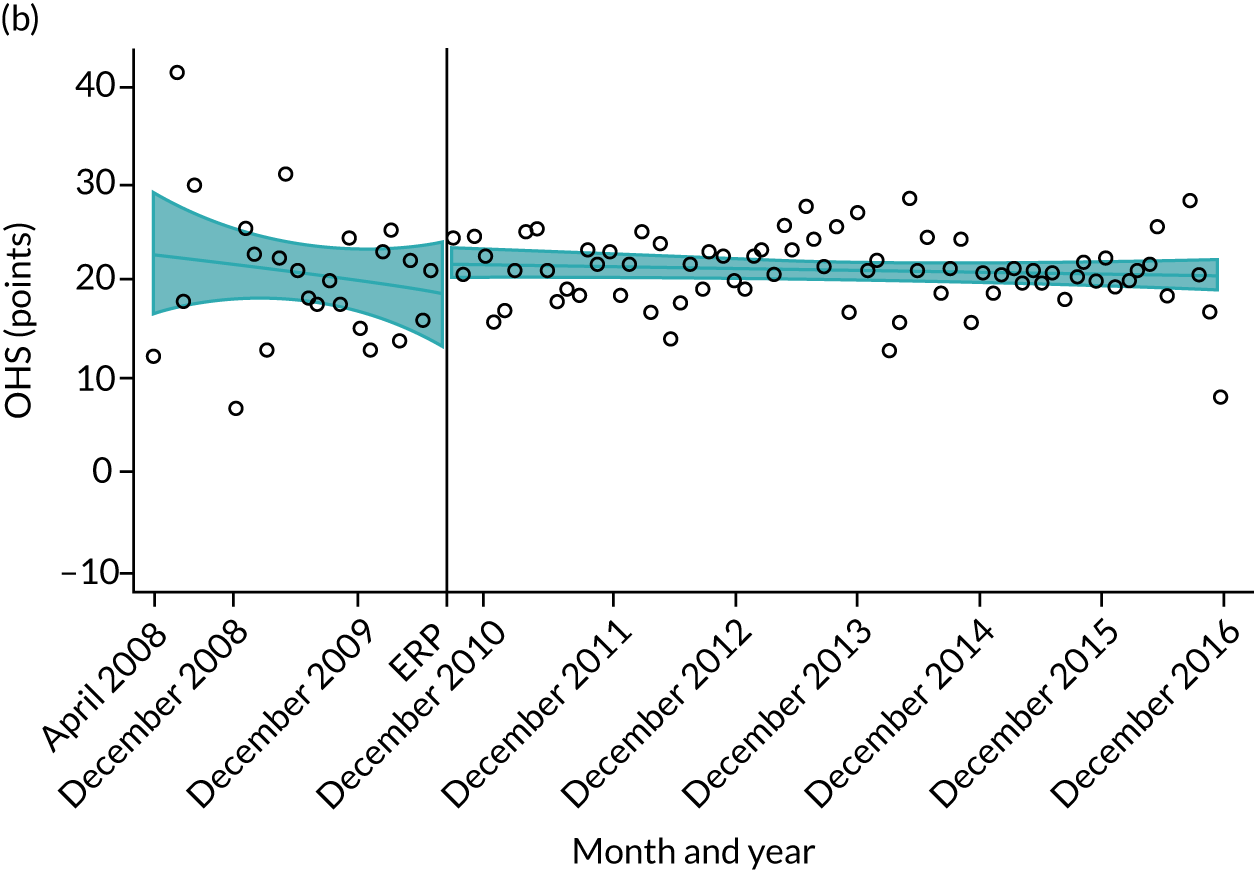

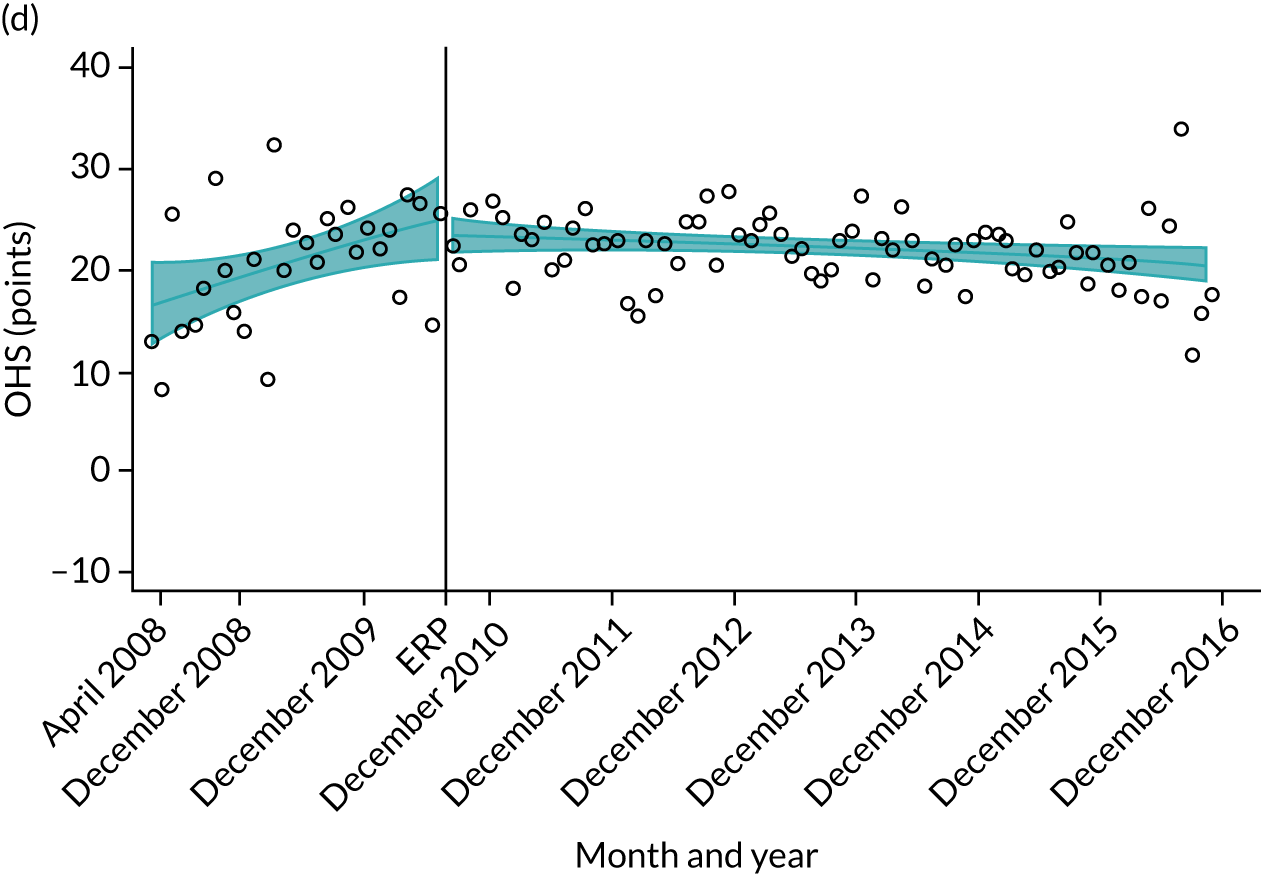
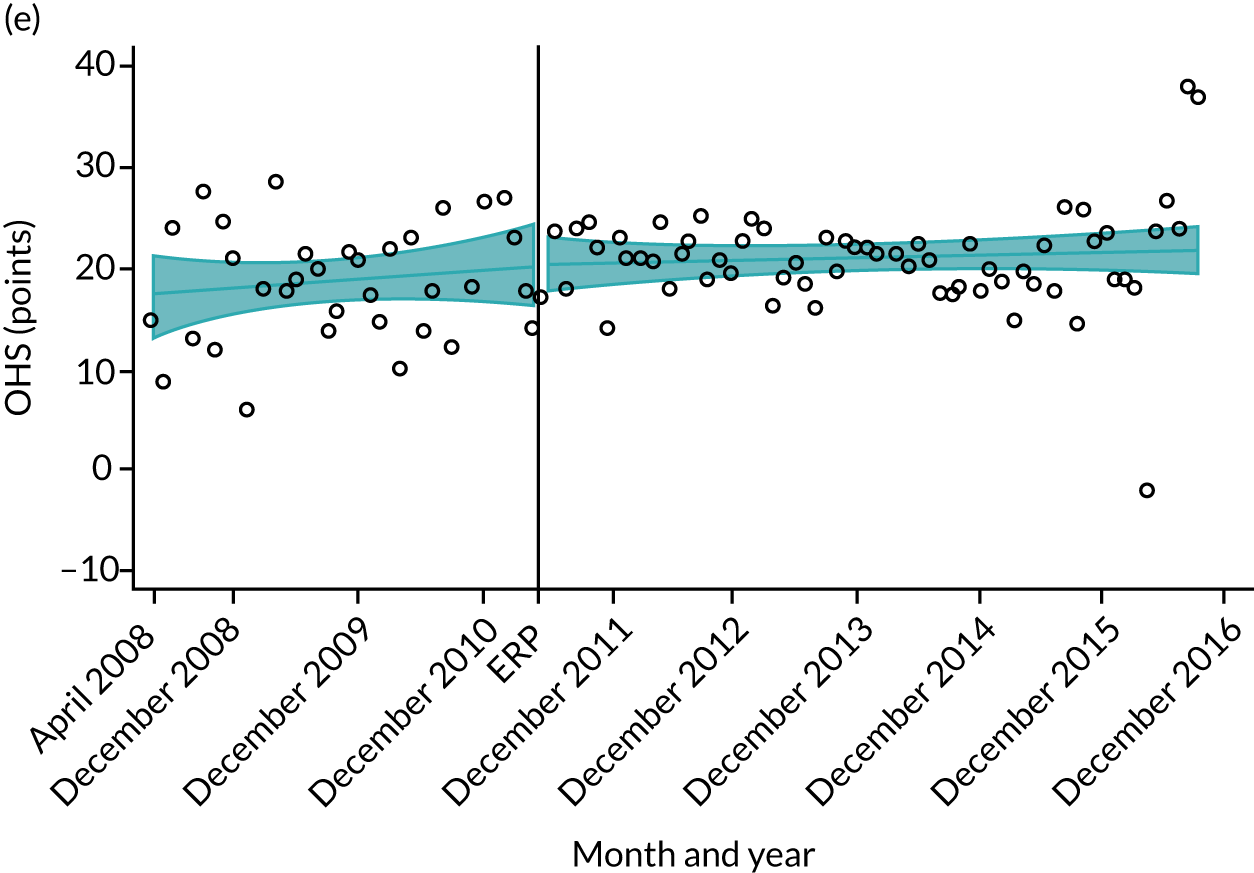
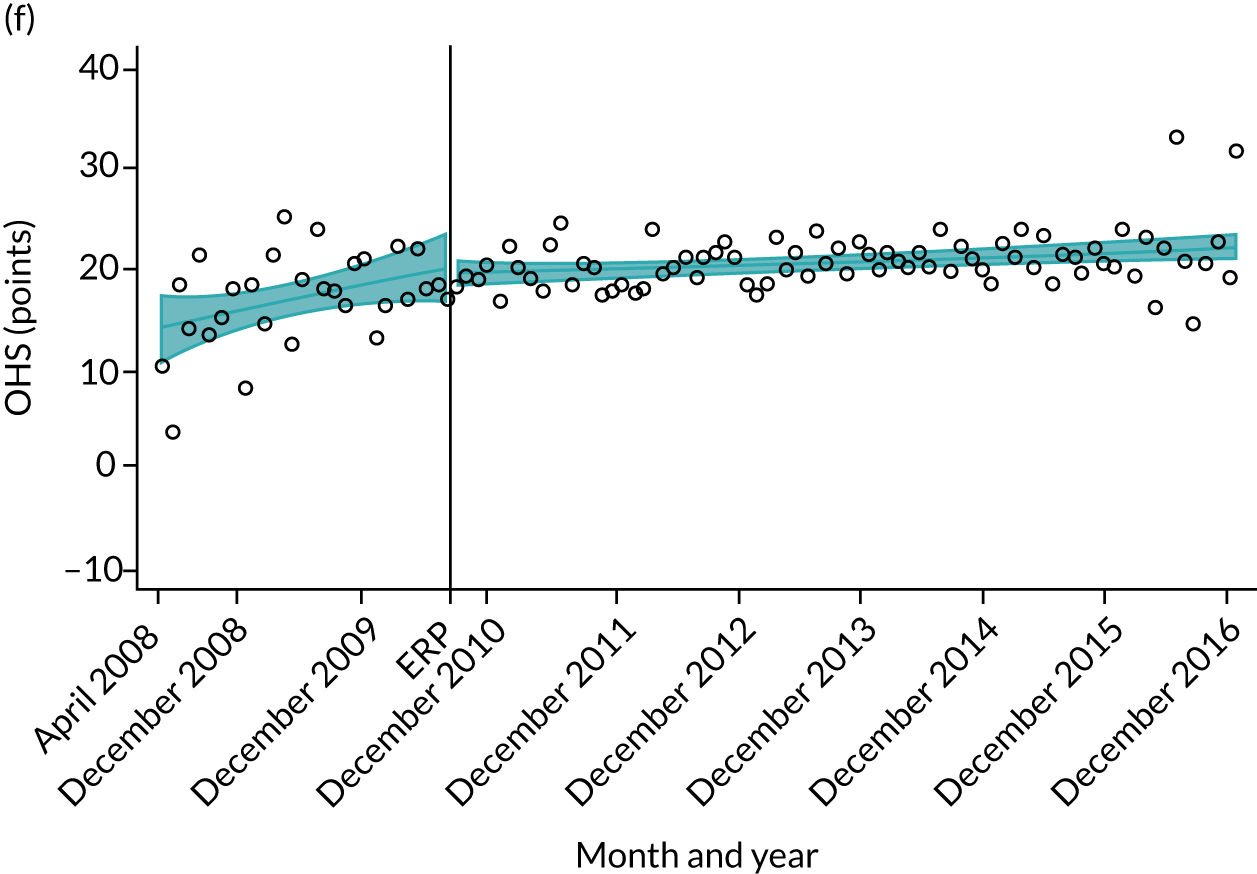
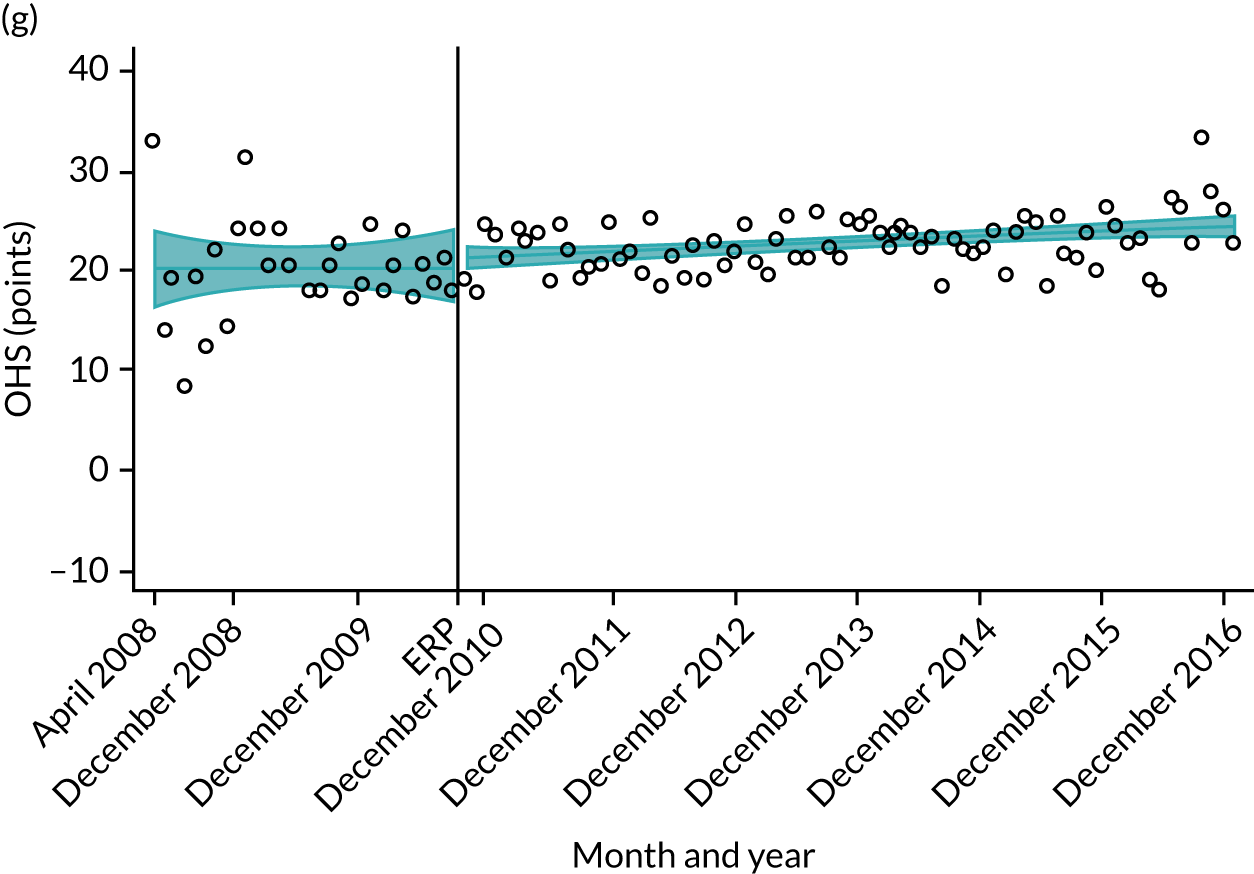

FIGURE 21.
Change in OKS at 6 months after primary THR for hospitals in the South Central region. (a) Hampshire Hospitals NHS Foundation Trust; (b) University Hospital Southampton NHS Foundation Trust; (c) Oxford University Hospitals NHS Foundation Trust; (d) Royal Berkshire NHS Foundation Trust; (e) Buckinghamshire Hospitals NHS Trust; (f) Heatherwood and Wexham Park Hospitals NHS Foundation Trust; (g) Portsmouth Hospitals NHS Trust; and (h) Isle of Wight NHS Primary Care Trust.
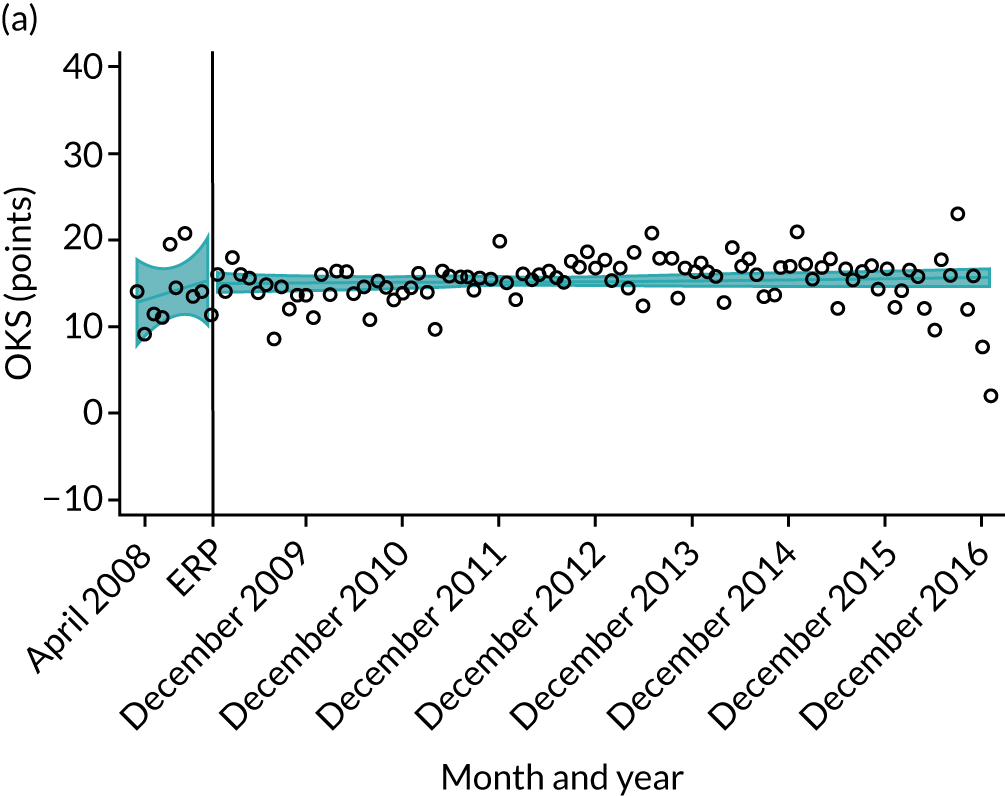
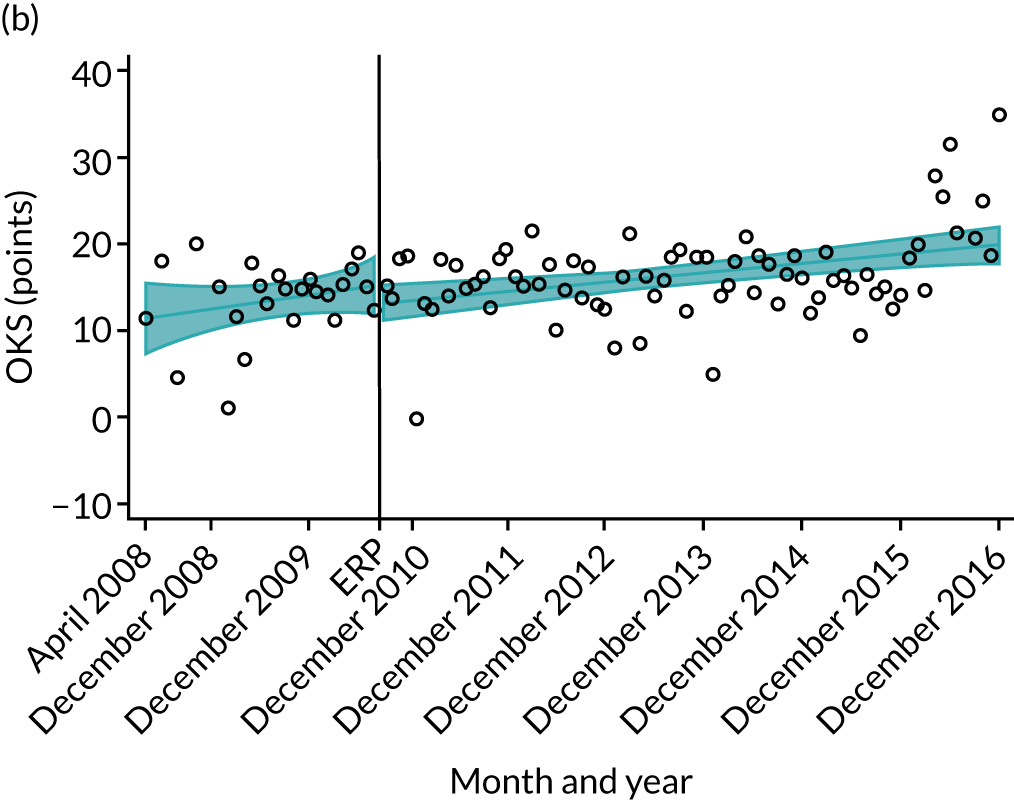

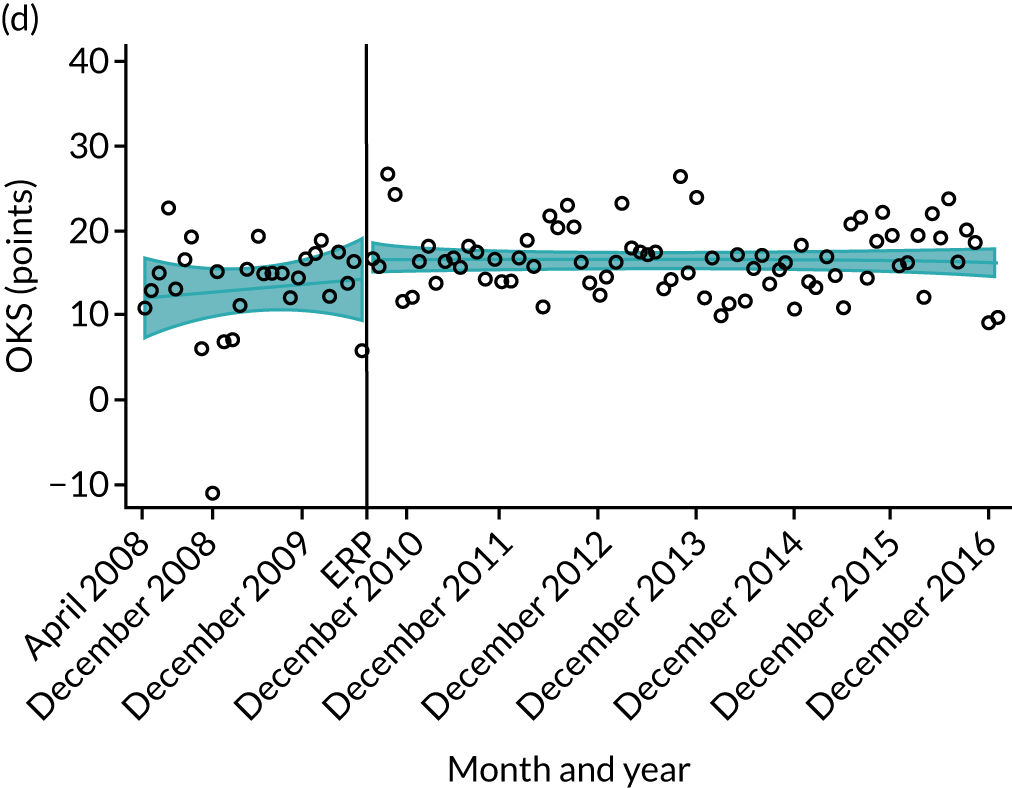
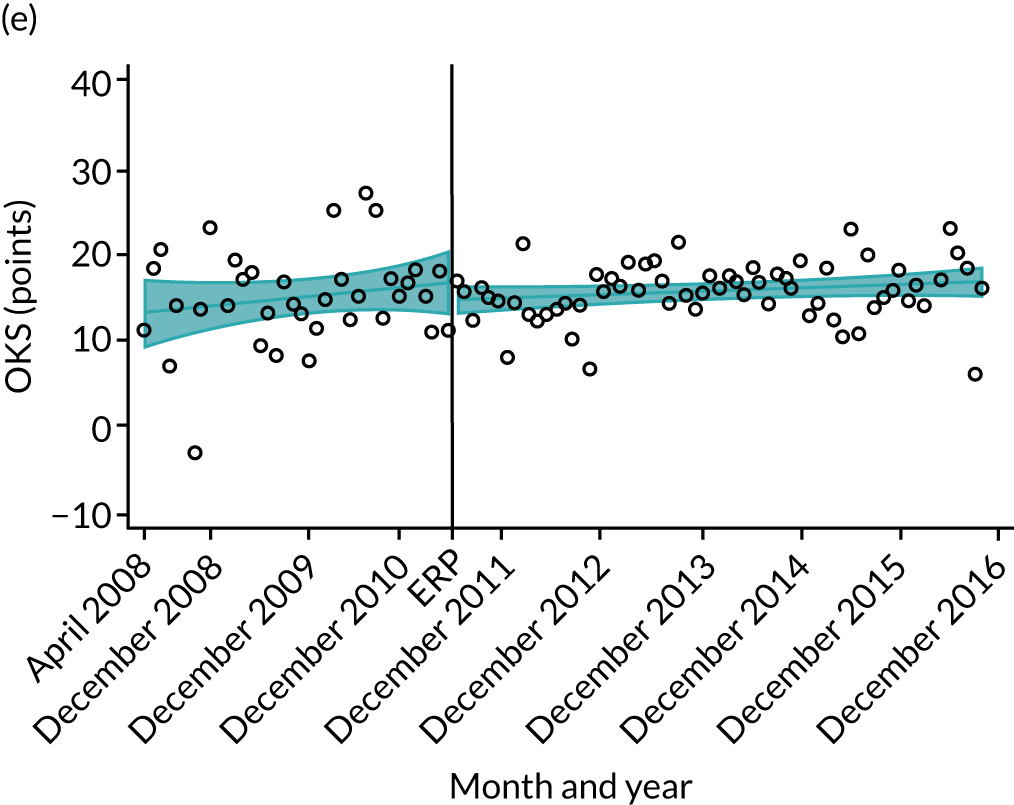
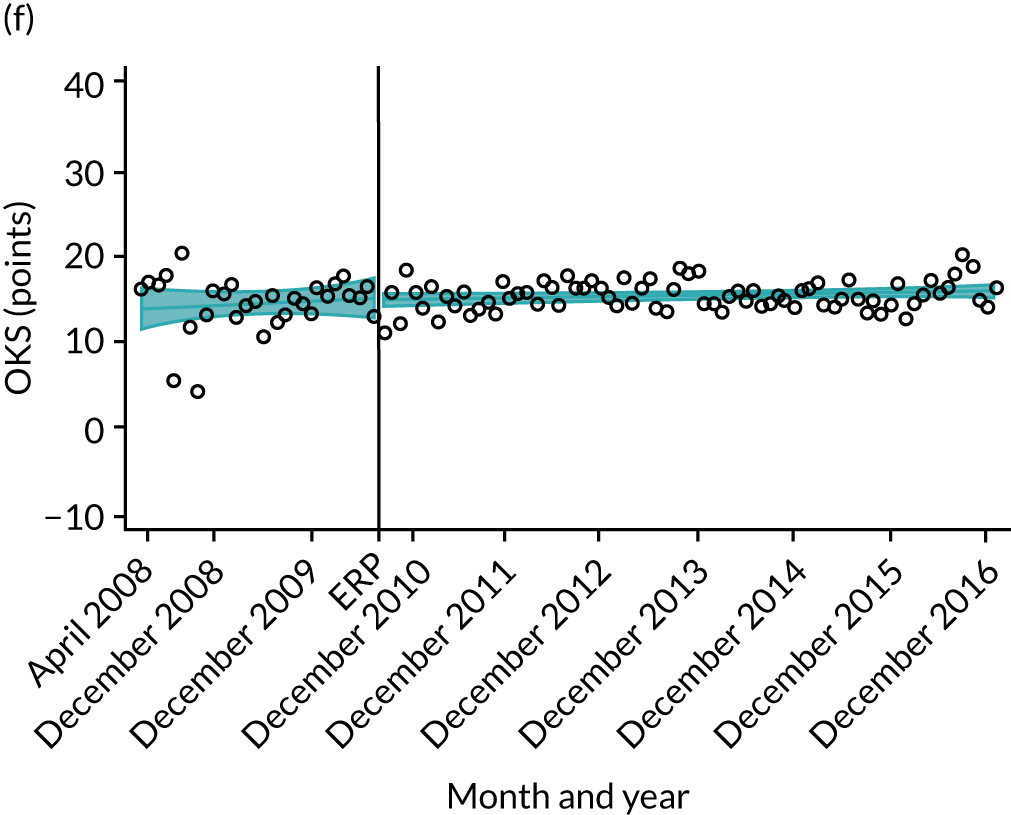
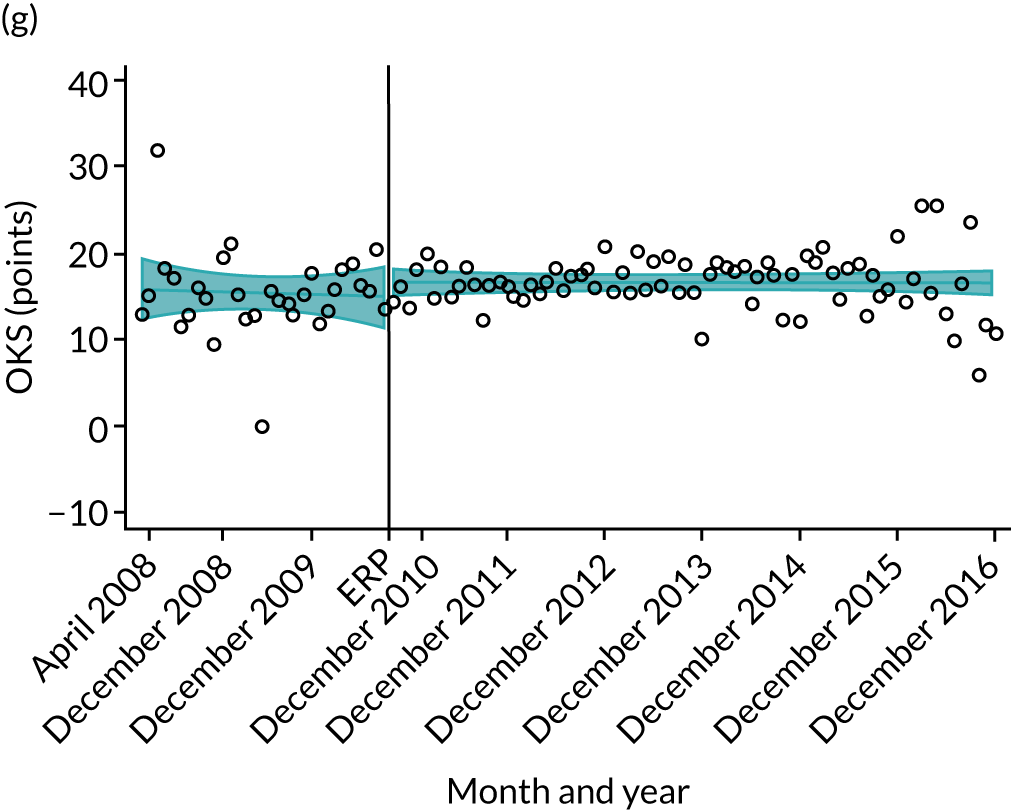
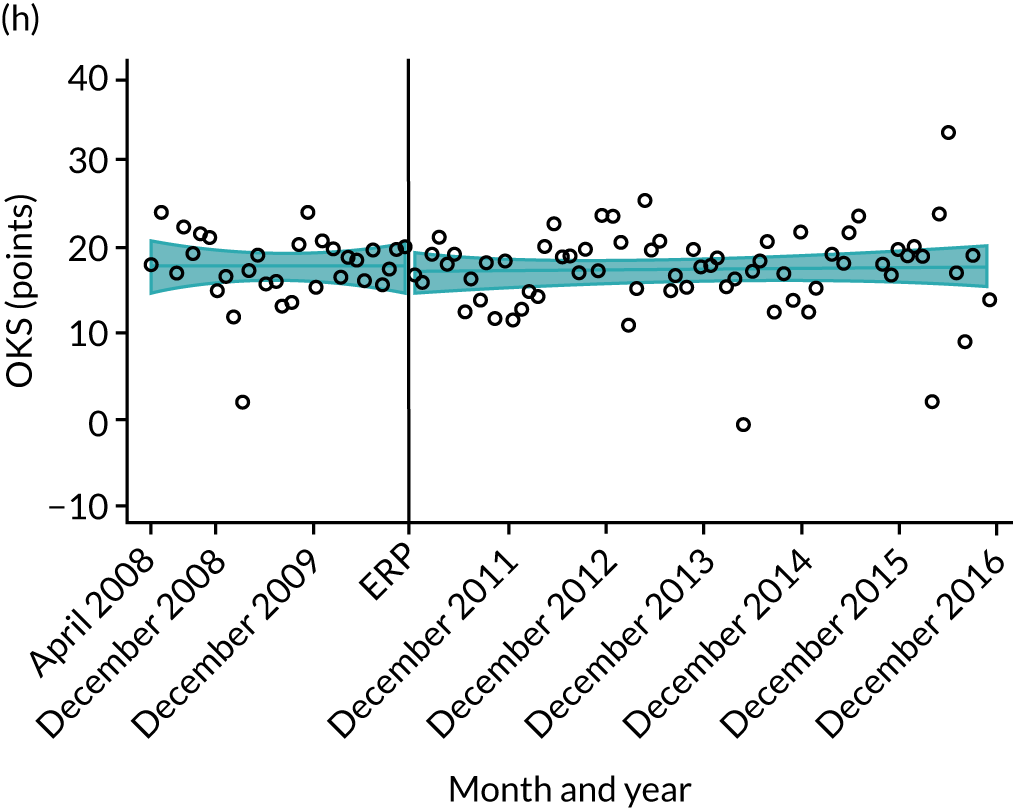
Discussion
Outcomes of primary THR and TKR have been gradually improving over time, with a decrease in LOS, improvement in patient-reported outcomes of pain and function, decrease in complications and reduction in 5-year revision risk. These trends of improving outcomes were seen across all age groups, and in those with and without comorbidity, and had begun prior to the start of the formal NHS ERAS roll-out. These findings are positive, in highlighting that reductions in LOS have been achieved without an adverse impact on patient outcomes.
We hypothesised that implementation of the national ERAS intervention would improve outcomes of primary THR and TKR by changing secular trends during and after its implementation. Our hypothesis was not confirmed, as implementation of ERAS did not influence these pre-existing secular trends. However, as we had data for only a relatively short period prior to the ERAS implementation (April 2008–March 2009), it is unclear how outcome trends varied over a longer pre-intervention period.
Our assumptions for this ‘natural experiment’ of the implementation of ERAS were that this large-scale intervention was implemented homogeneously across all England NHS trusts spanning this 2-year period. Our data suggest that there was already an encouraging trend towards reduction in LOS and improved outcomes that had begun prior to the official ERAS programme. This is likely to reflect early adoption of elements of ERAS methods in some trusts prior to the start of the Department of Health and Social Care-led programme in 2009. Not all hospitals had implemented the ERAS at the end of the planned period (March 2011). 17 The survey on the spread and adoption of the ERAS carried out close to the end of the implementation (February 2011) by the Department of Health Social Care reported full implementation in 81 consultant teams, whereas about 20 had partially implemented ERAS and about 30 still planned to implement ERAS. A limitation is the variation in interpretation and adoption across centres, because what constitutes ERAS was not clearly established after the expected identification of best practices in the first year of the ERAS programme. 67
Our results show trends in outcomes that have been achieved in the context of an increasing strain on NHS funding and hospital budgets. NHS funding growth is much slower than the historical long-term trend. 68 For THR, there are fewer hospital beds, and wards have been closed. For example, the average daily number of occupied beds open overnight for trauma and orthopaedics for England between April and June 2010 was 10,015, whereas in October–December 2016 it was 8770. Conversely, the number of primary THRs increased from 67,128 in 2008 to 87,733 in 2016 in England. It has been estimated that 97,516 THRs will take place to the year 2035. 69 Therefore, efficiencies need to be made to meet this demand within existing or lower capacity. An important issue is the large variation in services and practices across hospitals in England. The Getting It Right First Time (GIRFT) programme aims to reduce discrepancies between hospitals showing diversity in activity volumes, implant choice and guidelines follow-up. 70 The first GIRFT report was published in 2012, whereas the improving trends in outcomes in our study are detected since 2008. Although our results of a positive national trend are encouraging, there remains substantial variation in outcomes between hospital trusts. In 2016, mean LOS varied between a low of 2.5 days and a high of 11.6 days, and OHS between 12.0 and 23.5 points. Hence, although the national picture has improved for patients as a whole, there is still work to be done to reduce and understand unwarranted variations in outcome between individual hospitals.
Many studies supporting the implementation of ERAS pathways have been set in single institutions or are small trials. 71 Thus, they may not be generalisable to the wider population. Nevertheless, reductions in LOS prior to the official implementation of ERAS may reflect a commitment to improving the cost-effectiveness of this surgery, which represents an important expenditure for the NHS. 72–74 Reduction in LOS has been reported in systematic reviews and randomised clinical trials comparing patients following an ERAS programme for colorectal and other planned surgeries, against those under conventional care. 22 This reduction in days in hospital has been also observed for joint replacement surgeries in several studies. The type of ERAS for hip replacement differed among studies: physical therapy on the day of surgery in the recovery room;75 preoperative patient education; postoperative multimodal analgesia with periarticular injections; early physiotherapy and rehabilitation; discharge home with an outpatient rehabilitation programme;76,77 patient and staff education on ‘enhanced recovery’ principles; pre-admission medication; perioperative urinary catheterisation; low-dose spinal anaesthesia; aim for same-day mobilisation;78 perioperative care (information, pain relief, nausea control, nutrition, mobilisation and elimination);79 preoperative patient seminar; treatment of pain (spinal anaesthesia) and early mobilisation; standardised programme in the operating theatre (tranexamic acid and no drains); 1–2 hours of multimodal fast-track rehabilitation regime; daily physiotherapy within the first 24 hours; multimodal oral opioid-sparing analgesia;80 and perioperative analgesic blocking peripheral nerve. 81 These studies involved too few patients (170,75 57,76 1256,77 630,78 28,79 98,80 1581) to allow us to make generalisations at a nationwide level. In addition, these studies were limited to a single hospital or trust. Moreover, they were focused on the comparison of the intervention with traditional management. Our study investigates whether or not the ERAS pathway has been successfully implemented by comparing outcomes with a previous period without ERAS, as has been done in other studies,76–78 but also, and for the first time, comparing with the post-intervention period. Importantly, our study included all of the hospitals of a whole country.
Oxford Hip Score change increased across the study period, resulting in better scores (less pain and better function after the surgery) for patients in 2016 than in 2008. A review of ERAS in THR shows that better improvement in pain and function scores could be related to making patients active participants in their recovery and helping them to manage their expectations. 73
A Cochrane review of preoperative education for THR and TKR did not find additional benefits over usual care. 82 However, non-significant reduction in pain and better function were reported to be associated with preoperative education.
Six-month complications were decreasing until the implementation took place. Subsequently, the trend remained steady during the ERAS period and slightly increased following the intervention. A meta-analysis in colorectal surgery on several ERAS programmes did not find evidence of increased surgical complications83 (i.e. surgical site infections and anastomotic leakage), whereas medical complications were reduced in colorectal ERAS patients (cardiovascular, pulmonary and infectious complications). In patients with diabetes mellitus undergoing hip and knee replacement under ERAS protocols, the additional risk or complications otherwise associated with operating on patients with diabetes is reduced. 84
Five-year revision surgery rates diminished across the study. Surveillance of revisions, using joint registries, have long been the main measure of primary surgical success or failure. Revision rates could have declined as a consequence of the recommendation of the UK National Institute for Health and Care Excellence guidelines, which state that only implants with a revision rate of ≤ 5% at 10 years should be used in order to avoid surgeries using low-quality prostheses. 72
Conclusions
Our study shows that outcomes of THR and TKR are currently better than they were 10 years ago. LOS has declined substantially over the study period, consistent across all age groups and in people with and without comorbidity. Reductions in LOS have been achieved without adversely affecting patient outcomes. Patient-reported outcomes in respect of pain and function have improved, revision rates are in decline and complication rates remain stable. The introduction of a national ERAS programme maintained improvement, but did not alter the rate of change already under way.
Chapter 6 Enhanced recovery after surgery implementation in practice: an ethnographic study of services for hip and knee replacement
Introduction
In this chapter, we present the qualitative component of the study. The qualitative research had two aims: (1) to understand the organisational processes that help or hinder the implementation of ERAS programmes for hip and knee replacement [this work was informed by concepts from the Consolidated Framework for Implementation Research (CFIR)]; and (2) to explore patients’ experiences of ERAS for hip and knee replacement (this work used the ethnographer Mol’s work, which explores how care processes are negotiated between health-care professionals and patients).
This chapter provides a brief background to this component of the study, describes the methods and presents the findings. The chapter ends with a discussion of how the qualitative findings relate to current literature. Findings and discussion will be presented in two parts. Part 1 describes findings that explore organisational processes that help or hinder the implementation of ERAS programmes for hip and knee replacement. Part 2 characterises patients’ experiences of ERAS for hip and knee replacement.
Background
As described in the previous chapters, there is substantial variation in how ERAS programmes for hip and knee replacement are delivered,20 along with variation in health outcomes. 13 The qualitative research worked towards an understanding of ERAS in practice. This provides detail of the processes that enable ERAS to be embedded in health care and how patients experience ERAS in the care that they receive.
To provide structure and theoretical grounding for our research into health-care practice and delivery of ERAS, we conceptualised ERAS as a ‘complex intervention’,20 in which there are a number of interacting components. We then used implementation science85 as a way of understanding and interrogating the implementation of ERAS as a complex intervention, as implementation science focuses on delivery and what enables interventions to become embedded in practice. Within implementation science, the CFIR is one framework that outlines 31 constructs that have an impact on processes of implementation, grouped into five domains. These domains are (1) intervention characteristics that relate to the attributes of an intervention; (2) outer setting or external influences; (3) inner setting or factors within an organisation; (4) characteristics of individuals, that are the behaviours of individuals tasked with enacting the intervention; and (5) process, that is the planning and delivery of an intervention. 84
Health-care services should meet the needs of patients, which includes treating patients as individuals and enabling them to be involved in choices about treatment. As ERAS involves a close collaboration between health-care professionals and patients, meeting these needs may help patients invest in their care and, in this way, improve outcomes after surgery. To explore this in detail, we made use of Mol’s work, which focuses on how ‘good care’ is negotiated in practice. Meeting patients’ needs is not straightforward because patients may make choices that do not accord with clinical definitions of ‘good care’. The value of Mol’s work is the focus on a concept of ‘good care’,86 in which patients are not necessarily provided with unfettered choice, but in which care is negotiated between patients and health-care professionals. The role of health-care professionals, then, is to offer advice and encouragement and adapt care when possible to meet patient preferences and needs. Mol shows us that tensions emerge when the actions and expectations of health-care professionals and patients are not aligned. 86
A recent systematic review of existing qualitative studies exploring staff experiences of delivering ERAS for a range of conditions identified a number of factors that had an impact on successful implementation. These included communication and collaboration between staff, attitudes to change, the use of clinical protocols to standardise care, expectations around the intervention and the embedding of ERAS into everyday practice. 87 In addition, a previous qualitative review synthesised patient experiences of ERAS for a range of conditions, including colonic and colorectal surgery. Findings highlighted the need for comprehensive preoperative education and post-discharge support. 88 However, no studies have explored factors that have an impact on the implementation of ERAS programmes for hip and knee replacements or patients’ experiences of these programmes. As ERAS programmes for hip and knee replacement involve a considerable recovery period after discharge from hospital, patient experiences are likely to be different.
Aims
-
To understand organisational processes that may help or hinder the implementation of ERAS programmes for hip and knee replacement. This work used the CFIR to inform interpretation of results.
-
To characterise patients’ experiences of ERAS for hip and knee replacement using the ethnographer Mol’s work to explore how care processes are negotiated between patients and health-care professionals.
Understanding these issues will provide information to health-care professionals about how best to organise and deliver these services to provide effective patient care.
Methodology
The qualitative research used an ethnographic approach, which involved periods of ‘fieldwork’ in contexts. 89 Ethnography typically includes a range of methods to provide a well-rounded account of the issues under study. Ethnography aims to achieve a deep understanding of practice and systems from the perspective of people in a context. For this reason, it provides an ideal means of exploring how a service (ERAS) is implemented and experienced. 90
Hospital sites
Maximum variation sampling was used to identify four hospitals from England with a range of characteristics:91,92 (1) a teaching hospital, (2) a district general hospital, (3) a specialist orthopaedic hospital and (4) an independent-sector treatment centre. This aimed to provide a range of different experiences.
Part 1: exploring organisational processes that help or hinder the implementation of enhanced recovery after surgery programmes for hip and knee replacement
This component of the study used observations of clinical practice and semistructured interviews with health-care professionals to understand the implementation of ERAS programmes.
Observation sessions and job shadowing
Potential participants were identified by a staff member working in the orthopaedic department, or equivalent, of the individual hospital sites. Potential participants were then sent a study information pack that included information about the study, an invitation letter and a reply slip to return if they were interested in participating. Snowball sampling was also used, in which participants recommended other potential participants. 93
Using an observation checklist, observation sessions were conducted at each study site. Information was recorded in writing, as is standard in ethnographic research. The checklist was developed by the study team and provided structure for the researcher to collect information in a systematic manner so that field notes described the clinical setting, activities taking place, treatment protocols and factors that may have an impact on implementation. Informal interviews were also used. Initial notes were written up into full ethnographic ‘field notes’ during each day of data collection, or as soon as possible thereafter. To inform further data collection, memos or reflective notes were used to record emerging thematic ideas. A total of 19 staff agreed to be shadowed and approximately 160 hours of fieldwork was conducted (5 days of approximately 8 hours at each study site).
Semistructured interviews
Face-to-face semistructured interviews were undertaken with health-care professionals involved in service delivery. Interviews ranged from around 30 to 60 minutes in duration. Thirty-one health-care professionals participated in interviews, of whom 12 had also participated in observations. A ‘topic guide’ or list of themes to explore in the interviews was devised based on data collected during observation sessions. Interviews focused on participants’ views and experiences of delivering ERAS and factors having an impact on implementation. To ensure that the experiences of participants were not ‘forced’ into predefined concepts, data were not structured around implementation science theory. The topic guide was flexible to enable follow-up on issues raised. Interviews were audio-recorded, transcribed and anonymised.
Analysis
Analysis was iterative and ongoing and informed further data collection. Analysis was carried out in two phases, an interim and a final phase. Written field notes and transcripts of interviews were anonymised and imported into NVivo software for analysis (QSR International, Warrington, UK). Interview transcripts and field notes were analysed using an inductive thematic approach85 to identify themes and subthemes in the data. On account of the variation in service delivery between sites, data from each hospital site were analysed as a discrete data set. Twenty per cent of transcripts were double coded by another member of the research team (RG-H). Codes were then discussed and refined to reach a single code list. As part of the interim analyses, the CFIR was used to structure further analysis. This theory was identified as, unlike most other approaches, it suggests that successful implementation is dependent on how well the intervention meets patient needs, which accords with our findings. Using the CFIR as part of the analysis involved transposing themes that had been coded inductively onto the 31 constructs of the framework, grouped into the five domains: (1) ‘intervention characteristics’; (2) ‘outer setting’; (3) ‘inner setting’; (4) ‘characteristics of individuals’; and (5) ‘process’. This was an ‘abductive’ approach to analysis as described by Tavory and Timmermans. 94 Interpretive accounts of the data were then generated.
Part 2: exploring patients’ experiences of enhanced recovery after surgery for hip and knee replacement
We used qualitative semistructured interviews to explore patients’ experiences.
Recruitment
Potential participants were patients who had undergone THR or TKR at one of the four study hospitals. Study information packs were distributed by local hospital health-care professionals. Packs included an invitation letter, a booklet with study information and a reply slip. Reply slips were returned to a contact at each hospital. Potential participants were then either approached by the lead researcher while in hospital or contacted by telephone after discharge.
Semistructured interviews
Interviews ranged from around 30 to 60 minutes in duration. Thirty-seven patients participated in interviews, with the final sample size determined by data saturation. Interviews with patients 1 or 2 days postoperatively were conducted face to face in an inpatient setting. Those with patients who had been discharged took place by telephone owing to logistical challenges. A topic guide divided into themes was used to explore patients’ views and experiences of having a joint replacement throughout the care pathway.
Data analysis
Interviews were audio-recorded, transcribed, anonymised and imported into NVivo qualitative analysis software. An inductive thematic analysis was conducted, such that themes and subthemes were identified in the responses. 85 Memos were used to record emerging ideas and themes throughout the process of data collection and analysis. Ten per cent of interviews were independently double coded by a member of the study team and themes compared and contrasted to reach a single code list. Descriptive accounts of the data were then generated.
Ethics approval
Ethics approval was provided by the South-West Exeter Research Ethics Committee (reference 16/SW/0214). Participants provided their written consent before interview to confirm that they understood the aims and objectives of the research, that their participation was voluntary and that they were willing to let the study include anonymous quotations from them in reports of the study. Each NHS trust involved provided research and development approval.
Results
Characteristics of ERAS services for hip and knee replacement are displayed in Table 10. These present summarised information only to preserve the anonymity of sites.
| Study site (year ERAS first introduced) | Key features |
|---|---|
| Towerton (2011) |
|
| Shinebury (2000) |
|
| Lastmere (2014/15) |
|
| Woodland (around 2010) |
|
Part 1: exploring organisational processes that help or hinder the implementation of enhanced recovery after surgery programmes for hip and knee replacement
Sample characteristics
The 38 participants comprised 10 physiotherapists or occupational therapists (OTs), 18 nurses, five orthopaedic surgeons, one anaesthetist, one matron, two therapy technician assistants and one theatre manager. Twelve staff participated in interviews and observations, 19 took part in interviews only and seven took part in observations only. Between 4 and 14 participants took part from each study site. Participants’ characteristics are displayed in Table 11, which presents summarised information by study site to avoid the potential for identification of individual participants. We use pseudonyms for study sites and, in this part of the report, when we use the term ‘participant’ we are referring to hospital staff.
| Site pseudonym | Profession (n) | Sex (n) | Time spent in role at site |
|---|---|---|---|
| Shinebury: district general hospital | Physiotherapist (2) | Male (1); female (1) | 5–14 years |
| Staff nurse/sister (7) | Female (7) | 2 weeks–11 years | |
| Consultant orthopaedic surgeon (3) | Male (3) | 4–21 years | |
| Consultant anaesthetist (1) | Male (1) | 22 years | |
| Elmfield: specialist orthopaedic hospital | Physiotherapist (2) | Female (2) | 3–15 years |
| OT (3) | Female (3) | 18 months–12 years | |
| Staff nurse/sister/nurse specialist (6) | Female (6) | 1 month–1 year | |
| Matron (1) | Female (1) | 1 month | |
| Consultant orthopaedic surgeon (1) | Male (1) | 10 years | |
| Towerton: teaching hospital | Physiotherapist (1) | Male (1) | 10 years |
| Therapy technician assistant (2) | Female (2) | 1–2 years | |
| Staff nurse/sister/nurse specialist (4) | Female (4) | 3 months–7 years | |
| Orthopaedic surgeon (1) | Male (1) | 3 years | |
| Lastmere: independent-sector treatment centre | Physiotherapist (2) | Male (1); female (1) | 2–4 years |
| Staff nurse (1) | Female (1) | 4 years | |
| Theatre manager (1) | Male (1) | 3 years |
Seventeen CFIR constructs were found to influence processes of implementation for ERAS programmes in all five domains of the framework. A summary of the themes identified in the data and their relationship to these constructs and domains is given in Table 12.
| Domain (CFIR) | Construct | Description | Related theme |
|---|---|---|---|
| Intervention characteristics | Relative advantage | Perceived advantages of implementing the intervention |
Understanding of advantages Trade-off between reducing LOS and increasing readmissions |
| Intervention source | Views on whether the intervention had been internally or externally developed | Support for care pathway internally developed | |
| Adaptability | Adaptability of the intervention to meet the specific needs of the organisation | Adaptability of ERAS to hospital sites | |
| Outer setting | Patients’ needs and resources | The extent to which the intervention meets patient needs, including barriers to access |
Adaptability of ERAS to individual needs Importance of education to empower patients ERAS as a ‘message’ to be communicated to patients Concerns about post-discharge support |
| Cosmopolitanism | How effectively the organisation networks with external organisations to deliver the intervention |
Challenges in referral from primary care Tensions between primary and secondary care on discharge Inadequate post-discharge documentation |
|
| Inner setting | Networks and communication | How effectively individuals within an organisation network and communicate with each other |
Transferral of knowledge about patients along care pathway Multidisciplinary team meetings Informal communication Multidisciplinary paperwork Understanding of ERAS as a ‘message’ to be communicated across multidisciplinary team |
| Implementation climate | Receptiveness of individuals within an organisation to implementing the intervention and how well this is supported, rewarded and expected by the organisation |
ERAS champions to generate support Involvement in development of ERAS |
|
| Compatibility | Compatibility of the intervention with individuals’ norms and values, along with how well it fits within existing workflows | Variation in perceived compatibility of ERAS with existing roles | |
| Goals and feedback | The communication of goals and how they are acted on and fed back to staff | Formal and informal targets used to inform service delivery | |
| Available resources | Availability of resources for implementing the intervention, including physical resources, training and time |
Concerns about costs to maintain ERAS Shortage of available staff and high staff turnover High volumes of patients |
|
| Access to knowledge and information | Access to information about the intervention |
Varying levels of information and training Educational sessions Formal multidisciplinary team meetings Learning on the job |
|
| Characteristics of individuals | Knowledge and beliefs about the intervention | Individuals’ attitudes and support for the intervention |
Belief in relative advantages of ERAS Resistance where ERAS seen as incompatible with professional judgement |
| Process | Planning | Advanced planning of tasks to support the delivery of the intervention |
Use of protocols to streamline components of care Adaptability of protocols to meet individual needs |
| Engaging | Attracting and engaging relevant individuals involved in implementing the intervention through education and other similar strategies |
‘Top-down’ encouragement and monitoring Multidisciplinary team meetings to cascade information |
|
| Opinion leaders | Influential individuals who are able to help generate support for the intervention | Value of involving strong opinion leaders in development | |
| Champions | Individuals responsible for supporting and facilitating the delivery of the intervention |
Champions as a central point of contact and expertise Role in engendering enthusiasm |
|
| Reflecting and evaluating | Feedback about the progress of implementation, including feedback to individuals involved in its delivery |
Reviewing outcomes data Informal communication to discuss development Informal and formal feedback through questionnaires from patients |
We now explore factors that have an impact on the implementation of ERAS services. These are structured with the five domains of CFIR.
Intervention characteristics
Intervention characteristics illustrative quotations are displayed in Box 1.
[ERAS was] revolutionary . . . especially for the older nurses who had been there 20 years.
Senior sister, Towerton
When you’ve seen a patient with enhanced recovery protocols, you never want to go back to how you did things before . . . [seeing how quickly patients recover] was just an amazing transformation.
Consultant surgeon, Towerton
Reproduced from Drew et al. 95 © Author(s) (or their employer(s)) 2019. Re-use permitted under CC BY-NC. No commercial re-use. Published by BMJ. This is an open access article distributed in accordance with the Creative Commons Attribution Non Commercial (CC BY-NC 4.0) license, which permits others to distribute, remix, adapt, build upon this work non-commercially, and license their derivative works on different terms, provided the original work is properly cited, appropriate credit is given, any changes made indicated, and the use is non-commercial. See: http://creativecommons.org/licenses/by-nc/4.0/. Minor changes have been made to the formatting.
Staff expressed enthusiasm for the relative advantages of ERAS, as shortened LOS had resource and cost-saving implications. There was a sense of a ‘trade-off’ between reducing LOS and not increasing readmission and complication rates. At Shinebury, care pathways were developed internally by consultant surgeons who piloted ERAS and communicated findings to staff. This helped generate internal support. By contrast, a nurse sister at Elmfield described how ERAS practices had been ‘introduced on us’ and suggested that having someone to lead its development would have inspired enthusiasm.
Participants saw ERAS as adaptable, and this was key to it working in individual hospital contexts. None of those interviewed had seen any formal policies issued by the Department of Health and Social Care, although many were aware that ERAS was a government initiative. There were various views about which patients should be included in the pathway. At Shinebury, all patients were included in ERAS, whereas at Elmfield patients were selected only if it was felt that they were healthy enough for rapid discharge.
Outer setting
Outer setting illustrative quotations are displayed in Box 2.
You’ve got to bring the patient on board too. You’ve got to persuade them to go with the flow.
Consultant surgeon, Shinebury
You’re the one who’s going to make [the joint] work, so let’s get you working it. This is yours. It doesn’t belong to the NHS. It doesn’t belong to the surgeon. This is yours. [It’s about giving] them the ownership and the responsibility.
Deputy sister, Elmfield
Reproduced from Drew et al. 95 © Author(s) (or their employer(s)) 2019. Re-use permitted under CC BY-NC. No commercial re-use. Published by BMJ. This is an open access article distributed in accordance with the Creative Commons Attribution Non Commercial (CC BY-NC 4.0) license, which permits others to distribute, remix, adapt, build upon this work non-commercially, and license their derivative works on different terms, provided the original work is properly cited, appropriate credit is given, any changes made indicated, and the use is non-commercial. See: http://creativecommons.org/licenses/by-nc/4.0/. Minor changes have been made to the formatting.
As ERAS was viewed as a ‘partnership’ between members of staff and patients, participants thought that meeting patients’ needs would enable ERAS to work effectively. A number of patients could not be discharged because they were medically unfit, but some patients were also thought by staff to be somewhat resistant to ‘rapid’ discharge after their operation. A nurse at Elmfield thought that, to address these issues, it was crucial to adapt approaches to suit individual needs, adopting a recovery time that was manageable. Another emphasised the importance of education as a way of ‘breaking down’ attitudes that acted as a barrier to discharge.
Patient information was distributed in a range of formats. Written information helped to reinforce information provided at consultation and gave patients a source to refer back to. Sites operated hip and knee schools, regular classes designed to educate patients about their treatment, and participants thought that the ‘group dynamic’ created a safe space for asking questions and sharing experiences. Face-to-face contact was seen as an opportunity to clarify information. Participants thought that patient education had multiple aims, the most important of which was helping patients to have ownership of their recovery. Professionals thought that such education made it easier for them to provide postoperative support because patients had more knowledge about what to expect during recovery.
Participants conceptualised ERAS as a ‘message’, which had to be consistently communicated so that patients understood and adhered to recommendations. If the message and its consistency was ‘diluted’, then understanding and adherence could be reduced. Participants thought that new staff who were not familiar with ERAS and those who were ‘not buying into the process’ might provide inaccurate information.
Participants from all sites were concerned about post-discharge support. According to a nurse at Elmfield, this was important as patients ‘panicked’ without it. There was variation in post-discharge services provided by the sites. One participant felt that providing a telephone number as a point of contact was ‘the absolute minimum’. Staff thought that this made patients feel more ‘secure’.
Co-operation with external agencies was important, notably because the smoothness of connection with primary care at the point of referral and discharge had an impact on the successful implementation of ERAS. Staff suggested that GPs did not always understand the practicalities of ERAS, and referrals might be inappropriate or patients might receive information about recovery that may not accord with the information provided from within the hospital.
Participants highlighted some gaps in communication between primary and secondary care after patients’ discharge. One felt that GPs sometimes questioned patients’ readiness to return home; another felt that they got ‘cross’ when they thought that patients had been discharged by the hospital without sufficient pain relief. Participants at Shinebury and Elmfield were worried that patients had no point of contact in secondary care if they were experiencing difficulties before their follow-up review. This meant that such patients had to return to primary care first, which was seen as overly complex and placing an unnecessary burden on services. Furthermore, there were concerns that GPs were not provided with adequate post-discharge documentation. According to a nurse at Elmfield, there was a need to engage more closely with GPs and community services.
One of the key elements of success was effective networking and communication between staff. Multidisciplinary team members tended to operate in ‘silos’ with responsibility for delivering different components of care. To communicate patient information, knowledge had to be transferred along the care pathway as part of a ‘logical progression’. However, a nurse at Towerton was concerned that those undertaking pre-assessment were not consistently transferring information, meaning that potentially important details were missed.
Regular multidisciplinary team meetings to discuss ERAS were advocated, although these were challenging to organise. Informal communication was seen as being important and the location of staff in close proximity was seen to facilitate this. Nurses, physiotherapists and OTs at Shinebury and Lastmere ran ‘joint clinics’ together, and doing so encouraged collaboration. Multidisciplinary documentation was also valued, although the quality and consistency of this varied. For instance, at Elmfield, paperwork did not identify whether or not patients had been assigned to the ERAS pathway. A physiotherapist at Lastmere viewed documentation as a ‘back-up’, as staff were in ‘constant communication’ with one another.
A number of participants characterised ERAS as a ‘message’ that needed to be communicated across the multidisciplinary team to ensure that its components were being consistently delivered. However, this was not always achieved. For instance, at Elmfield, surgeons did not always agree with one another about which patients were eligible for ERAS. ERAS champions helped to ensure that the ‘message’ was successfully communicated and that staff were delivering components of care consistently.
Regarding the implementation climate, participants described the importance of a collective ethos and ‘belief’ in ERAS. ERAS champions helped to garner support from the multidisciplinary team. However, at Elmfield, there seemed to be no clear leadership. Furthermore, not all team members were invited to meetings to discuss ERAS development, and this made them feel less engaged.
There was variation in how compatible ERAS was seen to be with existing roles. A number of participants thought that ERAS involved expanding on existing working practices, making it easy for them to do the necessary work. However, some anaesthetists were reportedly resistant as they preferred using their own professional judgement over following protocols. Similarly, a participant at Towerton had found it difficult to change nursing practice, as colleagues were uncomfortable about encouraging patients to be so independent and were reluctant to send them home.
Targets and goals for LOS were established formally by the hospital or trusts and informally by ERAS services. Performance against formal and informal targets was fed back to staff and used as a basis to collaboratively improve service delivery. Failure to meet formal LOS targets led to fines, meaning that staff felt under substantial pressure to meet these goals.
The financial cost of maintaining ERAS was a concern, although the extent and nature of this varied. Elmfield staff were particularly worried about lack of current funding, which meant that they were not able to acquire sufficient staff or facilities, such as beds. Staff at Lastmere thought that funding cuts may prevent them from providing patient information booklets, which they saw as being central to effective rehabilitation.
A shortage of available staff and high staff turnover were seen as creating difficulties, as they meant that colleagues had to do additional work and struggled to find time to deliver care. At Shinebury, staff explained how time constraints made it challenging to arrange formal care packages after discharge and this had an impact on the quality of postoperative follow-up. A deputy nurse sister at Elmfield thought that follow-up reviews should be undertaken by nurses or physiotherapists, as they were at Shinebury, to relieve the ‘pressure’ on consultants. Patient numbers at Shinebury and Towerton were also seen to place pressures on services. Alongside this, operations could be cancelled at short notice when operating theatre space was needed for trauma surgery.
Staff at the four sites had received varying levels of access to knowledge and information about ERAS. Towerton appeared to have the most comprehensive training and education, and staff spent time with the nurse champion, who ran educational sessions and incorporated information on ERAS into ongoing orthopaedic training. Staff at Shinebury were also expected to attend joint school to help them educate patients more effectively. By contrast, a participant at Elmfield explained how the intervention had been introduced without any formal education and that this had not been effective. Multidisciplinary team meetings were used as a way of communicating information about changes in working practice, along with ‘learning on the job’.
Inner setting, characteristics of individuals and process
Participants emphasised the importance of individual commitment from staff. A strong belief in the relative advantages of ERAS meant that most staff were committed to delivering the service. Resistance to change existed where ERAS practices were seen as being incompatible with professional judgement.
Inner setting, characteristics of individuals and process illustrative quotations are provided in Box 3.
We [the physiotherapists] can actually gather information to save going through things . . . [the OT] might have gathered something that perhaps I might take an hour to get out of somebody.
Physiotherapist, Shinebury
The other thing that will sometimes get in the way is if the [ERAS] message has been diluted at some point.
Consultant surgeon, Shinebury
I think there are other people that have the same beliefs as my beliefs . . . the bond, the desire [to implement ERAS] is uniform from top to bottom.
Consultant surgeon, Towerton
The sadness we have is we did have a fabulous all singing and dancing booklet but it was funded by a particular company [who is no longer providing support] . . . the funding for that isn’t possible [any more].
Physiotherapist, Elmfield
Giving [patients] enough time to ask questions I think is important so it’s about having an appropriate length of clinic appointments which obviously [presents] a conflict between seeing a number of patients that the trust wants you to but giving patients enough time to do that.
Consultant surgeon, Elmfield
Having enough capacities for the key professionals to interact with the patient at the right time, from pre-op to post-op [is difficult].
Consultant surgeon, Towerton
Characteristics of individuals
Every anaesthetist was just doing his own individual recipe and it was very difficult . . . [it] took quite a lot of engagement to get the anaesthetists to really champion it and get their colleagues to embrace that.
OT, Elmfield
Process
The idea [of the meetings] was to keep reviewing the figures and make sure there was an emphasis that everybody cascades to their own colleagues about how we were doing and whether we [were] dropping off on our rapid recovery . . . it’s been a challenge to keep that momentum going.
Consultant surgeon, Shinebury
Reproduced from Drew et al. 95 © Author(s) (or their employer(s)) 2019. Re-use permitted under CC BY-NC. No commercial re-use. Published by BMJ. This is an open access article distributed in accordance with the Creative Commons Attribution Non Commercial (CC BY-NC 4.0) license, which permits others to distribute, remix, adapt, build upon this work non-commercially, and license their derivative works on different terms, provided the original work is properly cited, appropriate credit is given, any changes made indicated, and the use is non-commercial. See: http://creativecommons.org/licenses/by-nc/4.0/. Minor changes have been made to the formatting.
To plan processes of care, protocols were used to ‘streamline’ services and ensure that patients received key elements of care, although these were not always formally described. However, participants stressed that these should be sufficiently flexible to meet individual needs.
A consultant surgeon at Shinebury emphasised the importance of sustaining multidisciplinary commitment and advocated ‘top-down’ encouragement and close monitoring to do so. To facilitate this, staff at Shinebury held multidisciplinary meetings to ensure that key members of the team were cascading information to colleagues ‘to keep that momentum going’. However, a nurse at Elmfield explained that not all team members were invited to meetings to discuss ERAS development, and this made them feel less engaged.
Involving strong opinion leaders in the development of ERAS helped to generate internal support, whereas a lack of this at Elmfield was a barrier to engagement. The importance of having a recognised ERAS champion to ‘drive through’ changes was highlighted. Towerton had a designated nurse specialist who acted as the central point of contact. As a result, other members of the multidisciplinary team did not need to be familiar with all aspects of the protocol. Similarly, consultants at Shinebury were identified as a source of expertise. Clinical champions also helped to engender enthusiasm.
The ERAS programme had to be (re)activated on a continuous basis through reflection, evaluation and modification. To reconfigure care, staff at Shinebury used multidisciplinary meetings to review outcomes data and ‘brainstorm’ ways of improving services. Informal communication between team members, for instance in hip and knee schools, provided another opportunity for this. Patient feedback was used to shape patient education materials and joint schools. Feedback was collected informally or through patient satisfaction questionnaires. On account of these processes, ERAS was seen as having been improved or ‘refined’ at three study sites. ERAS at Shinebury was described as having a ‘core element’, which has grown outwards as the service has ‘tried to add bits on to try and improve the situation’. By contrast, staff at Elmfield talked about how ERAS was gradually being ‘nibbled at the edges’.
Part 2: exploring patients’ experiences of enhanced recovery after surgery for hip and knee replacement
Sample characteristics
The 37 participants were 15 men and 22 women. Between 6 and 16 participants took part from each study site; 14 had undergone TKR and 23 had undergone THR. Twenty-two participants were interviewed in an inpatient setting and 15 were interviewed once they had been discharged. Of those who had been discharged, five were interviewed 2–4 weeks postoperatively and 10 were interviewed 5–13 weeks postoperatively. Participants’ characteristics are displayed in Table 13. In this section, we use the term ‘participants’ to refer to patients.
| Site pseudonym | Participant pseudonym | Sex | Age (years) | Hip or knee replacement | Length of time since operation |
|---|---|---|---|---|---|
| Shinebury (district general hospital) | Rebecca | Female | 76 | Hip | Inpatient |
| Matthew | Male | 77 | Knee | Inpatient | |
| Susan | Female | 77 | Knee | Inpatient | |
| Jennifer | Male | 77 | Hip | Inpatient | |
| Bethan | Female | 70 | Hip | Inpatient | |
| Sarah | Female | 53 | Hip | Inpatient | |
| Stewart | Male | 68 | Knee | Inpatient | |
| Craig | Male | 59 | Hip | Inpatient | |
| Zoe | Female | 72 | Knee | Inpatient | |
| Andrew | Male | 63 | Knee | Inpatient | |
| Beth | Female | 71 | Hip | Inpatient | |
| Cathy | Female | 59 | Hip | Inpatient | |
| Dave | Male | 46 | Hip | Inpatient | |
| Elizabeth | Female | 85 | Hip | Inpatient | |
| Fiona | Female | 54 | Hip | Inpatient | |
| Kevin | Male | 69 | Hip | 13 weeks | |
| Elmfield (specialist orthopaedic hospital) | Adam | Male | 76 | Knee | Inpatient |
| Geoff | Male | 48 | Hip | Inpatient | |
| Robert | Male | 77 | Knee | Inpatient | |
| Henrietta | Female | 85 | Knee | Inpatient | |
| Linda | Female | 63 | Knee | 5 weeks | |
| Owen | Male | 71 | Hip | 4 weeks | |
| Towerton (teaching hospital) | Amanda | Female | 74 | Hip | Inpatient |
| Jayne | Female | 68 | Hip | Inpatient | |
| Ian | Male | 58 | Knee | Inpatient | |
| Martin | Male | 67 | Hip | 4 weeks | |
| Penny | Female | 36 | Hip | 9 weeks | |
| Steven | Male | 56 | Knee | 7 weeks | |
| Tom | Male | 72 | Hip | 12 weeks | |
| Ursula | Female | 90 | Knee | 10 weeks | |
| Veeda | Female | 77 | Hip | 8 weeks | |
| Lastmere (independent-sector treatment centre) | Harold | Female | 72 | Knee | 2 weeks |
| Irene | Female | 65 | Hip | 6 weeks | |
| Jackie | Female | 55 | Hip | 5 weeks | |
| Noura | Female | 57 | Hip | 4 weeks | |
| Rachel | Female | 72 | Hip | 10 weeks | |
| Quinn | Male | 42 | Hip | 3 weeks |
Referral process
Around half of the patients who were interviewed said that they had been given the chance to choose which hospital they would be seen at. Most participants made their choice of hospital based on previous experiences and ease or convenience. A smaller number of participants made their choices based on hospital performance. Others were guided by GPs in their decision-making, particularly those who had additional health-care needs. However, for most, choice of hospital was not a priority compared with the need to progress towards surgery.
Participants held varying views about waiting times for surgery. Some were surprised by the short period between referral, appointment and operation date, and others experienced delays.
Participants attributed delays to funding constraints and administrative difficulties, particularly at the interface between primary and secondary care. Several described how their operations had been cancelled and, although some were sympathetic to the pressures on the health-care system, for others this was emotionally difficult. The difficulty led to feelings of helplessness and frustration.
Preoperative education
Preoperative experiences illustrative quotations are displayed in Box 4.
I had every confidence in the hospital because of my other cancer operation, my life basically was in their hands and I never had any doubt about it.
Kevin
What happened is [the hospital] gave me a date [for the operation], which is what you look forward to, and then they cancelled, which drove me potty because I’ve never been depressed in my life but you’d be rest assured I was depressed then. I’m always upbeat. I’m Gemini so I’m normally a very happy person. Apparently, I was turning snappy, easily upset, generally fed up, which is like a mild form of depression, if you will, which is just not me.
Tom
I met the whole team . . . The nurses, the anaesthetist, the surgeons. You know, they really made you feel that they were going to look after you. I think one of the surgeons, actually that was his words, ‘We will look after you’.
Owen
[The health-care professionals] were upbeat about [the surgery], not like it used to be, not staying in bed, not being treated as though you’re 101 and getting you back up on your feet as soon as possible.
Cathy
[The health-care professionals] showed you how to use crutches properly and how to walk if you can; different things like that. So you’re already halfway set before you got here, which was very helpful.
Andrew
I can’t remember [when the hip school was] because of the delay. That’s really why I’ve forgotten some of the exercises really.
Amanda
Everybody will say you’re young to be having a hip replacement, I am young to be having a hip replacement but [the consultant] said I need to have a hip replacement and so I kind of try to Google [Google Inc., Mountain View, CA, USA] in the experiences of somebody young to get information.
Jackie
Patients were referred from primary care (GPs) to secondary care and most participants were satisfied with the verbal information that they had received in secondary care. The verbal information was augmented by written information, and they thought that written information about postoperative exercises was particularly useful, as they kept it until after discharge.
Participants valued the opportunity to attend classes for patients who were about to have hip or knee surgery, called hip or knee ‘schools’. Patients felt that the classes helped prepare them for surgery and gave them ‘confidence’ in the care they would receive. Classes helped make them feel enthusiastic about the potential for early discharge and invested in their recovery, preparing them to take on the role of ‘active’ participants in their own care. Guidance about how to use crutches and perform exercises was considered particularly useful. Most thought that it was useful to practise exercises to prepare them for standing and walking after their surgery, although some said that they had not practised consistently.
Classes were also a source of emotional support, as they were an opportunity to meet patients ‘in the same boat’. Those undergoing their first replacement found it useful to talk with and listen to patients who had undergone previous surgery: they used the classes as a time to ask others questions about their experiences. An understanding of the roles of both patients and health-care professionals meant that expectations of care were aligned prior to surgery.
The timing of these classes was sometimes problematic. Those who had received a rapid referral owing to a cancellation missed out on this component of care. Others felt that they had attended too far in advance of their operation, meaning that they could not remember the information on admission. These challenges potentially undermined patients’ ability to participate fully in their care.
Participants wanted health-care professionals to provide them and their families with more information about their recovery and their expected progress to help them take care of themselves. Some also felt that they would have liked more emotional support. A small number of younger participants wanted more information about joint replacements in younger people, with a focus on any differences in their likely recovery after surgery.
Participants also sought information from family and friends who had undergone surgery, and from the internet. Nevertheless, one participant raised concerns about the availability of conflicting information and thought that hospitals should guide them to reliable sources.
Preoperative preparation
All participants found the preoperative assessment straightforward and comprehensive. They reported that they were able to do everything that was required of them before surgery (see Box 4).
Waiting for operation
A number of participants described that they had to wait several hours from the point of admission to hospital until their operation. They found this hard because they were not permitted to eat or drink while waiting. Patients said that they would have valued more information about the reason for their wait and about the precise time of their operation, and that absence of this information made them feel more anxious.
Anaesthesia
Inpatient experiences illustrative quotations are provided in Box 5.
You get there for about 7.30 in the morning, or whatever it was. I was told we were second in the queue for operation under [the consultant] so saw the first person depart, whenever that was, 8.30-ish, and I thought – and I still didn’t go in until the afternoon. So therefore, there was that little bit of where that waiting you’re thinking, ‘What’s gone wrong? Am I going to get operated on?’ because unfortunately there was no communication.
Steven
I was recommended to have the spinal block and sedation, I asked for the sedation, I had no wish to sit there listening to the bone grinding with a saw and hammer . . . I liked having the choice, yes that was nice. They were lovely and they explained it all.
Cathy
It might surprise that I opted not for a general anaesthetic, which rather threw the cat amongst the pigeons [laughs]. At my pre-op I said to the nurse, ‘By the way, I don’t want a general anaesthetic’, I’d obviously committed a cardinal sin by saying that and she went, ‘Why don’t you want it?’, I said, ‘I don’t, that’s my choice, I’ve never had a general, I don’t want a general’. I caused a flurry apparently and when my surgeon happened to be there, went past and said, ‘Don’t worry, we’ll sort something out’, so I was obviously, they weren’t expecting that although in the NICE guidelines that is an option.
Rachel
When I said to the nurse, ‘do I really have to take codeine?’, she said ‘no, you can decide not to if you don’t want to’. I was pleased about that.
Noura
They gave us sticks [at the hip school] and said you’ll be discharged on sticks. They were quite adamant on that and yet the physios came along on the second morning and presented me with two crutches and I said ‘oh, crutches not sticks’. I thought communication has broken down slightly here somewhere, you get one message at hip school and a slightly different message as soon as you’ve had the operation.
Noura
This morning, they were coming round and they said, ‘We’ll start the exercise and whatever this morning’ . . . I was able to move and I could actually move my legs, move them up and down with no pain. I was like someone else. Just a lovely ache. An ache that – that was heaven, that was, absolutely.
Cathy
The day after the operation they got me up straightaway and with the help of them, try and get my feet walking again. It was all slowly done. There was no rush, a steady pace and eventually the day after that they had me try and walk up the stairs successfully. I walked up and back down again, and it was a success.
Kevin
The night nursing staff were, ‘Come on. Get on your feet. Mrs So-and-So’s out of bed. You should be’. They tended to treat us all the same and we were a bit ratty about that. It’s back to this, they’re not treating you as individuals . . . I didn’t want to keep going. I was in a lot of pain.
Beth
You just had to be organised [about going back home] and this is the one thing that they did impress, better organisation is how you feel better when you’re discharged.
Cathy
I’m slightly apprehensive [about going home] from the point of view that I’ve got to manage a very large shopping bag and a walking stick. I am just a little concerned and I’ve said to myself, ‘Leave it [Susan]. Wait till we get there and see what happens’.
Susan
Most participants were presented with the option of local or general anaesthesia, although they had different experiences of this. Although some were given this option during hip or knee schools or their preoperative assessment, others were asked on the day of surgery. These patients reported that it had made them feel ‘surprised’ and ‘alarmed’ and worried about ‘being awake’ during surgery. They also felt that receipt of information on the day of surgery meant they had not felt able to make an informed choice. Several explained that anaesthetists also expressed a clear preference for localised anaesthesia, which influenced their decision. Contrary to ERAS guidelines, one participant reported that she had not been offered localised anaesthesia, but had insisted on it against the advice of her anaesthetist.
Pain management
Patients were generally satisfied with how their pain was managed and felt that nurses were attentive to their needs (see Box 5). However, some patients at Shinebury felt under pressure to take their pain medicines, although they thought that the medicines provided were ‘excessive’ and made them feel ‘out of it’. Others wanted more information about the pain medicines that they had been prescribed. One patient expressed frustration and thought that nurses were reluctant to share this information, which meant that she was not able to make a fully informed choice about her pain medicines.
Inconsistencies in information
The majority of participants felt that they had been fully informed about what to expect during their inpatient stay and that, as a result, there were ‘no surprises’ (see Box 5). However, some participants identified inconsistencies between preoperative information and subsequent information, which they found unsettling.
Early postoperative mobilisation
Patients were surprised about being able to get up and walk so quickly after surgery (see Box 5). There was a sense of pride in being able to fulfil what they thought was required of them and they benchmarked their success against the content of the information that they had received before surgery, as well as feedback from health-care professionals. Positive affirmation was important to encourage patients to meet ERAS goals. Participants emphasised the importance of participating in exercises and working towards their own recovery, engaging in the emotional and physical work required of them as ‘active’ patients.
Most felt that mobilisation after their operation moved at an appropriate pace. When patients could not mobilise quickly, particularly older patients or those with complications, they felt that staff largely listened to their concerns. Likewise, a younger patient was satisfied that staff helped her to mobilise more quickly than anticipated. In this way, care was negotiated and plans were amended to meet patient needs.
However, other participants described how they had felt under pressure to mobilise and ‘conform’ to the demands of the programme. Such patients thought that health-care professionals did not listen to their concerns or respond to their individual needs. Others experienced a tension between giving their bodies time to ‘heal’ and the need to become active, expressing a concern that activity might be ‘damaging’. When expectations of patients and health-care professionals differed, this created frustrations for patients. A small number of participants thought that such tension undermined their right to autonomy and choice about their care.
Discharge
Most participants reported feeling ‘ready’ to return home by the time that discharge happened (see Box 5). They thought that it was better to go home than to remain in hospital. Feeling ‘prepared’ contributed to a feeling of confidence about discharge and return home. Participants valued the help and guidance that they had received before admission about how to prepare for discharge. Such preparations included reorganising the home, acquiring assistive devices and ensuring that family and friends were available to help. Participants at Towerton thought that assessing patients’ needs before admission and providing appropriate assistive devices were useful. Information empowered patients and instilled confidence. Those being discharged felt more reassured when they understood their recovery trajectories, how to perform post-discharge exercises and what they could and could not do. Part of the ERAS process is mobilisation (i.e. standing and walking) and participants said that their desire to go home motivates them to mobilise. Discharge delays due to staffing issues were a source of frustration and patients sometimes received conflicting information about which day they were being discharged, which made them feel unsettled.
By contrast, other participants reported that they felt under pressure to be discharged before they felt well enough. This was linked to their concerns that they were being made to mobilise too quickly. A small number of participants attributed this to a demand for beds. Among those who were concerned, worries about going home were wide-ranging and included not knowing what to expect, fear of falling and a lack of ability to sleep and perform everyday tasks. Those who lacked family support, particularly those who lived alone, were more anxious.
Postoperative
Post-discharge experiences illustrative quotations are provided in Box 6.
It would be useful [for the health-care professionals] to actually say what you might experience. It’s nice to know that what you’re feeling isn’t actually unusual or anything to worry about. You know, I was worried that I was pulling the pin out of the thigh or something when it started really, really aching. I wondered if I’d done something wrong.
Noura
Speaking to other people who’ve had hip replacements and who know of those who haven’t bothered with the physio after a week or two, because to be honest, who wants to put yourself through that three times a day when it hurts? But I came home and my husband would help me. He was good in that respect and he could see within a week the difference it was making, but it was hard.
Rachel
When I came home and I was doing my exercises and I didn’t I couldn’t quite do some. I was sort of, you know, what do I do? Do I walk more? Do I do the exercises more? Do I push through the pain? The physio said to push through the pain but at the joint school they said not to push through the pain.
Penny
You just wonder how much that you should do because I’m that sort of person you know, ‘did I overdo it? Should I have rested more with my leg up?’ and then you worry about developing problems and things if you don’t mobilise.
Linda
I’ve been on pain relief up until yesterday, when I got fed up with it all. And I’ve been gradually cutting down of my own accord and today I’ve not had a single anything. I know what my body needs. And it’s my body and I’ll do what I like with it.
Elizabeth
I took myself off everything and then the last couple of weeks I’ve actually had some problems with sort of swelling and things ‘cause I think I did it too quickly. There’s been no support from the GP, which might be quite nice. I suppose I could make those appointments myself but if it was more protocol that that’s what happened, you would feel more supported.
Penny
It’s difficult when you get home a few days later. I just felt I needed a bit more reassurance and you know I’m even nursing myself, but it depends on your family. You know people aren’t medically minded or haven’t got a clue about looking after somebody when you come out of hospital. So you do rely on professional people around you.
Noura
It was nice to be back home again after the hospital and I found it, with the help of my wife, she’d be there when I was doing these exercises, you know, in case I sort of toppled over or something. She was right behind me, literally.
Kevin
Realistically, I would like to think [in the future] I would suffer from no real noticeable pain in my left knee and hopefully the right knee once it’s operated on and I think, given what I’ve been able to do, most of it is going to work out in that I should be able to go for a nice long walk with family and friends.
Steven
I think [ERAS] is called a rapid recovery but I’ve seen that as just the normal.
Andrew
When you use the words enhanced recovery programme, what comes to my mind is get them recovered, get them out, save money, so they’re not bed blocking.
Geoff
Participants said that their initial recovery at home after discharge from hospital was the most challenging period of their journey through joint replacement. Physical challenges included postoperative bruising, high pain levels and ‘unfamiliar sensations’ that they had not anticipated. Participants facing such challenges explained that they were unsure what was ‘normal’. Although many were relieved to be back in their home environment, participants described unexpected practical challenges, such as bathing and going to the toilet. Participants said that adaptive devices were useful, but also found that ones that they needed were not necessarily available.
Physiotherapy exercises
Participants emphasised the importance of actively participating in their care by carrying out exercises that the physiotherapy team had provided. However, several were unsure if they were performing the exercise in keeping with the guidance they had received. Again, there was a reported tension between being active and allowing their bodies time to heal. Some felt uncertain about how far to ‘push themselves’. Participants also said that they were not always certain about whether or not some daily activities were safe to carry out, for instance whether or not they should be sleeping on their side.
Pain relief
Many participants were satisfied with the pain relief medicines that they had been given on discharge. These included medicines to take home with them. However, if things were not going well then managing pain after discharge could be a source of worry. One participant described feeling ‘alone’ and ‘abandoned’ when experiencing severe pain 1 week after discharge, and not knowing who to contact for support. Most participants described feeling confident in reducing their pain medications without clinical input. However, one thought that her decision to do this too quickly had caused her pain to return.
Post-discharge support
Although patients were expected to be independent in their recovery after discharge, many struggled to maintain their role as active participants without clinical input. Among those experiencing challenges, there was a desire for more support to provide ‘reassurance’. This included guidance from professionals in secondary care and their own GPs. The provision of contact details on discharge helped provide a feeling of security. Knowledge that they were receiving a follow-up appointment was also a source of reassurance and participants saw this as a key point in their recovery.
Family
The importance of family and friends as a source of practical and emotional support during this period was repeatedly emphasised. When this was not possible, a small number of participants had help from community services, which they also valued.
The future
Despite some of the challenges encountered, participants were largely optimistic about moving forwards and they enjoyed reflecting on progress. Many discussed how their joint replacement would enable them to participate more fully in everyday life. Expectations included having ‘pain-free joints’ and ‘going for short walks’, and participants emphasised the importance of having ‘realistic’ expectations. For some, discussions of the future were dominated by the prospect of future joint replacements. Others remained uncertain about what to expect.
Discussion
Overview of findings
Seventeen of the 31 CFIR constructs influenced the implementation of ERAS across all five domains. As described in Intervention characteristics, participants felt that ERAS afforded advantages over alternative solutions. Support was higher when ERAS was seen to have been developed internally rather than externally. Guidance was flexible and could be adapted to meet the demands of individual hospital services. In the ‘outer setting’, participants thought that ERAS should be tailored to patient needs and that education could empower them in their recovery.
There were concerns about a lack of post-discharge support and tensions between primary and secondary care. In the ‘inner setting’, one of the key elements of success was effective multidisciplinary collaboration. This was achieved by transferring knowledge about patients along the care pathway, through multidisciplinary team meetings and paperwork. ERAS was a ‘message’ that had to be communicated to all staff, but there were concerns about funding constraints, staffing levels and large numbers of patients. Access to information about the intervention was variable. The characteristics of individuals had an impact on implementation, and staff were reluctant to change working practices when ERAS was seen as being incompatible with professional judgements. Formal and informal targets were used to inform service delivery. Within ‘process’, protocols were used to streamline care, although these had to be flexible to meet individual needs. Participants thought that ‘top-down’ encouragement, monitoring and regular meetings helped to ensure team engagement. Involving strong opinion leaders in its development, and ‘champions’ who drove through implementation and acted as a point of contact, helped facilitate implementation. Reviewing outcomes data, informal communication to discuss progress and patient feedback helped to develop ERAS over time.
Findings on patients’ experiences of ERAS showed that time to surgery varied and cancellations were emotionally difficult. Patients valued preoperative education, but timings meant that not all patients were offered educational classes. Participants wanted more information on expected progress, along with emotional support. There were different experiences of being offered a choice of anaesthesia. For some, this was explained in advance of admission, and others were consulted on the day of surgery, which caused anxiety and prevented them from making an informed choice. Some participants identified inconsistencies in information between their preoperative education and inpatient care, which they found troubling. Most were enthusiastic about mobilising quickly after surgery, although others felt under pressure and wanted to leave their bodies time to ‘heal’. Most participants reported feeling ‘ready’ to return home, and this was enhanced by discharge preparation before admission and the support of family. However, a small number felt that they were under pressure to be discharged before they were well enough. Postoperative recovery was often most challenging in the first few weeks, and some were unsure how to perform exercises and daily tasks, or were worried about unfamiliar bodily sensations. They wanted more post-discharge input to provide ‘reassurance’. Follow-up appointments were therefore considered key points in recovery.
How findings relate to current literature
Findings characterise differences in how ERAS services for hip and knee replacement are delivered by identifying barriers to and enablers of their successful implementation. This may help to account for variation in health outcomes for these surgeries. 13 For instance, meeting patient needs may help them to work more successfully towards their own recovery. Findings reflect those from previous studies that have explored processes that influence implementation of ERAS for other conditions. 88,96,97 These found that multidisciplinary collaboration was essential and that this could be threatened by the need to co-ordinate working practices across different departments. 98 Likewise, components of ERAS were seen as incompatible with working practices of some members of the multidisciplinary team; this meant that some staff were resistant to change. 99 A need to engage staff was emphasised, and ERAS ‘champions’ were seen as a means of achieving this goal. 26,96 The importance of providing education and information to patients, and providing realistic expectations of their recovery, was discussed. 28,88 Temporality or strategies to embed ERAS over time were discussed in a small number of studies. 59 Studies have been synthesised in a recent systematic review. 87 Our study contributed to this literature by emphasising the importance of meeting patient needs in service design and for effective collaboration between primary and secondary care services.
Previous work has highlighted the value of preoperative education as a way of helping patients to prepare emotionally and practically for colorectal surgery. 100 In other surgeries, inconsistencies between preoperative education and inpatient experiences in colorectal and colonic surgeries have also been previously identified and our findings accord with these. 25,101 Patients undergoing colorectal surgery expressed enthusiasm about working towards their own recovery,100 a finding reflected in our work. In addition, some colorectal patients echoed the tension we identified between meeting the demands of the programme and allowing themselves time to recover. 102 Several of these also worried that they were being discharged too early. 24,25 A recent review of patient experiences of ERAS for a range of surgeries reflects one of the core findings of our study about the importance of post-discharge support. 24,103 Other issues identified in our study relate to challenges in the wider health-care system, such as the cancellation of elective surgeries owing to funding constraints104 and discharge delays. 27
Our study identified issues that may relate specifically to ERAS as delivered in hip and knee replacement. For instance, some patients felt unable to make an informed choice about anaesthesia, although both local and general anaesthesia may be used. 105 Challenges were identified in the postoperative period, particularly around difficulties in performing physiotherapy exercises that are a crucial component of rehabilitation17 and a desire for more assistive devices.
Patient experiences of ERAS for hip and knee replacement can be understood using Mol’s work, which explores how health-care professionals interact with patients and negotiate processes of care. 86 Processes of negotiation became apparent when patients began engaging in efforts to mobilise post surgery. In the immediate post-discharge period, most patients were enthusiastic about working towards their recovery or reported how decisions were taken in collaboration with health-care professionals who ‘tinkered’ with their care to address individual needs. However, others reported tensions between the expectations of health-care professionals and their own preferences, and expressed a desire for a greater element of control. Issues were echoed in discussions around timing of discharge. In contrast, once they had been discharged, patients struggled with their autonomy and wanted more support to guide their rehabilitation. The study also highlights the physical and emotional work that patients did as ‘active’ participants in their recovery. 86
Strengths and weaknesses
Using ethnographic research methods involved spending extended periods of time at study sites, using multiple research methods that provided a rounded account of practice. Analysis included information about what people did, as well as what they said, and their reasons for their actions and decisions. 106 Different numbers of participants were drawn from each of the study sites, meaning that experiences at some hospital sites may be over-represented in the analysis. This was mitigated by analysing data from each hospital as a discrete data set and then comparing and contrasting findings. We conducted recruitment of patients through busy health-care professionals working within services, and we did not ask them to keep records of those who were approached but who did not take part out of respect for the professionals’ busy workloads. This means that there is the chance that those who participated may not represent the experiences of all patients accessing services. However, inclusion of four hospitals, the relatively large sample size of health-care professionals (n = 38) and patients (n = 37) with diverse characteristics, achievement of data saturation92 and robust analysis provide confidence that findings may be transferable to other settings. 107 In addition, interviewed patients were either in hospital awaiting discharge or already at home.
Discussions around preoperative and inpatient experiences represent the views of all patients who participated in the study (n = 37). We found that experiences in both groups were broadly similar and therefore we do not make a distinction between them in the analysis. Postoperative accounts relate only to those who had been discharged from hospital at the time of interview (n = 15).
The CFIR provided a theoretical basis to our analysis. We used CFIR because of its emphasis on meeting patients’ needs in service design. Our study highlighted that meeting patients’ needs was central to the successful implementation of ERAS into everyday practice. By using inductive coding and transposing themes onto the theory that we thought was the best ‘fit’ for the data, we ensured that data were not forced into predefined constructs. A challenge that we encountered in analysis was how best to make decisions about where themes fitted best, particularly when it was possible that these could be mapped against more than one construct. When this was the case, themes were mapped onto the construct that was considered to be the best ‘fit’ or coded into more than one construct.
Future research
Study participants reflected on the role of primary care in delivering components of ERAS, including processes of referral and post-discharge support. Further research could explore how primary care interacts with ERAS protocols, providing a more comprehensive understanding of the delivery of ERAS. In addition, further research should explore patient experiences of referral from primary to secondary care services, to provide a more comprehensive account of experiences through the care pathway.
Conclusions
Our qualitative research with health-care professionals as participants demonstrates that successful implementation of ERAS services for THR and TKR depends on several aspects, such as the extent to which services have been adapted to meet individual needs, effective communication between staff and planning processes.
Our qualitative research with patients highlights the perceived value of preoperative education and information to empower patients to become active participants in their care. Our findings also show some tensions between the need to mobilise early and the desire to have time to ‘heal’ after surgery. There are also challenges after discharge, including how to access support when needed. This study highlights how patients might value more information and support from health-care professionals, particularly in the post-discharge period, to enable them to work more effectively towards their own recovery.
Chapter 7 Health economics of enhanced recovery and joint replacement
Background
Following the findings that the introduction of a national ERAS programme maintained improvement on patient outcomes but did not alter the rate of change already under way (see Chapter 6), we do not report the results of the cost-effectiveness model as it predicts no differences in outcomes following the implementation of the programme. Hence, we review the literature on the cost-effectiveness of enhanced recovery from hip and knee replacement. Previous systematic reviews have considered joint replacement compared with conservative management87,108 and specific components of enhanced recovery, such as thromboprophylaxis. 88,89 However, there are no reviews considering the cost-effectiveness of a complete ERP, or of most of the components. In addition, there is limited evidence about the primary care and hospital costs of primary elective joint replacement in the subsequent years after surgery. It is important to have up-to-date and robust data on the costs of joint replacement and its drivers, to inform decisions about changes in health service delivery and produce good practice guidelines. 68 Investment and disinvestment decisions regarding new osteoarthritis and joint replacement interventions are driven by cost-effectiveness evidence,72 in which resource use and costs are a key input.
Aims
-
To assess the evidence from cost–utility analyses of ERPs for patients having joint replacement for osteoarthritis, report on the quality of these studies and identify research gaps for future work.
-
To assess the primary care and hospital costs for NHS England of primary joint replacement up to 2 years post surgery, contrast resource use and costs by operation types, and estimate the main predictors of 1-year hospital costs following joint replacement.
Methods of the systematic review of the cost-effectiveness of enhanced recovery following hip and knee replacement
The methods of the systematic review were registered with the International Prospective Register of Systematic Reviews number CRD42017059473. We defined the search strategies and database selection with assistance from an information specialist, and by comparing our search terms with those from previous reviews and review protocols of economic evaluations of joint replacement. We searched Ovid MEDLINE, EMBASE, the NHS Economic Evaluation Database (via The Cochrane Library) and the American Economic Association’s electronic bibliography (EconLit) (via ProQuest) for English-language peer-reviewed papers published between 1 January 2000 and 1 March 2017 that included a cost–utility analysis of an ERP or components of one, compared with usual care, in patients having hip or knee replacement (the complete search strategy is presented in Report Supplementary Material 7). Abstracts or conference presentations were excluded, as results are not presented in sufficient detail to allow critical appraisal of the economic evaluations.
We included studies with participants undergoing joint replacement for osteoarthritis and excluded populations with other indications for surgery, such as avascular necrosis, inflammatory arthropathy, previous/failed surgery, cancer, congenital conditions or infection, as well as studies looking at emergency procedures (e.g. due to trauma). We assumed that studies without details of the indication for surgery were representative of a population with osteoarthritis, and therefore included these studies. We also excluded evaluations of surgical technique or choice of implant.
Economic evaluations of any preoperative, perioperative or postoperative intervention within the joint replacement ERP were included, in addition to studies considering ERPs as a whole. Interventions had to be those that form part of the usual pathway of care (with or without enhanced recovery) for joint replacement. We included model-based evaluation and randomised controlled trials/cohort-based economic evaluation, and restricted the analysis to cost–utility analyses [i.e. reporting costs per quality-adjusted life-year (QALY) gained], as this is the preferred approach to inform decisions. 90
The search strategy and inclusion and exclusion criteria were piloted by two reviewers. For the latter, the search was run and inclusion and exclusion criteria were applied to 10% of the search results to check consistency between reviewers. Studies were then independently screened based on their titles and abstracts by three reviewers. EndNote X7 (Clarivate Analytics, Philadelphia, PA, USA) was used to manage the references. Full texts were obtained for studies chosen for inclusion by any reviewer. As an amendment to the protocol, evaluations of thromboprophylaxis were excluded at the full-text stage because of a recent comprehensive systematic review in this area. 88 Data extraction was performed by three reviewers, with disagreements resolved by a fourth reviewer, using a standardised form (presented in Report Supplementary Material 8).
The quality of reporting and risk of bias of the economic evaluations were assessed using the Consensus on Health Economic Criteria (CHEC) list,91 the International Society for Pharmacoeconomics and Outcomes Research (ISPOR) questionnaire for modelling studies92 and the Assessment of the Validation Status of Health-Economic decision models (AdViSHE) tool. 93 Items in the checklists were marked as yes, no, unknown or not applicable for each study, and a final assessment of the risk of bias was made by the reviewer. We added the Cochrane Collaboration’s tool96 to the original protocol to assess risk of bias in trial-based studies, referring to the original reports of trial outcomes when necessary.
The principal outcomes reported in this review were a point estimate of cost-effectiveness, in terms of incremental cost per QALY gained, and the probability of an intervention being cost-effective according to the willingness-to-pay threshold used by the authors of each study.
Results of the systematic review
We identified 11,060 studies and one additional study was found from other sources. After excluding duplicates, we screened 6221 titles and abstracts. We excluded 6072 papers based on their abstracts and 136 following review of their full texts (reasons for exclusion are given in Figure 22). We therefore included 13 papers in this review. 86,97–106,109,110
FIGURE 22.
Preferred Reporting Items for Systematic Reviews and Meta-Analyses (PRISMA) flow diagram of studies included in this review. EconLit, American Economic Association’s electronic bibliography; NHS EED, NHS Economic Evaluation Database.
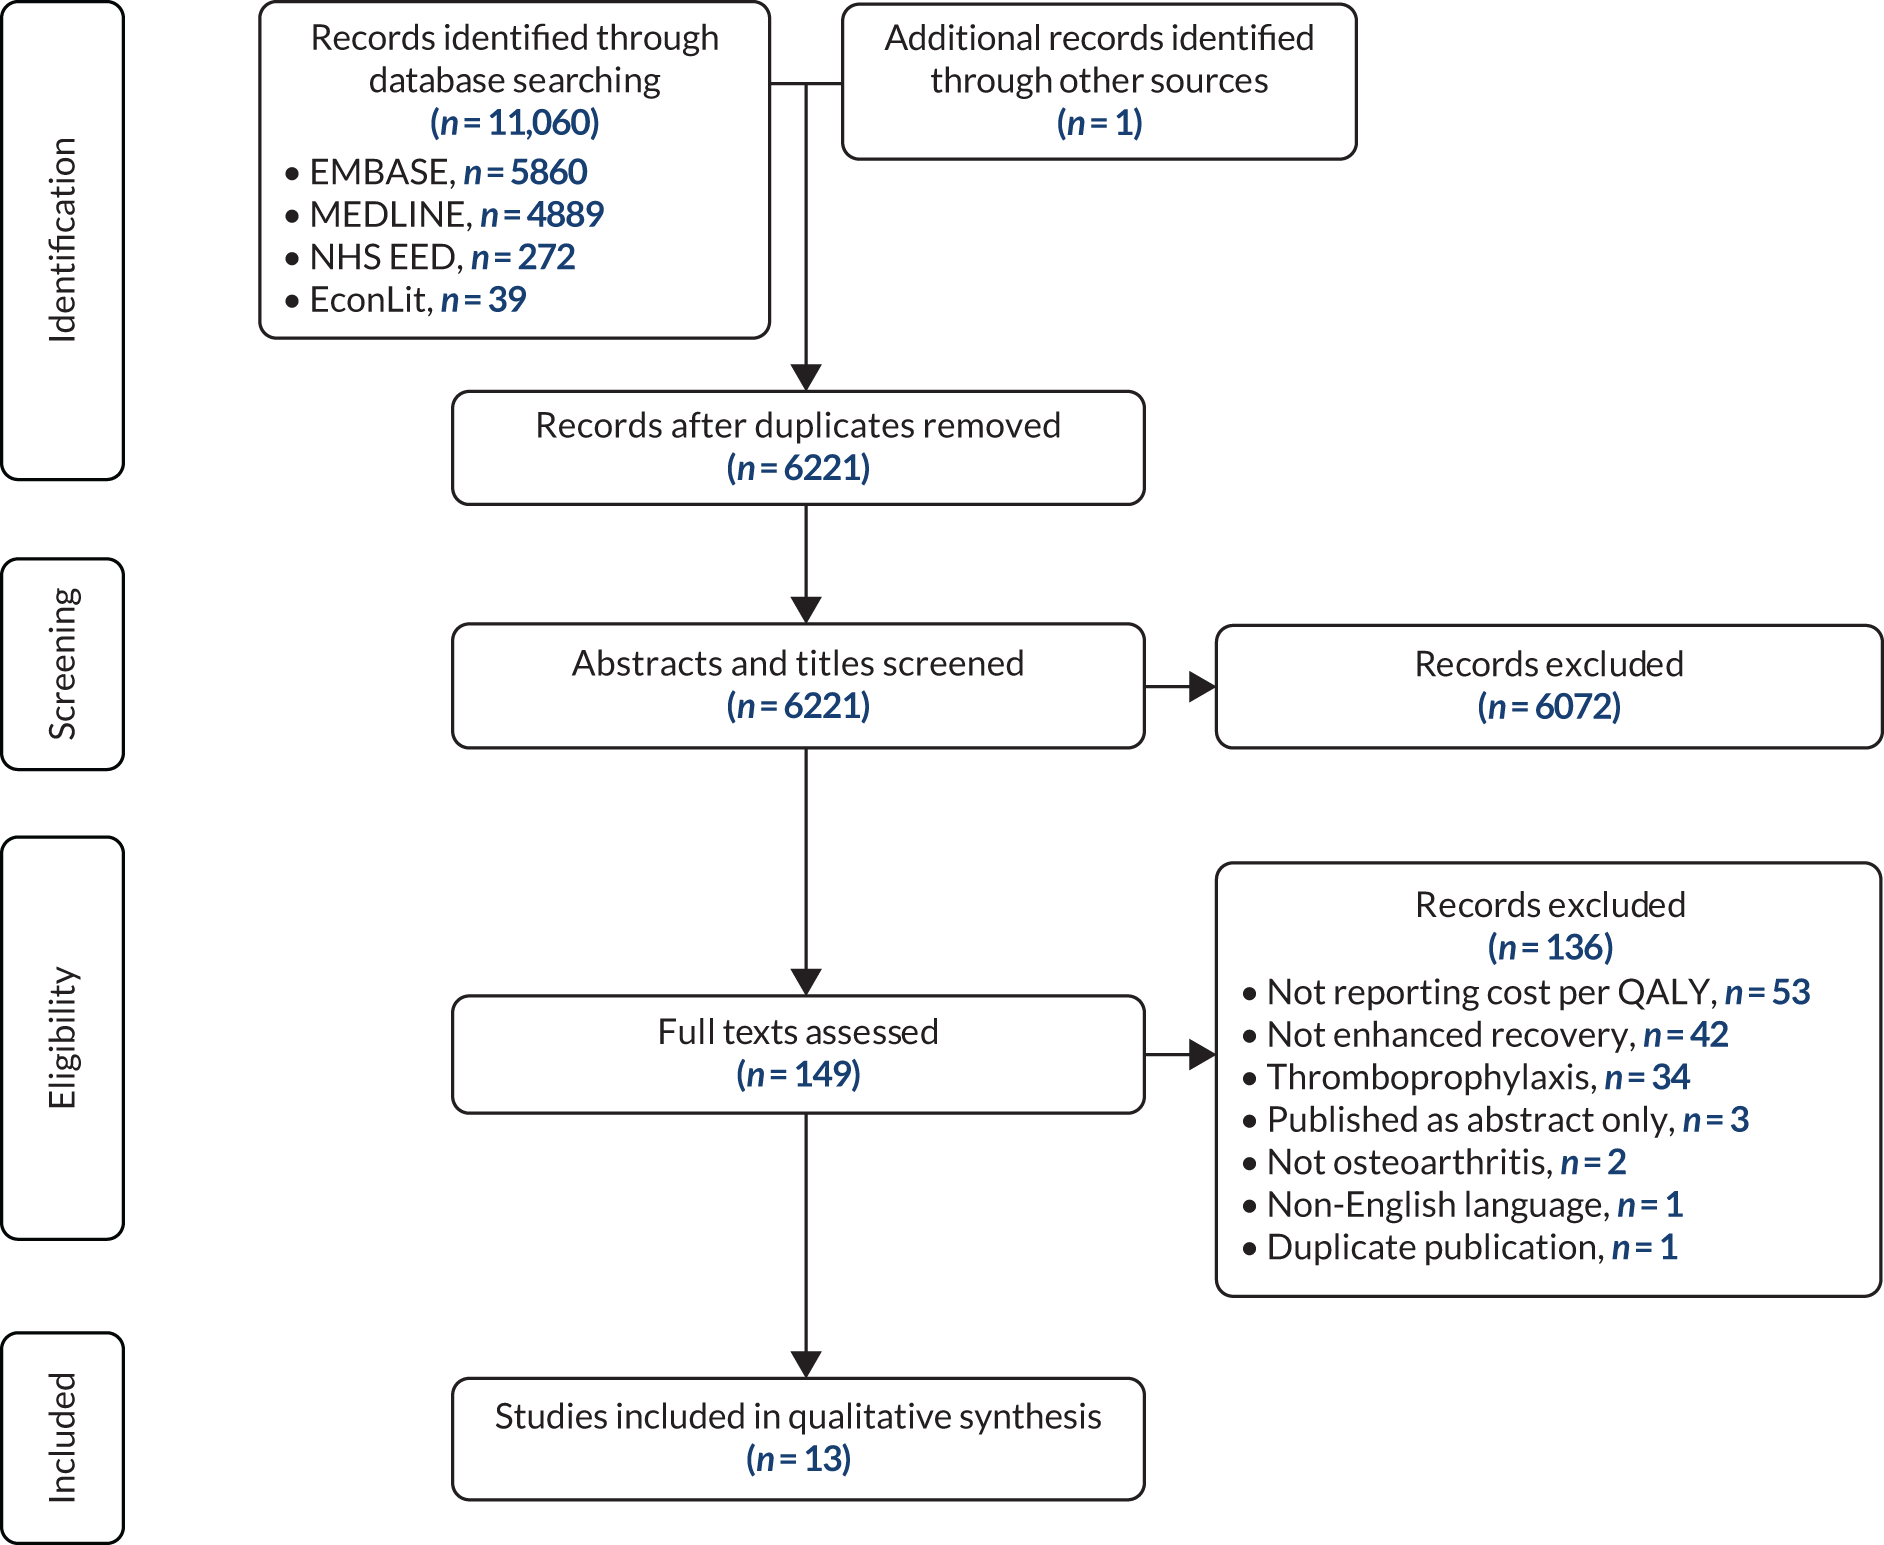
Table 14 summarises the characteristics of the 13 studies. Five studies included both hip and knee replacement patients,97–99,101,109 five included only hip replacement patients100,102–104,106 and three included only knee replacement patients. 86,105,110 Two papers evaluated an entire ERP98,109 and the remainder evaluated components of a pathway, such as optimisation of comorbidities (specifically morbid obesity),110 measures to reduce allogenic blood transfusion,99,100 local infiltration of anaesthetic,101 prophylactic antibiotics and other infection prevention measures,97,102–104 and physical therapy. 86,105 The final study106 concerned the optimal timing of follow-up post surgery.
| First author (year) | Comparison | Joint | Study type | Country |
|---|---|---|---|---|
| ERP | ||||
| Brunenberg (2005)98 | Joint recovery programme (pre assessment and intensive rehabilitation) vs. conventional care | Hip and knee | Trial based | The Netherlands |
| Larsen (2009)109 | Accelerated perioperative care and rehabilitation vs. conventional care | Hip and knee | Trial based | Denmark |
| Preoperative | ||||
| McLawhorn (2016)110 | Bariatric surgery followed by TKA 2 years later vs. immediate TKA | Knee | Markov model | USA |
| Courville (2012)97 | Preoperative nasal screening for S. aureus colonisation followed by mupirocin treatment for patients with positive cultures vs. empirical treatment of all preoperative patients with mupirocin vs. standard infection prevention measures without S. aureus screening or mupirocin decolonisation | Hip and knee | Decision tree model | USA |
| Intraoperative | ||||
| Jackson (2000)99 | Postoperative erythrocyte recovery and transfusion vs. usual transfusion practice | Hip and knee | Markov model | USA |
| Sonnenberg (2002)100 | Autologous blood donation and transfusion vs. usual practice without autologous donation | Hip | Markov model | USA |
| Marques (2015)101 | Intraoperative local anaesthetic wound infiltration administered before wound closure in addition to standard anaesthesia vs. standard anaesthesia | Hip and knee | Trial based | UK |
| Cummins (2009)103 | Antibiotic-impregnated bone cement vs. conventional cement | Hip | Markov model | USA |
| Graves (2016)102 | Nine arms, comparing combinations of prophylactic systemic antibiotics, antibiotic-impregnated cement, laminar airflow and body exhaust suits | Hip | Markov model | UK |
| Merollini (2013)104 | No antibiotic prophylaxis, antibiotic prophylaxis and antibiotic-impregnated cement, and antibiotic prophylaxis and laminar airflow, each compared with a baseline strategy of routine antibiotic prophylaxis | Hip | Markov model | Australia |
| Postoperative | ||||
| Fusco (2016)105 | 10 face-to-face rehabilitation sessions plus 10 telesessions vs. 20 face-to-face rehabilitation sessions | Knee | Markov model | Italy |
| Kauppila (2011)86 | Multidisciplinary biopsychosocial outpatient rehabilitation programme vs. conventional orthopaedic care | Knee | Trial based | Finland |
| Bolz (2010)106 | 2-yearly routine follow-up vs. follow-up at 3 months and 1 or 2 years vs. no follow-up | Hip | Markov model | Australia |
The results of the 13 studies are summarised in Table 15. The types of costs, populations and tools used for eliciting utilities and additional results for each study are reported in Report Supplementary Material 7.
| First author; country | Population | Strategy | Cost-effective? |
|---|---|---|---|
| ERP | |||
| Brunenberg;98 The Netherlands | THA and TKA | Conventional care | |
| Joint recovery programme (pre assessment and intensive rehabilitation) | Yes, more effective and less costly | ||
| Larsen;109 Denmark | THA | Conventional care | |
| Accelerated perioperative care and rehabilitation | Yes, more effective and less costly | ||
| TKA | Conventional care | ||
| Accelerated perioperative care and rehabilitation | Yes, less effective but less costly | ||
| Preoperative | |||
| McLawhorn;110 USA | Morbid obese TKA | Immediate TKA | |
| Bariatric surgery, followed by TKA 2 years later | Yes | ||
| Courville;97 USA | THA and TKA | Standard infection prevention measures without S. aureus screening or mupirocin decolonisation, or preoperative nasal screening for S. aureus followed by mupirocin treatment for patients with positive cultures | |
| Empirical treatment of all preoperative patients with mupirocin | Yes, more effective and less costly | ||
| Intraoperative | |||
| Jackson;99 USA | THA and TKA | Usual transfusion practice | |
| Postoperative erythrocyte recovery and transfusion | No | ||
| Sonnenberg;100 USA | THA | Usual practice without autologous donation | |
| Autologous blood donation and transfusion | Yes | ||
| Marques;101 UK | THA and TKA | Standard anaesthesia | |
| Intraoperative local anaesthetic wound infiltration administered before wound closure in addition to standard anaesthesia | Yes, more effective and less costly | ||
| Cummins;103 USA | THA | Conventional cement | |
| Antibiotic-impregnated bone cement | Yes, more effective and less costly | ||
| Graves;102 UK | THA | No systemic antibiotics, plain cement and conventional ventilation | |
| Systemic antibiotics, antibiotic-impregnated cement and conventional ventilation | Yes, more effective and less costly | ||
| Merollini;104 Australia | THA | No antibiotic prophylaxis, or antibiotic prophylaxis, or antibiotic prophylaxis and laminar airflow | |
| Antibiotic prophylaxis and antibiotic-impregnated cement | Yes, more effective and less costly | ||
| Postoperative | |||
| Fusco;105 Italy | TKA | 20 face-to-face rehabilitation sessions | |
| 10 face-to-face rehabilitation sessions plus 10 telesessions | Yes, same effectiveness but less costly | ||
| Kauppila;86 Finland | TKA | Conventional orthopaedic care | |
| Multidisciplinary biopsychosocial outpatient rehabilitation programme | No | ||
| Bolz;106 Australia | THA | 2-yearly routine follow-up, or follow-up at 3 months and 1 or 2 years | |
| No follow-up | Yes | ||
Whole enhanced recovery pathway
Larsen et al. 109 report an economic analysis alongside a randomised trial, with 56 hip replacement and 31 knee replacement participants in Denmark. The pathway used in the treatment arm (‘accelerated care’) was not different to that of the control group (‘conventional rehabilitation’) in terms of intraoperative management, analgesia, nausea control or bowel regulation. Differences in the treatment protocols between the two arms involved patient education, nutrition, admission times, staffing and mobilisation (described in Report Supplementary Material 7). The accelerated care pathway was less costly and more effective than the control, both overall and in the subgroup of hip replacement participants. For knee replacement patients, the authors reported the accelerated care pathway to be cost-saving but less effective than the control, albeit the difference was not statistically significant. They reported a cost saving of 618,075 Danish krone per QALY lost with accelerated care compared with conventional rehabilitation, which made it cost-effective (threshold of 160,000 krone per QALY in Denmark).
Brunenberg et al. 98 report an economic evaluation of a before-and-after trial with 98 hip and 62 knee replacement participants in the Netherlands. The intervention (‘joint recovery programme’) consisted of a 20-minute pre-assessment screening 6 weeks before the operation, for physical assessment and analysis of the home situation to aid discharge planning, patient education sessions 1–2 weeks before surgery, group rehabilitation sessions and supervision by physical therapists and nurses (described in Report Supplementary Material 7). Patients in the ‘usual care’ group underwent conventional physiotherapy for 1 hour daily, did not receive pre-assessment screening or information sessions, and discharge arrangements were addressed during admission to hospital. The joint recovery programme intervention was less costly and more effective than the control for both hip and knee replacement, resulting in a cost saving of US$1261 per patient for hip replacement and US$3336 per patient for knee replacement, albeit with no statistically significant difference in QALYs. The probability that the joint recovery programme was the most cost-effective option was > 80% for willingness-to-pay thresholds up to US$45,000.
Preoperative components of the enhanced recovery pathway
McLawhorn et al. 110 used a Markov model to assess the cost-effectiveness of bariatric surgery 2 years before total knee arthroplasty for morbidly obese (BMI ≥ 35 kg/m2) patients who were candidates for both operations because of end-stage knee osteoarthritis and failed non-operative weight loss interventions. The strategy including bariatric surgery was cost-effective at the stated willingness-to-pay threshold of US$100,000 per QALY in 98.8% of probabilistic simulations.
Courville et al. 97 compared three strategies of screening for and treating S. aureus colonisation to prevent deep surgical site infections following total knee arthroplasty and total hip arthroplasty. Courville et al. 97 found that decolonisation of all preoperative patients with mupirocin, without testing for S. aureus, was the dominant strategy (cheaper and more effective) when compared with treating only patients testing positive for S. aureus, or no screening or decolonisation for S. aureus.
Intraoperative components of the enhanced recovery pathway
Two studies investigated strategies to reduce allogenic blood transfusions: collecting autologous blood prior to surgery100 or aseptic collection of wound drainage. 99 Autologous blood prior to surgery was found to be cost-effective, at US$2750 per QALY gained, whereas aseptic collection of wound drainage was not, at a cost of US$5.7M per QALY gained.
Marques et al. 101 conducted economic evaluations alongside two randomised controlled trials of adding local wound infiltration with bupivacaine to usual anaesthetic care for total hip arthroplasty and total knee arthroplasty. 101 The infiltration of local anaesthetic was found to be less costly and more effective than standard anaesthesia in both hip and knee replacement patients. Three studies used Markov models to investigate measures to reduce surgical site infection in the USA,103 UK102 and Australia. 104 The cheapest and most effective measure in all three included use of antibiotic-impregnated cement. The two studies that looked at other factors102,104 each found the use of prophylactic systemic antibiotics to be less costly and more effective than non-use, and the use of conventional ventilation in operating theatres to be less costly and more effective than laminar airflow ventilation. Graves et al. 102 considered use of body exhaust suits and found them to be dominated by strategies that did not include use of these suits.
Postoperative components of the enhanced recovery pathway
Fusco and Turchetti105 used a Markov model to evaluate a strategy of 10 face-to-face rehabilitation sessions followed by 10 telerehabilitation sessions after knee replacement, compared with 20 face-to-face sessions. They found the strategy including telerehabilitation to be cost-saving and to improve range of movement (knee flexion). However, they found no utility data for patients following a telerehabilitation programme, so for their base case assumed it to be non-inferior to face-to-face rehabilitation. In a sensitivity analysis, if telerehabilitation conferred an improvement in quality of life of at least 2.5%, the strategy’s probability of being cost-effective was 1 (at a willingness-to-pay threshold of €30,000/QALY).
Kauppila et al. 86 performed an economic evaluation of a 10-day outpatient rehabilitation course between 2 and 4 months after knee replacement, which included clinical assessments, physical activity, sessions with a psychologist, and lectures from an orthopaedic surgeon, nutritionist and social worker. 107 They found that patients who completed this course had higher costs and slightly worse quality-of-life outcomes over the 1 year of follow-up (albeit not statistically significant) than those receiving conventional orthopaedic care.
Bolz et al. 106 compared three follow-up strategies: 2-yearly routine follow-up, follow-up twice (at 3 months, and between 1 and 2 years after surgery) or no follow-up. The model assumed that no revisions would be delayed in either strategy that included follow-up and the outcomes for these two strategies were identical in each analysis. The no follow-up strategy was dominant for any assumed rate of delayed revision between 1% and 50%.
Assessment of study quality and reporting quality
Using the CHEC list, the quality of the studies was generally good (Figure 23a). However, the time horizons in the four trial-based studies (1 year86,98,101,109) and two model-based studies (1 year97 and 7 years106) were too short to capture all relevant outcomes or costs. Furthermore, most studies did not report whether or not they had conflicts of interest.
FIGURE 23.
Assessments of study quality based on tools from (a) CHEC; (b) ISPOR questionnaire; (c) AdViSHE tool; and (d) the Cochrane Collaboration.

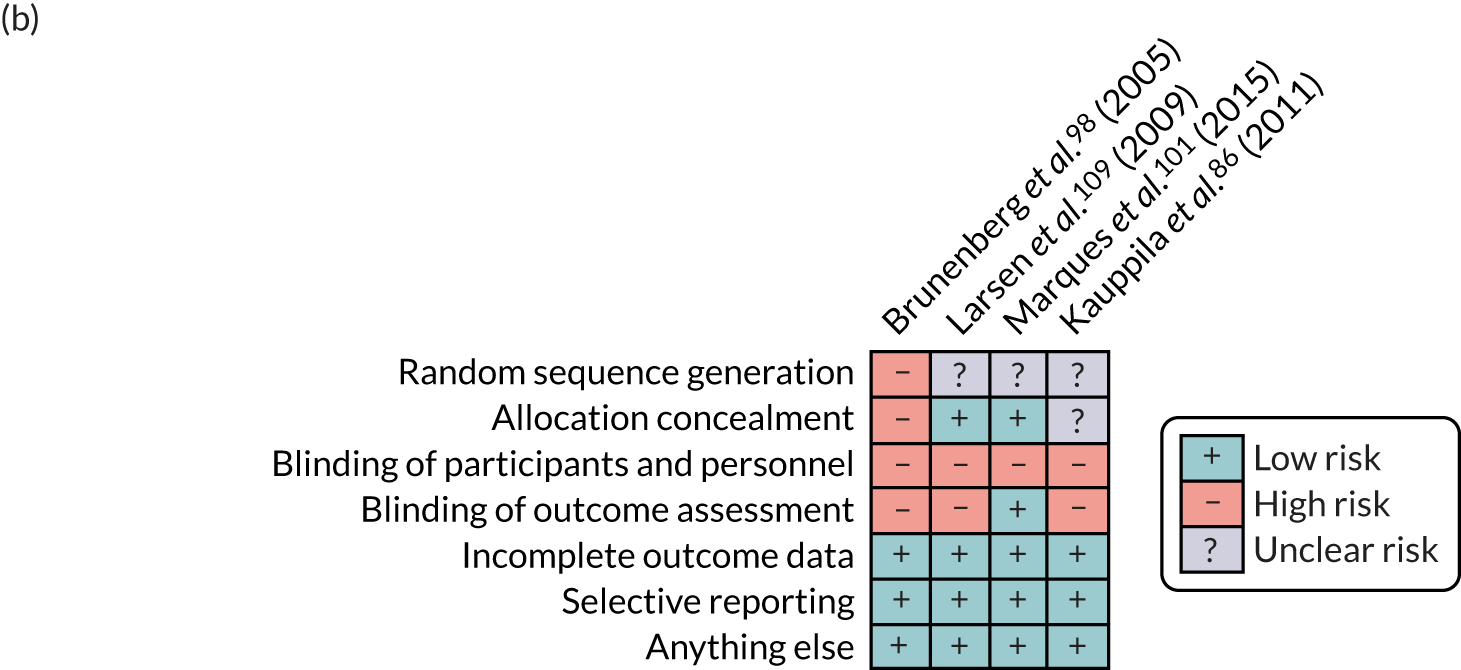

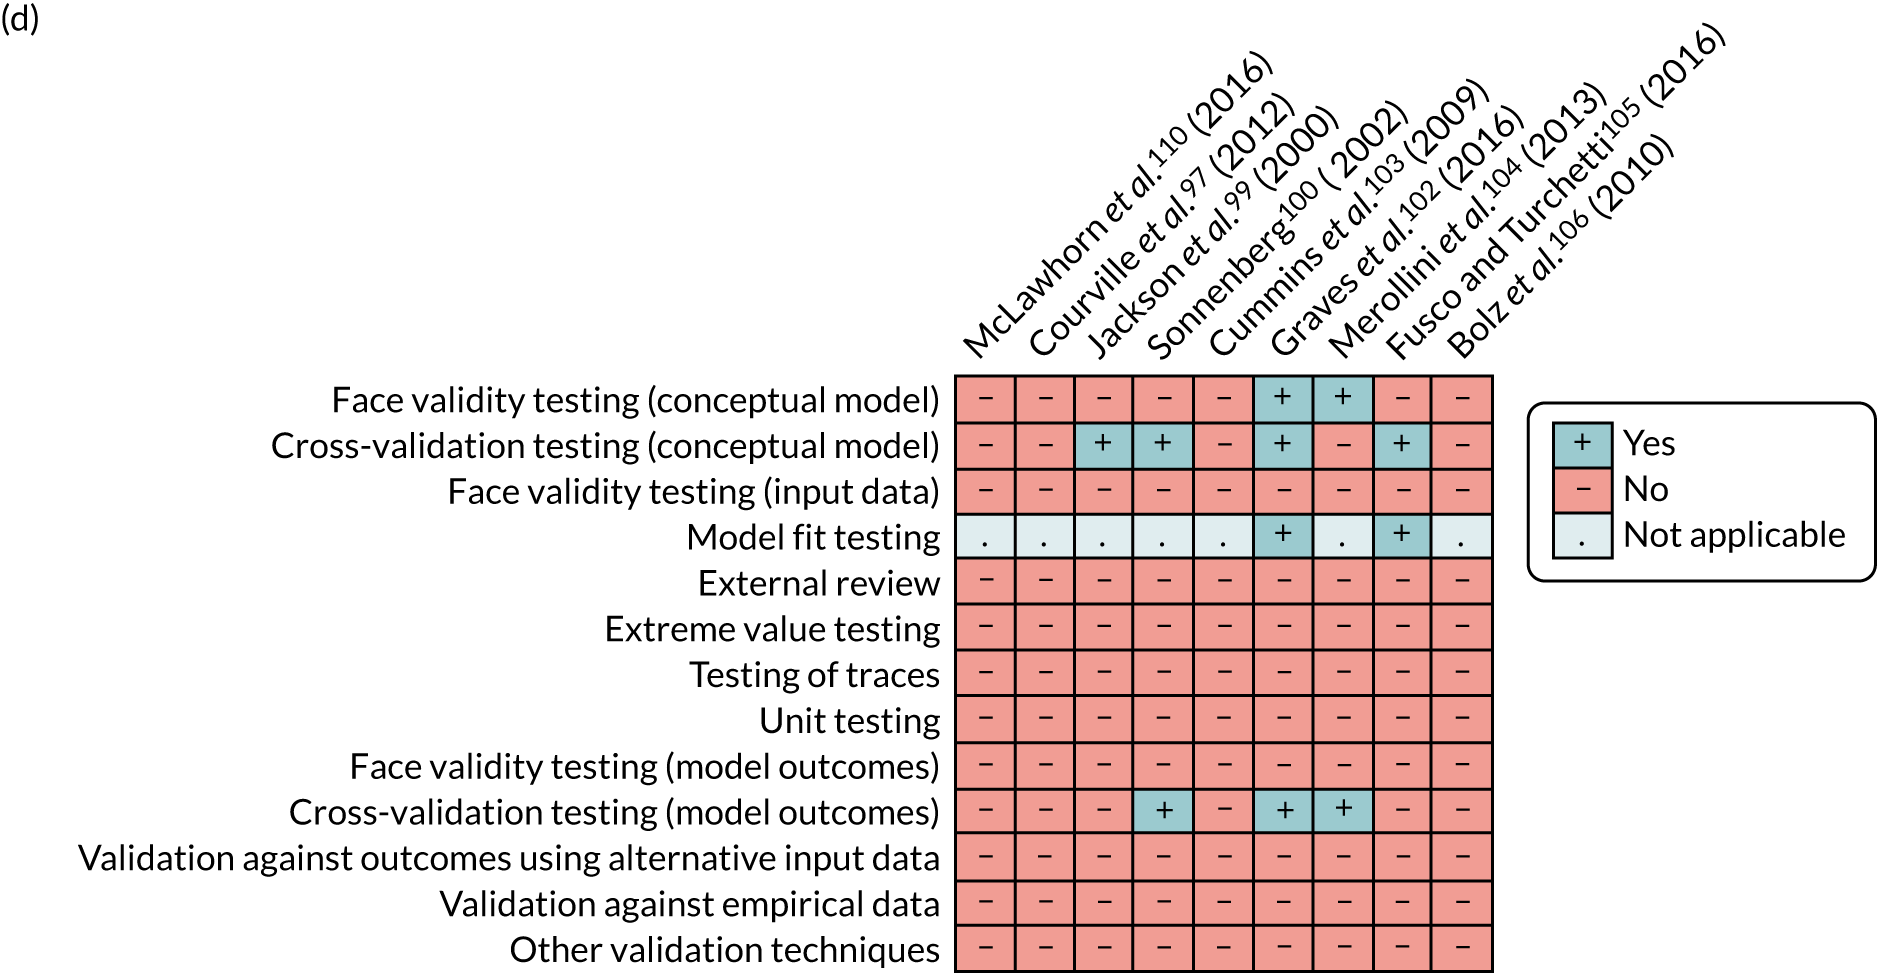
Using the Cochrane Collaboration’s tool (see Figure 23b), the risk of bias of the trial-based studies was rated as being low for items such as incomplete outcome data and selective reporting, but high or uncertain for the remainder. Three trial-based studies stated that participants were allocated at random;79,101,107 the fourth was a before-and-after trial whereby patients were recruited consecutively from a waiting list for hip and knee replacement. 98 Larsen et al. 79 discussed stratification and Kauppila et al. 107 reported a computer-generated sequence. The risk of bias could not be assessed accurately, as the random sequence generation was not described precisely in any of the studies. The staff administering the interventions were not blinded to allocation in any trial, and in three trials98,101,107 outcomes were assessed by researchers aware of the treatment allocation.
Using the ISPOR questionnaire, the quality of the model-based studies was generally good (see Figure 23c). However, none of the model-based studies reported a detailed process for internal and external validation. Three studies99,100,105 were based on previously published models. 111–113 Of these, only Briggs et al. 111 (the basis for Fusco and Turchetti’s model105) provided details of model validation. Further limitations in model validation were highlighted with the AdViSHE tool (see Figure 23d). 93
Methods of estimating costs of joint replacement
Setting and data sources
We used an incidence-based approach to estimate the primary and hospital care costs. Individuals undergoing an elective admission for joint replacement were identified and followed up retrospectively using data from three sources: the NJR, HES and CPRD GOLD (see Chapter 2).
Study participants
To estimate hospitalisation costs, we included only individuals identified in the NJR, HES and PROMs linked data set with a planned surgery for joint replacement between April 2008 and January 2017 (observation period). Patients without a concordant date of replacement between NJR and HES databases were excluded from the analysis. If an individual had a primary joint replacement and a contralateral joint replacement during the observation period, we counted the costs from the primary joint replacement and included the patient only once in the analysis. To estimate outpatient and primary care costs, we included only patients in the CPRD GOLD data set with a first ever clinical or referral record of planned joint replacement occurring from 1 April 2008 until 31 December 2016. For further detail on cost methodology, see Report Supplementary Material 9.
Death, complications and revisions at 1 year
All-cause mortality was estimated at 30 days and 1 year from the day of planned admission for joint replacement and using the date of death from the ONS mortality database.
For hospitalisation costs, we defined postoperative complications as one or more events happening up to 1 year after joint replacement. We also identified revisions occurring up to 1 year following joint replacement from revisions declared to the NJR registry by the surgeons and revisions reported to HES.
Costs
Hospitalisation costs were estimated by converting the diagnosis and operational codes for each finished consultant episode in a hospital admission into a HRG via the 2016/17 case mix grouper software (HRG4+ 2016/17 Local Payment Grouper, NHS Digital, UK). 36 HRGs are standard groups of clinically similar treatments that consume a common set of health-care resources. HRGs for each finished consultant episode were then valued using NHS Reference Costs 2016–17114 and appropriate methodology,115 and summed to produce the total cost per hospital admission.
Primary care contacts included GP consultations in clinic or surgery, telephone contacts and out-of-office visits. These also included nurse face-to-face and non-face-to-face contacts and contacts with other community health-care professionals (e.g. health visitor or physiotherapist). Primary care contacts and tests were costed using 2016/17 unit costs from national cost databases. 116 Pharmaceuticals were costed by matching each prescribed medication to a British National Formulary code and valuing these using 2016/17 cost data from NHS Digital Prescription Cost Analysis. 117 See Report Supplementary Material 9 for more details on the cost methodology. Total costs per patient were aggregated into monthly and annual amounts for the purposes of the analysis.
Statistical analysis
We report total hospital inpatient costs for patients with complete follow-up data at years 1 and 2 following joint replacement, and for the whole sample after adjusting for censoring using the methodology developed by Lin et al. 118 Costs are reported as means together with their 95% CIs, obtained from 1000 bootstrap estimates. We estimated the total annual joint replacement costs in the UK by multiplying the NHS primary and hospital costs in the year of surgery by the number of primary joint replacements in 2017 (96,717 hip replacements and 106,334 knee replacements).
Predictors of hospitalisation costs of joint replacement were estimated using a generalised linear model (GLM). After reviewing the literature, we examined the following predictors of costs in the year of the joint replacement: age, sex, EuroQol-5 Dimensions, three-level version/OHS/OKS before surgery and change at 6 months, complications and revision up to 1 year after surgery, social deprivation index; Charlson Comorbidity Index score, BMI prior to surgery, type of joint replacement (unicondylar, total and patellofemoral for knee; resurfacing or total for hip), surgical variables, ASA grade before surgery, thrombolysis agents used (low-molecular-weight heparin, none, aspirin and other), type of anaesthesia (general, epidural, spinal and nerve block), death and year of surgery.
We used t-test and Pearson’s chi-squared test to evaluate the missingness for the potential predictors of costs (e.g. BMI, EQ-5D/OHS/OKS before surgery and change at 6 months) in terms of age, sex, hospitalisation costs, LOS, Charlson Comorbidity Index score and type of joint replacement. We also performed multiple imputation of the missing data using a chained model with 20 iterations regressed on complete variables to inform the prediction models (see Report Supplementary Material 9 for more details).
The choice of the GLM family and link functions was informed by the modified Park test and the Box–Cox test, respectively. We applied stepwise backward selection (at a p-value of < 0.05) per 300 bootstrap samples to identify variables that were consistently selected for at least 50% of the analyses and to inform the final models. A two-tailed t-test with α = 0.01 (to account for the large sample size) was used to determine whether or not each coefficient was statistically significantly different from zero, and their selection as predictors of costs was informed using Akaike’s information criterion, mean square error and likelihood test. All analyses were performed using Stata.
Results of costs of joint replacement
We identified 397,119 and 457,747 patients as having had a primary THR or TKR, respectively, in the NJR, HES and PROMs linked data set. Table 16 reports the baseline characteristics of the two cohorts. There was a lower proportion of women in the THR cohort than in the TKR cohort (40.4% vs. 57.0%). More younger individuals (69.1 years vs. 69.5 years) with lower BMI (28.8 kg/m2 vs. 30.7 kg/m2) underwent THR than TKR. Furthermore, the Oxford and EQ-5D scores were slightly lower in the THR cohort than in the TKR cohort (17.4 vs. 18.2 for OHS/OKS and 0.33 vs. 0.37 for EQ-5D).
| Characteristic | Primary joint replacement | |
|---|---|---|
| Hip (N = 397,119) | Knee (N = 457,747) | |
| Age (years), mean (SD) | 69.1 (10.8) | 69.5 (9.5) |
| Female, % | 40.4 | 57.0 |
| White ethnicity, %a | 86.1 | 82.4 |
| Index of Multiple Social Deprivation, mean (SD)b | 18.0 (13.2) | 19.4 (14.0) |
| BMI (kg/m2), mean (SD)c | 28.8 (5.2) | 30.7 (5.4) |
| Underweight (< 18.5 kg/m2), % | 0.7 | 0.2 |
| Normal (18.5–25 kg/m2), % | 19.4 | 9.7 |
| Overweight (25–30 kg/m2), % | 39.8 | 34.4 |
| Class I obese (30–35 kg/m2), % | 26.6 | 32.8 |
| Class II obese (35–40 kg/m2), % | 10.1 | 16.4 |
| Class III obese (≥ 40 kg/m2), % | 3.4 | 6.7 |
| OHS/OKS before surgery, mean (SD)d | 17.4 (8.2) | 18.2 (7.8) |
| EQ-5D-3L score before surgery, mean (SD)e | 0.33 (0.32) | 0.37 (0.32) |
| Location, %f | ||
| Urban | 71.3 | 74.7 |
| Town and fringe | 12.8 | 11.8 |
| Village/isolated | 15.9 | 13.5 |
| Charlson Comorbidity Index score | ||
| Mean (SD) | 0.37 (0.75) | 0.4 (0.8) |
| Median (IQR) | 0 (0–1) | 0 (0–1) |
| ASA grade, % | ||
| Fit and healthy (1) | 13.8 | 10.2 |
| Mild disease not incapacitating (2) | 70.3 | 73.7 |
| Incapacitating systemic disease (3) | 15.5 | 15.9 |
| Life-threatening disease or expected to die within 24 hours (4 and 5) | 0.4 | 0.3 |
| Indication, % | ||
| Osteoarthritis | 96.8 | 98.8 |
| Osteoarthritis and other | 3.2 | 1.2 |
| Operation type, n (%)g | ||
| Total joint replacement | 381,145 (98.1) | 418,510 (92.4) |
| Partial joint replacement | 34,299 (7.8) | |
| Patellofemoral joint replacement | 4939 (1.1) | |
| MoM resurfacing | 7271 (1.9) | |
| Implant type, %h | ||
| Bicondylar | 92.0 | |
| MoM | 4.6 | |
| Non-MoM | 95.4 | |
| Anaesthesia, %i | ||
| General | 38.9 | 35.4 |
| Epidural | 4.6 | 4.6 |
| Nerve block | 8.0 | 15.3 |
| Spinal | 71.0 | 68.5 |
| Thromboprophylaxis for joint replacement, % | ||
| None | 3.1 | 3.7 |
| Aspirin only | 5.1 | 5.6 |
| LMWH (with or without other) | 66.0 | 72.3 |
| Other (no LMWH) | 25.8 | 18.4 |
Hospitalisation costs
The follow-up for the THR and TKR cohorts was 3.9 years (SD 2.5 years) (Table 17). In the first year after the joint replacement, 1.2% (4071/344,721) and 0.8% (2965/394,118) of individuals died in the hip and knee cohorts, respectively. An improvement at 6 months was reported for both cohorts using the EQ-5D and OHS/OKS instruments.
| Patient outcome/hospitalisation cost | Joint replacement | |
|---|---|---|
| Hip | Knee | |
| Follow-up time (years), mean (SD) | 3.9 (2.5) | 3.9 (2.5) |
| Mortality, n (%) | ||
| Within 30 daysa | 514 (0.1) | 0 (0) |
| Within 1 yearb | 4,071 (1.2) | 2,965 (0.8) |
| Initial hospitalisation (index admission to discharge),c mean (SD) | ||
| Hospital LOS (days) | 4.8 (3.8) | 4.8 (3.5) |
| Hospitalisation costs (£) | 6208 (969) | 6122 (967) |
| OHS/OKS change at 6 monthsd | 20.1 (10.2) | 15.3 (10.0) |
| EQ-5D-3L score change at 6 monthse | 0.40 (0.34) | 0.29 (0.33) |
| Hospitalisation costs (£) within 1 year of replacement,b mean (SD) | ||
| Index hospitalisation | 6, 07 (990) | 6110 (979) |
| Emergency hospitalisations after discharge | 648 (2880) | 606 (2730) |
| Planned hospitalisations after discharge | 963 (2825) | 1067 (2850) |
| Total | 7817 (4618) | 7784 (4520) |
| Total length of hospital stay (days) within 1 year of replacement,b mean (SD) | ||
| Index hospitalisation | 4.9 (3.8) | 4.8 (3.5) |
| Emergency hospitalisations after discharge | 1.4 (7.4) | 1.4 (7.2) |
| Planned hospitalisations after discharge | 0.9 (5.3) | 1.0 (5.5) |
| Total | 7.3 (11.2) | 7.2 (11.2) |
| Hospitalisation costs within year 2 after joint replacement,f mean (SD) | ||
| Emergency hospitalisations (£) | 524 (2598) | 549 (2692) |
| Planned hospitalisations (£) | 908 (2841) | 1090 (3020) |
| Total costs (£) | 1432 (4169) | 1639 (4353) |
| Total length of hospital stay (days) within year 2 after joint replacement,f mean (SD) | 1.9 (9.1) | 2.1 (9.5) |
Hospitalisation costs associated with index admission were £6208 (median £5824, SD £969) for THR compared with £6122 (median £5692, SD £967) for TKR. The mean LOS in the index admission was 4.82 [median 4, SD 3.8, interquartile range (IQR) 3–6] days and 4.77 (median 4, SD 3.5, IQR 3–5) days for THR and TKR, respectively. These costs and LOS represent averages across the whole observation period. However, we found no clear trend in costs over the observation period when resource use was valued using the recommended NHS Reference Costs 2016–17114 (Table 18).
| Year | Joint replacement, mean cost (95% CI) | |
|---|---|---|
| Hip | Knee | |
| Initial hospitalisation costs (£) (index admission to discharge)a | ||
| 2008 | Reference | Reference |
| 2009 | –3 (–20 to 15) | 6 (–10 to 23) |
| 2010 | 8 (–11 to 25) | 29 (12 to 46) |
| 2011 | –27 (–43 to –11) | 10 (–6 to 25) |
| 2012 | –42 (–59 to –26) | 1 (–14 to 17) |
| 2013 | –63 (–79 to –47) | –7 (–22 to 9) |
| 2014 | –67 (–83 to –51) | 16 (1 to 31) |
| 2015 | –56 (–72 to –40) | 43 (28 to 58) |
| 2016 | –52 (–68 to –36) | 66 (51 to 81) |
| Hospitalisation costs within 1 year of joint replacementb | ||
| 2008 | Reference | Reference |
| 2009 | –35 (–102 to 30) | –35 (–98 to 29) |
| 2010 | –78 (–144 to –12) | –80 (–141 to –19) |
| 2011 | –161 (–225 to –98) | –92 (–152 to –31) |
| 2012 | –201 (–264 to –139) | –138 (–198 to –79) |
| 2013 | –236 (–298 to –174) | –147 (–207 to –88) |
| 2014 | –279 (–340 to –218) | –211 (–269 to –152) |
| 2015 | –253 (–315 to –191) | –194 (–252 to –136) |
| Hospitalisation costs within 2 years after joint replacementc | ||
| 2008 | Reference | Reference |
| 2009 | –37 (–132 to 59) | –53 (–150 to 44) |
| 2010 | –116 (–210 to –22) | –160 (–253 to –66) |
| 2011 | –197 (–289 to –105) | –194 (–287 to –102) |
| 2012 | –224 (–315 to –131) | –234 (–326 to –142) |
| 2013 | –302 (–394 to –210) | –283 (–375 to –193) |
| 2014 | –323 (–413 to –233) | –373 (–463 to –283) |
The mean 1-year hospitalisation costs were estimated to be £7817 (median £6258, SD £4618) and £7784 (median £6226, SD £4520) for THR and TKR, respectively, of which the index admission accounted for 79.4% and 78.5% of the total. Hospitalisation costs and LOS within 1 year were highly correlated for both types of joint replacement (Spearman’s correlation coefficient 0.84). Comparing 1-year costs over the observation period, we found that joint replacements decreased in each year relative to the previous year (see Table 18). In 2015, TKR and THR 1-year costs were, respectively, £194 (95% CI £136 to £252) and £253 (95% CI £191 to £315) lower than in 2008, adjusting for other covariates.
Musculoskeletal diagnosis (ICD-10 chapter 1335) accounted for 32–35% of readmission costs within the first year of joint replacement, followed by injury diagnosis (ICD-10 chapter 19:35 21%) and circulatory system diagnosis (ICD-10 chapter 9:35 8–9%) (Table 19).
| Hip replacement | Knee replacement | ||||
|---|---|---|---|---|---|
| ICD-10 | Description | Mean cost (£) | ICD-10 | Description | Mean cost (£) |
| Year 1 | |||||
| 13 | Musculoskeletal | 506 | 13 | Musculoskeletal | 573 |
| 19 | Injury | 333 | 19 | Injury | 348 |
| 9 | Circulatory | 139 | 9 | Circulatory | 133 |
| 2 | Neoplasms | 119 | 18 | Symptoms | 112 |
| 18 | Symptoms | 111 | 2 | Neoplasms | 106 |
| NA | All others | 259 | NA | All others | 263 |
| Year 2 | |||||
| 13 | Musculoskeletal | 401 | 13 | Musculoskeletal | 508 |
| 19 | Injury | 213 | 19 | Injury | 274 |
| 2 | Neoplasms | 163 | 2 | Neoplasms | 157 |
| 9 | Circulatory | 154 | 9 | Circulatory | 155 |
| 11 | Digestive | 107 | 11 | Digestive | 117 |
| NA | All others | 297 | NA | All others | 312 |
Individuals undergoing partial knee replacement had, on average, lower 1-year costs and LOS [mean £6897 (SD £3263) and 4.4 (SD 5.9) days, n = 29,066] than individuals undergoing patellofemoral joint replacement [£7381 (SD £3892) and 5.4 (SD 7.7) days, n = 4370] and TKR [£7860 (SD £4606) and 7.5 (SD 11.5) days, n = 360,682]. Individuals undergoing metal-on-metal (MoM) resurfacing had, on average, lower 1-year costs and LOS [mean £6553 (SD £2900) and 4.8 (SD 5.8) days, n = 7000] than individuals undergoing THR [£7842 (SD £4643) and 7.4 (SD 11.3) days, n = 337,721].
After adjusting for censoring, the mean 1-year costs were similar to the complete-case analysis, at £7827 (95% CI £7813 to £7842) and £7805 (95% CI £7790 to £7818) for THR and TKR, respectively. For THR, the mean cost in the first 2 years following joint replacement (2-year) adjusted for censoring was £9258 (95% CI £9233 to £9280), compared with £9277 (SD £6927) using only the complete cases (n = 293,618). For TKR, the cost in the first 2 years following joint replacement (2-year) adjusted for censoring was £9452 (95% CI £9430 to £9475), similar to £9446 using only complete cases (n = 333,123). Comparing 2-year costs over the observation period, we found that joint replacements decreased each year relative to the previous year (see Table 18). In 2014, TKR and THR costs were £373 (95% CI £283 to £463) and £323 (95% CI £233 to £413) lower than in 2008, respectively, adjusting for other covariates.
Predictors of hospitalisation costs in the first year following joint replacement
Data were missing for 50% and 70% of patients concerning Oxford and EQ-5D scores (before surgery and at 6 months), BMI or other predefined variables to inform the prediction of hospitalisation costs for hip and knee replacement, respectively. The cohorts with incomplete data had a lower proportion of total joint replacements, higher mortality rates at 1 year, higher hospitalisation costs and higher LOS than complete cases. Following multiple imputation, the predictors of hospitalisation costs for THR and TKR are shown in Tables 20 and 21, respectively. A GLM with gamma family and identity link function was appropriate and had a good fit.
| Predictor | Proportion/mean in study cohort | Mean additional cost (£) | 95% CI (£) | p-value |
|---|---|---|---|---|
| Type of joint replacement | ||||
| THR | 97.9% | Reference | ||
| MoM resurfacing | 2.1% | –451 | –556 to –347 | p < 0.001 |
| Age (years) at replacement (centred at 69 years) | 69.1 | 28 | 27 to 30 | p < 0.001 |
| Age (years) at replacement squared | 0.9 | 0.8 to 0.9 | p < 0.001 | |
| Sex | ||||
| Male | 59.5% | Reference | ||
| Female | 40.5% | 167 | 147 to 188 | p < 0.001 |
| Charlson Comorbidity Index score | 0.36 | 380 | 362 to 399 | p < 0.001 |
| BMI (kg/m2) at hip replacement | 28.8 | –4 | –6 to –1 | p = 0.002 |
| EQ-5D score at baseline (per 0.10 units) | 0.32 | –105 | –113 to –96 | p < 0.001 |
| EQ-5D score change at 6 months (per 0.10 units) | 0.41 | –97 | –104 to –89 | p < 0.001 |
| OHS at baseline | 17.4 | –30 | –32 to –27 | p < 0.001 |
| OHS change at 6 months | 20.1 | –17 | –19 to –14 | p < 0.001 |
| Calendar year of replacement (centred at 2012) | –31 | –35 to –26 | p < 0.001 | |
| ASA grade | ||||
| Fit and healthy (1) | 13.9% | –150 | –174 to –126 | p < 0.001 |
| Mild disease not incapacitating (2) | 70.4% | Reference | ||
| Incapacitating systemic disease (3) | 15.3% | 637 | 600 to 675 | p < 0.001 |
| Life-threatening disease or expected to die within 24 hours (4 and 5) | 0.4% | 2112 | 1772 to 2452 | p < 0.001 |
| Head size (mm) | ||||
| ≤ 28 | 42.2% | Reference | ||
| 29–35 | 31.4% | 45 | 22 to 69 | p < 0.001 |
| 36–42 | 23.4% | 56 | 27 to 85 | p < 0.001 |
| 43–48 | 1.4% | 29 | –72 to 129 | p = 0.579 |
| 49–52 | 1.2% | 66 | –59 to 191 | p = 0.300 |
| ≥ 53 | 0.4% | 226 | 60 to 392 | p = 0.008 |
| Bearing surfaces | ||||
| MoP | 61.9% | Reference | ||
| MoM | 4.3% | –29 | –105 to 47 | p = 0.450 |
| CoC | 16.9% | –40 | –69 to –10 | p = 0.009 |
| CoP | 16.6% | –24 | –51 to 4 | p = 0.094 |
| Other (ceramic on metal or metal on ceramic) | 0.4% | –194 | –324 to –64 | p = 0.003 |
| Surgeon volume of hip procedures (per 100) | 97.4 | –16 | –28 to –4 | p = 0.007 |
| Complications within 1 year | 6.0% | 6601 | 6472 to 6731 | p < 0.001 |
| Revision within 1 year | 0.9% | 11,255 | 10,800 to 11,709 | p < 0.001 |
| Death | 1.0% | 4682 | 4374 to 4991 | p < 0.001 |
| Constant | 8600 | 8500 to 8700 | p < 0.001 | |
| Predictor | Proportion/mean in study cohort | Mean additional cost (£) | 95% CI (£) | p-value |
|---|---|---|---|---|
| Type of joint replacement | ||||
| TKR | 92.5% | Reference | p < 0.001 | |
| Unicondylar knee replacement | 7.4% | –391 | –429 to –353 | p < 0.001 |
| Patellofemoral replacement | 0.1% | –96 | –194 to 3 | p = 0.057 |
| Age (years) at replacement (centred at 69 years) | 31 | 30 to 32 | p < 0.001 | |
| Age (years) at replacement squared | 1.1 | 1.0 to 1.2 | p < 0.001 | |
| Sex | ||||
| Male | 56.8% | Reference | ||
| Female | 43.2% | 248 | 227 to 269 | p < 0.001 |
| Charlson Comorbidity Index score | 0.39 | 365 | 350 to 381 | p < 0.001 |
| Year of surgery (centred in 2012) | –10 | –15 to –6 | ||
| IMD score (divided by 100) | 0.19 | –247 | –320 to –174 | p < 0.001 |
| EQ-5D score at baseline (per 0.10 units) | 0.37 | –96 | –104 to –88 | p < 0.001 |
| EQ-5D score change at 6 months (per 0.10 units) | 0.30 | –92 | –99 to –85 | p < 0.001 |
| OKS at baseline | 18.2 | –26 | –32 to –25 | p < 0.001 |
| OKS change at 6 months | 15.2 | –8 | –12 to –7 | p < 0.001 |
| ASA grade | ||||
| Mild disease not incapacitating (2) | 73.7% | Reference | ||
| Fit and healthy (1) | 10.2% | –153 | –184 to –122 | p < 0.001 |
| Incapacitating systemic disease (3) | 15.7% | 622 | 590 to 653 | p < 0.001 |
| Life-threatening disease or expected to die within 24 hours (4 and 5) | 0.3% | 1579 | 1324 to 1834 | p < 0.001 |
| Deformity | ||||
| < 10 | 65.2% | Reference | ||
| 10–30 | 33.7% | 62 | 39 to 85 | p < 0.001 |
| > 30 | 1.1% | 496 | 386 to 606 | p < 0.001 |
| Range of flexion | ||||
| 91–110 | 45.3% | Reference | ||
| < 70 | 2.1% | 86 | 10 to 163 | p = 0.027 |
| 70–90 | 19.7% | 54 | 24 to 84 | p < 0.001 |
| > 110 | 32.9% | –15 | –40 to 10 | p = 0.238 |
| Type of surgeon | ||||
| Consultant | 78.5% | Reference | ||
| Other | 21.5% | 51 | 26 to 75 | p < 0.001 |
| Approach | ||||
| Medial parapatellar | 93.0% | Reference | ||
| Lateral parapatellar | 1.0% | 180 | 77 to 282 | p = 0.001 |
| Mid-vastus | 3.1% | 29 | –27 to 86 | p = 0.306 |
| Subvastus | 1.2% | 119 | 25 to 212 | p = 0.013 |
| Other | 1.7% | –15 | –90 to 60 | p = 0.686 |
| Type of fixation | ||||
| Cemented | 95.0% | Reference | ||
| Uncemented | 4.2% | –66 | –114 to –18 | p = 0.007 |
| Hybrid | 0.7% | 44 | –75 to 163 | p = 0.468 |
| General anaesthesia | 36.5% | 74 | 53 to 95 | p < 0.001 |
| Complications within 1 year | 6.0% | 6075 | 5994 to 6155 | p < 0.001 |
| Revision within 1 year | 1.1% | 7753 | 7528 to 7978 | p < 0.001 |
| Death | 0.8% | 4597 | 4368 to 4826 | p < 0.001 |
| Constant | 8068 | 8010 to 8126 | p < 0.001 | |
Holding all else constant, conventional THR was more expensive, on average, than MoM resurfacing (£451; p < 0.001). Women had higher mean hospitalisation costs than men (£167; p < 0.001) and increasing age was associated with higher costs (£28 per additional year). Individuals with higher quality-of-life values (EQ-5D and OHS) at baseline and reporting improvements at 6 months were associated with lower hospitalisation costs. Larger femur head size was associated with higher costs, with additional costs of up to £226 for head sizes of > 53 mm compared with the cost for head sizes of ≤ 28 mm. We found significant variation in hospitalisation costs concerning bearing surfaces with strong evidence (p < 0.01) that ceramic-on-ceramic, ceramic-on-metal and metal-on-ceramic bearings were associated with lower mean 1-year hospitalisation costs than metal-on-polythene bearings (the most common bearing type in the cohort). Costs were lower in recent years (–£31/year; p < 0.001), holding all else constant. Complications and revisions within the year were significantly associated with higher mean costs, with an additional £6601 (p < 0.001) and £11,255 (p < 0.001), respectively.
Holding all else constant, TKR was significantly associated with higher 1-year hospitalisation costs than unicondylar knee replacement (£391; p < 0.001). Women had higher mean hospitalisation costs than men (£248; p < 0.001) and costs were positively associated with age (£31 per additional year; p < 0.001) and higher deprivation, with individuals living in more deprived areas having higher costs. Individuals with higher quality-of-life values (EQ-5D and OKS) at baseline and those reporting improvements at 6 months had lower hospitalisation costs. Higher deformity and lower range of flexion were also significantly associated with higher costs. Costs were lower in recent years (–£10/year; p < 0.001), holding all else constant. Complications and revisions within the first year were significantly associated with higher costs, with an additional £6075 (p < 0.001) and £7753 (p < 0.001), respectively.
The mean 1-year hospitalisation costs were higher for patients who died (an additional £4682 for THR and £4597 for TKR), mostly as a result of higher LOS than those who survived the first year (mean of 30.4 days vs. 7.0 days for hip patients who did/did not die and 30.0 days vs. 7.0 days for knee patients who did/did not die).
Costs before and after joint replacement
Adding primary, outpatient and inpatient hospitalisation costs, the mean NHS costs associated with THR amounted to £9295 in the year of surgery (Figure 24) compared with £9483 following TKR (Figure 25). Using the annual number of UK primary joint replacements in 2017, the NHS primary and hospital care costs were estimated at £897M (n = 96,717) and £1007M (n = 106,334) in the year of the THR and TKR, respectively.
FIGURE 24.
Costs in the years before and after THR.
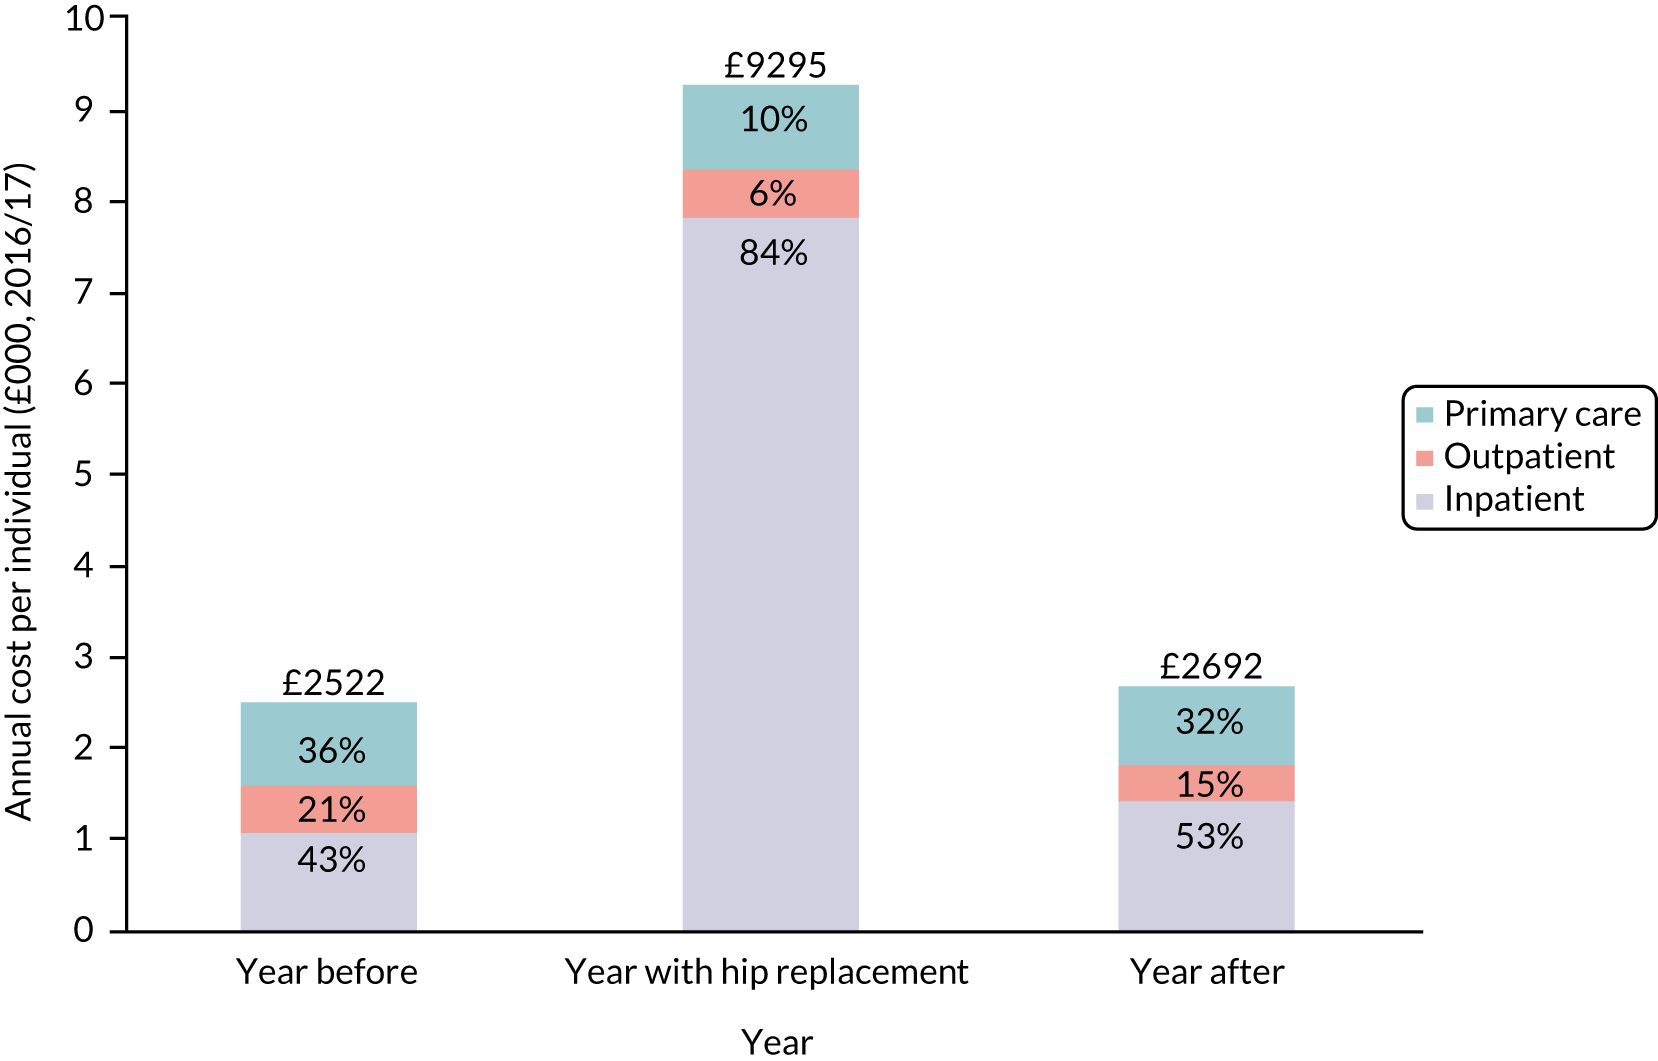
FIGURE 25.
Costs in the years before and after TKR.
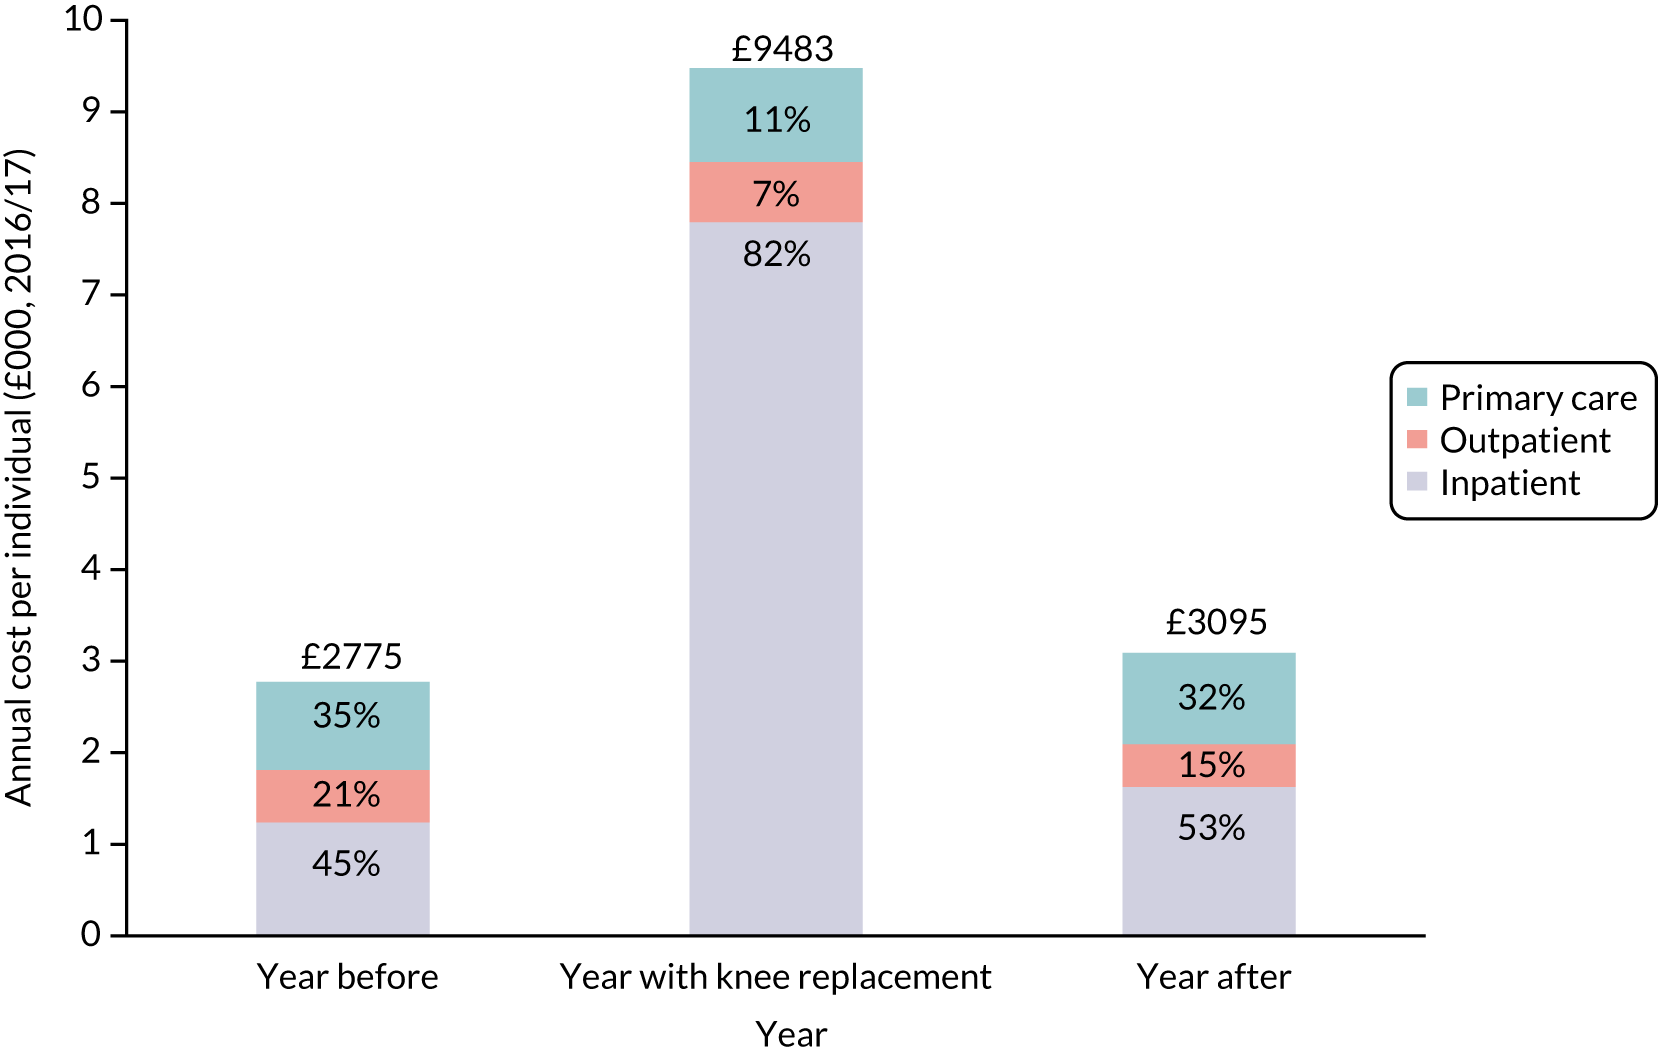
Hospitalisation costs accounted for the highest proportion of the total 1-year cost for both THR and TKR (82–84% of total costs in the year of joint replacement), followed by primary care (10–11% of total costs) and outpatient care (6–7% of total costs). In the second year after joint replacement, total costs decreased to £3095 for knee and £2692 for hip cohorts, with inpatient costs again being the largest component (53% for both knee and hip).
Figure 26 reports the hospitalisation costs in the months before and after joint replacement. The annual hospitalisation costs in the year of joint replacement were £6753 (95% CI £6732 to £6774) and £6563 (95% CI £6544 to £6583) higher for THR and TKR, respectively, than those of the previous year (Table 22). However, hospitalisation costs decreased in the 5 months prior to surgery, reflecting lower hospital admissions leading up to the elective admission. In the year of joint replacement, about 81–83% of hospitalisation costs occurred in the first month post joint replacement. Costs in the second year after joint replacement were £389 (95% CI £370 to £407) and £349 (95% CI £329 to £368) higher than costs in the year prior to surgery for knee and hip replacement, respectively.
FIGURE 26.
Hospitalisation costs in the months before and after joint replacement.
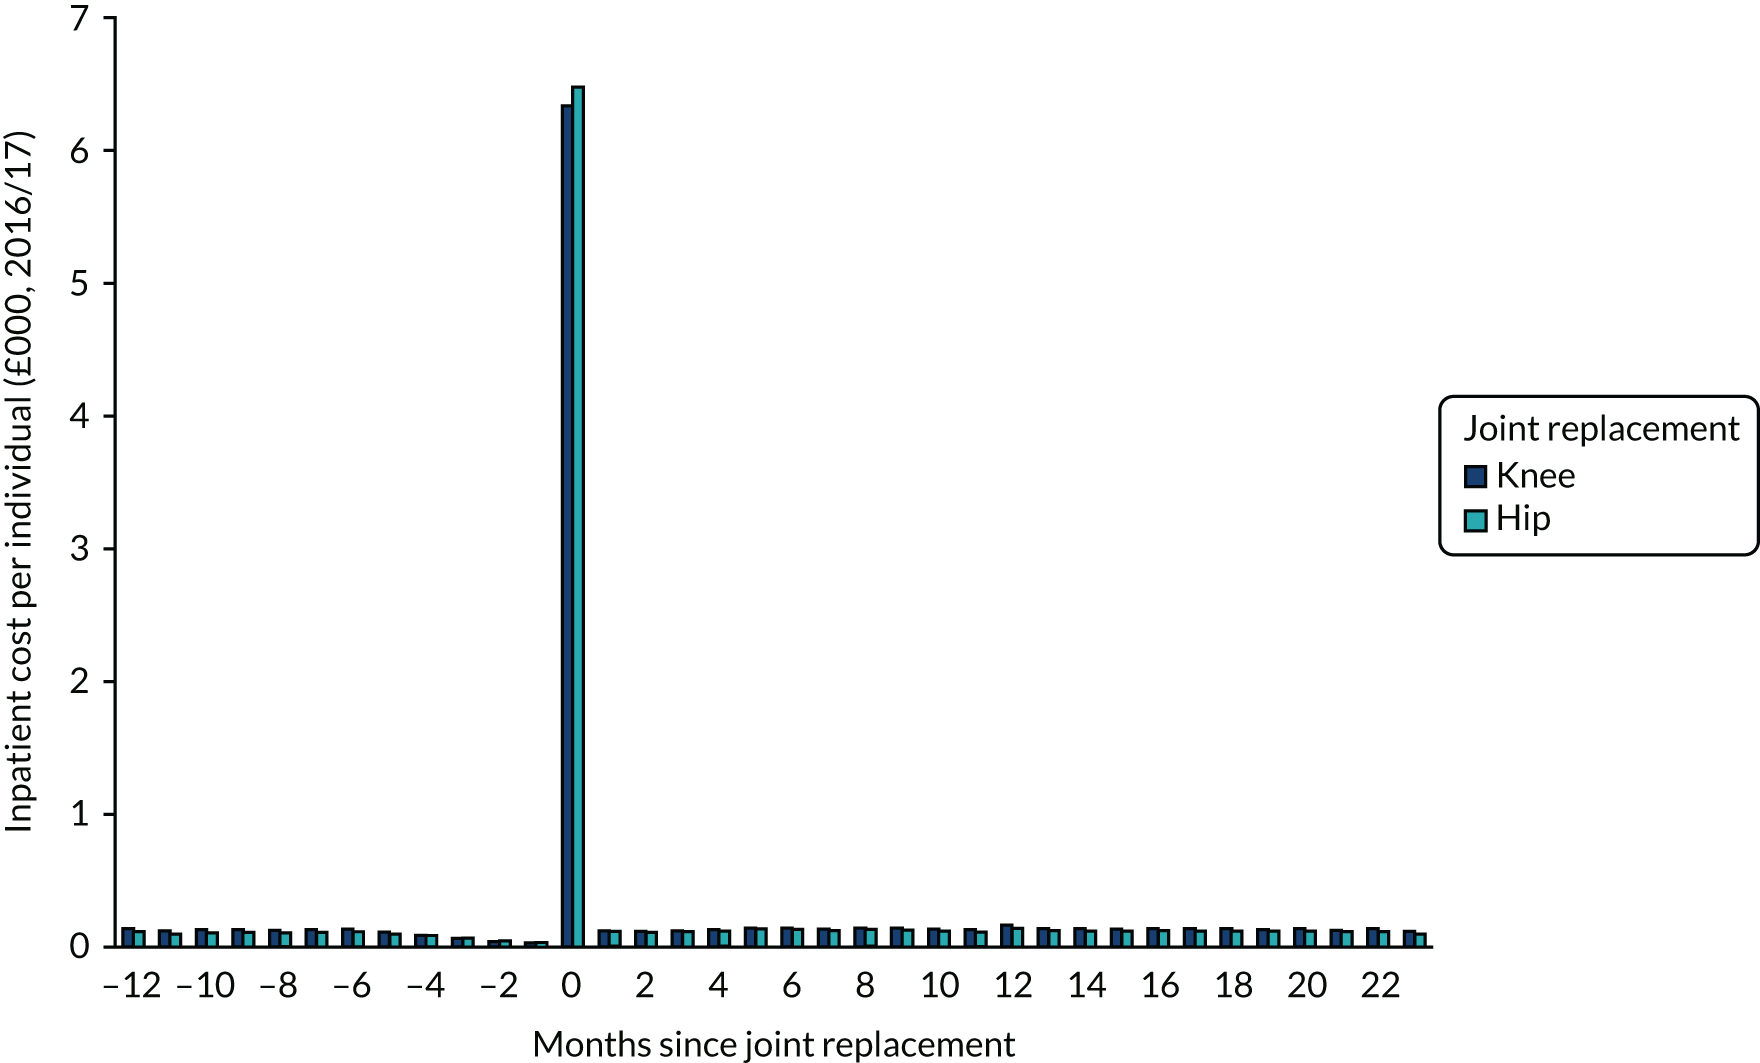
| Joint replacement | Time point | ||
|---|---|---|---|
| Year before | Year 1 | Year 2 | |
| Knee (£)a | 1240 | 7803 | 1628 |
| Difference vs. year before (£) (95% CI) | 6563 (6544 to 6583) | 389 (370 to 407) | |
| n | 297,794 | 297,794 | 297,794 |
| Hip (£)a | 1085 | 7838 | 1434 |
| Difference vs. year before (£) (95% CI) | 6753 (6732 to 6774) | 349 (329 to 368) | |
| n | 257,563 | 257,563 | 257,563 |
A similar pattern was observed with outpatient and primary care costs (Figures 27 and 28). Primary care costs in the year of the surgery were higher than in the previous year, at £64 (95% CI £37 to £91) and £5 (95% CI –£17 to £26) for TKR and THR, respectively (Table 23). The highest costs occurred in the first month after joint replacement. Outpatient costs were also higher in the year of surgery than in the previous year, with an additional £80 (95% CI £53 to £107) and £15 (95% CI –£31 to £61) for TKR and THR, respectively, with the highest costs occurring in the second month (Table 24). However, outpatient costs in the second year after surgery were significantly lower than in the year preceding the surgery for both types of joint replacement [–£105 (95% CI –£78 to –£133) and –£126 (95% CI –£109 to –£143) for knee and hip, respectively]. In contrast, primary care costs were lower in the second year after surgery for THR (by –£53), but higher for TKR (by £37) than in the year preceding surgery.
FIGURE 27.
Primary care costs in the months before and after joint replacement.
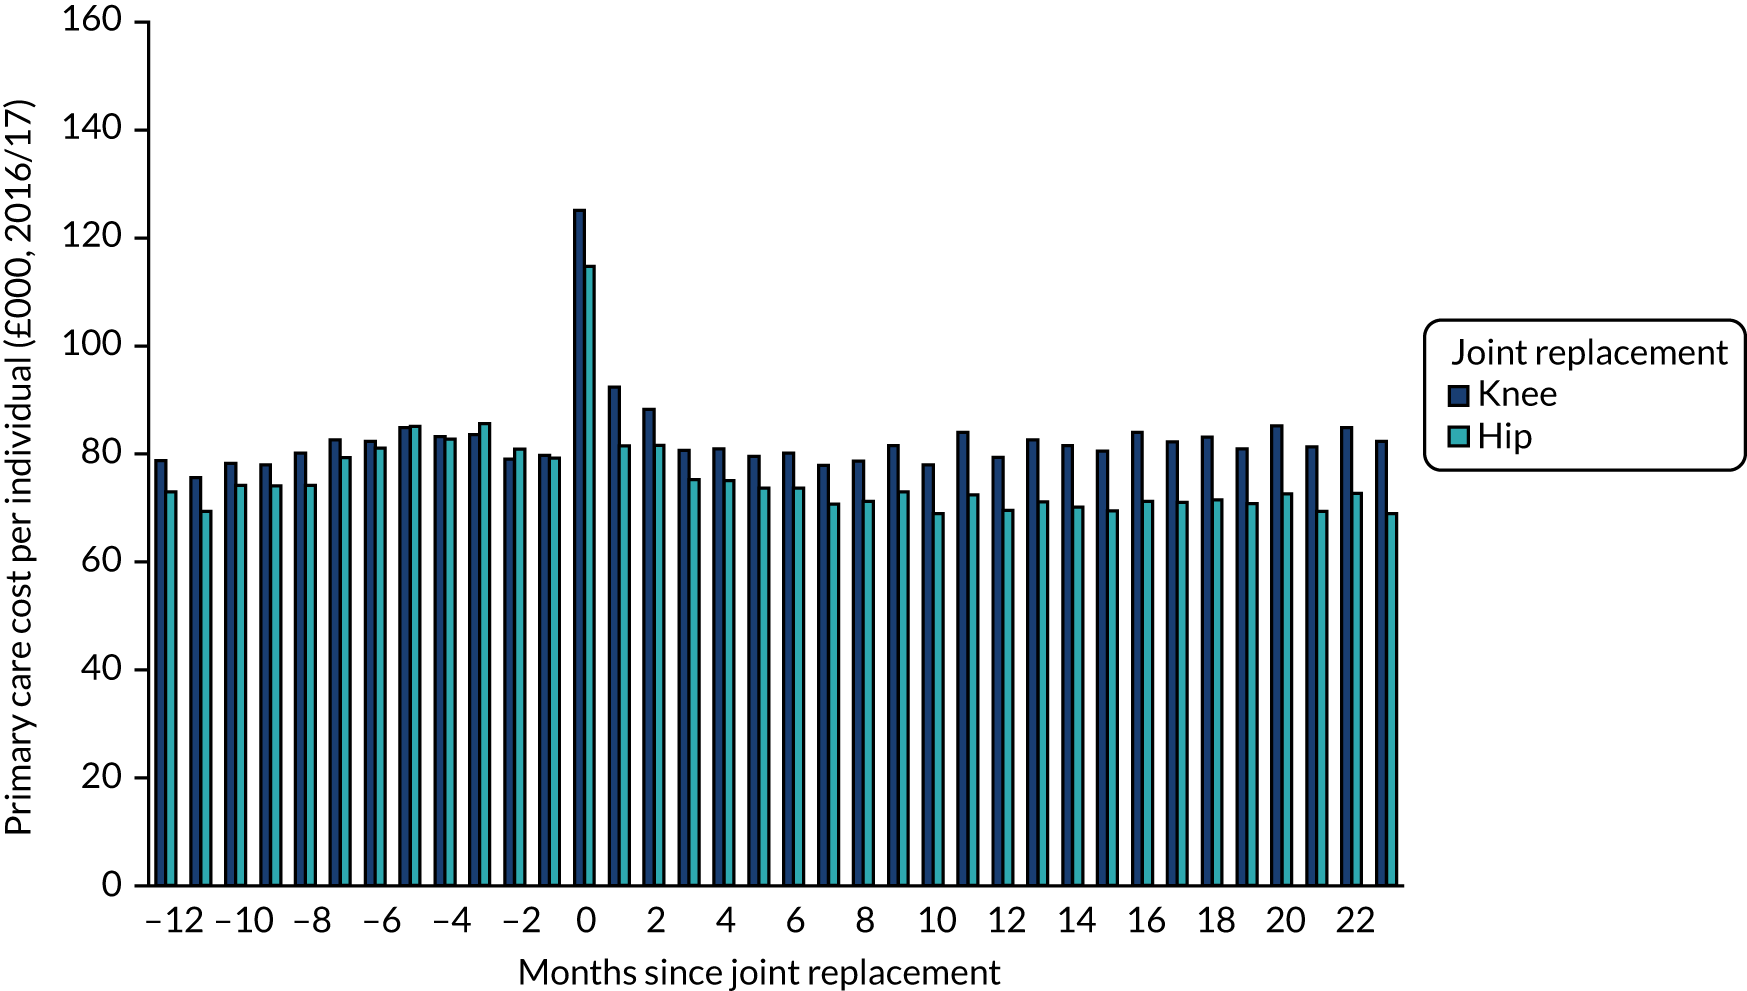
FIGURE 28.
Outpatient care costs in the months before and after joint replacement
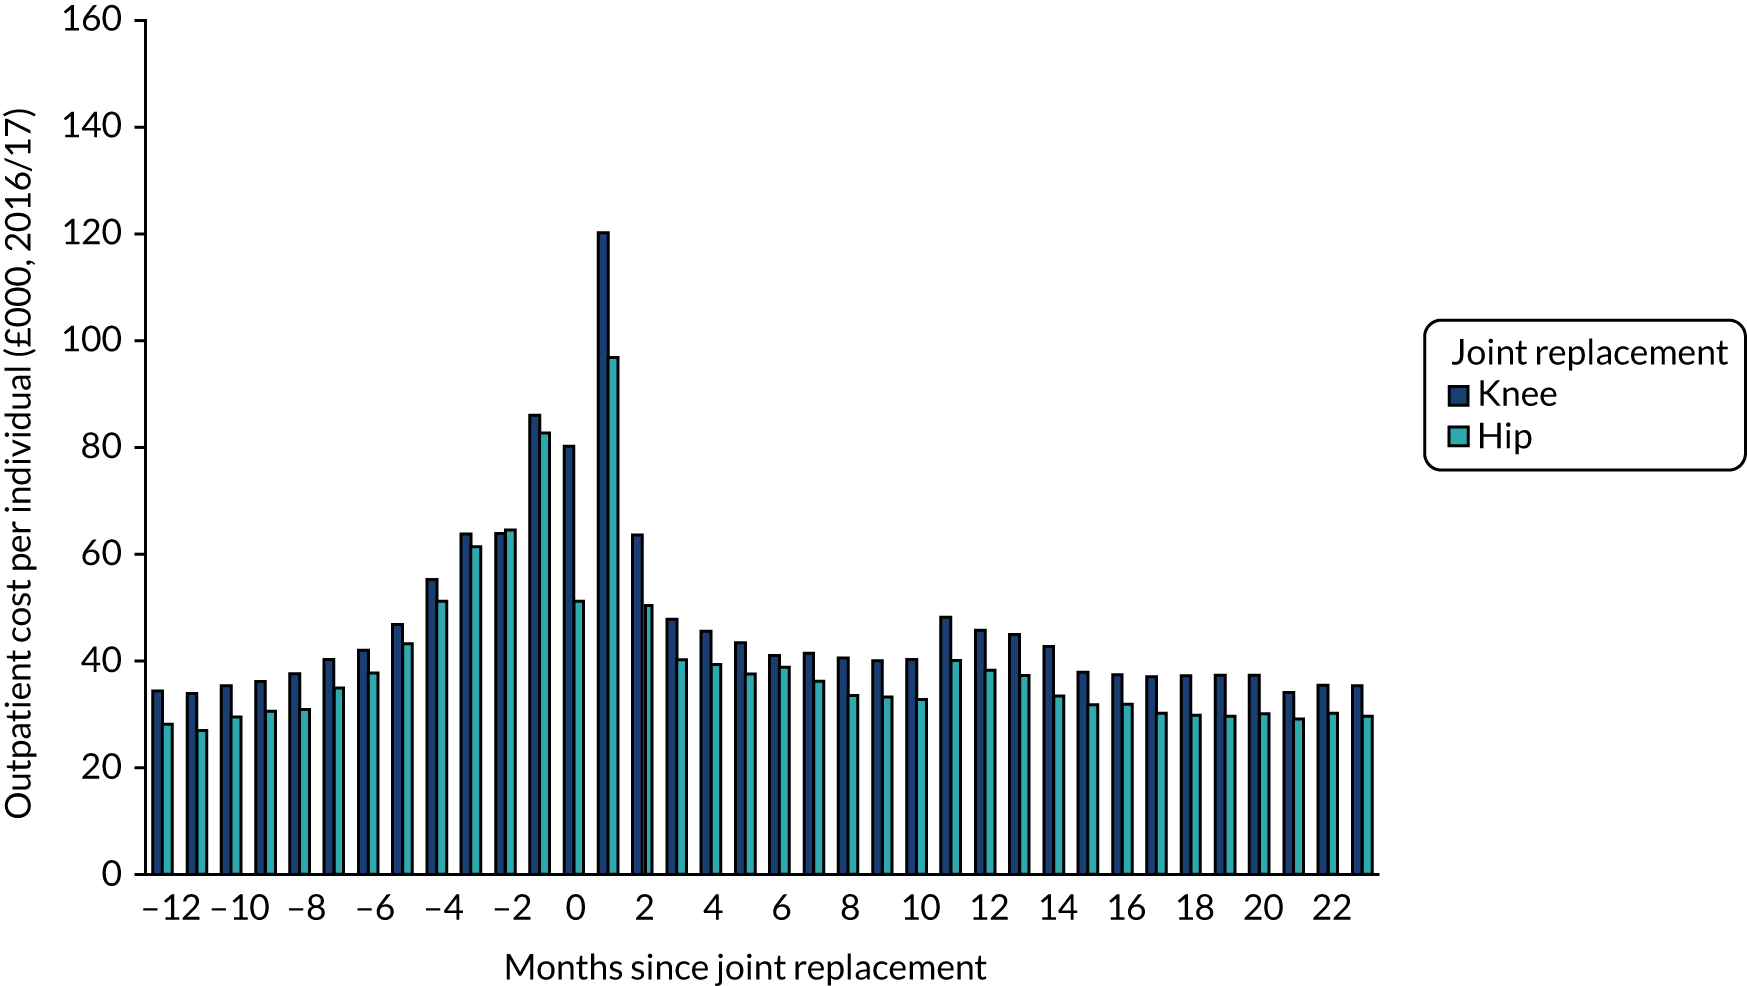
| Joint replacement | Time point | ||
|---|---|---|---|
| Year before | Year 1 | Year 2 | |
| Knee (£)a | 960 | 1024 | 997 |
| Difference vs. year before (£) (95% CI) | 64 (37 to 91) | 37 (9 to 64) | |
| n | 23,601 | 23,601 | 23,601 |
| Hip (£)a | 919 | 923 | 866 |
| Difference vs. year before (£) (95% CI) | 5 (–17 to 26) | –53 (–74 to –32) | |
| n | 24,509 | 24,509 | 24,509 |
| Joint replacement | Time point | ||
|---|---|---|---|
| Year before | Year 1 | Year 2 | |
| Knee (£)a | 576 | 656 | 470 |
| Difference vs. year before (£) (95% CI) | 80 (53 to 107) | –105 (–78 to –133) | |
| n | 13,793 | 13,793 | 13,793 |
| Hip (£)a | 518 | 533 | 392 |
| Difference vs. year before (£) (95% CI) | 15 (–31 to 61) | –126 (–109 to –143) | |
| n | 13,708 | 13,708 | 13,708 |
Discussion
The systematic review of cost-effectiveness evidence of enhanced recovery identified two studies evaluating an entire pathway. 98,109 This is consistent with reviews of cost-effectiveness of enhanced recovery programmes for other surgical sites,119–121 which have found few studies reporting the effect on quality of life and none presenting cost-effectiveness results using QALYs. The ERP was found to be associated with reduced costs for all patients and the incremental cost-effectiveness estimate favoured the enhanced recovery protocol, with a high probability of it being the most cost-effective option. Furthermore, we were able to examine the hospitalisation costs of different types of joint replacement through their identification in the NJR data set and linkage to hospital records. We found partial knee replacement to have lower 1-year costs than TKR, even after adjusting for potential confounders. Previous studies have examined the costs of joint replacement, but consisted of smaller samples and without linkage to NJR data. 74,122
Cost-effectiveness of enhanced recovery
We identified 11 studies presenting cost–utility data for components of an ERP. 86,97,99–106,110 However, these cover only a few of the potential ERP components and the available evidence was mostly based on single studies. These studies covered a variety of interventions, across different health-care systems, and used different cost perspectives. The studies identified in this review were generally of good quality, according to the CHEC list,91 with a short time horizon identified as a key limitation in six studies. 86,97,98,101,106,109 When the models were assessed against the ISPOR questionnaire,123 there were concerns about the lack of model validation work, potentially questioning the reliability of 9 of the 13 studies identified. 97,99,100,102–106,110 The trials were generally of good quality.
Our review had some limitations. We may have missed relevant evidence by limiting our search to reports published in the English language and excluding studies that did not report QALYs. Of the studies excluded because they did not report QALYs, one investigated a complete ERP. 124 This was a retrospective review of total knee arthroplasty patients in Turkey who followed either a rapid-recovery protocol or a standard care protocol. The rapid-recovery protocol was found to be cost-saving and associated with statistically significant differences in knee flexion and extension at 6 months.
Costs of joint replacement
Consistent with Chapter 5, we found 1- and 2-year hospitalisation costs to decrease over recent years. However, we found no clear trend concerning the costs of the elective surgery itself, despite a significant decrease in LOS between 2008 and 2016. This can be explained by the nature of costing in the NHS, which is based on HRGs for hospital episodes rather than days in hospital. Therefore, it is key to note that such a costing approach was shown here not to be sensitive to capture what we would expect to be a decrease in costs.
We identified a reduction in hospitalisation costs in the 5 months prior to surgery for both types of joint replacement, reflecting fewer hospitalisations leading up to the elective admission. This suggests that the selection of patients for joint replacement takes into account their recent history of hospital admissions. Furthermore, primary care costs were slightly lower in the second year after surgery for THR, but slightly higher for TKR, than in the year preceding surgery, possibly reflecting differences in recovery times between the two procedures.
The main predictors of costs were similar for THR and TKR. As in previous work,122 we found preoperative quality of life to be associated with hospitalisation costs: 1-year costs were higher for individuals with worse preoperative quality of life, even after adjusting for other covariates. In addition, 1-year costs were lower for individuals reporting improvements in quality of life at 6 months.
Having a revision or complication was found to be associated with very high additional costs in the first year after surgery, after adjusting for other covariates. Given the high annual primary care and hospital costs of £897M and £1007M for THR and TKR, respectively, there is a considerable economic incentive to fund research aimed at identifying cost-effective ways of improving the quality of life of patients following joint replacement and reducing the risk of revisions and complications.
Our study had some limitations. NJR data were obtained for individuals undergoing joint replacement, with osteoarthritis as an indication for surgery. Hence, individuals without osteoarthritis as one of the indications were not available for analysis (e.g. rheumatoid arthritis or hip fracture). A large proportion of the cohort had missing data for one or more key covariates of the hospitalisation costs, in particular EQ-5D or OHS responses and BMI, which necessitated the use of missing data methods, specifically multiple imputation. A key assumption whenever multiple imputation is utilised is that the missing data may be classified as missing at random. This assumption is always untestable, but owing to the large number of relevant covariates in our linked data we judged it to be reasonable in this case.
Conclusion
Our systematic review found limited cost–utility evidence, either for an entire ERP or for individual components of a pathway, for patients having THR or TKR. Our findings support the use of ERPs as a whole, prophylactic systemic antibiotics, antibiotic-impregnated cement and conventional ventilation. However, there is ample scope for future cost-effectiveness studies into enhanced recovery for total hip arthroplasty and total knee arthroplasty patients. Furthermore, our study reports the costs of joint replacement and shows these to have decreased in recent years. We highlight the significant costs associated with revisions and complications following joint replacement and the incentive to reduce these in the patient population. We also identified significant differences between types of operation in TKR and THR that warrant further research. A key advantage of this study is the use of large numbers of primary care and hospital care data collected routinely in the NHS, meaning that the data are representative of the range of individuals undergoing joint replacement. Therefore, the results are generalisable for use in other studies in the UK setting. Our results can be used as inputs in future work assessing the cost and cost-effectiveness of joint replacement and, in particular, to explore heterogeneity between patient subgroups.
Chapter 8 Patient and public involvement
Second forum results: Tuesday 7 November 2017
The group discussed the results of the statistical analyses in general. The group was encouraged to see that the preliminary results showed that the ERP had not had a negative impact on patient outcomes. Members of the group requested that the results be broken down for different age groups and different comorbidities. The group discussed the presentation of the charts and thought that some of the diagrams were unclear.
One member commented that ‘it was hard to see the results proportionally and they wanted the scale to be easier to read’. It was also noted that members were worried that some of the charts might be upsetting to patients. They want guidance rather than scaremongering. The group were interested in hospital-acquired infection and LOS. The group wanted to know if it would it be possible to look at patients who are living alone and how it affects their outcomes.
Final forum results: Tuesday 4 September 2018
Prior to the final meeting, the group members were given a brief plain English summary of the last meeting and a reminder of the project aims. The meeting began by refreshing the group on the research project and discussing the previous meeting outcomes. The group thought that the patient outcomes listed could also be described as ‘getting it right’ for the patient. It was agreed that the four top outcomes were still the most important.
The group was then asked to discuss some preliminary diagrams that had been created to map the top four different patient outcomes for both THR and TKR. One group member thought that it would be useful to compare the information in the maps with data on health and well-being, for example people who live in deprived areas. The group discussed whether or not the maps properly reflected if, in certain areas, patients might arrive in hospital with a higher score in the OHS and OKS but still had the replacement operation, and how that would affect the measure of outcomes. One group member commented that ‘If you lived in one of these areas that did not score well, you would then be questioning why’.
It was suggested that the colours for the different maps should be consistent. For example, dark blue is positive for the pain and function map, but displayed as negative on the complications map.
The group then moved on to discuss who this information should be given to. It was agreed that the information is most important for CCGs to look at and see what are they doing wrong, rather than for a patient. The group was then asked whether or not the maps would be helpful for patients. It was thought that not all patients would have the mental capacity or well-being to make the decision to choose a better-scoring hospital. It was agreed that most people would want to go to the local hospital particularly in order to help with travel before and after the operation and for family visiting. Waiting times would help to make a decision. For example, the hospital with the shortest waiting time would be preferable. It was agreed that the maps would be too ‘bewildering’ if they were just handed to patients, as they are already bombarded with information before operation. The PEP-R group agreed that the information would be useful for the CCGs, rather than for patients. It was agreed that it would be overwhelming for patients to see this information before an operation, as some areas are marked as good for pain but bad for complications. The group agreed that it was difficult to make decisions based on CCG area, as individual hospitals have their own results. It was thought that amalgamating all the results to get one score on one map would be helpful. One group member commented that ‘the information shown on the map is quite high level, but as a patient your choice is on a much smaller scale’.
Chapter 9 Final conclusions
Geographical variation
There are a number of factors that are predictive of whether or not a patient achieves a successful outcome following primary hip or knee replacement surgery. Consistent with the existing literature, we identified a number of patient and surgical factors that predicted outcome, in addition to some hospital organisational factors. In respect of patient case-mix factors, we found that patients achieving the best outcomes in respect of absolute change (improvement) in symptoms of patient self-reported pain and function, before and 6 months after surgery, were older age, people living in affluent areas and those with no comorbidities.
This is as expected and such case-mix factors are known within the literature. Surgical factors we identified included bigger femoral head size (≥ 44 mm). None of the hospital organisational factors we explored predicted pain and functional outcomes. As expected, patient case-mix factors were also predictors of complications and LOS. A number of the surgical and hospital organisational factors were found to predict these other outcomes. For example, hospitals with more beds available overnight for trauma and orthopaedics and those with units performing fewer THRs per year were associated with longer stays for patients undergoing primary THR.
The findings above tell us about predictors of outcomes of surgery at a population level. However, outcomes of surgery are likely to vary at the small area level, such as between individual hospitals and across health areas (e.g. CCGs). A strength of using large national data from the NJR is that we had the statistical power, and coverage, to explore geographical variation at the small area level. This allowed us to first describe variation in outcomes across health areas, and second to try to identify factors that could explain why such variation exists. In our study, we observed substantial evidence of variation in patient outcome across the 207 CCGs. A key point is that this variation is seen after a national ERAS programme has been rolled out. The absolute change in OKS varied from 11.2 to 19.1 (and in OHS from 17.5 to 24.9), 6-month complication rate of TKR varied from 1.5% to 8.4% (and for THR from 2.0% to 8.6%), mean LOS for TKR varied from 2.7 to 6.6 days (and for THR from 2.5 to 6.2 days) and bed-day costs varied from £4564 to £8901 (and for THR from £4322 to £8566). Accounting for patient case-mix factors did not explain the observed variation across health areas. Neither did further adjustment for surgical and hospital organisational factors. Hence, even though these factors do predict differences in outcome between patients, they do not explain the observed variation in outcome across health areas.
This is an important finding, as a CCG cannot use patient case mix as a justification for why it has worse outcomes than others. However, there is still the potential for residual confounding, due to other measures of patient case mix not fully accounted for in our models (e.g. the type of work that patients are returning to, levels of depression, assumptions about weighting in the Charlson Comorbidity Index that may not reflect the relative weight of different comorbidities’ influence over THR/TKR outcomes). This is, however, to the best of our knowledge, the most thorough attempt yet to adjust for patient, surgical and hospital factors, and, given the magnitude of variation that remains, there would have to be really very strong residual confounding to fully explain the remaining variability. It was disappointing not to be able to find any variables captured in routine health data that could explain these observed variations. The potential explanation is that this variation is down to historical local hospital organisational contexts, and specific to local care process and care pathways, that cannot be captured and adjusted for in routine health data. Nevertheless, the information we present is important in highlighting that this variation exists, such that local hospitals and CCGs can be aware of how they are performing and take the necessary action and local audit to attempt to tackle the problem. It is also informative to patients in making a decision in deciding where to have elective surgery, such as THR/TKR, as this is not emergency surgery and patients have a choice through the Patient Choice Agenda.
Enhanced recovery care pathway
Natural experimental study
Our data show that outcomes of primary THR and TKR have been gradually improving over time, with a decrease in LOS, reduction in estimated average inpatient bed-day cost, improvement in patient-reported outcomes of pain and function, decrease in complications and reduction in 5-year revision risk. These trends of improving outcomes were seen across all age groups, and in those with and without comorbidity. These findings are positive, in highlighting that reductions in LOS have been achieved without adversely affecting patient outcomes. However, these trends of improving outcomes had begun prior to the formal roll-out of ERPs through the national NHS ERAS implementation programme and were not temporally associated with the national ERAS programme. It is of note that when we looked at the effect of individual hospitals in a region of England, a significant impact of ERAS on LOS was seen at Southampton and the Isle of Wight, where, prior to implementing ERAS, LOS was stable and not changing, and, after ERAS implementation, LOS declined substantially. However, in many hospitals, formalising ERAS implementation saw no improvements in LOS, predominantly as mean LOS had already been declining, with little further reductions in LOS once ERAS was formally implemented.
Health economics
We found limited cost–utility evidence, either for an entire ERP or for individual components of a pathway, for patients having THR or TKR. There are also concerns regarding the ability of short time horizons in trials in this area to capture relevant outcomes, and regarding a general lack of reporting of model validation. However, our findings support the use of ERPs as a whole, prophylactic systemic antibiotics, antibiotic-impregnated cement and conventional ventilation.
We estimated the hospitalisation costs associated with index admission for THR to be £6208, compared with £6122 for TKR. Within 1 year of the joint replacement, the total hospitalisation costs were estimated to be £7827 and £7805 for THR and TKR, respectively, of which the index admission accounted for 79.4% and 78.5% of the total. Although complications, revision and reoperation are uncommon following surgery, they are associated with high costs. For THR, complications and revisions were significantly associated with higher costs, at £6601 and £11,255, respectively. Given that there are > 200,000 patients receiving THR and TKR each year in the UK, the costs associated with these operations are high, and remain higher in subsequent years after the operation. However, THR and TKR are the most cost-effective options in individuals with osteoarthritis. There is then a strong economic incentive to further improve the quality of life of individuals following joint replacement and reduce revision surgery and complications of surgery.
Process evaluation (qualitative research)
The ethnographic study of health professionals involved in the delivery of enhanced recovery services found that support for the care pathway was higher when the pathway was developed internally rather than externally. Guidance was flexible and could be adapted to meet the demands of individual hospital services. There were concerns about a lack of post-discharge support and tensions between primary and secondary care. One of the key elements of success was effective multidisciplinary collaboration, achieved through multidisciplinary team meetings and paperwork. Involving strong opinion leaders in its development and ‘champions’ who drove through implementation and acted as a point of contact helped facilitate implementation. The study highlighted the importance of ensuring that protocols are sufficiently flexible to meet individual patient needs. Services should also prioritise strategies to empower patients in their recovery through education.
The study of patients’ experiences of the ERP found that hip and knee schools (classes) for patients undergoing the surgeries were highly valued. Patients felt that they helped prepare them for surgery and provided ‘confidence’ in the care they would receive. They were enthusiastic about the potential for early discharge and invested in their recovery, preparing them to take on the role of ‘active’ participants in their care. Most thought that it was useful to practise exercises to prepare them for postoperative mobilisation. Most participants were presented with the option of local or general anaesthesia, although they had different experiences of this. Although some were given this option during hip or knee schools or at their preoperative assessment, others were asked on the day of surgery, meaning that they felt unable to make an informed choice. Patients were surprised about being able to mobilise so quickly after surgery. There was a sense of pride in being able to fulfil what they thought was required of them and they benchmarked their success against their preoperative education and feedback from health-care professionals. Participants emphasised the importance of participating in exercises and working towards their own recovery, engaging in the emotional and physical work required of them as ‘active’ patients. Most of those interviewed reported feeling ‘ready’ to return home and considered it preferable to remaining in hospital. Some participants reported feeling under pressure to be discharged before they felt well enough and this was linked to concerns that they were being made to mobilise too quickly. A small number of participants attributed this to a demand for beds. Those who lacked family support, particularly those who lived alone, were more anxious. The study highlights how patients might value more information and support from health-care professionals, particularly in the post-discharge period, to enable them to work more effectively towards their own recovery.
Research in context
Although at a national level we did not observe any impact of the ERAS pathway on changing trends in outcomes of surgery, hospitals will have implemented this at different time points, and may be early adopters having already implemented many of the ERP components before the national programme had begun. We therefore looked at the effect within individual hospitals within a region of England, and conducted the statistical interrupted time series analysis within these individual hospitals, focusing on the outcomes of pain/function and LOS. Three of these NHS hospitals were part of the qualitative process evaluation, allowing us to set the findings of the statistical analysis in context of what we observe from the qualitative data.
For all three of these hospitals, it is clear that there is no impact of the date they implemented ERAS on the OHS and OKS pain and functional outcome scores, these generally being continuations of existing trends. However, all three hospitals observed reductions in LOS over the study period.
In Shinebury, LOS for THR and TKR was already declining prior to the official ERAS start date, and it continued to decline over the study duration. This hospital was an early adopter and innovator and hence the official start date of 2009 from the NHS England planned care programme just reflects that ERAS was already implemented prior to the official national programme. Enhanced recovery and early discharge started as a research project for a hip arthroplasty database that the trust had been running since 1998. ERAS was piloted in 2000, and was originally initiated by a key consultant surgeon and a lead physiotherapist who has since moved on. Physiotherapists gradually took on more ERAS duties, in the form of 2- and 6-week joint review clinics from about 2002, and then hip school from about 2004. Digital versatile discs (DVDs) were first recored in 2005 and became available about 2006. Joint review clinics originally included both hips and knees, but, as the number of patients increased, two separate clinics were introduced (circa 2008). There were two nurses (sisters) who were the ‘main kind of driving force behind the clinic’, and were also central points of contact for doctors and consultants. The hospital won an innovation award in 2006 for implementing the DVD, booklet and clinic.
Fitness for surgery is evaluated at pre-assessment and includes full medical checks, and patients sometimes attend hip/knee school on that same day as well. Follow-up takes place at the joint review clinic at 2, 6 and 52 weeks; this takes place with the same team and in the same place as knee/hip school. If there are extra difficulties, the patient is seen by the consultant as an outpatient. All patients have to attend hip/knee school and they receive a booklet and a DVD as part of this: ‘they are as educated as they could possibly be’. The DVD includes consultants talking about THR surgery and previous patients talking about their experiences, while demonstrating some of the exercises. Hip and knee patients follow identical care pathways. Patients see OTs at pre-assessment and complete questionnaires (home environment sheet) about their home environment, to assess the level of support that will be needed post discharge. OTs have a printed list every week of joint patients coming to pre-assessment, so that they know in advance who they are expecting and when. Patients do not necessarily see an anaesthetist at pre-assessment, unless requested by the surgeon. For complex patients, notes are given to the anaesthetist in between pre-assessment and surgery. Patients are seen by physiotherapists and mobilised on day 1 after surgery. Joint review clinics are run by the lead physiotherapist, OTs and specialised orthopaedic nurses.
What is surprising is that, although an ERAS service had been in place for many years, LOS for this hospital trust (Shinebury) was still high at the start of the study in 2008, and was still able to decline so much. This may partly reflect coding of hospitals in the HES database (see Appendix 1, Figure 29). Shinebury Hospitals NHS Foundation Trust came into being in January 2012 as a result of the integration of two different NHS trusts, which achieved foundation trust status in 2006. Separating these sites out, we can see that LOS was already very low for THR at this site, whereas for TKR LOS was much higher in both hospital sites.
In Towerton Hospital, LOS for both THR and TKR was relatively high, with a stable trend prior to the ERAS start date; however, after the start date there was a significant reduction and decline in mean LOS (TKR: 5.6 days in April 2008 declining to 4.3 days in December 2016; THR: 6.2 days in April 2008 declining to 4.7 days in December 2016). In this hospital setting, there is a clear impact of ERAS on reducing LOS. The process evaluation shows that Towerton Hospital had a very strong and comprehensive ERAS service. There was a ‘nurse champion’ who, along with the matron, ran multidisciplinary team groups to decide how to implement ERAS at the hospital, and ran education classes for staff. The surgical pre-assessment involves a clinical assessment to establish patients’ fitness for surgery, taking next of kin details and who to call post operation. Pre-assessment includes looking at patients’ social history and current living arrangements, and home measurement forms are given to patients for them to complete and bring to hip/knee school, where a physiotherapist or OT can pick them up. Patients see OTs one to one at the end of the hip/knee school sessions if they are eligible for help (i.e. if they live in a certain postcode area). Equipment can be delivered to eligible patients’ homes preoperatively. Physiotherapists see patients on the ward as soon as possible post operation (sometimes day zero if appropriate, but no later than day 1 after surgery). Postoperative, OTs do a washing/dressing and kitchen assessment, to see whether or not extra support from social services is required. An ERAS nurse champion attends ward round meetings every morning, as do all multidisciplinary team staff. The hospital uses a ‘step-down’ ward (part of a maternity unit at a nearby hospital) for patients who are not quite ready to go home but are ‘too good’ to stay on the elective ward. Follow-up knee classes are held in the outpatient department, which is at another local hospital. Hip patients are not routinely scheduled for outpatient physiotherapy, unless they need it for a particular reason. The hospital provides education sessions and a ‘rolling education programme’, so ERAS is an ongoing and evolving concept.
In Elmfield Hospital, a different pattern was observed for THR and TKR. For THR, LOS was already declining. However, after the ERAS start date, there was no further decline and, if anything, LOS started to increase afterwards. For TKR, LOS was in decline and continued on the existing downwards trend after the official ERAS start date. From the information obtained about the service, there does not appear to be an officially running ERAS programme; rather, ERAS methods are used to reduce waiting times for hip replacement but not for knee replacement. There are separate care pathways for hip and knee patients. The initial implementation of ERAS for hips was through funding for a specialist physiotherapist, and involved streaming patients to include those considered appropriate for it. This was decided on the basis of a pro forma completed by patients, giving details of medical and social ‘fitness for it’. Patients whom Elmfield identified as suitable were flagged at the time they were first seen as outpatients. However, this funding for the physiotherapist was lost after about 18 months. Currently, it has a twice-monthly hip arthritis clinic set up to reduce waiting time, and a same-day assessment clinic so patients attend only once for all preoperative assessments. The anaesthetists introduced an anaesthetic protocol that included preoperative, perioperative and postoperative pain control and management. There is a hip school that is run twice weekly. There is not a formal ERAS for knees, but they do day-case UKR, and knee patients are also streamed according to comorbidities and analgesic requirements, but there is no knee school. There is nothing in the patient pre-assessment clinic paperwork to indicate that patients have been streamed to ERAS. At the beginning of ERAS implementation, home visits were undertaken as standard; this no longer happens. OTs used to see patients in pre-admission, but, since same-day assessment was introduced, they now see patients at a pre-admission clinic only if a ‘trigger’ has been flagged during the assessment; otherwise OTs do not see patients until hip school or post operation. It is ‘not the norm’ for patients to be specially referred to an OT.
Final conclusions
Our data show that outcomes of primary THR and TKR have been gradually improving over time, with a decrease in LOS, reduction in estimated average inpatient bed-day cost, improvement in patient-reported outcomes of pain and function, decrease in complications and reduction in 5-year revision risk. These trends of improving outcomes were seen across all age groups, and in those with and without comorbidity. However, trends of improving outcomes had begun prior to the introduction of the formal NHS ERAS roll-out and, hence, were not temporally associated with the national ERAS programme. These findings are positive, in highlighting that reductions in LOS have been achieved without adversely affecting patient outcomes.
Even though patient outcomes have been improving over time, analysis of the most recent years of data identified potentially unwarranted variations in patient outcomes of THR and TKR. This variation cannot be explained by differences in patient case mix, surgical factors or hospital organisational factors. This information is informative to commissioners in monitoring variations in outcomes of surgery.
The qualitative study of patients’ experiences of enhanced recovery illustrates how processes of care were negotiated between patients and health-care professionals, along with the emotional and physical work that patients did as ‘active’ participants in their recovery. Interviews with patients included discussion around preoperative educational needs, tensions between mobilising and giving themselves time to ‘heal’ after surgery, and challenges post discharge. The study also demonstrates that ‘good care’ remains an aspiration, particularly in the post-discharge period.
The ethnographic study, using observations and interviews of staff involved in delivery of ERAS, demonstrates that successful implementation of ERAS services for hip and knee replacement depends on several aspects, such as the extent to which services have been adapted to meet individual needs, effective communication between staff and planning processes. Doing so provides information to health-care providers on how best to organise and deliver these services in the future. The study may also be of use to clinicians and researchers in helping to understand service delivery for ERAS in other surgeries.
Implications for practice
There is variation in patient outcomes of primary THR and TKR. The determinants of this variation remain unknown and cannot be explained by a hospital treating healthier or fitter patients. In those hospitals with poorer outcomes, there is a need for hospital mangers and clinicians to understand why their outcomes are worse than others and take action to address this.
Reductions in LOS can be achieved without having a negative impact on patient outcomes. ERAS services are valued by both patients and health professionals involved in running these services. Patients valued hip and knee schools, feeling that they helped to prepare them for surgery and provided ‘confidence’ in the care they would receive. Patients emphasised the importance of participating in exercises and working towards their own recovery, engaging in the emotional and physical work required of them as ‘active’ patients. Although we found no observed impact of the national implementation of ERAS on patient outcomes, this probably reflects early adopters and innovators having already introduced ERAS components into their service, with the continuing decline in LOS nationally reflecting additional hospitals introducing ERAS. Exploring the effect of ERAS in individual hospitals, we can see that in sites that are implementing ERAS for the first time (those with a relatively high and stable LOS prior to implementation date), the introduction of ERAS can have an impact, with subsequent trends of reducing LOS. Those hospitals that are still observed to have a high LOS in our current years of registry data would probably see benefit from implementing ERAS principles.
Scope for future work
-
Although national trends towards improved patient outcome are encouraging, there is still substantial variation in outcome between hospital trusts and CCGs, so there is work to be done to understand why these potentially unwarranted variations in patient outcome exist, particularly those with consistently worse outcomes over time.
-
Further research should explore patient experiences of referral from primary to secondary care services, to provide a more comprehensive account of experiences through the care pathway. In addition, future research may also consider GPs’ views and experiences of ERAS, particularly at the points of referral and discharge. This would provide a ‘system-wide’ understanding of the delivery of ERAS.
Acknowledgements
We would like to thank the patients and staff who supported the project by participating in interviews. Your support has been invaluable to this work.
We acknowledge our advisory group members, who have provided us with expert advice and guidance on numerous occasions throughout the project.
The authors thank the patients and staff of all the hospitals in England and Wales who have contributed data to the NJR. We are grateful to the Healthcare Quality Improvement Partnership (HQIP), the NJR Research Subcommittee and staff at the NJR centre for facilitating this work. The authors have conformed to the NJR’s standard protocol for data access and publication. The views expressed represent those of the authors and do not necessarily reflect those of the NJR Steering Committee or the HQIP, which do not vouch for how the information is presented. The HQIP and/or the NJR take no responsibility for the accuracy, currency, reliability and correctness of any data used or referred to in this report, nor for the accuracy, currency, reliability and correctness of links or references to other information sources, and disclaims all warranties in relation to such data, links and references to the maximum extent permitted by legislation.
Contributions of authors
Professor Andrew Judge (https://orcid.org/0000-0003-3015-0432) (Professor of Translational Statistics) led the project.
Professor Andrew Carr (https://orcid.org/0000-0001-5940-1464) (Nuffield Professor of Orthopaedics) provided advice and support for the project.
Professor Andrew Price (https://orcid.org/0000-0002-4258-5866) (Professor of Orthopaedic Surgery) provided advice and support for the project.
Dr Cesar Garriga (https://orcid.org/0000-0001-7073-3611) (Postdoctoral Researcher) conducted statistical analysis for the project.
Professor Cyrus Cooper (https://orcid.org/0000-0003-3510-0709) (Professor of Musculoskeletal Science) provided advice and support for the project.
Professor Daniel Prieto-Alhambra (https://orcid.org/0000-0002-3950-6346) (Professor of Pharmaco- and Device Epidemiology) provided epidemiological advice and support for the project.
Dr Fraser Old (lay patient) provided advice and support for the project.
Professor George Peat (https://orcid.org/0000-0002-9008-0184) (Professor of Clinical Epidemiology) provided advice and support for the project.
Dr Jacqueline Murphy (https://orcid.org/0000-0002-3927-7002) (Researcher) conducted the analysis of economic models.
Dr Jose Leal (https://orcid.org/0000-0001-7870-6730) (University Research Lecturer) conducted the analysis of economic models.
Professor Karen Barker (https://orcid.org/0000-0001-9363-0383) (Professor of Physiotherapy) provided advice and support for the project.
Ms Lydia Underdown (https://orcid.org/0000-0001-9758-197X) (Research Co-ordinator) co-ordinated the study.
Professor Nigel Arden (https://orcid.org/0000-0002-3452-3382) (Professor of Rheumatic Diseases) provided advice and support for the project.
Professor Rachael Gooberman-Hill (https://orcid.org/0000-0003-3353-2882) (Professor of Health and Anthropology) provided advice and guidance for the qualitative research for the study.
Professor Raymond Fitzpatrick (https://orcid.org/0000-0003-0607-0563) (Professor of Public Health and Primary Care) provided advice and support for the project.
Dr Sarah Drew (https://orcid.org/0000-0002-2092-8506) (Qualitative Researcher) conducted the ethnographic research for the study.
Mr Mark G Pritchard (https://orcid.org/0000-0003-1726-8989) (Researcher) conducted the systematic review of cost-effectiveness.
All authors contributed to drafting this report or revising it critically for important intellectual content and have approved the final version. All authors agree to be accountable for all aspects of the work in ensuring that questions related to the accuracy or integrity of any part of the work are appropriately investigated and resolved.
Publications
Posters and presentations
Garriga C, Prats-Uribe A, Price A, Prieto-Alhambra D, Carr A, Arden N, et al. Repercussion of a National Intervention on Patient Outcomes of Primary Knee Arthroplasty to Enhance the Recovery Pathway: 2008–2016 England Trends. World Congress on Osteoporosis, Osteoarthritis and Musculoskeletal Diseases (WCO-IOF-ESCEO), Kraków, 19–22 April 2018. Poster number: P674.
Garriga C, Prats-Uribe A, Price A, Prieto-Alhambra D, Carr A, Arden N, et al. Impact of a National Enhanced Recovery Programme on Patient Outcomes of Primary Total and Unicompartmental Knee Replacement: 2008–2016 England Trends. Osteoarthritis Research Society International (OARSI), Liverpool, 26–29 April 2018. Abstract number: 387. Poster.
Garriga C, Price A, Prieto-Alhambra D, Carr A, Arden N, Leal J, et al. Impact of a National Enhanced Recovery Programme on Patient Outcomes of Primary Hip Replacement: An Interrupted Time Series Analysis from England. 19th European Federation of National Associations of Orthopaedics and Traumatology (EFORT) Congress, Barcelona, 30 May–1 June 2018. Oral. Abstract number: 1614.
Drew S, Judge A, Cohen R, Gooberman-Hill R. Enhanced Recovery After Surgery Implementation in Practice: An Ethnographic Study of Services for Hip and Knee Replacement. British Sociological Association, Medical Sociology Annual Conference, Glasgow, September 2018.
Garriga C, Leal J, Price A, Peat G, Prieto-Alhambra D, Carr A, et al. Geographical Variation in Outcomes of Primary Hip Replacement: Study from the National Joint Registry of England and Wales. World Congress on Osteoporosis, Osteoarthritis and Musculoskeletal Diseases, Paris, 4–7 April 2019. Poster presentation: P376.
Garriga C, Leal J, Price A, Prieto-Alhambra D, Carr A, Rangan A, et al. Geographical Variation in Patient Outcomes of Primary Knee Replacement Across Clinical Commissioning Groups: Study from the National Joint Registry of England, Wales, Ireland and the Isle of Man. Annual European Congress of Rheumatology (EULAR 2019), Madrid, 12–15 June 2019. Oral. Abstract number OP0306.
Articles
Murphy J, Pritchard MG, Cheng LY, Janarthanan R, Leal J. Cost-effectiveness of enhanced recovery in hip and knee replacement: a systematic review protocol. BMJ Open 2018;8:e019740.
Cohen R, Gooberman-Hill R. Staff experiences of enhanced recovery after surgery: systematic review of qualitative studies. BMJ Open 2019;9:e022259.
Drew S, Judge A, Cohen R, Fitzpatrick R, Barker K, Gooberman-Hill R. Enhanced recovery after surgery implementation in practice: an ethnographic study of services for hip and knee replacement. BMJ Open 2019;9:e024431.
Garriga C, Leal J, Sánchez-Santos MT, Arden N, Price A, Prieto-Alhambra D, et al. Geographical variation in outcomes of primary hip and knee replacement. JAMA Netw Open 2019;2:e1914325.
Garriga C, Murphy J, Leal J, Price A, Prieto-Alhambra D, Carr A, et al. Impact of a national enhanced recovery after surgery programme on patient outcomes of primary total knee replacement: an interrupted time series analysis from ‘The National Joint Registry of England,Wales, Northern Ireland and the Isle of Man’. Osteoarthritis Cartilage 2019;27:1280–93.
Garriga C, Murphy J, Leal J, Arden NK, Price A, Prieto-Alhambra D, et al. Assessment on patient outcomes of primary hip replacement: an interrupted time series analysis from ‘The National Joint Registry of England and Wales’. BMJ Open 2019;9:e031599.
Murphy J, Pritchard MG, Cheng LY, Janarthanan R, Judge A, Leal J. Enhanced recovery following hip and knee arthroplasty: a systematic review of cost-effectiveness evidence. BMJ Open 2020; in press.
Data-sharing statement
Anonymised data included in Chapter 4 are included within the report. Data obtained for Chapters 2 and 3 were sought through NHS Digital, the NJR and the CPRD. Please contact the corresponding author for further information and access may be granted following review.
Patient data
This work uses data provided by patients and collected by the NHS as part of their care and support. Using patient data is vital to improve health and care for everyone. There is huge potential to make better use of information from people’s patient records, to understand more about disease, develop new treatments, monitor safety, and plan NHS services. Patient data should be kept safe and secure, to protect everyone’s privacy, and it’s important that there are safeguards to make sure that it is stored and used responsibly. Everyone should be able to find out about how patient data are used. #datasaveslives You can find out more about the background to this citation here: https://understandingpatientdata.org.uk/data-citation.
Disclaimers
This report presents independent research funded by the National Institute for Health Research (NIHR). The views and opinions expressed by authors in this publication are those of the authors and do not necessarily reflect those of the NHS, the NIHR, NETSCC, the HS&DR programme or the Department of Health and Social Care. If there are verbatim quotations included in this publication the views and opinions expressed by the interviewees are those of the interviewees and do not necessarily reflect those of the authors, those of the NHS, the NIHR, NETSCC, the HS&DR programme or the Department of Health and Social Care.
References
- NHS Digital . Hospital Episode Statistics (HES) n.d. https://digital.nhs.uk/data-and-information/data-tools-and-services/data-services/hospital-episode-statistics (accessed 11 December 2019).
- NHS Digital . Patient Reported Outcome Measures (PROMs) n.d. https://digital.nhs.uk/data-and-information/data-tools-and-services/data-services/patient-reported-outcome-measures-proms (accessed 11 December 2019).
- Vos T, Flaxman AD, Naghavi M, Lozano R, Michaud C, Ezzati M, et al. Years lived with disability (YLDs) for 1160 sequelae of 289 diseases and injuries 1990-2010: a systematic analysis for the Global Burden of Disease Study 2010. Lancet 2012;380:2163-96. https://doi.org/10.1016/S0140-6736(12)61729-2.
- National Institute for Health and Care Excellence (NICE) . The Care and Management of Osteoarthritis in Adults. Clinical Guideline 59 2008.
- Chen A, Gupte C, Akhtar K, Smith P, Cobb J. The global economic cost of osteoarthritis: how the UK compares. Arthritis 2012;2012. https://doi.org/10.1155/2012/698709.
- National Joint Registry (NJR) . National Joint Registry for England, Wales, Northern Ireland and the Isle of Man. 15th Annual Report 2018.
- Department of Health and Social Care . Equity and Excellence: Liberating the NHS 2010.
- Great Britain . National Health Service Act 2006 2006.
- Great Britain . Health and Social Care Act 2012 2012.
- Judge A, Welton NJ, Sandhu J, Ben-Shlomo Y. Equity in access to total joint replacement of the hip and knee in England: cross sectional study. BMJ 2010;341. https://doi.org/10.1136/bmj.c4092.
- Cookson R, Laudicella M, Donni PL. Measuring change in health care equity using small-area administrative data – evidence from the English NHS 2001–2008. Soc Sci Med 2012;75:1514-22. https://doi.org/10.1016/j.socscimed.2012.05.033.
- NHS England . The NHS Atlas of Variation in Healthcare. Reducing Unwarranted Variation to Increase Value and Improve Quality 2010.
- Street A, Gutacker N, Bojke C, Devlin N, Daidone S. Variations in outcome and costs among NHS providers for common surgical procedures: econometric analyses of routinely collected data. Health Serv Deliv Res 2014;2. https://doi.org/10.3310/hsdr02010.
- Department of Health and Social Care (DHSC) . NHS Choice Framework 2014.
- Ravi B, Jenkinson R, Austin PC, Croxford R, Wasserstein D, Escott B, et al. Relation between surgeon volume and risk of complications after total hip arthroplasty: propensity score matched cohort study. BMJ 2014;348. https://doi.org/10.1136/bmj.g3284.
- Judge A, Chard J, Learmonth I, Dieppe P. The effects of surgical volumes and training centre status on outcomes following total joint replacement: analysis of the Hospital Episode Statistics for England. J Public Health 2006;28:116-24. https://doi.org/10.1093/pubmed/fdl003.
- Department of Health and Socical Care (DHSC) . Enhanced Recovery Partnership Programme Project Report, March 2011 2011.
- Wilmore DW, Kehlet H. Management of patients in fast track surgery. BMJ 2001;322:473-6. https://doi.org/10.1136/bmj.322.7284.473.
- Campbell M, Fitzpatrick R, Haines A, Kinmonth AL, Sandercock P, Spiegelhalter D, et al. Framework for design and evaluation of complex interventions to improve health. BMJ 2000;321:694-6. https://doi.org/10.1136/bmj.321.7262.694.
- Craig P, Dieppe P, Macintyre S, Michie S, Nazareth I, Petticrew M. Medical Research Council Guidance . Developing and evaluating complex interventions: the new Medical Research Council guidance. BMJ 2008;337. https://doi.org/10.1136/bmj.a1655.
- Starks I, Wainwright TW, Lewis J, Lloyd J, Middleton RG. Older patients have the most to gain from orthopaedic enhanced recovery programmes. Age Ageing 2014;43:642-8. https://doi.org/10.1093/ageing/afu014.
- Paton F, Chambers D, Wilson P, Eastwood A, Craig D, Fox D, et al. Effectiveness and implementation of enhanced recovery after surgery programmes: a rapid evidence synthesis. BMJ Open 2014;4. https://doi.org/10.1136/bmjopen-2014-005015.
- Moore G, Audrey S, Barker M, Bond L, Bonell C, Cooper C, et al. Process evaluation in complex public health intervention studies: the need for guidance. J Epidemiol Community Health 2014;68:101-2. https://doi.org/10.1136/jech-2013-202869.
- Blazeby JM, Soulsby M, Winstone K, King PM, Bulley S, Kennedy RH. A qualitative evaluation of patients’ experiences of an enhanced recovery programme for colorectal cancer. Colorectal Dis 2010;12:e236-42. https://doi.org/10.1111/j.1463-1318.2009.02104.x.
- Taylor C, Burch J. Feedback on an enhanced recovery programme for colorectal surgery. Br J Nurs 2011;20:286-90. https://doi.org/10.12968/bjon.2011.20.5.286.
- Pearsall EA, Meghji Z, Pitzul KB, Aarts MA, McKenzie M, McLeod RS, et al. A qualitative study to understand the barriers and enablers in implementing an enhanced recovery after surgery program. Ann Surg 2015;261:92-6. https://doi.org/10.1097/SLA.0000000000000604.
- Waring J, Marshall F, Bishop S, Sahota O, Walker M, Currie G, et al. An ethnographic study of knowledge sharing across the boundaries between care processes, services and organisations: the contributions to ‘safe’ hospital discharge. Health Serv Deliv Res 2014;2. https://doi.org/10.3310/hsdr02290.
- Dawson J, Doll H, Fitzpatrick R, Jenkinson C, Carr AJ. The routine use of patient reported outcome measures in healthcare settings. BMJ 2010;340. https://doi.org/10.1136/bmj.c186.
- Dolan P. Modeling valuations for EuroQol health states. Med Care 1997;35:1095-108. https://doi.org/10.1097/00005650-199711000-00002.
- Dawson J, Fitzpatrick R, Carr A, Murray D. Questionnaire on the perceptions of patients about total hip replacement. J Bone Joint Surg Br 1996;78:185-90. https://doi.org/10.1302/0301-620X.78B2.0780185.
- Dawson J, Fitzpatrick R, Murray D, Carr A. Questionnaire on the perceptions of patients about total knee replacement. J Bone Joint Surg Br 1998;80:63-9. https://doi.org/10.1302/0301-620X.80B1.0800063.
- Williams T, van Staa T, Puri S, Eaton S. Recent advances in the utility and use of the General Practice Research Database as an example of a UK primary care data resource. Ther Adv Drug Saf 2012;3:89-9. https://doi.org/10.1177/2042098611435911.
- Turk DC, Dworkin RH, Revicki D, Harding G, Burke LB, Cella D, et al. Identifying important outcome domains for chronic pain clinical trials: an IMMPACT survey of people with pain. Pain 2008;137:276-85. https://doi.org/10.1016/j.pain.2007.09.002.
- Gooberman-Hill R, Burston A, Clark E, Johnson E, Nolan S, Wells V, et al. PEP-R . Involving patients in research: considering good practice. Musculoskeletal Care 2013;11:187-90. https://doi.org/10.1002/msc.1060.
- World Health Organization . International Statistical Classification of Diseases and Related Health Problems 2004.
- Department of Health and Social Care (DHSC) . NHS Reference Costs 2015–16 2016.
- Garriga C, Leal J, Sánchez-Santos MT, Arden N, Price A, Prieto-Alhambra D, et al. Geographical variation in outcomes of primary hip and knee replacement. JAMA Netw Open 2019;2. https://doi.org/10.1001/jamanetworkopen.2019.14325.
- Judge A, Welton NJ, Sandhu J, Ben-Shlomo Y. Geographical variation in the provision of elective primary hip and knee replacement: the role of socio-demographic, hospital and distance variables. J Public Health 2009;31:413-22. https://doi.org/10.1093/pubmed/fdp061.
- Beard DJ, Harris K, Dawson J, Doll H, Murray DW, Carr AJ, et al. Meaningful changes for the Oxford hip and knee scores after joint replacement surgery. J Clin Epidemiol 2015;68:73-9. https://doi.org/10.1016/j.jclinepi.2014.08.009.
- Murray DW, Fitzpatrick R, Rogers K, Pandit H, Beard DJ, Carr AJ, et al. The use of the Oxford hip and knee scores. J Bone Joint Surg Br 2007;89:1010-14. https://doi.org/10.1302/0301-620X.89B8.19424.
- Wallace G, Judge A, Prieto-Alhambra D, de Vries F, Arden NK, Cooper C. The effect of body mass index on the risk of post-operative complications during the 6 months following total hip replacement or total knee replacement surgery. Osteoarthritis Cartilage 2014;22:918-27. https://doi.org/10.1016/j.joca.2014.04.013.
- Liddle AD, Judge A, Pandit H, Murray DW. Adverse outcomes after total and unicompartmental knee replacement in 101,330 matched patients: a study of data from the National Joint Registry for England and Wales. Lancet 2014;384:1437-45. https://doi.org/10.1016/S0140-6736(14)60419-0.
- Office for National Statistics . Clinical Commissioning Groups (April 2017) Full Clipped Boundaries in England V4 2019. http://geoportal1-ons.opendata.arcgis.com/datasets/de108fe659f2430d9558c20fe172638f_0 (accessed 19 November 2019).
- MacWilliam CH, Yood MU, Verner JJ, McCarthy BD, Ward RE. Patient-related risk factors that predict poor outcome after total hip replacement. Health Serv Res 1996;31:623-38.
- Fortin PR, Clarke AE, Joseph L, Liang MH, Tanzer M, Ferland D, et al. Outcomes of total hip and knee replacement: preoperative functional status predicts outcomes at six months after surgery. Arthritis Rheum 1999;42:1722-8. https://doi.org/10.1002/1529-0131(199908)42:8<1722::AID-ANR22>3.0.CO;2-R.
- Cushnaghan J, Coggon D, Reading I, Croft P, Byng P, Cox K, et al. Long-term outcome following total hip arthroplasty: a controlled longitudinal study. Arthritis Rheum 2007;57:1375-80. https://doi.org/10.1002/art.23101.
- Judge A, Cooper C, Arden NK, Williams S, Hobbs N, Dixon D, et al. Pre-operative expectation predicts 12-month post-operative outcome among patients undergoing primary total hip replacement in European orthopaedic centres. Osteoarthritis Cartilage 2011;19:659-67. https://doi.org/10.1016/j.joca.2011.03.009.
- Jones CA, Voaklander DC, Johnston DW, Suarez-Almazor ME. The effect of age on pain, function, and quality of life after total hip and knee arthroplasty. Arch Intern Med 2001;161:454-60. https://doi.org/10.1001/archinte.161.3.454.
- Quintana JM, Escobar A, Aguirre U, Lafuente I, Arenaza JC. Predictors of health-related quality-of-life change after total hip arthroplasty. Clin Orthop Relat Res 2009;467:2886-94. https://doi.org/10.1007/s11999-009-0868-9.
- Judge A, Arden NK, Cooper C, Kassim Javaid M, Carr AJ, Field RW, et al. Predictors of outcomes of total knee replacement surgery. Rheumatology (Oxford) 2012;51:1804-13. https://doi.org/10.1093/rheumatology/kes075.
- Judge A, Arden NK, Batra RN, Thomas G, Beard D, Javaid MK, et al. The association of patient characteristics and surgical variables on symptoms of pain and function over 5 years following primary hip-replacement surgery: a prospective cohort study. BMJ Open 2013;3. https://doi.org/10.1136/bmjopen-2012-002453.
- Braeken AM, Lochhaas-Gerlach JA, Gollish JD, Myles JD, Mackenzie TA. Determinants of 6-12 month postoperative functional status and pain after elective total hip replacement. Int J Qual Health Care 1997;9:413-18. https://doi.org/10.1093/intqhc/9.6.413.
- Judge A, Javaid MK, Arden NK, Cushnaghan J, Reading I, Croft P, et al. Clinical tool to identify patients who are most likely to achieve long-term improvement in physical function after total hip arthroplasty. Arthritis Care Res 2012;64:881-9. https://doi.org/10.1002/acr.21594.
- Rissanen P, Aro S, Sintonen H, Slätis P, Paavolainen P. Quality of life and functional ability in hip and knee replacements: a prospective study. Qual Life Res 1996;5:56-64. https://doi.org/10.1007/BF00435969.
- Judge A, Batra RN, Thomas GE, Beard D, Javaid MK, Murray DW, et al. Body mass index is not a clinically meaningful predictor of patient reported outcomes of primary hip replacement surgery: prospective cohort study. Osteoarthritis Cartilage 2014;22:431-9. https://doi.org/10.1016/j.joca.2013.12.018.
- Santaguida PL, Hawker GA, Hudak PL, Glazier R, Mahomed NN, Kreder HJ, et al. Patient characteristics affecting the prognosis of total hip and knee joint arthroplasty: a systematic review. Can J Surg 2008;51:428-36.
- Arden N, Altman D, Beard D, Clarke N, Collins G, Cooper C, et al. Lower limb arthroplasty: can we produce a tool to predict outcome and failure, and is it cost-effective? An epidemiological study. Programme Grants Appl Res 2017;5. https://doi.org/10.3310/pgfar05120.
- Craig P, Cooper C, Gunnell D, Haw S, Lawson K, Macintyre S, et al. Using Natural Experiments to Evaluate Population Health Interventions: Guidance for Producers and Users of Evidence. London: Medical Research Council; 2011.
- Wagner AK, Soumerai SB, Zhang F, Ross-Degnan D. Segmented regression analysis of interrupted time series studies in medication use research. J Clin Pharm Ther 2002;27:299-30. https://doi.org/10.1046/j.1365-2710.2002.00430.x.
- Kontopantelis E, Doran T, Springate DA, Buchan I, Reeves D. Regression based quasi-experimental approach when randomisation is not an option: interrupted time series analysis. BMJ 2015;350. https://doi.org/10.1136/bmj.h2750.
- Kastner M, Sawka A, Thorpe K, Chignel M, Marquez C, Newton D, et al. Evaluation of a clinical decision support tool for osteoporosis disease management: protocol for an interrupted time series design. Implement Sci 2011;6. https://doi.org/10.1186/1748-5908-6-77.
- Ramsay CR, Matowe L, Grilli R, Grimshaw JM, Thomas RE. Interrupted time series designs in health technology assessment: lessons from two systematic reviews of behavior change strategies. Int J Technol Assess Health Care 2003;19:613-23. https://doi.org/10.1017/S0266462303000576.
- Durbin J. Testing for serial correlation in least-squares regression when some of the regressors are lagged dependent variables. Econometrica 1970;38:410-21. https://doi.org/10.2307/1909547.
- Newey WK, West KD. A simple, positive semi-definite, heteroskedasticity and autocorrelation consistent covariance matrix. Econometrica 1987;55:703-8. https://doi.org/10.2307/1913610.
- Garriga C, Murphy J, Leal J, Arden NK, Price A, Prieto-Alhambra D, et al. Assessment on patient outcomes of primary hip replacement: an interrupted time series analysis from ‘The National Joint Registry of England and Wales’. BMJ Open 2019;9. https://doi.org/10.1136/bmjopen-2019-031599.
- Garriga C, Murphy J, Leal J, Price A, Prieto-Alhambra D, Carr A, et al. Impact of a national enhanced recovery after surgery programme on patient outcomes of primary total knee replacement: an interrupted time series analysis from ‘The National Joint Registry of England, Wales, Northern Ireland and the Isle of Man’. Osteoarthritis Cartilage 2019;27:1280-93. https://doi.org/10.1016/j.joca.2019.05.001.
- Department of Health and Social Care (DHSC) . Enhanced Recovery Partnership Programme. Delivering Enhanced Recovery – Helping Patients to Get Better Sooner After Surgery 2010.
- Luchinskaya D, Simpson P, Stoye G. UK Health and Social Care Spending. London: Institute for Fiscal Studies; 2017.
- Culliford D, Maskell J, Judge A, Cooper C, Prieto-Alhambra D, Arden NK. COASt Study Group . Future projections of total hip and knee arthroplasty in the UK: results from the UK Clinical Practice Research Datalink. Osteoarthritis Cartilage 2015;23:594-600. https://doi.org/10.1016/j.joca.2014.12.022.
- Briggs T. Getting It Right First Time. Improving the Quality of Orthopaedic Care Within the National Health Service in England 2012. www.hfma.org.uk/docs/default-source/our-networks/healthcare-costing-for-value-institute/external-resources/getting-it-right-first-time---improving-the-quality-of-orthopaedic-care-within-the-nhs-in-england-(professor-timothy-briggs) (accessed 19 November 2019).
- Kehlet H, Wilmore DW. Evidence-based surgical care and the evolution of fast-track surgery. Ann Surg 2008;248:189-98. https://doi.org/10.1097/SLA.0b013e31817f2c1a.
- National Institute for Health and Care Excellence (NICE) . Total Hip Replacement and Resurfacing Arthroplasty for End-Stage Arthritis of the Hip. Technology Appraisal Guidance TA304 2014.
- Ibrahim MS, Twaij H, Giebaly DE, Nizam I, Haddad FS. Enhanced recovery in total hip replacement: a clinical review. Bone Joint J 2013;95:1587-94. https://doi.org/10.1302/0301-620X.95B12.31303.
- Burn E, Edwards CJ, Murray DW, Silman A, Cooper C, Arden NK, et al. Trends and determinants of length of stay and hospital reimbursement following knee and hip replacement: evidence from linked primary care and NHS hospital records from 1997 to 2014. BMJ Open 2018;8. https://doi.org/10.1136/bmjopen-2017-019146.
- Tayrose G, Newman D, Slover J, Jaffe F, Hunter T, Bosco J. Rapid mobilization decreases length-of-stay in joint replacement patients. Bull Hosp Jt Dis 2013;71:222-6.
- Raphael M, Jaeger M, van Vlymen J. Easily adoptable total joint arthroplasty program allows discharge home in two days. Can J Anaesth 2011;58:902-10. https://doi.org/10.1007/s12630-011-9565-8.
- Khan SK, Malviya A, Muller SD, Carluke I, Partington PF, Emmerson KP, et al. Reduced short-term complications and mortality following enhanced recovery primary hip and knee arthroplasty: results from 6,000 consecutive procedures. Acta Orthop 2014;85:26-31. https://doi.org/10.3109/17453674.2013.874925.
- Malviya A, Martin K, Harper I, Muller SD, Emmerson KP, Partington PF, et al. Enhanced recovery program for hip and knee replacement reduces death rate. Acta Orthop 2011;82:577-81. https://doi.org/10.3109/17453674.2011.618911.
- Larsen K, Sørensen OG, Hansen TB, Thomsen PB, Søballe K. Accelerated perioperative care and rehabilitation intervention for hip and knee replacement is effective: a randomized clinical trial involving 87 patients with 3 months of follow-up. Acta Orthop 2008;79:149-59. https://doi.org/10.1080/17453670710014923.
- Husted H, Lunn TH, Troelsen A, Gaarn-Larsen L, Kristensen BB, Kehlet H. Why still in hospital after fast-track hip and knee arthroplasty?. Acta Orthop 2011;82:679-84. https://doi.org/10.3109/17453674.2011.636682.
- Hebl JR, Dilger JA, Byer DE, Kopp SL, Stevens SR, Pagnano MW, et al. A pre-emptive multimodal pathway featuring peripheral nerve block improves perioperative outcomes after major orthopedic surgery. Reg Anesth Pain Med 2008;33:510-17. https://doi.org/10.1097/00115550-200811000-00002.
- McDonald S, Page MJ, Beringer K, Wasiak J, Sprowson A. Preoperative education for hip or knee replacement. Cochrane Database Syst Rev 2014;5. https://doi.org/10.1002/14651858.CD003526.pub3.
- Greco M, Capretti G, Beretta L, Gemma M, Pecorelli N, Braga M. Enhanced recovery program in colorectal surgery: a meta-analysis of randomized controlled trials. World J Surg 2014;38:1531-41. https://doi.org/10.1007/s00268-013-2416-8.
- Jørgensen CC, Madsbad S, Kehlet H. Lundbeck Foundation Centre for Fast-track Hip and Knee Replacement Collaborative Group . Postoperative morbidity and mortality in type-2 diabetics after fast-track primary total hip and knee arthroplasty. Anesth Analg 2015;120:230-8. https://doi.org/10.1213/ANE.0000000000000451.
- May C. Towards a general theory of implementation. Implement Sci 2013;8. https://doi.org/10.1186/1748-5908-8-18.
- Kauppila AM, Sintonen H, Aronen P, Ohtonen P, Kyllönen E, Arokoski JP. Economic evaluation of multidisciplinary rehabilitation after primary total knee arthroplasty based on a randomized controlled trial. Arthritis Care Res 2011;63:335-41. https://doi.org/10.1002/acr.20398.
- Daigle ME, Weinstein AM, Katz JN, Losina E. The cost-effectiveness of total joint arthroplasty: a systematic review of published literature. Best Pract Res Clin Rheumatol 2012;26:649-58. https://doi.org/10.1016/j.berh.2012.07.013.
- Brockbank J, Wolowacz S. Economic evaluations of new oral anticoagulants for the prevention of venous thromboembolism after total hip or knee replacement: a systematic review. PharmacoEconomics 2017;35:517-35. https://doi.org/10.1007/s40273-017-0486-4.
- Kapoor A, Chuang W, Radhakrishnan N, Smith KJ, Berlowitz D, Segal JB, et al. Cost effectiveness of venous thromboembolism pharmacological prophylaxis in total hip and knee replacement: a systematic review. PharmacoEconomics 2010;28:521-38. https://doi.org/10.2165/11535210-000000000-00000.
- National Institute for Health and Care Excellence (NICE) . Guide to the Methods of Technology Appraisal 2013 2013.
- Evers S, Goossens M, de Vet H, van Tulder M, Ament A. Criteria list for assessment of methodological quality of economic evaluations: Consensus on Health Economic Criteria. Int J Technol Assess Health Care 2005;21:240-5. https://doi.org/10.1017/S0266462305050324.
- Jaime Caro J, Eddy DM, Kan H, Kaltz C, Patel B, Eldessouki R, et al. ISPOR-AMCP-NPC Modeling CER Task Forces . Questionnaire to assess relevance and credibility of modeling studies for informing health care decision making: an ISPOR-AMCP-NPC Good Practice Task Force report. Value Health 2014;17:174-82. https://doi.org/10.1016/j.jval.2014.01.003.
- Vemer P, Corro Ramos I, van Voorn GA, Al MJ, Feenstra TL. AdViSHE: A Validation-Assessment Tool of Health-Economic Models for Decision Makers and Model Users. PharmacoEconomics 2016;34:349-61. https://doi.org/10.1007/s40273-015-0327-2.
- Tavory I, Timmermans S. Abductive Analysis: Theorizing Qualitative Research. Chicago, IL: The University of Chicago Press; 2014.
- Drew S, Judge A, Cohen R, Fitzpatrick R, Barker K, Gooberman-Hill R. Enhanced recovery after surgery implementation in practice: an ethnographic study of services for hip and knee replacement. BMJ Open 2019;9. https://doi.org/10.1136/bmjopen-2018-024431.
- Higgins JP, Altman DG, Gotzsche PC, Juni P, Moher D, Oxman AD, et al. The Cochrane Collaboration’s tool for assessing risk of bias in randomised trials. BMJ 2011;343. https://doi.org/10.1136/bmj.d5928.
- Courville XF, Tomek IM, Kirkland KB, Birhle M, Kantor SR, Finlayson SR. Cost-effectiveness of preoperative nasal mupirocin treatment in preventing surgical site infection in patients undergoing total hip and knee arthroplasty: a cost-effectiveness analysis. Infect Control Hosp Epidemiol 2012;33:152-9. https://doi.org/10.1086/663704.
- Brunenberg DE, van Steyn MJ, Sluimer JC, Bekebrede LL, Bulstra SK, Joore MA. Joint recovery programme versus usual care: an economic evaluation of a clinical pathway for joint replacement surgery. Med Care 2005;43:1018-26. https://doi.org/10.1097/01.mlr.0000178266.75744.35.
- Jackson BR, Umlas J, AuBuchon JP. The cost-effectiveness of postoperative recovery of RBCs in preventing transfusion-associated virus transmission after joint arthroplasty. Transfusion 2000;40:1063-6. https://doi.org/10.1046/j.1537-2995.2000.40091063.x.
- Sonnenberg FA. A health economic analysis of autologous transfusion. Infus Ther Transfus Med 2002;29:175-83. https://doi.org/10.1159/000064238.
- Marques EM, Blom AW, Lenguerrand E, Wylde V, Noble SM. Local anaesthetic wound infiltration in addition to standard anaesthetic regimen in total hip and knee replacement: long-term cost-effectiveness analyses alongside the APEX randomised controlled trials. BMC Med 2015;13. https://doi.org/10.1186/s12916-015-0389-1.
- Graves N, Wloch C, Wilson J, Barnett A, Sutton A, Cooper N, et al. A cost-effectiveness modelling study of strategies to reduce risk of infection following primary hip replacement based on a systematic review. Health Technol Assess 2016;20. https://doi.org/10.3310/hta20540.
- Cummins JS, Tomek IM, Kantor SR, Furnes O, Engesaeter LB, Finlayson SR. Cost-effectiveness of antibiotic-impregnated bone cement used in primary total hip arthroplasty. J Bone Joint Surg Am 2009;91:634-41. https://doi.org/10.2106/JBJS.G.01029.
- Merollini KM, Crawford RW, Whitehouse SL, Graves N. Surgical site infection prevention following total hip arthroplasty in Australia: a cost-effectiveness analysis. Am J Infect Control 2013;41:803-9. https://doi.org/10.1016/j.ajic.2012.11.015.
- Fusco F, Turchetti G. Telerehabilitation after total knee replacement in Italy: cost-effectiveness and cost-utility analysis of a mixed telerehabilitation-standard rehabilitation programme compared with usual care. BMJ Open 2016;6. https://doi.org/10.1136/bmjopen-2015-009964.
- Bolz KM, Crawford RW, Donnelly B, Whitehouse SL, Graves N. The cost-effectiveness of routine follow-up after primary total hip arthroplasty. J Arthroplasty 2010;25:191-6. https://doi.org/10.1016/j.arth.2008.12.009.
- Kauppila AM, Kyllönen E, Ohtonen P, Hämäläinen M, Mikkonen P, Laine V, et al. Multidisciplinary rehabilitation after primary total knee arthroplasty: a randomized controlled study of its effects on functional capacity and quality of life. Clin Rehabil 2010;24:398-411. https://doi.org/10.1177/0269215509346089.
- Nwachukwu BU, Bozic KJ, Schairer WW, Bernstein JL, Jevsevar DS, Marx RG, et al. Current status of cost utility analyses in total joint arthroplasty: a systematic review. Clin Orthop Relat Res 2015;473:1815-27. https://doi.org/10.1007/s11999-014-3964-4.
- Larsen K, Hansen TB, Thomsen PB, Christiansen T, Søballe K. Cost-effectiveness of accelerated perioperative care and rehabilitation after total hip and knee arthroplasty. J Bone Joint Surg Am 2009;91:761-72. https://doi.org/10.2106/JBJS.G.01472.
- McLawhorn AS, Southren D, Wang YC, Marx RG, Dodwell ER. Cost-effectiveness of bariatric surgery prior to total knee arthroplasty in the morbidly obese: a computer model-based evaluation. J Bone Joint Surg Am 2016;98. https://doi.org/10.2106/JBJS.N.00416.
- Briggs A, Sculpher M, Britton A, Murray D, Fitzpatrick R. The costs and benefits of primary total hip replacement. How likely are new prostheses to be cost-effective?. Int J Technol Assess Health Care 1998;14:743-61. https://doi.org/10.1017/S0266462300012058.
- Birkmeyer JD, Goodnough LT, AuBuchon JP, Noordsij PG, Littenberg B. The cost-effectiveness of preoperative autologous blood donation for total hip and knee replacement. Transfusion 1993;33:544-51. https://doi.org/10.1046/j.1537-2995.1993.33793325048.x.
- Sonnenberg FA, Gregory P, Yomtovian R, Russell LB, Tierney W, Kosmin M, et al. The cost-effectiveness of autologous transfusion revisited: implications of an increased risk of bacterial infection with allogeneic transfusion. Transfusion 1999;39:808-17. https://doi.org/10.1046/j.1537-2995.1999.39080808.x.
- Department of Health and Social Care (DHSC) . NHS Reference Costs 2016–17 2016.
- Leal J, Manetti S, Buchanan J. The impact of hospital costing methods on cost-effectiveness analysis: a case study. PharmacoEconomics 2018;36:1263-72. https://doi.org/10.1007/s40273-018-0673-y.
- Curtis L, Burns A. Unit Costs of Health and Social Care 2017. Canterbury: PSSRU, University of Kent; 2017.
- NHS Digital . Prescription Cost Analysis. England 2017 2018. https://digital.nhs.uk/data-and-information/publications/statistical/prescription-cost-analysis/prescription-cost-analysis-england-2017 (accessed 1 May 2018).
- Lin DY, Feuer EJ, Etzioni R, Wax Y. Estimating medical costs from incomplete follow-up data. Biometrics 1997;53:419-34. https://doi.org/10.2307/2533947.
- Stowers MD, Lemanu DP, Hill AG. Health economics in enhanced recovery after surgery programs. Canadian J Anaesth 2015;62:219-30. https://doi.org/10.1007/s12630-014-0272-0.
- Lemanu DP, Singh PP, Stowers MD, Hill AG. A systematic review to assess cost effectiveness of enhanced recovery after surgery programmes in colorectal surgery. Colorectal Dis 2014;16:338-46. https://doi.org/10.1111/codi.12505.
- Lee L, Li C, Landry T, Latimer E, Carli F, Fried GM, et al. A systematic review of economic evaluations of enhanced recovery pathways for colorectal surgery. Ann Surg 2014;259:670-6. https://doi.org/10.1097/SLA.0b013e318295fef8.
- Eibich P, Dakin HA, Price AJ, Beard D, Arden NK, Gray AM. Associations between preoperative Oxford hip and knee scores and costs and quality of life of patients undergoing primary total joint replacement in the NHS England: an observational study. BMJ Open 2018;8. https://doi.org/10.1136/bmjopen-2017-019477.
- Jaime Caro J, Eddy DM, Kan H, Kaltz C, Patel B, Eldessouki R, et al. ISPOR-AMCP-NPC Modeling CER Task Forces . Questionnaire to assess relevance and credibility of modeling studies for informing health care decision making: an ISPOR-AMCP-NPC Good Practice Task Force report. Value Health 2014;17:174-82. https://doi.org/10.1016/j.jval.2014.01.003.
- Köksal İ, Tahta M, Şimşek ME, Doğan M, Bozkurt M. Efficacy of rapid recovery protocol for total knee arthroplasty: a retrospective study. Acta Orthop Traumatol Turc 2015;49:382-6. https://doi.org/10.3944/AOTT.2015.14.0353.
Appendix 1 Additional tables and figures
| Variable | Model | |
|---|---|---|
| Hip replacements (N = 173,107) | TKRs/UKRs (N = 210,725) | |
| Patient factors | ||
| Calendar year, n (%) | ||
| 2014 | 57,156 (33.0) | 69,001 (32.7) |
| 2015 | 57,535 (33.2) | 69,999 (33.2) |
| 2016 | 58,416 (33.8) | 71,725 (34.0) |
| Age (years), n (%) | ||
| < 50 | 7907 (4.6) | 4180 (2.0) |
| 50–59 | 22,887 (13.2) | 26,789 (12.7) |
| 60–69 | 51,097 (29.5) | 68,970 (32.7) |
| 70–79 | 61,994 (35.8) | 79,241 (37.6) |
| 80–84 | 19,426 (11.2) | 21,753 (10.3) |
| ≥ 85 | 9,796 (5.7) | 9,792 (4.7) |
| Women, n (%) | 103,860 (60.0) | 119,436 (56.7) |
| BMI (kg/m2), mean (SD) | 28.9 (5.2) | 31.1 (5.5) |
| Preoperative ASA physical function score, n (%) | ||
| Fit and healthy (grade 1) | 22,195 (12.8) | 18,909 (9.0) |
| Mild disease not incapacitating (grade 2) | 121,255 (70.1) | 155,093 (73.6) |
| Incapacitating systemic disease (grade 3) | 28,945 (16.7) | 36,171 (17.2) |
| Life-threatening disease or expected to die within 24 hours (grades 4 and 5) | 712 (0.4) | 552 (0.3) |
| IMD (quintile groupings), n (%) | ||
| Least deprived (20%) | 42,058 (24.3) | 46,435 (22.0) |
| Former less deprived (20–40%) | 43,001 (24.8) | 49,019 (23.3) |
| Current less deprived (40–60%) | 31,200 (18.0) | 40,216 (19.1) |
| More deprived (20–40%) | 29,289 (16.9) | 38,292 (18.2) |
| Most deprived (20%) | 27,559 (15.9) | 36,763 (17.5) |
| Rural/urban indicator, n (%) | ||
| Urban (≥ 10,000) | 123,862 (71.6) | 157,758 (74.9) |
| Town and fringe | 22,223 (12.8) | 25,083 (11.9) |
| Village/isolated | 27,022 (15.6) | 27,884 (13.2) |
| Primary indication, n (%) | ||
| Osteoarthritis | 167,686 (96.9) | 208,333 (98.9) |
| Osteoarthritis and other | 5421 (3.1) | 2392 (1.1) |
| Charlson Comorbidity Index score, n (%) | ||
| 0 (no comorbidity) | 122,047 (70.5) | 140,711 (66.8) |
| 1 (mild comorbidity) | 32,926 (19.0) | 46,984 (22.3) |
| 2 (moderate comorbidity) | 11,870 (6.9) | 15,341 (7.3) |
| ≥ 3 (severe comorbidity) | 6264 (3.6) | 7689 (3.7) |
| Baseline OHS/OKS, median (IQR) | 17 (11–23) | 18 (12–23) |
| EQ-5D-3L (quintile groupings), n (%) | ||
| Lowest quintile | 21,265 (12.3) | 40,798 (19.4) |
| Second quintile | 47,303 (27.3) | 29,601 (14.1) |
| Third quintile | 35,237 (20.4) | 54,583 (25.9) |
| Fourth quintile | 32,083 (18.5) | 20,352 (9.7) |
| Highest quintile | 37,219 (21.5) | 65,391 (31.0) |
| Surgical factors | ||
| Lead surgeon experience, n (%) | ||
| Consultant | 143,417 (82.9) | 172,183 (81.7) |
| Other | 29,690 (17.2) | 38,542 (18.3) |
| Surgical volume per lead surgeon (surgeries per year), n (%) | ||
| ≤ 10 | 3013 (1.4) | 3109 (1.8) |
| 11–50 | 45,279 (21.5) | 37,816 (21.9) |
| 51–75 | 41,610 (19.8) | 30,651 (17.7) |
| 76–100 | 38,898 (18.5) | 30,979 (17.9) |
| 101–150 | 45,056 (21.4) | 36,610 (21.2) |
| > 150 | 36,869 (17.5) | 33,942 (19.6) |
| Surgical volume per unit (surgeries per year), n (%) | ||
| ≤ 200 | 45,319 (26.2) | 31,321 (14.9) |
| 200–299 | 47,040 (27.2) | 51,335 (24.4) |
| 300–399 | 37,984 (21.9) | 50,346 (23.9) |
| 400–499 | 10,159 (5.9) | 32,782 (15.6) |
| ≥ 500 | 32,605 (18.8) | 44,941 (21.3) |
| Minimally invasive surgery, n (%) | 7076 (4.1) | 9332 (4.4) |
| Thromboprophylaxis, n (%) | ||
| None | 1598 (0.9) | 2049 (1.0) |
| Aspirin only | 5219 (3.0) | 7111 (3.4) |
| LMWH (± other) | 109,443 (63.2) | 152,836 (72.5) |
| Other (no LMWH) | 56,847 (32.8) | 48,729 (23.1) |
| Mechanical prophylaxis | 167,638 (96.8) | 204,642 (97.1) |
| Anaesthetic type, n (%) | ||
| General | 56,951 (32.9) | 62,447 (29.6) |
| Regional: epidural | 5230 (3.0) | 6841 (3.3) |
| Regional: nerve block | 8824 (5.1) | 21,619 (10.3) |
| Regional: spinal (intrathecal) | 131,627 (76.0) | 157,123 (74.6) |
| Type of approach, n (%) | ||
| Anterior, anterolateral, Hardinge, lateral, trochanteric osteotomy, other | 55,100 (31.8) | |
| Posterior | 118,007 (68.2) | |
| Lateral parapatellar | 1907 (0.9) | |
| Medial parapatellar | 197,718 (93.8) | |
| Mid-vastus | 5942 (2.8) | |
| Subvastus | 2302 (1.1) | |
| Other approaches in knee surgery | 2856 (1.4) | |
| Bone grafts, n (%) | ||
| Femoral | 921 (0.5) | 2225 (1.1) |
| Cup | 5669 (3.3) | |
| Tibia | 705 (0.3) | |
| Primary cup fixation, n (%) | ||
| Cementless cup | 110,862 (64.4) | |
| Cemented cup | 61,415 (35.7) | |
| Type of primary stem fixation, n (%) | ||
| Cementless THR stem | 72,509 (42.4) | |
| Cemented THR stem | 98,607 (57.6) | |
| Primary femoral fixation, n (%) | ||
| Cementless | 9461 (4.5) | |
| Cemented | 200,741 (95.5) | |
| Tibial fixation, n (%) | ||
| Cementless | 8855 (4.2) | |
| Cemented | 201,226 (95.8) | |
| Bearing surface (type of hip implant), n (%) | ||
| MoM | 991 (0.6) | |
| MoP | 106,548 (62.1) | |
| CoC | 20,821 (12.1) | |
| CoP | 43,138 (25.2) | |
| CoM or MoC or unknown | 23 (< 0.1) | |
| Femoral head size (mm) (type of hip implant), n (%) | ||
| ≤ 28 | 55,652 (32.4) | |
| 32 | 75,536 (44.0) | |
| 36–42 | 39,556 (23.0) | |
| ≥ 44 | 1141 (0.7) | |
| Type of knee implant, n (%) | ||
| Bicondylar | 16,409 (7.8) | |
| Unicondylar or hinged or linked or custom or preassembled | 194,201 (92.2) | |
| Hospital organisation factors | ||
| Unit type, n (%) | ||
| Public hospital | 123,481 (71.3) | 148,758 (70.6) |
| Independent sector: hospital | 40,842 (23.6) | 50,739 (24.1) |
| Independent sector: treatment centre | 8784 (5.1) | 11,228 (5.3) |
| FTE of specialty groups on trauma and orthopaedic surgery, n (%) | ||
| 0–24 | 20,558 (11.9) | 63,415 (30.1) |
| 25–29 | 17,541 (10.1) | 29,416 (14.0) |
| 30–39 | 32,725 (18.9) | 47,334 (22.5) |
| 40–49 | 32,528 (18.8) | 28,572 (13.6) |
| ≥ 50 | 69,755 (40.3) | 41,988 (19.9) |
| Consultant FTE, n (%) | ||
| 0–24 | 40,108 (23.2) | 92,154 (43.7) |
| 25–29 | 15,788 (9.1) | 21,437 (10.2) |
| 30–39 | 32,530 (18.8) | 33,396 (15.9) |
| 40–49 | 23,966 (13.8) | 25,209 (12.0) |
| ≥ 50 | 60,715 (35.1) | 38,529 (18.3) |
| Middle-grade doctor FTE, n (%) | ||
| 0–24 | 97,397 (56.3) | 151,270 (71.8) |
| 25–29 | 18,900 (10.9) | 17,590 (8.4) |
| 30–39 | 21,667 (12.5) | 19,425 (9.2) |
| 40–49 | 14,362 (8.3) | 9,306 (4.4) |
| ≥ 50 | 20,781 (12.0) | 13,134 (6.2) |
| Early-career doctor FTE, n (%) | ||
| 0–24 | 168,646 (97.4) | 208,405 (98.9) |
| 25–29 | 3757 (2.2) | 2055 (1.0) |
| 30–39 | 704 (0.4) | 265 (0.1) |
| 40–49 | 0 (0.0) | 0 (0.0) |
| ≥ 50 | 0 (0.0) | 0 (0.0) |
| Total beds available overnight, n (%) | ||
| 0–349 | 15,186 (8.8) | 41,447 (19.7) |
| 350–499 | 18,469 (10.7) | 40,887 (19.4) |
| 500–699 | 34,541 (20.0) | 51,403 (24.4) |
| 700–999 | 51,891 (30.0) | 41,415 (19.7) |
| ≥ 1000 | 53,020 (30.6) | 35,573 (16.9) |
| Total beds available overnight for trauma and orthopaedic surgery, n (%) | ||
| 0–34 | 15,873 (9.2) | 59,732 (28.4) |
| 35–49 | 26,118 (15.1) | 46,946 (22.3) |
| 50–69 | 47,209 (27.3) | 53,577 (25.4) |
| 70–99 | 52,178 (30.1) | 32,574 (15.5) |
| ≥ 100 | 31,729 (18.3) | 17,896 (8.5) |
| Total beds available overnight for rehabilitation, n (%) | ||
| 0 | 74,465 (57.8) | 59,793 (54.5) |
| > 0–10 | 9605 (7.5) | 8695 (7.9) |
| 11–20 | 16,923 (13.1) | 15,651 (14.3) |
| ≥ 20 | 27,754 (21.6) | 25,655 (23.4) |
| Operating theatres, n (%) | ||
| < 10 | 11,278 (6.5) | 53,927 (25.6) |
| 10–14 | 26,830 (15.5) | 45,205 (21.5) |
| 15–19 | 38,320 (22.1) | 42,661 (20.2) |
| 20–24 | 27,414 (15.8) | 22,226 (10.6) |
| ≥ 25 | 69,265 (40.0) | 46,706 (22.2) |
| Dedicated day-case operating theatres, n (%) | ||
| 0 | 24,951 (14.4) | 39,251 (18.6) |
| 1–2 | 32,531 (18.8) | 51,685 (24.5) |
| 3–4 | 37,891 (21.9) | 47,745 (22.7) |
| 5–6 | 42,126 (24.3) | 27,857 (13.2) |
| ≥ 7 | 35,608 (20.6) | 44,187 (21.0) |
| Category | Patient model | Surgical model | Hospital organisation model | ||||||
|---|---|---|---|---|---|---|---|---|---|
| Coefficient | 95% CI | p-value | Coefficient | 95% CI | p-value | Coefficient | 95% CI | p-value | |
| Intercept | 1.16 | 1.13 to 1.20 | < 0.01 | 1.17 | 1.14 to 1.21 | < 0.01 | 1.13 | 1.09 to 1.17 | < 0.01 |
| Patient factors | |||||||||
| Calendar year (reference: 2014) | |||||||||
| 2015 | 0.09 | 0.08 to 0.09 | < 0.01 | 0.08 | 0.07 to 0.08 | < 0.01 | 0.07 | 0.06 to 0.07 | < 0.01 |
| 2016 | 0.05 | 0.04 to 0.05 | < 0.01 | 0.04 | 0.03 to 0.04 | < 0.01 | 0.03 | 0.03 to 0.04 | < 0.01 |
| Age (years) (reference: < 50 years) | |||||||||
| 50–59 | 0.01 | < 0.01 to 0.03 | 0.12 | 0.01 | –0.01 to 0.02 | 0.29 | 0.02 | 0.01 to 0.04 | < 0.01 |
| 60–69 | 0.06 | 0.05 to 0.07 | < 0.01 | 0.05 | 0.03 to 0.06 | < 0.01 | 0.07 | 0.05 to 0.08 | < 0.01 |
| 70–79 | 0.20 | 0.19 to 0.22 | < 0.01 | 0.17 | 0.16 to 0.19 | < 0.01 | 0.19 | 0.18 to 0.21 | < 0.01 |
| 80–84 | 0.42 | 0.41 to 0.44 | < 0.01 | 0.38 | 0.37 to 0.40 | < 0.01 | 0.39 | 0.38 to 0.41 | < 0.01 |
| ≥ 85 | 0.63 | 0.61 to 0.64 | < 0.01 | 0.59 | 0.57 to 0.60 | < 0.01 | 0.59 | 0.57 to 0.61 | < 0.01 |
| Sex (reference: female) | |||||||||
| Male | –0.09 | –0.09 to –0.08 | < 0.01 | –0.09 | –0.09 to –0.08 | < 0.01 | –0.09 | –0.10 to –0.08 | < 0.01 |
| BMI (kg/m2) | < 0.01 | < 0.01 to < 0.01 | < 0.01 | < 0.01 | < 0.01 to < 0.01 | < 0.01 | < 0.01 | < 0.01 to < 0.01 | < 0.01 |
| Preoperative ASA physical function score (reference: mild disease not incapacitating, grade 2) | |||||||||
| Fit and healthy (grade 1) | –0.06 | –0.07 to –0.05 | < 0.01 | –0.05 | –0.06 to –0.05 | < 0.01 | –0.05 | –0.06 to –0.04 | < 0.01 |
| Incapacitating systemic disease (grade 3) | 0.22 | 0.21 to 0.22 | < 0.01 | 0.20 | 0.20 to 0.21 | < 0.01 | 0.17 | 0.17 to 0.18 | < 0.01 |
| Life-threatening disease or expected to die within 24 hours (grades 4 and 5) | 0.43 | 0.40 to 0.46 | < 0.01 | 0.41 | 0.38 to 0.44 | < 0.01 | 0.36 | 0.33 to 0.39 | < 0.01 |
| IMD (reference: most deprived 20%) | |||||||||
| Least deprived (20%) | –0.04 | –0.05 to –0.03 | < 0.01 | –0.03 | –0.05 to –0.02 | < 0.01 | –0.02 | –0.04 to –0.01 | < 0.01 |
| Former less deprived (20–40%) | –0.03 | –0.04 to –0.02 | < 0.01 | –0.03 | –0.04 to –0.01 | < 0.01 | –0.02 | –0.03 to –0.01 | < 0.01 |
| Current less deprived (40–60%) | –0.02 | –0.03 to –0.01 | < 0.01 | –0.02 | –0.03 to –0.01 | < 0.01 | –0.02 | –0.03 to –0.01 | < 0.01 |
| More deprived (20–40%) | –0.01 | –0.02 to < 0.01 | 0.07 | –0.01 | –0.02 to < 0.01 | 0.06 | –0.01 | –0.02 to < 0.01 | 0.11 |
| Rural/urban indicator (reference: urban ≥ 10,000 habitants) | |||||||||
| Town and fringe | –0.01 | –0.02 to < 0.01 | 0.08 | –0.01 | –0.02 to < 0.01 | 0.14 | < 0.01 | –0.02 to 0.01 | 0.44 |
| Village/isolated | –0.02 | –0.03 to –0.01 | < 0.01 | –0.02 | –0.03 to –0.01 | < 0.01 | –0.01 | –0.02 to < 0.01 | 0.04 |
| Primary indication (reference: osteoarthritis) | |||||||||
| Osteoarthritis and other | 0.18 | 0.17 to 0.20 | < 0.01 | 0.17 | 0.16 to 0.19 | < 0.01 | 0.14 | 0.13 to 0.15 | < 0.01 |
| Charlson score (reference: none, 0) | |||||||||
| Mild (1) | 0.08 | 0.07 to 0.08 | < 0.01 | 0.08 | 0.07 to 0.08 | < 0.01 | 0.07 | 0.06 to 0.07 | < 0.01 |
| Moderate (2) | 0.19 | 0.18 to 0.19 | < 0.01 | 0.18 | 0.17 to 0.19 | < 0.01 | 0.16 | 0.15 to 0.17 | < 0.01 |
| Severe (≥ 3) | 0.34 | 0.33 to 0.35 | < 0.01 | 0.33 | 0.32 to 0.34 | < 0.01 | 0.30 | 0.29 to 0.32 | < 0.01 |
| EQ-5D-3L (reference: highest quintile) | |||||||||
| Lowest quintile | –0.13 | –0.14 to –0.12 | < 0.01 | –0.13 | –0.14 to –0.12 | < 0.01 | –0.12 | –0.13 to –0.12 | < 0.01 |
| Second quintile | –0.17 | –0.18 to –0.16 | < 0.01 | –0.16 | –0.17 to –0.16 | < 0.01 | –0.16 | –0.17 to –0.15 | < 0.01 |
| Third quintile | –0.20 | –0.21 to –0.19 | < 0.01 | –0.19 | 0.20 to –0.18 | < 0.01 | –0.18 | –0.19 to –0.17 | < 0.01 |
| Fourth quintile | –0.24 | –0.25 to –0.23 | < 0.01 | –0.23 | –0.24 to –0.22 | < 0.01 | –0.22 | –0.23 to –0.21 | < 0.01 |
| Surgical factors | |||||||||
| Lead surgeon experience (reference: consultant) | |||||||||
| Other | 0.09 | 0.08 to 0.10 | < 0.01 | 0.02 | 0.01 to 0.03 | < 0.01 | |||
| Surgical volume per lead surgeon (reference: > 150 surgeries per year) | |||||||||
| ≤ 10 | 0.11 | 0.09 to 0.13 | < 0.01 | 0.04 | 0.03 to 0.06 | < 0.01 | |||
| 11–50 | 0.08 | 0.07 to 0.09 | < 0.01 | 0.02 | 0.02 to 0.03 | < 0.01 | |||
| 51–75 | 0.05 | 0.04 to 0.06 | < 0.01 | 0.01 | < 0.01 to 0.02 | 0.01 | |||
| 76–100 | 0.03 | 0.02 to 0.04 | < 0.01 | < 0.01 | –0.01 to 0.01 | 0.96 | |||
| 101–150 | 0.03 | 0.02 to 0.04 | < 0.01 | 0.01 | < 0.01 to 0.02 | 0.08 | |||
| Surgical volume per unit (reference: surgeries per year, ≥ 500) | |||||||||
| ≤ 200 | 0.05 | 0.04 to 0.06 | < 0.01 | 0.14 | 0.13 to 0.15 | < 0.01 | |||
| 200–299 | < 0.01 | –0.01 to 0.01 | 0.56 | 0.06 | 0.05 to 0.07 | < 0.01 | |||
| 300–399 | –0.04 | –0.06 to –0.03 | < 0.01 | 0.01 | < 0.01 to 0.03 | 0.02 | |||
| 400–499 | –0.04 | –0.06 to –0.03 | < 0.01 | 0.05 | 0.04 to 0.07 | < 0.01 | |||
| Minimally invasive surgery (reference: no) | |||||||||
| Yes | –0.05 | –0.07 to –0.04 | < 0.01 | –0.03 | –0.05 to –0.02 | < 0.01 | |||
| Thromboprophylaxis (reference: LMWH ± other) | |||||||||
| None | < 0.01 | –0.02 to 0.03 | 0.91 | 0.03 | < 0.01 to 0.05 | 0.04 | |||
| Aspirin only | –0.03 | –0.05 to –0.02 | < 0.01 | –0.02 | –0.04 to –0.01 | 0.01 | |||
| Other (no LMWH) | –0.02 | –0.03 to –0.02 | < 0.01 | < 0.01 | < 0.01 to 0.01 | 0.42 | |||
| Mechanical prophylaxis (reference: any) | |||||||||
| None | 0.08 | 0.06 to 0.09 | < 0.01 | 0.03 | 0.01 to 0.04 | < 0.01 | |||
| General anaesthesia (reference: no) | |||||||||
| Yes | 0.04 | 0.03 to 0.05 | < 0.01 | 0.04 | 0.03 to 0.04 | < 0.01 | |||
| Regional: epidural anaesthesia (reference: no) | |||||||||
| Yes | |||||||||
| Regional: nerve block anaesthesia (reference: no) | |||||||||
| Yes | 0.05 | 0.04 to 0.06 | < 0.01 | 0.04 | 0.03 to 0.05 | < 0.01 | |||
| Regional: spinal anaesthesia (reference: no) | |||||||||
| Yes | –0.03 | –0.04 to –0.03 | < 0.01 | –0.03 | –0.04 to –0.02 | < 0.01 | |||
| Type of approach (reference: posterior) | |||||||||
| Anterior, anterolateral, Hardinge, lateral, trochanteric osteotomy, other | 0.06 | 0.05 to 0.07 | < 0.01 | 0.06 | 0.06 to 0.07 | < 0.01 | |||
| Femoral bone graft (reference: no) | |||||||||
| Yes | 0.06 | 0.03 to 0.10 | < 0.01 | 0.06 | 0.03 to 0.10 | < 0.01 | |||
| Cup bone graft (reference: no) | |||||||||
| Yes | 0.07 | 0.06 to 0.08 | 0.68 | 0.05 | 0.04 to 0.07 | < 0.01 | |||
| Primary cup fixation (reference: cementless) | |||||||||
| Cemented | –0.01 | –0.02 to –0.01 | < 0.01 | –0.01 | –0.02 to < 0.01 | < 0.01 | |||
| Type of primary stem fixation (reference: cemented THR stem) | |||||||||
| Not available or resurfacing | 0.01 | –0.03 to 0.04 | 0.89 | 0.03 | –0.01 to 0.06 | 0.13 | |||
| Cementless THR stem | –0.07 | –0.08 to –0.07 | 1.00 | –0.04 | –0.05 to –0.04 | < 0.01 | |||
| Bearing surface (reference: MoP) | |||||||||
| MoM | –0.01 | –0.10 to 0.09 | < 0.01 | –0.07 | –0.17 to 0.02 | 0.14 | |||
| CoC | < 0.01 | –0.01 to 0.01 | < 0.01 | –0.03 | –0.04 to –0.02 | < 0.01 | |||
| CoP | –0.02 | –0.03 to –0.01 | 0.84 | –0.04 | –0.04 to –0.03 | < 0.01 | |||
| CoM or MoC or unknown | 0.10 | 0.08 to 0.13 | < 0.01 | 0.08 | 0.06 to 0.10 | < 0.01 | |||
| Femoral head size (mm) (reference: ≤ 28 mm) | |||||||||
| 32 | < 0.01 | –0.01 to 0.01 | 0.51 | –0.01 | –0.01 to < 0.01 | 0.10 | |||
| 36–42 | 0.03 | 0.02 to 0.04 | < 0.01 | 0.02 | 0.01 to 0.03 | < 0.01 | |||
| ≥ 44 | –0.03 | –0.11 to 0.06 | < 0.01 | –0.04 | –0.12 to 0.05 | 0.37 | |||
| Hospital organisation factors | |||||||||
| Unit type (reference: public hospital) | |||||||||
| Independent sector: hospital | –0.22 | –0.23 to –0.21 | < 0.01 | ||||||
| Independent sector: treatment centre | –0.40 | –0.41 to –0.38 | < 0.01 | ||||||
| FTE of specialty groups on trauma and orthopaedic surgery (reference: 0–24 FTEs) | |||||||||
| 25–29 | 0.01 | –0.01 to 0.02 | 0.40 | ||||||
| 30–39 | 0.03 | 0.02 to 0.04 | < 0.01 | ||||||
| 40–49 | 0.03 | 0.01 to 0.04 | < 0.01 | ||||||
| > 50 | 0.04 | 0.03 to 0.05 | < 0.01 | ||||||
| Consultant FTE (reference: 0–24 FTEs) | |||||||||
| 25–29 | 0.03 | 0.02 to 0.04 | < 0.01 | ||||||
| 30–39 | 0.04 | 0.03 to 0.05 | < 0.01 | ||||||
| 40–49 | 0.03 | 0.01 to 0.04 | < 0.01 | ||||||
| > 50 | 0.04 | 0.02 to 0.06 | < 0.01 | ||||||
| Middle-grade doctor FTE (reference: 0–24 FTEs) | |||||||||
| 25–29 | 0.01 | < 0.01 to 0.02 | 0.15 | ||||||
| 30–39 | < 0.01 | –0.01 to 0.01 | 0.77 | ||||||
| 40–49 | 0.01 | < 0.01 to 0.02 | 0.10 | ||||||
| > 50 | 0.04 | 0.03 to 0.05 | < 0.01 | ||||||
| Early-career doctor FTE (reference: 0–24 FTEs) | |||||||||
| 25–29 | –0.01 | –0.03 to 0.01 | 0.39 | ||||||
| 30–39 | –0.05 | –0.09 to –0.01 | 0.01 | ||||||
| Total beds available overnight (reference: 0–349) | |||||||||
| 350–499 | –0.04 | –0.05 to –0.02 | < 0.01 | ||||||
| 500–699 | –0.03 | –0.04 to –0.01 | < 0.01 | ||||||
| 700–999 | –0.05 | –0.06 to –0.03 | < 0.01 | ||||||
| ≥ 1000 | –0.09 | –0.11 to –0.07 | < 0.01 | ||||||
| Total beds available overnight for trauma and orthopaedic surgery (reference: 0–34) | |||||||||
| 35–49 | 0.02 | 0.01 to 0.03 | < 0.01 | ||||||
| 50–69 | 0.06 | 0.05 to 0.07 | < 0.01 | ||||||
| 70–99 | 0.11 | 0.09 to 0.12 | < 0.01 | ||||||
| ≥ 100 | 0.16 | 0.14 to 0.17 | < 0.01 | ||||||
| Total beds available overnight for rehabilitation (reference: 0) | |||||||||
| > 0–10 | 0.01 | –0.01 to 0.02 | 0.38 | ||||||
| 11–20 | 0.01 | < 0.01 to 0.03 | 0.02 | ||||||
| ≥ 20 | 0.07 | 0.06 to 0.08 | < 0.01 | ||||||
| Operating theatres (reference: < 10) | |||||||||
| 10–14 | 0.01 | –0.01 to 0.02 | 0.27 | ||||||
| 15–19 | –0.02 | –0.04 to < 0.01 | 0.01 | ||||||
| 20–24 | –0.09 | –0.11 to –0.07 | < 0.01 | ||||||
| ≥ 25 | –0.06 | –0.08 to –0.04 | < 0.01 | ||||||
| Dedicated day-case operating theatres (reference: ≥ 7) | |||||||||
| 0 | 0.09 | 0.08 to 0.10 | < 0.01 | ||||||
| 1–2 | 0.06 | 0.05 to 0.07 | < 0.01 | ||||||
| 3–4 | 0.07 | 0.06 to 0.08 | < 0.01 | ||||||
| 5–6 | 0.04 | 0.03 to 0.05 | < 0.01 | ||||||
| Category | Patient model | Surgical model | Hospital organisation model | ||||||
|---|---|---|---|---|---|---|---|---|---|
| Coefficient | 95% CI | p-value | Coefficient | 95% CI | p-value | Coefficient | 95% CI | p-value | |
| Intercept | 1.08 | 1.05 to 1.12 | < 0.01 | 1.09 | 1.05 to 1.13 | < 0.01 | 1.26 | 1.22 to 1.30 | < 0.01 |
| Patient factors | |||||||||
| Calendar year (reference: 2016) | |||||||||
| 2015 | 0.08 | 0.08 to 0.09 | < 0.01 | 0.08 | 0.07 to 0.08 | < 0.01 | 0.07 | 0.06 to 0.08 | < 0.01 |
| 2016 | 0.04 | 0.04 to 0.05 | < 0.01 | 0.04 | 0.03 to 0.04 | < 0.01 | 0.03 | 0.03 to 0.04 | < 0.01 |
| Age (years) (reference: < 50 years) | |||||||||
| 50–59 | –0.01 | –0.03 to < 0.01 | 0.11 | –0.04 | –0.06 to –0.02 | < 0.01 | –0.03 | –0.05 to –0.01 | < 0.01 |
| 60–69 | 0.04 | 0.02 to 0.06 | < 0.01 | –0.01 | –0.02 to 0.01 | 0.56 | 0.01 | –0.01 to 0.03 | 0.20 |
| 70–79 | 0.17 | 0.15 to 0.19 | < 0.01 | 0.11 | 0.10 to 0.13 | < 0.01 | 0.13 | 0.11 to 0.15 | < 0.01 |
| 80–84 | 0.38 | 0.36 to 0.40 | < 0.01 | 0.32 | 0.30 to 0.33 | < 0.01 | 0.32 | 0.31 to 034 | < 0.01 |
| ≥ 85 | 0.56 | 0.54 to 0.58 | < 0.01 | 0.50 | 0.48 to 0.52 | < 0.01 | 0.49 | 0.47 to 0.51 | < 0.01 |
| Sex (reference: female) | |||||||||
| Male | –0.05 | –0.05 to –0.04 | < 0.01 | –0.04 | –0.05 to –0.04 | < 0.01 | –0.04 | –0.05 to –0.04 | < 0.01 |
| BMI (kg/m2) | < 0.01 | < 0.01 to < 0.01 | < 0.01 | < 0.01 | < 0.01 to < 0.01 | < 0.01 | < 0.01 | < 0.01 to < 0.01 | < 0.01 |
| Preoperative ASA physical function score (reference: mild disease not incapacitating, grade 2) | |||||||||
| Fit and healthy (grade 1) | –0.06 | –0.07 to –0.05 | < 0.01 | –0.05 | –0.06 to –0.04 | < 0.01 | –0.03 | –0.04 to –0.03 | < 0.01 |
| Incapacitating systemic disease (grade 3) | 0.20 | 0.19 to 0.20 | < 0.01 | 0.18 | 0.18 to 0.19 | < 0.01 | 0.15 | 0.15 to 0.16 | < 0.01 |
| Life-threatening disease or expected to die within 24 hours (grades 4 and 5) | 0.39 | 0.36 to 0.42 | < 0.01 | 0.37 | 0.34 to 0.40 | < 0.01 | 0.32 | 0.29 to 0.35 | < 0.01 |
| IMD (reference: most deprived 20%) | |||||||||
| Least deprived (20%) | –0.03 | –0.04 to –0.02 | < 0.01 | –0.02 | –0.03 to –0.01 | < 0.01 | –0.01 | –0.02 to < 0.01 | 0.03 |
| Former less deprived (20–40%) | –0.01 | –0.02 to < 0.01 | 0.02 | –0.01 | –0.02 to < 0.01 | 0.15 | < 0.01 | –0.01 to 0.01 | 0.98 |
| Current less deprived (40–60%) | –0.01 | –0.02 to < 0.01 | 0.22 | < 0.01 | –0.01 to 0.01 | 0.40 | < 0.01 | –0.01 to 0.01 | 0.53 |
| More deprived (20–40%) | < 0.01 | –0.01 to 0.01 | 0.85 | < 0.01 | –0.01 to 0.01 | 0.89 | < 0.01 | –0.01 to 0.01 | 0.75 |
| Rural/urban indicator (reference: urban ≥ 10,000 habitants) | |||||||||
| Town and fringe | –0.01 | –0.02 to < 0.01 | 0.20 | –0.01 | –0.02 to < 0.01 | 0.18 | < 0.01 | –0.01 to 0.01 | 0.38 |
| Village/isolated | –0.02 | –0.03 to –0.01 | < 0.01 | –0.02 | –0.03 to –0.01 | < 0.01 | –0.01 | –0.02 to < 0.01 | 0.02 |
| Primary indication (reference: osteoarthritis) | |||||||||
| Osteoarthritis and other | 0.16 | 0.15 to 0.18 | < 0.01 | 0.15 | 0.13 to 0.16 | < 0.01 | 0.11 | 0.09 to 0.13 | < 0.01 |
| Charlson score (reference: none, 0) | |||||||||
| Mild (1) | 0.07 | 0.07 to 0.08 | < 0.01 | 0.08 | 0.07 to 0.08 | < 0.01 | 0.07 | 0.06 to 0.07 | < 0.01 |
| Moderate (2) | 0.18 | 0.17 to 0.19 | < 0.01 | 0.18 | 0.17 to 0.18 | < 0.01 | 0.16 | 0.15 to 0.16 | < 0.01 |
| Severe (≥ 3) | 0.31 | 0.30 to 0.32 | < 0.01 | 0.31 | 0.30 to 0.32 | < 0.01 | 0.28 | 0.27 to 0.29 | < 0.01 |
| EQ-5D-3L (reference: lowest quintile) | |||||||||
| Second quintile | –0.10 | –0.11 to –0.10 | < 0.01 | –0.10 | –0.11 to –0.09 | < 0.01 | –0.10 | –0.10 to –0.09 | < 0.01 |
| Third quintile | –0.13 | –0.14 to –0.13 | < 0.01 | –0.13 | –0.14 to –0.12 | < 0.01 | –0.12 | –0.13 to –0.12 | < 0.01 |
| Fourth quintile | –0.16 | –0.17 to –0.15 | < 0.01 | –0.15 | –0.16 to –0.14 | < 0.01 | –0.14 | –0.15 to –0.13 | < 0.01 |
| Highest quintile | –0.20 | –0.21 to –0.19 | < 0.01 | –0.19 | –0.20 to –0.19 | < 0.01 | –0.18 | –0.19 to –0.18 | < 0.01 |
| Surgical factors | |||||||||
| Lead surgeon experience (reference: consultant) | |||||||||
| Other | 0.09 | 0.08 to 0.09 | < 0.01 | 0.01 | < 0.01 to 0.02 | < 0.01 | |||
| Surgical volume per lead surgeon (reference: > 150 surgeries per year) | |||||||||
| ≤ 10 | 0.10 | 0.08 to 0.12 | < 0.01 | 0.03 | 0.01 to 0.04 | 0.01 | |||
| 11–50 | 0.08 | 0.07 to 0.09 | < 0.01 | 0.01 | 0.01 to 0.02 | < 0.01 | |||
| 51–75 | 0.07 | 0.06 to 0.08 | < 0.01 | 0.02 | 0.01 to 0.03 | < 0.01 | |||
| 76–100 | 0.05 | 0.05 to 0.06 | < 0.01 | 0.01 | 0.01 to 0.02 | < 0.01 | |||
| 101–150 | 0.03 | 0.02 to 0.04 | < 0.01 | < 0.01 | –0.01 to 0.01 | 0.67 | |||
| Surgical volume per unit (reference: surgeries per year, ≥ 500) | |||||||||
| ≤ 200 | 0.06 | 0.05 to 0.07 | < 0.01 | 0.10 | 0.09 to 0.11 | < 0.01 | |||
| 200–299 | 0.01 | < 0.01 to 0.01 | 0.23 | 0.01 | 0.01 to 0.02 | < 0.01 | |||
| 300–399 | –0.03 | –0.04 to –0.02 | < 0.01 | –0.02 | –0.03 to –0.01 | < 0.01 | |||
| 400–499 | –0.03 | –0.04 to –0.02 | < 0.01 | –0.02 | –0.03 to –0.01 | < 0.01 | |||
| Minimally invasive surgery (reference: no) | |||||||||
| Yes | –0.07 | –0.08 to –0.05 | < 0.01 | –0.05 | –0.07 to –0.04 | < 0.01 | |||
| Thromboprophylaxis (reference: LMWH ± other) | |||||||||
| None | –0.05 | –0.07 to –0.03 | < 0.01 | –0.02 | –0.04 to 0.01 | 0.21 | |||
| Aspirin only | –0.02 | –0.04 to –0.01 | 0.01 | –0.02 | –0.03 to < 0.01 | 0.01 | |||
| Other (no LMWH) | –0.01 | –0.02 to –0.01 | < 0.01 | 0.01 | < 0.01 to 0.02 | < 0.01 | |||
| Mechanical prophylaxis (reference: any) | |||||||||
| None | 0.08 | 0.06 to 0.09 | < 0.01 | 0.02 | < 0.01 to 0.03 | 0.01 | |||
| General anaesthesia (reference: no) | |||||||||
| Yes | 0.05 | 0.05 to 0.06 | < 0.01 | 0.05 | 0.05 to 0.06 | < 0.01 | |||
| Regional: epidural anaesthesia (reference: no) | |||||||||
| Yes | 0.04 | 0.03 to 0.05 | < 0.01 | 0.02 | 0.01 to 0.03 | < 0.01 | |||
| Regional: nerve block anaesthesia (reference: no) | |||||||||
| Yes | 0.05 | 0.04 to 0.05 | < 0.01 | 0.03 | 0.02 to 0.04 | < 0.01 | |||
| Regional: spinal anaesthesia (reference: no) | |||||||||
| Yes | |||||||||
| Type of approach (reference: medial parapatellar) | |||||||||
| Lateral parapatellar | 0.08 | 0.06 to 0.11 | < 0.01 | 0.07 | 0.04 to 0.09 | < 0.01 | |||
| Mid-vastus | –0.06 | –0.07 to –0.05 | < 0.01 | –0.07 | –0.08 to –0.05 | < 0.01 | |||
| Subvastus | –0.04 | –0.07 to –0.02 | < 0.01 | –0.03 | –0.05 to < 0.01 | 0.02 | |||
| Other | 0.04 | 0.02 to 0.06 | < 0.01 | 0.04 | 0.02 to 0.06 | < 0.01 | |||
| Femoral bone graft (reference: no) | |||||||||
| Yes | 0.02 | < 0.01 to 0.04 | 0.04 | 0.03 | 0.01 to 0.05 | 0.02 | |||
| Tibia bone graft (reference: no) | |||||||||
| Yes | 0.10 | 0.07 to 0.14 | < 0.01 | 0.09 | 0.05 to 0.13 | < 0.01 | |||
| Primary femoral fixation (reference: cemented) | |||||||||
| Cementless | |||||||||
| Primary tibial fixation (reference: cemented) | |||||||||
| Cementless | |||||||||
| Type of knee implant (reference: bicondylar) | |||||||||
| Unicondylar, hinged, linked, custom or preassembled | –0.24 | –0.25 to –0.22 | < 0.01 | –0.25 | –0.26 to –0.24 | < 0.01 | |||
| Hospital organisation factors | |||||||||
| Unit type (reference: public hospital) | |||||||||
| Independent sector: hospital | –0.26 | –0.27 to –0.26 | < 0.01 | ||||||
| Independent sector: treatment centre | –0.44 | –0.45 to –0.42 | < 0.01 | ||||||
| FTE of specialty groups on trauma and orthopaedic surgery (reference: 0–24 FTEs) | |||||||||
| 25–29 | 0.02 | 0.01 to 0.03 | < 0.01 | ||||||
| 30–39 | 0.02 | 0.02 to 0.03 | < 0.01 | ||||||
| 40–49 | 0.05 | 0.04 to 0.06 | < 0.01 | ||||||
| > 50 | 0.06 | 0.05 to 0.07 | < 0.01 | ||||||
| Consultant FTE (reference: 0–24 FTEs) | |||||||||
| 25–29 | 0.02 | 0.01 to 0.03 | < 0.01 | ||||||
| 30–39 | 0.01 | < 0.0 to –0.02 | 0.02 | ||||||
| 40–49 | 0.02 | 0.01 to 0.03 | < 0.01 | ||||||
| > 50 | 0.04 | 0.02 to 0.05 | < 0.01 | ||||||
| Middle-grade doctor FTE (reference: 0–24 FTEs) | |||||||||
| 25–29 | 0.01 | < 0.01 to 0.02 | 0.01 | ||||||
| 30–39 | 0.04 | 0.03 to 0.05 | < 0.01 | ||||||
| 40–49 | 0.03 | 0.02 to 0.05 | < 0.01 | ||||||
| > 50 | 0.04 | 0.02 to 0.06 | < 0.01 | ||||||
| Early-career doctor FTE (reference: 0–24 FTEs) | |||||||||
| 25–29 | |||||||||
| 30–39 | |||||||||
| Total beds available overnight (reference: 0–349) | |||||||||
| 350–499 | –0.03 | –0.04 to –0.02 | < 0.01 | ||||||
| 500–699 | –0.06 | –0.07 to –0.05 | < 0.01 | ||||||
| 700–999 | –0.08 | –0.09 to –0.07 | < 0.01 | ||||||
| ≥ 1000 | –0.10 | –0.12 to –0.08 | < 0.01 | ||||||
| Total beds available overnight for trauma and orthopaedic surgery (reference: 0–34) | |||||||||
| 35–49 | 0.02 | 0.01 to 0.03 | < 0.01 | ||||||
| 50–69 | 0.03 | 0.03 to 0.04 | < 0.01 | ||||||
| 70–99 | 0.04 | 0.02 to 0.05 | < 0.01 | ||||||
| ≥ 100 | 0.05 | 0.03 to 0.07 | < 0.01 | ||||||
| Total beds available overnight for rehabilitation (reference: 0) | |||||||||
| > 0–10 | < 0.01 | –0.02 to 0.01 | 0.93 | ||||||
| 11–20 | < 0.01 | –0.02 to 0.01 | 0.62 | ||||||
| ≥ 20 | 0.03 | 0.02 to 0.04 | < 0.01 | ||||||
| Operating theatres (reference: < 10) | |||||||||
| 10–14 | –0.02 | –0.03 to –0.01 | < 0.01 | ||||||
| 15–19 | –0.01 | –0.02 to < 0.01 | 0.20 | ||||||
| 20–24 | –0.04 | –0.06 to –0.03 | < 0.01 | ||||||
| ≥ 25 | –0.06 | –0.08 to –0.04 | < 0.01 | ||||||
| Dedicated day-case operating theatres (reference: ≥ 7) | |||||||||
| 0 | < 0.01 | < 0.01 to 0.01 | 0.35 | ||||||
| 1–2 | 0.01 | < 0.01 to 0.01 | 0.23 | ||||||
| 3–4 | < 0.01 | –0.01 to 0.01 | 0.49 | ||||||
| 5–6 | 0.01 | < 0.01 to 0.02 | 0.01 | ||||||
| Category | Patient model | Surgical model | Hospital organisation model | ||||||
|---|---|---|---|---|---|---|---|---|---|
| Coefficient | 95% CI | p-value | Coefficient | 95% CI | p-value | Coefficient | 95% CI | p-value | |
| Intercept | 35.1 | 34.3 to 35.8 | < 0.01 | 36.3 | 35.4 to 37.1 | < 0.01 | 35.9 | 35.1 to 36.8 | < 0.01 |
| Patient factors | |||||||||
| Calendar year (reference: 2014) | |||||||||
| 2015 | –0.4 | –0.5 to –0.2 | < 0.01 | –0.2 | –0.4 to –0.1 | 0.01 | –0.2 | –0.4 to –0.1 | 0.01 |
| 2016 | –0.1 | –0.3 to 0.1 | 0.23 | 0.0 | –0.2 to 0.1 | 0.65 | 0.0 | –0.2 to 0.1 | 0.67 |
| Age (years) (reference: < 50 years) | |||||||||
| 50–59 | 0.5 | 0.2 to 0.9 | < 0.01 | 0.6 | 0.3 to 1.0 | < 0.01 | 0.6 | 0.3 to 0.9 | < 0.01 |
| 60–69 | 0.8 | 0.5 to 1.1 | < 0.01 | 1.1 | 0.7 to 1.4 | < 0.01 | 1.0 | 0.7 to 1.3 | < 0.01 |
| 70–79 | < 0.1 | –0.4 to 0.3 | 0.82 | 0.4 | 0.1 to 0.8 | 0.01 | 0.4 | 0.1 to 0.7 | 0.02 |
| 80–84 | –1.0 | –1.3 to –0.6 | < 0.01 | –0.4 | –0.7 to 0.0 | 0.05 | –0.4 | –0.8 to < 0.1 | 0.03 |
| ≥ 85 | –1.6 | –2.0 to –1.2 | < 0.01 | –1.0 | –1.4 to –0.5 | < 0.01 | –1.0 | –1.4 to –0.6 | < 0.01 |
| Sex (reference: female) | |||||||||
| Male | 0.5 | 0.1 to 0.8 | 0.01 | 0.4 | < 0.1 to 0.8 | 0.03 | 0.4 | < 0.1 to 0.7 | 0.04 |
| BMI (kg/m2) | –0.1 | –0.1 to –0.1 | < 0.01 | –0.1 | –0.1 to –0.1 | < 0.01 | –0.1 | –0.1 to –0.1 | < 0.01 |
| Preoperative ASA physical function score (reference: mild disease not incapacitating, grade 2) | |||||||||
| Fit and healthy (grade 1) | 1.0 | 0.8 to 1.2 | < 0.01 | 1.0 | 0.8 to 1.1 | < 0.01 | 0.9 | 0.8 to 1.1 | < 0.01 |
| Incapacitating systemic disease (grade 3) | –1.6 | –1.8 to –1.4 | < 0.01 | –1.5 | –1.7 to –1.4 | < 0.01 | –1.4 | –1.6 to –1.3 | < 0.01 |
| Life-threatening disease or expected to die within 24 hours (grades 4 and 5) | –2.6 | –3.6 to –1.5 | < 0.01 | –2.5 | –3.6 to –1.5 | < 0.01 | –2.4 | –3.4 to –1.3 | < 0.01 |
| IMD (reference: most deprived 20%) | |||||||||
| Least deprived (20%) | 1.6 | 1.4 to 1.8 | < 0.01 | 1.5 | 1.3 to 1.7 | < 0.01 | 1.5 | 1.3 to 1.7 | < 0.01 |
| Former less deprived (20–40%) | 1.3 | 1.1 to 1.5 | < 0.01 | 1.2 | 1.0 to 1.4 | < 0.01 | 1.2 | 1.0 to 1.4 | < 0.01 |
| Current less deprived (40–60%) | 0.6 | 0.4 to 0.8 | < 0.01 | 0.6 | 0.4 to 0.8 | < 0.01 | 0.6 | 0.4 to 0.8 | < 0.01 |
| More deprived (20–40%) | 0.2 | < 0.1 to 0.4 | 0.03 | 0.2 | < 0.1 to 0.5 | 0.03 | 0.2 | < 0.1 to 0.5 | 0.02 |
| Rural/urban indicator (reference: urban ≥ 10,000 habitants) | |||||||||
| Town and fringe | 0.4 | 0.2 to 0.6 | < 0.01 | 0.4 | 0.2 to 0.6 | < 0.01 | 0.4 | 0.2 to 0.6 | < 0.01 |
| Village/isolated | 0.8 | 0.6 to 0.9 | < 0.01 | 0.8 | 0.6 to 0.9 | < 0.01 | 0.7 | 0.5 to 0.9 | < 0.01 |
| Primary indication (reference: osteoarthritis) | |||||||||
| Osteoarthritis and other | |||||||||
| Charlson Comorbidity Index score (reference: none, 0) | |||||||||
| Mild (1) | –1.0 | –1.1 to –0.8 | < 0.01 | –1.0 | –1.1 to –0.8 | < 0.01 | –0.9 | –1.1 to –0.8 | < 0.01 |
| Moderate (2) | –1.2 | –1.4 to –0.9 | < 0.01 | –1.1 | –1.4 to –0.9 | < 0.01 | –1.1 | –1.3 to –0.8 | < 0.01 |
| Severe (≥ 3) | –1.1 | –1.5 to –0.8 | < 0.01 | –1.1 | –1.4 to –0.8 | < 0.01 | –1.0 | –1.4 to –0.7 | < 0.01 |
| OHS baseline (points) | –0.8 | –0.8 to –0.8 | < 0.01 | –0.8 | –0.8 to –0.8 | < 0.01 | –0.8 | –0.8 to –0.8 | < 0.01 |
| EQ-5D-3L (reference: highest quintile) | |||||||||
| Lowest quintile | 2.3 | 2.0 to 2.5 | < 0.01 | 2.3 | 2.0 to 2.5 | < 0.01 | 2.3 | 2.0 to 2.5 | < 0.01 |
| Second quintile | 3.3 | 3.1 to 3.6 | < 0.01 | 3.3 | 3.0 to 3.6 | < 0.01 | 3.3 | 3.0 to 3.5 | < 0.01 |
| Third quintile | 3.2 | 2.9 to 3.5 | < 0.01 | 3.2 | 2.9 to 3.5 | < 0.01 | 3.2 | 2.9 to 3.4 | < 0.01 |
| Fourth quintile | 3.9 | 3.6 to 4.2 | < 0.01 | 3.9 | 3.6 to 4.2 | < 0.01 | 3.9 | 3.6 to 4.2 | < 0.01 |
| Female × EQ-5D-3L (reference: highest quintile) | |||||||||
| Female × lowest quintile | 0.9 | 0.5 to 1.3 | < 0.01 | 0.9 | 0.5 to 1.3 | < 0.01 | 0.9 | 0.5 to 1.4 | < 0.01 |
| Female × second quintile | 0.3 | –0.1 to 0.7 | 0.17 | 0.3 | –0.1 to 0.7 | 0.16 | 0.3 | –0.1 to 0.8 | 0.13 |
| Female × third quintile | 0.7 | 0.3 to 1.1 | < 0.01 | 0.7 | 0.3 to 1.1 | < 0.01 | 0.7 | 0.3 to 1.2 | < 0.01 |
| Female × fourth quintile | 0.5 | 0.1 to 0.9 | 0.03 | 0.5 | 0.1 to 0.9 | 0.03 | 0.5 | 0.1 to 0.9 | 0.02 |
| Surgical factors | |||||||||
| Lead surgeon experience (reference: consultant) | |||||||||
| Other | –0.6 | –0.7 to –0.4 | < 0.01 | –0.3 | –0.4 to –0.1 | < 0.01 | |||
| Surgical volume per lead surgeon (reference: > 150 surgeries per year) | |||||||||
| ≤ 10 | –1.2 | –1.6 to –0.8 | < 0.01 | –1.0 | –1.5 to –0.6 | < 0.01 | |||
| 11–50 | –0.7 | –0.9 to –0.5 | < 0.01 | –0.6 | –0.8 to –0.4 | < 0.01 | |||
| 51–75 | –0.5 | –0.7 to –0.4 | < 0.01 | –0.5 | –0.7 to –0.3 | < 0.01 | |||
| 76–100 | –0.5 | –0.7 to –0.3 | < 0.01 | –0.4 | –0.6 to –0.2 | < 0.01 | |||
| 101–150 | –0.3 | –0.5 to –0.1 | < 0.01 | –0.3 | –0.5 to –0.1 | < 0.01 | |||
| Surgical volume per unit (reference: surgeries per year, ≥ 500) | |||||||||
| ≤ 200 | –0.2 | –0.4 to < 0.1 | 0.13 | ||||||
| 200–299 | –0.2 | –0.4 to < 0.1 | 0.04 | ||||||
| 300–399 | –0.1 | –0.3 to 0.1 | 0.16 | ||||||
| 400–499 | 0.1 | –0.2 to 0.4 | 0.53 | ||||||
| Minimally invasive surgery (reference: no) | |||||||||
| Yes | |||||||||
| Thromboprophylaxis (reference: LMWH ± other) | |||||||||
| None | |||||||||
| Aspirin only | |||||||||
| Other (no LMWH) | |||||||||
| Mechanical prophylaxis (reference: any) | |||||||||
| None | |||||||||
| General anaesthesia (reference: no) | |||||||||
| Yes | –0.3 | –0.4 to –0.1 | < 0.01 | –0.3 | –0.5 to –0.1 | < 0.01 | |||
| Regional: epidural anaesthesia (reference: no) | |||||||||
| Yes | |||||||||
| Regional: nerve block anaesthesia (reference: no) | |||||||||
| Yes | |||||||||
| Regional: spinal anaesthesia (reference: no) | |||||||||
| Yes | 0.4 | 0.2 to 0.5 | < 0.01 | 0.3 | 0.2 to 0.5 | < 0.01 | |||
| Type of approach (reference: posterior) | |||||||||
| Anterior, anterolateral, Hardinge, lateral, trochanteric osteotomy, other | –0.9 | –1.0 to –0.8 | < 0.01 | –0.9 | –1.0 to –0.7 | < 0.01 | |||
| Femoral bone graft (reference: no) | |||||||||
| Yes | –0.8 | –1.6 to –0.1 | 0.03 | –0.8 | –1.5 to < 0.1 | 0.05 | |||
| Cup bone graft (reference: no) | |||||||||
| Yes | 0.5 | 0.2 to 0.8 | < 0.01 | 0.5 | 0.2 to 0.8 | < 0.01 | |||
| Primary cup fixation (reference: cementless) | |||||||||
| Cemented | –0.6 | –0.8 to –0.5 | < 0.01 | –0.6 | –0.7 to –0.4 | < 0.01 | |||
| Type of primary stem fixation (reference: cemented THR stem) | |||||||||
| Not available or resurfacing | < 0.1 | –0.8 to 0.9 | 0.91 | ||||||
| Cementless THR stem | < 0.1 | –0.1 to 0.1 | 0.94 | ||||||
| Bearing surface (reference: MoP) | |||||||||
| MoM | –1.7 | –3.9 to 0.4 | 0.11 | –1.6 | –3.6 to 0.3 | 0.10 | |||
| CoC | 0.2 | < 0.1 to 0.5 | 0.03 | 0.3 | 0.1 to 0.6 | < 0.01 | |||
| CoP | 0.2 | 0.1 to 0.4 | < 0.01 | 0.3 | 0.1 to 0.4 | < 0.01 | |||
| CoM, MoC or unknown | –0.5 | –1.1 to 0.1 | 0.07 | –0.4 | –1.0 to 0.2 | 0.20 | |||
| Femoral head size (mm) (reference: ≤ 28 mm) | |||||||||
| 32 | 0.1 | –0.1 to 0.2 | 0.45 | 0.1 | –0.1 to 0.2 | 0.32 | |||
| 36–42 | < 0.1 | –0.2 to 0.2 | 0.91 | < 0.1 | –0.2 to 0.2 | 0.64 | |||
| ≥ 44 | 2.0 | 0.2 to 3.8 | 0.03 | 2.1 | 0.3 to 3.9 | 0.02 | |||
| Hospital organisation factors | |||||||||
| Unit type (reference: public hospital) | |||||||||
| Independent sector: hospital | 0.8 | 0.6 to 0.9 | < 0.01 | ||||||
| Independent sector: treatment centre | 1.0 | 0.7 to 1.3 | < 0.01 | ||||||
| FTE of specialty groups on trauma and orthopaedic surgery (reference: 0–24 FTEs) | |||||||||
| 25–29 | |||||||||
| 30–39 | |||||||||
| 40–49 | |||||||||
| > 50 | |||||||||
| Consultant FTE (reference: 0–24 FTEs) | |||||||||
| 25–29 | |||||||||
| 30–39 | |||||||||
| 40–49 | |||||||||
| > 50 | |||||||||
| Middle-grade doctor FTE (reference: 0–24 FTEs) | |||||||||
| 25–29 | |||||||||
| 30–39 | |||||||||
| 40–49 | |||||||||
| > 50 | |||||||||
| Early-career doctor FTE (reference: 0–24 FTEs) | |||||||||
| 25–29 | |||||||||
| 30–39 | |||||||||
| Total beds available overnight (reference: 0–349) | |||||||||
| 350–499 | –0.5 | –0.8 to –0.2 | < 0.01 | ||||||
| 500–699 | –0.7 | –1.0 to –0.4 | < 0.01 | ||||||
| 700–999 | –0.7 | –1.0 to –0.4 | < 0.01 | ||||||
| ≥ 1000 | –0.8 | –1.1 to –0.4 | < 0.01 | ||||||
| Total beds available overnight for trauma and orthopaedic surgery (reference: 0–34) | |||||||||
| 35–49 | |||||||||
| 50–69 | |||||||||
| 70–99 | |||||||||
| ≥ 100 | |||||||||
| Total beds available overnight for rehabilitation (reference: 0) | |||||||||
| > 0–10 | |||||||||
| 11–20 | |||||||||
| ≥ 20 | |||||||||
| Operating theatres (reference: < 10) | |||||||||
| 10–14 | 0.4 | 0.1 to 0.7 | 0.02 | ||||||
| 15–19 | 0.7 | 0.3 to 1.0 | < 0.01 | ||||||
| 20–24 | 0.6 | 0.3 to 1.0 | < 0.01 | ||||||
| ≥ 25 | 0.6 | 0.2 to 1.0 | < 0.01 | ||||||
| Dedicated day-case operating theatres (reference: ≥ 7) | |||||||||
| 0 | –0.2 | –0.4 to < 0.1 | 0.12 | ||||||
| 1–2 | –0.3 | –0.5 to < 0.1 | 0.02 | ||||||
| 3–4 | < 0.1 | –0.2 to 0.2 | 0.89 | ||||||
| 5–6 | –0.1 | –0.3 to 0.1 | 0.19 | ||||||
| Category | Patient model | Surgical model | Hospital organisation model | ||||||
|---|---|---|---|---|---|---|---|---|---|
| Coefficient | 95% CI | p-value | Coefficient | 95% CI | p-value | Coefficient | 95% CI | p-value | |
| Intercept | 25.62 | 24.89 to 26.35 | < 0.01 | 25.96 | 25.18 to 26.73 | < 0.01 | 25.61 | 24.84 to 26.38 | < 0.01 |
| Patient factors | |||||||||
| Calendar year (reference: 2014) | |||||||||
| 2015 | –0.74 | –0.90 to –0.58 | < 0.01 | –0.71 | –0.87 to –0.55 | < 0.01 | –0.69 | –0.85 to –0.53 | < 0.01 |
| 2016 | –0.56 | –0.72 to –0.40 | < 0.01 | –0.57 | –0.73 to –0.41 | < 0.01 | –0.56 | –0.72 to –0.40 | < 0.01 |
| Age (years) (reference: < 50 years) | |||||||||
| 50–59 | 1.30 | 0.76 to 1.85 | < 0.01 | 1.30 | 0.76 to 1.85 | < 0.01 | 1.26 | 0.71 to 1.81 | < 0.01 |
| 60–69 | 2.57 | 2.04 to 3.10 | < 0.01 | 2.56 | 2.03 to 3.09 | < 0.01 | 2.51 | 1.98 to 3.03 | < 0.01 |
| 70–79 | 2.92 | 2.39 to 3.45 | < 0.01 | 2.92 | 2.39 to 3.45 | < 0.01 | 2.86 | 2.33 to 3.39 | < 0.01 |
| 80–84 | 2.54 | 1.99 to 3.09 | < 0.01 | 2.53 | 1.98 to 3.08 | < 0.01 | 2.48 | 1.93 to 3.03 | < 0.01 |
| ≥ 85 | 2.23 | 1.64 to 2.82 | < 0.01 | 2.21 | 1.62 to 2.80 | < 0.01 | 2.18 | 1.59 to 2.77 | < 0.01 |
| Sex (reference: female) | |||||||||
| Male | 0.38 | 0.27 to 0.50 | < 0.01 | 0.38 | 0.26 to 0.49 | < 0.01 | 0.38 | 0.27 to 0.50 | < 0.01 |
| BMI (kg/m2) | –0.08 | –0.09 to –0.07 | < 0.01 | –0.08 | –0.09 to –0.07 | < 0.01 | –0.07 | –0.08 to –0.06 | < 0.01 |
| Preoperative ASA physical function score (reference: mild disease not incapacitating, grade 2) | |||||||||
| Fit and healthy (grade 1) | 0.80 | 0.60 to 1.01 | < 0.01 | 0.81 | 0.60 to 1.01 | < 0.01 | 0.77 | 0.57 to 0.98 | < 0.01 |
| Incapacitating systemic disease (grade 3) | –1.16 | –1.32 to –1.00 | < 0.01 | –1.13 | –1.29 to –0.97 | < 0.01 | –1.05 | –1.21 to –0.90 | < 0.01 |
| Life-threatening disease or expected to die within 24 hours (reference: grades 4 and 5) | –3.11 | –4.36 to –1.86 | < 0.01 | –3.07 | –4.32 to –1.82 | < 0.01 | –2.94 | –4.19 to –1.69 | < 0.01 |
| IMD (reference: most deprived 20%) | |||||||||
| Least deprived (20%) | 1.31 | 1.10 to 1.52 | < 0.01 | 1.30 | 1.09 to 1.50 | < 0.01 | 1.28 | 1.07 to 1.49 | < 0.01 |
| Former less deprived (20–40%) | 1.08 | 0.89 to 1.28 | < 0.01 | 1.07 | 0.87 to 1.26 | < 0.01 | 1.05 | 0.85 to 1.25 | < 0.01 |
| Current less deprived (40–60%) | 0.45 | 0.25 to 0.65 | < 0.01 | 0.44 | 0.23 to 0.64 | < 0.01 | 0.44 | 0.23 to 0.64 | < 0.01 |
| More deprived (20–40%) | 0.27 | 0.07 to 0.48 | 0.01 | 0.26 | 0.06 to 0.47 | 0.01 | 0.27 | 0.06 to 0.47 | 0.01 |
| Rural/urban indicator (reference: urban ≥ 10,000 habitants) | |||||||||
| Town and fringe | 0.47 | 0.28 to 0.67 | < 0.01 | 0.48 | 0.29 to 0.68 | < 0.01 | 0.48 | 0.28 to 0.67 | < 0.01 |
| Village/isolated | 0.84 | 0.65 to 1.03 | < 0.01 | 0.85 | 0.66 to 1.04 | < 0.01 | 0.83 | 0.64 to 1.02 | < 0.01 |
| Primary indication (reference: osteoarthritis) | |||||||||
| Osteoarthritis and other | |||||||||
| Charlson Comorbidity Index score (reference: none, 0) | |||||||||
| Mild (1) | –1.01 | –1.15 to –0.88 | < 0.01 | –1.02 | –1.15 to –0.88 | < 0.01 | –1.00 | –1.13 to –0.86 | < 0.01 |
| Moderate (2) | –0.97 | –1.19 to –0.75 | < 0.01 | –0.96 | –1.18 to –0.74 | < 0.01 | –0.91 | –1.13 to –0.69 | < 0.01 |
| Severe (≥ 3) | –1.28 | –1.59 to –0.97 | < 0.01 | –1.27 | –1.58 to –0.96 | < 0.01 | –1.22 | –1.53 to –0.91 | < 0.01 |
| OKS baseline (points) | –0.67 | –0.68 to –0.66 | < 0.01 | –0.68 | –0.69 to –0.67 | < 0.01 | –0.68 | –0.69 to –0.67 | < 0.01 |
| EQ-5D-3L (reference: lowest quintile) | |||||||||
| Second quintile | 2.68 | 2.48 to 2.88 | < 0.01 | 2.67 | 2.47 to 2.87 | < 0.01 | 2.66 | 2.46 to 2.86 | < 0.01 |
| Third quintile | 3.06 | 2.88 to 3.25 | < 0.01 | 3.04 | 2.86 to 3.23 | < 0.01 | 3.02 | 2.84 to 3.21 | < 0.01 |
| Fourth quintile | 2.43 | 2.19 to 2.68 | < 0.01 | 2.42 | 2.17 to 2.66 | < 0.01 | 2.40 | 2.15 to 2.64 | < 0.01 |
| Highest quintile | 3.81 | 3.60 to 4.01 | < 0.01 | 3.78 | 3.57 to 3.99 | < 0.01 | 3.77 | 3.56 to 3.98 | < 0.01 |
| Surgical factors | |||||||||
| Lead surgeon experience (reference: consultant) | |||||||||
| Other | –0.49 | –0.63 to –0.34 | < 0.01 | –0.28 | –0.43 to –0.12 | < 0.01 | |||
| Surgical volume per lead surgeon (reference: > 150 surgeries per year) | |||||||||
| ≤ 10 | –0.54 | –1.01 to –0.06 | 0.03 | ||||||
| 11–50 | –0.33 | –0.52 to –0.13 | < 0.01 | ||||||
| 51–75 | –0.23 | –0.43 to –0.03 | 0.03 | ||||||
| 76–100 | –0.08 | –0.27 to 0.12 | 0.43 | ||||||
| 101–150 | –0.16 | –0.35 to 0.03 | 0.10 | ||||||
| Surgical volume per unit (reference: surgeries per year, ≥ 500) | |||||||||
| ≤ 200 | –0.19 | 0.42 to 0.03 | 0.10 | –0.43 | –0.66 to –0.20 | < 0.01 | |||
| 200–299 | –0.20 | –0.40 to 0.01 | 0.06 | –0.29 | –0.50 to –0.08 | 0.01 | |||
| 300–399 | –0.04 | –0.23 to 0.16 | 0.71 | –0.08 | –0.28 to 0.11 | 0.40 | |||
| 400–499 | –0.37 | –0.59 to –0.15 | < 0.01 | –0.40 | –0.62 to –0.19 | < 0.01 | |||
| Minimally invasive surgery (reference: no) | |||||||||
| Yes | |||||||||
| Thromboprophylaxis (reference: LMWH ± other) | |||||||||
| None | |||||||||
| Aspirin only | |||||||||
| Other (no LMWH) | |||||||||
| Mechanical prophylaxis (reference: any) | |||||||||
| None | –0.37 | –0.71 to –0.03 | 0.04 | ||||||
| General anaesthesia (reference: no) | |||||||||
| Yes | –0.41 | –0.59 to –0.23 | < 0.01 | –0.46 | –0.64 to –0.28 | < 0.01 | |||
| Regional: epidural anaesthesia (reference: no) | |||||||||
| Yes | |||||||||
| Regional: nerve block anaesthesia (reference: no) | |||||||||
| Yes | |||||||||
| Regional: spinal anaesthesia (reference: no) | |||||||||
| Yes | 0.29 | 0.10 to 0.48 | < 0.01 | 0.25 | 0.07 to 0.44 | 0.01 | |||
| Type of approach (reference: medial parapatellar) | |||||||||
| Lateral parapatellar | 0.40 | –0.23 to 1.02 | 0.21 | 0.45 | –0.17 to 1.08 | 0.16 | |||
| Mid-vastus | 0.17 | –0.18 to 0.52 | 0.34 | 0.20 | –0.15 to 0.56 | 0.26 | |||
| Subvastus | 0.67 | 0.11 to 1.24 | 0.02 | 0.63 | 0.07 to 1.19 | 0.03 | |||
| Other | –0.10 | –0.59 to 0.39 | 0.70 | –0.10 | –0.59 to 0.39 | 0.70 | |||
| Femoral bone graft (reference: no) | |||||||||
| Yes | |||||||||
| Tibia bone graft (reference: no) | |||||||||
| Yes | |||||||||
| Primary femoral fixation (reference: cemented) | |||||||||
| Cementless | |||||||||
| Primary tibial fixation (reference: cemented) | |||||||||
| Cementless | |||||||||
| Type of knee implant (reference: bicondylar) | |||||||||
| Unicondylar, hinged, linked, custom or preassembled | |||||||||
| Hospital organisation factors | |||||||||
| Unit type (reference: public hospital) | |||||||||
| Independent sector: hospital | 0.73 | 0.57 to 0.88 | < 0.01 | ||||||
| Independent sector: treatment centre | 0.57 | 0.28 to 0.85 | < 0.01 | ||||||
| FTE of specialty groups on trauma and orthopaedic surgery (reference: 0–24 FTEs) | |||||||||
| 25–29 | |||||||||
| 30–39 | |||||||||
| 40–49 | |||||||||
| > 50 | |||||||||
| Consultant FTE (reference: 0–24 FTEs) | |||||||||
| 25–29 | |||||||||
| 30–39 | |||||||||
| 40–49 | |||||||||
| > 50 | |||||||||
| Middle-grade doctor FTE (reference: 0–24 FTEs) | |||||||||
| 25–29 | |||||||||
| 30–39 | |||||||||
| 40–49 | |||||||||
| > 50 | |||||||||
| Early-career doctor FTE (reference: 0–24 FTEs) | |||||||||
| 25–29 | |||||||||
| 30–39 | |||||||||
| Total beds available overnight (reference: 0–349) | |||||||||
| 350–499 | |||||||||
| 500–699 | |||||||||
| 700–999 | |||||||||
| ≥ 1000 | |||||||||
| Total beds available overnight for trauma and orthopaedic surgery (reference: 0–34) | |||||||||
| 35–49 | |||||||||
| 50–69 | |||||||||
| 70–99 | |||||||||
| ≥ 100 | |||||||||
| Total beds available overnight for rehabilitation (reference: 0) | |||||||||
| > 0–10 | |||||||||
| 11–20 | |||||||||
| ≥ 20 | |||||||||
| Operating theatres (reference: < 10) | |||||||||
| 10–14 | |||||||||
| 15–19 | |||||||||
| 20–24 | |||||||||
| ≥ 25 | |||||||||
| Dedicated day-case operating theatres (reference: ≥ 7) | |||||||||
| 0 | |||||||||
| 1–2 | |||||||||
| 3–4 | |||||||||
| 5–6 | |||||||||
| Category | Patient model | Surgical model | Hospital organisation model | ||||||
|---|---|---|---|---|---|---|---|---|---|
| Coefficient | 95% CI | p-value | Coefficient | 95% CI | p-value | Coefficient | 95% CI | p-value | |
| Intercept | –4.95 | –5.24 to –4.65 | < 0.01 | –4.85 | –5.16 to –4.54 | < 0.01 | –4.84 | –5.16 to –4.53 | < 0.01 |
| Patient factors | |||||||||
| Calendar year (reference: 2014) | |||||||||
| 2015 | 0.10 | 0.04 to 0.16 | < 0.01 | 0.08 | 0.02 to 0.14 | 0.01 | 0.08 | 0.02 to 0.14 | 0.01 |
| 2016 | 0.11 | 0.05 to 0.17 | < 0.01 | 0.11 | 0.05 to 0.17 | < 0.01 | 0.11 | 0.05 to 0.17 | < 0.01 |
| Age (years) (reference: < 50 years) | |||||||||
| 50–59 | 0.08 | –0.10 to 0.25 | 0.38 | 0.07 | –0.10 to 0.25 | 0.41 | 0.08 | –0.10 to 0.25 | 0.40 |
| 60–69 | 0.22 | 0.06 to 0.39 | 0.01 | 0.20 | 0.04 to 0.37 | 0.02 | 0.21 | 0.04 to 0.37 | 0.02 |
| 70–79 | 0.55 | 0.39 to 0.71 | < 0.01 | 0.50 | 0.33 to 0.67 | < 0.01 | 0.50 | 0.33 to 0.67 | < 0.01 |
| 80–84 | 0.86 | 0.69 to 1.03 | < 0.01 | 0.81 | 0.63 to 0.99 | < 0.01 | 0.81 | 0.63 to 0.99 | < 0.01 |
| ≥ 85 | 1.16 | 0.98 to 1.33 | < 0.01 | 1.11 | 0.92 to 1.29 | < 0.01 | 1.10 | 0.91 to 1.28 | < 0.01 |
| Sex (reference: female) | |||||||||
| Male | 0.25 | 0.20 to 0.30 | < 0.01 | 0.27 | 0.21 to 0.32 | < 0.01 | 0.27 | 0.22 to 0.32 | < 0.01 |
| BMI (kg/m2) | 0.01 | 0.01 to 0.02 | < 0.01 | 0.01 | 0.01 to 0.02 | < 0.01 | 0.01 | 0.01 to 0.02 | < 0.01 |
| Preoperative ASA physical function score (reference: mild disease not incapacitating, grade 2) | |||||||||
| Fit and healthy (grade 1) | –0.22 | –0.32 to –0.12 | < 0.01 | –0.21 | –0.31 to –0.11 | < 0.01 | –0.21 | –0.31 to –0.10 | < 0.01 |
| Incapacitating systemic disease (grade 3) | 0.43 | 0.37 to 0.49 | < 0.01 | 0.42 | 0.37 to 0.48 | < 0.01 | 0.41 | 0.35 to 0.47 | < 0.01 |
| Life-threatening disease or expected to die within 24 hours (grades 4 and 5) | 0.85 | 0.63 to 1.08 | < 0.01 | 0.83 | 0.61 to 1.06 | < 0.01 | 0.82 | 0.59 to 1.04 | < 0.01 |
| IMD (reference: most deprived 20%) | |||||||||
| Least deprived (20%) | –0.04 | –0.12 to 0.05 | 0.38 | –0.02 | –0.11 to 0.06 | 0.56 | –0.02 | –0.11 to 0.06 | 0.60 |
| Former less deprived (20–40%) | –0.05 | –0.13 to 0.03 | 0.21 | –0.04 | –0.13 to 0.04 | 0.30 | –0.04 | –0.12 to 0.04 | 0.34 |
| Current less deprived (40–60%) | 0.08 | –0.01 to 0.16 | 0.07 | 0.08 | < 0.01 to 0.16 | 0.06 | 0.08 | < 0.01 to 0.17 | 0.06 |
| More deprived (20–40%) | 0.09 | 0.01 to 0.18 | 0.03 | 0.10 | 0.01 to 0.18 | 0.03 | 0.10 | 0.01 to 0.18 | 0.03 |
| Rural/urban indicator (reference: urban ≥ 10,000 habitants) | |||||||||
| Town and fringe | |||||||||
| Village/isolated | |||||||||
| Primary indication (reference: osteoarthritis) | |||||||||
| Osteoarthritis and other | 0.36 | 0.23 to 0.49 | < 0.01 | 0.35 | 0.23 to 0.48 | < 0.01 | 0.35 | 0.22 to 0.47 | < 0.01 |
| Charlson Comorbidity Index score (reference: none, 0) | |||||||||
| Mild (1) | 0.33 | 0.27 to 0.39 | < 0.01 | 0.33 | 0.27 to 0.39 | < 0.01 | 0.33 | 0.27 to 0.39 | < 0.01 |
| Moderate (2) | 0.50 | 0.41 to 0.58 | < 0.01 | 0.50 | 0.41 to 0.58 | < 0.01 | 0.49 | 0.41 to 0.57 | < 0.01 |
| Severe (≥ 3) | 0.75 | 0.66 to 0.85 | < 0.01 | 0.75 | 0.65 to 0.84 | < 0.01 | 0.74 | 0.64 to 0.83 | < 0.01 |
| EQ-5D-3L (reference: highest quintile) | |||||||||
| Lowest quintile | –0.14 | –0.21 to –0.06 | < 0.01 | –0.14 | –0.21 to –0.06 | < 0.01 | –0.14 | –0.21 to –0.06 | < 0.01 |
| Second quintile | –0.28 | –0.36 to –0.20 | < 0.01 | –0.28 | –0.36 to –0.19 | < 0.01 | –0.27 | –0.36 to –0.19 | < 0.01 |
| Third quintile | –0.29 | –0.37 to –0.20 | < 0.01 | –0.28 | –0.37 to –0.19 | < 0.01 | –0.28 | –0.36 to –0.19 | < 0.01 |
| Fourth quintile | –0.36 | –0.45 to –0.27 | < 0.01 | –0.35 | –0.44 to –0.26 | < 0.01 | –0.35 | –0.43 to –0.26 | < 0.01 |
| Surgical factors | |||||||||
| Lead surgeon experience (reference: consultant) | |||||||||
| Other | |||||||||
| Surgical volume per lead surgeon (reference: > 150 surgeries per year) | |||||||||
| ≤ 10 | |||||||||
| 11–50 | |||||||||
| 51–75 | |||||||||
| 76–100 | |||||||||
| 101–150 | |||||||||
| Surgical volume per unit (reference: surgeries per year, ≥ 500) | |||||||||
| ≤ 200 | 0.12 | 0.03 to 0.20 | 0.01 | 0.12 | 0.04 to 0.21 | 0.01 | |||
| 200–299 | 0.08 | < 0.01 to 0.17 | 0.06 | 0.08 | –0.01 to 0.17 | 0.07 | |||
| 300–399 | 0.07 | –0.01 to 0.16 | 0.10 | 0.08 | –0.01 to 0.17 | 0.09 | |||
| 400–499 | 0.05 | –0.09 to 0.18 | 0.48 | 0.05 | –0.09 to 0.18 | 0.48 | |||
| Minimally invasive surgery (reference: no) | |||||||||
| Yes | –0.28 | –0.43 to –0.13 | < 0.01 | –0.27 | –0.43 to –0.12 | < 0.01 | |||
| Thromboprophylaxis (reference: LMWH ± other) | |||||||||
| None | 0.14 | –0.12 to 0.40 | 0.29 | 0.15 | –0.10 to 0.41 | 0.25 | |||
| Aspirin only | 0.19 | 0.04 to 0.34 | 0.01 | 0.19 | 0.04 to 0.34 | 0.01 | |||
| Other (no LMWH) | –0.04 | –0.10 to 0.02 | 0.15 | –0.03 | –0.09 to 0.03 | 0.28 | |||
| Mechanical prophylaxis (reference: any) | |||||||||
| None | |||||||||
| General anaesthesia (reference: no) | |||||||||
| Yes | |||||||||
| Regional: epidural anaesthesia (reference: no) | |||||||||
| Yes | |||||||||
| Regional: nerve block anaesthesia (reference: no) | |||||||||
| Yes | |||||||||
| Regional: spinal anaesthesia (reference: no) | |||||||||
| Yes | –0.08 | –0.13 to –0.02 | 0.01 | –0.07 | –0.13 to –0.01 | 0.02 | |||
| Type of approach (reference: posterior) | |||||||||
| Anterior, anterolateral, Hardinge, lateral, trochanteric osteotomy, other | |||||||||
| Femoral bone graft (reference: no) | |||||||||
| Yes | |||||||||
| Cup bone graft (reference: no) | |||||||||
| Yes | |||||||||
| Primary cup fixation (reference: cementless) | |||||||||
| Cemented | |||||||||
| Type of primary stem fixation (reference: cemented THR stem) | |||||||||
| Not available or resurfacing | |||||||||
| Cementless THR stem | |||||||||
| Bearing surface (reference: MoP) | |||||||||
| MoM | –0.20 | –1.17 to 0.77 | 0.69 | –0.21 | –1.17 to 0.76 | 0.68 | |||
| CoC | –0.04 | –0.15 to 0.07 | 0.44 | –0.05 | –0.16 to 0.06 | 0.38 | |||
| CoP | –0.08 | –0.15 to –0.01 | 0.03 | –0.08 | –0.16 to –0.01 | 0.02 | |||
| CoM, MoC or unknown | 0.13 | –0.09 to 0.36 | 0.25 | 0.12 | –0.10 to 0.35 | 0.28 | |||
| Femoral head size (mm) (reference: ≤ 28 mm) | |||||||||
| 32 | –0.10 | –0.16 to –0.04 | < 0.01 | –0.10 | –0.16 to –0.04 | < 0.01 | |||
| 36–42 | –0.06 | –0.13 to 0.02 | 0.17 | –0.06 | –0.14 to 0.02 | 0.14 | |||
| ≥ 44 | –0.13 | –0.98 to 0.73 | 0.77 | –0.13 | –0.99 to 0.73 | 0.77 | |||
| Hospital organisation factors | |||||||||
| Unit type (reference: public hospital) | |||||||||
| Independent sector: hospital | –0.08 | –0.15 to –0.01 | 0.03 | ||||||
| Independent sector: treatment centre | –0.13 | –0.27 to 0.01 | 0.06 | ||||||
| FTE of specialty groups on trauma and orthopaedic surgery (reference: 0–24 FTEs) | |||||||||
| 25–29 | |||||||||
| 30–39 | |||||||||
| 40–49 | |||||||||
| > 50 | |||||||||
| Consultant FTE (reference: 0–24 FTEs) | |||||||||
| 25–29 | |||||||||
| 30–39 | |||||||||
| 40–49 | |||||||||
| > 50 | |||||||||
| Middle-grade doctor FTE (reference: 0–24 FTEs) | |||||||||
| 25–29 | 0.09 | < 0.01 to 0.17 | 0.04 | ||||||
| 30–39 | 0.05 | –0.03 to 0.13 | 0.19 | ||||||
| 40–49 | 0.07 | –0.03 to 0.16 | 0.17 | ||||||
| > 50 | 0.03 | –0.05 to 0.12 | 0.45 | ||||||
| Early-career doctor FTE (reference: 0–24 FTEs) | |||||||||
| 25–29 | |||||||||
| 30–39 | |||||||||
| Total beds available overnight (reference: 0–349) | |||||||||
| 350–499 | |||||||||
| 500–699 | |||||||||
| 700–999 | |||||||||
| ≥ 1000 | |||||||||
| Total beds available overnight for trauma and orthopaedic surgery (reference: 0–34) | |||||||||
| 35–49 | |||||||||
| 50–69 | |||||||||
| 70–99 | |||||||||
| ≥ 100 | |||||||||
| Total beds available overnight for rehabilitation (reference: 0) | |||||||||
| > 0–10 | |||||||||
| 11–20 | |||||||||
| ≥ 20 | |||||||||
| Operating theatres (reference: < 10) | |||||||||
| 10–14 | |||||||||
| 15–19 | |||||||||
| 20–24 | |||||||||
| ≥ 25 | |||||||||
| Dedicated day-case operating theatres (reference: ≥ 7) | |||||||||
| 0 | |||||||||
| 1–2 | |||||||||
| 3–4 | |||||||||
| 5–6 | |||||||||
| Category | Patient model | Surgical model | Hospital organisation model | ||||||
|---|---|---|---|---|---|---|---|---|---|
| Coefficient | 95% CI | p-value | Coefficient | 95% CI | p-value | Coefficient | 95% CI | p-value | |
| Intercept | –3.92 | –4.20 to –3.65 | < 0.01 | –4.02 | –4.30 to –3.73 | < 0.01 | –4.01 | –4.30 to –3.72 | < 0.01 |
| Patient factors | |||||||||
| Calendar year (reference: 2014) | |||||||||
| 2015 | 0.15 | 0.09 to 0.20 | < 0.01 | 0.14 | 0.09 to 0.20 | < 0.01 | 0.14 | 0.08 to 0.19 | < 0.01 |
| 2016 | 0.15 | 0.09 to 0.20 | < 0.01 | 0.14 | 0.08 to 0.20 | < 0.01 | 0.14 | 0.08 to 0.19 | < 0.01 |
| Age (years) (reference: < 50 years) | |||||||||
| 50–59 | –0.18 | –0.35 to < 0.01 | 0.05 | –0.19 | –0.37 to –0.01 | 0.04 | –0.18 | –0.36 to < 0.01 | 0.04 |
| 60–69 | –0.21 | –0.38 to –0.04 | 0.01 | –0.25 | –0.42 to –0.08 | < 0.01 | –0.24 | –0.42 to –0.07 | 0.01 |
| 70–79 | –0.01 | –0.18 to 0.16 | 0.94 | –0.05 | –0.22 to 0.12 | 0.55 | –0.04 | –0.22 to 0.13 | 0.61 |
| 80–84 | 0.25 | 0.08 to 0.43 | 0.01 | 0.21 | 0.03 to 0.38 | 0.02 | 0.21 | 0.03 to 0.39 | 0.02 |
| ≥ 85 | 0.61 | 0.43 to 0.80 | < 0.01 | 0.57 | 0.38 to 0.75 | < 0.01 | 0.57 | 0.38 to 0.75 | < 0.01 |
| Sex (reference: female) | |||||||||
| Male | 0.23 | 0.19 to 0.28 | < 0.01 | 0.24 | 0.20 to 0.29 | < 0.01 | 0.24 | 0.20 to 0.29 | < 0.01 |
| BMI (kg/m2) | |||||||||
| Preoperative ASA physical function score (reference: mild disease not incapacitating, grade 2) | |||||||||
| Fit and healthy (grade 1) | –0.22 | –0.32 to –0.12 | < 0.01 | –0.20 | –0.30 to –0.10 | < 0.01 | –0.19 | –0.29 to –0.09 | < 0.01 |
| Incapacitating systemic disease (grade 3) | 0.42 | 0.36 to 0.47 | < 0.01 | 0.41 | 0.35 to 0.46 | < 0.01 | 0.39 | 0.34 to 0.45 | < 0.01 |
| Life-threatening disease or expected to die within 24 hours (grades 4 and 5) | 0.94 | 0.68 to 1.20 | < 0.01 | 0.90 | 0.64 to 1.16 | < 0.01 | 0.88 | 0.62 to 1.15 | < 0.01 |
| IMD (reference: most deprived 20%) | |||||||||
| Least deprived (20%) | –0.13 | –0.20 to –0.05 | < 0.01 | –0.11 | –0.19 to –0.03 | < 0.01 | –0.11 | –0.18 to –0.03 | 0.01 |
| Former less deprived (20–40%) | –0.08 | –0.15 to –0.01 | 0.03 | –0.07 | –0.14 to < 0.01 | 0.06 | –0.07 | –0.14 to 0.01 | 0.08 |
| Current less deprived (40–60%) | –0.03 | –0.10 to 0.04 | 0.44 | –0.03 | –0.10 to 0.04 | 0.44 | –0.03 | –0.10 to 0.05 | 0.45 |
| More deprived (20–40%) | 0.03 | –0.04 to 0.10 | 0.43 | 0.03 | –0.04 to 0.10 | 0.43 | 0.03 | –0.05 to 0.10 | 0.46 |
| Rural/urban indicator (reference: urban ≥ 10,000 habitants) | |||||||||
| Town and fringe | |||||||||
| Village/isolated | |||||||||
| Primary indication (reference: osteoarthritis) | |||||||||
| Osteoarthritis and other | 0.26 | 0.07 to 0.44 | 0.01 | 0.25 | 0.06 to 0.44 | 0.01 | 0.24 | 0.05 to 0.42 | 0.01 |
| Charlson Comorbidity Index score (reference: none, 0) | |||||||||
| Mild (1) | 0.28 | 0.22 to 0.33 | < 0.01 | 0.28 | 0.23 to 0.33 | < 0.01 | 0.28 | 0.22 to 0.33 | < 0.01 |
| Moderate (2) | 0.41 | 0.34 to 0.49 | < 0.01 | 0.42 | 0.34 to 0.49 | < 0.01 | 0.41 | 0.33 to 0.48 | < 0.01 |
| Severe (≥ 3) | 0.69 | 0.60 to 0.78 | < 0.01 | 0.69 | 0.60 to 0.78 | < 0.01 | 0.68 | 0.59 to 0.77 | < 0.01 |
| EQ-5D-3L (reference: lowest quintile) | |||||||||
| Second quintile | –0.08 | –0.15 to < 0.01 | 0.04 | –0.07 | –0.15 to < 0.01 | 0.05 | –0.07 | –0.15 to < 0.01 | 0.06 |
| Third quintile | –0.18 | –0.25 to –0.12 | < 0.01 | –0.18 | –0.24 to –0.11 | < 0.01 | –0.17 | –0.24 to –0.11 | < 0.01 |
| Fourth quintile | –0.21 | –0.29 to –0.12 | < 0.01 | –0.20 | –0.29 to –0.11 | < 0.01 | –0.19 | –0.28 to –0.10 | < 0.01 |
| Highest quintile | –0.26 | –0.33 to –0.20 | < 0.01 | –0.25 | –0.32 to –0.19 | < 0.01 | –0.24 | –0.31 to –0.18 | < 0.01 |
| Surgical factors | |||||||||
| Lead surgeon experience (reference: consultant) | |||||||||
| Other | |||||||||
| Surgical volume per lead surgeon (reference: > 150 surgeries per year) | |||||||||
| ≤ 10 | –0.10 | –0.30 to 0.10 | 0.34 | ||||||
| 11–50 | 0.08 | < 0.01 to 0.16 | 0.05 | ||||||
| 51–75 | 0.07 | –0.01 to 0.15 | 0.08 | ||||||
| 76–100 | 0.06 | –0.02 to 0.14 | 0.14 | ||||||
| 101–150 | 0.08 | 0.01 to 0.16 | 0.04 | ||||||
| Surgical volume per unit (reference: surgeries per year, ≥ 500) | |||||||||
| ≤ 200 | 0.10 | 0.01 to 0.18 | 0.03 | 0.10 | 0.01 to 0.18 | 0.03 | |||
| 200–299 | 0.08 | 0.01 to 0.16 | 0.03 | 0.08 | < 0.01 to 0.16 | 0.04 | |||
| 300–399 | 0.08 | < 0.01 to 0.15 | 0.05 | 0.08 | < 0.01 to 0.16 | 0.04 | |||
| 400–499 | 0.05 | –0.03 to 0.14 | 0.23 | 0.05 | –0.04 to 0.13 | 0.27 | |||
| Minimally invasive surgery (reference: no) | |||||||||
| Yes | |||||||||
| Thromboprophylaxis (reference: LMWH ± other) | |||||||||
| None | –0.27 | –0.53 to < 0.01 | 0.05 | ||||||
| Aspirin only | –0.04 | –0.19 to 0.10 | 0.55 | ||||||
| Other (no LMWH) | –0.03 | –0.09 to 0.03 | 0.28 | ||||||
| Mechanical prophylaxis (reference: any) | |||||||||
| None | 0.13 | < 0.01 to 0.27 | 0.05 | ||||||
| General anaesthesia (reference: no) | |||||||||
| Yes | 0.09 | 0.04 to 0.14 | < 0.01 | 0.08 | 0.03 to 0.13 | < 0.01 | |||
| Regional: epidural anaesthesia (reference: no) | |||||||||
| Yes | |||||||||
| Regional: nerve block anaesthesia (reference: no) | |||||||||
| Yes | |||||||||
| Regional: spinal anaesthesia (reference: no) | |||||||||
| Yes | |||||||||
| Type of approach (reference: medial parapatellar) | |||||||||
| Lateral parapatellar | |||||||||
| Mid-vastus | |||||||||
| Subvastus | |||||||||
| Other | |||||||||
| Femoral bone graft (reference: no) | |||||||||
| Yes | |||||||||
| Tibia bone graft (reference: no) | |||||||||
| Yes | |||||||||
| Primary femoral fixation (reference: cemented) | |||||||||
| Cementless | |||||||||
| Primary tibial fixation (reference: cemented) | |||||||||
| Cementless | |||||||||
| Type of knee implant (reference: bicondylar) | |||||||||
| Unicondylar, hinged, linked, custom or preassembled | –0.38 | –0.49 to –0.27 | < 0.01 | –0.38 | –0.49 to –0.27 | < 0.01 | |||
| Hospital organisation factors | |||||||||
| Unit type (reference: public hospital) | |||||||||
| Independent sector: hospital | –0.10 | –0.16 to –0.04 | < 0.01 | ||||||
| Independent sector: treatment centre | –0.30 | –0.42 to –0.17 | < 0.01 | ||||||
| FTE of specialty groups on trauma and orthopaedic surgery (reference: 0–24 FTEs) | |||||||||
| 25–29 | |||||||||
| 30–39 | |||||||||
| 40–49 | |||||||||
| > 50 | |||||||||
| Consultant FTE (reference: 0–24 FTEs) | |||||||||
| 25–29 | |||||||||
| 30–39 | |||||||||
| 40–49 | |||||||||
| > 50 | |||||||||
| Middle-grade doctor FTE (reference: 0–24 FTEs) | |||||||||
| 25–29 | –0.01 | –0.10 to 0.07 | 0.77 | ||||||
| 30–39 | 0.02 | –0.06 to 0.11 | 0.56 | ||||||
| 40–49 | 0.11 | –0.01 to 0.22 | 0.07 | ||||||
| > 50 | 0.10 | < 0.01 to 0.21 | 0.05 | ||||||
| Early-career doctor FTE (reference: 0–24 FTEs) | |||||||||
| 25–29 | |||||||||
| 30–39 | |||||||||
| Total beds available overnight (reference: 0–349) | |||||||||
| 350–499 | |||||||||
| 500–699 | |||||||||
| 700–999 | |||||||||
| ≥ 1000 | |||||||||
| Total beds available overnight for trauma and orthopaedic surgery (reference: 0–34) | |||||||||
| 35–49 | |||||||||
| 50–69 | |||||||||
| 70–99 | |||||||||
| ≥ 100 | |||||||||
| Total beds available overnight for rehabilitation (reference: 0) | |||||||||
| > 0–10 | |||||||||
| 11–20 | |||||||||
| ≥ 20 | |||||||||
| Operating theatres (reference: < 10) | |||||||||
| 10–14 | 0.13 | 0.05 to 0.21 | < 0.01 | ||||||
| 15–19 | 0.06 | –0.02 to 0.13 | 0.16 | ||||||
| 20–24 | 0.10 | 0.02 to 0.18 | 0.01 | ||||||
| ≥ 25 | 0.11 | 0.02 to 0.20 | 0.01 | ||||||
| Dedicated day-case operating theatres (reference: ≥ 7) | |||||||||
| 0 | |||||||||
| 1–2 | |||||||||
| 3–4 | |||||||||
| 5–6 | |||||||||
FIGURE 29.
Trends in LOS and OHS and OKS at Hampshire Hospitals NHS Foundation Trust. (a) OHS LOS; (b) OHS 6 months – OHS baseline; (c) OKS LOS; and (d) OKS 6 months – OKS baseline.
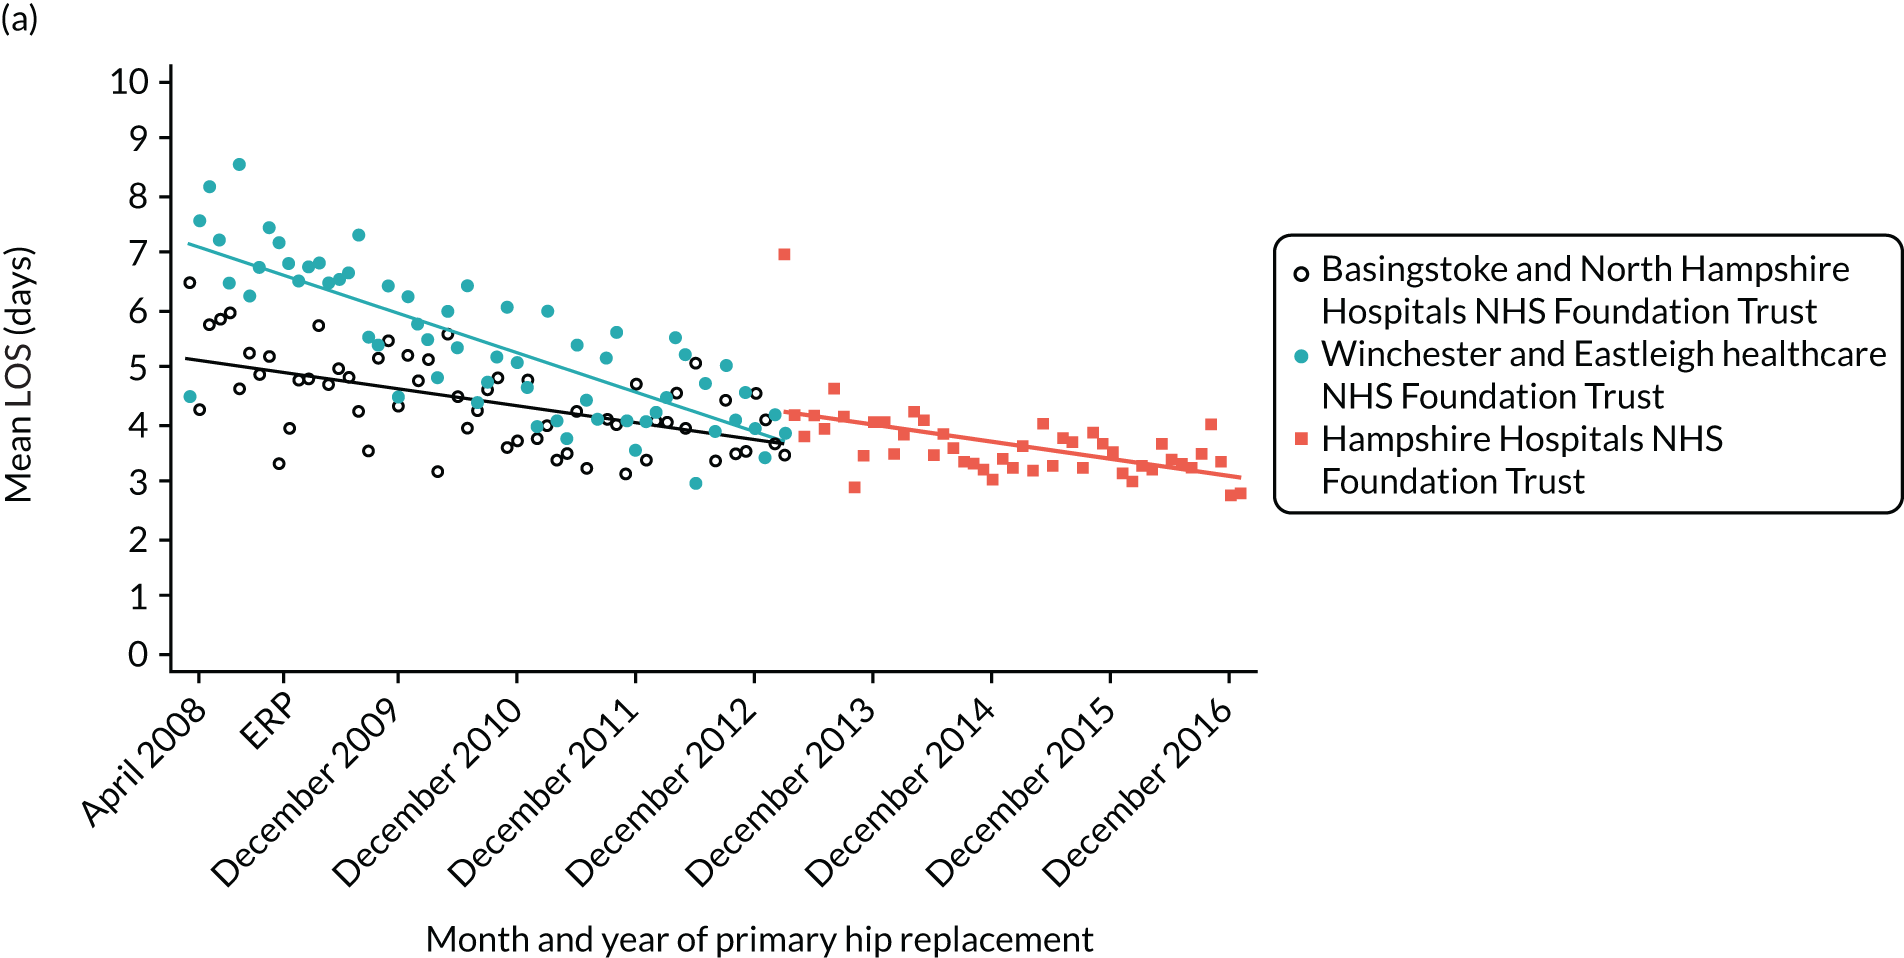
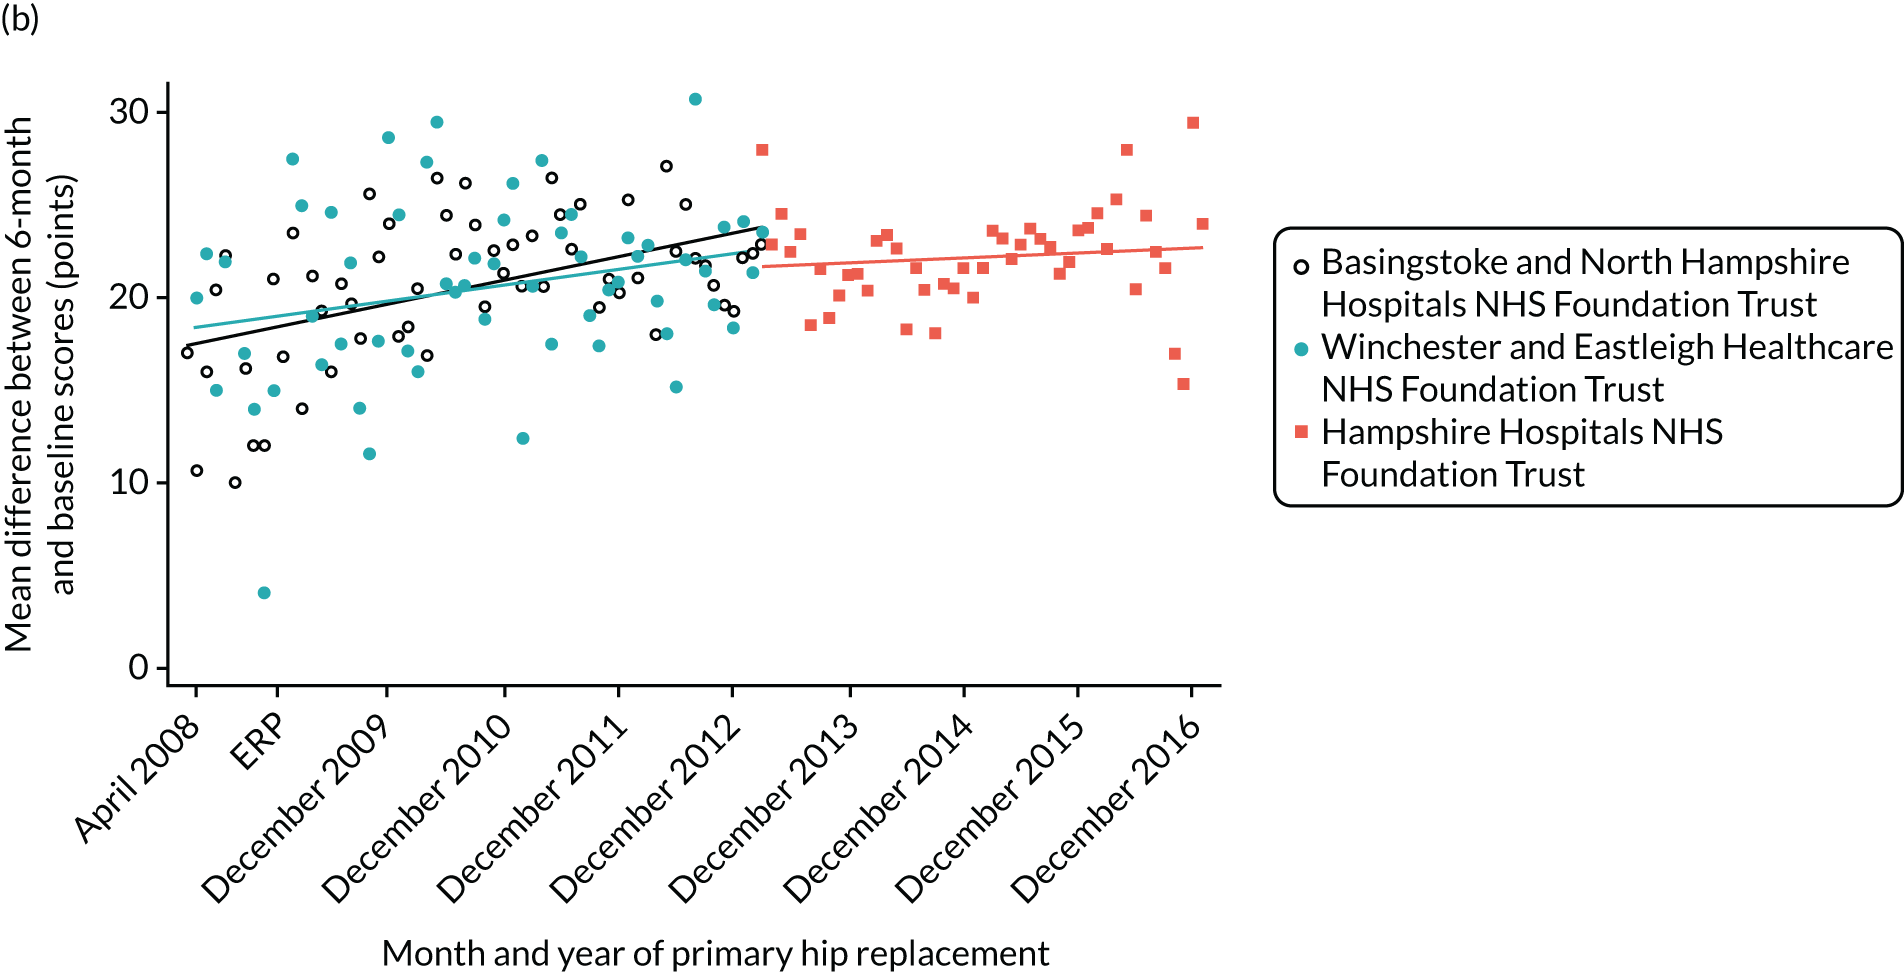
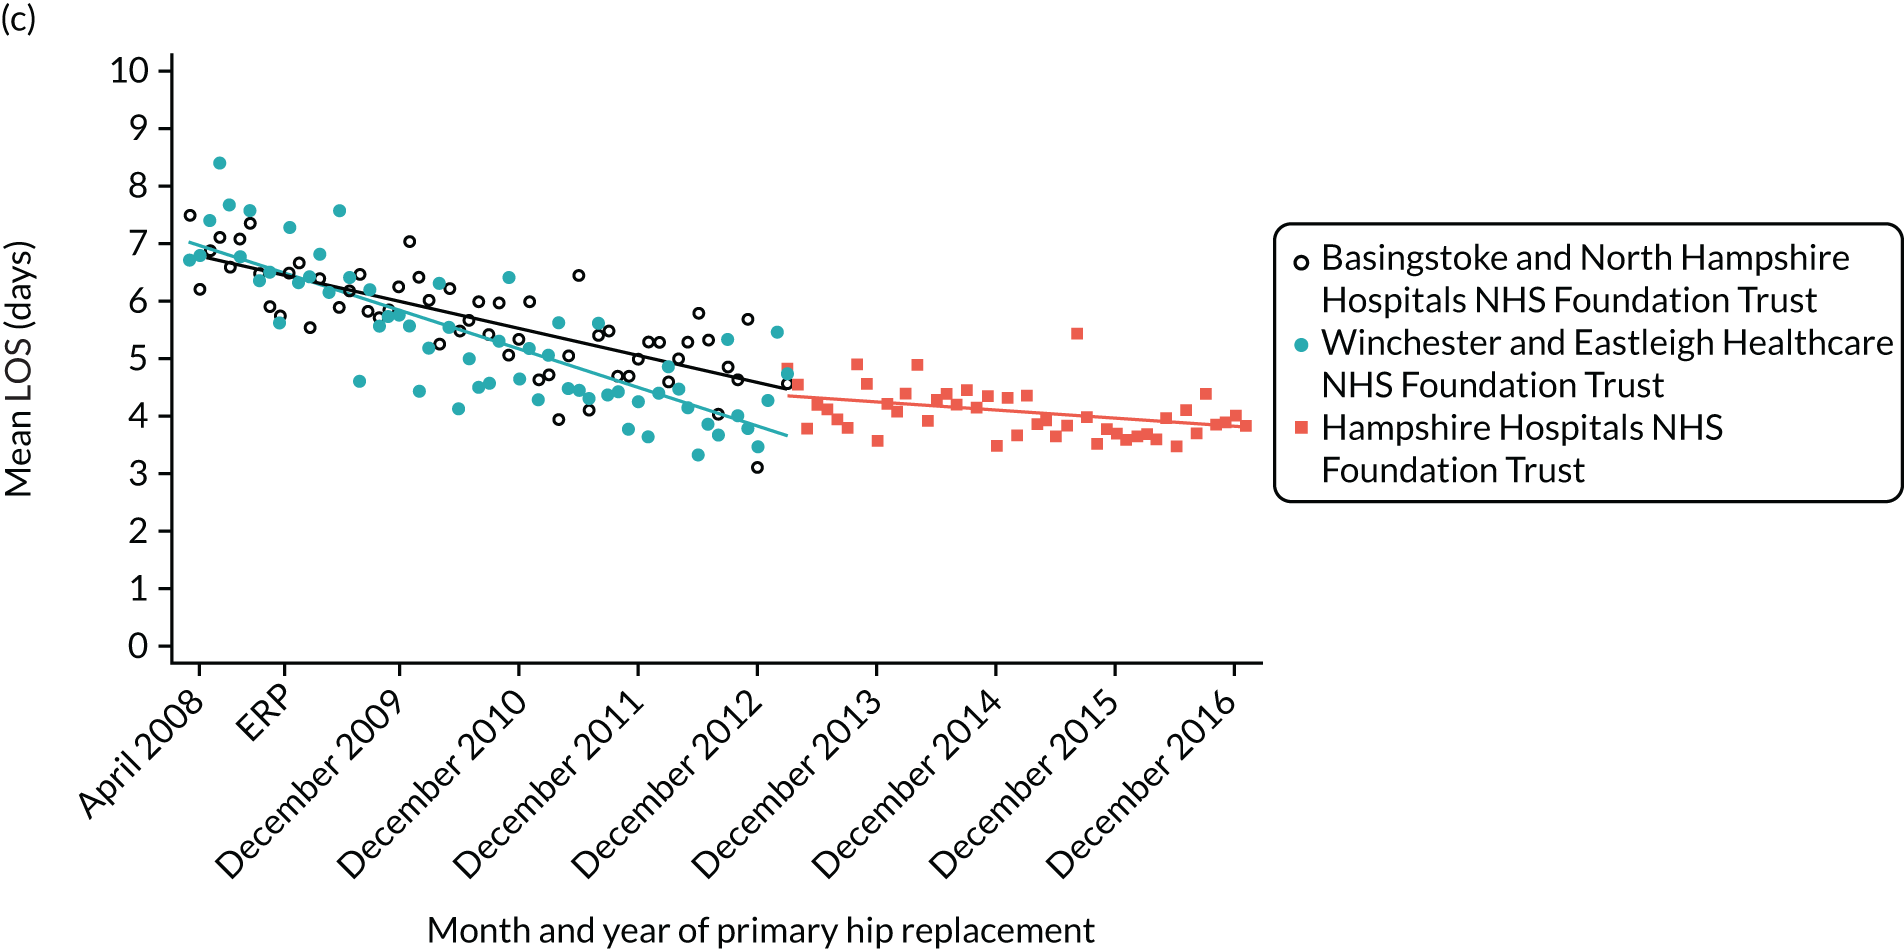
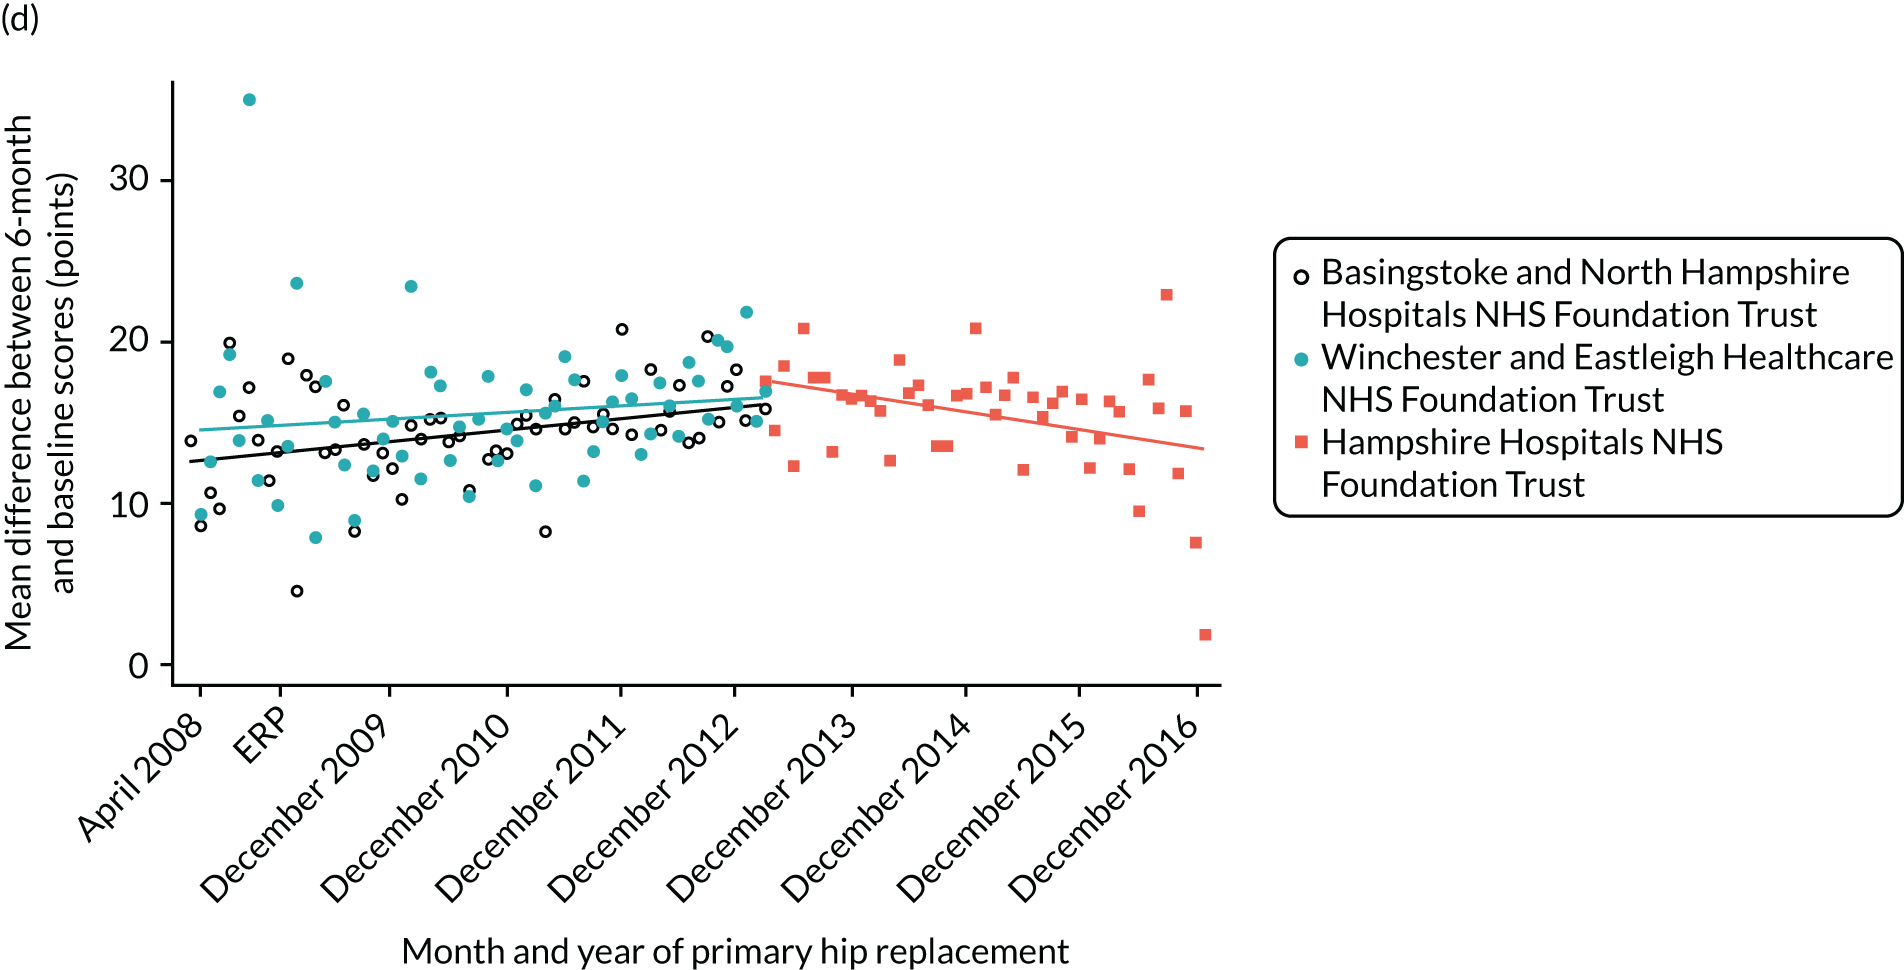
Glossary
- American Society of Anesthesiologists grade
- A measure of a person’s overall health, rather than a fitness for anaesthesia.
- Charlson Comorbidity Index
- An index of diseases that predicts 10-year mortality for a patient with comorbid conditions.
- Clinical Commissioning Group
- An NHS organisation that organises the delivery of NHS services in England.
- EuroQol-5 Dimensions
- A standardised instrument for measuring generic health status.
- Health-related quality of life
- A standardised instrument for measuring perceived physical and mental health over time.
- Normalisation process theory
- A method to look at how the collective actions of agents drive the implementation of a new service.
List of abbreviations
- AdViSHE
- Assessment of the Validation Status of Health-Economic decision models
- ASA
- American Society of Anesthesiologists
- BMI
- body mass index
- CCG
- Clinical Commissioning Group
- CFIR
- Consolidated Framework for Implementation Research
- CHEC
- Consensus on Health Economic Criteria
- CI
- confidence interval
- CPRD
- Clinical Practice Research Datalink
- DVD
- digital versatile disc
- EQ-5D
- EuroQol-5 Dimensions
- ERAS
- enhanced recovery after surgery
- ERP
- enhanced recovery pathway
- FTE
- full-time equivalent
- GLM
- generalised linear model
- GP
- general practitioner
- HCHS
- Hospital and Community Health Service
- HES
- Hospital Episode Statistics
- HQIP
- Healthcare Quality Improvement Partnership
- HRG
- Healthcare Resource Group
- ICD-10
- International Statistical Classification of Diseases and Related Health Problems, Tenth Revision
- IQR
- interquartile range
- ISPOR
- International Society for Pharmacoeconomics and Outcomes Research
- LLSOA
- lower-layer super output area
- LOS
- length of stay
- MoM
- metal on metal
- NIHR
- National Institute for Health Research
- NJR
- National Joint Registry
- OHS
- Oxford Hip Score
- OKS
- Oxford Knee Score
- ONS
- Office for National Statistics
- OPCS-4
- Operating Procedure Codes Classification of Interventions and Procedures
- OT
- occupational therapist
- PEP-R
- Patient Experience Partnership in Research
- PROM
- patient-reported outcome measure
- QALY
- quality-adjusted life-year
- S. aureus
- Staphylococcus aureus
- SD
- standard deviation
- THR
- total hip replacement
- TKR
- total knee replacement
- UKR
- unicompartmental knee replacement
Notes
-
The ICD-10 codes used to identify complications
-
The OPCS-4 codes used to identify blood transfusion complication
-
Methods for estimation of average bed-day costs using HES data
-
The OPCS-4 codes used to identify hip revision
-
The OPCS-4 codes used to identify knee revision
-
The ICD-10 codes used to identify comorbidities
-
Search strategy and tables supporting systematic review of cost-effectiveness of ERAS
-
Data extraction form used in systematic review of cost-effectiveness of ERAS
-
Costing methodology to support Chapter 7
Supplementary material can be found on the NIHR Journals Library report project page (www.journalslibrary.nihr.ac.uk/programmes/hsdr/144602/#/documentation).
Supplementary material has been provided by the authors to support the report and any files provided at submission will have been seen by peer reviewers, but not extensively reviewed. Any supplementary material provided at a later stage in the process may not have been peer reviewed.
