Notes
Article history
The research reported in this issue of the journal was commissioned by the HTA programme as project number 10/14/01. The contractual start date was in July 2011. The draft report began editorial review in November 2011 and was accepted for publication in February 2012. As the funder, by devising a commissioning brief, the HTA programme specified the research question and study design. The authors have been wholly responsible for all data collection, analysis and interpretation, and for writing up their work. The HTA editors and publisher have tried to ensure the accuracy of the authors’ report and would like to thank the referees for their constructive comments on the draft document. However, they do not accept liability for damages or losses arising from material published in this report.
Declared competing interests of authors
none
Permissions
Copyright statement
© Queen’s Printer and Controller of HMSO 2012. This work was produced by Cherry et al. under the terms of a commissioning contract issued by the Secretary of State for Health. This issue may be freely reproduced for the purposes of private research and study and extracts (or indeed, the full report) may be included in professional journals provided that suitable acknowledgement is made and the reproduction is not associated with any form of advertising. Applications for commercial reproduction should be addressed to NETSCC. This journal is a member of and subscribes to the principles of the Committee on Publication Ethics (COPE) (http://www.publicationethics.org/). This journal may be freely reproduced for the purposes of private research and study and may be included in professional journals provided that suitable acknowledgement is made and the reproduction is not associated with any form of advertising. Applications for commercial reproduction should be addressed to: NETSCC, Health Technology Assessment, Alpha House, University of Southampton Science Park, Southampton SO16 7NS, UK.
2012 Queen’s Printer and Controller of HMSO
Chapter 1 Assessment aims
The review assessed the clinical effectiveness and cost-effectiveness of primary stroke prevention treatments for children with sickle cell disease (SCD) who were identified by transcranial Doppler (TCD) ultrasonography to be at high risk of stroke. The review examined the existing health economics evidence and identified the key economic issues related to primary stroke prevention treatment in clinical care for this group of patients. A de novo economic model was developed and populated to evaluate the cost-effectiveness of TCD ultrasonography with blood transfusion as a primary stroke prevention treatment within the NHS.
Chapter 2 Background
Sickle cell disease is a recessive genetic blood disorder, caused by a mutation in the beta-globin gene. 1 This mutation results in an altered haemoglobin molecule that polymerises when deoxygenated and damages red cells, which adopt the characteristic sickle shape. Their abnormal shape and decreased flexibility means that they are more likely to obstruct small blood vessels, reducing the amount of oxygen delivered to the lungs, brain and other tissues, and causing vascular endothelial damage.
People who inherit one affected beta-globin gene have sickle cell trait and this does not normally cause health problems. People who inherit two genes for haemoglobin S (sickle haemoglobin, HbS) or one gene for HbS and one gene for beta-thalassaemia or haemoglobin C, D Punjab or O Arab have SCD. 1 SCD occurs more commonly in people whose family origins are African, African Caribbean, Asian or Mediterranean; the disease is rare in people of north European origin. 2 Sickle cell anaemia (SCA) is the most common form of SCD and may also be referred to as HbSS or SS disease. Types of SCD are summarised in Table 1.
| Type of SCD | Genetic profile | Other names | Severity of symptoms |
|---|---|---|---|
| HbAS | Heterozygous for HbS. Carries both defective gene (βS) and gene for normal haemoglobin (βA) | Sickle cell trait, often referred to as healthy carrier of HbS | Normally asymptomatic |
| HbSS | Homozygous for HbS. Most or all of normal haemoglobin is replaced with sickle haemoglobin (HbS) | Sickle cell anaemia (SCA) | Moderate to severe |
| HbSC | Double heterozygous for HbS and haemoglobin C | Haemoglobin SC or HbSC | Mild to moderate |
| HbSD Punjab | Double heterozygous for HbS and haemoglobin D | Haemoglobin SD or HbSD. Only if the D is D Punjab is there a clinical problem | Moderate to severe |
| HbSβ0 thalassaemia | Double heterozygous for HbS and beta zero-thalassaemia | Haemoglobin S-beta zero-thalassaemia | Moderate to severe |
| HbSβ+ thalassaemia | Double heterozygous for beta plus-thalassaemia (mild beta-thalassaemia mutation) | Haemoglobin S-beta plus-thalassaemia | Mild to severe |
A major complication of SCD is cerebrovascular disease, which can result in overt stroke. 3 Nearly all of the evidence on stroke in SCD refers to homozygous sickle cell disease (HbSS) and, to a lesser extent, haemoglobin Sβ0 thalassaemia (HbSβ0 thalassaemia). Without a primary prevention programme, rates of overt stroke in children and adults with SCD are higher than in the general population. The actuarial or predictive risk of an initial stroke before the age of 20 years in individuals with SCD is 0.761 episodes per 100 person-years, whereas after the age of 20 years the risk is 0.524 episodes per 100 person-years. 4
Epidemiology
Sickle cell disease
Sickle cell disease is one of the most common severe monogenic disorders in the world. 5 It is now the most common genetic condition in the UK; the incidence rate is estimated to be 1 in 2000 live births. 6 Rates are higher in some urban areas, affecting 1 in 300 live births. 2 There are approximately 5230 children aged < 16 years with SCD in the UK. As SCD is primarily found in black ethnicities (predominantly from sub-Saharan Africa), there is a very unequal geographic distribution of SCD in the UK; the highest density of the affected population is located in inner-city areas, where there is a high proportion of ethnic minority populations. 7 It is thought that 75% of children with SCD in the UK live in or around London (A Streetly, NHS Sickle Cell and Thalassaemia Screening Programme, and D Rees, School of Medicine, King’s College London, London, UK, 2011, personal communication). Streetly et al. 8 estimated the prevalence of SCD in the UK to be approximately 3 per 1000 children (1 : 330 babies with a positive result) in south-east London in comparison with 0.12 per 1000 children (1 : 8333 infants with positive result) in Cumbria and in Lancashire. Babies reported as Black African make up 4% of total births yet represent 61% of all suspected cases of SCD. 8 Carrier rates in Black African babies are 145 per 1000 children (1 : 7), in comparison with 1.85 per 1000 children reported as being White British (1 : 540). 8
Screening for sickle cell disease
The Human Genetics Commission considers that preconception genetic testing can be useful if offered to individuals from high-risk populations owing to their family history or ethnic background. Testing should be offered together with pre- and post-test genetic counselling, and should support reproductive choice. 9 In the UK, testing is undertaken on an ad hoc basis owing to a lack of national policy (A Streetly and D Rees, 2011, personal communication).
Both antenatal and postnatal screening programmes for SCD are in place; these were first introduced in England between September 2003 and July 2006. 10 The purpose of the screening programme is to facilitate informed choices, identify women/couples at risk of a pregnancy with sickle cell or thalassaemia disorders and provide appropriate referral and care for prenatal diagnosis with continuation of pregnancy or termination according to parental choice.
Antenatal screening for SCD is offered to women in England identified to be at high risk by a blood test in their eighth to tenth week of pregnancy (A Streetly and D Rees, 2011, personal communication). The roll-out of this screening programme was completed in September 2008. 9 Between April 2008 and March 2009, approximately 657,000 pregnant women were screened for SCD and thalassaemia in the UK. 9 Estimated rates of antenatal screening uptake in women vary, with one source reporting an uptake rate of 80%11 and another reporting uptake as ‘low’. 9
Newborn screening takes place as part of the newborn dried-blood-spot screening programme between 5 and 8 days after birth. The programme was fully implemented in England in 2006. All infants, regardless of ethnicity, are offered screening. 8
Complications of sickle cell disease
Sickle cell disease is associated with a number of serious complications, including acute pain, splenic sequestration and acute chest syndrome.
Acute pain
Acute pain (vaso-occlusive crisis) is a common occurrence in individuals with SCD, and pain caused by vaso-occlusion is the major cause of hospitalisation in patients with SCD. 12 The most commonly affected areas are the abdomen, back, legs, knees, arms and chest,13,14 with pain generally affecting two or more areas. The pain can be acute or chronic, but acute pain is more common, especially in children. Acute pain occurs when sickled red blood cells block blood flow to limbs and organs, which leads to ischaemic tissue injury and the occlusion of microvascular beds. Chronic pain occurs following recurrent crises, which lead to the destruction of bones, joints and organs. The effect of recurrent acute pain on chronic pain causes a unique pain syndrome. 13
Overall, patients with SCD have an average of about one hospital admission per year with vaso-occlusive crisis, but the susceptibility to severe painful crisis is highly variable and approximately 5.2% of patients with SCD have between 3 and 10 episodes of vaso-occlusive crises per year. 14 These generally resolve in between 5 and 7 days, although severe episodes can result in hospital admissions lasting 2–3 weeks. Treatment for acute pain may include strong opiate analgesia, fluids, antibiotic drugs and, if there is symptomatic anaemia, blood transfusion. 5
Acute splenic sequestration
Acute splenic sequestration happens as a result of rapid sequestration of red blood cells in the spleen. 15 It is a serious complication of SCD and is one of the leading causes of death in children with SCD in the first decade of life. 16,17 Splenic sequestration is most common in children aged between 5 months and 2 years, and is characterised by sudden onset of anaemia, splenomegaly (enlargement of spleen) and a spleen that regresses to its presequestration size following blood transfusion. 15 Viral causes of splenic sequestration have been suggested, as it is thought to be associated with upper respiratory tract infections. 15
In the short term, blood transfusion can be used to prevent recurrent attacks of splenic sequestration and is therefore advocated as treatment to prevent recurrent attacks. 18 Splenectomy is advocated if the child has two or more episodes of severe acute splenic sequestration requiring transfusion. 19,20
Acute chest syndrome
Acute chest syndrome can be caused by infection, fat embolism and vaso-occlusion of the pulmonary vasculature,5 and symptoms include pleuritic chest pain, fever, rales (crackles) on lung auscultation and pulmonary infiltrates observed on chest radiographs. 16 At least one episode of acute chest syndrome is experienced in the lives of approximately half of all patients with SCD. 17 Acute chest syndrome is the second most frequent cause of hospitalisation in patients with SCD (after acute pain),21 with a reported rate of 12.8 hospitalisations per 100 patient-years. 16 One-quarter of SCD-related deaths can be directly attributable to acute chest syndrome. 16 Death rates in patients with acute chest syndrome are 1.8% in children and 4.3% in adults. 22 Peak incidence has been reported as at between 2 and 4 years of age (25.3 per 100 patient-years), with a higher prevalence during the winter months. 16
Childhood stroke and sickle cell disease
For children with SCD, the risk of stroke is estimated to be 300 times higher than in the general childhood population. 23,24 Without screening, up to 10% of children with SCD suffer stroke, usually ischaemic. 25 A further 17–25% of patients suffer often unnoticed ‘silent infarctions’, resulting in neurological disability and damage. 26 Ischaemic strokes are characterised by slurred speech, weakness in limbs, seizures, coma and cognitive impairments. The most common presentation of stroke is acute hemiplegia (the inability to move, experienced on one side of the body). Recovery from stroke varies across children; functionality may be recovered over time. However, 50% of children who experience a stroke are likely to have remaining disability and 18% of these children will be severely disabled. 24 An underappreciated outcome of stroke in childhood is its association with serious intellectual and cognitive deficits; attention, memory and executive function may all be affected. 24 Once individuals have suffered a primary stroke, they have a 30–75% risk of a further (secondary) stroke if not receiving blood transfusions, and these strokes are associated with significant mortality and morbidity. 25
The risks of stroke for patients with SCD are thought to differ across the course of childhood. Data from the USA indicate that the childhood incidence of stroke in those with SCD is 1.02 per 100 patient-years in children aged between 2 and 5 years, and 0.79 per 100 patient-years in children aged between 6 and 9 years,27 with stroke in all individuals with SCD averaging 0.61 per 100 patient-years.
The Baltimore–Washington Cooperative Young Stroke Study23 identified all children aged 1–14 years in Maryland and Washington DC with a diagnosis of ischaemic stroke and intracerebral haemorrhage between 1988 and 1991. They estimated the incidence of stroke among children with SCD to be 0.28%, or 285 per 100,000 children with SCD per year. Stroke incidence in children without SCD has been estimated at 2.3 per 100,000 children per year. 28 Quinn and Miller29 calculated that by 18 years of age 11% of children with SCD will have suffered a clinically overt stroke and a further 20% will have a clinically ‘silent’ stroke. Data for the UK on stroke rates in children with SCD are not readily available but there is no reason to anticipate that they are significantly different to rates reported from the USA. A longitudinal study by Telfer et al. 30 in the UK followed a neonatal cohort of 252 children with SCD from 1983 to 2005 and used Kaplan–Meier techniques to estimate the risk of developing abnormal TCD scores in a cohort of children followed from birth to the age of 16 years. They found the incidence of first stroke to be 0.3 per 100 patient-years. Estimated risk of stroke was 0.7% per 100 patient-years at age 5 years, 2.7% at age 10 years, 4.3% at age 15 years and 12.8% at age 20 years. The majority of these patients had been screened with TCD ultrasonography and other modalities and, during the course of the study, primary stroke prophylaxis had been implemented.
Current methods of identifying stroke risk
Transcranial Doppler ultrasonography is a non-invasive technique that measures local blood velocity in the proximal portions of large intracranial arteries. Screening with TCD ultrasonography identifies individuals with high cerebral blood velocity rates; these children are at the highest risk of stroke (Table 2). 31
| Risk category | Velocity (cm/second) |
|---|---|
| Normal velocity: ‘standard risk’ | < 170 |
| Borderline velocity: ‘conditional risk’ | 170–199 |
| High velocity: ‘high risk’ | ≥ 200 |
There are 55 centres in the UK that currently offer TCD screening. The uptake of stroke screening nationally in children with SCD is not known, but figures provided by the North Middlesex University Hospitals NHS Trust indicate that > 90% of children who are offered screening are screened (M Roberts-Harewood, School of Medicine, King’s College London, London, UK, 2011, personal communication). The reported advantages and disadvantages32 of the use of TCD ultrasonography for identification of risk of early stroke in children are listed in Table 3.
| Advantage | Disadvantage |
|---|---|
| Can be performed at the bedside | Operator dependent, so requires skill and experience in interpretation |
| Gives immediate information as to intracerebral vasculature | Can be technically difficult owing to poor acoustic window |
| Can be easily repeated | Allows for examination of cerebral blood volume only in certain segments of large intracranial vessels |
| Less expensive than other techniques, such as magnetic resonance imaging | Detects indirect effects (such as abnormal waveform characteristics) of lesions |
| Does not use contrast agents, therefore avoiding allergic reactions and decreasing patient risk | Does not detect silent infarcts |
| High temporal resolution | Does not detect all children who are at increased risk of stroke |
| Safe and non-invasive procedure |
It is estimated31 that 9.7% of children screened will have an ‘abnormal’ TCD velocity of > 200 cm/second at their first TCD scan and these children are estimated to have a stroke rate of at least 10% per year (M Roberts-Harewood, 2011, personal communication). 33 Data from the UK suggest that 3% of children have an abnormal first TCD velocity and that 10–15% of children develop abnormal TCD velocities by the age of 16 years. 34
Current primary stroke prevention strategies
A number of primary stroke prevention strategies for children with SCD are currently used in clinical practice in the UK, including blood transfusion, treatment with hydroxycarbamide and bone marrow transplantation (BMT).
Regular blood transfusion
The primary prevention strategy for stroke resulting from SCD in both adults and children is regular blood transfusion, although the means by which transfusion prevents stroke is unknown. 35 The standard therapeutic goal of regular blood transfusion is to reduce the HbS to < 30% of the total haemoglobin36 and to maintain a haemoglobin level of > 9 g/dl.
Blood transfusions can be delivered using different methods. These include transfusion of packed red blood cells every 3–4 weeks and exchange transfusion (by hand or automated apheresis) every 4–8 weeks. Following 3 years of blood transfusion therapy, maintenance of HbS at < 50% may then be sufficient to prevent future stroke,31 although there is no direct evidence to support this.
Data are lacking regarding the exact number of children with SCD who are currently receiving blood transfusions in the UK. However, cohort data suggest that between 3.6% and 6.7% of children with SCD receive prophylactic blood transfusion for primary stroke prevention each year (M Roberts-Harewood, 2011, personal communication). 30 Data from a large UK centre suggest that 9% of children with HbSS receive prophylactic blood transfusion for primary stroke prevention each year (P Telfer, Barts and the London School of Medicine and Dentistry, London, UK, 2011, personal communication). The paediatric peer review programme suggests that between 1 : 30 and 1 : 10 children receive regular blood transfusion for all causes, of which primary stroke prevention in children with SCD is the most common (A Yardumian, North Middlesex University Hospital, UK, 2011, personal communication).
Blood transfusion is time consuming and regular transfusion is required to reduce and maintain the target levels of HbS. 36 There are also significant risks associated with chronic blood transfusion, including iron overload. Adverse events (AEs) associated with transfusion include alloimmunisation (development of antibodies to foreign red blood cells),37 risk of transfusion-transmitted infections [such as human immunodeficiency virus (HIV), hepatitis B, prion disease or hepatitis C (frequently occurring in developing countries where the rate of SCD is higher)] and haemolytic transfusion reactions. The risks of these events increase over time and must be carefully considered before undertaking a regimen of chronic blood transfusion.
It is estimated that approximately 67% of children who have a first overt stroke will have further overt strokes without transfusion therapy. 4 However, it is likely that between 17.5% and 20% of children will suffer a second overt stroke, despite receiving regular blood transfusion therapy. 38,39
Evidence for the efficacy of transcranial Doppler ultrasonography and blood transfusion
The clinical efficacy of implementing blood transfusions in children with high-risk TCD velocity readings in clinical practice is evidenced by cohort data from the UK and USA. 24,27,30,40–44 These are shown in Table 4 as incidence of stroke per 100 patient-years. It can be seen that in all cohorts, the rates of stroke per 100 patient-years is reduced after the introduction of a TCD scanning and blood transfusion programme.
| Authors | Setting | Incidence of stroke per 100 patient-years | TCD screening? | Age range (years) |
|---|---|---|---|---|
| Ohene-Frempong (1998)27 | Co-operative study of SCD (multicentre USA) | 0.84 | No | 1–9 |
| 0.41 | No | 10–19 | ||
| Quinn (2004)40 | Neonatal cohort, Dallas, TX, USA | 0.85 | No | 0–18 |
| Fullerton (2004)42 | California cohort 1991–8 | 0.88 | No | 0–20 |
| California cohort 1999 | 0.5 | Partial | 0–20 | |
| California cohort 2000 | 0.17 | Full | 0–20 | |
| McCarville (2008)41 | SCD Centre, Memphis, CA, Kaiser Permanente Medical Care Programme | 0.46 | No | 2–18 |
| 0.53 | Partial | 2–18 | ||
| 0.18 | Full | 2–18 | ||
| Armstrong Wells (2009)44 | Children’s Hospital of Philadelphia | 0.44 | No | Children and adults |
| 0.19 | Full | Children and adults | ||
| Enningful-Eghan (2010)43 | East London UK cohort | 0.67 | No | > 22 |
| 0.06 | Full | 2–18 | ||
| Telfer (2007, 2009)30,24 | East London UK cohort | 0.3 | Partial | 0–16 |
| 0.13 | Full | 0–16 |
In addition to these studies, in France a recent cohort study by Bernaudin et al. 45 reported the predictive factors and outcomes of cerebral vasculopathy in the Créteil newborn SCA cohort. The cohort was screened with TCD ultrasonography yearly from the age of 2 years, and transfusion was recommended to children with abnormal TCD velocities. Early TCD screening and introduction of blood transfusion following abnormal TCD reduced cumulative risk of stroke by the age of 18 years from previously reported 11% to 1.9%. The cumulative risk of stroke, abnormal TCD, stenosis or silent stroke by the age of 14 years was 49.9%. These data support the use of blood transfusion in children identified to be at high risk of stroke using TCD ultrasonography.
Chelation therapy
Death in early adulthood has been a common outcome of long-term treatment with blood transfusion in patients with thalassaemia owing to inadequate control of transfusional iron overload. 46 Complications due to iron overload can be prevented by iron chelation therapy, which is typically necessary after about 12 months of transfusion (although iron overload is less likely in individuals receiving exchange transfusion). In chelation, medication is administered, which binds to iron and allows it to be readily excreted from the body.
Current licensed chelation treatments for patients with SCD include deferoxamine and deferasirox (Table 5). A third chelator, deferiprone (Ferriprox®, ApoPharma), is licensed only for patients with thalassaemia, although it is used by patients with SCD in a minority of cases. Healthcare professionals at specialist centres decide on the choice of drug, monitoring for efficacy and side effects, dose adjustments and changes to the chelation regime required by their patients.
| Generic name (trade name, manufacturer) | Method of administration and dose | European licence | Side effects |
|---|---|---|---|
| Deferoxamine (Desferal®, Novartis) |
Subcutaneous infusion over 8–12 hours, 5–7 times per week 20–50 mg/kg per day |
To treat iron overload in patients receiving regular transfusion | Injection site reactions, arthralgia/myalgia, headache, urticaria, nausea, pyrexia. Ocular and auditory disturbances, and growth retardation in children (less common) |
| Deferasirox (Exjade®, Novartis) | Oral, 20–40 mg/kg per day | To treat iron overload in patients with SCD of ≥ 2 years | Increased serum creatinine, diarrhoea, constipation, nausea, abdominal pain, increased alanine transaminase. Ocular and auditory disturbances, and growth retardation in children (less common) |
Iron overload can be managed using iron chelating agents to remove toxic iron build-up;25 however, compliance with non-deferasirox chelating regimes is documented as being poor. 47 It is assumed that the introduction of an orally administered treatment (deferasirox) has the potential to improve adherence to chelation and thereby enhance long-term outcomes for patients treated with chronic transfusion. 48,49 Adverse events (AEs) may require the medication to be stopped and subjective side-effects still limit adherence to treatment.
Deferoxamine
Deferoxamine has a short half-life and cannot be absorbed from the intestine; therefore the treatment route is by subcutaneous infusion over 8–12 hours, 5–7 times per week. The dose varies depending on the degree of iron overload and the age of the patient. For established overload the dose is usually between 20 and 50 mg/kg daily. 50
The two main methods of deferoxamine administration are via a mechanical syringe-driver pump or disposable balloon infuser. The pump is relatively inexpensive; however, it is ‘noisy and cumbersome’ and patients are obliged to prepare the doses of deferoxamine. 51 The balloon infuser is more expensive but is smaller and quieter, and is supplied with preprepared doses of deferoxamine. It is thought that use of the balloon infuser may support patient compliance to chelation treatment, as it reduces the burden on the patient and facilitates normal daily activities. 51
Commonly reported side effects of deferoxamine use include injection site reactions, headache, urticaria, nausea and pyrexia. Less commonly reported side effects are ocular and auditory disturbances, and growth retardation in children. Three-monthly checks of weight and height are recommended for children who are treated with deferoxamine. 52
In the USA, National Institutes of Health guidelines54 recommend that chelation therapy (with deferoxamine) is considered once liver iron stores reach 7 mg/g dry weight, or when cumulative transfusions reach approximately 120 ml of packed red blood cells per kilogram of body weight. The guidelines also state that serum ferritin levels of > 1000 μg/l may be used as an indicator but stress that there is a risk of under- or overtreatment owing to the unreliability of this measure in patients with SCD.
Deferasirox
Deferasirox is licensed in Europe to treat iron overload in patients with SCD who are aged ≥ 2 years. It is an oral treatment that is mixed with water or juice and taken 30 minutes before food. Common side effects include increased serum creatinine, gastrointestinal disorders including diarrhoea, constipation, nausea and abdominal pain, and increased alanine transaminase. It is not recommended for patients with severe hepatic impairment or renal impairment. Less commonly reported side effects are ocular and auditory disturbances, and growth retardation in children.
The UK guidelines,53 by the Sickle Cell Society, for chelation therapy recommend that chelation with deferoxamine or deferasirox is considered when patients have received at least 20 top-up transfusions and once liver iron stores reach 7 mg/g dry weight. The guidelines53 state that deferoxamine should be offered as standard treatment and deferasirox should be offered if deferoxamine is not acceptable. In UK clinical practice, the actual uptake rates of deferoxamine and deferasirox are unclear; in some centres the majority of patients are prescribed deferasirox, whereas in others the majority are prescribed deferoxamine (which has a more established track record than deferasirox). In other centres treatment with deferasirox and deferoxamine is more evenly distributed, depending on prescriber preference (D Rees, C Chapman, University Hospital of Leicester NHS Trust, Leicester, UK, and P Telfer, 2011, personal communication).
Risk–benefit model of iron overload and blood transfusion for primary stroke prevention
A paper55 from the USA, published by Mazumdar et al. in 2007, describes the construction and outcomes of a decision model that compared six primary stroke prevention strategies among children with SCA. (The primary author was supported by a grant from the Agency for Healthcare Research and Quality, National Institutes of Health.) The three stated purposes of the model were to (1) compare the projected benefits and risks of the six primary stroke prevention strategies; (2) estimate the optimal frequency of TCD screening; and (3) identify key assumptions that influence the risk–benefit relationship. The primary stroke prevention strategies were chosen to reflect those recommended by professional societies or reported to be in use in the USA and are described in Table 6.
| Frequency and duration of TCD scanning | Duration of transfusion for high-risk patients |
|---|---|
| Annual to age 16 years | Monthly transfusions for life |
| Annual to age 16 years | Transfusion to age 18 years |
| Biannual to age 16 years | Transfusion to age 18 years |
| Annual to age 10 years | Transfusion to age 18 years |
| Once at 2 years of age | Transfusion to age 18 years |
| No screening | No transfusion |
In a hypothetical cohort of 2-year-old children (n = 2000), the optimal strategy (prevention of 32% of strokes) was found to be annual TCD screening until the age of 10 years and children at high risk of stroke receiving monthly transfusion until the age of 18 years. The paper55 highlighted that all strategies resulted in decreased life expectancy, as the model projected that reductions in death rates due to stroke prevention were offset by increases in deaths from transfusion. The authors noted that their results were sensitive to adherence rates to iron chelation treatment and that improvements in adherence would increase life expectancy.
The publication has attracted criticism on a number of grounds (P Telfer and D Rees, 2011, personal communication). First, the model considered long-term risk of stroke in children and adults, whereas the evidence for the efficacy of primary stroke prevention in a paper by Adams et al. [the STOP trial (Stroke Prevention Trial in Sickle Cell Anaemia)]31 is limited to children. In a paper by Paul Telfer et al. 24 the authors note that the model assumes an absence of any effect of childhood transfusion on subsequent adult stroke incidence; however, transfusing high-risk children will prevent future strokes in adulthood (although as yet there are no data available to support this assumption). Further, the data currently available allow an estimate of the risk benefit during childhood and by including all age groups, the beneficial effect of transfusion in childhood is underestimated. 24
Another criticism24 is levelled at the assumption in the model of an eightfold increase in mortality from iron overload after 2 years of regular transfusions, which is negated by adherence to iron chelation treatment. This assumption was derived from an observational study of a cohort of adults with SCD in the 1990s, who were regularly transfused although not for primary stroke prevention; deferasirox was not available as an iron chelation treatment. Although it is the case that the most important AE related to chronic blood transfusion is iron overload, current knowledge of mortality and morbidity resulting from iron overload is derived for the most part from studies of patients with thalassaemia major. The pathology of iron overload in patients with SCD has not been widely studied; however, the limited evidence available suggests that the pattern of iron-induced organ damage is different in patients with SCD from patients with thalassaemia, and the risks may be lower. 24,51 In studies that have investigated causes of mortality in children and adults in the developed world, transfusional iron overload is recorded as being ‘an unusual cause of death’. 24 In summary, these commentators regard the assumption of an increased risk of eightfold to be a ‘gross overestimate of the mortality risk in both childhood and adulthood’. Additionally, regular transfusions may be expected to reduce tissue damage caused by SCD, and so preserve organ function and prolong life.
Hydroxycarbamide
Data from non-randomised clinical studies suggest that hydroxycarbamide might be an alternative to transfusion for primary stroke prevention56 and might reduce the risk of stroke in children with SCD. The Royal College of Physicians recommends that children with SCD who cannot receive blood transfusion because of alloimmunisation, autoantibody formation or non-compliance with transfusion or chelation may be considered for treatment with hydroxycarbamide. Hydroxycarbamide increases the concentration of fetal haemoglobin, and is licensed as a treatment to reduce painful crises in patients with SCD. The number of children in the UK currently receiving treatment with hydroxycarbamide for primary stroke prevention is unknown.
A recent systematic review57 considered all published literature on the efficacy, effectiveness and toxicity of hydroxycarbamide in children with SCD, and found an increase in fetal haemoglobin from 5–10% to 15–20% in those children treated with hydroxycarbamide. Haemoglobin concentration increased modestly (1 g/l) but significantly across studies. Treatment with hydroxycarbamide also decreased hospitalisation rates from 87% to 56%. A small study58 has reported on the impact of hydroxycarbamide on the TCD blood velocities of 59 children with SCD and shows that the magnitude of TCD velocity decline was significantly correlated with the maximal baseline TCD value. Recently published data from the BABY HUG trial59 found a significantly lower average increase in TCD velocity in children aged between 9 months and 18 months receiving hydroxycarbamide than in those receiving placebo. The evidence for the use of hydroxycarbamide as a primary stroke prevention strategy is minimal but suggests that hydroxycarbamide may be useful in reducing TCD velocities in children from birth before they become abnormal. Based on the results of the Stroke With Transfusions Changing to Hydroxyurea (SWiTCH; hydroxurea is now known as hydroxcarbamide) trial,60 it is generally accepted that hydroxycarbamide should not be used for secondary stroke prevention.
Bone marrow transplantation
Bone marrow transplantation is reported to stabilise the cerebrovascular disease caused by SCD61 but is not often feasible due to the lack of availability of suitably matched donors. It is estimated that there are only four to five BMTs performed in the UK each year, and < 400 are performed annually worldwide (A Streetly and D Rees, 2011, personal communication). Successful transplantation of non-sickle cell bone marrow cures SCD, and therefore the children receiving BMT are no longer treated or followed up in the same way as children with SCD. This makes estimation of stroke risk in this population difficult.
Current guidelines for stroke prevention
Clinical guidelines from the USA and UK,62,63 outlined below, resulted from the findings of two randomised controlled trials (RCTs) by Adams; STOP31 and its follow-on trial Optimising Primary Stroke Prevention in Sickle Cell Anaemia (STOP 2). 35 In the STOP31 trial, patients with abnormal TCD scan results were randomised to receive either regular transfusion or no transfusion (standard care). The trial was halted prematurely after 19.6 months. The protocol followed in the STOP31 trial is incorporated in clinical guidelines in the USA and UK. 62,63 In the STOP 235 trial, patients who had received at least 30 months of transfusion therapy and whose TCD scan results were normalised were randomised to either continued-transfusion therapy or halted-transfusion therapy.
A clinical alert issued in 1997 by the National Heart, Lung and Blood Institute (NHLBI) in the USA64 recommended that children with SCA and HbSβ0 thalassaemia, with no previous history of stroke, and who are between the ages of 2 and 16 years, should be screened using TCD ultrasound to identify those with high cerebral blood velocity rates and who are at increased risk of stroke. The NHLBI further advocates considering transfusion for children who have received two sets of abnormal TCD ultrasonography results as a preventative measure for stroke. 64
A second alert was issued in 2004. 64 This recommended that, once started, blood transfusion should be continued for at least 3 years to reduce the rate of strokes in children with SCD. The American Heart Association Stroke Council and the Council on Cardiovascular Disease in the Young have since advised that transfusion continues for at least 5 years or until the child is 18 years old. 62
In 2009, the NHS Antenatal and Newborn Screening Programme produced UK guidelines on the management of stroke in children with SCA and HbSβ0 thalassaemia. 65 These guidelines (based on a combination of a review of the literature and clinical expert opinion) state that children and young adults with SCA and HbSβ0 thalassaemia should be offered annual TCD scans from the age of 2 years until at least the age of 16 years. Children should be classified as either ‘high risk’, ‘conditional’ or ‘standard risk’ in line with the definitions used in the STOP31 trial. The NHS Antenatal and Newborn Screening Programme guidelines further state that children with ‘high risk’ or ‘conditional’ TCD scans should have them repeated within 2 months and the benefits of receiving regular blood transfusion should be discussed with parents for those children remaining at high risk owing to their TCD reading. ‘Standard risk’ children are recommended to receive TCD scans every 12 months. ‘High risk’ children are recommended to be rescanned within 1–4 months. 65 Primary stroke prevention treatment following a second high velocity reading is recommended to be transfusion continued throughout childhood. 31 Guidelines published by the Royal College of Physicians in the UK endorse annual TCD ultrasound scanning of children with SCD from the age of 3 years. 63
Reviews of the effectiveness of primary stroke prevention strategies
A Cochrane review47 of the clinical effectiveness of blood transfusion treatment for primary stroke prevention in children and adults with SCD was published in 2009. A Cochrane review66 of the clinical effectiveness of stem cell transplantation was also published in 2009. Neither of these reviews considered the use of TCD ultrasonography. Both reviews are summarised in Table 7.
| Review | Focus of review | Conclusion |
|---|---|---|
| Hirst (2009)47 | To assess risks and benefits of chronic blood transfusion regimens in people with SCD to prevent first stroke or recurrence | Significantly reduced risk of first stroke in children receiving regular blood transfusions. Two RCTs available for inclusion |
| Oringanje (2009)66 | To determine whether or not stem cell transplantation can improve survival and prevent symptoms associated with SCD. To examine the risks of stem cell transplantation against potential long-term gain for people with SCD | No relevant trials found for inclusion. Further research needed |
The Hirst review47 considered randomised and quasi-RCTs that compared blood transfusion as prophylaxis for primary or secondary stroke in people with SCD with alternative prophylactic treatment or with no treatment. Two RCTs (STOP31 and STOP 235) were identified and the authors concluded that for children who received prophylactic blood transfusion for primary stroke, the risk of stroke was significantly reduced but that following discontinuation of transfusion the risk level reverts to the pre-transfusion level.
The Oringanje review66 focused on haematopoietic stem cell transplantation and considered randomised and quasi-RCTs that compared stem cell transplantation with (1) other methods of stem cell transplantation or (2) any preventative or supportive interventions (such as periodic blood transfusion, hydroxycarbamide, antibiotic drugs, pain relievers, supplemental oxygen) in children (< 16 years) with SCD. This review failed to identify any relevant trials for inclusion.
Aims and objectives of the current review
The purpose of the current review was to assess the clinical effectiveness and cost-effectiveness of primary stroke prevention in children with SCD who are identified (by TCD) as being at high risk of stroke. To this end, a systematic review and economic evaluation were conducted. The objectives were to systematically examine the published evidence for primary stroke prevention in children with SCD who were identified to be at high risk of stroke using TCD ultrasonography, identify gaps in the current clinical and economics literature, and make recommendations for future clinical research and practice.
Chapter 3 Methods
A systematic review and economic evaluation were conducted to assess the clinical effectiveness of primary stroke prevention strategies for children with SCD who were identified by TCD ultrasonography to be at high risk of primary stroke. The systematic review was guided by the general principles recommended by the Centre for Reviews and Dissemination (CRD) for undertaking reviews in health care. 67
In order to ensure that adequate clinical input was obtained, an advisory panel comprised of clinicians and experts in the field was established. The role of this panel was to comment on the draft report and answer specific clinical questions as the review progressed. In addition, a lay advisor was recruited to the panel to ensure that the review addressed patient issues.
Identification of evidence: clinical effectiveness
Search strategy
The search incorporated a number of strategies, combining index terms (for the disease) and free text words for the technologies involved. The search strategies had no language restrictions and did not include methodological filters that would limit results to a specific study design. Details of the search strategies and the number of records retrieved for each search are provided in Appendix 1. All references were exported to an EndNote version 5 (Thomson Reuters, CA, USA) bibliographic database.
The following electronic databases were searched (YD) for relevant published literature for the period 1950 to May 2011:
-
CDSR (Cochrane Database of Systematic Reviews)
-
CENTRAL (Cochrane Central Register of Controlled Trials)
-
DARE (Database of Abstracts of Reviews of Effects)
-
EMBASE
-
Health Technology Assessment database
-
ISI Web of Science Proceedings (Index to Scientific & Technical Proceedings)
-
ISI Web of Science Citation Index Expanded (SCIE)
-
MEDLINE
-
NHS EED (NHS Economic Evaluation Database).
Given the specialised nature of this disease, searches of conferences were not carried out; clinical advice suggested that the only published data would be found in the literature describing the existing clinical trials.
Selection of evidence
The records identified by the electronic searches were assessed for inclusion in two stages. Two reviewers (MGC and JG) independently scanned all titles and abstracts identified by the search to ascertain which articles may be relevant to the clinical review. Full-text versions of all records selected during the initial screening process were obtained to permit more detailed assessment. These were then assessed independently by two reviewers (MGC and JG), using the inclusion criteria shown in Table 8. The inclusion/exclusion assessment of each reviewer was recorded on a pre-tested, standardised form. Disagreements were resolved by discussion and, if necessary, another reviewer was consulted. A flow diagram summarising the selection and inclusion of studies is provided in Appendix 2, Figure 13.
| Population |
Children < 16 years With SCD Identified, using TCD ultrasonography, as being at high risk of stroke |
| Study design |
Clinical: RCT and systematic reviewsa Economic: Full economic evaluations – cost-effectiveness analysis, cost–benefit analysis, cost–utility analysis, cost-minimisation analysis |
| Intervention |
Blood transfusion Hydroxycarbamide Bone marrow transplantation |
| Setting | Secondary care |
| Comparator | No intervention (standard care) or with each other |
| Outcomes | Any one or more of the following outcomes:
|
Data abstraction
Data extraction for the review of clinical effectiveness was carried out by two reviewers (MGC and JG). Data were abstracted by one reviewer and then checked for accuracy by a second reviewer. Data presented from multiple reports of single trials were extracted as a single record.
Quality assessment
Two reviewers (MGC and JG) independently evaluated the included studies for methodological quality using criteria based on guidance published by CRD. 67 Any discrepancies in quality grading were resolved through discussion.
Methods of data synthesis
Individual study data and quality assessment are summarised in structured tables and as a narrative description. The primary treatment outcome relevant to this review was incidence of stroke. The differences in patient groups between the included trials precluded a statistical synthesis.
Identification of evidence: cost-effectiveness
Search strategy
A comprehensive review of the literature was undertaken to identify all published economic evaluations of primary stroke prevention in children with SCD identified to be at high risk of stroke by TCD ultrasonography using the main search strategy outlined above (see Identification of evidence: clinical effectiveness, above).
Selection of evidence
During the clinical effectiveness screening, all papers that appeared to include economic data were identified. Full-text copies of these papers were subsequently obtained and two reviewers (MGC and JG) independently assessed them for inclusion, using the inclusion criteria described in Table 8. Any disagreements regarding inclusion of economic studies were resolved by discussion. No relevant economic evaluations were identified for inclusion in this review. A flow diagram summarising the selection and inclusion of studies is provided in Appendix 2, Figure 14.
Chapter 4 Assessment of clinical effectiveness
Results
Number of studies identified and included
A total of 1337 non-duplicate records were identified by the search strategy (see Appendix 1) and subsequently screened for inclusion in the review. No trials were identified that evaluated the efficacy of hydroxycarbamide or BMT as primary stroke prevention strategies. Two RCTs31,35 made comparisons between blood transfusion and standard care and were included in the review. Data from these trials were published in peer-reviewed journals. A number of papers relating to these two RCTs were also identified.
Quality assessment of included trials
The methodological quality of the included trials is summarised in Table 9, using the criteria based on the guidance published by the CRD, which include key aspects of RCT design and quality. 67
| Checklist items | Randomisation | Baseline comparability | Eligibility criteria specified | Co-interventions identified | Blinding | Withdrawals | ITT | Outcomes | ||||||||
|---|---|---|---|---|---|---|---|---|---|---|---|---|---|---|---|---|
| Truly random | Allocation concealment | No. treated | Presented | Achieved | Assessors | Administration | Participants | Procedure assessed | Imbalances/dropouts | > 80% in final analysis | Reasons stated | |||||
| STOP, Adams (1998)31 | ✓ | NS | ✓ | ✓ | ✗/✓a | ✓ | ✗ | ✓ | NA | NA | NA | ✓ | ✓ | NA | ✓ | ✗ |
| STOP 2, Adams (2005)35 | ✓ | NS | ✓ | ✓ | ✓ | ✓ | ✗ | ✓ | NA | NA | NA | ✓ | ✓ | ✓ | ✗ | ✗ |
Overall, the methodological quality of the included trials was adequate. Both papers state that participants were randomised to treatment and describe the method of randomisation used, but neither trial reported whether, or how, allocation was concealed. The baseline characteristics of patients were reported for both trials and comparability was considered to be partially achieved in STOP31 and achieved in STOP 2. 35 Both trials fully reported their inclusion criteria. In trials of this type, blinding of participants and administrators would be difficult or unethical; however, the administrators of the TCD ultrasonography were blinded to treatment group and the adjudication of suspected strokes was conducted by blinded assessment in both trials. An intention-to-treat (ITT) analysis was reported in STOP31 but not in STOP 2. 35 Both trials reported outcomes for more than 80% of participants originally randomised and patient dropouts were accounted for. There was no evidence that data for any of the outcomes stated at the outset were not reported in the final analyses.
Trial characteristics
The key trial characteristics for the two included RCTs31,35 are presented in Table 10. Both trials31,35 were multicentred and open label. The intervention in both trials31,35 was blood transfusion and the comparator was standard care. Standard care at the time of the trials was defined as no blood transfusion for primary stroke prevention. Both arms also received penicillin prophylaxis, pneumococcal vaccination, folic acid supplementation, surgery and treatment of acute illness, including the use of transfusion when needed for transient episodes but excluding the use of hydroxycarbamide or antisickling agents.
| Trial name and design | Intervention and comparator | Outcomes | Inclusion criteria | Exclusion criteria | Follow-up (months) | Trial support |
|---|---|---|---|---|---|---|
|
STOP Adams (1998)31 Parallel, open label, multicentred, (n = 14), USA, N = 130 |
Blood transfusion (n = 63) To reach target HbS concentration of < 30% of total haemoglobin within 21 days without exceeding haemoglobin concentration of 12g/dl and haematocrit of 36% Once HbS > 30%, transfusion every 3–4 weeks [mean interval of 25 (SD = 8) days] Transfusion type at discretion of investigator Standard care (n = 67) (penicillin prophylaxis, pneumococcal vaccination, folic acid supplementation, surgery and treatment of acute illness, including transfusion when needed for transient episodes but excluding the use of hydroxycarbamide or antisickling agents) |
Primary: Incidence of cerebral infarction and intracranial haemorrhage |
|
|
Mean (SD): 19.6 (6.5) Trial halted after 14 months of planned 30 months due to 92% reduction of stroke incidence in transfusion group |
NHLBI |
|
STOP 2 Adams (2005)35 Parallel, open label, multicentred, (n = 23), USA and Canada, N = 79 |
Continued blood transfusion (n = 38) Transfusion type at investigator discretion Chelation therapy with deferoxamine recommended for serum levels of > 2500 ng/ml Transfusion halted (n = 41) Patients could receive transfusions to treat SCD complications |
Primary: Composite of incidence of stroke (cerebral infarction or intracranial haemorrhage)/reversion to abnormal TCD velocity |
|
|
Not reported Trial terminated 2 years early owing to number of strokes in transfusion-halted arm |
NHLBI |
The purpose of STOP31 was to evaluate the use of blood transfusion to prevent a first stroke; the purpose of STOP 235 was to determine whether or not the time on prophylactic transfusion could be limited so that children did not receive blood transfusions continually until the age of 18 years. Patients in STOP31 had not previously received blood transfusions for primary stroke prevention and all participants had at least two abnormal TCD readings prior to entering into the trial. STOP 235 was an extension of STOP31 and a number of STOP31 patients, whose TCD readings had normalised after ≥ 30 months of transfusion, participated in the trial. In addition to STOP31 patients, other children who did not participate in STOP31 but whose condition met the criteria for eligibility (TCD normalised after ≥ 30 months of transfusion) participated in STOP 2. 35 Thus, the patients in STOP 235 were all receiving regular blood transfusion for primary stroke prevention and were required to have had at least two normal TCD readings prior to entry into the trial. It is not clear how many patients in STOP31 were included in STOP 2. 35 It is worth noting that patients aged 2–16 years were eligible to participate in STOP,31 whereas patients aged 5–20 years were eligible to participate in STOP 2. 35 STOP31 was published in 1998 and STOP 235 was published in 2005. Both STOP31 and STOP 235 were small in terms of participant numbers (n = 130 and n = 79, respectively).
The primary outcome measure in STOP31 was stroke (cerebral infarction or intracerebral haematoma/haemorrhage). Focal symptoms consistent with the occurrence of a cerebral infarction or an intracerebral haemorrhage were required unless the presentation suggested a diagnosis of subarachnoid haemorrhage. In the absence of supporting magnetic resonance imaging (MRI) findings, clear and compelling clinical evidence of a stroke was required. Transient symptoms were included if changes consistent with the occurrence of stroke were evident on MRI.
The primary outcome measure in STOP 235 was a composite of stroke (cerebral infarction or intracranial haemorrhage) and/or reversion to an abnormal TCD velocity. Stroke was defined as persistent neurological abnormalities or transient symptoms accompanied by a new cerebral lesion appropriate to the patients’ clinical presentations. Suspected strokes were adjudicated by experts who were blinded as to treatment assignment. Abnormal velocity on TCD scans was defined as two consecutive studies with abnormal velocities, three consecutive scans with an average velocity of ≥ 200 cm/second or three consecutive inadequate studies plus evidence of severe stenosis on magnetic resonance angiography (MRA).
Both STOP31 and STOP 235 were halted prematurely according to a priori criteria; STOP31 was halted due to increased rate of stroke in the non-treatment arm and STOP 235 owing to increased rate of stroke and/or reversion to abnormal TCD scan results following discontinuation of blood transfusion. The mean duration of follow-up was 19.6 months for STOP. 31 The mean duration of follow-up for STOP 235 was not reported.
Participant characteristics
The key characteristics of the patients in STOP31 and STOP 235 are described in Table 11. In STOP31 the majority of the baseline patient characteristics appear to be well balanced between the two arms of the trial. In the published paper31 it is noted that baseline haemoglobin and haematocrit levels were slightly lower in the transfusion arm. Approximately half of the patients were male, with a mean age of 8.2 years (transfusion) and 8.4 years (standard care).
| Parameter | STOP, Adams (1998)31 | STOP 2, Adams (2005)35 | ||
|---|---|---|---|---|
| Blood transfusion group (n = 63) | Standard care group (n = 67) | Blood continued-transfusion group (n = 38) | Blood transfusion-halted group (n = 41) | |
| Type of anaemia | SCA/HbSβ0 thalassaemia | SCA/HbSβ0 thalassaemia | ||
| Gender (male), % | 49 | 43 | 53 | 32 |
| Mean age (SD), years | a8.2 (3.5) | 8.4 (3.2) | 12.5 (3.3) | 12.0 (3.1) |
| Mean haemoglobin (SD), g/dl | a7.2 (0.8) | 7.6 (0.7) | 9.3 (0.9) | d9.8 (1.2) |
| Mean haematocrit (SD), % | 20.4 (2.4) | 21.7 (2.1) | 28.1 (2.7) | d29.3 (3.5) |
| Mean white-cell count (SD), × 103/mm3 | a12.5 (3.7) | 12.2 (3.4) | 11.5 (4.1) | d11.7 (3.4) |
| Mean platelet count (SD), × 10–3/mm3 | b388 (115) | b402 (87) | e380 (103) | e381 (112) |
| Mean HbS (SD), % | a87 (10) | 87 (7) | 21.0 (8.6) | f19 (11) |
| Mean fetal haemoglobin (SD), % | a8.0 (5.2) | 9.4 (5.0) | 2.4 (1.8) | f2.3 (1.5) |
| Mean serum ferritin (SD), ng/ml | a164 (155) | 142 (101) | 3274 (1718) | f3005 (1504) |
| Systolic blood pressure (SD), mmHg | a106 (9) | 109 (11) | 113 (12) | 109 (12) |
| Diastolic blood pressure (SD), mmHg | a55 (10) | 56 (10) | 62 (8) | 59 (9) |
| cMean blood velocity (SD), cm/second | 223 (27) Median 214 | 223 (28) Median 212 | Qualifying velocity 215 (11) | Qualifying velocity 215 (15) |
| Median (range) 213 (205–221) | Median (range) 211 (205–221) | |||
| gLast two TCD before randomisation 139 (16) | Last two TCD before randomisation 143 (18) | |||
| Median (range) | Median (range) | |||
| 140 (128–152) | 149 (133–156) | |||
| Mean no. of patients with lesions on initial MRI (SD), % | 19 (31) | 25 (38) | 10 (26) | 11 (27) |
In STOP 235 the majority of the baseline patient characteristics appear to be well balanced between the two arms of the trial, except that there was a greater percentage of male participants in the continued-transfusion arm (53% vs 32%). No significant differences between the two arms of the trial with regard to any of the baseline patient characteristics were noted in the published paper. 35 The mean age of the patients was 12.5 years (transfusion) and 12 years (standard care).
It is clear from Table 11 that there are differences between the two trials. The differences in many of the variables are largely explained by the different trial selection criteria; STOP 235 is a partial follow-on from STOP31 and consists of patients with a history of regular blood transfusion (≥ 30 months) prior to their entry into the trial, and who have no significant cardiovascular disease on MRA. As a result, patients in STOP 235 are older; owing to their history of transfusion, they have greater mean haemoglobin and haematocrit levels, lower mean HbS and fetal haemoglobin levels, and vastly higher levels of serum ferritin than the patients in STOP. 31
Results
Number of and type of transfusion
In STOP,31 the 63 patients in the transfusion group received a total of 1521 transfusions. Of these, 63% were simple transfusions, 12% were exchange transfusions, and 25% were a combination of simple and exchange transfusions. The mean interval between transfusions was 25 days [standard deviation (SD) = 8]. The 143 episodes in which the target level of HbS of < 30% was exceeded were ‘usually isolated and minor’. Ten patients dropped out of the transfusion group – four due to compliance issues, one due to multiple antibodies, one due to ineligibility and four for unspecified reasons. Two patients crossed over to the transfusion group.
In STOP 2,35 the 38 patients in the transfusion group received 1070 transfusions. Of these, 19 patients received transfusion without phlebotomy, four received manual exchanges and seven received automated erythrocytapheresis (a method for administering exchange transfusion); eight patients received transfusion by two or more methods. Measures of HbS were reported as 76% meeting the stated target level of < 30%, 19% were above the target level but < 40%, and 5% were > 40%. Five patients discontinued participation in the transfusion group. Chelation therapy was received by 93% of patients in the transfusion arm and 76% in the transfusion-halted arm.
Primary outcomes
The primary outcome of STOP31 was stroke (cerebral infarction or intracranial haemorrhage). Table 12 shows that in STOP31 one patient in the transfusion group had a stroke compared with 11 patients in the standard care group (p < 0.001). This equates to a 92% lower risk of stroke for patients in the transfusion group.
| STOP, Adams (1998)31 | |||
|---|---|---|---|
| Transfusion | Standard care | p-value | |
| Primary end point | |||
| No. of strokes | 1 (cerebral infarction) | 11 (10 cerebral infarction, one intracerebral haematoma) |
< 0.001 Risk of stroke is 92% lower in transfusion group |
| STOP 2, Adams (2005)35 | |||
| Continued transfusion | Transfusion halted | p-value | |
| Primary end point | |||
| No. of strokes or reversion to abnormal TCD | 0 | 16 | < 0.001 |
| No. of strokes | 0 | 2 | |
| Reversion to abnormal TCD | 0 | 14 | |
In STOP 2,35 the primary composite end point was stroke (cerebral infarction or intracranial haemorrhage) or reversion to abnormal velocity on TCD scans. In Table 12, 16 patients in the transfusion-halted group experienced an event, whereas there were no events in the continued-transfusion group (p < 0.001). In the transfusion-halted group, two of the patients had a stroke, whereas 14 other patients reverted to abnormal velocities measured by TCD scan.
Quality of life
Quality-of-life outcomes were neither collected nor reported on in either STOP31 or STOP 2. 35
Adverse events relating to transfusion
In the STOP trial,31 10 patients in the transfusion group developed alloimmunisation to red blood cells. There were 16 mild reactions in 12 patients to blood products.
In the STOP 2 trial,35 one new patient (continued-transfusion arm) was identified with alloimmunisation. Nine transfusion reactions in seven patients were noted. One of these was serious enough to require hospitalisation. Chelation therapy was received by 93% (n = 35) of patients in the continued-transfusion arm and 76% (n = 31) in the transfusion-halted arm.
Degree of disability from stroke
It is reported in the STOP31 trial that the 11 patients with cerebral infarction presented with hemiparesis (six left-sided, five right-sided) but weakness had resolved by the time of the neurological examination. All infarctions were in the carotid circulation and the MRI scan showed new or larger lesions in the affected hemisphere in all but one patient. Of the 11 patients, 10 were hospitalised; at the time of discharge from hospital, two patients were rated as having major disability, five had moderate disability, two had symptoms but no disability, and one was asymptomatic.
In the STOP 235 trial, one of the two patients who had a stroke presented with a right hemisphere infarction. No further details of strokes are reported for this trial.
Non-randomised studies identified
Seven non-randomised studies41, 43–45, 68–70 were identified. The majority were retrospective cohort studies. Of these seven studies,41, 43–45, 68–70 data were able to be extracted from only one68 (Table 13). The remainder considered children with high, conditional and low TCD velocities and did not separately report stroke rates or other data for only the high-risk children. The single-arm study described in Table 13 was based in France (patients treated with transfusion) and included 17 patients aged between 2 and 16 years. The mean length of follow-up was 32.4 months. None of the 17 patients suffered a stroke while receiving blood transfusion.
| Study name and design | Intervention and dose (n) | Outcomes | Inclusion criteria | Exclusion criteria | Follow-up, months: mean (SD) | AE | Results |
|---|---|---|---|---|---|---|---|
|
Mirre (2010) 68 Retrospective cohort study, single centred, France, n = 17 |
Blood transfusion (n = 17) To reach target HbS concentration of < 30% of total haemoglobin without exceeding haemoglobin concentration of 12g/dl Once HbS > 30%, transfusion every 4 weeks Transfusion type at discretion of investigator |
Primary:
|
|
|
32.4 (20.4) | Hepatitis B 0/17; Hepatitis C 0/17; bone marrow transplant 2/17; increased TCD velocity 2/17; chelation NR; alloimmunisation NR | Stroke 0/17 |
Clinical discussion
The purpose of this clinical review was to evaluate the clinical effectiveness of primary stroke prevention treatments for children with SCD identified by TCD to be at high risk of stroke. The review considered the effectiveness of blood transfusion, hydroxycarbamide and BMT compared with standard care. Two relevant RCTs – STOP31 and STOP 235 – were identified for inclusion in the review; STOP31 compared blood transfusion with standard care, whereas STOP 235 compared continued blood transfusion with halted blood transfusion in previously transfused patients.
The STOP31 and STOP 235 trials both utilised stroke (and, in the case of STOP 2,35 reversion to abnormal TCD velocity) as their primary end point; however, we considered that the patient populations of these two trials were too different to synthesise their data using a standard meta-analytic approach. Patients in STOP 235 had all previously received blood transfusion for primary stroke prevention, whereas patients in STOP31 had not.
The results of STOP31 demonstrated a statistically significant difference in the number of strokes between the transfusion and standard-care arms (1 vs 11; p < 0.001). The trial was halted early due to the higher number of stroke events in the standard-care group compared with the blood transfusion group.
The results of STOP 235 demonstrated a statistically significant difference in the number of end point events (stroke or reversion to abnormal TCD velocity) between the two arms of the trial; no events occurred in the continued-transfusion arm compared with 16 patients in the halted-transfusion arm (p < 0.001). Two of the events were strokes; the remainder were reversions to abnormal TCD velocities. The STOP 235 trial was also closed early owing to the higher number of events in the halted-transfusion group compared with the continued-transfusion group.
The STOP31,35 trials were (relatively) small trials in terms of patient numbers. Both trials were terminated early due to the number of events that occurred in the comparator groups. Early closure is of concern given the findings of a recent meta-analysis71 that compared the results of 91 trials that were closed prematurely for benefit, with 424 similar trials that ran to full term. The authors reported large differences in treatment effect size between trials that were stopped early and similar trials that ran their full course. This was true regardless of the methodological quality of the trial or the presence of statistical stopping rules. One implication of this finding is that early closure of trials can lead to exaggerated treatment effects that would not be borne out in the longer term. Although it would clearly be unethical to have continued the STOP trials31,35 it is unclear what the full-term outcomes might have been.
In Chapter 2 (see Current guidelines for stroke prevention) it was reported that clinical guidelines in the UK65 and the USA64 for the management of children with SCD are based on the results of the STOP trials,31,35 i.e. children with SCD aged ≥ 2 years should receive annual TCD scans. Children who are identified as being at high risk of stroke (those with abnormal scan results) should be considered for prophylactic blood transfusions that will continue throughout their childhood. Studies of patient cohorts in the UK,30 the USA42 and France45 attest to the benefits of implementing the STOP31 protocol in clinical practice in terms of reduced rates of stroke per patient-year.
Following the publication of the seminal STOP31,35 trials, which clearly show the benefit of initiating and continuing chronic transfusion therapy in children with high TCD velocities, a number of key issues remain unresolved. Treatment with monthly blood transfusion carries a number of serious risks (such as iron overload, alloimmunisation, unknown future infection) and disbenefits (such as iron chelation treatment, regular hospital visits for transfusions), and yet it is not known for how long prophylactic blood transfusion should continue. At present, although guidelines recommend that blood transfusion be continued until the age of 18 years, most children are transfused at least until they are 16 years old, and approximately 75% of transfused children receive blood transfusion for life. This means that a number of children or adults may be receiving treatment beyond the time of its benefit. An estimated 60% of patients who have TCD scans that show abnormal velocities do not go on to have a stroke. 45 This means that a considerable proportion of patients will receive treatment that carries a number of serious risks but for no benefit. There is currently no means of predicting which children will go on to have a stroke.
Iron overload is a significant side effect of treatment with regular blood transfusion. It was noted in Chapter 2 (see Regular blood transfusion) that the majority of data with respect to iron overload are derived from patients with thalassaemia major. The pattern of iron overload in patients with SCD is poorly understood. This is an important area for future research. Data on compliance with older iron chelation therapy47,72 suggest that adherence to treatment is generally poor but may be improved by the use of newer oral chelation methods. 48,49 More recording of data that reflect the use of oral deferasirox is needed to enable the benefits of improved adherence to chelation treatment to be fully understood.
The effects of long-term blood transfusion on mortality rates are also unknown. The Mazumdar55 model discussed in Chapter 2 (see Regular blood transfusion) suggests that chronic transfusion, although decreasing stroke risk, may also impact negatively on mortality. This assumption has been criticised24 and the counter-argument proposed – that one would expect chronic transfusion to ameliorate the progression of chronic complications of SCD seen in adulthood and improve life expectancy. There are, as yet, no data to support any claims regarding mortality benefits or disbenefits.
The authors of this review experienced considerable difficulty in obtaining UK data regarding the numbers of children affected by SCD, their treatments and outcomes. A National Haemoglobinopathy Register (sponsored by the Department of Health) has recently been set up in order to obtain data on the prevalence of SCD across the country, and the frequency of specific treatment interventions and of specific severe complications, including mortality. In addition, the West Midland Quality Review Service very recently published an overview of services across the UK for children with haemoglobin disorders. 73 It is likely that the registry and overview will, in time, prove to be of great value in future treatment planning for patients with SCD, providing that funding continues.
No data were identified which considered the efficacy of hydroxycarbamide for primary stroke prevention. The recently completed BABY HUG RCT59 compared hydroxycarbamide with placebo in reducing organ dysfunction and clinical complications in children with SCD, aged between 9 and 18 months. The average increase in TCD velocity was found to be ‘significantly less’ when receiving hydroxycarbamide compared with placebo. These findings may impact on the future treatment of children with SCD by reducing TCD velocity prior to the recommended initial TCD scan at the age of 2 years.
The findings of this review suggest that TCD ultrasonography is an effective method of identifying children with SCD who may be at high risk of stroke. However, it is important to note that, historically, not all children in the UK have been within geographically easy access to a TCD screening centre74 and therefore some potentially high-risk children may not have received recommended care. Implementation of the NHS Sickle Cell and Thalassaemia Screening Programme75 has partially addressed this issue but further work is needed in this area to ensure greater access. It is recommended that scanning using TCD for all children with SCD should be made routinely available at hospitals across the country to ensure that all infants have easy access to a testing centre.
Chapter 5 Assessment of cost-effectiveness
Introduction
This section explores the published literature on the costs and benefits of blood transfusion therapy for the primary prevention of stroke in children with SCD who are identified by TCD screening as being at high risk of stroke. In addition, this section presents the results of a de novo economic model that was developed to assess the cost-effectiveness of TCD ultrasonography plus blood transfusions when high risk of stroke is identified, compared with TCD ultrasonography only in this patient population.
Systematic review of existing cost-effectiveness evidence
Full details of the search strategy conducted by the assessment group and the methods used for identifying economic evidence are presented in Chapter 3 (see Identification of evidence: clinical effectiveness) of this report. No relevant economic evaluations were identified via the review process.
Introduction and scope
In addition to the assessment of the clinical effectiveness of primary stroke prevention in children with SCD, a cost-effectiveness analysis was carried out. The objective of the cost-effectiveness analysis was to estimate the efficiency of providing blood transfusion following abnormal TCD scans for children with SCD.
Patients with SCD face an increased risk of stroke. The STOP trial31 has demonstrated that blood transfusions significantly reduce the risk of primary stroke in children with SCD identified to be at high risk of stroke using TCD ultrasonography (see Chapter 4, Trial characteristics). Key benefits of blood transfusion are therefore the avoided cost and disutilities associated with stroke. It is important, however, that the economic analysis also considers the dynamics associated with the incidence and severity of stroke in this patient population.
Clinical effect studies may underestimate the impact of blood transfusion on stroke, as they are often limited in their follow-up period. Furthermore, patients who have incurred one stroke have an increased likelihood of suffering a second or a third stroke. 76 Thus, even if the impact of blood transfusion on the incidence of first strokes is captured by an effect study, the limited time periods considered may mean that impact on second and third strokes is missed. It is, therefore, important that the cost-effectiveness analysis considers benefits beyond the time frames covered by effect studies.
Strokes can have varying impacts on health outcomes. Tengs et al. 77 categorise the impact of surviving a stroke on patients’ health into three levels, with important implications for costs and utility. These are summarised in Table 14. However, this varied impact on QoL of childhood stroke is often not considered in effect studies, which instead focus on numbers of strokes averted. The analysis should not just consider the impact of blood transfusion on the incidence of stroke but also its impact on the severity of stroke and implications for costs and QoL.
| Post-stroke health state | Characteristics |
|---|---|
| Mild | Patients experience minor or temporary disability (no organ failure but treatment required post stroke to recuperate) |
| Moderate | Patients experience some health complications, and possibly organ damage |
| Severe | Patients experience major complications, organ failure, and require long-term care |
Another benefit of blood transfusion that should be captured by the cost-effectiveness analysis is its positive impact on other health outcomes associated with SCD, including the reduced incidence of pain crises and acute chest syndrome, as blood transfusions reduce the likelihood of patients with SCD experiencing these health problems.
Against these benefits the extra cost of blood transfusion must be offset, as well as the cost and disutility associated with the many AEs associated with blood transfusion. As discussed in Chapter 2 (see Regular blood transfusion), there are several risks and AEs associated with blood transfusion, including iron overload and alloimmunisation.
Key characteristics
The key characteristics of the cost-effectiveness analysis are shown in Table 15.
| Intervention | TCD scans followed by blood transfusion where the scan revealed a blood velocity of > 200 cm/second |
| Comparator | TCD scans only |
| Population | Children aged 2 years of age diagnosed with SCD (specifically HbSS and HbSβ0) with no prior history of stroke |
| Time frame | Individuals aged from 2 years to death (estimated to be approximately 82 years) |
| Effects |
Incidence of stroke Severity of stroke Incidence of complications post stroke and impact of stroke (such as disabilities associated with stroke, intellectual and cognitive deficits and need for long-term care or specialist education) Incidence of other complications associated with SCD and blood transfusions, such as iron overload, alloimmunisation, pain crises and acute chest syndrome QoL impact of the above effects |
| Costs |
NHS cost increases associated with blood transfusion and accompanying treatments, such as chelation therapy NHS cost savings associated with reduced incidence and severity of stroke and associated disabilities, treatments for pain crises and acute chest syndrome and complications from blood transfusion |
| Analysis outputs | Cost per incremental quality-adjusted life-year (cost per QALY) gained; CPSA; new costs savings; and a balance sheet of costs and effects |
The model includes a starting population of 2-year-old children with SCD who have not experienced a stroke. The model is built in such a way that a hypothetical cohort of 1000 children is run for two scenarios: those receiving the blood transfusion intervention and those not receiving the intervention when their blood velocity on TCD ultrasonography is > 200 cm/second. Starting at the age of 2 years, in each scenario all 1000 patients are modelled for their lifetime, through both pre- and post-stroke states.
On entering the model, children’s blood flow velocity is measured using TCD ultrasonography. Patients are then screened yearly with TCD ultrasonography within the model in order to reflect the changing probability of developing an abnormal TCD velocity in childhood (as not all children develop abnormal TCD velocities at the age of 2 years). The model reflects real-life practice and the costs and benefits associated with this group of children as a whole (those with normal and abnormal TCD scans) are captured in the analysis.
In both arms of the model children receive TCD scans, in line with UK clinical guidelines for current best practice. 65 However, children who are identified to be at high risk of stroke after TCD ultrasonography receive chronic blood transfusion for primary stroke prevention in the intervention arm of the model only. Children in the non-intervention arm all receive TCD scans (reflecting current clinical practice) but do not receive blood transfusion for primary stroke prevention. Including the costs of scanning in the non-intervention arm may overestimate the costs in this group but it is important to note that the cost of a TCD scan is relatively small in relation to the overall cost of blood transfusion, stroke treatment and treatment of AEs, and is thus unlikely to influence the result of the analysis. This economic evaluation does not consider the added costs associated with implementing and running a TCD screening programme for children with SCD, as it is assumed that most centres across the UK already provide TCD ultrasonography to children with SCD. The cost-effectiveness analysis was undertaken in line with the National Institute for Health and Clinical Excellence (NICE) guidelines. 78 The analysis focuses on the health-care system costs and QoL impact of blood transfusions over the lifetime of the patients modelled.
Method
Data collection
The parameters and sources used in the model are summarised in Appendix 4. Given the multiplicity of data required to populate the model, a range of approaches were used to identify parameter estimates.
First, a systematic review was undertaken to identify parameter estimates reported in the existing literature. Details of the search strategy can be found in Chapter 3 (see Identification of evidence: cost-effectiveness). However, as described in Chapter 3 (see Identification of evidence: clinical effectiveness and Identification of evidence: cost-effectiveness), the clinical data available were limited and no relevant published economic evaluations were identified. Specifically, a paucity of relevant data were found for utility weights associated with paediatric SCD and stroke, cost of paediatric stroke care in the UK, probability of patients’ health state improvement post stroke, and frequency of SCD complications, such as pain crises and acute chest syndrome.
Second, the gaps in the evidence were filled using clinical expert opinion. This opinion was collected by means of electronic questionnaires and telephone interviews. A questionnaire was developed and sent to clinicians. A template of the questionnaire can be found in Appendix 5. From the 17 clinicians who were contacted, four questionnaire responses were received. The responses from clinicians were incorporated into the economic model by taking the average value of responses across the questionnaires. These responses are summarised in Appendix 6, Table 51.
A separate set of questions regarding utility weights for SCD health states was developed for use in a telephone interview. Of the five clinicians contacted for a telephone interview, two experts agreed to participate and provide data. The telephone interview was not formally structured and focused on the discussion of stroke management, stroke outcomes and QoL. Topics included interventions performed by clinicians to manage patients in mild, moderate and severe post-stroke states (see data in Appendix 4, Table 46). The probability of ending up in the different post-stroke states following a first, second or third stroke was estimated. Further details are presented in Appendix 4, Table 41. Discussion of patients’ QoL focused on the impact of blood transfusion, pain crises and stroke. Review of relevant published literature did not provide sufficient information to calculate the utility weights required for economic evaluation. Finally, calibration was performed on the death rates used in the model to ensure the model’s predicted death rates fitted with those from validated sources. 16,40 The death rates were adjusted while ensuring that death rates were kept within the bounds of the ranges specified by experts in the surveys and interviews conducted by the assessment group, clinical experts in their responses to the surveys and interviews developed by the Liverpool Reviews and Implementation Group (LRiG) and relativities between other transition probabilities were maintained. Once death rates were updated, alternative routes through the model were also updated. These updates were made to ensure that the ratio between the original transition probabilities did not change.
Additionally, calibration was used to adjust rates of transition between second and third post-stroke health states in order to obtain survival estimates predicted by the published literature. 16,40
Model structure
Following best practice, a Markov structure was adopted to represent the progression of patients with SCD and stroke. 55,79 Markov structures are used when the probability of an event occurring changes over time, when the timing of events is important and when important events may happen more than once, as is the case with changes in blood velocity and stroke. The ability of Markov models to represent such repetitive events and the time dependence of both costs and utilities allows for more accurate representation of cost-effectiveness when modelling conditions that evolve over time or occur at various points in time. 80
A Markov model was built and run separately for two scenarios: scenario 1 (intervention), in a population of 1000 2-year-olds, children whose blood velocity measured by TCD ultrasonography is > 200 cm/second are treated with blood transfusions and children whose blood velocity is < 200 cm/second are not treated, and scenario 2 (comparator), in a population of 1000 2-year-olds, children whose blood velocity measured by TCD ultrasonography is > 200 cm/second or < 200 cm/second are not treated.
The difference between the costs, incidence of health outcomes and QoL outcomes between these two scenarios was used to estimate the incremental costs and effects of blood transfusions. A description of the Markov structure used to model the costs and effects of blood transfusion (intervention arm) is presented in Figure 1. In each scenario the model was run for the lifetime of a hypothetical cohort of 1000 children aged 2 years who have SCD but have no history of stroke. In each instance – with and without blood transfusion – the starting cohort has the same blood transfusion profile. The only difference between the scenarios is the probability of receiving blood transfusion pre-stroke when blood velocity is > 200 cm/second.
FIGURE 1.
Markov model used to estimate the efficiency of blood transfusion for patients with SCD: pre-stroke (intervention arm only).
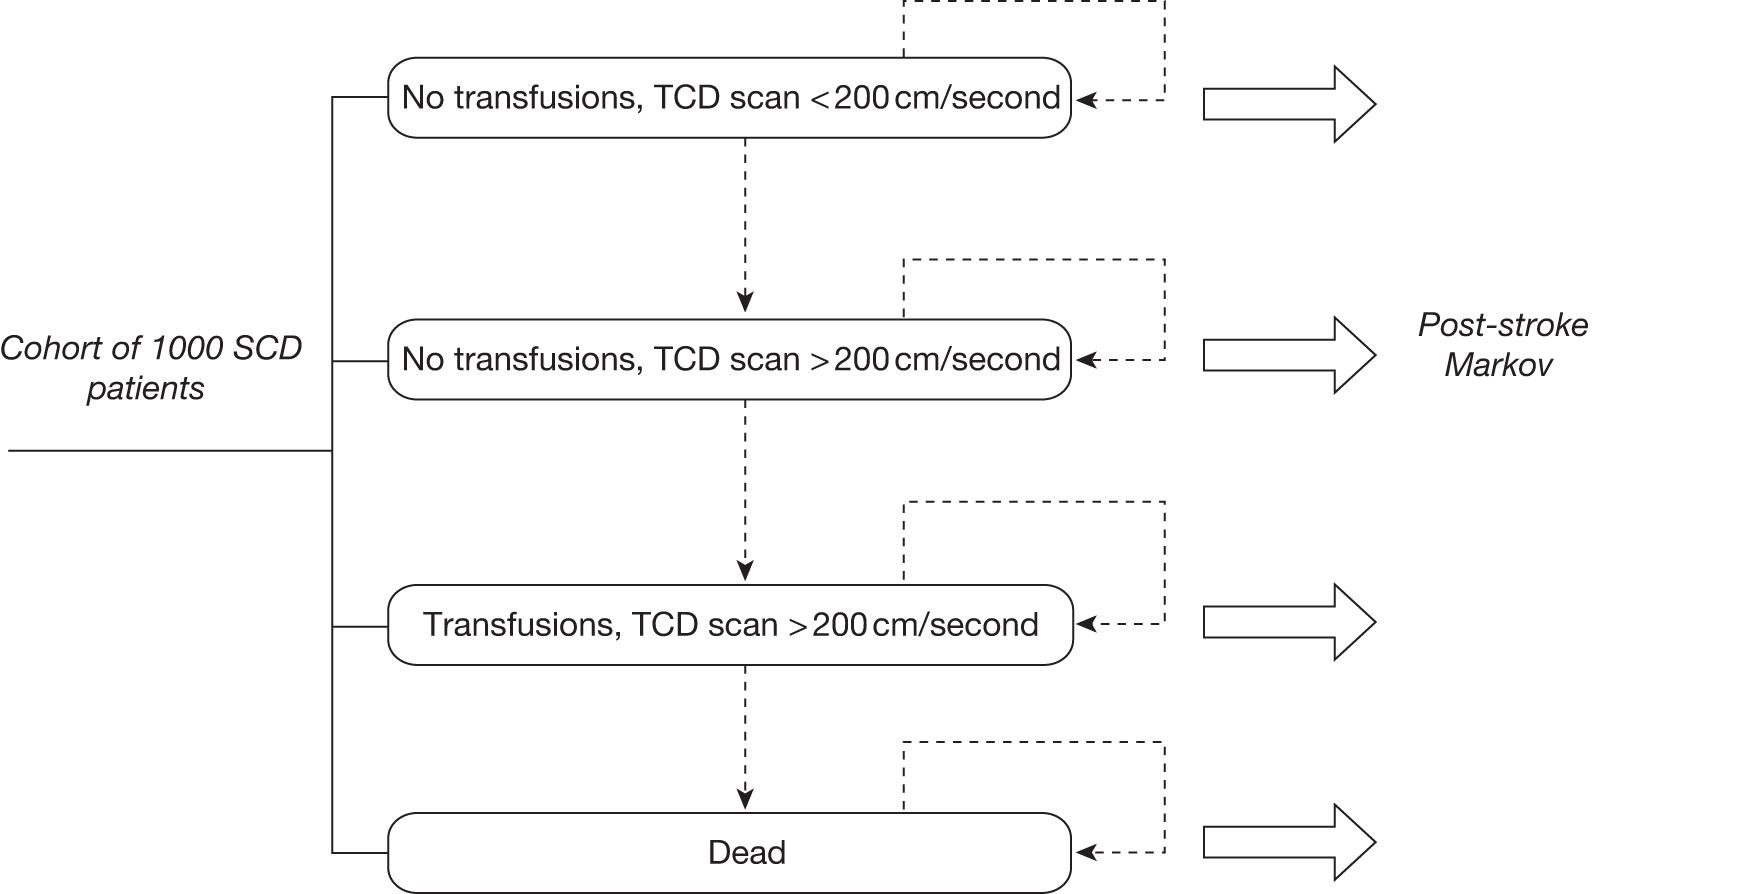
Figures 1 and 2 show that the model has been divided into two distinct components:
-
Pre-stroke component, which simulates the change in blood velocity and receipt of blood transfusion prior to having a stroke. As the cohort of interest is children aged 2 years with SCD, who have not yet experienced a stroke, all participants start in this part of the model.
-
Post-stroke component, which simulates the transition of patients with SCD who experience a stroke between post-stroke health states – i.e. mild post-stroke health state, moderate post-stroke health state, severe post-stroke health state and death. Once patients have a stroke, they move from the pre-stroke part to the post-stroke part of the model.
FIGURE 2.
Markov model used to estimate the efficiency of blood transfusion for patients with SCD: post stroke (intervention arm only).
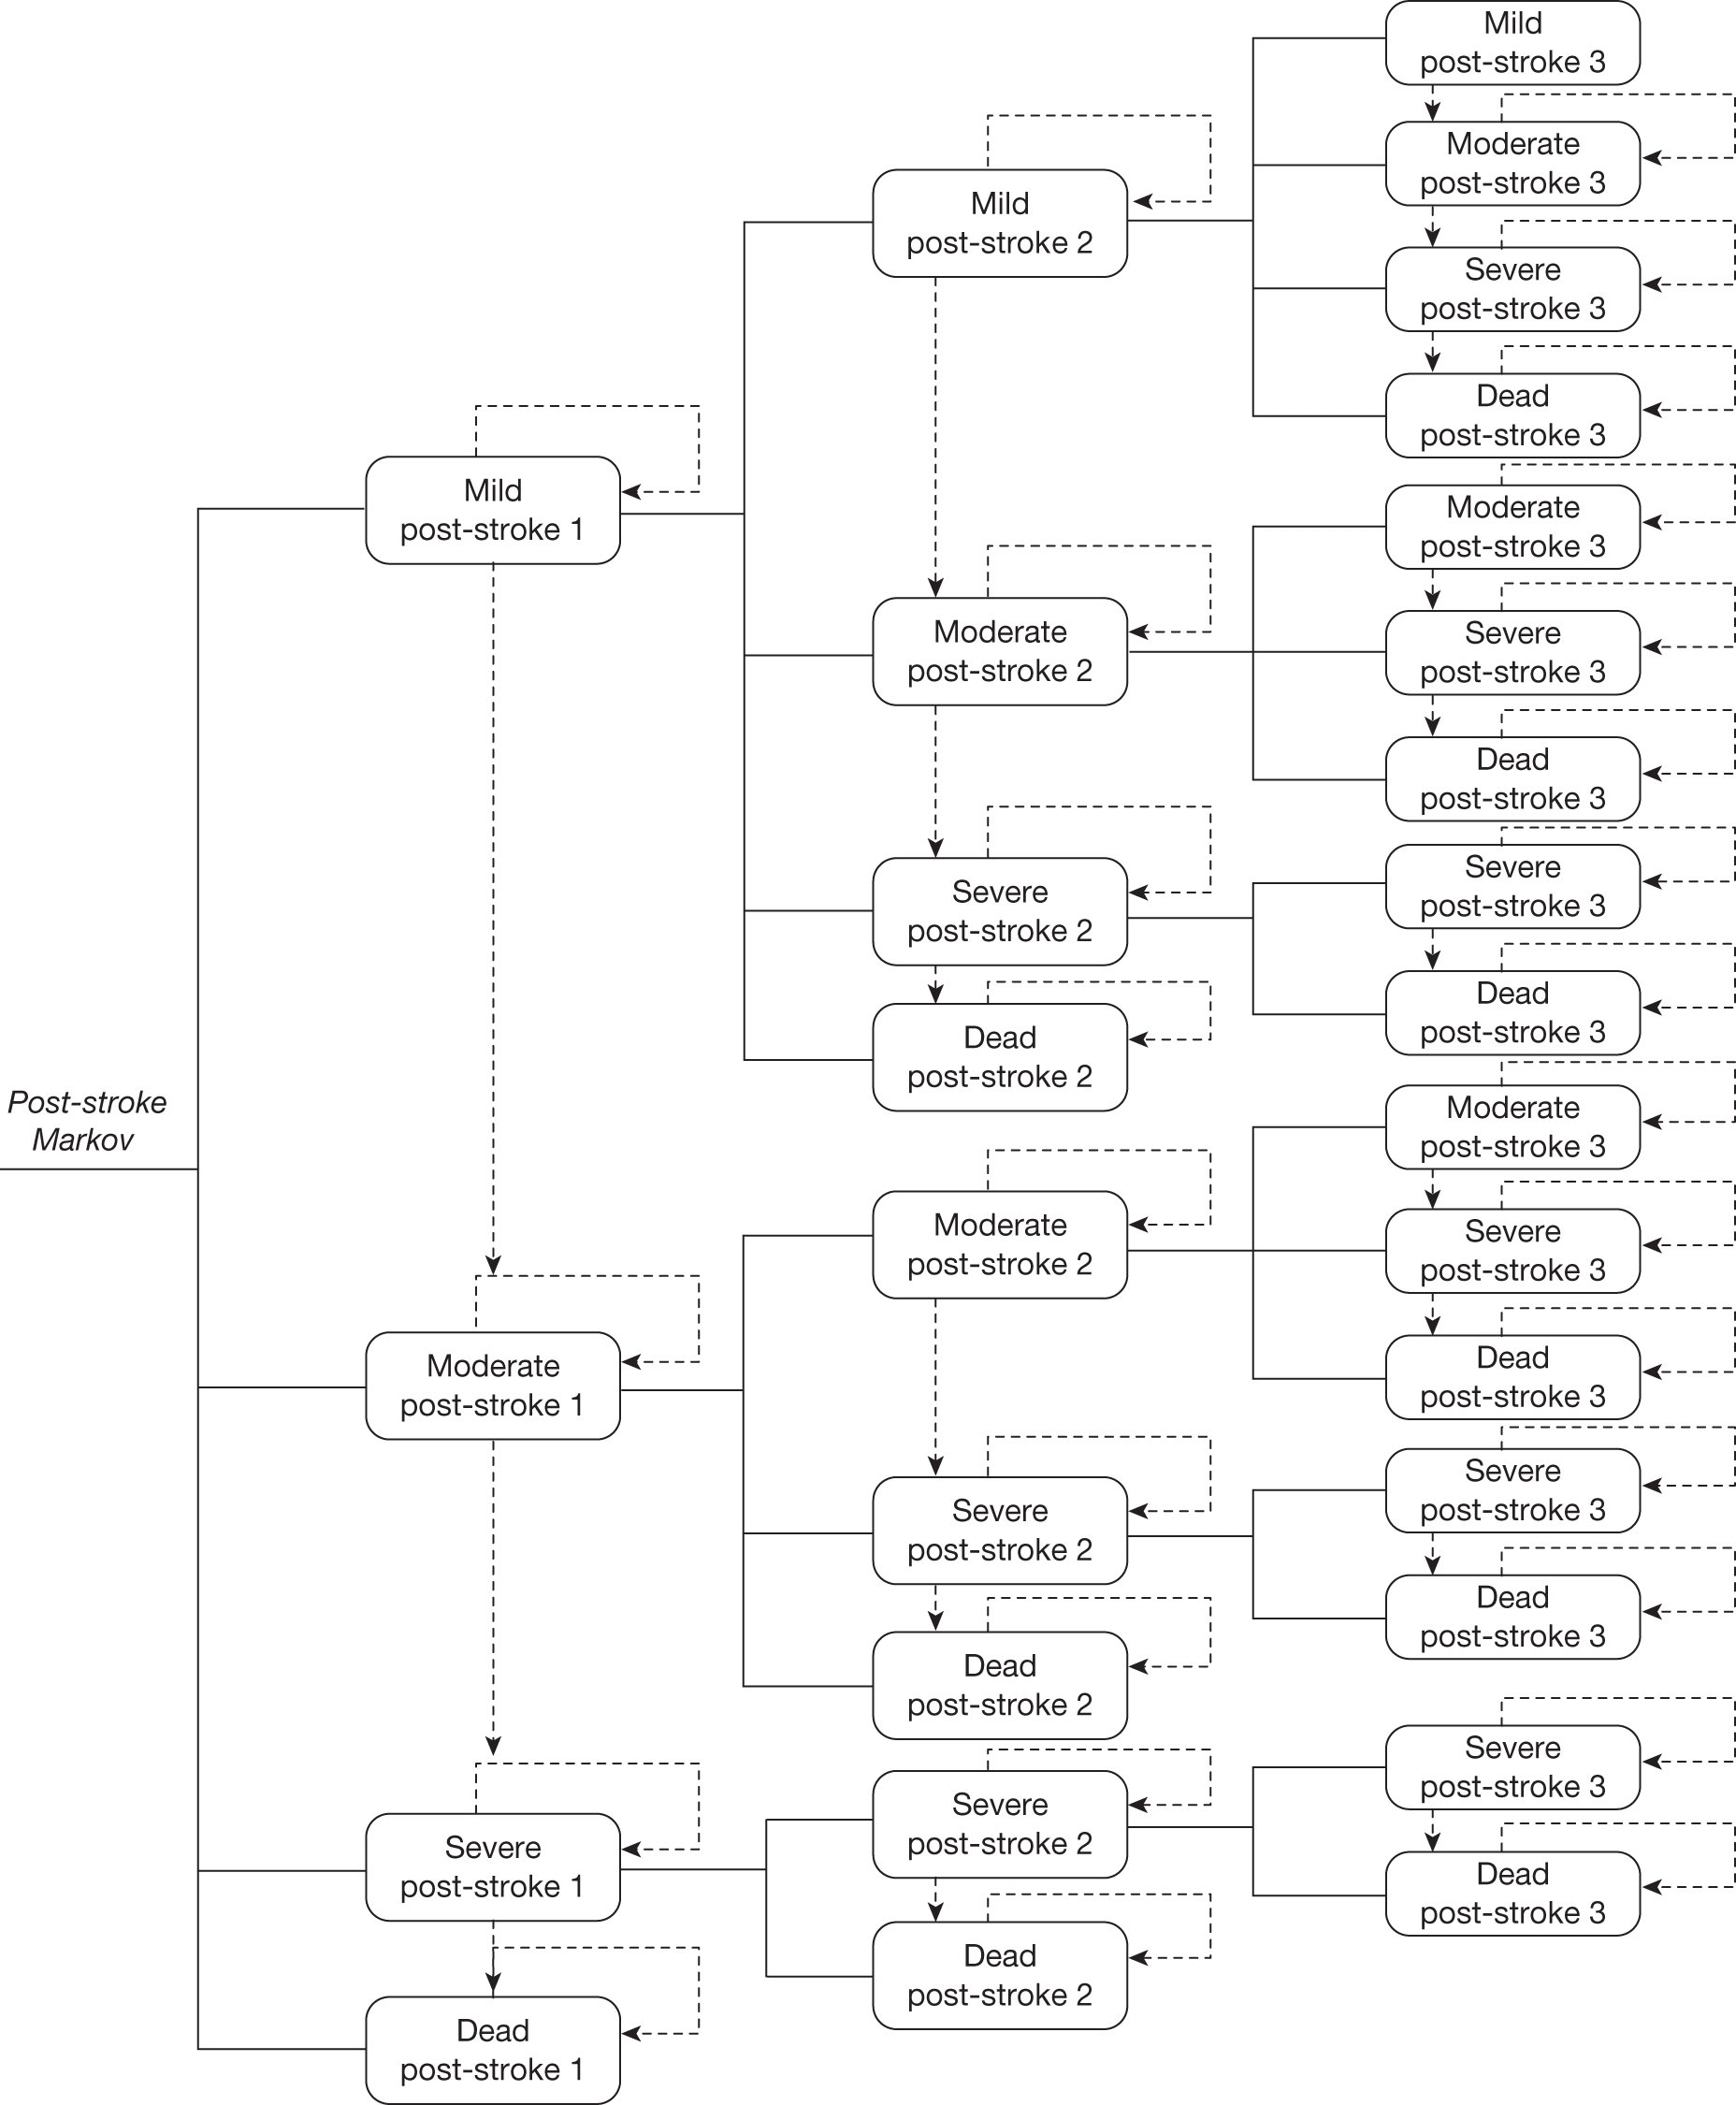
Pre-stroke component of the Markov model
This section provides an overview of the pre-stroke component of the model. Details on the data used to specify transition probabilities, costs, and utilities are available in Appendix 4.
The pre-stroke part of the model comprises four different health states, which are shown in Table 16.
| Health state | Description |
|---|---|
| No transfusion, TCD scan < 200 cm/second | The population in this state has normal blood velocity and therefore does not require blood transfusions |
| No transfusion, TCD scan > 200 cm/second | The population in this state has a high blood velocity but is not receiving blood transfusions. This reflects the small proportion of children in clinical practice who require a confirmatory scan before commencing blood transfusion |
| Transfusion, TCD scan > 200 cm/second | The population in this state has a high blood velocity, and is receiving blood transfusions. In this state the patient will also receive treatment for blood transfusion-related health outcomes, such as chelation therapy for iron overload |
| Death | The population in this state has died |
The population – 1000 patients aged 2 years, diagnosed with SCD – all start in this part of the model as none of the children has suffered a stroke. At the start of the model, 89.3% of patients are in the ‘no transfusion < 200 cm/second’ health state and 10.7% are in the ‘no transfusion > 200 cm/second’ health state. The population is distributed in this way for both the intervention and non-intervention scenarios. 31 Between the ages of 2 and 18 years, patients can move to the > 200 cm/second state, based on TCD scan result. In the intervention cohort, the population starting in the ‘no transfusion < 200 cm/second’ state can either stay in this state or move to ‘no transfusion > 200 cm/second’ if their blood velocity increases. They do not immediately receive blood transfusion, as a second TCD scan confirming a velocity of > 200 cm/second is required prior to starting blood transfusion (D Rees, 2011, personal communication). The population starting in the ‘no transfusion > 200 cm/second’ state will move into the ‘transfusion > 200 cm/second’ state in the second cycle of the model. Patients can die as a result of either general mortality or non-stroke-related SCD mortality. Table 17 outlines the transition probabilities used to model these dynamics.
| Health state | End of cycle | Source for death rates | ||||
|---|---|---|---|---|---|---|
| No transfusion, TCD scan < 200 cm/second | No transfusion, TCD scan > 200 cm/second | Transfusion, TCD scan > 200 cm/second | Death rate | |||
| Start of cycle | No transfusion, TCD scan < 200 cm/second | 0.998 | 0.001 | N/A | 0.001 | D Rees |
| No transfusion, TCD scan > 200 cm/second | N/A | N/A | 0.998 | 0.002 | Karnon 200081 | |
| Transfusion, TCD scan > 200 cm/second | N/A | N/A | 0.999 | 0.001 | D Rees | |
| Death | N/A | N/A | N/A | 1.000 | ||
It is evident from Table 17 that the number of patients with SCD with high TCD scores in the model increases gradually. That is, the majority of patients (99.8%) who start a cycle with a blood velocity of < 200 cm/second end the cycle with a blood velocity of < 200 cm/second (A Streetly and D Rees, 2011, personal communication). These parameters are based on D Rees’ estimation that between the ages of 2 and 18 years approximately 15% of the starting cohort would have a TCD scan of > 200 cm/second and receive transfusions. Transition probabilities were calibrated to reflect this. Assuming the transition probabilities were constant between the ages of 2 and 18 years, the calibration was performed by adjusting the probability of moving from a blood velocity of < 200 cm/second to a blood velocity of > 200 cm/second until 15% of the alive cohort was in the > 200 cm/second group at the age of 18 years. Given the uncertainty in these estimates, these transition probabilities have been extensively tested through sensitivity analysis (see Appendix 8).
Table 17 also demonstrates that the death rate doubles when a child moves from having a blood velocity of < 200 cm/second to having a blood velocity of > 200 cm/second (from 0.1% per 3-month cycle to 0.2% per 3-month cycle) without receiving blood transfusion. If blood transfusions are administered, the death rate among those with a blood velocity of > 200 cm/second is reduced back to that of those with a blood velocity of < 200 cm/second.
Children whose blood velocity increases to a level of > 200 cm/second remain in this state until the age of 18 years. The assumption was based on clinical opinion stating that, in current UK clinical practice, most patients with SCD who receive transfusions will remain on transfusion until they are adults (D Rees, 2011, personal communication). Appendix 3 contains the full list of assumptions used in the model. Currently, clinical guidelines do not state for how many years patients should stay on transfusion6 but recommend transfusion until at least 16 years in the UK65 and 18 years in the USA. 62 The pre-stroke Markov submodel is run until the age of 18 years. At that point, 75% of those on blood transfusion at 18 years are assumed to continue on blood transfusion for the remainder of their lifetime, and the remainder of the population do not continue on blood transfusion. It is assumed that once the population moves to either the ‘no transfusion’ or ‘transfusion’ health state at 18 years old, they remain in that health state until death.
In the comparator arm, in which blood transfusion is not available, the Markov model is the same, except that the probability of moving to ‘transfusion > 200 cm/second’ is considered to be zero. Therefore, in this scenario there are effectively three health states: (1) ‘no transfusion, TCD scan < 200 cm/second’; (2) ‘no transfusion, TCD scan > 200 cm/second’; and (3) death.
A 3-month cycle length was used to capture changes in all events. The cycle length was selected in order to reflect the dynamics of SCD. Several key events occur within short time frames, such as blood transfusions (every 4 weeks).
Utilities
Each of the states listed above is associated with different costs and utilities. Utility values are estimated by specifying the maximum utility associated with SCD and then adjusting for the disutility of different treatments and health states that may be experienced by patients with SCD, such as blood transfusion or chelation therapy.
Table 18 summarises the maximum utility value associated with a patient with SCD. The adjustments associated with, for example, chelation therapy are provided in subsequent tables.
| State | Age (years) | |||
|---|---|---|---|---|
| 2–7 | 8–18 | 19–30 | 31+ | |
| Pre-stroke off transfusion (blood velocity of < 200 cm/second) | 0.22 | 0.22 | NA | NA |
| Pre stroke on transfusion (blood velocity of > 200 cm/second) | 0.20 | 0.20 | NA | NA |
| Pre-stroke off transfusion (blood velocity of > 200 cm/second) | 0.19 | 0.19 | NA | NA |
| Pre-stroke off transfusion (adult) | NA | NA | 0.21 | 0.21 |
| Pre-stroke on transfusion (adult) | NA | NA | 0.18 | 0.18 |
Osborne et al. 82 established utility values to reflect the experience of adult thalassaemia patients on transfusion. This is a time trade off study using utility values from the general public. Owing to the unavailability of better quality or more suitable published data, these data were used to estimate the utility associated with (1) having a blood velocity of < 200 cm/second and (2) disutility associated with undergoing blood transfusion and chelation.
Utility values for those with a blood velocity of > 200 cm/second were derived from telephone interviews with clinicians, as there is no published literature on utility weights associated with QoL of patients (adults and children) with SCD. Clinical opinion states that patients with SCD experience better QoL if they have blood velocity of > 200 cm/second and receive transfusion compared with patients with SCD who have blood velocity of > 200 cm/second and are not on transfusion.
Transcranial Doppler ultrasonography scans
The frequency of TCD scans in the model is set at once per year. A TCD single scan is costed at £50 per scan (D Rees, 2011, personal communication). This approach potentially differs from actual practice in two ways. In practice, confirmatory scans (post abnormal TCD scan) are performed but the cost of these scans is not included in the model. However, current practice suggests that patients do not require annual TCD scans after transfusions are initiated, whereas the model includes annual scans until the age of 18 years.
The model was not designed to include the cost of confirmatory scans for the following reasons: reflecting this practice would have required structural changes to be made to the original model; these costs are relatively immaterial and will not impact the results of the analysis; and the impact on cost is at least partially offset, as not including confirmatory scans underestimates costs, whereas including annual scans overestimates costs.
Blood transfusion
The following types of blood transfusion are included in the analysis – exchange, simple, and combined – in proportion to the likelihood that they are used in current practice based on data from the clinician surveys. Where blood transfusions are administered in the pre-stroke part of the model, the cost of three transfusions is included per cycle. 83 The disutility associated with receiving transfusions is derived from Osborne et al. 82 Based on personal communication with D Rees, 2011, it is assumed that the disutility of being on transfusion is the same across transfusion types. Table 19 summarises the proportion of patients receiving each transfusion type, and the cost and disutility associated with these transfusions per 3-month cycle. Detail of the calculation of the cost of transfusion is presented in Appendix 4, Table 44.
| Type of transfusion | Proportion (%) receiving each transfusion type by age (years) | Cost of transfusion (£) | Disutility | |||
|---|---|---|---|---|---|---|
| 2–7 | 8–18 | 19–30 | 31+ | |||
| Simple | 97.5 | 68.7 | 50.7 | 49.8 | 4722 | 0.02 |
| Exchange | 0.0 | 20.1 | 36.4 | 31.5 | 2142 | 0.02 |
| Combined | 2.5 | 11.3 | 12.5 | 18.8 | 4722 | 0.02 |
Alloimmunisation
Alloimmunisation is one of the AEs associated with blood transfusion, and occurs when a patient develops antibodies to red cell membrane proteins (antigens) present on the donor cells but not on the recipient’s cells. The donor cells are therefore recognised as foreign and are able to provoke an immune response. 84 In the model, the likelihood of a child on transfusion experiencing alloimmunisation is based on data from Vichinsky et al. 84 Transfusing alloimmunised patients is a longer and a more expensive process requiring additional blood matching and sourcing of specific blood types, which may be in short supply. A child with alloimmunisation requires an additional 30 minutes of a skilled technician’s time, and a C, E and K antigen (CEK) reagent. 85 No evidence was found of alloimmunisation impacting on QoL. Table 20 summarises the proportion of children with alloimmunisation and its cost per 3-month cycle.
Chelation
Following blood transfusion, all patients will experience iron overload after approximately 12 months. Chelation therapy is used to reduce the impact of iron overload, thus improving patients’ QoL in the long term. In the short term, chelation therapy is difficult to administer and unpleasant for the patient, which may initially reduce QoL.
In clinical practice, patients begin chelation therapy 12 months after their first blood transfusion and the therapy ends 6 months after their final blood transfusion. In the model, chelation costs start 1 year after the age of 2 years and continue until two cycles after the patient moves off transfusion at the age of 18 years. The model structure does not allow the inclusion of the 12-month time lag for those patients who start transfusion past the age of 3 years (as this would have required an additional state), thus our model slightly overestimates the cost of chelation. Those patients who receive transfusion throughout their lifetimes are modelled to receive chelation as long as they receive transfusions.
The model assumes 100% adherence to chelation therapy. The literature currently reports adherence between 64% and 95%. 51 However, there is a strong tendency towards moving patients from injection chelation to oral chelation, which may result in improvement in adherence rates. A summary of chelation costs and disutilities used in the model is presented in Table 21 (further detail can be found in Appendix 4, Table 44). Based on clinical opinion (survey of clinicians), in the UK 20% of chelation therapy is injection chelation and 80% is oral chelation. The cost of chelation is derived from the British National Formulary (BNF). 86 The cost of chelation varies by age, as older age groups require a higher dosage of treatment. Those receiving injection chelation experience a utility loss, whereas, in comparison, those receiving oral chelation experience a utility gain. 82 These assumptions have been confirmed in repeated interviews with clinicians. The utility gain due to oral chelation is presented as a negative disutility in Table 21. Utility weights associated with two types of chelation have been tested through sensitivity analysis (see Appendix 8).
| Type of chelation | Proportion (%) receiving chelation | Cost (£) of chelation by age group (years) | Disutility | |
|---|---|---|---|---|
| 2–7 | 8–31+ | |||
| Injection chelation | 20 | 1377 | 1388 | 0.04 |
| Oral chelation | 80 | 1172 | 1922 | –0.03 |
| Weighted average | – | 1213 | 1816 | –0.16 |
The costs and utility of chelation therapy are applied to all patients in the ‘transfusion > 200 cm/second’ health state for > 1 year and are calculated as the weighted averages of those on oral and injection chelation.
Sickle cell disease complications
Patients with SCD experience SCD-related complications, such as acute pain, splenic sequestration and acute chest syndrome. 5,12,18 In the published literature it has been reported that blood transfusions may help reduce the incidence of these complications. 85 In the model, the probability of experiencing SCD-related complications was derived from Claster and Vichinsky,87 and was then adjusted based on the clinical opinion of D Rees. However, we are aware that there are varying clinical opinions regarding the probability of clinical complications by age group, and these are addressed in the sensitivity analyses described in Chapter 5 (see Sensitivity analysis).
The cost of treating each SCD-related complication is derived from Karnon et al. 81 The disutility associated with each AE is based on assumption informed by clinical opinion, as values for these parameters could not be found in the literature. Table 22 provides a summary of data used in the model. Detail on the calculation of the probability and cost of complications is available in Appendix 4.
| Health state | SCD complication | Probability (%) of SCD complication by age group (years) | Cost per episode (£) | Disutility per episode | |||
|---|---|---|---|---|---|---|---|
| 2–7 | 8–18 | 19–30 | 31+ | ||||
| No transfusion | Pain crisis | 5.26 | 8.73 | 11.25 | 6.56 | 841 | 0.02 |
| Acute chest syndrome | 1.37 | 4.50 | 0.44 | 0.44 | 1815 | 0.06 | |
| Transfusion | Pain crisis | 2.00 | 2.00 | 2.00 | 2.00 | 841 | 0.02 |
| Acute chest syndrome | 0.70 | 0.70 | 0.70 | 0.70 | 1815 | 0.06 | |
In the model the disutility values and costs of complications are presented per episode rather than per 3-month cycle, as these disutilities and costs are not applied continuously in the model but only if an event happens in a given 3-month cycle.
Probability of stroke
Each state in the pre-stroke element of the model is associated with a probability of having a stroke. The probability of having a stroke is a function of blood velocity, whether or not a patient is receiving blood transfusion and age. 35 The incidence of stroke for patients with SCD varies significantly with age. 27 Specifically, general clinical opinion is that stroke risk is higher between the ages of 2 and 7 years, and 19 and 30 years. However, published evidence on risk of stroke does not support this view. For the purpose of the model we have used published data and tested these probabilities in scenario analyses. In order to reflect this dynamic in the probability of stroke, the parameters used in the model distinguish between four distinct age groups: age 2–7, 8–18, 19–30 and ≥ 31 years.
Table 23 shows the varying likelihood (by health state and age) that patients with SCD experience a first stroke. In the model, between the ages of 2 and 18 years, individuals with a high blood velocity are assumed to have a significantly higher risk of stroke, and this risk is reduced by blood transfusions. After the age of 18 years, general stroke rates for patients with SCD are drawn from Ohene-Frempong et al. 27 and the probability of stroke is assumed to be the same across health states. However, this report acknowledges that the data supporting these assumptions are uncertain.
| Age (years) | Health state | |||||
|---|---|---|---|---|---|---|
| Transfusion > 200 cm/second | No transfusion > 200 cm/second | No transfusion < 200 cm/second | ||||
| Probability (%) | Source | Probability (%) | Source | Probability (%) | Source | |
| 2–7 | 0.20 | Adams (2005)35 | 2.5 | Adams 200535 | 0.01 | Assumption |
| 8–18 | 0.10 | Ohene-Frempong (1998)27 | 1.25 | Data from Ohene-Frempong (1998),27 adjusted based on effect size from the STOP trial35 | 0.01 | Assumption |
| 19–30 | 0.13 | Ohene-Frempong (1998)27 | 0.13 | Ohene-Frempong (1998)27 | 0.13 | Ohene-Frempong (1998)27 |
| 31+ | 0.22 | Data from Ohene-Frempong (1998),27 averaged for ages | 0.22 | Data from Ohene-Frempong (1998),27 averaged for ages | 0.22 | Data from Ohene-Frempong (1998),27 averaged for ages |
On having a stroke, a patient leaves the pre-stroke component of the Markov structure and enters the post-stroke component of the Markov structure.
Post-stroke component of the Markov model
This section describes the structure of the post-stroke components of the Markov model. Further detail on the data used to specify the parameters of the model is available in Appendix 4.
Health states included in the model
On having a stroke, and depending on the severity of the stroke, patients enter the post-stroke component of the Markov model in one of the four post-stroke health states77 shown in Table 24.
| Post-stroke health state | Condition |
|---|---|
| Mild | The population in this state has a minor or temporary disability (no organ failure, but treatment required post stroke to recuperate) |
| Moderate | The population in this state has a disability (possibly organ failure, prolonged treatment required, possible mental disability) |
| Severe | The population in this state has a major disability (multiple organ failure, paralysis, severe mental disability) |
| Death | The population in this state has died either due to general mortality or SCD mortality due to stroke |
It is assumed that the probability of being in either a mild, moderate or severe post-stroke health state after the first stroke is independent of pre-stroke health state.
Table 25 summarises the distribution of the population by post-stroke health state after a first stroke.
| Post-stroke health state | Probability (%) by age group (years) | |||
|---|---|---|---|---|
| 2–7 | 8–18 | 19–30 | 31+ | |
| Mild | 27.50 | 19.75 | 20.00 | 17.50 |
| Moderate | 50.00 | 46.25 | 40.00 | 25.00 |
| Severe | 22.50 | 33.25 | 32.00 | 45.00 |
| Death | 0.00 | 0.75 | 8.00 | 12.50 |
Model dynamics
As with the pre-stroke element of the model, a 3-month cycle length is adopted for the post-stroke element of the model. A number of different types of dynamics are included in this part of the model:
-
disease progression following first stroke
-
probability of having a second or third stroke
-
health outcome immediately after the second or third stroke
-
disease progression following second or third stroke.
Disease progression following first stroke
Table 25 describes the probability of being in different health states – mild, moderate, severe, and dead – following a first stroke. Table 26 summarises the probability of subsequent disease state deterioration. It is assumed that those who have had a first stroke will move through these states in sequence. For instance, the population can only move from ‘mild post stroke’ by first going through ‘moderate post stroke’, i.e. the population cannot directly move from ‘mild post stroke’ to ‘severe post stroke’ or vice versa.
| Parameter | Probability (%) by age group (years) | |||
|---|---|---|---|---|
| 2–7 | 8–18 | 19–30 | 31+ | |
| Probability of moving to a worse state post stroke | 1.00 | 1.00 | 6.00 | 10.00 |
Probability of having a second or third stroke
After individuals have incurred a first stroke, there is a probability of incurring a second and/or third stroke (Table 27). The process of calibration involves adjustment of all of the second and third stroke probabilities, so that the model predicts death rates reported in the literature. 21,45 Specifically, calibration was conducted on the probability of second and third stroke and the probability of post-stroke health state following the second and third stroke. Originally, the calibration was done so that the relativities between the first stroke and the second/third stroke were maintained, for example the second stroke would be relative to the first stroke by 10%, 20%, 30%, etc., and then the third stroke would be relative to the second stroke by 10%, 20%, 30%, etc. The calibration was required due to the absence of published data on the subject. The decision to model up to three strokes was based on clinical opinion and the absence of data on further strokes. 16,40 Based on clinician opinion, both the probability of a recurrent stroke and the disability associated with post-stroke health state are dependent on the patient’s current stroke health state.
| Parameters | Probability (%) by age group (years) | |||
|---|---|---|---|---|
| 2–7 | 8–18 | 19–30 | 31+ | |
| Probability of second stroke based on first stroke health state | ||||
| Mild state post first stroke | 0.25 | 0.25 | 0.25 | 0.00 |
| Moderate state post first stroke | 0.50 | 0.38 | 0.38 | 0.00 |
| Severe state post first stroke | 1.25 | 0.63 | 0.63 | 0.63 |
| Probability of third stroke based on second stroke health state | ||||
| Mild state post second stroke | 1.25 | 0.50 | 0.50 | 0.00 |
| Moderate state post second stroke | 1.25 | 1.00 | 1.00 | 0.00 |
| Severe state post second stroke | 2.50 | 1.25 | 1.25 | 0.00 |
Health outcome immediately after the second or third stroke
Table 28 presents the health outcomes post second and third strokes. It is assumed that following another stroke the population can move only to a health state the same as or worse than the one they were in before the stroke. For instance, the population in a moderate post-stroke state after an initial stroke can move only to a moderate or severe post-stroke state following a second stroke. This assumption is based on information from clinicians obtained via telephone interviews.
| Starting health state | Ending health state | Probability (%) by age group (years) | |||
|---|---|---|---|---|---|
| 2–7 | 8–18 | 19–30 | 31+ | ||
| Mild post stroke | Mild | 80 | 80 | 80 | 80 |
| Moderate | 18 | 18 | 18 | 18 | |
| Severe | 2 | 2 | 2 | 2 | |
| Dead | 0 | 0 | 0 | 0 | |
| Moderate post stroke | Moderate | 45 | 45 | 45 | 45 |
| Severe | 50 | 50 | 47 | 47 | |
| Dead | 5 | 5 | 8 | 8 | |
| Severe post stroke | Severe | 90 | 90 | 85 | 85 |
| Dead | 10 | 10 | 15 | 15 | |
Data for these parameters have been originally collected through the clinicians’ telephone interviews and then calibrated using the existing literature. 16,40
Disease progression following second or third stroke
As with the first stroke, once the second or third stroke has occurred and individuals are in one of the four post-stroke health states, there is a probability of staying within the same health state or moving to a worse health state over time. Table 29 summarises how health states progress following the second and third strokes.
| Parameter | Probability (%) by age group (years) | |||
|---|---|---|---|---|
| 2–7 | 8–18 | 19–30 | 31+ | |
| Probability of moving to a worse state post second stroke | 15 | 15 | 15 | 25 |
| Probability of moving to a worse state post third stroke | 20 | 20 | 20 | 30 |
Figures 3 and 4 show population outcomes under the intervention and the non-intervention arms. They demonstrate how the population in the intervention arm moves on to transfusion early in life owing to high blood flow velocities and how the population in the non-intervention arm moves on to transfusion only post stroke. Also it is clear that a larger percentage of the population lives longer in the intervention arm in comparison with patients in the non-intervention arm.
FIGURE 3.
Population outcomes with blood transfusion following TCD scans.
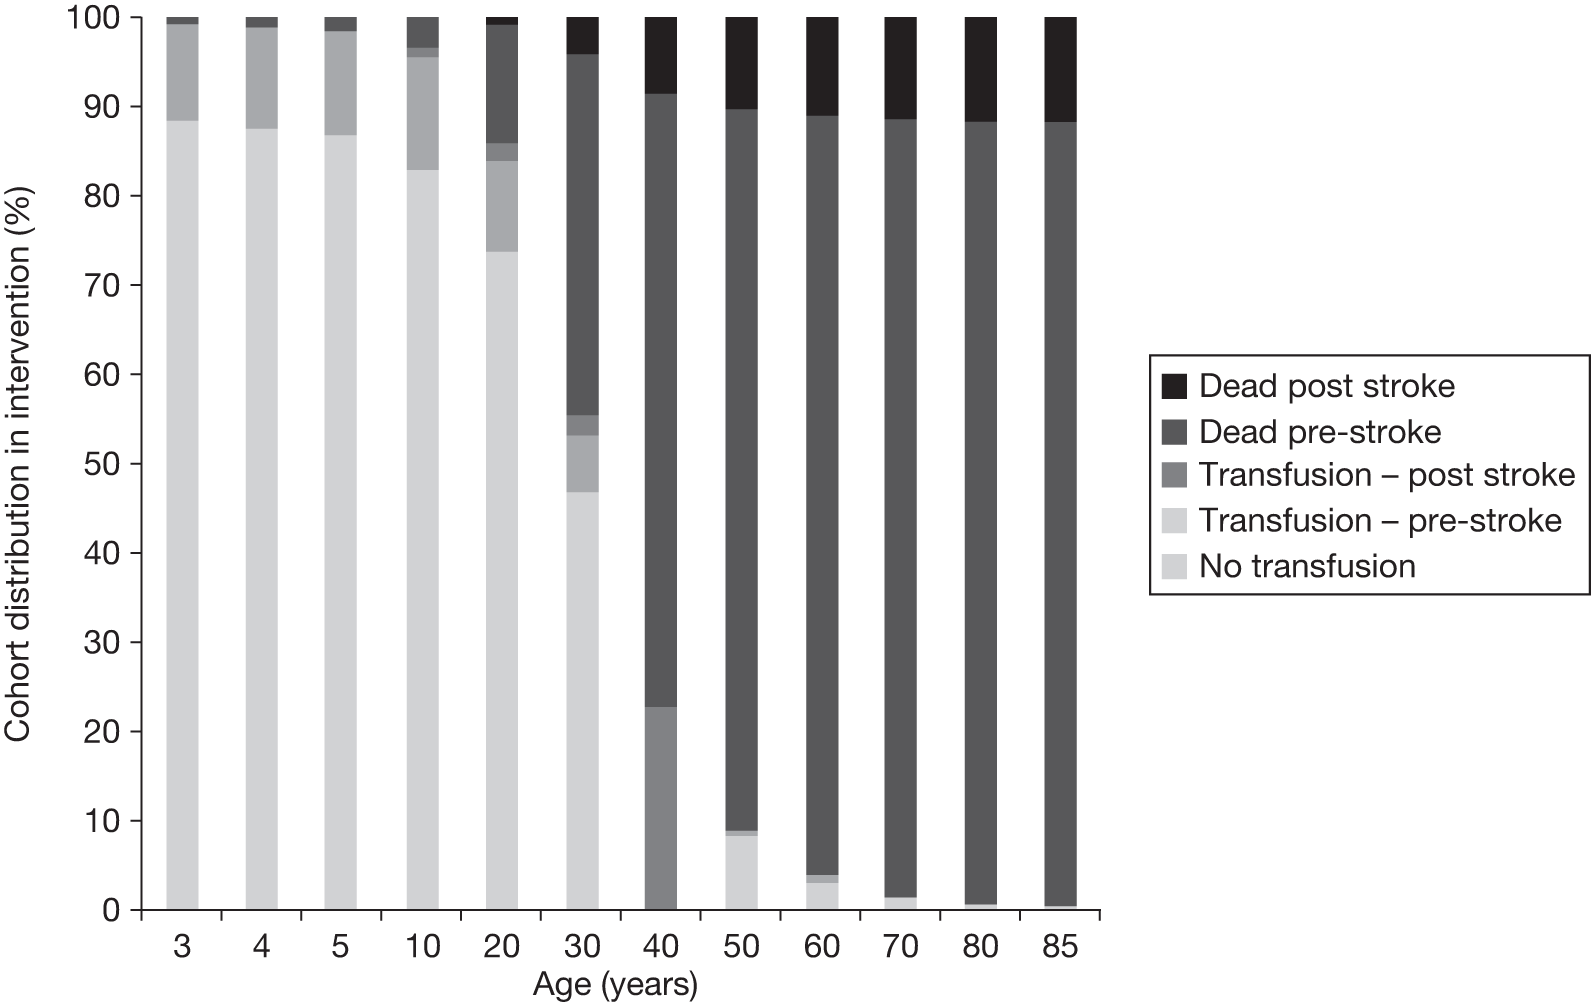
FIGURE 4.
Population outcomes without blood transfusion following TCD scans.
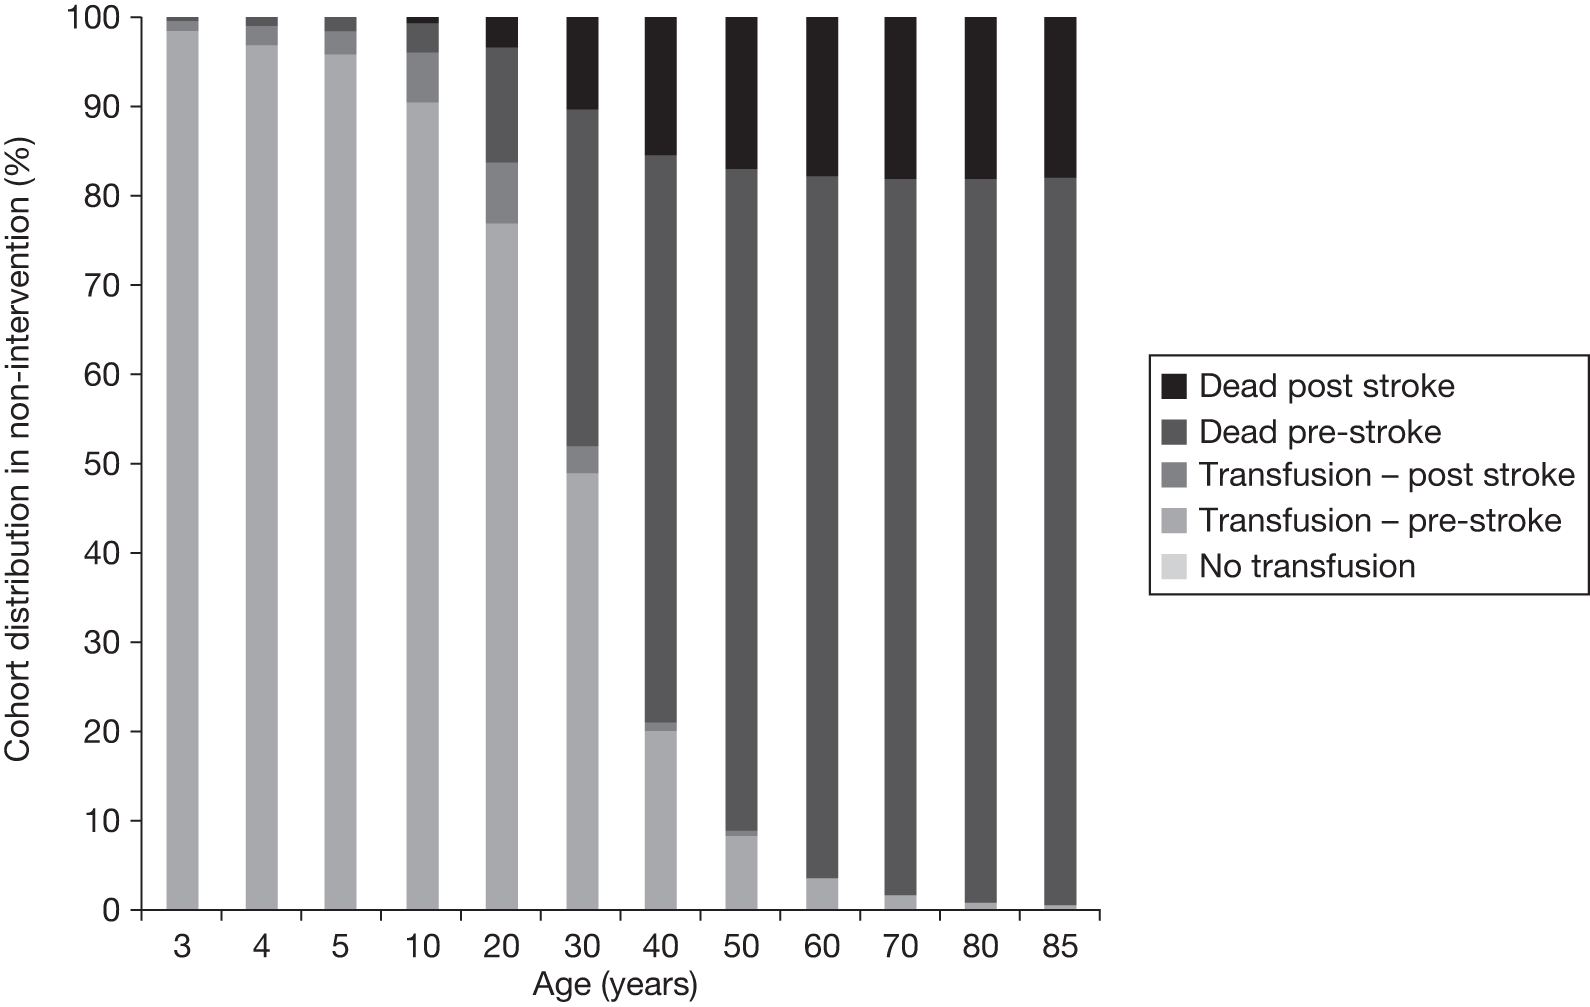
Patients receive blood transfusions following a stroke regardless of post-stroke health state. These transfusions are associated with a number of health benefits. Patients also receive relevant treatments for stroke-related disabilities. Based on communication with D Rees, 2011, it was identified that, in the first 3 months following a stroke, patients receive an initial large transfusion, which is six times the strength of a regular transfusion, and then five further regular transfusions. Following the first 3 months post stroke, patients will return to the regular transfusion schedule. Table 30 summarises the transfusion costs used in the model for stroke patients. Detail on the calculation of the cost of blood transfusion is presented in Appendix 4, Table 44. Six transfusions are included in the cost of the first cycle post stroke. From the second cycle post stroke there are three transfusions per cycle as in the pre-stroke model. Account was not taken of the large transfusion received immediately post stroke, as no cost data could be found for this. In order to reflect the uncertainty around the initial cost of stroke, sensitivity of the results to the cost of treatment in the first cycle post-stroke was tested (see Appendix 8).
| Time from stroke | No. of transfusions | Cost (£) by age group (years)a | |||
|---|---|---|---|---|---|
| 2–7 | 8–18 | 19–30 | 31+ | ||
| First cycle post stroke | 5b | 3667 | 4917 | 5691 | 5730 |
| Second cycle post stroke to death | 3 | 2206 | 2950 | 3415 | 3438 |
The cost of post-stroke treatment varies depending on the effect that stroke has on the patient. Data on the costs of paediatric stroke care in the UK were not available, and the published US data are not applicable. Thus, specific stroke treatments were determined via telephone interviews with clinicians. All post-stroke patients require hospitalisation. Depending on severity of stroke, patients may be put on a ventilator and spend additional days in an intensive care unit (ICU) or high-dependency unit (HDU). Patients who suffer moderate/severe strokes require physical and psychological rehabilitation which may last from a few months to a lifetime. Severely impacted patients would require part or full-time care after discharge. Detail of the calculation of the cost of treatment is presented in Appendix 4. Table 31 presents the cost of treatment per 3-month cycle in various states.
| Post-stroke state | Immediate (first 3 months) post-stroke care costs (£) | Ongoing post-stroke care costs (£) | Disutility |
|---|---|---|---|
| Mild | 3737 | 327 | 0.03 |
| Moderate | 8161 | 1649 | 0.08a |
| Severe | 18,417 | 6618 | 0.13 |
Analysis
Modelling and the calculation of model parameters were undertaken in Microsoft Excel, version 2007 (Microsoft Corporation, Redmond, WA, USA). All costs were uplifted to 2010 GBP using gross domestic product (GDP) deflators available from the Treasury. 88 All costs and effects occurring ≥ 1 year after the start of the model were discounted at 3.5%. The analysis was designed to generate two measures of efficiency: incremental cost per quality-adjusted life-year (QALY) gained and incremental cost per stroke avoided (CPSA). More detail on this analysis is presented in Appendix 7. The analysis was validated in a number of ways. First, a number of checks were run to ensure the internal consistency of the models. For instance, the size of the population in each part and cycle of the model was checked to ensure that the cohort size remained 1000 throughout the model. Second, model outcomes were compared with data in the published literature. Specifically, the predicted cost savings produced by the model (post-stroke costs and costs associated with the management of patients with SCD) were compared with those published in the literature. The estimated overall survival was validated against two US studies following patients with SCD from birth,16,40 and the estimated decrease in risk of stroke due to transfusions was validated against data from the STOP trial. 31
The validation should have been undertaken across a broader range of parameters; however, the majority of data available had already been used to specify the model parameters. In addition to validating the outcomes against published literature, the model outcomes were presented to D Rees, P Telfer and A Yardumian to ensure that the model was producing outcomes consistent with their clinical opinions.
Third, sensitivity analysis was performed to determine whether or not the model results are sensitive to any of the uncertainties identified in the evidence. The variables listed in Table 32 were tested as part of one-way sensitivity analyses, as they were considered to be the variables subject to greatest uncertainty.
| Type of parameter varied | Parameter applied to calculate |
|---|---|
| Probabilities |
Death when on and off transfusion for different age groups First stroke for different age groups and transfusion regimens Moving to a different health state post stroke Remaining on transfusion to the age of 18 years TCD scan of < 200 cm/second per cycle SCD complications |
| Costs |
Post-stroke treatment for different severity of strokes (immediate and ongoing costs) Chelation Transfusion Transfusion of alloimmunised patients |
| Disutilities | Associated with patients who have:
|
Results
Efficacy of blood transfusion
This section presents the results of the cost-effectiveness analysis. Table 33 shows the lifetime incremental costs and incremental effects of providing blood transfusions when blood velocity is > 200 cm/second compared with no blood transfusions when blood velocity is > 200 cm/second for a cohort of 2-year-old children with SCD.
| Parameters | Age (years) | ||||||
|---|---|---|---|---|---|---|---|
| 2–7 | 8–18 | 19–30 | 31+ | 2–18 | 2–30 | Total | |
| Discounted | |||||||
| Cost of non-intervention arm, £ | 4,369,682 | 18,568,588 | 12,195,631 | 3,586,150 | 22,938,270 | 35,133,900 | 38,720,051 |
| Cost of intervention, £ | 7,731,774 | 21,889,273 | 16,024,182 | 6,826,909 | 29,620,646 | 45,644,828 | 52,471,737 |
| QALYs non-intervention arm | 3813 | 6011 | 3216 | 1263 | 9824 | 13,039 | 14,302 |
| QALYs intervention arm | 3898 | 6264 | 3367 | 1344 | 10,162 | 13,529 | 14,873 |
| Incremental cost, £ | 3,361,692 | 3,320,685 | 3,828,551 | 3,240,758 | 6,682,376 | 10,510,928 | 13,751,686 |
| Incremental QALYs | 85 | 253 | 151 | 81 | 339 | 490 | 571 |
| Strokes averted | 38 | 29 | 2 | –1 | 67 | 69 | 68 |
| ICER, £ | 39,330 | 13,121 | 25,326 | 39,783 | 19,738 | 21,463 | 24,075 |
| CPSA, £ | 87,613 | 115,689 | 2,286,889 | –3,120,936 | 99,628 | 152,891 | 203,099 |
| Undiscounted | |||||||
| Cost of non-intervention arm, £ | 4,845,413 | 26,885,262 | 25,326,071 | 12,721,175 | 31,730,675 | 57,056,745 | 69,777,920 |
| Cost of intervention, £ | 8,491,617 | 31,569,032 | 33,169,658 | 24,767,537 | 40,060,649 | 73,230,307 | 97,997,844 |
| QALYs non-intervention arm | 4164 | 8592 | 6705 | 4565 | 12,756 | 19,461 | 24,026 |
| QALYs intervention arm | 4258 | 8961 | 7022 | 4863 | 13,219 | 20,242 | 25,105 |
| Incremental cost, £ | 3,646,204 | 4,683,770 | 7,843,587 | 12,046,362 | 8,329,974 | 16,173,561 | 28,219,923 |
| Incremental QALYs | 95 | 369 | 317 | 298 | 463 | 780 | 1078 |
| Strokes averted | 42 | 41 | 3 | –4 | 83 | 86 | 82 |
| ICER, £ | 38,555 | 12,705 | 24,743 | 40,394 | 17,983 | 20,730 | 26,167 |
| CPSA, £ | 87,102 | 114,142 | 2,406,834 | –3,096,359 | 100,487 | 187,727 | 343,040 |
The analysis suggests that over the lifetime of patients the intervention could be considered cost-effective with a cost per QALY gained of £24,075 and a CPSA of £203,099. The overall incremental cost-effectiveness ratio (ICER) is within the £20,000–30,000/QALY gained threshold that NICE uses to assess cost-effectiveness.
Over a lifetime, the intervention costs an additional £13.8M – or £13,751 per patient – generates an additional 571 QALYs (an additional 0.6-QALY gain per patient) and helps avoid 68 strokes (0.07 strokes avoided per patient).
Table 33 shows that patients in the intervention arm suffer fewer strokes than patients in the non-intervention arm up until the age of 30 years. After the age of 30 years, four additional strokes are observed in an intervention arm compared with the non-intervention arm. This trend can be explained by the impact of blood transfusion on the death rate. That is, as fewer people are dying as a result of stroke in the early parts of the model, they are living longer and thus increasing the number of strokes later in the model. Although the average likelihood of a stroke later in the model is still lower with blood transfusion than without blood transfusion, the greater number of the cohort alive later in the model causes the number of strokes to increase slightly, and thus increases costs.
The impact of blood transfusion on survival
Figure 5 shows the survival rate of the cohort of patients with SCD who receive blood transfusion.
FIGURE 5.
Overall survival rate of individuals with SCD identified to be at high risk of stroke following TCD and receiving blood transfusion.
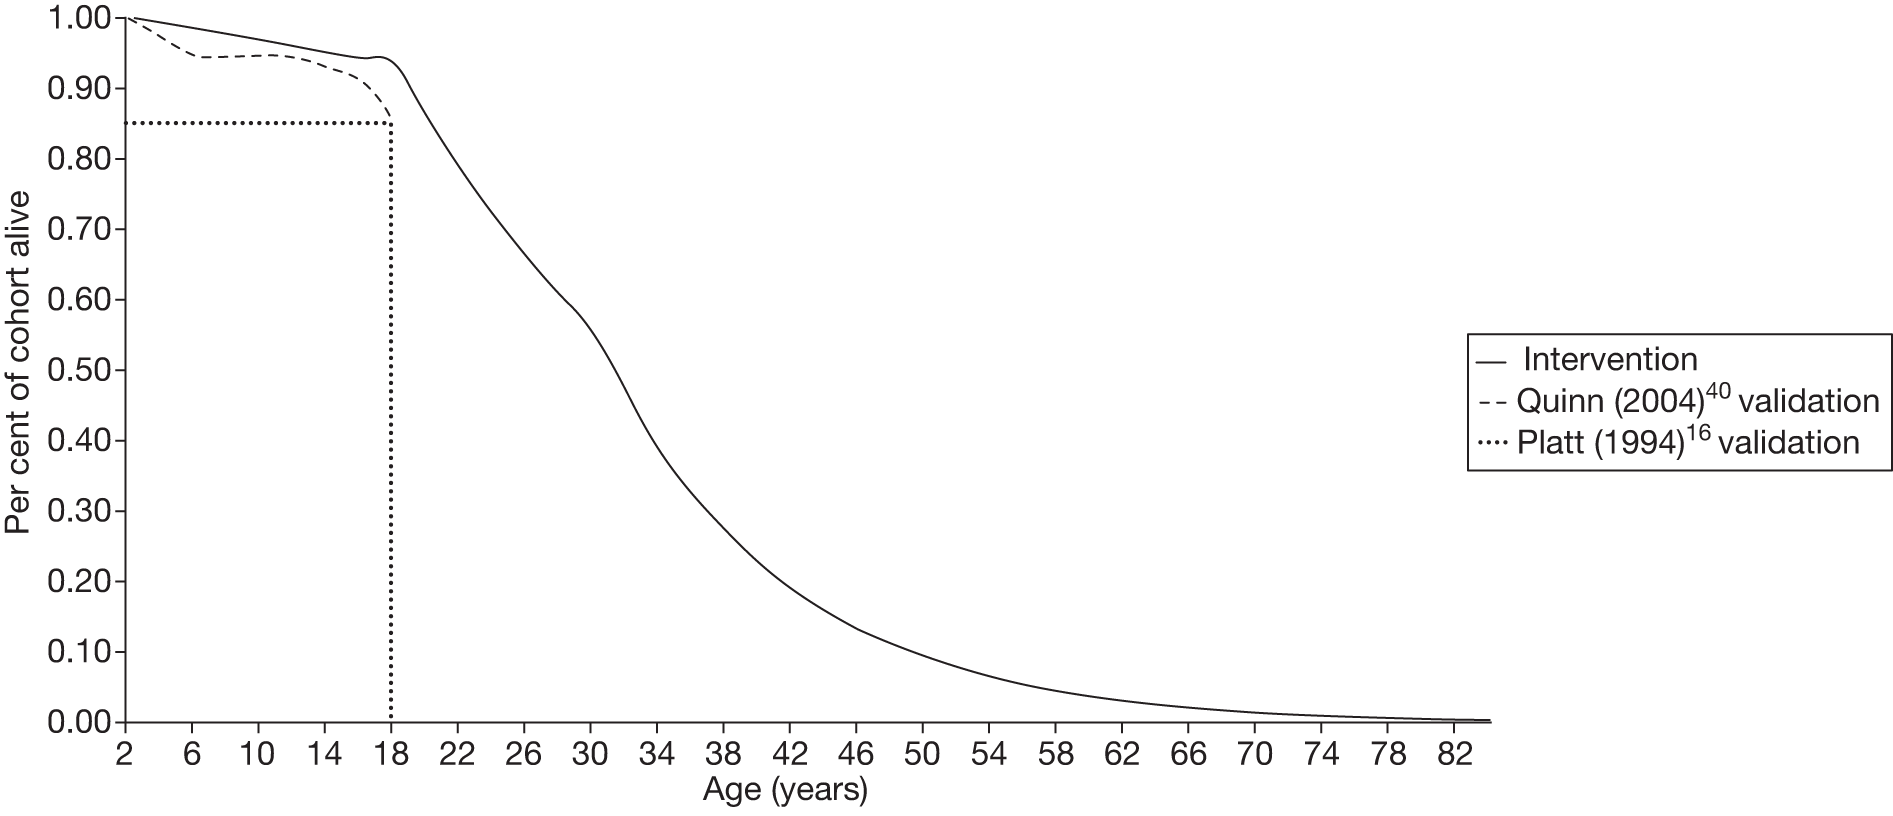
Figure 5 also shows a comparison of the results of the model with previous studies of patients with SCD. Quinn et al. 40 studied patients with SCD on transfusion in the USA. They followed the population from birth to the age of 18 years. The survival rate observed by Quinn et al. 40 is indicated on Figure 5 by the dashed grey line. Platt et al. 16 also studied a population with SCD in the USA. Although this population was on treatment, the precise nature of the treatment is not clear from the paper. The dotted line on Figure 5 represents the proportion of the cohort observed by Platt et al. ,16 who were alive at the age of 20 years.
The model was calibrated to the death rates estimated in Platt et al. 16 and Quinn et al. 40 The calibration was performed by adjusting the probabilities of having a second and third stroke. The resulting survival rate is higher than that in the Platt et al. 16 and Quinn et al. 40 studies. This is the result of limits to the number of people having first strokes, and thus able to have second and third strokes. The number of people with a blood velocity of > 200 cm/second by age 18 years was limited to 15% in accordance with clinical opinion (see Pre-stroke component of the Markov model, above).
Impact of blood transfusion on the incidence of stroke
The impact of blood transfusion on the incidence of strokes is summarised in Figure 6. It demonstrates the impact of blood transfusion on the number of first strokes. Without blood transfusion, nearly 13% of patients experience first stroke by the age of 30 years. The equivalent rate with blood transfusion is around 6%.
FIGURE 6.
Number of patients experiencing at least one stroke, with and without blood transfusion, following TCD (cohort size = 1000).
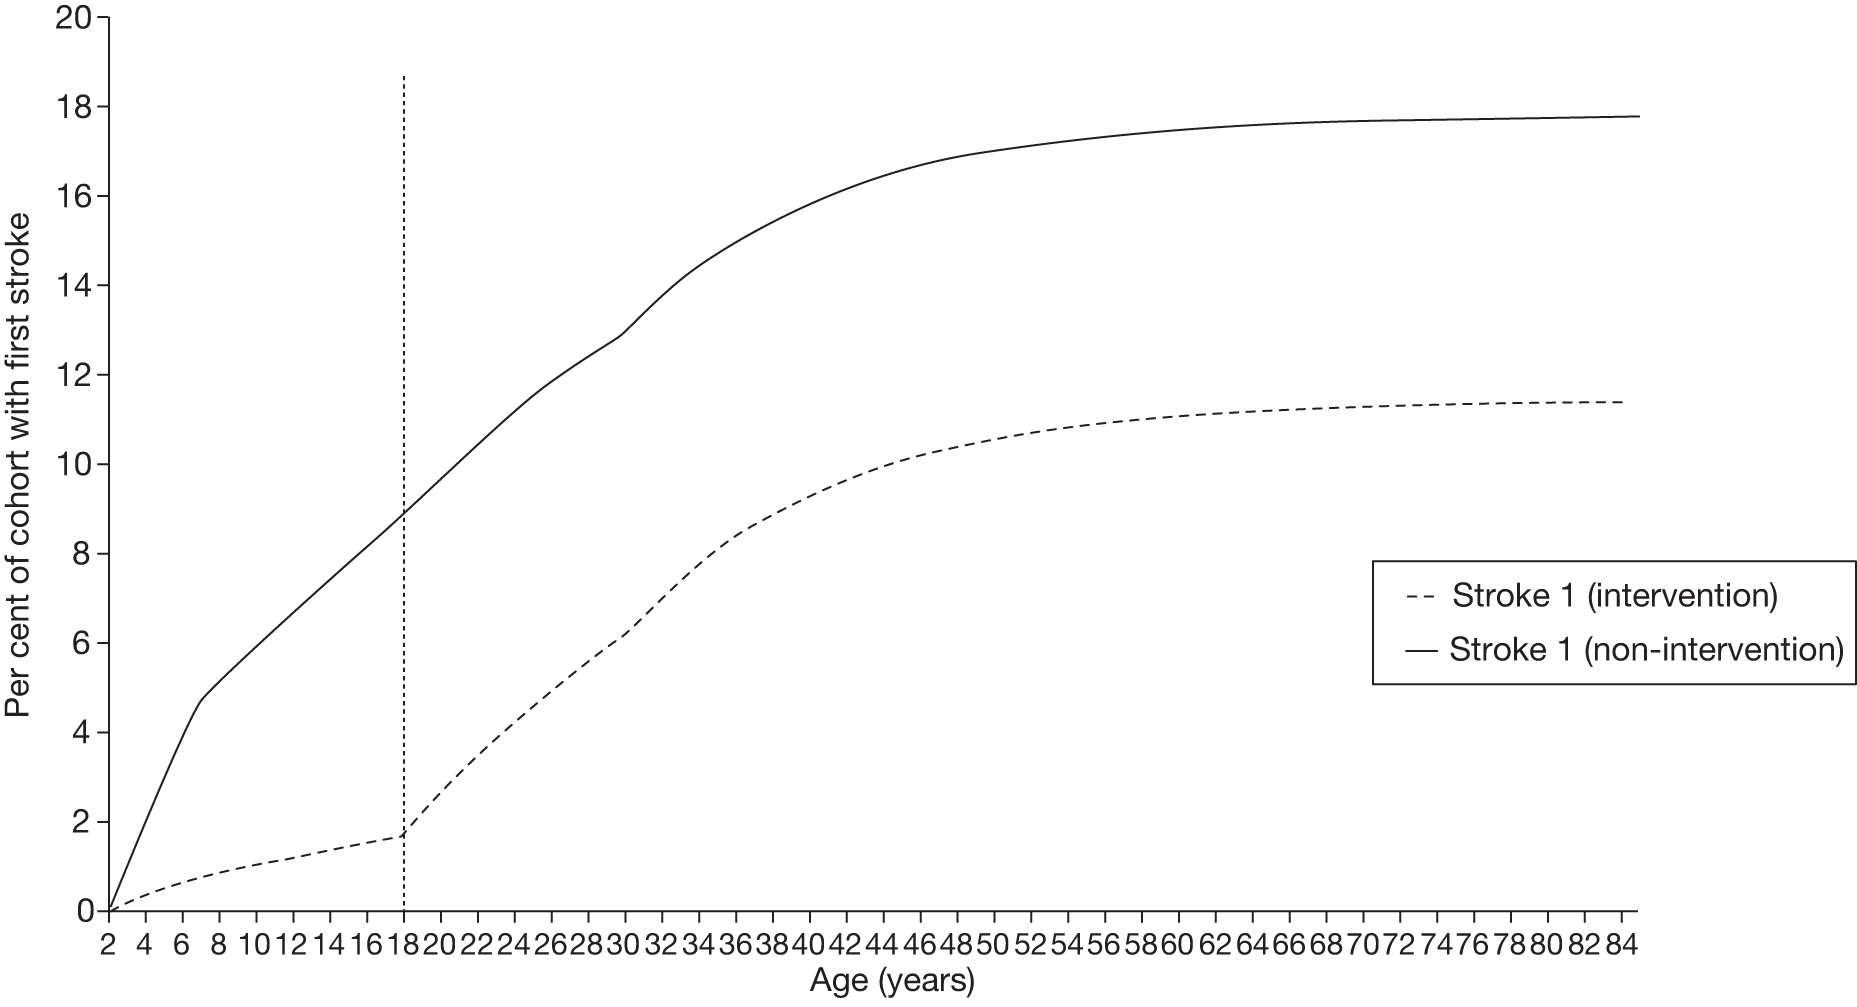
The existing literature on the incidence of first stroke in SCD children was used to populate the model and therefore it was not possible to validate these outputs against published literature. However, D Rees confirmed that incidence of first stroke predicted by the model reflected his clinical opinion.
Costs incurred by patients with sickle cell disease
The model estimates that the lifetime cost (until age 82 years) of treating a patient with SCD in the intervention arm is £52,472. This estimate compares well with those in the existing literature. 81,89 However, Karnon et al. 81 estimate the lifetime costs to be £185,614 (£248,300 in 2010 GBP). Karnon’s work includes the cost of a number of SCD complications, such as renal failure, hip replacement, leg ulcers, acute anaemia, chronic lung disease, retinopathy and other operations, which are not included in our analysis. This extensive list of complications explains the difference between estimates by Karnon et al. 81 and those produced by the model. Saka et al. 89 estimate direct costs of stroke in the UK to be £34,011 per year (in 2010 GBP); this is higher than the average direct annual cost per first stroke at £18,862 per patient per year produced by the model. The difference in these estimates can be explained by the fact that the model costs paediatric stroke. Paediatric patients who have mild or moderate post-stroke outcomes (61% of all strokes) incur fewer costs than the general stroke population, for whom additional comorbidities may prolong post-stroke recovery. For calculation of this comparison, see Appendix 4, Table 50.
Figures 7 and 8 show the breakdown of the costs of treating patients with SCD both with and without blood transfusion following TCD scans. In both arms of the model post-stroke treatment costs account for a sizeable proportion of all costs, and post-stroke treatment costs increase with age. However, there is a clear difference between the intervention and the non-intervention groups. In the latter, post-stroke treatment costs constitute the greatest cost, whereas in the intervention arm, cost of transfusion and chelation are significantly greater than the cost of post-stroke treatment. It is unsurprising that the costs of blood transfusion and chelation and associated treatments are higher with blood transfusion following TCD scans than without. Without blood transfusion following TCD scans, transfusions are provided only post stroke. Costs associated with complications of SCD (pain crisis, acute chest syndrome) are higher in the comparator arm than in the intervention arm and these costs are especially high before the age of 10 years. Once again, this is an expected outcome, as blood transfusion lowers the probability of complications and, consequently, the costs associated with these complications.
FIGURE 7.
Breakdown of cost types with blood transfusion following TCD scans.
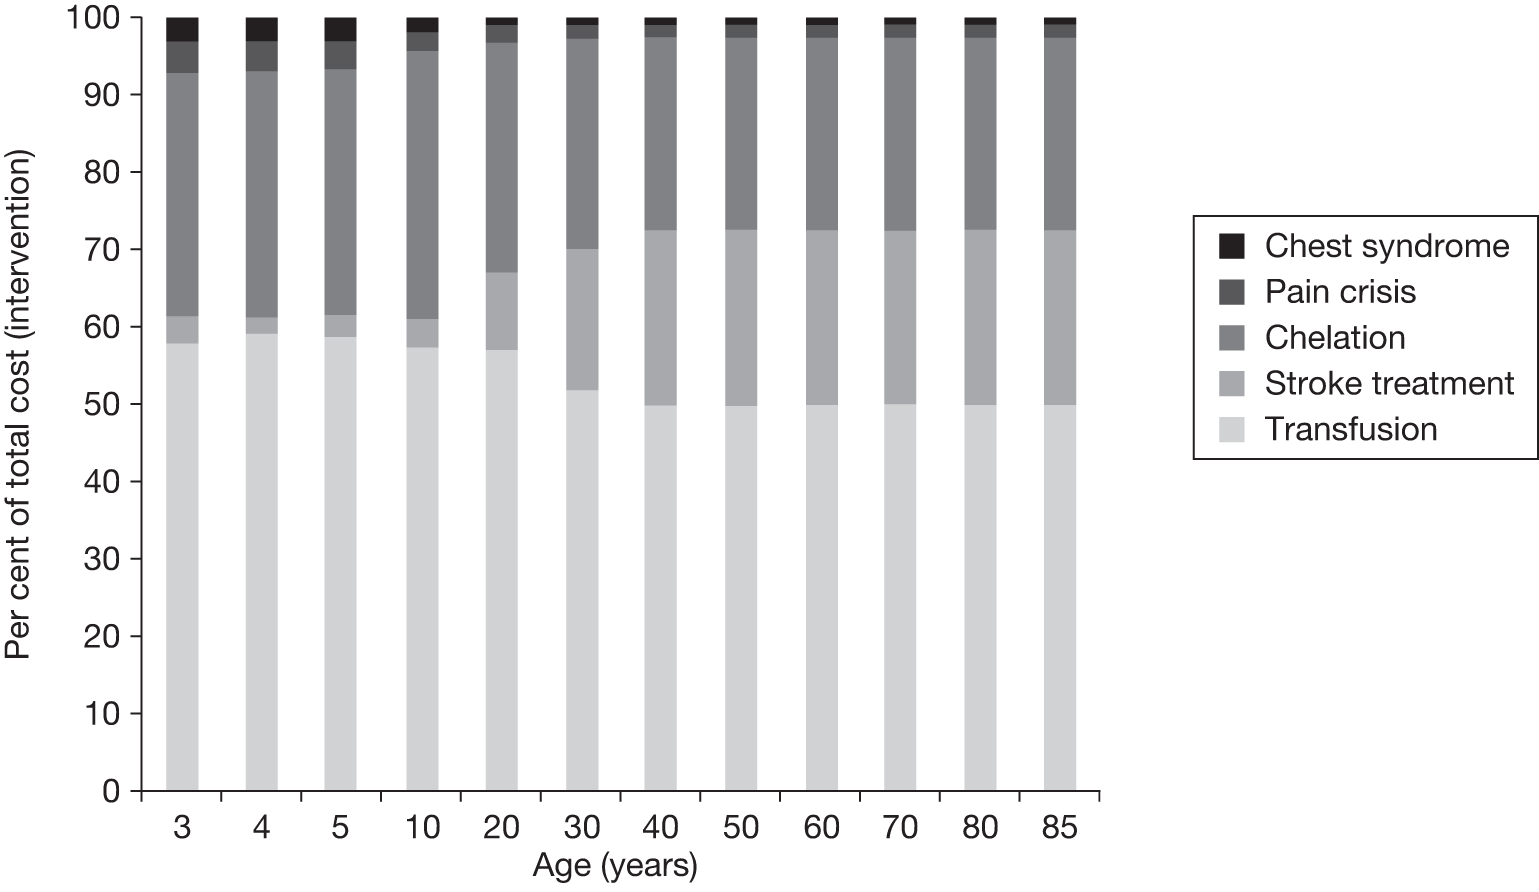
FIGURE 8.
Breakdown of cost types without blood transfusion following TCD scans.
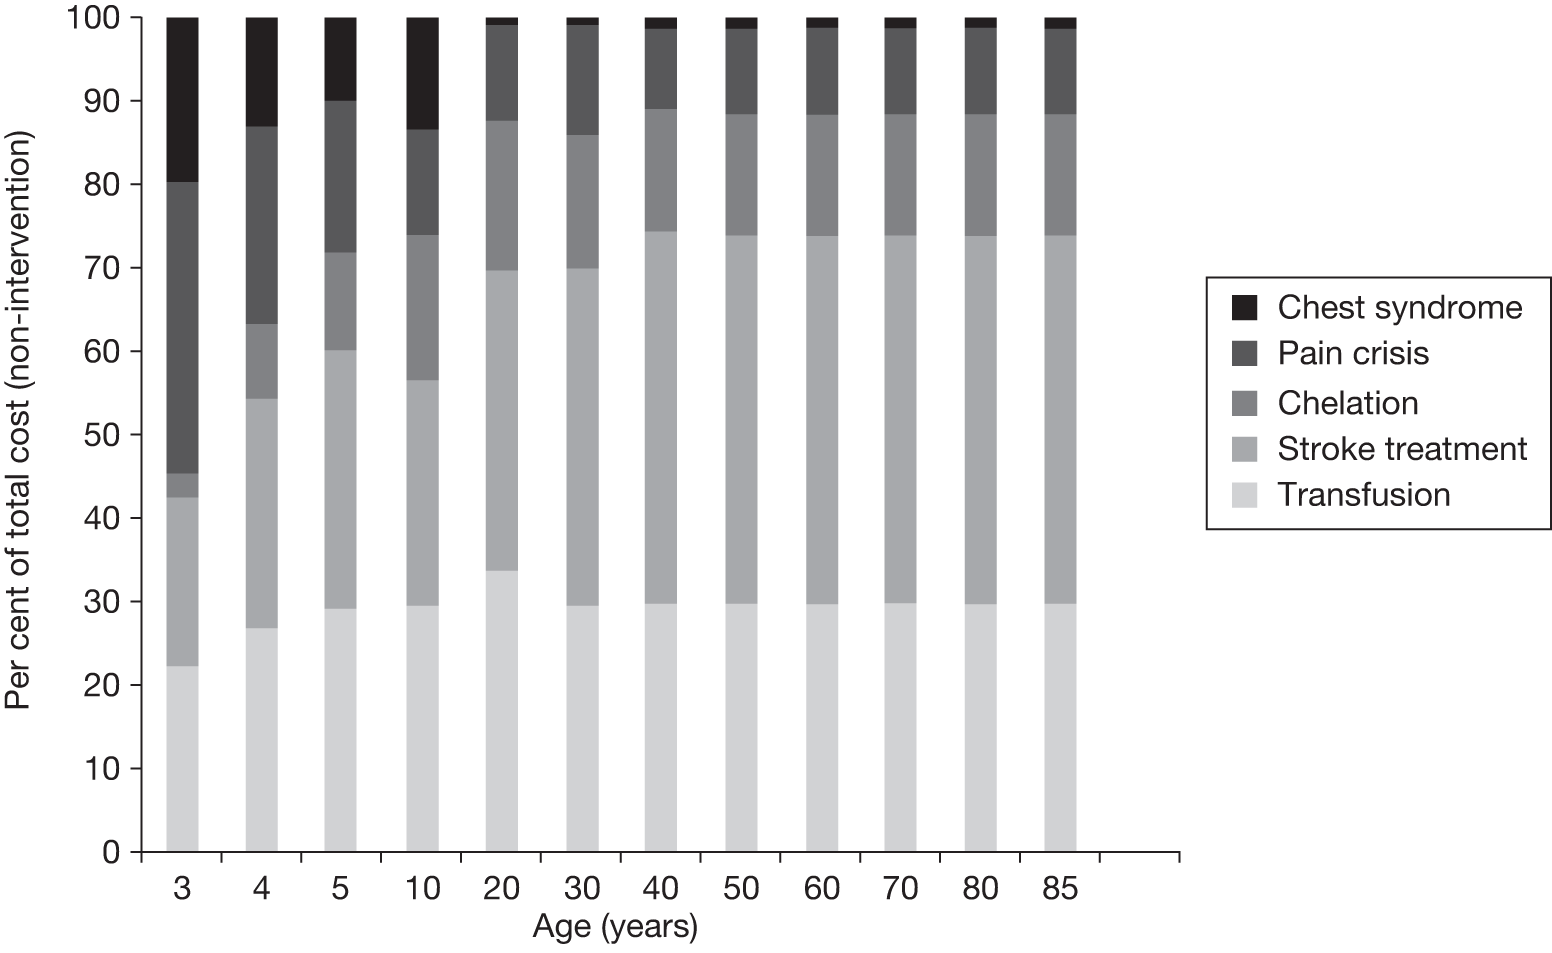
Impact of blood transfusion on sickle cell disease-related complications and adverse events
Figure 9 shows incidence of complications and AEs with and without the intervention. As expected, cases of SCD complications (pain crisis and acute chest syndrome) decrease as a result of the intervention.
FIGURE 9.
Number of complications, with and without blood transfusion, following TCD (cohort = 1000).
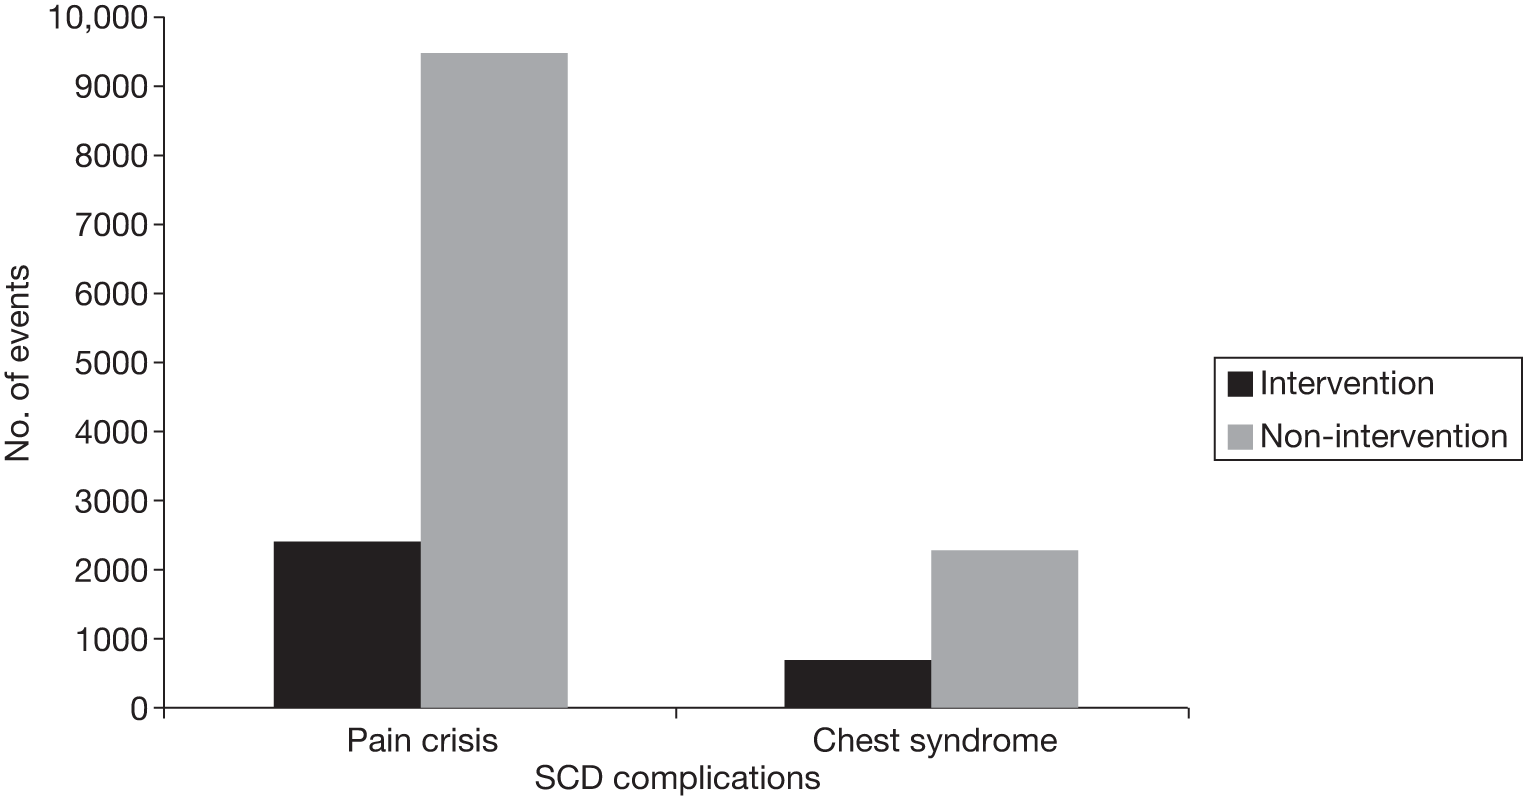
Figures 10–12 show the incidence of complications and AE over the lifetime of the intervention and comparator arms of the model.
FIGURE 10.
Number of alloimmunised patients, with and without blood transfusion, following TCD.
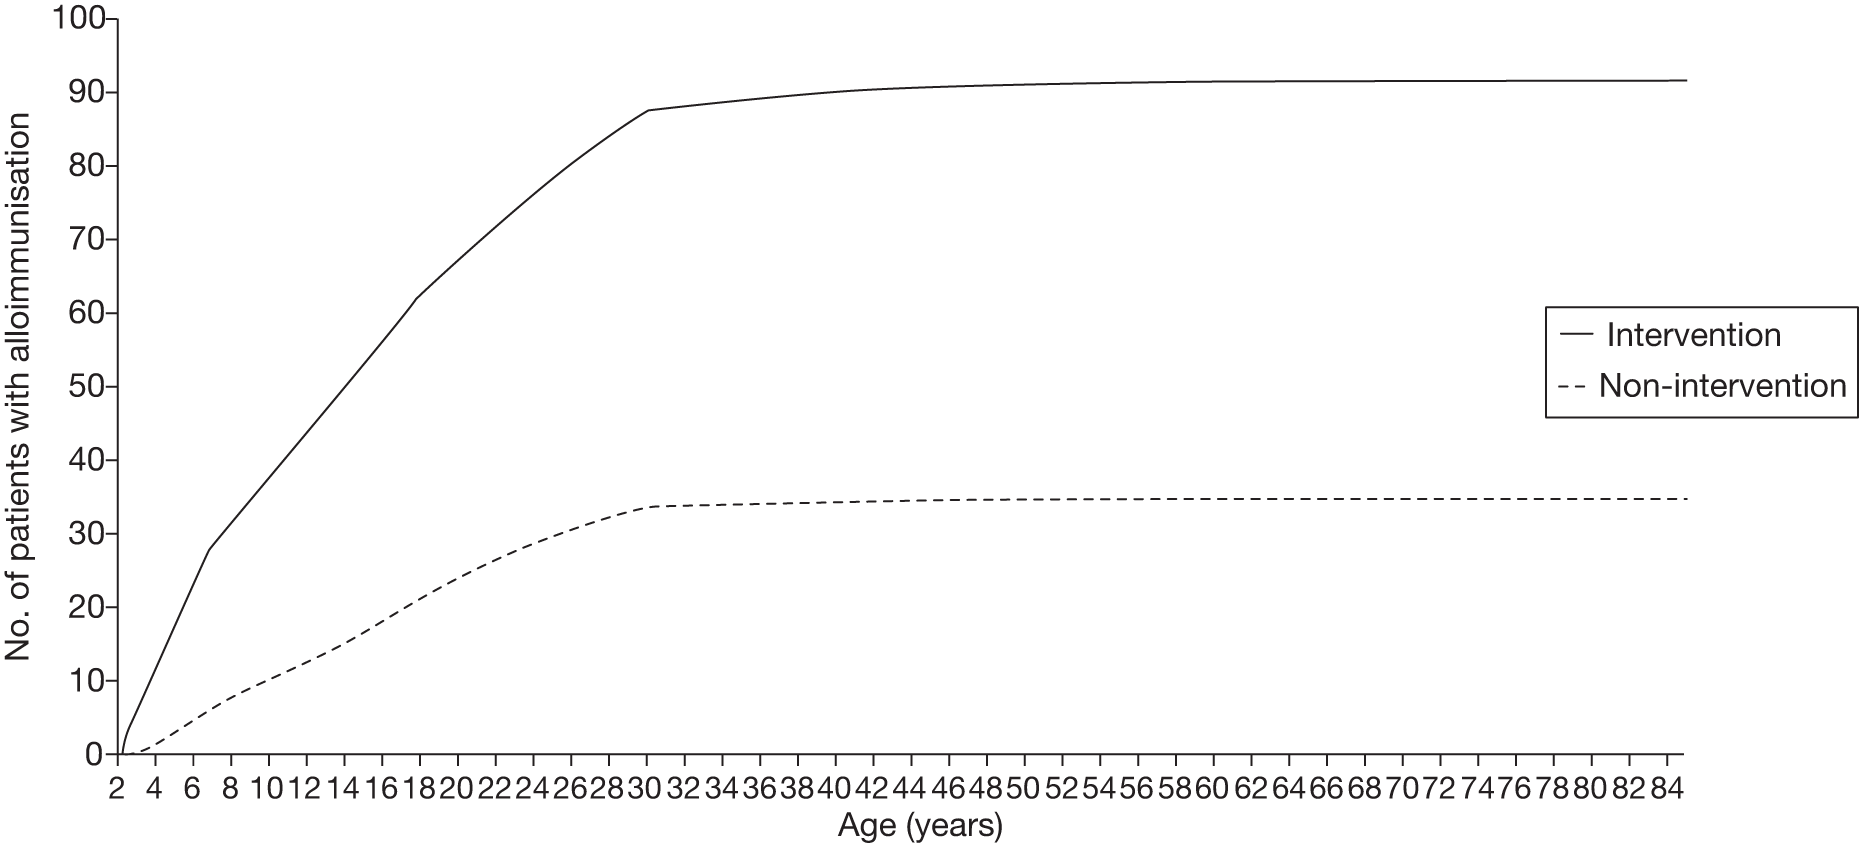
FIGURE 11.
Number of episodes of acute chest syndrome, with and without blood transfusion, following TCD.
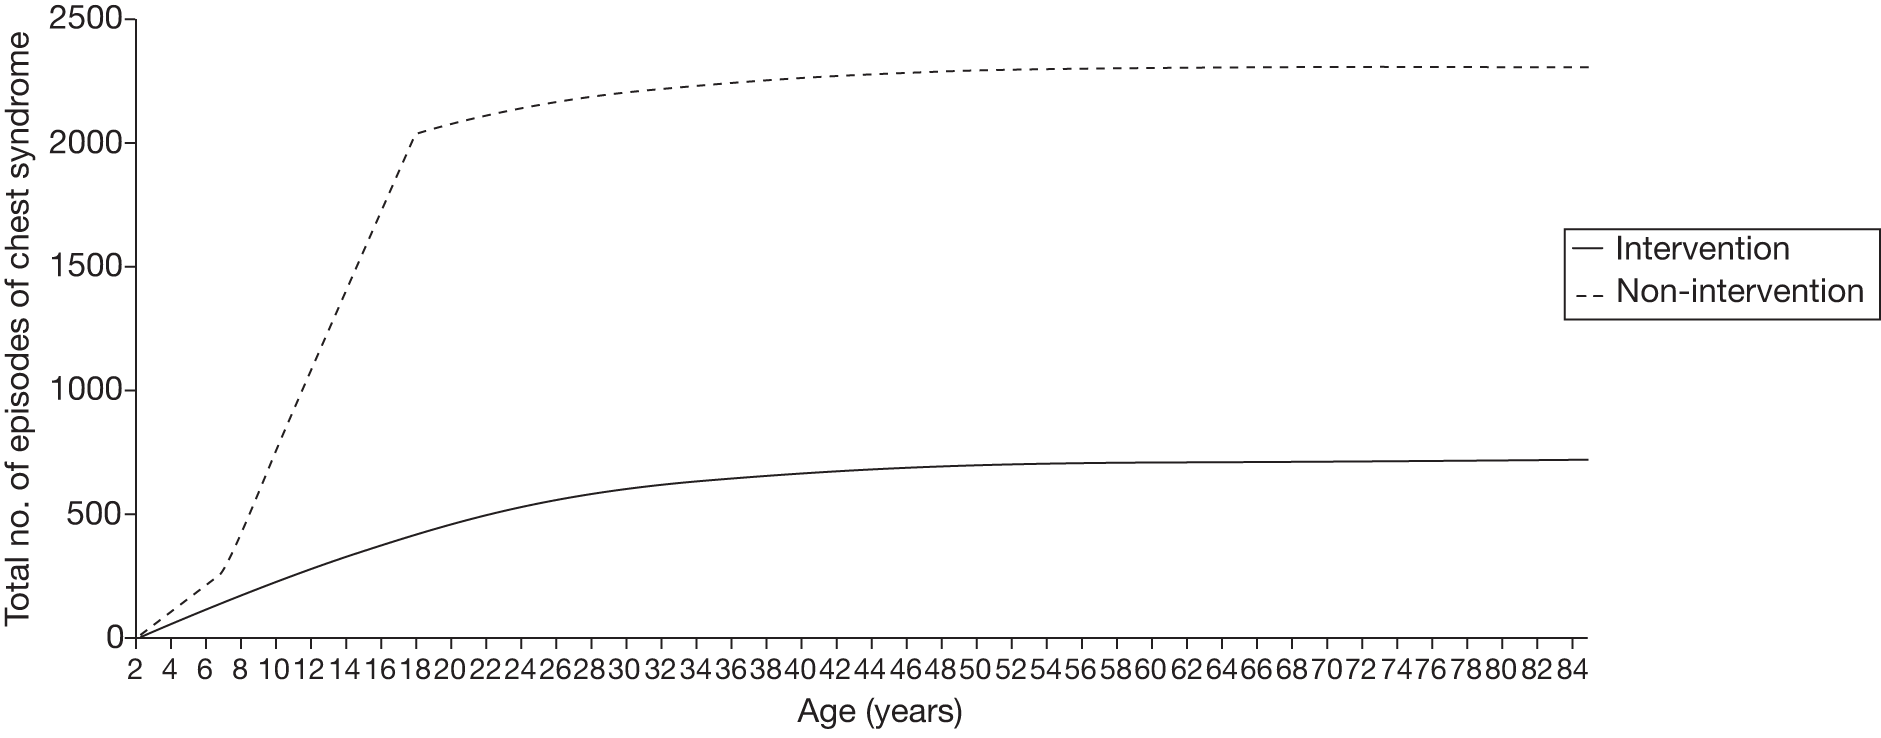
FIGURE 12.
Number of episodes experiencing serious pain crisis, with and without blood transfusion, following TCD.
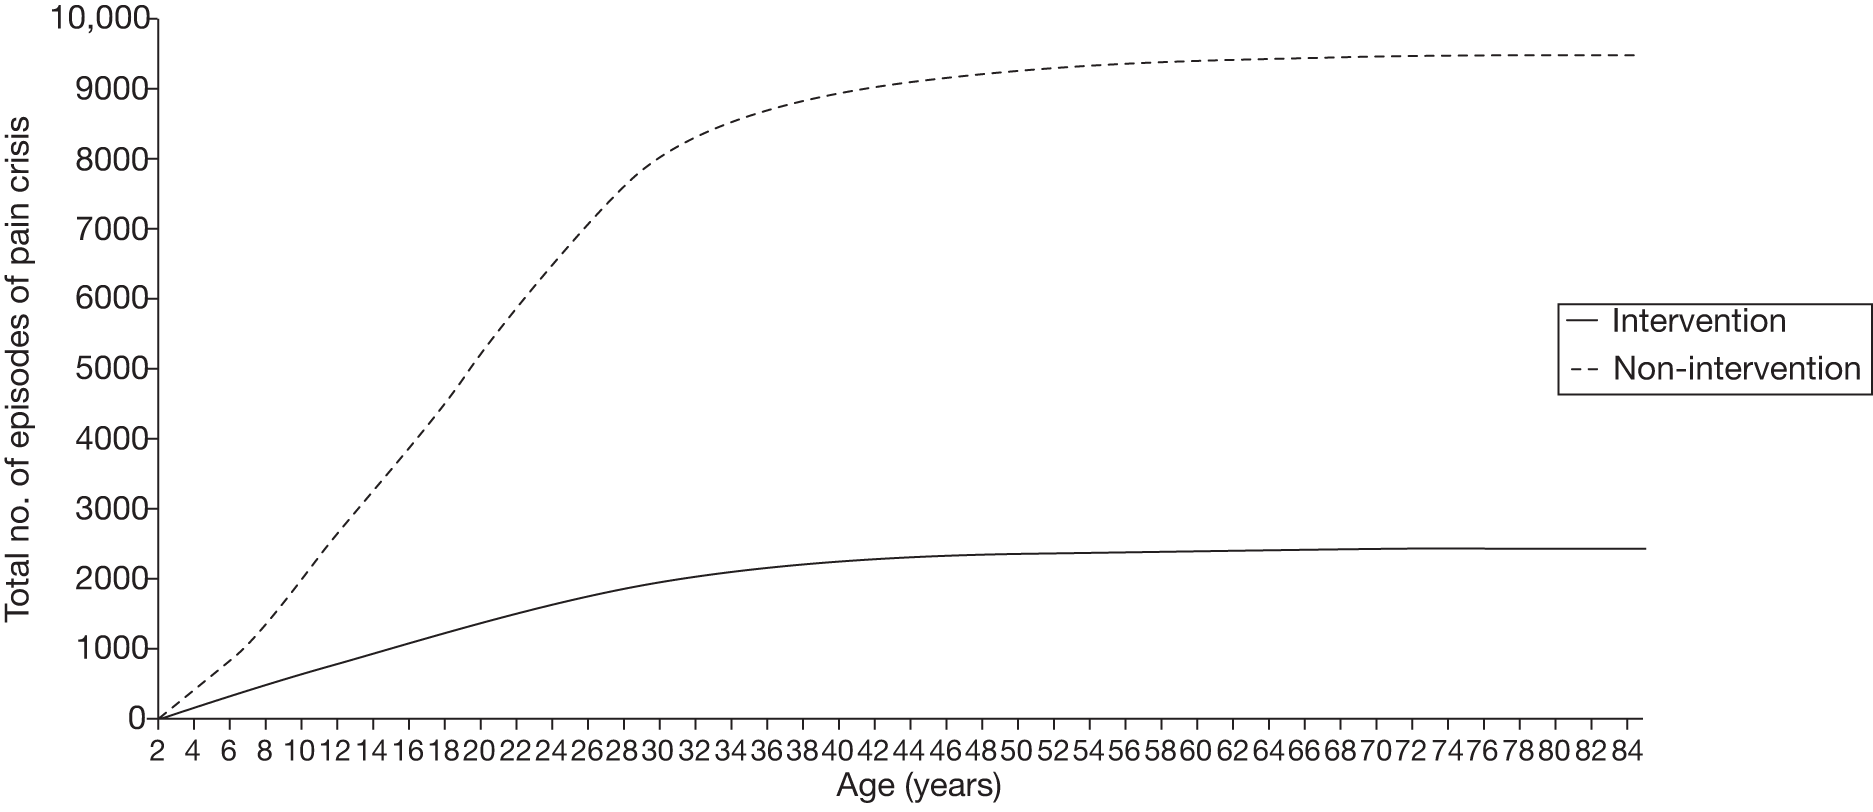
Cases of alloimmunisation (see Figure 10) are higher in the intervention arm as blood transfusions increase the probability of alloimmunisation. Rates of alloimmunisation become constant from about the age of 30 years, as by this time most patients who are on chronic transfusion have become alloimmunised or have been taken off transfusion. In the model no differentiation is made between different types of alloimmunisation, for example if a patient developed a reaction to at least one of the antibodies he/she is already considered to be alloimmunised and we do not account for further reactions developed to other antibodies.
Cases of complications of SCD (see Figures 11 and 12) are lower in the intervention arm. Rates of acute chest syndrome become constant at about the age of 30 years, as these are more prevalent in younger age groups.
The trends presented in Figure 12 are only for serious cases of pain crisis, defined as cases that require hospital admission or at least an Accident and Emergency department visit.
Sensitivity analysis
The data available to populate the cost-effectiveness models are subject to a great deal of uncertainty. A one-way sensitivity analysis was run in order to test the impact of uncertainty on the ICERs and CPSAs. The outputs of the sensitivity analyses are described in detail in Appendix 8. The results of these analyses are summarised in Table 34.
| Parameter | Age range (years) | Value in the model | Range in sensitivity analysis | Blood transfusion cost-effective?a |
|---|---|---|---|---|
| Probability (per cycle) of death when not on transfusion and TCD scan < 200 cm/second (not due to stroke) | 2–18 | 0.10% | 0.1 to 0.15% | Becomes not cost-effective with reduction of around 90% |
| Probability (per cycle) of death when TCD scan > 200 cm/second (not due to stroke) while off transfusion | 2–18 | 0.20% | 0.02 to 0.25% | Yes, always cost-effective |
| Probability (per cycle) of death when TCD scan > 200 cm/second (not due to stroke) while on transfusion | 2–18 | 0.10% | 0.02 to 0.20% | Yes, always cost-effective |
| Probability (per cycle) of first stroke when on transfusion and TCD > 200 cm/second | 2–7 | 0.2% | 0.20 to 0.70% | Yes, always cost-effective |
| Probability (per cycle) of first stroke when off transfusion and TCD > 200 cm/second | 2–7 | 2.5% | 1.0 to 4.0% | Becomes not cost-effective with reduction of around 20% |
| Probability (per cycle) of first stroke when on transfusion and TCD > 200 cm/second | 8–18 | 0.1% | 0.20 to 0.70% | Becomes not cost-effective with increase of around 400% |
| Probability (per cycle) of first stroke when off transfusion and TCD > 200 cm/second | 8–18 | 1.25% | 1.0 to 4.0% | Yes, always cost-effective |
| Probability (per cycle) of first stroke when on transfusion and TCD > 200 cm/second | 19–30 | 0.13% | 0.10 to 0.20% | Yes, always cost-effective |
| Probability (per cycle) of first stroke when off transfusion and TCD > 200 cm/second | 19–30 | 0.13% | 0.10 to 0.17% | Yes, always cost-effective |
| Probability (per cycle) of first stroke when on transfusion and TCD > 200 cm/second | 31+ | 0.22% | 0.17 to 0.27% | Yes, always cost-effective |
| Probability (per cycle) of first stroke when off transfusion and TCD > 200 cm/second | 31+ | 0.22% | 0.20 to 0.27% | Yes, always cost-effective |
| Probability (per cycle) of moving to a worse state post first stroke after one cycle | All | 1.00% | 0.1 to 2.6% | Yes, always cost-effective |
| Cost of treatment for mild post-stroke state (initial) | All | £3737 | £500 to 8500 | Yes, always cost-effective |
| Cost of treatment for moderate post-stroke state (initial) | All | £8161 | £2000 to 14,000 | Yes, always cost-effective |
| Cost of treatment for severe post-stroke state (initial) | All | £18,416 | £10,000 to 70,000 | Yes, always cost-effective |
| Cost of treatment for severe post-stroke state (ongoing) | All | £6618 | £5000 to 35,000 | Yes, always cost-effective |
| Probability of staying on transfusion until age 18 if TCD scan > 200 cm/second (intervention arm) | 2–18 | 100% | 10 to 100% | Yes, always cost-effective |
| Utility loss (per 3-month cycle) of those pre-stroke with TCD scan > 200 cm/second and no transfusion compared with those with a blood velocity of < 200 cm/second | All | 0.03 | 0.00 to 0.03 | Becomes not cost-effective with reduction of around 95% |
| Decrease in relative risk of SCD complications between those on transfusion and off transfusion | All | Rangeb | Doubled | Becomes not cost-effective with increase of around 60% |
| The incremental cost of transfusion for alloimmunised patients | All | £117 | £100 to 1000 | Yes, always cost-effective |
| The cost of chelation (oral and injection) | All |
0 Rangec |
Range of costs doubled | Becomes not cost-effective with increase of around 35% |
| The cost of transfusion (simple, exchange, combined) | All | Ranged | Range of costs doubled | Becomes not cost-effective with increase of around 20% |
| The probability of death in adults not due to stroke on and off transfusion (age 19–30 years) | 19–30 | 1% | 0.4 to 4% | Yes, always cost-effective |
| The probability of death in adults not due to stroke on and off transfusion (age 31+ years) | 31+ | 2% | 0.4 to 4% | Yes, always cost-effective |
| The probability TCD scan < 200 cm/second per cycle | 2–18 | 99.81% | 99.80 to 99.98% | Yes, always cost-effective |
| Disutility associated with oral chelation | All | –0.03 | –0.03 to 0.03 | Becomes not cost-effective with reduction of around 65% |
| Disutility (per cycle) associated with injection chelation | All | 0.04 | –0.02 to 0.06 | Yes, always cost-effective |
Most of the one-way sensitivity analyses suggest that the uncertainty in the model will not impact the conclusion of the analysis. Although 8 of the 27 parameters varied cause the ICER to rise above the £30,000 per QALY threshold within the range tested, the majority of these require large changes in parameter estimates to cause the threshold to be crossed. The exceptions to this rule are the following parameters:
-
The probability of first stroke if blood velocity is > 200 cm/second and when off transfusion A 20% reduction in this parameter will cause the ICER to move to > £30,000 per QALY.
-
The cost of chelation A 35% increase in this parameter will cause the ICER to move to > £30,000 per QALY.
-
The cost of transfusions A 20% increase in this parameter will cause the ICER to move to > £30,000 per QALY.
Chapter 6 Conclusions and research recommendations
Conclusions
The use of TCD ultrasonography to identify children at high risk of stroke, and treating these children with prophylactic blood transfusions, appears to be both clinically effective and cost-effective compared with using TCD ultrasonography alone.
Clinical review
-
No RCTs were identified which evaluated the efficacy of BMT for primary stroke prevention.
-
One RCT60 was identified which evaluated the efficacy of hydroxycarbamide for primary stroke prevention; this trial is currently recruiting participants.
-
Two RCTs were identified for inclusion in the review (STOP31 and STOP 235); both studied children with SCD identified to be at high risk of stroke using TCD ultrasonography. One study considered the effectiveness of blood transfusions compared with standard care in preventing primary stroke and the other compared discontinuation of prophylactic blood transfusion with continued transfusion.
-
Neither of these STOP studies was carried out in the UK.
-
The STOP trial31 demonstrated the efficacy of initiating blood transfusions in children with SCD, who were identified to be at high risk of stroke, using TCD ultrasonography in reducing stroke risk.
-
The STOP 2 trial35 demonstrated the importance of continued blood transfusion in reducing risk of primary stroke in children with SCD, identified to be at high risk of stroke, using TCD ultrasonography.
-
Both trials were terminated early owing to risks associated with the control arm.
-
No studies were identified which reported QoL data.
Economic review
-
No published economic evaluations relevant to the decision problem were identified from searching the published literature.
-
The assessment group developed a de novo economic model to compare TCD scans plus prophylactic blood transfusion in children at high risk, with TCD scans only in patients with SCD aged between 2 and 18 years.
-
The economic analysis suggests that blood transfusions post TCD scans for patients with SCD ≥ 2 years (compared with TCD scans alone) may be good value for money. The intervention has an ICER of £24,075 per QALY gained, within the range of the NICE threshold of £20,000–30,000 per QALY gained.
-
The intervention leads to improvement in health-related QoL, by helping to avoid 68 strokes over the lifetime of a population of 1000 patients. The intervention costs an additional £13,751 per patient and generates 0.6 extra years of life in full health per patient.
-
These estimates are subject to significant uncertainty, given the limitations in the published data. The sensitivity analysis and validation against existing data and expert opinion generally provide some reassurance that the conclusion that blood transfusions for patients with SCD may be cost-effective compared with no transfusion is reasonable. However, it is possible that the conclusion that blood transfusions are cost-effective may be influenced by uncertainty in a small number of model parameters. Further research is thus required to verify the results obtained here.
-
Given that the population of interest is patients with SCD of 2 years of age, estimates of costs and benefits later in life – age 18 years and onwards – are subject to substantial uncertainty. Just focusing on the short-term estimates of costs and benefits reinforces the conclusion that blood transfusions are cost-effective. For instance, the ICER is £19,738 if the model is just run between the ages of 2 and 18 years.
Research recommendations
Clinical research recommendations
The published literature on the use of TCD ultrasonography to identify children at high risk of stroke and implementation of primary stroke prevention strategies is limited. Most of the RCT data come from the two seminal STOP trials,31,35 both of which considered the efficacy of blood transfusion for primary stroke prevention, and were terminated early due to large numbers of harmful events in the comparator arms. Data on the effectiveness of blood transfusion are available from a number of cohort studies but there are still gaps for which further research would be welcomed.
For example, published data on stroke incidence, morbidity and mortality from stroke in older children and adults would be valuable, particularly if these data were to come from follow-up studies of existing published cohorts, such as the East London cohort30 and the Dallas cohort. 40
Additionally, clinicians still do not know the optimal duration of continuation of blood transfusion into adulthood. There are some data to suggest that patients with abnormal TCD velocities during childhood may not have velocities of > 200 cm/second in adulthood. The majority of patients exhibit no neurological deficit, absent transient ischaemic attack, no or minor cerebral ischaemia, and no or mild cerebrovascular disease, owing to the implementation of early TCD screening and treatment with blood transfusion for stroke prophylaxis before there is any evidence of neurological damage on MRI scanning.
Treatment with hydroxycarbamide is associated with reduced complications and costs compared with blood transfusion. More research is required to assess the potential effects of hydroxycarbamide in reducing risk of primary stroke in children with SCD. Two trials are suggested.
First, it is likely that there is a ‘window period’ of high risk of stroke in children with abnormal TCD velocities, up to age of about 10 years; velocities decrease with age (in adolescence) and an individual’s stroke risk also diminishes after the age of 10 years. It would therefore be useful to assess whether or when transfusions can be discontinued or replaced with hydroxycarbamide therapy in these children owing to the risks associated with long-term blood transfusion. Those children who have been fully protected by transfusion (i.e. those children who have had no stroke, minimal cerebral ischaemia and no, or minimal, cerebrovascular disease) could be randomised to either continued transfusions, discontinuation of transfusion or replacement of transfusion with hydroxycarbamide between the ages of 12 and 15 years. This trial may help to identify the optimal length of continuation of transfusion, and the potential role of hydroxycarbamide in this process. This has important implications for the QoL and cost of treating children with SCD and the subsequent implications for policy and practice within the NHS in the future.
Second, a trial that randomises patients to blood transfusion or hydroxycarbamide for TCD velocities in the borderline to low abnormal category (185–210 cm/second), and assesses the impact of this on stroke rate or HbS levels would be useful. Children with TCD velocities of between 185 and 200 cm/second do not currently receive transfusion for primary stroke prevention, thus this trial will assess the impact of hydroxycarbamide on borderline to low abnormal TCD velocities before they become a greater risk.
Although the clinical benefits of TCD scanning in children have been demonstrated, there are few data relating to long-term impact. Reports from more mature TCD screening programmes may be able to provide information about the long-term benefits associated with TCD scanning from the age of 2 years. There are also no published data relating to QoL in children with SCD who are identified to be at high risk of stroke using TCD ultrasonography and who are undergoing any primary stroke prevention strategy. Further research is required to identify QoL deficits in these children and to establish the impact of various primary stroke prevention strategies on children’s QoL.
In addition, data are needed on the outcomes of implementing TCD scans and blood transfusion in children with SCD (routine clinical practice in the UK). In particular, reports are needed of children’s uptake of TCD screening at the age of 2 years, uptake of transfusion therapy in children with high TCD velocities, and incidence of stroke. Reports on stroke incidence should focus not only on transfused children with high blood flow velocities, but also on children with velocities of < 200 cm/second and who therefore do not receive transfusion.
Economic research recommendations
The published literature on SCD contains a number of gaps in relation to the cost and clinical outcome data required to assess the cost-effectiveness of blood transfusion for patients with SCD. Further research is required to generate more robust data on which to base estimates of cost-effectiveness, or against which model outputs can be calibrated. Specifically, further research should be undertaken looking at utility weights associated with SCD and variation with age, transfusions, strokes and SCD complications – such as pain crisis and transfusion-related treatments (such as alloimmunisation and chelation). This call for further research follows Mazumdar et al. 55 and Nietert et al. ,79 who point out that utility weights associated with SCD have not been established and report QoL data sourced from expert clinical opinion.
Research is also needed around the cost of paediatric stroke care in the UK. In the UK there is a body of literature on costs associated with adult stroke. 89,90 Cost of paediatric stroke care has been estimated in the USA. 91 In the UK, an economic analysis would be helpful to collect relevant resource and cost data associated with paediatric strokes of various severity. Given that it is unlikely that any budget data will accurately reflect the costs of paediatric stroke, it is proposed that this analysis adopts a bottom-up approach. 92
In accordance with NICE guidance,78 data collection should focus on the incurred costs of the health-care system. However, anticipating greater interest in a broader set of costs, it is proposed that the research should also consider indirect costs and the cost of informal care. 93 For example, Saka et al. 89 concluded that indirect costs of post-stroke care constitute 24% and informal care is 27% of total post-stroke costs in the UK. These costs have not been established for post-paediatric stroke care.
In addition, research around post-stroke outcome data would be welcomed. No data were identified relating to the distribution of severity of paediatric stroke in order to identify what proportion of children with SCD end up in mild, moderate, severe or dead post-stroke health states. An ongoing study is currently attempting to develop and validate a paediatric stroke severity scale and to compare these scores with infarct volume and with functional outcomes at 3 and 12 months. 94 Further work would be useful to build on this study to elicit post-stroke outcomes in patients with SCD.
More information is needed about death rates (survival in SCD). Karnon et al. 81 state that there remains considerable uncertainty about the survival of newborn cohorts of patients with sickle cell disorders and the possible development of new complications of new interventions. The present review used survival data reported in Karnon et al. 81 validated by data reported by Platt et al. 16 in 1994. However, as Karnon et al. 81 point out, current management of SCD may have improved survival rates dramatically, so it is important that more recent data on the survival of patients with SCD are collected.
Finally, the frequency of complications and AEs in patients with SCD when on and off transfusion requires further research. The literature states that pain crisis and acute chest syndrome are more frequent in patients with SCD who are not receiving transfusion. However, no data were found regarding rate of these events. Data should be collected longitudinally from patients with SCD who are on and off transfusions to identify the frequency of complications they experience.
Acknowledgements
The authors are pleased to acknowledge the contributions of Drs A Streetly, P Telfer and A Yardumian, who provided clinical advice and reviewed the final draft of the report. Dr C Rudisill provided advice on the economic model and reviewed the final draft of the report. Dr P Nortey reviewed the final draft of the report and Mr J Mahon validated and reviewed the economic model.
Contribution of authors
-
M Gemma Cherry Review co-ordination, input into all aspects of clinical review.
-
Janette Greenhalgh Review co-ordination, input into all aspects of clinical review.
-
Leeza Osipenko Development of economic model.
-
Meena Venkatachalam Development of economic model.
-
Angela Boland Reviewing economic model, editing of drafts of the review.
-
Rumona Dickson Input into all aspects of the clinical component of the review.
-
Yenal Dundar Development of search strategies and input into aspects of the clinical component of the review.
-
Kevin Marsh Development of economic model.
-
David Rees Input into the clinical and economic components of the review, clinical advice.
Disclaimers
The views expressed in this publication are those of the authors and not necessarily those of the HTA programme or the Department of Health.
References
- Ashley-Koch A, Yang Q, Olney R. Sickle hemoglobin (Hb S) allele and sickle cell disease: a HuGE review. Am J Epidemiol 2000;151:839-45.
- Patient.co.uk . Sickle Cell Disease and Sickle Cell Anaemia 2011. www.patient.co.uk/health/Sickle-Cell-Disease-and-Sickle-Cell-Anaemia.htm (accessed 7 April 2011).
- Driscoll MC. Sickle cell disease. Pediatr Rev 2007;28:259-68.
- Powars D, Wilson B, Imbus C, Pegelow C, Allen J. The natural history of stroke in sickle cell disease. Am J Med 1978;65:461-71.
- Rees DC, Williams TN, Gladwin MT. Sickle-cell disease. Lancet 2010;376:2018-31.
- TCD Standards Working Group, NHS Antenatal and Newborn Screening Programmes . Sickle Cell Disease in Childhood: Standards and Guidelines for Clinical Care 2006.
- Davies S, Cronin E, Gill M, Hickman P, Normand C. Screening for sickle cell disease and thalassaemia: a systematic review with supplementary research. Health Technol Assess 2000;4.
- Streetly A, Latinovic R, Henthorn J. Positive screening and carrier results for the England-wide universal newborn sickle cell screening programme by ethnicity and area for 2005–07. J Clin Pathol 2010;63:626-9.
- Department of Health (DoH) . Annual Report 2009 2010 2010.
- Streetly A, Latinovic R, Hall K. Implementation of universal newborn bloodspot screening for sickle cell disease and other clinically significant haemoglobinopathies in England: screening results for 2005–2007. J Clin Pathol 2009;62:26-30.
- Dormandy E, Gulliford M, Bryan S, Roberts T, Calnan M, Atkin K, et al. Effectiveness of earlier antenatal screening for sickle cell disease and thalassaemia in primary care: cluster randomised trial. BMJ 2010;341.
- Solomon L. Treatment and prevention of pain due to vaso-occlusive crises in adults with sickle cell disease: an educational void. Blood 2008;111:997-1003.
- Shapiro B. The management of pain in sickle cell disease. Pediatr Clin N Am 1989;36:1029-45.
- Platt O, Thorington B, Brambilla D, Milner P, Rosse W, Vichinsky E, et al. Pain in sickle cell disease. Rates and risk factors. N Engl J Med 1991;325:11-6.
- Al-Salem A. Splenic complications of sickle cell anemia and the role of splenectomy [published online ahead of print October 2010]. ISRN Hematol n.d.
- Platt OS, Brambilla DJ, Rosse WF, Milner PF, Castro O, Steinberg MH, et al. Mortality in sickle cell disease: life expectancy and risk factors for early death. N Engl J Med 1994;330:1639-44.
- General Practice Notebook . Acute Chest Syndrome in Sickle Cell 2011. www.gpnotebook.co.uk/simplepage.cfm?ID=–308674522 (accessed August 2011).
- Al-Salem A, Qaisaruddin S, Al Jam’a A, Al-Kalaf J, El-Bashier A. Splenic abscess and sickle cell disease. Am J Hematol 1998;58:100-4.
- Smith-Whitley K, Zhao H, Hodinka R, Kwiatkowski J, Cecil R, Cecil T, et al. Epidemiology of human parvovirus B19 in children with sickle cell disease. Blood 2003;103:422-7.
- Emond A, Morais P, Venugopal S. Role of splenectomy in homozygous sickle cell disease in childhood. Lancet 1984;1:88-91.
- Sprinkle R, Cole T, Smith S, Buchanan G. Acute chest syndrome in children with sickle cell disease. A retrospective analysis of 100 hospitalised cases. Am J Pediatr Hematol 1986;8:105-10.
- Vichinsky E, Styles L, Colangelo L, Wright E, Castro O, Nickerson B. Acute chest syndrome in sickle cell disease: clinical presentation and course. The Cooperative Study of Sickle Cell Disease. Blood 1997;89:1787-92.
- Earley CJ, Kittner SJ, Feeser BR, Gardner J, Epstein A, Wozniak MA, et al. Stroke in children and sickle-cell disease: Baltimore-Washington Cooperative Young Stroke Study. Neurology 1998;51:169-76.
- Telfer P, Rees D, Roberts I, Kirkham F, Streetly A, Addei D. Transcranial Doppler Screening for Stroke Prevention in Children With Sickle Cell Disease: Clinical Rationale and Justification for Implementation As a Screening Programme in England 2009.
- Cohen A, Norris C, Smith-Whitley K, Capon S, Chambers L. New Directions in Pediatric Hematology. Bethesda, MD: American Association of Blood Banks; 1996.
- Kinney TR, Sleeper LA, Wang WC, Zimmerman RA, Pegelow CH, Ohene-Frempong K, et al. Silent cerebral infarcts in sickle cell anemia: a risk factor analysis. The Cooperative Study of Sickle Cell Disease. Pediatrics 1999;103:640-5.
- Ohene-Frempong K, Weiner SJ, Sleeper LA, Miller ST, Embury S, Moohr JW, et al. Cerebrovascular accidents in sickle cell disease: rates and risk factors. Blood 1998;91:288-94.
- Fullerton HJ, Wu YW, Zhao S, Johnston SC. Risk of stroke in children: ethnic and gender disparities. Neurology 2003;61:189-94.
- Quinn CT, Miller S. Risk factors and prediction of outcomes in children and adolescents who have sickle cell anemia. Hematol Oncol Clin N Am 2004;18:1339-54.
- Telfer P, Coen P, Chakravorty S, Wilkey O, Evans J, Newell H, et al. Clinical outcomes in children with sickle cell disease living in England: a neonatal cohort in East London. Haematologica 2007;92:905-12.
- Adams RJ, McKie VC, Hsu L, Files B, Vichinsky E, Pegelow C, et al. Prevention of a first stroke by transfusions in children with sickle cell anemia and abnormal results on transcranial Doppler ultrasonography. N Engl J Med 1998;339:5-11.
- Sloan MA, Alexandrov AV, Tegeler CH, Spencer MP, Caplan LR, Feldmann E, et al. Assessment: transcranial Doppler ultrasonography: report of the Therapeutics and Technology Assessment Subcommittee of the American Academy of Neurology. Neurology 2004;62:1468-81.
- Adams R, McKie V, Nichols F, Carl E, Zhang DL, McKie K, et al. The use of transcranial ultrasonography to predict stroke in sickle cell disease. N Engl J Med 1992;326:605-10.
- Telfer P, Evanson J, Hemmaway C, Abdullah C, Gadong N, Whitmarsh S, et al. Low Risk of Stroke in Children With Sickle Cell Disease Screened With Transcranial Doppler Ultrasonography n.d.
- Adams RJ, Brambilla D. Optimising Primary Stroke Prevention in Sickle Cell Anemia Trial I. Discontinuing prophylactic transfusions used to prevent stroke in sickle cell disease. N Engl J Med 2005;353:2769-78.
- National Heart Lung and Blood Institute, National Institute of Health . The Management of Sickle Cell Disease 2002.
- Vichinsky E, Earles A, Johnson R, Hoag M, Williams A, Lubin B. Alloimmunization in sickle cell anaemia and transfusion of racially unmatched blood. N Engl J Med 1990;322:1617-21.
- Scothorn DJ, Price C, Schwartz D, Terrill C, Buchanan GR, Shurney W, et al. Risk of recurrent stroke in children with sickle cell disease receiving blood transfusion therapy for at least five years after initial stroke. J Pediatr 2002;140:348-54.
- Hulbert ML, McKinstry RC, Lacey J, Moran C, Panepinto J, Thompson A, et al. Silent cerebral infarcts occur despite regular blood transfusion therapy after stroke in children with sickle cell disease. Blood 2010;117:772-9.
- Quinn CT, Rogers ZR, Buchanan GR. Survival of children with sickle cell disease. Blood 2004;103:4023-7.
- McCarville MB, Goodin GS, Fortner G, Li CS, Smeltzer MP, Adams R, et al. Evaluation of a comprehensive transcranial Doppler screening program for children with sickle cell anemia. Pediatr Blood Cancer 2008;50:818-21.
- Fullerton HJ, Adams RJ, Zhao S, Johnston SC. Declining stroke rates in Californian children with sickle cell disease. Blood 2004;104:336-9.
- Enninful-Eghan H, Moore RH, Ichord R, Smith-Whitley K, Kwiatkowski JL. Transcranial Doppler ultrasonography and prophylactic transfusion program is effective in preventing overt stroke in children with sickle cell disease. J Pediatr 2010;157:479-84.
- Armstrong-Wells J, Grimes B, Sidney S, Kronish D, Shiboski SC, Adams RJ, et al. Utilisation of TCD screening for primary stroke prevention in children with sickle cell disease. Neurology 2009;72:1316-21.
- Bernaudin F, Verlhac S, Arnaud C, Kamdem A, Chevret S, Hau I, et al. Impact of early transcanial Doppler screening and intensive therapy on cerebral vasculopathy outcome in a newborn sickle cell anemia cohort. Blood 2010;117:1130-40.
- Specialised Services National Definition Set (SSNDS) . Number 38: Specialised Haemoglobinopathy Services (all Ages) 2010.
- Hirst C, Wang WC. Blood transfusion for preventing stroke in people with sickle cell disease. Cochrane Database Syst Rev 2009;1.
- Cappellini M, Taher A. Long-term experience with deferasirox (ICL670), a once-daily oral iron chelator, in the treatment of transfusional iron overload. Expert Opin Pharmacother 2008;9:2391-402.
- Vichinsky E. Clinical application of deferasirox: practical patient management. Am J Hematol 2008;83:398-402.
- British Medical Association and Royal Pharmaceutical Society of Great Britain . British National Formulary 2007. www.bnf.org/bnf/.
- McLeod C, Fleeman N, Kirkham J, Bagust A, Boland A, Chu P, et al. Deferasirox for the treatment of iron overload associated with regular blood transfusions (transfusional haemosiderosis) in patients suffering with chronic anaemia: a systematic review and economic evaluation. Health Technol Assess 2009;13.
- Electronic Medicines Compendium . Desferal – Summary of Product Characteristics n.d. emc.medicines.org.uk (accessed 28 September 2006).
- Sickle Cell Society . Iron Monitoring and Management in Sickle Cell Disease 2008.
- National Institutes of Health, National Heart Lung and Blood Institute, Division of Blood Diseases and Resources . The Management of Sickle Cell Disease 2008.
- Mazumdar M, Heeney MM, Sox CM, Lieu TA. Preventing stroke among children with sickle cell anemia: An analysis of strategies that involve transcranial Doppler testing and chronic transfusion. Pediatrics 2007;120:e1107-16.
- Gulbis B, Haberman D, Dufour D, Christophe C, Vermylen C, Kagambega F, et al. Hydroxyurea for sickle cell disease in children and for prevention of cerebrovascular events: the Belgian experience. Blood 2005;105:2685-90.
- Strouse J, Lanzkron S, Beach M, Haywood C, Park H, Witkop C, et al. Hydroxyurea for sickle cell disease: A systematic review for efficacy and toxicity in children. Pediatrics 2008;122:1332-42.
- Zimmerman SA, Schultz WH, Burgett S, Mortier NA, Ware RE. Hydroxyurea therapy lowers transcranial Doppler flow velocities in children with sickle cell anemia. Blood 2007;110:1043-7.
- Pavlakis SG, Rees RC, Huang X, Brown RC, Casella JF, Iyer RV, et al. Transcranial Doppler ultrasonography (TCD) in infants with sickle cell anemia: baseline data from the BABY HUG trial. Pediatr Blood Cancer 2010;54:256-9.
- Ware R, Schultz W, Yovetich N, Mortier N, Alvarez O, Hilliard L, et al. Stroke with transfusions changing to hydroxyurea (SWiTCH): A phase III randomised clinical trial for treatment of children with sickle cell anemia, stroke, and iron overload. Pediatr Blood Cancer 2011;57:1011-17.
- Walters MC, Storb R, Patience M, Leisenring W, Taylor T, Sanders JE, et al. Impact of bone marrow transplantation for symptomatic sickle cell disease: an interim report. Multicenter investigation of bone marrow transplantation for sickle cell disease. Blood 2000;95:1918-24.
- Roach ES, Golomb MR, Adams R, Biller J, Daniels S, Deveber G, et al. Management of stroke in infants and children: a scientific statement from a Special Writing Group of the American Heart Association Stroke Council and the Council on Cardiovascular Disease in the Young. Stroke 2008;39:2644-91.
- Clinical Effectiveness & Evaluation Unit, Royal College of Physicians . Stroke in Childhood: Clinical Guidelines for Diagnosis, Management and Rehabilitation 2004. www.rcplondon.ac.uk/pubs/books/childstroke/childstroke_guidelines.pdf (accessed October 2011).
- National Heart Lung and Blood Institute, National Institute of Health . Clinical Alert: Periodic Transfusions Lower Stroke Risk in Children With Sickle Cell Anemia 1997. www.nlm.nih.gov/databases/alerts/sickle97.html (accessed August 2011).
- NHS Antenatal and Newborn Screening Programmes . Transcranial Doppler Scanning for Children With Sickle Cell Disease: Standards and Guidance 2009.
- Oringanje C, Nemecek E, Oniyangi O. Hematopoietic stem cell transplantation for children with sickle cell disease. Cochrane Database Syst Rev 2009;1.
- Centre for Reviews and Dissemination . CRD’s Guidance for Undertaking Reviews in Healthcare 2009. www.york.ac.uk/inst/crd/pdf/Systematic_Reviews.pdf.
- Mirre E, Brousse V, Berteloot L, Lambot-Juhan K, Verlhac S, Boulat C, et al. Feasibility and efficacy of chronic transfusion for stroke prevention in children with sickle cell disease. Eur J Haematol 2010;84:259-65.
- Bader-Meunier B, Verlhac S, Elmaleh-Berges M, Ithier G, Sellami F, Faid S, et al. Effect of transfusion therapy on cerebral vasculopathy in children with sickle-cell anemia. Haematologica 2009;94:123-6.
- Bernaudin F, Verlhac S, Coic L, Lesprit E, Brugieres P, Reinert P. Long-term follow-up of pediatric sickle cell disease patients with abnormal high velocities on transcranial Doppler. Pediatr Radiol 2005;35:242-8.
- Bassler D, Briel M, Montori VM, Lane M, Glasziou P, Zhou Q, et al. Stopping randomised trials early for benefit and estimation of treatment effects: systematic review and meta-regression analysis. JAMA 2010;303:1180-7.
- Delea T, Sofrygin O, Thomas S, Baladi J, Phatak P, Coates T. Cost-effectiveness of once-daily oral chelation therapy with deferasirox versus infusional deferoxamine in transfusion-dependent thalassemia patients: US healthcare system perspective. Pharmacoeconomics 2007;25:329-42.
- West Midlands Quality Review Service, UK Forum on Haemoglobin Disorders . Services for Children and Young People With Haemoglobin Disorders: Peer Review Programme 2011–2012 Overview Report 2011. www.wmqi.westmidlands.nhs.uk/wmqrs/review-programmes/view/sickle-cell-and-thalassaemia-children (accessed August 2011).
- Rees DC, Dick MC, Height SE, O’Driscoll S, Pohl KRE, Goss DE, et al. A simple index using age, hemoglobin, and aspartate transaminase predicts increased intracerebral blood velocity as measured by transcranial Doppler scanning in children with sickle cell anemia. Pediatrics 2008;121:e1628-32.
- NHS Sickle Cell & Thalassaemia Screening Programme n.d. sct.screening.nhs.uk (accessed 2011).
- Pegelow CH, Adams RJ, McKie V, Abboud M, Berman B, Miller ST, et al. Risk of recurrent stroke in patients with sickle cell disease treated with erythrocyte transfusions. J Pediatr 1995;126:896-9.
- Tengs T, Yu M, Luistro E. Health-related quality of life after stroke a comprehensive review. Stroke 2001;32:964-72.
- National Institute for Health and Clinical Excellence (NICE) . Guide to the Methods of Technology Appraisal 2008. www.nice.org.uk/media/B52/A7/TAMethodsGuideUpdatedJune2008.pdf (accessed July 2009).
- Nietert P, Abboud M, Silverstein M, Jackson S. Bone marrow transplantation versus periodic prophylactic blood transfusion in sickle cell patients at high risk of ischemic stroke: a decision analysis. Blood 2000;95:3057-64.
- Sonneberg F, Beck R. Markov models in medical decision making: a practical guide. Philadelphia, PA: Hanley and Belfus; 1993.
- Karnon J, Zeuner D, Ades A, Efimba W, Brown J, Yardumian A. The effects of neonatal screening for sickle cell disorders on lifetime treatment costs and early deaths avoided: a modelling approach. J Public Health Med 2000;22:500-11.
- Osborne R, De Abreu Lourenço R, Dalton A, Houltram J, Dowton D, Joshua D, et al. Quality of life related to oral versus subcutaneous iron chelation: a time trade-off study. Value 2007;10:451-6.
- Adams DM, Schultz WH, Ware RE, Kinney TR. Erythrocytapheresis can reduce iron overload and prevent the need for chelation therapy in chronically transfused pediatric patients. J Pediatr Haem Oncol 1996;18:46-50.
- Vichinsky E, Earles A, Johnson R, Hoag M, Williams A, Lubin B. Alloimmunization in sickle cell anemia and transfusion of racially unmatched blood. N Engl J Med 1990;322:1617-21.
- Sakhalkar V, Roberts K, Hawthorne L, McCaskill D, Veillon D, Caldito G, et al. Allosensitization in patients receiving multiple blood transfusions. Ann N Y Acad Sci 2005;1054:495-9.
- British Medical Association and Royal Pharmaceutical Society of Great Britain . British National Formulary 2007. www.bnf.org/bnf/.
- Claster S, Vichinsky E. Managing sickle cell disease. BMJ 2003;327:1151-5.
- HM Treasury . Gross Domestic Product (GDP) Deflators: A user’s Guide 2008. www.hm-treasury.gov.uk/Economic_Data_and_Tools/GDP_Deflators/data_gdp_index.cfm (accessed July 2011).
- Saka O, McGuire A, Wolfe C. Cost of stroke in the United Kingdom. Age Ageing 2009;38:27-32.
- Wolfe C, Taub N, Bryan S, Beech R, Warburton F, Burney G. Variations in the incidence, management and outcome of stroke in residents under the age of 75 in two health districts of southern England. J Public Health Med 1996;17:411-18.
- Gardner M, Hills N, Sidney S, Johnston S, Fullerton H. The 5-year direct medical cost of neonatal and childhood stroke in a population-based cohort. Neurology 2010;74:372-8.
- Mogyorosy Z, Smith P. The main methodological issues in costing health care services: a literature review. York: University of York; 2007.
- Department of Health (DoH) . A New Value Based Approach to the Pricing of Branded Medicines. Government Response to Consultation 2011. www.dh.gov.uk/prod_consum_dh/groups/dh_digitalassets/documents/digitalasset/dh_128404.pdf (accessed July 2011).
- Ichord R, Bastian R, Abraham L, Askalan R, Benedict S, Bernard T, et al. Interrater Reliability of the Pediatric National Institutes of Health Stroke Scale (PedNIHSS) in a multicenter study. Stroke 2011;42:613-17.
- Personal Social Services Research Unit (PSSRU) . Unit Costs of Health and Social Care 2010.
- Noyes J, Godfrey C, Beecham J. Resource use and service costs for ventilator-dependent children and young people in the UK. Health Soc Care Community 2006;14:508-22.
- National Health Service . NHS Reference Costs 2009–2010 n.d. www.dh.gov.uk/en/publications/publicationspolicyandguideance/DH_123459 (accessed 2011 July).
Appendix 1 Literature search strategies
| Database | Years | Search strategy | References identified |
|---|---|---|---|
| MEDLINE | 1950 to May 2011 (Week 18) | See below | 920 |
| EMBASE | 1980 to May 2011 (Week 18) | See below | 1065 |
| The Cochrane Library 2011a | 2011 |
105 (CENTRAL, CDSR, DARE, HTA database, NHS EED) |
|
| Total references identified | 2090 | ||
| Duplicates | 762 | ||
| Total | 1328 | ||
| Searches | Results | |
|---|---|---|
| 1 | exp Anemia, Sickle Cell/ | 15,785 |
| 2 | (sickle-cell or sickle cell).mp. | 18,041 |
| 3 | drepanocytosis.mp. | 189 |
| 4 | (sickling and (blood or plasma)).tw. | 377 |
| 5 | exp Hemoglobin, Sickle/ | 2513 |
| 6 | (hemoglobin s or haemoglobin s).tw. | 1095 |
| 7 | (hemoglobin sc disease or haemoglobin sc disease).tw. | 142 |
| 8 | exp Stroke/ | 63,305 |
| 9 | ((isc?emic or apoplectic) adj5 (event or events or insult or attack$)).tw. | 16,197 |
| 10 | (stroke or poststroke or post-stroke or cerebrovasc$ or brain vasc$ or cerebral vasc$ or cva$ or apoplex$ or isch?emi$attack$ or tia$1 or neurologic$deficit$ or SAH or AVM).tw. | 161,386 |
| 11 | (cerebrovascular adj (accident$ or infarction$ or insult$)).tw. | 4499 |
| 12 | ((brain$ or cerebr$ or cerebell$ or cortical or vertebrobasilar or hemispher$ or intracran$ or intracerebral or infratentorial or supratentorial or MCA or anterior circulation or posterior circulation or basal ganglia) adj5 (isch?emi$ or infarct$ or thrombo$ or emboli$ or occlus$ or hypox$ or vasospasm or obstruction or vasculopathy)).tw. | 71,283 |
| 13 | ((brain$ or cerebr$ or cerebell$ or intracerebral or intracran$ or parenchymal or intraventricular or infratentorial or supratentorial or basal gangli$ or subarachnoid or putaminal or putamen or posterior fossa) adj5 (haemorrhage$ or hemorrhage$ or haematoma$ or hematoma$ or bleed$)).tw. | 39,369 |
| 14 | ((brain or intracranial or basal ganglia or lenticulostriate) adj5 (vascular adj5 (disease$ or disorder or accident or injur$ or trauma$ or insult or event))).tw. | 779 |
| 15 | exp aphasia/or anomia/or hemiplegia/or hemianopsia/or exp paresis/or deglutition disorders/or dysarthria/or pseudobulbar palsy/or muscle spasticity/ | 43,818 |
| 16 | exp Brain Ischemia/or exp Cerebral Hemorrhage/or exp Cerebral Infarction/or exp Cerebrovascular Trauma/or exp Hypoxia-Ischemia, Brain/ | 94,307 |
| 17 | or/1–7 | 19,127 |
| 18 | or/8–16 | 302,677 |
| 19 | 17 and 18 | 1020 |
| 20 | limit 19 to (english language and humans) | 934 |
| Searches | Results | |
|---|---|---|
| 1 | exp sickle cell/ | 1163 |
| 2 | (sickle cell or sickle-cell).mp. | 21,977 |
| 3 | drepanocytosis.mp. | 218 |
| 4 | (sickling and (blood or plasma)).tw. | 417 |
| 5 | exp hemoglobin S/ | 2707 |
| 6 | (hemoglobin s or haemoglobin s).tw. | 1092 |
| 7 | (hemoglobin sc disease or haemoglobin sc disease).tw. | 139 |
| 8 | exp STROKE/ | 98,235 |
| 9 | ((isc?emic or apoplectic) adj5 (event or events or insult or attack$)).tw. | 20,249 |
| 10 | (stroke or poststroke or post-stroke or cerebrovasc$ or brain vasc$ or cerebral vasc$ or cva$ or apoplex$ or isch?emi$attack$ or tia$1 or neurologic$deficit$ or SAH or AVM).tw. | 207,204 |
| 11 | (cerebrovascular adj (accident$ or infarction$ or insult$)).tw. | 5591 |
| 12 | ((brain$ or cerebr$ or cerebell$ or cortical or vertebrobasilar or hemispher$ or intracran$ or intracerebral or infratentorial or supratentorial or MCA or anterior circulation or posterior circulation or basal ganglia) adj5 (isch?emi$ or infarct$ or thrombo$ or emboli$ or occlus$ or hypox$ or vasospasm or obstruction or vasculopathy)).tw. | 89,204 |
| 13 | ((brain$ or cerebr$ or cerebell$ or intracerebral or intracran$ or parenchymal or intraventricular or infratentorial or supratentorial or basal gangli$ or subarachnoid or putaminal or putamen or posterior fossa) adj5 (haemorrhage$ or hemorrhage$ or haematoma$ or hematoma$ or bleed$)).tw. | 48,392 |
| 14 | ((brain or intracranial or basal ganglia or lenticulostriate) adj5 (vascular adj5 (disease$ or disorder or accident or injur$ or trauma$ or insult or event))).tw. | 960 |
| 15 | exp aphasia/or anomia/or hemiplegia/or hemianopsia/or exp paresis/or deglutition disorders/or dysarthria/or pseudobulbar palsy/or muscle spasticity/ | 71,779 |
| 16 | *brain ischemia/or *brain infarction/ | 43,502 |
| 17 | or/1–7 | 23,021 |
| 18 | or/8–16 | 387,369 |
| 19 | 17 and 18 | 1546 |
| 20 | limit 19 to (human and English language) | 1224 |
| 21 | limit 20 to embase | 1072 |
| Searches | Results | |
|---|---|---|
| 1 | Hemoglobin sickle.mp. | 16 |
| 2 | sickle cell.mp. | 729 |
| 3 | (sickled or sickling).mp. | 52 |
| 4 | drepanocytosis.mp | 2 |
| 5 | (hemoglobin sc or haemoglobin sc).mp. | 27 |
| 6 | exp sickle cell anemia/ | 274 |
| 7 | exp brain ischemia/or exp cerebrovascular accident/or exp brain infarction/or exp cerebrovascular trauma/or exp hypoxia-ischemia, brain/ | 3633 |
| 8 | (stroke or poststroke or post-stroke or cerebrovasc* or brain vasc* or cerebral vasc* or cva* or apoplex* or ischemi* attack* or ischaemi* attack* or tia* or neurologic* deficit* or SAH or AVM).mp. | 22,884 |
| 9 | or/1–6 | 736 |
| 10 | 7 or 8 | 23,271 |
| 11 | 9 and 10 | 105 |
Appendix 2 Flow diagram of included studies
FIGURE 13.
Flow diagram of included clinical studies.
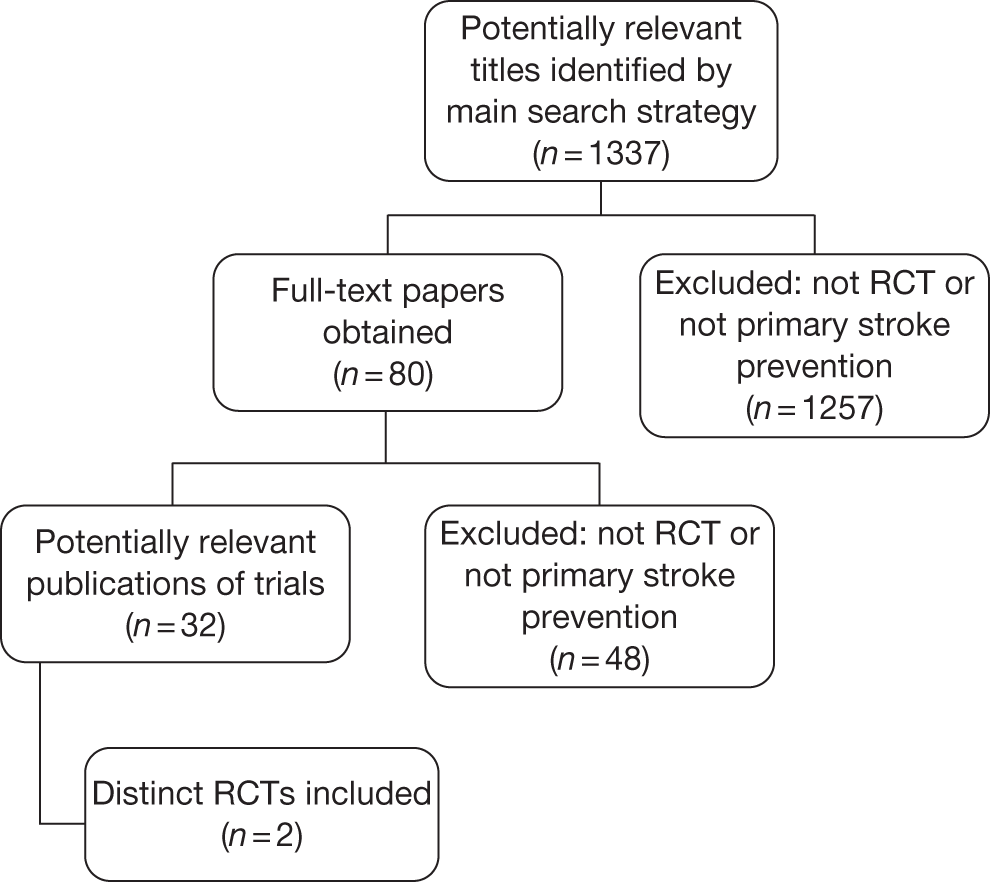
FIGURE 14.
Flow diagram of included economic studies.
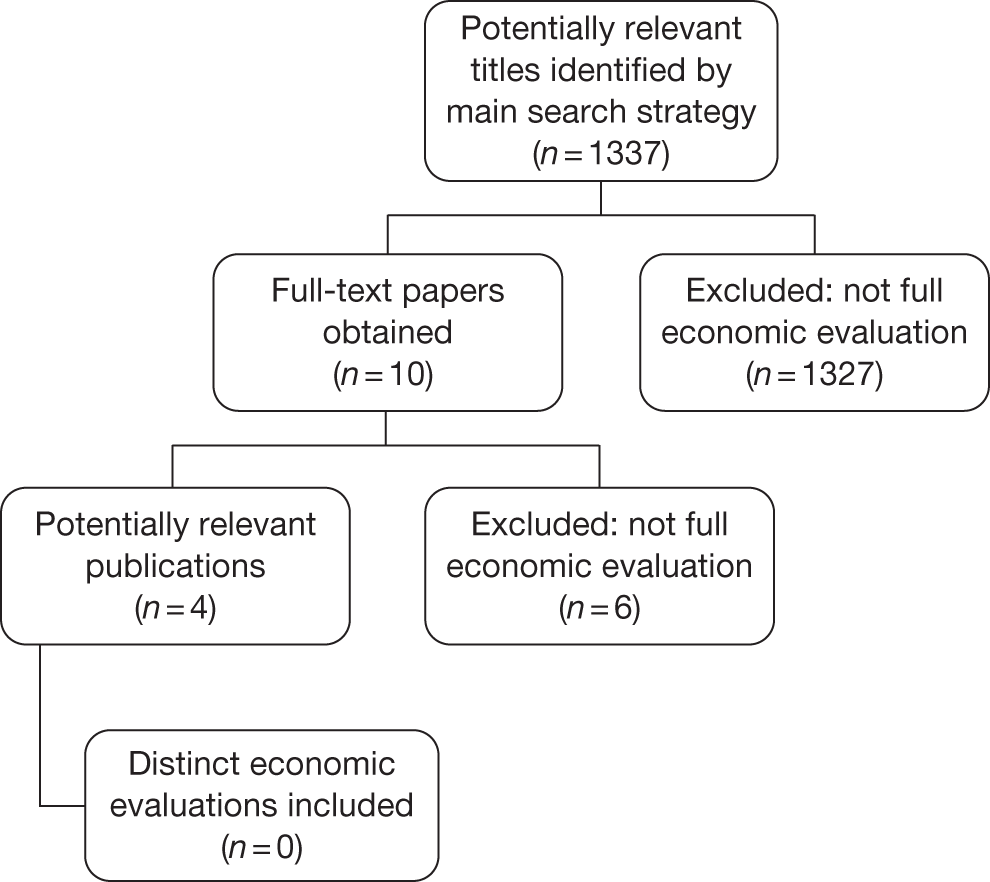
Appendix 3 Assumptions used in the cost-effectiveness analysis
| Assumption | Reason |
|---|---|
| TCD scans start at the age of 2 years and are repeated once a year for those with blood velocity of < 200 cm/second until the age of 18 years | Defined by the briefing document |
| TCD scans start at the age of 2 years and are repeated every year for those with blood velocity of > 200 cm/second until the age of 18 years | Clinical practice |
| Population enters the model stroke free (no previous strokes have been experienced by a patient) | Defined by the briefing document |
| Once blood transfusions are initiated, they continue until adulthood | Simplification based on clinician’s opinion |
| Adherence to chelation is assumed to be 100% | Simplification |
| Only three strokes are modelled owing to an assumption that no-one survives a fourth stroke | Clinical opinion |
| The population can move to ‘transfusion > 200 cm/second’ only by first going through ‘no transfusion > 200 cm/second’, i.e. the population cannot directly move from ‘no transfusion < 200 cm/second’ to ‘transfusion > 200 cm/second’ or vice versa | Model structure enforced assumption. Patients are kept in ‘no transfusion’ state for one cycle only |
| Post 18 years of age, the model is simplified to no longer account for annual TCD scan results | The briefing document states age 16 years, but experts are recommended to use 18 years |
| Post-stroke patients remain in the same state until they have a subsequent stroke | Clinical opinion and simplification |
| At the age of 18 years, patients remain in either ‘transfusion’ or ‘no transfusion’ until they die, unless patients have a stroke and are moved into a post-stroke health state | Clinical opinion and simplification |
| QoL of those with SCD on blood transfusion is similar to that for patients with thalassaemia who are on blood transfusion. Data from the Osborne et al.82 time trade-off study using utility values from the general public have been applied to the modelled population including children between the ages of 2 and 18 years | Assumption |
| Effect data from Adams et al.31 trial for 1 year is the same for ages 2–18 years | Assumption |
Appendix 4 Data used in the cost-effectiveness analysis
All of the data in this appendix are presented per 3-month cycle unless explicitly stated.
| Description of value | Value age (years) | Source | Comments | |||
|---|---|---|---|---|---|---|
| 2–7 | 8–18 | 19–30 | 31+ | |||
| Probability TCD scan is < 200 cm/second (non-transfusion patients only) – baseline, % | 89.3 | NA | NA | NA | Adams (1998)31 | |
| Probability of TCD scan is > 200 cm/second (non-transfusion patients only) – baseline, % | 0.11 | NA | NA | NA | Adams (1998)31 | |
| Probability of TCD scan remaining is < 200 cm/second after first scan (year 3 and up), % | 99.8 | 99.8 | NA | NA | Communication with D Rees | D Rees estimates that 15% of children by the age of 18 years will have a TCD scan of > 200 cm/second and receive transfusions |
| Probability of death when not on transfusion and TCD scan is < 200 cm/second (not due to stroke), % | 0.1 | 0.1 | NA | NA | Telephone interview with clinicians | Probability of death in low-risk patients is half of the value for high-risk patients |
| Probability of death when TCD scan is > 200 cm/second (not due to stroke) while off transfusion, % | 0.2 | 0.2 | NA | NA | Karnon (2000)81 | Calculated from survival data (SCA) presented by Karnon et al.81 for ages 2–18 years |
| Probability of death when TCD scan is > 200 cm/second (not due to stroke) while on transfusion, % | 0.1 | 0.1 | NA | NA | Mazumdar (2007)55 | |
| Probability of continuing transfusions past the age of 18 years for the rest of life, % | NA | NA | 75.0 | NA | Clinician survey | |
| Probability of death in adults due to other causes (no stroke) when off transfusion, % | NA | NA | 1.00 | 2.00 | Calibrated | Parameter was adjusted to reflect mean life expectancy of patients with SCD |
| Probability of death in adults due to other causes (no stroke) when on transfusion, % | NA | NA | 1.00 | 2.00 | Calibrated | Parameter was adjusted to reflect mean life expectancy of patients with SCD |
| Proportion of patients on simple transfusion, % | 97.50 | 68.67 | 50.67 | 49.75 | Clinician survey | |
| Proportion of patients on exchange transfusion, % | 0.00 | 20.08 | 36.83 | 31.50 | ||
| Proportion of patients on combined transfusion, % | 2.50 | 11.25 | 12.50 | 18.75 | ||
| Probability of pain crisis on transfusion, % | 2.0 | 2.0 | 2.0 | 2.0 | Telephone interview with clinicians | |
| Probability of pain crisis off transfusion, % | 5.26 | 8.73 | 11.25 | 6.56 | Karnon (2000),81 readjusted based on communication with D Rees | Base values adjusted based on communication with D Rees |
| Probability of acute chest syndrome on transfusion, % | 0.70 | 0.70 | 0.70 | 0.70 | Karnon (2000),81 readjusted based on communication with D Rees | |
| Probability of acute chest syndrome off transfusion, % | 1.37 | 4.50 | 0.44 | 0.44 | Karnon (2000),81 readjusted based on communication with D Rees | Base values adjusted based on communication with D Rees |
| Description of value | Value age (years) | Source | Comments | |||
|---|---|---|---|---|---|---|
| 2–7 | 8–18 | 19–30 | 31+ | |||
| Probability of first stroke when on transfusion and TCD > 200 cm/second, % | 0.20 | 0.10 | 0.13 | 0.22 | Adams (1998)31 (for values for 2–7 and 8–18 years); Ohene-Frempong (1998)27 (for age 19–30+ years) | Assumed data from Adams (1998)31 trial are representative of the yearly rate for the duration of the age group |
| Probability of first stroke when off transfusion and TCD > 200 cm/second, % | 2.50 | 1.25 | NA | NA | Adams (1998)31 | The relative difference in probability of first stroke on and off transfusion in age 2–7 years (i.e. 0.20% vs 2.%) is applied to derive probability of stroke off transfusion in age 7–18 years (i.e. 0.10% vs 125%) |
| Probability of first stroke when off transfusion and TCD < 200 cm/second, % | 0.01 | 0.10 | NA | NA | Assumption | |
| Probability of first stroke when off transfusions in adulthood, % | NA | NA | 0.13 | 0.22 | Ohene-Frempong (1998)27 | Value for 18+ years is derived from average stroke prevalence in adult population (non-sickle cell) |
| Proportion of patients ending up in mild state post first stroke, % | 27.50 | 19.75 | 20.00 | 17.50 | Telephone interview with clinicians | |
| Proportion of patients ending up in moderate state post first stroke, % | 50.00 | 46.25 | 40.00 | 25.00 | ||
| Proportion of patients ending up in severe state post first stroke, % | 22.50 | 33.25 | 32.00 | 45.00 | ||
| Proportion dying post first stroke, % | 0.00 | 0.75 | 8.00 | 12.50 | ||
| Probability of improving state post first stroke after one cycle, % | 0.00 | 0.00 | 0.00 | 0.00 | ||
| Probability of moving to a worse state post first stroke after one cycle, % | 1.00 | 1.00 | 6.0 | 10.0 | Telephone interview with clinicians | Communication with clinicians: patients will not improve or get worse post stroke. Stay in the same state |
| Probability of second stroke when in mild state, % | 0.25 | 0.25 | 0.25 | 0.00 | Values for age 19–30+ years were calibrated to reflect mean life expectancy of patient with SCD | |
| Proportion of patients ending up in mild state post stroke 2 (from mild stroke 1), % | 80.00 | 80.00 | 80.00 | 80.00 | Calibrated | |
| Proportion of patients ending up in moderate state post stroke 2 (from mild stroke 1), % | 18.00 | 18.00 | 18.00 | 18.00 | Calibrated | |
| Proportion of patients ending up in severe state post stroke 2 (from mild stroke 1), % | 2.00 | 2.00 | 2.00 | 2.00 | ||
| Proportion of patients ending up in dead state post stroke 2 (from mild stroke 1), % | 0.00 | 0.00 | 0.00 | 0.00 | ||
| Probability of second stroke when in moderate state, % | 0.50 | 0.38 | 0.38 | 0.00 | ||
| Proportion of patients ending up in moderate state post stroke 2 (from moderate stroke 1), % | 45.00 | 45.00 | 45.00 | 45.00 | Calibrated | |
| Proportion of patients ending up in severe state post stroke 2 (from moderate stroke 1), % | 50.00 | 50.00 | 47.00 | 47.00 | Calibrated | |
| Proportion of patients ending up in dead state post stroke 2 (from moderate stroke 1), % | 5.00 | 5.00 | 8.00 | 8.00 | ||
| Probability of second stroke when in severe state, % | 1.25 | 0.63 | 0.63 | 0.00 | ||
| Proportion of patients ending up in severe state post stroke 2 (from severe stroke 1), % | 90.00 | 90.00 | 85.00 | 85.00 | Calibrated | |
| Proportion of patients ending up in dead state post stroke 2 (from severe stroke 1), % | 10.00 | 10.00 | 15.00 | 15.00 | Calibrated | |
| Probability of improving state post second stroke after one cycle, % | 0.00 | 0.00 | 0.00 | 0.00 | ||
| Probability of moving to a worse state post second stroke after one cycle, % | 15.00 | 15.00 | 15.00 | 25.00 | Calibrated | |
| Probability of third stroke when in mild state, % | 1.25 | 0.50 | 0.50 | 0.00 | Values for age 19–30+ years were calibrated to reflect mean life expectancy of patient with SCD | |
| Proportion of patients ending up in mild state post stroke 3 (from mild stroke 2), % | 80.00 | 80.00 | 80.00 | 80.00 | Calibrated | |
| Proportion of patients ending up in moderate state post stroke 3 (from mild stroke 2), % | 18.00 | 18.00 | 18.00 | 18.00 | Calibrated | |
| Proportion of patients ending up in severe state post stroke 3 (from mild stroke 2), % | 2.00 | 2.00 | 2.00 | 2.00 | ||
| Proportion of patients ending up in dead state post stroke 3 (from mild stroke 2), % | 0.00 | 0.00 | 0.00 | 0.00 | ||
| Probability of third stroke when in moderate state, % | 1.25 | 1.00 | 1.00 | 0.00 | ||
| Proportion of patients ending up in moderate state post stroke 3 (from moderate stroke 2), % | 45.00 | 45.00 | 45.00 | 45.00 | Calibrated | |
| Proportion of patients ending up in severe state post stroke 3 (from moderate stroke 2), % | 50.00 | 50.00 | 47.00 | 47.00 | Calibrated | |
| Proportion of patients ending up in dead state post stroke 3 (from moderate stroke 2), % | 5.00 | 5.00 | 8.00 | 8.00 | ||
| Probability of third stroke when in severe state, % | 2.50 | 1.25 | 1.25 | 0.00 | ||
| Proportion of patients ending up in severe state post stroke 3 (from severe stroke 2), % | 90.00 | 90.00 | 85.00 | 85.00 | Calibrated | |
| Proportion of patients ending up in dead state post stroke 3 (from severe stroke 2), % | 10.00 | 10.00 | 15.00 | 15.00 | Calibrated | |
| Probability of improving state post third stroke after one cycle, % | 0.00 | 0.00 | 0.00 | 0.00 | ||
| Probability of moving to a worse state post third stroke after one cycle, % | 20.00 | 20.00 | 20.00 | 30.00 | Calibrated | Values for age 19–30+ years were calibrated to reflect mean life expectancy of patient with SCD |
| Description of value | Value age (years) | Source | Comments | |||
|---|---|---|---|---|---|---|
| 2–7 | 8–18 | 19–30 | 31+ | |||
| Utility weight for patients with blood velocity of < 200 cm/second per 3-month cycle (not loss) | 0.22 | 0.22 | Osborne (2007)82 | Osborne et al.82 report data for patients with thalassaemia who undergo transfusion. Osborne identifies utility weight in anchor state to be 0.8 (on transfusion); we report 0.87 to exclude impact on QoL associated with regular transfusions. Assumption: patients with thalassaemia on transfusion have similar QoL to sickle cell patients | ||
| Pre-stroke on simple transfusion per 3-month cycle | 0.02 | 0.02 | 0.02 | 0.02 | Disutility increment of 0.7 (∼0.2 per cycle) is taken from Osborne (2007).82 Based on communication with D Rees, one utility value used for all types of ‘on transfusion’ | |
| Pre-stroke on exchange transfusion per 3-month cycle | 0.02 | 0.02 | 0.02 | 0.02 | ||
| Pre-stroke on combined transfusion per 3-month cycle | 0.02 | 0.02 | 0.02 | 0.02 | ||
| Pre-stroke no transfusion (TCD > 200 cm/second) per 3-month cycle | 0.03 | 0.03 | NA | NA | Assumption | |
| Pre-stroke no transfusion (adult) per 3-month cycle | NA | NA | 0.01 | 0.01 | ||
| Pre-stroke transfusion (adult) per 3-month cycle | NA | NA | 0.04 | 0.04 | Assumption | |
| On oral chelation per 3-month cycle | –0.03 | –0.03 | –0.03 | –0.03 | Assumption | |
| On injection chelation per 3-month cycle | 0.04 | 0.04 | 0.04 | 0.04 | Osborne (2007)82 | Part of transfusion state: ‘treatment with a once-daily oral iron chelator had a mean (median) utility value that was 0.10 (0.13) (p < 0.001) higher than the anchor state.’ 0.93 vs 0.8 (anchor) |
| Alloimmunised patient per 3-month cycle | 0 | 0 | 0 | 0 | No evidence identified | |
| Pain crisis patient per 3-month cycle | 0.02 | 0.02 | 0.02 | 0.02 | ||
| Acute chest syndrome patient per 3-month cycle | 0.06 | 0.06 | 0.06 | 0.06 | Assumption | |
| Mild state post first stroke per 3-month cycle | 0.03 | 0.03 | 0.03 | 0.03 | ||
| Moderate state post first stroke per 3-month cycle | 0.08 | 0.08 | 0.08 | 0.08 | Tengs (2001)77 used for mild and severe stroke. The disutility associated with moderate stroke was the mid-point between mild and severe stroke | Median utility associated with stroke reported by Tengs (2001)77 for minor 0.76, moderate 0.39, major 0.36 strokes. Disutilities are calculated from ‘full health’ state presented above and adjusted to 3-month cycles |
| Severe state post first stroke per 3-month cycle | 0.13 | 0.13 | 0.13 | 0.13 | ||
| Mild state post second stroke per 3-month cycle | 0.03 | 0.03 | 0.03 | 0.03 | ||
| Moderate state post second stroke per 3-month cycle | 0.08 | 0.08 | 0.08 | 0.08 | ||
| Severe state post second stroke per 3-month cycle | 0.13 | 0.13 | 0.13 | 0.13 | ||
| Mild state post third stroke per 3-month cycle | 0.03 | 0.03 | 0.03 | 0.03 | ||
| Moderate state post third stroke per 3-month cycle | 0.08 | 0.08 | 0.08 | 0.08 | ||
| Severe state post third stroke per 3-month cycle | 0.13 | 0.13 | 0.13 | 0.13 | ||
| Description of value | Value age (years) | Source | Comments | |||
|---|---|---|---|---|---|---|
| 2–7 | 8–18 | 19–30 | 31+ | |||
| Probability of alloimmunisation when on simple transfusion, % | 1.25 | 0.57 | 0.52 | 0.11 | Vichinsky (1990)84 | Alloimmunisation affects 20–25% of patients on chronic transfusion. It is assumed that patients cannot be alloimmunised more than once.a Probabilities for each age group have been adjusted, based on the number of cycles |
| Probability of alloimmunisation when on exchange transfusion, % | 0 | 0.57 | 0.52 | 0.11 | ||
| Probability of alloimmunisation when on combined transfusion, % | 1.25 | 0.57 | 0.52 | 0.11 | ||
| Proportion on oral chelation, % | 80.0 | 80.0 | 78.0 | 68.0 | Clinician survey | |
| Proportion on injection chelation, % | 20.0 | 20.0 | 18.0 | 22.0 | Clinician survey | |
| Increase in frequency of transfusions/cycle post stroke (first post-stroke cycle only) | 1.67 | Personal communication with D Rees | After a stroke, the number of transfusions increases to six | |||
| Description of value | Value age (years) | Source | Comments | |||
|---|---|---|---|---|---|---|
| 2–7 | 8–18 | 19–30 | 31+ | |||
| Cost of exchange transfusion per cycle, £ | 4722 | Adams (1996)83 | Cost of erythrocytapheresis used as proxy. Patients received erythrocytapheresis approximately every 4 weeks. Therefore, this equates to 13 (52/4) transfusions per year using annual cost for transfusion therapy without chelation of US$20,226 (range: US$17,078–23,516). Adjusted to 3-monthly costs. Converted using 1995 $/£ rate of 1.56 and uprated to 2010 prices | |||
| Cost of simple transfusion per cycle, £ | 2142 | Adams (1996)83 | Transfusion without chelation US$9175 (range: US$7704–10,450). Annual costs. Adjusted to 3-monthly costs. Converted using 1995 $/£ rate of 1.56 and uprated to 2010 prices | |||
| Cost of combined transfusion per cycle, £ | 4722 | Assumed to be equal to exchange transfusion | ||||
| Cost of alloimmunisation (incremental cost of transfusion due to alloimmunisation) per cycle, £ | 117 | Salhalkar (2005)85 | Cost includes: 30 minutes of skilled technician time and extra CEK reagent cost. Uprated to 2010 prices | |||
| Cost of treatment for mild post-stroke state per cycle (initial), £ | 3737 | Data provided by clinicians via telephone interview. See calculations in Table 47 | Cost includes: HDU (24 hours), one emergency exchange transfusion MRI on admission, physiotherapy 1 hour × 2 per week, psychological assessment 1 hour × 2 per month (over 1 month), hospital for 1 week | |||
| Cost of treatment for mild post-stroke state per cycle (ongoing), £ | 327 | Data provided by clinicians via telephone interview. See calculations in Table 47 | Cost includes: physiotherapy 1 hour × 2 per week, psychological assessment 1 hour × 2 per month (over 1 month), MRI to follow up once a year | |||
| Cost of treatment for moderate post-stroke state per cycle (initial), £ | 8161 | Data provided by clinicians via telephone interview. See calculations in Table 47 | Cost includes: HDU (5 days), one emergency exchange transfusion MRI at admission, physiotherapy 1 hour × 2 per week, psychological assessment 1 hour × 2 per month (over 2 months), hospital for a week | |||
| Cost of treatment for moderate post-stroke state per cycle (ongoing), £ | 1649 | Data provided by clinicians via telephone interview. See calculations in Table 47 | Costs includes: physiotherapy 1 hour × 2 per week, psychological assessment 1 hour × 2 per month (over 6 months), MRI to follow up once a year | |||
| Cost of treatment for severe post-stroke state per cycle (initial), £ | 18,417 | Data provided by clinicians via telephone interview. See calculations in Table 47 | Cost includes: HDU (7 days), ventilator support 2–5 days, 1 emergency exchange transfusion MRI on admission, hospital 1–2 weeks, staffing costs for the care package associated with a technology-dependent child (PSSRU)95 | |||
| Cost of treatment for severe post-stroke state per cycle (ongoing), £ | 6617 | Data provided by clinicians via telephone interview. See calculations in Table 47 | Cost includes: MRI to follow up once a year (assumed to be equivalent to CT), staffing costs for the care package associated with a technology-dependent child (PSSRU)95 | |||
| Cost of chelation oral per cycle, £ | 1172 | 1922 | BNF86 |
3-months’ supply for 2- to 6-year-olds: £786.6 [28 pills (250 mg) @ £235.20/pack] 3-months’ supply for those > 6 years old: £1537.2 [28 pills (500 mg) @ £470.40/pack] Includes monitoring: monthly creatinine test and weekly neutrophil count |
||
| Cost of chelation injection per cycle, £ | 1377 | 1388 | BNF86 |
3 months’ supply for 2- to 6-year-olds: 1950 mg = £17.04 (£4.26 per 500-mg vial). Dose for children = 30 mg five times per week 3-months’ supply for ≥ 6 years: 3250 mg = £27.69 (£4.26 per 500-mg vial). Dose for adults = 50 mg five times per week Includes average cost of administration via pump and balloon infuser: £1359.90 |
||
| Cost of pain crisis per cycle, £ | 841 | Karnon (2000)81 | Based on 1998 price of £1466 per episode (7 days in hospital: normal). Adjusted to assume 3-day stay. Assumed inclusion of standard doses of painkiller (paracetamol, ibuprofen, morphine). Uprated to 2010 prices | |||
| Cost of acute chest syndrome per cycle, £ | 1815 | Karnon (2000)81 | Based on average of 1998 prices of £2932 for a child and £3162 per episode of acute chest syndrome. Recalculated to assume 7 days in hospital (7 days is normal but 5% require 5 days in ITU) and uprated to 2010 prices. Includes the cost of exchange transfusion. This has therefore been removed for 90% of patients (assumes remaining 10% require blood transfusion which is exchange) | |||
| Cost of TCD scan per cycle, £ | 50 | Communication with D Rees | Cost for TCD scan charged at King’s College Hospital, London, UK | |||
| Unit cost of resources (£) | Source | Assumption | Unit cost of resources converted to 2010 GBP | |
|---|---|---|---|---|
| HDU (per day) | 800 | Noyes (2006)96 | 886 | |
| Hospital (normal) (per day) | 209 | Karnon (2000)81 | 280 | |
| Ventilator support (per day) | 800 | Noyes (2006)96 | The same as being in HDU | 886 |
| Exchange transfusion | 348 | Karnon (2000)81 | Using (average) cost of exchange transfusion while in hospital so as not to double count hospital overhead costs which would occur if using ‘cost of exchange transfusion’ parameter | 466 |
| MRI | 252 | NHS reference costs 2009–2010 97 | 252 | |
| Rehabilitation: physiotherapy, psychological assessment | 1027 | Two physiotherapy sessions per week and two psychological assessments per month for 1 hour each | 1057 | |
| Staffing costs for the care package associated with a technology-dependent child (per year) | 25,480 | PSSRU95 | Assumed equivalent to annual staffing costs for technology-dependent children | 26,223 |
| Post-stroke state | HDU (days) | Hospital (days) | Ventilator support (days) | Exchange transfusion (no. at admission) | MRI scan (no. at admission) | Rehabilitation post stroke (months) | Carer staffing during first 3 months excluding hospitalisation |
|---|---|---|---|---|---|---|---|
| Mild | 1.00 | 7 | 0 | 1 | 1 | 1 | 0 |
| Moderate | 5.00 | 7 | 0 | 1 | 1 | 2 | 0 |
| Severe | 7.00 | 10.5 | 3.5 | 1 | 1 | 2 | 10 weeks of care based on PSSRU95 |
| Assumptions | 10.5 is average of 7–14 days (clinical opinion) | 3.5 average of 2–5 days (clinical opinion) | For the first month a patient is either at a hospital or too weak for physiotherapy |
In Table 47, resources from Table 46 are multiplied by £2010 prices in Table 45 (last column).
| Treatment | Post-stroke state | ||
|---|---|---|---|
| Mild | Moderate | Severe | |
| HDU | 886 | 4429 | 6200 |
| Hospital | 1958 | 1958 | 2936 |
| Ventilator support | 0 | 0 | 3100 |
| Exchange transfusion | 466 | 466 | 466 |
| MRI | 252 | 252 | 252 |
| Rehabilitation | 176 | 1057 | NAa |
| Staffing for a technology-dependent child (10 weeks) | NA | NA | 5462.28 |
| Total one-off 3-monthly costs | 3737 | 8161 | 18,471 |
In Table 49, resources from Table 48 are multiplied by £2010 prices in Table 45 (last column).
| Post-stroke state | MRI (no. per cycle) | Rehabilitation post stroke (months) | Carer staffing post stroke after first 3 months |
|---|---|---|---|
| Mild | 0.25 | 0.25 | 0 |
| Moderate | 0.25 | 1.5 | 0 |
| Severe | 0.25 | 3 | Three months of integrated care provision as per PSSRU95 requirement for technology-dependent children |
| Assumptions | MRI performed once a year |
| Post-stroke state | Costs (£) | |||
|---|---|---|---|---|
| MRI | Rehabilitation | Full-time carer | Ongoing 3-months’ costs | |
| Mild | 63 | £264 | 0 | 327 |
| Moderate | 63 | £1586 | 0 | 1649 |
| Severe | 63 | NA | 6554 | 6617 |
Saka et al. 89 estimate direct cost of post-stroke treatment in the UK to be £4383M in the first year. Annually, about 150,000 people in the UK suffer a stroke, which equals £29,220 or £34,011 in 2010 GBP per patient. In comparison, our model produces first year post-stroke care costs of £18,862. Calculations are presented in Table 50.
| Post-stroke state | Total one-off 3-monthly costs (£) | Ongoing 3-month costs (£) | Total first post-stroke year cost (£) | Prevalence of first stroke outcomes (%) | Weighted average cost of first stroke in year 1 (£) |
|---|---|---|---|---|---|
| Mild | 3737 | 327 | 4718 | 21 | 1000 |
| Moderate | 8161 | 1649 | 13,108 | 40 | 5283 |
| Severe | 18,417 | 6617 | 38,268 | 33 | 12,628 |
| Dead | NA | NA | NA | 6 | 0 |
| Weighted average cost of first stroke across all age groups | 18,862 | ||||
Appendix 5 Clinicians’ questionnaire
-
Out of 100 SC patients who are on transfusion:
-
How many continue transfusions past the age of 18 years for the rest of their lives?
-
___ /100 patients
-
-
Other comments:
-
-
Table 1 presents data that we obtained on the method of transfusion. If you disagree please fill out the last column (‘Your opinion’).
| % | Your opinion | |
|---|---|---|
| Proportion of patients on simple transfusion | 63 | |
| Proportion of patients on exchange transfusion | 12 | |
| Proportion of patients on combined transfusion | 25 |
Can we assume this (or your suggested) distribution for all age groups?
| Age group (years) | Do the data apply to this age group? | If no, what proportions of patients receive the following methods of transfusion? | |||
|---|---|---|---|---|---|
| Yes | No | Simple | Exchange | Combined | |
| 2–7 | |||||
| 8–18 | |||||
| 19–30 | |||||
| 31+ | |||||
-
Table 2 presents data that we obtained on hospital admissions for sickle cell patients (NOT due to stroke). If you disagree please fill out the last column (‘Your opinion’).
| % | Your opinion | |
|---|---|---|
| Probability/year of hospital admission on transfusion | 2.63 | |
| Probability/year of hospital admission off transfusion | 43.9 |
The group on which these data were collected had a mean age of 12 years old. Can we assume these probabilities for other age groups (2–7, 19–30, 31+ years)?
| Age group (years) | Do the data apply to this age group? | If no, what proportions of patients are hospitalised (not due to stroke/post-stroke complications) when: | ||
|---|---|---|---|---|
| Yes | No | On transfusion | Off transfusion | |
| 2–7 | ||||
| 19–30 | ||||
| 31+ | ||||
-
Is there a difference in occurrence of splenic sequestration among sickle cell patients when on or off transfusion?
-
Yes/no
If yes, out of 100 patients, how many are likely to have splenic sequestration in any year?
-
On transfusion: ___ /100 patients
-
Off transfusion: ___ /100 patients.
Per patient, how many times/year splenic sequestration occurs when:
-
On transfusion: ___ /year
-
Off transfusion: ___ /year.
Are there differences in the likelihood of splenic sequestration between age groups?
-
Yes/no
If yes, please indicate the proportions of different age groups experiencing splenic sequestration when on/off transfusion in the table below:
-
Comments:
-
Per 100 transfusions, what proportion of patients become alloimmunised when on simple, exchange or combined transfusion?
| Alloimmunisation when on | % |
|---|---|
| Simple transfusion | |
| Exchange transfusion | |
| Combined transfusion |
-
In Table 4, are the data that we obtained for age groups 2–6 years and 7–18 years on the proportion of sickle cell patients on transfusion who are also on oral and injection chelation? If you disagree please fill out the last column (‘Your opinion’).
| Chelation types | % | Your opinion |
|---|---|---|
| Proportion on oral chelation (deferiprone/Exjade) | 10 | |
| Proportion on injection chelation (desferroxamine) | 90 |
Can we assume this distribution for other age groups?
| Age group (years) | Do the data apply to this age group? | If no, what proportions of patients are on: | ||
|---|---|---|---|---|
| Yes | No | Oral chelation | Injection chelation | |
| 19–30 | ||||
| 31+ | ||||
-
What is the non-stroke-related mortality rate for patients who are not on transfusion? Specifically:
-
Of 100 patients not on transfusion and whose TCD scan is < 200 cm/second, how many are likely to die in each year (not due to stroke deaths only)?
-
___ /100 patients
-
-
Of 100 patients not on transfusion and whose TCD scan is > 200 cm/second, how many are likely to die in each year (not due to stroke deaths only)?
-
___ /100 patients.
-
-
How does the mortality rate vary between age groups?
-
| Age group (years) | Annual non-stroke-related deaths among 100 patients who are not on transfusion and whose: | |
|---|---|---|
| TCD scan is < 200 cm/second | TCD scan is > 200 cm/second | |
| 2–7 | ___ /100 patients | ___ /100 patients |
| 8–18 | ___ /100 patients | ___ /100 patients |
| 19–30 | ___ /100 patients | ___ /100 patients |
| 31+ | ___ /100 patients | ___ /100 patients |
Comments:
-
Annual stroke rate: Out of 100 sickle cell patients on transfusion, within a one year period how many would have their first stroke in the 19–30 age group and in the 31+ age group?
| Age group (years) | Annual stroke rate among 100 patients who are on transfusion |
|---|---|
| 19–30 | ___ /100 patients |
| 31+ | ___ /100 patients |
Comments:
-
16.4% of sickle cell patients aged 7–18 years per annum have a stroke when off transfusion if their TCD is > 200 cm/second. This figure drops to 2.4% for the same age group, also off transfusion, but with a TCD of < 200 cm/second. What are the equivalent proportions for sickle cell patients having a stroke each year for other age groups, off transfusion, and with TCDs of > 200 cm/second and < 200 cm/second?
| Age group (years) | Annual stroke rate among 100 patients who are off transfusion and: | |
|---|---|---|
| TCD scan is < 200 cm/second | TCD scan is > 200 cm/second | |
| 2–7 | ___ /100 patients | ___ /100 patients |
| 8–18 | 2.4/100 patients | 16.4/100 patients |
| 19–30 | ___ /100 patients | ___ /100 patients |
| 31+ | ___ /100 patients | ___ /100 patients |
Comments:
-
Table 5 provides data on the outcome of stroke for the 7–18 age group. If you disagree please fill out the last column (‘Your opinion’).
For the purpose of this study, stroke outcomes have been defined as follows:
-
mild minor health impact (minor stroke)
-
moderate temporary disability, some complications post stroke (minor stroke)
-
severe permanent disability, severe complications post stroke (major stroke).
Note: Definitions of states: http://stroke.ahajournals.org/cgi/content/short/32/6/1425
-
| Outcome post first stroke | % of patients | Your opinion |
|---|---|---|
| Mild | 18 | |
| Moderate | 45 | |
| Severe | 36 | |
| Death | 0 |
Given the above estimates for stroke outcomes for 7- to 18-year-olds, what outcomes would be expected for other age groups?
| Age group (years) | Outcome, 1 year post stroke (%) | |||
|---|---|---|---|---|
| Mild | Moderate | Severe | Death | |
| 2–7 | ||||
| 8–18 | 18 | 45 | 36 | 0 |
| 19–30 | ||||
| 31+ | ||||
Appendix 6 Responses to clinicians’ questionnaire
| Question reference | Questions | Subquestion | Original value, if applicable | Responses (%) | Average (as %) | ||||
|---|---|---|---|---|---|---|---|---|---|
| R1 | R2 | R3 | R4 | ||||||
| 1 | Out of 100 SC patients who are on transfusion: how many continue transfusions past the age of 18 years for the rest of their lives? | NA | 20 | 90 | 90 | 100 | 75 | ||
| 2 | Table 1 presents data that we obtained on the method of transfusion. Do you agree with these data? If you disagree please fill out the last column (Your opinion) in Table 1 | Proportion of patients on simple transfusion | 63 | NA | 10 | 63 | 67 | 47 | |
| Proportion of patients on exchange transfusion | 12 | NA | 90 | 12 | 33 | 45 | |||
| Proportion of patients on combined transfusion | 25 | NA | 0 | 25 | 0 | 8 | |||
| 2a | Do the data set out in question 2 apply to this age group? | 2–7 years | NA | No | No | No | No | No | |
| 8–18 years | NA | No | No | Yes | Yes | No/yes | |||
| 19–30 years | NA | Yes | Yes | Yes | 50/50 | Yes | |||
| 31+ years | NA | Yes | Yes | Yes | NA | Yes | |||
| If no, what proportions of patients receive the following methods of transfusion? | Age 2–7 years | Simple transfusion | 63 | 100 | 100 | 90 | 100 | 98 | |
| Exchange transfusion | 12 | 0 | 0 | 0 | 0 | 0 | |||
| Combined transfusion | 25 | 0 | 0 | 10 | 0 | 3 | |||
| Age 8–18 years | Simple transfusion | 63 | 65 | 80 | 0.63 | 0.67 | 69 | ||
| Exchange transfusion | 12 | 15 | 20 | 0.12 | 0.33 | 20 | |||
| Combined transfusion | 25 | 20 | 0 | 0.25 | 0 | 11 | |||
| Age 19–30 years | Simple transfusion | 63 | 0.63 | 0.1 | 0.63 | 0.67 | 51 | ||
| Exchange transfusion | 12 | 0.12 | 0.9 | 0.12 | 0.33 | 37 | |||
| Combined transfusion | 25 | 0.25 | 0 | 0.25 | 0 | 13 | |||
| Age 31+ years | Simple transfusion | 63 | 0.63 | 0.1 | 0.63 | 0.63 | 50 | ||
| Exchange transfusion | 12 | 0.12 | 0.9 | 0.12 | 0.12 | 32 | |||
| Combined transfusion | 25 | 0.25 | 0 | 0.25 | 0.25 | 19 | |||
| 3 | Table 2 presents data that we obtained on hospital admissions for sickle cell patients (not due to stroke/post-stroke complications). Do you agree with these data? If you disagree please fill out the last column (Your opinion) in Table 2 | Probability per year of hospital admission on transfusion | 3 | 10 | 2.63 | 2.63 | 1 | 4 | |
| Probability per year of hospital admission off transfusion | 44 | 43.90 | 20 | 43.90 | 50 | 39 | |||
| 3a | The group on which these data were collected had a mean age of 12 years. Can we assume these probabilities for other age groups (2–7, 19–30, 31+ years)? | 2–7 years | NA | No | Not sure | Yes | NA | No/yes | |
| 8–18 years | NA | No | No | Yes | NA | No | |||
| 19–30 | NA | No | No | Yes | NA | No | |||
| 31+ years | NA | No | No | Yes | NA | No | |||
| Age 2–7 years | On transfusion | 3 | NA | NA | 2.63 | 1.50 | 2 | ||
| Off transfusion | 44 | NA | NA | 43.90 | 50 | 47 | |||
| Age 8–18 years | On transfusion | 3 | 2.63 | 2.63 | 2.63 | 1.50 | 2 | ||
| Off transfusion | 44 | 43.90 | 43.90 | 43.90 | 43.90 | 44 | |||
| Age 19–30 years | On transfusion | 3 | NA | 2.50 | 2.63 | 1.50 | 2 | ||
| Off transfusion | 44 | NA | 20 | 43.90 | 50 | 38 | |||
| Age 31+ | On transfusion | 3 | NA | 2.50 | 2.63 | NA | 3 | ||
| Off transfusion | 44 | NA | 20 | 43.90 | NA | 32 | |||
| 4 | Is there a difference in occurrence of splenic sequestration among sickle cell patients when on or off transfusion? | Yes | NA | NA | NA | 1 | 1 | 100 | |
| No | NA | NA | NA | 0 | 0 | 0 | |||
| If yes, out of 100 patients, how many are likely to have splenic sequestration in any year? | On transfusion | NA | 0 | NA | NA | 0 | 0 | ||
| Off transfusion | NA | 3 | NA | NA | 3.5 | 3 | |||
| Per patient, how many times per year does splenic sequestration occur when: | On transfusion | NA | 0 | NA | NA | 0 | 0 | ||
| Off transfusion | NA | NA | NA | NA | NA | NA | |||
| Are there differences in the likelihood of splenic sequestration between age groups? | Yes | NA | 1 | NA | 1 | 1 | 100 | ||
| No | NA | 0 | NA | 0 | 0 | 0 | |||
| Age 2–7 years | On transfusion | NA | 0 | NA | 5 | 0 | 2 | ||
| Off transfusion | NA | 1.60 | NA | 0 | 5.50 | 2 | |||
| Age 8–18 years | On transfusion | NA | 0 | NA | 0 | 0 | 0 | ||
| Off transfusion | NA | 0.50 | NA | 0 | 1.50 | 1 | |||
| Age 19–30 years | On transfusion | NA | 0 | NA | 0 | 0 | 0 | ||
| Off transfusion | NA | 0.50 | NA | 0 | 0 | 0 | |||
| Age 31+ years | On transfusion | NA | 0 | NA | 0 | 0 | 0 | ||
| Off transfusion | NA | 0.50 | NA | 0 | 0 | 0 | |||
| 5 | Per 100 transfusions, what proportion of patients become alloimmunised when on simple, exchange or combined transfusion? | Proportion of patients on: | Simple transfusion | NA | 5 | NA | 5 | 2 | 4 |
| Exchange transfusion | NA | 10 | NA | 15 | 5.50 | 10 | |||
| Combined transfusion | NA | NA | NA | 10 | NA | 10 | |||
| 6 | Table 4 shows the proportions of transfused sickle cell patients who are treated with oral and injection chelation. These proportions are applicable to the age groups 2–6 years and 7–18 years. Do you agree with these figures? If you disagree please fill out the last column (Your opinion) in Table 4 | Age 2–7 years | Proportion on oral chelation (deferiprone/Exjade) | 10 | 50 | 90 | 90 | 90 | 80 |
| Proportion on injection chelation (deferoxamine) | 90 | 50 | 10 | 10 | 10 | 20 | |||
| Age 8–18 years | Proportion on oral chelation (deferiprone/Exjade) | NA | 50 | 90 | 90 | 90 | 80 | ||
| Proportion on injection chelation (deferoxamine) | NA | 50 | 10 | 10 | 10 | 20 | |||
| Age 19–30 years | Proportion on oral chelation (deferiprone/Exjade) | NA | 50 | 95 | 90 | NA | 78 | ||
| Proportion on injection chelation (deferoxamine) | NA | 37.50 | 5 | 10 | NA | 18 | |||
| Age 31+ years | Proportion on oral chelation (deferiprone/Exjade) | NA | 20 | 95 | 90 | NA | 68 | ||
| Proportion on injection chelation (deferoxamine) | NA | 50 | 5 | 10 | NA | 22 | |||
| 7 | What is the non-stroke-related mortality rate for patients who are not on transfusion? | NA | 0.27 | NA | NA | 0.50 | 0 | ||
| Of 100 patients not on transfusion and whose TCD scan is > 200 cm/second, how many are likely to die in each year (excluding stroke deaths)? | NA | NA | NA | NA | 0.50 | 1 | |||
| How does the mortality rate vary between age groups? | Age 2–7 years | TCD scan is < 200 cm/second | NA | NA | NA | NA | NA | – | |
| TCD scan is > 200 cm/second | NA | NA | NA | NA | NA | – | |||
| Age 8–18 years | TCD scan is < 200 cm/second | NA | NA | NA | NA | NA | – | ||
| TCD scan is > 200 cm/second | NA | NA | NA | NA | NA | – | |||
| Age 19–30 years | TCD scan is < 200 cm/second | NA | NA | NA | NA | NA | – | ||
| TCD scan is > 200 cm/second | NA | NA | NA | NA | NA | – | |||
| Age 31+ years | TCD scan is < 200 cm/second | NA | NA | NA | NA | NA | – | ||
| TCD scan is > 200 cm/second | NA | NA | NA | NA | NA | – | |||
| 8 | Annual stroke rate: out of 100 sickle cell patients on transfusion, within a one year period how many would have their first stroke in the 19–30 years age groups and in the 31+ years age group? | 19–30 years | NA | 0.50 | NA | 2 | NA | 1 | |
| 31+ years | NA | 0.50 | NA | 2 | NA | 1 | |||
| 9 | 16.4 of SC patients aged 8–18 years per annum have a stroke when off transfusion and if their TCD is > 200 cm/second. This figure drops to 2.4 for the same age group, also off transfusion, but with a TCD of < 200 cm/second. What are the equivalent proportions for sickle cell patients having a stroke each year for other age groups, off transfusion, and with TCDs of > 200 cm/second and < 200 cm/second? | Age 2–7 years | TCD scan is < 200 cm/second | NA | NA | NA | NA | 1 | 1 |
| TCD scan is > 200 cm/second | NA | NA | NA | NA | 10 | 10 | |||
| Age 8–18 years | TCD scan is < 200 cm/second | NA | 2.40 | NA | 2.40 | 2.40 | 2 | ||
| TCD scan is > 200 cm/second | NA | 16.40 | NA | 16.40 | 16.40 | 16 | |||
| Age 19–30 years | TCD scan is < 200 cm/second | NA | NA | NA | NA | 2.40 | 2 | ||
| TCD scan is > 200 cm/second | NA | NA | NA | NA | 16.40 | 16 | |||
| Age 31+ years | TCD scan is < 200 cm/second | NA | NA | NA | NA | 2.40 | 2 | ||
| TCD scan is > 200 cm/second | NA | NA | NA | NA | 16.40 | 16 | |||
| 10 | Table 5 provides data on the outcome of stroke for the 8–18 years age groups. Do you agree with these? If you disagree please fill out the last column (Your opinion) in Table 5 | Mild | 18 | NA | 25 | 0.18 | 20 | 21 | |
| Moderate | 45 | NA | 45 | 0.45 | 70 | 53 | |||
| Severe | 36 | NA | 25 | 0.36 | 10 | 24 | |||
| Death | 0 | NA | 5 | 0 | 0 | 2 | |||
| Age 2–7 years | Mild | NA | 30 | NA | 25 | NA | 28 | ||
| Moderate | NA | 50 | NA | 50 | NA | 50 | |||
| Severe | NA | 20 | NA | 25 | NA | 23 | |||
| Death | NA | 0 | NA | 0 | NA | 0 | |||
| Age 8–18 years | Mild | 18 | 25 | 18 | 18 | 18 | 20 | ||
| Moderate | 45 | 50 | 45 | 45 | 45 | 46 | |||
| Severe | 36 | 25 | 36 | 36 | 36 | 33 | |||
| Death | 0 | 0 | 0 | 0 | 0 | 0 | |||
| Age 19–30 years | Mild | NA | 15 | 30 | 15 | 20 | 20 | ||
| Moderate | NA | 40 | 40 | 30 | 50 | 40 | |||
| Severe | NA | 25 | 25 | 50 | 28 | 32 | |||
| Death | NA | 20 | 5 | 5 | 2 | 8 | |||
| Age 31+ years | Mild | NA | 25 | NA | 10 | NA | 18 | ||
| Moderate | NA | 30 | NA | 20 | NA | 25 | |||
| Severe | NA | 30 | NA | 60 | NA | 45 | |||
| Death | NA | 15 | NA | 10 | NA | 13 | |||
Appendix 7 Calculation of model outputs
Model outputs
Incremental cost
Incremental cost (iC) = CtI – CtC
where:
-
CtI = cost of treatment (intervention)
-
CtC = cost of treatment (non-intervention)
and:
where:
-
SPIbd = number of patients who have had at least one stroke in state b in cycle d
-
NSId = number of patients with no previous strokes in cycle d
-
SCb = cost of stroke treatment
-
Tf = probability of transfusion of type f
-
TCfg = cost of transfusion, type f (simple, exchange, combined), depending on whether old or new stroke (g)
-
Ghf = probability of complication h when on transfusion type f
-
GCh = cost of complication h
-
SSid = cost of TCD scan in cycle d, depending on previous TCD result (i).
Strokes avoided
Strokes avoided (SA) = nCC – nCI
where:
-
nCC = number of strokes in non-intervention [nCC = (∑PCabcd × Sabce)]
-
nCI = number of strokes in intervention [nCI = (∑PIabcd × Sabce)]
where:
-
PCabcd = number of patients in the age group a and state (mild/moderate/bad/dead) b who have had c strokes in cycle d (PIabcd = patients in intervention group)
-
Sabce = probability of strokes for patients in the age group a and state (mild/moderate/bad/dead) b who have had c strokes, post-stroke state e.
Cost per stroke avoided
Cost per stroke avoided (CPSA) = SAd/iCd
where:
-
SAd = the difference in the number of strokes avoided in the non-intervention scenario compared with the intervention scenario in period d
-
iCd = the difference in cost in the intervention scenario compared with the non-intervention scenario in period d.
Incremental quality-adjusted life-year
Incremental quality-adjusted life-year (iQALY) = QALYlc – QALYli
where:
where:
-
SPIbd = number of patients in the intervention arm who have had at least one stroke in state b in cycle d
-
SPCbd = number of patients in the non-intervention arm who have had at least one stroke in state b in cycle d
-
NSId = number of patients with no previous strokes in cycle d in the intervention arm
-
NSCd = number of patients with no previous strokes in cycle d in the non-intervention arm
-
sQALYb = QALY loss from stroke treatment, state b
-
Tf = probability of transfusion of type f
-
tQALYf = QALY loss from transfusion, type f (simple, exchange, combined)
-
Ghf = probability of complication h when on transfusion type f
-
gQALYh = QALY loss for complication h.
Incremental cost-effectiveness ratio
ICER = iQALYd/iCostd
where:
-
iQALYd = the difference in QALY loss in the intervention scenario compared with the non-intervention scenario in period d
-
iCostd = the difference in cost in the intervention scenario compared with the non-intervention scenario in period d.
Appendix 8 Outputs of sensitivity analyses
FIGURE 15.
Varied parameter: 3-month probability of death when not on transfusion and TCD scan is < 200 cm/second (not due to stroke). (a), ICER; (b), CPSA.
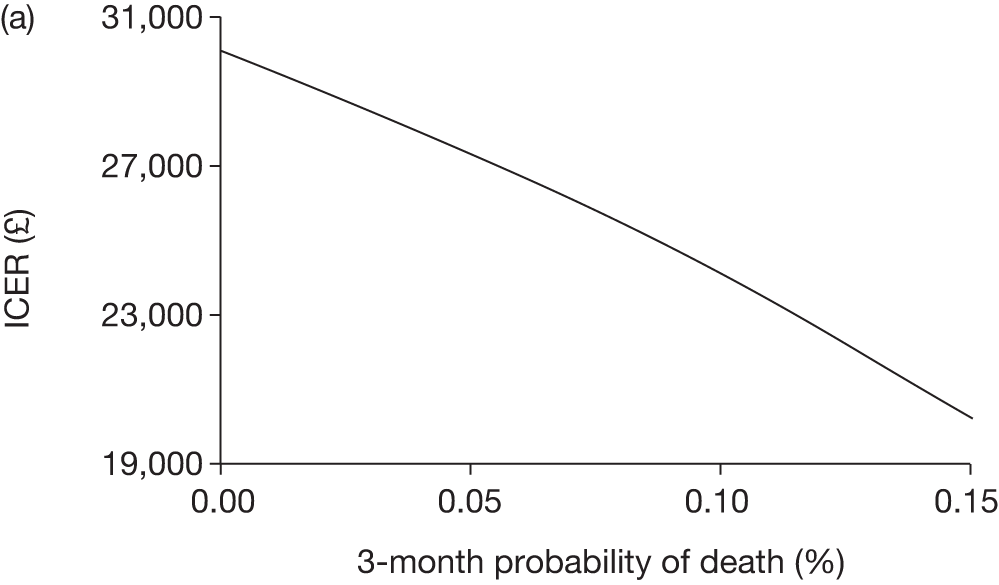
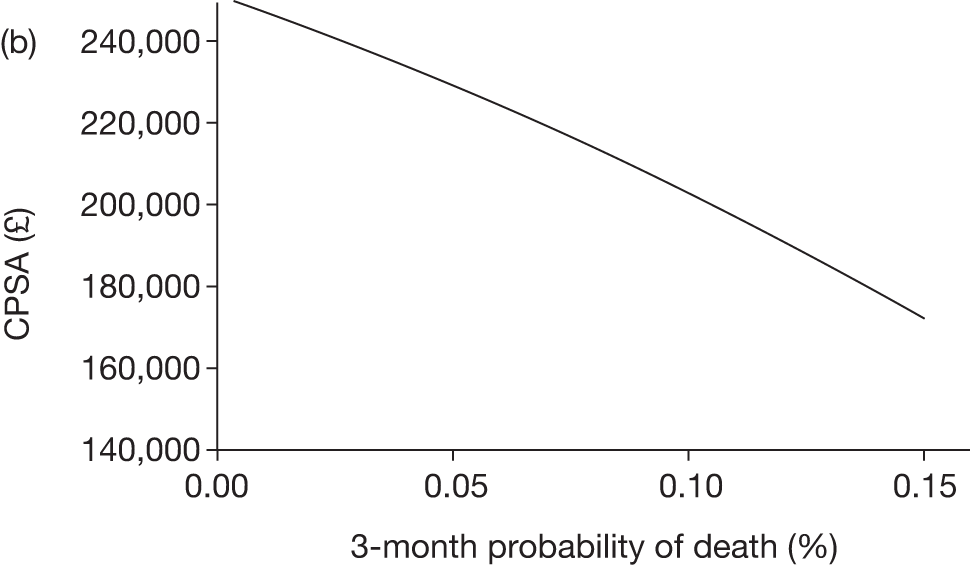
FIGURE 16.
Varied parameter: 3-month probability of death when TCD scan is > 200 cm/second (not due to stroke) while off transfusion. (a), ICER; (b), CPSA.
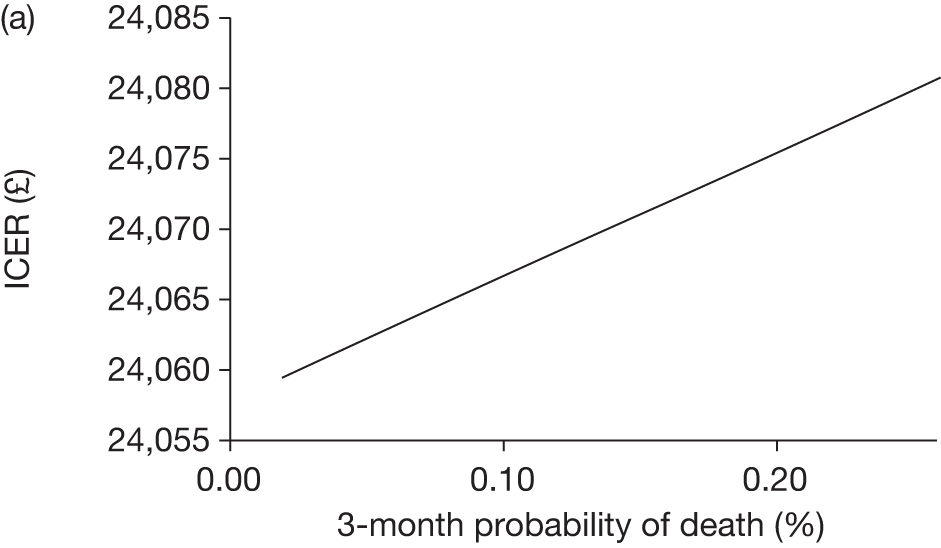
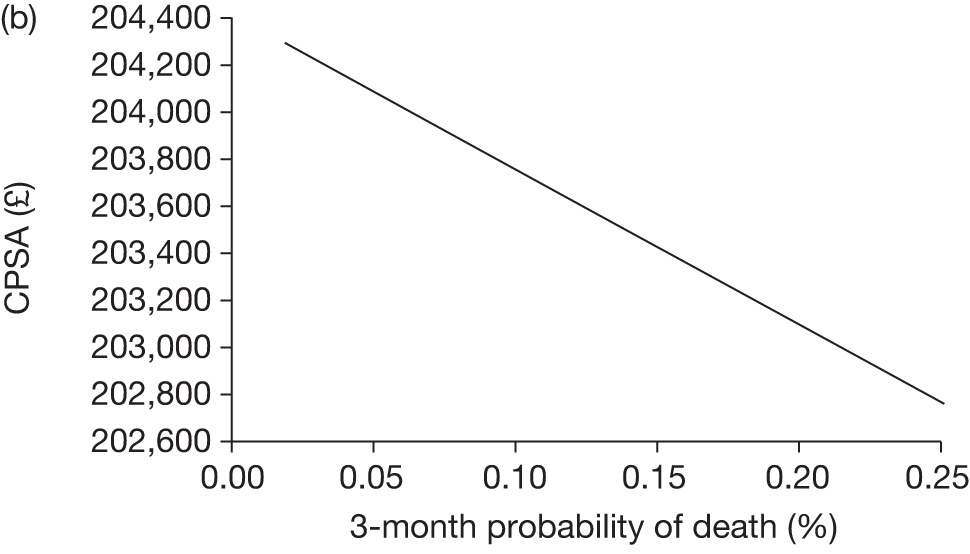
FIGURE 17.
Varied parameter: 3-month probability of death when TCD scan is > 200 cm/second (not due to stroke) while on transfusion. (a), ICER; (b), CPSA.
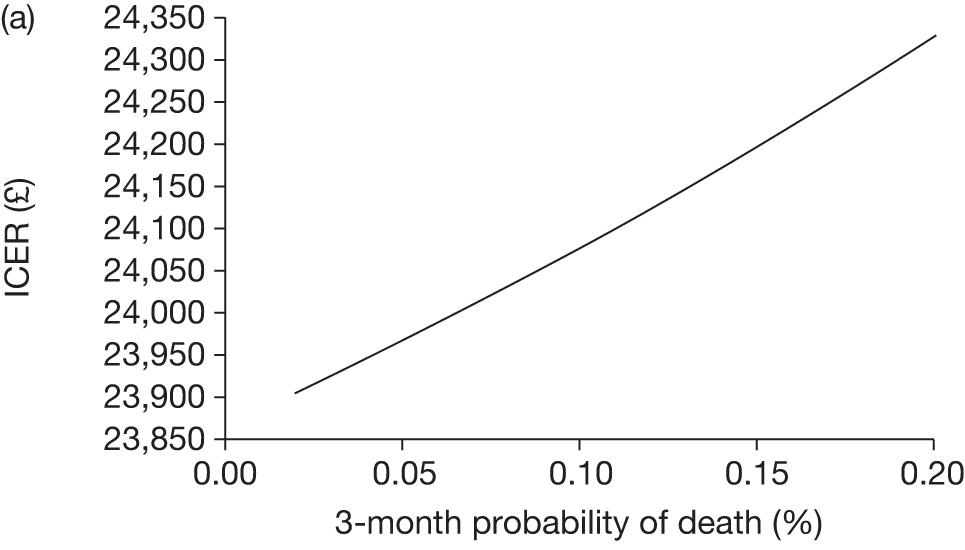
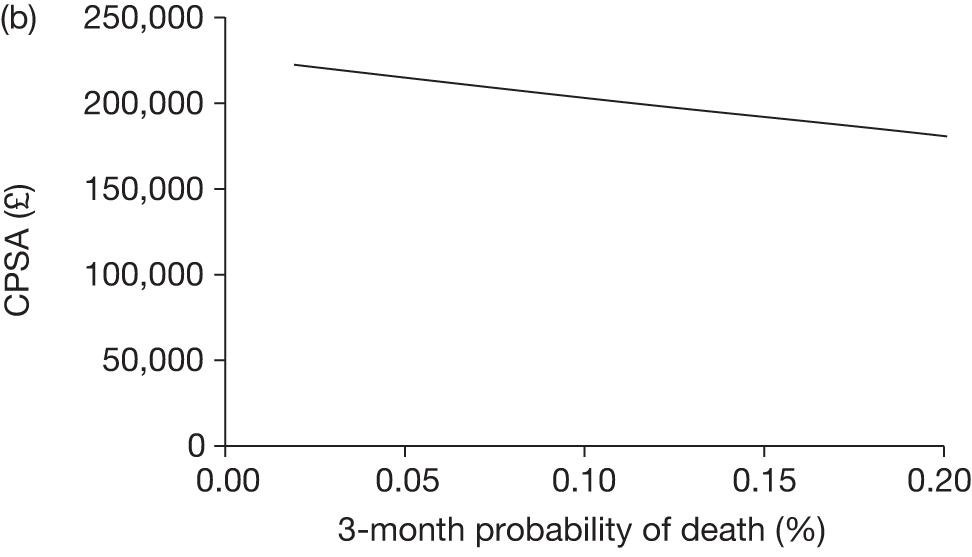
FIGURE 18.
Varied parameter: probability of first stroke when on transfusion and TCD is > 200 cm/second (2–7 years age group). (a), ICER; (b), CPSA.
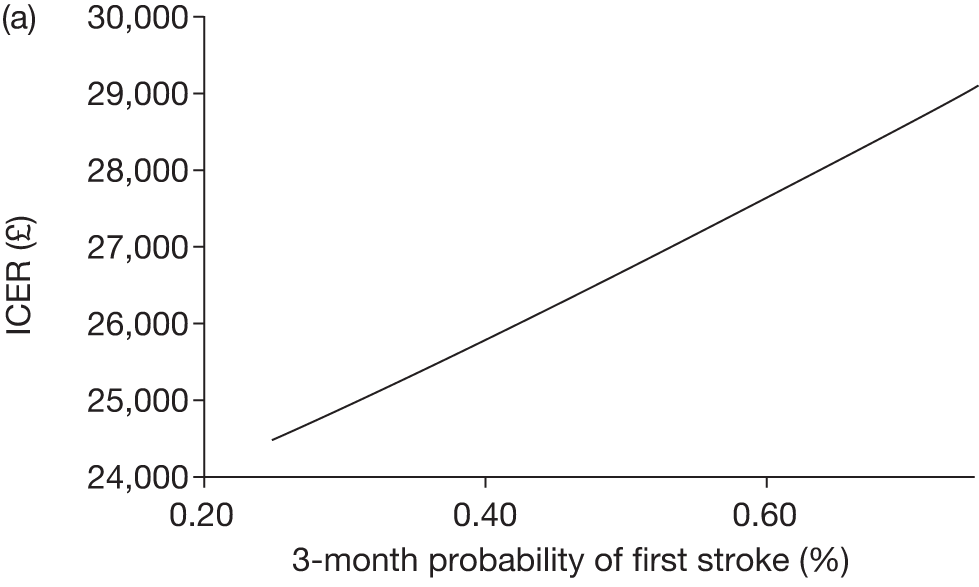
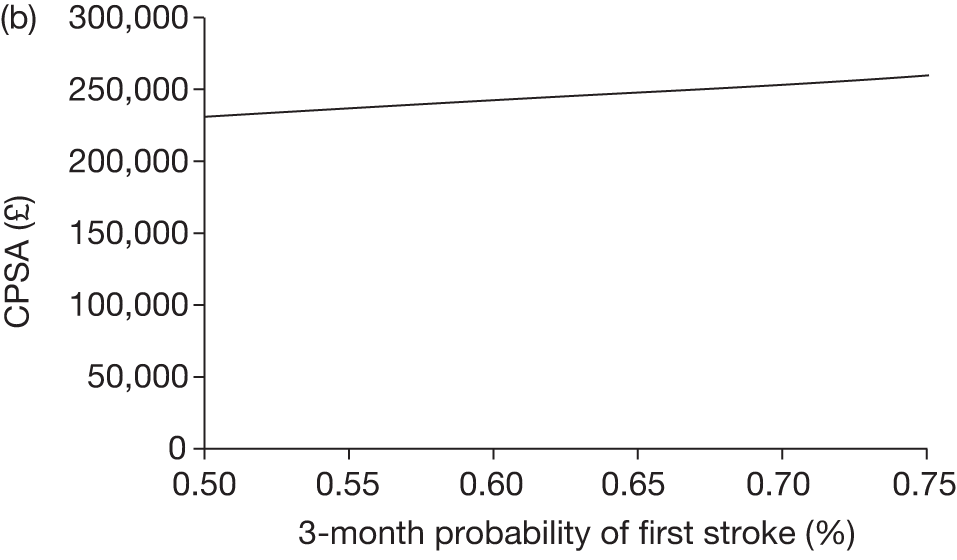
FIGURE 19.
Varied parameter: probability of first stroke when off transfusion and TCD is > 200 cm/second (2–7 years age group). (a), ICER; (b), CPSA.
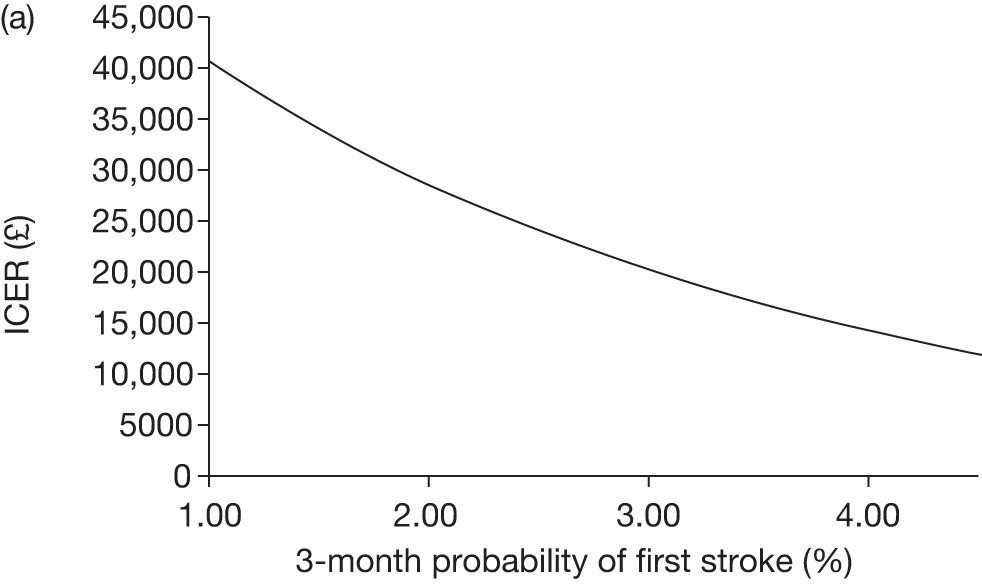
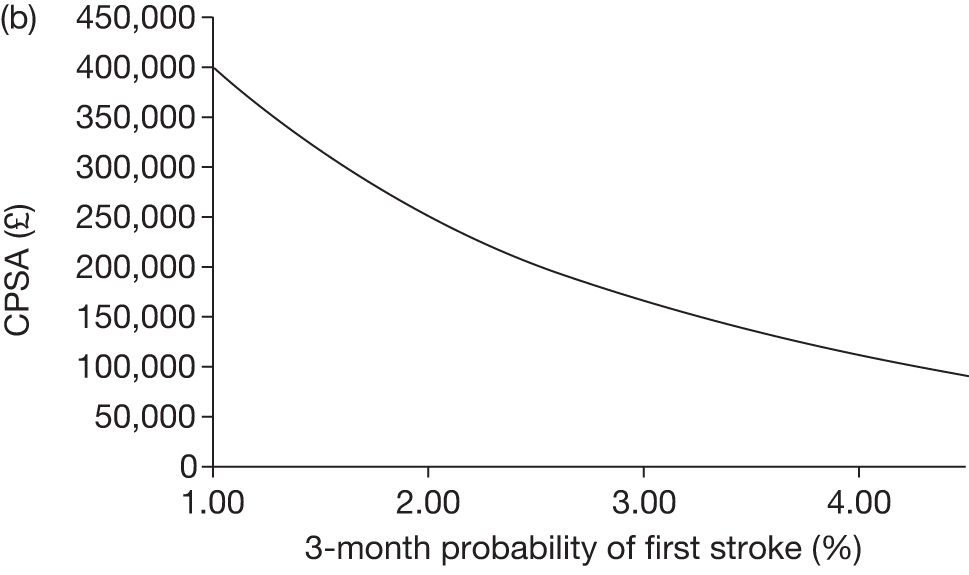
FIGURE 20.
Varied parameter: 3-month probability of first stroke when on transfusion and TCD is> 200 cm/second (8–18 years age group). (a), ICER; (b), CPSA.
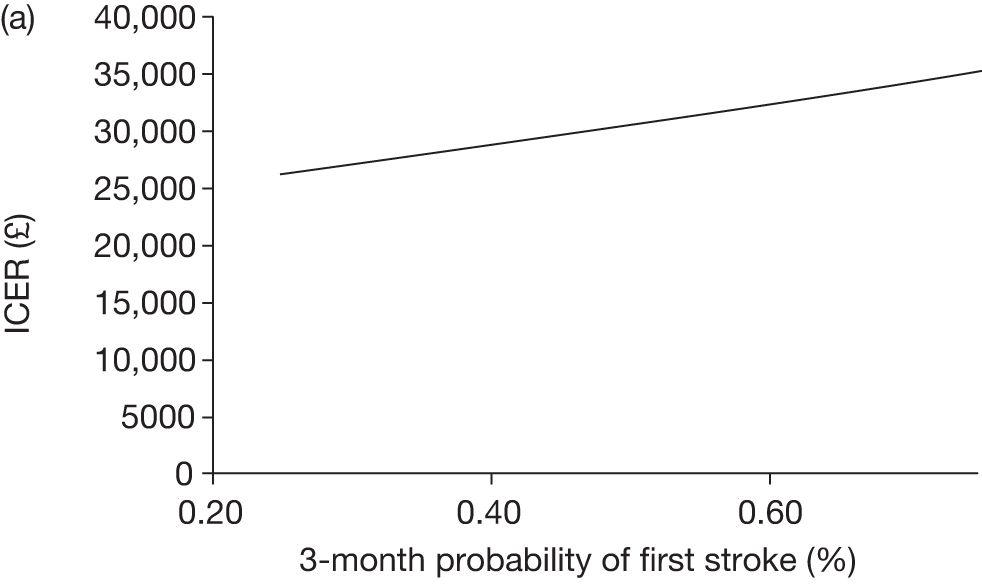
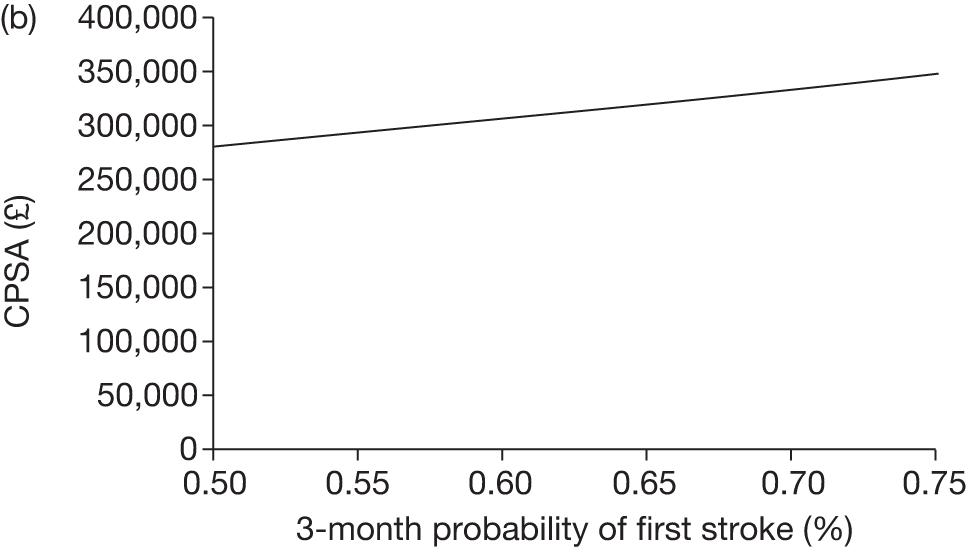
FIGURE 21.
Varied parameter: probability of first stroke when off transfusion and TCD is > 200 cm/second (8–18 years age group). (a), ICER; (b), CPSA.
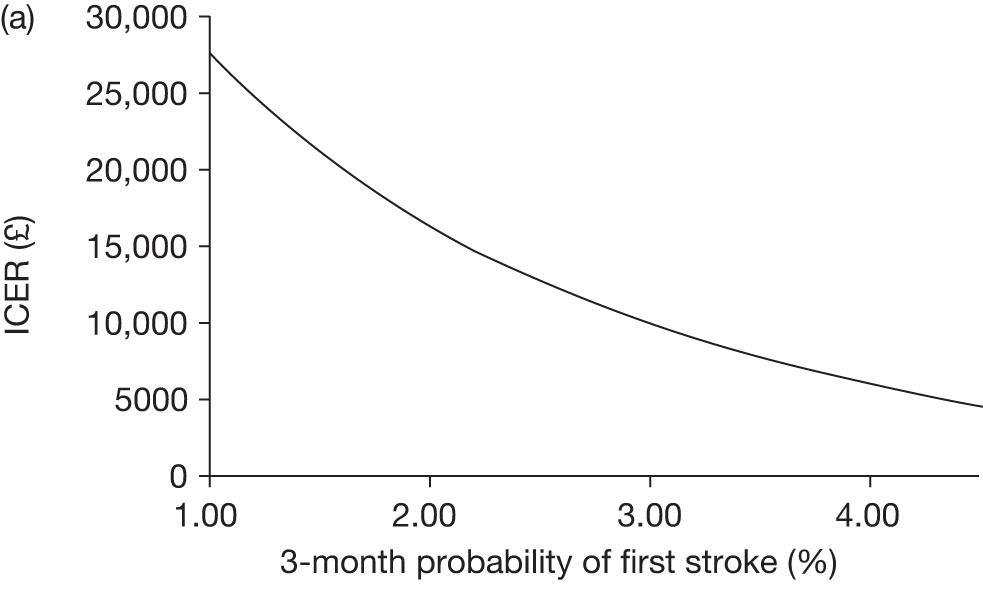
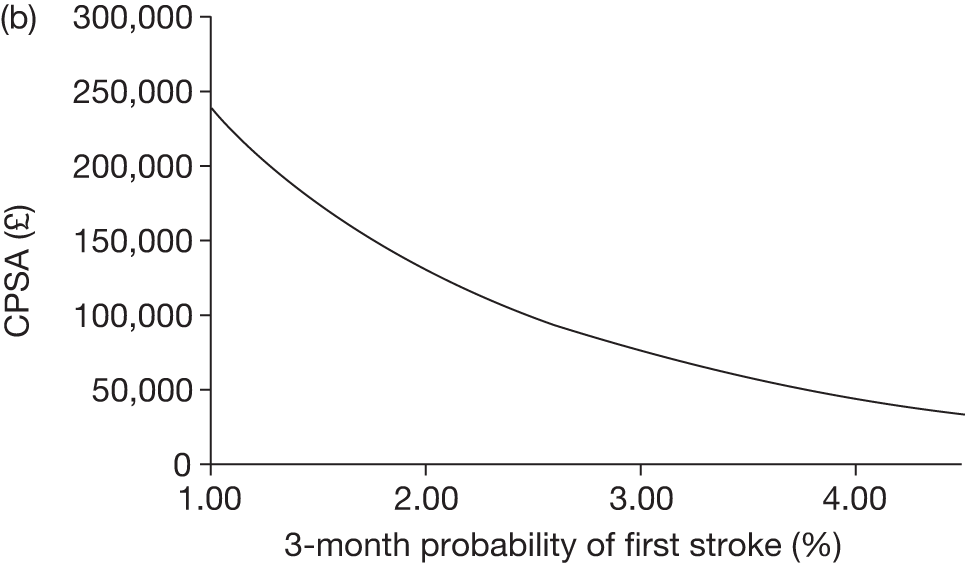
FIGURE 22.
Varied parameter: probability of first stroke when on transfusion and TCD is > 200 cm/second (19–30 years age group). (a), ICER; (b), CPSA.
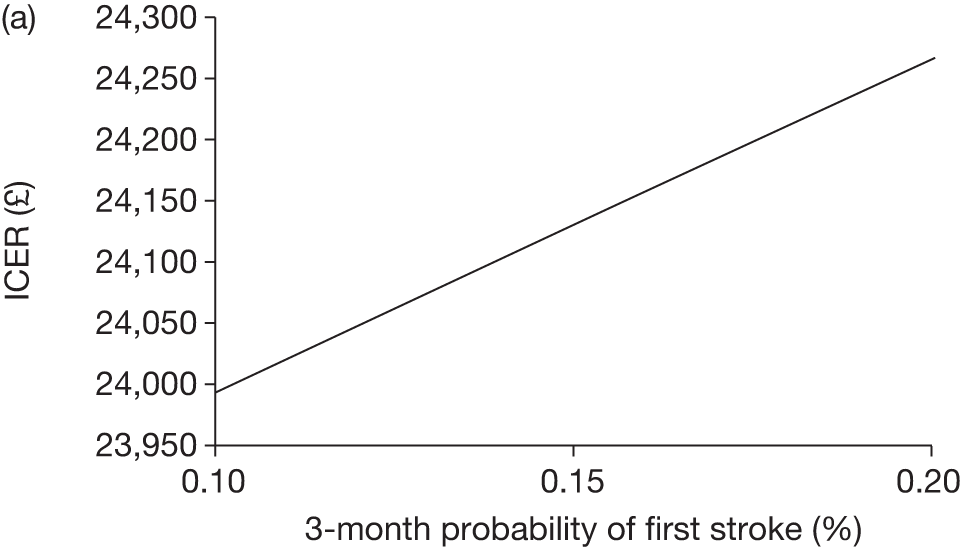
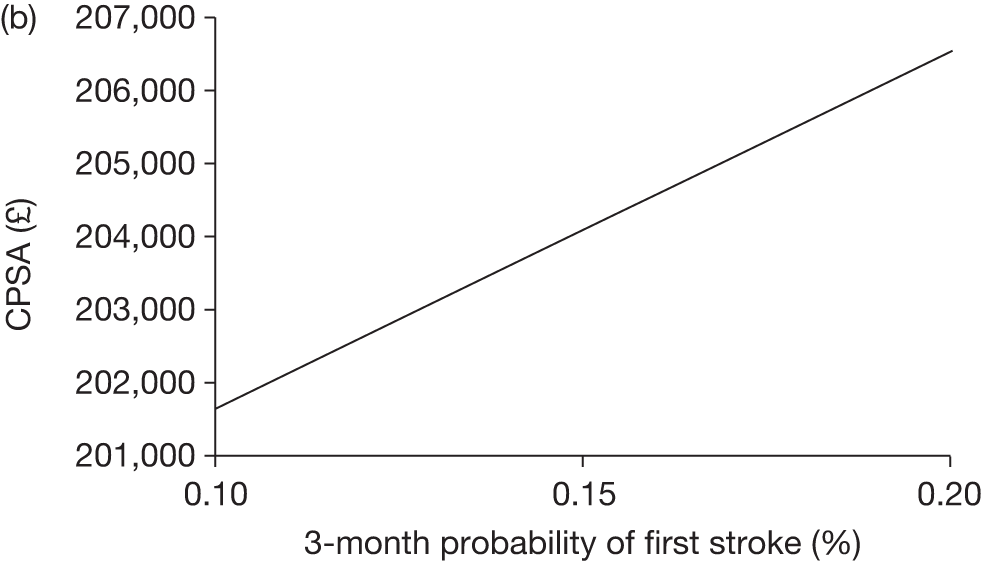
FIGURE 23.
Varied parameter: probability of first stroke when off transfusion and TCD is > 200 cm/second (19–30 years age group). (a), ICER; (b), CPSA.
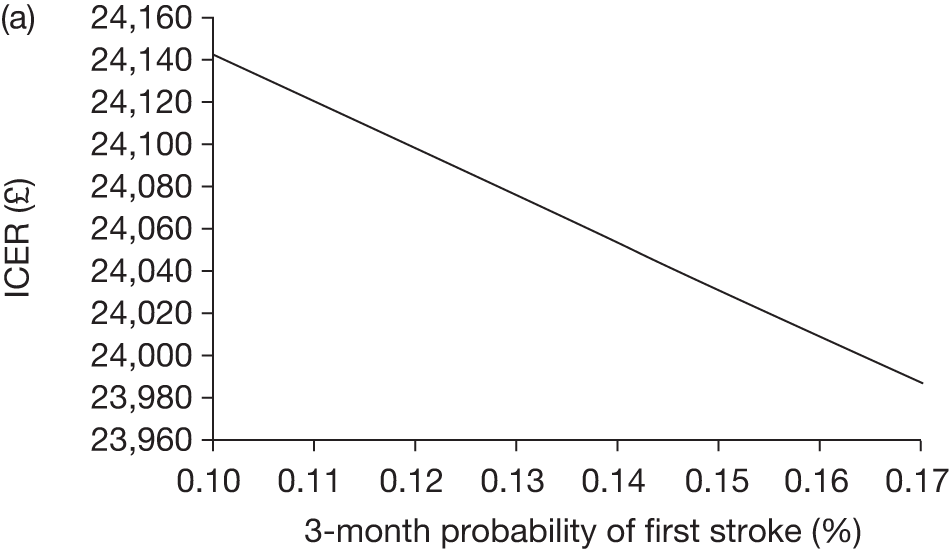
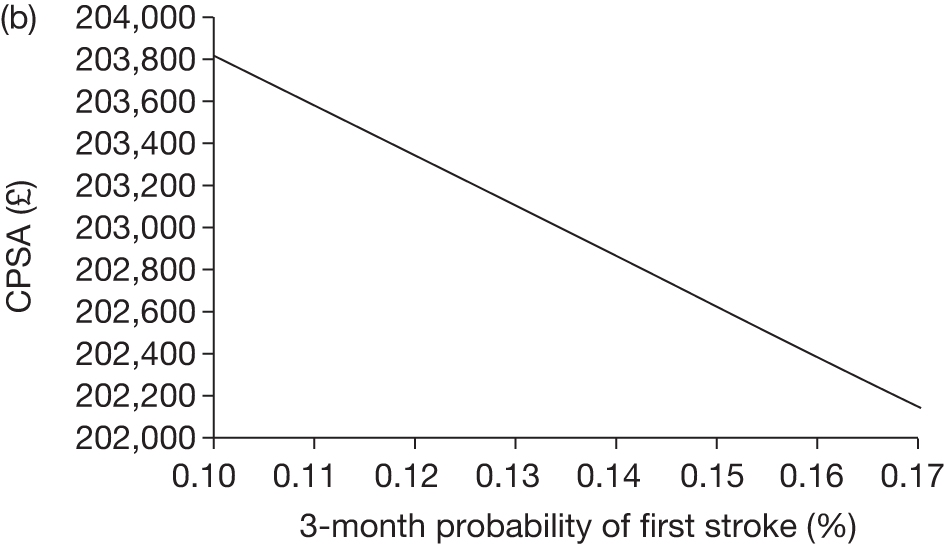
FIGURE 24.
Varied parameter: probability of first stroke when on transfusion and TCD is > 200 cm/second (31+ years age group). (a), ICER; (b), CPSA.
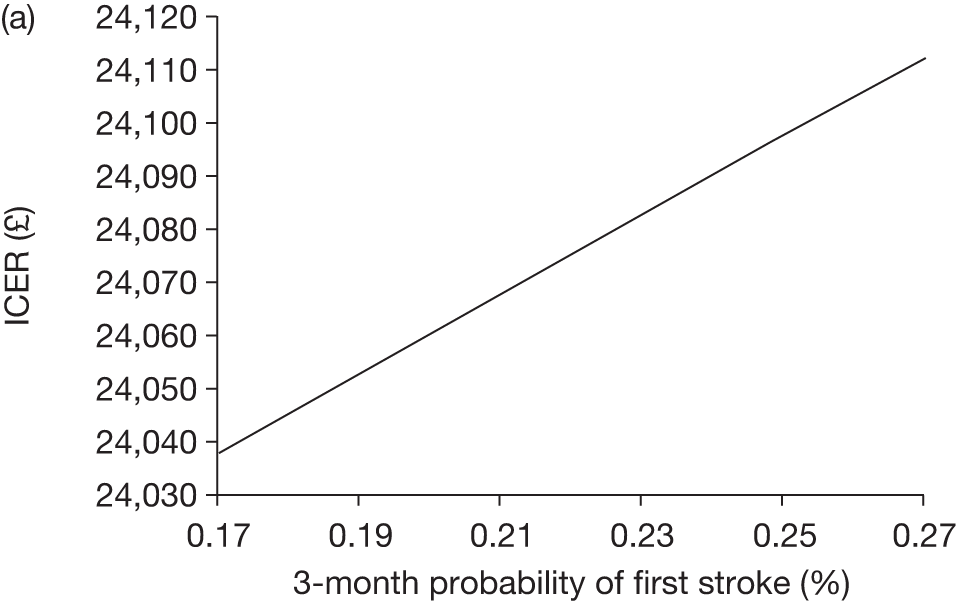
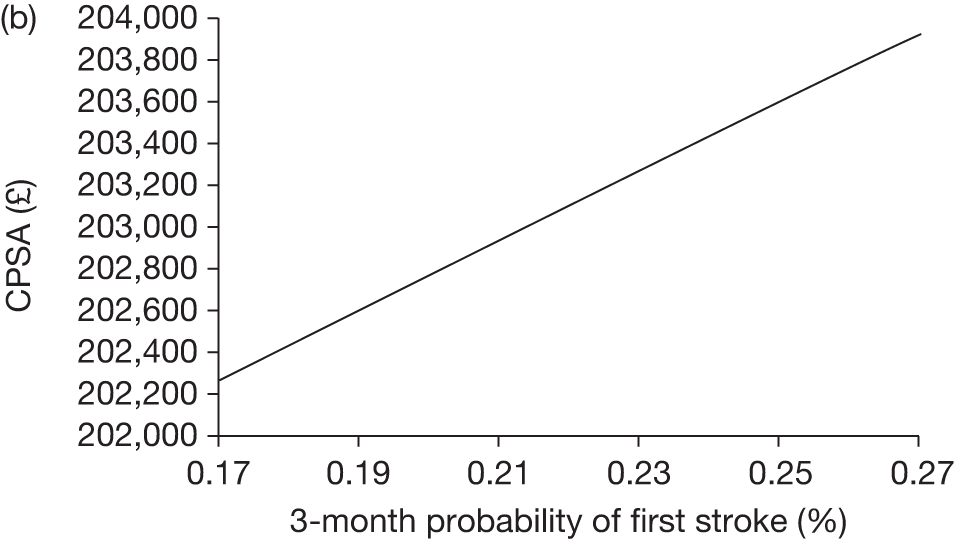
FIGURE 25.
Varied parameter: probability of first stroke when off transfusion and TCD is > 200 cm/second (31+ years age group). (a), ICER; (b), CPSA.
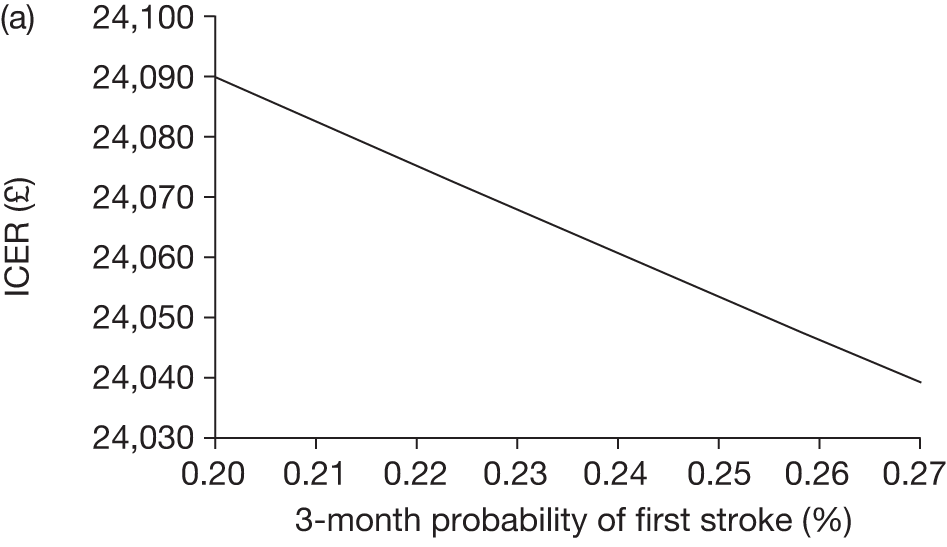
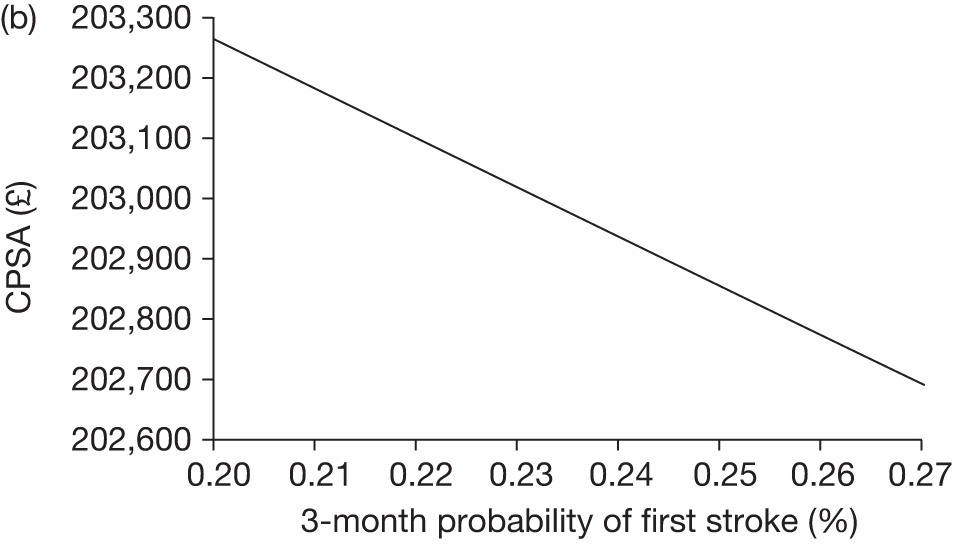
FIGURE 26.
Varied parameter: probability of moving to a worse state post first stroke after one cycle. (a), ICER; (b), CPSA.
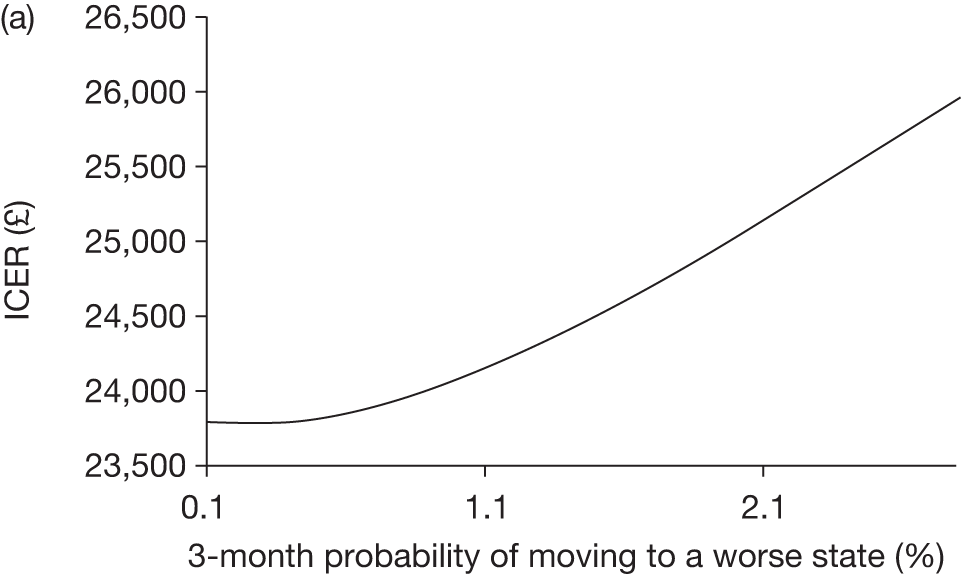
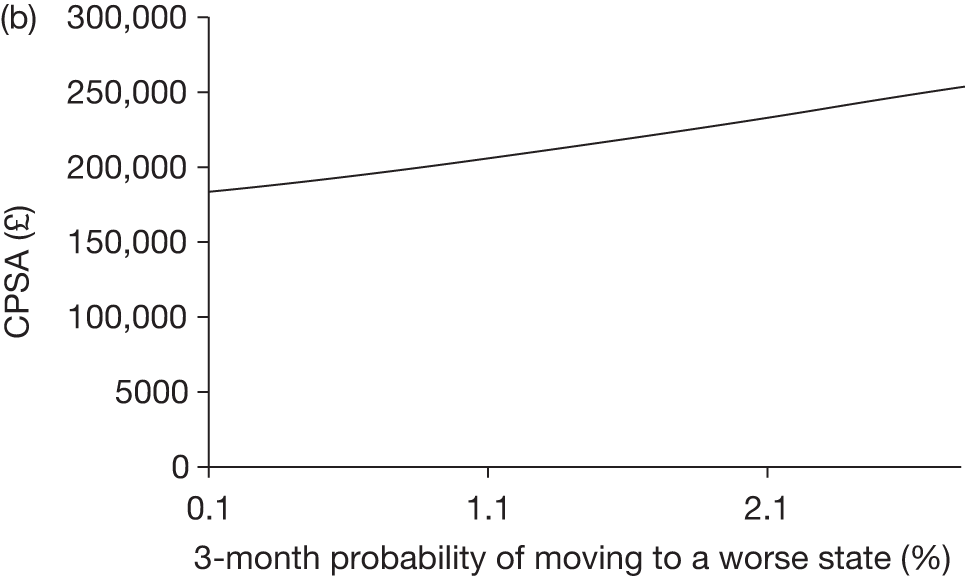
FIGURE 27.
Varied parameter: cost of treatment for mild post-stroke state (initial). (a), ICER; (b), CPSA.
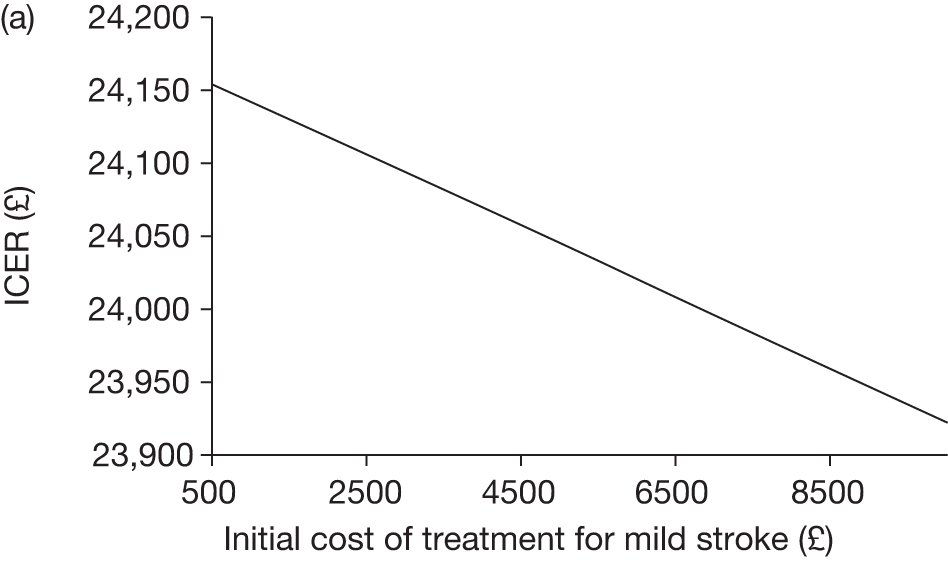
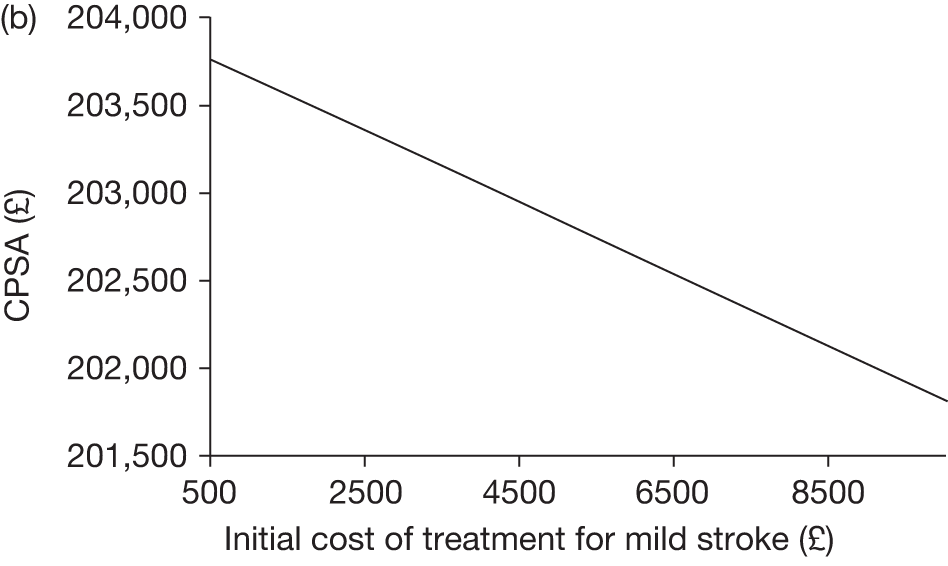
FIGURE 28.
Varied parameter: cost of treatment for moderate post stroke state (initial). (a), ICER; (b), CPSA.
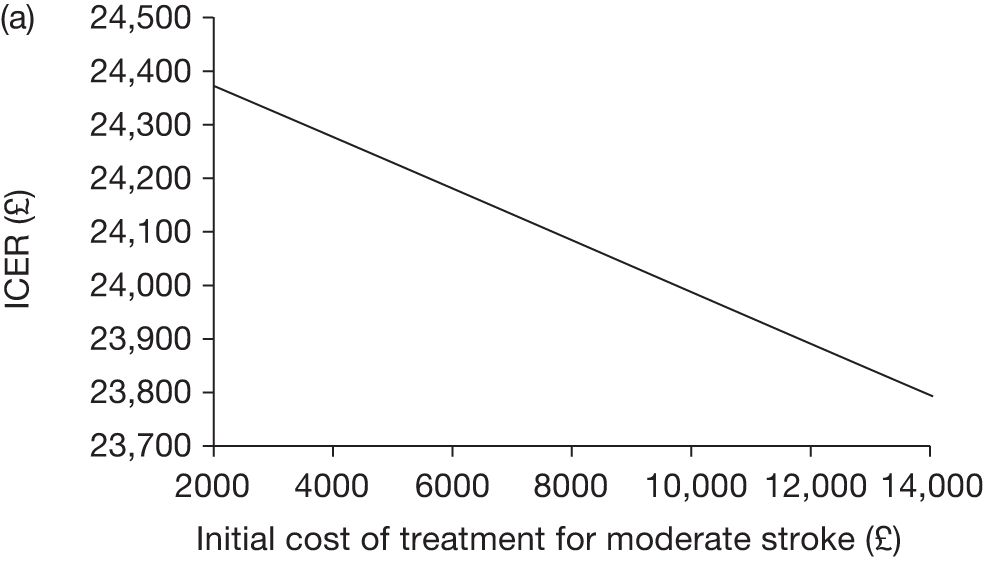
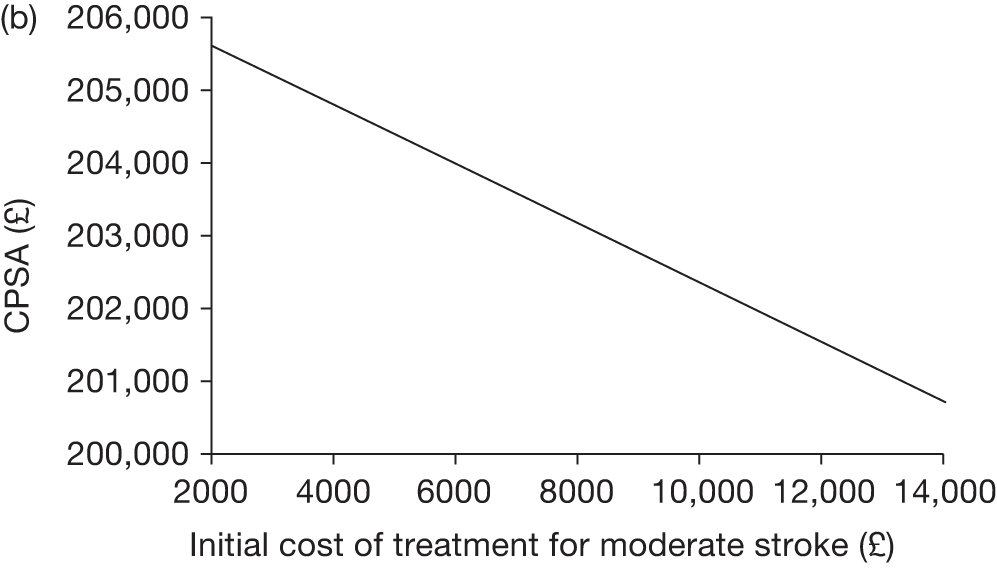
FIGURE 29.
Varied parameter: cost of treatment for severe post-stroke state (initial). (a), ICER; (b), CPSA.
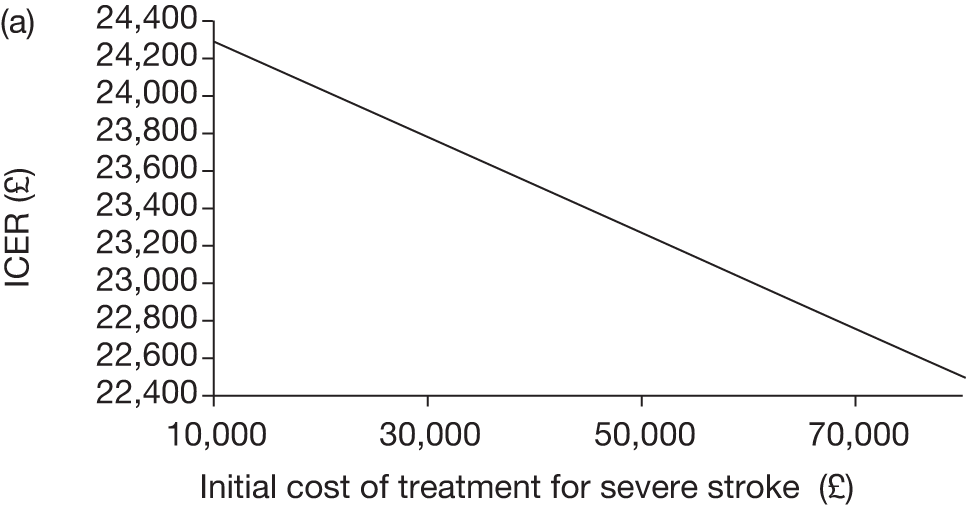
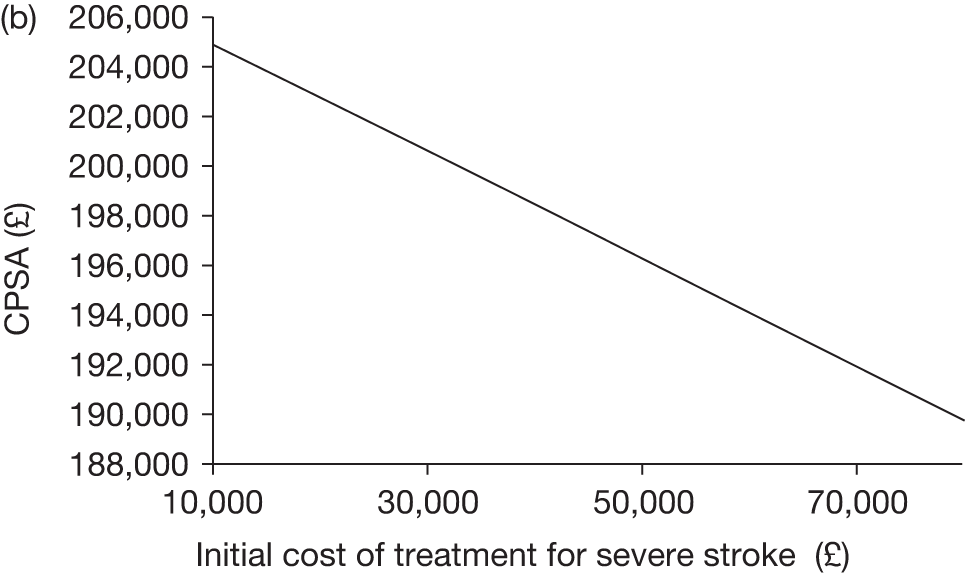
FIGURE 30.
Varied parameter: cost of treatment for severe post-stroke state (ongoing). (a), ICER; (b), CPSA.
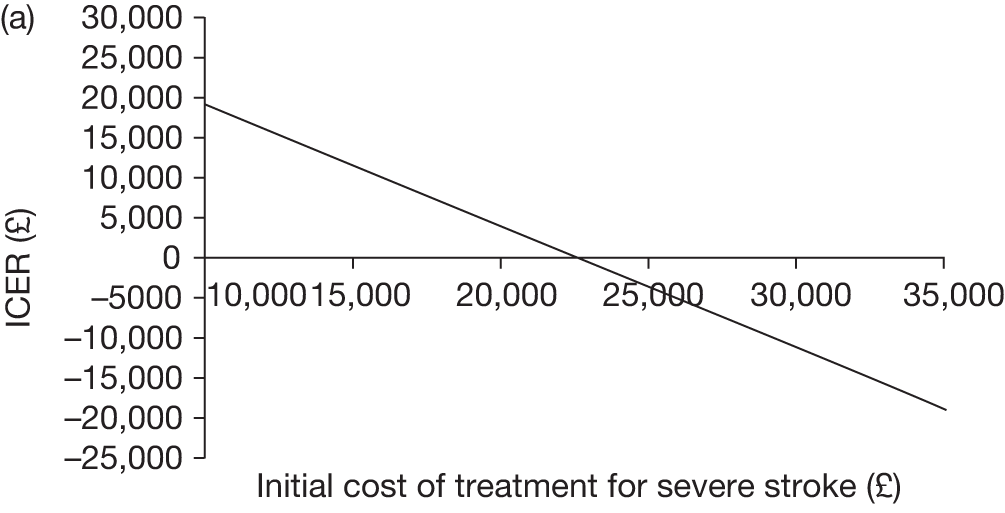
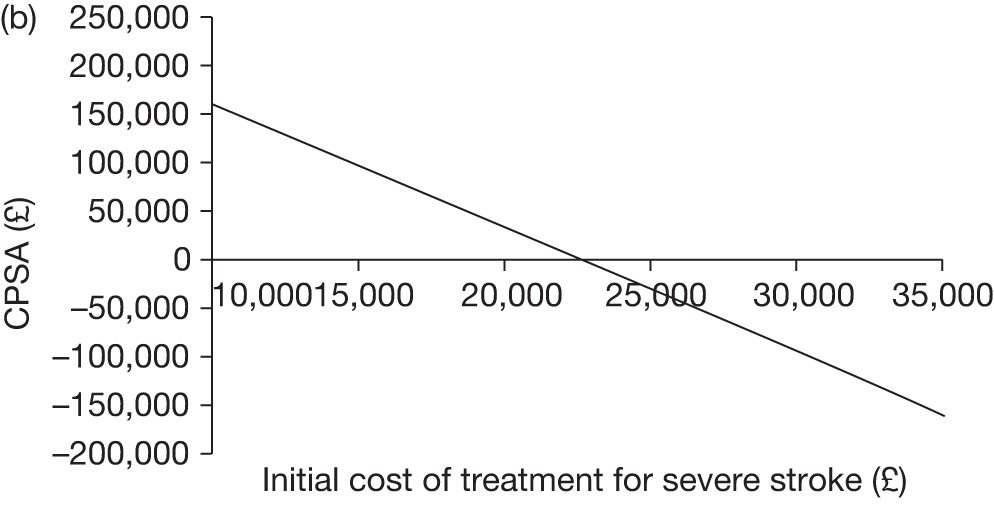
FIGURE 31.
Probability of staying on transfusion until 18 years if TCD scan is > 200 cm/second. (a), ICER; (b), CPSA.
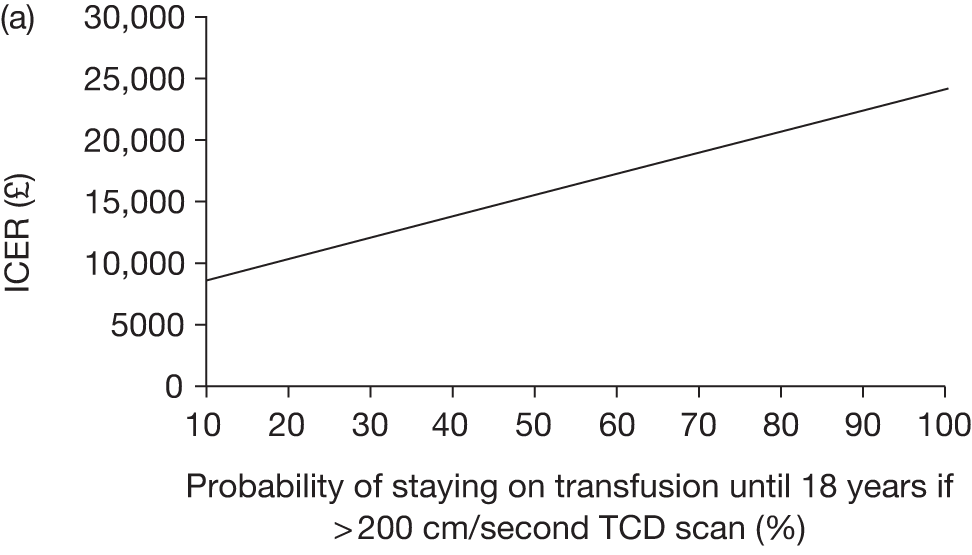
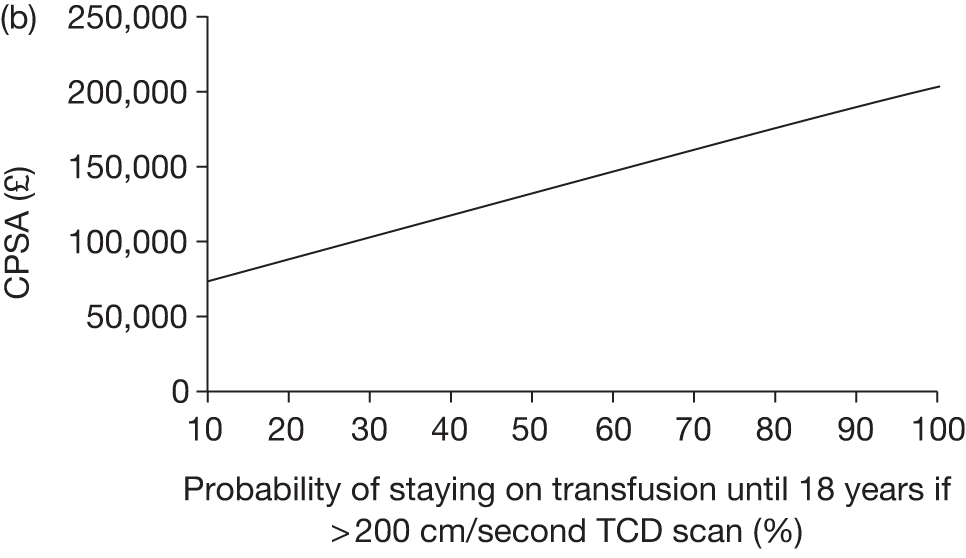
FIGURE 32.
Varied parameter: utility loss per 3-month cycle of those pre-stroke TCD scan is > 200 cm/second and no transfusion compared with those with TCD scan < 200 cm/second (changing the utility value has no impact on CPSA).
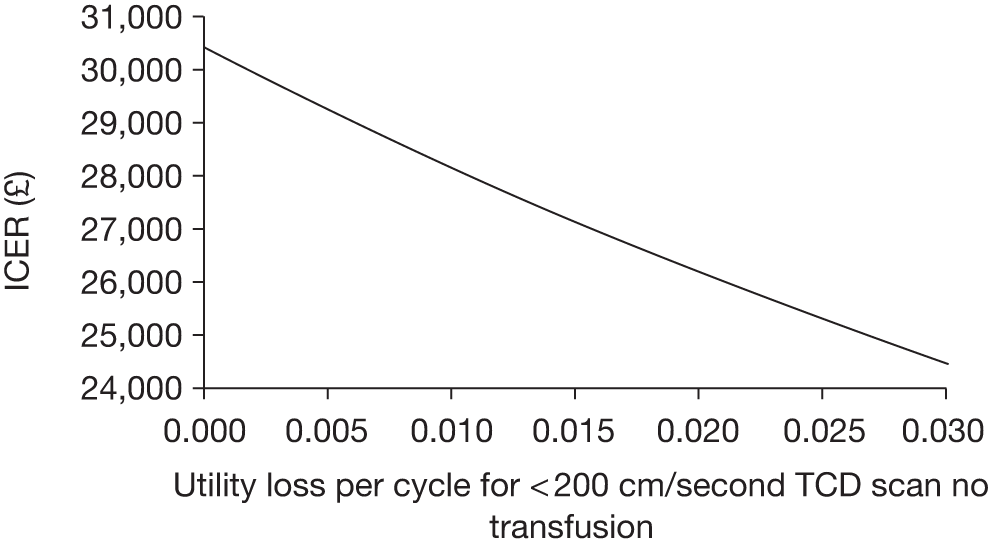
FIGURE 33.
Varied parameter: decrease in relative risk of SCD complications between those on transfusion and those off transfusion. (a), ICER; (b), CPSA.
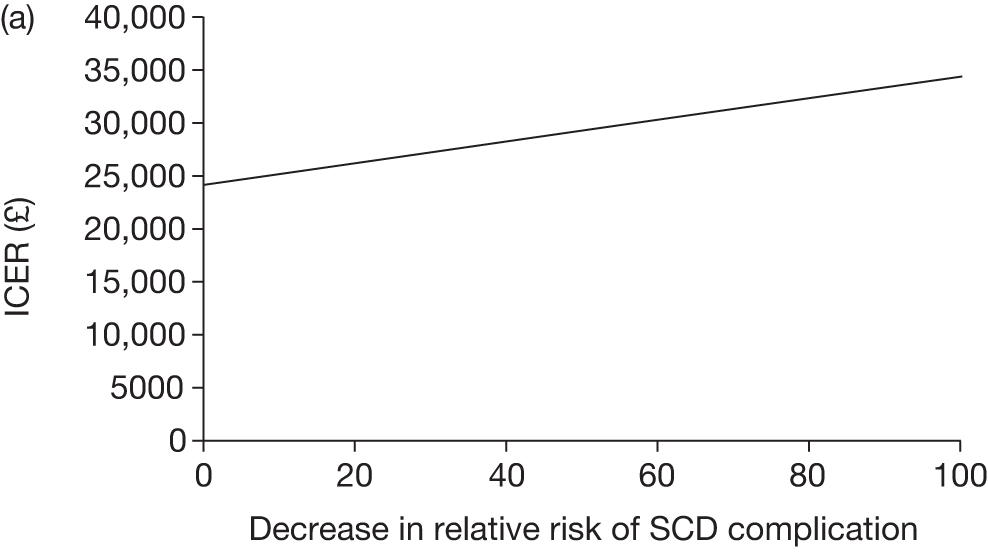
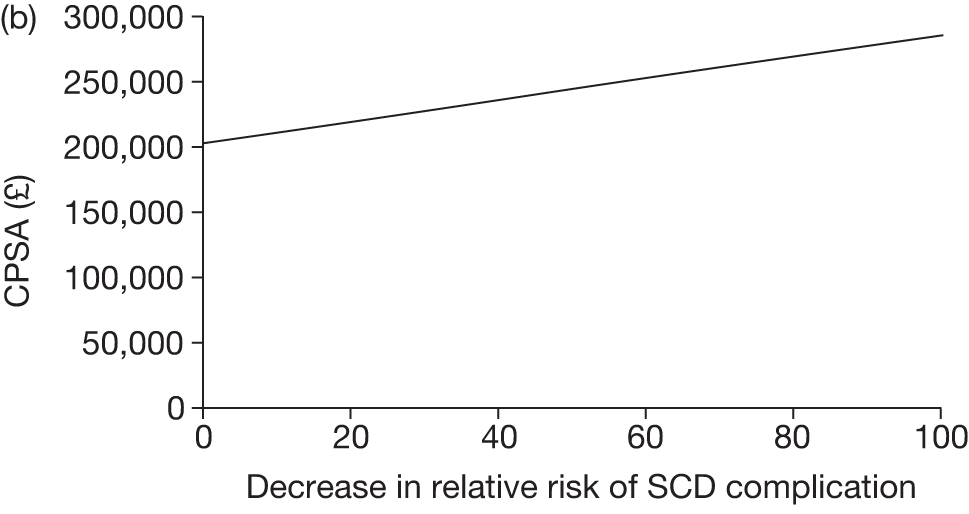
FIGURE 34.
Varied parameter: incremental cost of transfusion for alloimmunised patients. (a), ICER; (b), CPSA.
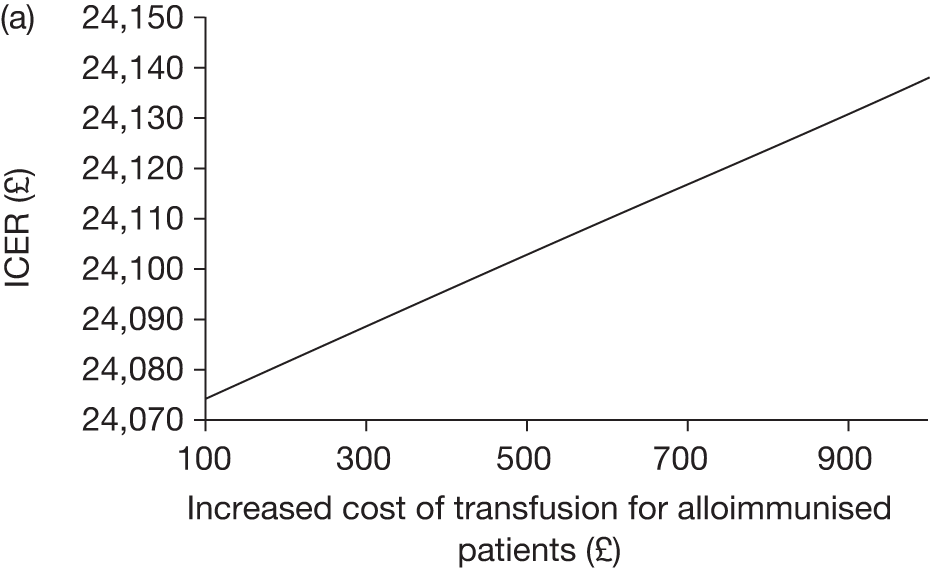
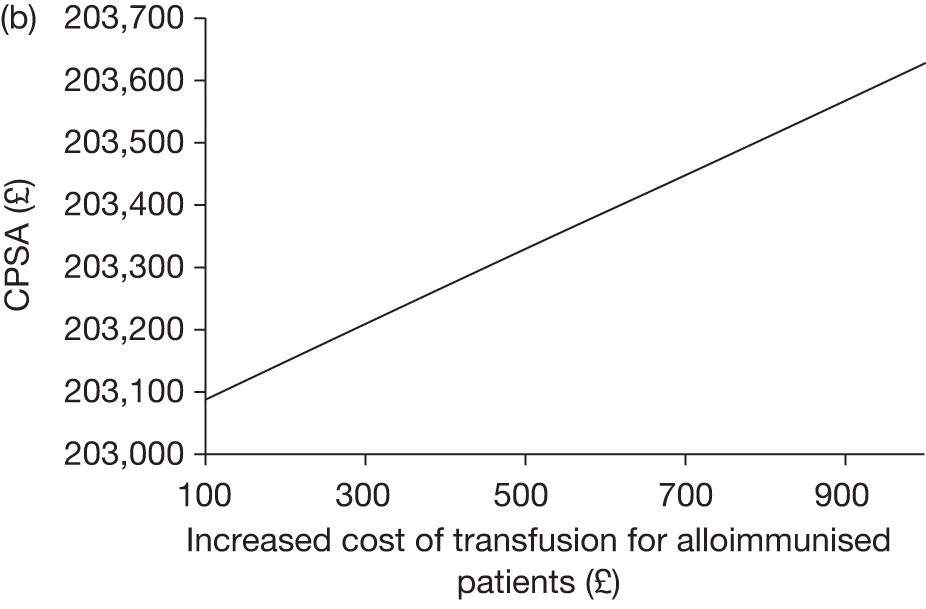
FIGURE 35.
Varied parameter: percentage increase in cost of chelation (oral and injection). (a), ICER; (b), CPSA.
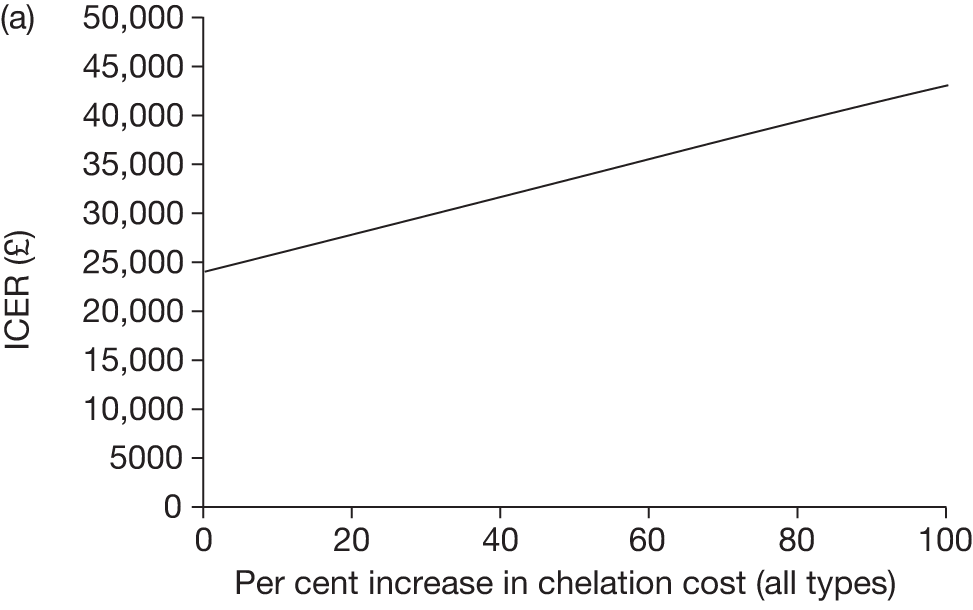
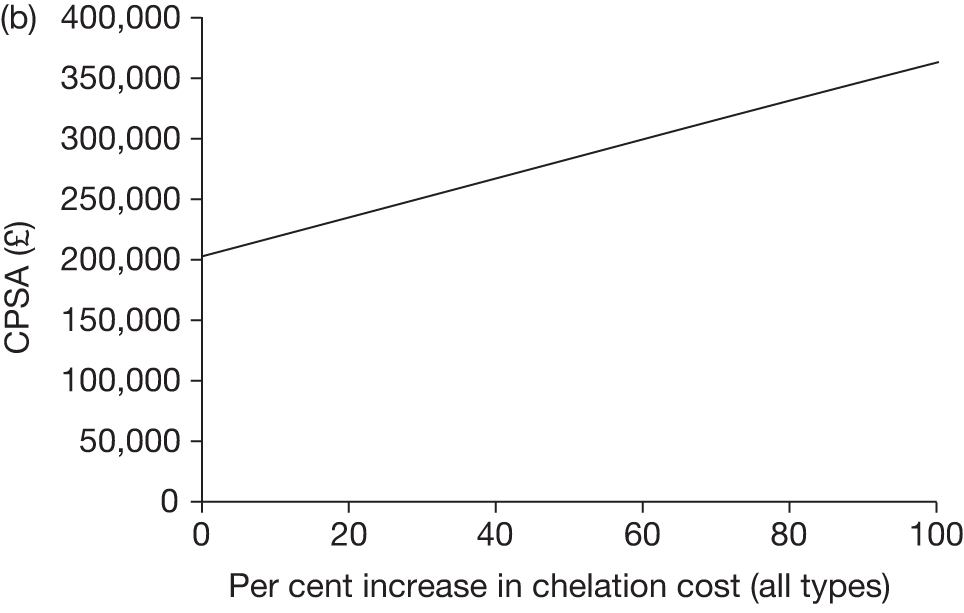
FIGURE 36.
Varied parameter: percentage increase in cost of transfusion (simple, exchange, combined). (a), ICER; (b), CPSA.
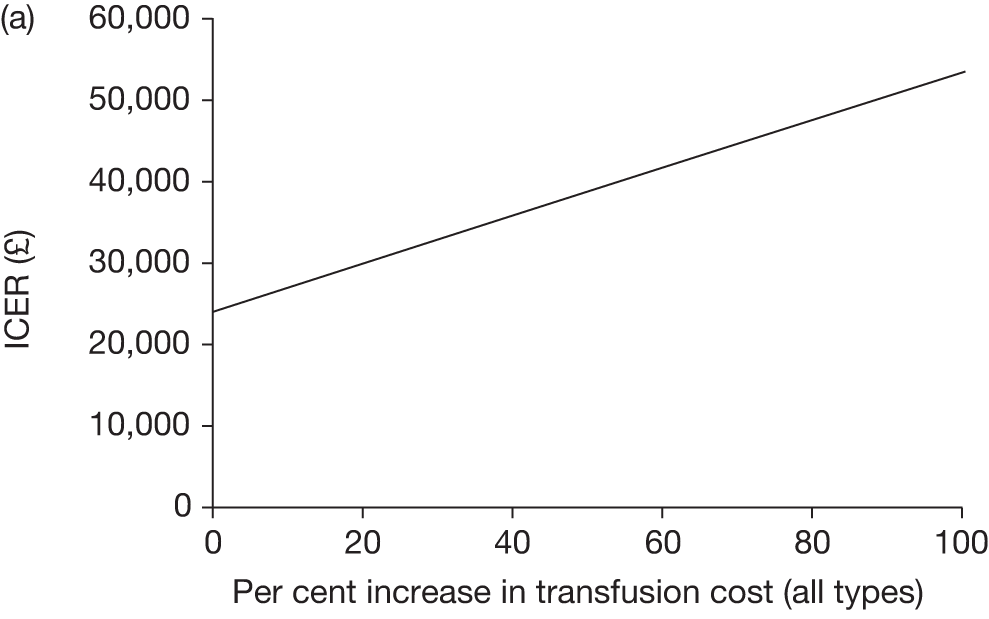
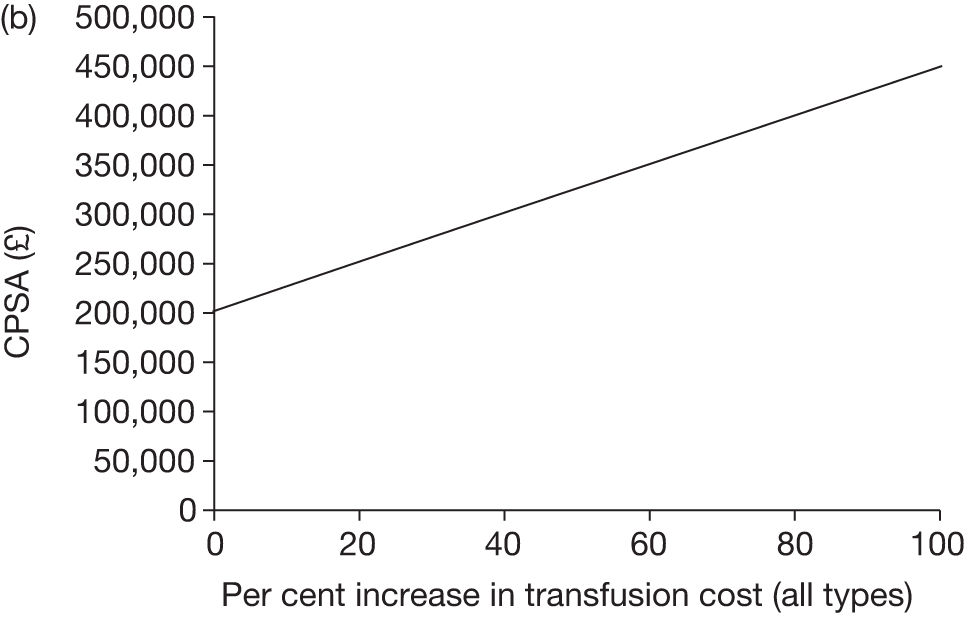
FIGURE 37.
Varied parameter: probability of death in adults not due to stroke on and off transfusion (age 19–30 years). (a), ICER; (b), CPSA.
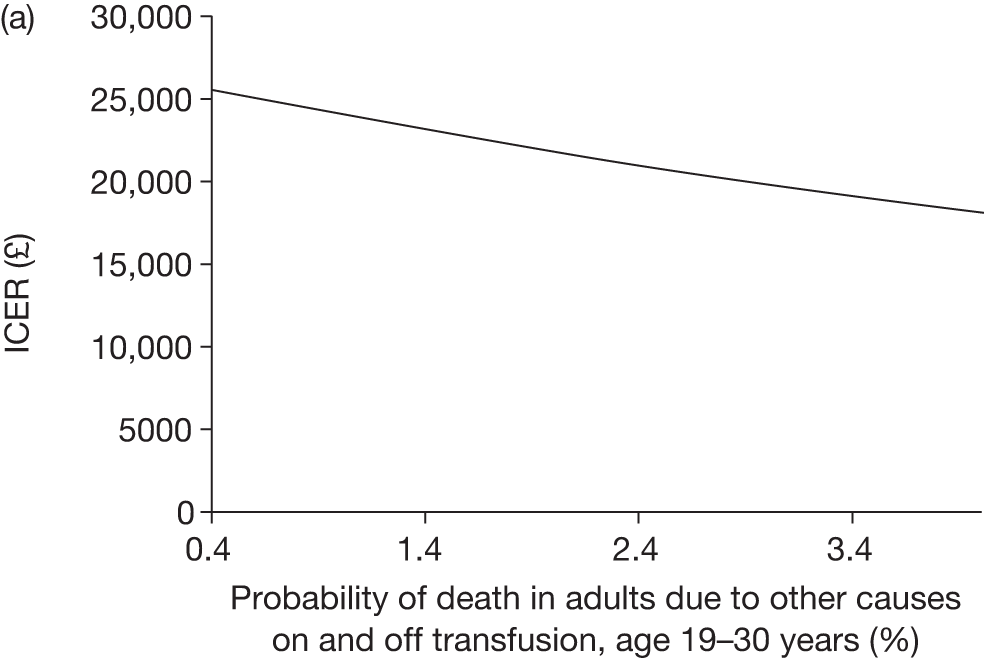
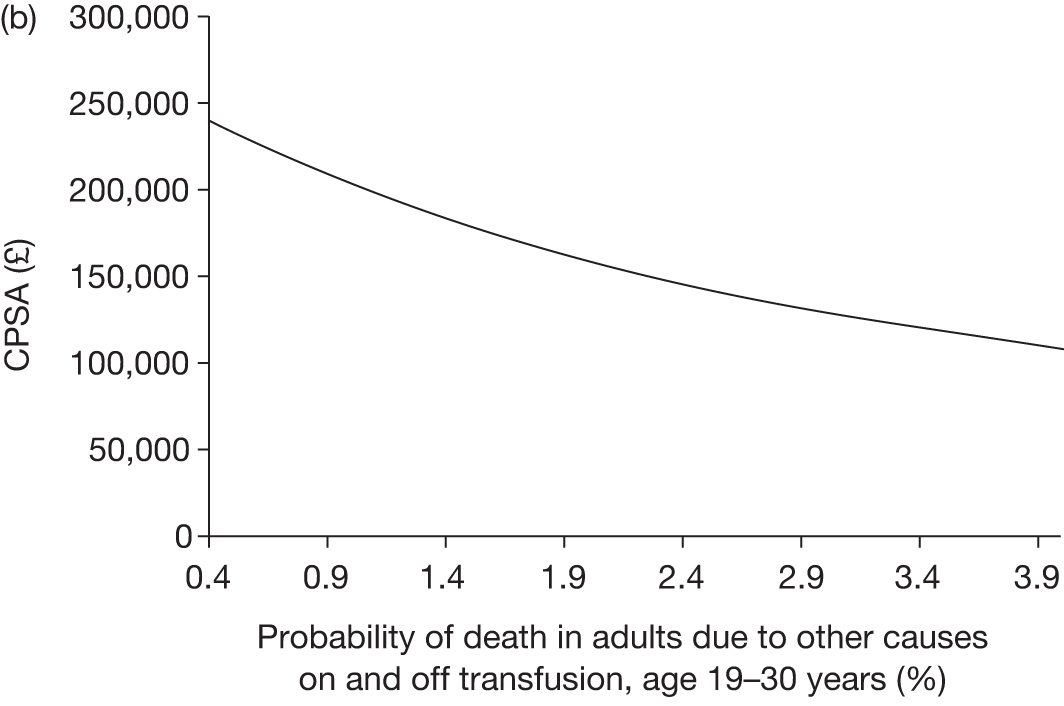
FIGURE 38.
Varied parameter: probability of death in adults not due to stroke on and off transfusion (age 31+ years). (a), ICER; (b), CPSA.
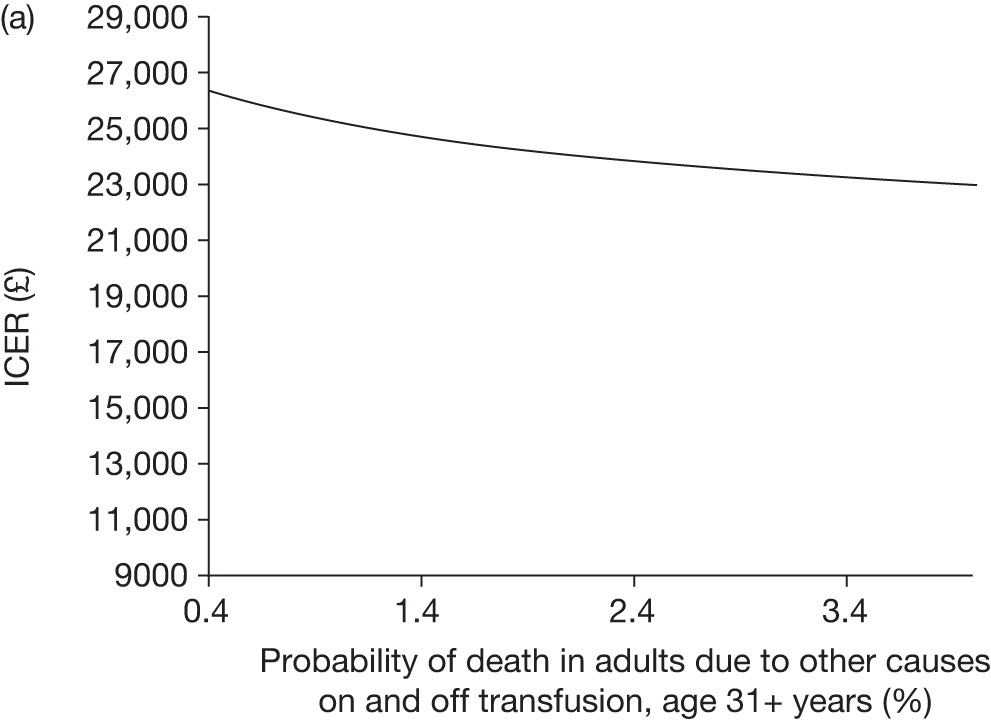
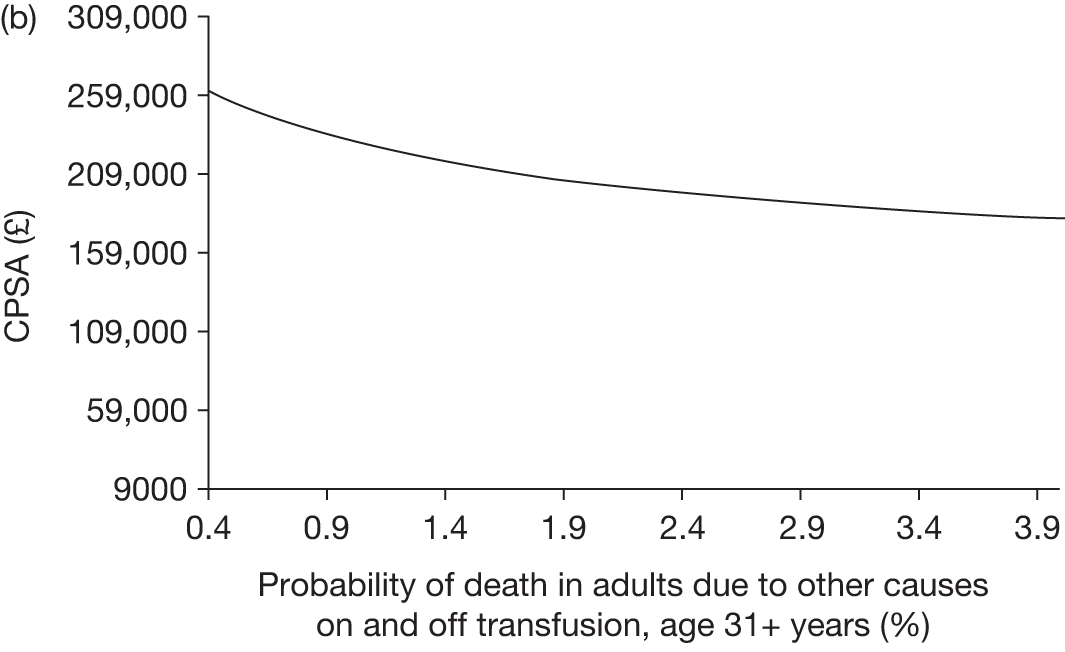
FIGURE 39.
Varied parameter: probability TCD scan is < 200 cm/second per cycle. (a), ICER; (b), CPSA.
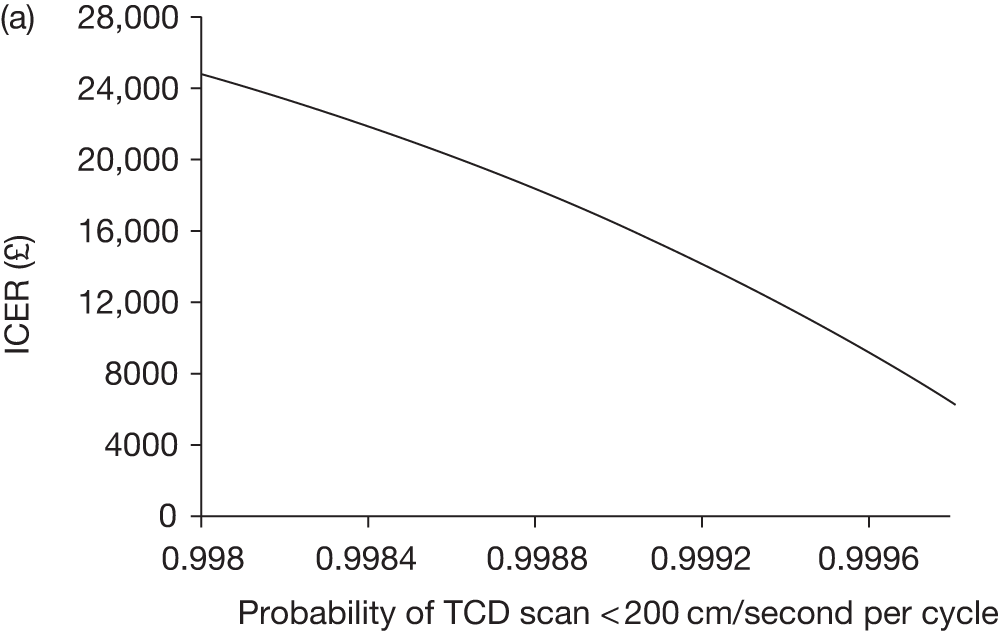
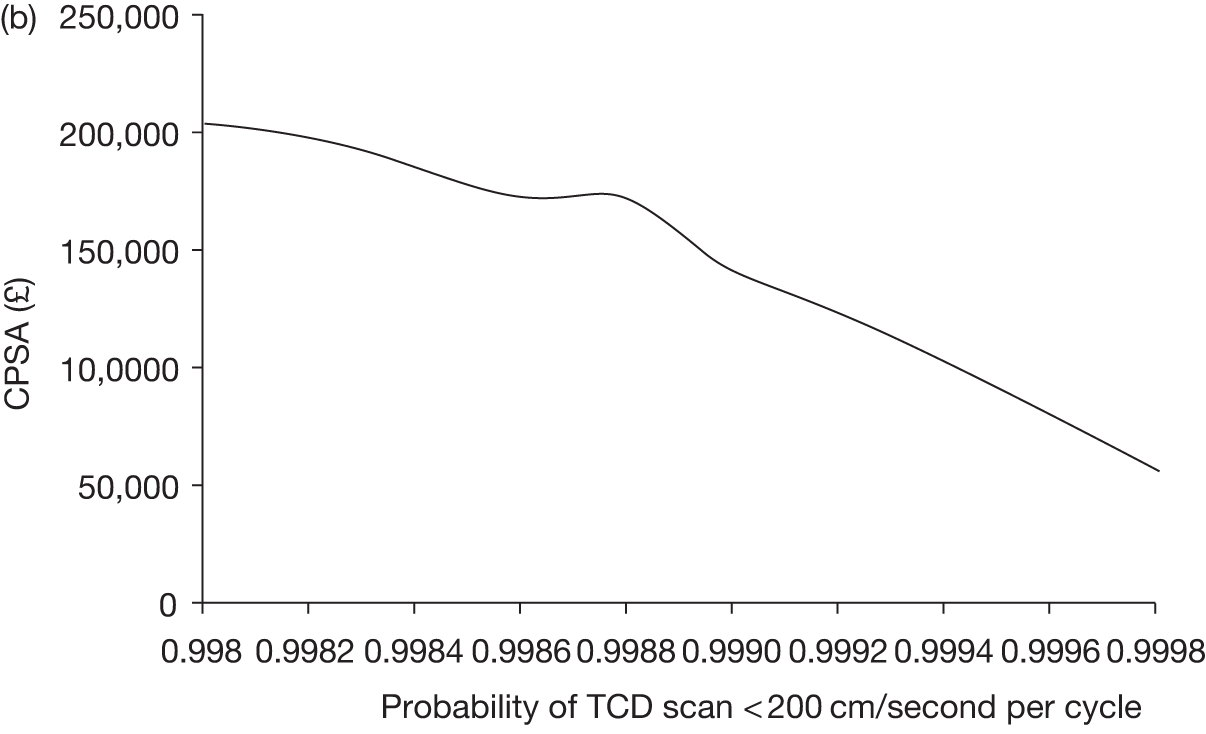
FIGURE 40.
Varied parameter: disutility associated with oral chelation per cycle.
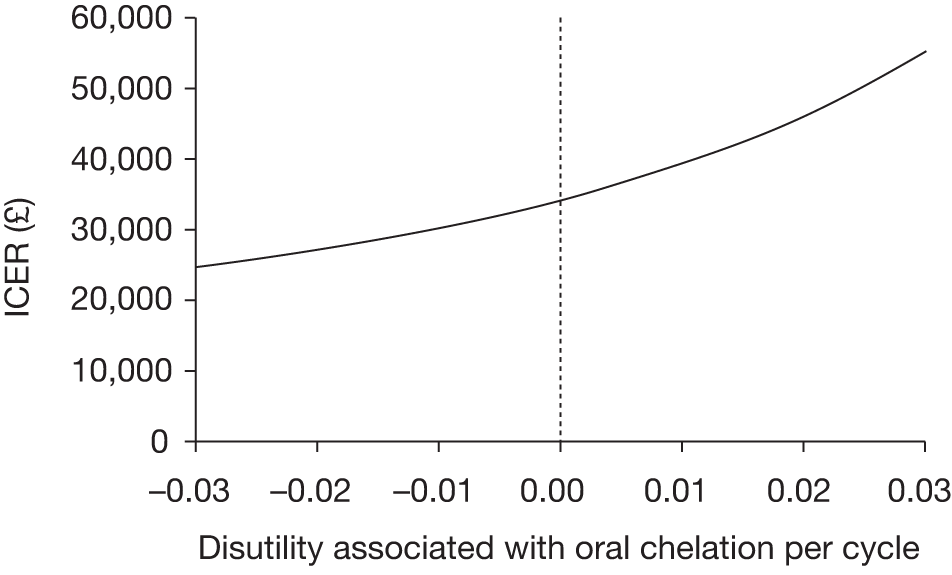
FIGURE 41.
Varied parameter: disutility associated with injection chelation per cycle.
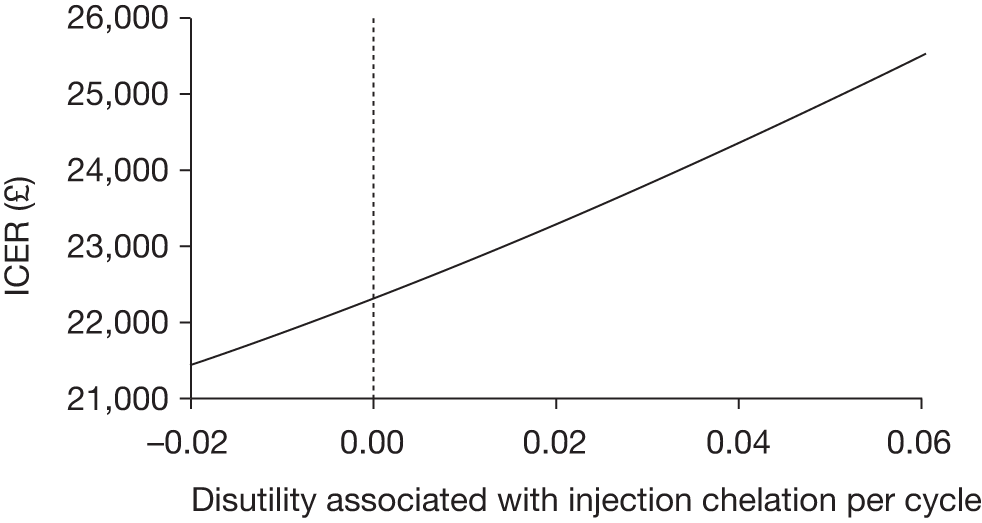
Appendix 9 Review protocol
Title of project
The clinical and cost-effectiveness of primary stroke prevention in patients with sickle cell disease.
TAR team
Liverpool Reviews and Implementation Group (LRiG), University of Liverpool
Correspondence to:
Rumona Dickson, Dr
Director, LRiG
University of Liverpool
Whelan Building
The Quadrangle
Brownlow Hill
Liverpool
L69 3GB
Tel: +44 (0) 151 794 5682/5067
Fax: +44 (0)151 794 5821
Email: R.Dickson@liv.ac.uk
For details of expertise within the TAR team, see Expertise in this TAR team and competing interests of authors, below.
Plain English summary
Sickle cell disease (SCD) is an inherited disorder characterised by unpredictable episodes of acute illness and chronic organ damage. Sickle cell disease is now the most common genetic condition in the UK, affecting approximately 1 in every 2000. Sickle cell anaemia (SCA) is the most common type of sickle cell disease, which occurs when the sickle mutation is inherited from both parents. Nearly all studies of stroke and SCD have involved people with SCA. Rates of stroke in individuals with SCA are higher than the general population, with risk of stroke estimated at 0.7 per 100 patient years at age 5 years, 2.7 at age 10 years, 4.3 at age 15 years and 12.8 at age 20 years.
Transcranial Doppler (TCD) ultrasonography can be used to identify children at high risk of stroke by measuring blood velocity in the brain. Approximately 10% of children who have blood velocity of > 200/second go on to suffer a stroke within a year. In order to identify those at high risk of stroke, TCD ultrasound screening is now recommended for children between the ages of 2 and 16 years who have SCA and no previous history of stroke. Treatment to prevent stroke, which in the UK is regular blood transfusions, may then be offered to children considered to be at high risk.
This review aims to assess whether or not primary stroke prevention strategies for use in children with SCA are clinically useful. The review will compare treatment with blood transfusions and treatment with hydroxycarbamide with no intervention and/or with each other. If suitable data are available, the review will also consider the cost-effectiveness of TCD ultrasound screening to identify children at high risk of stroke, and their subsequent treatment.
Decision problem
Clarification of research question and scope
From early infancy, children with SCA and a less common type of sickle cell disease due to the co-inheritance of the sickle mutation with severe β thalassaemia (HbS/β0 thalassaemia) are at increased risk of stroke compared with the general population; without intervention 1 in 10 children will have had a stroke by the age of 20 years. The aim of this report is to assess the clinical effectiveness and cost-effectiveness of primary stroke prevention strategies for use in children with SCA who are at high risk of stroke as identified by TCD ultrasound. The primary stroke prevention strategies considered will be treatment with blood transfusion and treatment with hydroxycarbamide.
Background
Sickle cell disease is a recessive genetic blood disorder, caused by a mutation in the β globin gene. This results in an altered haemoglobin molecule which polymerises when deoxygenated and damages red cells, which adopt the characteristic sickle shape. Their abnormal shape and decreased flexibility may obstruct small blood vessels, reducing the amount of oxygen delivered to lungs and other tissues, and causing vascular endothelial damage. There are several types of SCD, ranging from severe types (SCA and HbS/β0 thalassaemia) to less severe forms such as HbSC disease and HbS/β+ thalassaemia. Nearly all the evidence on stroke in sickle cell disease refers to SCA and to a lesser extent HbS/β0 thalassaemia.
Epidemiology
Sickle cell disease is now the most common genetic condition in England, affecting more than 1 in 2000 live births. 1 In England, screening for SCD was introduced between September 2003 and July 2006. 2 Screening takes place as part of the newborn dried blood-spot screening programme between 5 and 8 days after birth. All babies, regardless of ethnicity, are offered screening. 3
Streetly et al. 3 estimated the prevalence of SCD in the UK to be between 3 per 1000 children (1 : 330 babies with a positive result) in the south-east of London to 0.12 per 1000 children (1 : 8333 babies with positive result) in Cumbria and Lancashire. Overall, the prevalence rate for the UK was estimated to be 1 : 2000. Babies reported as Black African made up 4% of total births, yet represented 61% of all suspected SCD. Prevalence in Black African babies was 145 per 1000 children (1 : 7), in comparison with 1.85 in 1000 children reported as White British (1 : 540). 3
A major complication of SCD is cerebrovascular disease, which can result in overt stroke. Without a primary prevention programme, rates of overt stroke in people with SCD are higher than in the general population. Data from the USA indicate that the childhood incidence of stroke in those with SCA is 1.02 per 100 patient years in children aged between 2 and 5 years, and 0.68 per 100 patient years in children aged between 6 and 9 years,4 with stroke in all individuals with SCD averaging 0.61 per 100 patient years. The Baltimore-Washington Cooperative Young Stroke Study5 identified all children aged 1 to 14 years in Maryland and Washington DC with a diagnosis of ischaemic stroke and intracerebral haemorrhage between 1988 and 1991. They estimated the incidence of stroke among children with SCD to be 0.28% or 285 per 100,000 children per year. Stroke incidence in children without SCD has been estimated at 2.3 per 100,000 children per year. 6 Quinn and Miller7 calculated that by 18 years of age 11% of children with SCD will have suffered a clinically overt stroke and a further 20% will have a clinically ‘silent’ stroke. Data for the UK on stroke rates in children with SCD are not readily available but there is no reason to anticipate that they are significantly different to rates reported from the USA. A longitudinal study by Telfer et al. 8 followed a neonatal UK cohort of 252 children with SCD from 1983 to 2005, and found incidence of first stroke to be 0.3 per 100 years. Estimated risk of stroke was 0.7% per 100 years at age 5 years, 2.7% at age 10 years, 4.3% at age 15 years and 12.8% at age 20 years.
Current diagnostic options
Transcranial Doppler (TCD) ultrasonography is a non-invasive technique which measures local blood velocity and direction in the proximal portions of large intracranial arteries. Screening with TCD ultrasonography allows for the identification of individuals with high cerebral blood velocity rates, thereby identifying children at highest risk of stroke. Children with TCD cerebral blood velocity rates of > 200 cm/second have a stroke rate of at least 10% per year. 9 The reported advantages and disadvantages of the use of TCD ultrasonography for identification of risk of early stroke in children10 are listed in Table 1.
| Normal velocity: ‘standard risk’ | < 170 cm/s |
| Borderline velocity: ‘conditional risk’ | 170–199 cm/s |
| High velocity: ‘high risk’ | ≥ 200 cm/s |
There are 55 centres in the UK that currently offer TCD screening. The uptake of stroke screening nationally in children with SCD is not known, but figures provided by the North Middlesex University Hospitals NHS Trust indicate that > 90% of children who are offered screening accept and are screened (personal communication with M Roberts-Harewood, 2011). The reported advantages and disadvantages32 of the use of TCD ultrasonography for identification of risk of early stroke in children are listed in Table 2.
| Advantage | Disadvantage |
|---|---|
| Can be performed at the bedside | Operator dependent, so requires skill and experience in interpretation |
| Gives immediate information as to intracerebral vasculature | Can be technically difficult due to poor acoustic window |
| Can be easily repeated | Only allows for examination of cerebral blood volume in certain segments of large intracranial vessels |
| Is reported to be less expensive than other techniques, such as direct imaging | Detects indirect effects (such as abnormal waveform characteristics) of lesions? |
| Does not use contrast agents, therefore avoiding allergic reactions and decreases patient risk | More valuable in specific conditions? |
| High temporal resolution | Does not detect all children at increased risk of stroke |
| Safe and non-invasive procedure |
Current treatment options
Blood transfusion
At present, the primary prevention strategy for stroke resulting from SCD in both adults and children is through regular blood transfusions. The standard therapeutic goal of regular blood transfusions is to reduce the sickle haemoglobin to less than 30% of the total haemoglobin11 and to maintain a haemoglobin greater than about 9 g/dl. Transfusions can take several forms, such as transfusions of packed red blood cells every 3 to 4 weeks, or the use of apheresis to remove blood whilst adding donor red cells. Following 3 years of blood transfusion therapy, maintenance of sickle haemoglobin at < 50% may then be sufficient to prevent future stroke12 although there is no direct evidence to support this. It is estimated that approximately 67% of children will have second overt strokes without transfusion therapy. 13 However, it is likely that, despite receiving regular blood transfusion therapy, between 17.5% and 20% of children will suffer a second overt stroke. 14,15
Only one randomised controlled trial (RCT), and its subsequent follow up, has specifically compared chronic transfusion with standard care (transfusion only when clinically needed) in children with SCD who had abnormal TCD ultrasound results. The Stroke Prevention Trial in Sickle Cell Anemia (STOP)16 trial reported a statistically significant difference in stroke rates in the treatment group compared with the standard care group, whereas STOP 217 found a statistically significant increase in stroke rates when transfusion treatments were discontinued. These findings provided the evidence to support the use of TCD ultrasound screening to identify individuals at high risk of stroke as recommended by the NHS Screening Programmes in 2009. 18
It should be noted that iron overload inevitably accompanies regular blood transfusion, and iron chelation treatment is typically necessary after about 12 months of transfusion. Current licensed chelation treatments include deferoxamine, deferiprone and deferasirox.
Hydroxycarbamide
Hydroxycarbamide (or hydroxyurea) increases the concentration of foetal haemoglobin, and is used to reduce painful episodes in adults with SCD. Hydroxycarbamide is licensed for use in adults with SCD, but is not yet approved for use in children. A recent systematic review considered all published literature on the efficacy, effectiveness and toxicity of hydroxycarbamide in children with SCD, and found an increase in foetal haemoglobin from 5–10% to 15–20% on hydroxycarbamide. Haemoglobin concentration increased modestly (∼1 g/L) but significantly across studies. Hydroxycarbamide also decreased hospitalisation from 87% to 56%. Data from non-randomised clinical series suggest that hydroxycarbamide might be an alternative to transfusion for primary stroke prevention20 and may reduce the risk of stroke in children with SCD. The Royal College of Physicians recommend that children with SCD who cannot receive blood transfusions because of alloimmunisation, autoantibody formation or non-compliance with transfusion or chelation may be considered for treatment with hydroxycarbamide. 12
The clinical effectiveness of treatment with hydroxycarbamide is currently being assessed in the TWiTCH21,22 trial in the USA. In this Phase III clinical trial, children with sickle cell anaemia at high risk of primary stroke and are treated with blood transfusions will either receive hydroxycarbamide or continue with their transfusion regimen. The purpose of the trial is to compare blood transfusions with hydroxycarbamide on a number of important outcomes, including the prevention of primary stroke. Unfortunately, the results of this trial will not be available during the lifetime of this review.
Current guidelines
A clinical alert issued in 1997 by the National Heart, Lung and Blood Institute (NHLBI) in the USA,23 recommends that children with SCA and HbS/ β0 thalassaemia SCD, with no previous history of stroke and who are between the ages of 2 and 16 be screened using TCD ultrasound to identify those with high cerebral blood velocity rates, and therefore increased risk of stroke. This recommendation was based on the results of the STOP16 trial. The NHLBI further advocates considering transfusion for children who have received two abnormal TCD ultrasound results, as a preventative measure for stroke. 23
A second alert, based on the findings of STOP 2,17 was issued in 2004. 23 This recommended that blood transfusions be continued to reduce the rate of strokes in children with SCD until at least 3 years. The Special Writing Group of the American Heart Association Stroke Council and the Council on Cardiovascular Disease in the Young have since advised that transfusion be continued for at least 5 years or until the child is 18 years old. 24
In March 2009, the NHS Antenatal and Newborn Screening Programme produced guidelines on the management of stroke in children with SCA and HbS/β0 thalassaemia. 18 These guidelines (based on a combination of a review of the literature and clinical expert opinion) state that children and young adults with SCA and HbS/0thalassaemia should be offered annual TCD ultrasound scans from the age of 2 years until at least the age of 16 years. Children should be classified as either ‘high risk’, ‘conditional’ or ‘standard risk’ in line with the results of the STOP16 study (Table 3).
| Normal velocity: ‘standard risk’ | < 170 cm/second |
| Borderline velocity: ‘conditional risk’ | 170 to 200 cm/second |
| High velocity: ‘high risk’ | > 200 cm/second |
The NHS Antenatal and Newborn Screening Programme guidelines further state that children with ‘high risk’ and ‘conditional’ TCD scans should have them repeated within 2 months and the benefits of receiving regular blood transfusions should be discussed with parents for those children remaining at high risk. Primary stroke prevention treatment following a second high velocity reading is transfusion continued throughout childhood. 16
Recent guidelines published by the Royal College of Physicians in the UK endorse annual imaging using TCD ultrasound scanning of children with SCD from the age of 3 years. 12
Objectives of the HTA project
The aim of this review is to assess the clinical effectiveness and cost-effectiveness of primary stroke prevention treatments in children with SCD, identified to be at high risk of stroke following TCD ultrasonography. The review will consider the effectiveness of primary stroke prevention treatment, treatment with blood transfusion and treatment with hydroxycarbamide, for the prevention of stroke in children with SCD who are identified to be at high risk of stroke. The review will also examine the existing health economic evidence and identify the key economic issues related to primary stroke prevention treatment in clinical care for this group of patients. If suitable data are available, an economic model will be developed and populated to evaluate the cost-effectiveness of primary stroke prevention treatments within the NHS.
Methods for synthesising clinical effectiveness evidence
Search strategy
The major electronic databases including MEDLINE, EMBASE and The Cochrane Library will be searched for relevant published literature. Information on studies in progress, unpublished research or research reported in the grey literature will be sought by searching a range of relevant databases including National Research Register and Controlled Clinical Trials.
Bibliographies of previous systematic reviews and retrieved articles will also be examined. A database of published and unpublished literature will be assembled from systematic searches of electronic sources, hand searching, and consultation with experts in the field. The database will be held in the EndNote X4 software package.
Inclusion criteria
The inclusion criteria specified in Table 4 will be applied to all studies after screening.
| Population |
Children Under 16 years With sickle cell anaemia and HbS/0 thalassaemia Identified to be at high risk of stroke on TCD ultrasonography |
| Intervention |
Blood transfusion Hydroxycarbamide |
| Setting | Secondary care |
| Comparator | No intervention or with each other |
| Outcomes |
Any one of the following outcomes: |
| Study design | RCT and systematic review. Cohort (prospective and retrospective) data will be considered in the absence of RCTs and systematic reviews |
Study selection
The citations identified by the search strategy will be assessed for inclusion through two stages. Firstly, two reviewers will independently screen all relevant titles and abstracts identified via electronic searching to identify potentially relevant studies for inclusion in the review. Secondly, full text copies of these potentially relevant studies will be obtained and assessed independently by two reviewers using the inclusion criteria outlined in Table 4. Any disagreements between reviewers will be resolved by discussion at each stage and, if necessary, a third reviewer will be consulted.
Studies that do not meet the inclusion criteria will be excluded and their bibliographic details listed with reasons for exclusion. Ongoing studies that do not report relevant outcomes but meet the inclusion criteria will be listed for future use. In the event that data from RCTs are missing or limited, data from non-randomised studies may be used. The identification and use of such data will be described in the final report.
Data extraction strategy
Data relating to study design, findings and quality will be extracted by one reviewer and independently checked for accuracy by a second reviewer. Study details will be extracted using a standardised data extraction form. If time permits, attempts will be made to contact authors for missing data. Data from studies presented in multiple publications will be extracted and reported as a single study with all relevant other publications listed.
Quality assessment strategy
The quality of the clinical-effectiveness studies will be assessed according to criteria based on the CRD’s guidance for undertaking reviews in healthcare. 25,26 The quality of the individual clinical-effectiveness studies will be assessed by one reviewer, and independently checked for agreement by a second. Disagreements will be resolved through consensus and, if necessary, a third reviewer will be consulted.
Methods of analysis/synthesis
The results of the data extraction and quality assessment for each study will be presented in structured tables and as a narrative summary. The possible effects of study quality on the effectiveness data and review findings will be discussed. All summary statistics will be extracted for each outcome and where possible, data will be pooled using a standard meta-analysis. 27 Heterogeneity between the studies will be assessed using the I2 test. 25 Both fixed and random effects results will be presented as forest plots.
Methods for synthesising cost-effectiveness evidence
The economic section of the report will be presented in two parts. The first will include a standard review of relevant published economic evaluations. If appropriate, and data are available, the second part will include the development of an economic model. The model will be designed to estimate the cost-effectiveness of primary stroke prevention in children with SCD. This section of the report will also consider budget impact and will take account of available information on current and anticipated patient numbers and service configuration for the treatment of this condition in the NHS.
Systematic review of published economic literature
The literature review of economic evidence will identify any relevant published cost-minimisation, cost-effectiveness, cost-utility and/or cost-benefit analyses.
Search strategy
The search strategies detailed in Methods for synthesising clinical effectiveness evidence will be adapted accordingly to identify studies examining the cost-effectiveness of primary stroke prevention treatments in children with SCD identified to be at high risk of stroke using TCD. Other searching activities, including electronic searching of online health economic journals and contacting experts in the field, will also be undertaken. Full details of the search process will be presented in the final report. The search strategy will be designed to meet the primary objective of identifying economic evaluations for inclusion in the cost-effectiveness literature review. At the same time, the search strategy will be used to identify economic evaluations and other information sources which may include data that can be used to populate a de novo economic model where appropriate. Searching will be undertaken in MEDLINE and EMBASE as well as in The Cochrane Library, which includes the NHS Economic Evaluation Database (NHS EED).
Inclusion and exclusion
In addition to the inclusion criteria outlined in Table 4, specific criteria required for the cost-effectiveness review are described in Table 5. Typically, only full economic evaluations that compare two or more options and consider both costs and consequences would be included in the review of published literature. However, as it is anticipated that there will be a dearth of relevant economic studies, partial economic evaluations will also be reviewed. Studies that do not meet the criteria for inclusion will be excluded and their bibliographic details listed with reasons for exclusion.
| Study design |
Full economic evaluations that consider both costs and consequences (cost-effectiveness analysis, cost-utility analysis, cost-minimisation analysis and cost-benefit analysis) Partial economic evaluations (cost analyses, cost consequence studies, burden of illness studies, etc.) |
| Outcomes |
Incremental cost per stroke averted Incremental cost per life year gained Incremental cost per quality adjusted life year gained |
Data extraction strategy
Data relating to both study design and quality will be extracted by one reviewer and independently checked for accuracy by a second reviewer. Disagreement will be resolved through consensus and, if necessary, a third reviewer will be consulted. If time constraints allow, attempts will be made to contact authors for missing data. Data from multiple publications will be extracted and reported as a single study.
Quality assessment strategy
The quality of the cost-effectiveness studies/models will be assessed according to a checklist updated from that developed by Drummond et al. 28 This checklist will reflect the criteria for economic evaluation detailed in the methodological guidance developed by NICE. 29 The quality of the individual cost-effectiveness studies/models will be assessed by one reviewer, and independently checked for agreement by a second. Disagreements will be resolved through consensus and, if necessary, a third reviewer will be consulted. The information will be tabulated and summarised within the text of the report.
Methods of analysis/synthesis
Cost-effectiveness review of published literature
Individual study data and quality assessment will be summarised in structured tables and as a narrative description. Potential effects of study quality will be discussed.
Development of a de novo economic model by the AG
Cost data
The primary perspective for the analysis of cost information will be the NHS. Cost data will therefore focus on the marginal direct health service costs associated with the intervention. If evidence indicates that a societal perspective is required to credibly value all important costs and outcomes, this will be explored and presented in the sensitivity analysis.
Quantities of resources used will be identified from consultation with experts, primary data from relevant sources and the reviewed literature. Where possible, unit cost data will be extracted from the literature or obtained from other relevant sources (drug price lists, NHS reference costs and Chartered Institute of Public Finance and Accounting cost databases).
Where appropriate, costs will be discounted at 3.5% per annum, the rate recommended in NICE guidance to manufacturers and sponsors of submissions. 29
Assessment of benefits
A balance sheet will be constructed to list benefits and costs arising from alternative treatment options. LRiG anticipates that the main measures of benefit will be increased QALYs.
Where appropriate, effectiveness and other measures of benefit will be discounted at 3.5%, the rate recommended in NICE guidance to manufacturers and sponsors of submissions. 29
Modelling
The ability of LRiG to construct an economic model will depend on the data available. Where modelling is appropriate, a summary description of the model and a critical appraisal of key structures, assumptions, resources, data and sensitivity analysis (see Sensitivity analysis) will be presented. In addition, LRiG will provide an assessment of the model’s strengths and weaknesses and discuss the implications of using different assumptions in the model. The time horizon will be a patient’s lifetime in order to reflect the chronic nature of the disease.
A formal combination of costs and benefits will also be performed, although the type of economic evaluation will only be chosen in light of the variations in outcome identified from the clinical-effectiveness review evidence.
Typically, the results of an economic evaluation are presented as incremental cost per QALY ratios; however, a rapid review of the literature reveals that it is unlikely that useful QALY data are currently available from the published literature. If, after further exploration of the literature, it is clear that sufficient data are not available to construct cost per QALY estimates with reasonable precision, incremental cost-effectiveness analysis (for example using incremental cost per stroke avoided or cost per life year gained) or cost-minimisation analysis will be undertaken.
Sensitivity analysis
If appropriate, sensitivity analysis will be applied to LRiG’s model in order to assess the robustness of the results to realistic variations in the levels of the underlying parameter values and key assumptions. Where the overall results are sensitive to a particular variable, the sensitivity analysis will explore the exact nature of the impact of variations.
Imprecision in the principal model cost-effectiveness results with respect to key parameter values will be assessed by use of techniques compatible with the modelling methodology deemed appropriate to the research question and to the potential impact on decision making for specific comparisons (e.g. multi-way sensitivity analysis, probabilistic sensitivity analysis, cost-effectiveness acceptability curves, etc).
Expertise in this TAR team and competing interests of authors
The Liverpool Reviews and Implementation Group (LRiG) was established at the University of Liverpool in April 2001. It is a multi-disciplinary research group whose purpose, in the first instance, is to conduct Technology Assessment Reviews commissioned by the HTA programme. The team has substantial expertise in systematic reviewing, literature searching, assessing clinical outcomes, economic modelling and health economics, and is well practised in applying this expertise to health technology evaluations. This TAR team will be made up of the following individuals listed below:
| Team lead/clinical systematic reviewer | Janette Greenhalgh |
| Senior economic modeller | Matrix Evidence |
| Systematic reviewer (clinical) | Gemma Cherry |
| Systematic reviewer (economics) | Angela Boland |
| Economic modeller | Matrix Evidence |
| Information specialist | Yenal Dundar |
| Medical statistician | James Oyee/Michaela Blundell |
| Director | Rumona Dickson |
| Clinical advisor | David Rees, Consultant Haematologist (King’s College Hospital NHS Foundation Trust) |
A team of clinical experts and patient groups will be established to address clinical questions related to the technologies and to provide feedback on drafts of the final report.
No member of the research team has any competing interests to declare. Any competing interests relating to the external reviewers will be declared in the final report.
Project milestones
| Milestone | Date |
|---|---|
| Finalisation of protocol | March 2011 |
| Literature searches | March 2011 |
| Article screening | March 2011 |
| Data extraction | April 2011 |
| Quality assessment | April 2011 |
| Data analyses | May 2011 |
| Economic model development | May 2011 |
| Final draft of report for peer review | July 2011 |
| Submission of final report | August 2011 |
Protocol references
- TCD Standards Working Group, NHS Antenatal and Newborn Screening Programmes . Sickle Cell Disease in Childhood: Standards and Guidelines for Clinical Care 2006.
- Streetly A, Latinovic R, Hall K. Implementation of universal newborn bloodspot screening for sickle cell disease and other clinically significant haemoglobinopathies in England: screening results for 2005–2007. J Clin Pathol 2009;62:26-30.
- Streetly A, Latinovic R, Henthorn J. Positive screening and carrier results for the England-wide universal newborn sickle cell screening programme by ethnicity and area for 2005–07. J Clin Pathol 2010;63:626-9.
- Ohene-Frempong K, Weiner SJ, Sleeper LA, Miller ST, Embury S, Moohr JW, et al. Cerebrovascular accidents in sickle cell disease: rates and risk factors. Blood 1998;91:288-94.
- Earley CJ, Kittner SJ, Feeser BR, Gardner J, Epstein A, Wozniak MA, et al. Stroke in children and sickle-cell disease: Baltimore-Washington Cooperative Young Stroke Study. Neurology 1998;51:169-76.
- Fullerton HJ, Wu YW, Zhao S, Johnston SC. Risk of stroke in children: ethnic and gender disparities. Neurology 2003;61:189-94.
- Quinn CT, Miller S. Risk factors and prediton of outcomes in children and adolescents who have sickle cell anemia. Hematol Oncol Clin North Am 2004;18:1339-54.
- Telfer P, Coen P, Chakravorty S, Wilkey O, Evans J, Newell H, et al. Clinical outcomes in children with sickle cell disease living in England: a neonatal cohort in East London. Haematologica 2007;92:905-12.
- Adams R, McKie V, Nichols F, Carl E, Zhang DL, McKie K, et al. The use of transcranial ultrasonography to predict stroke in sickle cell disease. N Engl J Med 1992;326:605-10.
- Sloan MA, Alexandrov AV, Tegeler CH, Spencer MP, Caplan LR, Feldmann E, et al. Assessment: transcranial Doppler ultrasonography: report of the Therapeutics and Technology Assessment Subcommittee of the American Academy of Neurology. Neurology 2004;62:1468-81.
- National Heart Lung and Blood Institute, National Institute of Health . The Management of Sickle Cell Disease 2002.
- Clinical Effectiveness & Evaluation Unit, Royal College of Physicians . Stroke in Childhood: Clinical Guidelines for Diagnosis, Management and Rehabilitation 2004. URL: http://www.rcplondon.ac.uk/pubs/books/childstroke/childstroke_guidelines.pdf.
- Powars D, Wilson B, Imbus C, Pegelow C, Allen J. The natural history of stroke in sickle cell disease. Am J Med 1978;65:461-71.
- Scothorn DJ, Price C, Schwartz D, Terrill C, Buchanan GR, Shurney W, et al. Risk of recurrent stroke in children with sickle cell disease receiving blood transfusion therapy for at least five years after initial stroke. J Pediatr 2002;140:348-54.
- Hulbert ML, McKinstry RC, Lacey J, Moran C, Panepinto J, Thompson A, et al. Silent cerebral infarcts occur despite regular blood transfusion therapy after stroke in children with sickle cell disease. Blood 2011;117:772-9.
- Adams RJ, McKie VC, Brambilla D, Carl E, Gallagher D, Nichols FT, et al. Stroke prevention trial in sickle cell anemia. Control Clin Trials 1998;19:110-29.
- Adams RJ, Brambilla D. Optimising Primary Stroke Prevention in Sickle Cell Anemia Trial I. Discontinuing prophylactic transfusions used to prevent stroke in sickle cell disease. N Engl J Med 2005;353:2769-78.
- NHS Antenatal and Newborn Screening Programmes . Transcranial Doppler Scanning for Children With Sickle Cell Disease: Standards and Guidance 2009.
- Strouse J, Lanzkron S, Beach M, Haywood C, Park H, Witkop C, et al. Hydroxyurea for sickle cell disease: a systematic review for efficacy and toxicity in children. Pediatrics 2008;122:1332-42.
- Gulbis B, Haberman D, Dufour D, Christophe C, Vermylen C, Kagambega F, et al. Hydroxyurea for sickle cell disease in children and for prevention of cerebrovascular events: the Belgian experience. Blood 2005;105:2685-90.
- Physorg . Study Targets Stroke Prevention in Children With Sickle Cell 2009. URL: http://www.physorg.com/news175955305.html.
- National Heart Lung and Blood Institute . TWiTCH TCD With Transfusions Changing to Hydroxyurea: Data Co-Ordinating Centre n.d. URL: https://ccct.sph.uth.tmc.edu/twitch/.
- National Heart Lung and Blood Institute and National Institute of Health . Clinical Alert: Periodic Transfusions Lower Stroke Risk in Children With Sickle Cell Anemia 1997. URL: http://www.nlm.nih.gov/databases/alerts/sickle97.html.
- Roach ES, Golomb MR, Adams R, Biller J, Daniels S, Deveber G, et al. Management of stroke in infants and children: a scientific statement from a Special Writing Group of the American Heart Association Stroke Council and the Council on Cardiovascular Disease in the Young. Stroke 2008;39:2644-91.
- Higgins JPT, Thompson SG, Deeks JJ, Altman DG. Measuring inconsistency in meta-analysis. BMJ 2003;327:557-60.
- Centre for Reviews and Dissemination . Systematic Reviews: CRDs Guidance for Undertaking Reviews in Healthcare n.d. URL: http://www.york.ac.uk/inst/crd/darefaq.htm.
- Egger M, Smith GD, Altman DG. Systematic reviews in health care: meta-analysis in context. BMJ Books 2001.
- Drummond MF, Jefferson TO. Guidelines for authors and peer reviewers of economic submissions to the BMJ. Br Med J 1996;313:275-83.
- National Institute for Health and Clinical Excellence . Guide to the Methods of Technology Appraisal 2008. URL: http://www.nice.org.uk/media/B52/A7/TAMethodsGuideUpdatedJune2008.pdf.
Glossary
- Chelation
- The term used to refer to the binding of a compound to a metal ion. In the case of iron chelation, iron chelators (deferasirox, deferoxamine or deferiprone) are used to bind iron in the body. Once the iron is bound it can be more readily excreted from the body.
- Cost-effectiveness
- Cost-effectiveness has numerous meanings; however, for practical purposes it is usually given to mean that the cost per quality-adjusted life-year gained is below a notional willingness-to-pay threshold. Currently in the UK a threshold of £20,000–30,000 is commonly used. Hence, for the purposes of this review we interpret incremental cost-effectiveness ratios (ICERs) of < £20,000 as cost-effective, ICERs between £20,000 and £30,000 as possibly cost-effective, and ICERs above £30,000 as unlikely to be cost-effective.
- Disutility
- The marginal loss of utility associated with some adverse event or condition.
- Haemorrhagic stroke
- A type of stroke that is caused by bleeding in the brain.
- Incidence of stroke per 100 patient-years
- The number of first strokes divided by the number of years of observation and multiplied by 100.
- Ischaemic stroke
- A type of stroke that is caused by blockage in a cerebral blood vessel.
- Quality-adjusted life-year(s)
- An index of survival that is weighted or adjusted by a patient’s quality of life during the survival period. Quality-adjusted life-years are calculated by multiplying the number of life-years by an appropriate utility or preference score.
- Sickle
- This is used to refer to the crescent shape formed by red blood cells in sickle cell disease.
- Stroke
- The sudden death of brain cells due to a lack of oxygen when the blood flow to the brain is impaired by blockage or rupture of an artery to the brain, causing neurological dysfunction.
- Utility
- Well-being or preference that an individual or society may have for a particular health state.
- Utility score
- A number used to define utility, in which death is allocated a score of ‘0’ and perfect heath is allocated a score of ‘1’.
List of abbreviations
- AE
- adverse event
- BMT
- bone marrow transplantation
- BNF
- British National Formulary
- CPSA
- cost per stroke avoided
- CRD
- Centre for Reviews and Dissemination
- HbS
- sickle haemoglobin (haemoglobin S)
- HbSβ+
- haemoglobin S-beta plus
- HbSβ0
- haemoglobin S-beta zero
- HbSS
- homozygous sickle cell disease
- HDU
- high-dependency unit
- ICER
- incremental cost-effectiveness ratio
- ICU
- intensive care unit
- ITT
- intention to treat
- LRiG
- Liverpool Reviews and Implementation Group
- MRA
- magnetic resonance angiography
- MRI
- magnetic resonance imaging
- N/A
- transition probability not valid, i.e. zero
- NA
- not applicable
- NHLBI
- National Heart, Lung and Blood Institute
- NICE
- National Institute for Health and Clinical Excellence
- NR
- not reported
- NS
- not stated
- QALY
- quality-adjusted life-year
- QoL
- quality of life
- RCT
- randomised controlled trial
- SCA
- sickle cell anaemia
- SCD
- sickle cell disease
- SD
- standard deviation
- SS
- sickle cell disease
- STOP
- Stroke Prevention Trial in Sickle Cell Anaemia
- STOP 2
- Optimising Primary Stroke Prevention in Sickle Cell Anaemia
- SWiTCH
- Stroke With Transfusions Changing to Hydroxyurea (now known as hydroxcarbamide)
- TCD
- transcranial Doppler
- TWiTCH
- TCD With Transfusions Changing to Hydroxyurea (now known as hydroxcarbamide) trial
All abbreviations that have been used in this report are listed here unless the abbreviation is well known (e.g. NHS), or it has only been used once, or it is a non-standard abbreviation used only in figures/tables/appendices in which case the abbreviation is defined in the figure or table legend.
Notes
Health Technology Assessment programme
-
Director, NIHR HTA programme, Professor of Clinical Pharmacology, Department of Pharmacology and Therapeutics, University of Liverpool
-
Professor of Dermato-Epidemiology, Centre of Evidence-Based Dermatology, University of Nottingham
Prioritisation Group
-
Director, NIHR HTA programme, Professor of Clinical Pharmacology, Department of Pharmacology and Therapeutics, University of Liverpool
-
Professor Imti Choonara, Professor in Child Health, Academic Division of Child Health, University of Nottingham
Chair – Pharmaceuticals Panel
-
Dr Bob Coates, Consultant Advisor – Disease Prevention Panel
-
Dr Andrew Cook, Consultant Advisor – Intervention Procedures Panel
-
Dr Peter Davidson, Director of NETSCC, Health Technology Assessment
-
Dr Nick Hicks, Consultant Adviser – Diagnostic Technologies and Screening Panel, Consultant Advisor–Psychological and Community Therapies Panel
-
Ms Susan Hird, Consultant Advisor, External Devices and Physical Therapies Panel
-
Professor Sallie Lamb, Director, Warwick Clinical Trials Unit, Warwick Medical School, University of Warwick
Chair – HTA Clinical Evaluation and Trials Board
-
Professor Jonathan Michaels, Professor of Vascular Surgery, Sheffield Vascular Institute, University of Sheffield
Chair – Interventional Procedures Panel
-
Professor Ruairidh Milne, Director – External Relations
-
Dr John Pounsford, Consultant Physician, Directorate of Medical Services, North Bristol NHS Trust
Chair – External Devices and Physical Therapies Panel
-
Dr Vaughan Thomas, Consultant Advisor – Pharmaceuticals Panel, Clinical
Lead – Clinical Evaluation Trials Prioritisation Group
-
Professor Margaret Thorogood, Professor of Epidemiology, Health Sciences Research Institute, University of Warwick
Chair – Disease Prevention Panel
-
Professor Lindsay Turnbull, Professor of Radiology, Centre for the MR Investigations, University of Hull
Chair – Diagnostic Technologies and Screening Panel
-
Professor Scott Weich, Professor of Psychiatry, Health Sciences Research Institute, University of Warwick
Chair – Psychological and Community Therapies Panel
-
Professor Hywel Williams, Director of Nottingham Clinical Trials Unit, Centre of Evidence-Based Dermatology, University of Nottingham
Chair – HTA Commissioning Board
Deputy HTA Programme Director
HTA Commissioning Board
-
Professor of Dermato-Epidemiology, Centre of Evidence-Based Dermatology, University of Nottingham
-
Professor of Bio-Statistics, Department of Public Health and Epidemiology, University of Birmingham
-
Professor of Clinical Pharmacology, Director, NIHR HTA programme, Department of Pharmacology and Therapeutics, University of Liverpool
-
Professor Zarko Alfirevic, Head of Department for Women’s and Children’s Health, Institute of Translational Medicine, University of Liverpool
-
Professor Judith Bliss, Director of ICR-Clinical Trials and Statistics Unit, The Institute of Cancer Research
-
Professor David Fitzmaurice, Professor of Primary Care Research, Department of Primary Care Clinical Sciences, University of Birmingham
-
Professor John W Gregory, Professor in Paediatric Endocrinology, Department of Child Health, Wales School of Medicine, Cardiff University
-
Professor Steve Halligan, Professor of Gastrointestinal Radiology, Department of Specialist Radiology, University College Hospital, London
-
Professor Angela Harden, Professor of Community and Family Health, Institute for Health and Human Development, University of East London
-
Dr Joanne Lord, Reader, Health Economics Research Group, Brunel University
-
Professor Stephen Morris, Professor of Health Economics, University College London, Research Department of Epidemiology and Public Health, University College London
-
Professor Dion Morton, Professor of Surgery, Academic Department of Surgery, University of Birmingham
-
Professor Gail Mountain, Professor of Health Services Research, Rehabilitation and Assistive Technologies Group, University of Sheffield
-
Professor Irwin Nazareth, Professor of Primary Care and Head of Department, Department of Primary Care and Population Sciences, University College London
-
Professor E Andrea Nelson, Professor of Wound Healing and Director of Research, School of Healthcare, University of Leeds
-
Professor John David Norrie, Director, Centre for Healthcare Randomised Trials, Health Services Research Unit, University of Aberdeen
-
Professor Barney Reeves, Professorial Research Fellow in Health Services Research, Department of Clinical Science, University of Bristol
-
Professor Peter Tyrer, Professor of Community Psychiatry, Centre for Mental Health, Imperial College London
-
Professor Martin Underwood, Professor of Primary Care Research, Warwick Medical School, University of Warwick
-
Professor Caroline Watkins, Professor of Stroke and Older People’s Care, Chair of UK Forum for Stroke Training, Stroke Practice Research Unit, University of Central Lancashire
-
Dr Duncan Young, Senior Clinical Lecturer and Consultant, Nuffield Department of Anaesthetics, University of Oxford
-
Dr Tom Foulks, Medical Research Council
-
Dr Kay Pattison, Senior NIHR Programme Manager, Department of Health
HTA Clinical Evaluation and Trials Board
-
Director, Warwick Clinical Trials Unit, Warwick Medical School, University of Warwick and Professor of Rehabilitation, Nuffield Department of Orthopaedic, Rheumatology and Musculoskeletal Sciences, University of Oxford
-
Professor of the Psychology of Health Care, Leeds Institute of Health Sciences, University of Leeds
-
Director, NIHR HTA programme, Professor of Clinical Pharmacology, University of Liverpool
-
Professor Keith Abrams, Professor of Medical Statistics, Department of Health Sciences, University of Leicester
-
Professor Martin Bland, Professor of Health Statistics, Department of Health Sciences, University of York
-
Professor Jane Blazeby, Professor of Surgery and Consultant Upper GI Surgeon, Department of Social Medicine, University of Bristol
-
Professor Julia M Brown, Director, Clinical Trials Research Unit, University of Leeds
-
Professor Alistair Burns, Professor of Old Age Psychiatry, Psychiatry Research Group, School of Community-Based Medicine, The University of Manchester & National Clinical Director for Dementia, Department of Health
-
Dr Jennifer Burr, Director, Centre for Healthcare Randomised trials (CHART), University of Aberdeen
-
Professor Linda Davies, Professor of Health Economics, Health Sciences Research Group, University of Manchester
-
Professor Simon Gilbody, Prof of Psych Medicine and Health Services Research, Department of Health Sciences, University of York
-
Professor Steven Goodacre, Professor and Consultant in Emergency Medicine, School of Health and Related Research, University of Sheffield
-
Professor Dyfrig Hughes, Professor of Pharmacoeconomics, Centre for Economics and Policy in Health, Institute of Medical and Social Care Research, Bangor University
-
Professor Paul Jones, Professor of Respiratory Medicine, Department of Cardiac and Vascular Science, St George‘s Hospital Medical School, University of London
-
Professor Khalid Khan, Professor of Women’s Health and Clinical Epidemiology, Barts and the London School of Medicine, Queen Mary, University of London
-
Professor Richard J McManus, Professor of Primary Care Cardiovascular Research, Primary Care Clinical Sciences Building, University of Birmingham
-
Professor Helen Rodgers, Professor of Stroke Care, Institute for Ageing and Health, Newcastle University
-
Professor Ken Stein, Professor of Public Health, Peninsula Technology Assessment Group, Peninsula College of Medicine and Dentistry, Universities of Exeter and Plymouth
-
Professor Jonathan Sterne, Professor of Medical Statistics and Epidemiology, Department of Social Medicine, University of Bristol
-
Mr Andy Vail, Senior Lecturer, Health Sciences Research Group, University of Manchester
-
Professor Clare Wilkinson, Professor of General Practice and Director of Research North Wales Clinical School, Department of Primary Care and Public Health, Cardiff University
-
Dr Ian B Wilkinson, Senior Lecturer and Honorary Consultant, Clinical Pharmacology Unit, Department of Medicine, University of Cambridge
-
Ms Kate Law, Director of Clinical Trials, Cancer Research UK
-
Dr Morven Roberts, Clinical Trials Manager, Health Services and Public Health Services Board, Medical Research Council
Diagnostic Technologies and Screening Panel
-
Scientific Director of the Centre for Magnetic Resonance Investigations and YCR Professor of Radiology, Hull Royal Infirmary
-
Professor Judith E Adams, Consultant Radiologist, Manchester Royal Infirmary, Central Manchester & Manchester Children’s University Hospitals NHS Trust, and Professor of Diagnostic Radiology, University of Manchester
-
Mr Angus S Arunkalaivanan, Honorary Senior Lecturer, University of Birmingham and Consultant Urogynaecologist and Obstetrician, City Hospital, Birmingham
-
Dr Diana Baralle, Consultant and Senior Lecturer in Clinical Genetics, University of Southampton
-
Dr Stephanie Dancer, Consultant Microbiologist, Hairmyres Hospital, East Kilbride
-
Dr Diane Eccles, Professor of Cancer Genetics, Wessex Clinical Genetics Service, Princess Anne Hospital
-
Dr Trevor Friedman, Consultant Liason Psychiatrist, Brandon Unit, Leicester General Hospital
-
Dr Ron Gray, Consultant, National Perinatal Epidemiology Unit, Institute of Health Sciences, University of Oxford
-
Professor Paul D Griffiths, Professor of Radiology, Academic Unit of Radiology, University of Sheffield
-
Mr Martin Hooper, Public contributor
-
Professor Anthony Robert Kendrick, Associate Dean for Clinical Research and Professor of Primary Medical Care, University of Southampton
-
Dr Nicola Lennard, Senior Medical Officer, MHRA
-
Dr Anne Mackie, Director of Programmes, UK National Screening Committee, London
-
Mr David Mathew, Public contributor
-
Dr Michael Millar, Consultant Senior Lecturer in Microbiology, Department of Pathology & Microbiology, Barts and The London NHS Trust, Royal London Hospital
-
Mrs Una Rennard, Public contributor
-
Dr Stuart Smellie, Consultant in Clinical Pathology, Bishop Auckland General Hospital
-
Ms Jane Smith, Consultant Ultrasound Practitioner, Leeds Teaching Hospital NHS Trust, Leeds
-
Dr Allison Streetly, Programme Director, NHS Sickle Cell and Thalassaemia Screening Programme, King’s College School of Medicine
-
Dr Matthew Thompson, Senior Clinical Scientist and GP, Department of Primary Health Care, University of Oxford
-
Dr Alan J Williams, Consultant Physician, General and Respiratory Medicine, The Royal Bournemouth Hospital
-
Dr Tim Elliott, Team Leader, Cancer Screening, Department of Health
-
Dr Joanna Jenkinson, Board Secretary, Neurosciences and Mental Health Board (NMHB), Medical Research Council
-
Professor Julietta Patrick, Director, NHS Cancer Screening Programme, Sheffield
-
Dr Kay Pattison, Senior NIHR Programme Manager, Department of Health
-
Professor Tom Walley, CBE, Director, NIHR HTA programme, Professor of Clinical Pharmacology, University of Liverpool
-
Dr Ursula Wells, Principal Research Officer, Policy Research Programme, Department of Health
Disease Prevention Panel
-
Professor of Epidemiology, University of Warwick Medical School, Coventry
-
Dr Robert Cook, Clinical Programmes Director, Bazian Ltd, London
-
Dr Colin Greaves, Senior Research Fellow, Peninsula Medical School (Primary Care)
-
Mr Michael Head, Public contributor
-
Professor Cathy Jackson, Professor of Primary Care Medicine, Bute Medical School, University of St Andrews
-
Dr Russell Jago, Senior Lecturer in Exercise, Nutrition and Health, Centre for Sport, Exercise and Health, University of Bristol
-
Dr Julie Mytton, Consultant in Child Public Health, NHS Bristol
-
Professor Irwin Nazareth, Professor of Primary Care and Director, Department of Primary Care and Population Sciences, University College London
-
Dr Richard Richards, Assistant Director of Public Health, Derbyshire County Primary Care Trust
-
Professor Ian Roberts, Professor of Epidemiology and Public Health, London School of Hygiene & Tropical Medicine
-
Dr Kenneth Robertson, Consultant Paediatrician, Royal Hospital for Sick Children, Glasgow
-
Dr Catherine Swann, Associate Director, Centre for Public Health Excellence, NICE
-
Mrs Jean Thurston, Public contributor
-
Professor David Weller, Head, School of Clinical Science and Community Health, University of Edinburgh
-
Ms Christine McGuire, Research & Development, Department of Health
-
Dr Kay Pattison, Senior NIHR Programme Manager, Department of Health
-
Professor Tom Walley, CBE, Director, NIHR HTA programme, Professor of Clinical Pharmacology, University of Liverpool
External Devices and Physical Therapies Panel
-
Consultant Physician North Bristol NHS Trust
-
Reader in Wound Healing and Director of Research, University of Leeds
-
Professor Bipin Bhakta, Charterhouse Professor in Rehabilitation Medicine, University of Leeds
-
Mrs Penny Calder, Public contributor
-
Dr Dawn Carnes, Senior Research Fellow, Barts and the London School of Medicine and Dentistry
-
Dr Emma Clark, Clinician Scientist Fellow & Cons. Rheumatologist, University of Bristol
-
Mrs Anthea De Barton-Watson, Public contributor
-
Professor Nadine Foster, Professor of Musculoskeletal Health in Primary Care Arthritis Research, Keele University
-
Dr Shaheen Hamdy, Clinical Senior Lecturer and Consultant Physician, University of Manchester
-
Professor Christine Norton, Professor of Clinical Nursing Innovation, Bucks New University and Imperial College Healthcare NHS Trust
-
Dr Lorraine Pinnigton, Associate Professor in Rehabilitation, University of Nottingham
-
Dr Kate Radford, Senior Lecturer (Research), University of Central Lancashire
-
Mr Jim Reece, Public contributor
-
Professor Maria Stokes, Professor of Neuromusculoskeletal Rehabilitation, University of Southampton
-
Dr Pippa Tyrrell, Senior Lecturer/Consultant, Salford Royal Foundation Hospitals’ Trust and University of Manchester
-
Dr Nefyn Williams, Clinical Senior Lecturer, Cardiff University
-
Dr Kay Pattison, Senior NIHR Programme Manager, Department of Health
-
Dr Morven Roberts, Clinical Trials Manager, Health Services and Public Health Services Board, Medical Research Council
-
Professor Tom Walley, CBE, Director, NIHR HTA programme, Professor of Clinical Pharmacology, University of Liverpool
-
Dr Ursula Wells, Principal Research Officer, Policy Research Programme, Department of Health
Interventional Procedures Panel
-
Professor of Vascular Surgery, University of Sheffield
-
Consultant Colorectal Surgeon, Bristol Royal Infirmary
-
Mrs Isabel Boyer, Public contributor
-
Mr Sankaran Chandra Sekharan, Consultant Surgeon, Breast Surgery, Colchester Hospital University NHS Foundation Trust
-
Professor Nicholas Clarke, Consultant Orthopaedic Surgeon, Southampton University Hospitals NHS Trust
-
Ms Leonie Cooke, Public contributor
-
Mr Seumas Eckford, Consultant in Obstetrics & Gynaecology, North Devon District Hospital
-
Professor Sam Eljamel, Consultant Neurosurgeon, Ninewells Hospital and Medical School, Dundee
-
Dr Adele Fielding, Senior Lecturer and Honorary Consultant in Haematology, University College London Medical School
-
Dr Matthew Hatton, Consultant in Clinical Oncology, Sheffield Teaching Hospital Foundation Trust
-
Dr John Holden, General Practitioner, Garswood Surgery, Wigan
-
Dr Fiona Lecky, Senior Lecturer/Honorary Consultant in Emergency Medicine, University of Manchester/Salford Royal Hospitals NHS Foundation Trust
-
Dr Nadim Malik, Consultant Cardiologist/Honorary Lecturer, University of Manchester
-
Mr Hisham Mehanna, Consultant & Honorary Associate Professor, University Hospitals Coventry & Warwickshire NHS Trust
-
Dr Jane Montgomery, Consultant in Anaesthetics and Critical Care, South Devon Healthcare NHS Foundation Trust
-
Professor Jon Moss, Consultant Interventional Radiologist, North Glasgow Hospitals University NHS Trust
-
Dr Simon Padley, Consultant Radiologist, Chelsea & Westminster Hospital
-
Dr Ashish Paul, Medical Director, Bedfordshire PCT
-
Dr Sarah Purdy, Consultant Senior Lecturer, University of Bristol
-
Dr Matthew Wilson, Consultant Anaesthetist, Sheffield Teaching Hospitals NHS Foundation Trust
-
Professor Yit Chiun Yang, Consultant Ophthalmologist, Royal Wolverhampton Hospitals NHS Trust
-
Dr Kay Pattison, Senior NIHR Programme Manager, Department of Health
-
Dr Morven Roberts, Clinical Trials Manager, Health Services and Public Health Services Board, Medical Research Council
-
Professor Tom Walley, CBE, Director, NIHR HTA programme, Professor of Clinical Pharmacology, University of Liverpool
-
Dr Ursula Wells, Principal Research Officer, Policy Research Programme, Department of Health
Pharmaceuticals Panel
-
Professor in Child Health, University of Nottingham
-
Senior Lecturer in Clinical Pharmacology, University of East Anglia
-
Dr Martin Ashton-Key, Medical Advisor, National Commissioning Group, NHS London
-
Dr Peter Elton, Director of Public Health, Bury Primary Care Trust
-
Dr Ben Goldacre, Research Fellow, Division of Psychological Medicine and Psychiatry, King’s College London
-
Dr James Gray, Consultant Microbiologist, Department of Microbiology, Birmingham Children’s Hospital NHS Foundation Trust
-
Dr Jurjees Hasan, Consultant in Medical Oncology, The Christie, Manchester
-
Dr Carl Heneghan, Deputy Director Centre for Evidence-Based Medicine and Clinical Lecturer, Department of Primary Health Care, University of Oxford
-
Dr Dyfrig Hughes, Reader in Pharmacoeconomics and Deputy Director, Centre for Economics and Policy in Health, IMSCaR, Bangor University
-
Dr Maria Kouimtzi, Pharmacy and Informatics Director, Global Clinical Solutions, Wiley-Blackwell
-
Professor Femi Oyebode, Consultant Psychiatrist and Head of Department, University of Birmingham
-
Dr Andrew Prentice, Senior Lecturer and Consultant Obstetrician and Gynaecologist, The Rosie Hospital, University of Cambridge
-
Ms Amanda Roberts, Public contributor
-
Dr Gillian Shepherd, Director, Health and Clinical Excellence, Merck Serono Ltd
-
Mrs Katrina Simister, Assistant Director New Medicines, National Prescribing Centre, Liverpool
-
Professor Donald Singer, Professor of Clinical Pharmacology and Therapeutics, Clinical Sciences Research Institute, CSB, University of Warwick Medical School
-
Mr David Symes, Public contributor
-
Dr Arnold Zermansky, General Practitioner, Senior Research Fellow, Pharmacy Practice and Medicines Management Group, Leeds University
-
Dr Kay Pattison, Senior NIHR Programme Manager, Department of Health
-
Mr Simon Reeve, Head of Clinical and Cost-Effectiveness, Medicines, Pharmacy and Industry Group, Department of Health
-
Dr Heike Weber, Programme Manager, Medical Research Council
-
Professor Tom Walley, CBE, Director, NIHR HTA programme, Professor of Clinical Pharmacology, University of Liverpool
-
Dr Ursula Wells, Principal Research Officer, Policy Research Programme, Department of Health
Psychological and Community Therapies Panel
-
Professor of Psychiatry, University of Warwick, Coventry
-
Consultant & University Lecturer in Psychiatry, University of Cambridge
-
Professor Jane Barlow, Professor of Public Health in the Early Years, Health Sciences Research Institute, Warwick Medical School
-
Dr Sabyasachi Bhaumik, Consultant Psychiatrist, Leicestershire Partnership NHS Trust
-
Mrs Val Carlill, Public contributor
-
Dr Steve Cunningham, Consultant Respiratory Paediatrician, Lothian Health Board
-
Dr Anne Hesketh, Senior Clinical Lecturer in Speech and Language Therapy, University of Manchester
-
Dr Peter Langdon, Senior Clinical Lecturer, School of Medicine, Health Policy and Practice, University of East Anglia
-
Dr Yann Lefeuvre, GP Partner, Burrage Road Surgery, London
-
Dr Jeremy J Murphy, Consultant Physician and Cardiologist, County Durham and Darlington Foundation Trust
-
Dr Richard Neal, Clinical Senior Lecturer in General Practice, Cardiff University
-
Mr John Needham, Public contributor
-
Ms Mary Nettle, Mental Health User Consultant
-
Professor John Potter, Professor of Ageing and Stroke Medicine, University of East Anglia
-
Dr Greta Rait, Senior Clinical Lecturer and General Practitioner, University College London
-
Dr Paul Ramchandani, Senior Research Fellow/Cons. Child Psychiatrist, University of Oxford
-
Dr Karen Roberts, Nurse/Consultant, Dunston Hill Hospital, Tyne and Wear
-
Dr Karim Saad, Consultant in Old Age Psychiatry, Coventry and Warwickshire Partnership Trust
-
Dr Lesley Stockton, Lecturer, School of Health Sciences, University of Liverpool
-
Dr Simon Wright, GP Partner, Walkden Medical Centre, Manchester
-
Dr Kay Pattison, Senior NIHR Programme Manager, Department of Health
-
Dr Morven Roberts, Clinical Trials Manager, Health Services and Public Health Services Board, Medical Research Council
-
Professor Tom Walley, CBE, Director, NIHR HTA programme, Professor of Clinical Pharmacology, University of Liverpool
-
Dr Ursula Wells, Principal Research Officer, Policy Research Programme, Department of Health