Notes
Article history
The research reported in this issue of the journal was funded by the HTA programme as project number 08/30/02. The contractual start date was in November 2009. The draft report began editorial review in July 2012 and was accepted for publication in November 2012. The authors have been wholly responsible for all data collection, analysis and interpretation, and for writing up their work. The HTA editors and publisher have tried to ensure the accuracy of the authors' report and would like to thank the reviewers for their constructive comments on the draft document. However, they do not accept liability for damages or losses arising from material published in this report.
Permissions
Copyright statement
© Queen's Printer and Controller of HMSO 2013. This work was produced by Thompson et al. under the terms of a commissioning contract issued by the Secretary of State for Health. This issue may be freely reproduced for the purposes of private research and study and extracts (or indeed, the full report) may be included in professional journals provided that suitable acknowledgement is made and the reproduction is not associated with any form of advertising. Applications for commercial reproduction should be addressed to: NIHR Journals Library, National Institute for Health Research, Evaluation, Trials and Studies Coordinating Centre, Alpha House, University of Southampton Science Park, Southampton SO16 7NS, UK.
Chapter 1 Background
Abdominal aortic aneurysm screening
Abdominal aortic aneurysm (AAA) is an important cause of mortality, with around 4500 deaths each year in England and Wales. 1 Death due to an AAA usually occurs as a result of rupture, the overall survival rate from which is only about 20%. 2,3 AAAs are usually asymptomatic until rupture occurs, but can be detected by ultrasound (US) screening. Following detection of an AAA (aortic diameter of at least 3.0 cm), either through screening or incidentally, the principal surgical strategy is to repair the AAA before rupture occurs. However, elective open AAA repair is associated with a mortality rate in the region of 5%. 4 Although minimally invasive endovascular techniques can reduce this operative risk to < 2%,5 late complications make the long-term outcomes similar whatever operative method is chosen. 6
The evidence in favour of screening older men for an AAA by US has come from four population-based randomised trials in different countries, with the evidence being summarised in a Cochrane review. 7 In men, offering screening reduces aneurysm-related mortality by almost half [odds ratio (OR) 0.60, 95% confidence interval (CI) 0.47 to 0.78]. The data in women are too few to draw conclusions. Longer-term (10-year) follow-up of men randomised in the large UK Multicentre Aneurysm Screening Study (MASS) confirms a continued reduction in aneurysm-related mortality and indicates that offering screening is cost-effective within a 10-year time horizon. 4 Long-term modelling based on the MASS trial suggests that the lifetime cost-effectiveness of a policy of offering screening to men aged 65 years is very favourable, with an estimated incremental cost-effectiveness ratio (ICER) of £2970 (95% CI £2030 to £5430) per quality-adjusted life-year (QALY) saved. 8 Following this evidence, a national AAA screening programme for men aged 65 years was initiated in the UK. 9 However, any national AAA screening programme must have clear policies for intervention and surveillance protocols. Such policies will depend, in a large part, on the growth rate and rupture rate of small aneurysms.
Surveillance for small abdominal aortic aneurysms
The two UK AAA screening trials used diameters of either 5.5 cm or 6.0 cm, as measured by US, as the threshold for considering elective surgery, whereas the Danish screening trial used a threshold of 5.0 cm and in the Australian screening trial the intervention threshold was decided by local vascular surgeons. 7 A 5.5-cm threshold is being used in the UK NHS National Abdominal Aortic Aneurysm Screening Programme (NAAASP). 9
Screening programmes identify AAAs with a wide range of diameters, but the majority (about 90%) have diameters < 5.5 cm. 10 The evidence about managing these ‘small’ aneurysms has come from four randomised trials of intervention by open or endovascular surgical repair compared with surveillance for aneurysms 4.0–5.4 cm in diameter. 11 These trials did not show a survival benefit associated with a policy of early surgery below the 5.5-cm-diameter threshold, even after prolonged follow-up. 12 One reason that these trials have not shown a survival benefit is because the risk of rupture is very low while the aneurysm is still small.
The majority of small AAAs grow relatively slowly, but there is substantial variation in growth rates between different individuals. 13 To prevent undetected progression of an AAA to a size where there is a high risk of rupture, repeated radiological scanning is necessary. Most patients with small AAAs require surveillance for many years and undergo multiple AAA measurements.
There is no randomised trial comparing different surveillance protocols, and no recent systematic review of the growth and rupture rates of small AAAs. As a result, screening and surveillance programmes in different countries have adopted different intervals (Table 1), without a good evidence base for their choice. NAAASP employs surveillance intervals of 1 year for 3.0–4.4-cm AAAs and of 3 months for 4.5–5.4-cm AAAs. This choice corresponds to the intervals used in the large UK MASS trial, which has provided the majority of the randomised evidence worldwide (in terms of participants, person-years of follow-up and number of events) on the benefit of AAA screening. 4
Growth rates of small abdominal aortic aneurysms
Apart from the screening trials, many other observational studies have reported on growth rates of small aneurysms and recommended different frequencies of follow-up examinations. Published studies report estimates of AAA growth in different ways, making them difficult to summarise. In addition, they only rarely report the variability in growth rates between patients, which is crucial for determining appropriate surveillance intervals. 17 In many cases simple linear regression has been used to estimate growth rates. This does not account for the tendency for aneurysm growth to accelerate with increasing aneurysm diameter, nor for the bias introduced by termination of the available measurements after the threshold for surgical intervention is reached. Unbiased estimation of growth rates requires more complex statistical analysis using likelihood-based methods, for example based on multilevel modelling. 13 Application of such analytical techniques shows that aneurysm growth rates vary considerably between people. Although most aneurysms show a pattern of accelerating growth with increasing aneurysm diameter, some show a slowing of aneurysm growth, some linear growth, and some aneurysms even decrease in diameter over time.
Some studies report faster aneurysm growth in smokers and slower aneurysm growth in patients with diabetes, but evidence is inconsistent about sex differences. 13 Two recent systematic reviews have addressed the efficacy of pharmacotherapy for decreasing aneurysm growth rates. 18,19 These reviews concluded that, although beta blockers do not reduce growth rates, there is some promise that statins and other anti-inflammatory agents may reduce aneurysm growth rates. There is inconsistent evidence about the effect of blood pressure and other variables.
Rupture rates of small abdominal aortic aneurysms
The risk of rupture increases with AAA size. In patients with small aneurysms (< 5.5 cm in diameter), the risk of surgery is considered greater than the risk of rupture and a policy of surveillance is usually adopted. The low risk of rupture makes it difficult either to obtain reliable estimates of rupture rates of small aneurysms or to investigate how these rupture rates vary according to aneurysm size, sex and other patient characteristics. Reliable estimates of rupture rates are essential for planning the management of small aneurysms. Although some synthesis of data for rupture in large aneurysms has been reported previously,20 systematic reviews and meta-analyses of studies focused on the rupture rate of small aneurysms (< 5.5 cm) have not been reported. Randomised trials have reported aneurysm rupture rates of 1% per annum or less for aneurysms of 4.0–5.5 cm in diameter. 21,22 The rupture rate of smaller aneurysms appears to be even lower. 23
Need for systematic review and individual patient data analysis
To bring together the evidence on growth and rupture rates for small AAAs, a systematic review is required. However, individual studies publish their results in many different ways, making a quantitative synthesis problematic. This is compounded by the misuse of simple linear regression as an analysis tool, and by the selective (or lack of) information presented on how growth and rupture rates vary with patient characteristics. Thus, analysis of individual patient data (IPD) is likely to be necessary to obtain reliable estimates of small aneurysm growth and rupture rates, and for modelling the impact of different surveillance intervals.
Costs and cost-effectiveness
Different surveillance intervals lead to different associated costs, in terms of both the number of screens and the number of elective and emergency operations carried out. They also have different benefits in terms of life expectancy. Costs and benefits therefore have to be formally traded against each other by estimating the cost-effectiveness of different screening intervals, and expressing this as the incremental cost per QALY gained.
Overall aim of the project
This project has therefore sought to evaluate the available evidence pertinent to designing an evidence-based surveillance programme, by means of systematic reviews of the literature and analysis of IPD from surveillance studies. The choice of surveillance intervals should balance the frequency of rescreening intervals against their cost, and will depend on both aneurysm growth rates and aneurysm rupture rates. Although we focus on the UK context, and the NAAASP, our work clearly also has implications for other population-based screening and surveillance programmes.
| Country | Diameter bands (cm) | Surveillance interval (months) | Source of information |
|---|---|---|---|
| Denmark | 3.0–5.5 | 12 | Stather et al., 201314 |
| Englanda | 3.0–4.4 | 12 | NAAASP9 |
| 4.5–5.4 | 3 | ||
| Italy | 3.0–3.9 | 12b | Giardina et al., 201115 |
| 4.0–4.9 | 6 | ||
| New Zealand | 3.0–5.5 | 12 | Stather et al., 201314 |
| Norway | 3.0–3.9 | 24 | Stather et al., 201314 |
| 4.0–4.5 | 12 | ||
| 4.5–5.5 | 3–6 | ||
| Sweden | 2.5–2.9 | 60 | Stather et al., 201314 |
| 3.0–3.9 | 24 | ||
| 4.0–4.4 | 12 | ||
| 4.5–5.0 | 6 | ||
| 5.1–5.5 | 3 | ||
| USA | 2.5–2.9 | 60 | Chaikof et al., 200916 |
| 3.0–3.4 | 36 | ||
| 3.5–4.4 | 12 | ||
| 4.5–5.4 | 6 |
Chapter 2 Research objectives
Aims and objectives
The overall aim is to synthesise the available evidence on the growth and rupture rates of small AAAs, in such a way that can inform the appropriate choice of surveillance intervals.
The following questions are addressed:
-
What are the growth rates of small AAAs?
-
What are the rupture rates of small AAAs?
-
How does aneurysm size influence growth and rupture rates?
-
How do other individual characteristics affect growth and rupture rates?
-
What are the clinical implications of varying the surveillance intervals for small AAAs?
-
What are the cost implications of varying the surveillance intervals for small AAAs?
-
What is the incremental cost-effectiveness of changing the surveillance intervals from those currently implemented in the NAAASP?
To answer these questions we have:
-
conducted a systematic literature review of studies using US to monitor the growth of small AAAs
-
conducted a systematic literature review of the rates of rupture of small AAAs.
As this published information was not sufficient for detailed modelling of AAA growth and rupture rates, we then:
-
3. identified studies from these systematic reviews that could provide IPD to investigate AAA growth and rupture rates
-
4. collated and harmonised individual data from 18 surveillance studies
-
5. developed an extensive statistical modelling framework to analyse the growth rates of small AAAs by size and sex using likelihood-based multilevel modelling
-
6. undertook IPD meta-analyses of growth rates and of rupture rates
-
7. identified important patient characteristics associated with aneurysm growth and with aneurysm rupture
-
8. modelled surveillance intervals for persons identified with small AAAs, according to aneurysm size and sex.
We used bespoke statistical analyses from the IPD meta-analyses to provide inputs for health economic modelling, and:
-
9. developed an extended health economic modelling framework to estimate the incremental costs and cost-effectiveness of a range of surveillance strategies.
Structure of the report
Two systematic literature reviews were conducted: one of AAA growth rates and one of AAA rupture rates. The methods of these reviews are presented in Chapter 3, with results in Chapter 4. The protocols, search strategies and lists of excluded studies for these reviews are given in Appendices 1 and 2.
Under the name of the RESCAN Collaboration, IPD on small AAA surveillance were obtained from collaborating study groups. We collated data on both AAA diameters over time, to estimate growth rates, and ruptures. The collating and analysis of these data are described in Chapter 5 (with detailed statistical methods in Appendix 3). The results, given in Chapter 6, are expressed in a way that is directly relevant to the choice of surveillance intervals for different sized aneurysms.
The cost implications of different surveillance strategies, and the comparative cost-effectiveness of using them in an AAA screening programme, are then studied. The methods used for this are given in Chapter 7 (and additional details in Appendix 4), with results in Chapter 8.
Chapter 9 provides a discussion of all these component studies and conclusions are given in Chapter 10. A list of published papers arising from this work is provided in Acknowledgements.
Chapter 3 Methods for systematic reviews of growth and rupture rates
The project began with systematic literature reviews of small AAA growth rates and rupture rates. Their methods are described here (Systematic literature review of small abdominal aortic aneurysm growth rates and Systematic literature review of small abdominal aortic aneurysm rupture rates, respectively) and their results in Chapter 4.
Systematic literature review of small abdominal aortic aneurysm growth rates
Literature search
The systematic review followed quality reporting guidelines set by the Preferred Reporting Items for Systematic reviews and Meta-Analyses (PRISMA) group (www.prisma-statement.org/). 24 A review protocol, that outlined every step of the systematic review, was developed (see Appendix 1). The protocol was reviewed and approved by one collaborator (FGRF).
The following databases were searched from inception up until the end of 2009 using search strategies shown in Appendix 1: MEDLINE, EMBASE on OvidSP, Cochrane Central Register of Controlled Trials (CENTRAL) 2009 Issue 4, ClinicalTrials.gov and controlled-trials.com. There were no filters used to restrict study designs, nor were there any language restrictions. In addition, reference lists were also searched for further studies to be included. Additional studies published up to September 2012 are discussed in Chapter 9.
Two researchers (JTP and SMG) independently reviewed potential studies according to a set of eligibility criteria. The studies (minimum sample size n = 50; men or women; aged ≥ 50 years) must include participants with a small infrarenal AAA (baseline anterior–posterior or transverse diameter of between 3.0 and < 6.0 cm) and with either serial US or computerised tomography (CT) scans assessed on at least two occasions separated by at least 6 months. Studies which encompassed wider diameter ranges were included provided growth rate estimates were available separately within the range of 3.0 to 5.5 cm. At this stage, to enable reading in house, languages were restricted to English, Spanish, French, Swedish, Danish and Norwegian. In addition, the following were excluded: review articles, studies in which patient data were duplicated (in which case the most recent or comprehensive study was used), non-human studies, editorials and letters (since they are often not peer reviewed), case reports, studies using patients previously treated by AAA surgery or aneurysms of other arteries, and studies reporting on patients with Marfan syndrome. Study authors were contacted in cases where aneurysms could not easily be separated according to size range.
Data extraction
A data extraction form to record variables and potential biases in the eligible studies was designed. In particular, the following were identified: the study design (prospective, retrospective, randomised, multicentre); source of patients (population screening, hospital screening); defined intervention policy; method of follow-up (US, CT); frequency of follow-up; patient recruitment (number of patients with two or more scans, excluded patients); presence of a mortality review committee; length of follow-up [mean, median, standard deviation (SD)]; inclusion criteria; recruitment period; trial using a particular drug; baseline data including age, sex, ethnicity and other cardiovascular risk factors (e.g. blood pressure, smoking status, drugs, ischaemic heart disease, peripheral arterial disease, diabetes); outcomes (how was aortic diameter measured, measurement variability, if growth was reported by size band, number of non-AAA deaths, number of AAA repairs, who carried out the aortic measurements); analysis (statistical methods used); author affiliation; date of publication; and country (where study was undertaken). The same two researchers (JTP and SMG) independently extracted data of the potentially eligible primary studies and cross-checked their results. Any disagreements between the two reviewers were settled by a third person (LCB).
If any studies failed to provide essential variables (growth rates, frequency and length of patient follow-up) either the study was rejected or the study authors were contacted and asked to provide the missing data. If study authors did not respond to the reviewers' repeated correspondence, these studies were withdrawn from the selected publications. In addition, reasons for exclusion of particular studies were given.
Analysis
The reported overall mean growth rate (mm/year) and its standard error (SE) were extracted from each study, together with mean growth rates reported in size bands, by two statisticians (LCB and MJS). Median growth rates were used if means were not reported (3/15 studies). If percentage changes in AAA size were reported, these were converted to mean growth rates by using the mid-point of the reported size band.
Where 95% CIs were quoted in place of SEs, these values were converted by assuming normality and using the formula SE = (UCL − LCL)/3.92, where UCL and LCL are the upper and lower limits of the 95% CI. If a sample SD and number of patients (n) was quoted, then this was converted to a SE of the mean using the formula SE = SD/√n. If a 95% reference range was quoted, then this was first converted to a SD using the formula SD = (URR − LRR)/3.92, where URR and LRR are the upper and lower limits of the 95% reference range, and then to a SE of the mean, as above. Similarly, studies that reported interquartile ranges (IQRs) were first converted to SDs using the formula SD = IQR/1.35.
Studies that reported a number of different growth rates by size band (within the 3.0–5.5 cm range) but no overall growth rate were subjected to their own initial meta-analysis in which the size band estimates were pooled (using a fixed-effect meta-analysis) to obtain an additional overall growth rate estimate for that study. Studies with estimates from two treatment arms also were pooled in this way to obtain an overall study estimate. The overall estimates (one for each study) were then combined in a conventional random-effects meta-analysis. 25 Between-study heterogeneity was assessed using the I2 measure,26 which indicates the percentage of total variation across studies due to heterogeneity rather than chance.
Separate meta-analyses were also conducted for growth rates reported in 5-mm size bands in an attempt to account for some of the heterogeneity between study estimates. To account more comprehensively for heterogeneity due to varying AAA diameter ranges, a meta-regression model was fitted to the data using average AAA diameter as an explanatory variable. 27 Size band-specific estimates were included by using the mid-point of the size band as a proxy for average AAA diameter. Studies with only an overall estimate were included by using the mean baseline aneurysm diameter as the covariate value. A three-level model was then used to account for heterogeneity between studies, and between size bands within a study, after adjusting for average AAA diameter. 28 Average age and proportion of women in each study were also investigated as explanatory variables. All analyses were conducted using Stata version 11.0 (StataCorp LP, College Station, TX, USA) and R version 2.15.0 (The R Foundation for Statistical Computing, Vienna, Austria).
Systematic literature review of small abdominal aortic aneurysm rupture rates
Literature search
The systematic review followed quality reporting guidelines set by the PRISMA group (www.prisma-statement.org/). 24 Therefore a review protocol, that outlined every step of the systematic review including exclusion criteria, was developed before starting the literature search and subsequent data extraction (see Appendix 2). The protocol was reviewed and approved by one collaborator (FGRF).
The databases MEDLINE, EMBASE on OvidSP, CENTRAL 2009 Issue 3, ClinicalTrials.gov and controlled-trials.com were searched from inception up until the end of 2009 using search strategies shown in Appendix 2. Initially, there were no filters used to restrict study designs, nor were there any language restrictions. In addition, reference lists were also searched for further studies to be included. Additional studies published up to September 2012 are discussed in Chapter 9.
Two researchers (JTP and SMG) independently reviewed potential studies according to a set of eligibility criteria. Studies eligible for inclusion had participants (men or women, aged ≥ 50 years) with a small infrarenal AAA, spanning the baseline diameter range of between 3.0 and < 6.0 cm; for some studies this was a subgroup of the total patient group described. At this stage, languages were restricted to English, Spanish, French, Swedish, Danish and Norwegian (so that data could be extracted by the project team). In addition, review articles, studies in which patient data were duplicated (in which case the most recent or comprehensive study was used), non-human studies, editorials, letters, case reports, studies using patients previously treated by AAA surgery or aneurysms of other arteries, and studies reporting on patients with Marfan syndrome were all excluded.
There was no restriction on either the minimum number of ruptures or the timing when preceding aneurysm diameter measurements were recorded, although small studies of < 50 patients recruited over more than 3 years where rupture was not a primary outcome were excluded (because of probable patient selection and publication biases); although this proved never to be the sole reason for exclusion. In addition, study authors were contacted in cases where aneurysms could not easily be separated according to size range of interest. It also was essential that mean length or person-years of follow-up were reported in the eligible studies in order to calculate rupture rates; if these were not reported authors were contacted.
Data extraction
A data extraction form to record variables and potential biases in the eligible studies was designed. In particular, the following characteristics were identified: the study design; source of patients; defined intervention policy; method of follow-up; frequency of follow-up; patient recruitment; presence of a mortality review committee; length of follow-up (mean, median or total person-years); inclusion criteria; enrolment date; number of included patients (with more than one US scan or CT); age; sex; ethnicity; other baseline data (blood pressure, smoking status, drugs, ischaemic heart disease, peripheral artery disease, diabetes); outcomes (number of ruptures, how ruptures were diagnosed, whether or not ruptures were reported by size band, number of non-rupture deaths, number of AAA repairs, category of professional who carried out aortic measurements); analysis (statistical methods used); author affiliation; date of publication; and country (where study was undertaken). The same two researchers (JTP and SMG) independently extracted data from the eligible primary studies and cross-checked their results. Any disagreements between the two reviewers were settled by a third person (LCB).
Any studies that failed to provide essential variables (number of ruptures and length of follow-up) were either rejected or, if the study was published in the previous 15 years (1994–2009), the authors were contacted for this information. If study authors did not respond to the reviewers' repeated correspondence, these studies were withdrawn from the selected publications. The reasons for exclusion of studies are shown in Appendix 2.
Analysis
Rupture rates (per 100 person-years) were calculated from each study by extracting the number of reported ruptures and person-years of follow-up. For studies that reported mean follow-up, person-years were first calculated by multiplying the mean follow-up by the number of patients under surveillance. Any additional surveillance after aortic surgery was not included in the calculation of person-years. Rupture rates were estimated by dividing the number of ruptures by the person-years of follow-up and multiplying by 100. In addition, a small aneurysm rupture rate was calculated if the paper quoted the number of small aneurysm ruptures (last recorded measurement in the range of 3.0 to 5.5 cm) and person-years of follow-up in the small aneurysm range. This required the study to have recorded AAA diameter at regular intervals throughout follow-up, and crucially to have reported conditional follow-up within the diameter range of 3.0 to 5.5 cm. A 95% CI was calculated for each rupture rate by assuming the number of ruptures followed a Poisson distribution.
Chapter 4 Results of systematic reviews of growth and rupture rates
The results of the systematic reviews are presented here, in Systematic review and meta-analysis of small abdominal aortic aneurysm growth rates and in Systematic review and meta-analysis of small abdominal aortic aneurysm rupture rates.
Systematic review and meta-analysis of small abdominal aortic aneurysm growth rates
Identification of relevant studies
A total of 10,160 study titles were identified by the initial search strategy and, of these, 9951 were excluded after title searching (Figure 1). A total of 209 potential papers were selected, of which two had been identified by searching reference lists. In the next stage, abstracts were reviewed and 61 papers were selected for further review of full-text publications, while 148 were excluded. Of the eligible full-text publications, 46 were excluded for one or more of the following reasons: language (n = 2); duplicated data/patients (n = 12); no original data/data synthesis only (n = 2); growth rates not available/no longitudinal study (n = 11); selection criteria unspecified (n = 1); patient selection bias (n = 8); incorrect aneurysm size range (n = 13); no defined intervention policy (n = 2); too few patients (n = 6); growth rates not according to size range (n = 2); not restricted to AAA (n = 1); no frequency of follow-up (n = 2); and retrospective intervention policy (n = 1). A full list of excluded studies, with reasons, is provided in Appendix 1. Fifteen studies13,22,29–41 were identified as potentially eligible for inclusion in the systematic review and these are summarised in Table 2.
Study characteristics
The publication dates of the 15 potentially eligible studies13,22,29–41 ranged from 1994 to 2009, with patient recruitment from 1976 to 2005. Of these, 10 were prospective studies13,22,34–41 (including three randomised trials), four included both retrospective and prospective data29,30,32,33 and one study reported only retrospective data. 31 Aneurysm growth was the primary outcome measure in 10 of the 15 studies. Overall, there were 7630 persons included in these 15 studies (although the two Spanish studies32,33 may have included some duplicated patients). Some studies did not report accurately on the sex of participants,30,34 but in those that did the proportion of women ranged from 0% to 24% of the study population. The mean baseline age ranged from 65 to 71 years, although age was not reported in two studies. 29,30 The study size ranged from 134 to 1743 patients, with most patients followed up for between 1 and 5 years; not all of these studies stated the mean length of follow-up or patient-years of follow-up.
Most studies used US to monitor aortic diameter, but the plane and cursor positioning (internal vs. external) varied across the different studies and, for some studies, the precise plane of reference was not specified. Some studies used CT as well as US. 22,29,33 Most of these studies included aortic diameters from 30 mm (at baseline), except three studies, which reported from either 25 mm31,35 or 28 mm. 13 Not all studies restricted their reporting to the aneurysm diameter range of interest (3.0–5.5 cm) and in some instances substudies were identified, which reported on a more restricted range. 13,29,33 Different methods were used to estimate aneurysm growth, usually reported as mm/year, with linear regression or (last – first diameter)/time being the most common; two studies did not report how they estimated aneurysm growth. 29,36 One study only reported percentage changes in aneurysm diameter and used data from two screening programmes (Chichester and Huntingdon). 34 Two studies were more than 10 years old, so that requests to authors for further information met with little success. These and other details of the included studies are shown in Table 2. Quality indicators for both imaging and design of the 15 included studies13,22,29–41 are listed in Table 3.
Other patient characteristics, such as ethnicity, history of smoking, prevalence of diabetes, blood pressure, proportion of participants with ischaemic heart disease and peripheral arterial disease, were reported variably across the 15 studies. 13,22,29–41
Comparison of small aneurysm growth rates
Overall average growth rate estimates are shown in Figure 2, with separate estimates for the Huntingdon and Chichester studies. 34 There was very substantial heterogeneity between study estimates (I2 = 98%), with reported growth rates ranging from – 0.33 mm/year to + 3.95 mm/year. The Huntingdon study34 was reported as having a negative growth rate and the largest growth rate was reported from a study which only included 40- to 49-mm-diameter aneurysms. 33 One study could not be included because no SE could be calculated from the information reported. 30 The random-effects meta-analysis estimate of the average aneurysm growth rate was 2.32 mm/year (95% CI 1.95 mm/year to 2.70 mm/year). Restriction of the meta-analysis to those studies that only used ultrasonography imaging after 1990 (reflecting potentially better imaging quality), the growth rate reduced slightly to 2.05 mm/year (95% CI 1.64 mm/year to 2.45 mm/year), although the heterogeneity remained high (I2 = 97%).
Rates are summarised in Figure 3 for those studies that reported mean growth rates by 5-mm-diameter bands. 29,32,35–38 Estimates within these size bands generally were more homogeneous than the overall estimates, although heterogeneity still remained (I2 ranged from 11% to 91%). Growth rates increased steadily with aneurysm diameter band, with a pooled mean growth rate of 1.81 mm/year (95% CI 1.55 mm/year to 2.07 mm/year) for individuals whose baseline diameter measured 3.0–3.4 cm compared with 4.96 mm/year (95% CI 4.25 mm/year to 5.66 mm/year) for individuals whose baseline diameter measured 4.5–4.9 cm. The greater number of patients in the smaller diameter bands is one reason why the widths of the CIs increase with aneurysm diameter.
The statistical method used to calculate growth rates and the study design (retrospective or prospective) were significantly associated with growth rates. Studies that used hierarchical modelling or linear regression had, on average, growth rates that were respectively 1.52 mm/year (SE 0.51 mm/year) and 0.40 mm/year (SE 0.40 mm/year) smaller than studies that used (last – first diameter)/(time elapsed) to report growth rate. Prospective studies had, on average, growth rates that were 1.11 mm/year (SE 0.39 mm/year) smaller than either retrospective or partially retrospective designs, although this effect was no longer significant after adjusting for the method used to calculate growth rate.
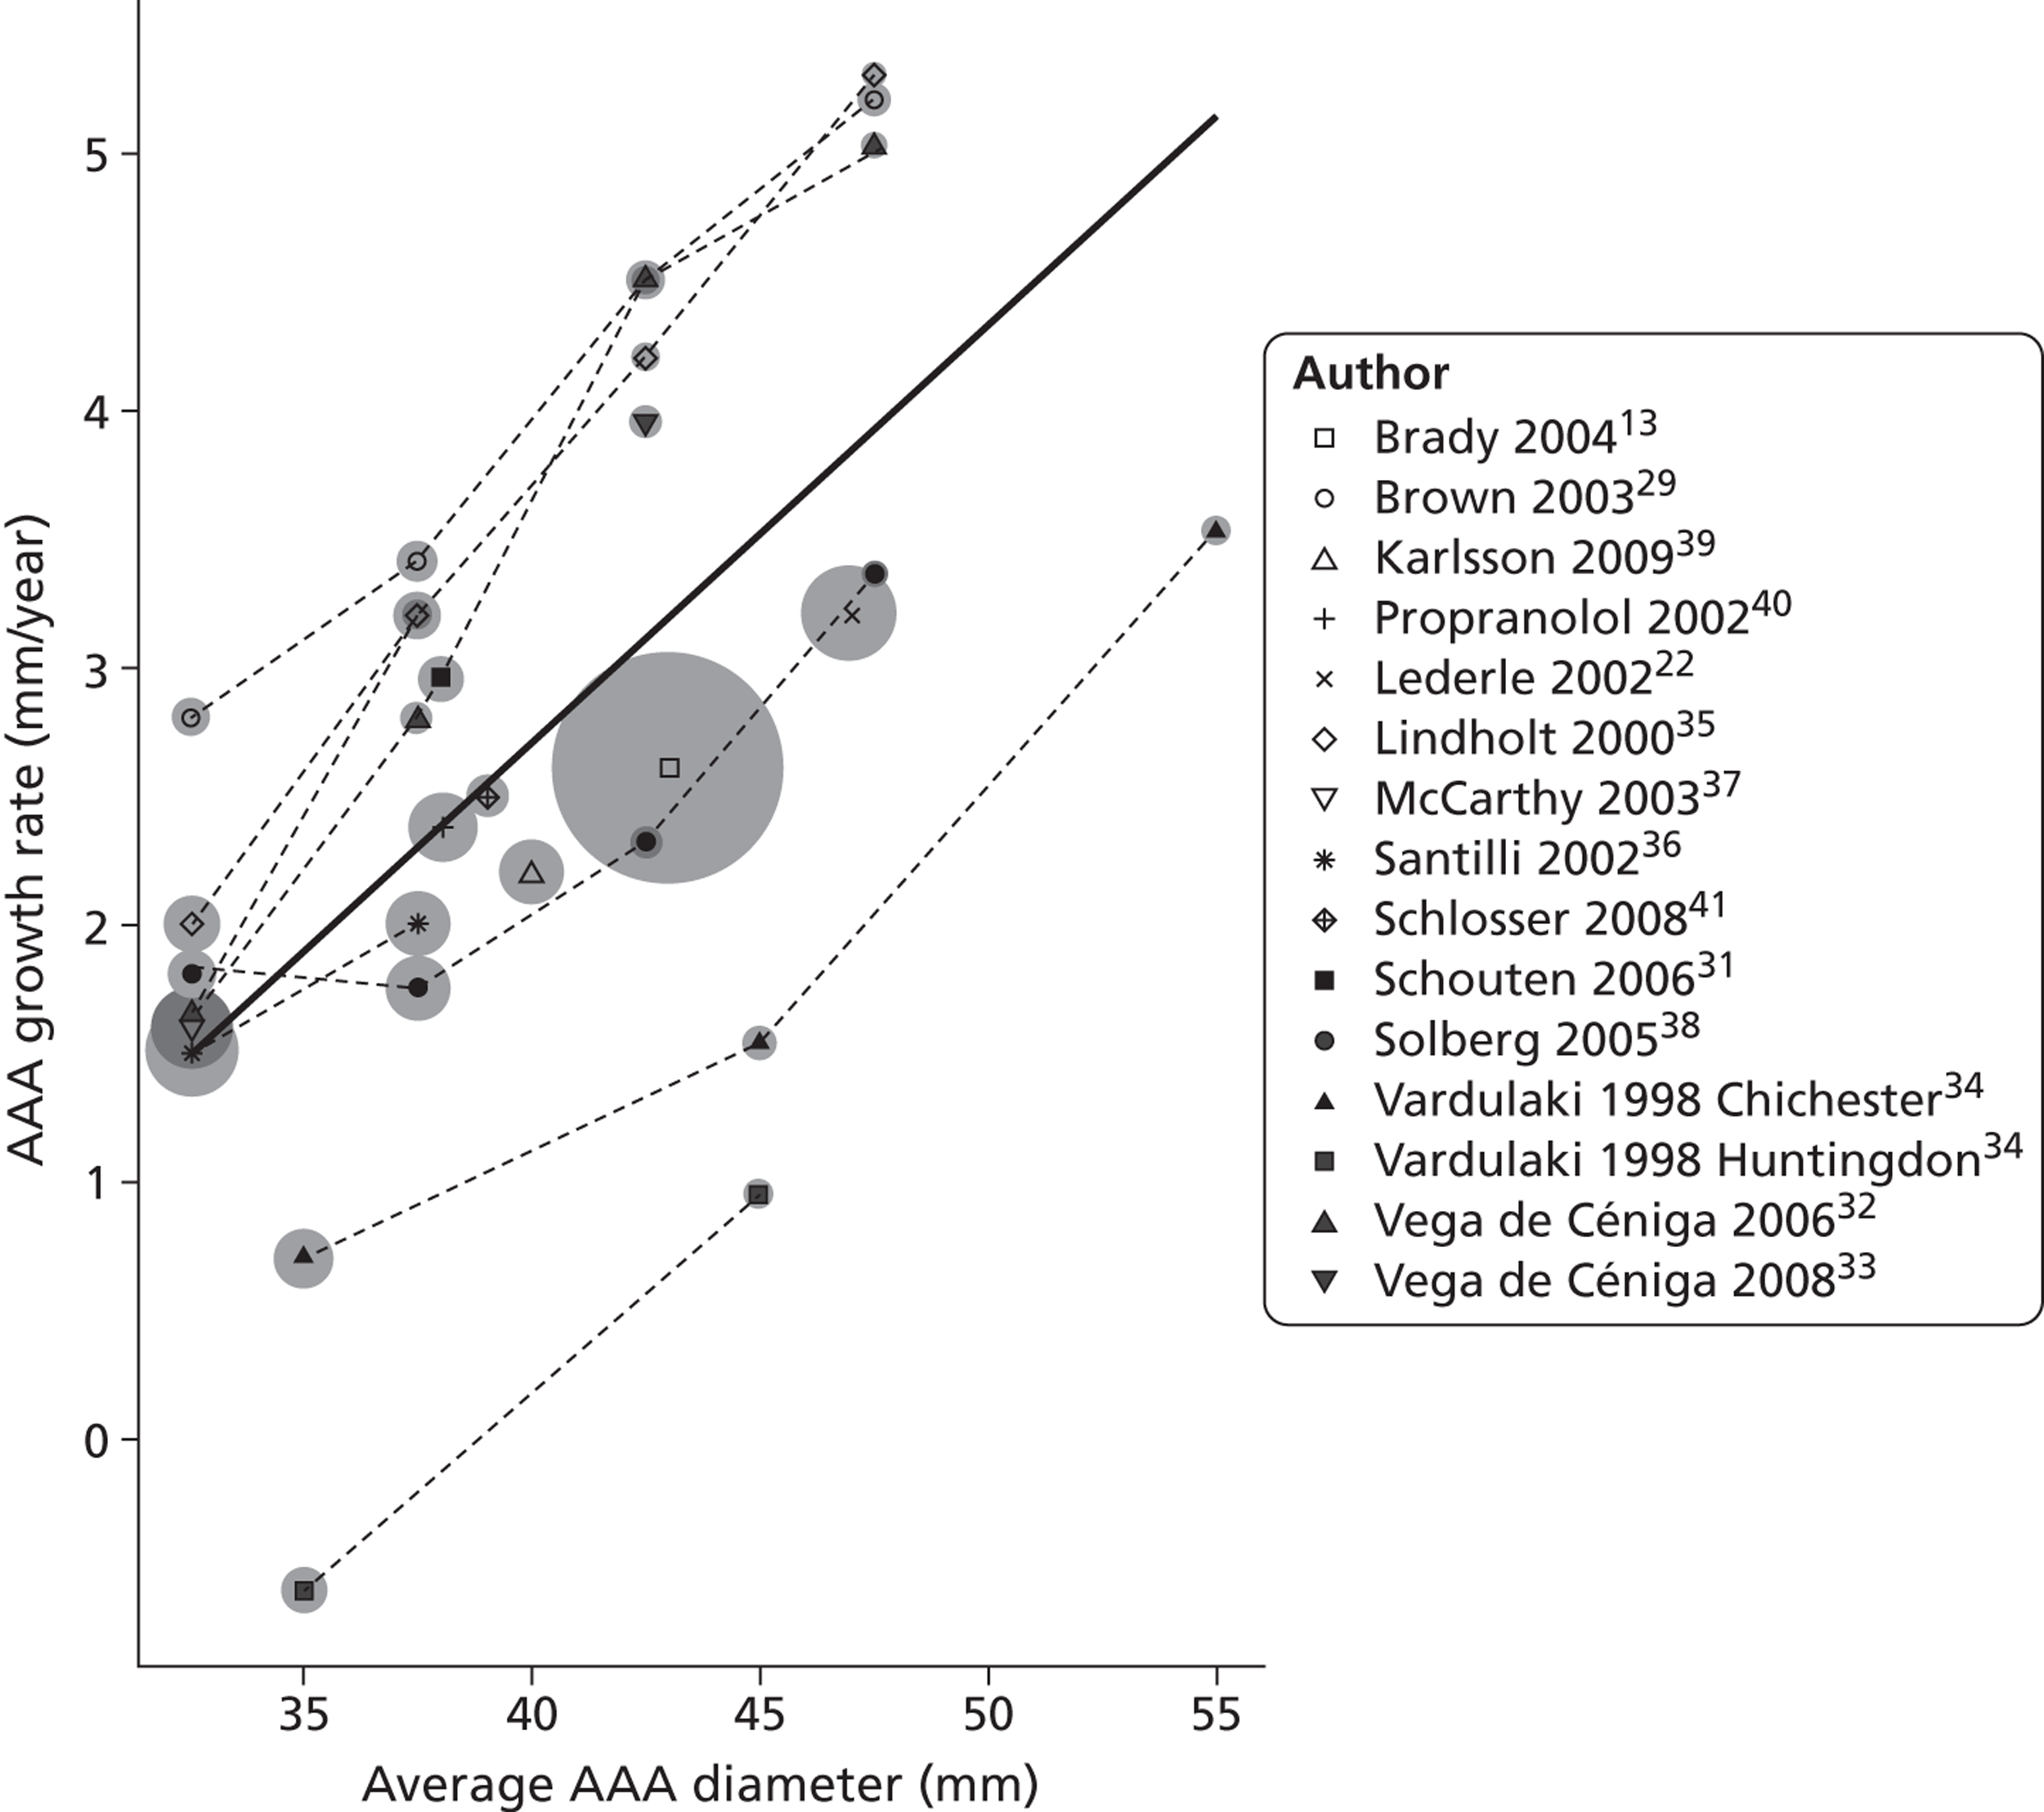
A meta-regression with average aneurysm diameter as an explanatory variable resulted in a strong trend between diameter and growth rate (Figure 4). After adjusting for average diameter, between-study heterogeneity was estimated to be about twice that of the heterogeneity between estimates within a study. A 1-cm increase in AAA diameter was found to be associated with a 1.62 mm/year (SE 0.20 mm/year) increase in growth rate. The age and sex of included patients was available for nearly all studies and were assessed as explanatory variables but found to be not statistically significant; a 10% increase in the percentage of women in a study increased the growth rate by a modest 0.13 mm/year (SE 0.26 mm/year), whereas a 5-year increase in mean study participant age decreased the growth rate by 0.01 mm/year (SE 0.56 mm/year).
Based on the linear relation between growth rate and aneurysm diameter (see Figure 4), the size of aneurysms is expected to grow exponentially with time. Given the meta-regression relationship shown, aneurysms with diameters of 3.0, 3.5, 4.0, 4.5 and 5.0 cm would be expected, on average, to take 9.6, 6.2, 4.0, 2.3 and 1.1 years, respectively, to reach 5.5 cm.
However, there was insufficient published data for the detailed modelling of AAA growth rates necessary to better inform surveillance intervals. For this, IPD are necessary, as described in Chapters 5 and 6.
FIGURE 1.
Preferred Reporting Items for Systematic Reviews and Meta-Analyses flow diagram – small AAA growth studies.
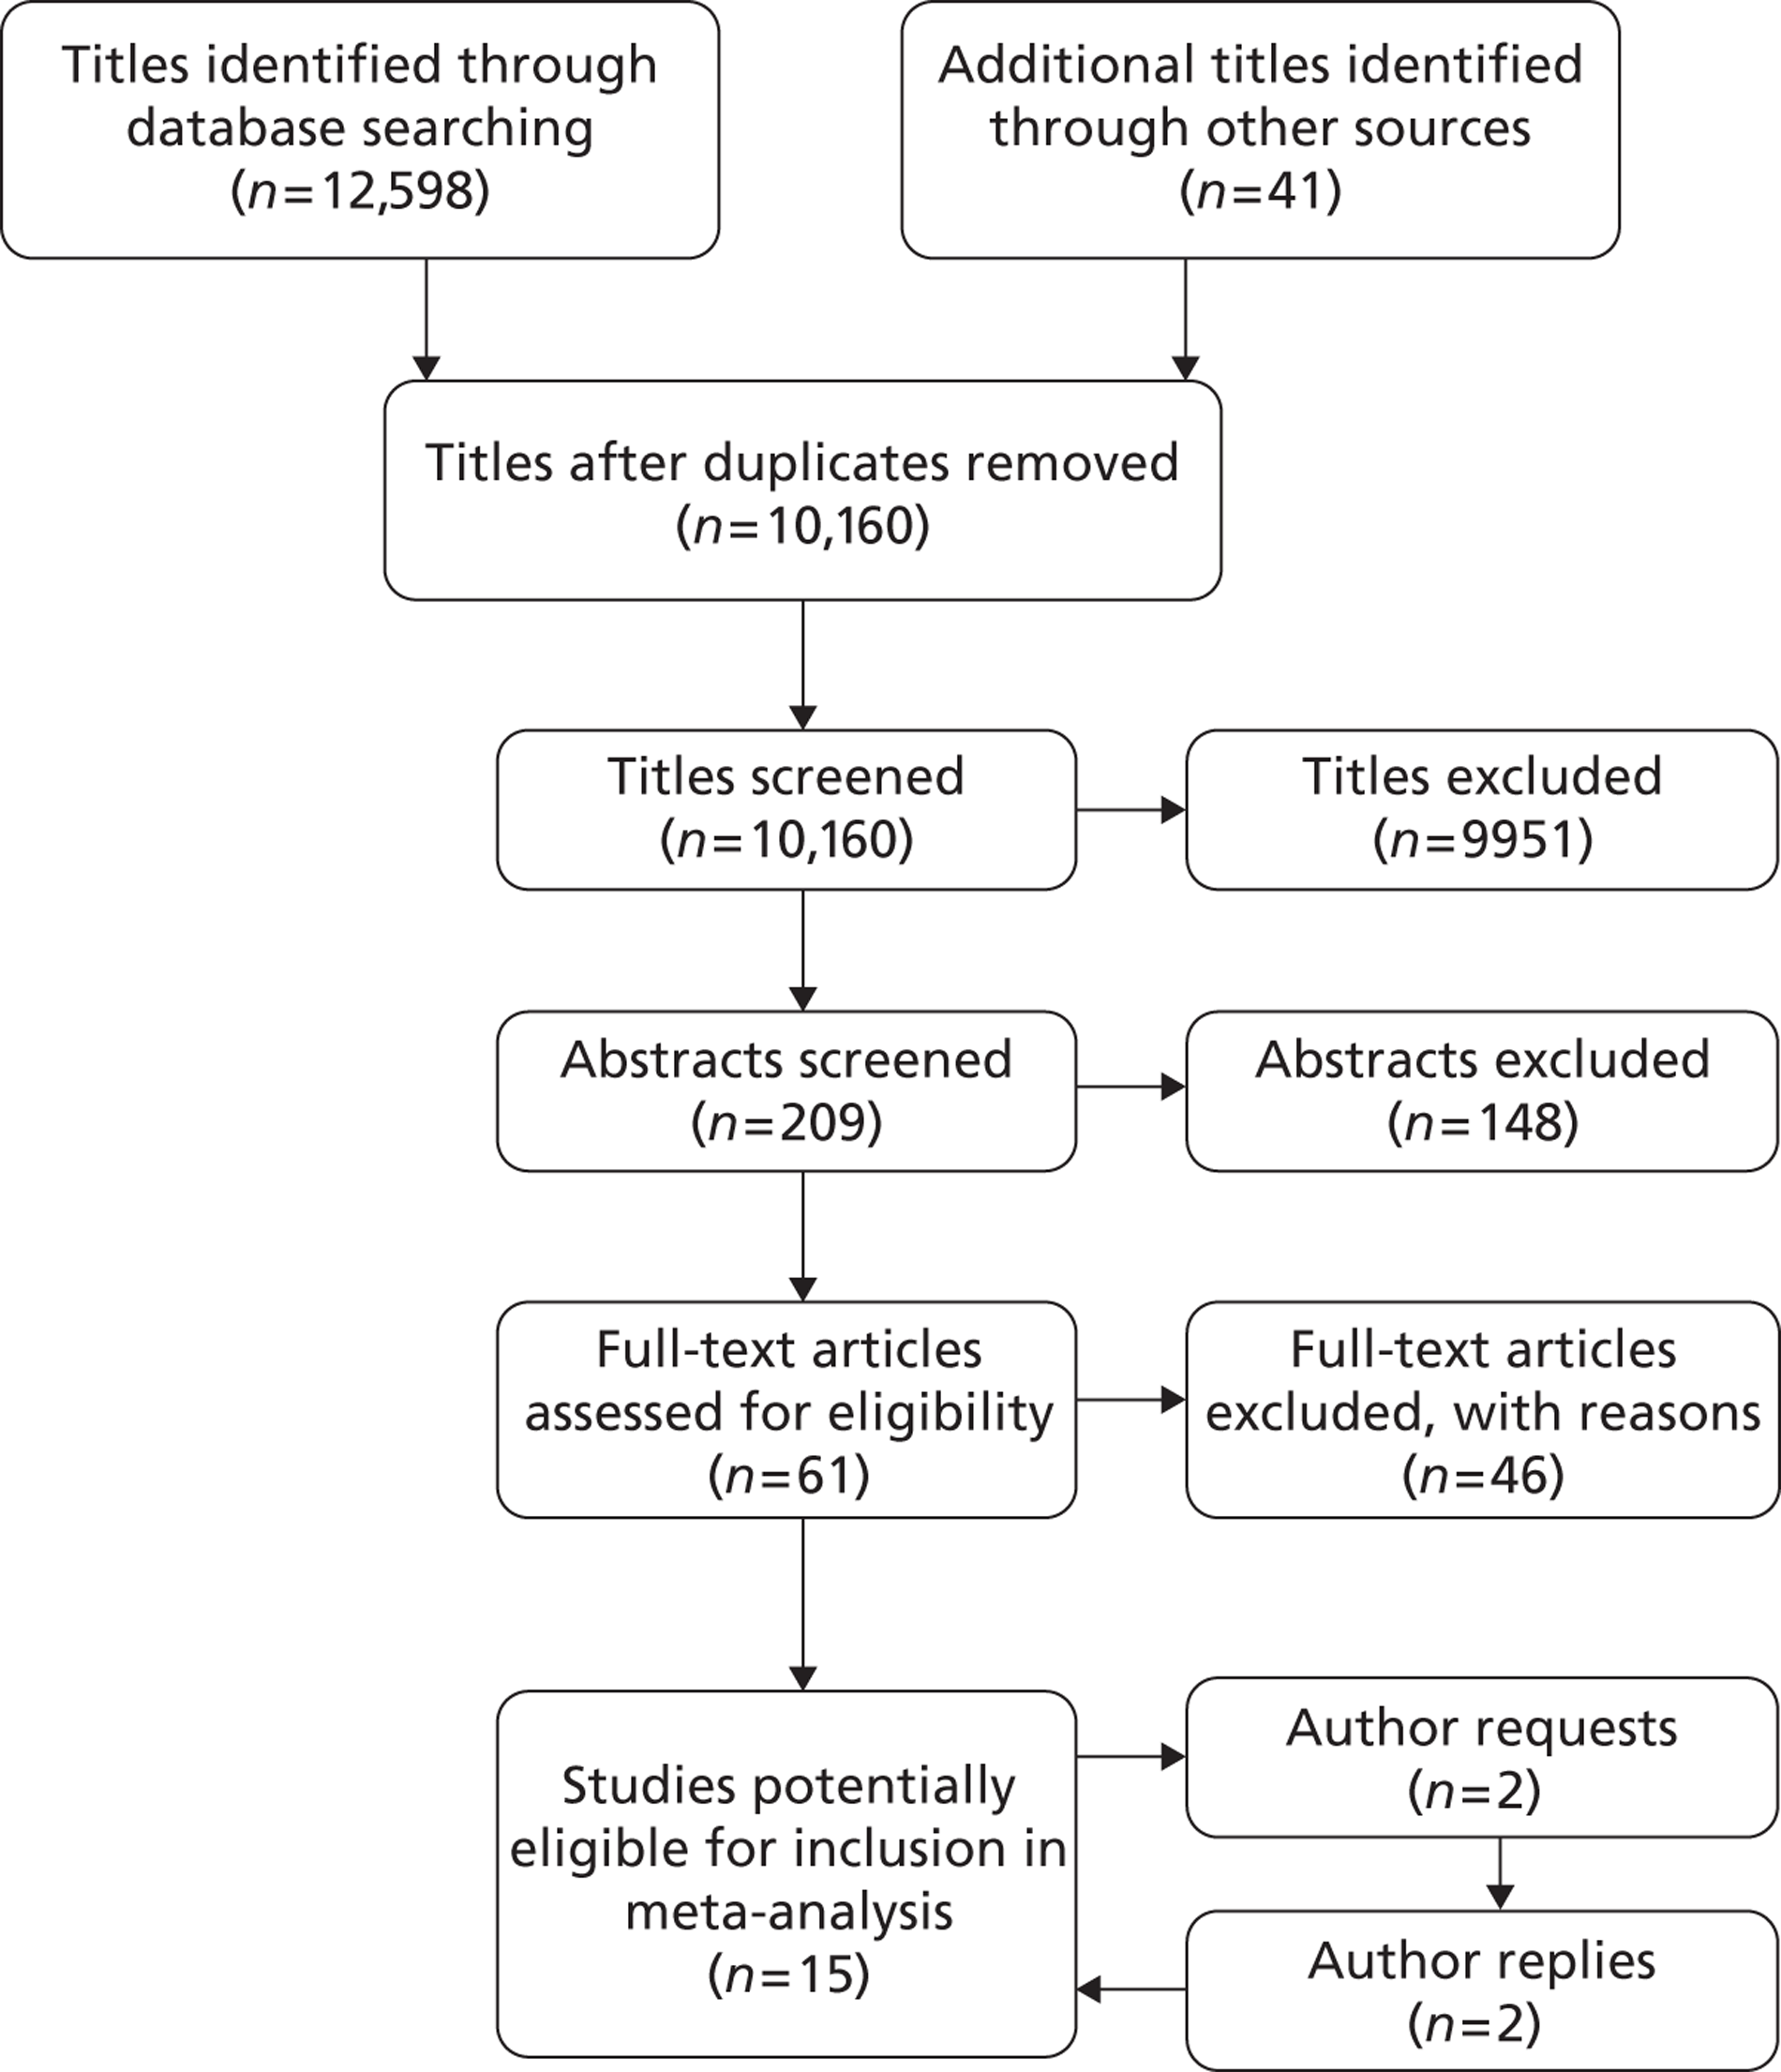
FIGURE 2.
Overall AAA growth rate estimates, one for each study, by baseline AAA diameter size range. Estimates are pooled using a random-effects meta-analysis, due to considerable heterogeneity (I2 = 98%). An estimate from Schewe et al. 30 could not be included due to no SE being available.
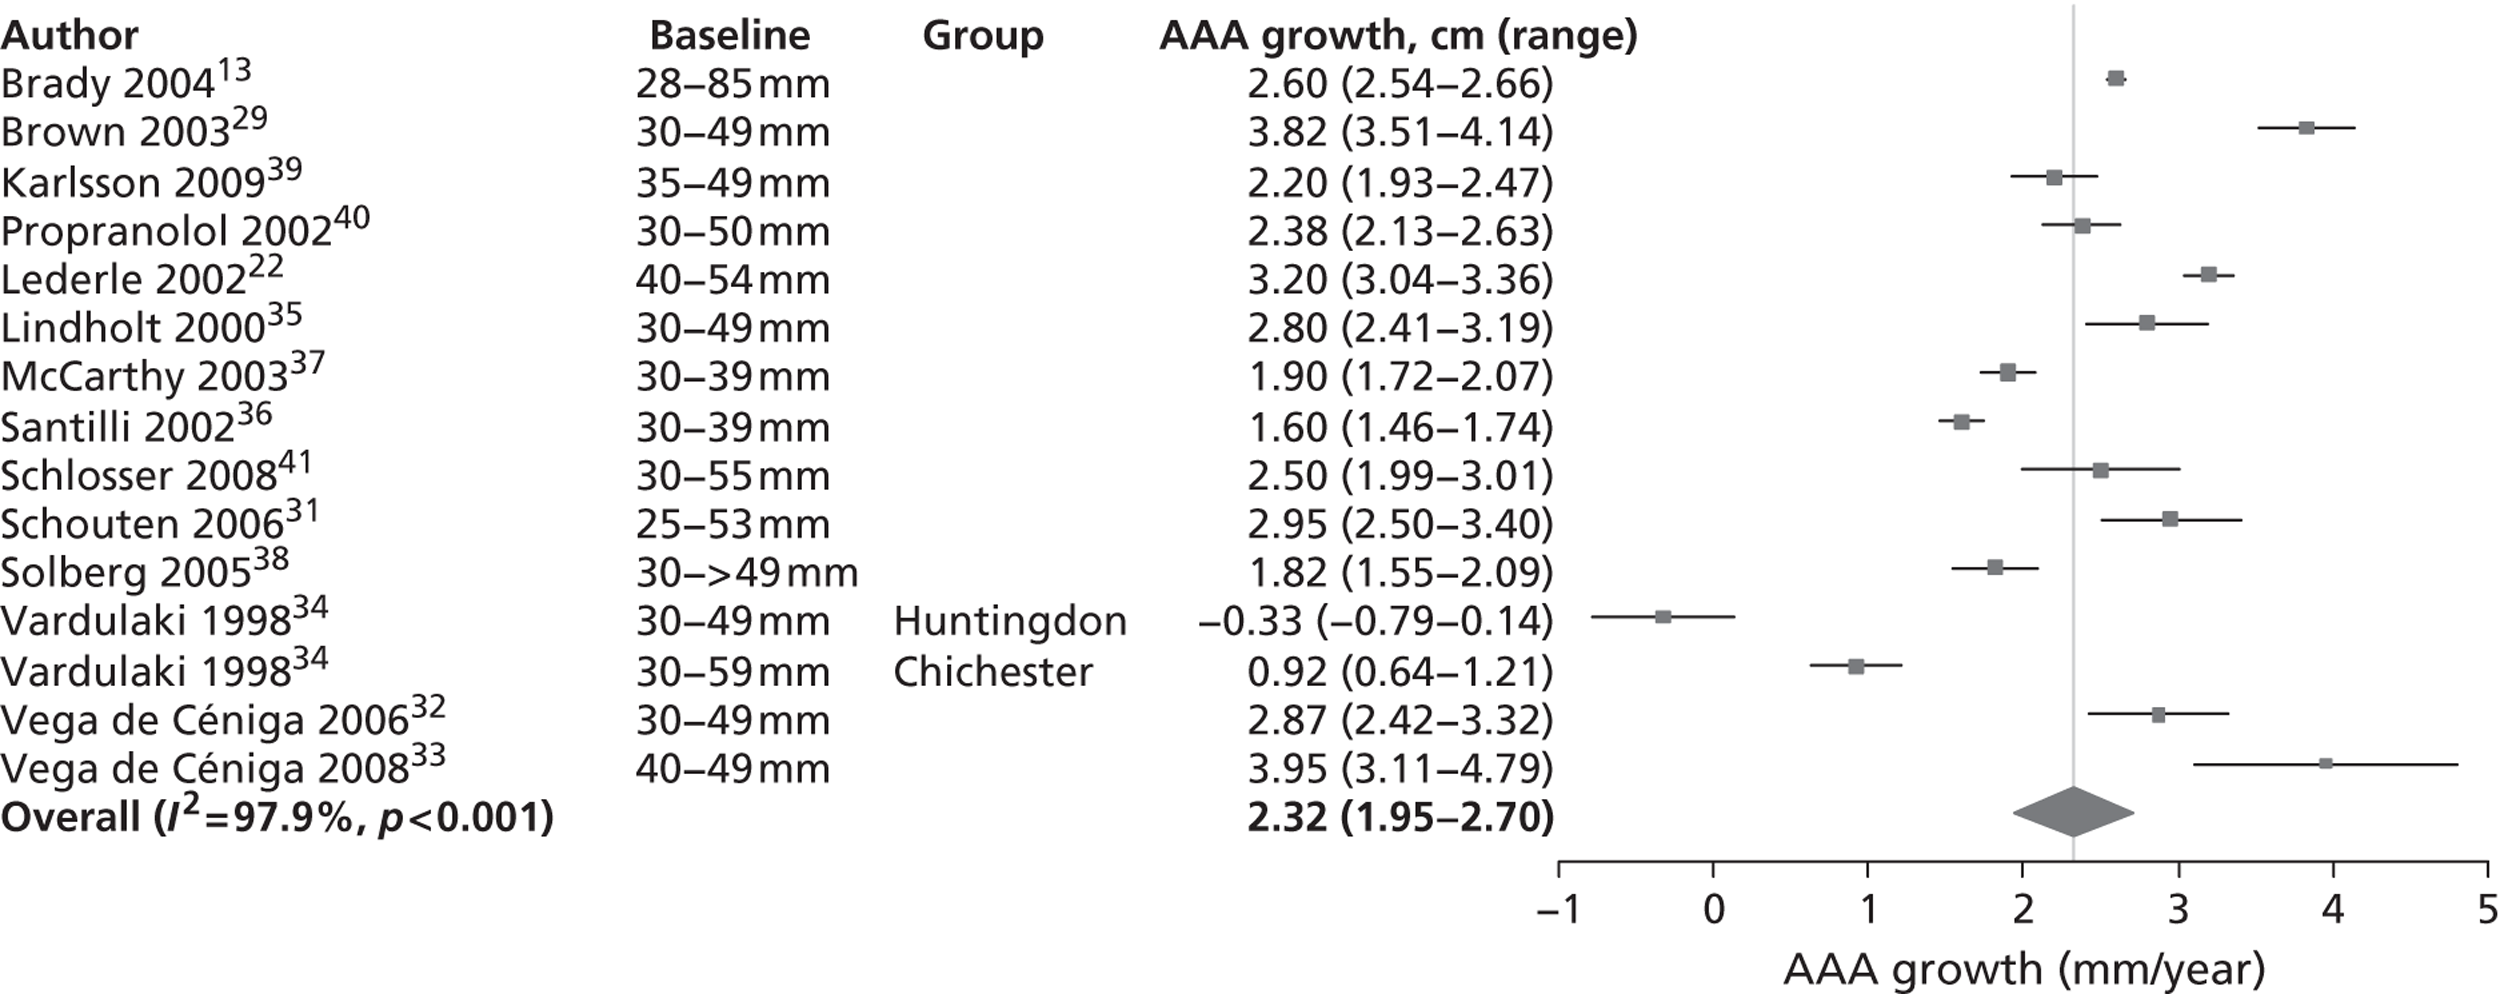
FIGURE 3.
Aneurysm growth rate by 5-mm size ranges of baseline aneurysm diameter: random-effect meta-analyses conducted within subgroups.
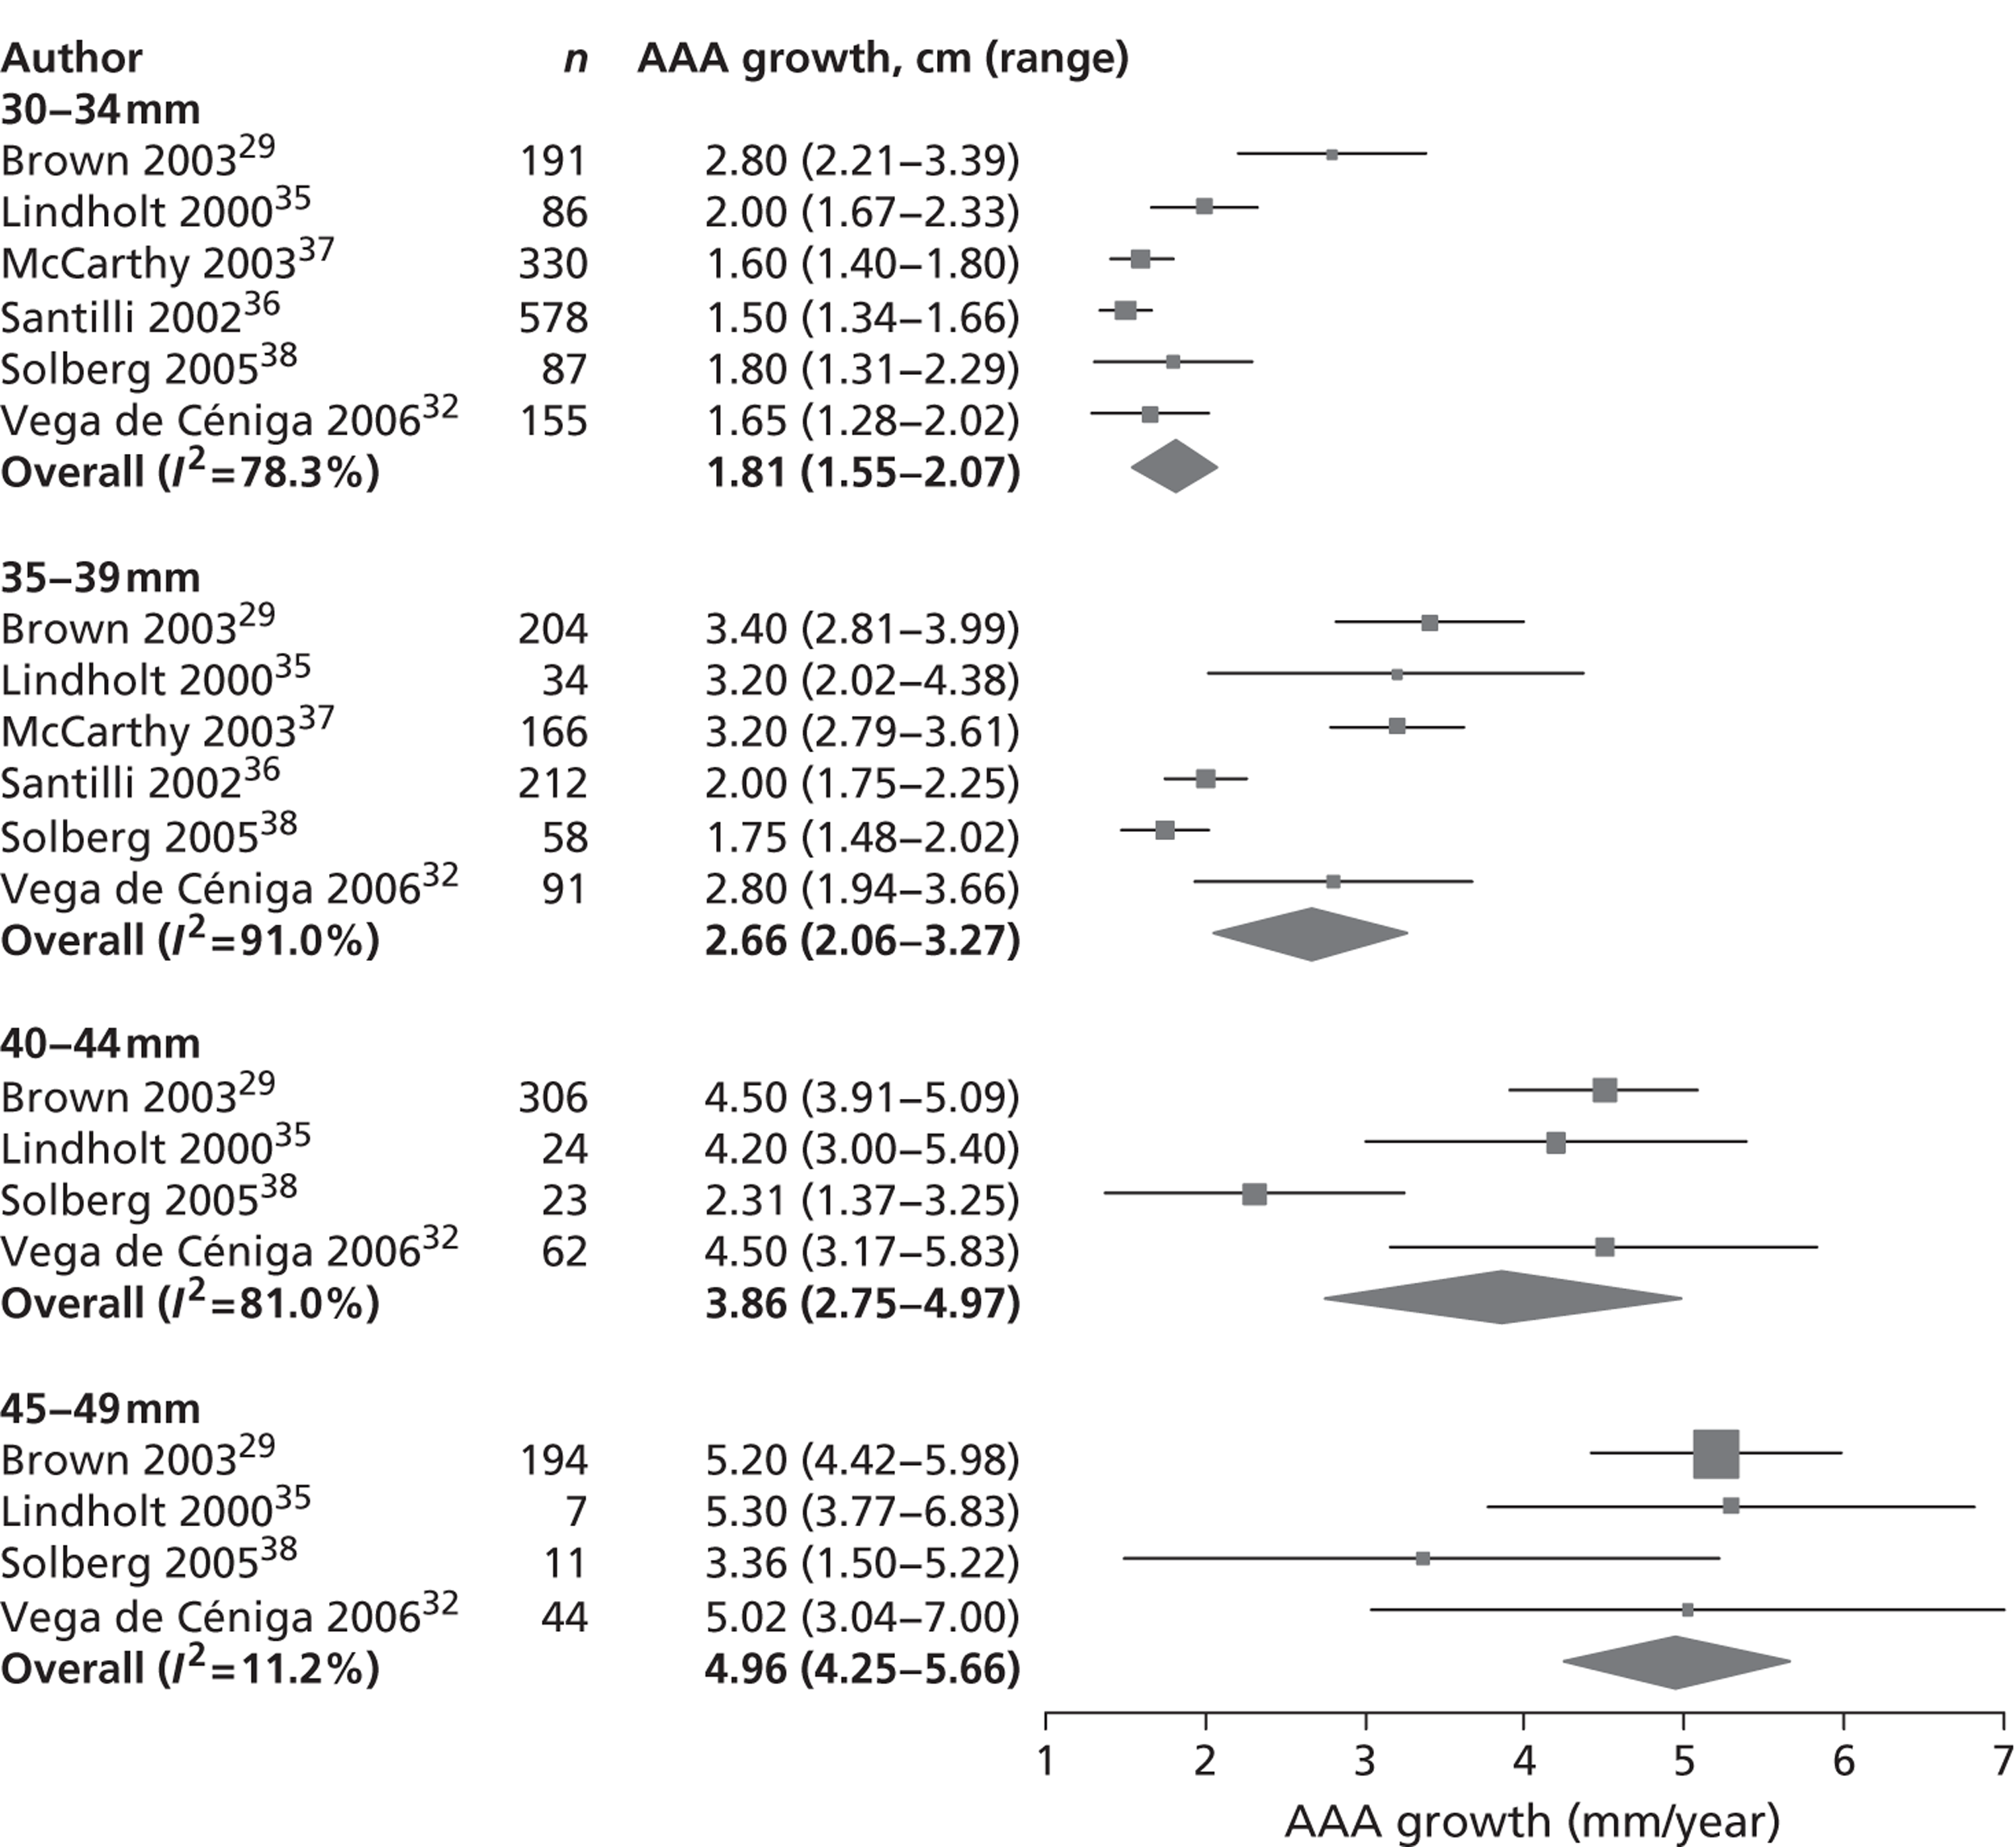
FIGURE 4.
Meta-regression of AAA growth rate estimates by AAA diameter. The overall regression line is shown by the solid bold line. The mid-point of the reported size range is used to calculate AAA diameter for range-specific estimates, whereas the mean baseline diameter is used for overall estimates. Estimates from the same study are joined by a dotted line. The circles have an area in proportion to the amount of information (inverse variance of the estimate).
| Author, year | Country, enrolment dates | Number of patients (women) | Aortic diameter measured [mean baseline diameter (mm)] | US/CT | Frequency of follow-up (intervention threshold, if specified) | Length of follow-up | Method of growth rate estimation and reporting | Baseline AAA size range(s) (mm) | Growth rates reported in mm/year (SE) |
|---|---|---|---|---|---|---|---|---|---|
| Brady et al., 200413 | UK, 1991–5 | 1743 (387) | Maximum external AP [43] | US | ≥ 50 mm: every 3 months; < 50 mm: every 6 months (5.5 cm) | 3312 person-years | Method: random-effects models (linear, quadratic) | Overall: 28–85 (n = 1743) | 2.6 (0.03) |
| Mean growth rates reported | |||||||||
| Brown et al., 200329 | Canada, 1976–2001 | 895 (207) | Not reported [40] | US (1976–82); CT (1983 onwards) | 6-monthly | 3088 person-years | Method: not reported | Overall: 30–49 (n = 895) | 3.8 (0.2) |
| Mean growth rates reported | 30–34 (n = 191) | 2.8 (0.3) | |||||||
| 35–39 (n = 204) | 3.4 (0.3) | ||||||||
| 40–44 (n = 306) | 4.5 (0.3) | ||||||||
| 45–49 (n = 194) | 5.2 (0.4) | ||||||||
| Karlsson et al., 200939 | Sweden, 2002–5 | 211 (50) | Wider of the external AP and transverse [40 in both groups] | US | 6-monthly | 18–36 months | Method: linear regression | Overall: 35–49 (n = 211) | 2.2 (0.1) |
| Median growth rates reported | |||||||||
| Propranolol Aneurysm Trial Investigators, 200240 | Canada, 1993–8 | 548 (87) | External AP [38 in both groups] | US | 6 months (5.0 or 5.5 cm by centre) | Mean 2.5 ± 1.1 years (range 0–4.5 years) | Method: unclear (last – first diameter)/time or linear regression | Overall: 30–50 (n = 531) [Growth rate only calculated for 531 patients] | 2.4 (0.1) |
| Mean growth rates reported | |||||||||
| Lederle et al., 200222 | USA, 1992–6 | 567 (2) | Maximal external cross-sectional in any plane [47] | US; CT (baseline and ≥ 53 mm) | Every 6 months | Mean 3.0 years | Method: (last – first diameter)/time | Overall: 40–54 (n = 567) | 3.2 (0.08) |
| Median growth rate reported | |||||||||
| Lindholt et al., 200035 | Denmark, 1994–8 | 151 (0) | Maximum external AP [mean diameter not reported] | US | Annually (5.0 cm) | 1–5 years | Method: (last – first diameter)/time | Overall: 30–49 (n = 151) | 2.8 (0.20) |
| Mean growth rate reported | |||||||||
| McCarthy et al., 200337 | UK, 1990–2002 | 496 (0) | Maximum AP | US | 26–39 mm: 12 months; > 40 mm: 6 months (5.5 cm) | Mean 4.2 (SD 2.4) years | Method: (last – first diameter)/time | Overall: 30–39 (n = 496) | 1.9 (0.1) |
| External A to internal P [34] | Median growth rate reported | ||||||||
| Santilli et al., 200236 | USA, 1990–6 | 790 (0) | Wider of external AP and lateral [33] | US | At least one further scan > 90 days after initial scan (5.5 cm) | 3071 person-years | Method: not reported | Overall: 30–39 (n = 790) | 1.6 (0.07) |
| Mean growth rates reported | 30–34 (n = 578) | 1.5 (0.08) | |||||||
| 35–39 (n = 212) | 2.0 (0.13) | ||||||||
| Schewe et al., 199430 | Germany, 1976–93 | 134 (not reported) | Mean of AP and transverse [37] | US | 6 months | 536 person-years (5.0 cm) | Method: (last – first diameter)/time | 30–39 (n = 69) | 2.3 (no SE) |
| Mean growth rates reported | 40–49 (n = 30) | 3.1 (no SE) | |||||||
| > 50 (n = 11) | 3.9 (no SE) | ||||||||
| Schlosser et al., 200841 | Holland, 1996–2005 | 147 (16) | AP diameter [39] | US | 30–39 mm: 12 months; 40–55 mm: 6 months (5.5 cm) | Median 3.3 years (range 0.5–11.1 years) | Method: linear regression | Overall: 30–55 (n = 147) | 2.5 (0.26) |
| 599 person-years | Mean growth rate reported | ||||||||
| Schouten et al., 200631 | Holland, 2002–5 | 150 (24) | Maximum external AP [38] | US | 6–12 months (5.0 cm) | Median 3.1 years | Method: linear regression | Overall: 25–53 (n = 150) | 2.95 (0.23) |
| Mean growth rate reported | |||||||||
| Solberg et al., 200538 | Norway, 1994–5 | 234 (49) | External transverse or AP [35] | US | Every 3 or 6 months | 1212 person-years | Method: linear regression | Overall: 30 to > 49 (n = 234) | 1.82 (0.14) |
| Mean growth rates reported | 30–34 (n = 87) | 1.80 (0.25) | |||||||
| 35–39 (n = 58) | 1.75 (0.14) | ||||||||
| 40–44 (n = 23) | 2.31 (0.48) | ||||||||
| 45–49 (n = 11) | 3.36 (0.95) | ||||||||
| > 49 (n = 9) | 2.63 (1.57) | ||||||||
| Vardulaki et al., 199834 | UK, Chichester 1983–96; Huntingdon 1991–6 | Chichester: 519 men and women; Huntingdon: 498 men (0 women) | In Chichester the wider of AP and transverse measurements | US | 3–12 months (Chichester: 6.0 cm initially; Huntingdon: 4.5 cm) | Chichester: mean 3.4 years | Method: random-effects model based on exponential growth | Chichester: | 0.9 (0.1) |
| External AP in Huntingdon [mean diameters not reported] | Huntingdon: mean 2.3 years | Percent change in growth rates reported | Overall: 30 to ≥ 50 (n = 519) | ||||||
| 30–39 | 0.7 (0.2) | ||||||||
| 40–49 | 1.5 (0.4) | ||||||||
| ≥ 50 | 3.5 (0.7) | ||||||||
| Huntingdon: | − 0.3 (0.2) | ||||||||
| Overall: 30–49 (n = 498) | |||||||||
| 30–39 | – 0.6 (0.3) | ||||||||
| 40–49 | 0.9 (0.6) | ||||||||
| aVega de Céniga et al., 200632 | Spain, 1988–2004 | 352 (19) | Wider of external AP and transverse [36] | US (for 30–39 mm); CT (for 40–49 mm) | Annually (group 30–39) | Overall mean 55.2 ± 37.4 months (range 6.3–200 months) | Method: (last – first diameter)/time | Overall: 30–49 (n = 352) | 2.87 (0.23) |
| 6-monthly (group 4.0–4.9) (5.0 cm) | Mean growth rates reported | ||||||||
| Vega de Céniga et al., 200833 | Spain 1998–2004 | 195 (12) | Wider of maximum external AP or transverse [42.5] | CT | 6 months (5.0 cm) | Mean 50 ± 36.4 months (range 6.5–194 months) | Method: (last – first diameter)/time | Overall: 40–49 (n = 195) | 3.95 (0.43) |
| Mean growth rate reported |
| Quality aspect | Brady et al., 200413 | Brown et al., 200329 | Karlsson et al., 200939 | Propranolol Aneurysm Trial Investigators, 200240 | Lederle et al., 200222 | Lindholt et al., 200035 | McCarthy et al., 200337 | Santilli et al., 200236 | Schewe et al., 199430 | Schlosser et al., 200841 | Schouten et al., 200631 | Solberg et al., 200538 | Vardulaki et al., 199834 | aVega de Céniga et al., 200632 | Vega de Céniga et al., 200833 | |
|---|---|---|---|---|---|---|---|---|---|---|---|---|---|---|---|---|
| C | H | |||||||||||||||
| After 1990 (image quality) | Y | N | Y | Y | Y | Y | Y | Y | N | Y | Y | Y | N | Y | N | Y |
| Standardisation of imaging | Y | N | Y | Y | N | Y | Y | N | N | N | N | N | N | N | N | N |
| Variability of diameter given | Y | N | N | Y | For CT only | Y | N | N | N | N | Y | N | N | N | N | N |
| Study type (P, R, PR) | P | PR | P | P | P | P | P | P | PR | P | R | P | P | P | PR | PR |
| Study type (RCT/obs) | RCT + obs | Obs | RCT | RCT | RCT | RCT + obs | Obs | Obs | Obs | Obs | Obs | Obs | Obs | Obs | Obs | Obs |
| Inclusion to obs comprehensive | N | Y | N | Y | N | N | Y | N | N | U | U | Y | Y | |||
| Intervention policy stated at start (diameter, cm) | Y (randomised at 4.0 or 5.5a) | N | N | Y (either 5 or 5.5) | Y (randomised at 4.0 or 5.5a) | Y (5.0) | Y (5.5) | Y (randomised at 4.0 or 5.5a) | Y (5.0) | Y (5.5) | Y (5.0) | N | Y (6.0, later 5.5) | Y (4.5) | Y (5.0) | Y (5.0) |
| Patient censorship defined | Y | N | Y | Y | Y | Y | Y | Y | N | Y | U | Y | Y | N | U | Y |
Systematic review and meta-analysis of small abdominal aortic aneurysm rupture rates
Identification of relevant studies
A total of 10,160 study titles were identified by the initial search strategy and, of these, 9951 titles were excluded (Figure 5). In the next step, a total of 209 potential abstracts were reviewed and 54 selected for further review of the full-text publication (155 were excluded). Of the 54 eligible full-text publications, 40 were excluded for the following reasons (see Appendix 2): (1) language (n = 3); (2) duplicated patients/data (n = 7); (3) modelling, no original data (n = 5); (4) person-years' follow-up not available (n = 21); (5) inaccurate diagnostic criteria of either aneurysm size or rupture (n = 3); (6) patient selection bias (n = 6); (7) ruptures in incorrect size range (n = 11); and (8) small studies (< 50 patients collected over more than 3 years) (n = 4). Some studies were excluded for more than one reason and some reasons were ascertained by author enquiry or after statistical review. A total of 14 eligible studies22,23,29,32,36,37,40–47 were identified for inclusion in the systematic narrative review and are shown in Table 4.
Study characteristics
The 14 included studies22,23,29,32,36,37,40–47 were published from 1991 to 2008 (with patients enrolled from 1976 to 2006); 11 of these were prospective studies22,23,29,32,36,37,40,41,43–45 (including four randomised trials), whereas the remaining three studies42,46,47 had both retrospective and prospective contributions. Only five of the studies had aneurysm rupture as a primary outcome measure23,41,43,45,46 and even in these studies the diagnostic criteria for aneurysm rupture were not reported. Overall, 9779 patients (8662 men, and 1117 women) were included, with study size ranging from 176 to 2257 patients and average length of follow-up ranging from 1.6 to 4.6 years. Most studies used US to monitor aortic diameter, but some studies used CT as well as US29,32,41,46,47 and one study also used magnetic resonance imaging. 47 Many studies included patients with aortas < 3.0 cm in diameter or with aneurysms > 5.5 cm in diameter and for many studies it was not clear if patients with aortas either < 3.0 cm or > 5.5 cm were included in the years of follow-up reported. Only one study44 unambiguously reported conditional follow-up for the diameter range of 3.0 to 5.5 cm, although this could be estimated in six further studies. 22,23,29,43,45,47 These seven studies comprised 5934 patients (86% male). 22,23,29,43–45,47 Many studies were more than 10 years old, so that requests to authors for further information met with little success.
The diagnostic criteria for aneurysm rupture were not reported in any study and methods for the ascertainment of rupture were reported in only two studies;22,23 only these studies and one other40 had any independent audit of deaths. One randomised trial22 reported 11 ruptures in the surveillance group; however, two cases were reported as being discovered at laparotomy for elective surgery (one as ‘a hole in the aortic wall covered by a thin layer of connective tissue’, the other as ‘a hole plugged by thrombus’), rather than findings made on pre-operative imaging. This information was reviewed independently by two professors of vascular surgery; in the absence of information about intramural or extramural haematoma, their decision was that these two cases should not be considered as ruptures for the purposes of this review. Causes of death other than from aneurysm rupture were often not collected systematically and were reported variably, which might have led to under-reporting of aneurysm rupture rates in several studies (only three studies had any independent review of causes of death22,23,41).
The mean or median age of patients was reported as between 65 and 75 years in most of the included studies,22,23,29,32,36,37,40–43,45,46 but age was not specified in two studies. 44,47 The majority of the studies included both sexes, although women were always in a minority. Three population-screening studies reported exclusively on male participants. 36,37,44 Details of the included studies (e.g. age, inclusion criteria, description of study follow-up and intervention policy, last diameter and time between last diameter and rupture) are summarised in Table 5.
Other characteristics, such as ethnicity, history of smoking, prevalence of diabetes, blood pressure and other clinical history, were not available for all studies.
Comparison of small aneurysm rupture rates
The seven studies reporting on aneurysms in the baseline diameter range of 3.0 to 5.5 cm, and with follow-up restricted to this range (conditional follow-up to 5.5 cm in diameter, larger aneurysms excluded), provided rupture rates estimated as varying from 0 to 1.61 ruptures per 100 person-years (Figure 6). The studies in the figure are sorted according to the mid-point of the diameter range and exhibit a slight trend towards higher rupture rates for larger diameters (for example, no ruptures were reported within 12 months of a measurement of < 4.0 cm). Nevertheless, the size range only partly explains the considerable heterogeneity between the rupture rate estimates, demonstrated by an I2 value of 89%. Two studies estimate the rupture rate to be greater than 1.0 rupture per 100 person-years,23,43 whereas the point estimates from the remaining five studies22,29,44,45,47 are all below 0.5 ruptures per 100 person-years. Owing to the large statistical and clinical heterogeneity, a formal synthesis of the results (meta-analysis) was not carried out.
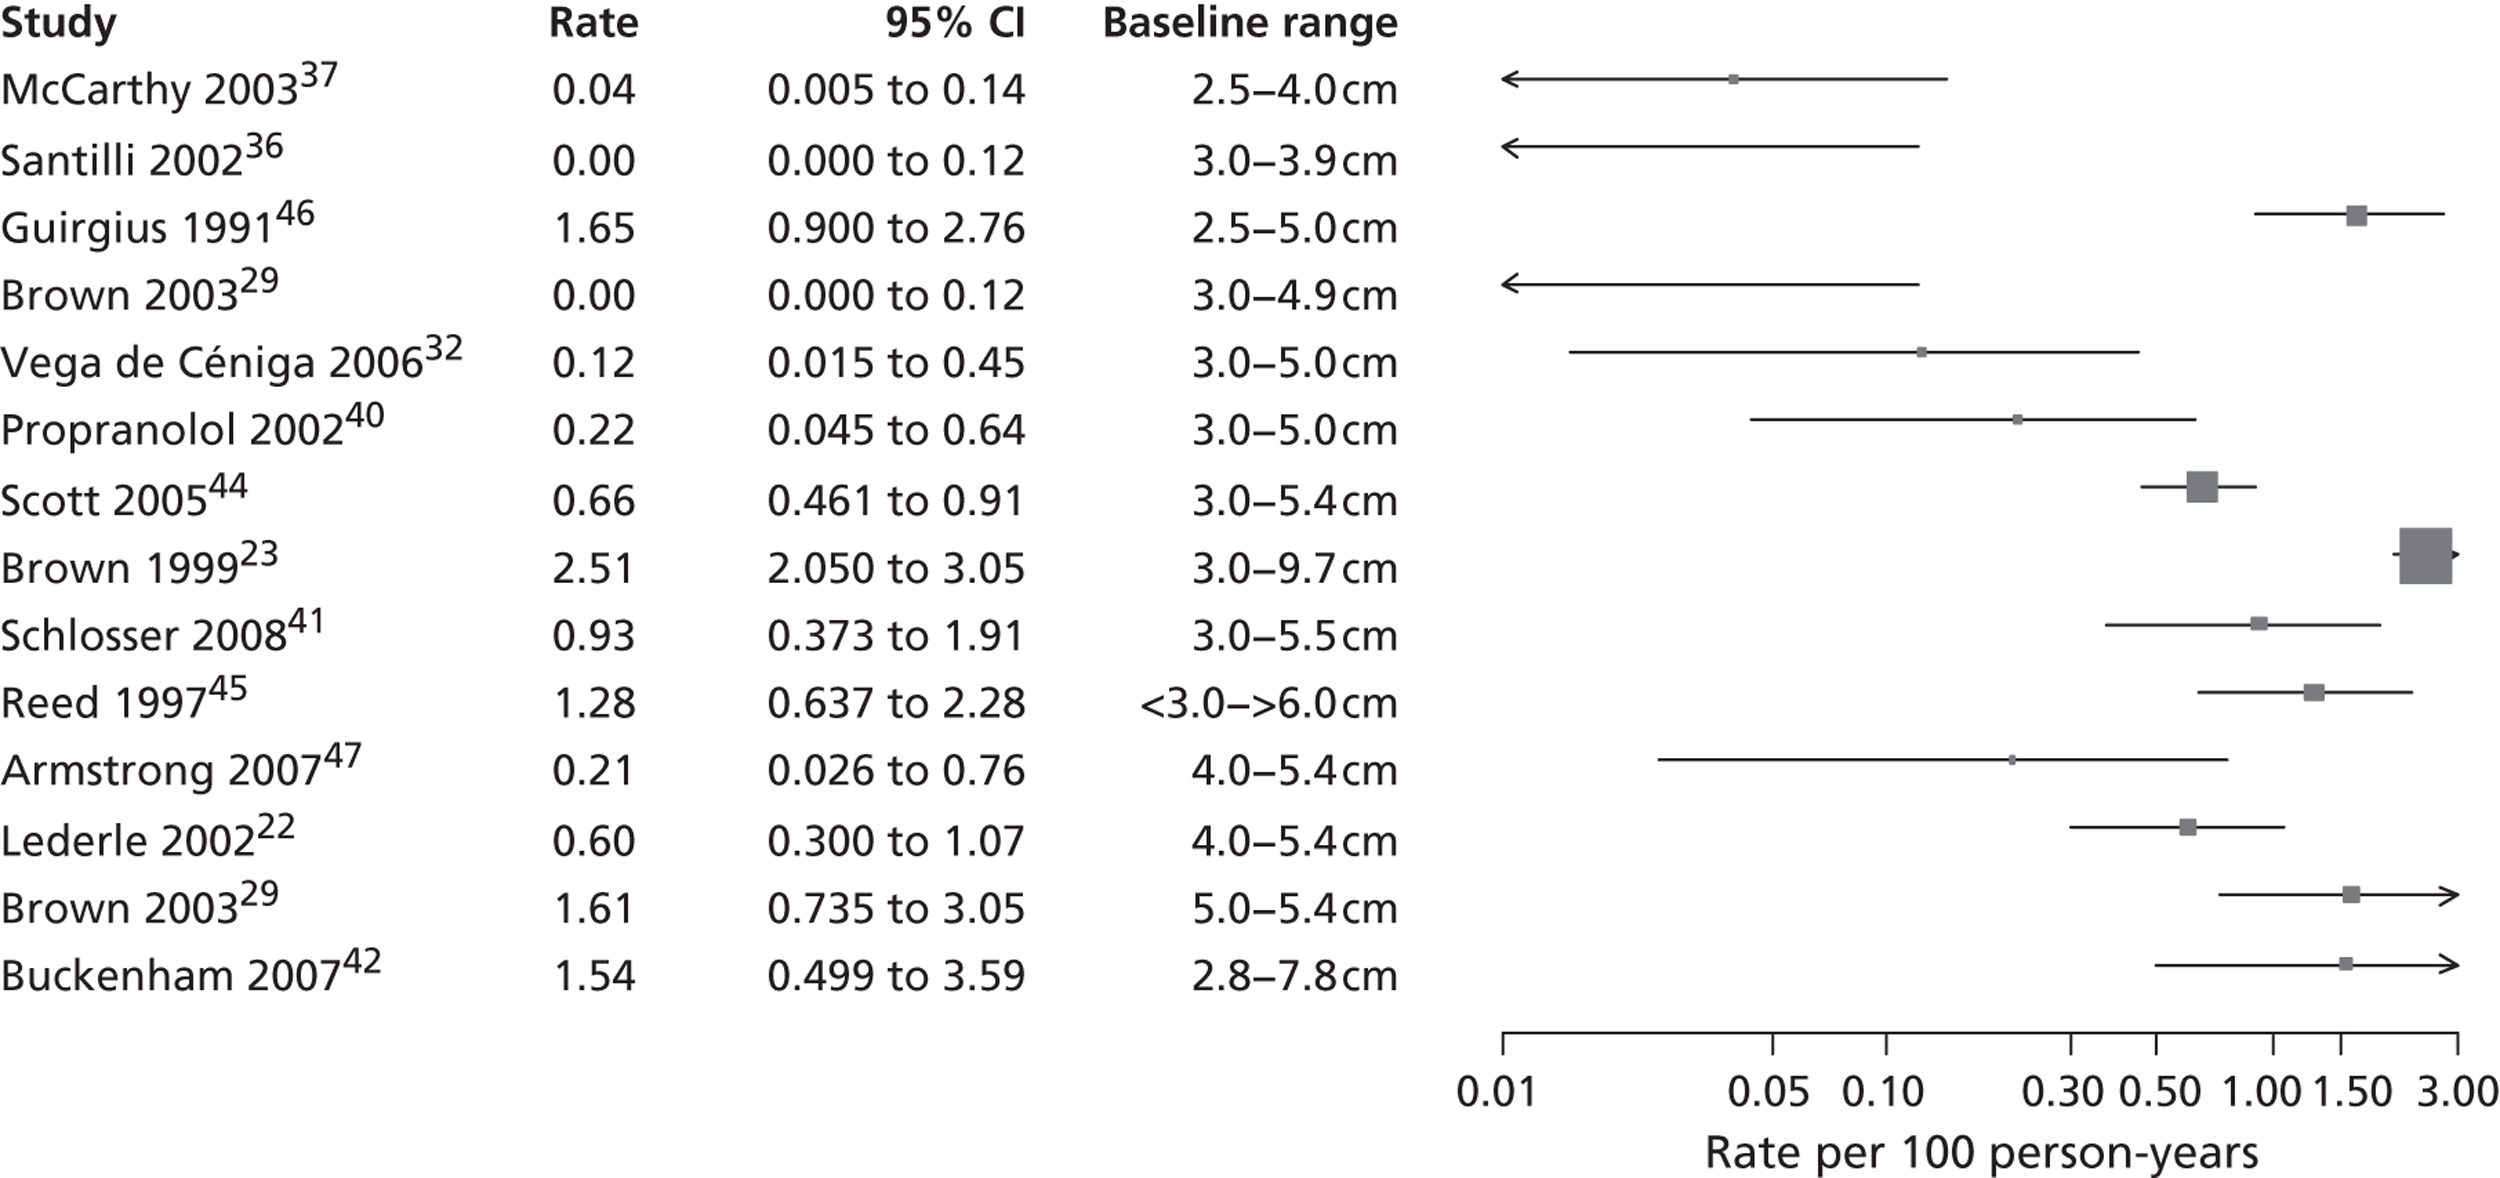
Rupture rates estimated from total reported ruptures and follow-up (including aneurysms > 5.5 cm) from all 14 studies22,23,29,32,36,37,40–47 (Figure 7) ranged from 0 to 2.51 ruptures per 100 person-years. In this figure, the studies are sorted according to the mid-point of the baseline diameter range. The between-study variation is even more extreme, with an I2 value of 96%.
The published information on rupture rates is thus inadequate for the detailed modelling needed to inform surveillance intervals. For this, IPD are necessary, as described in Chapters 5 and 6.
FIGURE 5.
Preferred Reporting Items for Systematic Reviews and Meta-Analyses flow diagram – small AAA rupture studies.
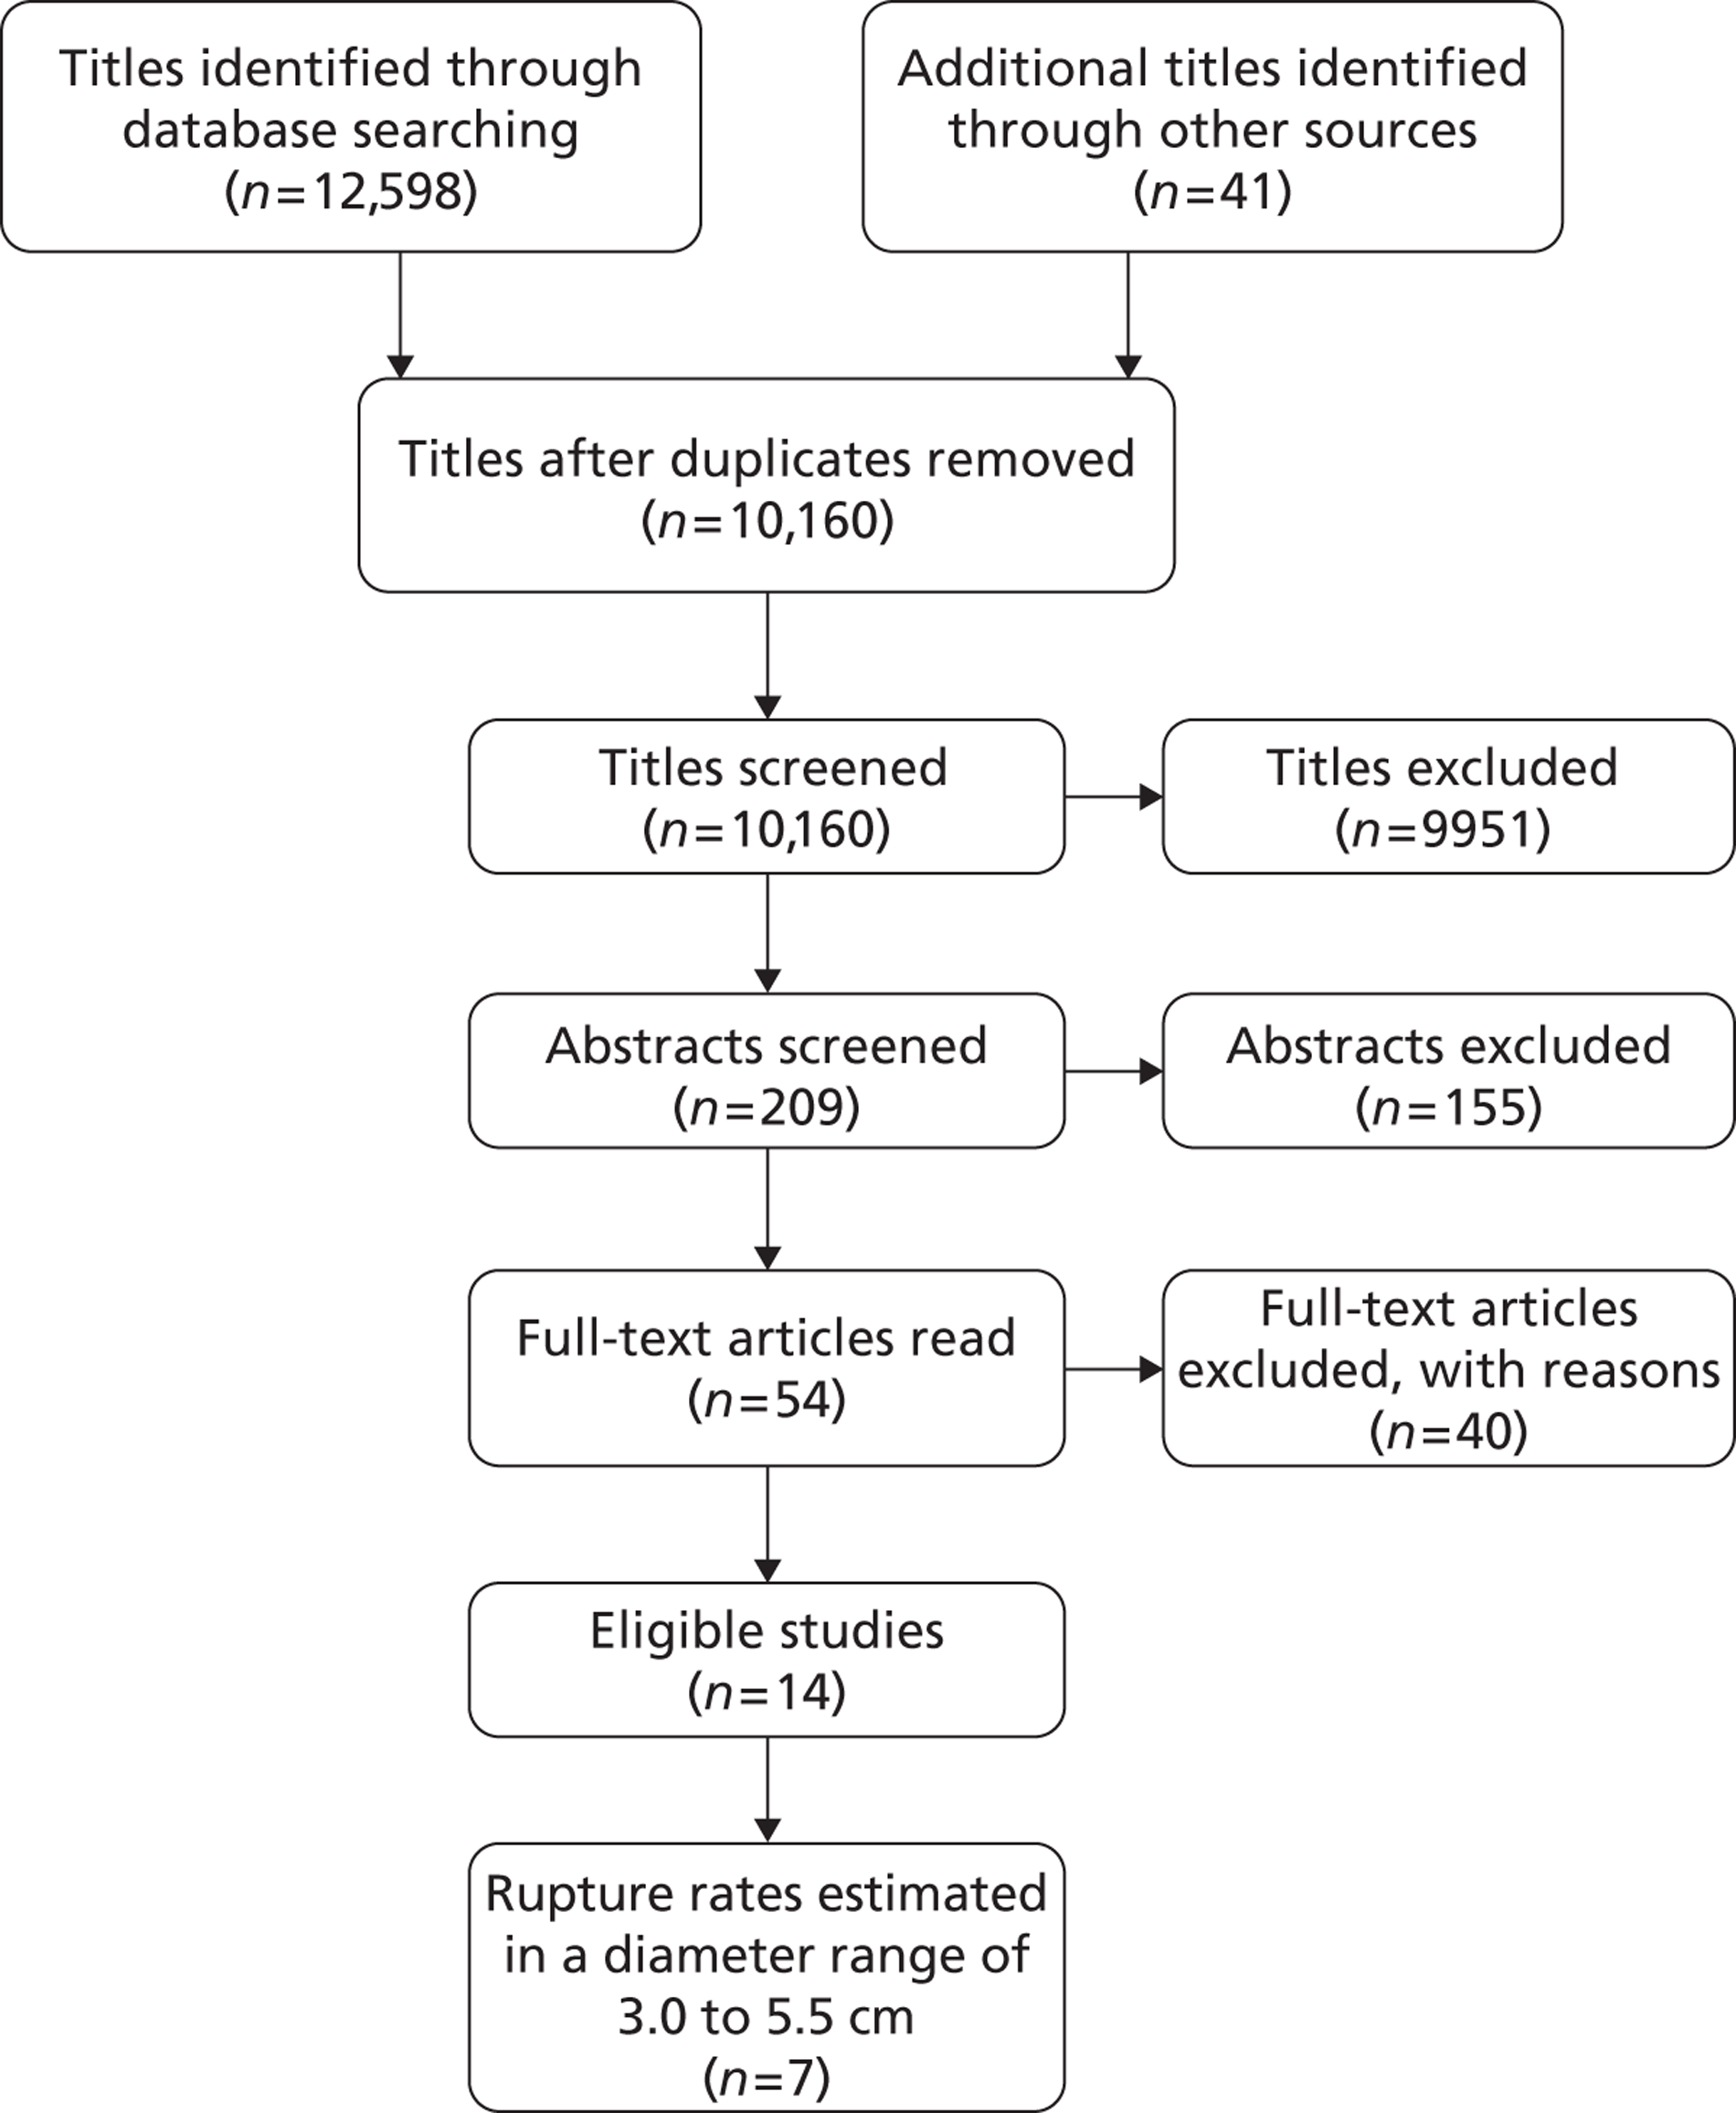
FIGURE 6.
Rupture rates (per 100 person-years) for small AAAs in each study, reporting conditional follow-up to 5.5-cm threshold, sorted by reported size range (total 5934 patients). Aneurysms reaching > 5.5 cm have been excluded. These studies are depicted in order of increasing aneurysm size range, but the distribution of diameters within these size ranges is not available.

FIGURE 7.
Total rupture rates (per 100 person-years) for small AAAs in each study, sorted by baseline diameter range (total 9779 patients). Including follow-up > 5.5 cm. These studies are depicted in order of increasing aneurysm baseline size range, but the distribution of diameters within these size ranges and over time is not available.
| Author, year and country | Total number of patients (women) [baseline AAA diameter] | Total ruptures per total person-years reported | Total small aneurysm ruptures per small aneurysm person-years [diameter range for subgroups] (fatal ruptures by 30 days) | Rate of small aneurysm ruptures per 100 person-years (95% CI) | Comments |
|---|---|---|---|---|---|
| Brown, 199923 | 2257 (465) [3.0–9.7 cm] | 103/4102 | 67/3215 [3.0–5.9 cm] | 2.08 (1.62 to 2.65) |
|
| UK | 27/2600 [3.0–4.9 cm] (fatal NR) | 1.04 (0.68 to 1.51) | |||
| 40/615 [5.0–5.9 cm] (fatal NR) | 6.50 (4.65 to 8.86) | ||||
| Buckenham, 200742 | 198 (50) [2.8–7.8 cm] | 5/325.05 | 3/unknown (3 fatal) | Unknown |
|
| New Zealand | |||||
| Brown, 200343 | 372 (99) [5.0–5.4 cm] | 9/560 | 9/560 [5.0–5.4 cm] (fatal NR) | 1.61 (0.73 to 3.05) | |
| Canada | |||||
| Scott, 200544 | 1333 (0) [3.0–5.4 cm] | 36/5465.3 | 12/3110.8 [3.0–5.4 cm] (fatal NR) | 0.39 (0.20 to 0.67) | |
| England | |||||
| Brown, 200329 | 895 (207) [3.0–4.9 cm] | 0/3088 | 0/3088 | 0.00 (0.00 to 0.12) |
|
| Canada | |||||
| Santilli, 200236 | 790 (0) [3.0–3.9 cm] | 0/3071.32 | 0/unknown | Unknown |
|
| USA | |||||
| Reed, 199745 | 176 (64–69) [< 3 to > 6 cm] | 11/862 | 1/333 [3.0–5.0 cm] (fatal NR) | 0.30 (0.01 to 1.67) |
|
| USA | |||||
| Guirgius, 199146 | 300 (89) [2.5–5.0 cm] | 14/850 | 2/unknown (fatal NR) | Unknown | |
| Canada | |||||
| Armstrong, 200747 | 334 (3) [4.0–5.4 cm] | 2/946 | 2/946 [4.0–5.4 cm] (1 fatal) | 0.21 (0.03 to 0.76) |
|
| USA | |||||
| Vega de Céniga, 200632 | 352 (19) [3.0–5.0 cm] | 2/1619 | 0/unknown | Unknown |
|
| Spain | |||||
| Propranolol Aneurysm Trial Investigators, 200240 | 552 (88) [3.0–5.0 cm] | At least 3/1380 | At least 2/unknown (< 5.5 cm fatal NR 2/3 total ruptures) | Unknown |
|
| Canada | |||||
| McCarthy, 200337 | 1423 (0) [2.5–4.0 cm] | 2/5045 | 2/unknown (2 fatal) | Unknown |
|
| England | |||||
| Lederle, 200222 | 567 (5) [4.0–5.4 cm] surveillance group only | 11/1833 | 9/1833 [4.0–5.4 cm] (8 fatal) | 0.49 (0.22 to 0.93) |
|
| USA | |||||
| Schlosser, 200841 | 230 (23) [3.0–5.5 cm] | 7/755 | 6/unknown (< 5.5 cm fatal NR; 6/7 total ruptures) | Unknown | |
| Netherlands |
| Author, year and type of study (R, P, PR) | Inclusion criteria (aortic diameter ranges) | Age (years) of participants (mean) | Surveillance policy | Intervention policya | Ascertainment of rupture described? | Time between last diameter and rupture reported? | Rupture rates as published |
|---|---|---|---|---|---|---|---|
| Brown and Powell, 199923 | AAA >3 cm (3.0–3.9; 4.0–5.5; 5.6–9.7 cm) | 70 | US | > 5.5 cm | Yes | Yes | Annual rupture rate: 2.2% (95% CI 1.7% to 2.8%); large and small aneurysms |
| P | 4–4.9 cm: 6 months | ||||||
| 5–5.5 cm: 3 months | |||||||
| Buckenham et al., 200742 | AAA 3–5.5 cm; fit for surgery (2.8–7.8 cm) | 73 (median) | US, varied with sex and size | Men > 5.5 cm | No | No | NR |
| PR | Women > 5.0 cm | ||||||
| Brown et al., 200343 | AAA 5–5.9 cm; unfit for surgery | 73 | US, 6-monthly | All patients unfit for surgery | No | No | 1% per year (men); 3.9% per year (women); large and small aneurysms |
| P | |||||||
| Scott et al., 200544 | AAA 3–5.5 cm; men aged 65–74 years | NR | US | 5.5 cm | No | No | 36 per 1000 person-years (95% CI 15 to 75 per 1000 person-years) for those with an AAA > 5.5 cm at recall |
| P | 3–4.4 cm: yearly | ||||||
| 4.5–5.4 cm: 3-monthly | |||||||
| Brown et al., 200329 | AAA 3.0–5.0 cm | 69 | US, CT, 6-monthly | NR | No | NR | No ruptures |
| P | |||||||
| Santilli et al., 200236 | AAA 3–3.9 cm | 69 | US, variable | NR | No | NR | No ruptures |
| P | |||||||
| Reed et al., 199745 | AAA not for surgery (< 3 to > 8 cm) | 74 | US, NR | NR | Yes | Yes | By last diameter: 3–3.99 cm: 0 ruptures per PY; 4–4.99 cm: 0.007 ruptures per PY; 5–5.99 cm: 0.11 ruptures per PY |
| P | |||||||
| Guirgius and Barber, 199146 | AAA initially managed non-operatively (2.5–9.3 cm) | 70 | US, CT, 6-monthly | NR | No | No | NR |
| PR | |||||||
| Armstrong et al., 200747 | AAA 4–5.4 cm | NR | US, CT, MRI | > 5.4 cm | No | No | Cumulative incidence only reported |
| PR | 3–4 cm: yearly | ||||||
| 4–5.4 cm: biannually | |||||||
| Vega de Céniga et al., 200632 | AAA 3–4.9 cm | 71 | US: yearly if < 4 cm | > 5.0 cm | No | No | NR |
| P | CT: every 6 months | ||||||
| Propranolol Aneurysm Trial Investigators, 200240 | AAA 3–5.0 cm; no contraindications to propranolol | 69 | US, 6-monthly | Variable, > 4.5 cm or > 5.0 cm by centre | No | No | NR |
| P | |||||||
| MaCarthy et al., 200337 | AAA 2.6–3.9 cm | 65 | US | > 5.5 cm | No | Yes | 2-year rupture rate: 1.4% (3.5–3.9-cm group), 0% at 3 years for smaller aortas |
| P | 2.6–3.9 cm: yearly | ||||||
| 4.0 cm: 6-monthly | |||||||
| Lederle et al., 200222 | AAA 4–5.4 cm; randomised to surveillance | 68 | US, 6-monthly | > 5.4 cm | Yes | No | < 0.6% per year of follow-up of unrepaired aneurysms |
| P | |||||||
| Schlosser et al., 200841 | AAA 3–5.5 cm | 66 | US | > 5.5 cm | No | No | 0.9% per PY, including aneurysms > 5.5 cm |
| P | 3–3.9 cm: yearly | ||||||
| 4–5.5 cm: 6-monthly |
Chapter 5 Methods for individual patient data analysis of existing surveillance data
As revealed by the literature reviews (see Chapters 3 and 4), published data were insufficient for the detailed modelling of small AAA growth rates and rupture rates necessary to better inform surveillance intervals. Therefore, IPD were sought for this purpose. This chapter describes the methods used and Chapter 6 provides the results.
In addition, surveillance intervals should be chosen to control to acceptable limits the risk of a small AAA reaching 5.5 cm, or of rupture, before the next scan. Such acceptable limits were informed by a focus group that we organised and which is also described in this chapter.
Data collection
Under the name of the RESCAN Collaboration, requests for IPD were addressed to the corresponding authors of 25 studies, each including more than 100 patients with small AAAs (3.0–5.5 cm in diameter) in a surveillance programme. Data sets for potential inclusion had been identified through a systematic literature search up to the end of 2009, as described in Chapters 3 and 4, and manual searching of abstracts from vascular surgical meetings during the interval 2007–10. Additional studies published up to September 2012 are discussed in Chapter 9.
The items requested included patient age, sex, sequential aneurysm diameters, ethnicity, smoking history, body mass index (BMI), presence of diabetes, dates of aneurysm repair, aneurysm rupture or death. The method used for US AAA diameter assessment was recorded for each study as internal (inner to inner luminal surface) or external (outer to outer aortic wall). A few studies used CT scans for some AAA measurements. Supplementary information for baseline histories of medication use, coronary and peripheral arterial disease as well as blood pressure was requested, if available. To allow for changing environmental factors (e.g. smoking), improvements in imaging quality as well as improving cardioprotective drug therapy, we also included year of patient enrolment as a variable. Additional information regarding AAA rupture (including death due to rupture), operative AAA repair and non-AAA death was collected for each patient where this was available. The definition of aneurysm rupture was pragmatic, based on locally used definition and reporting.
The RESCAN collaborators provided data for 18 studies, which were then subject to cleaning through an iterative process of correspondence with the study investigators to improve data quality, prior to the harmonisation of the data sets. All data sets were anonymised and, therefore, the study was subject to an ethical waiver.
For each individual, the baseline measurement was defined as the first measurement recorded between 3.0 and 5.4 cm. Measurements taken prior to a patient reaching a threshold of 3.0 cm were removed from the data sets. All data following baseline measurement were used until either a rupture event or censoring occurred. Censoring was defined as the first occurrence of: (1) a diameter measurement ≥ 5.5 cm (with this measurement included in the data set to properly account for informative dropout);17 (2) non-rupture-related death; (3) an elective AAA operation; or (4) the administrative censoring date of the data set. A patient's series of measurements was not censored if the aneurysm diameter dropped to < 3.0 cm, thus allowing some patients to have negative growth rates.
Focus group
In order to determine the level of risk of rupture or progression to 5.5 cm that would be acceptable to patients with small AAA, we conducted a patient focus group meeting. Men with small AAAs under surveillance in the Leicestershire AAA Surveillance Programme were invited to attend a meeting with a consultant vascular surgeon (MJ Bown) after verbal and written information about the RESCAN project was provided. A further explanation of the aims of the RESCAN project and its potential outcomes was given to the patients who attended the meeting prior to discussing the specific points below. Although the main aim of this focus group was to determine what risk of rupture and what risk of progression to a size threshold of 5.5 cm was acceptable to patients, a number of other issues relating to the surveillance of small AAA were discussed and these results are included below. The issues directly discussed were the acceptability of different intervals between surveillance scans, whether or not surveillance should be personalised, what factors patients think would improve surveillance, and what risks of rupture/progression were acceptable.
Surveillance intervals
The patients identified that the opinion of their surgeon was the most important factor that should influence the interval between surveillance scans. The patients expressed a wish to have surveillance intervals personalised depending on previous scan results and that any known factors influencing AAA growth should be taken into account when deciding surveillance intervals on an individual basis. The patients stated that sudden increases in AAA growth should mandate an expedited follow-up scan before their next scheduled scan and that AAA sizes of > 5 cm should also result in more frequent surveillance. The patients could not agree on a suitable time interval for such ‘early recall’ scans but felt that their surgeon should decide on the interval on an individual basis, taking absolute AAA size and rate of growth into account. The group stated that for the purposes of surveillance programmes (where vascular surgeons may not be directly involved in the decision-making process), the intervals between scans in the event of rapid growth should be standardised in a protocol to be followed by the surveillance programme.
Personalised surveillance
The group agreed that there was not enough evidence to base surveillance intervals on factors such as diabetes and smoking habits (summary data from a RESCAN publication48 were presented to the group). It was noted that there were no smokers in the group. However, the patients felt that size should not be the only guiding factor in the timing of scans, and that other factors should also be considered if there proved to be good evidence for these factors in the future.
Improving surveillance
The focus group participants stated that too much information is given to them in verbal format at the time of surveillance scans. The group felt that a personal written record would be informative for some, even though it might not be practically useful to the patient directly. Participants agreed that they wish to know the AAA measurement at the time of the scan and, also, what the implications of that measurement are. The group felt that this information could be formulated into a booklet that could include their personal measurements.
Acceptable risks of reaching 5.5 cm between surveillance scans
In order to determine the acceptable risk of attaining an AAA measurement of 5.5 cm between surveillance scans, the patients were asked what chance of reaching a threshold size of 5.5 cm was acceptable. There was a mixed response from the group in response to this. All patients agreed that there was always some risk of reaching 5.5 cm at the time of his or her next scan. All present agreed that a risk of up to 10% was acceptable, with some stating that this chance could even be as high as 20%. The patients pointed out that reaching a size of 5.5 cm was the threshold for referral to a vascular surgeon for consideration of surgery rather than being a size where surgery had to be performed. The patients stated that if they were not aware of this then the acceptable risk of reaching 5.5 cm would be likely to be much lower. The group stated that the general public, uneducated about aneurysmal disease, may say that no risk is acceptable, regardless of cost.
Acceptable risks of abdominal aortic aneurysm rupture between surveillance scans
The risk of AAA rupture before the next surveillance scan was discussed. Some patients felt that some risk of rupture was unavoidable as they recognised that even small AAAs can rupture. This section of the group felt that the risk should be < 2–3%. Some members of the group felt that there would be no point in participating in a surveillance programme unless the risk of rupture could be reduced to < 1%. All present felt that a surveillance interval that resulted in a 5% risk of rupture by the time of their next scan would be unacceptable.
Conclusion
This patient focus group indicated that patient experiences of AAA surveillance are generally positive. Patient satisfaction may be improved through more use of written information or individual patient-held records, but this would need to be determined in a larger patient group before widespread adoption. All patients stated that a 10% risk of reaching an AAA size of 5.5 cm between surveillance scans, and a 1% risk of rupture between scans, were acceptable. These risk thresholds (10% risk of expansion to 5.5 cm and 1% risk of rupture) were therefore used in the analyses of the IPD data sets, as described below.
Statistical methods
Full details of the statistical methods are provided in Appendix 3. A summary is given here.
Growth rates
Each study was analysed separately. Linear random-effects models were used, since linear and quadratic models had previously been shown to provide similar predictions over the period required to assess AAA surveillance intervals. 17 This method allows for individual variation in baseline diameters and growth rates, modelled as correlated random effects from a bivariate normal distribution, and independently normally distributed within-person variation (measurement error). Where both US and CT scans had been used to measure AAA diameter within the same study, an additive adjustment to the CT measurements was estimated within the analysis noting that scanning modality did not affect the estimated rate of growth. 48 Growth rates were estimated separately for men and women, through the inclusion of an interaction term. Results are primarily shown for men alone since this is the usual population of interest for AAA screening programmes.
Rupture rates
A joint model of AAA rupture and growth was employed. 49 The longitudinal AAA diameter measurements were fitted using a linear random-effects growth model as above, while a proportional hazards model with constant baseline hazard was used for the time-to-event rupture data. A log-linear effect of underlying diameter on risk of rupture was assumed. At least two ruptures per study were required to fit these models. An effect of sex on risk of rupture was included for studies that recruited both sexes.
Meta-analysis of growth and rupture rates
The following quantities were estimated from the growth and rupture models for each study: (1) mean growth rate given a baseline AAA diameter; (2) time taken to reach a 10% chance (as indicated by the focus group) of crossing the threshold for surgery (5.5 cm) given a baseline diameter; (3) the risk of rupture given underlying AAA diameter; and (4) the time taken to reach a 1% chance (as indicated by the focus group) of rupture given an underlying diameter. These outcomes were calculated for patients with an AAA between 3.0 and 5.4 cm, at 0.1 cm intervals, ignoring the risk of competing mortality from non-AAA causes of death. The estimates from each study were combined using random-effects meta-analysis,25 and overall means, 95% CIs and 95% prediction intervals for each AAA diameter were calculated. Ninety-five per cent prediction intervals give the range of values between which values in a new study, similar to those in the data set, would be expected to lie. 50 Between-study heterogeneity was assessed using the I2 measure,26 which indicates the percentage of total variation across studies that is due to heterogeneity rather than chance.
Predictors of growth
Each predictor of growth was considered in a quadratic random-effects model through the inclusion of a main effect and an interaction term with the linear component of time, thus allowing an assessment of the effect on the growth rate. Indicator variables were used for binary covariates, whereas other covariates were considered as continuous variables. To allow studies that recorded both US and CT measurements to be included, a dummy variable was added to distinguish between the two modalities. The effect of modality on both the overall size and the growth rate was investigated. Both univariate and multivariate (adjusted) analyses were considered for each predictor variable. The multivariate model adjusted for baseline age, calendar year, sex, smoking, diabetes, mean arterial blood pressure/pulse pressure, history of cardiovascular disease, and additionally any recorded use of angiotensin-converting enzyme (ACE) inhibitors, beta blockers, calcium channel blockers, statins or lipid-lowering drugs, and antiplatelet agents. The use of these drugs was generally recorded only at entry into each study. History of cardiovascular disease included angina, myocardial infarction, cardiac revascularisation, transient ischaemic attack, stroke and peripheral arterial disease. Studies that did not collect all these covariates were adjusted for as many covariates in the list as possible. Patients who had missing data on any of their study's covariates were excluded in the multivariate analyses.
Predictors of rupture
Cox regression models were used to assess the effect of each predictor variable on the risk of rupture in each study. All analyses were adjusted for AAA diameter, which was entered as a time-varying covariate. Owing to the small number of ruptures in each study, some covariate effects were not estimable.
Meta-analysis of effects of predictors
The parameter estimates and SEs were extracted from the above analyses for each study. Estimates for each predictor variable were pooled across all studies that provided an estimate, using random-effects meta-analysis as above.
Chapter 6 Results of individual patient data analysis of existing surveillance data
Study characteristics
Individual patient data were obtained from 18 different studies from Europe, Canada, the USA and Australia, with patients being admitted to these studies between 1983 and 2008; a summary of these studies is given in Table 6. A total of 15,475 patients are included, with an average of 4617 AAA measurements and 4.0 years of follow-up per study (Table 7). Not all patient demographics were available from all studies, and in some studies the data were incomplete for some individuals. Ethnicity was poorly reported. Baseline drug history was fully available in seven studies (see Table 7). Prevalence of drug use varied considerably between these studies (ACE inhibitors 9–41%, beta blockers 14–52%, calcium channel blockers 12–28%, statins/lipid-lowering drugs 0–78%, antiplatelet agents 27–94%). Data were not available from two randomised controlled trials (RCTs) and five other studies with a total of 2487 persons (see Appendix 3).
Study-specific thresholds for surgical intervention varied from 4.5 cm up to 6.0 cm (see Table 6). The majority of studies measured external (outer-to-outer) wall diameters, although three studies10,37,53 measured internal diameters. Rupture and censoring events were recorded in 14 out of the 18 studies allowing rupture rates to be investigated. The remaining four studies were used in the growth analysis only (see Table 6).
Four studies, Leeds (Professor D Julian A Scott, University of Leeds, 2010–12, personal communication), PIVOTAL,51 Galdakao32 and Stirling (Mr Richard Holdsworth, Stirling Royal Infirmary, 2010–12, personal communication), measured diameters using both US and CT scans. CT measurements were on average significantly larger than US measurements [Leeds 3.91 mm (SE 0.33 mm), PIVOTAL 1.75 mm (SE 0.21 mm), Galdakao 1.77 mm (SE 0.10 mm), Stirling 2.46 mm (SE 0.27 mm)]. However, there was no evidence of an effect of modality on estimated growth rates (i.e. a CT measurement was found to be larger than an US measurement throughout follow-up by a constant amount). Therefore, within each study an additive adjustment could be applied so that all measurements were included in the analysis of growth rates.
Small abdominal aortic aneurysm growth rates in men
The overall pooled estimates of AAA growth in men increased by about 0.5 mm/year for each 0.5-cm increase in baseline AAA diameter (Figures 8 and 9). The average estimated growth rate in men was 1.3 mm/year (95% CI 1.0 mm/year to 1.5 mm/year) for a 3.0-cm aneurysm and 3.6 mm/year (95% CI 3.3 mm/year to 3.9 mm/year) for a 5.0-cm aneurysm (Table 8). However, there was also substantial heterogeneity in growth rates between studies, so the 95% prediction intervals were wide. Much of this heterogeneity is unexplained. Although smokers and non-diabetics have higher rates of growth (see Predictors of abdominal aortic aneurysm growth rates), these factors did not explain the heterogeneity between studies: adjusting for baseline AAA diameter, smoking and diabetes only reduced the overall percentage of variation due to heterogeneity from 97.5% to 94.1%. Excluding the three studies (Chichester,53 Gloucestershire37 and MASS10) that measured internal diameters, the pooled mean growth rates decreased by between 0.10 mm/year and 0.13 mm/year, depending on baseline diameter, but the percentage of variation due to heterogeneity only decreased by between 1.5% and 3.3%.
The length of time taken for men under surveillance to have a 10% chance of reaching the threshold size of 5.5 cm decreased substantially with baseline AAA diameter (Figure 10). For men with a 3.0-cm aneurysm, the estimated mean time taken to have a 10% chance of reaching 5.5 cm was 7.4 years (95% CI 6.7 years to 8.1 years). The corresponding mean times for 4.0-cm and 5.0-cm aneurysms were 3.2 years (95% CI 3.0 years to 3.4 years) and 0.7 years (95% CI 0.6 years to 0.8 years), respectively (see Table 8). Again, the prediction intervals were substantially wider than the CIs because of the heterogeneity between studies.
Small abdominal aortic aneurysm rupture rates in men
Overall the number of ruptures was small, with 178 reported events among 11,262 men under surveillance and 50 among 1314 women. Crude rupture rates in men in each study varied between 0 and 0.77 ruptures per 100 person-years (see Table 6). There were 12 studies with at least two ruptures available to assess the relationship between rupture rates and AAA diameter in men, and five studies in women (see Table 6). Rupture rates in men increased with baseline AAA diameter, approximately doubling for every 0.5-cm increase (Figures 11 and 12). The average rupture rates were 0.05 per 100 person-years (95% CI 0.03 to 0.07 per 100 person-years) for a 3.0-cm AAA and 0.64 (95% CI 0.43 to 0.95 per 100 person-years) for a 5.0-cm AAA. The degree of heterogeneity between studies also increased with baseline AAA diameter; I2 ranged from 0% to 82% for diameters 3.0–5.4 cm. It was not possible to investigate the cause of this heterogeneity, due primarily to the small number of ruptures observed in each study making multivariate modelling infeasible. The time taken for men under surveillance to reach a rupture risk of 1% decreased with baseline AAA diameter (Figure 13). For AAA diameters in the range 3.0–4.5 cm the average time to reach a rupture risk of 1% was more than 2 years (see Table 8). For a 5.0-cm AAA, a 1% risk of rupture was reached on average in 1.4 years (95% CI 1.2 years to 1.8 years).
Small abdominal aortic aneurysm growth and rupture rates in women
The dependence of growth and rupture rates on AAA diameter was very similar in women and men (Figures 14 and 15 compared with Figures 8 and 11). Heterogeneity between studies was slightly less for women. Although absolute growth rates were similar for women and men (particularly for larger baseline AAA diameters), there were marked differences in the absolute risks of rupture. Women had about a fourfold greater rupture risk for all AAA sizes (see Predictors of abdominal aortic aneurysm growth rates), and reached a rupture risk of > 1% in a much shorter time than men (see Table 8).
Predictors of small abdominal aortic aneurysm growth rates
Unadjusted analysis of each demographic variable on aneurysm growth revealed significant effects among a number of individual study estimates. However, there was considerable heterogeneity between study estimates for many of the demographics considered (as measured using I2). When estimates were pooled using random-effects meta-analysis (with adjustment for initial aneurysm diameter), current smoking was significantly associated with faster aneurysm growth rates, whereas increased BMI, diabetes, increased pulse pressure, and history of cardiovascular disease were associated with slower growth rates (Table 9). After adjustment for all demographics, medical history and drug history, only current smoking and diabetes remained significant predictors of aneurysm growth (see Table 9). The growth rate in current smokers was on average 0.35 mm/year (SE 0.07 mm/year; p < 0.001) faster than in ex or never smokers, whereas diabetics had growth rates that were on average 0.51 mm/year (SE 0.10 mm/year; p < 0.001) slower than non-diabetics. This evidence is consistent across the studies as demonstrated in Figure 16. Men and women had similar growth rates.
Associations between baseline use of cardiovascular drugs and aneurysm growth rate are shown in Table 10. Univariate analyses suggest that many of the drugs could be protective against aneurysm growth, with the largest effect coming from the use of statins/lipid-lowering drugs. However, the magnitude of these effects was relatively small and could be confounded with their prescription in specific risk populations. Indeed, after adjustment for other demographics, the pooled meta-analysis estimates were no longer statistically significant for any class of drug investigated (see Table 10). Although the use of many of these drugs increased over time, calendar year of enrolment did not appear to influence aneurysm growth rate.
Predictors of small abdominal aortic aneurysm rupture rates
The differences in the crude rupture rates between the studies were large (from 0.07 up to 1.1 per 100 person-years). However, some of these differences could be explained by different baseline diameter ranges, different lengths of follow-up after last diameter measurement and proportions of women in each study. After adjustment for aneurysm diameter, the influence of demographics and medical history on rupture rates revealed a strong association between smoking and rupture [pooled hazard ratio (HR) 2.02, 95% CI 1.33 to 3.06; p = 0.001], and a far higher risk of rupture for women than men (pooled HR 3.76, 95% CI 2.58 to 5.47; p < 0.001) (Figure 17). The risk of rupture was also found to increase significantly for older patients, patients enrolled earlier in calendar time, those with lower BMI, and with higher mean arterial blood pressure or pulse pressure (Table 11). It was not possible to conduct fully adjusted analyses of these effects because of the small number of ruptures observed. However, effects did remain consistent after adjustment for age and calendar time.
Any association between cardiovascular drugs and aneurysm rupture was difficult to investigate with the present data because of the low prevalence of rupture and insufficient reporting of the drugs. Only six studies13,39,40,51,52,55 reported both rupture events and use of drugs. Of these, only two estimates, on average, could be obtained for each class of drug, none of which showed statistical significance (Table 12).
Inputs to health economic modelling
These IPD from 18 surveillance studies (see Table 6) were next used to provide inputs relating to growth and rupture rates for the health economic modelling, as described in Chapters 7 and 8.
FIGURE 8.
Forest plots of mean AAA growth rate (estimate and 95% CI) in men according to baseline AAA diameter. (a) Mr Simon Parvin, Royal Bournemouth Hospital, 2010–12, personal communication; (b) Professor D Julian A Scott, University of Leeds, 2010–12, personal communication; (c) Mr Matthew J Bown, University of Leicester and the NIHR Cardiovascular Biomedical Research Unit, 2010–12, personal communication; (d) Professor Charles N McCollum, University Hospital of South Manchester, 2010–12, personal communication; and (e) Mr Richard Holdsworth, Stirling Royal Infirmary, 2010–12, personal communication. UKSAT, United Kingdom Small Aneurysm Trial.
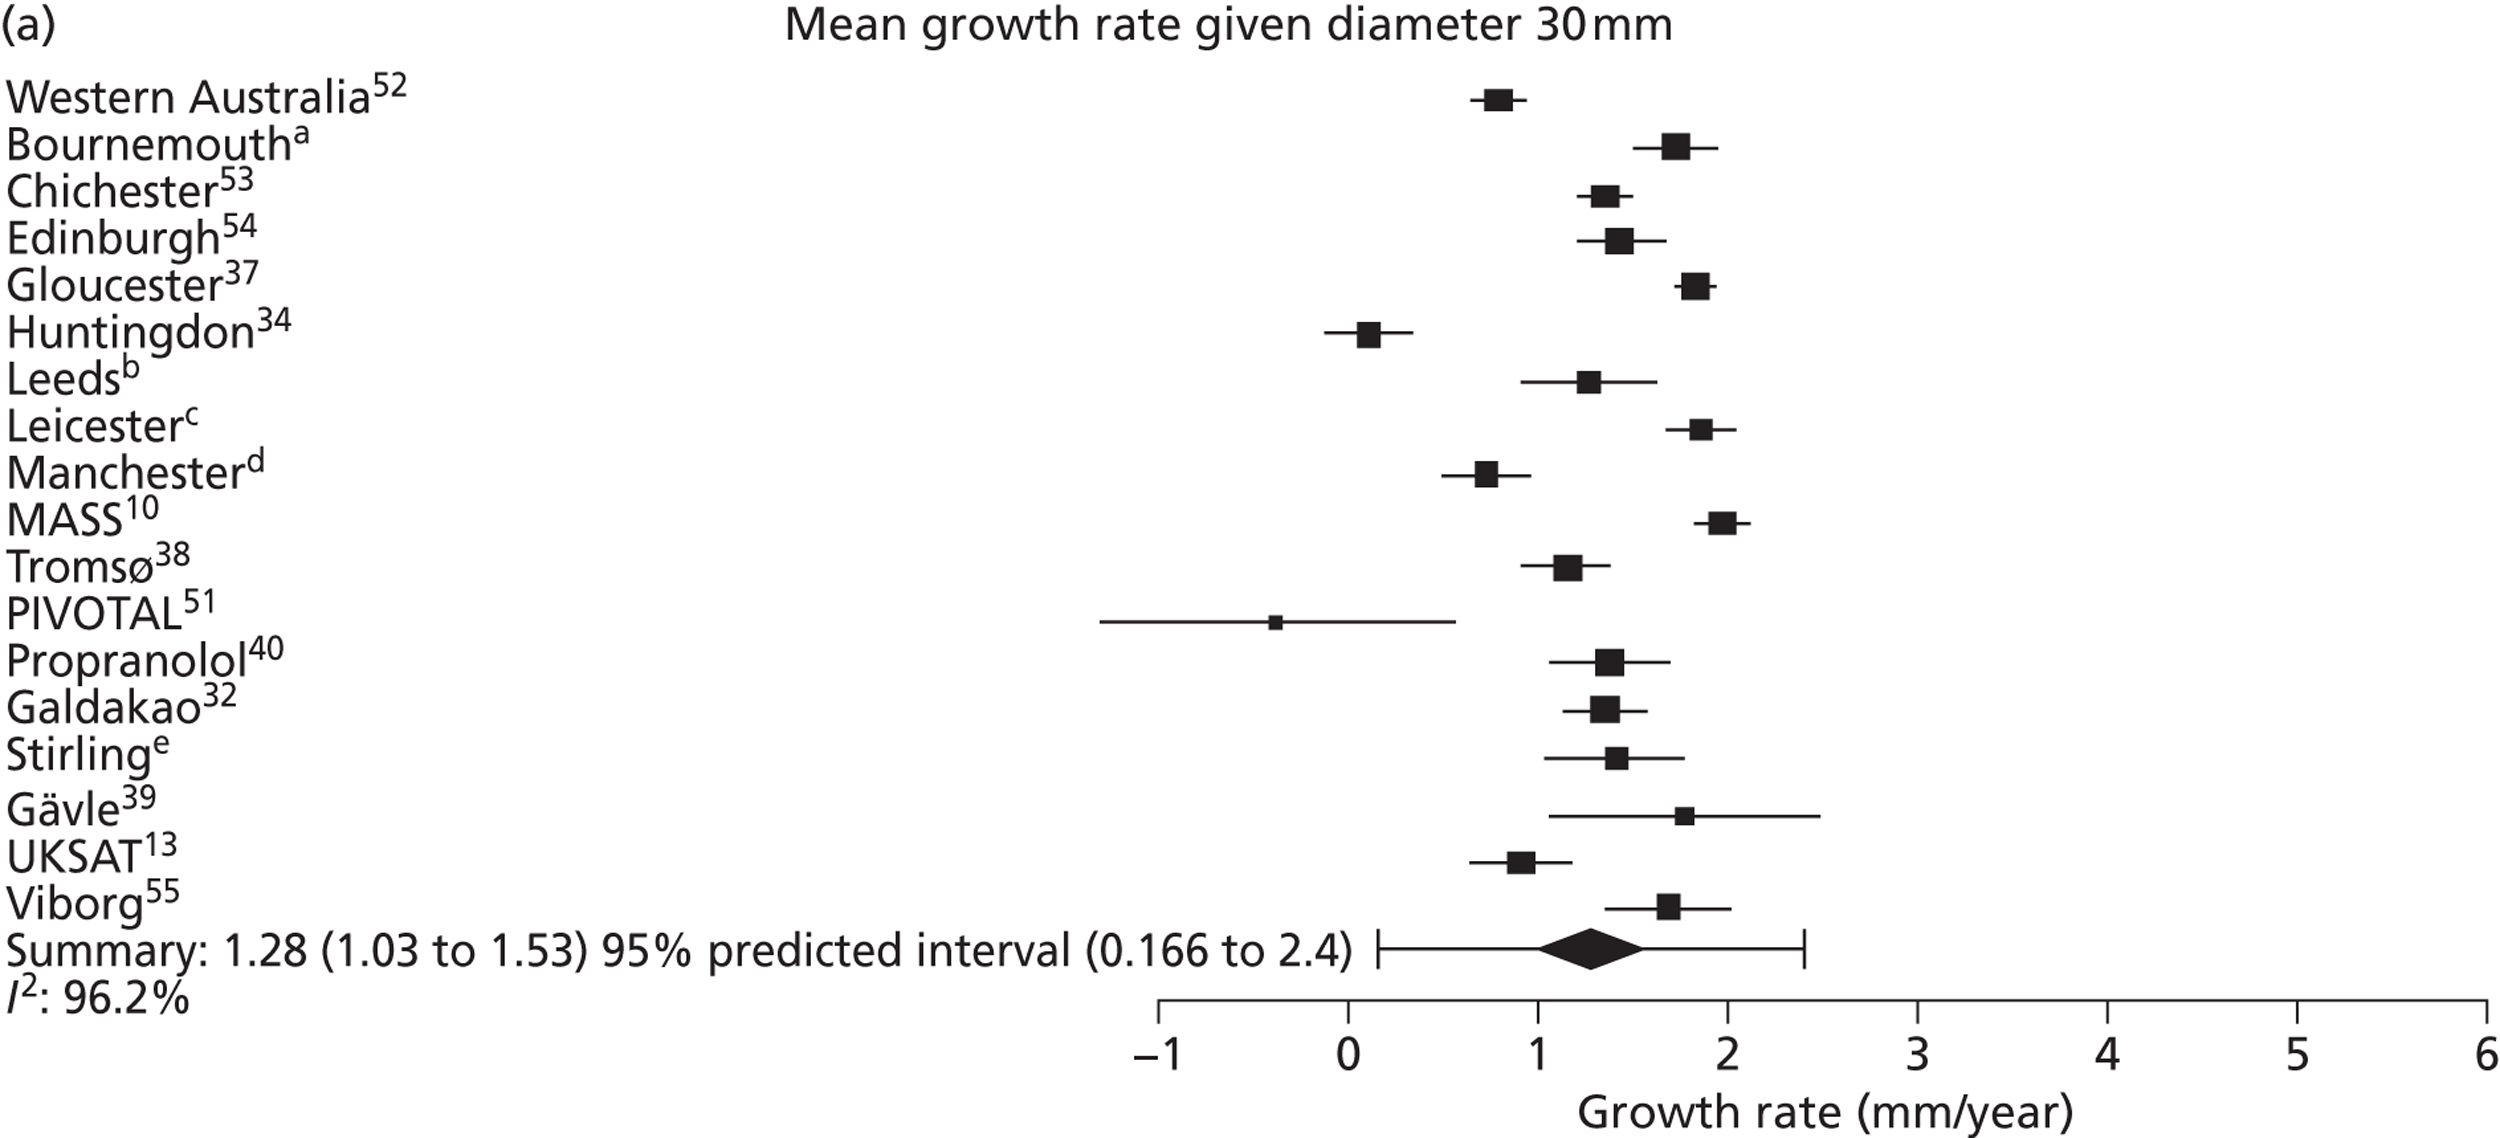
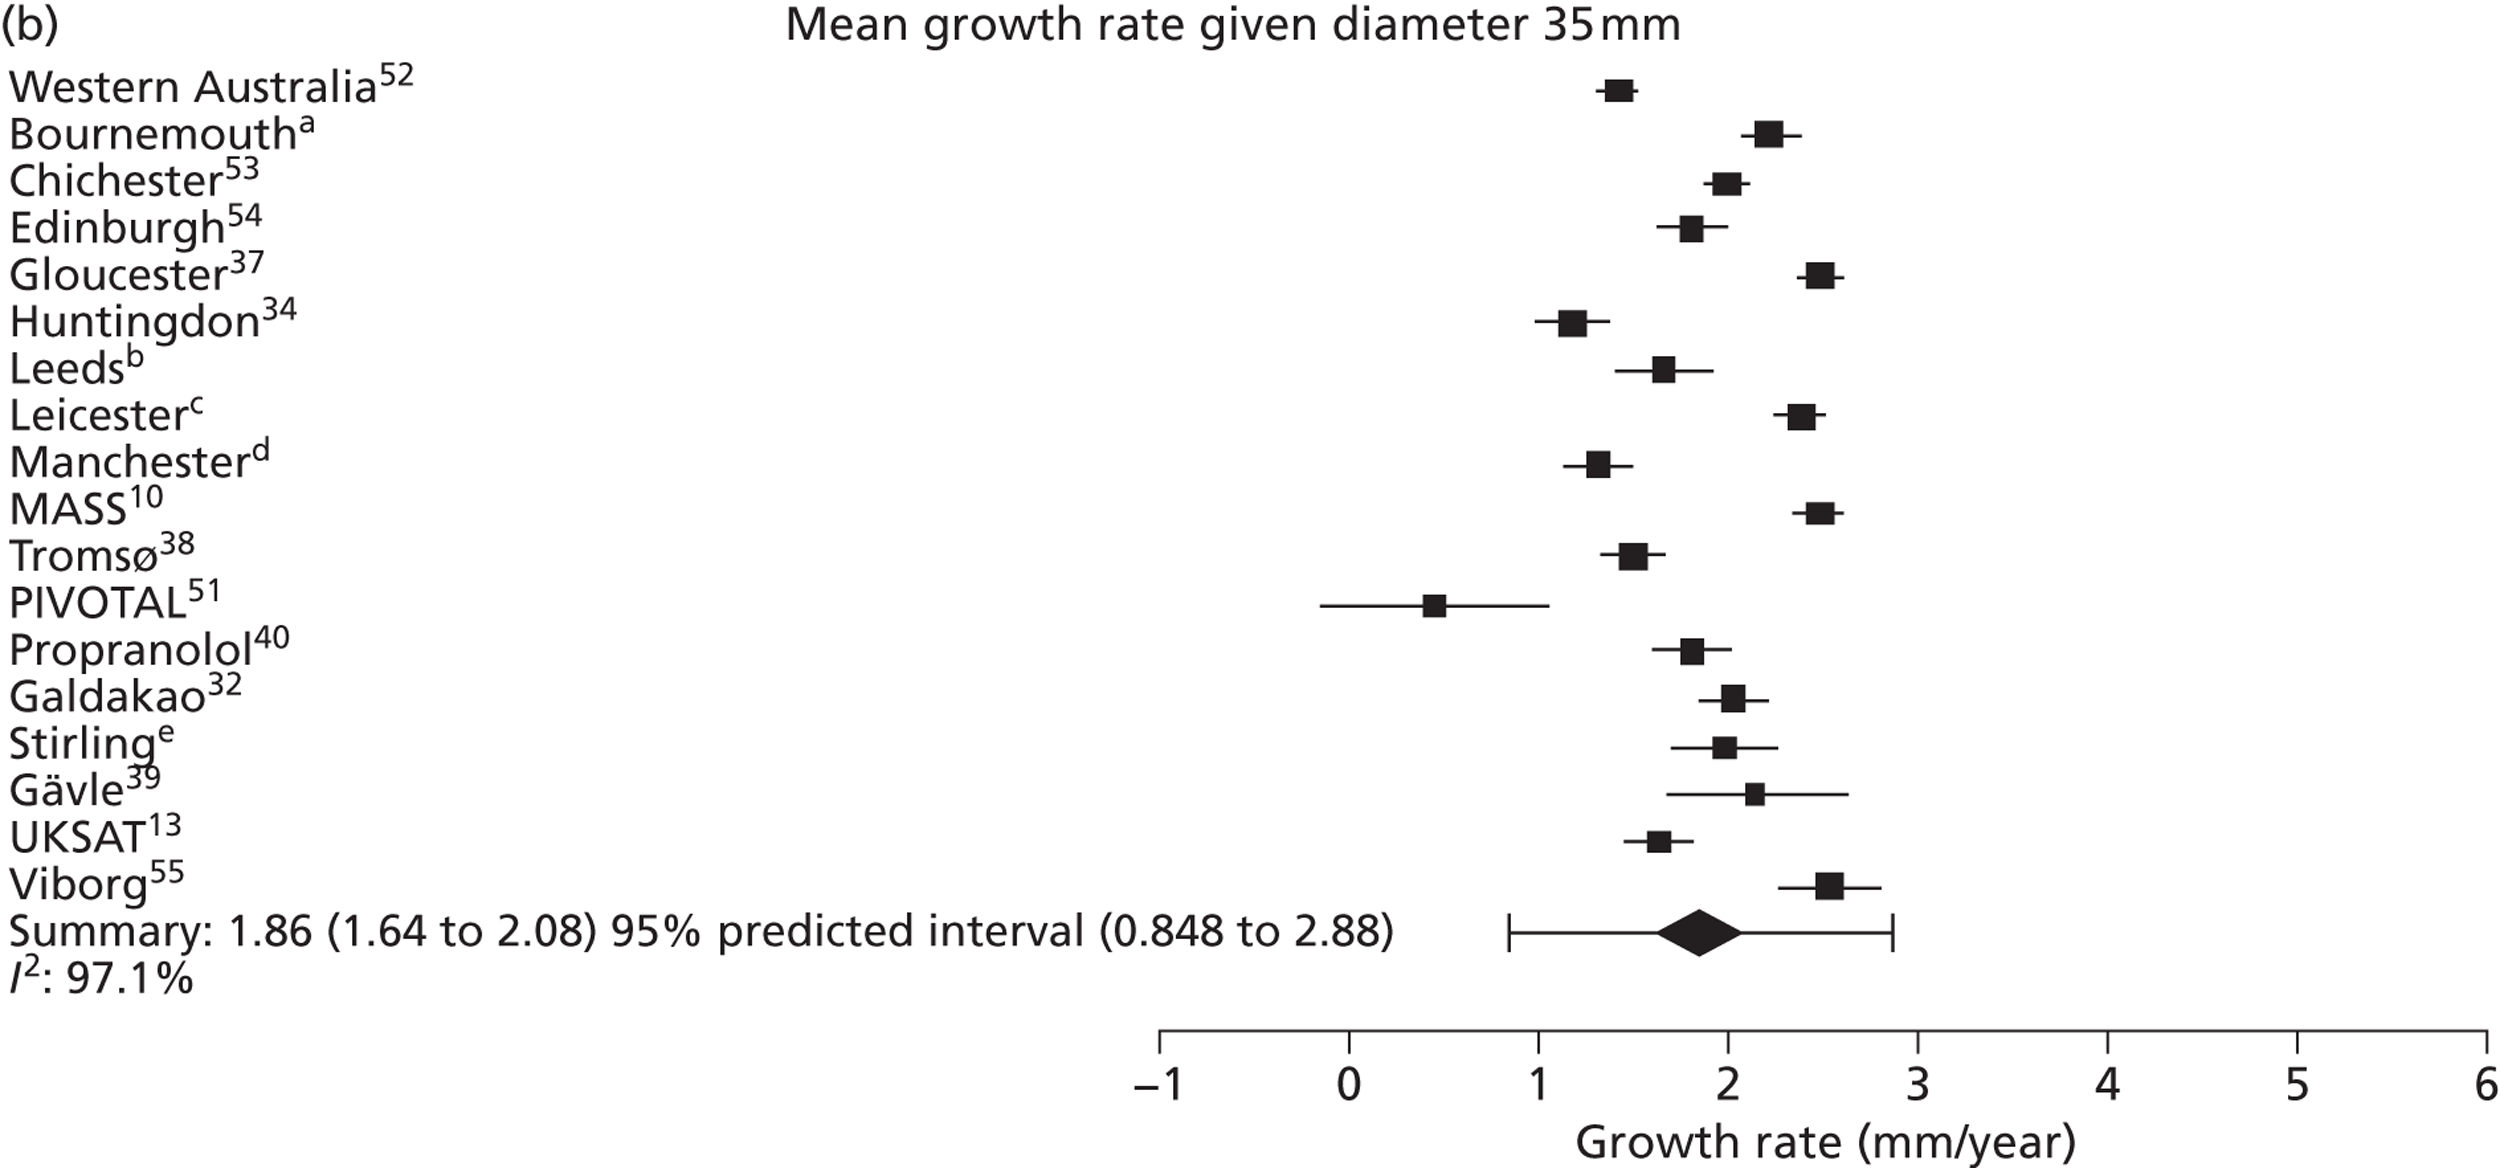
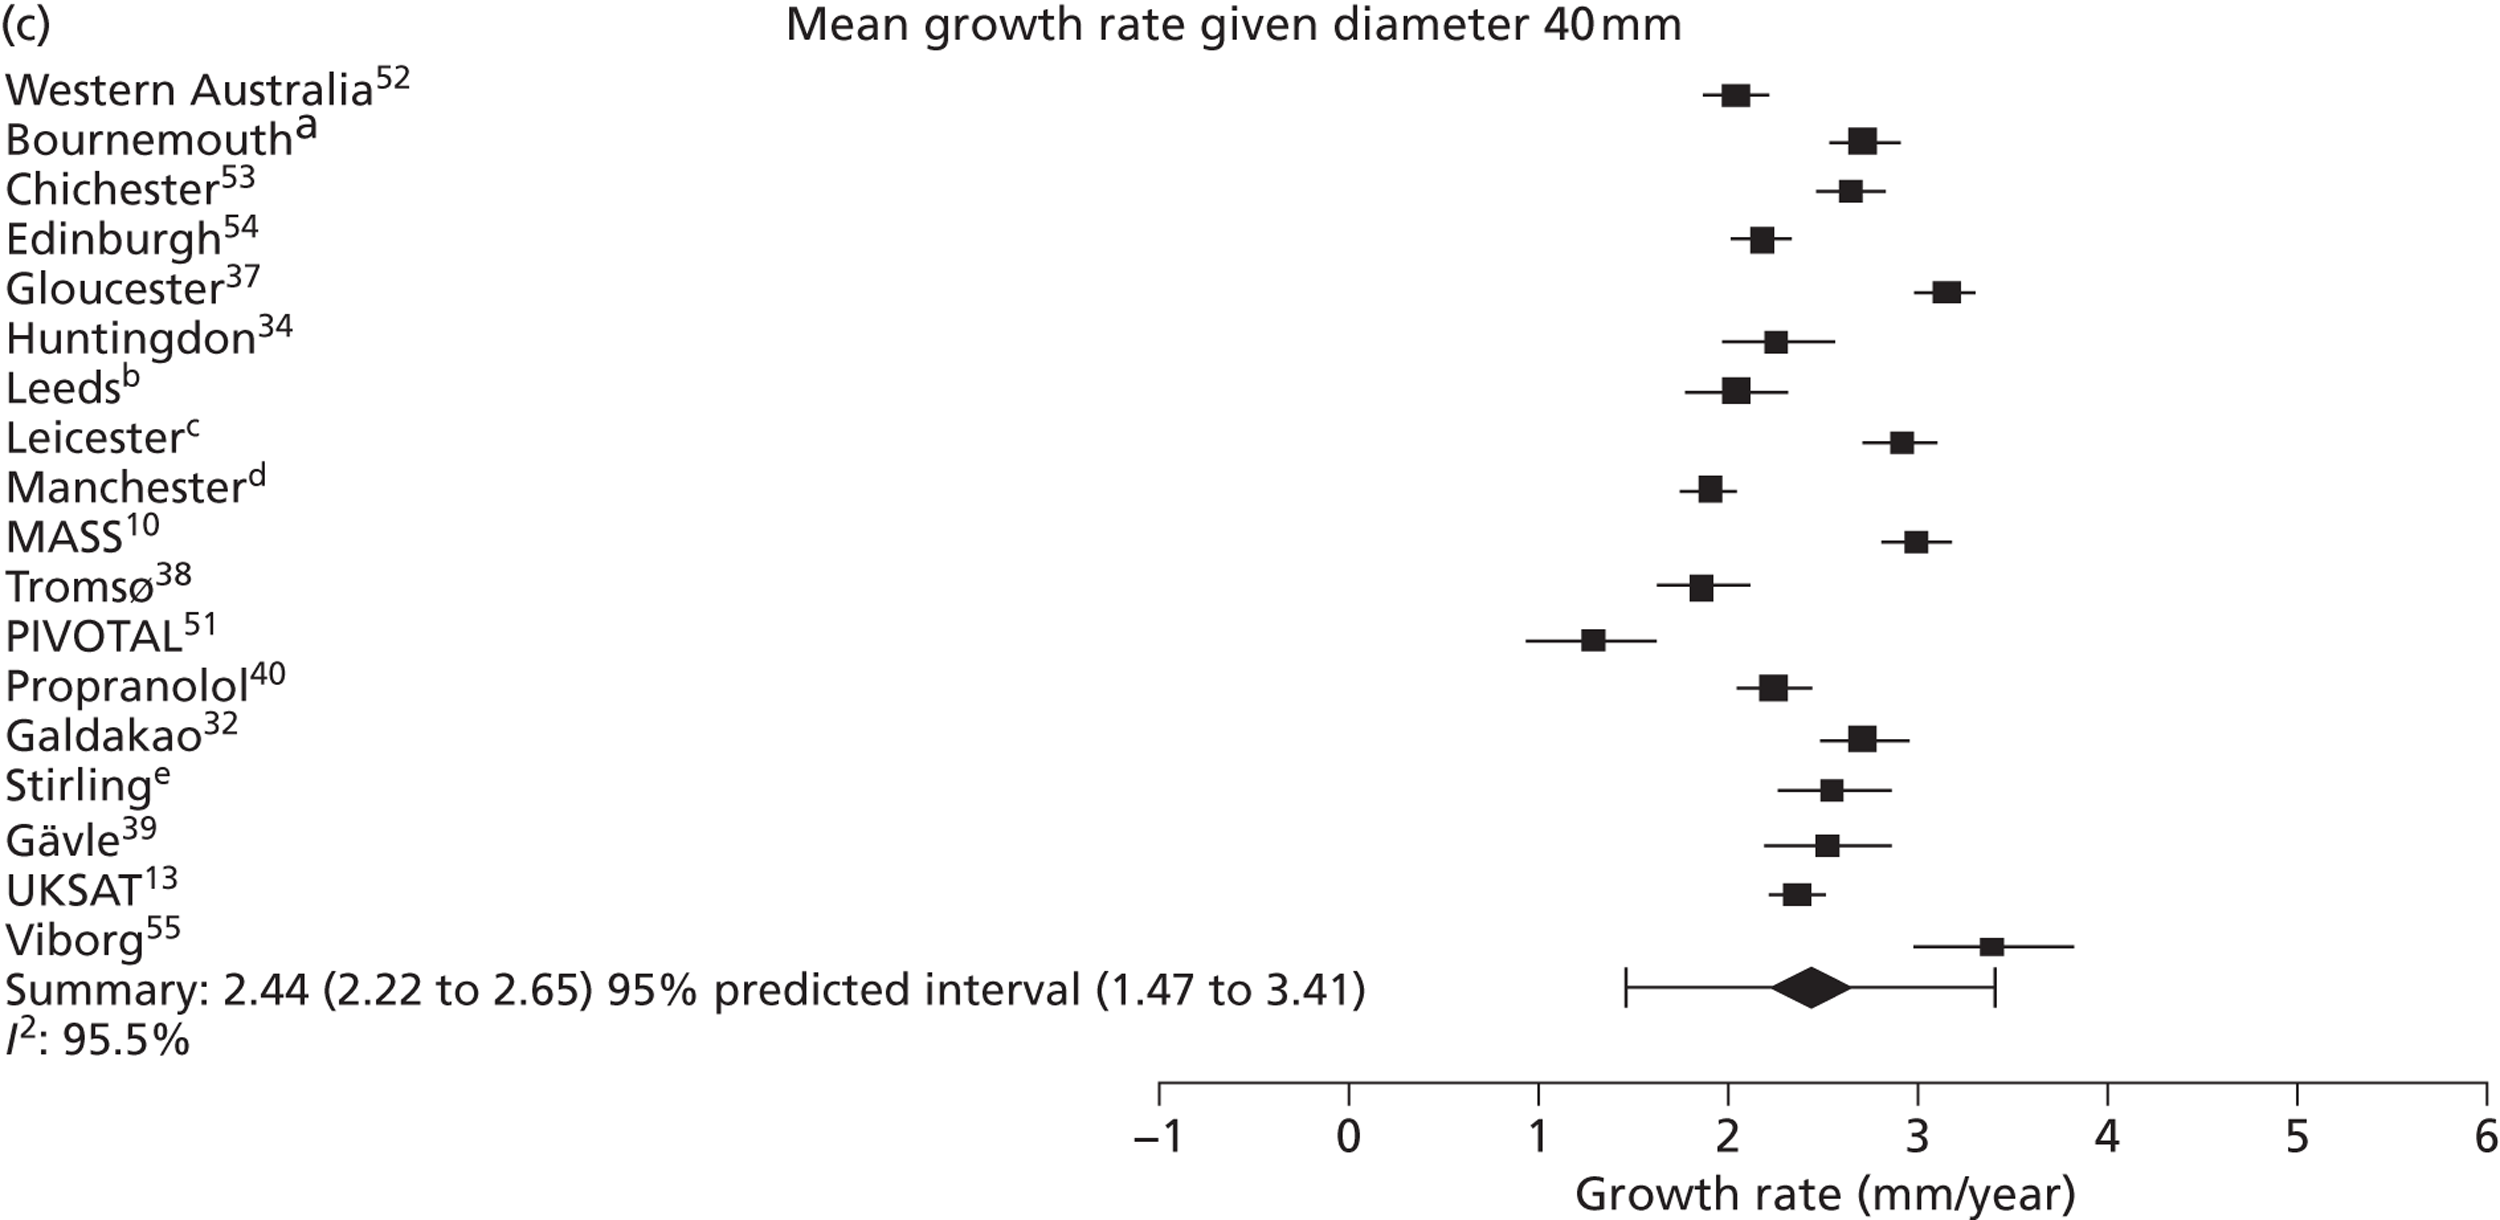
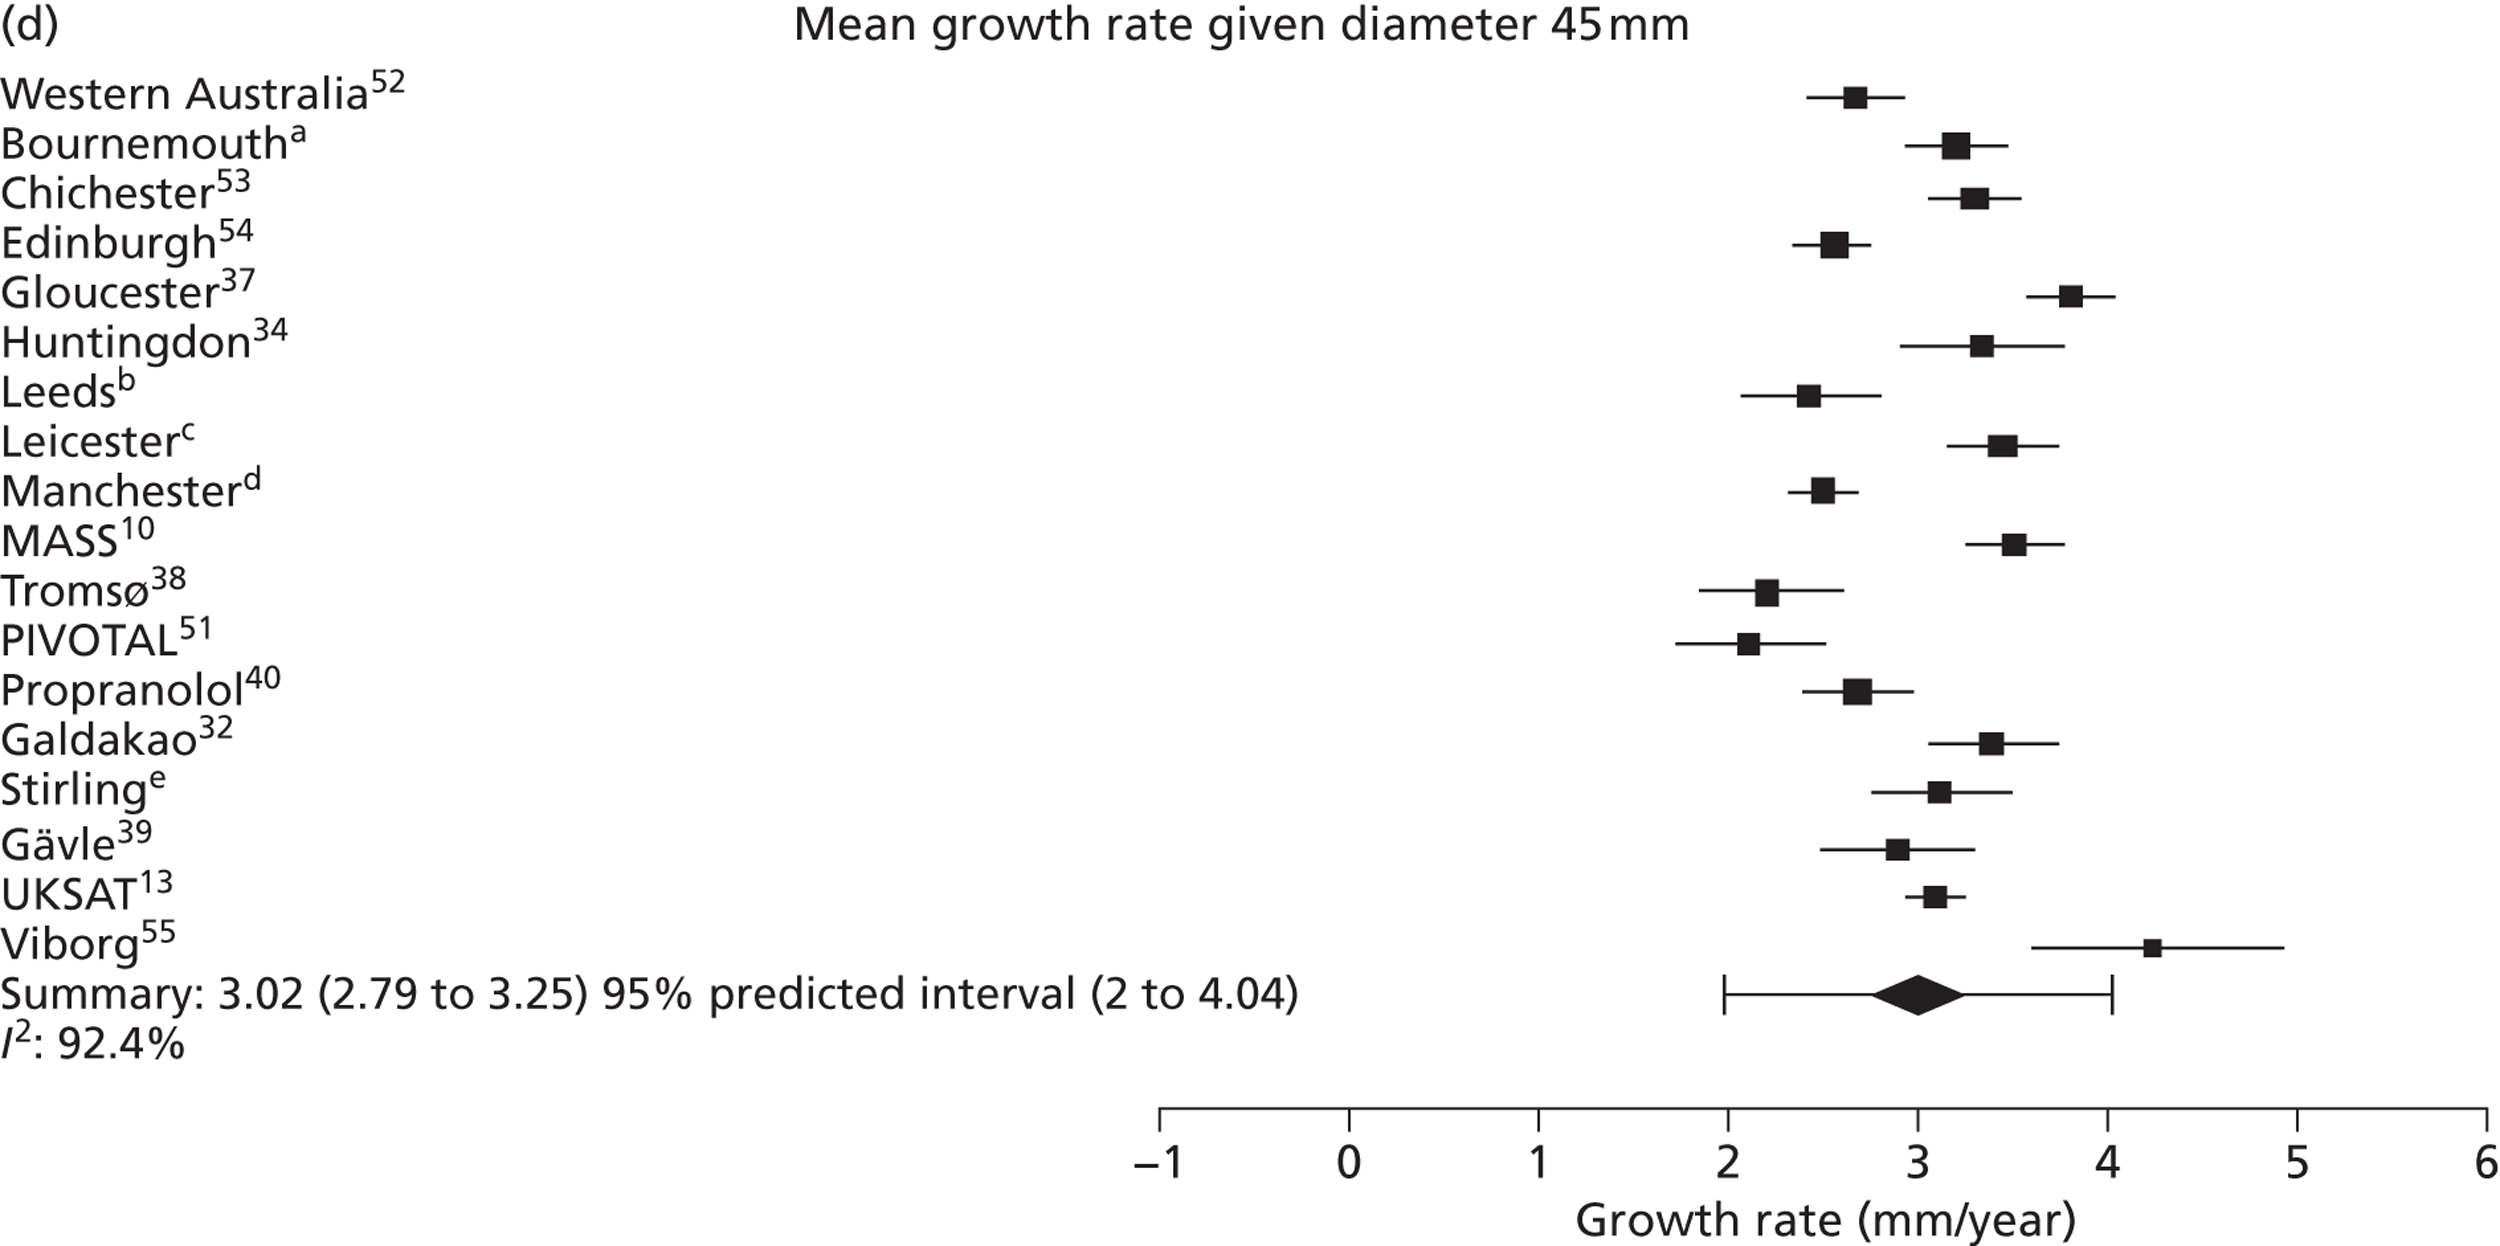
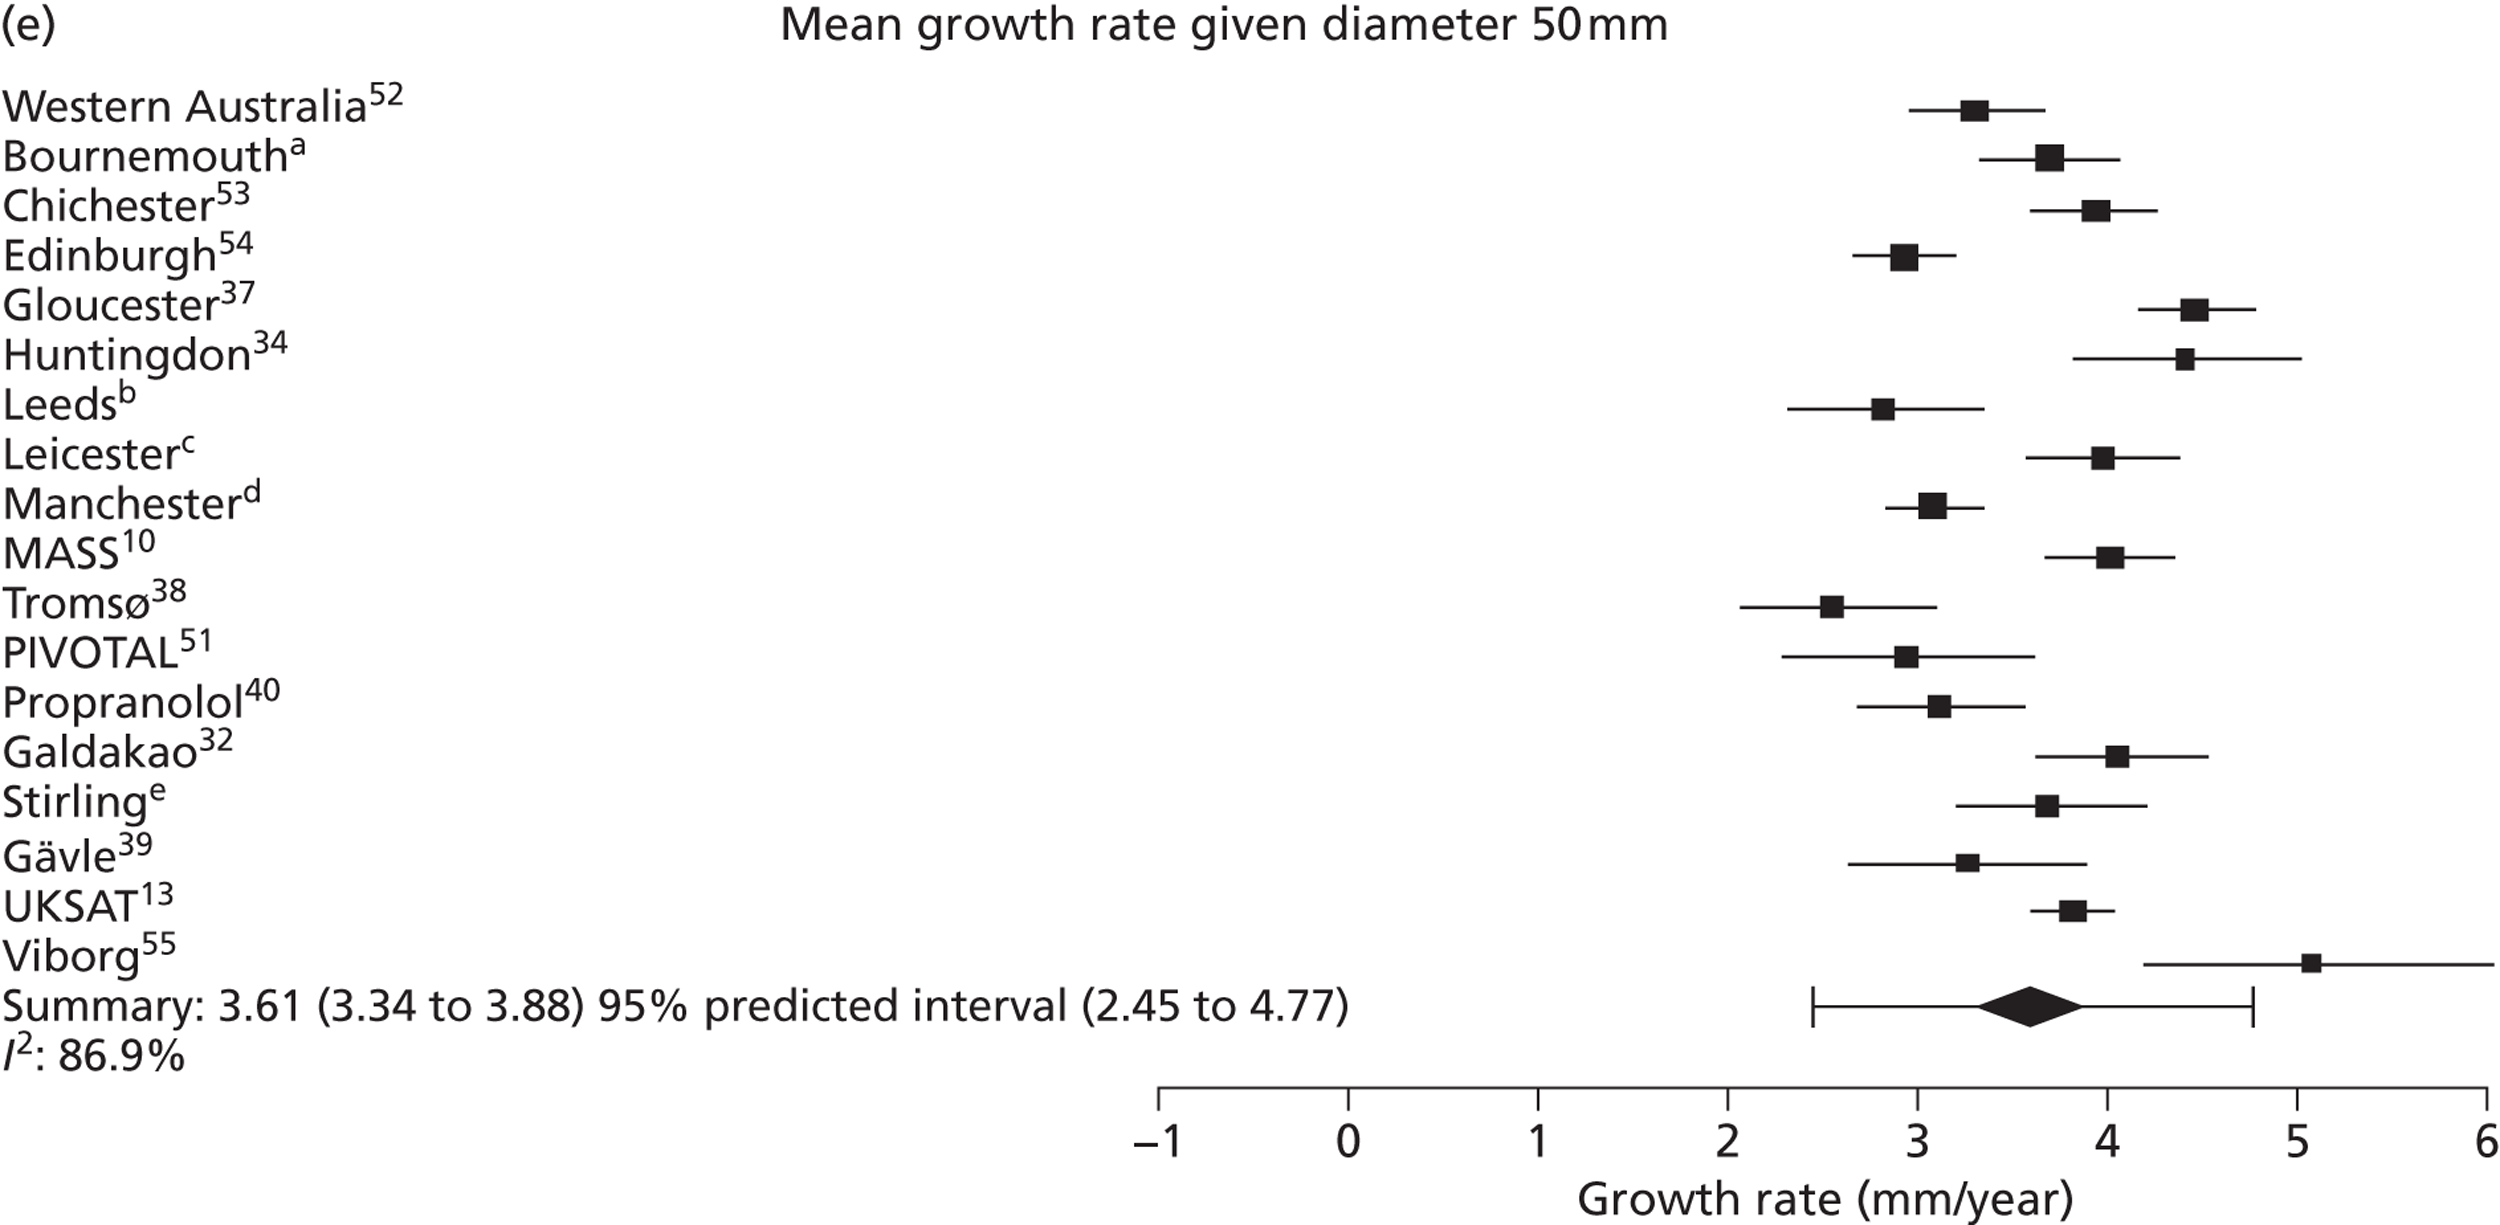
FIGURE 9.
Estimated mean growth rate given baseline AAA diameter, in men, by study and overall (with 95% CIs and prediction intervals). The area of each symbol is inversely proportional to its SE. (a) Mr Simon Parvin, Royal Bournemouth Hospital, 2010–12, personal communication; (b) Professor D Julian A Scott, University of Leeds, 2010–12, personal communication; (c) Mr Matthew J Bown, University of Leicester and the NIHR Cardiovascular Biomedical Research Unit, 2010–12, personal communication; (d) Professor Charles N McCollum, University Hospital of South Manchester, 2010–12, personal communication; and (e) Mr Richard Holdsworth, Stirling Royal Infirmary, 2010–12, personal communication. UKSAT, United Kingdom Small Aneurysm Trial.
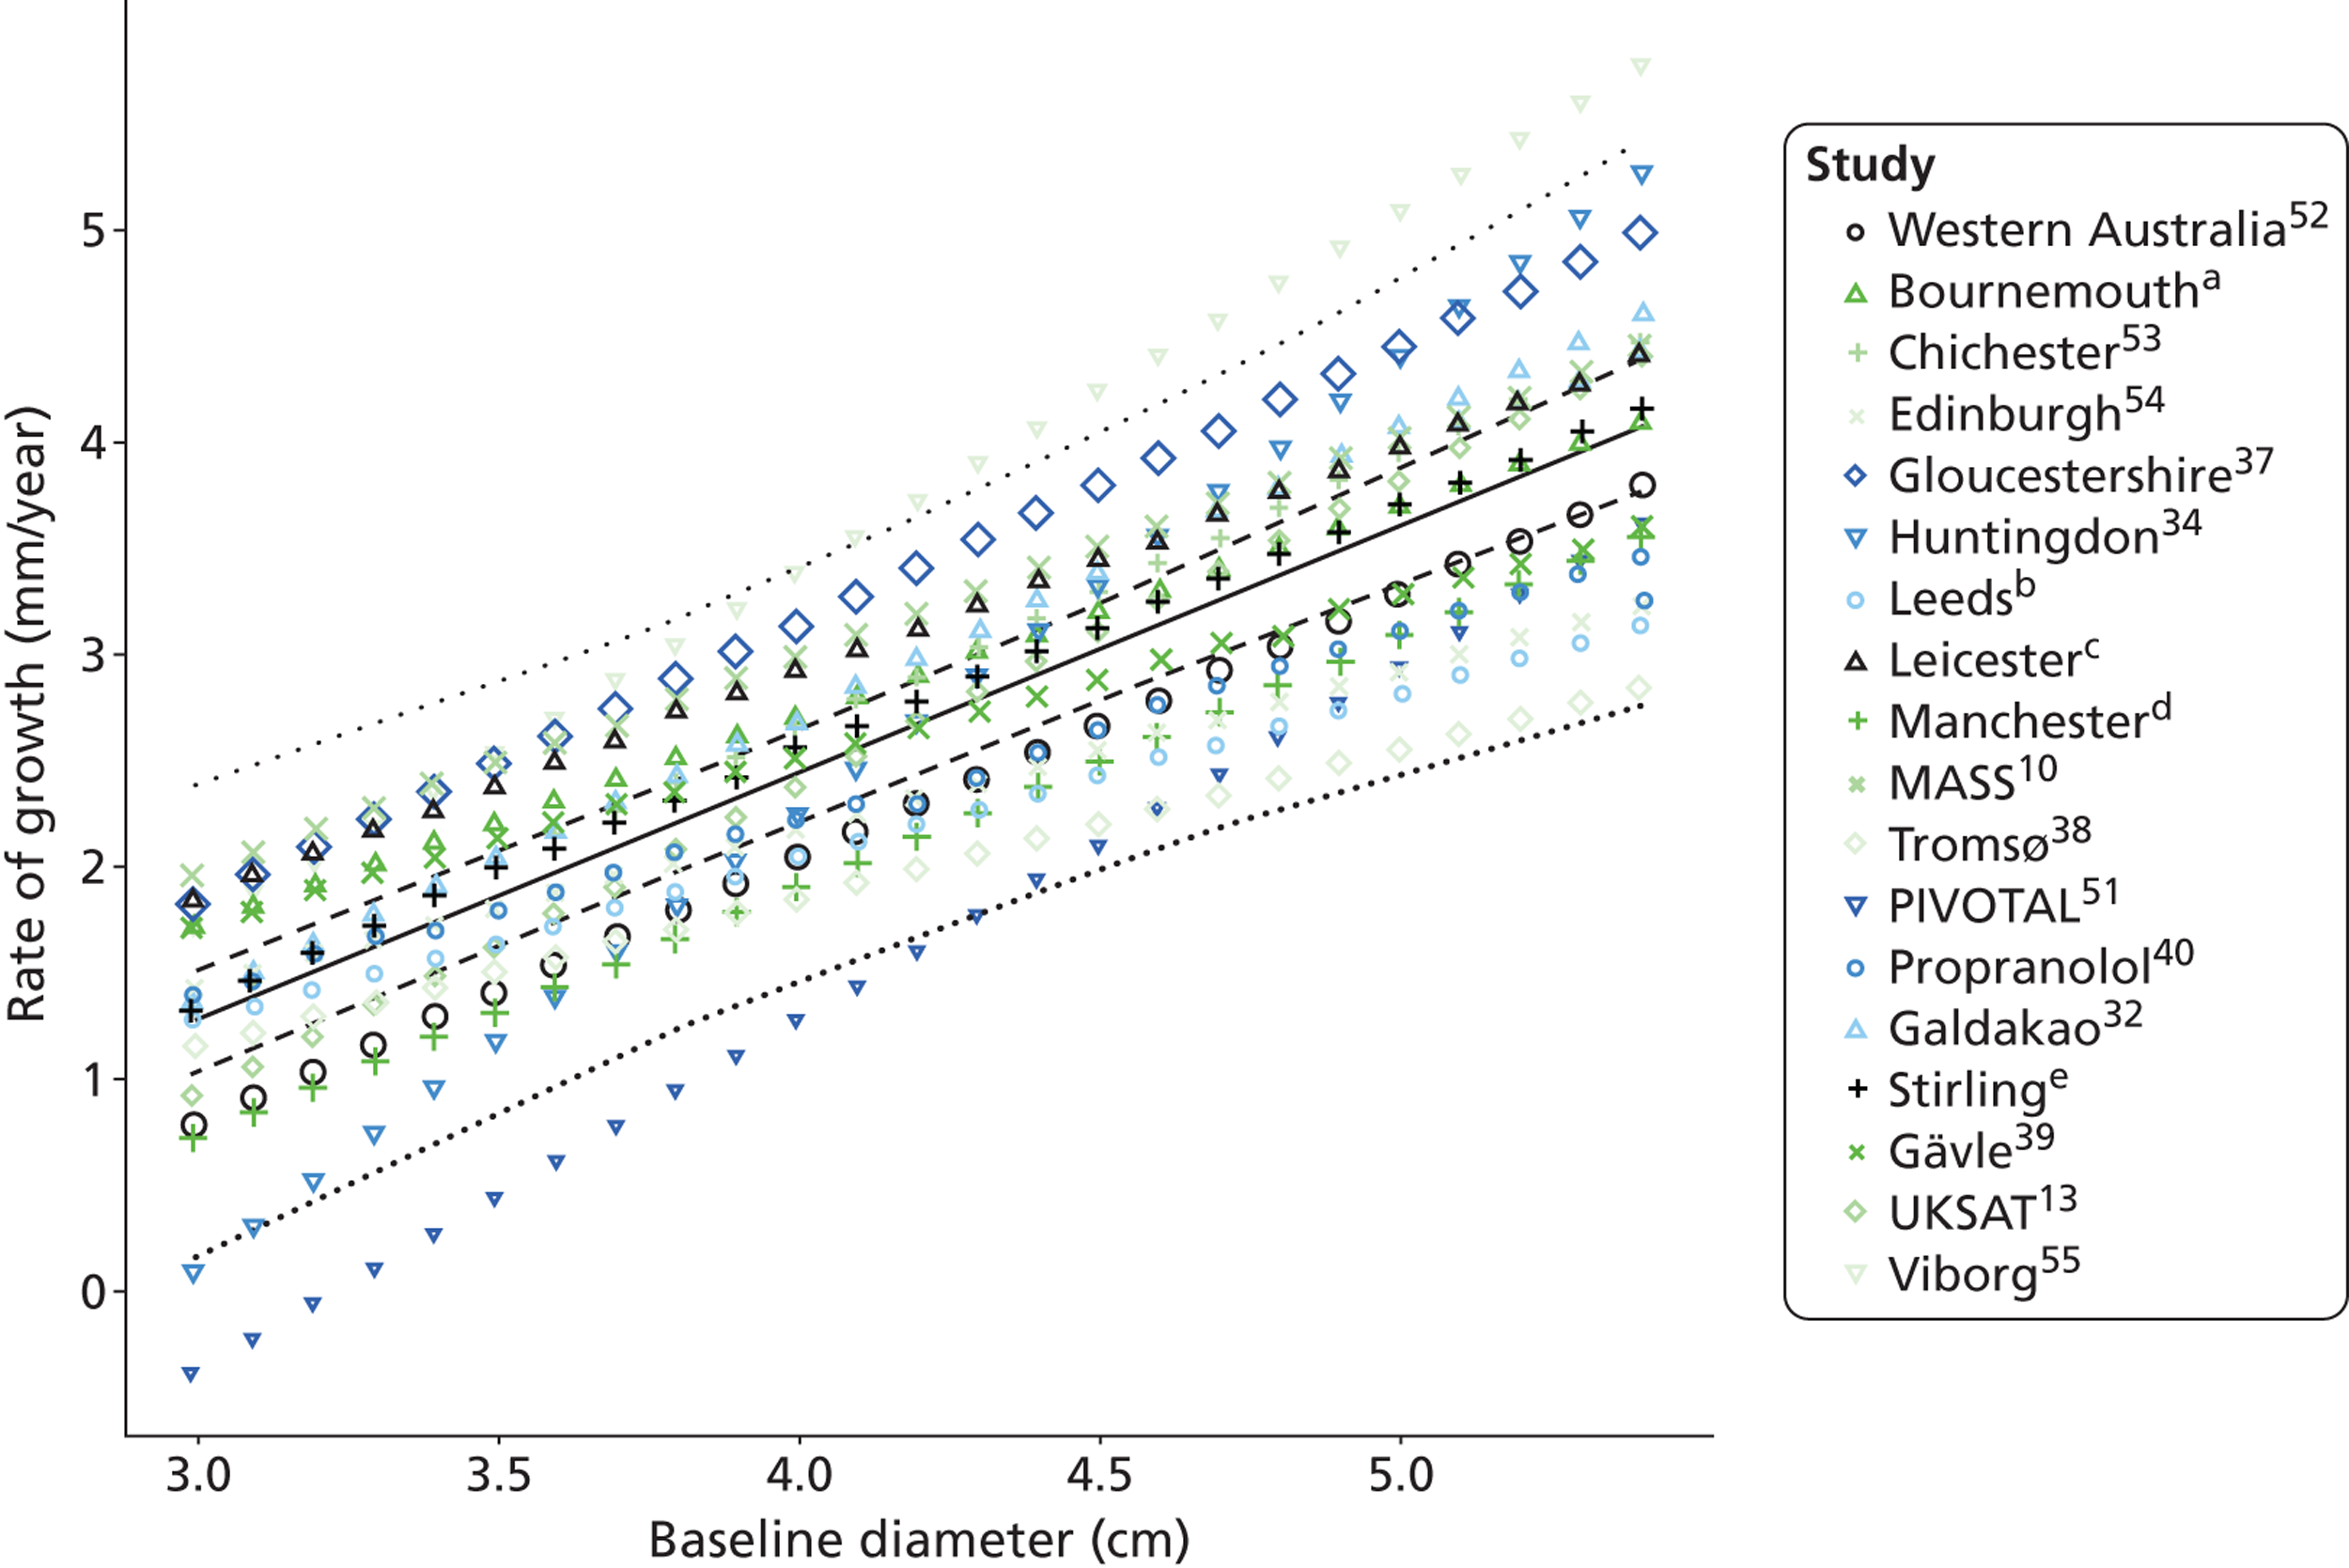
FIGURE 10.
Estimated time given baseline AAA diameter for which there is a 10% chance that the threshold diameter for surgery (5.5 cm) has been reached, in men, by study and overall (black diamonds represent 95% CIs, error bars are 95% prediction intervals). (a) Mr Simon Parvin, Royal Bournemouth Hospital, 2010–12, personal communication; (b) Professor D Julian A Scott, University of Leeds, 2010–12, personal communication; (c) Mr Matthew J Bown, University of Leicester and the NIHR Cardiovascular Biomedical Research Unit, 2010–12, personal communication; (d) Professor Charles N McCollum, University Hospital of South Manchester, 2010–12, personal communication; and(e) Mr Richard Holdsworth, Stirling Royal Infirmary, 2010–12, personal communication. UKSAT, United Kingdom Small Aneurysm Trial.
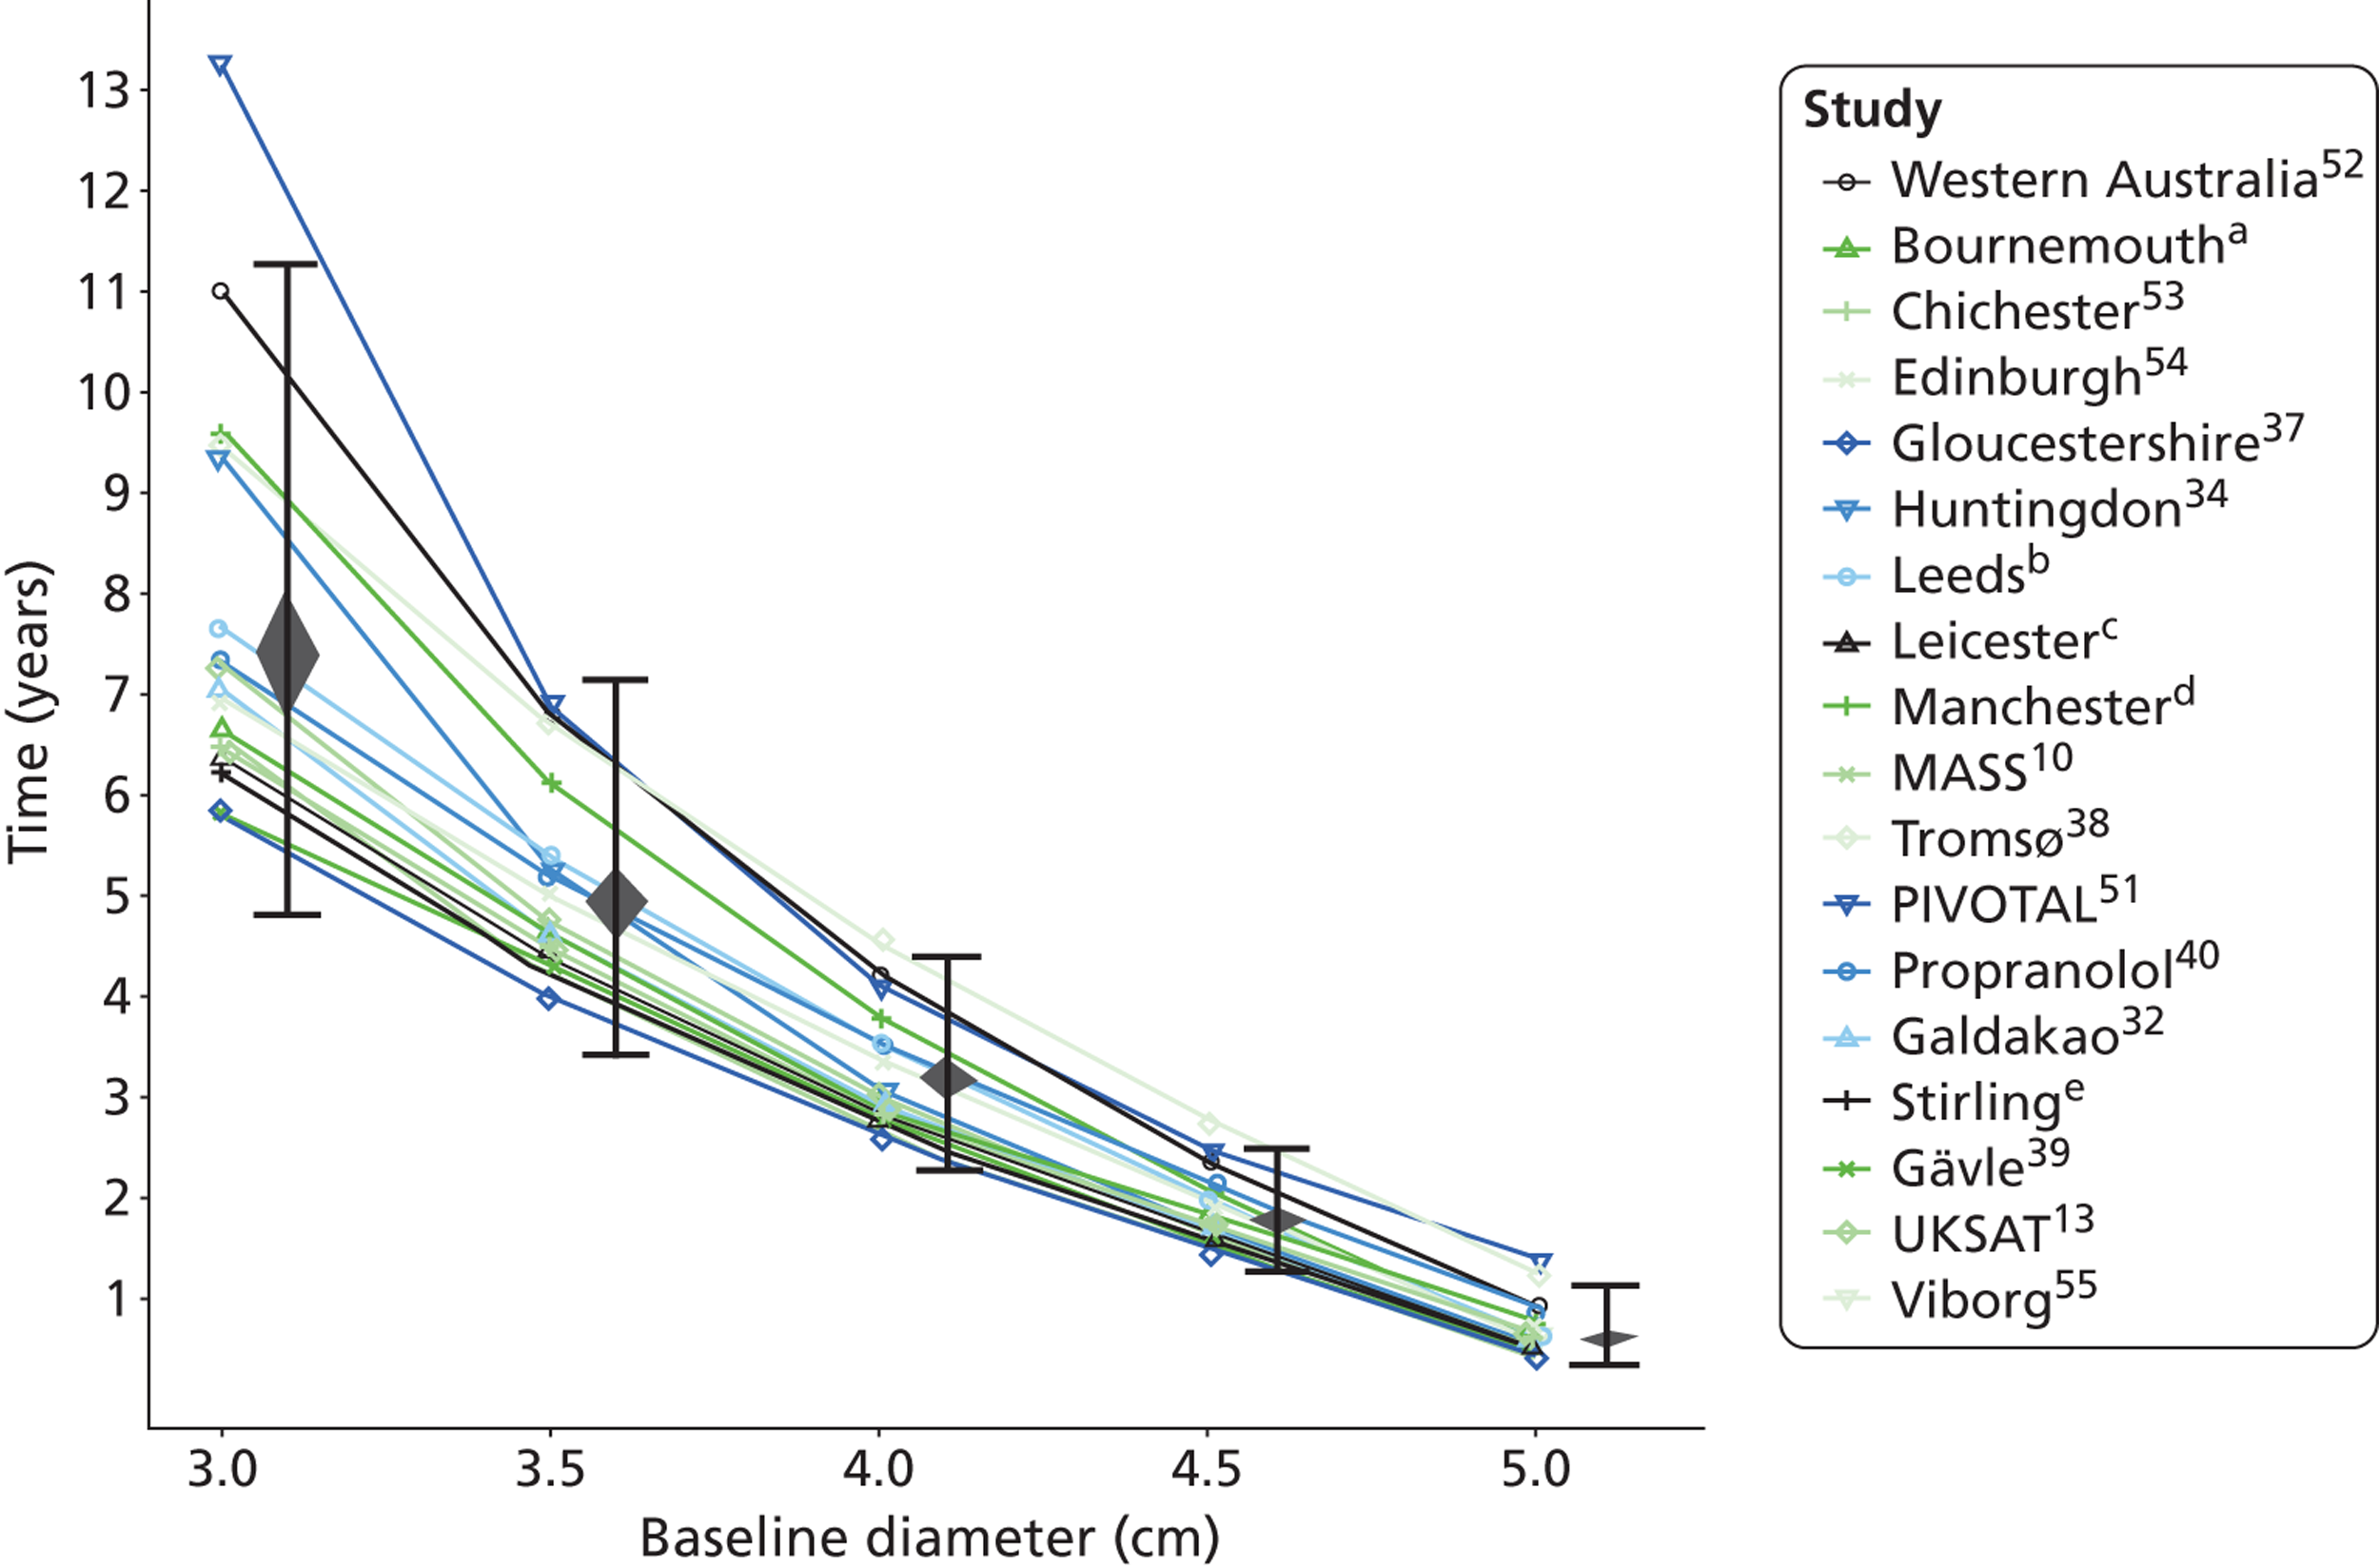
FIGURE 11.
Forest plots of rupture risk (estimate and 95% CI, log-scale) in men according to underlying AAA diameter. (a) Professor Charles N McCollum, University Hospital of South Manchester, 2010–12, personal communication; and (b) Mr Richard Holdsworth, Stirling Royal Infirmary, 2010–12, personal communication. UKSAT, United Kingdom Small Aneurysm Trial.
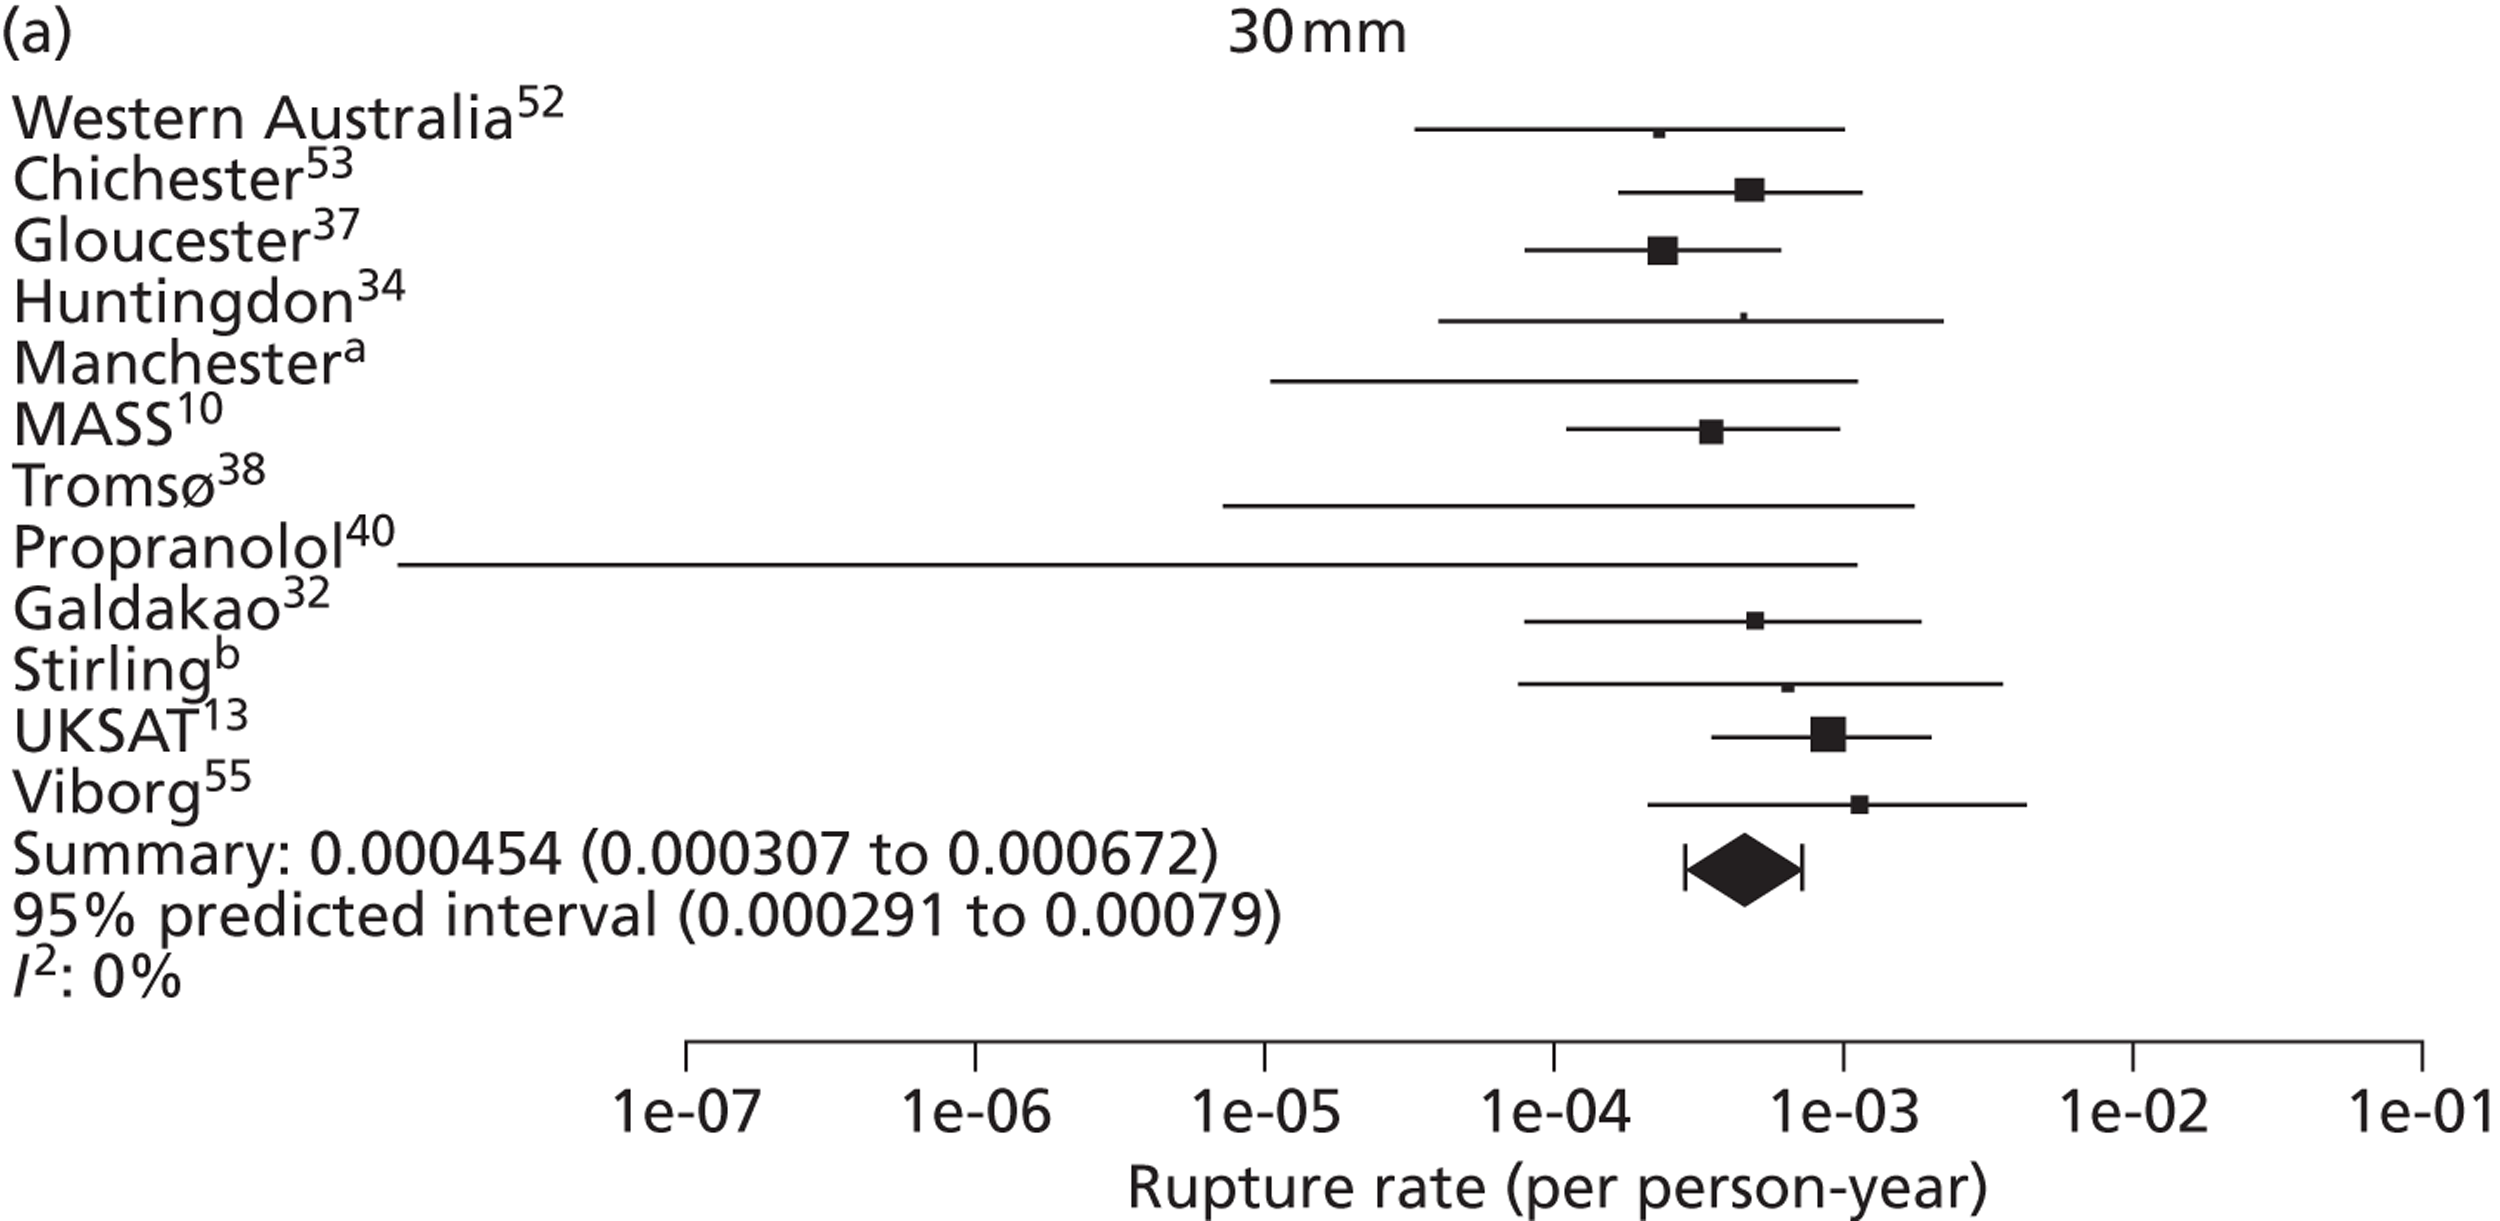
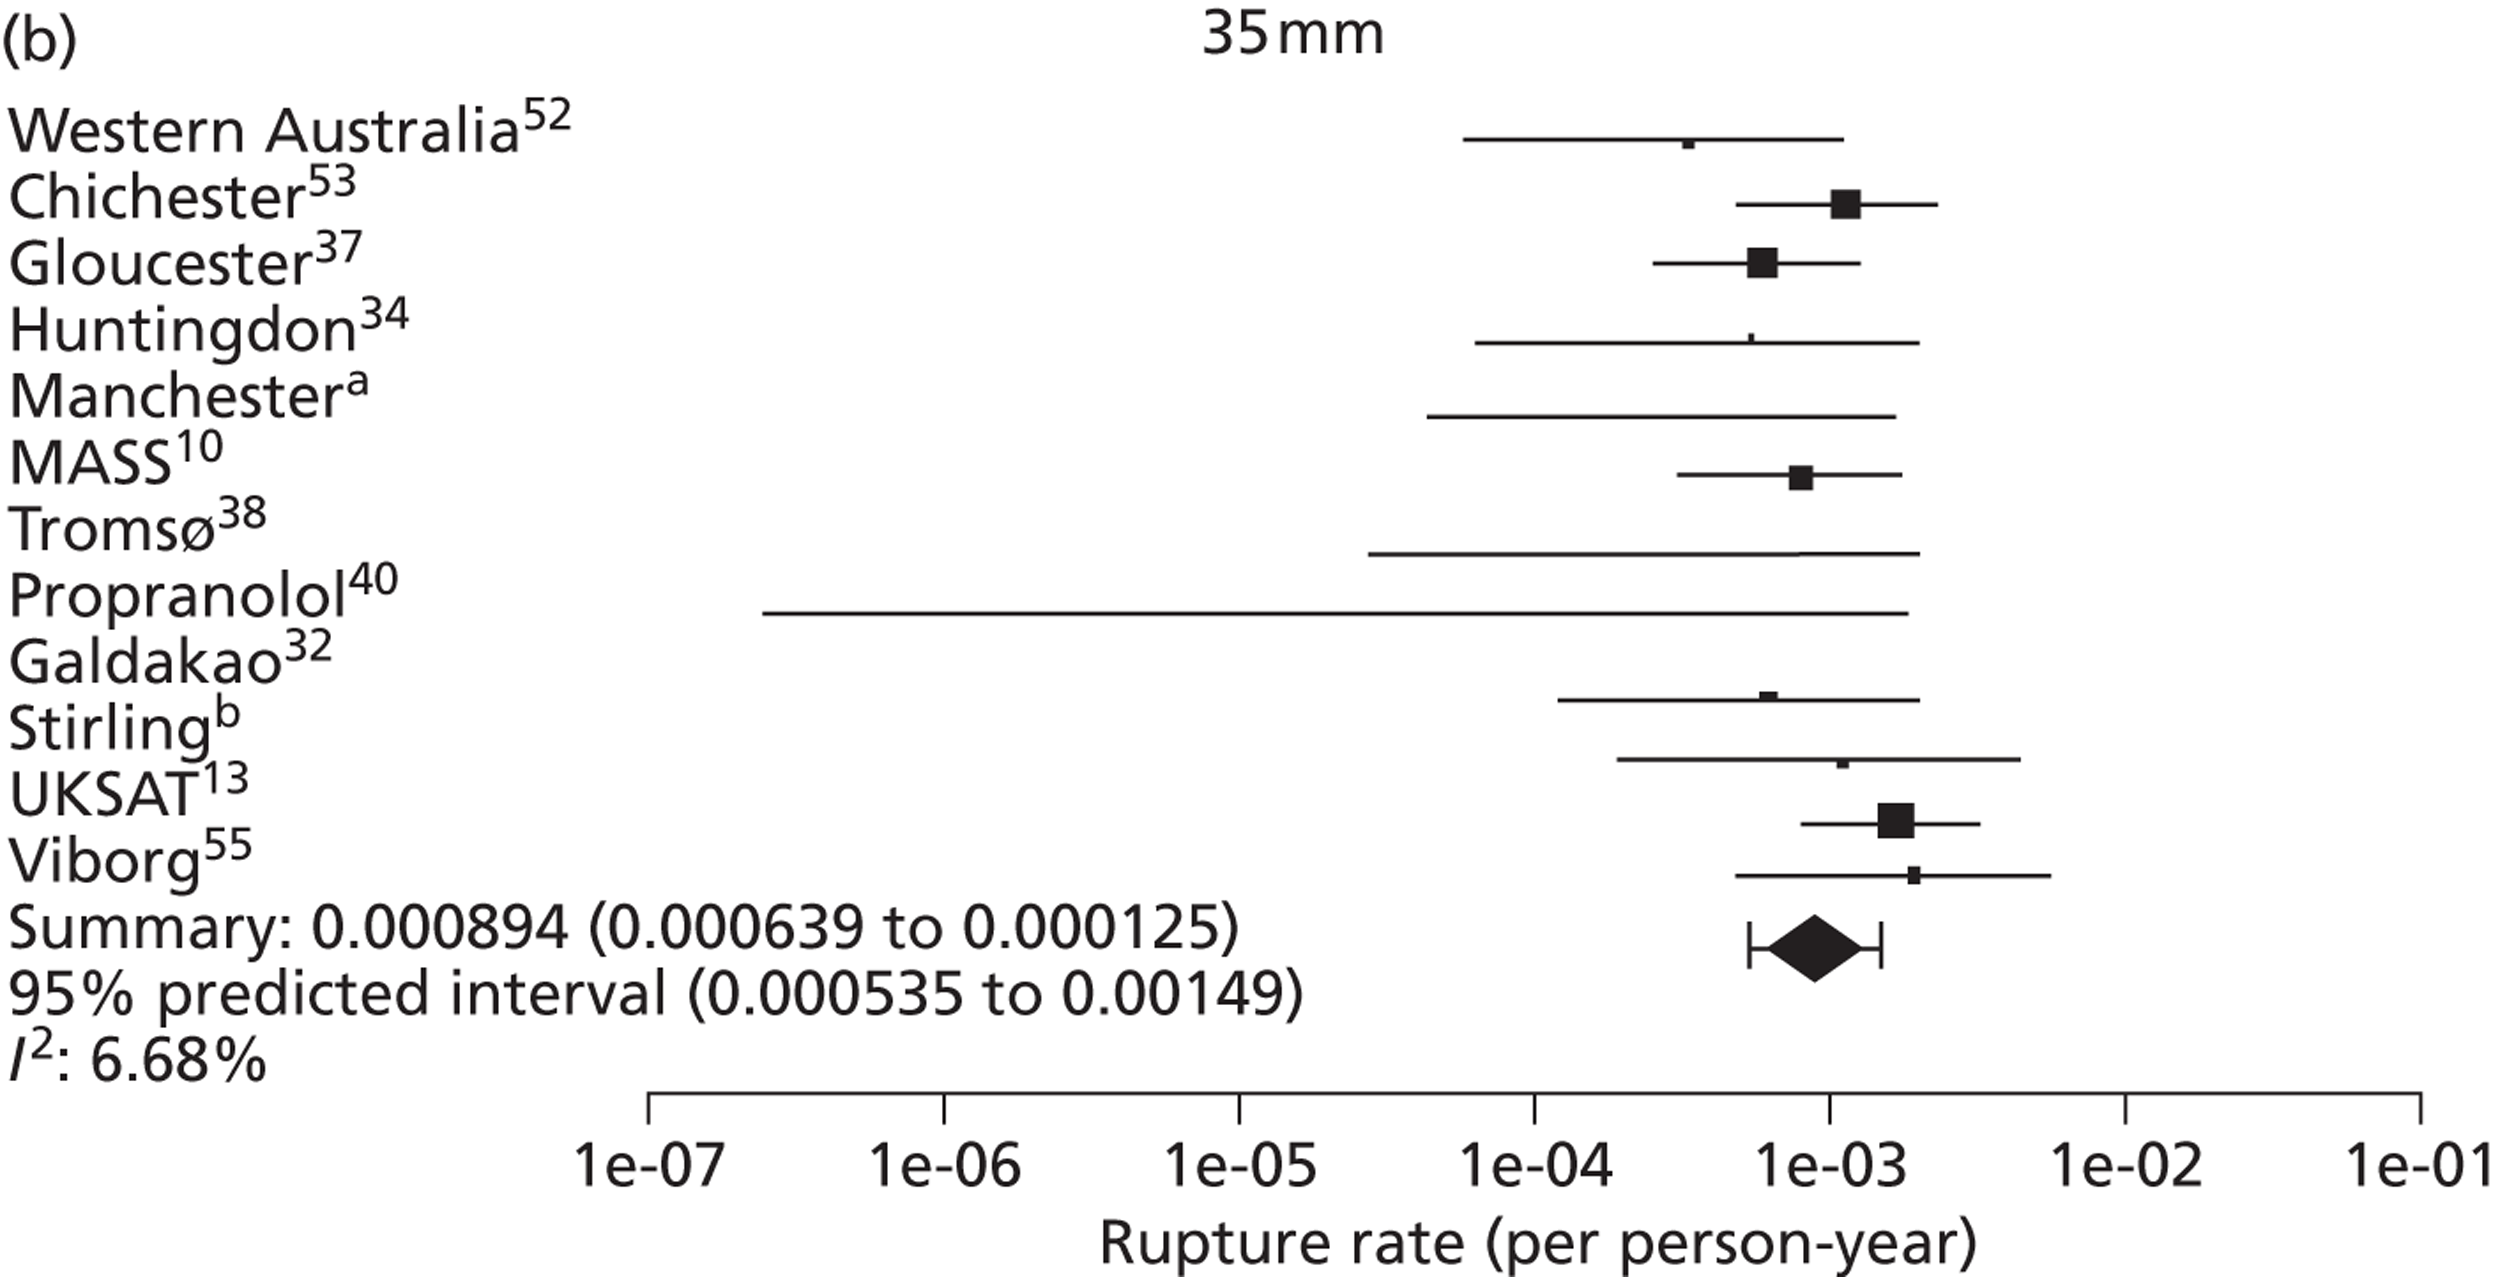
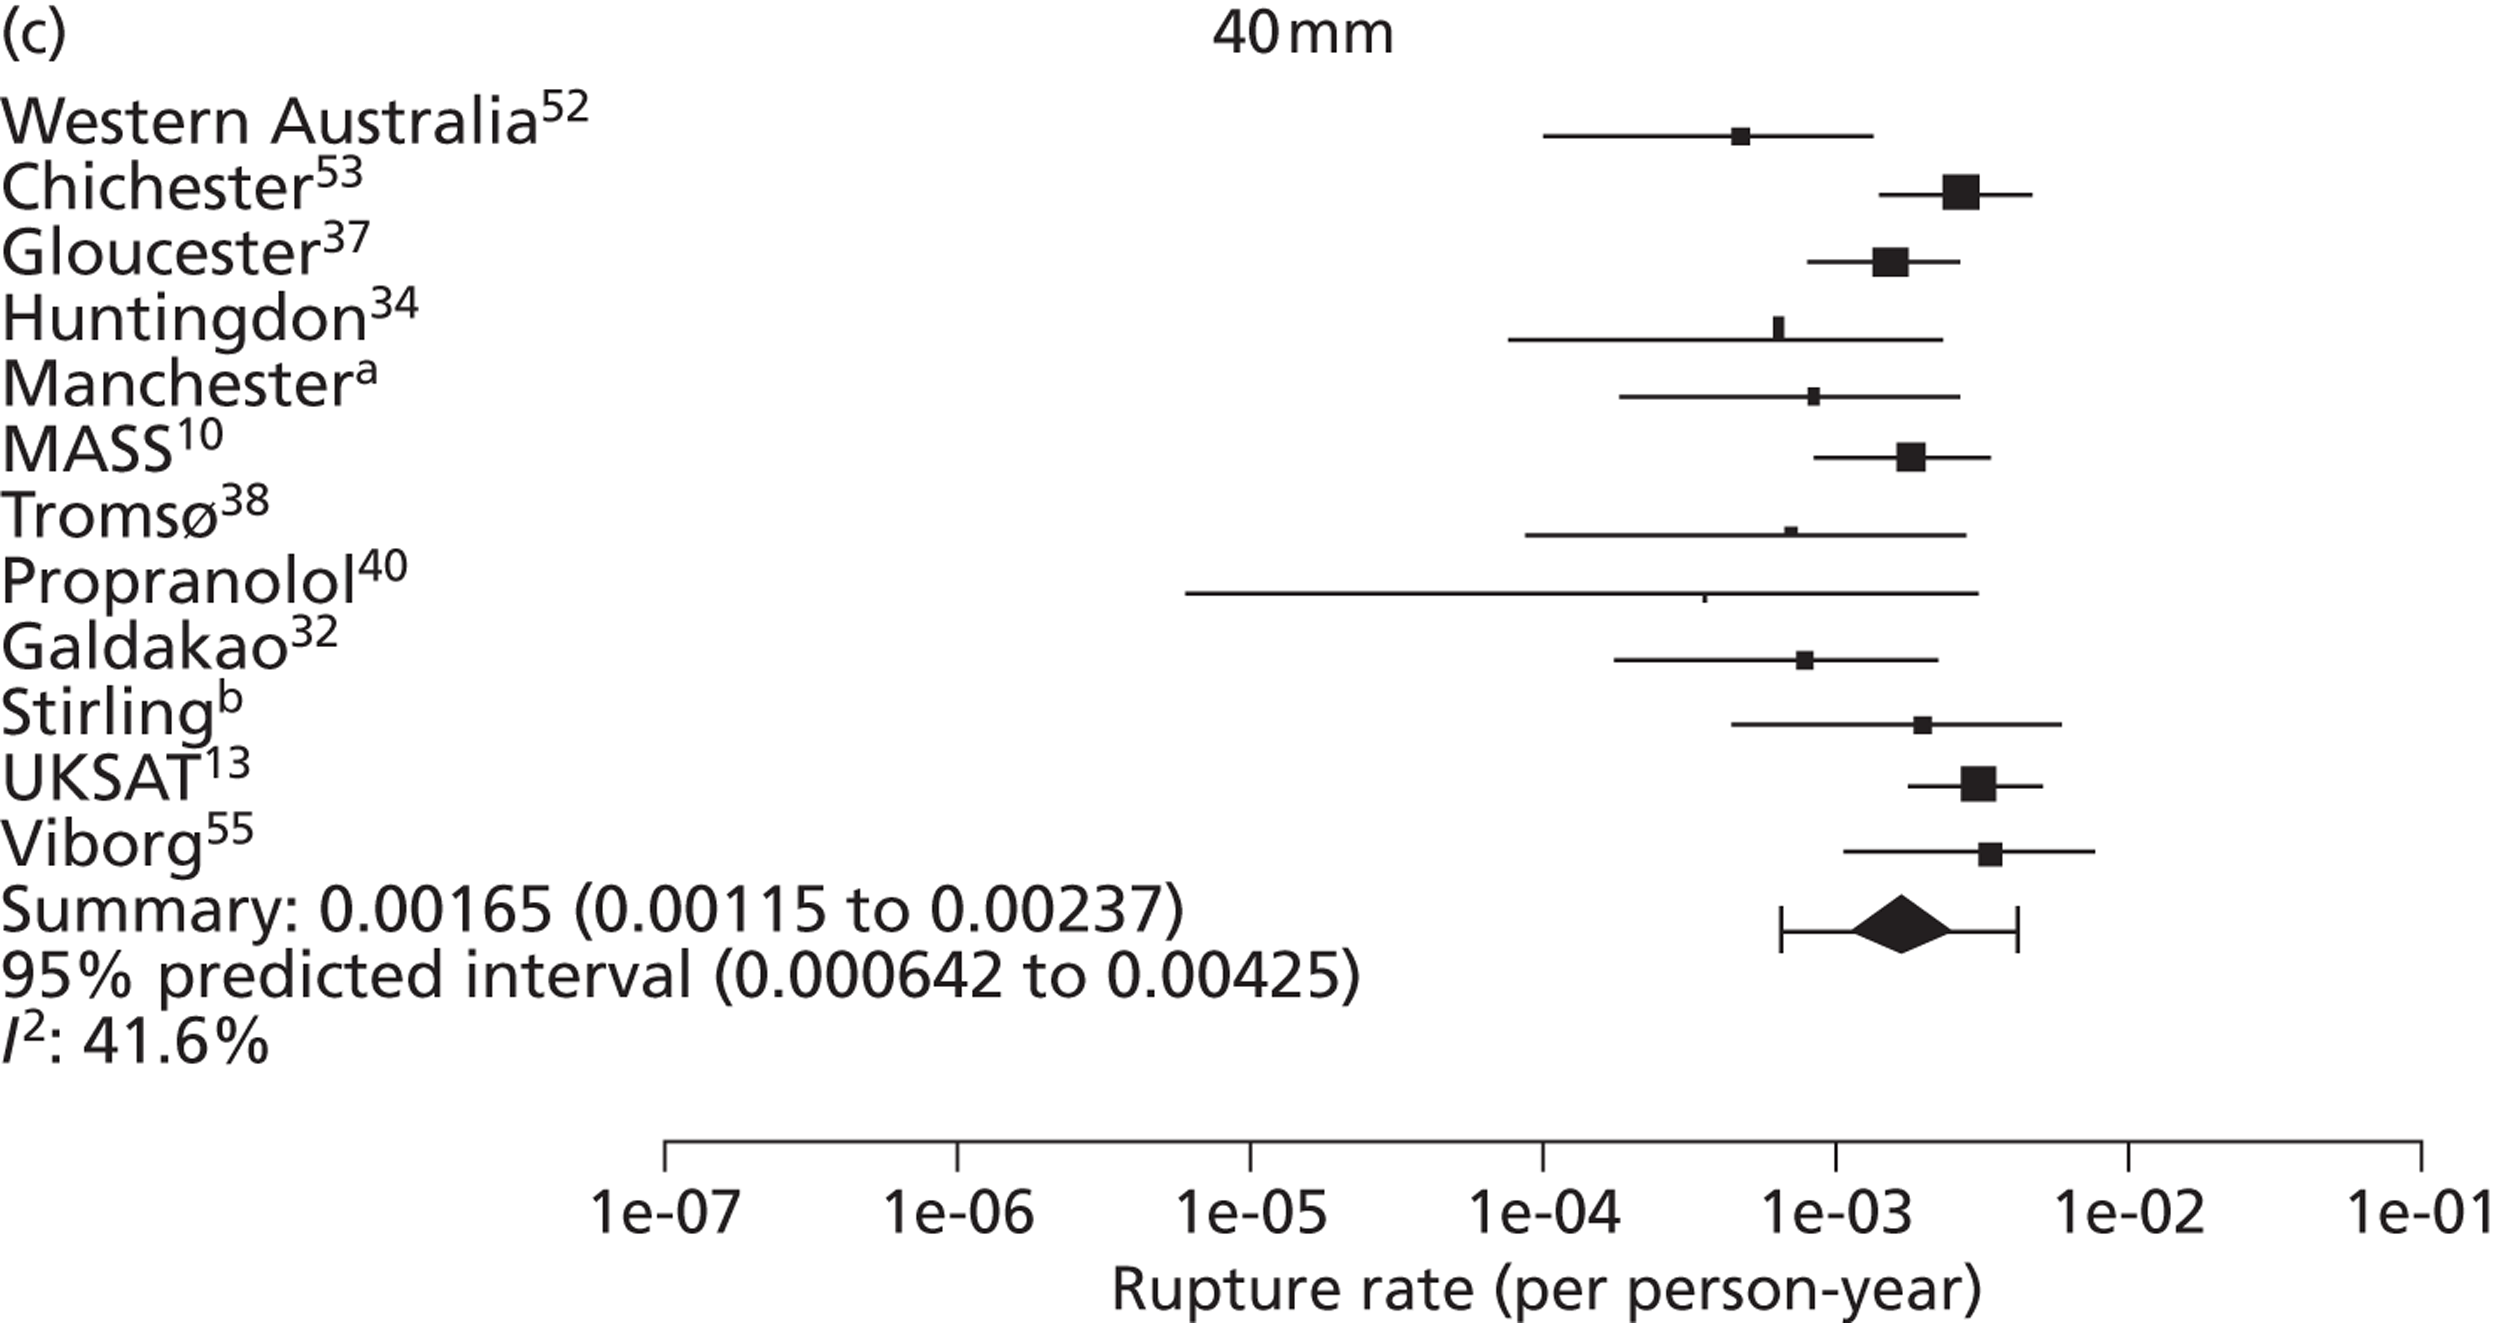
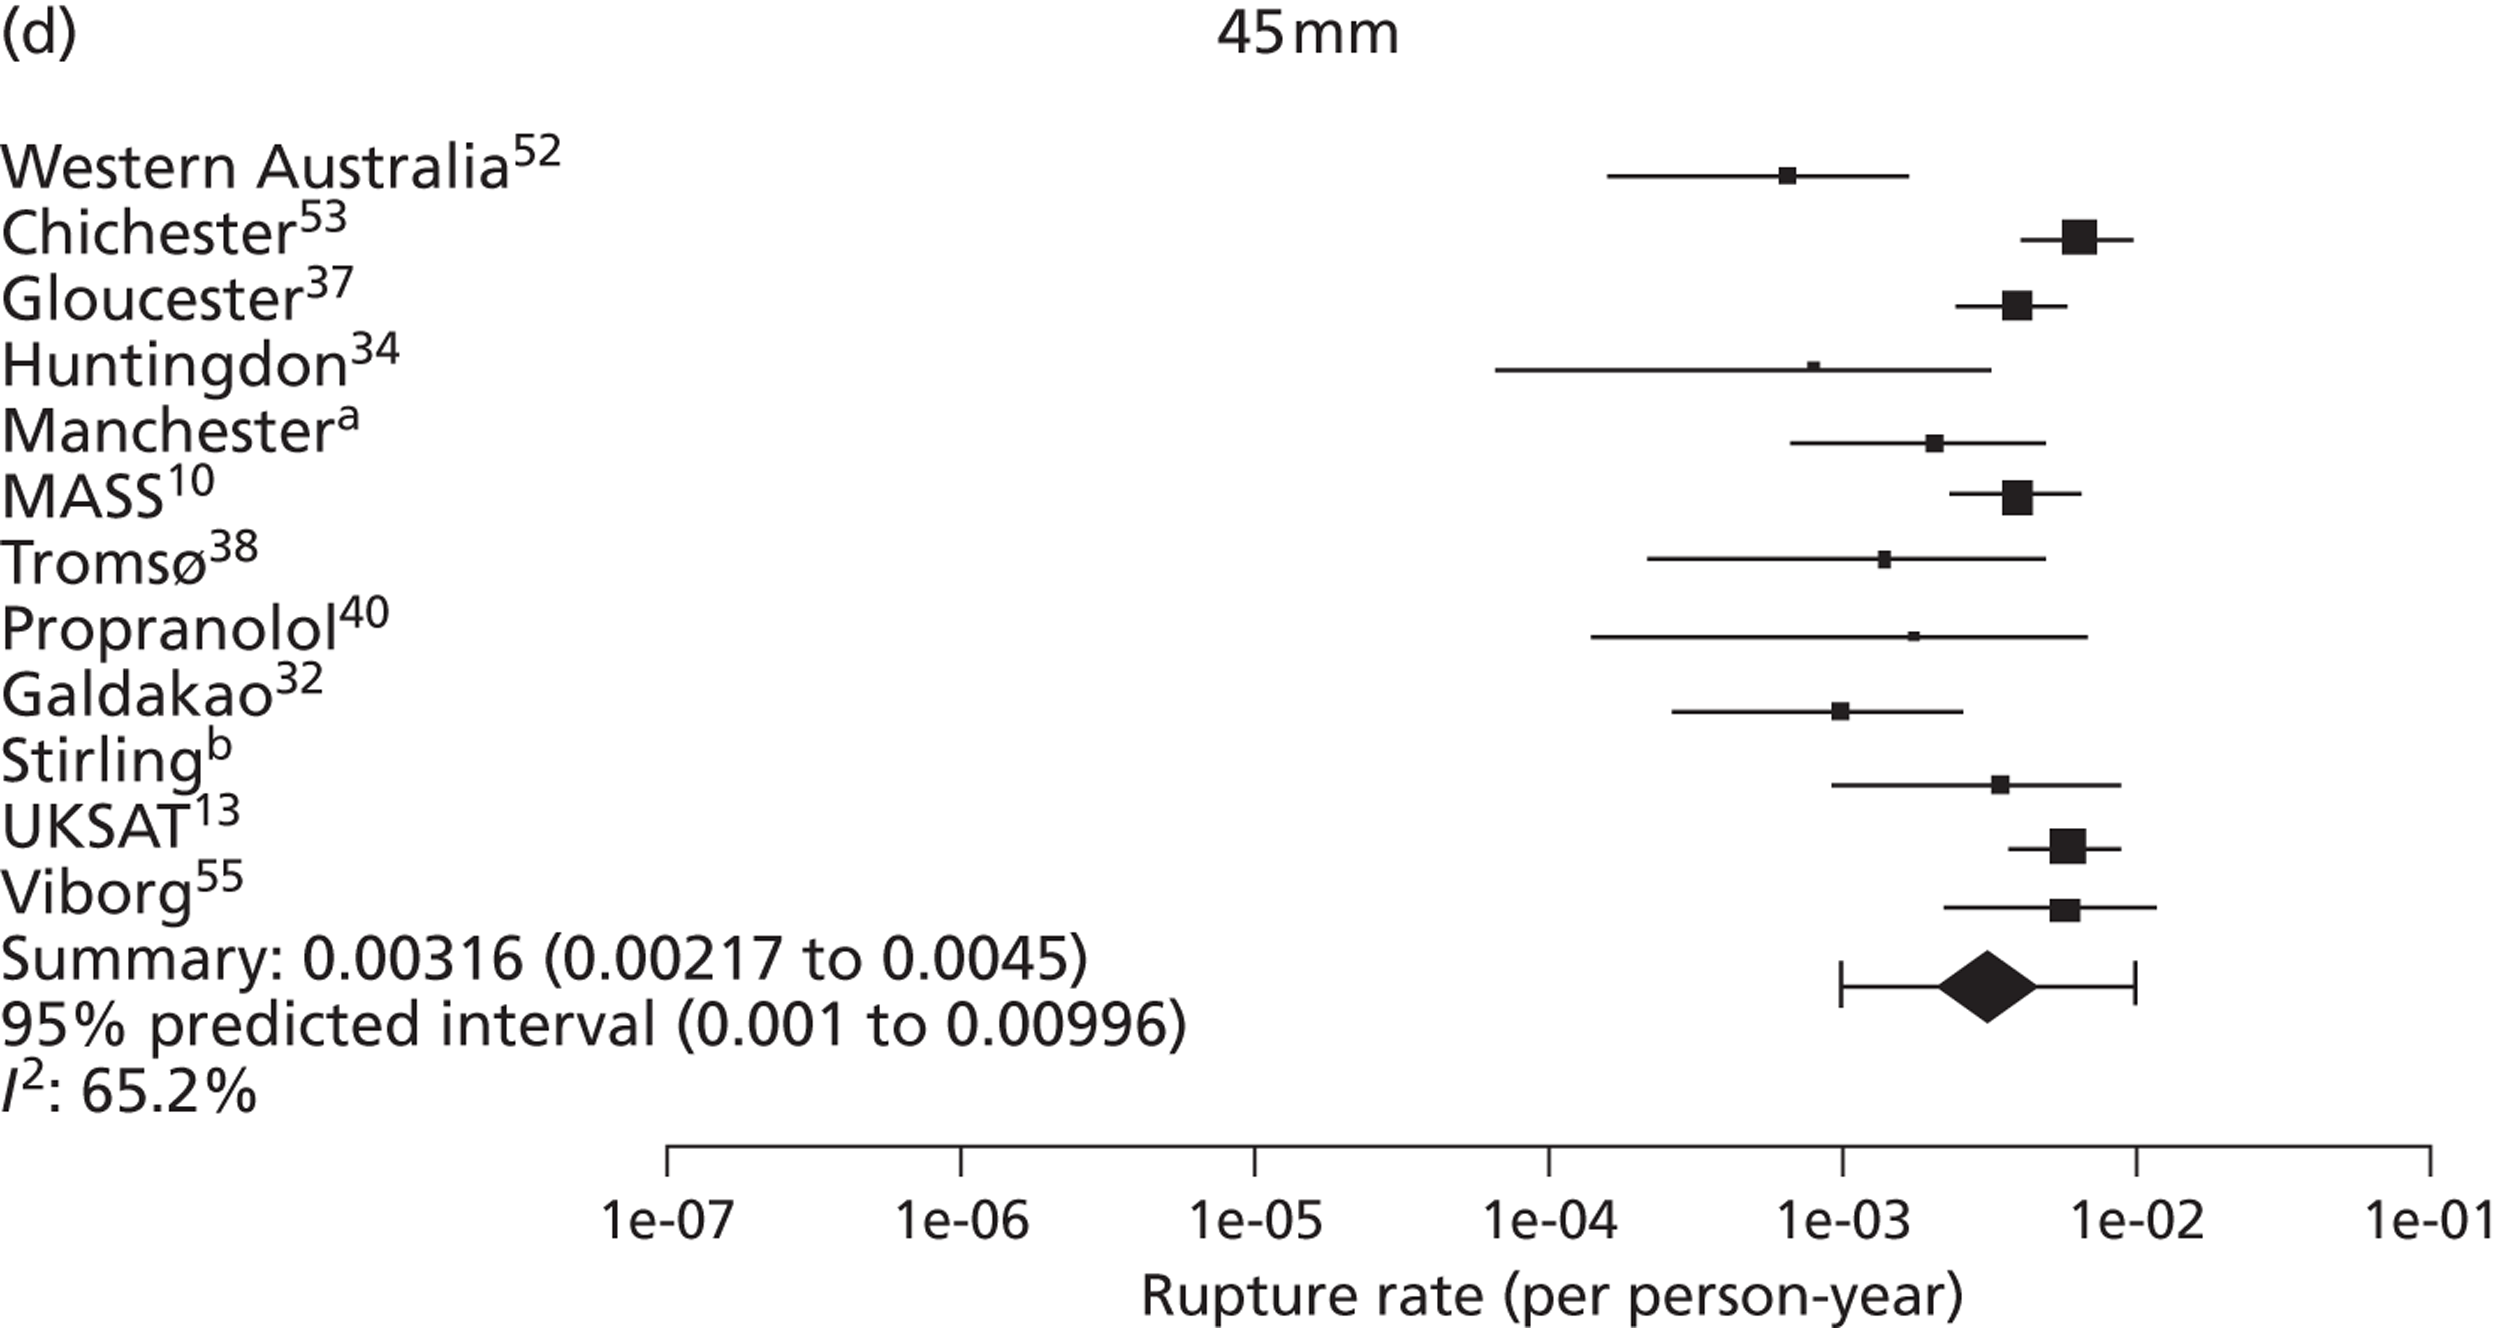
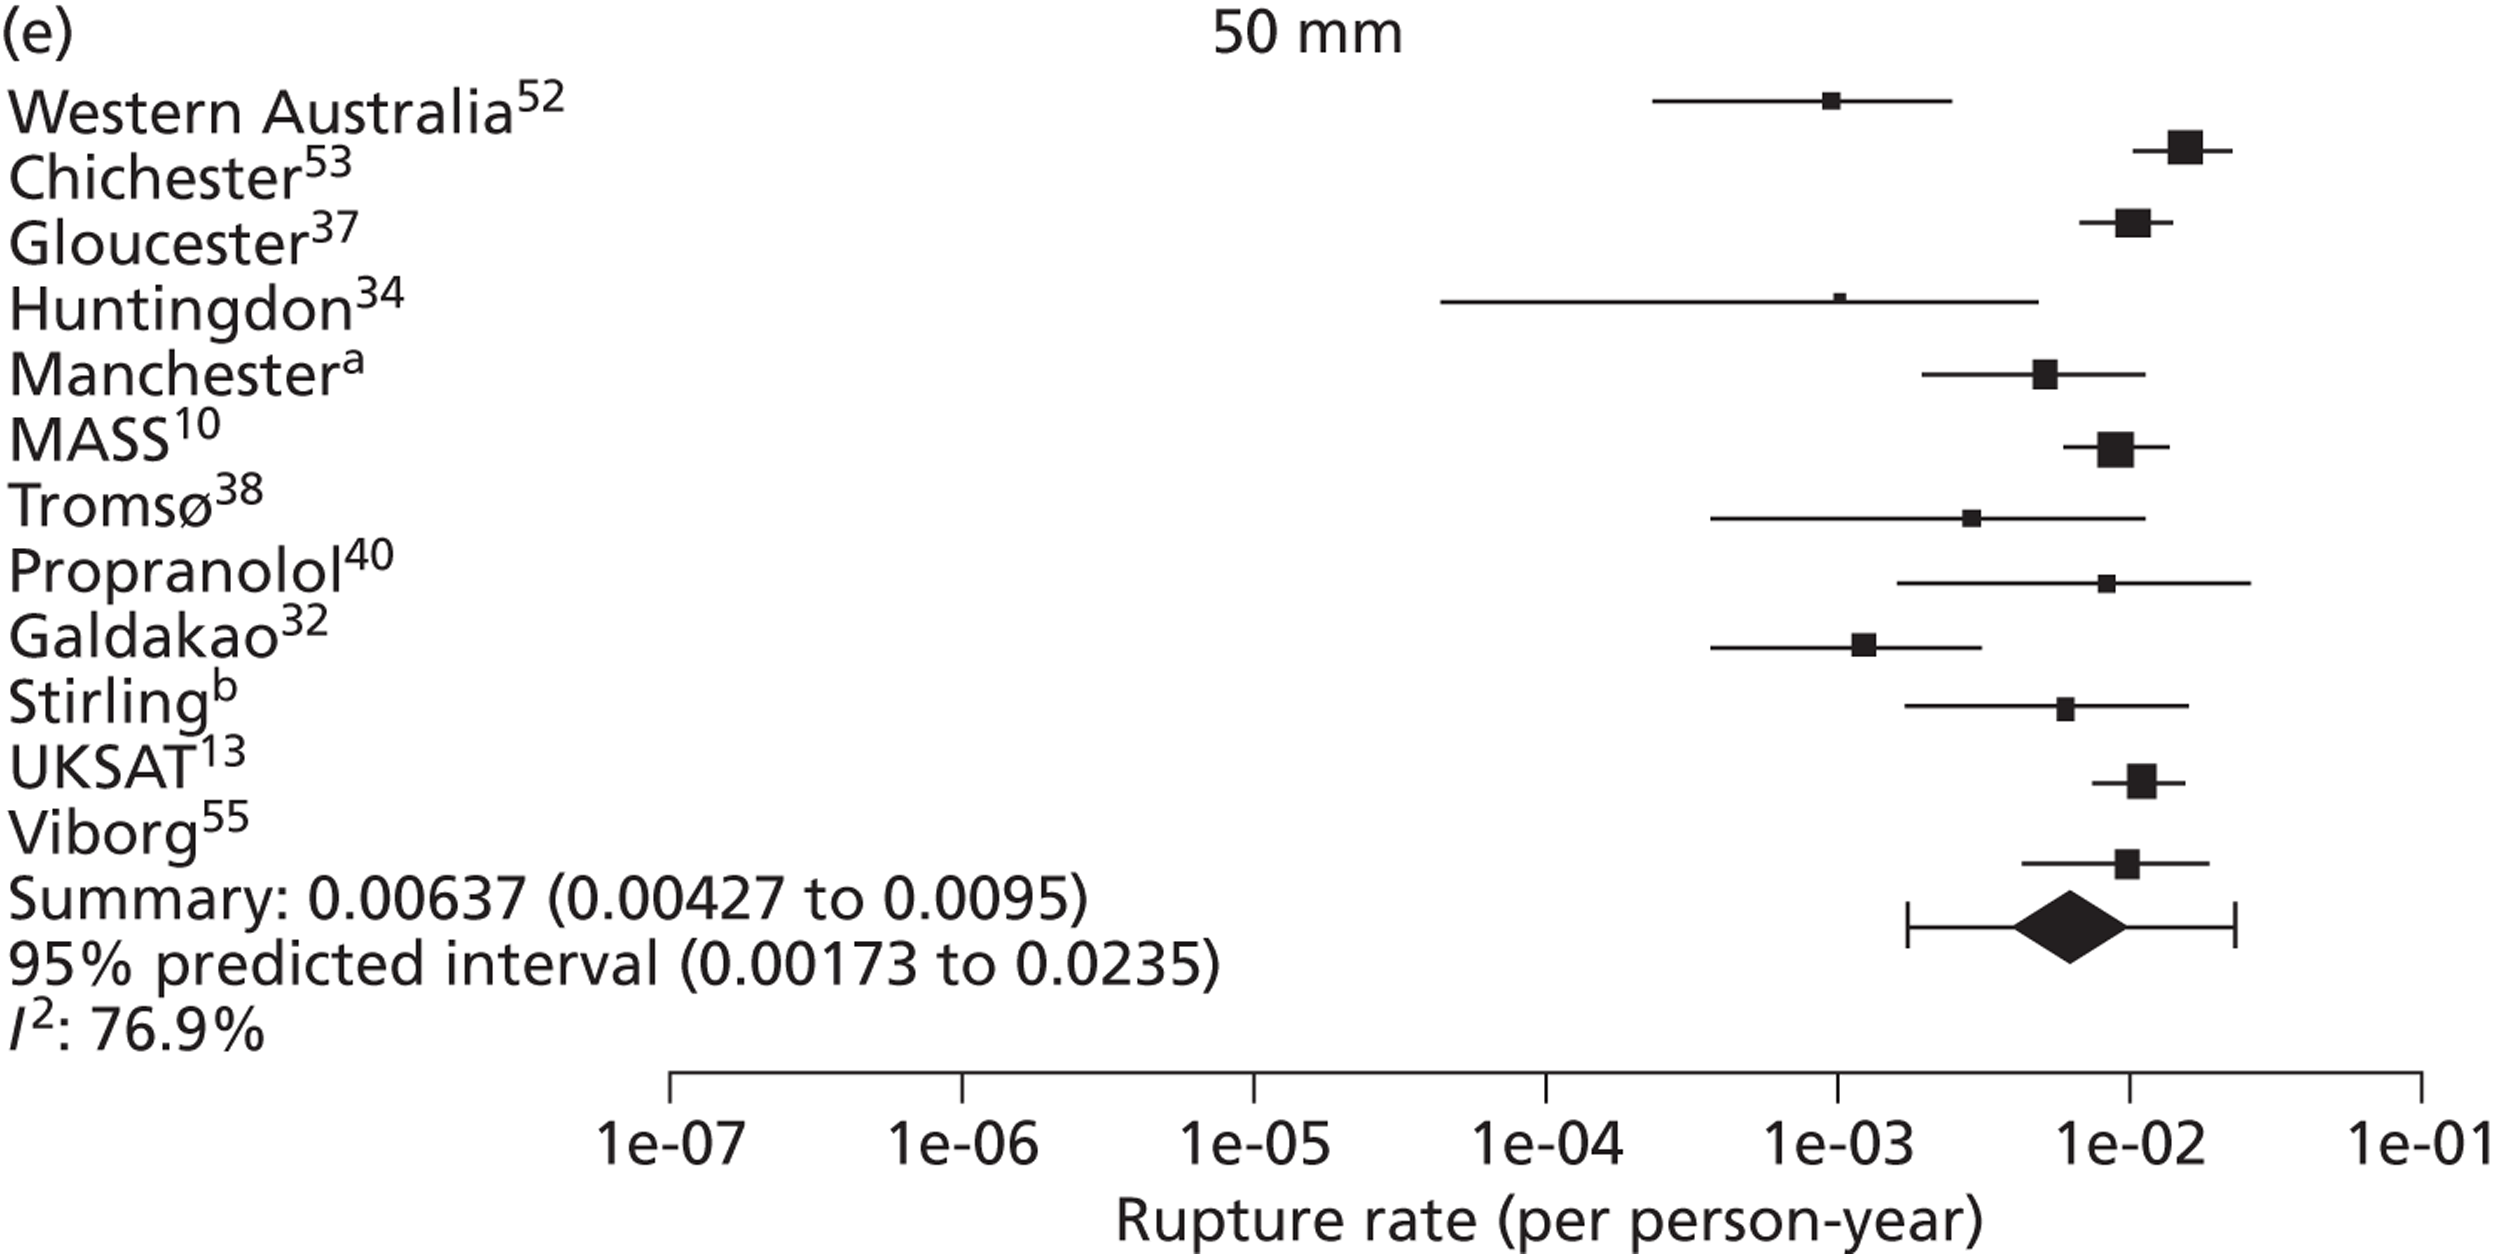
FIGURE 12.
Rupture risk according to underlying AAA diameter, in men, by study and overall (log-scale, with 95% CIs and prediction intervals). The area of each symbol is inversely proportional to its SE. (a) Professor Charles N McCollum, University Hospital of South Manchester, 2010–12, personal communication; and (b) Mr Richard Holdsworth, Stirling Royal Infirmary, 2010–12, personal communication. UKSAT, United Kingdom Small Aneurysm Trial.
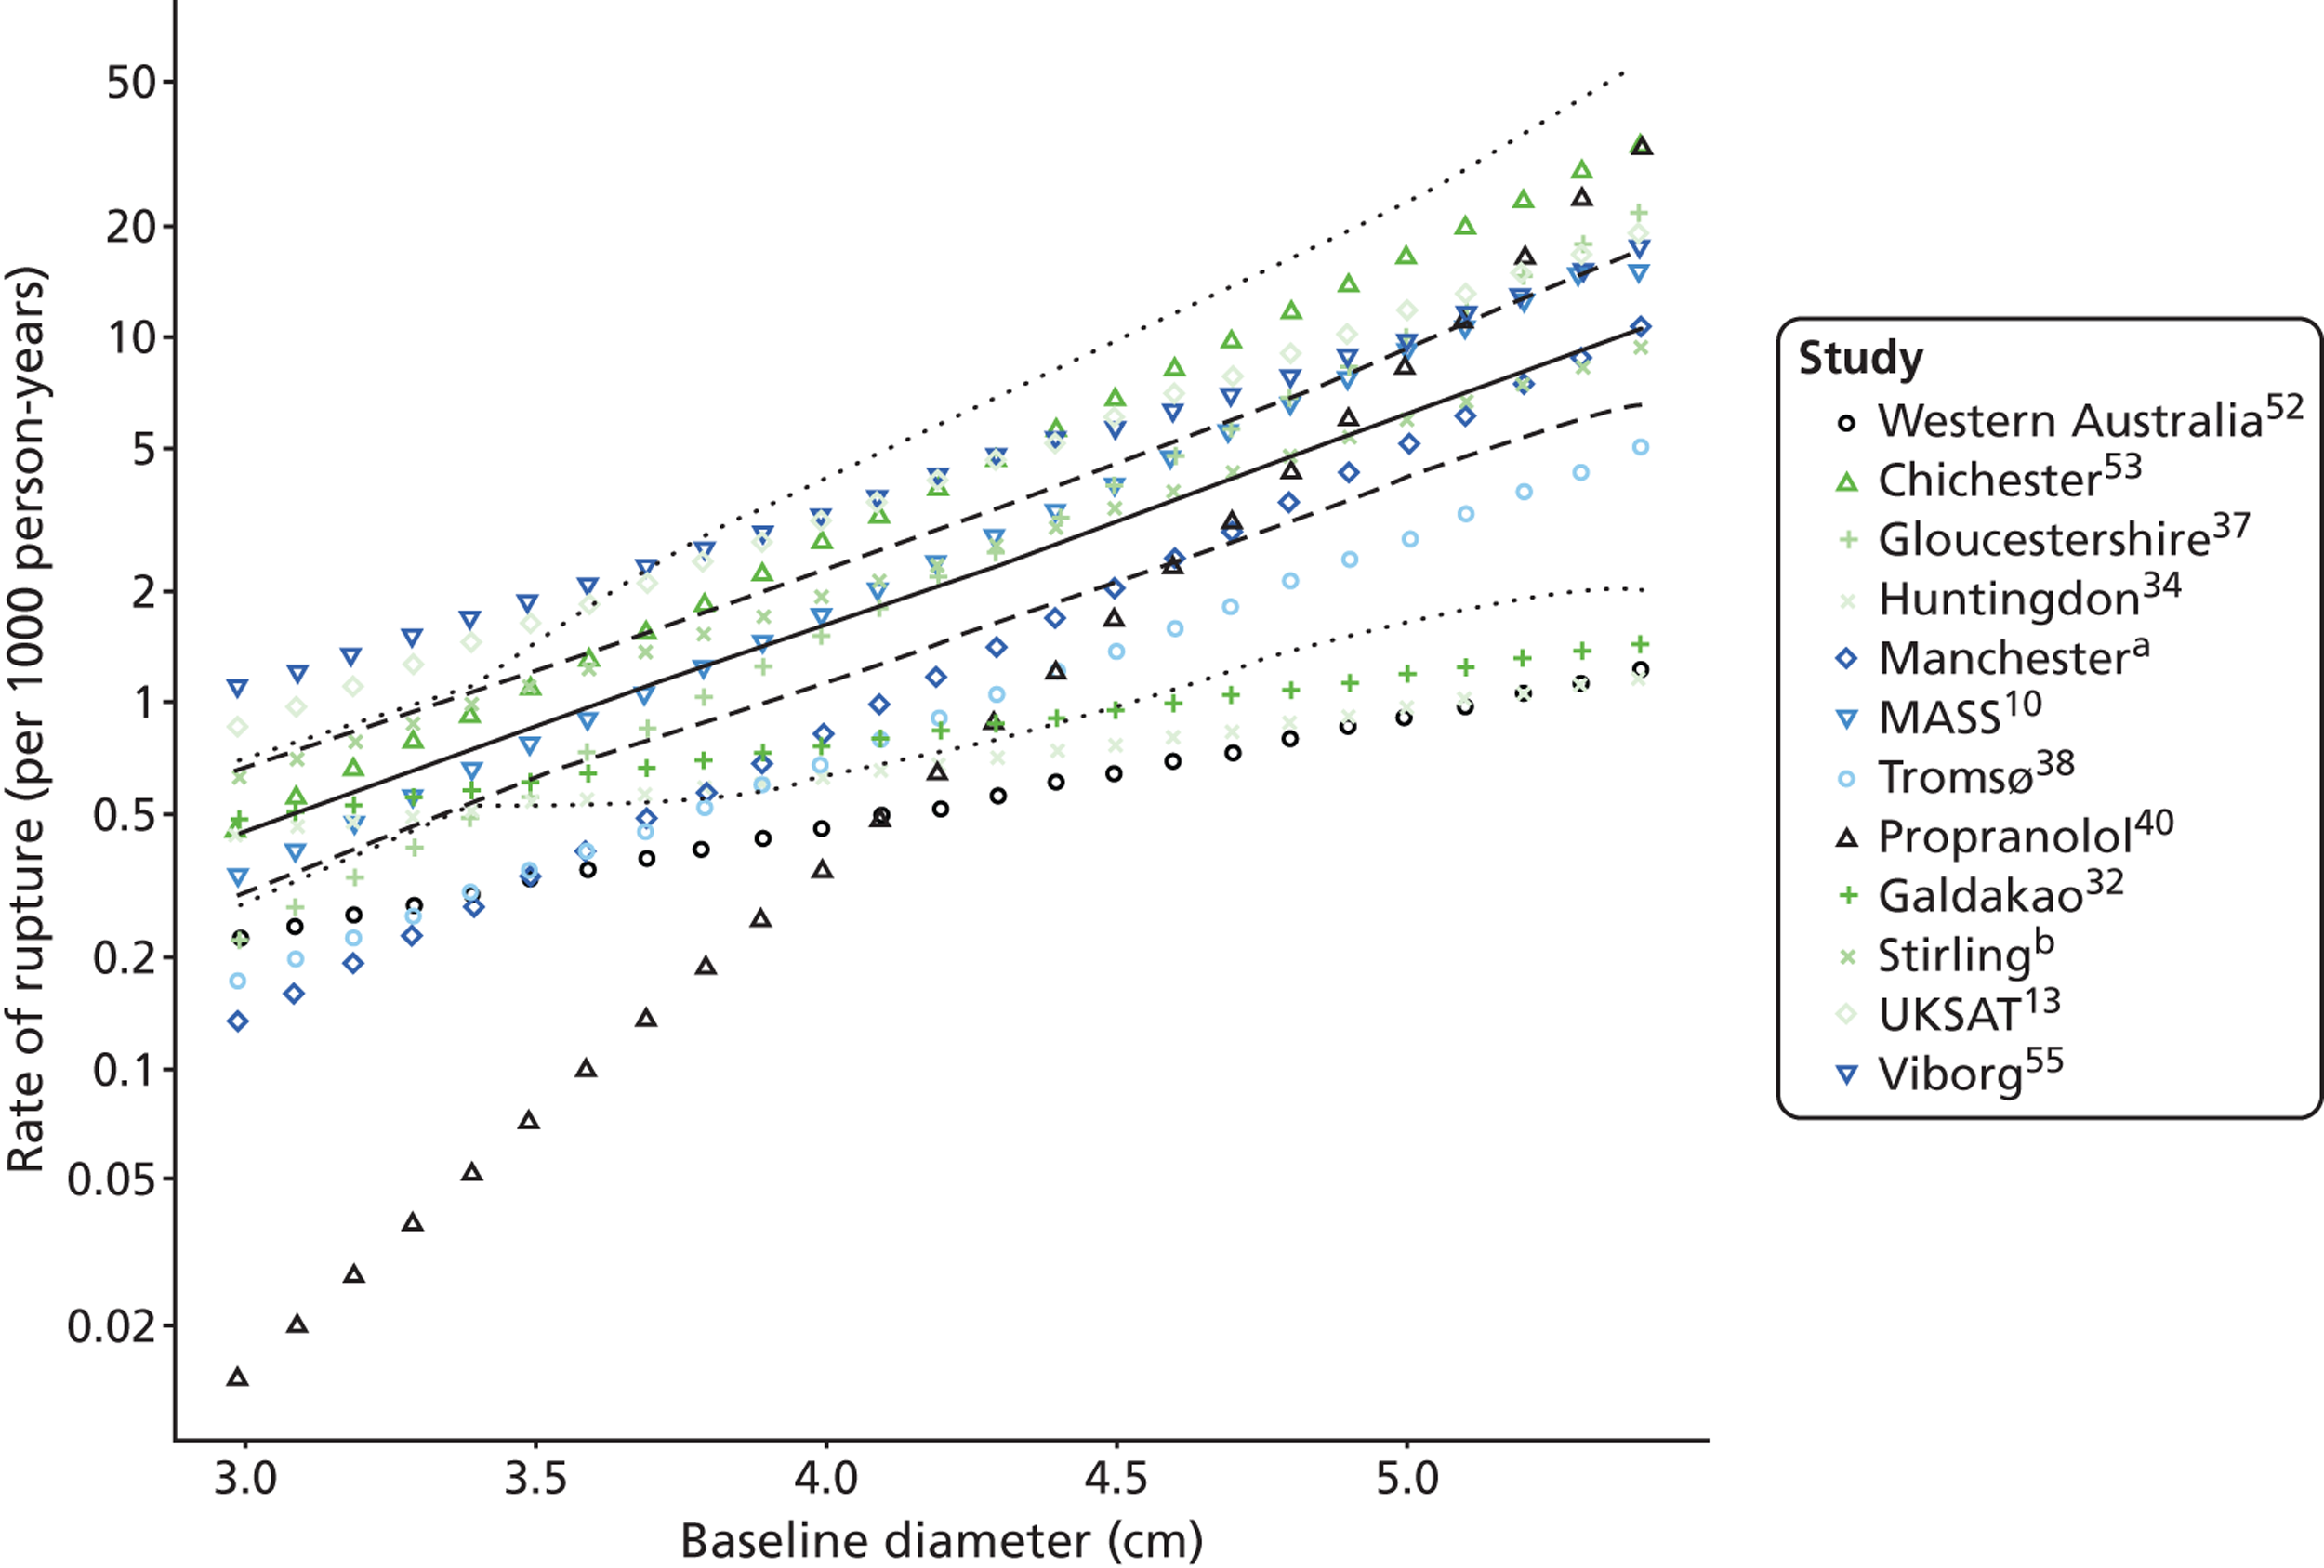
FIGURE 13.
Estimated time given underlying AAA diameter for which there is a 1% chance of rupture, in men, by study and overall (black diamonds represent 95% CIs, error bars are 95% prediction intervals). (a) Professor Charles N McCollum, University Hospital of South Manchester, 2010–12, personal communication; and (b) Mr Richard Holdsworth, Stirling Royal Infirmary, 2010–12, personal communication. UKSAT, United Kingdom Small Aneurysm Trial.
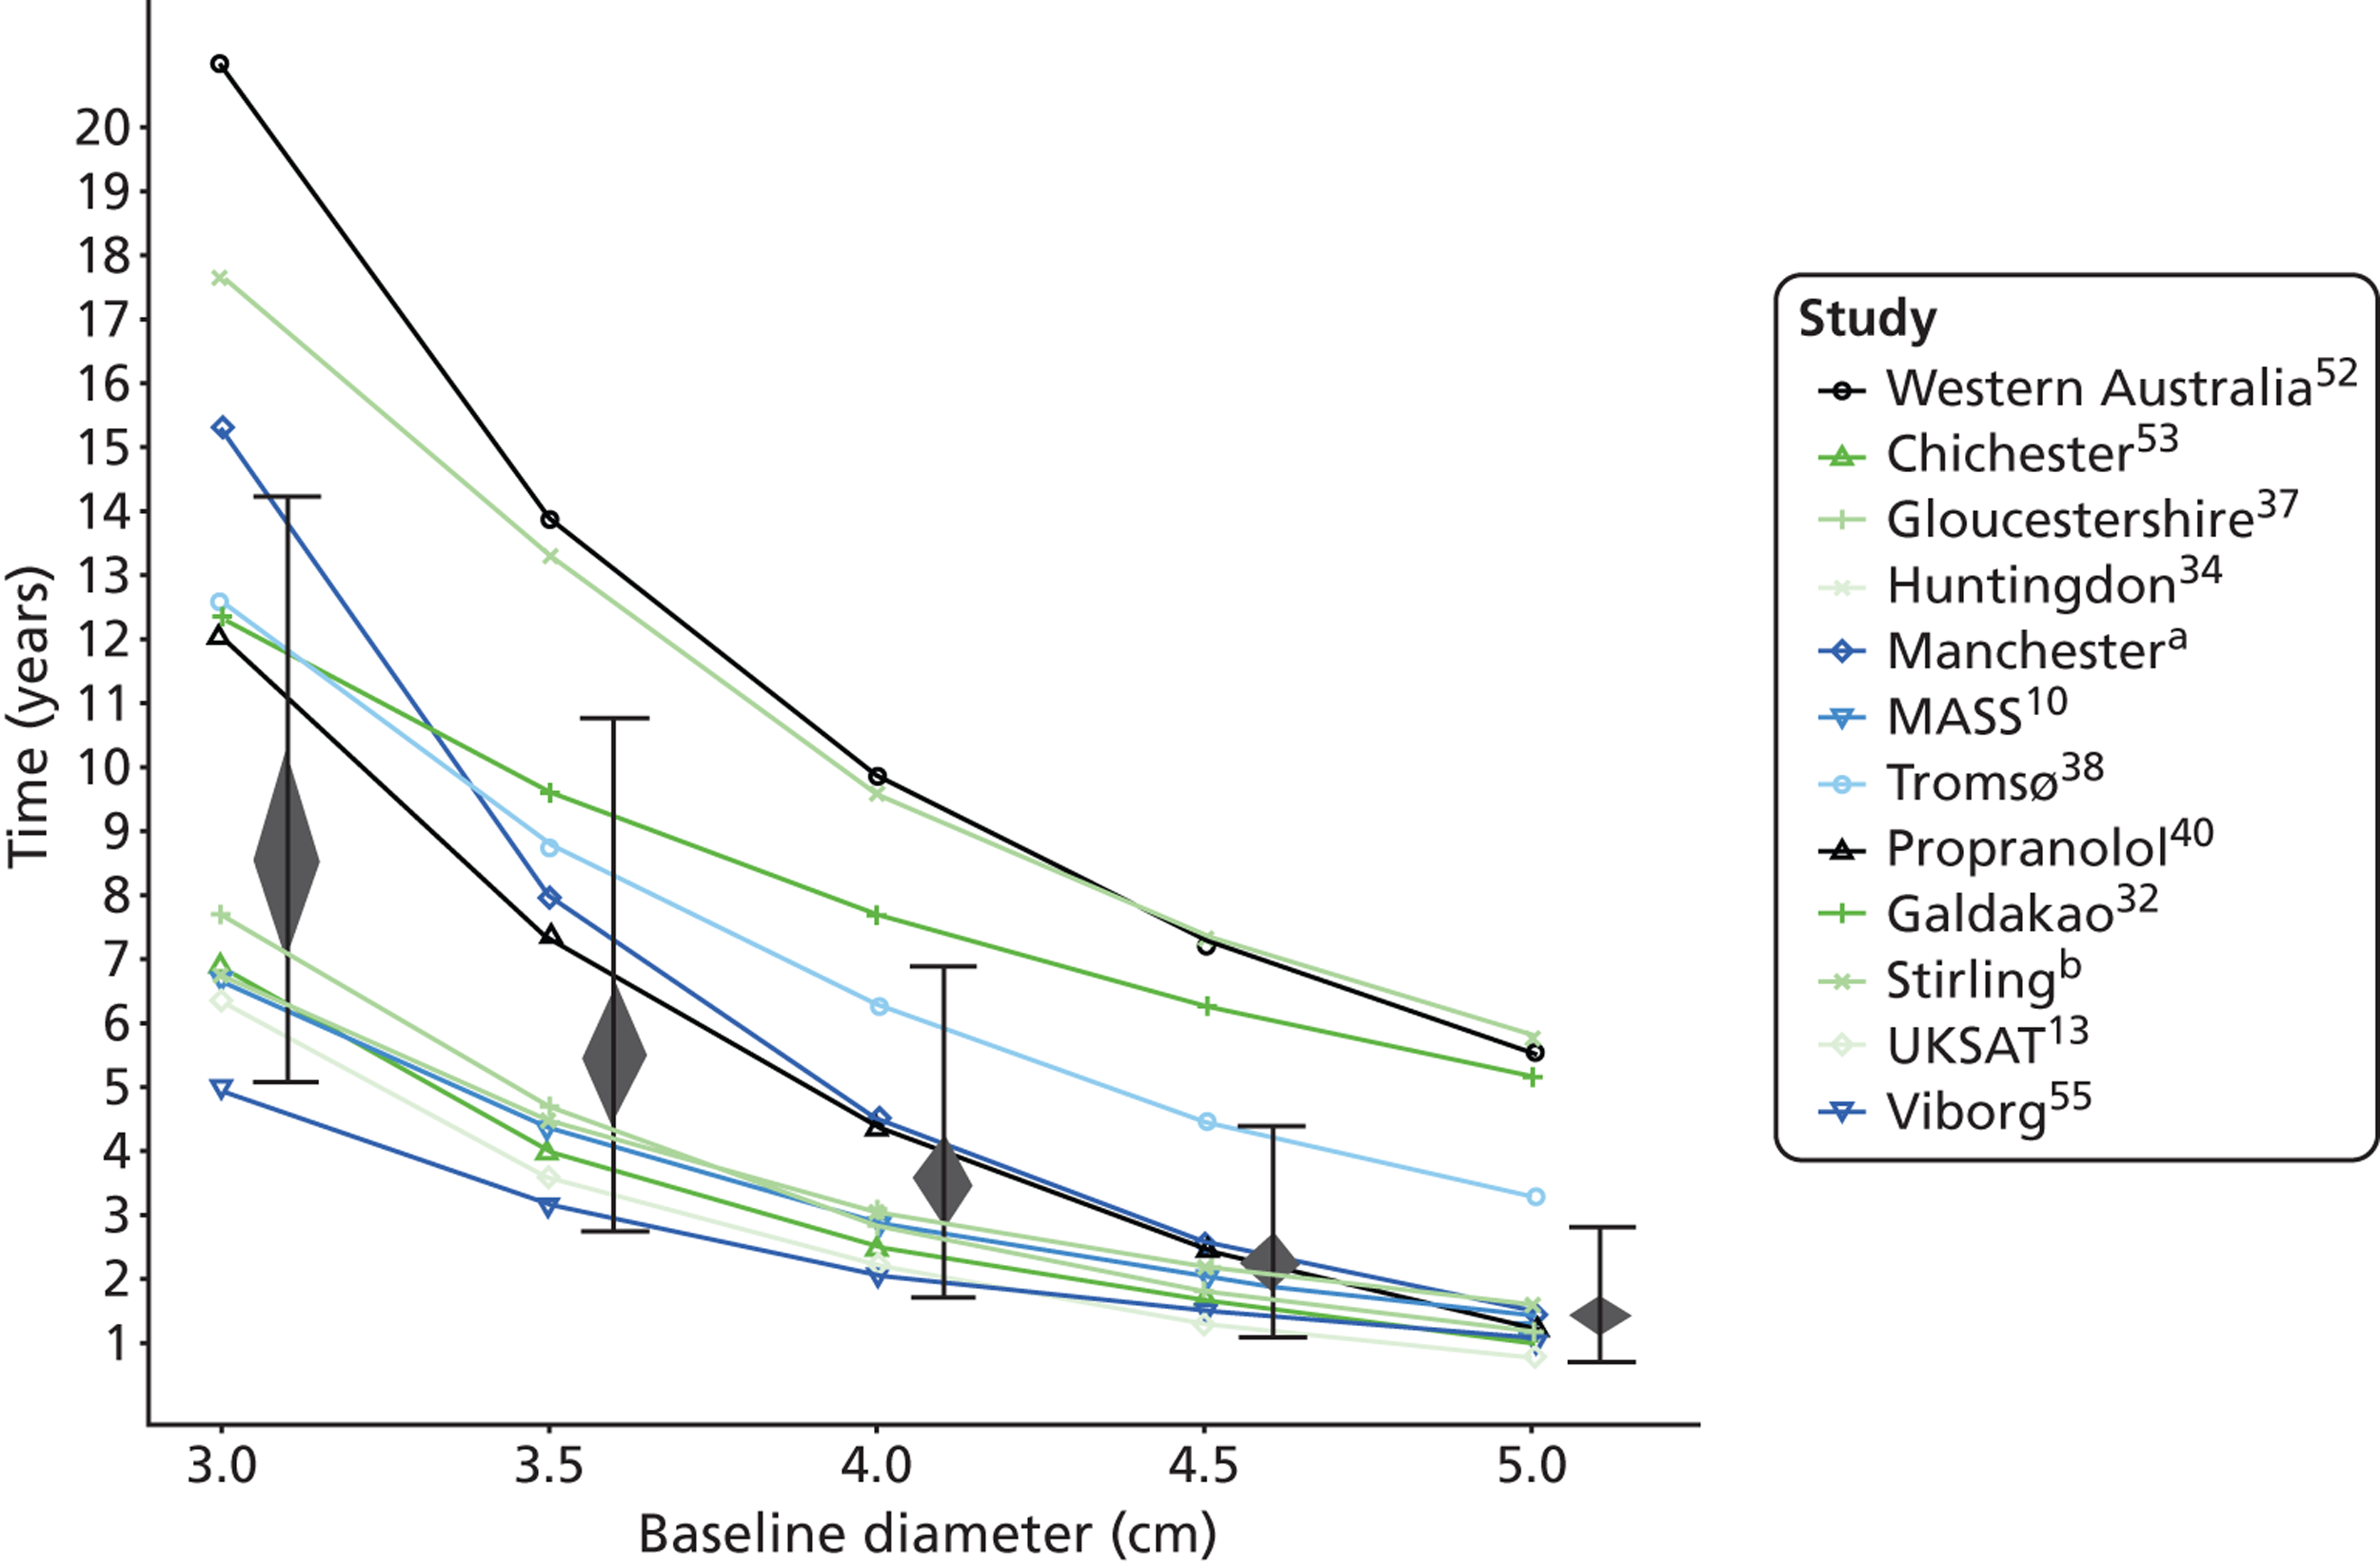
FIGURE 14.
Forest plots of mean AAA growth rate (estimate and 95% CIs) in women according to baseline AAA diameter. (a) Professor D Julian A Scott, University of Leeds, 2010–12, personal communication; (b) Professor Charles N McCollum, University Hospital of South Manchester, 2010–12, personal communication; and (c) Mr Richard Holdsworth, Stirling Royal Infirmary, 2010–12, personal communication. UKSAT, United Kingdom Small Aneurysm Trial.
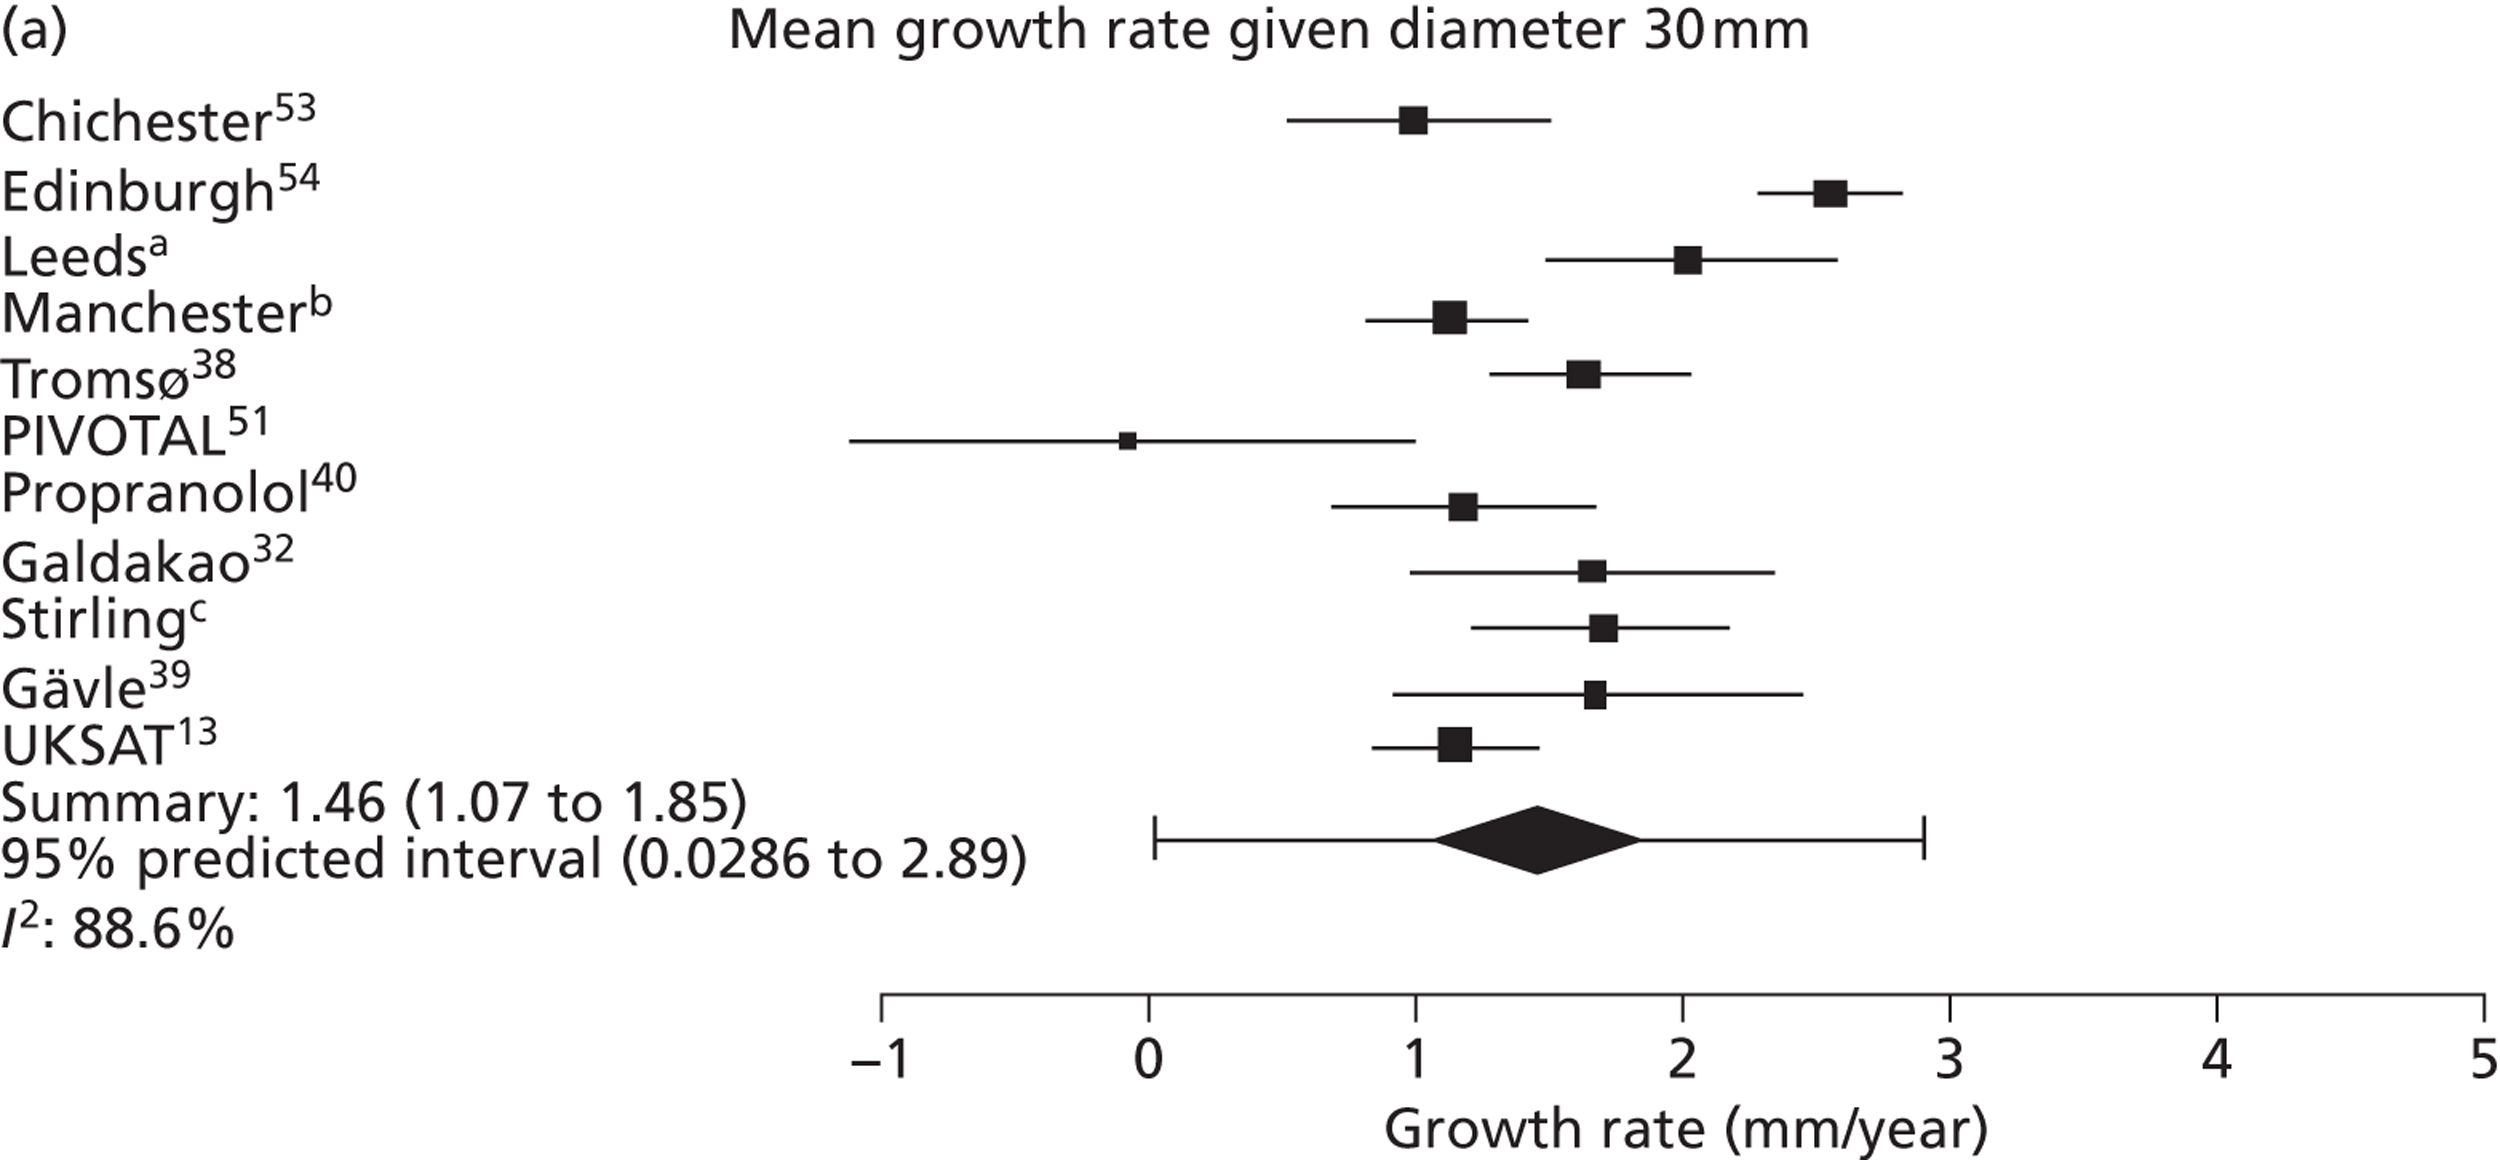
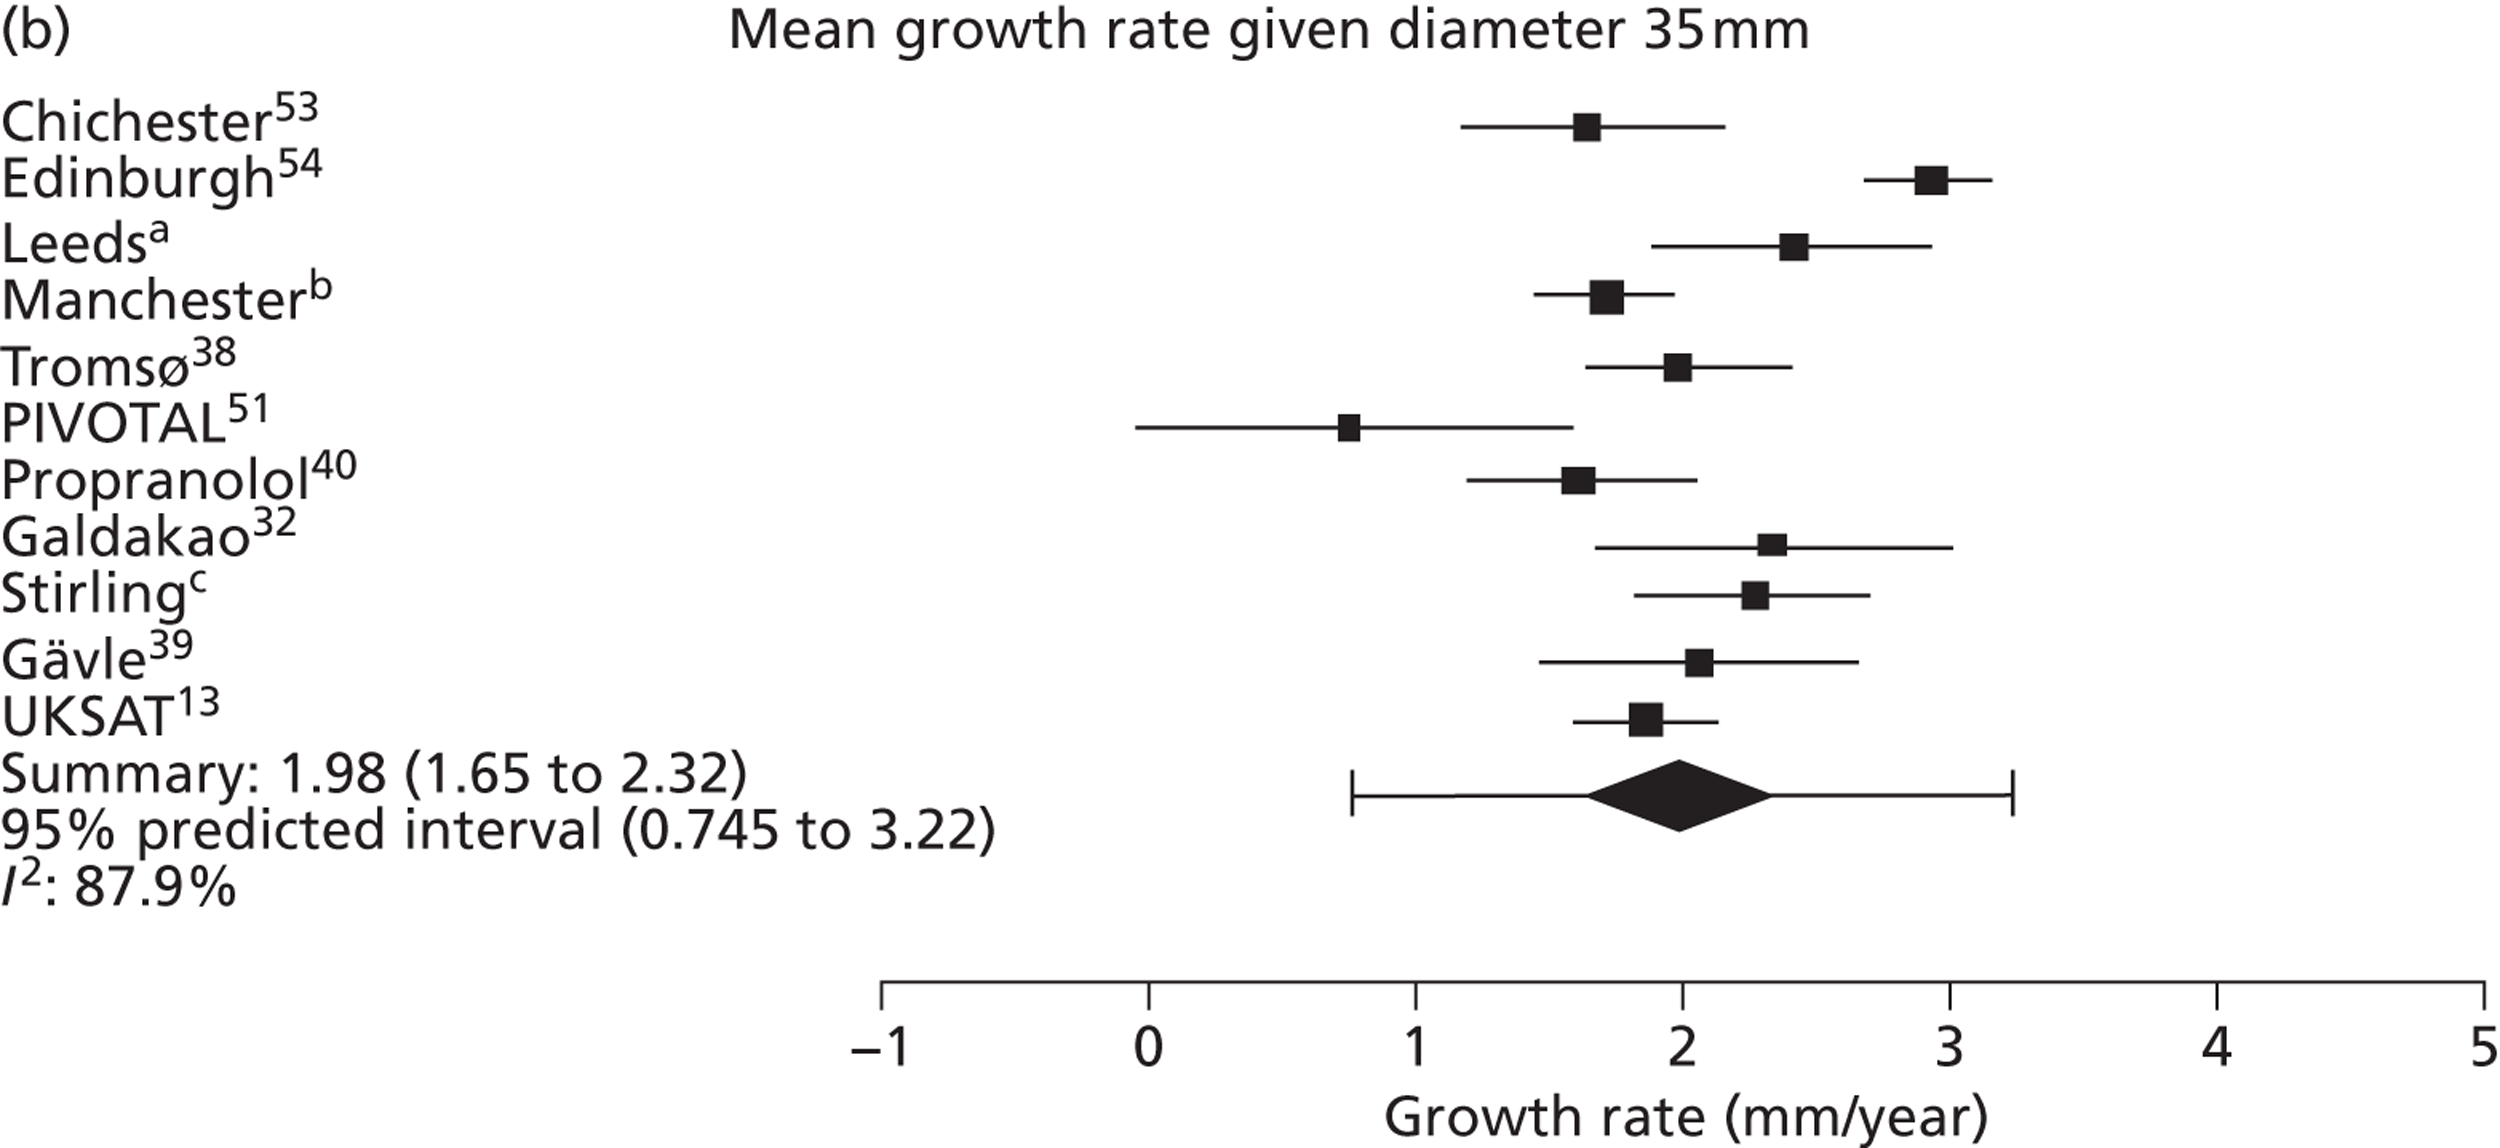
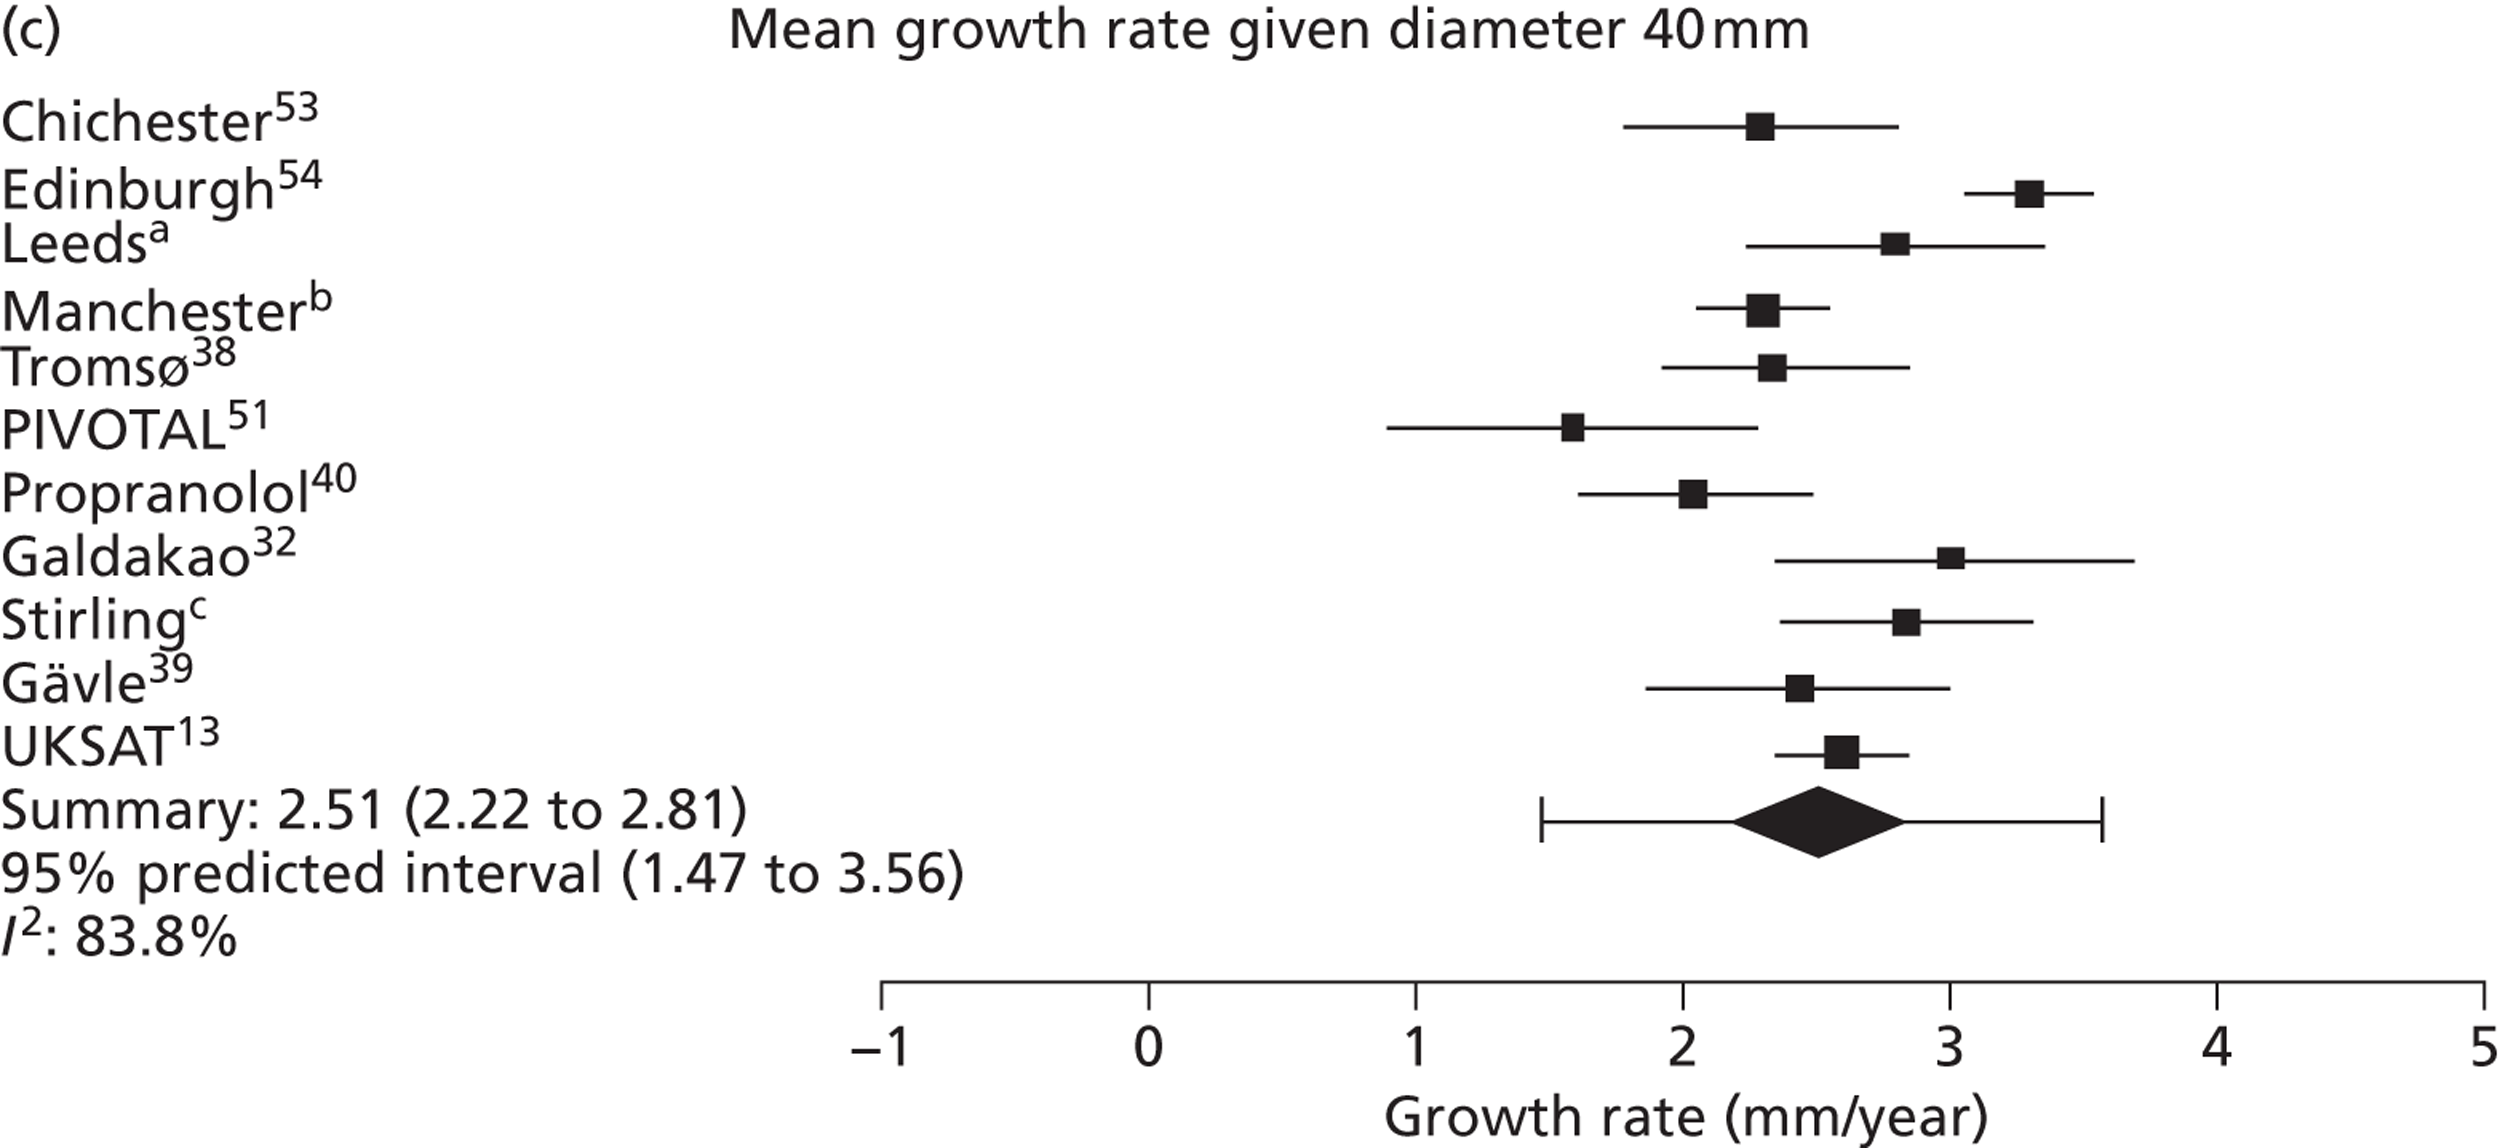
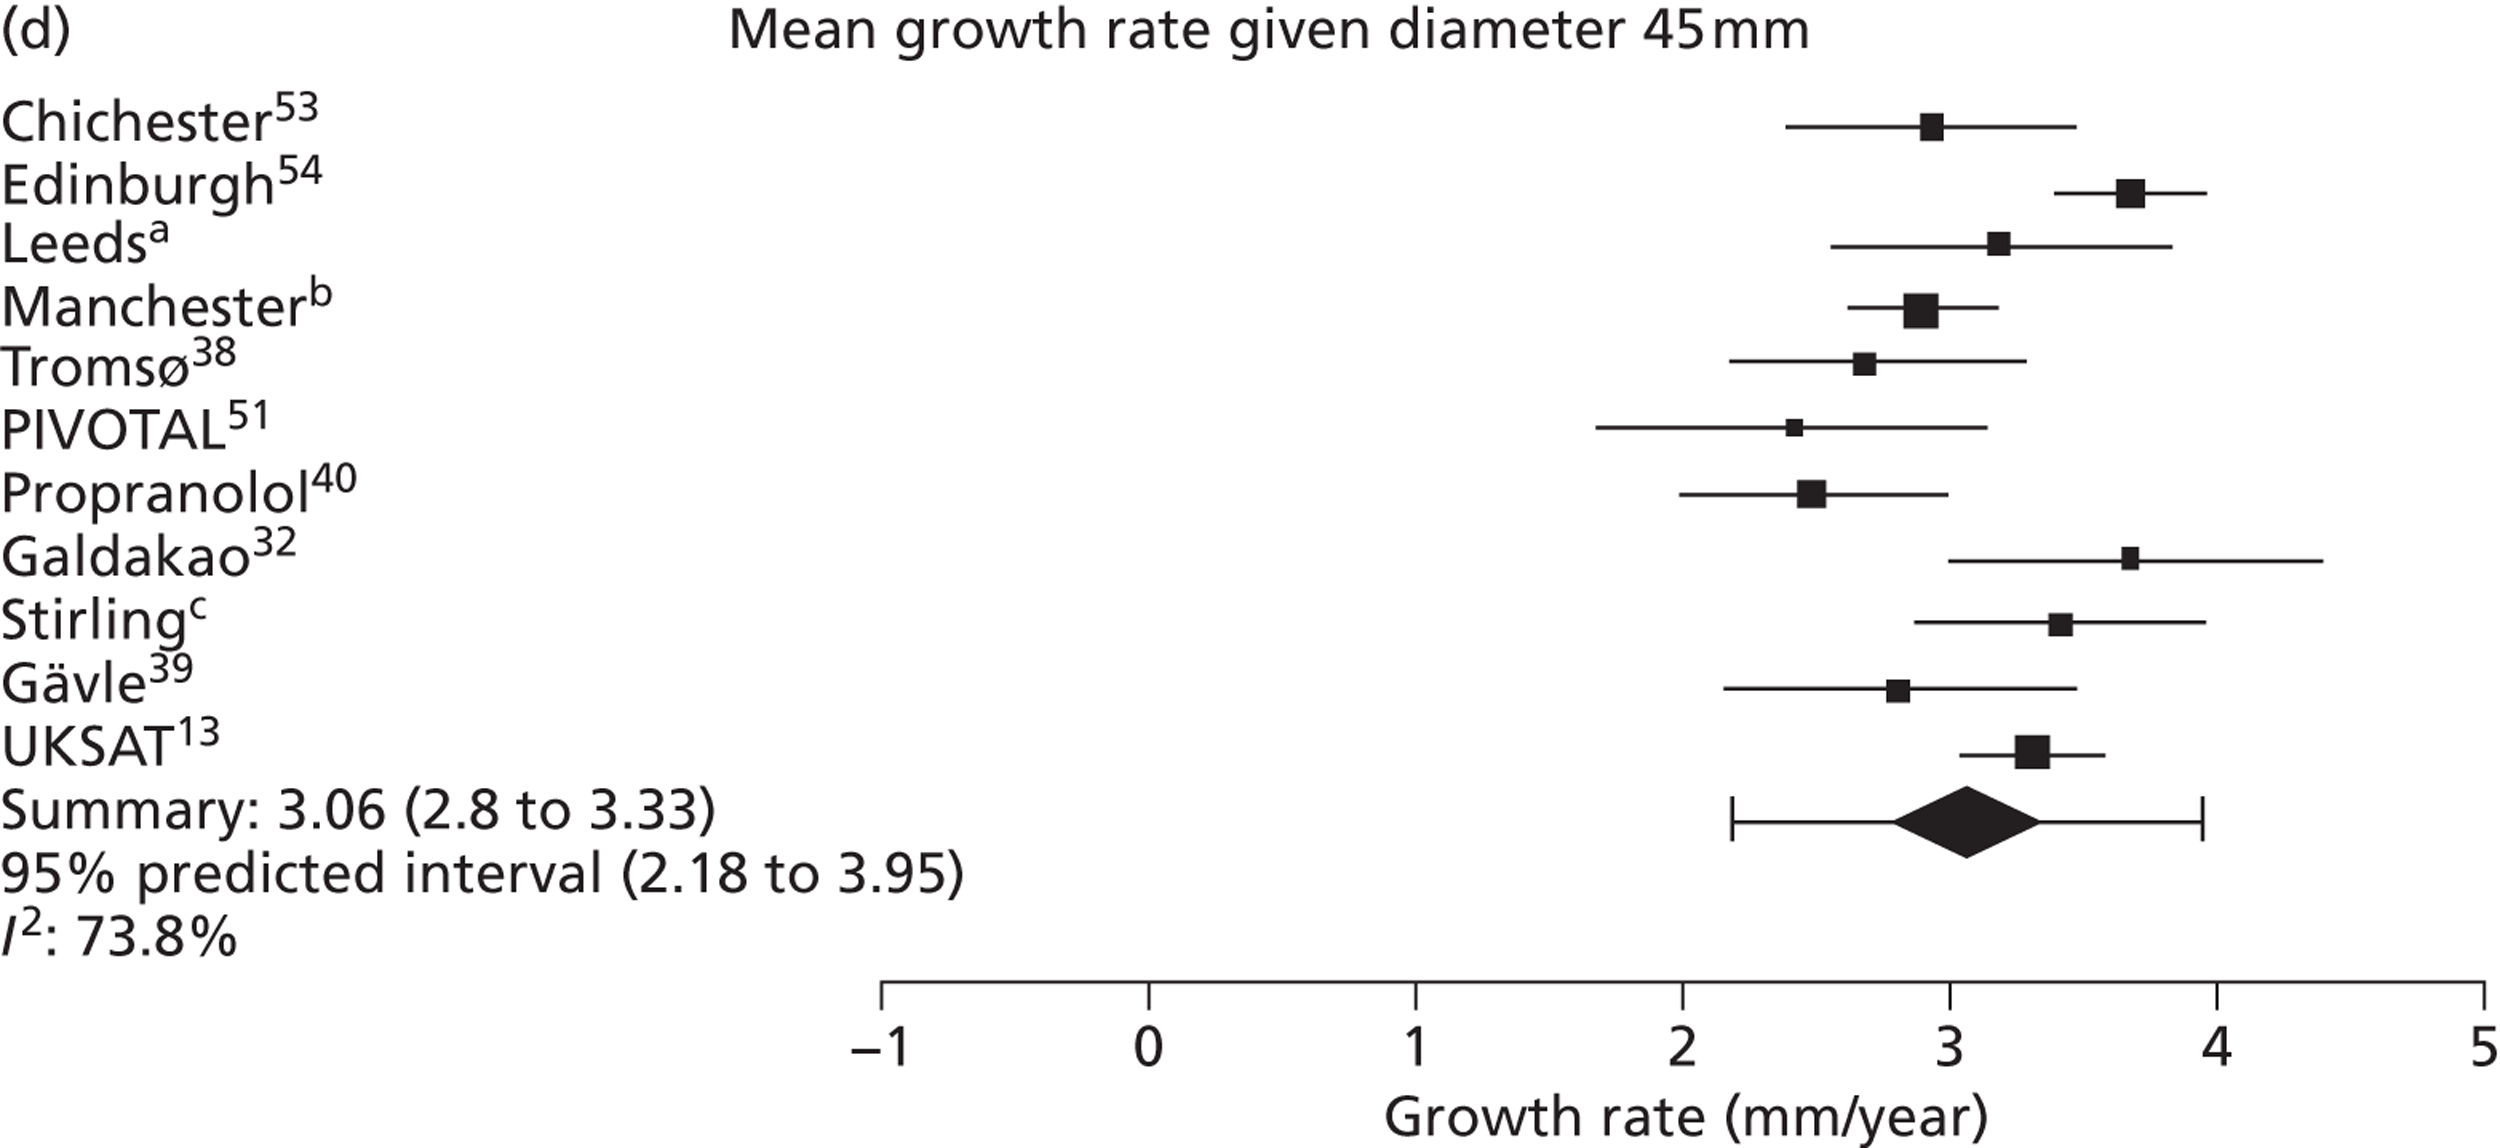
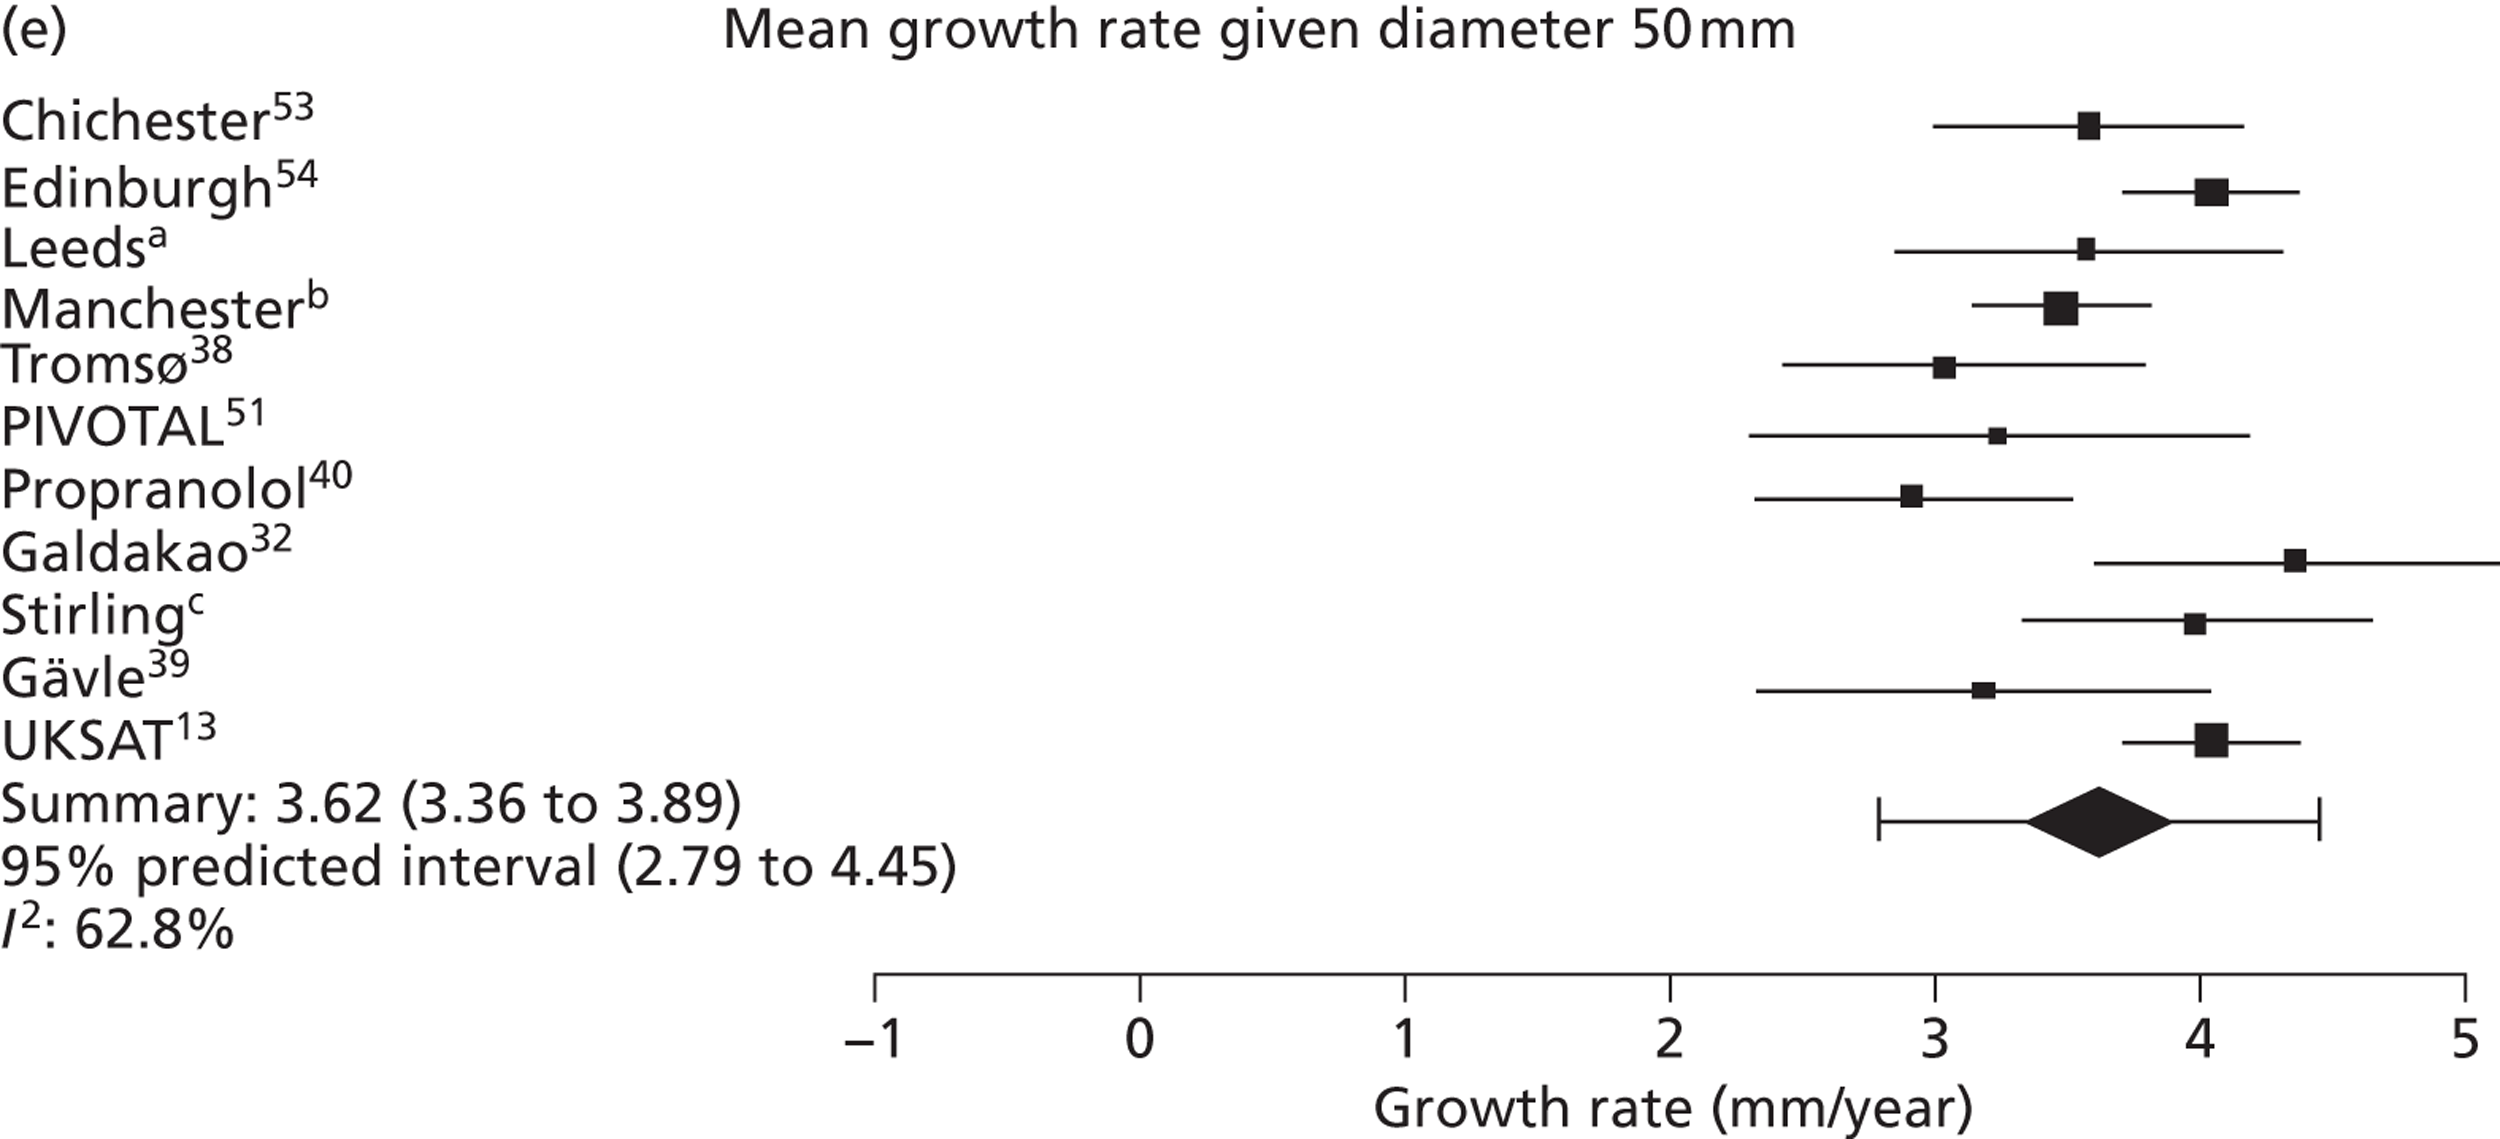
FIGURE 15.
Forest plots of rupture risk (estimate and 95% CIs, log-scale) in women according to underlying AAA diameter. a, Professor Charles N McCollum, University Hospital of South Manchester, 2010–12, personal communication; b, Mr Richard Holdsworth, Stirling Royal Infirmary, 2010–12, personal communication.
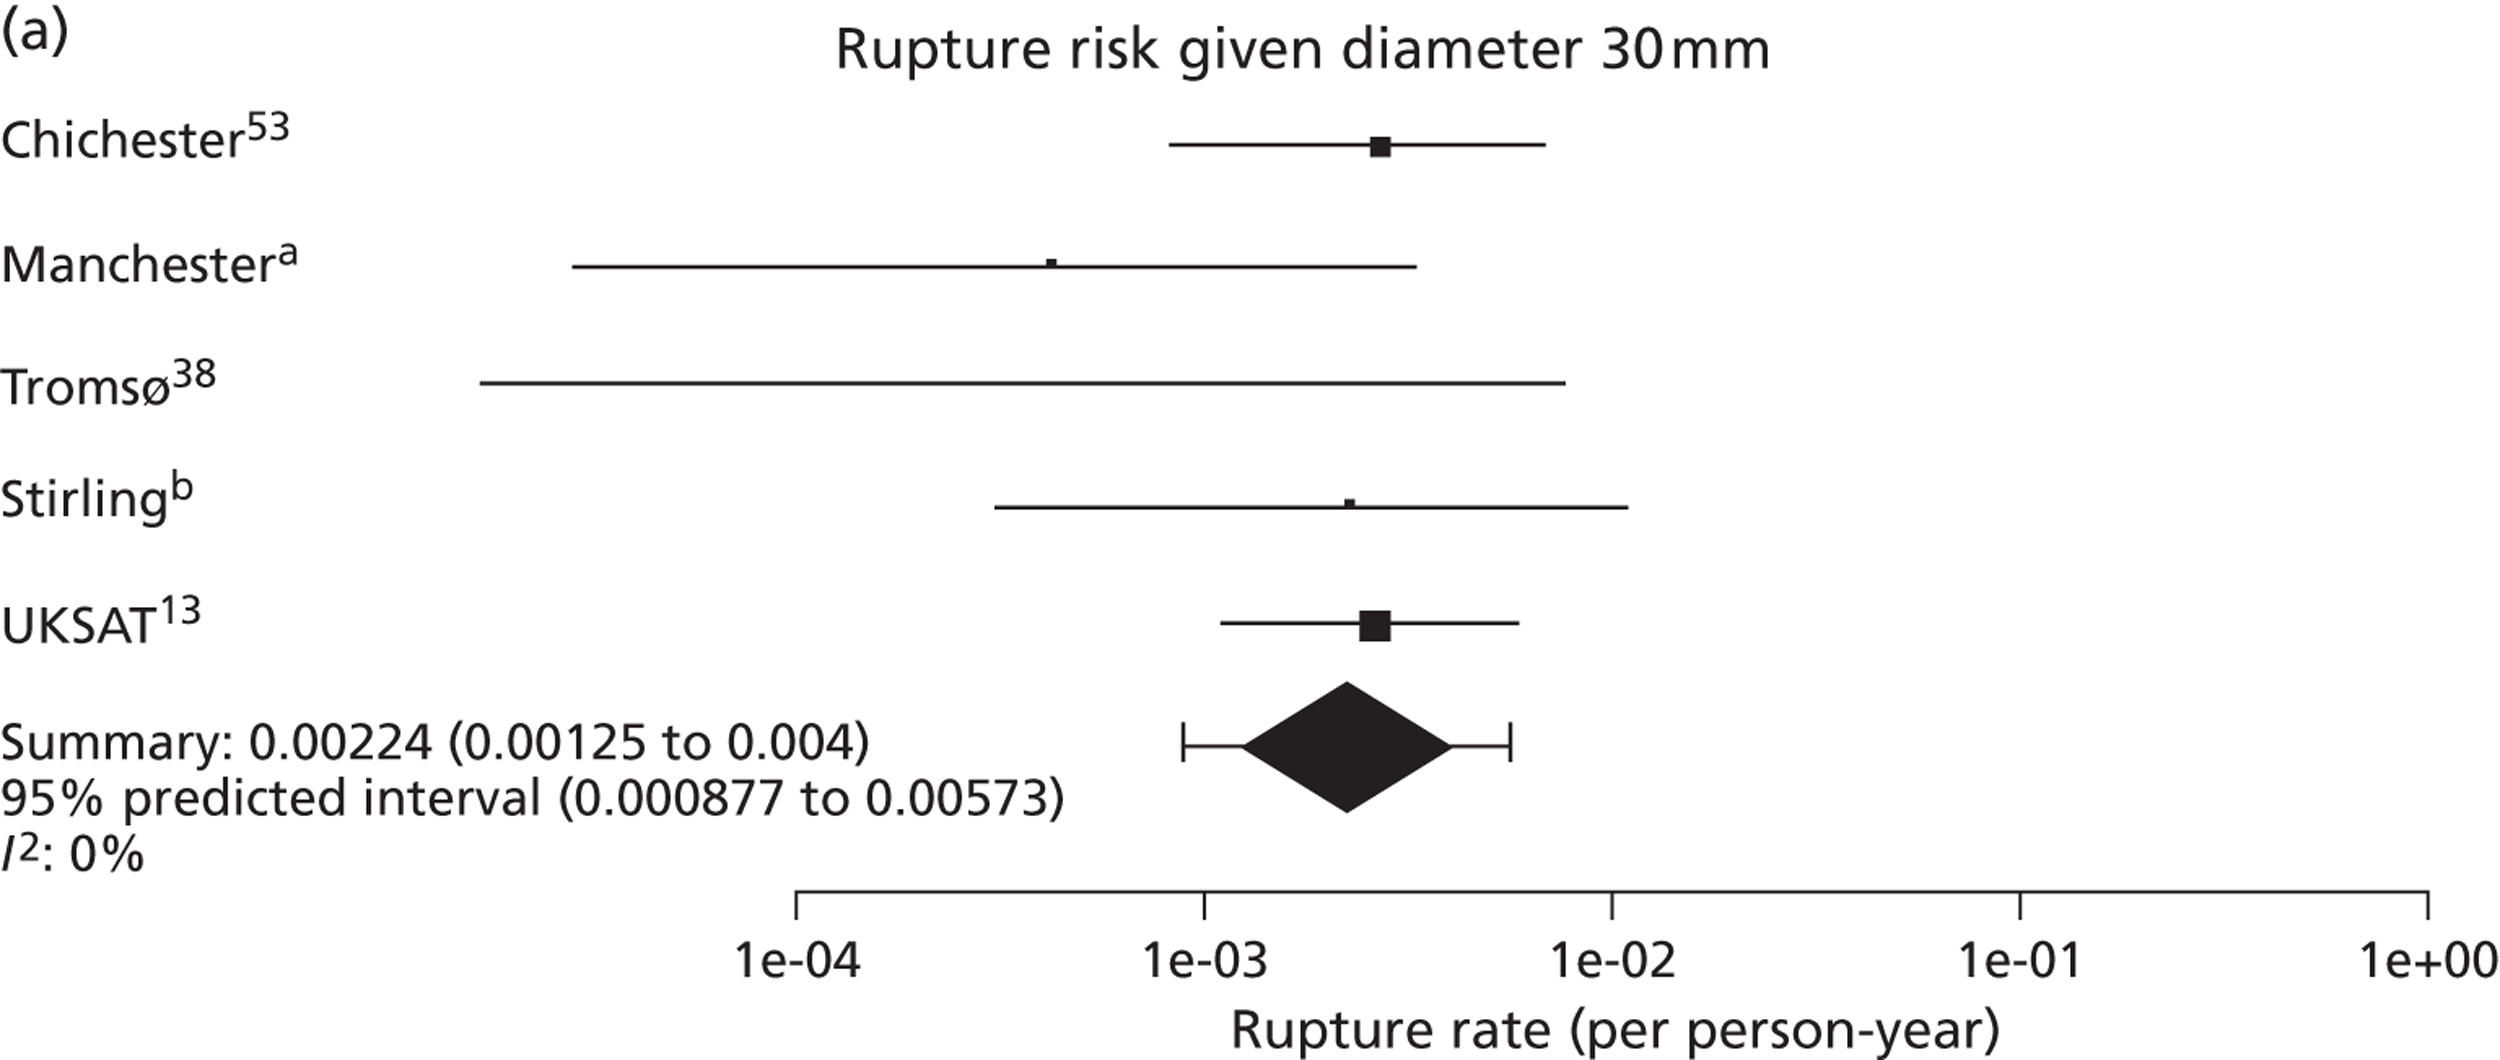
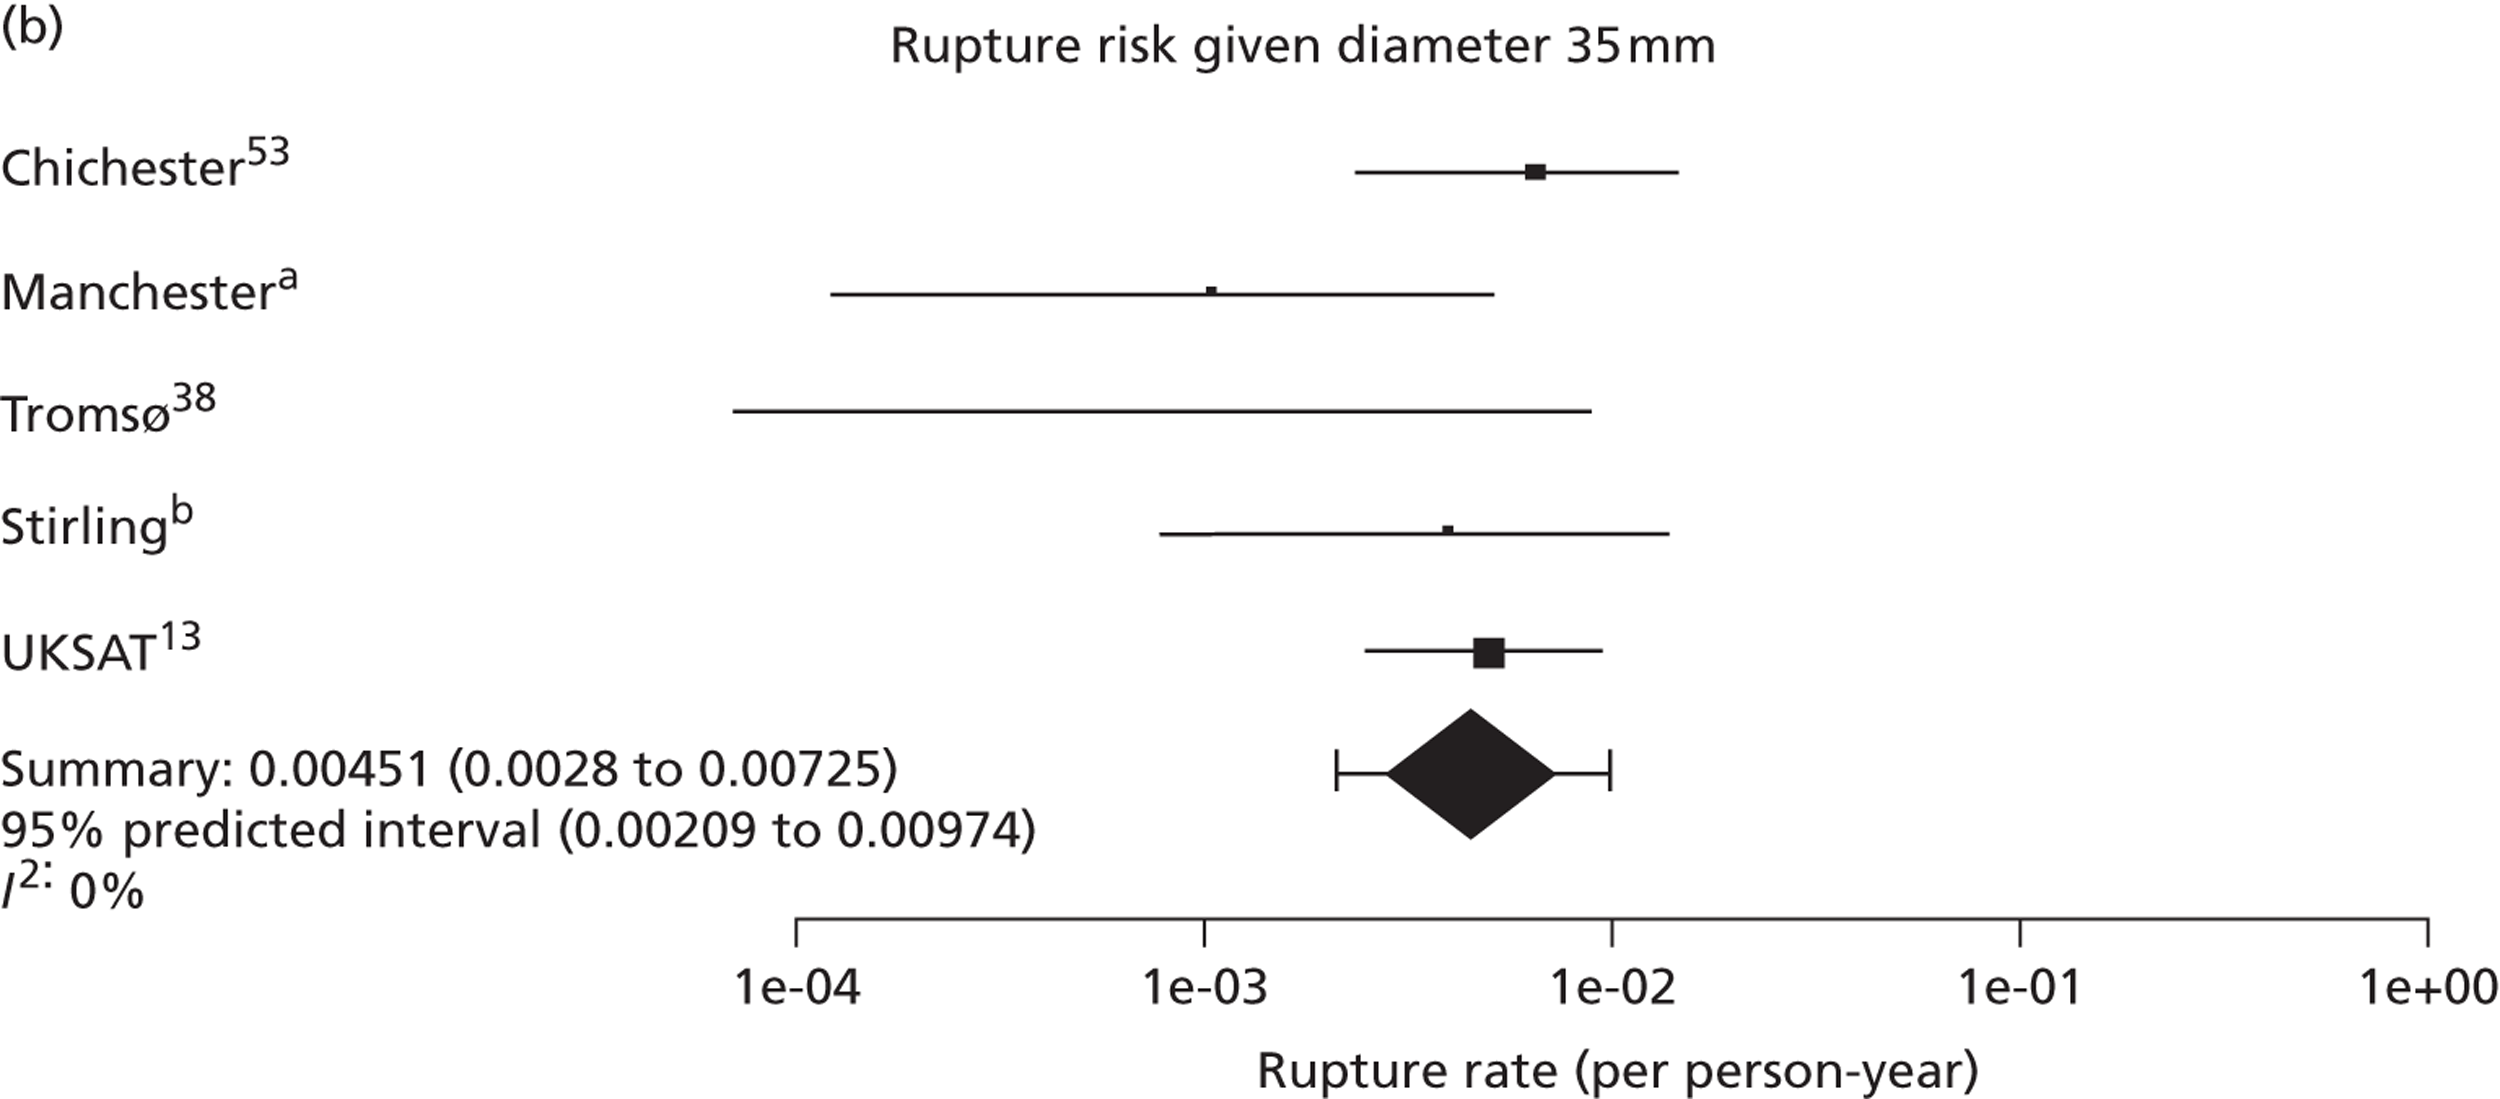
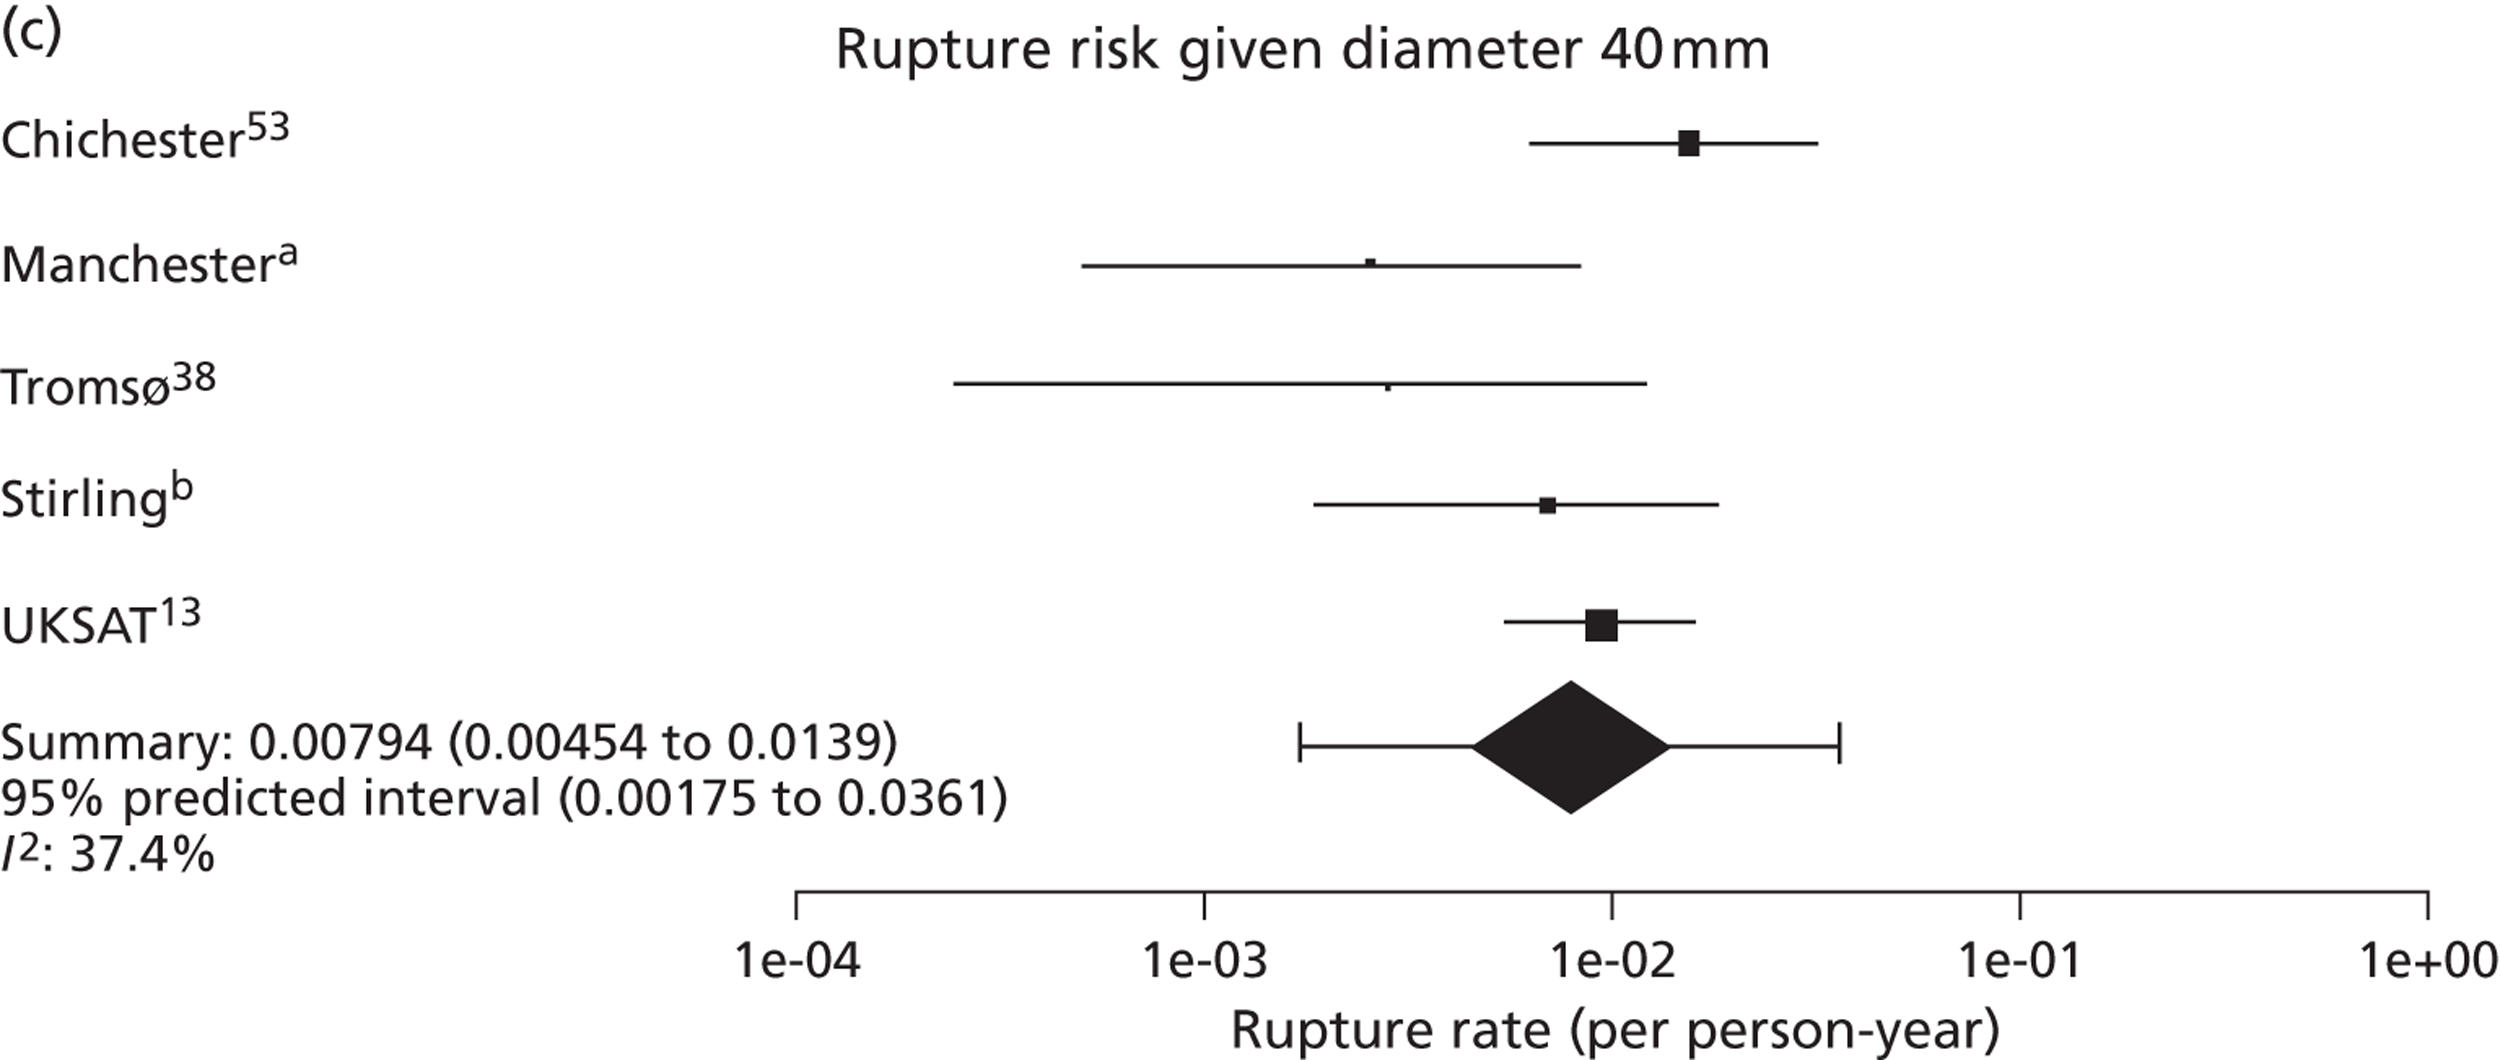
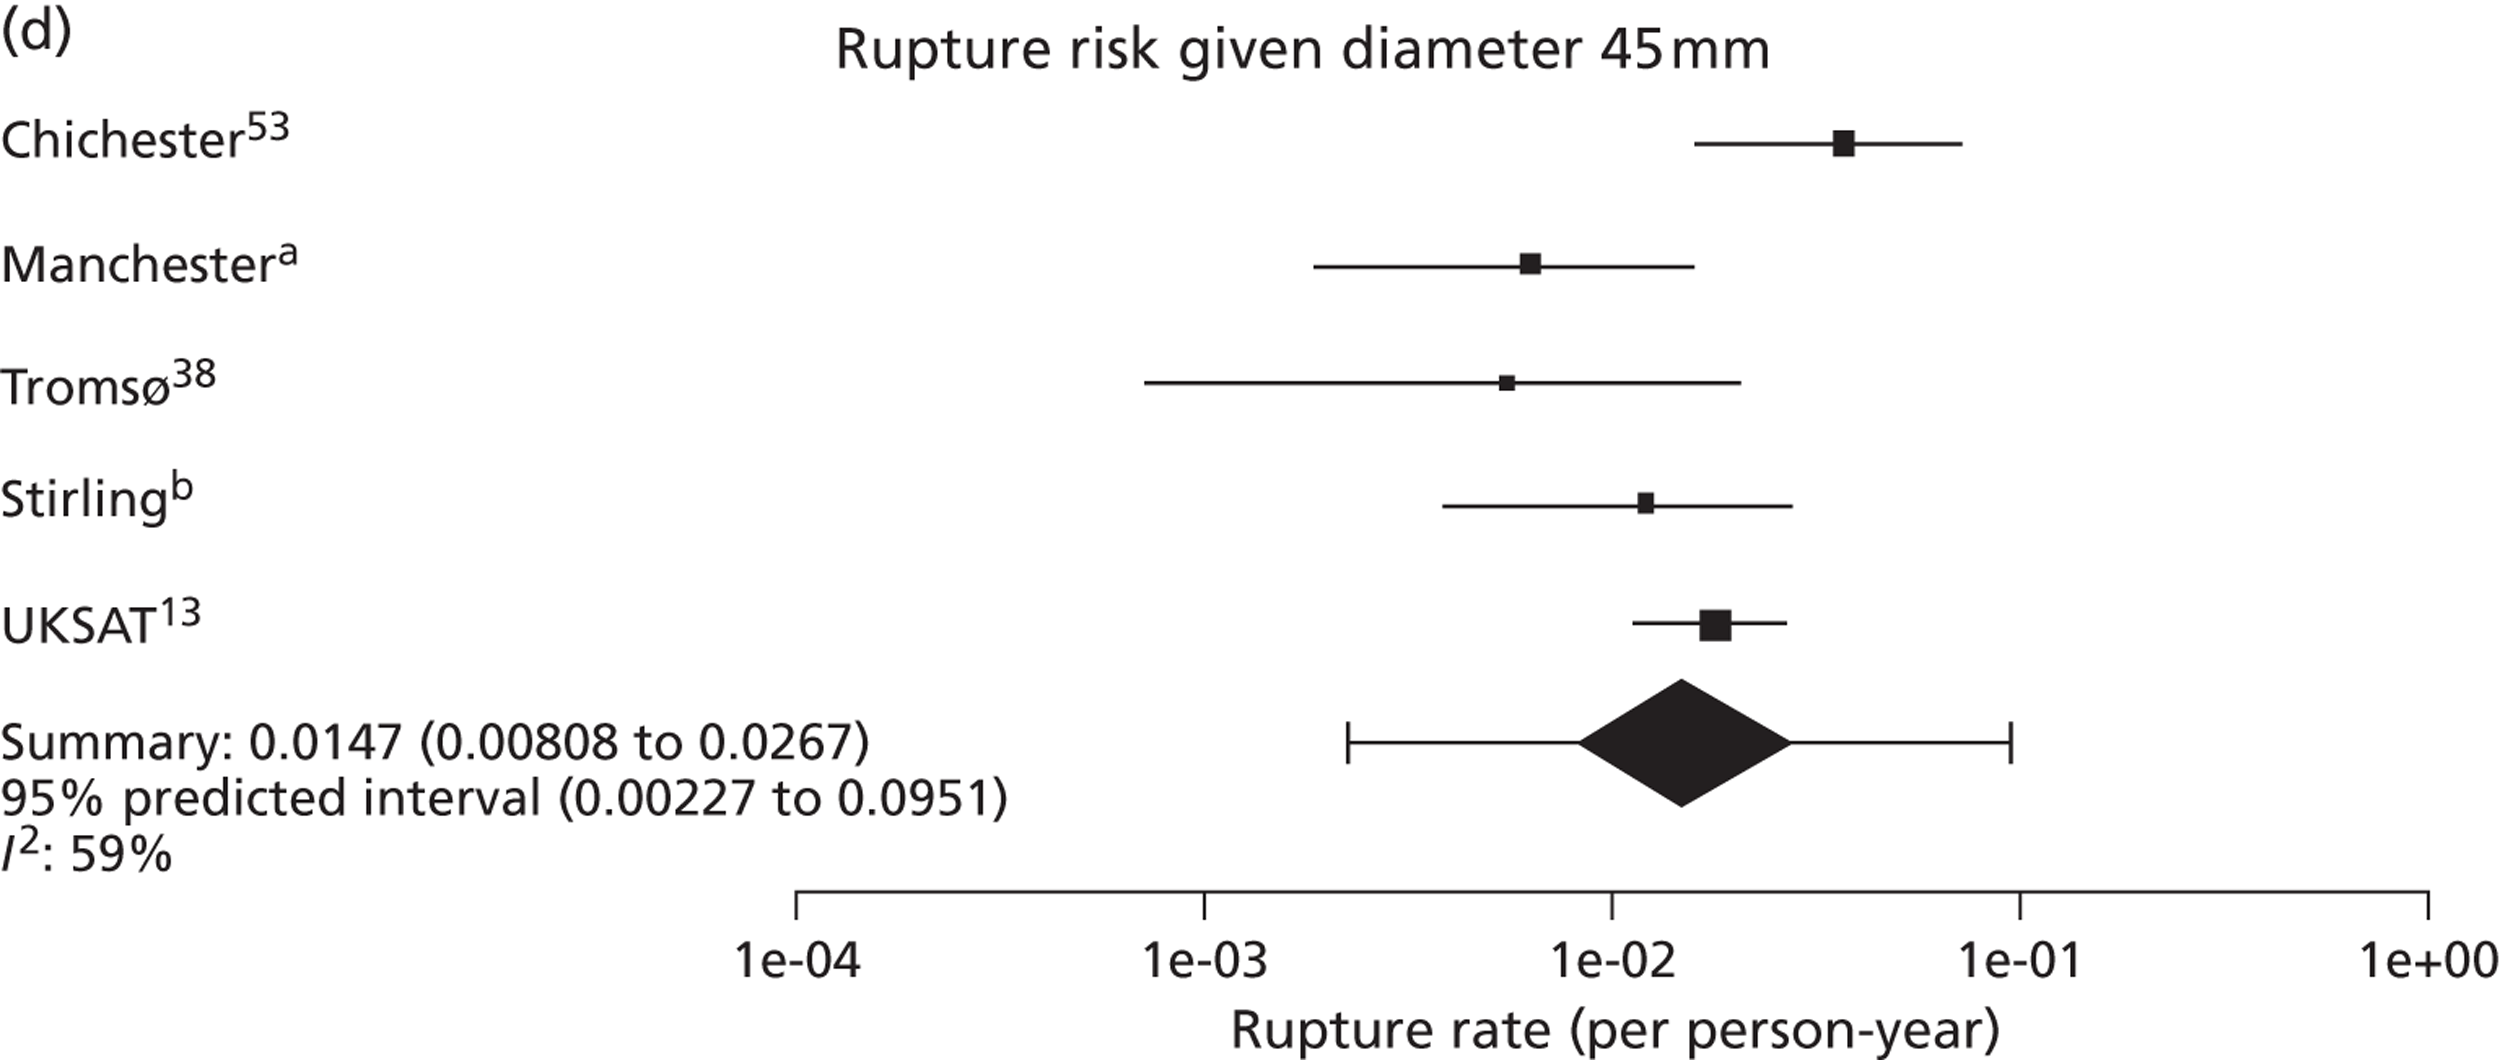
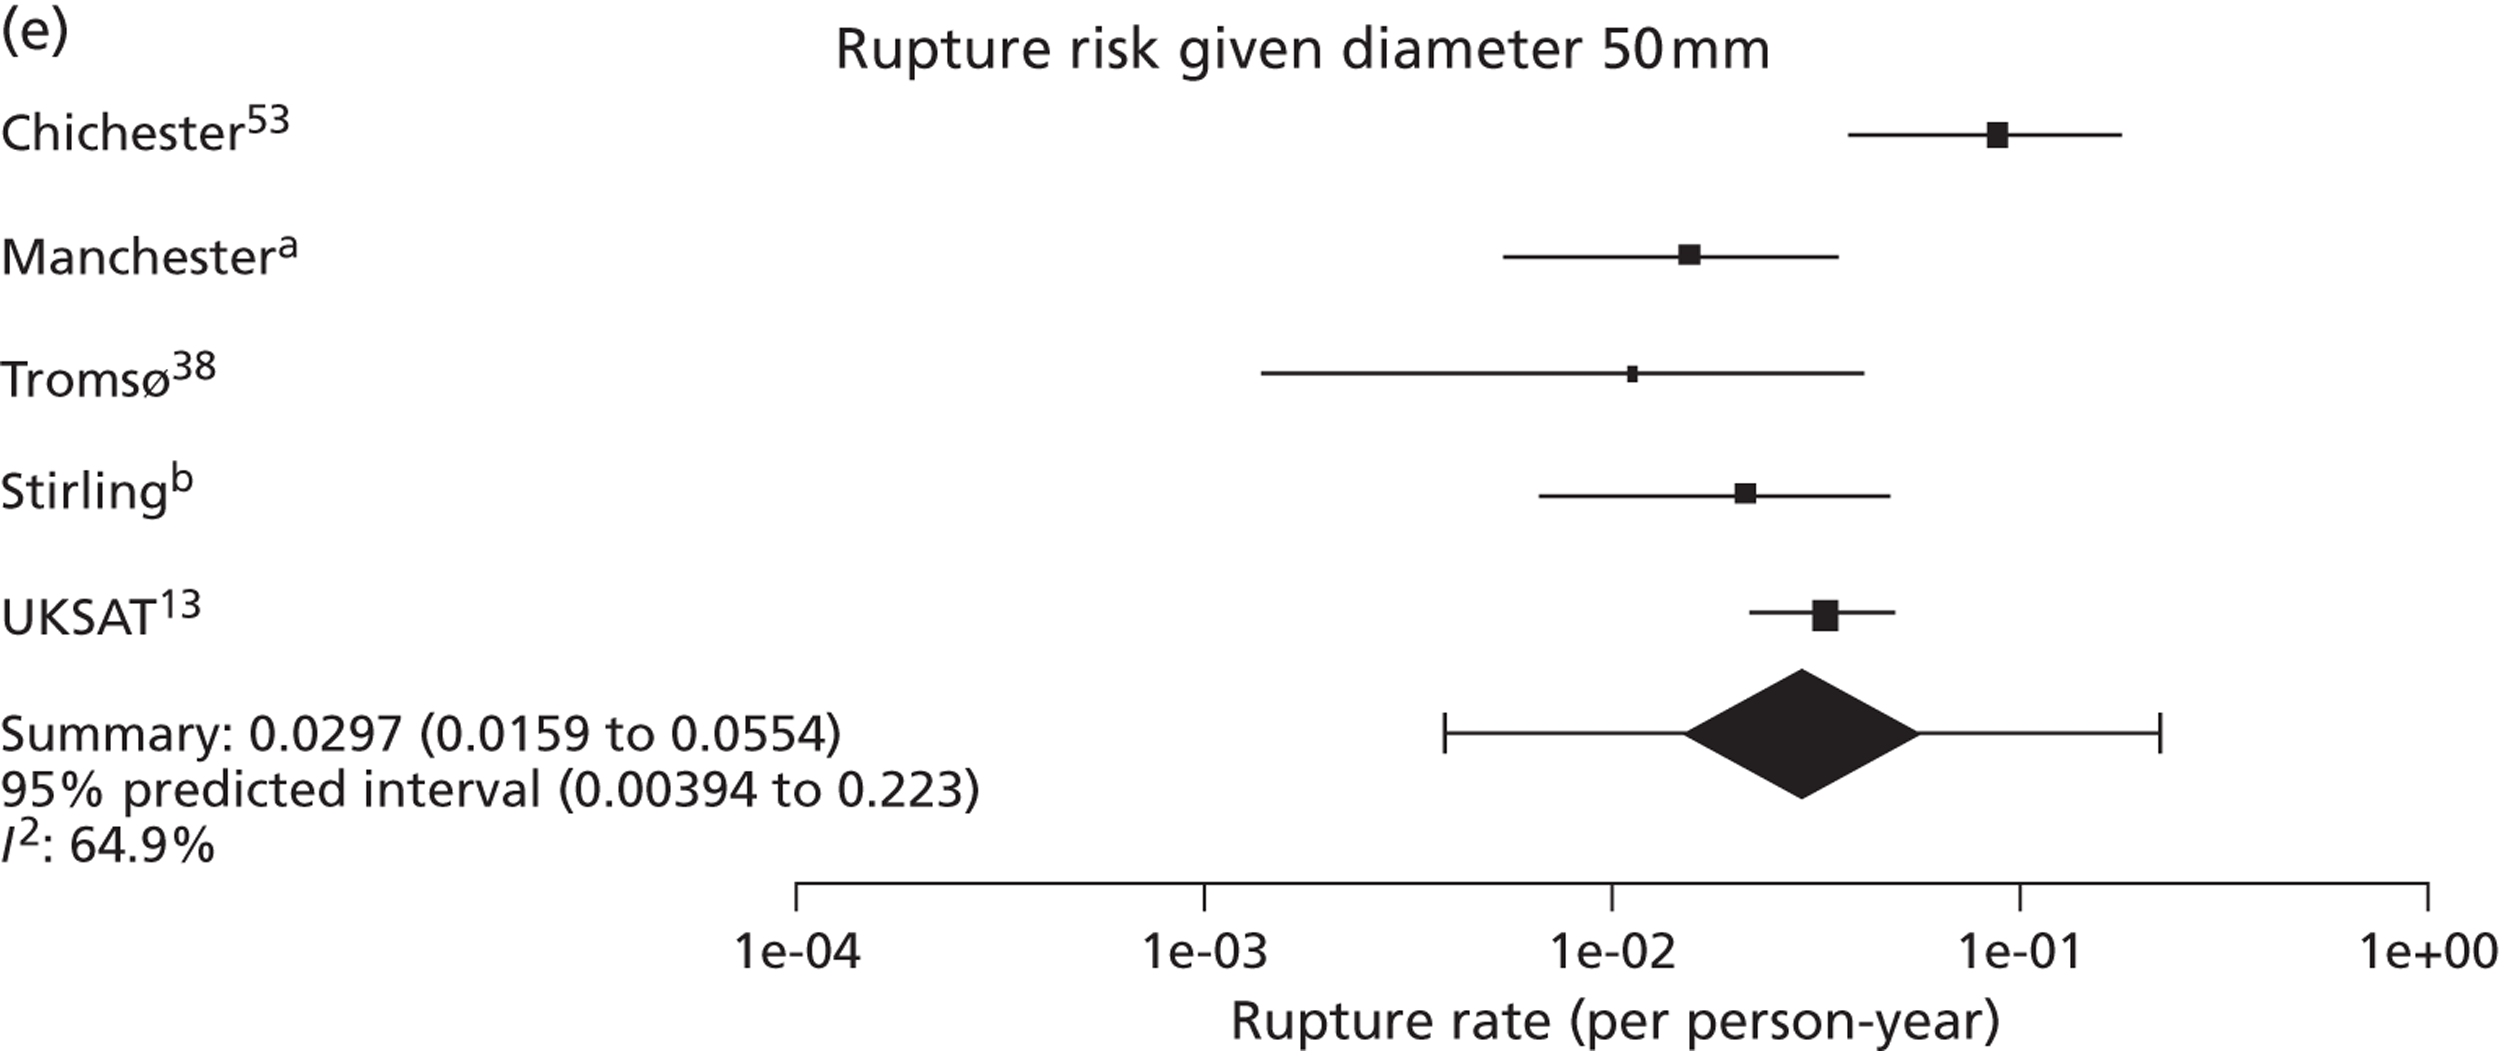
FIGURE 16.
Effect of (a) smoking status (current vs. ex/never) and (b) diabetes on aneurysm growth rates (mm/year) in individual studies and meta-analysis: adjusted estimates with 95% CI. (a) Professor D Julian A Scott, University of Leeds, 2010–12, personal communication; and (b) Mr Matthew J Bown, University of Leicester and the NIHR Cardiovascular Biomedical Research Unit, 2010–12, personal communication. UKSAT, United Kingdom Small Aneurysm Trial.
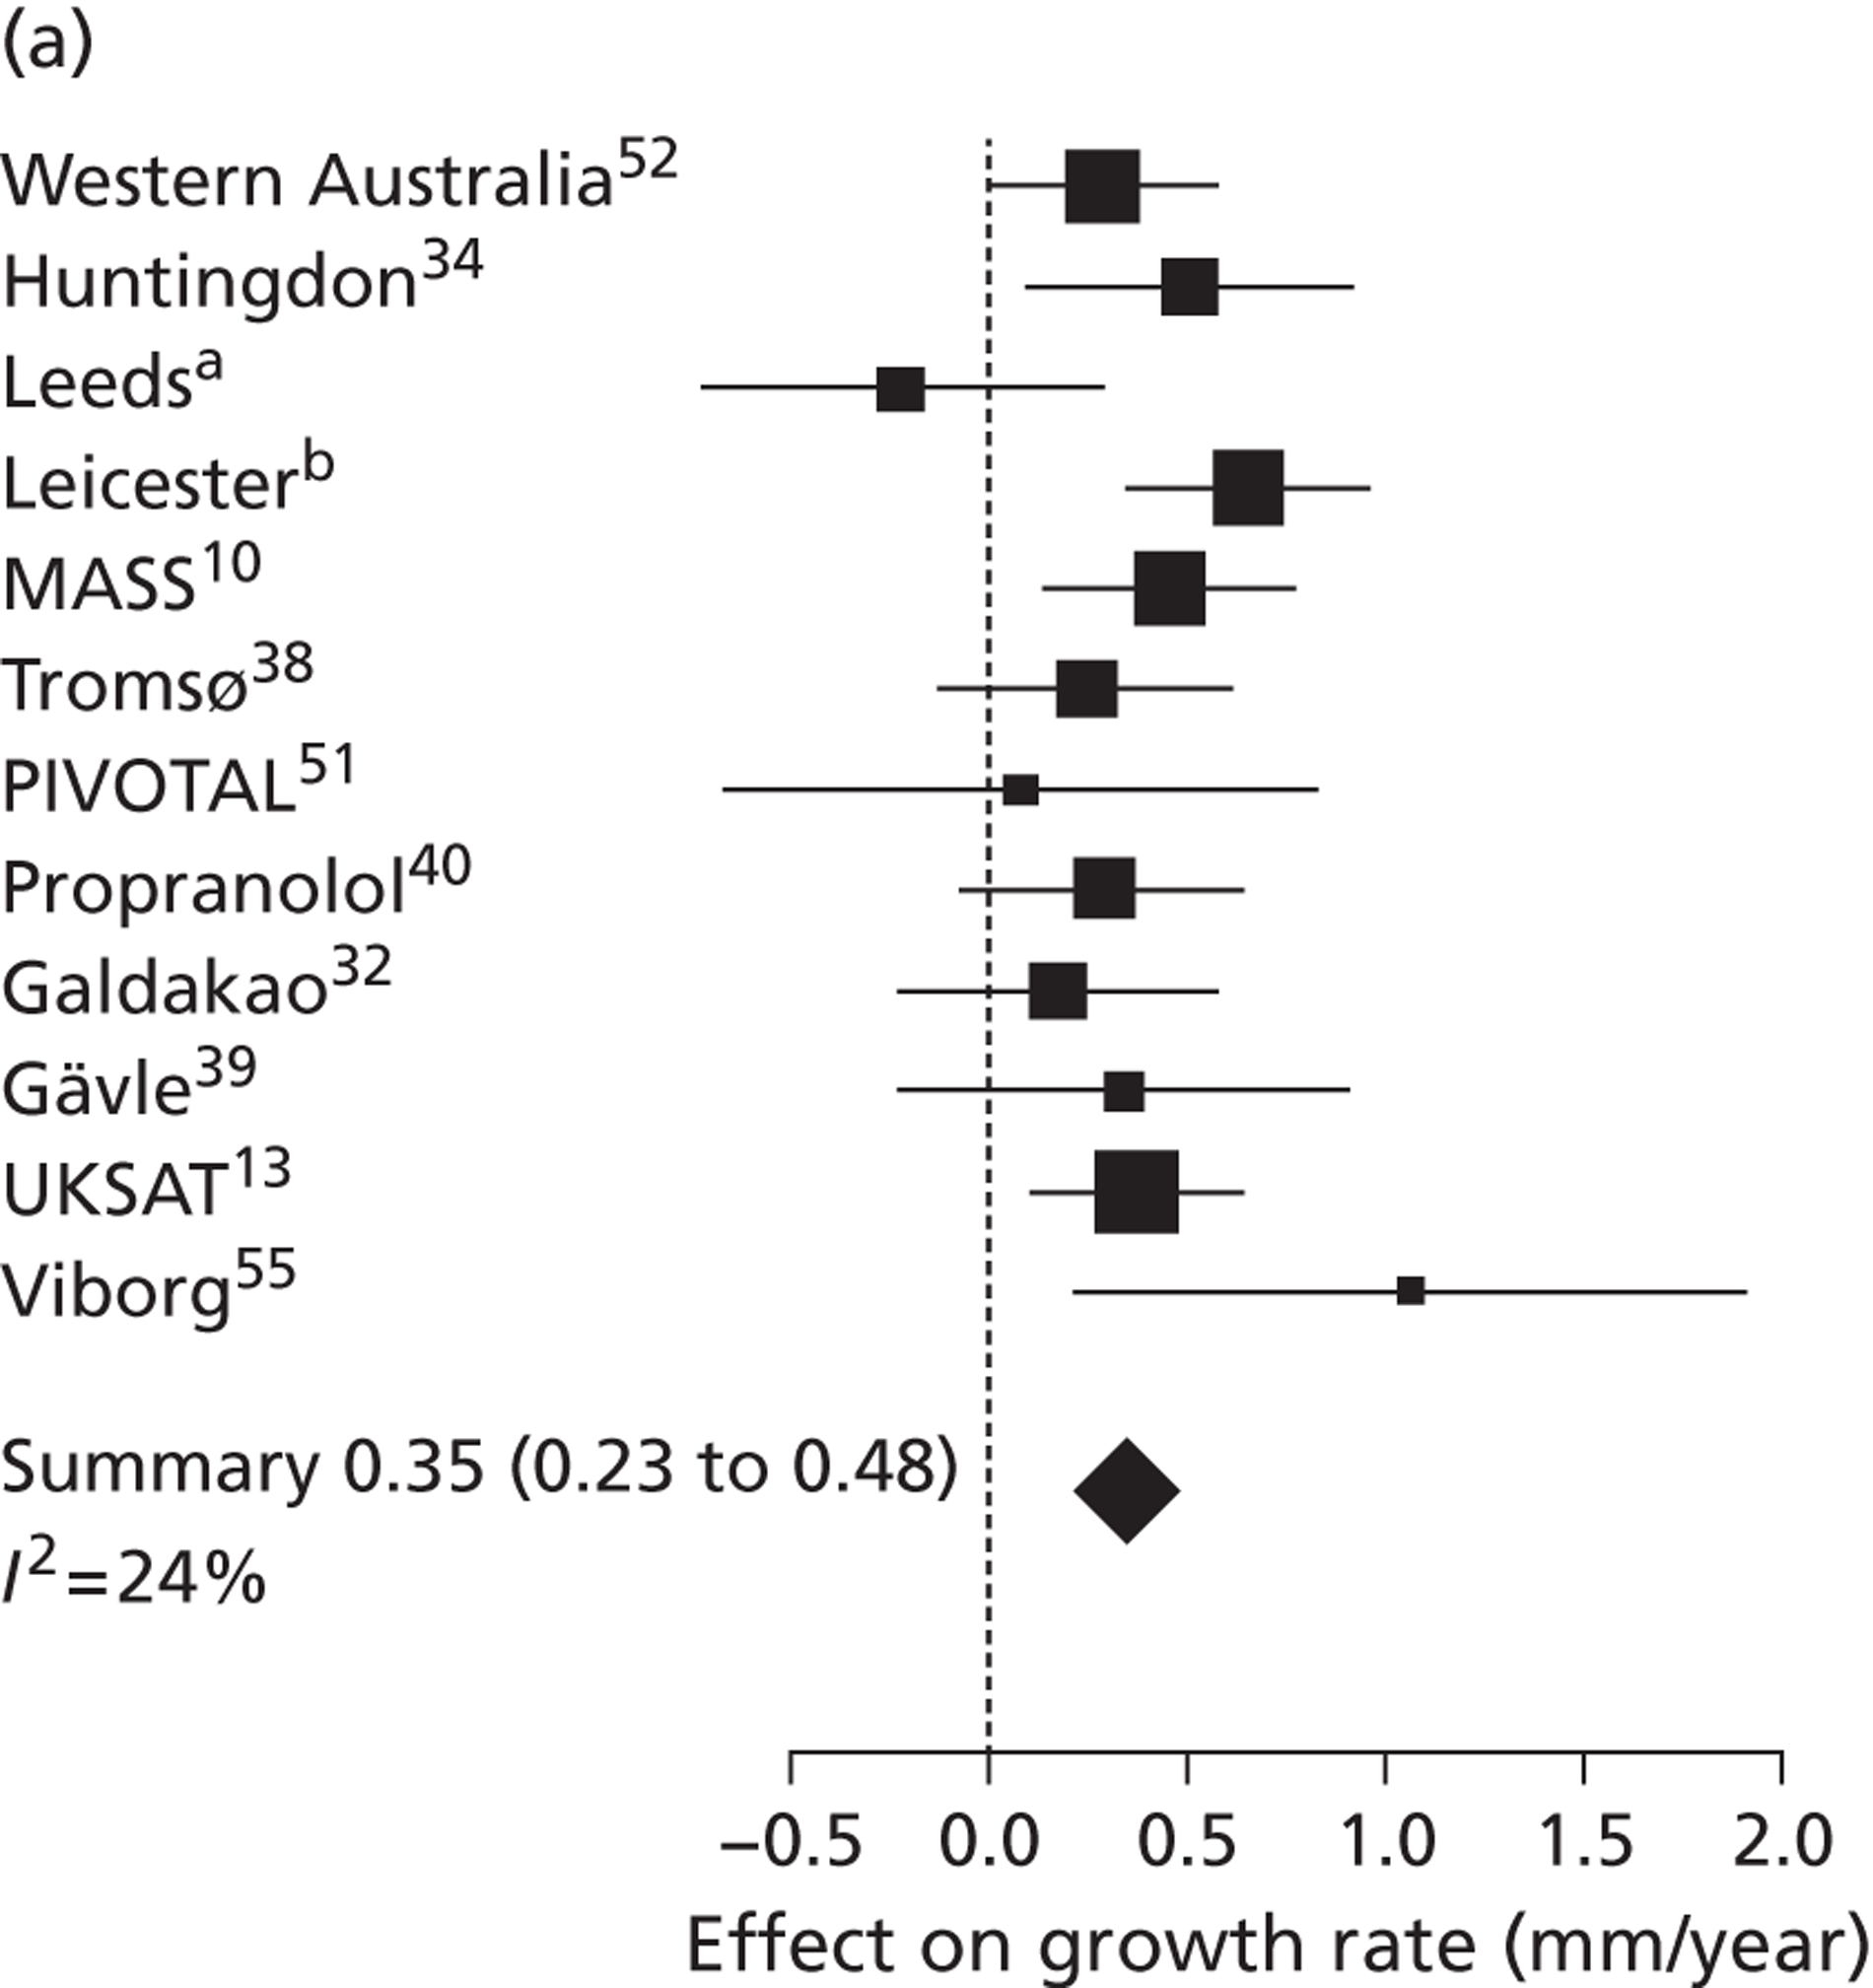
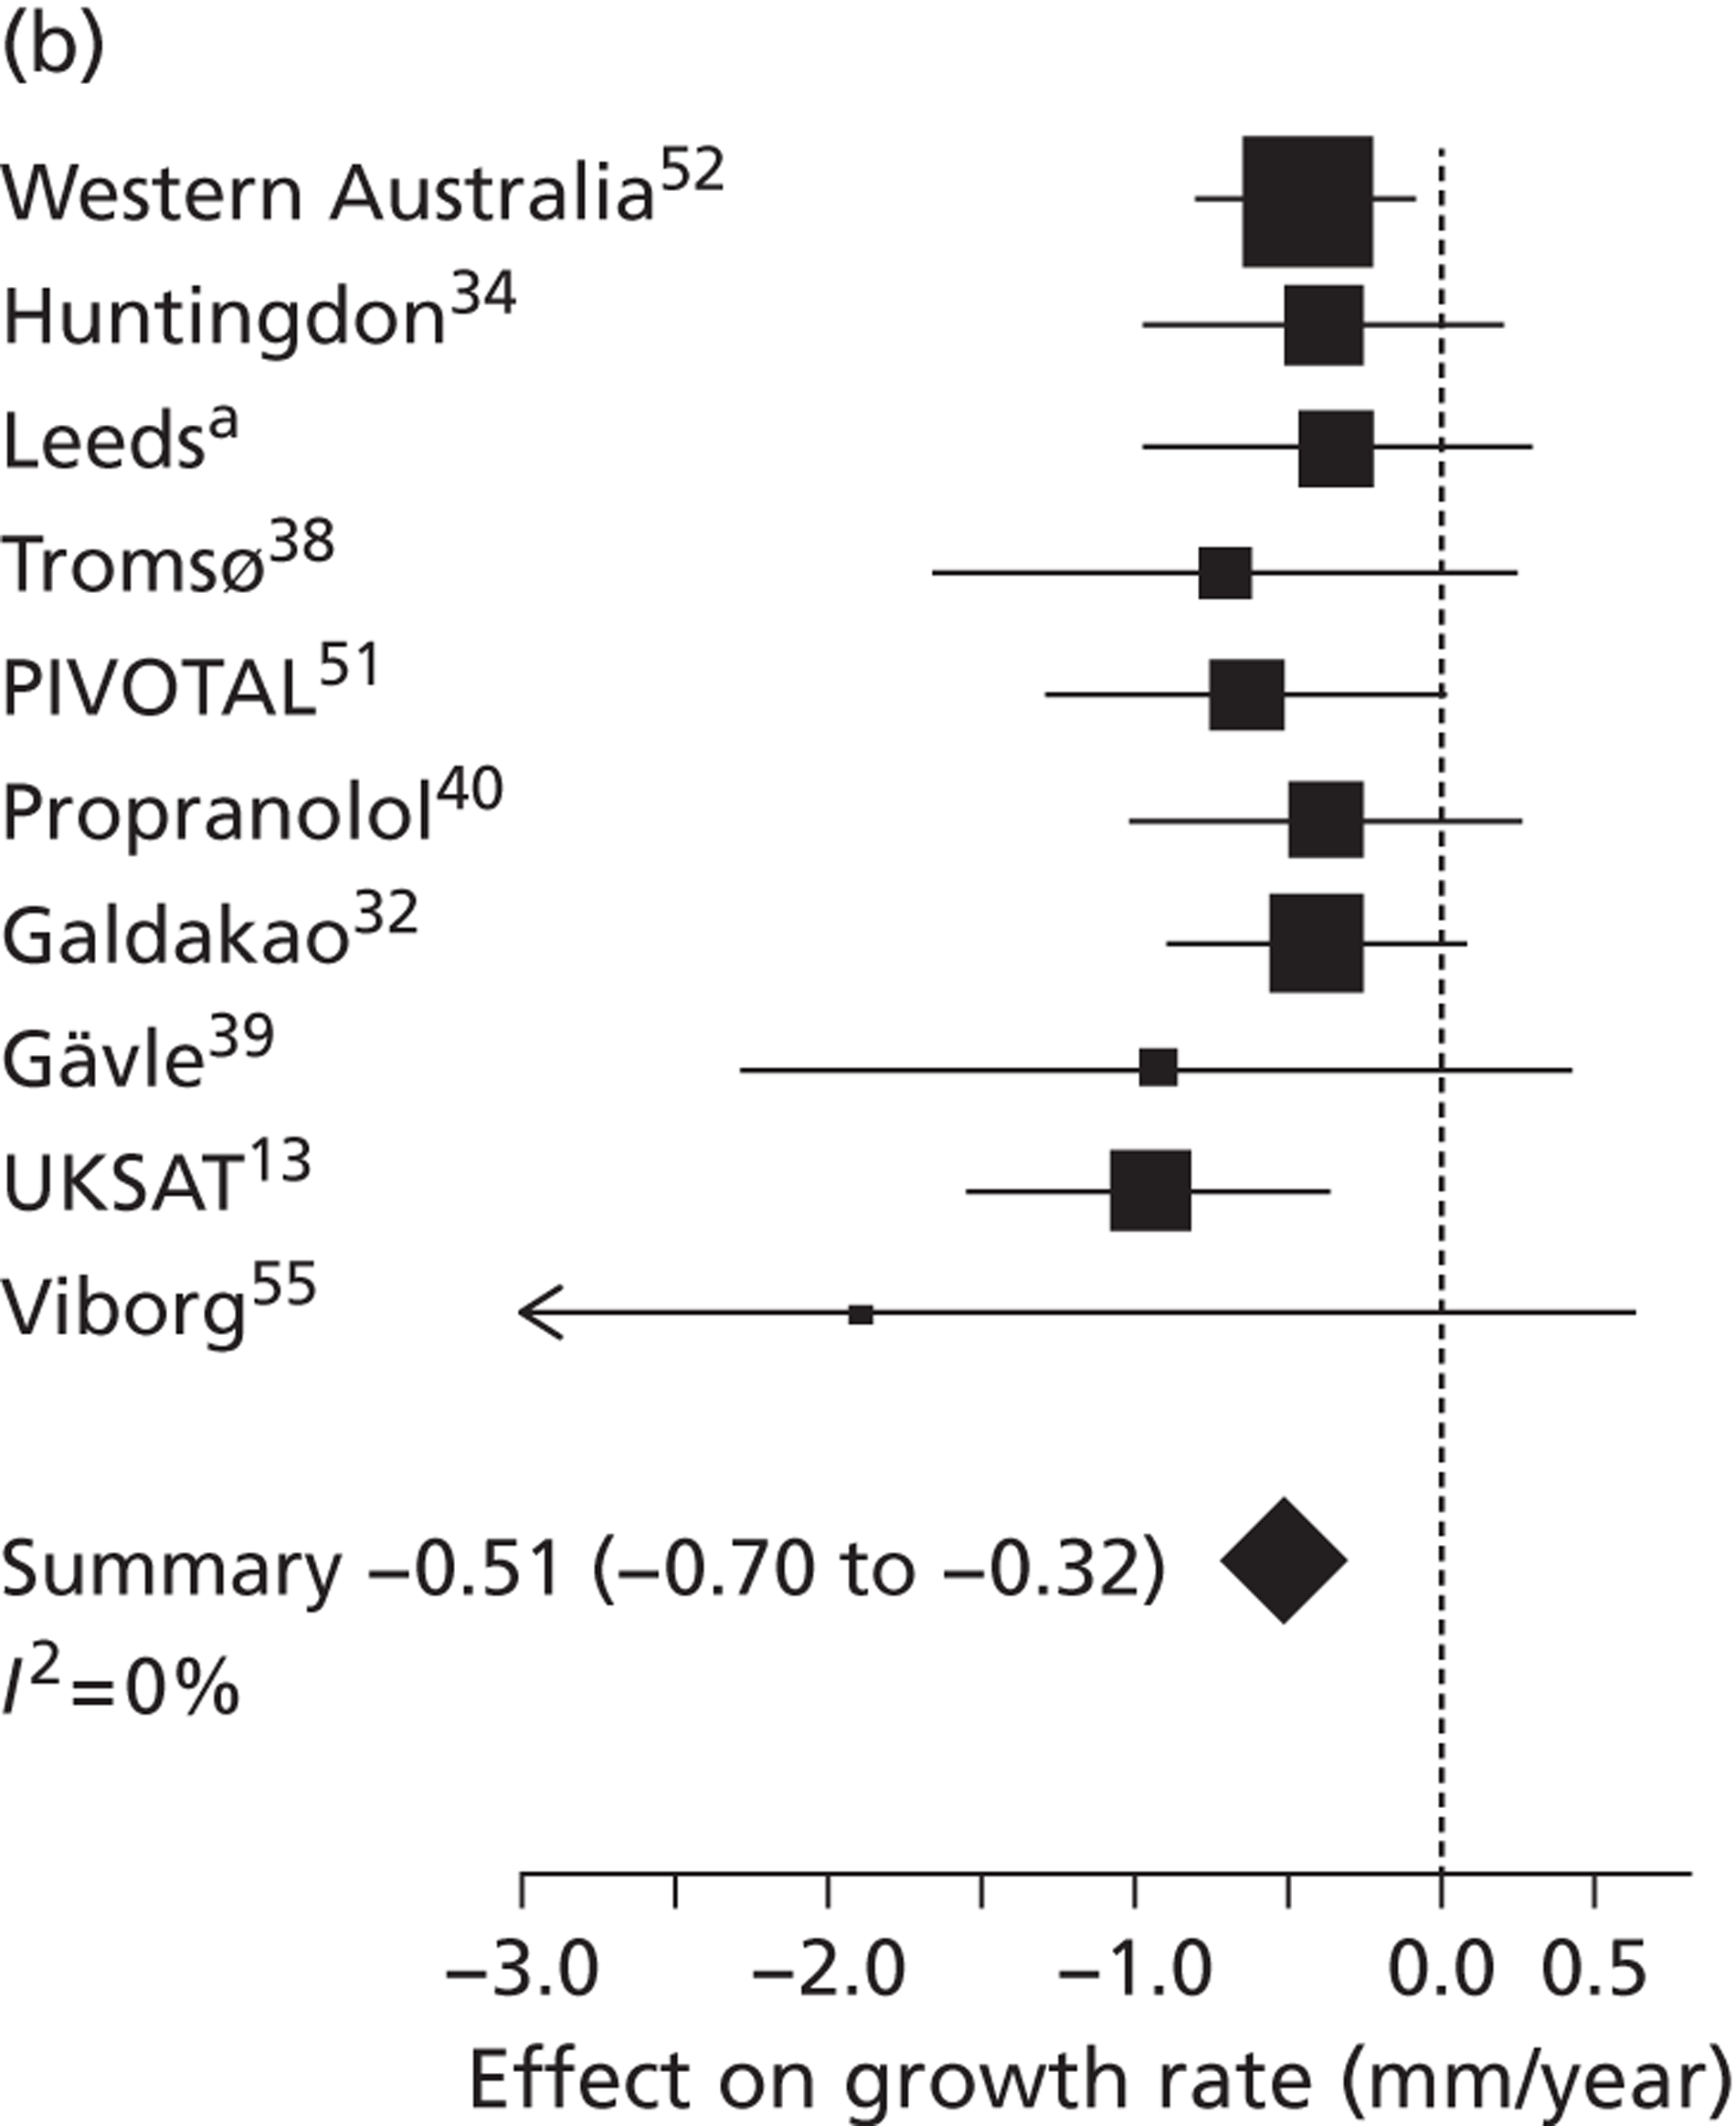
FIGURE 17.
Effect of (a) sex (female vs. male) and (b) smoking (current vs. ex/never) on aneurysm rupture rates in individual studies and meta-analysis: HRs (95% CI) adjusted for aneurysm diameter. (a) Professor Charles N McCollum, University Hospital of South Manchester, 2010–12, personal communication; and (b) Mr Richard Holdsworth, Stirling Royal Infirmary, 2010–12, personal communication. UKSAT, United Kingdom Small Aneurysm Trial.
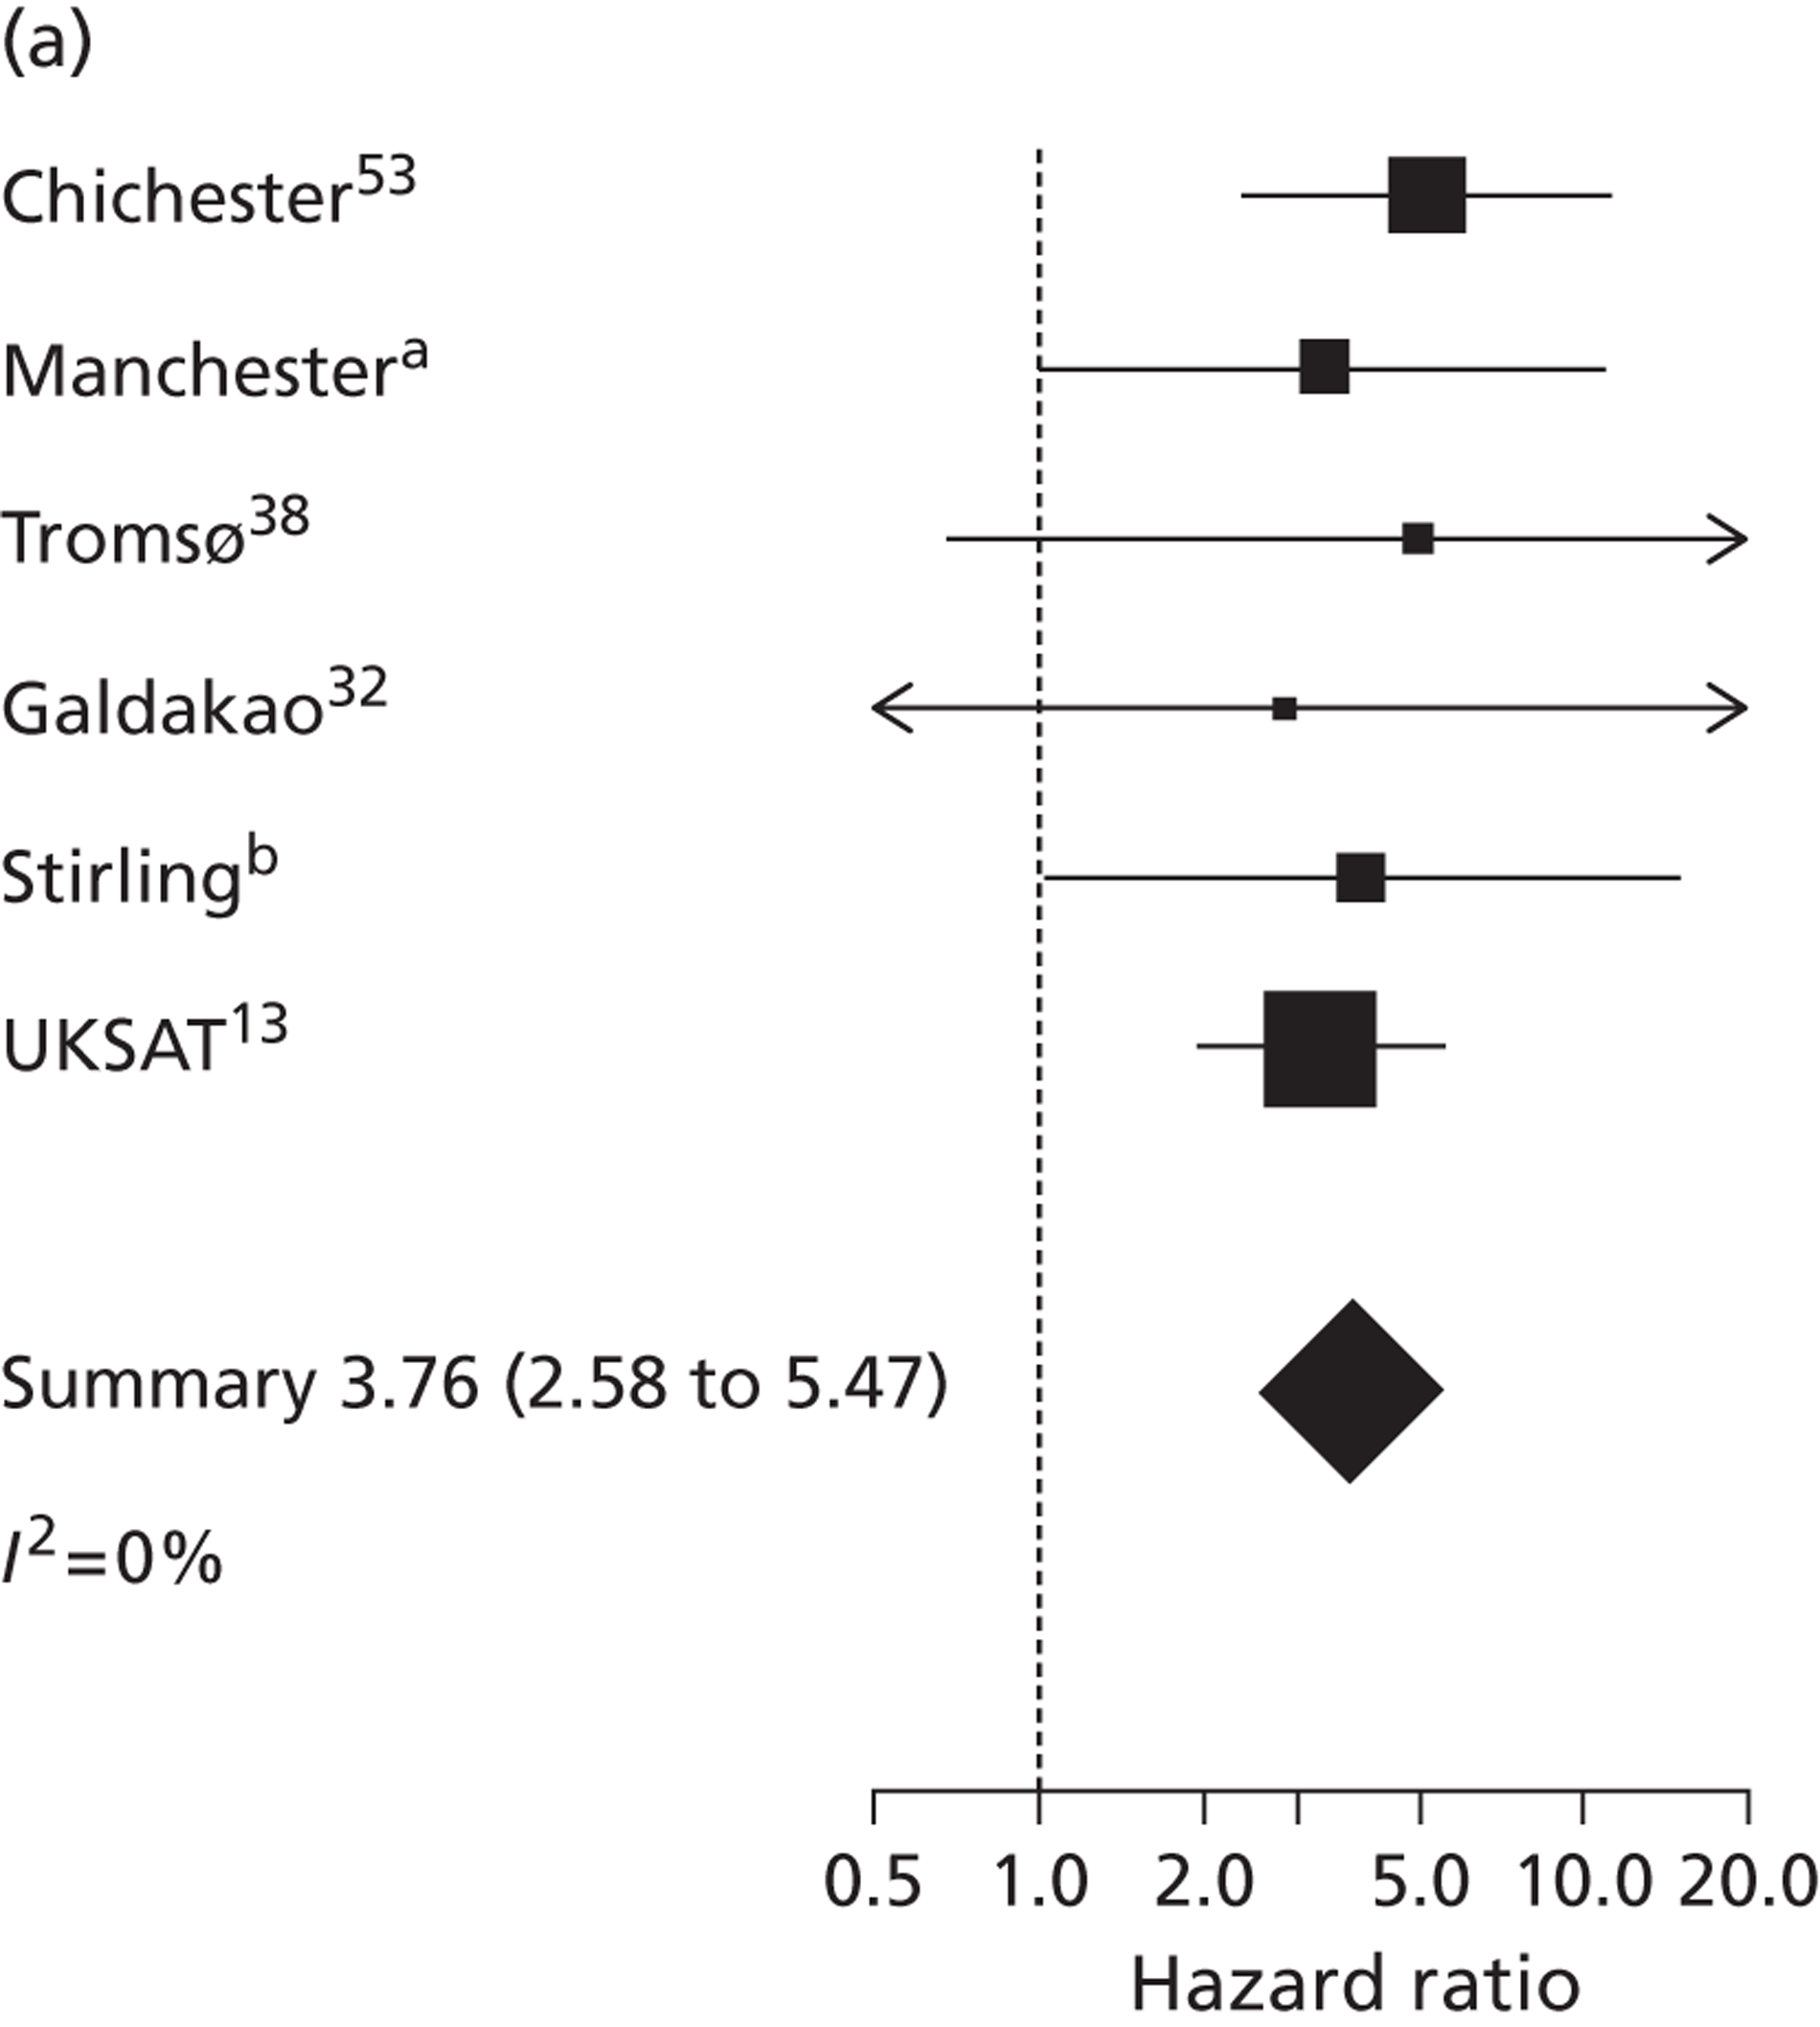
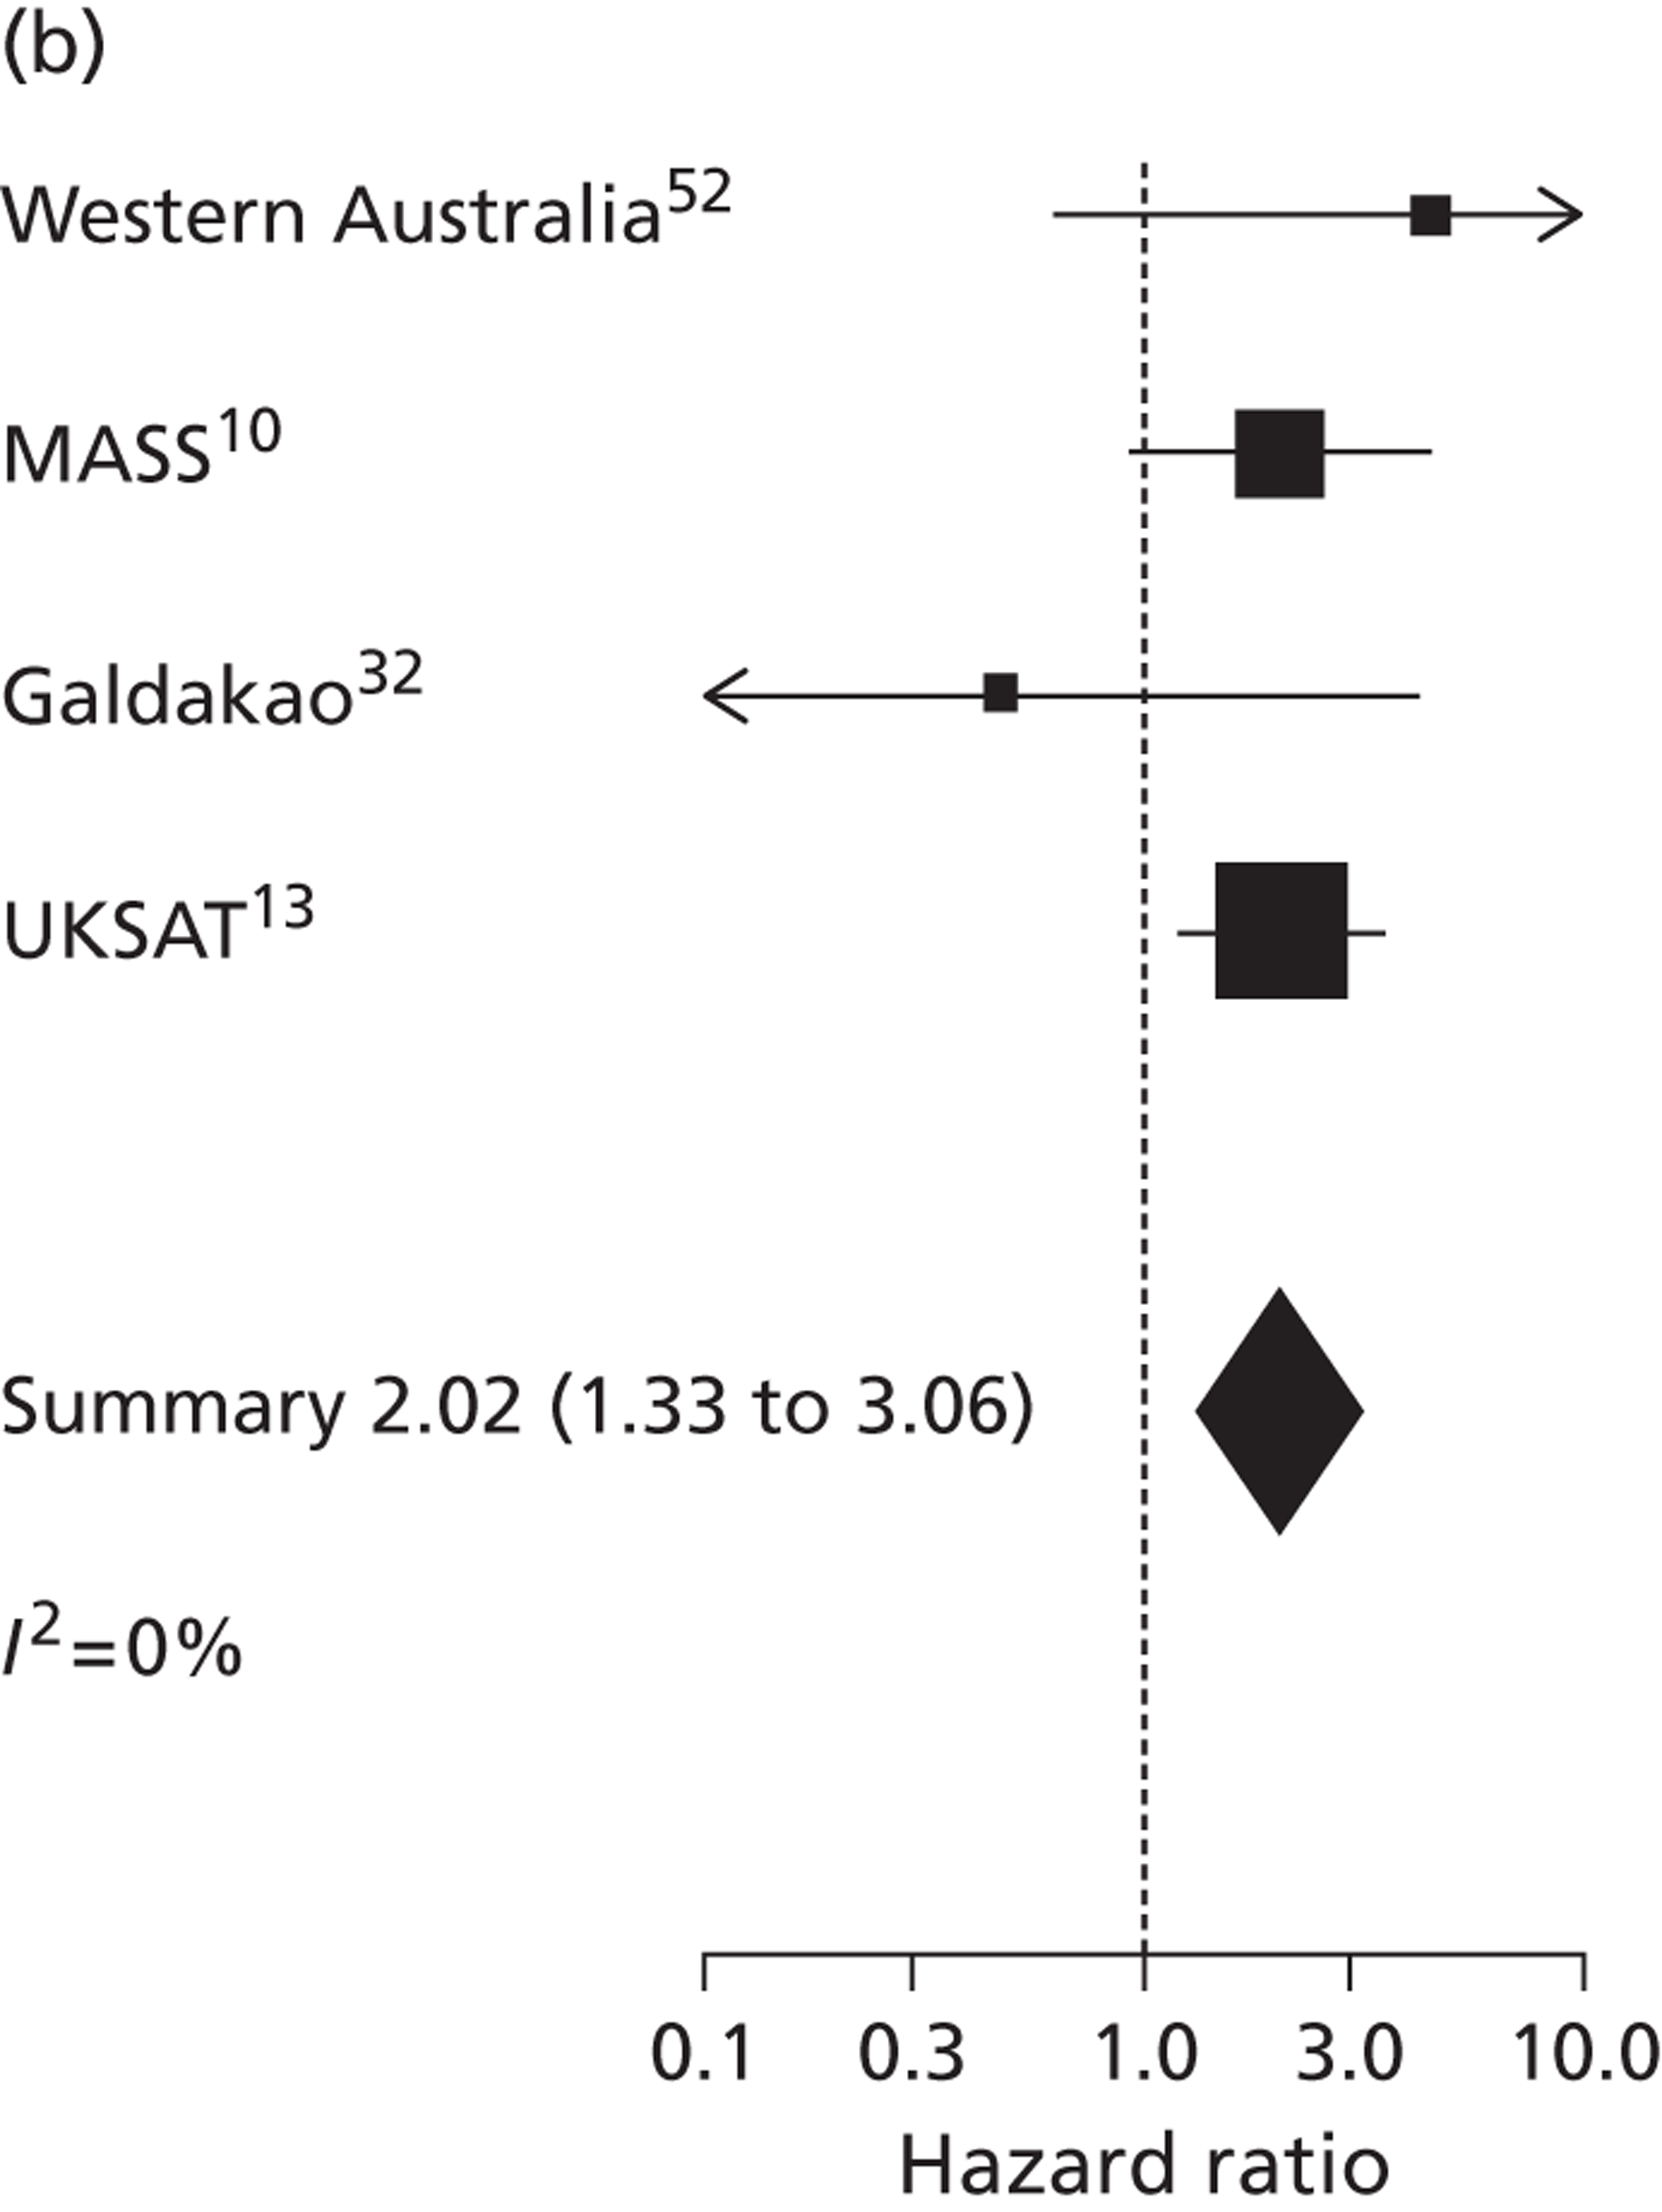
| Study (reference) | Mean calendar year at baseline | Threshold for intervention (cm) | Measurement modalities used | Internal/external diameter measured | Number of men/women | Mean follow-up (years) for men/women | Number of small AAA ruptures in men/women | Crude rupture rate (per 1000 person-years) in men/women |
|---|---|---|---|---|---|---|---|---|
| Western Australia52 | 1997 | 5.0 or 5.5 by centre | US only | External | 685/0 | 8.24/NA | 4/NA | 0.71/NA |
| aBournemouth, UK | 2002 | 5.5 | US only | External | 677/0 | 3.44/NA | NA/NA | NA/NA |
| Chichester, UK53 | 1999 | 6.0, later 5.5 | US only | Internal | 1405/99 | 4.45/4.42 | 43/8 | 6.88/18.26 |
| Edinburgh, UK54 | NAb | 5.5 | US only | External | 670/382 | 2.89/2.42 | NA/NA | NA/NA |
| Gloucestershire, UK37 | 2000 | 5.5 | US only | Internal | 1981/0 | 4.70/NA | 34/NA | 3.65/NA |
| Huntingdon, UK34 | 1995 | 4.5 | US only | External | 629/0 | 3.87/NA | 2/NA | 0.82/NA |
| cLeeds, UK | 2004 | 5.5 | US and CT | External | 220/47 | 3.27/3.14 | NA/NA | NA/NA |
| dLeicester, UK | 2002 | 5.5 | US only | External | 899/0 | 3.28/NA | NA/NA | NA/NA |
| eManchester, UK | 2005 | 5.5 | US only | External | 837/258 | 2.41/2.41 | 6/5 | 2.97/8.03 |
| MASS, UK10 | 1998 | 5.5 | US only | Internal | 1122/0 | 5.42/NA | 33/NA | 5.42/NA |
| Tromsø, Norway38 | 1995 | 5.5 | US only | External | 179/45 | 8.59/8.16 | 2/2 | 1.30/5.45 |
| PIVOTAL, USA51 | 2007 | 5.0 | US and CT | External | 619/96 | 0.92/0.96 | 0/1 | 0.00/10.84 |
| Propranolol, Canada40 | 1996 | 5.0 or 5.5 by centre | US only | External | 460/88 | 2.47/2.39 | 3/0 | 2.64/0.00 |
| Galdakao, Spain32 | 2001 | 5.0 | US and CT | External | 859/64 | 3.93/2.55 | 5/1 | 1.47/6.14 |
| fStirling, UK | 2003 | 5.5 | US and CT | No set protocol | 331/125 | 3.08/3.34 | 4/5 | 3.92/11.98 |
| Gävle, Sweden39 | 2003 | 5.0 or 5.5 by centre | US only | External | 184/59 | 2.46/2.52 | 1/0 | 2.21/0.00 |
| UKSAT, UK13 | 1993 | 5.5 | US only | External | 1747/480 | 2.38/2.65 | 32/28 | 7.68/22.00 |
| Viborg, Denmark55 | 1996 | 5.0 | US only | External | 224/0 | 6.09/NA | 9/NA | 6.59/NA |
| Study (reference) | Number of patients (diameter measures) | Mean age at baseline (years) | % male (% missing) | % current smokers (% missing) | Mean BMI (kg/m2) (% missing) | % diabetes (% missing) | Mean arterial blood pressure (mmHg) (% missing) | % history of cardiovascular disease (% missing) | Baseline drug history available |
|---|---|---|---|---|---|---|---|---|---|
| Western Australia52 | 685 (3738) | 73.4 | 100.0 (0.0) | 18.4 (0.7) | 27.2 (0.7) | 10.6 (0.7) | 112.9 (0.7) | 49.9 (9.3) | Yes |
| aBournemouth, UK | 677 (2959) | 72.8 | 100.0 (0.0) | NA | NA | NA | NA | NA | No |
| Chichester, UK53 | 1504 (9649) | 69.6 | 93.4 (0.0) | NA | NA | NA | 106.1 (18.9) | NA | No |
| Edinburgh, UK54 | 1052 (5155) | 71.4 | 63.7 (0.0) | NA | NA | NA | NA | NA | No |
| Gloucestershire, UK37 | 1981 (12,442) | 66.9 | 100.0 (0.0) | NA | NA | NA | NA | NA | No |
| Huntingdon, UK34 | 629 (3781) | 70.1 | 100.0 (0.0) | 29.8 (34.8) | NA | 9.4 (54.4) | 111.8 (7.0) | NA | Incomplete |
| bLeeds, UK | 267 (1870) | 71.8 | 82.5 (0.0) | 24.8 (0.7) | NA | 15.4 (0.4) | 107.4 (0.0) | 54.9 (0.7) | Yes |
| cLeicester, UK | 899 (4689) | 66.8 | 100.0 (0.0) | 41.4 (1.9) | NA | NA | NA | 28.3 (0.0) | No |
| dManchester, UK | 1095 (5315) | 74.0 | 76.4 (0.0) | NA | NA | NA | NA | NA | No |
| MASS, UK10 | 1122 (8361) | 70.2 | 100.0 (0.0) | 31.8 (14.8) | NA | NA | 106.9 (5.5) | NA | No |
| Tromsø, Norway38 | 224 (3817) | 67.0 | 79.9 (0.0) | 53.4 (0.4) | 26.7 (0.0) | 4.9 (0.0) | 107.5 (0.0) | 39.3 (0.0) | No |
| PIVOTAL, USA51 | 715 (1753) | 70.9 | 86.6 (0.0) | 27.5 (2.0) | NA | 20.7 (0.8) | NA | 72.3 (2.9) | Yes |
| Propranolol, Canada40 | 548 (2971) | 68.9 | 83.9 (0.0) | 36.7 (0.0) | 26.9 (0.2) | 6.2 (0.0) | 101.7 (0.0) | 36.7 (0.0) | Yes |
| Galdakao, Spain32 | 926 (3466) | 71.6 | 93.1 (0.4) | 29.3 (0.0) | NA | 15.7 (0.0) | NA | 67.3 (0.1) | Incomplete |
| eStirling, UK | 457 (1979) | 71.7 | 72.6 (0.2) | NA | NA | NA | NA | NA | No |
| Gävle, Sweden39 | 243 (1114) | 70.5 | 75.7 (0.0) | 39.1 (0.0) | NA | 4.1 (0.4) | NA | 51.9 (0.0) | Yes |
| UKSAT, UK13 | 2227 (9140) | 69.4 | 78.4 (0.0) | 38.0 (3.0) | 25.0 (5.2) | 4.3 (3.3) | 109.7 (4.0) | 26.7 (10.8) | Yes |
| Viborg, Denmark55 | 224 (912) | 68.1 | 100.0 (0.0) | 59.9 (14.3) | 26.6 (13.8) | 2.7 (0.0) | NA | 36.6 (0.0) | Yes |
| Meta-analysis estimate of: | Sex | AAA diameter (cm) | ||||
|---|---|---|---|---|---|---|
| 3.0 | 3.5 | 4.0 | 4.5 | 5.0 | ||
| Growth rate (mm/year) | Men | 1.28 (1.03 to 1.53) [0.17 to 2.40] | 1.86 (1.64 to 2.08) [0.85 to 2.88] | 2.44 (2.22 to 2.65) [1.47 to 3.41] | 3.02 (2.79 to 3.25) [2.00 to 4.04] | 3.61 (3.34 to 3.88) [2.45 to 4.77] |
| Women | 1.46 (1.07 to 1.85) [0.03 to 2.89] | 1.98 (1.65 to 2.32) [0.75 to 3.22] | 2.51 (2.22 to 2.81) [1.47 to 3.56] | 3.06 (2.80 to 3.33) [2.18 to 3.95] | 3.62 (3.36 to 3.89) [2.79 to 4.45] | |
| Time taken to reach a 10% chance that the threshold for surgery has been crossed (years) | Men | 7.4 (6.7 to 8.1) [4.9 to 11.3] | 5.0 (4.6 to 5.4) [3.4 to 7.1] | 3.2 (3.0 to 3.4) [2.3 to 4.4] | 1.8 (1.7 to 2.0) [1.3 to 2.5] | 0.7 (0.6 to 0.8) [0.4 to 1.2] |
| Women | 6.9 (6.1 to 7.8) [4.5 to 10.6] | 4.8 (4.3 to 5.3) [3.3 to 6.8] | 3.1 (2.9 to 3.4) [2.3 to 4.3] | 1.8 (1.7 to 2.0) [1.3 to 2.5] | 0.7 (0.6 to 0.8) [0.4 to 1.3] | |
| Rate of rupture (per 1000 person-years) | Men | 0.5 (0.3 to 0.7) [0.3 to 0.7] | 0.9 (0.6 to 1.3) [0.5 to 1.5] | 1.7 (1.1 to 2.4) [0.6 to 4.3] | 3.2 (2.2 to 4.6) [1.0 to 10.0] | 6.4 (4.3 to 9.5) [1.7 to 23.5] |
| Women | 2.2 (1.3 to 4.0) [0.9 to 5.7] | 4.5 (2.8 to 7.2) [2.1 to 9.7] | 7.9 (4.5 to 13.9) [1.7 to 36.1] | 14.7 (8.1 to 27.7) [2.3 to 95.1] | 29.7 (15.9 to 55.4) [3.9 to 222.9] | |
| Time taken to reach a 1% chance of rupture (years) | Men | 8.5 (7.0 to 10.5) [5.1 to 14.2] | 5.5 (4.4 to 6.8) [2.8 to 10.7] | 3.5 (2.8 to 4.3) [1.8 to 6.9] | 2.2 (1.8 to 2.8) [1.1 to 4.4] | 1.4 (1.2 to 1.8) [0.7 to 2.8] |
| Women | 3.5 (1.9 to 6.4) [0.8 to 14.6] | 2.1 (1.2 to 3.6) [0.4 to 11.1] | 1.4 (0.9 to 2.1) [0.3 to 5.8] | 0.9 (0.6 to 1.4) [0.2 to 3.5] | 0.7 (0.5 to 1.1) [0.2 to 3.3] | |
| Characteristic | Number of studies | Unadjusted analyses | Adjusted analyses | ||||||
|---|---|---|---|---|---|---|---|---|---|
| Total number of patients | Estimate (SE) mm/year | p-value | I2 (%) | Total number of patients | Estimate (SE) mm/year | p-value | I2 (%) | ||
| Age at baseline (per year) | 18 | 15,482 | − 0.004 (0.007) | 0.559 | 76 | 13,966 | − 0.001 (0.006) | 0.820 | 66 |
| Calendar year at baseline (per year) | 17 | 14,432 | 0.001 (0.021) | 0.965 | 86 | 12,914 | 0.012 (0.022) | 0.590 | 85 |
| Sex (female vs. male) | 11 | 9262 | 0.156 (0.144) | 0.278 | 78 | 8472 | 0.142 (0.150) | 0.344 | 78 |
| Smoking (current vs. ex/never) | 12 | 8196 | 0.375 (0.081) | < 0.001 | 57 | 7486 | 0.354 (0.065) | < 0.001 | 24 |
| BMI (per kg/m2) | 5 | 3756 | − 0.017 (0.008) | 0.039 | 0 | 3439 | − 0.008 (0.009) | 0.348 | 0 |
| Diabetes | 10 | 6268 | − 0.596 (0.092) | < 0.001 | 0 | 5697 | − 0.505 (0.097) | < 0.001 | 0 |
| Mean arterial blood pressure (per 10 mmHg) | 8 | 6723 | 0.003 (0.024) | 0.886 | 74 | 5957 | 0.013 (0.021) | 0.531 | 62 |
| Pulse pressure (per 10 mmHg) | 8 | 6723 | − 0.040 (0.018) | 0.024 | 67 | 5957 | − 0.027 (0.014) | 0.060 | 46 |
| History of cardiovascular disease | 10 | 6638 | − 0.177 (0.075) | 0.017 | 38 | 6302 | − 0.105 (0.088) | 0.230 | 46 |
| Drug | Number of studies | Unadjusted analyses | Adjusted analyses | ||||||
|---|---|---|---|---|---|---|---|---|---|
| Total number of patients | Estimate (SE) mm/year | p-value | I2 (%) | Total number of patients | Estimate (SE) mm/year | p-value | I2 (%) | ||
| ACE inhibitors | 7 | 4826 | − 0.125 (0.143) | 0.379 | 61 | 4269 | 0.002 (0.128) | 0.986 | 42 |
| Beta blockers | 7 | 4824 | − 0.189 (0.076) | 0.013 | 0 | 4269 | − 0.111 (0.083) | 0.183 | 0 |
| Calcium channel blockers | 6 | 4124 | − 0.199 (0.082) | 0.015 | 0 | 3723 | − 0.081 (0.088) | 0.358 | 0 |
| Statins/lipid-lowering drugs | 6 | 4621 | − 0.341 (0.133) | 0.010 | 47 | 4118 | − 0.205 (0.132) | 0.121 | 32 |
| Antiplatelets | 6 | 4137 | − 0.187 (0.101) | 0.065 | 32 | 3723 | − 0.125 (0.106) | 0.241 | 19 |
| Any antihypertensive | 7 | 4826 | − 0.189 (0.064) | 0.003 | 0 | 4271 | − 0.108 (0.075) | 0.149 | 0 |
| Characteristic | Number of studies | Number of AAA ruptures | HR (95% CI) | p-value | I2 (%) |
|---|---|---|---|---|---|
| Age at baseline (per year) | 14 | 228 | 1.04 (1.01 to 1.07) | 0.004 | 0 |
| Calendar year at baseline (per year) | 13 | 226 | 0.96 (0.92 to 1.00) | 0.033 | 0 |
| Sex (female vs. male) | 6 | 141 | 3.76 (2.58 to 5.47) | < 0.001 | 0 |
| Smoking (current vs. ex/never) | 4 | 103 | 2.02 (1.33 to 3.06) | 0.001 | 0 |
| BMI (per kg/m2) | 5 | 80 | 0.93 (0.88 to 0.99) | 0.029 | 0 |
| Diabetes | 2 | 66 | 1.27 (0.45 to 3.54) | 0.653 | 0 |
| Mean arterial blood pressure (per 10 mmHg) | 7 | 157 | 1.32 (1.11 to 1.56) | 0.001 | 31 |
| Pulse pressure (per 10 mmHg) | 7 | 157 | 1.11 (1.02 to 1.22) | 0.019 | 0 |
| History of cardiovascular disease | 3 | 73 | 1.32 (0.77 to 2.27) | 0.319 | 0 |
| Study | ACE inhibitors | Beta blockers | Calcium channel blockers | Statins/lipid-lowering drugs | Antiplatelets | Any antihypertensive |
|---|---|---|---|---|---|---|
| Western Australia52 | 1.25 (0.13 to 12.14) | a | 1.94 (0.20 to 18.96) | 0.66 (0.07 to 6.31) | a | 0.42 (0.04 to 4.12) |
| PIVOTAL, USA51 | a | a | a | a | a | |
| Propranolol, Canada40 | a | 1.99 (0.18 to 22.12) | 6.03 (0.54 to 67.16) | 2.33 (0.20 to 26.52) | 0.77 (0.07 to 8.54) | |
| Gävle, Sweden39 | a | a | a | a | a | a |
| UKSAT, UK13 | 1.17 (0.50 to 2.72) | 1.28 (0.66 to 2.46) | 1.42 (0.82 to 2.49) | a | 0.83 (0.46 to 1.52) | 1.08 (0.64 to 1.82) |
| Viborg, Denmark55 | a | a | a | a | a |
Chapter 7 Methods for cost-effectiveness analysis of alternative surveillance policies
In this chapter we describe the methods and preparatory work involved in assessing the cost-effectiveness of different surveillance policies. This includes how the information on small AAA growth rates and rupture rates from the IPD meta-analyses (see Chapters 5 and 6) is used to provide inputs for this health economic modelling. The results of the cost-effectiveness analyses are given in Chapter 8.
Introduction
Previous studies have estimated the cost-effectiveness of the screening strategy that was evaluated in the MASS trial. Estimates of the cost-effectiveness of this strategy have been adjusted over time, principally to reflect the emerging long-term data from the trial. The original cost-effectiveness estimates were based simply on 4 years of follow-up and estimated a mean cost per life-year gained within that truncated period of £28,400 (95% CI £15,000 to £146,000)56 at 2000–1 prices. Using the observed data at 10 years of follow-up, the estimate had fallen to £7600 (95% CI £5100 to £13,000) despite revaluing costs to 2008–9 prices. 4 Based on informal modelling, the original cost-effectiveness paper had suggested that the cost-effectiveness over 10 years would indeed be around £8000 per life-year saved. 56
However, it is clearly recognised that an investment in a screening programme needs to be assessed over a longer period that does not cut short the benefits from avoided aneurysm-related mortality and will require a formal model. Such a model, taking a 30-year perspective but initially based on the 4-year MASS results, was developed and this estimated the cost per life-year gained over a 30-year period as £2320 (with a 95% uncertainty interval of £1600 to £4240). 8 As the period of follow-up of the MASS trial has extended, the uncertainty associated with the longer-term effects of screening has been reduced, and scope now exists to compare the model results at 10 years and as necessary to recalibrate the model to more accurately reflect the longer-term observed data.
All these estimates have assumed a screening programme in elderly men with a surveillance pattern of: no recall for patients with an aortic diameter of < 3.0 cm; yearly rescanning of patients with an aortic diameter of 3.0–4.4 cm; 3-monthly rescans for patients with an aortic diameter of 4.5–5.4 cm; and consideration for surgery if an aortic diameter of ≥ 5.5 cm. This surveillance strategy adopted in MASS was based on the data available and expert clinical opinion at the time of the planning of the trial in 1995–6. The same pattern was subsequently adopted by the NAAASP. The analysis of growth and rupture rates in this RESCAN project provides an evidence base and opportunity to investigate whether or not a different surveillance strategy might be better than that used in MASS and subsequently by NAAASP.
Other economic models of AAA screening have of course been published. A systematic review of the models to 2006 emphasised the variability in their estimates of cost-effectiveness. 57 Since that review, a number of further modelling studies have been published drawing on data from a variety of sources: for example studies relating to Italy,15 to the Netherlands and Norway,58 to Canada59,60 and to Denmark. 61 These have all concluded that screening is acceptably cost-effective, with the exception of a study using data from Denmark and other sources, which concluded that screening did not seem to be cost-effective. 62 A recent modelling study, again using Danish data, contradicts that previous conclusion, suggesting that screening men at age 65 years is highly cost-effective compared with no screening and, additionally, that rescreening after 5 years may be a cost-effective extension to the programme. 63 However, no models of cost-effectiveness of AAA screening have been published that have specific relevance to NAAASP, other than those already cited relating to and derived from the MASS study, which is the largest randomised trial of AAA screening and contributes most to the international evidence. 7
The focus of the cost-effectiveness element of the current study is to analyse the implications of the RESCAN analyses, relating to the international evidence on growth rates and rupture rates, for the most cost-effective surveillance strategy following AAA screening. Cost-effectiveness is of course a function not only of these clinical parameters but also the behavioural, resource-use, and cost data relevant to a particular screening programme. Hence, we have chosen to use such country-specific data relevant to the current UK programme.
The work specifically undertaken on the model for this study consisted of the following elements:
-
Validation and recalibration of the previously published model8 to best reflect the accumulated 10-year follow-up data from MASS, including incorporation of time-dependent parameter values.
-
Adaption of the model structure to fully incorporate unobserved ‘tunnel’ states to reflect the growth and rupture probabilities for all aneurysms, whether or not reobserved and remeasured at a recall scan.
-
Re-estimation of current unit costs for screening interventions and elective and emergency surgery.
-
Incorporation of data from NAAASP, including attendance rates, prevalence of identified aneurysms, and distribution of aneurysm sizes at initial screening.
-
Incorporation of size-specific growth and rupture rates from the analysis of the IPD surveillance data sets reported in Chapters 5 and 6.
Each of these aspects of our development of the model is to enable us to address the issue of the cost-effectiveness of alternative surveillance strategies, in the context of the NAAASP, and each aspect is addressed in turn in this chapter.
The initial model
The starting point for the economic analysis in this project was the economic model that had previously been developed by members of the research team, to estimate the long-term cost-effectiveness of a screening programme using the MASS trial screening and surveillance protocol. Details of this model have previously been published. 8 In summary, it used a Markov model, with 3-monthly cycles, to compare the introduction of a formal screening programme of an invitation for a one-off US scan for men aged 65 years, and the MASS surveillance strategy described above if an aneurysm is identified, with the policy of no systematic screening. The original model is represented in Figure 18.
The model used a 30-year time horizon (so approximating lifetime results). The methods were consistent with those recommended for the National Institute for Health and Care Excellence (NICE)'s Technology Appraisal Programme. 64 The cost perspective was that of the NHS and the model estimated life-years gained and adjusted these for age-specific utility values relating to the UK population to provide ICERs in terms of QALYs.
For this model, parameter values were estimated from patient-level data from the 4-year analysis of the MASS study and the model structure was internally validated by comparing its results against observed event and cost-effectiveness data over the 4-year time period. In addition, it was externally validated against key outcomes from the Cochrane review of AAA screening and surveillance. 7
Validation and recalibration of the previously published model to better reflect the 10-year follow-up data from the Multi-centre Aneurysm Screening Study
The first step in the current study was to revalidate the model comparing the 10-year model outcomes against the 10-year observed data from the follow-up of MASS, and, where necessary, to adjust or ‘recalibrate’ the model parameters to better reflect that observed data. We used the 8.9–11.2 years of observed follow-up (mean 10.1 years) to better estimate the values for the parameterisation of the economic model. Outputs of the model were compared against those observed in the trial, by considering the numbers of key observed events and cost-effectiveness results at the end of this follow-up period.
Given the staggered recruitment of participants into the trial and the range of follow-up periods for individual patients, for the purpose of comparing numbers of key events the model replicated censoring patterns by removing equal proportions as observed in the trial of numbers in each state for every 3-month cycle, so that the total person-years of follow-up were comparable. The model was then run over 11.25 years to provide comparability. To produce estimates of costs and life-years at 10 years comparable with those observed in MASS, the model was run for 10 years with costs based on 2008–9 prices and survival based on all-cause mortality. Given the characteristics of the MASS trial population, it might be expected that mortality rates would not be comparable with the national statistics, and so for the internal validation exercise MASS-specific mortality data were used to estimate the probability of mortality in each 3-month cycle, rather than using national mortality statistics that were incorporated into the model to give it greater external validity or generalisability.
Initially the model did not appear to perform particularly well against observed data in terms of key events or cost-effectiveness results over the longer follow-up period. As the length of follow-up had increased, trends may have emerged in key parameter values and differences between modelling and observed outputs could be partly attributed to the use of time-constant parameters. Time-dependent transition probabilities were therefore estimated using ‘logistic’ and ‘Poisson’ regressions, to improve the fit of the model. The differences between the observed and modelled data may also have been in part due to parameters used to inform the modelling that could not be observed in MASS. In particular, two parameters, the probability of opportunistic detection among those not in active screening and the rupture rate of undetected large aneurysms, were seen as potentially unreliable. The first had been based on calculations utilising data from the control arm of the trial, to give a crude estimate of the detection rate. The latter had been estimated to fit the 4-year data, assuming it lay between the rupture rate in detected large aneurysms and the rupture rate among aneurysms contraindicated for elective surgery. A recalibration exercise was conducted using a range of figures for both these parameters, to obtain model results that gave more similar numbers of key events (i.e. elective operations, emergency operations and AAA deaths) to those observed in MASS.
It was not easy to achieve complete consistency between the observed and modelled clinical outcomes. Given that the long-term ICER was the primary outcome for the cost-effectiveness modelling, the recalibration focused on eliminating disparities in the modelled and observed differences between the arms.
Table 13 shows key event rates as observed in MASS, as estimated by the original model and as estimated by the model following recalibration. The pattern of events over time from the observed data, the initial model estimates and the recalibrated estimates are shown in Figure 19a–h.
This recalibration process achieved similarity between the modelled and observed differences in key events between the arms, as well as in the resultant ICERs (Table 14). The ICER was £7600 per life-year based on observed 10-year data: the original model estimated an ICER at 10 years of £18,000, the recalibrated model estimated the ICER at £8900, closer to that from the observed data. This suggested that, though imperfect, the model would be suitable for extrapolation of cost-effectiveness results over the long term.
Adapting the model structure to fully incorporate unobserved ‘tunnel’ states
The previously constructed Markov model8 needed adaption to account more explicitly for the incidence of rescans. The original model, with 3-monthly cycles, was built with a view to considering one surveillance policy (that pertaining to the MASS data of yearly recall for AAAs measuring 3.0–4.4 cm and 3-monthly recall for medium AAAs measuring 4.5–5.4 cm). The model averaged out the surveillance for the smaller aneurysms, effectively assuming that surveillance scans were being conducted every cycle but assigning only one-quarter of the rescan costs to each cycle. This meant that individuals were able to transition to larger aneurysmal states in each 3-month cycle and on reaching the large state they could be considered for elective surgery or returned to screening. However, in reality, those in a small AAA state (3.0–4.4 cm) are not rescanned every cycle and cannot move into the surveillance pattern for a larger aneurysm until the increased size of their aneurysm has been identified through a scan. In the original model, costs associated with rescanning were averaged across the cycles, 0.25 of a rescan cost per cycle for the small aneurysmal state and assigned as one per cycle for the medium-sized AAA. Although this approximation was adequate when considering the one surveillance strategy, the model needed to be adapted for the purposes of answering questions around different surveillance policies.
This adaption was achieved through the inclusion of ‘tunnel’ states for aneurysm growth, accounting for patients in whom aneurysm growth occurred but was not observed or acted on. The structure of the extended model is represented diagrammatically in Figure 20. These tunnel states allow aneurysms to grow in between scans, where the individual is subject to the relevant rupture rate. An individual can stay in the tunnel state that they have entered in subsequent cycles, or transition to larger AAA tunnel states. Only when a scheduled surveillance scan occurs are individuals then able to be move out of these unobserved tunnel states into observed states. On this they can then be subject to more frequent scanning, or events that occur as a result of entering the large AAA state (i.e. consideration for elective surgery). This provides a more accurate representation of reality and most importantly can allow for the effects of differing policies by adjusting the number of cycles that individuals spend in these states before a rescan and a return to observed states. Aneurysms that are detected opportunistically are assumed to enter an observed state before moving into tunnel states. However, given that this opportunistic detection can occur in every cycle, an approximation in the cycles immediately following opportunistic detection is used to bring these individuals into the same rescanning schedule as the rest of the detected aneurysm cohort. This retains programming efficiency and has the effect that some opportunistically detected patients will be assumed to receive their first 1-year scans after a shorter period than a full year.
It may be useful to consider the current screening policy of 1 year and 3 months for small and medium AAAs, respectively, as an example of the way the new structure works. An individual invited to and having attended screening, with a small aneurysm observed at baseline, would be invited to return for another scan in 1 year, equivalent to four cycles in the model. Assuming the AAA had not grown, nor ruptured and the individual had not dropped out of surveillance or died, they would move into the small (unobserved) tunnel state in cycle 2. If no transition had occurred in cycles 3 and 4, the individual would then move out of the small unobserved ‘tunnel’ state back into the small observed state where a rescan takes place. They would then move into tunnel states again following this scan. Alternatively, the aneurysm could have grown and the patient transitions into the tunnel state for medium aneurysms in cycle 2 and possibly into the tunnel state for large aneurysms in cycle 3. The tunnel states mean that this individual will not be treated as having a large aneurysm as regards the surveillance policy until this growth has been observed at the next scan in cycle 4.
These techniques for modelling growth also mean that the accrual of costs due to rescanning should be more accurate. Costs will accrue as rescans occur over time, as opposed to averaging costs over a number of cycles. By implementing these changes the model can be used to investigate a range of potential new surveillance policies and compare their cost-effectiveness.
Re-estimation of current unit costs for screening interventions, and elective and emergency surgery
The various estimates of cost-effectiveness based on MASS, referred to earlier, have so far all used original unit cost estimates at 2000–1 prices, updated as necessary only for general health service inflation. There was a clear need for a more thorough update of costs to reflect a range of changes in practice. All costs were re-estimated at 2010–11 price levels.
Screening intervention costs
The original costs for the elements of screening came directly from the costs of the services in the trial. These have now been superseded by costs directly provided by the NAAASP. Table 15 shows the original figures, those figures updated to 2010–11 price levels, and the current unit costs, again at 2010–11 price levels from the NAAASP.
Costs for elective and emergency aneurysm repair
The MASS estimates for the cost of elective and emergency procedures were calculated using very detailed bottom-up costing using patient notes and other detailed hospital records of 577 patients from the four surgery centres involved in the MASS study. 56 It was not feasible to re-estimate the costs using the same resource-intensive methods for this study. Rather we chose to estimate unit costs for surgery using more recent published studies where available and where more recent, relevant studies were not available by making explicit adjustments to the mean per patient costs previously calculated to reflect more recent routine data on resource use.
The most recent and largest (sample size) costing exercise was completed as part of the analysis of the endovascular aneurysm repair (EVAR)-1 trial, which we have used to estimate the costs of open repair and endovascular repair in an elective setting. 65 As per NICE guidance,66 we assumed that emergency EVAR operations are only being performed in a research environment and, so, we have only included costs for open emergency repair in our estimates. For emergency open repair an estimate of per patient costs was updated from the MASS trial, in the following way:
-
First, the major costs components were removed from the total mean per patient estimates for elective open repair and elective EVAR (from EVAR 1 trial65 estimates) and emergency OR (from MASS trial56 cost estimates). In each case, this constituted the removal of costs attributable to hospital stay and operation time. For EVAR this also included the cost of the stent. This cost was updated using more recent data from centres involved in the screening programme and correspondence with manufacturers.
-
The residual cost, made up of more minor resource-use items, such as blood products used and consumables, was inflated to 2010–11 prices according to Personal Social Services Research Unit indices. 67
-
The resource-use data were then updated for operation length and total hospital stay (apportioned using the same proportions for intensive care unit (ICU) and normal ward as had been observed in EVAR 1 trial or MASS, respectively) using recent data provided for us from the National Vascular Database (January 9 March 2012). 68 New unit costs for ICU, high-dependency unit (HDU) and vascular ward stay were all obtained from NHS reference costs for 2010–11. 69 A new unit cost estimate per hour of time in operating theatre was obtained. 70 These updated estimates were applied to the new resource-use estimates.
-
The elective cost has been weighted according to the proportion of cases that are EVAR and OR in the National Vascular Database sample (approximately 70/30 for EVAR and OR, respectively).
Tables 16–18 illustrate this process for updated components of resource use and unit costs, for elective open, elective EVAR, and for emergency procedures, respectively. Tables 19–21 show the magnitude of the residual component of each of these three costs, which was simply inflated to 2010–11 prices. Table 22 summarises the new cost estimates and compares them with the original estimates, and the original estimates inflated to 2010–11 prices.
Costs of pre-surgical consultations
No newer estimates were available for the costs of consultations when referred to surgery which included costs of associated tests. The original MASS56 estimates for these costs were simply inflated from 2000–1 to 2010–11 prices (£309.88 inflated to £435.25).
Incorporating data from the NHS Abdominal Aortic Aneurysm Screening Programme
To reflect current AAA screening in the UK, data from the NAAASP were utilised in the economic modelling. The attendance rate from those invited to screening in the NAAASP has been lower than that of the MASS trial (which was 83%); a figure of 73% from the NAAASP has been used in the modelling. 71 A lower prevalence of AAAs has also been noted in data from the NAAASP, which might have some effect on cost-effectiveness results. In the MASS trial the prevalence was 4.9%, but the current prevalence observed in the NAAASP is 1.6% and this rate was used in the modelling. Data were provided to us from the NAAASP on the distribution of aneurysm sizes detected in the screening programme, to reflect possible changes in aneurysm sizes observed at baseline compared with the MASS data used in the original model.
In addition, non-AAA mortality rates were estimated using data from Hospital Episodes Statistics72 and the Office for National Statistics (ONS) for 2010,73 incorporated into the modelling as age-specific 3-month probabilities.
Incorporating size-specific growth and rupture rates from the RESCAN analyses
Growth rates
From the reanalysis of existing surveillance data (see Chapter 6) we have developed random-effects models to describe AAA growth in each of the studies. These models are utilised to calculate how individuals pass through the size states of the Markov model used for the cost-effectiveness modelling. The methods are described fully in Appendix 4, with a summary given here.
Firstly, 3-month transition probabilities were calculated between 5-mm-wide size states (3.0–3.4 cm, 3.5–3.9 cm, 4.0–4.4 cm, 4.5–4.9 cm, 5.0–5.4 cm and 5.5+ cm). To achieve this, a cohort is envisaged with screening distribution of small aneurysm sizes taken from the Chichester screening study (shown to have an almost identical distribution to the NAAASP small diameters, as shown in Figure 21). This distribution is skewed towards small aneurysms with the mode close to 3.0 cm. The aneurysms in this envisaged cohort are then allowed to grow over time using the baseline size-specific growth rates estimated from each study separately. For any 3-month period following screening, the estimated occupancy probabilities in each 5-mm-wide size state were calculated using the predictive distribution of aneurysm sizes. Those screened as normal are assumed to account for 98.3% of the screened population9 and are also allowed to grow, with an estimated 0.207% reaching 3.0 cm every 3 months and, thereafter, growing at a rate equivalent to a screen detected patient with baseline diameter 3.0 cm. The occupancy probabilities from the cohort are then used to calculate 3-month transition probabilities between size states using the Chapman–Kolmogorov equations and assuming a progressive only Markov model. 74 The log-odds of the transition probabilities for each 3 months over a 30-year time period after screening are obtained together with their SEs, and these study-specific estimates are then pooled in a second stage using random-effects meta-analysis.
‘Equivalence’ probabilities
Different choices of small aneurysm states are considered in the Markov transition models to allow comparisons of different screening strategies. It is therefore necessary to calculate 3-month transition probabilities between any size states of interest. Given the 3-month transition probabilities calculated above for the 5-mm-wide size states we can obtain ‘equivalent’ transition probabilities for any concatenation of these states (e.g. 3.0–4.4 cm, 4.5–5.4 cm, 5.5+ cm). These ‘equivalence’ probabilities are defined by the requirement that two Markov models with different small aneurysm size states produce the same proportion of large aneurysms (> 5.5 cm) over time if no external intervention, deaths or censoring takes place. Hence, this facilitates a fair comparison of the different surveillance strategies since the rate of growth to large AAAs without intervention will be the same across all models. The method used to calculate these ‘equivalence’ probabilities is described in Appendix 4.
Rupture rates
To obtain 3-month transition probabilities of rupture over a 30-year time period, as required by the health economic model, we fit a parametric survival model to the data in each study. Only men are considered for this analysis (since men are the focus of the screening policy). Specifically, a Weibull proportional hazards model with time-updated covariate (AAA diameter) is used. Events other than rupture that terminate follow-up (lost to follow-up, non-rupture-related death or surgery) are classified as censored observations. The (transition) probability of rupturing over any 3-month time period given AAA diameter at the beginning of the period is then approximated from the survival distribution. The log-odds of these probabilities are obtained together with their SEs, and these study-specific estimates are pooled in a second stage using random-effects meta-analysis.
Analysis of cost-effectiveness using the adapted and updated model
These developments enable us to use the model to estimate the life-years, QALYs, costs and net monetary benefits for a series of strategies with different recall frequencies, compared initially with the base case of the existing strategy, and by looking at differences in net benefit to extend to comparisons between any two strategies.
In this particular context, a probabilistic sensitivity analysis (PSA), as might typically be provided as a representation of the overall uncertainty in the estimates of cost-effectiveness, would not adequately characterise that overall uncertainty. In particular, it is not readily feasible to estimate the correlated uncertainty around the very many (480) age- and size-related aneurysm growth and rupture rates derived from the IPD meta-analysis incorporated into the model, or to provide evidence-based estimates of uncertainty distributions around other parameters, or to characterise the underlying structural uncertainty in this complex model. Therefore, rather than provide a potentially misleading PSA, we have chosen to employ simple one-way sensitivity analyses to characterise the effects on net benefit of uncertainty around growth rate and rupture rate estimates, and to check whether or not the conclusions regarding the preferred strategy are sensitive to this uncertainty. For comparison we illustrate the effects of uncertainty around other important parameters in the model.
FIGURE 18.
Original health economic model structure. Reproduced with permission from figure 1 of Kim LG, Thompson SG, Briggs AH, Buxton MJ, Campbell HE. How cost-effective is screening for abdominal aortic aneurysms? J Med Screen 2007;14:46–52. http://dx.doi.org/10.1258/096914107780154477. 8
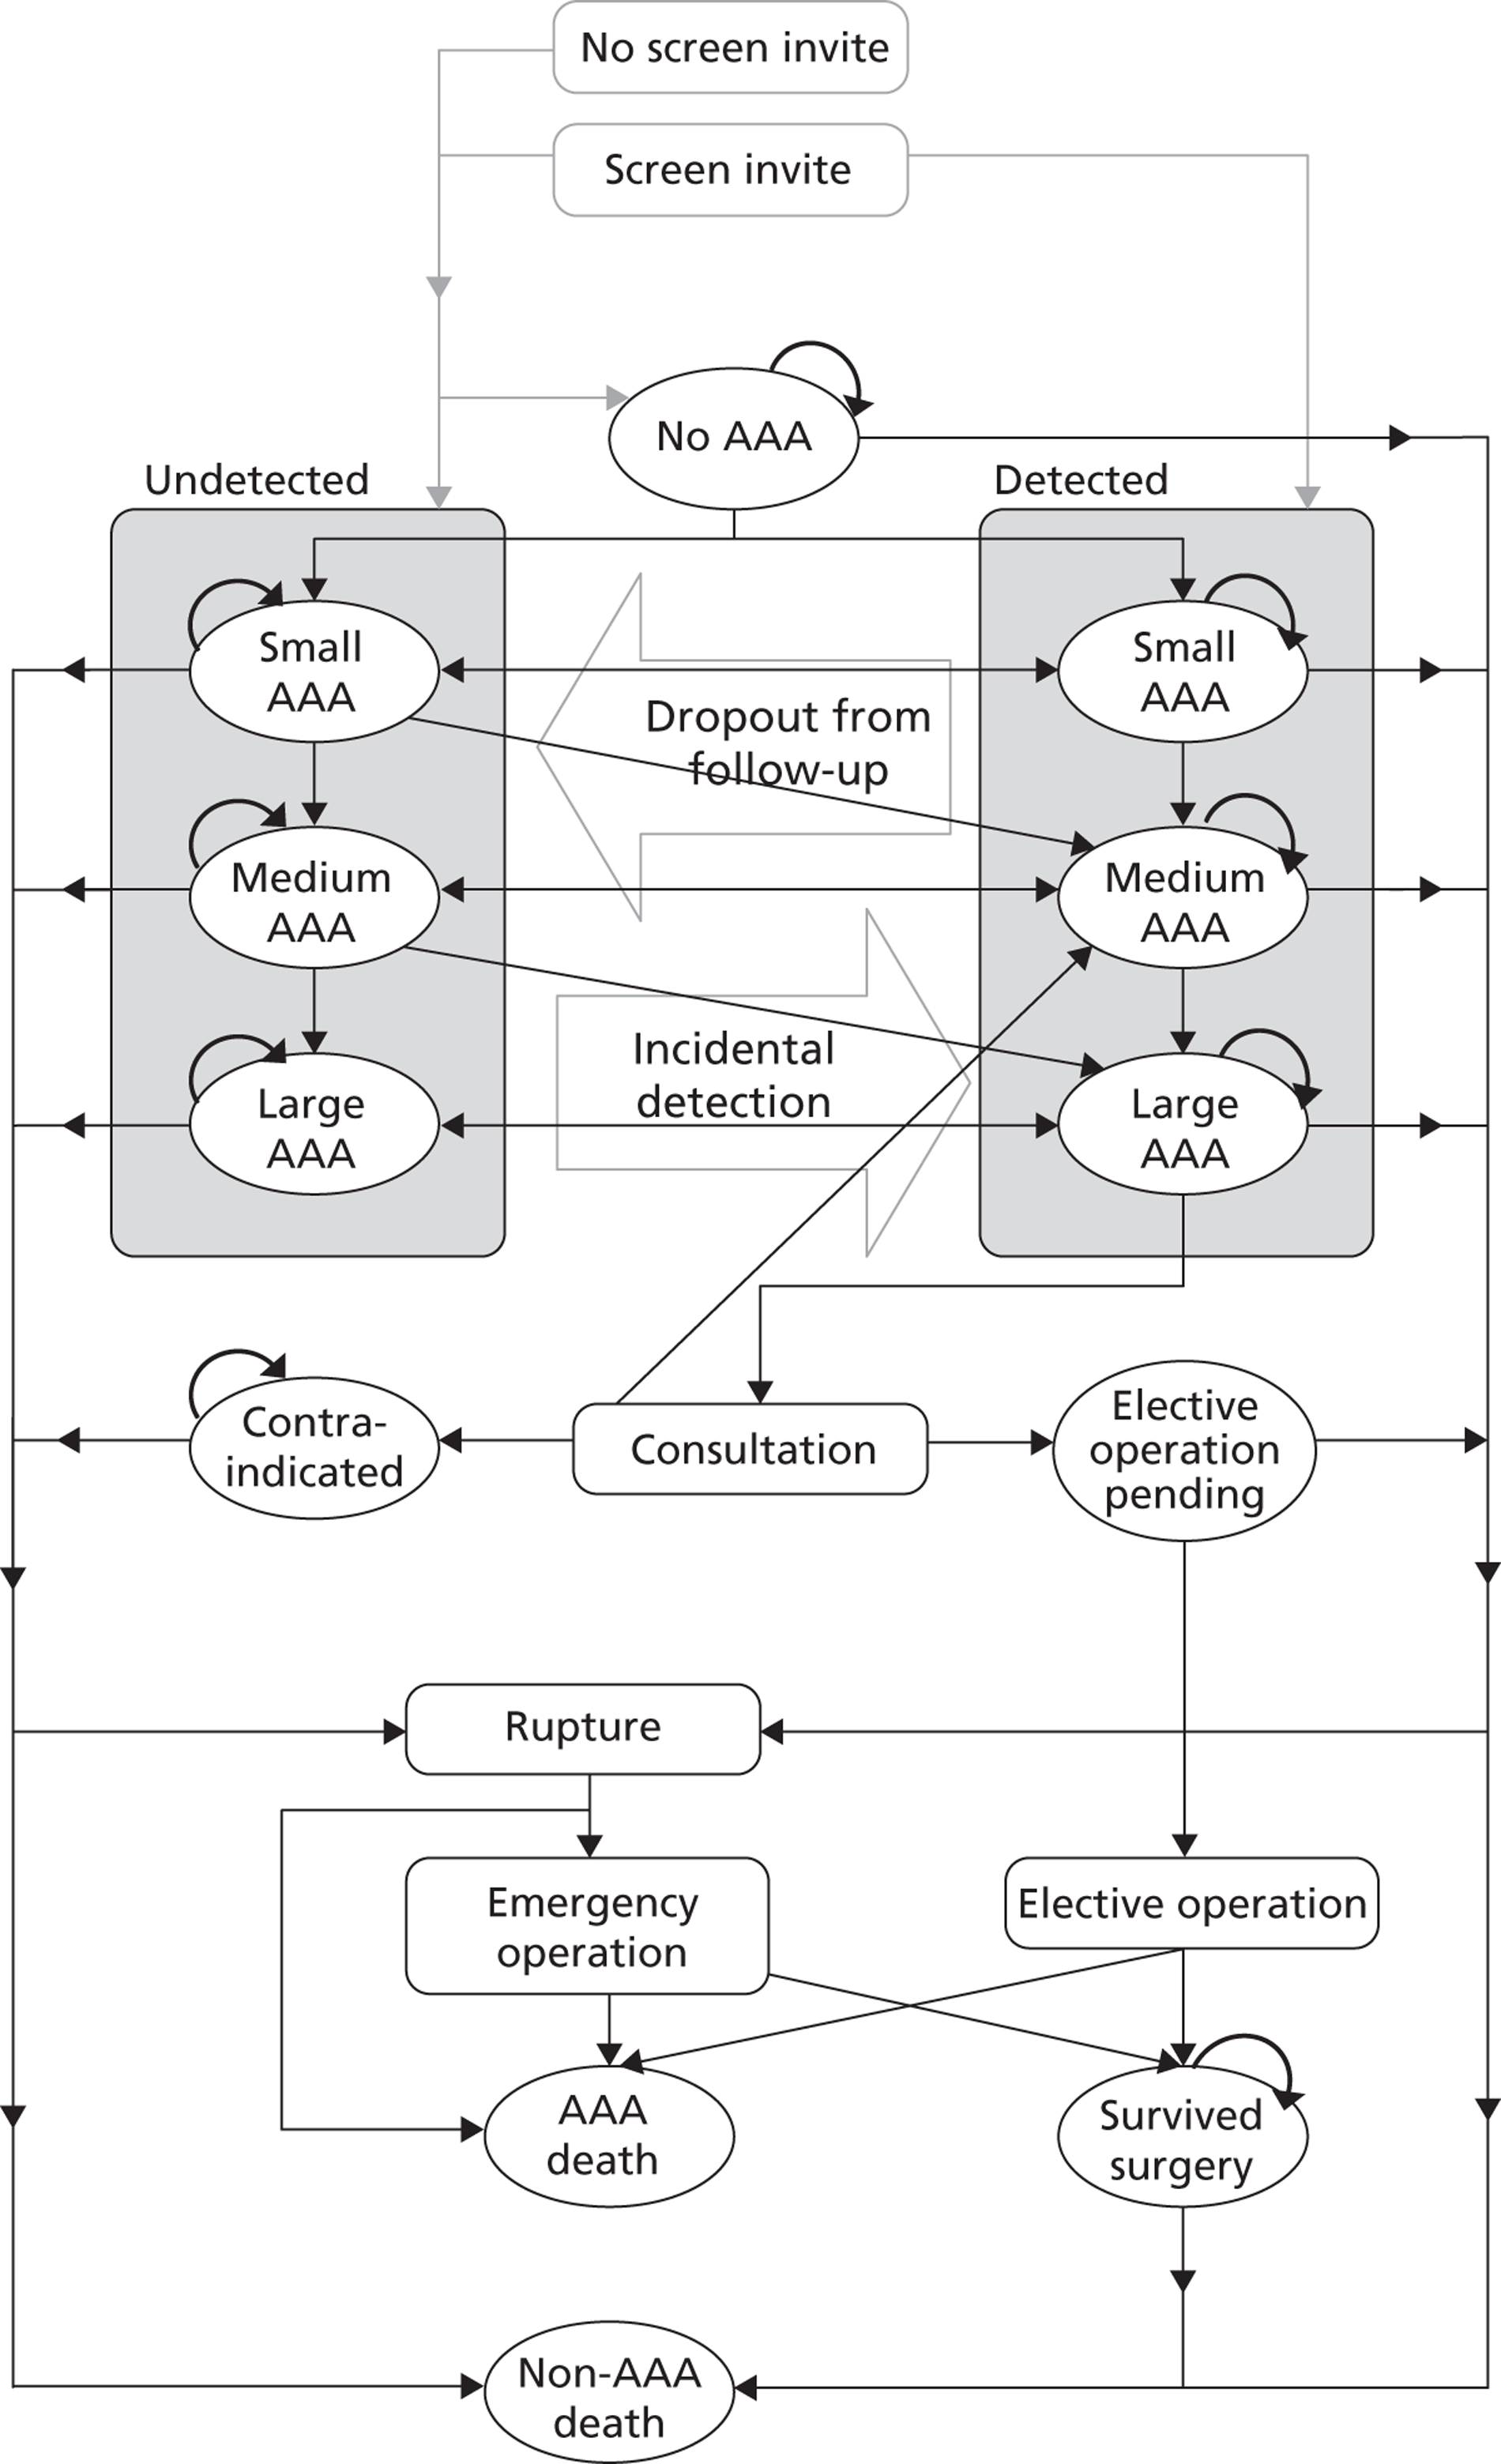
FIGURE 19a.
Number of elective operations in control group over 10 years' (mean) follow-up.
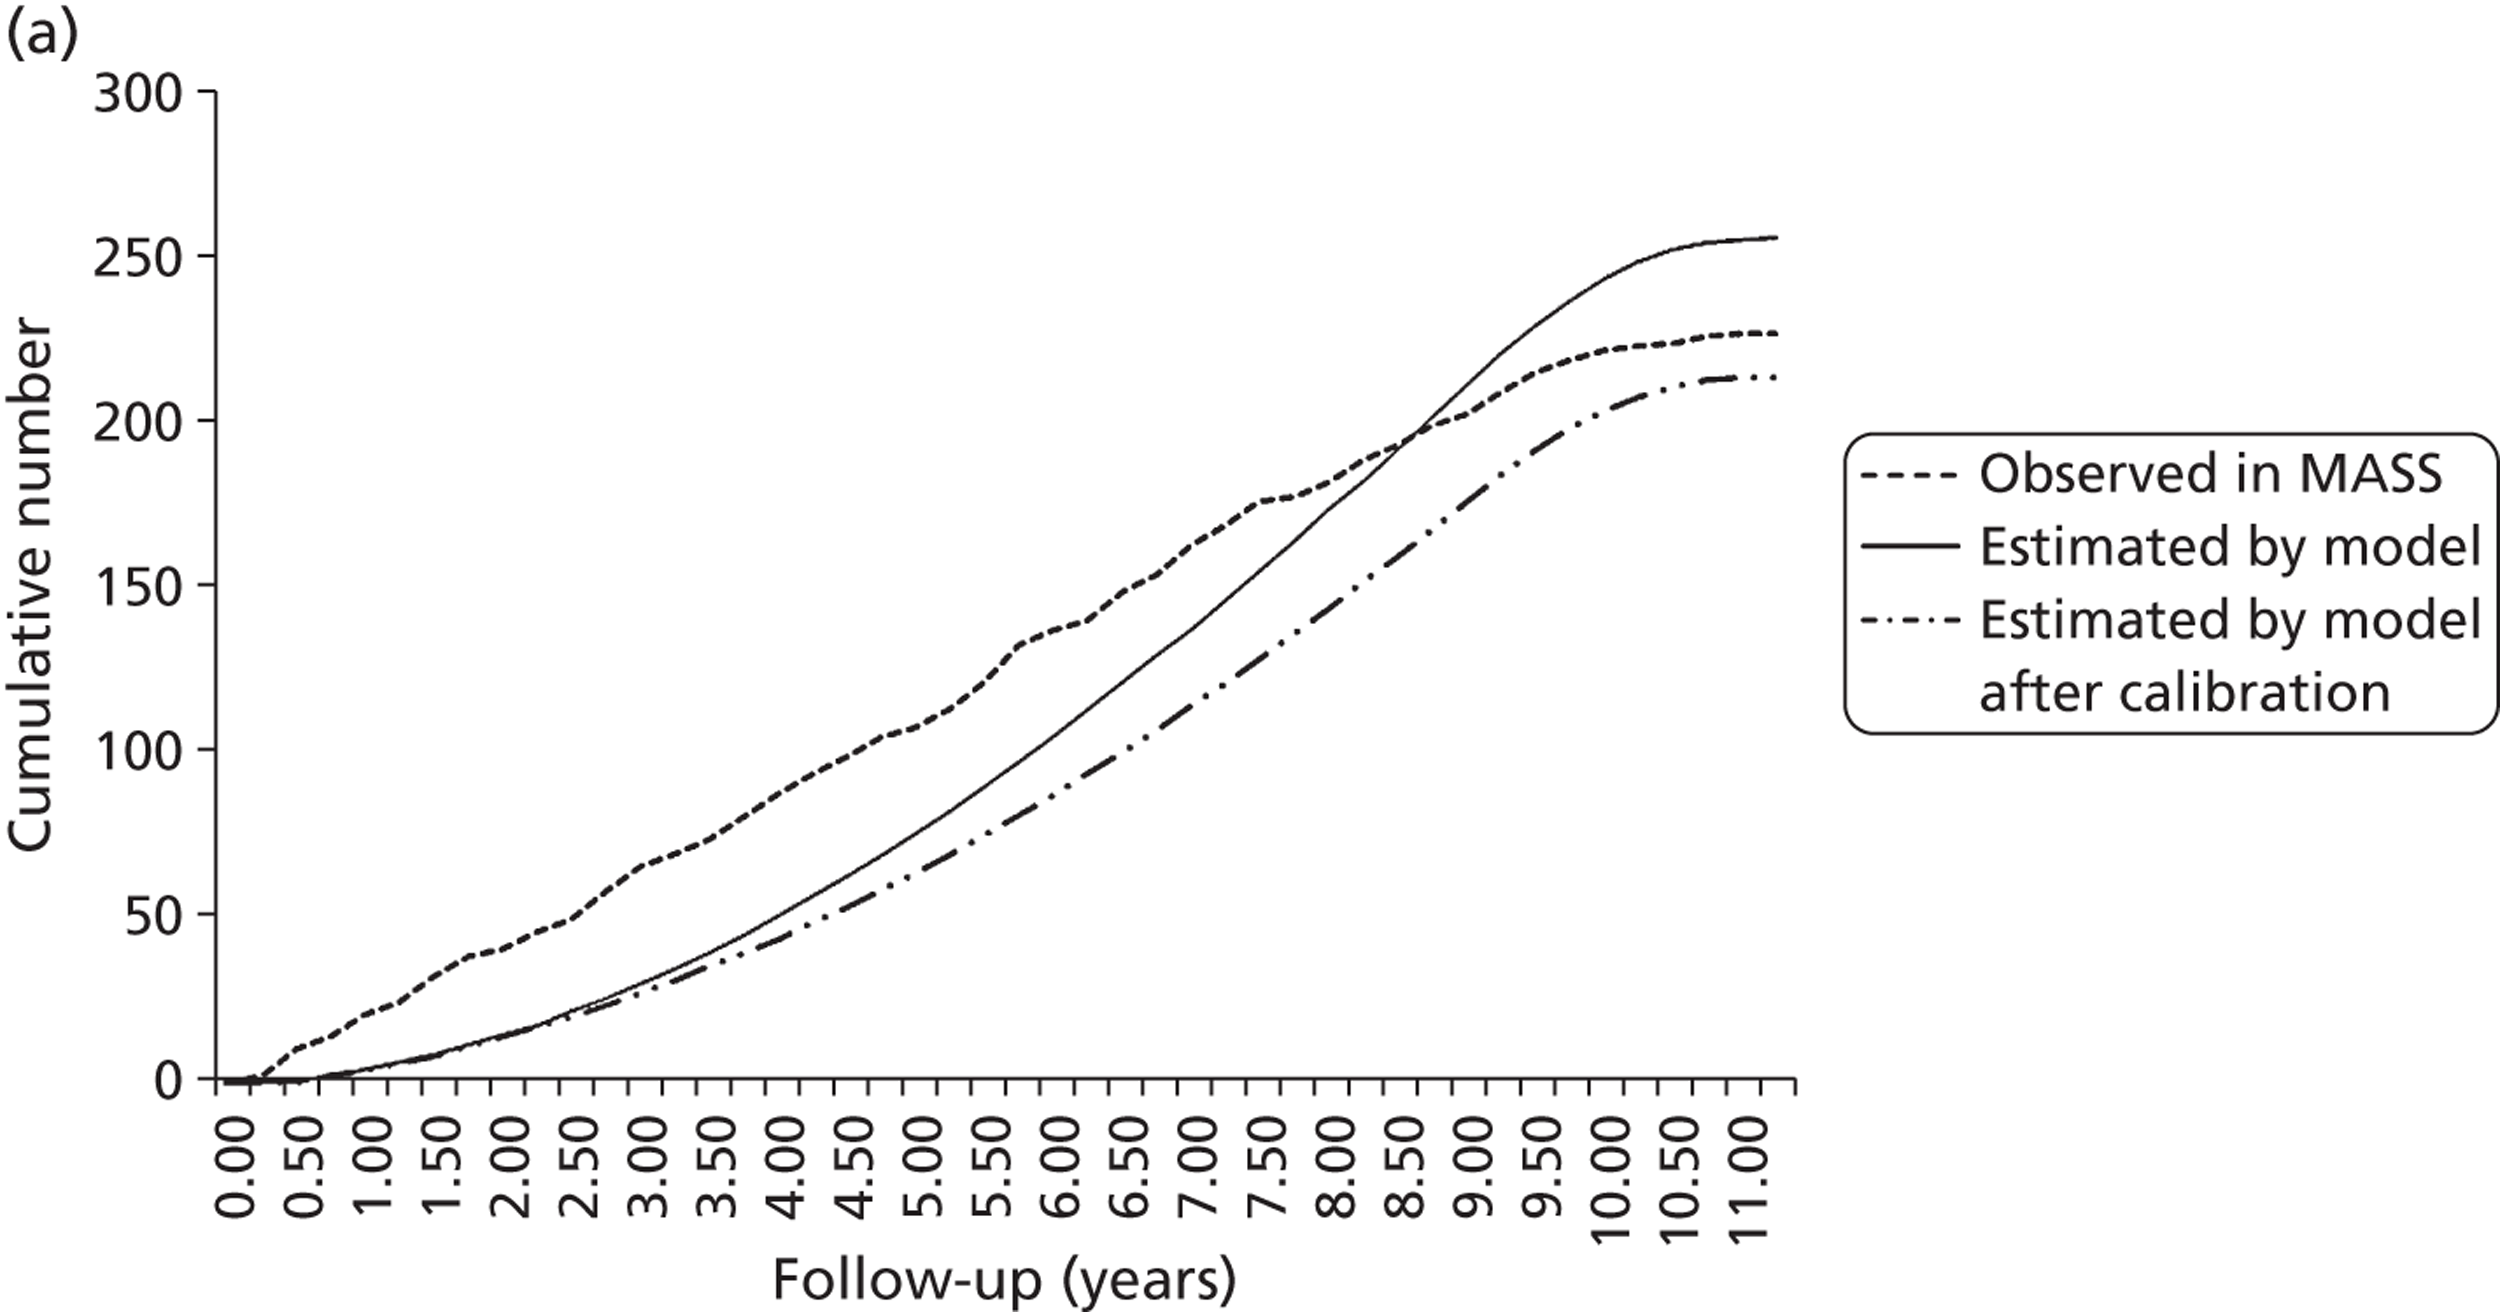
FIGURE 19b.
Number of emergency operations in control group over 10 years' (mean) follow-up.
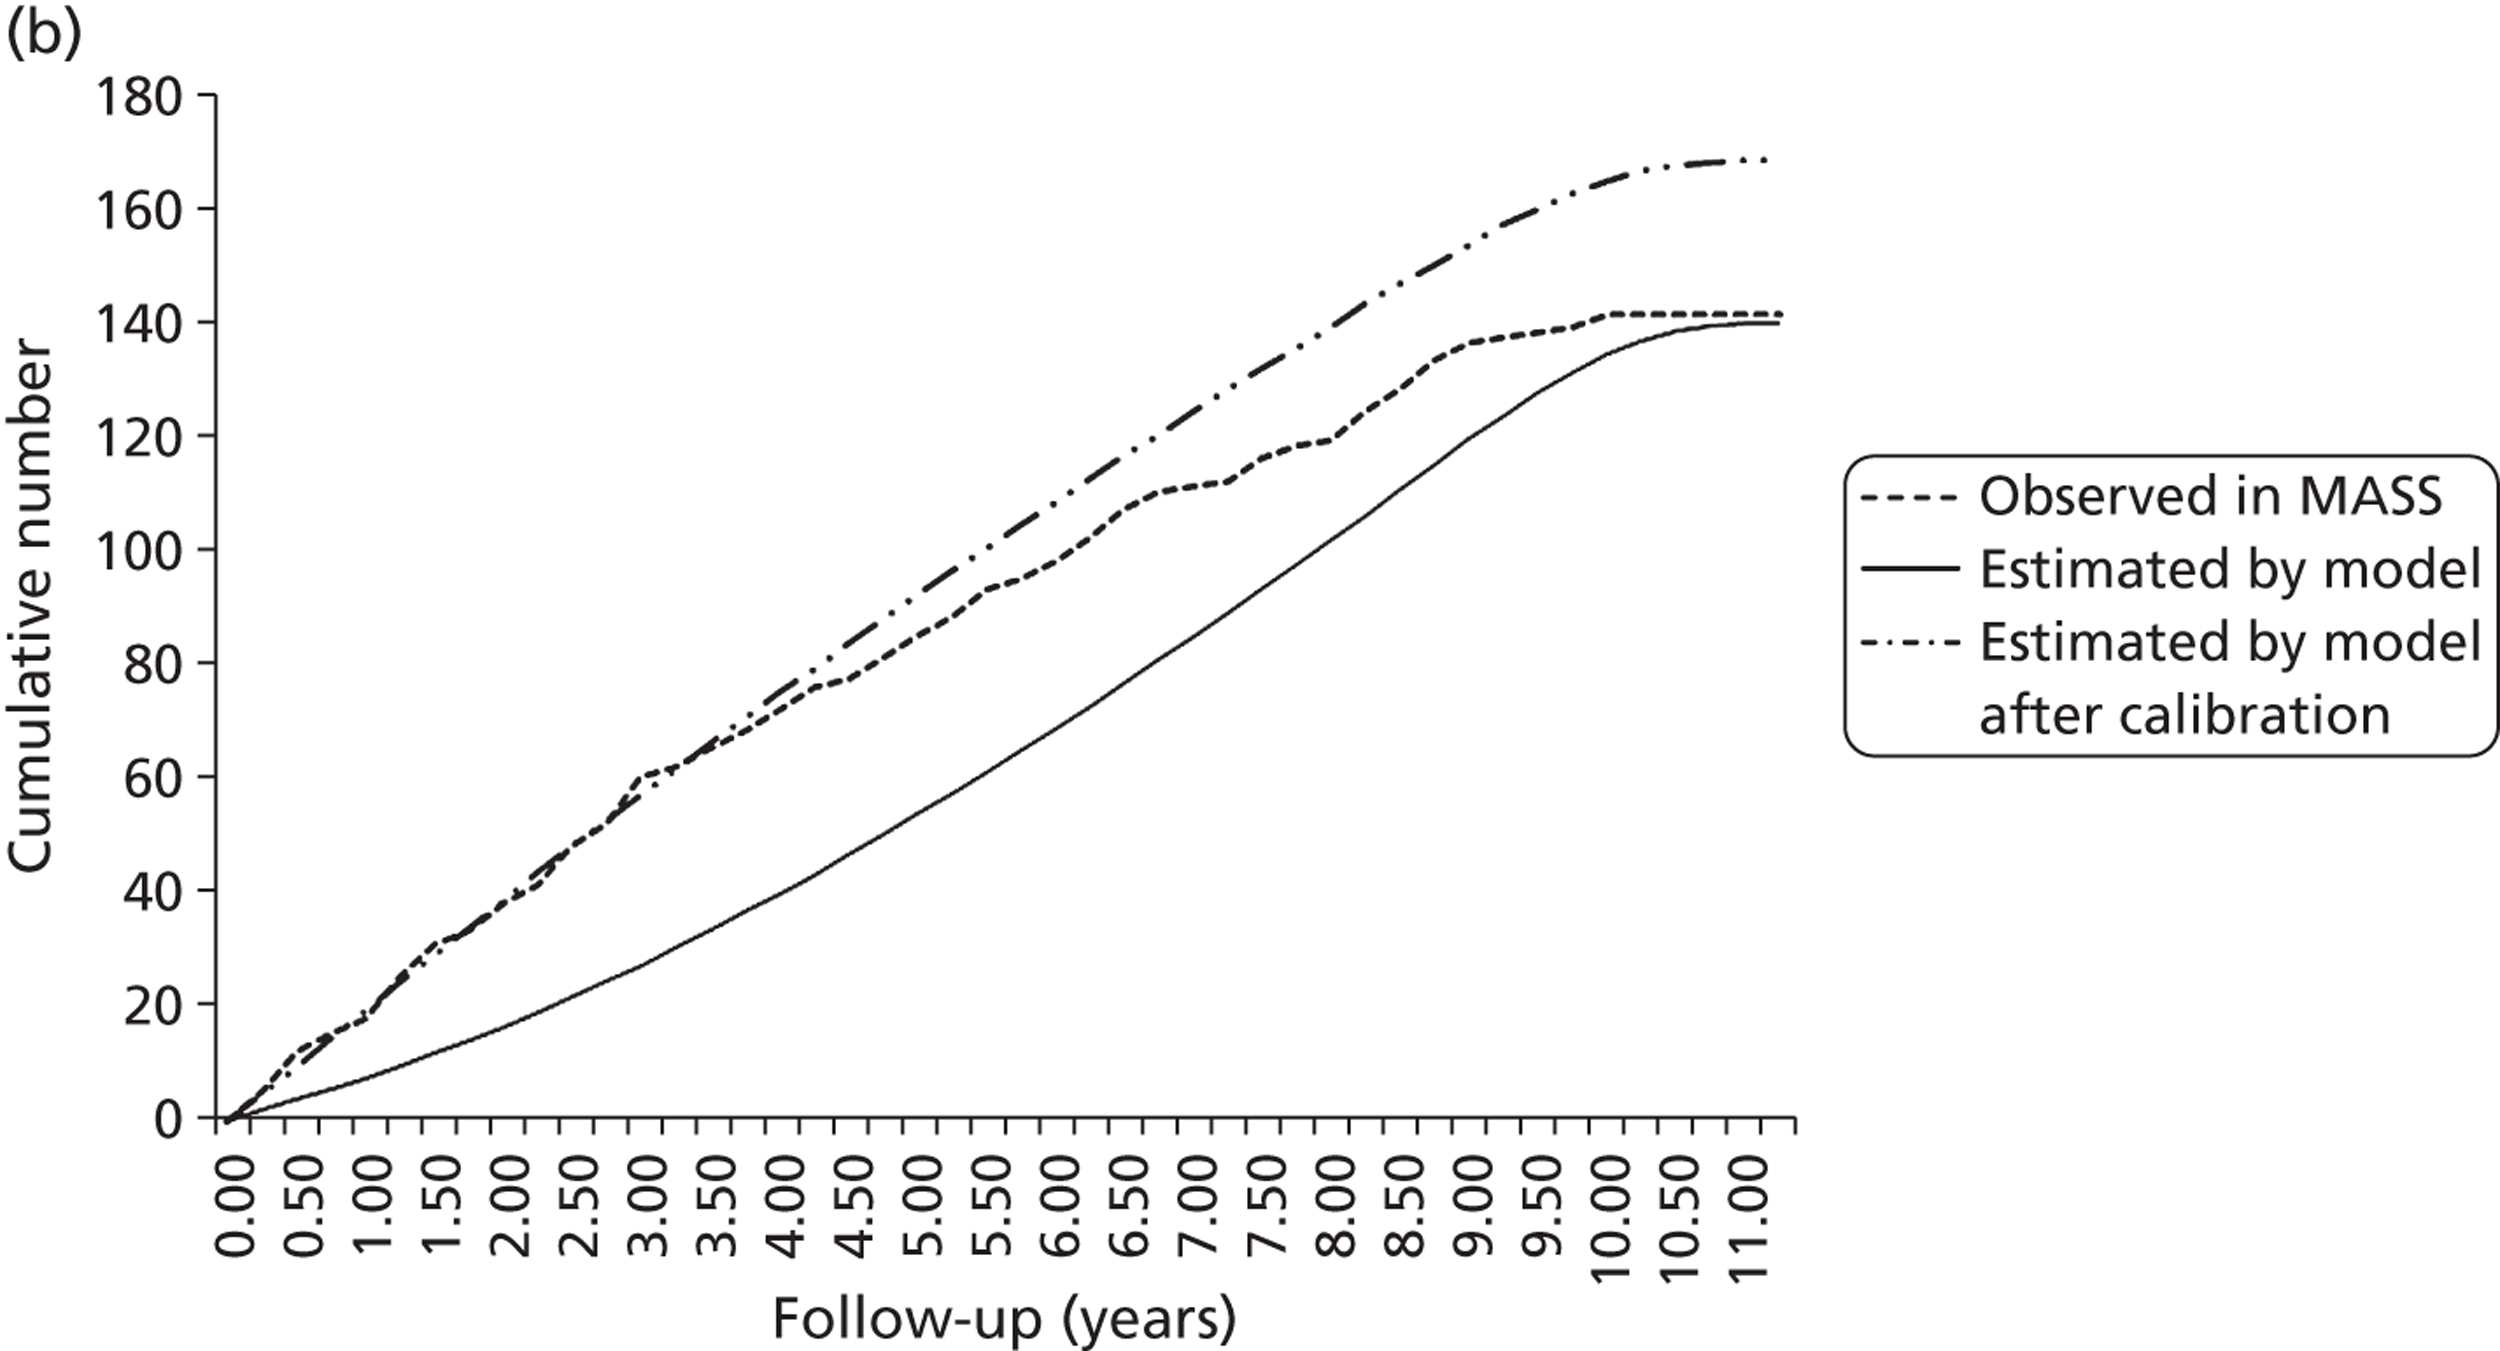
FIGURE 19c.
Number of AAA-related deaths in control group over 10 years' (mean) follow-up.
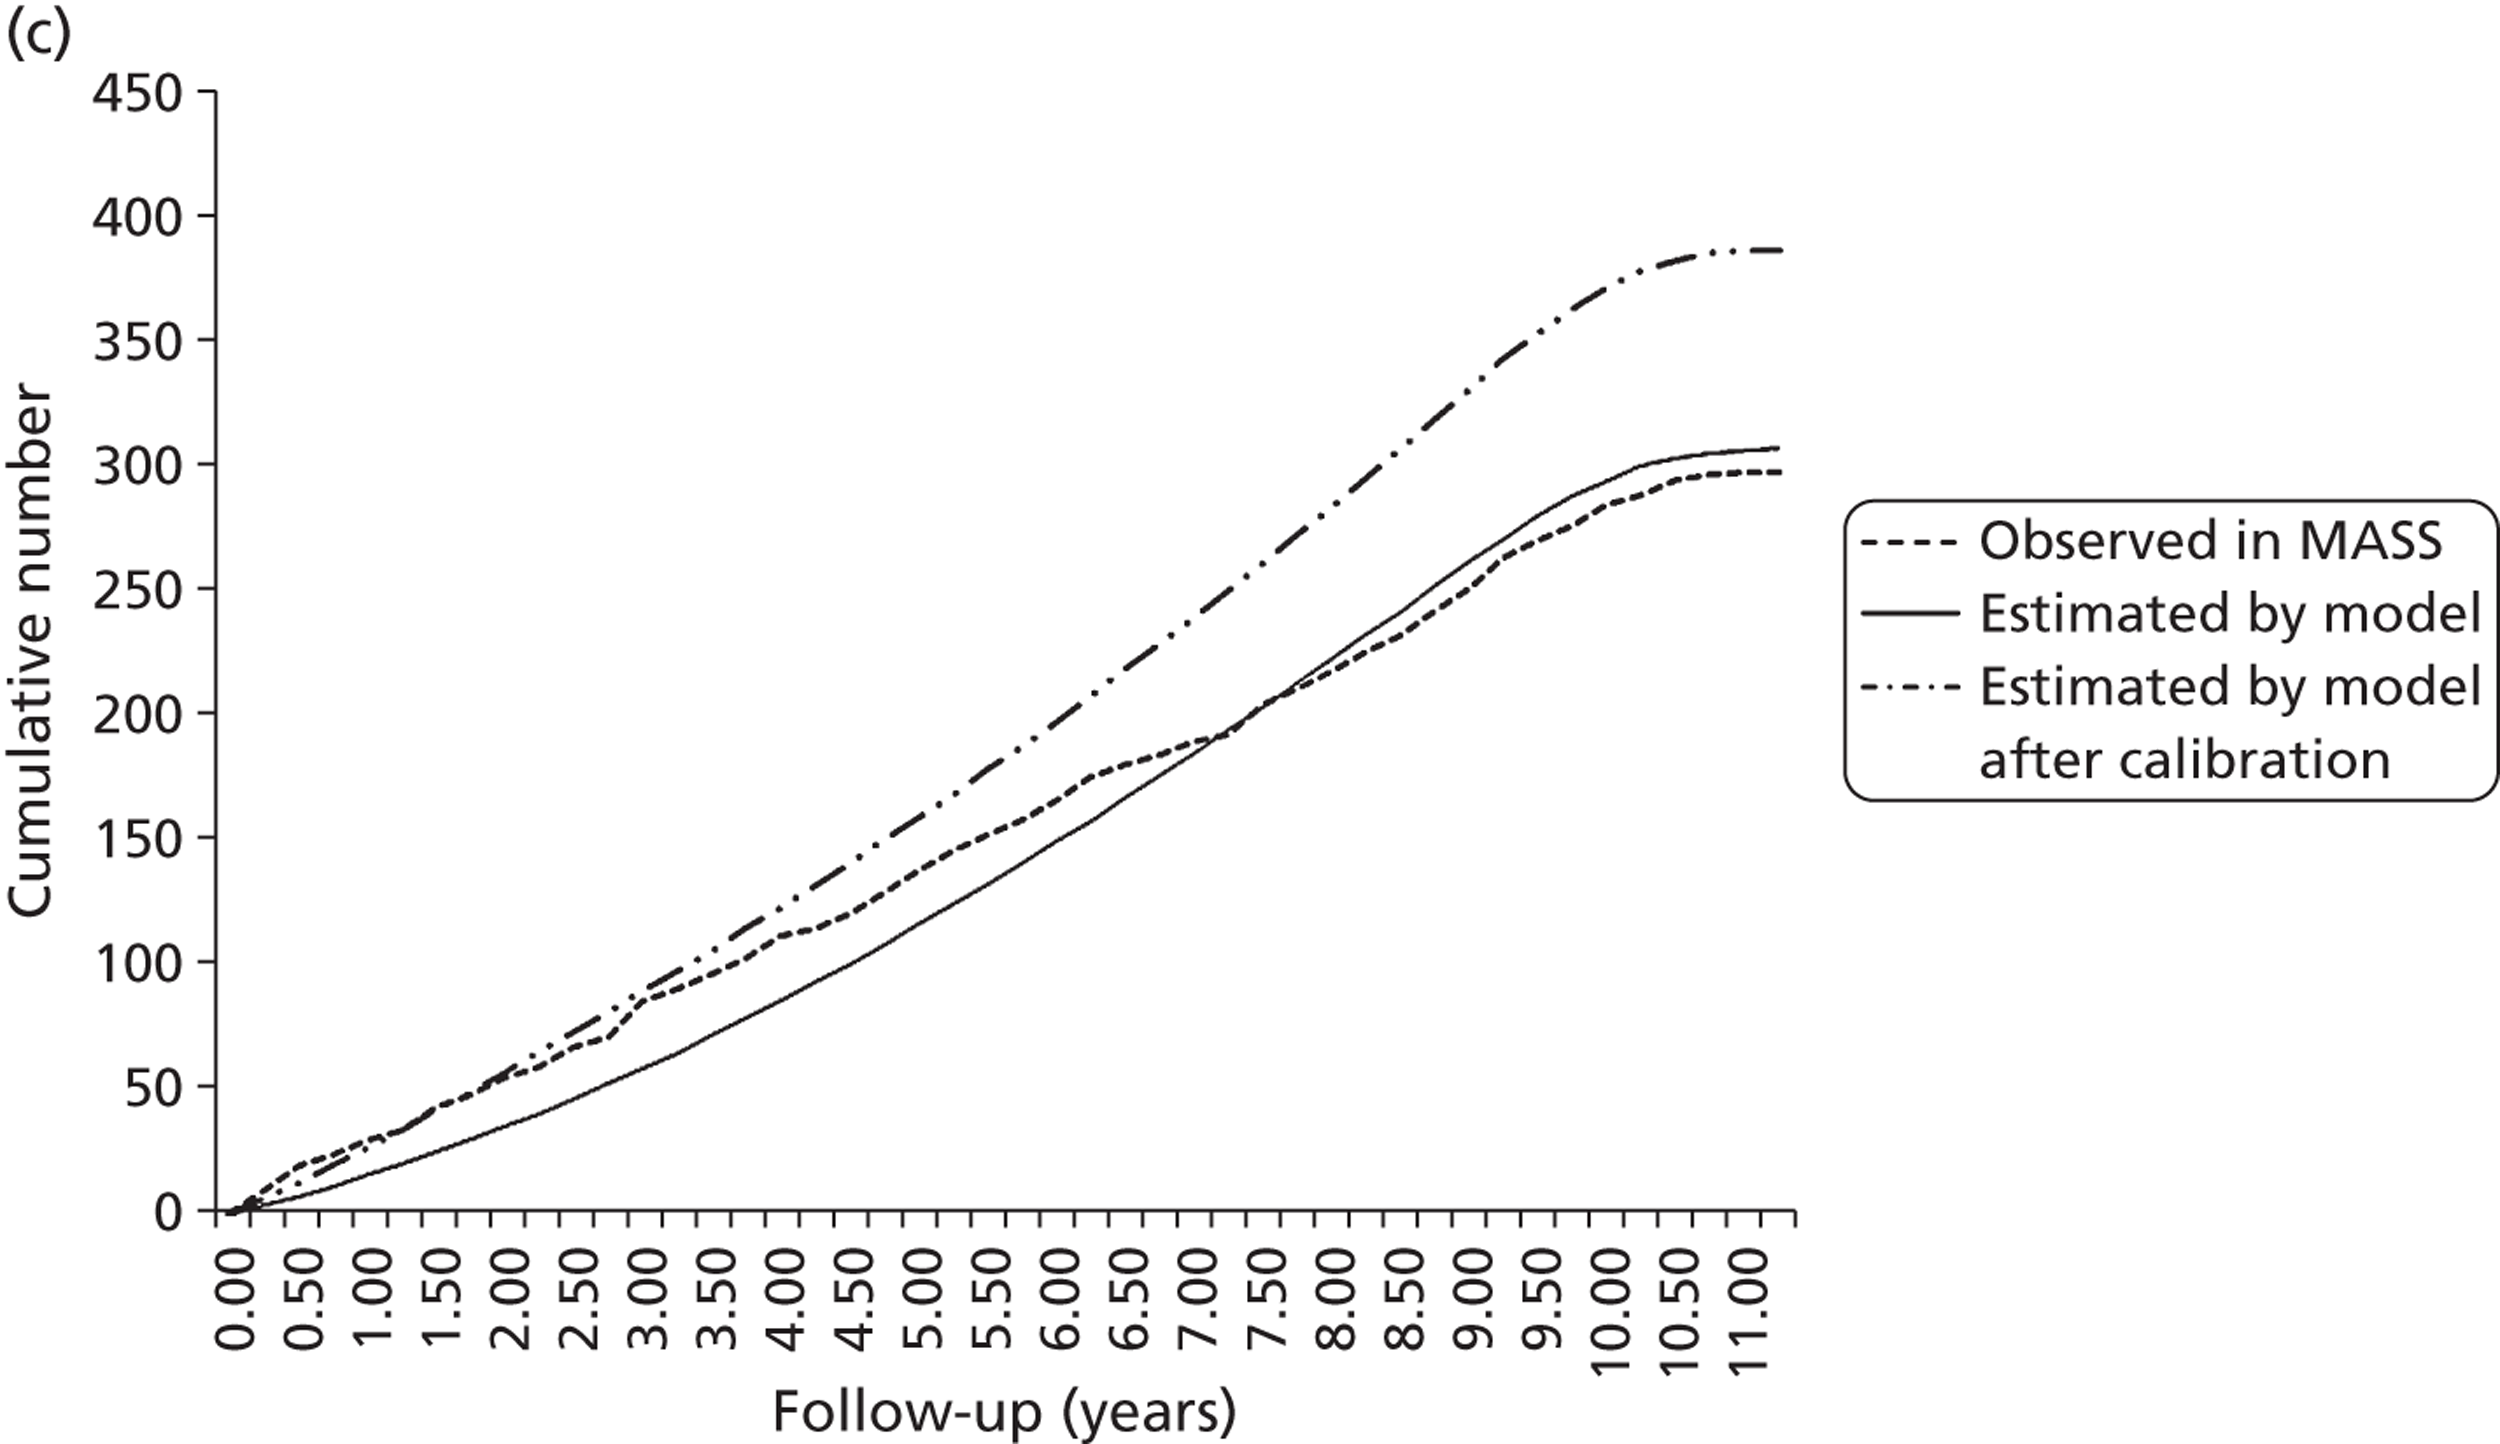
FIGURE 19d.
Number of non-AAA deaths in control group over 10 years' (mean) follow-up.
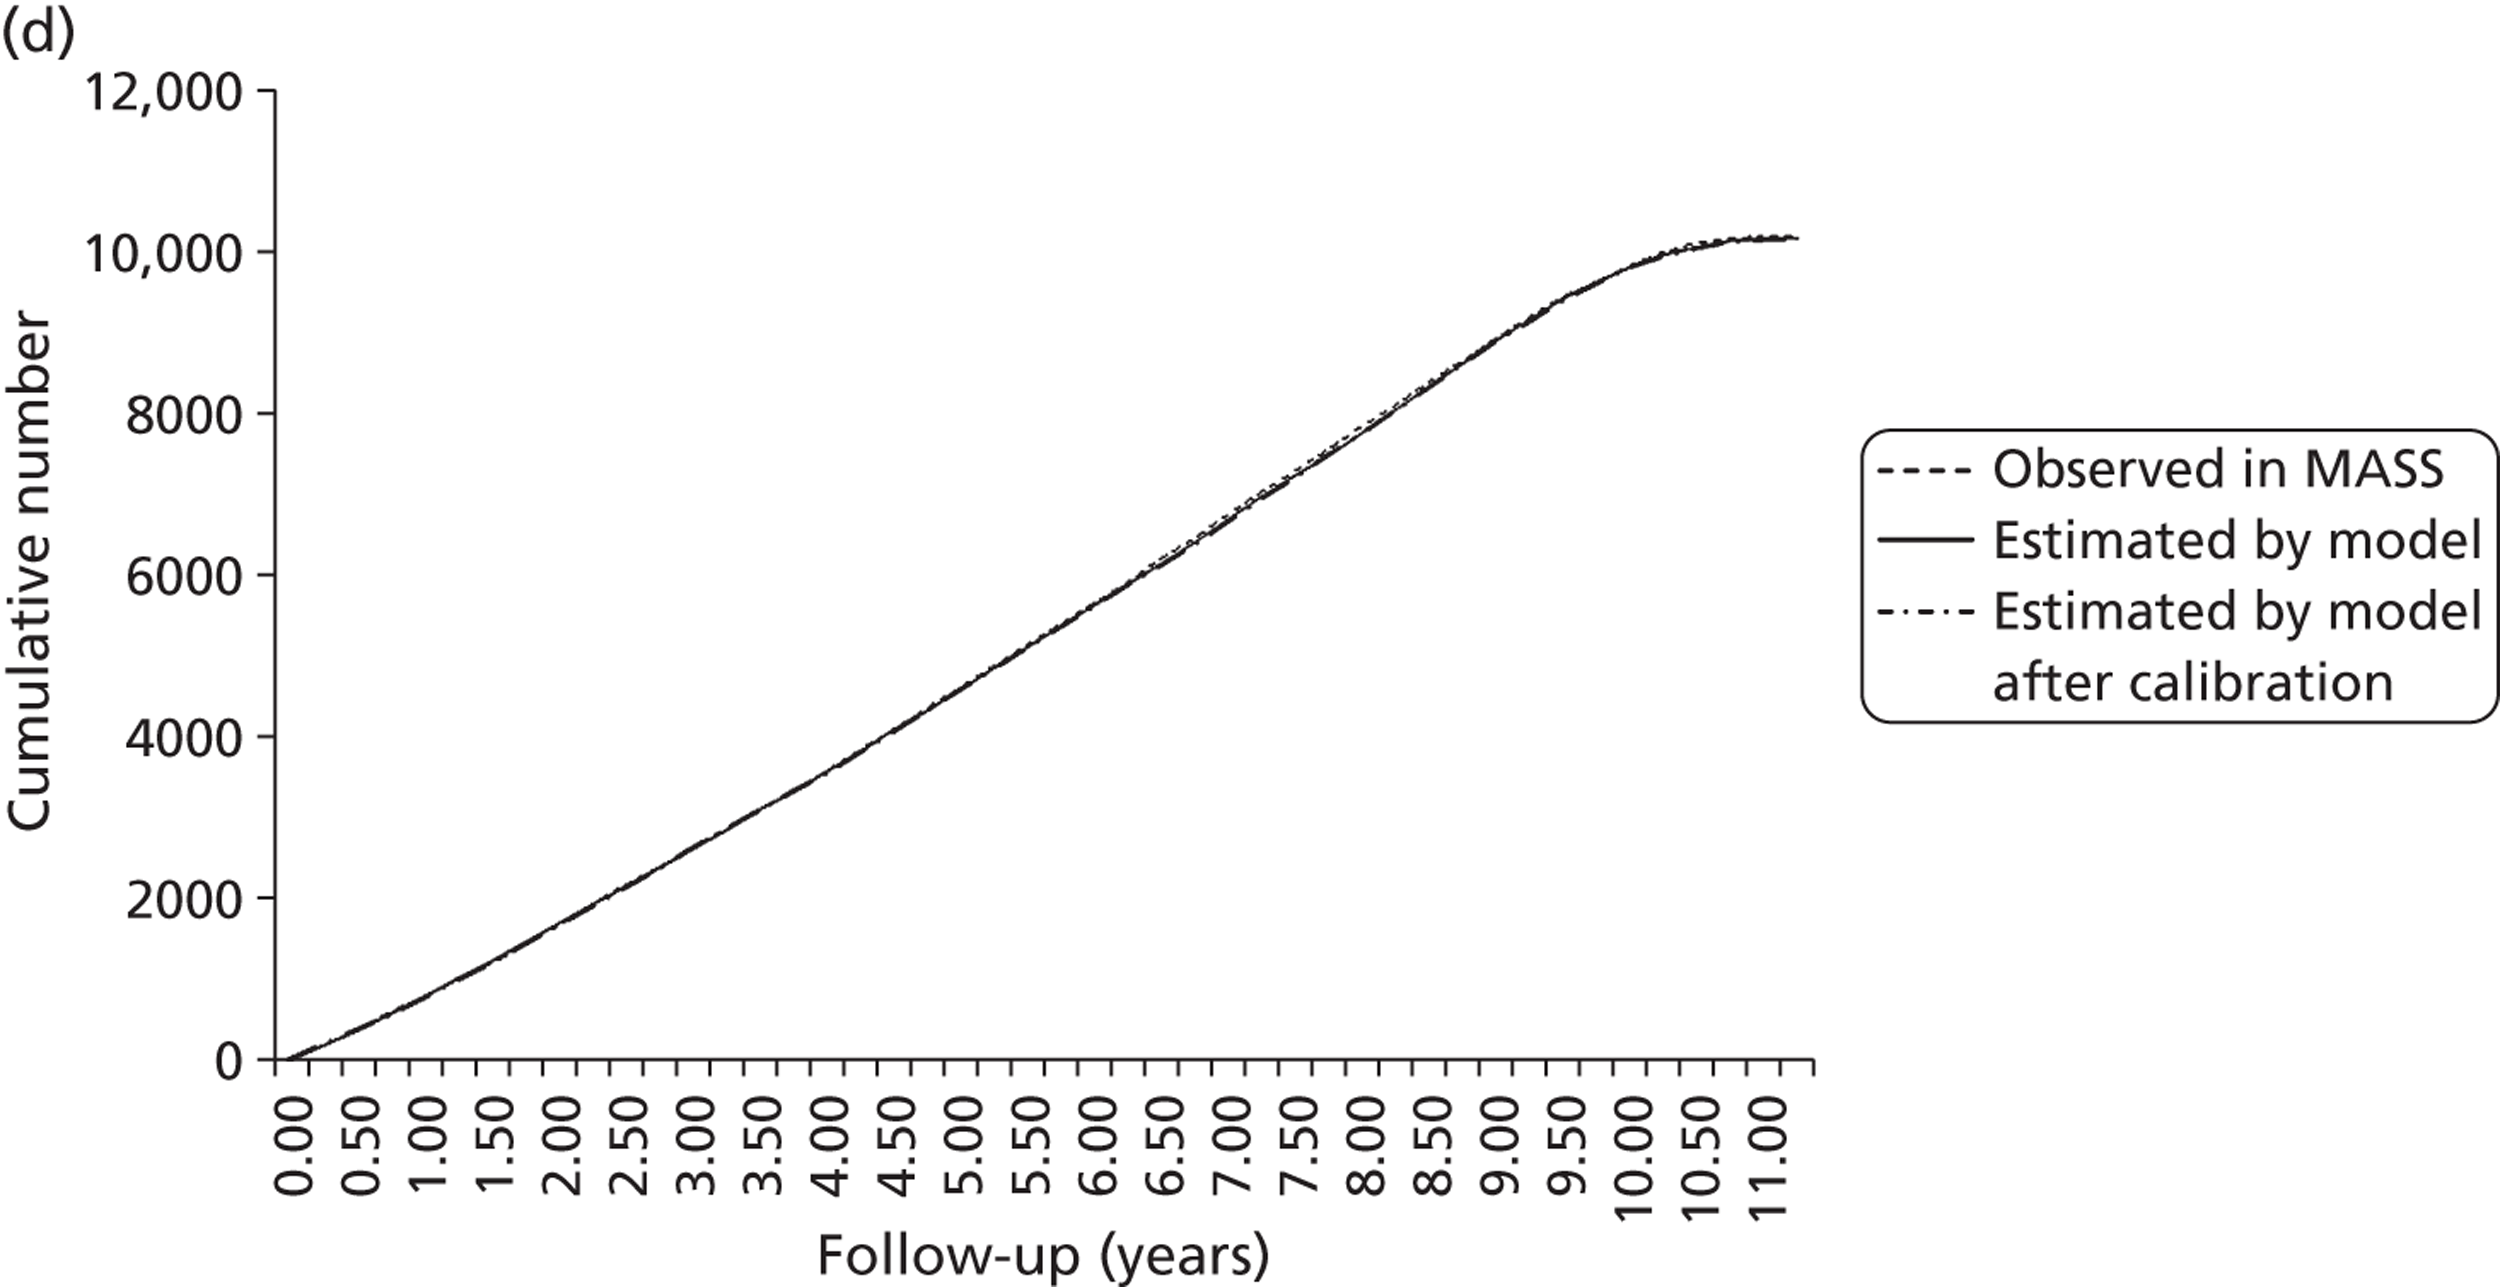
FIGURE 19e.
Number of elective operations in invited group over 10 years' (mean) follow-up.
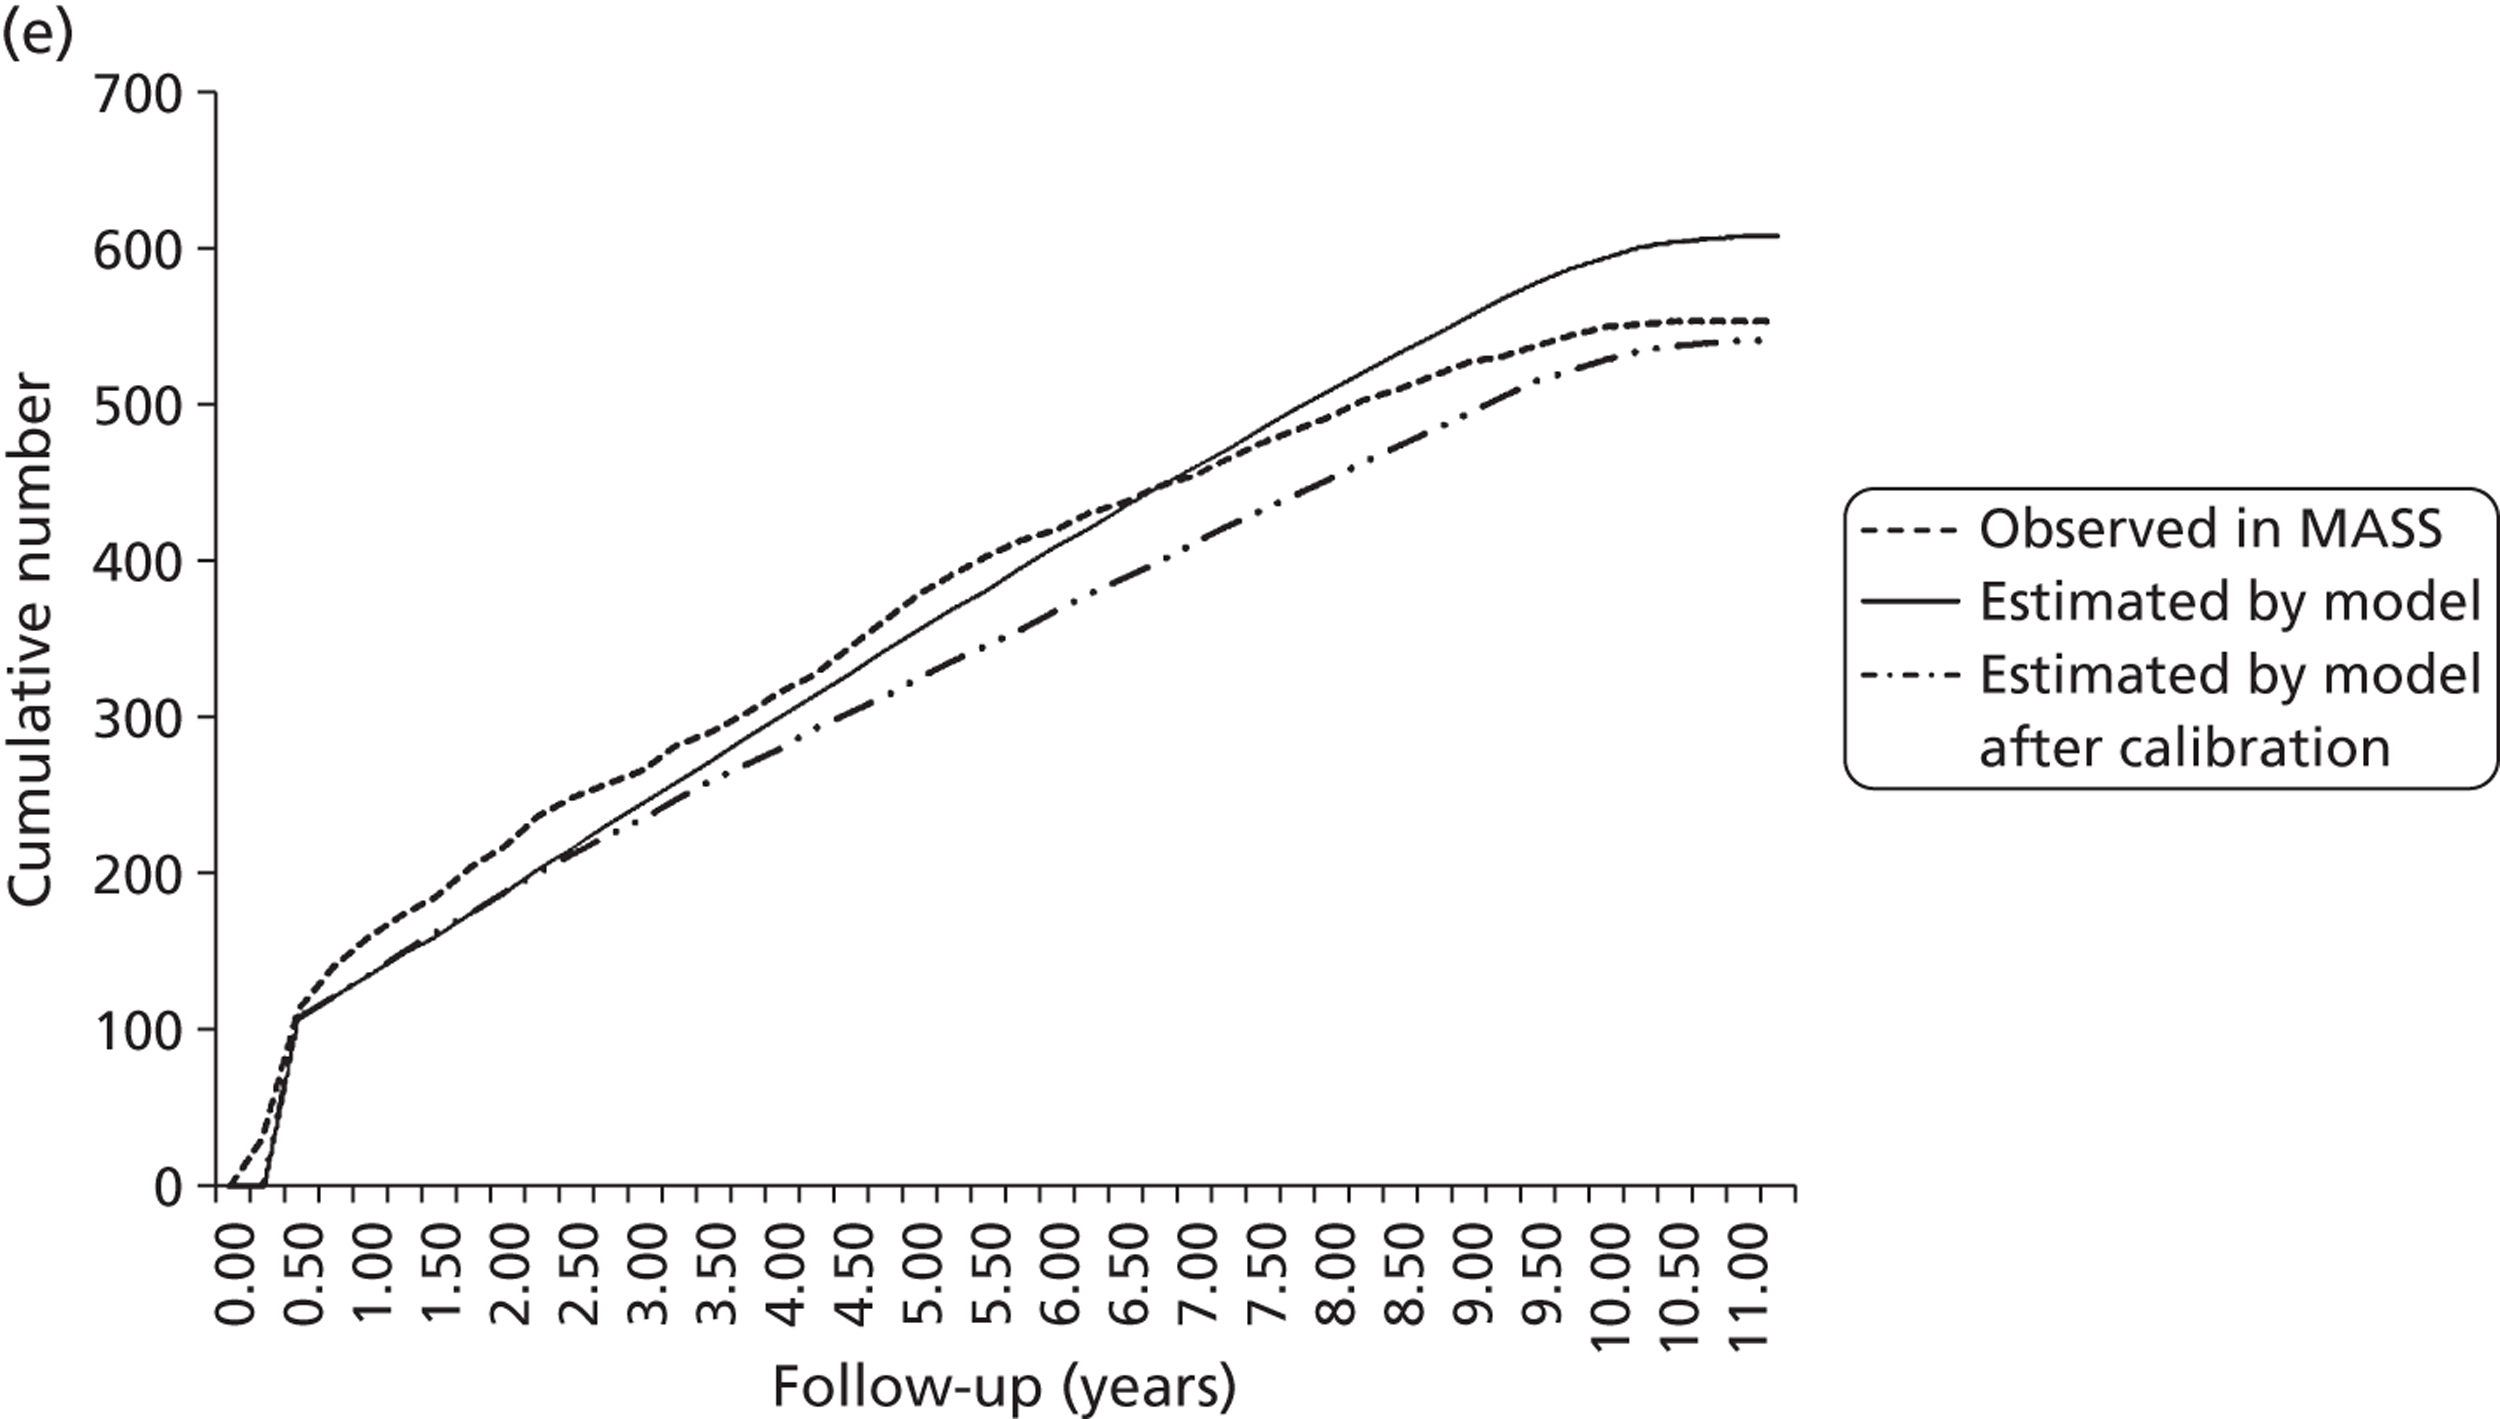
FIGURE 19f.
Number of emergency operations in invited group over 10 years' (mean) follow-up.
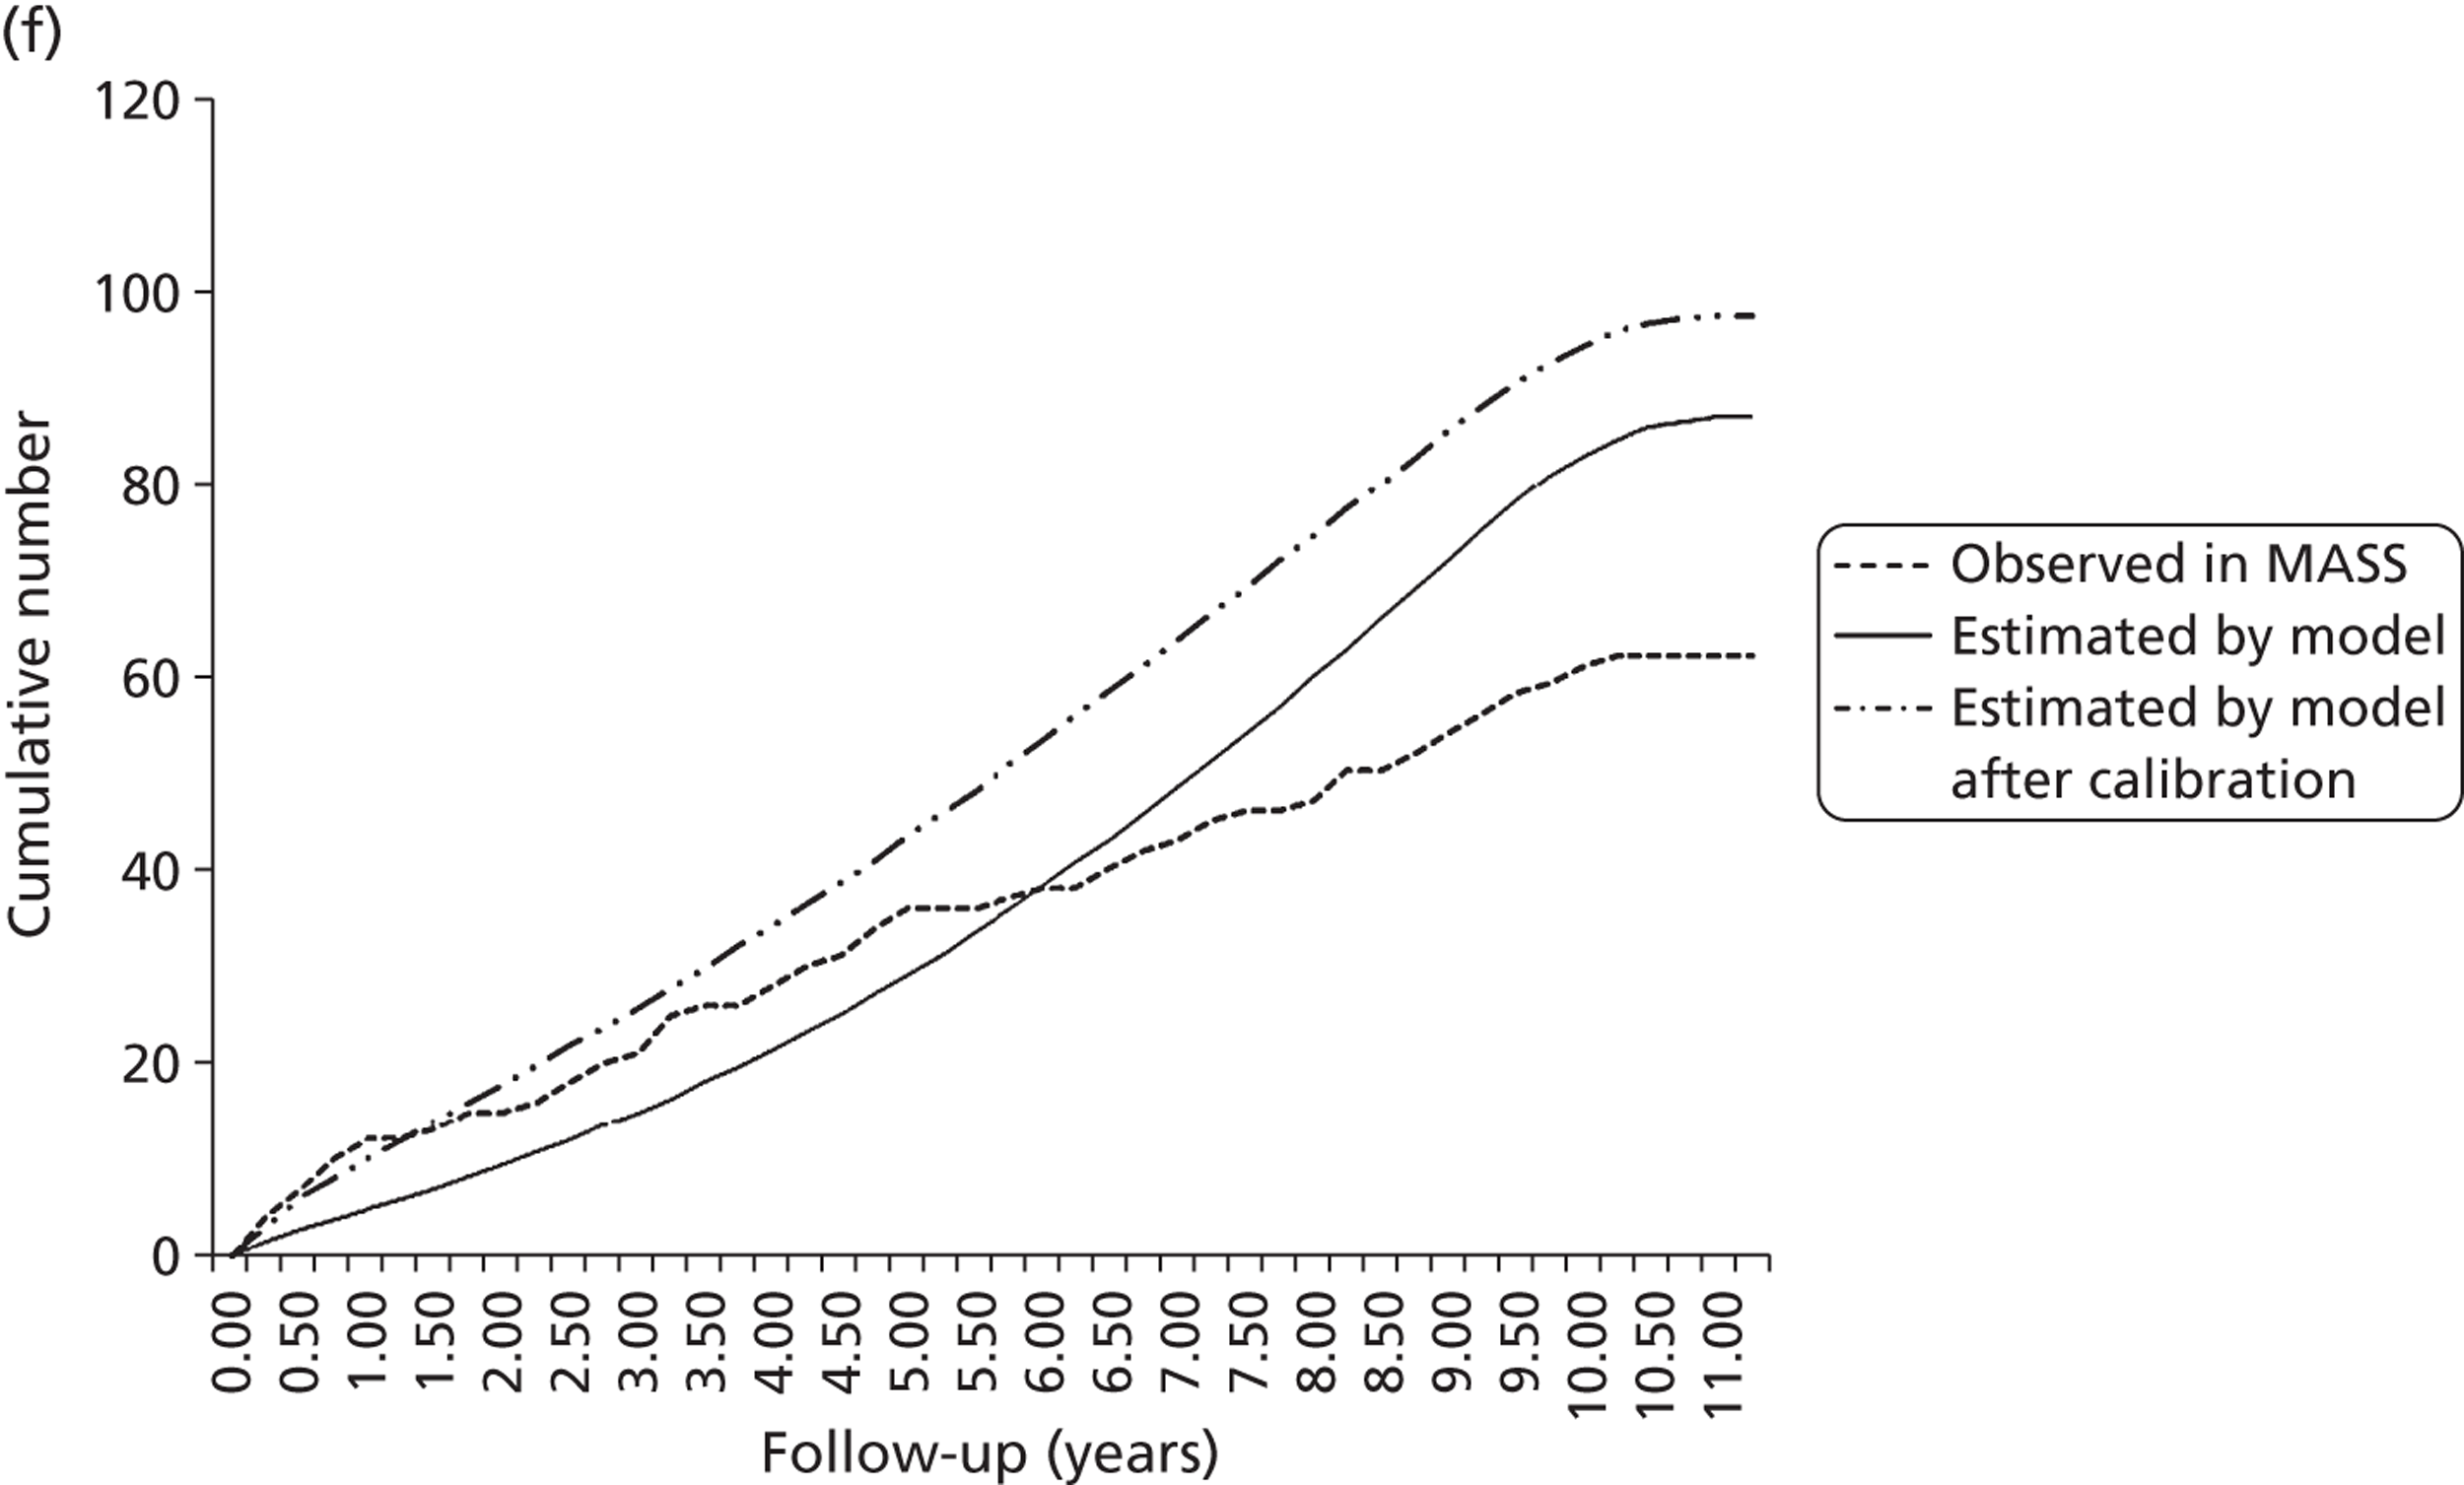
FIGURE 19g.
Number of AAA-related deaths in invited group over 10 years' (mean) follow-up.
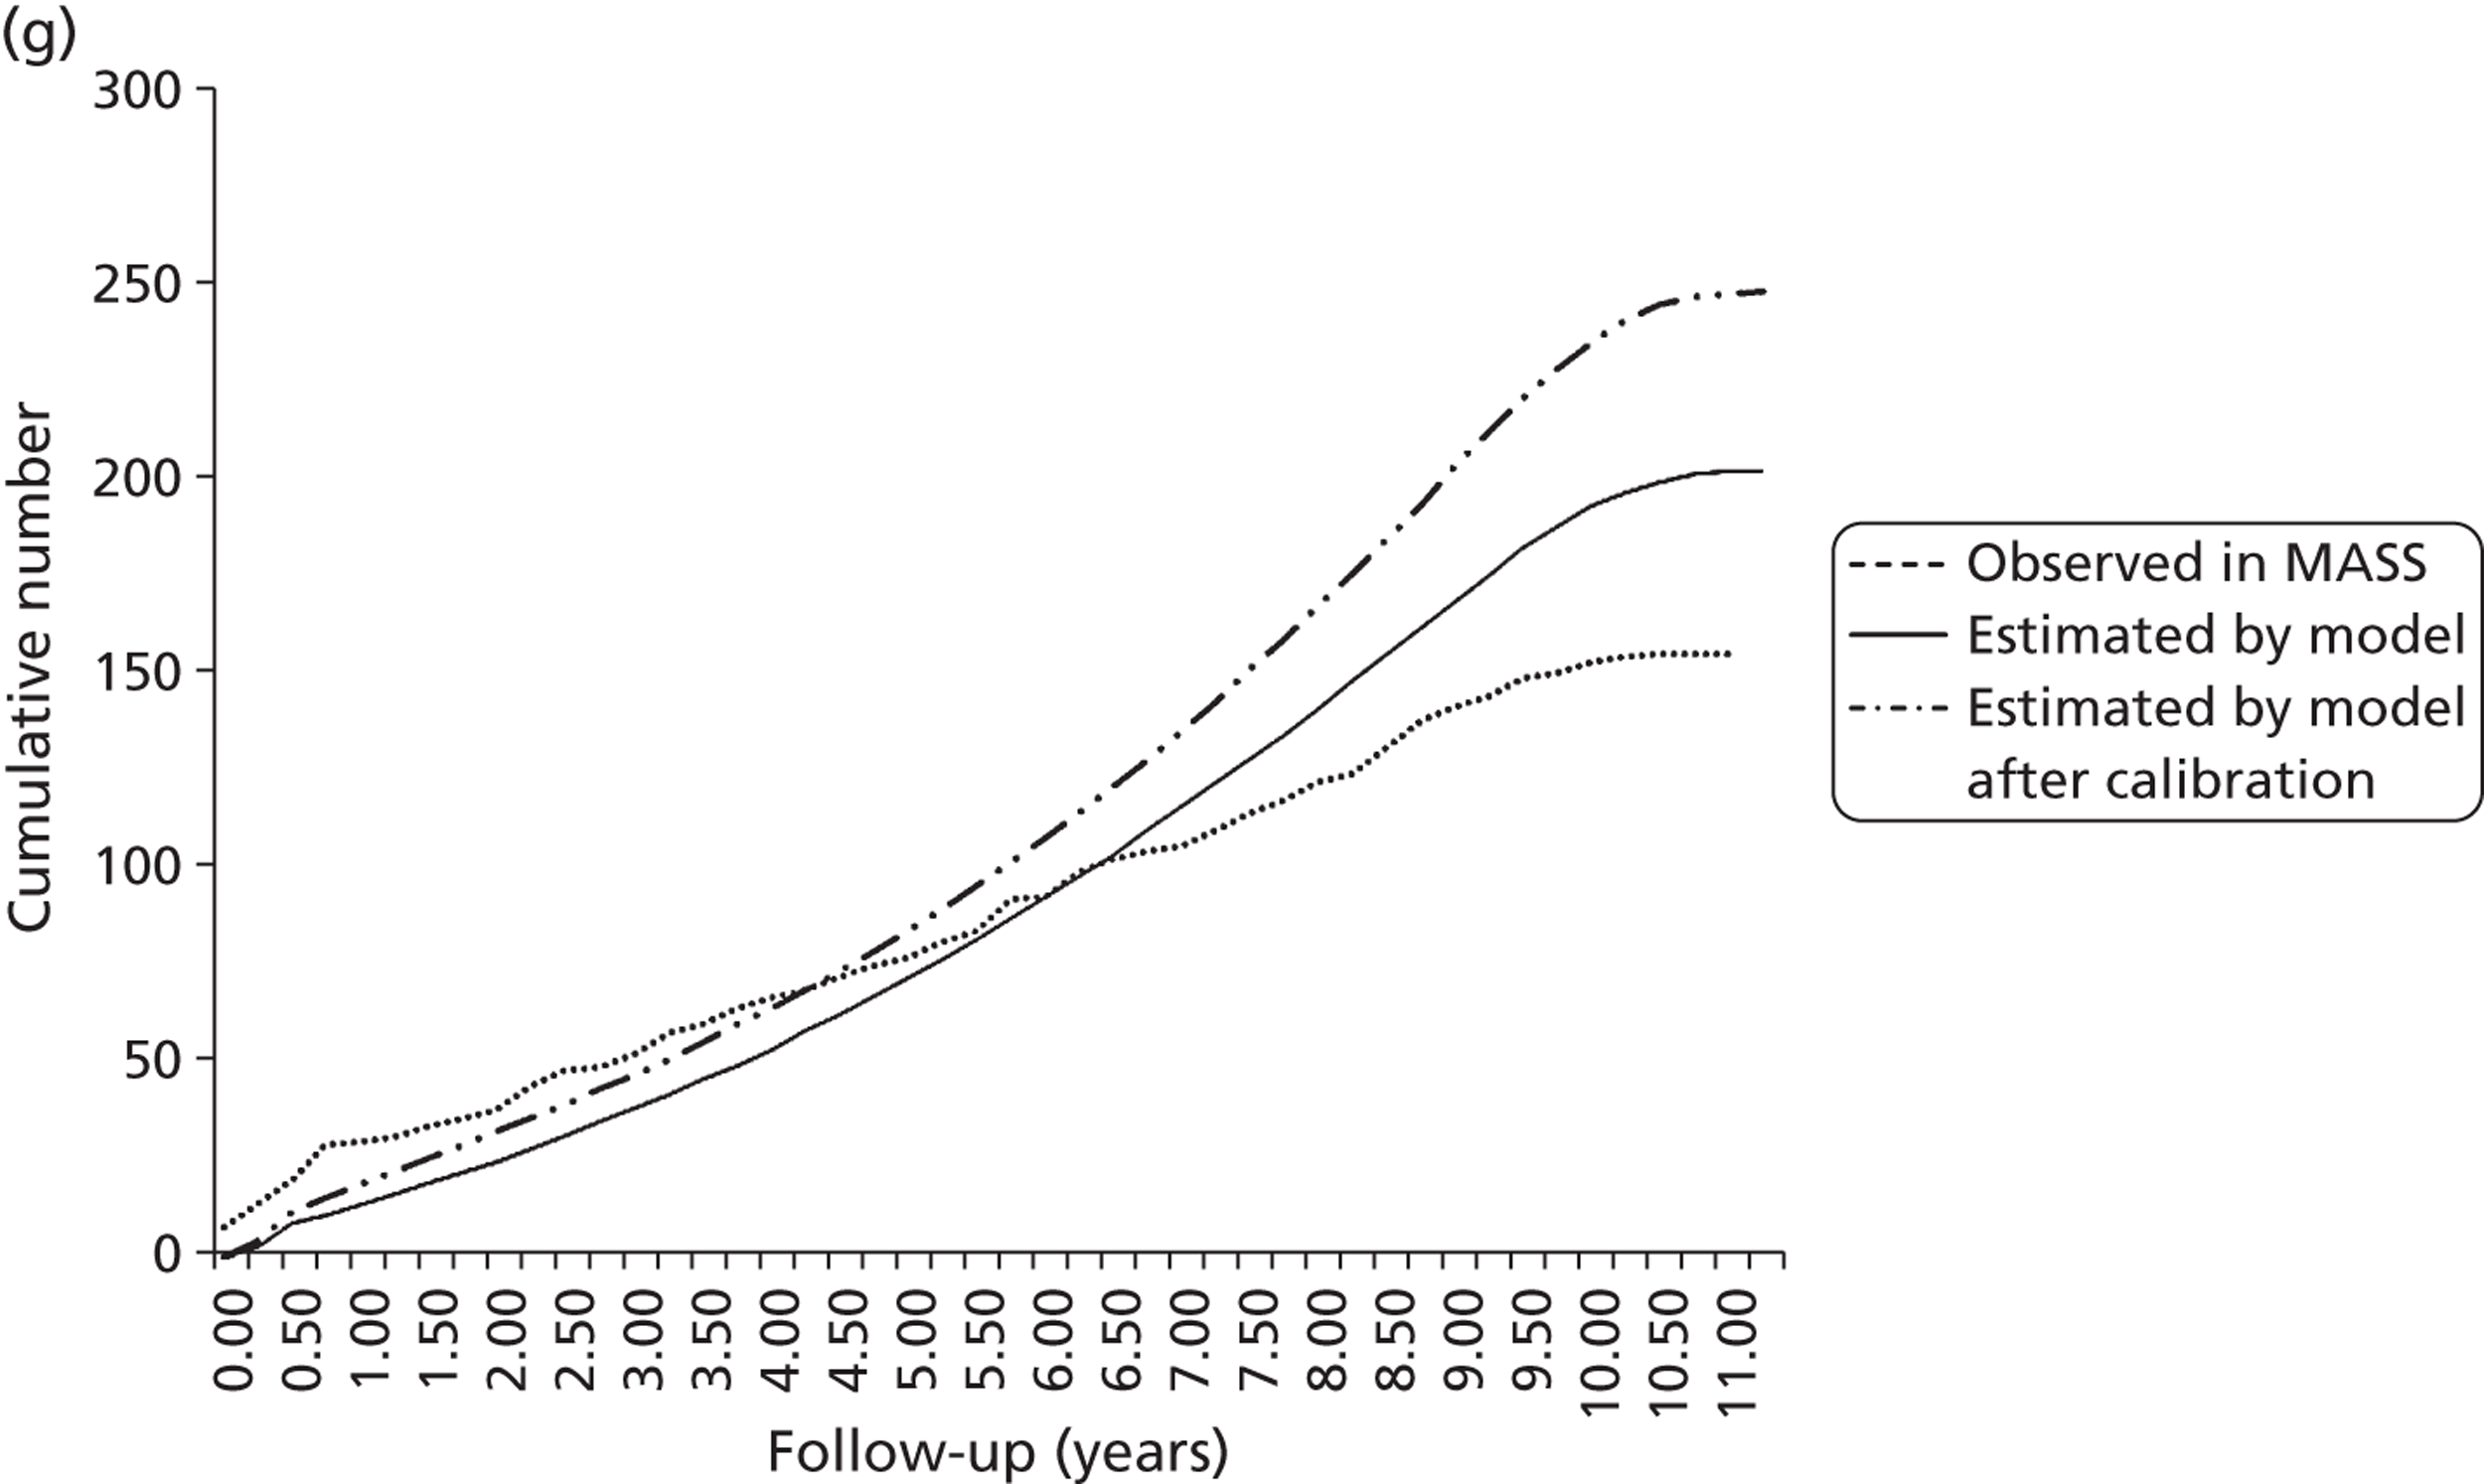
FIGURE 19h.
Number of non-AAA deaths in control group over 10 years' (mean) follow-up.
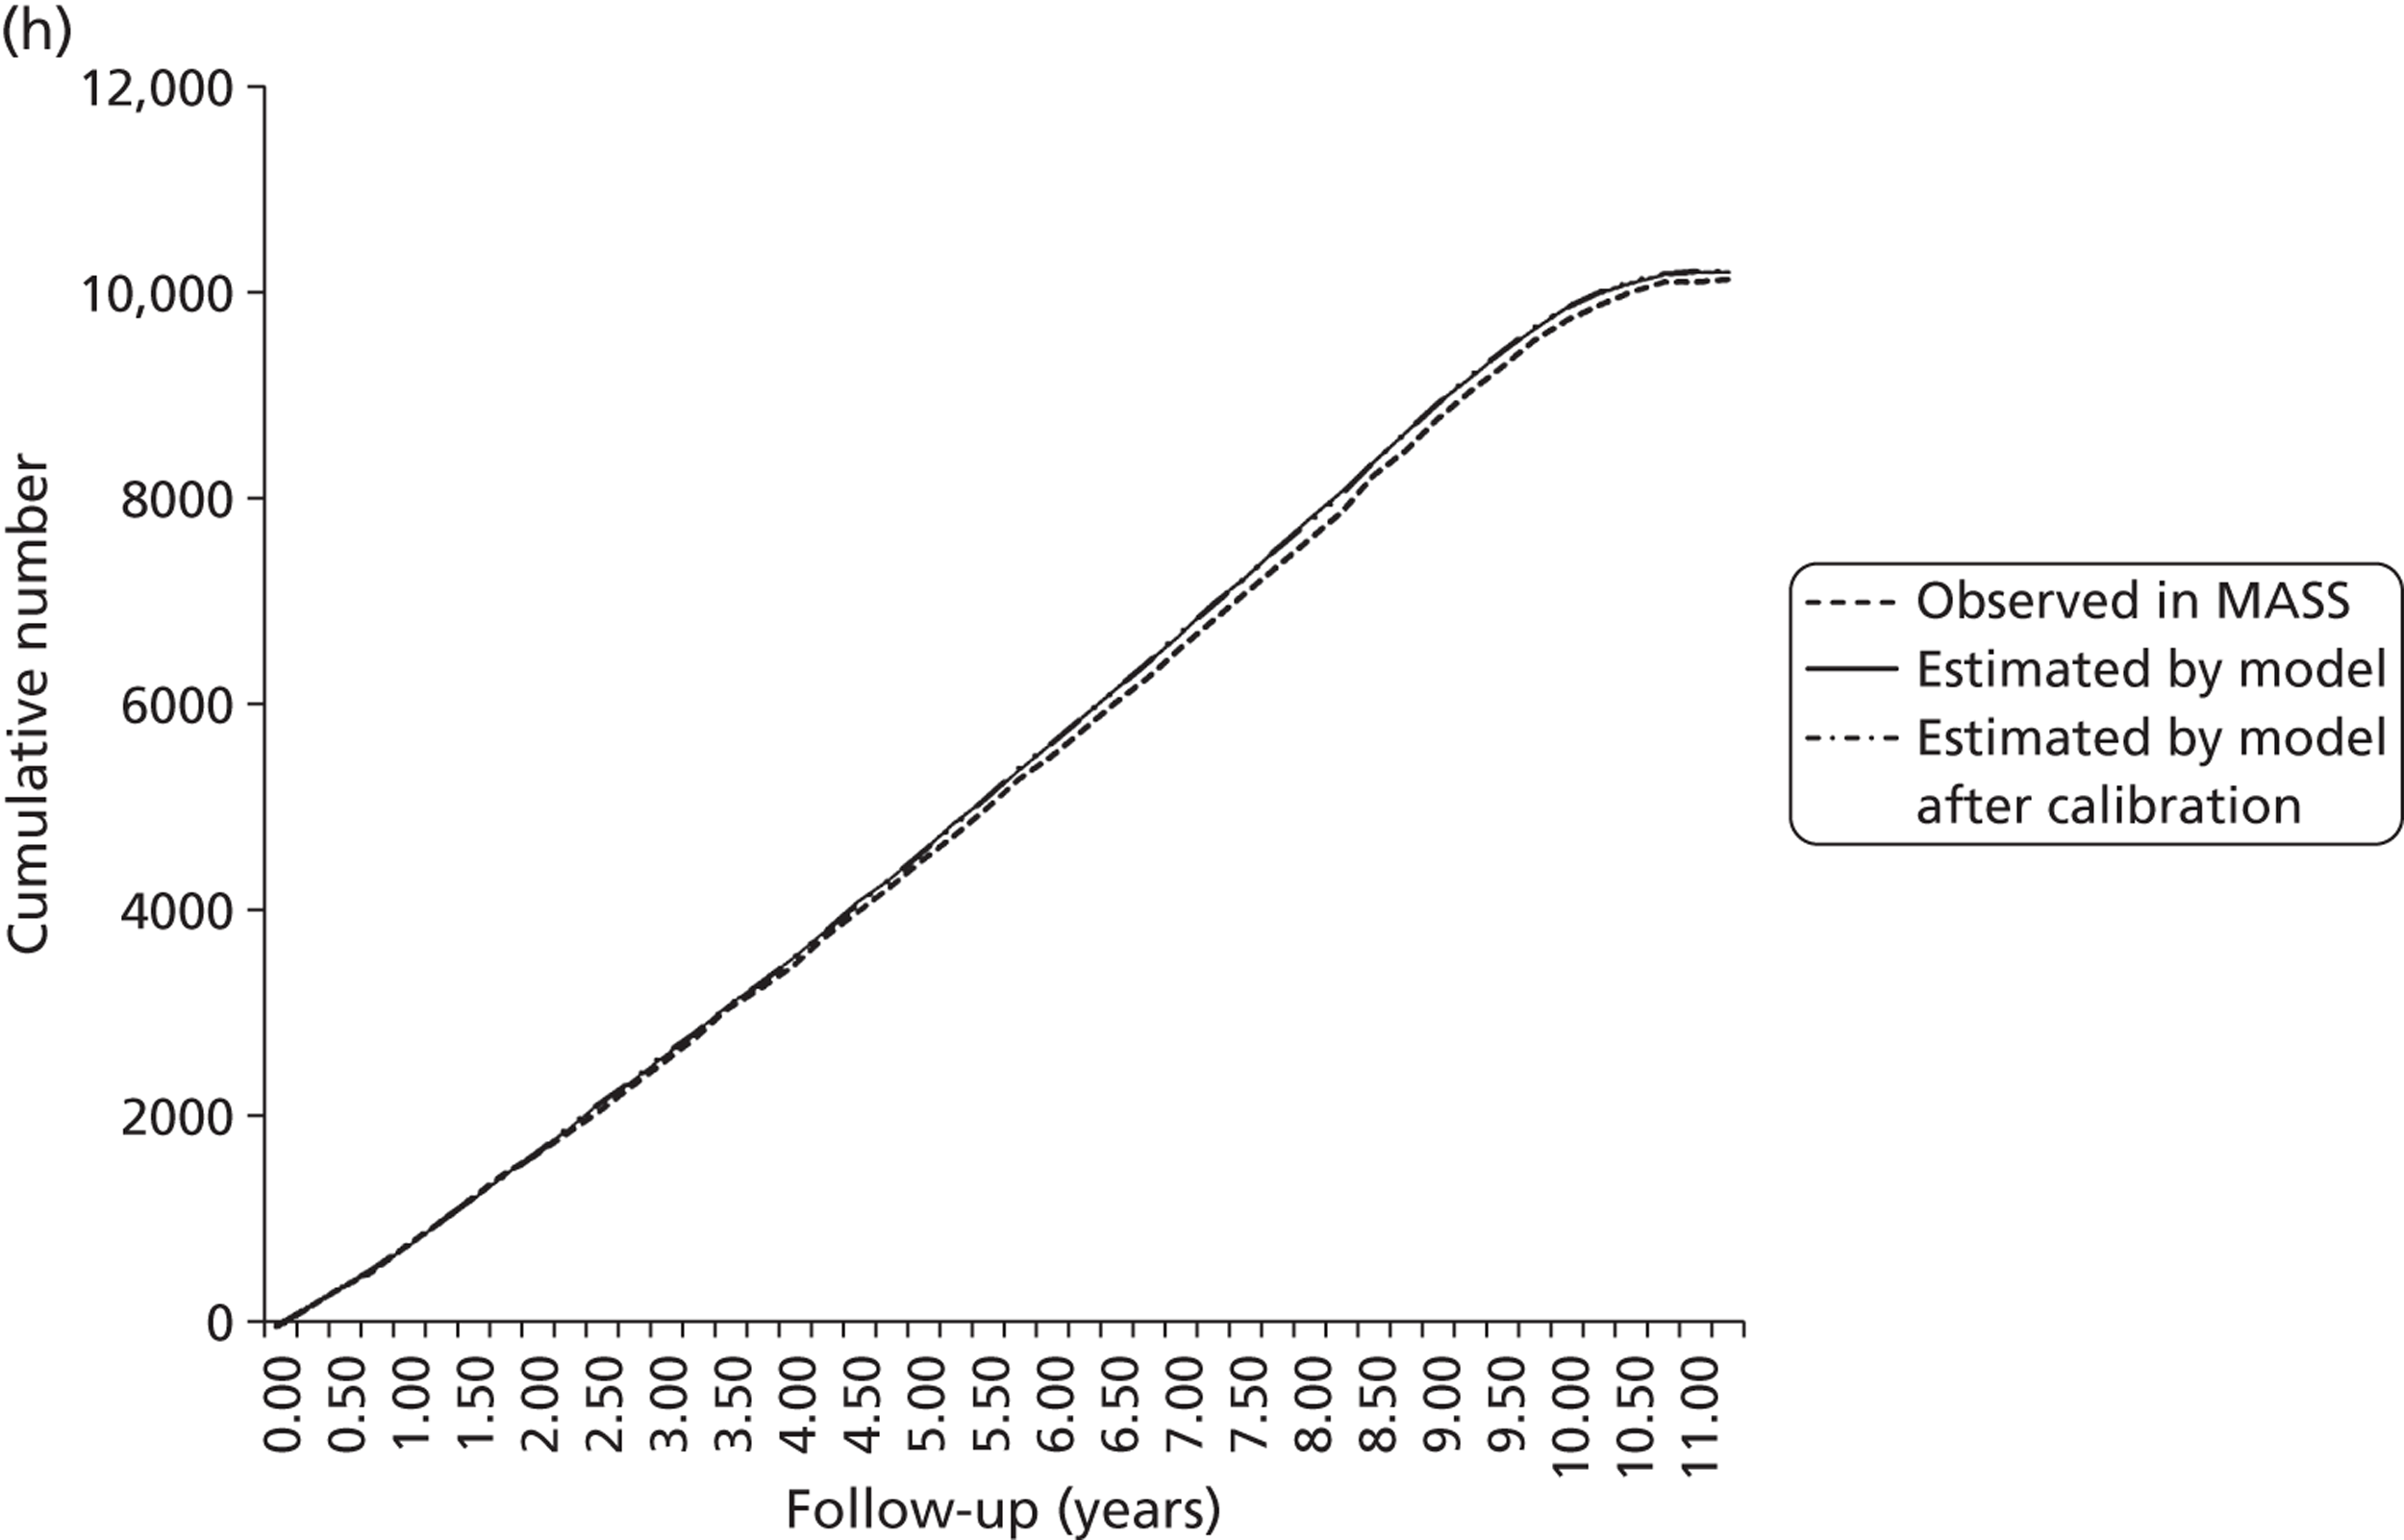
FIGURE 20.
Extension of original model structure to include unobserved ‘tunnel’ states.
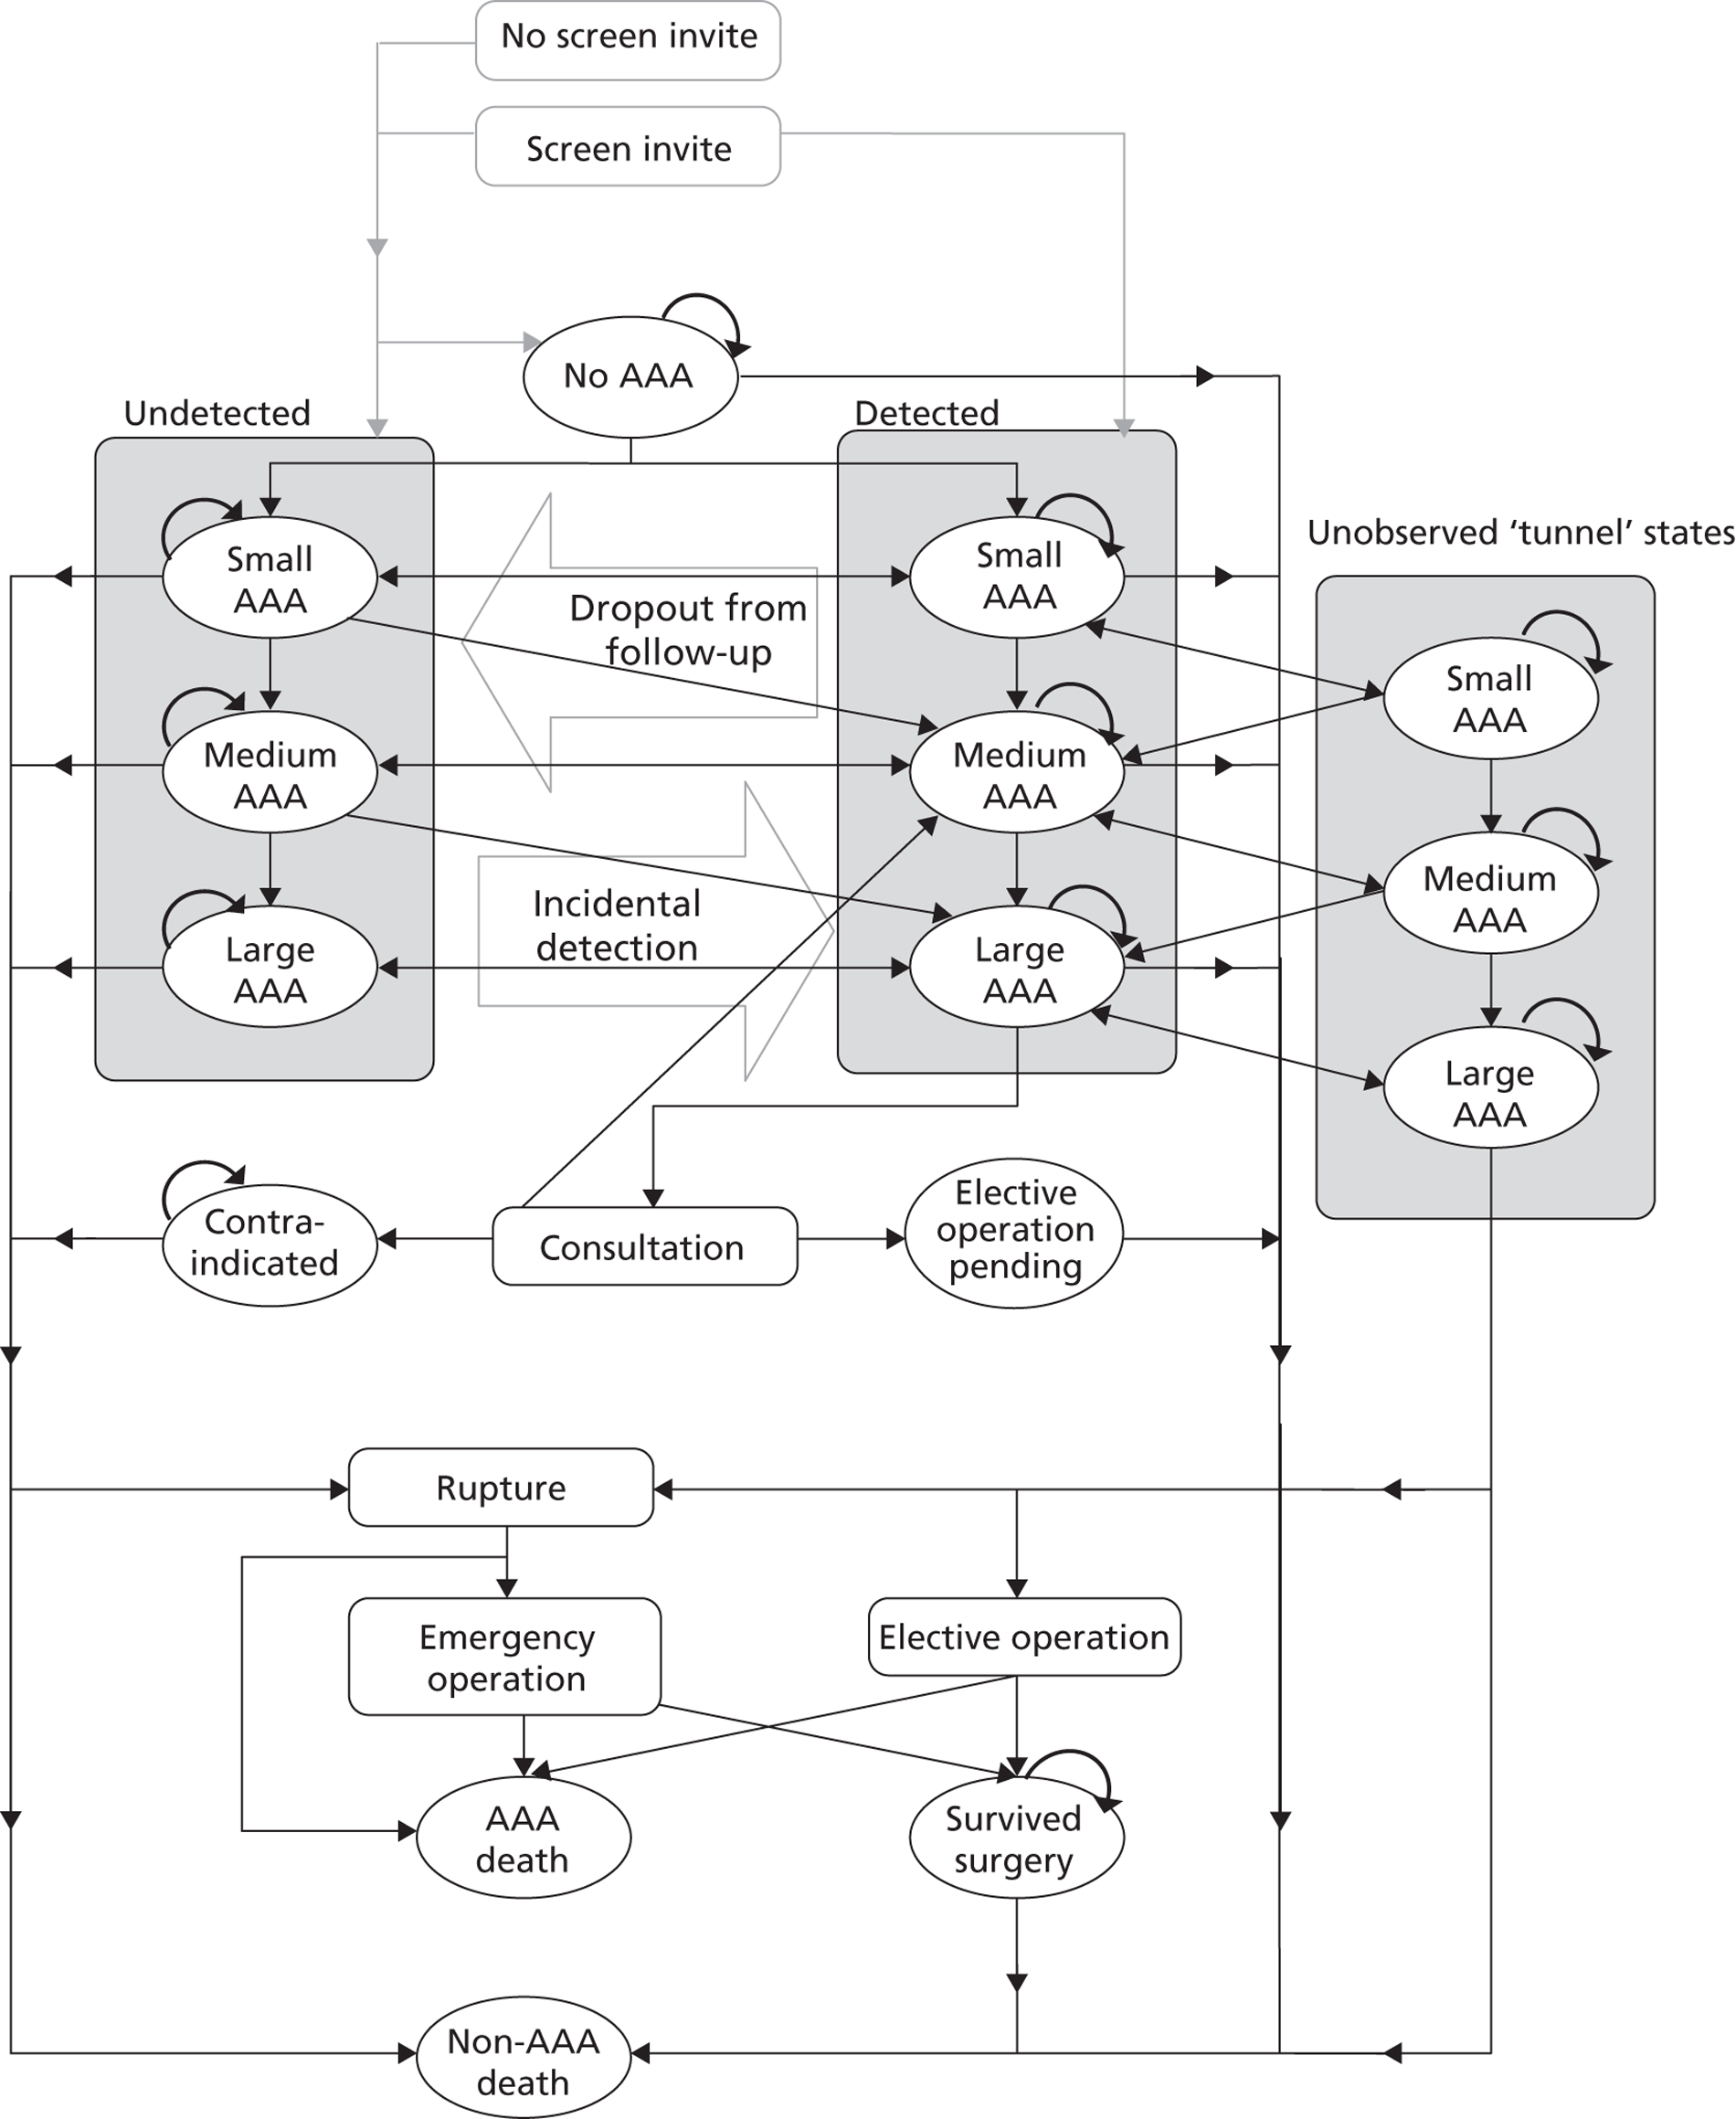
FIGURE 21.
Distribution of AAA diameter at first screen from NAAASP data and Chichester Screening Programme data.
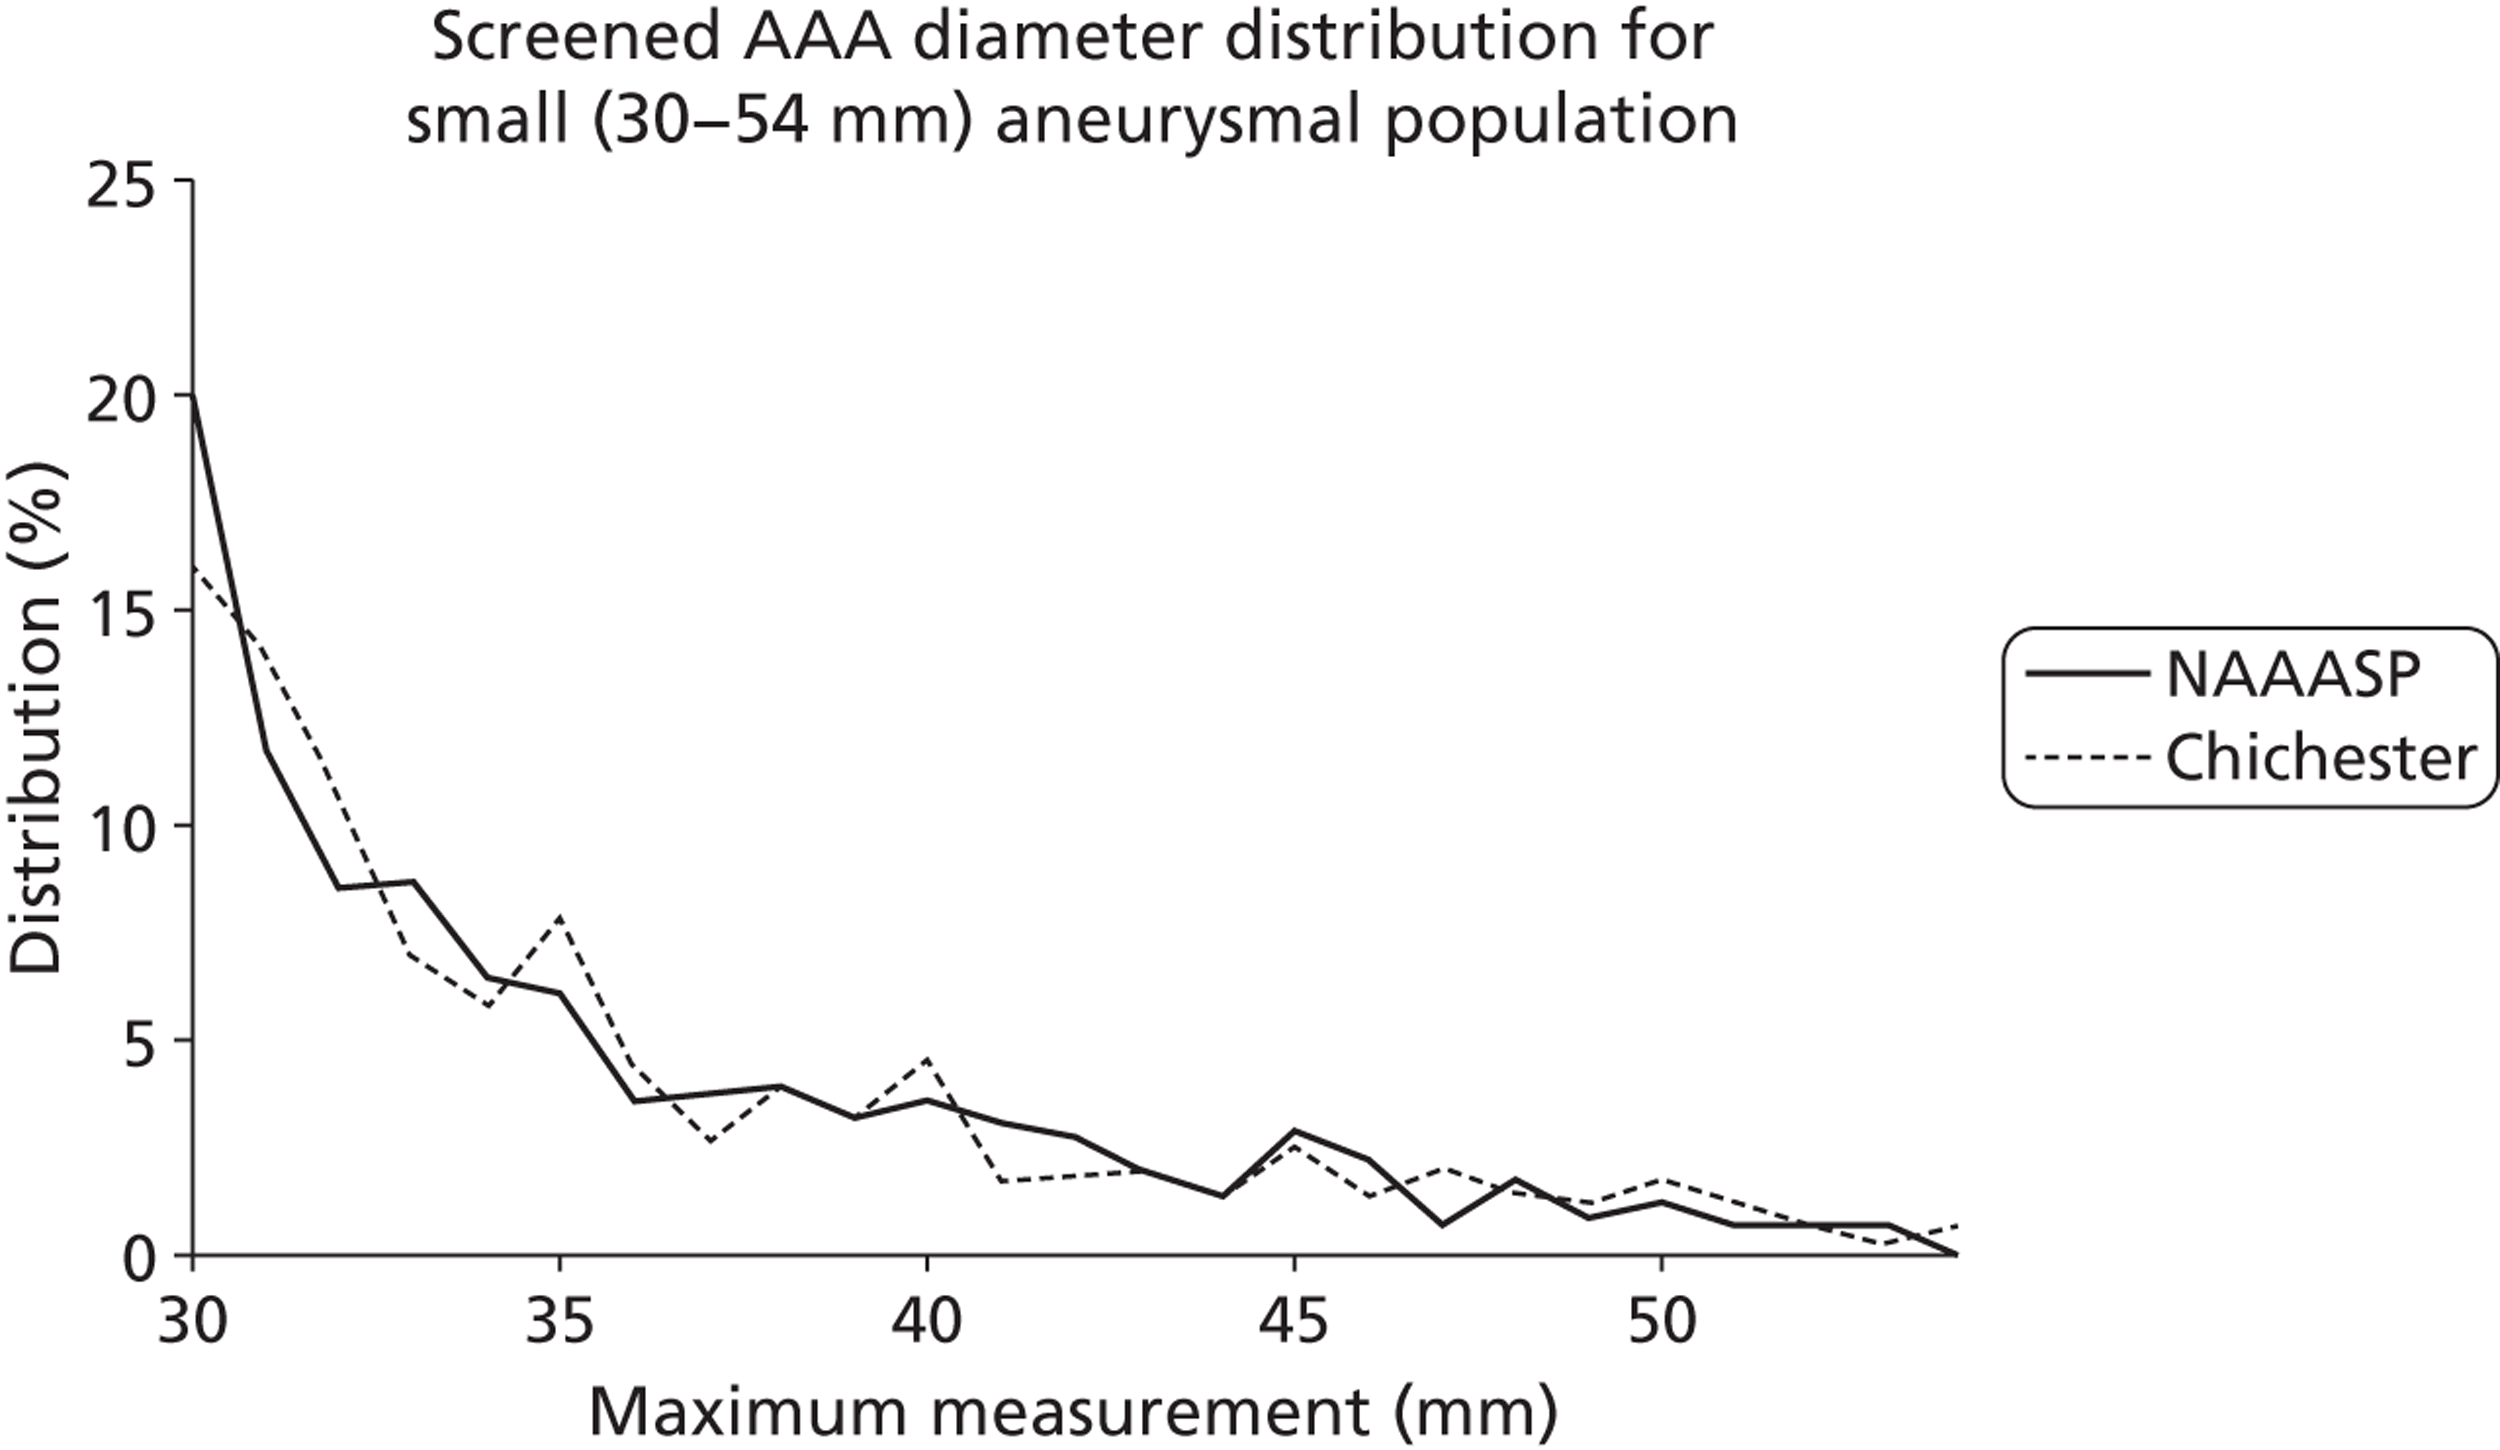
| 10-year cumulative key events | |||
|---|---|---|---|
| Observed in MASSa | Original modelb | Model after recalibrationc | |
| Control group | |||
| Elective operations | 226 | 256 | 213 |
| Emergency operations | 141 | 140 | 168 |
| AAA deaths | 296 | 305 | 385 |
| Non-AAA deaths | 10,185 | 10,139 | 10,148 |
| Invited group | |||
| Elective operations | 552 | 607 | 539 |
| Emergency operations | 62 | 88 | 97 |
| AAA deaths | 155 | 202 | 248 |
| Non-AAA deaths | 10,119 | 10,185 | 10,189 |
| Difference between invited and control groups | |||
| Elective operations | 326 | 351 | 326 |
| Emergency operations | –79 | –52 | –71 |
| AAA deaths | –141 | –103 | –137 |
| Non-AAA deaths | –66 | 46 | 41 |
| Cost-effectiveness at 10 yearsa | |||
|---|---|---|---|
| Observed in MASS | Original model | Model after recalibration | |
| Control group | |||
| Life-years (mean) | 7.509 | 7.291 | 7.282 |
| Cost, £ (mean) | 108 | 118 | 124 |
| Invited group | |||
| Life-years (mean) | 7.523 | 7.297 | 7.293 |
| Cost, £ (mean) | 208 | 233 | 225 |
| Difference between invited and control groups | |||
| Difference in life-years, £ (mean) | 0.014 | 0.006 | 0.011 |
| Difference in costs, £ (mean) | 100 | 115 | 101 |
| ICER (life-years), £ | 7600 | 18,000 | 8900 |
| ICER (QALYs), £b | 9700 | 23,000 | 11,400 |
| Element | Original MASS56 cost 2000–1 (£) | MASS56 cost inflated to 2010–11 (£) | Updated unit costa (£) |
|---|---|---|---|
| Invitation to screen | 1.31 | 1.84 | 1.70 |
| Cost of first scan | 19.08 | 26.80 | 32.20 |
| Surveillance scan | 46.04 | 64.67 | 68.00 |
| Component | EVAR 165 resource use | EVAR 165 unit cost (£) | Updated resource use | Updated unit cost (£) |
|---|---|---|---|---|
| Theatre time | 215 minutes | 17.58 | 181.97 minutes | 20.67 |
| HDU | 1.88 days | 832.00 | 1.65 days | 883.00 |
| ITU | 2.47 days | 1165.00 | 2.16 days | 1226.00 |
| Vascular ward | 11.41 days | 268.00 | 9.98 days | 266.00 |
| Total days | 15.76 days | 13.79 days |
| Component | EVAR 165 resource use | EVAR 165 unit cost (£) | Updated resource use | Updated unit cost (£) |
|---|---|---|---|---|
| Theatre time | 191 minutes | 17.58 | 147.04 minutes | 20.67 |
| HDU | 0.83 days | 832.00 | 0.63 days | 883.00 |
| ITU | 0.59 days | 1165.00 | 0.44 days | 1226.00 |
| Vascular ward | 8.34 days | 268.00 | 6.29 days | 266.00 |
| Total days | 9.76 days | 7.36 days | ||
| Stent cost | 5219.00 | 6500.00 |
| Component | MASS trial56 resource use | Updated resource use | Updated unit cost (£) |
|---|---|---|---|
| Theatre time | 182 minutes | 161.94 minutes | 20.67 |
| ITU | 4.74 days | 7.12 days | 1226.00 |
| Vascular ward | 7.66 days | 11.51 days | 266.00 |
| Total days | 12.4 days | 18.63 days |
| Component | Residual cost (£) |
|---|---|
| Total open repair cost as per EVAR 1 trial65 | 11,842 |
| Length of stay component | 7214 |
| Operation time component | 3647 |
| Total of components | 10,861 |
| Residual costs to inflate | 981 |
| Residual costs inflated to 2010–11 prices | 1014 |
| Component | Residual cost (£) |
|---|---|
| Total EVAR cost as per EVAR 165 | 13,019 |
| EVAR stent and parts component | 5219 |
| Length of stay component | 3543 |
| Operation time component | 3255 |
| Total of components | 12,017 |
| Residual costs to inflate | 1002 |
| Residual cost inflated to 2010–11 prices | 1036 |
| Component | Residual cost (£) |
|---|---|
| Total open repair cost as per MASS56 | 11,176 |
| Length of stay component | 6932 |
| Operation time component | 794 |
| Total of components | 7726 |
| Residual costs to inflate | 3450 |
| Residual cost inflated to 2010–11 prices | 4846 |
| Type of surgery | Updated cost per patient (£) | Cost per patient (EVAR 165) (£) | Cost per patient inflated to 2010–11 prices (EVAR 165) (£) | Cost per patient (MASS56) (£) | Cost per patient inflated to 2010–11 prices (MASS56) (£) |
|---|---|---|---|---|---|
| Elective OR | 11,532.69 | 11,842.00 | 12,241.17 | 6909.00 | 9704.24 |
| Elective EVAR | 13,345.66 | 13,019.00 | 13,457.84 | ||
| Elective weighted | 12,806.21 | ||||
| Emergency OR | 19,984.75 | 11,176.00 | 15,697.59 |
Chapter 8 Results of cost-effectiveness analysis of alternative surveillance policies
The current surveillance strategy used in the NAAASP follows that of the MASS trial. The strategy was based on the expert judgement informed by the limited data available at the planning stage of the trial. The analysis in this study of growth rates and rupture rates enable us now to analyse the cost-effectiveness of alternative surveillance in terms of the frequency of recall for men screened as having an aneurysm between 3.0 and 5.4 cm.
In this chapter we present the comparative cost-effectiveness of a number of alternative surveillance strategies using the revalidated, and extended model with updated unit costs and key characteristics from the NAAASP (uptake rates and distribution of aneurysm sizes at screening).
Alternative surveillance strategies
We used the adapted and updated model described in Chapter 7 to examine the health benefits (in terms of life-years) and overall costs, modelled over a 30-year period, for a range of alternative surveillance strategies as compared with the current strategy which we refer to as strategy A. Table 23 summarises the values and sources of clinical and cost parameters used. The alternative strategies included both lengthening and shortening the current time intervals between rescans for those identified with aneurysms between 3.0 and 4.4 cm (base case 1 year) and 4.5 and 5.4 cm (base case 3 months). We assumed that a recall more frequent than 3 months would be unworkable, so did not consider any such options. In analysing any of the different surveillance strategies we assume that the same strategy would also apply to all opportunistically identified aneurysms in both arms. This assumption explains the very small difference in the control arm life-years and cost between strategies.
Table 24 sets out the key comparison, which is illustrated on the cost-effectiveness plane in Figure 22. Strategy A represents the base case of the current screening strategy, with an ICER against no formal screening of £5572 per life-year gained and £7143 per QALY gained. To identify whether or not an alternative strategy was an improvement, and which was best, we focused on the ICERs (for both life-years and QALYS) and the net monetary benefit calculated as (Net QALYs × £20,000)–Net costs. We used the threshold value of £20,000 per QALY to be consistent with the opportunity cost of interventions within the NHS as articulated by NICE. 75
Each of the alternative strategies demonstrated appropriate directional changes in the life-years gained from screening and the QALYs gained from screening. The strategies, which extend one or more intervals, slightly reduce the QALY gain (by missing a small proportion of aneurysms that would go on to rupture) and slightly reduce the cost (by avoiding additional scans), whereas strategies that decrease intervals increase the QALY gain and increase the costs. This effect is shown in Figure 22, where the strategies that increase intervals (strategies B, C, D and G) fall in the south-west quadrant of the cost-effectiveness plane (where both costs and QALYs are reduced), whereas a strategy that decrease intervals (strategy E) falls in the north-east quadrant (where both QALYs and costs increase). Strategy F, in which all aneurysms between 3.0 and 5.5 cm are recalled at 6-monthly intervals, can be eliminated from further consideration in that it reduces QALYs and increases costs, so is dominated by existing strategy A which is clinically more effective and cheaper.
The economic question for strategy E is whether or not the increase in QALYs is sufficient to justify the increase in costs, while for each of strategies B, C, D and G it is whether or not the reductions in cost are sufficient to compensate for the QALY losses. This is assessed against a view of the acceptable cost per QALY or threshold. Using the threshold of £20,000 per QALY, we can see that strategy E far exceeds the acceptable threshold and is not cost-effective. Given the only other practical strategy, to increase frequency of scans, strategy F, was dominated by the present screening strategy, we can conclude that decreasing recall intervals is unlikely to be cost-effective. Looking at the strategies (B, C, D and G) that increase screening intervals, we are seeking a strategy that releases at least £20,000 in cost savings per QALY lost. All options meet that test, and of these we need to choose the one with the highest net benefit (highest excess in value of cost savings minus value of lost QALYs). Strategy C, with a recall pattern of 2 years for aneurysms between 3.0 and 4.4 cm and 3 months for aneurysms between 4.5 and 5.4 cm, has the highest net benefit, and is the most cost-effective strategy. Increasing intervals beyond this does not provide sufficient additional cost savings to justify the additional QALY losses.
To summarise these figures as clearly as possible, our analysis suggests that the effect of changing from the current surveillance strategy to surveillance strategy C, the best of the options considered, would mean that the loss of value from the QALY gain per man invited would be equivalent to a loss of £1.24, but that the cost would be reduced by £2.57 per man invited, giving a net monetary benefit gain of £1.33.
Uncertainty and sensitivity
As was indicated in Chapter 7, in this particular case it is not feasible, given available data and analytical possibilities, to provide a robust, meaningful PSA that encompasses all the parameter and structural uncertainty. We have therefore focused on a more appropriate series of one-way sensitivity analyses. These are summarised in Table 25.
The first of these applies growth and rupture rates drawn from the three UK population-based screening studies that used internal aortic diameter measurements (as does the NAAASP), namely MASS, Gloucester and Chichester (see Chapter 6), and which could therefore be seen as most applicable to the UK programme. Strategy C clearly remains the preferred option and, although it is slightly less cost-effective than in the base case, the net benefit is still positive and substantial. As an alternative way to address the uncertainty around growth and rupture rates, the next sensitivity analyses reduce or increase growth rates by 10% and rupture rates by 30%. These ranges approximate one SD in the estimates of the value of the relevant parameter. Again, in each case, the preference for strategy C, over all other strategies, remains unchanged. Using an estimate of operative mortality rates from the NAAASP, similarly does not change the choice of strategy. Further sensitivity analyses consider the possibility that dropout rates (from recall) might be affected by different recall strategies but again the preference for strategy C is unaltered. Finally, we consider the effect of (arbitrarily) different relative costs for elective and emergency surgery and for the cost of rescanning. In no case does the choice of strategy change, although, not surprisingly, the magnitude of the cost savings from less frequent recall in strategy C (and hence its net benefit) are somewhat affected by the unit cost of rescans.
Discussion and conclusions
Long-term modelling of the implications of screening programmes is always difficult and typically involves unverifiable assumptions and estimates that have long-term implications. Screening for AAA is an unusual case in that we have been able to compare results from a long-term model initially based on 4-year data with 10 years of observation. The resultant problem was to identify a set of model parameters that would replicate the observed results at 10 years. We were able to do this imperfectly, but nevertheless can have more confidence in the recalibrated model than would otherwise have been appropriate with the original model. Then, with the systematic reviews and the RESCAN analyses of growth and rupture rates, we were able to go further in estimating the cost-effectiveness implications of alternative surveillance strategies.
These show that from a cost-effectiveness perspective lengthening the surveillance interval for aneurysms of 4.5–5.4 cm reduces net monetary benefit and we have argued that decreasing that interval would not be practical. However, increasing the interval for recall of men with aneurysms between 3.0 and 4.4 cm from 1 year to 2 years improves cost-effectiveness, but increasing it further to 3 years worsens cost-effectiveness compared with 2 years and (marginally) compared with the current 1-year interval.
It is important to recognise that the absolute differences in outcomes and costs between the surveillance options we have considered are small, as are the absolute values of the net monetary benefit per man invited. They can be put into perspective by multiplying them up to reflect the impact on a large-scale screening programme. With a programme inviting around 260,000 men per year as will broadly be the situation when the NHS programme covers the whole of England,73 the (present value of the) cost difference for the preferred option would be of the order of £660,000 per year, but the QALY loss would be equivalent to around 16 QALYs. Given the remaining uncertainties there has to be a question of whether or not the differences involved justify a change from the existing surveillance programme particularly as it would have to be explicit that this strategy was expected to be slightly inferior in terms of clinical effectiveness.
FIGURE 22.
Cost-effectiveness plane for new screening interval strategies.
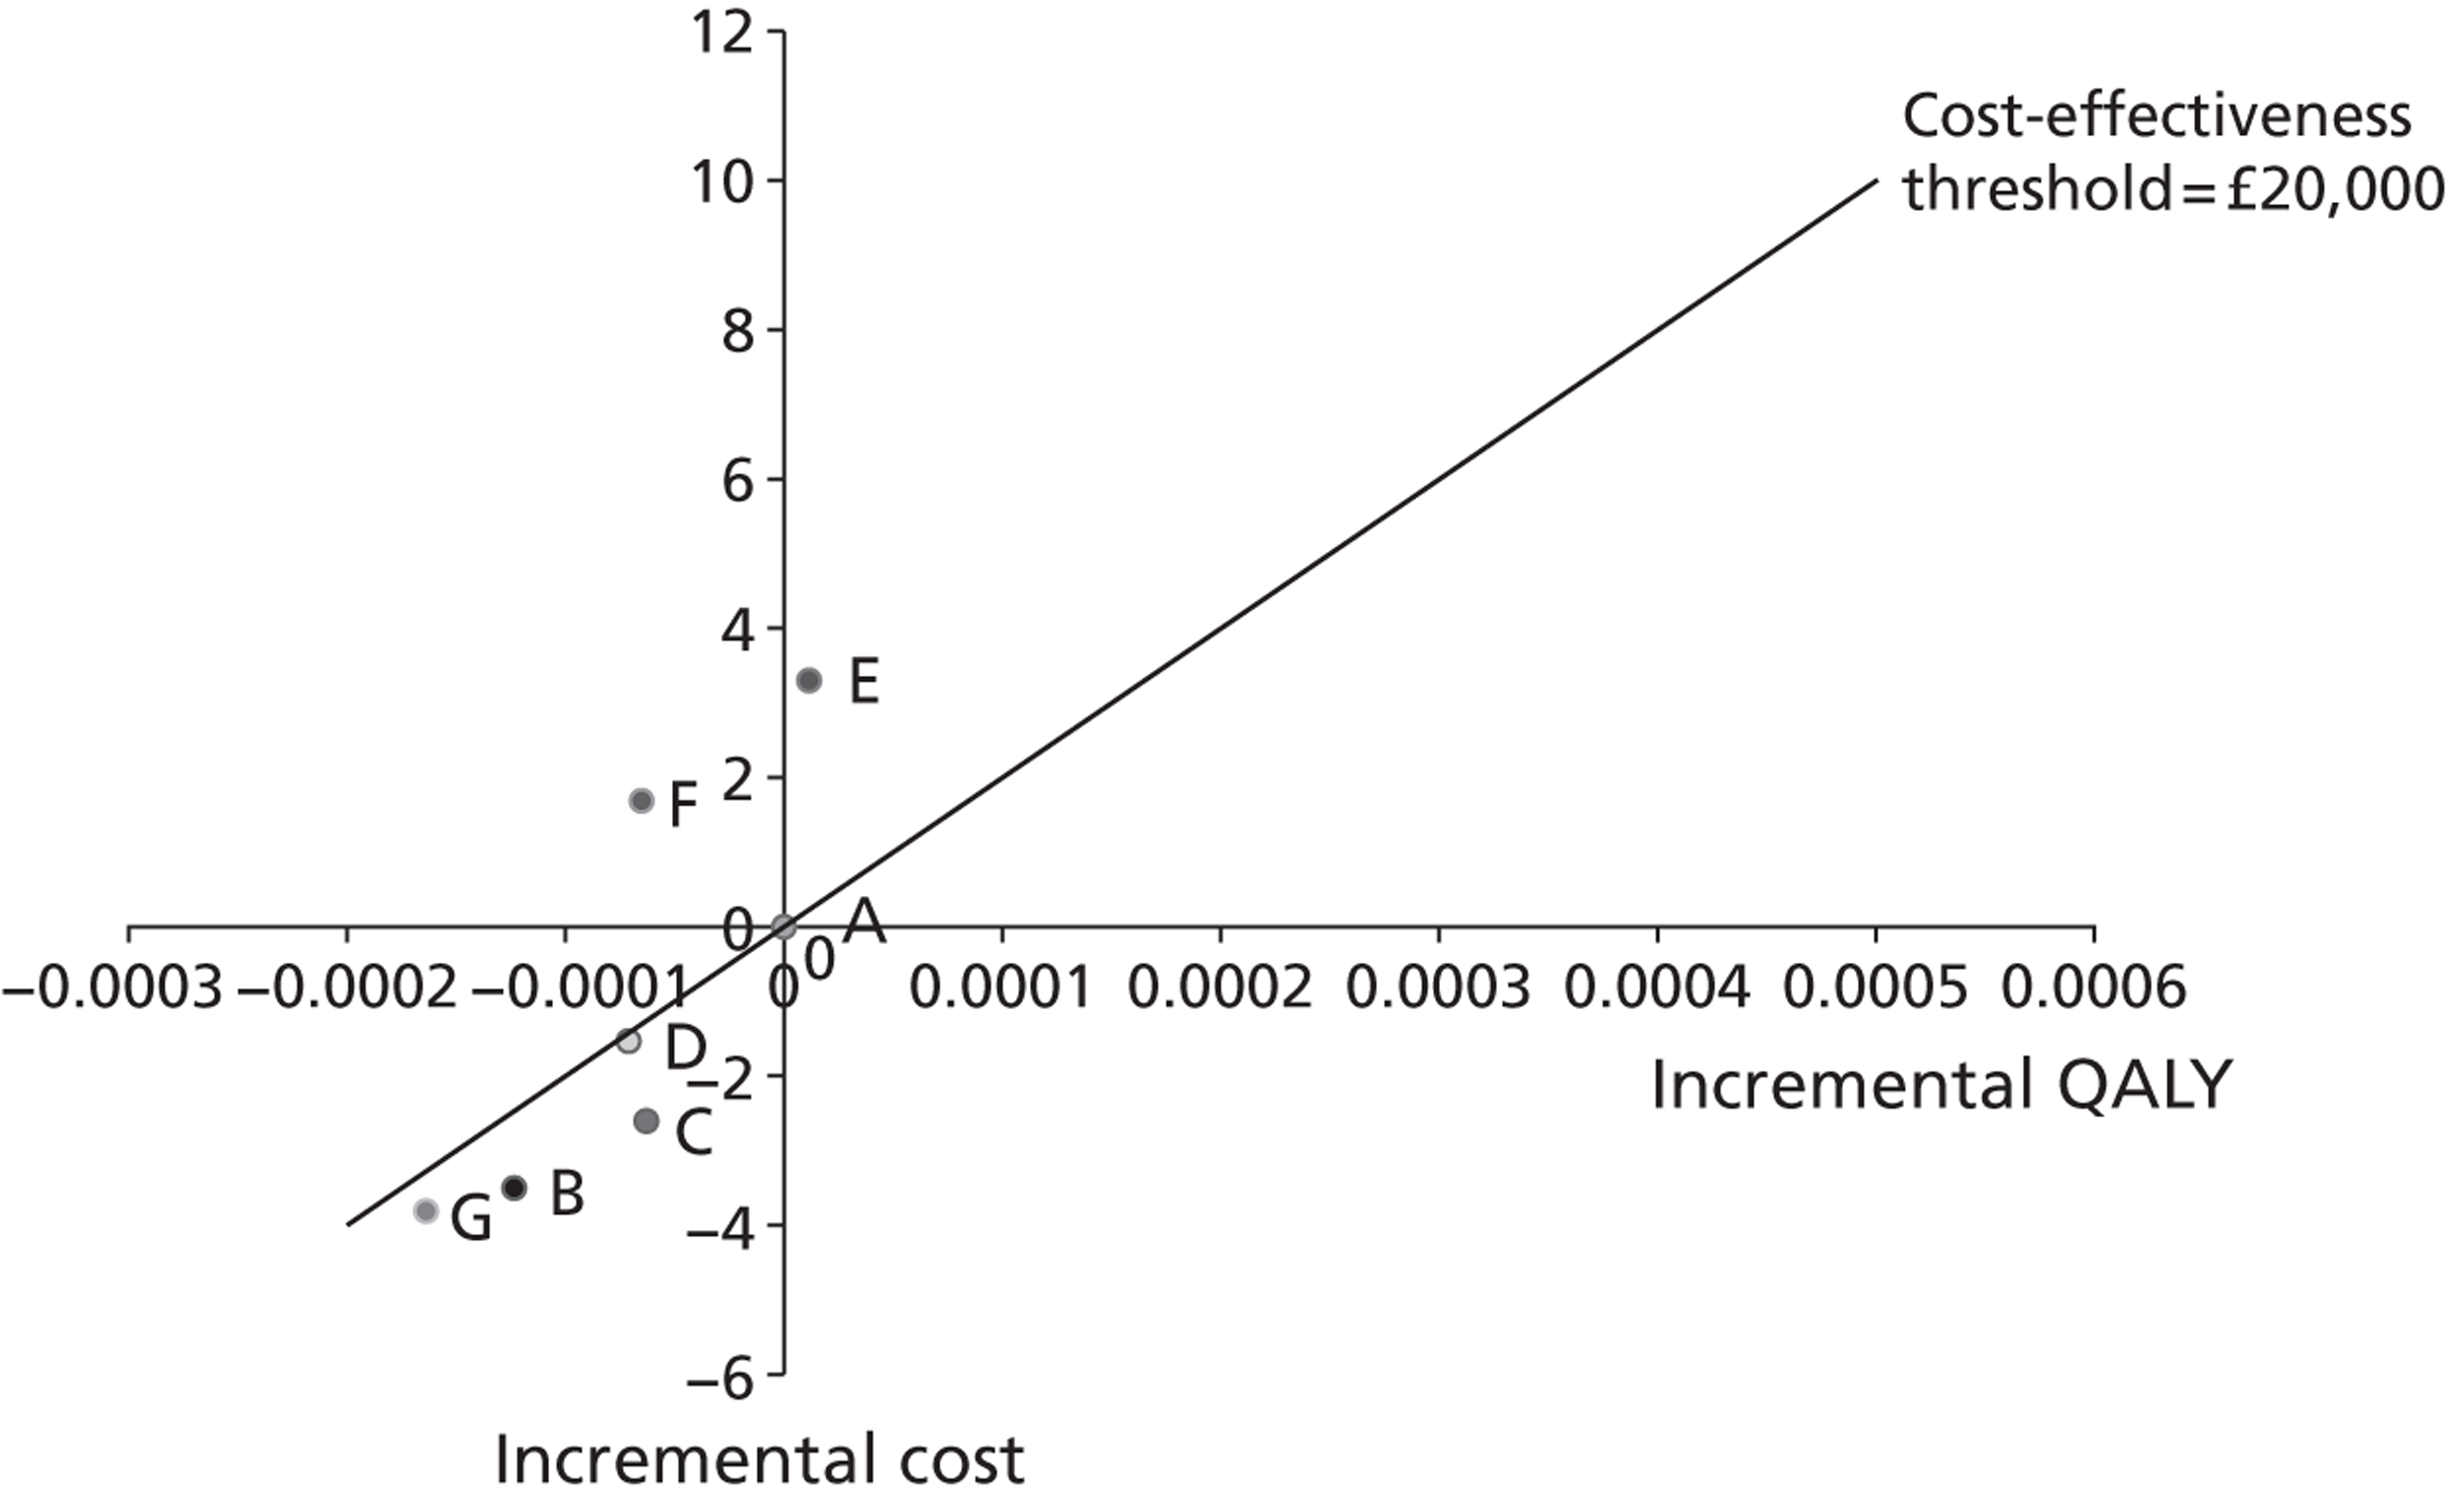
| Clinical parameters | Estimate | Source |
|---|---|---|
| Proportion reinvited to screening | 0.1360 | MASS8 |
| AAAs at first screen – attenders | 0.0166 | NAAASP71 |
| AAAs at first screen – non-attenders | 0.0166 | NAAASP71 |
| Non visualised AAAs | 0.0166 | NAAASP71 |
| Proportion of scans non-visualised | 0.0121 | MASS8 |
| Proportion of screen invited attending | 0.730 | NAAASP71 |
| Proportion of AAAs at first screen – small | 0.809 | NAAASP71 |
| Proportion of AAAs at first screen – medium | 0.106 | NAAASP71 |
| Proportion of AAAs at first screen – large | 0.0854 | NAAASP71 |
| Transition probabilities (3-monthly) | ||
| Grow from no AAA to small AAA | 0.00207 | Chichester53 |
| Grow from small AAA to medium AAA | TDTPa | RESCAN |
| Grow from medium AAA to large AAA | TDTP | RESCAN |
| Probability of dropout | 0.0142 | MASS |
| Rupture probability – no AAA | 0 | Assumption |
| Rupture probability – small AAA | TDTP | RESCAN |
| Rupture probability – medium AAA | TDTP | RESCAN |
| Rupture probability – detected large AAA | 0.0125 | MASS |
| Rupture probability – undetected large AAA | 0.0282 | Calibration |
| Rupture probability – contraindicated for surgery | 0.0282 | MASS |
| Probability of opportunistic detection | 0.0114 | Calibration |
| Probability of emergency surgery following rupture | 0.368 | MASS |
| Probability of death following emergency surgery | 0.342 | MASS |
| Proportion of large AAAs receiving surgery | 0.681 | MASS |
| Proportion of large AAAs returned to screening | 0.221 | MASS |
| Proportion of large AAAs contraindicated for elective surgery | 0.0977 | MASS |
| Probability of death following elective surgery – screen detected | 0.0298 | MASS |
| Probability of death following elective surgery – opportunistically detected | 0.0717 | MASS |
| All-cause mortality – contraindicated for surgery | 0.0599 | MASS |
| Age-specific all-cause mortality | Age specific | ONS73 |
| Cost parameters | ||
| Invitation to screen (£) | 1.70 | See Chapter 7 |
| Cost of first scan (£) | 32.20 | See Chapter 7 |
| Surveillance scan (£) | 68.00 | See Chapter 7 |
| Pre-surgical consultation (£) | 435.25 | See Chapter 7 |
| Elective repair (£) | 12,806.21 | See Chapter 7 |
| Emergency repair (£) | 19,984.75 | See Chapter 7 |
| Strategy A (1 year, 3 months) | Strategy B (2 years, 6 months) | ICER B compared with A | Strategy C (2 years, 3 months) | ICER C compared with A | Strategy D (1 year, 6 months) | ICER D compared with A | Strategy E (6 months, 3 months) | ICER E compared with A | Strategy F (6 months, 6 months) | ICER F compared with A | Strategy G (3 years, 3 months) | ICER G compared with A | |
|---|---|---|---|---|---|---|---|---|---|---|---|---|---|
| Control arm | |||||||||||||
| Life-years | 12.7157 | 12.7155 | 12.7157 | 12.7156 | 12.7158 | 12.7156 | 12.7155 | ||||||
| Cost (£) | 271.65 | 260.23 | 265.87 | 265.46 | 279.92 | 273.40 | 262.17 | ||||||
| Invited arm | |||||||||||||
| Life-years | 12.7244 | 12.7240 | 12.7242 | 12.7241 | 12.7244 | 12.7241 | 12.7240 | ||||||
| Cost (£) | 319.89 | 305.03 | 311.54 | 312.20 | 331.49 | 323.35 | 306.64 | ||||||
| Difference | |||||||||||||
| Life-years | 0.008659 | 0.008502 | − 0.0001578 | 0.008580 | − 0.00007983 | 0.008569 | − 0.00009086 | 0.008674 | 0.00001455 | 0.008576 | − 0.00008350 | 0.008449 | − 0.0002103 |
| QALYS | 0.006754 | 0.006631 | − 0.0001231 | 0.006692 | − 0.00006226 | 0.006683 | − 0.00007087 | 0.006766 | 0.00001135 | 0.006689 | − 0.00006513 | 0.006590 | − 0.0001640 |
| Cost (£) | 48.25 | 44.80 | − 3.45 | 45.68 | − 2.57 | 46.74 | − 1.51 | 51.57 | 3.32 | 49.95 | 1.70 | 44.47 | − 3.78 |
| ICER £ per LY | 5572 | 5270 | 21,853 | 5324 | 32,236 | 5454 | 16,650 | 5945 | 228,111 | 5824 | − 20,365 | 5263 | 17,972 |
| ICER £ per QALY | 7143 | 6756 | 28,016 | 6825 | 41,329 | 6993 | 21,346 | 7622 | 292,450 | 7467 | − 26,109 | 6748 | 23,041 |
| Net benefit (λ = £20,000 per QALY) | 0.99 | 1.33 | 0.10 | − 3.09 | − 3.00 | 0.50 | |||||||
| Strategy C (2 years, 3 months), INB (£) | Strategy B (2 years, 6 months), INB (£) | Strategy G (3 years, 3 months), INB (£) | Strategy D (1 year, 6 months), INB (£) | Strategy F (6 months, 6 months), INB (£) | Strategy E (6 months, 3 months), INB (£) | |
|---|---|---|---|---|---|---|
| Base case | 1.33 | 0.99 | 0.50 | 0.10 | − 3.00 | − 3.09 |
| Growth and rupture rates from three UK population screening studies10,37,53 that used internal aortic diameter measurements | ||||||
| Three UK screening studies | 1.09 | 0.61 | − 0.11 | − 0.04 | − 3.01 | − 2.96 |
| Growth rates | ||||||
| Growth rates ↓ 10% | 1.52 | 1.29 | 0.94 | 0.23 | − 2.95 | − 3.19 |
| Growth rates ↑ 10% | 1.13 | 0.68 | 0.03 | − 0.04 | − 3.05 | − 3.00 |
| Rupture rates | ||||||
| Rupture rates ↓ 30% | 1.33 | 0.96 | 0.47 | 0.08 | − 3.02 | − 3.10 |
| Rupture rates ↑ 30% | 1.33 | 1.01 | 0.53 | 0.11 | − 2.99 | − 3.09 |
| Operative mortality rate – base casea 0.029 and 0.074 | ||||||
| 0.024 (NAAASP) | 1.36 | 1.16 | 0.58 | 0.25 | − 2.85 | − 3.10 |
| Dropout rate from rescanning – base case 1.4% | ||||||
| Dropout rate ↓ 20% | 1.47 | 1.20 | 0.73 | 0.20 | − 3.06 | − 3.26 |
| Dropout rate ↑ 20% | 1.20 | 0.80 | 0.30 | 0.01 | − 2.95 | − 2.94 |
| Costs of elective and emergency surgery – base case £19,985 and £12,806 | ||||||
| Elective ↑ 10% Emergency ↓ 10% | 1.38 | 1.07 | 0.63 | 0.14 | − 2.96 | − 3.10 |
| Elective ↑ 30% Emergency ↓ 30% | 1.47 | 1.25 | 0.88 | 0.24 | − 2.87 | − 3.12 |
| Elective ↓ 10% Emergency ↑ 10% | 1.28 | 0.90 | 0.37 | 0.05 | − 3.05 | − 3.08 |
| Elective ↓ 30% Emergency ↑ 30% | 1.18 | 0.72 | 0.11 | − 0.05 | − 3.13 | − 3.07 |
| Cost of rescanning – base case £68 | ||||||
| Cost of rescan ↓ 10% | 1.10 | 0.69 | 0.20 | − 0.03 | − 2.81 | − 2.77 |
| Cost of rescan ↓ 30% | 0.64 | 0.11 | − 0.41 | − 0.28 | − 2.42 | − 2.11 |
| Cost of rescan ↑ 10% | 1.56 | 1.28 | 0.80 | 0.22 | − 3.20 | − 3.42 |
| Cost of rescan ↑ 30% | 2.02 | 1.87 | 1.41 | 0.47 | − 3.59 | − 4.07 |
Chapter 9 Discussion
In this chapter we discuss the results and interpretation of the two systematic literature reviews (see Systematic review of small abdominal aortic aneurysm growth rates and Systematic review of small abdominal aortic aneurysm rupture rates), the analyses of the IPD surveillance data sets (see Analysis of individual patient data surveillance data sets) and the patient factors influencing growth and rupture rates (see Factors influencing growth and rupture rates).
Systematic review of small abdominal aortic aneurysm growth rates
The methods and results of our systematic review are presented in Chapters 3 and 4. This is the first systematic review of small aneurysm growth rates since their inclusion in the earlier surgical management of aneurysms review of Hallin et al. ,76 which covered the literature from 1990 to 1997. Unlike this earlier study, which included only 816 patients from 13 different studies, we did not have to relax the eligibility criteria for studies (50 or more patients) and this allowed the identification of 15 suitable studies with 7630 persons for inclusion in a meta-analysis (see Table 2).
There are many reasons which might explain the large heterogeneity in growth rates between studies, particularly methodological and patient population issues. The methodological issues include the fact that patients have been entered into these studies since 1976, a 35-year time window during which the quality of aortic imaging has improved dramatically. Second, some recent studies have used imaging modalities other than US (such as CT) and it is known that there is poor agreement between CT and US aortic diameter measurements. 77,78 Some studies have used both methods of imaging. 22,29,32 However, a sensitivity analysis of studies that used only US imaging after 1990 was not associated with a reduction in heterogeneity. Third, aortic diameter has been measured in a variety of different planes, measurement cursors have been positioned on both the external and internal walls of the aorta (see Table 2) and only a minority of studies specified the standardisation of imaging protocol between observers (see Table 3). Fourth, growth rates have been estimated in a variety of different ways using (last – first diameter)/(time elapsed), linear regression or complex or multilevel modelling (see Table 2), and it has been reported that linear regression can overestimate aneurysm growth by up to 40% compared with multilevel modelling. 13 Hierarchical modelling also resolves the problem of a small number of measurements possibly leading to exaggerated growth rates. 13 There was evidence that some of the heterogeneity is explained by the use of linear regression and, in particular, (last − first diameter)/(time elapsed) to report aneurysm growth rates.
The patient population issues include ethnicity (which was reported rarely), the intervention policy of each study (which varied from aneurysm repair at 4.5 cm in the Huntingdon study to 6 cm in the Chichester study34), the variable proportion of women in each study (which ranged from 0% in some studies to 24% in one Canadian study29) and whether the aneurysm was identified by population screening or in hospital. During the period of patient recruitment to these studies, 1976–2005, there have been important improvements in medical therapy, with some studies reporting that use of statins slows the growth of aneurysms while ACE inhibitors may increase the growth of small aneurysms. 31,79 Medical therapies, smoking and comorbidities were reported inconsistently across the 15 studies included in our review and frequently only at study entry; therefore, their influence on growth rates could not be evaluated (see Table 2).
Although this meta-analysis, based on the published literature, provides very strong evidence that growth rates increase markedly with aneurysm size, it only provides partial information about appropriate surveillance intervals for small aneurysms. The growth rate for a 3.5-cm aneurysm is estimated at 1.9 mm/year, whereas that for a 4.5-cm aneurysm is 3.5 mm/year, both rates being somewhat lower than those presented in the earlier review. 76 Given an exponentially increasing aneurysm diameter, as implied from the meta-regression in Figure 4, it would take on average 6.2 years for a 3.5-cm aneurysm to grow to 5.5 cm, whereas a 4.5-cm aneurysm would take only 2.3 years. So surveillance intervals for a 4.5-cm aneurysm should be of the order of one-third of those for a 3.5-cm aneurysm. However, the meta-regression does not provide information about the variability of growth rates between individuals necessary to inform the choice of appropriate surveillance intervals.
Systematic review of small abdominal aortic aneurysm rupture rates
The methods and results of our systematic review were presented in Chapters 3 and 4. Rupture of an AAA is defined as blood leaking through the aortic wall into the peritoneal or retroperitoneal spaces; the diagnosis of rupture therefore depends on imaging (usually CT), findings at laparotomy or autopsy. A particular constellation of clinical symptoms including circulatory collapse, in the presence of a known aneurysm, also will give rise to the reporting of death from aneurysm rupture without autopsy. Contained or intramural rupture also may occur, when either the leak has sealed spontaneously or the bleeding remained intramural (the intramural blood from these ruptures usually can be detected by CT imaging). In contrast, abdominal or back pain and aortic tenderness in the presence of a known aneurysm does not necessarily imply rupture, although such aneurysms may be repaired urgently and listed as an emergency hospital admission. Very surprisingly, none of the eligible studies for this review reported their diagnostic criteria for aneurysm rupture and only 322,23,41 of 14 studies reported the evidence from which a diagnosis of rupture was made. This lack of clarity about the diagnosis of rupture is a major limitation of these studies. In the European Society for Vascular Surgery Guidelines for the management of AAAs,80 a clear definition of ruptured aneurysm is provided and hopefully this will be used in future studies: ‘AAA rupture is defined as bleeding outside the adventitia of a dilated aortic wall. Rupture is further classified into free rupture in the peritoneal cavity and retroperitoneal rupture where the retroperitoneal tissues provide tamponade and reduce temporarily the volume of blood loss’.
Although many studies report the number of aneurysm ruptures, few studies have length of follow-up information to permit the estimation of rupture rates. Nevertheless, there are many more studies, with almost 10,000 patients, describing rupture rates of small aneurysms than were available for a recent systematic review of rupture rates in large aneurysms. 20 The latter, including only 533 patients in total, reported a rupture rate of 10.3 (95% CI 7.5 to 14.3) per 100 person-years for aneurysms 5.0–5.9 cm in diameter in those considered unfit for aneurysm repair. 20 The rupture rates reported here, for aneurysms of 3.0–5.5 cm in diameter, are much lower at 0–1.61 per 100 person-years, with a trend for rupture rates to increase with increasing diameter.
As no study reported the diagnostic criteria for rupture, the evidence from post-mortem studies was examined. There are limited data from post-mortem studies and because the post-mortem diameter is lower than any in vivo measurement, post-mortem data may be unreliable. A prospective autopsy series of 78 aneurysms where the autopsy aorta was subject to pressure inflation at 80–100 mmHg did not show any ruptures in specimens of ≤ 5.0 cm. 81 This same study reported that without pressure inflation post-mortem diameters were usually smaller than any in vivo measurement, probably by 0.4–0.5 cm or in some cases by almost 50%. Therefore, data from the only large-scale autopsy series, which reported retrospectively on the rupture of aortic aneurysms in almost 24,000 consecutive autopsies at the Massachusetts General Hospital in the period 1952–75, are unreliable. 82
Both the PIVOTAL and CAESAR trials of endovascular repair compared with surveillance for small aneurysms reported in 2010 after the search for this review closed. 51,83 In the PIVOTAL trial51 the rupture rate in the surveillance was 0.17 per 100 patient-years (although this includes some follow-up after aneurysm repair, which occurred in 31%). In the CAESAR trial,83 although mean conditional follow-up was not reported, the rupture rate appears to be < 1 per 100 person-years. These are in keeping with the results reported here.
A new large prospective study based on population screening would be the most robust method of assessing the rupture rates of small aneurysms in the twenty-first century. Such a study would take time to set up and several years of follow-up before it could report. For now, an alternative way to assess the rupture rates of small aneurysms is through synthesis of a large amount of IPD from relevant studies. This is the strategy we pursued.
Analysis of individual patient data surveillance data sets
We presented our analysis of overall growth and rupture rates in men and women from 18 surveillance data sets in Chapters 5 and 6. Key results are shown in Table 8. This research has definitively quantified the extent to which AAA growth rates and risk of rupture increase with AAA diameter, to provide a scientific basis for selecting surveillance intervals for patients with small AAAs. For example, we have shown that the time taken for an AAA of ≤ 4.0 cm to have a 10% chance of growing to 5.5 cm is at least 3 years. For men with an AAA of ≤ 4.0 cm, it takes over 3.5 years to have a risk of rupture > 1%.
These results are based on the largest collection of IPD made to date, and consistent methods of statistical analysis across multiple studies. Although three additional studies84–86 have been published up to September 2012, since the literature search that identified the studies for this meta-analysis was completed, one84 had fewer than 100 patients, and another85 appears to have considerable overlap with data already included in our analysis. The third study86 includes 453 patients with 12 months of follow-up and would be unlikely to alter our findings which are based on 15,475 patients with longer follow-up.
Our findings have important implications for AAA surveillance programmes. As screening for AAA is becoming established in many countries there will soon be large cohorts of individuals under surveillance for AAAs. For example, the NAAASP provides yearly scans for 3.0–4.4-cm diameter AAAs and 3-monthly scans for 4.5–5.4-cm AAAs. 9 The 95% confidence estimates for rupture risk from our study suggest that these surveillance intervals could safely be extended to 3 years for AAAs < 4.5 cm and yearly for 4.5–5.4-cm AAAs. The risk of rupture would be maintained at < 1%, a figure that appears to be acceptable to patients with AAAs. This would reduce the average number of surveillance scans from approximately 22 to only 7 for a patient with a 3.0-cm AAA detected by screening. Even if the lower 95% prediction limits of our estimates are applied, to acknowledge that the populations in each study may have different growth and rupture rates, these surveillance intervals could be reduced to 2-yearly for 3.0–3.9-cm AAAs, yearly for 4.0–4.9-cm AAAs and 6-monthly for 5.0–5.4-cm AAAs. Using the same example as above, this would reduce the average number of surveillance scans required for a 3.0-cm AAA from approximately 22 to 10.
Most population-based screening programmes for AAA are focused on the elderly male population, aged ≥ 65 years. This study, which included 1743 women (11%), showed that overall there was no difference in aneurysm growth rates between men and women. Interestingly, when aneurysm growth rate was estimated using hierarchical modelling, allowing for accelerating growth rate with increasing aneurysm diameter, data from Tromsø no longer showed that growth rates were faster in women. 38 Only Edinburgh54 and Leeds (Professor D Julian A Scott, personal communication) showed a significantly different growth rate in women. This underscores the heterogeneity observed both in this meta-analysis of the influence of sex and many other covariates and in previously published meta-analyses based on varied methods for estimating growth rate. 19,87
The fourfold higher rupture rate found for women compared with men is intriguing, particularly given that these data demonstrate that both sexes have similar growth rates. The sex imbalance in the risk of rupture has been identified in previous studies;48 differences in anatomy, structure, sex steroids and smoking habits have all been suggested to play a role. 88 The clinical implication is that a lower AAA diameter threshold for surgery should be adopted for women, a recommendation already made by the joint council of the American Association for Vascular Surgery and Society for Vascular Surgery,89 but one not yet supported by randomised trial evidence. As the rupture rate for women with a 4.5-cm AAA is about the same as that for a man with a 5.5-cm AAA, a threshold for surgery of 4.5 cm might seem appropriate in women. However, the operative mortality and discharge outcomes appear to be worse in women than men. For instance, the US Medicare database shows that operative mortality after endovascular repair (now the majority procedure) is 3.2% in women compared with 1.8% in men, and similar findings have been reported in other studies. 90–92 Therefore, competing risks must be carefully considered before amending guidelines or recommendations for intervention in women.
Despite the strong conclusions that can be drawn from this study, there remain some areas of uncertainty where future research efforts could be focused. The most obvious need is for further evidence for women with aneurysms in the diameter range 4.5–5.4 cm. Second, the substantial heterogeneity between studies we identified in growth and rupture rates could not be explained by adjustment for individual factors or study-level characteristics. If the underlying causes for these differences are biological rather than simply methodological, these may yield insights for developing interventions to lower growth rates in patients with small AAA; such treatments have been sadly lacking up to the present time. 18,19 Such advances will only be possible through the analysis of large data sets, most likely to become available from surveillance within the national AAA screening programmes that are currently being set up. Third, recommended surveillance intervals may be lengthened in the future given the generally falling national rates of AAA rupture currently being experienced. 48,93 Last, more research is needed on the acceptable risk to patients of exceeding 5.5 cm or rupture before the next scan. An alternative approach is to consider the cost-effectiveness of different surveillance policies. Decreasing surveillance frequency would reduce surveillance costs. However, it may also very slightly increase rupture rates, thereby decreasing overall life expectancy in AAA patients under surveillance and increasing the burden and cost of emergency surgery. Hence, we conducted a formal evaluation to identify which surveillance intervals for different sized AAAs would be most cost-effective, as reported in Chapters 7 and 8.
Factors influencing growth and rupture rates
Factors apart from sex that influence growth and rupture rates were systematically examined in the analysis of the IPD surveillance data sets (see Chapters 5 and 6). Aneurysm growth rates were consistently increased by about one-sixth in current smokers and decreased by about one-quarter in patients with diabetes. There was no evidence of any change in aneurysm growth rates over time and neither age, mean arterial pressure nor cardioprotective drugs, had a significant effect on growth rates. In contrast, small aneurysm rupture rates were doubled in current smokers, with age, mean arterial pressure and calendar year of enrolment being additional factors influencing rupture rates. These data suggest that the follow-up and management of the patient with small AAA could potentially be tailored to factors such as current smoking, diabetes and blood pressure, in addition to aneurysm diameter.
In every study, the growth rate of aneurysms in patients with diabetes was on average lower than in patients without diabetes, with no heterogeneity observed in the meta-analysis. Furthermore, the magnitude of the change in growth rate (approximately 25%) associated with diabetes was far greater than for any other covariate tested. This suggests that routine surveillance of small aneurysms might safely be less frequent in patients with diabetes. The biology of the aortic wall may be altered in diabetes with increased glycosylation, which together with other changes might underlie the reduced aneurysm growth rate in patients with diabetes. Most of these studies did not discriminate between type I and type II diabetes, although unpublished data from the United Kingdom Small Aneurysm Trial (UKSAT) suggest that most of the patients with diabetes (78%) were not taking insulin and in the Leeds study only type II diabetes was reported (Professor D Julian A Scott, personal communication). This might explain the trend for increased BMI to be associated with a reduced aneurysm growth rate in the unadjusted analysis. However, overall the patients with diabetes were few, concordant with the observation that diabetes is negatively associated with AAA. 94 As there were only four ruptures reported in patients with diabetes, it was not possible to reliably evaluate the influence of diabetes on aneurysm rupture.
Smoking was second only to diabetes in the magnitude of its effect on aneurysm growth but while the effect of current smoking on aneurysm growth was modest (∼ 16%), current smoking doubled aneurysm rupture rates. The direction of the effect of smoking on aneurysm growth was consistent among all studies, except Leeds (Professor D Julian A Scott, personal communication). A limitation of our study, impacting on heterogeneity, is that non-smoking or ex-smoking status might have been defined differently in the different studies, particularly with respect to time from smoking cessation or very light tobacco usage.
The studies included in this meta-analysis span patients studied over a > 25-year period, since 1983. The prevalence of smoking has been decreasing since the mid-1970s and at the same time awareness of cardiovascular risk prevention in patients with small aneurysms has been increasing and the quality of US has improved dramatically. For these reasons, we explored whether or not the recruitment date of patients within each study (as a proxy for changing environmental, ultrasonographic and drug factors) might influence either aneurysm growth or rupture rates. Interestingly, although aneurysm growth rates appeared to be unchanged over time, rupture rates appeared to decrease. This is consistent with better control of hypertension (higher mean arterial pressure increases rupture rates) and lower prevalence of smoking as well as with the decreasing incidence of aneurysm rupture, which is being reported from several different countries. 95–97 The contrasting effects of enrolment date on growth and rupture rates also may indicate that although cardioprotective drugs might influence rupture rates they are unlikely to have any strong influence on aneurysm growth.
Individually, none of the cardioprotective drugs (lipid-lowering drugs, aspirin, beta blockers, calcium channel blockers or ACE inhibitors) showed significant associations with aneurysm growth, and the magnitude of any individual effect was very small (about 0.2 mm/year for statins and 0.1 mm/year for other drugs). One of the included studies was a formal evaluation of the effect of propranolol on aneurysm growth rate in about 500 patients. 40 Based on the findings reported here, this trial was very underpowered and trials of approximately 3700 patients would be necessary to show a reduction in aneurysm growth rates of 0.2 mm/year at 80% power, assuming growth rates have a SD 2.2 mm/year. The findings reported here for lipid-lowering drugs are consistent with other meta-analyses showing a possible association between statin usage and slower aneurysm growth rate. 18,19,98 The finding that ACE inhibitors increased growth rates in the UKSAT79 was not substantiated by other studies. Particularly in the older studies, few of the patients included in the current meta-analysis were taking cardioprotective medications and even if patients were taking these drugs at baseline, there is no evidence about continued patient compliance with medication. This is pertinent since both of the randomised trials assessing the effect of beta blockers on aneurysm growth illustrated the poor compliance with these drugs in patients with small aneurysms. 40,99
This individual patient meta-analysis of the influence of demographic factors and drugs on small aneurysm growth and rupture rates overcomes a number of limitations found in meta-analyses of published data. 18,19,87,100 First, data are strictly limited to the aneurysm diameter size range of 3.0–5.5 cm, the range which is relevant to most population screening programmes. Second, the study uses a single statistical method of estimating aneurysm growth rates, to overcome some of the heterogeneity associated with using different methods of growth rate estimation, particularly the use of (last – first diameter)/(time elapsed). Third, through application of an adjustment for overestimation of diameters using CT scans compared with ultrasonography, studies using both CT and US data could be included. Fourth, as rupture is a rare event in small aneurysms, there is an opportunity to study important factors, other than aortic diameter, which may influence rupture rates and alter patient management.
Chapter 10 Conclusions
Clinical and policy conclusions
In our systematic reviews of the growth and rupture rates of small AAA we primarily identified that both of these outcomes were related to AAA size, with larger AAA having higher rates of growth and higher rates of rupture. We estimated that the average time for a 3-cm AAA to grow to 5.5 cm is 9.6 years and for a 5-cm AAA is 1.1 years. We were unable to provide the same size-based estimates for risk of rupture from our systematic review since the data informing such an analysis were insufficient. We can only conclude that the rupture rate of small AAAs (3.0–5.5 cm in diameter) appears to lie between 0 and 1.61 per 100 person-years.
In order to address the deficiencies of the systematic reviews we went on to obtain IPD for 15,475 patients in AAA surveillance programmes. We harmonised and combined the data from these individual patients to obtain estimates of AAA growth and rupture rates. As expected, we identified that AAA growth and rupture rates were related to AAA size. In this analysis we determined outcomes for men and women separately. For men with a 3.0-cm AAA, the time taken to have a 10% chance of exceeding 5.5 cm was 7.4 years, and for a 5.0-cm AAA the time was 0.7 years. For women these times were 6.9 years and 0.7 years. We also assessed the time for small AAAs to exceed a 1% per annum rupture risk. In men with 3.0-cm and 5.0-cm AAAs these times were 9.3 years and 1.4 years, respectively. The times for women were 3.5 years and 0.7 years. These data highlight the sex difference in AAA rupture rates, with women more likely to rupture at lower AAA sizes than men, suggesting that the threshold for surgical intervention in women should be lower than in men.
From our analysis of IPD we identified that smoking was independently associated with both accelerated AAA growth and the risk of AAA rupture. Although all patients with AAA are routinely offered smoking cessation therapy in the majority of clinical practices, this finding underlines the importance of instituting measures to reduce tobacco consumption among patients with AAA and provides the most robust evidence to date with which to counsel patients. This information is also of importance to the non-specialist NHS practitioner, as the majority of patients with small AAAs will be managed in surveillance programmes with little or no physician contact.
Although we identified that higher mean arterial pressure was associated with a higher risk of AAA rupture, we were unable to demonstrate an effect of antihypertensive drugs. The appropriate use of antihypertensive medications, with targets of 130/80 mmHg, is nevertheless important in AAA patients. Although this strategy will require further investigation to determine any effect on rupture rates, the expected benefits in terms of overall cardiovascular mortality reduction justify its recommendation.
Our study has implications for surveillance strategies. From our IPD meta-analysis, we have demonstrated that most of the smallest AAAs will remain quiescent over many years. This suggests that current surveillance strategies for small AAAs could be refined to reduce the number and frequency of surveillance scans required and therefore the costs associated with AAA surveillance.
In theory the individual characteristics that influence growth or rupture rates, such as smoking and diabetes, could be taken into account to tailor surveillance intervals for each individual. However, the effects of such variables are not substantial enough to justify the organisational difficulty that such personalised surveillance strategies would involve, despite the desire for this from patients. Similarly, AAA measurements before the current one are informative about a person's rate of AAA growth17 and could, in principle, also be taken into account.
Our cost-effectiveness investigations showed that lengthening the surveillance intervals from 1 year for 3.0–4.4-cm AAAs was cost-effective, whereas lengthening the 3-month interval for 4.5–5.4-cm AAAs was neutral with respect to cost-effectiveness. However, the differences in costs were small, up to about £4 within an overall cost of £300 per man invited to AAA screening. Also our results may be susceptible to the detailed modelling assumptions made and parameter estimates used, and the fact that our updated health economic model did not validate very well on the 10-year MASS trial data. Nevertheless, the cost-effectiveness analyses support the lengthening of surveillance intervals for the smallest aneurysms, in line with our clinical conclusions.
Research implications
From the work we have undertaken, we draw a number of conclusions about future research priorities, as follows.
We identified that the definition and diagnostic criteria of AAA rupture were poorly reported in published studies. There is a need for standardised definitions and reporting, so that rupture rates can be more reliably estimated. One major hurdle to overcome is the determination of whether or not AAA rupture is reported accurately in mortality statistics. Many sudden deaths, particularly in elderly populations who are at the highest risk of AAA rupture, are likely to be recorded on death certificates as due to cardiac or cerebrovascular causes, missing many cases of AAA rupture. Declining post-mortem examination rates will contribute to the potential under-reporting of AAA-related mortality.
We demonstrated that surveillance intervals for most small aneurysms can be extended safely, with such extension being cost-effective for the smallest aneurysms. These recommendations are based on opinions from a single patient focus group rather than a more widespread patient preference study. Given the current knowledge, there is a need to investigate patient preferences concerning extending surveillance intervals, especially in the upper half of the small aneurysm diameter range where such extension could be clinically acceptable but without cost-effectiveness benefit.
We have determined that hierarchical modelling provides a methodologically appropriate framework for analysing data on AAA growth rates and recommend that this method be used in future studies.
Based on the observation of growth rates in patients with 3.0-cm diameter aneurysms, modelling could be conducted to indicate appropriate recall intervals for men identified as having an aortic diameter of 2.5–2.9 cm at initial aneurysm screening visit.
We observed large variation in growth rates between studies, which was largely unexplained. The identification of both methodological reasons, for example how AAA diameters are measured, and biological causes for this variation are important. The latter could lead to the identification of factors and biological pathways related to increased growth rates or rupture rates that were amenable to intervention. Such interventions might then be assessed in randomised trials.
We have shown that the clinical progression of an AAA is different in women compared with men, with women at substantially higher risk of rupture. Currently women are not screened for AAAs in the UK, and those with opportunistically detected AAAs are usually entered into generic rather than sex-specific surveillance programmes. In addition to obtaining evidence to investigate the efficacy and cost-effectiveness of AAA screening in women, surveillance programmes and criteria for considering surgery need to be tailored for women. Formal evaluation of a lower intervention threshold for women, either via a randomised trial or modelling studies, is a research priority.
We have shown that increasing mean arterial blood pressure increases the risk of aneurysm rupture. There is a need to formally evaluate whether or not reducing blood pressure to ≤ 130/80 mmHg would reduce the risk of rupture, in both small aneurysms managed in surveillance programmes and in high-risk patients with larger aneurysms who, as part of the National Quality Improvement Programme, are being turned down for elective aneurysm repair in increasing numbers.
The findings that age, sex and blood pressure appear to have strong associations with aneurysm rupture but not aneurysm growth are intriguing and hint at the presence of differential mechanisms promoting aneurysm growth and aneurysm rupture. The association of diabetes with retarded AAA growth rates reiterates the intriguing negative association between diabetes and AAA prevalence and further exploration of the mechanistic pathways leading to diabetes may provide insights into the pathogenesis of AAA.
Although we have provided evidence about appropriate surveillance intervals for small AAAs, we have always used the currently accepted diameter of 5.5 cm for considering elective surgery. Related research could aim to determine whether it is possible to develop personalised criteria or patient-specific thresholds for elective surgery.
Comparable studies with substantial patient numbers are required for the kind of research undertaken here. Future research should focus on the collection and use of large, well-structured and internationally compatible data sets, along with statistical and epidemiological methods needed for their harmonisation and analysis. For example, work is required to determine how to combine data based on different methods of AAA size measurement. The recent inception of national AAA screening programmes in several countries may facilitate such research.
Acknowledgements
Contributions of authors
SG Thompson was principal investigator of the project and the RESCAN Collaboration, provided overall direction and overview, supervised the statistical analyses, and collated and revised material for this report.
LC Brown undertook data extraction and evaluation of published studies in the systematic reviews, collated and harmonised the IPD surveillance data sets acquired from the RESCAN collaborators, and edited this report.
MJ Sweeting undertook statistical analyses for the systematic reviews, developed the statistical modelling framework for growth and rupture in the IPD data sets to inform surveillance intervals, and provided information from these analyses in a form suitable for the health economic analyses.
MJ Bown organised the patient focus group, collaborated on the analyses of the IPD surveillance data sets, and provided clinical input into the RESCAN Collaboration.
LG Kim undertook reanalyses of the MASS trial data and provided input into developing the health economic modelling framework.
MJ Glover developed the health economic modelling framework and undertook the cost-effectiveness analyses.
MJ Buxton supervised the health economic modelling work and drafted the conclusions from the cost-effectiveness analyses.
JT Powell directed the systematic reviews, invited investigators to participate in the RESCAN Collaboration, provided epidemiological and biological input for the analyses of growth and rupture rates, and led the drafting of a number of the resulting published papers.
All authors provided comments on a draft version of this report.
Other contributions
Systematic reviews, acquisition and management of data sets: Dr Susan Gotensparre (Imperial College London, London, UK).
Clinical input: Professor Roger Greenhalgh (Imperial College, London); and Professor Ross Naylor (University Hospitals of Leicester NHS Trust, Leicester, UK).
Imaging input: Mr Tim Hartshorne (University Hospitals of Leicester NHS Trust Leicester, Leicester, UK).
Epidemiology and review/approval of systematic review protocols: Professor F Gerald R Fowkes (University of Edinburgh, Edinburgh, UK).
Other RESCAN collaborators
Professor PE Norman (University of Western Australia, Crawley, WA, Australia).
Mr S Parvin (Royal Bournemouth Hospital, Bournemouth, UK).
Mrs Hilary Ashton (St Richard's Hospital, Chichester, UK).
Mr RTA Chalmers (Edinburgh Royal Infirmary, Edinburgh, UK).
Mr JJ Earnshaw (Gloucestershire Royal Infirmary, Gloucester, UK).
Mr ABM Wilmink (Heart of England NHS Trust, Birmingham, UK).
Professor DJA Scott (University of Leeds, Leeds, UK).
Professor CN McCollum (University Hospital of South Manchester, Manchester, UK).
Dr S Solberg (Rikshospitalet, Oslo, Norway).
Dr K Ouriel (Syntactx, New York, NY, USA).
Professor A Laupacis (St Michael's Hospital, Toronto, ON, Canada).
Dr M Vega de Céniga (Hospital de Galdakao, Bilbao, Spain).
Mr R Holdsworth (Stirling Royal Infirmary, Stirling, UK).
Dr L Karlsson (Gävle Hospital, Gävle, Sweden).
Professor JS Lindholt (Viborg Hospital, Viborg, Denmark).
Other acknowledgements
The authors would like to thank Dr Karen Welch (Cochrane Collaborative Review Group on Peripheral Vascular Diseases, University of Edinburgh Medical School, Edinburgh, UK) for conducting the search strategy for the systematic reviews. We also thank Dr Angela Talbot (Medical Research Council Biostatistics Unit, Cambridge, UK) for help with submission of this report to the Health Technology Assessment journal.
This project was supported by the UK National Institute for Health Research Health Technology Assessment Programme (project 08/30/02). The views expressed in this report are not necessarily those of the UK NHS.
Disclaimers
This report presents independent research funded by the National Institute for Health Research (NIHR). The views and opinions expressed by authors in this publication are those of the authors and do not necessarily reflect those of the NHS, the NIHR, NETSCC, the HTA programme or the Department of Health. If there are verbatim quotations included in this publication the views and opinions expressed by the interviewees are those of the interviewees and do not necessarily reflect those of the authors, those of the NHS, the NIHR, NETSCC, the HTA programme or the Department of Health.
Publications
1. RESCAN collaborators, Bown MJ, Sweeting MJ, Brown LC, Powell JT, Thompson SG. Surveillance intervals for small abdominal aortic aneurysms: a meta-analysis. JAMA 2013;309:806–13.
2. RESCAN collaborators, Sweeting MJ, Thompson SG, Brown LC, Powell JT. Meta-analysis of individual patient data to examine factors affecting growth and rupture of small abdominal aortic aneurysms. Br J Surg 2012;99:655–65.
3. Sweeting MJ, Thompson SG. Making predictions from complex longitudinal data, with application to planning monitoring intervals in a national screening programme. J Roy Statist Soc Ser A 2012;175:569–86.
4. Sweeting MJ, Thompson SG. Joint modelling of longitudinal and time-to-event data with application to abdominal aortic aneurysm growth and rupture. Biom J 2011;53:750–63.
5. Powell JT, Sweeting MJ, Brown LC, Gotensparre SM, Fowkes FGR, Thompson SG. Systematic review and meta-analysis of growth rates of small abdominal aortic aneurysms. Br J Surg 2011;98:609–18.
6. Powell JT, Gotensparre SM, Sweeting MJ, Brown LC, Fowkes FGR, Thompson SG. Rupture rates of small abdominal aortic aneurysms: a systematic review of the literature. Eur J Vasc Endovasc Surg 2011;41:2–10.
7. Sweeting MJ, Thompson SG, Brown LC, Greenhalgh RM, Powell JT. Use of angiotensin converting enzyme inhibitors is associated with increased growth rate of abdominal aortic aneurysms. J Vasc Surg 2010;52:1–4.
References
- Office for National Statistics . Mortality Statistics: 2012. www.ons.gov.uk/ons/publications/re-reference-tables.html?edition=tcm%3A77–230730 (accessed 1 March 2012).
- Budd JS, Finch DR, Carter PG. A study of the mortality from ruptured abdominal aortic aneurysms in a district community. Eur J Vasc Surg 1989;3:351-4. http://dx.doi.org/10.1016/S0950-821X(89)80073-8.
- Adam DJ, Mohan IV, Stuart WP, Bain M, Bradbury AW. Community and hospital outcome from ruptured abdominal aortic aneurysm within the catchment area of a regional vascular surgical service. J Vasc Surg 1999;30:922-8. http://dx.doi.org/10.1016/S0741-5214(99)70018-2.
- Thompson SG, Ashton HA, Gao L, Scott RA. Screening men for abdominal aortic aneurysm: 10 year mortality and cost effectiveness results from the randomised Multicentre Aneurysm Screening Study. BMJ 2009;338. http://dx.doi.org/10.1136/bmj.b2307.
- EVAR Trial Participants . Comparison of endovascular aneurysm repair with open repair in patients with abdominal aortic aneurysm (EVAR trial 1), 30-day operative mortality results: randomised controlled trial. Lancet 2004;364:843-8.
- Greenhalgh RM, Brown LC, Powell JT, Thompson SG, Epstein D, Sculpher MJ. Endovascular versus open repair of abdominal aortic aneurysm. N Engl J Med 2010;362:1863-71.
- Cosford PA, Leng GC. Screening for abdominal aortic aneurysm. Cochrane Database Syst Rev 2007;2. http://dx.doi.org/10.1002/14651858.CD002945.
- Kim LG, Thompson SG, Briggs AH, Buxton MJ, Campbell HE. How cost-effective is screening for abdominal aortic aneurysms?. J Med Screen 2007;14:46-52. http://dx.doi.org/10.1258/096914107780154477.
- National Health Service . NHS Abdominal Aortic Aneurysm Screening Programme n.d. http://aaa.screening.nhs.uk/ (accessed 4 July 2012).
- Ashton HA, Buxton MJ, Day NE, Kim LG, Marteau TM, Scott RA, et al. The Multicentre Aneurysm Screening Study (MASS) into the effect of abdominal aortic aneurysm screening on mortality in men: a randomised controlled trial. Lancet 2002;360:1531-9.
- Filardo G, Powell JT, Ashley-Marie M, Ballard DJ. Surgery for small asymptomatic abdominal aortic aneurysms. Cochrane Database Syst Rev 2012;3. http://dx.doi.org/10.1002/14651858.CD001835.pub3.
- Powell JT, Brown LC, Forbes JF, Fowkes FG, Greenhalgh RM, Ruckley CV, et al. Final 12-year follow-up of surgery versus surveillance in the UK Small Aneurysm Trial. Br J Surg 2007;94:702-8.
- Brady AR, Thompson SG, Fowkes FG, Greenhalgh RM, Powell JT. Abdominal aortic aneurysm expansion: risk factors and time intervals for surveillance. Circulation 2004;110:16-21. http://dx.doi.org/10.1161/01.CIR.0000133279.07468.9F.
- Stather PW, Dattani N, Bown MJ, Earnshaw JJ, Lees TA. International variations in AAA screening. Eur J Vasc Endovasc Surg 2013;45:231-4. http://dx.doi.org/10.1016/j.ejvs.2012.12.013.
- Giardina S, Pane B, Spinella G, Cafueri G, Corbo M, Brasseur P, et al. An economic evaluation of an abdominal aortic aneurysm screening program in Italy. J Vasc Surg 2011;54:938-46. http://dx.doi.org/10.1016/j.jvs.2011.03.264.
- Chaikof EL, Brewster DC, Dalman RL, Makaroun MS, Illig KA, Sicard GA, et al. The care of patients with an abdominal aortic aneurysm: the Society for Vascular Surgery practice guidelines. J Vasc Surg 2009;50:S2-49. http://dx.doi.org/10.1016/j.jvs.2009.07.002.
- Sweeting MJ, Thompson SG. Making predictions from complex longitudinal data, with application to planning monitoring intervals in a national screening programme. J Roy Stat Soc Ser A 2012;175:569-86. http://dx.doi.org/10.1111/j.1467-985X.2011.01005.x.
- Guessous I, Periard D, Lorenzetti D, Cornuz J, Ghali WA. The efficacy of pharmacotherapy for decreasing the expansion rate of abdominal aortic aneurysms: a systematic review and meta-analysis. PLOS ONE 2008;3. http://dx.doi.org/10.1371/journal.pone.0001895.
- Bergqvist D. Pharmacological interventions to attenuate the expansion of abdominal aortic aneurysm (AAA) – a systematic review. Eur J Vasc Endovasc Surg 2011;41:663-7. http://dx.doi.org/10.1016/j.ejvs.2011.01.009.
- Powell JT, Brown LC, Greenhalgh RM, Thompson SG. The rupture rate of large abdominal aortic aneurysms: is this modified by anatomical suitability for endovascular repair?. Ann Surg 2008;247:173-9. http://dx.doi.org/10.1097/SLA.0b013e3181557d2a.
- UK Small Aneurysm Trial Participants . Mortality results for randomised controlled trial of early elective surgery or ultrasonographic surveillance for small abdominal aortic aneurysms. Lancet 1998;352:1649-55.
- Lederle FA, Wilson SE, Johnson GR, Reinke DB, Littooy FN, Acher CW, et al. Immediate repair compared with surveillance of small abdominal aortic aneurysms. N Engl J Med 2002;346:1437-44. http://dx.doi.org/10.1056/NEJMoa012573.
- Brown LC, Powell JT. Risk factors for aneurysm rupture in patients kept under ultrasound surveillance. UK Small Aneurysm Trial Participants. Ann Surg 1999;230:289-96. http://dx.doi.org/10.1097/00000658-199909000-00002.
- Moher D, Liberati A, Tetzlaff J, Altman DG. Preferred reporting items for systematic reviews and meta-analyses: the PRISMA statement. Int J Surg 2010;8:336-41. http://dx.doi.org/10.1016/j.ijsu.2010.02.007.
- DerSimonian R, Laird N. Meta-analysis in clinical trials. Control 1986;7:177-88. http://dx.doi.org/10.1016/0197-2456(86)90046-2.
- Higgins JP, Thompson SG, Deeks JJ, Altman DG. Measuring inconsistency in meta-analyses. BMJ 2003;327:557-60. http://dx.doi.org/10.1136/bmj.327.7414.557.
- Thompson SG, Higgins JP. How should meta-regression analyses be undertaken and interpreted?. Stat Med 2002;21:1559-73. http://dx.doi.org/10.1002/sim.1187.
- Thompson SG, Turner RM, Warn DE. Multilevel models for meta-analysis, and their application to absolute risk differences. Stat Methods Med Res 2001;10:375-92. http://dx.doi.org/10.1191/096228001682157616.
- Brown PM, Sobolev B, Zelt DT. Selective management of abdominal aortic aneurysms smaller than 5.0 cm in a prospective sizing program with gender-specific analysis. J Vasc Surg 2003;38:762-5. http://dx.doi.org/10.1016/S0741-5214(03)00551-2.
- Schewe CK, Schweikart HP, Hammel G, Spengel FA, Zollner N, Zoller WG. Influence of selective management on the prognosis and the risk of rupture of abdominal aortic-aneurysms. Clinical Investigator 1994;72:585-91. http://dx.doi.org/10.1007/BF00227450.
- Schouten O, van Laanen JH, Boersma E, Vidakovic R, Feringa HH, Dunkelgrun M, et al. Statins are associated with a reduced infrarenal abdominal aortic aneurysm growth. Eur J Vasc Endovasc Surg 2006;32:21-6. http://dx.doi.org/10.1016/j.ejvs.2005.12.024.
- Vega de Céniga CM, Gomez R, Estallo L, Rodriguez L, Baquer M, Barba A. Growth rate and associated factors in small abdominal aortic aneurysms. Eur J Vasc Endovasc Surg 2006;31:231-6. http://dx.doi.org/10.1016/j.ejvs.2005.10.007.
- Vega de Céniga M, Gomez R, Estallo L, de la Fuente N, Viviens B, Barba A. Analysis of expansion patterns in 4–4.9 cm abdominal aortic aneurysms. Ann Vasc Surg 2008;22:37-44. http://dx.doi.org/10.1016/j.avsg.2007.07.036.
- Vardulaki KA, Prevost TC, Walker NM, Day NE, Wilmink AB, Quick CR, et al. Growth rates and risk of rupture of abdominal aortic aneurysms. Br J Surg 1998;85:1674-80. http://dx.doi.org/10.1046/j.1365-2168.1998.00946.x.
- Lindholt JS, Vammen S, Juul S, Fasting H, Henneberg EW. Optimal interval screening and surveillance of abdominal aortic aneurysms. Eur J Vasc Endovasc Surg 2000;20:369-73. http://dx.doi.org/10.1053/ejvs.2000.1191.
- Santilli SM, Littooy FN, Cambria RA, Rapp JH, Tretinyak AS, d’Audiffret AC, et al. Expansion rates and outcomes for the 3.0-cm to the 3.9-cm infrarenal abdominal aortic aneurysm. J Vasc Surg 2002;35:666-71. http://dx.doi.org/10.1067/mva.2002.121572.
- McCarthy RJ, Shaw E, Whyman MR, Earnshaw JJ, Poskitt KR, Heather BP. Recommendations for screening intervals for small aortic aneurysms. Br J Surg 2003;90:821-6. http://dx.doi.org/10.1002/bjs.4216.
- Solberg S, Singh K, Wilsgaard T, Jacobsen BK. Increased growth rate of abdominal aortic aneurysms in women. The Tromso study. Eur J Vasc Endovasc Surg 2005;29:145-9. http://dx.doi.org/10.1016/j.ejvs.2004.11.015.
- Karlsson L, Gnarpe J, Bergqvist D, Lindback J, Parsson H. The effect of azithromycin and Chlamydophilia pneumonia infection on expansion of small abdominal aortic aneurysms – a prospective randomized double-blind trial. J Vasc Surg 2009;50:23-9. http://dx.doi.org/10.1016/j.jvs.2008.12.048.
- Propranolol Aneurysm Trial Investigators . Propranolol for small abdominal aortic aneurysms: results of a randomized trial. J Vasc Surg 2002;35:72-9.
- Schlosser FJ, Tangelder MJ, Verhagen HJ, van der Heijden GJ, Muhs BE, van der Graaf Y, et al. Growth predictors and prognosis of small abdominal aortic aneurysms. J Vasc Surg 2008;47:1127-33. http://dx.doi.org/10.1016/j.jvs.2008.01.041.
- Buckenham T, Roake J, Lewis D, Gordon M, Wright I. Abdominal aortic aneurysm surveillance: application of the UK Small Aneurysm Trial to a New Zealand tertiary hospital. N Z Med J 2007;120.
- Brown PM, Zelt DT, Sobolev B. The risk of rupture in untreated aneurysms: the impact of size, gender, and expansion rate. J Vasc Surg 2003;37:280-4. http://dx.doi.org/10.1067/mva.2003.119.
- Scott RA, Kim LG, Ashton HA. Assessment of the criteria for elective surgery in screen-detected abdominal aortic aneurysms. J Med Screen 2005;12:150-4. http://dx.doi.org/10.1258/0969141054855247.
- Reed WW, Hallett JW, Damiano MA, Ballard DJ. Learning from the last ultrasound. A population-based study of patients with abdominal aortic aneurysm. Arch Intern Med 1997;157:2064-8. http://dx.doi.org/10.1001/archinte.157.18.2064.
- Guirguis EM, Barber GG. The natural history of abdominal aortic aneurysms. Am J Surg 1991;162:481-3. http://dx.doi.org/10.1016/0002-9610(91)90266-G.
- Armstrong PA, Back MR, Bandyk DF, Lopez AS, Cannon SK, Johnson BL, et al. Optimizing compliance, efficiency, and safety during surveillance of small abdominal aortic aneurysms. J Vasc Surg 2007;46:190-5. http://dx.doi.org/10.1016/j.jvs.2007.03.038.
- Sweeting MJ, Thompson SG, Brown LC, Powell JT. Meta-analysis of individual patient data to examine factors affecting growth and rupture of small abdominal aortic aneurysms. Br J Surg 2012;99:655-65. http://dx.doi.org/10.1002/bjs.8707.
- Sweeting MJ, Thompson SG. Joint modelling of longitudinal and time-to-event data with application to predicting abdominal aortic aneurysm growth and rupture. Biom J 2011;53:750-63. http://dx.doi.org/10.1002/bimj.201100052.
- Riley RD, Higgins JP, Deeks JJ. Interpretation of random effects meta-analyses. BMJ 2011;342. http://dx.doi.org/10.1136/bmj.d549.
- Ouriel K, Clair DG, Kent KC, Zarins CK. Endovascular repair compared with surveillance for patients with small abdominal aortic aneurysms. J Vasc Surg 2010;51:1081-7. http://dx.doi.org/10.1016/j.jvs.2009.10.113.
- Norman PE, Jamrozik K, Lawrence-Brown MM, Le MT, Spencer CA, Tuohy RJ, et al. Population based randomised controlled trial on impact of screening on mortality from abdominal aortic aneurysm. BMJ 2004;329. http://dx.doi.org/10.1136/bmj.38272.478438.55.
- Ashton HA, Gao L, Kim LG, Druce PS, Thompson SG, Scott RA. Fifteen-year follow-up of a randomized clinical trial of ultrasonographic screening for abdominal aortic aneurysms. Br J Surg 2007;94:696-701. http://dx.doi.org/10.1002/bjs.5780.
- Mofidi R, Goldie VJ, Kelman J, Dawson AR, Murie JA, Chalmers RT. Influence of sex on expansion rate of abdominal aortic aneurysms. Br J Surg 2007;94:310-14. http://dx.doi.org/10.1002/bjs.5573.
- Lindholt JS, Juul S, Fasting H, Henneberg EW. Screening for abdominal aortic aneurysms: single centre randomised controlled trial. BMJ 2005;330. http://dx.doi.org/10.1136/bmj.38369.620162.82.
- Multicentre Aneurysm Screening Study Group . Multicentre aneurysm screening study (MASS): cost effectiveness analysis of screening for abdominal aortic aneurysms based on four year results from randomised controlled trial. BMJ 2002;325.
- Campbell H, Briggs A, Buxton M, Kim L, Thompson S. The credibility of health economic models for health policy decision-making: the case of population screening for abdominal aortic aneurysm. J Health Serv 2007;12:11-7. http://dx.doi.org/10.1258/135581907779497594.
- Spronk S, van Kempen BJ, Boll AP, Jorgensen JJ, Hunink MG, Kristiansen IS. Cost-effectiveness of screening for abdominal aortic aneurysm in the Netherlands and Norway. Br J Surg 2011;98:1546-55. http://dx.doi.org/10.1002/bjs.7620.
- Thanos J, Rebeira M, Shragge BW, Urbach D. Vascular ultrasound screening for asymptomatic abdominal aortic aneurysm. Health Policy 2008;4:75-83.
- Montreuil B, Brophy J. Screening for abdominal aortic aneurysms in men: a Canadian perspective using Monte Carlo-based estimates. Can J Surg 2008;51:23-34.
- Lindholt JS, Sorensen J, Sogaard R, Henneberg EW. Long-term benefit and cost-effectiveness analysis of screening for abdominal aortic aneurysms from a randomized controlled trial. Br J Surg 2010;97:826-34. http://dx.doi.org/10.1002/bjs.7001.
- Ehlers L, Overvad K, Sorensen J, Christensen S, Bech M, Kjolby M. Analysis of cost effectiveness of screening Danish men aged 65 for abdominal aortic aneurysm. BMJ 2009;338. http://dx.doi.org/10.1136/bmj.b2243.
- Sogaard R, Laustsen J, Lindholt JS. Cost effectiveness of abdominal aortic aneurysm screening and rescreening in men in a modern context: evaluation of a hypothetical cohort using a decision analytical model. BMJ 2012;345. http://dx.doi.org/10.1136/bmj.e4276.
- National Institute for Health and Care Excellence . Technology Appraisal Process Guides 2011. www.nice.org.uk/aboutnice/howwework/devnicetech/technologyappraisalprocessguides/?domedia=1&mid=B52851A3–19B9-E0B5-D48284D172BD8459%5D (accessed 4 July 2012).
- Brown L, Powell J, Thompson S, Epstein D, Sculpher M, Greenhalgh R. The UK EndoVascular Aneurysm Repair (EVAR) trials: randomised trials of EVAR versus standard therapy. Health Technol Assess 2012;16.
- National Institute for Health and Care Excellence . Endovascular stent–grafts for the Treatment of Abdominal Aortic Aneurysm 2009. www.nice.org.uk/nicemedia/pdf/TA167Guidance.pdf (accessed 3 March 2009).
- Curtis L. Unit costs of health and social care 2010. Canterbury: Personal Social Services Research Unit, University of Kent; 2010.
- National Vascular Society . Abdominal Aortic Aneurysm Improvement Programme 2012. www.aaaqip.com/aaaqip/data.html (accessed 4 July 2012).
- Department of Health . 2010–11 Reference Costs Publication 2011. www.dh.gov.uk/en/Publicationsandstatistics/Publications/PublicationsPolicyAndGuidance/DH_131140 (accessed 4 July 2012).
- ISD Scotland . NHS Scotland, Information Services Division. Theatre Costs 2010 11 n.d. www.isdscotland.org/Health-Topics/Finance/Costs/Detailed-Tables/Theatres.asp (accessed 4 July 2012).
- National Health Service . NAAASP. n.d. http://aaa.screening.nhs.uk/annualreport (accessed 4 July 2012).
- Hospital Episode Statistics . Hospital Episode Statistics Online n.d. www.hesonline.nhs.uk/Ease/servlet/ContentServer?siteID=1937&categoryID=214 (accessed 4 July 2012).
- Office for National Statistics . Population Estimates for UK, England and Wales, Scotland and Northern Ireland, Mid-2010 2011. www.ons.gov.uk/ons/taxonomy/index.html?nscl=Population (accessed 4 July 2012).
- Grimmett G, Stirzaker D. Probability and random processes. 2nd edn. Oxford: Oxford University Press; 1992.
- National Institute for Health and Care Excellence . Guide to the Methodology of Technology Appraisals 2008. www.nice.org.uk/aboutnice/howwework/devnicetech/technologyappraisalprocessguides/?domedia=1&mid=B52851A3–19B9-E0B5-D48284D172BD8459 (accessed 4 July 2012).
- Hallin A, Bergqvist D, Holmberg L. Literature review of surgical management of abdominal aortic aneurysm. Eur J Vasc Endovasc Surg 2001;22:197-204. http://dx.doi.org/10.1053/ejvs.2001.1422.
- Ellis M, Powell JT, Greenhalgh RM. Limitations of ultrasonography in surveillance of small abdominal aortic aneurysms. Br J Surg 1991;78:614-16. http://dx.doi.org/10.1002/bjs.1800780529.
- Singh K, Jacobsen BK, Solberg S, Kumar S, Arnesen E. The difference between ultrasound and computed tomography (CT) measurements of aortic diameter increases with aortic diameter: analysis of axial images of abdominal aortic and common iliac artery diameter in normal and aneurysmal aortas. The Tromsø Study, 1994–1995. Eur J Vasc Endovasc Surg 2004;28:158-67. http://dx.doi.org/10.1016/j.ejvs.2004.03.018.
- Sweeting MJ, Thompson SG, Brown LC, Greenhalgh RM, Powell JT. Use of angiotensin converting enzyme inhibitors is associated with increased growth rate of abdominal aortic aneurysms. J Vasc Surg 2010;52:1-4. http://dx.doi.org/10.1016/j.jvs.2010.02.264.
- Moll FL, Powell JT, Fraedrich G, Verzini F, Haulon S, Waltham M, et al. Management of abdominal aortic aneurysms clinical practice guidelines of the European society for vascular surgery. Eur J 2011;41:S1-S58. http://dx.doi.org/10.1016/j.ejvs.2010.09.011.
- Simao da Silva E, Rodrigues AJ, Magalhaes Castro de Tolosa E, Rodrigues CJ, Villas Boas do Prado G, Nakamoto JC. Morphology and diameter of infrarenal aortic aneurysms: a prospective autopsy study. Cardiovasc 2000;8:526-32. http://dx.doi.org/10.1016/S0967-2109(00)00060-0.
- Darling RC, Messina CR, Brewster DC, Ottinger LW. Autopsy study of unoperated abdominal aortic aneurysms. The case for early resection. Circulation 1977;56:II161-4.
- Cao P, De Rango P, Verzini F, Parlani G, Romano L, Cieri E, et al. Comparison of surveillance versus aortic endografting for small aneurysm repair (CAESAR): results from a randomised trial. Eur J 2011;41:13-25. http://dx.doi.org/10.1016/j.ejvs.2010.08.026.
- Wiernicki I, Safranow K, Baranowska-Bosiacka I, Piatek J, Gutowski P. Haptoglobin 2–1 phenotype predicts rapid growth of abdominal aortic aneurysms. J Vasc Surg 2010;52:691-6. http://dx.doi.org/10.1016/j.jvs.2010.03.016.
- Ferguson CD, Clancy P, Bourke B, Walker PJ, Dear A, Buckenham T, et al. Association of statin prescription with small abdominal aortic aneurysm progression. Am Heart J 2010;159:307-13. http://dx.doi.org/10.1016/j.ahj.2009.11.016.
- De Haro J, Acin F, Bleda S, Varela C, Medina FJ, Esparza L. Prediction of asymptomatic abdominal aortic aneurysm expansion by means of rate of variation of C-reactive protein plasma levels. J Vasc Surg 2012;56:45-52. http://dx.doi.org/10.1016/j.jvs.2012.01.003.
- Powell JT, Sweeting MJ, Brown LC, Gotensparre SM, Fowkes FG, Thompson SG. Systematic review and meta-analysis of growth rates of small abdominal aortic aneurysms. Br J Surg 2011;98:609-18. http://dx.doi.org/10.1002/bjs.7465.
- Norman PE, Powell JT. Abdominal aortic aneurysm: the prognosis in women is worse than in men. Circulation 2007;115:2865-9. http://dx.doi.org/10.1161/CIRCULATIONAHA.106.671859.
- Brewster DC, Cronenwett JL, Hallett JW, Johnston KW, Krupski WC, Matsumura JS. Guidelines for the treatment of abdominal aortic aneurysms. Report of a subcommittee of the Joint Council of the American Association for Vascular Surgery and Society for Vascular Surgery. J Vasc Surg 2003;37:1106-17. http://dx.doi.org/10.1067/mva.2003.363.
- Abedi NN, Davenport DL, Xenos E, Sorial E, Minion DJ, Endean ED. Gender and 30-day outcome in patients undergoing endovascular aneurysm repair (EVAR): an analysis using the ACS NSQIP dataset. J Vasc Surg 2009;50:486-91. http://dx.doi.org/10.1016/j.jvs.2009.04.047.
- Egorova NN, Vouyouka AG, McKinsey JF, Faries PL, Kent KC, Moskowitz AJ, et al. Effect of gender on long-term survival after abdominal aortic aneurysm repair based on results from the Medicare national database. J Vasc Surg 2011;54:1-12. http://dx.doi.org/10.1016/j.jvs.2010.12.049.
- Mehta M, Byrne WJ, Robinson H, Roddy SP, Paty PS, Kreienberg PB, et al. Women derive less benefit from elective endovascular aneurysm repair than men. J Vasc Surg 2012;55:906-13. http://dx.doi.org/10.1016/j.jvs.2011.11.047.
- Choke E, Vijaynagar B, Thompson J, Nasim A, Bown MJ, Sayers RD. Changing epidemiology of abdominal aortic aneurysms in England and Wales: older and more benign?. Circulation 2012;125:1617-25. http://dx.doi.org/10.1161/CIRCULATIONAHA.111.077503.
- Lederle FA, Johnson GR, Wilson SE, Chute EP, Littooy FN, Bandyk D, et al. Prevalence and associations of abdominal aortic aneurysm detected through screening. Aneurysm Detection and Management (ADAM) Veterans Affairs Cooperative Study Group. Ann Intern Med 1997;126:441-9.
- Norman PE, Spilsbury K, Semmens JB. Falling rates of hospitalization and mortality from abdominal aortic aneurysms in Australia. J Vasc Surg 2011;53:274-7. http://dx.doi.org/10.1016/j.jvs.2010.08.087.
- Mureebe L, Egorova N, Giacovelli JK, Gelijns A, Kent KC, McKinsey JF. National trends in the repair of ruptured abdominal aortic aneurysms. J Vasc Surg 2008;48:1101-7. http://dx.doi.org/10.1016/j.jvs.2008.06.031.
- Sandiford P, Mosquera D, Bramley D. Trends in incidence and mortality from abdominal aortic aneurysm in New Zealand. Br J Surg 2011;98:645-51. http://dx.doi.org/10.1002/bjs.7461.
- Twine CP, Williams IM. Systematic review and meta-analysis of the effects of statin therapy on abdominal aortic aneurysms. Br J Surg 2011;98:346-53. http://dx.doi.org/10.1002/bjs.7343.
- Lindholt JS, Henneberg EW, Juul S, Fasting H. Impaired results of a randomised double blinded clinical trial of propranolol versus placebo on the expansion rate of small abdominal aortic aneurysms. Int Angiol 1999;18:52-7.
- Powell JT, Gotensparre SM, Sweeting MJ, Brown LC, Fowkes FG, Thompson SG. Rupture rates of small abdominal aortic aneurysms: a systematic review of the literature. Eur J Vasc Endovasc Surg 2011;41:2-10. http://dx.doi.org/10.1016/j.ejvs.2010.09.005.
Appendix 1 Protocol, search strategy and list of excluded studies for systematic review of growth of small abdominal aortic aneurysms
1.0 Protocol
1.1 Introduction
From spring 2009, the UK National aneurysm-screening programme has been slowly launched across England. The programme uses ultrasonography to detect and measure the diameter of abdominal aortic aneurysms (AAAs) to reduce the number of deaths. However, the programme still needs clear policies for their intervention and surveillance protocols. The policies, which are currently under development, will in large depend on the growth rate (GR) and rupture rate of aneurysms. At present, large aneurysms (over 5.5 cm in diameter) are referred to elective surgery (open surgery or endovascular aneurysm repair, EVAR), while optimal management of small aneurysms (less than 5.5 cm in diameter), which represents ca. 90 per cent of all screen-detected AAAs,1 seems to be in favour of surveillance. 2–5
A number of studies have reported on growth rates of small aneurysms and recommended the following frequencies of follow-up examinations (Table 1). The reported growth rates of small aneurysms (3.0 cm to 3.9 cm in aortic diameter) ranged from 0.2 to 0.41 cm per year,6,7 while Santilli et al. reported a lower rate of 0.11 cm per year. 8 In many cases, simple linear regression has been used to estimate growth rates. However, this does not take into account that aneurysmal growth rate may accelerate with an increased diameter. 9 In addition, it has been reported that aneurysm growth is faster in smokers and slower in patients with diabetes, while differences between genders are still unclear. 9–13 There have been several trials, using antibiotics and beta blockers, to reduce AAA growth (Table 2). None of these trials provide persuasive evidence that a treatment to slow aneurysm growth has been identified, but they should provide good quality data for aneurysm growth.
Most of these studies of aneurysm diameter surveillance have used ultrasonography for monitoring. A few studies have used CT scanning3 or a mixture of CT scanning and ultrasonography. In some comparative studies, the measurements recorded by CT scanning were different to those recorded by ultrasonography. 14–16 This observation will have to be accounted for in the systematic review and meta-analyses proposed. Therefore, it will be useful to assess the mean difference between ultrasonographic and CT diameter measurements to inform the analysis of this systematic review.
This systematic review will be made up of three elements, i.e. literature searching, summary of data, and meta-analysis (Figure 1). Studies will also be identified for an individual patient data (IPD) meta-analysis. The published data on GR for small AAA has not yet been synthesized nor has safe surveillance intervals been determined, especially in women. Therefore, further to the systematic review we will aim to re-analyse all the available individual patient data to achieve more precise estimates of growth rates and determine probabilities of growth within different ranges of aortic diameter. This, in turn, will have an impact on the re-screening intervals for patients with small AAAs.
| Author | Aortic diameter | Follow-up | Additional info |
|---|---|---|---|
| Santilli et al., 20028 | 3.0 cm to 3.9 cm | After 3 years | Male patients |
| McCarthy et al., 200317 | 3.0 cm to 3.4 cm | At 3 years | n/a |
| Lindholt et al., 20006 | 3.0 cm to 3.5 cm | At 3 years | n/a |
| Lindholt et al., 20006 | 3.5 cm to 3.9 cm | Every other year | n/a |
| McCarthy et al., 200317 | 3.5 cm to 3.9 cm | At 1 year | n/a |
| Lindholt et al., 20006 | 4.0 cm | Every year | n/a |
| Author | Agent | Aortic expansion rate |
|---|---|---|
| Mosorin et al., 200118 | Doxycycline | Doxycycline may positively change the outcome of patients with small AAA. |
| Vammen et al., 200119 | Roxithromycin | Roxithromycin reduced the expansion rate of AAAs, in comparison to placebo. |
| Baxter et al., 200220 | Doxycycline | Doxycycline is linked with a gradual reduction in plasma MMP-9 levels. Additional studies are needed to determine effects of doxycycline on aneurysm growth. |
| Karlsson et al., 200921 | Azithromycin | Azithromycin had no effect on AAA expansion. |
| Propranolol Aneurysm Trial Investigators, 200222 | Propranolol | The agent did not significantly affect growth rate of small AAAs. |
| Lindholt et al., 199923 | Propranolol | Only 22% of small AAA was treatable with propranolol (40 mg twice a day) for two years, in comparison to placebo. Need large-scale studies. |
FIGURE 1.
An outline of the strategy behind the systematic review.
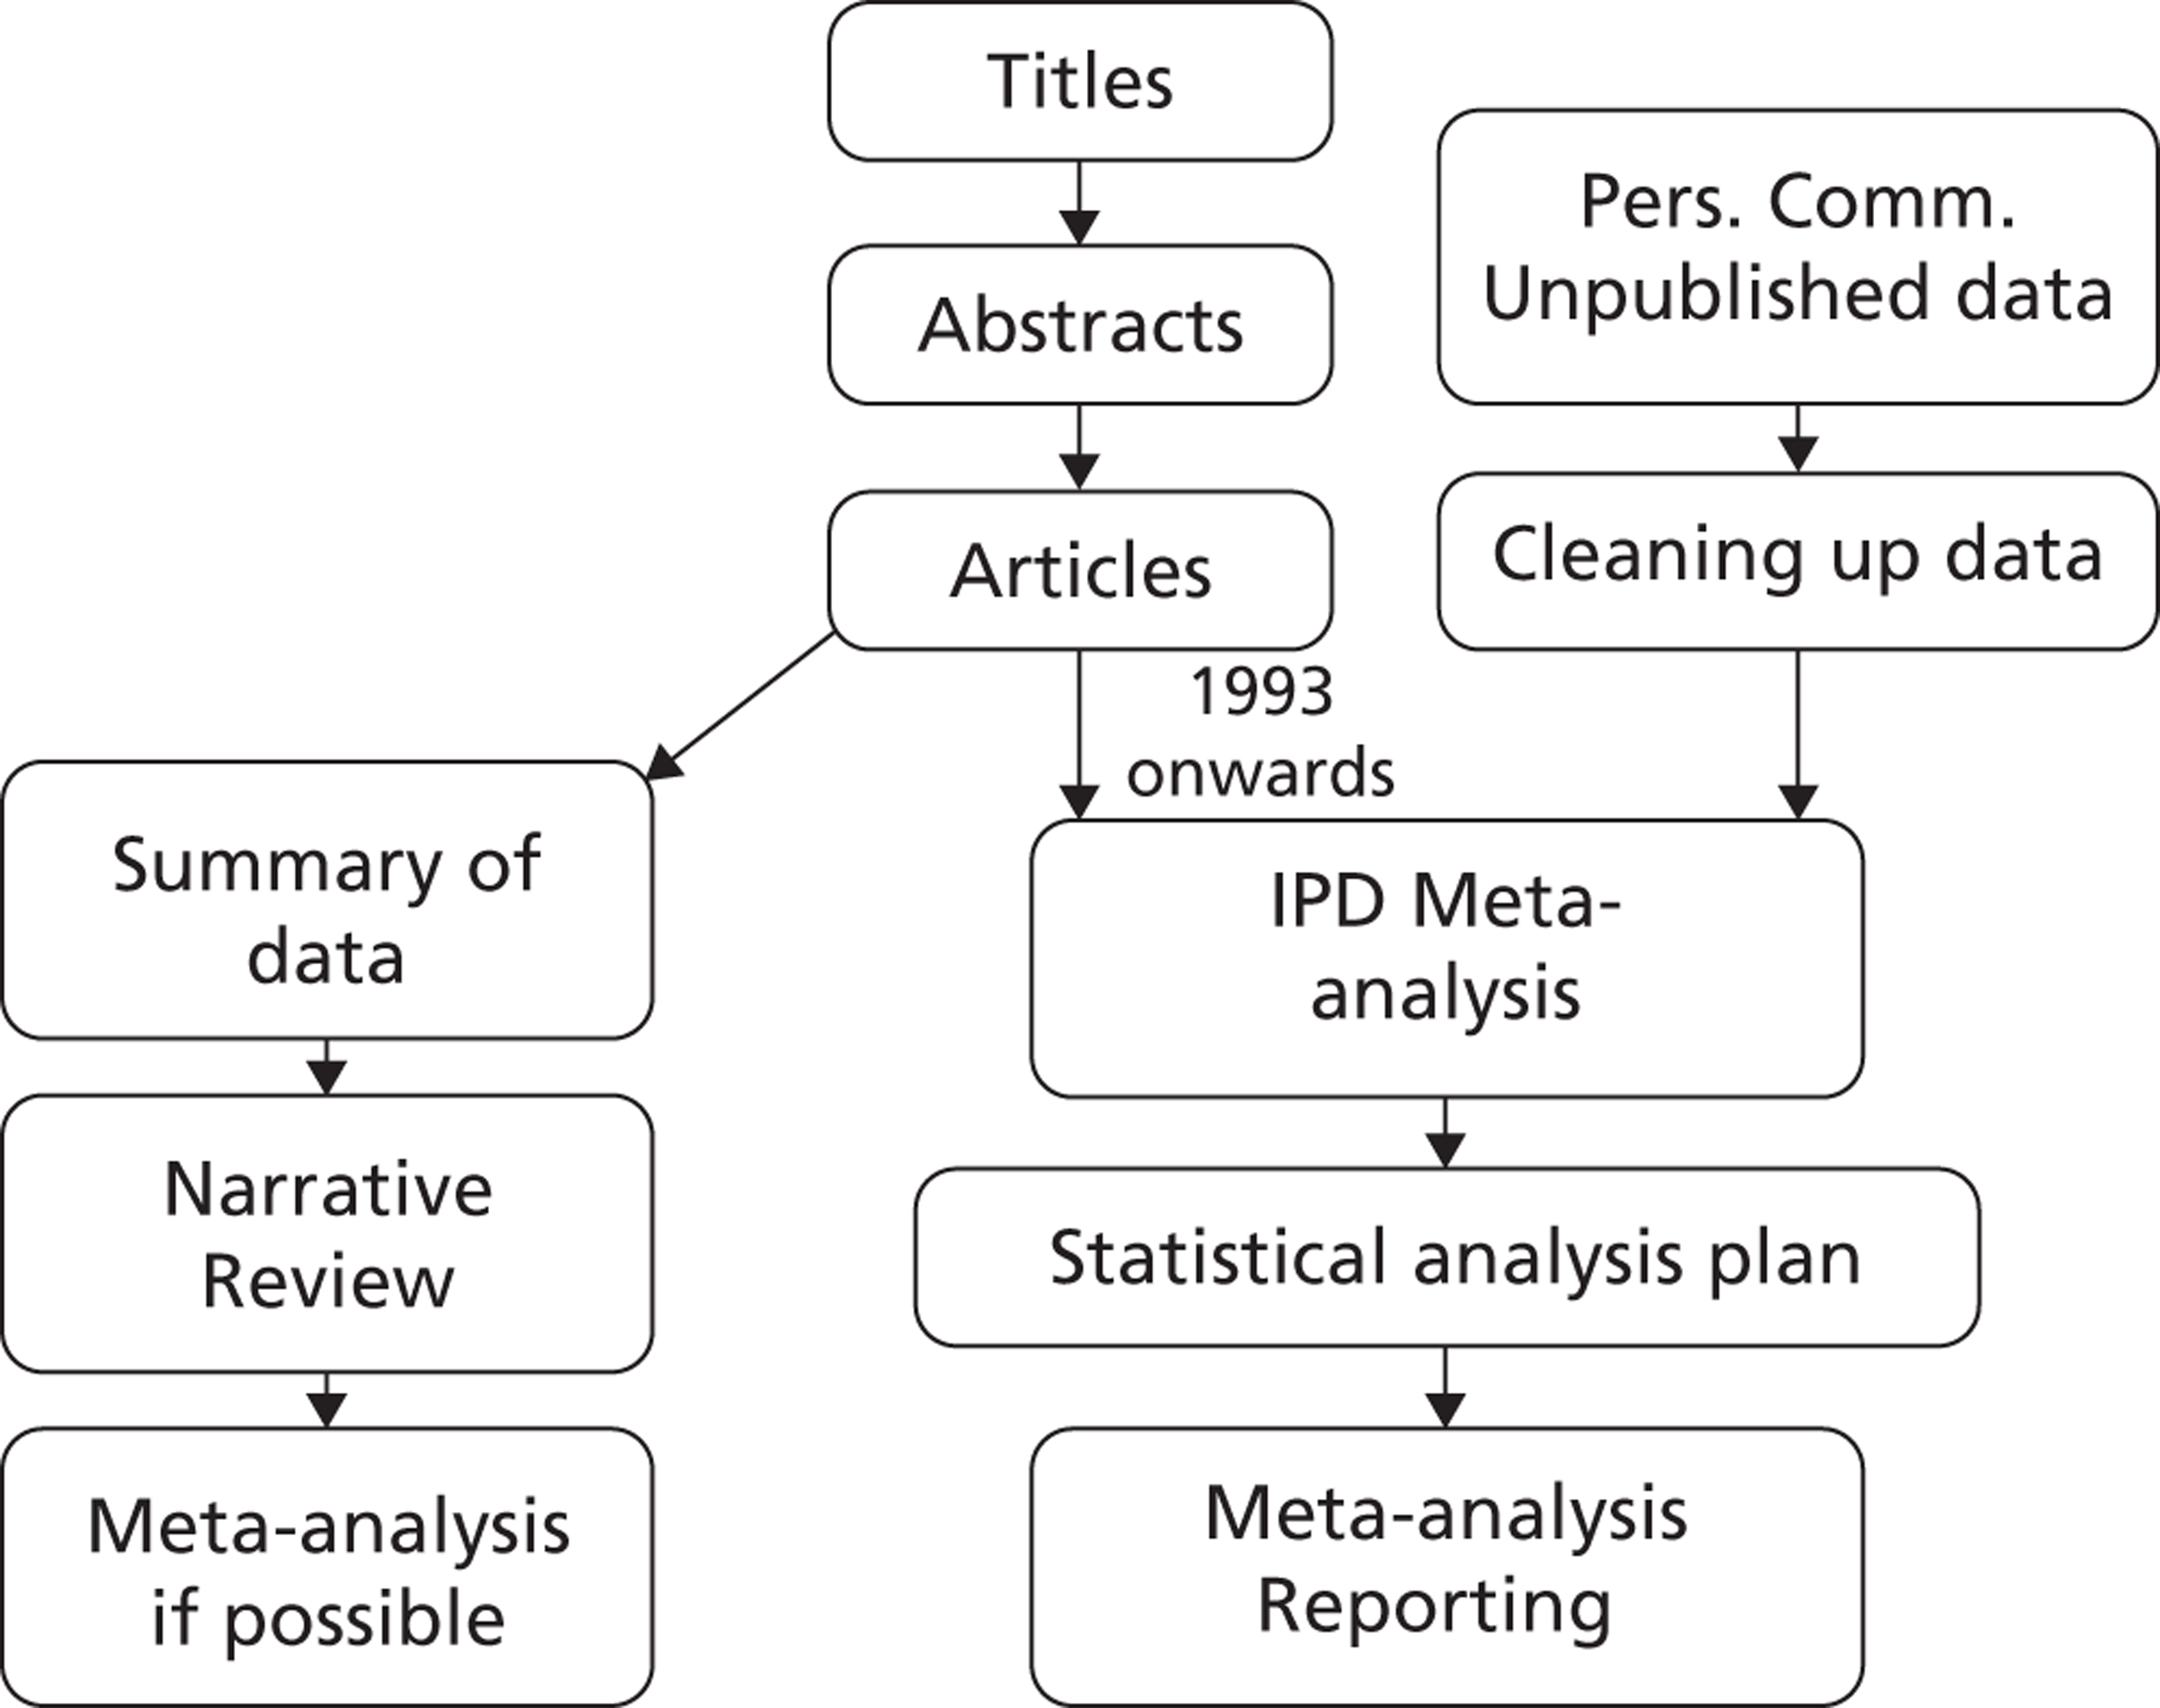
1.2 Specific Aims
The aims of this study are to systematically review published and unpublished data of growth rates of small AAA, as measured by ultrasound or a computed tomography (CT) scan.
We will focus on the following question:
-
What are the growth rates of small AAAs?
We are also interested in two related questions:
-
Given a particular aneurysm diameter, what is the probability of the aneurysm growth at specified time points (3 months, 6 months, or twelve months)?
-
Which factors (size, statins, etc.) influence growth rates?
1.3 Methods
Narrative review
This protocol will be approved by a review committee in order to answer the above questions and the protocol will be followed rigorously by the systematic reviewers (JTP, SMG). A systematic search of the literature will be performed. Search strategies will be designed for MEDLINE, EMBASE and CENTRAL using a combination of controlled vocabulary (MeSH or EMTREE) terms and free text terms. Clinicaltrials.gov (http://clinicaltrials.gov), Current Controlled Trials (http://www.controlled-trials.com/) and the National Research Register (UK) will also be searched for details of ongoing or unpublished trials. All articles between 1950 (MEDLINE) or 1980 (EMBASE) and up until 2009, which matched the inclusion and exclusion criteria (see below), will be selected for the systematic review.
Other sources of information will also be searched:
-
Reference lists of published key articles
-
Books and conference notes.
-
Key authors will be contacted to identify additional sources of publications/data.
The restriction on language of publications applies to English, German, French, Swedish, Danish, and Norwegian.
IPD meta-analysis review
Same as above, except for the following:
All articles between 1993 (MEDLINE) or 1993 (EMBASE) and up until the end of 2009, which matched the inclusion and exclusion criteria (see below), will be selected for the IPD meta-analysis. The IPD reviews will be limited by data availability and age of study (e.g. a 15 year cut off for paper inclusion because older papers are unlikely to provide us with IPD information).
1.4 Study Selection
The exclusion criteria (see below) will be applied to all the accumulated sources of information, such as peer-reviewed articles, conference notes, books, and unpublished data. The initial rejection or inclusion will be based on the study title. However, if the study title is obscure, the abstract will be reviewed. In cases where abstracts are unavailable or inconclusive, the full article will be acquired and reviewed.
Exclusion criteria:
-
Review articles.
-
Editorials.
-
Letters.
-
Case reports.
-
Studies where patient data have been duplicated.
-
Non-human studies (animal, in-vitro, post-mortem).
-
Less than 100 patients.
Full text-versions of the selected shortlist of documents will be obtained. The two reviewers (JTP, SMG) will individually assess them to make sure that they adhere to the initial eligibility criteria. The two reviewers will then individually select studies that meet the inclusion criteria (see below). If an agreement cannot be reached, a third author (LCB) will cast the deciding vote.
The inclusion criteria will be as follows:
-
Men or women ≥ 50 years of age.
-
All ethnic groups.
-
Studies must include participants with a baseline infrarenal AAA (from 3.0 to < 6.0 cm in diameter).
-
Studies must include 500-patient years of observation for small aneurysms (IPD).
-
For studies reporting duplicated patient data, the most recent or most comprehensive publication will be included.
-
Serial ultrasound or CT scans (with size assessed on at least two occasions separated by at least 6 months).
We will focus on retrieving additional information from studies with more than 500-patient years. All studies will be included in the narrative review.
1.5 Data Extraction and Quality Scoring
A data extraction form or a scoring system, which identifies technical details, patient characteristics and potential biases etc., in the selected documents, will be designed independently by the reviewers (JTP, SMG). Any disagreement will be resolved by a third person (LCB). The results of the checklist will be summarised for each study and any study publication that fails to provide sufficient details will be either rejected or the study authors will be contacted for completion of the checklist. The demographic details (age, gender, ethnicity, cigarette smoking status) will also be described. Any study in which authors who does not respond to the reviewer's repeated correspondence for essential information will be withdrawn from the selected shortlist of documents.
Criteria for quality control are as follows:
-
Prospective/retrospective.
-
Source: population screening versus hospital.
-
Consecutive patients entered.
-
Defined surveillance policy.
-
Defined intervention policy.
-
Description of outcomes how growth was ascertained, points of censorship (e.g. rupture, aneurysm repair and death) and how the study was evaluated (multiple, blinded, observation).
-
Reporting methods: graphic, descriptive, tables, statistical uncertainty.
Other data to be extracted:
-
Heterogeneity (men versus women; chronological time; country).
-
Description of baseline characteristics (specifically; age, sex, ethnicity, smoking status, diabetes).
1.6 Data synthesis and analysis
Narrative review
The data synthesis will summarise the extracted data of the included and eligible studies. All the relevant information (e.g. intervention, population, outcomes) will be tabulated. The ineligible studies will also be tabulated (giving reasons for exclusion).
Studies will present their results in many different ways, and so a semi-quantitative review is the most feasible option. For example, some studies present mean growth rate whilst others present the probability of exceeding a certain threshold within a specified time period. The nature in which the outcome is reported together with the statistical analysis used to calculate growth rates will be tabulated for each study.
If feasible, an estimate of the average growth rate (mm/year) together with its standard error will be extracted from each study. Where 95% confidence intervals are quoted in place of standard errors, these will be converted by assuming normality and using the formula SE = (UCL – LCL)/3.92, where UCL and LCL are the upper and lower limits of the 95% confidence interval. 24
If a sample standard deviation and the number of patients is quoted then this will be converted to a standard error of the mean using the formula SE = SD /sqrt(n). If a 95% reference range is quoted, then this will first be converted to a standard deviation using the formula SD = (URR – LRR)/3.92, where URR and LRR are the upper and lower limits of the 95% reference range, and then to a standard error of the mean as above.
A random-effects meta-analysis will be conducted on the rate scale (or on the log rate scale with standard errors transformed using the delta method) using the method of DerSimonian and Laird. 25 Heterogeneity will be assessed using the I2 statistic. Further exploration of between study heterogeneity will be investigated using meta-regression, for example using the mean baseline diameter as a study level covariate. Results will be presented with forest plots, and small study/ publication bias investigated using funnel plots.
IPD review
For studies that provide individual patient data the analysis of growth rates will proceed as follows. Linear random-effects models will be fit to the IPD data allowing for a random baseline diameter and growth rate for each individual in a study. To synthesise the evidence, if feasible, a three-level hierarchical model will be used, with levels for study, individual, and observation. The mean pooled growth rate can be estimated and predictions about the probability of crossing the 55 mm threshold can be made for a number of baseline diameters at different time points following screening. If a three-level model is not feasible then a two-stage approach will be implemented where the estimated mean baseline diameter and growth rate from each study will be synthesised using a bivariate meta-analysis to allow for the correlated outcomes.
Variables that may affect growth rates will be investigated by entering them into the growth model as covariates. However, such analyses may be considered secondary since covariate information will not be available from all studies.
2.0 Search strategy for systematic review of growth rates of small abdominal aortic aneurysms
Database: Ovid MEDLINE(R) <1950 to September Week 4 2009>
Search Strategy:
-
Aortic Aneurysm, Abdominal/ (9934)
-
Aortic Rupture/ (6705)
-
((abdominal or aort$) adj5 aneurysm?).ti,ab. (21792)
-
AAA.ti,ab. (5659)
-
or/1-4 (29273)
-
di.fs. (1607182)
-
ra.fs. (507926)
-
us.fs. (148151)
-
or/6-8 (2132304)
-
exp Ultrasonography/ (198667)
-
Mass Screening/ (65350)
-
Aortography/ (9130)
-
Angiography/ (48487)
-
exp Tomography/ (450036)
-
(survei$ or screen$ re-screen$ or rescreen$ or monitor$ or scan$ or ultrasound or ultra-sound or CT or angiography or ultrasonograph$).ti,ab. (919931)
-
or/10-15 (1401499)
-
5 and (9 or 16) (13876)
-
(grow$ or expan$ or diameter? or ruptur$ or size?).ti,ab. (1556989)
-
17 and 18 (5589)
Database: EMBASE <1980 to 2009 Week 51>
Search Strategy:
-
exp abdominal aorta aneurysm/ (9971)
-
exp aorta rupture/ (2109)
-
exp aneurysm rupture/ (6116)
-
((abdominal or aort$) adj5 aneurysm?).ti,ab. (16134)
-
or/1-4 (23719)
-
di.fs. (1441356)
-
dm.fs. (92679)
-
exp echography/ (252641)
-
screening/ or mass screening/ (47280)
-
disease surveillance/ (2250)
-
exp angiography/ (139893)
-
exp tomography/ (344103)
-
ultrasound/ (40545)
-
(survei$ or screen$ or re-screen$ or rescreen$ or monitor$ or scan$ or ultrasound or ultra-sound or CT or angiography or ultrasonograph$).ti,ab. (1029589)
-
or/6-14 (2426670)
-
5 and 15 (13915)
-
(grow$ or expan$ or diameter? or ruptur$ or size?).ti,ab. (1264858)
-
16 and 17 (6819)
CENTRAL Issue 3, 2009
Clinical Trials Registers
ClinicalTrials.gov and Current Controlled Trials – search term “abdominal aortic aneurysm” or AAA.
3.0 List of studies excluded from systematic review of growth rate of small abdominal aortic aneurysms
| Study | Title | First author | Journal/Year | Reasons for exclusion |
|---|---|---|---|---|
| (1) | AAA in high-risk patients. Outcome of selective management based on size and expansion rate. | Bernstein, E.F. | Ann Surg 1984 | 3 |
| (2) | Actuarial analysis of variables associated with rupture of small AAAs. | Cronenwett, J.L. | Surgery1985 | 3, 7 |
| (3) | How Fast do Very Small AAAs Grow. | Collin, J. | Eur J Vasc Surg 1989 | 2, 3, 7 |
| (4) | Prognosis of AAAs. A population-Based Study. | Nevitt, M.P. | N Engl J Med 1989 | 3 |
| (5) | Wachstumskurven von Bauchaortenaneurysmen. | Kremer, H. | Bildgebung/Imaging 1989 | 1, 2 |
| (6) | The Natural History of Small AAAs: an US study. | Walsh, A.K.M. | Eur J Vasc Surg 1990 | 3, 7 |
| (7) | Natural History of Patients with AAA. | Glimaker, H. | Eur J Vasc Surg 1991 | 3, 4 |
| (8) | Growth rates of subclinical AAAs – implications for review and rescreening programmes. | Collin, J. | Eur J Vasc Surg 1991 | 3 |
| (9) | The Natural History of AAAs. | Guirguis, E.M. | Am J Surg 1991 | 3, 7 |
| (10) | Determination of the expansion rate and incidence of rupture of AAA. | Limet, R. | J Vasc Surg 1991 | 3, 6 |
| (11) | The Spontaneous Course of Small AAAs. Aneurysmal Growth Rates and Life Expectancy. | Zollner, Z. | Klin Wochenschr 1991 | 7 |
| (12) | Aortic Aneurysms: Growth Rates Measured with CT. | Hirose, Y. | Radiology 1992 | 8 |
| (13) | The selective management of small AAA: The Kingston Study. | Brown, P.M. | J Vasc Surg 1992 | 2 |
| (14) | Expansion pattern and risk of rupture of AAA that were not operated on. | Bengtsson, H. | Eur J Surg 1993 | 3, 7 |
| (15) | Morphology of small aneurysms: definition and impact on risk of rupture. | Faggioli, G.L. | Am J Surg 1994 | 3, 4 |
| (16) | A statistical analysis of the growth of small AAAs. | Grimshaw, G.M. | Eur J Vasc Surg 1994 | 3, 4 |
| (17) | Screening for AAA. | Law, M.R. | J Vasc Surg 1994 | 9 |
| (18) | AAA expansion rate: Effect of size and beta-adrenergic blockade. | Gadowski, G.R. | J Vasc Surg 1994 | 3, 5, 6 |
| (19) | Selective management of AAAs in a prospective measurement program. | Brown, P.M | J Vasc Surg 1996 | 2 |
| (20) | A prospective study to define the optimum rescreening interval for small AAA. | Cook, T.A. | CardiovascSurg 1996 | 2, 4 |
| (21) | Growth Rate of Infrarenal Aortic Aneurysms. | Stonebridge, P.A. | Eur J Vasc Endovasc Surg 1996 | 2 |
| (22) | What is the Long-term Outcome for Patients With Very Small AAAs. | Watson, C.J.E. | Eur J Vasc Endovasc Surg 1997 | 3, 7 |
| (23) | Expansion rates of small AAAs. | Englund, R. | Aust N Z J Surg 1998 | 6, 7 |
| (24) | Mortality results for randomised controlled trials of early elective surgery or ultrasonographic surveillance for small AAAs. | UK Small Aneurysm Trial Participants | Lancet 1998 | 2 |
| (25) | AAA Wall Mechanics and their relation to Risk of Rupture. | Sonesson, B. | Eur J Vasc Endovasc Surg 1999 | 4, 7 |
| (26) | The relationship between AAA wall compliance, maximum diameter and growth rate. | Wilson, K. | Cardiovasc Surg 1999 | 2, 3 |
| (27) | Watchful waiting in cases of small AAAs - appropriate for all patients? | Valentine, R.J. | J Vasc Surg 2000 | 3, 4 |
| (28) | Optimal interval screening and observation of AAAs. | Lindholt, J.S. | Ugeskr Laeger 2001 | 2 |
| (29) | The incidence of Small AAAs and the Change in Normal Infrarenal Aortic Diameter: Implications for Screening. | Wilmink, A.B.M. | Eur J Vasc Endovasc Surg 2001 | 2, 4 |
| (30) | Are antihypertensive drugs associated with AAAs? | Wilmink, A.B.M. | J Vasc Surg 2002 | 2, 4 |
| (31) | Growth rate of AAAs. Ultrasounds study and clinical outcome. | Simoni, G. | Minerva Cardioangiol 2002 | 1 |
| (32) | Follow-up of small aneurysms in the infrarenal abdominal aorta. | Barba-Vellez, A. | Angiologia 2002 | 2 |
| (33) | Ten-year outcome of patients with small AAA. | Biancari, F. | Am J Surg 2002 | 3, 6, 7 |
| (34) | Long-term outcomes of immediate repair compared with surveillance of small AAAs. | UK Small Aneurysm Trial Participants | N Engl J Med 2002 | 2 |
| (35) | Prediction of rupture risk in AAA during observation: wall stress versus diameter. | Fillinger, M.F. | J Vasc Surg 2003 | 4 |
| (36) | Discontinuous, Staccato Growth of AAAs. | Kurvers, H. | J Am Coll Surg 2004 | 3, 6 |
| (37) | Four-year follow up of patients with untreated AAAs. | Aziz, M. | ANZ J Surg 2004 | 4 |
| (38) | Mortality and Size of AAA at Long-Term Follow-Up of Patients Not Treated Surgically and Treated With or Without Statins. | Sukhija, R. | Am J Cardiol 2006 | 4, 6, 7 |
| (39) | Influence of sex on expansion rate of AAAs. | Mofidi, R | Br J Surg 2007 | 4, 7 |
| (40) | Optimizing compliance, efficiency, and safety during surveillance of small AAAs. | Armstrong, P.A. | J Vasc Surg 2007 | 4 |
| (41) | Hyperhomocysteinaemia is Associated with the Rate of AAA Expansion. | Halazun, K.J. | Eur J Vasc Endovasc Surg 2007 | 6 |
| (42) | Ultrasound surveillance of ectatic abdominal aortas. | Devaraj, S. | Ann R Coll Surg Engl 2008 | 7 |
| (43) | Activated protein C-protein C inhibitor complex: A new biological marker for aortic aneurysms. | Kolbel, T. | J Vasc Surg 2008 | 4, 6 |
| (44) | The use of statins and fate of small abdominal aortic aneurysms. | Mosorin, M. | ICVTS 2008 | 5, 6 |
| (45) | Search for Serum Biomarkers Associated with AAA growth - A Pilot Study. | Vega de Ceniga, M. | Eur J Vasc Endo 2009 | 2, 3 |
| (46) | The PIVOTAL study: A randomized comparison of endovascular repair versus surveillance in patients with smaller abdominal aortic aneurysms | Ouriel, K. | J Vasc Surg 2009 | 4 |
References
- Ashton H. A., . The Multicentre Aneurysm Screening Study (MASS) into the effect of abdominal aortic aneurysm screening on mortality in men: a randomised controlled trial. Lancet 2002;360:1531-9.
- Cao P., . Results from the CAESAR Trial Comparing Observation with EVAR for Small AAAs. Veith Symposium Presentation n.d. URL: http://www.veithsymposium.org/pdf/vei/2671.pdf.
- Ouriel K., Clair D. G., Kent K. C., Zarins C. K. Endovascular repair compared with surveillance for patients with small abdominal aortic aneurysms. J. Vasc. Surg. 2010;51:1081-7.
- Powell J. T., . Final 12-year follow-up of surgery versus surveillance in the UK Small Aneurysm Trial. Br. J. Surg. 2007;94:702-8.
- Lederle F. A., . Immediate repair compared with surveillance of small abdominal aortic aneurysms. N. Engl. J. Med. 2002;346:1437-44.
- Lindholt J. S., Vammen S., Juul S., Fasting H., Henneberg E. W. Optimal Interval Screening and Surveillance of Abdominal Aortic Aneurysms. European Journal of Vascular and Endovascular Surgery 2000;20:369-73. https://doi.org/10.1053/ejvs.2000.1191.
- Brown P. M., Pattenden R., Vernooy C., Zelt D. T., Gutelius J. R. Selective management of abdominal aortic aneurysms in a prospective measurement program. J. Vasc. Surg. 1996;23:213-20.
- Santilli S. M., . Expansion rates and outcomes for the 3.0-cm to the 3.9-cm infrarenal abdominal aortic aneurysm. Journal of Vascular Surgery 2002;35:666-71.
- Brady A. R., Thompson S. G., Fowkes F. G., Greenhalgh R. M., Powell J. T. Abdominal aortic aneurysm expansion: risk factors and time intervals for surveillance. Circulation 2004;110:16-21.
- Brown L. C., Powell J. T. Risk factors for aneurysm rupture in patients kept under ultrasound surveillance. UK Small Aneurysm Trial Participants. Ann. Surg. 1999;230:289-96.
- Brown P. M., Zelt D. T., Sobolev B. The risk of rupture in untreated aneurysms: the impact of size, gender, and expansion rate. J. Vasc. Surg. 2003;37:280-4.
- Fillinger M. F., . Anatomic characteristics of ruptured abdominal aortic aneurysm on conventional CT scans: Implications for rupture risk. J. Vasc. Surg. 2004;39:1243-52.
- Heikkinen M., Salenius J. P., Auvinen O. Ruptured abdominal aortic aneurysm in a well-defined geographic area. J. Vasc. Surg 2002;36:291-6.
- Lederle F. A., . Variability in measurement of abdominal aortic aneurysms. Abdominal Aortic Aneurysm Detection and Management Veterans Administration Cooperative Study Group. J. Vasc.Surg. 1995;21:945-52.
- Ellis M., Powell J. T., Greenhalgh R. M. Limitations of ultrasonography in surveillance of small abdominal aortic aneurysms. Br. J. Surg. 1991;78:614-6.
- Wanhainen A., Bergqvist D., Bjorck M. Measuring the abdominal aorta with ultrasonography and computed tomography - difference and variability. Eur J Vasc Endovasc Surg 2002;24:428-34. https://doi.org/S107858840291748X [pii].
- McCarthy R. J., . Recommendations for screening intervals for small aortic aneurysms. Br. J. Surg. 2003;90:821-6.
- Mosorin M., . Use of doxycycline to decrease the growth rate of abdominal aortic aneurysms: a randomized, double-blind, placebo-controlled pilot study. J. Vasc. Surg. 2001;34:606-10.
- Vammen S., Lindholt J. S., Ostergaard L., Fasting H., Henneberg E. W. Randomized double-blind controlled trial of roxithromycin for prevention of abdominal aortic aneurysm expansion. Br. J. Surg. 2001;88:1066-72.
- Baxter B. T., . Prolonged administration of doxycycline in patients with small asymptomatic abdominal aortic aneurysms: report of a prospective (Phase II) multicenter study. J. Vasc. Surg. 2002;36:1-12.
- Karlsson L., Gnarpe J., Bergqvist D., Lindback J., Parsson H. The effect of azithromycin and Chlamydophilia pneumonia infection on expansion of small abdominal aortic aneurysms—a prospective randomized double-blind trial. J. Vasc. Surg. 2009;50:23-9.
- Propranolol Aneurysm Trial, I . Propranolol for small abdominal aortic aneurysms: results of a randomized trial. J. Vasc. Surg. 2002;35:72-9.
- Lindholt J. S., Henneberg E. W., Juul S., Fasting H. Impaired results of a randomised double blinded clinical trial of propranolol versus placebo on the expansion rate of small abdominal aortic aneurysms. Int. Angiol. 1999;18:52-7.
- Sutton A. J., Abrams K. R., Jones D. R., Sheldon T. A. Methods for Meta-analysis in Medical Research. Wiley; 2000.
- DerSimonian R., Laird N. Meta-analysis in clinical trials. Control Clin.Trials 1986;7:177-88.
Appendix 2 Protocol, search strategy and list of excluded studies for systematic review of rupture of small abdominal aortic aneurysms
1.0 Protocol
1.1 Introduction
From spring 2009, the UK National aneurysm screening programme has been slowly launched across England. The programme uses ultrasonography to detect and measure the diameter of abdominal aortic aneurysms (AAAs) to reduce the number of deaths. However, the programme still needs clear policies for their intervention and surveillance protocols. The policies, which are currently under development, will in large depend on the rupture rate (RR) and growth rate of aneurysms. At present, large aneurysms (over 5.5 cm in diameter) are referred to elective surgery (open surgery or endovascular aneurysm repair, EVAR), while optimal management of small aneurysms (less than 5.5 cm in diameter), which represents ca. 90 per cent of all screen-detected AAAs,1 seems to be in favour of surveillance. Three trials showed that survival in patients with small AAAs is not significantly improved by elective surgery,2–4 while other trials focused on whether early endovascular repair offer a survival benefit to patients with small AAAs. 5,6 Thus, there are a number of published trials that investigated rupture rates and growth rates of both large and small aneurysms. The consensus is that aneurysms, which are 4.0–5.5 cm in diameter, have a RR of 1% per annum or less,2,7 while smaller aneurysms have an even lower RR. 8
This systematic review will be made up of three elements, i.e. literature searching, summary of data, and meta-analysis (Figure 1). Studies will also be identified for an IPD meta-analysis. The published data on RR has not yet been synthesised nor has safe surveillance intervals been determined. Therefore, further to the systematic review we will aim to re-analyse all the available individual patient data to achieve more precise estimates of rupture rates and determine probabilities of rupture within different ranges of aortic diameter. This, in turn, will have an impact on the re-screening intervals for patients with small AAAs.
FIGURE 1.
An outline of the strategy behind the systematic review.
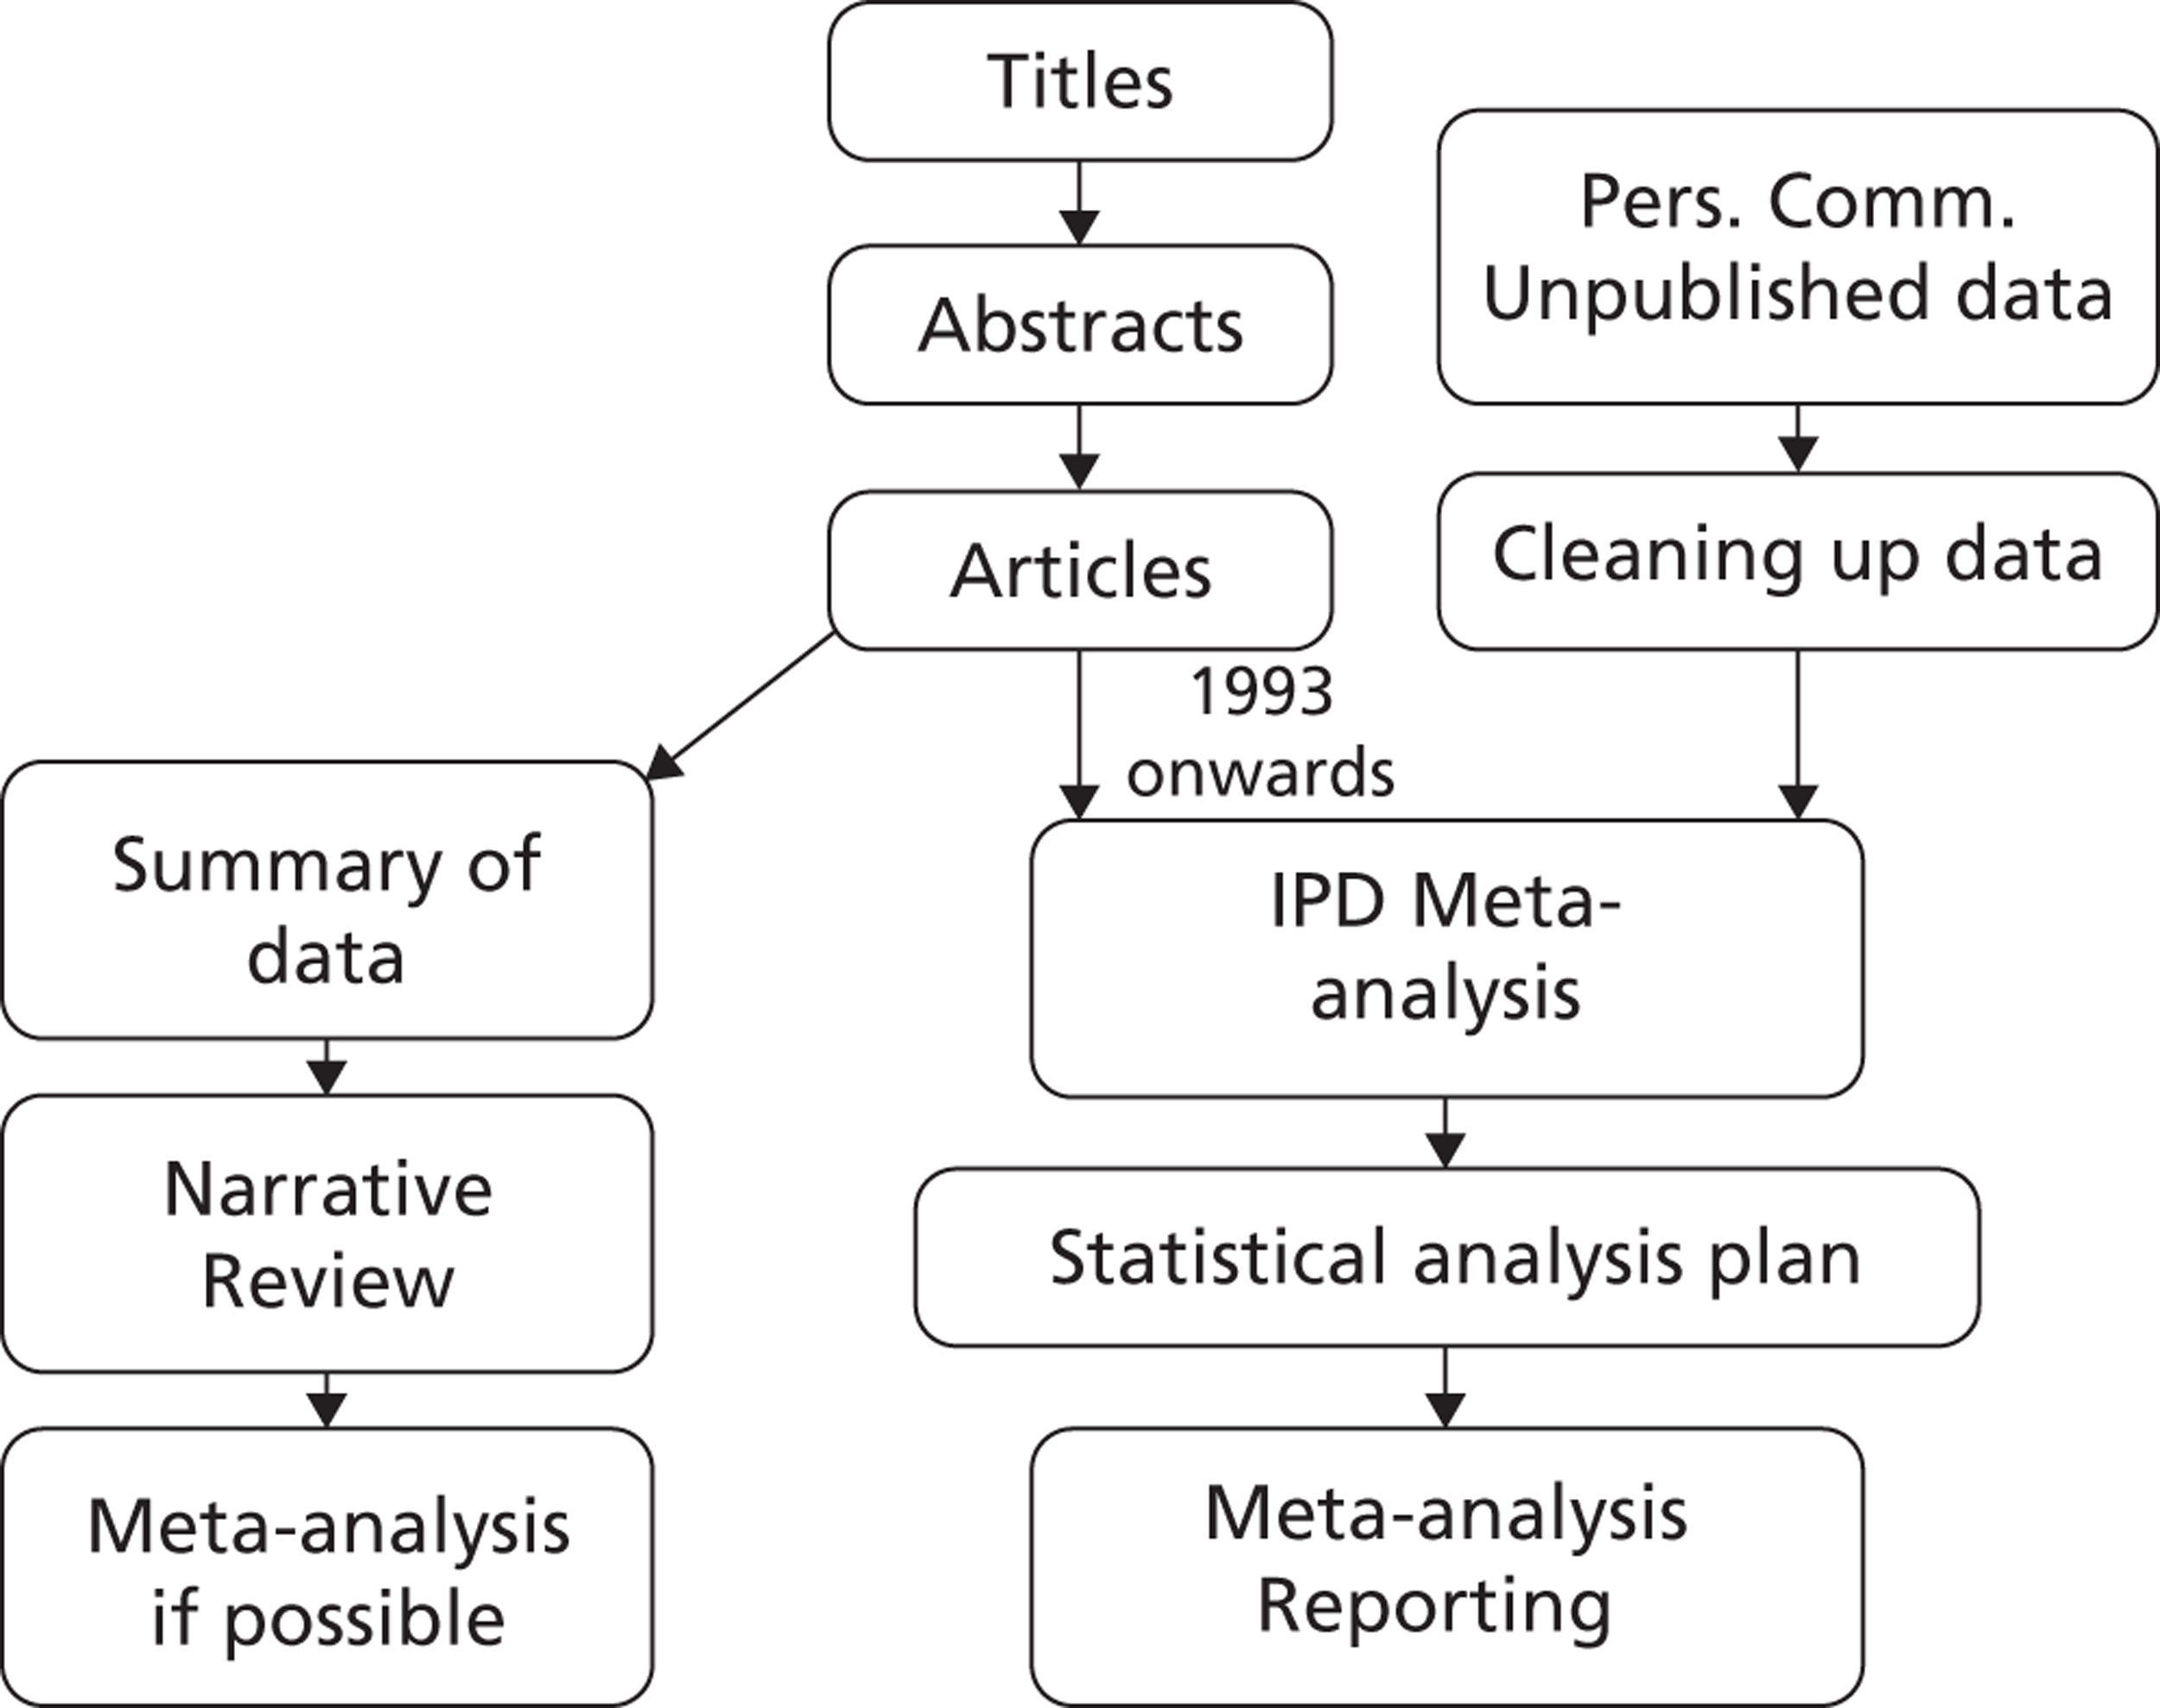
1.2 Specific Aims
The aims of this study are to systematically review published and unpublished data of rupture rates of small AAA, as measured by ultrasound or a computed tomography (CT) scan.
We will focus on the following question:
-
What are the rupture rates of small AAAs?
We are also interested in two related questions:
-
Given a particular aneurysm diameter, what is the probability of the aneurysm rupturing before the next scan appointment if it is timed, for example, at 3 months, 6 months, or a year?
-
What factors (size, etc.) influences rupture rates?
1.3 Methods
Narrative review
This protocol will be approved by a review committee in order to answer the above questions and the protocol will be followed rigorously by the systematic reviewers (JTP, SMG). Initially, a systematic search of the literature will be performed using databases, such as MEDLINE, EMBASE, Clinicaltrials.gov and Controlled Clinical Trials (including archived registers). In addition, an optimised search strategy will be generated for each database. All articles between 1950 (MEDLINE) or 1980 (EMBASE) and up until 2009, which matched the inclusion and exclusion criteria (see below), will be selected for the systematic review.
Other sources of information will also be searched:
-
Reference lists of published key articles.
-
Books and conference notes.
-
Key authors will be contacted to identify additional sources of publications/data.
The restriction on language of publications applies to English, German, French, Swedish, Danish, and Norwegian.
IPD meta-analysis review
Same as above, except for the following:
All articles between 1993 (MEDLINE) or 1993 (EMBASE) and up until the end of 2009, which matched the inclusion and exclusion criteria (see below), will be selected for the IPD meta-analysis.
1.4 Study Selection
The exclusion criteria (see below) will be applied to all the accumulated sources of information, such as peer-reviewed articles, conference notes, books, and unpublished data. The initial rejection or inclusion will be based on the study title. However, if the study title is obscure, the abstract will be reviewed. In cases where abstracts are unavailable or inconclusive, the full article will be acquired and reviewed.
Exclusion criteria:
-
Review articles.
-
Editorials.
-
Letters.
-
Case reports.
-
Studies where patient data have been duplicated.
-
Non-human studies (animal, in-vitro, post-mortem).
Full text-versions of the selected shortlist of documents will be obtained. The two reviewers (JTP, SMG) will individually assess them to make sure that they adhere to the initial eligibility criteria. The two reviewers will then individually select studies that meet the inclusion criteria (see below). If an agreement cannot be reached, a third author (LCB) will cast the deciding vote.
The inclusion criteria will be as follows:
-
Men or women ≥ 50 years of age.
-
All ethnic groups.
-
Studies must include participants with a baseline infrarenal AAA (from 3.0 to < 6.0 cm in diameter).
-
All papers on rupture will be retrieved to include low rupture rates. Instead of minimum rupture number, we will focus on 500 patient-years of observation for small aneurysms for collecting IPD data. Papers reporting on aneurysms of all sizes, including mainly those > 5.5 cm and having < 10 ruptures will be excluded.
-
For studies reporting duplicated patient data, the most recent or most comprehensive publication will be included.
We will focus on retrieving additional information from studies with more than 500-patient years. All studies will be included in the narrative review.
1.5 Data Extraction and Quality Scoring
A data extraction form or a scoring system, which identifies technical details, patient characteristics and potential biases etc., in the selected documents, will be designed independently by the reviewers (JTP, SMG). Any disagreement will be resolved by a third person (LCB). The results of the checklist will be summarised for each study and any studies that fail to provide all details will be either rejected or the study authors will be contacted for completion of the checklist. The demographic details (age, gender, ethnicity, cigarette smoking status) will also be described. Any study authors who does not respond to the reviewer's repeated correspondence will be withdrawn from the selected shortlist of documents.
Criteria for quality control are as follows:
-
Prospective/retrospective.
-
Source: population screening versus hospital.
-
Consecutive patients entered.
-
Defined surveillance policy: patients must be monitored at least annually (protocol or attendance) for aortic diameter by ultrasound or CT scan.
-
Defined intervention policy.
-
Description of outcomes (how ruptures was ascertained) and how the study was evaluated (multiple, blinded, observation). Ruptures must have occurred within 15 months of the previous measurement of aortic diameter.
-
Reporting methods: graphic, descriptive, tables, statistical uncertainty.
Other data to be extracted:
-
Heterogeneity (men versus women; chronological time; country).
-
Description of baseline characteristics (specifically; age, sex, smoking status, diabetes).
1.6 Data synthesis and analysis
Narrative review
The data synthesis will summarise the extracted data of the included and eligible studies. All the relevant information (e.g. number of ruptures, prophylactic interventions, population, outcomes) will be tabulated. The ineligible studies will also be tabulated (giving reasons for exclusion). The way in which the outcome is reported together with the statistical analysis used to calculate rupture rates will be tabulated for each study. If feasible, an estimate of the rupture rate (ruptures per person-year) will be calculated from each study by extracting the number of reported ruptures and person-years of follow-up. An ideal study would calculate length of follow-up by censoring individuals at death, aneurysm repair, or when the aneurysm becomes too large (> 54 mm or lower diameter e.g. 50 mm if relevant). We will describe the censoring mechanism for each study from which rupture rate data have been extracted.
The standard error of a log rate estimate will be calculated using the formula
where d is the number of observed ruptures for that study.
A random-effects meta-analysis will be conducted on the log rate scale using the method of DerSimonian and Laird. 9 Heterogeneity will be assessed using the I2 statistic. Further exploration of between study heterogeneity will be investigated using meta-regression, for example using the mean baseline diameter as a study level covariate. Results will be presented with Forest plots, and small study/publication bias investigated using funnel plots.
IPD review
For studies that provide individual patient data on both the rupture and growth of aneurysms, the analysis will proceed as follows. A joint longitudinal and survival model will be fit to the IPD data for each study to allow the relationship between the underlying AAA diameter and rate of rupture to be modelled. A joint model avoids the problem of using AAA diameter as a time-dependent covariate in a survival model, which can be problematic if AAA diameters are measured infrequently since an effect of diameter on hazard of rupture may be attenuated. Instead, the growth of the aneurysm is modelled for each individual and the estimated size at the time of rupture/censoring event is related to the hazard of rupture.
To synthesise the evidence, a two-stage approach is probably the most feasible approach. To extract estimates of the baseline hazard, parametric survival models will be considered. The suitability of a parametric model will be assessed by plotting log( – log(S(t))) against log t, where S(t) is estimated non-parametrically. A straight line suggests that a Weibull model is appropriate, whilst a straight line with gradient 1 suggests that an Exponential model is feasible. For a parametric survival model, estimates of the baseline hazard of rupture, and the log hazard ratio can be extracted from the joint model for each study. A multivariate random-effects meta-analysis of the model parameters can then be performed to obtain a pooled baseline hazard and log hazard ratio. Heterogeneity will be assessed, and results presented using forest plots.
2.0 Search strategy
Database: Ovid MEDLINE(R) <1950 to December Week 4 2009>
Search Strategy:
-
Aortic Aneurysm, Abdominal/ (9934)
-
Aortic Rupture/ (6705)
-
((abdominal or aort$) adj5 aneurysm?).ti,ab. (21792)
-
AAA.ti,ab. (5659)
-
or/1-4 (29273)
-
di.fs. (1607182)
-
ra.fs. (507926)
-
us.fs. (148151)
-
or/6-8 (2132304)
-
exp Ultrasonography/ (198667)
-
Mass Screening/ (65350)
-
Aortography/ (9130)
-
Angiography/ (48487)
-
exp Tomography/ (450036)
-
(survei$ or screen$ re-screen$ or rescreen$ or monitor$ or scan$ or ultrasound or ultra-sound or CT or angiography or ultrasonograph$).ti,ab. (919931)
-
or/10-15 (1401499)
-
5 and (9 or 16) (13876)
-
(grow$ or expan$ or diameter? or ruptur$ or size?).ti,ab. (1556989)
-
17 and 18 (5589)
Database: EMBASE <1980 to 2009 Week 51>
Search Strategy:
-
exp abdominal aorta aneurysm/ (9971)
-
exp aorta rupture/ (2109)
-
exp aneurysm rupture/ (6116)
-
((abdominal or aort$) adj5 aneurysm?).ti,ab. (16134)
-
or/1-4 (23719)
-
di.fs. (1441356)
-
dm.fs. (92679)
-
exp echography/ (252641)
-
screening/ or mass screening/ (47280)
-
disease surveillance/ (2250)
-
exp angiography/ (139893)
-
exp tomography/ (344103)
-
ultrasound/ (40545)
-
(survei$ or screen$ or re-screen$ or rescreen$ or monitor$ or scan$ or ultrasound or ultra-sound or CT or angiography or ultrasonograph$).ti,ab. (1029589)
-
or/6-14 (2426670)
-
5 and 15 (13915)
-
(grow$ or expan$ or diameter? or ruptur$ or size?).ti,ab. (1264858)
-
16 and 17 (6819)
CENTRAL Issue 3, 2009
Clinical Trials Registers
ClinicalTrials.gov and Current Controlled Trials – search term “abdominal aortic aneurysm” or AAA.
3.0 List of studies excluded from systematic review of rupture of small abdominal aortic aneurysms
| Study | Title | First author | Journal/Year | Reasons for exclusion |
|---|---|---|---|---|
| (1) | Abdominal Aortic Aneurysms. A Reappraisal. | Schatz, I.L. | Circulation 1962 | 4,7 |
| (2) | Contribution of Abdominal Aortic Aneurysmectomy to Prolongation of Life. | Szilagyi, D.E. | Ann Surg 1996 | 4,5 |
| (3) | The Unoperated Abdominal Aortic Aneurysm. | Klippel, A.P. | Am J Surg 1966 | 7,8 |
| (4) | Comparative study of elective resection and expectant treatment of abdominal aortic aneurysm. | Foster, J.H. | Surg Gyn Obs 1969 | 4 |
| (5) | Results of surgical versus non-surgical treatment of Abdominal Aortic Aneurysm. | Stanford, J.R. | Vasc Surg 1978 | 4,7 |
| (6) | Das infrarenale Bauchaorten-Aneurysma. Klinik, Therapie, und Langzeitprognose. | Ruckert, R.F. | Schweiz Med Wschr 1981 | 1,4 |
| (7) | Abdominal aortic aneurysms: The changing natural history. | Bickerstaff, L.K. | J Vasc Surg 1984 | 4 |
| (8) | Sonographische Verlaufsbeobachtungen von Bauchaortenaneurysmen. | Kremer, H. | Klin Wschr 1984 | 1,8 |
| (9) | Abdominal Aortic Aneurysm in High-Risk Patients. Outcome of Selective Management Based on Size and Expansion Rate. | Bernstein, E.F. | Ann Surg 1984 | 4 |
| (10) | Abdominal Aortic Aneurysm in Elderly Patients. Selective Management Based on Clinical Status and Aneurysmal Expansion Rate. | Sterpetti, A.V. | Am J Surg 1985 | 4,6 |
| (11) | Wachtumskurven von Bauchaortenaneurysmen | Kremer, H. | Bildgebung 1989 | 1 |
| (12) | Determination of the expansion rate and incidence of rupture. | Limet, R. | J Vasc Surg 1991 | 5,6 |
| (13) | Abdominal Aortic Aneurysm in High-Risk Patients. Outcome of Selective Management Based on Size and Expansion Rate. | Bengtsson, H. | Eur J Surg 1993 | 3,7 |
| (14) | Morphology of small aneurysms: definition and impact on Risk of Rupture. | Faggioli, G.L. | Am J Surg 1994 | 4 |
| (15) | Abdominal aortic aneurysm expansion rate: Effect of size and beta-adrenergic blockade. | Gadowski, G.R. | J Vasc Surg 1994 | 6,7 |
| (16) | Screening for abdominal aortic aneurysms. | Law, M.R. | J Med Screen 1994 | 3 |
| (17) | Influence of Selective Management on the Prognosis and the Risk of Rupture of Abdominal Aortic-Aneurysms. | Schewe, C.K. | ClinicalInvestigator 1994 | 4 |
| (18) | The cost-effectiveness of early surgery versus watchful waiting in the management of small abdominal aortic aneurysms. | Katz, D.A. | J Vasc Surg 1994 | 3 |
| (19) | Actuarial analysis of variables associated with rupture of small abdominal aortic aneurysms. | Cronenwett, J.L. | Surgery 1995 | 7 |
| (20) | Influence of screening on the incidence of ruptured abdominal aortic aneurysm: 5-year results of a randomized controlled study. | Scott, R.A.P. | Br J Surg 1995 | 2 |
| (21) | Selective management of abdominal aortic aneurysms in a prospective measurement program. | Brown, P.M. | J Vasc Surg 1996 | 2 |
| (22) | Growth rates and risk of rupture of abdominal aortic aneurysms. | Vardulaki, K.A. | J Vasc Surg 1996 | 3 |
| (23) | Abdominal aortic aneurysm rupture rates: A 7-year follow-up of the entire abdominal aortic aneurysm population detected by screening. | Scott, R.A.P. | J Vasc Surg 1998 | 2 |
| (24) | The influence of screening on the incidence of ruptured abdominal aortic aneurysms. | Wilmink, A.B.M. | J Vasc Surg 1999 | 4 |
| (25) | Quantitative Evaluation of Abdominal Aortic Aneurysm. | Kanaoka, Y. | Vasc Surg 1999 | 4, 7 |
| (26) | Abdominal Aortic Aneurysm Wall Mechanics and their Relation to Risk of Rupture. | Sonesson, B. | EJVES 1999 | 4 |
| (27) | In vivo analysis of mechanical wall stress and abdominal aortic aneurysm rupture risk. | Fillinger, M.F. | J Vasc Surg 2002 | 4,7 |
| (28) | Randomized clinical trial of screening for abdominal aortic aneurysm in women. | Scott, R.A.P. | Br J Surg 2002 | 4 |
| (29) | Long-term outcomes of immediate repair compared with surveillance of small abdominal aortic aneurysms. | Brady, A.R. | N Engl J Med 2002 | 2,7 |
| (30) | The relationship between aortic wall distensibility and rupture of infrarenal abdominal aortic aneurysm. | Biancari, F.B. | Am J Surg 2002 | 6,8 |
| (31) | Follow-up of small aneurysms in the infrarenal abdominal aorta. | Barba-Vellez, L. | Angiologia 2002 | 2 |
| (32) | Ten-year outcome of patients with very small abdominal aortic aneurysm. | Wilson, K.A. | J Vasc Surg 2002 | 4 |
| (33) | Four-year follow-up of patients with untreated abdominal aortic aneurysms. | Aziz, M. | ANZ J Surg 2004 | 7 |
| (34) | Fifteen-year follow-up of a randomized clinical trial of ultrasonographic screening for abdominal aortic aneurysms. | Ashton, H.A. | Br J Surg 2007 | 3,4 |
| (35) | Abdominal Aortic Aneurysms, Increasing Infrarenal Aortic Diameter, and Risk of Total Mortality and Incident Cardiovascular Disease Events. 10-Year Follow-Up Data From the Cardiovascular Health Study. | Freiberg, M.S. | Circulation 2008 | 4,5 |
| (36) | Activated protein C-protein C inhibitor complex in Patients With Abdominal Aortic Aneurysms: Is it Associated With Diameter and Growth Rate. | Kolbel, T. | Vasc Endovasc Surg 2008 | 4,6 |
| (37) | Analysis of Expansion Patterns in 4–4.9 cm Abdominal Aortic Aneurysms. | Vega de Ceniga, M. | Ann Vasc Surg 2008 | 2 |
| (38) | The use of statins and fate of small abdominal aortic aneurysms. | Mosorin, M. | ICVTS 2008 | 4,6 |
| (39) | Abdominal Aortic Aneurysm Development in Men Following a “normal” Aortic Ultrasound Scan. | Hafez, H. | EJVES 2008 | 4 |
| (40) | The effect of azithromycin and Chlamydophilia pneumonia infection on expansion of small abdominal aortic aneurysms – A prospective randomized double-blind trial. | Karlsson, L. | J Vasc Surg 2009 | 4 |
References
- Ashton H. A., . The Multicentre Aneurysm Screening Study (MASS) into the effect of abdominal aortic aneurysm screening on mortality in men: a randomised controlled trial. Lancet 2002;360:1531-9.
- Lederle F. A., . Immediate repair compared with surveillance of small abdominal aortic aneurysms. N.Engl.J.Med. 2002;346:1437-44.
- The United Kingdom Small Aneurysm Trial, P . Long-term outcomes of immediate repair compared with surveillance of small abdominal aortic aneurysms. N.Engl.J.Med. 2002;346:1445-52.
- Powell J. T., . Final 12-year follow-up of surgery versus surveillance in the UK Small Aneurysm Trial. Br.J.Surg. 2007;94:702-8.
- Ouriel K., Clair D. G., Kent K. C., Zarins C. K. Endovascular repair compared with surveillance for patients with small abdominal aortic aneurysms. J Vasc.Surg 2010;51:1081-7.
- Cao P., . Comparison of surveillance versus aortic endografting for small aneurysm repair (CAESAR): Results from a randomised trial. Eur J Vasc.Endovasc.Surg 2011;41:13-25.
- The, U. K. S. A. T. P . Mortality results for randomised controlled trial of early elective surgery or ultrasonographic surveillance for small abdominal aortic aneurysms. Lancet 1998;352:1649-55.
- Brown L. C., Powell J. T. Risk factors for aneurysm rupture in patients kept under ultrasound surveillance. UK Small Aneurysm Trial Participants. Ann.Surg. 1999;230:289-96.
- DerSimonian R., Laird N. Meta-analysis in clinical trials. Control Clin.Trials 1986;7:177-88.
Appendix 3 Statistical methods and excluded studies for individual patient data meta-analysis
Statistical methods
Growth
For each study separately, the AAA diameter for patient i at time t, yi(t), is modelled using a linear random-effects growth model:
where b0i and b1i are the random intercept and slope, respectively, for patient i. The random effects have mean β0 and β1 and variance–covariance matrix Σ, and εi(t) is the residual error term. The time origin (t = 0) is defined as the time of the baseline measurement for each individual (first measurement recorded between 3.0 and 5.4 cm).
Given this model, the expected growth rate, b1, for an individual with a single diameter measurement u taken at baseline, can be expressed as follows:
Bayesian Markov chain Monte Carlo (MCMC) methods are used to fit the model to each data set. The median, SD, and 2.5th and 97.5th percentiles of the posterior distribution are then obtained for the expected growth rate given baseline diameter u, using Equation 2.
A random-effects meta-analysis is then conducted in a second stage using the growth rates obtained from each study and separately for each possible millimetre increase in baseline diameter from 3.0 to 5.4 cm. Specifically, let xk(u) be the posterior median estimate of growth for study k given baseline diameter u and sk(u) the corresponding posterior SD. Then the random-effects meta-analysis model is:
where τ2(u) is the between-study heterogeneity variance and ɸ(u) is the overall pooled effect for baseline diameter u.
The estimated time after baseline for which there is a 10% chance of crossing the threshold for surgery (5.5 cm) is calculated as follows. First, the expected AAA diameter at time t is μy(t) = β0 + β1t, the variance is vy(t) = σ02 + t2σ12 + 2tρσ0σ1 + σw2, and the covariance between a measurement taken at time t > 0 and one taken at baseline (on the same individual) is cy(t) = σ02 + tρσ0σ1. Using these results, the expected AAA diameter at time t given a single diameter measurement u taken at baseline is:
using the properties of a bivariate normal distribution, and the variance of the measurement at t given baseline diameter u is:
Hence, the probability of a measurement at time t being over the threshold for surgery (5.5 cm) given baseline diameter u can be found from the tail area of a Gaussian distribution, as follows:
where Φ is the standard normal cumulative distribution function. The probability in Equation 6 is calculated repeatedly over a fine grid of times for different baseline diameters. The chosen grid is shown in Table 26 and is dependent on the baseline diameter:
| Baseline diameter (cm) | Grid of times to search over |
|---|---|
| 3.0 | 200 equally spaced times starting at 4 years, ending at 20 years (approximate grid spacings of 1 month) |
| 3.5 | 200 equally spaced times starting at 3 years, ending at 10 years (approximate grid spacings of 1/2 month) |
| 4.0 | 200 equally spaced times starting at 2 years, ending at 6 years (approximate grid spacings of 1/4 month) |
| 4.5 | 200 equally spaced times starting at 1 year, ending at 4 years (approximate grid spacings of 1/6 month) |
| 5.0 | 200 equally spaced times starting at 0 years, ending at 2 years (approximate grid spacings of 1/8 month) |
For each grid time, the median, 2.5th and 97.5th percentiles of the posterior distribution for PT are obtained. Since quantiles are invariant to one-to-one transformations, the posterior median time at which there is a 10% chance of being over the threshold is the grid time at which the posterior median probability is closest to 0.10. Similarly, the posterior 95% credibility range are the grid times where the 2.5th and 97.5th percentiles are closest to 0.10.
To obtain pooled estimates from a random-effects meta-analysis, the log of the posterior median time is used as the effect estimate, whose SE on the log-scale is approximated as:
where t50 and t97.5 are the posterior median and 97.5th percentile of time. A random-effects meta-analysis is then conducted using the log-estimate of time and its SE separately for the baseline diameters 3.0, 3.5, 4.0, 4.5 and 5.0 cm as specified in Equation 3.
Rupture
A joint model for the longitudinal (growth) and time-to-event (rupture) processes is used to estimate the rupture rate conditional on baseline diameter. The model is as follows:
where the longitudinal process is as specified previously in Equation 1, and the time-to-event process is defined by the hazard of rupture hi(t) for patient i at time t. The association parameter, α, is the log-hazard ratio for the effect of an underlying diameter on risk of rupture, whereas γ is the baseline log-hazard.
The hazard of rupture at baseline given baseline diameter u is therefore calculated as:
Bayesian MCMC methods are used to fit the model and to obtain the median, SD, 2.5th and 97.5th percentiles of the posterior distribution of the hazard (see Equation 9) and log-hazard for each millimetre diameter from 3.0 cm to 5.4 cm. The posterior median log-hazard and its SD are extracted from each study and combined in a random-effects meta-analysis as described in Equation 3.
Given baseline diameter, u, the predicted hazard, cumulative hazard and survival functions at time t > 0 are:
where the integrated hazard, H, can be written in a closed form since μyIy(0) = u(t) is a linear function of t. The probability of rupture by time t given baseline diameter u can therefore be written as:
The probability of rupture is evaluated over a fine grid of possible times. The posterior median, 2.5th and 97.5th percentiles of the probability PR are obtained at each time. The posterior median time at which there is a 1% chance of rupturing is then the grid time at which the posterior median probability is closest to 0.01. Similarly, the posterior 95% credibility range are the grid times where the 2.5th percentile and 97.5th percentile of PR are closest to 0.01.
Pooled estimates from a random-effects meta-analysis are obtained as before by taking the log of the posterior median time as the effect estimate, whose SE on the log-scale is approximated as in Equation 7. The meta-analysis is conducted separately for the baseline diameters 3.0, 3.5, 4.0, 4.5 and 5.0 cm as specified in Equation 3.
Excluded studies
| Author | Number of patients | Country | Study type |
|---|---|---|---|
| Brown et al.a | 476 | Canada | Observational |
| Bjorck (unpublished) | 179 | Sweden | Prospective observational |
| Cao et al.b | 178 | Italy | RCT |
| Lederle et al.c | 567 | USA | RCT |
| Santilli et al.d | 790 | USA | Screening |
| Schlosser et al.e | 147 | Netherlands | Prospective observational |
| Schouten et al.f | 150 | Netherlands | Retrospective observational |
| Total number of patients | 2487 |
Appendix 4 Statistical methods for cost-effectiveness analysis
Calculation of growth transition probabilities for health economic models
We wish to estimate 3-month transition probabilities between 5-mm-wide size states as shown in Figure 23. The state occupancy prevalence for each of the states at any time t following screening given baseline diameter y(0) < 5.5 can be calculated using the fitted mixed-effects models described in Appendix 3.
FIGURE 23.
Five-mm-wide Markov transition model.

Specifically, assume a discrete Markov chain with cycles of 3 months with states 0–6 as shown in Figure 23. This model is a simplified version used in the health economic analyses and does not consider any competing risks, such as surgery or death. Let S(t) represent the state occupied in this model at time t, t = 0,1,2, . . . ,T.
The probability of making a transition from state 0 to state 1 in any 3-month period is assumed to remain constant, and is given by q01 = 0.00207. It is also assumed that the probability of being screened normal (i.e. in state 0 at time t = 0) is π0 = 0.983, and the probability of having a small aneurysm of size u at screening is denoted by π(u), where π(u) is taken from the Chichester study baseline distribution of AAA diameters. For these calculations, no AAAs are assumed to be large at screening.
Then the (occupancy) probability of remaining in state 0 (< 3.0 cm) after t time periods is given by:
The occupancy probabilities of being in states s (s = 1, . . . , 6) at time t are expressed as the weighted sums of probabilities conditional on screened diameter:
where Ps(t|y(0) < 3.0) and Ps(t|y(0) = u) are the occupancy probabilities of being in state s at time t given the screened diameter is normal or a small aneurysm of size u, respectively.
Given an AAA is detected at screening (≥ 3.0 cm), the occupancy probability of being in state s at time t is calculated using the tail areas of the predictive distribution from each fitted mixed-effects model separately as follows:
where Us and Ls are the upper and lower cut-points of state s, respectively (e.g. 3.5 cm and 3.0 cm for state 1), and μy|y(0) = u(t) and vy|y(0) = u(t) are the predicted mean and variance as defined in Appendix 3. Note that U6 = ∞. Meanwhile, the occupancy probability of being in state s at time t given being screened normal, assuming that all newly developed aneurysms are initially measured at 3.0 cm, is:
where the second line follows if we further assume that once screened normals develop an aneurysm, they follow the same growth trajectory as the screen detected patients when they were screened, that is we assume a time-stationary Markov chain, i.e. Ps(t|y(l) = 30) = Ps(t – l|y(0) = 30).
The occupancy probabilities can now be related to the one-step (3-month) transition probabilities via the Chapman–Kolmogorov equations, which state that:
where qs,s + 1(t) is the 3-month transition probability at time t from state s to state s + 1, recalling that q01 is independent of time. Rearranging the equation above gives an expression for qs,s + 1(t) in terms of qs – 1,s(t). Hence, starting with calculating q12(t) in terms of q01, we can recursively estimate all the 3-month transition probabilities for any time t.
Calculation of ‘equivalence’ probabilities for different health economic models
We wish all the Markov models considered in the health economic analyses to be comparable in terms of the probability of developing large AAA, in the absence of any interventions. To achieve this, we recognise that all Markov models being considered will be collapsed versions of the general 5-mm size model.
Consider a collapsed Markov model with S* states and a known mapping from these states to those from the general 5-mm state model. For example, a two-state Markov model with states 3.0–4.4 cm and 4.5–5.4 cm has the mappings {{1} → {1,2,3},{2} → {4,5},{3} → {6}} from this model to the general 5-mm state model. The occupancy probabilities in each size state at time t for the collapsed model can be written in terms of the general 5-mm model and, hence, the new ‘equivalence’ transition probabilities can be derived. For example, in the two-state model the occupancy probability in state 1 at time t is as follows and is set equal to the occupancy probability in the first three states of the general 5-mm state model.
Rearranging and solving the recursive equation we can find values for q1,2*(t), noticing that P0*(t) = P0(t), q0,1* = q0,1 and P1*(0) = ∑s = 13P1(0). A similar strategy is then used to find values for q2,3*(t). This approach can be extended and used for any collapsed model of interest.
List of abbreviations
- AAA
- abdominal aortic aneurysm
- ACE
- angiotensin-converting enzyme
- BMI
- body mass index
- CENTRAL
- Cochrane Central Register of Controlled Trials
- CI
- confidence interval
- CT
- computerised tomography
- EVAR
- endovascular aneurysm repair
- HDU
- high-dependency unit
- HR
- hazard ratio
- ICER
- incremental cost-effectiveness ratio
- ICU
- intensive care unit
- IPD
- individual patient data
- IQR
- interquartile range
- MASS
- Multicentre Aneurysm Screening Study
- MCMC
- Markov chain Monte Carlo
- n
- sample size
- NAAASP
- NHS Abdominal Aortic Aneurysm Screening Programme
- NICE
- National Institute for Health and Care Excellence
- ONS
- Office for National Statistics
- OR
- odds ratio
- PRISMA
- Preferred Reporting Items for Systematic reviews and Meta-Analyses
- PSA
- probabilistic sensitivity analysis
- QALY
- quality-adjusted life-year
- RCT
- randomised controlled trial
- SD
- standard deviation
- SE
- standard error
- UKSAT
- United Kingdom Small Aneurysm Trial
- US
- ultrasound