Notes
Article history
The research reported in this issue of the journal was funded by the HTA programme as project number 10/57/08. The contractual start date was in February 2012. The draft report began editorial review in June 2014 and was accepted for publication in November 2014. The authors have been wholly responsible for all data collection, analysis and interpretation, and for writing up their work. The HTA editors and publisher have tried to ensure the accuracy of the authors’ report and would like to thank the reviewers for their constructive comments on the draft document. However, they do not accept liability for damages or losses arising from material published in this report.
Declared competing interests of authors
none
Permissions
Copyright statement
© Queen’s Printer and Controller of HMSO 2015. This work was produced by Crawford et al. under the terms of a commissioning contract issued by the Secretary of State for Health. This issue may be freely reproduced for the purposes of private research and study and extracts (or indeed, the full report) may be included in professional journals provided that suitable acknowledgement is made and the reproduction is not associated with any form of advertising. Applications for commercial reproduction should be addressed to: NIHR Journals Library, National Institute for Health Research, Evaluation, Trials and Studies Coordinating Centre, Alpha House, University of Southampton Science Park, Southampton SO16 7NS, UK.
Chapter 1 Background
The ageing population, widespread obesity and improved survival all mean that the prevalence of diabetes will more than double between 2000 and 2030. 1 Consequently, the serious complications of the disease are also anticipated to escalate and thus place an increasing demand on health-care resources. These complications are observed in the lower limb as peripheral vascular disease, foot ulceration, osteomyelitis (infection), gangrene and lower-extremity amputations (LEAs), and all are more likely to be experienced by those with diabetes than by the general population. 2
Published studies have reported variation in the incidence of diabetes-related foot ulceration between < 2% in UK primary care and community settings and 18% in hospital-based populations globally. 3–5 Routinely collected data from Scotland indicate that 13,789 (5.2%) people with type 1 or type 2 diabetes experienced a foot ulcer in 2013. 6 These foot ulcers give rise to considerable morbidity and generate a high monetary cost for health- and social-care systems2,7 and, importantly, 80% of diabetes-related foot amputations are preceded by a foot ulcer. 8 For those who experience diabetes-related amputations, the 5-year survival is poor, with mortality estimates of between 25% and 50% in 1985 in UK populations. 9,10
Changes in diabetes-related LEAs have been reported in parts of the UK. In common with some European countries and the USA, major LEA rates in Scotland have been reported to fall. A statistically significant reduction of 40% in LEA rates occurred between 2004 and 2008. 11 However, the 2013 Scottish Diabetes Survey shows that the absolute numbers and percentages of diabetes-related foot ulcerations and LEA have increased, although this is attributed to better recording procedures. In England, an analysis of national hospital activity data from 1996 to 2005 found that, although LEAs in people with type 1 diabetes fell, type 2 LEAs increased. 12 High levels of variation in diabetes-related LEAs are known to exist between primary care trusts (PCTs) across England, which may be explained by variation in the delivery of care. 13
The optimal clinical management of people with diabetes includes annual foot risk assessment, as recommended in national and international clinical guidelines and the Quality and Outcomes Framework (QOF) of the General Medical Contract (GMC) in the UK. 14–17 Risk classifications of three or four levels (low, moderate, high and active) are increasingly being recommended. At present, the evidence underpinning these classifications is not from randomised trials and does not include the totality of evidence (i.e. data from all cohort studies), and the effect of such surveillance and the use of interventions thought to prevent the development of a foot ulcer in the at-risk population lack clear evidence of clinical effectiveness or cost-effectiveness. 18
Clinically effective and cost-effective health care requires the careful measurement of health outcomes, and the need for an evidence-based approach to foot care services in diabetes has been documented. 19,20 Two systematic reviews highlight the gaps in the knowledge about the best way to identify those at risk.
The first systematic review evaluated the independent contribution of predictive factors for foot ulceration based on meta-analyses of aggregate data. It found that the duration of diabetes, glycated haemoglobin (HbA1c), peak plantar pressure (PPP) and vibration perception threshold (VPT) distinguish between those people who will develop a foot ulcer and those who will not. However, there was significant heterogeneity between studies, possibly owing to differences in lengths of follow-up, methods of ascertaining the presence of ulcers and the use of different cut-off points (thresholds) for some of the tests. Furthermore, some tests that are commonly believed to be predictive of risk, such as the absence of a pedal pulse, were not found to be so and data for other common tests such as monofilaments were not amenable to meta-analysis.
A second systematic review of clinical prediction rules (CPRs) used for risk assessment of developing diabetic foot ulceration (DFU) identified five different risk stratification tools derived from consensus among clinical experts, literature reviews and prospective studies using logistic regression methods. 21 The predictive factors in these five CPRs were foot deformity; peripheral neuropathy; peripheral vascular disease [absent pulses and/or positive ankle–brachial index (ABI) test] and previous amputation; the presence of callus; HbA1c; tinea pedis; and onychomychosis. The review authors concluded that it was unclear which CPR possessed the greatest accuracy in the assessment of risk.
These two systematic reviews found marked variation between the incidences of foot ulcers across different study populations. The predictive factors and CPRs derived from high-risk populations may not be of value in predicting risk in the general ‘low-risk’ diabetes population. It is a matter of some concern that the accuracy of recommended foot risk assessment procedures has not been fully explored in different groups of people with diabetes and that little validation of derivative cohort studies has taken place. 22,23
These two systematic reviews of aggregate data represent the best attempts to integrate evidence about the independent contribution of risk factors and CPRs in the assessment of the foot in diabetes to date. These findings are compromised, however, because the authors of primary included studies approached their analyses in different ways: some present adjusted estimates, whereas others are unadjusted, and it is sometimes unclear which confounders or effect modifiers were used. Conventional meta-analytic techniques use aggregate data that are averaged across all individuals in a study and these do not permit adjustments for confounding to be performed. The best way to reliably analyse data from several cohort studies using a standard approach is to use individual patient data (IPD). 24,25
The success of IPD systematic reviews depends on a high level of collaboration, trust and commitment between multidisciplinary researchers and the authors of the primary studies. 25 The ownership of data from primary studies by the pharmaceutical industry can represent an obstacle to IPD analysis being accomplished. However, our background work found that none of the cohort studies included in the systematic reviews had industry sponsorship. The authors who possess the data from the cohort studies identified in the published systematic reviews agreed to take part in an IPD systematic review and to contribute anonymised data from their primary studies for reanalysis.
The purpose of this systematic review and meta-analysis of IPD is to clarify the best risk assessment procedures for foot ulcers in people with diabetes. The international nature of these data, which are from more than 16,000 patients worldwide, should ensure a balanced interpretation. Given the increased worldwide prevalence in diabetes, the identification of the most predictive risk factors could lead to reduced costs for health-care providers.
Chapter 2 Hypotheses
Our research focused on the questions outlined below.
Review questions
-
What are the most highly prognostic factors for foot ulceration (i.e. symptoms, signs, diagnostic tests) in people with diabetes?
-
Can the data from each study be adjusted for a consistent set of adjustment factors?
-
Does the model accuracy change when patient populations are stratified according to demographic and/or clinical characteristics?
-
How predictive are the risk assessment recommendations in UK national clinical guidelines?
Research objectives
-
To systematically review IPD from cohort studies in a meta-analysis to estimate the predictive value of clinical characteristics (signs and symptoms) and diagnostic tests for DFU.
-
To develop a prognostic model of the risk factors for DFU based on data collected worldwide.
-
To test the robustness of the model in different demographic profiles, for example, age, duration of diabetes, control of diabetes (insulin, diet or oral medication), type of diabetes (type 1, type 2).
-
To create prognostic models of the risk factors for DFU contained in national and international clinical guidelines.
Chapter 3 Methods
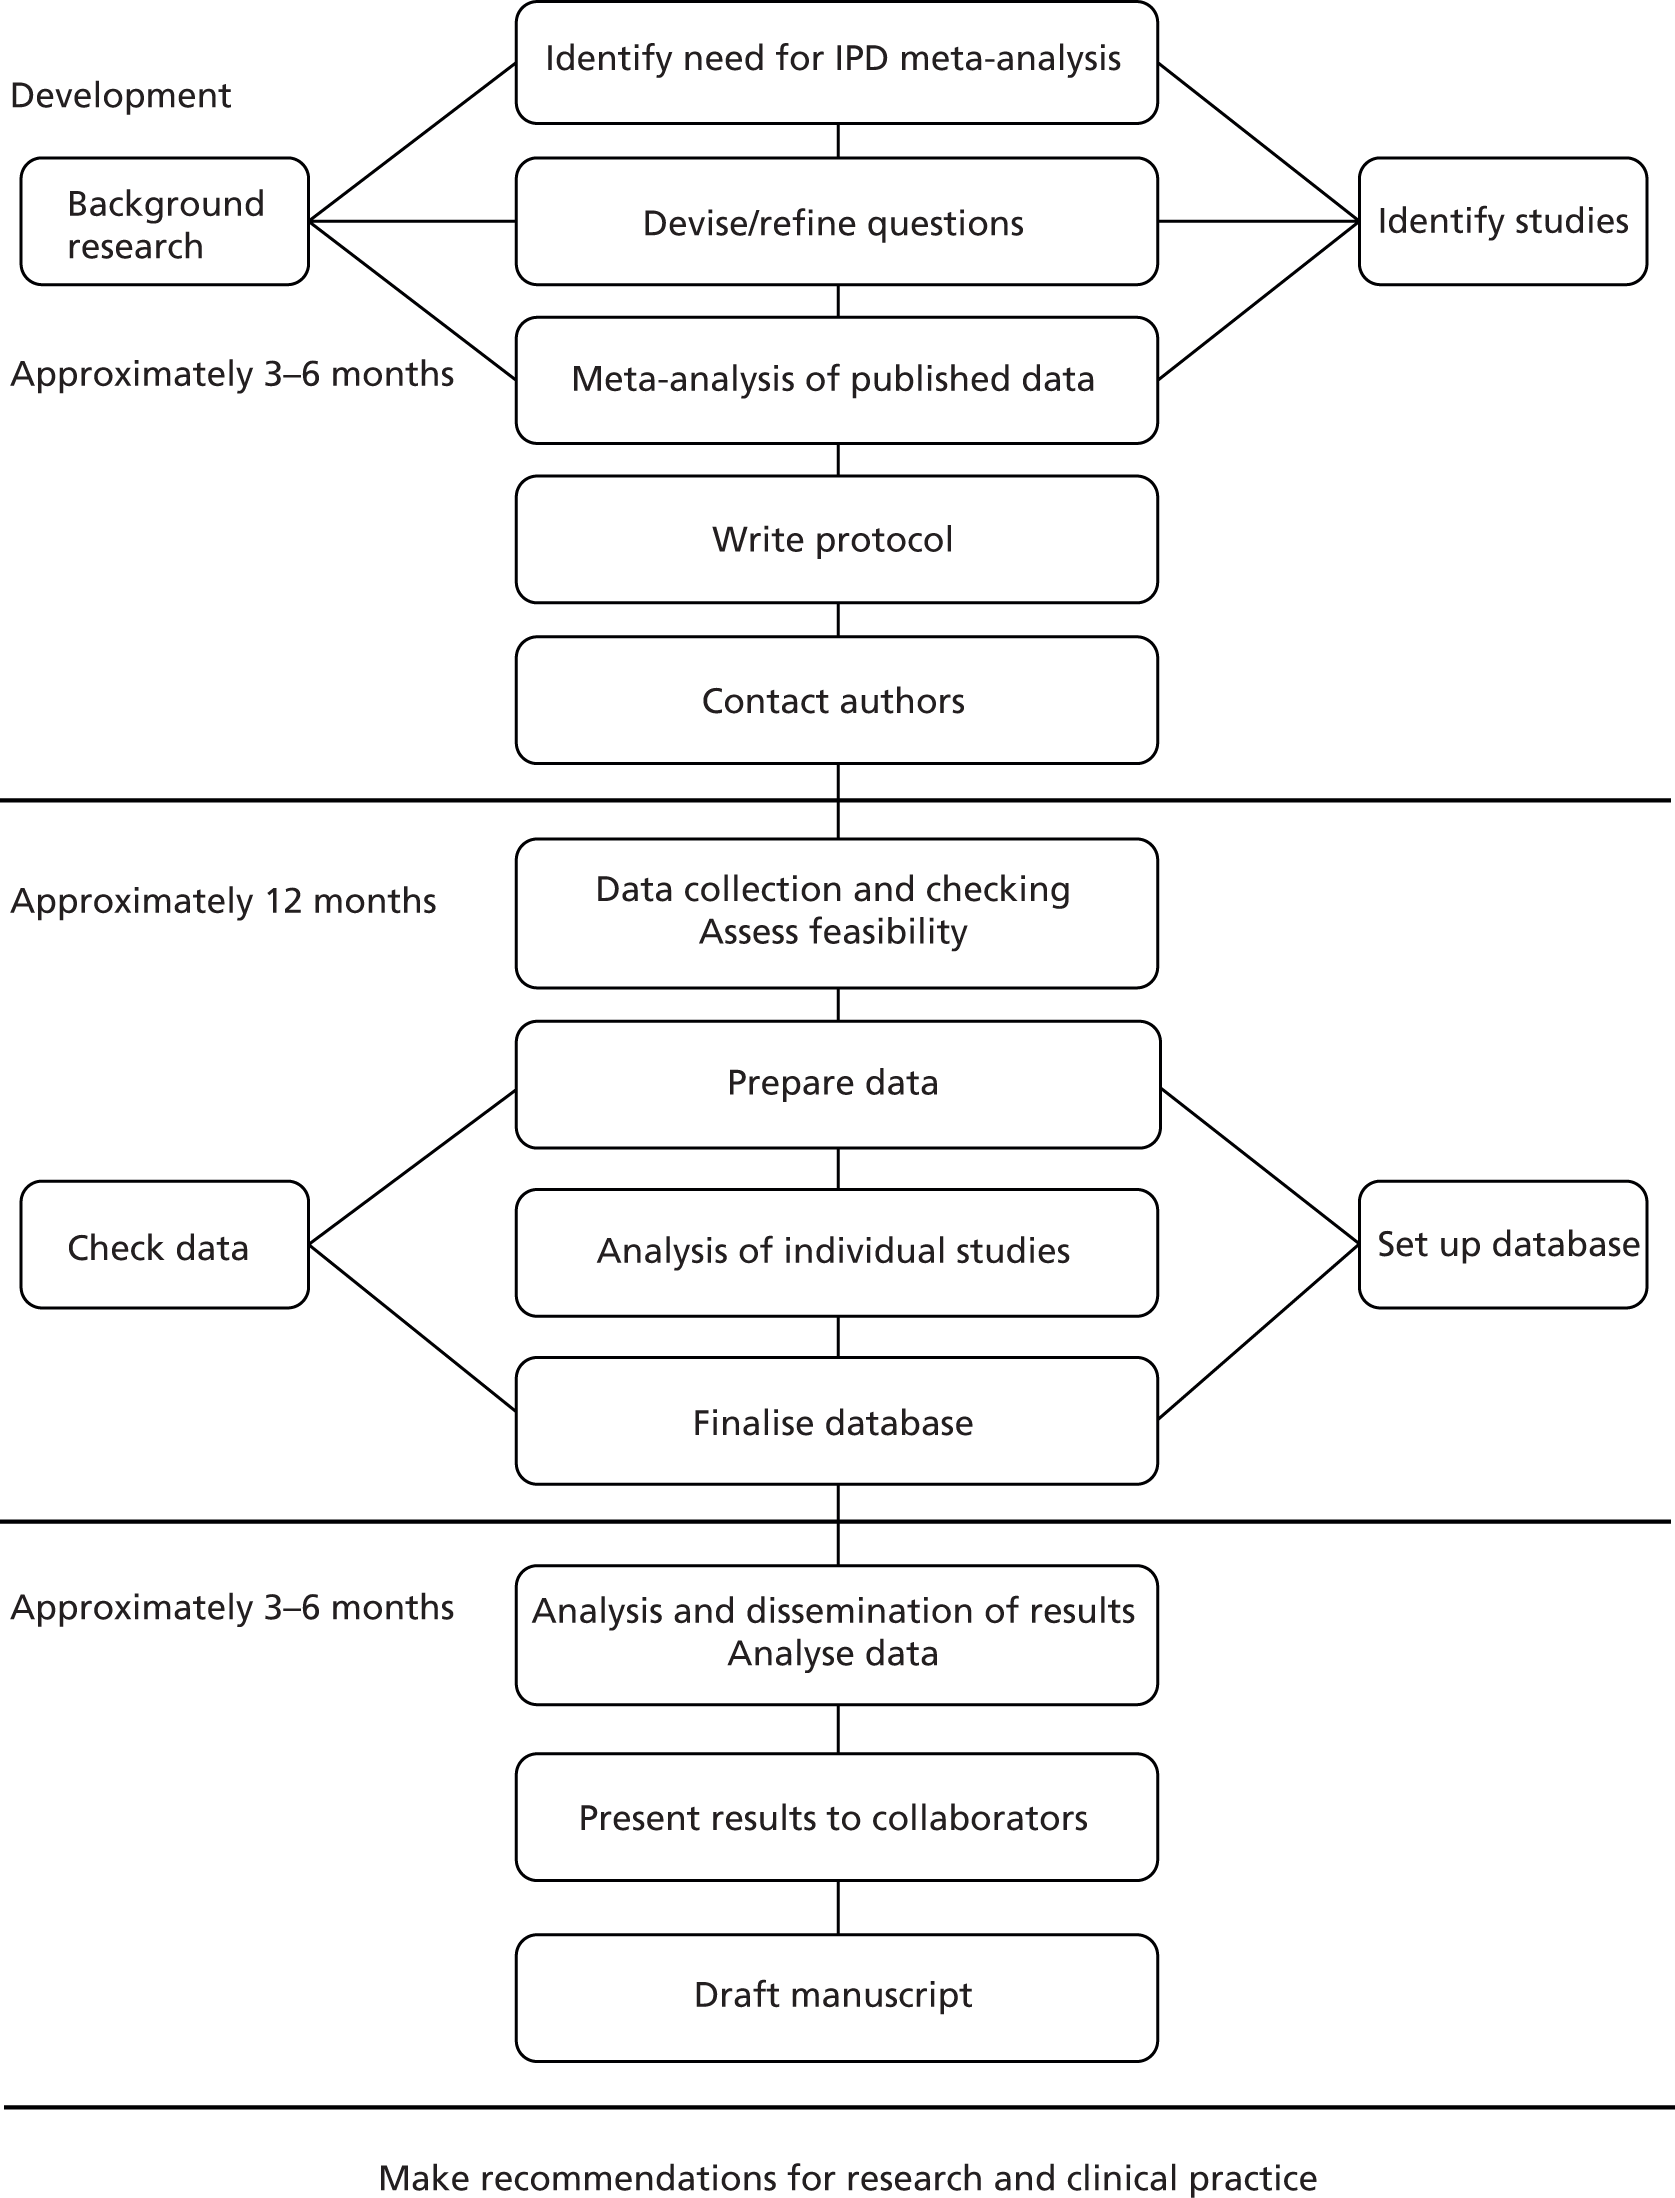
Systematic reviews and meta-analyses of IPD use ‘raw’ data obtained from the authors of individual studies instead of mean or aggregate data extracted from published reports. These complex reviews are more time-consuming and expensive than aggregate systematic reviews because obtaining study data and data dictionaries and undertaking data checking and cleaning takes more time than the extraction of data from a published report (Figure 1). 25
FIGURE 1.
Flow diagram: stages of an individual patient-based meta-analysis. Reproduced from the original25 with kind permission from John Wiley & Sons.
Individual patient data systematic reviews are useful for both randomised controlled trial (RCT) and observational data and enhance the main purpose of meta-analysis – the augmentation of statistical power – by permitting the conduct of complex statistical techniques, including multivariable analyses in which interactions between interventions and patient-level characteristics can be explored. 26 In the case of observational study designs, IPD is the best way to pool observational study data to allow adjustments and a standard statistical approach to be conducted.
This review method also confers an advantage on the process of quality assessment because the necessary communication between the review team and those contributing the data means that potential biases arising from the conduct, rather than the report, of the study can be investigated. However, although the opportunity to discuss the manner in which the study was conducted with the author means the reviewer is not required to interpret possible biases, IPD reviews do not avoid flaws in the original studies arising from conduct or design. 27
Ethics and governance
The ethics of obtaining data collected from a number of sources that cross international boundaries and different legal systems was carefully considered and informed by ethics advice issued by the Medical Research Council (UK). 28 This study did not require separate ethics committee approval for the following reasons:
-
Investigators of each of the original studies obtained local ethics committee approval and written, informed patient consent prior to each of the cohorts included in the review.
-
The data from each of the studies were already in the public domain.
-
The project uses anonymised data from individuals recruited to the original studies who cannot be identified.
Obtaining data
The aggregate systematic review of predictive factors for foot ulceration in diabetes led by the chief investigator (FC) identified 11 cohort studies that met the eligibility criteria. 4 During the review process requests were made to the corresponding author of each primary study for points of clarity, as per conventional systematic review methods. All those contacted provided additional information about their study, and there was strong encouragement for the aggregate review and enthusiasm for an IPD review to create a statistical model exploring the independent contribution of predicative factors for use in foot risk assessment procedures. A key factor in deciding to undertake the IPD meta-analysis was the total absence of industry sponsorship and the ownership of original study data by the corresponding authors who were prepared to contribute them if funding from a suitable source could be found to support the research.
The value of the IPD analysis lies in the production of a global data set. Anonymised data from each of the collaborators of the primary cohort studies were accepted in the way deemed most convenient to original study investigators.
Data were stored in password-protected files on a secure University of Edinburgh computer (University of Edinburgh data protection registration number Z6426984) during the conduct of the review and were only accessible to members of the Data Management Committee, membership of which can be found in the appendices (see Appendix 1).
Our published protocol29 incorporated a data confidentiality agreement making clear the need for the data provided to de-identify individual patients. It also included an assurance that the original investigators were in possession of local ethical approval for their study. A copy of this agreement can be found in the appendices (see Appendix 2).
Review Committee structure
A three-committee structure was created to manage the review:
-
The Data Management Committee developed the methods for the review and ensured the attainment of project milestones. They also took responsibility for reporting the progress to the National Institute for Health Research (NIHR) Health Technology Assessment (HTA) programme within the standard reporting mechanisms required by the Clinical Evaluation and Trials Board. Only these individuals had access to the data from individual cohort studies.
-
The research committee included a group of epidemiologists, health services researchers, clinicians and statisticians who advised the Data Management Committee about methodological and clinically relevant aspects.
-
An international steering committee comprising all principal investigators/corresponding authors of the included studies was strengthened with methodological input from five additional members with expertise in diabetic medicine, foot care provision in primary and community settings, methodological expertise in CPRs and IPD meta-analysis.
A list of members of each of these committees can be found in Appendix 1.
Identifying studies
Electronic search strategy
We searched for relevant studies using the highest methodological standards. 30 The electronic search strategies created during the aggregate systematic review of predictive factors for foot ulceration in diabetes were updated and rerun to January 2013. 4 Copies of the EMBASE and MEDLINE search strategies can be found in Appendix 3.
Selection criteria
One reviewer applied the IPD review eligibility criteria to the full-text articles of the studies identified in our literature search and also all studies excluded from our aggregate systematic review to ensure that we did not miss eligible IPD. A second reviewer applied the eligibility criteria to a 10% random sample of the search yield to ensure that no relevant material was missed.
Eligibility criteria
Types of participants
The review includes only data from individuals who were free of foot ulceration at the time of study entry and who had a diagnosis of diabetes mellitus (either type 1 or type 2). When we identified studies with patients who had prevalent foot ulcers at the time of recruitment, we ascertained whether or not IPD were available for patients who were free of ulcers at time of entry. The corresponding authors of all identified cohort studies were contacted and invited to share their data.
Types of exposure variables
All elements from the patient history, symptoms, signs and diagnostic test results were considered for inclusion in the prognostic model. These were collected variously as continuous, binary and multicategorical data.
Type of outcome variable
The outcome variables were incident foot ulceration (present/absent) and time to ulceration from initial diagnosis of diabetes as well as from the time of screening.
Types of studies
We included studies that used a cohort design and did not distinguish between those that planned the analysis before or after data collections. We excluded studies using all other study designs, including case–control designs. Our previous research indicated that data collected in older studies could be difficult to obtain and that some investigators were no longer in possession of their study data (David Armstrong, Southern Arizona Limb Salvage Alliance, University of Arizona, 2012, and Lawrence Lavery, UT Southwestern Medical Center, Texas, 2012, personal communication).
Risk of bias
The assessment of methodological quality is an important component of an IPD systematic review, but there is complexity in assessing potential threats to the validity of primary studies for this research genre. No widely agreed criteria exist for assessing the risk of bias in aggregate systematic reviews of prognostic studies,31 and, currently, there is a complete absence of established guidelines for prognostic IPD reviews (Douglas Altman, University of Oxford; Richard Riley, Research Institute of Primary Care and Health, Keele University, 2012, personal communication). Although flaws in the recruitment of patients or the manner of data collection can influence systematic review findings, some quality domains usually assessed by systematic reviewers of published reports are irrelevant in IPD reviews (e.g. those pertinent to the analysis performed by the primary authors). We compiled a list of items relevant to our IPD review question which were judged likely to identify studies with data compromised by threats of validity. This checklist of items can be found in Appendix 4;22,32–42 this has been refined during a pilot phase by two researchers working independently.
Data extraction was undertaken by two reviewers working independently, and disagreements were resolved by discussion. For quality assessment, a two-stage process was used; two reviewers worked independently using items available from the published report first of all, then supplementing this with additional details obtained from authors of the primary studies.
Plan for analysis and handling missing data
The methodology of IPD meta-analyses of observational studies is relatively undeveloped compared with that for RCTs and reviewers undertaking IPD meta-analyses of observational studies need to proceed with caution as guidance is not always available and the methodology is untested. 43
There were, therefore, difficult methodological issues regarding the analysis for this review, some of which were particular to IPD meta-analysis methodology, and others which were more general:
-
method of meta-analysis (one step vs. two step)
-
method of meta-analysis (random vs. fixed effects)
-
assessment and handling of heterogeneity
-
handling of missing data, where data are missing for some but not all patients in a given data set (ordinarily missing data)
-
handling of missing data, where data are missing for a given variable for all patients in a given data set (systematically missing data)
-
choice of predictors
-
choice of effect size
-
validating the model.
Method of meta-analysis: one-step versus two-step methods
The two main methods of meta-analysis are commonly known as one-step and two-step methods. 44 Both these methods have pros and cons.
The one-step method uses just one model fitted to all the studies, with a term to indicate which patient belongs to which study. The model can be sophisticated and used to explore common structures in the data sets that would otherwise be undetectable. For this reason, it is the preferred method of meta-analysis for some statisticians. 43 However, it does require that all the data sets be available at the same time to the meta-analysts in order to fit one model to all the data sets. This was not the case for this project. It is also a relatively new development of meta-analysis methods; although IPD meta-analyses have been used for some time, they have most often been used for RCT data, where the recommendation is to use a two-step method to avoid comparison of patient groups that were not randomised together. 45
Two large data sets were contributed to this project but access to one was constrained,46,47 with around 3412 patients’ data only available to the authors via a safe haven facility. The safe haven facility allowed the analyses of data to obtain an estimate of effect but not to remove or copy the data. Another data set48,49 with 1489 patients was not permitted to be shared by the US Institutional Review Board governing its use. However, specific analyses could be requested and estimates of effect obtained from the original study authors.
Use of the one-step method of meta-analysis would mean that neither of these large data sets could be used, although it is straightforward to include them in a two-step meta-analysis. The two-step method is also simpler and more transparent as it uses methods that have been much used and are well understood by systematic reviewers.
For the two-step method, each data set is analysed in turn by the meta-analysts, using ordinary methods of analysis such as logistic regression, and then the estimates from each analyses are combined using established meta-analysis methods. The advantage of the two-step method over a meta-analysis of published studies is that the statistician has some flexibility in the estimates they can obtain from each study. If, for example, they require all estimates to be adjusted for age, and all the data sets have the patients’ ages, it is simple to get age-adjusted estimates.
We did consider a refinement to the one-step method that, in theory, would have enabled us to perform a one-step meta-analysis and incorporate the aggregate results from the two data sets not directly available to us. 50 However, like much of the methodology of IPD meta-analysis of observational studies, it is a new and therefore relatively untested development, and we did not consider it for this project.
Method of meta-analysis: random versus fixed-effects meta-analysis
The data sets contributing IPD covered a range of temporal, geographical and clinical settings. It is therefore reasonable to expect some degree of heterogeneity between the studies. The data sets also varied in size from a few hundred to a few thousand patients. There has been much discussion among experts in the field about standard meta-analytic methods for examining the difference between random- and fixed-effects meta-analyses. 51 We have chosen to use random-effects meta-analysis, which does not assume that all the estimates from each study are estimates of the same underlying true value, but rather that the estimates belong to the same distribution. It has been argued that random-effects methods more appropriately weight the contribution of smaller versus larger studies. 52 Moreover, as the estimates will be adjusted odds ratios (ORs) (note that the same is true for hazard ratios), the appropriate method of meta-analysis is the generic inverse method. 52
Assessment and handling of heterogeneity
Before undertaking any meta-analysis we assessed the extent of heterogeneity. We employed the standard methods of assessing heterogeneity, by examining forest plots of estimates and calculating I2- and τ-statistics. However, we also conducted a thorough examination of heterogeneity, by visual comparison of histograms of continuous variables and bar charts of categorical variables. We also produced summary statistics for each continuous variable (mean, standard deviation, median, 25th and 75th percentile, minimum and maximum) and proportions with confidence intervals (CIs) for each categorical variable.
The assessment of heterogeneity for any meta-analysis was a matter of judgement, covering both statistical and clinical aspects. Therefore, the decision on whether or not a particular variable and/or study should be included in the meta-analyses was made in discussion between methodological and clinical authors, with due consideration of any possible bias or loss of precision in the estimate as a result of inclusion or exclusion. Specifically, we did not define any particular I2 percentage as representing an acceptable level of heterogeneity.
Handling of ordinarily missing data
Ordinarily missing data in epidemiological cohort studies occur when a variable is not recorded, completed or collected for one patient. For example, one patient may not want to provide personal information or test results may not be performed, available or readable. Handling missing data by analysing complete cases leads only to loss of information (exclusion of a portion of the original data) and bias. Methods to address missing data assume specific patterns of missingness and allow patients with incomplete data to be included in the analysis.
Our method of handling missing data depends on the extent of the missingness and if the mechanism causing the missingness is known, specifically if they are missing at random (MAR) or missing not at random. Under the MAR assumption, we planned to use the multiple imputation using chained equations (MICE) developed in R [R 2.13.1, Murray Hill, NJ, USA; see (http://cran.r-project.org/)],53,54 which is a flexible and practical approach to handling missing data. To account for all patients’ data available and to help predict missing data for the risk factors of interest, we applied multiple imputations on the set of variables selected in our final model of predictors where the percentage of missing value did not exceed 15% and included the outcome variable. 55 We created m = 20 imputed data sets, where missing values were replaced by imputed values using imputation techniques specific to each type of variable (logistic regression for binary variables and Bayesian linear regression for continuous variables). The final model estimators were calculated for each imputed data set and differed owing to the variation introduced by the imputed set of missing values. Estimators were averaged and standard errors calculated using Rubin’s rules, which take into account the variability between imputed sets. To discuss the potential bias attributable to missing data, the results of the final model after imputation procedure were interpreted and compared with the complete case analysis.
Handling of systematically missing data
A systematically missing variable is a variable that has not been collected at all in a given data set. For example, not all the studies contributing IPD collected HbA1c, as it has not always been part of routine care. Therefore, if we wanted to adjust ORs of ulceration in patients with and without positive monofilament tests for HbA1c, then our analysis choices are:
-
to use only ORs from studies that collected HbA1c data, with resulting loss of data from not using all the studies (i.e. complete case analysis)
-
to use all studies by treating all ORs as if they have been adjusted for HbA1c, with resulting possible bias in the summary estimate
-
to use multiple imputation for the systematically missing data.
Given that all of the studies have not collected at least one of the variables of interest, we had systematically missing data. The methodology of handling systematically missing data in IPD meta-analysis is still very much in development and key papers were published after the start of this project. 56 We therefore felt that it would be useful to present the results of a complete case, as complete case analyses are known not to be biased, providing the missing data are MAR. 57 However, the loss of power by not using all the data results in wide CIs and large p-values. To overcome the loss of power, we could have used either the second or third method listed above. However, the second method was not chosen because it produces possibly biased estimates. The third method was another relatively new and untested method, and statistical methodological contributions also fell outside the scope of this project.
Choice of predictors
The studies contributing data to this IPD analysis collected data on hundreds of variables. It would not have been statistically rigorous or clinically relevant to meta-analyse all these variables. We therefore needed a method to select candidate variables for meta-analysis. We used the following criteria:
-
Variables had to have been collected in at least three studies, with < 60% missing.
-
Variables needed to have been coded in such a way to allow standardisation across data sets. For example, we were unable to use eye data, because in some data sets this had been defined as retinopathy and in others as requiring glasses.
We did not use a common method of variable selection, namely choosing variables for a multivariable model on the basis of univariate results, as we believe this to be a flawed method. 58,59
We also had the aim of producing a model with easily collectable or readily available data, and therefore had a preference for such variables.
Choice of effect size
Initially, we had hoped to use time-to-ulceration data to perform survival analyses and so obtain hazard ratios for a meta-analysis. Unfortunately, not all the data sets had time-to-event data and we therefore decided to use a binary outcome (ulcer vs. no ulcer) and use logistic regression to obtain ORs. Neither of the two largest data sets, with a combined total of over 9000 patients, had time-to-event data. Logistic regression is considered a less statistically powerful method than survival analysis, but we thought the loss of more than half of the data that would occur with a survival analysis would not compensate for the method’s increased power.
Chapter 4 Development of the model
The criteria for consideration for inclusion in the primary meta-analysis were:
-
variables had to have been collected in at least three data sets
-
variables had to have been consistently defined across data sets (or could be recoded so)
-
the extent of heterogeneity should not invalidate the results of meta-analysis.
The majority of the variables collected were not suitable for the primary meta-analysis, because often they had been collected in only one or two studies. Also, in some cases, there was some variation in the definition of the variable across all the data sets, and it was a matter of judgement to decide if the degree of inconsistency was acceptable or not. However, variables that met the first two criteria were used in univariate logistic regression to obtain ORs. The ORs were plotted in forest plots so that heterogeneity could be assessed.
As the assessment of heterogeneity includes both clinical and statistical aspects, it cannot be designed solely on methodological grounds. Therefore, to ensure that all important clinical considerations were fully addressed, all the variables considered to be potential candidates were presented to the clinical and methodological co-authors at our international meeting.
All authors of the original studies presented details of the study design and conduct, with particular emphasis on the characteristics of the patient cohort and the particular risk factors studied. Univariate analyses of common variables were presented on forest plots to display the degree of heterogeneity between studies. Because the co-authors were also involved in the original studies producing the data sets, there was ample opportunity to discuss reasons for heterogeneity, encompassing inconsistency in the definitions, and what variables were felt to be clinically important.
The variables that met the first two criteria (collected in at least three data sets and consistently defined) were:
-
age
-
sex
-
body mass index (BMI)
-
smoking
-
height
-
weight
-
alcohol
-
HbA1c
-
insulin regime
-
duration of diabetes
-
eye problems
-
kidney problems
-
monofilament
-
pulses
-
tuning fork
-
biothesiometer
-
ankle reflexes
-
ABI
-
PPP
-
prior ulcer
-
prior amputation
-
foot deformity.
We chose not to present height and weight. BMI, height and weight are all obviously highly correlated. Using variables that are highly correlated in a statistical model can lead to collinearity problems, which are unstable estimates, as well as incorrect CIs and p-values. To avoid using a model with high collinearity, we decided to use BMI rather than height or weight. BMI is very commonly used as a measure of body size, and there were six studies with BMI data but only four each for height and weight.
The following variables, which did not meet the criteria, were also presented to demonstrate explicitly why we were unable to include them in any meta-analyses, despite their potential as predictors of foot ulceration: ethnicity, living alone, pinprick test, temperature test (i.e. possibly important demographic and foot sensation variables).
After a discussion of each variable in turn, the members of the group were asked to select a few variables to be examined for inclusion in the primary analysis to ensure that the final model was simple and easy to implement in a clinical environment; widely used CPRs tend not to have many predictors. In addition, for a study to be included, it must have collected data on all the relevant variables, which means that there is an inevitable trade-off between the number of variables and the number of studies to be included. For example, a model with just age and sex could use data from all the studies, but a model with age, sex and ABI could include only four studies. Therefore, limiting the number of predictors also maximises the number of studies that can be included.
The variables chosen at the international meeting for possible inclusion in the primary analysis were age, sex, duration of diabetes, prior ulceration or amputation and monofilament results. In addition, insulin use and kidney problems were to be added to the primary model to assess their impact on prediction of ulcer. E-mail was used to continue the discussion of the predictors after the meeting, resulting in some significant changes.
Patients with a known history of ulcer or amputation are already known to be at high risk of a further ulcer or amputation. These patients therefore have a different risk profile from patients with no history of ulceration or amputation, who may generally be at low risk. From a clinical view, it was regarded as important to be able to identify those patients without history who are nonetheless at high risk of ulceration to allow targeted treatment. Therefore, it was decided on clinical grounds to construct two models, one for all patients and the other for those patients with no history of ulceration or amputation, and, consequently, to drop history as a predictor from the model for patients with no previous ulceration or amputation.
Another predictor dropped from the primary analysis was insulin use. Discussion at the international meeting covered the difficulties of interpreting the use of insulin as a predictor. A patient may simply be using insulin because he or she has type 1 diabetes. However, it is also possible that a patient is using insulin because he or she has poorly controlled type 2 diabetes. A further complication is that some patients with type 2 diabetes achieve good control with insulin. Moreover, the definition of insulin use varied from insulin use at any time prior to the study to current insulin use at the time of recruitment to the study. This was given as a possible explanation for inconsistency and a high degree of heterogeneity among the ORs for insulin use. It was therefore decided to drop insulin use from the primary analysis and retain it for secondary analyses only.
A similar line of reasoning was followed for the predictor kidney problems. These had been defined as outright nephropathy in some data sets and were derived from estimated glomerular filtration rate (eGFR) in others, which may or may not always be an adequate proxy. 60 In multivariate models, the effect of kidney problems was not consistent, being apparently protective against ulceration in some cases5,61 but predictive in others, for example. 3,46,47,62 Again, it was decided to drop kidney problems from the primary model but retain it for secondary analyses.
Dropping three predictors from the primary model meant that other potential predictors could be considered. We added pulses to the primary model. The argument in favour of use of pulses is that it is a test of the vascular integrity of the foot. The model already included monofilaments, a neurological test. Therefore, by including both a vascular and a neurological test of the foot, the model would encompass the major mechanisms by which foot ulceration occurs in diabetes.
It was decided to include HbA1c in a secondary analysis in order to include a predictor in the model that could be influenced by patients themselves. The only variables in the list of potential predictors that could be influenced by patients were BMI, smoking, alcohol and HbA1c. However, discussion of BMI at the international meeting suggested that it would not be a good predictor, because a BMI in the low range could be indicative of two opposing states, either the patient does not gain weight through appropriate diet and exercise or the patient is unable to maintain weight owing to advanced diabetic illness. The univariate forest plot for BMI showed that a low BMI was protective of ulceration in some studies but predictive of ulceration in others. Furthermore, the data on the effect of smoking and alcohol were also not clear, with both smoking and drinking being protective against ulceration in some data sets and predictive of ulceration in others. These results were discussed, with some speculation on the vasodilation properties of nicotine and the possible benefits of moderate alcohol intake. Therefore, HbA1c was chosen for use in a secondary analysis. It is also the only patient-modifiable predictor directly related to diabetes. Two further tests, namely VPT by either tuning fork or biothesiometer and the ABI, were also retained for secondary analyses, as these were of particular interest to the clinical co-authors.
In summary, the primary model has the following predictors: age, sex, duration of diabetes, monofilament and pulses. The secondary models are:
-
age, sex and duration of diabetes
-
age, sex, duration of diabetes and monofilament
-
age, sex, duration of diabetes, monofilament and insulin
-
age, sex, duration of diabetes, monofilament and kidney problems
-
age, sex, duration of diabetes, monofilament, pulses and VPT
-
age, sex, duration of diabetes, monofilament, pulses and HbA1c
-
age, sex, duration of diabetes, monofilament and ABI.
The primary model meets our aim of a parsimonious model of easily obtainable predictors. The purpose of the secondary models is to allow comparison with the primary model, for example to see what the value of HbA1c is as a predictor in addition to the predictors of the primary model. Prediction models are often assessed in terms of their discrimination (how well they distinguish between groups of patients) and calibration (how well the model’s estimated probability matches the actual probability of outcome for each patient).
Given two patients, one with an ulcer at follow-up and the other with no ulcer at follow-up, the area under the curve (AUC) is the probability that the model calculates a higher risk for the ulcer patient; thus, the AUC can be used to assess the discrimination of the model. The AUC takes a value between 0.5 (no discrimination) and 1 (perfect discrimination). Values between 0 and 0.5 are theoretically possible but would only occur if a model was worse than using a coin toss to predict outcome. The Brier score is an indication of how well the model is calibrated and takes a value between 0 and 1. A perfect model would have a Brier score of 0, and, as a rule of thumb, a prediction model should have a Brier score of 0.25 or under. 63
Chapter 5 Validation of the model
Validation is an essential part of assessing prediction models. For most studies that have access to only one data set, the emphasis is on internal validation. Internal validation is an assessment of model performance based on the data set used for development. Prediction models tend to perform best in the data set in which they were developed, and, therefore, one of the purposes of internal validation is to try and assess to what degree the estimates reflect true relationships between variables rather than the idiosyncrasies of the development data set. Teasing apart true and spurious relationships can be a problem when there are too many predictors and/or predictors are selected using a data-driven method such as stepwise regression.
The aim of our methodology was to avoid this problem by choosing a priori few predictors based on the criteria described above; see Chapter 3, Choice of predictors. These criteria do not use any information based on p-values or CIs and so avoid the problems of data-driven methods.
Internal validation methods generally consider the concepts of model discrimination and model calibration. In this context, discrimination is a reflection of how well the model differentiates between patients who do and do not ulcerate. Calibration is a reflection of how well the model assigns the relative proportions of risk categories; a poorly calibrated model would place many patients in the wrong risk category. A statistic that encompasses both these concepts is the two-component Brier score, which takes values between 0 and 1, with a perfectly calibrated model having a score of 0 and model with no calibration having a score of 1.
Given that we had several data sets, we also addressed external validation. External validation is the assessment of model performance in data sets other than the development data set and was arguably more important than internal validation because it related directly to the generalisability of our results. Performing external validation required two decisions to be made: how should it be done and which data should be used? There are six different methods of external validation for logistic regression models described by Steyerberg et al. 64 We chose one method for ease of implementation and interpretation, which was simply to re-estimate the ORs of our final model in a new data set not previously used in any analysis. We then compared the ORs from the meta-analyses with those from the validation data set. The validation data set had to fulfil one mandatory criterion, that is, it had to have all the variables used in the primary model, and more than one data set fulfilled this criterion. However, one data set in particular seemed to be the natural choice as the validation data set. The reasons for this were:
-
The validation data set was only available for analysis at a late stage. By using this data set for validation rather than model development, work on the meta-analyses could proceed in a timely manner.
-
The validation data set was not accessible to those performing the meta-analyses. Analyses could be requested and aggregate results supplied from the validation data set. This ensured that the persons conducting the meta-analyses were not influenced by any validation results, which were requested only after the meta-analyses had been completed.
-
The persons conducting the validation analyses were not informed of the results of any meta-analyses until after the validation analyses had been completed and supplied. This ensured that they were not influenced by any meta-analysis results.
Therefore, our methods allowed the validation process to be independent of the model development process and vice versa. It is also worth noting that the use of this particular data set, which was analysed by statisticians not otherwise involved in the project, meant that the method of external validation had to be simple, as the time available to conduct the validation by these statisticians was necessarily limited. To ensure that the time required was minimal, Statistical Analysis System [(SAS); SAS Institute Inc., Cary, NC, USA; see www.sas.com] programs (version 9.3) were supplied to produce all the required analyses.
Chapter 6 Results of the systematic review
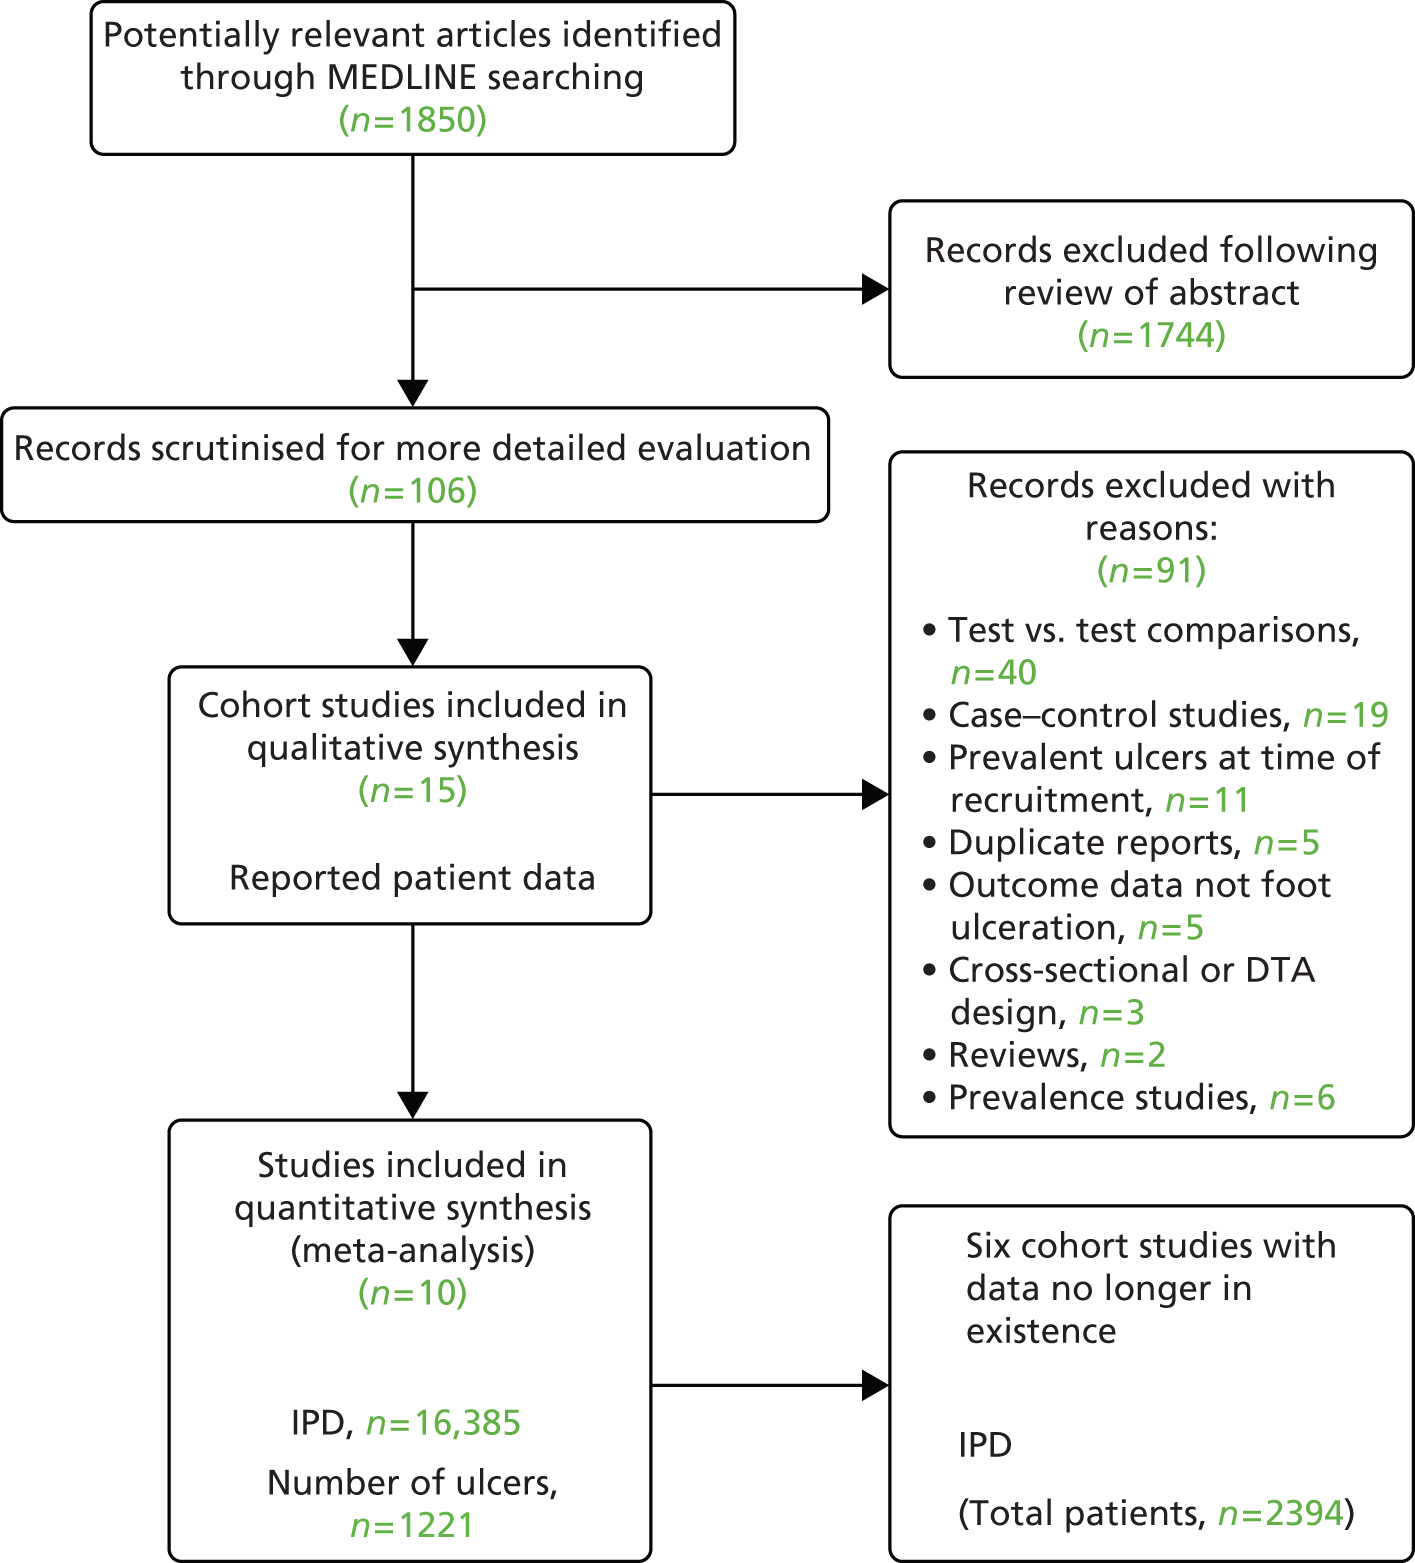
The flow diagram below (Figure 2) depicts the flow of literature during the review process.
FIGURE 2.
Flow diagram of studies in the IPD systematic review, showing the studies included in the review and meta-analysis. 65 DTA, diagnostic test accuracy.
Chapter 7 Characteristics of included studies
There were 16 eligible studies identified from our search activities. We were unable to obtain IPD from six of these because either we could not make contact with the authors66–68 or the authors were no longer in possession of the data69–71 (Aristidis Veves, Harvard Medical School; Lawrence Lavery, UT Southwestern Medical Center, Texas, David Armstrong, Southern Arizona Limb Salvage Alliance, University of Arizona, personal communication) (see Figure 2).
The corresponding authors of eight studies made raw data available to the Data Management Committee. 3,5,61,62,72–75 Data from a ninth study46,47 were made available to the Data Management Committee via Safe Haven, a data-management system. Finally, a 10th corresponding author was not granted permission to share the data from a cohort study by the Institutional Review Board48 but was able to contribute to the meta-analysis by subjecting the data to the same analytical procedures as all other studies to provide estimates of effect, which could be incorporated into the final (meta) analysis. Of these 10 studies, nine were derivation studies, and all are summarised in Table 1. Below, we briefly describe each.
| Author (date) | Inclusion/exclusion criteria | Derivation/validation study; recruitment dates; duration of follow-up | Setting | Origin of the data | Who took the measurements | Types and number of events |
|---|---|---|---|---|---|---|
| Abbott et al., 20023 | Type 1 or type 2 diabetes | Derivation study | GP practices Diabetes centres Hospital outpatients Podiatry clinics in north-west England, UK |
Consultation and examinations | Podiatrists and research nurses | Patients = 6603 Ulcers = 291 Amputations = 27 Deaths = 0 |
| April 1994–6 | ||||||
| 2 years | ||||||
| Boyko et al., 200649 | Inclusion: all general internal medicine clinic patients with diabetes Exclusion: current foot ulcer; bilateral foot amputations; wheelchair use or inability to ambulate; illness too severe to participate; psychiatric illness preventing informed consent |
Derivation study | The general internal medicine clinic of a single Department of Veterans Affairs Medical Center | Consultations in specialised foot research clinic whose sole purpose was the collection of data for this research | Two nurse practitioners and two technicians who worked full-time for this research | Patients = 1489 Ulcers = 229 Amputations = 50 Deaths = 121 |
| Recruitment initiated in 1990 and continued until end of follow-up on 31 October 2012 | ||||||
| Mean duration of follow-up: 48.7 months | ||||||
| Crawford et al., 20115 | ≥ 18 years of age; diagnosis of diabetes mellitus; ambulant; free of foot ulceration; able to give informed consent | Derivation study | 32 podiatry clinics in primary care settings in Tayside, UK | Consultations and examinations Events ascertained from patient paper records by individuals blind to test results |
Eight podiatrists | Patients = 1193 Ulcers = 23 Amputations = 0 Deaths = 59 |
| March 2006–June 2007 | ||||||
| 11.4 months | ||||||
| Kästenbauer et al., 200162 | Inclusion: type 2 diabetes in men and women aged < 75 years old; normal gait pattern; plantar pressure could be reliably measured Exclusion: past or current foot ulcers; LEAs; severe peripheral arterial disease; severe neurological deficits attributable to diseases other than diabetes; Charcot foot |
Derivation study | Diabetes centre within a hospital in Vienna, Austria | Consultation and examinations | Two biologists working in the field of diabetes foot research, one diabetologist, who was responsible for the diabetic foot clinic | Patients = 187 Ulcers = 18/10 patients Amputations = 3 Deaths = 9 |
| January 1994–5 | ||||||
| Mean: 3.6 years | ||||||
| Leese et al., 201147 | Inclusion: all people with diabetes and on the diabetes register who had undergone foot risk assessment between 2004 and 2006 | Derivation study | Community and hospital diabetes foot clinics in Tayside, UK | Routinely collected clinical information (regional diabetes electronic register) Linked data Same electronic records The local multidisciplinary foot clinic and community and hospital podiatry paper records (for ascertaining events) |
Any GP, podiatrist nurse or specialist caring for diabetes mellitus patients | Patients = 3412 Ulcers = 322 Amputations = 55 Deaths = 575 |
| 2004–6 | ||||||
| 1.19 ± 0.91 | ||||||
| Monami et al., 200972 | Inclusion: type 2 diabetes outpatients referred the diabetes clinic of the geriatric unit | Derivation study | Diabetic clinic of the geriatric unit of a hospital, Florence, Italy | Consultation Ulcer ascertained by routinely collected data |
Diabetologists and research fellows | Patients = 1944 Ulcers = 91 Amputations = 0 Deaths = 321 |
| December 1995–December 2000 | ||||||
| 4.2 ± 2.2 years | ||||||
| Monteiro-Soares and Dinis-Ribeiro, 201061 | Diabetes mellitus Exclusion: unable to walk; data incomplete; fewer than three podiatry appointments |
Validation study | A public tertiary hospital, Portugal | Consultation (interview and foot examination) Medical records for both predictive and outcome variables |
Two podiatrists with 6 and 10 years’ experience in the management of the diabetic foot | Patients = 360 Ulcers = 94 Amputations = 0 Deaths = 0 |
| February 2002–October 2008 | ||||||
| 25 months (range 3–86) | ||||||
| Pham et al., 200073 | Diabetes mellitus who attended one of three large diabetic foot centres. Diabetes mellitus diagnosis confirmed by primary care provider | Derivation study | Three large diabetic foot centres, USA | Consultation interview and examination | Podiatrists | Patients = 248 Ulcers = 73 Amputations = 0 Deaths = 13 |
| January 1995–6 | ||||||
| Followed up for 30 months (range 6–40) | ||||||
| Rith-Najarian et al., 199274 | On diabetes register and had an annual foot examination | Derivation study | Primary care setting native American Indian reservation, USA | Consultation | Physical therapist and a physician | Patients = 358 Ulcers = 41 Amputations = 14 Deaths = 19 |
| July 1988–February 1991 | ||||||
| 32 months | ||||||
| Young et al., 199475 | At least one pedal pulse, no history of ulceration | Derivation study | Foot clinic in diabetes centre | Consultation Medical patient notes for ascertainment of ulcers |
A physician | Patients = 592 Ulcers = 47 Amputations = 0 Deaths = 8 |
| April 1988–March 1989 |
Derivation cohort studies
A total of 6603 people diagnosed with type 1 or 2 diabetes mellitus were recruited in the north-west of England, from several different settings, including general medical practices, diabetes specialist centres, hospital out-patient departments and podiatry clinics. Podiatrists and research nurses performed examinations and collected data for each of the exposure variables between April 1994 and April 1996. Ascertainment of the outcome variable (ulcer present/ulcer absent) was collected using a patient self-report postal questionnaire after an average follow-up period of 2 years. 76
A total of 1489 people with diabetes mellitus were recruited from a general internal medical clinic of a Veterans Affairs Medical Center in the USA. Patients were excluded if they had current foot ulcers or bilateral foot amputations, used a wheelchair, were too sick from illness to participate, or had psychiatric illness that prevented informed consent. Patients were recruited between 1990 and 2012 by two nurse practitioners and two technicians who performed all examinations and data collection. Ascertainment of the outcome variable (ulcer present/ulcer absent) was established by examination, and the average follow-up period was almost 49 months (4 years). 49
A total of 1193 people with diabetes mellitus were recruited from community podiatry clinics in Tayside, UK. Participants were free of foot ulceration at the time of recruitment, more than 18 years of age, ambulant and able to give informed consent. Recruitment took place between March 2006 and June 2007, and examinations were performed by eight NHS community podiatrists. Ascertainment of the outcome variable (ulcer present/ulcer absent) was collected from patients’ paper records by podiatrists who were unaware of the results of the patients’ examinations. The follow-up period was, on average, 11.4 months. 5
A total of 187 patients with diabetes mellitus were recruited from a hospital diabetes centre in Vienna, Austria. The study inclusion criteria were a diagnosis of type 2 diabetes in men and women aged < 75 years, a normal gait pattern and a reliable measurement of plantar pressure. The study exclusion criteria were past or current foot ulcers, LEAs, severe peripheral arterial disease, severe neurological deficits attributable to diseases other than diabetes and Charcot foot. Patients were recruited between 1994 and 1995, and examinations and follow-ups were performed by two biologists, who worked in the field of diabetes foot research, and a diabetologist, who was responsible for the diabetic foot clinic. Ascertainment of the outcome variable (ulcer present/ulcer absent) was collected by the same individuals. The period of follow-up was, on average, 3.6 years. 62
Data from 3412 people with diabetes who had undergone a foot risk assessment between 2004 and 2006 were routinely collected from a regional diabetes electronic register. The data originated from patients being managed in community hospital diabetes foot clinics in Tayside, UK, and were entered into the electronic system by general practitioners (GPs), podiatrists and nurses providing patient care. Ascertainment of the outcome variable (ulcer present/ulcer absent) was performed using the same electronic register. 46,47
A total of 1944 patients with a diagnosis of type 1 or type 2 diabetes mellitus were recruited from a diabetes outpatient clinic in a geriatric unit of an Italian hospital. The data were collected by diabetologists and research fellows between 1995 and 2000. Follow-up occurred, on average, 4.2 ± 2.2 years, and ascertainment of the outcome variable was achieved by accessing routinely collected data. 72
Two hundred and forty-eight people with diabetes were recruited from one of three large diabetic foot centres in the USA between January 1995 and January 1996. The diagnosis of diabetes mellitus was confirmed by a primary care provider or from medical records. Podiatrists conducted data collection during interviews and examination consultations. Patients were followed up by the study podiatrists, who ascertained the presence or absence of a foot ulcer during a follow-up period, which was, on average, 30 months. 73
Three hundred and fifty-seven patients were recruited from a primary health-care facility on a native American reservation. All participants had diabetes mellitus, were on a diabetes register and had an annual foot examination by a physician or a physical therapist. The results were recorded on a paper form which was placed in the medical record. The date of the examination and risk category were logged into a clinic-based electronic diabetes registry of the community. At the conclusion of the study, the forms were abstracted from the form to the medical record and the data entered in to an Epi Info database (Centers for Disease Control and Prevention, Atlanta, GA, USA). The study was conducted between July 1988 and February 1991, and follow-up was performed at 32 months on average. The ascertainment of the outcome variable was obtained from an Epi Info database by the study physician or physical therapist. 74
Five hundred and ninety-two patients with diabetes mellitus were recruited by a physician working in a specialist diabetes foot clinic in the UK. Patients were invited to take part in the research if they had at least one pedal pulse and no history of ulceration. The study was conducted between April 1988 and March 1989, and exposure data were collected during a consultation. The ascertainment of the outcome ulcers was performed from medical notes. 75
Validation cohort studies
One study validated the risk factors previously identified in a derivation cohort study by Boyko et al. 49 Three hundred and sixty people with diabetes mellitus were recruited from a public tertiary hospital in Portugal between February 2002 and October 2008. Patients were excluded if they could not walk, if they had had fewer than three podiatry appointments or if their data were incomplete. Two podiatrists collected data in interview and examination consultations and obtained routinely collected data for the exposure variables. Patients were followed up at 25 months, on average, and ascertainment of the outcome variable was achieved using routinely collected data. 61
Chapter 8 Risk of bias
The tabulated results of the quality assessment process can be found in Appendix 5. Of the four items used to assess the quality of the conduct of the studies, three indicated a low risk of bias. Patients were recruited consecutively in all but one study. 74 Follow-ups were conducted at least 1 month after the data collection of risk factors, allowing enough time for an ulcer to develop, and all reports provided enough detail for the tests to be replicated.
The collection of outcomes in a ‘blind’ manner to protect the data from investigator bias was a feature of only 50% of the studies included in our review. 3,5,61,73,75
All study reports provided sufficient details about the conduct of the tests to permit their replication.
Chapter 9 Data cleaning and pattern of missingness
Data preparation
All data sets were prepared the same way, following a list of rules, exclusion criteria and a selected number of variables. Few data sets contained more patients than presented in the corresponding manuscript owing to multipurpose collection. We focused on the data collected to assess an ulcer or amputation outcomes in diabetic patients.
Two sets of authors5,46,47 collected their data in the same geographical area; common patient encrypted identifiers were placed in a safe haven and merged with the data set of the Leese study in order to exclude duplicated patients.
The data preparation was performed using the SAS software in a uniform way across studies. The SAS code was structured in steps of data preparation for each study: importing the data set; including any additional relevant data; checking the data set content and each variable of interest for inconsistent values; cross-checking information; applying exclusion criteria; correcting errors and values by applying rules; formatting dates; and combining information in order to create all the variables for analysis in a consistent way across studies. A list of inconsistencies and queries were sent to each author when required to ensure that corrections were made appropriately. This allowed the validation of the data preparation. A harmonised data set was created for each study and subsequently merged with the other for validation of harmonisation.
Inclusion and exclusion criteria
Inclusion criteria were age > 18 years, a diagnosis of diabetes (type 1 or type 2), and having at least one foot. At the stage of data preparation, a total of 21 patients aged below 18 years, one patient with gestational diabetes and one bilateral amputee were excluded. The same inclusion criteria were used to exclude 47 patients in the Boyko et al. 49 data set (Table 2).
| Study | Abbott et al., 20023 | Leese et al., 201147 | Monami et al., 200972 | Crawford et al., 20115 | Young et al., 199475 | Monteiro-Soares and Dinis-Ribeiro, 201061 | Rith-Najarian et al., 199274 | Pham et al., 200073 | Kästenbauer et al., 200162 | Boyko et al., 200649 |
|---|---|---|---|---|---|---|---|---|---|---|
| Data available | ||||||||||
| Number of patients with outcome | 6613 | 3712 | 1945 | 1196 | 598 | 360 | 358 | 248 | 187 | 1536 |
| Number of patients excluded | 10 | 5 | 1 | 0 | 6 | 0 | 1 | 0 | 0 | 47 |
| Number of duplicate patients | 295 | 3 | ||||||||
| Total patients for analysis | 6603 | 3412 | 1944 | 1193 | 592 | 360 | 357 | 248 | 187 | 1489 |
Rules for data cleaning
The rules were developed in order to include atypical but plausible values from an adult diabetic population. Extreme values were checked with authors for confirmation. Any irrelevant information was either corrected or removed prior to analysis.
-
Age and duration of diabetes were recorded in years. They were calculated from relevant dates and rounded to the lowest integer value when necessary.
-
Duration of follow-up was recorded in months. It was converted into months or calculated from relevant dates when available.
-
For anthropometrics, the following ranges were considered as possible and reasonable to include: weight between 35 kg and 180 kg; height between 120 and 210 cm; and BMI between 16 kg/m2 and 65 kg/m2. The measurements of three patients were confirmed as real and accurate: a weight of 27.3 kg for a small person75 (height 125 cm and BMI 17.5 kg/m2); a height of 211 cm for a tall person;73 and a weight and BMI of 230 kg and 71 kg/m2, respectively, for an extremely obese person. 73 Malignant obesity (BMI over 50 kg/m2) remains rare in the general population, but is considered possible in a person with diabetes.
-
Smoking was recorded as smoking history (yes/no) and as smoking status (never smoker/ex-smoker/current smoker). The possible number of cigarettes per day ranged between 1 and 60. A number of cigarettes per day higher than 60 was corrected by the maximum value of 60 and a value below 1 was considered as zero.
-
Alcohol was classified as current alcohol consumption (yes/no), with a very occasional alcohol intake being grouped with no alcohol. The possible number of alcoholic units per week was ranged from 1 to 100. A number of alcohol units per week higher than 100 was corrected by the maximum value of 100 and a value below 1 was considered as null.
-
HbA1c between 3% and 21% was considered possible. When multiple measurements were taken, the measure at the initial visit or the first measure available was used.
-
Kidney problems were identified as ‘nephropathy’ or ‘chronic kidney disease (CKD) stages 3–4–5 [glomerular filtration rate (GFR) < 60 ml/minute/1.73 m2]’. In some cases, only a more advanced stage of the disease was available and was used, such as ‘end-stage renal disease’ or ‘kidney failure’ (CKD stage 5). CKD levels were calculated from GFR and creatinine levels.
-
The serum creatinine level (measured in µmol/l) was converted into eGFR using the Cockcroft–Gault formula:
-
(140 – age) × weight (in kg) × 1.04/creatinine, for women
-
(140 – age) × weight (in kg) × 1.23/creatinine, for men.
-
-
A wide inclusive range of creatinine levels between 20 and 300 was considered acceptable.
-
CKD stages were derived from the eGFR level (ml/minute/1.73 m2):
-
stage 1 ≥ 90
-
stage 2 60–89
-
stage 3 30–59
-
stage 4 15–29
-
stage 5 < 15.
-
-
eGFR can be recorded as 60+ ml/minute/1.73 m2, which does not allow the distinction between stages 0, 1 and 2. The moderate and severe stages of renal disease (stages 3, 4 and 5), which correspond to an eGfR below 60 ml/minute/1.73 m2, were considered to be a ‘kidney problem’ for the analysis.
-
-
The foot test results were combined, when available, for both feet. The measure used was from the worst outcome for any foot (at least one foot) at the initial visit or baseline.
-
A VPT value over 25 V in any foot, as measured by a biothesiometer, was considered an abnormal VPT.
-
An ABI of < 0.9 or > 1.3 was considered an abnormal value.
-
A dichotomised foot pressure with an abnormal result (high foot pressure > 6 kg/cm) was available in one study. This was applied in other studies to harmonise the results.
-
Pattern of missingness
Table 3 presents the numbers and percentages of missing values for each selected variable by study. It also identifies studies in which a variable is systematically missing with a percentage of 100. More than 10% missing data in available variables were identified in specific studies for the following potential predictors: height, weight, BMI, HbA1C, diabetes duration, kidney problems, VPT tuning fork, Achilles reflexes and ABI.
| Studies | ||||||||||||
|---|---|---|---|---|---|---|---|---|---|---|---|---|
| Abbott et al., 20023 | Leese et al., 201147 | Monami et al., 200972 | Crawford et al., 20115 | Young et al., 199475 | Monteiro-Soares and Dinis-Ribeiro, 201061 | Rith-Najarian et al., 199274 | Pham et al., 200073 | Kästenbauer et al., 200162 | Boyko et al., 200649 | Total | ||
| Number of patients in data set | 6603 | 3412 | 1944 | 1193 | 592 | 360 | 358 | 248 | 187 | 1489 | 16,385 | |
| Variables | Statistics | |||||||||||
| Age | Number missing | 31 | 1 | 1 | 33 | |||||||
| % missing | 0.47 | 0.17 | 0.40 | 0.20 | ||||||||
| Sex | Number missing | 1 | 1 | |||||||||
| % missing | 0.02 | 0.01 | ||||||||||
| Weight | Number missing | 6603 | 3412 | 1944 | 33 | 170 | 360 | 358 | 52 | 21 | 12,952 | |
| % missing | 100 | 100 | 100 | 2.76 | 28.72 | 100 | 100 | 20.97 | 1.41 | 79.05 | ||
| Height | Number missing | 6603 | 3412 | 1944 | 68 | 122 | 360 | 358 | 86 | 12,952 | ||
| % missing | 100 | 100 | 100 | 5.69 | 20.61 | 100 | 100 | 5.78 | 79.05 | |||
| BMI | Number missing | 6603 | 217 | 293 | 113 | 239 | 360 | 358 | 52 | 89 | 8323 | |
| % missing | 100 | 6.36 | 15.07 | 9.47 | 40.37 | 100 | 100 | 20.97 | 5.98 | 50.80 | ||
| Lives alone | Number missing | 49 | 3412 | 1944 | 592 | 360 | 358 | 248 | 187 | 1498 | 8638 | |
| % missing | 0.74 | 100 | 100 | 100 | 100 | 100 | 100 | 100 | 100 | 52.72 | ||
| Smoking | Number missing | 14 | 59 | 1944 | 358 | 2374 | ||||||
| % missing | 0.21 | 1.73 | 100 | 100 | 14.49 | |||||||
| Alcohol | Number missing | 38 | 3412 | 1944 | 592 | 360 | 358 | 50 | 6753 | |||
| % missing | 0.58 | 100 | 100 | 100 | 100 | 100 | 3.36 | 41.21 | ||||
| HbA1c | Number missing | 6603 | 48 | 166 | 128 | 227 | 357 | 248 | 18 | 7795 | ||
| % missing | 100 | 1.41 | 8.54 | 10.73 | 38.34 | 100 | 100 | 1.21 | 47.57 | |||
| Insulin treatment | Number missing | 10 | 357 | 248 | 1 | 616 | ||||||
| % missing | 0.15 | 100 | 100 | 0.07 | 3.76 | |||||||
| Diabetes type | Number missing | 52 | 3412 | 1193 | 19 | 4676 | ||||||
| % missing | 0.79 | 100 | 100 | 3.21 | 28.54 | |||||||
| Diabetes duration (full years) | Number missing | 33 | 10 | 612 | 2 | 39 | 1 | 1 | 689 | |||
| % missing | 0.50 | 0.29 | 31.48 | 0.17 | 6.59 | 0.40 | 0.07 | 4.26 | ||||
| Eye problems | Number missing | 57 | 3412 | 1944 | 592 | 357 | 248 | 187 | 20 | 6817 | ||
| % missing | 0.86 | 100 | 100 | 100 | 100 | 100 | 100 | 1.34 | 41.61 | |||
| Eye problems (retinopathy) | Number missing | 6603 | 3412 | 1193 | 592 | 357 | 15 | 4 | 12,176 | |||
| % missing | 100 | 100 | 100 | 100 | 100 | 8.02 | 0.27 | 74.31 | ||||
| Kidney problems | Number missing | 109 | 1291 | 148 | 366 | 357 | 6 | 71 | 2348 | |||
| % missing | 1.65 | 37.84 | 12.41 | 61.82 | 100 | 3.21 | 4.77 | 14.33 | ||||
| Monofilament | Number missing | 125 | 2 | 1944 | 13 | 592 | 3 | 48 | 2727 | |||
| % missing | 1.89 | 0.06 | 100 | 1.09 | 100 | 1.21 | 3.22 | 16.64 | ||||
| Pulses | Number missing | 3 | 76 | 1944 | 357 | 2 | 187 | 115 | 2684 | |||
| % missing | 0.05 | 2.23 | 100 | 100 | 0.81 | 100 | 7.72 | 16.38 | ||||
| Pinprick | Number missing | 11 | 3412 | 1944 | 592 | 360 | 357 | 248 | 187 | 1489 | 8600 | |
| % missing | 0.17 | 100 | 100 | 100 | 100 | 100 | 100 | 100 | 100 | 52.49 | ||
| VPT: tuning fork | Number missing | 8 | 3412 | 1944 | 592 | 189 | 357 | 248 | 187 | 727 | 7664 | |
| % missing | 0.12 | 100 | 100 | 100 | 52.50 | 100 | 100 | 100 | 48.82 | 46.77 | ||
| VPT: biothesiometer | Number missing | 6603 | 3412 | 1 | 360 | 357 | 2 | 1055 | 11,790 | |||
| % missing | 100 | 100 | 0.08 | 100 | 100 | 0.81 | 70.85 | 71.96 | ||||
| VPT: combined | Number missing | 8 | 3412 | 1944 | 1 | 0 | 189 | 357 | 2 | 187 | 293 | 4261 |
| % missing | 0.12 | 100 | 100 | 0.08 | 52.50 | 100 | 0.81 | 100 | 19.68 | 26.01 | ||
| Ankle reflexes (tendon hammer) | Number missing | 87 | 3412 | 1944 | 592 | 190 | 357 | 248 | 187 | 24 | 7041 | |
| % missing | 1.32 | 100 | 100 | 100 | 52.78 | 100 | 100 | 100 | 1.61 | 42.97 | ||
| Temperature sensation (hot, cold) | Number missing | 73 | 3412 | 1944 | 592 | 360 | 357 | 248 | 187 | 1489 | 8662 | |
| % missing | 1.11 | 100 | 100 | 100 | 100 | 100 | 100 | 100 | 100 | 52.87 | ||
| ABI | Number missing | 6603 | 3412 | 1944 | 223 | 66 | 360 | 169 | 248 | 3 | 13,028 | |
| % missing | 100 | 100 | 100 | 18.69 | 11.15 | 100 | 47.34 | 100 | 1.60 | 79.51 | ||
| PPP | Number missing | 6603 | 3412 | 1944 | 109 | 592 | 360 | 357 | 9 | 2 | 1489 | 14,877 |
| % missing | 100 | 100 | 100 | 9.14 | 100 | 100 | 100 | 3.63 | 1.07 | 100 | 90.80 | |
| Foot deformity | Number missing | 19 | 1944 | 592 | 248 | 2 | 2805 | |||||
| % missing | 0.29 | 100 | 100 | 100 | 0.13 | 17.12 | ||||||
Each author provided information about the reasons for the data being missing where possible. This information was essential to confirm the patterns of missing data. In most studies, the data were missing because they were not collected or recorded by clinicians or there were administrative problems in some period of collection. Our exploration of missing data found the pattern of ‘missingness’ to be MAR.
Chapter 10 Patients with diabetes: description
Demographics, anthropometrics and lifestyle
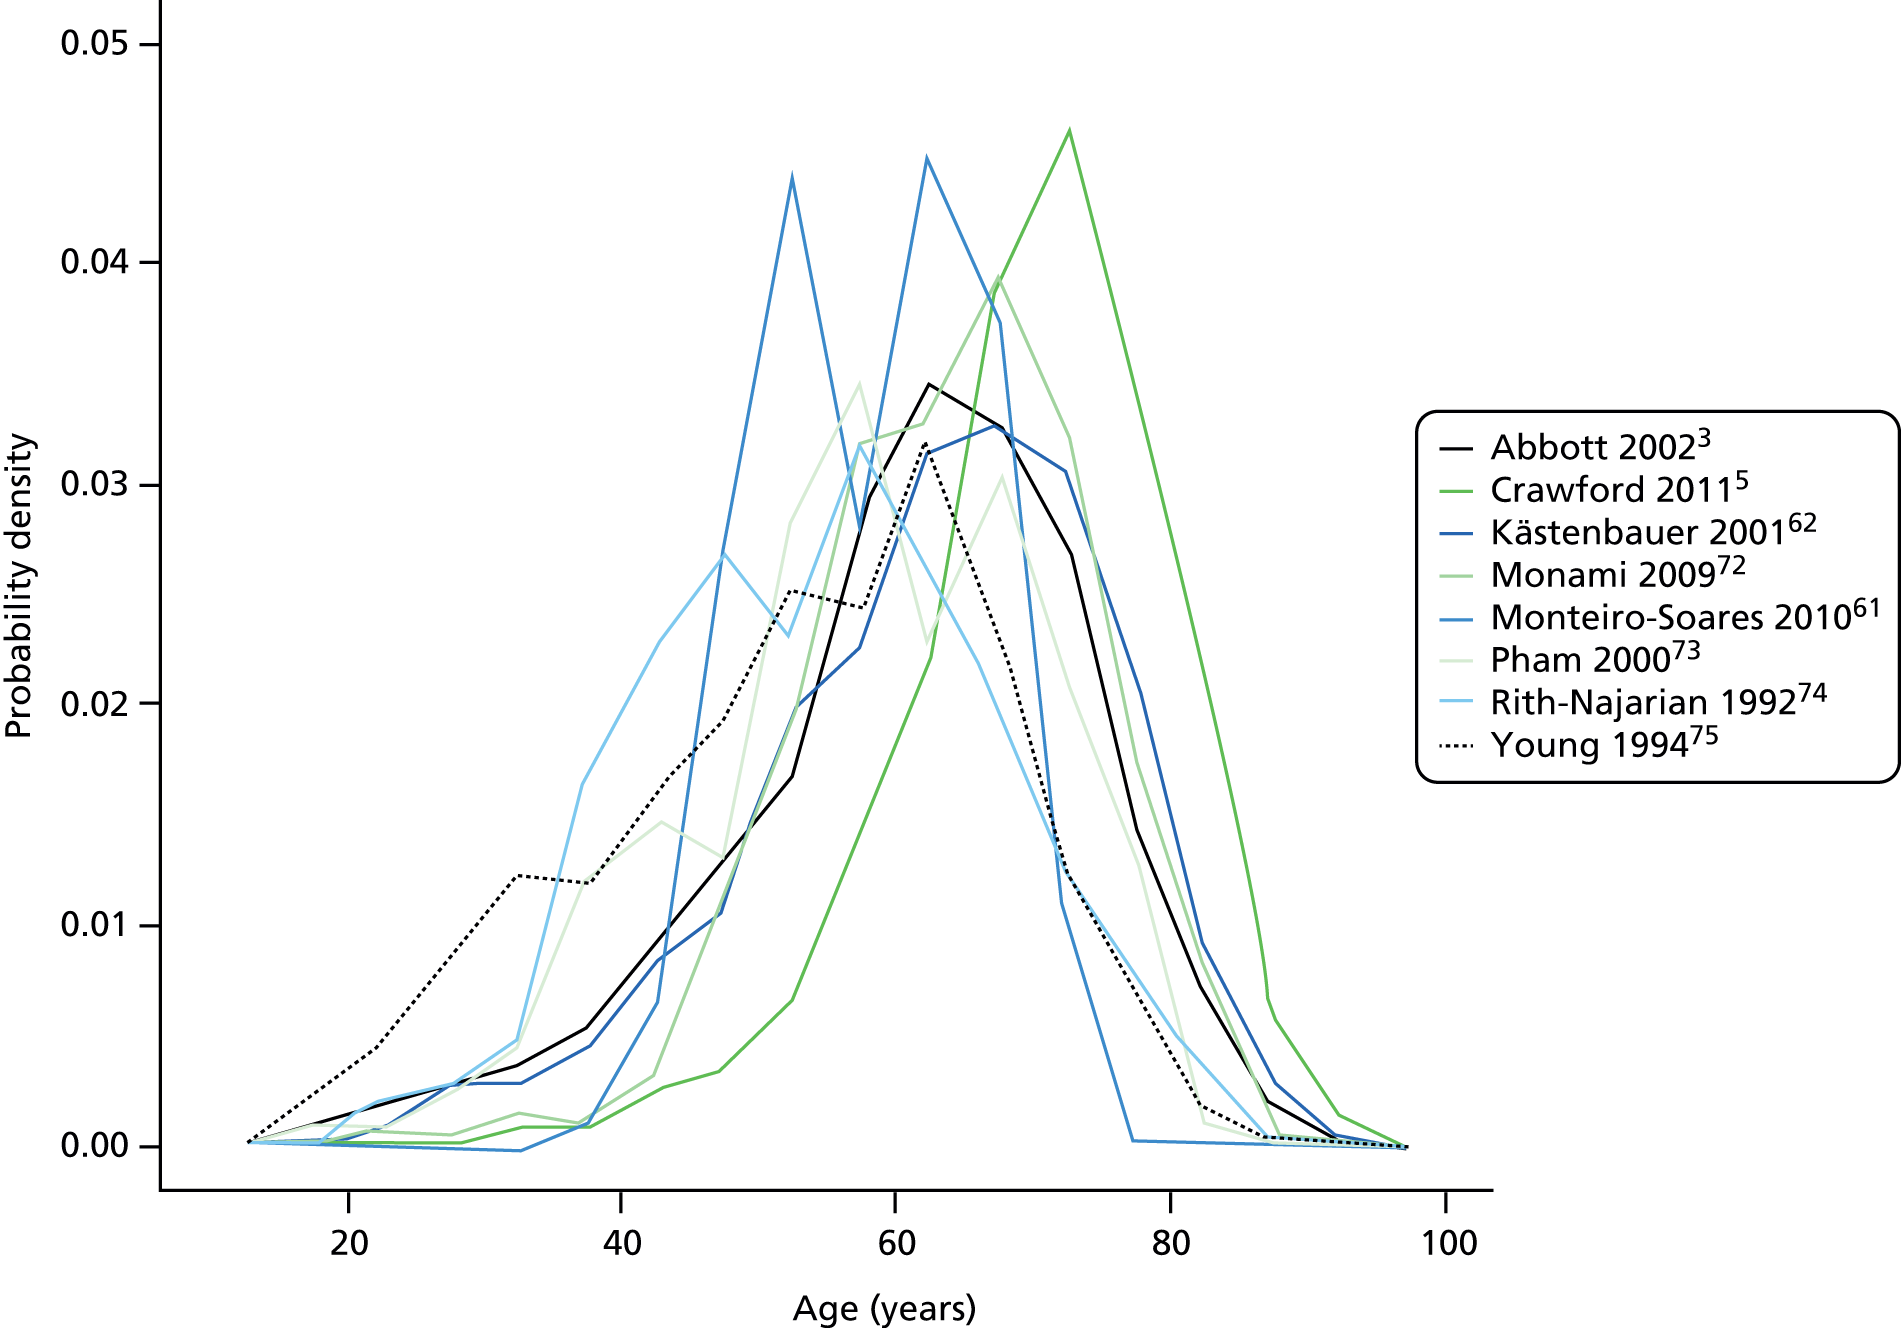
Appendix 6 shows the demographic, anthropometric and lifestyle profile of the diabetic population per study. The overall average age was 63 years, ranging from 54 and 55 years in the two earliest studies,74,75 to 71 years in the study by Crawford et al. 5 Figure 3 shows the similar distribution of age per study, with higher modes for the more recent studies by Monami72 and Crawford. 5 The overall percentage of men was 58% and varied from 44% to 57% for most studies, but was 98% in the study by Boyko et al. 49
FIGURE 3.
Distribution of age per study.
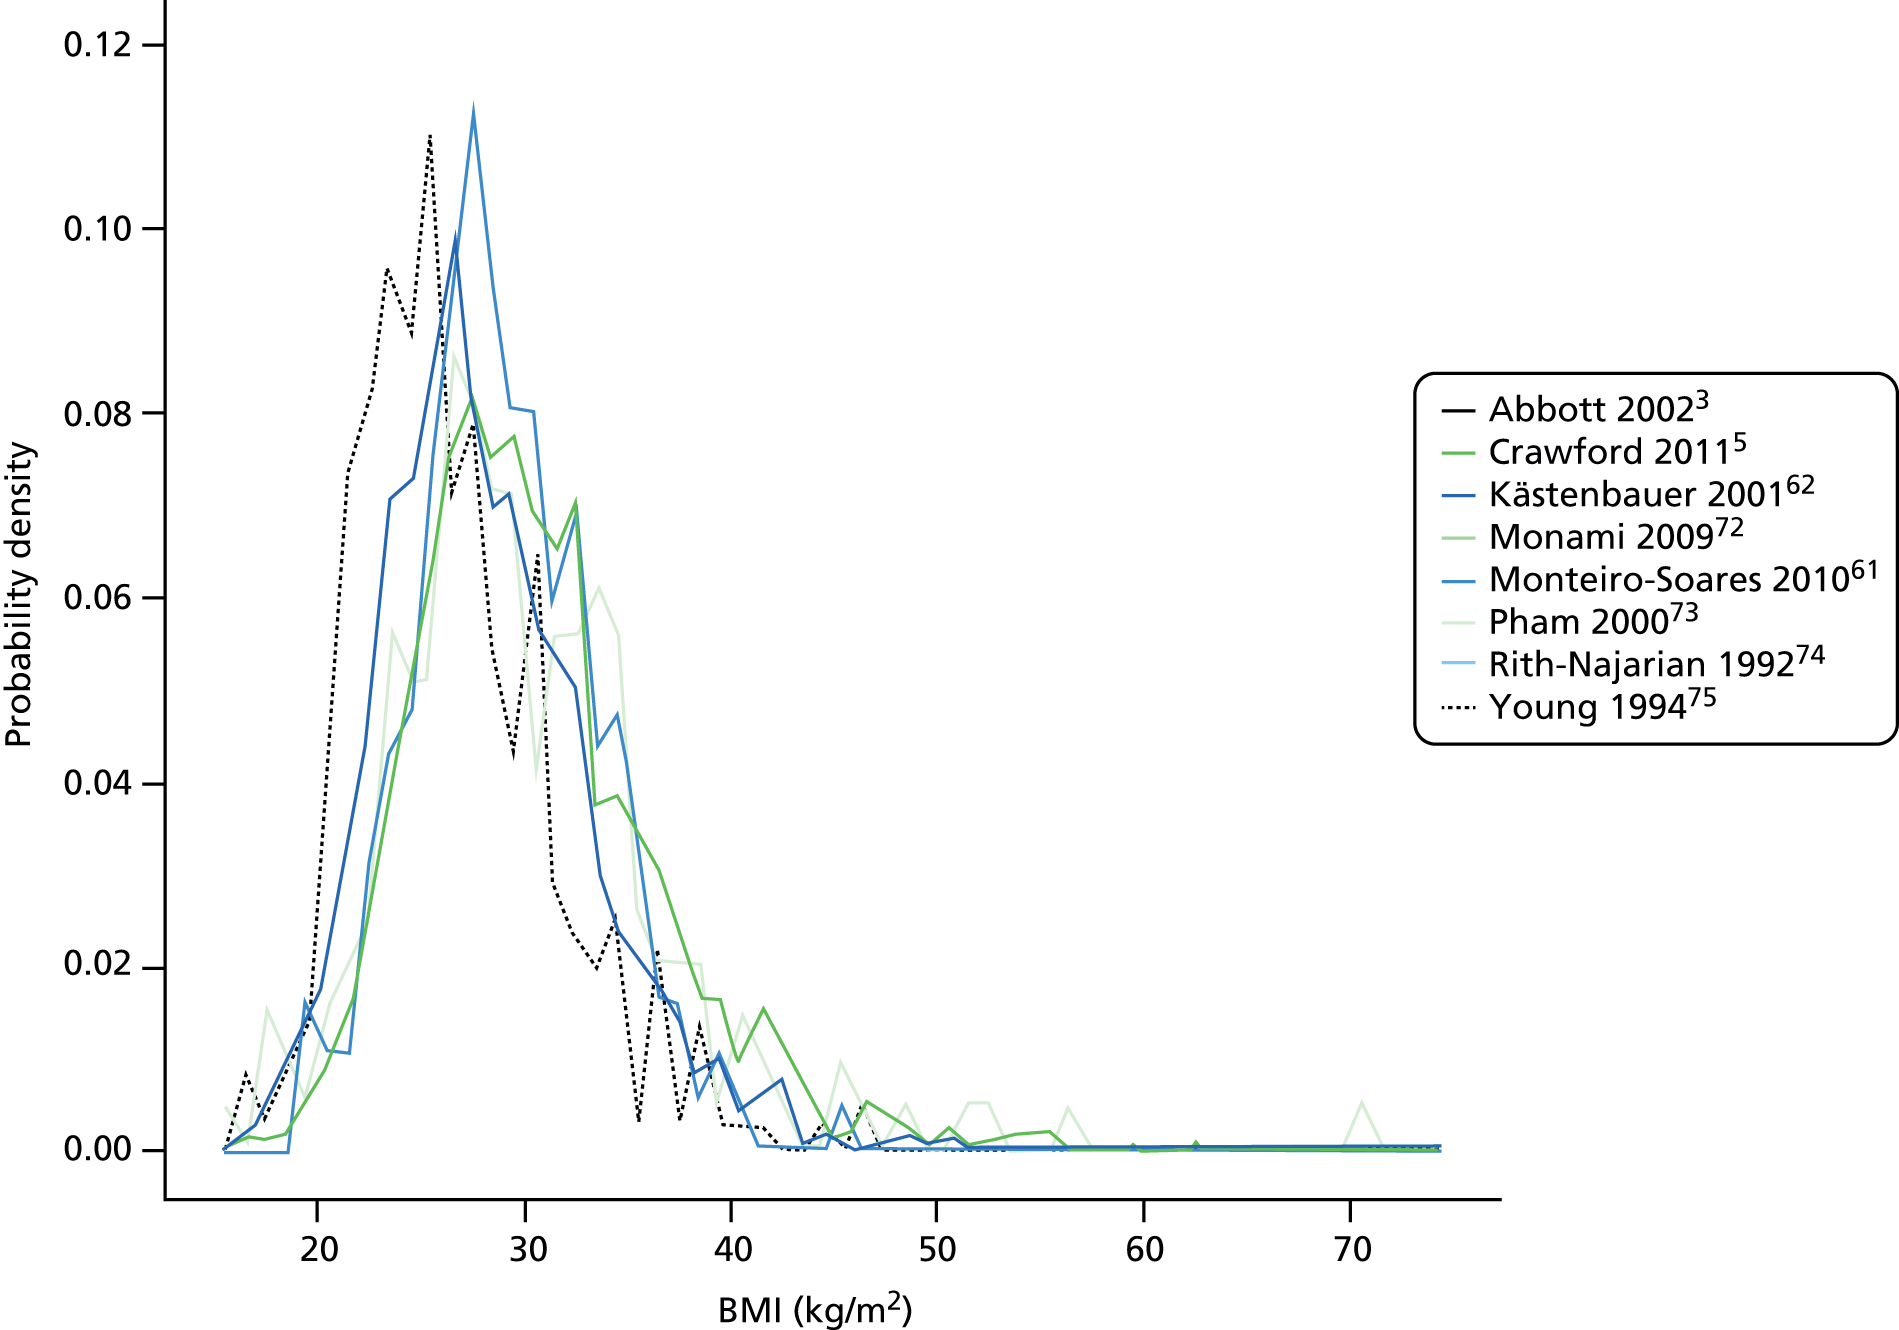
Average weight and height were recorded for only four studies, with BMI recorded more commonly. The overall mean weight and height were 89 kg and 171 cm, respectively. The distributions of weight and height were very similar across studies, although the patients in the study by Young et al. 75 were slightly lighter. Mean BMI ranged from 27 kg/m2 to 31 kg/m2, with an overall average of 30 kg/m2 just at the threshold for obesity. Figure 4 shows the similar distribution of BMI per study. Most patients had a BMI between 20 kg/m2 and 40 kg/m2, with few cases of extreme and malignant obesity.
FIGURE 4.
Distribution of BMI per study.
The studies by Abbott et al. 3 and Crawford et al. 5 observed the proportion of diabetic patients living alone to be 22% and 29%, respectively. Smoking and alcohol consumption were heterogeneous across studies; 19–81% of patients had ever smoked and 17–55% were consuming alcohol. For most studies, around 50% or more of the patients had a history of smoking, and the trends were similar for alcohol consumption.
Diabetes and comorbidities
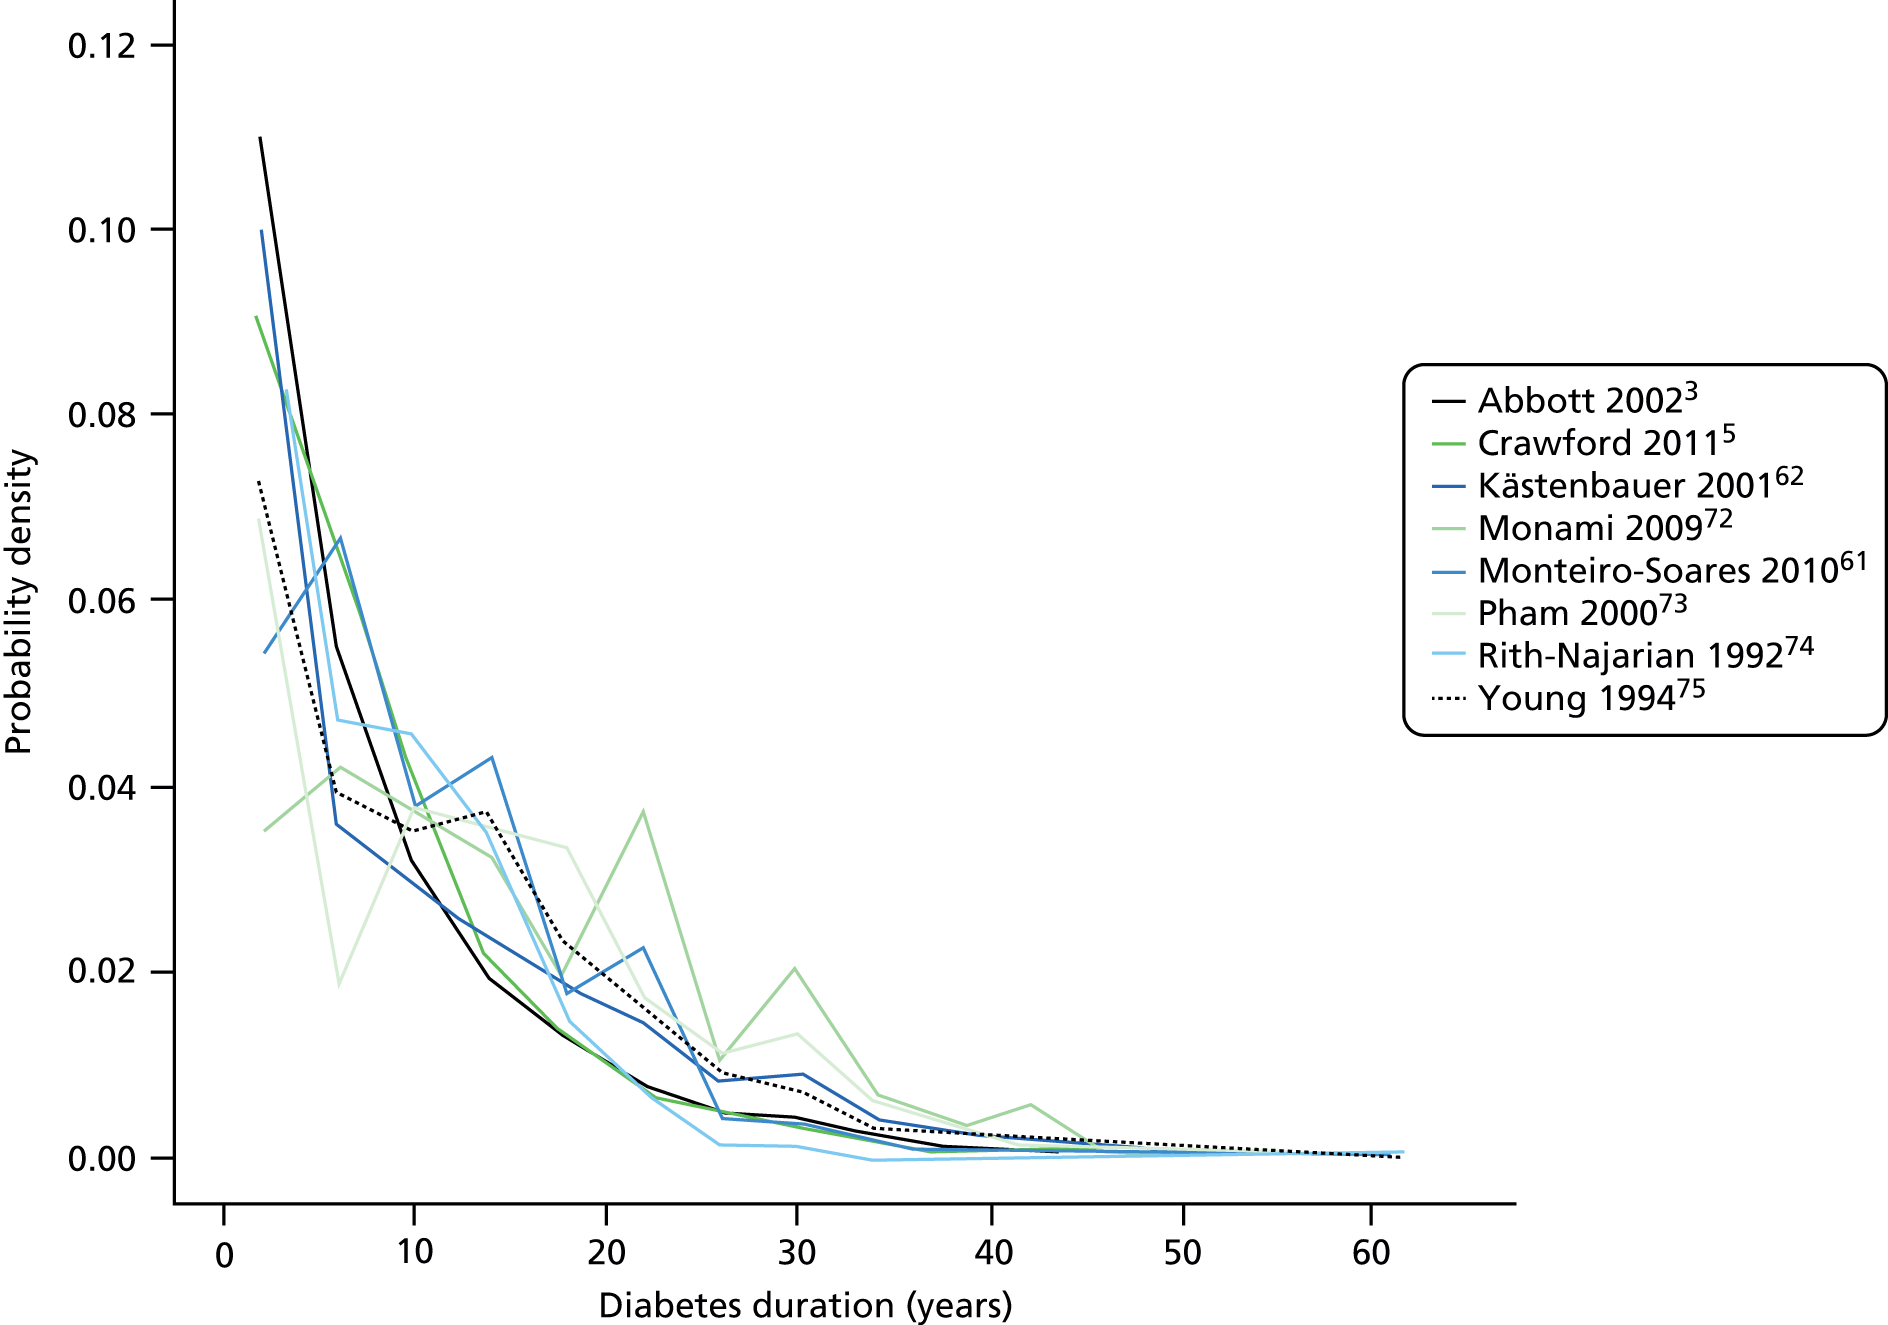
Appendix 7 shows the diabetic, eye and renal profile of the diabetic population per study. The majority of patients had type 2 diabetes. Three studies focused on patients with type 2 diabetes only; in the remaining studies the proportion of patients with type 2 diabetes was between 61% and 98% . Overall, type 1 diabetes accounted for about 9% of recorded types of diabetes. Insulin treatment accounted mostly for 20–40% of each diabetic population. Overall, the average diabetes duration was 9 years and was disparate across studies, average duration ranging from 7 to 16 years. Figure 5 shows that the distribution of diabetes duration per study was similar overall. HbA1c was, on average, 8% in each study apart from the studies by Young et al. 75 (11%), Kästenbauer et al. 62 (10%) and Boyko et al. 49 (10%).
FIGURE 5.
Distribution of diabetes duration per study.
Four studies recorded visual impairment and/or blindness with heterogeneous results. Retinopathy was collected for four studies and recorded diagnoses ranged from 9% to 49% of the population. Renal problems were collected for most studies but in various ways. Nephropathy accounted for 2% and 17% of the population in two studies, stage 3–5 CKD accounted for 13–37% of the population in two studies, and end-stage renal failure for 2% and 4% of the population in another two studies.
Foot measurements by study
Appendix 8 presents the descriptive statistics of 10 foot measures per study. Insensitivity to monofilament, pulses, VPT and any kind of foot deformity were the most frequently collected variables. The proportion of abnormal results varied across studies; the proportion of patients insensitive to monofilament in any foot ranged from 7% to 76%. The proportion of patients with no pulses in any foot ranged from 3% to 30%, and the proportion with abnormal VPT ranged from 25% to 95%. The proportion of patients with abnormal ABI ranged from 25% to 78%, and the proportion with any foot deformity ranged from 4% to 80%. Abnormal temperature sensation accounted for 21% and 33% of the diabetic population in the studies by Abbott et al. 3 and Crawford et al. ,5 respectively. The same studies had 33% and 50% of patients, respectively, with abnormal pinprick test. Abnormal ankle reflexes were recorded in 50% or more of patients for three studies, and PPP was recorded in about half of the patients in the same studies.
Chapter 11 Common variables
The data dictionary relating to these tables can be found in Appendix 9. The variables common to the included studies can be found in Table 4.
| Abbott et al., 20023 | Leese et al., 201147 | Monami et al., 200972 | Crawford et al., 20115 | Young et al., 199475 | Monteiro-Soares and Dinis-Ribeiro, 201061 | Rith-Najarian et al., 199274 | Pham et al., 200073 | Kästenbauer et al., 200162 | Boyko et al., 200649 | Total | |
|---|---|---|---|---|---|---|---|---|---|---|---|
| Publication information | |||||||||||
| Year of publication | 2002 | 2011 | 2009 | 2011 | 1994 | 2010 | 1992 | 2000 | 2001 | 2006 | |
| Level of analysis | Patient | Visit | |||||||||
| Number of patients | 6613 | 3719 | 1945 | 1192 | 469 | 360 | 358 | 248 | 187 | 1536 | 16,627 |
| Demographics, anthropometrics, lifestyle | |||||||||||
| Age | ✓ | ✓ | ✓ | ✓ | ✓ | ✓ | ✓ | ✓ | ✓ | ✓ | 10 |
| Sex | ✓ | ✓ | ✓ | ✓ | ✓ | ✓ | ✓ | ✓ | ✓ | ✓ | 10 |
| Weight | ✓ | ✓ | ✓ | ✓ | ✓ | 5 | |||||
| Height | ✓ | ✓ | ✓ | ✓ | ✓ | 5 | |||||
| BMI | ✓ | ✓ | ✓ | ✓ | ✓ | ✓ | ✓ | 7 | |||
| Lives alone | ✓ | ✓ | 2 | ||||||||
| Smoking | ✓ | ✓ | ✓ | ✓ | ✓ | ✓ | ✓ | ✓ | 8 | ||
| Alcohol | ✓ | ✓ | ✓ | ✓ | ✓ | ✓ | 6 | ||||
| Diabetes | |||||||||||
| HbA1c | ✓ | ✓ | ✓ | ✓ | ✓ | ✓ | ✓ | 7 | |||
| Insulin treatment | ✓ | ✓ | ✓ | ✓ | ✓ | ✓ | ✓ | ✓ | 8 | ||
| Diabetes type | ✓ | ✓ | ✓ | ✓ | ✓ (type 2) | ✓ | ✓ (type 2) | ✓ | 8 | ||
| Diabetes duration | ✓ | ✓ | ✓ | ✓ | ✓ | ✓ | ✓ | ✓ | ✓ | ✓ | 10 |
| Eye problems | ✓ | ✓ | ✓ | ✓ | ✓ | ✓ | ✓ | ✓ | 8 | ||
| Kidney problems | ✓ | ✓ | ✓ | ✓ | ✓ | ✓ | ✓ | ✓ | ✓ | 9 | |
| Foot measurements | |||||||||||
| Monofilament | ✓ | ✓ | ✓ | ✓ | ✓ | ✓ | ✓ | ✓ | 8 | ||
| Pulses | ✓ | ✓ | ✓ | ✓ | ✓ | ✓ | ✓ | 7 | |||
| Pinprick | ✓ | ✓ | 2 | ||||||||
| VPT: tuning fork | ✓ | ✓ | ✓ | ✓ | 4 | ||||||
| VPT: biothesiometer | ✓ | ✓ | ✓ | ✓ | ✓ | ✓ | 6 | ||||
| Ankle reflexes (tendon hammer) | ✓ | ✓ | ✓ | 3 | |||||||
| Temperature sensation | ✓ | ✓ | 2 | ||||||||
| ABI | ✓ | ✓ | ✓ | ✓ | ✓ | 5 | |||||
| PPP | ✓ | ✓ | ✓ | 3 | |||||||
| Foot deformity | ✓ | ✓ | ✓ | ✓ | ✓ | ✓ | ✓ | 7 | |||
| History and outcome | |||||||||||
| Prior ulcer | ✓ | ✓ | ✓ | ✓ | ✓ | ✓ | ✓ | ✓ | 0 | ✓ | 10 |
| Prior amputation | ✓ | ✓ | ✓ | ✓ | ✓ | 0 | ✓ | 7 | |||
| Ulcer outcome | ✓ | ✓ | ✓ | ✓ | ✓ | ✓ | ✓ | ✓ | ✓ | ✓ | 10 |
| Amputation outcome | ✓ | ✓ | ✓ | ✓ | ✓ | 5 | |||||
| Death | ✓ | ✓ | ✓ | ✓ | ✓ | ✓ | ✓ | ✓ | ✓ | 9 | |
All data were analysed with SAS 9.3 (www.sas.com) and R.2.13.1 (cran.r-project.org/). Logistic regression analyses were carried out using SAS PROC LOGISTIC; meta-analyses were performed using an edited version of the metagen function in the R meta package; and multiple imputation was carried out with the R MICE package.
Chapter 12 Univariate meta-analysis of the data sets: suitability of studies for meta-analysis
The purpose of the univariate meta-analyses was to explore potential differences between the data sets, assess heterogeneity and facilitate discussion at the international meeting of clinical and methodological co-authors. For each candidate predictor, a logistic regression analysis with ulceration as outcome was undertaken in each of the studies (see Table 4). The resulting ORs were then used in a generic inverse variance meta-analysis. ORs were displayed on forest plots and discussed at the meeting.
Forest plots with ORs for the following 24 variables were presented (see Appendix 10): age, sex, BMI, smoking, alcohol, HbA1c, insulin regimen, duration of diabetes, eye problems, kidney problems, monofilament, pulses, tuning fork, biothesiometer, ankle reflexes, ABI, PPP, prior ulcer, prior amputation, foot deformity, ethnicity, living alone, pinprick test and temperature test.
The following variables were rejected for being included in fewer than three studies: ethnicity, living alone, pinprick test and temperature test. This left 20 candidate predictors. The following variables – eye problems, PPP and foot deformity – were rejected for being inconsistently defined across data sets, leaving 17 candidate predictors. Owing to high similarity the following variables were combined: tuning fork and biothesiometer, as both measure vibration perception; and prior ulcer and amputation, as both indicate a prior tendency to ulcerate. This left 15 candidate predictors.
We considered that the foot sensation tests would often be measuring the same underlying neurological impairment. From a statistical viewpoint, there are challenges to including highly correlated variables in one statistical model because it becomes difficult to assess the relationships between predictor variables and outcome. It was therefore deemed preferable to include fewer rather than more tests of foot sensation. It was also preferable to use tests that had been collected by more studies. Monofilaments, pulses and VPT (by either tuning fork or biothesiometer) had been collected in six studies, ABIs in four studies and ankle reflexes in three studies. Therefore, monofilaments, pulses and VPT were used in preference to the other tests, leaving 13 candidate predictors.
Some variables appeared to have complex relationships with ulceration outcome, namely BMI, smoking and alcohol. As discussed above (see Chapter 3, Choice of predictors), a high BMI is generally associated with worse health outcomes, but, for some diabetic patients, a low BMI can be an indication of weight loss as a result of a diabetes-related problem such as kidney disease. In addition, smoking and alcohol seemed to be protective against ulceration in some studies and predictive of ulceration in others. This may be another example of the so-called smoker’s paradox. 77 At our international collaborators’ meeting, there was some speculation about the biological effects of nicotine that could possibly help protect against diabetic foot disease, and it is also possible to speculate that both smoking and drinking alcohol could be associated with another variable that is genuinely protective against ulceration, for example younger age. However, given that the aim of these analyses is to produce a simple, parsimonious model that may be readily used in clinical contexts for screening, interaction terms that could be used to explore the relationships between BMI, smoking and drinking with ulceration were not utilised, although this could, of course, be an item for further research.
This left 10 variables: age, sex, duration of diabetes, monofilaments, pulses, insulin regime, kidney problems, VPT, HbA1c and previous history of either amputation or ulceration. The univariate forest plots for these showed some degree of heterogeneity, as expected from clinical knowledge of the individual studies. Nonetheless, most of the forest plots have overlapping CIs for most of the studies, although there are some exceptions. We examined the forest plots together with the I2- and τ-statistics and concluded that the extent of heterogeneity, although present, did not preclude meta-analyses of multivariable estimates. We noted that further assessment of heterogeneity would be done for the multivariable meta-analyses, and where necessary, results would be interpreted cautiously.
Chapter 13 Multivariable meta-analysis: the final model
Primary meta-analysis
The primary meta-analysis included age, sex, duration of diabetes, monofilaments and pulses as predictors. The analysis was repeated twice, once for patients with no previous history of foot ulceration or LEA (Table 5) and again for all patients, including those with a previous history (Table 6).
| Predictor | OR | 95% CI | I 2 | τ |
|---|---|---|---|---|
| Age | 1.008 | 0.995 to 1.021 | 29.8% | 0 |
| Duration of diabetes | 1.029 | 1.017 to 1.04 | 4.9% | 0 |
| Monofilament | 3.438 | 2.772 to 4.264 | 0% | 0 |
| Pulses | 2.605 | 1.808 to 3.754 | 42.7% | 0.054 |
| Sex (female) | 0.841 | 0.682 to 1.037 | 0% | 0 |
| Predictor | OR | 95% CI | I 2 | τ |
|---|---|---|---|---|
| Age | 1.005 | 0.994 to 1.016 | 37.4% | 0 |
| Duration of diabetes | 1.024 | 1.011 to 1.036 | 38.1% | 0 |
| Monofilament | 3.184 | 2.654 to 3.82 | 0% | 0 |
| Pulses | 1.968 | 1.624 to 2.386 | 1.6% | 0.001 |
| Sex (female) | 0.743 | 0.598 to 0.922 | 20.7% | 0.013 |
| Previous history | 6.589 | 2.488 to 17.45 | 94.2% | 1.134 |
In meta-analysis, it is desirable for valid estimates to exhibit low heterogeneity. For example, the OR for previous history in Table 6 below may not be generalisable, as the high estimates of heterogeneity (I2 = 94.2%, τ = 1.134) and the forest plots (see Figure 17) suggest that the OR varies from study to study to an extent that rules out a valid meta-analysis.
The flow diagram below (Figure 6) shows the number of patients involved throughout the review process.
FIGURE 6.
Flow diagram of patients in the IPD meta-analysis.
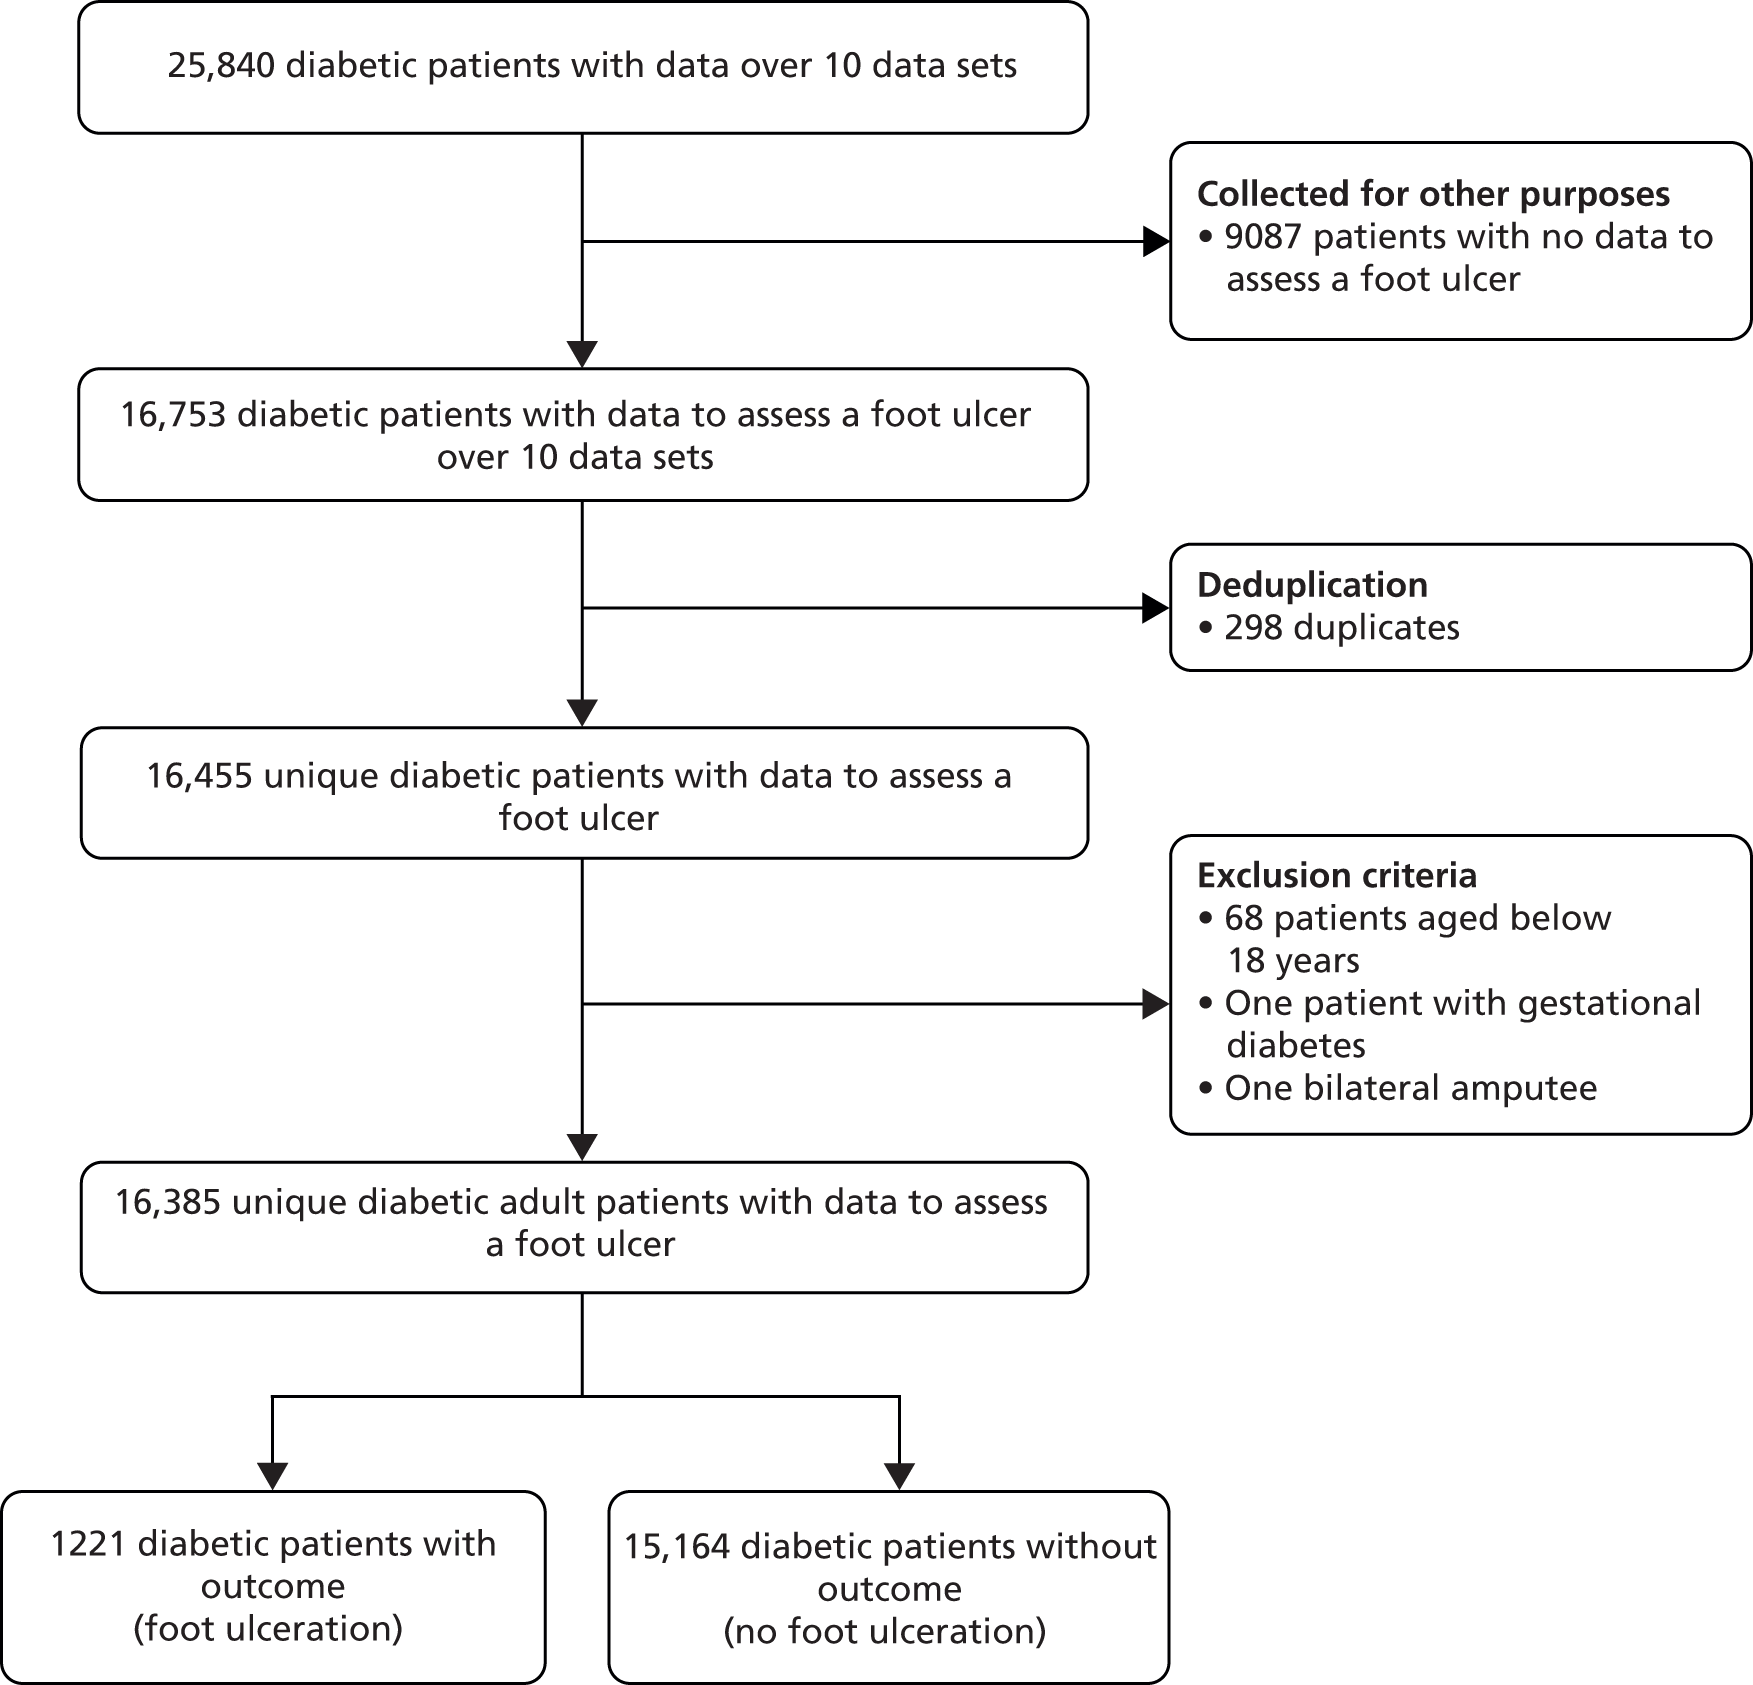
The independent contribution of tests, symptoms and signs to the prediction of foot ulceration risk assessment procedures in people with no history of ulceration or lower-extremity amputation
The following graphs show pooled estimates for the prognostic utility of age (Figure 7), an increase of 1 year’s duration of diabetes (Figure 8), the inability to feel a 10-g monofilament (Figure 9), one absent pedal pulse (Figure 10) and sex (Figure 11).
FIGURE 7.
Pooled estimates for age in people with no history of ulceration or amputation (model adjusted for sex, duration of diabetes, inability to feel a 10-g monofilament and absent pedal pulses). The OR of 1.008 (95% CI 0.995 to 1.021) indicates that age is not predictive of diabetes-related foot ulceration. The observed heterogeneity was I2 = 29.8%. External validation using Boyko et al. 200649 data: OR 0.984 (95% CI 0.965 to 1.003).
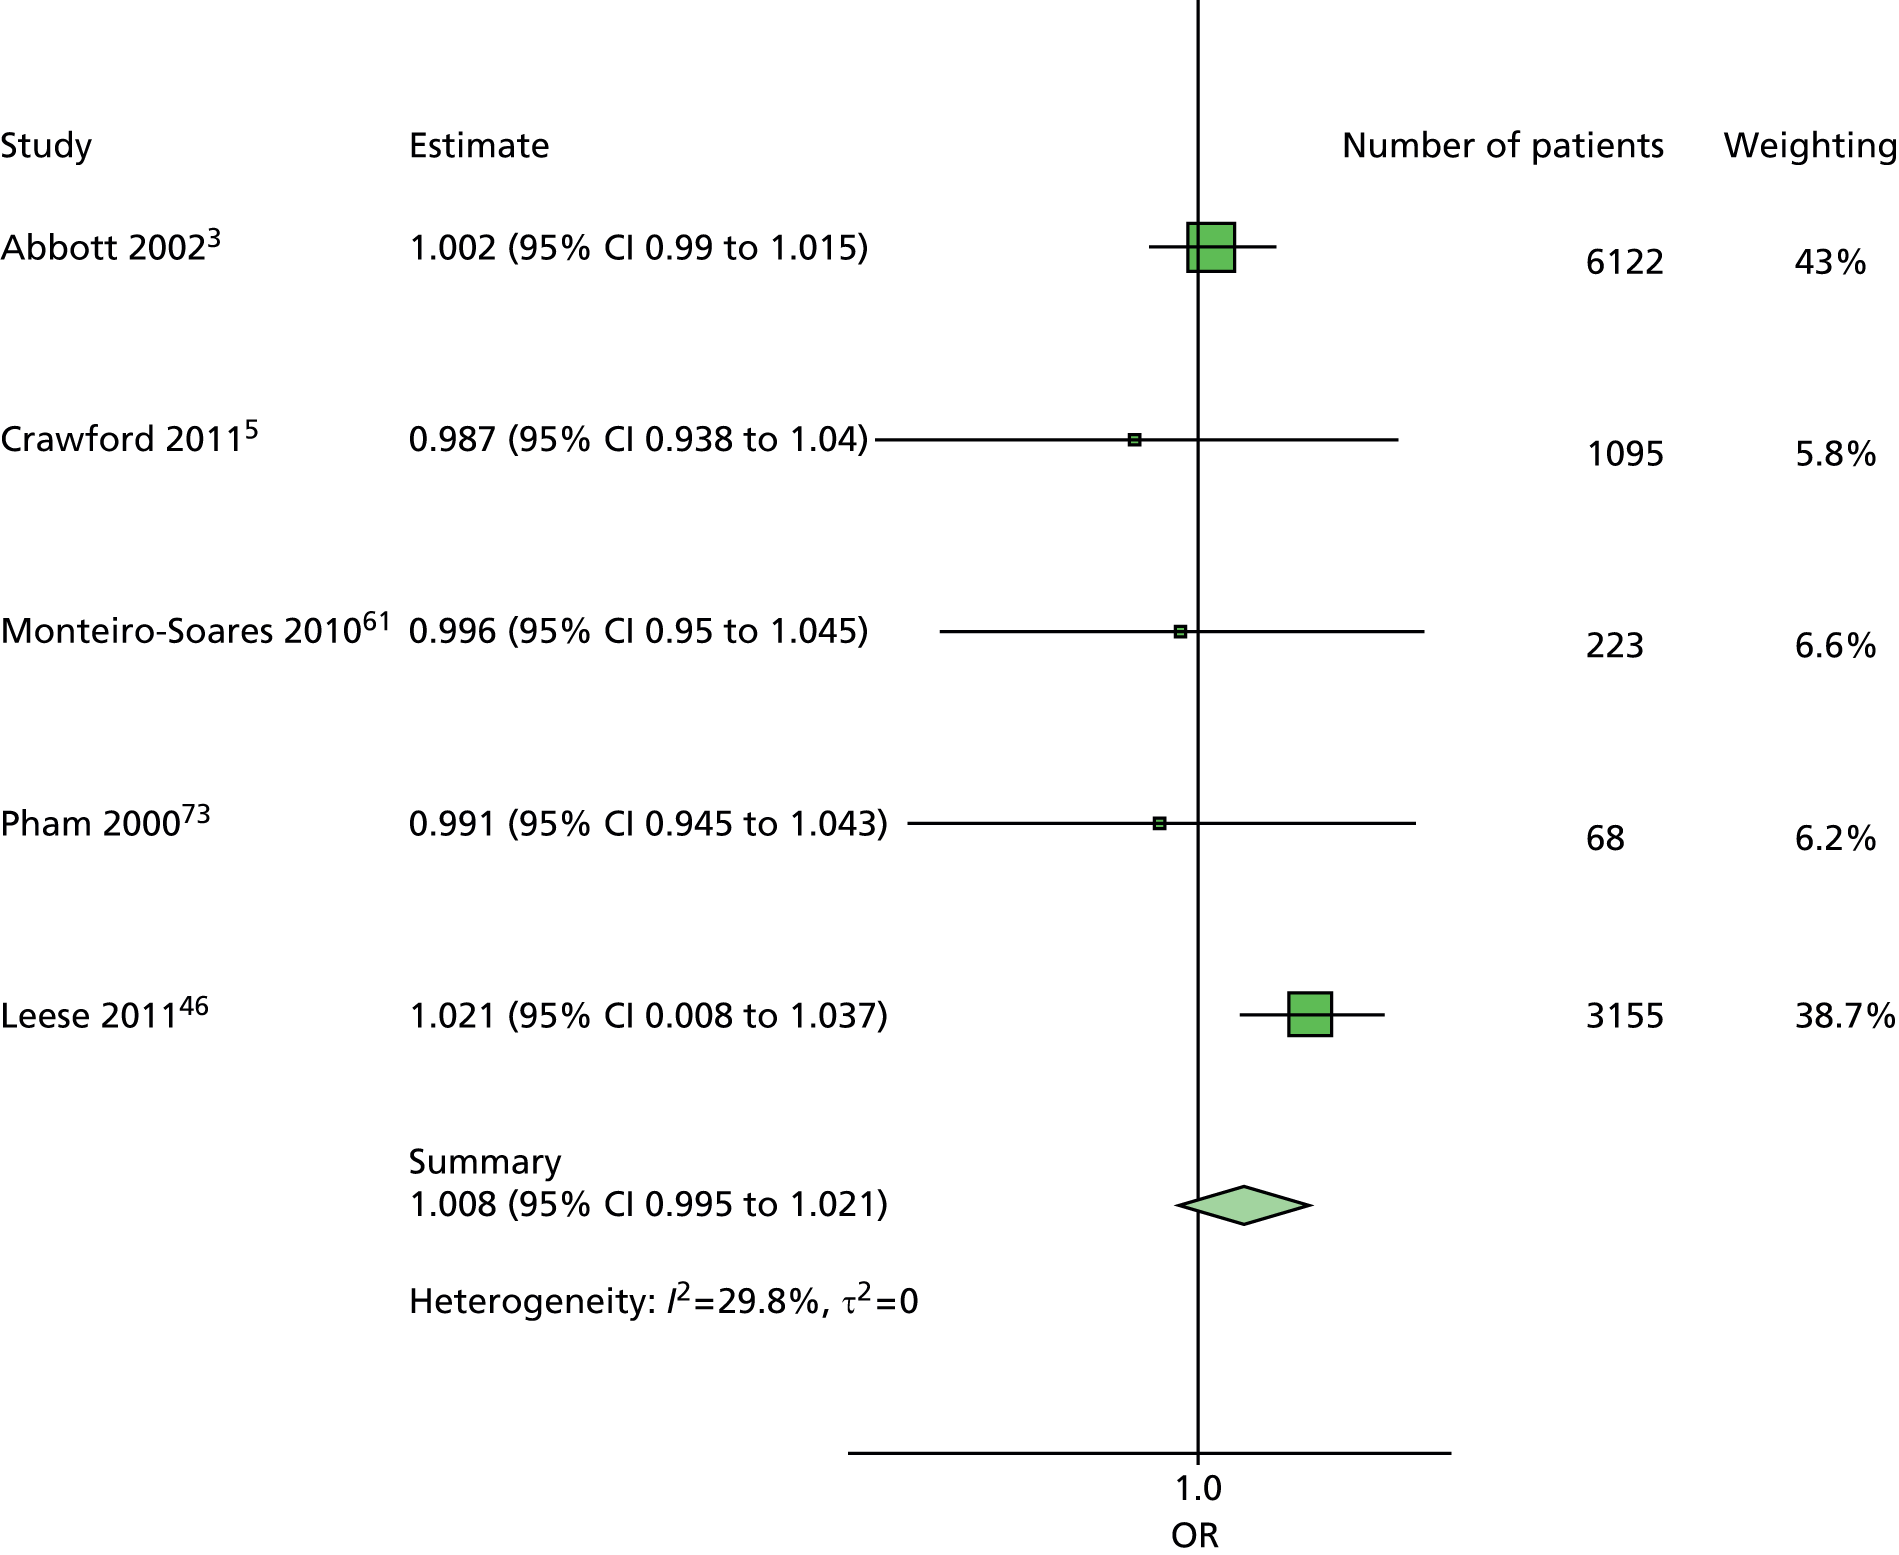
FIGURE 8.
Pooled estimates for an increase of 1 year’s duration of diabetes in people with no history of ulceration or amputation (model adjusted for age, sex, inability to feel a 10-g monofilament and absent pedal pulses). The OR of 1.029 (95% CI 1.017 to 1.04) indicates an increase of 1 year’s duration of diabetes is predictive of diabetes-related foot ulceration. The observed heterogeneity was I2 = 4.9%. External validation using Boyko et al. 200649 data: OR 0.970 (95% CI 0.954 to 0.987).

FIGURE 9.
Pooled estimates for the inability to feel a 10-g monofilament in people with no history of ulceration or amputation (model adjusted for age, sex, duration of diabetes and absent pedal pulse). The OR of 3.438 (95% CI 2.772 to 4.264) indicates that the inability to feel a 10-g monofilament is predictive of diabetes-related foot ulceration. The observed heterogeneity was I2 = 0%. External validation using Boyko et al. 200649 data: OR 3.913 (95% CI 2.581 to 5.933).

FIGURE 10.
Pooled estimates of one absent pedal pulse in people with no history of ulceration or amputation (model adjusted for age, sex, duration of diabetes and inability to feel a 10-g monofilament). The OR of 2.605 (95% CI 1.808 to 3.754) indicates that the absence of at least one pedal pulse is predictive of diabetes-related foot ulceration. The observed heterogeneity was I2 = 42.7%. External validation using Boyko et al. 200649 data: OR 1.416 (95% CI 0.466 to 4.301).

FIGURE 11.
Pooled estimates of sex in people with no history of ulceration or amputation (model adjusted for age, duration of diabetes, inability to feel a 10-g monofilament and absent pedal pulses). The OR of 0.841 (95% CI 0.682 to 1.037) does not indicate that sex is predictive of diabetes-related foot ulceration. The observed heterogeneity was I2 = 0.% External validation using Boyko et al. 200649 data: OR 1.303 (95% CI 0.282 to 6.022).

The independent contribution of tests, symptoms and signs in the total individual patient data population
The following graphs show pooled estimates for the prognostic utility of age (Figure 12), an increase of a 1 year duration of diabetes (Figure 13), the inability to feel a 10-g monofilament (Figure 14), one absent pedal pulse (Figure 15), sex (Figure 16) and previous history of foot ulceration or LEA (Figure 17).
FIGURE 12.
Pooled estimates for age in the total IPD population (model adjusted for sex, duration of diabetes, inability to feel a 10-g monofilament, absent pedal pulses and previous history of foot ulceration or amputation). The OR of 1.005 (95% CI 0.994 to 1.016) indicates that age is not predictive of diabetes-related foot ulceration. The observed heterogeneity was I2 = 37.4%. External validation using Boyko et al. 200649 data: OR 0.993 (95% CI 0.977 to 1.009).
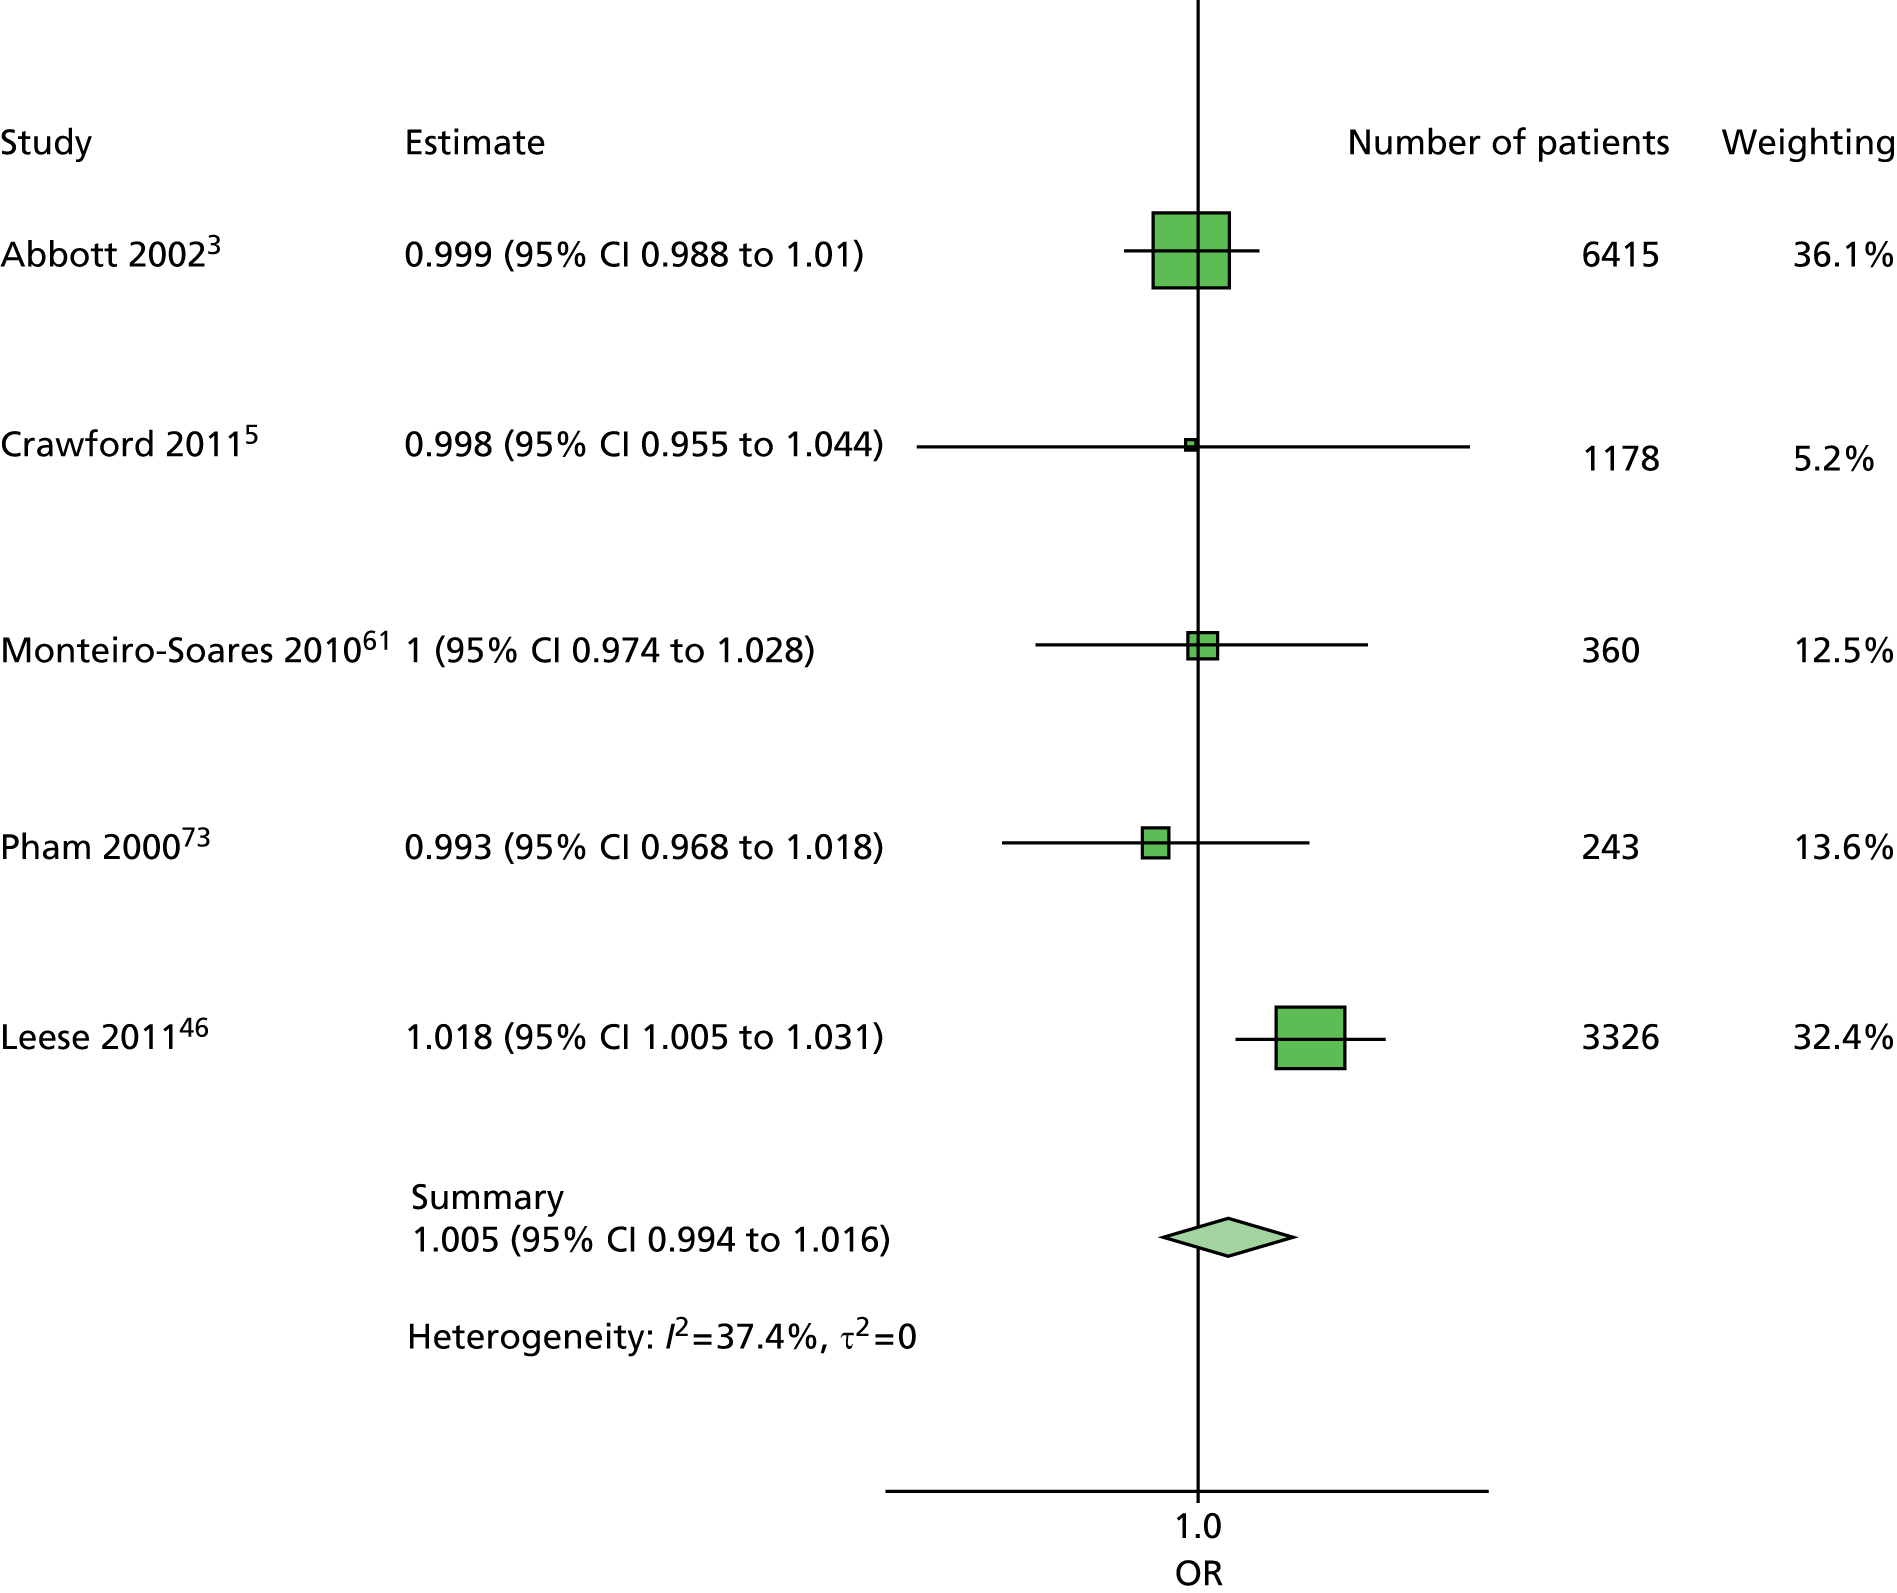
FIGURE 13.
Pooled estimates for an increase of 1 year’s duration of diabetes in the total IPD population (model adjusted for age, sex, inability to feel a 10-g monofilament, absent pedal pulses and previous history of foot ulceration or amputation). The OR of 1.024 (95% CI 1.011 to 1.036) indicates an increased duration of diabetes is predictive of diabetes-related foot ulceration. The observed heterogeneity was I2 = 38.1%. External validation using Boyko et al. 200649 data: OR 0.981 (95% CI 0.968 to 0.994).
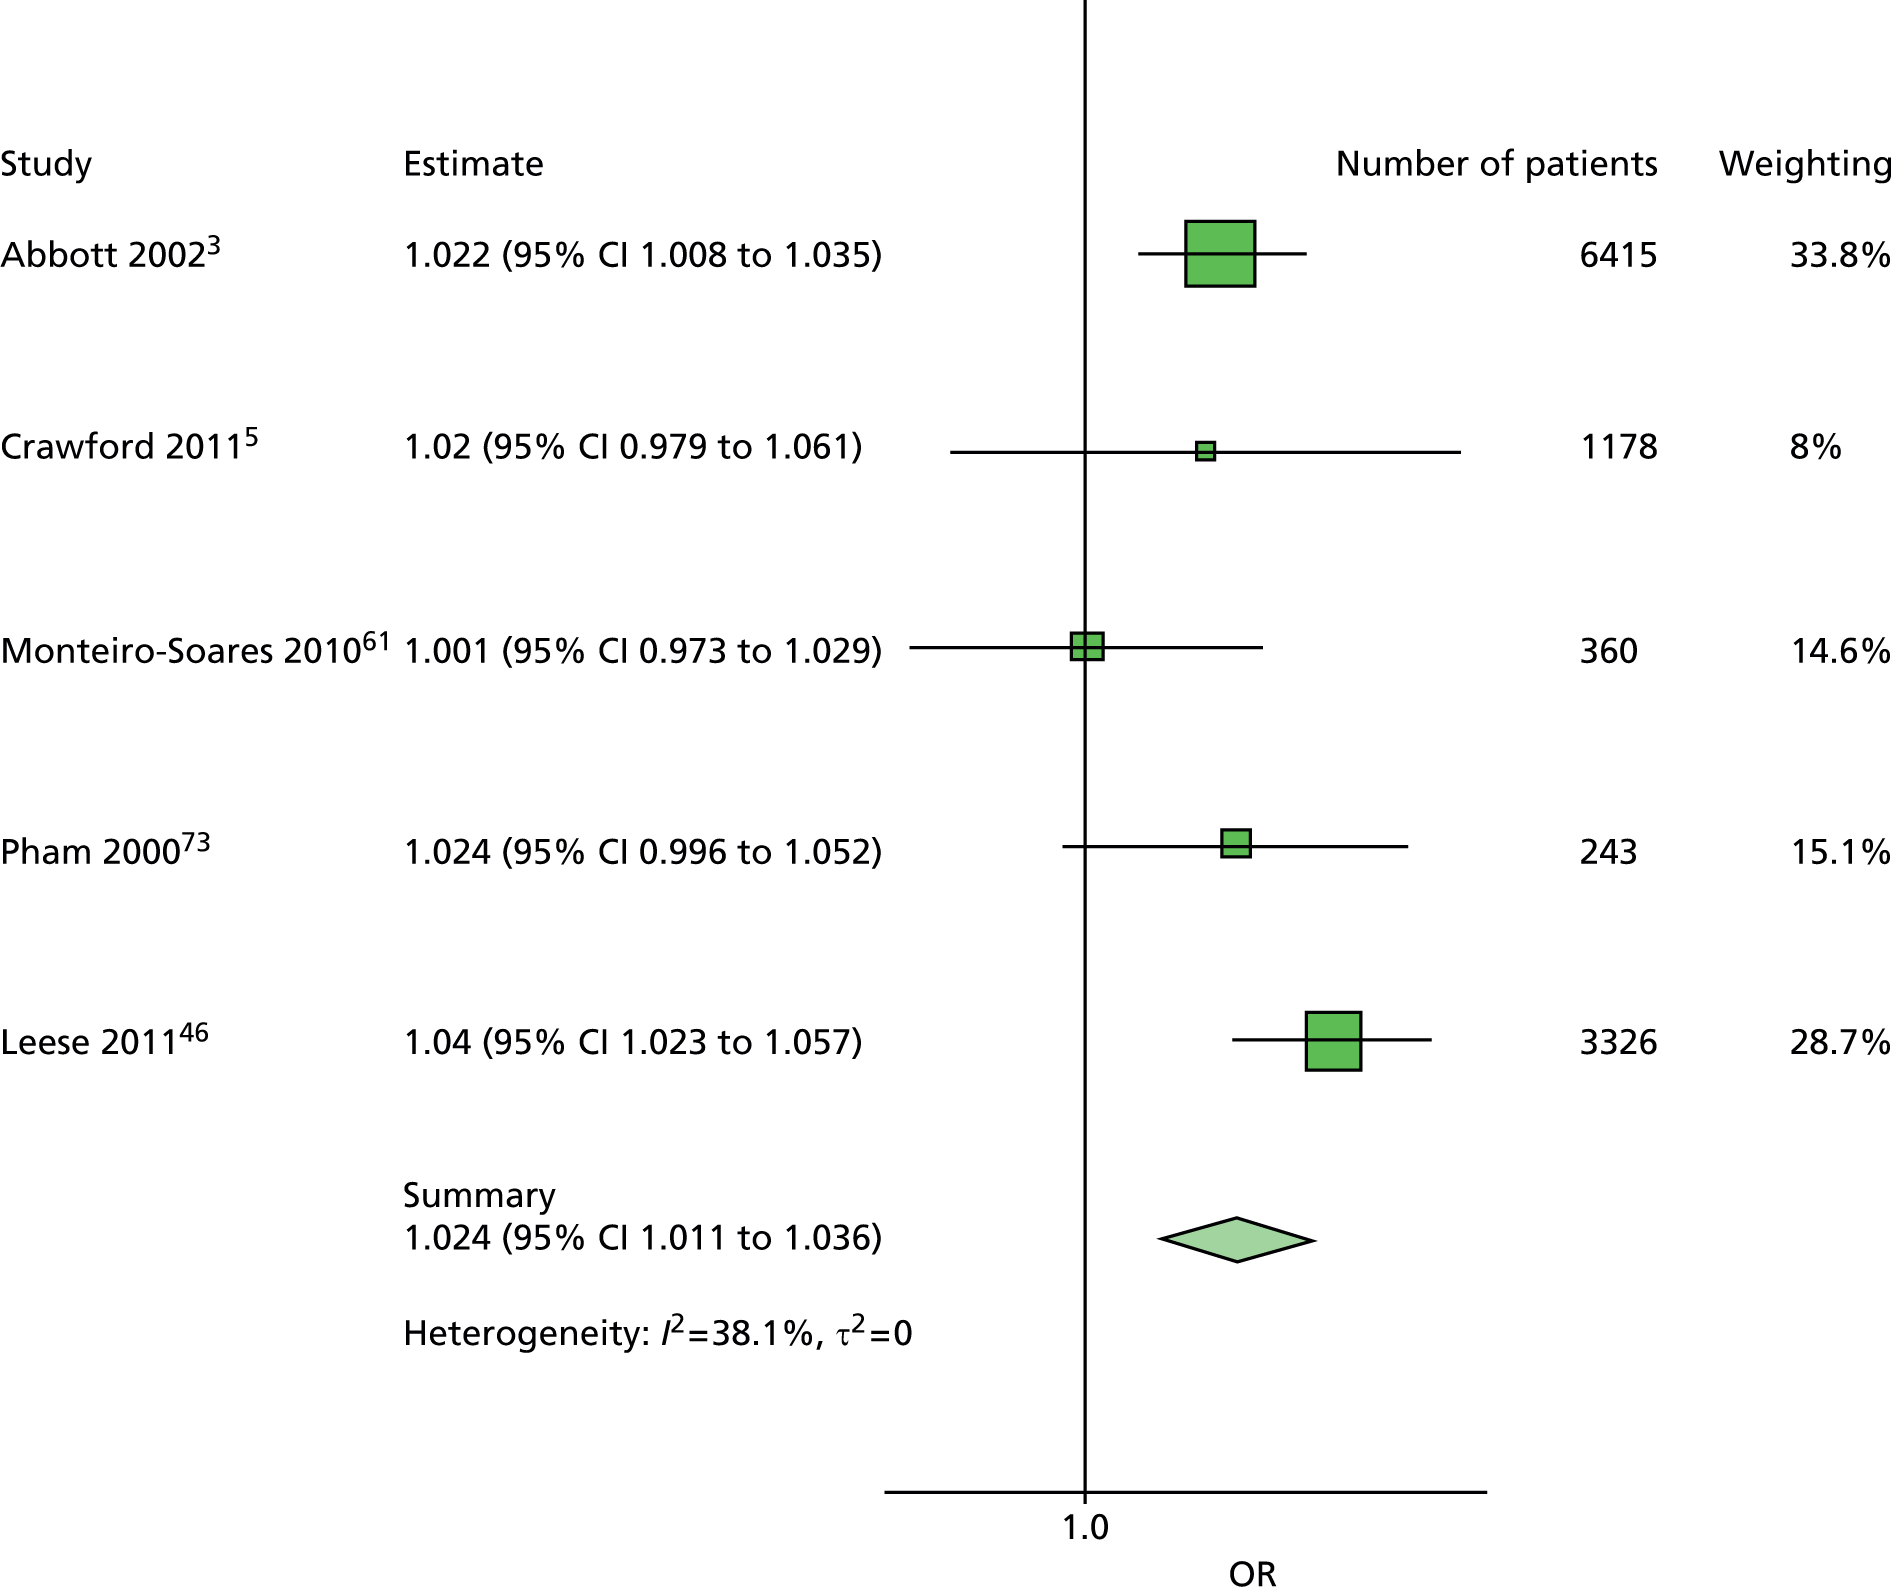
FIGURE 14.
Pooled estimates for the inability to feel a 10-g monofilament in the total IPD population (model adjusted for age, sex, duration of diabetes, absent pedal pulses and previous history of foot ulceration or amputation). The OR of 3.184 (95% CI 2.654 to 3.82) indicates that an inability to feel a 10-g monofilament is predictive of diabetes-related foot ulceration. The observed heterogeneity was I2 = 0%. External validation using Boyko et al. 200649 data: OR 3.489 (95% CI 2.486 to 4.896).

FIGURE 15.
Forest plot showing pooled estimates for one absent pedal pulses in the total IPD population (model adjusted for age, sex, duration of diabetes, inability to feel a 10-g monofilament and previous history of foot ulceration or amputation). The OR of 1.968 (95% CI 1.624 to 2.386) indicates that the absence of a pedal pulse is predictive of diabetes-related foot ulceration. The observed heterogeneity was I2 = 1.6%. External validation using Boyko et al. 200649 data: OR 2.557 (95% CI 1.220 to 5.361).
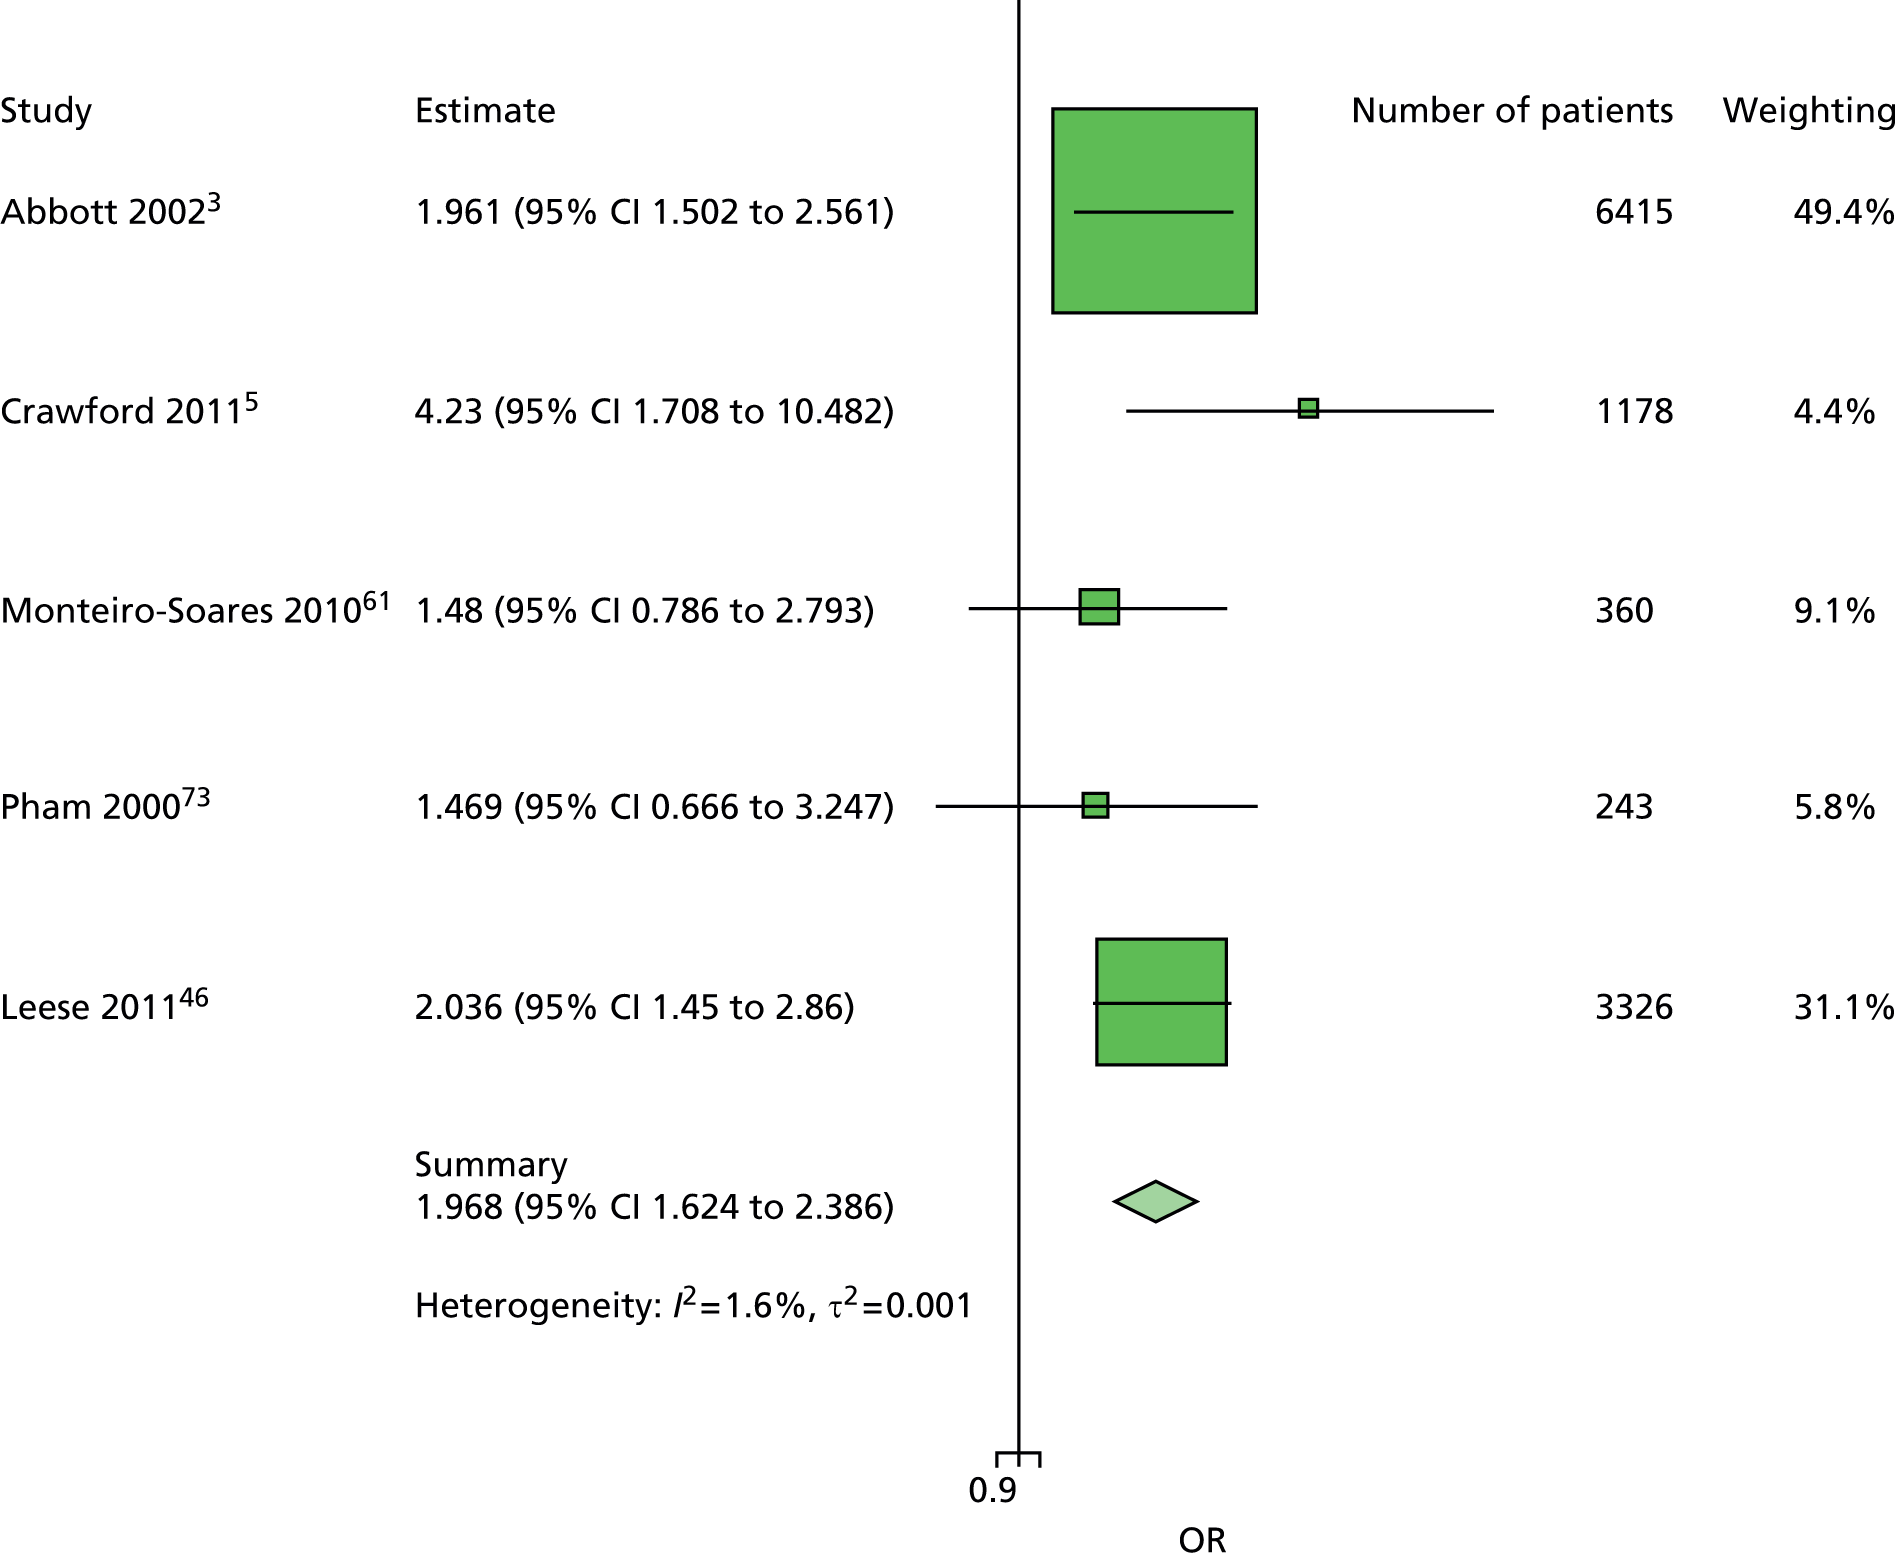
FIGURE 16.
Pooled estimates for sex in the total IPD population (model adjusted for age, duration of diabetes, inability to feel a 10-g monofilament, absent pedal pulses and previous history of foot ulceration or amputation). The OR of 0.743 (95% CI 0.598 to 0.922) indicates male sex to be predictive of diabetes-related foot ulceration. The observed heterogeneity was I2 = 20.7%. External validation using Boyko et al. 200649 data: OR 1.491 (95% CI 0.418 to 5.317).
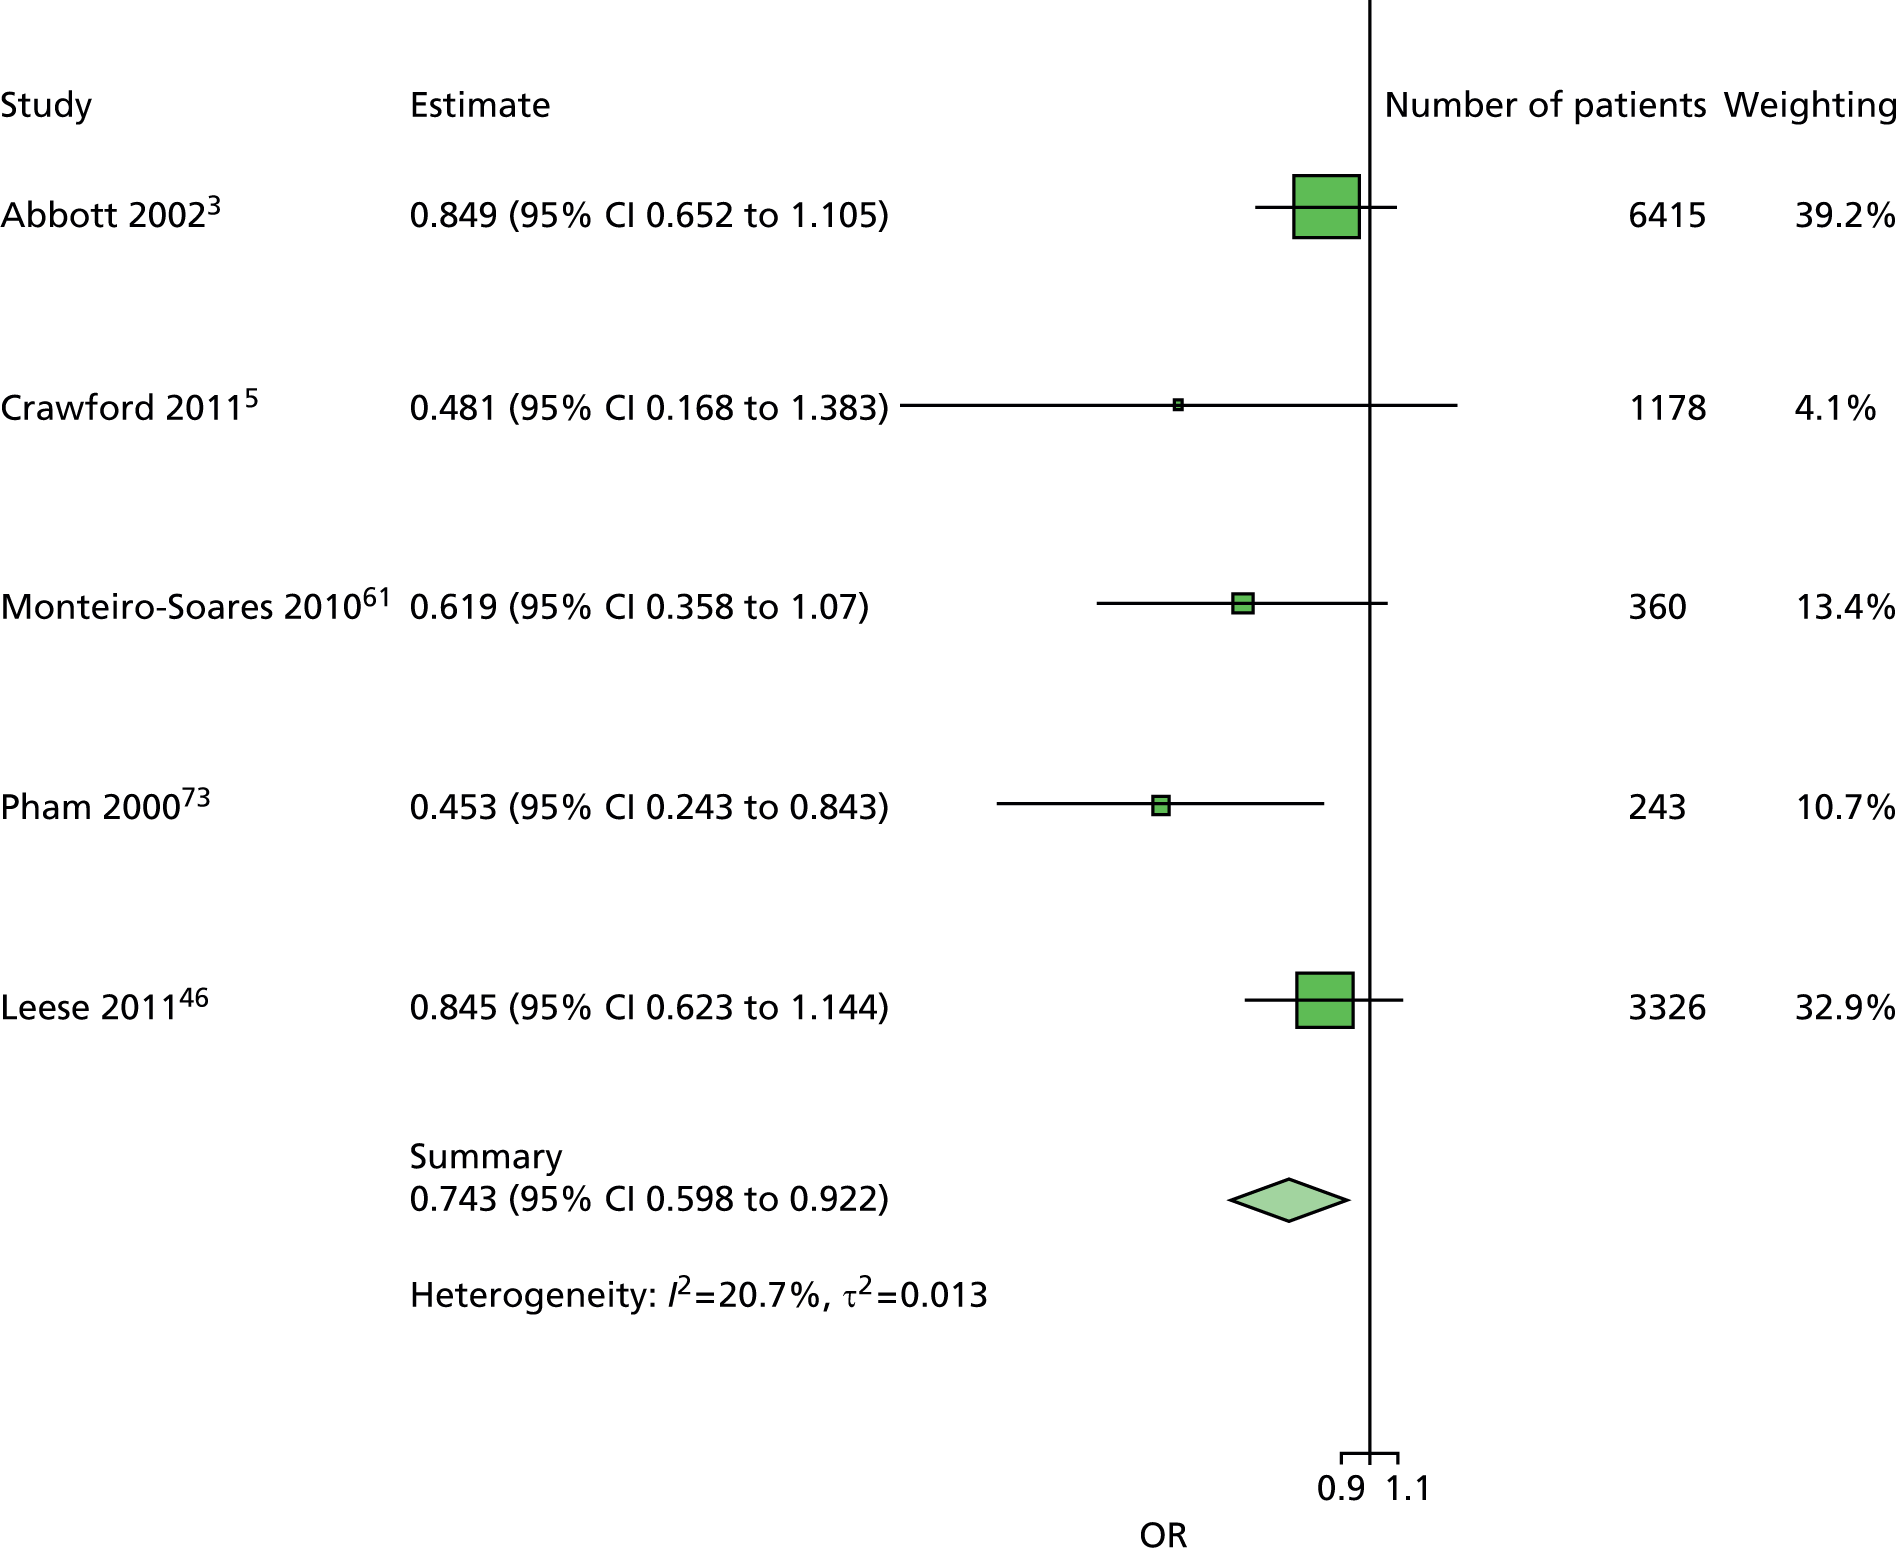
FIGURE 17.
Pooled estimates for previous history of LEA in the total IPD population. (Model adjusted for age, sex, duration of diabetes, inability to feel a 10-g monofilament and absent pedal pulses.) The OR of 6.589 (95% CI 2.488 to 17.454) indicates that a previous history of foot ulceration or LEA is predictive of diabetes-related foot ulceration. The observed heterogeneity was I2 = 94.2%. External validation using Boyko et al. 200649 data: OR 2.979 (95% CI 2.146 to 4.135).
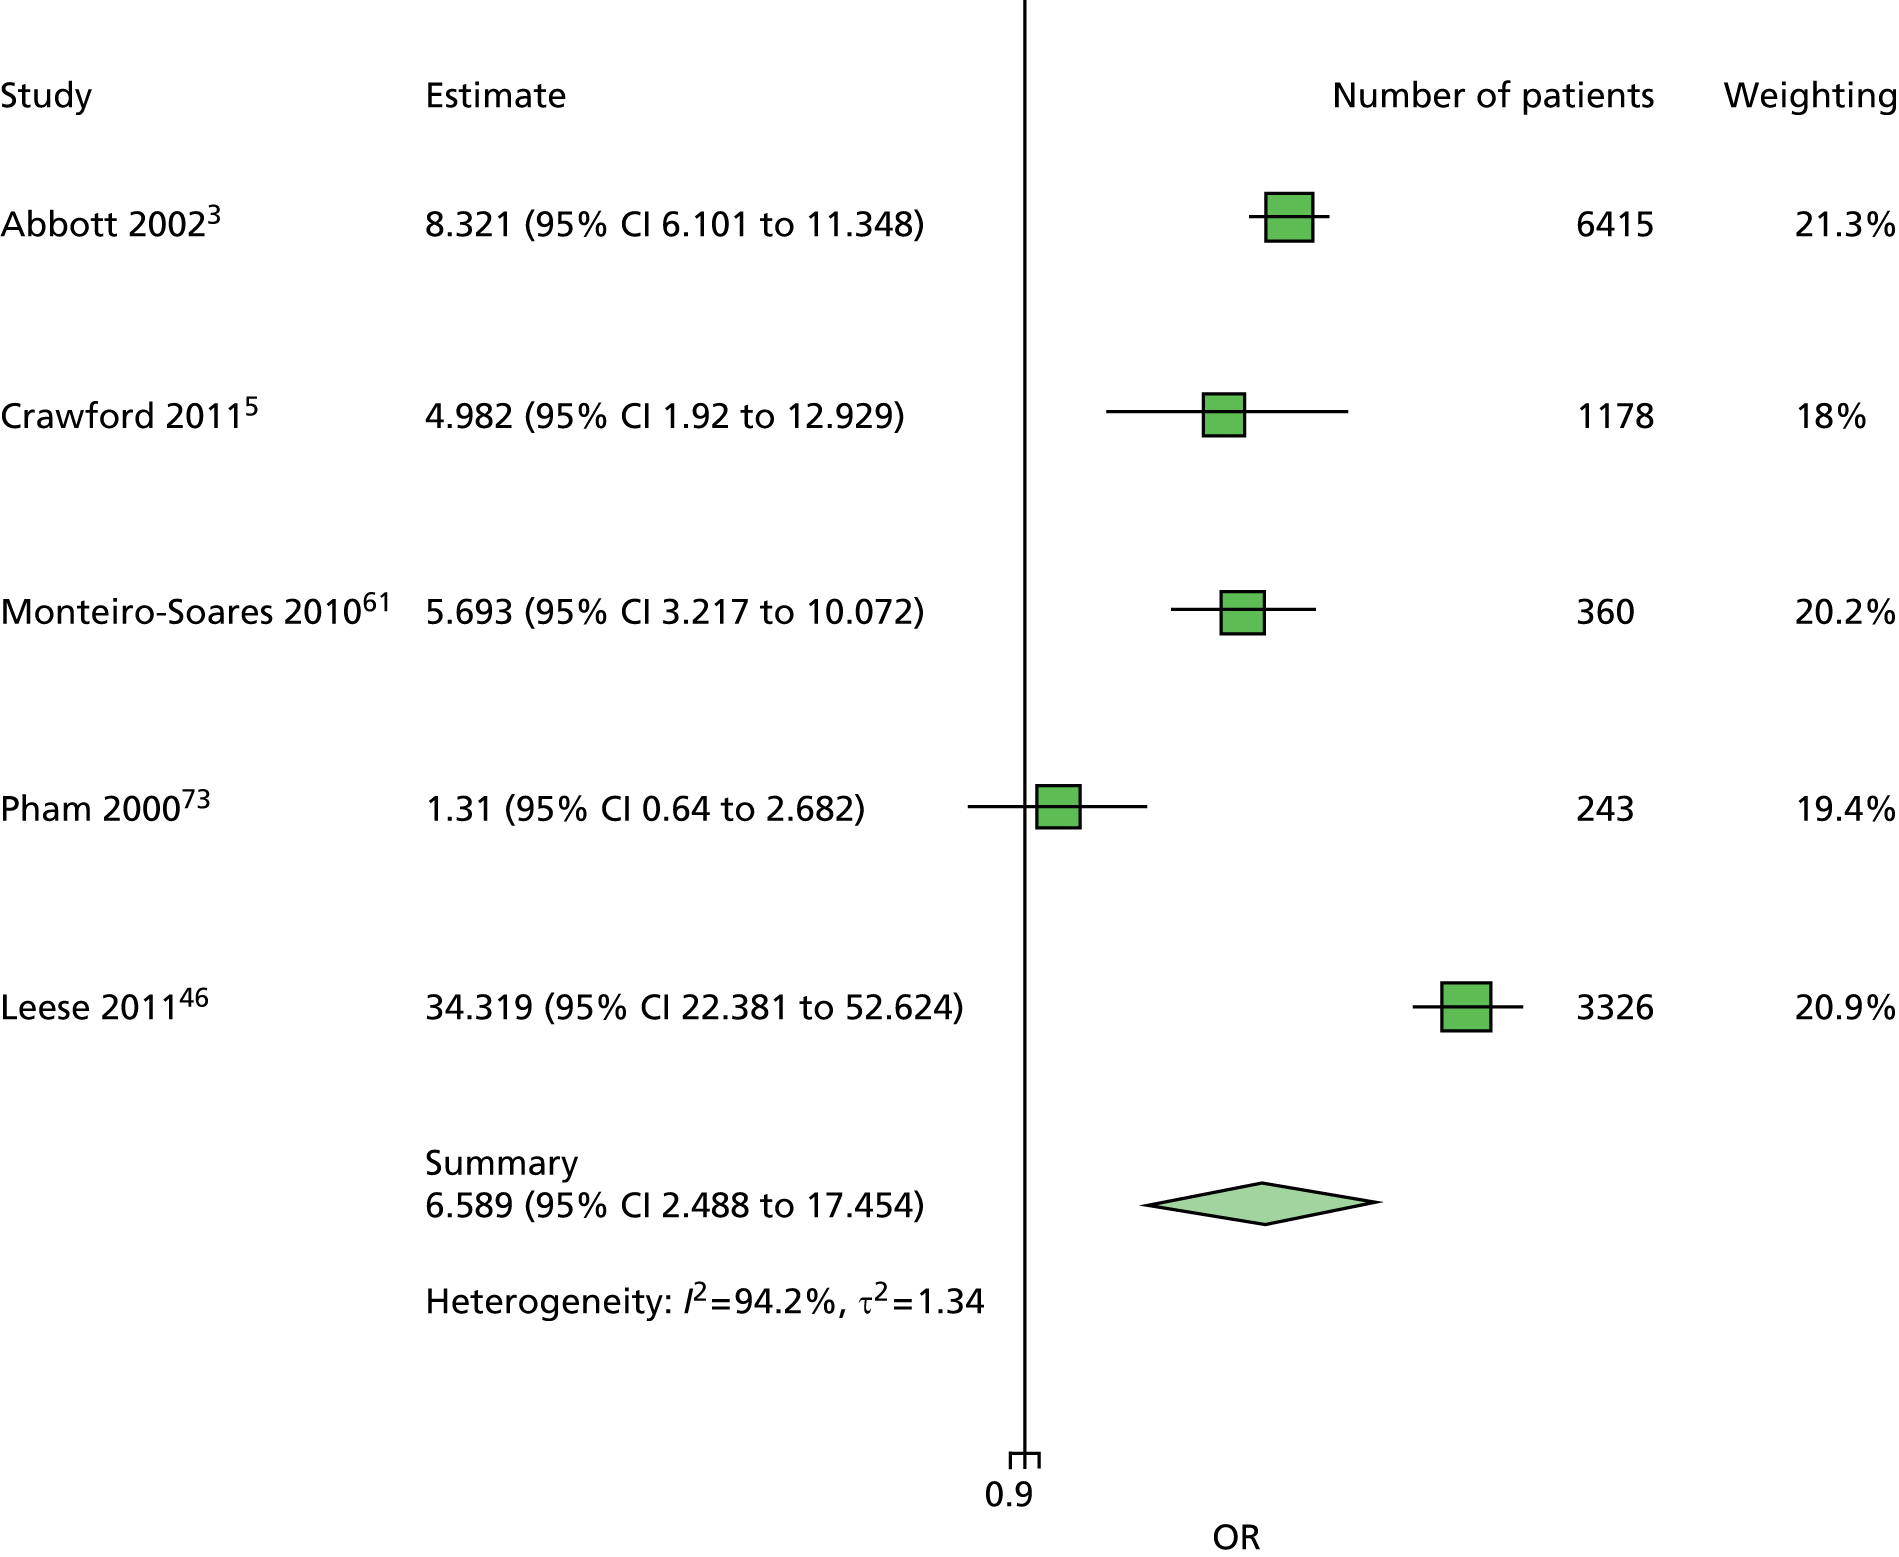
The absence of heterogeneity and consistency of the estimates for the inability to feel a 10-g monofilament was noted across a number of models and between the two patient groups (see Appendix 11). Out of the 14 meta-analyses that included monofilament as a predictor, only two did not estimate the heterogeneity to be zero, and these two studies had low heterogeneity estimates (Table 7). Some of these ORs are based on more data than others – depending on the variables in the model and those available in the individual studies. The OR for insensitivity to a 10-g monofilament is around 3.5, despite the test being conducted in a number of different ways by the individual study investigators, different anatomical sites on the foot being used and the number of sites varying. We had also expected to observe heterogeneity owing to other methodological and patient cohort differences.
| Other model predictors | Patient group | OR | 95% CI | I 2 | τ |
|---|---|---|---|---|---|
| Age, duration, sex | No history | 3.823 | 3.106 to 4.705 | 0% | 0 |
| Age, duration, sex, previous history | All | 3.444 | 2.891 to 4.103 | 0% | 0 |
| Age, duration, pulses, sex | No history | 3.438 | 2.772 to 4.264 | 0% | 0 |
| Age, duration, pulses, previous history | All | 3.184 | 2.654 to 3.82 | 0% | 0 |
| Age, duration, insulin, sex | No history | 3.763 | 2.837 to 4.991 | 0% | 0 |
| Age, duration, insulin, sex, previous history | All | 3.189 | 2.524 to 4.028 | 0% | 0 |
| Age, duration, kidney problems, sex | No history | 4.008 | 3.17 to 5.069 | 0% | 0 |
| Age, duration, kidney problems, sex, previous history | All | 3.435 | 2.821 to 4.183 | 0% | 0 |
| Age, duration, pulses, sex, VPT | No history | 2.501 | 1.844 to 3.393 | 0% | 0 |
| Age, duration, pulses, sex, VPT, previous history | All | 2.003 | 1.333 to 3.011 | 27.9% | 0.055 |
| Age, duration, pulses, sex, HbA1c | No history | 3.350 | 2.488 to 4.512 | 0% | 0 |
| Age, duration, pulses, sex, HbA1c, previous history | All | 2.770 | 1.938 to 3.960 | 28.9% | 0.033 |
| Age, duration, pulses, sex, ABI | No history | 2.635 | 0.824 to 8.426 | 0% | 0 |
| Age, duration, pulses, sex, ABI, previous history | All | 2.657 | 1.127 to 6.261 | 0% | 0 |
This consistency of results across individual studies and meta-analyses for the 10-g monofilament test is not observed for any other predictive variable, and this makes it harder to reach conclusions about their true value in risk assessment. All predictive factors were subject to some heterogeneity, which affects the generalisability of their estimates. All forest plots, with ORs for the individual studies and meta-analyses, together with I2 and τ estimates of heterogeneity, can be found in Appendix 11.
We calculated an AUC and Brier score for the studies in model 4 for the total population and for patients with no previous history of foot ulceration or LEAs. The tables in Appendix 12 show AUC values of between 0.71832 and 0.8654 for the total population, and between 0.70436 and 0.77636 in the total population minus those without a history of a foot ulcer or LEA, thus showing that the model possesses good discrimination.
The low Brier scores indicate that the model is also well calibrated (total population = 0.03704 to 0.18342; total population minus those without a history of a foot ulcer or LEA = 0.01214 to 0.14659).
Imputation analysis: final model
The missing data patterns of the common harmonised variables have been assessed to be MAR. We could therefore apply the MICE method. In this section, we focus on imputing the set of variables selected in the final model and these are: age, sex, duration of diabetes, monofilament, pulses and previous history of ulcer or amputation. The data set to be imputed also includes the following outcome: ulcer. The set of variables for the final model was collected in five studies. 3,5,47,61,73
An initial step prior to any imputation for each data set is to look at the missing data patterns of the specified set of variables. Table 8 provides such patterns by study. Group 1 represents the ‘complete case’ where a patient has no missing data in any of the variables specified. Groups 2 to 9 represent patients with one or two missing variables. Apart from the study by Monteiro-Soares and Dinis-Ribeiro,61 which had no case of missing data for the specified set of variables, all studies had between 1% and 3% of overall missing data.
| Study | |||||||||||||||||
|---|---|---|---|---|---|---|---|---|---|---|---|---|---|---|---|---|---|
| Abbott et al., 20023 | Crawford et al., 20115 | Monteiro-Soares and Dinis-Ribeiro, 201061 | Pham et al., 200073 | Leese et al., 201147 | |||||||||||||
| Group | Ulcer | Age | Sex | Diabetes duration | Monofilament | Pulses | Previous history | n | % | n | % | n | % | n | % | n | % |
| 1 | ✗ | ✗ | ✗ | ✗ | ✗ | ✗ | ✗ | 6415 | 97.15 | 1178 | 98.74 | 360 | 100 | 243 | 97.98 | 3326 | 97.48 |
| 2 | ✗ | ✗ | ✗ | ✗ | ✗ | ✗ | 121 | 1.83 | 13 | 1.09 | 1 | 0.4 | |||||
| 3 | ✗ | ✗ | ✗ | ✗ | ✗ | 3 | 0.05 | 2 | 0.81 | 2 | 0.06 | ||||||
| 4 | ✗ | ✗ | ✗ | ✗ | ✗ | ✗ | 74 | 2.17 | |||||||||
| 5 | ✗ | ✗ | ✗ | ✗ | ✗ | ✗ | 31 | 0.47 | 2 | 0.17 | 1 | 0.4 | 10 | 0.29 | |||
| 6 | ✗ | ✗ | ✗ | ✗ | ✗ | 1 | 0.02 | ||||||||||
| 7 | ✗ | ✗ | ✗ | ✗ | ✗ | ✗ | 1 | 0.02 | |||||||||
| 8 | ✗ | ✗ | ✗ | ✗ | ✗ | ✗ | 30 | 0.45 | 1 | 0.4 | |||||||
| 9 | ✗ | ✗ | ✗ | ✗ | ✗ | 1 | 0.02 | ||||||||||
| Total 2–9 | 188 | 2.86 | 15 | 1.26 | 0 | 0 | 5 | 2.01 | 86 | 2.52 | |||||||
Because of the absence of missing data for the Monteiro-Soares and Dinis-Ribeiro61 study, there was no need for the use of multiple imputation. We applied MICE in the remaining four studies, where there were missing data, although the percentage of missing data was very low. We created 20 imputed data sets, recalculated the logistic regression estimates and pooled the estimates for each study. ORs and 95% CIs were calculated from the logistic regression estimates and standard errors and results were compared before and after imputation.
There was little difference in point estimates between the ORs of the ‘complete case’ final model and the ORs of the final model with imputation (ORs not shown but available on request). Most of the differences between ORs were quasi null, which can be explained by the low percentage of overall missing data in each study. The wider differences were seen in the Abbott et al. 3 study for the previous ulcer or amputation estimates (OR = 8.21 before, OR = 8.37 after, difference –0.152) and in the Pham et al. 73 study for the monofilament estimates (OR = 3.15 before, OR = 3.06 after, difference 0.083). Table 9 summarises and quantifies the differences between the ORs of the final model with multiple imputation and the ORs of the ‘complete case’ final model.
| Predictors in final model | Study | |||
|---|---|---|---|---|
| Abbott et al., 20023 | Crawford et al., 20115 | Pham et al., 200073 | Leese et al., 201147 | |
| Age | 0.000 | 0.000 | 0.000 | 0.000 |
| Sex | 0.009 | –0.001 | –0.005 | 0.001 |
| Duration of diabetes | 0.000 | 0.000 | 0.000 | 0.000 |
| Previous ulcer or amputation | 0.013 | –0.012 | 0.083 | –0.008 |
| Monofilament | 0.013 | 0.012 | –0.019 | –0.003 |
| Pulses | –0.152 | –0.011 | –0.067 | –0.054 |
The small differences observed in ORs enabled us to conclude that there was little bias attributable to missing data in our model, which is very likely to be related to a very small proportion of missing data in the original data sets.
Validation of the primary meta-analysis
We compared the ORs estimated in the primary meta-analysis with those in an independent study. 49 The validation study was different in a key characteristic, which might explain some of the differences found below, namely the fact that the validation study’s patient sample was 98.3% male.
However, the validation results for inability to feel a 10-g monofilament, absent pulses, and previous history of ulceration mostly converge, particularly those for the inability to feel a 10-g monofilament, where the meta-analysis and validation estimates are very close (Tables 10 and 11).
| Predictor | Source | OR | 95% CI |
|---|---|---|---|
| Age | Meta-analysis | 1.008 | 0.995 to 1.021 |
| Boyko et al., 200649 | 0.984 | 0.965 to 1.003 | |
| Duration of diabetes | Meta-analysis | 1.029 | 1.017 to 1.040 |
| Boyko et al., 200649 | 0.970 | 0.954 to 0.987 | |
| Inability to feel a 10-g monofilament | Meta-analysis | 3.438 | 2.772 to 4.264 |
| Boyko et al., 200649 | 3.913 | 2.581 to 5.933 | |
| Absent pedal pulses | Meta-analysis | 2.605 | 1.808 to 3.754 |
| Boyko et al., 200649 | 1.416 | 0.466 to 4.301 | |
| Sex (female) | Meta-analysis | 0.841 | 0.682 to 1.037 |
| Boyko et al., 200649 | 1.303 | 0.282 to 6.022 |
| Predictor | Source | OR | 95% CI |
|---|---|---|---|
| Age | Meta-analysis | 1.005 | 0.994 to 1.016 |
| Boyko et al., 200649 | 0.993 | 0.977 to 1.009 | |
| Duration of diabetes | Meta-analysis | 1.024 | 1.011 to 1.036 |
| Boyko et al., 200649 | 0.981 | 0.968 to 0.994 | |
| Inability to feel a 10-g monofilament | Meta-analysis | 3.184 | 2.654 to 3.82 |
| Boyko et al., 200649 | 3.489 | 2.486 to 4.896 | |
| Absent pedal pulses | Meta-analysis | 1.968 | 1.624 to 2.386 |
| Boyko et al., 200649 | 2.557 | 1.220 to 5.361 | |
| Sex (female) | Meta-analysis | 0.743 | 0.598 to 0.922 |
| Boyko et al., 200649 | 1.491 | 0.418 to 5.317 | |
| Previous history | Meta-analysis | 6.589 | 2.488 to 17.45 |
| Boyko et al., 200649 | 2.979 | 2.146 to 4.135 |
The results in the validation data set for duration of diabetes were unexpected, where a longer duration of diabetes was protective against ulceration. The results for sex were also different from the results for the studies in the meta-analysis, but, because there were very few women in the validation data set, these estimates are not as reliable as those in the meta-analysis.
Despite these differences between the validation data set and the meta-analysis, the results for the monofilament test are remarkably consistent and provide evidence that the OR for monofilaments is generalisable across a variety of clinical contexts.
Chapter 14 Secondary analyses
As part of the process of disseminating the findings of the systematic review and meta-analyses, we presented the preliminary analyses at two scientific seminars in the UK during 2014. 78,79 In response to questions raised by seminar participants about the value of using less or more tests (or signs), two additional (secondary) analyses have been performed.
What is the value of other commonly used tests not included in the models, particularly tests that permit patients to influence outcome?
Vibration perception threshold
Vibration perception threshold is often used in foot risk assessments for people with diabetes. A range of equipment can be used, including biothesiometers, neurothesiometers and tuning forks. These give continuous data (biothesiometers, neurothesiometers and calibrated tuning forks) or binary data (standard tuning forks).
We used data from four studies3,5,61,73 to calculate the predictiveness of VPT measured with any one of these types of tests. In the model, VPT is adjusted for age, sex, duration of diabetes, monofilament and pulses from study-level multivariable logistic regressions. The predictiveness of VPT in all patients – including those with a history of ulceration or amputation (n = 8003) – is shown in Figure 18 (OR 3.026, 95% CI 1.353 to 6.765). A high level of heterogeneity is observed with an I2 of 73.3%.
FIGURE 18.
Predictiveness of VPT in all patients.

The predictiveness of VPT in 7370 people with no history of ulceration or amputation is shown in Figure 19 (OR 2.294, 95% CI 1.189 to 4.426). A low level of heterogeneity is observed in this smaller population (I2 = 24.9%).
FIGURE 19.
Predictiveness of VPT in 7370 people with no history of ulceration or amputation.

Glycohaemoglobin or glycated haemoglobin
The glycated haemoglobin test
Glycated haemoglobin is the most common blood test used to assess the amount of glucose carried on the red blood cells and its control is thought to improve patient outcomes such as neuropathy and retinopathy. HbA1c was traditionally expressed as a percentage but the unit has changed to mmol/mol in accordance with the International Federation of Clinical Chemistry reference measurement procedure. Because glucose attaches to the haemoglobin molecule in the red blood cell, which has a life cycle of 100–120 days, the plasma HbA1c represents a record of the plasma glucose level for approximately the previous 3 months. Normal levels of HbA1c are 6.5–7% or 48–53 mmol/mol. Conversion tools are available to convert percentages into mmol/mol. 80
We used data from three studies5,46,47,61 to calculate the predictiveness of an increase of 1% HbA1c. HbA1c is adjusted for age, sex, duration of diabetes, monofilament and pulses in the meta-analyses of estimates from study-level multivariable logistic regressions.
The predictiveness of a 1% increase in HbA1c in all patients – including those with a history of ulceration or amputation (n = 4979) – is shown in Figure 20 (OR 1.218, 95% CI 0.969 to 1.532). A high level of heterogeneity is observed (I2 = 79.8).
FIGURE 20.
Predictiveness of a 1% increase in HbA1c in all patients.
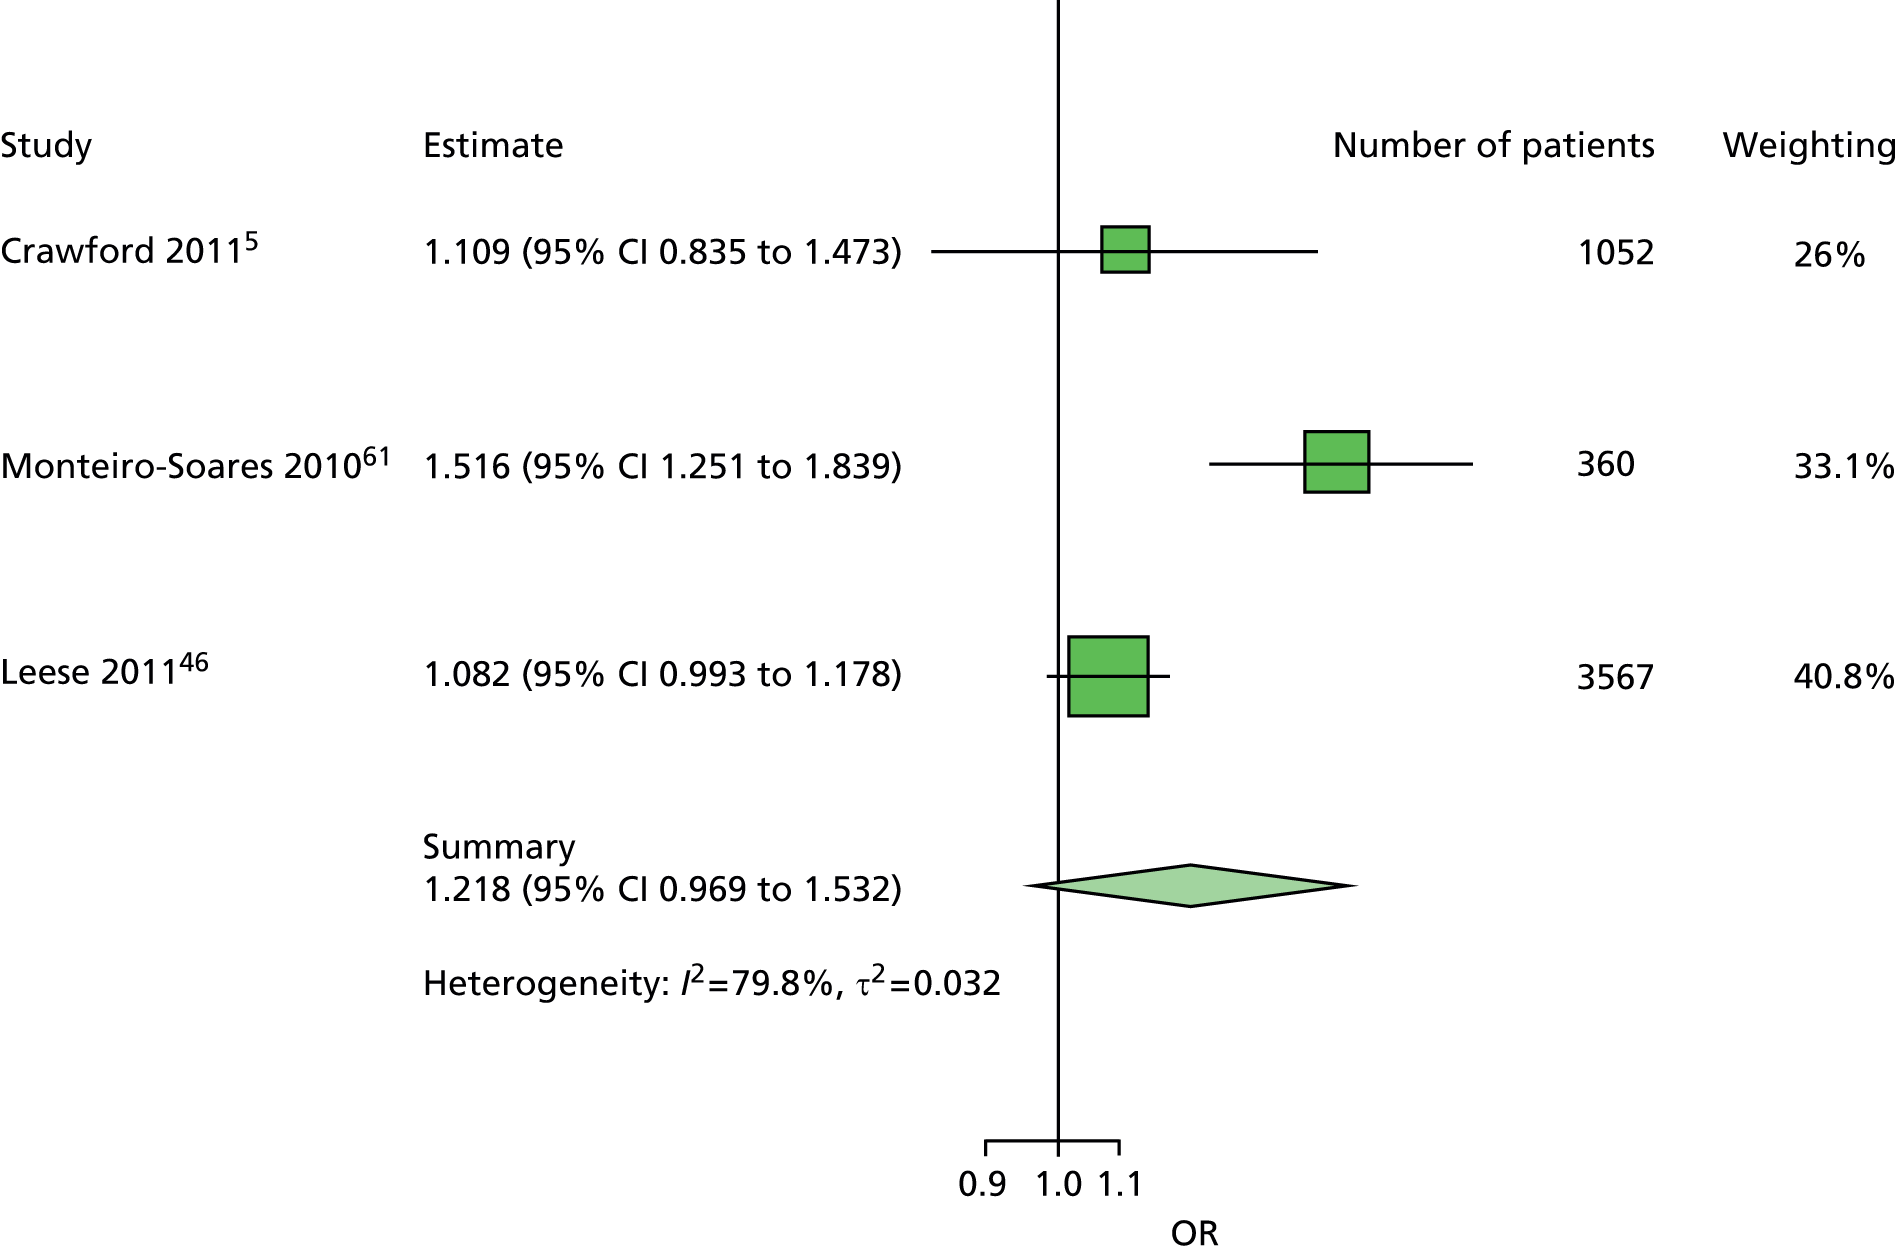
The predictiveness of a 1% increase in HbA1c in 4595 people with no history of ulceration or amputation is shown in Figure 21 (OR 1.201, 95% CI 0.971 to 1.178). A high level of heterogeneity is observed (I2 = 79.8%).
FIGURE 21.
Predictiveness of a 1% increase in HbA1c in 4595 people with no history of ulceration or amputation.

Monofilaments plus or minus absent pulses
Does the failure to feel a 10-g monofilament test plus absent pedal pulses identify those at risk of foot ulceration better than the monofilament test alone?
A comparison of model 2 and model 4
Models 2 and 4 included the same predictors, namely age, sex, duration of diabetes and insensitivity to monofilaments, although model 4 also included presence/absence of pulses. Our comparison of these two models is restricted to their performance in patients without a history of previous ulceration or amputation.
Various statistics are available for the comparison of regression models to assess different aspects of model performance, such as discrimination or calibration. However, in this clinical context, it is important to consider the consequences to the patient of a wrong prediction. A patient wrongfully predicted to be ulcer free who goes on to ulcerate will bear a much greater cost, which may include pain, loss of mobility, infection and amputation, than a patient wrongfully predicted to ulcerate who does not, for whom the consequences would be higher levels of foot and general diabetes health care. A full cost-effectiveness analysis is beyond the scope of this project, but below we examine predictions of ulceration in patients who do and do not develop ulcers in two models. The natural statistical framework for such an exploration is sensitivity, specificity and receiver operating characteristic (ROC) curves.
Sensitivity is the proportion of times the model will correctly predict an ulcer outcome out of all patients who go on to develop an ulcer. Specificity is the proportion of times the model will correctly predict an ulcer-free outcome out of all patients who remain ulcer free. However, the logistic regression models used for the main analyses do not provide predictions of ulcer versus ulcer-free outcomes for the individual patients. Instead, they provide an individual probability of ulceration for each patient based on his or her age, sex, duration of diabetes, insensitivity to monofilaments, and, in the case of model 4, presence/absence of pulses. These probabilities can then be used to make predictions about individual patients; predictions of an ulcer-free outcome could be applied to those with a small estimated probability of ulceration and predictions of ulceration could be applied to those with a high estimated probability of ulceration. This is a reasonable approach but requires a decision as to when the estimated probability, which may take any value between 0 and 1, becomes large enough that the prediction changes from ulcer free to ulceration. This point at which the prediction changes from one outcome to the other is known as the threshold. It is not possible to calculate a model’s sensitivity or specificity unless a threshold is used.
Choosing the value of this threshold is not a trivial task. Sensitivity and specificity have an inverse relationship as the threshold varies, so choosing a threshold to raise sensitivity will lower specificity and vice versa. For the prediction of foot ulcers in this clinical context, it would be preferable to favour sensitivity over specificity, but the choice of threshold is still somewhat arbitrary, as it is hard to judge to what extent sensitivity should be favoured. Given that the choice of any particular estimated probability as the threshold is hard to justify, we decided to use ROC curves. ROC curves are a way of comparing the sensitivity and specificity of a model without having to choose a threshold. The choice of threshold is avoided by using all possible thresholds. Each possible threshold is used to calculate the corresponding sensitivity and specificity. These sensitivity–specificity pairs are then plotted on a square graph. Traditionally, 1 minus specificity is plotted on the horizontal (x-)axis and sensitivity is plotted on the vertical (y-)axis, resulting in a characteristic curve known as a ROC curve. ROC curves go from the bottom left-hand corner to the top right-hand corner. The ROC curve for a perfect model would go vertically from the bottom left corner to the top left corner, and then horizontally to the top right corner. The ROC for a model with no predictive value would go straight from the bottom left to top left corner in a line at 45 degrees. Most ROC curves are somewhere in between, bending towards but not reaching the top left-hand corner. Because ROC curves use all possible thresholds, they allow comparison of models at all levels of predicted probability of ulceration.
We used empirical ROC curves, where each sensitivity–specificity pair plotted on the graph is calculated directly from the data, with straight lines connecting the pairs. In these particular ROC curves, the bottom left-hand area shows the performance of the models in higher-risk patients, while the top right area shows the performance for lower-risk patients (Figures 22–26 and Table 12).
FIGURE 22.
Receiver operating characteristic curves for models 2 and 4 when applied to the Abbott et al. 3 data set in patients without previous history of ulceration or amputation.
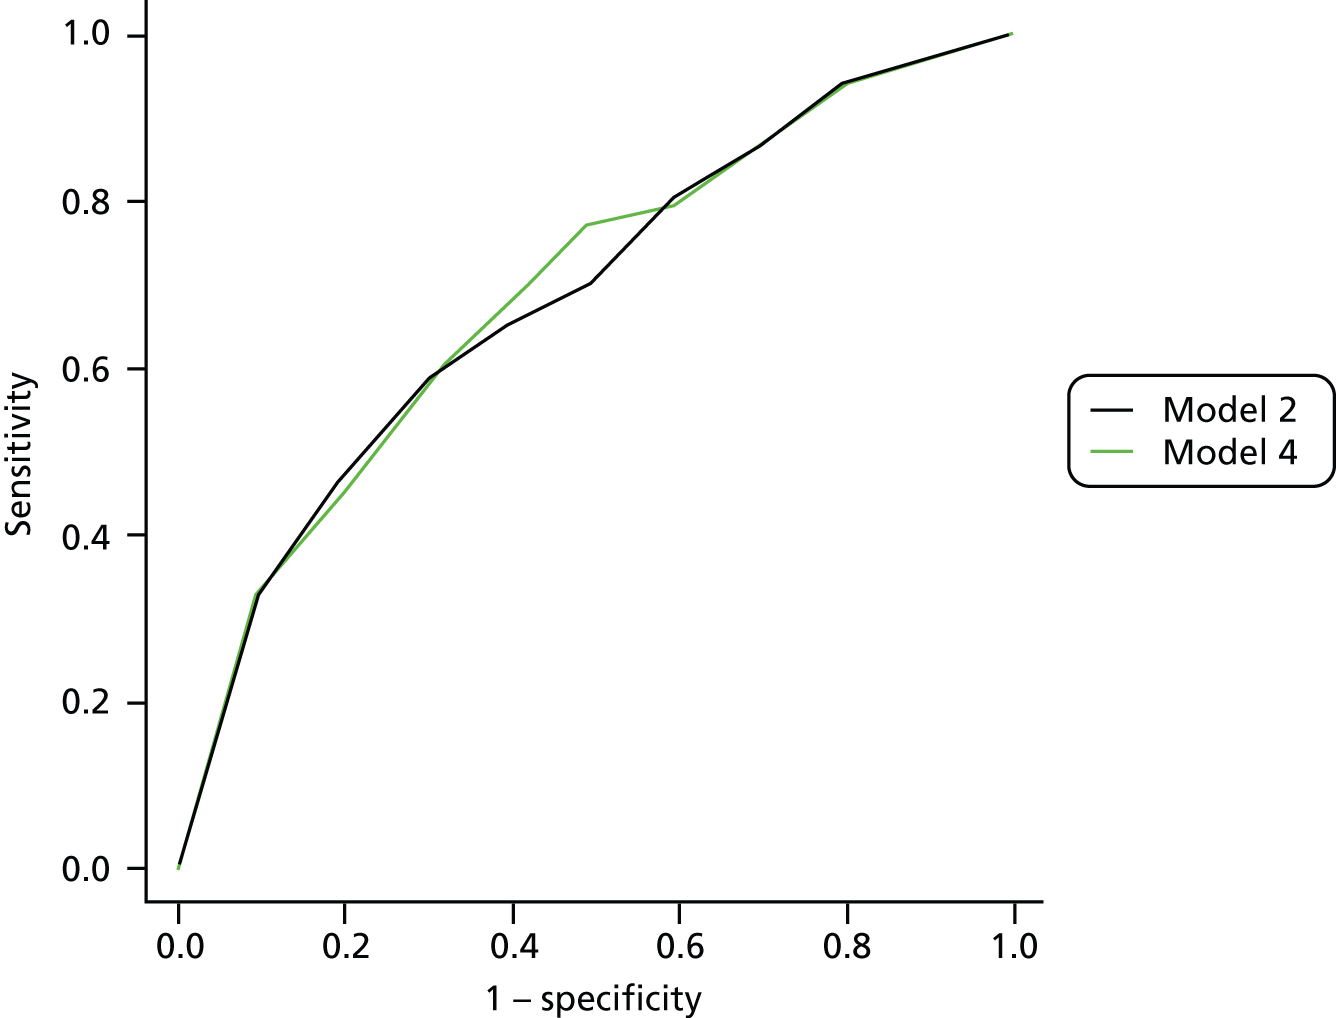
FIGURE 23.
Receiver operating characteristic curves for models 2 and 4 when applied to the Crawford et al. 5 data set.
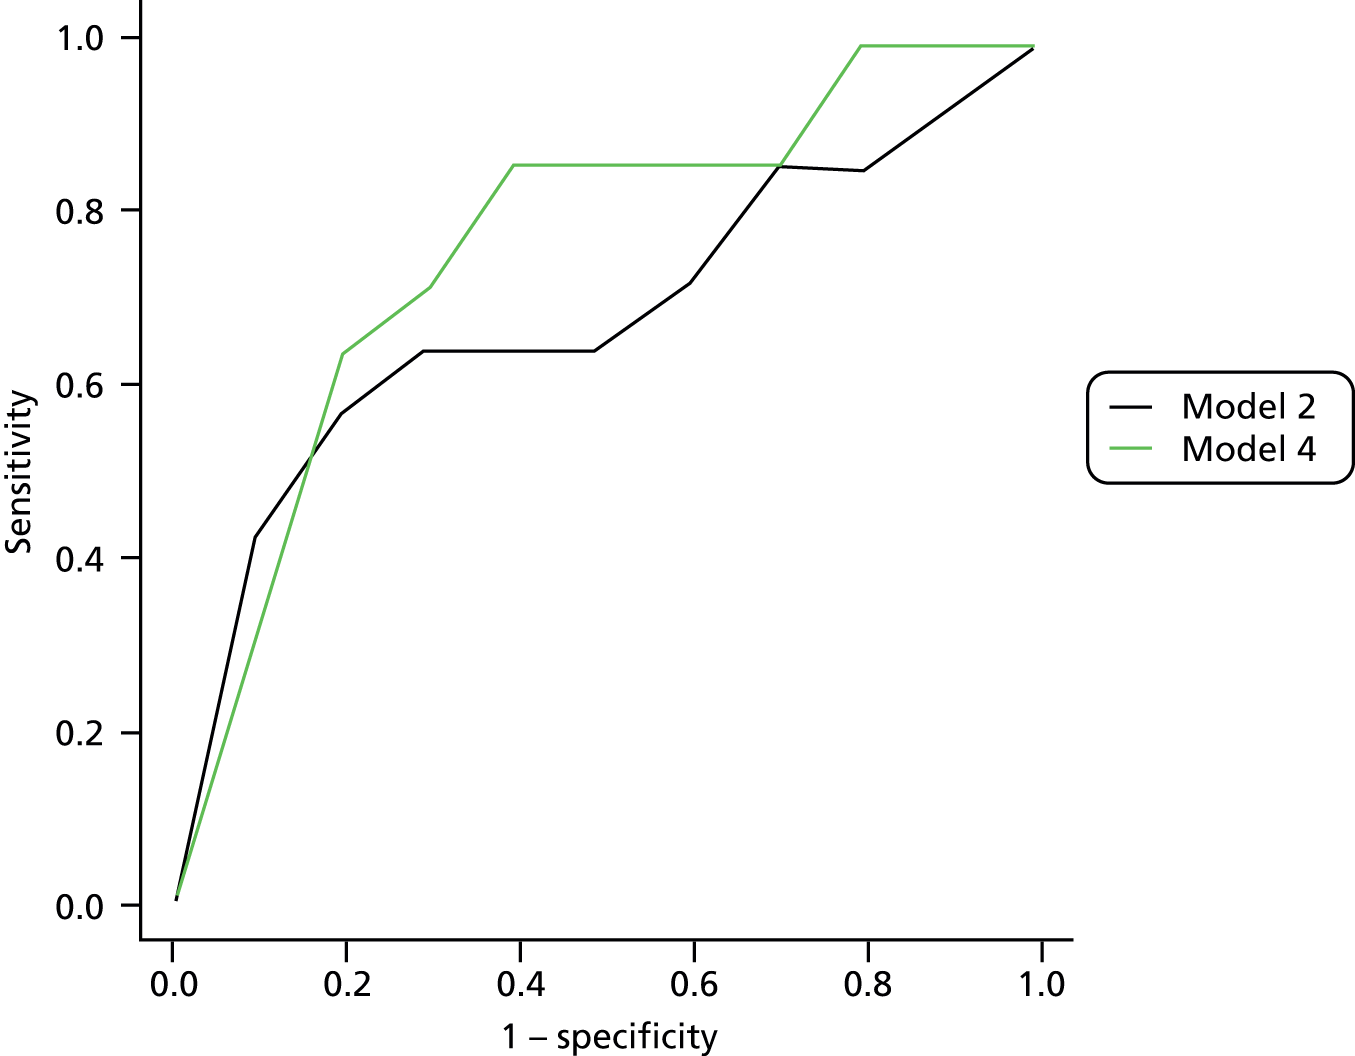
FIGURE 24.
Receiver operating characteristic curves for models 2 and 4 when applied to the Monteiro-Soares and Dinis-Ribeiro61 data set in patients without previous history of ulceration or amputation.
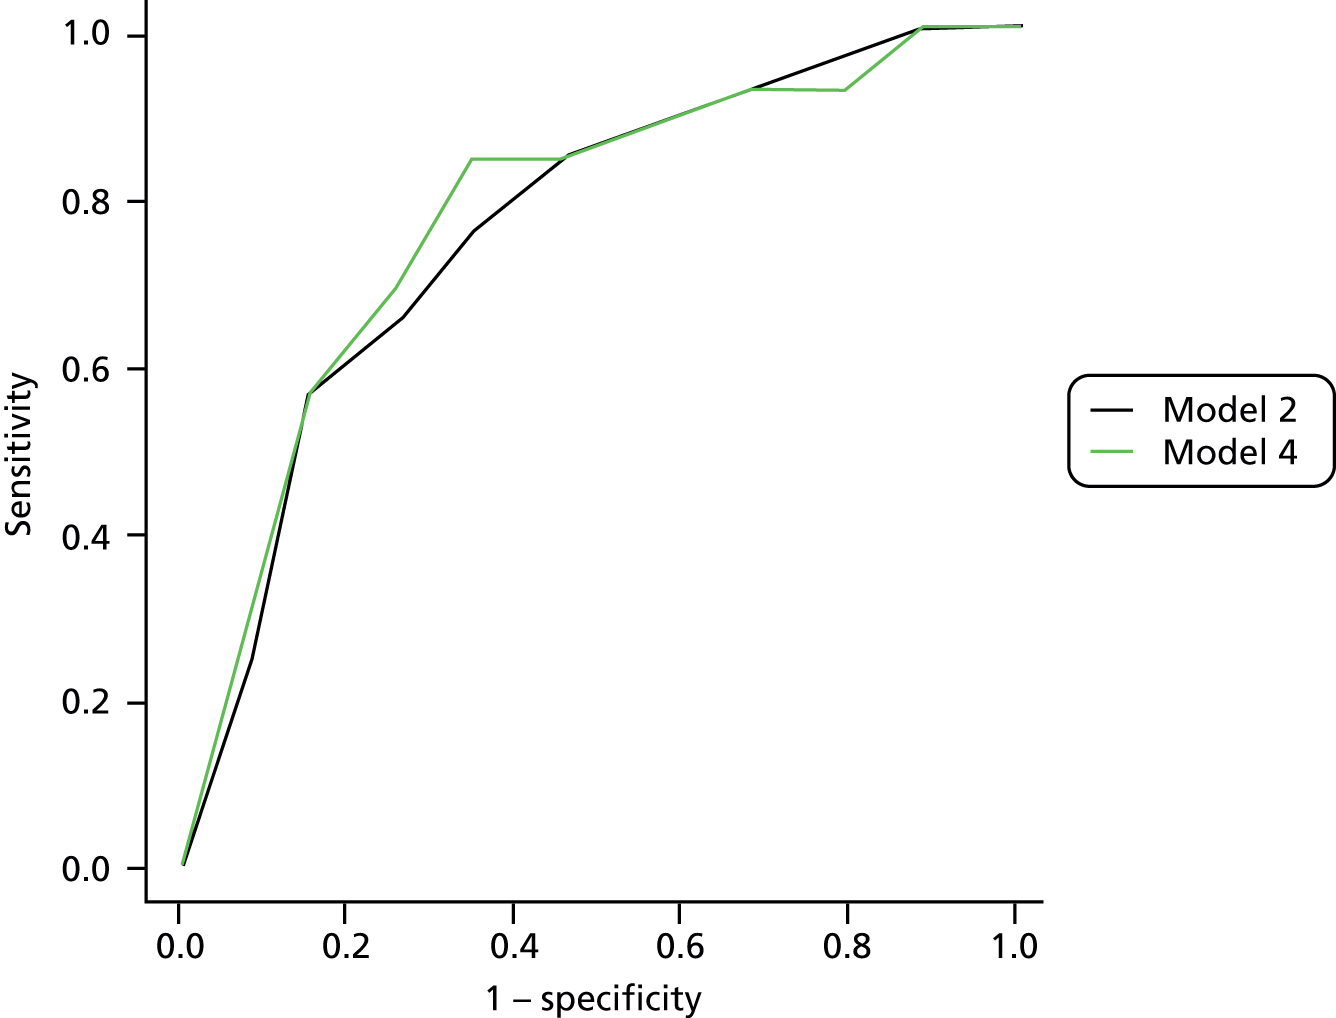
FIGURE 25.
Receiver operating characteristic curves for models 2 and 4 when applied to the Pham et al. 73 data set in patients without previous history of ulceration or amputation.
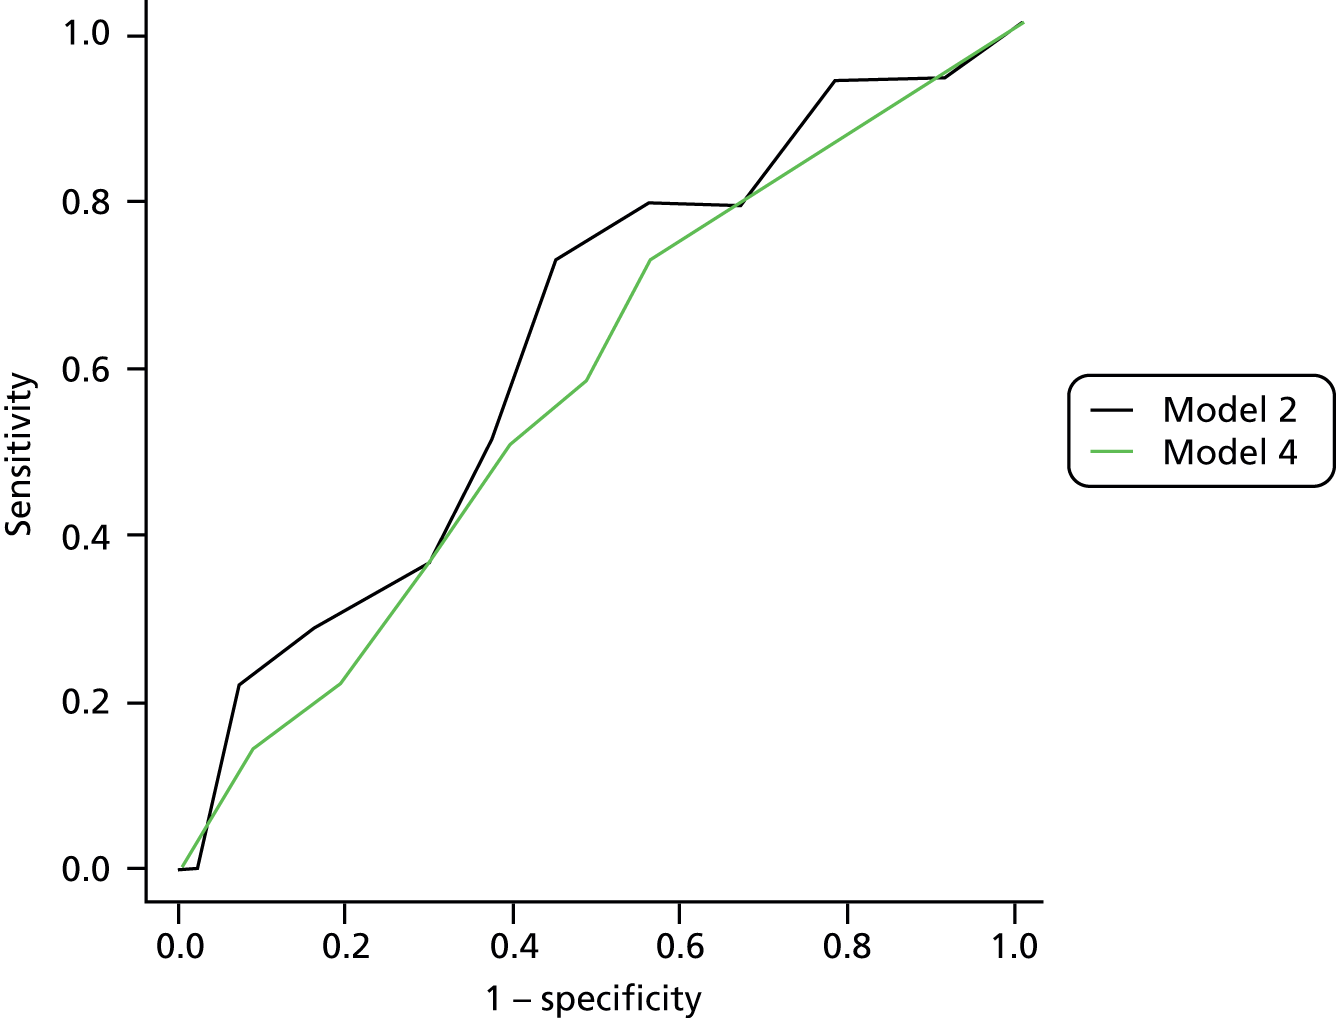
FIGURE 26.
Receiver operating characteristic curves for models 2 and 4 when applied to the Leese et al. 47 data set in patients without previous history of ulceration or amputation.

| Data set | Model 2 | Model 4 |
|---|---|---|
| Abbott et al., 20023 | 0.684 | 0.692 |
| Crawford et al., 20115 | 0.681 | 0.767 |
| Leese et al., 201147 | 0.759 | 0.759 |
| Monteiro-Soares and Dinis-Ribeiro, 201061 | 0.760 | 0.772 |
| Pham et al., 200073 | 0.623 | 0.573 |
A model with perfect discrimination would have an AUC of 1; a model that discriminates no better than chance would have an AUC of 0.5. The AUC may be interpreted as the probability that a patient who goes on to ulcerate will have a higher predicted probability than a patient who does not.
The only data set with which model 4 convincingly outperforms model 2 judging from the ROC curve and the AUC is taken from the Crawford et al. 5 study. However, in this data set, only 14 patients without a previous history of ulceration or amputation went on to develop an ulcer. This means that all the sensitivity estimates are based on only 14 patients and are not highly reliable estimates. The data in the study by Pham et al. 73 also come from only 14 patients with no history who developed ulcers. The three larger data sets, with more patients who developed ulcers, suggest that the differences between models 2 and 4 are minimal, with ROC curves that largely overlap and similar AUCs. The closeness of the ROC curves for models 2 and 4 for the Abbott et al. ,3 Monteiro-Soares and Dinis-Ribeiro,61 and Leese et al. 47 data sets suggests that the discrimination of the two models differs very little at all levels of risk. Consequently, these data, based on a large sample of patients (n = 10,375) recruited to three studies,3,47,61 do not indicate an advantage in using both the monofilament test and the ‘absence of pulses’ sign in assessing patients’ risk of developing a foot ulcer in diabetes.
Predictiveness of UK national and International Working group on the Diabetic Foot guidelines for foot ulceration in diabetes
There are two national clinical guidelines in use in the UK and one other issued by the International Working Group on the Diabetic Foot (IWGDF). 15,16,81 These all recommend the classification of people with diabetes into low, increased (or moderate) and high risk as part of annual foot risk assessments. The Scottish Intercollegiate Guidelines Network (SIGN) and IWGDF guidelines also differ from those of the National Institute for Health and Care Excellence (NICE) in respect of the number of risk factors. In addition, the Scottish Clinical Information – Diabetes (SCI-Diabetes) foot risk stratification tool, which underpins the SIGN guidelines, also contains a ‘traffic light’ grading system (see Appendix 13).
Scottish Clinical Information – Diabetes algorithm
The SCI-Diabetes electronic decision support tool algorithm (Figure 27) underpinning recommendations in the SIGN 116 guideline15 differs from that in the traffic light depiction of the diabetic foot risk stratification and triage system in SIGN 116, and the latter is not intended to determine patients’ risk score per se (Professor Graham Leese, Ninewells Hospital and Medical School, 2014, personal communication).
FIGURE 27.
Scottish Clinical Information – Diabetes foot risk algorithm.

Diabetic foot risk stratification overall distribution in the individual patient data diabetic foot ulceration data sets
Data for these combinations of variables were available for four studies. 3,5,47,61 A total of 11,568 diabetic patients had the necessary variables available at baseline to allocate their risk categories. Five studies62,72–75 did not collect these variables. Table 13 shows the number and percentage of patients allocated to each category per study.
| SIGN category | Statistics | Study | Total | |||
|---|---|---|---|---|---|---|
| Abbott et al., 20023 | Crawford et al., 20115 | Leese et al., 201147 | Monteiro-Soares and Dinis-Ribeiro, 201061 | |||
| High | n (%) | 2348 (35.6) | 344 (28.8) | 464 (13.6) | 205 (56.9) | 3361 (29.1) |
| Moderate | n (%) | 3081 (46.7) | 643 (53.9) | 806 (23.6) | 121 (33.6) | 4651 (40.2) |
| Low | n (%) | 1174 (17.8) | 206 (17.3) | 2142 (62.8) | 34 (9.4) | 3556 (30.7) |
| Total | N | 6603 | 1193 | 3412 | 360 | 11,568 |
Table 14 shows the number and percentage of patients with no previous ulcer or amputation allocated to each category per study. Because all patients with a history of ulcer or amputation are categorised in the high category, the number of patients is naturally reduced in this category when those patients are excluded.
| SIGN category | Statistics | Study | Total | |||
|---|---|---|---|---|---|---|
| Abbott et al., 20023 | Crawford et al., 20115 | Leese et al., 201147 | Monteiro-Soares and Dinis-Ribeiro, 201061 | |||
| High | n (%) | 2036 (32.4) | 258 (23.3) | 268 (8.3) | 68 (30.5) | 2630 (24.3) |
| Moderate | n (%) | 3081 (49.0) | 643 (58.1) | 806 (25.1) | 121 (54.3) | 4651 (42.9) |
| Low | n (%) | 1174 (18.7) | 206 (18.6) | 2142 (66.6) | 34 (15.3) | 3556 (32.8) |
| Total | N | 6291 | 1107 | 3216 | 223 | 10,837 |
Foot ulcer and the diabetic foot risk stratification by study
Table 15 shows the total number of foot ulcers (outcome) per foot risk category pooled from each of the four studies. Within the high-, moderate- and low-risk categories, 15.5%, 3.0% and 1.9%, respectively, of the total population developed a foot ulcer. Of those 730 patients who developed a foot ulcer, 71.4% were in the high-risk category, 19.3% were in the moderate-risk category and 9.3% were in the low-risk category.
| SIGN category | Statistics | Foot ulcer | Total | |
|---|---|---|---|---|
| No | Yes | |||
| High | n (% row) (% column) | 2840 (84.5) (26.2) | 521 (15.5) (71.4) | 3361 (29.1) |
| Moderate | n (% row) (% column) | 4510 (97.0) (41.6) | 141 (3.0) (19.3) | 4651 (40.2) |
| Low | n (%row) (% column) | 3488 (98.1) (32.2) | 68 (1.9) (9.3) | 3556 (30.7) |
| Total | N (%) | 10,838 (93.7) | 730 (6.3) | 11,568 (100) |
Table 16 shows the categories for 402 patients with no history of foot ulcer or amputation who developed a foot ulcer during the study period. The risk categories distribution of those who developed a foot ulcer but had no previous history is as follows: 48.0%, 35.1% and 16.9% in the high-, moderate- and low-risk categories, respectively.
| SIGN category | Statistics | Foot ulcer | Total | |
|---|---|---|---|---|
| No | Yes | |||
| High | n (% row) (% column) | 2437 (92.7) (23.4) | 193 (7.3) (48.0) | 2630 (24.3) |
| Moderate | n (% row) (% column) | 4510 (97.0) (43.2) | 141 (3.0) (35.1) | 4651 (42.9) |
| Low | n (% row) (% column) | 3488 (98.1) (33.4) | 68 (1.9) (16.9) | 3556 (32.8) |
| Total | N (% row) | 10,435 96.3 | 402 (3.7) | 10,837 (100) |
Tables 17 and 18 detail the risk categories of those who developed a foot ulcer for each study. In two studies (Crawford et al. 5 and Monteiro-Soares and Dinis-Ribeiro61), there were no patients in the ‘low’-risk category.
| SIGN category | Statistics | Study | Total | |||
|---|---|---|---|---|---|---|
| Abbott et al., 20023 | Crawford et al., 20115 | Leese et al., 201147 | Monteiro-Soares and Dinis-Ribeiro, 201061 | |||
| High | n (%) | 220 (75.6) | 18 (78.3) | 195 (60.6) | 88 (93.6) | 521 (71.4) |
| Moderate | n (%) | 59 (20.3) | 5 (21.7) | 71 (22.1) | 6 (6.4) | 141 (19.3) |
| Low | n (%) | 12 (4.1) | 0 (0.0) | 56 (17.4) | 0 (0.0) | 68 (9.3) |
| Total | N | 291 | 23 | 322 | 94 | 730 |
| SIGN category | Statistics | Study | Total | |||
|---|---|---|---|---|---|---|
| Abbott et al., 20023 | Crawford et al., 20115 | Leese et al., 201147 | Monteiro-Soares and Dinis-Ribeiro, 201061 | |||
| High | n (%) | 119 (62.6) | 10 (66.7) | 45 (26.2) | 19 (76.0) | 193 (48.0) |
| Moderate | n (%) | 59 (31.1) | 5 (33.3) | 71 (41.3) | 6 (24.0) | 141 (35.1) |
| Low | n (%) | 12 (6.3) | 0 (0.0) | 56 (32.6) | 0 (0.0) | 68 (16.9) |
| Total | N | 190 | 15 | 172 | 25 | 402 |
Meta-analyses of the prognostic utility of the SCI-Diabetes foot risk stratification tool
Below we present meta-analyses of the prognostic utility of the high and moderate SCI-Diabetes risk classification in two populations of patients. In the first we include all patients from each of the four studies with corresponding variables (n = 11,568) and in the second we include the data from only those patients without a history of foot ulceration or amputation (n = 10,837).
The calculated estimates of effect (ORs) show the SCI-Diabetes high-risk category to be predictive of a foot ulcer in the total population (OR 11.2, 95% CI 5.7 to 21.8). The level of heterogeneity is high (I2 = 89.2%) (Figure 28).
FIGURE 28.
Forest plot with ORs of the new foot ulcer predicted by the SCI-Diabetes foot risk categories (high vs. moderate + low).

Being classified in the moderate rather than the low SCI-Diabetes category was predictive of the development of a foot ulcer (pooled OR 2.7, 95% CI 1.5 to 5.1). A high level of heterogeneity is observed (I2 = 67.4%) (Figure 29).
FIGURE 29.
Forest plot with ORs of the new foot ulcer predicted by the diabetic foot risk categories (moderate vs. low).
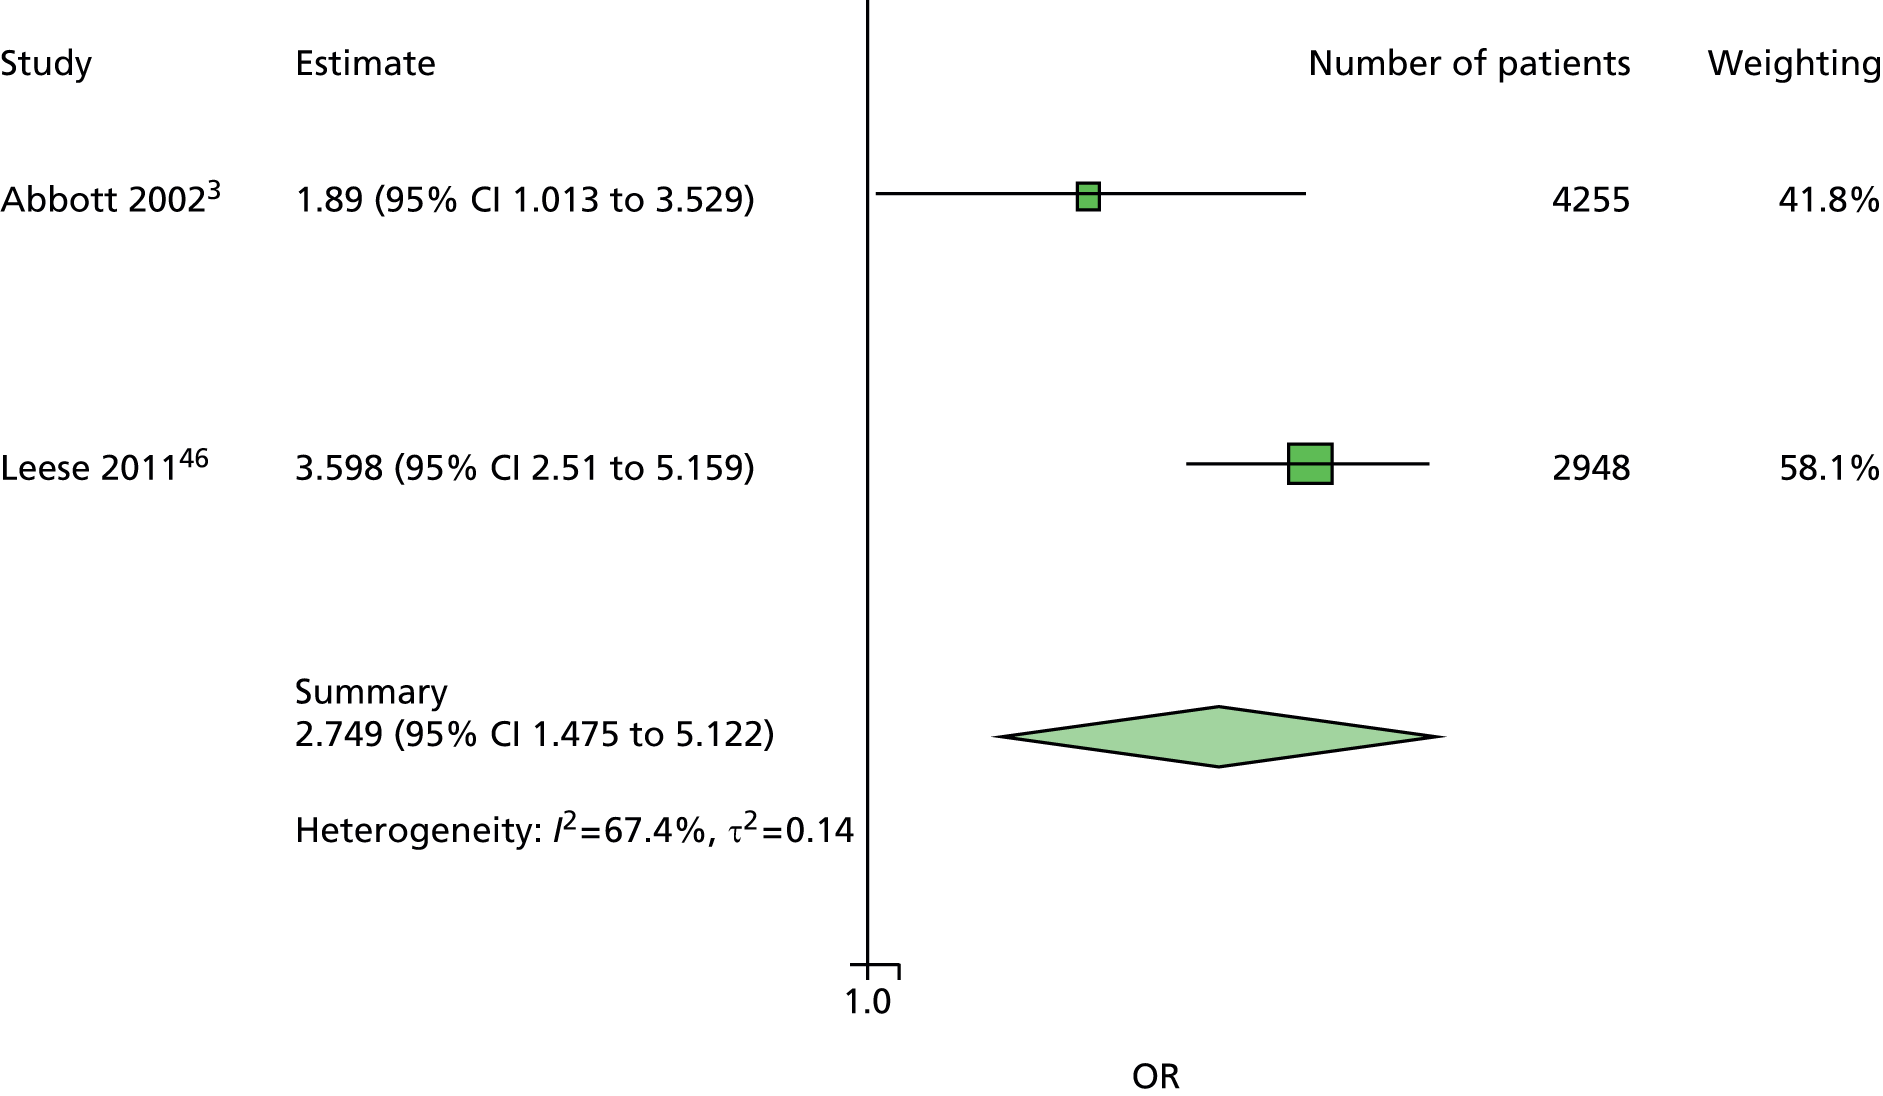
Figure 30 shows a meta-analysis of data from people with no previous ulcer or amputation predicted by the SCI-Diabetes foot risk categories high versus moderate plus low. The OR of 4.5 (95% CI 3.3 to 6.2) shows that the risk classification tool is predictive in this population too, but it is much lower than that obtained in the meta-analysis including patients with a history of ulceration or amputation (see Figure 28). The heterogeneity is also much lower. (I2 = 33.2%).
FIGURE 30.
Forest plot with ORs of the new foot ulcer (with no previous ulcer or amputation) predicted by the diabetic foot risk categories (high vs. moderate + low).

Figure 31 shows the meta-analysis of data from people with no previous ulcer or amputation predicted by the SCI-Diabetes foot risk categories; moderate versus low. The OR exactly matches that calculated in the meta-analysis of moderate versus low using data collected from the whole IPD population (i.e. including those with a history of ulceration or amputation) (OR 2.74, 95% CI 1.47 to 5.12) (see Figure 29). The same high level of heterogeneity is also observed.
FIGURE 31.
Forest plot with ORs of the new foot ulcer (with no previous ulcer or amputation) predicted by the diabetic foot risk categories (moderate vs. low).

Scottish Intercollegiate Guidelines Network 116: management of diabetic foot disease traffic light system
Categories are defined as follows:
-
High: previous ulceration or amputation or more than one risk factor present (e.g. loss of sensation or signs of peripheral vascular disease with callus or deformity).
-
Moderate: one risk factor present (e.g. loss of sensation or signs of peripheral vascular disease without callus or deformity).
-
Low: no risk factor present (e.g. no loss of sensation, no signs of peripheral vascular disease and no other risk factors).
For a total of 11,755 diabetic patients from five studies, the necessary data were available to allocate them to the defined risk categories.
Foot ulcer
Table 19 shows the total number of new foot ulcers per diabetic foot risk categories for five studies together. Within the high-, moderate- and low-risk categories, 13.6%, 5.6% and 2.0% of patients, respectively, developed a foot ulcer. The analysis shows that 3496 patients were not categorised into any of the active/high, moderate or low definitions of risk, and use of this classification would mean that 14% of foot ulcers would be missed.
| SIGN risk category | New ulcer, n (%) | ||
|---|---|---|---|
| Frequency | No | Yes | Total |
| Not classified | 3391 (30.79) | 105 (14.19) | 3496 (29.74) |
| High | 3153 (28.62) | 497 (67.16) | 3650 (31.05) |
| Moderate | 1217 (11.05) | 72 (9.73) | 1289 (10.97) |
| Low | 3254 (29.54) | 66 (8.92) | 3320 (28.24) |
| Total | 1101 (93.70) | 740 (6.30) | 11,755 (100.00) |
The National Institute for Health and Care Excellence CG10 guidelines and the Quality and Outcomes Framework of the General Medical Contract
The primary care QOF of the GMC and the NICE CG10 guidelines define diabetic foot risk classification as follows:81
-
low risk: normal sensation, palpable pulses
-
increased risk: neuropathy or absent pulses
-
high risk: neuropathy or absent pulses plus deformity or skin changes or previous ulcer.
Normal sensation is assessed using both monofilament and VPT.
Diabetic foot risk classification overall distribution in individual patient data diabetic foot ulceration by study
Within the assembled IPD data set the above data were available for four studies. 3,5,46,47,61
A total of 11,568 diabetic patients from four studies had the specific variables at baseline to allocate their data into NICE/QOF risk categories. Table 20 shows the number of patients allocated to each category.
| NICE CG10 category | Statistics | Study | Total | |||
|---|---|---|---|---|---|---|
| Abbott et al., 20023 | Crawford et al., 20115 | Leese et al., 201147 | Monteiro-Soares and Dinis-Ribeiro, 201061 | |||
| High | n (%) | 2942 (44.6) | 453 (38.0) | 208 (6.1) | 205 (56.9) | 3808 (32.9) |
| Increased | n (%) | 635 (9.6) | 272 (22.8) | 800 (23.4) | 32 (8.9) | 1739 (15.0) |
| Low | n (%) | 3026 (45.8) | 468 (39.2) | 2404 (70.5) | 123 (34.2) | 6021 (52.0) |
| Total | N | 6603 | 1193 | 3412 | 360 | 11,568 |
We also analysed data from a subgroup of 10,837 patients with no history of ulcer or amputation. Table 21 shows the number and percentage of this subgroup of patients allocated to each category per study.
| NICE CG10 category | Statistics | Study | Total | |||
|---|---|---|---|---|---|---|
| Abbott et al., 20023 | Crawford et al., 20115 | Leese et al., 201147 | Monteiro-Soares and Dinis-Ribeiro, 201061 | |||
| High | n (%) | 2634 (41.9) | 368 (33.2) | 35 (1.1) | 68 (30.5) | 3105 (32.9) |
| Increased | n (%) | 632 (10.1) | 271 (24.5) | 793 (24.7) | 32 (14.4) | 1728 (15.0) |
| Low | n (%) | 3025 (48.1) | 468 (42.3) | 2388 (74.3) | 123 (55.2) | 6004 (52.0) |
| Total | N | 6291 | 1107 | 3216 | 223 | 10,837 |
Foot ulcer and the diabetic foot risk stratification by study
Table 22 shows the total number of new foot ulcers per diabetic foot risk categories for the four studies together. Within the high-, increased- and low-risk categories, 12.9%, 7.1% and 1.9%, respectively, developed a foot ulcer.
| Statistics | Foot ulcer | Total | |
|---|---|---|---|
| No | Yes | ||
| n (% row) (% column) | 3318 (87.1) (30.6) | 490 (12.9) (67.1) | 3808 (32.9) |
| n (% row) (% column) | 1616 (92.9) (14.9) | 123 (7.1) (16.8) | 1739 (15.0) |
| n (% row) (% column) | 5904 (98.1) (54.5) | 117 (1.9) (16.0) | 6021 (52.0) |
| N (% row) | 10,838 (93.7) | 730 (6.3) | 11,568 (100) |
Table 23 shows that 402 patients with no history of ulcer or amputation developed a foot ulcer during their study. The percentage of those who developed a foot ulcer is reduced by more than half within the high category (5.5%) and very slightly in the increased category (6.9%) and low category (1.9%).
| NICE CG10 category | Statistics | Foot ulcer | Total | |
|---|---|---|---|---|
| No | Yes | |||
| High | n (% row) (% column) | 2934 (94.5) (28.1) | 171 (5.5) (42.5) | 3105 (28.7) |
| Increased | n (% row) (% column) | 1608 (93.1) (15.4) | 120 (6.9) (29.9) | 1728 (16.0) |
| Low | n (% row) (% column) | 5893 (98.2) (56.5) | 111 (1.9) (27.6) | 6004 (55.4) |
| Total | N (% row) | 10,435 (96.3) | 402 (3.7) | 10,837 (100) |
Tables 24 and 25 show the risk categories of the patients who developed a foot ulcer in each individual study. In the Crawford et al. study,5 none of the patients who developed a foot ulcer was categorised as being at low risk according to the NICE/QOF classification system.
| NICE CG10 category | Statistics | Study | Total | |||
|---|---|---|---|---|---|---|
| Abbott et al., 20023 | Crawford et al., 20115 | Leese et al., 201147 | Monteiro-Soares and Dinis-Ribeiro, 201061 | |||
| High | n (%) | 233 (80.1) | 19 (82.6) | 151 (46.9) | 87 (92.6) | 490 (67.1) |
| Increased | n (%) | 16 (5.5) | 4 (17.4) | 99 (30.8) | 4 (4.3) | 123 (16.8) |
| Low | n (%) | 42 (14.4) | 0 (0.0) | 72 (22.4) | 3 (3.2) | 117 (16.0) |
| Total | N | 291 | 23 | 322 | 94 | 730 |
| NICE CG10 category | Statistics | Study | Total | |||
|---|---|---|---|---|---|---|
| Abbott et al., 20023 | Crawford et al., 20115 | Leese et al., 201147 | Monteiro-Soares and Dinis-Ribeiro, 201061 | |||
| High | n (%) | 132 (69.5) | 11 (73.3) | 10 (5.8) | 18 (72.0) | 171 (42.5) |
| Increased | n (%) | 16 (8.4) | 4 (26.7) | 96 (55.8) | 4 (16.0) | 120 (29.9) |
| Low | n (%) | 42 (22.1) | 0 (0.0) | 66 (38.4) | 3 (12.0) | 111 (27.6) |
| Total | N | 190 | 15 | 172 | 25 | 402 |
Meta-analyses of the predictive value of the clinical guideline recommendations from NICE CG10 and the Quality and Outcomes Framework
Our meta-analyses found that the high- and increased-risk categories in the NICE guideline are predictive of foot ulceration.
Figure 32 shows the results of a meta-analysis comparing the predictiveness of categories (high vs. increased + low). The pooled estimates (OR 13.5, 95% CI 3.6 to 51.3) show the high-risk category to be predictive with a high level of heterogeneity (I2 = 96.7%).
FIGURE 32.
Pooled estimate of new foot ulcer predicted by the NICE (QOF) diabetic foot risk categories (high vs. increased + low).
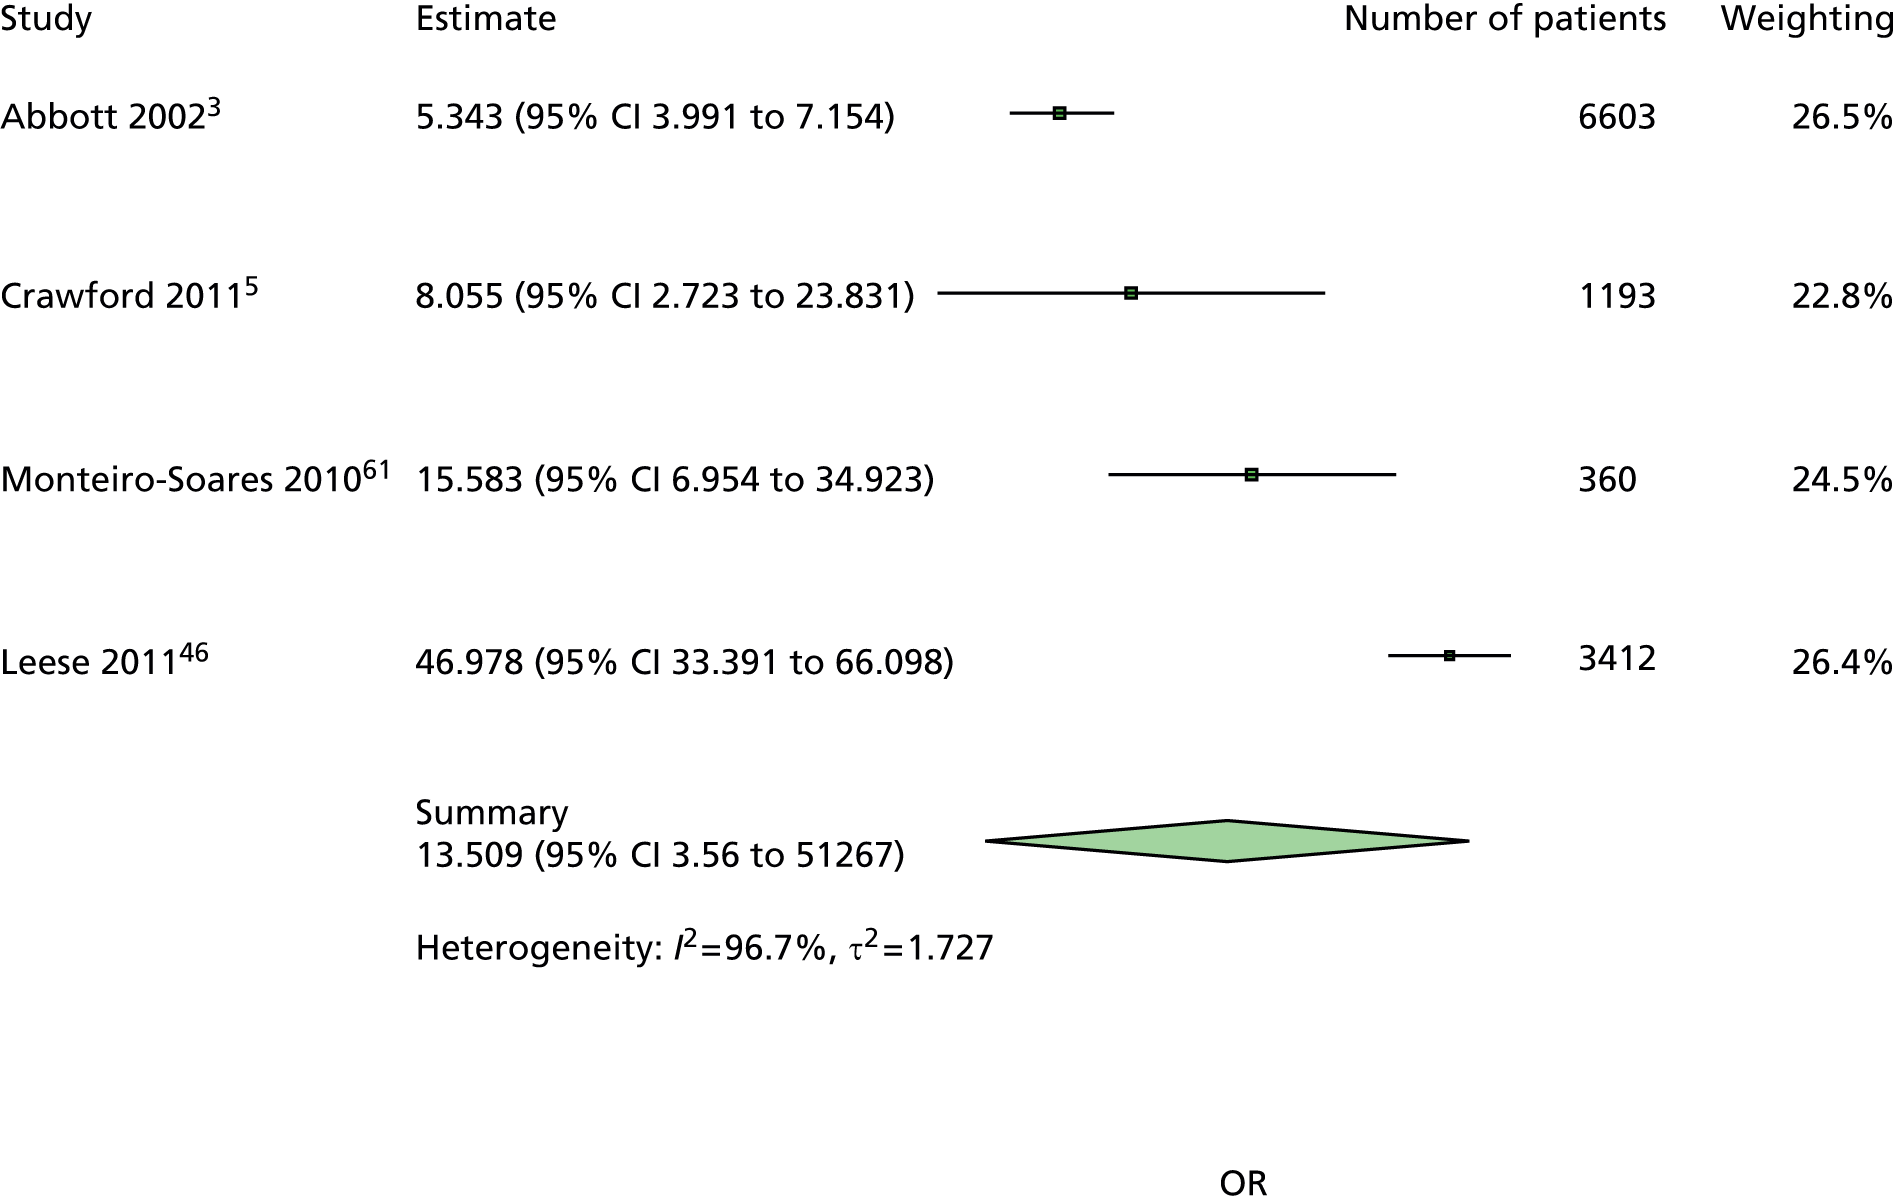
Figure 33 shows a meta-analysis of increased- versus low-risk categories and the pooled meta-analysis estimates based on data from three studies.
Being in the increased-risk category, rather than the low-risk category, was predictive of the development of a foot ulcer (OR 3.3, 95% CI 1.6 to 7.0) with a high level of heterogeneity (I2 = 73.6).
FIGURE 33.
Pooled estimate of new foot ulcer predicted by the NICE (QOF) diabetic foot risk categories (increased vs. low).

Figure 34 shows the results of a meta-analysis populated with data from those patients with no history of ulcer or amputation from four studies. This meta-analysis compared high versus increased + low categories, and the pooled estimates (OR 5.1, 95% CI 3.0 to 8.6) are smaller than those in the total population but still show the high-risk category to be predictive with less heterogeneity (I2 = 53.2%).
FIGURE 34.
Pooled estimate of new foot ulcer in people with no history of ulceration or amputation predicted by the NICE (QOF) diabetic foot risk categories (high vs. increased + low).

Figure 35 shows the results of a meta-analysis based on data from those with no history of ulcer or amputation in three studies. The comparison is between the increased- and low-risk categories. The pooled estimate (OR 3.4, 95% CI 1.6 to 7.4) and levels of heterogeneity are similar to those in the meta-analysis of data from the total population and are highly predictive of foot ulceration (see Figure 18).
FIGURE 35.
Pooled estimate of new foot ulcer in people with no history of ulceration or amputation predicted by the NICE (QOF) diabetic foot risk categories (increased vs. low).
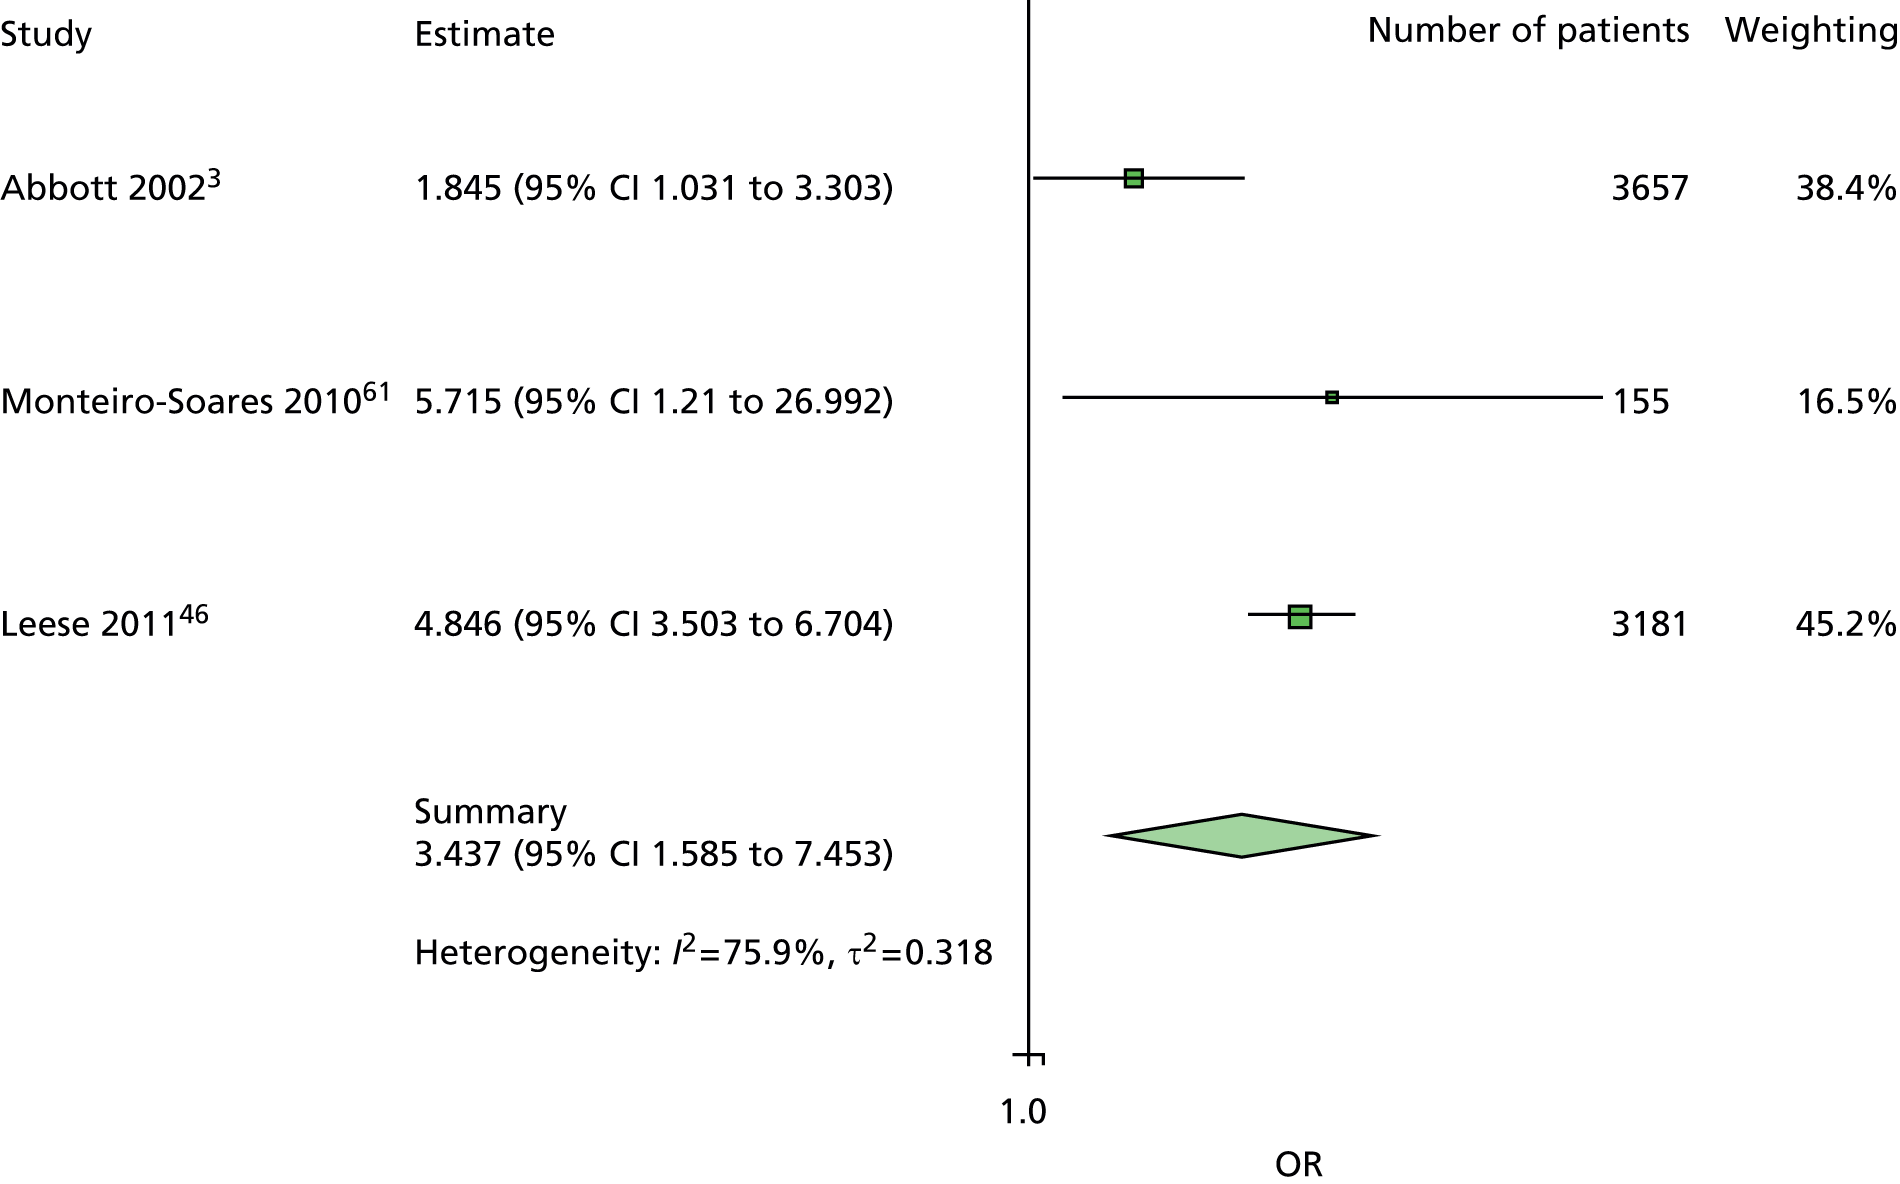
International Working Group on the Diabetic Foot: the international diabetes federation
The International Working Group on the Diabetic Foot guidelines
The practical guidelines of the International Consensus on Diabetic Foot 1999 published in Bakker et al. ’s article, as well as in the 2011 interactive DVD version of the International Consensus on Diabetic Foot, and the Practical and Specific Guidelines on the Management and Prevention of the Diabetic Foot provided risk categories for the identification of the at-risk foot. 16,82 Following examination of the foot, each patient can be assigned to a risk category, which should guide subsequent management.
Progression of risk categories
-
Sensory neuropathy and/or foot deformities or bony prominences and/or signs of peripheral ischaemia and/or previous ulcer or amputation.
-
Sensory neuropathy.
-
Non-sensory neuropathy.
To assess sensory loss and detection of diabetic neuropathy, the guidelines recommended the use of the 10-g Semmes–Weinstein monofilament, 128-Hz tuning fork, pinprick (dorsum), cotton wisp (dorsum) or Achilles tendon reflexes as described in Table 26.
| Sensory loss owing to diabetic polyneuropathy can be assessed using the following techniques | |
|---|---|
| Pressure perception | Semmes–Weinstein monofilaments. The risk of future ulceration can be determined with a 10-g monofilament |
| Vibration perception | 128-Hz tuning fork (hallux) |
| Discrimination | Pinprick (dorsum of foot, without penetrating the skin) |
| Tactile sensation | Cotton wool (dorsum of foot) |
| Reflexes | Achilles tendon reflexes |
Other foot tests and history components are defined in Table 27.
| Other foot tests and history components and their definitions | |
|---|---|
| History | Previous ulcer/amputation, previous foot education, social isolation, poor access to health care, barefoot walking |
| Neuropathy | Symptoms such as tingling or pain in the lower limb, especially at night |
| Vascular status | Claudication, rest pain, pedal pulses |
| Skin | Colour, temperature, oedema |
| Bone/joint | Deformities (e.g. claw toes, hammer toes) or bony prominences |
| Footwear/socks | Assessment of both inside and outside |
International Working Group on the Diabetic Foot diabetic foot risk categories overall distribution in individual patient data diabetic foot ulceration
Within the IPD for DFU, the information on sensory loss was available on pressure perception, vibration perception, discrimination or reflexes, but no cotton wool data were available. Additional information on history (previous ulcer, previous amputation, living alone), vascular status (pulses) or skin (temperature) or bone/joint (deformities) was also available.
We applied the three IWGDF risk categories to data from seven IPD studies. 3,5,47,61,62,73,74 For convenience of reporting, IWGDF risk categories were relabelled as low (non-sensory neuropathy), medium [sensory neuropathy (i.e. abnormal monofilament, tuning fork, pinprick or Achilles tendon reflexes)] and high (sensory neuropathy and either history of ulcer, history of amputation, living alone, no pulses, no temperature sensation or foot deformity).
For a total of 2536 patients from two studies,72,75 the variables required to assess sensory loss were not available. For a total of 12,360 diabetic patients from seven studies, the necessary variables were available at baseline to allocate their risk categories. Table 28 shows the number and percentage of patients allocated to each category per study. We also analysed data from a subgroup of 11,406 patients with no history of ulcer or amputation. Table 29 shows the number and percentage of this subgroup of patients allocated to each category per study. All patients with a history of ulcer/amputation and sensory neuropathy are categorised in the high-risk category, but those with a history of ulcer/amputation and non-sensory neuropathy are categorised in the low-risk category. Consequently, when excluding patients with a history of ulcer/amputation, the number of patients reduces in the high- and low-risk categories.
| IWGDF | Statistics | Study | Total | ||||||
|---|---|---|---|---|---|---|---|---|---|
| Abbott et al., 20023 | Crawford et al., 20115 | Kästenbauer et al., 200162 | Leese et al., 201147 | Monteiro-Soares and Dinis-Ribeiro, 201061 | Pham et al., 200073 | Rith-Najarian et al., 199274 | |||
| High | n (%) | 4112 (62.3) | 917 (76.9) | 10 (5.4) | 279 (8.18) | 185 (51.4) | 147 (59.3) | 41 (11.5) | 5691 (46.0) |
| Medium | n (%) | 440 (6.7) | 177 (14.8) | 3 (1.6) | 428 (12.5) | 22 (6.1) | 38 (15.3) | 30 (8.4) | 1138 (9.2) |
| Low | n (%) | 2051 (31.1) | 99 (8.3) | 174 (93.1) | 2705 (79.3) | 153 (42.5) | 63 (25.4) | 286 (80.1) | 5531 (44.8) |
| Total | N | 6603 | 1193 | 187 | 3412 | 360 | 248 | 357 | 12,360 |
| IWGDF | Statistics | Study | Total | ||||||
|---|---|---|---|---|---|---|---|---|---|
| Abbott et al., 20023 | Crawford et al., 20115 | Kästenbauer et al., 200162 | Leese et al., 201147 | Monteiro-Soares and Dinis-Ribeiro, 201061 | Pham et al., 200073 | Rith-Najarian et al., 199274 | |||
| High | n (%) | 3822 (60.8) | 834 (75.3) | 10 (5.4) | 165 (5.1) | 80 (35.9) | 4 (5.6) | 16 (5.1) | 4931 (43.2) |
| Medium | n (%) | 440 (7.0) | 177 (16.0) | 3 (1.6) | 428 (13.3) | 22 (9.9) | 38 (53.5) | 30 (9.7) | 1138 (10.0) |
| Low | n (%) | 2029 (32.3) | 96 (8.7) | 174 (93.1) | 2623 (81.6) | 121 (54.3) | 29 (40.9) | 265 (85.2) | 5337 (46.8) |
| Total | N | 6291 | 1107 | 187 | 3216 | 223 | 71 | 311 | 11,406 |
Foot ulcer and diabetic foot risk categories by study
Table 30 shows the total number of new foot ulcers per diabetic foot risk category for the seven studies together. Within the high-, medium- and low-risk categories, 9.9%, 6.7% and 3.9%, respectively, developed a foot ulcer. Looking at the risk categories assigned to the 854 patients who further developed a foot ulcer, 65.9% were in the high-risk category, 8.9% were in the medium-risk category and 25.2% were in the low-risk category. Table 31 shows that 444 patients with no previous ulcer or amputation developed a foot ulcer. The percentage of those who developed a foot ulcer is reduced by more than half within the high category (4.3%) and reduced in the low category (2.5%). Henceforth, the risk categories distribution of those who developed a foot ulcer but had no previous history is as follows: 52.9%, 17.1% and 30.0% in the high-, medium- and low-risk categories, respectively.
| IWGDF | Statistics | Foot ulcer | Total | |
|---|---|---|---|---|
| No | Yes | |||
| High | n (% row) (% column) | 5128 (90.1) (44.6) | 563 (9.9) (65.9) | 5691 (46.0) |
| Medium | n (% row) (% column) | 1062 (93.3) (9.2) | 76 (6.7) (8.9) | 1138 (9.2) |
| Low | n (% row) (% column) | 5316 (96.1) (46.2) | 215 (3.9) (25.2) | 5531 (44.8) |
| Total | N (% row) | 11,506 (93.1) | 854 (6.9) | 12,360 (100) |
| IWGDF | Statistics | Foot ulcer | Total | |
|---|---|---|---|---|
| No | Yes | |||
| High | n (% row) (% column) | 4696 (95.2) (42.8) | 235 (4.8) (52.9) | 4931 (43.2) |
| Medium | n (% row) (% column) | 1062 (93.3) (9.7) | 76 (6.7) (17.1) | 1138 (10.0) |
| Low | n (% row) (% column) | 5204 (97.5) (47.4) | 133 (2.5) (30.0) | 5337 (46.8) |
| Total | N (% row) | 10,962 (96.1) | 444 (3.9) | 11,406 (100) |
Tables 32 and 33 show the risk categories of the patients who developed a foot ulcer in each study. In a few studies, the patients who developed a foot ulcer were categorised in only one category: the high category in the Crawford et al. 5 study and the low category in the Kästenbauer et al. 62 study. When patients with a history of ulcer/amputation were excluded, no patient who developed a foot ulcer was left in the high category in the Pham et al. study. 73
| IWGDF | Statistics | Study | Total | ||||||
|---|---|---|---|---|---|---|---|---|---|
| Abbott et al., 20023 | Crawford et al., 20115 | Kästenbauer et al., 200162 | Leese et al., 201147 | Monteiro-Soares and Dinis-Ribeiro, 201061 | Pham et al., 200073 | Rith-Najarian et al., 199274 | |||
| High | n (%) | 257 (88.3) | 23 (100.0) | 0 (0.0) | 134 (41.6) | 75 (79.8) | 54 (74.0) | 20 (48.8) | 563 (65.9) |
| Medium | n (%) | 8 (2.9) | 0 (0.0) | 0 (0.0) | 49 (15.2) | 2 (2.1) | 11 (15.1) | 6 (14.6) | 76 (8.9) |
| Low | n (%) | 26 (8.9) | 0 (0.0) | 10 (100.0) | 139 (43.2) | 17 (18.1) | 8 (11.0) | 15 (36.6) | 215 (25.2) |
| Total | N | 291 | 23 | 10 | 322 | 94 | 73 | 41 | 854 |
| IWGDF | Statistics | Study | Total | ||||||
|---|---|---|---|---|---|---|---|---|---|
| Abbott et al., 20023 | Crawford et al., 20115 | Kästenbauer et al., 200162 | Leese et al., 201147 | Monteiro-Soares and Dinis-Ribeiro, 201061 | Pham et al., 200073 | Rith-Najarian et al., 199274 | |||
| High | n (%) | 160 (84.2) | 15 (100.0) | 0 (0.0) | 36 (20.9) | 19 (76.0) | 0 (0.0) | 5 (29.4) | 235 (52.9) |
| Medium | n (%) | 8 (4.2) | 0 (0.0) | 0 (0.0) | 49 (28.5) | 2 (8.0) | 11 (73.3) | 6 (35.3) | 76 (17.1) |
| Low | n (%) | 22 (11.6) | 0 (0.0) | 10 (100.0) | 87 (50.6) | 4 (16.0) | 4 (26.7) | 6 (35.3) | 133 (30.0) |
| Total | N | 190 | 15 | 10 | 172 | 25 | 15 | 17 | 444 |
Meta-analyses of the predictive value of the clinical guideline recommendations from the International Working Group on the Diabetic Foot
All the ORs calculated presented the diabetic foot risk category high as being predictive of the development of a new foot ulcer. The estimates of the Crawford et al. 5 and Kästenbauer et al. 62 studies had to be removed from the forest plots owing to a complete separation case. The Pham et al. 73 estimates were removed from the forest plot (see Figure 38) for the same reason.
Figure 36 shows the forest plot with ORs of the new foot ulcer predicted by the diabetic foot risk categories (high vs. medium + low) by study and the pooled meta-analysis estimates. The estimates across studies and the pooled estimates (OR 6.7, 95% CI 3.4 to 13.1) show the high-risk category to be predictive of the development of a new foot ulcer, although with a high heterogeneity (I2 = 90.6%).
FIGURE 36.
Pooled estimate of new foot ulcer predicted by the IWGDF diabetic foot risk categories (high vs. medium + low).
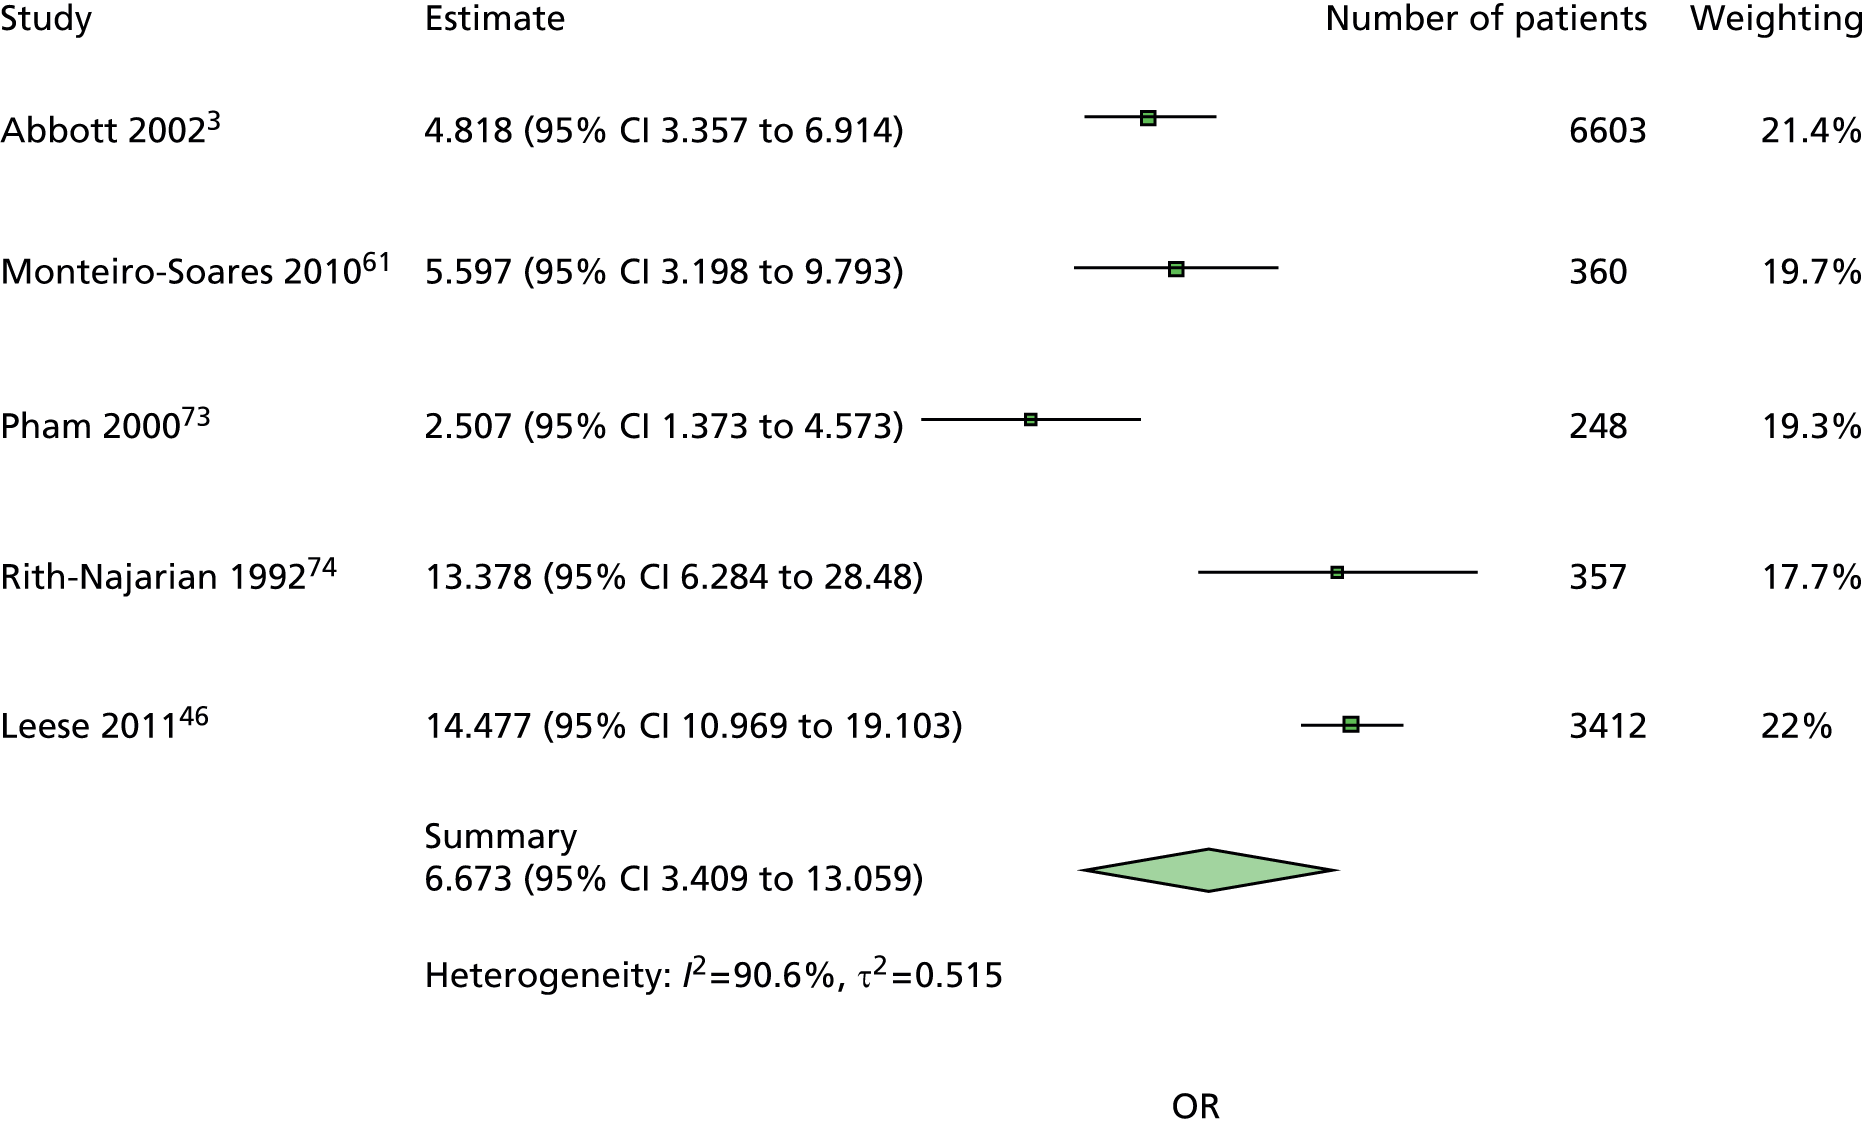
Figure 37 shows the forest plot with ORs of the new foot ulcer predicted by the diabetic foot risk categories (medium vs. low) by study and the pooled meta-analysis estimates. The pooled estimates (OR 2.3, 95% CI 1.5 to 3.3) show the medium-risk category rather than the low-risk category to be predictive of the development of a new foot ulcer although estimates across studies are not consistently showing this association.
FIGURE 37.
Pooled estimates of new foot ulcer predicted by the IWGDF diabetic foot risk categories (medium vs. low).

Figure 38 shows the forest plot with ORs of the new foot ulcer (with no previous ulcer or amputation) predicted by the diabetic foot risk categories (high vs. medium + low) by study and the pooled meta-analysis estimates. Apart from the estimates from the Monteiro-Soares and Dinis-Ribeiro study,61 the estimates across studies and the pooled estimates (OR 5.3, 95% CI 3.5 to 8.1) are lower than in Figure 22 but still show the high-risk category to be predictive of the development of a new foot ulcer, with less heterogeneity (I2 = 47.2%).
FIGURE 38.
Pooled estimates of new foot ulcer in people with no history of ulceration or amputation by the IWGDF diabetic foot risk categories (high vs. medium + low).
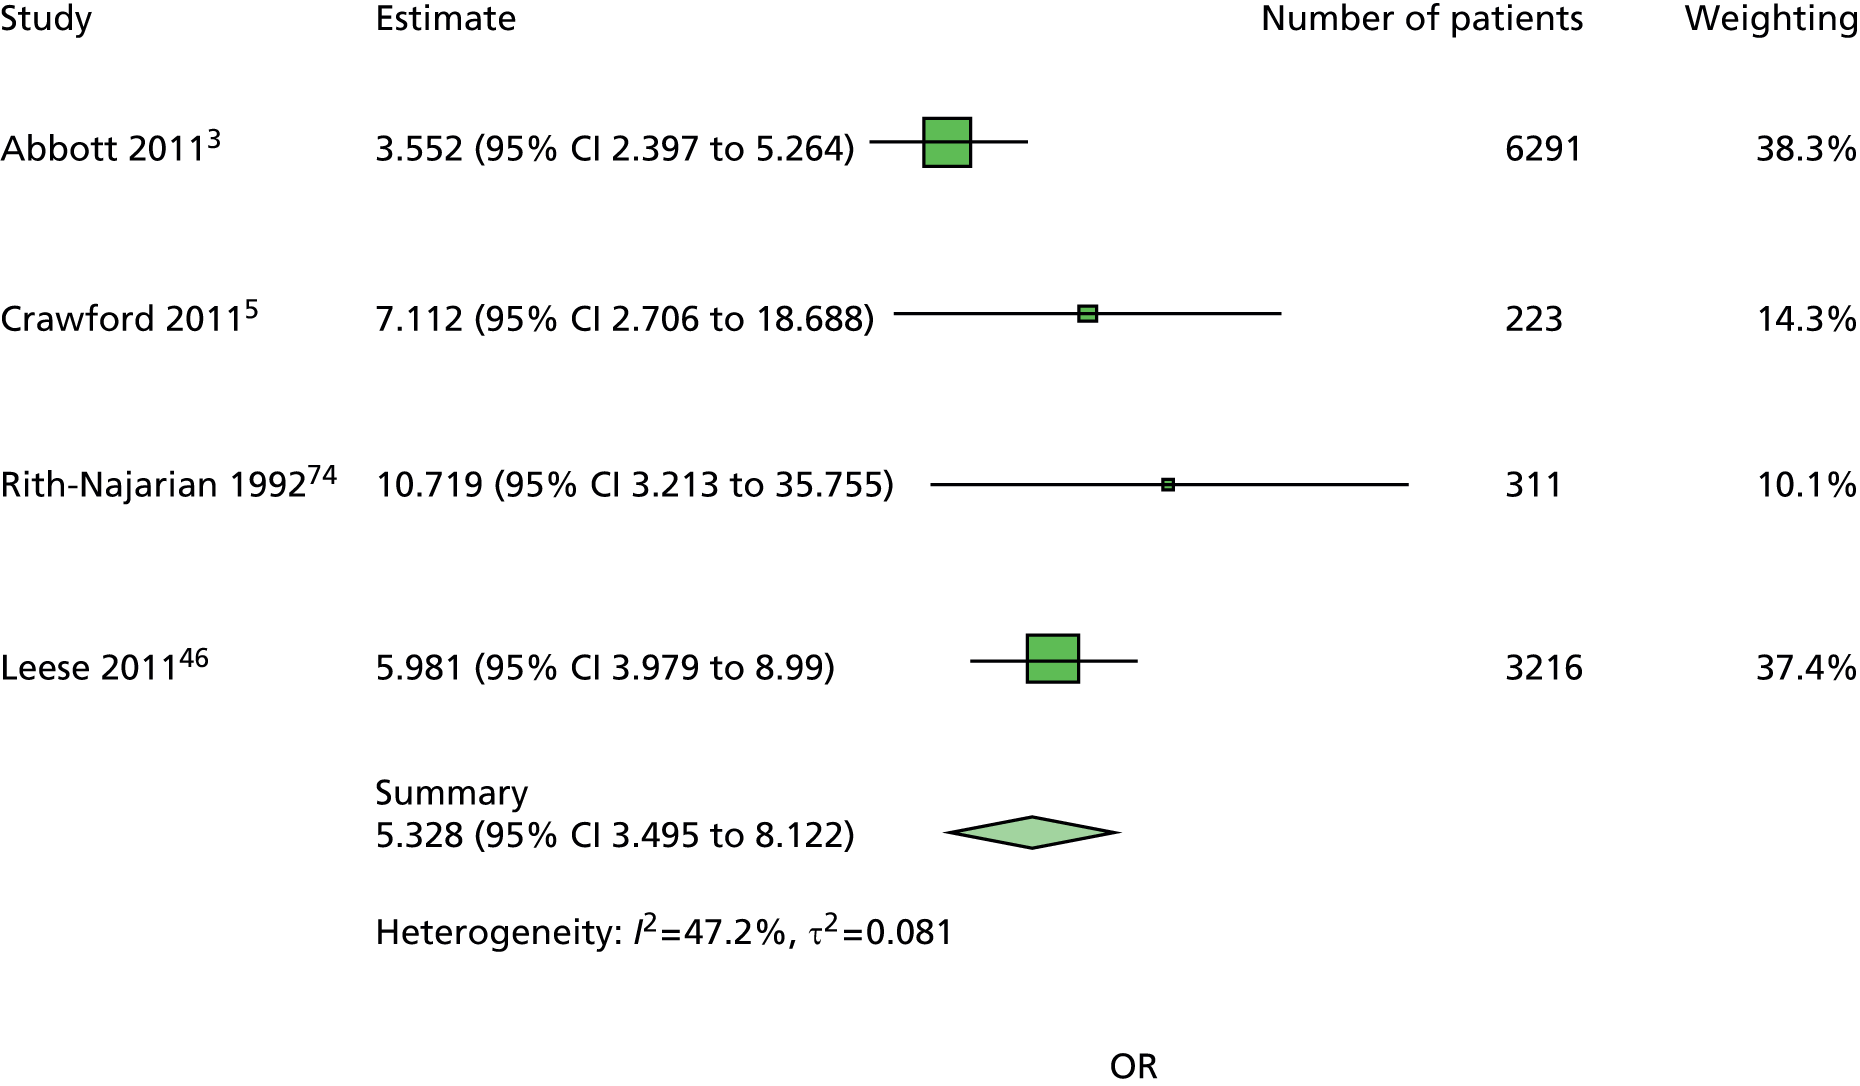
Figure 39 shows the forest plot with ORs of the new foot ulcer (with no previous ulcer or amputation) predicted by the diabetic foot risk categories (medium vs. low) by study and the pooled meta-analysis estimates. The estimates are higher than those of Figure 22, although significant for only two studies out of five. The pooled estimates (OR 3.4, 95% CI 2.0 to 5.8) show the medium-risk category rather than the low-risk category to be predictive of the development of a new foot ulcer with heterogeneity (I2 = 41.6%).
FIGURE 39.
Pooled estimates of new foot ulcer in people with no history of ulceration or amputation predicted by the IWGDF diabetic foot risk categories (medium vs. low).

Chapter 15 Discussion
This systematic review and meta-analysis of IPD includes patients recruited to cohort studies conducted worldwide and is the first of its kind to evaluate the predictive factors of foot ulceration in diabetes. The resultant increased statistical power has permitted analyses that have previously not been possible in individual studies and has resulted in new insights into the independent contribution of symptoms signs and diagnostic tests used for foot risk assessment in different patient populations. The increased statistical power has also allowed us to compare fully the performance of individual tests against the risk categories contained in national and international diabetes guidelines.
In our meta-analyses, a previous ulceration or diabetes-related LEA produced large ORs and there is no doubt about the correctly categorised high-risk status of individuals with this history. It was not possible to explore the predictive value of LEA (either minor or major) as an independent explanatory variable because there were relatively few events of this nature in the data sets (n = 146). The requirement for patients to be ambulant to meet the inclusion criteria in some of the included studies may explain the small number of patients with LEA who were recruited.
However, it is important to distinguish between meta-analyses based on data collected from patients who have experienced a foot ulcer or LEA and meta-analyses based on data from those who have not, because it is preferable to identify those at risk of ulceration earlier in the disease pathway so that attempts can be made to alter the clinical course of the disease and beneficially influence patient outcomes. More clinically useful are the estimates observed in the never-ulcerated population, which show that being insensate to a 10-g monofilament, having one absent pedal pulse or having a longer duration of a diabetes diagnosis are independently predictive of risk in ulcer-naive patients.
The most consistent results were obtained from the 10-g monofilament test and clearly show this quick, simple and relatively cheap test to be predictive of foot ulceration for everyone with a diagnosis of diabetes. The almost complete absence of heterogeneity in the meta-analyses is remarkable given that the pooled estimates are based on data from five different studies and 11,522 people from three different countries. Additionally, the 10-g monofilament was applied to different sites on the feet in each of the five studies and this indicates that the number of sites and the anatomical position of the sites matters little. The estimates for absent pedal pulses are also consistent in the two meta-analyses and show that the absence of at least one pedal pulse is independently predictive of risk. However, adding the palpation of pedal pulses to the risk assessment examination appears to confer no additional predictive value than using a 10-g monofilament alone. This is clear from the ROC analyses of five individual studies – the data from the largest studies show almost identical estimates for these two tests, but the consistency of the results for the 10-g monofilament favour its use. This observed effect may be due to the underlying pathophysiology of the majority of foot ulcers in these cohorts being neurological rather than vascular. 83
Perhaps not surprisingly, the number of years that a person has had a diagnosis of diabetes was found to be a risk factor, although there is a high level of heterogeneity in both meta-analyses. Because the OR is close to 1, this aspect of patients’ history is much less predictive than an inability to feel a 10-g monofilament, the absence of one pedal pulse or a history of ulceration and LEA.
When data from the never-ulcerated population are separated from the total population, male sex is no longer observed to be predictive of risk of ulceration. However, the ORs for the data in the largest studies are hardly altered in the never-ulcerated and total population group analyses, and most of the variation occurs in the smaller data sets where the difference in OR could be explained by the play of chance. Comparison of these independent predictive factors with the risk stratification categories in national and international diabetes guidelines does indicate that using the various groups of tests recommended therein does not produce additional predictive value. The meta-analyses of data from the SIGN, NICE and IWGDF guidelines allow a direct comparison of the effects from recommended risk categories. The ORs and CIs are not statistically significantly different from those estimates obtained from a failure to feel a 10-g monofilament in populations at both high and moderate risk and history of ulceration and LEA in high-risk populations.
The large number of patients in the derivation data sets and the use of two different approaches to validate the model underpin its reliability and suggest that the guidance in clinical guidelines and the QOF should be simplified to include only the inability to feel a 10-g monofilament or an absent pedal pulse to identify those at moderate (or increased) risk of ulceration. Using patient history of ulceration and/or a previous LEA will accurately classify those at high risk. The implementation of this greatly simplified approach to annual diabetes foot checks would reduce the amount of clinical time spent testing, avoid the cost associated with acquiring more expensive tests and reduce the ambiguity currently surrounding some components of risk assessment procedures such as ‘unable to see or reach foot’ and avoid unclassified/missed cases from the use of the traffic light system contained in the SIGN guideline. 15 CPRs are usually defined as containing three or more variables22 and the fewer tests and elements from the patient history that health-care professionals are required to consider, the more likely it is that risk assessment procedures will be performed.
The accurate assessment of risk is, however, only the first step in an overall improvement in health outcomes, and there is little randomised evidence about the effect of annual foot screening in existence. 84 One RCT found that those screened demonstrated statistically significantly fewer amputations than a group of patients whose risk was not assessed, but a statistically significant reduction in incident foot ulcerations was not observed in the study population and the true value of specialist foot care services remains uncertain. 18,85 There also remain gaps in the knowledge about any benefit of potentially preventative interventions, such as patient education, routine podiatry, foot orthoses and specialist footwear. 84,86–88 NICE recommends further research to identify the appropriate level and combination of risk factors used to categorise patients as being at high risk of ulceration and that these individuals should then be offered attendance on a protection programme. A UK-wide RCT to evaluate the clinical effectiveness and cost-effectiveness of such protection programmes is needed to evaluate the delivery of this type of health care.
The quality of the conduct of the 10 studies included in the systematic review was assessed as high. Only one item was found to risk the validity of the included studies: the blinding of the individuals who ascertained the outcome variable (ulceration) to the status of the exposure variables was not maintained in 50% of the included studies. This is widely believed to be an important quality factor in prognostic studies and CPRs. 23 However, the meta-analyses on which our conclusions are based included only one study in which the investigators knew the status of the index test results in some, but not all, cases46,47 and the estimates these data contribute statistically differ from pooled estimates for only one prognostic factor – previous history of ulceration or amputation. Data from the study by Leese et al. 47 were found to be statistically significantly more predictive than the pooled estimate. However, rather than this effect arising from an absence of blinding, it may result from the inherent difference in study design, this study being the only one to use routinely collected data.
Of the 10 studies included in this systematic review and meta-analysis, few contained data for variables associated with patients’ systemic health such as history of stroke, myocardial infarctions or kidney failure. 46,47 Consequently, we are unable to make suggestions about the independent contribution of elements from patients’ general medical history.
Chapter 16 Conclusions
The consistent results for the inability to feel a 10-g monofilament test in all five different regression models, together with the total absence of heterogeneity, has produced robust evidence for the high predictive value of this cheap and simple-to-use diagnostic test. An inability to feel a 10-g monofilament appears to be at least as predictive as the groups of tests currently recommended in national and international clinical guidelines.
Strengths and limitations of the results
We have taken a thorough and systematic approach to individual predictive factors and the classification systems in clinical guidelines using all obtainable IPD collected in published cohort studies until January 2013. The review makes a unique contribution to the global evidence base for the risk assessment of diabetes-related foot ulcers. The separate analyses of data from people with and without a history of foot ulceration shows, for the first time, the risk factors pertinent to patients with a low/moderate risk in whom prevention – in the absence of randomised evidence – is at least theoretically possible. We have justified the predictive factors included in the model and presented all univariate and multivariable analyses for inspection by readers who may wonder about the exclusion of particular tests. Furthermore, we have validated the prognostic model using an independent data set.
The absence of data pertaining to elements of patients’ general medical history prevented the identification of risk factors of a more systemic nature, and the review cannot support conclusions about predictive factors such as history of stroke or cardiovascular diseases.
Generalisability of the findings
Data from more than 16,000 patients worldwide were made available and data from up to 11,522 were included in meta-analyses. The international nature of the data included in the review and meta-analyses ensures the findings are widely generalisable.
Implications for clinical practice
The strong evidence from this research supports the use of a 10-g monofilament and the palpation of pedal pulses to identify those at moderate or intermediate risk of foot ulceration. A patient’s history of foot ulcers or LEA is sufficient to identify those at high risk. Variations in international diabetes guideline recommendations are commonplace. That the ‘globalisation of recommended management of diabetes is not a simple consequence of the globalisation of research evidence’89 may prove to be true in this instance. But, because these meta-analyses include IPD from 11,755 patients worldwide, their international nature has allowed a balanced interpretation and efforts are now required to bridge the clear gap that currently exists between research evidence and clinical practice. Given the increased worldwide prevalence in diabetes, the adoption of these three independent risk factors into guideline recommendations and routine care could lead to reduced costs for health-care providers and improved outcomes for patients.
Implications for research
We propose the development of a CPR from our existing model using the following predictor variables: insensitivity to a 10-g monofilament; absent pedal pulses; and a history of ulceration or LEA. This CPR could replace the many tests, signs and symptoms that patients currently have measured using equipment that is either costly or difficult to use.
The clinical effectiveness and cost-effectiveness of the therapeutic impact of the CPR should be compared with standard care and evaluated in large, well-designed RCTs across different health-care settings. The paucity of randomised evidence for the clinical effectiveness and cost-effectiveness of interventions to prevent foot ulcers in those found to be at risk should not be overlooked; there is an urgent need for randomised evidence of interventions to prevent diabetes-related ulcerations in those found to be at increased risk. Because there is also uncertainty regarding the optimal frequency for foot screening, empirical research to identify the most cost-effective screening intervals, especially in low-/moderate-risk patients, would be helpful.
Finally, we suggest that future research into prognostic factors for foot ulceration in diabetes should focus on elements from the patients’ systemic medical history, such as cerebral, cardiovascular and renal events rather than signs, symptoms and tests used at the periphery.
Acknowledgements
The idea for this research came from FC (Senior Health Services Researcher) and the mentors of her CSO/DH NHS Research and Development Postdoctoral fellowship (2004–7): Professors Tom Fahey (General Practice), Jos Kleijnen (Systematic Reviews) and Aziz Sheikh (General Practice R&D).
We thank Dr Chantelle Anandan (Research Fellow, Epidemiology) for her work on preliminary aspects of the review, Mr Martin Maxwell (Public Partner) for his enduring enthusiasm about our research and Mrs Elsbeth Hamilton (project secretary) for working in the most efficient way possible to help keep the project on-track. Ms Nikki Coates (Specialist Diabetes Podiatrist), Dr Nicola Leech (Consultant Diabetologist), Professor William Jeffcoate (Professor of Diabetic Medicine), Professor Tom Fahey, Dr Jayne Tierney (Senior Research Scientist) and Ms Marshall Dozier (Librarian and Information Specialist) all helped at important times during the process.
We are also grateful to Professors Martin Bland (Professor of Medical Statistics) and Benjamin Lipsky (Professor of Medicine) for their insightful questions about aspects of our analyses after seminar and conference presentations. These prompted additional analyses and we hope their questions are finally answered in the secondary analysis section.
The collegiate spirit of the authors of primary cohort studies who donated, or provided access to, anonymised IPD is commendable: Dr Caroline Abbott (Research Fellow), Professor Andrew Boulton (Professor of Medicine), Professor Edward Boyko (Professor General Internal Medicine and Epidemiology), Dr Thomas Kästenbauer (Biologist), Professor Graham Leese (Consultant and Honorary Professor in Diabetes/Endocrinology), Dr Matteo Monami (Director of the Diabetes Section), Dr Matilde Monteiro-Soares (Podiatrist and Research Fellow), Dr Stephen Rith-Najarian (Family Practice Physician), Dr Amber Seelig (Medical Statistician), Professor Aris Veves (Assistant Professor of Surgery) and Dr Matthew Young.
We are conscious that this research would not have been possible without the consent of 16,385 people with diabetes who allowed their data to be used for research purposes and we are all indebted to them.
Contributions of authors
All authors contributed to the writing of the report.
Fay Crawford (chief investigator) obtained the data and, with Francesca M Chappell and Gordon D Murray (Professor of Medical Statistics), designed the systematic review and statistical approach to the meta-analysis.
Genevieve Cezard (Research Fellow, Epidemiology) performed the data checking and cleaning process and contributed to the analysis.
The writing group comprised Fay Crawford, Genevieve Cezard, Francesca M Chappell and Gordon D Murray.
Jacqueline F Price (Professor of Molecular Epidemiology) and Fay Crawford carefully considered the most important items to detect study bias for the construction of a Quality Assessment tool.
Aziz Sheikh (Professor of General Practice R&D), Colin R Simpson (Reader in Informatics), Gerard P Stansby (Professor of Vascular Surgery) and Matthew J Young (Consultant Diabetologist) provided advice and content-specific expertise.
Publications
Crawford F, Anandan C, Chappell FM, Murray GD, Price JF, Sheikh A, et al. Protocol for a systematic review and individual patient data meta-analysis of prognostic factors of foot ulceration in people with diabetes: the international research collaboration for the prediction of diabetic foot ulcers (PODUS). BMC Med Res Methodol 2013;13:22.
Data sharing statement
Requests for data sharing should be sent to the corresponding author.
Disclaimers
This report presents independent research funded by the National Institute for Health Research (NIHR). The views and opinions expressed by authors in this publication are those of the authors and do not necessarily reflect those of the NHS, the NIHR, NETSCC, the HTA programme or the Department of Health. If there are verbatim quotations included in this publication the views and opinions expressed by the interviewees are those of the interviewees and do not necessarily reflect those of the authors, those of the NHS, the NIHR, NETSCC, the HTA programme or the Department of Health.
References
- Wild S, Roglic G, Green A, Sicree R, King H. Global prevalence of diabetes: estimates for the year 2000 and projections for 2030. Diabetes Care 2004;27:1047-53. http://dx.doi.org/10.2337/diacare.27.5.1047.
- Boulton AJ, Vileikyte L, Ragnarson-Tennvall G, Apelqvist J. The global burden of diabetic foot disease. Lancet 2005;366:1719-24. http://dx.doi.org/10.1016/S0140-6736(05)67698-2.
- Abbott CA, Carrington AL, Ashe H, Bath S, Every LC, Griffiths J, et al. The North-West Diabetes Foot Care Study: incidence of, and risk factors for, new diabetic foot ulceration in a community-based patient cohort. Diabet Med 2002;19:377-84. http://dx.doi.org/10.1046/j.1464-5491.2002.00698.x.
- Crawford F, Inkster M, Kleijnen J, Fahey T. Predicting foot ulcers in patients with diabetes: a systematic review and meta-analysis. QJM 2007;100:65-86. http://dx.doi.org/10.1093/qjmed/hcl140.
- Crawford F, McCowan C, Dimitrov BD, Woodburn J, Wylie GH, Booth E, et al. The risk of foot ulceration in people with diabetes screened in community settings: findings from a cohort study. QJM 2011;104:403-10. http://dx.doi.org/10.1093/qjmed/hcq227.
- Scottish Diabetes Monitoring Group . Scottish Diabetes Survey 2013 n.d. www.diabetesinscotland.org.uk/Publications/SDS2013.pdf (accessed 14 October 2014).
- Mason J, O’Keeffe C, McIntosh A, Hutchinson A, Booth A, Young RJ. A systematic review of foot ulcer in patients with Type 2 diabetes mellitus. I: prevention. Diabet Med 1999;16:801-12. http://dx.doi.org/10.1046/j.1464-5491.1999.00133.x.
- Pecoraro RE, Reiber GE, Burgess EM. Pathways to diabetic limb amputation. Basis for prevention. Diabetes Care 1990;13:513-21. http://dx.doi.org/10.2337/diacare.13.5.513.
- Spencer F, Sage R, Graner J. The incidence of foot pathology in a diabetic population. J Am Podiatr Med Assoc 1985;75:590-2. http://dx.doi.org/10.7547/87507315-75-11-590.
- Young MJ, McCardle JE, Randall LE, Barclay JI. Improved survival of diabetic foot ulcer patients 1995–2008: possible impact of aggressive cardiovascular risk management. Diabetes Care 2008;31:2143-7. http://dx.doi.org/10.2337/dc08-1242.
- Kennon B, Leese GP, Cochrane L, Colhoun H, Wild S, Stang D, et al. Reduced incidence of lower-extremity amputations in people with diabetes in Scotland: a nationwide study. Diabetes Care 2012;35:2588-90. http://dx.doi.org/10.2337/dc12-0511.
- Vamos EP, Bottle A, Majeed A, Millett C. Trends in lower extremity amputations in people with and without diabetes in England, 1996–2005. Diabetes Res Clin Pract 2010;87:275-82. http://dx.doi.org/10.1016/j.diabres.2009.11.016.
- Holman N, Young RJ, Jeffcoate WJ. Variation in the recorded incidence of amputation of the lower limb in England. Diabetologia 2012;55:1919-25. http://dx.doi.org/10.1007/s00125-012-2468-6.
- McIntosh A, Peters J, Young R, Hutchinson A, Chiverton R, Clarkson S, et al. Prevention and Management of Foot Problems in Type 2 diabetes: Clinical Guidelines and Evidence. Sheffield: University of Sheffield; 2003.
- 116 Management of Diabetes: A National Clinical Guideline. Edinburgh: SIGN; 2010.
- International Working Group on the Diabetic Foot. Amsterdam: International Diabetes Federation; 2011.
- British Medical Association . General Medical Services Contract 2011 n.d. www.bma.org.uk/employmentandcontracts/independent_contractors/quality_outcomes_framework/qofguidance2011.jsp (accessed 24 April 2011).
- Crawford F. How can we best prevent new foot ulcers in people with diabetes?. BMJ 2008;337. http://dx.doi.org/10.1136/bmj.a1234.
- Macran S, Kind P, Collingwood J, Hull R, McDonald I, Parkinson L. Evaluating podiatry services: testing a treatment specific measure of health status. Qual Life Res 2003;12:177-88. http://dx.doi.org/10.1023/A:1022257005017.
- Jeffcoate WJ. Stratification of foot risk predicts the incidence of new foot disease, but do we yet know that the adoption of routine screening reduces it?. Diabetologia 2011;54:991-3. http://dx.doi.org/10.1007/s00125-011-2075-y.
- Monteiro-Soares M, Boyko EJ, Ribeiro J, Ribeiro I, Dinis-Ribeiro M. Risk stratification systems for diabetic foot ulcers: a systematic review. Diabetologia 2011;54:1190-9. http://dx.doi.org/10.1007/s00125-010-2030-3.
- Laupacis A, Sekar N, Stiell IG. Clinical prediction rules. A review and suggested modifications of methodological standards. JAMA 1997;277:488-94. http://dx.doi.org/10.1001/jama.1997.03540300056034.
- McGinn TG, Guyatt GH, Wyer PC, Naylor CD, Stiell IG, Richardson WS. Users’ guides to the medical literature: XXII: how to use articles about clinical decision rules. Evidence-Based Medicine Working Group. JAMA 2000;284:79-84. http://dx.doi.org/10.1001/jama.284.1.79.
- Clark MJ, Stewart LA, Egger M, Davey Smith G, Altman DG. Systematic Reviews in Health Care: Meta-Analysis in Context. London: BMJ Books; 2001.
- Stewart LA, Clarke MJ. Practical methodology of meta-analyses (overviews) using updated individual patient data. Cochrane Working Group. Stat Med 1995;14:2057-79. http://dx.doi.org/10.1002/sim.4780141902.
- Stewart LA, Tierney JF, Clark MJ, Higgins JPT, Green S. Reviews of Individual Patient Data. Cochrane Handbook for Systematic Reviews of Interventions Version 5.1.0 2011. http://handbook.cochrane.org/ (accessed 19 July 2015).
- Systematic Reviews: CRD’s Guidance on Undertaking Reviews in Health Care. Centre for Reviews and Dissemination, University of York: York; 2009.
- Medical Research Council (MRC) Ethics Series . Personal Information in Medical Research 2000 n.d. www.mrc.ac.uk/Utilities/Documentrecord/index.htm?d=MRC002452 (accessed 14 May 2012).
- Crawford F, Anandan C, Chappell FM, Murray GD, Price JF, Sheikh A, et al. Protocol for a systematic review and individual patient data meta-analysis of prognostic factors of foot ulceration in people with diabetes: the international research collaboration for the prediction of diabetic foot ulcerations (PODUS). BMC Med Res Methodol 2013;13. http://dx.doi.org/10.1186/1471-2288-13-22.
- Lefebvre C, Manheimer E, Glanville J, Higgins JPT, Green S. Cochrane Handbook for Systematic Reviews of Interventions Version 5.1.0. Cochrane; 2011.
- Hayden JA, Cote P, Bombardier C. Evaluation of the quality of prognosis studies in systematic reviews. Ann Intern Med 2006;144:427-37. http://dx.doi.org/10.7326/0003-4819-144-6-200603210-00010.
- Crombie IK. The Pocket Guide to Critical Appraisal. London: BMJ Publishing Group; 1996.
- McShane LM, Altman DG, Sauerbrei W, Taube SE, Gion M, Clark GM. Reporting recommendations for tumour marker prognostic studies (REMARK). J Natl Canc Inst 2005;97:1180-4. http://dx.doi.org/10.1093/jnci/dji237.
- Altman DG, Lyman GH. Methodological challenges in the evaluation of prognostic factors in breast cancer. Breast Cancer Res Treat 1998;52:289-303. http://dx.doi.org/10.1023/A:1006193704132.
- Rector TS, Taylor BC, Wilt TJ. Systematic review of prognostic tests. J Gen Intern Med 2012;27:S94-101. http://dx.doi.org/10.1007/s11606-011-1899-y.
- Altman DG. Systematic reviews of evaluations of prognostic variables. BMJ 2001;323:224-8. http://dx.doi.org/10.1136/bmj.323.7306.224.
- Wasson JH, Sox HC, Neff RK, Goldman L. Clinical prediction rules. Applications and methodological standards. New Engl J Med 1985;313:793-9. http://dx.doi.org/10.1056/NEJM198509263131306.
- Fowkes FG, Fulton PM. Critical appraisal of published research: introductory guidelines. BMJ 1991;302:1136-40. http://dx.doi.org/10.1136/bmj.302.6785.1136.
- Vandenbroucke JP, von Elm E, Altman DG, Gotzsche PC, Mulrow CD, Pocock SJ, et al. Strengthening the Reporting of Observational Studies in Epidemiology (STROBE): explanation and elaboration. PLOS Med 2007;4. http://dx.doi.org/10.1371/journal.pmed.0040297.
- von Elm E, Altman DG, Egger M, Pocock SJ, Gotzsche PC, Vandenbroucke JP. The Strengthening the Reporting of Observational Studies in Epidemiology (STROBE) statement: guidelines for reporting observational studies. J Clin Epidemiol 2008;61:344-9. http://dx.doi.org/10.1016/j.jclinepi.2007.11.008.
- Whiting PF, Rutjes AW, Westwood ME, Mallett S, Deeks JJ, Reitsma JB, et al. QUADAS-2: a revised tool for the quality assessment of diagnostic accuracy studies. Ann Intern Med 2011;155:529-36. http://dx.doi.org/10.7326/0003-4819-155-8-201110180-00009.
- Stroup DF, Berlin JA, Morton SC, Olkin I, Williamson GD, Rennie D, et al. Meta-analysis of observational studies in epidemiology: a proposal for reporting. Meta-analysis Of Observational Studies in Epidemiology (MOOSE) group. JAMA 2000;283:2008-12. http://dx.doi.org/10.1001/jama.283.15.2008.
- Debray TP, Moons KG, Abo-Zaid GM, Koffijberg H, Riley RD. Individual participant data meta-analysis for a binary outcome: one-stage or two-stage?. PLOS ONE 2013;8. http://dx.doi.org/10.1371/journal.pone.0060650.
- Stewart GB, Altman DG, Askie LM, Duley L, Simmonds MC, Stewart LC. Statistical analysis of individual participant data meta-analyses: a comparison of methods and recommendations for practice. Res Synth Methods 2010;1:97-111. http://dx.doi.org/10.1371/journal.pone.0046042.
- Higgins JPT, Green S. Cochrane Handbook for Systematic Reviews of Interventions Version 5.1.0. Cochrane; 2011.
- Leese GP, Reid F, Green V, McAlpine R, Cunningham S, Emslie-Smith AM, et al. Stratification of foot ulcer risk in patients with diabetes: a population-based study. Int J Clin Pract 2006;60:541-5. http://dx.doi.org/10.1111/j.1368-5031.2006.00899.x.
- Leese GP, Cochrane L, Mackie AD, Stang D, Brown K, Green V. Measuring the accuracy of different ways to identify the ‘at-risk’ foot in routine clinical practice. Diabet Med 2011;28:747-54. http://dx.doi.org/10.1111/j.1464-5491.2011.03297.x.
- Boyko EJ, Ahroni JH, Stensel V, Forsberg RC, Davignon DR, Smith DG. A prospective study of risk factors for diabetic foot ulcer. The Seattle Diabetic Foot Study. Diabetes Care 1999;22:1036-42. http://dx.doi.org/10.2337/diacare.22.7.1036.
- Boyko EJ, Ahroni JH, Cohen V, Nelson KM, Heagerty PJ. Prediction of diabetic foot ulcer occurrence using commonly available clinical information: the Seattle Diabetic Foot Study. Diabetes Care 2006;29:1202-7. http://dx.doi.org/10.2337/dc05-2031.
- Riley RD, Steyerberg EW. Meta-analysis of a binary outcome using individual participant data and aggregate data. Res Synth Methods 2010;1:2-19. http://dx.doi.org/10.1002/jrsm.4.
- Borenstein M, Hedges LV, Higgins JPT, Rothstein HR. A basic introduction to fixed-effect and random-effects models for meta-analysis. Res Synth Methods 2010;1:97-111. http://dx.doi.org/10.1002/jrsm.12.
- Deeks JJ, Higgins JPT, Altman DG, Higgins JPT, Green S. Cochrane Handbook for Systematic Reviews of Interventions Version 5.1.0. The Cochrane Collaboration; 2011.
- van Buuren S, Groothuis-Oudshoorn K. MICE: Multivariate imputation by chained equations in R. J Stat Software 2011;45:1-67.
- White IR, Royston P, Wood AM. Multiple imputation using chained equations: issues and guidance for practice. Stat Med 2011;30:377-99. http://dx.doi.org/10.1002/sim.4067.
- Sterne JAC, White IR, Carlin JB, Spratt M, Royston P, Kenward MG, et al. Multiple imputation for missing data in epidemiological and clinical research: potential and pitfalls. BMJ 2009;338. http://dx.doi.org/10.1136/bmj.b2393.
- Resche-Rigon M, White IR, Bartlett JW, Peters SA, Thompson SG. PROG-IMT Study Group . Multiple imputation for handling systematically missing confounders in meta-analysis of individual participant data. Stat Med 2013;32:4890-905. http://dx.doi.org/10.1002/sim.5894.
- Little RJA. Regression with missing X’s: a review. J Am Stat Assoc 1992;87:1227-37. http://dx.doi.org/10.2307/2290664.
- Steyerberg EW. Clinical Prediction Models: A Practical Approach to Development, Validation, and Updating. New York, NY: Springer; 2009.
- Harrell FE. Regression Modelling Strategies: With Applications to Linear Models, Logistic Regression, and Survival Analysis. New York, NY: Springer-Verlag; 2001.
- O’Riordan P, Stevens PE, Lamb EJ. Estimated glomerular filtration rate. BMJ 2014;348. http://dx.doi.org/10.1136/bmj.g264.
- Monteiro-Soares M, Dinis-Ribeiro M. External validation and optimisation of a model for predicting foot ulcers in patients with diabetes. Diabetologia 2010;53:1525-33. http://dx.doi.org/10.1007/s00125-010-1731-y.
- Kästenbauer T, Sauseng S, Sokol G, Auinger M, Irsigler K. A prospective study of predictors for foot ulceration in type 2 diabetes. J Am Podiatr Med Assoc 2001;91:343-50. http://dx.doi.org/10.7547/87507315-91-7-343.
- Gerds TA, Cai T, Schumacher M. The performance of risk prediction models. Biometrical J 2008;50:457-79. http://dx.doi.org/10.1002/bimj.200810443.
- Steyerberg EW, Borsboom GJ, van Houwelingen HC, Eijkemans MJ, Habbema JD. Validation and updating of predictive logistic regression models: a study on sample size and shrinkage. Stat Med 2004;23:2567-86. http://dx.doi.org/10.1002/sim.1844.
- Moher D, Liberati A, Tetzlaff J, Altman DG. Preferred reporting items for systematic reviews and meta-analyses: the PRISMA statement. J Clin Epidemiol 2009;62:1006-12. http://dx.doi.org/10.1016/j.jclinepi.2009.06.005 (accessed 4 April 2015).
- Litzelman DK, Marriott DJ, Vinicor F. Independent physiological predictors of foot lesions in patients with NIDDM. Diabetes Care 1997;20:1273-8. http://dx.doi.org/10.2337/diacare.20.8.1273.
- Murray HJ, Young MJ, Hollis S, Boulton AJ. The association between callus formation, high pressures and neuropathy in diabetic foot ulceration. Diabet Med 1996;13:979-82. http://dx.doi.org/10.1002/(SICI)1096-9136(199611)13:11<979::AID-DIA267>3.0.CO;2-A.
- Peters EJ, Lavery LA. Effectiveness of the diabetic foot risk classification system of the International Working Group on the Diabetic Foot. Diabetes Care 2001;24:1442-7. http://dx.doi.org/10.2337/diacare.24.8.1442.
- Veves A, Murray HJ, Young MJ, Boulton AJ. The risk of foot ulceration in diabetic patients with high foot pressure: a prospective study. Diabetologia 1992;35:660-3. http://dx.doi.org/10.1007/BF00400259.
- Lavery LA, Armstrong DG, Wunderlich RP, Tredwell J, Boulton AJ. Predictive value of foot pressure assessment as part of a population-based diabetes disease management program. Diabetes Care 2003;26:1069-73. http://dx.doi.org/10.2337/diacare.26.4.1069.
- Armstrong DG, Lavery LA, Holtz-Neiderer K, Mohler MJ, Wendel CS, Nixon BP, et al. Variability in activity may precede diabetic foot ulceration. Diabetes Care 2004;27:1980-4. http://dx.doi.org/10.2337/diacare.27.8.1980.
- Monami M, Vivarelli M, Desideri CM, Colombi C, Marchionni N, Mannucci E. Pulse pressure and prediction of incident foot ulcers in type 2 diabetes. Diabetes Care 2009;32:897-9. http://dx.doi.org/10.2337/dc08-1679.
- Pham H, Armstrong DG, Harvey C, Harkless LB, Giurini JM, Veves A. Screening techniques to identify people at high risk for diabetic foot ulceration: a prospective multicenter trial. Diabetes Care 2000;23:606-11. http://dx.doi.org/10.2337/diacare.23.5.606.
- Rith-Najarian SJ, Stolusky T, Gohdes DM. Identifying diabetic patients at high risk for lower-extremity amputation in a primary health care setting. A prospective evaluation of simple screening criteria. Diabetes Care 1992;15:1386-9. http://dx.doi.org/10.2337/diacare.15.10.1386.
- Young MJ, Breddy JL, Veves A, Boulton AJ. The prediction of diabetic neuropathic foot ulceration using vibration perception thresholds. A prospective study. Diabetes Care 1994;17:557-60. http://dx.doi.org/10.2337/diacare.17.6.557.
- Abbott CA, Garrow AP, Carrington AL, Morris J, Van Ross ER, Boulton AJ. Foot ulcer risk is lower in South-Asian and African-Caribbean compared with European diabetic patients in the U.K.: the North-West diabetes foot care study. Diabetes Care 2005;28:1869-75. http://dx.doi.org/10.2337/diacare.28.8.1869.
- Cohen DJ, Doucet M, Cutlip DE, Ho KK, Popma JJ, Kuntz RE. Impact of smoking on clinical and angiographic restenosis after percutaneous coronary intervention: another smoker’s paradox?. Circulation 2001;104:773-8. http://dx.doi.org/10.1161/hc3201.094225.
- Crawford F, Cezard G, Chappell FM, Murray GD. behalf of the international PODUS group . Predictive Factors for Foot Ulceration in Diabetes: An Individual Patient Data Systematic Review and Meta-Analysis n.d.
- PODUS group . Predictive Factors for Diabetic Foot Ulcerations: An Individual Patient Data Systematic Review and Meta-Analysis n.d.
- Diabetes UK. Testing 2014. www.diabetes.org.uk/Guide-to-diabetes/Monitoring/Testing/#HbA1c (accessed 30 May 2014).
- National Institute for Health and Care Excellence . Clinical Guidelines for Type 2 Diabetes. Prevention and Management of Foot Problems 2014. http://publications.nice.org.uk/type-2-diabetes-foot-problems-cg10 (accessed 29 May 2014).
- Bakker K, Schaper NC. International Working Group on the Diabetic Foot Editorial Board . The development of global consensus guidelines on the management and prevention of the diabetic foot 2011. Diabetes Metab Res Rev 2012;28:116-18. http://dx.doi.org/10.1002/dmrr.2254.
- Singh N, Armstrong DG, Lipsky BA. Preventing foot ulcers in patients with diabetes. JAMA 2005;293:217-28. http://dx.doi.org/10.1001/jama.293.2.217.
- Dorresteijn JAN, Kriegsman DMW, Valk GD. Complex interventions for preventing diabetic foot ulceration. Cochrane Database Syst Rev 2010;1. http://dx.doi.org/10.1002/14651858.CD007610.pub2.
- McCabe CJ, Stevenson RC, Dolan AM. Evaluation of a diabetic foot screening and protection programme. Diabet Med 1998;15:80-4. http://dx.doi.org/10.1002/(SICI)1096-9136(199801)15:1<80::AID-DIA517>3.0.CO;2-K.
- Dorresteijn JAN, Kriegsman DMW, Assendelft WJJ, Valk GD. Patient education for preventing diabetic foot ulceration. Cochrane Database Syst Rev 2012;10. http://dx.doi.org/10.1002/dmrr.2237.
- Paton J, Bruce G, Jones R, Stenhouse E. Effectiveness of insoles used for the prevention of ulceration in the neuropathic diabetic foot: a systematic review. J Diabetes Complications 2011;25:52-6. http://dx.doi.org/10.1016/j.jdiacomp.2009.09.002.
- Bus SA, Valk GD, van Deursen RW, Armstrong DG, Caravaggi C, Hlavacek P, et al. The effectiveness of footwear and offloading interventions to prevent and heal foot ulcers and reduce plantar pressure in diabetes: a systematic review. Diabetes Metab Res Rev 2008;24:162-80. http://dx.doi.org/10.1002/dmrr.850.
- Burgers JS, Bailey JV, Klazinga NS, Van Der Bij AK, Grol R, Feder G. Inside guidelines: comparative analysis of recommendations and evidence in diabetes guidelines from 13 countries. Diabetes Care 2002;25:1933-9. http://dx.doi.org/10.2337/diacare.25.11.1933.
Appendix 1 Committee structure
Data Management Committee
Ms Genevieve Cezard, Centre for Population Health Sciences, University of Edinburgh, Edinburgh, UK.
Dr Francesca Chappell, Centre for Population Health Sciences, University of Edinburgh, Edinburgh, UK.
Dr Fay Crawford, Department of Vascular Surgery, Newcastle upon Tyne Hospitals NHS Foundation Trust, Newcastle upon Tyne, UK.
Professor Gordon Murray, Centre for Population Health Sciences, University of Edinburgh, Edinburgh, UK.
Research Management Committee
Dr Chantelle Anandan, Centre for Population Health Sciences, University of Edinburgh, Edinburgh, UK.
Ms Elsbeth Hamilton, Centre for Population Health Sciences, University of Edinburgh, Edinburgh, UK.
Mr Martin Maxwell, Centre for Population Health Sciences, University of Edinburgh, Edinburgh, UK.
Dr Jackie Price, Centre for Population Health Sciences, University of Edinburgh, Edinburgh, UK.
Professor Aziz Sheikh, Centre for Population Health Sciences, University of Edinburgh, Edinburgh, UK.
Dr Colin Simpson, Centre for Population Health Sciences, University of Edinburgh, Edinburgh, UK.
Professor Gerard Stansby, Consultant Vascular Surgeon, Newcastle upon Tyne Hospitals NHS Foundation Trust, Newcastle upon Tyne, UK.
Dr Matthew Young, Department of Diabetes, Royal Infirmary of Edinburgh, Edinburgh, UK.
International Steering Committee
Dr Caroline A Abbott, Centre for Endocrinology & Diabetes, University of Manchester, Manchester, UK.
Professor Andrew JM Boulton, Manchester Royal Infirmary, Division of Medicine, Manchester, UK.
Professor Edward J Boyko, Epidemiologic Research and Information Center, University of Washington, Seattle, WA, USA.
Ms Nicola Coates, Podiatry Department, Newcastle Hospitals Community Health, Newcastle upon Tyne, UK.
Professor Tom Fahey, Royal College of Surgeons in Ireland, Dublin, Ireland.
Dr William J Jeffcoate, Department of Diabetes and Endocrinology, Nottingham University Hospitals NHS Trust, Nottingham, UK.
Dr Thomas Kästenbauer, Science Consulting & Clinical Monitoring SCCM, Vienna, Austria.
Dr Nicola Leech, Newcastle upon Tyne Hospitals NHS Foundation Trust, Newcastle upon Tyne, UK.
Professor Graham P Leese, Department of Diabetes and Endocrinology, Ninewells Hospital and Medical School, Dundee, UK.
Dr Matteo Monami, Dirigente medico I livello, Cardiologia Geriatrica – DAI Cuore e Vasi, Azienda Ospedaliero-Universitaria Careggi, Florence, Italy.
Ms Matilde Monteiro-Soares, Serviço de Endocrinologia–Pé Diabético, Centro Hospitalar de Vila Nova de Gaia/Espinho EPE, Vila Nova de Gaia, Portugal.
Dr Stephen J Rith-Najarian, Department of Family Medicine, Sanford Bemidji Medical Center, Bemidji, MN, USA.
Ms Amber Seelig, Epidemiologic Research and Information Center, University of Washington, Seattle, WA, USA.
Dr Jayne Tierney, Medical Research Council Clinical Trials Unit, London, UK.
Professor Aristidis Veves, Harvard Medical School, Cambridge, MA, USA.
Appendix 2 Data confidentiality agreement
Appendix 3 EMBASE and MEDLINE searches
EMBASE
Date searched: inception to 31 January 2013.
Date of search: 31 January 2013.
-
diabet$.ti,ab.
-
(foot or feet or toe$).ti,ab.
-
Diabetes Mellitus, Experimental/
-
Diabetes Mellitus, Type I/
-
Diabetes Mellitus, Type II/
-
Diabetic Angiopathies/
-
Diabetic Foot/
-
Foot Ulcer/
-
Diabetic Neuropath$.mp. [mp = title, abstract, original title, name of substance word, subject heading word, protocol supplementary concept, rare disease supplementary concept, unique identifier]
-
Vascular Diseases/
-
Peripheral Vascular Diseases/
-
ISCHAEMIA/
-
(foot ulcer$or isch#em$or vascular dis$).ti,ab.
-
amput$.ti,ab.
-
(vibration or touch or skin temperature$or tuning fork$).ti,ab.
-
(monofilament$or biothesiometer$or ankle brachial ind$or ultraso$).ti,ab.
-
Skin Temperature/
-
ULTRASONOGRAPHY/
-
Ultrasonography, Doppler/
-
or/10–14
-
or/15–19
-
1 and 2
-
(or/3–6) or 9
-
8 and (22 or 23)
-
1 and 2 and 21
-
7 and 21
-
2 and 21 and 23
-
21 and 24
-
or/25–28
-
(screen$or predict$or sensitiv$or specific$or risk factor$or assess$).ti,ab.
-
(or/15–19) or 30
-
1 and 2 and 30
-
7 and 31
-
2 and 23 and 31
-
24 and 31
-
or/32–35
MEDLINE
Date searched: inception to 31 January 2013.
Date of search: 31 January 2013.
1. diabet$.ti,ab. 2. (foot or feet or toe$).ti,ab. 3. Diabetes Mellitus, Experimental/4. Diabetes Mellitus, Type I/5. Diabetes Mellitus, Type II/6. Diabetic Angiopathies/
7. Diabetic Neuropathies
8. Diabetes Mellitus/9. Diabetic Foot/10. Foot Ulcer/11. Vascular Diseases/12. Peripheral Vascular Diseases/13. ISCHAEMIA/14. (foot ulcer or isch#em$or vascular disease$).ti,ab. 15. amput$.mp. [mp = title, original title, abstract, name of substance, mesh subject heading] 16. or/10–15 17. (1 and 2) or 9
18. OR/3–8
19.17 and 18
20.17 OR 19
Limit to 2004 – current
Appendix 4 Data extraction and quality assessment checklist
| Questions | Details |
|---|---|
| Was the purpose of the study to derive or validate a model of prognostic factors for foot ulceration? | Derive yes/no Validate yes/no |
| Methods | |
| Setting/context | |
| Describe the setting (primary care, hospital, GP practice) | |
| Who took the measurements? (podiatrist, GP, nurse, etc.) | |
| Geographical location | |
| Year study was carried out | |
| Document dates during which study was conducted for periods of: recruitment examination measurement follow-up |
|
| Participants | |
| Describe the eligibility criteria | |
| Selection of patients | Was the selection of patients conducted in such a way to avoid bias? | Yes: a consecutive or random sample of patients with diabetes was recruited No: a consecutive or random sample of patients with diabetes was not recruited Unclear: no information about the manner in which patients were recruited is given |
| Timing of follow-up | Was the timing of follow-up long enough for an ulcer to develop? | Yes: the follow-up was conducted at least 1 month after the baseline tests were completed No: the follow-up was conducted within 1 month after the baseline tests were completed Unclear: the timing of the follow-up is not known |
| Replicating the tests | Is there sufficient explanation of the conduct of the tests to permit their replication? | Yes: the conduct of each test can be replicated from the explanation No: it is not possible to replicate the conduct of each test from the explanation Unclear: no information about the test conduct exists |
| Blinding | Were the investigators who collected the follow-up data blind to the results of the index test? | Yes: the follow-up was conducted by investigators who were unaware of the results of the index test No: the follow-up was conducted by investigators who knew the results of the index test Unclear: no information about the follow-up exists |
| Study size | Has the study size been explained in detail? | Yes: a sample-size calculation to justify the study size is available No: a sample-size calculation to justify the study size is unavailable Unclear: no information about the study size exists |
| Results | ||
|---|---|---|
| Participants | Is a flow diagram available showing the numbers of individuals at all stages of the study, the numbers of potentially eligible patients, the numbers examined for eligibility, numbers included in the study, and numbers of completed follow-ups and outcomes)? | Yes: a flow diagram showing the numbers of individuals at all stages of the study, the numbers potentially eligible, numbers examined for eligibility, numbers included in the study and numbers of completed follow-ups and outcomes exists No: a flow diagram showing the numbers of individuals at all stages of the study, the numbers potentially eligible, numbers examined for eligibility, numbers included in the study, and numbers of completed follow-ups and outcomes does not exist |
Appendix 5 Risk of bias
| Study | Was a consecutive sample of patients recruited? | Was the timing of the follow-up long enough for an ulcer to develop? | Can the test be replicated from the description in the published report? | Were the investigators who collected the outcomes blind to the results of the index tests? | Has the study size been fully justified? |
|---|---|---|---|---|---|
| Abbott et al., 20023 | Y | Y | Y | Y | N |
| Boyko et al., 200649 | Y | Y | Y | N | Y |
| Crawford et al., 20115 | Y | Y | Y | Y | Y |
| Kästenbauer et al., 200162 | Y | Y | Y | N | N |
| Leese et al., 201147 | Y | Y | Y | N | N |
| Monami et al., 200972 | Y | Y | Y | N | N |
| Monteiro-Soares and Dinis-Ribeiro, 201061 | Y | Y | Y | Y | N |
| Pham et al., 200073 | Y | Y | Y | Y | N |
| Rith-Najarian et al., 199274 | N | Y | Y | N | N |
| Young et al., 199475 | Y | Y | Y | Y | N |
Appendix 6 Demographic, anthropometric and lifestyle profile of the diabetic population by study
| Study | Statistics | Abbott et al., 20023 | Leese et al., 201147 | Monami et al., 200972 | Crawford et al., 20115 | Young et al., 199475 | Monteiro-Soares and Dinis-Ribeiro, 201061 | Rith-Najarian et al., 199274 | Pham et al., 200073 | Kästenbauer et al., 200162 | Boyko et al., 200649 | Total |
|---|---|---|---|---|---|---|---|---|---|---|---|---|
| Total patients for analysis | N | 6603 | 3412 | 1944 | 1193 | 592 | 360 | 357 | 248 | 187 | 1489 | 16,585 |
| Age (years) | Mean (SD) | 61 (13) | 65 (13) | 63 (13) | 71 (10) | 54 (14) | 64 (10) | 55 (13) | 58 (12) | 59 (8) | 62 (11) | 63 |
| Sex (men) | n (%) | 3515 (53) | 1931 (57) | 1101 (57) | 611 (51) | 308 (52) | 164 (46) | 156 (44) | 124 (50) | 102 (55) | 1489 (98) | (58) |
| Weight (kg) | Mean (SD) | 85 (19) | 75 (15) | 86 (22) | 83 (13) | 97 (21) | 89 | |||||
| Height (m) | Mean (SD) | 166 (9) | 166 (10) | 168 (12) | 169 (10) | 178 (8) | 171 | |||||
| BMI (kg/m2) | Mean (SD) | 30 (6) | 28 (5) | 31 (6) | 27 (5) | 31 (7) | 29 (4) | 31 (6) | 30 | |||
| Lives alone | n (%) | 1436 (22) | 347 (29) | (3) | ||||||||
| Smoking (history) | n (%) | 3857 (59) | 2165 (65) | 779 (65) | 250 (42) | 70 (19) | 115 (46) | 108 (58) | 1210 (81) | (61) | ||
| Alcohol (any) | n (%) | 3092 (47) | 602 (50) | 43 (17) | 103 (55) | 422 (29) | (44) |
Appendix 7 Diabetes and comorbidities by study
| Study | Statistics | Abbott et al., 20023 | Leese et al., 201147 | Monami et al., 200972 | Crawford et al., 20115 | Young et al., 199475 | Monteiro-Soares and Dinis-Ribeiro, 201061 | Rith-Najarian et al., 199274 | Pham et al., 200073 | Kästenbauer et al., 200162 | Boyko et al., 200649 | Total |
|---|---|---|---|---|---|---|---|---|---|---|---|---|
| Total patients for analysis | N | 6603 | 3412 | 1944 | 1193 | 592 | 360 | 357 | 248 | 187 | 1489 | 16,585 |
| HbA1c | Mean (SD) | 8 (2) | 8 (2) | 8 (1) | 11 (2) | 8 (1) | 10 (2) | 10 (3) | 8 | |||
| Insulin treatment | n (%) | 1471 (22) | 125 (4) | 627 (32) | 276 (23) | 246 42% | 150 (42) | 70 (37) | 609 (41) | (23) | ||
| Diabetes type | ||||||||||||
| Type 1, n (%) | 674 (10) | 225 (39) | 6 (2) | 49 (20) | 101 (7) | (9) | ||||||
| Type 2, n (%) | 5877 (90) | 1944 (100) | 348 (61) | 354 (98) | 357 (100) | 199 (80) | 187 (100) | 1388 (93) | (91) | |||
| Diabetes duration | Mean (SD) | 8 (8) | 7 (7) | 10 (10) | 9 (8) | 12 (10) | 16 (10) | 8 (6) | 14 (11) | 11 (7) | 15 (13) | 9 |
| Eye problems | n (%) | 859 (13) blind | 192 (16) visual impairment | 155 (43) visual impairment/blind | 267 (18) | |||||||
| Retinopathy | n (%) | 171 (9) | 177 (49) | 117 (47) | 66 (38) | 229 (15) | (18) | |||||
| Kidney problems | n (%) | 157 (2) nephropathy | 334 (16) CKD 3–5 | 75 (4) renal failure | 387 (37) CKD 3–5 | 34 (15) CKD 3–5 | 62 (17) nephropathy | 5 2% end stage | 24 (13) CKD 3–5 | 392 (28) CKD 3–5 |
Appendix 8 Foot measurements by study
| Study | Statistics | Abbott et al., 20023 | Leese et al., 201147 | Monami et al., 200972 | Crawford et al., 20115 | Young et al., 199475 | Monteiro-Soares and Dinis-Ribeiro, 201061 | Rith-Najarian et al., 199274 | Pham et al., 200073 | Kästenbauer et al., 200162 | Boyko et al., 200649 | Total |
|---|---|---|---|---|---|---|---|---|---|---|---|---|
| Total patients for analysis | N | 6603 | 3412 | 1944 | 1193 | 592 | 360 | 357 | 248 | 187 | 1489 | 16,585 |
| Monofilament | n (%) | 1278 (20) | 707 (21) | 266 (23) | 166 (46) | 71 (20) | 185 (76) | 13 (7) | 629 (44) | (24) | ||
| Pulses | n (%) | 1957 (30) | 478 (14) | 224 (19) | 103 (17) | 73 (20) | 36 (15) | 46 (3) | (22) | |||
| Pinprick | n (%) | 2023 (31) | 586 (49) | (34) | ||||||||
| VPT: tuning fork | n (%) | 2254 (34) | 427 (36) | 49 (29) | 725 (95) | (40) | ||||||
| VPT: biothesiometer | n (%) | 488 (25) | 459 (39) | 274 (46) | 137 (56) | 52 (28) | 40 (9) | (32) | ||||
| Ankle reflexes (tendon hammer) | n (%) | 3393 (52) | 846 (71) | 76 (45) | 796 (54) | (55) | ||||||
| Temperature sensation | n (%) | 1342 (21) | 390 (33) | (22) | ||||||||
| ABI | n (%) | 759 (78) | 187 (36) | 47 (25) | 70 (38) | 653 (44) | (51) | |||||
| PPP | n (%) | 588 (54) | 109 (46) | a | (53) | |||||||
| Foot deformity | n (%) | 4825 (73) | 149 (4) | 700 (59) | 265 74% | 82 (23) | 149 (80) | 696 (47) | (51) |
Appendix 9 Full data variable dictionary
The completed list of variables available in the data set has been produced automatically from each data set with SAS.
The list of variables for Boyko et al. 49 has been provided from the author in a different format because the data set is not available to use externally.
Crawford et al.5
| Data set name | IPDDFU.CRAWFORD | Observations | 1196 |
| Member type | DATA | Variables | 339 |
| Engine | V9 | Indexes | 0 |
| Variables in creation order | ||||||
|---|---|---|---|---|---|---|
| # | Variable | Type | Len | Format | Informat | Label |
| 1 | IDNo | Num | 8 | F8. | ID number | |
| 2 | expr1000 | Num | 8 | F11. | ?? | |
| 3 | ulcerpod | Num | 8 | F11. | ?? | |
| 4 | pod_id | Num | 8 | F11. | ID of podiatris | |
| 5 | age | Num | 8 | F11. | Age | |
| 6 | sex | Num | 8 | SEX. | sex | |
| 7 | chino | Char | 22 | $22. | $22. | CHI Number |
| 8 | livingst | Num | 8 | LIVINGS. | Living status (alone) | |
| 9 | postcode | Char | 6 | $6. | $6. | Postcode of patient |
| 10 | hba1c1st | Num | 8 | F11. | hba1c1 1st measurement | |
| 11 | hba1c1_1 | Num | 8 | F8.2 | empty variable | |
| 12 | hba1c2nd | Num | 8 | F11. | hba1c1 2nd measurement | |
| 13 | hba1c2_1 | Num | 8 | F8.2 | empty variable | |
| 14 | hba1c3rd | Num | 8 | F11. | hba1c1 3rd measurement | |
| 15 | hba1c3_1 | Num | 8 | F8.2 | empty variable | |
| 16 | smoking | Num | 8 | SMOKING. | Smoking history | |
| 17 | noperday | Num | 8 | F11. | Number of cigarettes per day | |
| 18 | alcohol | Num | 8 | ALCOHOL. | Alcohol use | |
| 19 | unitsper | Num | 8 | F11. | Units per week | |
| 20 | diabetes | Num | 8 | F11. | Duration of diabetes | |
| 21 | insulind | Num | 8 | INSULIN. | Insulin dependent | |
| 22 | oralhypo | Num | 8 | ORALHYP. | Oral hypoglycemic | |
| 23 | dietalon | Num | 8 | DIETALO. | Diet alone yes/no | |
| 24 | visualim | Num | 8 | VISUALI. | Visual impairment yes/no | |
| 25 | physdisa | Num | 8 | PHYSDIS. | Physical disability yes/no | |
| 26 | routinep | Num | 8 | ROUTINE. | Routine podiatry treatment | |
| 27 | noccramp | Num | 8 | NOCCRAM. | Nocturnal cramps in feet yes/no | |
| 28 | hotcold | Num | 8 | HOTCOLD. | Abnormal hot cold sensations yes/no | |
| 29 | tingling | Num | 8 | TINGLIN. | Tingling sensations yes/no | |
| 30 | numbness | Num | 8 | NUMBNES. | Numbness yes/no | |
| 31 | burning | Num | 8 | BURNING. | Burning pain yes/no | |
| 32 | aching | Num | 8 | ACHING. | Aching pain yes/no | |
| 33 | ulcerati | Num | 8 | ULCERAT. | Previous ulceration yes/no | |
| 34 | amputati | Num | 8 | AMPUTAT. | Amputation yes/no | |
| 35 | dorsal | Num | 8 | DORSAL. | Dorsal callus Right | |
| 36 | plantar | Num | 8 | PLANTAR. | Plantar callus Right | |
| 37 | apical | Num | 8 | APICAL. | Apical callus Right | |
| 38 | leftdors | Num | 8 | LEFTDOR. | Callus on left foot, dorsal aspect yes/no | |
| 39 | leftplan | Num | 8 | LEFTPLA. | Callus on left foot, plantar aspect yes/no | |
| 40 | leftapic | Num | 8 | LEFTAPI. | Callus on left foot, apices of toes yes/no | |
| 41 | rightdor | Num | 8 | RIGHTDO. | Callus on right foot, dorsal aspect yes/no | |
| 42 | rightpla | Num | 8 | RIGHTPL. | Callus on right foot, plantar aspect yes/no | |
| 43 | rightapi | Num | 8 | RIGHTAP. | Callus on right foot, apices of toes yes/no | |
| 44 | halluxle | Num | 8 | HALLUXL. | hallux valgus (bunion) left foot yes/no | |
| 45 | halluxri | Num | 8 | HALLUXR. | hallux valgus (bunion) right foot yes/no | |
| 46 | taylorsl | Num | 8 | TAYLORS. | taylors bunion left yes/no | |
| 47 | taylorsr | Num | 8 | TAYLOR1 A. | taylors bunion right yes/no | |
| 48 | charcott | Num | 8 | CHARCOT. | charcott joint left yes/no | |
| 49 | charco_1 | Num | 8 | CHARCO_. | charcott joint right yes/no | |
| 50 | footwear | Num | 8 | FOOTWEA. | footwear (shoes) yes/no | |
| 51 | orthoses | Num | 8 | ORTHOSE. | Othoses (issued) yes/no | |
| 52 | padinsol | Num | 8 | PADINSO. | Have you had a pad or an insole from the chemist yes/no | |
| 53 | claudica | Num | 8 | CLAUDIC. | Intermittent claudication | |
| 54 | prevvasc | Num | 8 | PREVVAS. | Previous vascular surgery (left side) | |
| 55 | prevva_1 | Num | 8 | PREVVA_. | Previous vascular surgery (right side) | |
| 56 | shinyski | Num | 8 | SHINYSK. | Does the patient have Shiny skin | |
| 57 | dryskin | Num | 8 | DRYSKIN. | Does the patient have dry skin | |
| 58 | fungalin | Num | 8 | FUNGALI. | Does the patient have Fungal infection (skin) | |
| 59 | leghairl | Num | 8 | LEGHAIR. | Does the patient have Leg hairlessness | |
| 60 | toehairl | Num | 8 | TOEHAIR. | Does the patient have Toe hairlessness | |
| 61 | toenai_1 | Num | 8 | TOENAI_. | Does the patient have Toe nail pathology (including fungal infection) on one or more toenail | |
| 62 | poorcapi | Num | 8 | POORCAP. | Poor capillary filling time in toes (> 3 seconds)? | |
| 63 | oedema | Num | 8 | OEDEMA. | Oedema present? | |
| 64 | ltdjoi_1 | Num | 8 | LTDJOI_. | Limited joint mobility big toe (left) | |
| 65 | ltdjoi_2 | Num | 8 | LTDJOI1 A. | Limited joint mobility big toe (right) | |
| 66 | ltdjoi_3 | Num | 8 | LTDJOI2 A. | Limited joint mobility ankle (left) | |
| 67 | ltdjoi_4 | Num | 8 | LTDJOI3 A. | Limited joint mobility ankle (right) | |
| 68 | neurompj | Num | 8 | F11. | Neurothesiometer left 1st | |
| 69 | neurom_1 | Num | 8 | F11. | Neurothesiometer left 2nd | |
| 70 | neurom_2 | Num | 8 | F11. | Neurothesiometer left 3rd | |
| 71 | neuorole | Num | 8 | NEUOROL. | ????Not sure about patients responses (please tick)? | |
| 72 | neurom_3 | Num | 8 | F11.1 | Neurothesiometer right 1st | |
| 73 | neurom_4 | Num | 8 | F11. | Neurothesiometer right 2nd | |
| 74 | neurom_5 | Num | 8 | F11. | Neurothesiometer right 3rd | |
| 75 | neurorig | Num | 8 | NEURORI. | ????Not sure about patients responses (please tick)? | |
| 76 | mono1stl | Num | 8 | MONO1ST. | Monofilament left 1st | |
| 77 | mono2ndl | Num | 8 | MONO2ND. | Monofilament left 2nd | |
| 78 | mono3rdl | Num | 8 | MONO3RD. | Monofilament left 3rd | |
| 79 | mono4thl | Num | 8 | MONO4TH. | Monofilament left 4th | |
| 80 | mono5thl | Num | 8 | MONO5TH. | Monofilament left 5th | |
| 81 | mono1str | Num | 8 | MONO1S1 A. | Monofilament right 1st | |
| 82 | mono2ndr | Num | 8 | MONO2N1 A. | Monofilament right 2nd | |
| 83 | mono3rdr | Num | 8 | MONO3R1 A. | Monofilament right 3rd | |
| 84 | mono4thr | Num | 8 | MONO4T1 A. | Monofilament right 4th | |
| 85 | mono5thr | Num | 8 | MONO5T1 A. | Monofilament right 5th | |
| 86 | tuningfo | Num | 8 | TUNINGF. | Tuning fork (left MTPJ) | |
| 87 | tuning_1 | Num | 8 | TUNING_. | Tuning fork (right MTPJ) | |
| 88 | neurolef | Num | 8 | NEUROLE. | Neuro tip (left hallux) | |
| 89 | neuror_1 | Num | 8 | NEUROR_. | Neuro tip (right hallux) | |
| 90 | cottonwo | Num | 8 | COTTONW. | Cotton wool (dab, left dorsum) | |
| 91 | cotton_1 | Num | 8 | COTTON_. | Cotton wool (dab right dorsum) | |
| 92 | thermall | Num | 8 | THERMAL. | Thermal sensitivity (left hallux) Correctly identified | |
| 93 | thermalr | Num | 8 | THERMA1 A. | Thermal sensitivity (right hallux) Correctly identified | |
| 94 | dorsalis | Num | 8 | DORSALI. | Left dorsalis pedis | |
| 95 | posterio | Num | 8 | POSTERI. | Left posterior tibial | |
| 96 | dorsal_1 | Num | 8 | DORSAL_. | Right dorsalis pedis | |
| 97 | poster_1 | Num | 8 | POSTER_. | Right posterior tibial | |
| 98 | abilefta | Num | 8 | F11. | Ankle brachial index left | |
| 99 | abilef_1 | Num | 8 | F11. | Arm brachial index left | |
| 100 | abiright | Num | 8 | F11. | Ankle brachial index right | |
| 101 | abirig_1 | Num | 8 | F11. | Arm brachial index right | |
| 102 | abinotdo | Num | 8 | ABINOTD. | ABI could not be done | |
| 103 | taleft | Num | 8 | TALEFT. | Tendon hammer ankle reflexes (left TA) | |
| 104 | taright | Num | 8 | TARIGHT. | Tendon hammer Ankle reflexes (right TA) | |
| 105 | planusle | Num | 8 | PLANUSL. | Pes planus (left foot) | |
| 106 | planusri | Num | 8 | PLANUSR. | Pes planus (right foot) | |
| 107 | cavuslef | Num | 8 | CAVUSLE. | Pes cavus (left foot) | |
| 108 | cavusrig | Num | 8 | CAVUSRI. | Pes cavus (right foot) | |
| 109 | podotrac | Char | 22 | $22. | $22. | Podotrack (peak plantart pressure) left |
| 110 | podotr_1 | Char | 13 | $13. | $13. | Podotrack (peak plantart pressure) right |
| 111 | heightcm | Num | 8 | F11. | Height in cm | |
| 112 | heightft | Num | 8 | F11. | Height in ft | |
| 113 | heightin | Num | 8 | F11. | Height in inches | |
| 114 | weight | Num | 8 | F11. | weight (kg) | |
| 115 | patulcer | Num | 8 | PATULCE. | How likely did the patient think that they would get an ulcer? | |
| 116 | patrecov | Num | 8 | PATRECO. | How likely that they patient would think that it would heal up | |
| 117 | pod_init | Num | 8 | F8.2 | Podiatrist initials | |
| 118 | pod_clin | Num | 8 | F11. | podiatry clinic | |
| 119 | podulcer | Num | 8 | PODULCE. | ***How likely did the podiatrist think that the patient would get an ulcer? | |
| 120 | ulcerfay | Char | 22 | $22. | $22. | ulcers ascertained by Fay during telephone follow-up |
| 121 | ulcerdar | Num | 8 | ULCERDA. | ulcers ascertained by from patient records | |
| 122 | ulcerp_1 | Num | 8 | ULCERP_. | total ulcers? | |
| 123 | podrecov | Num | 8 | F11. | ***Likelihood the patient’s ulcer would heal up? | |
| 124 | hypo | Num | 8 | HYPO. | Hypoglycaemic drugs | |
| 125 | antihyp | Num | 8 | ANTIHYP. | antihypertensives | |
| 126 | insulin | Num | 8 | INSULI1 A. | Insulin dependent Yes/No | |
| 127 | oral | Num | 8 | ORAL. | oral hypoglycemic drugs | |
| 128 | ketos | Num | 8 | KETOS. | ***ketos?? | |
| 129 | aspirin | Num | 8 | ASPIRIN. | asprin | |
| 130 | statins | Num | 8 | STATINS. | statins | |
| 131 | fungals | Num | 8 | FUNGALS. | antifungals | |
| 132 | hypob4 | Num | 8 | HYPOB4 A. | hypoglycaemic drugs 3 months before recruitment | |
| 133 | insulinb | Num | 8 | INSULI2 A. | insulin drugs 3 months before recruitment | |
| 134 | oralb4 | Num | 8 | ORALB4 A. | oral hypoglycemic drugs 3 months before recruitment | |
| 135 | ketosb4 | Num | 8 | KETOSB4 A. | ketos drugs 3 months before recruitment | |
| 136 | antihypb | Num | 8 | ANTIHY1 A. | antihypertensive drugs 3 months before recruitment | |
| 137 | aspirinb | Num | 8 | ASPIRI1 A. | asprin 3 months before recruitment | |
| 138 | statinsb | Num | 8 | STATIN1 A. | statins drugs 3 months before recruitment | |
| 139 | fungalsb | Num | 8 | FUNGAL1 A. | fungals drugs 3 months before recruitment | |
| 140 | hypoafte | Num | 8 | HYPOAFT. | hypoglycaemic drugs 3 months after recruitment | |
| 141 | insulina | Num | 8 | INSULI3 A. | insulin drugs 3 months after recruitment | |
| 142 | oralafte | Num | 8 | ORALAFT. | oral hypoglycemic drugs 3 months after recruitment | |
| 143 | ketosaft | Num | 8 | KETOSAF. | ketos drugs 3 months after recruitment | |
| 144 | antihypa | Num | 8 | ANTIHY2 A. | antihypertensive drugs 3 months after recruitment | |
| 145 | aspirina | Num | 8 | ASPIRI2 A. | asprin 3 months after recruitment | |
| 146 | statinsa | Num | 8 | STATIN2 A. | statins drugs 3 months after recruitment | |
| 147 | fungalsa | Num | 8 | FUNGAL2 A. | fungals drugs 3 months after recruitment | |
| 148 | hba1clas | Num | 8 | HBA1CLA. | ***Hbaclas? | |
| 149 | hba1cl_1 | Num | 8 | F11.1 | hba1cl_1st reading | |
| 150 | hba1c2_2 | Num | 8 | DATETIME23.2 | hba1c2_2 | |
| 151 | hba1c2_3 | Num | 8 | F11.1 | hba1c2_3 | |
| 152 | hba1c3_2 | Num | 8 | DATETIME23.2 | hba1c3_2 | |
| 153 | hba1c3_3 | Num | 8 | F11.1 | hba1c3_3 | |
| 154 | choleste | Num | 8 | DATETIME23.2 | ***choleste | |
| 155 | choles_1 | Num | 8 | F11.1 | choles_1st reading | |
| 156 | choles_2 | Num | 8 | DATETIME23.2 | choles_2 | |
| 157 | choles_3 | Num | 8 | F11.1 | choles_3 | |
| 158 | choles_4 | Num | 8 | DATETIME23.2 | choles_4 | |
| 159 | choles_5 | Num | 8 | F11.1 | choles_5 | |
| 160 | creatini | Num | 8 | DATETIME23.2 | ***creatini | |
| 161 | creati_1 | Num | 8 | F11. | creati_1st reading | |
| 162 | creati_2 | Num | 8 | DATETIME23.2 | creati_2 | |
| 163 | creati_3 | Num | 8 | F11. | creati_3 | |
| 164 | creati_4 | Num | 8 | DATETIME23.2 | creati_4 | |
| 165 | creati_5 | Num | 8 | F11. | creati_5 | |
| 166 | hdlcholl | Num | 8 | DATETIME23.2 | Date – HDL cholesterol ratio | |
| 167 | hdlcho_1 | Num | 8 | F11.1 | HDL cholesterol ratio 1st reading | |
| 168 | hdlchol2 | Num | 8 | DATETIME23.2 | HDL cholesterol ratio 2 | |
| 169 | hdlcho_2 | Num | 8 | F11.1 | HDL cholesterol ratio 2b | |
| 170 | hdlchol3 | Num | 8 | DATETIME23.2 | HDL cholesterol ratio 3 | |
| 171 | hdlcho_3 | Num | 8 | F11.1 | HDL cholesterol ratio 3b | |
| 172 | malastda | Num | 8 | DATETIME23.2 | Date – macroalbumin urea 1 | |
| 173 | malastre | Num | 8 | F11. | macroalbumin urea 2 | |
| 174 | ma2ndlas | Num | 8 | F8.2 | macroalbumin urea 3 | |
| 175 | ma2ndl_1 | Num | 8 | F8.2 | macroalbumin urea 4 | |
| 176 | ma3rdlas | Num | 8 | F8.2 | macroalbumin urea 5 | |
| 177 | ma3rdl_1 | Num | 8 | F8.2 | macroalbumin urea 6 | |
| 178 | microalb | Num | 8 | DATETIME23.2 | Date – microalbumin urea | |
| 179 | microa_1 | Num | 8 | F11. | microalbumin urea 1 | |
| 180 | microa_2 | Num | 8 | F8.2 | microalbumin urea 2 | |
| 181 | microa_3 | Num | 8 | F8.2 | microalbumin urea 3 | |
| 182 | microa_4 | Num | 8 | F8.2 | microalbumin urea 4 | |
| 183 | microa_5 | Num | 8 | F8.2 | microalbumin urea 5 | |
| 184 | urinelas | Num | 8 | DATETIME23.2 | Date – urine protein | |
| 185 | urinel_1 | Char | 22 | $22. | $22. | urine protein 1st reading |
| 186 | urine2nd | Num | 8 | DATETIME23.2 | urine protein 2nd reading | |
| 187 | urine2_1 | Char | 22 | $22. | $22. | urine protein 2nd b |
| 188 | urine3rd | Num | 8 | DATETIME23.2 | urine protein 3rd | |
| 189 | urine3_1 | Char | 22 | $22. | $22. | urine protein 3rd b |
| 190 | cholhdlr | Num | 8 | DATETIME23.2 | Date – Cholesterol HDL | |
| 191 | cholhd_1 | Num | 8 | F11.1 | Cholesterol HDL 1st reading | |
| 192 | cholhd_2 | Num | 8 | DATETIME23.2 | Cholesterol HDL 2 | |
| 193 | cholhd_3 | Num | 8 | F11.1 | Cholesterol HDL 3 | |
| 194 | cholhd_4 | Num | 8 | DATETIME23.2 | Cholesterol HDL 4 | |
| 195 | cholhd_5 | Num | 8 | F11.1 | Cholesterol HDL 5 | |
| 196 | finaldat | Num | 8 | F11. | ??? | |
| 197 | finald_1 | Num | 8 | F11. | ??? | |
| 198 | finald_2 | Num | 8 | F11. | ??? | |
| 199 | finald_3 | Num | 8 | F11. | ??? | |
| 200 | finald_4 | Num | 8 | F11. | ??? | |
| 201 | finald_5 | Num | 8 | F11. | ??? | |
| 202 | finald_6 | Num | 8 | F11. | ??? | |
| 203 | finald_7 | Num | 8 | F11. | ??? | |
| 204 | finald_8 | Num | 8 | F11. | ??? | |
| 205 | finald_9 | Num | 8 | F11. | ??? | |
| 206 | deceased | Num | 8 | F8.2 | Deceased | |
| 207 | depcat | Num | 8 | F11. | Deprivation score | |
| 208 | dateofbi | Char | 12 | $12. | $12. | DOB |
| 209 | consulta | Char | 10 | $10. | $10. | Date of consultation |
| 210 | consul_1 | Num | 8 | F11.1 | Age at consultation | |
| 211 | neurol_1 | Num | 8 | F11.1 | neurothesiometer left | |
| 212 | neuror_2 | Num | 8 | F11.1 | neurothesiometer right | |
| 213 | neurol_2 | Num | 8 | F11. | neurothesiometer 2 | |
| 214 | neuror_3 | Num | 8 | F11. | neurothesiometer 3 | |
| 215 | monole_1 | Num | 8 | MONOLE_. | Monofilaments 1 | |
| 216 | monole_2 | Num | 8 | MONOLE1 A. | Monofilaments 2 | |
| 217 | monoleft | Num | 8 | MONOLEF. | Monofilaments left [0 = do not know; 1 = yes; 2 = no] | |
| 218 | monorigh | Num | 8 | MONORIG. | Monofilaments right [0,1,2,3,4,5?] | |
| 219 | monori_1 | Num | 8 | F11. | Monofilaments [0,1,2,3,4,5?] | |
| 220 | monori_2 | Num | 8 | F11. | Monofilaments 4 [0 = do not know; 1 = yes; 2 = no] | |
| 221 | abileftr | Num | 8 | F11.1 | ankle brakial index left 1 | |
| 222 | abirig_2 | Num | 8 | F11.1 | ankle brakial index right | |
| 223 | abileftg | Num | 8 | ABILEFT. | ankle brakial index left 2 | |
| 224 | abirig_3 | Num | 8 | ABIRIG_. | ankle brakial index right 2 | |
| 225 | ht_in_m | Num | 8 | F11.1 | height in metres | |
| 226 | bmi | Num | 8 | F11.1 | BMI | |
| 227 | bmicat | Num | 8 | BMICAT. | BMI categories | |
| 228 | abspostr | Num | 8 | ABSPOST. | Absent posterior pulse right | |
| 229 | abspostl | Num | 8 | ABSPOS1 A. | Absent posterior pulse left | |
| 230 | absdorsr | Num | 8 | ABSDORS. | Absent dorsalis pedis pulse right | |
| 231 | absdorsl | Num | 8 | ABSDOR1 A. | Absent dorsalis pedis pulse left | |
| 232 | abspulse | Num | 8 | ABSPULS. | absent pulse 1 | |
| 233 | abspul_1 | Num | 8 | ABSPUL_. | absent pulse 2 | |
| 234 | calluspr | Num | 8 | CALLUSP. | calluspr | |
| 235 | noself | Num | 8 | NOSELF. | noself | |
| 236 | signrisk | Num | 8 | SIGNRIS. | signrisk | |
| 237 | dnsrpass | Num | 8 | F11. | dnsrpass [0,1,2,3,4,5] | |
| 238 | dnsrfail | Num | 8 | F11. | dnsrfail [0,1,2,3,4,5] | |
| 239 | dnsr | Num | 8 | DNSR. | dnsr | |
| 240 | dnslpass | Num | 8 | F11. | dnslpass [0,1,2,3,4,5] | |
| 241 | dnslfail | Num | 8 | F11. | dnslfail [0,1,2,3,4,5] | |
| 242 | dnsl | Num | 8 | DNSL. | dnsl – left | |
| 243 | dnssrpas | Num | 8 | F11. | dnssrpas [0,1,2,3,4,5,6] | |
| 244 | dnssrfai | Num | 8 | F11. | dnssrfai [0,1,2,3,4,5,6] | |
| 245 | dnssr | Num | 8 | F11. | dnssr – right | |
| 246 | dnsslpas | Num | 8 | F11. | dnsslpa s [0,1,2,3,4,5,6] | |
| 247 | dnsslfai | Num | 8 | F11. | dnsslfai [0,1,2,3,4,5,6] | |
| 248 | dnssl | Num | 8 | DNSSL. | dnssl | |
| 249 | callusab | Num | 8 | F11. | callusab | |
| 250 | bnfcatb4 | Num | 8 | F11. | bnfcatb4 0–9 | |
| 251 | polyphar | Num | 8 | POLYPHA. | polyphar | |
| 252 | hba1cmea | Num | 8 | F11.1 | hba1c mean | |
| 253 | cholmean | Num | 8 | F11.1 | cholesterol mean] | |
| 254 | creatmea | Num | 8 | F11.1 | creat mean | |
| 255 | hdlchome | Num | 8 | F11.1 | hdl chol mean | |
| 256 | mamean | Num | 8 | F11. | ma?? mean | |
| 257 | microa_6 | Num | 8 | F11. | microa_6 | |
| 258 | cholhd_6 | Num | 8 | F8.2 | cholhd_6 | |
| 259 | leftptra | Num | 8 | F8.2 | leftptra [1–5] | |
| 260 | rightptr | Num | 8 | F8.2 | rightptr [1–5] | |
| 261 | leftptpa | Num | 8 | F8.2 | leftptpa [0, system] | |
| 262 | leftptfa | Num | 8 | F8.2 | leftptfa [1, system] | |
| 263 | rightptp | Num | 8 | F8.2 | rightptp [0, system] | |
| 264 | rightptf | Num | 8 | F8.2 | rightptf [1, system] | |
| 265 | ulcerp_n | Num | 8 | ULCERP1 A. | ulcerp_n | |
| 266 | routin_1 | Num | 8 | ROUTIN_. | routin_1 | |
| 267 | podotr_2 | Num | 8 | PODOTR_. | podotr_2 | |
| 268 | dead | Num | 8 | F8.2 | dead | |
| 269 | bloodglu | Num | 8 | F8.2 | bloodglu [1,2] | |
| 270 | dorsalca | Num | 8 | F8.2 | dorsalca [0,3] | |
| 271 | plantarc | Num | 8 | F8.2 | plantarc [0,3] | |
| 272 | apicalca | Num | 8 | F8.2 | apicalca [0,3] | |
| 273 | anycallu | Num | 8 | F8.2 | anycallu [0,1] | |
| 274 | dns | Num | 8 | F8.2 | dns [0,1] | |
| 275 | monofil | Num | 8 | F8.2 | monofil [0,3] | |
| 276 | hallux | Num | 8 | F8.2 | hallux [0,3] | |
| 277 | taylors | Num | 8 | F8.2 | taylors [0,3] | |
| 278 | charcot | Num | 8 | F8.2 | charcot [0,3] | |
| 279 | prevva_2 | Num | 8 | F8.2 | prevva_2 [1,2] | |
| 280 | ltdjoint | Num | 8 | LTDJOIN. | ltdjoint [0,1,2] | |
| 281 | ltd1stjo | Num | 8 | LTD1STJ. | ltd1stjo [0,1]. | |
| 282 | ltdankle | Num | 8 | LTDANKL. | ltdankle [0,1,2] | |
| 283 | ltdank_1 | Num | 8 | LTDANK_. | ltdank_1 [0,1] | |
| 284 | neuro | Num | 8 | NEURO. | neuro [0,1,2] | |
| 285 | neuropen | Num | 8 | NEUROPE. | neuropen [0,1] | |
| 286 | cotton_2 | Num | 8 | COTTON1 A. | cotton_2 [0,1,2] | |
| 287 | cotton_3 | Num | 8 | COTTON2 A. | cotton_3 [0,1] | |
| 288 | thermal | Num | 8 | THERMA2 A. | thermal [0,1,2] | |
| 289 | temperat | Num | 8 | TEMPERA. | temperat [0,1] | |
| 290 | abi | Num | 8 | F8.2 | abi [0–3] | |
| 291 | abspost | Num | 8 | F8.2 | abspost [0,3] | |
| 292 | absdors | Num | 8 | F8.2 | absdors [0,3] | |
| 293 | tendonha | Num | 8 | TENDONH. | tendonha [0,1,2] | |
| 294 | planus | Num | 8 | PLANUS. | planus [0,1] | |
| 295 | cavus | Num | 8 | CAVUS. | cavus [0,1] | |
| 296 | tuning_2 | Num | 8 | TUNING1 A. | tuning_2 [0,1,2] | |
| 297 | tf | Num | 8 | TF. | tf [0,1] | |
| 298 | neuromea | Num | 8 | NEUROME. | neuromea [0,1,2] | |
| 299 | routin_2 | Num | 8 | ROUTIN1 A. | routin_2 [0,1] | |
| 300 | oedemati | Num | 8 | OEDEMAT. | oedemati [0,1] | |
| 301 | poorcap | Num | 8 | POORCA1 A. | poorcap [0,1] | |
| 302 | toenail | Num | 8 | TOENAIL. | toenail [0,1] | |
| 303 | toehair | Num | 8 | TOEHAI1 A. | toehair [0,1] | |
| 304 | leghair | Num | 8 | LEGHAI1 A. | leghair [0,1] | |
| 305 | fungal_1 | Num | 8 | FUNGAL_. | fungal_1 [0,1] | |
| 306 | drysk | Num | 8 | DRYSK. | drysk [0,1] | |
| 307 | shine | Num | 8 | SHINE. | shine [0,1] | |
| 308 | vascular | Num | 8 | VASCULA. | vascular [0,1] | |
| 309 | toehairs | Num | 8 | TOEHAI2 A. | toehairs [0,1] | |
| 310 | leghairs | Num | 8 | LEGHAI2 A. | leghairs [0,1] | |
| 311 | toenailp | Num | 8 | TOENAI1 A. | toenailp [1,2] | |
| 312 | tailors | Num | 8 | TAILORS. | tailors [1,2] | |
| 313 | charcotj | Num | 8 | CHARCO1 A. | charcotj [1,2] | |
| 314 | neurotip | Num | 8 | NEUROTI. | neurotip [1,2] | |
| 315 | cwool | Num | 8 | CWOOL. | cwool [1,2] | |
| 316 | temp | Num | 8 | TEMP. | temp [1,2] | |
| 317 | posttib | Num | 8 | POSTTIB. | posttib [1,2] | |
| 318 | dorspedi | Num | 8 | DORSPED. | dorspedi [1,2] | |
| 319 | tunfork | Num | 8 | TUNFORK. | tunfork [1,2] | |
| 320 | diabns | Num | 8 | DIABNS. | diabns [1,2] | |
| 321 | tailors_ | Num | 8 | TAILOR1 A. | tailors_ [1,2] | |
| 322 | amputa_1 | Num | 8 | AMPUTA_. | amputa_1 [1,2,3] | |
| 323 | amputa_n | Num | 8 | AMPUTA1 A. | amputa_n [0,1,2] | |
| 324 | tailorsn | Num | 8 | TAILOR2 A. | tailorsn [1,2] | |
| 325 | tunforkn | Num | 8 | TUNFOR1 A. | tunforkn [0,1] | |
| 326 | signri_h | Num | 8 | SIGNRI_. | signri_h [1,2] | |
| 327 | signr_n | Num | 8 | SIGNR_N. | signr_n [1–3] | |
| 328 | amputa_c | Num | 8 | AMPUTA2 A. | amputa_c [0,1] | |
| 329 | NEUROP_R | Num | 8 | NEUROP_. | NEUROP_R [0,1] | |
| 330 | ABI_C | Num | 8 | F8.2 | ABI_C [0–3] | |
| 331 | ABI_3C | Num | 8 | ABI_3C. | ABI_3C [0–2] | |
| 332 | ABI_3N | Num | 8 | ABI_3 N. | ABI_3 N [0–2] | |
| 333 | AMPUTA1 | Num | 8 | AMPUTA3 A. | AMPUTA1 [1,2] | |
| 334 | FINALD51 | Num | 8 | FINALD5 A. | FINALD51 [1–3] | |
| 335 | TEMP1 | Num | 8 | TEMP1 A. | TEMP1 [1,2] | |
| 336 | TUNFORK1 | Num | 8 | TUNFOR2 A. | TUNFORK1 [1,2] | |
| 337 | TAILORS1 | Num | 8 | TAILOR3 A. | TAILORS1 [1,2] | |
| 338 | FOLLOWUPDATE | Char | 10 | $10. | $10. | Follow up date |
| 339 | consulta2 | Num | 8 | DDMMYY10. | Date of consultation | |
Kästenbauer et al.62
| Data set name | IPDDFU.KASTENBAUER | Observations | 671 |
| Member type | DATA | Variables | 235 |
| Engine | V9 | Indexes | 0 |
| Variables in creation order | ||||||
|---|---|---|---|---|---|---|
| # | Variable | Type | Len | Format | Informat | Label |
| 1 | GRUPPE | Num | 8 | F11. | Group (for internal purposis – other analysis) | |
| 2 | NR | Num | 8 | F11. | Patient ID within groups | |
| 3 | VI | Num | 8 | F11. | Visit Number | |
| 4 | ID | Char | 22 | $22. | $22. | Patient ID, all groups together |
| 5 | NP | Num | 8 | F11. | Neuropathy defined as VPT > = 25 volts at visit 1; = eVPT (Code 1) or nVPT (Code 0);MAIN CODING VARIABLE | |
| 6 | UDAT | Num | 8 | DDMMYY8. | Date of investigation | |
| 7 | UDAT_VI1 | Num | 8 | DDMMYY8. | Date of visit 1 | |
| 8 | STUD_E | Num | 8 | F11. | Date of end of trial (last visit or event date) | |
| 9 | UDAT_N | Num | 8 | DDMMYY8. | Date of last visit done | |
| 10 | STUDAU | Num | 8 | F11. | Study duration | |
| 11 | DM_NEU | Num | 8 | F11. | Newly diagnosed type 2 diabetes | |
| 12 | E_STAT | Char | 8 | $8. | $8. | Event censoring indicator |
| 13 | ULK_STAT | Char | 8 | $8. | $8. | Ulcer censoring indicator |
| 14 | E_1 | Char | 5 | $5. | $5. | Event 1; Type of event: Ulk = Ulcer, Tod = death, Fiss = fissure, Blase = blister, Amp = amputation |
| 15 | E_1_DAT | Num | 8 | DDMMYY8. | Date of event 1 | |
| 16 | E_2 | Char | 3 | $3. | $3. | Event 2 |
| 17 | E_2_DAT | Num | 8 | DDMMYY8. | Date of event 2 | |
| 18 | E_3 | Char | 3 | $3. | $3. | Event 3 |
| 19 | E_3_DAT | Num | 8 | DDMMYY8. | Date of event 3 | |
| 20 | UDAT_MAX | Num | 8 | DDMMYY8. | Maximal visit date; used for calculations | |
| 21 | VPT25 | Num | 8 | VPT25 A. | VPT > = 25 volts at single visit | |
| 22 | D_HIGH2 | Num | 8 | F11. | Elevated plantar pressure at 2 or more sites (calculated out of mean values of left + right feet) | |
| 23 | D_HIGH1 | Num | 8 | F11. | Elevated plantar pressure at 1 site | |
| 24 | DROPOUT | Num | 8 | F11. | Drop-out during the study | |
| 25 | TOD | Num | 8 | F11. | Death | |
| 26 | DO_TOD | Num | 8 | F11. | Drop-out + death (combines both into one variable) | |
| 27 | ALTER | Num | 8 | F11. | Age | |
| 28 | SEX | Char | 1 | $1. | $1. | Gender: w = weiblich = femal, m = male |
| 29 | DIAB_DAU | Num | 8 | F11. | Diabetes duration, years | |
| 30 | GEWICHT | Num | 8 | F11. | Weight, kg | |
| 31 | GR__E | Num | 8 | F11. | Height, cm | |
| 32 | BMI | Num | 8 | F13. | Body mass index, kg*m-2 | |
| 33 | DI_T | Num | 8 | F11. | Diabetes treatment: diet only | |
| 34 | OAD | Num | 8 | F11. | Oral antidiabetics | |
| 35 | INS | Num | 8 | F11. | Insulin | |
| 36 | OAD_INS | Num | 8 | F11. | Oral antidiabetics + insulin | |
| 37 | ANG_PEC | Num | 8 | F11. | Angina pectoris | |
| 38 | MCI | Num | 8 | F11. | Myocardial infarction | |
| 39 | INSULT | Num | 8 | F11. | Insult | |
| 40 | ANGIO | Num | 8 | F11. | Angiography done | |
| 41 | PAVK | Num | 8 | F11. | Peripheral vascular disease (PVD) | |
| 42 | GEF___OP | Num | 8 | F11. | Surgery for PVD | |
| 43 | NP_MED | Num | 8 | F11. | Concomitant medications: neuropathy | |
| 44 | FETTSOFF | Num | 8 | F11. | Concomitant medications: lipid lowering agents | |
| 45 | RR_MED | Num | 8 | F11. | Concomitant medications: antihypertensives | |
| 46 | NIK_NIE | Num | 8 | NIK_NIE. | Never smoked cigarettes | |
| 47 | NIK_DZT | Num | 8 | NIK_DZT. | Active cigarette smoking | |
| 48 | NIK_JA | Num | 8 | NIK_JA. | Ever smoked cigarettes (former a/o active smokers) | |
| 49 | NIK_JAHR | Num | 8 | F11. | Duration of smoking, years | |
| 50 | NIK_MENG | Num | 8 | F11. | Average packs of cigarettes smoked daily | |
| 51 | ALK_NEIN | Num | 8 | ALK_NEI. | Never drunk alcohol | |
| 52 | ALK_GELE | Num | 8 | ALK_GEL. | Alcohol drinking: seldom | |
| 53 | ALK_TGL | Num | 8 | ALK_TGL. | Daily alcohol intake | |
| 54 | ALK_JAHR | Num | 8 | F11. | Duration of alcohol intake, years | |
| 55 | ALK_MENG | Num | 8 | F11. | Daily amount of alcohol intake, grams | |
| 56 | BERUF | Num | 8 | F11. | Bodily activities due to profession, Code 1 = inactive (sitting) to 3 = heavy worker | |
| 57 | SPORT_4 | Num | 8 | F11. | Bodily activities by sports; 0 = no sports, 4 = intensive | |
| 58 | SPORT_2 | Num | 8 | F11. | Bodily activities, binary coded | |
| 59 | HBA1C | Num | 8 | F12.11 | HbA1c, % | |
| 60 | KREA | Num | 8 | F13.12 | Creatinine, umol/l | |
| 61 | CHOL | Num | 8 | F11. | Cholesterol, mg/dl | |
| 62 | HDL | Num | 8 | F11. | HDL-Cholesterol, mg/dl | |
| 63 | TG | Num | 8 | F11. | Triglycerides, mg/dl | |
| 64 | EW | Num | 8 | F11. | Proteinuria | |
| 65 | HAZE_RE | Num | 8 | F11. | Hammer toe right | |
| 66 | HAZE_LI | Num | 8 | F11. | Hammer toe left | |
| 67 | HAZE | Num | 8 | F11. | Hammer toe right or left | |
| 68 | DEFORMIT | Num | 8 | F11. | Foot deformities, summary of hohlfuus, senkfuss, spreizfuss, hallux valgus | |
| 69 | HOHLFUSS | Num | 8 | F11. | Pes cavus | |
| 70 | SENKFUSS | Num | 8 | F11. | Flatfoot | |
| 71 | SPREIZFU | Num | 8 | F11. | splayfoot | |
| 72 | HAL_LEIC | Num | 8 | F11. | Hallux valgus deformity, mild | |
| 73 | HAL_SCHW | Num | 8 | F11. | Hallux valgus deformity, severe | |
| 74 | HALLUX | Num | 8 | F11. | Hallux valgus: combined (mild a/o severe) | |
| 75 | STRA_ENS | Num | 8 | F11. | Oxford type shoes | |
| 76 | SPORTSCH | Num | 8 | F11. | Gymnastic/sport shoes | |
| 77 | ORTHOP_S | Num | 8 | F11. | Orthopaedic/diabetic shoes | |
| 78 | EINL_STD | Num | 8 | F11. | Insoles, standard (hard cover, hard inlay) | |
| 79 | EINL_GEI | Num | 8 | F11. | Orthepedic/diabetes insoles | |
| 80 | EINL_SEI | Num | 8 | F11.1 | Orthepedic/diabetes insoles | |
| 81 | _DE | Num | 8 | F11. | Edeme lower extremities, summary | |
| 82 | O_R_SCHW | Num | 8 | F11. | Oedema right foot, mild | |
| 83 | O_R_STAR | Num | 8 | F11. | Oedema right foot, severe | |
| 84 | O_L_SCHW | Num | 8 | F11. | Oedema left foot mild | |
| 85 | O_L_STAR | Num | 8 | F11. | Oedema left foot severe | |
| 86 | VAR | Num | 8 | F11. | Varicositas, summary | |
| 87 | VAR_RE | Num | 8 | F11. | Varicositas right | |
| 88 | VAR_LI | Num | 8 | F11. | Varicositas left | |
| 89 | VAR_OP | Num | 8 | F11. | Surgery for varicositas | |
| 90 | HYP | Num | 8 | HYP. | Hyperkeratosis, summary | |
| 91 | HYP_VORF | Num | 8 | HYP_VOR. | Hyperkeratosis, forefoot, summary | |
| 92 | H_R_D1 | Num | 8 | H_R_D1 A. | Hyperkeratosis, right, digit 1 | |
| 93 | H_R_D25 | Num | 8 | H_R_D25 A. | Hyperkeratosis right Digits 2–5 | |
| 94 | H_R_M1 | Num | 8 | H_R_M1 A. | Hyperkeratosis Right metatarsal head 1 | |
| 95 | H_R_M25 | Num | 8 | H_R_M25 A. | Hyperkeratosis right Metatarsal heads 2–5 | |
| 96 | H_RE_FE | Num | 8 | H_RE_FE. | Hyperkeratosis Right heel (plantar) | |
| 97 | H_L_D1 | Num | 8 | H_L_D1 A. | Hyperkeratosis, left, digit 1 | |
| 98 | H_L_D25 | Num | 8 | H_L_D25 A. | Hyperkeratosis left Digits 2–5 | |
| 99 | H_L_M1 | Num | 8 | H_L_M1 A. | Hyperkeratosis left metatarsal head 1 | |
| 100 | H_L_M25 | Num | 8 | H_L_M25 A. | Hyperkeratosis left Metatarsal heads 2–5 | |
| 101 | H_L_FE | Num | 8 | H_L_FE. | Hyperkeratosis left heel (plantar) | |
| 102 | ULK | Num | 8 | F11. | Ulceration, summary | |
| 103 | U_R_D1 | Num | 8 | F11. | Locations as described under hyperkeratosis | |
| 104 | U_R_D25 | Num | 8 | F11. | Ulcer, right, digit 1 | |
| 105 | U_R_M1 | Num | 8 | F11. | Ulcer, right Digits 2–5 | |
| 106 | U_R_M25 | Num | 8 | F11. | Ulcer, right metatarsal head 1 | |
| 107 | U_R_FE | Num | 8 | F11. | Ulcer, right Metatarsal heads 2–5 | |
| 108 | U_L_D1 | Num | 8 | F11. | Ulcer, right heel (plantar) | |
| 109 | U_L_D25 | Num | 8 | F11. | Ulcer, left, digit 1 | |
| 110 | U_L_M1 | Num | 8 | F11. | Ulcer,left Digits 2–5 | |
| 111 | U_L_M25 | Num | 8 | F11. | Ulcer,left metatarsal head 1 | |
| 112 | U_L_FE | Num | 8 | F11. | Ulcer,left Metatarsal heads 2–5 | |
| 113 | AMP | Num | 8 | F11. | Amputation of lower extremities | |
| 114 | USG_R_FR | Num | 8 | USG_R_F. | Ankle mobility unrestricted, right | |
| 115 | USG_R_VE | Num | 8 | USG_R_V. | Reduced mobility | |
| 116 | USG_R_FI | Num | 8 | USG_R_1 A. | Joint fixation (no mobility) | |
| 117 | USG_L_FR | Num | 8 | USG_L_F. | For left ankle | |
| 118 | USG_L_VE | Num | 8 | USG_L_V. | Ankle mobility unrestricted, left | |
| 119 | USG_L_FI | Num | 8 | USG_L_1 A. | Reduced mobility, left | |
| 120 | LJM | Num | 8 | LJM. | Limited joint mobility, summary | |
| 121 | GEPFLEGT | Num | 8 | F11. | Good Foot care | |
| 122 | UNGEPFLE | Num | 8 | F11. | Bad foot care | |
| 123 | PATIENT | Num | 8 | F11. | Foot care done by patient | |
| 124 | FU_PFLEG | Num | 8 | F11. | Foot care done professionally | |
| 125 | NP_BESCH | Num | 8 | NP_BESC. | Symptoms of peripheral neuropathy, summary | |
| 126 | TAUB | Num | 8 | F11. | Numbness | |
| 127 | BURNING | Num | 8 | F11. | Burning | |
| 128 | SCHMERZE | Num | 8 | F11. | Pain | |
| 129 | BEI_RUHE | Num | 8 | F11. | Pain during resting | |
| 130 | HAUT_NOR | Num | 8 | F11. | Normal skin | |
| 131 | HAUT_TRO | Num | 8 | F11. | Dry skin | |
| 132 | HAUT_HAA | Num | 8 | F11. | Hairless skin | |
| 133 | ATROPHIE | Num | 8 | F11. | Atrophic skin | |
| 134 | MF_PATH | Num | 8 | MF_PATH. | Abnormal monofilament test | |
| 135 | D_R_D1 | Num | 8 | F11. | Plantar pressure right digit 1, kPa | |
| 136 | D_R_D25 | Num | 8 | F11. | Plantar pressure – right digits 2–5 | |
| 137 | D_R_M1 | Num | 8 | F11. | Plantar pressure, right metatarsal head 1 | |
| 138 | D_R_M25 | Num | 8 | F11. | Plantar pressure, right metatarsal heads 2–5 | |
| 139 | D_R_MF | Num | 8 | F11. | Plantar pressure – MF??? | |
| 140 | D_R_FE | Num | 8 | F11. | Plantar pressure, right heel (plantar) | |
| 141 | D_L_D1 | Num | 8 | F11. | Plantar pressure left digit 1, kPa | |
| 142 | D_L_D25 | Num | 8 | F11. | Plantar pressure – left digits 2–5 | |
| 143 | D_L_M1 | Num | 8 | F11. | Plantar pressure, left metatarsal head | |
| 144 | D_L_M25 | Num | 8 | F11. | Plantar pressure, left metatarsal heads 2–5 | |
| 145 | D_L_MF | Num | 8 | F11. | Plantar pressure – MF??? | |
| 146 | D_L_FE | Num | 8 | F11. | Plantar pressure, left heel (plantar) | |
| 147 | D_DIG1 | Num | 8 | F11. | Plantar pressure, mean value left and right foot – digit 1, kPa | |
| 148 | D_DIG25 | Num | 8 | F11.1 | Plantar pressure, mean value left and right foot – digits 2–5 | |
| 149 | D_MTK1 | Num | 8 | F11. | Plantar pressure, mean value left and right foot – metatarsal heads 1 | |
| 150 | D_MTK25 | Num | 8 | F11.1 | Plantar pressure, mean value left and right foot – right metatarsal heads 2–5 | |
| 151 | D_MF | Num | 8 | F11.1 | Plantar pressure, mean value left and right foot - | |
| 152 | D_FE | Num | 8 | F11. | Plantar pressure, mean value left and right foot – heel (plantar) | |
| 153 | D1_TRANS | Num | 8 | F13.12 | Transformed values of plantar pressure for digits 1 | |
| 154 | D2_TRANS | Num | 8 | F13.12 | Transformed values of plantar pressure for digits 2 | |
| 155 | M1_TRANS | Num | 8 | F13.12 | For metatarsal heads 1 | |
| 156 | M2_TRANS | Num | 8 | F13.12 | For metatarsal heads 2 | |
| 157 | MW_TRANS | Num | 8 | F13.12 | For metatarsal heads 3 | |
| 158 | T_R_D1 | Num | 8 | F11. | Time (gait speed), right digit 1, ms | |
| 159 | T_R_D25 | Num | 8 | F11. | Time (gait speed), right digit – Digits 2–5 | |
| 160 | T_R_M1 | Num | 8 | F11. | Time (gait speed), right digit – metatarsal head 1 | |
| 161 | T_R_M25 | Num | 8 | F11. | Time (gait speed), right digit – right metatarsal heads 2–5 | |
| 162 | T_R_MF | Num | 8 | F11. | Time (gait speed), right digit | |
| 163 | T_R_FE | Num | 8 | F11. | Time (gait speed), right digi – right heel (plantar) | |
| 164 | T_L_D1 | Num | 8 | F11. | Time (gait speed), left digit 1, ms | |
| 165 | T_L_D25 | Num | 8 | F11. | Time (gait speed), left digit – digits 2–5 | |
| 166 | T_L_M1 | Num | 8 | F11. | Time (gait speed), left digit – metatarsal heads 1 | |
| 167 | T_L_M25 | Num | 8 | F11. | Time (gait speed), left digit – right metatarsal heads 2–5 | |
| 168 | T_L_MF | Num | 8 | F11. | Time (gait speed), left digit | |
| 169 | T_L_FE | Num | 8 | F11. | Time (gait speed), left digit–right heel (plantar) | |
| 170 | PT_R_D1 | Num | 8 | F11. | Pressure–time integral, right foot, digit 1 | |
| 171 | PT_R_D25 | Num | 8 | F11. | Pressure–time integral, digits 2–5 | |
| 172 | PT_R_M1 | Num | 8 | F11. | Pressure–time integral, right metatarsal head 1 | |
| 173 | PT_R_M25 | Num | 8 | F11. | Pressure–time integral, metatarsal heads 2–5 | |
| 174 | PT_R_MF | Num | 8 | F11. | Pressure–time integral | |
| 175 | PT_R_FE | Num | 8 | F11. | Pressure–time integral, right heel (plantar) | |
| 176 | PT_L_D1 | Num | 8 | F11. | Pressure–time integral, left foot, digit 1 | |
| 177 | PT_L_D25 | Num | 8 | F11. | Pressure–time integral left, digits 2–5 | |
| 178 | PT_L_M1 | Num | 8 | F11. | Pressure–time integral left, metatarsal head 1 | |
| 179 | PT_L_M25 | Num | 8 | F11. | Pressure–time integral left, metatarsal heads 2–5 | |
| 180 | PT_L_MF | Num | 8 | F11. | Pressure–time integral, left | |
| 181 | PT_L_FE | Num | 8 | F11. | Pressure–time integral, left heel (plantar) | |
| 182 | KN__RE | Num | 8 | F11. | Blood pressure ankle, right | |
| 183 | ARM_RE | Num | 8 | F11. | Blood pressure arm right | |
| 184 | KAI_RE | Num | 8 | F11. | Ankle–arm index (AAI) right | |
| 185 | KN__LI | Num | 8 | F11. | Blood pressure ankle, left | |
| 186 | ARM_LI | Num | 8 | F11. | Blood pressure arm left | |
| 187 | KAI_LI | Num | 8 | F11. | AAI, left | |
| 188 | KAI | Num | 8 | F11. | Mean value of left + right AAI | |
| 189 | VIS_RE | Num | 8 | F13.12 | Visus right eye | |
| 190 | VIS_RE_B | Num | 8 | F11. | VIS_RE_B | |
| 191 | VIS_LI | Num | 8 | F13.12 | Visus left eye | |
| 192 | VIS_LI_B | Num | 8 | F11. | VIS_LI_B | |
| 193 | VIS_0_5 | Num | 8 | F11. | VIS_0_5 | |
| 194 | RETINO_R | Char | 22 | $22. | $22. | Diabetic retinopathy, right (Airlie house scale) |
| 195 | RETINO_L | Char | 22 | $22. | $22. | Left |
| 196 | DRP | Num | 8 | F11. | Diabetic retinopathy, summary as binary variable | |
| 197 | NLG | Num | 8 | F13.12 | Peroneal nerve conduction velocity, ms–1 | |
| 198 | STADIUM | Num | 8 | F11. | Staging of peron. NCV | |
| 199 | NLG_OB | Num | 8 | F11. | pNCV normal | |
| 200 | NLG_PATH | Num | 8 | F11. | pNCV abnormal | |
| 201 | NLG_NM | Num | 8 | F11. | pNCV not done | |
| 202 | VPT_RE | Num | 8 | F11. | Vibration perception threshold right, volts | |
| 203 | VPT_LI | Num | 8 | F11. | VPT left | |
| 204 | VPT_DIG1 | Num | 8 | F11. | Mean value of VPT left + right | |
| 205 | VPT_OB | Num | 8 | VPT_OB. | VPT normal | |
| 206 | VPT_PAT | Num | 8 | VPT_PAT. | VPT abnormal (other criteria used than 25 volts) | |
| 207 | VK | Num | 8 | F13.12 | VK, EI, MCR, VAL: measures of autonomic neuropathy; VK = variation coefficient during resting, % | |
| 208 | VK_GW | Num | 8 | F13.12 | Limiting values of VK (healthy population) | |
| 209 | VK_A | Num | 8 | F11. | VK in per cent of healthy population | |
| 210 | EI | Num | 8 | F13.12 | Expiration–inspiration ratio (during deep breathing) | |
| 211 | EI_GW | Num | 8 | F13.12 | EI_GW | |
| 212 | EI_A | Num | 8 | F11. | EI_A | |
| 213 | MCR | Num | 8 | F13.12 | Mean circular resultant (during deep breathing) | |
| 214 | MCR_GW | Num | 8 | F12.11 | MCR_GW | |
| 215 | MCR_A | Num | 8 | F11. | MCR_A | |
| 216 | VAL | Num | 8 | F13.12 | Valsalva test | |
| 217 | VAL_GW | Num | 8 | F13.12 | VAL_GW | |
| 218 | VAL_A | Num | 8 | F11. | VAL_A | |
| 219 | PSC_OB | Num | 8 | F11. | PSC = ProSciCard (Name of maschine); PSC ob = normal = no autonimoc neuropathy | |
| 220 | PSC_BL | Num | 8 | F11. | Borderline ANP | |
| 221 | PSC_PAT | Num | 8 | F11. | Abnormal ANP testing | |
| 222 | PSC_NM | Num | 8 | F11. | ANP tests not done | |
| 223 | RRSYS_LI | Num | 8 | F11. | BP systolic, lying, mmHg | |
| 224 | RRDIA_LI | Num | 8 | F11. | BP diastolic, lying | |
| 225 | RRSYS_ST | Num | 8 | F11. | Standing syst | |
| 226 | RRDIA_ST | Num | 8 | F11. | Standing diast | |
| 227 | DROPRRSY | Num | 8 | F11. | Drop of BP after standing-up, mmHg | |
| 228 | DROP_20 | Num | 8 | F11. | Drop of BP > 20 mmHg | |
| 229 | ORTHO_OB | Num | 8 | F11. | Orthostatic hypertension test normal | |
| 230 | ORTHO_BL | Num | 8 | F11. | Borderline | |
| 231 | ORTHO_PA | Num | 8 | F11. | Abnormal orthostatic hypertension test | |
| 232 | R__PATH | Num | 8 | F11. | X-ray abnormal | |
| 233 | MEDIASKL | Num | 8 | F11. | Mediasclerosis | |
| 234 | SKELETTA | Num | 8 | F11. | Skeletal abnormalities (X-ray) | |
| 235 | OSTEOLYS | Num | 8 | F11. | Signs of osteolysis | |
Pham et al.73
| Data set name | IPDDFU.PHAM | Observations | 496 |
| Member type | DATA | Variables | 45 |
| Engine | V9 | Indexes | 0 |
| Variables in creation order | ||||||
|---|---|---|---|---|---|---|
| # | Variable | Type | Len | Format | Informat | Label |
| 1 | Study___0 | Char | 5 | $5. | $5. | Study number |
| 2 | Centre_0 | Num | 8 | F11. | Study group – 3 centres | |
| 3 | Age | Num | 8 | F11. | Age continuous variable | |
| 4 | Sex | Num | 8 | SEXA. | Sex | |
| 5 | National | Num | 8 | NATIONA. | Racial origin | |
| 6 | DM | Num | 8 | DM. | Diabetes type I/II | |
| 7 | Dur_DM | Num | 8 | F11. | Duration of diabetes (months) | |
| 8 | Weight | Num | 8 | F11. | Weight (kg) | |
| 9 | Height | Num | 8 | F11.1 | Height (m) | |
| 10 | BMI | Num | 8 | F11.4 | BMI | |
| 11 | F_Hx | Num | 8 | F_HX. | Previous foot problems | |
| 12 | Ulc_Hx | Num | 8 | ULC_HX. | Ulcer history | |
| 13 | Renal | Num | 8 | RENAL. | Nephropathy | |
| 14 | Retina | Num | 8 | RETINA. | Retinopathy | |
| 15 | PVD | Num | 8 | PVD. | Peripheral vascular disease | |
| 16 | Smoking | Num | 8 | F11. | Smoking (yes), number of pack-years | |
| 17 | Alcohol | Num | 8 | F11. | Alcohol (units per week) | |
| 18 | FCK | Num | 8 | F11. | Foot care knowledge (see paper and data dictionary for details) | |
| 19 | NSS | Num | 8 | F11.2 | Neuropathy symptom score (modified). NSS > 3 considered abnormal | |
| 20 | NDS | Num | 8 | F11. | Neuropathy Disability Score. NDS > 5 existence of moderate or severe neuropathy | |
| 21 | VPT | Num | 8 | F11. | Vibration perception threshold (biothesiometer). Mean of 3 readings. > 25 V risk of foot ulceration | |
| 22 | SWF | Num | 8 | F11. | Semmes Weinstein monofilament. Inability to feel 5.07SWF indicative of high risk of foot ulceration | |
| 23 | Arteries | Num | 8 | ARTERIE. | Foot pulses | |
| 24 | _1_MTH_mo | Num | 8 | F11. | Joint mobility – 1st month | |
| 25 | Subtalar | Num | 8 | F11. | Joint mobility – subtalar | |
| 26 | Force | Num | 8 | F11.8 | Force that the foot hits the ground when walk | |
| 27 | P_Rear | Num | 8 | F11.9 | Pressure – foot rear | |
| 28 | P_Fore | Num | 8 | F11.9 | Pressure – foot fore | |
| 29 | P_Max | Num | 8 | F11.9 | F-Scan, max plantar foot pressure. Mean reading of three midgait footsteps. Foot pressure > 6 kg/cm high risk. continuous? 1.5 –3.67 | |
| 30 | Ulcer_0 | Num | 8 | ULCER_0 A. | Develop ulcer during study (prospective) | |
| 31 | Loc_0 | Num | 8 | LOC_0 A. | Location of the ulcer | |
| 32 | Month_0 | Num | 8 | F11. | The month that they developed the ulcer | |
| 33 | Live | Num | 8 | LIVE. | Alive or dead at the end of the study – refers to feet | |
| 34 | Entry | Num | 8 | MMDDYY10. | Date of entry to study | |
| 35 | Followup | Num | 8 | F11. | Follow-up (in months) | |
| 36 | Persons_ulcers | Num | 8 | PERSONS. | Development of ulcer in the two feet (one person) | |
| 37 | NDS_H | Num | 8 | NDS_H. | NDS high (> 5) | |
| 38 | VPT_H | Num | 8 | VPT_H. | VPT high (> 25 V risk of foot ulceration) | |
| 39 | SWF_H | Num | 8 | SWF_H. | SWF high (inability to feel 5.07swf) | |
| 40 | Pres_H | Num | 8 | PRES_H. | Foot pressure high (> 6 kg/cm) | |
| 41 | nd_vpt | Num | 8 | ND_VPT. | High NDS (> 5) and high VPT (> 25 V) | |
| 42 | nd_sw | Num | 8 | ND_SW. | High NDS (> 5) and high SWF (5.07 swf) | |
| 43 | vpt_sw | Num | 8 | VPT_SW. | VPT high (> 25 V) and high SWF (5.07 swf) | |
| 44 | Smokoing | Num | 8 | SMOKOIN. | Smoking history | |
| 45 | Live_persons | Num | 8 | LIVE_PE. | Alive or dead at the end of the study – refers to persons | |
Rith-Najarian et al.74
| Data set name | IPDDFU.RITHNAJARIAN | Observations | 358 |
| Member type | DATA | Variables | 43 |
| Engine | V9 | Indexes | 0 |
| Variables in creation order | ||||||
|---|---|---|---|---|---|---|
| # | Variable | Type | Len | Format | Informat | Label |
| 1 | RECORD | Num | 8 | F11. | RECORD | |
| 2 | DOB | Char | 10 | $10. | $10. | DOB |
| 3 | DODX | Char | 10 | $10. | $10. | DODX |
| 4 | SEX | Num | 8 | F11. | SEX | |
| 5 | DINEX | Char | 10 | $10. | $10. | DINEX |
| 6 | IEBBP | Num | 8 | F11. | IEBBP | |
| 7 | IERABP | Num | 8 | F11. | IERABP | |
| 8 | IELABP | Num | 8 | F11. | IELABP | |
| 9 | IERABI | Num | 8 | F11.2 | IERABI | |
| 10 | IELABI | Num | 8 | F11.2 | IELABI | |
| 11 | IERD | Num | 8 | F11. | IERD | |
| 12 | IELD | Num | 8 | F11. | IELD | |
| 13 | IERS | Num | 8 | F11. | IERS | |
| 14 | IELS | Num | 8 | F11. | IELS | |
| 15 | IGRADE | Num | 8 | F11. | IGRADE | |
| 16 | FEDATE | Char | 10 | $10. | $10. | FEDATE |
| 17 | FEBBP | Num | 8 | F11. | FEBBP | |
| 18 | FERABP | Num | 8 | F11. | FERABP | |
| 19 | FELABP | Num | 8 | F11. | FELABP | |
| 20 | FERABI | Num | 8 | F11.2 | FERABI | |
| 21 | FELABI | Num | 8 | F11.2 | FELABI | |
| 22 | FERD | Num | 8 | F11. | FERD | |
| 23 | FELD | Num | 8 | F11. | FELD | |
| 24 | FERS | Num | 8 | F11. | FERS | |
| 25 | FELS | Num | 8 | F11. | FELS | |
| 26 | FGRADE | Num | 8 | F8.2 | FGRADE | |
| 27 | AUHX | Num | 8 | F11. | AUHX | |
| 28 | AU1DATE | Char | 10 | $10. | $10. | AU1DATE |
| 29 | AU1SIDE | Num | 8 | F11. | AU1SIDE | |
| 30 | AU1TYPE | Num | 8 | F11. | AU1TYPE | |
| 31 | AU2DATE | Char | 10 | $10. | $10. | AU2DATE |
| 32 | AU2SIDE | Num | 8 | F11. | AU2SIDE | |
| 33 | AU2TYPE | Num | 8 | F11. | AU2TYPE | |
| 34 | AU3DATE | Char | 10 | $10. | $10. | AU3DATE |
| 35 | AU3SIDE | Num | 8 | F11. | AU3SIDE | |
| 36 | AU3TYPE | Num | 8 | F11. | AU3TYPE | |
| 37 | DEATH | Num | 8 | F11. | DEATH | |
| 38 | INACDATE | Num | 8 | F11. | INACDATE | |
| 39 | DURDM | Num | 8 | F11.2 | DURDM | |
| 40 | STARTDATE | Char | 10 | $10. | $10. | STARTDATE |
| 41 | ENDDATE | Char | 10 | $10. | $10. | ENDDATE |
| 42 | PRSNYRS | Num | 8 | F11.2 | PRSNYRS | |
| 43 | AGE | Num | 8 | F11.2 | AGE | |
Young et al.75
| Data set name | IPDDFU.YOUNG | Observations | 598 |
| Member type | DATA | Variables | 32 |
| Engine | V9 | Indexes | 0 |
| Variables in creation order | ||||||
|---|---|---|---|---|---|---|
| # | Variable | Type | Len | Format | Informat | Label |
| 1 | IDNo | Num | 8 | F8. | ID number | |
| 2 | VPT | Num | 8 | VPT. | VPT group (average of three readings) | |
| 3 | HospitalNo | Num | 8 | F8. | Hospital No [F003] | |
| 4 | Treatmentgroup | Char | 12 | $12. | $12. | Treatment group [F004] Diagnosis of diabetes |
| 5 | Diagnosisgroupcode | Num | 8 | DIAGNOS. | Diagnosis group code [F005] Type I or II diabetes | |
| 6 | DOB | Char | 10 | $10. | $10. | Date of birth [F006] |
| 7 | Sex | Char | 1 | $1. | $1. | Sex [F007] |
| 8 | Dateof1stvisit | Num | 8 | DATE9. | Date of 1st visit [F009] – First visit to diabetes clinic | |
| 9 | Dateofdiagnosis | Num | 8 | DATE9. | Date of diagnosis [F010] – diagnosis of diabetes | |
| 10 | Height | Num | 8 | F8.2 | Height (cm) [F010] | |
| 11 | Alcoholunitswk | Num | 8 | F8.2 | Alcohol (units/wk) [F011] | |
| 12 | Agestartedsmoking | Num | 8 | F8.2 | Age started smoking [F012] | |
| 13 | Agestoppedsmoking | Num | 8 | F8.2 | Age stopped smoking [F013] | |
| 14 | Max_cigarettesperday | Num | 8 | F8.2 | Max. cigarettes per day [F014] | |
| 15 | Footdate | Num | 8 | DATE9. | Date of foot screening [F015] MY cannot remember what this is | |
| 16 | Vib_perc_01 | Num | 8 | F8.2 | Vib.perc. [01] [F016] LEFT | |
| 17 | APIratio01 | Num | 8 | F8.2 | API ratio [01] [F017] LEFT | |
| 18 | FootpulsesL | Num | 8 | FOOTPUL. | Foot pulses L [F018] LEFT | |
| 19 | Vib_perc_02 | Num | 8 | F8.2 | Vib.perc. [02] [F019] RIGHT | |
| 20 | APIratio02 | Num | 8 | F8.2 | API ratio [02] [F020] RIGHT | |
| 21 | FootpulsesR | Num | 8 | FOOTPU1 A. | Foot pulses R [F021] RIGHT | |
| 22 | Previousfootulcer | Char | 4 | $4. | $4. | Previous foot ulcer [F022] |
| 23 | Weight | Num | 8 | F8.2 | Weight [F023] | |
| 24 | HbA1c_first | Num | 8 | F6.1 | HbA1c first reading | |
| 25 | Creatinine_first | Num | 8 | F4.1 | Creatinine first reading | |
| 26 | ulcer | Num | 8 | ULCER. | New ulcer | |
| 27 | Height2 | Num | 8 | F8.2 | Height (m) | |
| 28 | BMI | Num | 8 | F8.2 | BMI | |
| 29 | Death | Num | 8 | DEATH. | Death | |
| 30 | Footulcerdate | Num | 8 | DATE9. | Date foot ulcer diagnosed | |
| 31 | VPT_Left | Num | 8 | VPT_LEF. | VPT left | |
| 32 | VPT_Right | Num | 8 | VPT_RIG. | VPT right | |
Monami et al.72
| Data set name | IPDDFU.MONAMI | Observations | 1945 |
| Member Type | DATA | Variables | 59 |
| Engine | V9 | Indexes | 0 |
| Variables in creation order | ||||||
|---|---|---|---|---|---|---|
| # | Variable | Type | Len | Format | Informat | Label |
| 1 | n | Num | 8 | F11. | Patient ID number | |
| 2 | Dateofbirth | Num | 8 | DATE9. | Date of birth | |
| 3 | Gender | Char | 6 | $6. | $6. | Gender |
| 4 | Diabetesonset | Num | 8 | DATE9. | Diabetes onset | |
| 5 | Durationofdiabetes | Num | 8 | F11.5 | Duration of diabetes | |
| 6 | Typeofdiabetes | Char | 1 | $1. | $1. | Type of diabetes |
| 7 | Firstvisit | Num | 8 | DATE9. | Date of first visit | |
| 8 | Age | Num | 8 | F13.12 | Age | |
| 9 | Previousfootulcer | Num | 8 | PREVIOU. | Have they had a previous foot ulcer | |
| 10 | Nonmetastaticcancer | Num | 8 | NONMETA. | Have they had Nonmetastatic cancer | |
| 11 | Metatstaticcancer | Num | 8 | METATST. | Have they had Metatstatic cancer | |
| 12 | Neuropathy | Num | 8 | NEUROPA. | Do they have Neuropathy | |
| 13 | Retinopathy | Num | 8 | RETINOP. | Do they have Retinopathy | |
| 14 | Microalbuminuria_ | Num | 8 | MICROAL. | Microalbuminuriaù -If they have at least 2 values > 20 µg/min | |
| 15 | Ischemicheartdisease | Num | 8 | ISCHEMI. | Do they have Ischaemic heart disease | |
| 16 | StrokeTIA | Num | 8 | STROKET. | Have they had Stroke/Transient Ishemic Attack | |
| 17 | Renalfailure | Num | 8 | RENALFA. | Do they have Renal failure | |
| 18 | COPD | Num | 8 | COPD. | Do they have COPD | |
| 19 | NAFLD | Num | 8 | NAFLD. | Do they have Non-alcholic fatty liver disease | |
| 20 | Liverfailure | Num | 8 | LIVERFA. | Do they have Liver failure | |
| 21 | SystolicBP | Num | 8 | F11. | Systolic BP | |
| 22 | DiastolicBP | Num | 8 | F11. | Diastolic BP | |
| 23 | HbA1c | Num | 8 | F11. | HbA1c – one reading | |
| 24 | Uricacid | Num | 8 | F11. | Uric acid – blood sample. The amount of uric acid in a blood sample | |
| 25 | AST | Num | 8 | F11. | AST-Liver enzyme, blood sample | |
| 26 | ALT | Num | 8 | F11. | ALT--Liver enzyme, blood sample | |
| 27 | gammaGT | Num | 8 | F11. | gammaGT-Liver enzyme, blood sample | |
| 28 | HBV | Num | 8 | F11. | If they have Hepatitis B | |
| 29 | HCV | Num | 8 | F11. | If they have Hepatitis C | |
| 30 | BMI | Num | 8 | F11.2 | BMI | |
| 31 | Waistcircumference | Num | 8 | F11. | Waist circumference | |
| 32 | Totalcholesterol | Num | 8 | F11. | Total cholesterol | |
| 33 | HDLCholesterol | Num | 8 | F11. | HDL Cholesterol | |
| 34 | Trigliceryde | Num | 8 | F11. | Trigliceryde – One reading. Sample collected during the first visit | |
| 35 | Glibenclamide | Num | 8 | F11. | Glibenclamide- A glucose-lowering agent (sulfonylurea) | |
| 36 | Dose | Num | 8 | F11. | Dose mg*day | |
| 37 | Gliclazide | Num | 8 | F11. | Gliclazide – a glucose-lowering agent (sulfonylurea) | |
| 38 | Dose_A | Num | 8 | F11. | Dose mg*day | |
| 39 | Metformin | Num | 8 | F11. | Metformin – a glucose-lowering agent (biguanide) | |
| 40 | Dose_B | Num | 8 | F11. | Dose mg*day | |
| 41 | Glimepiride | Num | 8 | F11. | Glimepiride – a glucose-lowering agent (sulfonylurea) | |
| 42 | Dose_C | Num | 8 | F11. | Dose mg*day | |
| 43 | Repaglinide | Num | 8 | F11. | Repaglinide a glucose-lowering agent (insulin secreatagogue) | |
| 44 | Dose_D | Num | 8 | F11. | Dose mg*day | |
| 45 | OtherSus | Num | 8 | F11. | Other Sus – Sus means sulfonylureas other than the others (glibenclamide, glimeppiride etc..) mg*day | |
| 46 | Phenformin | Num | 8 | F11. | Phenformin – a glucose-lowering agent (biguanide) mg*day | |
| 47 | Thiazolidinediones | Num | 8 | F11. | Thiazolidinediones – a glucose-lowering agent (pioglitazone or rosiglitazone, we did not specify what molecule was prescribed to the patient) | |
| 48 | Acarbose | Num | 8 | F11. | Acarbose – a glucose-lowering agent (alfa-glucosidase inhibitor) | |
| 49 | Insulin | Num | 8 | INSULINA. | Insulin use | |
| 50 | Statin | Num | 8 | STATIN. | Statin use | |
| 51 | Antiaggregantsanticoagulants | Num | 8 | ANTIAGG. | Antiaggregants/anticoagulants use | |
| 52 | Antihypertensives | Num | 8 | ANTIHYPA. | Antihypertensives use | |
| 53 | Death | Num | 8 | DEATH. | Death (ICD codes) | |
| 54 | Causeofdeath | Char | 4 | $4. | $4. | Cause of death |
| 55 | DateofdeathorendofFU31_12_2005 | Num | 8 | DATE9. | Date of death or end of FU (31.12.2005) | |
| 56 | Timetodeathdays | Num | 8 | F11. | Time to death (days) | |
| 57 | Incidentulcer | Num | 8 | INCIDEN. | Incident ulcer | |
| 58 | Dateofulceronset | Num | 8 | DATE9. | Date of ulcer onset | |
| 59 | Timetoulcer | Num | 8 | F11. | Time to ulcer (days) | |
Monami (additional data set)
| Data set name | WORK.MONAMI_MORE | Observations | 1945 |
| Member type | DATA | Variables | 61 |
| Engine | V9 | Indexes | 0 |
| Variables in creation order | ||||||
|---|---|---|---|---|---|---|
| # | Variable | Type | Len | Format | Informat | Label |
| 1 | n | Num | 8 | BEST. | n | |
| 2 | Date_of_birth | Num | 8 | DATE9. | Date of birth | |
| 3 | Gender | Char | 6 | $6. | $6. | Gender |
| 4 | Diabetes_onset | Num | 8 | DATE9. | Diabetes onset | |
| 5 | Duration_of_diabetes | Num | 8 | BEST. | Duration of diabetes | |
| 6 | Type_of_diabetes | Char | 1 | $1. | $1. | Type of diabetes |
| 7 | First_visit | Num | 8 | DATE9. | First visit | |
| 8 | Age | Num | 8 | BEST. | Age | |
| 9 | Previous_foot_ulcer | Num | 8 | BEST. | Previous foot ulcer | |
| 10 | Nonmetastatic_cancer | Num | 8 | BEST. | Nonmetastatic cancer | |
| 11 | Metatstatic_cancer | Num | 8 | BEST. | Metatstatic cancer | |
| 12 | Neuropathy | Num | 8 | BEST. | Neuropathy | |
| 13 | Retinopathy | Num | 8 | BEST. | Retinopathy | |
| 14 | Microalbuminuria_ | Num | 8 | BEST. | Microalbuminuriaù | |
| 15 | Ischaemic_heart_disease | Num | 8 | BEST. | Ischaemic heart disease | |
| 16 | Stroke_TIA | Num | 8 | BEST. | Stroke/TIA | |
| 17 | Renal_failure | Num | 8 | BEST. | Renal failure | |
| 18 | COPD | Num | 8 | BEST. | COPD | |
| 19 | NAFLD | Num | 8 | BEST. | NAFLD | |
| 20 | Liver_failure | Num | 8 | BEST. | Liver failure | |
| 21 | Systolic_BP | Num | 8 | BEST. | Systolic BP | |
| 22 | Diastolic_BP | Num | 8 | BEST. | Diastolic BP | |
| 23 | HbA1c | Num | 8 | BEST. | HbA1c | |
| 24 | Uric_acid | Num | 8 | BEST. | Uric acid | |
| 25 | AST | Num | 8 | BEST. | AST | |
| 26 | ALT | Num | 8 | BEST. | ALT | |
| 27 | gammaGT | Num | 8 | BEST. | gammaGT | |
| 28 | HBV_ | Num | 8 | BEST. | HBV+ | |
| 29 | HCV_ | Num | 8 | BEST. | HCV+ | |
| 30 | BMI | Num | 8 | BEST. | BMI | |
| 31 | Waist_circumference | Num | 8 | BEST. | Waist circumference | |
| 32 | Total_cholesterol | Num | 8 | BEST. | Total cholesterol | |
| 33 | HDL_Cholesterol | Num | 8 | BEST. | HDL Cholesterol | |
| 34 | Trigliceryde | Num | 8 | BEST. | Trigliceryde | |
| 35 | VPT_sx | Num | 8 | BEST. | VPT sx | |
| 36 | VPT_dx | Num | 8 | BEST. | VPT dx | |
| 37 | Glibenclamide | Num | 8 | BEST. | Glibenclamide | |
| 38 | Dose | Num | 8 | BEST. | Dose | |
| 39 | Gliclazide | Num | 8 | BEST. | Gliclazide | |
| 40 | Dose_1 | Num | 8 | BEST. | Dose_1 | |
| 41 | Metformin | Num | 8 | BEST. | Metformin | |
| 42 | Dose_2 | Num | 8 | BEST. | Dose_2 | |
| 43 | Glimepiride | Num | 8 | BEST. | Glimepiride | |
| 44 | Dose_3 | Num | 8 | BEST. | Dose_3 | |
| 45 | Repaglinide | Num | 8 | BEST. | Repaglinide | |
| 46 | Dose_4 | Num | 8 | BEST. | Dose_4 | |
| 47 | Other_Sus | Num | 8 | BEST. | Other Sus | |
| 48 | Phenformin | Num | 8 | BEST. | Phenformin | |
| 49 | Thiazolidinediones | Num | 8 | BEST. | Thiazolidinediones | |
| 50 | Acarbose | Num | 8 | BEST. | Acarbose | |
| 51 | Insulin | Num | 8 | BEST. | Insulin | |
| 52 | Statin | Num | 8 | BEST. | Statin | |
| 53 | Antiaggregants_anticoagulants | Num | 8 | BEST. | Antiaggregants/anticoagulants | |
| 54 | Antihypertensives | Num | 8 | BEST. | Antihypertensives | |
| 55 | Death | Num | 8 | BEST. | Death | |
| 56 | Cause_of_death | Char | 4 | $4. | $4. | Cause of death |
| 57 | Date_of_death_or_end_of_FU__31_1 | Num | 8 | DATE9. | Date of death or end of FU (31.12.2005) | |
| 58 | Time_to_death__days_ | Num | 8 | BEST. | Time to death (days) | |
| 59 | Incident_ulcer | Num | 8 | BEST. | Incident ulcer | |
| 60 | Date_of_ulcer_onset | Num | 8 | DATE9. | Date of ulcer onset | |
| 61 | Time_to_ulcer | Num | 8 | BEST. | Time to ulcer | |
Monteiro-Soares and Dinis-Ribeiro61
| Data Set Name | IPDDFU.MONTEIRO | Observations | 360 |
| Member Type | DATA | Variables | 45 |
| Engine | V9 | Indexes | 0 |
| Variables in Creation Order | |||||
|---|---|---|---|---|---|
| # | Variable | Type | Len | Format | Label |
| 1 | Number | Num | 8 | F8. | Patient ID |
| 2 | EntryDate | Num | 8 | DDMMYY10. | Entry Date |
| 3 | Gender | Num | 8 | GENDER. | Patient Gender |
| 4 | AgeEntry | Num | 8 | F2. | Age at entry |
| 5 | DiabType | Num | 8 | DIABTYP. | Diabetes Type |
| 6 | DiabDur | Num | 8 | F2. | Diabetes Duration (years) |
| 7 | DiabTreat | Num | 8 | DIABTRE. | Diabetes Treatment |
| 8 | HbA1C | Num | 8 | F5.1 | HbA1C |
| 9 | HbA1Ccat | Num | 8 | HBA1CCA. | HbA1C categoric |
| 10 | Retinopathy | Num | 8 | RETINOPA. | Diabetic Retinopathy |
| 11 | Laser | Num | 8 | LASER. | Laser Photocoagulation |
| 12 | MI | Num | 8 | MI. | History of Myocardial Infarction |
| 13 | VCA | Num | 8 | VCA. | History of Vascular Cerebral Accident |
| 14 | Smoking | Num | 8 | SMOKINGA. | Smoking History |
| 15 | Vision | Num | 8 | VISION. | Visual Impairment |
| 16 | Nephropathy | Num | 8 | NEPHROP. | Diabetic Nephropathy |
| 17 | Education | Num | 8 | EDUCATI. | Scholar Degree |
| 18 | Physical | Num | 8 | PHYSICA. | Physical Impairment |
| 19 | PrevUlcer | Num | 8 | PREVULC. | Ulcer History |
| 20 | PrevAmp | Num | 8 | PREVAMP. | Amputation History |
| 21 | Callus | Num | 8 | CALLUS. | Callus |
| 22 | Onychomycosis | Num | 8 | ONYCHOM. | Onychomycosis |
| 23 | TineaPedis | Num | 8 | TINEAPE. | Tinea Pedis |
| 24 | FootDef | Num | 8 | FOOTDEF. | Foot Deformity |
| 25 | FootApMNSI | Num | 8 | FOOTAPM. | Foot Appearance Michigan neuropathy screening instrument (MSNI) |
| 26 | HalluxLimitus | Num | 8 | HALLUXLA. | Hallux Limitus |
| 27 | NailCare | Num | 8 | NAILCAR. | Nail Self Care |
| 28 | Hidratation | Num | 8 | HIDRATA. | Foot Skin Hidratation |
| 29 | Footwear | Num | 8 | FOOTWEAA. | Footwear |
| 30 | PVD | Num | 8 | PVD. | Peripheral Vascular Disease |
| 31 | PVDScore | Num | 8 | F2. | Peripheral Vascular Disease Score |
| 32 | Claudication | Num | 8 | CLAUDICA. | Claudication |
| 33 | Oedema | Num | 8 | OEDEMA. | Oedema |
| 34 | TexasVQ | Num | 8 | TEXASVQ. | DPN University of Texas Verbal Questionnaire |
| 35 | SWM | Num | 8 | SWM. | Semmes-Weinstein Monofilament |
| 36 | TunFork | Num | 8 | TUNFORKA. | Non Graduated Tunning Fork |
| 37 | AchilesRef | Num | 8 | ACHILES. | Achiles Reflex |
| 38 | MNSIScore | Num | 8 | F3.1 | MNSI Score |
| 39 | OriginalModel | Num | 8 | F8.2 | Original model |
| 40 | Risk | Num | 8 | RISK. | Original model stratification |
| 41 | Ulcer | Num | 8 | ULCER. | Ulcer Development |
| 42 | UlcerCause | Num | 8 | ULCERCA. | Cause of Ulceration |
| 43 | DateUlcer | Num | 8 | DDMMYY10. | Date Ulcer Development |
| 44 | LastCons | Num | 8 | DDMMYY10. | Date Last Consult |
| 45 | FollowUp | Num | 8 | F8.2 | Follow-up |
Abbott et al.3
| Data set name | IPDDFU.ABBOTT | Observations | 15692 |
| Member type | DATA | Variables | 91 |
| Engine | V9 | Indexes | 0 |
| Variables in creation order | |||||
|---|---|---|---|---|---|
| # | Variable | Type | Len | Format | Label |
| 1 | Number | Num | 8 | F8. | Order number |
| 2 | random | Num | 8 | F8.2 | random number |
| 3 | uniqueno | Num | 8 | F8.2 | uniqueno |
| 4 | serialno | Num | 8 | F8.2 | serialno |
| 5 | basenum | Num | 8 | F8.2 | basenum |
| 6 | group | Num | 8 | GROUP. | Phase screened |
| 7 | sex | Num | 8 | SEX. | gender |
| 8 | age | Num | 8 | F8.2 | age |
| 9 | age2 | Num | 8 | AGE2 A. | age categories |
| 10 | typediab | Num | 8 | TYPEDIA. | diabetes type |
| 11 | typediabRECODE | Num | 8 | TYPEDI1 A. | Recoded diabetes type |
| 12 | areano1 | Num | 8 | AREANO1 A. | district |
| 13 | ethnic1 | Num | 8 | ETHNIC1 A. | all ethnic groups |
| 14 | ethgrps | Num | 8 | ETHGRPS. | main ethnic groups |
| 15 | ethgrps2 | Num | 8 | ETHGRP1 A. | all others v asians |
| 16 | occup1 | Num | 8 | OCCUP1 A. | occupation groups |
| 17 | alone1a | Num | 8 | ALONE1 A. | live alone |
| 18 | blind1 | Num | 8 | BLIND1 A. | blind |
| 19 | nephrp1a | Num | 8 | NEPHRP1 A. | nephropathy |
| 20 | diabdur1 | Num | 8 | F8.2 | diabetes duration |
| 21 | diabdr1a | Num | 8 | DIABDR1 A. | diabetes duration categories |
| 22 | treat1 | Num | 8 | TREAT1 A. | diabetes treatment |
| 23 | treat2 | Num | 8 | TREAT2 A. | diabetes treatment |
| 24 | trtdur1 | Num | 8 | F8.2 | treatment duration |
| 25 | smoke1 | Num | 8 | SMOKE1 A. | smoking status |
| 26 | smoke2 | Num | 8 | SMOKE2 A. | smoking status |
| 27 | smoke3 | Num | 8 | SMOKE3 A. | current smokers |
| 28 | smoknum1 | Num | 8 | F8.2 | Number cigarettes per day |
| 29 | alcohol1 | Num | 8 | ALCOHOL. | alcohol |
| 30 | alctyp1 | Num | 8 | ALCTYP1 A. | Alcohol type (for those who drink alcohol and go on to specify type) |
| 31 | alcunit1 | Num | 8 | F8.2 | Units per week |
| 32 | amput1 | Num | 8 | AMPUT1 A. | amputation |
| 33 | ulcer1 | Num | 8 | ULCER1 A. | foot ulcer history |
| 34 | ulcer1a | Num | 8 | ULCER11 A. | foot ulcer history Y/N |
| 35 | ulcpres | Num | 8 | F8.2 | present ulcer |
| 36 | ulcdur1 | Num | 8 | F8.2 | ulcdur1 |
| 37 | ulcgrad1 | Num | 8 | ULCGRAD. | Wagner ulcer grades |
| 38 | ulccaus1 | Num | 8 | F8.2 | ulccaus1 |
| 39 | ulcsize1 | Num | 8 | F8.2 | ulcsize1 |
| 40 | prevtt1 | Num | 8 | PREVTT1 A. | Has the patient, with a foot ulcer present, received any previous treatment for their ulcer? |
| 41 | shoesnew | Num | 8 | SHOESNE. | shoe categories |
| 42 | shoes1 | Num | 8 | SHOES1 A. | shoes – risk category |
| 43 | nss1 | Num | 8 | F8.2 | neuropathy symptom score |
| 44 | nss2 | Num | 8 | NSS2 A. | nss categories |
| 45 | nsscateg | Num | 8 | NSSCATE. | NSS categories – none, mild, mod, severe |
| 46 | fds1 | Num | 8 | F8.2 | foot deformity score |
| 47 | fds2 | Num | 8 | FDS2 A. | fds categories |
| 48 | fds3 | Num | 8 | FDS3 A. | foot deformity score |
| 49 | nds1 | Num | 8 | F8.2 | neuropathy disability score |
| 50 | ndsgrps1 | Num | 8 | NDSGRPS. | nds categories |
| 51 | ndsgrps2 | Num | 8 | NDSGRP1 A. | nds categories |
| 52 | ndsgrps3 | Num | 8 | NDSGRP2 A. | nds cut-offs (diff codes) |
| 53 | ndsgrps4 | Num | 8 | NDSGRP3 A. | nds severe category |
| 54 | ndsgrps5 | Num | 8 | NDSGRP4 A. | nds cut-offs 0–3, 4–10 |
| 55 | pain1 | Num | 8 | PAIN1 A. | pin-prick |
| 56 | pain2 | Num | 8 | PAIN2 A. | pin-prick categories |
| 57 | vibr1 | Num | 8 | VIBR1 A. | tuning fork |
| 58 | vibr2 | Num | 8 | VIBR2 A. | tuning fork categories |
| 59 | temp1 | Num | 8 | TEMP1 A. | hot/cold rods |
| 60 | temp2 | Num | 8 | TEMP2 A. | hot/cold rods |
| 61 | ankrflx1 | Num | 8 | ANKRFLX. | ankle reflexes |
| 62 | ankrflx2 | Num | 8 | ANKRFL1 A. | ankle reflexes categories |
| 63 | rdors1 | Num | 8 | RDORS1 A. | On the dorsal surface of Right Foot: |
| 64 | rdors2 | Num | 8 | RDORS2 A. | the dorsal surface of Right Foot |
| 65 | rplant1 | Num | 8 | RPLANT1 A. | At any of 3 plantar surfaces tested on Right Foot (1st and 5th MTH, heel): |
| 66 | rplant2 | Num | 8 | RPLANT2 A. | On the plantar surface of Right Foot |
| 67 | ldors1 | Num | 8 | LDORS1 A. | On the dorsal surface of Left Foot: |
| 68 | ldors2 | Num | 8 | LDORS2 A. | On the dorsal surface of Left Foot: |
| 69 | lplant1 | Num | 8 | LPLANT1 A. | At any of 3 plantar surfaces tested on Left Foot (1st and 5th MTH, heel): |
| 70 | lplant2 | Num | 8 | LPLANT2 A. | On the plantar surface of Left Foot: |
| 71 | insens1 | Num | 8 | INSENS1 A. | Insensitive to 10 g-Monofilament at any site on either foot (phase 1 patients only) |
| 72 | rdororpl | Num | 8 | RDORORP. | Right foot insensitivity to 10 g-MF |
| 73 | ldororpl | Num | 8 | LDORORP. | Left foot insensitivity to 10 g-MF |
| 74 | dorslorr | Num | 8 | DORSLOR. | Dorsal insensitivity to 10 g-MF (R or L foot or both) |
| 75 | plnllorr | Num | 8 | PLNLLOR. | Plantar insensitivity to 10 g-MF (R or L foot or both) |
| 76 | edoropl | Num | 8 | EDOROPL. | Insensitive to 10 g-Monofilament at any site on either foot |
| 77 | pulse1 | Num | 8 | PULSE1 A. | Dorsalis pedis and posterior tibial pulses on both feet. Total number of pulses recorded |
| 78 | pulse1a | Num | 8 | PULSE11 A. | Cut-off values for number of palpable foot pulses |
| 79 | vaschis1 | Num | 8 | VASCHIS. | peripheral vascular history |
| 80 | risk1 | Num | 8 | RISK1 A. | Risk of future foot problems |
| 81 | chirop1 | Num | 8 | CHIROP1 A. | regular chiropody or previous education |
| 82 | ctretype | Num | 8 | CTRETYP. | centre type |
| 83 | ankrflx3 | Num | 8 | ANKRFL2 A. | ankle reflexes normal/abnormal |
| 84 | occup2 | Num | 8 | OCCUP2 A. | main socioeconomic categories |
| 85 | mfinsens | Num | 8 | MFINSEN. | insensitivity to MF – all |
| 86 | var00002 | Num | 8 | F8.2 | var00002 |
| 87 | fuqnaire | Num | 8 | FUQNAIR. | 2 yr follow-up qnaire |
| 88 | newamp | Num | 8 | NEWAMP. | Any new Lower Limb Amputation at 2 years follow-up (including patients with existing LLA at baseline). Identified from the Phase 1 patient cohort (n = 9710) who returned their follow-up postal questionnaires (n = 6613) |
| 89 | newulc2y | Num | 8 | NEWULC2 A. | Any new foot ulcer at 2 years follow-up after baseline. Identified from the Phase 1 patient cohort (n = 9710) who returned their follow-up postal questionnaires (n = 6613) |
| 90 | newamp2 | Num | 8 | F8.2 | Any new, first Lower Limb Amputation at 2 years follow-up (i.e. excluding patients with existing LLA at baseline). Identified from the Phase 1 patient cohort (n = 9710) who returned their follow-up postal questionnaires (n = 6613) |
| 91 | datescr1 | Num | 8 | DATE9. | Date screened |
Leese et al.46,47
| Data set name | WORK.LEESE | Observations | 3720 |
| Member type | DATA | Variables | 50 |
| Engine | V9 | Indexes | 0 |
| Alphabetic list of variables and attributes | ||||||
|---|---|---|---|---|---|---|
| # | Variable | Type | Len | Format | Informat | Label |
| 1 | PROCHI | Char | 36 | $36. | $36. | CHI number |
| 2 | DoBirth | Num | 8 | DATE9. | Date of birth | |
| 3 | DoDiagnosis | Num | 8 | DATE9. | Date of diagnosis ‒ of diabetes | |
| 4 | YearDiagnosis | Num | 8 | F8. | Year of diagnosis ‒ of diabetes | |
| 5 | YearDeath | Num | 8 | F8. | Year of death | |
| 6 | DoDeath | Num | 8 | DATE9. | Date of death | |
| 7 | Died | Num | 8 | DIED. | Died | |
| 8 | AmpType | Num | 8 | AMPTYPE. | Amputation type | |
| 9 | AmpRecord | Num | 8 | AMPRECO. | Record of an amputation | |
| 10 | UlcerRecord | Num | 8 | ULCERRE. | Record of an ulcer | |
| 11 | Insulin | Num | 8 | INSULIN. | Insulin dependent | |
| 12 | Pulses | Num | 8 | PULSES. | Pulses | |
| 13 | OldPulses | Num | 8 | OLDPULS. | Old pulses | |
| 14 | TimeDiabeticYrs | Num | 8 | F8.1 | Length of time had diabetes | |
| 15 | AbleToSelfCare | Num | 8 | ABLETOS. | Able to self-care | |
| 16 | Callus | Num | 8 | CALLUS. | Callus present | |
| 17 | Monofilament | Num | 8 | MONOFIL. | Monofilament | |
| 18 | PriorUlcer | Num | 8 | PRIORUL. | Previous foot ulcer | |
| 19 | StructuralAbnormality | Num | 8 | STRUCTU. | Structural Abnormality | |
| 20 | FootRisk | Num | 8 | FOOTRIS. | At risk of foot ulceration | |
| 21 | Gender | Num | 8 | GENDER. | Gender | |
| 22 | First_BMI | Num | 8 | DATE9. | Date of First BMI reading | |
| 23 | BMI | Num | 8 | F5.2 | BMI | |
| 24 | DoFirst_BP | Num | 8 | DATE9. | Date of First BP reading | |
| 25 | SBP | Num | 8 | F3. | Systolic BP | |
| 26 | DBP | Num | 8 | F3. | Diastolic BP | |
| 27 | DoFirst_Chol | Num | 8 | DATE9. | Date of first cholesterol test | |
| 28 | Cholesterol | Num | 8 | F4.2 | cholesterol reading | |
| 29 | DoFirst_Creat | Num | 8 | DATE9. | Date of first creatinine test | |
| 30 | Creatinine | Num | 8 | F8. | creatinine test | |
| 31 | DoFirst_eGFR | Num | 8 | DATE9. | Date of first glomerular filtration rate | |
| 32 | eGFR | Num | 8 | F5. | glomerular filtration rate test | |
| 33 | DoFirst_HbA1c | Num | 8 | DATE9. | Date of first HbA1c | |
| 34 | HbA1c | Num | 8 | F5.2 | HbA1c test | |
| 35 | DoFirst_MA | Num | 8 | DATE9. | Date of first microabumin test | |
| 36 | MA | Num | 8 | F6. | microabumin test | |
| 37 | DoFirst_PU | Num | 8 | DATE9. | DoFirst.PU | |
| 38 | PU | Num | 8 | PU. | PU | |
| 39 | DoFirstSmoker | Num | 8 | DATE9. | Date first smoked? Date first question about smoking habits | |
| 40 | Smoker | Num | 8 | SMOKER. | Smoker | |
| 41 | FollowUpYrs | Num | 8 | F8.1 | Follow up years From first record in the database to data on which date were extracted | |
| 42 | DoFirstFootRisk | Num | 8 | DATE9. | Date of first foot risk | |
| 43 | First_Risk | Num | 8 | FIRST_R. | Foot risk of ulcer | |
| 44 | First_Pulses | Num | 8 | FIRST_P. | First Pulses | |
| 45 | First_MF | Num | 8 | FIRST_M. | First Monofilament | |
| 46 | First_PriorUlcer | Num | 8 | FIRST_1 A. | First prior ulcer | |
| 47 | First_Abnormality | Num | 8 | FIRST_A. | First abnormality | |
| 48 | First_SelfCare | Num | 8 | FIRST_S. | First.SelfCare | |
| 49 | First_Callus | Num | 8 | FIRST_C. | First.Callus | |
| 50 | First_Amp | Num | 8 | F8. | First.Amp | |
Boyko et al.49
The Boyko et al. study data dictionary was not prepared by the investigators and was not available.
Appendix 10 Univariate forest plots
This appendix contains the results of the meta-analysis with forest plots of selected variables. Each model uses one selected predictor at a time and provides ORs for a new ulcer development.
FIGURE 40.
Model 1. New ulcer OR predicted by age.

FIGURE 41.
Model 2. New ulcer OR predicted by sex (women vs. men).
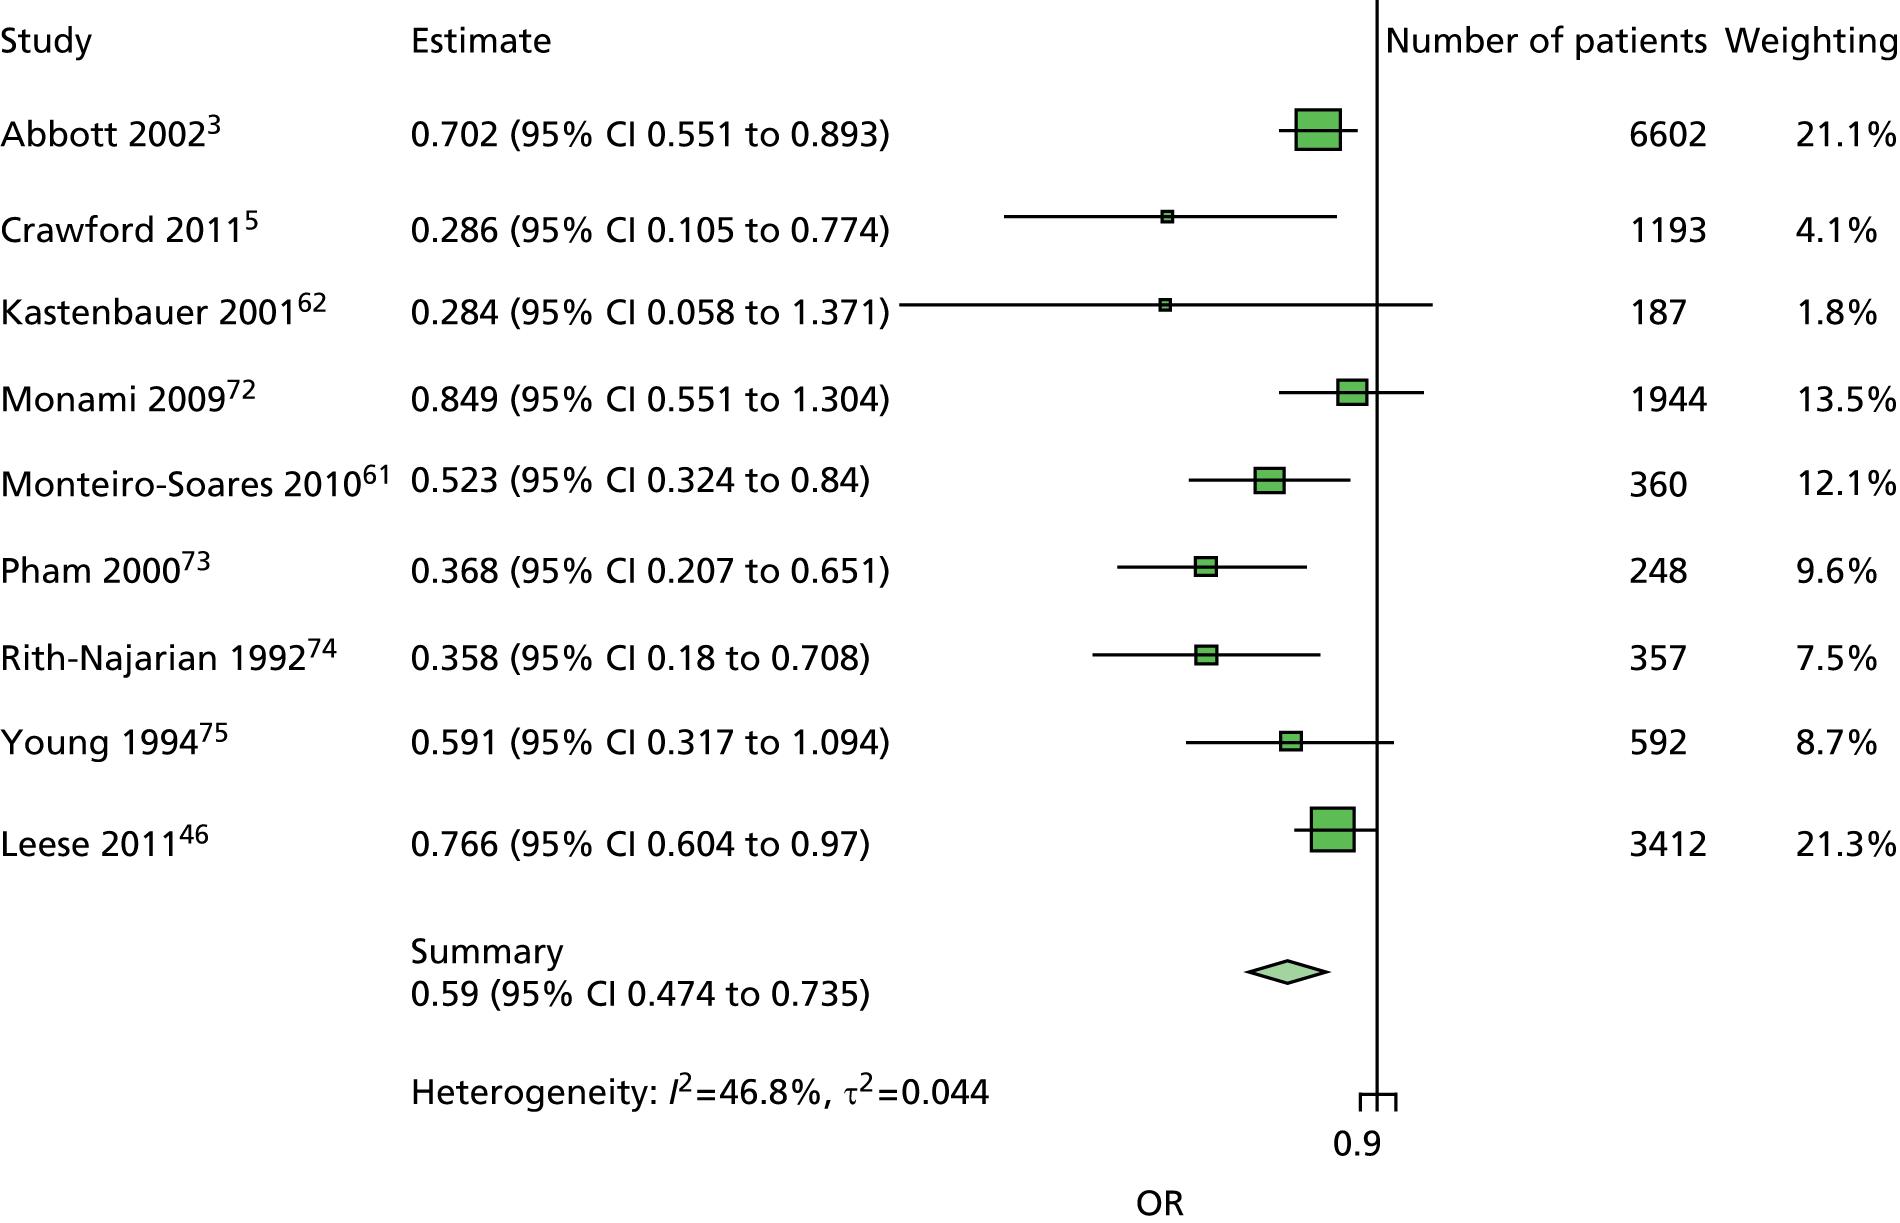
FIGURE 42.
Model 3. New ulcer OR predicted by weight.
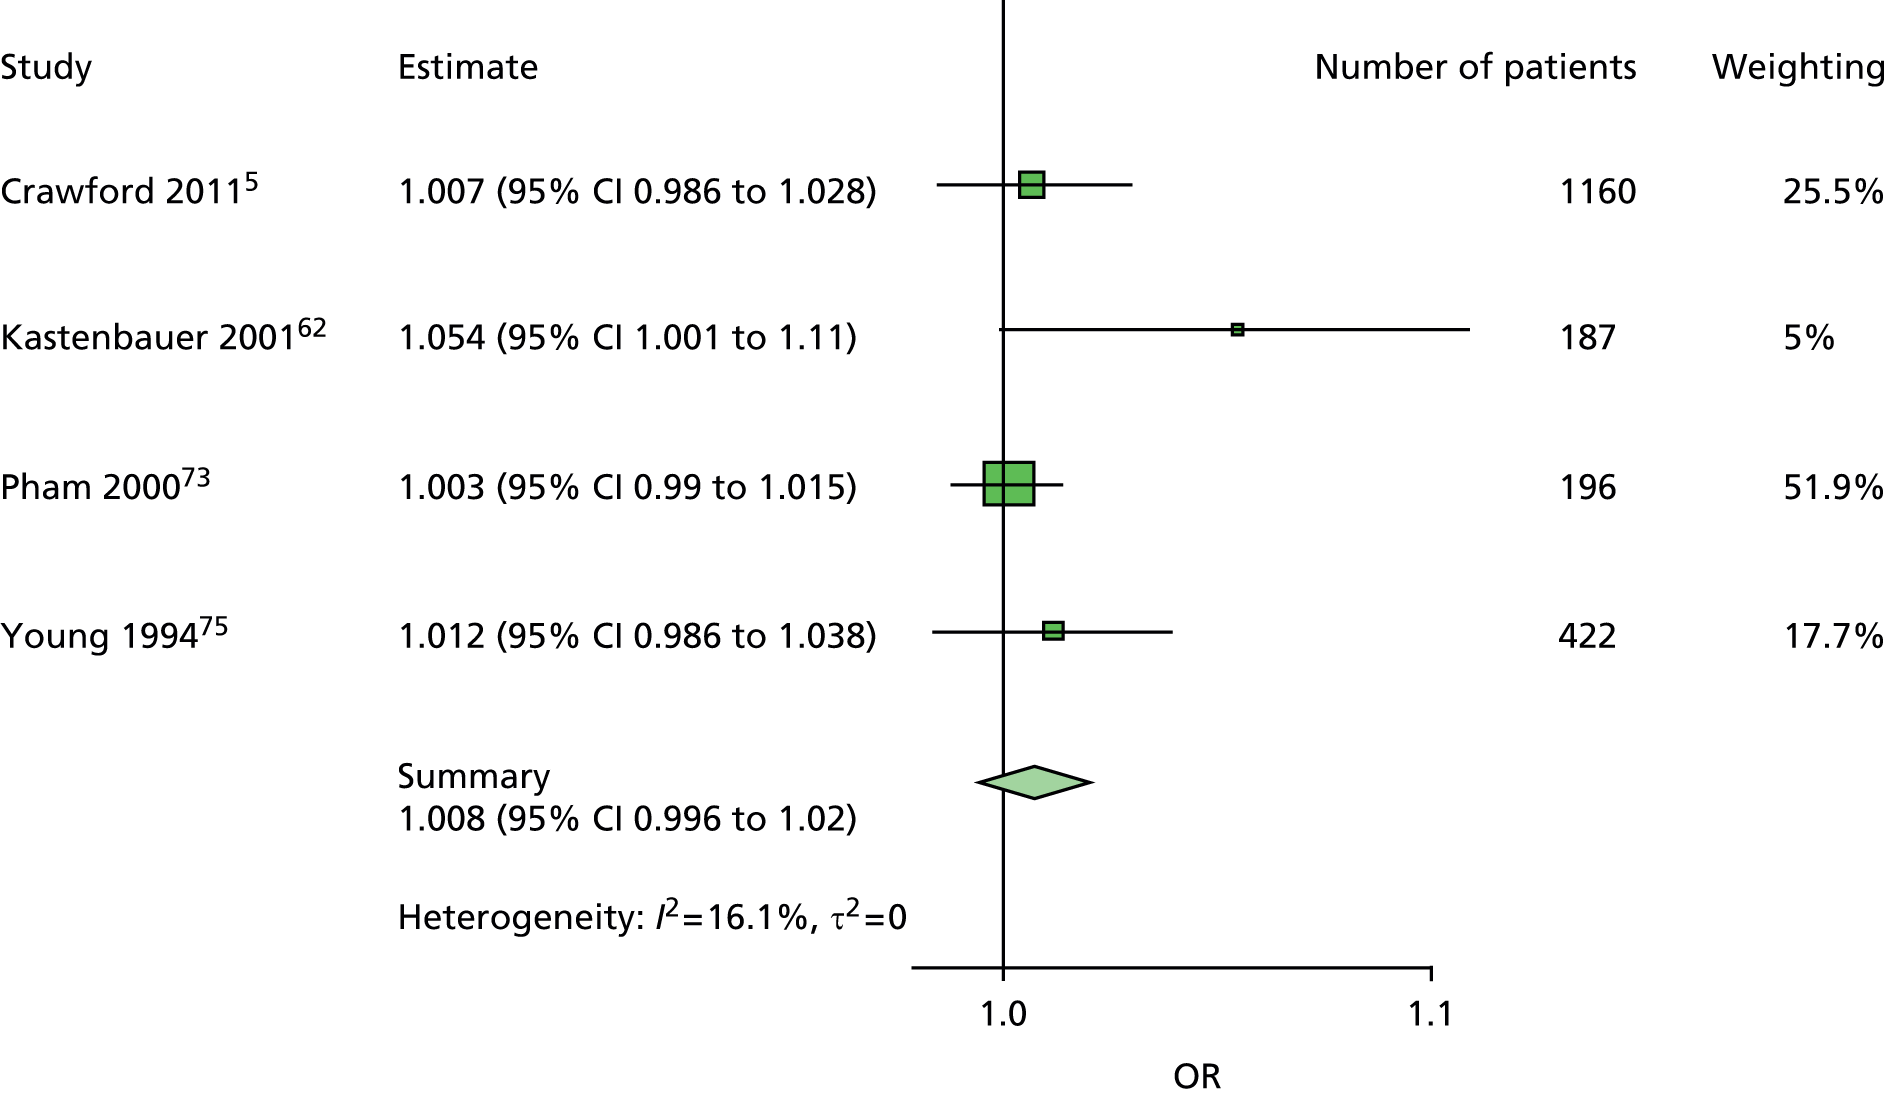
FIGURE 43.
Model 4. New ulcer OR predicted by height.
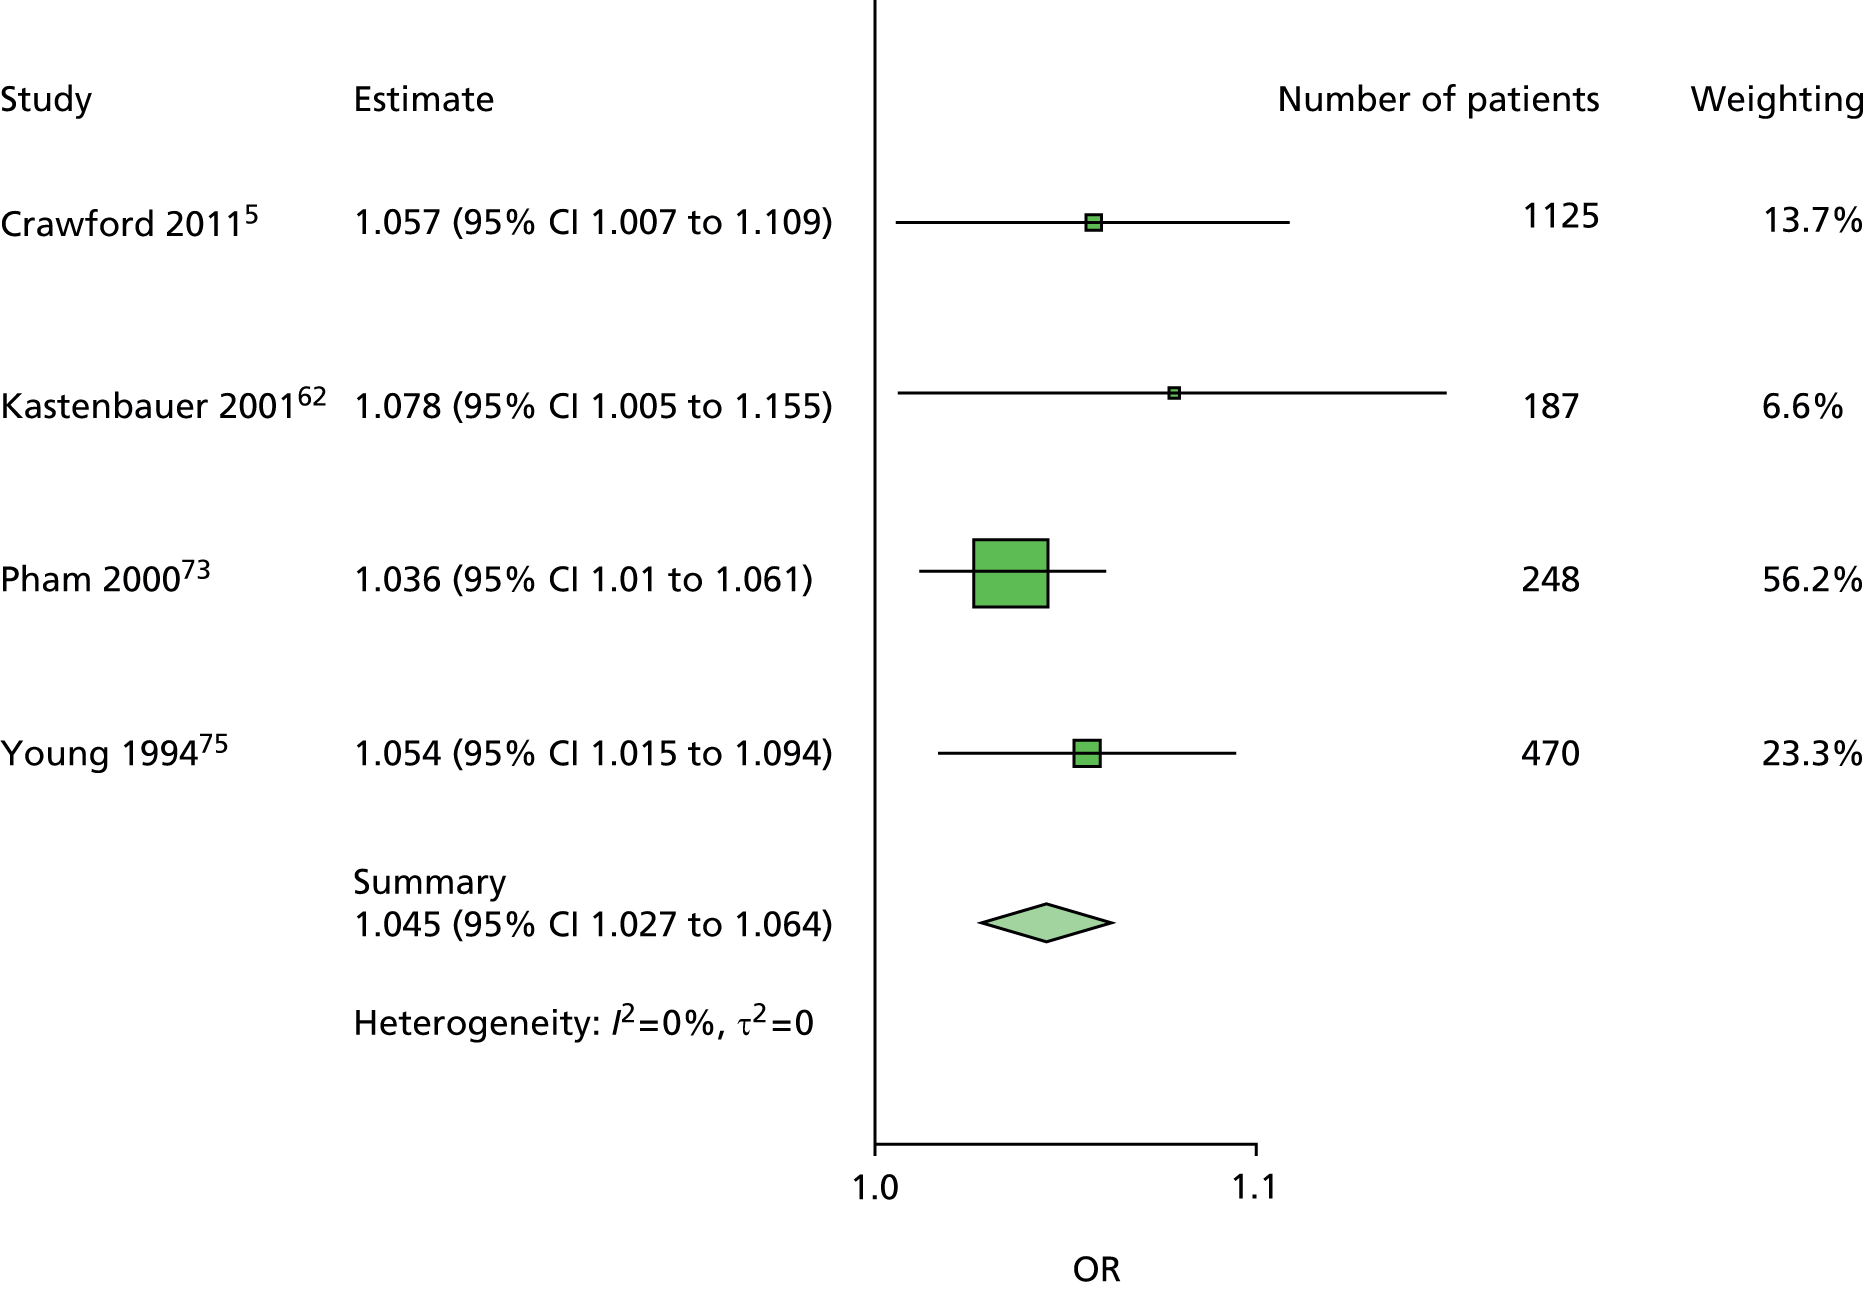
FIGURE 44.
Model 5. New ulcer OR predicted by BMI.

FIGURE 45.
Model 6. New ulcer OR predicted by living alone (yes/no).

FIGURE 46.
Model 7. New ulcer OR predicted by smoking (yes/no).

FIGURE 47.
Model 8. New ulcer OR predicted by number of cigarettes per day.

FIGURE 48.
Model 9. New ulcer OR predicted by alcohol (yes/no).

FIGURE 49.
Model 10. New ulcer OR predicted by alcohol units per week.
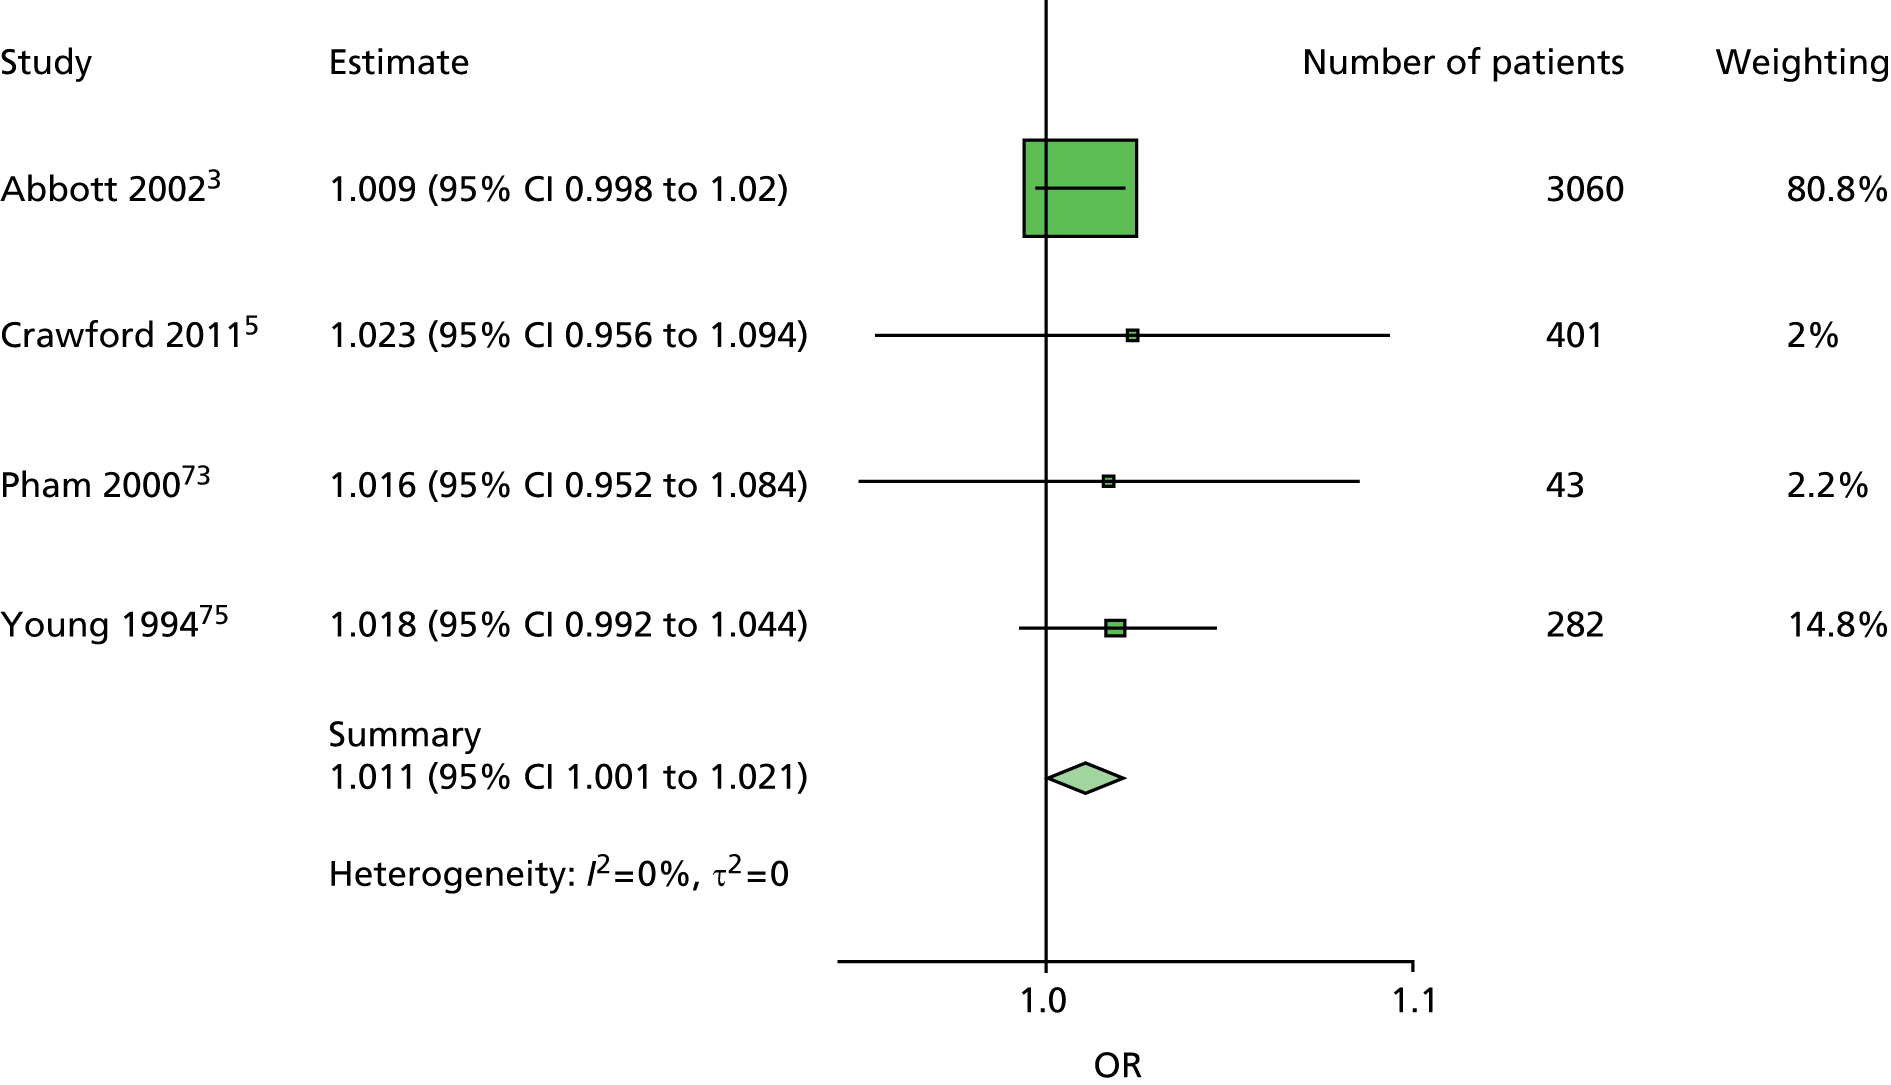
FIGURE 50.
Model 11. New ulcer OR predicted by HbA1c.
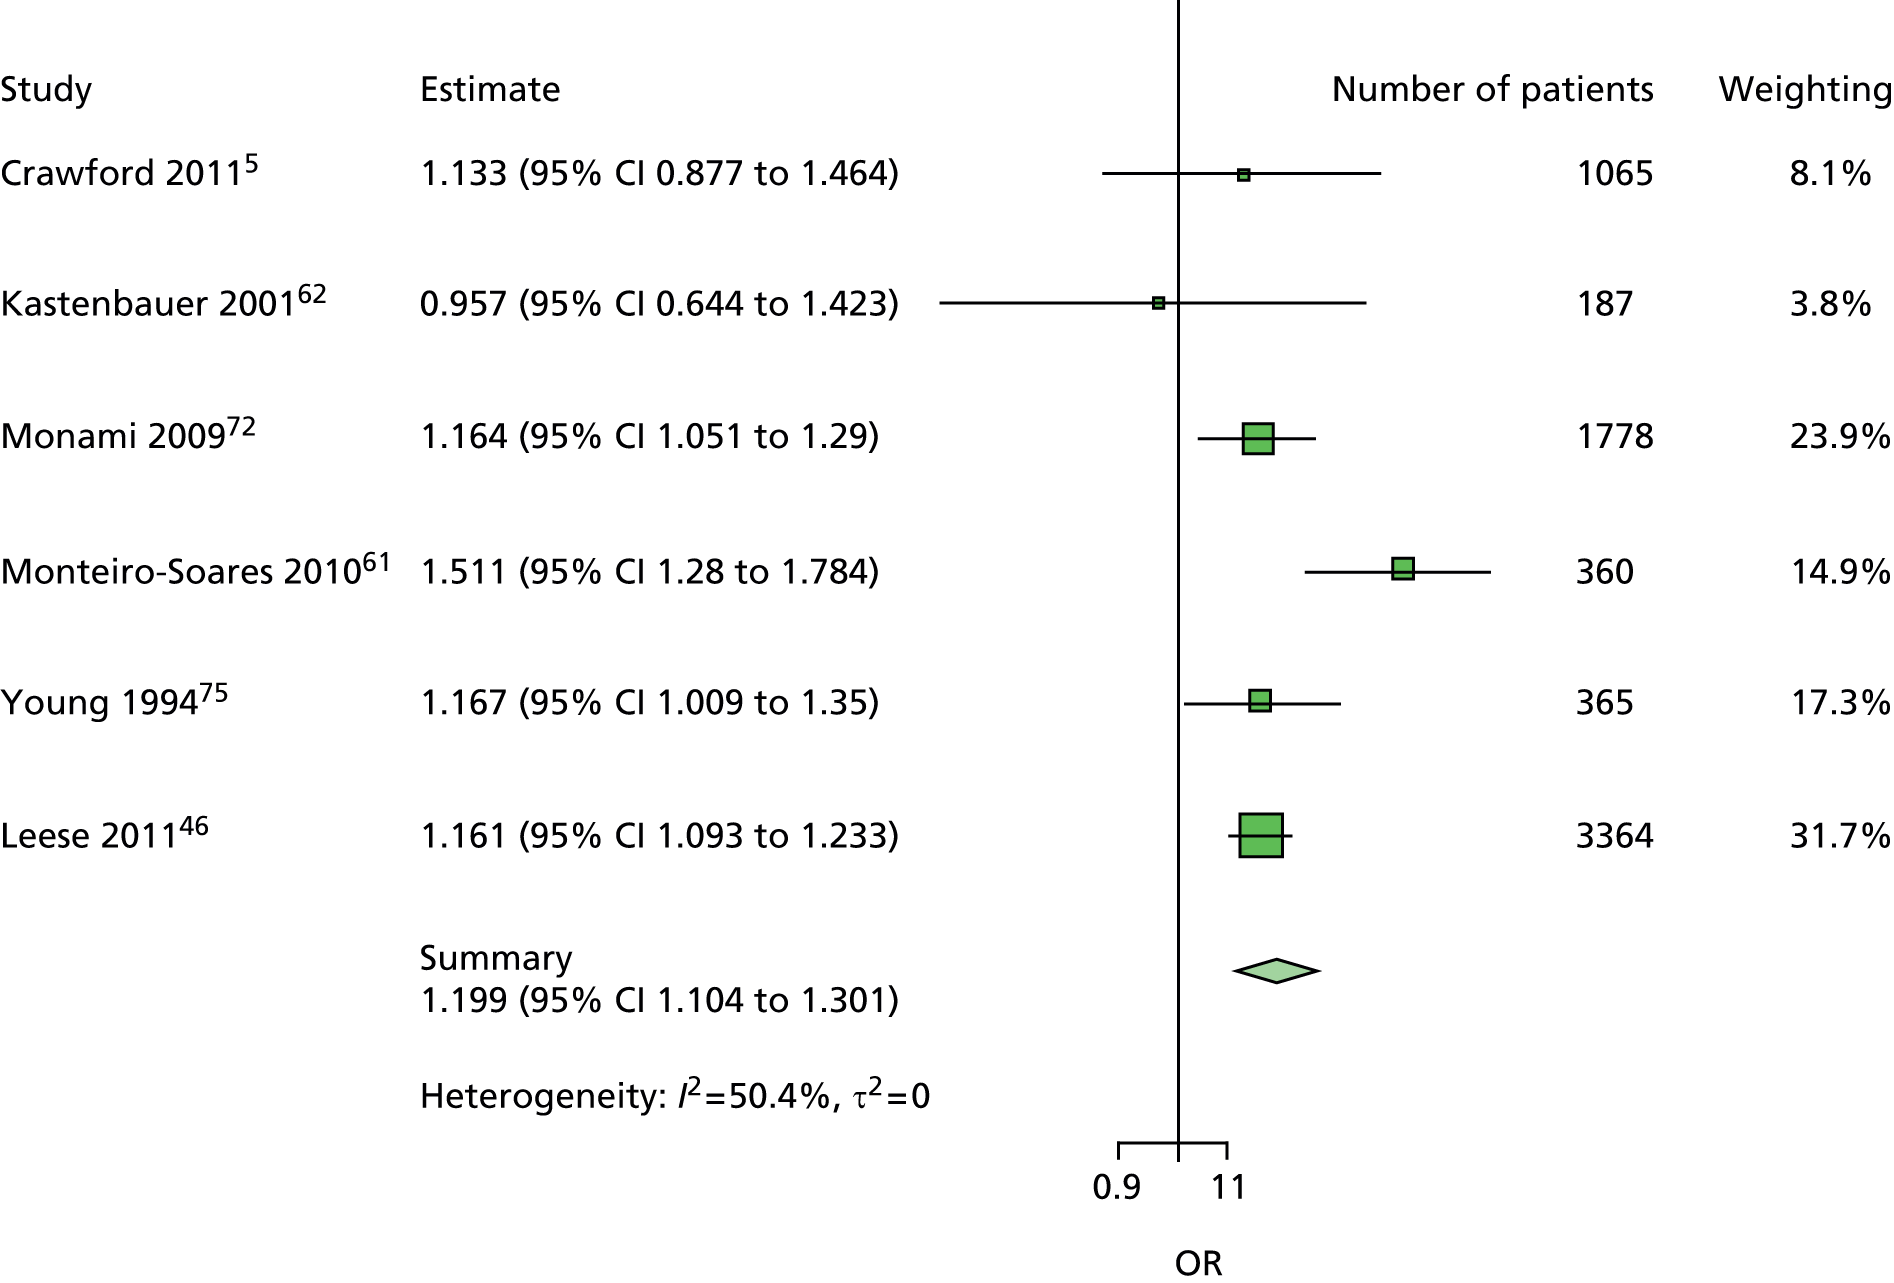
FIGURE 51.
Model 12. New ulcer OR predicted by insulin treatment (yes/no).

FIGURE 52.
Model 13. New ulcer OR predicted by diabetes duration.
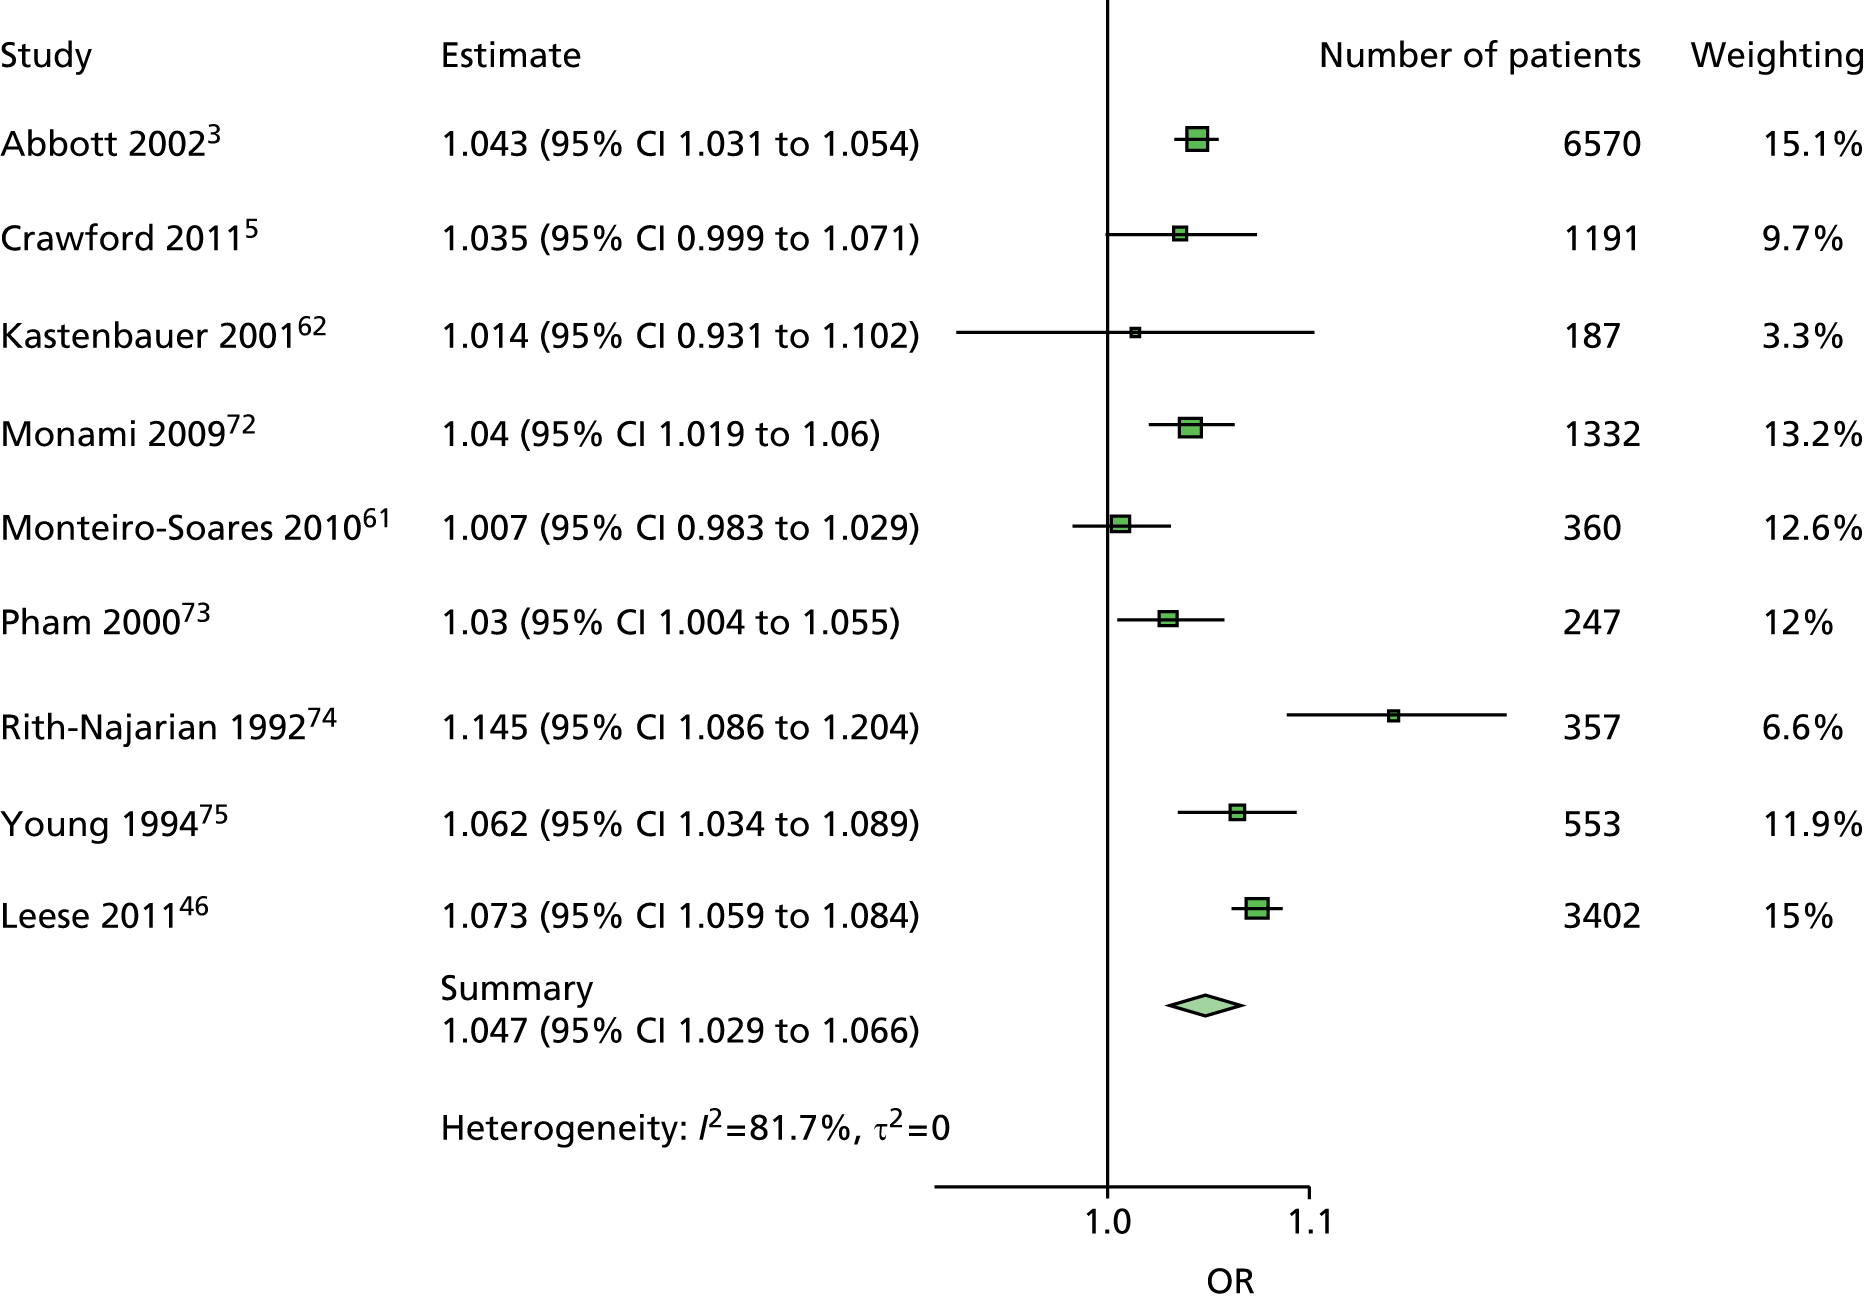
FIGURE 53.
Model 14. New ulcer OR predicted by eye problem (yes/no).

FIGURE 54.
Model 15. New ulcer OR predicted by retinopathy (yes/no).

FIGURE 55.
Model 16. New ulcer OR predicted by kidney problems (yes/no).

FIGURE 56.
Model 17. New ulcer OR predicted by any abnormal monofilament.

FIGURE 57.
Model 18. New ulcer OR predicted by any abnormal pulses.
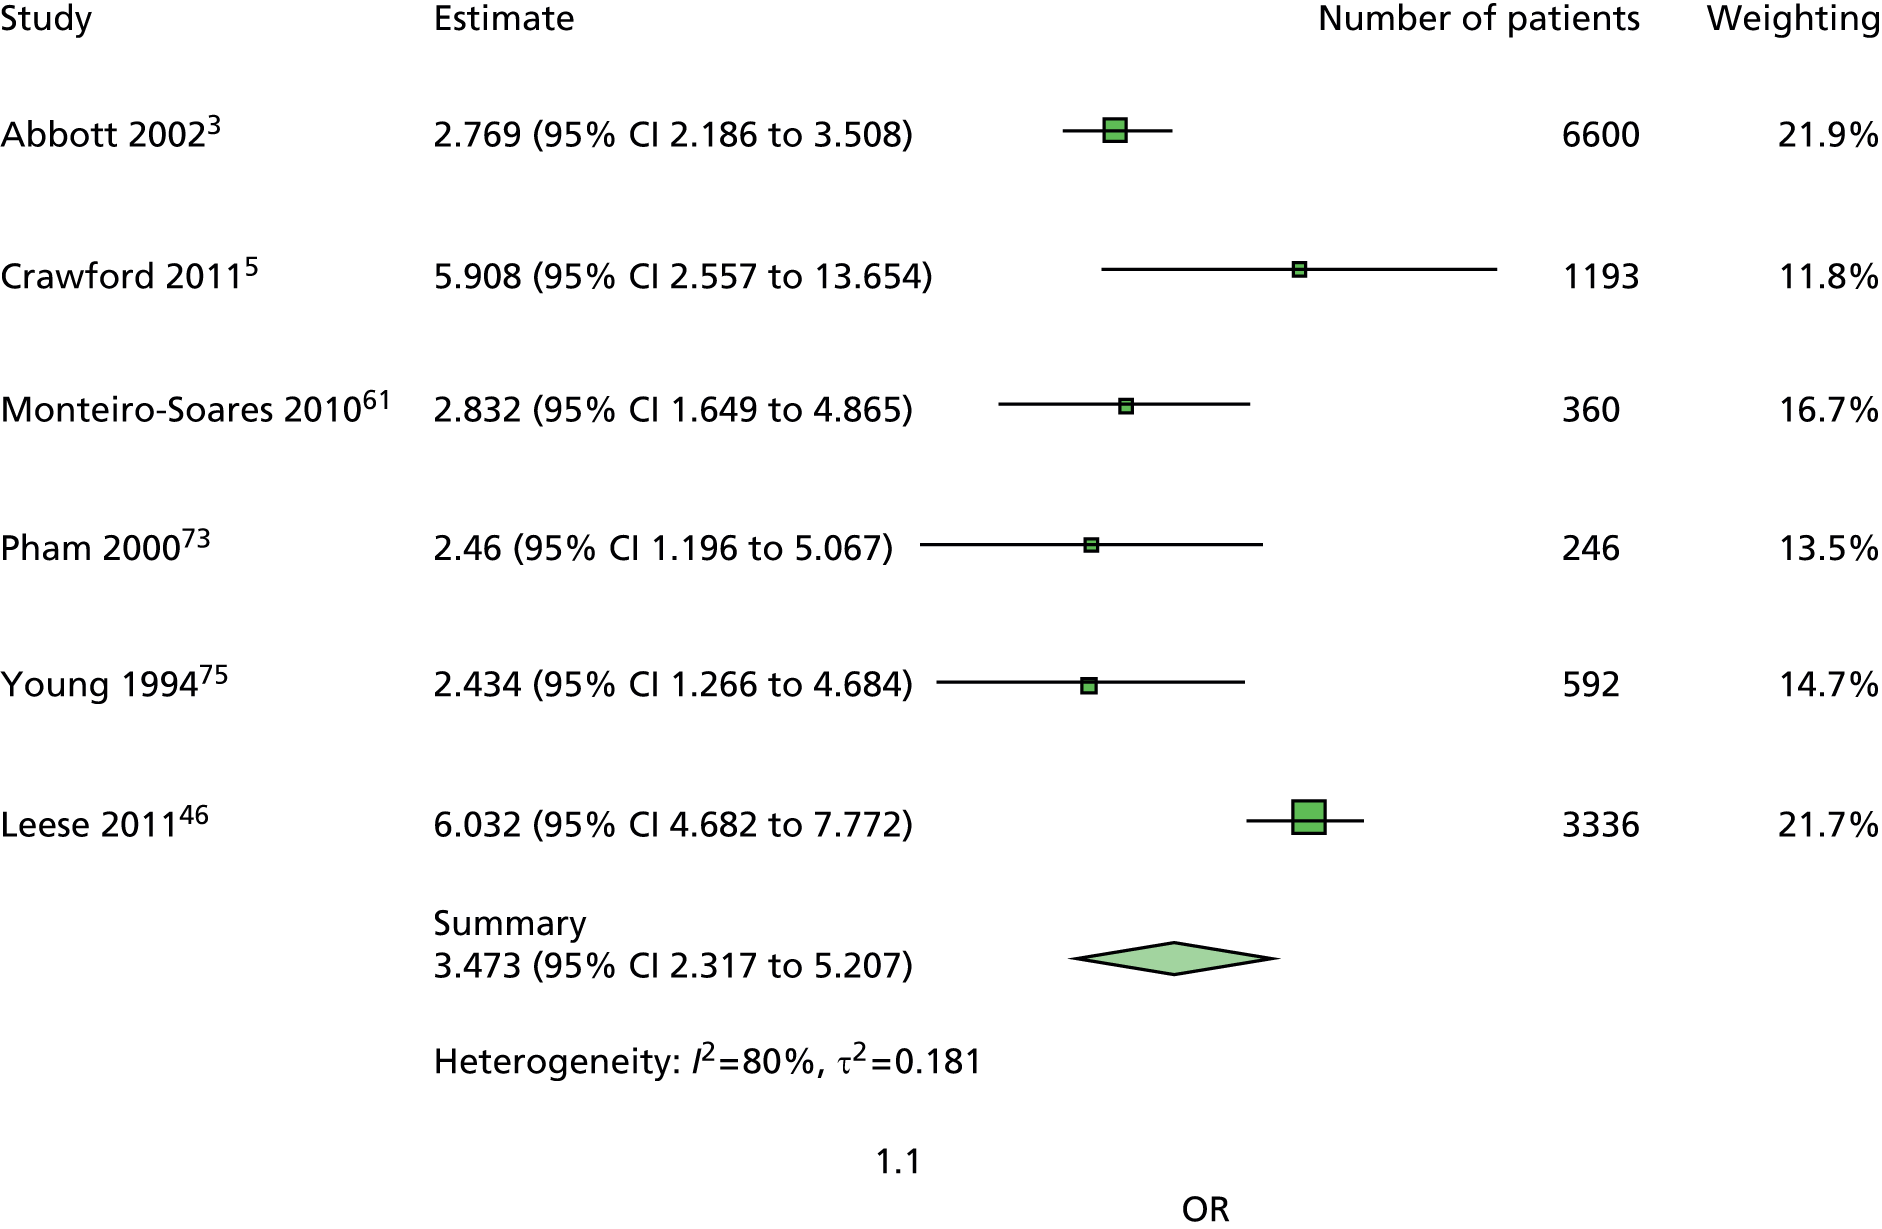
FIGURE 58.
Model 19. New ulcer OR predicted by any abnormal pinprick.

FIGURE 59.
Model 20. New ulcer OR predicted by any abnormal VPT.
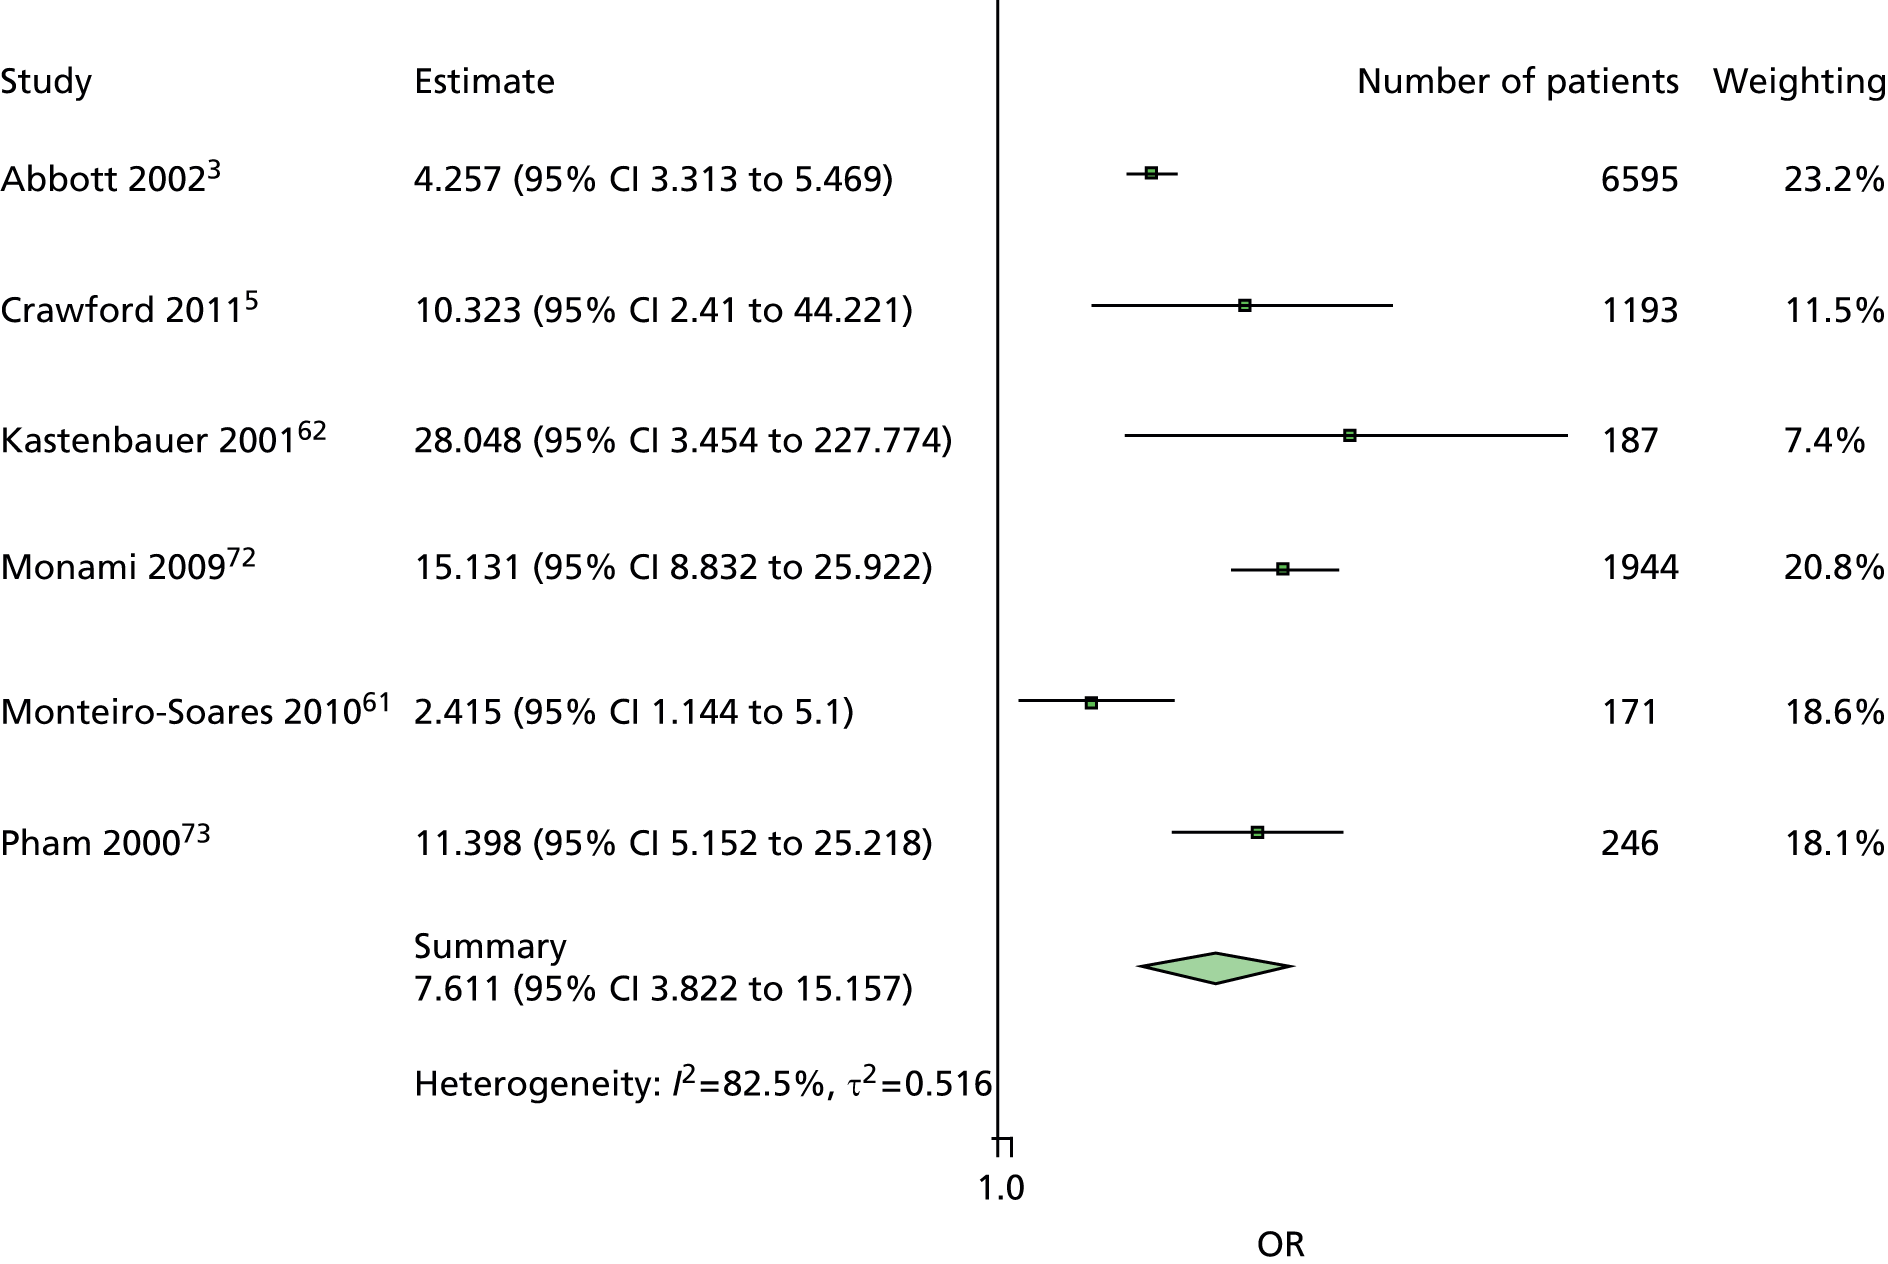
FIGURE 60.
Model 21. New ulcer OR predicted by no ankle reflex.
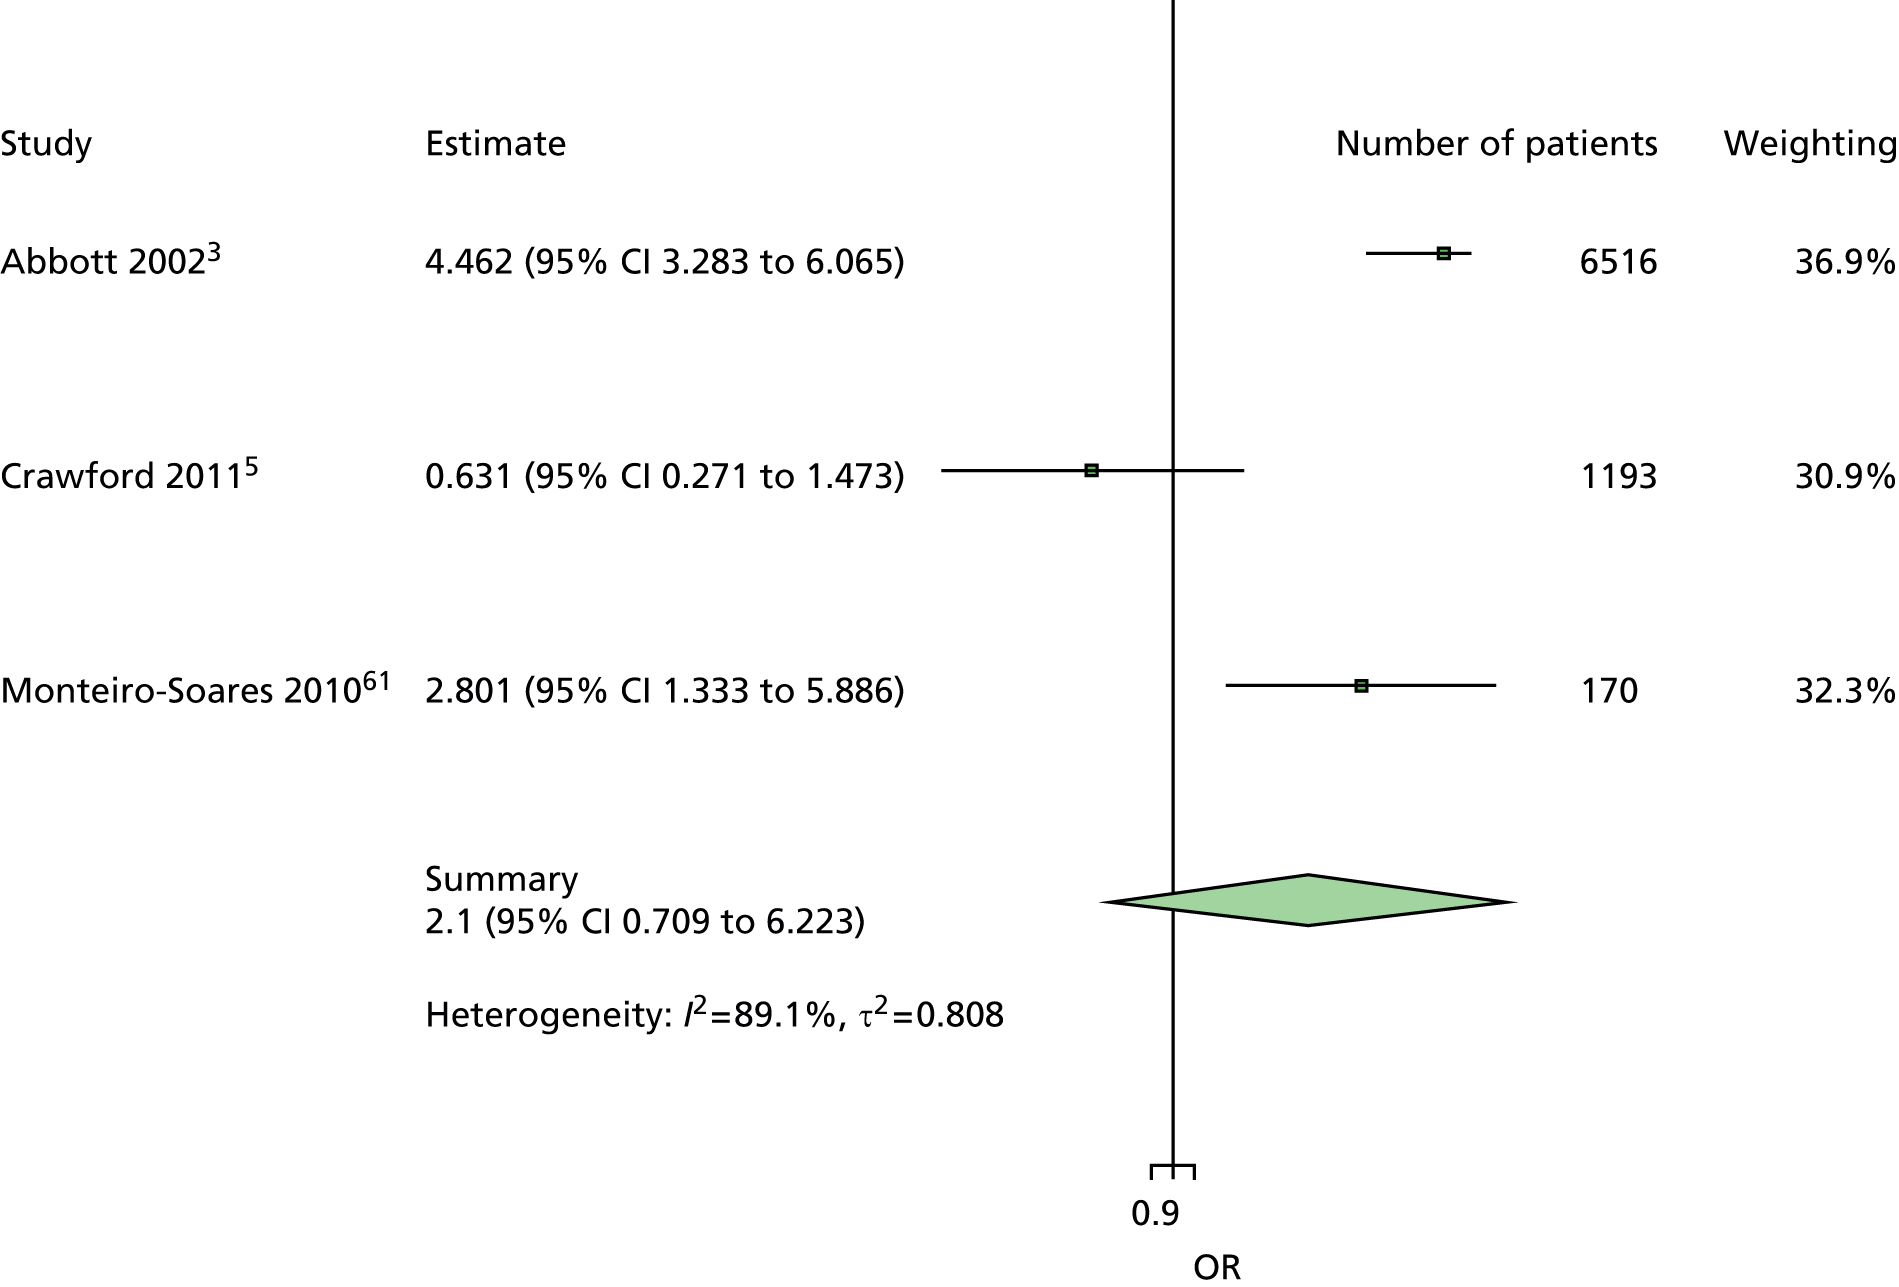
FIGURE 61.
Model 22. New ulcer OR predicted by no temperature sensation.
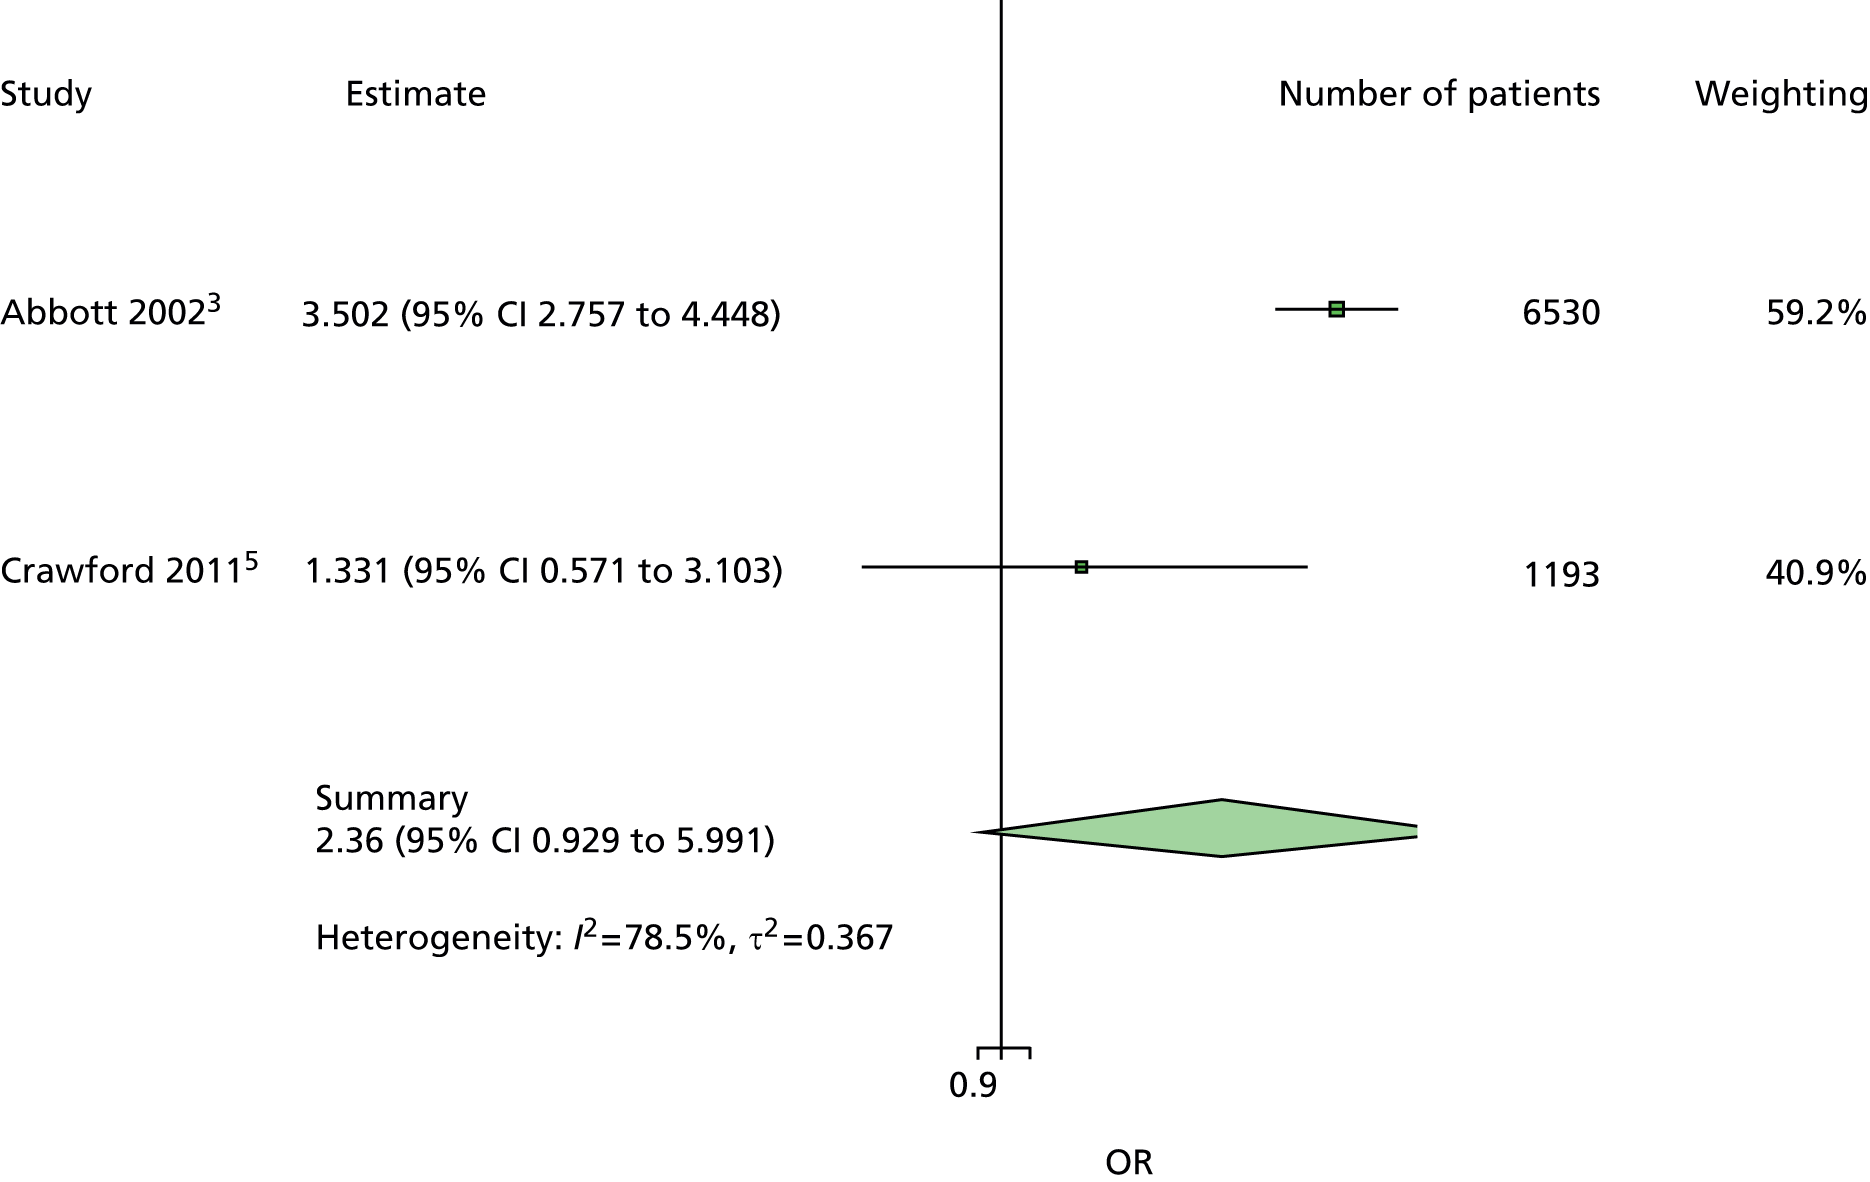
FIGURE 62.
Model 23. New ulcer OR predicted by any abnormal ABI.

FIGURE 63.
Model 24. New ulcer OR predicted by any abnormal PPP.
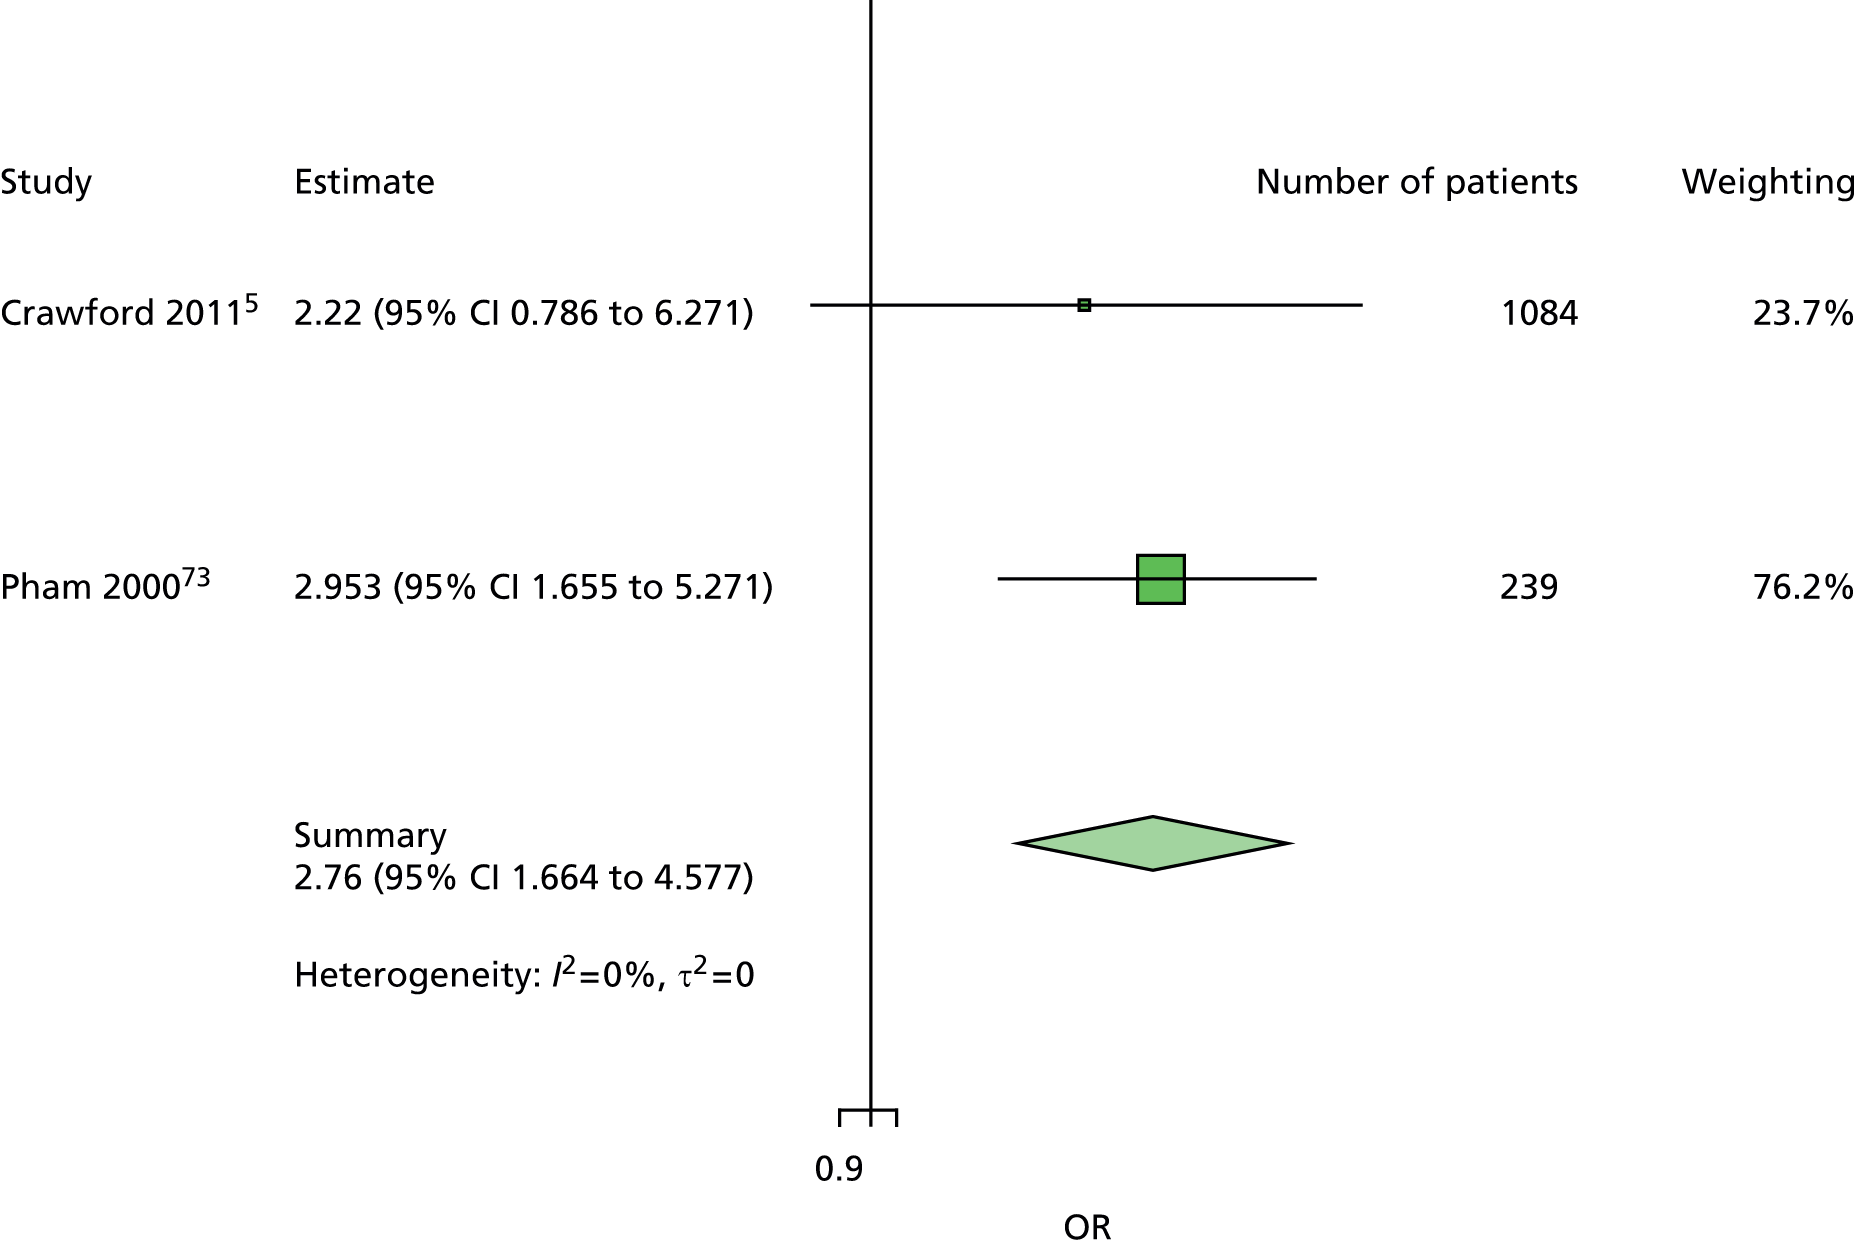
FIGURE 64.
Model 25. New ulcer OR predicted by any foot deformity.

FIGURE 65.
Model 26. New ulcer OR predicted by prior ulcer.

FIGURE 66.
Model 27. New ulcer OR predicted by prior amputation.

FIGURE 67.
Model 28. New ulcer OR predicted by prior history of ulcer or amputation.

Appendix 11 Multivariable models
FIGURE 68.
Model 1. Age first ulcer. Age has been adjusted for sex and duration of diabetes. There is some, but not extensive, heterogeneity. There appears to be an overall signficant OR for age, similar to those of the two largest studies, and a small amount of fluctuation around the line of no effect.

FIGURE 69.
Model 1. Age new ulcer. Age has been adjusted for sex, duration of diabetes and previous ulceration or amputation. Overall, the result for all patients is similar to that for patients without history, and, again, the studies are broadly similar (heterogeneity is not high).
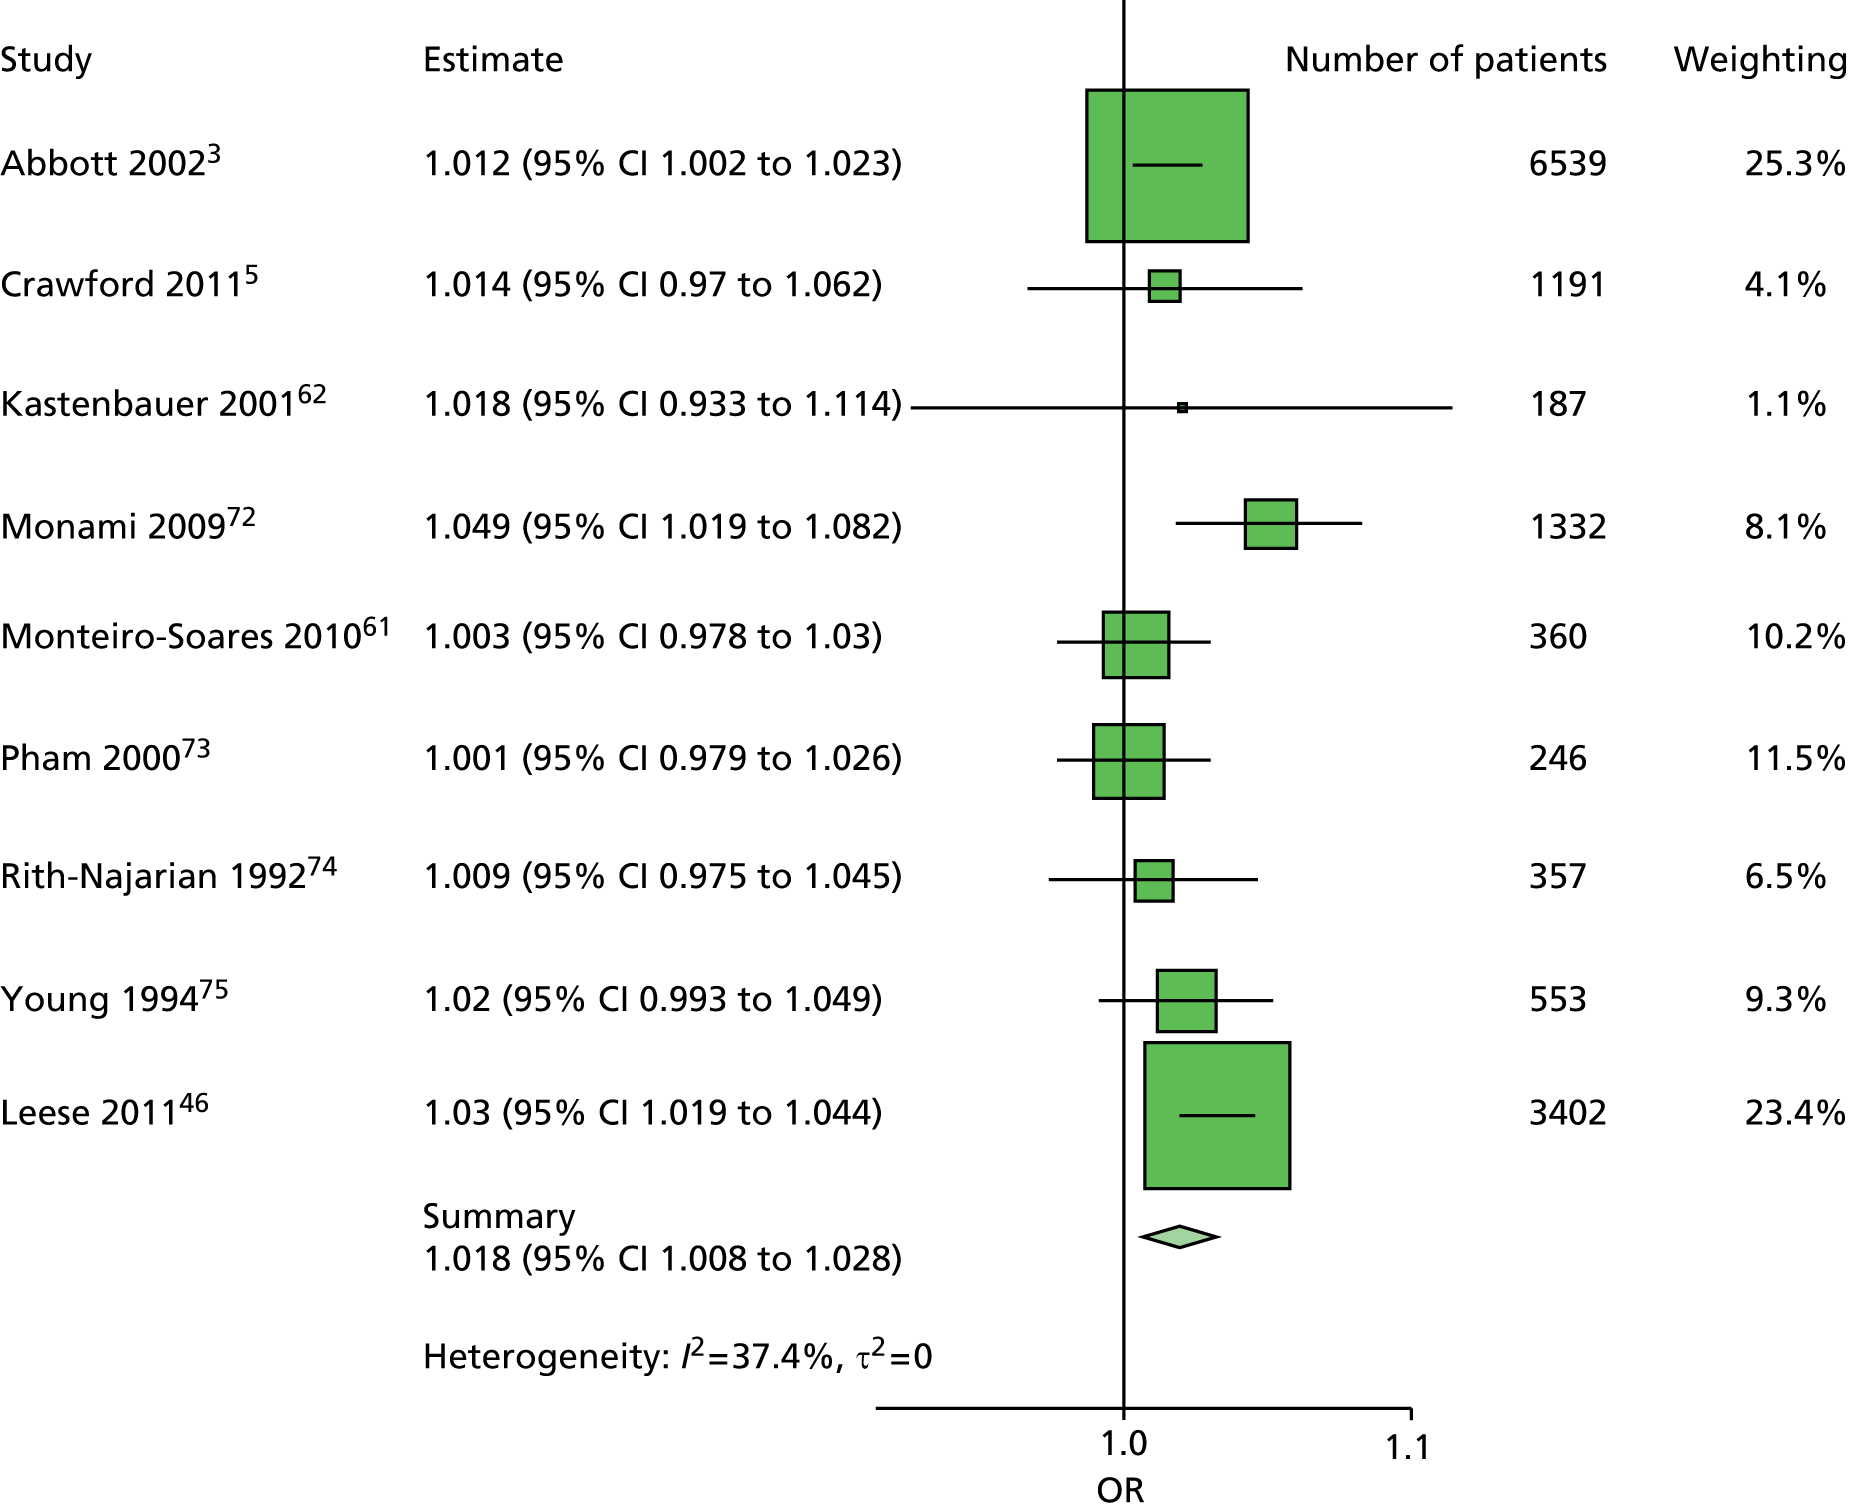
FIGURE 70.
Model 1. Duration first ulcer. Duration of diabetes has been adjusted for age and sex. The studies are very similar except that the Rith-Najarian et al. 74 study used a cohort of Pima Indians.
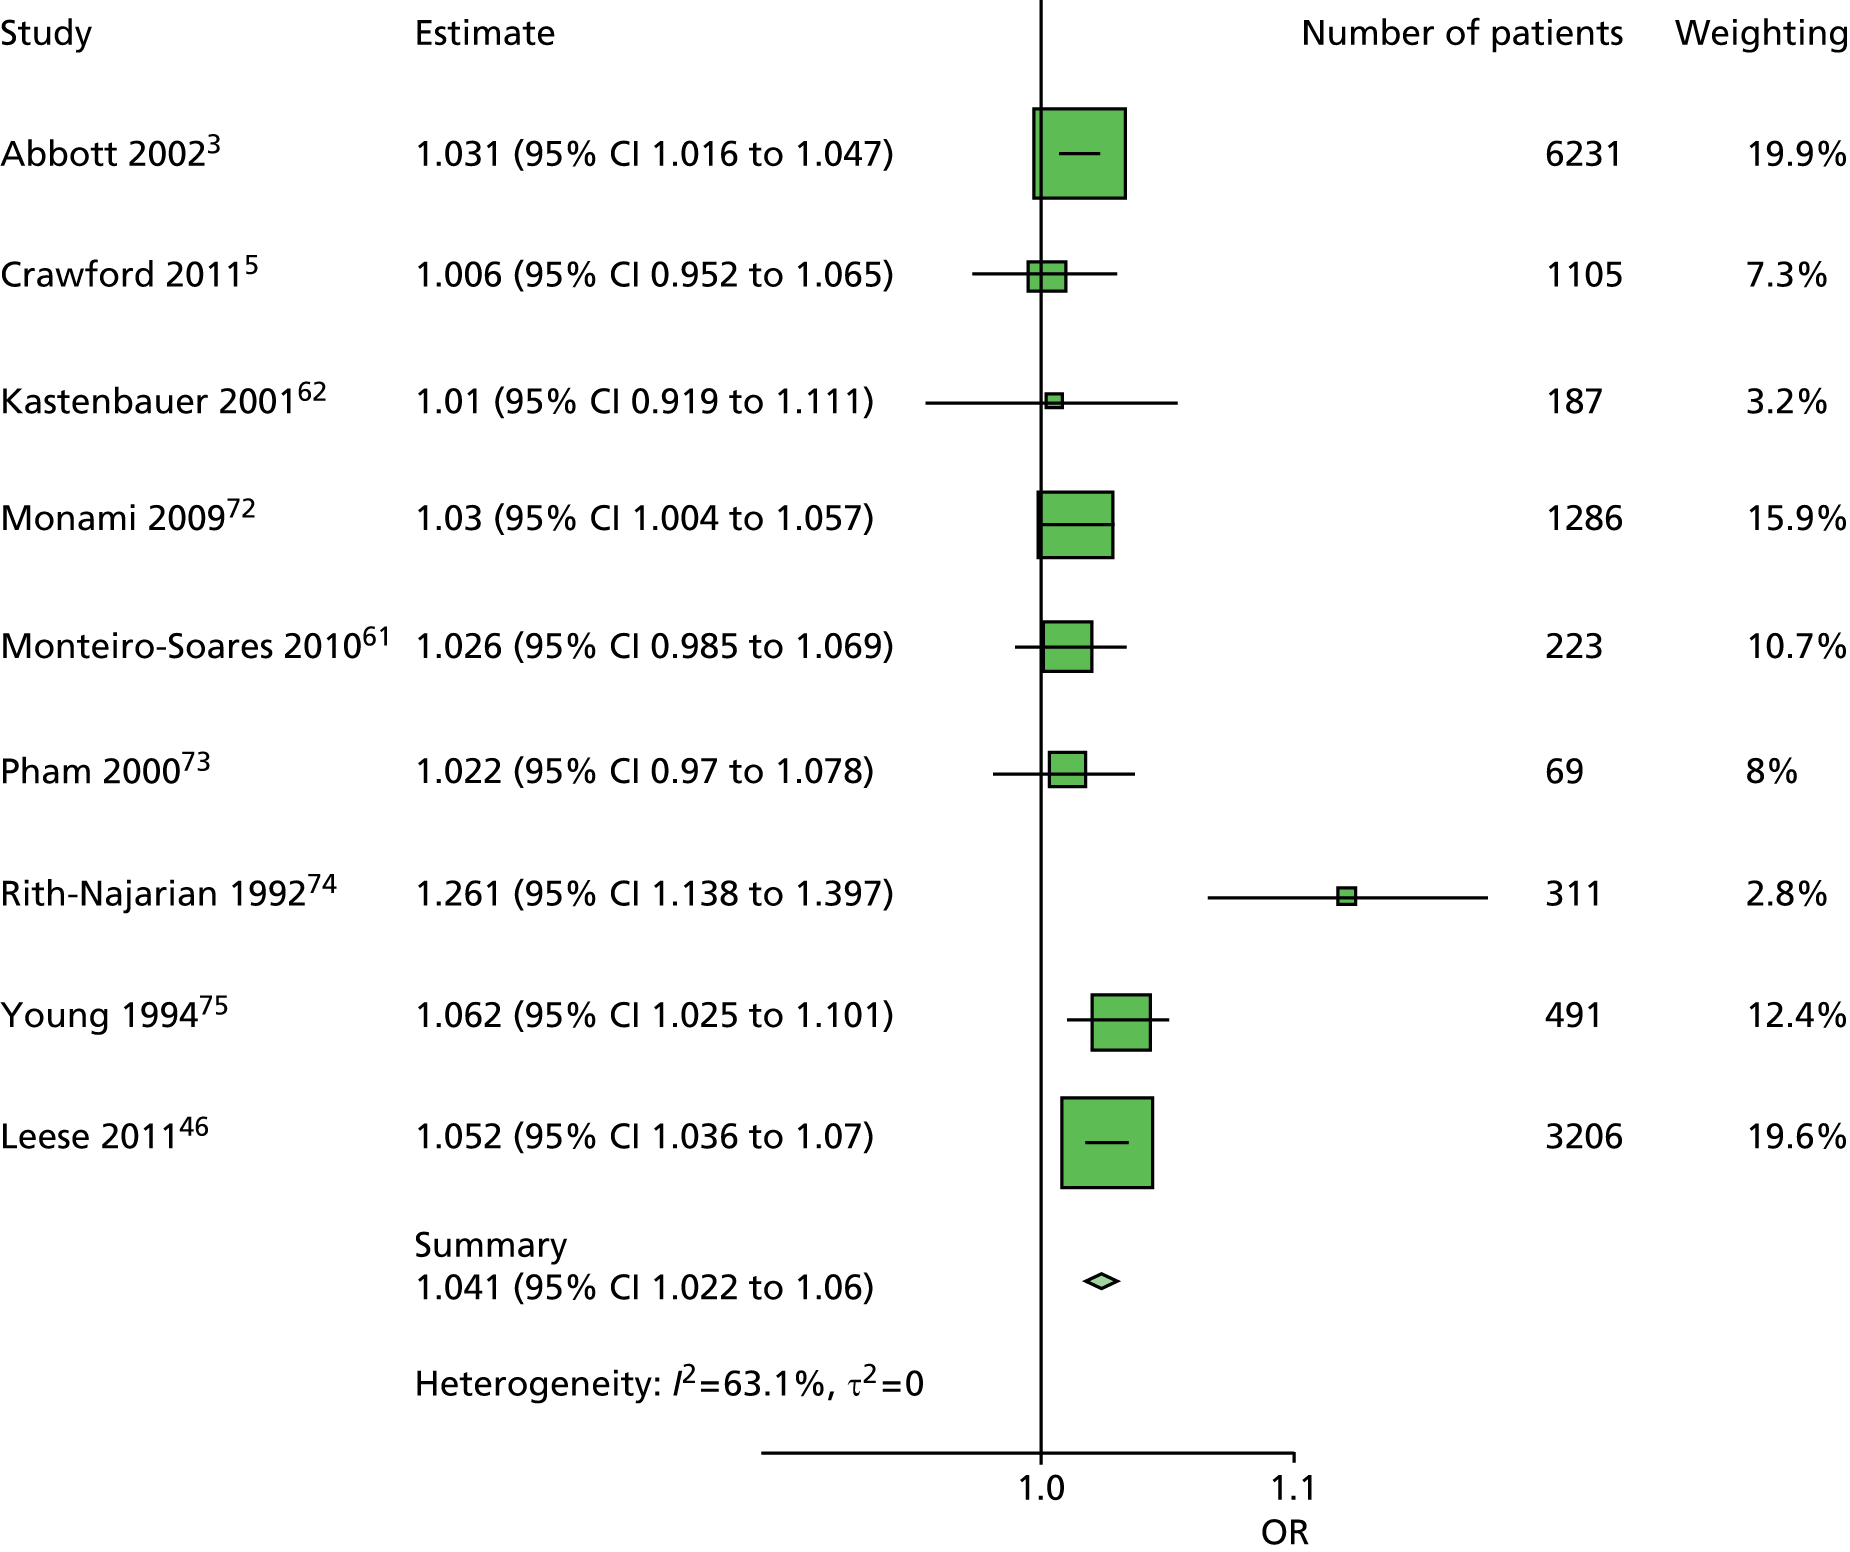
FIGURE 71.
Model 1. Duration new ulcer. Duration of diabetes has been adjusted for age, sex and previous ulceration or amputation. Again, the Rith-Najarian et al. 74 study has a higher OR than the other studies, and the results are similar to those for patients with no history.
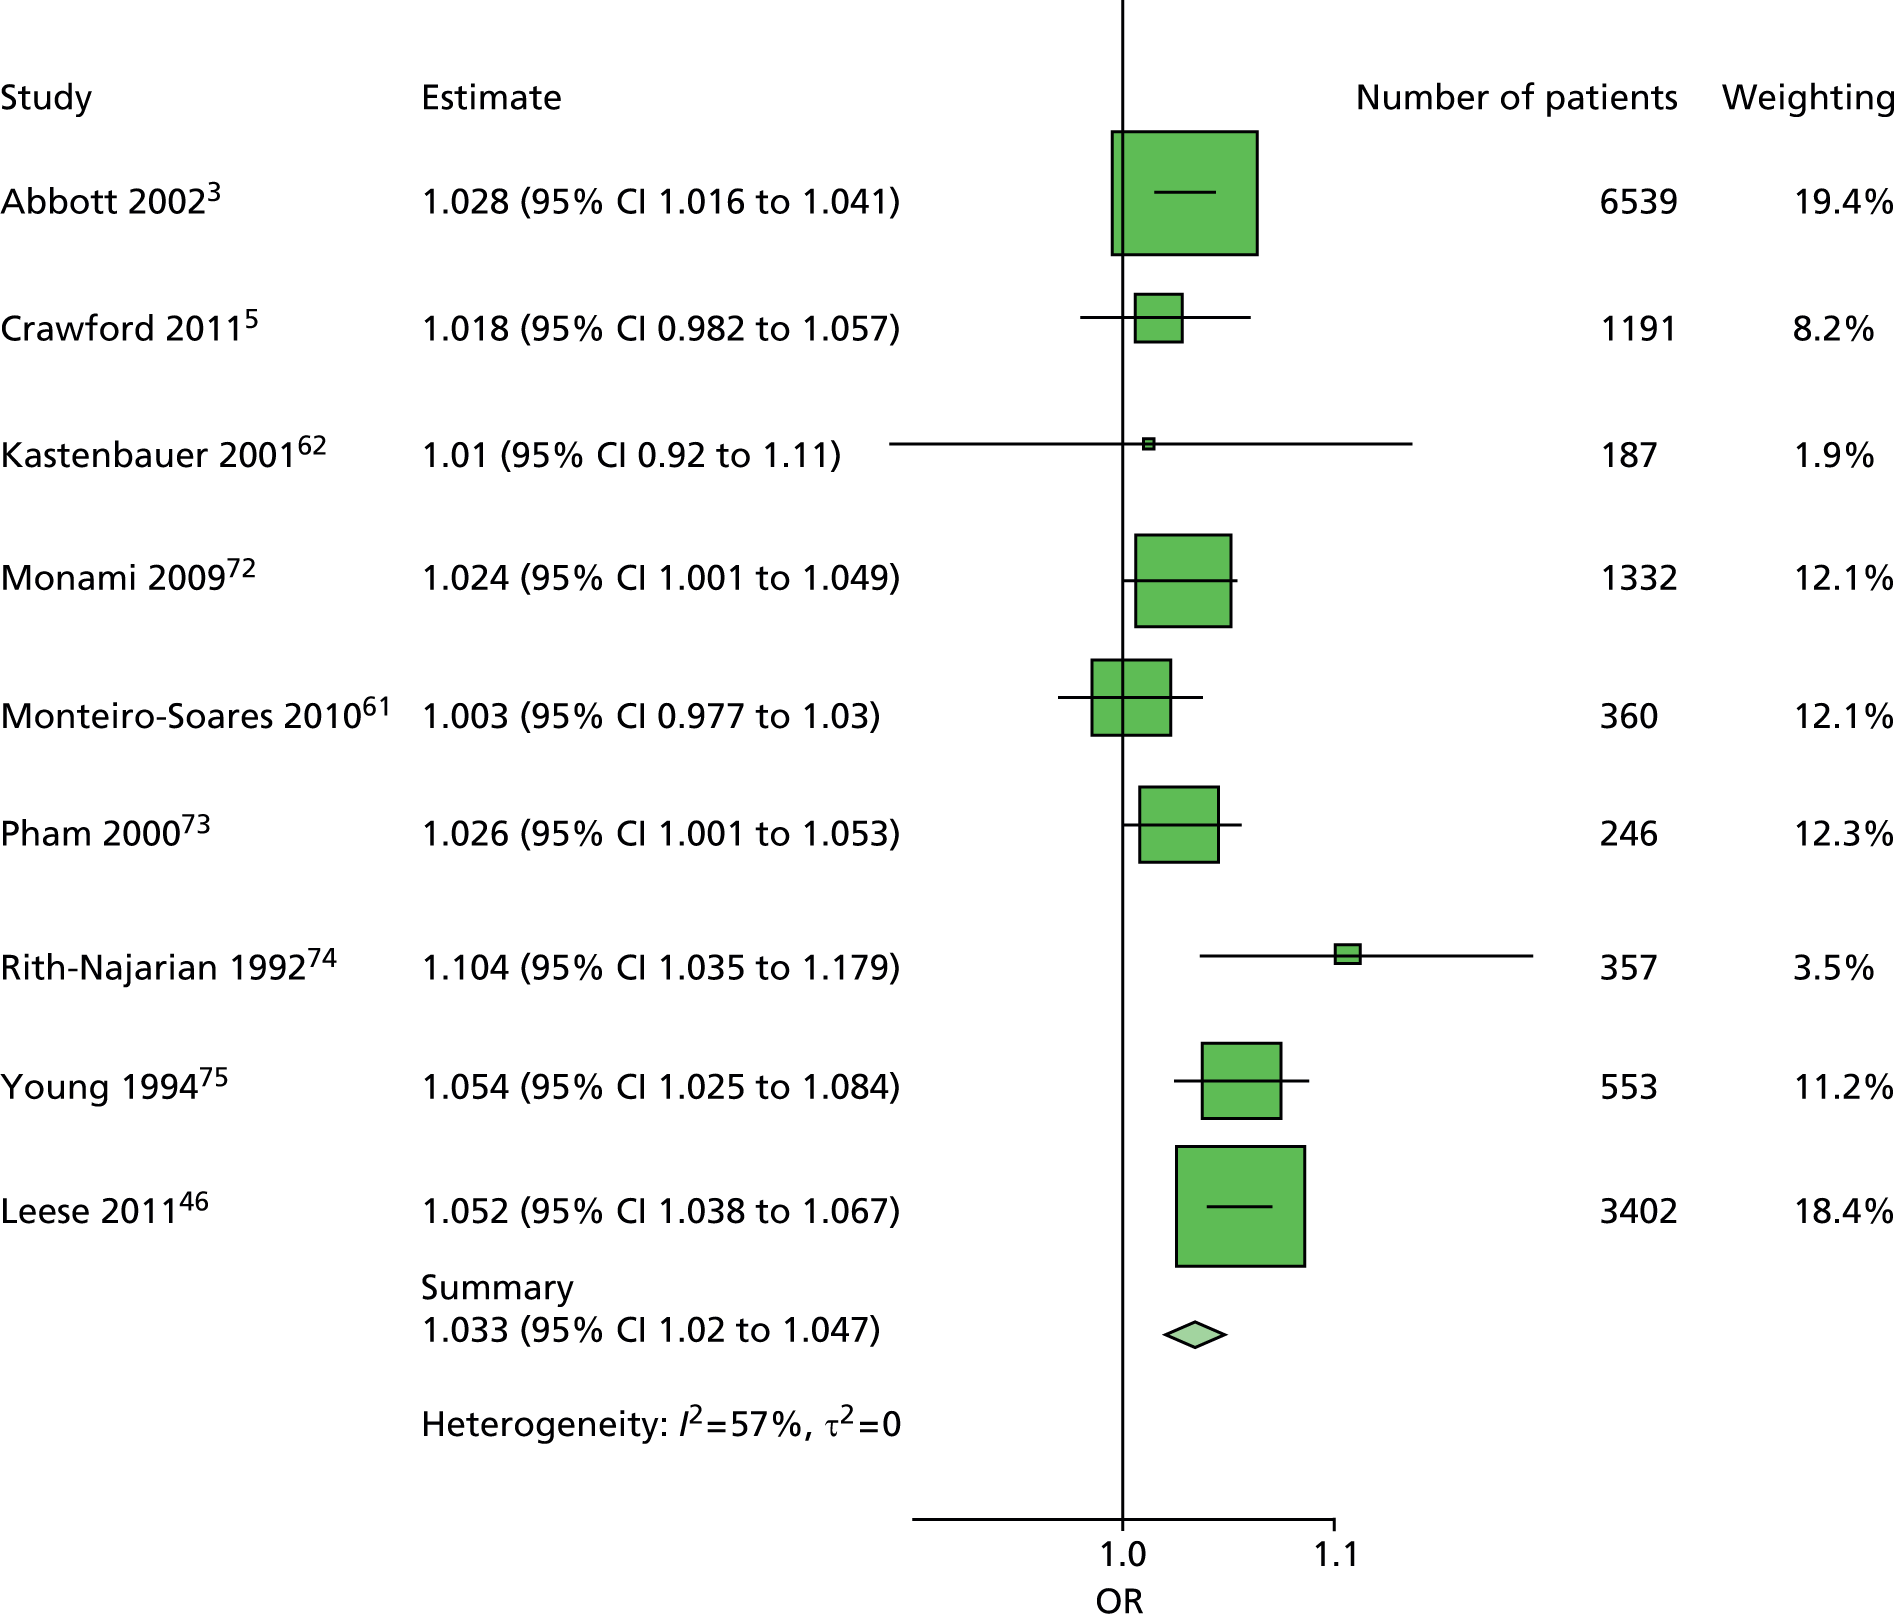
FIGURE 72.
Model 1. History of ulceration. History of ulceration or amputation has been adjusted for age, sex and duration of diabetes. There is a high level of heterogeneity visible in the forest plots and also shown by the I2 and τ-statistics. Assessment of the individual studies indicated that the level of risk varied from study to study, and this forest plot is consistent with the hypothesis that the tendency to ulcerate, whether historical or not, varied in the individual studies.
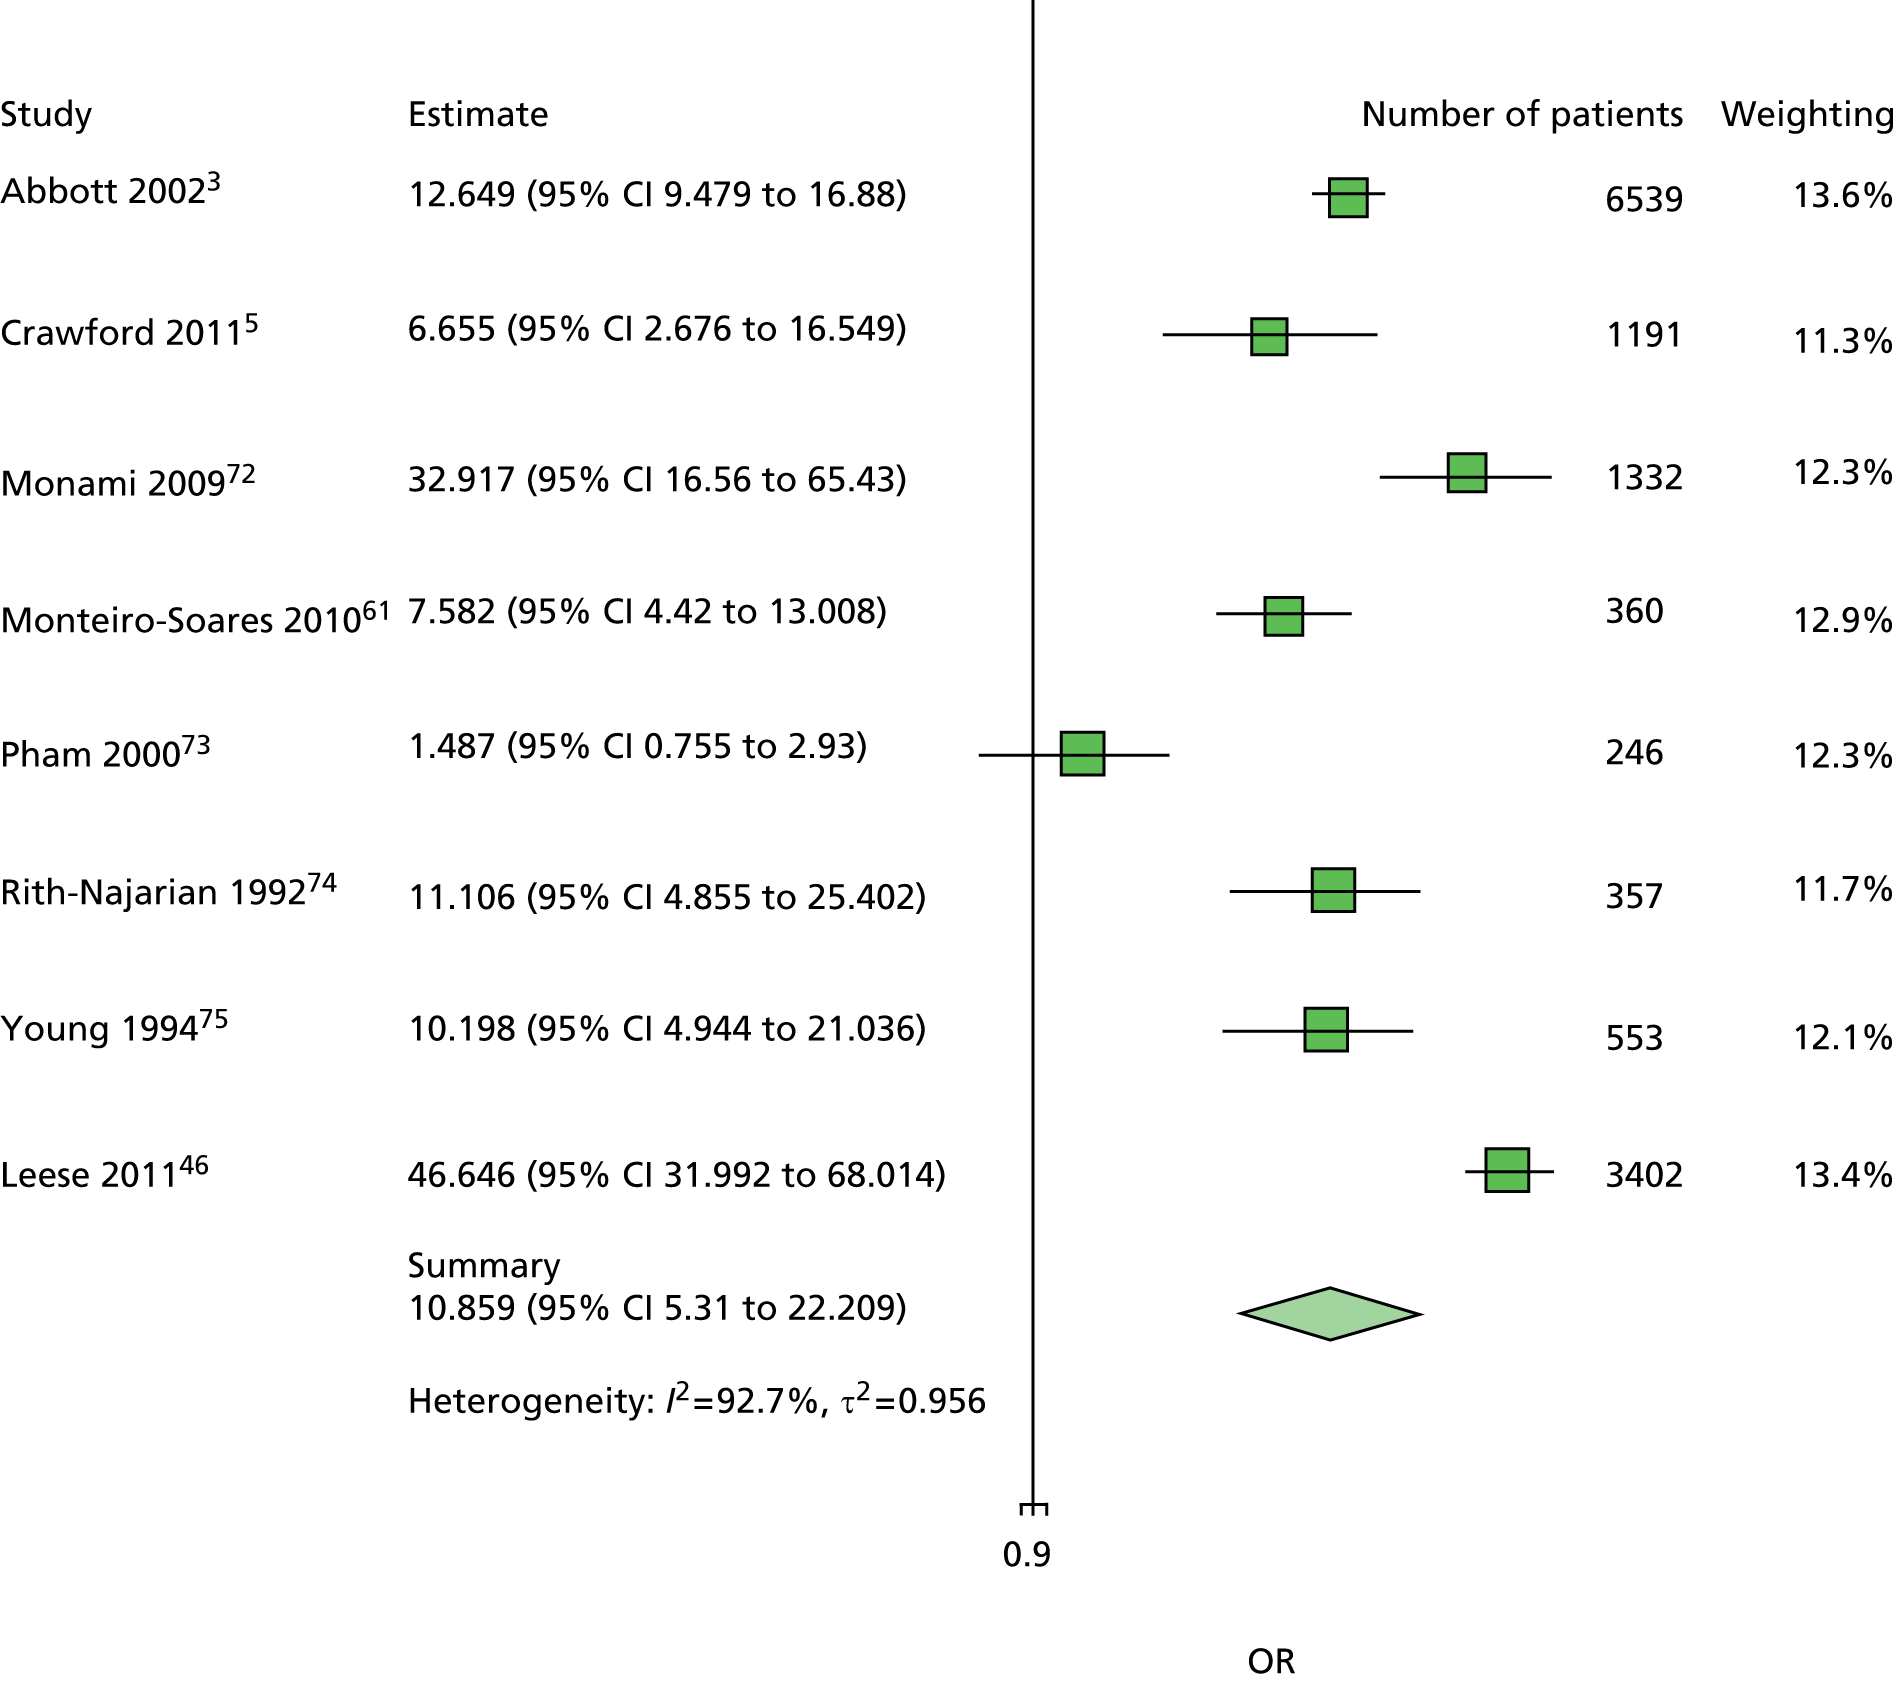
FIGURE 73.
Model 1. Sex first ulcer. Sex has been adjusted for age and duration of diabetes. The extent of heterogeneity is minimal and all studies consistently predict lower odds of ulceration for women than men.

FIGURE 74.
Model 1. Sex new ulcer. Sex has been adjusted for age, sex, duration of diabetes and previous history of ulceration or amputation. There is greater heterogeneity here than in the analyses restricted to patients without history, but again all studies estimated a lower odds of ulceration for women than men.

FIGURE 75.
Model 2. ABI first ulcer. ABI has been adjusted for age, sex, duration of diabetes and monofilament. The statistical heterogeneity is lower than expected, given the number of ways an ABI test may be done. There is not strong evidence to support the use of ABI in comparison with some of the other tests, for example, monofilaments and pulses – only one study has a statistically significant result.
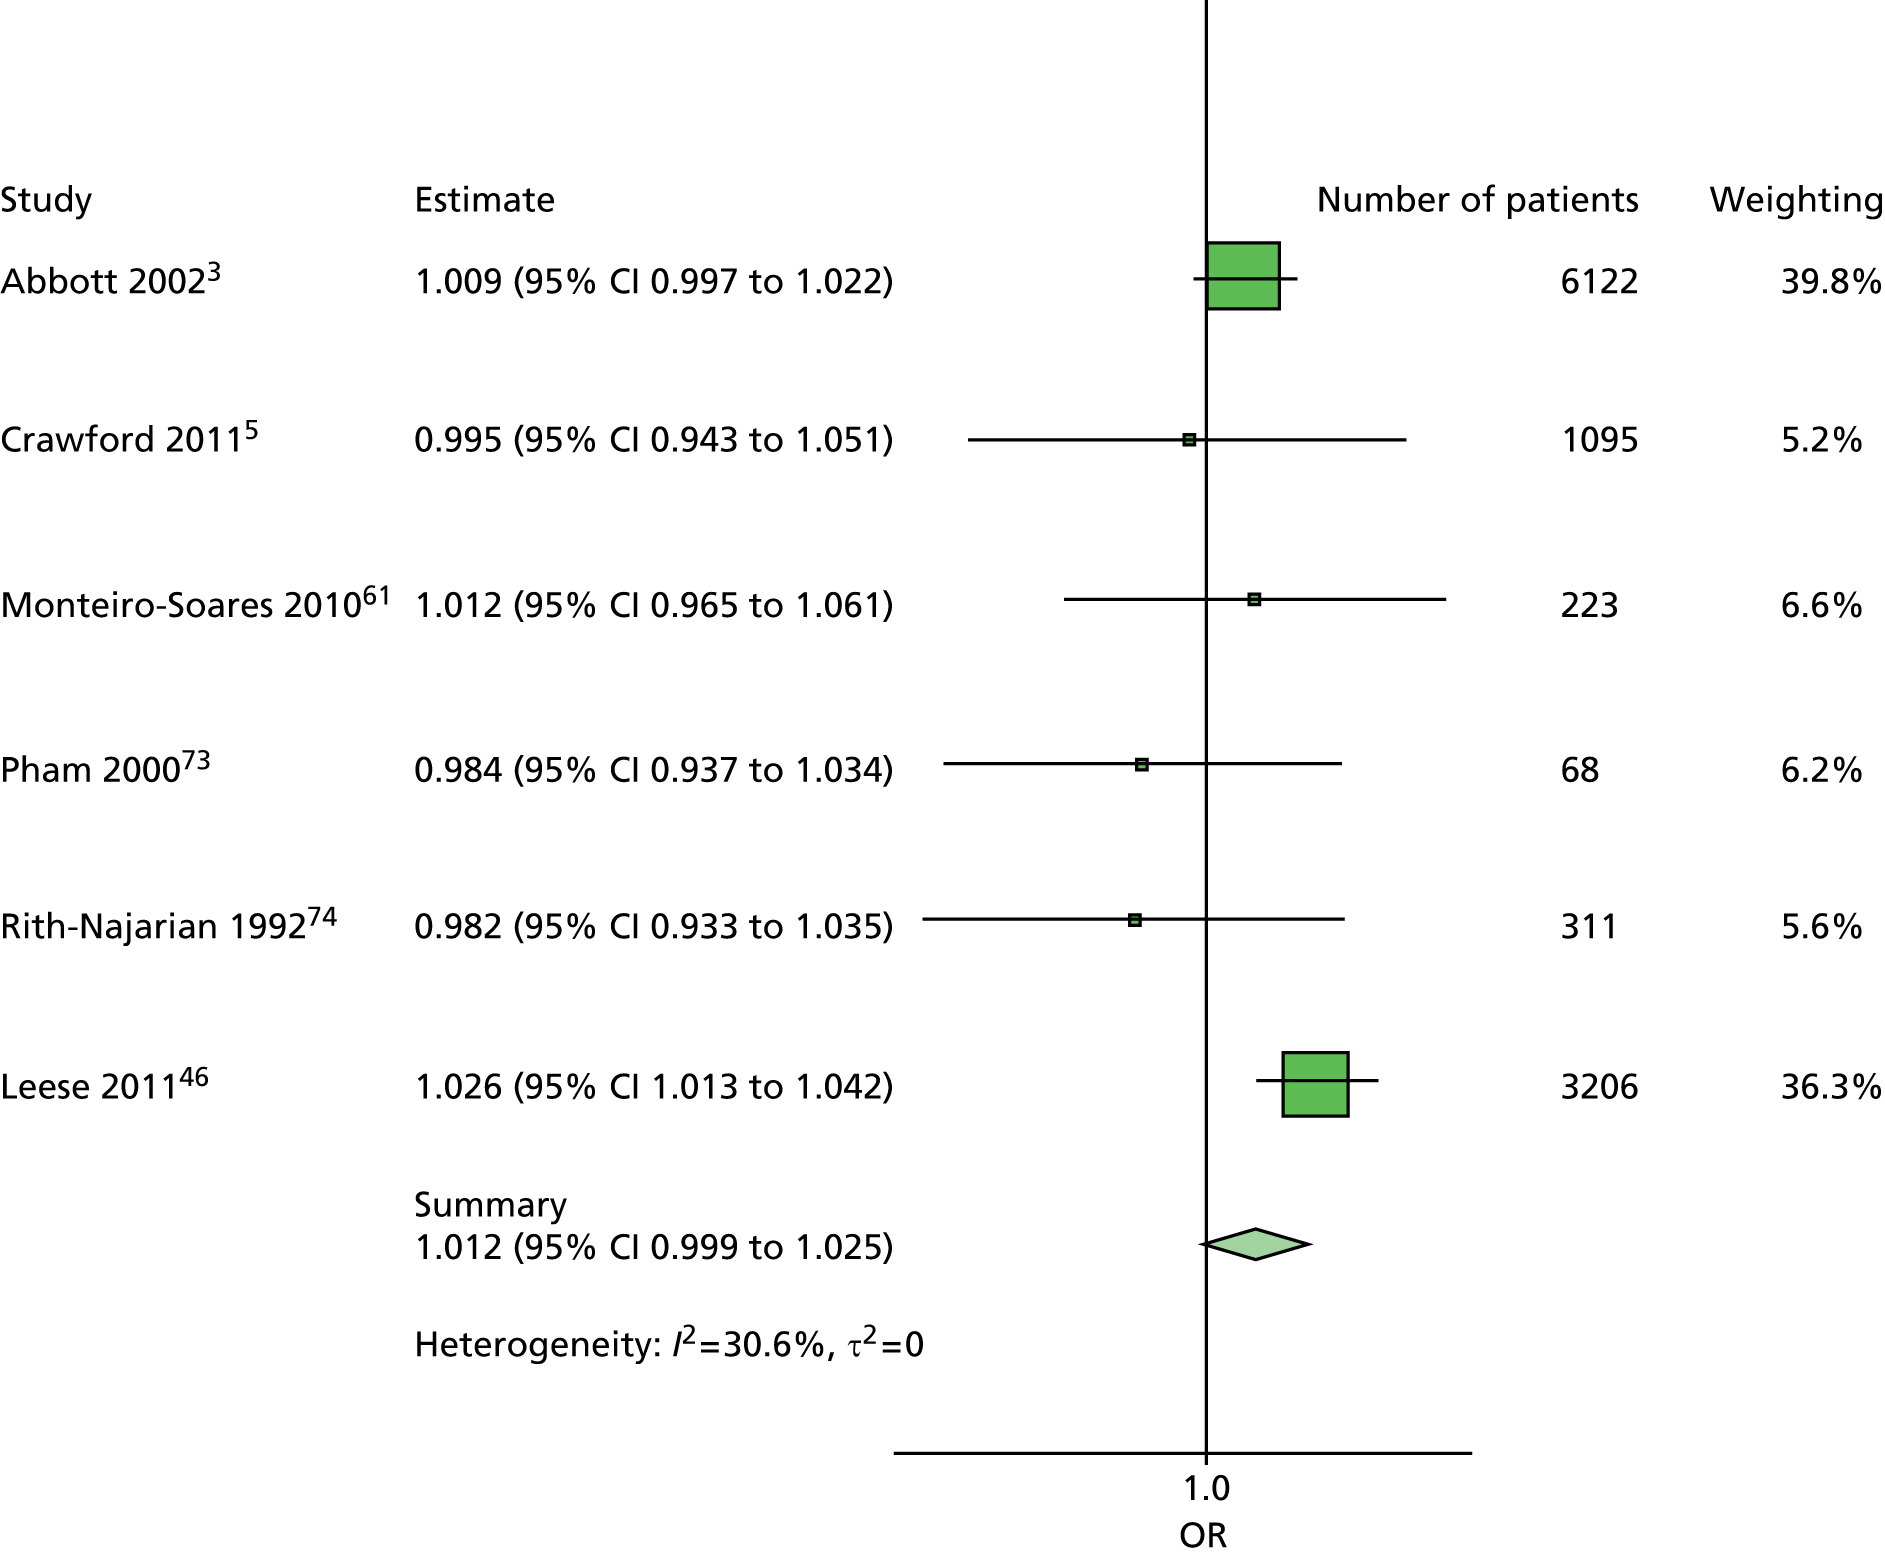
FIGURE 76.
Model 2. ABI new ulcer. ABI has been adjusted for age, sex, duration of diabetes, previous history of ulceration or amputation and monofilament. The forest plot is consistent with the ABI forest plot for patients without previous history of ulceration or amputation. The results suggest that ABI is a less useful test than some of the others.

FIGURE 77.
Model 2. Duration first ulcer. Duration of diabetes has been adjusted for age, sex, monofilament and ABI. As with Model 1, the Rith-Najarian study et al. 74 with a Pima Indian patient cohort appears to be an outlier. However, there is low heterogeneity, and duration of diabetes appears to predict ulceration.

FIGURE 78.
Model 2. Duration new ulcer. Duration of diabetes has been adjusted for age, sex, previous history of ulceration or amputation, monofilament and ABI. This forest plot is consistent with the forest plot for patients with no history. Again the Rith-Najarian et al. 74 estimate is higher than those of the other studies, and there is evidence for duration of diabetes being a predictor of ulceration.
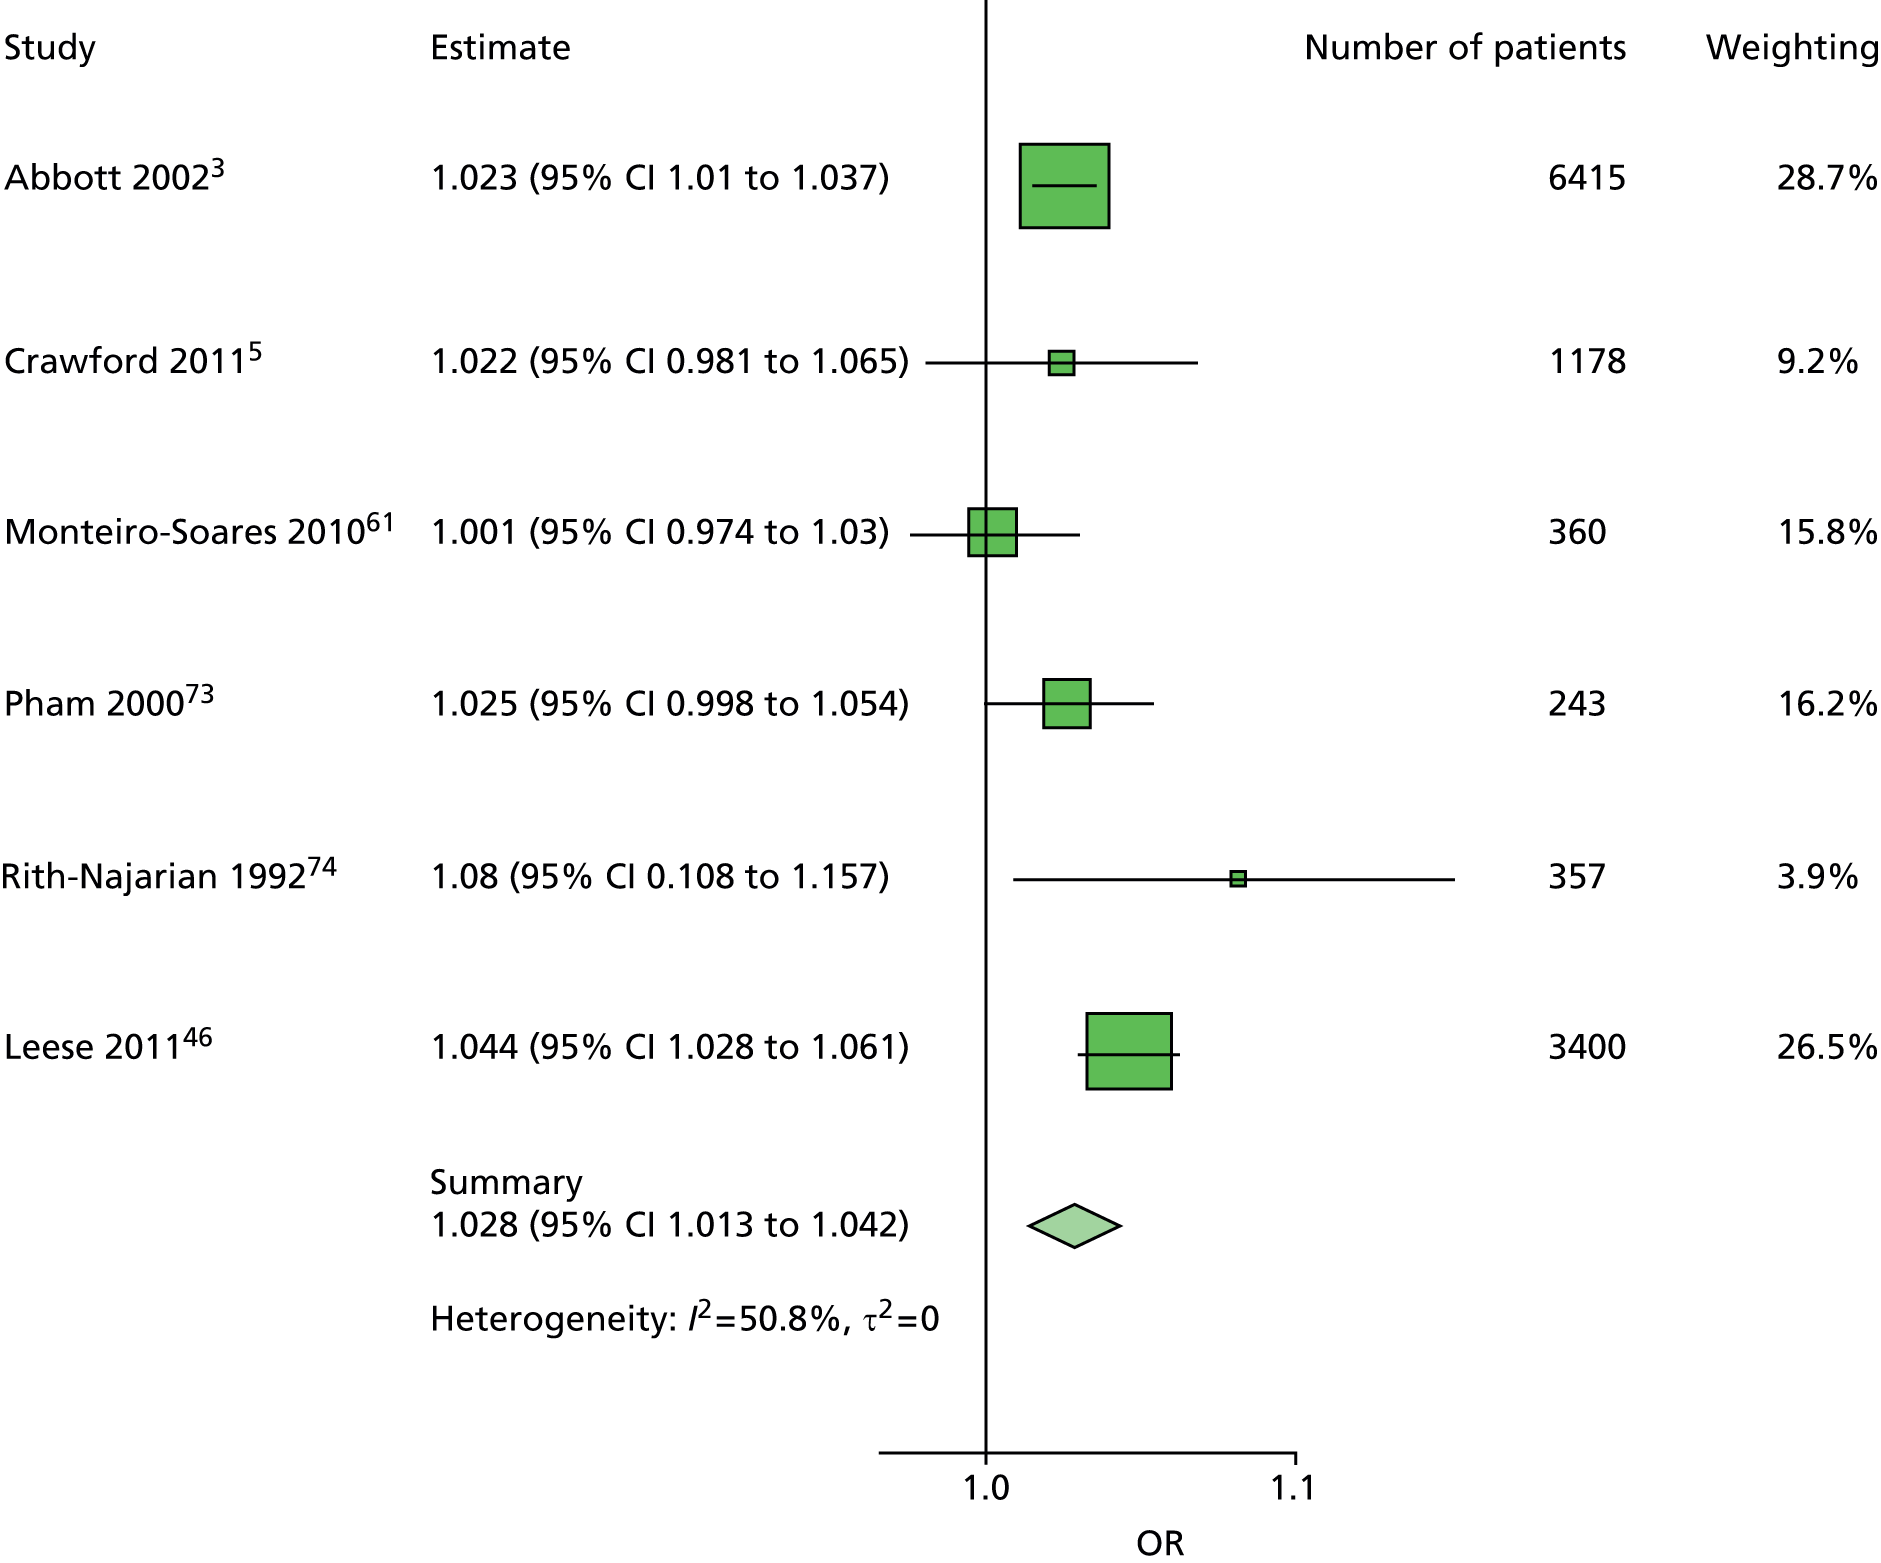
FIGURE 79.
Model 2. Monofilaments first ulcer. Monofilament has been adjusted for age, sex, duration of diabetes and ABI. This forest plot is in agreement with the other forest plots for monofilament, with low heterogeneity and a summary OR near 3.5.

FIGURE 80.
Model 2. Monofilaments new ulcer. Monofilament has been adjusted for age, sex, duration of diabetes, previous history of ulceration or amputation and ABI. This is a similar forest plot to the one for patients with no history and is consistent with the other monofilament forest plots.
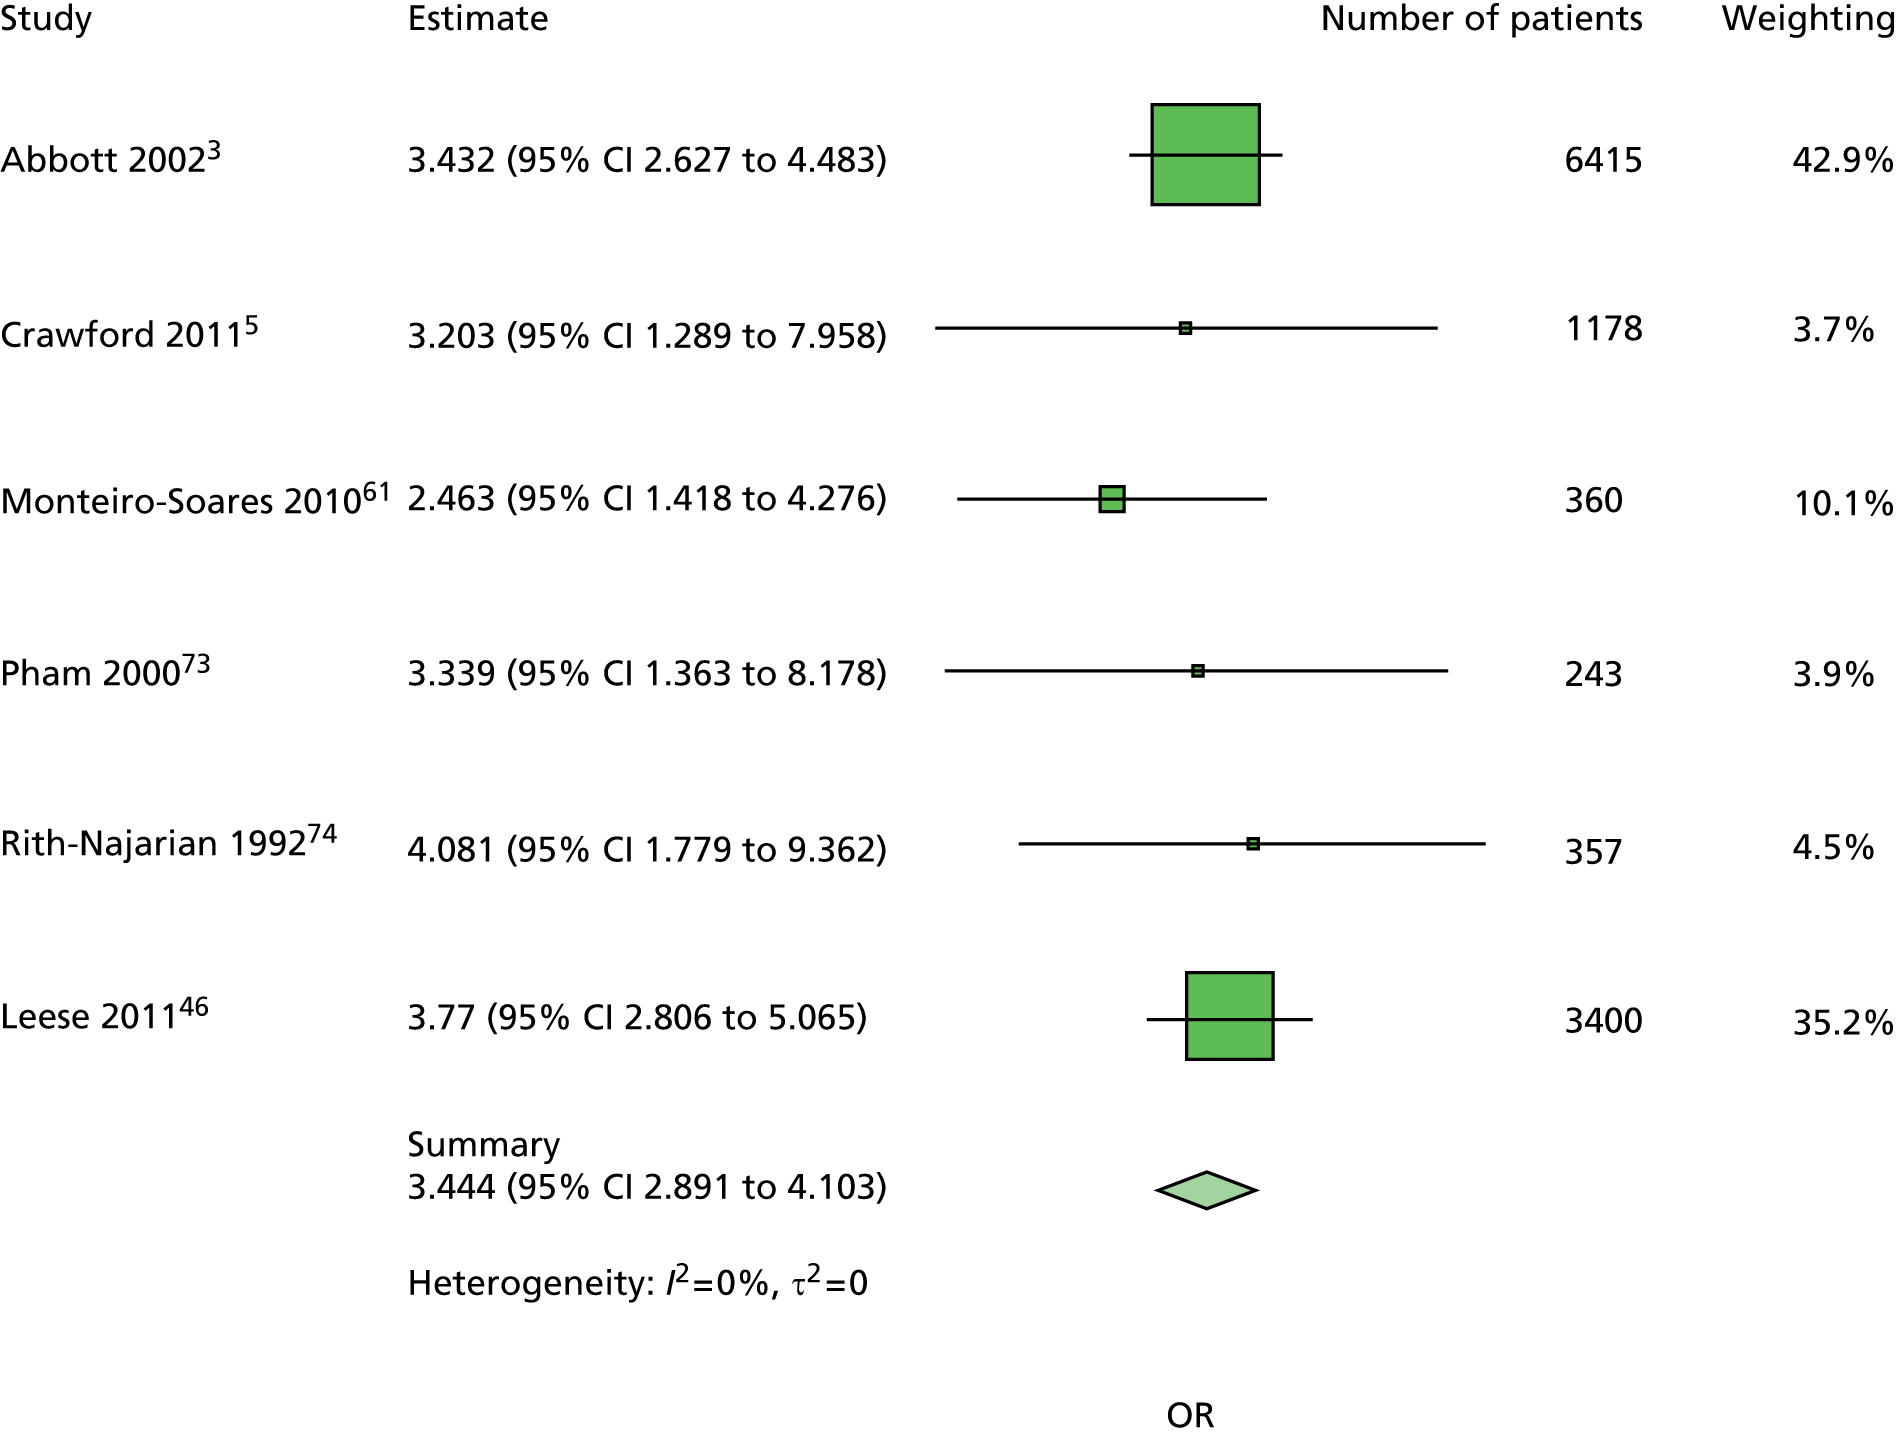
FIGURE 81.
Model 2. History of ulceration and LEA. Previous history of ulceration or amputation has been adjusted for age, sex, duration of diabetes, monofilament and ABI. There is a high level of heterogeneity in these estimates, reflecting the different clinical contexts of the individual studies, and the consequent different levels of risk for each patient cohort.
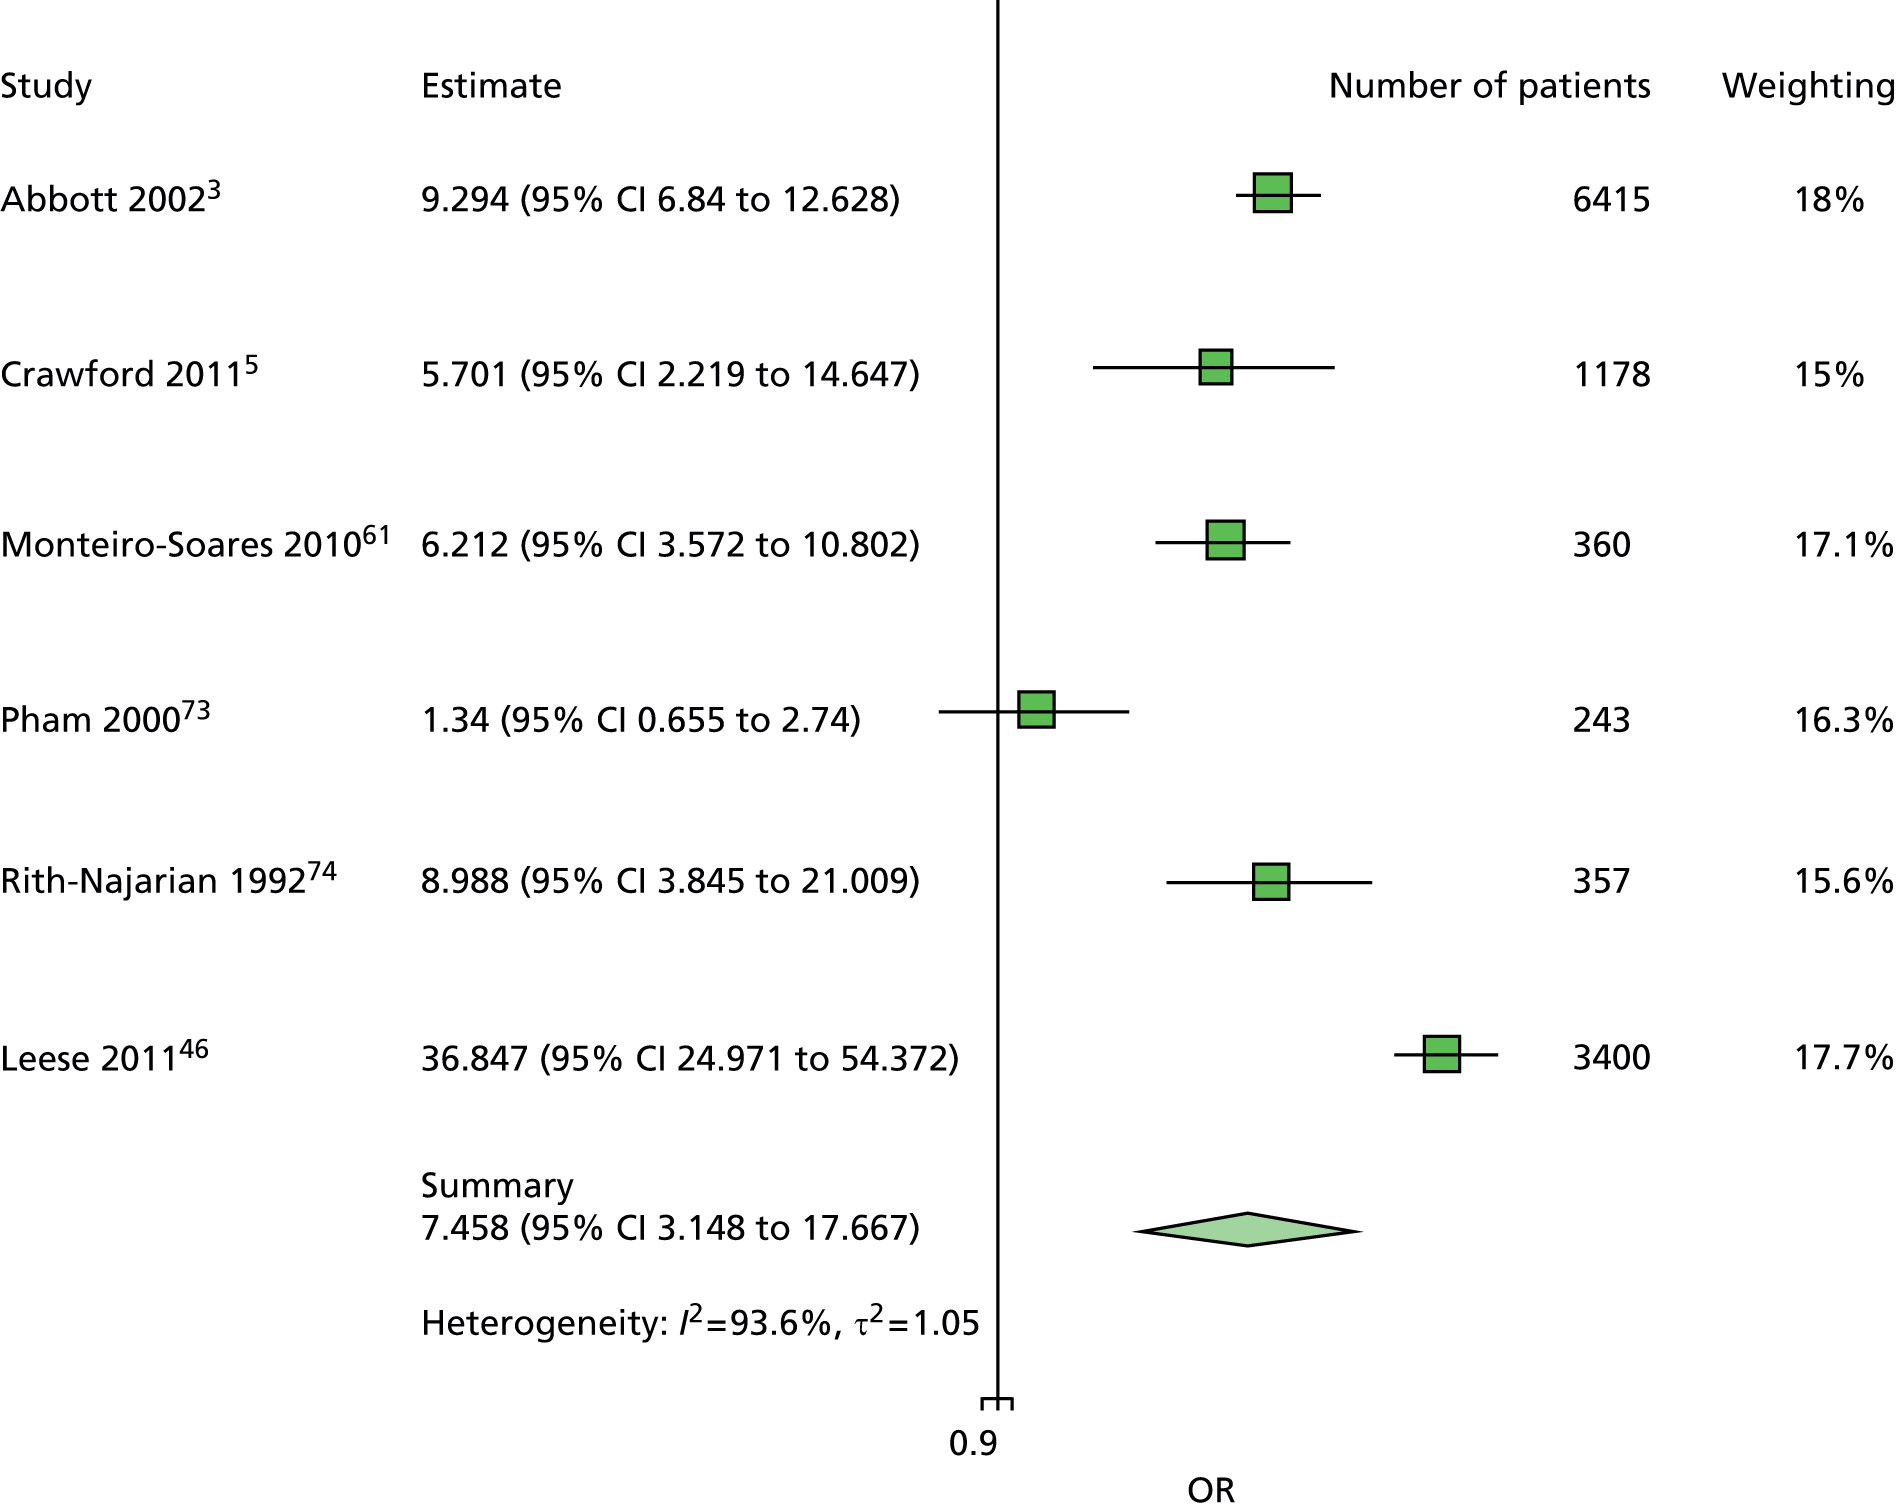
FIGURE 82.
Model 2. Sex first ulcer. Sex has been adjusted for age, duration of diabetes, monofilaments and ABI. There is low heterogeneity and some weak evidence that female sex is protective against ulceration.
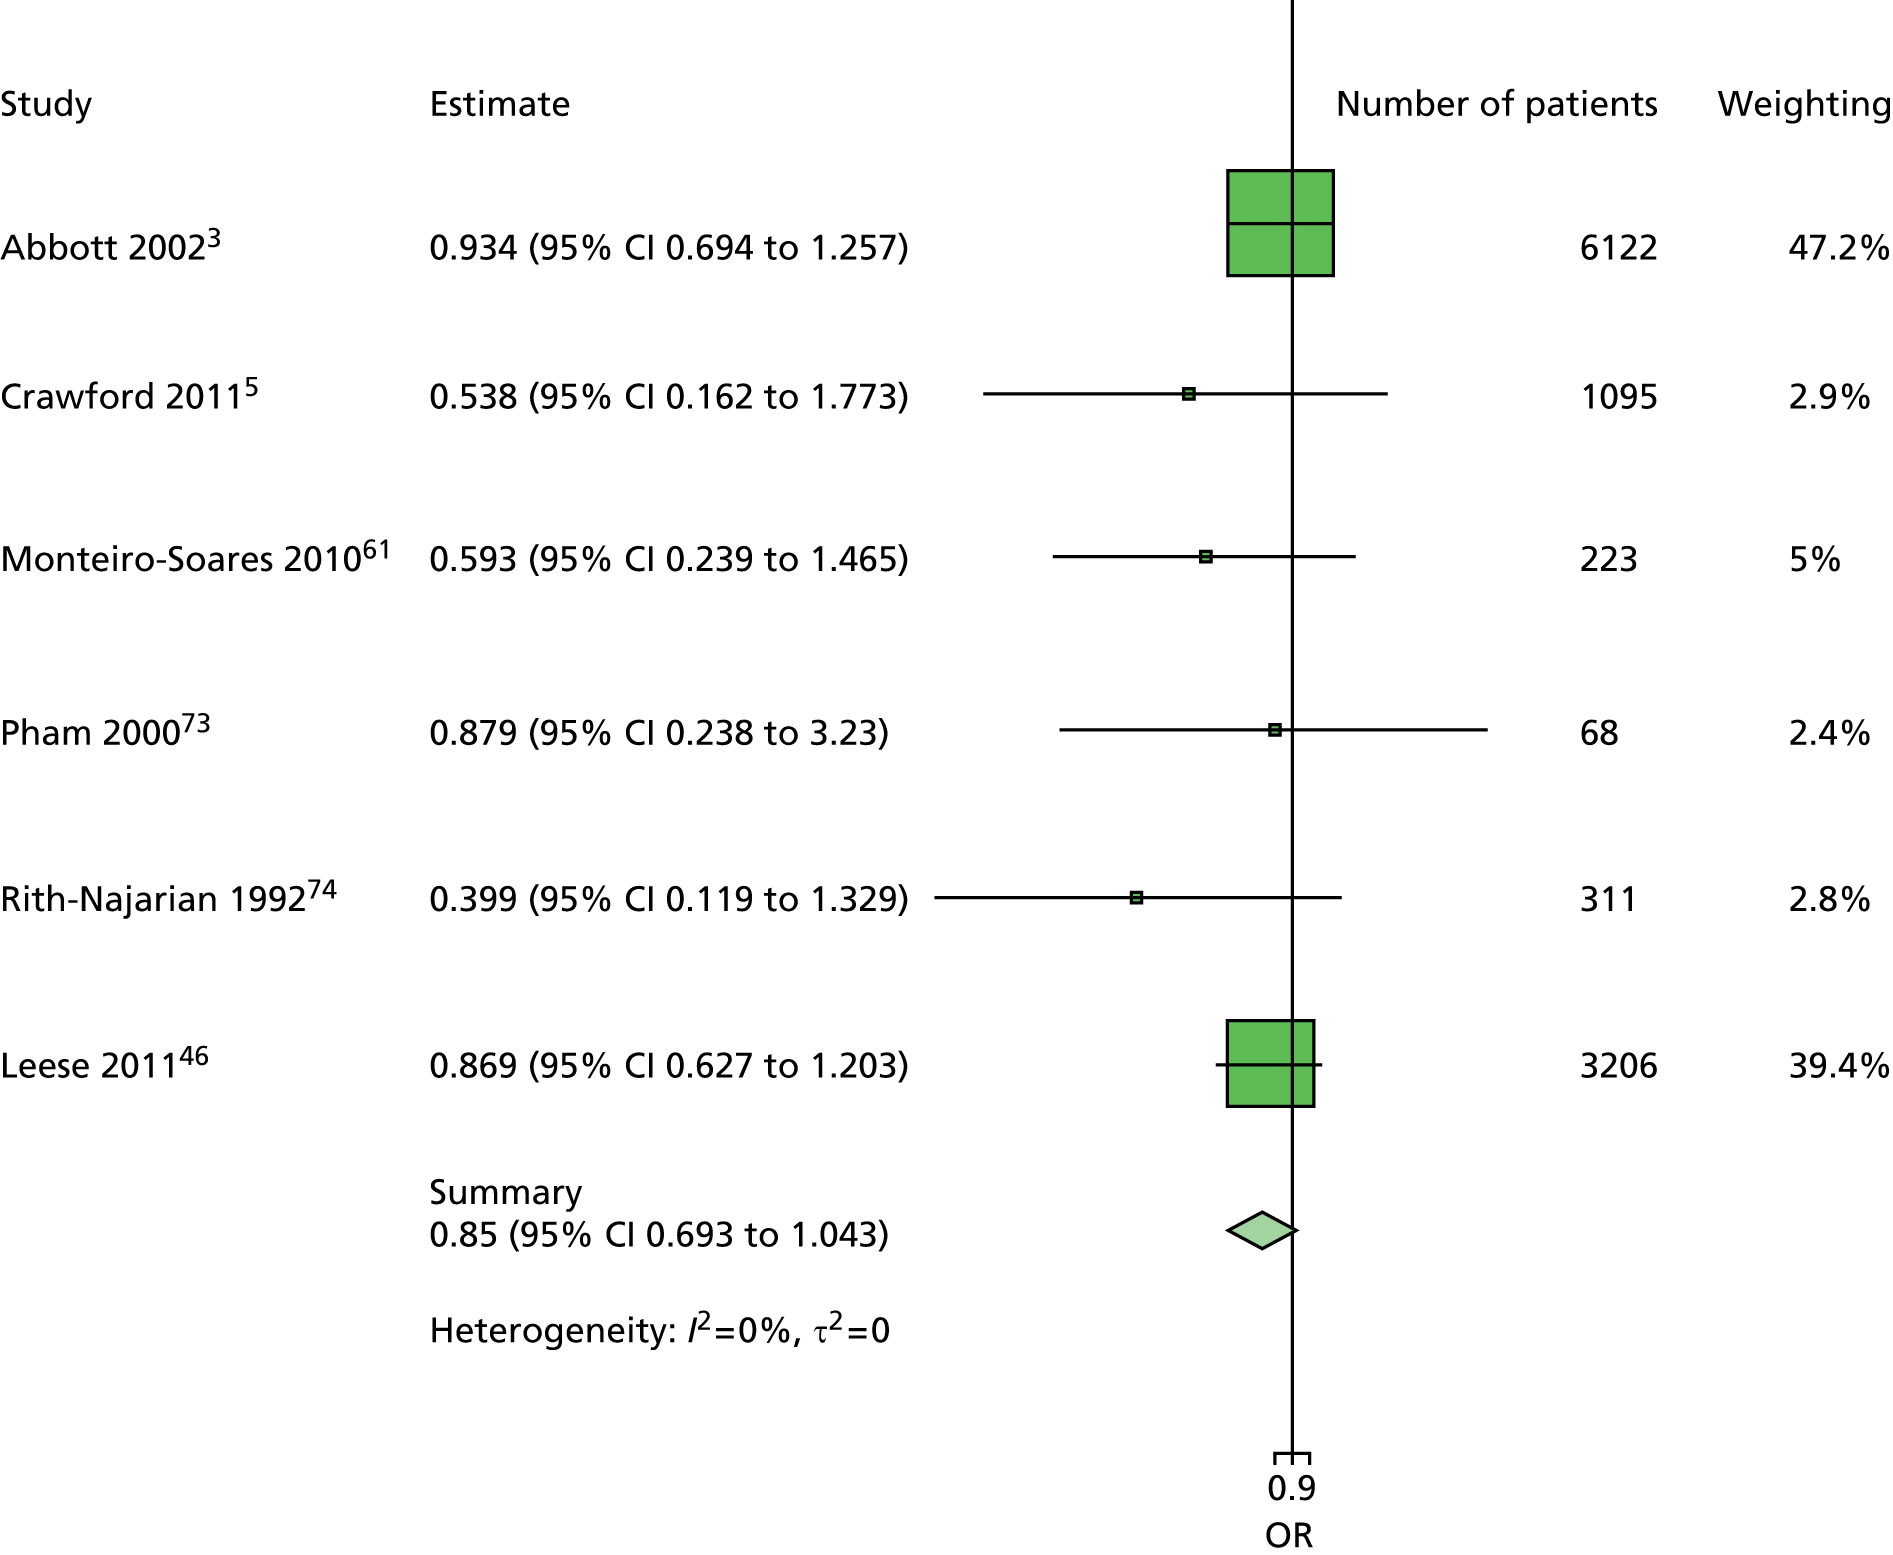
FIGURE 83.
Model 2. Sex new ulcer. Sex has been adjusted for age, duration of diabetes, previous history of ulceration or amputation, monofilaments and ABI. There is notably greater heterogeneity in this forest plot than the corresponding one for patients with no history.
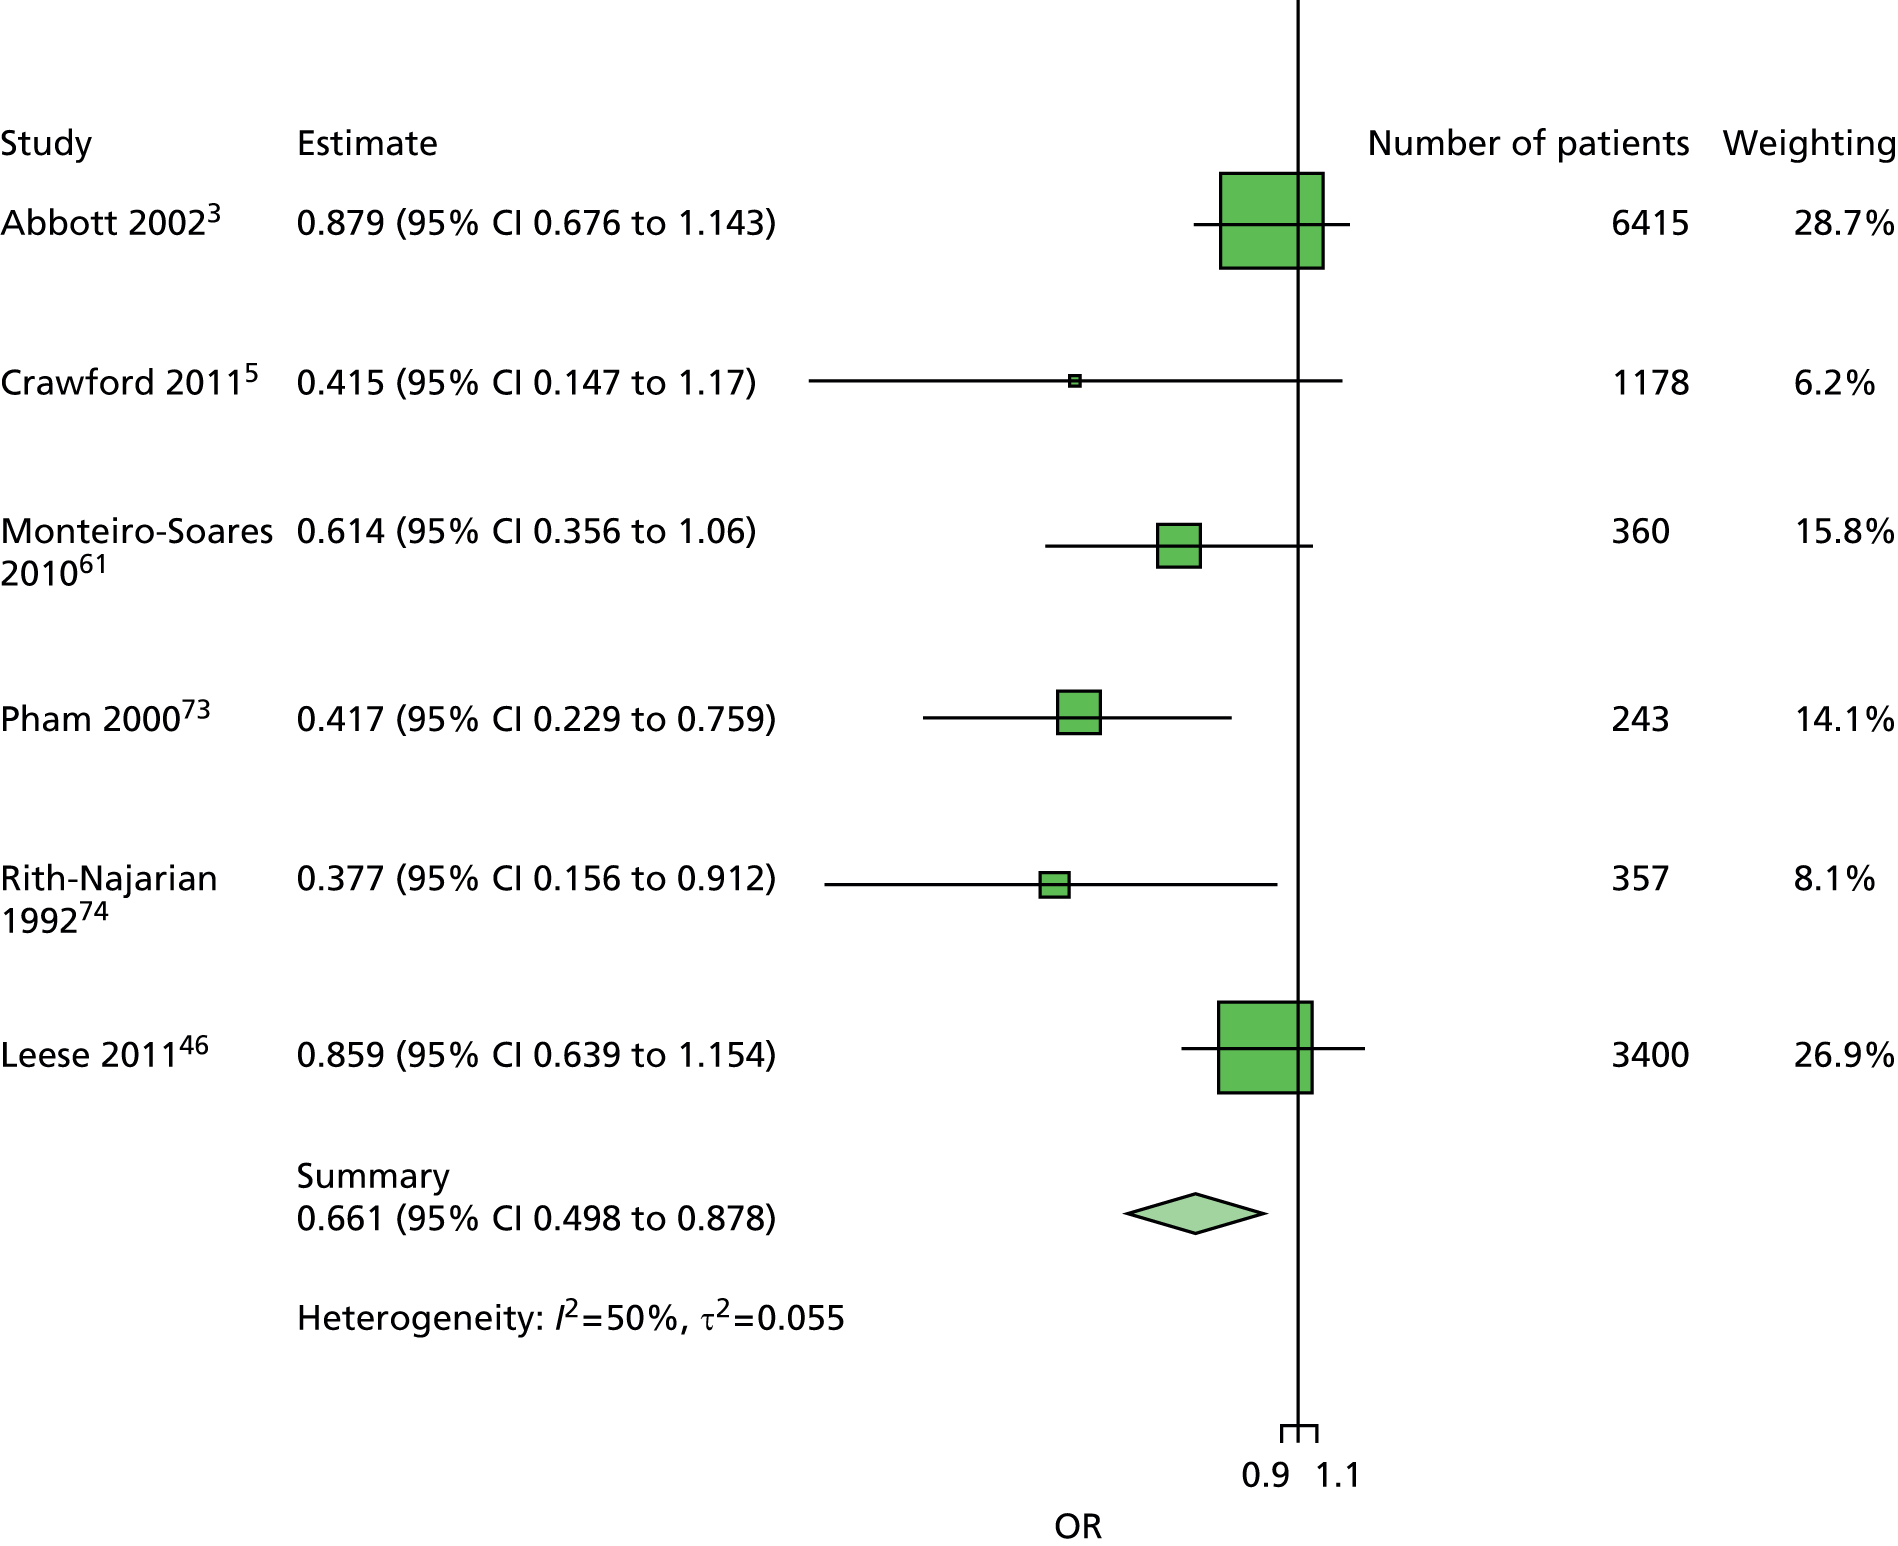
FIGURE 84.
Model 3. Age first ulcer. Age has been adjusted for sex, duration of diabetes, insulin use and monofilaments. There is very little evidence of heterogeneity, less so than for some of the other models (e.g. model 1). However, the point estimates here are not very different from those for the same studies in model 1, suggesting that the lack of heterogeneity is partly explained by the restricted number of studies.

FIGURE 85.
Model 3. Age new ulcer. Age has been adjusted for sex, duration of diabetes, previous history of ulceration or amputation, insulin use and monofilament. This is similar to the forest plot for patients with no history. Again, the number of studies prevents firm conclusions being made with respect to heterogeneity or the generalisability of the summary estimate.

FIGURE 86.
Model 3. Duration first ulcer. Duration of diabetes has been adjusted for age, sex, insulin use and monofilaments. The point estimate for the Crawford et al. 5 study is different from that in some of the other models. Here it suggests that longer duration of diabetes is protective against ulceration. This may be because of imprecision in the estimate (the true value for the Crawford study may be > 1, but ‘wobble’ in the data may have caused the point estimate to be < 1) or because of complexities in the variable relationships.
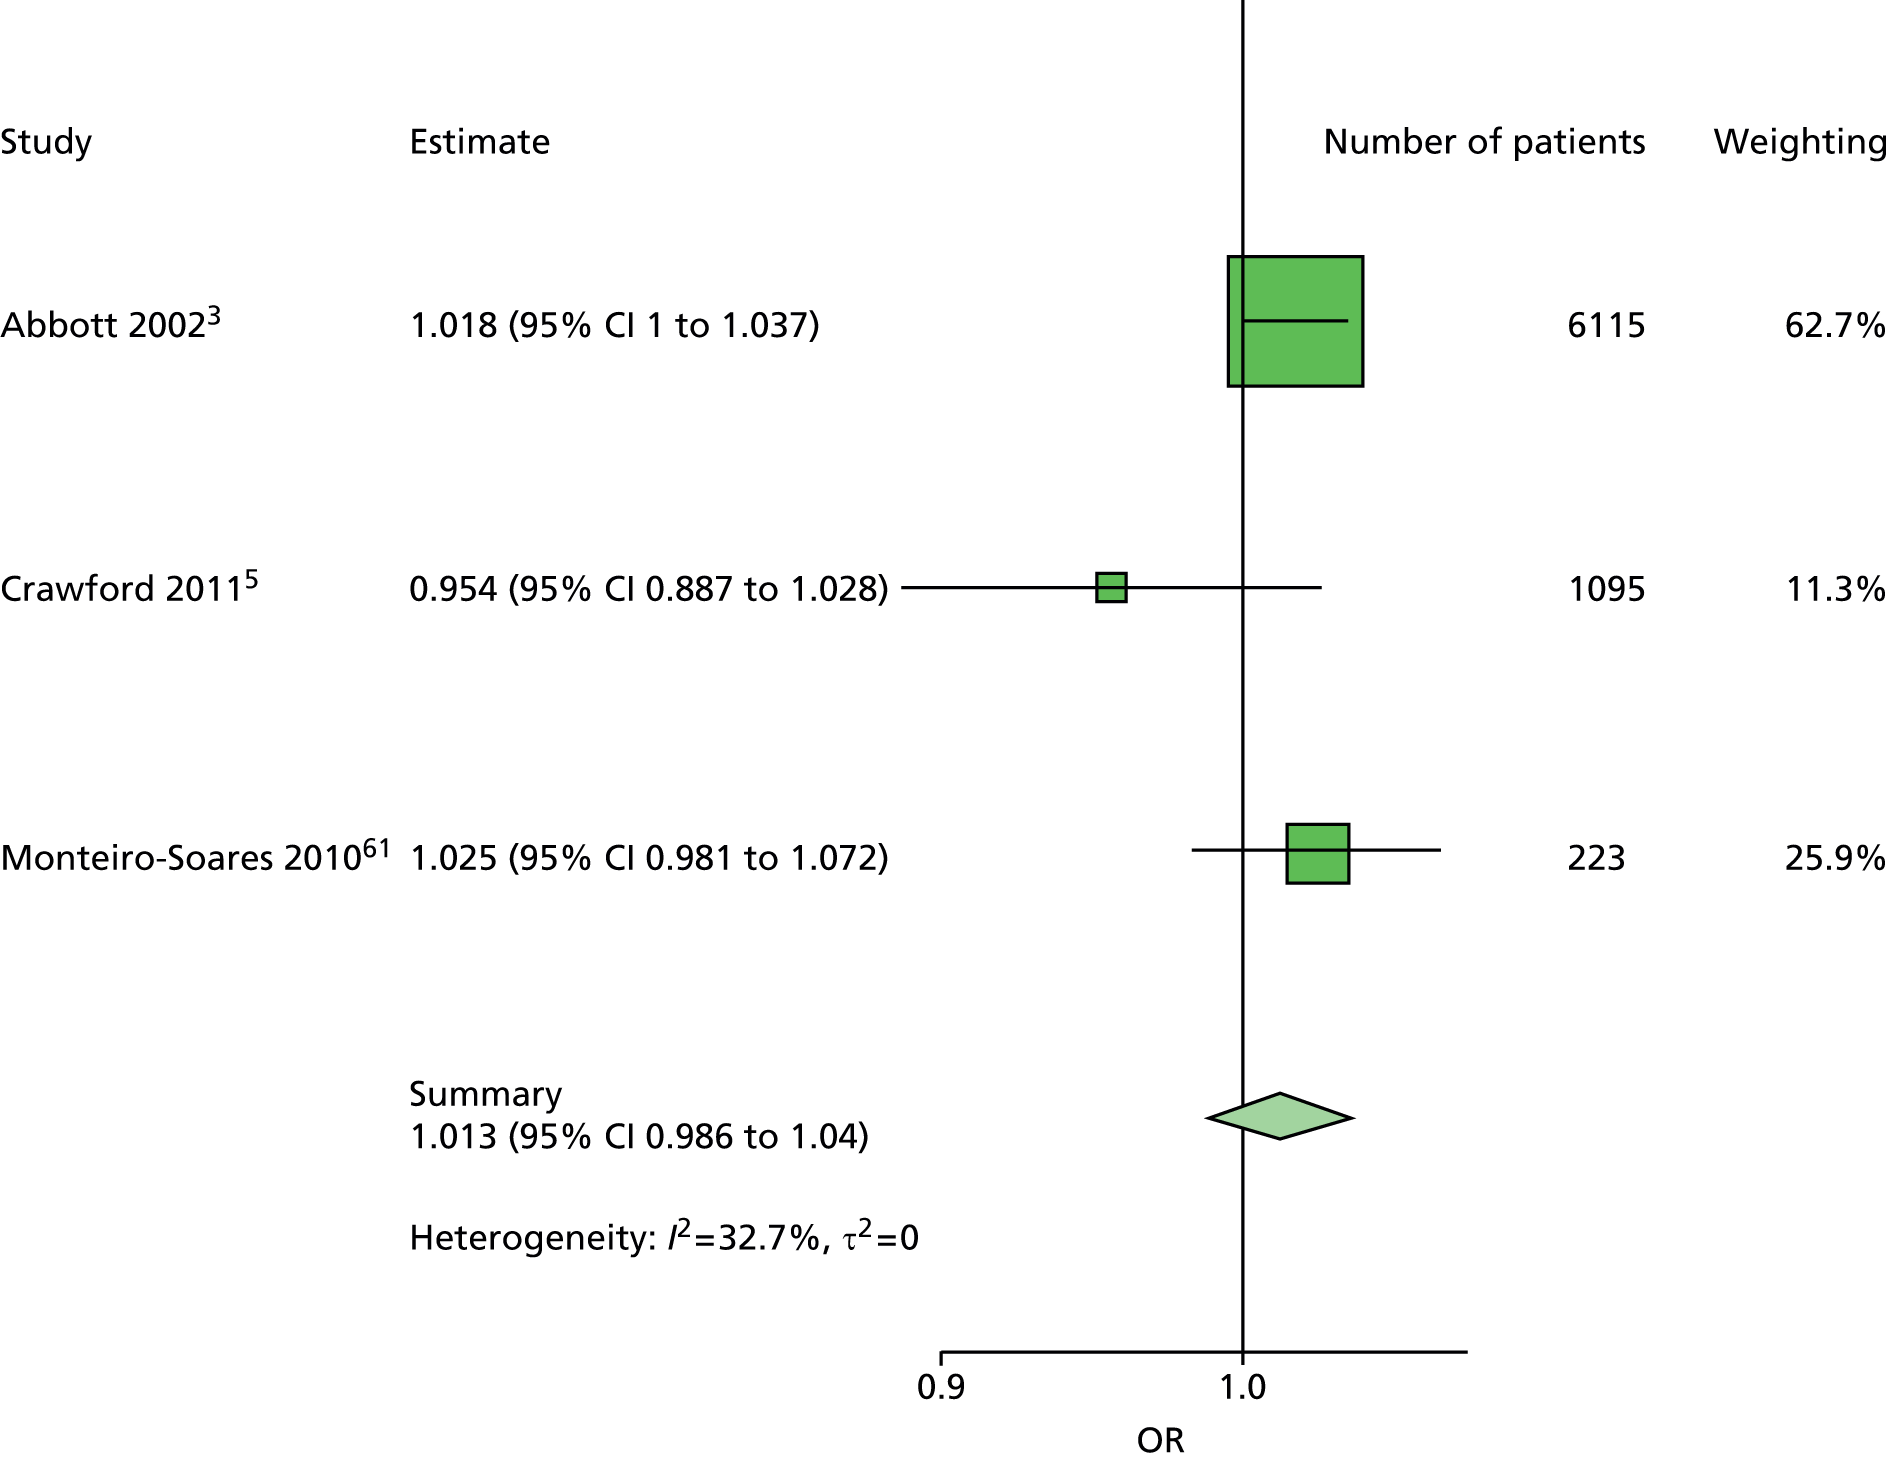
FIGURE 87.
Model 3. Duration new ulcer. Duration of diabetes has been adjusted for age, sex, previous history of ulceration or amputation, insulin use and monofilaments. This is consistent with the corresponding forest plot for patients with no history. Again the point estimate for the Crawford et al. 5 data set has an unexpected direction and this may be because of imprecision in the point estimate.

FIGURE 88.
Model 3. Insulin first ulcer. Insulin use has been adjusted for age, sex, duration of diabetes and monofilament. This is a similar forest plot to that produced for the univariate analyses, where use of insulin can be both protective against and predictive of ulceration, probably reflecting the different pathways patients may take to be prescribed insulin.
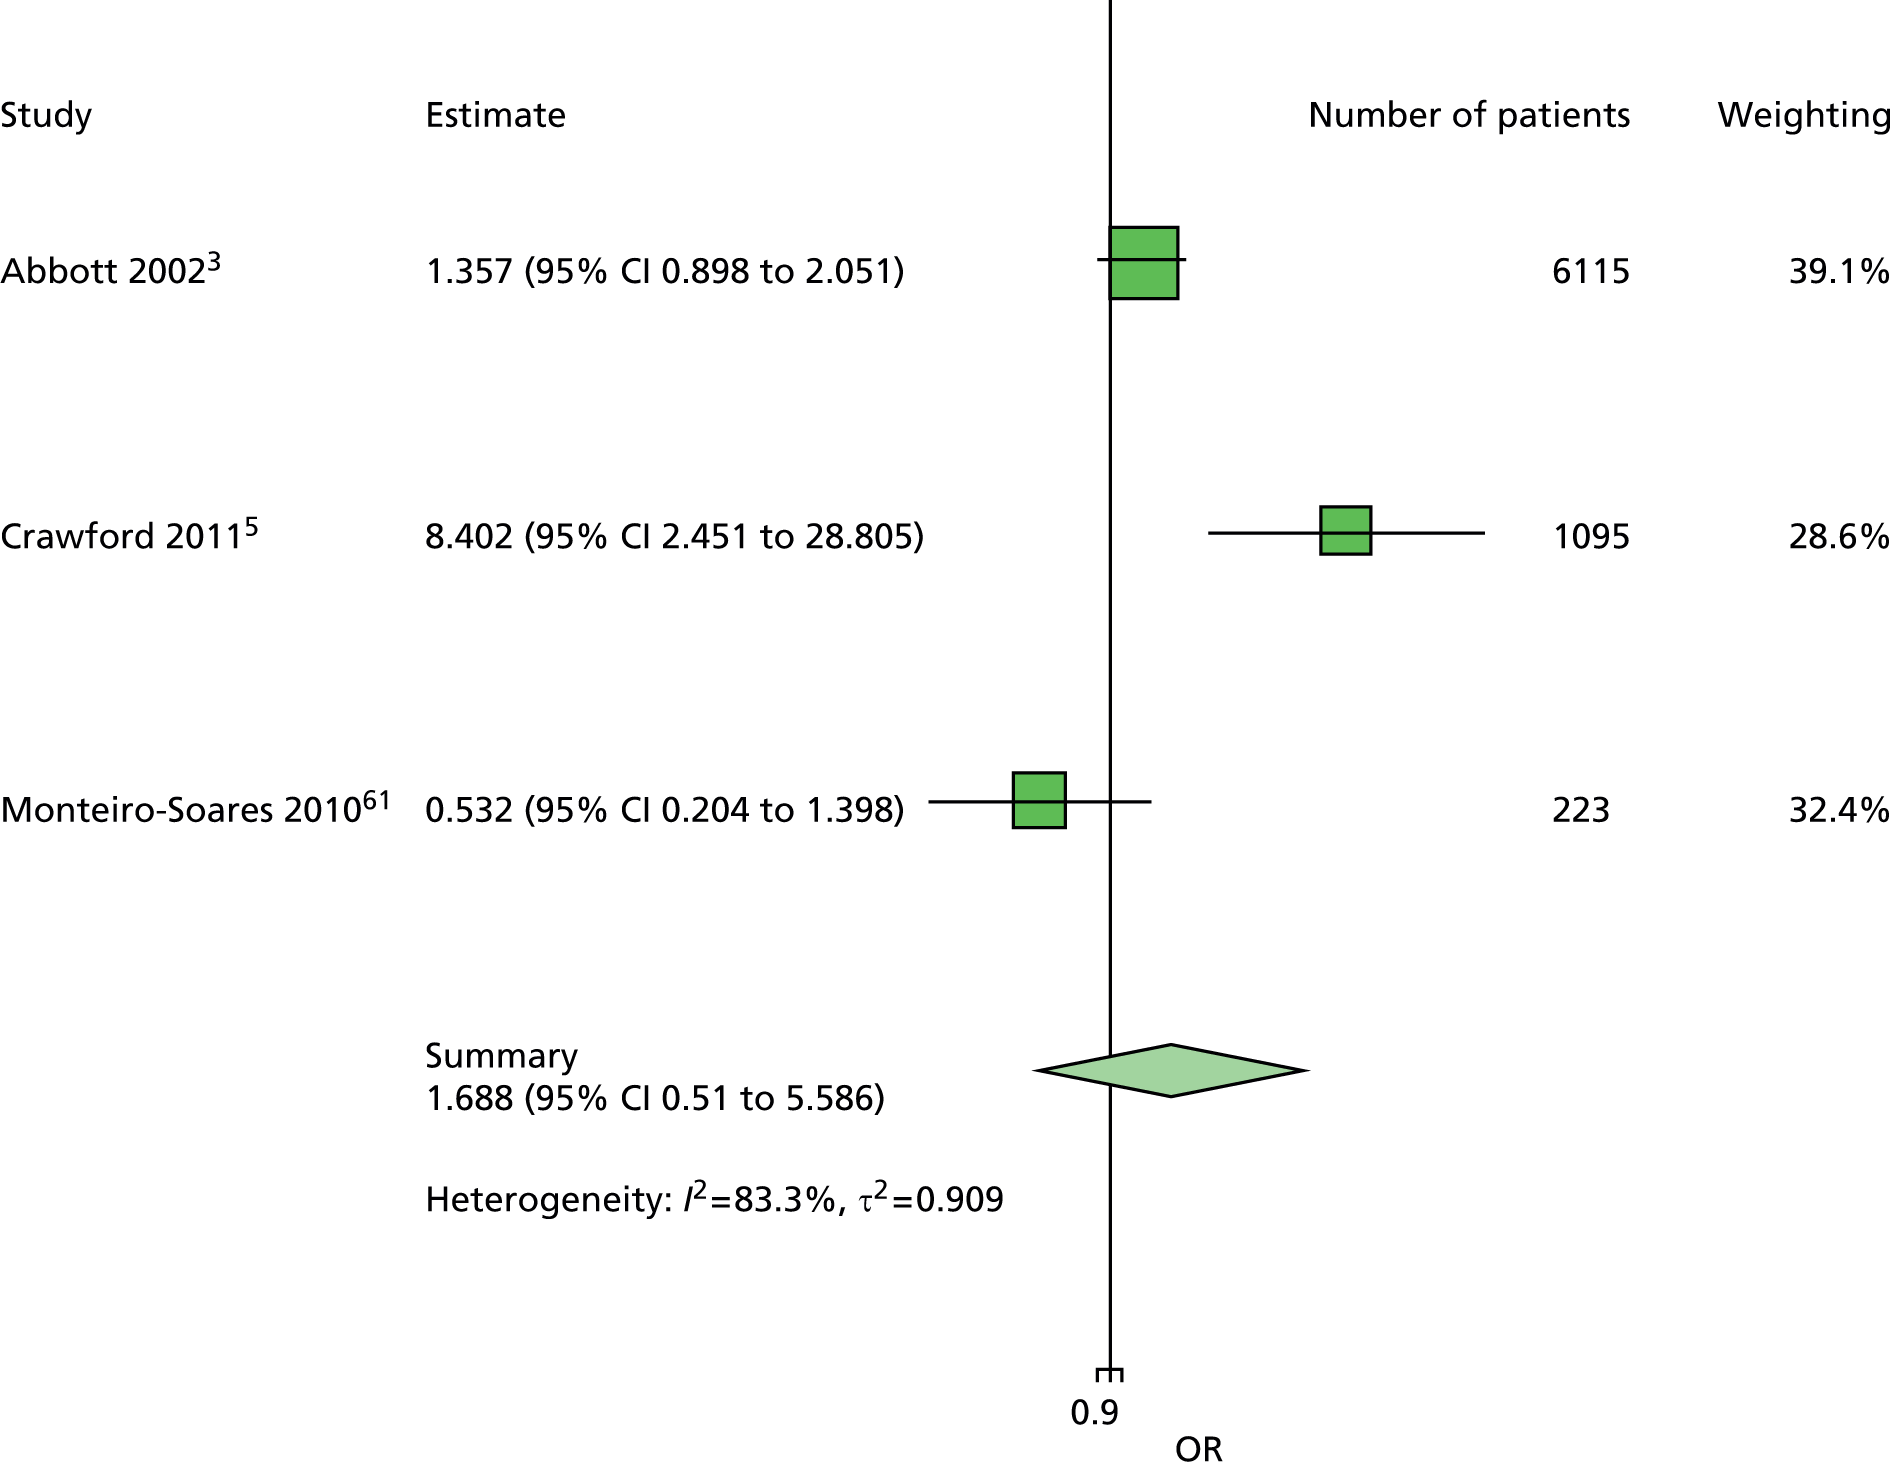
FIGURE 89.
Model 3. Insulin new ulcer. Insulin use has been adjusted for age, sex, duration of diabetes, previous history of ulceration or amputation and monofilament. This forest plot is consistent with the corresponding forest plot for patients with no history of ulceration or amputation and also that for the univariate analyses. The relationship between insulin use and ulceration deserves further investigation.

FIGURE 90.
Model 3. Monofilaments first ulcer. Monofilament has been adjusted for age, sex, duration of diabetes and insulin use. This forest plot is consistent with the other monofilament forest plots – low heterogeneity and a summary estimate near 3.5.
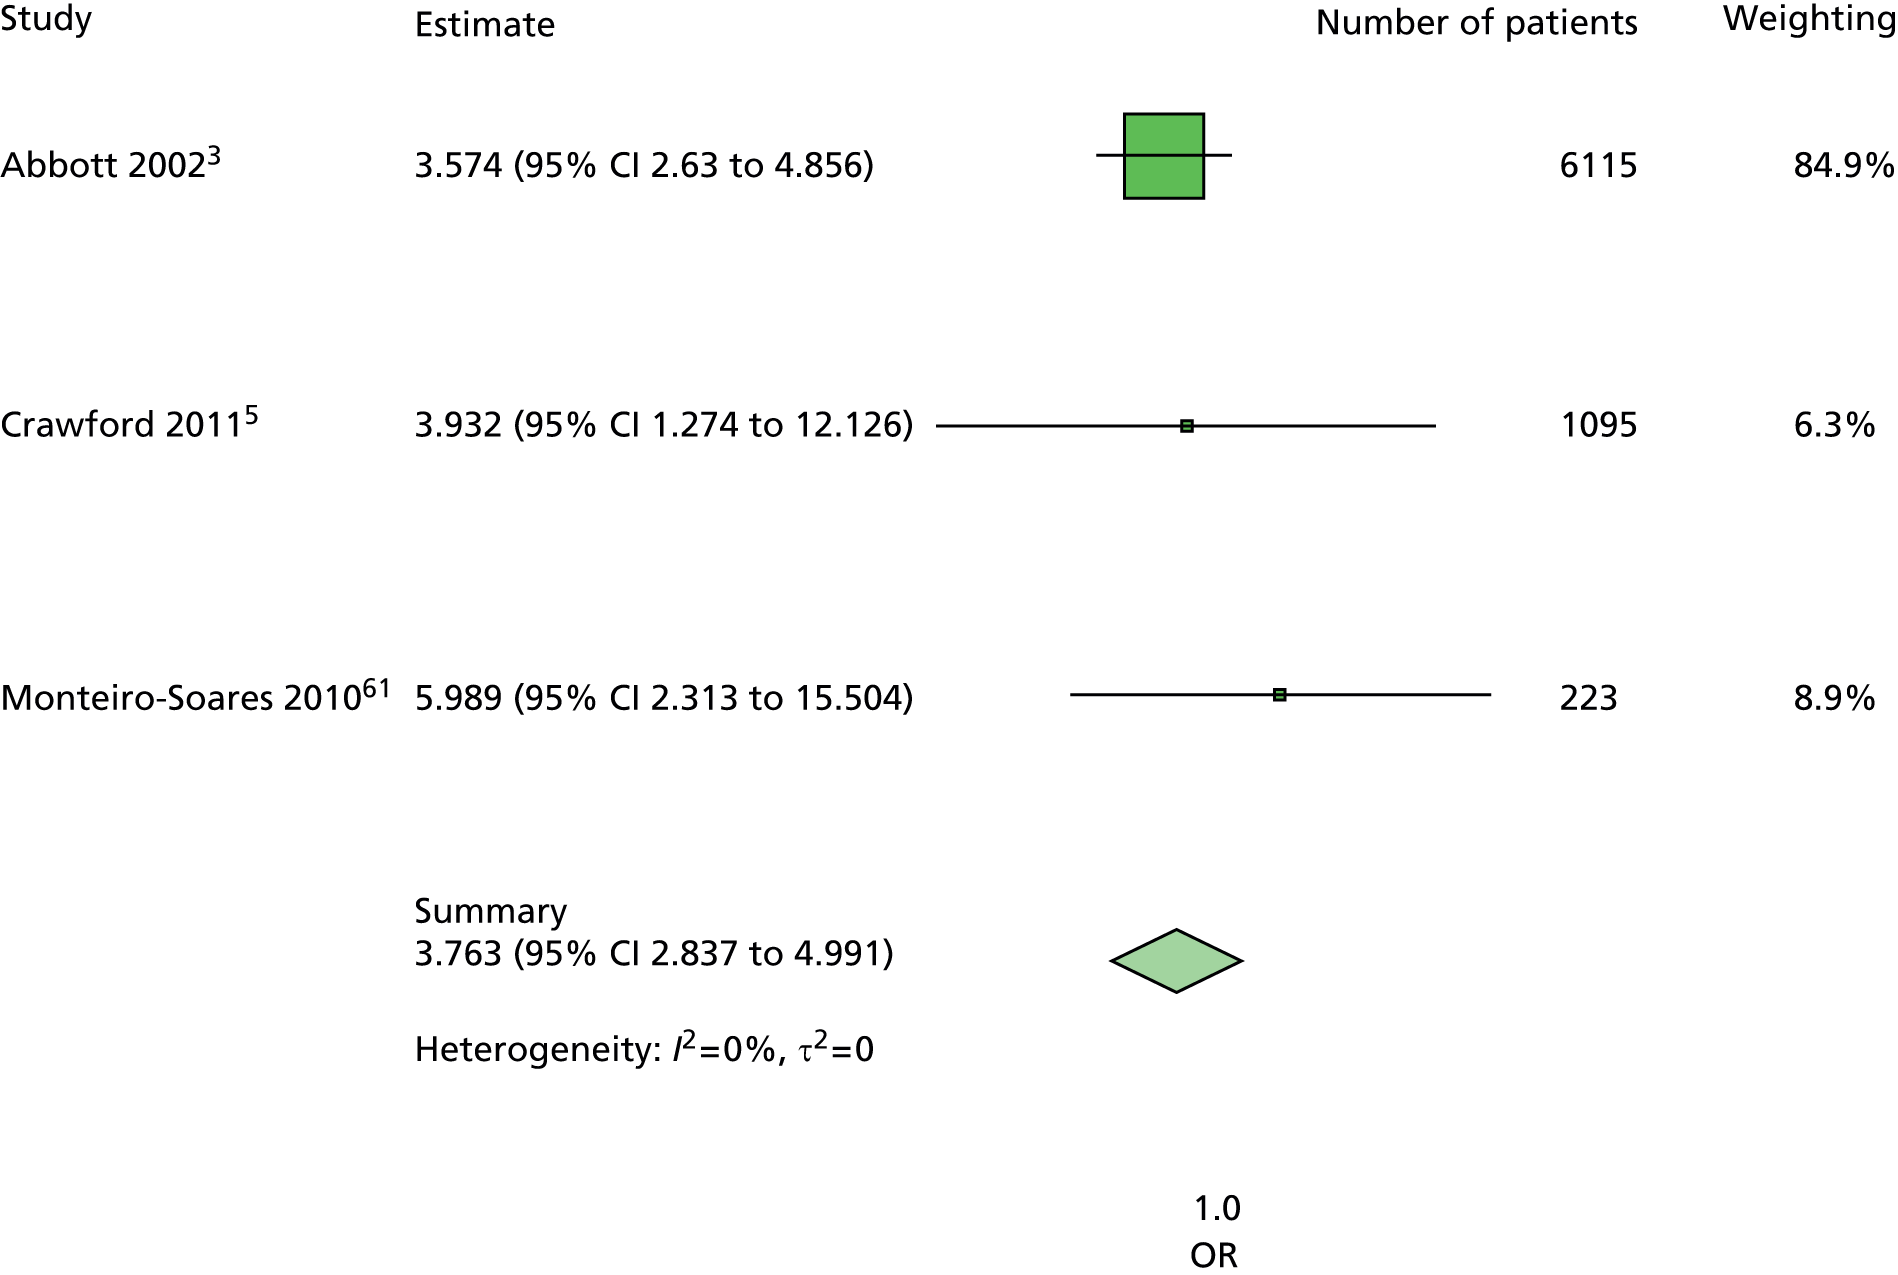
FIGURE 91.
Model 3. Monofilaments new ulcer. Monofilament has been adjusted for age, sex, duration of diabetes, previous history of ulceration or amputation and insulin use. This forest plot is consistent with the corresponding forest plot for patients with no history, and also with the other models’ forest plots for monofilament.
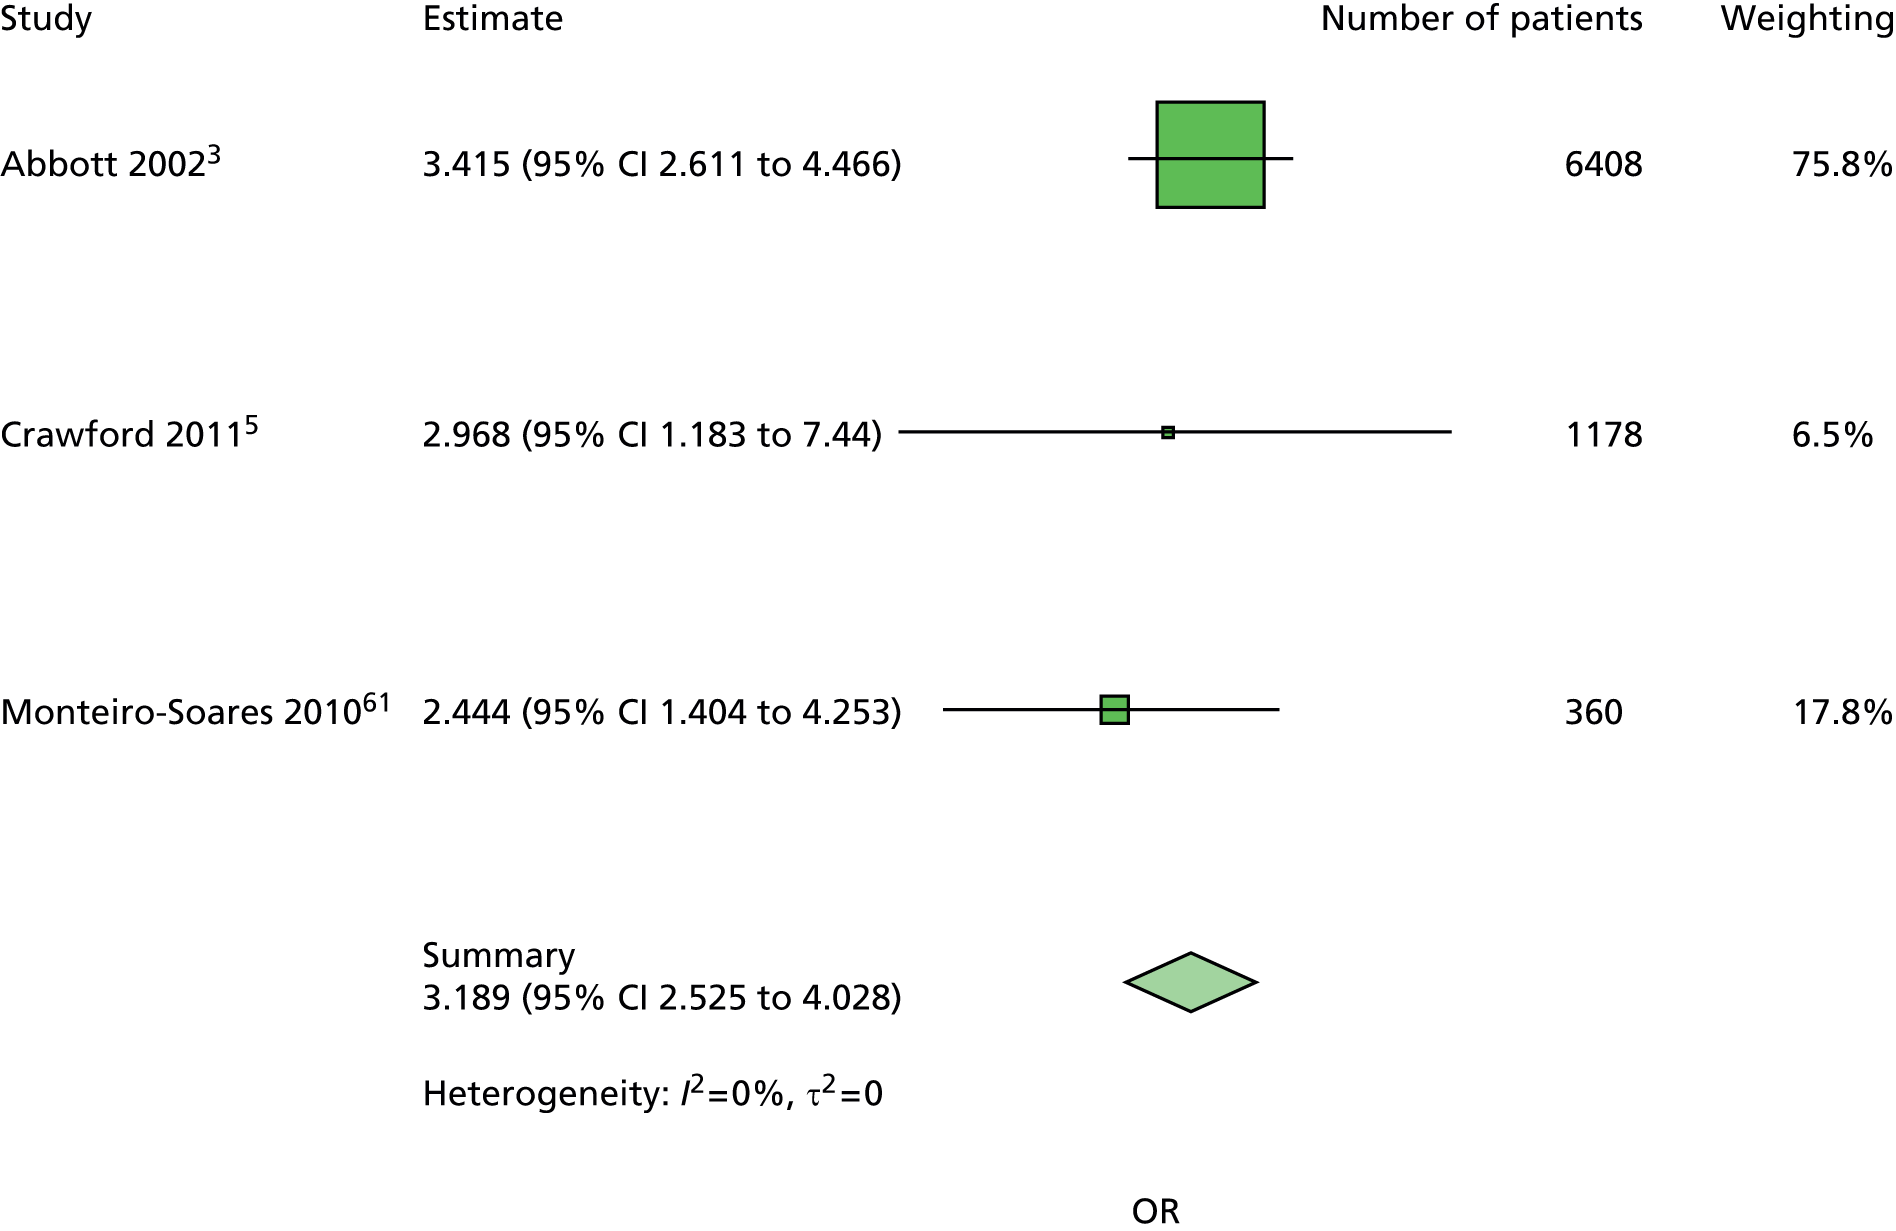
FIGURE 92.
Model 3. Previous history of ulceration and amputation. Previous history of ulceration and amputation has been adjusted for age, sex, duration of diabetes, insulin use and monofilament. There is very little heterogeneity in this forest plot, although this is probably attributable to the restricted number of studies, as there is significant heterogeneity for this predictor in some of the other forest plots with more studies. However, most estimates suggest that previous ulceration or amputation is a predictor of further ulceration, although to what extent varies from study to study.

FIGURE 93.
Model 3. Sex first ulcer. Sex has been adjusted for age, duration of diabetes, insulin use and monofilament. This forest plot is consistent with the other forest plots for sex, where there is low heterogeneity and a summary estimate close to 1.

FIGURE 94.
Model 3. Sex new ulcer. Sex has been adjusted for age, duration of diabetes, previous history of ulceration or amputation, insulin use and monofilament. Again, there is greater heterogeneity apparent in the forest plot for all patients compared with the forest plot for patients with no history.
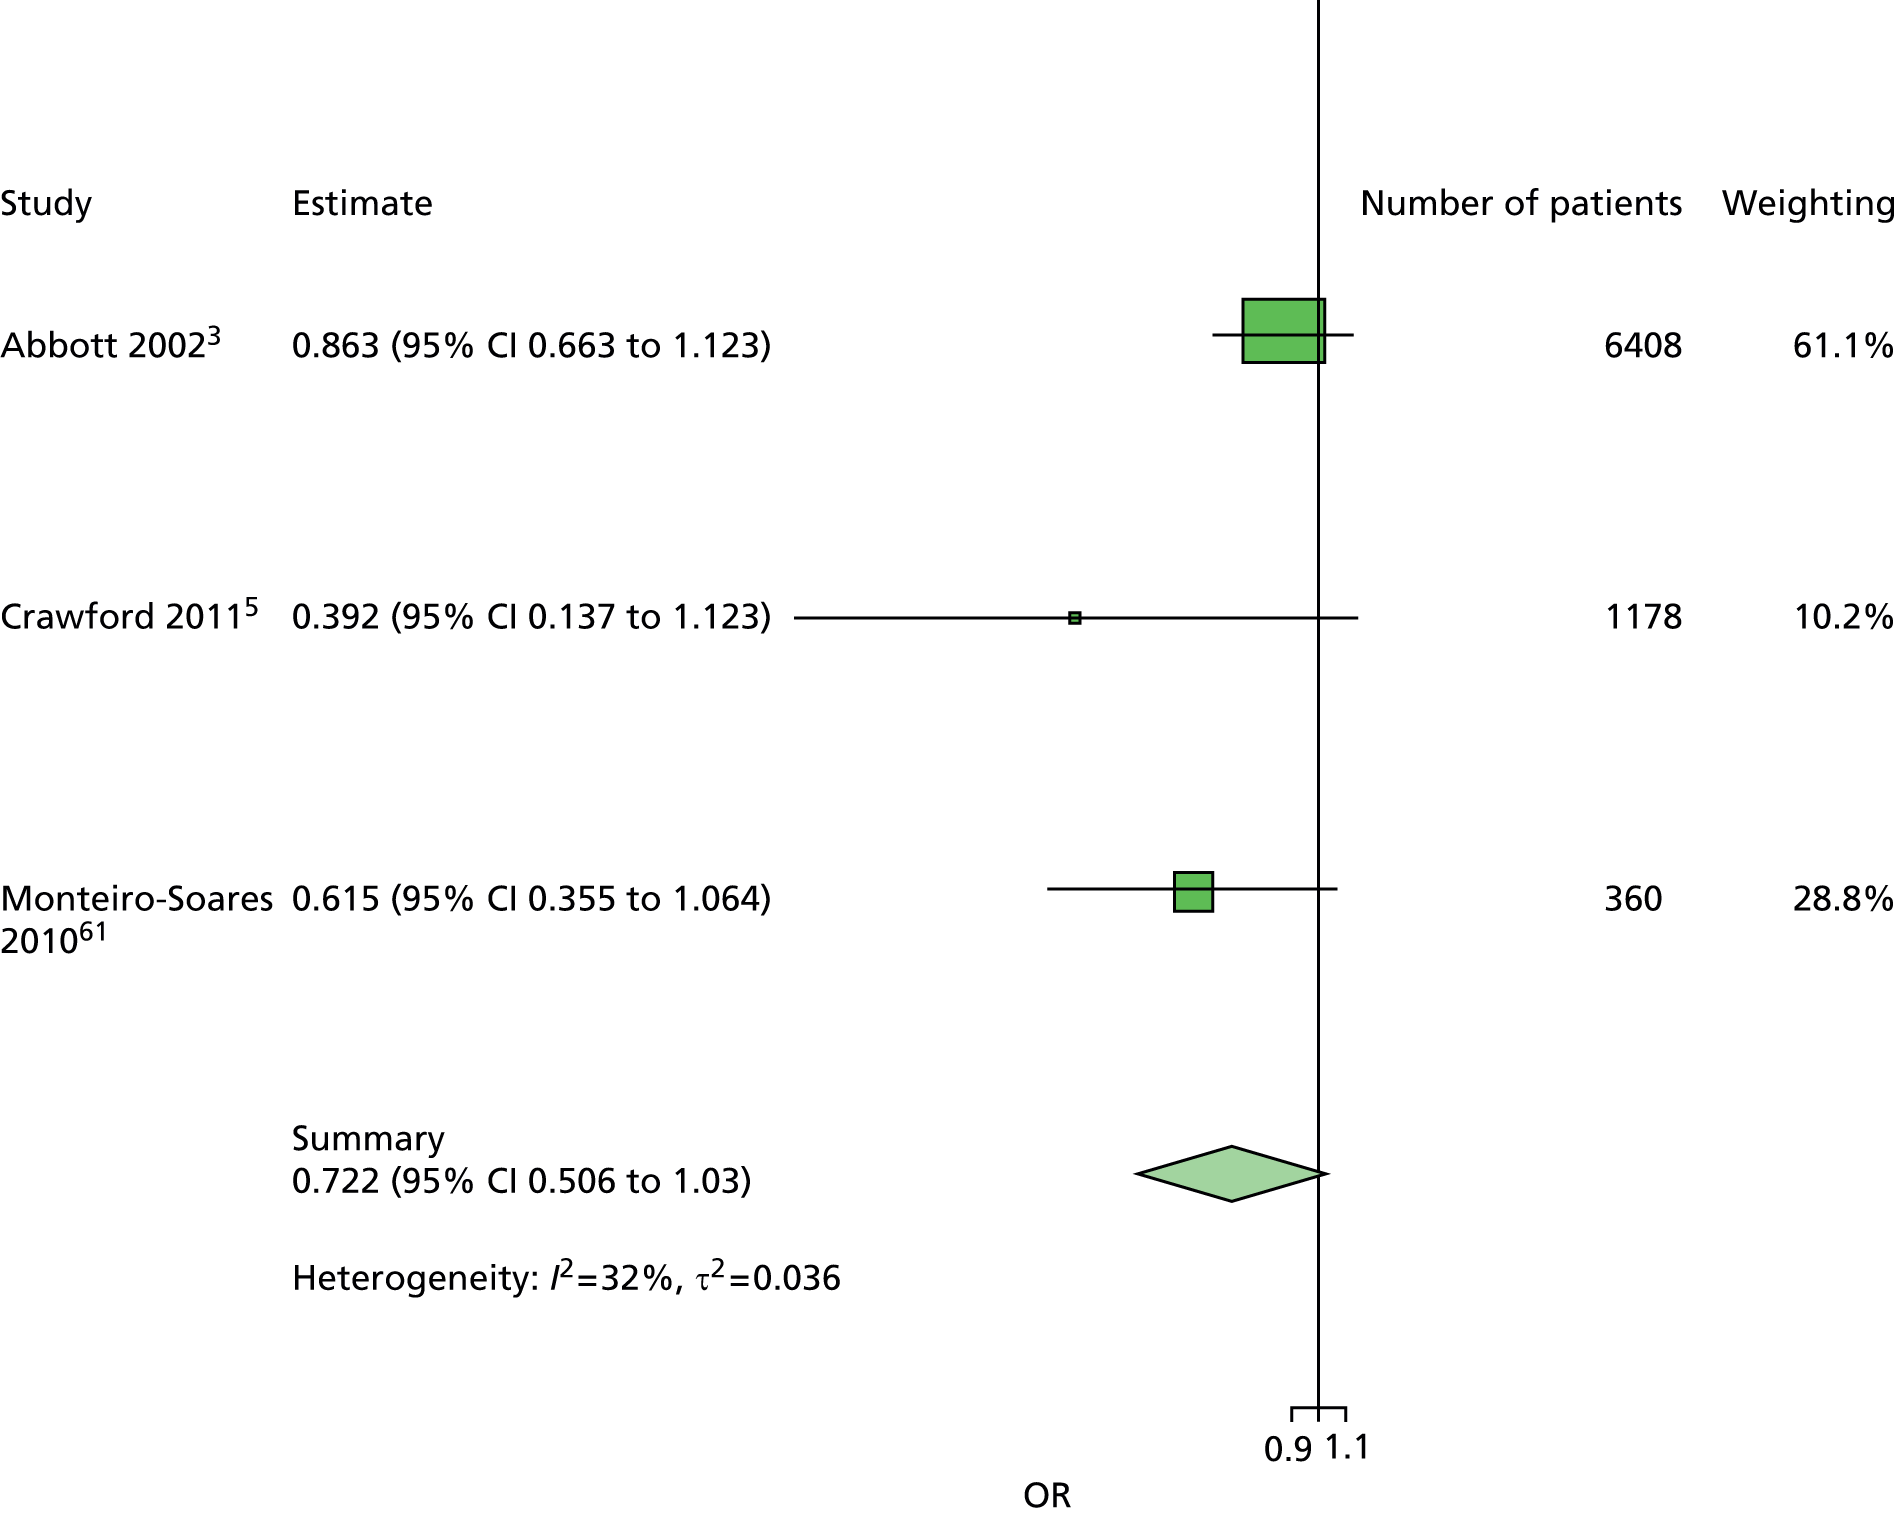
FIGURE 95.
Model 5. Age first ulcer. Age has been adjusted for sex, duration of diabetes, kidney function, and monofilament. There is low heterogeneity and as in the other models, and point estimates on either side of the line of no effect.

FIGURE 96.
Model 5. Age new ulcer. Age has been adjusted for sex, duration of diabetes, previous history of ulceration or amputation, kidney function and monofilament. This forest plot is consistent with the corresponding forest plot for patients with no history of ulceration or amputation: low heterogeneity and point estimates on both sides of the line of no effect.
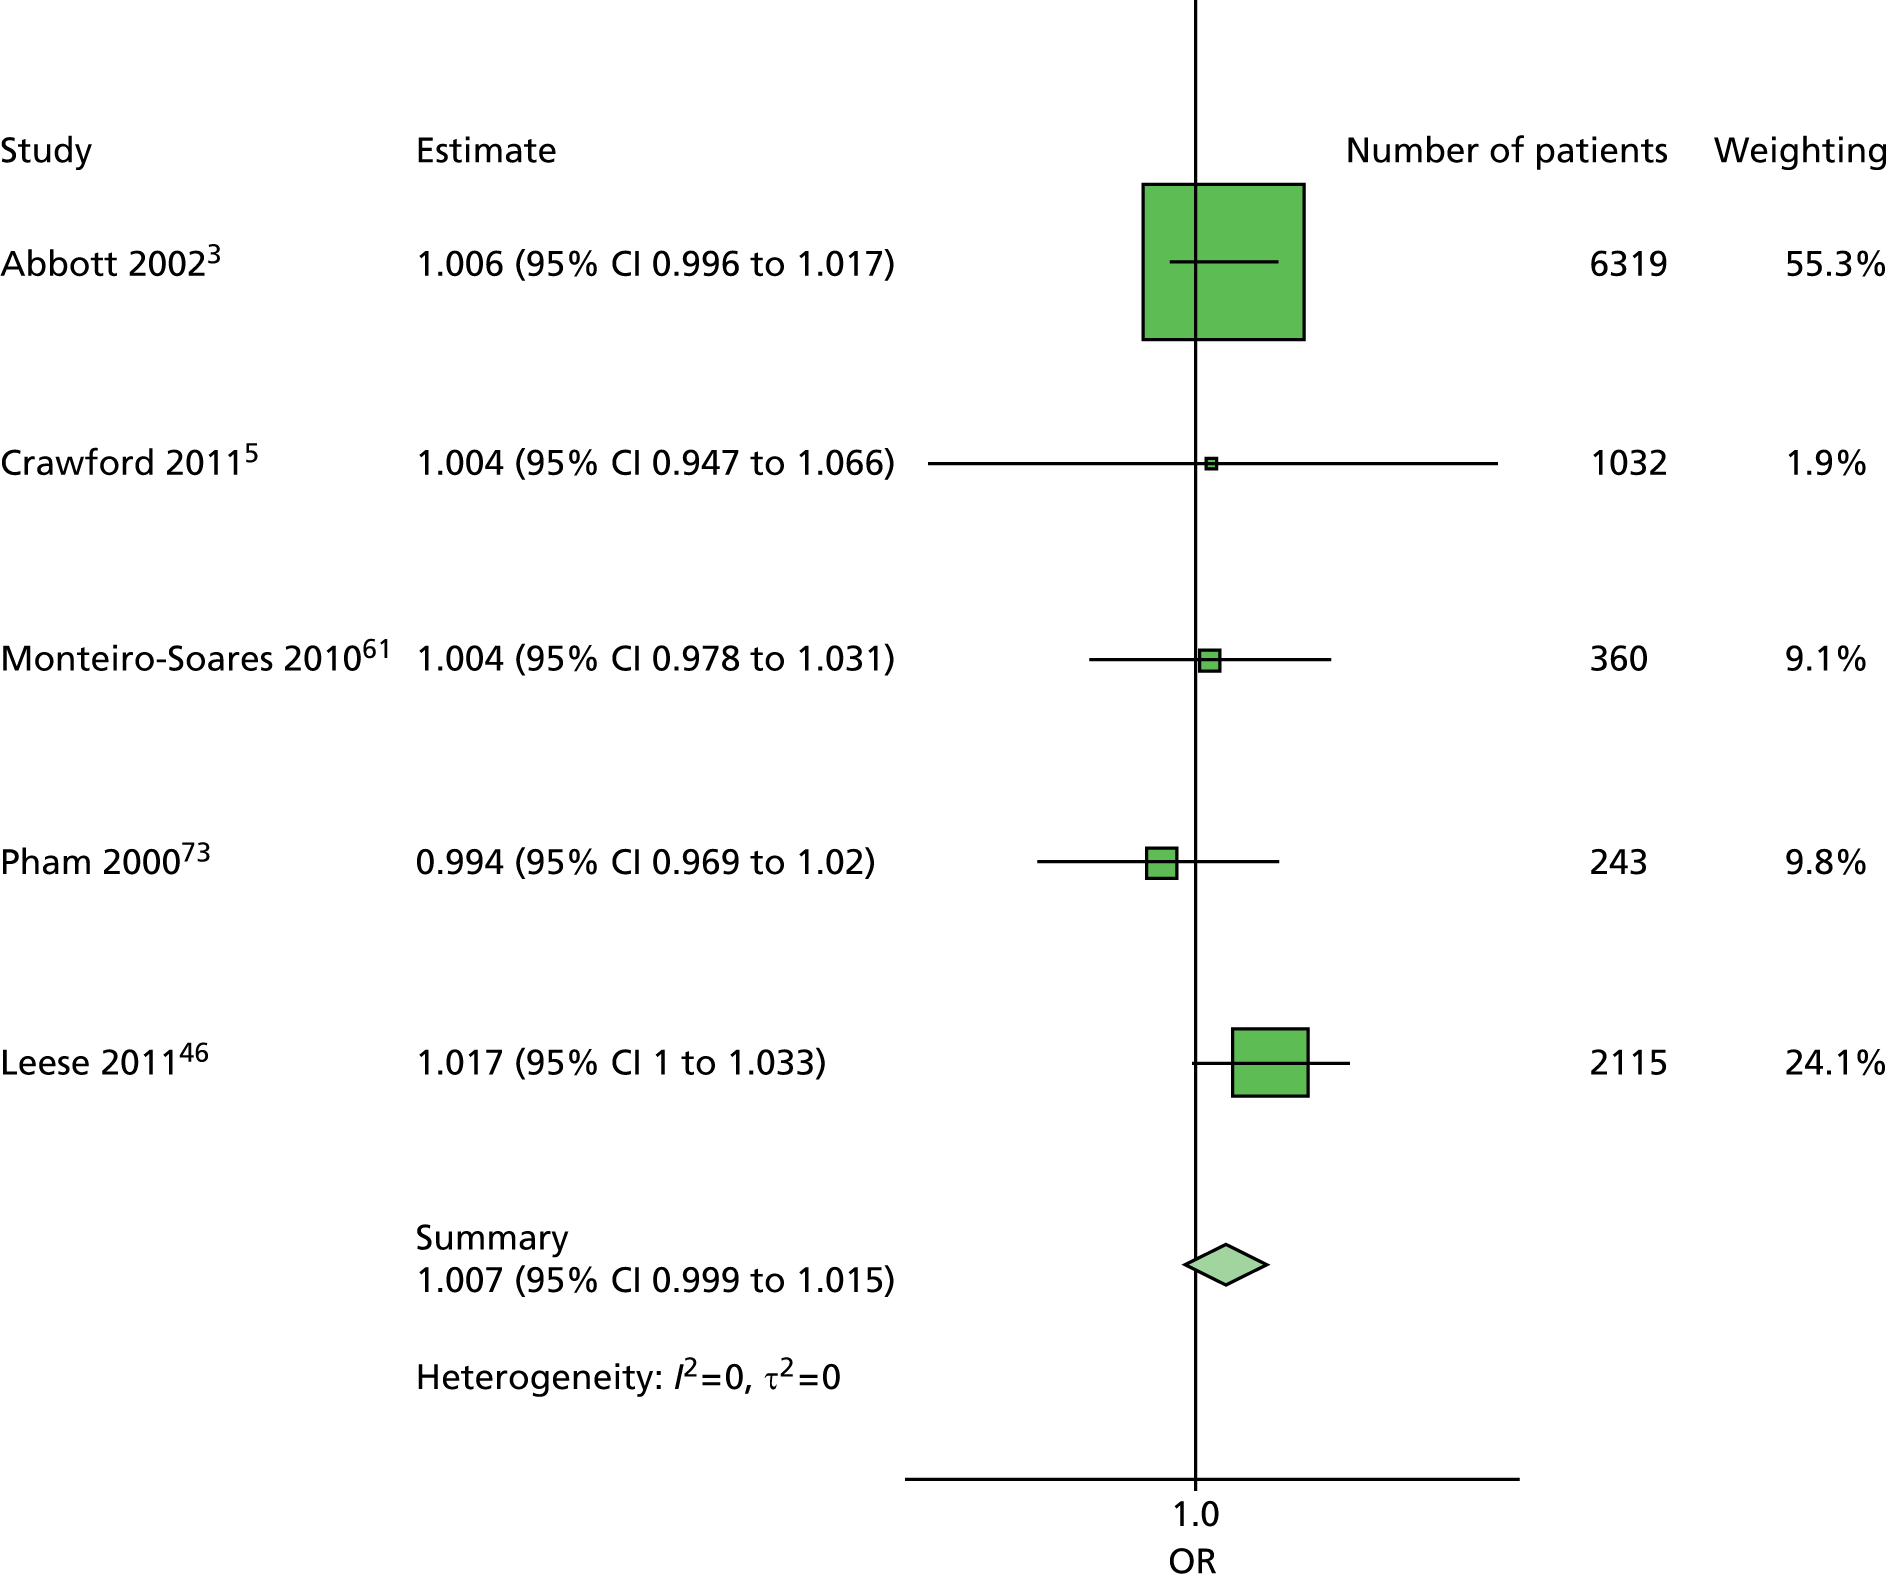
FIGURE 97.
Model 5. Duration first ulcer. Duration of diabetes has been adjusted for age, sex, previous history of ulceration or amputation, kidney function and monofilament. There is some minimal heterogeneity and some consistency in the individual studies’ estimates finding duration of diabetes to be predictive of ulceration. Although the point estimate for the Crawford study is below 1, nearly half its CI includes values above 1.
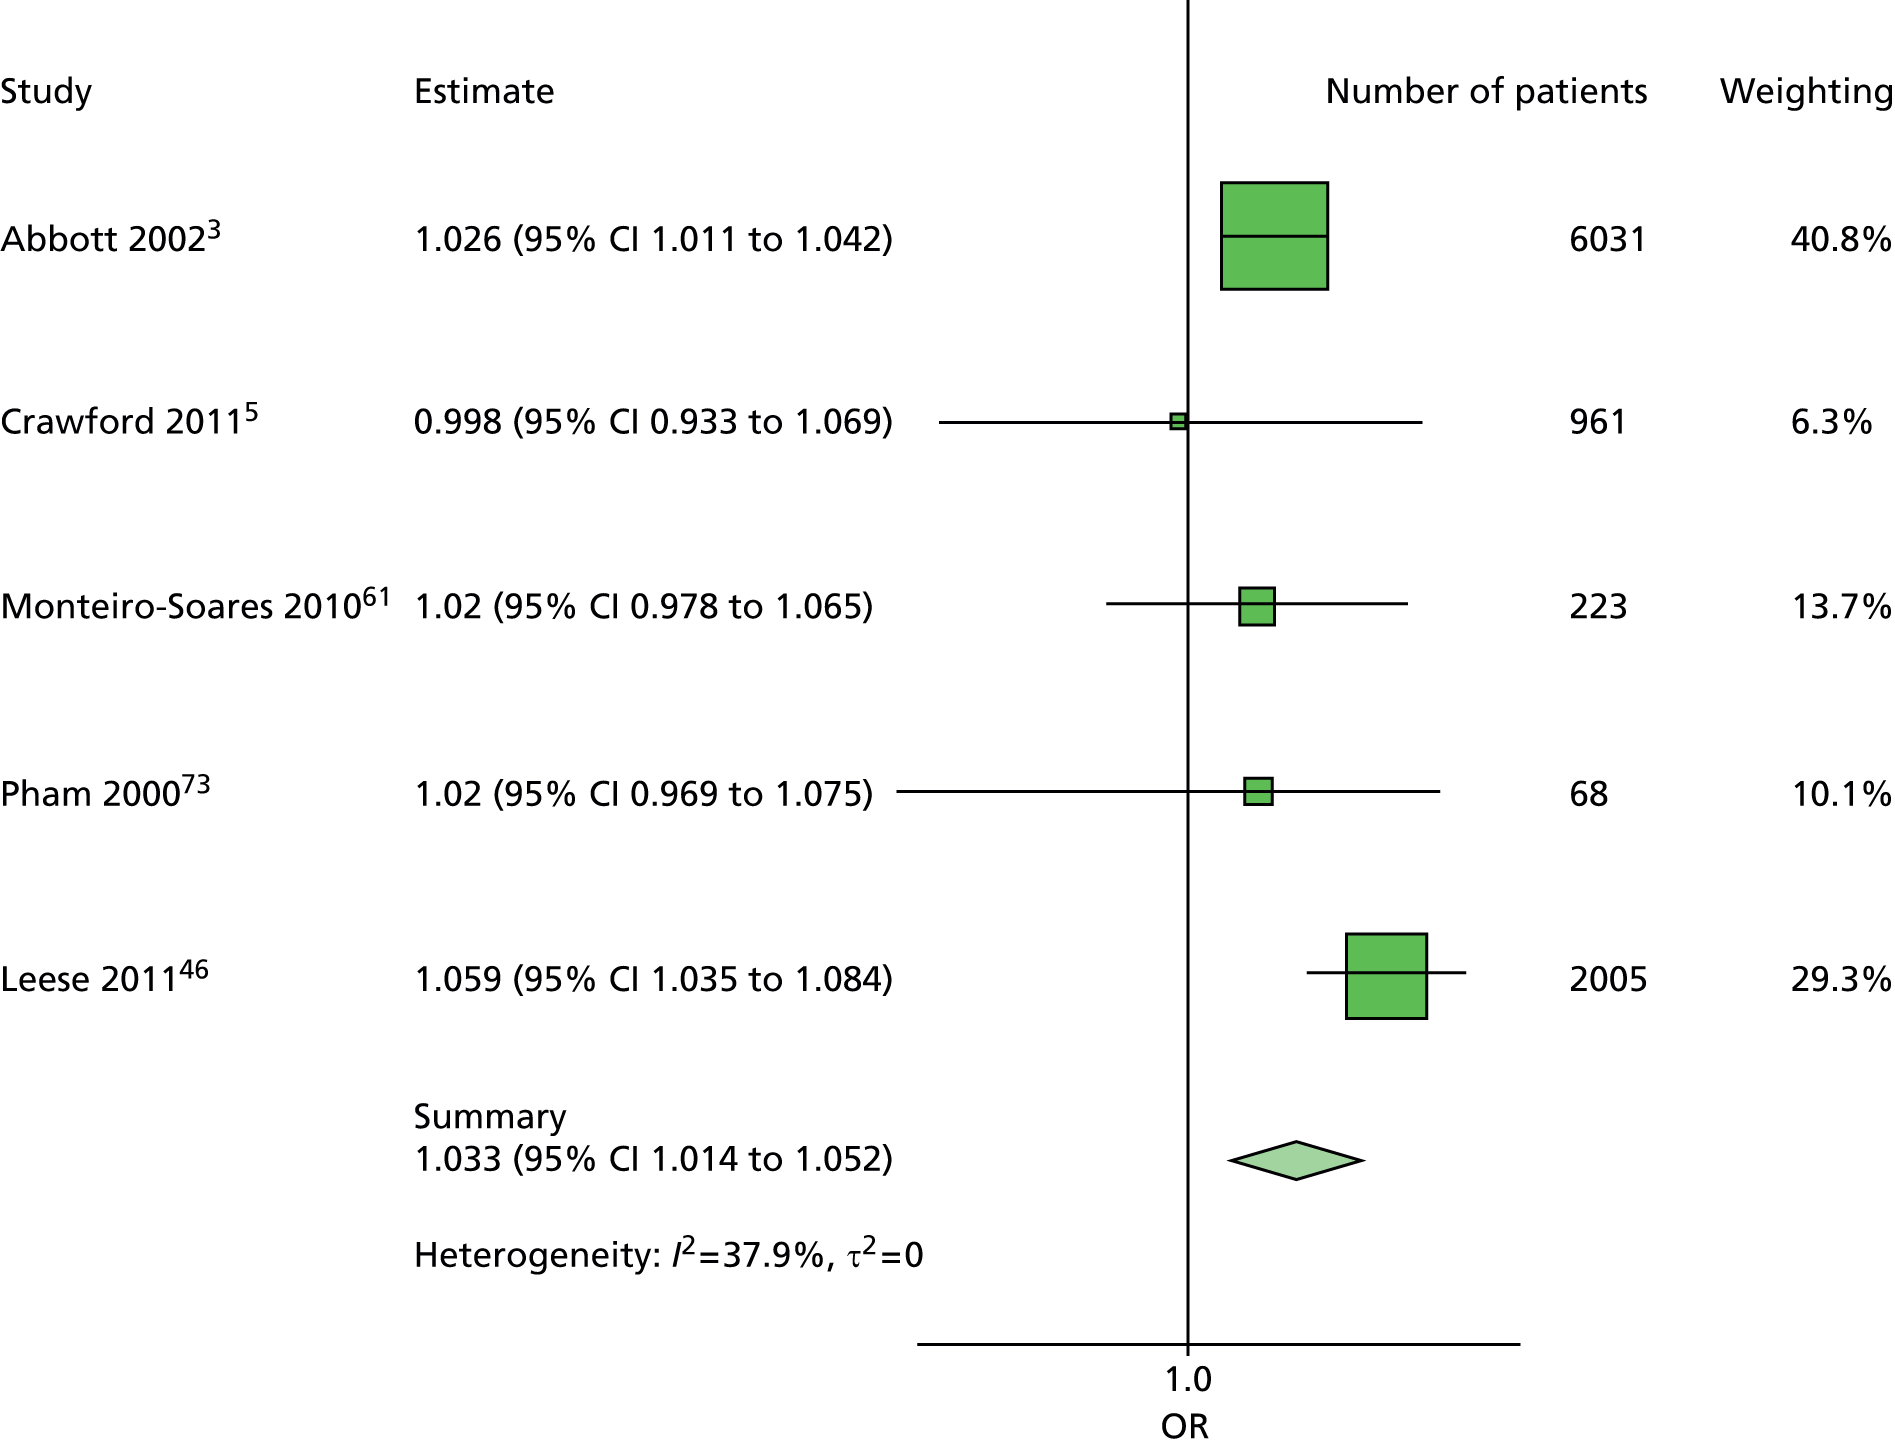
FIGURE 98.
Model 5. Duration new ulcer. Duration of diabetes has been adjusted for age, sex, previous history of ulceration or amputation, kidney function and monofilament. There is greater heterogeneity here than in the corresponding forest plot for patients with no history of ulceration or amputation. There may be greater differences from study to study for patients with history compared with patients with no history.

FIGURE 99.
Model 5. Kidney function first ulcer. Kidney function has been adjusted for age, sex, duration of diabetes and monofilament. The relationship between kidney function and ulceration is not clear. It would seem plausible that poor kidney function indicates poor diabetic health and so a greater likelihood of ulceration. However, three of the four studies and the summary estimate do not corroborate this theory.

FIGURE 100.
Model 5. Kidney function new ulcer. Kidney function has been adjusted for age, sex, duration of diabetes, previous history of ulceration or amputation and monofilament. This forest plot is consistent with the corresponding forest plot for patients with no history of ulceration or amputation, with most studies not providing evidence that poor kidney function is a predictor of ulceration.

FIGURE 101.
Model 5. Monofilament first ulcer. Monofilament has been adjusted for age, sex, duration of diabetes and kidney function. As with the other forest plots for monofilaments in the other models, there is no evidence of heterogeneity. The summary estimate here is a little higher than the other models.

FIGURE 102.
Model 5. Monofilament new ulcer. Monofilament has been adjusted for age, sex, duration of diabetes, previous history of amputation or ulceration, and kidney function. This forest plot is very similar to the other forest plots for monofilament, with low heterogeneity and a point estimate near 3.5.
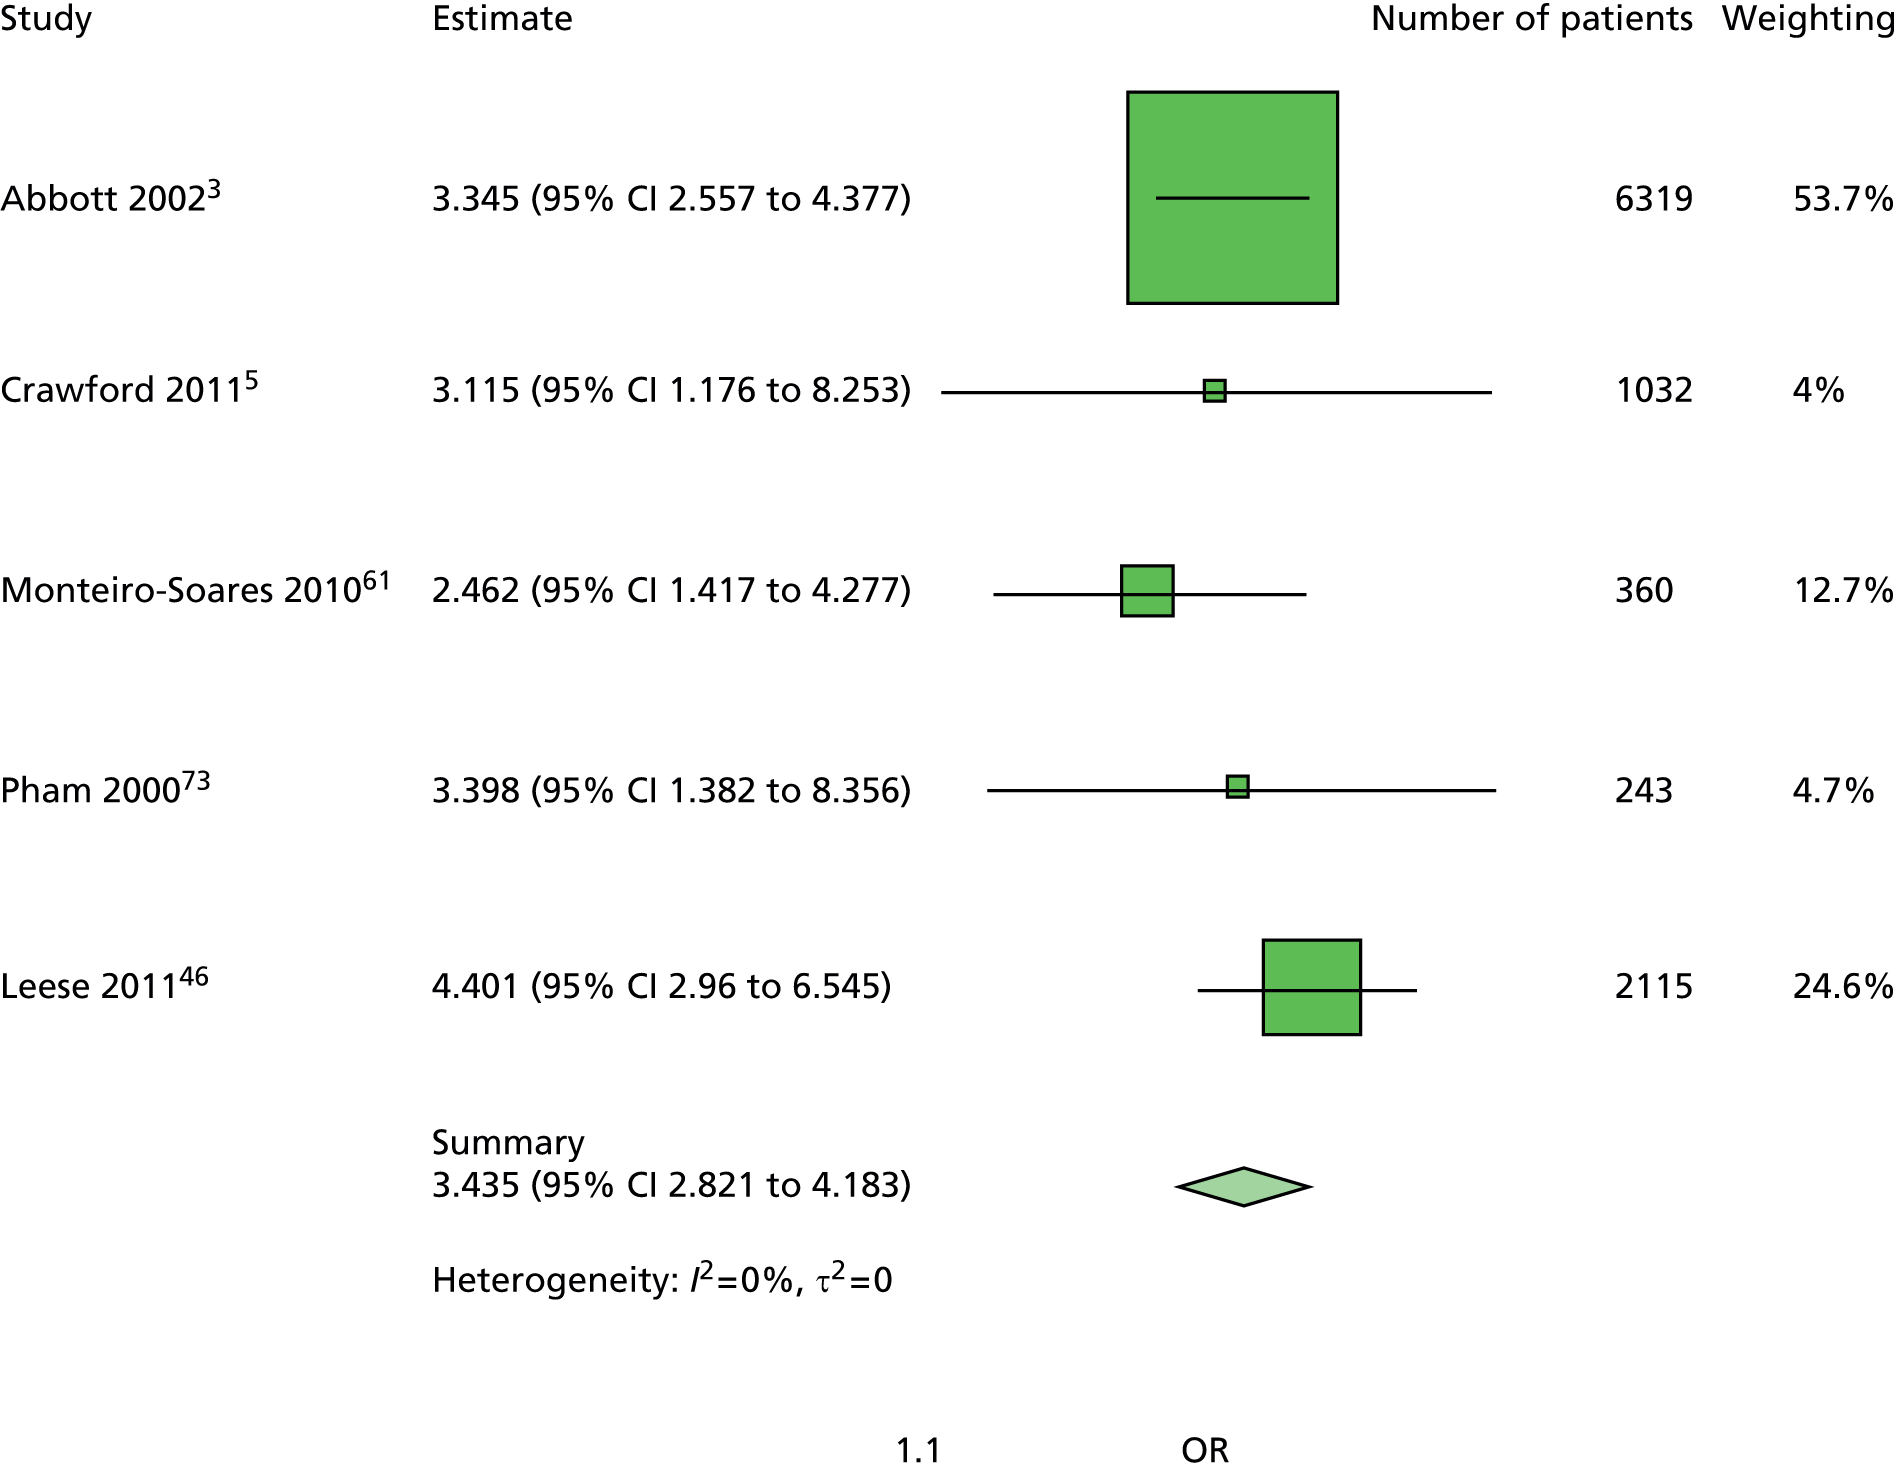
FIGURE 103.
Model 5. Previous history. Previous history of ulceration or amputation has been adjusted for age, sex, duration of diabetes, kidney function and monofilament. There is significant heterogeneity here, reflecting the different risk profiles in the individual studies.
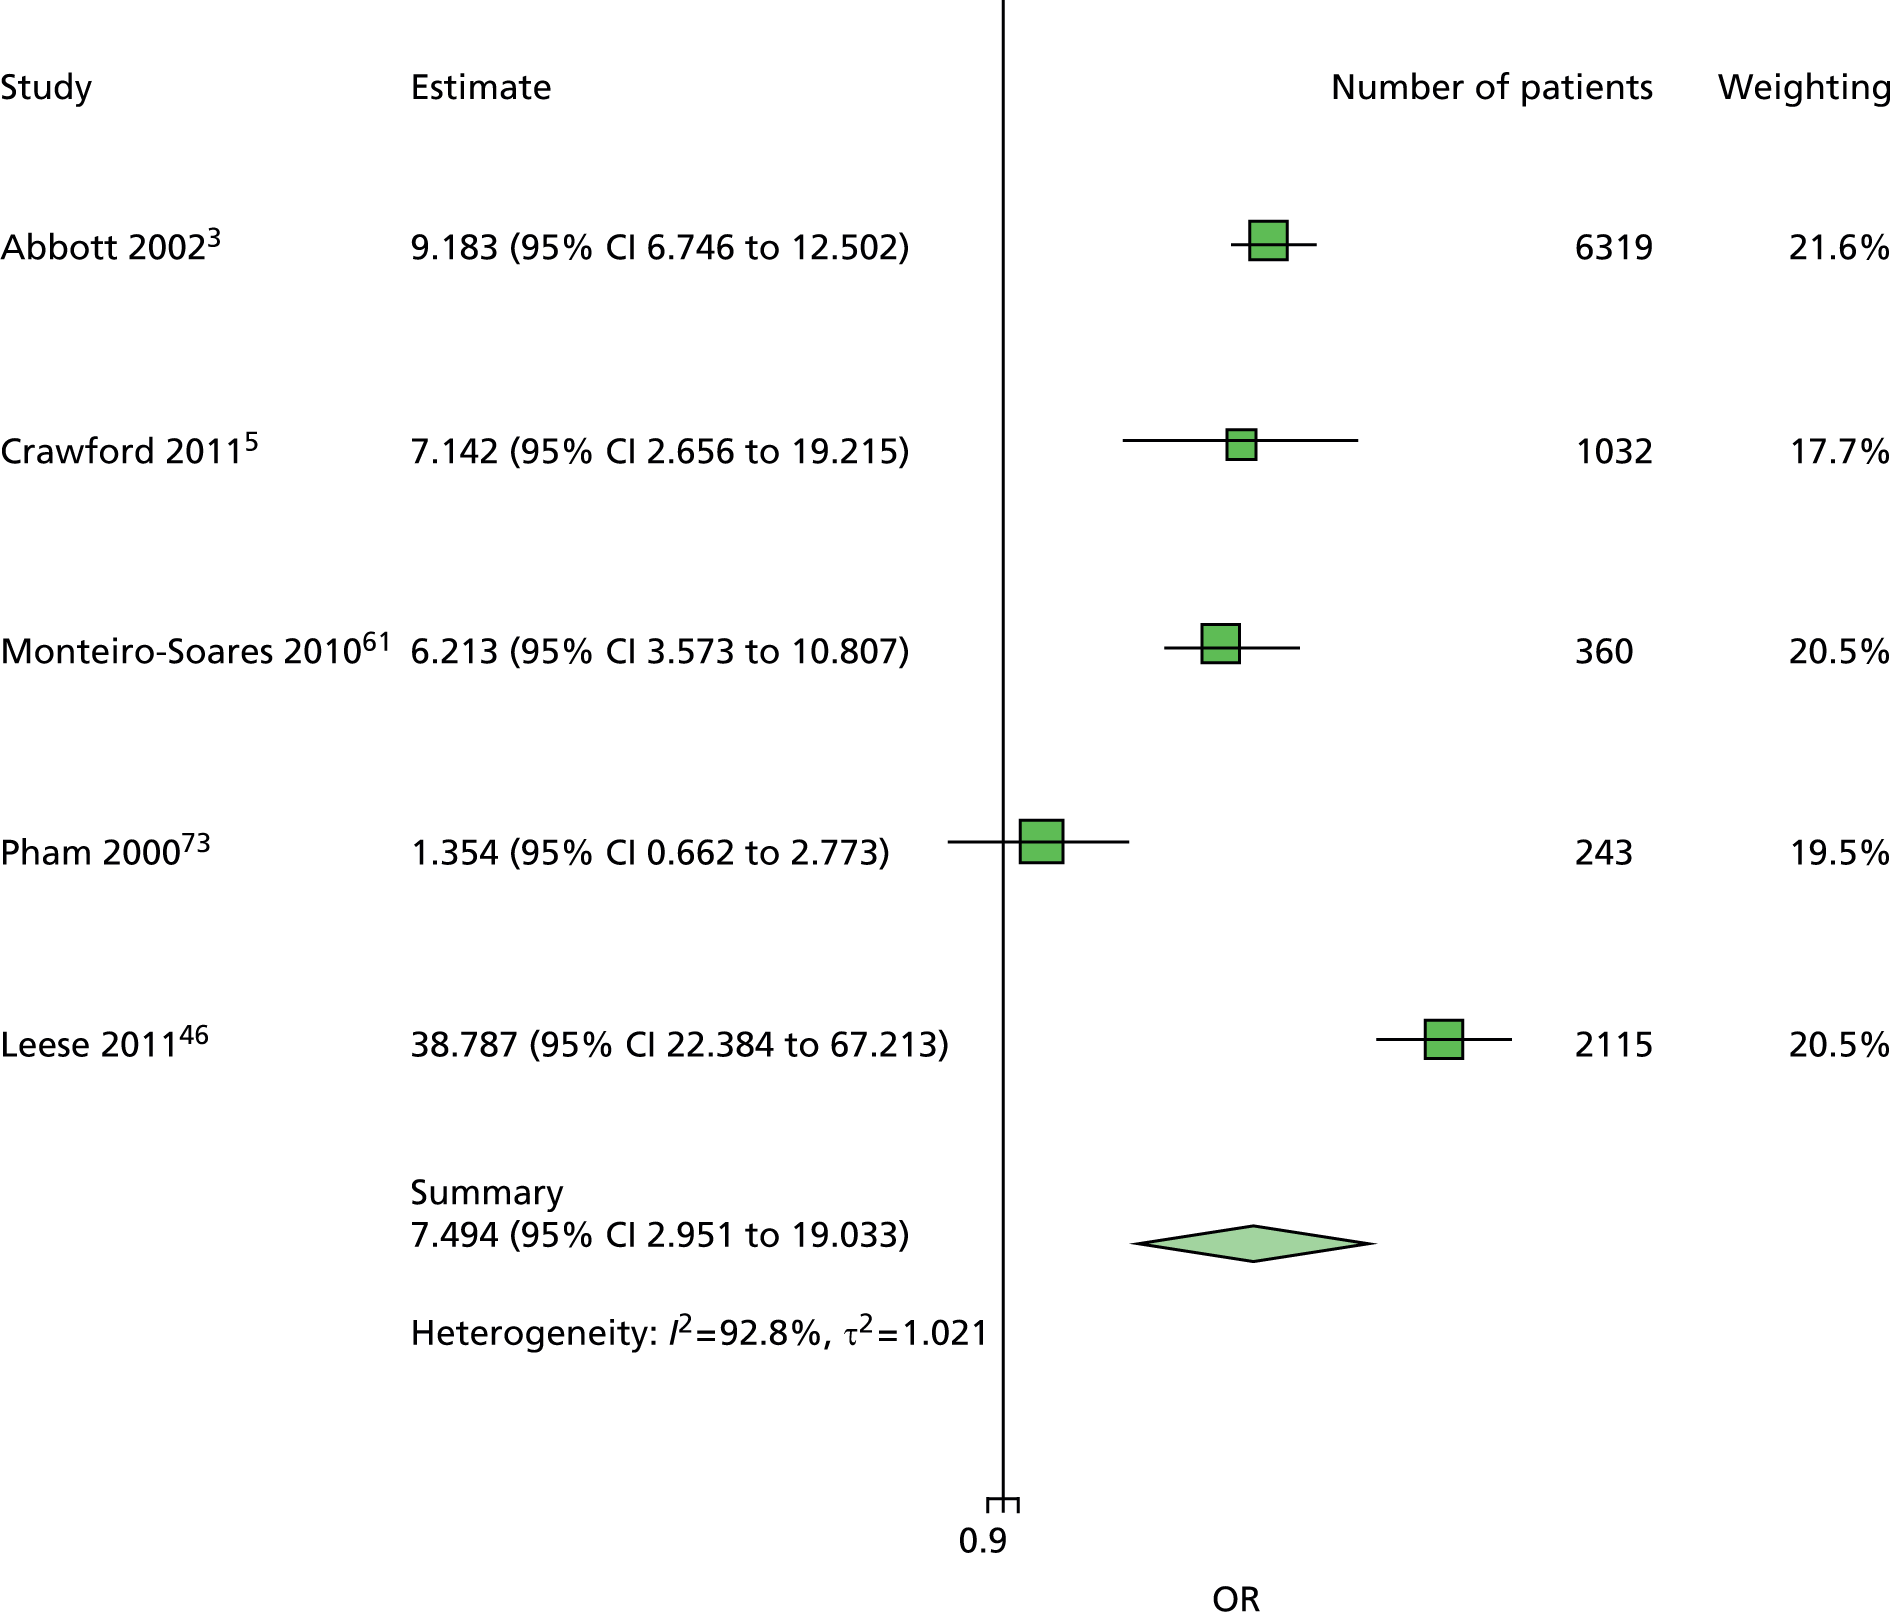
FIGURE 104.
Model 5. Sex first ulcer. Sex has been adjusted for age, duration of diabetes, kidney function and monofilament. This forest plot is similar to the other models’ forest plots for sex, with low heterogeneity and a point estimate near 1.
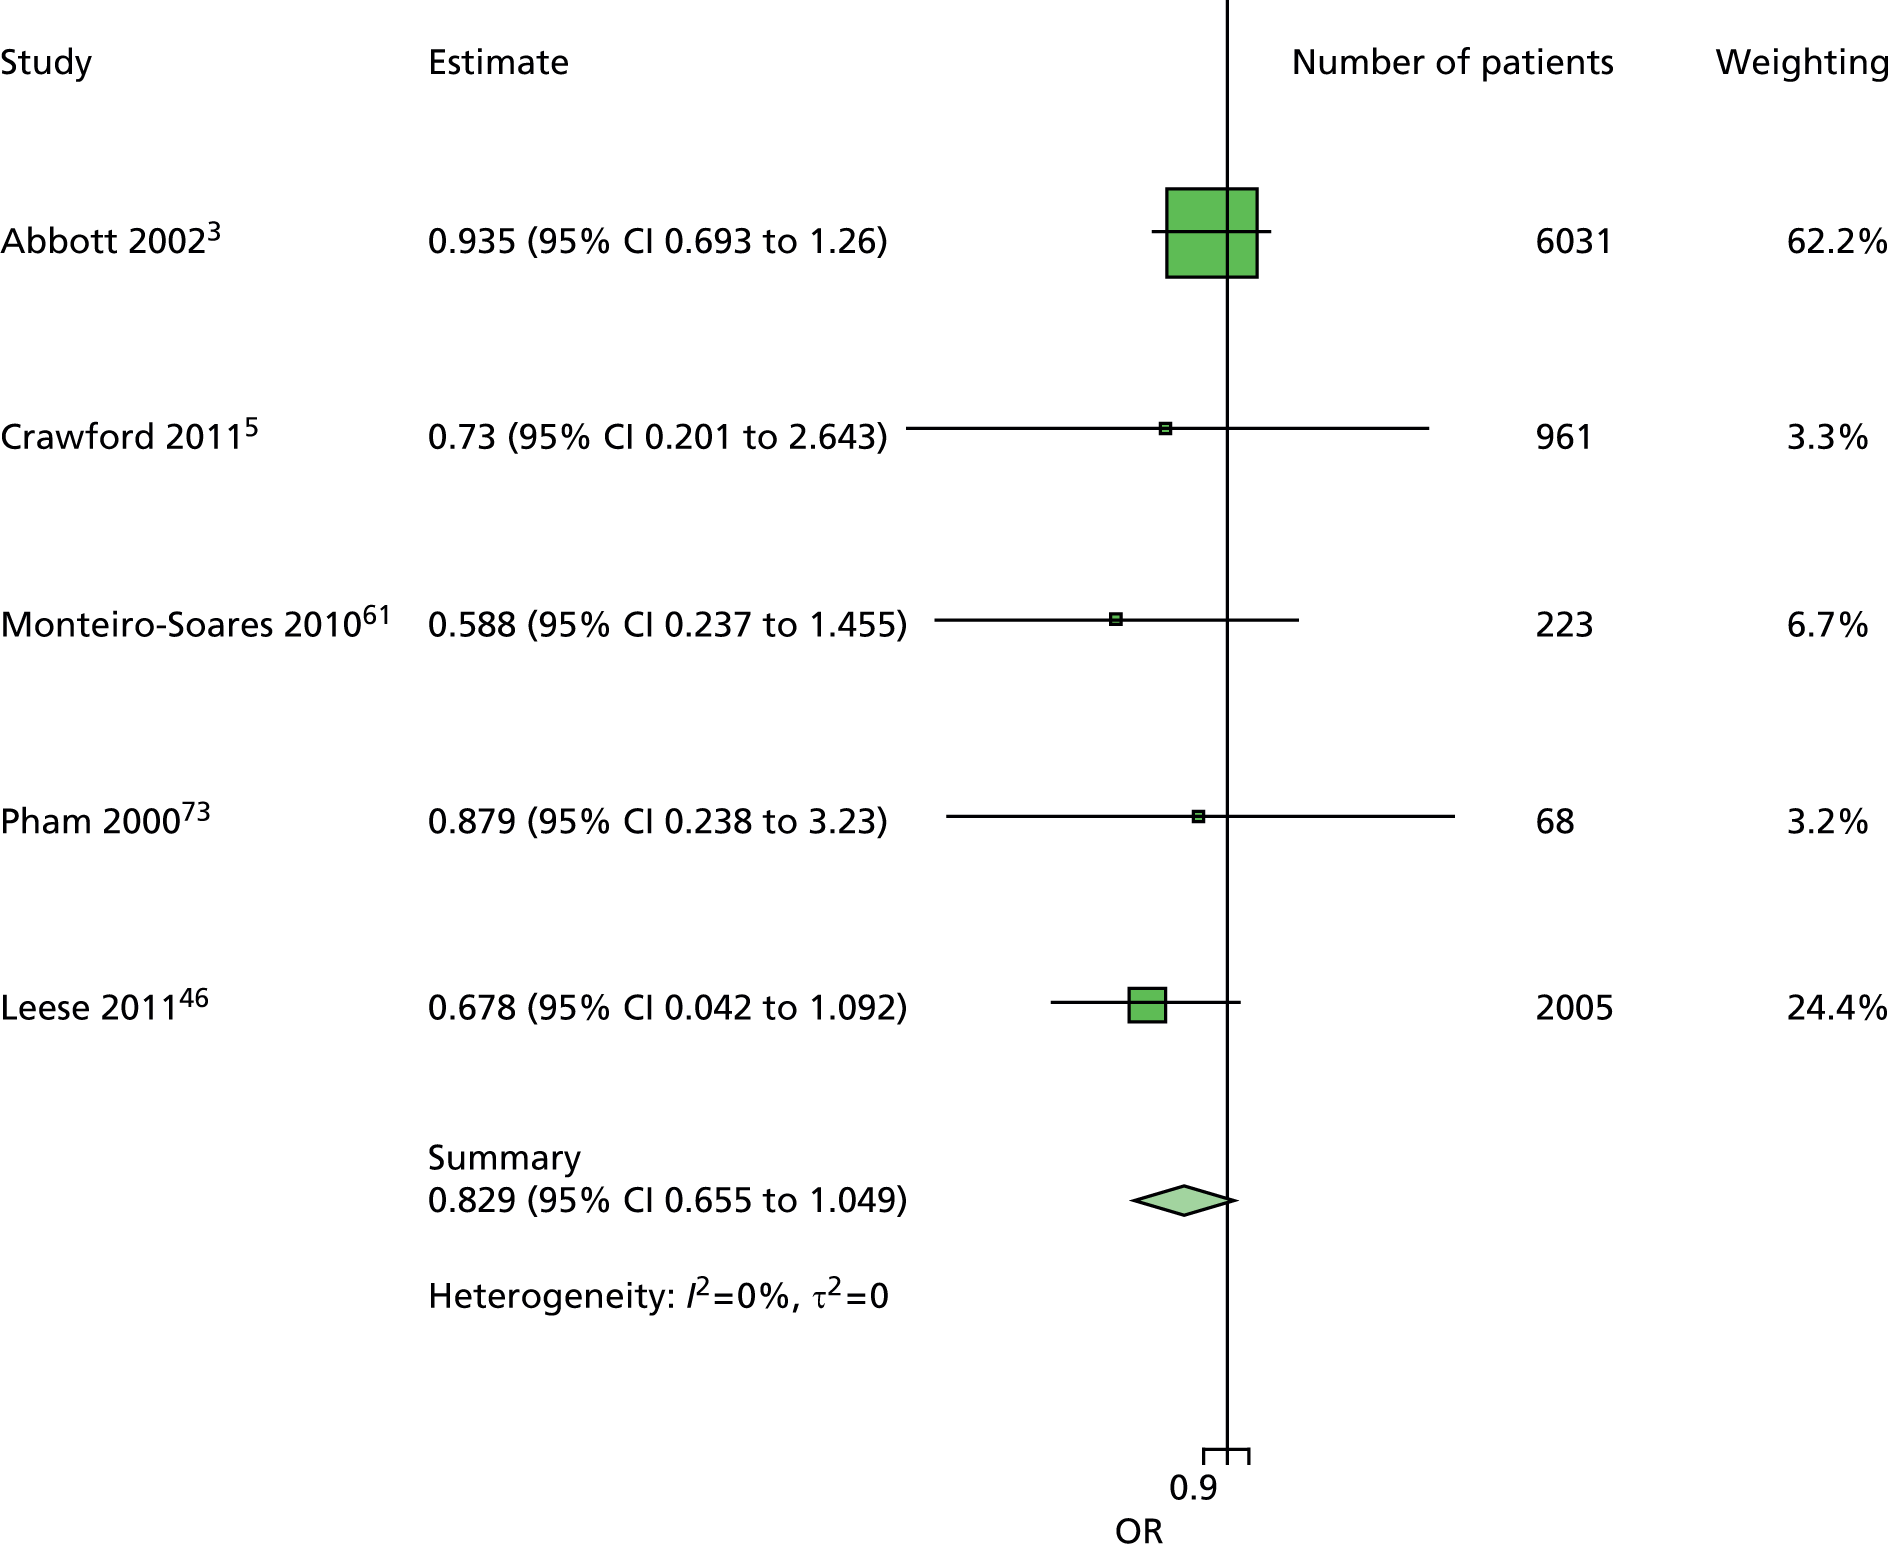
FIGURE 105.
Model 5. Sex new ulcer. Sex has been adjusted for age, duration of diabetes, previous history of ulceration or amputation, kidney function and monofilament. Again, there is greater heterogeneity in this forest plot than the corresponding forest plots for patients with no history.

Appendix 12 Area under the curve and Brier scores
Appendix 13 Scottish Clinical Information: diabetes foot risk stratification and triage traffic light grading system
Reproduced from SIGN. URL: www.sign.ac.uk.

List of abbreviations
- ABI
- ankle–brachial index
- AUC
- area under the curve
- BMI
- body mass index
- CI
- confidence interval
- CKD
- chronic kidney disease
- CPR
- clinical prediction rule
- DFU
- diabetic foot ulceration
- eGFR
- estimated glomerular filtration rate
- GFR
- glomerular filtration rate
- GMC
- General Medical Contract
- GP
- general practitioner
- HbA1c
- glycated haemoglobin
- IPD
- individual patient data
- IWGDF
- International Working Group on the Diabetic Foot
- LEA
- lower-extremity amputation
- MAR
- missing at random
- MICE
- multiple imputation using chained equations
- NICE
- National Institute for Health and Care Excellence
- OR
- odds ratio
- PCT
- primary care trust
- PPP
- peak plantar pressure
- QOF
- Quality and Outcomes Framework
- RCT
- randomised controlled trial
- ROC
- receiver operating characteristic
- SAS
- Statistical Analysis System
- SCI-Diabetes
- Scottish Clinical Information – Diabetes foot risk stratification tool
- SIGN
- Scottish Intercollegiate Guidelines Network
- VPT
- vibration perception threshold