Notes
Article history
The research reported in this issue of the journal was funded by the HTA programme as project number 10/94/02. The contractual start date was in October 2012. The draft report began editorial review in July 2014 and was accepted for publication in July 2015. The authors have been wholly responsible for all data collection, analysis and interpretation, and for writing up their work. The HTA editors and publisher have tried to ensure the accuracy of the authors’ report and would like to thank the reviewers for their constructive comments on the draft document. However, they do not accept liability for damages or losses arising from material published in this report.
Declared competing interests of authors
none
Permissions
Copyright statement
© Queen’s Printer and Controller of HMSO 2016. This work was produced by Ensor et al. under the terms of a commissioning contract issued by the Secretary of State for Health. This issue may be freely reproduced for the purposes of private research and study and extracts (or indeed, the full report) may be included in professional journals provided that suitable acknowledgement is made and the reproduction is not associated with any form of advertising. Applications for commercial reproduction should be addressed to: NIHR Journals Library, National Institute for Health Research, Evaluation, Trials and Studies Coordinating Centre, Alpha House, University of Southampton Science Park, Southampton SO16 7NS, UK.
Chapter 1 Background
Venous thromboembolism aetiology and outcomes
The term venous thrombosis describes the development of a clot, usually within the veins of the legs (deep-vein thrombosis; DVT) and lungs (pulmonary embolism; PE). It is a chronic disease with DVT and PE considered as different presentations of the same disease. Patients with DVT may present with a clot confined either to the calf (distal DVT) or above the knee (proximal DVT), with proximal DVT often conveying a greater risk of recurrent venous thromboembolism (VTE). Upper limb thrombosis is a rare event usually associated with either anatomical anomalies of underlying thrombophilia. This report focuses on DVT and PE.
There are several recognised pre-disposing risk factors for an initial VTE, including hormone intake, surgery, trauma, pregnancy and prolonged immobility. Where these factors have contributed to the development of a first VTE, this is termed ‘provoked’. These factors can be considered as transient or removable risk factors, because although they increase the risk of an initial VTE, they are temporary and when the provoking factor is removed the patient is at a low risk of recurrent VTE (e.g. post surgery). In contrast, an initial VTE is termed ‘unprovoked’ if it occurs in the absence of a known provoking factor. This distinction is important because recurrence of VTE (following appropriate therapy with anticoagulation) is largely driven by whether the initial episode was provoked rather than unprovoked. Due to the temporary nature of provoking factors, those with a first unprovoked VTE are at much higher risk of recurrent VTE (approaching 30% at 5 years after cessation of therapy) as there is no known cause.
For the purposes of this report an initial VTE will be defined as unprovoked where there is no history in the previous 3 months of any of the following risk factors:
-
major surgery
-
lower limb trauma
-
use of combined oral contraceptive (OC) pill or hormone replacement therapy (HRT)
-
pregnancy
-
significant immobility
-
cancer.
Therapy for venous thromboembolism
The aim of therapy for VTE is twofold, initially to prevent extension of the acute thrombosis and secondarily to prevent both recurrence and long term sequelae such as post-thrombotic syndrome (PTS) and pulmonary hypertension. Current treatment comprise initial management with heparin, usually low-molecular weight heparin for a minimum of 5 days, overlapping with oral anticoagulant (OAC) therapy (usually warfarin in the UK) until the international normalised ratio (INR) is above two. It is usual to treat an initial VTE for a minimum of 3 months; however, the optimum duration of therapy beyond this is unclear, particularly in the unprovoked population where individuals risk is heterogeneous. Alternative treatments to heparin and warfarin are now available with rivaroxaban (Xarelto®, Janssen Pharmaceuticals, Inc.) now licensed for treatment of VTE in the UK, with other new agents in the pipeline. The decision problem with regard to length of therapy still remains with these newer treatments.
The clinical problem
Prevention of recurrent VTE poses a difficult clinical decision problem; a balance must be struck between the risks of recurrent thrombosis if anticoagulant treatment is stopped versus the risks of bleeding associated with continued anticoagulation therapy.
This has been highlighted in recommendations from the 9th American College of Chest Physicians (ACCP) antithrombotic guidelines,1 which particularly highlighted this issue of balancing the risks of recurrence and bleeding in unprovoked population. The guidelines suggested that those suffering an initial unprovoked DVT should be treated with different lengths of anticoagulation therapy dependent on their bleeding risk. 1 Those at low to moderate risk of bleeding are suggested to have extended treatment over 3 months of therapy, whereas those at high risk are recommended to have a further 3 months of therapy beyond this. 1
Previously the emphasis from a clinical perspective has been to identify those patients at sufficiently high risk of recurrence to justify continuing therapy. More recently the emphasis has shifted to identifying those patients at sufficiently low risk of recurrence to justify cessation of therapy. This reflects an appreciation of the importance of risk of recurrence, with recurrent events being fatal in approximately 5–9% of patients. 2
The current UK guidelines from the British Committee for Standards in Haematology (BCSH)3 state that all patients with a proximal DVT or PE should be treated for at least 3 months, in line with ACCP guidance. In terms of extending treatment beyond 3 months it is stated that therapy should be continued if the risk from recurrence on stopping treatment is greater than the risk from anticoagulant-related bleeding. However, these opposing risks are not easily predicted in an individual. In a patient with an average risk of warfarin-related bleeding the annual risk of recurrent VTE that would favour continued anticoagulant therapy has been estimated to be between 3% and 9%. 3
In terms of identifying those patients who may require longer duration of therapy, the BCSH guidelines identify that patients with unprovoked venous thrombosis have an annual risk of recurrence of more than 9% in the first year after stopping treatment. 3 As this risk exceeds the risk of warfarin-related bleeding, the BCSH recommend that patients with a first unprovoked or recurrent episode of proximal DVT or PE should be considered for long-term anticoagulation. 3 The issue is not straightforward, however, as although the cohort risk for patients with a history of unprovoked venous thrombosis may be > 9% as suggested by the BCSH, individual patients risk of recurrence is highly heterogeneous.
The BCSH guidelines illustrate this through identification of a lower annual risk in patients with a normal D-dimer result after completion of initial warfarin therapy compared with those with an elevated D-dimer (3.5% vs. 9%). 3 D-dimer is a breakdown product of fibrin, the principal constituent of a venous clot, and has been mainly used within the context of diagnosis of VTE. Within the diagnostic context a normal D-dimer result, defined usually by the laboratory, effectively rules out an acute VTE when used in combination with a clinical risk score. 4 Risk of recurrence has also been related to the presence of PTS and male sex. 5–7
A further consideration is the consequence of recurrent VTE. Patients with an initial unprovoked PE are three to four times more likely to suffer recurrence as PE rather than DVT. This may be significant given that the risk of fatal PE is two to four times more likely in patients with symptomatic PE as compared with patients with symptomatic DVT alone. 3
It remains uncertain if recurrence is more likely after a second or subsequent episode of unprovoked VTE than after a first event. However, given that risk of recurrence is sufficiently high after a first event to justify consideration of continued treatment, unprovoked recurrence is at least confirmation that the recurrence risk is high in that individual patient and recurrent events are fatal in approximately 5–9% of patients. 2
Prognostic factors
As most recurrences are easily preventable using anticoagulant therapy, it is of great importance that patient characteristics associated with risk of recurrence are identified, so that patient therapy can be stratified. Stratification of patients with unprovoked VTE according to their recurrence risk might be achieved on the basis of clinical predictors such as sex, comorbidities or weight, or by measuring laboratory markers of thrombophilia such as factor V Leiden, the prothrombin 20210A mutation, natural coagulation inhibitor deficiencies, elevated coagulation factors and antiphospholipid antibodies. 2,6,8,9 More recently efforts have been made to utilise global coagulation markers, including D-dimer, as prognostic tools. 2,9
Prognostic factors provide a wealth of potential uses. 10 For example, they identify groups of patients at highest risk of recurrence and thus inform prevention therapy, patient counselling and policies: they allow clinicians to monitor potential changes in treatment response and outcome risk; they may reveal the causal pathway between onset and recurrence of VTE; they are potential adjustment and confounding factors in randomised trial and observational analyses; they inform sample size and randomisation strategies in future trials; and they can be combined within a prognostic model to predict outcome risk for individuals. 10
Prognostic models
Prognostic models, prediction models, clinical decision rules, or clinical prediction guides are some of the terms used to describe statistical models which allow individual prediction of an outcome of interest. Prognostic models are useful tools in the area of VTE recurrence because the population is highly heterogeneous and therefore it is useful to have a mechanism to predict individuals risk rather than arbitrarily categorise patients when deciding on treatment strategies. 2,9 A prognostic model combines multiple predictors to predict the risk of a patient with particular characteristics having an event within a specified time. Individual risk predictions can help to inform clinical and patient decision-making with regard to treatment strategies, in this scenario whether or not to extend treatment with OACs to prevent recurrent VTE.
Aims of the project
The three main aims of the project are broadly outlined below, with specific project aims detailed further in Chapter 2.
Systematic review of prognostic models The first aim of the project is to systematically review all the evidence on existing prognostic models for VTE recurrence and adverse outcome following cessation of therapy for a first unprovoked VTE. The findings should inform clinical practice and patient care by summarising the current prognostic models and their predictive performance. The conclusions of the review will also help to inform the development of a new model within the context of existing research.
Development and validation of prognostic model The second and main aim of the project is to develop a prognostic model for the prediction of individual recurrence risk following cessation of therapy for a first unprovoked VTE. Individual patient data (IPD) will be utilised from one large prospective database in order to develop a new prognostic model based on multiple predictors and to externally validate the developed model. The results of this aim will provide a final prognostic model which allows individualised recurrence risk prediction, which could be used to inform patient care as part of an evidence-based approach.
Economic evaluation The third aim of the project is to undertake a cost-effectiveness analysis of a decision rule based on the developed prognostic model. A Markov patient-level simulation will be used to compare standard treatment strategy to a treatment strategy based on the proposed decision rule. Various risk thresholds will be assessed, where if patients predicted risk falls above the threshold the patient would be recommended to continue therapy, and where patients risk falls below the threshold, therapy may be discontinued. The conclusions of the cost-effectiveness analysis will identify an optimum risk threshold at which such a decision rule is cost-effective.
The primary database for use in developing the prognostic model is the Recurrent VTE Collaborative (RVTEC) database which contains seven trials investigating an association between D-dimer, measured after anticoagulation was stopped, and VTE recurrence. 11 It includes a total of 1634 patients with a first VTE (given the working definition of unprovoked VTE); of these, there was no missing follow-up information post treatment and 230 had a recurrence post treatment. The median follow-up time post treatment is 22 months.
The two additional databases for external validation of the developed model include the Registro Informatizado de Enfermedad TromboEmbólica (RIETE) and Multiple Environmental and Genetic Assessment of risk factors for venous thrombosis study (MEGA) databases. The RIETE database (www.riete.org) is primarily a Spanish registry which has recruited 40,000 consecutive patients with confirmed VTE, 30,000 of which are a first episode. The database contains 6291 patients with a median of 6 months’ follow-up data post treatment. The total number of recurrent episodes of VTE within this population is 742.
The MEGA database consists of the cases from a case–control study including 5961 patients with a first VTE consecutively enrolled from two anticoagulation clinics in the Netherlands which was compiled between 1999 and 2004. Within the database there are 1218 patients with a first episode of unprovoked VTE with 278 patients sustaining a recurrence: the median follow-up post treatment is 67 months.
Chapter 2 Research aims
As discussed above the main aim of the project is to develop and validate a prognostic model for predicting VTE recurrence post cessation of therapy for a first unprovoked VTE. A systematic review of existing prognostic models in the area will help to inform the development of the new model within the context of existing research. In addition, an economic evaluation will identify an optimal decision rule based on the prognostic model, giving an indication of the potential performance of such a rule within clinical practice. Detailed project aims are listed below.
-
To undertake a systematic review to identify and summarise studies of any design examining prognostic models (and clinical decision rules based on such models) that utilise multiple prognostic factors in combination to predict the risk of VTE recurrence and/or adverse outcome in patients that have ceased therapy for a first unprovoked VTE. The patients examined must, before cessation of therapy, have received at least 3 months’ treatment with an OAC therapy.
-
To undertake univariate (unadjusted) analyses within each of the three IPD databases to identify prognostic factors associated with VTE recurrence.
-
To undertake multivariate (adjusted) analyses within the three databases to identify those factors that have independent prognostic value for the risk of VTE recurrence (i.e. to examine if the prognostic ability of factors identified in part 2 remains even when adjusting for other variables).
-
To use the seven trials within the RVTEC database (including 1863 patients and 290 recurrences) to develop and validate (using internal–external cross-validation; IECV) a prognostic model that predicts individual risk of VTE recurrence after cessation of therapy, based on the most important prognostic factors identified in parts 1, 2 and 3. The most parsimonious model (with fewest prognostic factors included), which results in high predictive accuracy will be sought.
-
To use the prognostic model from part 4 and health economic modelling to develop and evaluate a clinical decision rule for stopping anticoagulation therapy for patients with unprovoked VTE being considered for cessation of routine anticoagulation therapy.
-
To externally validate the prognostic model from part 4 and the decision rule from part 5 in different study populations than those used to generate the model: first, the RIETE database (6291 suitable patients and 742 recurrences post treatment); then second, the MEGA database (containing 1218 patients with follow-up information post treatment). Then, if necessary, to refine the prognostic model and decision rule as appropriate.
-
To compare, if possible, the performance of existing published prognostic models (and clinical decision rules) found through the systematic review in part 1 with the new rule.
Chapter 3 Systematic review of existing prognostic models for the recurrence of venous thromboembolism following treatment for a first unprovoked venous thromboembolism
Introduction
The aim of this chapter was to undertake a systematic review of studies developing or validating a prognostic model for individual recurrence risk prediction following cessation of therapy for a first unprovoked VTE. The review identified current prognostic models and critically appraised the development and validation of these models. This systematic review highlights the current work in this area and informed the development of a new prognostic model (see Chapter 4) within the context of the existing models.
It is common in areas where prognostic models are useful, for several models to be developed, due to the myriad ways of developing a model and differences between the underlying populations used to develop these models. As such, it can be difficult for practitioners to identify which model is the most appropriate to their problem and to understand the shortcomings of the model. 12 A definitive review and critique of the existing models could help clinicians and other practitioners to better understand the strengths and weaknesses of each model, allowing informed decisions to be made on which (if any) models to use in practice.
The systematic review could also help to identify predictors for which evidence towards their prognostic effect was strong or weak, highlighting predictors for consideration within the model development (see Chapter 4). Further issues found within the development of existing models could also be considered within the development of a prognostic model for this project (e.g. related to model development methodology). Finally, as detailed in the research aims (see Chapter 2), the performance of existing models found in the review could be compared with the newly developed prognostic model (see Chapter 4), where the included predictors are similar.
A protocol for this systematic review was submitted to the National Institute for Health Research, outlining the methods which follow, published in BioMed Central Systematic Reviews journal13 and was registered on PROSPERO (CRD42013003494).
Methods
Aims of the review
The primary aim for the review was to identify studies that had developed or validated a prognostic model utilising multiple (at least two) predictors to predict the risk of recurrent VTE or adverse outcome (mortality or bleeding) following cessation of therapy for a first unprovoked VTE. Then to critique and summarise the development and validation (internal and external performance) of the identified prognostic models, with a view to identifying issues which may be considered in the development of a new prognostic model (see Chapter 4). For all models a summary of their context was described qualitatively including the predictors modelled, the development population and the setting of the model.
Search strategy
The following bibliographic databases were searched: The Cochrane Library (Wiley) (including the Cochrane Database of Systematic Reviews, Database of Abstracts of Reviews of Effects, Health Technology Assessment databases and the Cochrane Central Register of Controlled Trials), MEDLINE (Ovid) 1950–2014, MEDLINE In-Process & Other Non-Indexed Citations (Ovid) to date and EMBASE (Ovid) 1980–2014. Searches used index terms and text words that encompassed the patient group supplemented by terms relating to recurrence or adverse outcome and prognostic factors (see sample MEDLINE search in Appendix 1).
Publicly available trials registers were also searched, such as ClinicalTrials.gov, UK Clinical Research Network Study Portfolio Database, World Health Organization International Clinical Trials Registry Platform and the metaRegister of Current Controlled Trials. Reference lists of all included papers were checked and subject experts were contacted. No restrictions on publication language were applied.
In addition, abstracts from the following national and international conferences from 2005 onwards were hand-searched in order to capture studies that were not yet fully published:
-
haematology conferences: International Society of Thrombosis and Haemostasis, American Society of Hematology, European Hematology Association, British Society of Haematology
-
cardiology conferences: British Cardiac Society, American College of Cardiology, European Society of Cardiology, American Heart Association, ACCP.
Selection criteria
Inclusion criteria
Study design
Studies of any design [e.g. cohorts, randomised controlled trials (RCTs)] or systematic reviews that developed, compared or validated a prognostic model (or clinical prediction rule based on a model) utilising multiple (at least two) predictors to predict the risk of recurrent VTE or adverse outcome (mortality or bleeding) following cessation of therapy for a first unprovoked VTE.
Patient group
Patients aged ≥ 18 years with a first unprovoked VTE where the patient has received at least 3 months treatment with an OAC therapy. Studies with mixed populations (including those outside the remit), were included provided that appropriate data for the defined group of patients were extractable.
Setting
Studies in any setting were included.
Potential prognostic models
Studies must have reported a prognostic model utilising multiple prognostic factors to predict the risk of recurrent VTE or adverse outcome following cessation of therapy for a first unprovoked VTE. A prognostic model was defined as a combination of at least two predictors within a statistical model, used to predict an individual’s risk of outcome (e.g. VTE recurrence).
Study selection
Study selection followed a two-step process. Titles (and abstracts where available) were initially screened by two reviewers independently, using predefined screening criteria (see Appendix 2). These were broadly based on whether or not studies (1) included patients with a first unprovoked VTE, who received a minimum of 3 months OAC therapy, and (2) developed or examined prognostic models in relation to individual prediction of VTE recurrence or other clinical outcomes. Full texts of any potentially relevant articles were then obtained and two reviewers independently applied the full inclusion criteria (see Appendix 2). Any discrepancies between reviewers were resolved by discussion or by referral to a third reviewer. Portions of non-English-language studies were translated where necessary to facilitate study selection and subsequent data extraction. The study selection process was documented using the Preferred Reporting Items for Systematic Reviews and Meta-Analyses (PRISMA) flow diagram. 14 Any relevant systematic reviews identified were screened for further primary studies. Reference management software was used to record reviewer decisions, including reasons for exclusion.
Data extraction
Data extraction was conducted independently by two reviewers using an in-depth piloted data extraction form. Disagreements were resolved through discussion or referral to a third reviewer.
Data extraction included the following elements:
-
study characteristics (e.g. sample size, country, year)
-
study design characteristics (e.g. RCT, prospective, length of follow-up)
-
patient characteristics (e.g. summaries of age, sex, family history, treatment details in the sample)
-
candidate prognostic factors considered (e.g. any thresholds used for continuous predictors, methods of measurement, timing of measurement post cessation of therapy)
-
outcome measures (e.g. recurrence of VTE, mortality, bleeding)
-
statistical methods employed and how prognostic factors included in the analysis were handled (e.g. continuous, dichotomised)
-
prognostic models {e.g. the final model (its specification and included factors), how it was developed and an individual risk probability was produced, and any internal and external validation performance statistics for discrimination [such as the c-statistic (area under the curve; AUC)] and for calibration [such as the E/O ratio (expected/observed events)], together with their confidence intervals (CIs)}.
Assessment of study quality
The quality (risk of bias) of any studies developing or evaluating a prognostic model was assessed by piloting Prediction study Risk Of Bias Assessment Tool (PROBAST), a tool for assessing risk of bias and applicability of prognostic model studies that was nearing completion and ready for piloting when this review was undertaken. 15
Particular elements were considered in the following domains:
-
Patient selection (such as whether or not it was a prospective design, what study design was used, if appropriate inclusions and exclusions were used, and whether or not patients had similar disease presentation, or if this was accounted for in analyses).
-
Outcomes (such as whether or not the outcome definition was pre specified, predictors were excluded from the definition, the same definition and assessment was used for all patients and whether or not the outcome was determined blind to predictor information).
-
Predictors (such as whether or not the same predictor definitions were used for all patients, predictors were measured blinded to outcome data, all predictor information was available at the time the model was intended for use and whether or not non-linear associations for continuous predictors were considered and categorisation was not data driven).
-
Sample size (such as whether or not there was a pre-specified sample size consideration accounting for numbers of events and multiple comparisons in selection of factors, whether or not all enrolled patients were included in analyses and how many data were available for external validation).
-
Missing data (such as adequate reporting on completeness of data and whether or not imputation was investigated).
-
Statistical analysis (such as handling of continuous variables, selection of possible predictors irrespective of univariable analyses, whether or not overfitting and optimism was accounted for using bootstrapping or shrinkage and whether or not weights assigned to predictors related to regression coefficients).
-
Internal and external model validation (such as whether or not model validations are reported and how these were carried out).
Evidence synthesis
Details on the methodology of model development and findings from studies reporting a prognostic model were summarised narratively, and in the context of any potential risk of bias identified. Key components were the predictors included in the final model; how the included predictors were coded; what the specification of the model was, and how it produces an individual outcome probability or risk score; the reported predictive accuracy of the model; and whether or not the model was validated internally and externally and, if so, how.
The consistency of development methods used and main findings was examined to identify if studies at higher risk of bias produced different results and conclusions to those considered to be at low risk of bias.
If multiple studies were found that validated the same prognostic model, then it was planned to synthesise calibration statistics (such as E/O events) and discriminatory statistics (such as the c-statistic, AUC), using the random-effects meta-analysis of DerSimonian and Laird,16,17 to summarise the model’s average performance across different settings and its predicted performance in a future setting. 18,19
Amendments to protocol
The original protocol for this review stated that a systematic review of all potential prognostic factors would be undertaken, which would include any individual factor shown to be associated with risk of recurrence or adverse outcome. Due to the large wealth of information on potential prognostic factors and high levels of heterogeneity in the evidence, a review of all prognostic factors would require significant resource for limited conclusions. Due to the large heterogeneity between studies it was thought to be unwise to attempt to synthesise such evidence as no firm conclusions could be drawn from such a review.
It is widely accepted within the prognostic research community that individual risk prediction requires the use of a combination of factors. 18 Therefore summarising the prognostic ability of individual factors in isolation would also not meet the primary aim of this project. As a result, a protocol amendment was submitted to undertake a systematic review of only prognostic models, including any study utilising a combination of multiple factors in a model to predict individual risk of recurrence or adverse outcome after cessation of therapy in patients with a first unprovoked VTE. Thus studies only considering the prognostic ability of a candidate prognostic factor were no longer included or synthesised, unless they also reported the development and/or validation of a multivariable prognostic model.
These amendments were discussed with, and agreed by, the National Institute for Health Research and a revised protocol submitted.
Results
Quantity of research available
Searching of bibliographic databases as described in Search strategy resulted in 13,516 records identified after automatic removal of 1879 duplicate records. A further 2747 records were manually removed as duplicates, leaving 10,769 records to be screened for inclusion. Screening of titles and abstracts identified that 10,485 were not relevant to the review question. Full-text articles were sought for eligibility assessment, three articles were unobtainable,20–22 and while 16 non-English-language articles were translated, a further three articles could not be translated into English despite extensive efforts to obtain translations23–25 (see Appendix 3). This resulted in a total of 278 full-text articles sourced for assessment. Of the 278 full-text articles assessed for inclusion, 258 articles were excluded (see Appendix 3), with 91 articles excluded as discussion or review articles not developing or updating a prognostic model, 150 articles were excluded based on issues related to the model (e.g. not developed for individual prediction, adjusted a single predictor, etc.), three articles were excluded based on the study population, and 14 were excluded based on both study population and issues around the model used (Figure 1).
FIGURE 1.
Preferred Reporting Items for Systematic Reviews and Meta-Analyses flow diagram.
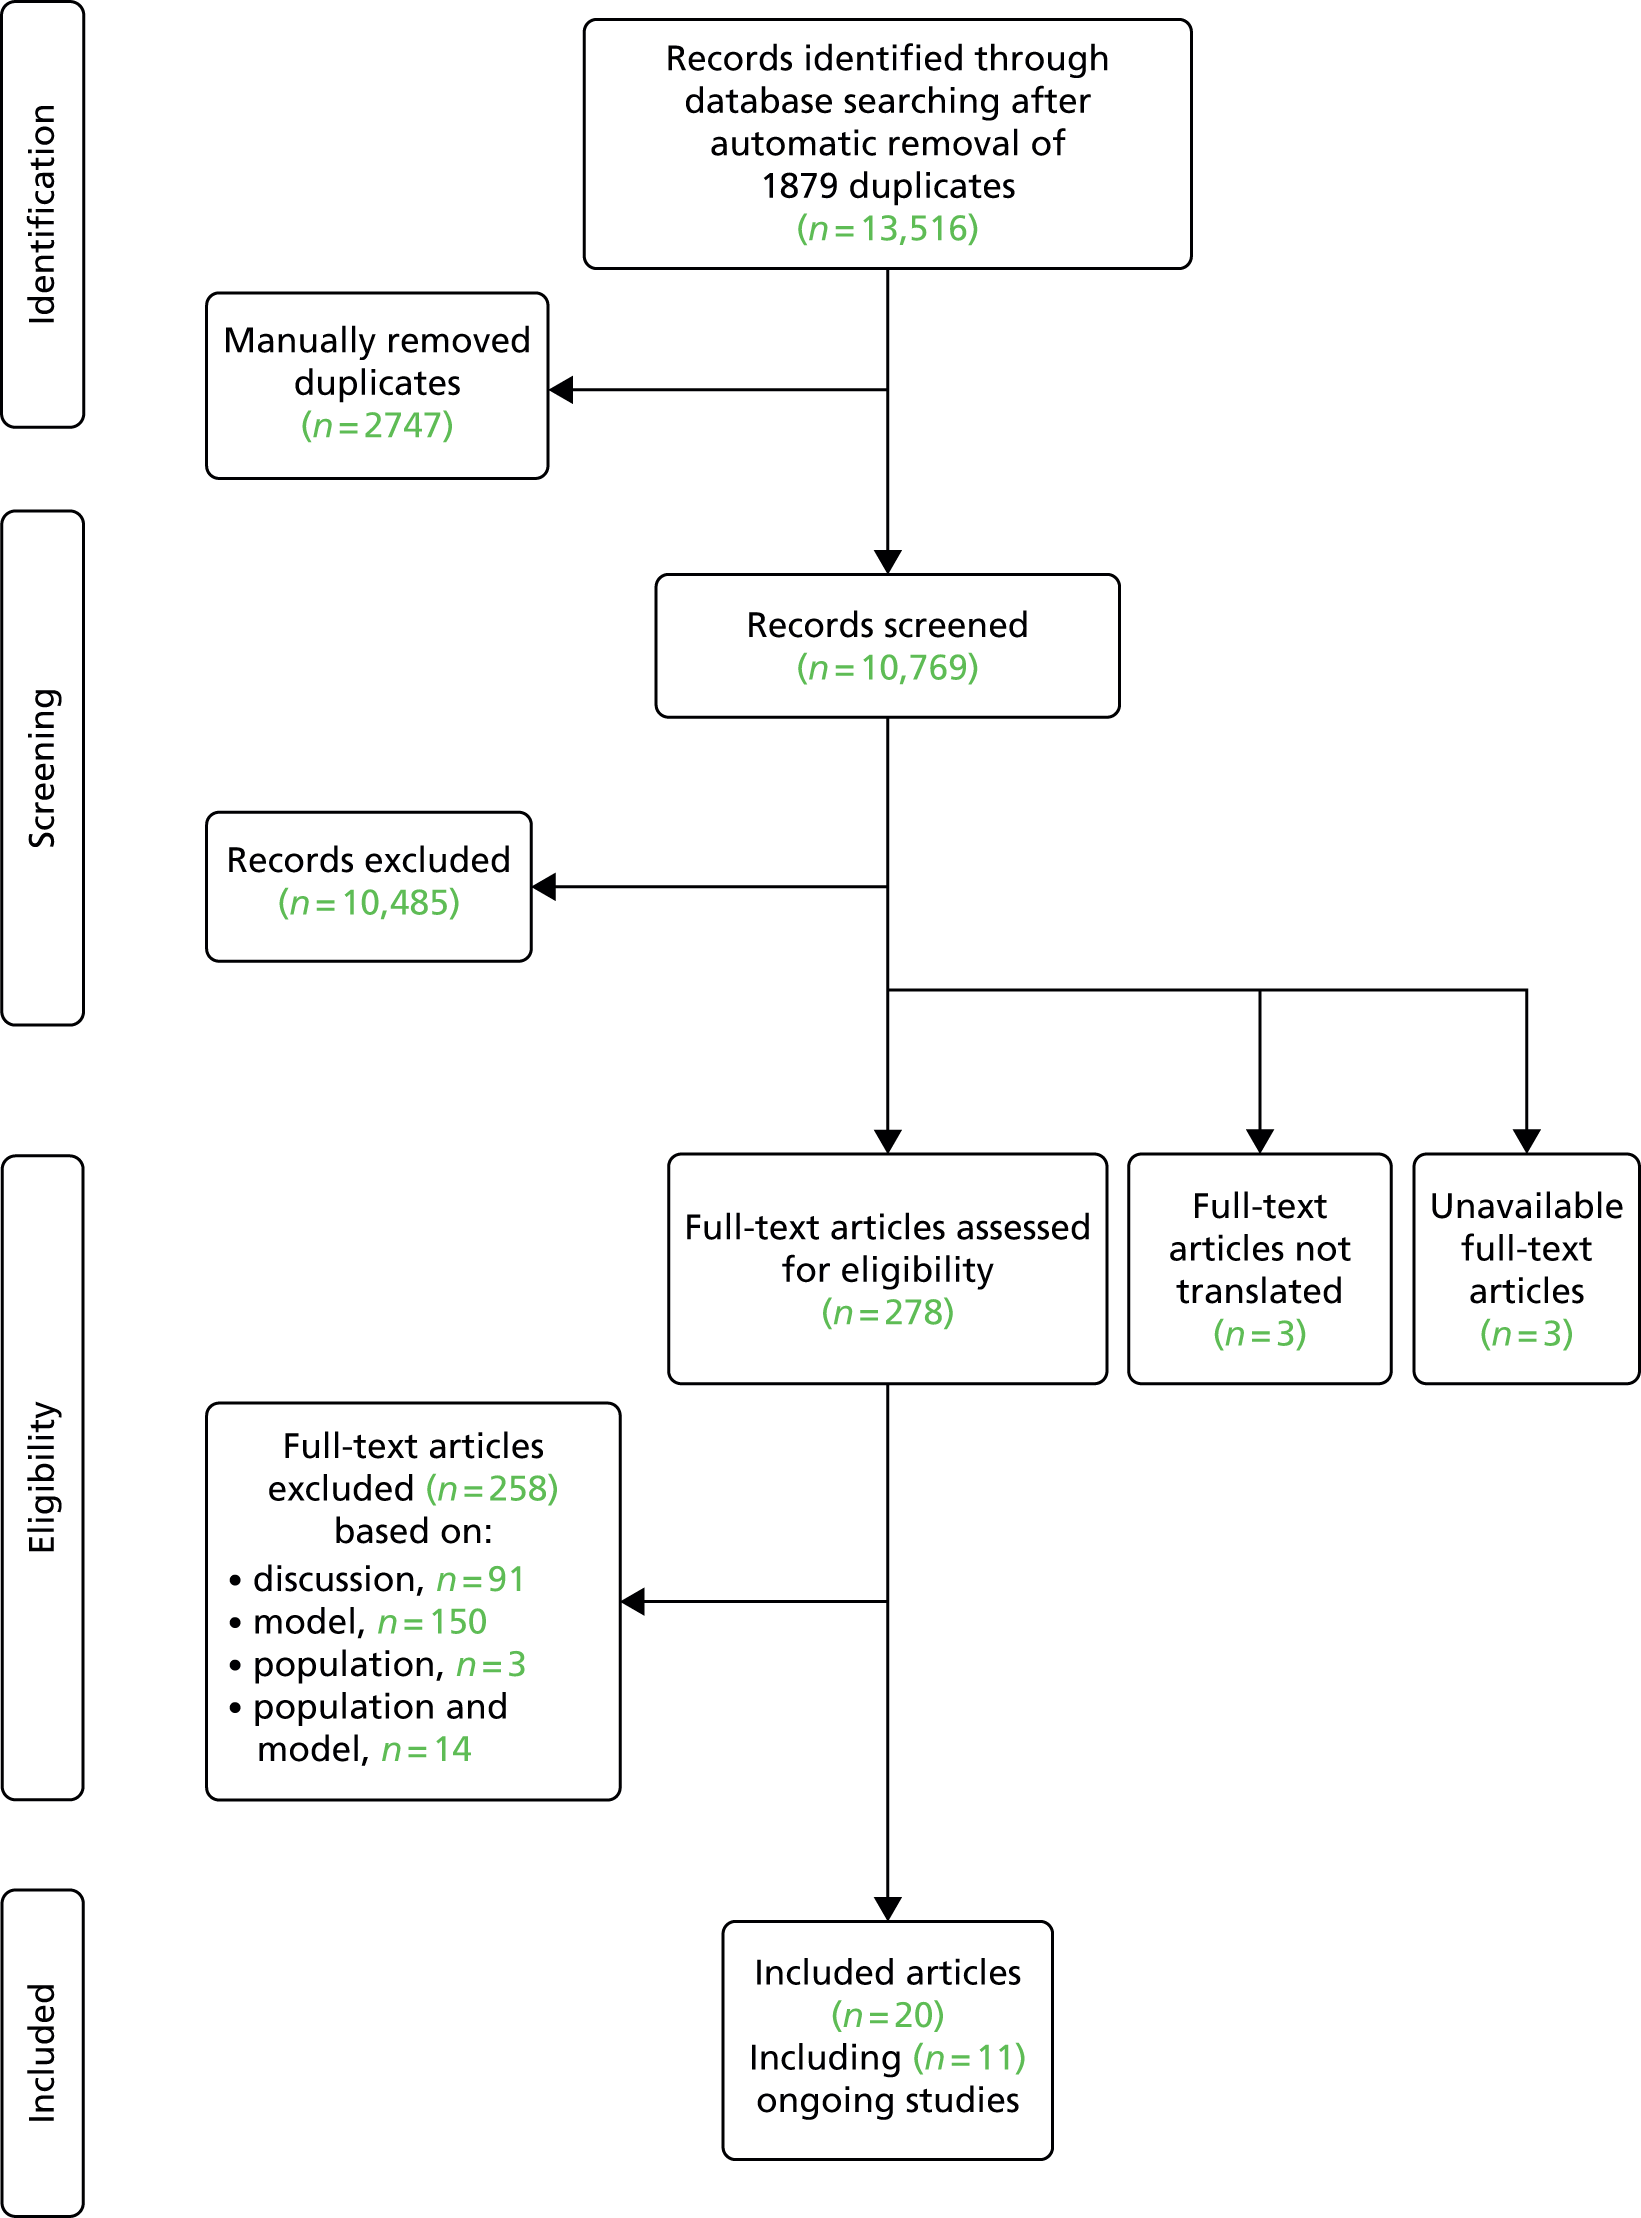
As a result of the screening process a total of 20 articles met the inclusion criteria, including seven ongoing studies8,26–35 (see Ongoing studies), eight conference abstracts relating to studies which appeared to meet the inclusion criteria,30–40 one record of this Health Technology Assessment report29 and four full-text peer-reviewed articles,2,9,41,42 one of which appeared to be an update to one of the other three articles. 42 The authors of the 15 included conference abstracts and ongoing studies were contacted to seek additional information, such as a subsequent publication. Based on author responses, 13 of the 15 articles were associated with the four full-text articles included. The authors of the remaining two articles did not respond to further enquiry and so no further publications could be found to supplement the available abstracts. 26,37 One, a study by Raskob et al. ,37 is based on data from the EINSTEIN extension study43 and aimed to identify a subgroup of patients at high and low risk of recurrent VTE. The analyses investigated patient characteristics including age (dichotomised), sex, body mass index (BMI) (dichotomised), idiopathic presentation, site of index event, malignancy, creatinine clearance, known thrombophilia, immobilisation, and comorbid cardiac and pulmonary disorders; it was unclear from the abstract if analyses were univariable or multivariable. Further information regarding the study was unavailable from the included abstract, therefore it was unclear whether or not a prognostic model was developed and if individual recurrence risk could be predicted from such a model. The second abstract relates to the ongoing VISTA study,26 which is further discussed in Ongoing studies.
The four full-text articles included in the review (and 13 associated abstracts) will be discussed in further detail throughout the remaining sections of this chapter: Main study and patient characteristics, Description, critique and main findings of model studies, Comparison of included studies quality (which compare and contrast the three main articles and discuss common strengths and weaknesses), and Discussion (which provides an overall discussion on the issues found which may help to inform the development of a new prognostic model). The ongoing studies identified will be discussed in Ongoing studies. Three of the articles developed three independent prognostic models or rules (whereas the fourth is an update to one of the models), outlined briefly below.
HER DOO 2: Rodger et al.9
Rodger et al. 9 used a conditional logistic regression model to develop a clinical decision rule which suggested that a female patient with less than two predictors (post-thrombotic signs, D-dimer level ≥ 250 µg/l, BMI ≥ 30 kg/m2 or aged ≥ 65 years) could potentially safely discontinue OAC therapy after 5–7 months of initial OAC therapy for an unprovoked VTE. A low risk (< 3% annual recurrence risk) group of males could not be identified in the study and therefore Rodger et al. 9 recommended that all male patients continue OAC therapy. 9
Vienna prediction model: Eichinger et al.2,42
Eichinger et al. 2,42 used a Cox proportional hazards model to develop a prognostic model including sex, site of index event and D-dimer as predictors. A nomogram based on the prognostic model was derived to allow easy implementation of the model and can be used to calculate patient’s cumulative recurrence rate at 12 and 60 months from cessation of therapy, with estimated 95% CIs. 2 An extension to the Vienna model has been proposed which aimed to utilise D-dimer measurements over time to allow prediction using the Vienna model from time points at 3, 9 and 15 months after cessation of therapy. 42
DASH score: Tosetto et al.41
Tosetto et al. 41 used a Cox proportional hazards model to develop a clinical prediction guide including predictors for abnormal D-dimer levels (+2 score), age ≤ 50 years (+1 score), male sex (+1 score) and hormone use (–2 score). This proposed score can be used to calculate patients’ cumulative recurrence rate at 1, 2 and 5 years from cessation of therapy, with estimated 95% CIs. Tosetto et al. 41 suggest that a combined D-dimer, Age, Sex, Hormone therapy (DASH) score of ≤ 1 would indicate an annual recurrence risk < 5% and therefore indicate that a patient could potentially stop OAC therapy, conversely a DASH score of ≥ 2 would indicate annual recurrence risk > 5% and thus suggest patients should potentially continue OAC therapy. 41
Throughout this chapter these articles will be referred to using their author’s name, while the corresponding models will be referred to using their given name as above.
Main study and patient characteristics
In this section study and patient characteristics will be compared across the three included articles where possible. Due to the large heterogeneity in the methods used for model development and the presentation of the final models, a detailed assessment and discussion of the methods used and proposed models will follow in a critical appraisal of the included articles (see Description, critique and main findings of model studies).
The study characteristics of included articles are described in Table 1. Two of the articles, Rodger et al. 9 and Eichinger et al. ,2,42 conducted prospective cohort studies to develop their prognostic models. Tosetto et al. 41 collected IPD from seven prospective cohort studies with which to build their prognostic model. All studies included recurrent VTE as their outcome of interest, and each included patients from several different centres across a range of countries creating the opportunity for heterogeneity in overall results and making it difficult to define the population in which the developed models can be applied. Table 2 shows the variable inclusion and exclusion criteria used across the three studies, with different criteria applied for treatment duration; for example, Rodger et al. including those treated for 5–7 months with OAC therapy, and Eichinger et al. including any patient treated for greater than 3 months OAC therapy.
| Model | HER DOO 2 | Vienna | DASH |
|---|---|---|---|
| Author | Rodger et al.9 | Eichinger et al.2,42 | Tosetto et al.41 |
| Year of publication | 2008 | 2010 | 2012 |
| Country | Four countries (unspecified) | Austria | Austria, Canada, Italy, Switzerland, UK, USA |
| Study setting | Twelve tertiary care centres, patients enrolled between October 2001 and March 2006 | Recruited from four thrombosis centres in Vienna between July 1992 and August 2008 | Patient-level meta-analysis of previously published studies11 |
| Study design | Multicentre prospective cohort study | Prospective cohort study | IPD from seven prospective studies |
| Clinical outcome | Recurrent VTE | Recurrent VTE | Recurrent VTE |
| Total sample size, n | 646 | 929 | 1818 |
| Events, n | 91 | 176 | 239 |
| Model | HER DOO 2 | Vienna | DASH |
|---|---|---|---|
| Author | Rodger et al.9 | Eichinger et al.2,42 | Tosetto et al.41 |
| Inclusion criteria | Patients with first unprovoked thromboembolism (proximal DVT or segmental or greater PE), received heparin for 5+ days and received oral anticoagulation therapy for 5–7 months Includes patients that had recurrent VTE during treatment period |
Aged > 18 years with a first VTE, treated with OACs for at least 3 months | Initial unprovoked VTE event VTE in association with oral hormonal therapy or thrombophilic blood abnormality and no other VTE risks were included |
| Exclusion criteria | Aged ≤ 17 years, already discontinued OAC, required ongoing OAC for reasons other than VTE, geographically inaccessible for follow-up, treated for recurrent unprovoked VTE, or known high-risk thrombophilia (deficiency of protein S, protein C or antithrombin, persistently positive lupus anticoagulant, or 2+ thrombophilic defects) | Initial provoked VTE event | Patients with known antiphospholipid antibodies or anti-thrombin deficiency Excluded if not proximal DVT or PE index event |
| Definition of unprovoked | Not provoked by leg fracture or plaster cast, immobility for > 3 days, surgery in 3 months prior to index event, diagnosis of cancer in last 5 years | Not provoked by surgery, trauma, pregnancy, hormone intake; deficiency in antithrombin, protein C, protein S; presence of lupus anticoagulant; or cancer | Not provoked by surgery, trauma, pregnancy and the puerperium, immobility, or cancer |
Importantly, there were some differences across the studies in terms of the definition of unprovoked VTE used. Although surgery, trauma, immobility, pregnancy and cancer all appear as provoking factors across the studies, only the Vienna study2,42 excludes hormone therapy as a provoking factor. Hormone therapy is considered to be a weak risk factor for recurrent VTE and as such is often included in the definition of unprovoked VTE. However, hormone therapy is a transient risk factor and unprovoked VTE is defined as an absence of transient risk factors, making its inclusion concerning. The patient population may differ in terms of recurrence risk due to including patients with a lower risk of recurrence than the unprovoked VTE population, which will impact on the estimated predictor effects in any developed model (see Description, critique and main findings of model studies).
The study populations differed in various ways across the three included studies, and differing patient characteristics and predictors were recorded. Those characteristics which were commonly reported across the studies are presented in Table 3, including patient age, sex, site of index VTE, BMI, D-dimer level, presence of factor V Leiden, duration of OAC therapy, duration of follow-up and definition of unprovoked VTE.
| Patient characteristic | HER DOO 2:9 mean (SD) or frequency (%) | Vienna:2,42 median (25th, 75th percentiles) or frequency (%) | DASH:41 median or % | |||||||
|---|---|---|---|---|---|---|---|---|---|---|
| n | Recurrence | n | No recurrence | n | All | n | Recurrence | n | No recurrence | |
| Age (years) | 91 | 53.6 (14.8) | 555 | 52.3 (17.9) | 929 | 54 (43, 63) | 239 | 63 | 1579 | 61 |
| Male proportion | 91 | 63 (69.2%) | 555 | 269 (48.5%) | 929 | 562 (60%) | 239 | 69.40% | 1579 | 48.60% |
| Site (distal DVT) proportion | 91 | NA | 555 | NA | 929 | 164 (17.7%) | 239 | NA | 1579 | NA |
| Site (proximal DVT) proportion | 91 | NA | 555 | NA | 929 | 327 (35.2%) | 239 | NA | 1579 | NA |
| Site (PE) proportion | 91 | NA | 555 | NA | 929 | 438 (47.1%) | 239 | NA | 1579 | NA |
| BMI (kg/m2) | 91 | 30.3 (7.6) | 555 | 28.9 (7.1) | 909 | 27.1 (24.4, 30.1) | a | 27.2 | a | 27.2 |
| D-dimer (µg/l)b | 91 | 383 (738) | 555 | 294 (314) | 832 | 355 (236, 558) | 239 | 67.7%c | 1579 | 42%c |
| Factor V Leiden proportion | 91 | 19 (20.9%) | 554 | 81 (14.6%) | 916 | 224 (24.4%) | 239 | NA | 1579 | NA |
| Duration of OAC (months) | 91 | 5 to 7 | 555 | 5 to 7 | 929 | 6.6 (6.1, 8.0) | 239 | 6.7 | 1579 | 6.8 |
| Duration of follow-up (months) | 18 (1–47)d | 43.3 (14.7, 78.5) | 22.4 | |||||||
There were differences in the presentation of results across the studies, with the Vienna2,42 and DASH41 studies presenting the median of continuous characteristics and frequency of categorical characteristics, whereas the HER DOO 2 [Hyperpigmentation, Edema, Redness/D-dimer, Obese (body mass index > 30 km/m2), Old (age > 65 years)/2 or more factors should indicate for patients to continue therapy]9 study presented means for continuous characteristics (see Table 3). Both the HER DOO 29 and DASH41 studies split characteristic data by event status (recurrent VTE/no recurrence), whereas the Vienna2,42 study presented overall population characteristics, making comparisons across the studies difficult.
There were distinct differences in the number of observed events across the included studies, with 176, 239 and 91 events for the Vienna,2,42 DASH41 and HER DOO 29 studies respectively (see Table 3). The small number of events seen in the Vienna2,42 and HER DOO 29 studies may lead to insufficient statistical power, which will be discussed within the critical appraisal (see Description, critique and main findings of model studies). The DASH41 study combined IPD from seven source studies providing greater sample size and statistical power; the same IPD database was utilised in the development of a prognostic model in Chapter 4. 11
Other characteristics, such as patient age, proportion of males, BMI and duration of OAC therapy, appeared to be somewhat consistent in terms of reporting across the studies (see Table 3). D-dimer levels were consistent across the Vienna2,42 and HER DOO 29 models, where both measured the median D-dimer level. Comparison to the DASH41 study was not possible as D-dimer was dichotomised (normal vs. abnormal) within the study. The proportion of patients with factor V Leiden appears to be greater in the Vienna2,42 study than the comparable HER DOO 29 study, though this may be explained by greater chance discrepancies in the prevalence of factor V Leiden likely to occur in smaller studies.
Description, critique and main findings of model studies
Quality assessment of the three included articles was undertaken using an early version of the PROBAST for assessing risk of bias and applicability of prognostic model studies. 15 The results of this assessment formed the structure and content of this critical appraisal covering areas including patient selection, outcomes, predictors, sample size and analysis methods of the three included studies (see Assessment of study quality).
Key similarities and differences between the models are then summarised, focussing on the implications for the robustness of the respective findings. The findings from the PROBAST assessment, in terms of areas of potential risk of bias in the included studies, are summarised in Table 4, and presented validation statistics for the studies are summarised in Table 5.
| Model | HER DOO 29 | Vienna2,42 | DASH41 |
|---|---|---|---|
| Use of a selection procedure? | Yes | Yes | Yes |
| Adjustment for optimism in selection procedure? | No | Yes | Yes |
| Events per predictor > 10? | No | Yes | Yes |
| Appropriate type of model? | No | Yes | Yes |
| Modelled continuous predictors as linear/non-linear? | No | Yes | No |
| Considered multiple imputation to handle missing data? | No | No | No |
| Internal validation? | No | Yes | Yes |
| External validation? | No | Yesa | No |
| Adjustment for optimism in internal validation? | Yes | Yes | Yes |
| Reported discrimination? | No | Yesa | Yes |
| Reported calibration? | No | Yesa | Yesa |
| Were final model predictor weightings related to regression coefficients? | Yes | Yes | Yes |
| Risk of bias? | High | Moderate | Moderate |
| Key reason for decision | No external validation/several quality issues | External validation | No external validation |
| Model | Calibration slopea | Apparent discriminationb | Bootstrap-adjusted discriminationc |
|---|---|---|---|
| HER DOO 29 | |||
| Model for use (score) | – | – | – |
| Development model (Beta terms) | – | – | – |
| Vienna2,42 | |||
| Model for use (nomogram) | – | – | – |
| Development model (Beta terms) | 0.88 | 0.651 | 60 months = 0.646 |
| DASH41 | |||
| Model for use (score) | – | 0.71 | – |
| Development model (Beta terms) | 0.974 | 0.72 | – |
HER DOO 29
Rodger et al. 9 aimed to develop and internally validated a clinical decision rule to identify a subgroup of patients at low risk of recurrent VTE, in whom OAC therapy could be stopped after 6 months.
Patient selection
Rodger et al. 9 used a prospective cohort study with consecutive unselected patients from 12 tertiary care centres in four countries. The prospective cohort design ensures that predictor information can be collected blinded of patient outcome. Inclusion criteria were patients treated with low-molecular-weight heparin for at least 5 days, OAC therapy for between 5 and 7 months with an INR between 2 and 3, and with no recurrence during therapy. Patients were excluded if they would not provide consent, were aged < 17 years, had already ceased therapy, required therapy for another reason, were inaccessible for follow-up, were being treated for unprovoked recurrence or known thrombophilia. Thrombophilia testing was not performed as part of the study, but any patients with known thrombophilia prior to the start point were excluded.
The definition of unprovoked VTE used by Rodger et al. 9 was based on an absence of the following provoking factors:
-
leg fracture or plaster cast
-
immobility for > 3 days
-
surgery using general anaesthetic (in the 3 months prior to the index event)
-
diagnosis of cancer (in the past 5 years).
This definition of unprovoked VTE therefore includes women who have currently, or previously, used OCs or HRT. Hormone therapy should be considered as a provoking factor for recurrent VTE; though some argue that because the effect of hormone therapy is weak it may be included within the definition. 41,44 Strictly, the definition of unprovoked VTE refers to a VTE in the absence of any transient risk factors, hence why hereditary thrombophilia can be considered unprovoked VTE. 45 As hormone therapy is a transient risk factor patients with a history of hormone therapy could be considered provoked. As a result there may be patients included in the model development who are at potentially lower risk than other unprovoked patients. This could lead to biased estimation of effect sizes within analyses, particularly for the effect of sex, which could lead to poor validation in external populations which may not include patients with hormone-related index events.
Outcomes
The primary outcome of the study was recurrent VTE, with associated deaths also recorded. Suspected DVT was confirmed by compression ultrasound, whereas suspected PE was confirmed by high-probability ventilation/perfusion scanning and/or spiral computed tomography. All events were adjudicated by independent physicians who were blinded to predictor information. As such, outcomes were pre-specified with the same definition and assessment used for all patients reducing the risk of detection bias, where there are differences in the determination of outcomes. The outcome definition excluded any candidate predictors again reducing the risk of detection bias and overall providing a low risk of bias with regard to outcome assessment.
Predictors
Rodger et al. 9 report that information was collected on 69 potential predictors based on evidence from a pre-specified systematic review. Summary information was provided for 21 candidate predictors (with categories equating to 39 candidate predictors) including:
-
sex
-
ethnicity
-
age (years)
-
weight (kg)
-
height (cm)
-
BMI (kg/m2)
-
abnormal baseline imaging
-
abnormal baseline compression ultrasound
-
D-dimer (µg/l)
-
homocystine (mmol/l)
-
haemoglobin (g/l)
-
heterozygous for prothrombin gene mutation
-
factor VIII (U/ml)
-
factor V Leiden
-
ventilation/perfusion scan or pulmonary vascular obstruction result < 95%
-
post-thrombotic signs
-
history of chronic obstructive pulmonary disease or emphysema
-
family history of VTE
-
previous secondary VTE
-
use of OC in year before event
-
HRT in year before the event.
All predictors were measured before outcomes occurred, with laboratory predictors measured from samples taken while still on OAC therapy, and predictor definitions were consistent for all patients. Therefore the risk of selection bias due to differences in the characteristics of patients, and also the risk of reporting bias through differences in the reporting of predictors based on outcomes, could be considered low.
The use of a systematic review to identify potential predictors, the consistent updating of the systematic review and the assessment of all identified predictors provides confidence that there is a low risk of selection bias where patients are selected based on their characteristics, and attrition bias based on exclusions from analyses.
Rodger et al. 9 categorised all continuous predictors that had a p-value < 0.2 at univariable analysis, by dichotomising at various thresholds and identifying ‘optimal’ thresholds as those with the highest chi-squared value. The process of categorisation was therefore completely data driven which often leads to reporting bias, where the most significant results are presented. 46 Rodger et al. 9 indicate that dichotomised predictors were used to enhance the applicability and acceptance of the proposed clinical decision rule. Although it is a valid reasoning, with researchers and clinicians looking for parsimony in any decision rule,12 the dichotomisation of continuous predictors leads to a loss of information. Dichotomisation splits patient’s risks into two groups treating patients on either side of a threshold as distinctly different, when in reality they may be very similar on the original scale. 47 Best practice recommends that continuous predictors remain continuous in any analysis and to investigate non-linear associations. 47–50
Sample size and patient flow
A total of 646 patients had at least one follow-up visit and were included within the analysis. Only 600 of these patients completed follow-up, with 14 lost to follow-up, 10 patients dying after their first follow-up, nine patients withdrawn and 13 patients restarting OAC therapy for another reason. There were 91 events recorded out of the 646 patients included in the analysis, which could be considered insufficient power to investigate the 36 predictors described within the article. As a rough guide at least 10 events are required for each candidate predictor being investigated to give enough power for the analysis to yield valid conclusions. 51 Therefore, to investigate 36 predictors would require roughly 360 events. It is unclear from the article whether or not model building included the 36 predictors summarised within the article, or the 96 predictors for which information was recorded: roughly 960 events would be required to adequately power such an analysis. 51 As the study was substantially underpowered (with a maximum of 2.5 events per predictor), the results of model building and conclusions drawn must be carefully interpreted. Predictor effects could be substantially biased, with overestimation or underestimation of both the effect size and its associated uncertainty. 51
Rodger et al. 9 conducted a complete-case analysis, excluding patients with any missing predictor information. There was missing predictor information quantified for five predictors included in the predictor selection procedure:
-
abnormal baseline compression ultrasound (events = 14/non-events = 180)
-
factor V Leiden (events = 0/non-events = 1)
-
ventilation/perfusion scan or pulmonary vascular obstruction result < 95% (events = 53/non-events = 283)
-
post-thrombotic signs (hyperpigmentation, edema or redness in either leg) = (events = 18/non-events = 83)
-
family history of VTE (events = 0/non-events = 1).
The use of a complete-case analysis for the final model may introduce attrition bias by excluding patients who have outcome data but are missing information from one or more candidate predictors. The drop in the number of events is also a cause for concern; a potential total of 85 events were missing across the five predictors, enhancing the possibility of spurious relationships being seen or important prognostic effects being missed during the predictor selection procedure. In terms of the final model, only post-thrombotic signs were included and so the complete-case analysis sample size was reduced by 101 patients, of whom 18 were events. Overall the sample size and handling of missing data within the study indicate a potentially high risk of bias within the model development.
Analysis
Rodger et al. 9 used a conditional logistic regression model and selected predictors using a stepwise forward selection process. As the outcome of interest was time to recurrent VTE, a time-to-event analysis may have been more appropriate here as logistic regression does not account for the censoring of patients over time and variable lengths of follow-up. The analysis also did not consider the potential heterogeneity across the three tertiary centres from four different countries, stratification by centre or country would take into account any heterogeneity in the baseline risk of recurrence within these potentially different populations. 52
Predictors were only included in multivariable analysis if univariable analysis yielded a p-value < 0.2, though univariable results were not presented in the article. This exclusion of candidate predictors from multivariable analysis was therefore completely data driven based on univariable results, which could lead to potential bias in results because predictors which may be important in combination (e.g. in a multivariable model) were not considered for multivariable analysis. Univariable analyses are not recommended for decisions about inclusion criteria in a multivariable model. 53
The use of a forward selection procedure in model development can lead to overoptimism in regression coefficients (betas) and therefore a method such as shrinkage or bootstrapping should be used to account for this optimism. Rodger et al. 9 did not use methods to account for optimism in their analyses and as such there is a risk that the performance of their proposed model could be weaker when applied to a new population.
Rodger et al. 9 decided to split patients into two groups based on sex in a post-hoc analysis because a specified low-risk group (< 3% annual risk of recurrence) could not be identified. Post-hoc subgroup analyses such as this are often not considered in any assessment of study power. Stratifying by sex reduced the number of events for females and males to 28 and 63 events, respectively, creating similar issues to those discussed above in the estimation of regression coefficients within the model. 51
Five clinical decision rules were developed for women and two for men, the final decision rule was selected based on criteria including the classification of performance; the proportion of patients identified as low risk; the face validity of the model; ease of use of the model; and more parsimonious models. The performance of decision rules for men was considered poor, particularly in identifying a low-risk group of men which could be considered for cessation of therapy, as such the study recommended that men continue with OAC therapy. The final decision rule for women included predictors for:
-
post-thrombotic signs:
-
hyperpigmentation
-
oedema
-
redness in either leg
-
-
D-dimer level ≥ 250 µg/l
-
BMI ≥ 30 kg/m2
-
aged ≥ 65 years.
Rodger et al. 9 suggested that any female patient with fewer than two of these predictors could potentially safely cease OAC therapy after 5–7 months of initial OAC therapy for an unprovoked VTE. The specification of the model is not described in full, with regression coefficients presented for the final model only, but without any measurement of variability such as a standard error or 95% CI for the coefficients. It is unclear if or how the decision rule is related to the regression coefficients, though it may be that a rounding of the coefficients to the nearest integer was used. There is no indication of the level of risk associated with a particular score using the proposed decision rule; for example, what the risk of recurrence at 1 year post cessation of therapy is for a female with three of the included factors.
The decision rules developed were internally validated using split-sample cross-validation. Five hundred subsamples, half the size of the study sample, consisting of randomly selected patients from the population were used to assess rule performance. The mean annual recurrence risk predicted by the clinical decision rule was recorded within each subsample and showed that for all subsamples the decision rule identified a low-risk group of women with mean annual risk of recurrence between 0% and 3%, suggesting that the rule performed well in internal validation. No measure of performance in terms of calibration or discrimination was presented, and no external validation of the rule was conducted. An external validation of the clinical decision rule is currently being undertaken comparing use of the decision rule to decide on cessation of therapy versus standard therapy. 27,28
Summary
Overall there are significant concerns over the robustness of the proposed clinical decision rule. The testing of many more predictors than the study was powered for could lead to potentially spurious predictor effects. The data-driven dichotomisation of continuous predictors does not allow for non-linear effects, and instead suggests a constant effect in patients at either side of the chosen threshold. 48 The effects of missing predictor information were not assessed which could have resulted in different conclusions had there been more data available. Potentially inappropriate analyses were performed, without accounting for heterogeneity in baseline risk across differing populations and performing post-hoc subgroup analysis. The decision rule was poorly presented, with a lack of explanation linking regression coefficients with the decision rule. Furthermore, there was no reporting of uncertainty surrounding coefficients and no description of calibration or discrimination given. Therefore, there is substantial concern that the proposed decision rule would not perform as presented when applied in a new population and examined in new data independent to that used to develop the model.
Vienna prediction model2,42
Eichinger et al. 2,42 aimed to develop and internally validate a prognostic model to improve VTE recurrence risk prediction for patients following a first unprovoked VTE.
Patient selection
Eichinger et al. 2,42 also used a prospective cohort design with consecutive unselected patients recruited from four thrombosis centres in Vienna, between July 1992 and August 2008. Similar to Rodger et al. ,9 a prospective cohort design ensures that predictor information can be collected blinded of patient outcome. Patients were included if they were at least 18 years old and had been treated with OAC therapy for at least 3 months for a first unprovoked VTE.
The definition of unprovoked VTE used by Eichinger et al. 2,42 was based on an absence of the following provoking factors:
-
surgery
-
trauma
-
pregnancy
-
hormone intake
-
deficiency in antithrombin, protein C, protein S
-
presence of lupus anticoagulant, or
-
cancer.
This definition of unprovoked VTE therefore follows a standard definition based on an absence of any transient risk factors. As a result the study population should be representative of the unprovoked VTE population and therefore provides a low risk of bias in the model development.
Outcomes
The main outcome of the study was recurrent VTE, with suspected DVT confirmed by venography or colour duplex ultrasonography. Suspected PE was confirmed by ventilation/perfusion scan and/or spiral computed tomography. All events were adjudicated by a committee of independent radiologists. Detection bias was limited by pre-specification of outcome definitions, with the same definition and assessment used for all patients, meaning systematic differences in the determination of outcomes were avoided. Outcomes were pre-specified with the same definition and assessment used for all patients reducing the risk of differences in the diagnosis and reporting of outcomes. The outcome definition excluded any candidate predictors and was also determined blind to any predictor information, again, reducing the risk of detection bias and overall resulting in a low risk of bias based on the study outcomes.
Predictors
Eichinger et al. 2,42 pre-specified a selection of clinical and laboratory predictors based on criteria including independent confirmation of the association with risk of recurrence (literature), simplicity of assessment and reproducibility. Using pre-specified candidate predictors reduces the risk of bias through unnecessary investigations, limiting the number of hypothesis tests and therefore reducing the chance of multiple testing issues. Candidate predictors included:
-
sex
-
age (years)
-
BMI (kg/m2)
-
site of index event (distal DVT, proximal DVT, PE)
-
D-dimer (µg/l)
-
factor V Leiden
-
factor II mutation
-
peak thrombin.
All predictors were measured blinded to outcome data (with laboratory predictors measured at cessation of OAC therapy), and predictor definitions were consistent for all patients. These methods reduce the risk of selection bias due to differences in the patient characteristics and also the risk of bias in the reporting of predictors based on outcomes.
Eichinger et al. 2,42 investigated linear forms of all continuous predictors including age, BMI and D-dimer level. The study authors also investigated a dichotomisation of BMI based on the standard threshold for obesity (BMI > 30 kg/m2) used in clinical practice. The study therefore avoided introducing bias from data-driven methods of categorising continuous predictors, but this approach can still lead to a loss of information by splitting patients risk into distinct groups. 47
Sample size and flow
A total of 929 patients were included within the analysis with 176 recurrent events being recorded. Given that Eichinger et al. 2,42 investigated a total of eight predictors (15 predictors including categorisations of predictors), the number of events seen could be considered sufficient given the rule of thumb of 10 events per predictor. 51 As the study could be considered suitably powered (with a maximum of 12 events per predictor), the inclusion of predictors and their effects are likely to be at low risk of bias, with effect sizes and associated uncertainty likely to be reliably estimated. 51
Eichinger et al. 2,42 conducted a complete-case analysis, excluding patients with any missing predictor information. There was missing predictor information quantified for five predictors included in predictor selection, but no indication of the number of associated events:
-
BMI = 20
-
D-dimer = 97
-
peak thrombin = 300
-
factor V Leiden = 13, and
-
factor II G20210A mutation = 14.
Complete-case analysis introduces attrition bias through excluding patients with outcome data because they have missing information related to one or more candidate predictors. The drop in the number of events could have an impact on the regression coefficients and selection of predictors for inclusion within the final model, particularly for peak thrombin with a third of patients missing predictor information. Any analyses including peak thrombin would exclude a third of the study population, markedly reducing sample size and causing issues with the estimation of predictor effects. As D-dimer is the only predictor included in the final model, the complete-case analysis would have reduced the sample size by 97, though it is unclear how many events this represents and therefore could present a high risk of bias in the results presented. Overall the sample size and handling of missing data within the study indicate a potentially high risk of bias within the model development.
Analysis
Eichinger et al. 2,42 used a Cox proportional hazards model and selected predictors using a forwards stepwise selection process. A Cox regression model accounts for the censoring of patients over time and variable length of follow-up in a time-to-event analysis, making it an appropriate choice for the recurrent VTE outcome. No stratification by centre was performed as part of the analysis, which did not account for potential heterogeneity in the baseline risk of recurrence for patients from the four different thrombosis centres. Failing to account for differences in baseline risk (or at least to investigate whether or not stratification is necessary), could lead to biased predictor effects which may not be replicated when the model is applied in a new population. 52
Eichinger et al. 2,42 first fitted a saturated model using all clinical predictors and then performed forward selection to investigate laboratory predictors (using an inclusion threshold of p-value < 0.5). To account for optimism associated with the stepwise selection procedure, Eichinger et al. 2,42 evaluated the statistical significance of included predictors using bootstrap zero-corrected 95% CIs. From 1000 bootstrap resamples of the population, only factors for which the 95% CI did not overlap zero were included in the model. Further to this, Eichinger et al. 2,42 applied a shrinkage factor (calculated by bootstrap resampling), to the final beta coefficients to adjust for optimism which may affect the models performance in new study populations. The extensive use of methods to account for optimism in their analyses suggests that performance of the model is unlikely to be affected when applied to a new population.
Two prognostic models were presented within the study including the following predictors:
-
sex (female as the reference category)
-
site of index event (distal DVT as the reference category)
-
peak thrombin (included in the first model)
-
D-dimer (included in the second model).
Both models included sex and site of index event as predictors, but during initial predictor selection peak thrombin was identified as significantly prognostic and D-dimer did not enter the model [hazard ratio (HR) 1.21, 95% CI 0.87 to 1.53; p = 0.622]. The authors then decided to evaluate a model including D-dimer without peak thrombin, and in this model D-dimer was a significant predictor of recurrent VTE. Eichinger et al. 2,42 chose to take forward the model including D-dimer levels as a final model because ‘D-dimer is a well-standardised and widely established parameter’. The ad hoc selection of predictors may be a cause for concern as it was not pre-specified that D-dimer was to be included and there was strong evidence against the prognostic value of D-dimer compared with peak thrombin levels. However, as discussed by the authors, the inclusion of D-dimer within the model could potentially improve the implementation of the model, as D-dimer is an established predictor more readily measured in practice. Prognostic models should aim to include predictors with standard definitions, which are easily available at the time the model is intended for use; however, the performance of the model may have been significantly improved by the inclusion of peak thrombin as a predictor (which showed strong evidence of prognostic value). However, it is also worth noting the substantial number of missing data for peak thrombin (300/929 patients missing peak thrombin data), which could have influenced the estimated effect of peak thrombin within the complete-case analysis performed.
Eichinger et al. 2,42 proposed a nomogram based on the final model including sex, site of index event and D-dimer as predictors. The nomogram can be used to calculate patient’s cumulative recurrence rate at 12 and 60 months from cessation of therapy, with estimated 95% CIs. The relationship between the regression coefficients of the model and the simplified nomogram is not explicitly stated, though it is suggested that the coefficients are first multiplied by the estimated shrinkage factor. No estimate of baseline risk is provided and therefore it is only possible to estimate patients predicted risk of recurrence at the specified time points within the study (1 and 5 years). The use of estimated recurrence risk at specific time points (with associated uncertainty), improves on the HER DOO 2 model9 by allowing practitioners to apply their own judgement based on the predicted risk, using current guidelines and patient consultation, to make an informed decision on treatment strategy for the individual patient.
Internal validation of the model was performed using bootstrap cross-validated risk scores. Patients were randomly drawn with replacement from the original sample, to make a new bootstrap sample of 929 patients. Eichinger et al. 2,42 re-evaluated their model within this new bootstrap sample and validated their model in the sample of patients that were not selected from the original study data. The process was repeated 1000 times and an average risk score for each patient was calculated from the 1000 replications. Using these averaged risk scores the performance of the model (within the validation subsets) was assessed using the AUC, which is a measure of model discrimination. For recurrence risk at 12 and 60 months from cessation of therapy the optimism adjusted (bootstrapped) AUC was estimated at 0.674 and 0.646, respectively, indicating moderate discrimination, which suggests moderate ability of the model to separate groups of patients such as high- and low-risk patients (where AUC = 1 represents perfect discrimination). The study also reported an apparent c-statistic (assessing discrimination across all time points, and without adjustment for optimism) of 0.651 for the developed model as a measure of discrimination (where c-statistic = 1 represents perfect discrimination), which suggests a small reduction in model performance after accounting for optimism. The Vienna model also calculated a bootstrap optimism-adjusted calibration slope (or uniform shrinkage factor), which showed moderate calibration performance of 0.88 (with 1 indicating perfect calibration). This shrinkage factor was also used to adjust the predictor effect values in their final model, to adjust for the overoptimism. However, the performance of a model measured in the same data set used to develop the model will always be biased, showing greater performance than can be expected in an external setting.
An external validation of the Vienna prediction model is currently being undertaken, which should provide a more reliable indication of model performance in a new patient population. It should also be noted that the internal validation of the Vienna prediction model relates to the multivariable Cox regression model developed, and it is unclear whether or not internal validation of the simplified nomogram was conducted.
Summary
In summary, there was a moderate risk of bias associated with the Vienna predication model, mainly because no external validation has yet been performed. Model development itself was undertaken well. Patient selection avoided inappropriate exclusions and outcomes were defined consistently for all patients and blinded to predictor information. Continuous predictors were assessed in their linear form as opposed to categorising, therefore avoiding a loss of information. Overoptimism in the estimated regression coefficients was accounted for by using bootstrapping methods to adjust these coefficients.
However, there were also some areas for concern which could have introduced bias into the model development. The analysis did not investigate potential heterogeneity in the baseline risk of recurrence in the different populations from the four thrombosis centres used, potentially affecting the models applicability to a new population. The study authors made an ad hoc decision to include D-dimer as a predictor in the model, despite its lack of prognostic value during predictor selection. There was strong evidence of an important effect for peak thrombin, which meant D-dimer was originally excluded. The decision to include D-dimer was based on practical implications for model use, as it is a more established predictor. There were also some issues with missing predictor information, with marked reductions in data for both D-dimer and peak thrombin, and no information on the number of events excluded from complete case analyses investigating these predictors. Furthermore, it was not clear how the nomogram was created and whether or not the internal validation of the nomogram was examined.
Overall the Vienna prediction rule was presented well and classed as low risk of bias in terms of model development. External validation is, however, now essential for the proposed nomogram. If performance was found to be acceptable, the model would allow individual prediction of recurrence risk limited to the two specified time points. The model was presented in a nomogram which may facilitate uptake of the model in practice, though this format limits the precision available (e.g. in specifying a patient’s exact D-dimer level). The predicted recurrence rate is provided with associated uncertainty (95% CI), which allows both clinician and patient to make an informed decision regarding treatment.
Finally, the extension to the Vienna model aimed to allow prediction of recurrence risk at further time points post cessation of therapy by measuring D-dimer over time. 42 Measurements were made at 3, 9 and 15 months post cessation of therapy, and three more nomograms were developed to allow risk prediction using the Vienna model at these time points. D-dimer levels did not vary over the observation time and the associated HRs remained very similar (only the point estimate slightly decreased over time). 42 A web-based calculator allows users to predict recurrence risk at any time between baseline (3 weeks) and 15 months post cessation of therapy. 42 The model was adjusted for optimism using leave-one-out resampling to calculate shrinkage factors for 3, 9 and 15 months of 0.79, 0.81 and 0.7, indicating moderate calibration of the model at all time points but reduced performance compared with the original Vienna model (optimism-adjusted calibration slope = 0.88). In terms of discrimination performance (for 5-year predictions) at each time point, optimism adjusted AUC values were 0.61, 0.61 and 0.58, representing a small reduction in performance compared with the original model (AUC = 0.646). 2,42 However, although the earlier Vienna model has recently been externally validated, this model has not been externally validated to date.
DASH score41
Tosetto et al. 41 aimed to develop and internally validate a clinical prediction guide to stratify unprovoked VTE patients by their risk of recurrence and identify those suitable for long-term OAC therapy. The study performed a meta-analysis of IPD from seven prospective studies (see Main study and patient characteristics), so as to alleviate issues of statistical power often encountered in single prospective study.
Patient selection
Tosetto et al. 41 used IPD from seven prospective cohort studies with consecutive unselected patients described by Douketis et al. 11 previously. The prospective cohort design as used in the previous studies ensures that predictor information can be collected blinded of patient outcome. Patients were included if they were at least 18 years old and had been treated with OAC therapy for at least 3 months for a first unprovoked VTE. Patients were excluded if follow-up ended before D-dimer measurement, or if they had a distal DVT; only proximal DVT and PE were included as valid index sites.
The definition of unprovoked VTE used by Tosetto et al. 41 was based on an absence of the following provoking factors:
-
surgery
-
trauma
-
pregnancy and the puerperium
-
immobility
-
cancer.
This definition of unprovoked VTE therefore includes women who have currently, or previously, used OCs or HRT. As described for the Rodger et al. 9 study, hormone therapy is sometimes included in the definition of unprovoked VTE because the effect of hormone therapy is weak;41,44 however, hormone therapy should be considered as a provoking factor. The definition of unprovoked VTE refers to a VTE in the absence of any transient risk factors, hence why hereditary thrombophilia can be considered unprovoked VTE. 45 As hormone therapy is a transient risk factor patients with a history of hormone therapy could be considered provoked. This could lead to effect sizes within the analyses being incorrectly estimated, particularly the effect of sex, because there may be subgroups of patients included in the model development who are at potentially lower risk than other unprovoked patients.
Outcomes
The primary outcome of the study was recurrent VTE, with associated deaths also recorded. All suspected outcomes were objectively confirmed and independently adjudicated. 11 Outcomes were pre-specified with the same definition and assessment used for all patients, therefore reducing the risk of differences in the determination of outcomes. The outcome definition excluded any candidate predictors and outcomes were also determined blind to any predictor information again reducing the risk of detection bias.
Predictors
Tosetto et al. 41 used a backward elimination approach, starting with a saturated model including the following candidate predictors:
-
sex
-
age (years)
-
site of index event (DVT alone, or DVT and PE)
-
D-dimer (ng/ml)
-
hormone use at time of VTE (women)
-
previous history of cancer.
All predictors were measured blinded to outcome data (with D-dimer measured 3–5 weeks after cessation of OAC therapy), and predictor definitions were consistent for all patients. These methods reduce the risk of selection bias due to differences in the patient characteristics and also the risk of bias in the reporting of predictors based on outcomes.
Tosetto et al. 41 also stratified their analyses by source study to allow for potential heterogeneity in the baseline risk of recurrence within these seven different populations. The adjustment for underlying differences in the source study populations may make the final model more robust when applied within a new population, not used in the development process.
Tosetto et al. 41 categorised all continuous predictors, creating a dichotomisation of D-dimer (normal vs. abnormal), while categorising age into quartiles. Quartiles of age were used to control for a non-linear relationship between patient age and recurrence risk. The study may have therefore introduced bias from categorisation of continuous predictors, which can lead to a loss of information by separating patients risk into distinct groups. 47 Categorisation of age appeared to be data driven, whereas dichotomisation of D-dimer was likely based on the instrument used (though it was not stated), both inducing the risk of reporting biases.
Sample size and flow
A total of 1818 patients were included within the analysis with 239 recurrent events being recorded. Given that Tosetto et al. 41 investigated a total of six predictors (14 predictors including categorisations of predictors), the number of events seen could be considered sufficient given the rule of thumb of 10 events per predictor. 51 As the study could be considered suitably powered (with a maximum of 17 events per predictor), the inclusion of predictors and their effect estimates may be considered to be at low risk of bias. Predictor effects are likely to be at low risk of bias, with effect sizes and associated uncertainty likely to be reliably estimated. 51
There was no missing predictor information in the analyses performed by Tosetto et al. 41 and therefore it was not necessary to allow for the effects of potential attrition bias. The previous two studies have both suffered with missing predictor information and conducted complete case analyses, potentially introducing attrition bias into their analyses. Tosetto et al. 41 were therefore able to use all patient data in their analyses and thus statistical power remained appropriate to assess all predictors for inclusion. However, the study also used a selection procedure meaning more predictors were considered, resulting in a proportion of missing predictor data. The DASH model considered predictors including BMI, for which only 802 out of 1818 patients had complete predictor information, which may have effected the ability to detect a BMI effect. Overall the sample size and handling of missing data within the study resulted in a low risk of bias associated with the model development.
Analysis
Tosetto et al. 41 used a Cox proportional hazards model and selected predictors using a backwards elimination process. A Cox regression model accounts for variable lengths of follow-up and the censoring of patients over time and in a time-to-event analysis, making it an appropriate choice for the time to recurrent VTE outcome. The analyses were stratified by source study to allow for the differences in the baseline risk across the seven different study populations, therefore avoiding biased predictor effects which may improve the external performance of the model. 52
Tosetto et al. 41 first fitted a saturated model using all clinical predictors, and then performed backward elimination to investigate candidate predictors (using an exclusion threshold of p-value > 0.1). To account for excessive optimism associated with the backward selection procedure, Tosetto et al. 41 evaluated this using a heuristic formula and linear shrinkage by bootstrapping. A correction factor was calculated and applied to the final beta coefficients to adjust for optimism which may affect the models performance in new study populations. The use of shrinkage methods to account for overoptimism in their selection process and analyses provides a low risk that the performance of their proposed model could differ when applied to a new population.
The final DASH score was developed by multiplying the regression coefficients by the calculated correction factor, doubling these coefficients and rounding them to the nearest integer. Giving a final model included the following predictors:
-
abnormal D-dimer (post therapy), score = +2
-
age (≤ 50 years), score = +1
-
sex (male), score = +1
-
hormone use (at time of index event, in women), score = –2.
The proposed score can be used to calculate patients’ cumulative recurrence rate at 1, 2 and 5 years from cessation of therapy, with estimated 95% CIs. Despite stratification for source study in the analysis, there is no reported estimate of baseline risk and therefore patients’ predicted risk of recurrence can only be estimated at the specified time points presented. The use of estimated recurrence risk at specific time points (with associated uncertainty) is similar to that presented for the Vienna prediction model. 2,42 This is a substantial improvement compared with the HER DOO 2 model9 as it allows physicians and patients to make an informed decision on treatment duration for the individual patient.
Internal validation of the model was performed using a bootstrap procedure similar to that described for the Eichinger et al. study. 2,42 Patients were randomly drawn with replacement from the original sample, to make a new bootstrap sample of 1818 patients. Tosetto et al. 41 then re-estimated the DASH score within this new bootstrap sample, to confirm the recurrence rate and associated CI for DASH score of < 1 (identified as having an annual recurrence risk < 5%). The process was repeated 500 times and an average risk of recurrence was calculated to be less than the agreed 5% annual recurrence risk. Apparent c-statistics (which represent the discriminatory performance within the development data without adjustment for optimism using, for example, bootstrapping) were between 0.71 and 0.72 for the score and model (beta terms), respectively, indicating moderate discrimination ability even for the simplified score for use in practice; however, apparent performance is likely to be optimistic. The DASH model also provided a bootstrap optimism-adjusted calibration slope (or uniform shrinkage factor) as the Vienna model did, which also showed strong calibration performance of 0.97 for the DASH model (with 1 indicating perfect calibration). The shrinkage factor was then used to adjust the predictor effect values for overoptimism in the final model. However, the performance of a model measured within the development data set is likely to be biased, indicating stronger performance than could be expected in a new population. The use of IPD meta-analysis in the derivation of the model and stratification for source studies may make the DASH score more robust to departures from the development population’s characteristics, but external validation should be sought to identify the true performance of the model in a new patient population.
Summary
In summary the DASH score proposed by Tosetto et al. 41 could be considered at moderate risk of bias, mainly due to the lack of external validation and the categorisation of continuous predictors in the model development. Many aspects of model development were done well. Patient selection avoided inappropriate exclusions and outcomes were defined consistently for all patients and blinded to predictor information. Stratification was used in analyses to account for heterogeneity in the baseline risk of recurrence across the source studies. Missing predictor information was not an issue in the model development, avoiding attrition bias and preserving statistical power. Overoptimism in the selection of predictors and estimated effects was accounted for by a correction factor calculated by bootstrapping. Reporting of the final score was clear with recurrence risks associated with particular scores presented including uncertainty.
However, there were also some areas for concern which could have introduced bias into development of the DASH score. There were issues with categorisation of continuous predictors, which could lead to a loss of important prognostic information. Furthermore, and most importantly, there was no external validation.
External validation is therefore now essential. The DASH score provides individual recurrence risk prediction at specific time points post cessation of therapy. If externally validated and found to perform well, then the score could be useful in practice as the included predictors are well defined and readily available at the time the decision rule would be applied. However, the true performance of the DASH score within a new patient population is unclear given the lack of internal and external validation statistics. Any physician or patient using the DASH score should therefore interpret the predicted recurrence risk with care, and the included 95% CIs are importantly presented within the study, allowing informed decision-making regarding treatment.
Comparison of included studies quality
All studies performed suitable patient selection avoiding inappropriate exclusions, used appropriate study designs, pre-specified outcomes and assessed outcomes blinded to predictor information, giving low risk of bias across all studies. All studies recruited patients from different centres or countries; however, only one (Tosetto et al. 41) stratified by source in their analyses. Stratification accounts for heterogeneity in the baseline recurrence risk in different patient groups. Ignoring the clustering of patients within centres or countries could lead to poor model calibration,52 where model predictions do not closely fit observed recurrence rates, and could diminish performance in a new setting.
The three studies investigated a wide variety of candidate predictors, including clinical and laboratory predictors. Eichinger et al. 2,42 avoided the categorisation of continuous candidate predictors (see Table 4), Tosetto et al. 41 investigated patient age in quartiles, but pre-specified the analysis to allow for non-linear associations between age and recurrence risk. Rodger et al. ,9 in contrast, performed chi-squared testing to identify the optimal threshold to dichotomise every continuous predictor under consideration. The data-driven nature of the analysis incites reporting biases where the optimal thresholds are reported without any clinical meaning. Dichotomisation of continuous predictors is also methodologically poor, as it seeks to separate patients risk into two categories treating those above and below the threshold as having different constant risks, which is unrealistic in practice. 48
The HER DOO 2 model development by Rodger et al. 9 was markedly underpowered, having collected information on 69 predictors and assessed at least 36 candidate predictors, with only 91 recurrent events. Given a rule of thumb based on at least 10 events per candidate predictor to be investigated,51 Rodger et al. 9 only had 2.5 events per predictor, indicating a lack of power that could lead to biased estimates of predictor effects. Following the same rule, the other two studies had sufficient numbers of events to assess the predictors of interest with appropriate statistical power (see Table 4).
All included studies suffered from some degree of missing predictor information (either in predictor selection or final model predictors) and used a complete-case analysis to overcome this issue within the final models (see Table 4). No methods to assess the impact of this missing predictor information were used (i.e. an imputation procedure), and in the study by Eichinger et al. 2,42 the number of missing recurrent events was not reported, so no assessment of the statistical power could be made accurately. Attrition bias can lead to unbalanced groups of patients and exclusion of patients reduces sample size making estimation of predictor effects biased and performance of the model specific to a subgroup of the population for whom information was not missing (there may be a risk of bias due to the nature of the missing data).
Two studies used bootstrapping and shrinkage methods to adjust predictor coefficients for over-optimism (see Table 4),2,41,42 whereas the HER DOO 2 development did not account for optimism in predictor estimates. 9 The use of optimism correction methods provides a lower risk of biased, unrealistic predictor effects, and should ensure the model performance is more consistent in a new patient population. Another methodological issue relating to model performance is validation; internal validation was performed across all of the studies, but only one has since been external validated (see Table 4). 2,42 Internal validation was reported in terms of both calibration and discrimination within the DASH41 and Vienna models2,42 (though not for the simplified nomogram), whereas Rodger et al. 9 presented neither (see Table 5): both calibration and discrimination are vitally important performance statistics for any prognostic model. External validation is the true indication of model performance, as a model validated within its development data set will always give optimistic performance statistics. 18 The Vienna model has now externally validated (see Relevant studies identified after the search cut-off dates),2,42 but issues remain because (i) validation was shown to be lower than expected and uncertainty was high;54 (ii) a new Weibull model component was added, which itself requires additional validation; (iii) the nomogram version of Vienna, which is the most used, was not validated; and (iv) validation was not made by independent authors to the original model development. Thus, until further external validation is undertaken, the true performance in new populations cannot be ascertained. Further external validation studies are currently being undertaken to validate both the HER DOO 2 decision rule8,27,28 and the Vienna prediction model, which will provide a true indication as to the overall performance (in terms of calibration and discrimination) of these models in new patient populations where they are intended for use.
Finally, the application of the proposed models was described in various ways across the studies. Both the Vienna prediction model2,42 and the DASH score41 were presented well, with an indication of how the predictors are combined to calculate a patient’s recurrence risk at a specific time point (see Table 4). Both provided cumulative recurrence rates at specific time points after cessation of therapy including an estimate of the uncertainty surrounding these estimates (95% CIs). This information could be used to direct the decision-making process, informing clinicians and patients of the individual’s level of risk and therefore allowing individualised treatment strategies. Conversely, the HER DOO 2 model9 derived a clinical decision rule splitting patients into those with less than two predictors (from their model) and those greater than two predictors, suggesting that one group could continue OAC therapy, while the other could safely stop. Rodger et al. 9 did not report individuals risk at specific time points, only that fewer than two predictors would indicate a < 3% annual risk of recurrence. This therefore does not allow clinicians or patients to make decisions based on their preference of recurrence risk threshold, limiting the applicability of the decision rule.
Ongoing studies
There were two ongoing studies identified through the literature searches: the REVERSE II study (Recurrent Venous thromboembolism Risk Stratification Evaluation II)27,28 related to the HER DOO 2 rule, and the VISTA study26 related to the Vienna prediction model.
The first was an external validation trial of the HER DOO 2 rule proposed by Rodger et al. 9 which was internally validated within the original study. This ongoing randomised trial aims to compare the use of the proposed decision rule to decide on cessation of OAC therapy, compared with standard practice. 27,28 The second is an ongoing randomised trial comparing the use of the Vienna prediction model to decide on treatment duration, compared with usual care where treatment duration is based on physician judgement. 26
Relevant studies identified after the search cut-off dates
Subsequent to the completion of our review searches, one additional highly relevant study was identified related to one of the ongoing studies found through the systematic review. 34,54 This was an external validation of the Vienna prediction model using IPD from five studies, which aimed to assess the performance of the Vienna model in terms of both discrimination and calibration in a new population. 11,54
The study reported that the derivation and validation populations were homogeneous after removal of patients with provoked VTE and those with missing predictor information. 54 Discrimination was calculated using the c-statistic for comparison with the original Vienna model, with a c-statistic in the validation cohort of 0.626 compared with 0.646 (the optimism adjusted discrimination – see Table 5) for the derivation data, indicating a reduction in the discriminatory performance of the model in a new setting.
The true calibration of the model in the validation data could not be assessed without the baseline hazard function. 55 As the original Vienna model was developed using a Cox model which does not parameterise the baseline hazard function, this meant that assumptions about the shape of the baseline hazard function had to be made. 54,56 The authors recalibrated the Vienna model assuming a Weibull distribution; however, because this new component of the model was developed, this new model would itself require further external validation. 56 As the authors could not use the Cox model directly to predict survival probabilities (due to the lack of baseline hazard function), they could only assess calibration using the prognostic index to make predictions within the validation data. 55 Comparison of observed and expected survival probabilities in five risk groups showed a general trend for the Vienna model to underpredict the risk of VTE recurrence at 12 months post cessation of therapy. 54
Discussion
The systematic review of prognostic models for recurrence risk identified three full-text articles developing three independent prognostic models, or clinical decision tools,2,9,41 from 257 eligible full texts which met the full inclusion criteria. Data extraction of the three included articles showed that study characteristics and patient populations differed in some respects, particularly in terms of the definition of unprovoked VTE and in the number of patients and events included within their analyses (see Main study and patient characteristics). A critique of the included studies described and identified the strengths and weaknesses of the studies with a particular focus on methods of patient selection, outcome reporting, predictor selection, sample size, model development and validation (see Description, critique and main findings of model studies).
Data extraction highlighted the variable definitions of unprovoked VTE across the included studies (see Table 2). Eichinger et al. 2,42 excluded patients provoked by use of female hormones, such as the OC pill or HRT, whereas Rodger et al. 9 and Tosetto et al. 41 defined patients taking hormones as unprovoked. Risk factors consistently defined as provoking across the studies included surgery, trauma, immobility and pregnancy. The use of varying definitions to describe the unprovoked population creates confusion as to what population the proposed models apply to. Tosetto et al. 41 justify including hormone intake as unprovoked because evidence suggests hormone therapy is a weak risk factor for VTE. 41,44 However, hormone intake should be considered as a transient risk factor, provoking initial VTE but an easily removable risk factor, whereas unprovoked VTE is not categorised by removable risk factors. Further research in developing prognostic models to predict recurrence risk in an unprovoked population should use a standard, consistent definition, excluding transient/removable risk factors to ensure that model predictions are reliable for intended patients. Given the definition of unprovoked VTE used by Tosetto et al. ,41 the proposed DASH score is not applicable within an unprovoked population as it is defined in this report (see Chapter 1).
Across the included studies various predictors were included within the proposed final models, with sex, age and D-dimer level being included consistently within all three models, indicating strong evidence of an association with recurrence risk. As such, any future model development should investigate the effect of these predictors (along with other important predictors) in multivariable modelling due to their repeatable association with recurrence.
Quality assessment based on an early version of the PROBAST showed that there was evidence throughout the included studies of a moderate to high risk of bias, predominantly because of a lack of external validation (see Tables 4 and 5). The HER DOO 2 model9 development suffered high risk of bias, and some marked methodological issues, including the choice of analysis model, substantially underpowered analyses, data-driven categorisation of predictors, lack of adjustment for optimism and the presentation of the model for use. The Vienna prediction model2,42 and DASH score41 were more methodologically sound than the HER DOO 2 model,9 but had moderate risk of bias due to a lack of external validation. Both had statistical power to investigate their candidate predictors, accounted for optimism in their selection procedures and Eichinger et al. 2,42 assessed continuous predictors without categorisation and loss of information (though Tosetto et al. 41 did categorise continuous predictors). Both studies presented their proposed models more clearly than the HER DOO 2 model;9 indicating the recurrence rate associated with predictor values and the uncertainty around those estimates. However, predictions are only provided for particular, discretised values of risk; for example, both models provide predictions for only a small selection of time points (Vienna model for 12 and 60 months post therapy, DASH score for 1, 2 and 5 years from cessation of therapy), and both models only provide 95% CIs for a small selection of predicted annual recurrence rates. However, until further external validation is undertaken, the true performance in new populations cannot be ascertained. Further research should aim to consider some of the issues discussed here with regard to study quality to improve the performance of any proposed models within practice, provide transparent reporting of model development and finally to improve statistical analyses to ensure model predictions are more robust.
Chapter 4 Development and validation of a prognostic model and clinical decision rule
Introduction
The aim of this chapter is to describe the development and validation of a prognostic model for the risk of recurrent VTE on cessation of therapy following a first unprovoked VTE. Seven RCTs57–63 from the RVTEC database (see Chapter 1) were used to develop the model and externally validate it using IECV; further external validation was then sought in the RIETE and MEGA databases (see Chapter 1).
Evidence from the systematic review of existing prognostic models to predict recurrence risk highlighted several applicability and methodological issues in existing models (see Chapter 3). There was a lack of consistent and appropriate definitions for a first unprovoked VTE, with some studies, for example, not considering hormone intake to be a provoking risk factor. 9,41 Several methodological issues were also identified, including mishandling of continuous predictors in analyses, underpowered analyses and poor presentation of final models for use in practice. Existing models identified by the systematic review (see Chapter 3) had not been externally validated (to date), and though internal validation had often been performed, external validation is essential to indicate true performance of the model in practice.
The prognostic model will be used in subsequent chapters to inform a clinical decision rule for treatment cessation following initial therapy for a first unprovoked VTE and subsequent cost-effectiveness analysis (see Chapter 5).
Methods
The aims and methods for data collection, patient inclusion, model development and model validation are now described.
Identifying, obtaining and cleaning individual patient data
Individual patient data were identified for the project through external collaborators in Spain, the Netherlands and Canada. Agreement on the sharing of this data was made with each database holder, clearly stating the intended use of the data for this project and agreeing appropriate recognition for those that originally collected the data to be used.
Three IPD databases were provided by the external collaborators:
-
RIETE database (Spanish registry data)
-
MEGA database (Dutch)
-
RVTEC database (Canadian).
The RIETE database (www.riete.org) is primarily a Spanish registry which has recorded 40,000 consecutive patients with confirmed VTE, 30,000 of which are a first episode. There are 15,041 patients who have had a first episode of unprovoked VTE with at least 3 months’ follow-up. The database contains 6291 patient records with a median of 6 months’ follow-up data post treatment. The total number of recurrent episodes of VTE within this population is 742.
The MEGA database is a population-based prospective cohort study including 5961 patients consecutively enrolled from two centres in the Netherlands which was compiled between 1999 and 2004. Within the database there are 1218 patients with a first episode of unprovoked VTE with 278 patients sustaining a recurrence; the median follow-up post treatment is 67 months.
The primary database for use in developing the model is the RVTEC database which contains seven trials investigating an association between D-dimer, measured after anticoagulation was stopped and VTE recurrence. It includes a total of 1634 patients with a first unprovoked VTE; the median follow-up time post-treatment is 22 months and there are 230 recurrent events post treatment. This database was prioritised because of (i) the availability of D-dimer values, which clinical members of the team thought might add considerable predictive value, and (ii) the seven trials in the database allowed IECV,64,65 a novel way to develop a model while also examining its performance in external data.
Population at baseline and outcome of interest
What defined a relevant population?
Unprovoked patients were selected from the RVTEC database by excluding those patients with a history of provoking risk factors within the last 3 months, based on the definition of unprovoked VTE as discussed in Chapter 1, where provoking risk factors included:
-
major surgery
-
lower limb trauma
-
pregnancy
-
combined OC pill/HRT
-
significant immobility
-
active cancer.
Baseline characteristics of the Recurrent VTE Collaborative databases
The characteristics of the population of the seven trials in the RVTEC database at baseline were summarised using means and standard deviations (SDs) for continuous variables, and using counts and percentages for categorical variables. Variables available in the database to be considered for inclusion in the model included patient’s age, sex, D-dimer post treatment, time from treatment cessation to D-dimer testing (lag time), treatment duration, BMI and site of index event.
Baseline patient characteristics were summarised first for the whole database and second by individual trial. A summary of the number of recurrent events, total patients, as well as the median and longest follow-up for each of the seven trials was also presented to describe the recurrent events within the RVTEC database. The percentage of missing data within the whole database was also presented by each candidate prognostic variable.
Outcome of interest
The outcome of interest was the recurrence of a VTE following cessation of therapy for a first unprovoked VTE.
Available candidate predictors
Seven candidate predictors were available within the RVTEC database and all were considered for inclusion in the prognostic model including:
-
age (years)
-
BMI (kg/m2)
-
sex (female/male)
-
site of index event (distal DVT/proximal DVT/PE)
-
treatment duration before cessation of therapy (months)
-
D-dimer level post cessation of therapy (ng/ml)
-
lag time between cessation of therapy and measurement of D-dimer (days).
All candidate factors were continuous except for sex and site of index event which were categorical, with sex being dichotomous (male/female) and site of index event having three categories (proximal DVT, distal DVT, PE). Patient age and BMI were measured at cessation of therapy. 11
Aims: develop and validate two models, based on different start points
Given the available candidate predictors two models were consider for development based on the timing of predictor measurement. Most predictors were available at the cessation of therapy. However, D-dimer was measured after some lag time from cessation of therapy, to allow for the effects of therapy on D-dimer to diminish. The average lag time was around 37 days post therapy within the RVTEC database, whereas the standard lag time is around 30 days post therapy. 66 Thus two models were considered: pre D-dimer (start point at cessation of therapy) and post D-dimer (start point at the time of D-dimer measurement) (Figure 2).
FIGURE 2.
Timeline of patient therapy and start points for pre and post D-dimer use.
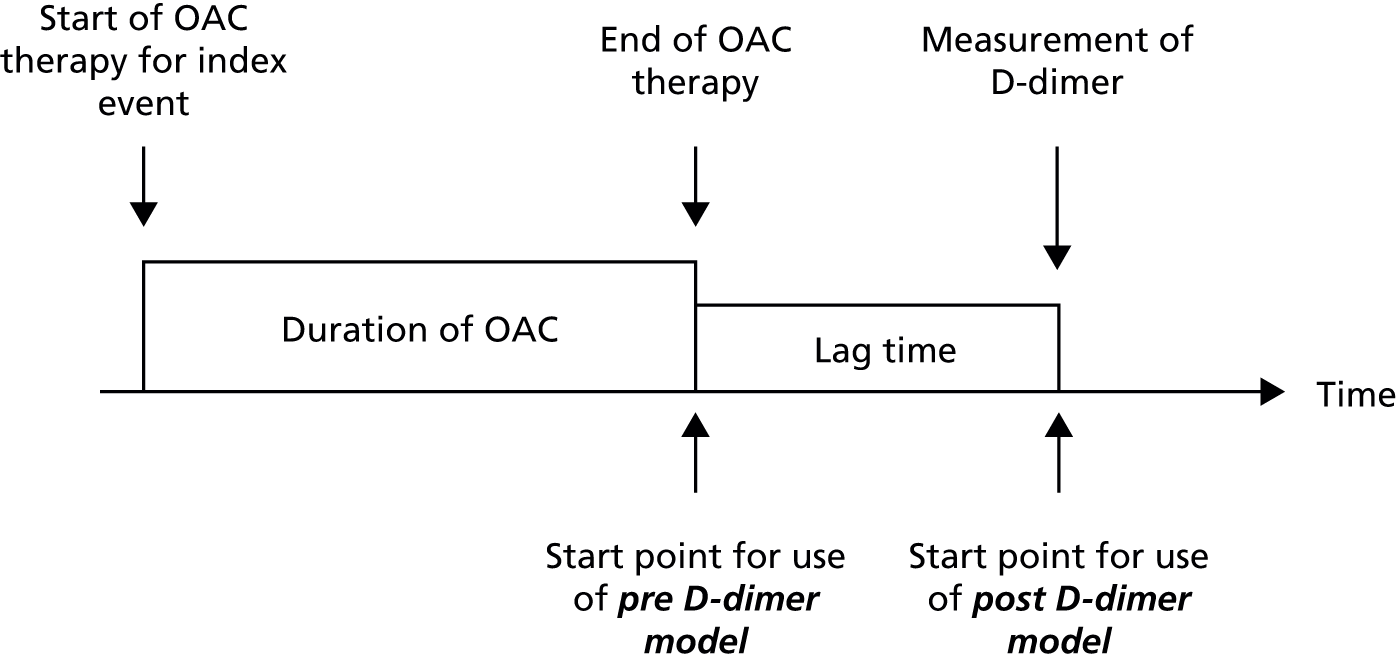
Pre D-dimer model: start point at cessation of therapy
The first aim was to develop a prognostic model which could be used to predict individual’s risk of recurrent VTE at the time of cessation of therapy. As such, candidate predictors would include age, sex, BMI, site of index event and treatment duration. Such a model could be used to obtain individual risk predictions at the exact time when cessation of therapy is being considered. This could therefore inform decisions on whether or not to continue or stop therapy, based on a patients predicted risk of recurrence, balanced against the risk of bleeding and patient preference.
Post D-dimer model: start point when D-dimer measured
The second aim was to utilise D-dimer post cessation of therapy to potentially improve the predictive performance of the prognostic model, as the predictive ability of D-dimer is well documented2,11,58,60,61,67–70 Such a model could be used to inform a decision on extended duration of therapy in patients who have already stopped therapy for a given lag time. All seven candidate predictors could be included for predictor selection in the model.
Univariable (unadjusted) summary of candidate predictors
The univariable (unadjusted) association between each variable and recurrence was assessed using a Cox proportional hazards model,71 so as to assess the impact of each variable individually in relation to recurrence. A summary table of the univariable association with recurrence for each candidate variable was presented, including the estimated HR with 95% CIs and the corresponding p-value.
Development of prognostic model
Sample size considerations
A general rule of thumb is for at least 10 events to be available for each candidate predictor considered in a prognostic model. 51 There were seven candidate predictors (age, sex, site of VTE, BMI, D-dimer post-treatment, lag time and treatment duration) for consideration, but some of these were continuous predictors, which may potentially require non-linear modelling (e.g. fractional polynomials) that would slightly increase the number of variables further (e.g. if age + age2 is included, then ‘age’ relates to two predictors).
The RVTEC database has seven trials in total, with 1634 patients with follow-up information post-treatment and 230 of these have a recurrence [there is good follow-up (median 22 months) and nearly all patients have data on all seven candidate predictors available]. During the IECB procedure (see Internal–external cross-validation), six of the seven trials are used for model development, so there are between 1196 and 1543 patients and between 161 and 221 recurrences available for the development phase of the prognostic models. Thus, there will be at least 23 ( = 161 events divided by seven candidate predictors) events for each of the seven candidate predictors, which is considerably greater than the minimum 10 per variable required, this gives adequate scope for fractional polynomial modelling of non-linear trends as necessary. Subsequently, the sample size for the development of the prognostic model is suitable. Furthermore, the external validation databases also had large numbers. The RIETE database has 6291 patients with follow-up information post-treatment and 742 of these have a recurrence (though only 10% of patients have D-dimer values). The MEGA database has 1218 patients with follow-up information with 278 recurrences (though none have D-dimer levels and so cannot be used to externally validate the post D-dimer model).
Model structure
As the outcome of interest was time to event (time to recurrence), prognostic models were developed using a flexible parametric survival model, fitted using the methods of Royston and Parmar. 72,73 Flexible parametric models allow first, a risk score to be calculated for an individual patient, which is the combination of parameter estimates (log-HR estimates) from the model with the individual patient’s values for the predictors included in the model; and second, the probability of recurrence by particular time points to be estimated for an individual patient, by utilising the risk score alongside the estimated baseline hazard in the population.
The flexible parametric survival methods of Royston and Parmar72,73 model the baseline hazard (on the log-cumulative hazard scale) using restricted cubic splines and, under a proportional hazards assumption, produce hazards ratios that are very similar to a Cox regression. The advantage of modelling the baseline hazard explicitly is that individual risk can be predicted over time and predicted individual survival curves obtained. In contrast a standard Cox regression approach does not model the baseline hazard and so does not allow individual prediction, with patients generally categorised into a number of risk groups based on their risk score. The Royston and Parmar models were fitted using maximum likelihood estimation via the stpm274 command in Stata 12.1 (StataCorp LP, College Station, TX, USA), with extension to random effects (frailty modelling) as required. Model assumptions (e.g. proportional hazards) and model fit were suitably checked throughout (see Model checking).
Modelling baseline hazard
A key part of model development in the Royston and Parmar framework is to estimate the baseline hazard. First, the spline complexity for the baseline hazard which best fits the available data was investigated visually and through model fit statistics, considering possible degrees of freedom (df) ranging from 1 df to 5 df. Cubic splines in the Royston and Parmar framework allow the baseline hazard to be modelled more flexibly than a standard parametric model (such as the Weibull model), better capturing the true form of the underlying hazard. 75
Comparisons were made between models with different df using the Akaike information criterion (AIC) and Bayesian information criterion (BIC) statistics, with smaller values preferred. The AIC and BIC provide a measure of how well the model fits the data, while penalising models with greater complexity. 76 The AIC and BIC are somewhat subjective in isolation and therefore should be compared as a difference relative to the lowest value. As a guideline when comparing models, a difference of < 2 (in AIC or BIC) would provide strong evidence of an appropriate model fit, differences between 4 and 7 weaker evidence and differences > 10 essentially no evidence of a strong model fit. 76 For example, when comparing a model with additional predictors to a model without, a difference of < 2 in the AIC or BIC would suggest that the additional predictor is not required to improve the model fit.
Accounting for clustering by trial
Recall that the RVTEC database contained seven trials and so accounting for clustering of patients within trials is potentially important. During model development a comparison of the baseline hazards across the trials was carried out. If the shape and magnitude of the baseline hazard was similar between trials a simplistic model would consider using a common baseline hazard for all seven trials. This could be achieved by stacking all seven trial data sets into one large data set and ignoring the clustering of patients within trials, thereby calculating a single baseline hazard. However, ignoring the clustering of patients within trials is known to create bias in the predictor–outcome associations. 52 Therefore, if the baseline hazard between trials did not appear similar, clustering of patients within trials was accounted for by allowing for any between-trial heterogeneity in the baseline hazard across trials. 52 This was achieved using flexible parametric models with a random-effect on the baseline hazard, thereby producing a weighted mean baseline hazard and an estimate of between-study variability around this mean. This approach thus allows a separate baseline hazard for each trial and estimates the distribution of these (proportional) baselines across trials. 65 The average baseline hazard was taken as the baseline hazard to be used in the final model, though it was recognised that large between-study variability in the baseline may affect calibration of the model in some populations. This would be investigated using IECV (see Internal–external cross-validation).
Predictor selection and specification
In order to identify a suitable set of predictors within the risk score for the prognostic model, the multivariable fractional polynomial (MFP) algorithm described by Sauerbrei and Royston49 and Sauerbrei et al. 50 was used. The MFP algorithm selects predictors and their transformations as appropriate using a backward selection process with a nominal alpha of 0.15 used to warrant exclusion from the model and prevent overfitting. However, variables considered to be of clinical importance were forced to remain in the model, where clinical evidence suggested that they were strong predictors of outcome (see Selection of predictors and model estimates during internal–external cross-validation cycles). The MFP algorithm allows continuous variables to be modelled appropriately using fractional polynomials for non-linear trends50 as opposed to being categorised, which has been discussed throughout the literature as suboptimal (e.g. leading to a loss of power). 46–48
Where a final model could be developed, a potential interaction effect between the candidate predictors, age and D-dimer, was considered based on clinical judgement and prior external evidence of a potential interaction effect. Potential time-dependent effects (non-proportional hazards) were also evaluated for the final models.
Handling missing data
Complete case data were used in the development of all models. As a sensitivity analysis, and under the assumptions of a missing at random (MAR) mechanism, multiple imputation was used to impute missing values of patient-level data for the predictors included in the final model so as to avoid excluding patients from the analysis. 77 Model coefficients were compared with those of the complete case as a sensitivity analysis. Data omission may not have occurred at random, but rather selectively (i.e. selectively missing data). To give an indication whether or not missing data were indeed missing at random, summary statistics for population characteristics were compared between complete cases and those with missing information.
Multiple imputation uses the distribution of the observed data to estimate the missing data, incorporating the uncertainty associated with imputing unknown values. 78 It follows three steps. First, missing data are imputed several times, creating several new data sets of imputed data. Second, each of the new imputed data sets are analysed identically; the results will vary because different values will have been imputed for the missing data in each new data set. Third, the estimates from each of the analysed data sets are combined using Rubin’s rules. 79
As there was more than one predictor with missing data to be included in the model, multiple imputation by chained equations was used. This approach uses a set of imputation equations including one for each of the predictors with missing data; all equations include all of the predictors of interest. Missing values for the first predictor are imputed by initially regressing the predictor on all other predictors of interest and then drawing from the corresponding posterior predictive distribution of the predictor. 78 The second predictor with missing values is imputed in the same manner, but includes the imputed values of the first predictor in the regression model. The imputation is repeated for all predictors with missing values and this forms one cycle; cycles are repeated to stabilise the results and then the whole process is repeated to create a set of m imputed data sets. As a rough guide, the number of imputed data sets should equal the largest proportion of incomplete data observed within individual trial populations,78 in this analysis 48% was the largest proportion of incomplete data, resulting in 50 imputed data sets being used.
Multiple imputation was performed assuming that all missing variable data was MAR. This missing data mechanism assumes that the probability of an observation being missing is dependent on the observed data. 80 For example, where missingness may be dependent on patients BMI, missing data may lead to a subgroup of the population without clinically obese patients being recorded. Specification of the imputation models should take into account all predictors within the analysis model; including more predictors within the model makes the MAR assumption more plausible by potentially including factors that may explain the missingness. As a survival model was used in the final model development, predictors for the observed recurrences and the baseline hazard were also included within the imputation models as suggested by White et al. 78
In order to ensure that the results of the multiple imputation are reproducible (delivering the same conclusions when repeated), the Monte Carlo (MC) error of the results was examined. The MC error equates to the SD of the estimated statistic; for example, a HR, across all repetitions of the imputation procedure. As a rule of thumb described by White et al. 78 the MC error of a derived estimate should be no greater than 10% of the estimates standard error to give an appropriate level of consistency. To achieve a MC error of this level requires approximately a number of imputed data sets, m, equal to or greater than the percentage of missing information,78 in this case 50 imputed data sets were used.
Assumption checks and sensitivity analyses
Continuous predictor variables were assumed to be normally distributed and this assumption was checked using graphical methods. After inspection of the distribution of candidate factors a log-transformation was applied as necessary to achieve approximate normality (prior to the use of the MFP algorithm). Influence of individual data points was assessed by plotting leverage residuals against fitted data. The proportional hazards assumption for each predictor was tested using scaled Schoenfeld residuals plotted against the variable of interest. Plots of Martingale residuals against continuous covariates were used to assess their functional form. Deviance residuals were used to identify outliers. When running the final model, sensitivity analyses were performed by excluding any outlying values and checking the robustness (accuracy) of the model to these.
Internal–external cross-validation
Internal–external cross-validation framework
The model development strategy outlined in Development of prognostic model was implemented within the framework laid out by Debray et al. 65 for developing, implementing and evaluating clinical prediction models using an IPD meta-analysis (IPD from multiple studies). This approach adapts the IECV procedure first described by Royston et al. ,64 whereby N-1 trials are iteratively selected from the N total trials in the IPD meta-analysis, and the prognostic model is developed within this subset of trials, leaving the remaining trial for validation of the model (Figure 3). Thus, N different models are derived (one for each set of included trials) and each is subsequently validated in the other omitted trial. In this manner, it is possible to investigate (across all permutations of the excluded trial) whether or not model performance remains consistent when applied in another trial’s population that is not included during model development (external validation).
FIGURE 3.
Schematic of IECV approach.
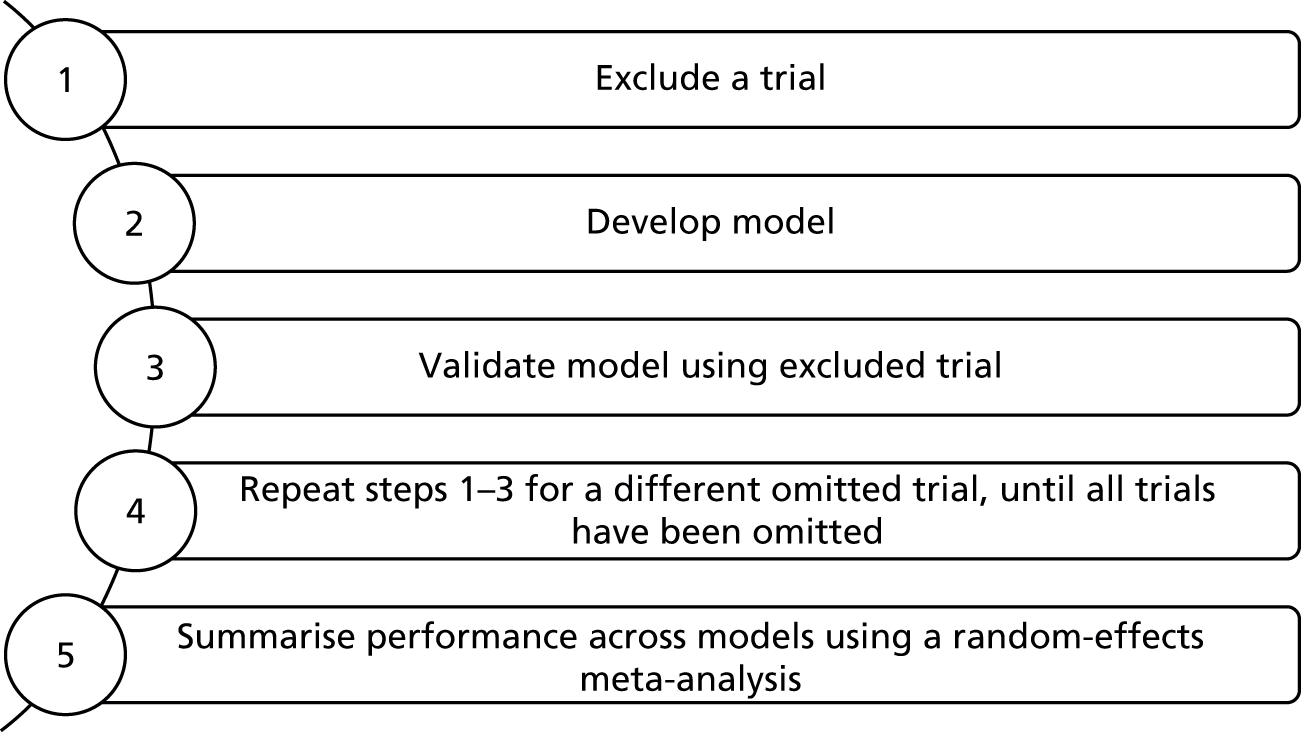
Validation performance statistics
For each cycle of the IECV approach, the Royston and Parmar model was developed and estimated according to Development of prognostic model, thereby producing a model with an average baseline hazard and risk score equation for the included predictors. The performance of this model was then assessed in the excluded validation trial based on both its discrimination and calibration. 81
The discriminatory ability of the developed model (to distinguish between those who will and those who will not have a recurrence) was examined in the external data set using Harrell’s c-statisitc82,83 with bootstrap (1000 resamples) 95% CIs. Larger c-statistics indicate a greater degree of separation in a prognostic models risk score, with a c-statistic of 1 showing perfect discrimination and a value of 0.5 showing no discrimination beyond chance.
Calibration of the developed model was assessed by comparing E/O probabilities of recurrence over time, both visually and statistically. To do this, in the external data set each individual’s predicted probability of recurrence was calculated over time and the population average of these predicted survival curves was then plotted against the Kaplan–Meier curve of observed event risk over time in the population. Excellent calibration would be revealed by the Kaplan–Meier and predicted survival curves matching closely. To quantify differences in the curves for each group at particular time point, the observed recurrence-free probability (from the Kaplan–Meier curve) and the predicted recurrence-free probability were calculated, and then their difference calculated with 95% CIs. A difference of zero would indicate perfect calibration.
Meta-analysis to summarise performance
Development and validation was repeated across all cycles of the IECV, each time excluding a different trial from model development for external validation (see Figure 3). Therefore across all cycles, n of each validation statistic was obtained (n discrimination statistics, and n calibration statistics at each time point, etc.). For each statistic, a random-effects meta-analysis was undertaken to summarise the performance across all cycles of the IECV. This analysis weights by the inverse of the variance of each omitted study’s estimated statistic plus the estimated between-study heterogeneity in the true statistic value. The model was estimated using the method of moments (DerSimonian and Laird), giving an estimate of the average statistic, the between-study heterogeneity in the statistic and a 95% prediction interval for the statistic in an external validation population. 17 Good prognostic models would have excellent average estimates for each calibration and discrimination statistic, and ideally have little or no heterogeneity in the statistic across different external validation populations.
Production of final model after completion of internal–external cross-validation
If the meta-analysis showed that the performance of the model produced by the IECV approach was consistently good across all cycles, then a final model was developed using all the trial data combined, with clear guidance for how to use the model to make individual predictions of recurrence risk over time. However, where model performance was not consistently good across each cycle, trials in which the model performed badly in external validation were identified and investigated for any unusual features. Potential trial features that may lead to poor validation included different methods of measuring variables or different treatment strategies. Where trials with poor validation were identified a model based on a set of IPD, excluding these trials was considered.
Finally, where a suitable model was identified, the performance of simpler versions was also examined, to check whether or not adequate model performance could be achieved with fewer included predictors, so as to ensure the simplest and most easily applicable, yet accurate model for clinical practice was derived. 84
External validation of performance
Where possible the final developed models were also externally validated in data outside of the RVTEC database, using the same validation techniques for calibration and discrimination as described in Internal–external cross-validation, by applying it to those patients in the RIETE and MEGA databases. All these patients are independent of model development and thus help gauge generalisability (also called transportability) to other populations.
Of the seven candidate predictors available for consideration, the variables age, sex, site of index event, treatment duration and BMI were available in all databases. D-dimer levels post-treatment and time from treatment cessation to D-dimer testing were only available in the RVTEC database. Thus, the MEGA and RIETE databases could only be used to validate a prognostic model without D-dimer variables included (the pre D-dimer model). However, validation of a prognostic model including D-dimer variables was still possible in the RVTEC database through the IECV procedure, as discussed above (see Development of prognostic model).
Comparison to existing prognostic models
The performance of any existing prognostic models or decision rules identified by the systematic review (see Chapter 3) were examined in the RIETE, MEGA and RVTEC databases, if the necessary predictors within these models were available in these databases. In particular, comparisons were made of their performance in relation to the newly developed model.
NB: the following results sections are split into three parts to aid clarity. Part I summarises the characteristics of the individuals and their candidate predictor values in the RVTEC database. Part II summarises the development and validation of the pre D-dimer model. Part III summarises the development and validation of the Post D-dimer model.
Results I: summary characteristics of available data
Within this section a description and summary of the individuals and candidate predictors in the RVTEC database are presented.
Description of data
Summary statistics for the baseline patient characteristics and available predictors in the RVTEC database are described in Table 6 and show that across the whole database there were 230 recurrent events out of 1634 patients with a first unprovoked VTE. There are some trials with very small numbers of recurrences, for example Tait et al. 63 and Shrivastava et al. ,62 with 17 and 9 recurrent events respectively. Other trials are larger, with the Eichinger et al. 60 trial having the largest number of events and patients, with 69 recurrent events out of 391 patients. The exclusion of hormone-related index VTE events, in line with the definition of unprovoked VTE within the study (see Population at baseline and outcome of interest), showed that there were 14 hormone-related recurrent events excluded.
| Trial | Palareti57 | Palareti58 | Poli59 | Tait63 | Eichinger60 | Baglin61 | Shrivastava62 | Total |
|---|---|---|---|---|---|---|---|---|
| Recurrences/total | 31/280 | 38/438 | 26/156 | 17/100 | 69/391 | 40/178 | 9/91 | 230/1634 |
| Follow-up (months) | ||||||||
| Median | 20.8 | 20 | 24 | 22.2 | 28.6 | 37.6 | 26 | 22.1 |
| Longest | 31.4 | 37.2 | 96 | 41.6 | 119.2 | 70.9 | 51.2 | 119.2 |
| Candidate factors | ||||||||
| Agea (years) | 70.1 (12.3) | 64.5 (13.4) | 62.9 (15.2) | 60.9 (13.8) | 54.1 (15) | 64.6 (16.6) | 55.4 (12.6) | 62.1 (15.2) |
| BMIa (kg/m2) | 28.9 (6.5) | 28 (4.8) | 26.9 (6.6) | 32.3 (7.2) | 28.5 (6) | |||
| Treatment durationa (months) | 7.5 (6.2) | 21.1 (104.7) | 14.9 (11.2) | 5.8 (0.9) | 8.2 (11.2) | 6.3 (0.9) | 7.9 (5.2) | 11.8 (54.9) |
| D-dimera (ng/ml) | 842.6 (883.4) | 773.1 (762.3) | 432.7 (803.7) | 884.9 (1009) | 490.1 (471.6) | 907.3 (820.3) | 546.1 (598.8) | 698.3 (762.6) |
| Lag timea (days) | 28.6 (4.8) | 32.5 (9.1) | 30 (0) | 33.5 (20.8) | 30.6 (42.6) | – | 143.6 (168.3) | 37.6 (54) |
| Sexb | ||||||||
| Female | 128 (45.7) | 179 (40.9) | 55 (35.3) | 37 (37) | 147 (37.6) | 65 (36.5) | 24 (26.4) | 635 (38.9) |
| Male | 152 (54.3) | 259 (59.1) | 101 (64.7) | 63 (63) | 244 (62.4) | 113 (63.5) | 67 (73.6) | 999 (61.1) |
| Site of index eventb | ||||||||
| Proximal DVT | 217 (77.5) | 274 (62.6) | 96 (61.5) | 60 (60) | 148 (37.9) | 107 (60.1) | 60 (65.9) | 962 (58.9) |
| Distal DVT | 12 (4.3) | 0 (0) | 0 (0) | 0 (0) | 88 (22.5) | 0 (0) | 12 (13.2) | 112 (6.9) |
| PE | 51 (18.2) | 164 (37.4) | 60 (38.5) | 40 (40) | 155 (39.6) | 71 (39.9) | 19 (20.9) | 560 (34.3) |
| Unspecified DVT | 0 (0) | 0 (0) | 0 (0) | 0 (0) | 0 (0) | 0 (0) | 0 (0) | 0 (0) |
The median follow-up across all seven trials was 22 months, with the longest follow-up being almost 10 years in the Eichinger et al. 60 trial, giving sufficient follow-up time to yield meaningful conclusions from the prognostic model.
Summary statistics for each of the candidate predictors are also presented in Table 6, with continuous predictors described as means and SDs and categorical predictors described as counts and percentages. Across the seven trials patient age appeared to be similar, with an overall average age of 61 years for the whole population. Treatment duration appeared generally similar across trials, with an average across trials of around 12 months, and the greatest average treatment duration seen in the Palareti et al. 58 trial of 21 months. D-dimer levels appeared to have large variability, with high SDs and two trials having noticeably lower mean D-dimer levels (Poli et al. 59 = 432 and Eichinger et al. 60 = 490). There may be significant outliers causing the large variation seen in D-dimer levels recorded in each trial and this was investigated in the exploratory analysis (see Distribution of candidate predictors, correlation and outliers). The mean BMI across the seven trials was around 28 kg/m2; however, there was a large proportion of missing data across the trials for BMI. There were also missing data from one trial for lag time, but overall across the trials there was an average lag time of around 38 days, with the greatest mean lag time being 143 days in the Shrivastava et al. 62 trial. The percentage of males and females were consistent across the trials (see Table 6), as were the proportions of index site, except for distal DVT where the Eichinger et al. 60 trial had a noticeably greater proportion of patients with a first distal DVT, possibly explained by differences in inclusion criteria across the studies (Table 7).
| Trial | Inclusion criteria | Exclusion criteria |
|---|---|---|
| Palareti57 | First VTE | Lupus anticoagulant |
| Palareti58 | First unprovoked VTE | Recent pregnancy or puerperium, leg fracture, immobilisation for > 3 days, surgery, APS, active cancer, antithrombin deficiency, serious liver or renal disease, other indication or contraindication for anticoagulation, limited life expectancy, geographic inaccessibility |
| Poli59 | First unprovoked VTE | APS, active cancer |
| Tait63 | Acute VTE (last 5 weeks) | Life expectancy < 3 months, anticipated duration of OAC > 1 year, unavailable for follow-up |
| Eichinger60 | First unprovoked VTE | Surgery, pregnancy or trauma in previous 3 months, cancer, APS, natural coagulation inhibitor deficiency, long-term anticoagulation |
| Baglin61 | First VTE | Postoperative or pregnancy-associated VTE, APS, cancer, thrombosis within 6 weeks of surgery, other indication for prolonged anticoagulation |
| Shrivastava62 | First unprovoked VTE | Surgery or trauma within 90 days of first VTE, APS, previous or active cancer, life expectancy < 3 years |
A summary of the percentage of missing data across the trials, and as a whole, is presented by candidate predictors in Table 8. As mentioned previously, there were a large number of missing data across the trials for the candidate factor BMI, with around 57% of BMI data missing over the whole database. This mostly consisted of three trials (Palareti et al. 57,58 and Poli et al. 59) where patient BMI data were not originally recorded, but there were also a significant number of missing BMI data in the Baglin et al. 61 trial (27% missing). Across the trials there were also missing data on D-dimer values and lag time, with 15% and 11.4% missing respectively. There was a large percentage of missing D-dimer values in the Palareti et al. 58 (38%) and Poli et al. 59 (48%) trials. Lag time data were not available by individual patient within the Baglin et al. 61 trial, though D-dimer was reported to have been measured between 1 and 2 months after cessation of therapy. 61 No missing data were present for the age, sex, treatment duration or site of index event variables.
| Candidate factor | Palareti57 | Palareti58 | Poli59 | Tait63 | Eichinger60 | Baglin61 | Shrivastava62 | All |
|---|---|---|---|---|---|---|---|---|
| Age | 0.0 | 0.0 | 0.0 | 0.0 | 0.0 | 0.0 | 0.0 | 0.0 |
| BMI | 100.0 | 100.0 | 100.0 | 0.0 | 1.8 | 27.0 | 0.0 | 56.9 |
| Treatment duration | 0.0 | 0.0 | 0.0 | 0.0 | 0.0 | 0.0 | 0.0 | 0.0 |
| D-dimer | 0.0 | 38.4 | 48.1 | 0.0 | 0.0 | 0.0 | 2.2 | 15.0 |
| Lag time | 0.0 | 0.0 | 0.0 | 0.0 | 1.0 | 100.0 | 5.5 | 11.4 |
| Sex | 0.0 | 0.0 | 0.0 | 0.0 | 0.0 | 0.0 | 0.0 | 0.0 |
| Site of index event | 0.0 | 0.0 | 0.0 | 0.0 | 0.0 | 0.0 | 0.0 | 0.0 |
Given that no BMI data was recorded for any patient in three of the trials,57–59 and the need to recognise the clustering of patients within the same trial, it was not deemed sensible to impute these missing values using the data available from the other trials in which BMI was recorded. 85 Therefore, in the primary analyses for both models (pre and post D-dimer models), utilising all seven trials’ data, it was decided to exclude BMI as a candidate predictor due to the number of missing data.
Other candidate predictors were known in all studies for at least some patients. As there was a degree of missing data in these candidate predictors (D-dimer, lag time, treatment duration), a sensitivity analysis imputing any missing information was considered. Therefore, as mentioned in the methods section above (see Development of prognostic model), prognostic models were developed based first on a complete case scenario and second on a scenario using multiple imputation techniques to impute missing patient data. Comparisons were made between the two scenarios in terms of the models’ predictive performance (calibration and discrimination), to ascertain if models based on multiple imputation improved or changed performance importantly (see Sensitivity analysis).
Distribution of candidate predictors, correlation and outliers
An exploratory analysis was performed on each of the candidate predictors, first considering their empirical distributions and assessing these for normality using histograms and normal probability plots (see Appendix 4), with transformations considered as appropriate where there were departures from normality. Possible outliers were inspected, with erroneous patient values leading to removal of patient data, and outliers deemed to be extreme (but plausible) considered for sensitivity analysis to assess their effect on the final model. Associations between the candidate predictors were investigated using scatterplots (see Appendix 4) and correlation statistics (Table 9) for continuous factors, and box plots (see Appendix 4) to assess the relationship between categorical and continuous factors.
| Candidate factor | Age | BMI | Log-D-dimer | Log-lag time | Log-treatment duration |
|---|---|---|---|---|---|
| Age | 1.00 | ||||
| BMI | –0.03 | 1.00 | |||
| Log D-dimer | 0.50 | 0.02 | 1.00 | ||
| Log lag time | 0.02 | 0.14 | 0.08 | 1.00 | |
| Log treatment duration | –0.13 | 0.06 | –0.06 | –0.02 | 1.00 |
The candidate factors of patient age and BMI were found to be approximately normally distributed, with some extreme values identified (patient ages of 0 years and BMI values < 10 kg/m2) which were removed from the data set as erroneous data. D-dimer score, lag time and treatment duration were all found to have a strong positively skewed empirical distribution and a log-transformation was therefore considered in order to approximate normality (for histograms and normal plots of transformed factors see Appendix 4). Patients with treatment durations > 1000 days were removed as this was considered erroneous data based on clinical expertise.
Continuous candidate predictors were examined visually using scatterplots (see Appendix 4, Figure 63) and empirically using correlation coefficients (see Table 9). It is clear from Table 9 that there were low to moderate correlation between the continuous candidate factors and visual inspection of the scatterplots confirmed these findings. The strongest correlation was between age and log-D-dimer, which was 0.5 (see Table 9). Investigation of relationships between continuous factors and categorical factors for sex and site of index event was undertaken using box plots (see Appendix 4, Figures 64–75). Across the five continuous factors considered for inclusion there appeared to be no distinct differences between males and females, or between proximal DVT, distal DVT and PE based on visual examination of the box plots. There were several outliers observed in the box plots, particularly for treatment duration and lag time, but also in the other candidate factors. When establishing the final prognostic models a sensitivity analysis was performed by excluding any outlying values for any predictor and checking the robustness of the model to these extreme values.
Results II: development and validation of pre D-dimer model
The results of model development and validation for the pre D-dimer model to predict risk of VTE recurrence are now described.
Complete case data
The complete case data for the development of the pre D-dimer were almost identical to the original RVTEC database described in Table 6. Given the predictors included in the pre D-dimer model (see Aims: development and validate two models, based on different start points), there was no missing predictor information (see Table 8) and therefore no patients were excluded due to missing data. Eight patients were excluded based on the exploratory analysis conducted above (see Distribution of candidate predictors, correlations and outliers). As discussed previously, extreme values of predictors were excluded from the data set; age equal to 0 years (n = 1), BMI < 10 kg/m2 (n = 3) and treatment durations > 1000 days (n = 4). These exclusions led to a reduction in overall sample size to 1626 patients, but did not affect the number of included events, remaining at 230 recurrent events (Table 10).
| Trial | Palareti57 | Palareti58 | Poli59 | Tait63 | Eichinger60 | Baglin61 | Shrivastava62 | Total |
|---|---|---|---|---|---|---|---|---|
| Recurrences/total | 31/280 | 38/434 | 26/156 | 17/99 | 69/391 | 40/175 | 9/91 | 230/1626 |
| Follow-up (months) | ||||||||
| Median | 20.8 | 20.2 | 24 | 21.9 | 28.6 | 37.6 | 26 | 22.1 |
| Longest | 31.4 | 37.2 | 96 | 41.6 | 119.2 | 70.9 | 51.2 | 119.2 |
| Candidate factors | ||||||||
| Agea (years) | 70.1 (12.3) | 64.7 (13.4) | 62.9 (15.2) | 60.9 (13.8) | 54.1 (15) | 65 (15.9) | 55.4 (12.6) | 62.2 (15.1) |
| BMIa (kg/m2) | – | – | – | 29.1 (6.2) | 28 (4.8) | 27.3 (5.9) | 32.3 (7.2) | 28.6 (5.7) |
| Treatment durationa (months) | 7.5 (6.2) | 12.4 (11.2) | 14.9 (11.2) | 5.8 (0.9) | 8.2 (11.2) | 6.2 (0.9) | 7.9 (5.2) | 9.5 (9.6) |
| D-dimera (ng/ml) | 842.6 (883.4) | 770.6 (763.8) | 432.7 (803.7) | 889.4 (1013.1) | 490.1 (471.6) | 910.4 (826.7) | 546.1 (598.8) | 697.8 (763.9) |
| Lag timea (days) | 28.6 (4.8) | 32.5 (9.1) | 30 (0) | 33.7 (20.9) | 30.6 (42.6) | – | 143.6 (168.3) | 37.7 (54.1) |
| Sexb | ||||||||
| Female | 128 (45.7) | 178 (41) | 55 (35.3) | 36 (36.4) | 147 (37.6) | 65 (37.1) | 24 (26.4) | 633 (38.9) |
| Male | 152 (54.3) | 256 (59) | 101 (64.7) | 63 (63.6) | 244 (62.4) | 110 (62.9) | 67 (73.6) | 993 (61.1) |
| Site of index eventb | ||||||||
| Distal DVT | 12 (4.3) | 0 (0) | 0 (0) | 0 (0) | 88 (22.5) | 0 (0) | 12 (13.2) | 112 (6.9) |
| Proximal DVT | 217 (77.5) | 272 (62.7) | 96 (61.5) | 59 (59.6) | 148 (37.9) | 105 (60) | 60 (65.9) | 957 (58.9) |
| PE | 51 (18.2) | 162 (37.3) | 60 (38.5) | 40 (40.4) | 155 (39.6) | 70 (40) | 19 (20.9) | 557 (34.3) |
| Unspecified DVT | 0 (0) | 0 (0) | 0 (0) | 0 (0) | 0 (0) | 0 (0) | 0 (0) | 0 (0) |
Univariable analysis
Initial univariable analyses were performed by fitting each candidate predictor against recurrence individually using a Cox proportional hazards model, to assess the association between each predictor and recurrence. Summaries of the univariable association between each predictor and recurrence including the HR and a 95% CI are presented in Table 11.
| Candidate factor | HR | Lower 95% CI | Upper 95% CI | p-value |
|---|---|---|---|---|
| Age | 0.997 | 0.989 | 1.006 | 0.513 |
| Treatment duration (months) | 1.075 | 0.859 | 1.346 | 0.526 |
| Sex | ||||
| Male | 1.828 | 1.360 | 2.458 | < 0.001 |
| Site of index event | ||||
| Proximal DVT | 5.735 | 2.118 | 15.529 | 0.001 |
| PE | 5.360 | 1.961 | 14.648 | 0.001 |
The results of the univariable analysis for the pre D-dimer scenario (see Table 11) show that unadjusted HRs for patient age and treatment duration are close to 1, with HRs of 0.997 (95% CI 0.99 to 1.02) and 1.005 (95% CI 0.99 to 1.02) respectively. As these are continuous predictors, the HRs compared the change in rate of VTE recurrence for each 1-unit change in the predictor, and so HRs close to 1 may actually have a large impact when multiplied by a large predictor value. However, CIs for both predictors included 1, with large p-values, providing no statistical evidence that the unadjusted recurrence rate was affected by age or duration of treatment. Conversely, the effect of male sex appears to be significantly different from 1 with a HR of 1.83 (95% CI 1.36 to 2.46), indicating that the unadjusted recurrence rate is around 80% higher for men than for women. Compared with distal DVT, both proximal DVT and PE have a greater than fivefold increase in recurrence rate, with HRs of 5.74 (95% CI 2.12 to 15.53) and 5.36 (95% CI 1.96 to 14.65) respectively. Although sex and site of index event appear to have significant prognostic value independently, multivariable analysis will assess whether or not they retain prognostic value when adjusted for other predictors (see Development of multivariable prognostic model).
Development of multivariable prognostic model
Given its large number of patients relative to the other trials, the Eichinger et al. 60 trial was forced to remain in the development data set throughout all cycles of the IECV approach. Therefore no model was built without the Eichinger et al. 60 trial population and subsequently no external validation was performed in the Eichinger et al. 60 trial. The trial was included in all models developed because it was the largest population available and therefore would have a large impact on any final model produced. Thus, although there were seven trials available, there were only six cycles of the IECV approach for the pre D-dimer model.
Baseline spline complexity
In order to consider the complexity (number of knots) required for the baseline spline function a series of preliminary models were fit with varying numbers of knots for the spline function. Comparisons were then made between the models using the AIC and BIC statistics, with smaller values preferred. Although simply concerned with the complexity of the model there is no need for variable selection and so a saturated model is fit, assuming linearity for continuous predictors. 75
Table 12 shows the AIC and BIC values for proportional hazards models with between 1 df and 5 df for each of the seven models fitted (seven cycles of the IECV), where the model is built using a derivation data set based on six trials excluding the trial named in the column header. For simplicity at this stage, the clustering of patients within trials was ignored and so the set of six trials used in each cycle of the IECV approach was analysed as one large data set.
| Information criterion | df | External validation trial namea | |||||
|---|---|---|---|---|---|---|---|
| Palareti57 | Palareti58 | Poli59 | Tait63 | Baglin61 | Shrivastava62 | ||
| AIC | 1 | 1523.6 | 1449.0 | 1603.8 | 1661.6 | 1511.1 | 1721.3 |
| 2 | 1513.0 | 1438.2 | 1589.4 | 1652.5 | 1501.3 | 1707.6 | |
| 3 | 1503.8 | 1425.4 | 1582.7 | 1639.7 | 1489.7 | 1693.0 | |
| 4 | 1503.7 | 1425.1 | 1582.8 | 1638.3 | 1488.5 | 1693.0 | |
| 5 | 1499.5 | 1425.9 | 1581.6 | 1637.0 | 1490.2 | 1692.2 | |
| BIC | 1 | 1546.6 | 1471.8 | 1627.1 | 1685.1 | 1533.8 | 1745.1 |
| 2 | 1539.3 | 1464.3 | 1616.0 | 1679.4 | 1527.3 | 1734.8 | |
| 3 | 1533.5 | 1454.7 | 1612.5 | 1670.0 | 1518.9 | 1723.6 | |
| 4 | 1536.6 | 1457.7 | 1616.0 | 1671.9 | 1521.0 | 1726.9 | |
| 5 | 1535.7 | 1461.7 | 1618.1 | 1673.9 | 1525.9 | 1729.6 | |
Given that lower values of the information criteria represent a better fit, it can be seen that, in general, across the seven derivation data sets a model with 3 df minimises the BIC. The lowest values of AIC vary between 3 df and 5 df across the derivation data sets, but the unit value of the AIC actually varies very little. The BIC often selects simpler models because increasing numbers of parameters carry greater penalties on the BIC,76 as such increasing the number of df increases the internal knots used and so inflates the number of parameters giving higher BIC values.
A strong tendency for BIC towards 3 df and a relatively small unit difference in AIC between a 3 df model and the model with the minimum AIC value was observed. The greatest difference between the minimum AIC and that of a 3 df model was around 4, with the majority of differences being < 2 (see Development of prognostic model). Visually a convergence in the survival curves at higher df could be seen (Figure 4) and the curve with the lowest number of internal knots was the 3 df model. Therefore given these results, 3 df were selected to represent the baseline spline complexity for models in the pre D-dimer scenario. This relates to a baseline spline function with four knots.
FIGURE 4.
Comparison of baseline spline complexity with differing numbers of internal knots (example shown for development data set excluding the Palareti et al. 57 trial).

Baseline hazard within and across trials
Investigation of the baseline hazard function using a null model (with no predictors) within each trial in the RVTEC database was undertaken to ascertain whether or not the shape and magnitude of the baseline hazards in each trial were noticeably different from one another.
Figure 5 illustrates the baseline hazard function within each trial population plotted against years from cessation of therapy. It is clear that for all trials there is a similar peak in hazard at just under 1 year from cessation of therapy; however, this peak is of varying magnitude across the seven trials. There is also a rise in the baseline hazard seen in the Poli et al. 59 trial after 2 years from cessation of therapy, which is not seen in the other trials; however, this was considered to be potentially due to the small number of individuals in this trial, as illustrated in Figure 6 by the large CI surrounding the tail of the hazard function.
FIGURE 5.
Baseline hazard within each trial for the pre D-dimer scenario (null model).
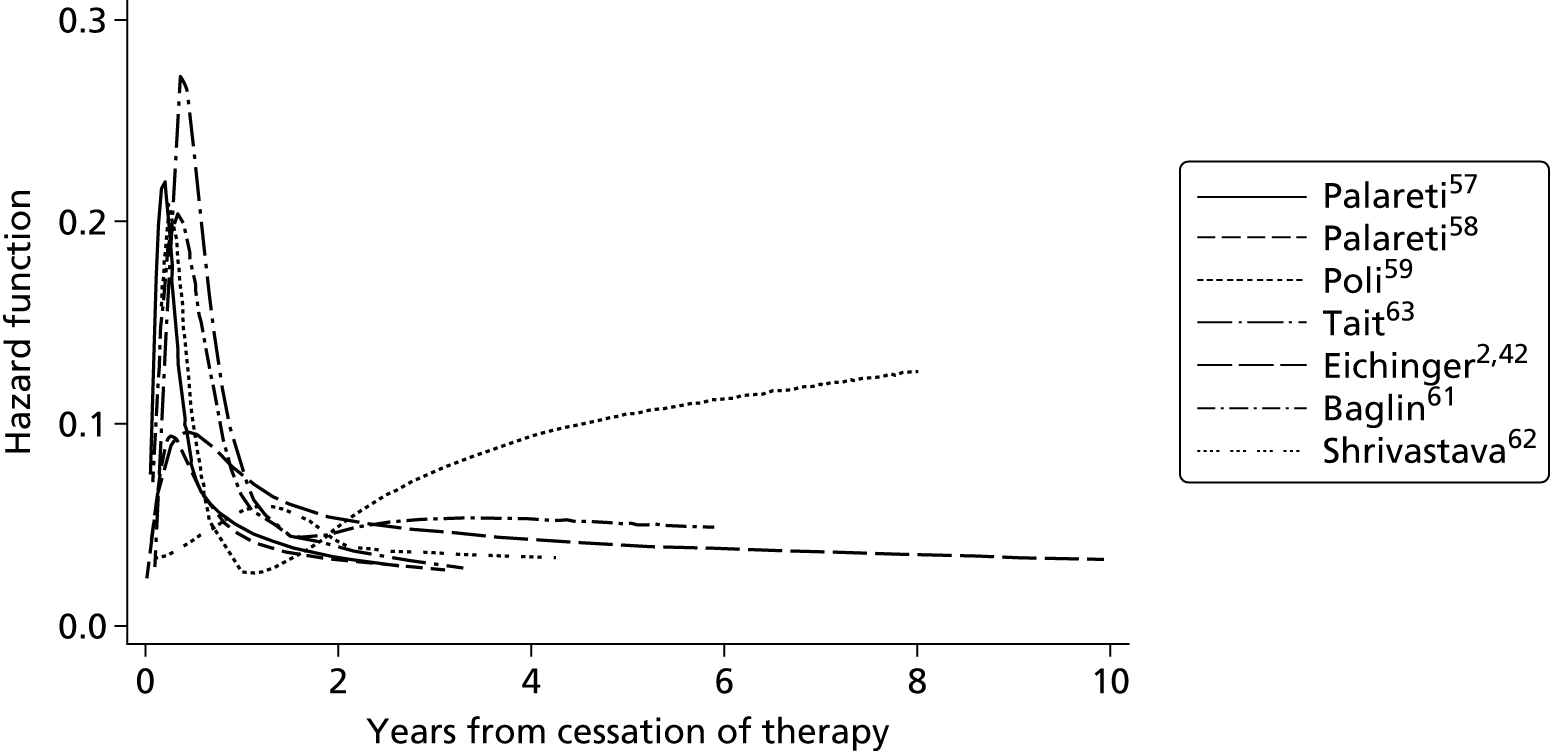
Given the differences seen in the magnitude of the hazard function for each trial, it was deemed appropriate for model development to include a random effect on the baseline hazard, to allow for variability in the baseline hazard between trials. However, given the similarities in the general shape of the baseline hazard function in individual trials, it was deemed appropriate to assume the baseline hazards for the trials were proportional to one another.
Selection of predictors and model estimation
Candidate predictors were entered into the MFP algorithm of Royston and Sauerbrei49 and Sauerbrei et al. 50 (see Development of prognostic model).
Candidate predictors considered for variable selection in the pre D-dimer model were age, sex, site of index event and treatment duration (see Aims: develop and validate two models, based on different start points). The results of variable selection for the pre D-dimer model using a random effect on the baseline hazard are shown in Table 13 and reveal that very similar coefficient estimates were obtained across all cycles of the IECV.
| Trial excluded | Candidate factors, HR (95% CI) | |||
|---|---|---|---|---|
| Sex, male | Site of index event | Constant | ||
| Proximal DVT | PE | |||
| Palareti57 | 1.92 (1.37 to 2.70) | 5.93 (2.03 to 17.36) | 5.26 (1.8 to 15.4) | 0.01 (0.00 to 0.03) |
| Palareti58 | 1.8 (1.28 to 2.53) | 6.05 (2.19 to 16.72) | 5.7 (2.01 to 16.13) | 0.02 (0.01 to 0.06) |
| Poli59 | 1.73 (1.27 to 2.35) | 6.17 (2.11 to 18.07) | 5.58 (1.86 to 16.71) | 0.01 (0.00 to 0.03) |
| Tait63 | 1.97 (1.45 to 2.68) | 6.05 (2.07 to 17.71) | 5.58 (1.86 to 16.71) | 0.01 (0.00 to 0.03) |
| Baglin61 | 1.62 (1.19 to 2.20) | 5.87 (2.00 to 17.19) | 5.99 (2.05 to 17.54) | 0.01 (0.00 to 0.03) |
| Shrivastava62 | 1.82 (1.36 to 2.43) | 5.99 (2.07 to 17.34) | 5.16 (1.78 to 14.94) | 0.02 (0.01 to 0.06) |
Throughout the cycles, the only factors selected for inclusion in the model were sex and site of index event; with both factors showing similar effect sizes to those estimated through univariable analysis (see Table 11). The HR for male compared with female sex ranges from 1.62 to 1.97, indicating a higher recurrence rate in males compared with females. The 95% CIs estimated for the effect of sex are substantially larger than seen in univariable analysis, suggesting greater uncertainty surrounding the adjusted HR for sex.
Hazard ratios for proximal DVT range from 5.87 to 6.17, showing a greater recurrence rate for patients with proximal compared with distal DVT. Similarly, HRs for PE compared with distal DVT show higher recurrence rates in patients with PE. The estimated CIs for site of index event appear to be smaller than those seen in univariable analysis suggesting that the adjusted HRs for site of index event have greater certainty.
Model validation
The final step of the IECV approach (see Internal–external cross-validation) is to assess model performance within the validation trial, at each cycle of the IECV approach. As the validation trial was excluded from model development, the performance of the model within this data set can be deemed as external validation. Model performance is now assessed in terms of both discrimination and calibration (see Internal–external cross-validation).
Discrimination and calibration results for each cycle of the IECV for the pre D-dimer model are presented in Table 14, under a random-effects assumption on the baseline hazard. c-statistic estimates for the developed model range from 0.47 in the Tait et al. 63 trial to 0.58 in both the Palareti et al. 58 and Poli et al. 59 trials. A random-effects meta-analysis of the c-statistics from each validated model (each cycle of the IECV) provides a pooled estimate of the performance across all developed models (Figure 7). A random-effects meta-analysis was performed as there were expected to be different discriminatory effects within each validation trial, as opposed to one true c-statistic in all trials as assumed under a fixed-effects meta-analysis. The pooled c-statistic of 0.56 (95% CI 0.51 to 0.60) represents the overall weighted average c-statistic from all validation trials, showing poor discriminatory ability of the models developed in the cycles of the IECV approach. However, as this is a weighted average of the performance within each validation trial, it is expected that the discrimination would average out to that of a model built using the whole data set. In this case it is of more interest to examine the heterogeneity across the trials and the 95% prediction interval. 86 The prediction interval provided is a useful tool for interpreting the potential range of performance of the new model in a new setting (where the model will be applied), by accounting for the uncertainty in the pooled estimate, the heterogeneity between trials and the between trial SD. 17 The interval suggests that the c-statistic for the model used in a new setting could vary anywhere between 0.49 and 0.62, which represents a potentially broad range of performance from awful discrimination to a higher but still quite poor level. The heterogeneity, or variability, across the trial populations appears to be minimal (I2-statistic = 0), indicating that the discrimination of the model appears consistent in new populations and that any variation is due to chance. 17 However, as this zero heterogeneity is only an estimate, its uncertainty is propagated in the 95% prediction interval, which is why the prediction interval is so wide.
| Summary statistics | External validation trial, estimate (95% CI) | |||||
|---|---|---|---|---|---|---|
| Palareti57 | Palareti58 | Poli59 | Tait63 | Baglin61 | Shrivastava62 | |
| Recurrences/total patients | 31/280 | 38/434 | 26/156 | 17/99 | 40/175 | 9/91 |
| c-statistic | 0.56 (0.44 to 0.65) | 0.58 (0.50 to 0.67) | 0.58 (0.43 to 0.72) | 0.47 (0.31 to 0.61) | 0.57 (0.48 to 0.65) | 0.52 (0.34 to 0.69) |
| S(t) – Ŝ(t) statistic (6 months) | 0.02 (–0.01 to 0.05) | –0.02 (–0.04 to 0.00) | 0.03 (–0.02 to 0.07) | 0.03 (–0.02 to 0.09) | 0.02 (–0.02 to 0.06) | –0.03 (–0.06 to 0.00) |
| S(t) – Ŝ(t) statistic (1 year) | 0.00 (–0.03 to 0.03) | –0.03 (–0.05 to –0.01) | 0.01 (–0.04 to 0.05) | 0.04 (–0.03 to 0.11) | 0.06 (0.00 to 0.11) | –0.06 (–0.10 to –0.02) |
| S(t) – Ŝ(t) statistic (2 years) | –0.01 (–0.05 to 0.03) | –0.05 (–0.08 to –0.02) | 0.01 (–0.05 to 0.08) | 0.06 (–0.02 to 0.14) | 0.03 (–0.03 to 0.08) | –0.05 (–0.11 to 0.02) |
| S(t) – Ŝ(t) statistic (3 years) | –0.05 (–0.09 to –0.01) | –0.10 (–0.13 to –0.06) | 0.01 (–0.07 to 0.09) | 0.02 (–0.07 to 0.1) | 0.03 (–0.03 to 0.09) | –0.05 (–0.13 to 0.03) |
FIGURE 7.
Random-effects meta-analysis of c-statistic estimates obtained from each external validation of the pre D-dimer models from the IECV cycle.
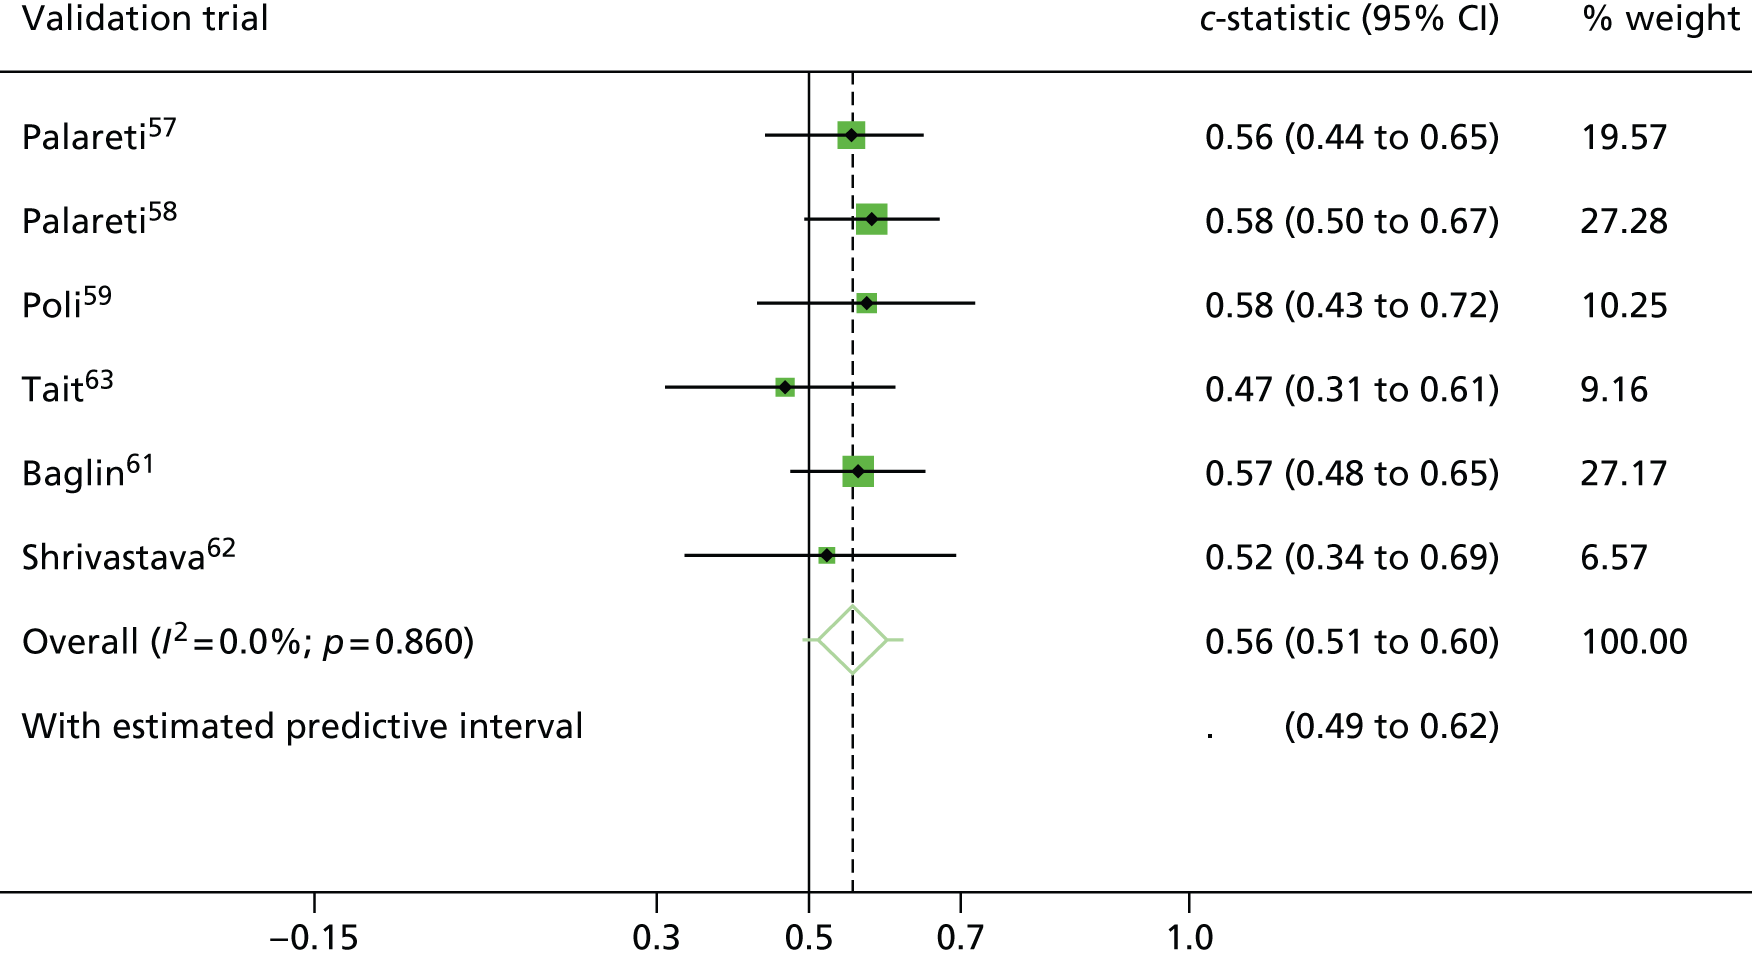
Calibration is examined visually across all time points in Figure 8. It is then quantified further in Table 14 at four time points: 6 months, 1 year, 2 years and 3 years after cessation of therapy. The model appears to be well calibrated (see Table 14), with expected minus observed, S(t) – Ŝ(t), probabilities with a recurrence very close to zero and 95% CIs including zero across all cycles of the IECV. Plots of the observed probability of recurrence (based on the Kaplan–Meier survival estimates) compared with the expected probability of recurrence (based on the predictions of the model) are presented for each validation trial in Figure 8. A perfectly calibrated model would give a predicted curve very similar to the observed Kaplan–Meier curve, which can be seen for validation trials Palareti et al. 57 and Poli et al. 59 Within the remaining validation trials the developed model either over or underpredicted the probability of recurrence, compared with the observed probabilities within the validation trial. For example, over prediction can be seen in the Palareti et al. 58 trial beyond 6 months post cessation of therapy (see Figure 8). Plots of the S(t) – Ŝ(t) statistic and 95% CIs for each validation trial can be seen in Figure 9, showing the difference in proportion survived remains close to zero over time from cessation of therapy.
The pooled calibration from a random-effects meta-analysis gives an overall S(t) – Ŝ(t) statistic of zero (95% CI –0.03 to 0.03) at 1 year post cessation of therapy (Figure 10), showing excellent calibration on average. However, there appears to be large heterogeneity across trials, with an I2-statistic of 71.5% suggesting that the calibration of the model is not consistent in all populations. Indeed, the 95% prediction interval ranges from 0.1 to –0.09, indicating that the discrepancy in the predicted and true observed S(t) could range from 0.1 to –0.09 in a particular population. The wide CI is also a reflection of uncertainty in the heterogeneity estimate. Similar results can be seen for a random-effects meta-analysis of calibration statistics at 2 years post cessation of therapy (Figure 11) showing consistent agreement on average in the validation trials at 2 years.
FIGURE 10.
Random-effects meta-analysis of calibration performance (at 1 year post therapy) estimates from each external validation trial in the IECV cycles for the pre D-dimer model. Exp-obs, expected–observed.

FIGURE 11.
Random-effects meta-analysis of calibration performance (at 2 years post therapy) estimates from each external validation trial in the IECV cycles for the pre D-dimer model. Exp-obs, expected–observed.

In summary, discrimination of the model developed is generally poor with c-statistics ranging from 0.47 to 0.58 (see Table 14 and Figure 7); other published clinical prediction models have shown stronger discriminatory ability. 87 Furthermore, although on average across all trials calibration appears good, there is a large amount of heterogeneity in calibration performance across the different trial populations.
Final pre D-dimer model
Although model performance was generally weak, it was considered important to present a final pre D-dimer model for future research to build on. The final model therefore used the data from all trials and estimated predictor effects and the baseline hazard with a random effect on the baseline hazard to allow for trial differences.
A description, performance and sensitivity analyses of the final model is now discussed.
Specification and parameter estimates
The pre D-dimer model was fitted to the whole data set, with the candidate predictors for patient age, sex, treatment duration and site of index event (distal DVT, proximal DVT and PE) considered. A random-effects model on the baseline hazard was estimated using a Royston and Parmar model with 3 df on the proportional hazards scale. The MFP algorithm was used to perform predictor selection as described previously (see Development of prognostic model); subsequently, only sex and site of index event were selected for inclusion in the final pre D-dimer model. The estimated HRs for included predictors remained similar to those seen throughout the IECV cycles as expected (Table 15). Sex and site of index event had large HRs consistent with the literature. 2,7,88 Male sex was associated with an almost 80% increase in recurrence rate compared with females (HR 1.79, 95% CI 1.33 to 2.41), whereas proximal DVT and PE were associated with around a sixfold increase in recurrence rate compared with patients with a first distal DVT (see Table 15).
| Predictor | Beta coefficient (95% CI) | HR (95% CI) | p-value |
|---|---|---|---|
| Sex | |||
| Male | 0.58 (0.29 to 0.88) | 1.79 (1.33 to 2.41) | < 0.001 |
| Site of index event | |||
| Proximal DVT | 1.82 (0.76 to 2.88) | 6.17 (2.13 to 17.86) | 0.001 |
| PE | 1.71 (0.64 to 2.79) | 5.55 (1.90 to 16.23) | 0.002 |
To make predictions from the model, Equation 1 (equation to predict probability of recurrence-free survival at time t) is required:
where for the pre D-dimer model, βχ within Equation 1 is the risk score which is equal to Equation 2 (risk score equation for the pre D-dimer model):
and where S0(t) is the average baseline survival function at a specific time t, which is shown in Figure 12 up to 4 years post cessation of therapy. Values of S0(t) can be read from the Kaplan–Meier plot at specific time points (see Figure 12), as presented in Table 16 for 6 months, 1, 2 and 3 years post cessation of therapy.
FIGURE 12.
Average baseline (recurrence-free) survival function [S0(t)] for the pre D-dimer model.

| Model predictor | Time from cessation of therapy | |||
|---|---|---|---|---|
| 6 months | 1 year | 2 years | 3 years | |
| S0(t) | 0.9938 | 0.9895 | 0.9835 | 0.9780 |
Equation 1 allows the prediction of a recurrence-free survival probability at a particular time point after cessation of therapy, meaning that the probability of recurrence by a specific time point, R(t), is defined by Equation 3:
The apparent calibration of the predicted probability of recurrence to the observed probabilities (Kaplan–Meier estimates) within this whole trial data set appeared under visual inspection to calibrate well up to 4 years from cessation of therapy (Figure 13). This is expected, as the model is estimated on the same data set, so the apparent calibration is naturally a good fit.
FIGURE 13.
Calibration of the pre D-dimer model fit to all trial data. KM, Kaplan–Meier.
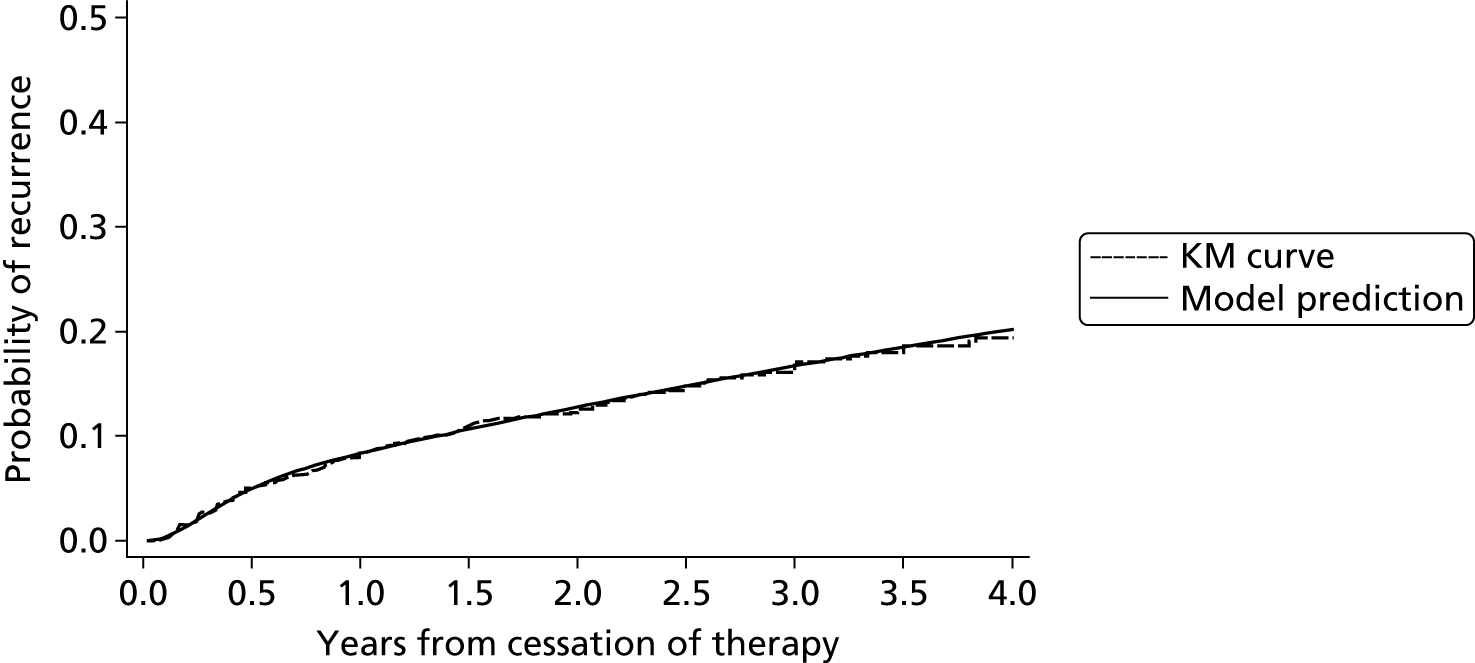
The probability of recurrence over time from cessation of therapy varies across the risk spectrum, illustrating what happens to individuals at the edges of the risk spectrum. 75 It can be seen that individuals in the 90th centile of the distribution of the prognostic index having higher probability of recurrence compared with those in the 10th centile of the prognostic index (Figure 14). However, the range of discrimination for the model appears to be limited, with little gap between some centiles, which corresponds with the discrimination statistics observed during model development (see Model validation). This is expected, as the IECV showed the discrimination is low, with the average c-statistic of 0.56 across all cycles (see Figure 7).
FIGURE 14.
Probability of recurrence across the risk spectrum (the pre D-dimer model).
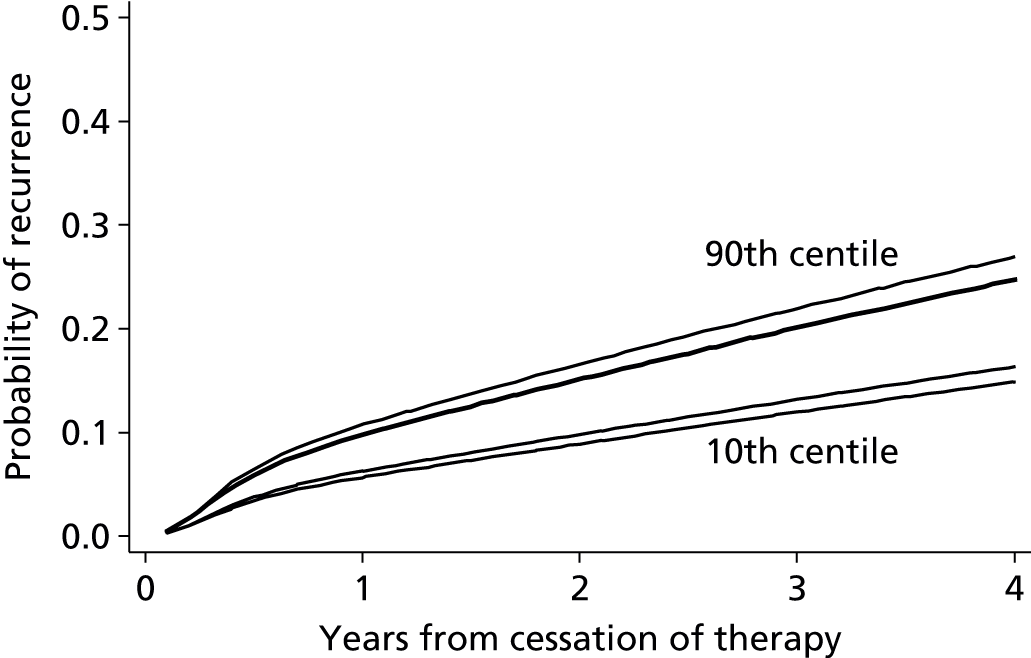
Model checking
The final model above was checked in terms of proportional hazards assumptions, functional form of continuous predictors (non-linear trends), outliers, leverage, interactions and time-dependent effects (see Appendix 5). There was no evidence of any concerns and no indication that the model could be improved or modified in regard these aspects. None of the predictors had missing observations (see Table 8) and, as such, a sensitivity analysis using multiple imputation was not required.
External validation in RIETE and MEGA data sets
Two independent databases were available for potential external validation of the pre D-dimer prognostic model (see Identifying, obtaining and cleaning individual patient data). First, the RIETE database, a Spanish registry database containing approximately 15,000 unprovoked VTE patients. Second, the MEGA database containing almost 5000 patients with a first unprovoked VTE from two centres in the Netherlands.
RIETE data set
The RIETE database contained factors describing the site of index event but only described categories in terms of either (1) DVT and PE, (2) DVT or (3) PE. The site of index event factor used in the development of the pre D-dimer model included categories for distal DVT, proximal DVT and PE, therefore breaking down the types of DVT into the lower-risk distal DVT and higher-risk proximal DVT. As no other information was provided within the RIETE database, with regard to site of index event, the required categories as described in the development database could not be recreated. Therefore the pre D-dimer model unfortunately could not be validated in the RIETE database.
MEGA data set
Within the MEGA data set there was no variable describing the site of index event using the same categorisation as the RVTEC database, which was essential for validation of the developed models. To overcome this, a separate variable identifying the patients site of index event in categorisations representing the vein or artery location was recategorised according to Martinelli et al. 89 (Table 17). After recategorisation, summary statistics showed a small number of distal DVT’s (6.5%) compared with the higher-risk proximal DVT (29%) and PE (42%) (Table 18).
| Original MEGA classification | Recategorisation to concur with RVTEC |
|---|---|
| Isolated inferior vena cava | Proximal DVT |
| Isolated iliac vein | Proximal DVT |
| Iliofemoral vein | Proximal DVT |
| Isolated femoral vein | Proximal DVT |
| Popliteal-iliofemoral vein | Proximal DVT |
| Popliteal-femoral vein | Proximal DVT |
| Isolated popliteal vein | Proximal DVT |
| Distal | Distal DVT |
| PE | PE |
| Characteristic | Summary statistics | |
|---|---|---|
| MEGA | RVTEC | |
| Follow-up (months)a | 69.3 (16.4–91.9) | 22.1 (14.2–32.0) |
| Ageb | 49.37 (13.28) | 62.2 (15.1) |
| Sexc | ||
| Female | 2588 (54.14) | 633 (38.9) |
| Male | 2192 (45.86) | 993 (61.1) |
| Site of index eventc | ||
| Distal DVT | 311 (6.51) | 112 (6.9) |
| Proximal DVT | 1404 (29.37) | 957 (58.9) |
| PE | 2025 (42.36) | 557 (34.3) |
| Unspecified | 1040 (21.76) | 0 (0) |
The median follow-up within the MEGA database was around 69 months providing substantial information on patient’s long-term prognosis. Summary statistics from the MEGA database, for the predictors included within the pre D-dimer model, are presented in Table 18. The average (mean) age of patients was around 49 years old; there were slightly more females within the data set than males (54% females).
The summary statistics appeared to indicate that the population in the MEGA database was different in a number of ways to that of the RVTEC database. The distribution of index events was different between the two databases with the proportion of proximal DVTs around double that seen in the MEGA data set (58.9% to 29.4%). The RVTEC population had a higher average age (approximately 60 years) and greater proportion of males (approximately 60% males) (see Table 18).
To assess the external performance of the pre D-dimer model, predicted risk of recurrence over time was calculated for all individuals in the MEGA data set using the pre D-dimer model equation as shown in Specification and parameter estimates (see Equation 1). The predicted recurrence probabilities were compared with the true observed recurrence probabilities estimated by a Kaplan–Meier survival curve (Figure 15). On visual inspection the expected probability of recurrence appeared to be overpredicted slightly up to 1 year from cessation of therapy and underpredicted beyond 1 year post therapy. This was reflected in the expected minus observed statistics at 6 months, 1 year, 2 years and 3 years post cessation of therapy (Table 19). CIs for S(t) – Ŝ(t) showed increasing uncertainty over time from cessation of therapy, with the greatest difference in probability of recurrence at 3 years from therapy. Predictions appeared to calibrate very well at 1 year from cessation of therapy with a difference of < 0.1 in the percentage of those observed and expected to have a recurrence by 1 year. Before 1 year and after 1 year the calibration is not as close, but the difference in observed and expected percentage with a recurrence is quite small. In terms of discrimination the c-statistic for the pre D-dimer model within the MEGA database remained similar to that seen in the RVTEC database (0.56). This again indicates poor ability to separate high- and low-risk patients. Moreover, the performance seen in the MEGA data set lies well within the 95% prediction interval (0.49 to 0.62) estimated from the random-effects meta-analysis of c-statistics from the IECV approach (see Figure 7).
FIGURE 15.
Calibration of the pre D-dimer model predicted probability of recurrence (expected) compared with observed probabilities (from Kaplan–Meier curve) within the MEGA external data set.
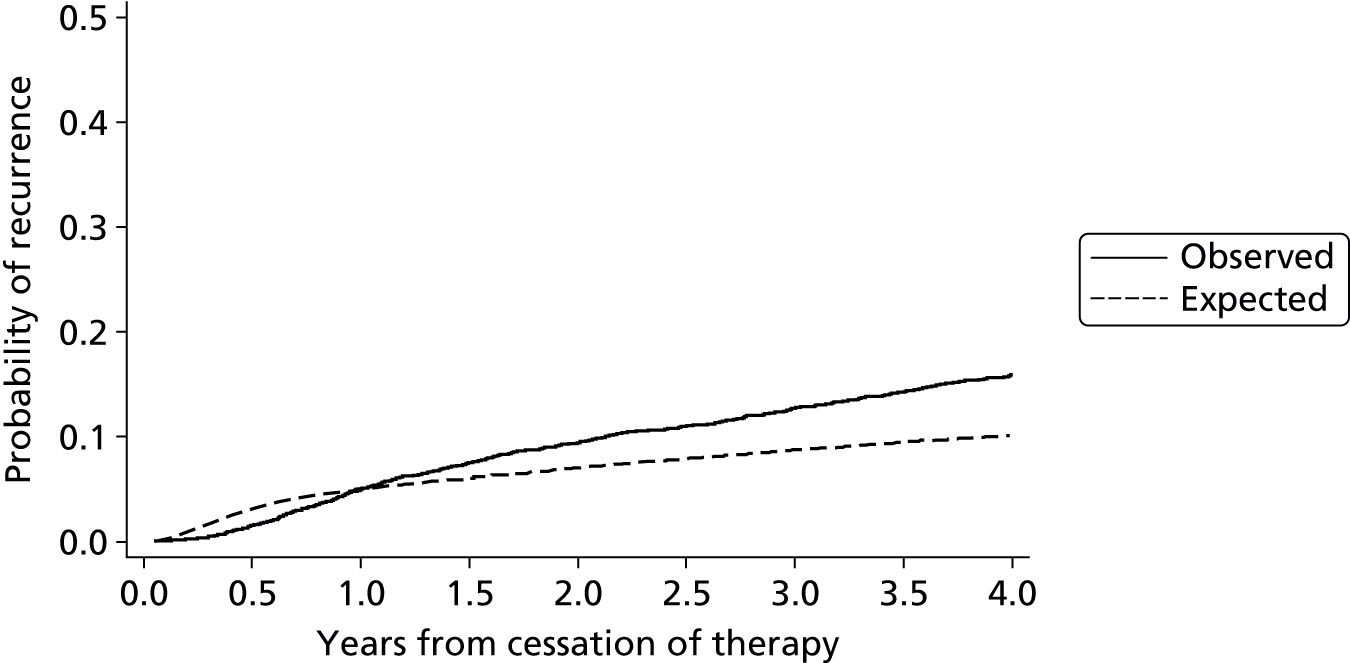
| Statistic | Time from cessation of therapy | |||
|---|---|---|---|---|
| 6 months | 1 year | 2 years | 3 years | |
| Observed %a | 1.49 | 4.92 | 9.41 | 12.73 |
| Expected %a | 3.13 | 4.99 | 7.04 | 8.71 |
| Expected % – observed %b | 1.64 (1.29 to 1.29) | 0.06 (–0.58 to 0.71) | –2.37 (–3.27 to –1.48) | –4.02 (–5.06 to –2.98) |
| c-statistic (MEGA) | 0.56 (0.54 to 0.57) | |||
| c-statistic (RVTEC)c | 0.56 (0.51 to 0.60) | |||
External validation by risk groups in RIETE and MEGA data sets
Though Figure 15 shows calibration in the overall data set is reasonable, Figures 16–18 and Table 20 reveal that calibration in categories of risk is less adequate. In particular, in the lower predicted risk categories (e.g. < 3%), the observed risk is noticeably higher.
FIGURE 16.
Comparison of observed and expected probability of recurrence at 1% annual recurrence risk threshold within the MEGA data set (external validation of decision rule).
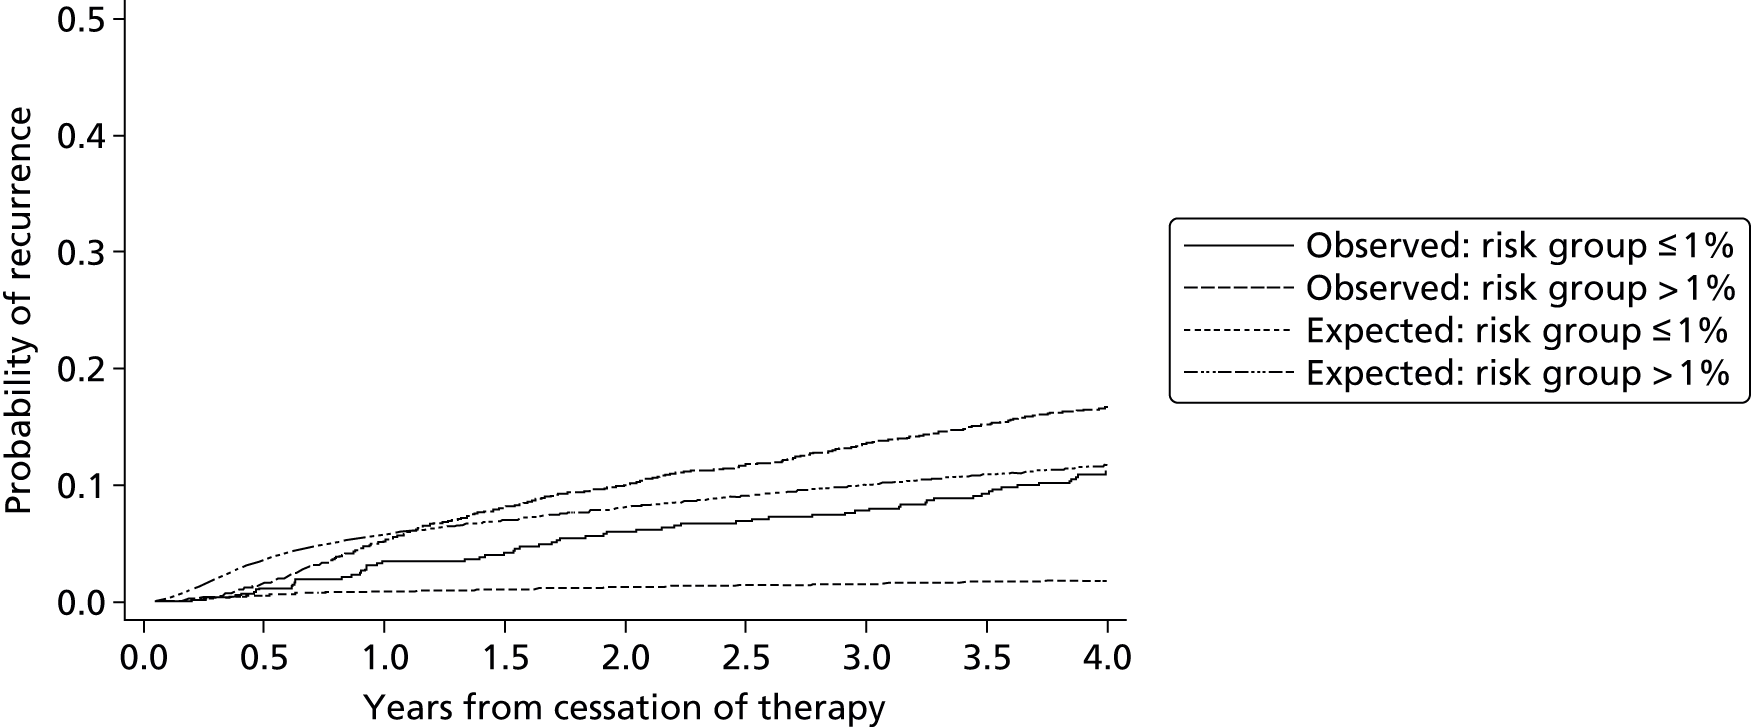
FIGURE 17.
Comparison of observed and expected probability of recurrence at 3% annual recurrence risk threshold within the MEGA data set (external validation of decision rule).

FIGURE 18.
Comparison of observed and expected probability of recurrence at 5% annual recurrence risk threshold within the MEGA data set (external validation of decision rule).
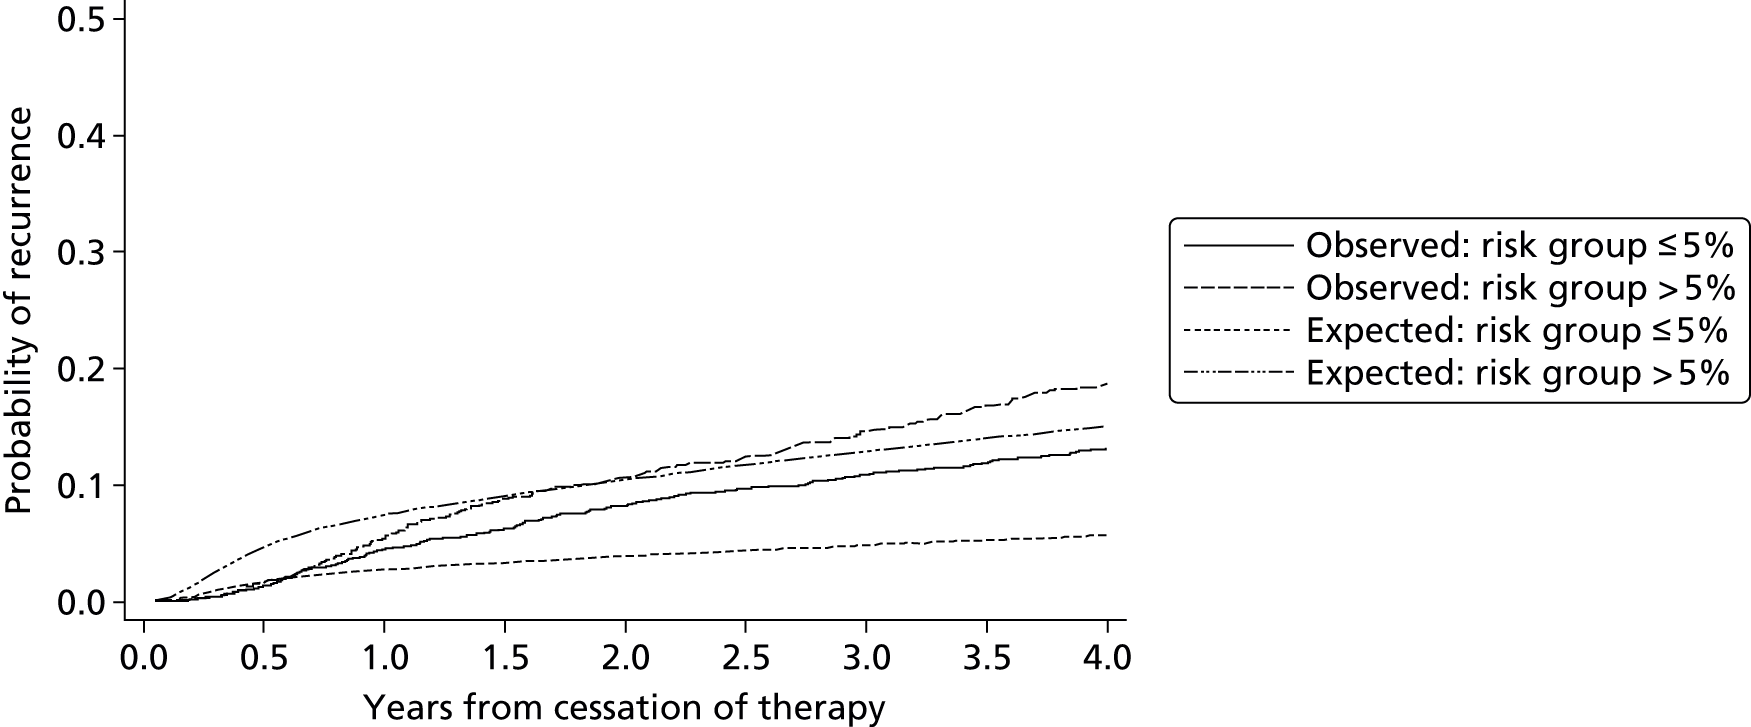
| Risk of recurrence threshold | Risk group | Number of patients in risk group | Proportion of recurrences (%) | |||||||
|---|---|---|---|---|---|---|---|---|---|---|
| 6 months | 1 year | 2 years | 3 years | |||||||
| O | E | O | E | O | E | O | E | |||
| 1% | Below | 732 | 1.16 | 0.53 | 3.48 | 0.85 | 5.99 | 1.21 | 7.80 | 1.52 |
| 1% | Above | 4048 | 1.55 | 3.60 | 5.17 | 5.74 | 10.00 | 8.09 | 13.58 | 10.01 |
| 3% | Below | 1351 | 1.72 | 0.71 | 5.67 | 1.15 | 9.43 | 1.64 | 12.33 | 2.05 |
| 3% | Above | 3429 | 1.40 | 4.08 | 4.64 | 6.50 | 9.40 | 9.16 | 12.87 | 11.33 |
| 5% | Below | 2485 | 1.38 | 1.71 | 4.45 | 2.74 | 8.20 | 3.89 | 10.91 | 4.84 |
| 5% | Above | 2295 | 1.61 | 4.66 | 5.42 | 7.42 | 10.66 | 10.45 | 14.60 | 12.90 |
A comparison of the characteristics of patients classified as low risk in the two data set populations was performed (Table 21). There appeared to be some distinct differences between the two low-risk populations which may account for the poor fit seen in the external validation of the decision rule (see Figures 16–18). The greatest difference was in the proportion of patients suffering higher-risk index events. In the RVTEC database only patients suffering a distal DVT were classified as low risk, whereas in the MEGA database 42% of patients classified as low risk suffered a PE, which is associated with a significant increase in risk of recurrence (see Table 15). This increased risk due to site of index event explains the higher observed risk of recurrence in the ‘low-risk’ category for the MEGA data set and therefore the poor fit of the decision rule (which is based on a lower-risk population from the RVTEC database).
| Characteristic | Summary statistics | |
|---|---|---|
| MEGA | RVTEC | |
| Follow-up (months)a | 69.8 (15.2–92.2) | 30.4 (15.8–53.3) |
| Ageb | 48.4 (13.5) | 54.2 (13.8) |
| Sexc | ||
| Female | 1866 (75.1) | 53 (47.3) |
| Male | 619 (24.9) | 59 (52.7) |
| Site of index eventc | ||
| Distal DVT | 311 (12.52) | 112 (100) |
| Proximal DVT | 0 (0) | 0 (0) |
| PE | 1134 (45.63) | 0 (0) |
| Unspecified | 1040 (41.85) | 0 (0) |
As such, the external validation of the risk groups derived from prognostic model does not appear to validate well and therefore may be inappropriate for use in new patient populations. This is likely due to the differences in the two populations risk profiles.
This external validation therefore confirms the findings of the IECV approach: the final pre D-dimer model is unlikely to be suitable given its poor discrimination ability and heterogeneity in calibration performance across different populations. Further predictors are required to improve the model, building on the model presented here as a basis.
Summary
The final pre D-dimer model proposed in this chapter contained site of index event and sex as predictors. It forms a starting point for individual recurrence risk prediction at the time of stopping therapy, to help inform immediate decisions on the need for extended therapy. However, throughout the IECV approach and through external validation of the final model, the performance of the model was rather poor in terms of discrimination and there was heterogeneity in calibration performance across populations. Thus the pre D-dimer model should not currently be recommended for use in practice and needs improving. One way the model performance may be improved is through the inclusion of more candidate predictors, which may better explain individuals risk and the variation between patients. As such, the next section will investigate the addition of D-dimer post therapy as a further predictor. D-dimer has been shown to be predictive of recurrence throughout the literature. 2,11,57,60,61,67–70
Results III: development and validation of post D-dimer model
The results of the development and validation of the post D-dimer model for prediction of the risk of VTE recurrence are now described below. Candidate predictors available for the post D-dimer model were age, sex, site of index, treatment duration, D-dimer and lag time (the number of days from cessation of therapy to measurement of D-dimer) (see Aims: develop and validate two models, based on different start points). This involved six trials within the RVTEC database. For the IECV approach, due to its large size, the Eichinger et al. 60 trial was always included in the model development set of studies and thus there were five cycles of the IECV approach when it was conducted.
Complete case data
The complete case data for the development of the post D-dimer were somewhat different from the original RVTEC database described previously in Table 6. Given the predictors included in the post D-dimer model (see Aims: develop and validate two models, based on different start points), there was missing predictor information (see Table 8) and therefore these patients with missing data were excluded from the complete-case analysis. Eight patients were excluded based on the exploratory analysis conducted previously (see Distribution of candidate predictors, correlation and outliers) and as discussed in Complete case data. There were substantial missing data for both D-dimer and lag time predictors investigated in the post D-dimer model; 243 patients were excluded from the analysis based on missing D-dimer levels, while a further 183 patients were excluded based on missing lag time data (despite having recorded D-dimer levels). The whole of the Baglin et al. 61 trial had to be excluded from the complete-case analysis due to missing (unspecified) lag time data. These exclusions led to a reduction in overall sample size to 1200 patients and a reduction in the number of included events down to 161 recurrent events (Table 22).
| Characteristic | Palareti57 | Palareti58 | Poli59 | Tait63 | Eichinger60 | Baglin61 | Shrivastava62 | All |
|---|---|---|---|---|---|---|---|---|
| Recurrences/total | 31/280 | 23/268 | 12/81 | 17/99 | 69/387 | – | 9/85 | 161/1200 |
| Follow-up (months) | ||||||||
| Median | 20.8 | 20.2 | 19 | 21.9 | 28.5 | – | 26.2 | 21.6 |
| Longest | 31.4 | 37.2 | 49 | 41.6 | 114.8 | – | 51.2 | 114.8 |
| Candidate factorsa | ||||||||
| Age (years) | 70.1 (12.3) | 65.5 (13.52) | 64.5 (14.2) | 60.9 (13.8) | 54.1 (15) | – | 54.9 (12.8) | 61.7 (15.2) |
| BMI (kg/m2) | – | – | – | 29.1 (6.2) | 27.9 (4.8) | – | 32.3 (7.2) | 28.8 (5.7) |
| Treatment duration (months) | 7.5 (6.2) | 11.9 (12.3) | 13 (11.03) | 5.8 (0.9) | 8.2 (11.2) | – | 8 (5.3) | 8.9 (9.9) |
| D-dimer (ng/ml) | 842.6 (883.4) | 770.6 (763.8) | 432.7 (803.7) | 889.4 (1013.1) | 486.8 (469.7) | – | 550.5 (609.9) | 667.3 (751.3) |
| Lag time (days) | 28.6 (4.8) | 32.4 (8.7) | 30 (0) | 33.7 (20.9) | 30.6 (42.6) | – | 143.7 (169.3) | 38.8 (59.1) |
| Sexb | ||||||||
| Female | 128 (45.7) | 99 (36.9) | 28 (34.6) | 36 (36.4) | 146 (37.7) | – | 22 (25.9) | 459 (38.25) |
| Male | 152 (54.3) | 169 (63.1) | 53 (65.4) | 63 (63.6) | 241 (62.3) | – | 63 (74.1) | 741 (61.75) |
| Site of index eventb | ||||||||
| Distal DVT | 12 (4.3) | 0 (0) | 0 (0) | 0 (0) | 88 (22.7) | – | 10 (11.8) | 110 (9.2) |
| Proximal DVT | 217 (77.5) | 165 (61.6) | 57 (70.4) | 59 (59.6) | 147 (38) | – | 57 (67) | 702 (58.5) |
| PE | 51 (18.2) | 103 (38.4) | 24 (29.6) | 40 (40.4) | 152 (39.3) | – | 18 (21.2) | 388 (32.3) |
| Unspecified DVT | 0 (0) | 0 (0) | 0 (0) | 0 (0) | 0 (0) | – | 0 (0) | 0 (0) |
Univariable analysis
Initial univariable analyses were performed by fitting each candidate predictors against recurrence individually using a Cox proportional hazards model, so as to assess the association between each predictor and recurrence (ignoring clustering of patients within trials). Summaries of the univariable association between each predictor and recurrence including the HR and a 95% CI are presented in Table 23. These unadjusted results do not consider each factor’s independent prognostic association, which is more important for the prognostic model (see Selection of predictors and model estimates during internal–external cross-validation cycles), but provide an initial summary.
| Candidate factor | HR | Lower 95% CI | Upper 95% CI | p-value |
|---|---|---|---|---|
| Age | 1.003 | 0.993 | 1.014 | 0.513 |
| Treatment duration (months) | 1.199 | 0.926 | 1.552 | 0.169 |
| Sex | ||||
| Male | 1.564 | 1.108 | 2.207 | 0.011 |
| Site of index event | ||||
| Proximal DVT | 5.498 | 2.015 | 15.007 | 0.001 |
| PE | 5.693 | 2.060 | 15.736 | 0.001 |
| D-dimer (log) | 1.716 | 1.428 | 2.061 | < 0.001 |
| Lag time in days (log) | 0.824 | 0.627 | 1.083 | 0.166 |
Univariable analyses of the predictors considered in the post D-dimer scenario (see Table 23) show similar results for patient age, treatment duration, sex and site of index event to those seen in the pre D-dimer scenario (see Complete case data). The effect of a patient’s D-dimer score appears to indicate an increase in recurrence rate of around 70% for every 1 ng/ml increase in D-dimer score, with a HR of 1.716 (95% CI 1.43 to 2.06). Conversely, the lag time between cessation of therapy and measurement of a patient’s D-dimer appears to decrease recurrence rate by around 20% for every day increase in lag time.
Development of multivariable prognostic model
Baseline spline complexity
In order to consider the complexity (number of knots) required for the baseline hazard spline function in the post D-dimer model, a series of preliminary models were fit with varying numbers of knots for the spline function. Comparisons were then made between the models using the AIC and BIC information criteria statistics, as described previously (see Development of prognostic model). The information criteria for proportional hazards models fitted for the post D-dimer model through five cycles of the IECV approach (Table 24) show a similar trend to those seen for the pre D-dimer scenario (see Baseline spline complexity). The BIC criteria are consistently minimised by a model with 3 df except in one instance where the minimum value is very close (difference < 1) to the BIC for a 3 df model. The AIC is variable, with the minimum AIC most often occurring for models with 4 df; however, the unit value of the AIC is very close (difference no greater than three) to that for 3 df models. Given that 3 df minimises the BIC consistently and the minimal AIC values are close to 3 df models, as well as considering visually the shapes seen in the baseline hazards for each trial (Figure 19), a complexity of 3 df was deemed appropriate for the post D-dimer model.
| Information criterion | df | External validation trial name | ||||
|---|---|---|---|---|---|---|
| Palareti57 | Palareti58 | Poli59 | Tait63 | Shrivastava62 | ||
| AIC | 1 | 974.0 | 1026.6 | 1141.8 | 1110.5 | 1173.2 |
| 2 | 969.2 | 1020.0 | 1134.6 | 1106.6 | 1165.0 | |
| 3 | 964.7 | 1012.6 | 1128.9 | 1097.3 | 1154.4 | |
| 4 | 963.2 | 1012.2 | 1127.6 | 1094.0 | 1153.7 | |
| 5 | 962.8 | 1014.5 | 1129.4 | 1095.7 | 1155.5 | |
| BIC | 1 | 999.8 | 1053.0 | 1168.8 | 1137.2 | 1200.5 |
| 2 | 997.9 | 1049.3 | 1164.6 | 1136.3 | 1195.2 | |
| 3 | 996.2 | 1044.8 | 1161.9 | 1130.0 | 1187.7 | |
| 4 | 997.6 | 1047.3 | 1163.6 | 1129.6 | 1190.0 | |
| 5 | 1000.0 | 1052.5 | 1168.5 | 1134.3 | 1194.8 | |
FIGURE 19.
Baseline hazard within each trial for the post D-dimer scenario (null model).

Baseline hazard within trials
Investigation of the baseline hazard function using a null model (with no predictors) was also undertaken within each trial in the RVTEC database, to ascertain whether or not the shape and magnitude of the baseline hazard in each trial was noticeably different. Examination of the baseline hazard functions within each trial (see Figures 19 and 20) shows a similar pattern to that seen for the pre D-dimer investigation (see Baseline hazard within and across trials). The shape of the baseline hazard across trials is similar, with a peak in hazard just under 1 year from cessation of therapy and a fall in hazard thereafter. Similarly to the pre D-dimer scenario, a rise in the hazard after around 1 year is observed in the Poli et al. 59 trial, which contains very low numbers of events (see Complete case data). Although the shape of the baseline hazard across trials appeared to be homogenous, the magnitude of the baseline hazard varied across trials distinctly.
Given that the shape of the baseline hazard appeared similar across trials, but there was variation in the magnitude, it was considered appropriate to develop the post D-dimer model by assuming proportional baseline hazards across trials and placing a random effect on the baseline hazard. This therefore allowed estimation of an average baseline hazard across trials and allowed for variability in each trial’s own baseline hazard away from this average.
Selection of predictors and model estimates during internal–external cross-validation cycles
Candidate predictors were entered into the MFP algorithm of Royston and Sauerbrei49 and Sauerbrei et al. 50 (see Development of prognostic model).
As mentioned, the Eichinger et al. 60 trial was selected to remain in the development data set throughout all cycles of the IECV approach, therefore no model could be built without the Eichinger et al. 60 trial population and, subsequently, no validation was performed in the Eichinger et al. 60 trial. The trial was included in all models developed because it was the largest population available and therefore would have a large impact on any final model developed.
Candidate predictors considered in variable selection for the post D-dimer scenario included age, sex, site of index event, treatment duration, D-dimer post cessation of therapy and lag time between ceasing therapy and measurement of D-dimer (see Aims: develop and validate two models, based on different start points). The results of variable selection and parameter estimates at each cycle of the IECV approach are shown in Table 25.
| Candidate predictora | External validation trial name, beta coefficients (95% CI) | ||||
|---|---|---|---|---|---|
| Palareti57 | Palareti58 | Poli59 | Tait63 | Shrivastava62 | |
| Age (years) | – | – | –0.01 (–0.03 to 0.01) | –0.01 (–0.03 to 0.01) | –0.01 (–0.03 to 0.01) |
| D-dimer (log) | 0.64 (0.44 to 0.84) | 0.59 (0.39 to 0.79) | 0.72 (0.50 to 0.94) | 0.69 (0.47 to 0.91) | 0.67 (0.47 to 0.87) |
| Lag time (log) | –0.31 (–0.60 to –0.02) | – | –0.29 (–0.60 to 0.02) | –0.32 (–0.63 to –0.01) | – |
| Sex | |||||
| Male | 0.63 (0.24 to 1.02) | 0.57 (0.20 to 0.94) | 0.52 (0.15 to 0.89) | 0.66 (0.29 to 1.03) | 0.54 (0.19 to 0.89) |
| Site of index event | |||||
| Proximal DVT | 1.65 (0.55 to 2.75) | 1.64 (0.58 to 2.70) | 1.71 (0.59 to 2.83) | 1.71 (0.65 to 2.77) | 1.70 (0.60 to 2.80) |
| PE | 1.68 (0.58 to 2.78) | 1.79 (0.71 to 2.87) | 1.79 (0.65 to 2.93) | 1.78 (0.72 to 2.84) | 1.65 (0.53 to 2.77) |
| Constant | –4.21 (–5.31 to –3.11) | –4.16 (–5.22 to –3.10) | –4.31 (–5.43 to –3.19) | –4.36 (–5.42 to –3.30) | –4.18 (–5.28 to –3.08) |
Treatment duration was not significant during variable selection and so was excluded from the developed models in all cycles. The effect of age was estimated in the opposite direction to that estimated in univariable analysis. All other variable coefficients were estimated to be similar in magnitude to those seen during univariable analysis for the post D-dimer scenario (see Univariable analysis), although 95% CIs changed, either being much larger or smaller than those from univariable analysis of the same factors.
Model validation in the internal–external cross-validation cycles
The final step of the IECV approach (see Internal–external cross-validation) is to assess the developed model’s performance within the validation trial for each cycle of the IECV. As the validation trial was excluded from model development, the performance of the model within this data set can be deemed as external validation. Model performance is now assessed in terms of both discrimination and calibration as described previously (see Internal–external cross-validation).
Model performance statistics for the post D-dimer model developed in each cycle of the IECV approach are presented in Table 26 and show c-statistics ranging from 0.65 in the Poli et al. 59 trial to 0.80 in the Shrivastava et al. 62 trial. Discrimination overall across all validation trials appears to be substantially greater than that of the pre D-dimer model (see Model validation), with a pooled c-statistic from a random-effects meta-analysis (Figure 21) of 0.69 (95% CI 0.63 to 0.75), which reveals moderately good discrimination on average. Importantly, the observed heterogeneity in the c-statistic is low (I2-statistic = 3%) (see Figure 21), which indicates that the discrimination performance of the model is very consistent across the different trial populations. The 95% prediction interval for the c-statistic in a new population is 0.59 to 0.79, which represents consistently moderate to good discriminatory ability and improves substantially on the pre D-dimer model which had a prediction interval with a maximum c-statistic of only 0.62 (see Figure 7).
| Summary statistics | External validation trial, estimate (95% CI) | ||||
|---|---|---|---|---|---|
| Palareti57 | Palareti58 | Poli59 | Tait63 | Shrivastava62 | |
| Recurrences/total patients | 31/280 | 23/268 | 12/81 | 17/99 | 9/85 |
| c-statistic | 0.66 (0.55 to 0.76) | 0.66 (0.53 to 0.78) | 0.65 (0.48 to 0.82) | 0.67 (0.52 to 0.80) | 0.80 (0.68 to 0.93) |
| S(t) – Ŝ(t) statistic (6 months) | 0.01 (–0.02 to 0.04) | –0.03 (–0.05 to 0.00) | 0.06 (0.00 to 0.13) | 0.01 (–0.04 to 0.07) | –0.03 (–0.06 to 0.00) |
| S(t) – Ŝ(t) statistic (1 year) | –0.01 (–0.05 to 0.02) | –0.05 (–0.08 to –0.02) | 0.05 (–0.02 to 0.12) | 0.02 (–0.05 to 0.08) | –0.05 (–0.09 to –0.01) |
| S(t) – Ŝ(t) statistic (2 years) | –0.04 (–0.08 to 0.00) | –0.07 (–0.11 to –0.03) | 0.08 (–0.03 to 0.19) | 0.02 (–0.06 to 0.10) | –0.04 (–0.11 to 0.03) |
| S(t) – Ŝ(t) statistic (3 years) | –0.09 (–0.13 to –0.05) | –0.13 (–0.17 to –0.09) | 0.21 (–0.09 to 0.51) | –0.03 (–0.12 to 0.05) | –0.04 (–0.12 to 0.05) |
FIGURE 21.
Random-effects meta-analysis of discrimination performance as measured by the c-statistics obtained, for each cycle of the IECV approach for the post D-dimer model.

Calibration for the post D-dimer model (see Table 26) was also consistently strong across all cycles of the IECV up to 2 years post cessation of therapy. The S(t) – Ŝ(t) statistics were close to zero for time points up to 2 years, but larger discrepancies were apparent thereafter (e.g. in the Palareti et al. 58 and Poli et al. 59 trials). The close relationship between the models predictions (expected) and the true observed recurrence risk (observed) up to 2 years can be seen for each trial in Figure 22. There does not seem to be any systematic under or overprediction in the external validation data sets.
A random-effects meta-analysis of the calibration statistics at 1 year post cessation of therapy (Figure 23) gave a pooled value of –0.02 (95% CI –0.05 to 0.01), indicating close agreement on average in the validation trials. There is heterogeneity in calibration performance (I2-statistic = 61.7%) and the 95% prediction interval for the calibration at 1 year in a new population is –0.12 to 0.08. The interval is wide partly due to the observed heterogeneity, but also partly reflecting the uncertainty in the between-study heterogeneity estimate (due to there being only five validation trials). Similar results can be seen for a random-effects meta-analysis of calibration statistics at 2 years post cessation of therapy (Figure 24), showing consistent agreement on average in the validation trials at 2 years.
FIGURE 23.
Random-effects meta-analysis of calibration performance (at 1 year post therapy) within validation trials across IECV cycles (the post D-dimer model). Exp-obs, expected–observed.
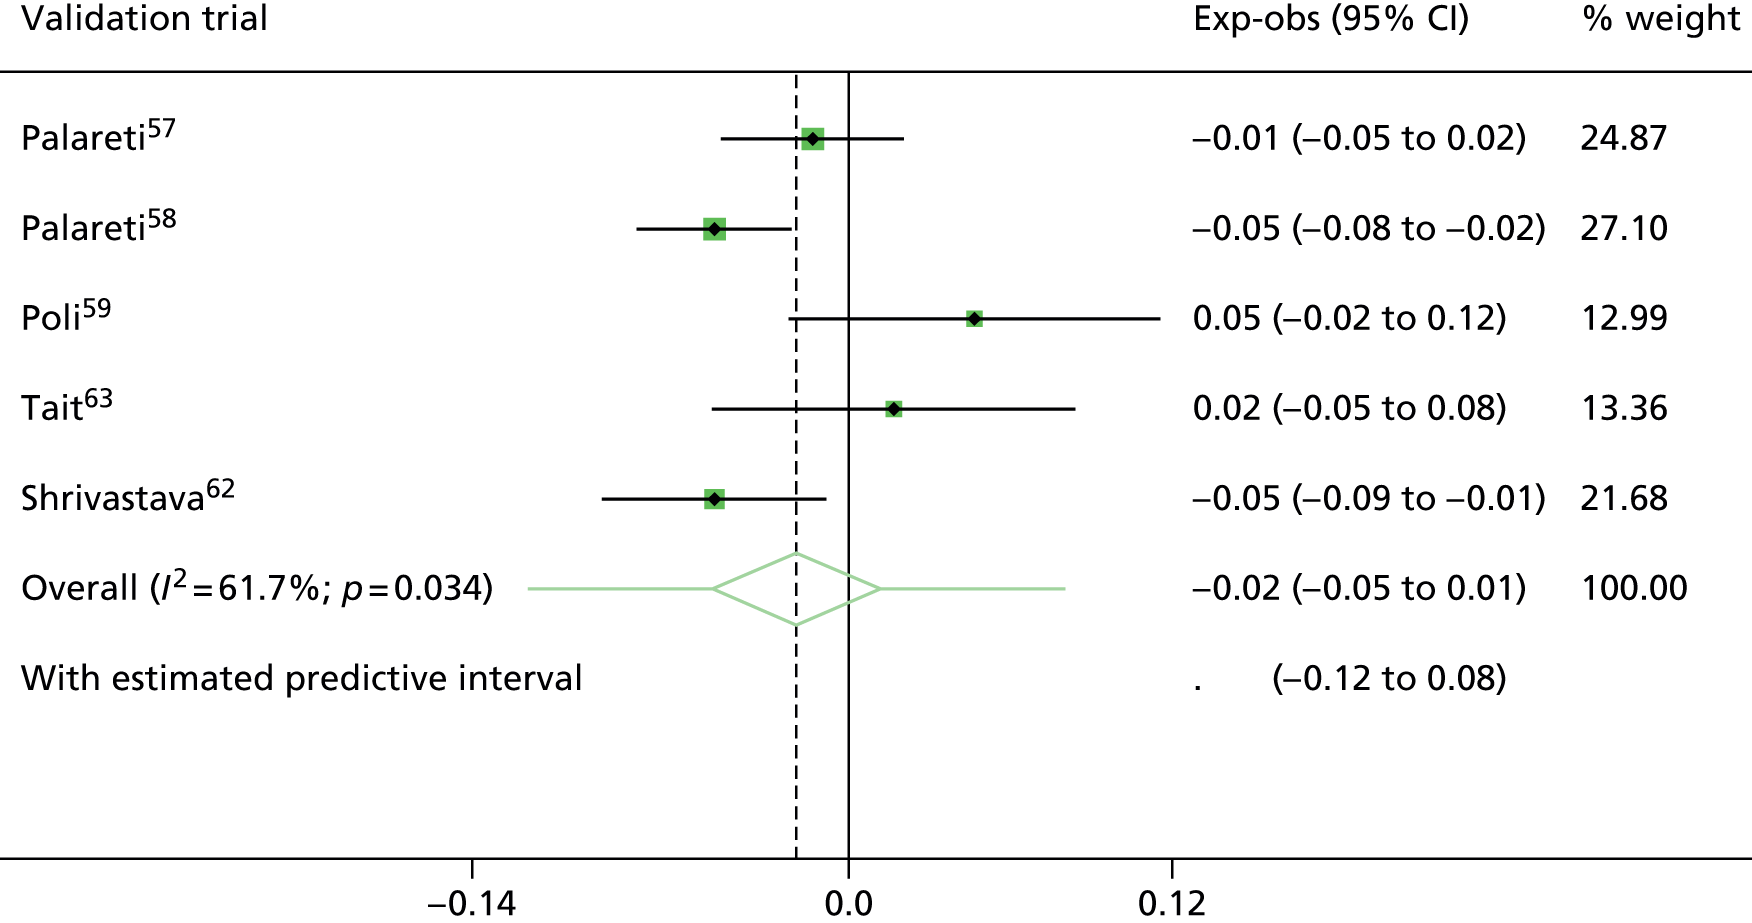
FIGURE 24.
Random-effects meta-analysis of calibration performance (at 2 years post therapy) within validation trials across IECV cycles (the post D-dimer model). Exp-obs, expected–observed.
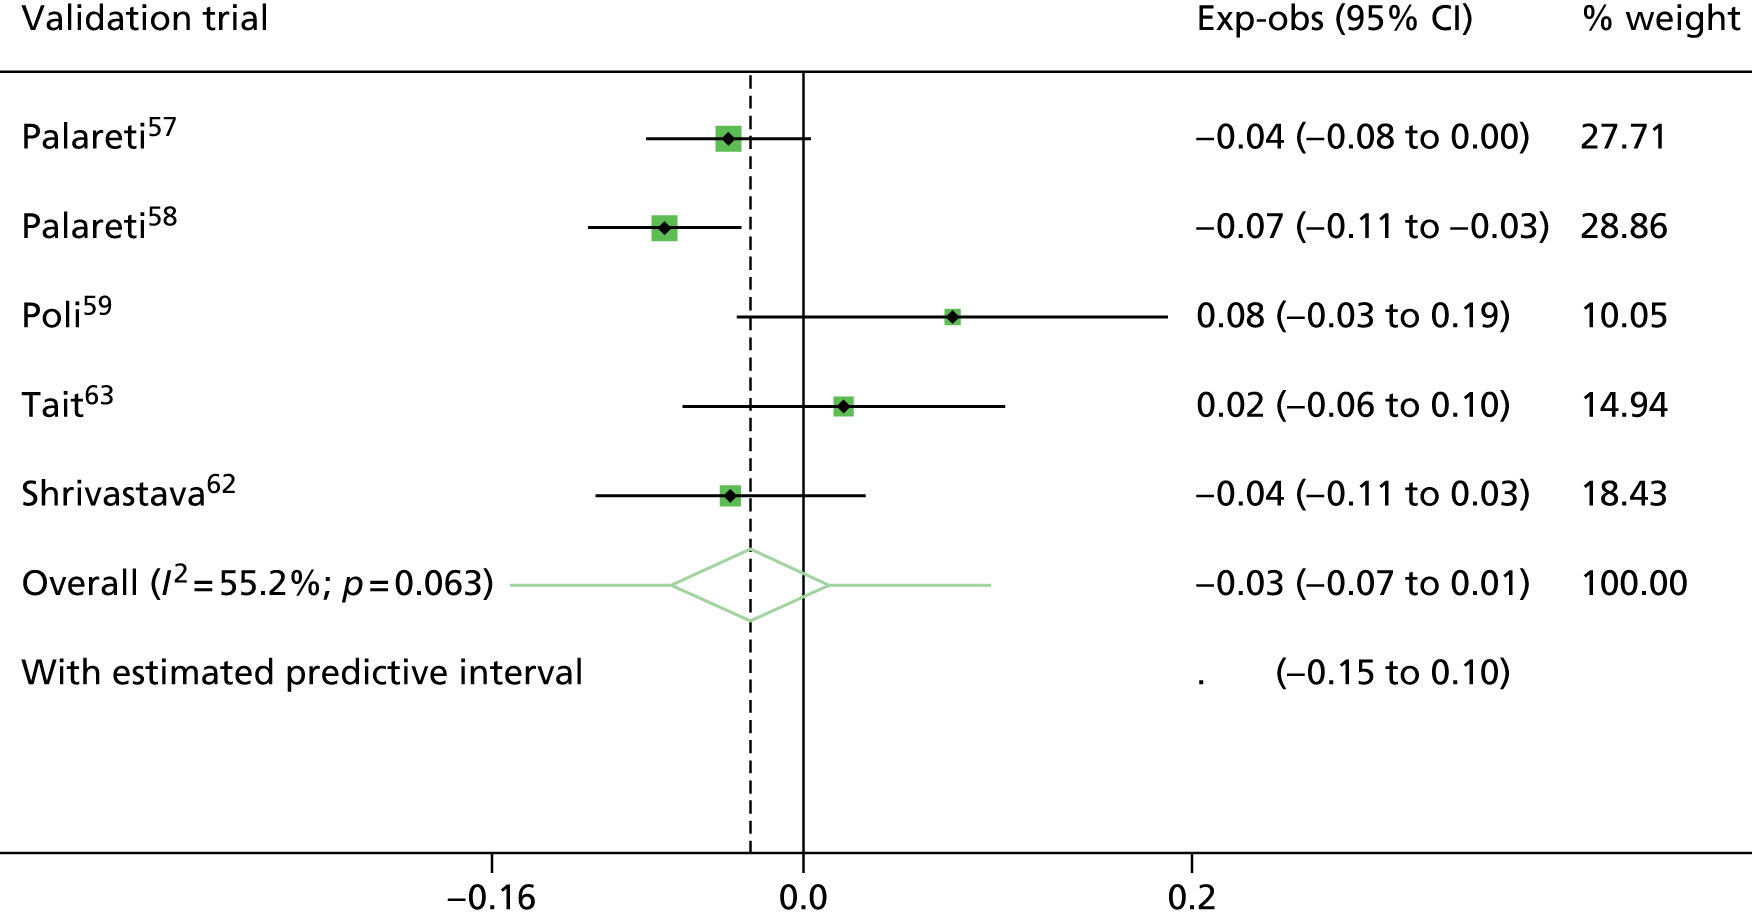
Final model: post D-dimer model
Given that the post D-dimer model had moderately good discrimination, with an average c-statistic of 0.69 (similar to other published risk prediction models87) and good calibration on average across trials (especially up to 2 years), it was deemed appropriate to produce a final D-dimer model based on all the trials combined.
Thus model development proceeded as before, but now with all six trials included. The specification and parameter estimates of this final post D-dimer model are now described, alongside sensitivity analysis evaluating some aspects of model fit.
Specification and parameter estimates
The final post D-dimer model was developed using the whole trial data set, with potential candidate predictors including patient age, sex, treatment duration, site of index event, D-dimer and lag time as discussed previously (see Aims: develop and validate two models, based on different start points). A random effect was placed on the baseline hazard to allow for between-trial heterogeneity (see Baseline hazard within trials). The MFP algorithm was used to perform predictor selection, as described previously (see Development of prognostic model), with patient age, sex, site of index event, D-dimer and lag time (note the natural logarithm of D-dimer and lag time were used due to skewness) being selected for inclusion in the final post D-dimer model. Estimated HRs remained similar to those seen through cycles of the IECV as expected (Table 27), and the effect of age, sex and site of index event was similar to that of the final pre D-dimer model (see Final pre D-dimer model). D-dimer was associated with a twofold increase in recurrence rate for every 1 unit increase in log-ng/ml. Lag time was associated with a 25% reduction in recurrence rate, which is likely to reflect that healthier patients live longer, therefore the more time that passes before measuring D-dimer, the more likely patients remaining in the trial are healthier and therefore have a lower recurrence rate (see Table 27).
| Predictor | Beta coefficient (95% CI) | HR (95% CI) | p-value |
|---|---|---|---|
| Age | –0.0105 (–0.022 to 0.0011) | 0.99 (0.98 to 1.001) | 0.075 |
| Sex | |||
| Male | 0.55 (0.19 to 0.89) | 1.72 (1.22 to 2.44) | 0.002 |
| Site of index event | |||
| Proximal DVT | 1.74 (0.67 to 2.79) | 5.67 (1.96 to 16.43) | 0.001 |
| PE | 1.76 (0.68 to 2.83) | 5.79 (1.98 to 16.94) | 0.001 |
| D-dimer (log) | 0.7 (0.51 to 0.89) | 2.01 (1.66 to 2.45) | < 0.001 |
| Lag time (log) | –0.29 (–0.58 to 0.002) | 0.75 (0.56 to 1.002) | 0.051 |
The estimated average baseline S0(t) from this model is shown in Figure 40 and allows practitioners to estimate the average baseline survival for a specific time point, which can be used to predict recurrence-free survival probability using Equation 1. Using the post D-dimer model to make predictions for new individuals: a detailed illustration of the model in practice details how to use the estimated baseline S0(t) in combination with the estimated predictor effects to make predictions over time for new individuals.
The apparent calibration of the model in the entire data set is excellent, as expected due to the final model being developed on the same set of data. There is a very slight underprediction at some time points (Figure 25). A plot of the recurrence probabilities over time in centiles of the distribution of the prognostic index was used to give an idea of what may happen to individuals at the fringes of the risk spectrum (Figure 26). 75 It is clear from Figure 26 that while the 50th centile corresponds roughly to the predicted curve seen in Figure 25, there is a marked increase in the probability of recurrence for those in the 90th centile of the prognostic index. This separation reflects the good discrimination observed during the IECV approach, where the average c-statistic was 0.69 (see Figure 21). The superior discrimination in the post D-dimer model compared with the pre D-dimer model is illustrated by far larger separation in the centiles of risk predictions from the model (see Figures 14 and 26).
FIGURE 25.
Calibration of the post D-dimer model fit to all trial data. KM, Kaplan–Meier.

FIGURE 26.
Probability of recurrence across the risk spectrum (the post D-dimer model).
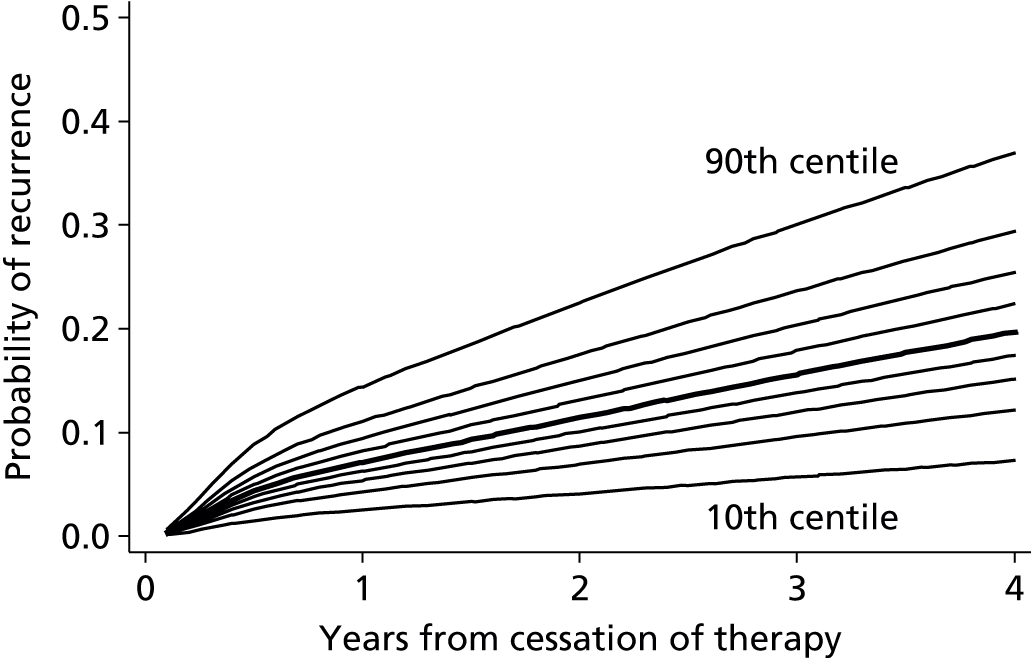
Validation of final post D-dimer model in risk groups
Figures 25 and 26 show the apparent overall calibration of the final model across all patients in all trials. One can also examine the calibration in subgroups of patients, across different risk groups.
Here high- and low-risk groups are considered according to a particular threshold of risk, with 1%, 3% and 5% risk of recurrence at 1 year from cessation of therapy used. The observed probability of recurrence within the high- and low-risk groups was compared over time with the expected predictions from the model (Table 28).
| Risk of recurrence thresholda | Risk group | Number of patients in risk group | Probability of recurrence (%) | |||||||
|---|---|---|---|---|---|---|---|---|---|---|
| 6 months | 1 year | 2 years | 3 years | |||||||
| O | E | O | E | O | E | O | E | |||
| 1% | Below | 29 | 0.00 | 0.47 | 0.00 | 0.79 | 0.00 | 1.28 | 0.00 | 1.74 |
| 1% | Above | 1171 | 5.55 | 5.43 | 7.95 | 8.97 | 12.91 | 13.90 | 17.75 | 18.29 |
| 3% | Below | 135 | 0.00 | 0.93 | 0.00 | 1.58 | 0.96 | 2.54 | 2.40 | 3.45 |
| 3% | Above | 1065 | 6.10 | 5.86 | 8.73 | 9.68 | 14.11 | 14.99 | 19.69 | 19.72 |
| 5% | Below | 292 | 2.09 | 1.73 | 2.45 | 2.93 | 3.35 | 4.68 | 6.43 | 6.34 |
| 5% | Above | 908 | 6.49 | 6.46 | 9.46 | 10.65 | 15.64 | 16.46 | 21.32 | 21.61 |
The complete case data set (see Table 22) for the post D-dimer model contained 29, 135 and 292 patients categorised as low risk at the 1%, 3% and 5% thresholds respectively (see Table 28). The calibration of the decision rule in the high-risk group across all thresholds considered appeared strong even up to around 3 years post cessation of therapy. Calibration in the low-risk groups was also very close at the 3% and 5% thresholds, though the smaller numbers of patients classified as low risk at 1% makes the low-risk group at this threshold hard to examine (Figures 27–29).
FIGURE 27.
Comparison of observed and expected probability of recurrence in risk groups above or below a 1% risk of recurrence (at 1-year) threshold derived from the post D-dimer model.
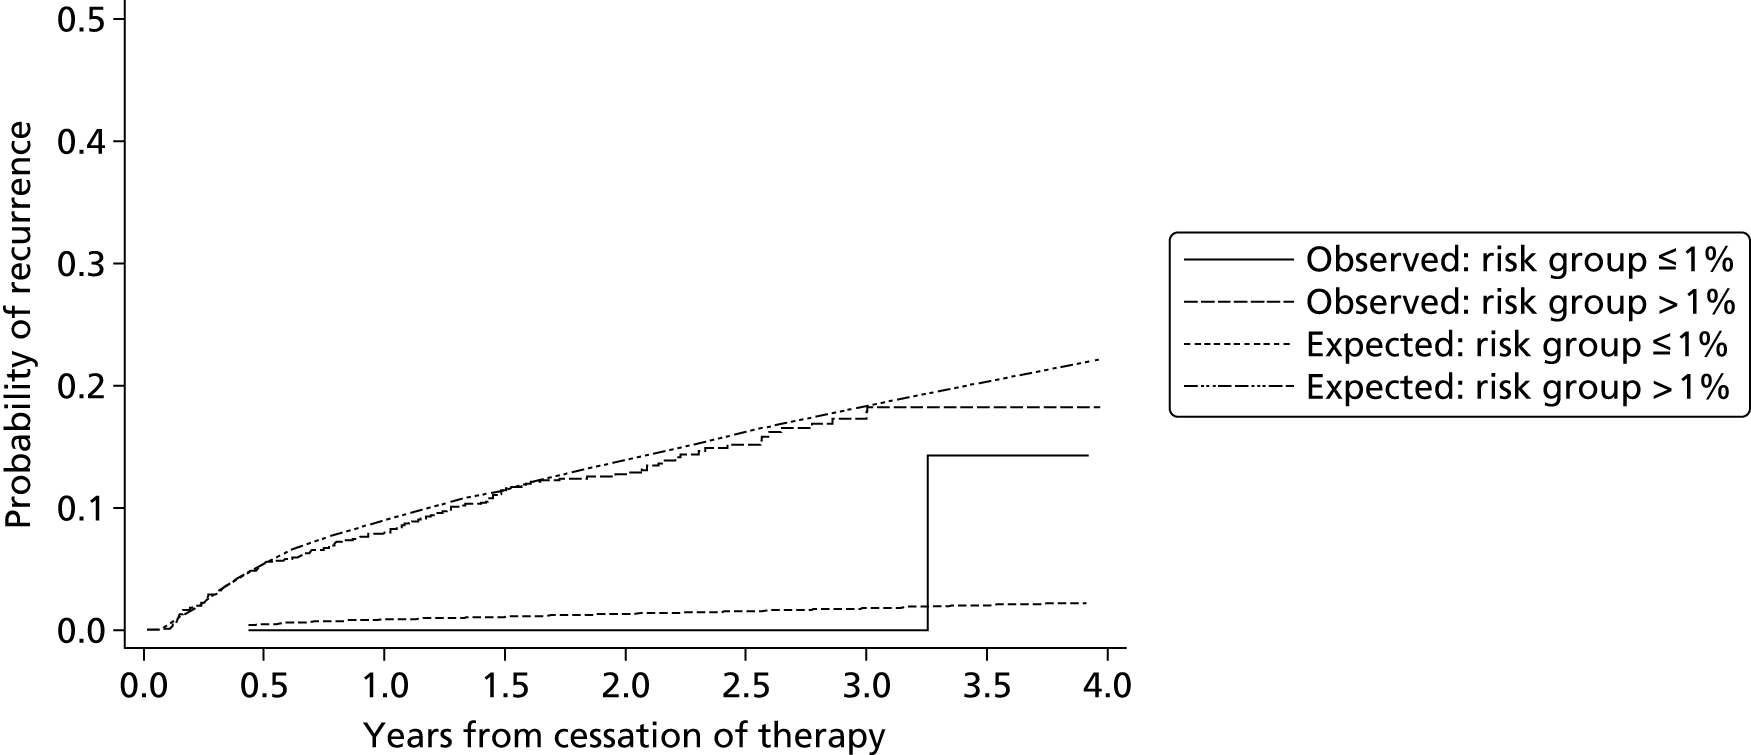
FIGURE 28.
Comparison of observed and expected probability of recurrence in risk groups above or below a 3% risk of recurrence (at 1-year) threshold as defined by the post D-dimer model.
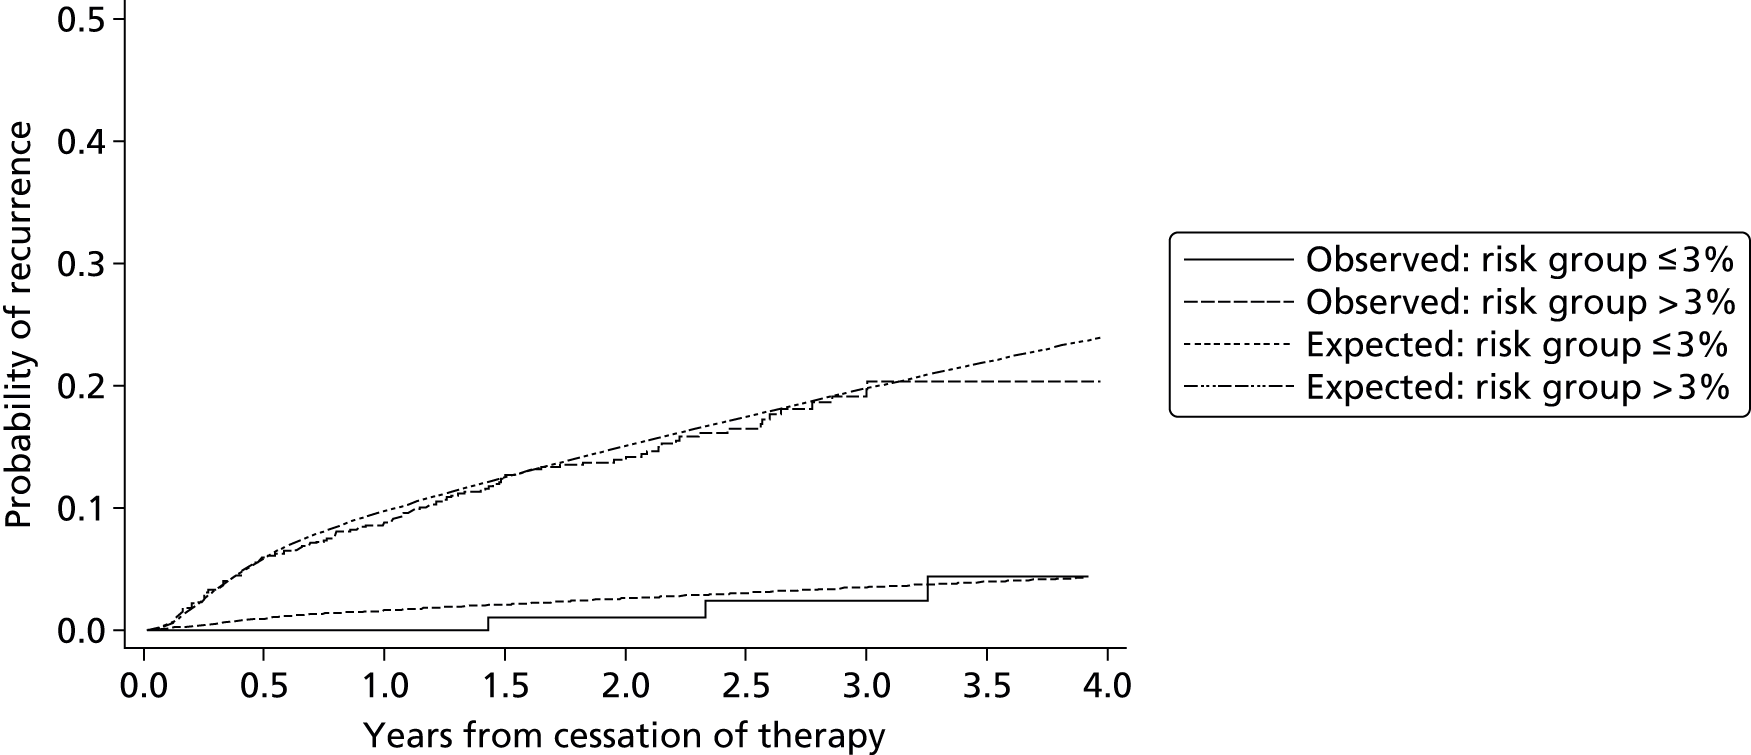
FIGURE 29.
Comparison of observed and expected probability of recurrence in risk groups above or below a 5% risk of recurrence (at 1-year) threshold as defined by the post D-dimer model.

Overall the final post D-dimer model appears to calibrate well, and within high- and low-risk groups. As this validation was performed using patient data also used in the development of the model, it should be interpreted as merely evidence of a good fit of the model to the data. The true calibration performance in new data is better revealed by the external validation results from the cycles of the IECV approach, which showed on average that calibration is excellent across trials up to about 2 years (see Model validation in the internal–external cycles).
Model checking
During development of the post D-dimer model, a number of assumptions were made and only complete data were used. The robustness of the final model to these assumptions and other issues is investigated below.
Proportional hazards assumption
A scatterplot of the scaled Schoenfeld residuals against log-time, with a lowess smoother, was used to check the proportional hazards assumption for factors in the post D-dimer model as described previously (see Development of prognostic factor). Plots for log-D-dimer (Figure 30) and log-lag time (Figure 31) show that the proportional hazards assumption is valid for the post D-dimer model; the lowess smoothed line roughly follows the reference line for each covariates log-HR, indicating proportionality. Similar plots testing the proportional hazards assumption were inspected for the remaining covariates in the post D-dimer model, the proportional hazards assumption was valid for all predictors (see Appendix 5).
FIGURE 30.
Scaled Schoenfeld residuals vs. log-time from cessation of therapy for log-D-dimer (HR 0.539).
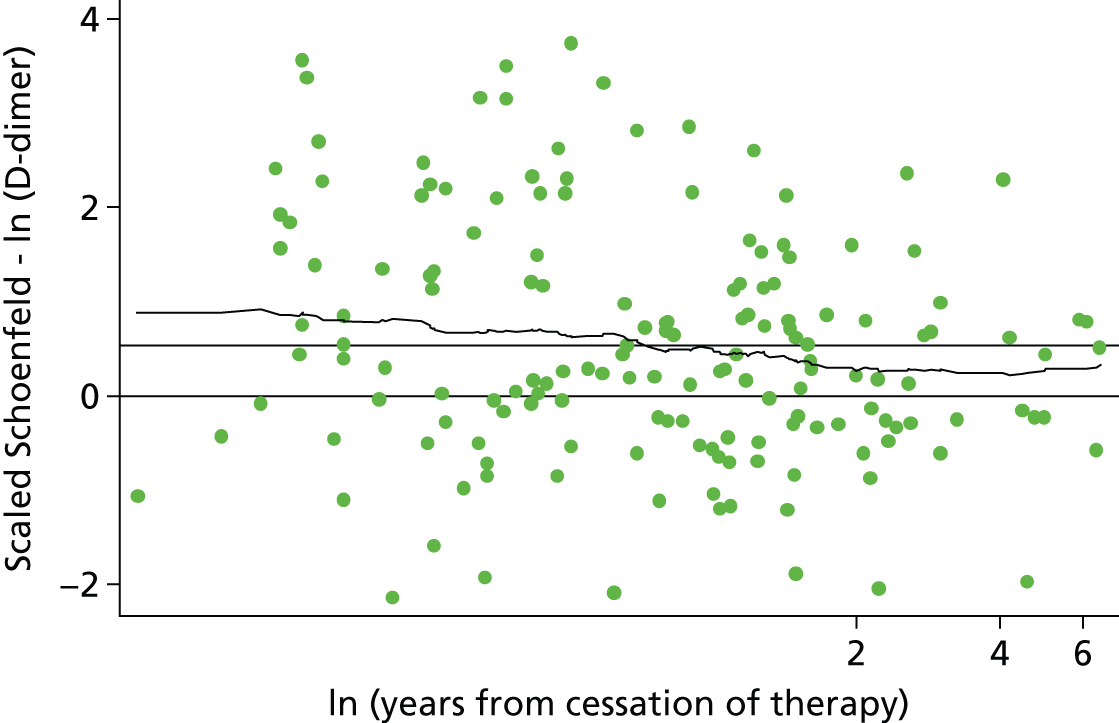
FIGURE 31.
Scaled Schoenfeld residuals vs. log-time from cessation of therapy for log-lag time (HR –0.19).
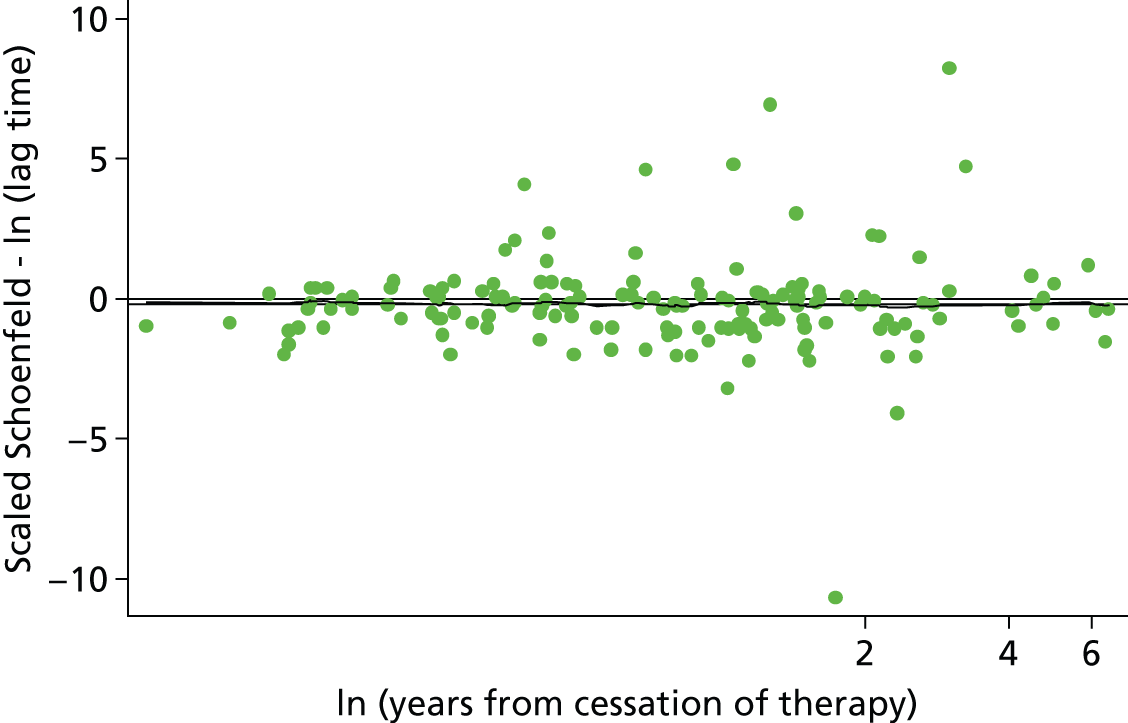
Functional form
To check that continuous predictors were included in the model with appropriate functional form, scatterplots of Martingale residuals against the predictors with a lowess smoother applied were inspected. Patient age, log-D-dimer and lag time were the only continuous predictors included in the post D-dimer model and the functional form of these covariates was checked using Martingale residuals. Figures 32 and 33 show a lowess smoother applied to a scatter of Martingale residuals against log-D-dimer and log-lag time respectively. In both cases the smoother appears to follow a linear trend over the covariate values, indicating a linearity assumption (on the log-scale) for both factors was appropriate.
FIGURE 32.
Scatterplot of Martingale residuals against log-D-dimer (the post D-dimer model).
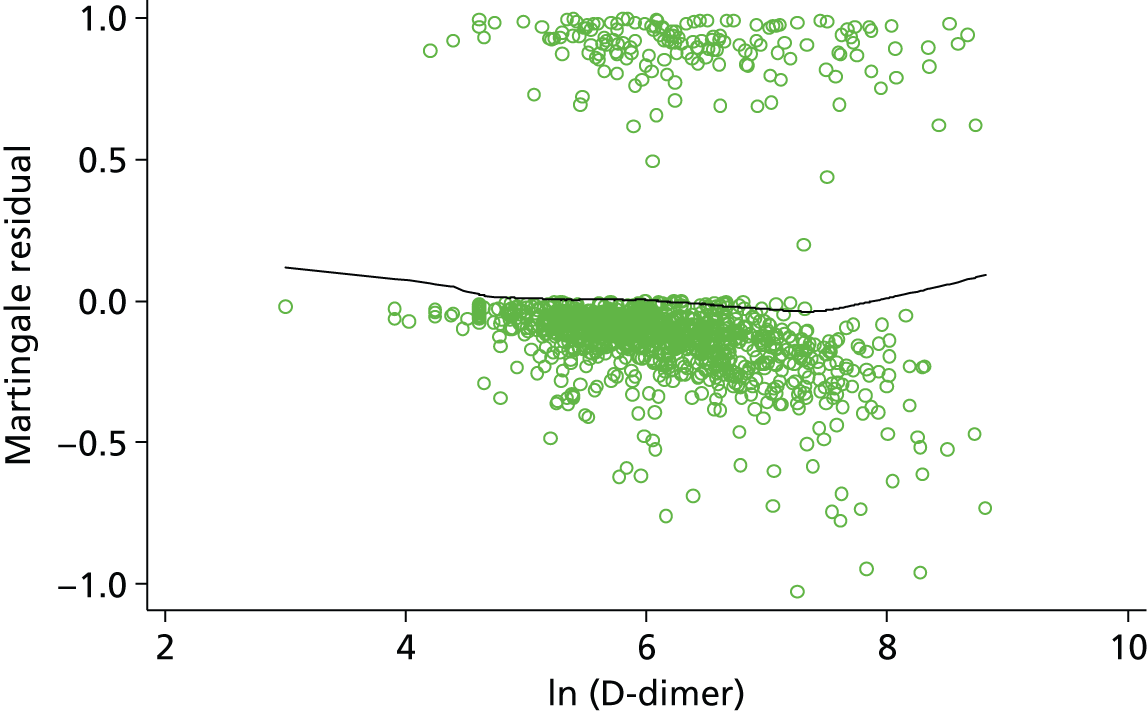
FIGURE 33.
Scatterplot of Martingale residuals against log-lag time (the post D-dimer model).
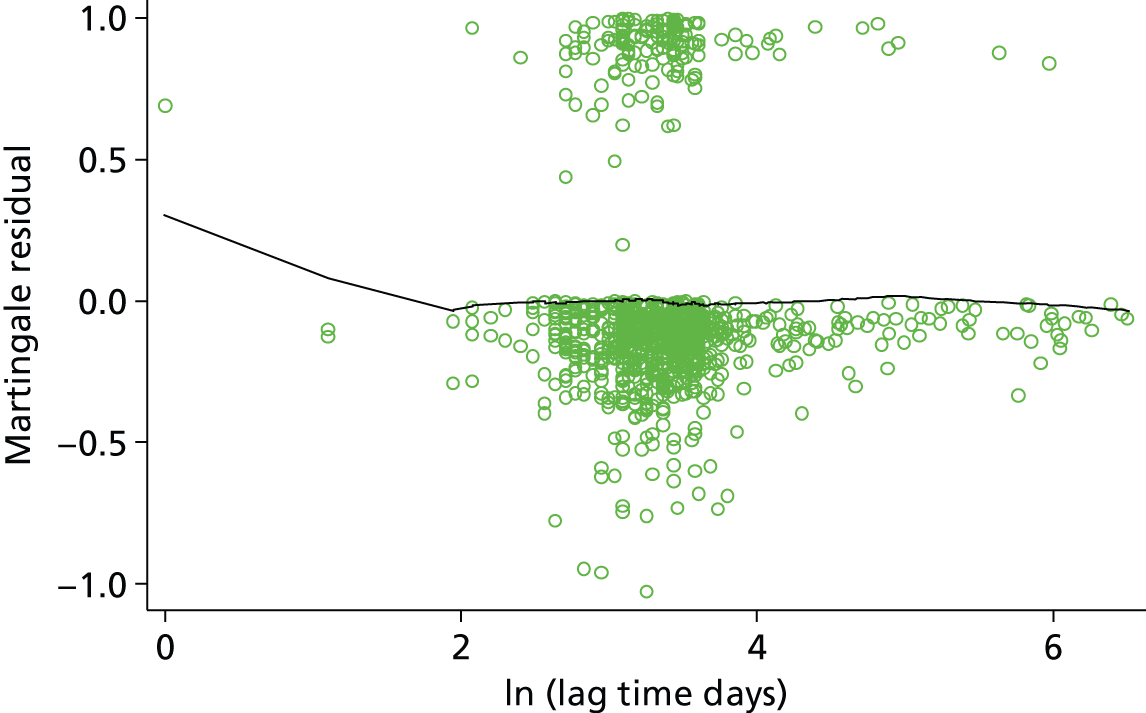
Outliers
As seen for the pre D-dimer model (see Appendix 5), plots of the deviance residuals against a patient indicator (Figure 34) and against time (Figure 35) indicate some outlying individuals. Figure 34 illustrates a scatter of the deviance residuals for the post D-dimer model; they clearly do not follow a normal distribution and this may again be due to heavy censoring in the data set, a small number of individuals fall above the 1.96 critical z-value.
FIGURE 34.
Scatterplot of deviance residuals vs. patient ID (the post D-dimer model). ID, identification.

FIGURE 35.
Scatterplot of deviance residuals vs. years from cessation of therapy (the post D-dimer model).

A plot of the deviance residuals against years from cessation of therapy allows investigation of any trend in the deviance residuals. In Figure 35 for the post D-dimer model there is again a trend in the deviance residuals over time based on the cumulative hazard at the event time (or censoring time). The deviance residuals which lie in the top left of the plot are, as for the pre D-dimer model, likely to be those individuals who had a recurrence early and therefore did not accumulate much hazard.
Leverage
To check the influence of individuals on the parameter estimates, leverage can be assessed using delta–beta changes for each covariate as seen in the pre D-dimer model (see Appendix 5). Scatterplots of delta–betas for log-D-dimer (Figure 36) and log-lag time (Figure 37) show that even individuals with the greatest leverage on these parameter estimates have very small effects on the log-HR as seen for the pre D-dimer model. Similar, small delta–beta changes were observed for the other covariates included in the post D-dimer model (see Appendix 5).
FIGURE 36.
Scatterplot of delta–beta for log-D-dimer vs. years from cessation of therapy (log-HR 0.666).
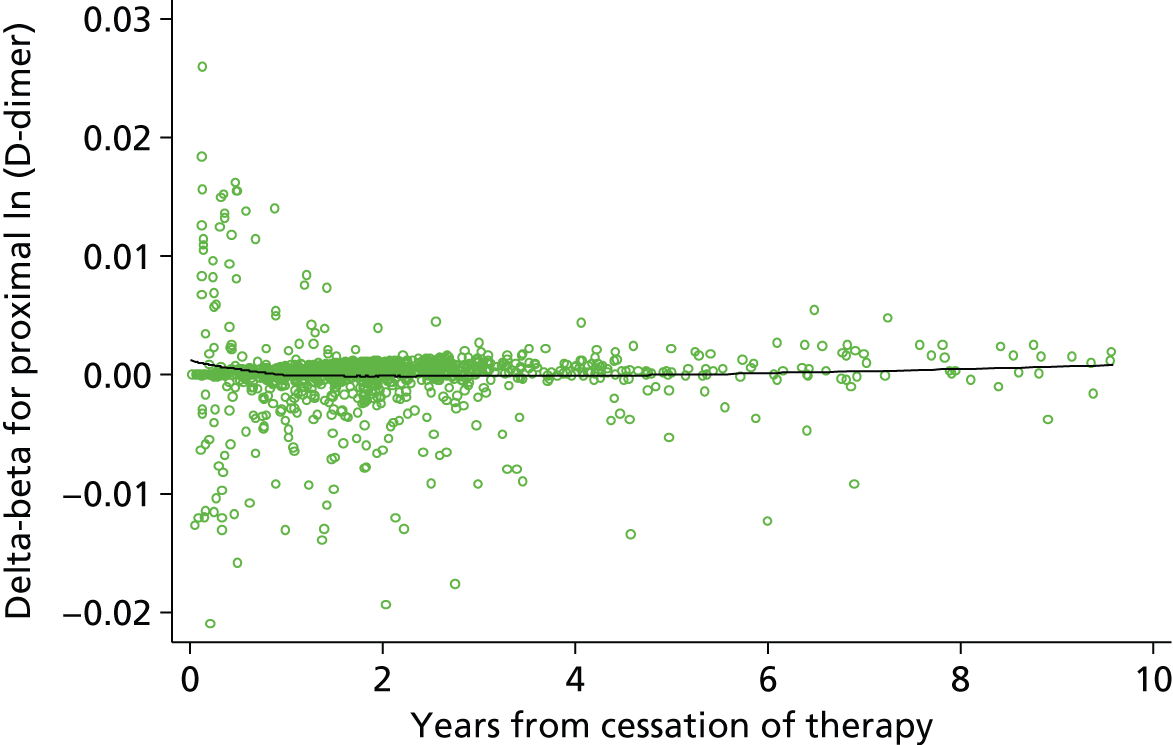
FIGURE 37.
Scatterplot of delta–beta for log-lag time vs. years from cessation of therapy (log-HR –0.361).
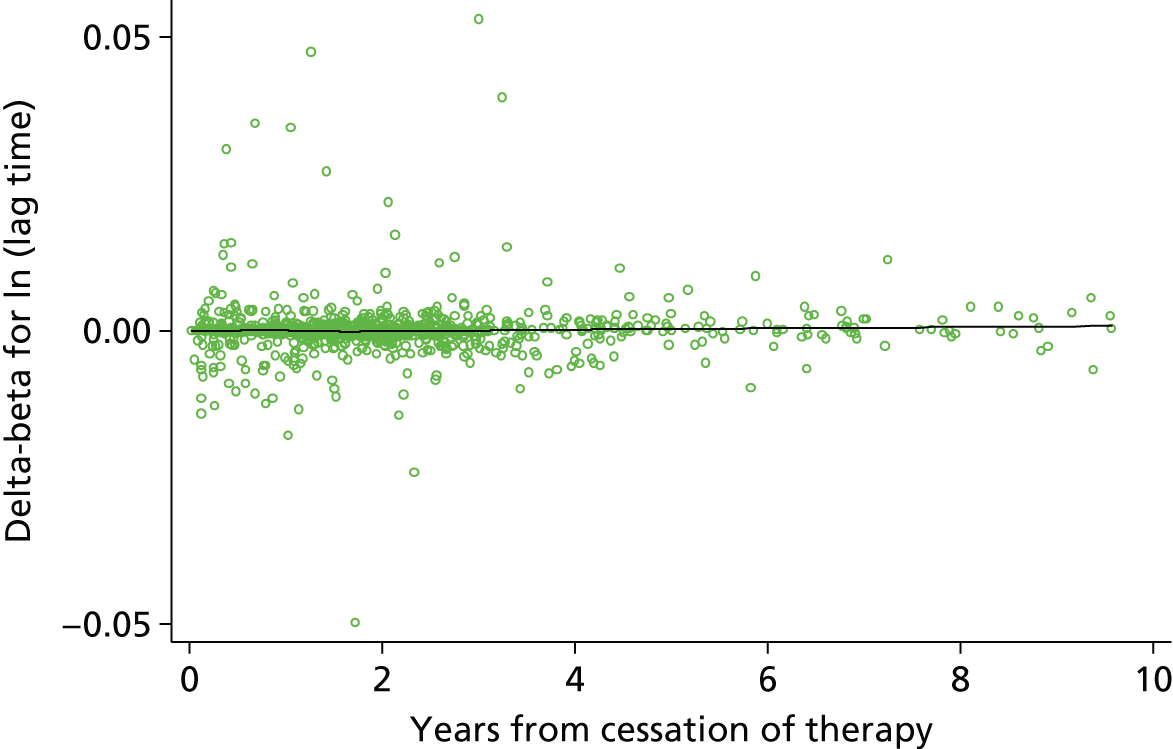
Interaction effects
Interaction effects quantify a differential effect of a predictor in a specific subgroup of the population. An interaction effect can be either an increased risk or decreased risk beyond that associated with a single characteristic. For example, within the pre D-dimer model, both sex (being male) and site of index event (having a first PE) are associated with significant increases in recurrence rate; thus, an interaction between sex and site of index event would imply that patients who are both male and have a PE are at increased risk beyond that associated with being male or having a PE alone.
As genuine interaction effects are rare and hard to identify, and because data dredging to identify interactions may find spurious results, the clinical team were asked for their guidance regarding which interaction terms are most important to examine. The clinical team suggested investigating an interaction of D-dimer and age, as it was felt plausible that the predictive effect of D-dimer value (a measure of general coagulability) may change as age increases.
To test for an interaction between age and D-dimer, the final post D-dimer model was refitted including a term for the multiplication of age and D-dimer score. The interaction effect was shown to be insignificant at the 5% level, with a 95% CI ranging from 0.98 to 1.01 and a p-value of 0.3 (Table 29). Thus no interaction term was included in the final model.
| Predictor | Beta coefficient (95% CI) | HR (95% CI) | p-value |
|---|---|---|---|
| Age | 0.026 (–0.048 to 0.101) | 1.03 (0.95 to 1.11) | 0.49 |
| Sex | |||
| Male | 0.539 (0.185 to 0.894) | 1.71 (1.2 to 2.44) | 0.003 |
| Site of index event | |||
| Proximal DVT | 1.633 (0.623 to 2.643) | 5.12 (1.86 to 14.05) | 0.002 |
| PE | 1.671 (0.651 to 2.691) | 5.32 (1.92 to 14.74) | 0.001 |
| D-dimer (log) | 1.045 (0.309 to 1.781) | 2.84 (1.36 to 5.94) | 0.01 |
| Lag time in days (log) | –0.371 (–0.675 to –0.067) | 0.69 (0.51 to 0.93) | 0.02 |
| Age × D-dimer interaction term | –0.006 (–0.018 to 0.006) | 0.99 (0.98 to 1.01) | 0.298 |
Further to this, an interaction effect between D-dimer levels and lag time was examined as the two predictors are inextricably linked; it is plausible that the prognostic importance of D-dimer levels varies over lag time (the time taken between cessation of therapy and the measurement of D-dimer levels). As previously, the final post D-dimer model was refitted including a term for the multiplication of D-dimer level and lag time. The interaction effect was shown to be insignificant at the 5% level, with a 95% CI for the HR ranging from 0.79 to 1.57 and a p-value of 0.552 (Table 30). Thus no interaction term for D-dimer and lag time was included in the final model.
| Predictor | Beta coefficient (95% CI) | HR (95% CI) | p-value |
|---|---|---|---|
| Age | –0.012 (–0.024 to –0.001) | 0.988 (0.976 to 0.999) | 0.037 |
| Sex | |||
| Male | 0.55 (0.2 to 0.91) | 1.74 (1.22 to 2.48) | 0.002 |
| Site of index event | |||
| Proximal DVT | 1.65 (0.64 to 2.66) | 5.19 (1.89 to 14.24) | 0.001 |
| PE | 1.68 (0.66 to 2.7) | 5.38 (1.94 to 14.92) | 0.001 |
| D-dimer (log) | 0.31 (–0.86 to 1.49) | 1.37 (0.42 to 4.45) | 0.601 |
| Lag time in days (log) | –1.02 (–3.23 to 1.18) | 0.36 (0.04 to 3.27) | 0.364 |
| D-dimer × lag time interaction term | 0.11 (–0.24 to 0.45) | 1.11 (0.79 to 1.57) | 0.552 |
Time-dependent effects
Allowing for time-dependent predictor effects might improve the performance of the model if it better fits the underlying data. Non-proportional hazards can be a sign of a time-dependent effect and, as such, including time-dependent effects can account for departures from the proportional hazards assumption. The validity of the proportional hazards assumption was assessed for predictors above (see Model checking), and the assumption was considered appropriate for all predictors. It was therefore not expected that any time-dependent effects would be found to significantly improve the performance of either final model.
To further check this, a procedure proposed by Royston and Lambert75 was used to identify potential time-dependent effects. The procedure first identifies the p-value associated with including each predictor in the model as a time-dependent effect using a likelihood ratio test. A time-dependent effect is included for the predictor with the smallest p-value, providing the p-value is less than a pre-defined alpha significance level. The process is repeated until no time-dependent effects are significant at the chosen alpha level.
A 1% significance level was selected to test for time-dependent effects so as to account for multiple testing. The baseline spline function for the post D-dimer model used 3 df (see Baseline spline complexity) and therefore 3 df were used for the time-dependent effects to allow more flexibility. After one cycle of the procedure no predictors in the post D-dimer model were found to be significantly time dependent at the 1% level, though log-D-dimer was close to significance with a p-value from the likelihood ratio test of 0.02 (Table 31). Given the lack of formal significance, and the aim for a more parsimonious model, the time-dependent effect was excluded.
| Predictors | Deviance difference | p-value vs. null |
|---|---|---|
| Age | 2.49 | 0.477 |
| Sex (male) | 4.491 | 0.213 |
| Site of index event (proximal DVT) | 0.658 | 0.883 |
| Site of index event (PE) | 2.495 | 0.476 |
| Log-D-dimer | 9.68 | 0.022 |
| Log-lag time | 3.98 | 0.264 |
Sensitivity analysis
Multiple imputation of missing data
As the RVTEC data set used for model development included some missing data for some of the potential predictors, a complete-case analysis was performed for model development, excluding any patient with missing data from the analysis. Sensitivity analysis was performed using multiple imputation, to evaluate how model estimates compared with those from the complete-case analysis.
Of the included predictors only D-dimer and lag time had missing values, with 15% and 11.4% incomplete data, respectively, across the whole data set of six trials (see Table 8). It was therefore possible to consider multiple imputation for these two factors within the post D-dimer model. As the RVTEC data set consisted of multiple trial populations for development of the post D-dimer model, it was important to account for this clustering when imputing missing observations; imputation across trials can lead to bias where the association between factors differs by trial. 85 As such, missing data for lag time, which were 100% incomplete within the Baglin et al. trial,61 could not be imputed (see Table 8) and so the same set of six trials (excluding Baglin et al. 61) were used as in the complete data analysis for the post D-dimer model.
Imputation models were selected to include all included predictors from the final post D-dimer model as well as predictors for the observed recurrences (event indicator) and the baseline hazard to account for the time-to-event outcome;78 imputation was performed within trial populations. The largest proportion of incomplete data observed within individual trial populations was 48.1% missing D-dimer observations within the Poli et al. trial;59 therefore, 50 imputed data sets were created to provide the greatest reproducibility. 78 Imputation was performed for 10 cycles within each of the 50 imputed data sets to stabilise the results.
Box plots were used to check that the distributions of the observed and imputed data broadly matched; large differences could indicate an inappropriate imputation model. 78 On inspection, the imputed distributions for both D-dimer and lag time (Figures 38 and 39) appeared to be very similar to the corresponding observed distributions (indicated as zero on the box plots). Therefore the imputation process appeared to be appropriate.
FIGURE 38.
Comparison of observed and imputed data for log-D-dimer (the post D-dimer model).

FIGURE 39.
Comparison of observed and imputed data for log-lag time (the post D-dimer model).
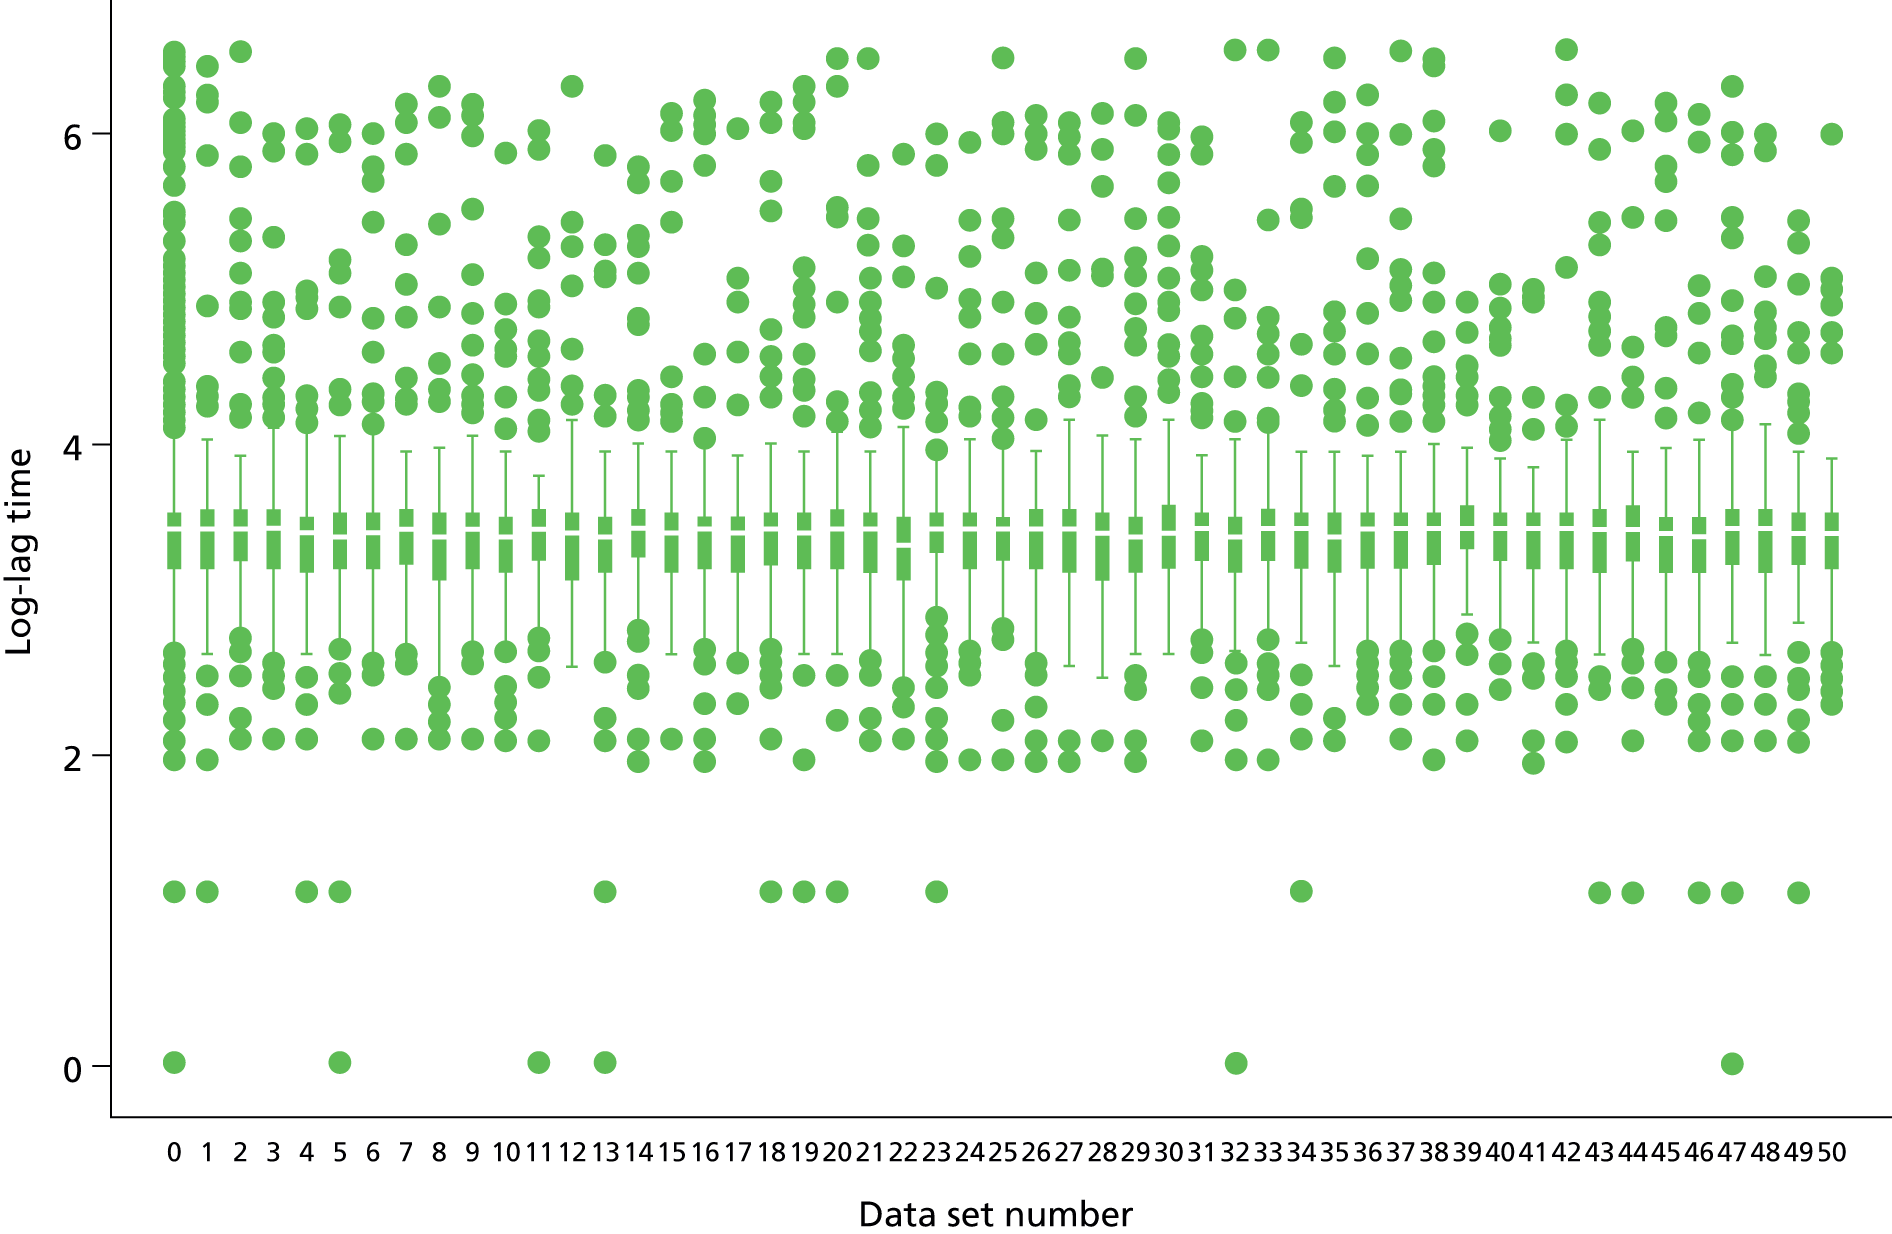
The model, including all predictors identified as important in the complete-case analysis (age, site of index event, sex, D-dimer and lag time), was fitted to the 50 imputed data sets and the coefficients of each were combined using Rubin’s rules79 (Table 32). In comparison with the specification of the post D-dimer model under a complete-case analysis (see Table 27), the estimated HRs after imputation were reasonably similar. The effect of each factor within the model did not have a dramatically different interpretation between the complete case and multiple imputation models. In particular, the effects of D-dimer and lag time are relatively unchanged with HRs of 1.93 and 0.74 compared with 2.01 and 0.75 for the complete case model. In general, the 95% CIs were similar with the exception of site of index event where the multiple imputation model estimated slightly smaller 95% CIs, showing greater precision, likely due to the increased number of observations. The effect of age and lag time were borderline significantly different from null in the complete case model, but appeared to be significant in the multiple imputation model. This adds further weight to the inclusion of age and lag time factors in the prognostic model.
| Predictor | Beta coefficient (95% CI) | HR (SE) | p-value | FMIa |
|---|---|---|---|---|
| Age | –0.017 (–0.026 to –0.007) | 0.983 (0.974 to 0.993) | 0.001 | 0.032 |
| Sex | ||||
| Male | 0.666 (0.352 to 0.98) | 1.946 (1.434 to 2.640) | < 0.001 | 0.007 |
| Site of index event | ||||
| Proximal DVT | 1.662 (0.627 to 2.697) | 5.27 (1.933 to 14.368) | 0.001 | 0.001 |
| PE | 1.639 (0.596 to 2.683) | 5.151 (1.875 to 14.153) | 0.002 | 0.002 |
| Log-D-dimer | 0.657 (0.485 to 0.829) | 1.93 (1.607 to 2.317) | < 0.001 | 0.169 |
| Log-lag time | –0.298 (–0.572 to –0.025) | 0.742 (0.555 to 0.992) | 0.044 | 0.167 |
The inclusion of treatment duration as a predictor in the multiple imputation model was investigated given the increased complete patient data; treatment duration did not reach significance within the imputation model with a HR of 1.07 (95% CI 0.85 to 1.35) and p-value of 0.574, providing confirmatory evidence towards the exclusion of treatment duration within the complete case post D-dimer model.
To check that the imputation results were reproducible, such that similar conclusions could be drawn from an identical imputation approach, the MC error of each estimated HR and standard error was checked. The MC error was measured as a percentage of the standard error of the estimated HR, where an MC error lower than 10% of the standard error was considered appropriate. The MC errors observed from the imputation procedure used were all lower than 10%, with the greatest being 5.74% for D-dimer, meaning that it is highly likely that the results of multiple imputation procedure would lead to consistent conclusions across the imputed data sets (Table 33).
| Predictor | HR | SE | p-value | Lower 95% CI | Upper 95% CI | FMIa |
|---|---|---|---|---|---|---|
| Age | 0.98 | 0.005 | 0.001 | 0.97 | 0.99 | 0.03 |
| MC error | 0.00 | 6.90 × 10⁻⁷ | 0.000 | 1.26 × 10⁻⁷ | 1.21 × 10⁻⁷ | 0.01 |
| % of SE | 2.50 | 0.01 | ||||
| Sex (male) | 1.95 | 0.302 | 0.000 | 1.43 | 2.64 | 0.01 |
| MC error | 0.00 | 0.0003 | 0.000 | 0.003 | 0.005 | 0.00 |
| % of SE | 1.16 | 0.12 | ||||
| Site (proximal DVT) | 5.27 | 2.694 | 0.001 | 1.93 | 14.37 | 0.00 |
| MC error | 0.01 | 0.003 | 0.000 | 0.01 | 0.04 | 0.00 |
| % of SE | 0.54 | 0.12 | ||||
| Site (PE) | 5.15 | 2.653 | 0.002 | 1.87 | 14.15 | 0.00 |
| MC error | 0.01 | 0.003 | 0.000 | 0.01 | 0.04 | 0.00 |
| % of SE | 0.56 | 0.13 | ||||
| Log-D-dimer | 1.93 | 0.180 | 0.000 | 1.61 | 2.32 | 0.17 |
| MC error | 0.01 | 0.001 | 0.000 | 0.01 | 0.02 | 0.03 |
| % of SE | 5.74 | 0.78 | ||||
| Log-lag time | 0.74 | 0.110 | 0.044 | 0.56 | 0.99 | 0.17 |
| MC error | 0.01 | 0.002 | 0.006 | 0.006 | 0.009 | 0.03 |
| % of SE | 5.70 | 1.37 |
Summary of sensitivity analysis
Compared with the complete data model, the multiple imputation approach suggests similar conclusions about the predictors to include and their magnitude of effect. As the complete data model was already validated during the IECV approach, and it performed well in terms of calibration and discrimination, it was decided by the team to retain the post D-dimer model as derived using complete data as the final model. Furthermore, the multiple imputation approach makes the additional assumption about MAR, which may not hold.
External validation in RIETE and MEGA data sets
Two independent databases (RIETE and MEGA) were available for potential external validation of the proposed post D-dimer model (see Identifying, obtaining and cleaning individual patient data). Unfortunately neither included D-dimer or lag time predictors, meaning that the post D-dimer model could not be externally validated in these databases. However, it should be emphasised that through the IECV approach external validation has been conducted already as discussed above (see Internal–external cross-validation).
Summary
Compared with the pre D-dimer model, the performance of the post D-dimer model was substantially improved in terms of discrimination and it retained good calibration up to at least 2 years post cessation of therapy. Thus including D-dimer and lag time appears beneficial for improved prediction of recurrence risk following cessation of therapy for a first unprovoked VTE. Performance may be improved by the inclusion of further predictors not available in the RVTEC database, but – given the good discrimination and calibration identified through the IECV external validations – the model appears robust and potentially useful for informing clinical decisions.
Using the post D-dimer model to make predictions for new individuals: a detailed illustration of the model in practice
The post D-dimer model has the potential to stratify the largely heterogeneous population of unprovoked patients, allowing for better decision-making on duration of treatment for these high-risk patients. Although Final model: post D-dimer model discussed development, assumption checking and external validation, this section now explains the practical application of the final post D-dimer model.
In order to predict an individual’s risk of recurrence the beta coefficients must be combined with the baseline risk corresponding to the time that prediction is required for. The equation to combine these parameters is given below (Equation 4), along with the beta values from the post D-dimer model (see Equation 5, risk score equation for the post D-dimer model). In Equation 4, S0(t) represents the average baseline (recurrence-free survival) risk at time t, and βχ represents the risk score for a patient as shown in Equation 5.
Equation 4 allows the prediction of a recurrence-free survival probability at a particular time point after cessation of therapy, meaning that the probability of recurrence by a specific time point, R(t), can also be predicted and is equal to Equation 6.
The average baseline risk at time t, S0(t), can be estimated for any time t (post cessation of therapy) by reading off its value from the Kaplan–Meier presented in Figure 40 and provided for specific time points (6 months, 1 year, 2 years and 3 years) within Table 34.
FIGURE 40.
Average baseline (recurrence-free) survival function for the post D-dimer model.
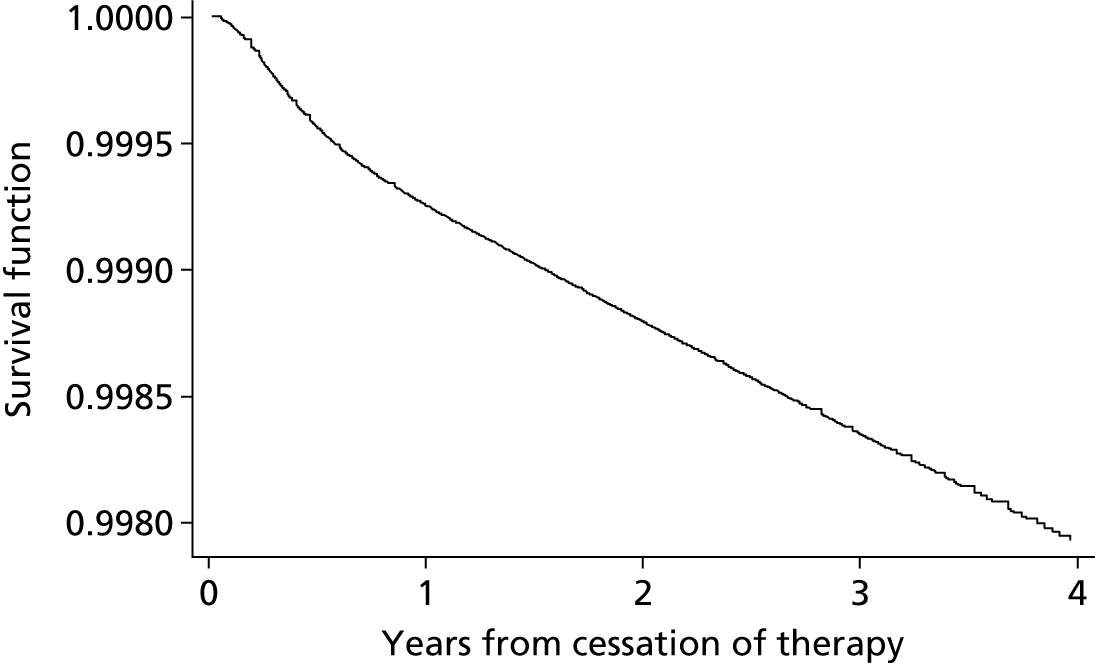
| Model predictor | Time from cessation of therapy | |||
|---|---|---|---|---|
| 6 months | 1 year | 2 years | 3 years | |
| S0(t) | 0.9996 | 0.9993 | 0.9988 | 0.9983 |
Example application of the model
As an example of the potential application of the post D-dimer model, three example patients were created using varying predictor information to illustrate patients at different risk of recurrence (Table 35). For each of the continuous predictors (age, log-D-dimer and log-lag time), the 25th, 50th and 75th percentile of the predictors distribution was used for patients A, B and C, respectively, to reflect the RVTEC database (see Table 22). All three patients were selected as male, and the site of index event was selected as distal DVT, proximal DVT and PE for patients A, B and C respectively. An example of the risk score created using these patient characteristics is presented for patient A in Equation 7 (risk score equation for patient A using the post D-dimer model). Both recurrence-free survival probability and probability of recurrence were predicted at 1, 2 and 3 years post cessation of therapy for patients A, B and C, respectively, to show a range of predictions (see Table 35).
| Model predictor | Patient A | Patient B | Patient C |
|---|---|---|---|
| Years from cessation of therapy | 1 year | 2 years | 3 years |
| S0(t) | 0.9993 | 0.9988 | 0.9983 |
| Age (years) | 51 | 64 | 74 |
| Sex | |||
| Male | 1 | 1 | 1 |
| Female | 0 | 0 | 0 |
| Site of index | |||
| Distal DVT | 1 | 0 | 0 |
| Proximal DVT | 0 | 1 | 0 |
| PE | 0 | 0 | 1 |
| D-dimer (ng/ml) | 275 | 417.5 | 747 |
| Log-D-dimer | 5.55 | 6.03 | 6.62 |
| Lag time (days) | 22 | 29 | 33 |
| Log-lag time | 3.14 | 3.4 | 3.53 |
| Individual prediction | 1 year | 2 years | 3 years |
| S(t)a | 0.985 | 0.858 | 0.755 |
| R(t)b | 0.015 | 0.142 | 0.245 |
The post D-dimer model predictions are presented in Table 35, with recurrence-free survival probability and probability of recurrence calculated using Equations 4 and 6 respectively. Predicted recurrence-free survival probability can be seen to decrease over time for all three example patients (Figure 41). The predicted S0(t) is markedly different between patient A and the other two patients, this is likely due to lower values of continuous predictors such as D-dimer and also the low-risk site of index event (distal DVT) contributing little within the post D-dimer model (see Equation 4) to patient A’s risk of recurrence. Smaller differences were observed between patients B and C, reflecting the similar effect seen for proximal DVT and PE index events (see Specification and parameter estimates).
FIGURE 41.
Predicted recurrence-free survival for three example patients using the post D-dimer model.

The predicted probabilities of recurrence-free survival can be seen in Figure 41 at points on the predicted curves corresponding to time from the cessation of therapy. For example, at 1 year from cessation of therapy, patient A has a predicted probability of recurrence-free survival of 0.985, from Equation 4, using patient A’s risk score (see Equation 7 and Table 35).
Similarly, the predicted probability of recurrence over time from cessation of therapy can be predicted using the post D-dimer model (see Equation 6). The probability of recurrence is opposite to the probability of recurrence-free survival, increasing over time from cessation of therapy (Figure 42). The same trends seen in Figure 41 between patients A, B and C can be seen in Figure 42 as expected.
FIGURE 42.
Predicted probability of recurrence for three example patients using the post D-dimer model.

Comparison with existing prognostic models
It was hoped that the performance of any existing prognostic models or decision rules identified by the systematic review (see Chapter 3) could be examined within the RIETE, MEGA and RVTEC databases, to allow comparison across the existing models and in relation to the post D-dimer model, in terms of their performance. However, the predictors included within the existing models identified through the systematic review (see Chapter 3), were not all available within any individual database, making validation and comparison of the existing models impossible.
Discussion
The aim of this chapter was to develop and validate two prognostic models for recurrence of VTE following cessation of therapy for a first unprovoked VTE: one model for use at the exact time of cessation of therapy (called the pre D-dimer model) and one model for use after some ‘lag time’ following cessation of therapy at which D-dimer could be measured (called the post D-dimer model). The key findings of this chapter are summarised below and in Box 1.
-
The RVTEC database, containing patients from seven trials, was used to develop and externally validate two prognostic models for the risk of VTE recurrence following cessation of therapy.
-
The first model, the pre D-dimer model, is applicable at the exact time of cessation of therapy. The second model, the post D-dimer model, is applicable when D-dimer is measured at a particular lag time following cessation of therapy.
-
Both models allowed for heterogeneity in the baseline hazard across trials and the average hazard was used in the final models.
-
IECV allowed each model to be developed and externally validated on multiple occasions.
-
The final pre D-dimer model contained three predictors: site of index, sex and age, with the latter retained on clinical grounds rather than statistical significance.
-
The final post D-dimer model contained five predictors: site of index, sex, age, D-dimer and lag time, all of which were statistically significant.
-
The pre D-dimer model had good calibration on average across the external validation trials; however, discrimination was poor with an average c-statistic of 0.56.
-
The pre D dimer model is not suitable for use and requires additional predictors to be included in future research.
-
The post D-dimer model had excellent calibration up to at least 2 years on average across the validation trials; discrimination was also moderately good, with an average c-statistic of 0.69.
-
The post D-dimer model is useful for patient counselling and informing clinical decisions, but requires patients to be off therapy for a lag time, at which D-dimer can be measured.
A detailed and transparent strategy was used for developing the two models using a set of candidate predictors available in the RVTEC database, a large database containing data from patients enrolled across seven trials. 11 The candidate predictors included a set of potentially important clinical and laboratory predictors, as evidenced in previous research identified within the systematic review of existing models (see Chapter 3). A novel IECV approach was used in the development of the model so as to maximise the benefits of having IPD from several trials. The IECV approach allowed external validation of each developed model through exclusion of a single trial in cycles (see Development of prognostic model). Therefore, compared with previous prognostic models in this field (see Chapter 3),2,9,41 external validation was possible and on multiple occasions. Patients who died without any recurrence were censored, therefore our predictions relate to a hypothetical world where patients cannot die before a recurrence occurs. The proportion of deaths before a recurrence is likely to be very small (especially up to 2–3 years follow-up where the model calibrates well), and therefore the model predictions would not change importantly if a competing risks model had been used.
Model performance was measured in the validation trials by both discrimination and calibration of the model. Discrimination was assessed using Harrell’s c-statisitc,82,83 and was far greater for the post D-dimer model, with the average c-statistic 0.69 in the external validation of this model compared with 0.56 in the external validation of the pre D-dimer model. The post D-dimer model (see Results III: development and validation of post D-dimer model), additionally included D-dimer and lag time (see Aims: develop and validate two models, based on different start points). This suggests that D-dimer and its associated lag time are important and strong predictors, which add significantly to the discriminatory ability of the model. The predictive ability of D-dimer has also been evidenced widely by others. 2,11,58,60,61,67–70
The calibration of both the post D-dimer model and the pre D-dimer model was, on average across all external validation trials, very good with close agreement between observed and predicted risk of recurrence up to at least 2 years. Given that external validation was performed within the IECV and the average calibration was excellent across trials, it was considered unnecessary to adjust for optimism in performance (e.g. using bootstrapping). There was heterogeneity in calibration performance across different trial populations, likely due to the heterogeneity in the baseline risk across populations; however, with only five or six validation trials in the IECV approach, it was not possible to estimate heterogeneity reliably here. Interrogation of the model fit in regard to multiple imputation of missing data, interaction terms, non-linear trends, outliers and other advanced aspects did not suggest the final models produced should be modified.
The pre D-dimer model is clearly inadequate, given its poor discrimination. This is not surprising given it only contained two factors of statistical significance, sex and site of index event. However, in terms of recurrent VTE events within the standard lag time of around 30 days, there were 20 additional recurrences which could have been accounted for in the pre D-dimer model, due to the earlier start point, highlighting the need for a model applicable at cessation of therapy. Therefore further research should build on this model, by looking to include additional predictors. This is considered further in Chapter 6.
In contrast, given the good discrimination and excellent average calibration, the post D-dimer model would seem useful for clinical practice. In particular, it could inform patient counselling, and help patients and their clinicians make decisions about remaining off treatment and continued monitoring. An individual’s risk predicted using the post D-dimer model should be seen as an additional tool in an evidence-based approach to patient care, both clinical judgement and patient preference should also be considered alongside the predicted risk of recurrence. A caveat is that the model can only be applied in patients who have been off therapy for a certain lag time, at which D-dimer is then measured. In the database, a large majority of lag times were around 30 days from cessation of therapy11 and so the model is likely to be most reliable when D-dimer is measured at that time.
Finally it should be noted that a limitation of the developed post D-dimer model is that external validation within non-trial populations was not possible due to some of the model predictors not being recorded in these data sets (e.g. D-dimer). Despite performing external validation through the IECV approach, it is clear that further external validation in non-trial data sets from different sources would be advantageous, and therefore the post D-dimer model could also be considered at moderate risk of bias (based on the definition used within the systematic review undertaken in Chapter 3), until such external validation is undertaken.
The following chapter evaluates the cost-effectiveness of a clinical decision rule to decide on extension of OAC therapy, with the rule based on an individual’s risk prediction estimates from the post D-dimer model.
Chapter 5 Economic evaluation
The previous chapter developed two prognostic models, the latter of which (the post D-dimer model) was considered to have good external validity in terms of calibration and discrimination performance. Therefore, the post D-dimer model is potentially useful for informing clinical practice. When any prognostic model is used to inform decisions for clinical practice, it should be evaluated like any other health technology; that is, there should be evidence that the use of the model to inform therapy decisions is cost-effective for the NHS when evaluated in the context of relevant populations and health outcomes. One mechanism for implementing a prognostic model is to use it to inform a decision rule, for whether individuals do or do not receive a particular therapy. In the context of this report, the post D-dimer model could therefore be used to obtain a predicted probability of VTE recurrence (e.g. by 2 years) for individuals, and if this is at or above a particular threshold (e.g. 5%) then the individual could be put back onto therapy, but if not (< 5%) the individual remains off therapy. In this chapter we undertake extensive health economic modelling to ascertain, under a variety of assumptions, the cost-effectiveness of such a decision rule that uses predictions from the post D-dimer model to make a decision about continued cessation of therapy or not.
This chapter is in two main parts. The first part describes the methods and results of a systematic review of cost-effectiveness studies evaluating the use of a decision rule for patients with a first unprovoked VTE. The second and substantive part of the chapter reports the de novo decision model-based cost-effectiveness analysis of the use of a decision rule in this patient group.
Systematic review of cost-effectiveness studies
Methods
Search strategy
A comprehensive literature search was conducted to identify papers reporting the costs or cost-effectiveness of the use of a clinical decision rule compared with the absence of a clinical decision rule for a first unprovoked VTE. The searches, performed in December 2013, aimed to identify all costing studies, trial-based economic evaluations and economic models from three electronic databases (EMBASE, MEDLINE and NHS Economic Evaluation Database). The search strategy used the same terms applied in the clinical effectiveness review (see Chapter 3), supplemented with relevant economic search terms. Examples of these search strategies can be found in Appendix 1. The search results were supplemented with any further economic evaluations and cost studies identified during screening of the literature identified in the systematic review of prognostic models (see Chapter 3).
Study selection and data extraction
Two reviewers independently screened titles and abstracts for relevance, using all of the pre-specified selection criteria (Box 2). Full texts were obtained in any of the following situations: if the article appeared to fulfil the selection criteria, if it was unclear whether the paper was relevant, or in the case of disagreement between reviewers. Full-text articles were then independently assessed against the full criteria (see Box 2) by the two reviewers. Articles not meeting all the criteria were excluded from subsequent review and the reason for exclusion noted. Articles meeting all the criteria had relevant information extracted and methodological quality assessed by one reviewer with checking by a second reviewer. Information extracted included study characteristics, data or parameter estimates, methods of analysis and results. Studies were quality assessed using the Philips checklist90 for model-based analyses. Studies that did not meet the inclusion criteria but included potentially useful data for the economic model were coded for further review at the model building stage.
-
Study design: cost–consequence analysis, cost-effectiveness analysis, cost–benefit analysis, cost–utility analysis, cost studies.
-
Population: patients aged ≥ 18 years. Patients with a first unprovoked VTE who had received at least 3 months oral anticoagulation therapy. Studies with mixed populations were to be included as long as data for relevant patients could be extracted.
-
Intervention: clinical decision rule for the resumption of anticoagulation.
-
Outcomes: cost-effectiveness, cost estimates, quality-of-life estimates.
Results
A total of 1045 records were identified from the searches. Duplicates were removed both automatically using reference management software and manually. Once duplicates were removed, there were 775 unique records. An initial screening of title and abstracts excluded 734 records, leaving 41 full-text articles to be accessed for assessment against the full screening criteria. No studies fulfilled the criteria for inclusion out of the 41 full-text articles assessed for eligibility. The excluded articles are listed in Appendix 6 with reasons for exclusion. The main reasons for exclusion were an inappropriate study design, the study population did not fulfil the selection criteria, or the intervention did not include a decision rule. A flow diagram presenting the process of selecting studies can be found in Figure 43.
FIGURE 43.
Preferred Reporting Items for Systematic Reviews and Meta-Analyses flow diagram of selection process for cost-effectiveness review.
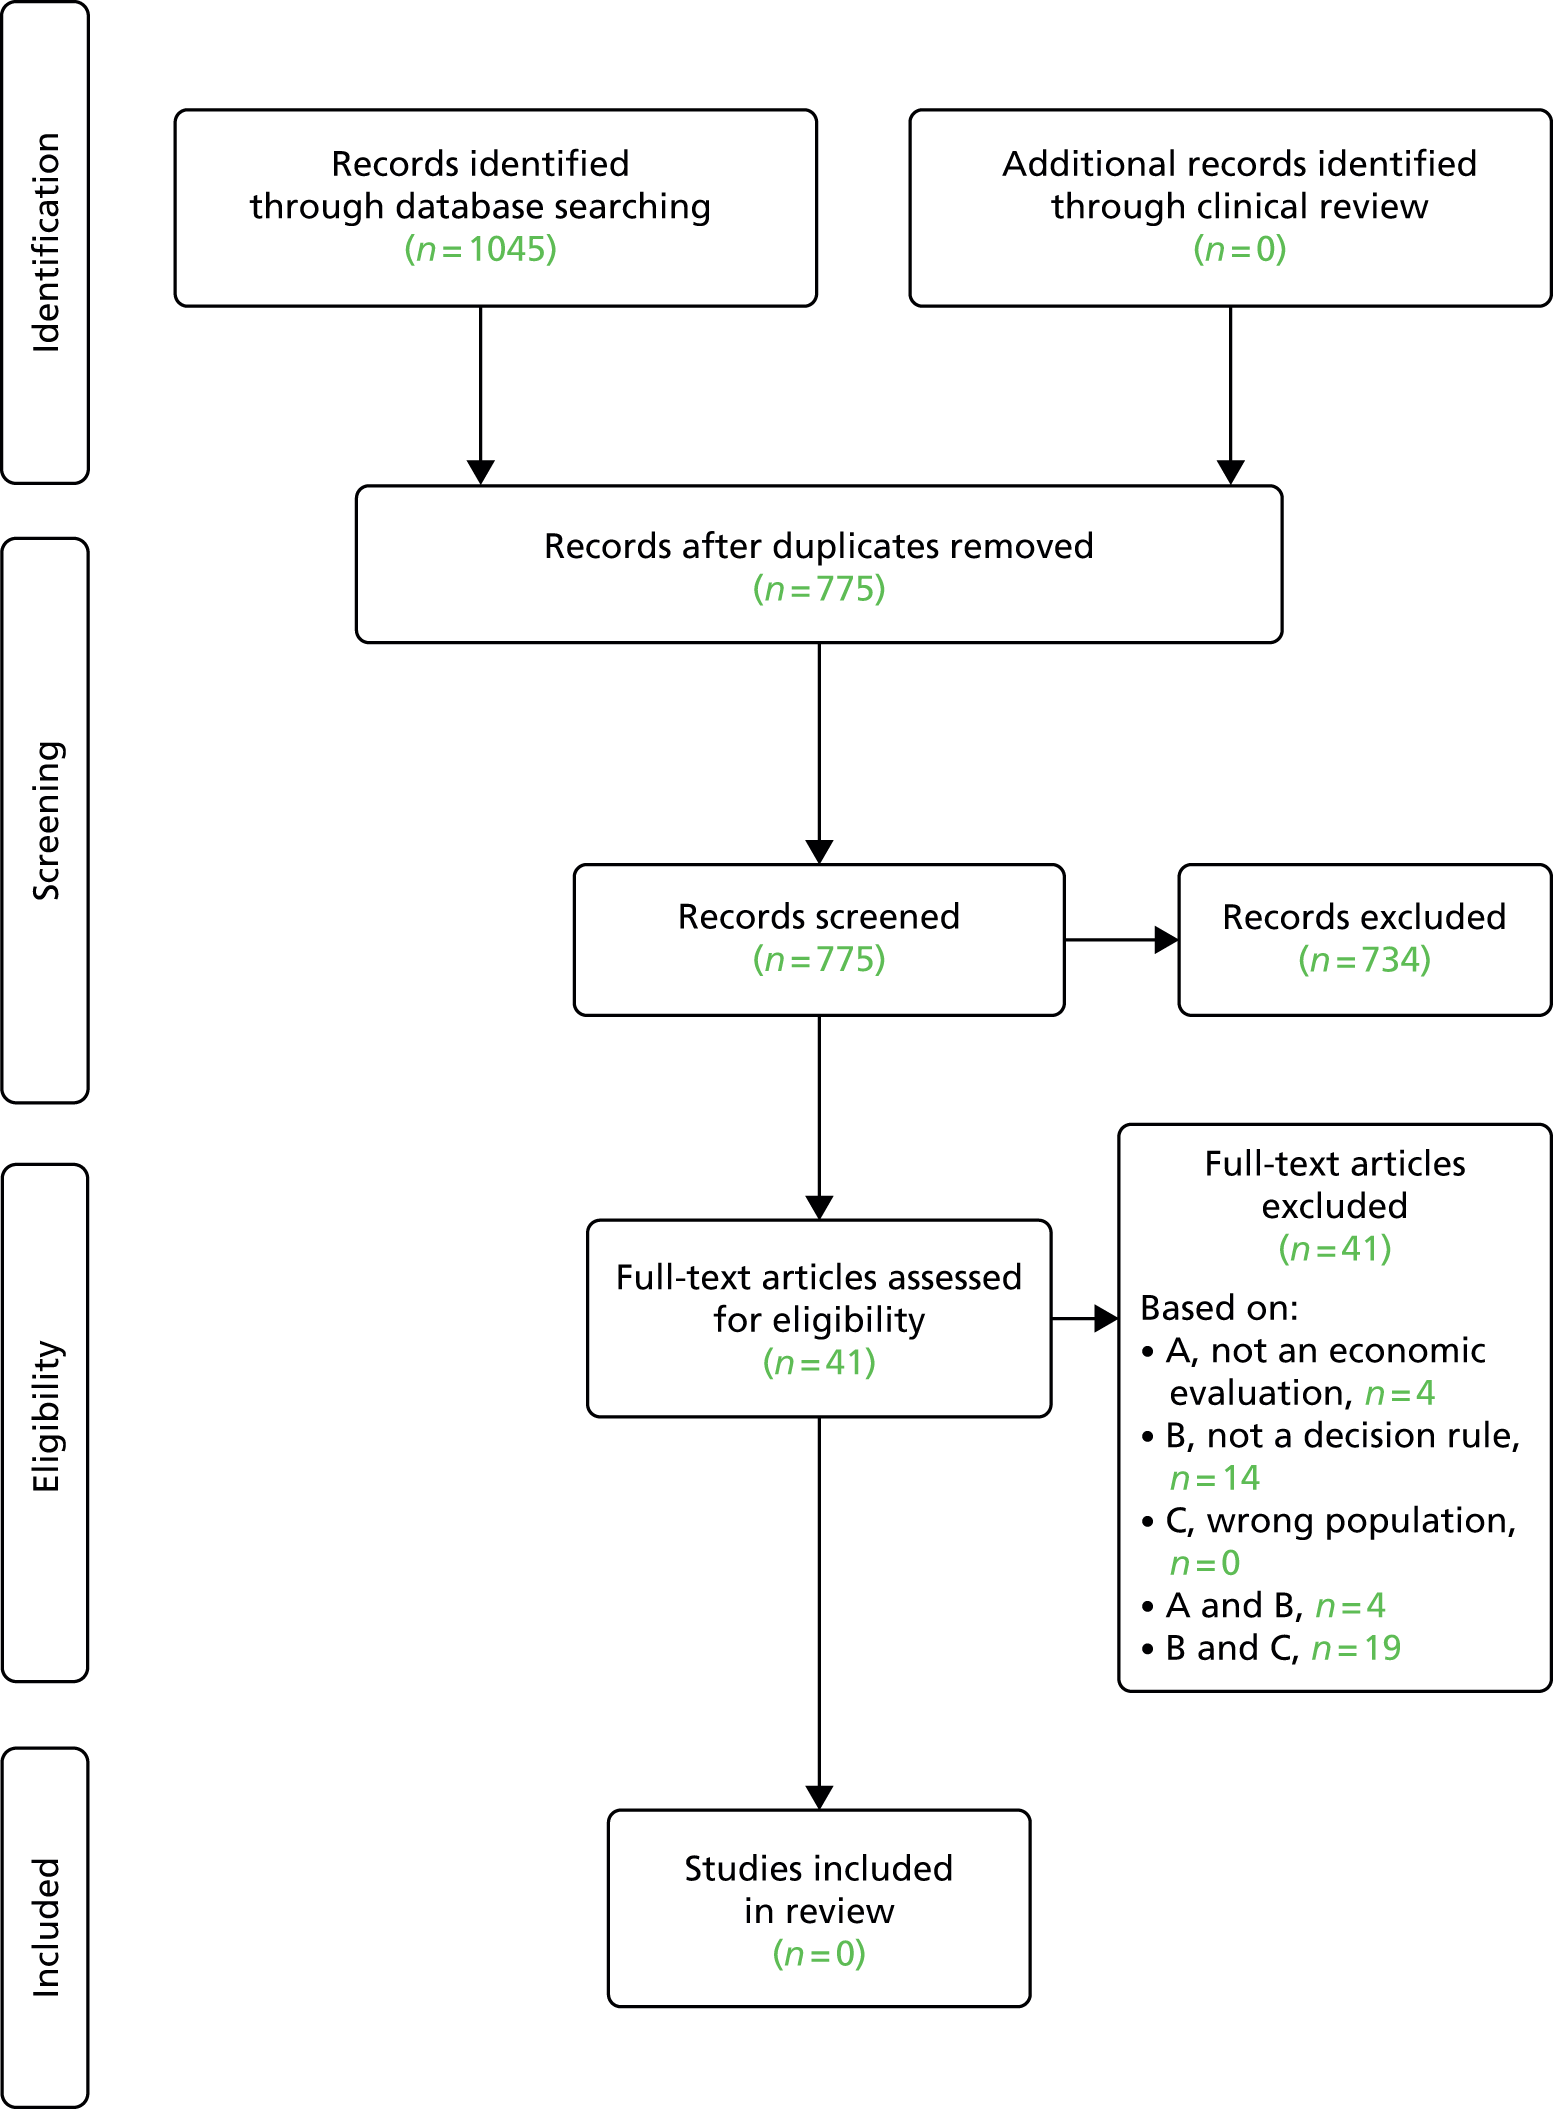
Summary
The review demonstrates there is currently no evidence on the costs or cost-effectiveness of using a decision rule in patients with a first unprovoked VTE, thus highlighting the need for this analysis to be undertaken. The next section describes an economic model developed to consider a decision rule for resumption of therapy in this patient population.
Economic modelling
Introduction
This section provides a detailed description of the economic model developed to evaluate the cost-effectiveness of using a clinical decision rule in patients with a first unprovoked VTE. The model calculates a predicted 1-year risk of a VTE using the post D-dimer model and compares this risk with a decision rule (with a specified threshold risk of recurrence, e.g. 5%) to determine whether or not cessation of therapy is continued or therapy is restarted. The model compares a strategy of no therapy (usual care) with a number of decision rule strategies, where therapy is restarted if the predicted risk of a VTE is equal to or greater than the given threshold risk. In the model, a total of five decision rule strategies were compared with usual care, each one using a different threshold risk (1%, 3%, 5%, 10% and 15%). A further strategy was evaluated where all patients recommenced therapy (a ‘treat all’ strategy, with a 0% threshold), meaning six strategies were compared with no therapy in the model. The specific thresholds were chosen to reflect the recurrence thresholds reported previously in Chapter 4, Validation of final post D-dimer model in risk groups (1%, 3%, 5%), with the addition of two higher thresholds (10%, 15%) to estimate the cost-effectiveness of only resuming therapy in those individuals with a considerable risk of suffering a VTE in 1 year.
The model describes possible clinical pathways that a patient can move through once they have suffered a first unprovoked VTE. These pathways include remaining event free, having another VTE (either a DVT or a PE), having a major bleed and dying from a clinical event or other causes. The model takes into account whether or not a patient is on therapy and the risks of further clinical events are determined by their therapy status. In addition, events within the model can change the therapy status of a patient; for example, if someone is not on therapy and has a further VTE they are put on therapy for life, and if someone has a major bleed on therapy, therapy is stopped. The key feature of the model is that it can weigh up the risk of a further VTE off therapy with the risk of bleeding on therapy, by attaching costs, impact on quality of life and survival to both therapy and clinical events. These costs and outcomes, in quality-adjusted life-years (QALYs), can be compared between strategies to determine the most cost-effective strategy. The following sections will give a detailed description of the model structure, data inputs and methods of analysis, and will then provide base case results and sensitivity analyses and discussion of these results.
Methods
Model description
Model overview
A Markov patient-level simulation was developed in TreeAge version 2014 (TreeAge Software, Inc., Williamstown, MA, USA) to estimate the cost-effectiveness of the use of a decision rule compared with treating no-one (usual care) in patients with a first unprovoked VTE event. In patients no longer receiving therapy, the clinical decision rule used a threshold risk of recurrent VTE in 1 year to make a decision about return to therapy as follows:
-
If the post D-dimer model gives a predicted probability of recurrence equal to or above the threshold, an individual should have their therapy resumed.
-
If the post D-dimer model gives a predicted probability of recurrence less than the threshold, an individual should remain off therapy
The comparators for the treat no-one strategy were decision rules using threshold risks of 1%, 3%, 5%, 10%, 15% and a strategy where everyone restarts therapy (0% threshold). The decision rule used the risk of recurrent VTE at 1 year provided by the post D-dimer model described in detail in Chapter 4, Final model: post D-dimer model.
A Markov model is the most appropriate model type for this decision problem as the model can represent a clinical situation where patients change health states or experience recurrent events over a long period of time. A patient-level simulation was chosen instead of a cohort model. This allowed individual patients to be created, using data on existing patients where a number of characteristics could vary, with the model predicting individual VTE risks. Model results represent the mean costs and QALYs for a realistic patient population. This is in contrast to running the model for a hypothetical cohort of patients. The model was run for 50,000 simulated patients and had a time cycle of 1 month. The number of simulated patients was determined to be sufficiently large to reduce the variability in the model results. A time cycle of 1 month was chosen as it was agreed through clinical consensus that it is a short enough period of time to allow an assumption of only one clinical event occurring within a time cycle. The base-case analysis used a lifetime time horizon and the evaluation was conducted from a UK NHS/Personal Social Services perspective, to take into account health-care costs and longer-term care costs of recurrent VTE and major bleeds. Costs, utilities and clinical probabilities were converted into monthly equivalents in accordance with the time cycle length.
Model population
Individuals were created from the patient-level data previously used to develop the post D-dimer model (RVTEC database). The patient population consisted of patients aged ≥ 18 years with a first unprovoked VTE, having completed at least 3 months of anticoagulation for the unprovoked VTE. The patient-level data contained information on age, sex, type of index VTE event (distal DVT, proximal DVT and PE) and post-warfarin D-dimer level. Further details on this data set can be found in Chapter 4, Results I: summary characteristics of available data sets.
In order to align the economic model with the post D-dimer model developed in Chapter 4, Results III: development and validation of post D-dimer model, the starting point of the economic model is defined as the point where a patient had received at least three months of anticoagulation therapy after suffering their first unprovoked VTE. The model assumed all individuals entered the model with their D-dimer measured 30 days after stopping their anticoagulation (known as the ‘lag time’ in the post D-dimer model). At model entry, the characteristics of an individual patient were determined by randomly sampling from the patient-level data11 using a uniform distribution. Sex was sampled first, and once this was determined, age was sampled from a sex-specific age distribution, again from the patient level data. D-dimer and site of index VTE were sampled independently of age and sex as no clear relationship was observed in the data set (see Table 9 and Figure 63). After an individual’s characteristics were determined, the risk of a recurrent VTE in 1 year was estimated by entering these characteristics into the risk equation taken from the post D-dimer model. Table 36 contains summary statistics of the patient-level data, which contained information on 1200 patients. Graphical representations of the distributions used for age and D-dimer can be found in Figures 48 and 54 in Appendix 4.
| Predictor | Summary statistics | |
|---|---|---|
| Continuous | Mean (SD) | Median |
| Age | 61.70 (15.21) | 63.59 |
| D-dimer | 667.29 (751.27) | 417.5 |
| Categorical | % (n) | |
| Sex | ||
| Male | 61.8 (741) | |
| Site of index event | ||
| Distal DVT | 9.2 (110) | |
| Proximal DVT | 58.5 (702) | |
| PE | 32.3 (388) | |
Model pathways and clinical events
In the clinical decision rule strategy, a specific threshold risk was chosen (1%, 3%, 5%, 10% or 15%), then the decision rule was applied. If the patient had a first year risk of a VTE event equal to or higher than the specified threshold risk, it was assumed they resume therapy, otherwise they continued without further therapy. The clinical decision rule was only assumed to be applied at this point in the model. In the comparator with no decision rule, individuals remained off therapy. Once the clinical decision rule was applied, all individuals had the same potential patient pathways, with probabilities of events, costs and utilities determined by their characteristics.
Figure 44 shows the potential patient pathways each simulated individual could progress along, irrespective of whether the clinical decision rule dictated they resumed therapy or remained off therapy. Given the very low probability of more than one clinical event occurring in a month, it was assumed that only one clinical event could occur per time cycle. In 1 month, an individual has a probability of experiencing a clinical event: death from other causes, recurrent VTE (distal or proximal DVT, fatal or non-fatal PE), or fatal or non-fatal major bleed [intracranial bleed, gastrointestinal (GI) bleed, other bleed]. The following describes the details for each possible event.
FIGURE 44.
Model patient pathways.

An individual patient could die from other causes, with other-cause mortality dependent on the current age and sex of the patient. Patients had a risk of a recurrent VTE, with risk determined by the patient’s characteristics, whether or not they had already suffered a recurrent event, length of time since entering the model and whether or not the patient was on anticoagulant therapy. If the patient had a recurrent VTE, this could be a PE, proximal DVT or distal DVT. It was assumed that the type of recurrent VTE was influenced by the patient’s index VTE location. For example, a patient with an index PE had a higher probability of having a further PE that a patient who had index DVT. If the patient suffered a PE, there was a risk the PE was fatal, whereas a DVT alone was assumed not to be fatal. Once a recurrent VTE occurred, an individual was put on lifelong therapy if they were not already on therapy. All VTE events incurred an acute cost of therapy. Surviving patients were assumed to suffer a one-off reduction of quality of life, and a proportion of patients were also assumed to suffer from PTS and had quality of life reduced for life.
An individual was also at risk of a major bleed. The risk of a major bleed depended on age and whether or not the patient was on therapy, and bleeds were split into GI bleeds, intracranial bleeds and other major bleeds. Each of the major bleeds had a risk of death and was associated with acute costs and a short-term reduction in quality of life. An intracranial bleed was assumed to have ongoing health-care costs and a permanent reduction in quality of life. For the purposes of the model and in order to assign costs and utilities, an ‘other major bleed’ was assumed to have the same cost and quality-of-life reduction as a GI bleed. If the patient was on anticoagulation therapy, any bleed led to immediate cessation of therapy. If they suffered a recurrent VTE in a subsequent cycle, they were put back on therapy.
Model parameters
Clinical parameters
This section outlines the sources used to populate the base-case parameters in the model and any related assumptions. Parameter estimates are presented in Table 37. The model assumes the base-case anticoagulation therapy is warfarin. The base-case analysis considers warfarin as the therapy of choice, with newer anticoagulant therapies [dabigatran (Pradaxa®, Boehringer Ingelheim), rivaroxaban] explored in the sensitivity analysis.
| Clinical parameter (distribution type) | Estimate (distribution) | Source |
|---|---|---|
| Annual risk of recurrent VTE off therapy | Calculated using the post D-dimer model | See Chapter 4, Final model: post D-dimer model |
| Annual risk of recurrent VTE on therapy (anticoagulation) (beta) | 1.3% (α = 8, β = 594) | Romualdi 201143 |
| Long-term annual risk of VTE recurrence beyond 3 years (beta) | ||
| Off therapy | 5.0% (α = 5, β = 95) | Palareti 200266 |
| On therapy | 1.3% (α = 8, β = 594) | Romualdi 201143 |
| Annual risk of further VTE off therapy after previous recurrent VTE (beta) | ||
| Off therapy | 12.0% (α = 11, β = 81) | Shrivastava 200662 |
| On therapy | 5.0% (α = 5, β = 95) | |
| Probability a recurrent VTE is a PE by index event (beta) | ||
| Index event DVT | 0.15 (α = 15, β = 88) | RVTEC data set11 |
| Index event PE | 0.48 (α = 28, β = 30) | |
| Probability of death from PE (first month) (beta) | 0.2 (α = 2, β = 8) | Clinical consensus |
| Proportion of recurrent VTE resulting in severe PTS (beta) | 1.1% (α = 4, β = 345) | Chitsike 201291 |
| Annual risk of major bleed by age group (beta) | ||
| Not on therapy | 0.45% (α = 25, β = 5593) | Castellucci 201492 |
| On therapy aged | Eikelboom 201193 | |
| < 65 years | 2.43% (α = 23, β = 929) | |
| 65–74 years | 3.25% (α = 86, β = 2554) | |
| 75+ years | 4.37% (α = 106, β = 2324) | |
| Split of major bleeds by bleed type (Dirichlet) | ||
| GI | 36.5% | RIETE database94 |
| Intracranial haemorrhage | 17.9% | |
| Other major bleed | 45.6% | |
| (α1; α2; α3) = (499; 245; 622) | ||
| Risk of death from major bleed (first month) (beta) | ||
| GI | 18.4% (α = 92, β = 407) | RIETE database94 |
| Intracranial haemorrhage | 32.2% (α = 79, β = 166) | |
| Other major bleeds | 10.5% (α = 65, β = 557) | |
| Standardised mortality ratio for after an intracranial bleed (log-normal)a | 2.2 (95% CI 2.0 to 2.4) | Fogelholm 200595 |
The initial off-therapy risk of a recurrent VTE was calculated using the information on simulated patient characteristics which were then entered into the post D-dimer model. Risks were estimated for 6 months, 1 year, 2 years and 3 years post D-dimer measurement 30 days after initial therapy cessation. Beyond 3 years, the post D-dimer model was considered to have weak calibration statistics and therefore was not used; rather an annual risk of 5% for recurrent VTE off therapy was assumed for all patients after 3 years. This value was taken from a cohort study of patients who had discontinued anticoagulation, using incidence data from patients who had stopped therapy for more than a year. 66 The risk of a VTE on therapy was assumed to be 1.3%, taken from a trial of long-term therapy with rivaroxaban after VTE. 43 For those individuals who had a recurrent VTE event within the model, the risk of a further VTE was taken from the Prevention of Recurrent Venous Thromboembolism (PREVENT) trial, which considered low-intensity warfarin and placebo, and reported recurrence rates with normal and elevated D-dimer in those with two or more prior VTE. 62 The risk of VTE recurrence was estimated as 12% if off therapy and 5% if on therapy, with risks assumed to be between those values for patients with normal and elevated D-dimer. On-therapy VTE risks were assumed to be applicable for warfarin, dabigatran and rivaroxaban. The RVTEC data set11 provided the probabilities on the type of recurrent VTE event by index event, with a probability of 0.4828 for a PE after an index PE and a probability of 0.1456 for a PE after an index DVT. The risk of death from a PE was estimated by clinical consensus and was assumed to be 20% for the base case, with a higher estimate of 30% to be used in the sensitivity analysis. It was assumed that a proportion (1.1%) of patients who suffered a recurrent VTE would develop severe PTS and have a reduced quality of life, and these data were obtained from a study of patients on subtherapeutic warfarin after a first idiopathic VTE. 91
The model assumes that all patients have an age-related risk of major bleeding on and off therapy, with a greater risk on anticoagulation therapy which increases with age. The bleeding risk for patients with a first unprovoked VTE not receiving anticoagulant therapy (0.45%) was taken from a systematic review and meta-analysis of patients who had completed anticoagulant therapy for secondary prevention of VTE. 92 The bleeding risk for those on warfarin by age category is taken from the warfarin arm of the Randomized Evaluation of Long-Term Anticoagulation Therapy (RE-LY) trial which compares warfarin with dabigatran for atrial fibrillation. 93 Bleeding was assumed to increase with age from 2.43% if aged < 65 years to 3.25% for those aged 65–74 years and 4.37% if aged ≥ 75 years. Major bleeds were split into GI bleeds, intracranial bleeds and other major bleeds, with the split between types of bleed 36.5%, 17.9% and 45.6% respectively. All bleeds had a risk of being fatal and the risk of death from each type of bleed in the first month after the bleed was 18.4%, 32.2% and 10.5% respectively. Data on bleeds were obtained from a Spanish registry of patients who have suffered a first VTE. 94 Once an individual suffered a non-fatal intracranial bleed, it was assumed that they had an increased risk of death for the rest of their life, and a standardised mortality ratio of 2.2 was applied, taken from a study looking at long-term survival after an intracerebral haemorrhage. 95 All clinical parameter estimates and their sources are presented in Table 37.
Resource use and costs
The model included costs of therapy (drugs and monitoring) and acute costs for clinical events and long-term costs for intracerebral haemorrhage. Base-case anticoagulation costs included warfarin tablets, assuming an average dose of 4 mg of warfarin per day and INR monitoring. In the sensitivity analysis, dabigatran and rivaroxaban were explored as therapy options. All drug costs were obtained from the British National Formulary. 96 Monitoring was only assumed for warfarin and annual INR test costs were obtained from the economic modelling in a National Institute for Health and Care Excellence (NICE) technology appraisal for dabigatran in the treatment of VTE. 97
One-off acute care costs for DVT and PE, GI bleeds and other major bleeds were obtained from NHS reference costs,98 with costs for DVT and PE calculated as a weighted cost taking into account all Healthcare Resource Group categories for these events. The cost for other bleeds was assumed to be the same as the cost of a GI bleed, due to the huge amount of heterogeneity in the other bleeds category. This assumption was agreed through clinical consensus. Intracranial bleeds were assigned an acute cost and it was assumed that a non-fatal intracranial bleed would lead to lifelong health-care costs. The source of both costs was a study reporting costs of all types of stroke. 99 All unit costs were updated to 2012/13 prices using the Hospital and Community Health Services index100 and are presented in Table 38.
| Parameter | Value (£) | Source |
|---|---|---|
| PE | 1519 | NHS Reference Costs 2012–2013 98 |
| Distal DVT | 732 | NHS Reference Costs 2012–2013 98 |
| Proximal DVT | 732 | NHS Reference Costs 2012–2013 98 |
| Warfarin monitoring (12 months) | 337 | NICE 201497 |
| Warfarin (4 mg per day, 12 months) | 22.29 | BNF 201496 |
| Rivaroxaban (20 mg per day, 12 months) | 767 | BNF 201496 |
| Dabigatran (150 mg twice daily, 12 months) | 803 | BNF 201496 |
| GI bleed | 1092 | NHS Reference Costs 2012–2013 98 |
| Other major bleed | 1092 | Assumed same as GI bleed |
| Intracranial bleed: acute cost | 8350 | Luengo-Fernandez 201299 |
| (Gamma distribution) | (α = 30.99, λ = 0.0037) | |
| Intracranial bleed: annual cost | 1300 | Luengo-Fernandez 201299 |
Estimation of quality-adjusted life-years
Utility values were required for all possible health states and clinical events, and were combined with information on survival in order to calculate QALYs. The initial post-index VTE health state was assumed to have a utility value related to the age of each individual as they enter the model using European Quality of Life-5 Dimensions UK normative values. 101 As individuals age within the model, their utility score changes to reflect the score for that age range (Table 39).
| Age range (years) | Mean utility score |
|---|---|
| > 25 | 0.94 |
| 25–34 | 0.93 |
| 35–44 | 0.91 |
| 45–54 | 0.85 |
| 55–64 | 0.80 |
| 65–74 | 0.78 |
| ≥ 75 | 0.73 |
Therapy with warfarin was associated with a very small disutility of 0.997102 (applied multiplicatively). DVTs and non-fatal PEs were assumed to reduce quality of life for a month then patients returned to their previous utility level. Non-fatal intracranial bleeds and PTS were assumed to reduce quality of life for the rest of the patient’s lifetime. GI bleeds and other major bleeds reduced quality of life for 2 weeks after the event and the same level of disutility was assumed. Median utility values and their interquartile range for a DVT, PE, GI bleed, intracranial bleeds and PTS are taken from Locadia et al. ,103 who used the time trade-off method to elicit utility weights from a 124 participants who had been affected by a VTE, major bleeding event or PTS. All utility values were applied to the age-related utility multiplicatively. For example, for an individual aged between 55 and 64 years (utility value 0.80), PTS would reduce their utility to a value of 0.66 (0.80 × 0.82 = 0.66). Utility values and their sources can be found in Table 40. In addition to event-specific mortality, other-cause mortality was also included in the model, dependent on the current age and sex of the patient, and the risk of death was taken from UK life tables. 104
| Health state/clinical event | Utility value, median (IQR) | Beta distribution | Duration of disutility | Source |
|---|---|---|---|---|
| DVT | 0.84 (0.64–0.98) | α = 2.00, β = 0.60 | 1 month | Locadia 2004103 |
| PE | 0.63 (0.36–0.86) | α = 1.15, β = 0.79 | 1 month | Locadia 2004103 |
| Non-fatal intracranial bleed | 0.33 (0.14–0.53) | α = 1.17, β = 2.06 | Permanent | Locadia 2004103 |
| GI bleed | 0.65 (0.49–0.86) | α = 1.22, β = 0.78 | 2 weeks | Locadia 2004103 |
| Other bleeds | 0.65 (0.49–0.86) | α = 1.22, β = 0.78 | 2 weeks | Assumed same as GI bleeds |
| PTS | 0.82 (0.66–0.97) | α = 3.03, β = 0.89 | Permanent | Locadia 2004103 |
| Warfarina | 0.997 (0.95–1.0)a | α = 16.43, β = 0.26 | Treatment length | Gage 1996102 |
| Dead | 0 | Permanent | Assumption |
Assessment of cost-effectiveness
The incremental analysis was designed to generate the cost per additional QALY gained for opting to use the clinical decision rule versus using treat no-one (usual care). The comparators for the treat no-one strategy were decision rules using threshold risks of 1%, 3%, 5%, 10%, 15% and a strategy where everyone restarts therapy. In addition, a range of values for the threshold VTE risk was applied in order to determine the lowest risk at which using a decision rule to determine resumption of therapy was cost-effective. The standard approach of ordering strategies from lowest to highest cost and comparing each strategy to the next best strategy (rather than no therapy) is not appropriate in this context. Here, the analysis seeks to estimate the cost-effectiveness of different possible decision rules when compared with no therapy rather than compare each strategy incrementally. Cost-effectiveness was assessed in relation to the NICE lower threshold of £20,000 per QALY gained, where a value of £20,000 per QALY is deemed to be cost-effective. 105 All costs and outcomes are discounted by 3.5%.
Sensitivity analysis
Additional model runs were undertaken to determine the impact of changing key parameters on the model results. The parameters where the incremental cost-effectiveness ratio (ICER) was demonstrated to be particularly sensitive to change were explored in more detail. The following analyses were undertaken:
-
The time horizon was restricted to 3 years, 5 years and 10 years.
-
The cost of warfarin monitoring was reduced by 50% and increased by 100%. The rationale behind this analysis was that the costs of monitoring vary widely, depending on the model of care, with secondary care monitoring having a lower cost than the primary care near-patient testing model.
-
The disutility from warfarin therapy was changed from 0.997 to 0.95, representing greater disutility. The model was also run with an assumption of no disutility. These alternative values were used to reflect the variability in patient disutility from being on warfarin.
-
The cost-effectiveness of the decision rule strategies assuming the use of newer anticoagulants, dabigatran and rivaroxaban were explored. They were assumed to have the same effectiveness and same impact on bleeds as warfarin, but the cost of the drug was changed and the cost of monitoring was removed. In addition, there was assumed to be no disutility on these newer anticoagulants due to no requirements for regular monitoring.
-
Alternative values for utility losses due to VTE and bleeding events were used, obtained from an alternative source. 106 These values were from a cohort study measuring quality of life in acute DVT, acute PE and with bleeding complications using standard gamble methods. The alternative values were 0.81 for a DVT for 1 month, 0.75 for a PE for 1 month, 0.65 for a GI bleed for 1 week and 0.15 for a major intracranial bleed for patient lifetime.
-
The disutility from PTS was changed from 0.82 to 0.93107 to reflect the uncertainty around this value in the literature.
-
The proportion of patients who could suffer from severe PTS after a recurrent VTE was increased from 1.1% to 10%, again to reflect uncertainty around this parameter.
-
As there was uncertainty within the group of clinical experts on the study concerning the assumption of the probability of death from a PE, this was increased from 20% to 30%.
-
As the base-case model was concerned with a broad patient population, across a wide age range, a subgroup analysis was undertaken to consider the cost-effectiveness of using a decision rule in those aged ≥ 60 years, where risk of bleeding on therapy would be higher.
-
Subgroup analyses were undertaken for index PE patients and index DVT patients, to determine whether a lower or higher threshold risk may be more appropriate for these patient groups.
Where available, data were entered into the model as distributions in order to fully incorporate the uncertainty around parameter values in order that a probabilistic sensitivity analysis (PSA) could be undertaken. Risks and probabilities were entered as beta distributions. A log-normal distribution was used for the standardised mortality ratio for an intracranial bleed and a gamma distribution was used for the cost of an acute intracranial bleed. The split between different types of major bleed was represented as a Dirichlet distribution. The PSA was run with 10,000 simulations for each trial of 1000 simulated patients and cost-effectiveness planes and acceptability curves were produced for the base-case analysis.
Summary of economic modelling assumptions
The following assumptions were made during the economic evaluation:
-
Patients have received at least 3 months anticoagulation and had their D-dimer measured 1 month after stopping therapy before their risk of recurrent VTE is assessed at the starting point of the model.
-
An individual VTE risk can be correctly predicted for the first 3 years, using the post D-dimer model. Beyond 3 years, a constant risk of recurrent VTE is assumed.
-
Patients are put on lifelong therapy if they suffer a further VTE event.
-
The type of recurrent event is influenced by their first event, with a PE more likely to be followed by another PE.
-
A proportion of those suffering a recurrent VTE will develop PTS and their quality of life will be reduced.
-
Recurrent DVT is not fatal; however, a PE can be fatal.
-
All bleeds result in a loss of quality of life, with short-term disutility for PE, DVT, GI bleeds and other bleeds, and permanent disutility for intracranial bleeds.
-
Other bleeds are assigned the same cost as GI bleeds and have the same acute cost.
-
If a patient has a major bleed, they cease anticoagulation until they have a current VTE.
-
Only one clinical event can occur in a 1-month time cycle.
-
Newer anticoagulants, explored in the sensitivity analysis, were assumed to be effective as warfarin in preventing recurrence of VTE and the same risk of major bleeding, but had no disutility due to the absence of regular monitoring.
Results
This section presents the results of the base-case analyses and a series of sensitivity analyses for the use of a clinical decision rule for resumption of anticoagulation in patients with first unprovoked VTE. The sensitivity analyses explored the impact of changing parameter values and assumptions within the model.
Base-case analysis (warfarin)
The base-case analyses considered the use of a clinical decision rule for resuming therapy, assuming the use of warfarin, using different possible thresholds for risk of recurrence compared with a baseline strategy of treating no-one, over a lifetime time horizon. Table 41 shows the results for recurrence thresholds of 1%, 3%, 5%, 10% and 15%, plus treat all (0% threshold). All options with a threshold of 3% or higher resulted in greater QALYs and increased costs compared with treating no-one. A threshold of 1% and the treat all strategy had higher costs and lower QALYs, and were therefore dominated by the treat no-one strategy. Comparing thresholds of 3% and 5% with no therapy resulted in ICERs > £20,000 per QALY gained, indicating that using these risk thresholds in a decision rule would not be cost-effective if the health service was not willing to pay more than £20,000 per QALY. Using either a 10% or 15% risk threshold in a decision rule could be considered cost-effective, with ICERs of £11,624 and £4616 per QALY gained respectively. The 10% threshold results in the greatest QALY gain of all the options (0.0525); however, the 15% threshold has the lower ICER due to the smallest incremental cost of £228.
| Strategy | Mean cost (£) | Mean QALYs | Cost difference (£) | QALY difference | ICER (cost/QALY)(£) |
|---|---|---|---|---|---|
| Treat no-one | 3228 | 10.4751 | |||
| Decision rule: 15% | 3456 | 10.5244 | 228 | 0.0493 | 4616 |
| Decision rule: 10% | 3838 | 10.5276 | 610 | 0.0525 | 11,624 |
| Decision rule: 5% | 4818 | 10.4947 | 1590 | 0.0195 | 81,340 |
| Decision rule: 3% | 5303 | 10.4612 | 2075 | –0.0139 | Dominated |
| Decision rule: 1% | 5644 | 10.4323 | 2416 | –0.0428 | Dominated |
| Treat all | 5738 | 10.4223 | 2510 | –0.0528 | Dominated |
Table 42 presents the results for risk thresholds between 5% and 10%. This is to determine, compared only to no therapy, what is the lowest threshold risk for the decision rule to be considered cost-effective at £20,000 per QALY gained. The lowest threshold appears to be about 8%, with an ICER of £18,514 per QALY gained.
| Strategy | Mean cost (£) | Mean QALYs | ICER (cost/QALY) (£) compared with treat no-one |
|---|---|---|---|
| Treat no-one | 3228 | 10.4751 | |
| Decision rule: 15% | 3456 | 10.5244 | 4616 |
| Decision rule: 10% | 3838 | 10.5276 | 11,624 |
| Decision rule: 9% | 3971 | 10.5241 | 15,175 |
| Decision rule: 8% | 4143 | 10.5246 | 18,514 |
| Decision rule: 7% | 4351 | 10.5156 | 27,755 |
| Decision rule: 6% | 4575 | 10.5012 | 51,585 |
| Decision rule: 5% | 4818 | 10.4947 | 81,340 |
The results of the PSA for decision rules with 8%, 10% and 15% thresholds are shown in the cost-effectiveness plane in Figure 45 and cost-effectiveness acceptability curve in Figure 46. The cost-effectiveness plane shows the large amount of uncertainty in the QALY differences for all strategies. Most of the cost–QALY difference points show all strategies to be more costly than treating no-one; however, many of the points on the plane are in the area which indicates that a strategy is more expensive and less effective. At a willingness-to-pay threshold of £20,000 per QALY gained, the 15% threshold strategy has a 58% probability of being cost-effective. This drops to 40% for the 10% threshold and 31% for the 8% threshold. These results demonstrate that the model is very sensitive and there is a large amount of uncertainty around the ICERs. Therefore, although the calculated ICERs for all three strategies appear to suggest cost-effectiveness, there should be caution in adopting any of the strategies, due to the uncertainty around the results.
FIGURE 45.
Cost-effectiveness plane of cost–QALY difference pairs for 15%, 10% and 8% threshold strategies vs. treat no-one.

FIGURE 46.
Cost-effectiveness acceptability curve of 15%, 10% and 8% threshold strategies vs. treat no-one.
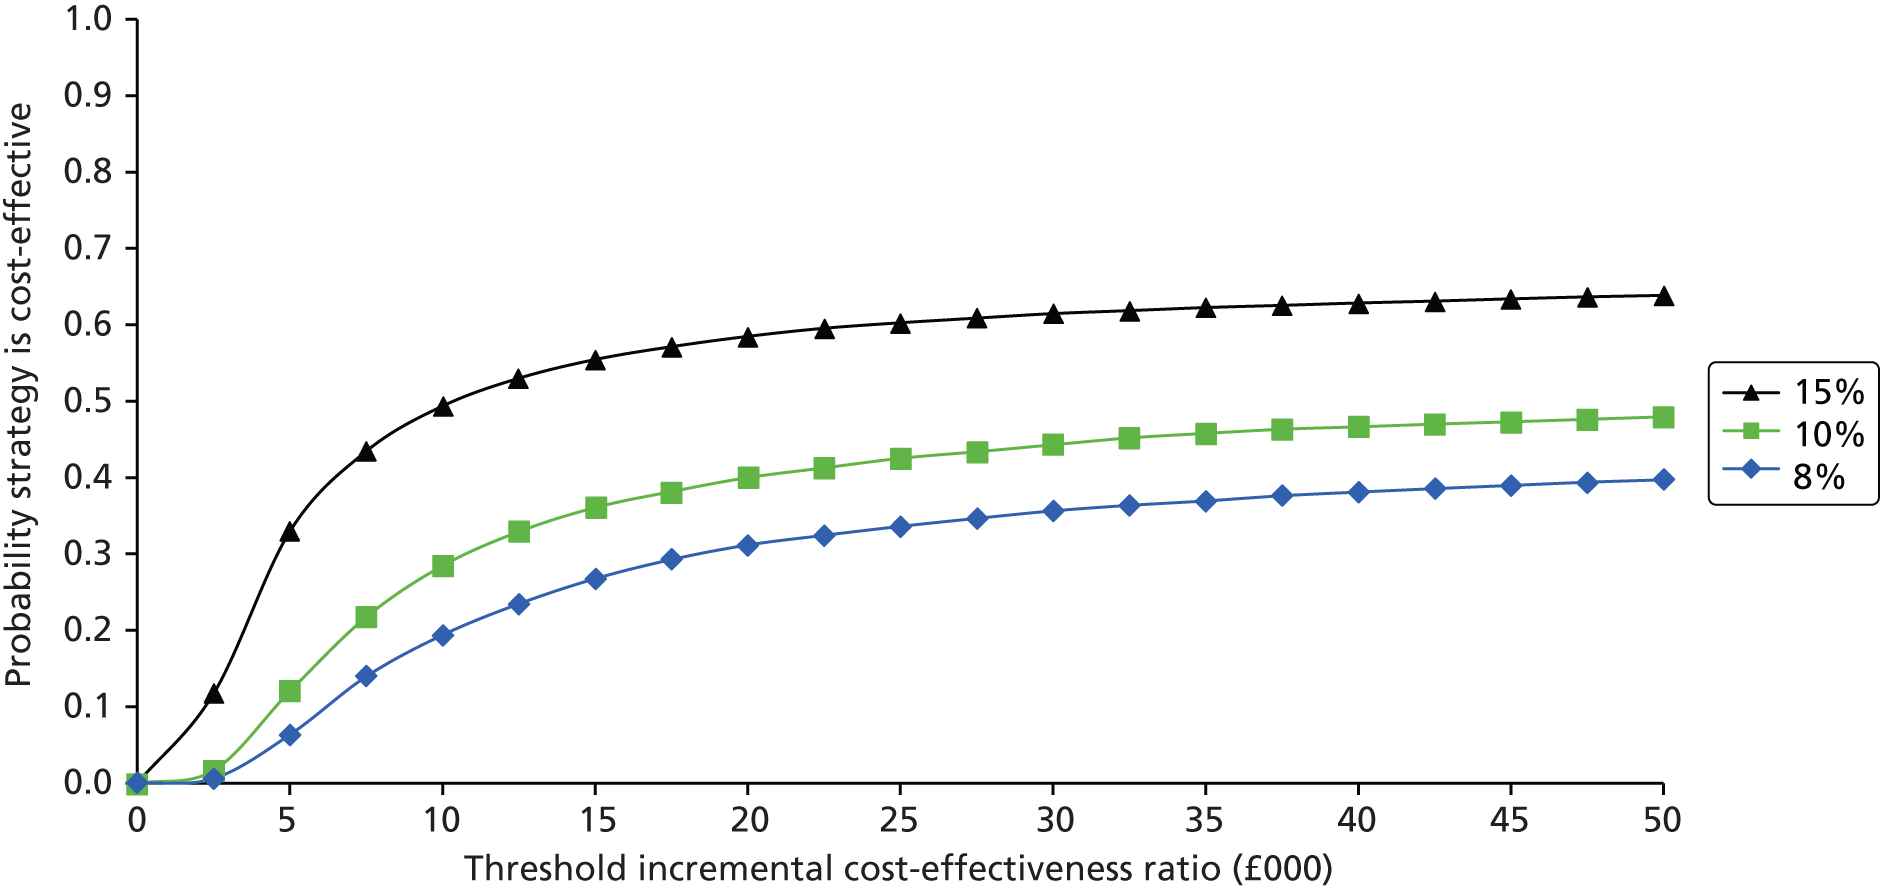
Sensitivity analysis
This section presents the results of the sensitivity analysis conducted on the base-case parameter estimates and assumptions. All analyses were run for the same threshold risk estimates as the base case.
Time horizon restricted to 3, 5 and 10 years
In order to determine the impact of a decision rule over a shorter time horizon, the model was run for time horizons of 3, 5 and 10 years. In particular, 3 years was the length of time the post D-dimer model could provide predicted recurrence estimates with good calibration statistics (see Model validation in the internal–external cross-validation cycles). The results, shown in Tables 43–45, show all ICERs were larger for the shorter time horizons than the lifetime time horizon. The 15% threshold strategy could be considered be cost-effective within 3 years; however, the 10% threshold strategy is no longer cost-effective, although is close to the £20,000 per QALY threshold by 10 years.
| Strategy | Mean cost (£) | Mean QALYs | ICER (cost/QALY) (£) compared with treat no-one |
|---|---|---|---|
| Treat no-one | 366 | 2.2027 | |
| Decision rule: 15% | 423 | 2.2074 | 12,162 |
| Decision rule: 10% | 544 | 2.2082 | 32,504 |
| Decision rule: 5% | 877 | 2.2055 | 180,357 |
| Decision rule: 3% | 1053 | 2.2024 | Dominated |
| Decision rule: 1% | 1175 | 2.2001 | Dominated |
| Treat all | 1211 | 2.1992 | Dominated |
| Strategy | Mean cost (£) | Mean QALYs | ICER (cost/QALY) (£) compared with treat no-one |
|---|---|---|---|
| Treat no-one | 620 | 3.4538 | |
| Decision rule: 15% | 712 | 3.4615 | 11,919 |
| Decision rule: 10% | 897 | 3.4620 | 33,574 |
| Decision rule: 5% | 1398 | 3.4548 | 772,271 |
| Decision rule: 3% | 1660 | 3.4509 | Dominated |
| Decision rule: 1% | 1834 | 3.4462 | Dominated |
| Treat all | 1883 | 3.4448 | Dominated |
| Strategy | Mean cost (£) | Mean QALYs | ICER (cost/QALY) (£) compared with treat no-one |
|---|---|---|---|
| Treat no-one | 1278 | 5.9348 | |
| Decision rule: 15% | 1441 | 5.9523 | 9307 |
| Decision rule: 10% | 1721 | 5.9555 | 21,451 |
| Decision rule: 5% | 2485 | 5.9401 | 227,988 |
| Decision rule: 3% | 2872 | 5.9245 | Dominated |
| Decision rule: 1% | 3138 | 5.9131 | Dominated |
| Treat all | 3207 | 5.9098 | Dominated |
Cost of warfarin monitoring
The model was run with scenarios where the cost of warfarin monitoring was doubled and where the cost was halved. For the a higher cost of monitoring, the 15% threshold strategy remained potentially cost-effective at £9830 per QALY gained, but the ICER for the 10% threshold strategy increased to £23,597 per QALY gained, above the threshold for cost-effectiveness (Table 46). Lowering the cost of monitoring resulted in lower ICERs for the 15% and 10% threshold strategies, thus becoming more cost-effective. However, the 5% threshold strategy, with an ICER of £42,066 per QALY, was still not a cost-effective option (Table 47).
| Strategy | Mean cost (£) | Mean QALYs | ICER (cost/QALY) (£) compared with treat no-one |
|---|---|---|---|
| Treat no-one | 5009 | 10.4751 | |
| Decision rule: 15% | 5493 | 10.5244 | 9830 |
| Decision rule: 10% | 6247 | 10.5276 | 23,597 |
| Decision rule: 5% | 8134 | 10.4947 | 159,887 |
| Decision rule: 3% | 9045 | 10.4612 | Dominated |
| Decision rule: 1% | 9674 | 10.4323 | Dominated |
| Treat all | 9844 | 10.4223 | Dominated |
| Strategy | Mean cost (£) | Mean QALYs | ICER (cost/QALY) (£) compared with treat no-one |
|---|---|---|---|
| Treat no-one | 2338 | 10.4751 | |
| Decision rule: 15% | 2437 | 10.5244 | 2009 |
| Decision rule: 10% | 2634 | 10.5276 | 5637 |
| Decision rule: 5% | 3160 | 10.4947 | 42,066 |
| Decision rule: 3% | 3432 | 10.4612 | Dominated |
| Decision rule: 1% | 3629 | 10.4323 | Dominated |
| Treat all | 3685 | 10.4223 | Dominated |
Disutility of warfarin
Tables 48 and 49 present the results of changing the disutility on warfarin. It is evident the model is sensitive to this variable, with only the 15% threshold decision rule that could be considered cost-effective if there is a greater disutility of 0.95, with all other options dominated by no therapy. However, if there is no disutility, then all ICERs decrease; however, the 15% and 10% threshold strategies still remain the only potentially cost-effective options at the £20,000 per QALY willingness-to-pay threshold.
| Strategy | Mean cost (£) | Mean QALYs | ICER (cost/QALY) (£) compared with treat no-one |
|---|---|---|---|
| Treat no-one | 3228 | 10.2937 | |
| Decision rule: 15% | 3456 | 10.3155 | 10,425 |
| Decision rule: 10% | 3838 | 10.2795 | Dominated |
| Decision rule: 5% | 4818 | 10.1525 | Dominated |
| Decision rule: 3% | 5303 | 10.0757 | Dominated |
| Decision rule: 1% | 5644 | 10.0174 | Dominated |
| Treat all | 5738 | 9.9996 | Dominated |
| Strategy | Mean cost (£) | Mean QALYs | ICER (cost/QALY) (£) compared with treat no-one |
|---|---|---|---|
| Treat no-one | 3228 | 10.4867 | |
| Decision rule: 15% | 3456 | 10.5378 | 4458 |
| Decision rule: 10% | 3838 | 10.5434 | 10,752 |
| Decision rule: 5% | 4818 | 10.5165 | 53,340 |
| Decision rule: 3% | 5303 | 10.4858 | Dominated |
| Decision rule: 1% | 5644 | 10.4588 | Dominated |
| Treat all | 5738 | 10.4493 | Dominated |
Newer anticoagulants
The model was run for the newer anticoagulants rivaroxaban and dabigatran, using their higher drug costs, but assuming the same effectiveness and impact on bleeds, and also assuming they resulted in no disutility for individuals. If patients are treated with either therapy, only a strategy with a threshold of 15% could be considered cost-effective, with all ICERs higher than those for warfarin (Tables 50 and 51). The 10% threshold strategy is no longer cost-effective, with ICERs above the £20,000 per QALY willingness-to-pay threshold.
| Strategy | Mean cost (£) | Mean QALYs | ICER (cost/QALY) (£) compared with treat no-one |
|---|---|---|---|
| Treat no-one | 5242 | 10.4751 | |
| Decision rule: 15% | 5761 | 10.5244 | 10,514 |
| Decision rule: 10% | 6563 | 10.5276 | 25,167 |
| Decision rule: 5% | 8569 | 10.4947 | 170,187 |
| Decision rule: 3% | 9536 | 10.4612 | Dominated |
| Decision rule: 1% | 10,202 | 10.4323 | Dominated |
| Treat all | 10,383 | 10.4223 | Dominated |
| Strategy | Mean cost (£) | Mean QALYs | ICER (cost/QALY) (£) compared with treat no-one |
|---|---|---|---|
| Treat no-one | 5423 | 10.4751 | |
| Decision rule: 15% | 5967 | 10.5244 | 11,043 |
| Decision rule: 10% | 6807 | 10.5276 | 26,382 |
| Decision rule: 5% | 8906 | 10.4947 | 178,158 |
| Decision rule: 3% | 9916 | 10.4612 | Dominated |
| Decision rule: 1% | 10,611 | 10.4323 | Dominated |
| Treat all | 10,800 | 10.4223 | Dominated |
Alternative values for utility losses: all clinical events
Alternative values for utility losses due to VTE and bleeding events were used, as an alternative source for values was available. 106 Results in Table 52 demonstrate that changing values for all types of event does not change the overall result a great deal, rather than just changing values related to therapy.
| Strategy | Mean cost (£) | Mean QALYs | ICER (cost/QALY) (£) compared with treat no-one |
|---|---|---|---|
| Treat no-one | 3228 | 10.4757 | |
| Decision rule: 15% | 3456 | 10.5250 | 4615 |
| Decision rule: 10% | 3838 | 10.5282 | 11,610 |
| Decision rule: 5% | 4818 | 10.4955 | 80,114 |
| Decision rule: 3% | 5303 | 10.4621 | Dominated |
| Decision rule: 1% | 5644 | 10.4334 | Dominated |
| Treat all | 5738 | 10.4234 | Dominated |
Alternative values for utility loss: post-thrombotic syndrome
By lessening the quality-of-life impact of one condition (PTS) the values on mean QALYs for different decision rules all increase; however, the overall results do not differ greatly from the base case (Table 53). This is due to only a small proportion of patients in the model being affected by severe PTS.
| Strategy | Mean cost (£) | Mean QALYs | ICER (cost/QALY) (£) compared with treat no-one |
|---|---|---|---|
| Treat no-one | 3228 | 10.4828 | |
| Decision rule: 15% | 3456 | 10.5309 | 4732 |
| Decision rule: 10% | 3838 | 10.5331 | 12,125 |
| Decision rule: 5% | 4818 | 10.4983 | 102,520 |
| Decision rule: 3% | 5303 | 10.4642 | Dominated |
| Decision rule: 1% | 5644 | 10.4353 | Dominated |
| Treat all | 5738 | 10.4252 | Dominated |
Alternative value for risk of severe post-thrombotic syndrome after recurrent venous thromboembolism
Increasing the risk of severe PTS after a recurrent VTE decreases all ICERs, with no strategies dominated. This demonstrates the positive impact of avoiding VTE and therefore PTS by treating more patients. However, the 15% and 10% threshold strategies still remain the only cost-effective options (Table 54).
| Strategy | Mean cost (£) | Mean QALYs | ICER (cost/QALY) (£) compared with treat no-one |
|---|---|---|---|
| Treat no-one | 3228 | 10.3580 | |
| Decision rule: 15% | 3456 | 10.4270 | 3296 |
| Decision rule: 10% | 3838 | 10.4469 | 6863 |
| Decision rule: 5% | 4819 | 10.4362 | 20,357 |
| Decision rule: 3% | 5304 | 10.4099 | 40,052 |
| Decision rule: 1% | 5644 | 10.3846 | 90,888 |
| Treat all | 5738 | 10.3752 | 146,019 |
Alternative value for risk of death from pulmonary embolism
The model appears to be very sensitive to the risk of death from PE, with the 5% threshold strategy now potentially cost-effective compared with no therapy, with an ICER of £13,979 per QALY gained (Table 55). This demonstrates how sensitive the model is to small changes in risk of death and a greater risk of PE being fatal makes continuing therapy appear to be worthwhile even at a relatively low 1-year risk of VTE.
| Strategy | Mean cost (£) | Mean QALYs | ICER (cost/QALY) (£) compared with treat no-one |
|---|---|---|---|
| Treat no-one | 3115 | 10.2948 | |
| Decision rule: 15% | 3365 | 10.3762 | 3074 |
| Decision rule: 10% | 3765 | 10.4082 | 5742 |
| Decision rule: 5% | 4758 | 10.4124 | 13,979 |
| Decision rule: 3% | 5252 | 10.3905 | 22,349 |
| Decision rule: 1% | 5598 | 10.3661 | 34,843 |
| Treat all | 5691 | 10.3566 | 41,721 |
Subgroup analysis: patients aged ≥ 60 years
A subgroup analysis was undertaken to determine the cost-effectiveness of alternative strategies when considering only a patient population over the age of 60 years, where risks of bleeding are higher. Only data for those aged ≥ 60 years were used from the patient-level data set for simulating individuals for the model. The 15% threshold strategy could still be considered cost-effective, albeit at a higher ICER of £7337 per QALY (Table 56). The 10% threshold strategy was no longer cost-effective and all other strategies were dominated by treating no-one. This highlights the impact of higher bleeding risks which outweigh the risk of recurrent VTE.
| Strategy | Mean cost (£) | Mean QALYs | ICER (cost/QALY) (£) compared with treat no-one |
|---|---|---|---|
| Treat no-one | 2334 | 8.2497 | |
| Decision rule: 15% | 2506 | 8.2714 | 7337 |
| Decision rule: 10% | 2817 | 8.2682 | 20,958 |
| Decision rule: 5% | 3745 | 8.2090 | Dominated |
| Decision rule: 3% | 4256 | 8.1777 | Dominated |
| Decision rule: 1% | 4591 | 8.1550 | Dominated |
| Treat all | 4678 | 8.1469 | Dominated |
Subgroup analysis: modelling index pulmonary embolism and index deep-vein thrombosis patients separately
The model was run for two separate subgroups, to determine whether the cost-effectiveness of the decision rules strategies were different for different index VTE types. If the model is only run for individuals who have an index PE, all strategies are cost-effective compared with treat no-one, even the treat all option (Table 57). This suggests that the risk of further VTE in this subgroup, which has a higher probability of being a PE (with the risk of being fatal), far outweighs any risk of bleeding on therapy. When the model is run for index DVT patients, the only cost-effective strategy is the 15% threshold strategy, with all other options dominated (Table 58). This suggests that the impact of bleeds and the small disutility on warfarin outweighs the short-term impact of a recurrent VTE in most patients.
| Strategy | Mean cost (£) | Mean QALYs | ICER (cost/QALY) (£) compared with treat no-one |
|---|---|---|---|
| Treat no-one | 3247 | 10.1270 | |
| Decision rule: 15% | 3523 | 10.2379 | 2486 |
| Decision rule: 10% | 3959 | 10.2887 | 4403 |
| Decision rule: 5% | 5031 | 10.3153 | 9479 |
| Decision rule: 3% | 5538 | 10.3058 | 12,819 |
| Decision rule: 1% | 5720 | 10.2954 | 14,685 |
| Treat all | 5720 | 10.2954 | 14,685 |
| Strategy | Mean cost (£) | Mean QALYs | ICER (cost/QALY) (£) compared with treat no-one |
|---|---|---|---|
| Treat no-one | 3248 | 10.6534 | |
| Decision rule: 15% | 3459 | 10.6674 | 15,114 |
| Decision rule: 10% | 3834 | 10.6477 | Dominated |
| Decision rule: 5% | 4822 | 10.5743 | Dominated |
| Decision rule: 3% | 5312 | 10.5293 | Dominated |
| Decision rule: 1% | 5658 | 10.4982 | Dominated |
| Treat all | 5750 | 10.4875 | Dominated |
Discussion
Economic modelling was conducted to determine the cost-effectiveness of using a clinical decision rule for resumption of therapy in patients with first unprovoked VTE, using warfarin as the base-case therapy. This is the first economic model to consider the use of a clinical decision rule for extending therapy in this patient group, with the systematic review of economic evidence yielding no previous studies. The results demonstrate that the use of a decision rule with a threshold risk of VTE recurrence, where individuals with a 1-year risk equal to or above approximately 8% are treated, could be considered a cost-effective strategy over the lifetime of a patient. This result holds if this strategy is compared with no therapy and not compared incrementally with other strategies with a higher threshold. It is appropriate for the purpose of this analysis is to look at each strategy individually. The key findings of this chapter are summarised below and in Box 3.
-
Economic modelling can be used to apply a clinical decision rule using a threshold risk of recurrence for lifelong therapy.
-
Results from the economic modelling suggest that a base-case threshold risk of 8% or higher for therapy with warfarin could be considered cost-effective if decision-makers are willing to pay up to £20,000 per QALY gained, if compared with no therapy. However, the results of the PSA show the model is highly sensitive to overall parameter uncertainty.
-
The model is sensitive to changes in utility and mortality estimates that either solely favour the no therapy comparator or a decision rule strategy.
-
Better data are required to predict long-term bleeding risks on therapy in this patient group.
Sensitivity analyses which only consider the strategies of 1%, 3%, 5%, 10% and 15% threshold risk demonstrate that only a decision rule using a 15% threshold could be considered cost-effective with a much shorter time horizon of 3 years. Again, only a decision rule with a threshold of 15% was potentially cost-effective for both newer anticoagulants, although the 10% threshold strategy was between the £20,000 and £30,000 per QALY willingness-to-pay thresholds. This suggests that using a decision rule could still be cost-effective even if a more expensive treatment option is used; however, it is important to note a number of assumptions regarding the newer drugs were included in the model. The base-case results were particularly sensitive to changes in mortality risk or disutility that affect one side of the benefit/risk balance of therapy. If a greater risk of death from PE is assumed, then lower threshold decision rules become cost-effective. Conversely, if there is greater disutility from being on warfarin, only the 15% threshold is likely to be cost-effective, with all other options dominated by treat no-one.
Subgroup analysis demonstrated how sensitive the model was when considering a specific group of patients. When only those aged ≥ 60 years were considered, only the 15% threshold strategy remained potentially cost-effective, demonstrating the impact of increased risk of bleeding on therapy in older people. The impact was even more marked when index DVT and index PE patients were considered separately. This analysis suggested that all PE patients should receive therapy, but only those DVT patients with a predicted 1-year risk of recurrence of 15% or over should be considered for therapy. The PSA results demonstrated the large amount of uncertainty around the model results, with even the 15% threshold strategy only having a 58% probability of being cost-effective at a £20,000 per QALY willingness-to-pay threshold. This uncertainty was primarily due to about half of the cost–QALY difference points on the cost-effectiveness plane showing strategies to be less effective. This result is in line with the results of the deterministic sensitivity analysis, where changes in disutility on therapy and risk of death from PE had the greatest impact.
There are a number of key strengths of this modelling work. First, as stated above, this is the first model to consider this decision problem, so therefore represents a step forward in providing a tool for decision-making, weighing up the risks of recurrent VTE and bleeding in order to determine the optimal therapy strategy. Furthermore, the model is an individual-level simulation, using real patient data, which allows the calculation of risk of recurrence using the post D-dimer model for each hypothetical individual entering the model. This is a more intuitive way of considering this decision problem of this type where risk of recurrence will vary from patient to patient, and is dependent on their baseline characteristics and subsequent clinical events.
The main limitation of this economic modelling is the number of clinical and data assumptions that underpin this model. Key simplifying assumptions are the use of constant risks of recurrent VTE after 3 years, after a further VTE and with therapy. In reality this risk of a recurrent event will vary from individual to individual, and be influenced by age, whether the VTE is unprovoked or provoked and whether or not the individual has an INR within a therapeutic range on warfarin. There is also uncertainty around the outcome of intracranial bleeds in this patient group, with a wide range of possible outcomes, from a mild bleed with a good outcome to a more severe event which leads to a poor quality of life and ongoing care costs. In this model, a more severe bleed has been assumed, thus favouring fewer individuals to be treated with anticoagulation and suggesting a higher threshold risk for the decision rule. The model also required assumptions regarding the use and discontinuation of anticoagulation when a major bleed occurred. In the model it was assumed that a major bleed stopped therapy, which was restarted only if a further VTE occurred. In reality, some patients will have a bleed and continue with their anticoagulation and others will go on to suffer a VTE but not resume therapy as their bleeding risk is too high.
It is evident from the sensitivity analysis that many of these assumptions and data inputs will have a large impact on the direction of the results. Therefore, this work has highlighted that good-quality long-term data are required from patient cohorts with first unprovoked VTE and recurrent VTE, to estimate individual VTE risk beyond 3 years, and also to provide data to predict major bleeds in this patient group, possibly using a prognostic model as utilised here for recurrent VTE. Furthermore, more research is required to determine the short- and long-term impact of VTE, PTS and major bleeds on quality of life.
Chapter 6 Overall discussion
This report has conducted research into the risk of VTE recurrence following cessation of therapy in those patients with a first, unprovoked VTE. Three research strands were undertaken. First, in Chapter 3, a systematic review of existing prognostic models was performed, to examine the quality, content and performance of models currently proposed for identifying those at high recurrence risk. Second, in Chapter 4, a large IPD meta-analysis database was used to develop and externally validate two new prognostic models: a pre D-dimer model (applicable at the exact time when cessation of therapy may begin) and a post D-dimer model (applicable at a particular lag time after cessation of therapy, typically 30 days, at which D-dimer is measured). The post D-dimer model showed good discrimination and calibration performance across trial populations, and so Chapter 5 evaluated the cost-effectiveness of a decision rule based on individual predictions from this model. The key conclusions and limitations of these three research strands are now discussed, followed by clinical recommendations based on our findings and further research requirements.
Systematic review of prognostic models
The extensive systematic review identified three published articles that proposed a prognostic model for risk of VTE recurrence following cessation of therapy in patients with a first unprovoked VTE. These were referred to as the HER DOO 2 model, the DASH score, and the Vienna model. We chose the term ‘unprovoked’ rather than ‘idiopathic’ as this aligns with Baglin et al. 45 who identified low recurrence rates for patients with first provoked VTE rather than including underlying hereditary thrombophilia. Furthermore, after evaluation of the models’ development and validation criteria, all models were labelled with at least a moderate risk of bias. This was mainly due to a lack of any external validation, which is essential as prognostic model performance is known to be optimistic when evaluated on the same data used to develop the model. The HER DOO 2 model development was classed at high risk of bias, as – alongside no external validation – it had methodological concerns, including the choice of analysis model, substantially underpowered analyses, data-driven categorisation of predictors, lack of adjustment for optimism and the presentation of the model for use. The Vienna model and DASH score were more methodologically sound, as they had adequate statistical power to investigate their candidate predictors, accounted for optimism in their selection procedures, assessed continuous predictors without categorisation and loss of information, and presented their proposed models clearly. However, until external validation is performed, the true performance in new populations cannot be ascertained. This is especially important for the Vienna model, which presented internal validation results adjusted for optimism, but it was not clear if the evaluation related to the fitted model, or the nomogram (a potentially simplified version of the model). External validation of the Vienna model is under way. 26
Development and validation of a new prognostic model
As the systematic review identified that existing prognostic models were inconsistent in their definition of an unprovoked VTE, and were at a moderate to high risk of bias due to a lack of external validation, it was important to address this in new research. This project therefore used the IPD meta-analysis database supplied by the RVTEC group to develop and externally validate two new models: a pre D-dimer model and a post D-dimer model.
The RVTEC database contained seven trials57–63 and therefore allowed the novel framework of Debray et al. 65 to be utilised for model development and external validation. This approach adapts the IECV procedure first described by Royston et al. 64 whereby N-1 trials are iteratively selected from the N total trials in the IPD meta-analysis, and the prognostic model is developed within this subset of trials, leaving the remaining trial for validation of the model. In this manner, it was possible to investigate (across all permutations of the excluded trial) whether or not model performance remains consistent when applied in another trial’s population that was not included during model development. In other words, external validation was possible on multiple occasions. The database also contained adequate sample size, with at least 23 events per candidate predictor available, giving ample power to consider non-linear relationships and interaction terms. Although a complete-case analysis was primarily performed, a sensitivity analysis using multiple imputation led to the same set of predictors being included and gave similar parameter estimates in the models.
In all models, the Royston and Parmar72,73 approach was used to flexibly model the baseline hazard using restricted cubic splines. The baseline hazard is essential for individualised predictions from a survival model, and the use of splines allowed the shape to be modelled flexibly, without forcing a particular parametric form. This is likely to improve the performance and generalisability of the developed prognostic models, especially as the shape of the baseline hazard was observed to be very similar across the set of trials in the RVTEC database.
The development of the pre D-dimer model was considered as, in contrast to the post D-dimer scenario, it allows individual risk predictions at the exact time therapy might cease. However, it contained only two predictors: sex and site of index event. On external validation (in the IECV approach using the RVTEC database and also additionally in the MEGA database) the model had poor discrimination with an average c-statistic of 0.58 across the trials. Although calibration appeared good on average, there was heterogeneity in calibration performance across trials and in some it was rather poor (as evident in MEGA). The pre D-dimer model is thus clearly inadequate, which is not surprising given only two predictors were identified as important. Further research is needed to extend the set of included predictors. In particular, it may be that D-dimer measured without a lag time is also a prognostic factor and therefore data sets need to be collected to examine whether or not this adds prognostic value in terms of calibration and discrimination. There are currently three studies known to be ongoing in UK [extended anticoagulation treatment for VTE (ExACT)], Holland (VISTA) and Canada [D-dimer Optimal Duration Study (DODS)], which may provide further information regarding D-dimer testing while still on OAC therapy.
The development of the post D-dimer model allowed the inclusion of D-dimer measured at a particular lag time, along with age, sex and site of index. This model had substantially improved discrimination performance compared to the pre D-dimer model. c-statistics ranged from 0.64 to 0.81 in the IECV cycles, with the average c-statistic of 0.69; other published clinical prediction models have similar discriminatory ability. 87 Calibration of the model again appeared excellent on average across the external validation trials, although there remained heterogeneity. Ideally, further external validation studies would be helpful to examine this heterogeneity further, as it was estimated with large uncertainty in the IECV approach (due to only five external validation trials). Furthermore, the patients included in the RVTEC database were enrolled in clinical trials and thus may not be representative of all populations of interest.
Examining heterogeneity of prognostic model performance across studies and populations is a novel idea; most prognostic models are just considered in one external validation study, or just report the average performance across multiple clusters (e.g. practices, studies). Ideally there would be no heterogeneity, but this is a very high standard to attain and this issue is not even evaluated for other well-used prediction models (such as QRISK®), and was never considered for the DASH, Vienna or HER DOO 2 models for VTE recurrence. The IECV showed that calibration of the post D-dimer model was excellent up to 2 years, on average across the trials. This means that across applicable populations, it is expected the final D-dimer model would perform well on average up to 2 years. Heterogeneity in calibration performance at the individual population level would be reduced if a population-specific baseline hazard were used, rather than our average baseline hazard (or equivalently a population-specific S0(t) rather than our average S0(t) currently in the model). Identifying population-specific baseline survival functions is difficult, however. Heterogeneity might also be reduced by including additional predictors. These areas could be the subject of further work.
One particular area for potential heterogeneity is in the use of various D-dimer assays across the studies in the RVTEC database. There is inherent variability in the different assays used, particularly in the recommended cut-offs used to decide on a normal or abnormal D-dimer result. In the RVTEC database there were five D-dimer assays used, with each study using one assay exclusively (Table 59). This is a potential limitation of the post D-dimer model in that the model was built on data using these five assays to measure patient D-dimer, and therefore predictions from the model in practice may only be valid in cases where one of these assays was used. However, it may also be considered a strength to have used data based on multiple assays, as this enhances the generalisability of the model, making applicable to a wider population. Previous research has investigated the link between variability in D-dimer assays and recurrent VTE and found that various assays do not differ in ability to predict recurrence. 11 It is also not possible to differentiate the study-level assay effect from other study-level covariates, such as location of study or year of study. It is therefore difficult to discern if any assay effect is genuine, as it may be confounded by other study-level covariates. Furthermore, if one included assay in the model, then external validation of the model in the excluded trials would not be possible as most trials used a unique assay. The discrimination of the post D-dimer model was shown to be reasonably consistent, with moderate to good discrimination regardless of the D-dimer assay used in the validation study. Similarly, the calibration performance up to 2 years appears very good in all trials, with generally tiny miscalibration on average and small heterogeneity in calibration across studies. Therefore, by developing a model using all assays, the HR obtained for D-dimer appears to provide reasonably robust predictions in external validation, regardless of the assay available. Finally, a small sensitivity analysis was conducted to crudely assess the impact of differences in the continuous scale of D-dimer assays on the predicted risk of recurrent VTE from the post D-dimer model. Assuming that there could be a potential discrepancy of up to 10% in D-dimer values across assays, the change in predicted risk of recurrence was assessed using example patients with true D-dimer values at the 25th, 50th and 75th percentiles of the distribution of D-dimer values within the RVTEC population. These were varied by 10% either greater or lower and the resulting predicted survival probabilities were plotted over time (see Appendix 7). The results showed very little change in the predictions, certainly not enough to alter a clinical decision on choice of therapy.
| Trial | Palareti57 | Palareti58 | Poli59 | Tait63 | Eichinger60 | Baglin61 | Shrivastava62 |
|---|---|---|---|---|---|---|---|
| D-dimer assay | VIDAS (ELISA) | VIDAS (ELISA) | IL-Test (LIA) | VIDAS (ELISA) | Asserachrom (ELISA) | MDA (LIA) | STA Liatest (ELISA) |
An interesting area for discussion is the observed effect of D-dimer and lag time in the final post D-dimer model. The effect of a patient’s D-dimer score appears to indicate an increase in recurrence rate of around 70% for every 1 ng/ml increase in D-dimer score, with a HR of 1.716 (95% CI 1.43 to 2.06). Conversely, the lag time between cessation of therapy and measurement of patient’s D-dimer appears to decrease recurrence rate by around 20% for every day increase in lag time. This effect appears to be counterintuitive as it may be expected that recurrence rate would increase the longer it takes to measure patients D-dimer and identify those with high D-dimer at greater risk of recurrence. However, the observed effect of lag time may be acting as a proxy for time from cessation of therapy itself, in that the more time which elapses from cessation of therapy the greater chance that patients at higher risk of recurrence will have already had a recurrence, leaving a population of healthier patients.
Given the good discrimination and the excellent average calibration performance demonstrated through external validation, the post D-dimer model would appear suitable for informing patient counselling and clinical decision making at a particular lag time post cessation of therapy. Chapter 4, Using the post D-dimer model to make predictions for new individuals: a detailed illustration of the model in practice detailed how to apply the model in practice, to obtain individual risk predictions for new patients.
In terms of usefulness in clinical practice, it should be noted that the post D-dimer model has important limitations. As anticoagulation significantly lowers D-dimer, measurement of D-dimer in the data set was always performed after some lag time (or wash-out period), to allow the effects of therapy to subside. Therefore the post D-dimer model is only applicable at a set lag time post cessation of therapy, meaning it can be used only after a delay in making the decision on a patient’s therapy. Although this is current practice, with D-dimer recommended to be measured around 30 days after cessation of therapy, there has been some evidence towards the predictive ability of D-dimer on therapy108 and there are several ongoing studies investigating the predictive ability of D-dimer on-therapy. Evidence from the RVTEC database suggests that approximately 58.7% of recurrent events occurred within the 30-day lag time before D-dimer measurement (for the pre D-dimer model data set). Thus, as mentioned above, more clinically useful models might to be derived by extending the pre D-dimer model with other predictors measured without any lag time.
It should be discussed that many may consider an initial distal DVT as a low-risk group of patients, in whom many would not favour prolonged OAC therapy, and that some would chose not to include such a low-risk group within the model development (e.g. the DASH model did not consider such patients). However, this tendency to cease therapy in patients with initial distal DVT has, in this case, been captured within the post D-dimer model through the inclusion of such patients. This means that predictions from the model indicate that in the majority of cases these patients have low predicted risk of recurrence. Subsequently, in practice post D-dimer model predictions would lead to the same decision not to prolong OAC therapy.
A potential limitation of the study is the exclusion of BMI as a candidate predictor due to complete missingness in four of the included studies. Although it was the intention of the study to consider BMI as a potential predictor, it would be inappropriate to impute across studies (due to complete missingness within studies). Selection of the BMI predictor within the model was also not assumed certain, because while there is evidence to suggest that BMI is an important predictor for a first VTE event, there is conflicting evidence for the effect of BMI on VTE recurrence. The systematic review undertaken here (see Chapter 3), identified three models which assessed the impact of predictors in combination on VTE recurrence and could therefore be considered the strongest evidence to date of which predictors affect recurrence risk. Of these three, the Vienna model found BMI to be a weak predictor (1.19 HR per 5 kg/m2 change in BMI) and to be non-significant when adjusted for optimism. 2 The DASH model found BMI to be non-significant at univariate analysis, as did the HER DOO 2 model. 9,41 The HER DOO 2 then went on to split their analysis by sex and only then found BMI to be important in women alone (p-value = 0.02). 9 Eichinger et al. 109 and Heit et al. 110 also provide conflicting evidence suggesting that BMI is a weak risk factor in the order of around 1.2 HR, with borderline 95% CIs. This evidence suggests that BMI may not be a strong consistent predictor of VTE recurrence risk when adjusted for other important predictors including site of index event.
Further limitations concern the use of new/novel oral anticoagulants (NOACs). The studies included in the RVTEC database used primarily warfarin to treat patients first VTE, none of the studies used any of the NOACs. In this regard the model is built on and therefore applicable to patients treated with warfarin. This was a limitation of the available study data, as no studies used NOACs, the effect of these drugs could not be accounted for in the modelling process. However, the economic evaluation did investigate the effect of using NOACs in the economic modelling as a sensitivity analysis which is further discussed below (see also Chapter 5, Sensitivity analysis). In the economic evaluation the effectiveness of the NOACs was assumed to be equal to that of warfarin, whereas the detriments of treatment with NOACs were assumed to be lesser than those associated with warfarin (such as monitoring). If the NOACs can be considered equivalent in efficacy to warfarin then inferences from the model are valid and there would be no requirement for a separate model for patients undergoing NOAC therapy. However, though no new model would be required, the post D-dimer model would need to be further validated in patient populations where NOACs were used.
It must also be noted that while external validation was possible using the IECV approach, it would also be beneficial to undertake external validation in non-trial data sets, and therefore the post D-dimer model could also be considered at moderate risk of bias (see quality assessment defined within Chapter 3), until such external validation is undertaken.
There are also potentially broader uses of the post D-dimer model, as prognostic models are useful at many stages of the translational pathway towards improved patient outcomes. 18 For example, it might be used to improve the design and analysis of randomised therapeutic trials in patients with a first unprovoked VTE, as a stratification factor in the randomisation process (to ensure treatment groups are balanced in the predicted risk of recurrence) or as an adjustment factor to increase statistical power. Inclusion criteria for trials may also be restricted to individuals with a high risk of recurrence based on the model. It could also be used to adjust for case-mix variation (confounding) in health services research and observational studies.
Recurrent venous thromboembolism collaborative database
One of the key findings of the systematic review was that the existing prognostic models had not received external validation. Therefore, when presented with the available data sets for use in this new research, it was deemed a high priority to ensure that the new research allowed external validation. Given that different sets of predictors (variables) were recorded in the three different data sets, it was decided to focus primarily on the RVTEC database by Douketis et al. 11 as it contained seven trials. This allowed enhanced research in this area by implementing the novel IECV approach to develop a new model and, crucially, also externally validate this model. Furthermore, the database contained D-dimer, which was deemed likely to be a crucial prognostic factor based on earlier research conducted by others. A slight tension with the choice of this database was that parts of it had already been used to develop the DASH score and Vienna model. However, the new research conducted within this report can be seen to enhance current research which uses the RVTEC database, and research in this field in general, by:
-
using the novel IECV approach to externally validate the model multiple times, unlike existing scores
-
the identification of additional predictors not previously picked up (e.g. age, lag time)
-
directly modelling the baseline hazard; this allows predictions over all follow-up times up to 5 years or more (rather than at just a few time points as in previous models)
-
not requiring simplification of the model to make predictions; this report provides an equation to predict recurrence using the values at hand (i.e. no need for a simplified score) and the baseline survival
-
identify the distribution of population characteristics for use in the subsequent health economics model
-
evaluating the cost-effectiveness of our prognostic model which has not been done for previous scores.
Furthermore, the DASH score developed by Tosetto et al. 41 using the RVTEC database is fundamentally different from the proposed post D-dimer model developed within this research report. The DASH score is only applicable in a distinctly different population of patients, one which uses a different definition of an unprovoked first VTE. Indeed the DASH score includes predictors for hormone intake, where any patients provoked by hormone intake were excluded from the post D-dimer model development as per the pre-defined definition of unprovoked VTE (see Chapter 1). As such, the DASH score could not be compared with the post D-dimer model, as they include different predictors and are applicable in different populations, despite both being developed within the RVTEC database.
Cost-effectiveness of a decision rule based on the post D-dimer model
Prognostic models aim to assist clinicians with their prediction of a patient’s future outcome and to enhance informed decision-making with the patient. Indeed, a prognostic model can only influence patient outcome (or the cost-effectiveness of care) when changes in clinical management are based on the prognostic information provided by the model. 18 Prognostic models also have a cost in their implementation (e.g. measurement of D-dimer levels) and might even have adverse consequences on clinical outcomes if they lead to decisions that withhold beneficial treatments. Therefore it is important to formally evaluate the impact of a prognostic model when used to make clinical decisions: as for any health technology, it should only be used if it can be shown to improve patient outcomes and/or reduce costs whilst ensuring acceptable patient outcomes. This can perhaps best be achieved in a randomised trial, where individuals are randomised to two groups, those that utilise the prognostic model and those that do not, and their subsequent outcomes (and costs) compared. However, such trials are rare, as they are expensive and time-consuming. Therefore, health economic models are important to ascertain – under a variety of assumptions – the cost-effectiveness of using a prognostic model to make decisions in the context of current care and expenditure, for relevant populations and outcomes of interest. For this purpose, Chapter 5 performed a cost-effectiveness analysis of using the post D-dimer model as a decision rule regarding continued cessation of therapy or not.
It was assumed that the post D-dimer model would inform clinical decision-making by using it to establish if an individual was above a pre-defined threshold of recurrence risk. If they were above the threshold, then they would be returned to therapy, if they were below the threshold, they would remain off therapy. This strategy therefore defined a decision rule for cessation of therapy. A range of recurrence risk thresholds were considered (1%, 3%, 5%, 10% and 15%). The 5% threshold was selected to reflect the recommendations of Kearon et al. 111 based on consensus that an annual risk of recurrence up to 5% may be deemed acceptable.
The aim of the economic modelling was to determine the cost-effectiveness of using a clinical decision rule for resumption of therapy in this patient group, using warfarin as the base-case therapy. The modelling allows the risk of recurrence of VTE and risk of bleeding on therapy, plus the associated costs, impact on quality of life and mortality to be taken into account simultaneously. The results demonstrated that the use of a decision rule with a threshold risk of VTE recurrence of about 8% could be a cost-effective strategy over the lifetime of a patient, with any threshold risk higher than this also a cost-effective strategy. However, the economic model appeared to be very sensitive to changes in a number of variables including disutility on warfarin and death from PE. The subgroup analyses gave very different results for patients aged ≥ 60 years, where the thresholds for treatment appeared to be higher and the difference in results was even more marked when considering index DVT and index PE patients separately. The PSA results were in line with the deterministic sensitivity analyses, suggesting there is still a great deal of uncertainty around which thresholds are cost-effective.
This is the first economic model to estimate the cost-effectiveness of using a clinical decision rule for extending treatment with anticoagulation in this patient group. This represents a step forward in providing a tool for decision making, to weighing up the risk of recurrent VTE and bleeding, in order to determine the optimal treatment strategy. However, this modelling assumes the prognostic model can reliably predict risk of recurrence, as risks and the decision rule are based on these risk calculations. Further assumptions were required, regarding the use of constant risks of recurrent VTE after 3 years, after a further VTE and with treatment, and the use and discontinuation of therapy when a major bleed occurs. Therefore, caution should be applied when interpreting the results of the economic analysis; however, this should be regarded as evidence that economic modelling has potential in this clinical area. This work has highlighted that good longitudinal data are required from patient cohorts with first unprovoked VTE and recurrent VTE, to estimate individual VTE risk beyond 3 years and also to provide data to predict major bleeds. The latter could be utilised to develop a prognostic model for major bleeds, which in turn could be used by the decision model to get better estimates of bleeding.
Implications of research for clinical practice
The systematic reviews and model development within this study provide us with a new prognostic tool to aid clinical decision-making for patients who sustain a first unprovoked VTE. The clinical paradigm has shifted while this project has been undertaken with a view now to identify those patients at sufficiently low risk of recurrence that they can safely stop OAC therapy after a relatively short period of time (usually 3–6 months). The post D-dimer model developed within this project performs better in terms of identifying this group than previously reported models. Currently available models are not routinely used within UK practice and have not been included within NICE guidelines. The utility of the post D-dimer model may be improved by including D-dimer measured before potential cessation of therapy, but it can certainly be introduced into clinical practice immediately. This will enable, with a high degree of certainty, identification of patients in whom it is safe to stop therapy while continuing therapy for those with a relatively high risk of recurrence.
Further research recommendations
A number of further research recommendations arise from this work, which are now outlined.
-
Develop and externally validate a prognostic model that can be used at the point of considering cessation of therapy. This should build on the pre D-dimer model and thus include sex and site of index event. Evaluation of the prognostic ability of D-dimer levels measured at the exact time of cessation of therapy is needed (i.e. measured at a lag time of 0).
-
Further external validation of the post D-dimer model, especially in non-trial populations. Trial populations available within the RVTEC database may be a select groups of individuals and thus the post D-dimer model requires validation in other populations (e.g. from cohort studies or large databases). Such data sets may not currently be available that contain D-dimer values and so further observational studies are needed that enrol new patients, measure their predictors following cessation of therapy (including D-dimer measurements and lag time) and recording of VTE outcomes.
-
Further research to examine if between-study heterogeneity in the calibration performance of post D-dimer model can be reduced. Though the post D-dimer model performed excellently on average across all trial populations, there was between-trial heterogeneity in the calibration. Further research should seek to reduce this heterogeneity, by potentially updating the model with additional predictors (requiring further external validation of course) and/or by identifying revised S0(t) functions for populations that differ importantly from the average S0(t) currently used in the model (this is sometimes referred to as model recalibration).
-
Further research to develop and validate a prognostic model for bleeding on therapy. There is an immediate need to develop a prognostic model to predict individuals’ risk of bleeding while on therapy. This would allow the balance between risk of recurrence and risk bleeding to be accounted for in the decision of treatment strategy and also a more effective economic evaluation to be undertaken.
-
Further research to investigate the prognostic importance of D-dimer over time. Sensitivity analyses considered the inclusion of time-dependent effects within the post D-dimer model, and although the inclusion of such effects was not warranted within this study, evidence suggests a potential time-dependent effect of log-D-dimer. Future research could aim to investigate the potential prognostic value of D-dimer over time to predict VTE recurrence risk.
-
Further research to reduce the uncertainty of conclusions drawn from any economic evaluation. Research should aim to incorporate more robust estimates of key economic parameters which have large uncertainty such as bleeding risk and long-term risk of VTE.
Chapter 7 Conclusion
We have developed a prognostic model which can be used in clinical practice to aid decision-making with regard to the duration of OAC therapy for patients sustaining a first unprovoked VTE. This has been robustly evaluated within a trials database using novel methodology. We have demonstrated improved performance of the prognostic model in comparison with previously reported models. A speculative health economic model has suggested that the prognostic model would be cost-effective for patients with predicted risk of recurrence of over 5–10% over the next 3 years. Although the health economic model relies on many assumptions due to lack of routinely collected data, it will provide a platform for evaluating further prognostic models once these data are available. This will be useful also for evaluating cost-effectiveness of treatment strategies based on the new generation of OACs. Further work is required in this area in terms of evaluating this prognostic model in routine clinical practice and improving our ability to predict severe bleeding events for patients taking long-term OACs.
Acknowledgements
We wish to thank the custodians of the pooled database (James Douketis, Alfonso Iorio, Alberto Tosetto and Maura Marcucci) for their continual support of our project. In particular, for obtaining agreement from the principal investigators of the seven trials within the pooled database, providing the data to us and for their feedback on our findings. Similarly, we thank Frits Rosendaal for the provision of the MEGA database, and his colleagues Suzanne C Cannegieter, Willem Lijfering, Astrid van Hylckama Vlieg and Linda Flinterman. We also thank Manuel Monreal for provision of the RIETE database and acknowledge the hard work of all the investigators who entered data of patients in the RIETE database (for a full list see Appendix 8).
PIT-STOP investigators: Frits Rosendaal (Departments of Clinical Epidemiology and Thrombosis and Haemostasis, Leiden University Medical Centre, Leiden, the Netherlands); Maura Marcucci (Department of Clinical Sciences and Community Health, University of Milan, Milan, Italy); Manuel Monreal (Department of Medicine, University Hospital Germans Trias i Pujol, Faculty of Medicine, Autonomous University of Barcelona, Barcelona, Spain).
The authors also thank the following:
-
Simon Stevens for his invaluable administrative support and excellent organisational skills
-
Janine Dretzke for her help and guidance in the systematic review element of the project
-
Frits Rosendaal, Gregory YH Lip, Manuel Monreal, Maura Marcucci and Trevor Baglin for contributions to wider team meetings
-
Pelham Barton for economic modelling guidance
-
Janine Dretzke, Susan Bayliss and Xiaoying Wu who kindly gave their time to help translate articles.
Contributions of authors
Joie Ensor (Research Fellow in Biostatistics) was the lead statistician and lead systematic reviewer, contributed to all aspects of the project and compiled, wrote and edited sections of the report. Joie Ensor undertook study selection, data extraction and appraisal, and quality assessment for the review of existing prognostic models. Joie Ensor undertook database cleaning, exploratory analysis, univariable and multivariable analyses and validation for the new prognostic model.
Richard D Riley (Professor of Biostatistics) devised and supervised the development and validation of the new prognostic model, informed the evaluation of existing prognostic models identified by the systematic review, contributed to all aspects of the project, wrote and edited sections of the report.
Sue Jowett (Senior lecturer in Health Economics) led the economic section of the report and contributed to all parts of the economic review, development of the economic model and associated analysis, and wrote sections of the report.
Mark Monahan (Research Fellow in Health Economics) undertook the systematic review of cost-effectiveness, contributed to the development of the economic model, undertook cost-effectiveness analyses and wrote sections of the report.
Kym IE Snell (Research Fellow in Biostatistics) advised on statistical aspects, undertook data extraction and edited statistical methodological sections of the report.
Susan Bayliss (Information Specialist) devised the search strategies and ran the searches in electronic databases.
David Moore (Senior lecturer in Evidence Synthesis) led the review section of this report, contributed to all aspects of the project and edited sections of the report.
David Fitzmaurice (Professor of Primary Care) was principal investigator and clinical lead, oversaw all clinical aspects of the project, undertook study selection, and wrote and commented on sections of the report.
All authors contributed to team meetings and read and approved a draft of the report.
Data sharing statement
The data in the systematic review chapter reported here can be obtained from the corresponding author on request. No additional data used in this report are available beyond those reported here.
Disclaimers
This report presents independent research funded by the National Institute for Health Research (NIHR). The views and opinions expressed by authors in this publication are those of the authors and do not necessarily reflect those of the NHS, the NIHR, NETSCC, the HTA programme or the Department of Health. If there are verbatim quotations included in this publication the views and opinions expressed by the interviewees are those of the interviewees and do not necessarily reflect those of the authors, those of the NHS, the NIHR, NETSCC, the HTA programme or the Department of Health.
References
- Kearon C, Akl EA, Comerota AJ, Prandoni P, Bounameaux H, Goldhaber SZ, et al. Antithrombotic therapy for VTE disease: antithrombotic therapy and prevention of thrombosis, 9th edn: American College of Chest Physicians Evidence-Based Clinical Practice Guidelines. Chest 2012;141:e419S-94S.
- Eichinger S, Heinze G, Jandeck LM, Kyrle PA. Risk assessment of recurrence in patients with unprovoked deep vein thrombosis or pulmonary embolism: the Vienna prediction model. Circulation 2010;121:1630-6. http://dx.doi.org/10.1161/CIRCULATIONAHA.109.925214.
- Keeling D, Baglin T, Tait C, Watson H, Perry D, Baglin C, et al. Guidelines on oral anticoagulation with warfarin – fourth edition. Br J Haematol 2011;154:311-24. http://dx.doi.org/10.1111/j.1365-2141.2011.08753.x.
- Thachil J, Fitzmaurice DA, Toh CH. Appropriate use of D-dimer in hospital patients. Am J Med 2010;123:17-9. http://dx.doi.org/10.1016/j.amjmed.2009.09.011.
- Schulman S, Lindmarker P, Holmstrom M, Larfars G, Carlsson A, Nicol P, et al. Post-thrombotic syndrome, recurrence, and death 10 years after the first episode of venous thromboembolism treated with warfarin for 6 weeks or 6 months. J Thromb Haemost 2006;4:734-42. http://dx.doi.org/10.1111/j.1538-7836.2006.01795.x.
- Douketis J, Tosetto A, Marcucci M, Baglin T, Cosmi B, Cushman M, et al. Risk of recurrence after venous thromboembolism in men and women: patient level meta-analysis. BMJ 2011;342. http://dx.doi.org/10.1136/bmj.d813.
- Douketis J, Tosetto A, Marcucci M, Baglin T, Cushman M, Eichinger S, et al. Are Men at Higher Risk for Disease Recurrence Than Women n.d.
- Rodger MA. Clinical Decision Rule Validation Study to Predict Low Recurrent Risk in Patients With Unprovoked Venous Thromboembolism n.d. clinicaltrials.gov/ct2/show/record/NCT00967304 (accessed 22 July 2015).
- Rodger MA, Kahn SR, Wells PS, Anderson DA, Chagnon I, Le Gal G, et al. Identifying unprovoked thromboembolism patients at low risk for recurrence who can discontinue anticoagulant therapy. CMAJ 2008;179:417-26. http://dx.doi.org/10.1503/cmaj.080493.
- Riley RD, Hayden JA, Steyerberg EW, Moons KG, Abrams K, Kyzas PA, et al. Prognosis Research Strategy (PROGRESS) 2: prognostic factor research. PLOS Med 2013;10. http://dx.doi.org/10.1371/journal.pmed.1001380.
- Douketis J, Tosetto A, Marcucci M, Baglin T, Cushman M, Eichinger S, et al. Patient-level meta-analysis: effect of measurement timing, threshold, and patient age on ability of D-dimer testing to assess recurrence risk after unprovoked venous thromboembolism. Ann Intern Med 2010;153:523-31. http://dx.doi.org/10.7326/0003-4819-153-8-201010190-00009.
- Adams ST, Leveson SH. Clinical prediction rules. BMJ 2012;344. http://dx.doi.org/10.1136/bmj.d8312.
- Ensor J, Riley RD, Moore D, Bayliss S, Jowett S, Fitzmaurice DA. Protocol for a systematic review of prognostic models for the recurrence of venous thromboembolism (VTE) following treatment for a first unprovoked VTE. Syst Rev 2013;2. http://dx.doi.org/10.1186/2046-4053-2-91.
- Liberati A, Altman DG, Tetzlaff J, Mulrow C, Gotzsche PC, Ioannidis JP, et al. The PRISMA statement for reporting systematic reviews and meta-analyses of studies that evaluate health care interventions: explanation and elaboration. J Clin Epidemiol 2009;62:e1-34. http://dx.doi.org/10.1016/j.jclinepi.2009.06.006.
- PROBAST Project Summary 2014. http://s371539711.initial-website.co.uk/probast/ (accessed 21 January 2016).
- DerSimonian R, Laird N. Meta-analysis in clinical trials. Control Clin Trials n.d.;7:177-88. http://dx.doi.org/10.1016/0197-2456(86)90046-2.
- Riley RD, Higgins JP, Deeks JJ. Interpretation of random effects meta-analyses. BMJ 2011;342. http://dx.doi.org/10.1136/bmj.d549.
- Steyerberg EW, Moons KG, van der Windt DA, Hayden JA, Perel P, Schroter S, et al. Prognosis Research Strategy (PROGRESS) 3: prognostic model research. PLOS Med 2013;10. http://dx.doi.org/10.1371/journal.pmed.1001381.
- Altman DG, Vergouwe Y, Royston P, Moons KG. Prognosis and prognostic research: validating a prognostic model. BMJ 2009;338. http://dx.doi.org/10.1136/bmj.b605.
- Emmerich J. Risk factors of the recurrence of venous thromboembolism. Revue Du Praticien 2007;57:717-18.
- Meyer G. Pulmonary embolism. Significant diagnostic and therapeutic advances. Revue Du Praticien 2007;57:709-10.
- Ramalle-Gomara E, Javier Ochoa-Gomez F. Low risk of pulmonary embolism after discontinuing anticoagulant treatment for deep venous thrombosis?. FMC Formacion Medica Continuada En Atencion Primaria 2008;15. http://dx.doi.org/10.1016/S1134-2072(08)72238-2.
- Man M, Bugalho A. Update in pulmonary thromboembolic disease. Revista Portuguesa De Pneumologia 2009;15:483-505. http://dx.doi.org/10.1016/S0873-2159(15)30148-3.
- Vorob’eva NM, Panchenko EP, Dobrovol’skii AB, Titaeva EV, Fedotkina I, Kirienko AI. Risk factors for venous thromboembolic complications and their association with D-dimer level. Ter Arkh 2010;82:30-4.
- Vorob’eva NM, Panchenko EP, Dobrovol’skii AB, Titaeva EV, Khasanova ZB, Konovalova NV, et al. Independent predictors of deep vein thrombosis (results of prospective 18 months study). Kardiologiia 2010;50:52-8.
- Cost-Effectiveness of Tailoring Anticoagulant Therapy by a VTE Recurrence Prediction Model in Patients With Venous Thrombo-Embolism As Compared to Care-As-Usual: The VISTA Study 2013. www.trialregister.nl/trialreg/admin/rctview.asp?TC=2680 (accessed 21 January 2016).
- Rodger M, Kovacs CMJ, Kahn S, Wells P, Anderson D, Gregoire LG, et al. Extended Follow-Up of the Multi-Center Multi-National Prospective Cohort Study That Derived the ‘Men Continue and HERDOO2’ Clinical Decision Rule Which Identifies Low Risk Patients Who May Be Able to Discontinue Oral Anticoagulants (OAC) 5–7 Months After Treatment for Unprovoked Venous Thromboembolism (VTE) n.d.
- Rodger MA, Rodger M, Kovacs M, Le Gal G, Kahn S, Anderson D, et al. Extended Follow-Up of the Multi-Center Prospective Cohort That Derived the ‘Men Continue and HERDOO2’ Clinical Decision Rule Identifying Low Risk Unprovoked Patients n.d.
- The Development and Evaluation of a Prognostic Model and Clinical Decision Rule to Help Decide on Cessation of Anticoagulant Therapy in Patients With Idiopathic Venous Thromboembolism (VTE) 2014. http://onlinelibrary.wiley.com/o/cochrane/clhta/articles/HTA-32013001066/frame.html (accessed 21 January 2016).
- Eichinger S, Heinze G, Kyrle PA. D-Dimer Levels Over Time and the Risk of Recurrent Venous Thromboembolism: An Update of the Vienna Prediction Model n.d. http://dx.doi.org/10.1161/jaha.113.000467.
- Eichinger S, Heinze G, Kyrle PA. D-Dimer Levels Over Time and the Risk of Recurrent Venous Thromboembolism: An Update of the Vienna Prediction Model n.d.
- Eichinger S, Heinze G, Kyrle PA. D-Dimer Levels Over Time and the Risk of Recurrent Venous Thromboembolism: An Update of the Vienna Prediction Model n.d.
- Lazo-Langner A, Abdulrehman J, Taylor EJ, Sharma S, Kovacs MJ. The Use of the REVERSE Study Clinical Prediction Rule for Risk Stratification After Initial Anticoagulation Results in Decreased Recurrences in Patients With Idiopathic Venous Thromboembolism n.d.
- Marcucci M, Eichinger S, Iorio A, Douketis JD, Tosetto A, Baglin TPT, et al. External Validation and Updating of the Vienna Prediction Model for Recurrent Venous Thromboembolism Using a Pooled Individual Patient Data Database n.d.
- Rodger M, Kovacs M, Le GG, Anderson D, Righini M, Beaudoin T. The REVERSE I and II Studies: Impact of Using Men Continue and HERDOO2 Clinical Decision Rule to Guide Anticoagulant Therapy in Patients With First Unprovoked Venous Thromboembolism n.d.
- Eichinger S, Heinze G, Kyrle PA. Risk Assessment Model to Predict Recurrence in Patients With Unprovoked Deep Vein Thrombosis or Pulmonary Embolism n.d.
- Raskob GE, Anthonie LWA, Prins MH, Schellong S, Buller HR. Risk Assessment for Recurrent Venous Thromboembolism (VTE) After 6–14 Months of Anticoagulant Treatment n.d.
- Tosetto A, Lorio A, Marcucci M, Baglin T, Cushman M, Eichinger S, et al. Predicting Disease Recurrence in Patients With Previous Unprovoked Venous Thromboembolism: The DASH Prediction Score n.d.
- Tosetto A, Lorio A, Marcucci M, Baglin T, Cushman M, Eichinger S, et al. Clinical Prediction of VTE Recurrence in Patients With Previous Unprovoked Venous Thromboembolism. Results from an Individual-Level Meta-Analysis n.d.
- Tosetto A, Lorio A, Marcucci M, Baglin T, Cushman M, Eichinger S, et al. Clinical Prediction Guide to Predict Thrombosis Recurrence After a First Unprovoked Venous Thromboembolism n.d.
- Tosetto A, Lorio A, Marcucci M, Baglin T, Cushman M, Eichinger S, et al. Predicting disease recurrence in patients with previous unprovoked venous thromboembolism: a proposed prediction score (DASH). J Thromb Haemost 2012;10:1019-25. http://dx.doi.org/10.1111/j.1538-7836.2012.04735.x.
- Eichinger S, Heinze G, Kyrle PA. D-dimer levels over time and the risk of recurrent venous thromboembolism: an update of the Vienna prediction model. J Am Heart Assoc 2014;3. http://dx.doi.org/10.1161/JAHA.113.000467.
- Romualdi E, Donadini MP, Ageno W. Oral rivaroxaban after symptomatic venous thromboembolism: the continued treatment study (EINSTEIN-extension study). Expert Rev Cardiovasc Ther 2011;9:841-4. http://dx.doi.org/10.1586/erc.11.62.
- Douketis JD, Ginsberg JS, Holbrook A, Crowther M, Duku EK, Burrows RF. A reevaluation of the risk for venous thromboembolism with the use of oral contraceptives and hormone replacement therapy. Arch Intern Med 1997;157:1522-30. http://dx.doi.org/10.1001/archinte.1997.00440350022002.
- Baglin T, Luddington R, Brown K, Baglin C. Incidence of recurrent venous thromboembolism in relation to clinical and thrombophilic risk factors: prospective cohort study. Lancet 2003;362:523-6. http://dx.doi.org/10.1016/S0140-6736(03)14111-6.
- Altman DG, Lausen B, Sauerbrei W, Schumacher M. Dangers of using ‘optimal’ cutpoints in the evaluation of prognostic factors. J Natl Cancer Inst 1994;86:829-35. http://dx.doi.org/10.1093/jnci/86.11.829.
- Altman DG, Royston P. The cost of dichotomising continuous variables. BMJ 2006;332. http://dx.doi.org/10.1136/bmj.332.7549.1080.
- Altman DG. Prognostic models: a methodological framework and review of models for breast cancer. Cancer Invest. n.d.;27:235-43. http://dx.doi.org/10.3109/9781420019940.002.
- Royston P, Sauerbrei W. Multivariable Model-Building: A Pragmatic Approach to Regression Analysis Based on Fractional Polynomials for Modelling Continuous Variables. Chichester: John Wiley & Sons Ltd; 2008.
- Sauerbrei W, Royston P, Binder H. Selection of important variables and determination of functional form for continuous predictors in multivariable model building. Stat Med 2007;26:5512-28. http://dx.doi.org/10.1002/sim.3148.
- Peduzzi P, Concato J, Kemper E, Holford TR, Feinstein AR. A simulation study of the number of events per variable in logistic regression analysis. J Clin Epidemiol 1996;49:1373-9. http://dx.doi.org/10.1016/S0895-4356(96)00236-3.
- Abo-Zaid G, Guo B, Deeks JJ, Debray TP, Steyerberg EW, Moons KG, et al. Individual participant data meta-analyses should not ignore clustering. J Clin Epidemiol. 2013;66:865-73. http://dx.doi.org/10.1016/j.jclinepi.2012.12.017.
- Sun GW, Shook TL, Kay GL. Inappropriate use of bivariable analysis to screen risk factors for use in multivariable analysis. J Clin Epidemiol 1996;49:907-16. http://dx.doi.org/10.1016/0895-4356(96)00025-X.
- Marcucci M, Iorio A, Douketis JD, Eichinger S, Tosetto A, Baglin T, et al. Risk of recurrence after a first unprovoked venous thromboembolism: external validation of the Vienna prediction model using pooled individual patient data. J Thromb Haemost 2015;13:775-81. http://dx.doi.org/10.1111/jth.12871.
- Royston P, Altman DG. External validation of a Cox prognostic model: principles and methods. BMC Med Res Methodol 2013;13. http://dx.doi.org/10.1186/1471-2288-13-33.
- van Houwelingen HC. Validation, calibration, revision and combination of prognostic survival models. Stat Med 2000;19:3401-15. http://dx.doi.org/10.1002/1097-0258(20001230)19:24<3401::AID-SIM554>3.0.CO;2-2.
- Palareti G, Legnani C, Cosmi B, Valdre L, Lunghi B, Bernardi F, et al. Predictive value of D-dimer test for recurrent venous thromboembolism after anticoagulation withdrawal in subjects with a previous idiopathic event and in carriers of congenital thrombophilia. Circulation 2003;108:313-18. http://dx.doi.org/10.1161/01.CIR.0000079162.69615.0F.
- Palareti G, Cosmi B, Legnani C, Tosetto A, Brusi C, Iorio A, et al. D-dimer testing to determine the duration of anticoagulation therapy. N Engl J Med 2006;355:1780-9. http://dx.doi.org/10.1056/NEJMoa054444.
- Poli D, Antonucci E, Ciuti G, Abbate R, Prisco D. Combination of D-dimer, F1 + 2 and residual vein obstruction as predictors of VTE recurrence in patients with first VTE episode after OAT withdrawal. J Thromb Haemost 2008;6:708-10. http://dx.doi.org/10.1111/j.1538-7836.2008.02900.x.
- Eichinger S, Minar E, Bialonczyk C, Hirschl M, Quehenberger P, Schneider B, et al. D-dimer levels and risk of recurrent venous thromboembolism. JAMA 2003;290:1071-4. http://dx.doi.org/10.1001/jama.290.8.1071.
- Baglin T, Palmer CR, Luddington R, Baglin C. Unprovoked recurrent venous thrombosis: prediction by D-dimer and clinical risk factors. J Thromb Haemost 2008;6:577-82. http://dx.doi.org/10.1111/j.1538-7836.2008.02889.x.
- Shrivastava S, Ridker PM, Glynn RJ, Goldhaber SZ, Moll S, Bounameaux H, et al. D-dimer, factor VIII coagulant activity, low-intensity warfarin and the risk of recurrent venous thromboembolism. J Thromb Haemost 2006;4:1208-14. http://dx.doi.org/10.1111/j.1538-7836.2006.01935.x.
- Tait R, Lowe GDO, McColl MD, McMahon AD, Robertson L, King L. Predicting risk of recurrent venous thrombosis using a 5-point scoring system including fibrin D-dimer. J Thromb Haemost 2007;5.
- Royston P, Parmar MK, Sylvester R. Construction and validation of a prognostic model across several studies, with an application in superficial bladder cancer. Stat Med 2004;23:907-26. http://dx.doi.org/10.1002/sim.1691.
- Debray TP, Moons KG, Ahmed I, Koffijberg H, Riley RD. A framework for developing, implementing, and evaluating clinical prediction models in an individual participant data meta-analysis. Stat Med 2013;32:3158-80. http://dx.doi.org/10.1002/sim.5732.
- Palareti G, Legnani C, Cosmi B, Guazzaloca G, Pancani C, Coccheri S. Risk of venous thromboembolism recurrence: high negative predictive value of D-dimer performed after oral anticoagulation is stopped. Thromb Haemost 2002;87:7-12.
- Cosmi B. Value of D-dimer testing to decide duration of anticoagulation after deep vein thrombosis: yes. J Thromb Haemost 2006;4:2527-9. http://dx.doi.org/10.1111/j.1538-7836.2006.02247.x.
- Cosmi B, Legnani C, Pengo V, Tosetto A, Ghirarduzzi A, Alatri A, et al. D-Dimer and Sex As Risk Factors for Recurrence After a First Episode of Venous Thromboembolism in the Extended Follow-Up of the Prolong Study n.d.
- Douketis J. D-dimer can predict risk of recurrent venous thromboembolism regardless of patient age, timing of testing, or characteristics of assay. J Clin Outcomes Manag 2011;18:246-8.
- Douketis J, Tosetto A, Marcucci M, Baglin T, Cushman M, Eichinger S, et al. D-Dimer to Determine Risk for Disease Recurrence After Unprovoked Venous Thromboembolism: Addressing Unanswered Questions With a Large Individual Patient Meta-Analysis n.d.
- Cox DR. Regression models and life tables. JR Stat Soc B Stat Methodol 1972;34:187-220.
- Royston P. Flexible parametric alternatives to the Cox model, and more. Stata J 2001;1:1-28.
- Royston P, Parmar MKB. Flexible parametric proportional hazards and proportional odds models for censored survival data, with application to prognostic modelling and estimation of treatment effects. Stat Med 2002;21:2175-97. http://dx.doi.org/10.1002/sim.1203.
- Lambert PC, Royston P. Further development of flexible parametric models for survival analysis. Stata Journal 2009;9:265-90.
- Royston P, Lambert PC. Flexible Parametric Survival Analysis Using Stata: Beyond the Cox Model. College Station, TX: Stata Press; 2006.
- Burnham KP, Anderson DR. Multimodel inference understanding AIC and BIC in model selection. Sociol Methods Res 2004;33:261-304. http://dx.doi.org/10.1177/0049124104268644.
- Sterne JA, White IR, Carlin JB, Spratt M, Royston P, Kenward MG, et al. Multiple imputation for missing data in epidemiological and clinical research: potential and pitfalls. BMJ 2009;338. http://dx.doi.org/10.1136/bmj.b2393.
- White IR, Royston P, Wood AM. Multiple imputation using chained equations: issues and guidance for practice. Stat Med 2011;30:377-99. http://dx.doi.org/10.1002/sim.4067.
- Rubin DB. Multiple Imputation for Nonresponse in Surveys. New York, NY: Wiley; 1987.
- Little R, Rubin D. Statistical Analysis with Missing Data. Hoboken, NJ: Wiley; 2002.
- Steyerberg EW, Vickers AJ, Cook NR, Gerds T, Gonen M, Obuchowski N, et al. Assessing the performance of prediction models: a framework for some traditional and novel measures. Epidemiology 2010;21:128-38. http://dx.doi.org/10.1097/EDE.0b013e3181c30fb2.
- Harrell FE, Califf RM, Pryor DB, Lee KL, Rosati RA. Evaluating the yield of medical tests. JAMA 1982;247:2543-6. http://dx.doi.org/10.1001/jama.1982.03320430047030.
- Harrell FE, Lee KL, Califf RM, Pryor DB, Rosati RA. Regression modelling strategies for improved prognostic prediction. Stat Med 1984;3:143-52. http://dx.doi.org/10.1002/sim.4780030207.
- Steyerberg EW. Clinical Prediction Models: A Practical Approach to Development, Validation, and Updating. New York, NY: Springer Science; 2009.
- Koopman L, van der Heijden GJ, Grobbee DE, Rovers MM. Comparison of methods of handling missing data in individual patient data meta-analyses: an empirical example on antibiotics in children with acute otitis media. Am J Epidemiol 2008;167:540-5. http://dx.doi.org/10.1093/aje/kwm341.
- Higgins JP, Thompson SG, Spiegelhalter DJ. A re-evaluation of random-effects meta-analysis. J R Stat Soc Ser A Stat Soc 2009;172:137-59. http://dx.doi.org/10.1111/j.1467-985X.2008.00552.x.
- van Klaveren D, Steyerberg E, Perel P, Vergouwe Y. Assessing discriminative ability of risk models in clustered data. BMC Med Res Methodol 2014;14. http://dx.doi.org/10.1186/1471-2288-14-5.
- Douketis J, Iorio A, Marcucci M, Baglin T, Cushman M, Eichinger S, et al. Does the Clinical Presentation of Venous Thromboembolism Predict the Risk for and Type of Thrombosis Recurrence? n.d.
- Martinelli I, Battaglioli T, Razzari C, Mannucci P. Type and location of venous thromboembolism in patients with factor V Leiden or prothrombin G20210A and in those with no thrombophilia. J Thromb Haemost 2007;5:98-101. http://dx.doi.org/10.1111/j.1538-7836.2006.02291.x.
- Philips Z, Bojke L, Sculpher M, Claxton K, Golder S. Good practice guidelines for decision-analytic modelling in health technology assessment: a review and consolidation of quality assessment. Pharmacoeconomics 2006;24:355-71. http://dx.doi.org/10.2165/00019053-200624040-00006.
- Chitsike RS, Rodger MA, Kovacs MJ, Betancourt MT, Wells PS, Anderson DR, et al. Risk of post-thrombotic syndrome after subtherapeutic warfarin anticoagulation for a first unprovoked deep vein thrombosis: results from the REVERSE study. J Thromb Haemost 2012;10:2039-44. http://dx.doi.org/10.1111/j.1538-7836.2012.04872.x.
- Castellucci LA, Le Gal GF, Rodger MA, Carrier M. Major bleeding during secondary prevention of venous thromboembolism in patients who have completed anticoagulation: a systematic review and meta-analysis. J Thromb Haemost 2014;12:344-8. http://dx.doi.org/10.1111/jth.12501.
- Eikelboom JW, Wallentin L, Connolly SJ, Ezekowitz M, Ezekowitz M, Healey JS, et al. Risk of bleeding with 2 doses of dabigatran compared with warfarin in older and younger patients with atrial fibrillation: an analysis of the randomized evaluation of long-term anticoagulant therapy (RE-LY) trial. Circulation 2011;123:2363-72. http://dx.doi.org/10.1161/CIRCULATIONAHA.110.004747.
- Laporte S, Mismetti PF, Decousus HF, Uresandi FF, Otero RF, Lobo JI, et al. Clinical predictors for fatal pulmonary embolism in 15,520 patients with venous thromboembolism: findings from the Registro Informatizado de la Enfermedad TromboEmbolica venosa (RIETE) Registry. Circulation 2008;117:1711-16. http://dx.doi.org/10.1161/CIRCULATIONAHA.107.726232.
- Fogelholm R, Murros KF, Rissanen AF, Avikainen S. Long term survival after primary intracerebral haemorrhage: a retrospective population based study. J Neurol Neurosurg Psychiatry 2005;76:1534-8. http://dx.doi.org/10.1136/jnnp.2004.055145.
- British National Formulary. London: BMJ Group and Pharmaceutical Press; 2014.
- Rivaroxaban for the Treatment of Deep Vein Thrombosis and Prevention of Recurrent Deep Vein Thrombosis and Pulmonary Embolism (NICE Technology Appraisal TA261). London: NICE; 2014.
- NHS Reference Costs 2012–2013. London: DH; 2013.
- Luengo-Fernandez R, Gray AM, Rothwell P, Rothwell PM. A population-based study of hospital care costs during 5 years after transient ischemic attack and stroke. Stroke 2012;43:3343-51. http://dx.doi.org/10.1161/STROKEAHA.112.667204.
- Unit Costs of Health and Social Care 2013. London: PSSRU; 2013.
- Kind P, Hardman G, Macran S. UK Population Norms for EQ-5D. York: Centre for Health Economics, University of York; 1999.
- Gage BF, Cardinalli AB, Owens DK. The effect of stroke and stroke prophylaxis with aspirin or warfarin on quality of life. Arch Intern Med 1996;156:1829-36. http://dx.doi.org/10.1001/archinte.1996.00440150083009.
- Locadia M, Bossuyt PM, Stalmeier PF, Sprangers MA, van Dongen CJ, Middeldorp S, et al. Treatment of venous thromboembolism with vitamin K antagonists: patients’ health state valuations and treatment preferences. Thromb Haemost 2004;92:1336-41. http://dx.doi.org/10.1160/th04-02-0075.
- England and Wales Interim Life Tables 1980–82 and 2009–11. London: Office for National Statistics; 2012.
- Appleby J, Devlin N, Parkin D. NICE’s cost effectiveness threshold. BMJ 2007;335:358-9. http://dx.doi.org/10.1136/bmj.39308.560069.BE.
- Hogg K, Kimpton M, Carrier M, Coyle D, Forgie M, Wells P. Estimating quality of life in acute venous thrombosis. JAMA Intern Med 2013;173:1067-72. http://dx.doi.org/10.1001/jamainternmed.2013.563.
- Lenert LA, Soetikno RM. Automated computer interviews to elicit utilities: potential applications in the treatment of deep venous thrombosis. J Am Med Inform Assoc 1997;4:49-56. http://dx.doi.org/10.1136/jamia.1997.0040049.
- Fattorini A, Crippa L, Vigano DAS, Pattarini E, D’Angelo A. Risk of deep vein thrombosis recurrence: high negative predictive value of D-dimer performed during oral anticoagulation. Thromb Haemost 2002;88:162-3.
- Eichinger S, Hron G, Bialonczyk C, Hirschl M, Minar E, Wagner O, et al. Overweight, obesity, and the risk of recurrent venous thromboembolism. Arch Intern Med 2008;168:1678-83. http://dx.doi.org/10.1001/archinte.168.15.1678.
- Heit JA, Mohr DN, Silverstein MD, Petterson TM, O’Fallon WM, Melton LJ. Predictors of recurrence after deep vein thrombosis and pulmonary embolism: a population-based cohort study. Arch Intern Med 2000;160:761-8. http://dx.doi.org/10.1001/archinte.160.6.761.
- Kearon C, Iorio A, Palareti G. Subcommittee on Control of Anticoagulation of the SSCotI . Risk of recurrent venous thromboembolism after stopping treatment in cohort studies: recommendation for acceptable rates and standardized reporting. J Thromb Haemost 2010;8:2313-15. http://dx.doi.org/10.1111/j.1538-7836.2010.03991.x.
- Harrell FE. Regression Modeling Strategies: With Applications to Linear Models, Logistic Regression, and Survival Analysis. New York, NY: Springer-Verlag; 2001.
Appendix 1 Search strategies
Prognostic model searches
MEDLINE
Ovid MEDLINE(R) 1946 to June week 3 2014.
Search strategy
-
exp Venous Thromboembolism/
-
Pulmonary Embolism/
-
exp Venous Thrombosis/
-
(vte or dvt or pe).ti,ab.
-
deep vein thrombosis.ti,ab.
-
pulmonary embolism.ti,ab.
-
venous thrombo$.ti,ab.
-
or/1-7
-
(recurr$ or re-occur$).ti,ab.
-
Recurrence/
-
exp Death/
-
(death$ or mortality).ti,ab.
-
Mortality/
-
clot$.ti,ab.
-
Hypertension, Pulmonary/
-
pulmonary hypertension.ti,ab.
-
post thrombotic syndrome.ti,ab.
-
PTS.ti,ab.
-
or/9-18
-
“Predictive Value of Tests”/
-
predict$.ti,ab.
-
exp Risk/
-
risk$.ti,ab.
-
prognos$.ti,ab.
-
or/20-24
-
exp Anticoagulants/
-
(anti-coagul$ or anticoagul$ or warfarin or acenocoumarol or coumadin or coumarin or phenprocoumon or sintrom or sinthrome or jantoven or marevan or waran or nicoumalone or dicoumarol or dicumarol).ti,ab.
-
(phenindione or dabigatran or ximelagatran or apixaban or rivaroxaban or edoxaban or azd0837 or ly517717 or ym150 or betrixaban or idraparinux).ti,ab.
-
or/26-28
-
8 and 19 and 25 and 29
MEDLINE In-Process & Other Non-Indexed Citations
Ovid MEDLINE(R) In-Process & Other Non-Indexed Citations 30 June 2014.
Searched: inception to 2014.
Search strategy
-
(vte or dvt or pe).ti,ab.
-
deep vein thrombosis.ti,ab.
-
pulmonary embolism.ti,ab.
-
venous thrombo$.ti,ab.
-
or/1-4
-
(recurr$ or re-occur$).ti,ab.
-
(death$ or mortality).ti,ab.
-
clot$.ti,ab.
-
pulmonary hypertension.ti,ab.
-
post thrombotic syndrome.ti,ab.
-
PTS.ti,ab.
-
or/6-11
-
predict$.ti,ab.
-
risk$.ti,ab.
-
prognos$.ti,ab.
-
or/13-15
-
(anti-coagul$ or anticoagul$ or warfarin or acenocoumarol or coumadin or coumarin or phenprocoumon or sintrom or sinthrome or jantoven or marevan or waran or nicoumalone or dicoumarol or dicumarol).ti,ab.
-
(phenindione or dabigatran or ximelagatran or apixaban or rivaroxaban or edoxaban or azd0837 or ly517717 or ym150 or betrixaban or idraparinux).ti,ab.
-
or/17-18
-
5 and 12 and 16 and 19
EMBASE
EMBASE 1980 to 2014 week 26.
Search strategy
-
exp venous thromboembolism/
-
lung embolism/
-
exp vein thrombosis/
-
deep vein thrombosis.ti,ab.
-
(vte or dvt).mp. or pe.ti,ab.
-
pulmonary embolism.ti,ab.
-
venous thrombo$.ti,ab.
-
or/1-7
-
(recurrence or recurr or re-occur$).ti,ab.
-
recurrent disease/
-
death/
-
death$ or mortality.ti,ab.
-
mortality/
-
clot$.ti,ab.
-
pulmonary hypertension/
-
pulmonary hypertension.ti,ab.
-
post thrombotic syndrome.ti,ab.
-
PTS.ti,ab.
-
or/9-18
-
predictive value/
-
predict$.ti,ab.
-
exp risk/
-
risk$.ti,ab.
-
prognos$.ti,ab.
-
or/20-24
-
exp anticoagulant agent/
-
(anti-coagul$ or anticoagul$ or warfarin or acenocoumarol or coumadin or coumarin or phenprocoumon or sintrom or sinthrome or jantoven or marevan or waran or nicoumalone or dicoumarol or dicumarol).ti,ab.
-
phenindione or dabigatran or ximelagatran or apixaban or rivaroxaban or edoxaban or azd0837 or ly517717 or ym150 or betrixaban or idraparinux).ti,ab.
-
or/26-28
-
8 and 19 and 25 and 29
The Cochrane Library
The Cochrane Library (Wiley) 2014.
Searched: inception to 2014.
Search strategy
#1 MeSH descriptor: [Venous Thromboembolism] explode all trees
#2 MeSH descriptor: [Pulmonary Embolism] this term only
#3 MeSH descriptor: [Venous Thrombosis] explode all trees
#4 vte or dvt or pe
#5 deep next vein next thrombosis
#6 pulmonary next embolism*
#7 venous next thrombo*
#8 #1 or #2 or #3 or #4 or #5 or #6 or #7
#9 recurrence or recurr* or re-occur*
#10 MeSH descriptor: [Recurrence] this term only
#11 MeSH descriptor: [Death] explode all trees
#12 death* or mortality
#13 MeSH descriptor: [Mortality] this term only
#14 clot*
#15 MeSH descriptor: [Hypertension, Pulmonary] this term only
#16 pulmonary next hypertension
#17 post next thrombotic next syndrome
#18 PTS
#19 #9 or #10 or #11 or #12 or #13 or #14 or #15 or #16 or #17 or #18
#20 MeSH descriptor: [Predictive Value of Tests] this term only
#21 predict*
#22 MeSH descriptor: [Risk] explode all trees
#23 risk*
#24 prognos*
#25 #20 or #21 or #22 or #23 or #24
#26 MeSH descriptor: [Anticoagulants] explode all trees
#27 anti-coagul* or anticoagul* or warfarin or acenocoumarol or coumadin or coumarin or phenprocoumon or sintrom or sinthrome or jantoven or marevan or waran or nicoumalone or dicoumarol or dicumarol
#28 phenindione or dabigatran or ximelagatran or apixaban or rivaroxaban or edoxaban or azd0837 or ly517717 or ym150 or betrixaban or idraparinux
#29 #26 or #27 or #28
#30 #8 and #19 and #25 and #29
Cost-effectiveness searches
MEDLINE
Ovid MEDLINE (Ovid) 1946 to November week 3 2013.
Search strategy
-
exp Venous Thromboembolism/
-
Pulmonary Embolism/
-
exp Venous Thrombosis/
-
(vte or dvt or pe).ti,ab.
-
deep vein thrombosis.ti,ab.
-
pulmonary embolism.ti,ab.
-
venous thrombo$.ti,ab.
-
or/1-7
-
(recurr$ or re-occur$).ti,ab.
-
Recurrence/
-
exp Death/
-
(death$ or mortality).ti,ab.
-
Mortality/
-
clot$.ti,ab.
-
Hypertension, Pulmonary/
-
pulmonary hypertension.ti,ab.
-
post thrombotic syndrome.ti,ab.
-
PTS.ti,ab.
-
or/9-18
-
“Predictive Value of Tests”/
-
predict$.ti,ab.
-
exp Risk/
-
risk$.ti,ab.
-
prognos$.ti,ab.
-
or/20-24
-
exp Anticoagulants/
-
(anti-coagul$ or anticoagul$ or warfarin or acenocoumarol or coumadin or coumarin or phenprocoumon or sintrom or sinthrome or jantoven or marevan or waran or nicoumalone or dicoumarol or dicumarol).ti,ab.
-
(phenindione or dabigatran or ximelagatran or apixaban or rivaroxaban or edoxaban or azd0837 or ly517717 or ym150 or betrixaban or idraparinux).ti,ab.
-
or/26-28
-
8 and 19 and 25 and 29
-
economics/
-
exp “costs and cost analysis”/
-
cost of illness/
-
exp health care costs/
-
economic value of life/
-
exp economics medical/
-
exp economics hospital/
-
economics pharmaceutical/
-
exp “fees and charges”/
-
econom$ or cost or costs or costly or costing or price or pricing or pharmacoeconomic$).tw.
-
expenditure$ not energy).tw.
-
value adj1 money).tw.
-
budget$.tw.
-
or/31-43
-
30 and 44
EMBASE
EMBASE (Ovid) 1980 to 2013 week 49.
Search strategy
-
exp venous thromboembolism/
-
lung embolism/
-
exp vein thrombosis/
-
deep vein thrombosis.ti,ab.
-
(vte or dvt).mp. or pe.ti,ab.
-
pulmonary embolism.ti,ab.
-
venous thrombo$.ti,ab.
-
or/1-7
-
(recurr$ or re-occur$.ti,ab.
-
recurrent disease/
-
death/
-
death$ or mortality.ti,ab.
-
mortality/
-
clot$.ti,ab.
-
pulmonary hypertension/
-
pulmonary hypertension.ti,ab.
-
post thrombotic syndrome.ti,ab.
-
PTS.ti,ab.
-
or/9-18
-
predictive value/
-
predict$.ti,ab.
-
exp risk/
-
risk$.ti,ab.
-
prognos$.ti,ab.
-
or/20-24
-
exp anticoagulant agent/
-
(anti-coagul$ or anticoagul$ or warfarin or acenocoumarol or coumadin or coumarin or phenprocoumon or sintrom or sinthrome or jantoven or marevan or waran or nicoumalone or dicoumarol or dicumarol).ti,ab.
-
(phenindione or dabigatran or ximelagatran or apixaban or rivaroxaban or edoxaban or azd0837 or ly517717 or ym150 or betrixaban or idraparinux).ti,ab.
-
or/26-28
-
8 and 19 and 25 and 29
-
cost benefit analysis/
-
cost effectiveness analysis/
-
cost minimization analysis/
-
cost utility analysis/
-
economic evaluation/
-
(cost or costs or costed or costly or costing).tw.
-
(economic$ or pharmacoeconomic$ or price$ or pricing).tw.
-
(technology adj assessment$).tw.
-
or/31-38
-
30 and 39
The Cochrane Library
The Cochrane Library (Wiley) NHS Economic Evaluation Database 2012 Issue 4 of 4.
Search strategy
#1 MeSH descriptor: [Venous Thromboembolism] explode all trees
#2 MeSH descriptor: [Pulmonary Embolism] this term only
#3 MeSH descriptor: [Venous Thrombosis] explode all trees
#4 vte or dvt or pe
#5 deep next vein next thrombosis
#6 pulmonary next embolism*
#7 venous next thrombo*
#8 #1 or #2 or #3 or #4 or #5 or #6 or #7
#9 recurrence or recurr* or re-occur*
#10 MeSH descriptor: [Recurrence] this term only
#11 MeSH descriptor: [Death] explode all trees
#12 death* or mortality
#13 MeSH descriptor: [Mortality] this term only
#14 clot*
#15 MeSH descriptor: [Hypertension, Pulmonary] this term only
#16 pulmonary next hypertension
#17 post next thrombotic next syndrome
#18 PTS
#19 #9 or #10 or #11 or #12 or #13 or #14 or #15 or #16 or #17 or #18
#20 MeSH descriptor: [Predictive Value of Tests] this term only
#21 predict*
#22 MeSH descriptor: [Risk] explode all trees
#23 risk*
#24 prognos*
#25 #20 or #21 or #22 or #23 or #24
#26 MeSH descriptor: [Anticoagulants] explode all trees
#27 anti-coagul* or anticoagul* or warfarin or acenocoumarol or coumadin or coumarin or phenprocoumon or sintrom or sinthrome or jantoven or marevan or waran or nicoumalone or dicoumarol or dicumarol
#28 phenindione or dabigatran or ximelagatran or apixaban or rivaroxaban or edoxaban or azd0837 or ly517717 or ym150 or betrixaban or idraparinux
#29 #26 or #27 or #28
#30 #8 and #19 and #25 and #29
Appendix 2 Inclusion/exclusion forms
Titles and abstracts inclusion/exclusions form
| Title and/or abstract | ||
|---|---|---|
| Include | Exclude | |
| Prognostic models | Prognostic models | |
| Study design | RCTs | Non-human studies |
| Cohort | Commentaries | |
| Case–control | Case reports (single case reports) | |
| Case series | Study design papers | |
| Letters | Non-systematic reviews | |
| Systematic reviews (at least one database used) | Cross-sectional | |
| Conference abstracts (2005 onwards) | Conference abstracts (pre 2005) | |
| Unclear study designs | ||
| Modelling keywords | ‘model’ (e.g. prediction model) | No mention of a ‘model’/’rule’/’score’/’prediction’/’index’/’algorithm’, etc. |
| ‘rule’ | ||
| ‘score’ (e.g. risk/prediction score) | ||
| ‘prediction’ | ||
| ‘index’ | ||
| ‘algorithm’ | ||
| ‘risk stratification’ | ||
| ‘adjustment for’ | ||
| ‘factors contribution to risk’ | ||
| ‘adjusted odds ratio/hazard ratio/relative risk’, etc. | ||
| Population | Majority of patients aged ≥ 18 years | Patients aged < 18 years |
| Patients with a first unprovoked VTE (unprovoked = no history of major surgery; lower limb trauma, e.g. fracture, cast, limping for 3 days; use of the combined OC pill or HRT; pregnancy; significant immobility, e.g. confined to bed for 3 days; cancer) | Patients with a first provoked VTE (provoked = history of major surgery; lower limb trauma, e.g. fracture, cast, limping for 3 days; use of the combined OC pill or HRT; pregnancy; significant immobility, e.g. confined to bed for 3 days; cancer) | |
| Patients must have received at least 3 months oral anticoagulation treatment | Patients not treated with OACs, or treated for less than 3 months | |
| Mixed populations; only where data extractable for patients meeting above criteria | Healthy individuals, or with conditions other than those described under inclusion criteria (e.g. portal, mesenteric, cerebral vein thrombosis, etc.) | |
| Prognostic model | Prognostic models utilising multiple prognostic variables | Does not report prognostic models |
| Outcome | Recurrence of VTE | Outcomes other than those mentioned in the inclusion criteria |
| Adverse outcomes including mortality and bleeding | ||
| Quality of life/cost-effectiveness | ||
| Link | Appears to (or could possibly) utilise model to predict risk of VTE recurrence or adverse outcome | Clearly does not link prognostic models to VTE recurrence or adverse outcomes |
Full-text inclusion/exclusion form
| Criteria | Yes | C/T | No | Prognostic model |
|---|---|---|---|---|
| Reviews and discussions | Does the study do more than just discuss a model | |||
| Population | Are patients at least 18 years old | |||
| Could the population or a defined subpopulation be considered as unprovoked (if not why not) | ||||
| Can we identify results specifically for the unprovoked population | ||||
| Did patients receive at least 3 months treatment with either a vitamin K antagonist or an OAC | ||||
| Outcome | Does the model predict least one of: recurrence/mortality/bleeding/quality of life | |||
| Models | Does the model aim to do more than assess a single factor adjusted for other things | |||
| Is the model used to predict individuals risk of one of the above outcomes | ||||
| Decision | ||||
| Exclude with reason | ||||
| Does the study include an economic evaluation of a model? | ||||
| Comments | ||||
| If included | Yes | C/T | No | Factors |
| If the study is included, what is their definition of unprovoked? | Major surgery | |||
| Lower limb trauma | ||||
| Use of OC pill or HRT | ||||
| Pregnancy | ||||
| Significant immobility | ||||
| Cancer | ||||
| Thrombophillia (e.g. antiphosphlipid syndrome, factor V leiden, etc.) | ||||
Appendix 3 List of excluded studies from systematic review
| Article | Reason for exclusion |
|---|---|
| Depenbrock PJ. Long-term standard-dose warfarin to prevent thrombosis. Am Fam Physician 1941;72:36 | A |
| Stiegler H. [Venous thrombosis--diagnosis and treatment.] MMW Fortschr Med 1969;153:65–7 | A |
| Prandoni P, Mannucci PM. Deep-vein thrombosis of the lower limbs: diagnosis and management. Baillieres Clinical Haematology 1994;7:693–712 | A |
| Chesterman CN. After a first episode of venous thromboembolism. BMJ 1995;311:700–1 | A |
| Hirsh J. The optimal duration of anticoagulant therapy for venous thrombosis. N Engl J Med 1995;332:1710–11 | A |
| Hirsh J, Kearon C, Ginsberg J. Duration of anticoagulant therapy after first episode of venous thrombosis in patients with inherited thrombophilia. Arch Intern Med 1997;157:2174–7 | A |
| Solymoss S. Optimising the duration of anticoagulation therapy for venous thrombosis. CMAJ 1999;160:1317–18 | A |
| van der Heijden JF, Kraaijenhagen RA, Buller HR. The risk of recurrent venous thrombosis. N Engl J Med 2000;342:214–15 | A |
| Schulman S. Duration of anticoagulants in acute or recurrent venous thromboembolism. Curr Opin Pulm Med 2000;6:321–5 | A |
| Schulman S. Optimal duration of anticoagulation therapy after venous thromboembolism. Arch Hellenic Med 2000;17:A71–4 | A |
| Diet F. [Optimum duration of anticoagulation for deep-vein thrombosis – How long?] Herz Kreislauf 2000;32:16–18 | A |
| Dickey TL. Can thrombophilia testing help to prevent recurrent VTE? Part 2. JAAPA 2002;15:23–4 | A |
| Bounameaux H. [Venous thromboembolism recurrence: is there a place for D-dimer?] Rev Med Interne 2002;23:810–12 | A |
| Levesque H. [Risk of haemorrhage with oral anticoagulants for deep-vein thrombosis.] J Mal Vasc 2002;27:129–36 | A |
| D’Angelo A, Piovella F. Optimal duration of oral anticoagulant therapy after a first episode of venous thromboembolism: where to go? Haematologica 2002;87:1009–13 | A |
| Palareti G, Legnani C, Cosmi B, Guazzaloca G, Pancani C, Coccheri S. Risk of venous thromboembolism recurrence: high negative predictive value of D-dimer performed after oral anticoagulation is stopped. Thromb Haemost 2002;87:7–12 | A |
| Douketis JD, Crowther MA. Identifying patients at increased risk for recurrent venous thromboembolism: clinical, biochemical, and radiologic risk factors. Cardiovasc Rev Rep 2002;23:280–5 | A |
| Chodri TA, Groth ML. Optimal duration of anticoagulation therapy for idiopathic deep-vein thrombosis. Clin Pulm Med 2002;9:131–2 | A |
| Brotman DJ. Identifying patients at risk of recurrent venous thromboembolism. JAMA 2003;290:3192 | A |
| van Dongen CJ, Vink R, Hutten BA, Buller HR, Prins MH. Recurrent thromboembolism after treatment with vitamin K antagonists. Arch Intern Med 2003;163:2793–822 | A |
| Kyrle PA, Eichinger S. The risk of recurrent venous thromboembolism: the Austrian study on recurrent venous thromboembolism. Wien Klin Wochenschr 2003;115:471–4 | A |
| Hyers TM. Duration of anticoagulation in venous thromboembolism. Arch Intern Med 2003;163:1265–6 | A |
| Ridker PM, Goldhaber SZ, Glynn RJ. Low-intensity versus conventional-intensity warfarin for prevention of recurrent venous thromboembolism. N Engl J Med 2003;49:2164–7 | A |
| Seneviratne C, Kupfer Y, Tessler S. Low-intensity warfarin therapy for the prevention of recurrent venous thromboembolism. N Engl J Med 2003;349:398–400 | A |
| Preventing idiopathic DVT recurrence. Med Today 2003;4:9 | A |
| Dargaud Y. [Predictive value of D dimer in recurrent venous thromboembolism.] Hematologie 2003;9:281–2 | A |
| Prandoni P, Pagnan A. The optimal long-term treatment of venous thromboembolism: current status and future perspectives. Cardiovasc Rev Rep 2003;24:468–72 | A |
| Goldhaber SZ. Prevention of recurrent idiopathic venous thromboembolism. Circulation 2004;110:IV20–4 | A |
| Palareti G, Cosmi B. Predicting the risk of recurrence of venous thromboembolism. Curr Opin Hematol 2004;11:192–7 | A |
| Abdel-Razeq HN, Radwi GR. Duration of anticoagulation after first episode of unprovoked venous thromboembolism. Saudi Med J 2004;25:1776–7 | A |
| Agnelli G. Long-term low-dose warfarin use is effective in the prevention of recurrent venous thromboembolism: no. J Thromb Haemost 2004;2:1038–40 | A |
| Elliott CG, Rubin LJ. Mars or venus – is sex a risk factor for recurrent venous thromboembolism? N Engl J Med 2004;350:2614–16 | A |
| Boger C, Schroll S, Holmer S. Ximelagatran for secondary prevention of venous thromboembolism. N Engl J Med 2004;350:618–19 | A |
| Becattini C, Agnelli G. Duration of anticoagulant treatment after venous thromboembolism. Pathophysiol Haemost Thromb 2004;33:354–7 | A |
| Agnelli G, Becattini C, Prandoni P, Nieto JA, Monreal M, Kahn SR, et al. Recurrent venous thromboembolism in men and women. N Engl J Med 2004;351:2015–18 | A |
| Cosmi B, Palareti G. D-dimer, oral anticoagulation, and venous thromboembolism recurrence. Semin Vasc Med 2005;5:365–70 | A |
| Rychlik PG, Henry KS, Bussey HI. Duration of treatment of deep-vein thrombosis: time for a new approach? Pharmacotherapy 2005;25:1112–15 | A |
| Couturaud F, Lacut K, Gut-Gobert C, Leroyer C, Mottier D. [Long term antivitamin K therapy: what degree of anticoagulation, what efficiency and risk?] Sang Thrombose Vaisseaux 2005;17:23–31 | A |
| Kamphuisen PW. Can anticoagulant treatment be tailored with biomarkers in patients with venous thromboembolism? J Thromb Haemost 2006;4:1206–7 | A |
| Cosmi B. Value of D-dimer testing to decide duration of anticoagulation after deep-vein thrombosis: yes. J Thromb Haemost 2006;4:2527–9 | A |
| Baglin T. Value of D-dimer testing to decide duration of anticoagulation after deep-vein thrombosis: not yet. J Thromb Haemost 2006;4:2530–2 | A |
| Pengo V, Prandoni P. Sex and anticoagulation in patients with idiopathic venous thromboembolism. Lancet 2006;368:342–3 | A |
| Betancourt MT, Rodger MA. Risk stratification for recurrent venous thromboembolism in unprovoked venous thromboembolism patients. Acta Chir Belg 2007;107:636–40 | A |
| Baglin T. Unprovoked deep-vein thrombosis should be treated with long-term anticoagulation – no. J Thromb Haemost 2007;5:2336–9 | A |
| Kearon C. Indefinite anticoagulation after a first episode of unprovoked venous thromboembolism: yes. J Thromb Haemost 2007;5:2330–5 | A |
| Pernod G, Sevestre MA, Labarere J. D-dimer and duration of anticoagulation. N Engl J Med 2007;356:421 | A |
| Garcia D. Duration of anticoagulant therapy for patients with venous thromboembolism. Thromb Res 2008;123:S62–4 | A |
| Righini M, Perrier A. [D-dimers measurement to predict the risk of thromboembolic recurrence.] Revue de Medecine Interne 2008;29:476–81 | A |
| Agnelli G, Becattini C. Treatment of DVT: how long is enough and how do you predict recurrence. J Thromb Thrombolysis 2008;25:37–44 | A |
| Kearon C. Stopping anticoagulant therapy after an unprovoked venous thromboembolism. CMAJ 2008;179:401–2 | A |
| Prandoni P. Recurrence of venous thromboembolism and its prevention. Phlebolymphology 2008;15:3–11 | A |
| Cortese F. Is lifelong anticoagulation worth the risk in patients with unprovoked DVT? Ann Intern Med 2009;151:827 | A |
| Eichinger S, Kyrle PA. Duration of anticoagulation after initial idiopathic venous thrombosis – the swinging pendulum: risk assessment to predict recurrence. J Thromb Haemost 2009;7:291–5 | A |
| Siragusa S, Caramazza D, Malato A. How should we determine length of anticoagulation after proximal deep-vein thrombosis of the lower limbs? Br J Haematol 2009;144:832–7 | A |
| Madhusudhana S, Moore A, Moormeier JA. Current issues in the diagnosis and management of deep-vein thrombosis. Mo Med 2009;106:43–8 | A |
| Pabinger I, Ay C. Biomarkers and venous thromboembolism. Arterioscler Thromb Vasc Biol 2009;29:332–6. | A |
| Zhu T, Martinez I, Emmerich J. Venous thromboembolism: risk factors for recurrence. Arterioscler Thromb Vasc Biol 2009;29:298–310 | A |
| Raju NC, Hirsh J, Eikelboom JW. Duration of anticoagulant therapy for venous thromboembolism. Med J Aust 2009;190:659–60 | A |
| Goldhaber SZ. Is lifelong anticoagulation worth the risk in patients with unprovoked DVT? Ann Intern Med 2009;151:827 | A |
| Kyrle PA, Rosendaal FR, Eichinger S. Risk assessment for recurrent venous thrombosis. Lancet 2010;376:2032–9 | A |
| Kearon C, Iorio A, Palareti G, Subcommittee on Control of Anticoagulation of the SSC of the ISTH. Risk of recurrent venous thromboembolism after stopping treatment in cohort studies: recommendation for acceptable rates and standardised reporting. J Thromb Haemost 2010;8:2313–15 | A |
| East AT, Wakefield TW. What is the optimal duration of treatment for DVT? An update on evidence-based medicine of treatment for DVT. Semin Vasc Surg 2010;23:182–91 | A |
| Rodger M, Carrier M, Gandara E, Le Gal, G. Unprovoked venous thromboembolism: short term or indefinite anticoagulation? Balancing long-term risk and benefit. Blood Rev 2010;24:171–8 | A |
| Reitter S, Laczkovics C, Waldhoer T, Mayerhofer M, Vutuc C, Pabinger I. Long-term survival after venous thromboembolism: a retrospective selected cohort study among young women. Haematologica 2010;95:1425–8 | A |
| Malato A, Saccullo G, Iorio A, Ageno W, Siragusa S. Residual vein thrombosis and D-dimer for optimising duration of anticoagulation in idiopathic deep-vein thrombosis. Curr Pharm Des 2010;16:3483–6 | A |
| Spurzem JR, Geraci SA. Outpatient management of patients following pulmonary embolism. Am J Med 2010;123:987–90 | A |
| Cosmi B, Palareti G. Update on the predictive value of D-dimer in patients with idiopathic venous thromboembolism. Thromb Res 2010;125:S62–5 | A |
| Holmes G. Optimum duration of anticoagulation for idiopathic venous thromboembolism. J R Coll Physicians Edinb 2010;40:380 | A |
| Hunt JM, Bull TM. Clinical review of pulmonary embolism: diagnosis, prognosis, and treatment. Med Clin North Am 2011;95:1203–22 | A |
| Van EJ, Eerenberg ES, Kamphuisen PW, Buller HR. How to prevent, treat, and overcome current clinical challenges of VTE. J Thromb Haemost 2011;9:265–74 | A |
| Rodger MA, Ramsay T, Le Gal G, Carrier M. Assessment of recurrence risk after unprovoked venous thromboembolism. Ann Intern Med 2011;154:644 | A |
| Fujita T. Risk assessment for recurrent venous thrombosis. Lancet 2011;377:1072–3 | A |
| Donadini MP, Ageno W. Which patients with unprovoked VTE should receive extended anticoagulation? The minority. J Thromb Thrombolysis 2011;31:301–5 | A |
| Lindhoff-Last E. [Risk assessment of recurrence of venous thromboembolism.] Hamostaseologie 2011;31:7–12 | A |
| De Stefano V, Za T, Ciminello A, Betti S, Rossi E. Testing for inherited thrombophilia and predictive value for venous thromboembolism. 10th International Winter Meeting on Coagulation: Basic, Laboratory and Clinical Aspects of Venous and Arterial Thromboembolic Diseases, Bormio, Italy, 10–16 October 2011 | A |
| Baglin T. Using the laboratory to predict recurrent venous thrombosis. Int J Lab Hematol 2011;33:333–42 | A |
| Oo TH. Optimal duration of anticoagulation in idiopathic venous thromboembolism should be determined by multiple variables. J R Coll Physicians Edinb 2011;41:91–2 | A |
| Risk of recurrence after venous thromboembolism. Drug Ther Bull 2011;49:51 | A |
| Cosmi B, Legnani C, Iorio A, Pengo V, Ghirarduzzi A, Testa S, et al. [Referat zu: Residual venous obstruction, alone and in combination with D-dimer, as a risk factor for recurrence after anticoagulation withdrawal following a first idiopathic deep-vein thrombosis in the prolong study.] Vasomed 2011;23:97–8 | A |
| Iorio A, Douketis J. Assessment of recurrence risk after unprovoked venous thromboembolism. Ann Intern Med 2011;154:644 | A |
| Spencer FA, Ginberg JS. Recurrence after unprovoked venous thromboembolism. BMJ 2011;342:508 | A |
| Goldhaber SZ, Piazza G. Optimal duration of anticoagulation after venous thromboembolism. Circulation 2011;123:664–7 | A |
| Emadi A, Streiff M. Diagnosis and management of venous thromboembolism: an update a decade into the new millennium. Arch Iran Med 2011;14:341–51 | A |
| Sinescu C, Hostiuc M, Bartos D. Idiopathic venous thromboembolism and thrombophilia. J Med Life 2011;4:57–62 | A |
| Kroger A, Ulrich-Somaini S. [Pulmonary embolism.] Praxis 2011;100:453–62 | A |
| Kyrle PA. Treatment of venous thrombosis – a view of the future. 55th Annual Meeting of the Gesellschaft fur Thrombose und Hamostaseforschung, GTH 2011, Wiesbaden, Germany, 16–19 February 2011 | A |
| Prandoni P, Piovella C, Spiezia L, Dalla VF, Pesavento R. The optimal duration of anticoagulation in patients with venous thromboembolism: how long is long enough? Panminerva Medica 2012;54:39–44 | A |
| Geersing GJ, Oudega R, Hoes AW, Moons KG. Managing pulmonary embolism using prognostic models: future concepts for primary care. CMAJ 2012;184:305–10 | A |
| Eichinger S, Kyrle PA. Duration of anticoagulation after venous thrombosis. Vasa 2012;41:11–17 | A |
| Baglin T, Bauer K, Douketis J, Buller H, Srivastava A, Johnson G. Duration of anticoagulant therapy after a first episode of an unprovoked pulmonary embolus or deep-vein thrombosis: guidance from the SSC of the ISTH. J Thromb Haemost 2012;10:698–702 | A |
| Kyrle PA, Eichinger S, Kyrle PA, Eichinger S. Clinical scores to predict recurrence risk of venous thromboembolism. Thromb Haemost 2012;108:1061–4 | A |
| Hamann H, Reuchlin G. [Secondary prevention after leg and pelvic vein thrombosis with low-molecular-weight heparin.] Vasa Suppl 1992;35:107–8 | B |
| Sudlow MF, Campbell IA, Angel JH, Bentley DP, Fennerty AG, Prescott RJ, et al. Optimum duration of anticoagulation for deep-vein thrombosis and pulmonary embolism. Lancet 1992;340:873–6 | B |
| Monreal M, Lafoz E, Ruiz J, Callejas JM, Arias A. Recurrent pulmonary embolism in patients treated because of acute venous thromboembolism: a prospective study. Eur J Vasc Surg 1994;8:584–9 | B |
| Sarasin FP, Bounameaux H. Duration of oral anticoagulant therapy after proximal deep-vein thrombosis: a decision analysis. Thromb Haemost 1994;71:286–91 | B |
| Sarasin FP, Bounameaux H. Duration of oral anticoagulant therapy after proximal deep-vein thrombosis: a decision analysis. Medecine et Hygiene 1994;52:2309–13 | B |
| Ridker PM, Miletich JP, Stampfer MJ, Goldhaber SZ, Lindpaintner K, Hennekens CH. Factor V Leiden and risks of recurrent idiopathic venous thromboembolism. Circulation 1995;92:2800–2 | B |
| Meissner MH, Caps MT, Bergelin RO, Manzo RA, Strandness DE Jr. Propagation, rethrombosis and new thrombus formation after acute deep venous thrombosis. J Vasc Surg 1995;22:558–67 | B |
| Schulman S, Rhedin A-S, Lindmarker P, Carlsson A, Larfars G, Nicol P, et al. A comparison of six weeks with six months of oral anticoagulant therapy after a first episode of venous thromboembolism. N Engl J Med 1995;332:1661–5 | B |
| Schulman S, Wiman B. The significance of hypofibrinolysis for the risk of recurrence of venous thromboembolism. Duration of Anticoagulation (DURAC) Trial Study Group. Thromb Haemost 1996;75:607–11 | B |
| White RH, Zhou H, Romano PS. Length of hospital stay for treatment of deep venous thrombosis and the incidence of recurrent thromboembolism. Arch Intern Med 1998;158:1005–10 | B |
| Sparano N, English R. Extended anticoagulation for a first episode of idiopathic venous thromboembolism. J Fam Pract 1999;48:579–80 | B |
| Schulman S. The effect of the duration of anticoagulation and other risk factors on the recurrence of venous thromboembolisms. Duration of Anticoagulation Study Group. Wiener Medizinische Wochenschrift 1999;149:66–9 | B |
| Lindmarker P, Schulman S, Sten-Linder M, Wiman B, Egberg N, Johnsson H. The risk of recurrent venous thromboembolism in carriers and non-carriers of the G1691A allele in the coagulation factor V gene and the G20210A allele in the prothrombin gene. DURAC Trial Study Group. Duration of Anticoagulation. Thromb Haemost 1999;81:684–9 | B |
| Marchetti M, Pistorio A, Barosi G. Extended anticoagulation for prevention of recurrent venous thromboembolism in carriers of factor V Leiden – cost-effectiveness analysis. Thromb Haemost 2000;84:752–7 | B |
| Kyrle PA, Minar E, Hirschl M, Bialonczyk C, Stain M, Schneider B, et al. High plasma levels of factor VIII and the risk of recurrent venous thromboembolism. N Engl J Med 2000;343:457–62 | B |
| Heit JA, Mohr DN, Silverstein MD, Petterson TM, O’Fallon WM, Melton LJ III. Predictors of recurrence after deep-vein thrombosis and pulmonary embolism: a population-based cohort study. Arch Intern Med 2000;160:761–8 | B |
| Hansson PO, Sorbo J, Eriksson H. The recurrence rate of venous thromboembolism after a first or second episode of deep venous thrombosis was high. Evid Based Med 2000;5:188 | B |
| Lindmarker P, Schulman S. The risk of ipsilateral versus contralateral recurrent deep-vein thrombosis in the leg. J Intern Med 2000;247:601–6 | B |
| Farquhar D. Duration of anticoagulant therapy for deep-vein thrombosis. CMAJ 2001;165:636 | B |
| Eichinger S, Weltermann A, Mannhalter C, Minar E, Bialonczyk C, Hirschl M, et al. The risk of recurrent venous thromboembolism in heterozygous carriers of factor V Leiden and a first spontaneous venous thromboembolism. Arch Intern Med 2002;162:2357–60 | B |
| Fattorini A, Crippa L, Vigano’ DS, Pattarini E, D’Angelo A. Risk of deep-vein thrombosis recurrence: high negative predictive value of D-dimer performed during oral anticoagulation. Thromb Haemost 2002;88:162–3 | B |
| Palareti G, Legnani C, Cosmi B, Guazzaloca G, Pancani C, Coccheri S. Risk of venous thromboembolism recurrence: high negative predictive value of D-dimer performed after oral anticoagulation is stopped. Thromb Haemost 2002;87:7–12 | B |
| Schonauer V, Kyrle PA, Weltermann A, Minar E, Bialonczyk C, Hirschl M, et al. Superficial thrombophlebitis and risk for recurrent venous thromboembolism. J Vasc Surg 2003;37:834–8 | B |
| Linkins LA, Choi PT, Douketis JD. Clinical impact of bleeding in patients taking oral anticoagulant therapy for venous thromboembolism: a meta-analysis. Ann Intern Med 2003;139:893–900 | B |
| Palareti G, Legnani C, Cosmi B, Valdre L, Lunghi B, Bernardi F, et al. Predictive value of D-dimer test for recurrent venous thromboembolism after anticoagulation withdrawal in subjects with a previous idiopathic event and in carriers of congenital thrombophilia. Circulation 2003;108:313–18 | B |
| van Dongen CJ, Vink R, Hutten BA, Buller HR, Prins MH. The incidence of recurrent venous thromboembolism after treatment with vitamin K antagonists in relation to time since first event: a meta-analysis. Arch Intern Med 2003;163:1285–93 | B |
| Ombandza-Moussa E, Samama MM, Horellou MH, Elalamy I, Conard J. Potential use of D-dimer measurement in patients treated with oral anticoagulant for a venous thromboembolic episode. Int Angiol 2003;22:364–9 | B |
| Baglin T, Luddington R, Brown K, Baglin C. Incidence of recurrent venous thromboembolism in relation to clinical and thrombophilic risk factors: prospective cohort study. Lancet 2003;362:523–6 | B |
| Biron-Andreani C. Evaluation of risk of recurrent venous thromboembolism: role of D-dimers. Angeiologie 2003;55:37–9 | B |
| Marcucci R, Liotta AA, Cellai AP, Rogolino A, Gori AM, Giusti B, et al. Increased plasma levels of lipoprotein(a) and the risk of idiopathic and recurrent venous thromboembolism. Am J Med 2003;115:601–5 | B |
| Spiezia L, Bernardi E, Tormene D, Simioni P, Girolami A, Prandoni P. Recurrent thromboembolism in fertile women with venous thrombosis: incidence and risk factors. Thromb Haemost 2003;90:964–6 | B |
| Kyrle PA, Minar E, Bialonczyk C, Hirschl M, Weltermann A, Eichinger S. The risk of recurrent venous thromboembolism in men and women. N Engl J Med 2004;350:2558–63 | B |
| Eichinger S, Weltermann A, Minar E, Stain M, Schonauer V, Schneider B, et al. Symptomatic pulmonary embolism and the risk of recurrent venous thromboembolism. Arch Intern Med 2004;164:92–6 | B |
| Willey VJ, Bullano MF, Hauch O, Reynolds M, Wygant G, Hoffman L, et al. Management patterns and outcomes of patients with venous thromboembolism in the usual community practice setting. Clin Ther 2004;26:1149–59 | B |
| Cristina L, Benilde C, Michela C, Mirella F, Giuliana G, Gualtiero P. High plasma levels of factor VIII and risk of recurrence of venous thromboembolism. Br J Haematol 2004;124:504–10 | B |
| Baglin T, Luddington R, Brown K, Baglin C. High risk of recurrent venous thromboembolism in men. J Thromb Haemost 2004;2:2152–5 | B |
| Monaco J, Newton W. Elevated D-dimer level predicts recurrent VTE. J Fam Pract 2004;53:20–3 | B |
| Cosmi B, Legnani C, Cini M, Guazzaloca G, Palareti G. D-dimer levels in combination with residual venous obstruction and the risk of recurrence after anticoagulation withdrawal for a first idiopathic deep-vein thrombosis. Thromb Haemost 2005;94:969–74 | B |
| Garcia-Fuster MJ, Forner MJ, Fernandez C, Gil J, Vaya A, Maldonado L. Long-term prospective study of recurrent venous thromboembolism in patients younger than 50 years. Pathophysiol Haemost Thromb 2005;34:6–12 | B |
| Hoke M, Kyrle PA, Minar E, Bialonzcyk C, Hirschl M, Schneider B, et al. Tissue factor pathway inhibitor and the risk of recurrent venous thromboembolism. Thromb Haemost 2005;94:787–90 | B |
| Eriksson H, Lundstrom T, Wahlander K, Clason SB, Schulman S, THRIVE III Investigators. Prognostic factors for recurrence of venous thromboembolism (VTE) or bleeding during long-term secondary prevention of VTE with ximelagatran. Thromb Haemost 2005;94:522–7 | B |
| Palareti G, Legnani C, Cosmi B, Guazzaloca G, Cini M, Mattarozzi S. Poor anticoagulation quality in the first 3 months after unprovoked venous thromboembolism is a risk factor for long-term recurrence. J Thromb Haemost 2005;3:955–61 | B |
| Schulman S, Lundstrom T, Walander K, Billing CS, Eriksson H. Ximelagatran for the secondary prevention of venous thromboembolism: a complementary follow-up analysis of the THRIVE III study. Thromb Haemost 2005;94:820–4 | B |
| Ost D, Tepper J, Mihara H, Lander O, Heinzer R, Fein A. Duration of anticoagulation following venous thromboembolism: a meta-analysis. JAMA 2005;294:706–15 | B |
| Christiansen SC, Cannegieter SC, Koster T, Vandenbroucke JP, Rosendaal FR. Thrombophilia, clinical factors, and recurrent venous thrombotic events. JAMA 2005;293:2352–61 | B |
| Young L, Ockelford P, Milne D, Rolfe-Vyson V, Mckelvie S, Harper P. Post-treatment residual thrombus increases the risk of recurrent deep-vein thrombosis and mortality. J Thromb Haemost 2006;4:1919–24 | B |
| Legnani C, Mattarozzi S, Cini M, Cosmi B, Favaretto E, Palareti G. Abnormally short activated partial thromboplastin time values are associated with increased risk of recurrence of venous thromboembolism after oral anticoagulation withdrawal. Br J Haematol 2006;134:227–32 | B |
| Shrivastava S, Ridker PM, Glynn RJ, Goldhaber SZ, Moll S, Bounameaux H, et al. D-dimer, factor VIII coagulant activity, low-intensity warfarin and the risk of recurrent venous thromboembolism. J Thromb Haemost 2006;4:1208–14 | B |
| Hron G, Eichinger S, Weltermann A, Quehenberger P, Halbmayer WM, Kyrle PA. Prediction of recurrent venous thromboembolism by the activated partial thromboplastin time. J Thromb Haemost 2006;4:752–6 | B |
| Schulman S, Lindmarker P, Holmstrom M, Larfars G, Carlsson A, Nicol P, et al. Post-thrombotic syndrome, recurrence, and death 10 years after the first episode of venous thromboembolism treated with warfarin for 6 weeks or 6 months. J Thromb Haemost 2006;4:734–42 | B |
| van Hylckama Vlieg A, Christiansen SC, Luddington R, Cannegieter SC, Rosendaal FR, Baglin TP. Elevated endogenous thrombin potential is associated with an increased risk of a first deep venous thrombosis but not with the risk of recurrence. Br J Haematol 2007;138:769–74 | B |
| Prandoni P, Noventa F, Ghirarduzzi A, Pengo V, Bernardi E, Pesavento R, et al. The risk of recurrent venous thromboembolism after discontinuing anticoagulation in patients with acute proximal deep-vein thrombosis or pulmonary embolism. A prospective cohort study in 1,626 patients. Haematologica 2007;92:199–205 | B |
| Poli D, Antonucci E, Ciuti G, Abbate R, Prisco D. Anticoagulation quality and the risk of recurrence of venous thromboembolism. Thromb Haemost 2007;98:1148–50 | B |
| Prandoni P, Hutten BA, van Dongen CJ, Pesavento R, Prins MH. Quality of oral anticoagulant treatment and risk of subsequent recurrent thromboembolism in patients with deep-vein thrombosis. J Thromb Haemost 2007;5:1555 | B |
| Kyrle PA, Hron G, Eichinger S, Wagner O. Circulating P-selectin and the risk of recurrent venous thromboembolism. Thromb Haemost 2007;97:880–3 | B |
| Kamphuisen PW. 6 or 3 months of anticoagulant therapy did not differ for treatment failure in patients with DVT, PE, or both. Evid Based Med 2007;12:143 | B |
| Eichinger S, Hron G, Kollars M, Kyrle PA. Prediction of recurrent venous thromboembolism by endogenous thrombin potential and D-dimer. 2008;54:2042–8 | B |
| Coppens M, Reijnders JH, Middeldorp S, Doggen CJ, Rosendaal FR. Testing for inherited thrombophilia does not reduce the recurrence of venous thrombosis. J Thromb Haemost 2008;6:1474–7 | B |
| Besser M, Baglin C, Luddington R, van Hylckama Vlieg A, Baglin T. High rate of unprovoked recurrent venous thrombosis is associated with high thrombin-generating potential in a prospective cohort study. J Thromb Haemost 2008;6:1720–5 | B |
| Cosmi B, Legnani C, Cini M, Favaretto E, Palareti G. D-dimer and factor VIII are independent risk factors for recurrence after anticoagulation withdrawal for a first idiopathic deep-vein thrombosis. Thromb Res 2008;122:610–17 | B |
| Eichinger S, Hron G, Bialonczyk C, Hirschl M, Minar E, Wagner O, et al. Overweight, obesity, and the risk of recurrent venous thromboembolism. Arch Intern Med 2008;168:1678–83 | B |
| Siragusa S, Malato A, Anastasio R, Cigna V, Milio G, Amato C, et al. Residual vein thrombosis to establish duration of anticoagulation after a first episode of deep-vein thrombosis: the Duration of Anticoagulation based on Compression UltraSonography (DACUS) study. Blood 2008;112:511–15 | B |
| Poli D, Antonucci E, Ciuti G, Abbate R, Prisco D. Combination of D-dimer, F1 + 2 and residual vein obstruction as predictors of VTE recurrence in patients with first VTE episode after OAT withdrawal. J Thromb Haemost 2008;6:708–10 | B |
| Baglin T, Palmer CR, Luddington R, Baglin C. Unprovoked recurrent venous thrombosis: prediction by D-dimer and clinical risk factors. J Thromb Haemost 2008;6:577–82 | B |
| Linnemann B, Zgouras D, Schindewolf M, Schwonberg J, Jarosch-Preusche M, Lindhoff-Last E. Impact of sex and traditional cardiovascular risk factors on the risk of recurrent venous thromboembolism: results from the German MAISTHRO Registry. Blood Coagul Fibrinolysis 2008;19:159–65 | B |
| Lechner D, Wiener C, Weltermann A, Eischer L, Eichinger S, Kyrle PA. Comparison between idiopathic deep-vein thrombosis of the upper and lower extremity regarding risk factors and recurrence. J Thromb Haemost 2008;6:1269–74 | B |
| Legnani C, Palareti G, Cosmi B, Cini M, Tosetto A, Tripodi A, et al. Different cut-off values of quantitative D-dimer methods to predict the risk of venous thromboembolism recurrence: a post-hoc analysis of the PROLONG study. Haematologica 2008;93:900–7 | B |
| Cosmi B, Legnani C, Tosetto A, Pengo V, Ghirarduzzi A, Alatri A, et al. Use of D-dimer testing to determine duration of anticoagulation, risk of cardiovascular events and occult cancer after a first episode of idiopathic venous thromboembolism: the extended follow-up of the PROLONG study. J Thromb Thrombolysis 2009;28:381–8 | B |
| Haspel J, Bauer K, Goehler A, Roberts DH. Long-term anticoagulant therapy for idiopathic pulmonary embolism in the elderly: a decision analysis. Chest 2009;135:1243–51 | B |
| Prandoni P, Prins MH, Lensing AW, Ghirarduzzi A, Ageno W, Imberti D, et al. Residual thrombosis on ultrasonography to guide the duration of anticoagulation in patients with deep venous thrombosis: a randomised trial. Ann Intern Med 2009;150:577–85 | B |
| Taliani MR, Becattini C, Agnelli G, Prandoni P, Moia M, Bazzan M, et al. Duration of anticoagulant treatment and recurrence of venous thromboembolism in patients with and without thrombophilic abnormalities. Thromb Haemost 2009;101:596–8 | B |
| Kim TM, Kim JS, Han SW, Hong YS, Kim I, Ha J, et al. Clinical predictors of recurrent venous thromboembolism: a single institute experience in Korea. Thromb Res 2009;123:436–43 | B |
| Prandoni P, Lensing AWA, Prins MH. Ultrasonography to guide duration of anticoagulation in DVT. Ann Intern Med 2009;151:826–7 | B |
| Lijfering WM, Veeger NJGM, Middeldorp S, Hamulyak K, Prins MH, Buller HR, et al. A lower risk of recurrent venous thrombosis in women compared with men is explained by sex-specific risk factors at time of first venous thrombosis in thrombophilic families. Blood 2009;114:2031–6 | B |
| Block JP. Ultrasonography may help guide decisions to discontinue anticoagulation therapy for deep venous thrombosis. J Clin Outcomes Manag 2009;16:304–5 | B |
| Tripodi A, Legnani C, Palareti G, Chantarangkul V, Mannucci PM. More on: high thrombin generation and the risk of recurrent venous thromboembolism. J Thromb Haemost 2009;7:906–7 | B |
| Garcia DA. Review: D-dimer concentrations predict risk of recurrent VTE after anticoagulant therapy is stopped. Evid Based Med 2009;14:59 | B |
| Lee C-H, Yang Y-H, Lin L-J, Cheng C-L. The relationship between the length of oral anticoagulation and recurrence of venous thromboembolism in Taiwan – a nationwide population-base study. 25th International Conference on Pharmacoepidemiology and Therapeutic Risk Management Providence, RI, 16–19 September 2009 | B |
| Marcucci M, Iorio A, Douketis J, Baglin T, Cushman M, Eichinger S, et al. D-dimer to predict thrombosis recurrence: comparison of aggregate data and individual patient data meta-analyses. 22nd Congress of the International Society of Thrombosis and Haemostasis, Boston, MA, 11–16 July 2009 | B |
| Reitter SE, Laczkovics C, Waldhoer T, Vutuc C, Pabinger-Fasching I. Long-term survival after venous thromboembolism: a cohort study among young women. 22nd Congress of the International Society of Thrombosis and Haemostasis, Boston, MA, 11–16 July 2009 | B |
| Douketis J, Iorio A, Marcucci M, Baglin T, Cushman M, Eichinger S, et al. Does the clinical presentation of venous thromboembolism predict the risk for and type of thrombosis recurrence? 22nd Congress of the International Society of Thrombosis and Haemostasis Boston, MA, 11–16 July 2009 | B |
| Grifoni E, Ciuti G, Poli D, Antonucci E, Marcucci R, Arcangeli C, et al. Hyperhomocysteinemia and risk of venous thromboembolism recurrence after a first episode of pulmonary embolism. 22nd Congress of the International Society of Thrombosis and Haemostasis, Boston, MA, 11–16 July 2009 | B |
| Cosmi B, Legnani C, Pengo V, Tosetto A, Ghirarduzzi A, Alatri A, et al. D-dimer and sex as risk factors for recurrence after a first episode of venous thromboembolism in the extended follow-up of the prolong study. 22nd Congress of the International Society of Thrombosis and Haemostasis Boston, MA, 11–16 July 2009 | B |
| Emmerich J, Zhu T, Carcaillon L, Martinez I, Olie V, Remones V, et al. Risk factor for the prediction of recurrent venous thromboembolism. 22nd Congress of the International Society of Thrombosis and Haemostasis Boston, MA, 11–16 July 2009 | B |
| Iorio A, Douketis J, Marcucci M, Baglin T, Cushman M, Eichinger S, et al. D-dimer to predict thrombosis recurrence after unprovoked venous thromboembolism: effect of patient-and D-dimer-related factors on recurrence prediction. 22nd Congress of the International Society of Thrombosis and Haemostasis Boston, MA, 11–16 July 2009 | B |
| Ten Cate-Hoek AJ, Dielis AJWH, Spronk HMH, Van OR, Hamulyak K, Prins MH, et al. Increasing levels of thrombin generation precede recurrent DVT. 22nd Congress of the International Society of Thrombosis and Haemostasis Boston, MA, 11–16 July 2009 | B |
| Douketis J, Lorio A, Marcucci M, Baglin T, Cushman M, Eichinger S, et al. Does patient sex and prior hormonal therapy predict risk for thrombosis recurrence after a first venous thromboembolism? 22nd Congress of the International Society of Thrombosis and Haemostasis Boston, MA, 11–16 July 2009 | B |
| Hron G, Eischer L, Eichinger S, Kyrle PA. Risk of recurrence among heterozygous carriers of Factor II (FII) G20210A and a first unprovoked venous thromboembolism (VTE). 22nd Congress of the International Society of Thrombosis and Haemostasis, Boston, MA, 11–16 July 2009 | B |
| Conard J, Ombandza-Moussa E, Samama MM, Turpie AG, Horellou MH, Elalamy I. D-dimer testing, thrombophilia screening and recurrences in patients with venous thromboembolism: a 6-year follow-up. European Society of Cardiology, ESC Congress 2009 Barcelona, Spain, 29 August–2 September 2009 | B |
| Zotz RB, Gerhardt A. Risk stratification of recurrent venous thromboembolism. 51st Annual Meeting of the American Society of Haematology, New Orleans, LA, 5–8 December 2009 | B |
| Makelburg ABU, Middeldorp S, Hamulyak K, Prins M, Buller HR, Lijfering WM. Thrombophilia and cardiovascular risk factors on the absolute risk of first and recurrent venous thrombosis. Results from a retrospective family cohort study involving 2097 relatives. 51st Annual Meeting of the American Society of Haematology, New Orleans, LA, 5–8 December 2009 | B |
| Baglin T, Douketis J, Tosetto A, Marcucci M, Cushman M, Kyrle P, et al. Does the clinical presentation and extent of venous thrombosis predict likelihood and type of recurrence? A patient-level meta-analysis. J Thromb Haemost 2010;8:2436–42 | B |
| Cosmi B, Legnani C, Tosetto A, Pengo V, Ghirarduzzi A, Testa S, et al. Sex, age and normal post-anticoagulation D-dimer as risk factors for recurrence after idiopathic venous thromboembolism in the prolong study extension. J Thromb Haemost 2010;8:1933–42 | B |
| Douketis J, Tosetto A, Marcucci M, Baglin T, Cushman M, Eichinger S, et al. Patient-level meta-analysis: effect of measurement timing, threshold, and patient age on ability of D-dimer testing to assess recurrence risk after unprovoked venous thromboembolism. Ann Intern Med 2010;153:523–31 | B |
| Mello TB, Orsi FL, Montalvao SA, Ozelo MC, de Paula EV, Nichinno-Bizzachi JM. Long-term prospective study of recurrent venous thromboembolism in a Hispanic population. Blood Coagul Fibrinolysis 2010;21:660–5 | B |
| Deitelzweig SB, Lin J, Kreilick C, Hussein M, Battleman D. Warfarin therapy in patients with venous thromboembolism: patterns of use and predictors of clinical outcomes. Adv Ther 2010;27:623–33 | B |
| Tripodi A, Legnani C, Lemma L, Cosmi B, Palareti G, Chantarangkul V, et al. Abnormal Protac-induced coagulation inhibition chromogenic assay results are associated with an increased risk of recurrent venous thromboembolism. J Thromb Thrombolysis 2010;30:215–19 | B |
| Cosmi B, Legnani C, Tosetto A, Pengo V, Ghirarduzzi A, Testa S, et al. Comorbidities, alone and in combination with D-dimer, as risk factors for recurrence after a first episode of unprovoked venous thromboembolism in the extended follow-up of the PROLONG study. Thromb Haemost 2010;103:1152–60 | B |
| Lijfering WM, Middeldorp S, Veeger NJ, Hamulyak K, Prins MH, Buller HR, et al. Risk of recurrent venous thrombosis in homozygous carriers and double heterozygous carriers of factor V Leiden and prothrombin G20210A. Circulation 2010;121:1706–12 | B |
| Cosmi B, Legnani C, Iorio A, Pengo V, Ghirarduzzi A, Testa S, et al. Residual venous obstruction, alone and in combination with D-dimer, as a risk factor for recurrence after anticoagulation withdrawal following a first idiopathic deep-vein thrombosis in the prolong study. Eur J Vasc Endovasc Surg 2010;39:356–65 | B |
| Cosmi B, Legnani C, Tosetto A, Pengo V, Ghirarduzzi A, Testa S, et al. Usefulness of repeated D-dimer testing after stopping anticoagulation for a first episode of unprovoked venous thromboembolism: the PROLONG II prospective study. Blood 2010;115:481–8 | B |
| Eischer L, Tscholl V, Heinze G, Traby L, Kyrle PA, Eichinger S. Haematocrit and the risk of recurrent venous thrombosis: a prospective cohort study. 52nd Annual Meeting of the American Society of Haematology, Orlando, FL , 4–7 January 2010 | B |
| Kondal D, Taglalakis V, Moride Y, Boivin J-F, Kahn S. A Large, Population based study of sex differences in the risk of recurrent venous thromboembolism. Conference: 52nd Annual Meeting of the American Society of Haematology, Orlando, FL, 4–7 January 2010 | B |
| Sonnevi K, Tchaikovski SN, Bremme K, Holmstrom M, Professor JR, Larfars G. High thrombin generation measured in the presence of activated protein C is associated with an increased risk of recurrence among women 18–64 years after a first event of VTE. 52nd Annual Meeting of the American Society of Haematology, 2010 Orlando, FL, 4–7 January 2010 | B |
| [Blood coagulation self management facilitates anticoagulant therapy. Reduces risk of complications and mortality.] MMW Fortschritte der Medizin 2010;152:44–5 | B |
| Jimenez D, Aujesky D, Diaz G, Monreal M, Otero R, Marti D, et al. Prognostic significance of deep-vein thrombosis in patients presenting with acute symptomatic pulmonary embolism. M J Respir Crit Care Med 2010;181:983–91 | B |
| Legnani C, Cosmi B, Cini M, Palareti G. Different cut-off values of quantitative D-dimer (DD) assays to establish duration of oral anticoagulation treatment (OAT) after venous thromboembolism (VTE). 20th International Society on Fibrinolysis and Proteolysis, ISFP Congress Amsterdam, Netherlands, 24–28 August 2010 | B |
| Cosmi B, Legnani C, Iorio A, Pengo V, Ghirarduzzi A, Testa S, et al. Residual venous obstruction, alone and in combination with D-dimer, as a risk factor for recurrence after anticoagulation withdrawal following a first idiopathic deep-vein thrombosis in the PROLONG study. 11th Meeting of the European Venous Forum, EVF 2010 Antwerp, Belgium, 24–16 June 2010 | B |
| Douketis J, Tosetto A, Marcucci M, Baglin T, Cushman M, Eichinger S, et al. D-dimer to determine risk for disease recurrence after unprovoked venous thromboembolism: addressing unanswered questions with a large individual patient meta-analysis. 21st International Congress on Thrombosis – The Start of a New Era – Antithrombotic Agents, Milan, Italy, 6–9 July 2010 | B |
| Marcucci M, Douketis JD, Tosetto A, Tudur-Smith C, Baglin T, Cushman M, et al. D-dimer to predict recurrence after a first episode of unprovoked venous thromboembolism: comparison of individual patient and aggregate data meta-analysis. 21st International Congress on Thrombosis – The Start of a New Era – Antithrombotic Agents, Milan, Italy, 6–9 July 2010 | B |
| Baglin T, Douketis J, Tosetto A, Marcucci M, Cushman M, Eichinger S, et al. Does the clinical presentation and extent of venous thrombosis predict likelihood and type of recurrence? A patient level meta-analysis of 2,554 unselected patients after a first thrombosis. 21st International Congress on Thrombosis – The Start of a New Era – Antithrombotic Agents Milan, Italy, 6–9 July 2010 | B |
| Douketis J, Tosetto A, Marcucci M, Baglin T, Cushman M, Eichinger S, et al. Are men at higher risk for disease recurrence than women. 21st International Congress on Thrombosis – The Start of a New Era – Antithrombotic Agents, Milan, Italy, 6–9 July 2010 | B |
| Cosmi B, Legnani C, Tosetto A, Pengo V, Ghirarduzzi A, Testa S, et al. Sex, age and normal post-anticoagulation D-dimer as risk factors for recurrence after idiopathic venous thromboembolism in the Prolong study extension. 21st International Congress on Thrombosis – The Start of a New Era – Antithrombotic Agents, Milan, Italy, 6–9 July 2010 | B |
| Siragusa S, Malato A, Saccullo G, Lo CL, Paolo GF, Iorio A, et al. Idiopathic vein thrombosis: identification of populations at different risk of relapse following oral anticoagulant treatment. The results of the ‘Extended-DACUS Study’. 21st International Congress on Thrombosis – The Start of a New Era – Antithrombotic Agents, Milan, Italy, 6–9 July 2010 | B |
| Chantarangkul V, Tripodi A, Legnani C, Lemma L, Cosmi B, Palareti G, et al. Abnormal Agkistrodon contortrix contortrix venom-induced coagulation inhibition chromogenic assay results are associated with an increased risk of recurrent VTE. 21st International Congress on Thrombosis – The Start of a New Era – Antithrombotic Agents, Milan, Italy, 6–9 July 2010 | B |
| Verso M, Agnelli G, Ageno W, Imberti D, Moia M, Palareti G, et al. Long-term clinical outcomes in patients with venous thromboembolism: findings From the master registry. 21st International Congress on Thrombosis – The Start of a New Era – Antithrombotic Agents, Milan, Italy, 6–9 July 2010 | B |
| Cosmi B, Legnani C, Iorio A, Pengo V, Ghirarduzzi A, Testa S, et al. Residual venous obstruction, alone and in combination with D-dimer, as a risk factor for recurrence after anticoagulation withdrawal following a first idiopathic deep-vein thrombosis in the prolong study. Eur J Vasc Endovasc Surg 2010;39:356–65 | B |
| Cosmi B, Legnani C, Tosetto A, Pengo V, Ghirarduzzi A, Testa S, et al. Sex, age and normal post-anticoagulation D-dimer as risk factors for recurrence after idiopathic venous thromboembolism in the Prolong study extension. J Thromb Haemost 2010;8:1933–42 | B |
| Cosmi B, Legnani C, Tosetto A, Pengo V, Ghirarduzzi A, Testa S, et al. Comorbidities, alone and in combination with D-dimer, as risk factors for recurrence after a first episode of unprovoked venous thromboembolism in the extended follow-up of the PROLONG study. Thromb Haemost 2010;103:1152–60 | B |
| Lewis DA, Stashenko GJ, Akay OM, Price LI, Owzar K, Ginsburg GS, et al. Whole blood gene expression analyses in patients with single versus recurrent venous thromboembolism. Thromb Res 2011;128:536–40 | B |
| Heit JA, Lahr BD, Petterson TM, Bailey KR, Ashrani AA, Melton LJ III. Heparin and warfarin anticoagulation intensity as predictors of recurrence after deep-vein thrombosis or pulmonary embolism: a population-based cohort study. Blood 2011;118:4992–9 | B |
| Andresen MS, Sandven I, Brunborg C, Njaastad AM, Strekerud F, Abdelnoor M, et al. Mortality and recurrence after treatment of VTE: long term follow-up of patients with good life-expectancy. Thromb Res 2011;127:540–6 | B |
| Boutitie F, Pinede L, Schulman S, Agnelli G, Raskob G, Julian J, et al. Influence of preceding length of anticoagulant treatment and initial presentation of venous thromboembolism on risk of recurrence after stopping treatment: analysis of individual participants’ data from seven trials. BMJ 2011;342:d3036 | B |
| Douketis J, Tosetto A, Marcucci M, Baglin T, Cosmi B, Cushman M, et al. Risk of recurrence after venous thromboembolism in men and women: patient level meta-analysis. BMJ 2011;342:d813 | B |
| Ortel TL, Beckman M, Hooper WC, Lewis DA, Chi J-T, Kenney KM, et al. Identification of patients at high risk for recurrent venous thromboembolism by whole blood gene expression analysis. 53rd Annual Meeting of the American Society of Haematology 2011, San Diego, CA, 10–13 November 2011 | B |
| Gauthier K, Sabri E, Kahn SR, Wells PS, Anderson D, Gal GL, et al. Family history of venous thromboembolism (VTE) and the risk of VTE recurrence in patients with a first unprovoked VTE: a multicenter prospective cohort study. 53rd Annual Meeting of the American Society of Haematology 2011, San Diego, CA, 10–13 November 2011 | B |
| Papadakis E, Theocharidou D, Mpanti A, Spyrou A, Loukidis K, Tsepanis K, et al. Anatomical distribution of first VTE event and risk of VTE recurrence: long term follow-up and retrospective analysis of 346 Patients. Experience from a single centre. 53rd Annual Meeting of the American Society of Haematology 2011, San Diego, CA, 10–13 November 2011 | B |
| Spirk D, Aujesky D, Husmann M, Hayoz D, Baldi T, Frauchiger B, et al. Cardiac troponin testing and the simplified pulmonary embolism severity index. The Swiss venous thromboembolism registry (SWIVTER). Thromb Haemost 2011;106:978–84 | B |
| Douketis J. D-dimer can predict risk of recurrent venous thromboembolism regardless of patient age, timing of testing, or characteristics of assay. J Clin Outcomes Manag 2011;18:246–8 | B |
| Wang Y, Liu Z. Elevated N-terminal pro-brain natriuretic peptide increases the risk of recurrent thromboembolic events after acute pulmonary embolism. American Heart Association’s Scientific Sessions 2011, Orlando, FL, 12–16 November 2011 | B |
| Vorob’eva NM, Khasanova ZB, Doroshchuk NA, Postnov AY, Kirienko AI, Panchenko EP. Fibrinogen-Beta-249C/T polymorphism is a novel genetic predictor for recurrence of deep-vein thrombosis in Russian population. 23rd Congress of the International Society on Thrombosis and Haemostasis, 57th Annual SSC Meeting, Kyoto, Japan, 23–28 July 2011 | B |
| Traby L, Heinze G, Kollars M, Eischer L, Eichinger S, Kyrle PA. Hypofibrinolysis and the risk of recurrent venous thromboembolism: a prospective cohort study. 23rd Congress of the International Society on Thrombosis and Haemostasis, 57th Annual SSC Meeting, Kyoto, Japan, 23–28 July 2011 | B |
| Ten Cate-Hoek AJ, Erkens P, Hamulyak K, Verhezen P, Ten CH. Is the predictive quality of D-dimer for the recurrence of thrombosis time dependent? 23rd Congress of the International Society on Thrombosis and Haemostasis 57th Annual SSC Meeting, Kyoto, Japan, 23–28 July 2011 | B |
| Spirk D, Ugi J, Korte W, Husmann M, Hayoz D, Baldi T, et al. Long-term anticoagulation treatment for acute venous thromboembolism in patients with and without cancer: The Swiss venous thromboembolism registry (SWIVTER) II. Thromb Haemost 2011;105:962–7 | B |
| Gandara E, Kovacs MJ, Kahn S, Wells P, Anderson DA, Solymoss S, et al. Does ABO blood group increase the rate of recurrent events after initial treatment for a first unprovoked venous thromboembolism (VTE) Event? Reverse cohort subgroup analysis. 23rd Congress of the International Society on Thrombosis and Haemostasis 57th Annual SSC Meeting, Kyoto, Japan, 23–28 July 2011 | B |
| Ruiz-Artacho P, Pedrajas-Navas JM, Molino-Gonzalez A, Sendin-Martin V, Sanchez-Martinez N, Gonzalez-Casanova B. et al. Idiopathic venous thromboembolism: risk factors of recurrence and optimal duration of anticoagulant therapy. 10th Congress of the European Federation of Internal Medicine, Athens, Greece, 5–8 November 2011 | B |
| Yuan Y-D, Gong X-W, Yang Y-H. [Meta-analysis of risk factors for recurrent pulmonary thromboembolism.] Nat Med J Chin 2012;92:2419–25 | B |
| Verso M, Agnelli G, Ageno W, Imberti D, Moia M, Palareti G, et al. Long-term death and recurrence in patients with acute venous thromboembolism: the MASTER registry. Thromb Res 2012;130:369–73 | B |
| Galanaud JP, Bosson JL, Genty C, Presles E, Cucherat M, Sevestre MA, et al. Superficial vein thrombosis and recurrent venous thromboembolism: a pooled analysis of two observational studies. J Thromb Haemost 2012;10:1004–11 | B |
| Wang Y, Liu Z-H, Zhang H-L, Luo Q, Zhao Z-H, Zhao Q. Association of elevated NTproBNP with recurrent thromboembolic events after acute pulmonary embolism. Thromb Res 2012;129:688–92 | B |
| Lutsey PL, Folsom AR. Taller women are at greater risk of recurrent venous thromboembolism: the Iowa Women’s Health Study. Am J Hematol 2012;87:716–17 | B |
| van Schouwenburg IM, Mahmoodi BK, Veeger NJ, Kluin-Nelemans HC, Gansevoort RT, Meijer K. Elevated albuminuria associated with increased risk of recurrent venous thromboembolism: results of a population-based cohort study. Br J Haematol 2012;156:667–71 | B |
| Poli D, Cenci C, Antonucci E, Grifoni E, Arcangeli C, Prisco D, et al. Risk of recurrence in patients with pulmonary embolism: predictive role of D-dimer and of residual oerfusion defects on lung scintigraphy. 22nd National Congress of the Italian Society for Thrombosis and Hemostasis – SISET Vicenza, Italy, 4–6 October 2012 | B |
| Cosmi B, Legnani C, Ghiraduzzi A, Testa S, Vittorio P, Favaretto E, et al. D-Dimer and ultrasound in combination Italian study (Dulcis) to establish the optimal duration of anticoagulation for venous thromboembolism: preliminary results. 58th Annual Meeting of the Scientific and Standardisation Committee of the International Society on Thrombosis and Haemostasis, Liverpool, 27–30 June 2012 | B |
| Donadini MP, Ageno W, Antonucci E, Cosmi B, Kovacs MJ, Le GG, et al. Prognostic significance of residual venous obstruction in patients with treated unprovoked deep-vein thrombosis: a patient-level meta-analysis. Thromb Haemost 2014;111:172–9 | B |
| Donovan AK, Smith KJ, Ragni MV. Anticoagulation duration in heterozygous factor V Leiden: a decision analysis. Thromb Res 2013;132:724–8 | B |
| Lijfering W, Braekkan S, Caram-Deelder C, Rosendaal FR, Cannegieter SC. Statin use and risk of recurrent venous thrombosis: results from the MEGA follow-up study. 55th Annual Meeting of the American Society of Haematology 2013, New Orleans, LA, 7–10 December 2013 | B |
| Martinez C, Katholing A, Cohen A. Risk factors for recurrent venous thromboembolism: VTE Epidemiology Group (VEG) Study. 24th Congress of the International Society on Thrombosis and Haemostasis, Amsterdam, Netherlands, 29 June–4 July 2013 | B |
| Memon AA, Sundquist J, Zoller B, Wang X, Dahlback B, Svensson PJ, et al. Apolipoprotein M and the risk of unprovoked recurrent venous thromboembolism. Thromb Res 2014;133:322–6 | B |
| van Hylckama Vlieg A, Flinterman LE, Bare LAL, Cannegieter SC, Arellano AR, Tong CH, et al. Assessment of the risk of recurrent venous thrombosis using a genetic risk score comprising five genetic markers. 24th Congress of the International Society on Thrombosis and Haemostasis, Amsterdam, 29 June–4 July 2013 | B |
| Wicki J, Perrier A, Perneger TV, Bounameaux H, Junod AF. Predicting adverse outcome in patients with acute pulmonary embolism: a risk score. Thromb Haemost 2000;84:548–52 | C |
| Baloira VA, Ruiz Iturriaga LA. [Pulmonary thromboembolism.] Arch Bronconeumol 2010;46:31–7 | C |
| Kooiman J, Van HN, Iglesias Del SA, Planken E, Lip GYH, Van Der Meer FJM, et al. Predictive Value of the HAS-BLED score for major bleeding in patients with venous thromboembolism during anticoagulant treatment. 24th Congress of the International Society on Thrombosis and Haemostasis Amsterdam, Netherlands, 29 June–4 July 2013 | C |
| Schulman S. How long should oral anticoagulation continue after venous thromboembolism? Cardiology Rev 1996;13:13–16 | B, C |
| Sarasin FP, Bounameaux H. Decision analysis model of prolonged oral anticoagulant treatment in factor V Leiden carriers with first episode of deep-vein thrombosis. BMJ 1998;316:95–9 | B, C |
| Hansson PO, Sorbo J, Eriksson H. Recurrent venous thromboembolism after deep-vein thrombosis: incidence and risk factors. Arch Intern Med 2000;160:769–74 | B, C |
| Vink R, Kraaijenhagen RA, Levi M, Buller HR. Individualised duration of oral anticoagulant therapy for deep-vein thrombosis based on a decision model. J Thromb Haemost 2003;1:2523–30 | B, C |
| Breddin HK, Kadziola Z, Scully M, Nakov R, Misselwitz F, Kakkar VV. Risk factors and coagulation parameters in relationship to phlebographic response and clinical outcome in the treatment of acute deep-vein thrombosis. Thromb Haemost 2003;89:272–7 | B, C |
| Rose P, McManus A, Paneesha S, Scriven N, Farren T, Bacon S, et al. Clinical predictors of adverse outcome in VTE outpatients – the VERITY PUSH Study. 50th Annual Scientific Meeting of the British Society for Haematology, Edinburgh, 19–21 April 2010 | B, C |
| Roh BS, Bang D-H, Lee YH. Recurrent venous thrombosis after endovascular management of iliofemoral deep-vein thrombosis: incidence and risk factors. Cardiovascular and Interventional Radiological Society of Europe, CIRSE 2010, Valencia, Spain, 2–6 January 2010 | B, C |
| Rose P, McManus A, Paneesha S, Scriven N, Farren T, Bacon S, et al. Clinical predictors of adverse outcome in VTE outpatients – analysis of patients with ‘first event’ VTE. 21st International Congress on Thrombosis – The Start of a New Era – Antithrombotic Agents Milan, Italy, 6–9 July 2010 | B, C |
| Chen S, Gulseth MP, Bookhart B, Boulanger L, Fields LE, Schein J, et al. Compliance with warfarin treatment for venous thromboembolism in high-risk patients and its association with recurrent events. Conference: 24th Annual Meeting and Expo of the Academy of Managed Care Pharmacy, AMCP 2012 San Francisco, CA, 18–20 March 2012 | B, C |
| Alhadad A, Miniati M, Alhadad H, Gottsater A, Bajc M. The value of tomographic ventilation/perfusion scintigraphy (V/PSPECT) for follow-up and prediction of recurrence in pulmonary embolism. Thromb Res 2012;130:877–81 | B, C |
| Cohen AT, Rietbrock S, Martinez C. Mortality Following venous thromboembolism. Risk factors from a large cohort. VTE Epidemiology Group (VEG) Study. 24th Congress of the International Society on Thrombosis and Haemostasis Amsterdam, Netherlands, 29 June–4 July 2013 | B, C |
| Poli D, Cenci C, Antonucci E, Grifoni E, Arcangeli C, Prisco D, et al. Risk of recurrence in patients with pulmonary embolism: predictive role of D-dimer and of residual perfusion defects on lung scintigraphy. Thromb Haemost 2013;109:181–6 | B, C |
| Wang Y, Zhang XT. [Analysis of the risk factors influencing the recurrence of deep venous thrombosis in lower extremity after interventional treatment.] J Interv Radiol (China) 2013;22:764–7 | B, C |
| Wiggins KL, Harrington LB, Blondon M, Rice KM, Sitlani CM, Heckbert SR, et al. Risk factors for incident venous thrombosis and their associations with recurrence. American Heart Association’s Epidemiology and Prevention/Nutrition, Physical Activity, and Metabolism 2014 Scientific Sessions, San Francisco, CA, 18–21 March 2014 | B, C |
| Article | Reason for exclusion |
|---|---|
| Emmerich J. [Risk factors of the recurrence of venous thromboembolism.] Rev Prat 2007;57:717–18 | Not available |
| Meyer G. [Pulmonary embolism. Significant diagnostic and therapeutic advances.] Rev Prat 2007;57:709–10 | Not available |
| Ramalle-Gomara E, Javier Ochoa-Gomez F. [Low risk of pulmonary embolism after discontinuing anticoagulant treatment for deep venous thrombosis?] FMC Form Med Contin Aten Prim 2008;15:480 | Not available |
| Man M, Bugalho A. [Update in pulmonary thromboembolic disease.] Rev Port Pneumol 2009;15:483–505 | No translation possible |
| Vorob’eva NM, Panchenko EP, Dobrovol’skii AB, Titaeva EV, Khasanova ZB, Konovalova NV, et al. [Independent predictors of deep-vein thrombosis (results of prospective 18 months study).] Kardiologiia 2010;50:52–8 | No translation possible |
| Vorob’eva NM, Panchenko EP, Dobrovol’skii AB, Titaeva EV, Fedotkina I, Kirienko AI. [Risk factors for venous thromboembolic complications and their association with D-dimer level.] Ter Arkh 2010;82:30–4 | No translation possible |
Appendix 4 Exploratory analysis
FIGURE 47.
Box plot of patient age (years).
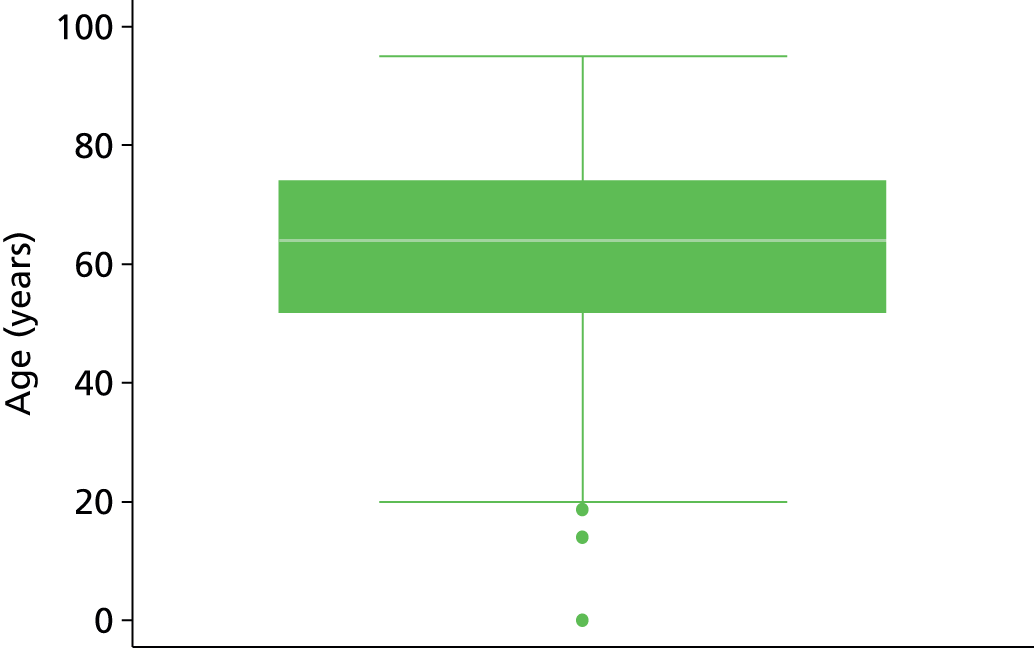
FIGURE 48.
Patient age (years). (a) Histogram; and (b) normal plot.


FIGURE 49.
Patient age (years) (squared). (a) Histogram; and (b) normal plot.

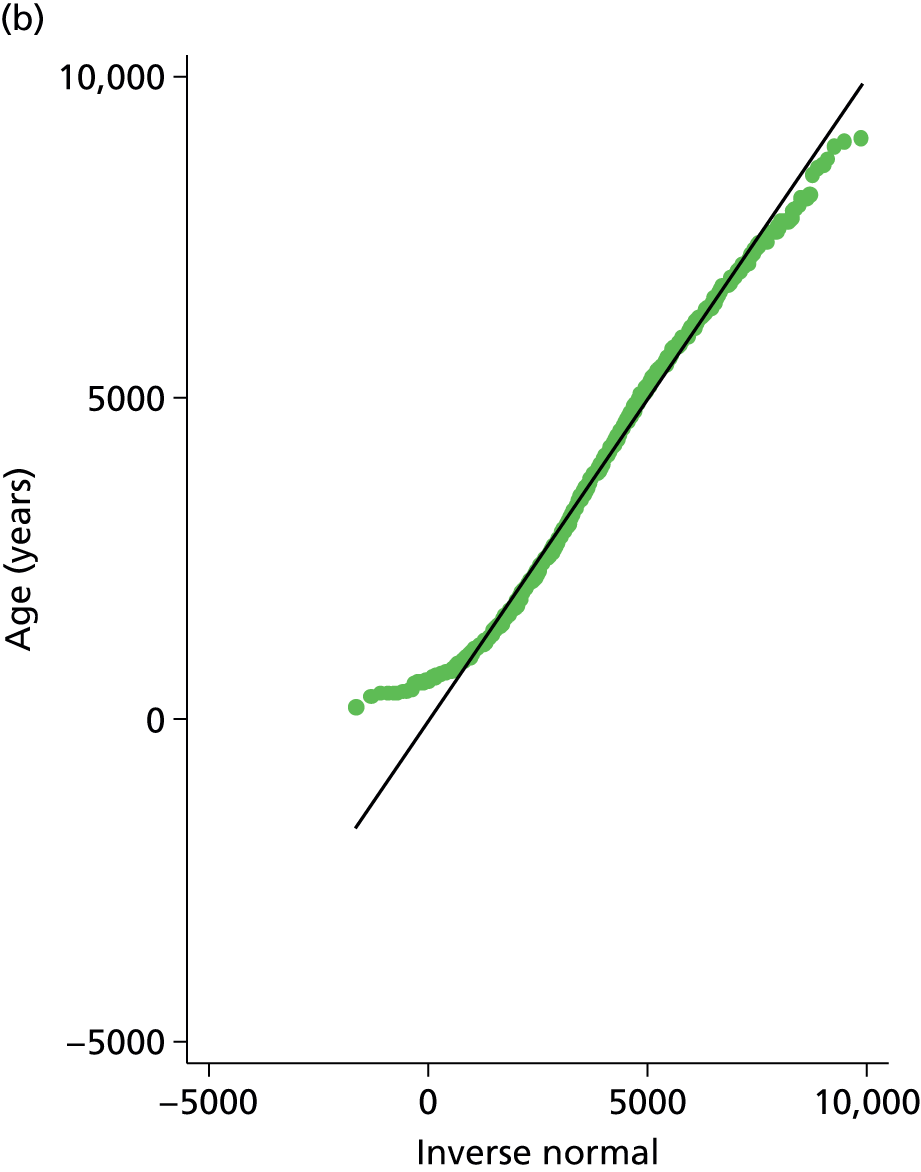
FIGURE 50.
Box plot for patient BMI.
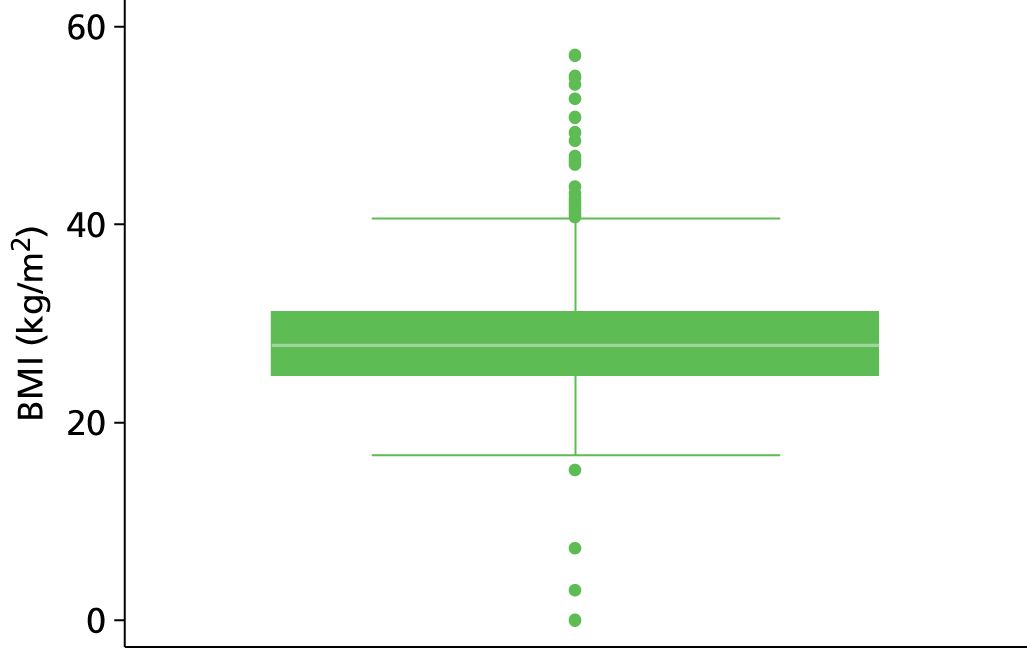
FIGURE 51.
Patient BMI. (a) Histogram; and (b) normal plot.
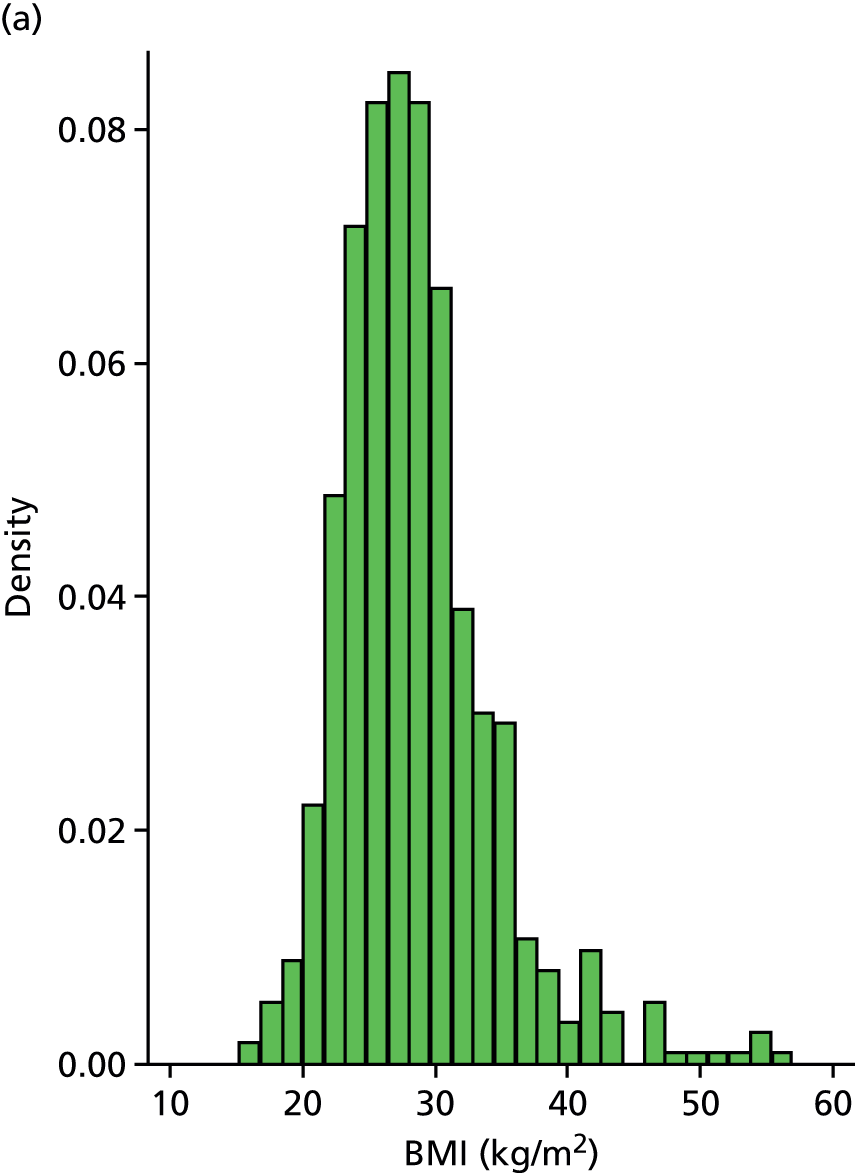
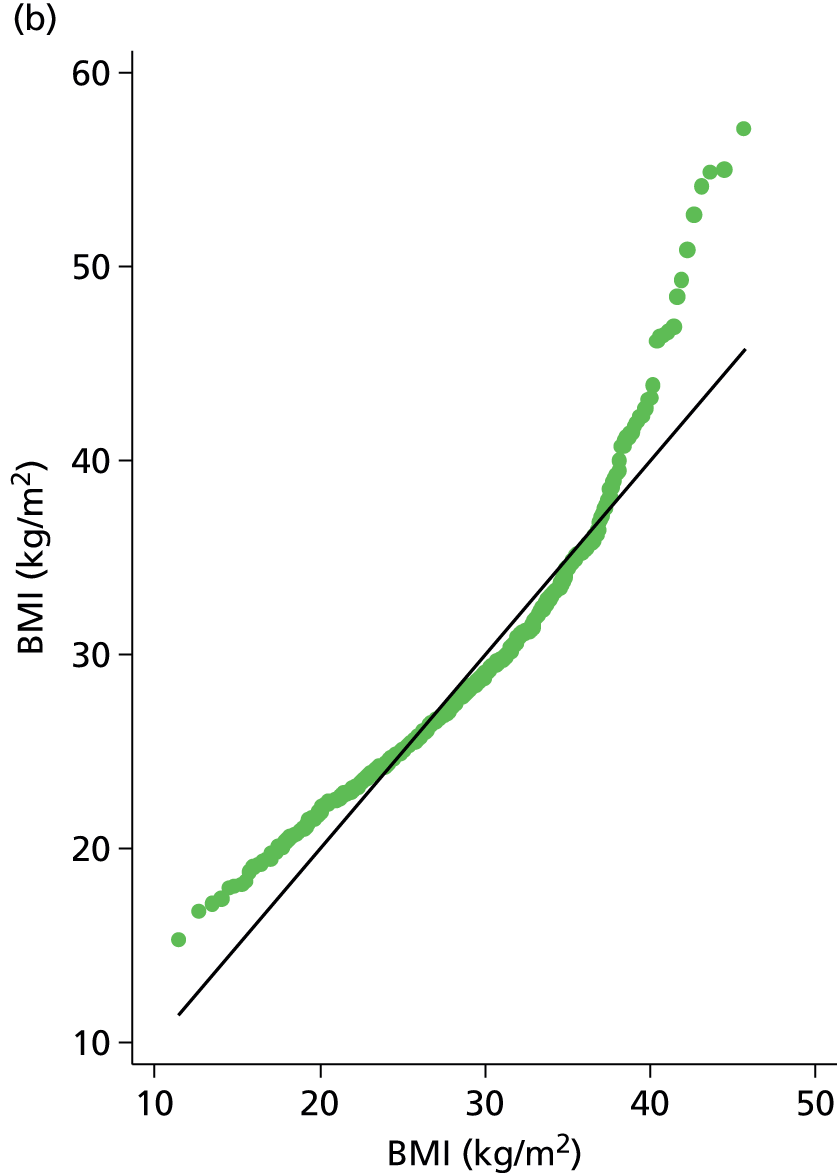
FIGURE 52.
Patient BMI (BMI > 45 kg/m2 removed). (a) Histogram; and (b) normal plot.
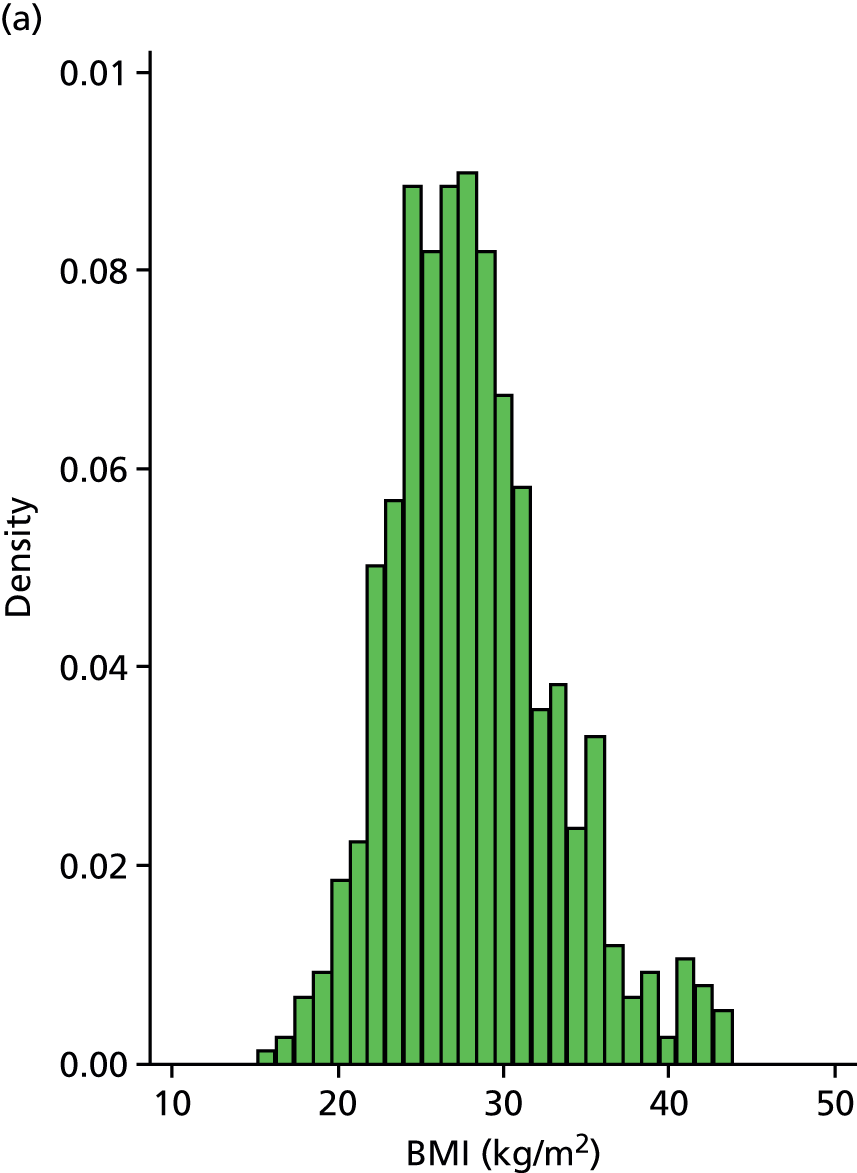
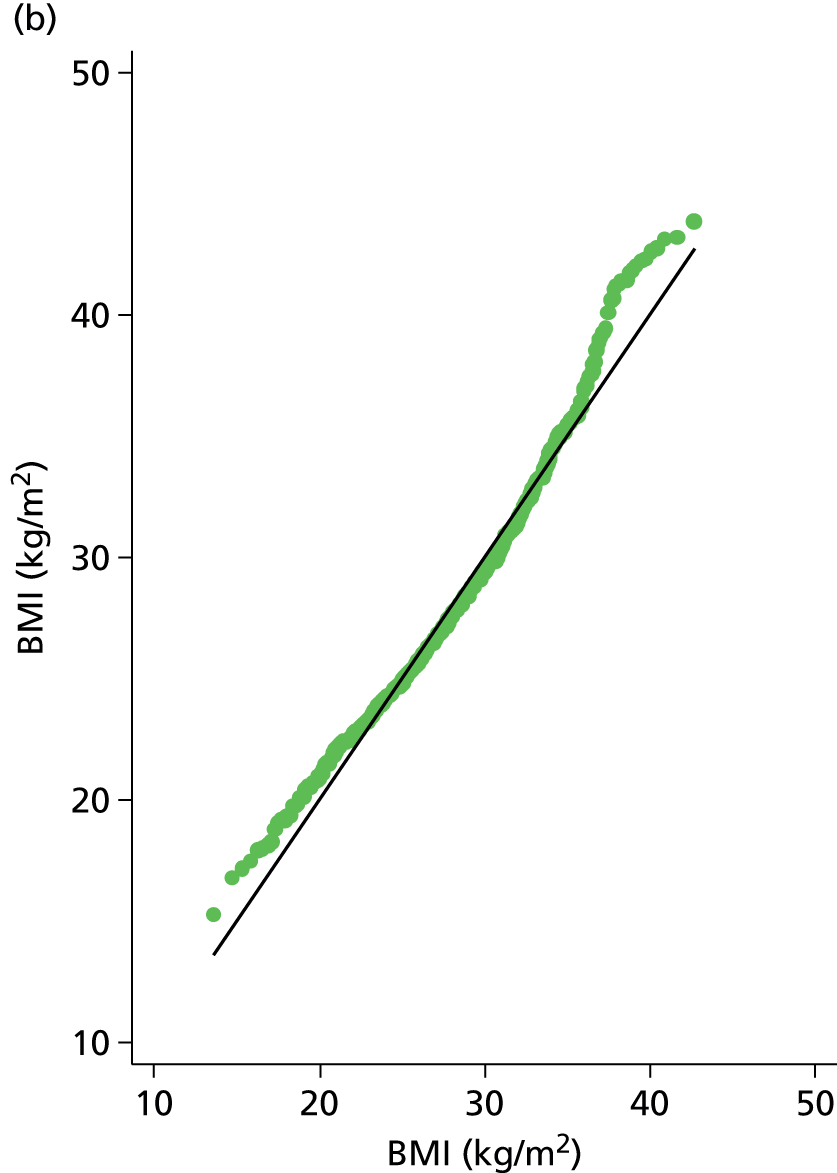
FIGURE 53.
Box plot for patient D-dimer score (ng/ml).

FIGURE 54.
Patient D-dimer score (ng/ml). (a) Histogram; and (b) normal plot.


FIGURE 55.
Patient log-D-dimer score (ng/ml) (outlier – D-dimer = 20). (a) Histogram; and (b) normal plot.


FIGURE 56.
Box plot for patient lag time (days).

FIGURE 57.
Patient lag time (days). (a) Histogram; and (b) normal plot.
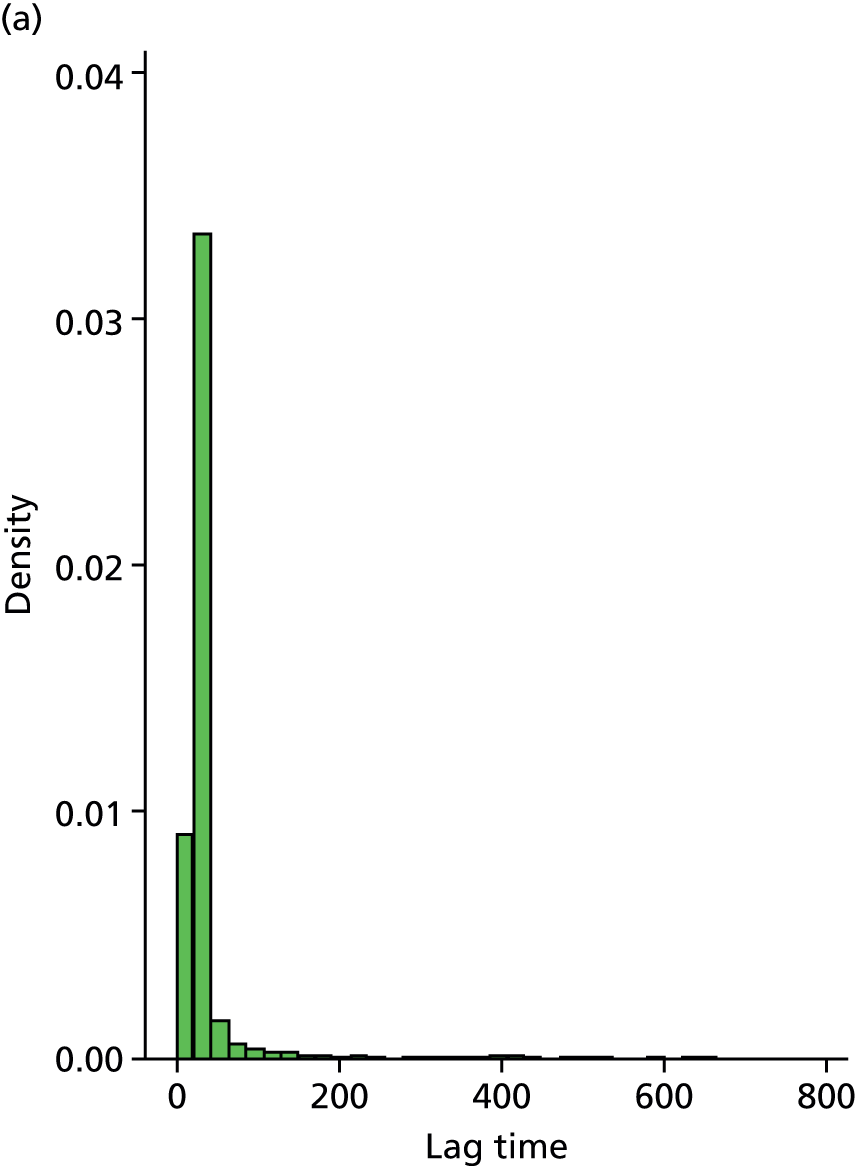
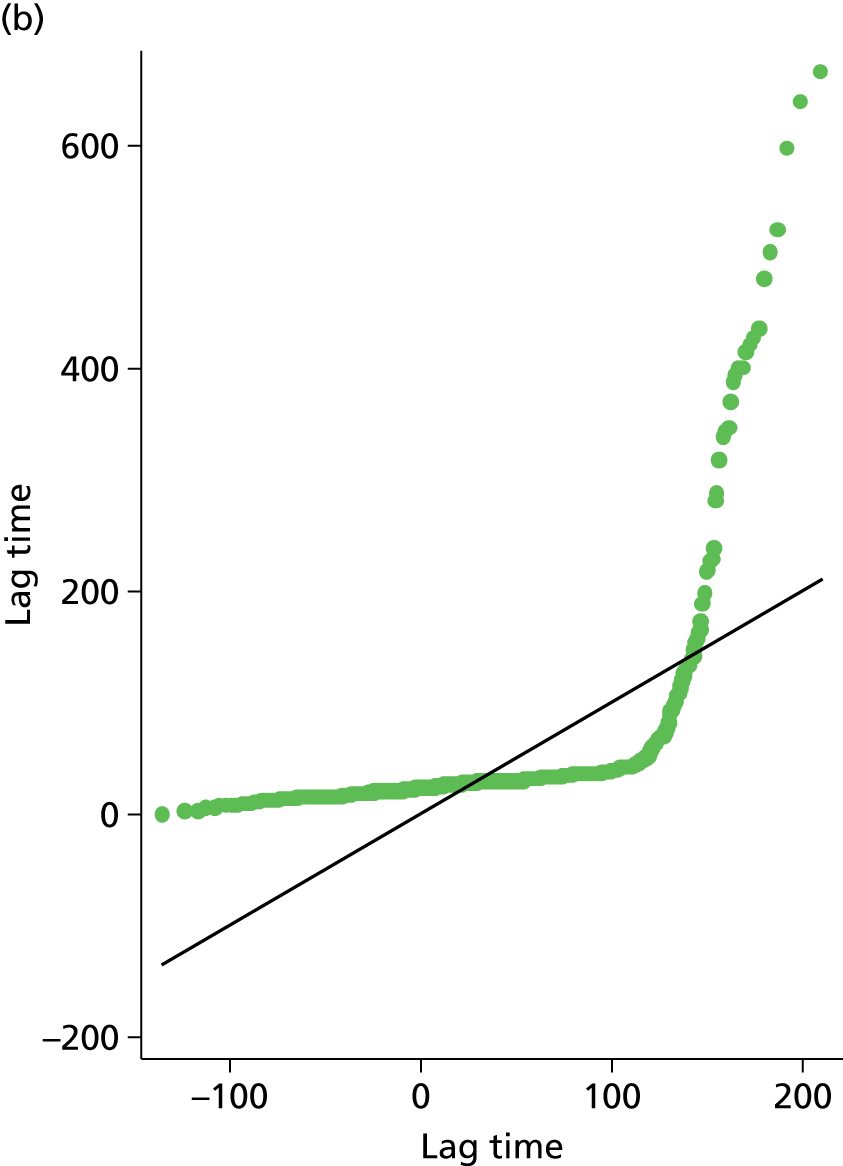
FIGURE 58.
Patient log-lag time (days). (a) Histogram; (b) box plot; and (c) normal plot.
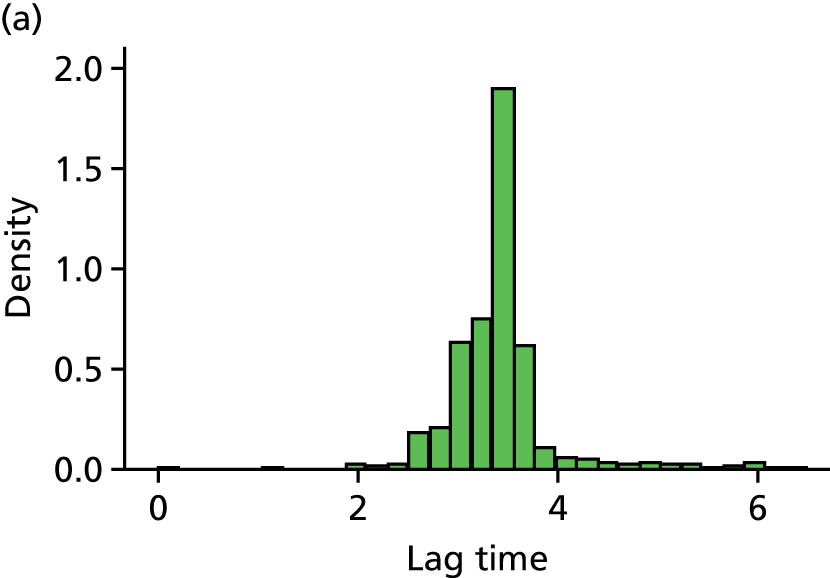
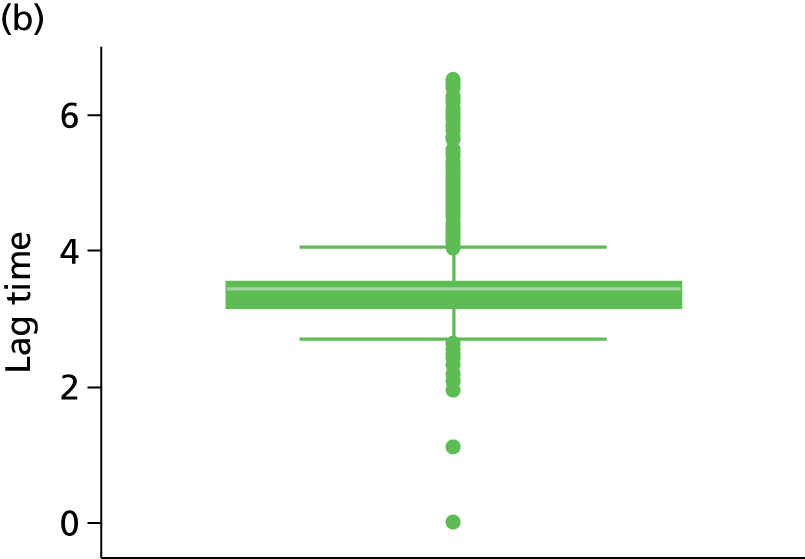

FIGURE 59.
Box plot for patients treatment duration (months).

FIGURE 60.
Patient treatment duration (months). (a) Histogram; and (b) normal plot.
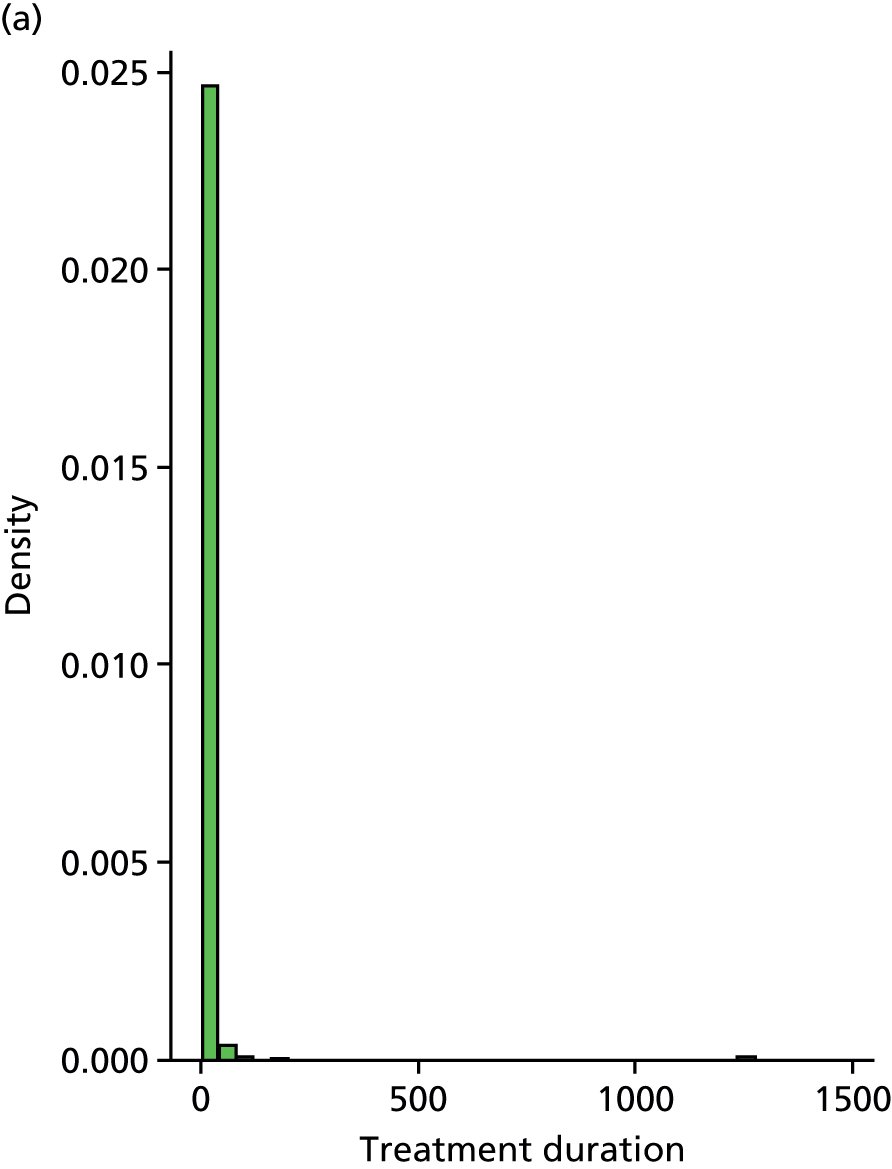
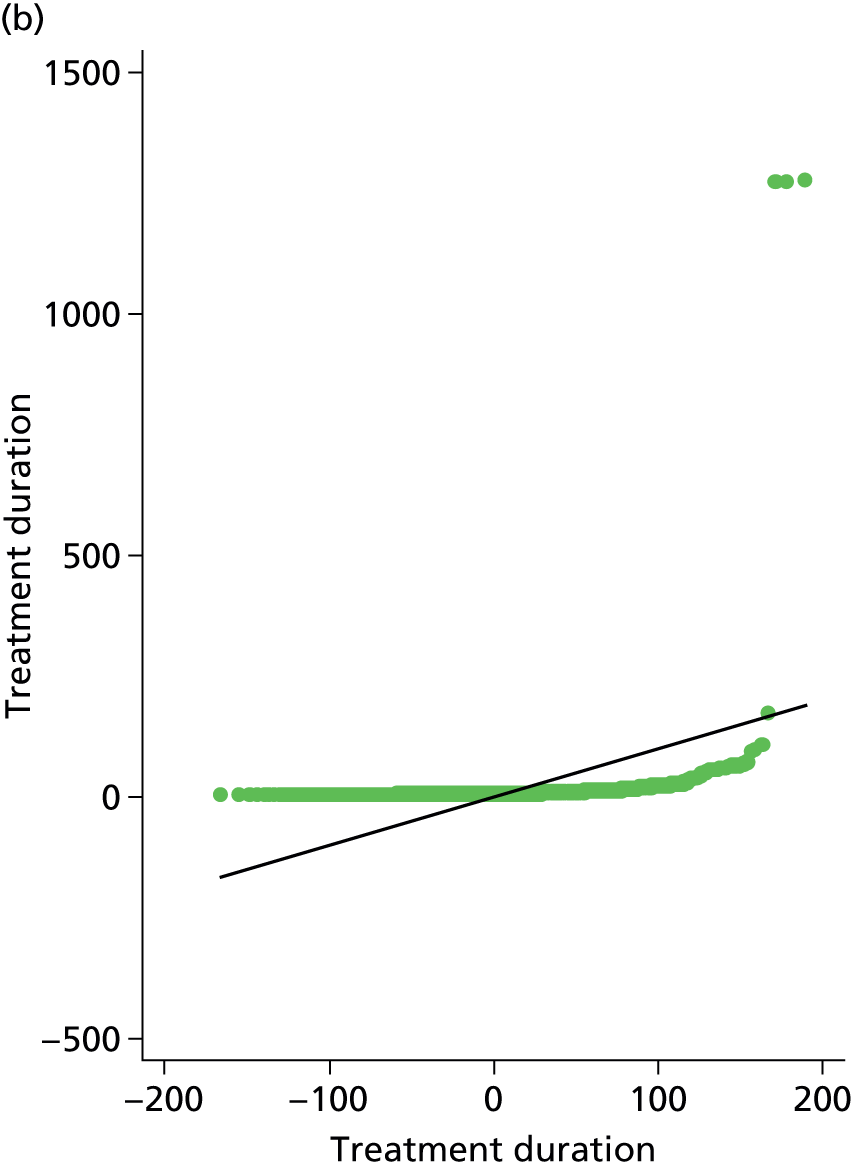
FIGURE 61.
Box plot for patient log-treatment duration (months).
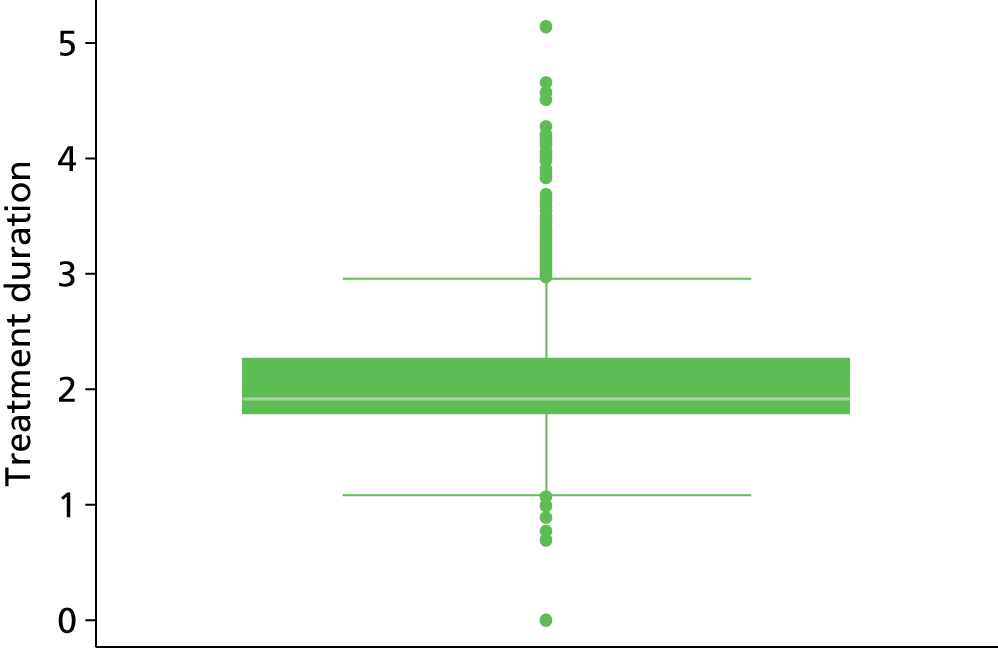
FIGURE 62.
Patient log-treatment duration (months) (treatment durations > 1000 months removed). (a) Histogram; and (b) normal plot.
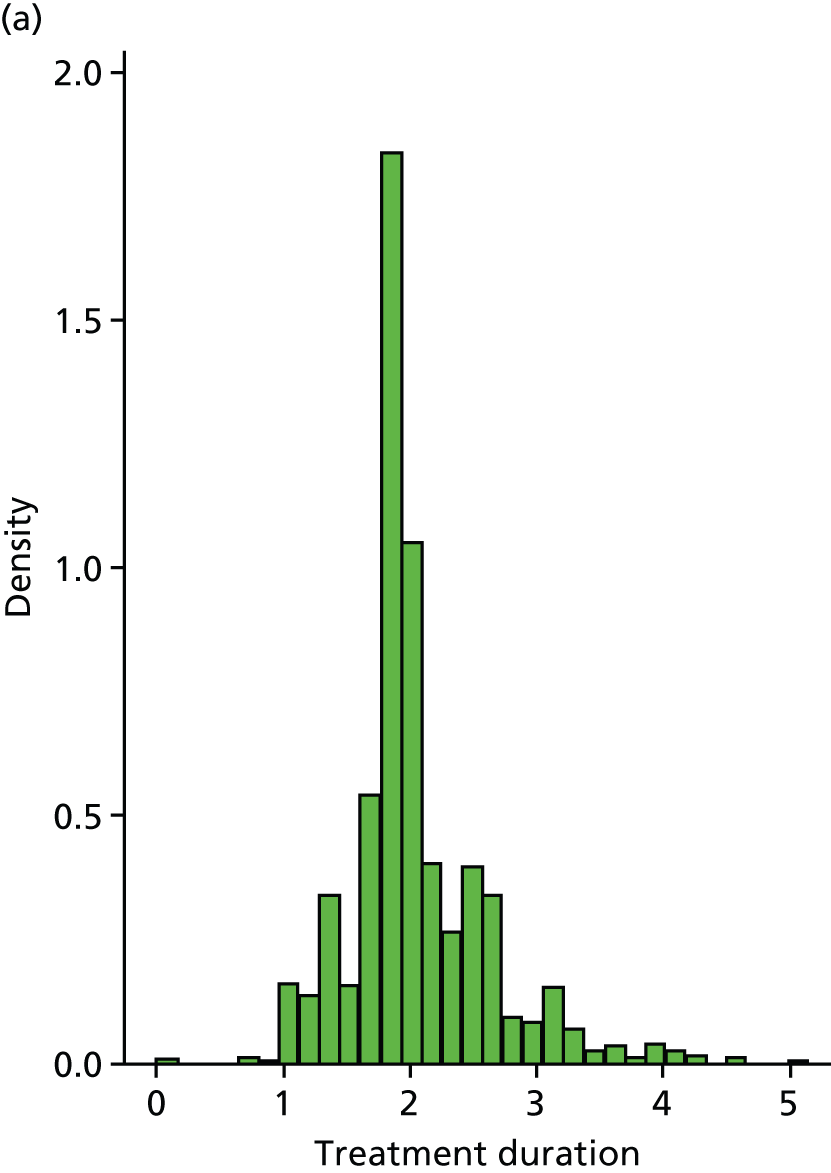

FIGURE 63.
Scatterplots of continuous candidate factors.
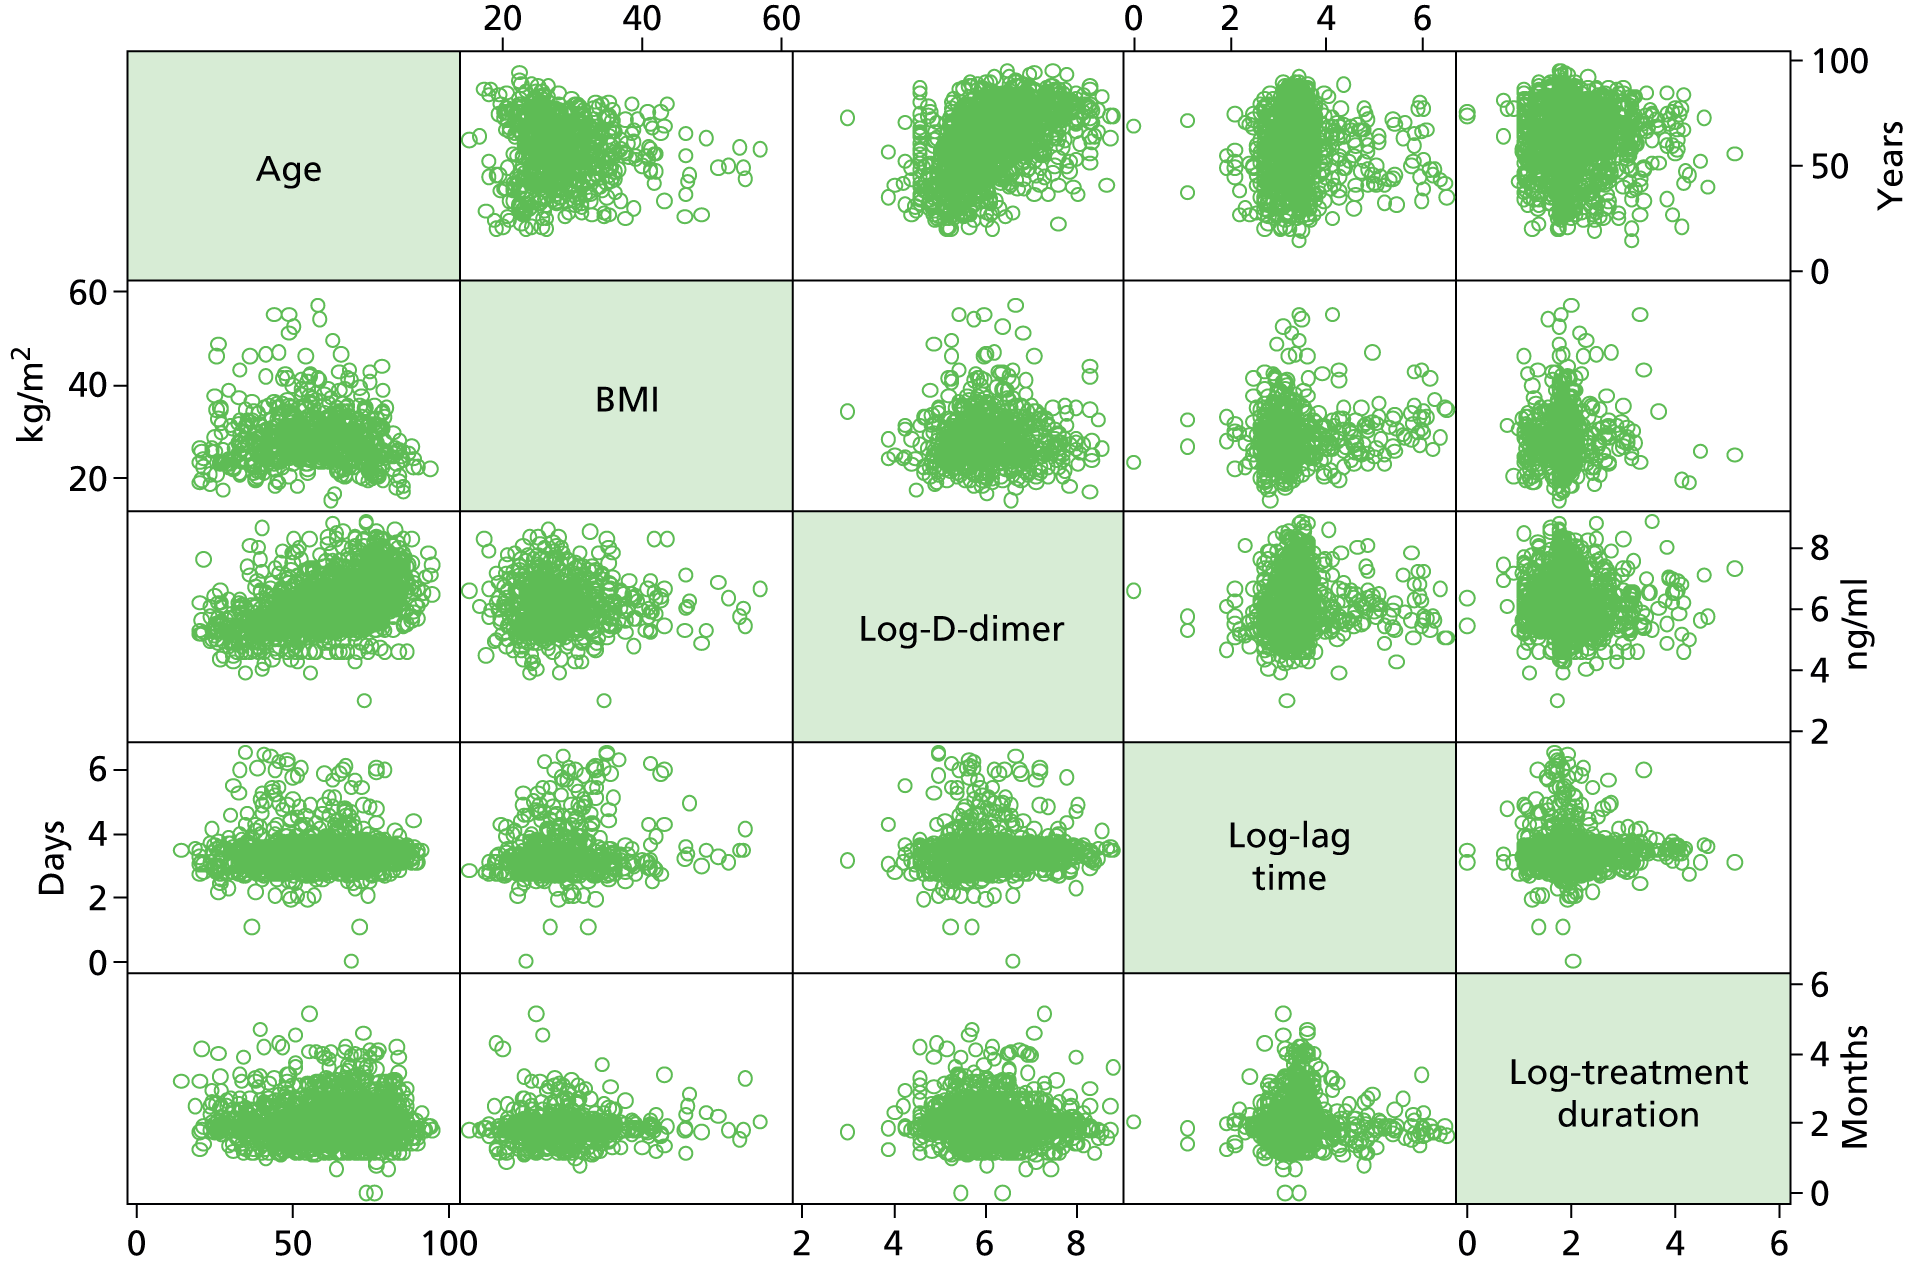
FIGURE 64.
Box plots for patient age (years) by sex. (a) Female; and (b) male.
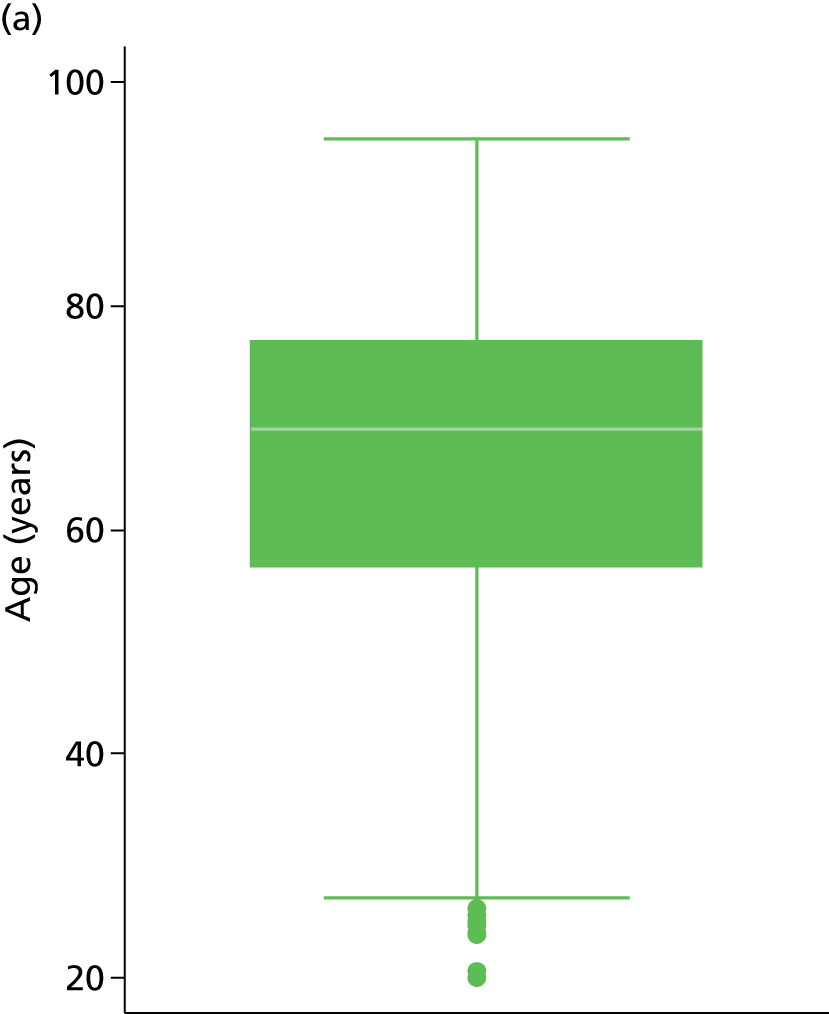

FIGURE 65.
Box plots of patient age (years) by site of index event. (a) Proximal DVT; (b) PE; and (c) distal DVT.
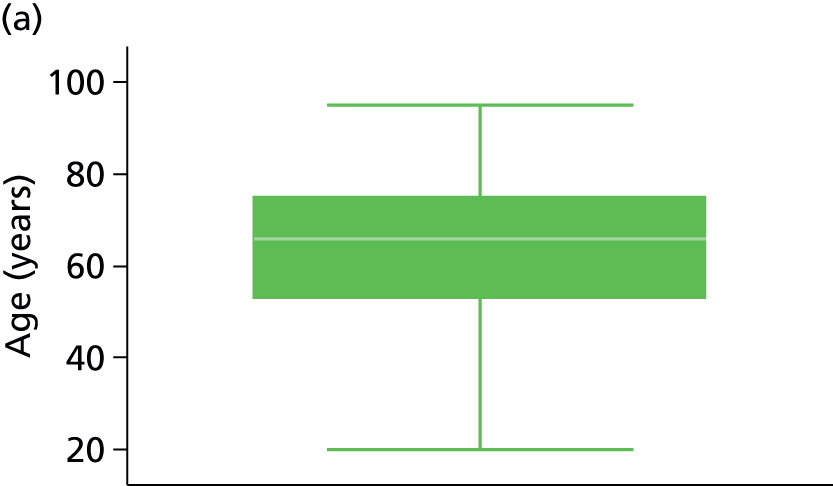


FIGURE 66.
Box plots of patients BMI by sex. (a) Female; and (b) male.
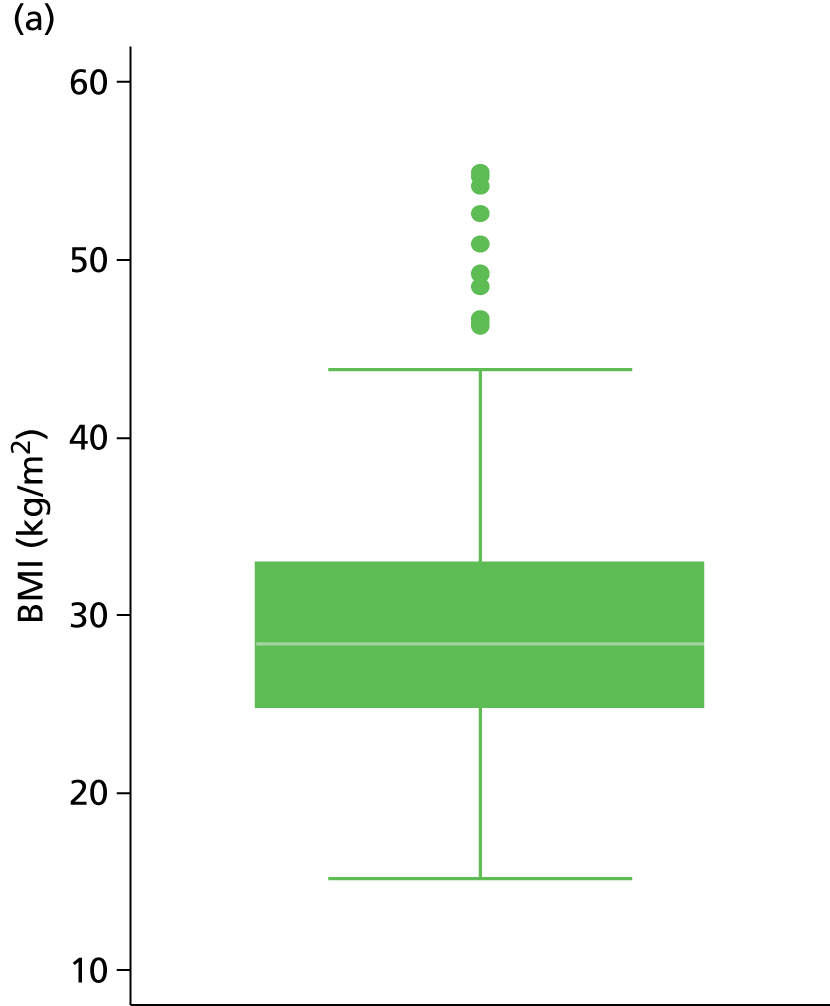
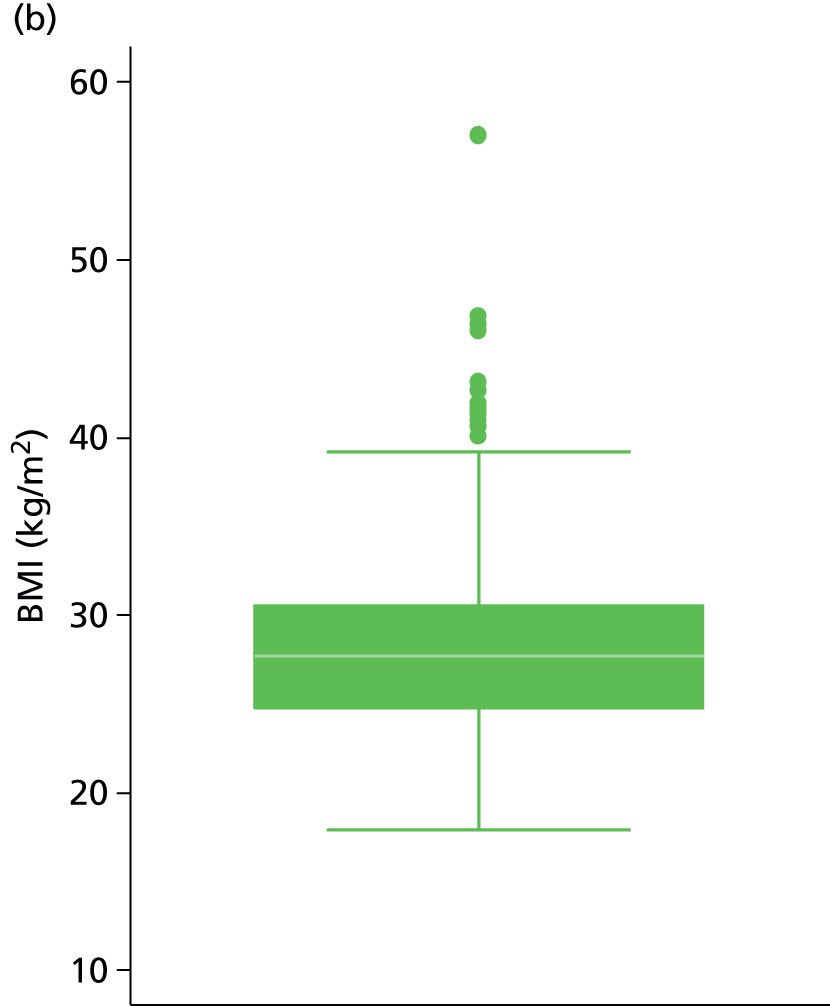
FIGURE 67.
Box plots of patients BMI by site of index event. (a) Proximal DVT; (b) PE; and (c) distal DVT.

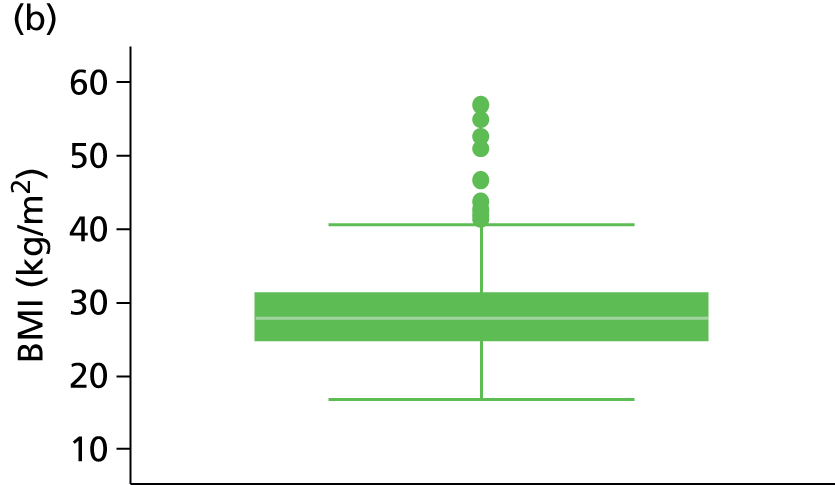
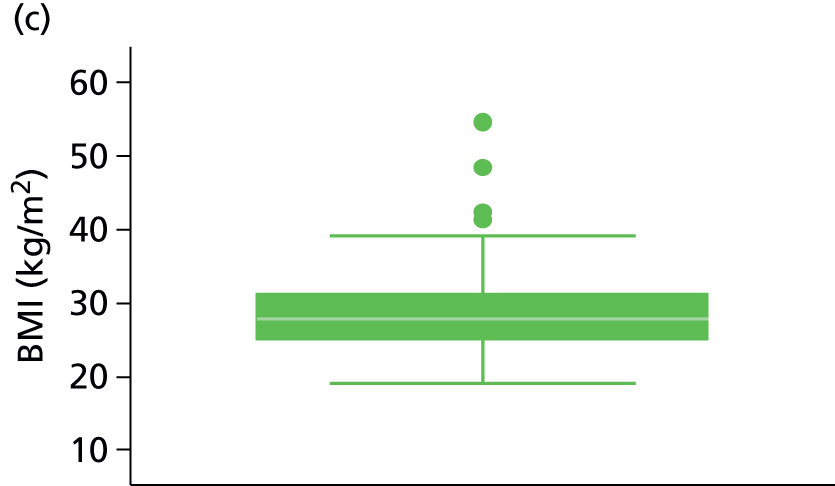
FIGURE 68.
Box plots of patients log-D-dimer score (ng/ml) by sex. (a) Female; and (b) male.


FIGURE 69.
Box plots of patients log-D-dimer score (ng/ml) by site of index event. (a) Proximal DVT; (b) PE; and (c) distal DVT.
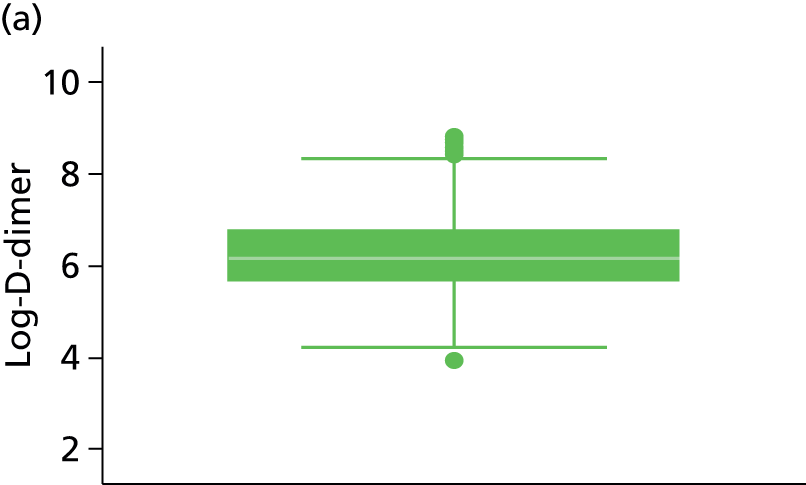
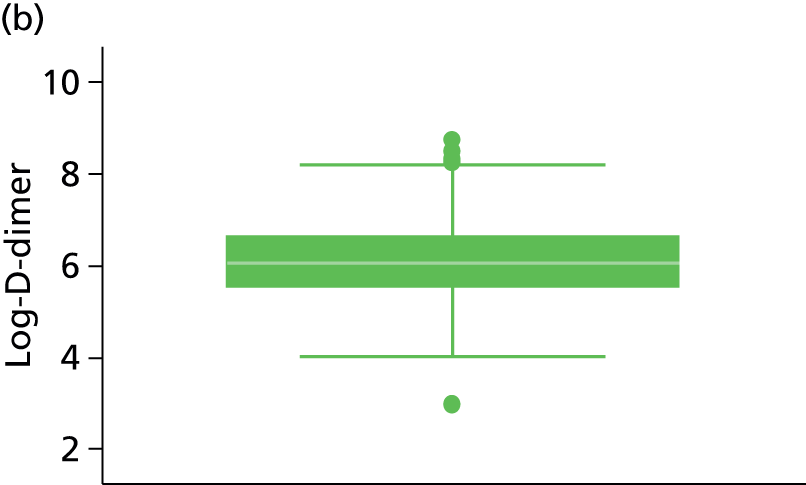
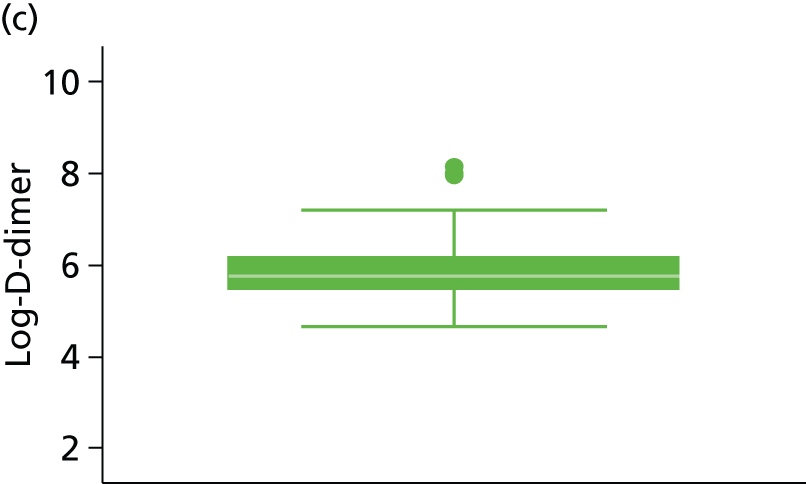
FIGURE 70.
Box plots of patient log-lag time (days) by sex. (a) Female; and (b) male.
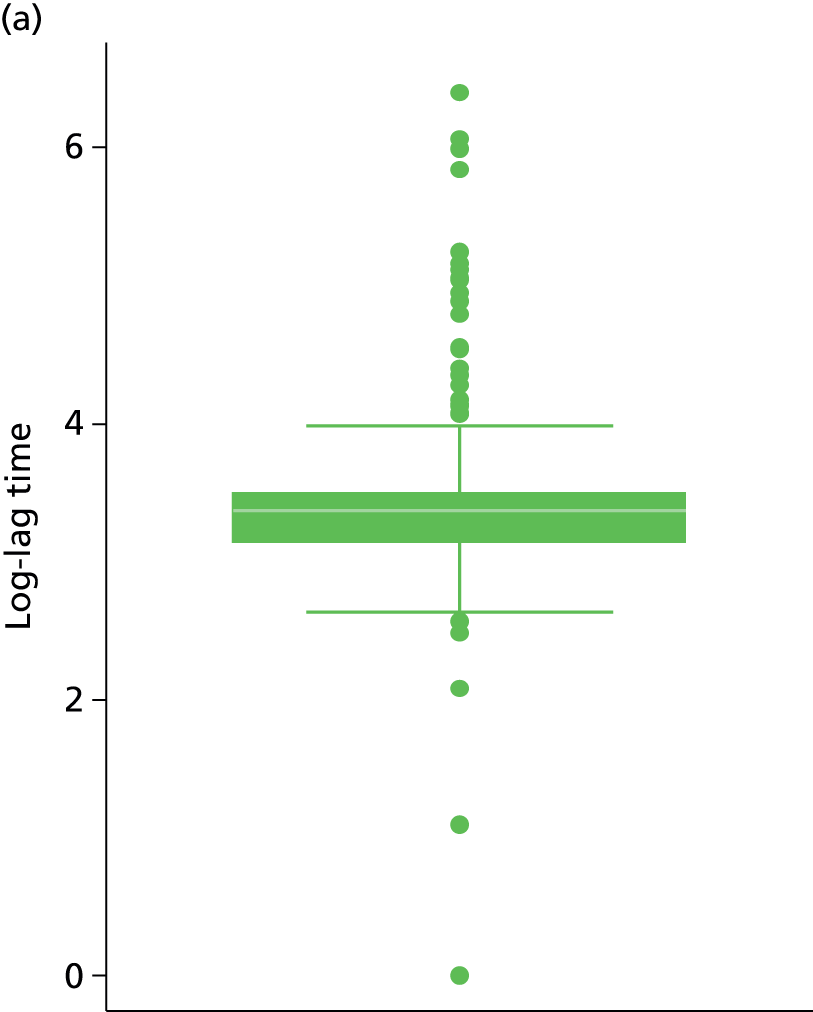

FIGURE 71.
Box plots of patient log-lag time (days) by site of index event. (a) Proximal DVT; (b) PE; and (c) distal DVT.

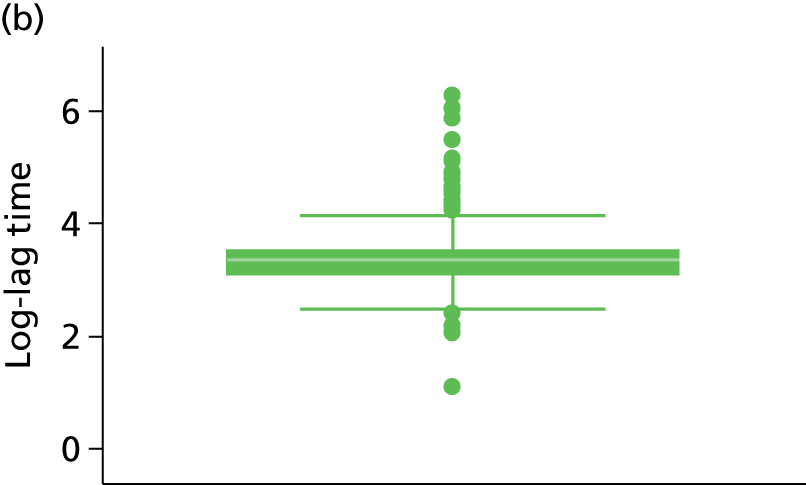
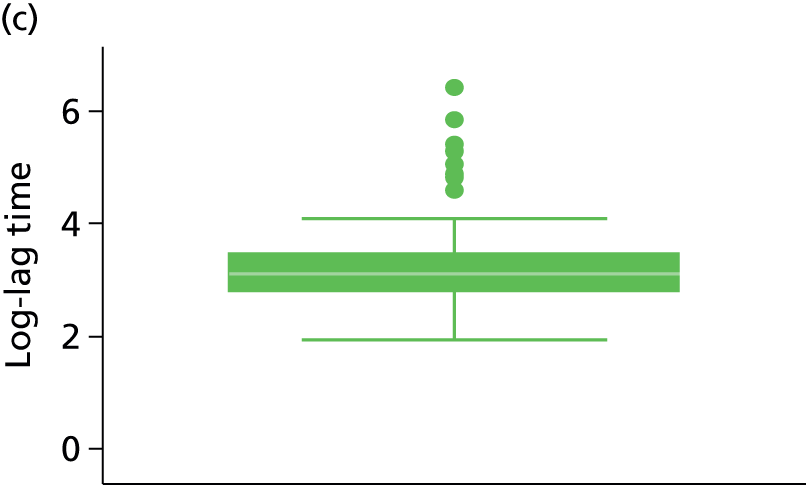
FIGURE 72.
Box plots of patient log-treatment duration (months) by sex. (a) Female; and (b) male.
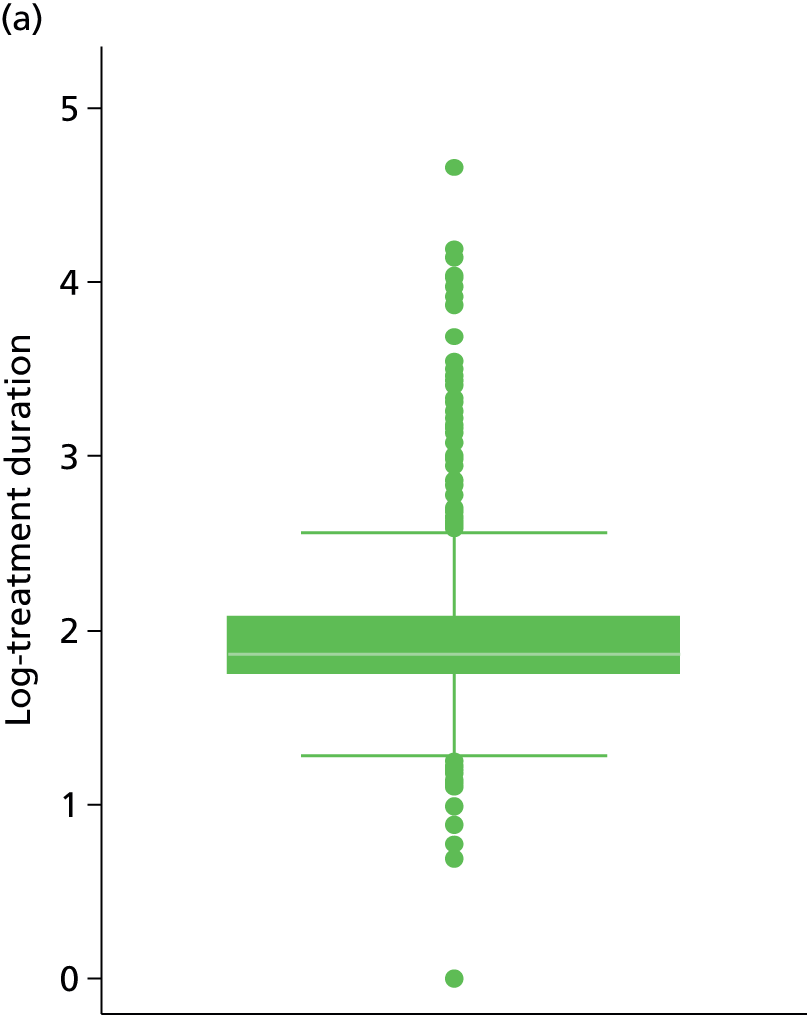

FIGURE 73.
Box plots of patient log-treatment duration (months) by site of index event. (a) Proximal DVT; (b) PE; and (c) distal DVT.
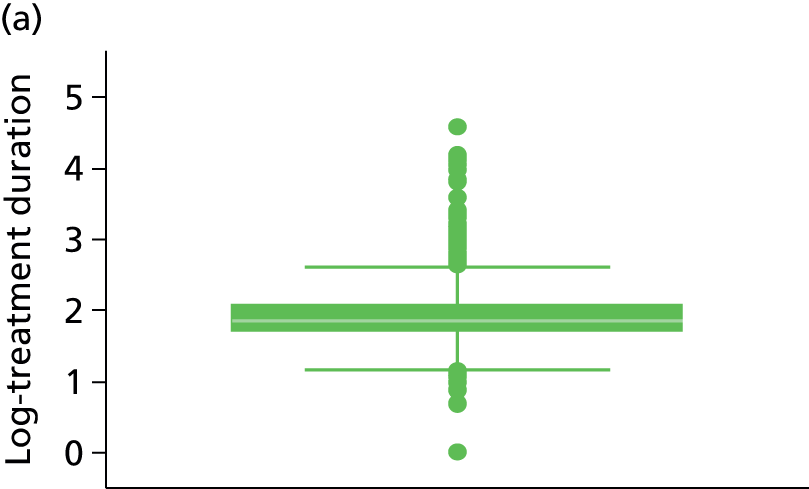


FIGURE 74.
Box plots of patient age × log-D-dimer interaction by sex. (a) Female; and (b) male.


FIGURE 75.
Box plots of patient age × log-D-dimer interaction by site of index event. (a) Proximal DVT; (b) PE; and (c) distal DVT.

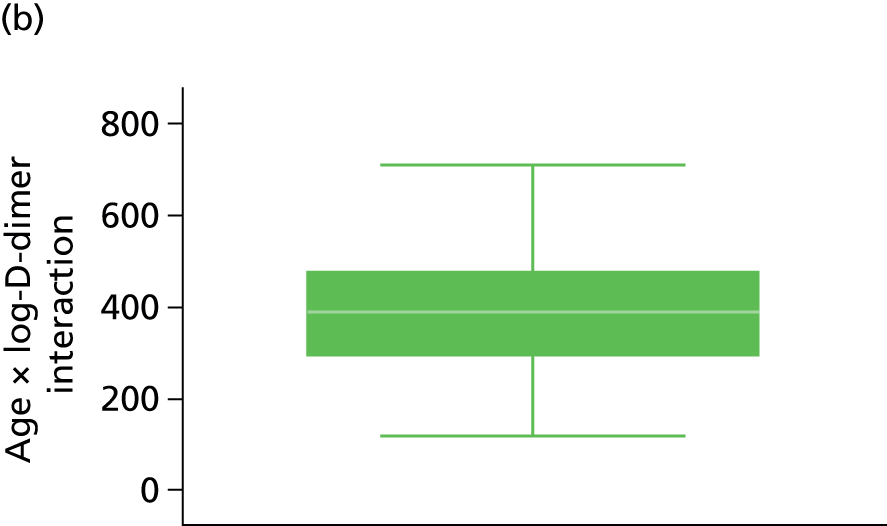
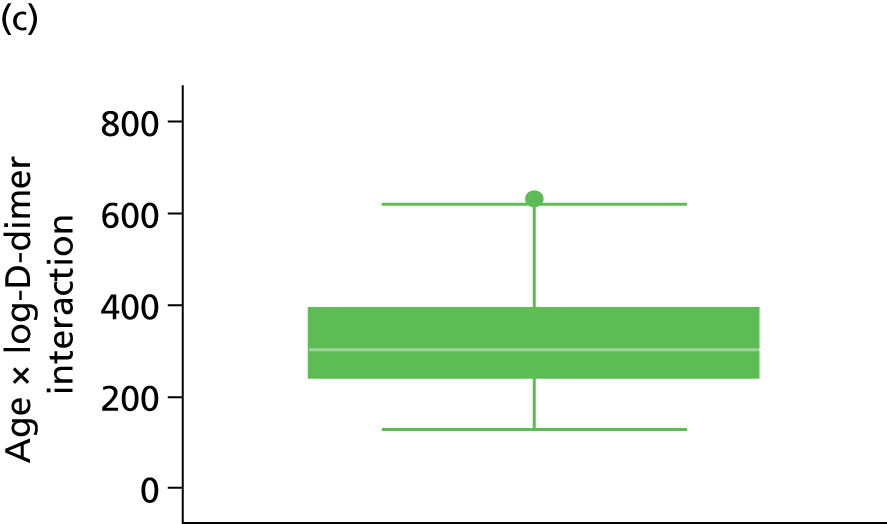
Appendix 5 Model checking results
The pre D-dimer model
Proportional hazards assumption
For the pre D-dimer model a Royston and Parmar model72,73 was fitted on the proportional hazards scale, which assumes that the effect of factors in the model are not associated with time, so that any two rates predicted from the model are proportional. To test whether or not the proportional hazards assumption is valid for the pre D-dimer model, a plot of the scaled Schoenfeld residuals against the natural logarithm of time from cessation of therapy was examined for each factor in the model (Figures 76 and 77). Horizontal reference lines in Figure 76 indicate zero and the log-HR for the factor, a smoother is applied and should follow the log-HR reference line over log-time when the proportional hazards assumption is valid. It is clear from Figures 76 and 77 for site of index event that the proportional hazards assumption is met, and similar plots indicate the assumption is valid for both age and sex covariates (Figures 78 and 79).
FIGURE 76.
Scaled Schoenfeld residuals vs. log-time from cessation of therapy for proximal DVT (the pre D-dimer model) (HR –0.25).
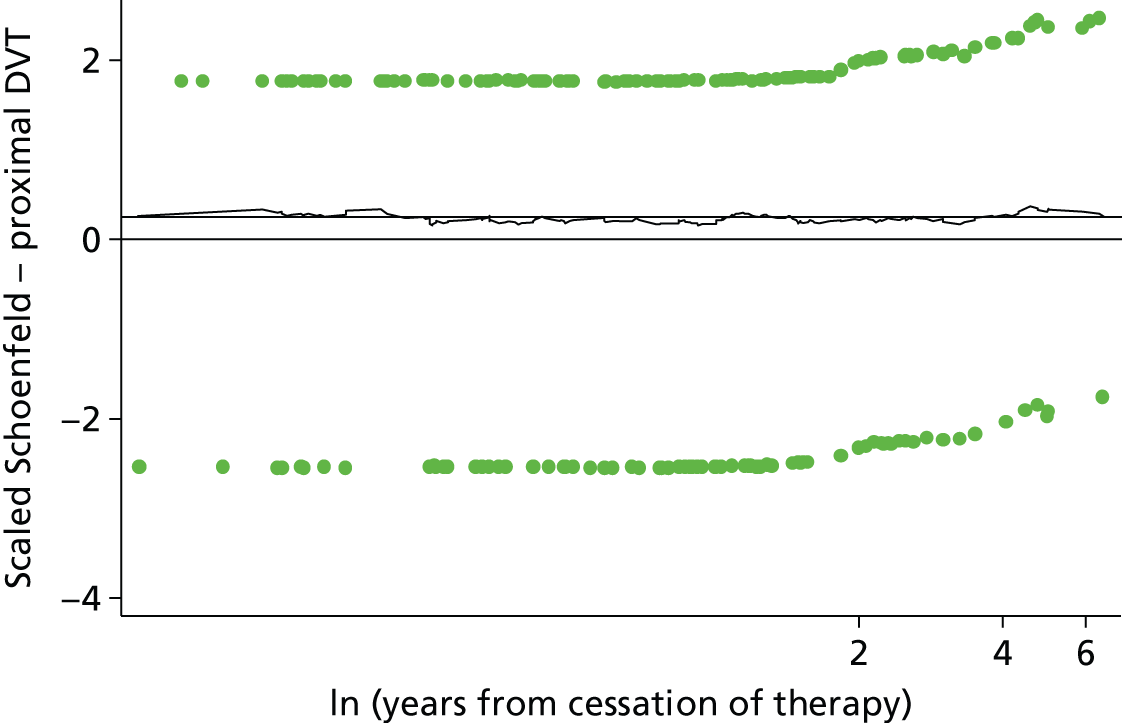
FIGURE 77.
Scaled Schoenfeld residuals vs. log-time from cessation of therapy for PE (the pre D-dimer model) (HR –0.053).
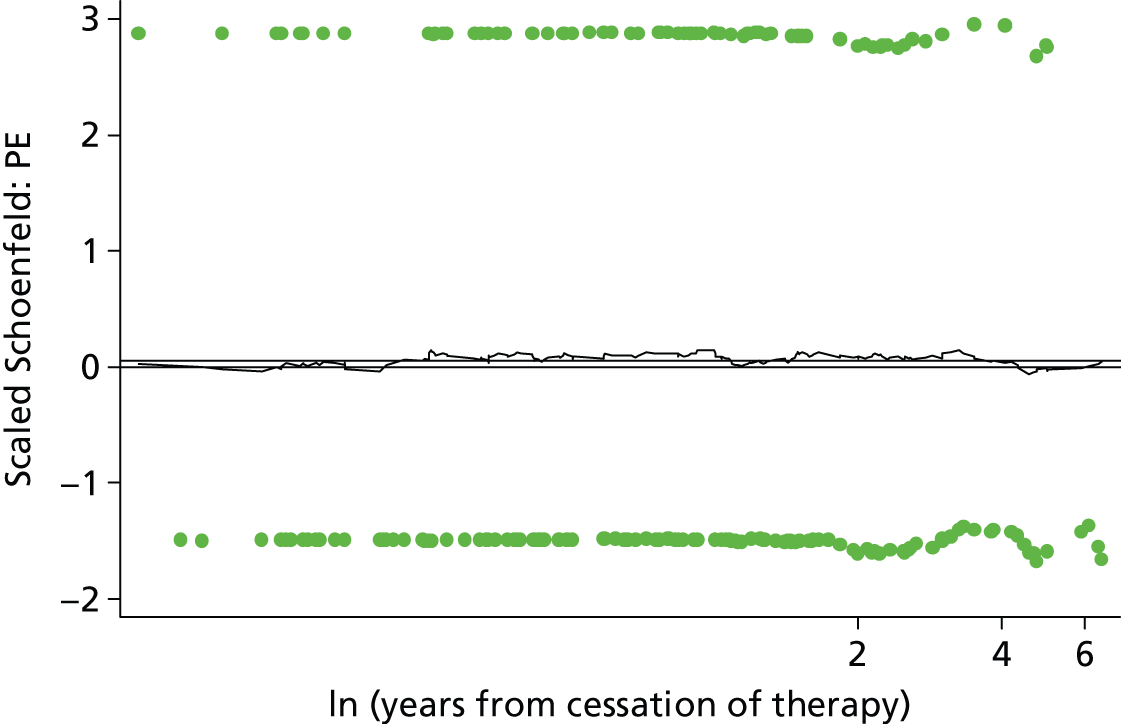
FIGURE 78.
Scaled Schoenfeld residuals vs. log-time from cessation of therapy for age (the pre D-dimer model) (HR –0.0028).
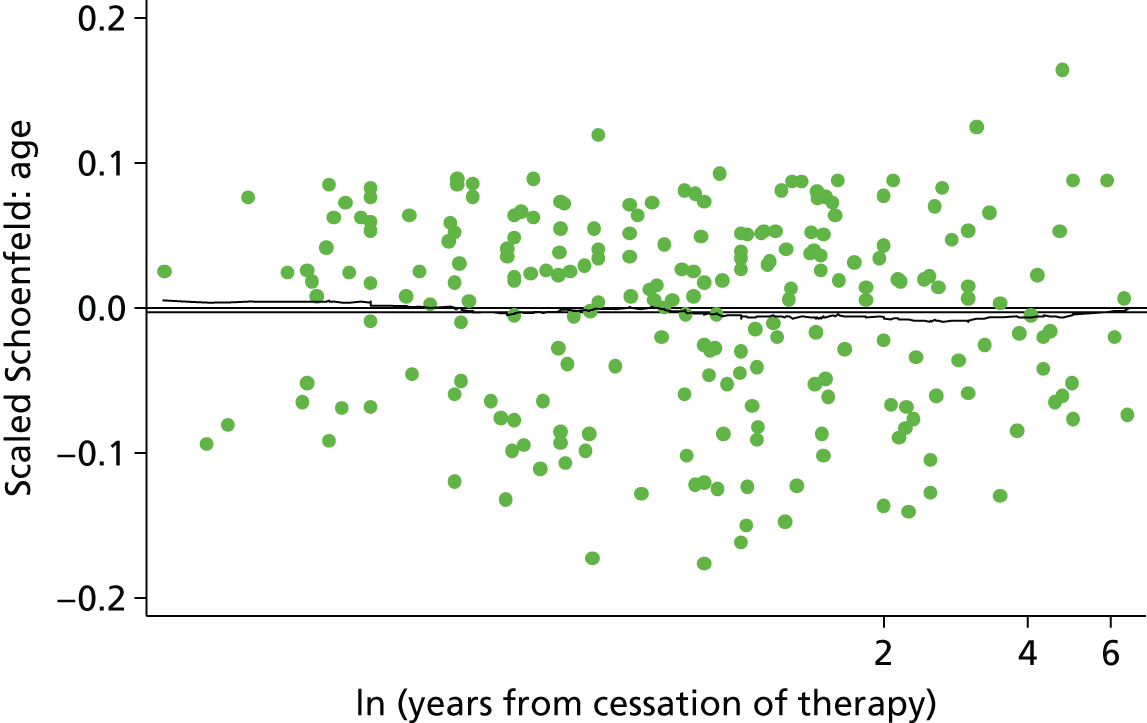
FIGURE 79.
Scaled Schoenfeld residuals vs. log-time from cessation of therapy for sex (the pre D-dimer model) (sex: male HR –0.6).

Functional form
The functional form of continuous covariates within the model can be checked using Martingale residuals. A scatterplot of the Martingale residuals against the continuous covariate of interest with a smoother applied can reveal whether linearity is appropriate, or if non-linear forms should be considered.
As patient age was the only continuous covariate within the pre D-dimer model the functional form within the model was checked using Martingale residuals. Figure 80 shows the lowess smoother applied to a scatter of Martingale residuals against age appears to follow a linear trend over age, indicating that inclusion of age as linear within the model was appropriate.
FIGURE 80.
Scatterplot of Martingale residuals against age (the pre D-dimer model).

Outliers
Deviance residuals can be used to investigate potential outliers in whom the model will perform poorly. A scatterplot of the deviance residuals against a simple patient indicator enables us to assess the normality of the deviance residuals and identify outliers which fall outside of the critical z-values associated with a 95% CI. Figure 81 illustrates a scatter of the deviance residuals for the pre D-dimer model, the deviance residuals do not appear to follow a normal distribution and this may be due to heavy censoring in the data set, there are some values which fall above the 1.96 critical z-value.
FIGURE 81.
Scatterplot of deviance residuals vs. patient ID (the pre D-dimer model). ID, identification.
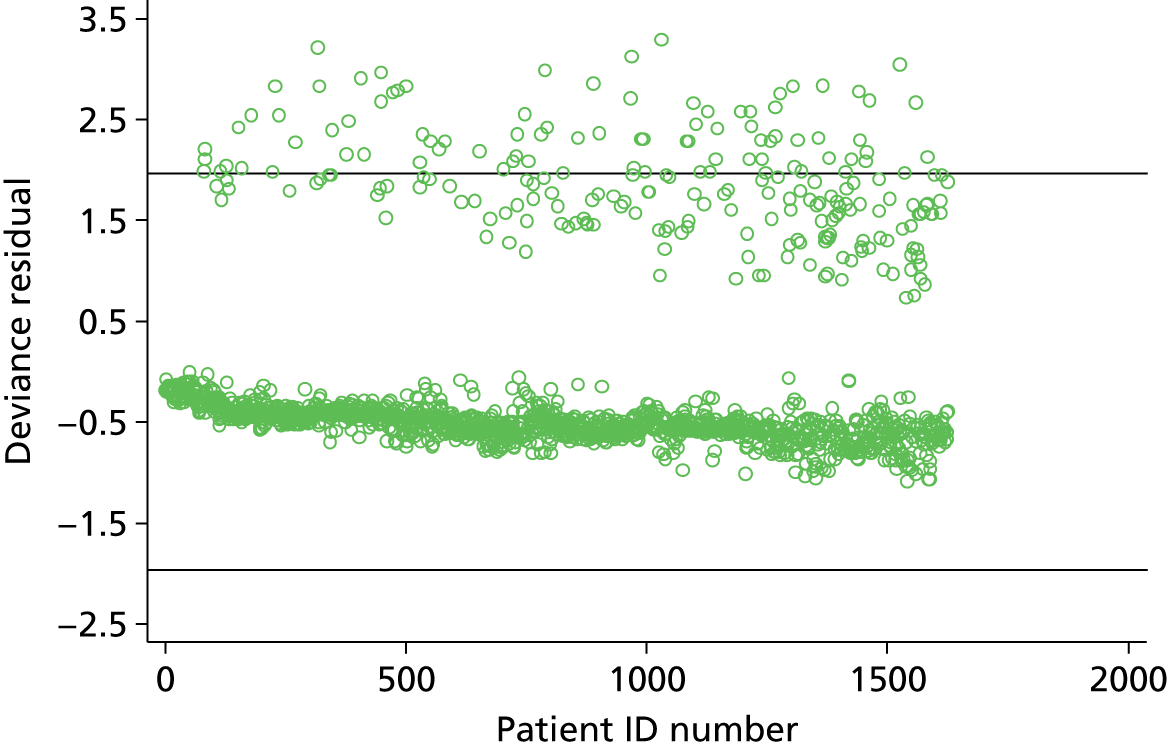
A plot of the deviance residuals against years from cessation of therapy allows investigation of any trend in the deviance residuals. In Figure 82, for the pre D-dimer model there is a clear trend in the deviance residuals over time, this is to be expected because deviance residuals are based on the cumulative hazard at the event time (or censoring time). The deviance residuals which lie in the top left of the plot are likely to be those individuals who had a recurrence early and therefore did not accumulate much hazard.
FIGURE 82.
Scatterplot of deviance residuals vs. years from cessation of therapy (the pre D-dimer model).

Leverage
To check the influence of individuals on the parameter estimates, leverage can be assessed using delta–beta changes for each covariate. A scatterplot of the delta–beta change for the covariate of interest against time allows inspection of the largest change with respect to the log-HR of the covariate.
Scatterplots of delta–betas for age (Figure 83) and sex (Figure 84) show that even individuals with the greatest leverage on these parameter estimates, have very small effects on the log-HR. Similarly, small delta–beta changes were observed for site of index event (Figures 85 and 86).
FIGURE 83.
Scatterplot of delta–beta for age vs. years from cessation of therapy (log-HR –0.002).
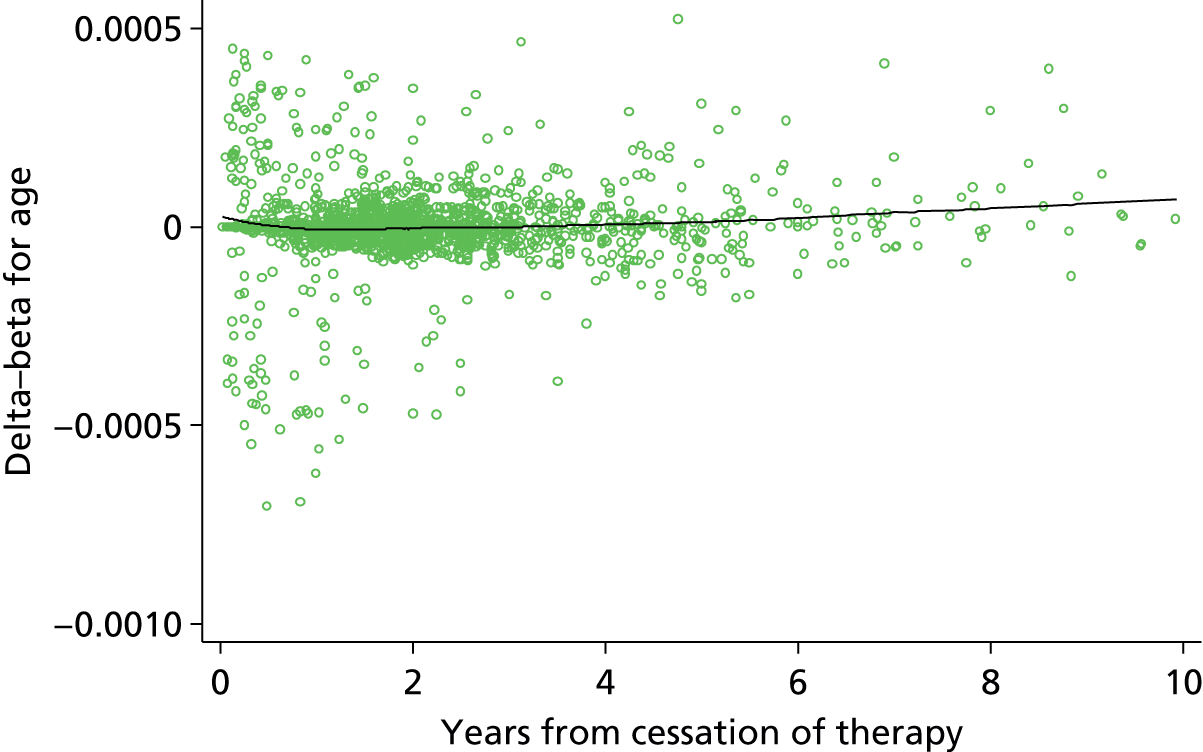
FIGURE 84.
Scatterplot of delta–beta for sex vs. years from cessation of therapy (log-HR 0.573)
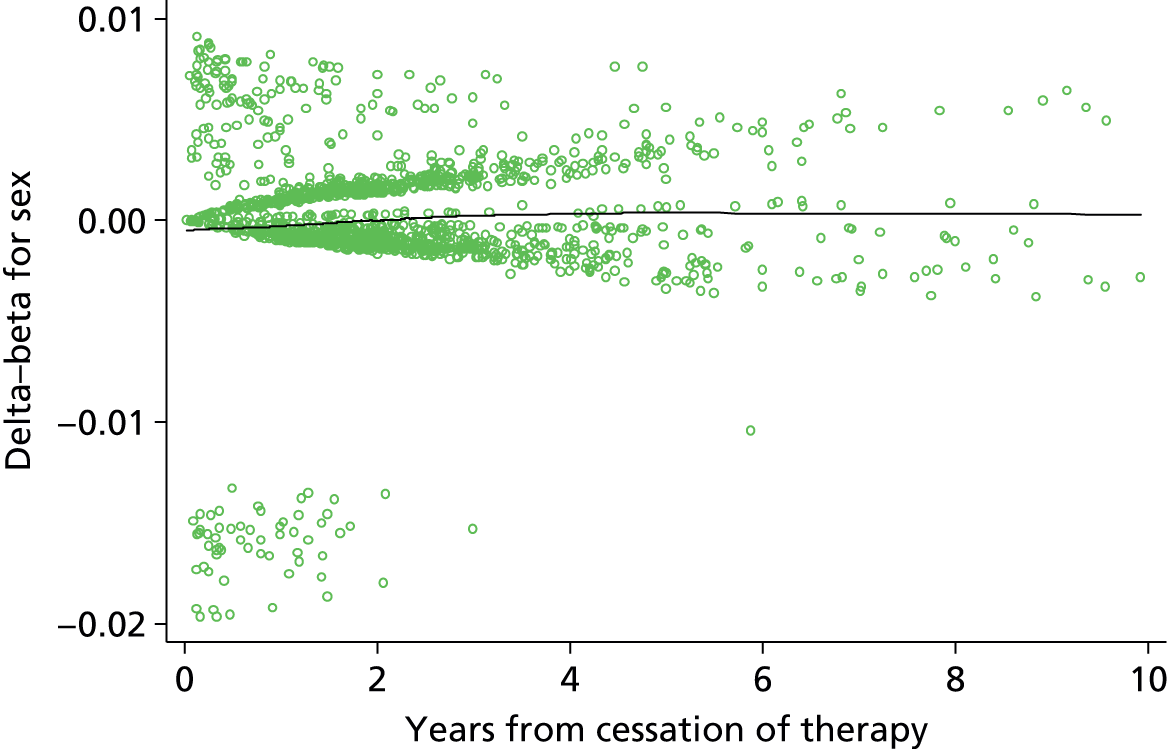
FIGURE 85.
Scatterplot of delta–beta for site (proximal DVT) vs. years from cessation of therapy (log-HR 1.726).

FIGURE 86.
Scatterplot of delta–beta for site (PE) vs. years from cessation of therapy (log-HR 1.659).
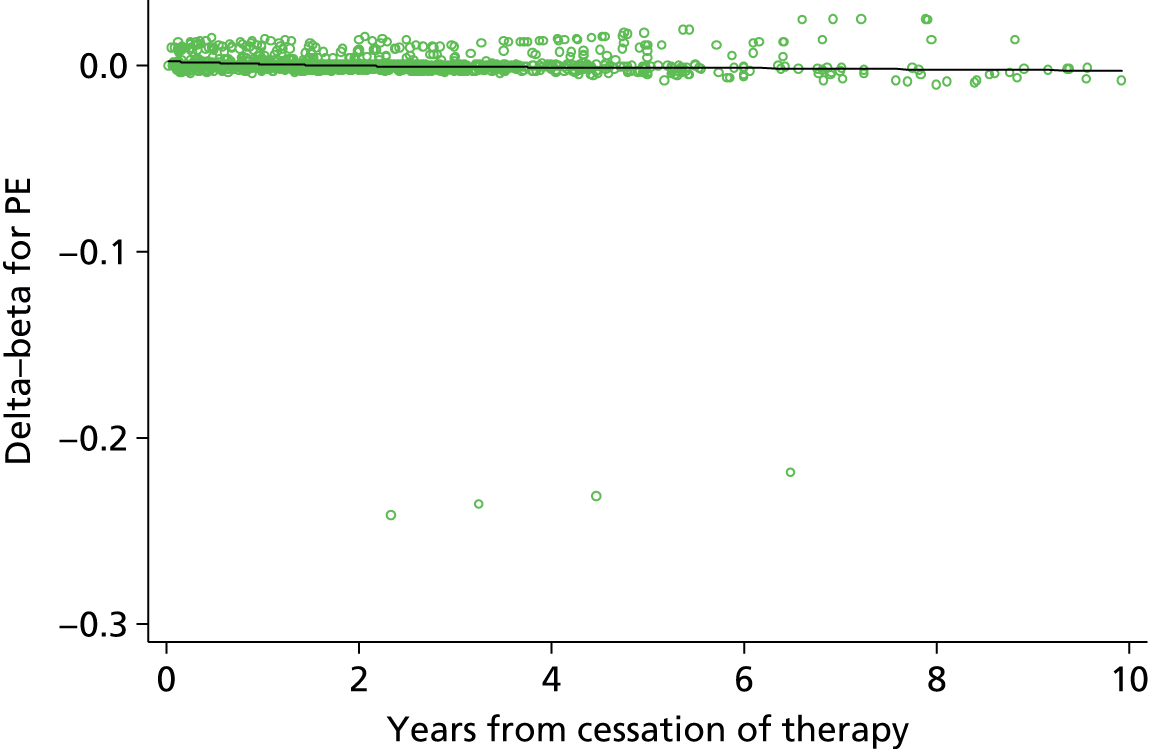
Interaction effects
Interaction effects quantify a differential effect in a specific subgroup of the population. An interaction effect can be either an increased risk or decreased risk beyond that associated with a single characteristic. For example, within the pre D-dimer model, both sex (being male) and site of index event (having a first PE) are associated with significant increases in recurrence rate, an interaction between sex and site of index event would imply that patients who are both male and have a PE are at increased risk beyond that associated with being male or having a PE alone.
The pre D-dimer model includes factors for patient age, sex and site of index event (distal DVT, proximal DVT or PE). Given this set of factors no interactions were considered plausible, either biologically or as evidenced within previous research. As there were no plausible effect-modifying interactions, testing for interactions was not performed to avoid overfitting and prevent a more complex model being produced. 112
Time-dependent effects
Often time-fixed covariates may have time-dependent effects, where the effect (e.g. HR) varies with time. 75 Allowing for time-dependent effects could improve the performance of the prognostic model by better fitting the underlying data.
Non-proportional hazards can be a sign of a time-dependent effect and, as such, including time-dependent effects can account for departures from the proportional hazards assumption. The validity of the proportional hazards assumption for the pre D-dimer model was assessed in Appendix 5, and the assumption was met for all factors included in the models. It was therefore not expected that any time-dependent effects would be found to significantly improve the performance of either final model.
A procedure proposed by Royston and Lambert75 was used to identify potential time-dependent effects within the final model. The procedure first identifies the p-value associated with including each covariate in the model as a time-dependent effect using a likelihood ratio test. A time-dependent effect is included for the factor with the smallest p-value, providing the p-value is less than a pre-defined alpha significance level. The process is repeated until no time-dependent effects are significant at the chosen alpha level.
Following the procedure described above, an alpha of 0.01 was selected so as to allow for multiple testing of time-dependent effects. The same level of df was used to assess time-dependent effects as was selected for the model, therefore allowing complex forms of time dependency. 75 The procedure completed one cycle through the potential covariates and found none of the covariates to be significantly time dependent at the 1% level as expected (Table 62).
| Predictors | Deviance difference | p-value vs. null |
|---|---|---|
| Age | 2.208 | 0.530 |
| Sex (male) | 9.323 | 0.025 |
| Site of index event (proximal DVT) | 1.321 | 0.724 |
| Site of index event (PE) | 3.421 | 0.331 |
The post D-dimer model additional plots
See Chapter 4, Model checking.
Proportional hazards assumption
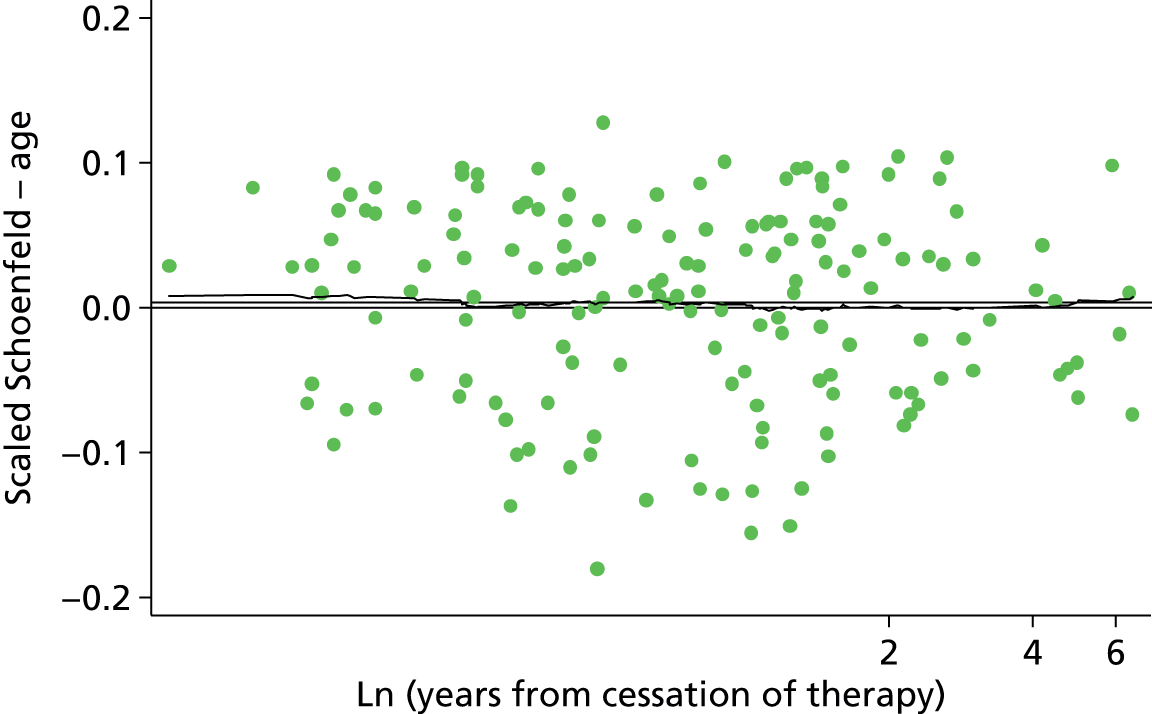


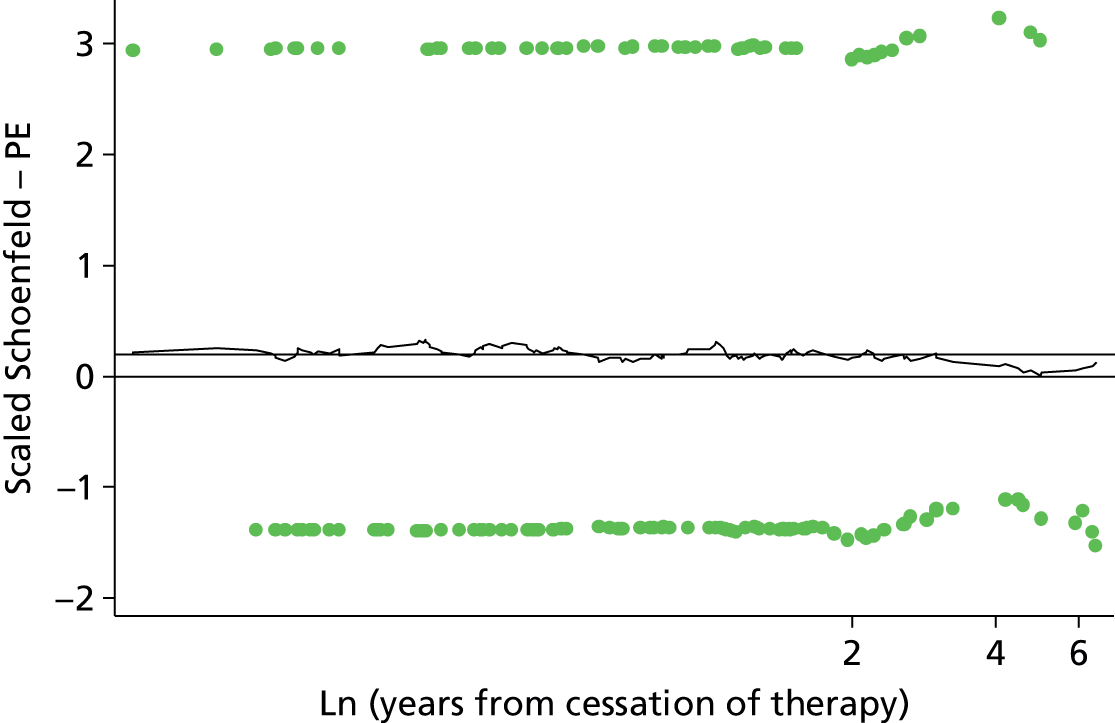
Functional form

Influence


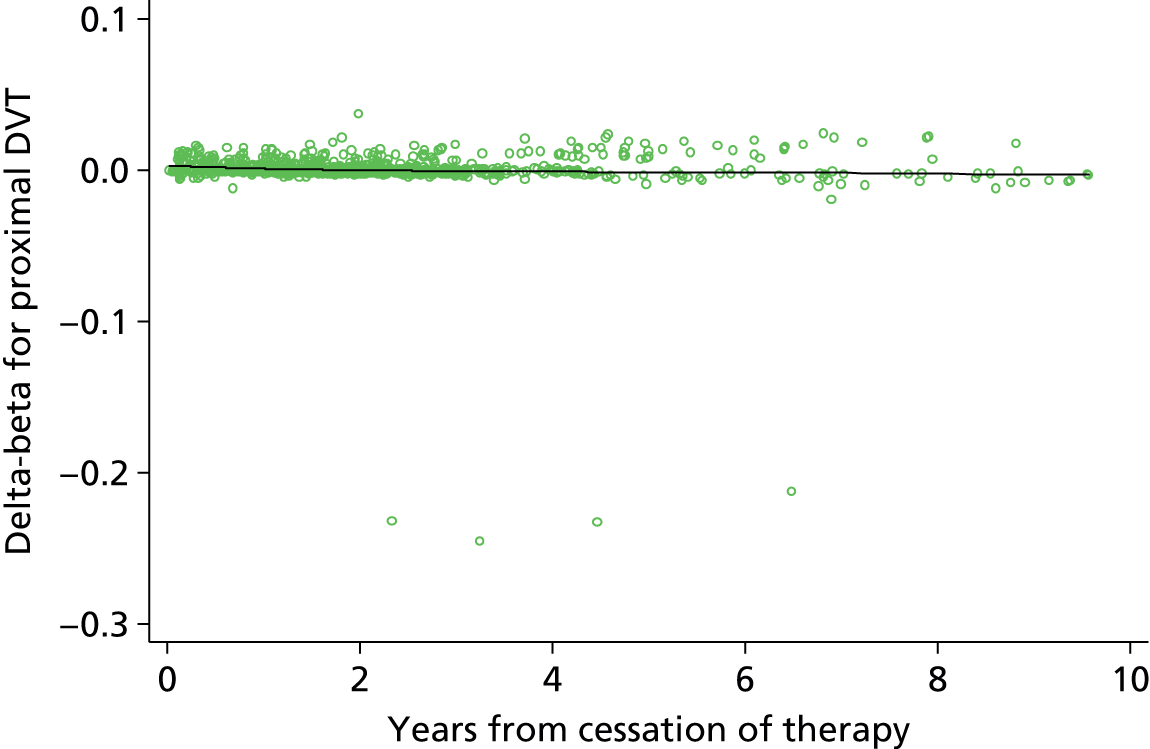

Appendix 6 List of excluded studies from cost-effectiveness review
| Article | Reason for exclusion |
|---|---|
| Aujesky D, Smith KJ, Cornuz J, Roberts MS. Cost-effectiveness of low-molecular-weight heparin for secondary prophylaxis of cancer-related venous thromboembolism. Thromb Haemost 2005;93:592 | B, C |
| Aujesky D, Smith KJ, Roberts MS. Oral anticoagulation strategies after a first idiopathic venous thromboembolic event. Am J Med 2005;118:625–35 | B |
| Becattini C, Agnelli G, Poggio R, Eichinger S, Bucherini E, Silingardi M, et al. Aspirin after oral anticoagulants for prevention of recurrence in patients with unprovoked venous thromboembolism. The WARFASA Study. American Society of Hematology 53rd Annual Meeting, 10–13 December 2011, San Diego, CA, abstract no. 543 | B |
| Pishko A, Smith KJ, Ragni MV. Anticoagulation in ambulatory cancer patients. American Society of Hematology 53rd Annual Meeting, 10–13 December 2011, San Diego, CA, abstract no. 2071 | B, C |
| Pishko A, Smith K, Ragni M. Anticoagulation in ambulatory cancer patients with no indication for prophylactic or therapeutic anticoagulation. Hämostaseologie 2012;32:139–44 | B, C |
| Saultz A, Mathews EL, Saultz JW, Judkins D. Clinical inquiries. Does hypercoagulopathy testing benefit patients with DVT? J Fam Pract 2010;59:291–4 | B |
| Deitelzweig SB, Becker R, Lin J, Benner J. Comparison of the two-year outcomes and costs of prophylaxis in medical patients at risk of venous thromboembolism. Thromb Haemost 2008;100:810–20 | B, C |
| Nuijten MJC, Berto P, Kosa J, Nadipelli V, Cimminiello C, Spreafico A. Cost-effectiveness of enoxaparin as thromboprophylaxis in acutelly ill medical patients from the Italian NHS perspective. Recenti Prog Med 2002;93:80–91 | B, C |
| Couturaud F, Pernod G, Pison C, Mismetti P, Sanchez O, Meyer G, et al. [Prolongation of anti-vitamin K treatment for 18 months versus placebo after 6 months treatment of a first episode of ideopathic pulmonary embolism: A multicentre, randomised double blind trail. The PADIS-EP Trial.] Rev Mal Respir 2008;25:885–93 | B |
| Chiasson TC, Manns BJ, Stelfox HT. An economic evaluation of venous thromboembolism prophylaxis strategies in critically ill trauma patients at risk of bleeding. PLOS Med 2009;6:e1000098 | B, C |
| Kearon C, Kahn SR, Agnelli G, Goldhaber S, Raskob GE, Comerota AJ. Antithrombotic therapy for venous thromboembolic disease: American College of Chest Physicians Evidence-Based Clinical Practice Guidelines (8th edition). Chest 2008;133:454S–545S | A, B |
| Kwong LM. Cost-effectiveness of rivaroxaban after total hip or total knee arthroplasty. Am J Manag Care 2011;17:S22–6 | B, C |
| Marchetti M, Quaglini S, Barosi G. Cost-effectiveness of screening and extended anticoagulation for carriers of both factor V Leiden and prothrombin G20210A. QJM 2001;94:365–72 | B |
| Auerbach AD, Sanders GD, Hambleton J. Cost-effectiveness of testing for hypercoagulability and effects on treatment strategies in patients with deep-vein thrombosis. Am J Med 2004;116:816–28 | B |
| Pereira R, Diamantopoulos A, Bielik J, Lees M, Tomek D, Lukac M. Cost–utility analysis of rivaroxaban compared with enoxaparin in prevention of venous thromboembolism after total hip replacement in Slovakia. Value Health 2010;13:A166 | B, C |
| Dranitsaris G, Vincent M, Crowther M. Dalteparin versus warfarin for the prevention of recurrent venous thromboembolic events in cancer patients: a pharmacoeconomic analysis. Pharmacoeconomics 2006;24:593–607 | B, C |
| Guanella R, Ducruet T, John M, Miron MJ, Roussin A, Desmarais S, et al. Economic burden and cost determinants of deep venous thrombosis during the 2 years following diagnosis: a prospective evaluation. Blood 2010;116:250–1 | B, C |
| Wolowacz SE, Roskell NS, Maciver F, Beard SM, Robinson PA, Plumb JM, et al. Economic evaluation of dabigatran etexilate for the prevention of venous thromboembolism after total knee and hip replacement surgery. Clin Ther 2009;31:194–212 | B, C |
| Marchetti M, Pistorio A, Barosi G. Extended anticoagulation for prevention of recurrent venous thromboembolism in carriers of factor V Leiden: cost-effectiveness analysis. Thromb Haemost 2000;84:752–7 | B |
| De Miguel Diez J, Calderon Moreno M, Jimenez Castro D, Ojeda Castillejo E, Gomez Garcia T, Garcia Angulo J, et al. [Identification of patients with low risk pulmonary thromboembolism.] Revista de Patologia Respiratoria 2009;12:115–18 | A, B |
| Christiaens L. Idiopathic venous thromboembolic disease. [Risk factors for recurrence in 2006.] Arch Mala Coeur Vaiss 2007;100:133–8 | A, B |
| Marchetti M, Pistorio A, Barone M, Serafini S, Barosi G. Low-molecular-weight heparin versus warfarin for secondary prophylaxis of venous thromboembolism: a cost-effectiveness analysis. Am J Med 2001;111:130–9 | B |
| Sarasin FP, Eckman MH. Management and prevention of thromboembolic events in patients with cancer-related hypercoagulable states: a risky business. J Gen Int Med 1993;8:476–86 | B, C |
| Sullivan SD, Kahn SR, Davidson BL, Borris L, Bossuyt P, Raskob G. Measuring the outcomes and pharmacoeconomic consequences of venous thromboembolism prophylaxis in major orthopaedic surgery. Pharmacoeconomics 2003;21:477–96 | B, C |
| Sarasin FP, Bounameaux H. Out of hospital antithrombotic prophylaxis after total hip replacement: low-molecular-weight heparin, warfarin, aspirin or nothing? A cost-effectiveness analysis. Thromb Haemost 2002;87:586–92 | B, C |
| Goldhaber SZ. Prevention of recurrent idiopathic venous thromboembolism. Circulation 2004;110:IV20–4 | A |
| Bick, RL. Proficient and cost-effective approaches for the prevention and treatment of venous thrombosis and thromboembolism. Drugs 2000;60:575–95. | B |
| Botteman MF, Caprini J, Stephens JM, Nadipelli V, Bell CF, Pashos CL, et al. Results of an economic model to assess the cost-effectiveness of enoxaparin, a low-molecular-weight heparin, versus warfarin for the prophylaxis of deep-vein thrombosis and associated long-term complications in total hip replacement surgery in the United States. Clin Ther 2002;24:1960–86 | B, C |
| Eichinger S, Heinze G, Kyrle PA. Risk assessment model to predict recurrence in patients with unprovoked deep-vein thrombosis or pulmonary embolism. Blood 2009;114 | A |
| Baser O, Sengupta N, Wang L. Risk of venous thromboembolism and prophylaxis use in hospitalised medically ill U.S. patients up to 180 days post-hospital discharge. J Manag Care Pharm 2011;17:269–70 | C |
| Stevenson M, Scope A, Holmes M, Rees A, Kaltenthaler E. Rivaroxaban for the prevention of venous thromboembolism: a single technology appraisal. Health Technol Assess 2009;13(Suppl. 3). | B |
| Smith KJ, Monsef BS, Ragni MV. Should female relatives of factor V Leiden carriers be screened prior to oral contraceptive use? A cost-effectiveness analysis. Thromb Haemost 2008;100:447–52 | B |
| Eckman MH, Singh SK, Erban JK, Kao G. Testing for factor V Leiden in patients with pulmonary or venous thromboembolism: a cost-effectiveness analysis. Med Decis Making 2002;22:108–24 | B |
| Skedgel C, Goeree R, Pleasance S, Thompson K, O’Brien B, Anderson D. The cost-effectiveness of extended-duration antithrombotic prophylaxis after total hip arthroplasty. J Bone Joint Surg Am 2007;89:819–28 | B, C |
| Walshe TM, Browne AM, O’Riordan C, O’Sullivan GJ. The cost-effectiveness of the Trellis Peripheral Infusion System (‘Trellis’) compared with catheter-directed thrombolysis or treatment with standard anticoagulation therapy for patients who are poor responders to act: an exploratory Markov analysis. Phlebology 2010;25:310–11 | B, C |
| Caprini JA. The future of medical therapy for venous thromboemboli. Am J Med 2008;121:S10–19 | A, B |
| Shorr AF. The pharmacoeconomics of deep-vein thrombosis treatment. Am J Med 2007;120:S35–S41 | B |
| Simpson EL, Stevenson MD, Rawdin A, Papaioannou D. Thrombophilia testing in people with venous thromboembolism: systematic review and cost-effectiveness analysis. Health Technol Assess 2009;13(2) | B |
| Lukac M, Bielik J, Lees M, Tomek D, Foltan V. Thromboprophylaxis after total knee replacement: cost–utility analysis of rivaroxaban versus enoxaparin in Slovakia. Value Health 2010;13:A358 | B, C |
| van Der Heijden JF, Hutten BA, Buller HR, Prins MH. Vitamin K antagonists or low-molecular-weight heparin for the long term treatment of symptomatic venous thromboembolism. Cochrane Database System Rev 2000;4:CD002001 | A |
| Hyers TM, Shetty HG, Campbell IA. What is the optimum duration of anticoagulation for the management of patients with idiopathic deep venous thrombosis and pulmonary embolism? J R Coll Physicians Edinb 2010;40:224–8 | A |
Appendix 7 Sensitivity analysis on D-dimer assays
A sensitivity analysis was performed to assess the impact of variability in D-dimer measurements, which could be due to different D-dimer assays. The effect of a 10% change in D-dimer values on the predicted probabilities from the post D-dimer model was calculated and plotted (Table 64 and Figures 87–89). To give a broad picture the median and upper and lower quartile values of D-dimer were selected from the RVTEC database. All other predictor values were forced to be constant in the model for the predictions. The figures show very little difference in predicted recurrence-free survival, indicating that in practice a similar treatment decision would be made regardless of such a discrepancy in D-dimer measurements.
| Values of log-D-dimer used in the post D-dimer model | Percentile of the data set | ||
|---|---|---|---|
| 25th | 50th | 75th | |
| D-dimer 10% lower | 247.5 | 375.75 | 672.3 |
| Log-D-dimer 10% lower | 5.51 | 5.93 | 6.51 |
| D-dimer | 275 | 417.5 | 747 |
| Log-D-dimer | 5.55 | 6.03 | 6.62 |
| D-dimer 10% higher | 302.5 | 459.25 | 821.7 |
| Log-D-dimer 10% higher | 5.71 | 6.13 | 6.71 |
FIGURE 87.
Predicted recurrence-free survival for the 25th percentile of D-dimer values and 10% change in D-dimer values.
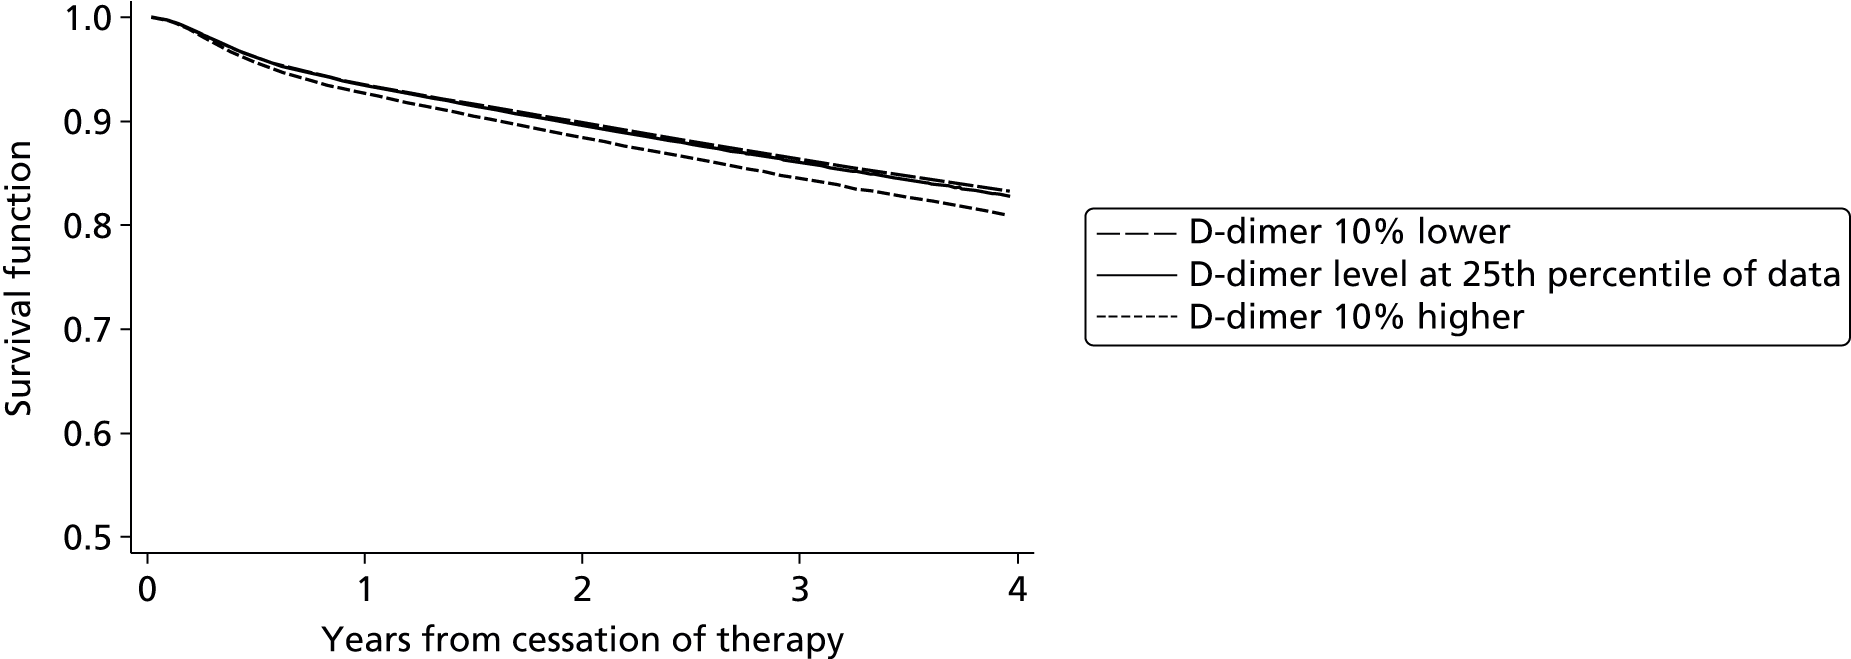
FIGURE 88.
Predicted recurrence-free survival for the 50th percentile of D-dimer values and 10% change in D-dimer values.
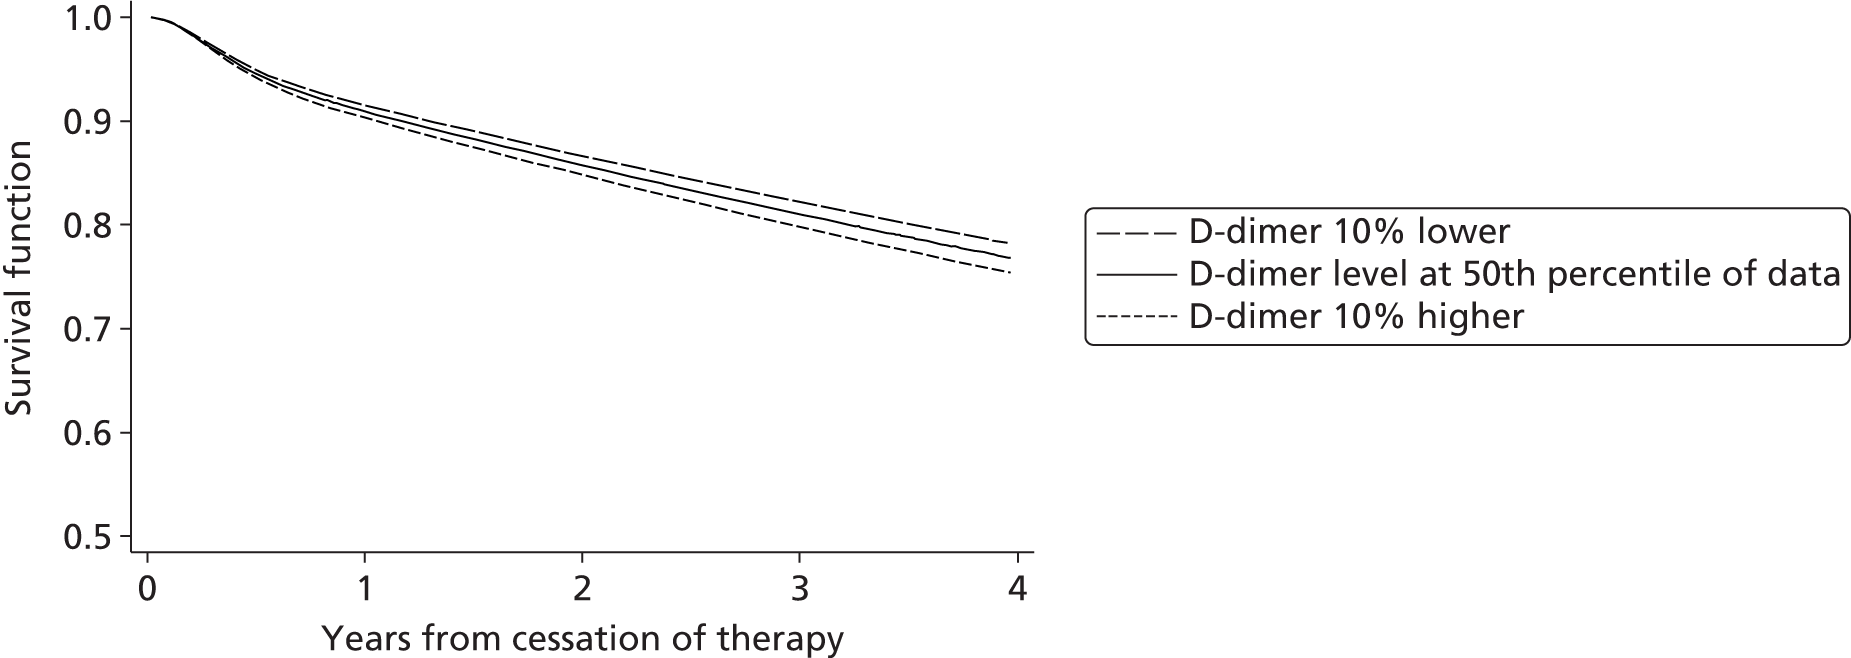
FIGURE 89.
Predicted recurrence-free survival for the 75th percentile of D-dimer values and 10% change in D-dimer values.
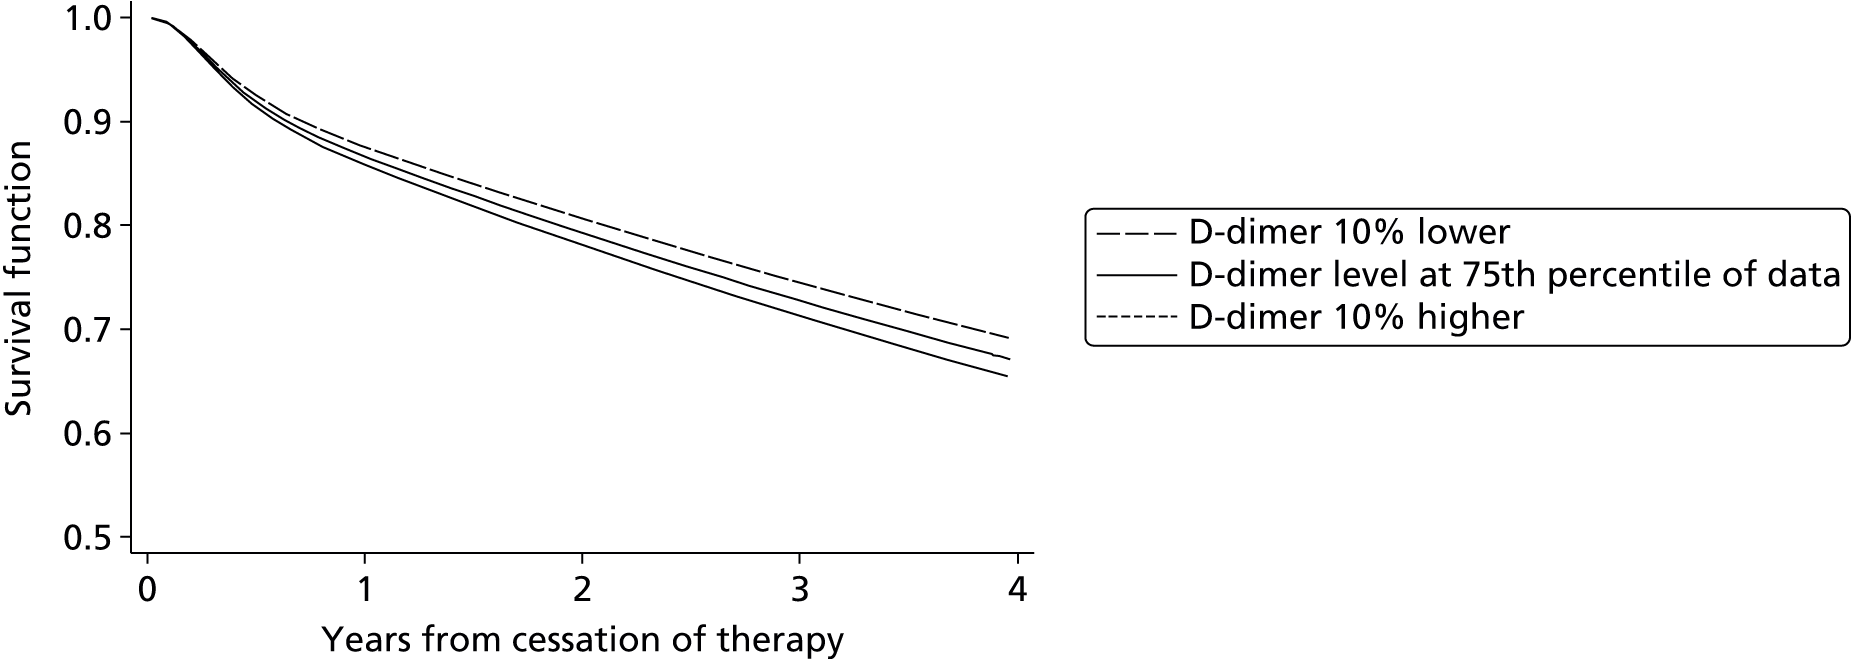
Appendix 8 RIETE official appendix and acknowledgements of investigators
Co-ordinator of the RIETE Registry
Dr Manuel Monreal (Spain).
RIETE Steering Committee Members
Dr Hervè Decousus (France).
Dr Paolo Prandoni (Italy).
Dr Benjamin Brenner (Israel).
RIETE National Co-ordinators
Dr Raquel Barba (Spain).
Dr Pierpaolo Di Micco (Italy).
Dr Laurent Bertoletti (France).
Dr Sebastian Schellong (Germany).
Dr Manolis Papadakis (Greece).
Dr Inna Tzoran (Israel).
Dr Abilio Reis (Portugal).
Dr Marijan Bosevski (Republic of Macedonia).
Dr Henri Bounameaux (Switzerland).
Dr Radovan Malý (Czech Republic).
Dr Philip Wells (Canada).
RIETE Registry Co-ordinating Centre
S&H Medical Science Service.
Members of the RIETE group
Spain: Adarraga MD, Alcalde M, Andújar V, Arcelus JI, Barba R, Barrón M, Barrón-Andrés B, Bascuñana J, Blanco-Molina A, Bueso T, Casado I, Climent A, Conget F, del Molino F, del Toro J, Falgá C, Fernández-Capitán C, Font L, Gallego P, García-Bragado F, Gómez V, González J, González-Bachs E, Grau E, Guijarro R, Guil M, Gutiérrez J, Jara-Palomares L, Jaras MJ, Jiménez D, Jiménez R, Lecumberri R, Lobo JL, López-Jiménez L, López-Montes L, López-Reyes R, López-Sáez JB, Lorente MA, Lorenzo A, Luque JM, Madridano O, Marchena PJ, Martín-Antorán JM, Mellado M, Monreal M, Morales MV, Nauffal D, Nieto JA, Núñez MJ, Ogea JL, Otero R, Pagán B, Pedrajas JM, Pérez-Rus G, Peris ML, Porras JA, Pons I, Riera-Mestre A, Rivas A, Rodríguez-Dávila MA, Román P, Rosa V, Ruiz-Giménez N, Ruiz J, Sabio P, Samperiz A, Sánchez R, Soler S, Suriñach JM, Tiberio G, Trujillo-Santos J, Uresandi F, Valero B, Valle R, Vela J and Villalobos A.
Argentina: Malfante P.
Belgium: Verhamme P and Peerlinck K.
Canada: Wells P.
Czech Republic: Malý R, Hirmerova J, Kaletova M and Tomko T.
France: Bertoletti L, Bura-Riviere A, Farès M, Grange C, Mahe I, Merah A and Quere I.
Germany: Schellong S.
Greece: Papadakis M.
Israel: Braester A, Brenner B, Tzoran I and Zeltser D.
Italy: Apollonio A, Barillari G, Ciammaichella M, Di Micco P, Duce R, Guida A, Maida R, Pace F, Pasca S, Piovella C, Pesavento R, Poggio R, Prandoni P, Rota L, Tiraferri E, Tonello D, Tufano A, Visonà A and Zalunardo B.
Portugal: Almeida S, Leal-Seabra F and Sousa MS.
Republic of Macedonia: Bosevski M.
Switzerland: Alatri A, Bounameaux H, Calanca L and Mazzolai L.
Venezuela: Serrano JC.
RIETE acknowledgements
We express our gratitude to Sanofi Spain for supporting this registry with an unrestricted educational grant. We also express our gratitude to Bayer Pharma AG for supporting this registry. Bayer Pharma AG’s support was limited to the part of RIETE outside Spain, which accounts for a 21.30% of the total patients included in the RIETE Registry. We also thank the RIETE Registry Co-ordinating Centre, S&H Medical Science Service, for their quality control data, logistic and administrative support.
Glossary
- Calibration
- A measure of agreement between the observed probability of recurrence-free survival and the expected (predicted) probability of recurrence-free survival at a specified time point.
- c-statistic
- A measure of discrimination, where a value of one represents perfect discrimination and a value of 0.5 represents poor discrimination.
- Discrimination
- A measure of a model’s ability to separate between two patients of differing risk. For example, for any two patients, one at high risk of outcome and one at low risk, the discrimination is the probability that the high-risk patient will be assigned a higher probability of outcome than the low-risk patient.
- Expected/observed
- A measure of calibration, where expected (E) represents the expected probability of recurrence-free survival, and observed (O) represents the observed probability of survival at a specified time point.
- Incremental cost-effectiveness ratio
- A measure of cost-effectiveness defined as the change in costs divided by the incremental benefits of an intervention.
- Predictor
- Within this report ‘predictor’ is used to refer to any clinical, laboratory or demographic characteristic. The term ‘predictor’ encompasses other similar terms such as prognostic factor, covariate, variable, dependent variable, etc.
- Prognostic model
- Other terms also related to prognostic model may include prediction models, clinical decision rules, or clinical prediction guides. The term ‘prognostic model’ is used within this report to encompass all of these terms, therefore all are considered to refer to the same thing. Within this report a prognostic model is defined as a combination of at least two predictors within a statistical model, used to predict an individual’s risk of outcome.
- Quality-adjusted life-year
- A measure of disease burden, including both the quality and the quantity of life lived. It is used in assessing the value for money/cost-effectiveness of a medical intervention.
- S(t) – Ŝ(t)
- A measure of calibration. Where S(t) represents the observed probability of recurrence-free survival and Ŝ(t) represents the expected (predicted) probability of recurrence.
- Unprovoked/idiopathic
- Defined within this report as a first venous thromboembolism in a patient with no history in the previous 3 months of major surgery, significant immobility, pregnancy, use of combined oral contraceptive pill or hormone replacement therapy, or active cancer. These factors can all be characterised as transient or temporary, meaning that where one of these factors was associated with initial VTE, the risk of a recurrent VTE after removing the transient risk factor is low. Patients with a transient risk factor are defined as provoked. Conversely to unprovoked, the term idiopathic is often used to refer to a first venous thromboembolism for which there is no known cause. Under this definition it is often considered that thrombophilia is a provoked factor, and so these patients are not defined as idiopathic. However, under the definition of unprovoked first venous thromboembolism, thrombophilia would be considered unprovoked, as it is not a transient risk factor, rather a constant, hereditary risk factor which cannot be removed. As such, those with hereditary thrombophilia are considered as unprovoked within this report.
List of abbreviations
- ACCP
- American College of Chest Physicians
- AIC
- Akaike information criterion
- AUC
- area under the curve
- BCSH
- British Committee for Standards in Haematology
- BIC
- Bayesian information criterion
- BMI
- body mass index
- CI
- confidence interval
- DASH
- D-dimer, Age, Sex, Hormone therapy
- df
- degrees of freedom
- DVT
- deep-vein thrombosis
- E/O
- expected/observed
- GI
- gastrointestinal
- HER DOO 2
- Hyperpigmentation, Edema, Redness/D-dimer, Obese (body mass index > 30 km/m2), Old (age > 65 years)/2 or more factors should indicate for patients to continue therapy
- HR
- hazard ratio
- HRT
- hormone replacement therapy
- ICER
- incremental cost-effectiveness ratio
- IECV
- internal–external cross-validation
- INR
- international normalised ratio
- IPD
- individual patient data
- MAR
- missing at random
- MC
- Monte Carlo
- MEGA
- Multiple Environmental and Genetic Assessment of risk factors for venous thrombosis study
- MFP
- multivariable fractional polynomial
- NICE
- National Institute for Health and Care Excellence
- NOAC
- new/novel oral anticoagulant
- OAC
- oral anticoagulant
- OC
- oral contraceptive
- PE
- pulmonary embolism
- PROBAST
- Prediction study Risk Of Bias Assessment Tool
- PSA
- probabilistic sensitivity analysis
- PTS
- post-thrombotic syndrome
- QALY
- quality-adjusted life-year
- RCT
- randomised controlled trial
- RIETE
- Registro Informatizado de Enfermedad TromboEmbólica
- RVTEC
- Recurrent VTE Collaborative
- SD
- standard deviation
- VTE
- venous thromboembolism

