Notes
Article history
The research reported in this issue of the journal was funded by the HTA programme as project number 11/136/81. The contractual start date was in March 2013. The draft report began editorial review in March 2016 and was accepted for publication in August 2016. The authors have been wholly responsible for all data collection, analysis and interpretation, and for writing up their work. The HTA editors and publisher have tried to ensure the accuracy of the authors’ report and would like to thank the reviewers for their constructive comments on the draft document. However, they do not accept liability for damages or losses arising from material published in this report.
Declared competing interests of authors
none
Permissions
Copyright statement
© Queen’s Printer and Controller of HMSO 2017. This work was produced by Shinkins et al. under the terms of a commissioning contract issued by the Secretary of State for Health. This issue may be freely reproduced for the purposes of private research and study and extracts (or indeed, the full report) may be included in professional journals provided that suitable acknowledgement is made and the reproduction is not associated with any form of advertising. Applications for commercial reproduction should be addressed to: NIHR Journals Library, National Institute for Health Research, Evaluation, Trials and Studies Coordinating Centre, Alpha House, University of Southampton Science Park, Southampton SO16 7NS, UK.
Chapter 1 Introduction
International guidelines recommend that, after completion of primary surgical treatment for colorectal cancer, blood carcinoembryonic antigen (CEA) levels are measured at 3- to 6-monthly intervals for 5 years to detect recurrent cancer. 1–5 CEA is a glycoprotein involved in cell adhesion, which is produced during foetal development; production usually ceases at birth, but elevated blood levels can be detected in colorectal cancer (as well as in breast, lung and pancreatic cancer), smokers and benign conditions such as cirrhosis of the liver, jaundice, diabetes mellitus, pancreatitis, chronic renal failure, colitis, diverticulitis, irritable bowel syndrome, pleurisy and pneumonia. 6,7 Blood CEA levels are raised in most patients at first diagnosis of colorectal cancer and are thought to be detectable between 4 and 8 months before the development of cancer-related symptoms. 8 CEA levels fall after successful primary curative treatment but then tend to rise again if the cancer recurs. It has been suggested that CEA appears to be most sensitive for detecting hepatic and retroperitoneal metastases and is least sensitive for local recurrences and peritoneal or pulmonary disease. 9,10 However, the CEA blood level gives no information about the location and extent of recurrence and it is therefore used as a diagnostic triage test, with a rise in CEA triggering further investigation [usually by computerised tomography (CT) imaging] rather than initiation of therapy. 1
The evidence base to support CEA follow-up is limited. The one Cochrane review estimating the effectiveness of colorectal cancer follow-up11 included very scant data on CEA. Data on overall survival were available from only one trial [odds ratio (OR) 0.57, 95% confidence interval (CI) 0.26 to 1.29] and data on recurrence rate were available from only two (OR 0.85, 95% CI 0.58 to 1.25). We reported the interim results of the FACS (Follow-up After Colorectal Surgery) trial in 2014. 12 The results showed that measuring blood CEA every 3 to 6 months for 5 years, augmented by a single CT scan at 12–18 months, leads to earlier diagnosis of recurrence and increases by about threefold the proportion of recurrences that can be treated with curative intent. As CEA monitoring does not involve radiography, it can be carried out in the community and is potentially more cost-effective than CT imaging. However, the optimal interval for monitoring blood CEA and the blood level at which further investigation is initiated appear not to have a clear evidence base.
The research reported here was commissioned as an add-on component of the FACS trial. In the FACS trial, which was designed in 2001, further investigation to look for recurrence was initiated if the patient’s CEA level was 7 µg/l above their postoperative baseline level. Although the test result was confirmed by a repeat test, no notice was taken of previous results. Most national guidelines cited above now recommend taking action at a lower threshold (5 µg/l) but still focus on a single test result and take no notice of trend. Moreover, the most recent systematic review at the time that we proposed this substudy13 suggested that an even lower threshold of 2.2 µg/l provides the ideal balance between sensitivity and specificity. We therefore sought to assess whether the threshold we had been using in the trial was suboptimal and had impacted negatively on our results. We also hypothesised that focusing on an individual test and ignoring trend over time was likely, on first principles,14 to be a suboptimal approach to monitoring.
The research specified in the original protocol was restricted to a secondary analysis of data from the FACS trial. As we began the research and reviewed the original papers, it became clear that the review by Tan et al. ,13 cited above, was both incomplete and had a number of methodological flaws. As we had used this review to justify our proposal, we felt obliged to conduct a more rigorous systematic review of previous work, applying the quality criteria for systematic reviews of diagnostic accuracy specified by the Cochrane Diagnostic Review Group. 15 This work has now been published in full on the Cochrane Library website16 but, as it was initiated to guide the research described here (in terms of both analytical method and interpretation of the results), we provide a summary of the findings in Chapter 2 before presenting the aims, methods and results of the main analysis.
The FACS trial was not powered to assess the effect of CEA testing on survival but it is important to note here that, although it provides clear evidence that 3- to 6-monthly CEA monitoring increases significantly the number of detected recurrences treatable surgically with curative intent, the CIs around the mortality outcome (at a median of 8.7 years from trial entry) show that any survival benefit must be small. The rate of recurrence in the FACS trial was also significantly lower than that in the diagnostic studies reported in the systematic review, reflecting the level of work-up before trial entry to detect residual disease.
Chapter 2 Systematic review
Parts of this report are based on Shinkins et al. 17 This is an open access article distributed under the terms of the Creative Commons Attribution License (CC BY 4.0), which permits unrestricted use, distribution and reproduction in any medium, provided the original author and source are credited.
Introduction
As stated in the previous chapter, this review was initiated when it became clear that the systematic review cited in justification of our funding application13 was potentially flawed. To ensure that our systematic review was carried out to the highest quality standard, it was undertaken under the auspices of the Cochrane Colorectal Cancer Group and the Cochrane Screening and Diagnostic Tests Methods Group (which refereed both the protocol and the results). We present the results here, before the main analysis, as they informed the thresholds investigated in the analysis as well as the way in which we interpreted our results. As these results have been published in full on the Cochrane Library website,16 we present only a summary of the methods and main findings.
Methods
Review question
The review question was, ‘What is the accuracy of single-measurement blood CEA as a triage test to prompt further investigation for colorectal cancer recurrence after curative resection?’.
Search
The search terms used are reported on the Cochrane Library website. 16 We avoided the use of search filters and did not restrict our review to English-language publications. Two reviewers (BN and IP) extracted data independently and, with a third reviewer (BS), independently assessed the methodological quality. We retrieved and analysed all full-text articles that we felt could be potentially relevant based on the title and abstract. We based additional searches on the citations of full-text articles to reduce the risk of missing relevant studies. Foreign-language articles were translated or assessed or both by colleagues of the authors who were proficient in the language in question.
Studies included
The following studies were included: cross-sectional diagnostic test accuracy studies, cohort studies or randomised trials, conducted in primary care or hospital settings, involving adults with no detectable residual disease after curative surgery (with or without adjuvant therapy) and reporting results extractable in a 2 × 2 format (i.e. test +/– by case +/–).
Index test and reference standard
The index test was blood CEA level. The reference standard was clinical diagnosis of recurrence of colorectal cancer following primary treatment confirmed by imaging, histology or clinical follow-up (for details of the reference standard, see the full report on the Cochrane website16).
Quality assessment
Two review authors extracted data independently and three authors independently performed a quality assessment [using a modified Quality Assessment of Diagnostic Accuracy Studies 2 (QUADAS-2) schedule18] of the included studies, with subsequent discussion to reach consensus on overall judgements of risk of bias and applicability.
Statistical analyses
Binary diagnostic accuracy data were extracted from all excluded studies as 2 × 2 tables. We used the bivariate model to perform meta-analysis of sensitivity and specificity19 using the xtmelogit command in Stata version 12(StataCorp LP, College Station, TX, USA). 20 The quality assessment was used to identify the probable sources of heterogeneity (including threshold) and subgroup analyses and meta-regression were implemented to explore these factors.
As an exploratory analysis, we estimated the absolute numbers of false alarms (false positives) and missed cases (false negatives) per 1000 patients tested for each 3-monthly testing interval by applying the pooled sensitivity and specificity derived from this review to (1) the observed median reported prevalence of recurrence divided by 15 (because a recommended schedule of 3-monthly testing for 2 years followed by 6-monthly testing means that, typically, 14–15 tests are undertaken during 5 years of follow-up) and (2) the incidence of recurrence data per follow-up period reported by Sargent et al. 21 (because in reality the proportion developing recurrence between tests is not constant but falls over time).
Results
Main findings
We identified 52 studies amenable to meta-analysis, including in aggregate 9717 participants [median sample size 139, interquartile range (IQR) 72–247]. The median proportion of recurrences in each study was 30% (IQR 24–36%). The diagnostic accuracy of CEA was reported at 15 different thresholds, ranging from 2 to 40 µg/l.
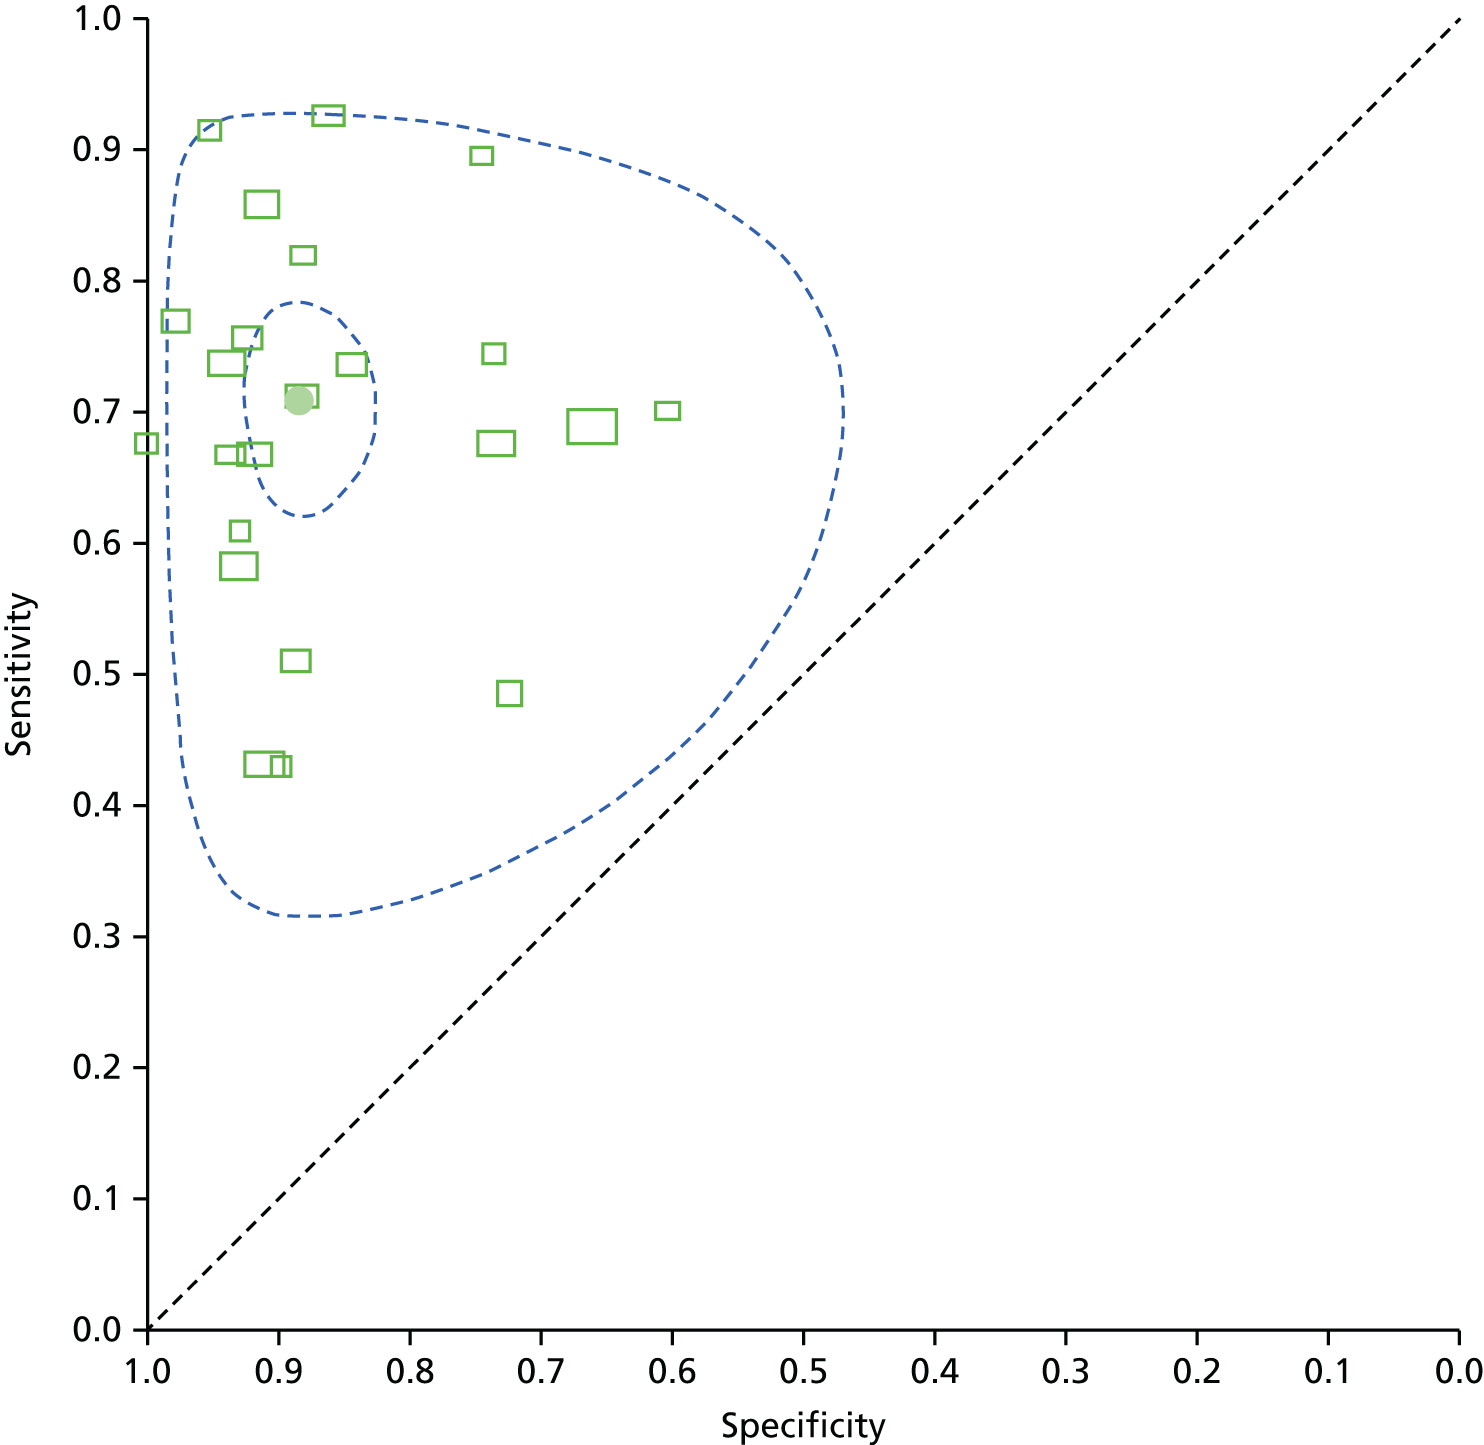
Diagnostic accuracy at the most commonly recommended threshold in national guidelines of 5 µg/l (23 studies, 44%) is shown in Figure 1. The filled black circle indicates that the pooled sensitivity is 71% (95% CI 64% to 76%) and the specificity is 88% (95% CI 84% to 92%). Each box in the figure represents the 2 × 2 data extracted from each study. The width of the box is proportional to the number of patients who did not experience recurrence in each study and the height is proportional to the number of patients who did develop recurrent colorectal cancer. The smaller dashed ellipse represents the 95% credible region around the summary estimate; the larger dashed ellipse represents the 95% prediction region for individual study estimates.
FIGURE 1.
Summary receiver operating characteristic (ROC) plot of CEA accuracy at detecting recurrence at a threshold of 5 µg/l (reference standard clinical diagnosis of recurrence confirmed by imaging, histology or clinical follow-up; see the Cochrane Library website16 for full details of authors’ definitions). This figure is a copy of Figure 8 in the review; copyright is held by the Wiley Online Library and it is reproduced with their permission (http://onlinelibrary.wiley.com/doi/10.1002/14651858.CD011134.pub2/full; last accessed 6 November 2016).
Implications of applying other thresholds
In the seven studies that reported accuracy at a threshold of 2.5 µg/l, the pooled sensitivity was 82% (95% CI 78% to 86%) and the specificity was 80% (95% CI 59% to 92%). Seven studies also reported accuracy at a threshold of 10 µg/l, with a pooled sensitivity of 68% (95% CI 53% to 79%) and a specificity of 97% (95% CI 90% to 99%). Table 1 shows the implications of applying these thresholds in clinical practice, assuming a 2% incidence of recurrent disease in each testing interval. The estimate of 2% is based on an observed median prevalence of recurrence of 30% in the studies included in this review and on national guidance to conduct 14 or 15 CEA tests during follow-up. 22
| Threshold (µg/l) | Studies (participants), n | Sensitivity (95% CI) (%) | Specificity (95% CI) (%) | Implications for 1000 people tested |
|---|---|---|---|---|
| 2.5 | 7 (1515) | 82 (78 to 86) | 80 (59 to 92) | 16 cases of recurrence detected and four cases missed, 196 people referred unnecessarily for further testing |
| 5 | 23 (4585) | 71 (64 to 76) | 88 (84 to 92) | 14 cases of recurrence detected and six cases missed, 118 people referred unnecessarily for further testing |
| 10 | 7 (2341) | 68 (53 to 79) | 97 (90 to 99) | 14 cases of recurrence detected and six cases missed, 29 people referred unnecessarily for further testing |
Implications of applying current UK national guidelines
Table 2 shows the clinical implications of applying the recommended absolute CEA threshold of 5 µg/l to trigger further investigation at each recommended test during 5 years of follow-up, applying the pooled estimates of sensitivity and specificity to the most recently published estimates of the number of cases of recurrence occurring in each test interval21 rather than the constant 2% incidence rate derived from the studies included in the review. As the sensitivity estimate applied is constant and independent of the number of cases of recurrence, the reported small differences in the percentage of cases missed reflects rounding; they are included to highlight the limited sensitivity of the test. The rate of false alarms (people investigated who do not have a recurrence) is dependent on the number of recurrences at each time point but the difference between the time points (range 78–92%) is less striking than the high level of false alarms at every time point if the recommended threshold of 5 µg/l is applied.
| Month of CEA test | Estimated recurrences, n | Referred with high CEA level, n | Cases detected, n | Cases missed, n (%) | False alarms, n (%) |
|---|---|---|---|---|---|
| 3-monthly testing, years 1 and 2 | |||||
| 3 | 19 | 131 | 13 | 6 (31.6) | 118 (90.1) |
| 6 | 19 | 131 | 13 | 6 (31.6) | 118 (90.1) |
| 9 | 39 | 143 | 28 | 11 (28.2) | 115 (80.4) |
| 12 | 39 | 143 | 28 | 11 (28.2) | 115 (80.4) |
| 15 | 37 | 142 | 26 | 11 (29.7) | 116 (81.7) |
| 18 | 37 | 142 | 26 | 11 (29.7) | 116 (81.7) |
| 21 | 31 | 138 | 22 | 9 (29.0) | 116 (84.1) |
| 24 | 31 | 138 | 22 | 9 (29.0) | 116 (84.1) |
| 6-monthly testing, years 3–5 | |||||
| 30 | 46 | 147 | 33 | 13 (28.3) | 114 (77.6) |
| 36 | 36 | 142 | 26 | 10 (27.8) | 116 (81.7) |
| 42 | 27 | 136 | 19 | 8 (29.6) | 117 (86.0) |
| 48 | 25 | 135 | 18 | 7 (28.0) | 117 (86.7) |
| 54 | 17 | 130 | 12 | 5 (29.4) | 118 (90.8) |
| 60 | 14 | 128 | 10 | 4 (28.6) | 118 (92.2) |
Quality and robustness
The subgroup analyses to assess the impact of variance in quality and analytical method applied by included studies focused on the 5 µg/l threshold. The two possible approaches to constructing the 2 × 2 tables (i.e. evaluate the CEA measurement taken closest to the time point at which recurrence was detected or look across all measurements to assess whether or not any had crossed the threshold during the entire follow-up period) gave similar estimates of test performance: the estimated sensitivity was 69.0% and 64.5% and estimated specificity was 90.0% and 89.5%, respectively.
Although we were unable to carry out a subgroup analysis based on specific laboratory techniques because of incomplete reporting, we were able to compare studies carried out before and after the introduction of the International Reference Preparation (IRP) 73/601 calibration. 23 Before the introduction of the IRP, the pooled sensitivity was 73.6% and pooled specificity was 88.5%; after IRP introduction, pooled sensitivity was 67.9% and pooled specificity was 88.6% (95% CI 80.0% to 93.7%). The effect of the covariate in the meta-regression was non-significant (p = 0.96).
Restricting the analyses to the studies deemed to be at low risk of bias in the patient selection, index test, reference standard and timing/flow domains of the QUADAS-2 assessment made little difference to the estimates of pooled sensitivity and specificity and, when the risk of bias in each domain was added as an ordinal covariate in the meta-regression analysis of diagnostic accuracy, the effect on the model was non-significant (patient selection p = 0.77; index test p = 0.90; reference standard p = 0.29; flow/timing p = 0.66).
Discussion
Differences from the review cited in the original application
The systematic review cited in the original application13 identified only 20 studies and reported the accuracy of CEA for the diagnosis of colorectal cancer recurrence using the Moses–Littenberg method. 24 We identified more than twice as many studies and implemented the bivariate meta-analyses recommended in the Cochrane Handbook for Systematic Reviews of Diagnostic Test Accuracy. 16,19,25 This is a statistically more rigorous method that directly accounts for the correlation between sensitivity and specificity. However, our pooled estimate of specificity at a CEA threshold of 5 µg/l was the same as that of Tan et al. 13 (88%). Although our pooled estimate for sensitivity was noticeably higher than that of Tan et al. 13 (71% vs. 63%), the variance around both estimates means that the difference is not statistically significant.
The method used by Tan et al. 13 to identify 2.2 µg/l as the ‘optimum’ CEA threshold was based on linear extrapolation beyond the data (the lowest threshold included in their study was 3 µg/l). We now question the recommendation of 2.2 µg/l (which was based on achieving high sensitivity), not just on the basis of the low specificity (and high false-alarm rate), but also because there appears to be a ‘ceiling’ effect in terms of sensitivity; even at a threshold of 2.5 µg/l, around one in five cases of recurrence would be missed. The failure to exceed a sensitivity of about 80% even with a low threshold and poor specificity reflects the well-documented fact that some recurrent cancers are not associated with a rise in blood CEA level. Our interpretation of the data is therefore that (1) the use of an absolute single test threshold should be questioned; (2) if an absolute single test threshold is applied, it should be higher than the level of 5 µg/l recommended in most national guidelines, using another monitoring modality in parallel with CEA level (such as a single CT scan at 12–18 months) to deal with the ‘sensitivity gap’ – trying to increase sensitivity by lowering the CEA threshold achieves little at high cost.
Limitations of the review
The major limitation of the review is the quality of the studies included. There was also considerable between-study variation in the reporting of factors known to impact on CEA level (e.g. stage of primary disease included, approach to ensuring no residual disease, reporting of smoking, reporting of chemotherapy treatment, and the location of recurrence). Over half of the included studies were at high risk of selection bias, mainly because of inappropriate patient exclusions. The methods used to measure CEA were also poorly reported: three studies (6%) did not report the CEA threshold used to determine a positive result, 15 studies (29%) did not report which laboratory technique had been used and 43 studies (83%) failed to report any indicator of method accuracy or an estimate of CEA test reproducibility.
The reference standard was also inadequately described in many studies. In nine studies the reference standard was assessed only if a rise in CEA was detected, raising the possibility of verification bias. Furthermore, most studies implemented a composite reference standard but failed to report consistently which investigation (within the composite) actually diagnosed recurrence; in half of these studies, positive results for certain reference tests triggered the use of other reference tests. Although three studies were assessed as having no risk of bias or applicability concerns, they reported accuracy at different CEA thresholds, implemented different CEA laboratory techniques and used differing composite reference standards to detect recurrence. It was therefore infeasible to provide pooled diagnostic accuracy estimates restricted to these studies.
The time between the CEA measurement and the reference test used in the 2 × 2 table was not reported in any of the studies. There is therefore a high chance of misclassification because of disease progression during the time between the CEA test and the reference test. Understanding this relationship is important because (1) a high-grade recurrence will progress more quickly than a low-grade recurrence and (2) this information is required to estimate lead time. Furthermore, no study reported 2 × 2 data for each 3- to 6-month period of follow-up, which would be desirable given that the incidence of recurrence falls over the 5 years of follow-up.
Implications for the main analysis
Despite the difference between our findings and those of Tan et al. ,13 in most aspects the review underlined the importance of the questions and analysis set out in our protocol. It highlighted a number of methodological aspects of the FACS study data, including four key strengths: CEA measurement was centralised in a laboratory with high-level quality assurance, the time between index test and diagnosis is known, the reference standard was quality assured [by local oncology multidisciplinary teams (MDTs)] and we obtained data on recurrence and test performance at each testing point during the scheduled 5 years of follow-up. It also highlighted an unanticipated weakness, namely the potential for verification bias. In the FACS trial, the threshold for triggering further investigation was 7 µg/l. When we submitted the application we assumed that our interest would be limited to thresholds below this level. The review meant that this was not the case.
Before we undertook the review, we were less clear about the plateau effect on sensitivity (i.e. decreasing the absolute threshold does not increase sensitivity above what appears to be a maximum achievable value of about 80%). This finding made us expand the planned analysis to investigate whether factors other than preoperative CEA level could characterise in advance those at high risk of experiencing recurrence without a rise in CEA. The high rate of false alarms identified by the review also reminded us of the importance of characterising test performance in terms of predictive value as well as sensitivity and specificity. The failure of previous studies to report and adjust for factors other than cancer recurrence that are known to influence CEA levels also encouraged us to investigate the potential of such adjustment to improve test performance.
We had already specified in the original protocol that we would investigate (1) whether making the decision to investigate further on the basis of the trend in CEA levels over time, rather than the absolute level of a single test, would provide better diagnostic accuracy and (2) whether the recommended testing intervals in national guidelines (commonly every 3 months for 2 years and then every 6 months for 3 years) are optimal. The review reminded us that these two issues are likely to be interdependent. It also reminded us of the limitations of retrospective analysis in predicting clinical performance over time. We therefore augmented the static analytical method described in the original protocol by attempting to model real-time performance prospectively.
Implications for future research (other than our main analysis)
The generic outcome from this review is the overall poor quality of reporting of diagnostic accuracy studies in this field. This poor reporting is compounded by the considerable between-study heterogeneity and limitations of study quality. In response to the methodological limitations highlighted in this review, authors of future research investigating the diagnostic accuracy of CEA should take care to report the CEA threshold and technique used, with an indication of method accuracy and CEA reproducibility; the time point at which the CEA level is measured; the reference test used; and the time between the CEA test and the reference test.
The lack of significant improvement in diagnostic accuracy following a sensitivity analysis limited to studies at low risk of bias (based on a QUADAS-2 assessment) also suggests that modifications to the QUADAS-2 schedule may be warranted in assessing the quality of diagnostic tests used for follow-up monitoring. Any future studies commissioned would be more useful if augmented by a cost–benefit analysis of different strategies for the timing of monitoring tests and the optimal combination of CEA blood testing and CT imaging.
Chapter 3 Main study: aim and objectives
Main aim
The main aim was to determine how CEA test results should be interpreted to inform the decision to undertake further investigation to detect treatable recurrences of colorectal cancer.
Other objectives stated in the protocol
The protocol listed four other objectives:
-
to determine how CEA test results should be interpreted to inform the decision that risk of recurrence is sufficiently low that no further follow-up is necessary
-
to determine the extent to which the performance of CEA testing in detecting recurrence or cure postoperatively is dependent on the extent to which the tumour secreted CEA preoperatively, as indicated by the preoperative CEA level
-
to determine whether or not the recommended CEA testing interval is appropriate
-
to determine whether or not the diagnostic accuracy of CEA testing is different in late recurrence (> 3 years after surgery).
Simplified objectives
These specific objectives are interdependent and underpinned by the same methodology for estimating diagnostic accuracy. In reporting the results we have therefore simplified them, presenting in turn our investigation of the:
-
diagnostic accuracy of CEA testing as a single diagnostic test
-
factors that may affect the diagnostic accuracy of CEA (including preoperative CEA level)
-
diagnostic accuracy of the trend in CEA level over time
-
diagnostic accuracy of CEA testing for detecting early compared with late recurrence
-
optimal testing interval.
Chapter 4 Main study: methods
Design
This study consisted of a secondary observational analysis of data from the FACS trial, a 2 × 2 pragmatic randomised factorial controlled trial comparing minimum post-surgery follow-up of colorectal cancer patients for 5 years with 3- to 6-monthly blood tests for CEA and 6- to 12-monthly CT imaging. 12 We analysed the two arms of the trial that required CEA testing.
Participants
Participants were recruited from the centre at which they received their primary treatment, spanning 39 NHS hospitals across all regions of England. To be eligible for the study, participants had to have undergone curative surgery for primary colorectal cancer and, after extensive testing (histology, imaging and a CEA level of ≤ 10 µg/l), to be confirmed to have no residual disease. Further detail regarding the study setting, participant inclusion and exclusion criteria and randomisation procedures can be found in the original publication. 12
The CEA-only arm (n = 300) involved measurement of blood CEA every 3 months for 2 years, and then every 6 months for 3 years, with a single chest, abdominal and pelvic CT scan at 12–18 months. The CEA and CT arm (n = 302) involved the same CEA measurement schedule but, in addition, chest, abdominal and pelvic CT scans were carried out every 6 months for the first 2 years and then annually for the following 3 years. Overall, compliance with scheduled CEA follow-up schedule was high (70.6% of patients never missed a test) but 20 patients were removed from the data set as they did not have any CEA measurements (10 died before the first CEA test was scheduled, nine withdrew from the trial and one was not tested for reasons unknown), leaving 582 patients in the analysis. The participant flow chart is shown in Appendix 1 (see Figure 9).
Carcinoembryonic antigen measurement
Blood CEA levels measured prior to trial entry were assessed at local laboratories. Only 157 patients (27.0%) had a preoperative CEA level but 569 (97.8%) had a postoperative level.
After recruitment to the trial, blood collection kits were sent directly to the patients, who then attended their own general practice for phlebotomy. Blood samples were sent to the biochemistry laboratory at the John Radcliffe Hospital, Oxford; the CEA analysis was carried using a Siemens Centaur XP analyser (Siemens Healthcare, Erlangen, Germany).
If the blood CEA level was ≥ 7 µg/l above a patient’s baseline level at trial entry the test was repeated as soon as possible; if the second test was also above this threshold the general practitioner was asked to refer the patient urgently to the local hospital for further investigation. All CEA measurements taken after recurrence had been clinically diagnosed (35 CEA measurements in total, affecting 23 unique individuals) and 30 repeat measurements taken to confirm an increase in CEA of ≥ 7µg/l were excluded from this analysis.
The median number of CEA measurements available for each participant was 14 (IQR 10–14), with a median of five (IQR 2–9) measurements in patients who developed a recurrence and 14 (IQR 13–14) in those who did not develop a recurrence. The total number of CEA measurements available for analysis at each time point is shown in Appendix 1 (see Table 11).
Diagnostic reference standard
The reference standard against which diagnostic accuracy was assessed was clinical diagnosis of recurrence of colorectal cancer as determined by the colorectal cancer MDT at the participating hospital centre. The evidence on which this diagnostic decision was based was case specific, but, in the vast majority of cases, involved CT scans of the chest, abdomen and pelvis plus other investigations (e.g. blood biochemistry, pathology results, colonoscopy, other site-specific imaging) as appropriate. As investigation for suspected recurrence could be triggered for reasons other than a raised CEA level (e.g. suspicious symptoms or abnormal results on colonoscopy or CT imaging), the diagnostic modality that first triggered investigation for recurrence was recorded.
Statistical analysis
Evaluating the diagnostic accuracy of carcinoembryonic antigen level as a single diagnostic test
To evaluate the accuracy of CEA for diagnosing recurrence based on the data from the FACS trial, receiver operating characteristic (ROC) curves are presented alongside 95% bootstrap CIs using the pROC package in R version 3.1.3 (The R Foundation for Statistical Computing, Vienna, Austria). 26 CIs were calculated using 2000 stratified bootstrap replicates. The areas under the receiver operating characteristic curves (AUCs) are also reported. Sensitivity and specificity, likelihood ratios and predictive values (along with their respective 95% CIs) are summarised for the most commonly recommended and implemented threshold of 5 µg/l.
In contrast to the traditional diagnostic accuracy paradigm in which only one measurement is taken, in this scenario we evaluated multiple CEA measurements taken within a single individual. Two alternative methods for evaluating the accuracy of CEA testing were identified in our Cochrane review: some studies reported the accuracy of the CEA measurement closest to the time at which recurrence was detected by the reference standard, whereas others defined the CEA level as positive if any CEA measurement crossed the threshold at any time within the follow-up period. As the latter method better represents how CEA levels are interpreted in practice, that is, CEA is monitored and all CEA measurements are interpreted prospectively, we applied this method in the analyses here.
For comparison with the results of the Cochrane review, we also report as a secondary analysis results based on the measurement taken closest to the time at which recurrence was detected. For patients who did not experience recurrence, the CEA measurement taken at the end of follow-up was evaluated.
An operational analysis of the probable impact of CEA testing if used prospectively in clinical practice was also conducted, hypothetically applying the four most commonly reported thresholds in the systematic review (2.5, 5, 7.5 and 10 µg/l) to trigger further investigation on the basis of the result of each individual test carried out during the follow-up period. Two outcomes are reported: (1) the proportion of recurrences that would have been missed and not referred for further investigation because the CEA level was below the threshold and (2) the proportion of patients with a CEA level above the threshold who were subject to a false alarm (i.e. an unnecessary referral for further investigation of a patient who did not experience recurrence throughout the whole follow-up period). The data for the 7.5-µg/l and 10-µg/l thresholds are less robust than those for the 5-µg/l and 2.5-µg/l thresholds, as these thresholds were above the action threshold applied in the FACS trial and therefore were influenced more by work-up bias.
We also calculated for each individual the lead time (i.e. the number of days earlier that the CEA test would have triggered further investigation compared with the reference standard) by applying different thresholds retrospectively. As a CEA value of 7 µg/l triggered further investigation within the trial, we could look only at thresholds up to this level. The median lead time across all individuals, alongside the proportion of recurrences detected earlier than by the reference standard, is presented.
Evaluating the diagnostic accuracy of baseline-adjusted carcinoembryonic antigen testing
The aim of this analysis was to ascertain whether or not individualising the interpretation of CEA results by adjusting for each individual’s postoperative CEA measurement improves the diagnostic accuracy of CEA testing. Two methods of adjustment were compared: (1) taking the difference between the CEA level at each time point and each individual’s postoperative CEA level and (2) using the ratio between the CEA level at each time point and each individual’s postoperative CEA level.
Comparative ROC curves are presented, again assuming that the CEA test was positive if any CEA measurement crossed the threshold at any time within the follow-up period. The AUC for each interpretation method is also reported. The median lead time and proportion of false alarms (as previously defined) were compared across interpretation methods by selecting fixed levels of sensitivity (ranging from 60% to 80%).
Evaluating the effect of preoperative carcinoembryonic antigen levels on the subsequent performance of carcinoembryonic antigen testing to detect recurrence during follow-up
Because of the limited number of preoperative CEA measurements available, a comparative ROC analysis broken down by preoperative CEA level was not possible. Instead, we report a very simple 2 × 2 analysis taking the difference between individuals’ CEA levels at the time that recurrence was diagnosed (i.e. when it should be most elevated) and their preoperative CEA levels and using a threshold of 2.5 µg/l.
Exploring factors that may predict missed cases and false alarms
The following factors were included in this analysis: (1) patient characteristics (age and smoking status); (2) primary tumour characteristics [colon or rectum, N stage (number of nearby lymph nodes involved) and whether treated with chemotherapy or radiotherapy]; (3) the time elapsing between surgery and the first follow-up CEA measurement; and (4) the site of recurrence.
The relationship between these variables and a ‘missed case’ (defined here as a patient suffering a recurrence without a rise in CEA level above 5 µg/l) and a ‘false alarm’ (defined here as a patient who does not have a recurrence during the follow-up period but who has at least one CEA measurement above 5 µg/l) was explored. Univariate relative risks are reported alongside adjusted ORs derived by logistic regression in which all of the listed explanatory variables have been forced into the model. These analyses were carried out in Stata version 12.
Diagnostic accuracy of trend in carcinoembryonic antigen measurements over time
To investigate the diagnostic accuracy of assessing the trend in serial CEA measurements within an individual rather than simply interpreting the most recent CEA measurement taken, linear regression models were fitted to the CEA values for each individual over time. For those patients who recurred during the follow-up period, all CEA measurements up to the point at which recurrence was detected were included in the model. For patients who did not recur during the follow-up period, all measurements available were modelled. Patients who recurred in the first 6 months were excluded from these analyses, as there were insufficient measurements to depict a trend.
The distribution of slope coefficients for individuals who did and did not experience recurrence was compared and ROC analysis was implemented to evaluate the diagnostic accuracy of CEA trend. The preliminary analysis reported in 201427 suggested that we should not restrict the analysis to downwards trend.
In practice, trends in CEA measurements would be evaluated prospectively and modelling all of the available CEA measurements for those who do not go on to recur does not represent what would happen in clinical practice. To overcome this and to ensure that the results better represent what would occur in clinical practice, we have broken down the ROC analysis by year of recurrence so that only the measurements that would be available up to that year are included in the linear regression models.
Optimal testing interval
The optimal testing interval was explored in two ways: (1) by estimating the lead time (the time elapsed between the rise in CEA level that triggers further investigation and the confirmation of a diagnosis of recurrence) that would potentially be gained by initiating further investigation at different CEA levels; and (2) by describing when recurrences occurred during the 5-year follow-up period. The number of recurrences potentially detectable during each 3- or 6-monthly testing interval (i.e. the interval between any two CEA tests) was then estimated by subtracting different amounts of lead time (0, 3, 6 and 9 months) from the actual time elapsed between the start of follow-up and the actual date of confirmation of recurrence.
Chapter 5 Main study: results
The characteristics of patients enrolled in the FACS trial, the recurrence rates and the pattern of recurrences have been described in detail elsewhere. 12 The individual plots of CEA values over time for each patient who suffered a recurrence are included in Appendix 1 (see Figure 10).
Diagnostic accuracy of carcinoembryonic antigen level as a single diagnostic test
Figure 2 shows that the diagnostic accuracy of CEA testing across all thresholds, estimated on the basis of all CEA tests carried out prior to clinical diagnosis of recurrence, is modest (AUC 0.74, 95% CI 0.68 to 0.80). The green shading highlights the 95% CI around the ROC curve.
FIGURE 2.
Receiver operating characteristic plot showing the accuracy of any rise in CEA level above threshold. Sensitivities and specificities achieved at thresholds of 2.5, 5, 7.5 and 10 µg/l are highlighted (reference standard: recurrent cancer as assessed by the local hospital MDT).
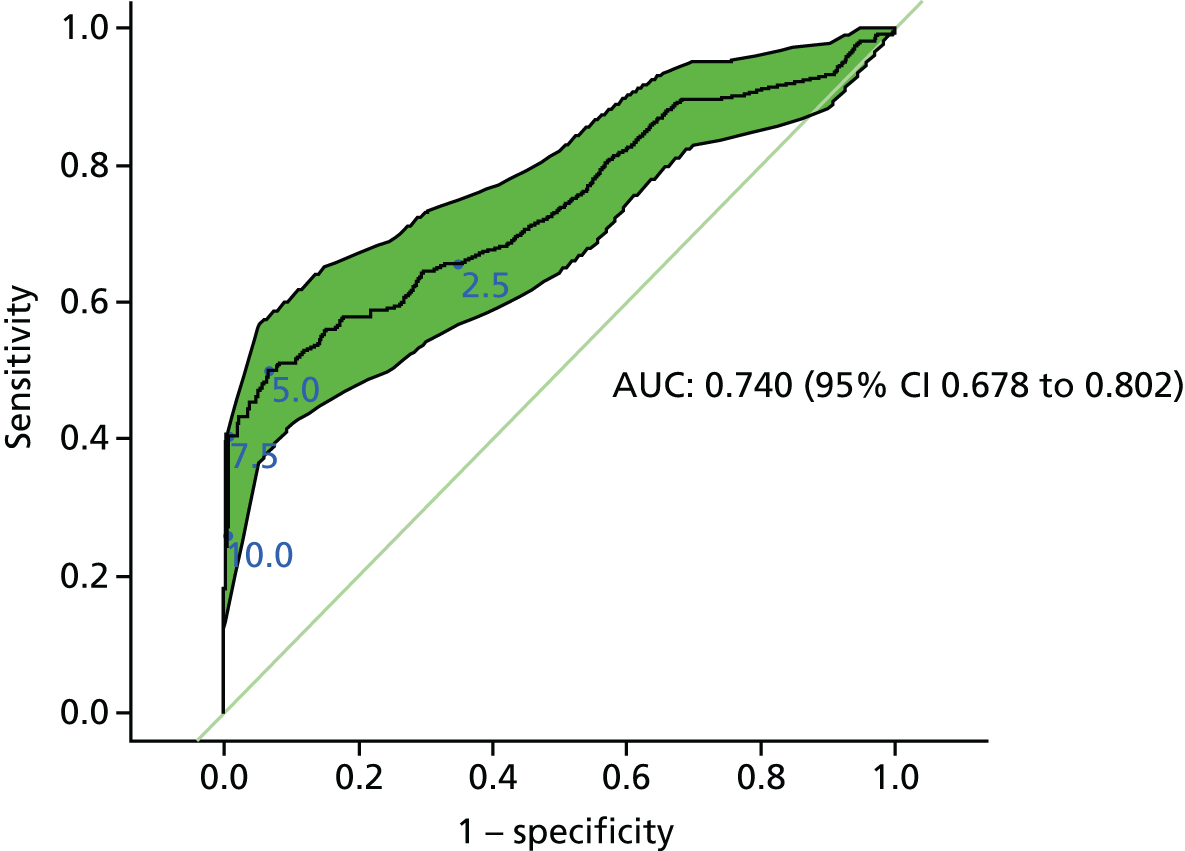
Table 3 presents the sensitivity, specificity, likelihood ratios and predictive values of blood CEA level at the threshold of 5 µg/l, which is commonly recommended in national guidelines.
| Accuracy measure | Value (95% CI) |
|---|---|
| Sensitivity (%) | 50.0 (40.1 to 59.9) |
| Specificity (%) | 93.3 (90.6 to 95.3) |
| Positive predictive value (%) | 61.9 (50.6 to 72.1) |
| Negative predictive value (%) | 89.6 (86.5 to 92.0) |
| Positive likelihood ratio | 7.5 (5.1 to 11.0) |
| Negative likelihood ratio | 0.5 (0.4 to 0.7) |
Many of the studies identified in the Cochrane review considered only the final CEA value before the confirmation of recurrence. In our data set, this improved the AUC (0.80, 95% CI 0.75 to 0.86) but, interestingly, made minimal difference to sensitivity (final value 49% vs. all values 50%). As this method of analysis does not represent how CEA measurements are interpreted in clinical practice (all measurements taken are interpreted), the higher estimate of specificity (97.5%) is potentially misleading as it underestimates the proportion of false-positive results.
A positive predictive value of 62% (based on the observed 17.9% recurrence rate) implies that about four in 10 patients without a recurrence will have at least one CEA test result above the threshold of 5 µg/l. The 89 false alarms triggered at a threshold of 5 µg/l were clustered in 29 individuals, 15 of whom (51.7%) would have more than one false alarm and eight of whom (27.6%) would have more than five false alarms. The proportion of false alarms also increased over time, from 34.5% in year 1 to 94.5% in year 5, which is consistent with the falling incidence of recurrence.
Choosing the threshold for further investigation
The ROC curve in Figure 2 shows that trying to improve the sensitivity of CEA by reducing the threshold for further investigation has a high cost in terms of reduced specificity. The impact on missed cases and false alarms of either reducing the recommended threshold from 5 µg/l to 2.5 µg/l (or increasing it to 7.5 µg/l or 10 µg/l) is shown in Table 4. A breakdown of this table for each test point (according to the currently recommended follow-up schedule) is available in Appendix 1 (see Tables 12 and 13).
| Outcome | 2.5 µg/l | 5 µg/l | 7.5 µg/l | 10 µg/l |
|---|---|---|---|---|
| CEA above threshold, n (%) (of 6609 tests) | 1097 (16.6) | 157 (2.4) | 50 (0.8) | 28 (0.4) |
| Missed cases, n (%) (of 104 recurrences) | 38 (36.5) | 56 (53.8) | 65 (62.5) | 78 (75.0) |
| False alarms,a n (%) (of tests above threshold) | 924 (84.2) | 89 (56.7) | 4 (8.0) | 2 (7.1) |
Although the estimated sensitivity is increased to 63.5% (95% CI 54.2% to 72.8%) by reducing the threshold to 2.5µg/l, there is a sevenfold increase in the number of times that further investigation is triggered and, in 84% of these cases, no recurrence is detected. Increasing the threshold to 10 µg/l substantially reduces the number of positive tests (by approximately six times) and false alarms (to < 10%) but at a cost of increasing the proportion of missed cases (to 75%, 95% CI 66.7% to 83.3%).
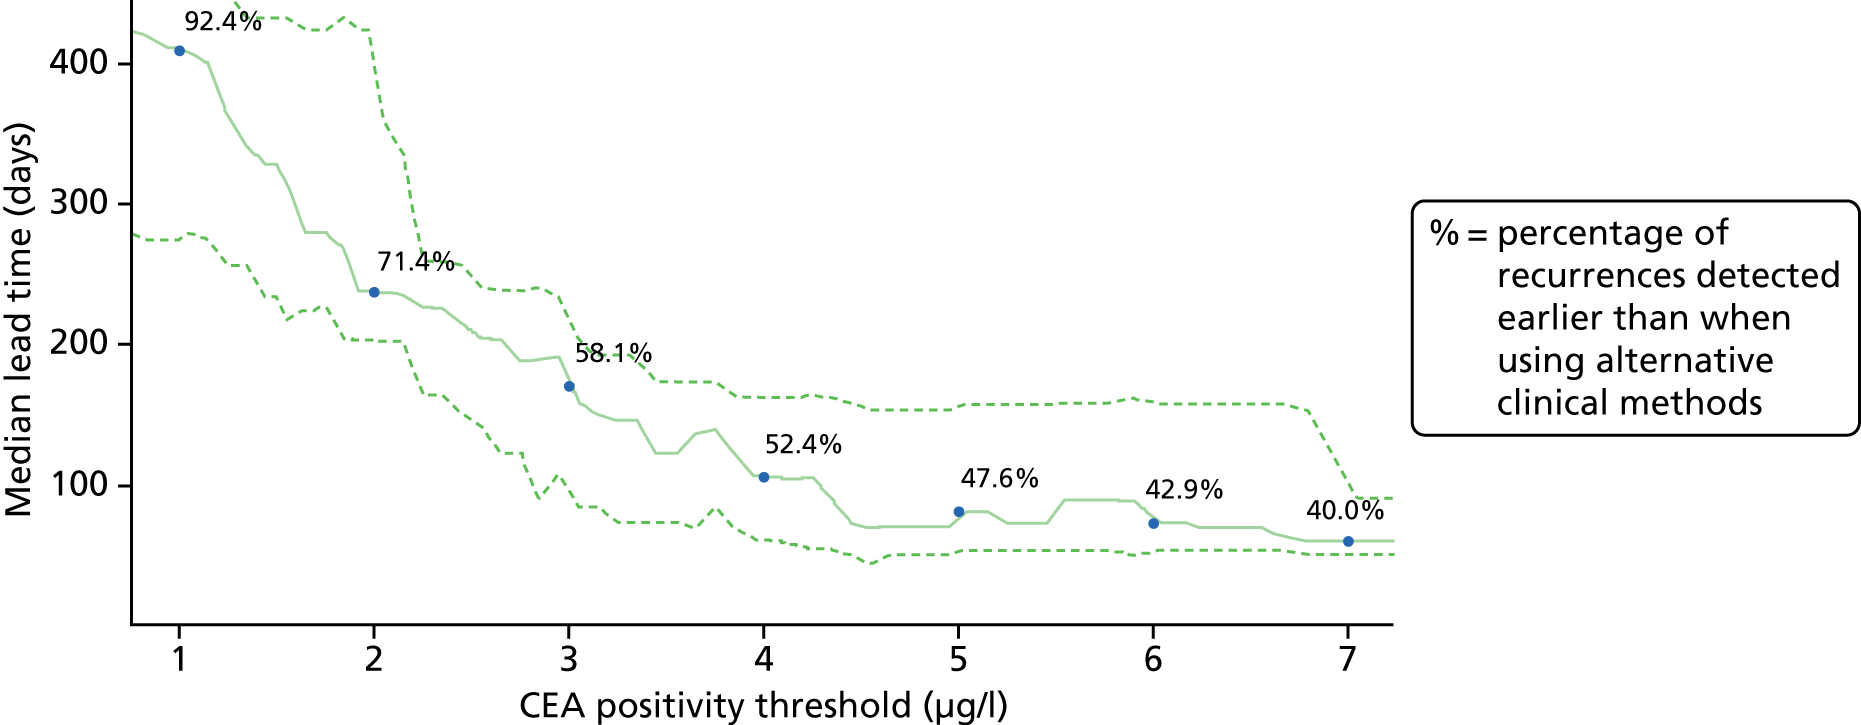
Figure 3 estimates the impact of adopting different CEA thresholds (x-axis) on the median lead time that can be gained (y-axis). Figure 3 is also annotated to show for each potential CEA cut-off point (at 1-µg/l intervals) the proportion of potentially detectable recurrences that we estimate would be detected. It suggests that the commonly used threshold of 5 µg/l achieves a lead time of about 3 months. It also suggests that setting a lower test threshold would achieve a greater lead time (e.g. if a CEA value of 2.5 µg/l was implemented to trigger further investigation, the median lead time might be increased to 6 months). However, there is a high cost in terms of false alarms (see Table 4).
FIGURE 3.
Median lead time between a CEA test result and the confirmation of recurrence applying different thresholds for instigating further investigation. Dashed lines show 95% bootstrap CIs.
The effect of baseline carcinoembryonic antigen level and other pretest patient characteristics
Baseline adjustment
Figure 4 compares the diagnostic accuracy of adjusting the CEA value for the baseline (postoperative) level with the diagnostic accuracy of simply interpreting the CEA result. The ROC curves for each method of interpretation substantially overlap, as do the 95% CIs around the estimates of the AUCs, suggesting that adjusting the CEA value by an individual’s baseline measurement offers no notable improvement in diagnostic accuracy.
FIGURE 4.
Receiver operating characteristic plots comparing the diagnostic performance of the single test baseline-adjusted CEA value (expressed as a ratio and difference) with that of the unadjusted CEA value (reference standard: recurrent cancer as assessed by the local hospital MDT).

Interpreting the baseline-adjusted CEA level is complicated by the fact that CEA levels appear to continue to fall after the ‘baseline’ postoperative test. Of the 6611 CEA measurements in the database, 3344 (51%) were lower than their baseline measurement and therefore had a negative ‘difference’ value or ratio values of < 1. Nearly one-quarter (133/582, 22.9%) of patients always had a negative-adjusted value (i.e. all of their CEA measurements were less than the baseline), of whom 116 remained recurrence free but 17 developed recurrence.
Effect of baseline adjustment on lead time and false alarms
Table 5 reports the estimated median lead time across a fixed range of sensitivity levels from 50% to 80% for the two baseline-adjusted CEA values (difference and ratio) compared with the unadjusted CEA value. It also shows the percentage of recurrence-free patients who are unnecessarily referred for further investigation (false alarms). When considering plausible levels of sensitivities, using a baseline transformation is akin to lowering the positivity threshold.
| Sensitivity (%) | Unadjusted CEA | Difference from baseline | Ratio to baseline | |||
|---|---|---|---|---|---|---|
| Median lead time (days) | False alarms (%)a | Median lead time (days) | False alarms (%)a | Median lead time (days) | False alarms (%)a | |
| 80 | 267 | 76.3 | 336 | 80.7 | 336 | 80.7 |
| 75 | 237 | 76.2 | 325 | 80.8 | 325 | 80.7 |
| 70 | 235 | 74.4 | 344 | 80.0 | 335 | 79.9 |
| 65 | 214 | 70.7 | 211 | 76.3 | 267 | 77.9 |
| 60 | 191 | 66.4 | 217 | 70.0 | 237 | 75.8 |
| 55 | 139 | 56.8 | 187 | 63.0 | 167 | 63.2 |
| 50 | 72 | 44.5 | 104 | 47.2 | 143 | 59.4 |
Adjusting for presurgery carcinoembryonic antigen level
It has been suggested that individuals who do not present with an elevated CEA level pre surgery are less likely to produce elevated CEA levels during follow-up, despite the development of recurrence. 28 Only 25 patients with recurrence in this analysis had a preoperative CEA measurement. Table 6 shows that there is no indication that a low CEA level at the time of diagnosis of the primary tumour predicts CEA level at the time of recurrence, indicating that the secretory behaviour of the recurrent tumour is not determined by that of the primary tumour.
| Preoperative CEA measurement | CEA measurement closest to point of recurrence detection | |
|---|---|---|
| ≤ 2.5 µg/l | > 2.5 µg/l | |
| ≤ 2.5 µg/l | 2 | 7 |
| > 2.5 µg/l | 5 | 11 |
Predicting missed cases
The other characteristics of the patient and primary tumour assessed (e.g. patient age and smoking status, site and stage of the primary tumour, receipt of adjuvant therapy, delay in commencing monitoring) were equally unhelpful in predicting the likelihood of being a missed case (i.e. a patient suffering a recurrence without a rise in blood CEA level above the 5 µg/l threshold). Although there was a potentially important increase in missed cases in patients with delayed initiation of follow-up, it was not statistically significant (adjusted OR 2.66, 95% CI 0.87 to 8.15; p = 0.09).
Predicting false alarms
Table 7 explores the possibility of predicting which patients are likely to experience false alarms with CEA monitoring. Again, neither the site nor stage of the primary tumour, nor the site of recurrence, nor the timing of the start of follow-up are significantly predictive of false alarms, although the CIs on these estimates are wide. However, current smoking is significantly predictive of multiple false alarms (adjusted OR 6.55, 95% CI 1.52 to 28.2; p = 0.01). Current smokers have a 12% (95% CI 2.55% to 31.2%) chance of experiencing more than one false alarm during 5 years of follow-up.
| Characteristic | n/N (%) | Univariate RR | Adjusted OR | |||
|---|---|---|---|---|---|---|
| RR (95% CI) | p-value | OR (95% CI) | p-value | |||
| Patient characteristics | ||||||
| Age (years) | < 70a | 6/245 (2) | 1.58 (0.57 to 4.36) | 0.38 | 1.26 (0.37 to 4.29) | 0.71 |
| ≥ 70 | 9/233 (4) | |||||
| Current smoker | Noa | 12/443 (3) | 4.43 (1.34 to 14.7) | 0.01 | 6.55 (1.52 to 28.21) | 0.01 |
| Yes | 3/25 (12) | |||||
| Primary tumour characteristics | ||||||
| Site of primary tumour | Colona | 12/338 (4) | 0.44 (0.1 to 1.92) | 0.26 | 0.64 (0.29 to 1.43) | 0.28 |
| Rectum | 2/129 (2) | |||||
| N stage | 0a | 12/353 (3) | 0.53 (0.12 to 2.33) | 0.39 | 1.06 (0.14 to 7.82) | 0.95 |
| 1–2 | 2/111 (2) | |||||
| Chemotherapy or radiotherapy | Noa | 11/283 (4) | 0.53 (0.17 to 1.63) | 0.26 | 0.43 (0.07 to 2.66) | 0.36 |
| Yes | 4/195 (2) | |||||
| Timing | ||||||
| Surgery to first follow-up CEA test (months) | < 6a | 4/106 (4) | 0.75 (0.24 to 2.34) | 0.62 | 0.78 (0.2 to 3.05) | 0.72 |
| ≥ 6 | 10/354 (3) | |||||
The diagnostic accuracy of the trend in carcinoembryonic antigen level
There were 42 individuals with fewer than three CEA measurements (76% of whom experienced recurrence). Patients with only one CEA measurement (n = 23) were removed from the analyses, leaving 88 patients who did develop recurrence and 471 recurrence-free patients. Patients with two CEA measurements (n = 19) were included following a sensitivity analysis showing no significant impact on the effect of inclusion or exclusion.
The individual plots (see Appendix 1, Figure 10) for patients who developed recurrence show that there is substantial variability, with only a minority displaying the anticipated pattern of a sharp rise in CEA level following a period of stability. Of the 97 patients who had undergone at least two CEA tests prior to the diagnosis of recurrence, six had a falling CEA level (and a further six had an initial fall before it began to rise), 13 had a stable level and 23 had a rising CEA level but never exceeded the 5-µg/l threshold that normally triggers further investigation. Even among the 55 patients whose CEA levels rose above 5 µg/l, in 23 patients the CEA rose gradually (over a period of 1–4 years) before it exceeded the threshold. The plots in themselves suggest that the trend in CEA level may have more diagnostic value than an absolute threshold for a single test.
The individual plots also highlight two other important issues. First, the rise in CEA is not always smooth – there is sometimes a dip in CEA level within a clear rising trend, presumably reflecting both within-person variability and measurement error. Second, there is sometimes a significant delay between a CEA level that would have triggered further investigation in the FACS trial and the confirmation of recurrence (during which time patients have resumed CEA testing). This situation would have occurred when further investigation did not initially detect the recurrence (indicating that CEA level may sometimes be a more sensitive method for investigating recurrence than CT imaging).
Distribution of beta-coefficients
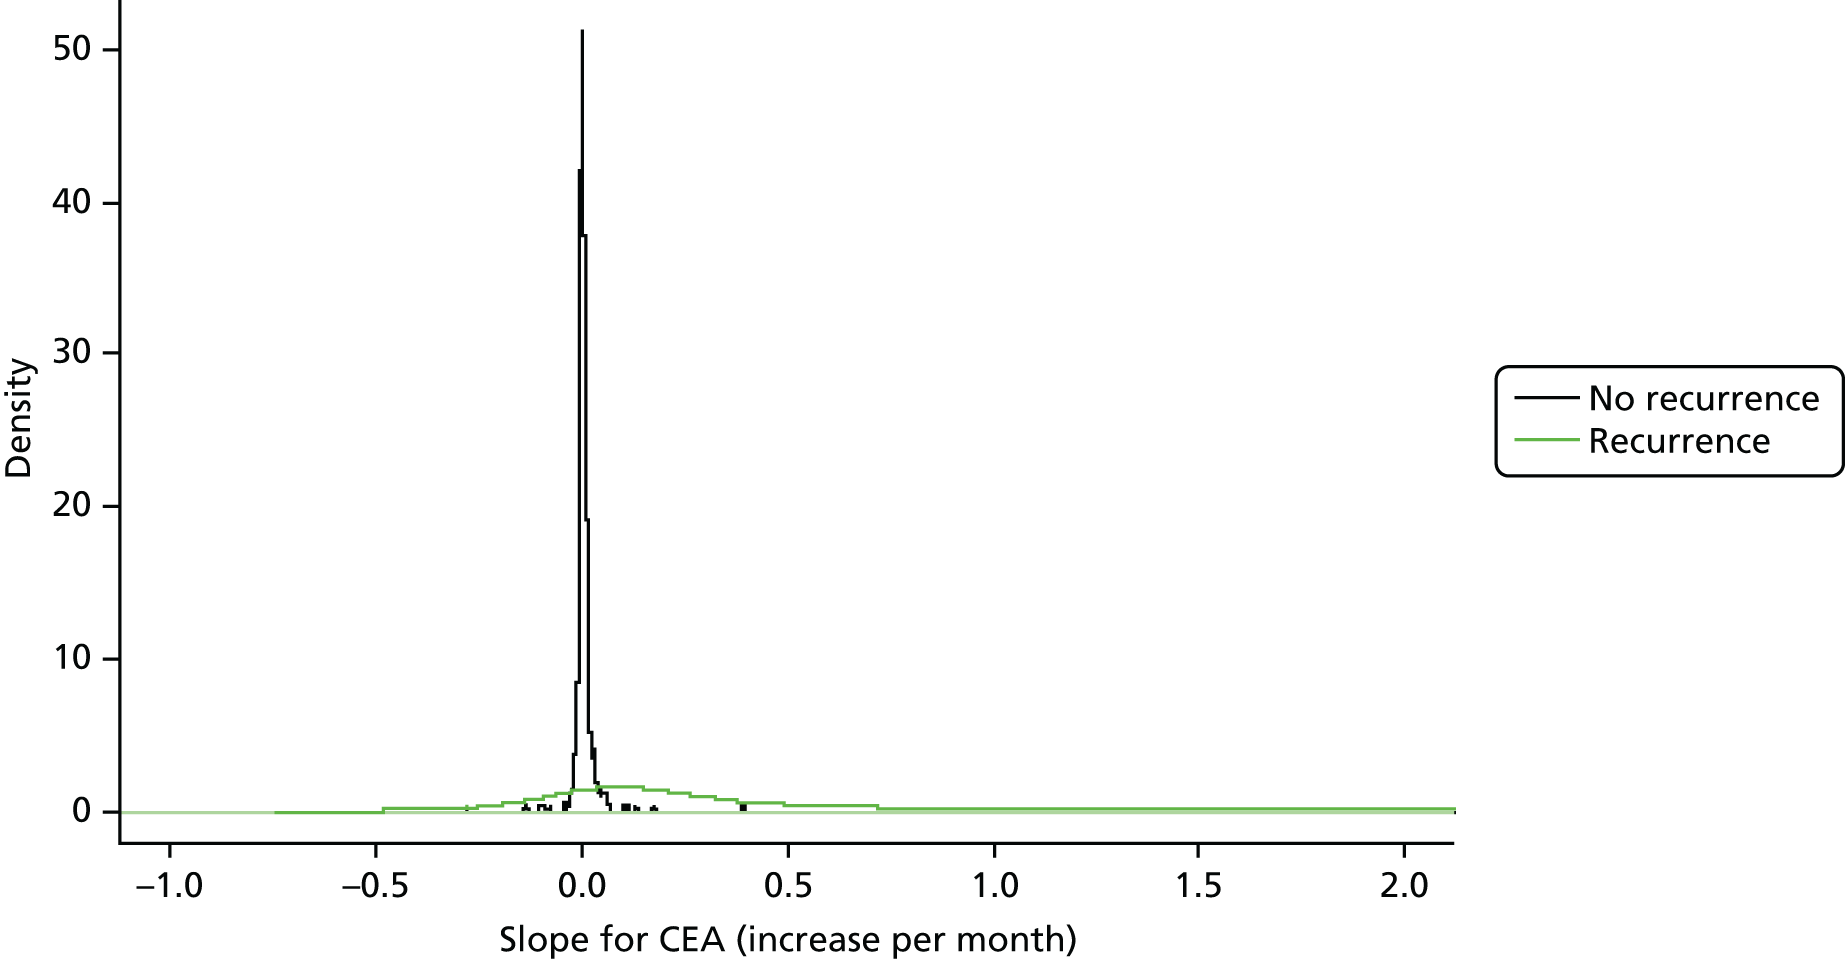
Figure 5 shows the distributions of the beta-coefficients (i.e. the gradient of the linear trend in the CEA measurements) for the group of patients who did develop recurrence and the group who remained recurrence free. The difference in variance around the mean of the two distributions is stark, indicating much greater stability in CEA levels in patients who do not experience recurrence. For the recurrence-free patients, the beta coefficients are centred on zero and show relatively little variability [mean 0.000006, standard deviation (SD) 0.00003]. For patients who suffered recurrence, the distribution is much wider, with a 100 times greater SD (0.0035 vs. 0.00003). Although the distribution for the patients who suffered recurrence centres above zero (mean 0.001), indicating that a positive trend is more indicative of recurrence, the extent of the variance suggests that a negative trend may also have some diagnostic value. The distributions of the intercepts were also plotted (not shown) and heavily overlapped, indicating that there is minimal discriminatory information contained in the intercepts of the linear regression models.
FIGURE 5.
Distribution of regression coefficients of CEA levels in patients with and without recurrence.
Diagnostic accuracy of a positive trend in carcinoembryonic antigen level
Figure 6 shows the ROC curve for basing the decision to investigate further on an increase in blood CEA level over time (using the beta-coefficients from the individual patient linear regression models) rather than on the result of a single test. The ROC curve shows a clear elbow towards the upper left-hand corner, indicating that the slope in CEA level holds some discriminatory information for predicting recurrence. The AUC suggests that the rate of change provides better overall discriminatory power than the single-value CEA transformations explored so far (AUC 0.85, 95% CI 0.78 to 0.91).
FIGURE 6.
Receiver operating characteristic plot for the diagnostic performance of a positive trend in CEA level (assessed by beta-coefficients derived by linear regression of CEA levels) (reference standard: recurrent cancer as assessed by the local hospital MDT).
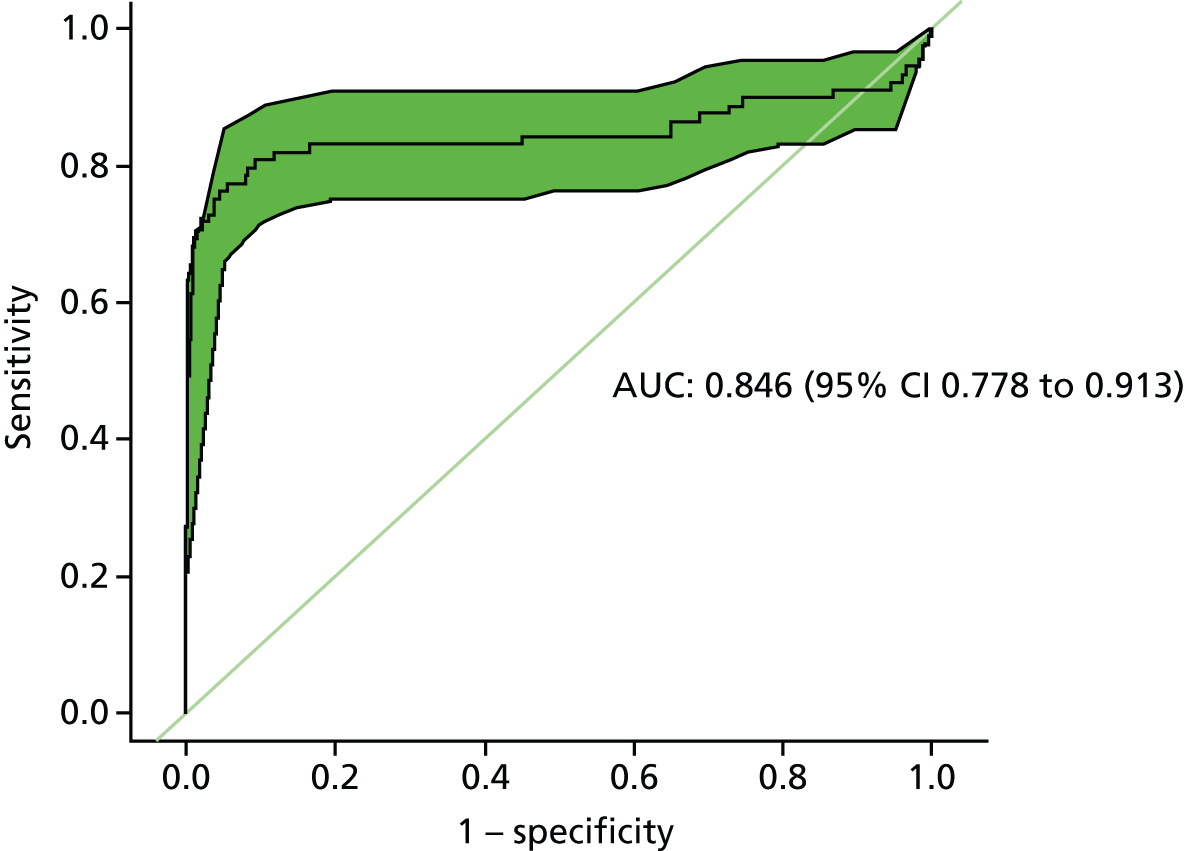
A key limitation of this analysis is that it is retrospective and the beta-coefficients are based on all of the CEA measurements (up to the point that recurrence is clinically detected). In clinical practice the decision to investigate will be made prospectively as results accrue. However, excluding CEA measurements taken closest to the diagnosis of recurrence (up to 1 year) made no important or statistically significant difference to the AUC.
Effect of censoring
There is a trade-off in estimating CEA trend between improving the overall accuracy of the beta-coefficient by including more measurements and diluting the effect of an increase in later measurements (i.e. if you cumulatively include all measurements in calculating the regression line, if the CEA rise starts only late in follow-up, a bigger CEA rise than at the beginning would be needed to shift the curve). The plots in Appendix 1 (see Figure 10) show that a sudden late rise in CEA after a period of relative stability (i.e. an ‘elbow’ shape) was less common than a gradual slow rise and this is reflected in Table 8, which shows that there is no obvious gain in censoring the number of CEA tests used to estimate the beta-coefficient. If anything, ignoring earlier tests and calculating the slope only on the most recent tests reduces rather than improves diagnostic accuracy.
| Number of retrospective measurements included in the model | AUC | 95% CI |
|---|---|---|
| 5 | 0.74 | 0.66 to 0.82 |
| 6 | 0.74 | 0.67 to 0.82 |
| 7 | 0.80 | 0.73 to 0.87 |
| 8 | 0.81 | 0.74 to 0.88 |
| 9 | 0.80 | 0.74 to 0.87 |
| 10 | 0.81 | 0.75 to 0.87 |
| 11 | 0.80 | 0.75 to 0.86 |
| 12 | 0.78 | 0.73 to 0.84 |
| 13 | 0.84 | 0.77 to 0.90 |
| 14 | 0.85 | 0.78 to 0.91 |
Diagnostic accuracy of a trend in either direction
The beta-coefficients reflect the individual plots shown in Appendix 1 (see Figure 10); 13.6% of patients with recurrence (n = 12/88) had a negative beta-coefficient, indicating that, overall, their CEA levels showed a downwards trend during the follow-up period. Given that the distribution of beta-coefficients for the recurrence-free group is tightly centred around zero, allowing a negative as well as a positive trend to trigger further investigation further improves the AUC (0.91, 95% CI 0.87 to 0.96), but the 95% CIs overlap substantially; thus, both the statistical and the clinical significance of this finding remain unclear.
Clinical application
As mentioned above, a key limitation of the accuracy evaluations of trend so far is that they have been based on a retrospective analysis of all available measurements. Figure 7 shows the accuracy of interpreting trends prospectively, as measurements are collected over the follow-up period. Based on the AUCs, although there is some between-year variation in accuracy, assessing trends in CEA levels over time still appears to be more accurate than interpreting just the most recent CEA measurement.
FIGURE 7.
Receiver operating characteristic curves showing the diagnostic accuracy of the trend in CEA level by year of follow-up (reference standard: recurrent cancer as assessed by the local hospital MDT).

Diagnostic accuracy of carcinoembryonic antigen level in detecting early compared with late recurrence
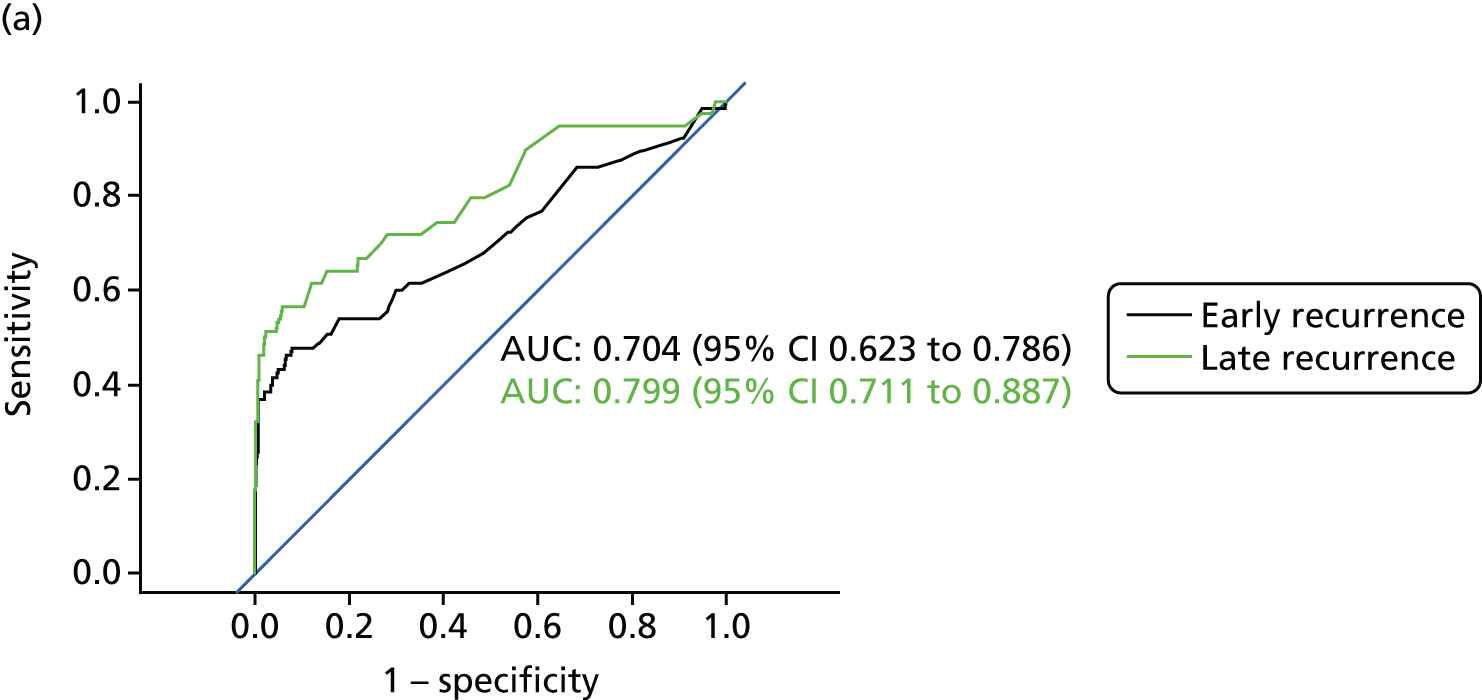
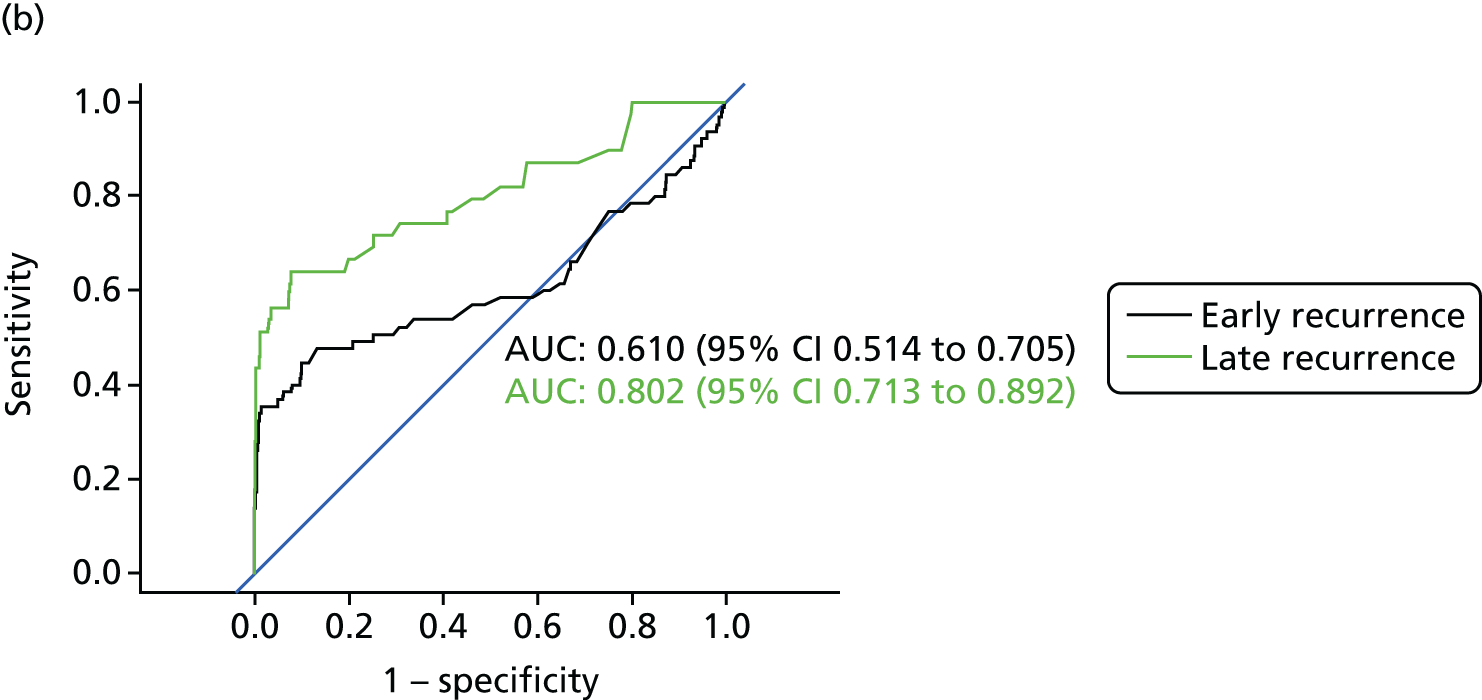
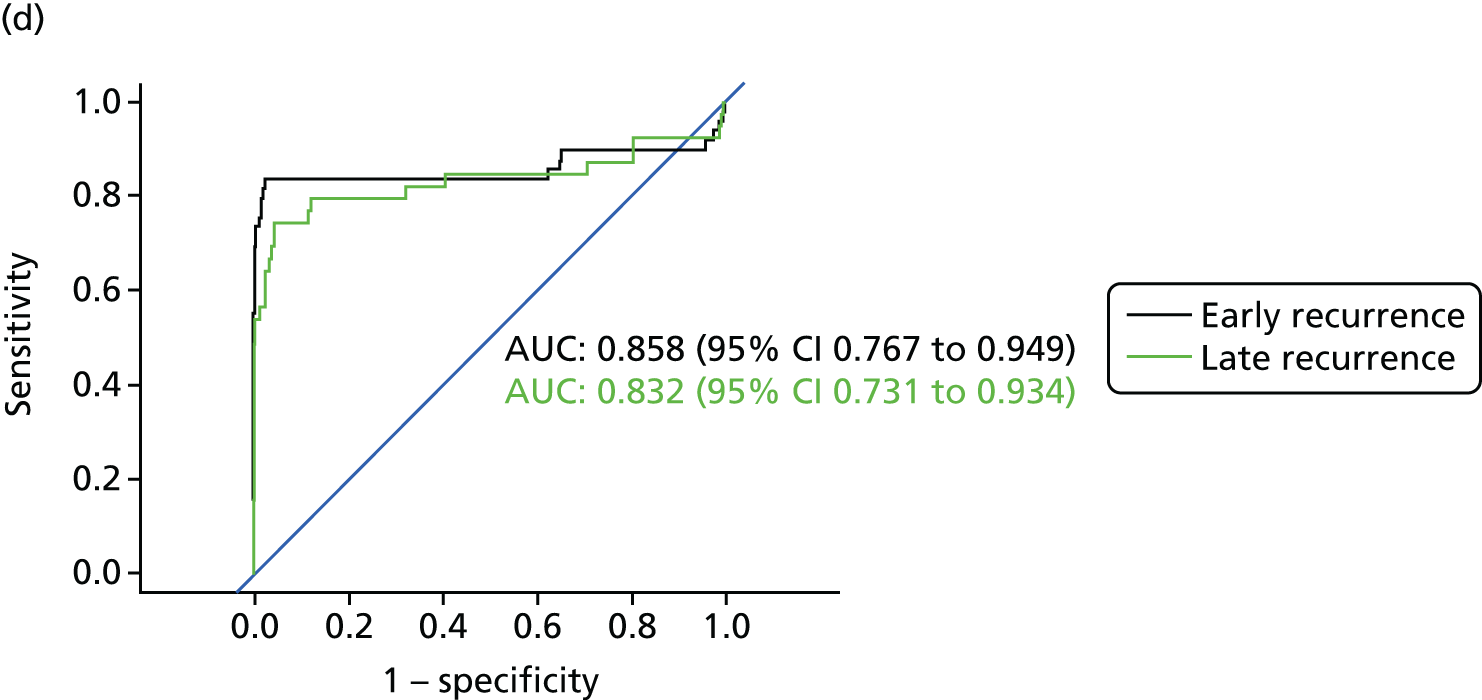
Figure 8 shows the diagnostic accuracy of the different approaches to interpreting CEA levels broken down by whether the recurrence was detected early into follow-up (recurrence in the first 2 years after treatment) or late (recurrence in years 3–5). As demonstrated above, interpreting trends in serial CEA measurements (i.e. the beta-coefficient of a linear regression model) is more accurate than assessing single CEA measurements for the detection of recurrence. The results in Figure 8 show that the accuracy of trend is also less dependent on whether recurrence occurs early or late into follow-up. The accuracy of single CEA measurements (particularly in those adjusted for baseline difference or ratio) is notably poorer for early recurrences.
FIGURE 8.
Receiver operating characteristic curves for different approaches to interpreting CEA levels in early and late recurrence (reference standard: recurrent cancer as assessed by the local hospital MDT). (a) Single CEA measurement: unadjusted; (b) single CEA measurement: difference from postoperative baseline level; (c) single CEA measurement: ratio to postoperative baseline level; and (d) trend in CEA measurements over time.

The test interval
Optimal test interval for a single test
Table 9 shows the mean number of recurrences detected in each year of the FACS trial and an estimate of the number of recurrences detectable in each testing interval assuming (1) an equal distribution of recurrence within the year; (2) that the current UK testing schedule of 3-monthly intervals in years 1 and 2 and then 6-monthly intervals in years 3–5 was used; and (3) that the CEA level will be above the CEA threshold between 0 and 9 months prior to the FACS reference standard detecting recurrence. The results are based on the actual threshold applied in the FACs trial of 7 µg/l.
| Outcome | Year | ||||
|---|---|---|---|---|---|
| 1 | 2 | 3 | 4 | 5 | |
| Number of recurrences confirmed | 43 | 23 | 17 | 15 | 6 |
| Mean number of new recurrences detectable at each scheduled CEA test | |||||
| At point at which diagnosis was confirmed | 10.75 | 5.75 | 8.5 | 7.5 | 3.0 |
| 3 months earlier | 12.5 | 6.25 | 6.0 | 6.5 | NA |
| 6 months earlier | 14.25 | 4.75 | 5.5 | 6.5 | NA |
| 9 months earlier | 15.75 | 4.0 | 5.0 | 1.0 | NA |
The actual lead time that should be applied in interpreting Table 9 depends on the threshold used for interpreting the test. For example, as Figure 3 shows, a threshold of 5 µg/l is associated with approximately 3 months of lead time. At this threshold, the testing interval needs to be halved in year 1 to ensure that the number of recurrences detectable, and therefore test performance, remains fairly constant over time. As the FACS trial follow-up stopped at 5 years, it is not possible to estimate in the same way the effect of applying action thresholds of < 7 µg/l on the number of recurrences detectable in year 5. However, at this threshold, the number of recurrences detected was less than half that in years 3 and 4. Although this might suggest that the testing interval should be reduced from 6- to 12-monthly intervals to achieve constant performance, this would constrain any potential diagnostic lead time gained.
Optimal test interval for carcinoembryonic antigen trend
Although trend was estimated on two measurements in 19 participants (as stated earlier), it is self-evident that the beta-coefficient is assessed with increasing precision as more measurements accrue. In patients without recurrence, this improvement in precision levelled off after about 10 measurements. It is also self-evident that you cannot assess trend on the basis of a single measurement. This in itself implies the need to increase the frequency of testing in the first year as, at present (with 3-monthly testing), trend assessment would not be possible until 6 months and it would not be measured with any precision until 9 months, by which time 31 (29.8%) recurrences had already been diagnosed (and another 13 might already have been detected if a 5-µg/l threshold had been applied).
The beta-coefficient lacks clinical face validity and could probably be implemented only within a computerised algorithm, either calculating a risk of recurrence or giving dichotomous refer/do not refer advice. Table 10 therefore presents the beta-coefficients in terms of change in CEA level per year.
| Year | Sensitivity 70% | Sensitivity 80% | ||
|---|---|---|---|---|
| Specificity (%) | Change per year (µg/l) | Specificity (%) | Change per year (µg/l) | |
| 1 | 93.0 | 1.75 | 73.6 | 0.82 |
| 2 | 89.8 | 1.40 | 78.1 | 0.92 |
| 3 | 90.2 | 0.65 | 87.1 | 0.50 |
| 4 | 91.7 | 0.50 | 79.4 | 0.29 |
| 5 | 87.3 | 0.30 | 79.0 | 0.21 |
It is clear from Table 10 that (1) the optimal threshold (to maintain the selected trade-off between sensitivity and specificity) is not constant but falls over time and (2) to maintain a specificity of around 90% it is necessary to accept a sensitivity of 70% rather than 80%. Aiming for a sensitivity of 80% means accepting a level of specificity associated with a substantial number of false alarms.
The between-year instability in specificity estimates reflects the relatively small numbers contributing to the analysis when it is stratified by year. CIs are not given to avoid complicating the table, but Figure 7 shows that CIs around the AUCs for each year overlap.
Chapter 6 Discussion
Main findings
The importance of not triaging with carcinoembryonic antigen level alone
Our main analysis confirms the findings of the systematic review: CEA testing alone is insufficient as a triage test for colorectal cancer recurrence. Whatever threshold is applied for interpreting the CEA test result (based on a single test or trend), a significant number of patients will suffer recurrence without a detectable change in CEA levels. This underlines the importance of combining CEA testing with scheduled imaging, as recommended in most national guidelines. However, this does not imply that CT imaging has to be carried out alongside every CEA test – in the comparative analysis of the FACS trial, combining 3- to 6-monthly CEA testing with a single CT scan of the chest, abdomen and pelvis at 12–18 months achieved similar results in detecting treatable recurrence as combining CEA testing with regular 6- to 12-monthly CT scanning. 12
The advantage of making decisions on a trend in carcinoembryonic antigen levels
The diagnostic performance of the trend in CEA level, assessed by the slope (beta-coefficient) of the linear regression line, was consistently better than interpreting the results of a single test, regardless of whether the single test was adjusted for the baseline postoperative CEA level. In particular, assessing trend detects recurrence in patients with a slowly rising CEA level below the single test threshold. The main clinical limitations of making decisions to further investigate on trend rather than on a single test result are that (1) most recurrences occur early in the follow-up period when fewer test results have been accrued and (2) it has less face validity than interpreting a single test result and will require the application of a computer algorithm at the laboratory or testing facility. The observation that optimal performance was achieved by taking account of negative as well as positive trends merits further investigation. It suggests that slow post-treatment reduction in CEA level is itself a marker of recurrence.
The choice of carcinoembryonic antigen threshold
The systematic review highlighted the very high cost in terms of false alarms of trying to improve single-test sensitivity by reducing the action threshold below the 5 µg/l commonly recommended by national guidelines. The results of the main analysis confirmed that, even at this recommended threshold, more than half of patients referred for further investigation will not have recurrence; decreasing the single-test threshold to try to achieve the sort of sensitivity feasible by making decisions on trend would cause this false-alarm rate to increase to ≥ 90%. Even using trend analysis, the number of false alarms suggests that aiming for a sensitivity of 70% – augmenting CEA testing with another triage test such as a single CT scan to detect the missed 30% of recurrences – may be the clinically preferable option. In applying the trend analysis, the main results also highlight the importance of not applying the same action threshold throughout the 5-year follow-up period. For example, to achieve 70% sensitivity at a constant specificity of around 90% requires the threshold applied to be reduced from 1.75 µg/l in year 1 to 0.3 µg/l in year 5. In applying such thresholds, the current advice to use the same laboratory technique to avoid method bias error1 needs to be endorsed (to minimise both false alarms and missed recurrence) and the CEA immunoassay techniques require improved reproducibility in the 2.5–10 µg/l concentration range.
The choice of testing interval
More recurrences were detected at the beginning than at the end of the 5-year follow-up period. Although this has been reported before, the finding remains important because the FACS cohort were so thoroughly investigated for residual disease before trial entry. It implies that, ignoring the fact that static test performance (i.e. sensitivity and specificity) also changes over time because of the characteristics of presenting recurrences, operational performance (i.e. predictive value) will decline during follow-up. This is at present reflected in the common practice of reducing CEA testing from 3-monthly intervals in years 1–2 to 6-monthly intervals in years 3–5. Our results suggest that this is not optimal. On the basis of the number of detectable recurrences alone, testing would need to be carried out more frequently in year 1 (arguably twice as frequently as in year 2). Increasing the frequency of testing in year 1 is also important if the action threshold is to be based on assessing trend (as, at present, one-third of recurrences occur before a trend is measurable). Adopting this increased testing frequency would be challenging in some health-care systems and would need careful planning (as it requires rapid turnaround of results, good communication with patients and access to a clinician who is able to discuss and act on the results quickly). Although the falling incidence of recurrence would suggest that testing frequency should be reduced to one test in year 5, this would have implications for the achievable lead time.
Who should not be followed up with carcinoembryonic antigen testing
It is not possible on the basis of any of the variables we assessed to predict in advance which patients will fail to experience a rise in CEA level with recurrence and therefore should not be followed up by blood CEA monitoring. There is no suggestion that patient age, characteristics of the primary tumour or the recurrence site predict either missed cases from non-response or false alarms. However, the likelihood of multiple false alarms is significantly higher in smokers, suggesting that CEA monitoring is not an appropriate follow-up method for patients who continue to smoke.
Consistency with existing evidence
The modest sensitivity of CEA testing at the recommended 5-µg/l threshold is well documented, although our estimate of 50% from the FACS data is even lower than the pooled sensitivity of 71% (95% CI 64% to 76%) in our systematic review. This could reflect the efforts made to ensure that any residual disease was identified (by rigorous postoperative investigation) before FACS trial entry and not labelled as recurrence. We have criticised the meta-analytic method used by Tan et al. 13 in their 2009 systematic review, but for comparison they reported a sensitivity of 63% at a threshold of 5 µg/l and 84% at a threshold of 2.2 µg/l. Our reported specificity is broadly consistent with that in previous studies, although the impact on prospective operational performance (i.e. imaging workload and false alarms) will depend on the testing interval and prevalence of recurrence in the population being followed up. We are not aware of any previous studies estimating predicted operation performance to allow comparison with our results.
The number of recurrences in the FACS trial of < 20% is similar to that reported in other recent trials of adjuvant therapy such as the Multicenter International Study of Oxaliplatin/5-Fluorouracil/Leucovorin in the Adjuvant Treatment of Colon Cancer (MOSAIC) trial29 but less than that in the previous trials reported in the review by Jeffery et al. 11 and most of the diagnostic accuracy studies cited in our review. 16 This almost certainly reflects the completion of any adjuvant treatment and very intensive investigation for residual disease that occurred prior to trial entry in the FACS trial. Nevertheless, consistent with recent adjuvant trials,21 most recurrences were still detected in the first 18 months of follow-up, with very few occurring by the final fifth year of scheduled follow-up. We therefore see no reason why our estimates of operative performance of CEA testing in follow-up (such as false-alarm rates) and of the optimal testing interval and threshold needed to maintain optimal performance levels are not generalisable to everyday clinical practice.
A number of previous studies have advocated the use of looking at the trend in CEA level during follow-up, rather than trying to interpret the results of a single test. Almost 40 years ago, Minton and Martin30 suggested use of a nomogram to interpret serial test results and to guide the decision to undertake second-look surgery, pointing out that this implied more frequent testing in the first 18 months. In 1985, Staab et al. 31 presented data supporting the proposal to make the decision to embark on second-look surgery subject to the trend in three or four sequential CEA test results rather than a single test, also pointing out that a rapidly rising level significantly reduced the chance of the recurrence being operable. A Danish group replicated the findings of Staab et al. ,31 constructing a simulation model using data on 295 patients drawn from a clinical trial;32 they confirmed that in many patients with recurrence, individual CEA values did not exceed 5 µg/l but test sensitivity could be increased to 70–80% (with a specificity of 80–90%) if the decision to investigate further was based on trend (CEA doubling time), but that test frequency would need to be increased. The CEAwatch trial investigators published a review in 2011 summarising much of the relevant evidence and justifying their decision to adopt a dynamic threshold for the CEAwatch trial (a 20% rise in CEA between two consecutive measurements). 33–35
The only previous study that we could find that provides comparable data on the threshold that should be applied in interpreting trend based on the regression coefficient was that by Boey. 33 This study (based on 146 patients) reported that a sensitivity of 86% could be achieved by applying a threshold of a 5% rise per month, but the specificity of this threshold was poor (76%). A recent report on interpreting CEA trend in order to initiate positron emission tomography scans to detect recurrence is based on very small numbers and does not report a comparable threshold. 36 Interestingly, in the context of our finding that a negative trend had diagnostic value, Ito et al. 37 reported that a slow reduction in the CEA level following primary surgical treatment was predictive of recurrence (presumably residual disease) in the early period after primary surgery.
The problem of false alarms with current CEA thresholds has been raised recently by Litvak et al. 38 based on a review of 728 patients with resected colorectal cancer followed up at the Memorial Sloane Kettering Cancer Center. They observed that almost 50% of patients (358/728) had a false-positive elevation above the normal range based on single test results. However, they also observed that at levels of > 15 µg/l, false-positive results were rare and there were no false positives if the CEA level was > 35 µg/l.
Strengths and limitations
Quality of carcinoembryonic antigen measurement
The main strengths of the FACS trial data in this context are that CEA testing was centrally managed with high compliance with scheduled testing and all analyses were carried out in one laboratory with consistent quality control. A key strength of this analysis, compared with previous diagnostic accuracy studies of CEA for detecting recurrence of which we are aware, is that we modelled the operational performance of CEA when used prospectively in clinical practice in addition to looking retrospectively at sensitivity and specificity in relation to a series of tests.
Limitations of the reference standard
The main limitation of the data is that we do not have a reference standard at all time points. We do not know the precise time when a recurrence would have been detectable by our reference standard. Our estimate of unnecessary referrals is likely to be an underestimate as it includes only patients who did not experience recurrence throughout the whole follow-up period. However, the length of follow-up and within-trial surveillance means that we are unlikely to have missed cases of recurrence. Even if we had been able to apply the reference standard at every time point, there may be a lead time between detectability of recurrence by CEA testing and detectability of recurrence by imaging. The other limitation of the reference standard that we report here (and which has been used by almost all previous studies of which we are aware) is that it assesses the diagnostic performance of CEA testing in detecting any recurrence. We did not have a sufficient number of cases of recurrence to stratify the analysis by the treatability of recurrence, as only half of the patients in the FACS trial were allocated to CEA testing.
Work-up bias
The other important limitation is work-up bias. Patients in the FACS trial with a CEA level of > 7 µg/l above their personal baseline were referred for further investigation. This relatively high threshold means that the analyses of diagnostic accuracy at the thresholds of 2.5 µg/l and 5 µg/l are not subject to work-up bias, but the estimates of operational performance at higher thresholds reported in Appendix 1 are less robust.
Statistical precision and external validation
Although this is a relatively large diagnostic study, the limited number of cases of recurrence (n = 104) limited the statistical precision of our estimates of sensitivity. The estimates based on statistical modelling may also suffer from overfitting and merit external validation before clinical implementation.
Implications for clinical practice and research
Advantages of carcinoembryonic antigen testing as a triage test
Carcinoembryonic antigen testing has three great advantages over other forms of follow-up: it is relatively inexpensive, it can be carried out in community settings and it does not expose the patient to radiation. It can therefore be perfomed more frequently than other tests and has the potential to provide important lead time in detecting recurrence (about 3 months at the currently implemented threshold). However, our data underline that it cannot be used alone as a triage test because of its low sensitivity.
Clinical implications
Sensitivity can clearly be increased by reducing the threshold but, as stated above, the impact on workload and high false-alarm rate make that a very unattractive solution. However, it is probably time to stop defining the threshold for further investigation in terms of an absolute threshold. We have already shown that much better diagnostic performance, including better sensitivity, can be achieved by considering trend over time in a series of tests. 27 This also implies that testing should be performed more frequently during the first year of follow-up because almost half of the recurrences present during this early period.
Suggested monitoring schedule
The monitoring schedule that we suggest on the basis of our results is summarised in Box 1. The suggestion that colonoscopy and CT of the chest, abdomen and pelvis may be a possible mechanism to increase sensitivity to > 70% is based on the main analysis of the FACS trial. We suggest that evidence is now sufficient to increase the testing interval in the first year and to adopt additional tests to maintain sensitivity. We also think that the evidence on false alarms from the Cochrane analysis is sufficient to advise raising the threshold for interpreting a single test from 5 to 10 µg/l and to advise smokers to quit or not be monitored for CEA level. However, we suggest strongly that the implementation of interpreting CEA levels after 3 months on the basis of trend rather than individual level is staged so that optimal cut-off points can be refined in one or two pilot sites before wider roll-out.
-
Year 1: eight tests – months 1–3, monthly; months 4–12, every 2 months.
-
Year 2: four tests – 3 monthly.
-
Years 3–5: 6-monthly.
Single test months 1 and 2, thereafter trend assessed by beta-coefficients.
Threshold for further investigation-
Single test: 10 µg/l.
-
Trend (change per year): year 1, 1.7 µg/l; year 2, 1.4 µg/l; year 3, 0.8 µg/l; year 4, 0.5 µg/l; year 5, 0.3 µg/l.
-
One CT scan of the chest, abdomen and pelvis at 12 months (or one at 12 months and one at 18 months).
-
Colonoscopy at 12 months.
All patients following surgical treatment of Dukes’ stages A–C colorectal cancer, after completion of adjuvant treatment, with a CEA level of < 10 µg/l and no sign of residual disease on CT of the chest, abdomen and pelvis and colonoscopy and who are non-smokers.
Smokers should be informed of the false-alarm risk and receive support to quit if they so choose (or be followed up with a different modality).
Other research implications
The systematic review drew attention to the poor quality of the majority of diagnostic studies on CEA monitoring. Moreover, virtually all studies assessed CEA levels as a single diagnostic test, ignoring the fact that it is used as a monitoring test performed repeatedly over time. Even the Cochrane diagnostic accuracy review methodology focuses on single test results rather than monitoring performance. This issue needs to be addressed, not just in relation to CEA testing.
As mentioned above, the most pressing further research is the need to conduct implementation studies to refine the suggested cut-off points for monitoring CEA trend. In conducting this work, it would be preferable to use a reference standard based on recurrence treatable with curative intent rather than simply any recurrence.
Acknowledgements
The authors would like to acknowledge the key role of the other FACS trial investigators in providing the data analysed in this substudy:
University of Southampton, UK: Louisa Little Corkhill (Clinical Trial Manager), Scott Regan and Jane Mellor (Clinical Trial Co-ordinators).
University of Oxford, UK: Alice Fuller (Data Manager who managed the logistics of CEA testing during the trial) and Helen Campbell (Research Fellow in Health Economics).
Oxford University Hospitals NHS Foundation Trust, UK: Helen Bungay (Clinical Radiologist).
Participating NHS hospitals: Birmingham Heartlands Hospital (Mr Gamal Barsoum); Castle Hill Hospital, Hull (Mr John Hartley); Charing Cross Hospital, London (Mr Peter Dawson); Cumberland Infirmary, Carlisle (Dr Jonathan Nicoll); Darent Valley Hospital, Dartford (Mr Mike Parker); Derriford Hospital, Plymouth (Mr Mark Coleman); Grantham and District Hospital (Mr Dilip Mathur); Harrogate District Hospital (Mr Jon Harrison); Hillingdon Hospital, Uxbridge (Mr Yasser Mohsen); Hinchingbrooke Hospital (Dr Litee Tan); King’s Mill Hospital, Sutton-in-Ashfield (Mr Mukul Dube); St James’s University Hospital, Leeds (Mr Simon Ambrose); Leeds General Infirmary (Mr Paul Finan); Leighton Hospital, Crewe (Mr Arif Khan); Maidstone Hospital (Dr Mark Hill); Mayday Hospital (Croydon University Hospital), London (Mr Muti Abulafi); Newham University Hospital, London (Mr Roger Le Fur); John Radcliffe Hospital, Oxford (Professor Neil Mortensen); Queen Alexandra Hospital, Portsmouth (Mr Daniel O’Leary); Queen Elizabeth Hospital Birmingham (Dr Neil Steven); Queen’s Hospital, Burton-on-Trent (Mr Stelios Vakis); Queen’s Medical Centre, Nottingham (Professor John Scholefield); Royal Cornwall Hospital, Truro (Mr Ponnandai Arumugam); Royal Derby Hospital (Mr Jonathan Lund); Royal Shrewsbury Hospital (Mr Trevor Hunt); Russells Hall Hospital, Dudley (Professor David Ferry); Scarborough Hospital (Dr Ian Renwick); Southampton General Hospital (Professor John Primrose); St Mark’s Hospital, Harrow (Professor John Northover and Dr Arun Gupta); St Peter’s Hospital, Chertsey (Mr Philip Bearn); St Richard’s Hospital, Chichester (Mr Neil Cripps); Musgrove Park Hospital, Taunton (Dr Mary Tighe); Torbay Hospital, Torquay (Mr Rupert Pullan); Manor Hospital, Walsall (Mr Jonathan Stewart); Warrington Hospital (Mr Barry Taylor); West Middlesex University Hospital, London (Mr Subramanian Ramesh); Wexham Park Hospital, Slough (Dr H Wasan); Worcestershire Royal Hospital, Worcester (Mr Stephen Lake); and Wycombe General Hospital, High Wycombe (Dr Andrew Weaver).
The Data Monitoring and Ethics Committee included Jack Hardcastle (Emeritus Professor of Surgery, Nottingham University), Michael Campbell (Professor of Statistics, Sheffield University) and David Whynes (Professor of Health Economics, Nottingham University).
We also acknowledge the invaluable contribution of the local National Institute for Health Research (NIHR) cancer research networks, NHS trusts and patients who agreed to participate in this trial.
Funding and conduct of the main trial
The main FACS project was funded by the UK NIHR Health Technology Assessment (HTA) programme (project number 99/10/99). The views and opinions expressed therein are those of the authors and do not necessarily reflect those of the HTA programme, NIHR, NHS or Department of Health. The funding agency had no role in the design and conduct of the study; collection, management, analysis and interpretation of the data; preparation, review or approval of the manuscript; or the decision to submit the manuscript for publication. The authors accept full responsibility for the research.
The trial was conducted in accordance with the International Council for Harmonisation of Technical Requirements for Pharmaceuticals for Human Use Harmonised Tripartite Guideline for Good Clinical Practice,39 the European Directive on good clinical practice in clinical trials (2001/20/EC)40 and the NHS NIHR Research Governance Framework. 41
Contributions of authors
Bethany Shinkins (Statistician) designed and conducted the main analyses for this substudy, conducted the statistical analyses for the systematic review and helped DM to draft the manuscript.
Brian D Nicholson (Clinical Research Fellow) was the principal investigator on the systematic review and contributed to the subanalysis on the impact of smoking on CEA monitoring.
Tim James (Head Biomedical Scientist) was responsible for the laboratory analysis of CEA for the FACS trial and gave scientific advice on the interpretation of the data.
Indika Pathiraja (Visiting Clinical Research Fellow) was co-investigator on the systematic review.
Sian Pugh (Specialist Registrar in Surgery) provided clinical support for the data analysis and helped to draft the manuscript at each stage.
Rafael Perera (Head of Statistics) was the lead statistician for the FACS trial and supervised BS in designing and conducting both the main substudy analysis and the systematic review.
John Primrose (Professor of Surgery) was co-principal investigator on the main FACS trial, obtained the funding for the substudy and advised on the clinical interpretation of the findings.
David Mant (Emeritus Professor of General Practice) was co-principal investigator on the main FACS trial, obtained the funding for the substudy, helped BS to design and conduct the main analysis and drafted the manuscript.
All authors commented on more than one draft of the manuscript and approved the final draft. BS and RP had full access to all of the data in the study and take responsibility for the integrity of the data and the accuracy of the data analysis.
Publications
Shinkins B, Nicholson BD, James TJ, Primrose JN, Mant D. Carcinoembryonic antigen monitoring to detect recurrence of colorectal cancer: how should we interpret the test results? Clin Chem 2014;60:1572–4.
Nicholson BD, Shinkins B, Mant D. Blood measurement of carcinoembryonic antigen level for detecting recurrence of colorectal cancer. JAMA 2016;316:1310–11.
Shinkins B, Nicholson BD, Primrose J, Perera R, James T, Pugh S, et al. The diagnostic accuracy of a single CEA blood test in detecting colorectal cancer recurrence: results from the FACS trial. PLOS ONE 2017;12:e0171810.
Data sharing statement
The data reported here are a subset extracted from the main FACS trial data set. Requests to access anonymised data for the purposes of non-commercial research for patient benefit should be addressed to Professor John Primrose (j.n.primrose@soton.ac.uk).
Disclaimers
This report presents independent research funded by the National Institute for Health Research (NIHR). The views and opinions expressed by authors in this publication are those of the authors and do not necessarily reflect those of the NHS, the NIHR, NETSCC, the HTA programme or the Department of Health. If there are verbatim quotations included in this publication the views and opinions expressed by the interviewees are those of the interviewees and do not necessarily reflect those of the authors, those of the NHS, the NIHR, NETSCC, the HTA programme or the Department of Health.
References
- Duffy MJ, Lamerz R, Haglund C, Nicolini A, Kalousová M, Holubec L, et al. Tumor markers in colorectal cancer, gastric cancer and gastrointestinal stromal cancers: European group on tumor markers 2014 guidelines update. Int J Cancer 2014;134:2513-22. http://dx.doi.org/10.1002/ijc.28384.
- Labianca R, Nordlinger B, Beretta GD, Brouquet A, Cervantes A. ESMO Guidelines Working Group . Primary colon cancer: ESMO Clinical Practice Guidelines for diagnosis, adjuvant treatment and follow-up. Ann Oncol 2010;21:70-7. http://dx.doi.org/10.1093/annonc/mdq168.
- Locker GY, Hamilton S, Harris J, Jessup JM, Kemeny N, Macdonald JS, et al. ASCO 2006 update of recommendations for the use of tumor markers in gastrointestinal cancer. J Clin Oncol 2006;24:5313-27. http://dx.doi.org/10.1200/JCO.2006.08.2644.
- Freedman-Cass D, Gregory KM. Clinical Practice Guidelines in Oncology (NCCN Guidelines): Colon Cancer. Fort Washington, PA: National Comprehensive Cancer Network Foundation; 2016.
- National Institute for Health and Care Excellence . Colorectal Cancer: Diagnosis and Management n.d. www.nice.org.uk/guidance/cg131/chapter/1-recommendations 2011 (accessed 5 December 2015).
- Sturgeon CM, Lai LC, Duffy MJ. Serum tumour markers: how to order and interpret them. BMJ 2009;339. http://dx.doi.org/10.1136/bmj.b3527.
- Newton KF, Newman W, Hill J. Review of biomarkers in colorectal cancer. Colorectal Dis 2012;14:3-17. http://dx.doi.org/10.1111/j.1463-1318.2010.02439.x.
- Goldstein MJ, Mitchell EP. Carcinoembryonic antigen in the staging and follow-up of patients with colorectal cancer. Cancer Invest 2005;23:338-51. http://dx.doi.org/10.1081/CNV-58878.
- Scheer A, Auer RA. Surveillance after curative resection of colorectal cancer. Clin Colon Rectal Surg 2009;22:242-50. http://dx.doi.org/10.1055/s-0029-1242464.
- Tsikitis VL, Malireddy K, Green EA, Christensen B, Whelan R, Hyder J, et al. Postoperative surveillance recommendations for early stage colon cancer based on results from the clinical outcomes of surgical therapy trial. J Clin Oncol 2009;27:3671-6. http://dx.doi.org/10.1200/JCO.2008.20.7050.
- Jeffery M, Hickey BE, Hilder PN. Follow-up strategies for patients treated for non-metastatic colorectal cancer. Cochrane Database Syst Rev 2007;1. http://dx.doi.org/10.1002/14651858.cd002200.pub2.
- Primrose JN, Perera R, Gray A, Rose P, Fuller A, Corkhill A, et al. Effect of 3 to 5 years of scheduled CEA and CT follow-up to detect recurrence of colorectal cancer: the FACS randomized clinical trial. JAMA 2014;311:263-70. http://dx.doi.org/10.1001/jama.2013.285718.
- Tan E, Gouvas N, Nicholls RJ, Ziprin P, Xynos E, Tekkis PP. Diagnostic precision of carcinoembryonic antigen in the detection of recurrence of colorectal cancer. Surg Oncol 2009;18:15-24. http://dx.doi.org/10.1016/j.suronc.2008.05.008.
- Glasziou P, Irwig L, Mant D. Monitoring in chronic disease: a rational approach. BMJ 2005;330:644-8. http://dx.doi.org/10.1136/bmj.330.7492.644.
- Cochrane Diagnostic Review Group Quality Criteria n.d. http://methods.cochrane.org/sdt/handbook-dta-reviews (accessed 5 November 2016).
- Nicholson BD, Shinkins B, Pathiraja I, Roberts NW, James TJ, Mallett S, et al. Blood CEA levels for detecting recurrent colorectal cancer. Cochrane Database Syst Rev 2015;12. http://dx.doi.org/10.1002/14651858.CD011134.pub2.
- Shinkins B, Nicholson BD, Primrose J, Perera R, James T, Pugh S, et al. The diagnostic accuracy of a single CEA blood test in detecting colorectal cancer recurrence: results from the FACS trial. PLOS ONE 2017;12.
- Whiting PF, Rutjes AW, Westwood ME, Mallett S, Deeks JJ, Reitsma JB, et al. QUADAS–2: a revised tool for the quality assessment of diagnostic accuracy studies. Ann Intern Med 2011;55:529-36. http://dx.doi.org/10.7326/0003-4819-155-8-201110180-00009.
- Reitsma JB, Glas AS, Rutjes AW, Scholten RJ, Bossuyt PM, Zwinderman AH. Bivariate analysis of sensitivity and specificity produces informative summary measures in diagnostic reviews. J Clin Epidemiol 2005;58:982-90. http://dx.doi.org/10.1016/j.jclinepi.2005.02.022.
- Takwoingi Y. Meta-Analysis of Test Accuracy Studies in Stata: A Bivariate Model Approach. Version 1 n.d. http://methods.cochrane.org/sites/methods.cochrane.org.sdt/files/public/uploads/Chapter%2010%20-%20Version%201.0.pdf (accessed 6 November 2016).
- Sargent DJ, Patiyil S, Yothers G, Haller DG, Gray R, Benedetti J, et al. End points for colon cancer adjuvant trials: observations and recommendations based on individual patient data from 20,898 patients enrolled onto 18 randomized trials from the ACCENT Group. J Clin Oncol 2007;25:4569-74. http://dx.doi.org/10.1200/JCO.2006.10.4323.
- Agency for Healthcare Research and Quality . National Guideline Clearing House. Follow-Up of Colorectal Cancer or Polyps n.d. www.guideline.gov/summaries/summary/46911 (accessed 5 November 2016).
- Laurence DJ, Turberville C, Anderson SG, Neville AM. First British standard for carcinoembryonic antigen (CEA). Br J Cancer 1975;32:295-9. http://dx.doi.org/10.1038/bjc.1975.227.
- Moses LE, Shapiro D, Littenberg B. Combining independent studies of a diagnostic test into a summary ROC curve: data-analytic approaches and some additional considerations. Stat Med 1993;12:1293-316. http://dx.doi.org/10.1002/sim.4780121403.
- Cochrane . Cochrane Handbook for Systematic Reviews of Diagnostic Test Accuracy n.d. http://methods.cochrane.org/sdt/handbook-dta-reviews (accessed 5 November 2016).
- Robin X, Turck N, Hainard A, Tiberti N, Lisacek F, Sanchez JC, et al. pROC: an open-source package for R and S+ to analyze and compare ROC curves. BMC Bioinformatics 2011;12. http://dx.doi.org/10.1186/1471-2105-12-77.
- Shinkins B, Nicholson BD, James TJ, Primrose JN, Mant D. Carcinoembryonic antigen monitoring to detect recurrence of colorectal cancer: how should we interpret the test results?. Clin Chem 2014;60:1572-4. http://dx.doi.org/10.1373/clinchem.2014.228601.
- Su BB, Shi H, Wan J. Role of serum carcinoembryonic antigen in the detection of colorectal cancer before and after surgical resection. World J Gastroenterol 2012;18:2121-6. http://dx.doi.org/10.3748/wjg.v18.i17.2121.
- André T, Boni C, Navarro M, Tabernero J, Hickish T, Topham C, et al. Improved overall survival with oxaliplatin, fluorouracil, and leucovorin as adjuvant treatment in stage II or III colon cancer in the MOSAIC trial. J Clin Oncol 2009;27:3109-16. http://dx.doi.org/10.1200/JCO.2008.20.6771.
- Minton JP, Martin EW. The use of serial CEA determinations to predict recurrence of colon cancer and when to do a second-look operation. Cancer 1978;42:1422-7. http://dx.doi.org/10.1002/1097-0142(197809)42:3+<1422::AID-CNCR2820420807>3.0.CO;2-1.
- Staab HJ, Anderer FA, Stumpf E, Hornung A, Fischer R, Kieninger G. Eighty-four potential second-look operations based on sequential carcinoembryonic antigen determinations and clinical investigations in patients with recurrent gastrointestinal cancer. Am J Surg 1985;149:198-204. http://dx.doi.org/10.1016/S0002-9610(85)80064-7.
- Carl J, Bentzen SM, Nørgaard-Pedersen B, Kronborg O. Modelling of serial carcinoembryonic antigen changes in colorectal cancer. Scand J Clin Lab Invest 1993;53:751-5. http://dx.doi.org/10.3109/00365519309092581.
- Boey J, Cheung HC, Lai CK, Wong J. A prospective evaluation of serum carcinoembryonic antigen (CEA) levels in the management of colorectal carcinoma. World J Surg 1984;8:279-86. http://dx.doi.org/10.1007/BF01655052.
- Verberne CJ, Zhan Z, van den Heuvel E, Grossmann I, Doornbos PM, Havenga K, et al. Intensified follow-up in colorectal cancer patients using frequent carcino-embryonic antigen (CEA) measurements and CEA-triggered imaging: results of the randomised ‘CEAwatch’ trial. Eur J Surg Oncol 2015;41:1188-96. http://dx.doi.org/10.1016/j.ejso.2015.06.008.
- Grossmann I, Verberne C, De Bock G, Havenga K, Kema I, Klaase J. The role of High frequency Dynamic Threshold (HiDT) Serum Carcinoembryonic antigen (CEA) measurements in colorectal cancer surveillance: a (revisited) hypothesis paper. Cancers 2011;3:2302-15. http://dx.doi.org/10.3390/cancers3022302.
- Huang YY, Lee PI, Liu MC, Chen CC, Huang KC, Huang AT. A general cutoff level combined with personalised dynamic change of serum carcinoembryonic antigen can suggest timely use of FDG PET for early detection of recurrent colorectal cancer. Clin Nucl Med 2015;40:e465-9. http://dx.doi.org/10.1097/RLU.0000000000000900.
- Ito K, Hibi K, Ando H, Hidemura K, Yamazaki T, Akiyama S, et al. Usefulness of analytical CEA doubling time and half-life time for overlooked synchronous metastases in colorectal carcinoma. Jpn J Clin Oncol 2002;32:54-8. http://dx.doi.org/10.1093/jjco/hyf011.
- Litvak A, Cercek A, Segal N, Reidy-Lagunes D, Stadler ZK, Yaeger RD, et al. False-positive elevations of carcinoembryonic antigen in patients with a history of resected colorectal cancer. J Natl Compr Canc Netw 2014;12:907-13.
- International Conference on Harmonisation of Technical Requirements for Registration of Pharmaceuticals for Human Use . ICH Harmonised Tripartite Guideline. Guideline for Good Clinical Practice E6(R1) 1996. www.ich.org/fileadmin/Public_Web_Site/ICH_Products/Guidelines/Efficacy/E6/E6_R1_Guideline.pdf (accessed 6 November 2016).
- European Parliament and Council . Directive 2001 20 EC of the European Parliament and of the Council of 4 April 2001 on the Approximation of the Laws, Regulations and Administrative Provisions of the Member States Relating to the Implementation of Good Clinical Practice in the Conduct of Clinical Trials on Medicinal Products for Human Use n.d. http://ec.europa.eu/health/files/eudralex/vol-1/dir_2001_20/dir_2001_20_en.pdf (accessed 6 November 2016).
- NHS NIHR Research Governance Framework n.d. www.nihr.ac.uk/policy-and-standards/framework-for-research-support-services.htm (accessed 6 November 2016).
Appendix 1 Additional information
FIGURE 9.
Flow chart of patients allocated to CEA testing within the FACS cohort to show the origin of the data analysed here.
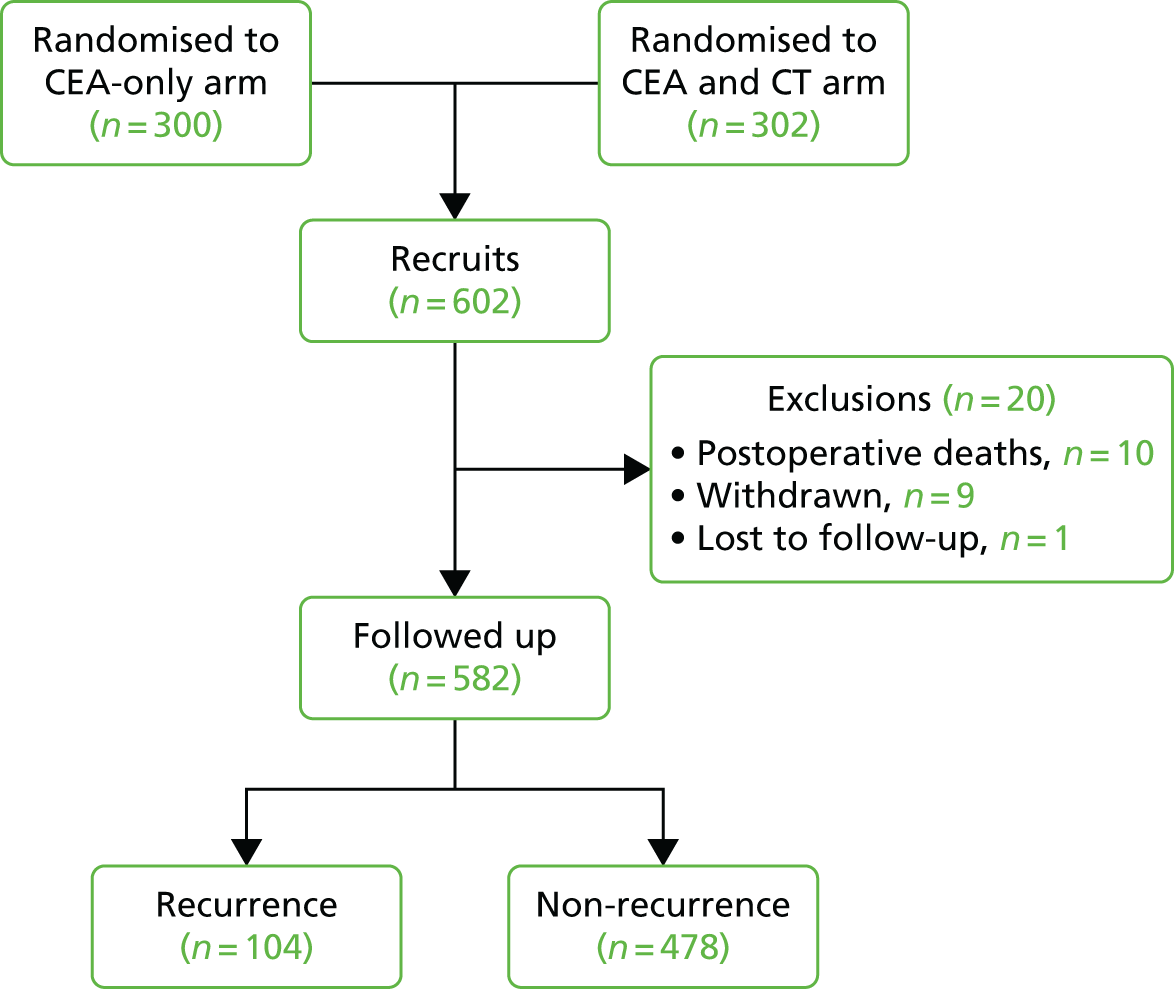
FIGURE 10.
Individual plots of CEA values in those patients who suffered recurrence. Both horizontal and vertical scales vary to fit the data but the blue vertical line indicates the time of confirmation of recurrence and the green horizontal line indicates a CEA level of 7 µg/l; ‘CEADay’ is the day after the start of follow-up on which the test was carried out.
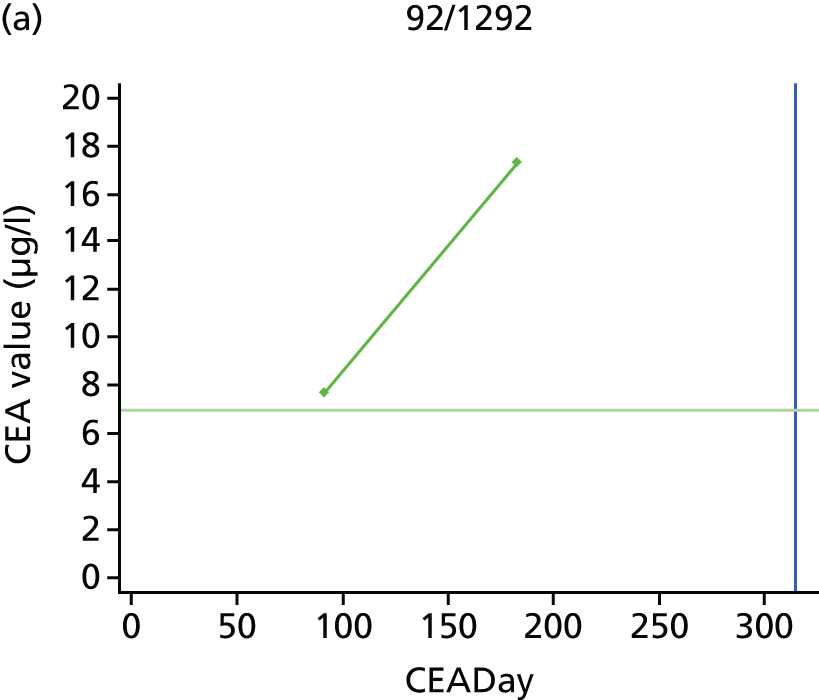

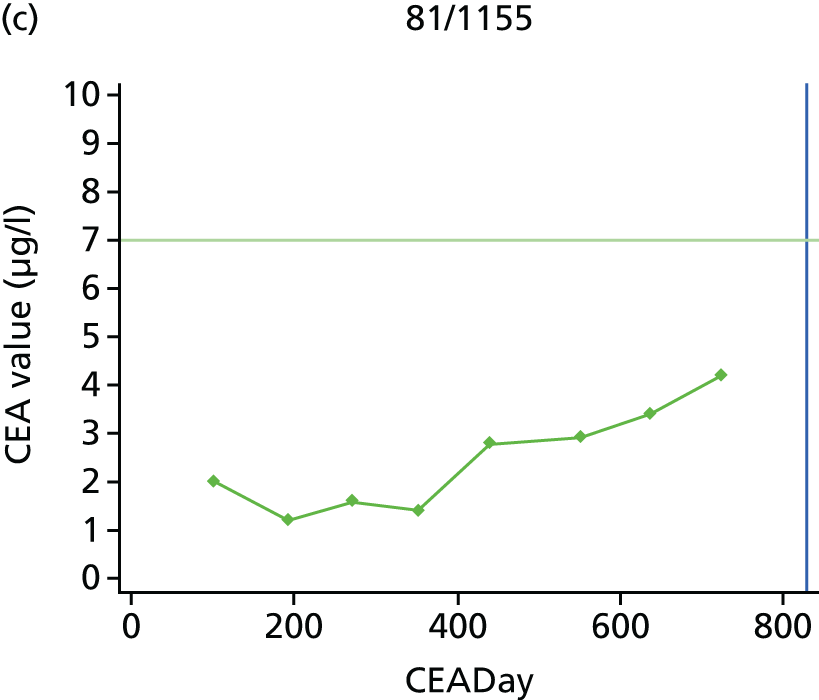


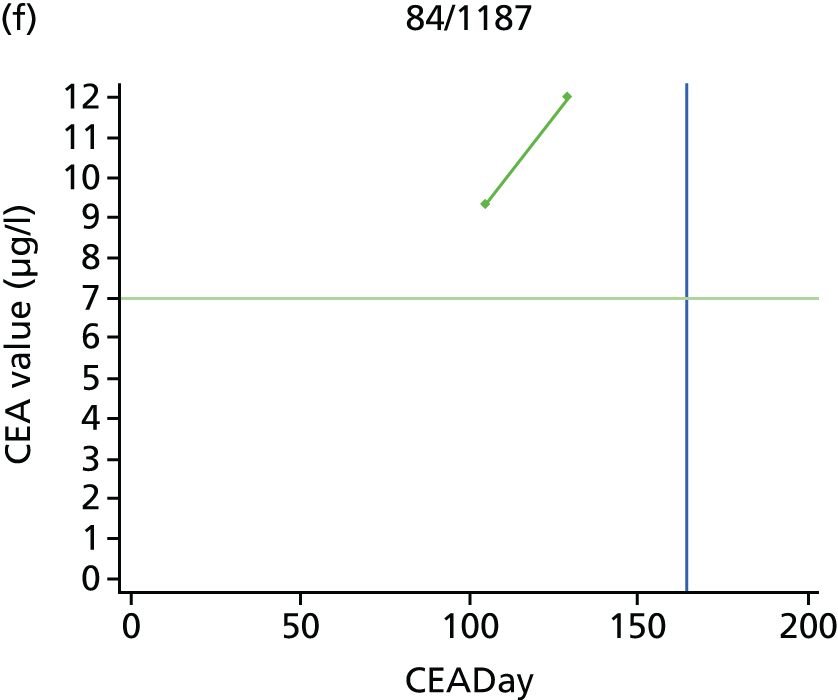
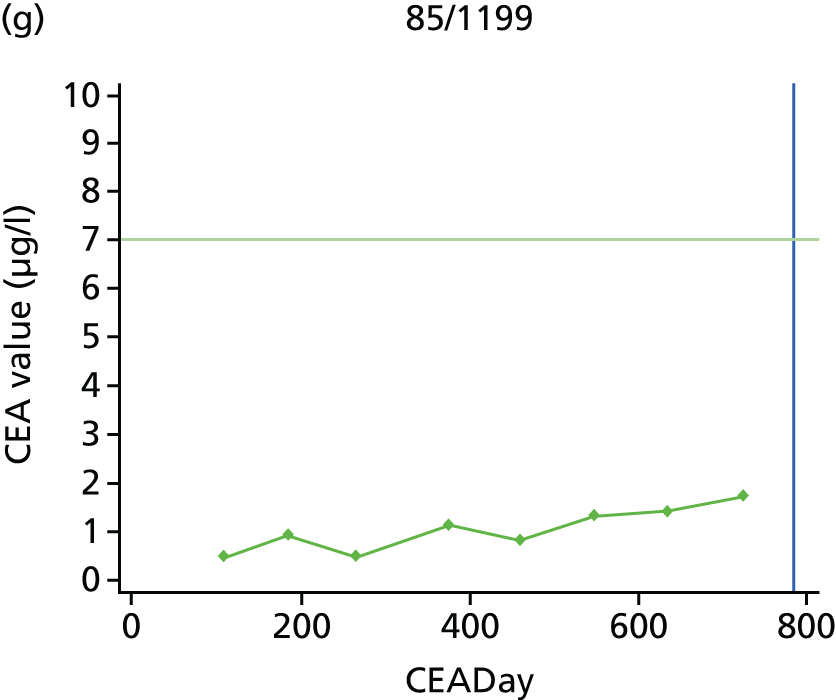
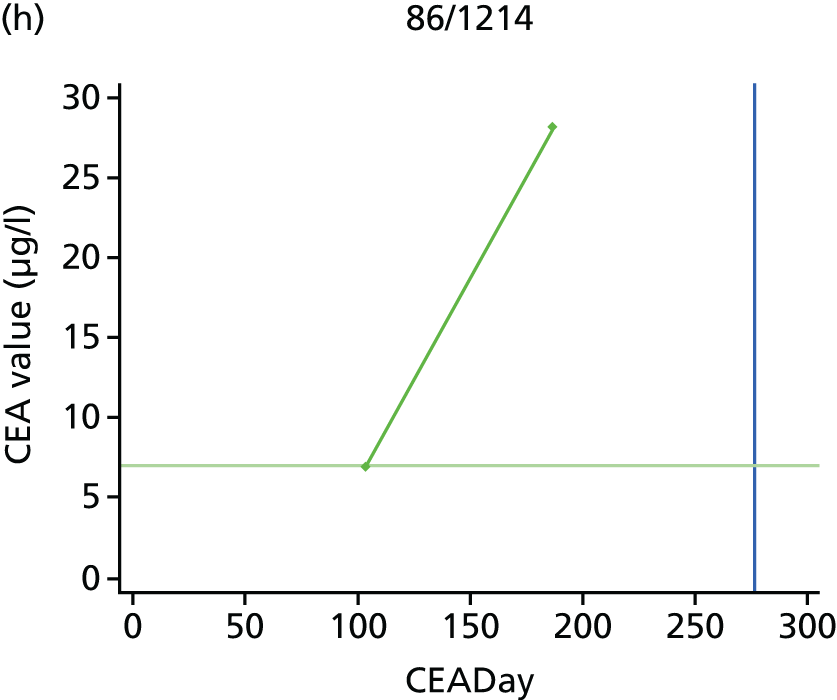


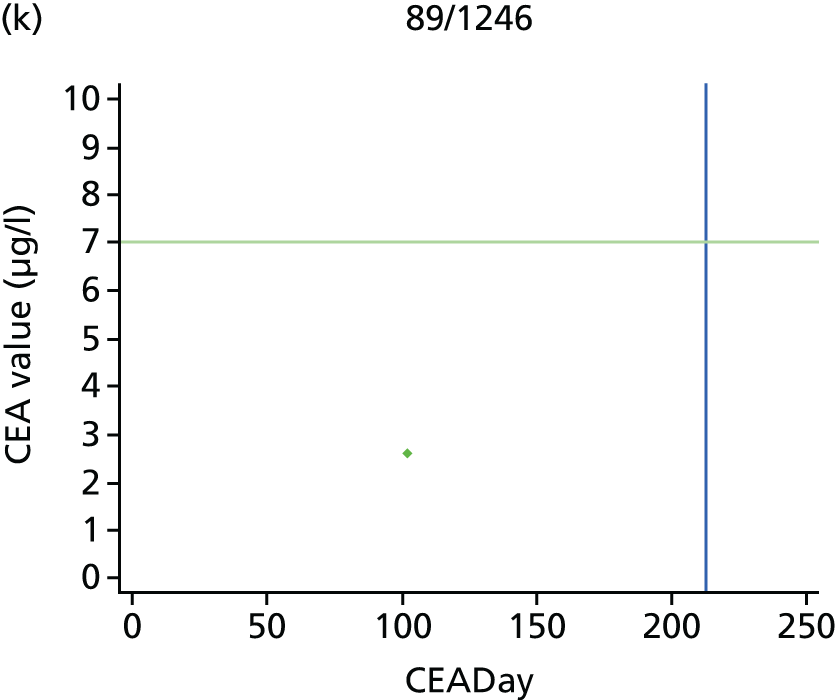
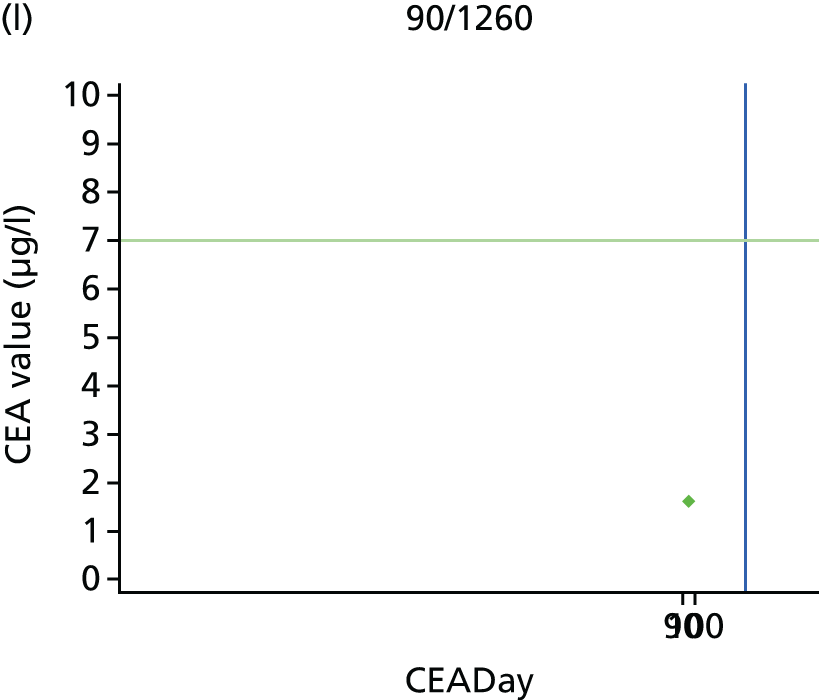
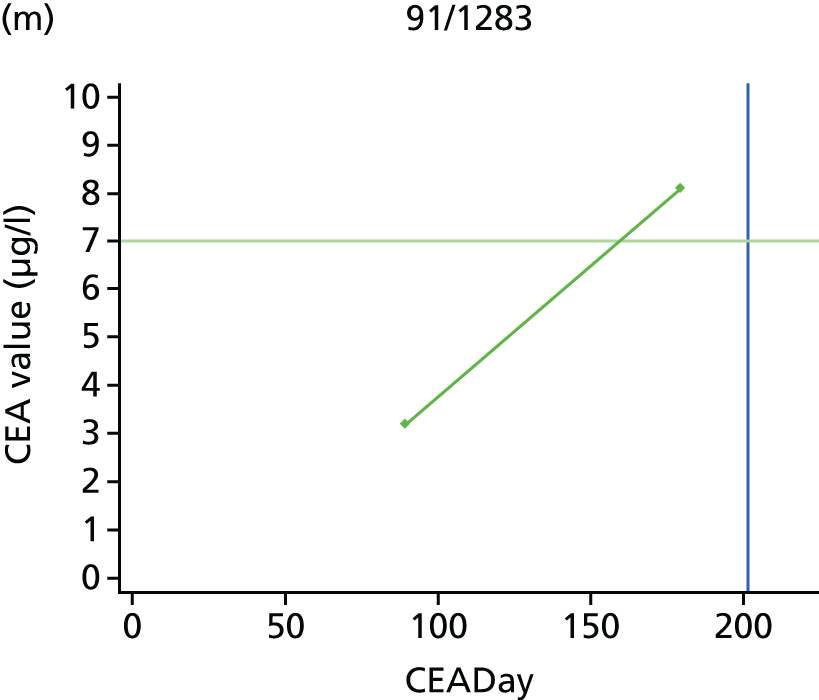
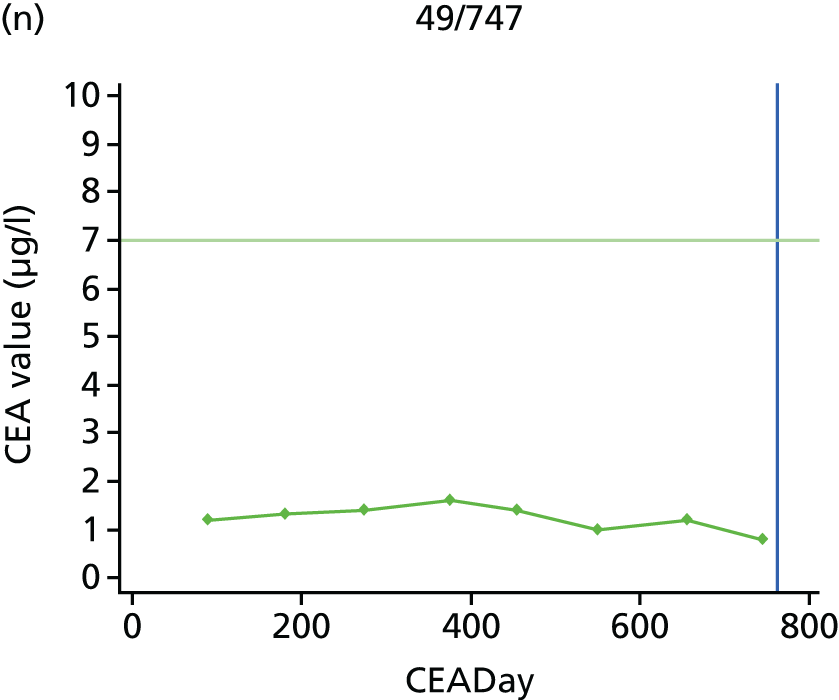
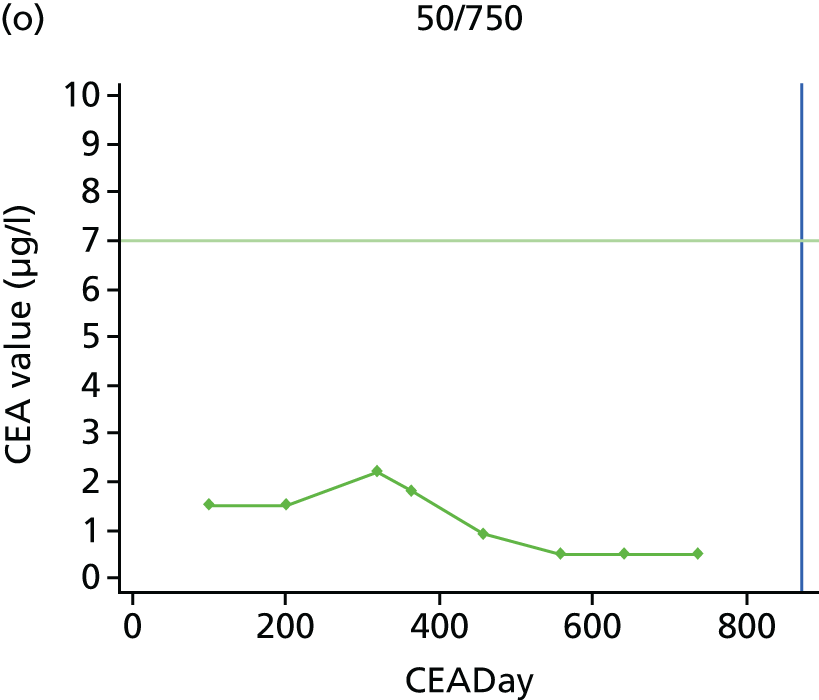
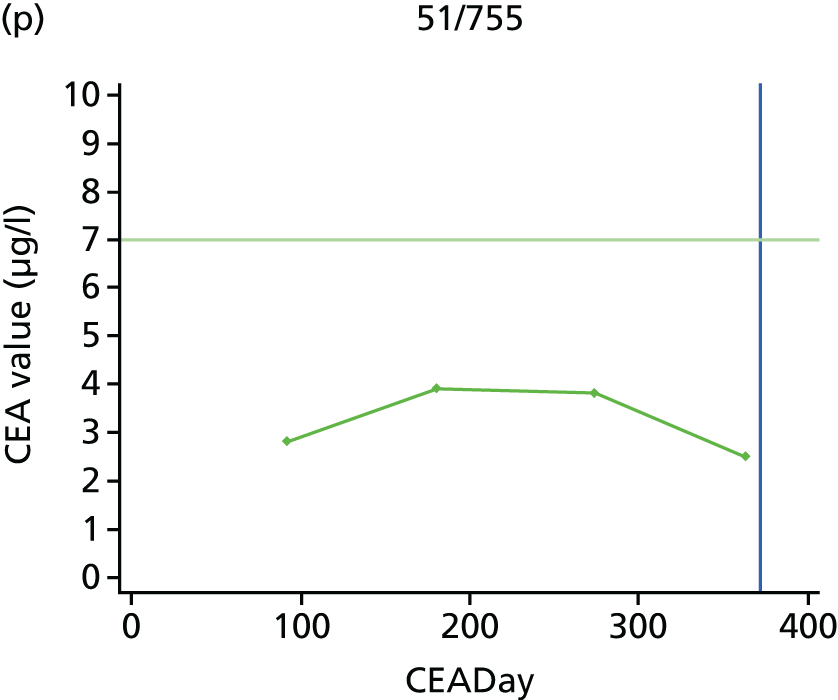
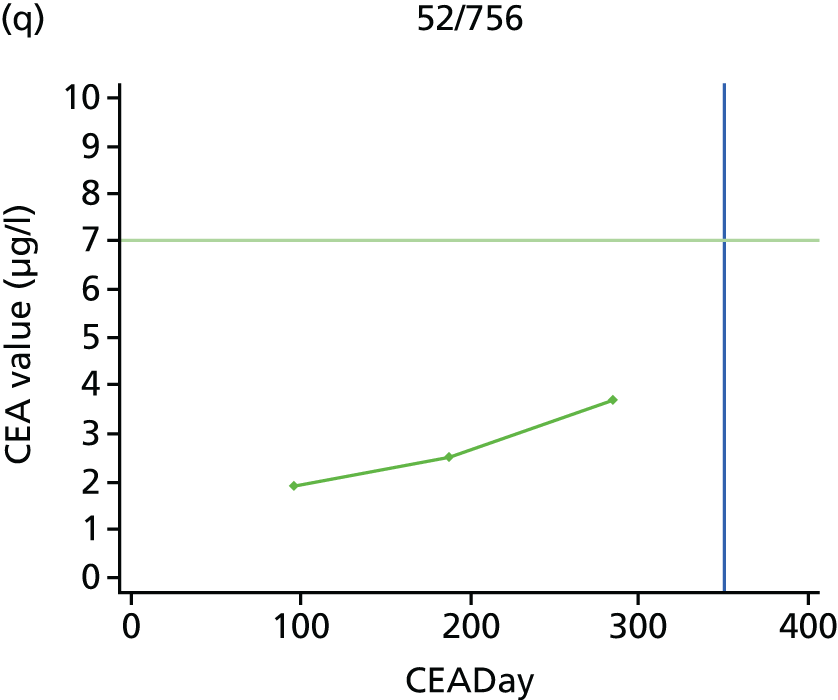


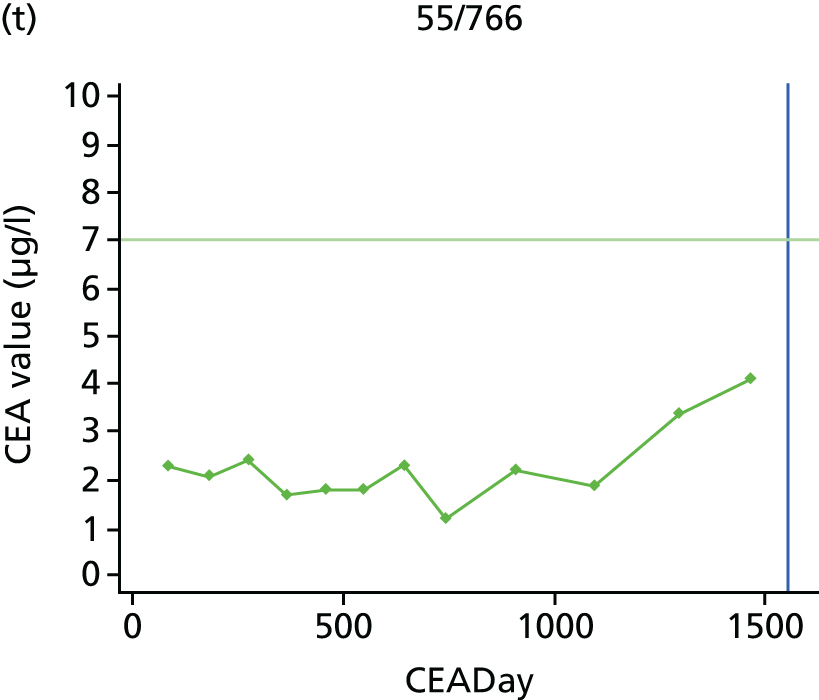

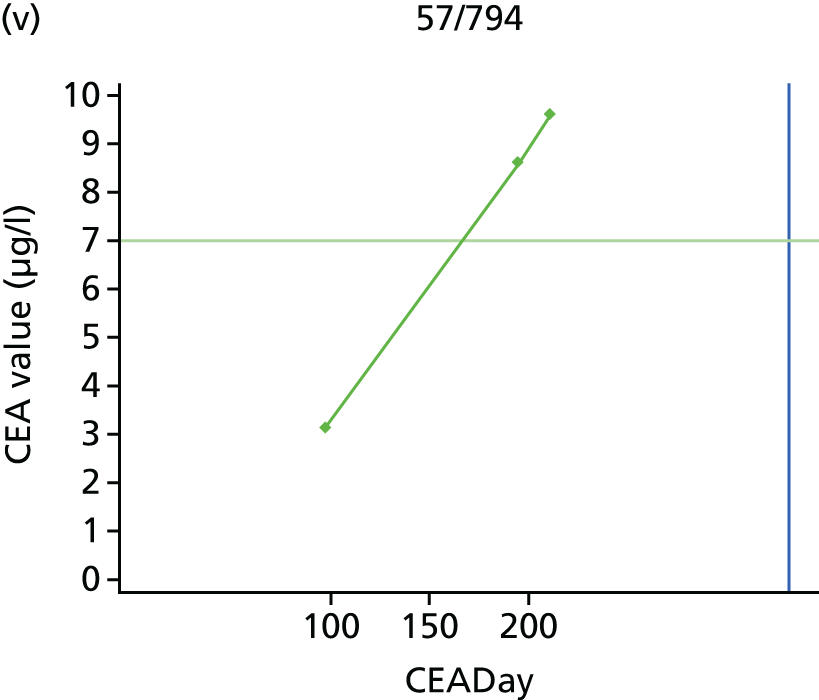
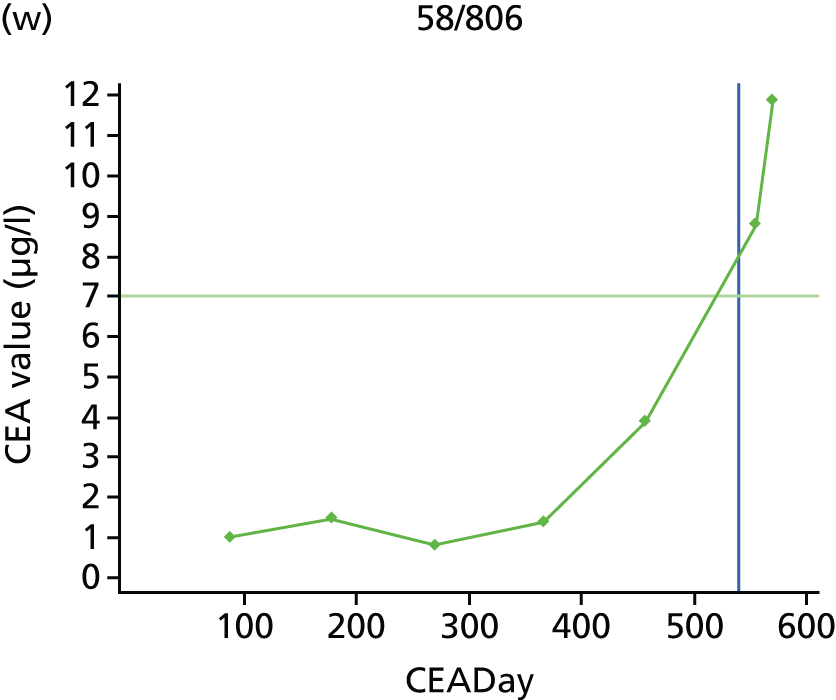

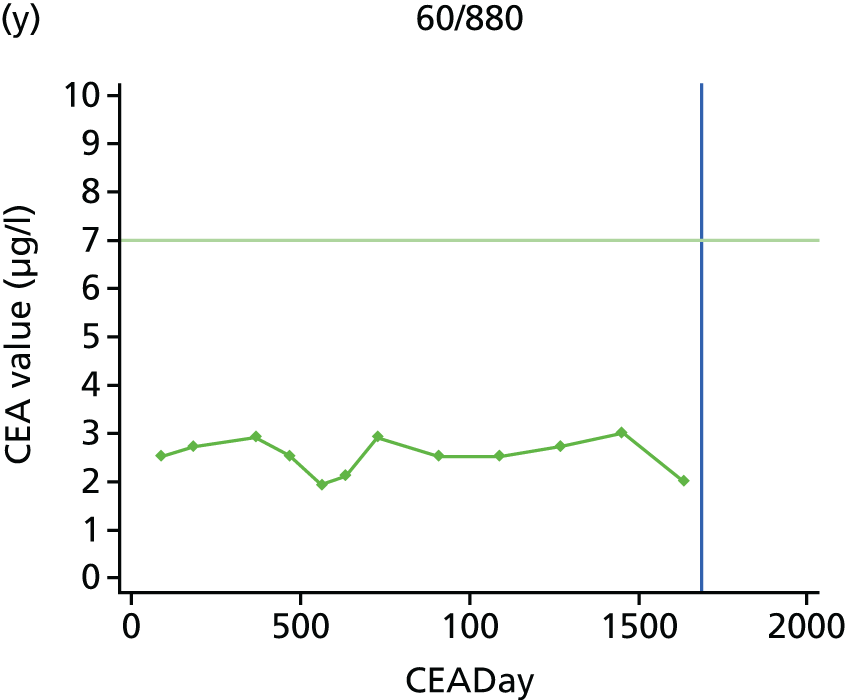


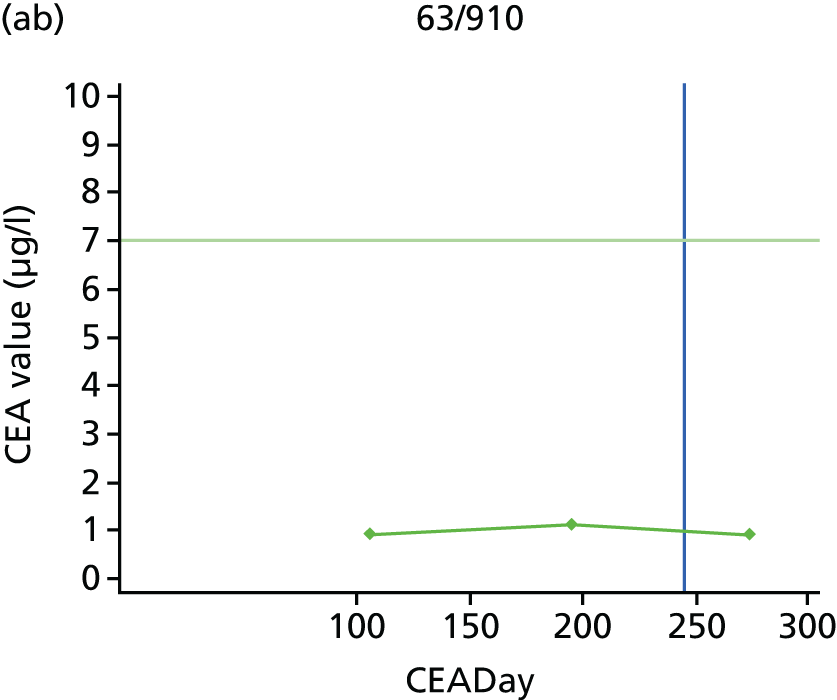
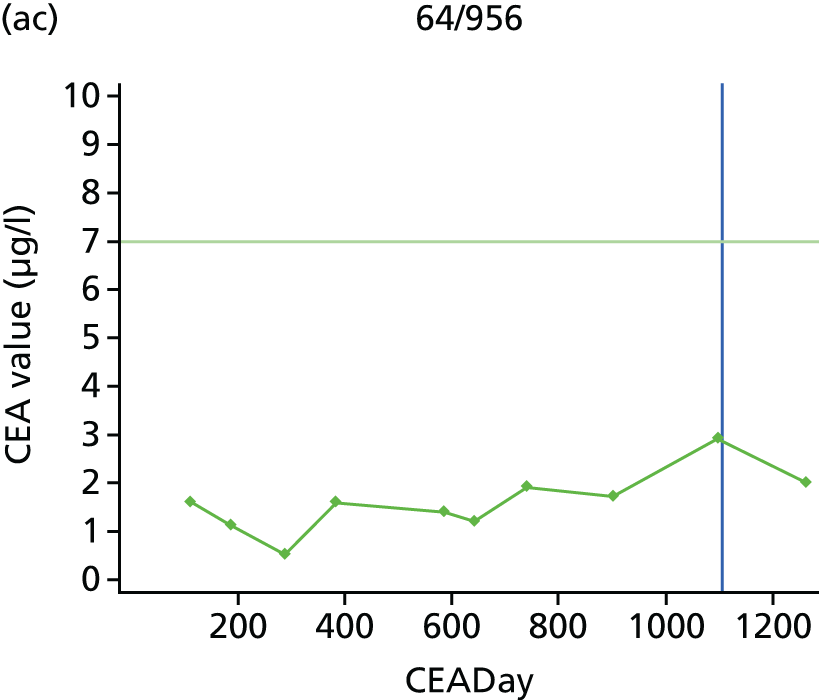

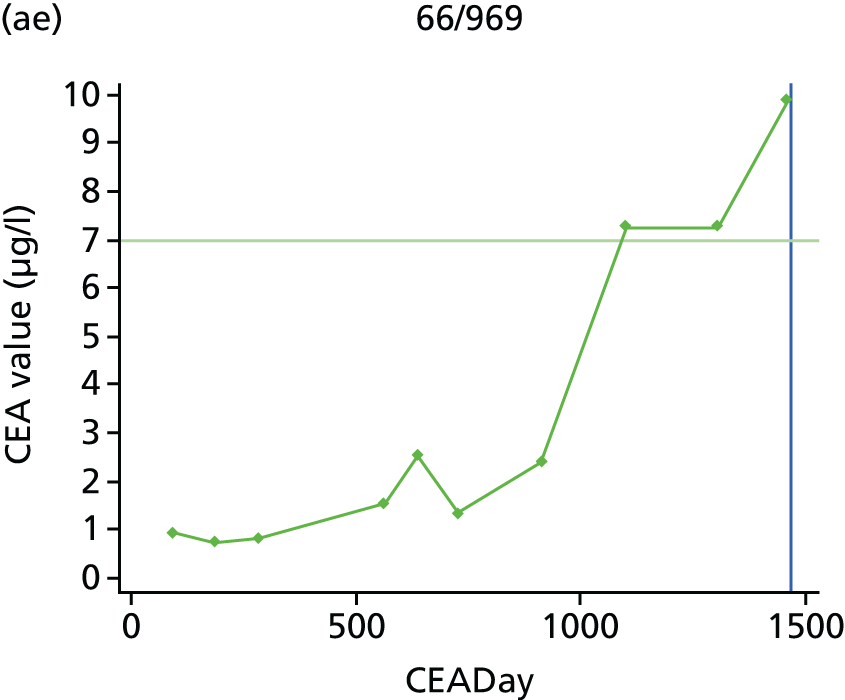

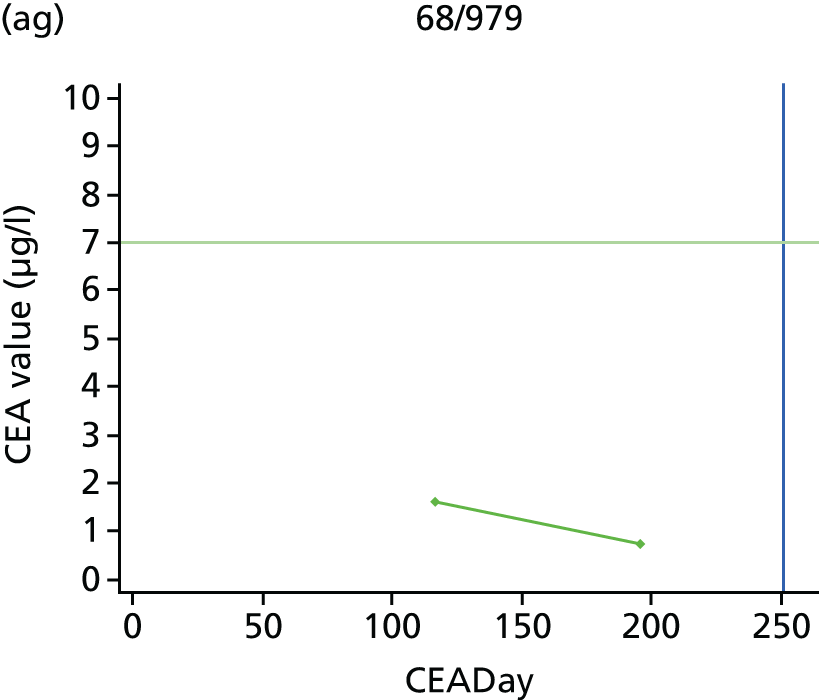
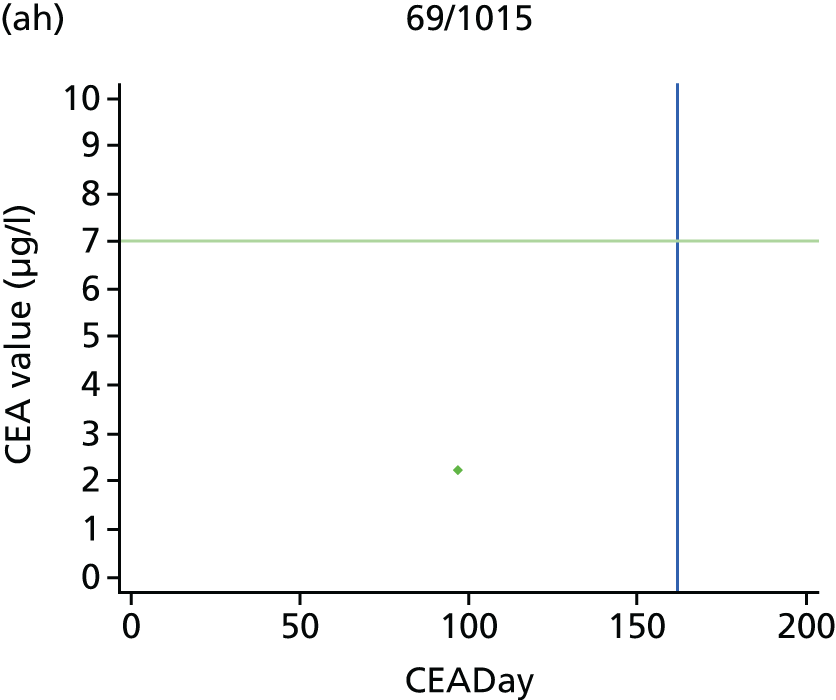


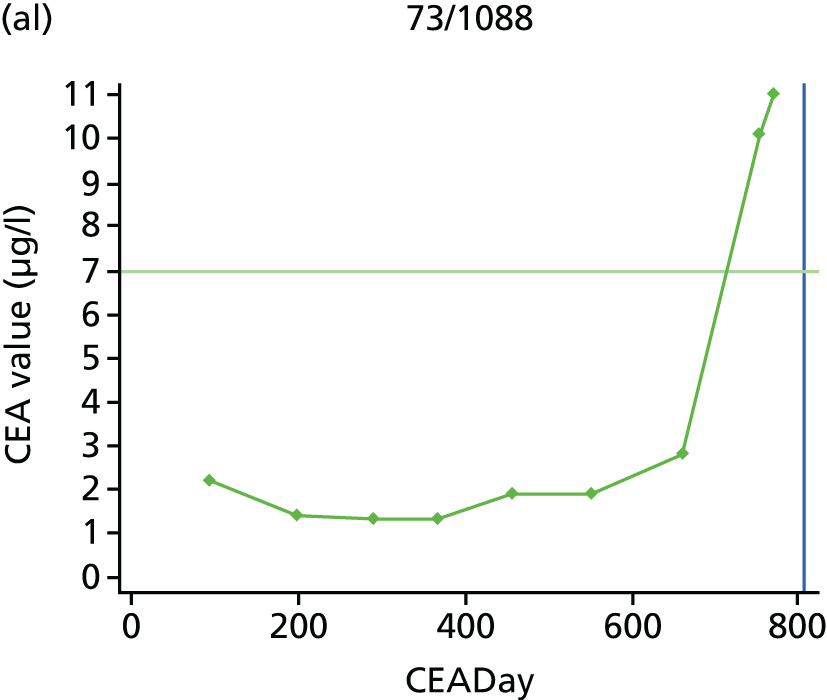


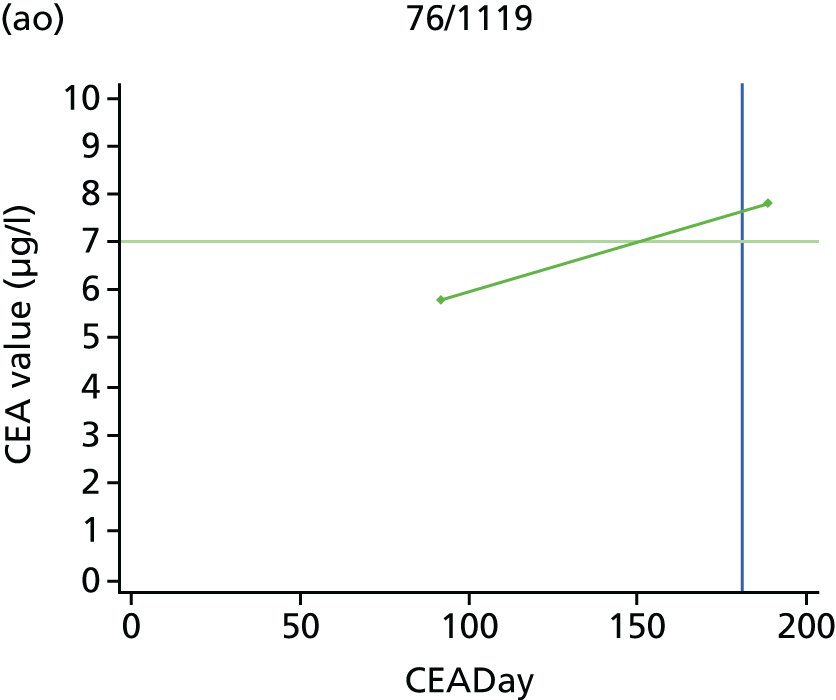
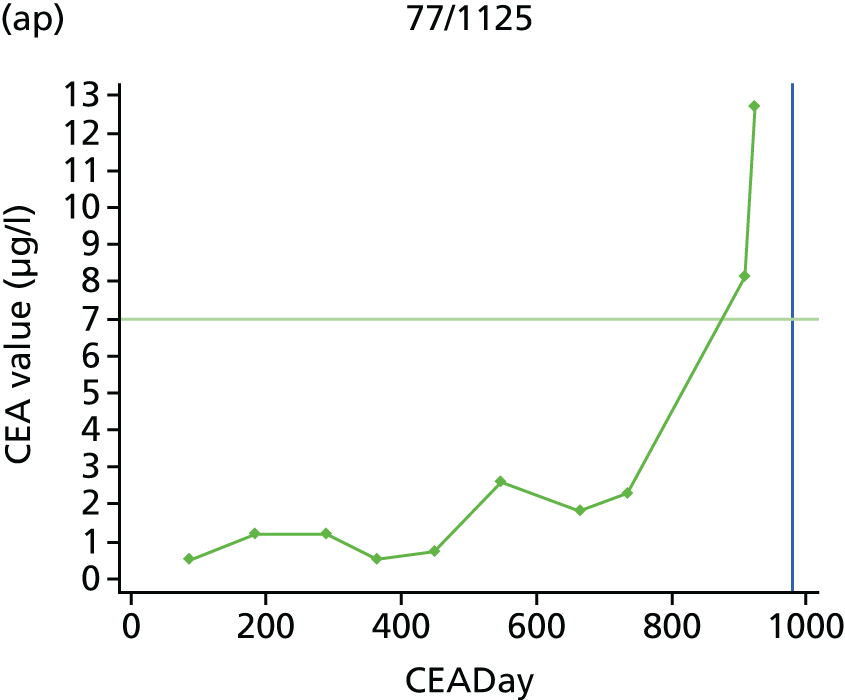
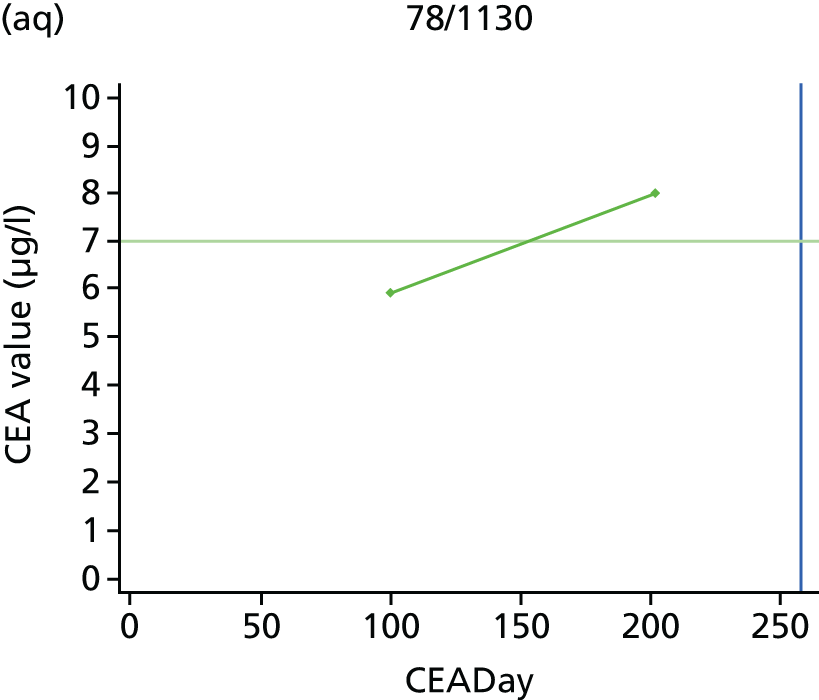

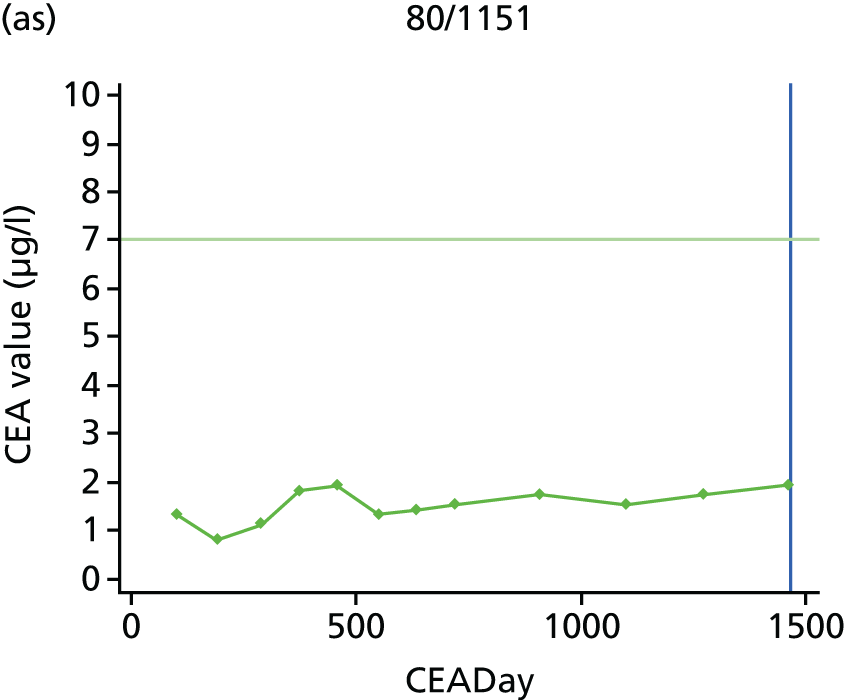
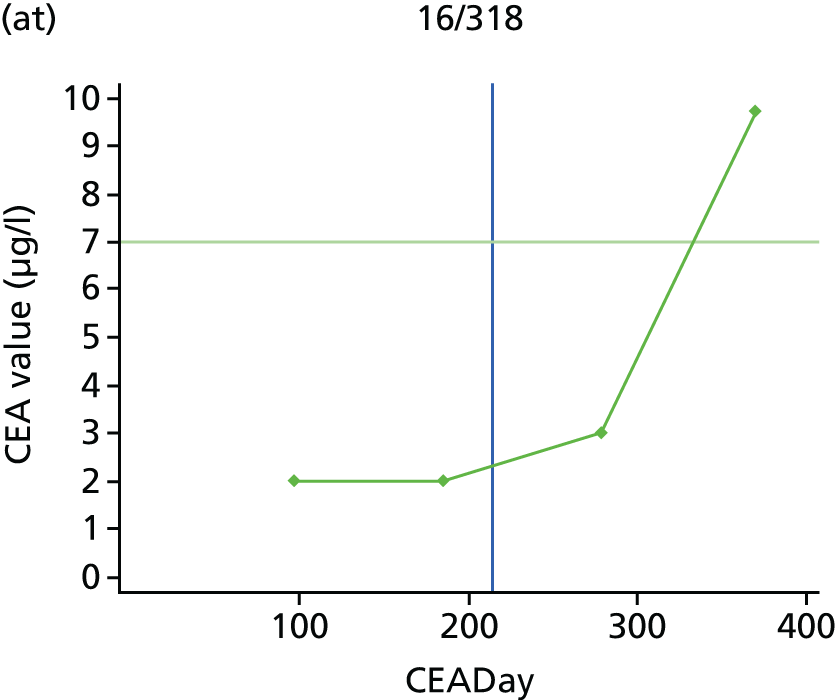
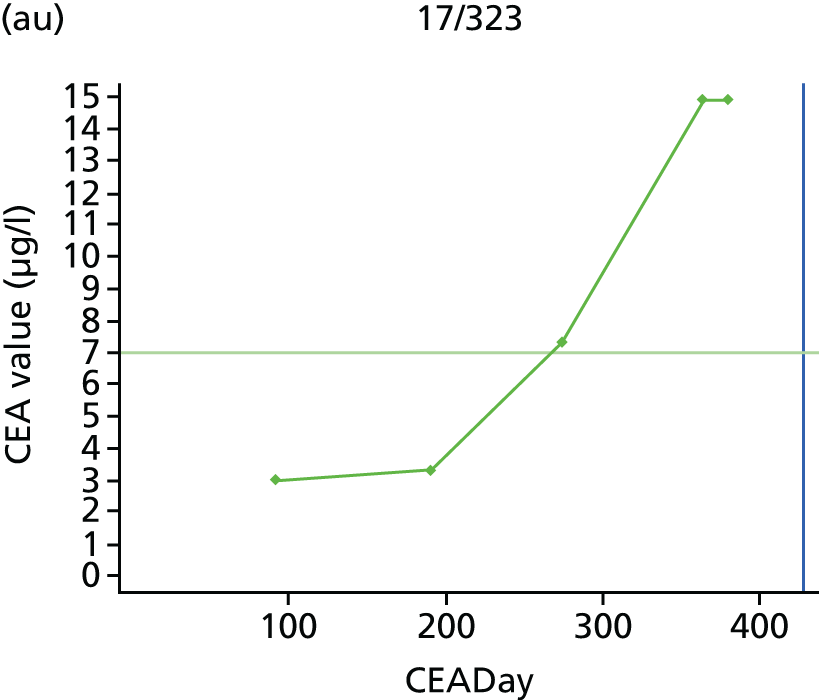
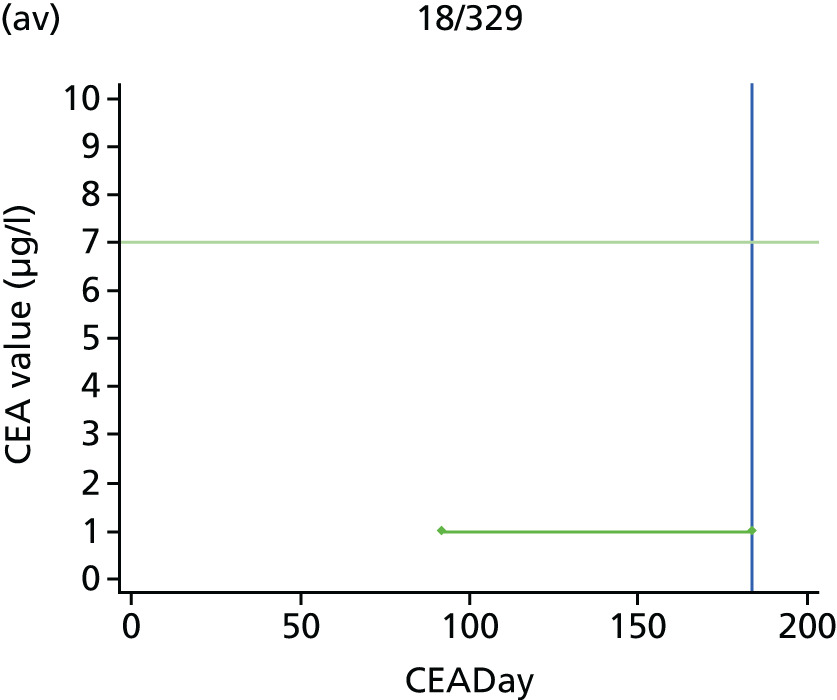
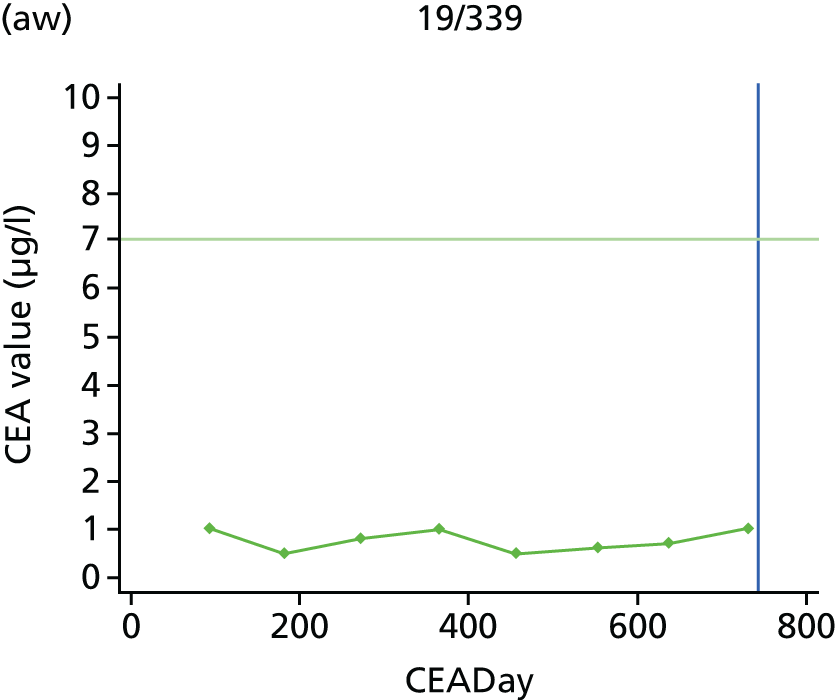


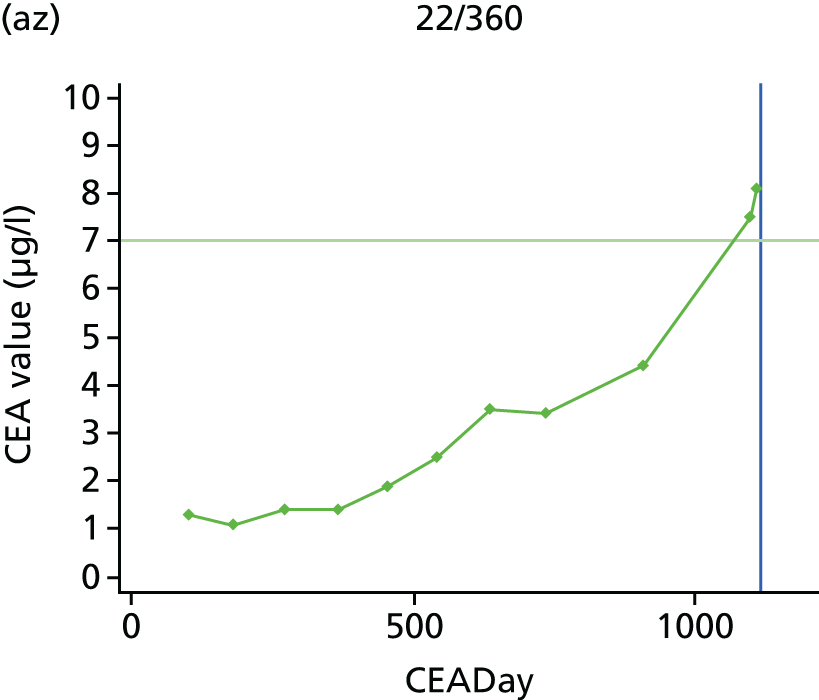

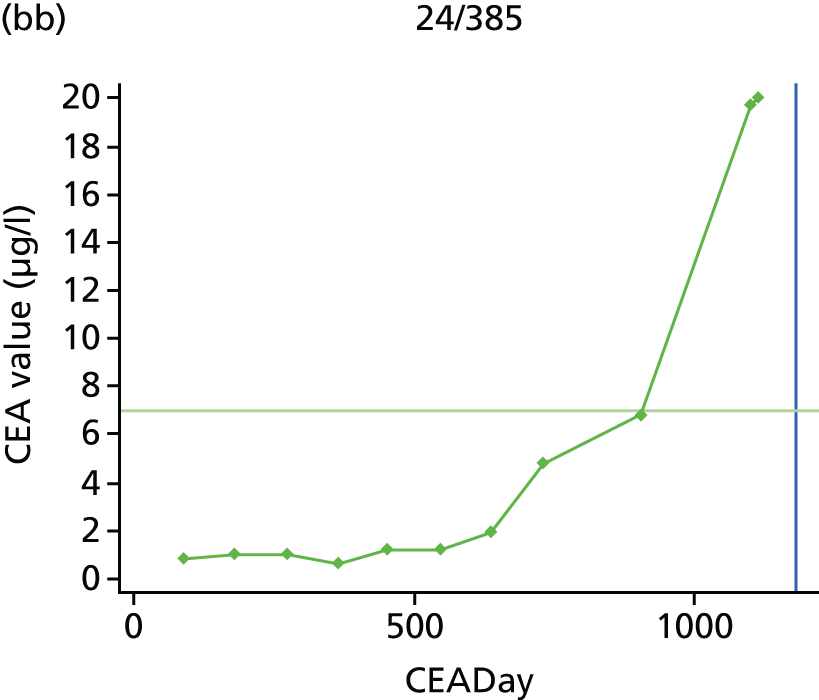
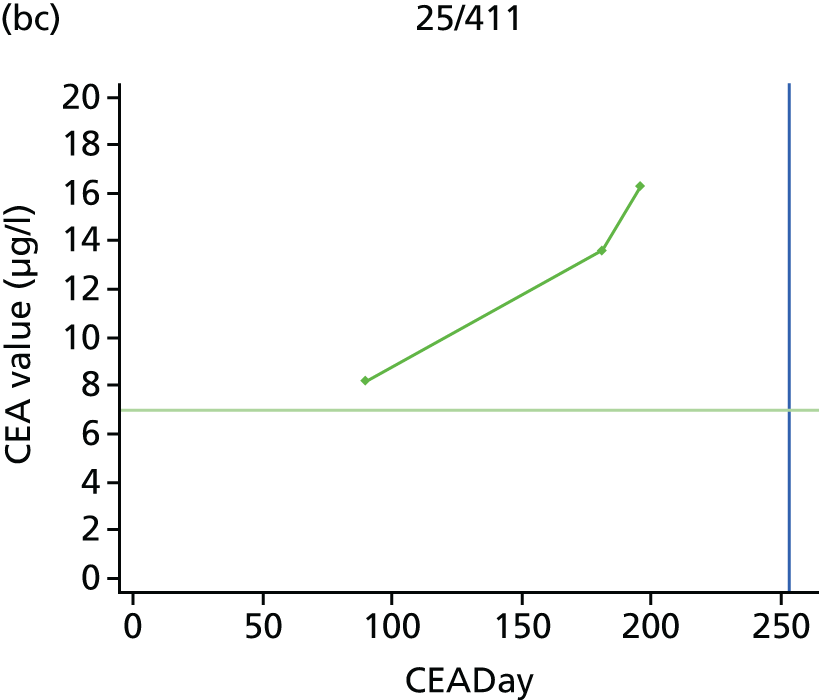


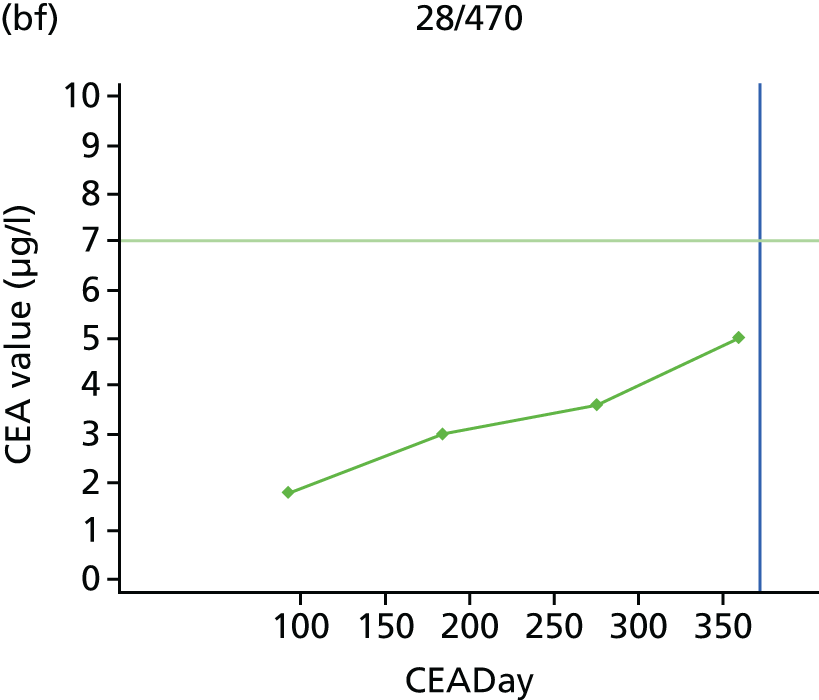
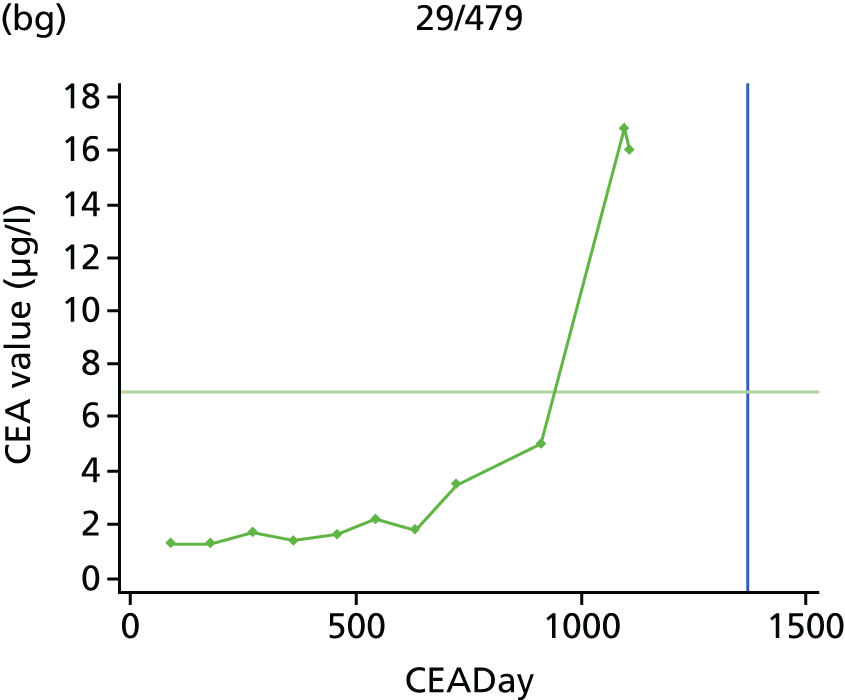
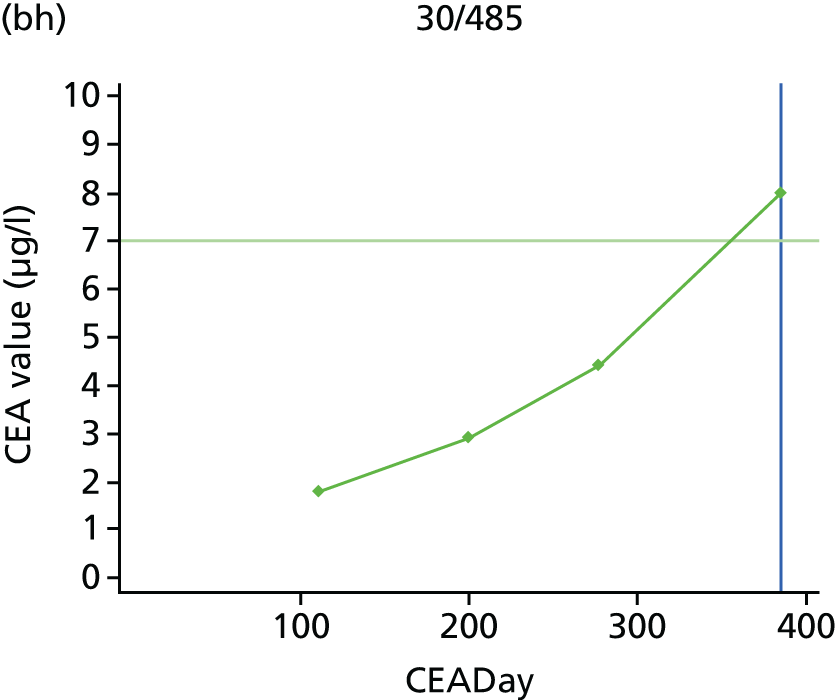
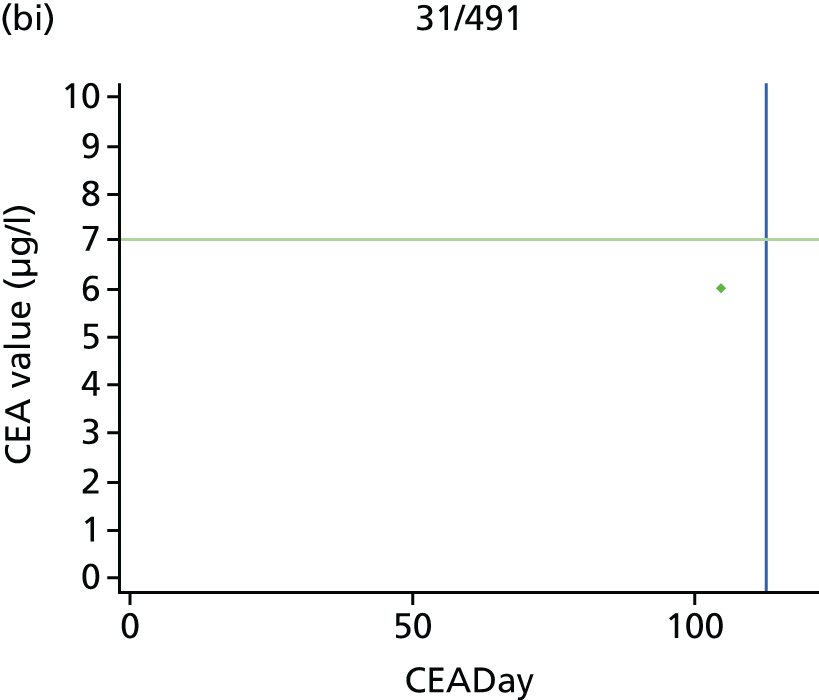

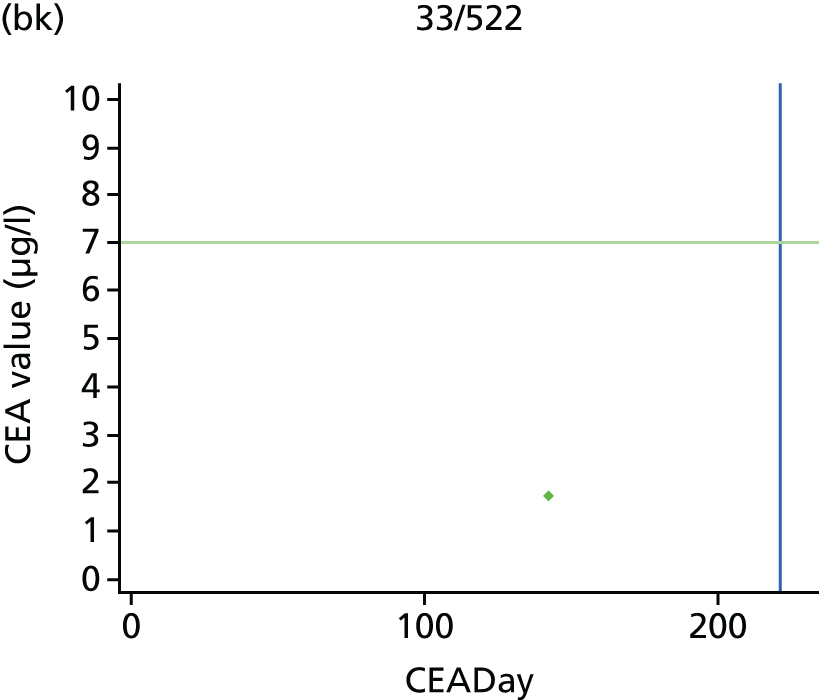

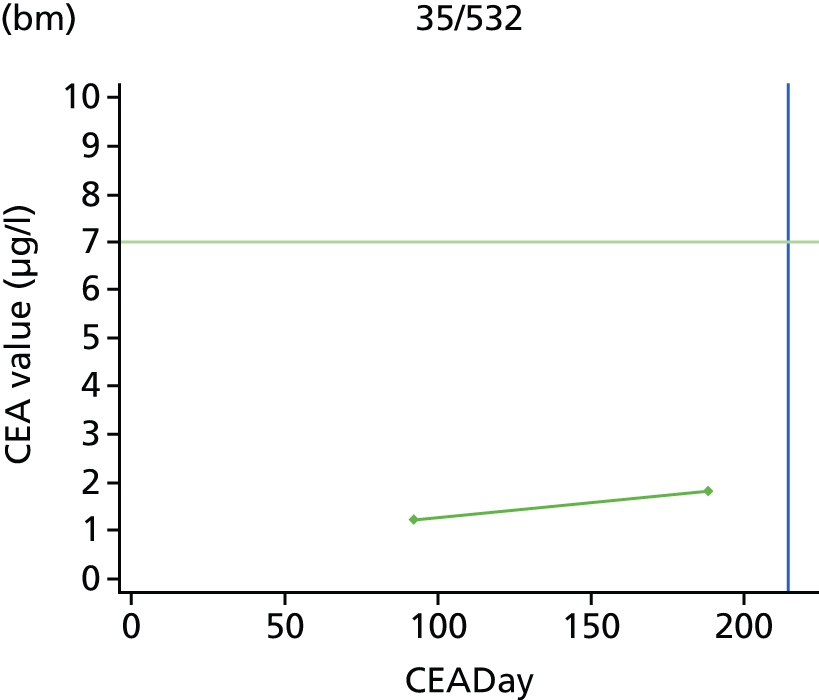

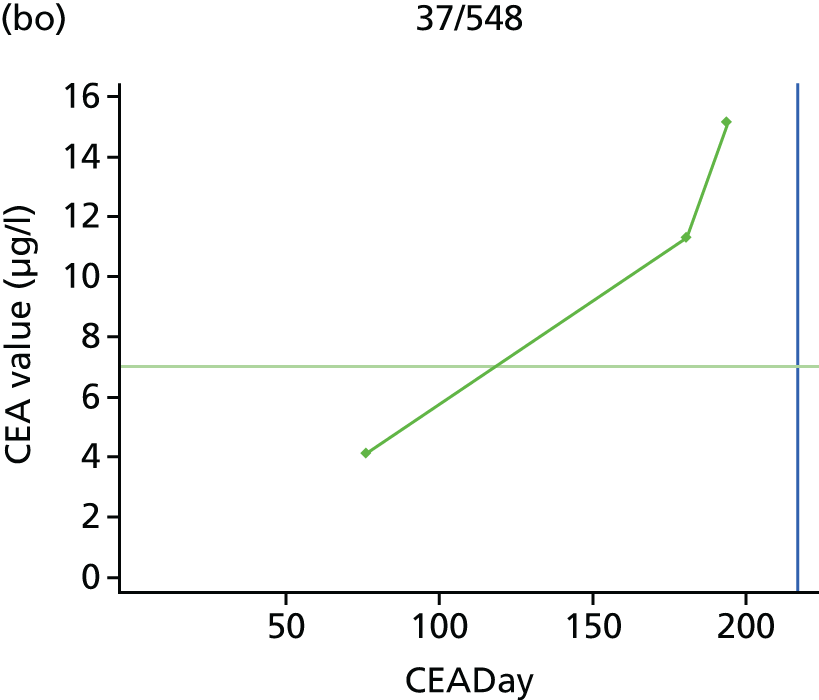
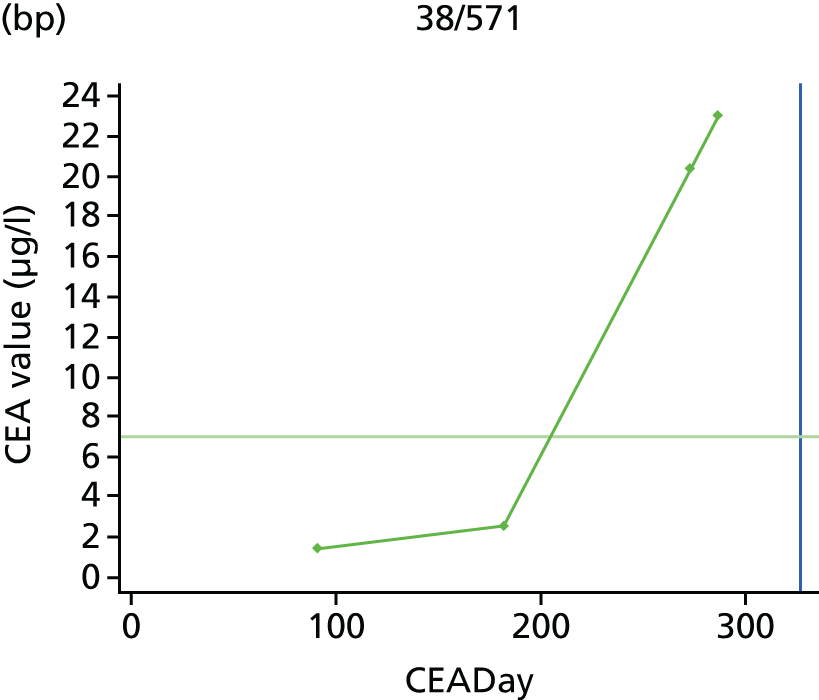


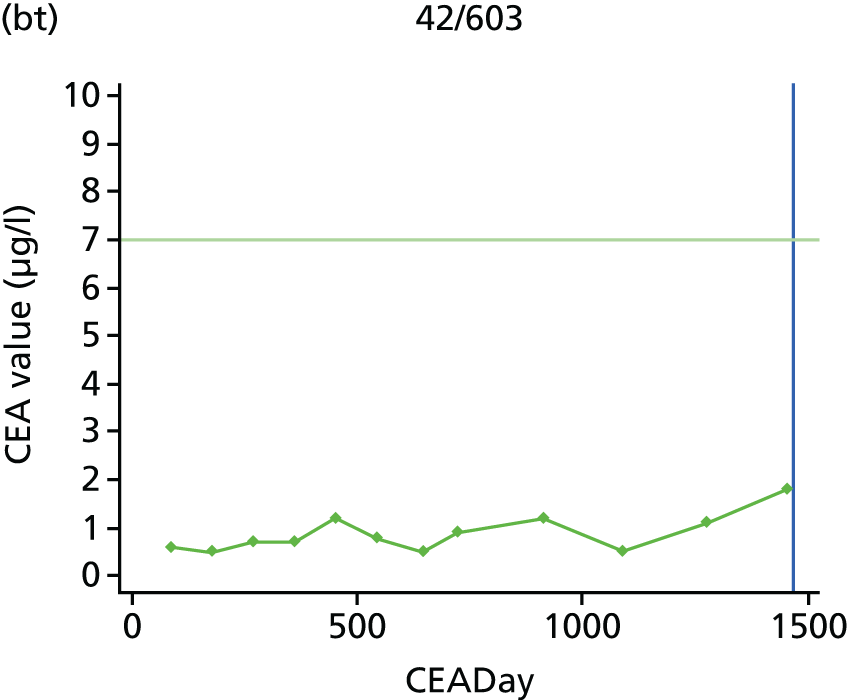
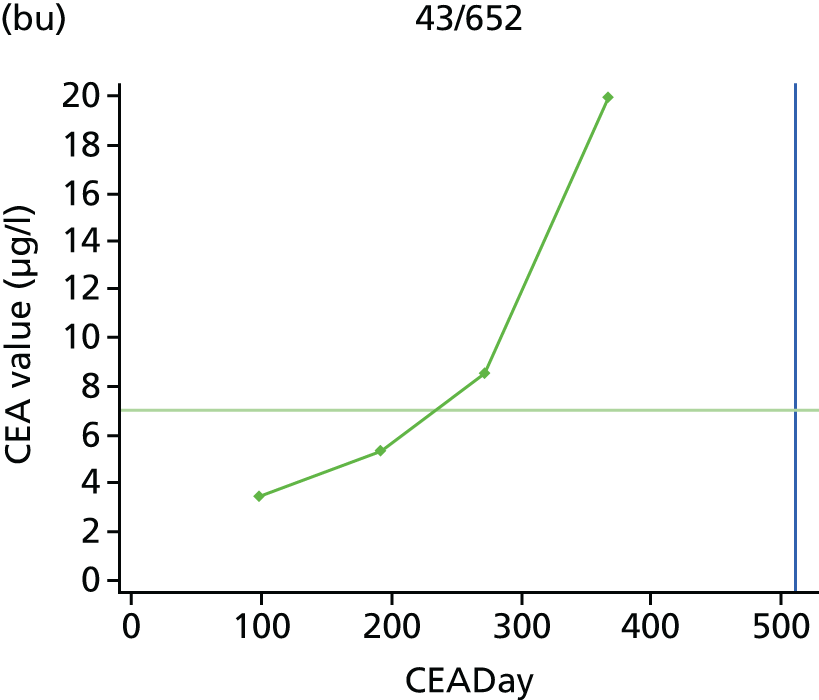
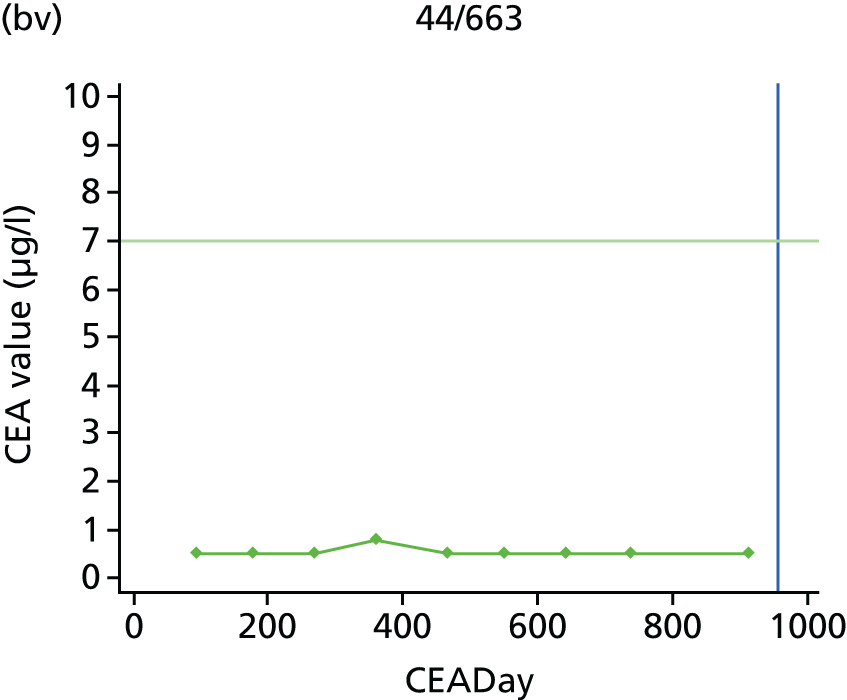
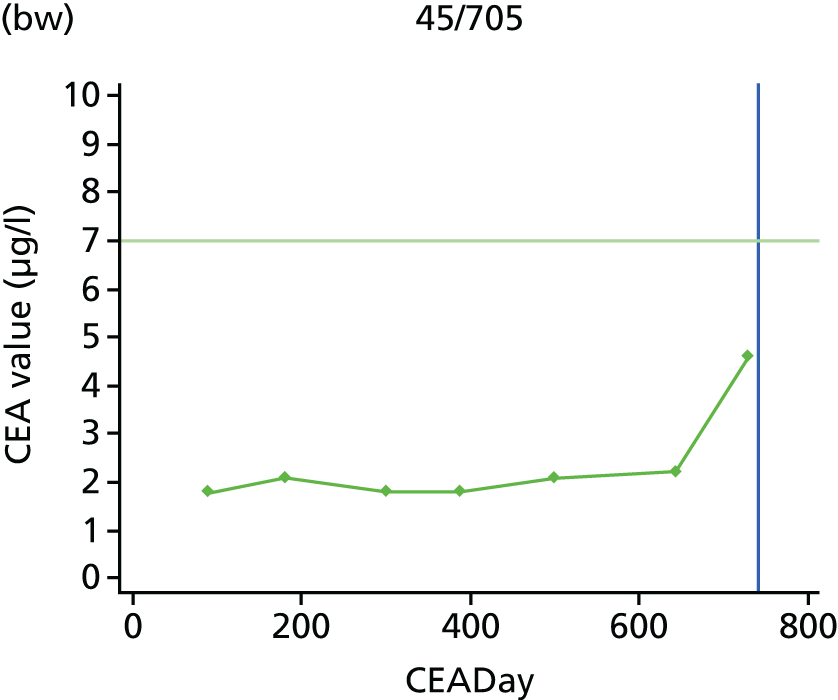
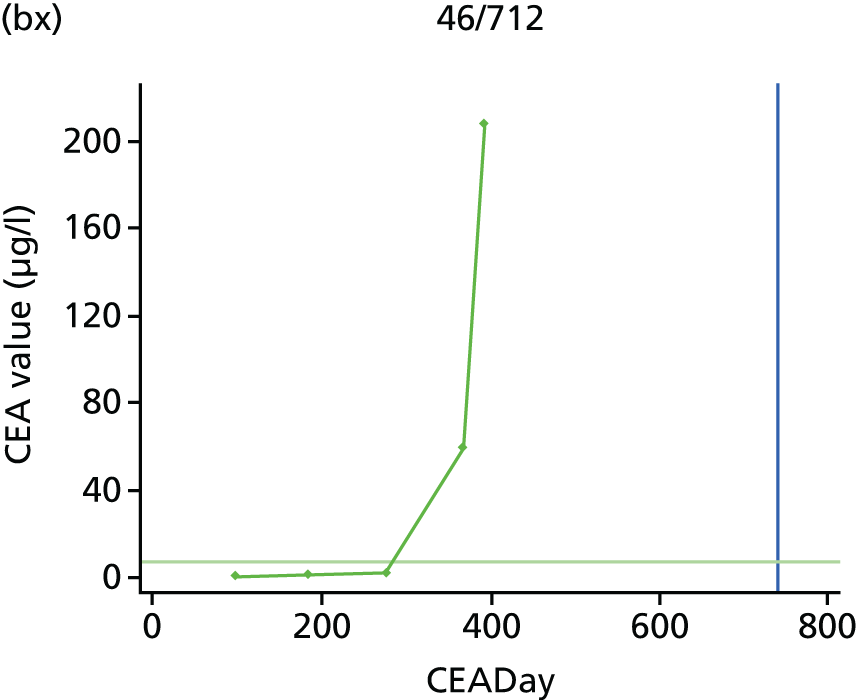

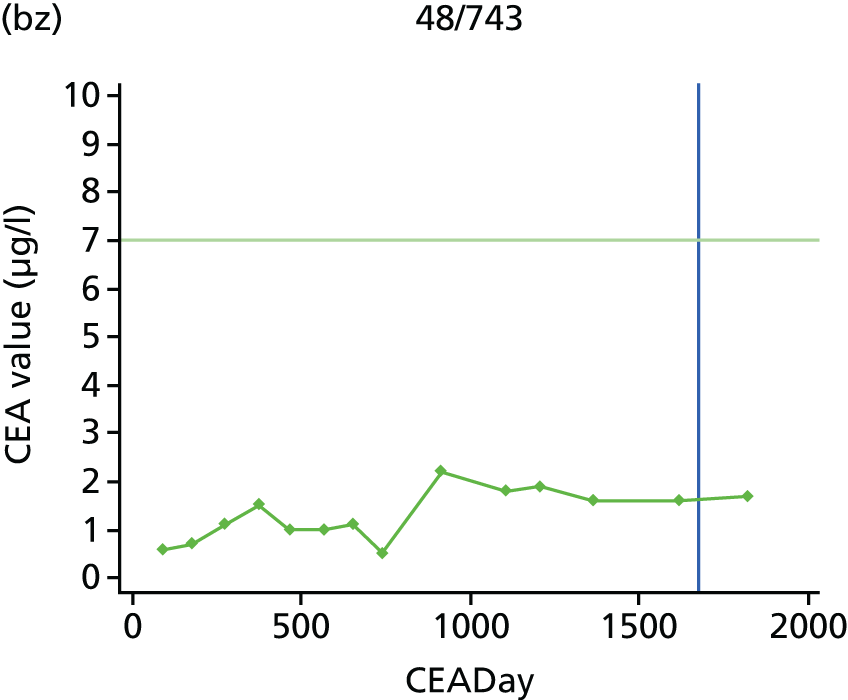

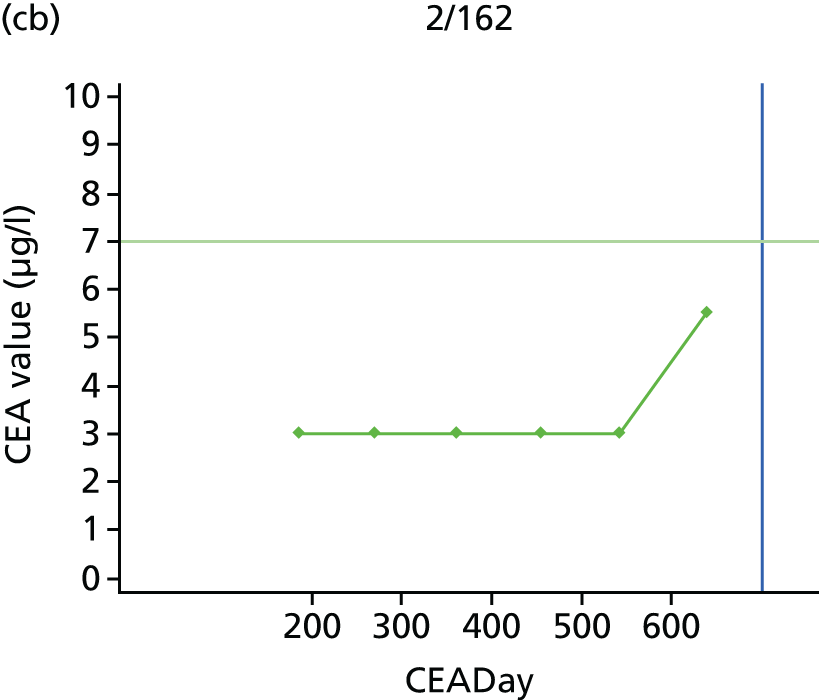
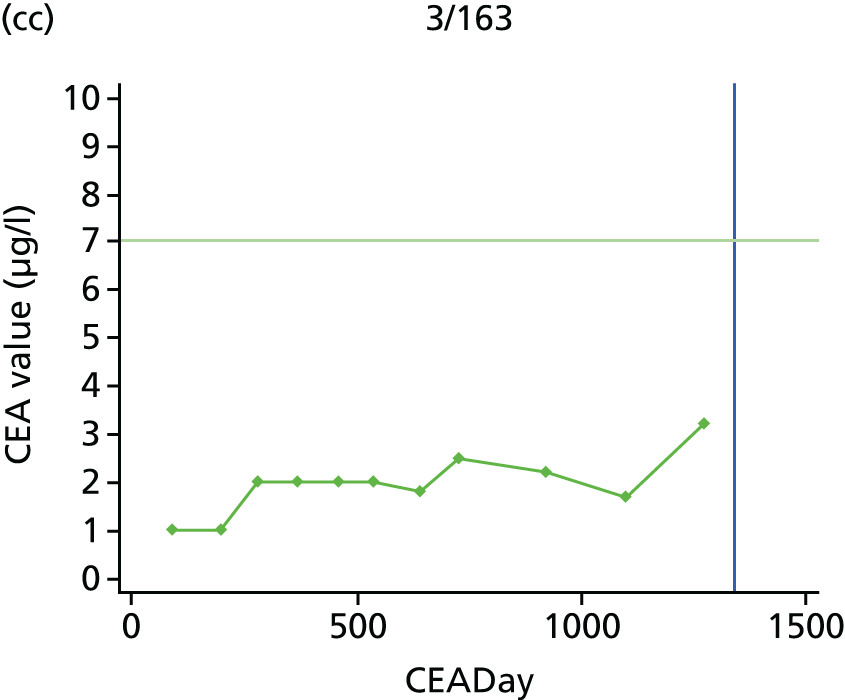
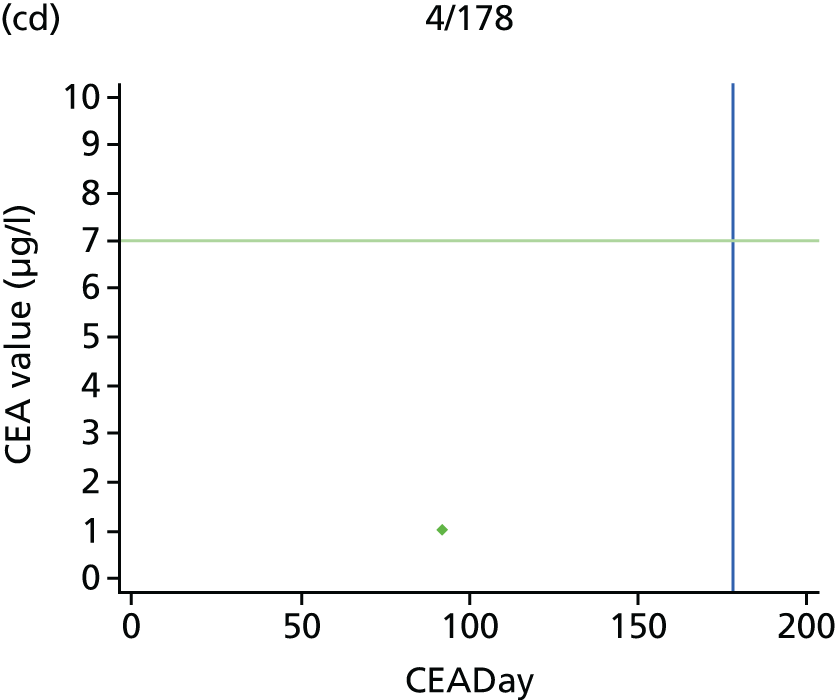
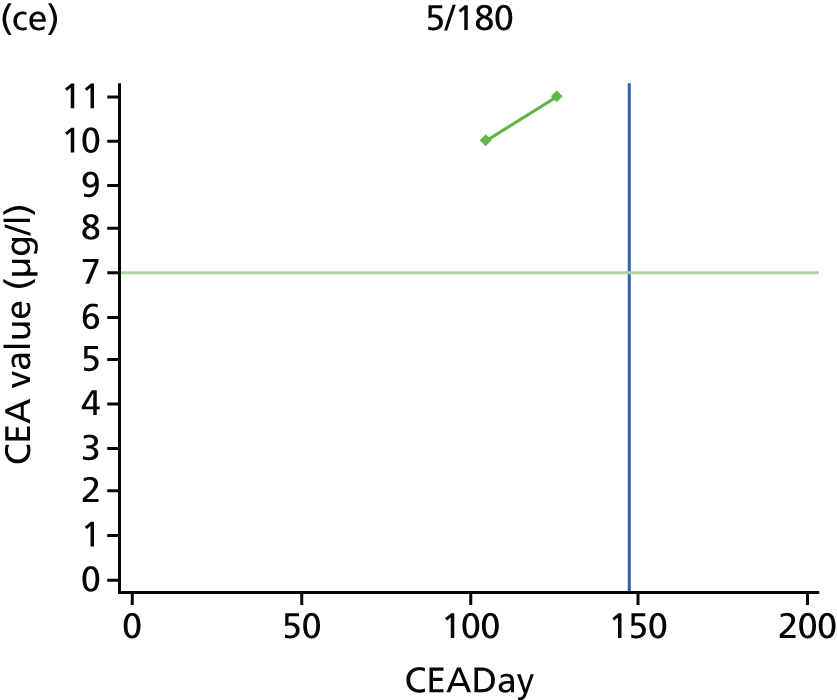

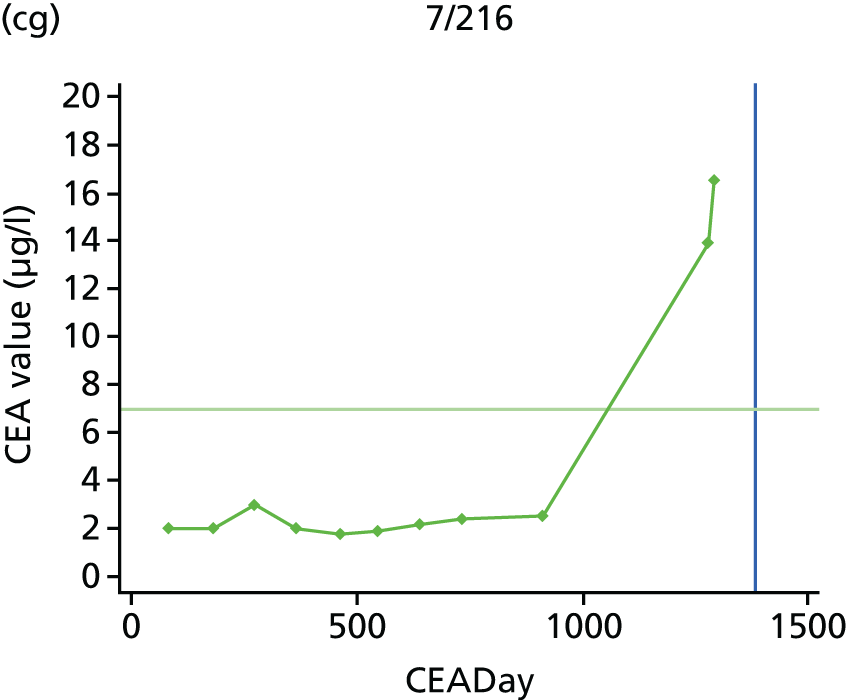

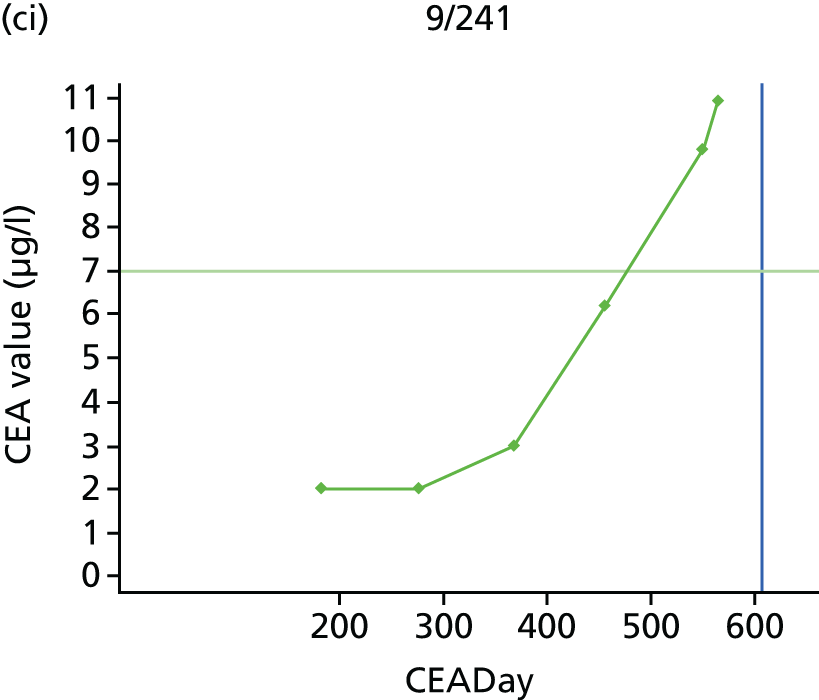

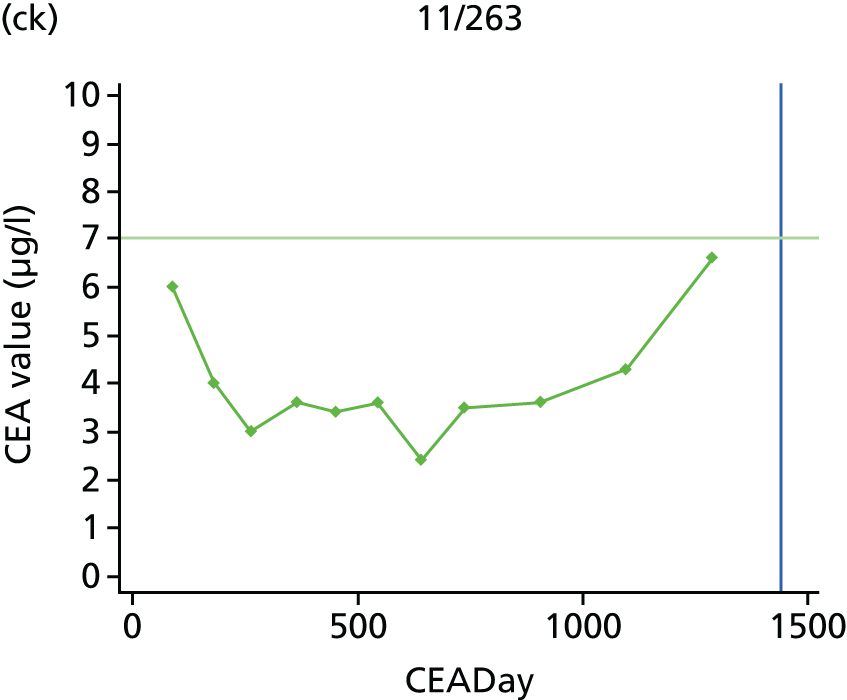


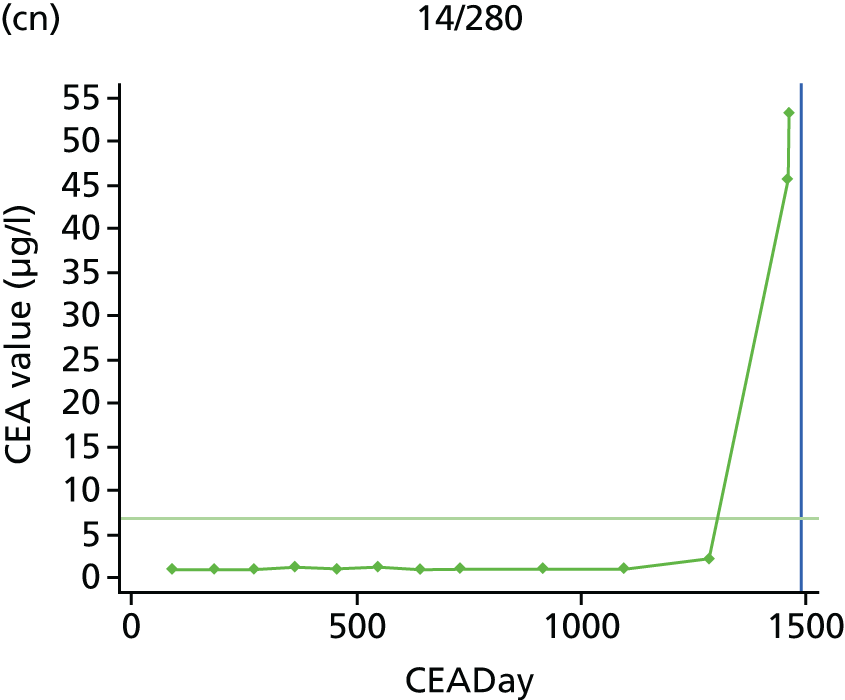


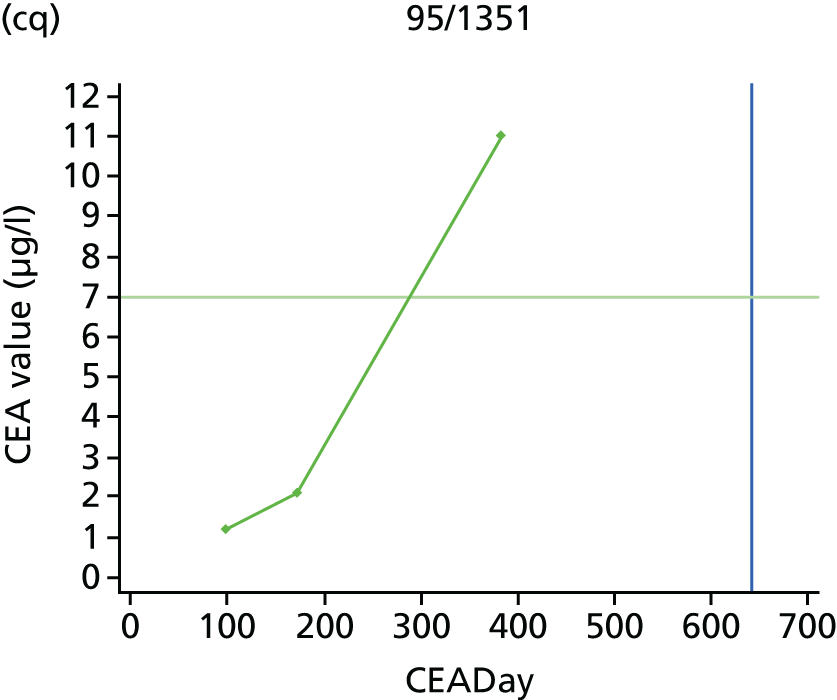
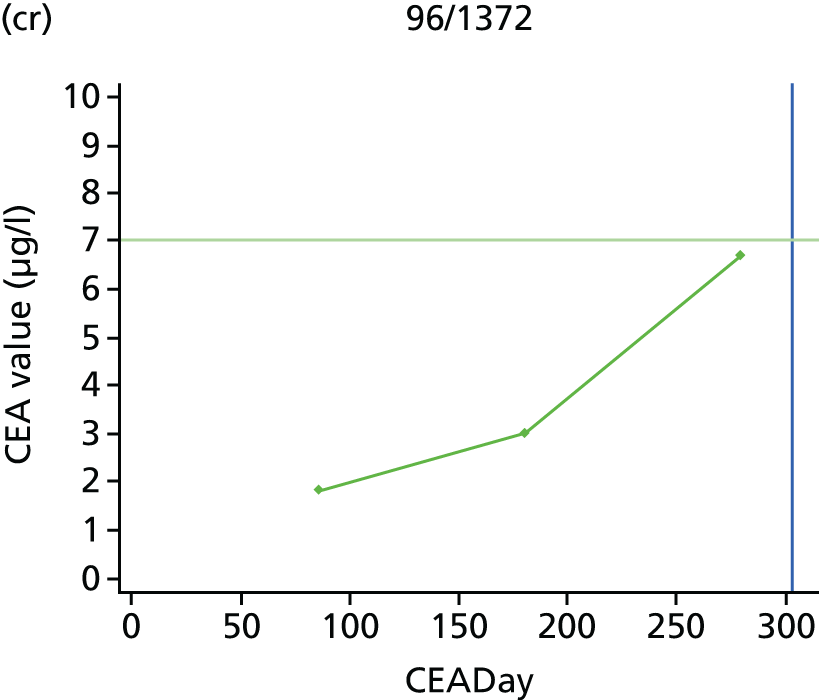

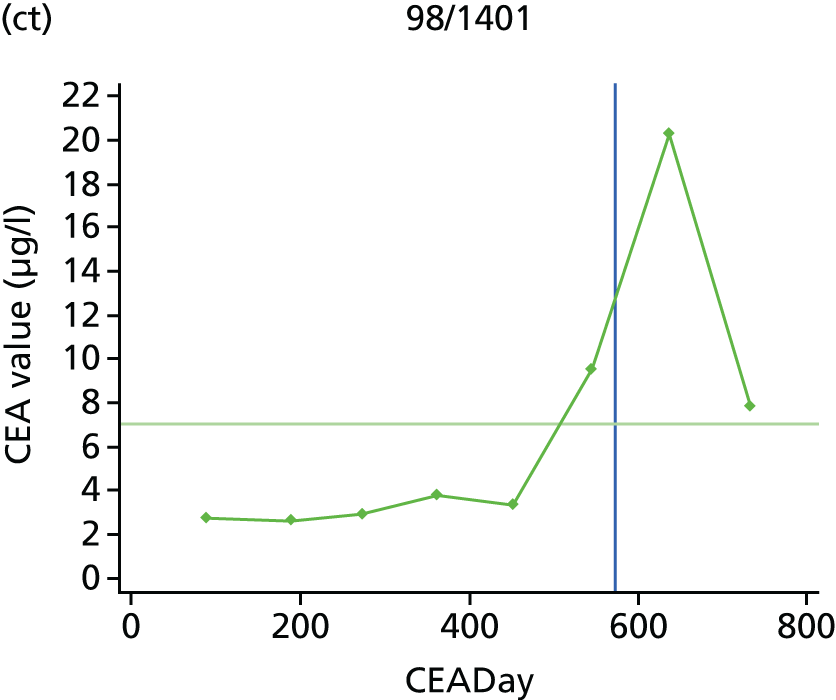

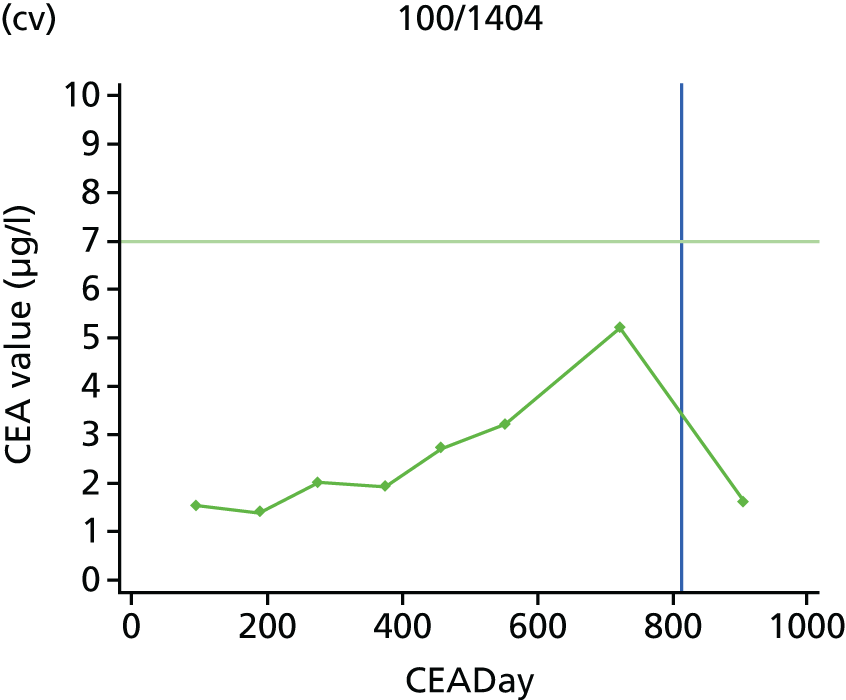

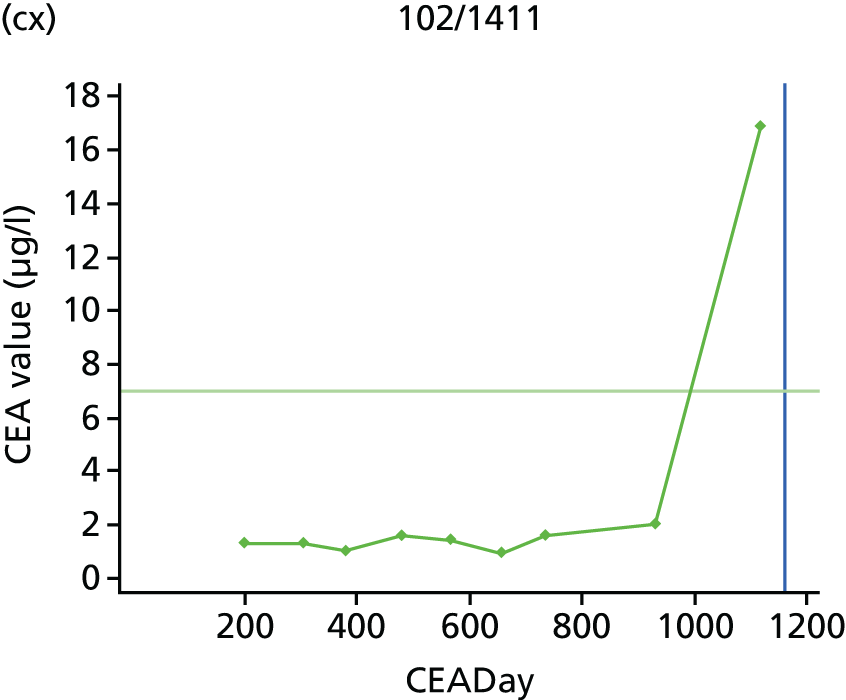

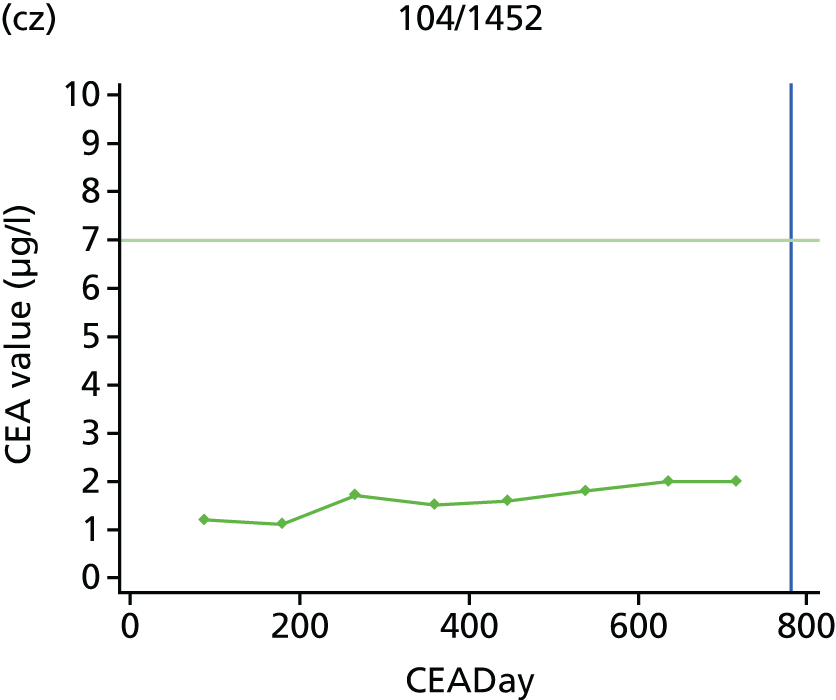
| Time point (months) | CEA measurements, n |
|---|---|
| 0 | 563 |
| 3 | 543 |
| 6 | 530 |
| 9 | 519 |
| 12 | 500 |
| 15 | 493 |
| 18 | 482 |
| 21 | 477 |
| 24 | 456 |
| 30 | 443 |
| 36 | 429 |
| 42 | 408 |
| 48 | 396 |
| 54 | 372 |
| 60 | 12 |
| Time of test | CEA tests, n | Recurrences, n | 5 µg/l action threshold | 2.5 µg/l action threshold | |||
|---|---|---|---|---|---|---|---|
| Year | Month | Missed cases, n (%) | False alarms, n/Na (%) | Missed cases, n (%) | False alarms, n/Na (%) | ||
| 1 | 3 | 563 | 15 | 9 | 3/15 | 7 | 63/88 |
| 6 | 542 | 17 | 10 | 6/16 | 10 | 68/92 | |
| 9 | 530 | 7 | 3 | 2/9 | 2 | 68/87 | |
| 12 | 519 | 12 | 7 | 8/15 | 3 | 66/86 | |
| All | 2154 | 51 | 29 (56.9) | 19/55 (34.5) | 22 (43.1) | 265/353 (75.1) | |
| 2 | 15 | 500 | 7 | 3 | 2/8 | 1 | 62/76 |
| 18 | 493 | 7 | 4 | 9/12 | 2 | 67/80 | |
| 21 | 482 | 1 | 0 | 6/7 | 0 | 64/70 | |
| 24 | 477 | 11 | 7 | 8/12 | 5 | 65/78 | |
| All | 1952 | 26 | 14 (53.8) | 25/39 (64.1) | 8 (30.8) | 258/304 (84.9) | |
| 3 | 30 | 455 | 6 | 4 | 7/10 | 4 | 67/76 |
| 36 | 444 | 7 | 1 | 9/16 | 0 | 68/80 | |
| All | 899 | 13 | 5 (38.5) | 16/26 (61.5) | 4 (30.8) | 135/156 (86.5) | |
| 4 | 42 | 427 | 6 | 2 | 6/11 | 0 | 71/81 |
| 48 | 408 | 5 | 3 | 7/9 | 2 | 69/74 | |
| All | 835 | 11 | 5 (45.5) | 13/20 (65.0) | 2 (18.2) | 140/155 (90.3) | |
| 5 | 54 | 395 | 2 | 2 | 12/12 | 2 | 65/66 |
| 60 | 374 | 1 | 1 | 4/5 | 0 | 61/63 | |
| All | 769 | 3 | 3 (100) | 16/17 (94.1) | 2 (66.7) | 126/129 (97.7) | |
| Time of test | CEA tests, n | Recurrences, n | 7.5 µg/l action threshold | 10 µg/l action threshold | |||
|---|---|---|---|---|---|---|---|
| Year | Month | Missed cases, n (%) | False alarms, n/Na (%) | Missed cases, n (%) | False alarms, n/Na (%) | ||
| 1 | 3 | 563 | 15 | 11 | 1/8 | 13 | 0/2 |
| 6 | 542 | 17 | 10 | 0/8 | 13 | 0/4 | |
| 9 | 530 | 7 | 4 | 0/5 | 4 | 0/3 | |
| 12 | 519 | 12 | 7 | 0/6 | 8 | 0/4 | |
| All | 2154 | 51 | 32 (62.7) | 1/27 (3.7) | 38 | 0/13 (0) | |
| 2 | 15 | 500 | 7 | 3 | 0/4 | 4 | 0/3 |
| 18 | 493 | 7 | 4 | 0/3 | 7 | 0/0 | |
| 21 | 482 | 1 | 1 | 1/2 | 1 | 1/1 | |
| 24 | 477 | 11 | 9 | 0/1 | 10 | 0/1 | |
| All | 1952 | 26 | 17 (65.4) | 1/10 (10.0) | 22 | 1/5 (20.0) | |
| 3 | 30 | 455 | 6 | 5 | 1/2 | 6 | 1/1 |
| 36 | 444 | 7 | 2 | 1/2 | 2 | 0/5 | |
| All | 899 | 13 | 7 (53.8) | 2/4 (50.0) | 8 | 1/6 (16.7) | |
| 4 | 42 | 427 | 6 | 4 | 0/6 | 4 | 0/2 |
| 48 | 408 | 5 | 3 | 0/2 | 4 | 0/1 | |
| All | 835 | 11 | 7 (63.6) | 0/8 (0) | 8 | 0/3 (0) | |
| 5 | 54 | 395 | 2 | 2 | 0/0 | 2 | 0/0 |
| 60 | 374 | 1 | 0 | 0/1 | 0 | 0/1 | |
| All | 769 | 3 | 2 (66.7) | 0/1 (0) | 2 | 0/1 (0) | |
| Threshold (µg/l) | Number of CEA measurements over the threshold | ||||||||||||||
|---|---|---|---|---|---|---|---|---|---|---|---|---|---|---|---|
| 1 | 2 | 3 | 4 | 5 | 6 | 7 | 8 | 9 | 10 | 11 | 12 | 13 | 14 | Total | |
| 2.5 | 42 | 18 | 13 | 7 | 7 | 3 | 7 | 5 | 9 | 4 | 10 | 8 | 11 | 12 | 156 |
| 5 | 14 | 5 | 1 | 1 | 2 | 2 | 1 | 0 | 1 | 2 | 0 | 0 | 0 | 0 | 29 |
List of abbreviations
- AUC
- area under the receiver operating characteristic curve
- CEA
- carcinoembryonic antigen
- CI
- confidence interval
- CT
- computerised tomography
- FACS
- Follow-up After Colorectal Surgery
- HTA
- Health Technology Assessment
- IQR
- interquartile range
- IRP
- International Reference Preparation
- MDT
- multidisciplinary team
- NIHR
- National Institute for Health Research
- OR
- odds ratio
- QUADAS-2
- Quality Assessment of Diagnostic Accuracy Studies 2
- ROC
- receiver operating characteristic
- SD
- standard deviation