Notes
Article history
The research reported in this issue of the journal was commissioned and funded by the HTA programme on behalf of NICE as project number NIHR132154. The protocol was agreed in August 2020. The assessment report began editorial review in October 2020 and was accepted for publication in January 2021. The authors have been wholly responsible for all data collection, analysis and interpretation, and for writing up their work. This report has been published following a shortened production process and, therefore, did not undergo the usual number of proof stages and opportunities for correction. The HTA editors and publisher have tried to ensure the accuracy of the authors’ report and would like to thank the reviewers for their constructive comments on the draft document. However, they do not accept liability for damages or losses arising from material published in this report.
Permissions
Copyright statement
Copyright © 2021 Stevenson et al. This work was produced by Stevenson et al. under the terms of a commissioning contract issued by the Secretary of State for Health and Social Care. This is an Open Access publication distributed under the terms of the Creative Commons Attribution CC BY 4.0 licence, which permits unrestricted use, distribution, reproduction and adaption in any medium and for any purpose provided that it is properly attributed. See: https://creativecommons.org/licenses/by/4.0/. For attribution the title, original author(s), the publication source – NIHR Journals Library, and the DOI of the publication must be cited.
2021 Stevenson et al.
Chapter 1 Introduction
Severe acute respiratory syndrome coronavirus 2 (SARS-CoV-2) is the virus that causes coronavirus disease 2019 (COVID-19), which was identified in China in 2019. At the time of writing (October 2020), the number of cases of COVID-19 had been approaching 38 million and more than 1 million deaths had been attributed to it. 1 Based on the reported number of cases, SARS-CoV-2 appears to be highly transmissible and is spread primarily through secretions from the nose or mouth, which can occur when coughing, sneezing or talking.
The National Institute for Health and Care Excellence (NICE) scope2 details the exploratory economic modelling of SARS-CoV-2 viral detection point-of-care tests (POCTs) and serology tests that is to be undertaken. The scope covers a number of use cases, including hospitals, care homes, prisons and general practice, and also includes the use of both viral detection POCTs and serology tests. With the agreement of NICE, this report covers only a small portion of the scope, namely the clinical effectiveness and cost-effectiveness of the use of viral detection POCTs in the treatment pathway for patients who present at an accident and emergency (A&E) department. This also includes repeat testing, where appropriate, and the testing of staff employed in the hospital. Future work will focus on some of the remaining areas in the scope. Aside from focusing on patients presenting to an A&E department, the work performed did not vary from that described in the original protocol.
The potential benefit of SARS-CoV-2 POCTs for patients admitted to hospital will be, primarily, the time taken to obtain the test result. A shorter time will allow a decision to be made more quickly about whether a patient should be allocated to a SARS-CoV-2-infected bay or to a non-SARS-CoV-2-infected bay, reducing the expected level of infections prior to bay allocation, when people with and people without SARS-CoV-2 infection potentially mix. The perspective taken was that of the NHS, with prices in Great British pounds at 2020 values. The results presented provide an exploratory evaluation of the clinical effectiveness and cost-effectiveness of hypothetical SARS-CoV-2 POCTs compared with current laboratory-based SARS-CoV-2 tests.
This work is atypical of a standard diagnostic assessment report (DAR) for NICE for the following reasons. First, the SARS-CoV-2 POCTs being evaluated are hypothetical and, thus, there may be no results relevant to marketed tests. Second, as discussed, there is the fragmentation of the scope, which will result in multiple reports. Third, and linked to the second point, the time allocated for this DAR has been reduced markedly because of the importance of the topic, with the NICE Diagnostic Advisory Committee meeting occurring 2 months earlier than originally planned. Fourth, the software package used in this DAR, Simul8 (Simul8 Corporation, Glasgow, UK), is not one of NICE’s standard packages, but NICE consented to its use, given the complexity of the decision problem and the reduced timelines; the External Assessment Group (EAG) requested this package owing to its speed in constructing, debugging and running complex individual patient models and the EAG’s familiarity with it. Fifth, owing to the reduced timelines, it was agreed with NICE in the protocol2 that there would be no systematic review related to the diagnostic accuracy of the performance of the tests. It was further anticipated that the EAG would not ‘undertake systematic literature reviews for model parameters but will instead use publicly available data from bodies such as Public Health England (PHE), request confidential data from bodies such as PHE or rely on expert advice to populate the model’. 2 The protocol also states that the EAG ‘will try to keep abreast of newly published evidence relating to SARS-CoV-2/COVID-19 and anticipates that where NICE or the specialist committee members recruited to the Diagnostic Advisory Committee become aware of potentially relevant research that this would be signalled to the EAG’. 2 (reproduced with permission from © NICE 2020 Exploratory Economic Modelling of SARS-CoV-2 Viral Detection Point of Care Tests and Serology Tests. Available from www.nice.org.uk/guidance/indevelopment/gid-dg10038/documents All rights reserved. Subject to Notice of rights. NICE guidance is prepared for the National Health Service in England. All NICE guidance is subject to regular review and may be updated or withdrawn. NICE accepts no responsibility for the use of its content in this product/publication.)
Finally, given the complexity of the model, and the uncertainty around key variables in the model, the results produced should be taken as indicative rather than definitive to a greater extent than results from other DARs.
There is an inevitable trade-off between the model’s complexity, construction time and running time. Simplifications have been made so that results can be generated more quickly. In discussion with NICE, it was agreed that this model would focus on patients presenting to A&E, either through their own volition or as a result of referral from their general practitioner.
The EAG stresses that the work undertaken is based largely on target product profiles (TPPs) issued by the Medicines and Healthcare products Regulatory Agency (MHRA). 3 There is no certainty that SARS-CoV-2 POCTs can meet the criteria for turnaround times in hospitals. If the time required to process SARS-CoV-2 POCT results is lengthy, then the results in this report relating to SARS-CoV-2 POCTs may be redundant.
This work was discussed at a NICE Diagnostic Advisory Committee meeting. The process for such appraisals includes patient and public involvement representatives who are involved in the making of recommendations and present slides to comment on issues related to patient and public involvement. Therefore, no patient and public involvement was sought by the EAG, which was to respond to any issue raised during the committee’s deliberations. No such issues were explicitly raised to the EAG.
Chapter 2 Estimating the clinical effectiveness and cost-effectiveness of SARS-CoV-2 viral detection point-of-care tests and serology tests
The conceptual model: patients
The EAG spoke with many of the NICE specialist committee members (SCMs) for this topic and colleagues of the SCMs to validate the proposed conceptual model and to highlight potential sources of data that could populate the model. It was clear that hospitals had heterogeneous pathways in place; accordingly, the model has been structured to allow an exploration of the clinical effectiveness and cost-effectiveness of SARS-CoV-2 tests using different underlying assumptions.
A simplified schematic of the hospital pathway for people arriving at an A&E department is shown in Figure 1. The use of SARS-CoV-2 testing, in particular the differences between POCTs and laboratory-based tests, is not shown in this diagram but will be discussed in this chapter.
FIGURE 1.
A simplified schematic of the hospital pathway for people arriving at A&E. ICU, intensive care unit.

Each model run curtails patients entering the model after 90 days (3 months). In the base case, this is associated with simulating 22,500 patients attending A&E (see Interarrival times and time required to make a decision on whether or not hospital admission is needed). Each patient who entered the model would have their full experience simulated; thus, a patient entering in month 3 who required a 2-month hospital admission would not leave the model until month 5. The 3-month duration is arbitrary, although any (non-infinite) time point would not allow consideration of the full pathway of all potential infections. However, 3 months was believed to be a reasonable period during which indicative results would be useful and was assumed to cover the winter months of 2020/21, when the rate of hospital admissions would be highest. To allow for patient care that could last a considerable time (see Length of stay in the hospital), the model is stopped after 200 days.
Scenario analyses will be conducted to show the impact of factors such as greater (or smaller) numbers of patients arriving and a higher (or lower) prevalence of SARS-CoV-2 infection. It is assumed that the model starts cold, in that no patients are assumed to be in the hospital at the start of the model. This is a simplification but was not assumed to affect the indicative comparative results between different strategies related to the use of SARS-CoV-2 tests.
As the consequences of a patient contracting COVID-19 can be severe, the modelling assumes a lifetime perspective. Discounting is undertaken at a rate of 3.5% per annum for health as recommended by NICE;4 costs were considered for the initial year only and have not been discounted.
Detailing the elements of Figure 1
Each sub-section discusses the assumptions and data sources associated with each element of Figure 1.
Attendance at accident and emergency department
This element simulates the arrival of a patient at hospital. The next step is dependent on the SARS-CoV-2 testing strategy that is in place, as the model has the functionality to explore testing all patients who attend A&E or testing only those patients who are to be admitted to hospital.
If the strategy of testing all patients who attend A&E is selected, then the patient would have a SARS-CoV-2 test performed (see Testing strategies for patients arriving at accident and emergency) before moving to ‘waiting for a decision on admission’. When tests are performed only on those admitted to hospital, the person moves directly to ‘waiting for a decision on admission’. For this report, only results for when testing is used for those admitted to hospital are presented.
Waiting for a decision on admission
This element simulates the period during which a patient is waiting in a hospital to see a clinician who will make a definitive decision about whether or not the patient requires hospital admission. The time required for this decision is not modelled explicitly based on the number of patients and number of staff but uses estimated times that differ by time of day. Further details are provided in Interarrival times and time required to make a decision on whether or not hospital admission is needed.
During this period, the person could possibly be infected by another person with SARS-CoV-2 who is waiting for a decision about hospital admission, or this person, if infected with SARS-CoV-2, could potentially infect other people who do not currently have SARS-CoV-2. Further details are provided in Simulation of the spread of SARS-CoV-2 infection.
Following the definitive clinical decision, patients who do not need to be admitted are discharged. Those who require hospital admission receive a SARS-CoV-2 test, if they did not receive this test on arrival at A&E, and are moved to the ‘waiting for a decision on bed allocation’ element. It is assumed that all patients can be accommodated within the ‘waiting for a decision on bed allocation’ area (see The configuration of the hospitals used in the example).
Waiting for a decision on bed allocation
This element is divided into two sub-elements: those who have symptoms indicative of potential COVID-19 infection and those who do not. Currently, the EAG has heard that hospitals will try to separate patients into these groups while a SARS-CoV-2 test is performed to aid the decision about allocating the patient to a designated SARS-CoV-2-infected bay or to a designated non-SARS-CoV-2-infected bay to reduce the risk of spreading or contracting infection while in hospital. Hence, if a patient receives a test more quickly, then this is manifested in a shorter time waiting for a decision about the appropriate bed and less capacity pressure on the waiting bays. It is assumed that all patients can be accommodated in the SARS-CoV-2-infected bays and the non-SARS-CoV-2-infected bays (see The configuration of the hospitals used in the example).
In the base-case model, all patients who have clinical symptoms suggestive of COVID-19 would have a second test if their initial test result was negative, in case that result was a false negative. The allocation of the patient would be made on the basis of the second SARS-CoV-2 test unless the patient had chest imaging results indicative of COVID-19, in which case both tests would be over-ridden and the patient would be sent to a SARS-CoV-2-infected bay. The model has the functionality to alter the proportion of instances in which two negative tests were over-ridden. Sensitivity analyses have been undertaken assuming that the proportion of patients over-ridden was zero.
Patients who have clinical symptoms suggestive of COVID-19 and a positive SARS-CoV-2 test are moved to a SARS-CoV-2-infected bay. Patients without clinical symptoms have only one test, with a positive SARS-CoV-2 test resulting in them being placed in a SARS-CoV-2-infected bay and a negative SARS-CoV-2 test resulting in the them being placed in a non-SARS-CoV-2-infected bay.
For all patients there is a possibility that the SARS-CoV-2 test fails. In this instance the patient remains in the waiting bay while the test is reconducted. The probability of SARS-CoV-2 test failure is detailed in Characteristics of the point-of-care tests and laboratory-based tests.
The model has the functionality to alter the base case with these amendments explored in scenario analyses. Exceptions to allocating based purely on the base-case model are:
-
Allocation of a patient to an intermediate bay (henceforth labelled a ‘pink bay’). Where the hospital has sufficient capacity, pink bays may be created for patients who have no clinical symptoms of COVID-19 and no evidence from chest imaging that would indicate SARS-CoV-2 infection. In this instance a clinician may suspect that the test was a false positive and not wish to confine the patient to a SARS-CoV-2-infected bay. When pink bays were used, a new tranche of staff working in pink bays was activated.
-
Allowing patients with clinical symptoms of COVID-19 and two negative SARS-CoV-2 tests to remain in a waiting bay until discharge, transfer to the intensive care unit (ICU) or death. This option is explored in scenario analyses and may be feasible for only some hospitals.
-
Removing the requirement to retest patients who have clinical symptoms suggestive of COVID-19 but a negative SARS-CoV-2 test result. In this scenario, people with a negative SARS-CoV-2 test result and no symptoms of COVID-19 on chest imaging would be allocated to a non-SARS-CoV-2-infected bay. Those with chest imaging indicative of COVID-19 would have their destination (SARS-CoV-2-infected bay or non-SARS-CoV-2-infected bay) chosen depending on the assumption used for over-riding the SARS-CoV-2 test.
The configuration of the bays in the area reserved for patients who require hospital admission and are waiting for the result of a SARS-CoV-2 test is user-definable. The assumptions used in the modelling are discussed in The configuration of the hospitals used in the example.
Allocated to an appropriate bed in a SARS-CoV-2-infected bay or a non-SARS-CoV-2-infected bay
As detailed in Waiting for a decision on bed allocation, for a patient admitted to hospital there are a number of options regarding the allocated bed.
Scenario analyses expand the choices of destination by allowing the patient to move to a pink bay (see Waiting for a decision on bed allocation) or to remain in the waiting bay until discharge or until ICU care is required (see Retesting strategies for patients admitted to hospital).
Based on the patient’s characteristics, he or she is assumed to leave the SARS-CoV-2-infected bay or non-SARS-CoV-2-infected bay by one of three routes: to discharge, following recovery; to the ICU, following a worsening of the condition; or as a result of death while in the bay. The probability of these three options, and the length of stay before leaving the bay, is discussed in Simulation of the spread of SARS-CoV-2 infection.
When the general bay (SARS-CoV-2-infected or non-SARS-CoV-2-infected) has been determined, patients can infect, and by infected by, other patients in the bay and by staff employed in that bay. Staff attend patients in more than one bay and, thus, it is possible for staff to pass infection between bays. See Simulation of the spread of SARS-CoV-2 infection for more details.
Patients in non-SARS-CoV-2-infected bays can develop clinical symptoms of COVID-19 if they have been infected while in hospital (see Simulation of the spread of SARS-CoV-2 infection) and can also have a positive SARS-CoV-2 test when they are routinely tested in hospital (see Retesting strategies for patients admitted to hospital). In both instances, the patient would be moved to a SARS-CoV-2-infected bay. The model assumes that clinical symptoms develop only following SARS-CoV-2 infection and not as a result of other diseases such as pneumonia.
Admission to intensive care unit
The ICU is subdivided into ICU bays reserved for those who are suspected of having SARS-CoV-2 infection, or have a positive SARS-CoV-2 test, and ICU bays for the remaining patients. Typically, this will be decided depending on whether or not the patient had been in a bay for patients with SARS-CoV-2 infection immediately before their admission to ICU. An exception to this would be a patient requiring ICU care who had been in a non-SARS-CoV-2-infected bay in which another patient had developed clinical symptoms suggestive of COVID-19 or had a positive SARS-CoV-2 test during routine retesting. This patient would go to a SARS-CoV-2-infected ICU bay, rather than to a non-SARS-CoV-2-infected ICU bay.
Patients in non-SARS-CoV-2-infected ICU bays can develop clinical symptoms of COVID-19 if they have been infected while in hospital and can also have a positive SARS-CoV-2 test when routinely tested in hospital (see Retesting strategies for patients admitted to hospital) as a result of infection in hospital, a false-negative result to testing on admission to hospital or a false-positive result on the repeat test. In both of these instances the patient would be moved to a SARS-CoV-2-infected ICU bay.
Once admitted to ICU, the patient can leave in one of two ways: recovery and removal to a non-ICU bay, conditional on whether or not the patient had previously been allocated to a SARS-CoV-2-infected bay; or death. The probability of these events happening is based on the patient’s characteristics and is detailed in The characteristics of patients attending accident and emergency. For simplicity, patients who are moved from the ICU to a general bay on their recovery are assumed to no longer be infectious with SARS-CoV-2 because of the likely number of days since clinical onset, although these patients would still be assumed to be grouped in SARS-CoV-2-infected bays. It is assumed that patients cannot be reinfected during the same hospital stay and will be discharged following a period in the general bay.
During a patient’s stay in the ICU, they can infect, and be infected by, other patients in the ICU bay and by staff employed in that ICU bay.
The configurations of SARS-CoV-2-infected ICU bays and of non-SARS-CoV-2-infected ICU bays are user-definable. The assumptions used in the modelling are discussed in The configuration of the hospitals used in the example.
The model does not currently have the facility to allow patients to enter the ICU directly.
Discharge
Patients can be discharged from either A&E or a general bay. The earliest point of discharge is after medical assessment of whether or not the patient requires hospital admission (see Waiting for a decision on admission). If this patient has a SARS-CoV-2 test, then they will be informed of the result on discharge if this is known, or at a later date otherwise. Patients can also be discharged from a general bay if they do not require ICU care. Those patients who have received ICU care will be transferred as detailed in Allocated to an appropriate bed in a SARS-CoV-2-infected bay or a non-SARS-CoV-2-infected bay. In a scenario analysis in which patients who have clinical symptoms suggestive of COVID-19 but have two negative tests are kept in waiting bays, discharge can occur from the waiting bay (see Retesting strategies for patients admitted to hospital).
There is the possibility that, on discharge, the patient could infect a member of staff or be infected by a member of staff. Further details on this are provided in Effective contacts and attack rates.
Death in hospital
Patients can die in the hospital. This is detailed in The mortality rates for patients admitted to hospital.
The conceptual model: staff
The staff in the model have been grouped into 10 categories related to distinct areas through which patients can progress. These staff are those involved in:
-
deciding whether or not a patient requires admission to hospital
-
performing the SARS-CoV-2 test
-
attending patients in suspected SARS-CoV-2-infected waiting bays
-
attending patients in non-suspected SARS-CoV-2-infected waiting bays
-
attending patients in SARS-CoV-2-infected bays
-
attending patients in non-SARS-CoV-2-infected bays
-
attending patients in SARS-CoV-2-infected ICU bays
-
attending patients in non-SARS-CoV-2-infected ICU bays
-
discharging a patient
-
attending patients in pink bays (in scenario analyses).
To simplify the model, these groups include all staff members involved in that work, such as doctors, nurses, allied health staff, cleaners and receptionists.
Staff contact with patients and the risks of infection are detailed in Effective contacts and attack rates. The risks of staff being infected with SARS-CoV-2 outside the hospital are detailed in The characteristics of staff members working in the hospital. Strategies assumed for testing staff are detailed in Testing strategies for asymptomatic staff.
Population of the model
Each subsection discusses the assumptions and data sources associated with populating the model.
The characteristics of patients attending accident and emergency
Categorisation of patients by SARS-CoV-2 infection status and need for hospitalisation
Patients have been grouped into four categories depending on their SARS-CoV-2 infection status and whether or not they require hospitalisation.
The proportion of patients attending A&E who are infected with SARS-CoV-2 (both symptomatic and asymptomatic) has been estimated to be 5.3%, based on Feng et al. ,5 which is reasonably in line with estimations from clinical experts. The proportion of patients with SARS-CoV-2 infection who require hospitalisation was assumed to be two-thirds, based on the approximate weighted average for male and female patients with suspected COVID-19 reported by Goodacre et al. 6
Among the patients attending A&E without SARS-CoV-2 infection, it was assumed that 18.7% would require hospitalisation, based on data before SARS-CoV-2 was identified. This figure represents the weighted average of 2017–18 data in NHS Digital’s summary report 14 (‘Percentage of attendances admitted from A&E by month’). 7 However, it has been reported that 32% of patients admitted to hospital do not require an overnight stay. 8 For simplicity, it has been assumed that these patients will be discharged rather than admitted to hospital, given the circulation of SARS-CoV-2, resulting in an admission rate among non-SARS-CoV-2-infected patients of 12.7%.
Given these proportions, the breakdown of patients arriving at A&E with SARS-CoV-2 infection status and their requirement, or not, for hospital admission used in the base-case model are shown in Table 1.
| SARS-CoV-2 status | Requiring hospital admission | |
|---|---|---|
| Yes | No | |
| SARS-CoV-2 infected | 3.53% | 1.80% |
| Not SARS-CoV-2 infected | 12.04% | 82.63% |
The prevalence of clinical symptoms indicative of COVID-19 in those patients admitted to hospital
The probability that a patient admitted to hospital has clinical symptoms indicative of COVID-19 is conditional on whether the patient has or has not been infected with SARS-CoV-2. For patients hospitalised because of a SARS-CoV-2 infection, the proportion with clinical symptoms was set at 95.5% using the value reported by Docherty et al. 9
We estimated the proportion of patients who have not been infected with SARS-CoV-2 but who nevertheless have symptoms indicative of COVID-19 using data presented in Goodacre et al. 6 and Docherty et al. 9 Goodacre et al. 6 provide the number of patients admitted to hospital who are suspected of having COVID-19 based on clinical assessment that noted that the diagnostic criteria for COVID-19 at the time the data were collected were fever (i.e. temperature of ≥ 37.8 °C) and presence of at least one of a number of clinical conditions that had to be of acute onset: persistent cough (with or without sputum), hoarseness, nasal discharge or congestion, shortness of breath, sore throat, wheezing or sneezing. A total of 5768 patients had a positive SARS-CoV-2 test and 8229 patients had a negative SARS-CoV-2 test or were not tested.
The proportion of patients who are hospitalised who do not have COVID-19 but have symptoms indicative of COVID-19 is equal to:
where:
A is the proportion of total patients attending A&E who have COVID-19 and who will be hospitalised. In the base case, this is 0.035, calculated as 0.053 (from Feng et al. 5) × 2/3 (from Goodacre et al. 6).
B is the proportion of patients with COVID-19 who are hospitalised and who have clinical symptoms of COVID-19. In the base case, this is 95.5% from Docherty et al. 9
C is the ratio of the number of patients with clinical symptoms indicative of COVID-19 who have COVID-19 to the number of patients with clinical symptoms indicative of COVID-19 who do not have COVID-19. Goodacre et al. report a value of 0.70 (5768/8339). 6 However, the data presented in Goodacre et al. 6 assume that patients who are not tested do not have COVID-19 and could also potentially include false-negative tests. Thus, the ratio of admitted patients with clinical symptoms who have COVID-19 to admitted patients with clinical symptoms who do not have COVID-19 is likely to be underestimated. In the base case we have used a ratio of COVID-19 to non-COVID-19 for those with symptoms suggestive of COVID-19 of 1.
D is the proportion of the total patients attending A&E who do not have COVID-19 and who will be hospitalised. In the base case this is 0.120, calculated as 1 – 0.053 (from Feng et al. 5) × 0.12777 (data adjusted for non-overnight stays).
Following these calculations for patients admitted to hospital, it was estimated that 28.02% of patients admitted to hospital would have symptoms suggestive of COVID-19 but would not have COVID-19. However, it is likely that in the winter months the proportion of patients with a respiratory illness would increase and, thus, in the base-case model we have increased the proportion of patients admitted to hospital without a SARS-CoV-2 infection but with symptoms suggestive of COVID-19 to 50%. We use the 28.02% value in sensitivity analyses.
The breakdown of SARS-CoV-2 infection status and probability of clinical symptoms suggestive of COVID-19 for patients admitted to hospital on entry to A&E is shown in Table 2. In both the base case and the sensitivity analyses, 15.58% of people attending A&E are admitted to hospital. Of the remaining 84.42% who are not admitted, an estimated 2.14% will have SARS-CoV-2 infection and have the potential to infect those without SARS-CoV-2 infection while both are waiting for a decision to be made on hospital admission.
| SARS-CoV-2 status | Clinical symptoms suggestive of COVID-19 (%) | |
|---|---|---|
| Yes | No | |
| Base case | ||
| SARS-CoV-2 infected | 21.66 | 1.02 |
| Not SARS-CoV-2 infected | 38.66 | 38.66 |
| Sensitivity analyses | ||
| SARS-CoV-2 infected | 21.66 | 1.02 |
| Not SARS-CoV-2 infected | 21.66 | 55.65 |
The infectious status of patients with SARS-CoV-2 infection and time until the patient is no longer infectious
It was assumed that all patients who arrived at A&E infected with SARS-CoV-2 had reached the infectious period and could infect other people (both patients and staff) with whom they came into contact. The time before these patients would no longer be infectious was estimated using data from Clifford et al. ,10 He et al. 11 (see Times to becoming infectious, developing symptoms if symptomatic, and becoming non-infectious for a patient infected with SARS-CoV-2 in hospital) and a systematic review by Jefferson et al. 12 that indicated that a patient is unlikely to be infectious 8 days from the emergence of clinical symptoms. As a simplification, we assumed that the time at which patients arriving at A&E infected with SARS-CoV-2 would no longer be infectious could be represented by a uniform distribution of 3–6 days. Near the completion of the report, data from Singanayagam et al. 13 were published that indicated a potentially longer period of being infectious. The impact of using a longer period was explored in sensitivity analyses.
The age and sex of patients attending accident and emergency who are admitted to hospital
The age distributions of patients admitted to hospital with a SARS-CoV-2 infection were presented in table 1 of Docherty et al. ,9 conditional on sex, with the paper reporting that 59.9% of patients with SARS-CoV-2 infection were male. More recent data were provided by International Severe Acute Respiratory and emerging Infection Consortium Coronavirus Clinical Characterisation Consortium (ISARIC4C) investigators (Lisa Norman, Centre for Medical Informatics, University of Edinburgh, 2020, personal communication). These distributions of age by sex are reported in Table 3. For patients with clinical symptoms indicative of COVID-19, we assumed the same distribution as for patients with a SARS-CoV-2 infection, as data from Goodacre et al. 6 (table 6 of that paper) showed values for patients with a SARS-CoV-2 positive test similar to those for patients who either had a negative SARS-CoV-2 test or were not tested.
| Age (years) | Patients requiring hospitalisation with at least one of SARS-CoV-2 infection and symptoms indicative of COVID-19 (%) | Patients requiring hospitalisation with neither SARS-CoV-2 infection nor symptoms indicative of COVID-19a (%) | |
|---|---|---|---|
| Male | Female | Male and female | |
| < 15 | 1.0 | 0.9 | 12.1 |
| 15–19 | 0.3 | 0.4 | 2.4 |
| 20–24 | 0.6 | 0.9 | 4.2 |
| 25–29 | 0.8 | 1.7 | 5.4 |
| 30–34 | 1.3 | 2.1 | 5.6 |
| 35–39 | 2.0 | 2.1 | 4.6 |
| 40–44 | 2.9 | 2.4 | 4.3 |
| 45–49 | 4.3 | 3.6 | 5.2 |
| 50–54 | 6.0 | 4.9 | 5.9 |
| 55–59 | 7.4 | 5.7 | 6.4 |
| 60–64 | 7.9 | 6.3 | 6.6 |
| 65–69 | 8.5 | 6.7 | 8.3 |
| 70–74 | 11.1 | 9.2 | 7.9 |
| 75–79 | 12.6 | 11.4 | 7.6 |
| 80–84 | 14.0 | 14.1 | 6.4 |
| 85–89 | 11.8 | 14.6 | 4.4 |
| ≥ 90 | 7.4 | 13.0 | 2.6 |
| All ages | 100 | 100 | 100 |
The age distributions of patients who required hospitalisation but had neither a SARS-CoV-2 infection nor clinical symptoms indicative of COVID-19 were taken from NHS admissions data for 2015–16. 14 These distributions are shown in Table 3. Data on patients needing hospitalisation for reasons other than COVID-19 were not separated by sex; in consultation with SCMs, it was decided that using the same proportion for male and female patients was a reasonable assumption.
Age distributions for patients not hospitalised were not required as the model does not explicitly take into consideration the consequences of reinfection for patients discharged from A&E.
The requirement for intensive care unit care among patients admitted to hospital
The proportions of patients with SARS-CoV-2 infection admitted to hospital who need ICU care by age band were provided by ISARIC4C investigators (Lisa Norman, personal communication). These data are shown in Table 4.
| Age (years) | Patients with SARS-CoV-2 infection requiring ICU care (%) | Patients without SARS-CoV-2 infection requiring ICU care (%) |
|---|---|---|
| < 15 | 18.9 | 0.5 |
| 15–19 | 20.7 | 1.8 |
| 20–24 | 31.8 | 1.6 |
| 25–29 | 14.8 | 1.5 |
| 30–34 | 13.7 | 1.6 |
| 35–39 | 13.2 | 2.2 |
| 40–44 | 18.0 | 3.0 |
| 45–49 | 22.9 | 3.3 |
| 50–54 | 24.6 | 3.4 |
| 55–59 | 26.8 | 3.6 |
| 60–64 | 27.2 | 4.0 |
| 65–69 | 29.8 | 4.2 |
| 70–74 | 27.5 | 4.1 |
| 75–79 | 22.8 | 4.1 |
| 80–84 | 15.2 | 3.7 |
| 85–89 | 9.1 | 2.8 |
| ≥ 90 | 3.9 | 1.2 |
| All ages | 100 | 100 |
The proportion of patients without SARS-CoV-2 infection who need ICU care was estimated, having first estimated the number of patients admitted via A&E and then estimated the number of patients going to the ICU from A&E admission.
The numbers of patients admitted via A&E were taken from a House of Commons Library briefing paper15 and the number of total finished admission episodes was taken from supplementary information of NHS Digital’s ‘Hospital admitted patient care activity 2015-16’ report. 14 It was assumed that the proportion of total patients admitted who were admitted via A&E (26.4%) could be applied to each age band for patients admitted via A&E to calculate the number of admissions from A&E for each age band.
The age distribution of total ICU admissions in 2016 was extracted from Intensive Care National Audit and Research Centre data. 16 An assumption was made that patients admitted from A&E who require ICU care would follow this distribution. The proportions by age band were then multiplied by the total number of admissions from A&E requiring ICU care16 to estimate the number of ICU admissions from A&E by age band. The proportion of patients without SARS-CoV-2 infection was then estimated by dividing the number of patients admitted to hospital via A&E by age band by the number of patients admitted via A&E who require ICU care. The proportions are shown in Table 4. All data were prior to the identification of SARS-CoV-2.
The mortality rates for patients admitted to hospital
The proportions of patients with SARS-CoV-2 infection admitted to hospital who died were provided by ISARIC4C investigators (Lisa Norman, personal communication). These data are shown in Table 5 using the assumption that the mortality rate among patients receiving ongoing care was the same as the mortality rate among those who had reached a final outcome (being discharged or having died). The data were divided into the proportion of patients who die without ICU care and the proportion of patients who die in the ICU.
| Age (years) | Patients with SARS-CoV-2 infection (%) | Patients without SARS-CoV-2 infection (%) | |||
|---|---|---|---|---|---|
| Non-ICU | ICU | Non-ICU | ICU | ||
| Male | Female | Both sexes | Both sexes | Both sexes | |
| < 15 | 0.6 | 0.0 | 7.1 | 0.1 | 7.1 |
| 15–19 | 3.7 | 1.2 | 3.6 | 0.5 | 3.6 |
| 20–24 | 2.0 | 0.0 | 8.3 | 0.2 | 8.3 |
| 25–29 | 3.0 | 0.4 | 10.2 | 0.3 | 10.2 |
| 30–34 | 1.4 | 0.5 | 16.7 | 0.2 | 16.7 |
| 35–39 | 2.4 | 1.1 | 16.1 | 0.4 | 16.1 |
| 40–44 | 2.9 | 1.8 | 20.3 | 0.5 | 20.3 |
| 45–49 | 3.5 | 1.5 | 23.2 | 0.5 | 23.2 |
| 50–54 | 5.6 | 3.5 | 29.2 | 1.0 | 29.2 |
| 55–59 | 9.8 | 2.6 | 37.7 | 1.2 | 37.7 |
| 60–64 | 13.8 | 9.9 | 47.3 | 2.7 | 47.3 |
| 65–69 | 20.0 | 17.2 | 51.9 | 4.3 | 51.9 |
| 70–74 | 31.2 | 23.1 | 61.9 | 6.2 | 61.9 |
| 75–79 | 40.1 | 32.8 | 65.2 | 8.5 | 65.2 |
| 80–84 | 48.5 | 39.6 | 71.7 | 10.2 | 71.7 |
| 85–89 | 55.3 | 42.1 | 62.1 | 11.2 | 62.1 |
| ≥ 90 | 61.6 | 47.2 | 56.0 | 12.5 | 56.0 |
The proportion of patients without SARS-CoV-2 infection who died was estimated from Meacock et al. ,17 who indicated a mortality rate across all patients of 3.5% following admission from A&E. The age profile of patients admitted to hospital without SARS-CoV-2 infection (see Table 4) was multiplied by the ratio of non-ICU deaths for patients with SARS-CoV-2 infection, assuming that this was generalisable to patients without SARS-CoV-2 infection and using a multiplication factor such that the estimated proportion of patients dying was approximately 3.5%. The estimated data for mortality among patients admitted to hospital without SARS-CoV-2 infection are shown in Table 5.
It is assumed that, owing to the critical condition of patients requiring ICU care, the proportion of patients dying in ICU without SARS-CoV-2 infection was the same as that of those with SARS-CoV-2 infection. This may underestimate the probability of death for patients who require ICU care and are also infected with SARS-CoV-2.
The outcomes associated with chest imaging
It is assumed that people with clinical symptoms suggestive of COVID-19 would receive chest imaging to provide the clinician with information. For this report, as a simplification it is assumed that patients without symptoms suggestive of COVID-19 do not receive chest imaging, although the model has the functionality to incorporate chest imaging for those without clinical symptoms suggestive of COVID-19.
As described in Waiting for a decision on bed allocation, the model allows a negative SARS-CoV-2 test result not to be acted on if the clinician has a strong belief, based on clinical symptoms and chest imaging, that the result may be a false negative. The proportion of patients with clinical symptoms and COVID-19 who were assumed to have chest imaging results suggestive of COVID-19 was 56% (taken from Borakati et al. 18). The proportion of patients with clinical symptoms but without COVID-19 who were assumed to have chest imaging results suggestive of COVID-19 was 40% (taken from Borakati et al. 18), equating to a specificity of detecting COVID-19 of 60%. These values were for chest X-ray. In sensitivity analyses, the values reported by Borakati et al. 18 for computed tomography were used, which were a sensitivity of detecting COVID-19 of 85% and a specificity of 50%. In this study, polymerase chain reaction results were assumed to be the gold standard.
Immunity to SARS-CoV-2 infection
It has been hypothesised that some people may have immunity to SARS-CoV-2 infection, although this theory is subject to much debate. 19 In the base case it has been assumed that no person has immunity to SARS-CoV-2 infection, unless they had SARS-CoV-2 infection when attending A&E or were infected with SARS-CoV-2 during hospital admission. The model has the functionality to allow a proportion of patients entering A&E without a current SARS-CoV-2 infection to be considered immune to infection.
Ethnicity and the prevalence of comorbidities
The model was constructed to provide functionality for other patient characteristics, such as the prevalence of comorbidities and whether or not a patient is from an ethnic minority, as these are believed to be correlated with poorer outcomes. However, this functionality has not been used as we are using observed patient characteristics and outcomes and using additional weighting for death or ICU requirement would result in an overinflation of poor outcomes.
The characteristics of staff members working in the hospital
At the start of the model, it is assumed that no staff members have been infected by SARS-CoV-2 and that none exhibits clinical symptoms suggestive of COVID-19. The age distributions, ethnicity and comorbidity status of staff members were not required as the model does not explicitly take into consideration the consequences of infection for staff beyond infecting other staff members and patients.
To simplify the model, it was assumed that each area bullet-pointed in The conceptual model: staff used 20 staff. These staff members work across multiple bays in the distinct areas and so infection can be passed between bays. Thus, staff members assigned to SARS-CoV-2 infection bays would not work in non-SARS-CoV-2 infection bays or at discharge. Staff members were randomly chosen when contacting patients and other staff members (as detailed in Effective contacts and attack rates).
It is assumed that staff members can be infected with SARS-CoV-2 outside the hospital setting. The risk of this per day is assumed to be 0.6 per 10,000 people, based on data from the Office for National Statistics. 20
The configuration of the hospitals used in the example
The model has the functionality to assess different levels of patient attendance per day and different numbers of bays. In this report we focus on an example of a large hospital. It is acknowledged that these numbers will not reflect a specific hospital, but they are there, along with the sensitivity analysis, to provide indicative results. For each of the waiting bays, the admitted bays, the ICU bays and the waiting for decision on admission bays, the last bay is set to an infinite capacity to signify the use of non-designated areas when necessary or to take into account transfers to alternative hospitals or facilities if required. The number of people in each infinite bay across time has been presented for selected strategies.
The configuration of the example hospital is provided in Table 6. In sensitivity analyses, three four-bed SARS-CoV-2-infected bays were removed and replaced with three four-bed pink bays and one infinite pink bay.
| Hospital area | Allocated capacity |
|---|---|
| Waiting for a decision to admit to hospital or not | 3 10-person areas and 1 infinite area |
| Waiting area after decision to admit to hospital for patients with clinical symptoms suggestive of COVID-19 | 4 single-bed bays, 4 four-bed bays and 1 infinite bay |
| Waiting area after decision to admit to hospital for patients without clinical symptoms suggestive of COVID-19 | 6 four-bed bays and 1 infinite bay |
| SARS-CoV-2-infected bays | 10 four-bed bays and 1 infinite bay |
| Non-SARS-CoV-2-infected bays | 17 four-bed bays and 1 infinite bay |
| SARS-CoV-2-infected ICU bays | 6 four-bed bays and 1 infinite bay |
| Non-SARS-CoV-2-infected ICU bays | 6 four-bed bays and 1 infinite bay |
| SARS-CoV-2-infected post-ICU bays | 4 four-bed bays and 1 infinite bay |
| Non-SARS-CoV-2-infected ICU bays | 4 four-bed bays and 1 infinite bay |
The routing into all bays assumes that patients will fill the bays in numerical order, so if there were six four-bed bays then the first four patients would be put in to the first bay, with the fifth patient being allocated to the second bay, unless one of the patients in the first bay was no longer occupying a bed. The EAG notes that if hospitals were prepared to open multiple bays and fill these sequentially, this may reduce the number of infections.
Interarrival times and time required to make a decision on whether or not hospital admission is needed
The model does not explicitly simulate the interaction between staff and patients to work out queueing times. A simplified approach has been taken, whereby patients arrive at constant rates but the time before a decision is made whether or not to admit the person is altered depending on the time of day to simulate variable waiting times before the decision is made to admit to hospital or to discharge.
The number of people attending A&E per day was assumed to be 250 following discussion with clinical experts. The waiting time before a decision to admit or not to admit was assumed depending on the time of day the patient arrived, with the assumption that the 250 patients would be spaced equally throughout the day. The time required for the admission decision was assumed to be 2 hours for patients arriving between midnight and 6 a.m., 3 hours for patients arriving between 6 a.m. and 6 p.m. and 4 hours for patients arriving between 6 p.m. and midnight. For simplicity, it was assumed that the time until the decision on admission was independent of the severity of a person’s injury.
Simulation of the spread of SARS-CoV-2 infection
The model simulates infections in the following four categories: patient to patient, patient to staff, staff to patient and staff to staff. It has been assumed that infection can be passed only to patients and staff who did not enter A&E with SARS-CoV-2 infection and have not been infected previously during the hospital stay.
Effective contacts and attack rates
Key components of the spread of SARS-CoV-2 are effective contacts and attack rates, and the number of subsequent transmissions within hospital bays from infectious patients or staff is correlated with the product of these components. Patients and staff can become infected if they have one or more ‘effective contacts’ with someone infected with SARS-CoV-2, and the probability that the infection will be passed during that contact is termed the ‘attack rate’. To decrease the running time of the model, it was assumed that the simulation of infections with SARS-CoV-2 occurred only once per day. This has the limitation that people who had died or were discharged would not contribute to the transmission of SARS-CoV-2 infection, even though they spent some time in the hospital.
Evaluating the number of effective contacts is the number of people with whom an infectious person is assumed to come into contact and could potentially infect during a stated time period, which in the model is 1 day. As described in The conceptual model: staff, staff are grouped by discipline, with each effective contact being assumed to be with a randomly selected member of the relevant pool. Potential contacts between the remaining pairing of staff and patients are handled similarly; for example, in the case of patient-to-patient contact, a contact would be made with a random patient in the same bay/ICU bay. Therefore, patients allocated to a single-bed bay cannot directly infect other patients while in this bay, although infection could occur indirectly via staff.
The model has been constructed so that if the number of effective contacts is greater than the number of people who could be infected (e.g. the number of other patients in the bay/ICU bay), then it is assumed that the patient had effective contact with all patients in that location. The model has the functionality for the number of effective contacts to differ by (1) location (waiting for admission decision, testing, waiting bay, general bay, ICU bay and discharge), (2) designation of location (suspected SARS-CoV-2-infected bays, non-suspected SARS-CoV-2-infected bays or pink bays) and (3) the relevant pairings (patient to patient, patient to staff, staff to patient and staff to staff).
Evaluating the number of effective contacts in non-bay areas (waiting for a decision to be made on hospital admission, and at discharge and testing) uses a slightly different methodology, assessing ‘one-off’ contacts, rather than periodically assessing the contacts, as patients are not expected to spend significant time in contact with other patients or staff. While waiting for a decision to be made about admission to hospital, it is assumed that an infectious patient will make effective contact with a defined number of patients already in the waiting area, or the number of people in the care area if smaller. When being tested for SARS-CoV-2 or being discharged, the patient can make contact with a maximum of one member of staff only.
Effective contacts can be a non-integer number. In this instance, the number is probabilistically adjusted to an integer in each time period. For example, if the effective contact between a patient and staff a member was assumed to be 0.8, then there would be an 80% chance of an effective contact with one staff member and a 20% chance of zero effective contacts with staff.
Following an effective contact, the model determines whether or not the infection has been passed on by using the attack rate. The model has the functionality for attack rates to differ by (1) location (waiting for admission decision, testing, waiting bay, general bay, ICU bay and discharge); (2) designation of location (suspected SARS-CoV-2-infected bays, non-suspected SARS-CoV-2-infected bays or pink bays); (3) the relevant pairings (patient to patient, patient to staff, staff to patient and staff to staff); and (4) whether or not the person with SARS-CoV-2 infection is symptomatic, as it has been reported that asymptomatic patients have a lower chance of passing on infection than symptomatic patients.
The attack rate lies between 0 and 1, this value being the probability that a patient has become infected. Thus, if the attack rate was 40%, then, assuming that an infinite number of patients were run through the model, 40% of those with an effective contact would become infected with SARS-CoV-2 and 60% would not.
Given the lack of robust data on either attack rates or effective contacts, and the potential ambiguity in whether or not the increased used of personal protective equipment would decrease effective contacts or the attack rate, it was decided that these would effectively be dealt with as one value (the product of effective contacts and attack rates). As discussed in Results, an attempt was made to calibrate the product of effective contacts and attack rates to observed data regarding the proportion of hospital-identified COVID-19 patients who were not identified at the time the decision was made to allocate a patient to a bay.
There is debate on whether or not the product of attack rate and effective contacts for asymptomatic patients is equivalent to that of symptomatic patients. It is unclear whether or not the viral load differs, but the lack of coughing in asymptomatic patients could reduce the transmission of SARS-CoV-2. Data from Koh et al. 21 indicate that the product of the attack rate and effective contacts of asymptomatic patients is 39% (1/2.55) that of symptomatic patients; however, work undertaken by Grassly et al. 22 suggests a value of 50% (range 10–100%). Given the wide uncertainty and suggestions from SCMs that there may be no difference in infection rates, an arbitrary assumption was made that asymptomatic patients had a product of attack rate and effective contacts that was 69% that of symptomatic patients.
Times to becoming infectious, developing symptoms if symptomatic, and becoming non-infectious for a patient infected with SARS-CoV-2 in hospital
Patients and staff who have been infected have defined periods before they become infectious, have clinical symptoms (if they are symptomatic), and reach a point at which they are no longer infectious for SARS-CoV-2. These values, along with their sources, are shown in Table 7. It has been assumed that symptomatic and asymptomatic patients have the same time to key milestones, although asymptomatic patients have a lower probability of transmitting infection (see Effective contacts and attack rates).
| Event: time from element 1 to element 2 | Assumed time to the event (days) | Source |
|---|---|---|
| Infection to becoming infectious | 3.4 | Clifford et al.10 |
| Becoming infectious to having clinical symptoms if patient develops COVID-19 | 2.3 | He et al.11 |
| Becoming infectious for SARS-CoV-2 to becoming non-infectious | 7.1 | Clifford et al.10 |
The model updates the infectious status and the status of clinical symptoms for those who are simulated to be symptomatic of patients every 6 simulated hours. This was believed to represent a compromise between model complexity and sufficient accuracy, given the uncertainty of the decision problem.
If a patient becomes symptomatic after being infected in hospital, then they are moved to a SARS-CoV-2-infected bay if they were in a non-SARS-CoV-2-infected bay, or moved to a SARS-CoV-2-infected ICU bay if they were in a non-SARS-CoV-2-infected ICU bay.
The probability of patients infected with SARS-CoV-2 in hospital having a worse prognosis
The consequences of SARS-CoV-2 infections in hospital can vary by patient, although all patients can infect other patients. It was assumed that two-thirds of patients would develop symptoms based on the approximate mid-point of data reported by the Imperial College response team [Grassly22 (67%, range 50–80%), Lavezzo23 (57.5%, 95% confidence interval 45.4% to 68.5%), Riley23 (31%, 95% confidence interval 24% to 39%), Clifford10 (76.8%, 95% confidence interval 50.5% to 94.1%, calculated from the reported beta distribution)] and the Centers for Disease Control and Prevention24 (50%).
The probability that a person would need ICU care or die from COVID-19 was estimated from the proportion of patients aged 70–74 years, an approximate median range of those attending A&E who require hospitalisation due to COVID-1925 (24.3%), multiplied by the sum of the proportion of patients hospitalised who require ICU care or who die in hospital [54.7%: 27.5% (see Table 4) + 27.2%, the average of male and female patient deaths in hospital (see Table 5)]. This would equate to a risk of a critical outcome (i.e. ICU care or death) of 8.9% (2/3 × 24.3% × 54.7%). This value is changed in sensitivity analyses.
If a patient was simulated to have a critical outcome, then it would be sampled whether this outcome was death or ICU care (where patients could still die) based on the probability of deaths in a general bay by age band (see Table 5) and the proportions admitted to ICU by age band (see Table 4). This resulted in the proportions shown in Table 8. Patients simulated to die in hospital prior to SARS-CoV-2 infection were assumed to not have their prognosis changed; those simulated to be admitted to ICU prior to SARS-CoV-2 infection did not have their prognosis changed unless the SARS-CoV-2 infection was simulated to result in death.
| Age (years) | Male patients | Female patients |
|---|---|---|
| < 15 | 0.031 | – |
| 15–19 | 0.152 | 0.055 |
| 20–24 | 0.059 | – |
| 25–29 | 0.169 | 0.026 |
| 30–34 | 0.093 | 0.035 |
| 35–39 | 0.154 | 0.077 |
| 40–44 | 0.139 | 0.091 |
| 45–49 | 0.133 | 0.061 |
| 50–54 | 0.185 | 0.125 |
| 55–59 | 0.268 | 0.088 |
| 60–64 | 0.337 | 0.267 |
| 65–69 | 0.402 | 0.366 |
| 70–74 | 0.532 | 0.457 |
| 75–79 | 0.638 | 0.590 |
| 80–84 | 0.761 | 0.723 |
| 85–89 | 0.859 | 0.822 |
| ≥ 90 | 0.940 | 0.924 |
Testing strategies for patients arriving at accident and emergency
As described in The conceptual model: patients, the model has the functionality to employ two testing strategies: to test all people arriving at A&E or to test only those about whom a decision has been made to admit to hospital. Only the scenario of testing patients on admission to hospital has been evaluated in this report.
Characteristics of the point-of-care tests and laboratory-based tests
The POCTs for SARS-CoV-2 are hypothetical. The assumed diagnostic accuracies of the POCTs and laboratory-based tests, the times for the result to become known by the treating physician, and the failure rates used in the base-case model are shown in Table 9. Sensitivity analyses using these parameters have been undertaken. It is assumed that neither the laboratory-based test nor the POCT could detect SARS-CoV-2 until 0.5 days after infection, based on Jarvis et al. 26 The model uses a simplifying assumption that, until this point is reached, SARS-CoV-2 cannot be detected, although false-positive tests could still occur in this situation. Beyond this time point the sensitivity values reported in Table 9 are considered appropriate. All patients arriving at A&E with SARS-CoV-2 infection are assumed to be at, or near, the peak of their viral levels.
| Sensitivity analysis | Assumed time to obtain the result (hours) | Assumed sensitivity (symptomatic patients) (%) | Assumed sensitivity (asymptomatic patients) (%) | Assumed specificity (%) | Assumed failure rate (%) |
|---|---|---|---|---|---|
| SARS-CoV-2 laboratory-based test | |||||
| Base case | 35.9 | 89.0 | 73.5 | 100 | 5 |
| Sensitivity analysis 1 | 24 | 89.0 | 73.5 | 100 | 5 |
| Sensitivity analysis 2 | 6 | 89.0 | 73.5 | 100 | 5 |
| SARS-CoV-2 POCTa | |||||
| Base-case TPP – desirable | 0.5 | 86.3 | 71.3 | 99 | 5 |
| TPP – acceptablea | 2 | 71.2 | 58.8 | 95 | 5 |
| Data from currently available tests | 3.8 | 84.7 | 70 | 98.9 | 5 |
| Data from currently available tests sensitivity analysis 1 | 8 | 84.7 | 70 | 98.9 | 5 |
The time required for the treating physician to receive the test result has an impact on the capacity utilisation of the waiting bays. A shorter time for a test result would mean quicker allocation to either a SARS-CoV-2-infected or a non-SARS-CoV-2-infected bay. These times are longer than the actual processing times of POCTs and should take into account all relevant steps in the process. Sensitivity analyses have been conducted using alternative times to obtain the result. The failure rates of all tests have been set to that in the TPP.
In the base case for SARS-CoV-2 laboratory-based tests, a time of 35.9 hours was used, as this was the median time reported by Collier et al. 27 However, some hospitals may have access to more rapid turnaround times, and sensitivity analyses have been run at 24 hours and at 6 hours. 28 The sensitivity of laboratory-based tests was assumed to be 89%, based on a meta-analysis conducted by Kim et al. ,29 with a specificity of 100% following Grassly et al. 22 It was believed that the sensitivity of SARS-CoV-2 tests might be reduced in asymptomatic patients. Based on data provided in Clifford et al. ,10 the ratio of sensitivities was assumed to be 82.6%, as values of 75% sensitivity in symptomatic patients and 62% sensitivity in asymptomatic patients were reported.
For the SARS-CoV-2 POCTs, the TPPs published by the Medicines and Healthcare products Regulatory Agency3 were used. These were divided into desired and acceptable characteristics. In addition, a sensitivity analysis using data from currently available SARS-CoV-2 POCTs was used. In this scenario, the time to obtain the result was assumed to be 3.8 hours, based on data presented in Collier et al. ,27 with sensitivity and specificity taken from a Cochrane review by Dinnes et al. 30 but adjusted to take into consideration that these were compared with laboratory-based tests, which were assumed to have imperfect sensitivity (0.89; see Table 9). The sensitivity reported in Dinnes et al. was, therefore, multiplied by 0.89.
The cost of the hypothetical POCT is assumed to be £27.76,31 based on the 5.8 million DnaNudge test the UK government has for £161M. The deal is likely to include 5000 platforms for running the tests which overestimate the cost. The cost of a urine and plasma laboratory-based test (BioPorto, Hellerup, Denmark) used to assess acute kidney failure in people considered for admission to critical care was used as a proxy for the cost of a laboratory-based test, and was assumed to be £21.90. 32 We have assumed that the staff costs associated with POCTs and laboratory-based tests are equivalent. The costs of tests are explored in sensitivity analyses. All costs used in the analyses are assumed to be in Great British pounds in 2020.
Retesting strategies for patients admitted to hospital
Retesting strategies fall into three categories: retesting of those admitted to hospital who had a failed test; routine retesting of those allocated to a non-SARS-CoV-2-infected bay following negative SARS-CoV-2 tests; and, depending on the strategy chosen, retesting of patients with clinical symptoms suggestive of COVID-19 who had a negative SARS-CoV-2 test.
Retest following test failure after admission to hospital
Patients admitted to hospital whose test result was a failure will be retested while they remain in the appropriate waiting bay (SARS-CoV-2 infection suspected or SARS-CoV-2 infection not suspected) until the result of at least one valid SARS-CoV-2 test is known (see Waiting for a decision on bed allocation for more details).
Routine retesting following admission to hospital in a non-SARS-CoV-2 infection-suspected bay
Following Department of Health and Social Care advice, patients in non-SARS-CoV-2 infection-suspected bays will be retested. 33 The aim of the retesting strategy is to enable the detection of patients who may have been infected since their entry to hospital or whose viral load has increased during their hospital stay. Patients who receive a positive test result will be moved to a SARS-CoV-2-infected bay. In the base-case model, the default testing occurs 6 days from entry to the non-suspected SARS-CoV-2-infected bay. Under this assumption, it is possible that more patients are retested when initial tests are quicker as length of stay in hospital for each patient is assumed to be fixed, comprising time in a waiting bay and time in a general bay. Thus, if more time is spent in a waiting bay, then less time is spent in the general bay. Additional time in a waiting bay due to a slower initial test could mean that the patient is discharged before being retested, whereas they would be retested if the initial test was quicker.
Retesting if the treating physician suspects a false-negative test
The base-case model assumes that all patients with clinical symptoms suggestive of COVID-19 will get a second SARS-CoV-2 test if their first test result was negative. For simplicity, it is assumed that the diagnostic accuracy of the second test is the same as that of the first test. It is acknowledged that there may be reasons why a negative SARS-CoV-2 test result was obtained that would mean that the two tests were not independent and that a false negative result was more likely, but also that viral levels may increase between the two tests, which could reduce the chances of a false negative result.
In scenario analyses, the model has the functionality to allow a patient to remain in the waiting bay until discharge, requirement for the ICU or death, if that patient has clinical symptoms suggestive of COVID-19 but negative chest imaging results and underwent two SARS-CoV-2 tests that produced negative results. In this scenario, it is assumed that if ICU care is needed the patient will go to a SARS-CoV-2-infected ICU bay.
Testing strategies for asymptomatic staff
The model has the functionality for staff to be tested at user-defined intervals, or for a strategy of no staff testing to be employed. In both the testing and the no-testing strategies, it has been assumed that any staff member with clinical symptoms indicative of COVID-19, due to infection either in the community or in the hospital, would be removed from duty.
Staff testing can be undertaken with either POCTs or laboratory-based tests. The characteristics of the tests are the same as those for patients. There is a delay in the staff test result becoming available in line with the SARS-CoV-2 test used (POCT or laboratory based). Those staff members with a positive SARS-CoV-2 test result would be removed from duty. When testing of asymptomatic staff is employed, the duration between tests is user-definable. It is assumed that if a staff member has a test result that is a failure they will wait until the next test period to receive a second test, assuming that they do not develop clinical symptoms suggestive of COVID-19 in the interim.
Length of stay in the hospital
For patients with COVID-19, the distribution of length of stay conditional on being discharged alive or dead is depicted in the appendix of Docherty et al. 9 It was assumed that for patients who died in hospital the distribution could be represented by a log-normal distribution with a mean of 2.00 and a standard deviation of 0.79, which give values resembling the mode and the percentage of people alive at 14 days. For patients alive at discharge, a distinction was made between those aged < 70 years and those aged ≥ 70 years. For the younger group a log-normal distribution with a mean of 1.95 and a standard deviation of 0.59 was assumed; and for the older group a log-normal distribution with a mean of 2.29 and a standard deviation of 0.59 was assumed.
For patients admitted to hospital without SARS-CoV-2 infection the average number of nights spent in hospital was 7.5. 8 For simplicity, it was assumed that this could be represented by a triangular distribution (1, 5, 12) for patients aged ≤ 69 years and a triangular distribution (6, 12, 18) for patients aged ≥ 70 years. For simplicity, it was assumed that these outcomes were independent of other outcomes (discharge, ICU care or death).
For patients admitted to ICU it was assumed that the length of stay was 2 days regardless of age, SARS-CoV-2 infection status, or outcome based on data presented to the NICE diagnostic committee. 32 The time in post-ICU beds was set at 4 days also independent of age and SARS-CoV-2 infection status.
Quality-adjusted life-years lost through death in the hospital
The model estimates the additional discounted quality-adjusted life-years (QALYs) lost assuming a discount rate of 3.5% per annum as recommended by NICE,4 and life-years lost through SARS-CoV-2 infections acquired within the hospital for admitted patients. These values have been estimated using 2016–18 data from Office for National Statistics life tables34 and age- and sex-adjusted general population utility values reported by Ara and Brazier,35 and take into account the death rates at each age by sex, the utility by age and sex, and the NICE recommended discount rate. Patients who are younger will therefore have greater expected QALYs than older patients as they are expected to both live longer and have a higher utility at the start of the model.
Example values of the estimated QALY losses and life-years lost for selected ages are provided in Table 10.
| Patient age (years) | QALYs lost | Life-years lost | ||
|---|---|---|---|---|
| Male | Female | Male | Female | |
| 30 | 19.24 | 18.85 | 50.10 | 53.52 |
| 40 | 17.15 | 16.96 | 40.57 | 43.80 |
| 50 | 14.71 | 14.73 | 31.38 | 34.33 |
| 60 | 11.87 | 12.12 | 22.67 | 25.28 |
| 70 | 8.76 | 9.13 | 14.87 | 16.91 |
| 80 | 5.64 | 5.96 | 8.39 | 9.69 |
| 90 | 3.18 | 3.28 | 4.06 | 4.61 |
For patients who were infected with SARS-CoV-2 in hospital but were discharged alive, a multiplier can be applied to take into consideration that the QALYs gained would be lower than that of the average age- and sex-matched patients due to reduced life expectancy and/or reduced quality of life. No data were found to populate these multipliers; an arbitrary value of 0.8 was applied for patients who needed ICU care as a result of a SARS-CoV-2 infection acquired in hospital. For patients who did not require ICU care the multiplier was set to 1 to signify no loss in expected future QALYs.
Modelling methodology
The strategies modelled
Initially, 10 strategies were modelled, as shown in Table 11. All of these used the base-case values for the laboratory-based test and the POCT, as shown in Table 9. Further scenario analyses were run using the variations in Table 9, which included reduced times for the laboratory based-tests, using the acceptable TPP for POCTs and data from currently available POCTs. 27,30 It was assumed that there were sufficient testing kits, reagents and consumables for all SARS-CoV-2 tests. We did not assess any strategies that used confirmatory laboratory-based SARS-CoV-2 tests after a SARS-CoV-2 POCT.
| Strategy number | Test on admission | Retest those with clinical symptoms suggestive of COVID-19 but with a negative SARS-CoV-2 test | Test in non-SARS-CoV-2-infected bays | Weekly asymptomatic staff testing |
|---|---|---|---|---|
| 1 | ||||
| 2 | ||||
| 3 | ||||
| 4 | ||||
| 5 | ||||
| 6 | ||||
| 7 | ||||
| 8 | ||||
| 9 | ||||
| 10 | ||||
| SARS-CoV-2 laboratory-based tests (35.9 hours) | SARS-CoV-2 POCTs (30 minutes) | No SARS-CoV-2 test | ||
Sensitivity analyses were undertaken on selected strategies to show the sensitivity of the model to changes in key assumptions. These are detailed in Sensitivity analyses applied to strategy 22, strategy 24 and strategy 25.
Further strategies were run that expanded on those outlined in Table 11. These, along with a description, are provided in Table 12; the analyses are not exhaustive but it is believed that inferences can be made for any strategies not explicitly run.
| Strategy number | Description | Strategy number | Description |
|---|---|---|---|
| 11 | As strategy 2 but using a time to test result of 24 hours for the laboratory-based test | 21 | As strategy 6 but using a time to test result of 6 hours for the laboratory-based test |
| 12 | As strategy 2 but using a time to test result of 6 hours for the laboratory-based test | 22 | As strategy 7 but using a time to test result of 24 hours for the laboratory-based test |
| 13 | As strategy 3 but using the acceptable TPP for POCTs | 23 | As strategy 7 but using a time to test result of 6 hours for the laboratory-based test |
| 14 | As strategy 3 but using data from currently available POCTs | 24 | As strategy 8 but using the acceptable TPP for POCTs |
| 15 | As strategy 14 but using a time to test result of 8 hours | 25 | As strategy 8 but using data from currently available POCTs |
| 16 | As strategy 4 but using the acceptable TPP for POCTs | 26 | As strategy 25 but using a time to test result of 8 hours |
| 17 | As strategy 4 but using data from currently available POCTs | 27 | As strategy 9 but using the acceptable TPP for POCTs |
| 18 | As strategy 5 but using a time to test result of 24 hours for the laboratory-based test | 28 | As strategy 9 but using data from currently available POCTs |
| 19 | As strategy 5 but using a time to test result of 6 hours for the laboratory-based test | 29 | As strategy 10 but using a time to test result of 24 hours for the laboratory-based test |
| 20 | As strategy 6 but using a time to test result of 24 hours for the laboratory-based test | 30 | As strategy 10 but using a time to test result of 6 hours for the laboratory-based test |
Calibration of the model
It is acknowledged that many parameter estimates are uncertain or have no data (e.g. effective contacts and attack rates). To attempt to provide meaningful results, the product of effective contacts and attack rates was calibrated. Carter et al. 36 reported that approximately 8.7% of the total patients diagnosed (i.e. those diagnosed at admission plus those diagnosed after admission) had nosocomial infections. We therefore set a target for the number of patients moved from non-SARS-CoV-2-infected bays to SARS-CoV-2-infected bays as approximately 8.7% of the sum of those patients identified as SARS-CoV-2 infected at admission and the numbers moved to SARS-CoV-2-infected bays in strategy 1, using 50 random number streams.
In the absence of data, the product of the number of effective contacts and attack rates per infectious person (θ1) was assumed to be the same in each bay, with the exception that this was assumed to be 31% lower for symptomatic patients (see Effective contacts and attack rates). θ1 was assumed applicable for patient-to-patient contact and staff-to-staff contact while waiting for a decision on admission, and for staff-to-staff contact for those working within the distinct areas of testing, discharge and informing patients of the admission decision. For the staff and patient contact during testing, discharge and informing the patient of the decision to admit to hospital or discharge, it was assumed that the product of effective contacts and attack rate was θ1/100.
In the calibration analysis it was assumed that the base-case laboratory-based SARS-CoV-2 test was used and that there was no retesting following negative SARS-CoV-2 tests, but that all patients with clinical symptoms of COVID-19 and chest imaging suggestive of COVID-19 would be allocated to a SARS-CoV-2-infected bay. Following calibration, θ1 was assumed to be 0.096 which estimated from 100 simulation runs that of the total number of identified COVID-19 cases 8.7% were identified after admission to a bay.
The number of different random number streams used per analysis
As with all individual-patient-based models, there is the possibility of ‘first-order’ uncertainty, which is the phenomenon that identical patients do not get identical outcomes because of the random numbers drawn to simulate whether or not a patient has an event of interest. The results for a given strategy will therefore change depending on the random number stream seed selected, as will the comparative results with alternative strategies/scenarios even when the same random number seed is used, as the allocation of random numbers will differ between the strategies/scenarios. To reduce the impact of random number streams, sufficient simulations, using different random number seeds, should be undertaken.
Analyses were undertaken to assess the variability in the mean results as the number of simulations were increased using a near-final version of the calibration model. Figure 2 depicts the number of patients infected in the hospital across each simulation and the average across all prior simulations and the current one.
FIGURE 2.
Assessment of how many simulations are required to stabilise the number of patients infected in hospital.

There is a trade-off between decreased model computation time and improved accuracy as more simulations with different random number streams are undertaken. Considering both aspects, we assumed that 50 random number streams would be sufficient to provide indicative results for number of infections in the hospital, which was believed to be an important outcome measure. For more rare events, such as critical events caused by SARS-CoV-2 infections, the presence of Monte Carlo sampling error (the differences in results purely due to the random numbers used) is significantly larger. To present meaningful results, regressions were undertaken of estimated QALYs lost through death in hospital as a result of SARS-CoV-2 infection and of estimated QALYs gained after COVID-19-related ICU stays caused by SARS-CoV-2 infection in hospital. The results of the regression were used in preference to the actual simulated results.
The use of net monetary benefit
As ratios of incremental costs divided by incremental QALYs, incremental cost-effectiveness ratios (ICERs) can be misleading when incremental QALY gains are low or when the estimated values are very close between two interventions and one is stated to be dominating the other. Incremental net monetary benefit, which is defined as the cost-per-QALY threshold multiplied by the incremental QALY gain minus the incremental cost,37 removes these limitations. For brevity, incremental net monetary benefit will be shortened to net monetary benefit (NMB) throughout this report. Within this framework, the largest NMB is associated with the most cost-effective strategy at the stated cost-per-QALY distribution, and multiple strategies can be compared simultaneously, as the absolute difference in strategies in terms of cost, having monetarised health differences, can be easily determined. These analyses have been undertaken at assumed cost-per-QALY thresholds of £20,000, £30,000 and £50,000, which are used in NICE technology appraisals,4 with the highest value used for treatments that meet end-of-life criteria.
Results
The estimated number of infections per strategy
Figure 3 provides the modelled number of infections for each of the 30 strategies listed in Tables 11 and 12 for patients infected after a decision to admit to hospital. SARS-CoV-2 infections that occur in people not admitted to hospital have been excluded, as these are similar for all strategies and differ only as a result of Monte Carlo sampling error. The excluded infections total approximately 27 per simulation.
FIGURE 3.
The estimated number of infections per strategy.
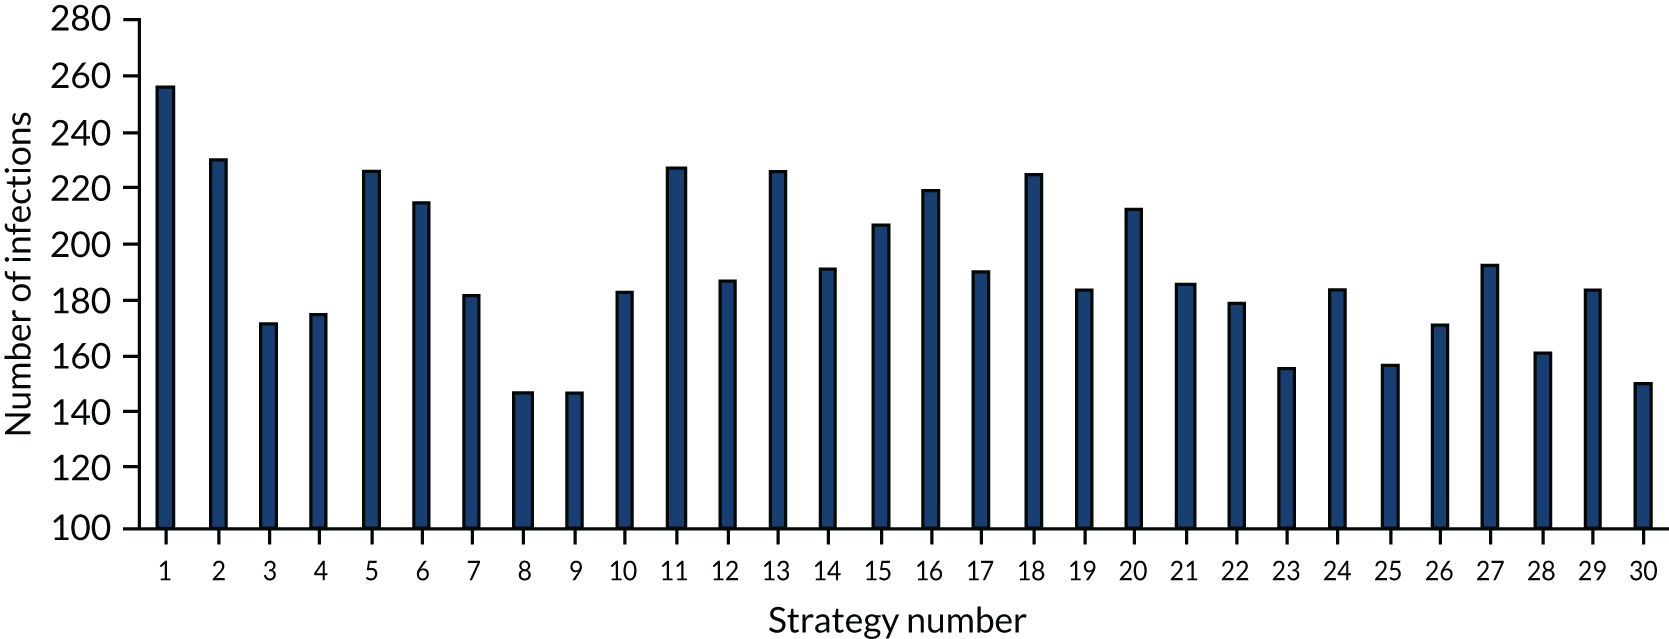
Strategy 1, which was believed to have been used in many hospitals during the early response to SARS-CoV-2 infection, is seen to result in the largest number of infections. As expected, SARS-CoV-2 POCTs with the desirable TPP result in fewer infections than SARS-CoV-2 POCTs with the acceptable TPP, and tests with a quicker turnaround time result in fewer infections.
The estimated occupancy level in the infinite bays
As described in The configuration of the hospitals used in the example, the example hospital had infinite bays to acknowledge that patients would be treated somewhere in the hospital or transferred to an alternative facility. One possible advantage of SARS-CoV-2 POCTs is the potential for allocating patients more quickly to a SARS-CoV-2-infected bay or a non-SARS-CoV-2-infected bay, thus reducing occupancy pressure on the waiting bays. Figures have been produced that indicate the level of occupancy in the infinite bays; these are in Figure 4 for strategy 1 and in Figures 18 and 19 (see Appendix 1) for the remaining strategies. There are two things to note for these analyses. First, Simul8 does not have the capability to produce such figures using multiple random number streams and so a particular random number stream has been selected. This was the random number stream that produced the estimated amount of time in the waiting bays closest to the mean value across the 50 streams. Second, Simul8 provides the average occupancy across the full Simul8-modelled time horizon of 200 days, although patients stop entering the model after 90 days; the default occupancy level is, therefore, approximately half of the actual value, and an inspection of the underlying data is more informative.
Figure 4 shows the occupancy levels of the infinite bays among people waiting for a decision about allocation to a SARS-CoV-2-infected bay or a non-SARS-CoV-2-infected bay. Among SARS-CoV-2-infected patients, non-SARS-CoV-2-infected patients, SARS-CoV-2-infected patients post ICU and non-SARS-CoV-2-infected patients post ICU, none entered the infinitely sized ICU, so figures for these are not presented. For information, SARS-CoV-2-infected patients entered a fifth ICU bay, non-SARS-CoV-2-infected patients entered a fourth ICU bay, SARS-CoV-2-infected patients post ICU entered a sixth bay and non-SARS-CoV-2-infected patients post ICU entered a fourth bay. Occupancy levels in areas where people waited for the decision to be made about whether or not they will be admitted to hospital have not been presented as these levels would be unaffected by which test is used.
FIGURE 4.
The occupancy level in the infinite bay. (a) For patients with clinical symptoms suggestive of COVID-19 while waiting for a decision on whether or not to allocate to a SARS-CoV-2-infected hospital bay; (b) for patients with clinical symptoms not suggestive of COVID-19 while waiting for a decision on whether or not to allocate to a SARS-CoV-2-infected hospital bay; (c) for patients allocated to a SARS-CoV-2-infected bay; and (d) for patients allocated to a non-SARS-CoV-2-infected bay.


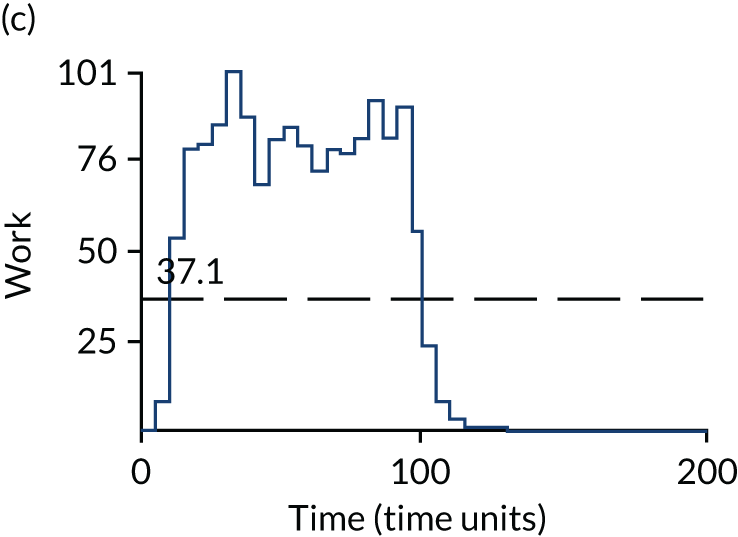
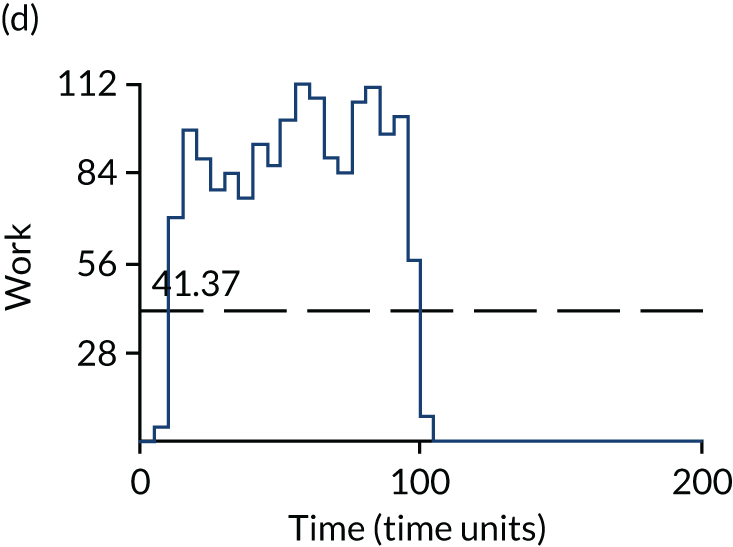
As the impact of the SARS-CoV-2 tests is likely to lead to differences in the occupancy of waiting bays before patients are allocated to a SARS-CoV-2-infected bay or a non-SARS-CoV-2-infected bay, only the occupancy levels in these two infinite bays are presented in Appendix 1 (see Figures 18 and 19). As anticipated, the tests with the shorter turnaround times resulted in lower occupancy levels in the waiting bays, with patients spending correspondingly more time in SARS-CoV-2-infected or non-SARS-CoV-2-infected bays. The desired TPP for SARS-CoV-2 POCTs (strategy 3) resulted in three single-bed bays being required for patients with clinical symptoms suggestive of COVID-19 and one single-bed bay being required for those without clinical symptoms suggestive of COVID-19. By contrast, strategy 1 required the infinite bays for both those with and those without clinical symptoms suggestive of COVID-19. As shown in Figure 4, among patients with clinical symptoms of COVID-19 the occupancy rate (labelled ‘work’ in the Simul8 output) in the infinite bay reached a maximum of 33, and among patients without clinical symptoms of COVID-19 the occupancy rate in the infinite bay reached a maximum of 7. To aid interpretation, the label of ‘time (time units)’ in the Simul8 output denotes the time in days.
Time spent in bays waiting to be allocated to a SARS-CoV-2-infected bay or a non-SARS-CoV-2-infected bay
An impact of different turnaround times for SARS-CoV-2 tests is differences in the time patients spend in waiting bays before being allocated to a SARS-CoV-2-infected bay or a non-SARS-CoV-2-infected bay, with times reduced in general bays on the assumption that the waiting time does not affect a patient’s overall time in hospital. The time spent in relevant bays is provided in Figure 5. Monte Carlo sampling error means that the total time in the bays is not identical for all strategies, although it is relatively similar, with the range between the highest and lowest summed value representing < 0.4% of the average total time.
FIGURE 5.
The days spent in bays awaiting a decision to be allocated to a SARS-CoV-2-infected bay or a non-SARS-CoV-2-infected bay and the days spent in a general bay.

Estimating the discounted quality-adjusted life-years lost due to death from SARS-CoV-2 infection
The model has the functionality to estimate the number of SARS-CoV-2 infections in hospital that result in a critical outcome (divided separately by the requirement for ICU care or by death). However, for rare events the Monte-Carlo sampling error is much greater and it was seen that 50 random number streams were not sufficient to remove this. To produce meaningful results a linear regression was undertaken to provide a general relationship between the number of infections and the number of deaths, as it was believed that the SARS-CoV-2 test employed would not influence the outcomes. A plot of infections and estimated QALY losses is provided in Figure 6, which uses as data points the results from the 30 strategies and the results from the sensitivity analyses detailed in Sensitivity analyses applied to strategy 22, strategy 24 and strategy 25, and in Appendix 2, which evaluates strategy 25 as well as strategy 22 and strategy 24. It is estimated that every SARS-CoV-2 infection in a hospitalised patient would result in 0.0604 QALY losses.
FIGURE 6.
Relationship between number of infections and simulated QALY losses due to SARS-CoV-2 infection among hospitalised patients.
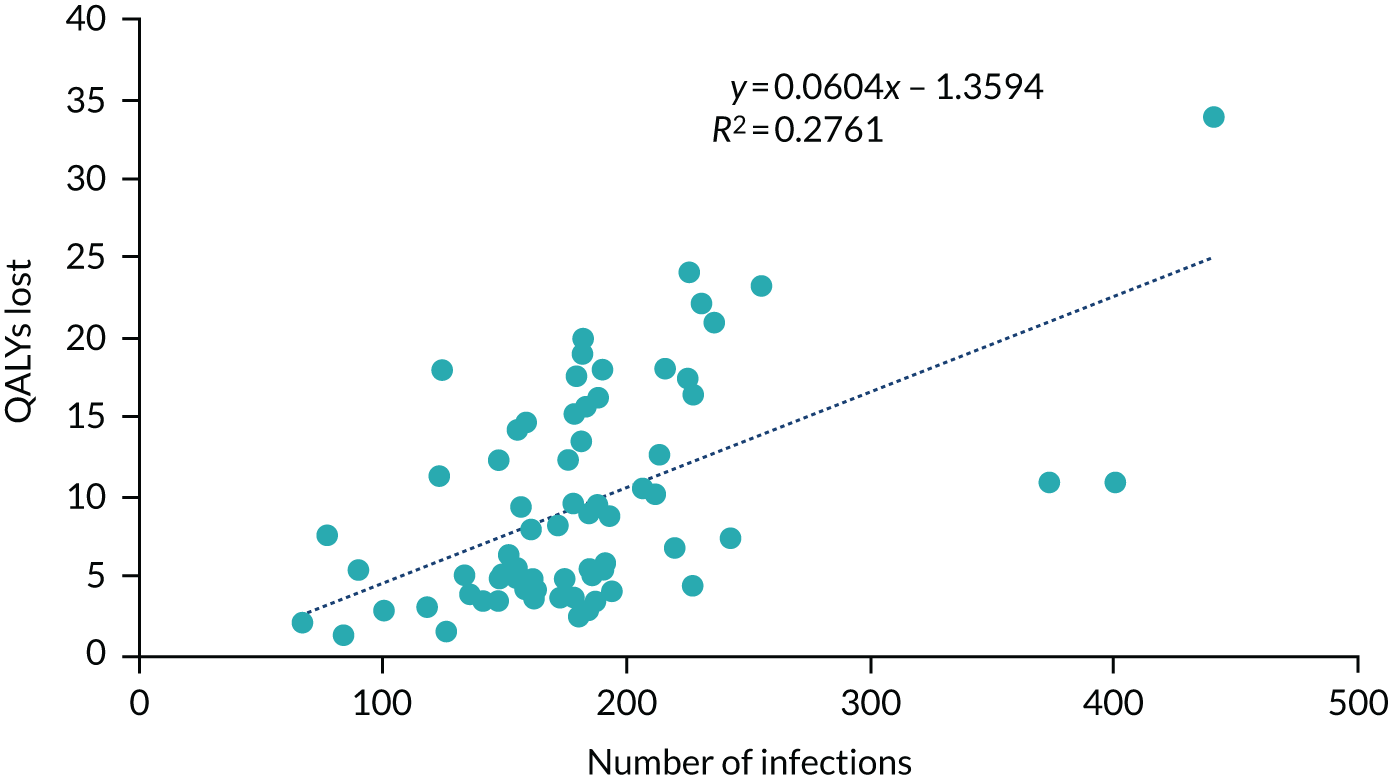
It has been recently reported that if patients become co-infected with both SARS-CoV-2 and influenza then the odds of mortality increase by 2.27 (95% confidence interval 1.23 to 4.19) compared with SARS-CoV-2 infection alone. 38 These figures are presumed to refer to SARS-CoV-2 infection that becomes COVID-19. The model does not include the potential for increased risks following co-infection, which may represent a limitation.
The estimated QALY losses associated with each strategy are shown in Figure 7.
FIGURE 7.
Estimated QALY losses per strategy due to SARS-CoV-2 infection in hospitalised patients.
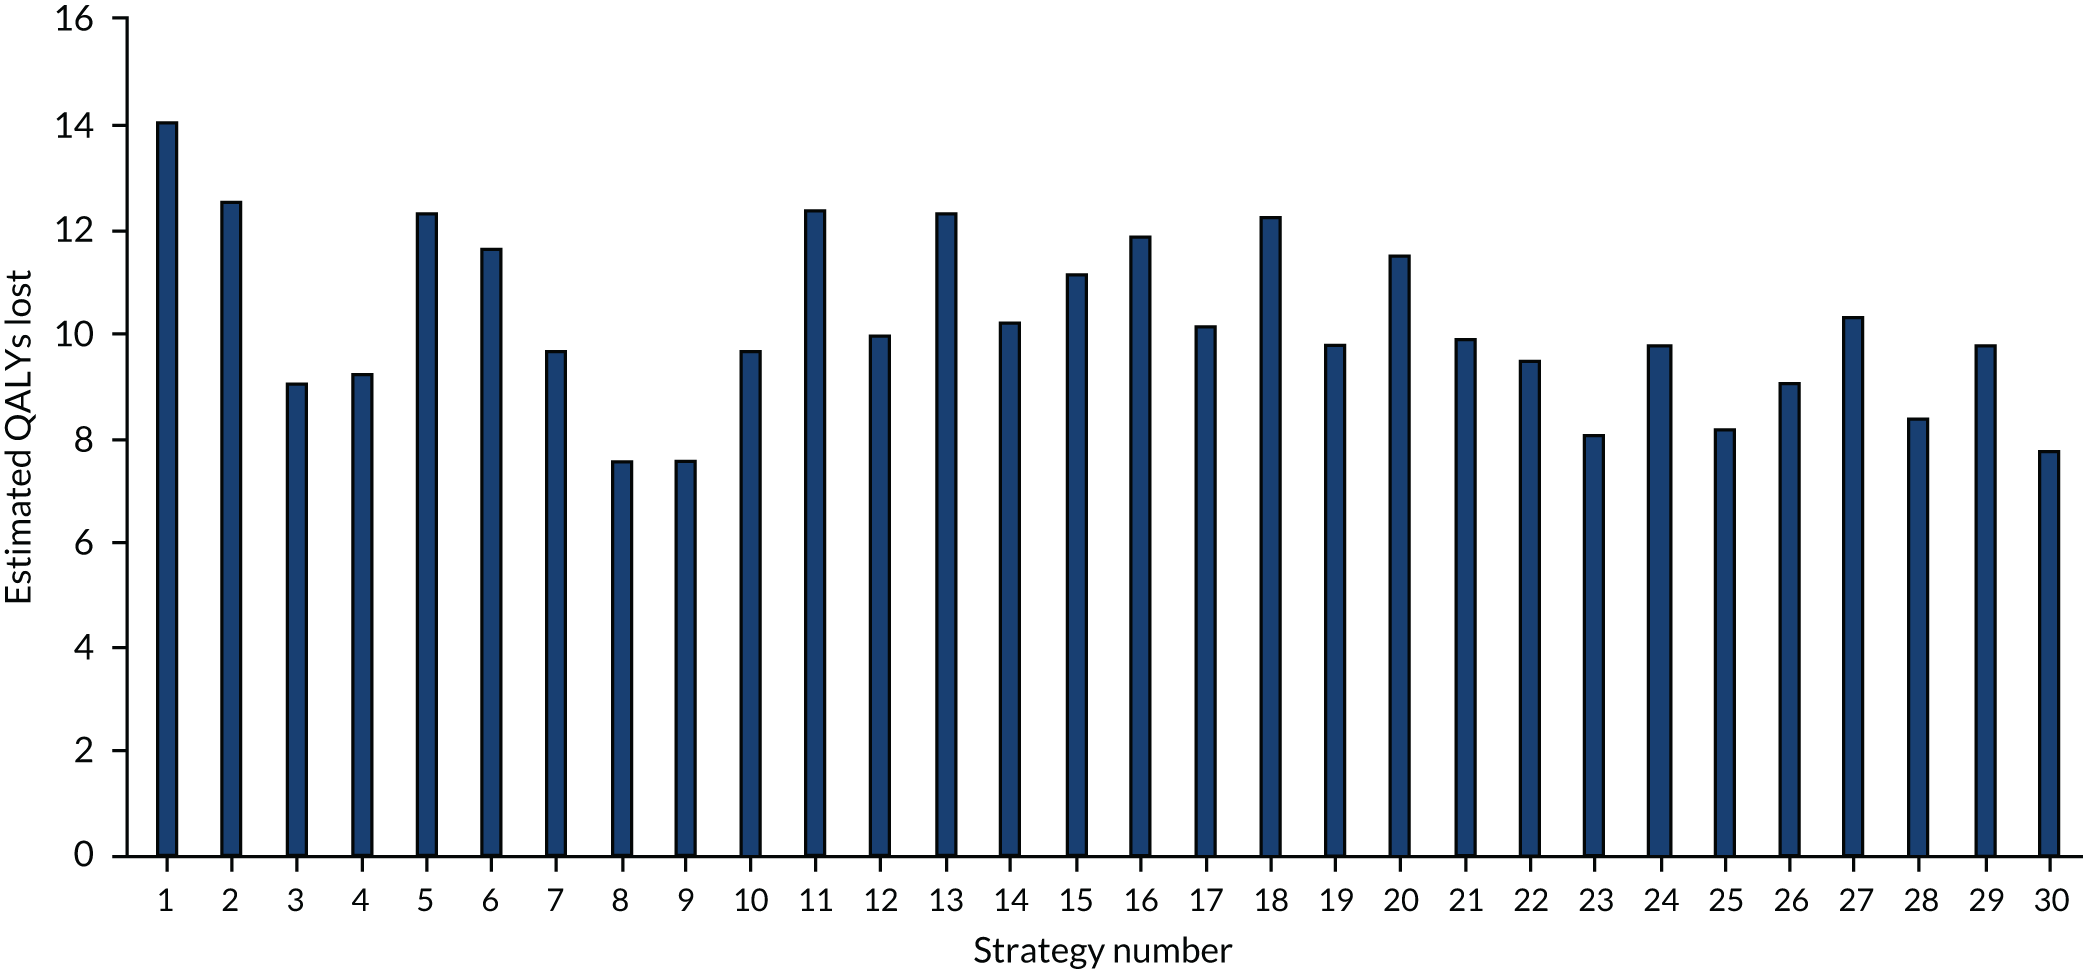
Estimating the discounted quality-adjusted life-years lost owing to requirement of intensive care unit care for SARS-CoV-2 infection
The model has the functionality to estimate the number of QALYs that are accrued for patients after they are discharged alive from ICU. It is anticipated that, following ICU care, the length and/or quality of life of these patients may be impaired compared with that of patients who have not had ICU care. An arbitrary QALY multiplier of 0.9 has been incorporated to take into account the loss of QALYs following ICU care, loosely based on the impact observed by Cuthbertson et al. 39 at 5 years for patients who had a severe sepsis episode. There was noticeable Monte Carlo sampling error for these values and, as with QALYs lost from death, a relationship was estimated using linear regression. The regression model fitted is shown in Figure 8 and allows the number of QALYs gained after ICU to be calculated from the estimated number of SARS-CoV-2 infections.
FIGURE 8.
Relationship between number of infections and simulated QALY losses due to SARS-CoV-2 infection in hospitalised patients.
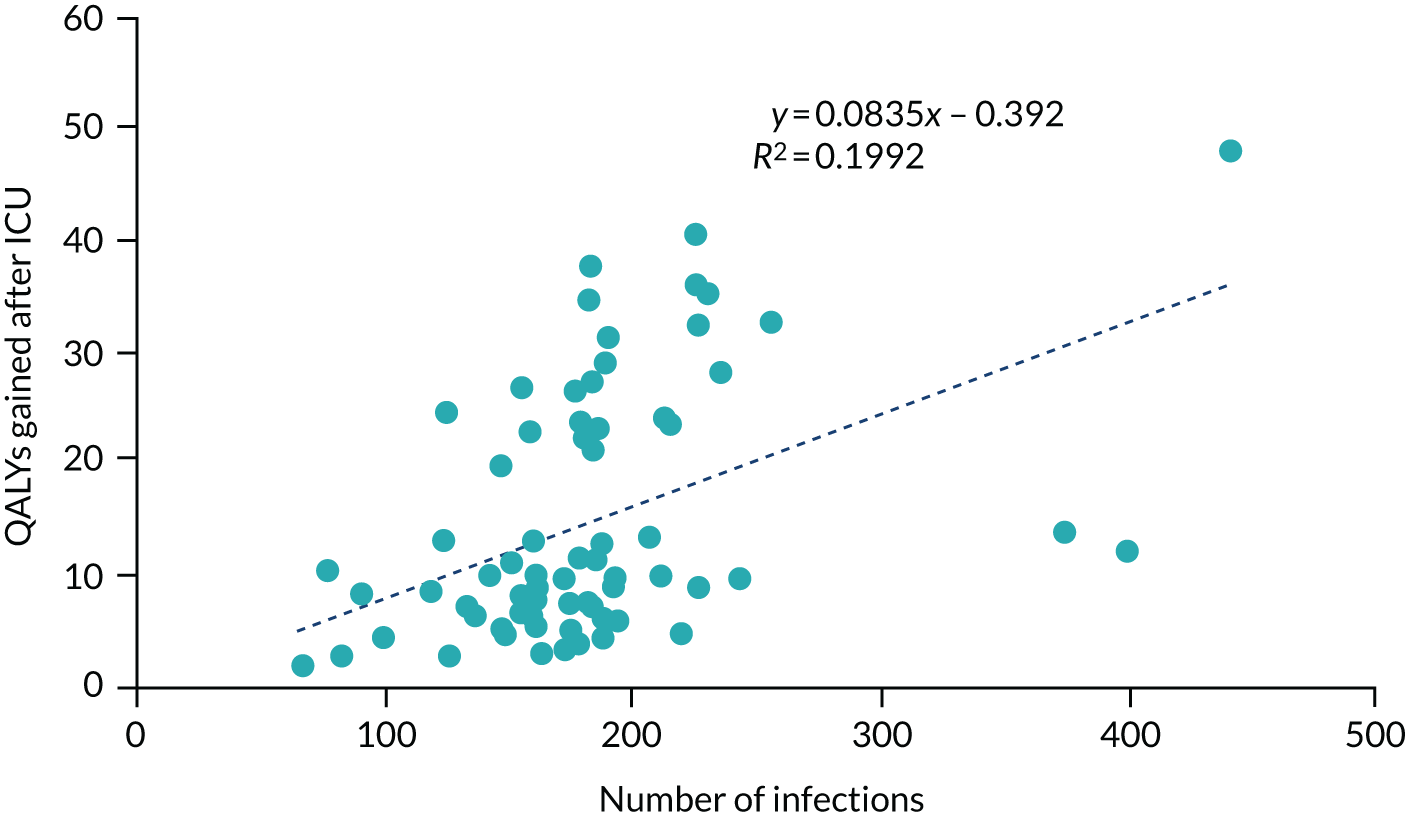
The estimated QALYs gained post ICU for each strategy have been multiplied by 0.1 to obtain an estimate of the number of QALY losses caused by additional requirement for ICU care. These data are presented in Figure 9.
FIGURE 9.
Estimated number of QALYs lost due to the requirement of additional ICU care in patients infected with SARS-CoV-2 in hospital.
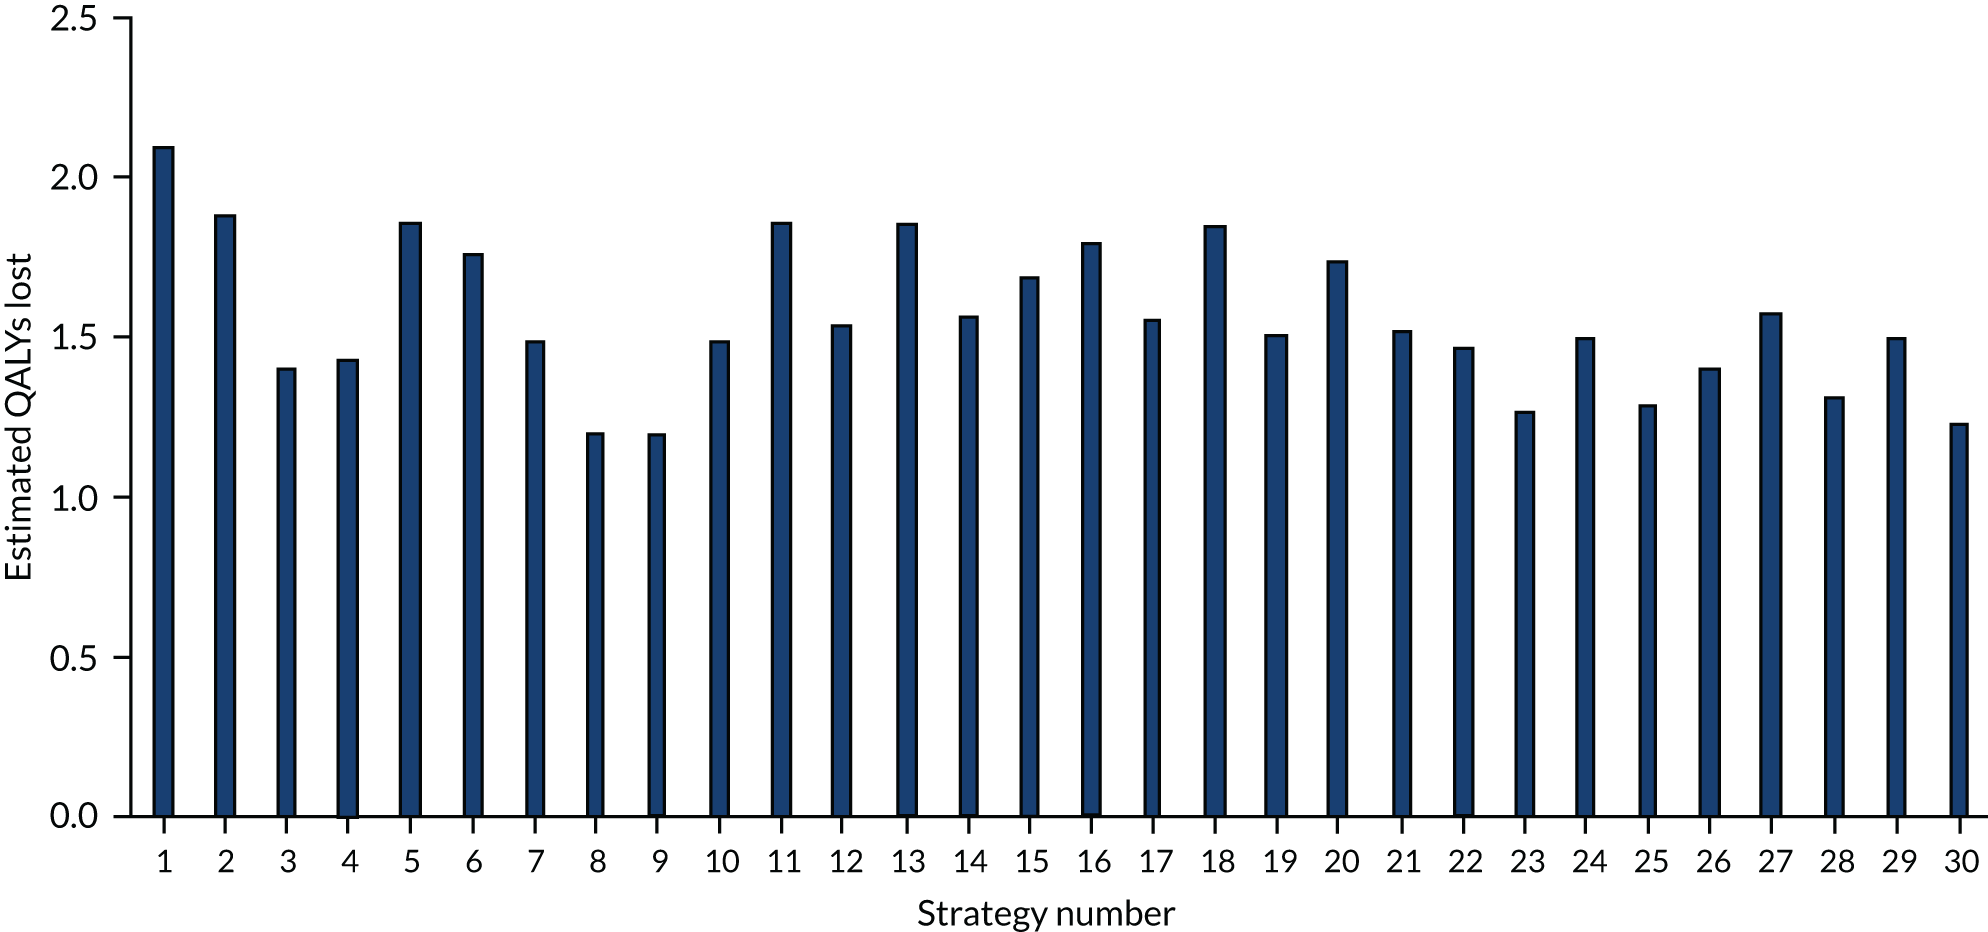
Estimating the number of tests performed, by strategy
The numbers of tests undertaken for each strategy are shown in Figure 10. These are divided into the number of tests undertaken before allocation to a SARS-CoV-2-infected bay or a non-SARS-CoV-2-infected bay and the number of routine retests in non-SARS-CoV-2-infected bays or in staff, as some strategies use laboratory-based SARS-CoV-2 tests for one group and SARS-CoV-2 POCTs for the other group.
FIGURE 10.
The estimated number of tests performed, by strategy.

Estimating the costs of tests performed, by strategy
The estimated costs of tests undertaken for each strategy are shown in Figure 11. These are divided into the costs of tests prior to allocation to a SARS-CoV-2-infected bay or a non-SARS-CoV-2-infected bay and the costs of routine retests in non-SARS-CoV-2-infected bays or in staff, as some strategies use laboratory-based SARS-CoV-2 tests for one group and SARS-CoV-2 POCTs for the other.
FIGURE 11.
The estimated costs of tests performed, by strategy.
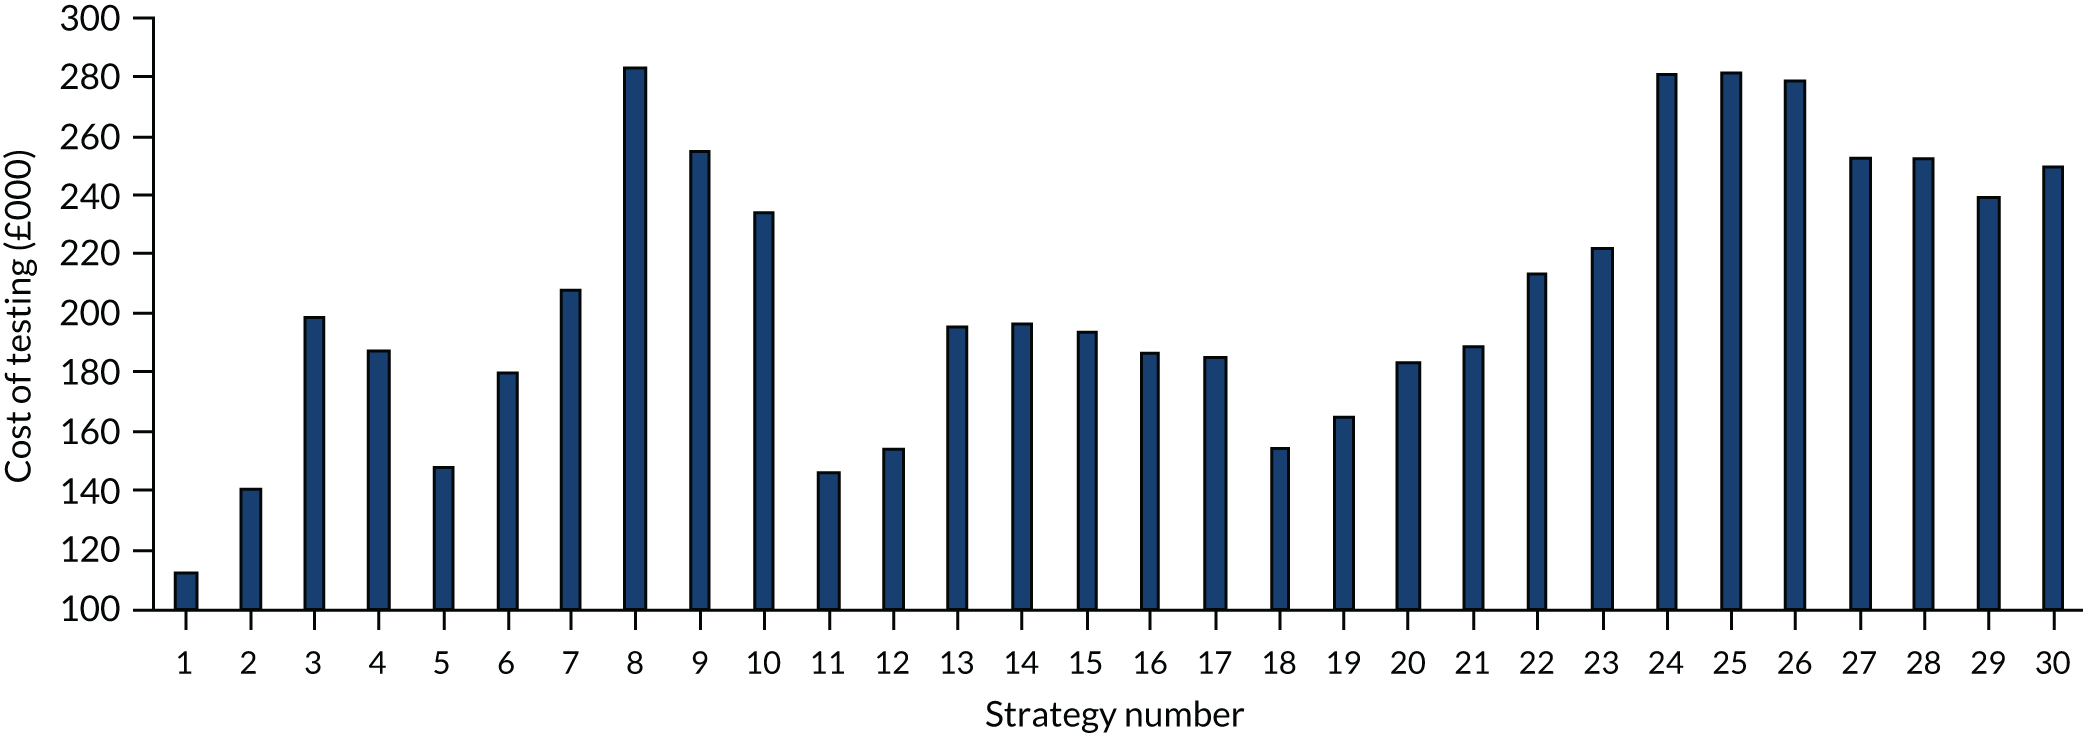
Estimating the costs of additional intensive care unit requirement
The model calculated the time spent in ICU with each strategy, as some patients infected with SARS-CoV-2 may require ICU care when they did not previously. Analyses were performed looking at the relationship between the number of infections in hospitals and the increased time associated with ICU care. The relationship was positive but very weak (R2 < 0.001) and so these costs have been omitted, which may be unfavourable to more accurate SARS-CoV-2 tests.
Estimating the cost-effectiveness of the strategies
The model calculated the estimated QALY losses for each strategy. These need to be transformed into QALY gains to be interpreted using the usual method. As a result, the QALY losses have been subtracted from a constant number (50); this does not affect the differences between strategies and hence the ICER and NMB values are not affected. The costs of testing and the transformed QALYs associated with each strategy are shown in Table 13.
| Strategy number | Cost of testing (£) | 50 – QALYs lost | Efficiency frontier (£) |
|---|---|---|---|
| 1 | 112,416 | 33.81 | – |
| 2 | 140,849 | 35.56 | Extendedly dominated |
| 11 | 145,745 | 35.78 | Extendedly dominated |
| 5 | 147,922 | 35.86 | Extendedly dominated |
| 18 | 154,174 | 35.93 | Extendedly dominated |
| 12 | 154,280 | 38.46 | 9003 |
| 19 | 164,783 | 38.68 | Extendedly dominated |
| 6 | 179,564 | 36.61 | Dominated |
| 20 | 183,198 | 36.77 | Dominated |
| 17 | 185,817 | 38.25 | Dominated |
| 16 | 185,889 | 36.31 | Dominated |
| 4 | 187,209 | 39.32 | Extendedly dominated |
| 21 | 189,360 | 38.56 | Dominated |
| 15 | 193,851 | 37.15 | Dominated |
| 13 | 195,743 | 35.80 | Dominated |
| 14 | 196,501 | 38.18 | Dominated |
| 3 | 198,217 | 39.53 | Extendedly dominated |
| 7 | 208,196 | 38.86 | Dominated |
| 22 | 213,279 | 39.02 | Dominated |
| 23 | 221,579 | 40.64 | 30,899 |
| 10 | 233,537 | 38.83 | Dominated |
| 29 | 239,515 | 38.71 | Dominated |
| 30 | 250,014 | 40.99 | Extendedly dominated |
| 28 | 252,965 | 40.27 | Dominated |
| 27 | 253,016 | 38.08 | Dominated |
| 9 | 254,316 | 41.23 | 54,733 |
| 26 | 278,931 | 39.57 | Dominated |
| 24 | 280,828 | 38.72 | Dominated |
| 25 | 281,597 | 40.52 | Dominated |
| 8 | 283,233 | 41.24 | 5,257,711 |
A full incremental analysis has been performed providing ICERs (in terms of the incremental cost per QALY gained) for those strategies on the efficiency frontier. The efficiency frontier includes only those points that are not dominated (dominated: providing equal or fewer QALYs at higher cost, or fewer QALYs at an equal or higher cost) by a single strategy, or that are not extendedly dominated. A strategy is extendedly dominated when a combination of two other strategies results in combined cost and QALY values that would dominate the initial strategy.
However, the full incremental analyses have little meaning, as the desirable TPP for a POCT will always dominate a POCT with an acceptable TPP and yet these may not be choices available to the decision-maker. The use of a NMB approach may be preferable, as is detailed.
As ratios of incremental costs divided by incremental QALYs, ICERs can be misleading when incremental QALY gains are low or when the estimated values are very close between two interventions and one is stated to be dominating the other. NMB is helpful for removing these limitations, although it requires a threshold for the cost-per-QALY ratio to be stated, which is a decision made by the NICE committee. NMB values are presented here using threshold values of £20,000, £30,000 and £50,000 per QALY gained for all strategies compared with strategy 1. These supplementary data are presented in Figure 12. The NMB values are those associated with all 22,500 patients entering the hypothetical hospital during the 90-day period.
FIGURE 12.
The NMB associated with each strategy at stated cost-per-QALY thresholds compared with strategy 1.

It is cautioned that the cost-effectiveness analyses should not be taken in isolation. In addition to the uncertainty within the model, the characteristics of the POCT or laboratory-based SARS-CoV-2 tests may not exist or may not be available, and some strategies may not be feasible because of the configuration of the hospital. The data provided in The estimated occupancy level in the infinite bays, Time spent in bays waiting for allocation to a SARS-CoV-2-infected bay or a non-SARS-CoV-2-infected bay and Appendix 1 should be considered alongside the cost-effectiveness output.
In addition, for each of the 30 strategies evaluated in the main report, data were extracted for patients discharged after admission to hospital on the estimated numbers of people in three groups: ‘correct isolation’, ‘missed isolation’ and ‘unnecessary isolation’. Respectively, these groups comprised patients who had SARS-CoV-2 infection and were correctly told this information; had SARS-CoV-2 infection and were not told this information, because they had either a negative test result or a failed test result that was not repeated; and did not have SARS-CoV-2 infection but were told that they did.
The missed isolation group represents people who should be self-isolating but were told that this was not required, whereas the unnecessary isolation group represents people who were told that they should self-isolate even though this was not required. The estimated results are presented in Figure 13. These values include the results of SARS-CoV-2 tests that become known after the patient has been discharged, with the results conveyed to the patient when they are at home. It is seen that strategies that use the acceptable TPP for SARS-CoV-2 POCTs (strategies 13, 16, 24 and 27) are associated with increased numbers of unnecessary isolations as a result of the lower specificity associated with this TPP. This may have negative impacts if there are other pressures on isolation bays.
FIGURE 13.
Data on the number of correct isolations, missed isolations and unnecessary isolations by strategy.

Sensitivity analyses undertaken
There is considerable uncertainty relating to the parameters within the model. This has been explored in sensitivity analyses, although these were constrained by the deadlines for the report. Where additional runs of the model were necessary, three strategies that may be plausible were selected: strategy 22, in which patients and staff are tested using a laboratory-based SARS-CoV-2 test that takes 24 hours, was compared with strategy 24, which differs from strategy 22 as a SARS-CoV-2 POCT with an acceptable TPP was used rather than the 24-hour laboratory test, and strategy 25, in which the laboratory-based test was replaced with data from currently available SARS-CoV-2 POCTs. The change in the difference in key outcomes between the strategies may be informative to the committee.
A further set of sensitivity analyses were run, removing the testing of asymptomatic staff using strategy 2 and strategy 14 to provide indicative results. Strategy 2 assumes a laboratory-based SARS-CoV-2 test with a turnaround time of 35.9 hours, whereas strategy 14 uses data from currently available SARS-CoV-2 POCTs. The change in the difference in key outcomes between the strategies may be informative to the committee. As turnaround time was a key element of the decision problem, additional sensitivity analyses were undertaken that varied the turnaround time of the laboratory-based SARS-CoV-2 test in strategy 2 and of the SARS-CoV-2 POCT in strategy 14.
A final set of sensitivity analyses were run that explored the estimated number of infections if SARS-CoV-2 testing were not possible.
When interpreting the results, it should be noted that the model was not recalibrated for all sensitivity analyses described here. However, the model was recalibrated for three sensitivity analyses: (1) the relative product of attack rate and effective contacts for asymptomatic patients to that of symptomatic patients, (2) where the time before a patient became non-infectious was increased and (3) where it was assumed that the laboratory-based SARS-CoV-2 test had a turnaround time of 21.3 hours. Recalibration was necessary because (1) these were not believed to be changes that have occurred since the early stages of the pandemic but would have been the values throughout the simulation and (2) these were shown to significantly affect the results when the model was not recalibrated. For the reduction in asymptomatic product of attack rates and effective contacts, θ1 was 0.1285; this value was 0.0759 when the time to becoming non-infectious was increased and 0.0885 when the turnaround time of the laboratory-based SARS-CoV-2 test was assumed to be 21.3 hours. θ1 increasing when the turnaround time of a laboratory-based test was decreased was unexpected. On inspection, this could be explained as the model being calibrated based on those who received a positive SARS-CoV-2 test while in hospital. When the test took 35.9 hours, more patients had been discharged from hospital at the time of the result being known than if the SARS-CoV-2 test took 24 hours. Only patients in hospital at the time of the test result becoming available contributed to the calibration.
Sensitivity analyses applied to all strategies
The following scenario analyses could be applied after the model runs: setting the cost of laboratory tests equal to the costs of POCTs; increasing the multiplier for QALYs gained post ICU to 1; decreasing the multiplier for QALYs gained post ICU to 0.8; and reducing the proportion of SARS-CoV-2 infections that resulted in critical outcomes by 90%.
Setting the costs of laboratory-based SARS-CoV-2 tests equal to the costs of SARS-CoV-2 point-of-care tests
Characteristics of the point-of-care tests and laboratory-based tests details that the costs assumed per test were £27.76 for a POCT and £21.90 for a laboratory-based test. Sensitivity analyses have been performed setting both costs equal to £27.76. As anticipated, the results are more favourable to POCTs.
The NMB analyses in this scenario are shown in Figure 14. The efficiency frontier becomes strategy 1, strategy 3 (£3520) and strategy 8 (£49,702).
FIGURE 14.
The NMB compared with strategy 1 when the costs of SARS-CoV-2 laboratory testing are set equal to the costs of SARS-CoV-2 POCTs.

Amending the multiplier associated with quality-adjusted life-years gained post intensive care unit care caused by a SARS-CoV-2 infection
The multiplier used post ICU was 0.9, although this was arbitrary (see Estimating the discounted quality-adjusted life-years lost owing to requirement of intensive care unit care for SARS-CoV-2 infection). Analyses have been run assuming that this increased to 1 (indicating that ICU had no effect on length or quality of life after discharge) and decreased to 0.8.
When the multiplier was 1, the strategies on the efficiency frontier remained strategy 1, strategy 12 (£10,247), strategy 23 (£35,171), strategy 9 (£62,300) and strategy 8 (£5,984,563). The NMB for this sensitivity analysis is provided in Figure 20 (see Appendix 2).
When the multiplier was 0.8, the strategies on the efficiency frontier remained strategy 1, strategy 12 (£8028), strategy 23 (£27,333), strategy 9 (£48,805) and strategy 8 (£4,688,296). The NMB for this sensitivity analysis is provided in Figure 21 (see Appendix 2).
Reducing the proportion of patients infected with SARS-CoV-2 who have a critical outcome
The chance of a patient being infected with SARS-CoV-2 in hospital and now requiring ICU care or dying was detailed in The probability of patients infected with SARS-CoV-2 in hospital having a worse prognosis, with a value of 8.9% used in the base case. This value was based on many assumptions, including the proportion of SARS-CoV-2 infections that are symptomatic, which may be overestimated if there are a large number of unreported symptomatic cases, or if fatality rates have improved due to treatment enhancement since SARS-CoV-2 was identified. A sensitivity analysis was performed that reduced the risk of a critical outcome by 90%. It is seen (Figure 15) that this markedly changed the results, with strategy 1 having the highest NMB as it was the cheapest in terms of testing costs. The elements on the efficiency frontier were the same, but the ICERs were 10 times higher: strategy 1, strategy 12 (£90,025), strategy 23 (£308,993), strategy 9 (£547,329) and strategy 8 (£52,577,110).
FIGURE 15.
The NMB compared with strategy 1 when the risks of critical outcomes are reduced by 90%.

Sensitivity analyses applied to strategy 22, strategy 24 and strategy 25
As described, these strategies have been chosen to represent a plausible laboratory-based SARS-CoV-2 test and a potentially plausible SARS-CoV-2 POCT.
In the base case, there were an estimated 180.04 infections after admission to hospital in strategy 22, while there were an estimated 184.44 infections after admission to hospital in strategy 24 and 158.26 infections in strategy 25. Strategy 22 was estimated to dominate strategy 24, with an increase of 0.30 QALYs and a saving of £67,549. Strategy 25 had an ICER of £45,635 compared with strategy 22, providing 1.50 more QALYs at an additional cost of £68,318, as shown in Table 14.
| Strategy | Testing costs (£) | 50 – QALYs lost | Efficiency frontier (ICER) (£) |
|---|---|---|---|
| 22 | 213,279 | 39.02 | – |
| 24 | 280,828 | 38.72 | Dominated |
| 25 | 281,597 | 40.52 | 45,625 |
The following sensitivity analyses were run: assuming that clinicians do not over-ride negative SARS-CoV-2 test results; amending the product of effective contacts and attack rates; allowing a pink bay; allowing patients to stay in waiting bays until they are discharged; ICU or death following two negative SARS-CoV-2 tests; allowing patient and staff immunity; amending the hospital configuration; changing the number of patients attending A&E per day; reducing the proportion of patients attending A&E with conditions that do not necessitate hospitalisation; changing the ratio of patients with clinical symptoms suggestive of COVID-19 between those with COVID-19 and those without; removing the possibility that staff were infected in the community; changing the test failure rate; assuming that failed SARS-CoV-2 tests would be interpreted as negative results for SARS-CoV-2 infection; increasing the length of time for which a person with SARS-CoV-2 is infectious; decreasing the turnaround time for laboratory-based SARS-CoV-2 tests; and assuming a lower attack rate for people with asymptomatic SARS-CoV-2 infection.
A summary of how these sensitivity analyses affect the number of patients infected is shown in Table 15. A description of each sensitivity analysis is presented below. Given the small differences between the three strategies, it is unclear the extent to which Monte Carlo sampling error may have an impact on the results.
| Sensitivity analysis | Number of patients infected during a hospital stay | Efficiency frontier (ICER) (£) | ||||
|---|---|---|---|---|---|---|
| Strategy 22 | Strategy 24 | Strategy 25 | Strategy 22 | Strategy 24 | Strategy 25 | |
| Base case | 180.04 | 184.44 | 158.26 | – | Dominated | 32,177 |
| Assuming that clinicians do not over-ride a negative SARS-CoV-2 test | 124.50 | 141.82 | 90.68 | – | Dominated | 32,177 |
| Halving the product of attack rates and effective contacts | 77.52 | 83.40 | 66.74 | – | Dominated | 91,984 |
| Doubling the product of attack rates and effective contacts | 441.16 | 399.50 | 373.46 | – | Extendedly dominated | 14,845 |
| Allowing pink bays | 186.54 | 178.78 | 154.72 | – | Extendedly dominated | 32,250 |
| Allowing patients with two negative SARS-CoV-2 tests but with clinical symptoms to remain in the waiting bay | 182.22 | 179.12 | 160.34 | – | Extendedly dominated | 39,746 |
| Assuming that 10% of patients and staff without SARS-CoV-2 infection are immune | 155.48 | 163.50 | 136.06 | – | Dominated | 51,256 |
| All bays are single-bedded apart from the infinite bay | 159.28 | 161.76 | 133.98 | – | Dominated | 39,254 |
| No single-bedded bays for those with clinical symptoms suggestive of COVID-19 awaiting allocation to a SARS-CoV-2-infected bay or a non-SARS-CoV-2-infected bay | 188.46 | 191.16 | 158.26 | – | Dominated | 33,036 |
| Increasing the number of patients attending A&E to 350 per day | 236.18 | 243.04 | 212.24 | – | Dominated | 53,808 |
| Decreasing the number of patients attending A&E to 150 per day | 123.10 | 126.00 | 100.20 | – | Dominated | 30,927 |
| Decrease in the proportion of patients without SARS-CoV-2 infection and who do not need to be hospitalised | 179.16 | 180.26 | 161.24 | – | Dominated | 43,459 |
| Decrease in the proportion of patients without SARS-CoV-2 infection who need to be hospitalised and who do not have clinical symptoms suggestive of COVID-19 | 147.48 | 154.94 | 118.58 | – | Extendedly Dominated | 24,879 |
| Assuming that staff cannot get infected with SARS-CoV-2 in the community | 179.16 | 180.26 | 155.50 | – | Dominated | 32,769 |
| Changing the failure rates of SARS-CoV-2 tests to 1% | 175.86 | 175.36 | 160.48 | – | Dominated | 53,266 |
| Changing the failure rates of SARS-CoV-2 tests to 10% | 189.92 | 187.72 | 155.50 | – | Extendedly dominated | 36,507 |
| Using the sensitivity and specificity of detecting COVID-19 from data relating to computed tomography | 181.60 | 174.24 | 162.76 | – | Extendedly dominated | 30,010 |
| Assuming that the breakdown of patients attending A&E was as follows: SARS-CoV-2 infected needing hospitalisation, 10%; SARS-CoV-2 infected not needing hospitalisation, 5%; non-SARS-CoV-2 infected needing hospitalisation, 11%; non-SARS-CoV-2 infected not needing hospitalisation, 74% | 248.78 | 245.56 | 203.80 | – | Dominated | Dominated |
| Changing the failure rates of laboratory-based SARS-CoV-2 tests to 2.5% | 182.94 | 184.44 | 158.26 | – | Extendedly dominated | 51,762 |
| Assuming that test failures are to be taken as a negative SARS-CoV-2 test | 185.92 | 182.54 | 163.44 | – | Extendedly dominated | 43,444 |
| Assuming a longer time before a patient infected with SARS-CoV-2 is non-infectious | 167.96 | 181.36 | 148.94 | – | Dominated | 52,366 |
| Assuming the laboratory-based SARS-CoV-2 tests had a turnaround time of 21.3 hours when calibrating the model | 143.88 | 144.98 | 127.22 | – | Dominated | 59,669 |
| Reducing the attack rate of asymptomatic patients to 0.31 that of symptomatic patients | 159.46 | 157.94 | 139.20 | – | Extendedly dominated | 49,187 |
Assuming clinicians do not over-ride a negative SARS-CoV-2 test
The base-case model assumes that patients who have clinical symptoms of COVID-19 and who have chest imaging results suggestive of COVID-19 would be moved to a SARS-CoV-2-infected bay despite two negative tests. In sensitivity analyses, clinicians were assumed not to over-ride SARS-CoV-2 test results in order to explore the impact of this on the results. These results are provided in Table 18 (see Appendix 2), with the ICER for strategy 25 compared with strategy 22 reducing to £32,177 compared with the base-case value of £45,625 (see Table 14).
It may be inferred that if SARS-CoV-2 tests are significantly accurate then clinicians over-riding the SARS-CoV-2 tests and placing patients with other diseases such as pneumonia into bays containing patients with COVID-19 may harm patients, as QALYs increase when it is assumed that no SARS-CoV-2 tests are over-ridden. However, if the chest imaging method is sufficiently accurate, this conclusion may be changed (see Changing the assumed sensitivity and specificity of chest imaging).
Changing the product of effective contacts and attack rates
There is considerable uncertainty in both the attack rates and the number of effective contacts, although this was mitigated to some extent by the calibration undertaken that was described in Calibration of the model. Sensitivity analyses were undertaken with the product of effective contacts and attack rates halved and doubled compared with the start of the pandemic. These analyses could represent better knowledge and protective equipment or more crowding in hospitals, respectively. As anticipated, the ICER increases for the more clinically effective strategy when the product of attack rates and effective contacts is halved (see Appendix 2, Table 19) but decreases when the product of attack rates and effective contacts is doubled (see Appendix 2, Table 20). When the product was doubled, strategy 24 was no longer dominated by strategy 22 and had an ICER of £23,967 compared with strategy 22.
Allowing the hospital to use pink bays
Pink bays are described in Waiting for a decision on bed allocation. When these were used, the direction in the change in the number of patients infected in hospital was inconsistent, as it increased in strategy 22, but decreased in strategy 24 and strategy 25, which is expected to be due to Monte Carlo sampling error. The ICER for strategy 25 compared with strategy 22 decreased with the introduction of pink bays (see Appendix 2, Table 21). When pink bays were utilised, strategy 24 was no longer dominated by strategy 22 and had an ICER of £130,646 compared with strategy 22.
Allowing patients with two negative SARS-CoV-2 tests but with clinical symptoms to remain in the waiting bay
Rather than being discharged to either a SARS-CoV-2-infected bay or a non-SARS-CoV-2-infected bay, this sensitivity analyses explored the impact of allowing patients with clinical symptoms of COVID-19 but with two negative tests to remain in the waiting bay until discharge, ICU care or death. The ICER of strategy 25 compared with strategy 22 decreased and strategy 24 was no longer dominated by strategy 22 but had an ICER of £272, 570 compared with strategy 22 (see Appendix 2, Table 22).
Assuming that 10% of patients and staff without SARS-CoV-2 infection are immune
As anticipated, when a proportion of patients are considered immune, the number of infections in each strategy decreases. The ICER for strategy 25 compared with strategy 22 also increases (see Appendix 2, Table 23).
Changing the hospital configuration
As stated in The configuration of the hospitals used in the example, the hospital configuration is arbitrary. Two sensitivity analyses have been performed. The first sensitivity analysis makes all of the non-infinite bays in Table 6 single-bedded, with the remaining bay an infinite one. The second sensitivity analysis assumes that there are no single-bedded bays in the waiting bay for patients who have clinical symptoms suggestive of COVID-19.
With single-bedded bays, the number of infections in hospital reduced, although the ICER for strategy 25 decreased, which may be due to Monte Carlo sampling error (see Appendix 2, Table 24). With single-bedded bays removed for those with clinical symptoms awaiting allocation to a SARS-CoV-2-infected bay or a non-SARS-CoV-2-infected bay, the number of infections increased, and the ICER of strategy 25 compared with strategy 22 decreased (see Appendix 2, Table 25).
Changing the number of accident and emergency attendances per day
Two sensitivity analyses were performed: (1) increasing the number of patients from 250 per day to 350 and (2) reducing the number to 150 per day. The results are shown in Tables 26 and 27, respectively (see Appendix 2).
As expected, with more patients, there were more infections after admission to hospital and fewer infections after admission to hospital when fewer patients attended A&E; the costs of testing were correlated with the number of attendees. The ICER for strategy 25 compared with strategy 22 increased when more patients were assumed to attend A&E and decreased when fewer patients attended.
Changing the composition of attendances at accident and emergency per day
It is hypothesised that if there is considerable SARS-CoV-2 infection in the population then patients with more minor injuries may not attend A&E. To explore the impact of this, it was assumed that 50% of patients who would not be hospitalised and did not have SARS-CoV-2 infection would not turn up at hospital. This resulted in an estimated 144 attendees per day, of whom 6.11% would have SARS-CoV-2 infection and need hospitalisation, 1.56% would have SARS-CoV-2 infection and not need hospitalisation, 20.83% would not have SARS-CoV-2 infection but would need hospitalisation and 71.51% would not have SARS-CoV-2 infection and would not need hospitalisation. The times to decision on admission were reduced in line with fewer patients entering A&E for this sensitivity analysis, being 0.90 hours for those arriving between midnight and 6 a.m., 1.36 hours for those arriving between 6 a.m. and 6 p.m. and 1.81 hours for those arriving between 6 p.m. and midnight. The results (see Appendix 2, Table 28) in this scenario were similar to those in the base case.
An additional analysis assumed that the breakdown of patients attending A&E were: SARS-CoV-2 infected needing hospitalisation, 10% (previously 3.5%); SARS-CoV-2 infected not needing hospitalisation, 5% (previously 1.8%); non-SARS-CoV-2 infected needing hospitalisation, 11% (previously 12.0%); and non-SARS-CoV-2 infected not needing hospitalisation, 74% (previously 82.6%). The increase is arbitrary but the proportion of people with SARS-CoV-2 infection entering A&E is approaching three times that in the base case, which was thought to be a big enough difference to be informative should the proportion of SARS-CoV-2 in the community be higher than that during the initial periods of the pandemic. These results showed that the ICER for strategy 25 compared with strategy 22 decreased (see Appendix 2, Table 29). Strategy 24 was no longer dominated by strategy 22 and had an ICER of £377,351 compared with strategy 22.
Changing the proportion of patients who need hospitalisation who do not have a SARS-CoV-2 infection but have clinical symptoms suggestive of COVID-19
The prevalence of clinical symptoms indicative of COVID-19 in those patients admitted to hospital details the calculations and assumptions used to populate the proportion of patients hospitalised who do not have a SARS-CoV-2 infection but have clinical symptoms suggestive of COVID-19. The value estimated (28.02%) was increased to 50% to account for the higher prevalence of respiratory illness in the winter months. The sensitivity analysis uses the 28.02% value.
When the proportion is reduced, the number of infections within hospital is noticeably reduced, although it is noted that this parameter is not within the control of decision-makers. The ICER for strategy 25 was seen to decrease compared with the base case (see Appendix 2, Table 30).
Removing the possibility that staff members were infected in the community
In the base case there was a risk of a staff member being infected in the community of 6 in 10,000 per day (see The characteristics of staff members working in the hospital), which is a potential source of Monte Carlo sampling error. To explore the possibility of this, the possibility of staff members being infected in the community was removed.
The numbers of infections after hospital admission decreased for all strategies, with the ICER for strategy 25 compared with strategy 22 increasing to £53,266 (see Appendix 2, Table 31).
Changing the assumed test failure rate
The failure rate for both laboratory-based SARS-CoV-2 tests and SARS-CoV-2 POCTs was set at 5% in the base case. Sensitivity analyses were undertaken changing the rate to 10% and 1%. In both sensitivity analyses, the ICER for strategy 25 compared with strategy 22 decreased and strategy 24 was no longer dominated by strategy 22, which suggests Monte Carlo sampling error (see Appendix 2, Tables 32 and 33). The ICER for strategy 24 compared with strategy 22 was £1.9M (1% failure rate) and £466,032 (10% failure rate).
A further analysis was conducted assuming that the failure rates were lower with a laboratory-based SARS-CoV-2 test than with a SARS-CoV-2 POCT, with the failure rate reduced to 2.5% in laboratory-based tests. This resulted in lower costs in strategy 22, as would be expected with fewer tests conducted, but also a decrease in QALYs, which may be due to either Monte Carlo sampling error or a reduced risk of infection in the waiting bays. The ICER for strategy 25 compared with strategy 22 decreased modestly (see Appendix 2, Table 34).
Changing the assumed sensitivity and specificity of chest imaging
In the base case, values of 56% (sensitivity) and 60% (specificity) were used based on data obtained from chest X-rays. In the sensitivity analyses we use results for computed tomography of 85% for sensitivity and 50% for specificity. Chest imaging was used to over-ride negative SARS-CoV-2 test results if the patient also had clinical symptoms suggestive of COVID-19. The computed tomography values result in more patients with SARS-CoV-2 infection and clinical symptoms indicating SARS-CoV-2 being correctly allocated after a false-negative SARS-CoV-2 test, but fewer patients without SARS-CoV-2 infection but symptoms suggestive of COVID-19 being correctly allocated after a true-negative SARS-CoV-2 test.
The change in the number of infections differed between strategies, being higher in strategy 22 and strategy 25 (see Appendix 2, Table 35), which is likely to be Monte Carlo sampling error given the relatively high diagnostic accuracy of these tests (see Table 9), although there were fewer infections with strategy 24, which had poorer diagnostic accuracy. The ICER for strategy 25 compared with strategy 22 increased to £51,762; the ICER for strategy 24 compared with strategy 22 was £131,171.
Assuming that all failed SARS-CoV-2 tests would be interpreted as negative results rather than reperformed
When it was assumed that failed tests would not be identified as such, the testing costs of all strategies decreased, although the QALYs gained differed, being relatively greater in strategy 24, which had a lower diagnostic accuracy. The ICER for strategy 25 compared with strategy 22 decreased (see Appendix 2, Table 36) and strategy 24 was no longer dominated, but had an ICER of £287,733 compared with strategy 22.
Assuming a longer period of infectiousness
The model was recalibrated for strategy 1 assuming that that the time from becoming infectious to becoming non-infectious was 12.3 days, using data on time from clinical symptom onset to being non-infectious (10 days) from Singanayagam et al. 13 rather than 7.1 days as used in the base case. The ICER for strategy 25 compared with strategy 22 increased (see Appendix 2, Table 37).
Assuming that the laboratory-based SARS-CoV-2 test took 21.3 hours
The model was recalibrated for strategy 1 assuming that the time to obtain a result from the laboratory-based SARS-CoV-2 test was 21.3 hours from Clark et al. ,40 rather than 35.9 hours. The ICER for strategy 25 compared with strategy 22 increased (see Appendix 2, Table 38).
Assuming a lower attack rate associated with asymptomatic SARS-CoV-2 infection
In the base-case model it was assumed that the probability of an asymptomatic patient infecting a susceptible person would be 31% lower, based on the considerable uncertainty in this parameter, the wide range in this value for a recent study from Imperial College London,22 which included a sensitivity analysis of no reduction, and SCM input. In a sensitivity analysis we have set the reduction to 61% in line with data from Koh et al. 21 The model was recalibrated for strategy 1 assuming a reduction of 61%. The ICER for strategy 25 compared with strategy 22 increased (see Appendix 2, Table 39), although strategy 24 was no longer dominated by strategy 22 and had an ICER of £647,720 compared with strategy 22.
Sensitivity analyses on the turnaround time of SARS-CoV-2 tests applied to strategy 2 and strategy 14
Additional sensitivity analyses were undertaken specifically changing the time to test result for strategies 2 and 14. These represent laboratory-based SARS-CoV-2 tests and SARS-CoV-2 POCTs using data on diagnostic accuracy from currently available SARS-CoV-2 POCTs. The turnaround times evaluated, along with the estimated number of infections associated with each time, are shown in Table 16. The rationale for the analysis is that the time to get a laboratory-based SARS-CoV-2 test result will differ markedly across hospitals; POCTs are likely to have uncertain queueing times.
| Laboratory-based SARS-CoV-2 test | SARS-CoV-2 POCT | ||
|---|---|---|---|
| Turnaround time (hours) | Number of infections | Turnaround time (hours) | Number of infections |
| 4 | 175 | 0.5 | 177 |
| 6 (strategy 12) | 188 | 1 | 175 |
| 12 | 209 | 2 | 182 |
| 16 | 221 | 3.8 (strategy 14) | 192 |
| 24 (strategy 11) | 227 | 6 | 197 |
| 35.9 (strategy 2) | 230 | 8 (strategy 15) | 207 |
A slight Monte Carlo sampling error is seen in the reduction in the estimated number of infections after hospital admittance when the turnaround time of the SARS-CoV-2 POCT was increased from 30 minutes to 1 hour.
The number of infections was used to estimate QALY losses, with the costs of testing coming from the model. It should be noted that these costs are lower than for strategies 22, 24 and 25 because of the lack of testing of asymptomatic patients.
A plot of the estimated testing costs of each strategy and the QALY losses subtracted from 50 for different turnaround times is provided in Figure 16. Test costs are lower in scenarios when the turnaround time is longer, as a higher proportion of patients would be discharged (or would have died) prior to retesting in non-SARS-CoV-2-infected bays.
FIGURE 16.
The estimated testing costs and QALY gains of each strategy under different assumptions related to turnaround times. Legend represents type of test (L, laboratory based; P, POCT) and time in hours to get the result.
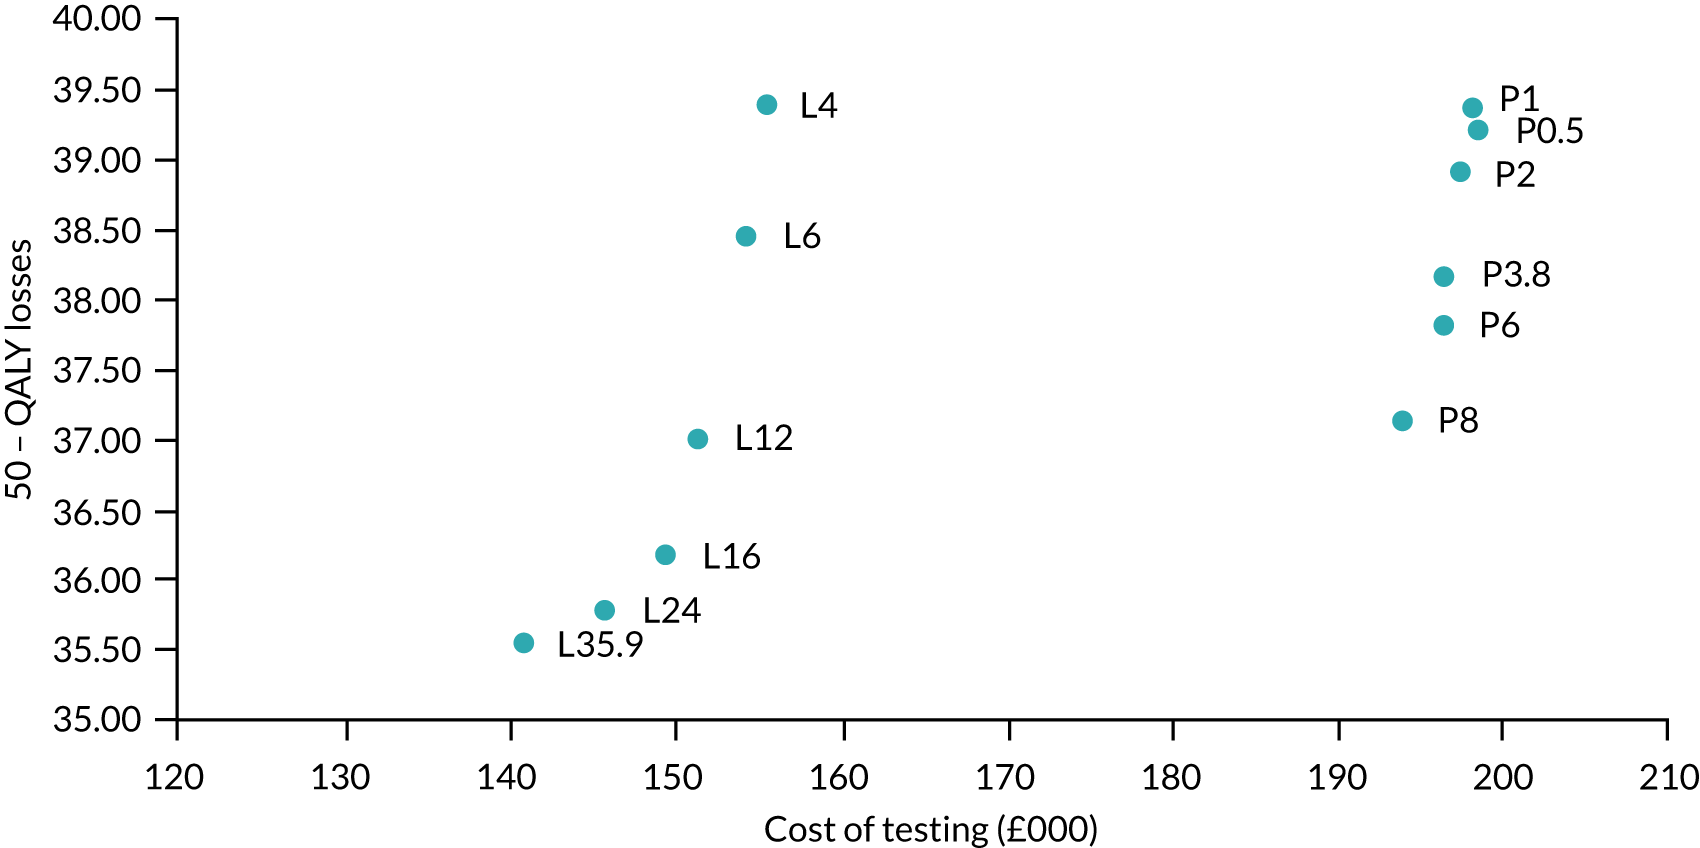
The ICER for each pairwise comparison of laboratory-based SARS-CoV-2 tests and SARS-CoV-2 POCTs is provided in Table 17. It can be seen that the cost-effectiveness of SARS-CoV-2 POCTs reduces as the turnaround time between a laboratory-based SARS-CoV-2 test and a SARS-CoV-2 POCT decreases.
| Turnaround time for SARS-CoV-2 POCT (hours) | |||||||
|---|---|---|---|---|---|---|---|
| 0.5 | 1 | 2 | 3.8 | 6 | 8 | ||
| Turnaround time for laboratory-based SARS-CoV-2 test (hours) | 4 | Dominated | Dominated | Dominated | Dominated | Dominated | Dominated |
| 6 | £58,257 | £48,545 | £96,601 | Dominated | Dominated | Dominated | |
| 12 | £21,331 | £19,869 | £24,288 | £38,441 | £55,315 | £291,517 | |
| 16 | £16,152 | £15,306 | £17,616 | £23,499 | £28,601 | £45,541 | |
| 24 | £15,365 | £14,643 | £16,565 | £21,166 | £24,874 | £35,127 | |
| 35.9 | £15,750 | £15,057 | £16,905 | £21,202 | £24,544 | £33,201 | |
Sensitivity analyses exploring the impact of no testing
Sensitivity analyses were undertaken exploring the results in the situation that it was not possible to undertake SARS-CoV-2 testing. Two strategies were tested, denoted strategy 31 and strategy 32. In strategy 31 patients were assumed to be allocated to bays based on clinical symptoms alone, whereas in strategy 32 patients were allocated to SARS-CoV-2-infected bays if they had clinical symptoms and chest imaging results suggestive of COVID-19, with all other patients going to non-SARS-CoV-2-infected bays. These strategies have more infections than those detailed in Tables 11 and 12, with 284 infections for strategy 31 and 293 infections for strategy 32. However, these strategies would not incur the costs of SARS-CoV-2 testing and would also not necessitate waiting before test results were known. Figure 17 provides the NMB at different thresholds of willingness to pay per QALY for strategies 31 and 32, and other relevant strategies: strategy 3 (a SARS-CoV-2 POCT with the desirable TPP), strategy 11 (a laboratory-based SARS-CoV-2 test with a turnaround time of 24 hours), strategy 13 (a SARS-CoV-2 POCT with the acceptable TPP) and strategy 14 (using data from currently available SARS-CoV-2 POCTs). All strategies are compared with strategy 1, the strategy assumed to be in place at the start of the pandemic.
FIGURE 17.
The estimated NMB of selected strategies assuming two no-testing strategies.

It is seen that, at low willingness-to-pay values (≤ £30,000 per QALY), no testing appears to be one of the options with the highest NMB values, owing to the high costs associated with testing. As the willingness-to-pay threshold increases to £50,000 per QALY, these strategies compare unfavourably with other strategies. This indicates that the cost of SARS-CoV-2 tests is, as expected, a key driver of the cost-effectiveness of SARS-CoV-2 testing.
Chapter 3 Discussion and conclusions
The EAG has constructed a mathematical model to simulate the spread of SARS-CoV-2 infection among patients admitted to hospital following attendance at A&E. This was developed with SCM input and other expert clinical advice. The model was populated using the best data identified, and the model was calibrated in an attempt to try to obtain plausible parameters where data were unknown; however, there is considerable uncertainty in parameter population estimates. Sensitivity analyses have been conducted to provide insight into the impact of uncertain parameter values. As a result, the model results should be viewed with caution and be taken as indicative rather than definitive, as a degree of Monte Carlo sampling error also remains. However, given that the reduction in sampling error will be correlated with the square root of the number of random number streams, considerably more computational time would be required to provide markedly more precise answers, which was not possible within the time scales of this work. When more data are available for the characteristics of both non-hypothetical SARS-CoV-2 POCTs and laboratory-based SARS-CoV-2, these specific strategies should be run using a greater number of random number streams to reduce Monte Carlo sampling error.
Full incremental analyses have been undertaken, although these are of limited value if the strategies evaluated are not realistic. For example, at the time of writing, it is uncertain if a SARS-CoV-2 POCT that meets the desirable, or even acceptable, TPPs will be available in the near future. If results from SARS-CoV-2 POCTs cannot be turned around in a timely manner when used in a hospital, then the results for SARS-CoV-2 POCTs in this report are redundant.
Analyses using data from currently available SARS-CoV-2 POCTs have been undertaken, and although these tests do not meet the turnaround time required for an acceptable TPP, simulated results using the data from currently available SARS-CoV-2 POCTs appear to produce fewer infections than the acceptable TPP even with longer turnaround times than reported. The currently available SARS-CoV-2 POCTs would fail to meet the criterion of turnaround time to have an acceptable TPP.
If a SARS-CoV-2 POCT with a desirable TPP exists, it appears to have a relatively high NMB, although this may be lower than that of a laboratory-based test that has a turnaround time of 6 hours, depending on the cost-per-QALY threshold (see Figure 12, strategy 3, for a SARS-CoV-2 POCT with a desirable TPP, and strategy 12 for a laboratory-based POCT with a turnaround time of 6 hours). If the SARS-CoV-2 POCT has the acceptable TPP, then it appears to have a lower NMB than a SARS-CoV-2 laboratory-based test with a 24-hour turnaround time (see Figure 12, strategy 13, for a SARS-CoV-2 POCT with an acceptable TPP, and strategy 11 for a laboratory-based POCT with a turnaround time of 24 hours).
It appears that strategies involving SARS-CoV-2 testing of asymptomatic staff and removing these staff members from duty reduces the number of infections and is associated with higher NMBs than strategies that do not test asymptomatic staff, at higher willingness-to-pay levels but not at lower levels [see Figure 12: comparing strategies 1–5 (no staff testing) with strategies 6–10 (testing of asymptomatic staff)].
However, cost-effectiveness is only one dimension of the decision problem, as it may not be logistically possible to keep patients in a waiting bay until the laboratory-based SARS-CoV-2 test returns a result, particularly if this turnaround time approaches 36 hours. Analyses of the occupancy levels of the waiting bays (see Figure 4, and Appendix 1, Figures 18 and 19) showed that quicker SARS-CoV-2 POCTs reduce the numbers of patients in waiting bays considerably, which may have benefits beyond those purely related to COVID-19.
The model has limitations in that it did not consider patients entering hospital through routes other than A&E, the implications of patients with respiratory diseases such as pneumonia catching SARS-CoV-2, testing at discharge following a hospital stay and the costs associated should hospital wards need to be closed following an outbreak. If these aspects were to be considered it is likely that the ICERs for SARS-CoV-2 tests with better diagnostic accuracy would become more favourable. There is considerable uncertainty in parameter values associated with key variables and a small degree of Monte Carlo sampling error remains in the results, indicating that more random number streams would need to be run to give more accurate results. Additionally, simplifications have been made regarding the use of POCTs, including not having designated staff for this procedure, and in not explicitly incorporating batching of patients’ tests where appropriate. Nevertheless, broad conclusions can be drawn from the results presented, and intuitively these have face validity. For example, improvements in diagnostic accuracy reduced the number of infections, and reductions in the turnaround times of tests were associated with smaller numbers of infections and less time spent in waiting bays prior to allocation to a SARS-CoV-2-infected or a non-SARS-CoV-2-infected bay.
Considerable uncertainty remains about the parameters used to populate the model, including the time from requesting a SARS-CoV-2 test to obtaining the result, whether through a POCT or a laboratory-based approach; the diagnostic accuracy of SARS-CoV-2 POCTs compared with laboratory-based tests; the occupancy levels of waiting bays and isolation rooms; and the impact on quality of life after COVID-19 that requires treatment in the ICU. Further research on these parameters appears worthwhile. Establishing the costs of SARS-CoV-2 POCTs is also important in determining their cost-effectiveness.
In conclusion, given the heterogeneity of hospitals, no blanket solution can be provided. This report contains information that should be useful for decision-makers in assessing their own specific problem. In addition, the modelling structure developed is anticipated to be useful in assessing the cost-effectiveness of SARS-CoV-2 POCTs as further information on the costs, turnaround times and diagnostic accuracy of these becomes known.
Acknowledgements
We would like to thank Tom Walker and Tosin Oladapo at NICE for their advice throughout this work and for highlighting relevant literature. We would also like to thank the National Institute for Health Research (NIHR) Newcastle In Vitro Diagnostics Co-operative for advice on patient flows. We thank Andrea Shippam for help in formatting the document. We would like to acknowledge those within the ISARIC4C project who provided additional data for the model through personal communication.
No patient or public involvement was directly used in producing this report. However, patient and public involvement representatives on the NICE committee provided guidance to the authors.
Contributions of authors
Matt Stevenson (https://orcid.org/0000-0002-3099-9877) is a Professor of Health Technology Assessment at ScHARR, University of Sheffield. He led the project, constructed the mathematical model and interpreted the results.
Andrew Metry (https://orcid.org/0000-0001-7412-6093) is a Research Associate at ScHARR, University of Sheffield. He reviewed the evidence to populate the model, critiqued the model and helped interpret the results.
Michael Messenger (https://orcid.org/0000-0002-4975-0158) is Head of Personalised Medicine and Health, University of Leeds; and Deputy Director of NIHR Leeds Medtech and In Vitro Diagnostics Co-operative. He reviewed the results, suggested additional strategies to run and provided guidance throughout the work.
All authors commented on the final monograph.
Publications
For related publications and further information, see the NIHR funding and awards web page for the overall project: https://fundingawards.nihr.ac.uk/award/NIHR132154.
Data-sharing statement
All data requests should be submitted to the corresponding author for consideration.
Patient data
This work uses data provided by patients and collected by the NHS as part of their care and support. Using patient data is vital to improve health and care for everyone. There is huge potential to make better use of information from people’s patient records, to understand more about disease, develop new treatments, monitor safety, and plan NHS services. Patient data should be kept safe and secure, to protect everyone’s privacy, and it’s important that there are safeguards to make sure that it is stored and used responsibly. Everyone should be able to find out about how patient data are used. #datasaveslives You can find out more about the background to this citation here: https://understandingpatientdata.org.uk/data-citation.
Disclaimers
This report presents independent research funded by the National Institute for Health Research (NIHR). The views and opinions expressed by authors in this publication are those of the authors and do not necessarily reflect those of the NHS, the NIHR, NETSCC, the HTA programme or the Department of Health and Social Care. If there are verbatim quotations included in this publication the views and opinions expressed by the interviewees are those of the interviewees and do not necessarily reflect those of the authors, those of the NHS, the NIHR, NETSCC, the HTA programme or the Department of Health and Social Care.
References
- WorldoMeter . COVID-19 Coronavirus Pandemic 2020. www.worldometers.info/coronavirus/ (accessed 15 November 2020).
- National Institute for Health and Care Excellence . Exploratory Economic Modelling of SARS-CoV-2 Viral Detection Point of Care Tests and Serology Tests. Final Scope 2020. www.nice.org.uk/guidance/gid-dg10038/documents/final-scope (accessed 19 January 2021).
- Medicines and Healthcare products Regulatory Agency (MHRA) . TARGET PRODUCT PROFILE. Point of Care SARS-CoV-2 Detection Tests 2020. https://assets.publishing.service.gov.uk/government/uploads/system/uploads/attachment_data/file/895745/TPP_Point_of_Care_SARS-CoV-2_Detection_Tests.pdf (accessed 16 July 2020).
- National Institute for Health and Care Excellence . Guide to the Methods of Technology Appraisal 2013 2013. www.nice.org.uk/process/pmg9/ (accessed 7 September 2020).
- Feng C, Huang Z, Wang L, Chen X, Zhai Y, Zhu F, et al. A novel triage tool of artificial intelligence assisted diagnosis aid system for suspected COVID-19 pneumonia in fever clinics. MedRxiv 2020. https://doi.org/10.1101/2020.03.19.20039099.
- Goodacre S, Thomas B, Lee E, Sutton L, Loban A, Waterhouse S, et al. Characterisation of 22445 patients attending UK emergency departments with suspected COVID-19 infection: observational cohort study. PLOS ONE 2020;15. https://doi.org/10.1371/journal.pone.0240206.
- NHS Digital . Hospital Accident and Emergency Activity, 2017–18 2018. https://digital.nhs.uk/data-and-information/publications/statistical/hospital-accident--emergency-activity/2017-18 (accessed 14 September 2020).
- Steventon A, Deeny S, Friebel R, Gardner T, Thorlby R. Briefing: Emergency Hospital Admissions in England: Which may be Avoidable and How?. London: The Health Foundation; 2018.
- Docherty AB, Harrison EM, Green CA, Hardwick HE, Pius R, Norman L, et al. Features of 20 133 UK patients in hospital with covid-19 using the ISARIC WHO Clinical Characterisation Protocol: prospective observational cohort study. BMJ 2020;369. https://doi.org/10.1136/bmj.m1985.
- Clifford S, Quilty B, Russell T, Liu Y, Chan Y-W, Pearson C, et al. Strategies to reduce the risk of SARS-CoV-2 reintroduction from international travellers. MedRxiv 2020. https://doi.org/10.1101/2020.07.24.20161281.
- He X, Lau EHY, Wu P, Deng X, Wang J, Hao X, et al. Temporal dynamics in viral shedding and transmissibility of COVID-19. Nat Med 2020;26:672-5. https://doi.org/10.1038/s41591-020-0869-5.
- Jefferson T, Spencer E, Brassey J, Heneghan C. Viral cultures for COVID-19 infectious potential assessment – a systematic review [published online ahead of print December 3 2020]. Clin Infect Dis 2020. https://doi.org/10.1093/cid/ciaa1764.
- Singanayagam A, Patel M, Charlett A, Lopez Bernal J, Saliba V, Ellis J, et al. Duration of infectiousness and correlation with RT-PCR cycle threshold values in cases of COVID-19, England, January to May 2020. Euro Surveill 2020;25. https://doi.org/10.2807/1560-7917.ES.2020.25.32.2001483.
- NHS Digital . Hospital Admissions Hit Record High As Population Ages 2016. https://digital.nhs.uk/news-and-events/news-archive/2016-news-archive/hospital-admissions-hit-record-high-as-population-ages (accessed 14 September 2020).
- Baker C. Accident and Emergency Statistics: Demand, Performance and Pressure. London: House of Commons Library; 2017.
- Intensive Care National Audit and Research Centre (ICNARC) . Key Statistics from the Case Mix Programme 2015-16 — Adult, General Critical Care Units 2017.
- Meacock R, Anselmi L, Kristensen SR, Doran T, Sutton M. Higher mortality rates amongst emergency patients admitted to hospital at weekends reflect a lower probability of admission. J Health Serv Res Policy 2017;22:12-9. https://doi.org/10.1177/1355819616649630.
- Borakati A, Perera A, Johnson J, Sood T. Chest X-ray has poor diagnostic accuracy and prognostic significance in COVID-19: a propensity matched database study. MedRxiv 2020. https://doi.org/10.1101/2020.07.07.20147934.
- Doshi P. Covid-19: do many people have pre-existing immunity?. BMJ 2020;370. https://doi.org/10.1136/bmj.m3563.
- Sutherland E, Donnarumma H. Coronavirus (COVID-19) Infection Survey Pilot: England and Wales, 11 September 2020. Newport: Office for National Statistics; 2020.
- Koh W, Naing L, Rosledzana M, Alikhan M, Chaw L, Griffith M, et al. What do we know about SARS-CoV-2 transmission? A systematic review and meta-analysis of the secondary attack rate, serial interval, and asymptomatic infection. MedRxiv 2020. https://doi.org/10.1101/2020.05.21.20108746.
- Grassly NC, Pons-Salort M, Parker EPK, White PJ, Ferguson NM. Imperial College COVID-19 Response Team. Comparison of molecular testing strategies for COVID-19 control: a mathematical modelling study. Lancet Infect Dis 2020;20:1381-9. https://doi.org/10.1016/S1473-3099(20)30630-7.
- Lavezzo E, Franchin E, Ciavarella C, Cuomo-Dannenburg G, Barzon L, Del Vecchio C, et al. Suppression of a SARS-CoV-2 outbreak in the Italian municipality of Vo’. Nature 2020;584:425-9. https://doi.org/10.1038/s41586-020-2488-1.
- Centers for Disease Control and Prevention (CDC) . Interim Clinical Guidance for Management of Patients With Confirmed Coronavirus Disease (COVID-19). 2020. www.cdc.gov/coronavirus/2019-ncov/hcp/clinical-guidance-management-patients.html (accessed 14 September 2020).
- Ferguson N, Laydon D, Nedjati-Gilani G, Imai N, Ainslie K, Baguelin M, et al. on behalf of the Imperial College COVID-19 Response Team . Report 9: Impact of Non-Pharmaceutical Interventions (NPIs) to Reduce COVID-19 Mortality and Healthcare Demand 2020.
- Jarvis KF, Kelley JB. Temporal dynamics of viral load and false negative rate influence the levels of testing necessary to combat COVID19 spread. MedRxiv 2020. https://doi.org/10.1101/2020.08.12.20173831.
- Collier DA, Assennato SM, Warne B, Sithole N, Sharrocks K, Ritchie A, et al. Point of care nucleic acid testing for SARS-CoV-2 in hospitalized patients: a clinical validation trial and implementation study. Cell Reports Med 2020;1. https://doi.org/10.1016/j.xcrm.2020.100062.
- Department of Health and Social Care . Weekly Statistics for NHS Test and Trace (England) and Coronavirus Testing (UK): 3 September to 9 September. 2020 2020.
- Kim H, Hong H, Yoon SH. Diagnostic performance of CT and reverse transcriptase polymerase chain reaction for coronavirus disease 2019: a meta-analysis. Radiology 2020;296:E145-E155. https://doi.org/10.1148/radiol.2020201343.
- Dinnes J, Deeks JJ, Adriano A, Berhane S, Davenport C, Dittrich S, et al. Rapid, point-of-care antigen and molecular-based tests for diagnosis of SARS-CoV-2 infection. Cochrane Database Syst Rev 2020;8. https://doi.org/10.1002/14651858.CD013705.
- Scheuber A. 90 Minute COVID-19 Tests: Government Orders 5.8 Million DnaNudge Kits 2020. www.imperial.ac.uk/news/201073/90-minute-covid-19-tests-government-orders/ (accessed 14 September 2020).
- Brazzelli M, Aucott L, Aceves-Martins M, Robertson C, Jacobsen E, Imamura M, et al. The ARCHITECT and Alinity Urine NGAL Assays, Urine NephroCheck Test, and Urine and Plasma NGAL Tests to Help Assess the Risk of Acute Kidney Injury for People who are Being Considered for Admission to Critical Care. Aberdeen: Aberdeen HTA Group, Institute of Applied Health Sciences, University of Aberdeen; 2019.
- NHS England and NHS Improvement . Healthcare Associated COVID-19 Infections – Further Action 2020.
- Office for National Statistics . Dataset: National Life Tables: UK 2019.
- Ara R, Brazier JE. Populating an economic model with health state utility values: moving toward better practice. Value Health 2010;13:509-18. https://doi.org/10.1111/j.1524-4733.2010.00700.x.
- Carter B, Collins JT, Barlow-Pay F, Rickard F, Bruce E, Verduri A, et al. Nosocomial COVID-19 infection: examining the risk of mortality. The COPE-Nosocomial study (COVID in Older PEople). J Hosp Infect 2020;106:376-84. https://doi.org/10.1016/j.jhin.2020.07.013.
- Stinnett AA, Mullahy J. Net health benefits: a new framework for the analysis of uncertainty in cost-effectiveness analysis. Med Decis Making 1998;18:68-80. https://doi.org/10.1177/0272989X98018002S09.
- Iacobucci G. Covid-19: Risk of death more than doubled in people who also had flu, English data show. BMJ 2020;370. https://doi.org/10.1136/bmj.m3720.
- Cuthbertson BH, Elders A, Hall S, Taylor J, MacLennan G, Mackirdy F, et al. Scottish Critical Care Trials Group . Mortality and quality of life in the five years after severe sepsis. Crit Care 2013;17. https://doi.org/10.1186/cc12616.
- Clark T, Brendish N, Poole S, Naidu V, Mansbridge C, Norton N, et al. Clinical impact of molecular point-of-care testing for suspected COVID-19 in hospital (COV-19POC): a prospective, interventional, non-randomised, controlled study. Lancet Respir Med 2020;8:1192-200. https://doi.org/10.1016/S2213-2600(20)30454-9.
Appendix 1 Results relating to occupancy levels in waiting bays while a decision to allocate to a SARS-CoV-2-infected bay or a non-SARS-CoV-2-infected bay is being made
Figure 18 shows the occupancy of the infinite bay under the different strategies for people who have clinical symptoms suggestive of COVID-19. When a timely SARS-CoV-2 test is used, the infinite bay may not be required, and the highest numbered used bay occupancy is shown instead. For example, in strategy 3, instead of a ninth bay being used, only three bays are used. Figure 19 shows the occupancy of the infinite bay under the different strategies for people who do not have clinical symptoms suggestive of COVID-19.
FIGURE 18.
Occupancy levels in the infinite bay (bay 9), unless stated otherwise, for patients with symptoms suggestive of COVID-19 waiting to be allocated to a SARS-CoV-2-infected or a non-SARS-CoV-2-infected bay for each strategy. (a) S2; (b) S3 – bay 3; (c) S4 – bay 3; (d) S5; (e) S6; (f) S7; (g) S8 – bay 3; (h) S9 – bay 3; (i) S10; (j) S11; (k) S12; (l) S13 – bay 5; (m) S14 – bay 6; (n) S15; (o) S16 – bay 5; (p) S17 – bay 4; (q) S18; (r) S19; (s) S20; (t) S21 – bay 6; (u) S22; (v) S23; (w) S24 – bay 5; (x) S25 – bay 6; (y) S26; (z) S27 – bay 5; (aa) S28 – bay 6; (ab) S29; and (ac) S30 – bay 7. S, strategy.
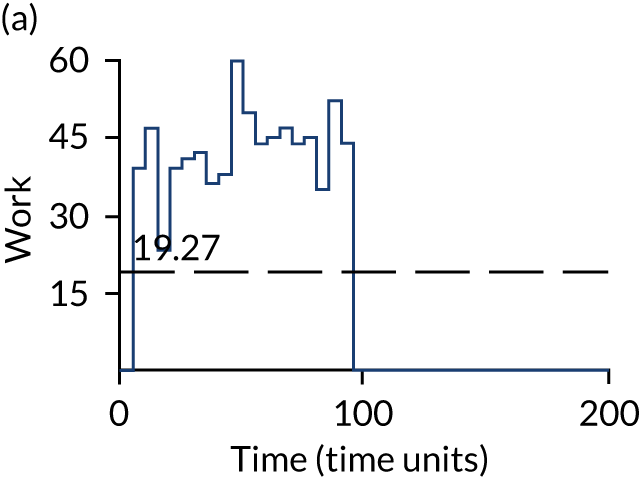
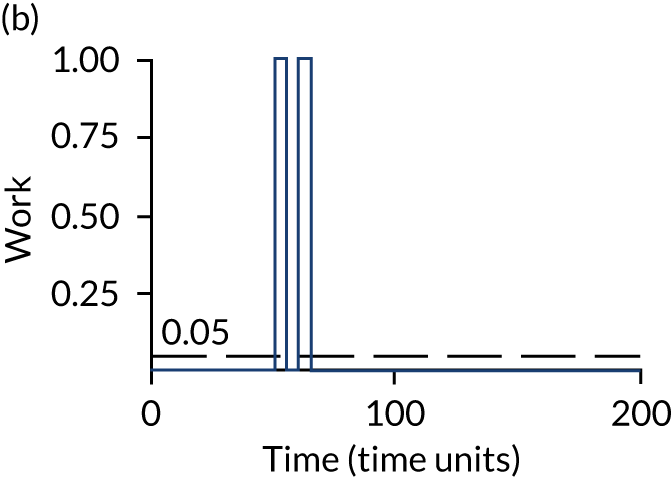
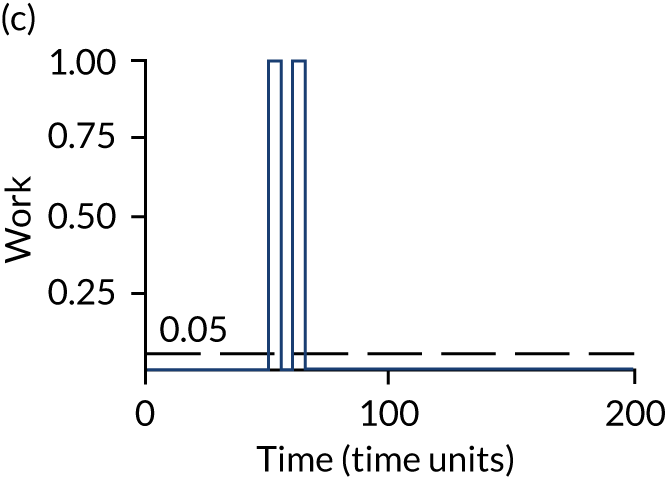
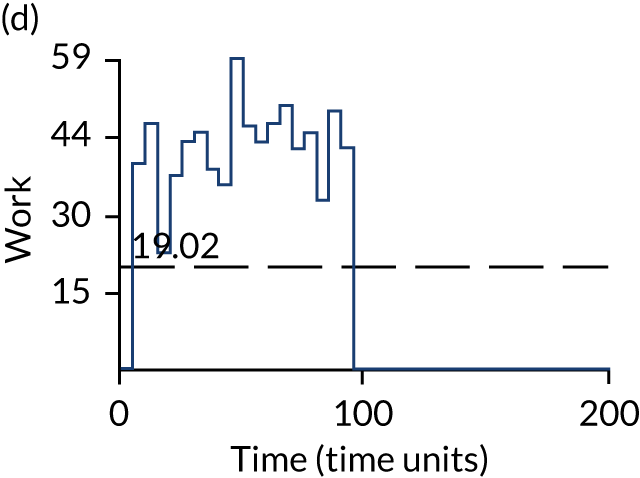
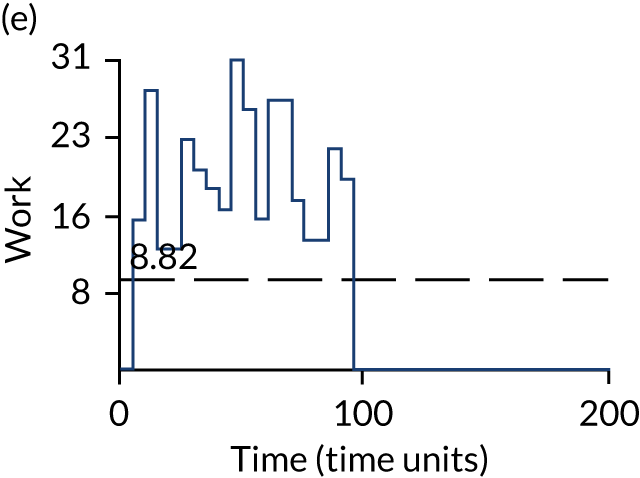
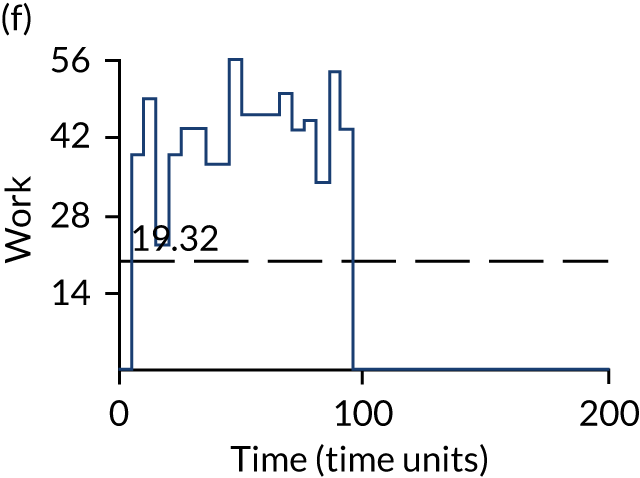
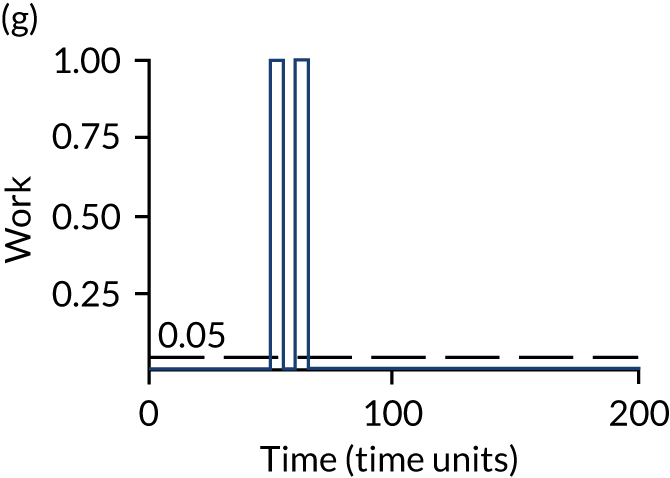
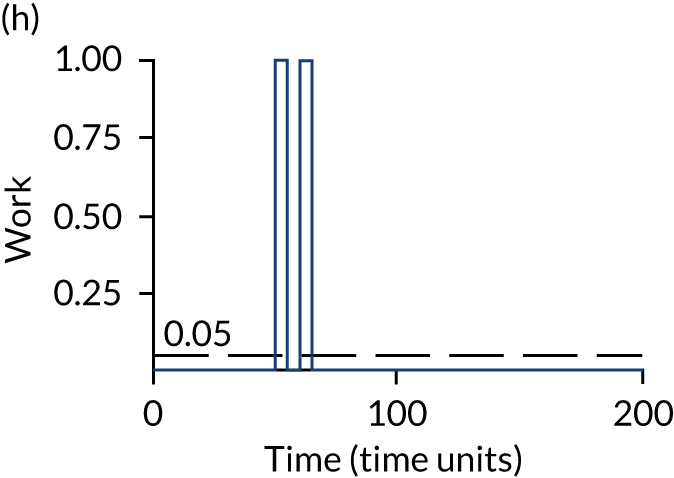

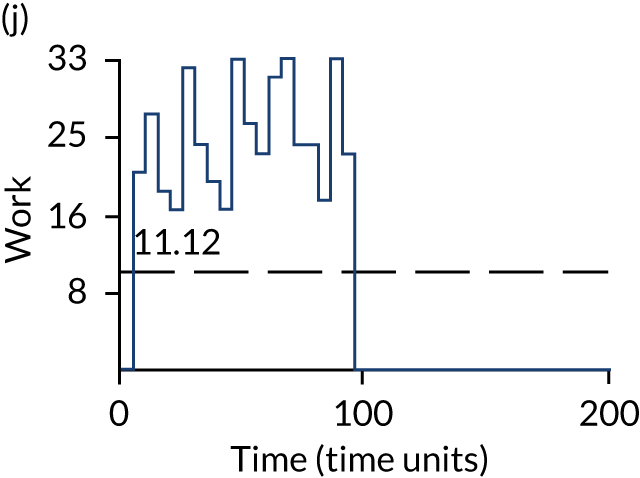
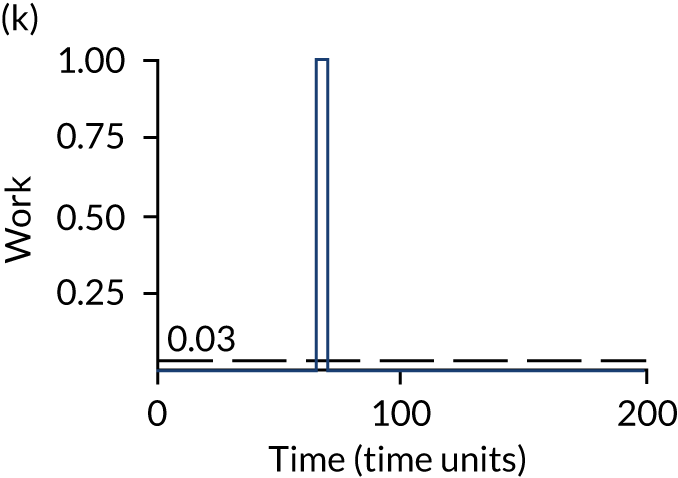
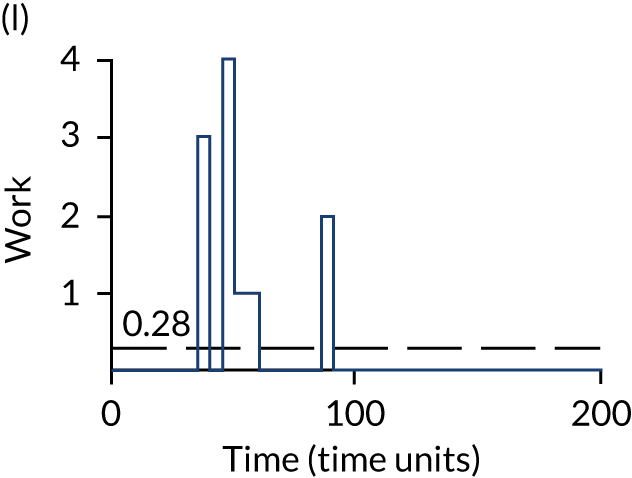


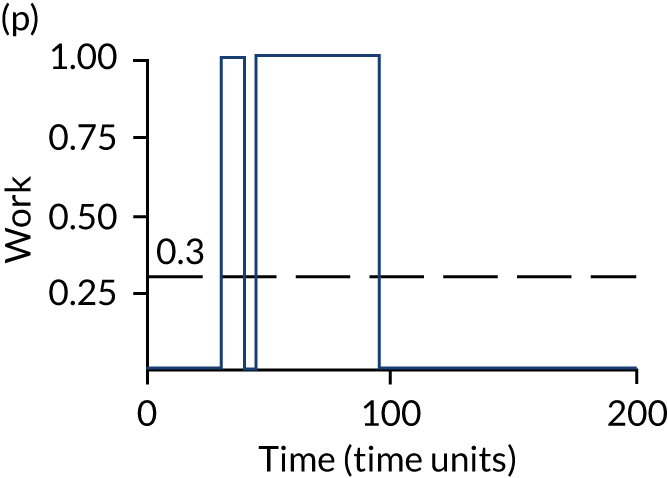


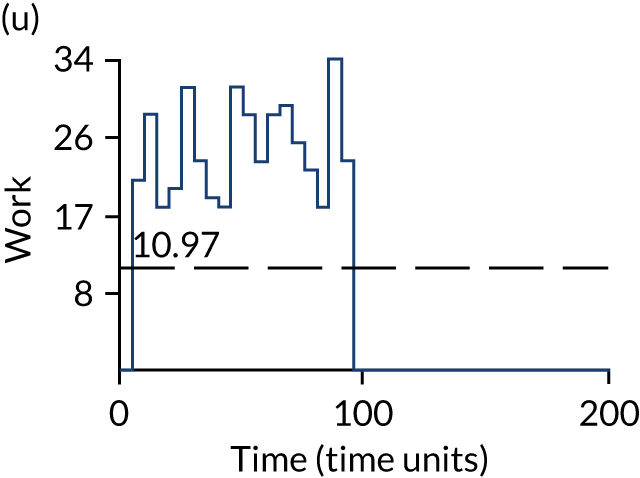
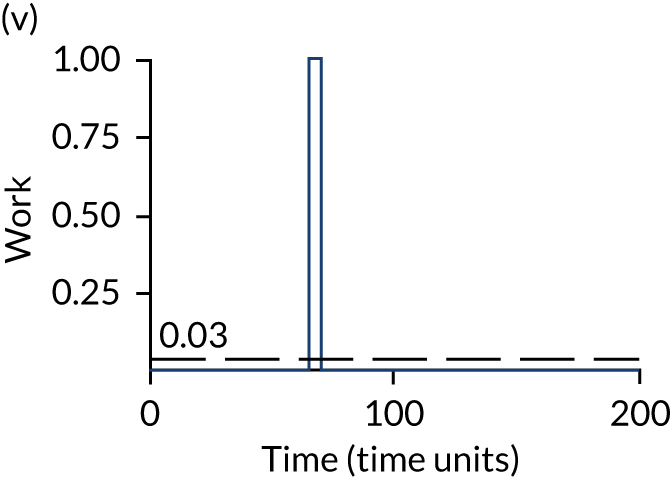
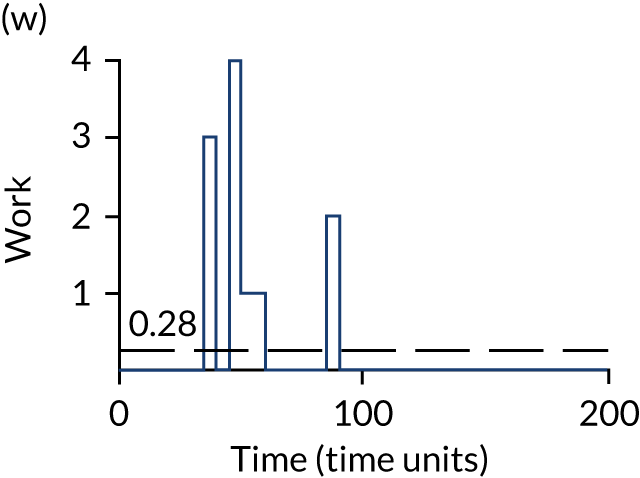
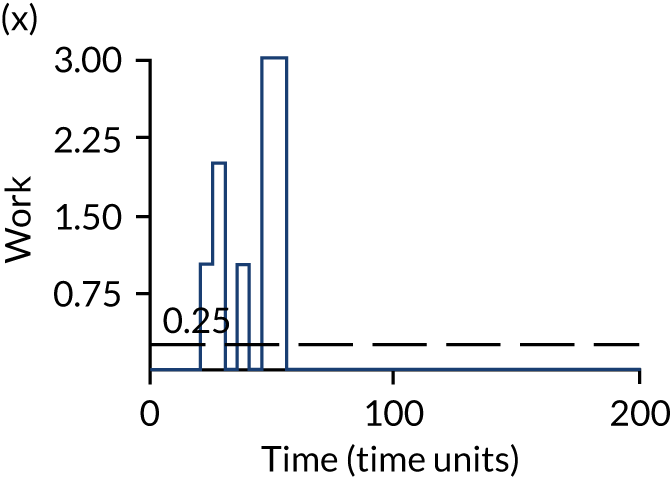
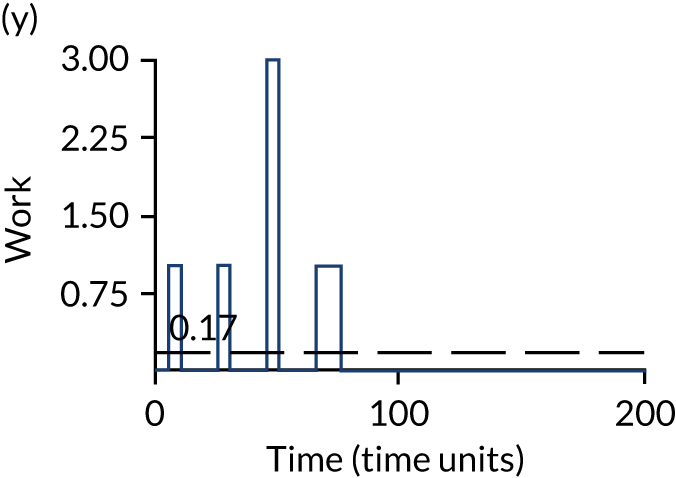
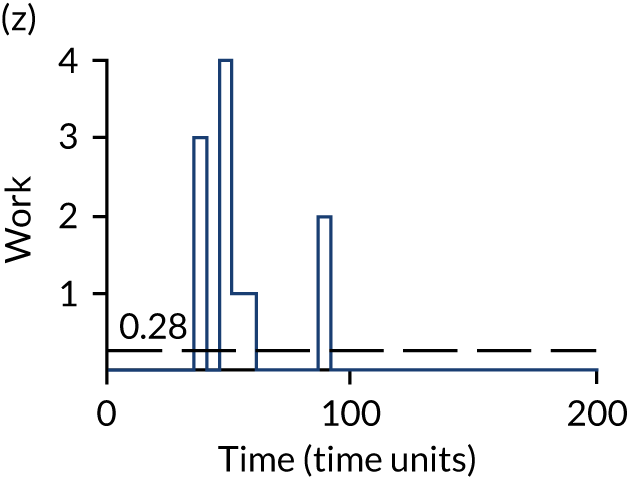
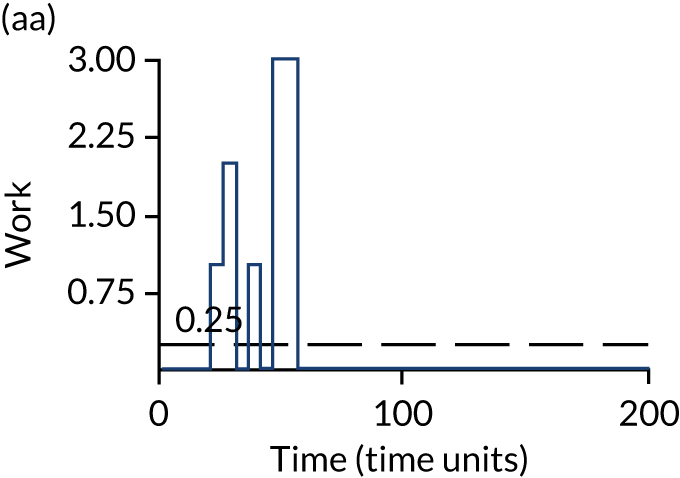
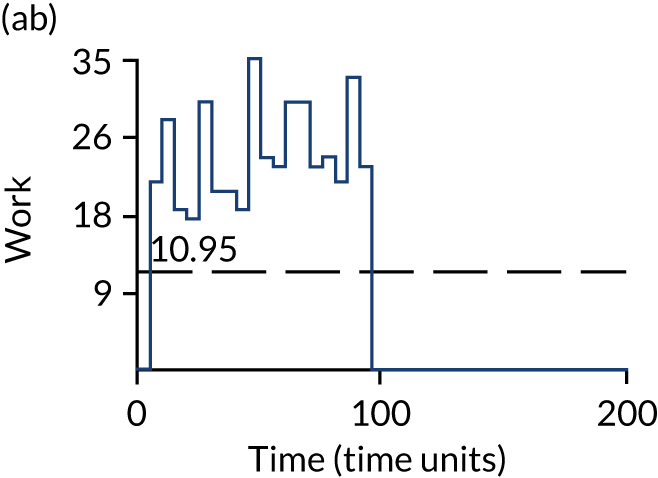
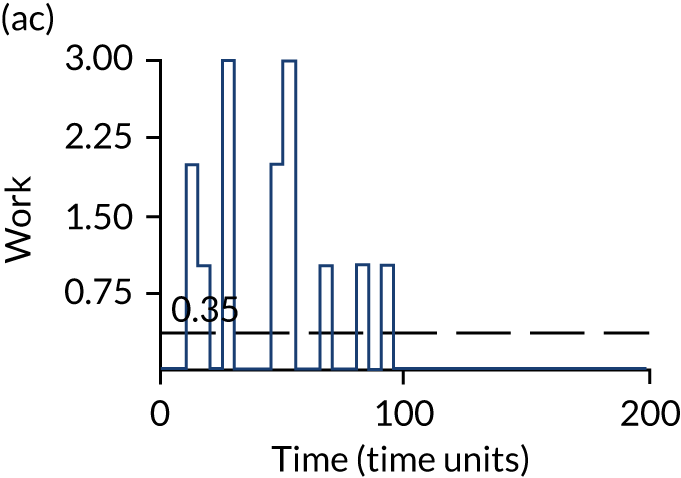
FIGURE 19.
Occupancy levels in the infinite bay (bay 7), unless stated otherwise, for patients without symptoms suggestive of COVID-19 waiting to be allocated to a SARS-CoV-2-infected or a non-SARS-CoV-2-infected bay for each strategy. (a) S2; (b) S3 – bay 1; (c) S4 – bay 1; (d) S5; (e) S6; (f) S7; (g) S8 – bay 1; (h) S9 – bay 1; (i) S10; (j) S11; (k) S12; (l) S13 – bay 1; (m) S14 – bay 2; (n) S14 – bay 3; (o) S16 – bay 1; (p) S17 – bay 2; (q) S18; (r) S19 – bay 3; (s) S20; (t) S21 – bay 3; (u) S22; (v) S23 – bay 3; (w) S24 – bay 1; (x) S25 – bay 2; (y) S26 – bay 3; (z) S27 – bay 1; (aa) S28 – bay 2; (ab) S29; and (ac) S30 – bay 3. S, strategy.
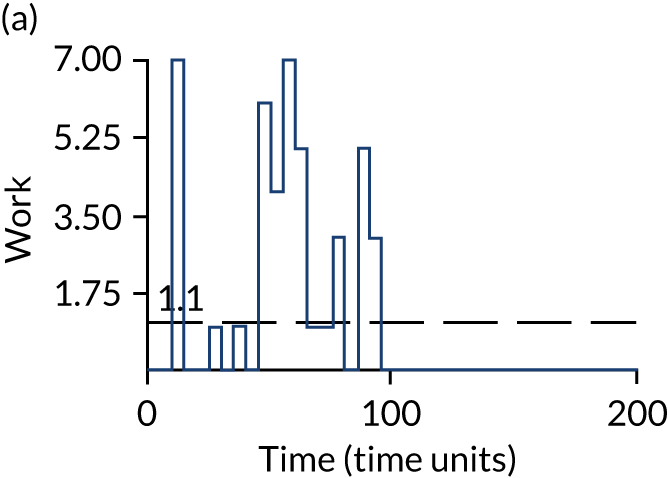


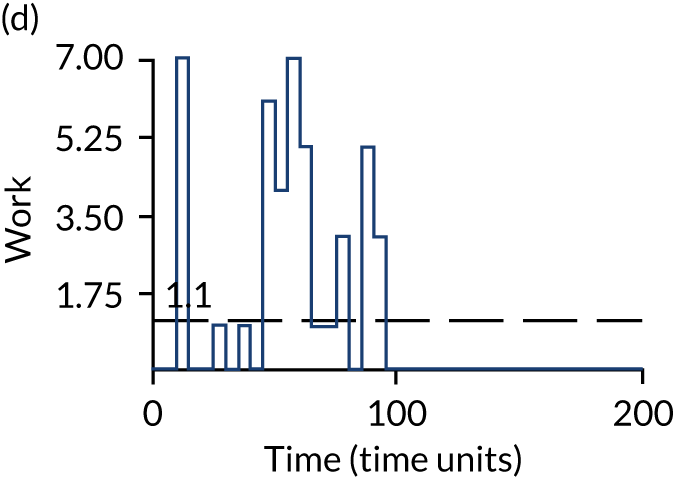

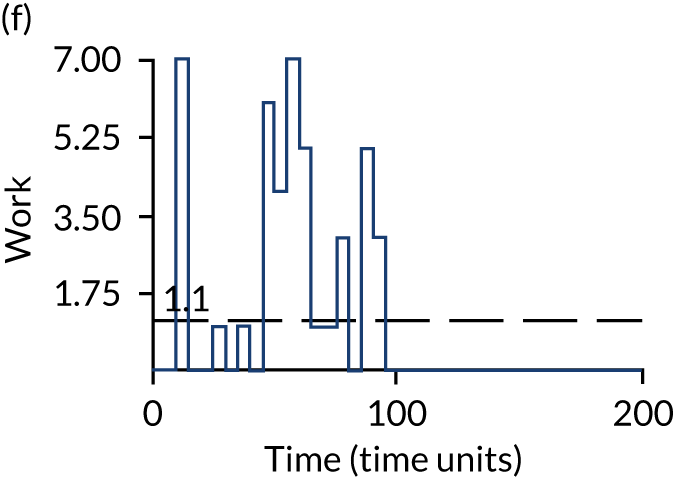


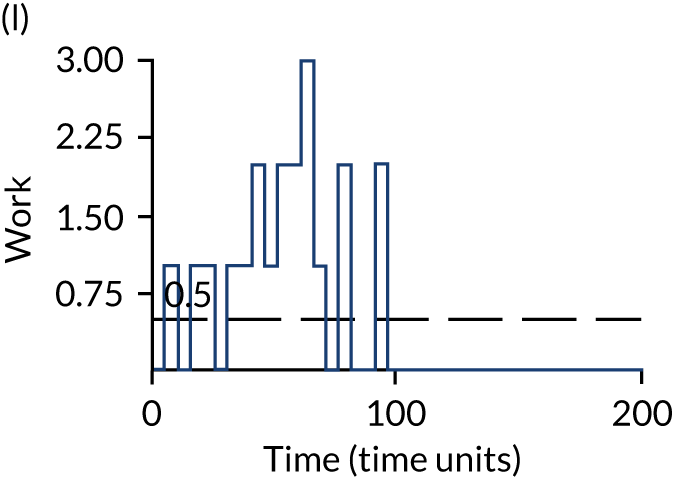

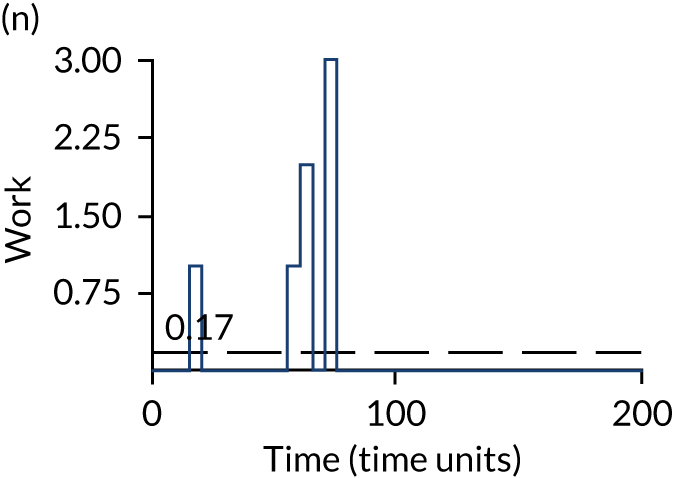


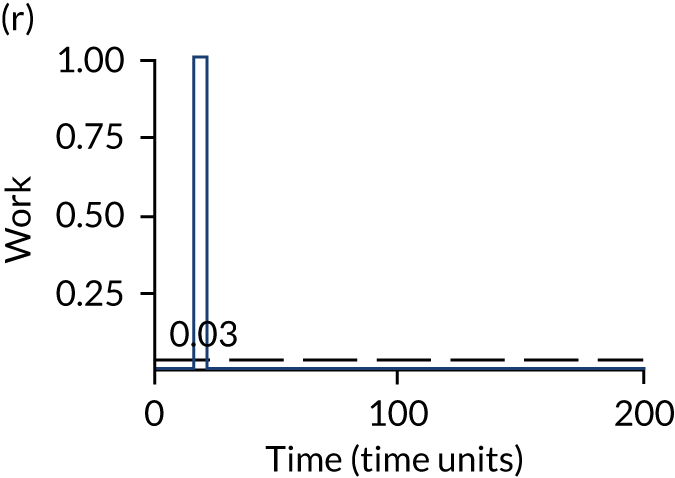
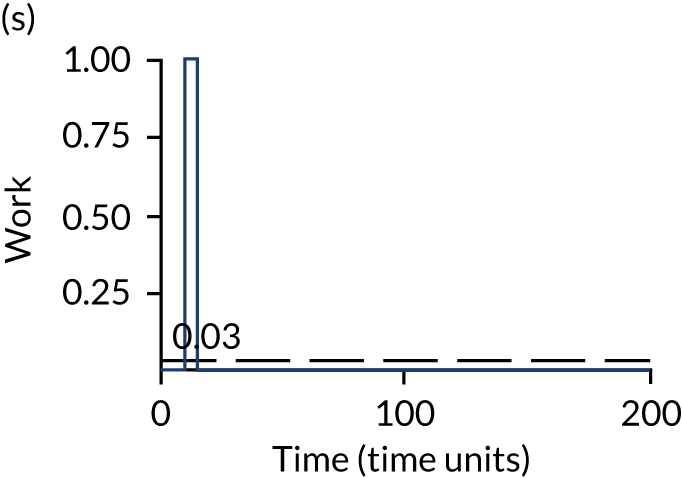


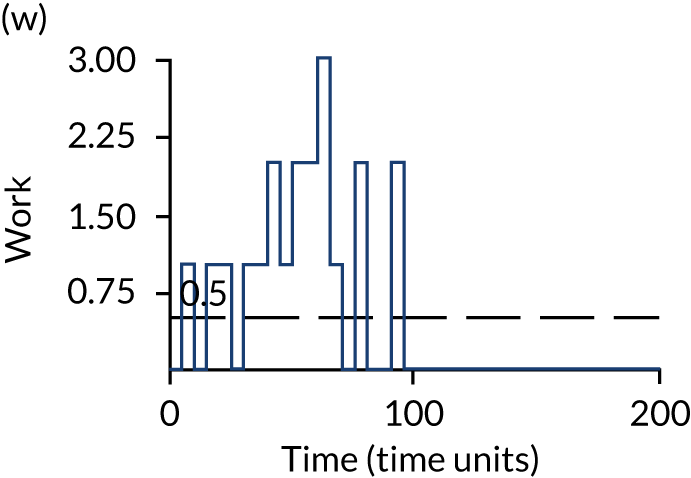
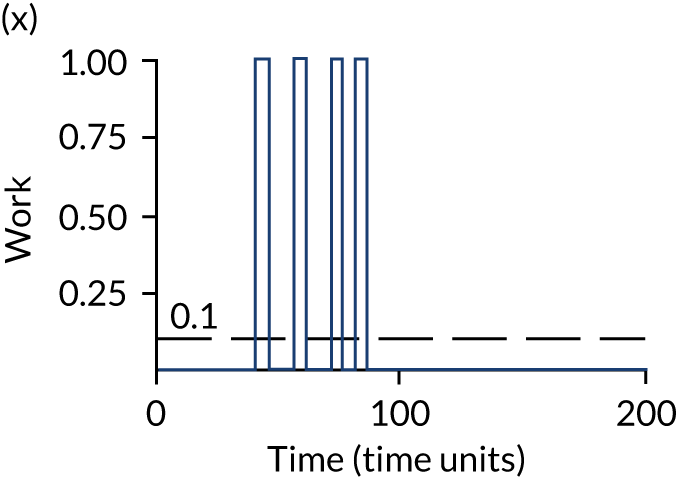


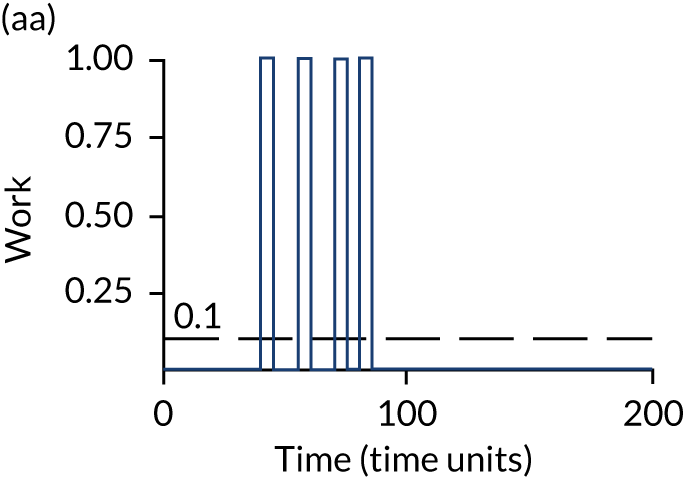
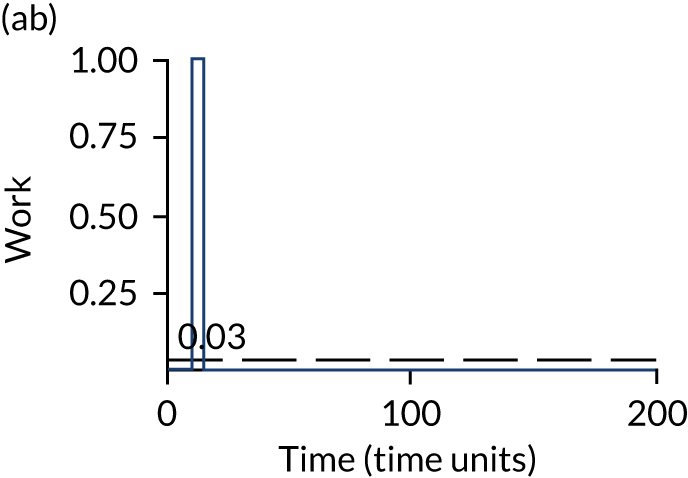

As in most strategies where patients with symptoms of COVID-19 are retested if the result of their first SARS-CoV-2 test is negative, the occupancy level is proportionately higher in the waiting bay for those with clinical symptoms suggestive of COVID-19 than in the waiting bay for those without clinical symptoms suggestive of COVID-19.
Appendix 2 Supplementary results
| Strategy | Testing cost (£) | 50 – QALYs lost | Efficiency frontier (ICER) (£) |
|---|---|---|---|
| 22 | 221,143 | 42.84 | – |
| 24 | 294,951 | 41.65 | Dominated |
| 25 | 295,959 | 45.16 | 32,177 |
| Strategy | Testing cost (£) | 50 – QALYs lost | Efficiency frontier (ICER) (£) |
|---|---|---|---|
| 22 | 213,917 | 46.07 | – |
| 24 | 281,122 | 45.66 | Dominated |
| 25 | 282,088 | 46.81 | 91,984 |
| Strategy | Testing cost (£) | 50 – QALYs lost | Efficiency frontier (ICER) (£) |
|---|---|---|---|
| 22 | 211,515 | 21.07 | – |
| 24 | 280,158 | 23.93 | Extendedly dominated |
| 25 | 280,607 | 25.72 | 14,845 |
| Strategy | Testing cost (£) | 50 – QALYs lost | Efficiency frontier (ICER) (£) |
|---|---|---|---|
| 22 | 220,558 | 38.57 | – |
| 24 | 290,257 | 39.11 | Extendedly dominated |
| 25 | 291,110 | 40.76 | 32,250 |
| Strategy | Testing cost (£) | 50 – QALYs lost | Efficiency frontier (ICER) (£) |
|---|---|---|---|
| 22 | 204,990 | 38.87 | – |
| 24 | 263,082 | 39.08 | Extendedly dominated |
| 25 | 264,779 | 40.38 | 39,746 |
| Strategy | Testing cost (£) | 50 – QALYs lost | Efficiency frontier (ICER) (£) |
|---|---|---|---|
| 22 | 213,408 | 40.71 | – |
| 24 | 281,097 | 40.16 | Dominated |
| 25 | 281,841 | 42.04 | 51,256 |
| Strategy | Testing cost (£) | 50 – QALYs lost | Efficiency frontier (ICER) (£) |
|---|---|---|---|
| 22 | 212,529 | 40.45 | – |
| 24 | 280,208 | 40.28 | Dominated |
| 25 | 280,806 | 42.19 | 39,254 |
| Strategy | Testing cost (£) | 50 – QALYs lost | Efficiency frontier (ICER) (£) |
|---|---|---|---|
| 22 | 213,007 | 38.44 | – |
| 24 | 280,903 | 38.26 | Dominated |
| 25 | 281,597 | 40.52 | 33,036 |
| Strategy | Testing cost (£) | 50 – QALYs lost | Efficiency frontier (ICER) (£) |
|---|---|---|---|
| 22 | 271,674 | 35.16 | – |
| 24 | 359,455 | 34.69 | Dominated |
| 25 | 360,235 | 36.81 | 53,808 |
| Strategy | Testing cost (£) | 50 – QALYs lost | Efficiency frontier (ICER) (£) |
|---|---|---|---|
| 22 | 155,075 | 42.94 | – |
| 24 | 203,350 | 42.74 | Dominated |
| 25 | 203,766 | 44.51 | 30,927 |
| Strategy | Testing cost (£) | 50 – QALYs lost | Efficiency frontier (ICER) (£) |
|---|---|---|---|
| 22 | 213,042 | 38.74 | – |
| 24 | 280,610 | 38.72 | Dominated |
| 25 | 281,403 | 40.31 | 43,459 |
| Strategy | Testing cost (£) | 50 – QALYs lost | Efficiency frontier (ICER) (£) |
|---|---|---|---|
| 22 | 238,605 | 34.29 | – |
| 24 | 322,141 | 34.52 | Extendedly dominated |
| 25 | 315,541 | 37.39 | 24,879 |
| Strategy | Testing cost (£) | 50 – QALYs lost | Efficiency frontier (ICER) (£) |
|---|---|---|---|
| 22 | 202,230 | 41.26 | – |
| 24 | 267,337 | 40.75 | Dominated |
| 25 | 267,699 | 43.25 | 32,769 |
| Strategy | Testing cost (£) | 50 – QALYs lost | Efficiency frontier (ICER) (£) |
|---|---|---|---|
| 22 | 213,197 | 39.08 | – |
| 24 | 280,861 | 39.01 | Dominated |
| 25 | 281,604 | 40.37 | 53,266 |
| Strategy | Testing cost (£) | 50 – QALYs lost | Efficiency frontier (ICER) (£) |
|---|---|---|---|
| 22 | 208,846 | 39.31 | – |
| 24 | 274,970 | 39.34 | Extendedly dominated |
| 25 | 275,911 | 41.15 | 36,507 |
| Strategy | Testing cost (£) | 50 – QALYs lost | Efficiency frontier (ICER) (£) |
|---|---|---|---|
| 22 | 218,703 | 38.34 | – |
| 24 | 289,190 | 38.49 | Extendedly dominated |
| 25 | 289,718 | 40.71 | 30,010 |
| Strategy | Testing cost (£) | 50 – QALYs lost | Efficiency frontier (ICER) (£) |
|---|---|---|---|
| 22 | 210,496 | 38.82 | – |
| 24 | 280,828 | 38.72 | Dominated |
| 25 | 281,597 | 40.52 | 41,904 |
| Strategy | Testing cost (£) | 50 – QALYs lost | Efficiency frontier (ICER) (£) |
|---|---|---|---|
| 22 | 211,103 | 38.91 | – |
| 24 | 277,476 | 39.42 | Extendedly dominated |
| 25 | 278,147 | 40.21 | 51,762 |
| Strategy | Testing cost (£) | 50 – QALYs lost | Efficiency frontier (ICER) (£) |
|---|---|---|---|
| 22 | 209,090 | 38.62 | – |
| 24 | 275,952 | 38.85 | Extendedly dominated |
| 25 | 276,234 | 40.16 | 43,444 |
| Strategy | Testing cost (£) | 50 – QALYs lost | Efficiency frontier (ICER) (£) |
|---|---|---|---|
| 22 | 213,267 | 39.85 | – |
| 24 | 280,920 | 38.93 | Dominated |
| 25 | 281,741 | 41.16 | 52,366 |
| Strategy | Testing cost (£) | 50 – QALYs lost | Efficiency frontier (ICER) (£) |
|---|---|---|---|
| 22 | 213,385 | 41.51 | – |
| 24 | 280,935 | 41.43 | Dominated |
| 25 | 281,728 | 42.65 | 59,669 |
| Strategy | Testing cost (£) | 50 – QALYs lost | Efficiency frontier (ICER) (£) |
|---|---|---|---|
| 22 | 213,069 | 40.44 | – |
| 24 | 280,756 | 40.54 | Extendedly dominated |
| 25 | 281,581 | 41.83 | 49,187 |
FIGURE 20.
The NMB compared with strategy 1 when the multiplier for QALYs post ICU care following SARS-CoV-2 infection in hospital is set at 1.

FIGURE 21.
The NMB compared with strategy 1 when the multiplier for QALYs post ICU care following SARS-CoV-2 infection in hospital is set at 0.8.

List of abbreviations
- A&E
- accident and emergency
- COVID-19
- coronavirus disease 2019
- DAR
- diagnostic assessment report
- EAG
- External Assessment Group
- ICER
- incremental cost-effectiveness ratio
- ICU
- intensive care unit
- ISARIC4C
- International Severe Acute Respiratory and emerging Infection Consortium Coronavirus Clinical Characterisation Consortium
- NICE
- National Institute for Health and Care Excellence
- NMB
- net monetary benefit
- POCT
- point-of-care test
- QALY
- quality-adjusted life-year
- SARS-CoV-2
- severe acute respiratory syndrome coronavirus 2
- SCM
- specialist committee member
- TPP
- target product profile
