Notes
Article history
The research reported in this issue of the journal was funded by the HTA programme as project number 15/80/13. The contractual start date was in March 2017. The draft report began editorial review in March 2020 and was accepted for publication in June 2020. The authors have been wholly responsible for all data collection, analysis and interpretation, and for writing up their work. The HTA editors and publisher have tried to ensure the accuracy of the authors’ report and would like to thank the reviewers for their constructive comments on the draft document. However, they do not accept liability for damages or losses arising from material published in this report.
Permissions
Copyright statement
Copyright © 2022 Cross et al. This work was produced by Cross et al. under the terms of a commissioning contract issued by the Secretary of State for Health and Social Care. This is an Open Access publication distributed under the terms of the Creative Commons Attribution CC BY 4.0 licence, which permits unrestricted use, distribution, reproduction and adaption in any medium and for any purpose provided that it is properly attributed. See: https://creativecommons.org/licenses/by/4.0/. For attribution the title, original author(s), the publication source – NIHR Journals Library, and the DOI of the publication must be cited.
2022 Cross et al.
Chapter 1 Introduction
Context and rationale for the research
Adenomas are the precursor lesions of most colorectal cancers (CRCs), and removal of adenomas by polypectomy prevents development of CRC. 1–5 However, as adenomas tend to recur, some patients remain at increased risk of CRC following polypectomy. 6 National guidelines, therefore, recommend surveillance by colonoscopy. 7–10
The 2002 UK adenoma surveillance guidelines (UK-ASG) divide patients with adenomas into three risk groups according to the size and number of adenomas removed at baseline colonoscopy, and recommend different surveillance strategies for each group. 7 In the low-risk group, comprising patients with one or two small adenomas (i.e. < 10 mm in size), the guidelines recommend either no surveillance or surveillance at 5 years. In the intermediate-risk group, comprising patients with three or four small adenomas or one or two adenomas of which at least one is ≥ 10 mm in size, 3-yearly surveillance is recommended. In the high-risk group, comprising patients with five or more small adenomas or three or more adenomas of which at least one is ≥ 10 mm in size, surveillance is recommended at 1 year and then usually every 3 years.
The UK-ASG were developed at a time when few high-quality data were available to inform the risk group definitions. The risk groups were defined mostly based on evidence from studies that used detection rates of advanced adenomas (AAs) at follow-up colonoscopy as a proxy for CRC risk. 11–14 The use of AAs as a surrogate for CRC is limited because the malignant potential of AAs varies6 and AAs are detected more frequently at follow-up than CRC, resulting in overestimations of risk. 14,15
The evidence used to inform the surveillance recommendations was also limited. Namely, the recommendation for 3-yearly surveillance in intermediate-risk patients was based mainly on one trial14 that showed that the detection rate of advanced colorectal neoplasia (AAs or CRC) was the same (i.e. 3%) among patients attending surveillance at 1 and 3 years, and at 3 years only. A second study15 reported higher rates of advanced colorectal neoplasia among patients undergoing surveillance at 4 years (i.e. 9%) than in those examined at 2 years (i.e. 5%), but the difference was not significant. Additional evidence to inform optimal surveillance intervals was not available.
A further limitation of the UK-ASG was that they were developed prior to the significant improvements in colonoscopy quality seen over the past two decades. These improvements, driven by the implementation of colonoscopy quality improvement initiatives in 2001 and the introduction of new endoscopic technologies and techniques,16,17 saw rates of post-colonoscopy CRCs fall by 30% from 2001 to 2007. 18 Therefore, it is likely that patients now receiving high-quality baseline colonoscopies are at lower risk of CRC and require less surveillance than is recommended in the 2002 UK-ASG.
In 2004, the Department of Health and Social Care issued a call for research proposals to examine the optimal frequency of post-polypectomy surveillance, specifically focusing on the intermediate-risk group, which accounts for the majority of surveillance colonoscopies. 19 This call was issued in anticipation that the introduction of the national Bowel Cancer Screening Programme (BCSP) in 2006 would lead to more individuals having adenomas detected and being funnelled into surveillance. There was concern that the increased demand for surveillance would overwhelm already overstretched endoscopy services.
In response to this call, we performed a retrospective cohort study assessing CRC incidence among intermediate-risk patients over a median of 7.9 years and estimated the effects of surveillance on CRC incidence. 20 Our findings suggested that the intermediate-risk group can be divided into higher- and lower-risk subgroups. The higher-risk subgroup comprised patients with an incomplete colonoscopy or colonoscopy of unknown completeness, poor bowel preparation, adenoma ≥ 20 mm in size or with high-grade dysplasia, or proximal polyps at baseline. These patients had a higher CRC risk than the general population following baseline colonoscopy and polypectomy, and they derived significant benefit from attending at least one surveillance visit. In contrast, among lower-risk patients without these baseline features, CRC risk was no higher than in the general population before any surveillance. We therefore suggested that surveillance might not be necessary for the lower-risk subgroup.
These findings suggest that adequate protection against the development of CRC can be achieved with less surveillance than is currently recommended. This is of timely importance as surveillance represents a substantial burden on endoscopy resources, accounting for 20% of all colonoscopies performed in the UK. 21 Additionally, as colonoscopy is an invasive procedure associated with a small risk of serious complications,22 it is important that surveillance is directed to patients who remain at an increased CRC risk following polypectomy compared with the general population. It was, therefore, seen as a priority to revise the 2002 UK-ASG to minimise the number of unnecessary colonoscopies while ensuring that patients at increased CRC risk undergo surveillance.
Aims and objectives
The overall aim of the study was to examine the need for, and benefit of, post-polypectomy surveillance among each of the three risk groups defined in the UK-ASG, in terms of detecting AAs and preventing CRC, while being cost-effective and minimising exposure of patients to unnecessary colonoscopies.
The primary objectives were to examine, for each risk group, heterogeneity in long-term CRC incidence by baseline patient, procedural and polyp characteristics and number of surveillance visits, and detection rates of AAs and CRC at the first surveillance visit by surveillance interval length. The aim of the economic evaluation was to evaluate the cost-effectiveness of adopting surveillance compared with no surveillance for each risk group. The objectives of the within-study analysis and lifetime analysis were to assess cost-effectiveness in terms of incremental costs per CRC prevented and incremental costs per quality-adjusted life-year (QALY) gained, respectively.
Study design and setting
This was a retrospective multicentre cohort study, performed using data from 17 NHS hospitals. The hospitals included teaching and general hospitals and were located throughout the UK. We obtained endoscopy and pathology data from these hospitals on patients undergoing diagnostic and surveillance colonic examinations. For the economic evaluation, we conducted both a within-study analysis (using resource use and outcomes data from the main study) and a lifetime analysis (using a Markov model).
Structure of this report
We describe the methods in Chapter 2, the findings from the main analyses in Chapter 3 and the economic evaluation in Chapter 4. We describe how patients and the public were involved in the study in Chapter 5. In Chapter 6 we present a synthesis of all the findings and discuss the strengths and limitations, implications for practice and research recommendations.
Chapter 2 Methods
For the present study, the methods used to select hospitals for inclusion, collect data from participating hospitals; transform, clean and code data; and define study variables were the same as for our previous study23 of the intermediate-risk group. These methods are described in full in the National Institute for Health and Care Research (NIHR) final report of this previous study23 and are summarised in this chapter.
Hospital selection
To be selected for inclusion in the study, hospitals were required to have electronically recorded endoscopy and pathology data for lower gastrointestinal procedures for at least 6 years prior to the start of the study in 2006. We contacted endoscopy and pathology database manufacturers to identify potentially eligible hospitals. A total of 28 NHS hospitals were identified, and we contacted each of these to request their participation in the study. Of the 28 hospitals, 10 were excluded because of difficulties in obtaining research and development approval, problems with data extraction or missing data (see Appendix 1, Table 23).
These exclusions left 18 hospitals, two of which were subsequently merged into one site. Therefore, in total, 17 hospital sites were included in the study, which are listed in the Acknowledgements.
Data collection, matching and pseudo-anonymisation
We first searched hospital endoscopy databases for patients who had undergone colonic examination before 31 December 2010. We extracted data from relevant reports, including the date of examination, type of examination, name of endoscopist, indications, bowel preparation quality, colonic segment reached, polyp size, shape and location, information on any biopsies taken, complications, diagnoses and endoscopist comments. We also extracted the following pieces of patient-identifiable information: forename(s), surname, date of birth, sex, hospital number(s), NHS number and postcode. We removed duplicate patient identifiers and resolved any other inconsistencies and errors, and then assigned each patient a unique study number.
We searched pathology databases for reports of colorectal lesions using Systematized Nomenclature of Medicine codes (SNOMED) (versions 2 and 3), Systematized Nomenclature of Pathology codes (the first four digits of SNOMED version 2 codes), keywords or multiple search terms. We extracted data from relevant reports, including the date of the report, unique report number, type of examination at which the pathology specimen was collected, number of specimens and histopathology results.
We matched endoscopy and pathology extracts based on name, date of birth and hospital number. We removed all patient identifiers except for date of birth, and encrypted the data before removing it from the hospital. We stored patient identifiers with the corresponding unique study number in a patient-linking file in Microsoft Excel® (.xls or .xlsx format) (Microsoft Corporation, Redmond, WA, USA). We encrypted the patient-linking files and copied them onto compact discs, together with the raw endoscopy and pathology data. The compact discs were stored at each hospital in a secure location and were supervised by the local principal investigator.
The study database
We developed a bespoke study database to store the patient data. We transformed, cleaned and automatically coded the data, when possible, so that these could be stored in a standardised, structured format. Data were classified as quantitative or qualitative variables. Reference data (or look-up tables) were used to define the set of permissible values for the data fields. This helped to ensure that data from different hospitals were coded in the same way. We stored the transformed data on the study database together with the raw endoscopy and pathology data, in case data loss occurred during subsequent coding. We used programming techniques to identify ineligible patients and automatically exclude them. Approximately 17% of patients were excluded in this way.
Manual coding
We went through the records of the remaining patients who were not automatically excluded, checking that any automatic coding was correct and performing additional manual coding tasks. We developed a web-based coding application on which we performed these coding tasks. We developed standard operating procedures to describe the methods and rules for coding to ensure uniformity of coding. The standard operating procedures are detailed in the appendices of our previous NIHR final report. 23 Regular coding audits were carried out to check consistency.
Coding tasks included:
-
checking that endoscopy and pathology reports were matched properly
-
coding raw endoscopy and pathology data into structured data
-
creating pathology-based endoscopy reports when pathology reports did not have a linked endoscopy report
-
assigning polyps a unique polyp number if they were seen at more than one examination
-
creating individual polyp records from endoscopy reports that described polyps as groups
-
creating summary values for polyp characteristics that were described in multiple data fields
-
coding the date, type and quality of endoscopic examination
-
defining baseline and surveillance visits.
The final five coding tasks are discussed further below. For a full description of the first three tasks, please refer to the appendices of our previous NIHR final report. 23
Polyp numbering
We assigned a unique polyp number to polyps seen at more than one examination so that different sightings could be linked. We thought that different sightings were likely to be of the same polyp when sightings were in the same or adjacent colonic segment, there was an indication that a polyp seen at an earlier examination had not been completely removed, bowel preparation quality at an earlier examination was poor and/or the grades of dysplasia and histology reported at the different sightings were similar. We assigned a match probability to sightings to indicate our confidence that they were of the same polyp. Match probabilities were estimated to the nearest 10%. We considered sightings matched with a probability of ≥ 70% to be of the same polyp.
Polyp groups
When polyps were described as groups rather than as individual polyps we created a single record for each polyp group. We then populated the record with information on the number, size, shape, histopathology and location of polyps in the group. We assigned a unique group number to each polyp group and a group-linking number to polyp groups seen at more than one examination. When information was recorded for an individual polyp within a group we created an individual polyp record and linked it to the group record.
Terms such as ‘some’, ‘several’ and ‘many’ were often used to describe the number of polyps in a group. We assigned numeric values to these descriptive terms (e.g. some = 3), using the median value calculated from endoscopy reports that gave both a descriptive term and an exact polyp number. Once we had an estimate for the number of polyps in each group we created individual polyp records from the group records. Information recorded for the group was replicated in the individual polyp records.
Summary values for polyp characteristics
Polyp characteristics were often described in multiple data fields on the study database, particularly if the polyp was seen at more than one examination. In such cases, we combined all available data to create summary values for polyp size, shape, histology and location, using hierarchies of rules.
Polyp size
We created three derived polyp size values: (1) derived-endoscopy-size, (2) derived-pathology-size and (3) derived-endoscopy-size-descriptor. Derived-endoscopy-sizes were created by combining the exact polyp size (in mm) on the endoscopy report with any reported minimum and maximum sizes, using a hierarchy of rules. Minimum and maximum sizes were reported when sizes were given as ranges (e.g. 7–10 mm). Most pathology reports gave an exact polyp size, which was used as the derived-pathology-size. Derived-endoscopy-size-descriptors were created by assigning numeric values to descriptors of polyp size that were qualitative or approximate; for example, for polyps described as ‘tiny’ or ‘< 10mm’, we assigned values of 3 mm and 8 mm, respectively. In most cases, we assigned the median value calculated from endoscopy reports, which gave both a descriptive term and an exact polyp size.
For each polyp we identified the largest of each derived polyp size, comparing across examinations. We then compared the largest derived sizes and, in most cases, used the largest of these as the summary polyp size. However, when the largest size was the derived-endoscopy-size-descriptor, the largest derived-endoscopy-size or derived-pathology-size was used instead, if available.
Polyp shape
We used the first recorded description of the shape of a polyp as the summary value. We did this because polyp shape can change after a biopsy or resection is performed and so the first record is likely to be the most accurate. There were three shape values: (1) pedunculated (i.e. attached to the bowel wall by a stalk), (2) sessile (i.e. no stalk) and (3) flat. We used the polyp shape values, together with histopathology values described below, to classify polyps into different categories, such as hyperplastic polyps or adenomas (see Appendix 1, Table 24).
Polyp histopathology
Histopathological data were available for two-thirds of polyps. For the other one-third, histopathological data were missing because the polyp was not retrieved at endoscopy, the polyp was not described in the pathology report, a biopsy was not taken or we could not find a pathology report at the hospital.
For polyps with histopathological data we assumed that those with any villous features or dysplasia were adenomas. For polyps without histopathological data we assumed that those ≥ 10 mm in size were adenomas if the patient had at least one recorded sighting of an adenoma. Histopathology was coded as ‘specimen not seen’ or ‘not able to diagnose’ when histopathological data were not recorded at any polyp sighting.
Some adenomas sighted multiple times were not recorded as adenomas at the first sightings. In such cases, we mapped the diagnosis of an adenoma back to the earlier sightings, if the earlier sightings occurred within 3 years of the adenoma diagnosis. Polyps sighted multiple times also sometimes had different histopathological features recorded at each sighting. In these cases, we compared the records and gave precedence to the histopathological outcomes of interest (see Appendix 1, Table 24) over other histopathological outcomes.
Polyp location
Polyp location was defined according to the colonic segment in which the polyp was found. Colonic segments included the ileum, caecum, ascending colon, hepatic flexure, transverse colon, splenic flexure, descending colon, sigmoid colon, rectosigmoid, rectum and anus. We used a number of rules to derive a summary value for polyp location:
-
If a surgical procedure was performed, we used the segment recorded at that procedure.
-
If a surgical procedure was not performed, we used the segment mentioned most frequently at other procedures.
-
If no segment was mentioned more frequently than any other, we used the most distal segment. (Distal was defined as anus to sigmoid colon and proximal was defined as descending colon to terminal ileum.)
-
If a segment range was given, we recorded this range on the study database.
-
If more than one segment range was given, we recorded the narrowest segment range on the study database, provided that the most distal and proximal segments in the range were no more than two segments apart (see Appendix 1, Table 25). If the most distal and proximal segments were more than two segments apart, we manually reviewed the records to help reach a decision.
Colonic examinations
Examination date
In most cases, the date recorded on the endoscopy report was used as the examination date. However, when there was no endoscopy report, the examination date was derived from the pathology report. When multiple dates were given on the pathology report, precedence was given in the following order: (1) to the date that the biopsy was performed, (2) to the date that the biopsy sample arrived at the pathology laboratory and (3) to the date of the pathologist’s report. We excluded the patient from the study when an examination date could not be derived.
Examination type
We determined the type of endoscopic examination that had been carried out by examining the hospital endoscopy report and, if this was not available, the pathology report. These reports covered a range of examination types, including colonoscopy, sigmoidoscopy and surgery.
When the type of examination was not specified, we assumed that examinations reaching the transverse colon or beyond were colonoscopies. If information on bowel preparation quality and depth of insertion was recorded, the examinations were assumed to be either a colonoscopy or flexible sigmoidoscopy, as were examinations at which a large lesion (i.e. ≥ 10 mm in size) or three or more adenomas were removed.
Examination quality
Examination completeness was determined based on the colonic segment reached, the most proximally recorded polyp, the quality of bowel preparation before the examination and whether or not the examination was recorded as incomplete. Examinations were defined as complete if the endoscope reached the caecum or polyps were found in the caecum or beyond. Bowel preparation quality was graded as excellent, good, satisfactory or poor.
Defining baseline and surveillance visits
We divided examinations into visits, defined as one or more examinations performed in close succession, to achieve a full examination of the colon and remove all detected lesions. The baseline visit included the earliest examination at which an adenoma was sighted and any examinations occurring within the following 11 months. A time period of 11 months was chosen because a longer period might have captured surveillance examinations performed in high-risk patients in whom surveillance at 1 year is recommended.
In some cases it was necessary to extend the baseline visit to capture examinations occurring within 6 months of the last baseline examination. We did this because examinations occurring so soon after baseline were unlikely to be surveillance examinations. In a few rare cases we extended the baseline a second time to capture examinations occurring 6–9 months after the last baseline examination. This was done in the below scenarios:
-
The last baseline examination was incomplete or had poor bowel preparation.
-
A polyp ≥ 15 mm in size was seen at the last baseline examination.
-
The same polyp was seen at the last baseline examination and at the examination occurring within 6–9 months.
-
A surgical procedure was performed shortly after the last baseline examination.
Surveillance visits included the first examination after baseline (or after a previous surveillance visit) and any examinations occurring within the following 11 months. When necessary, we extended the surveillance visit using the same criteria described previously for the extension of the baseline visit.
Once we had grouped examinations into baseline and surveillance visits, we defined examination completeness and bowel preparation quality according to the most complete examination and best bowel preparation achieved during a visit, respectively. Similarly, we defined adenoma histology and dysplasia according to the greatest degree of villous architecture and highest grade of dysplasia recorded in a visit, respectively.
It was important to determine whether or not patients had a colonoscopy during the baseline visit because this was necessary for inclusion in the study. Therefore, we reviewed the records of patients whose baseline visit was coded as ‘colonoscopy or sigmoidoscopy’. In the case of patients diagnosed with three or more adenomas or an adenoma ≥ 10 mm in size or with tubulovillous or villous histology or high-grade dysplasia at baseline, we assumed that colonoscopy rather than sigmoidoscopy had been performed.
In the case of other patients it was clear that colonoscopy had been performed at the first surveillance visit but not during the baseline visit. In our previous study of intermediate-risk patients,23 in all such cases the first surveillance visit was reassigned as the baseline visit and the original baseline visit was designated as a ‘prior’ visit. For patients in the present study this reassignment of baseline was applied only if the interval between the first examination in baseline and the first examination in the first surveillance visit was < 3 years. The cut-off point of 3 years was used as it is the recommended surveillance interval for intermediate-risk patients. 7 When we came to stratify the patients into risk groups we considered any adenomas diagnosed at the prior visit in the determination of risk, in addition to those diagnosed at the new baseline visit.
Patient selection and follow-up
We included patients in whom colonoscopy was performed and at least one adenoma was diagnosed during the baseline visit. We excluded patients who had CRC at or before baseline; had undergone bowel resection at or before baseline; had Lynch syndrome or a family history of familial adenomatous polyposis; had inflammatory bowel disease (IBD) or colitis at baseline; had polyposis, juvenile polyps or hamartomatous polyps; had colorectal carcinoma in situ reported in registry data > 3 years before baseline; or had undergone any examination without a date recorded. We also excluded patients for whom the information required for risk group classification was missing. In a sensitivity analysis we additionally excluded patients who did not have a complete colonoscopy at baseline.
We classified patients into low-, intermediate- and high-risk groups according to the characteristics of baseline adenomas, as per the 2002 UK-ASG. 7 Patients were classed as low risk if they had one or two small (i.e. < 10 mm in size) adenomas. Patients were classed as intermediate risk if they had three or four small adenomas or one or two adenomas of which at least one was ≥ 10 mm in size. Patients were classed as high risk if they had five or more small adenomas, or three or more adenomas of which at least one was ≥ 10 mm in size.
We obtained data on CRC diagnoses and deaths occurring among our study cohort from NHS Digital, NHS Central Register and National Services Scotland (NSS) through 2016 and uploaded these data to the study database. We compared the cancer data with the pathology data already stored on the database and resolved any duplications and discrepancies.
Variables
Outcomes and exposures
The primary outcome measures were long-term CRC incidence after baseline and the first surveillance visit and detection rates of AAs and CRC at the first surveillance visit. Outcomes of AA and CRC were ascertained using pathology data stored on the study database and cancer data from national data sources (for CRC).
We defined AAs as adenomas ≥ 10 mm in size or with villous or tubulovillous histology, or high-grade dysplasia. We defined CRC sites by the International Classification of Diseases revisions 8, 9 and 10,24–26 including codes C18–C20. We defined CRC morphology by the Manual of Tumor Nomenclature and Coding27 and the International Classification of Diseases for Oncology revisions 1 and 2. 28,29 We included adenocarcinomas of the colorectum as CRC outcomes, as well as cancers with unspecified morphology but assumed to be adenocarcinomas (i.e. those located between the rectum and caecum). Cancers with unspecified morphology but assumed to be squamous cell carcinomas (i.e. those located around the anus) and in situ cancers were not included as CRC outcomes.
We excluded CRCs that we assumed had developed from lesions that were incompletely resected at baseline. We did this because we thought that their inclusion could bias our estimates of CRC risk and lead to inappropriate surveillance recommendations. We assumed that CRCs had arisen from an incompletely resected lesion if all of the below criteria were met:
-
The CRC was found in the same or adjacent colonic segment to a baseline lesion.
-
The baseline lesion was an adenoma.
-
The baseline adenoma was ≥ 15 mm in size.
-
The baseline adenoma was seen on two or more occasions within 5 years before the cancer diagnosis.
In a sensitivity analysis we excluded some additional cancers that met some but not all the criteria above that we thought were likely to have arisen from an incompletely resected baseline lesion.
For our analyses of findings at the first surveillance visit we excluded all AAs seen during the baseline visit. We did this because we had previously showed that adenomas detected at first surveillance that were also seen at baseline were likely to be under polypectomy site surveillance and that the inclusion of such adenomas confounded analyses. 23
The primary exposures of interest were the number of surveillance visits and the length of the surveillance interval from baseline to the first surveillance visit. Patient follow-up was censored at first CRC diagnosis, first diagnosis of a condition affecting colonic surveillance regimen (including IBD, colitis, hyperplastic polyposis, proctitis or volvulus), performance of bowel resection, death, emigration, or the date when cancer registration data were considered complete (for patients matched to national data sources) or when the last examination was recorded on the study database (for patients not matched to national data sources).
In all analyses we excluded surveillance visits that fully occurred after censoring (i.e. if all examinations in the visit occurred after censoring). In our analyses of long-term CRC incidence, visits at which a censoring event occurred and visits with the last examination occurring after the date of censoring were not included as surveillance visits, as they did not offer protection against the development of CRC. By contrast, in our analyses of findings at first surveillance we included any first surveillance visits at which a censoring event occurred.
We defined the surveillance interval as the time period between the latest most complete examination in one visit to the first examination in the next visit. The surveillance interval was represented as a categorical variable and patients with the shortest surveillance interval were the reference group against which we compared patients exposed to a longer interval. In the case of the low- and intermediate-risk groups, the surveillance interval was categorised into the following: < 18 months, 2 years (± 6 months), 3 years (± 6 months), 4 years (± 6 months), 5 years (± 6 months), 6 years (± 6 months), 7 years (± 6 months), 8 years (± 6 months), 9 years (± 6 months) and ≥ 9.5 years. The following categories were used for the high-risk group: < 15 months, 1.5 years (± 3 months), 2 years (± 3 months), 2.5 years (± 3 months), 3 years (± 3 months), 3.5 years (± 3 months), 4 years (± 3 months), 4.5 years (± 3 months), 5 years (± 3 months) and ≥ 5.25 years.
Risk factors and confounders
We assessed the following patient, procedural and polyp characteristics as potential risk factors and confounders at baseline: age, sex, year of visit, length of visit (in days or months), examination completeness, bowel preparation quality, number of adenomas, adenoma size, histology, dysplasia, presence of proximal polyps, presence of hyperplastic polyps, presence of a large (i.e. ≥ 10 mm in size) hyperplastic polyp and family history of cancer/CRC. In a sensitivity analysis we additionally considered the hospital that patients attended as a confounding variable.
Family history of cancer/CRC was defined as ‘family history of cancer or CRC reported at an examination before or during visit’. Of cases reported to have a ‘family history of cancer’, 72% came from a specialist hospital for colorectal diseases and we therefore assumed that these cases had a family history of CRC.
We created categorical variables for the following continuous quantitative variables: number of surveillance visits, age, length of visit, number of adenomas and adenoma size. We created an unknown category for variables with missing data.
Sample size calculations
We based our sample size calculation on obtaining estimates of CRC incidence with a coefficient of variation of approximately 30% [i.e. the standard error (SE) of the incidence estimate being approximately 30% of the value of the estimate]. We assumed an approximate Poisson distribution of incidence and a univariate estimate of the rate, and estimated that nine CRCs in any given risk subgroup would provide a coefficient of variation of 33%. Under these assumptions, only the number of CRCs diagnosed is relevant to the satisfaction of the stipulated criterion on the coefficient of variation (the number of person-years in the denominator has no bearing). Assuming that the size of the smallest subgroup would be 15% of the size of the whole corresponding risk group, we calculated that a minimum number of 60 CRCs were required in each risk group to ensure that the coefficient of variation was no higher than 33% in any of the risk subgroups.
At the time of applying for funding we estimated that approximately 120, 170 and 50 CRCs had been diagnosed during 6 years of follow-up in the low-, intermediate- and high-risk groups, respectively. With more than 3 additional years of follow-up anticipated we expected to accrue at least 60 CRCs in each risk group and thus achieve sufficient precision in all risk groups.
Statistical analyses
We conducted the statistical analyses in Stata®/IC 13.1 (StataCorp LP, College Station, TX, USA). We performed two-tailed tests and used a significance level of 0.05. All of the following analyses were performed separately for the low-, intermediate- and high-risk groups.
We compared the distribution of baseline characteristics (see Risk factors and confounders) among patients who attended at least one surveillance visit with that among those who did not attend any surveillance using the chi-squared test.
Long-term colorectal cancer incidence after baseline
We estimated the long-term incidence of CRC after baseline. Time at risk started from the last examination at baseline. Time-to-event data were censored at first CRC diagnosis; first diagnosis of IBD, colitis, hyperplastic polyposis, proctitis or volvulus; performance of bowel resection; death; emigration; or the date of complete case ascertainment in cancer registries. Patients who were not matched to national data sources were censored at the date of their last examination recorded on the study database rather than the date of complete case ascertainment.
We assessed the effects of baseline characteristics (see Risk factors and confounders) and surveillance on CRC incidence using Cox proportional-hazards models to calculate hazard ratios (HRs) and 95% confidence intervals (CIs). Exposure to successive surveillance visits started at the last examination in each visit.
We used multivariable Cox proportional hazards models to identify baseline CRC risk factors (i.e. characteristics independently associated with increased long-term CRC incidence). This involved using a backward stepwise selection procedure to retain variables with p-values of < 0.05 in the likelihood ratio test (LRT). We included the number of surveillance visits as a time-varying covariate, meaning that patients who had any surveillance contributed person-years to more than a single category of number of surveillance visits. We investigated interactions between the number of surveillance visits and age or sex by fitting the models with interaction parameters.
Higher- and lower-risk subgroups
We used the identified baseline CRC risk factors to divide each of the three risk groups into higher- and lower-risk subgroups. Patients with any of the baseline risk factors were assigned to the higher-risk subgroup, whereas those with none of the risk factors were assigned to the lower-risk subgroup. We did not include age in the risk classification criteria because older age is associated with poorer colonoscopy quality and greater risks of colonoscopy-related complications. 30 We also did not include the year or length of the baseline visit as these factors do not help define clinically meaningful patient subgroups.
We conducted a sensitivity analysis of the risk classification criteria for intermediate-risk patients. This involved using the baseline risk factors identified in our previous study of the intermediate-risk group in the classification of higher risk (i.e. incomplete colonoscopies or colonoscopies of unknown completeness, poor bowel preparation, adenomas ≥ 20 mm in size or with high-grade dysplasia, and proximal polyps). 20,23
Cumulative incidence of colorectal cancer
We used one minus the Kaplan–Meier estimator of the survival function to show time to CRC diagnosis and to estimate cumulative incidence of CRC with 95% CIs at 3, 5 and 10 years. We used the log-rank test to compare cumulative incidence curves.
Comparisons with colorectal cancer incidence in the general population
We compared CRC incidence with that in the general population by calculating standardised incidence ratios (SIRs). These were calculated as the ratio of observed to expected cases of CRC, with exact Poisson 95% CIs. We estimated the number of expected cases by multiplying the observed sex- and 5-year age group-specific number of person-years by the corresponding CRC incidence in the general population of England in 2007. 31
For our analyses of CRC incidence we divided each patient’s follow-up time into four distinct blocks of time:
-
without surveillance (i.e. from start of time-at-risk, censored at any first surveillance)
-
after first surveillance (i.e. from first surveillance, censored at any second surveillance)
-
after second surveillance (i.e. from second surveillance, censored at any third surveillance)
-
after third surveillance (i.e. from third surveillance, censored at end of follow-up).
In some analyses we combined the last two blocks of time to show CRC incidence in the presence of two or more surveillance visits. We compared CRC incidence in the presence of one surveillance visit with two or more surveillance visits using univariable Cox proportional hazards models.
Findings at the first surveillance visit
We assessed detection rates of AAs and CRC at the first surveillance visit by interval length (from baseline to first surveillance), overall and by risk subgroup. A test for trend was used to test for association between detection rates and interval length. Univariable logistic regression was used to calculate unadjusted odds ratios (ORs) and 95% CIs, comparing the detection of AAs and CRC between risk subgroups.
For the analyses of AA detection rates we excluded patients in whom CRC was detected at first surveillance because we expected that their risk of having an AA detected would be different from that of patients without CRC and that their inclusion could therefore lead to biased estimates.
Selection of interval length cut-off point
For our analyses of findings at first surveillance we selected an interval length cut-off point for each risk group to determine which patients in whom a surveillance examination was recorded should actually be included as having had a surveillance examination.
In our main analysis we chose interval length cut-off points of 8.5 years for the low-risk group, 6.5 years for the intermediate-risk group and 3.75 years for the high-risk group. We used the surveillance intervals recommended in the 2002 UK-ASG to inform these cut-off points (i.e. 5 years, 3 years and 1 year for the low-, intermediate- and high-risk groups, respectively), although we allowed the period for the surveillance examination to occur within each risk group to extend to account for the long waits often experienced in endoscopy services and for any delays due to rescheduling. 32 We did not want to extend the intervals further, however, because this would have probably captured patients who were re-presenting, perhaps with symptoms, rather than attending a surveillance examination.
When we applied these cut-off points, low-risk patients were included as having had surveillance if the interval length to their first surveillance visit was < 8.5 years. Low-risk patients with interval lengths ≥ 8.5 years were not included as having undergone surveillance. By the same token, intermediate- and high-risk patients with interval lengths < 6.5 years and < 3.75 years, respectively, were included as having undergone surveillance, whereas those with interval lengths ≥ 6.5 years and ≥ 3.75 years, respectively, were not.
In a sensitivity analysis, we assessed the effects of a shorter interval cut-off point for the low-risk group, changing the cut-off point from 8.5 years to 6.5 years.
Economic evaluation
The aim of the economic evaluation was to evaluate the cost-effectiveness of adopting surveillance compared with no surveillance for each risk group. The economic evaluation involved a within-study analysis and a lifetime analysis.
Within-study analysis
We first conducted a within-study analysis using resource use and outcomes data from the main study. We considered resource use associated with both adenoma surveillance and treatment of CRC. Surveillance procedures included diagnostic and therapeutic colonoscopies, flexible sigmoidoscopies and rigid sigmoidoscopies. Unit costs for these procedures were taken from the NHS national schedule of reference costs for 2017–18. 33 We estimated the lifetime costs of CRC treatment using published estimates from a whole-disease model of CRC,34 inflating these costs from 2012/13 to 2017/18 prices using the gross domestic product deflator. Treatment costs varied according to patient age and CRC stage at diagnosis. We handled missing CRC staging data by means of multiple imputation using an ordered logit model. We discounted costs and the number of CRC cases at a rate of 3.5% per year.
For each of the three main risk groups we calculated the following for the higher- and lower-risk subgroups:
-
incremental cost associated with adopting surveillance compared with no surveillance per 1000 person-years
-
incremental number of CRCs diagnosed among patients attending surveillance compared with those not attending surveillance
-
incremental cost per CRC prevented by adopting surveillance compared with no surveillance.
Lifetime analysis
For the lifetime analysis we used an extrapolation model to extrapolate results from the within-study analysis over a lifetime horizon. We designed a Markov model that consisted of eight states: (1) no surveillance visits, (2) surveillance visits, (3) Dukes’ stage A CRC, (4) Dukes’ stage B CRC, (5) Dukes’ stage C CRC, (6) Dukes’ stage D CRC, (7) death from CRC and (8) death from other causes. We estimated time-homogeneous probabilities of transitions between states for each risk group. We used multiple data sources to estimate these probabilities, including the main study database, the 2013 National Bowel Cancer Audit Annual Report35 and the Office for National Statistics. 36
We assigned quality-of-life (QoL) estimates to each state. For the CRC states we used mean EuroQol-5 Dimensions (EQ-5D) scores from a study37 that collected patient-reported outcome measures (PROMs) from patients with CRC. For the non-cancer states we used EQ-5D scores from a study38 that pooled responses in the Health Survey for England from people without cancer.
We ran the Markov model for the higher- and lower-risk subgroups of each risk group. This allowed us to calculate the costs and QALYs associated with surveillance. We discounted future costs and QALYs at an annual rate of 3.5%. We calculated incremental cost-effectiveness ratios (ICERs) as the ratio between the mean difference in QALYs and the mean difference in costs. Cost-effectiveness was evaluated assuming a willingness-to-pay threshold of £20,000 per QALY gained.
Research governance
Previous approvals for our original study of the intermediate-risk group
We initially obtained research governance approvals to permit data collection from hospitals and national databases for our original study of the intermediate-risk group. These approvals are described in full in the NIHR final report for the original study23 and are summarised below:
-
Ethics approval was granted by the Royal Free Research Ethics Committee (reference 06/Q0501/45).
-
Approval for the processing of patient-identifiable information without consent in England was granted by the Patient Information Advisory Group (PIAG) under Section 60 of the Health and Social Care Act 200139 (re-enacted by Section 251 of the NHS Act 200640) (reference PIAG 1–05[e]/2006).
-
Approval was granted by the Community Health Index Advisory Group of NSS to access the Community Health Index. This enabled the Information Services Division of the NSS to link patient-identifiable information with data from cancer and death registries.
-
Research and development approval was obtained for all participating hospitals.
Approvals for the present study of all three risk groups
We subsequently obtained additional ethics approval from the London – Hampstead Research Ethics Committee and the Health Research Authority (reference 06/Q0501/45, IRAS ID 59943) for substantial amendments that extended the scope of the study protocol to examine the low- and high-risk groups, in addition to the intermediate-risk group previously analysed. Amendments and annual reviews of our approval to process patient-identifiable information without consent were approved by the Health Research Authority Confidentiality Advisory Group (reference PIAG 1–05[e]/2006).
Our data-sharing agreements with NHS Digital (reference DARS-NIC-147827-NC2TC) and NHS NSS (reference PBPP 1718–0048/SR244) were amended to include these additional analyses, and a new application was made to the Public Health England (PHE) Office for Data Release (reference ODR1718_326) to obtain cancer staging and treatment data for the health economic analysis.
We renewed our Data Access Agreements to allow continued access to data from the participating hospitals through December 2022.
To protect patient confidentiality, all information kept at the Cancer Screening and Prevention Group’s office was pseudo-anonymised and no patient-identifiable information, except for date of birth, was stored on the study database (Oracle database, Oracle Corporation, Redwood City, CA, USA). Access controls to the study database are in place, including password control and a firewall that limited access to a subset of Cancer Screening and Prevention Group computers.
Role of the funding source
The NIHR stipulated that we use a retrospective cohort study design, but it had no involvement in data collection, analysis or interpretation, in the writing of the report or in the decision to submit the report for publication.
Chapter 3 Results
In total, 33,011 patients were identified as having had a colonoscopy performed and at least one adenoma diagnosed during the baseline visit. Indications for colonoscopy were various and included the presence of CRC symptoms (e.g. a change in bowel habit, abdominal pain, anaemia, rectal bleeding), a family history of CRC or a personal history of colorectal polyps (indications are listed in full in the appendices of our previous NIHR final report). 23
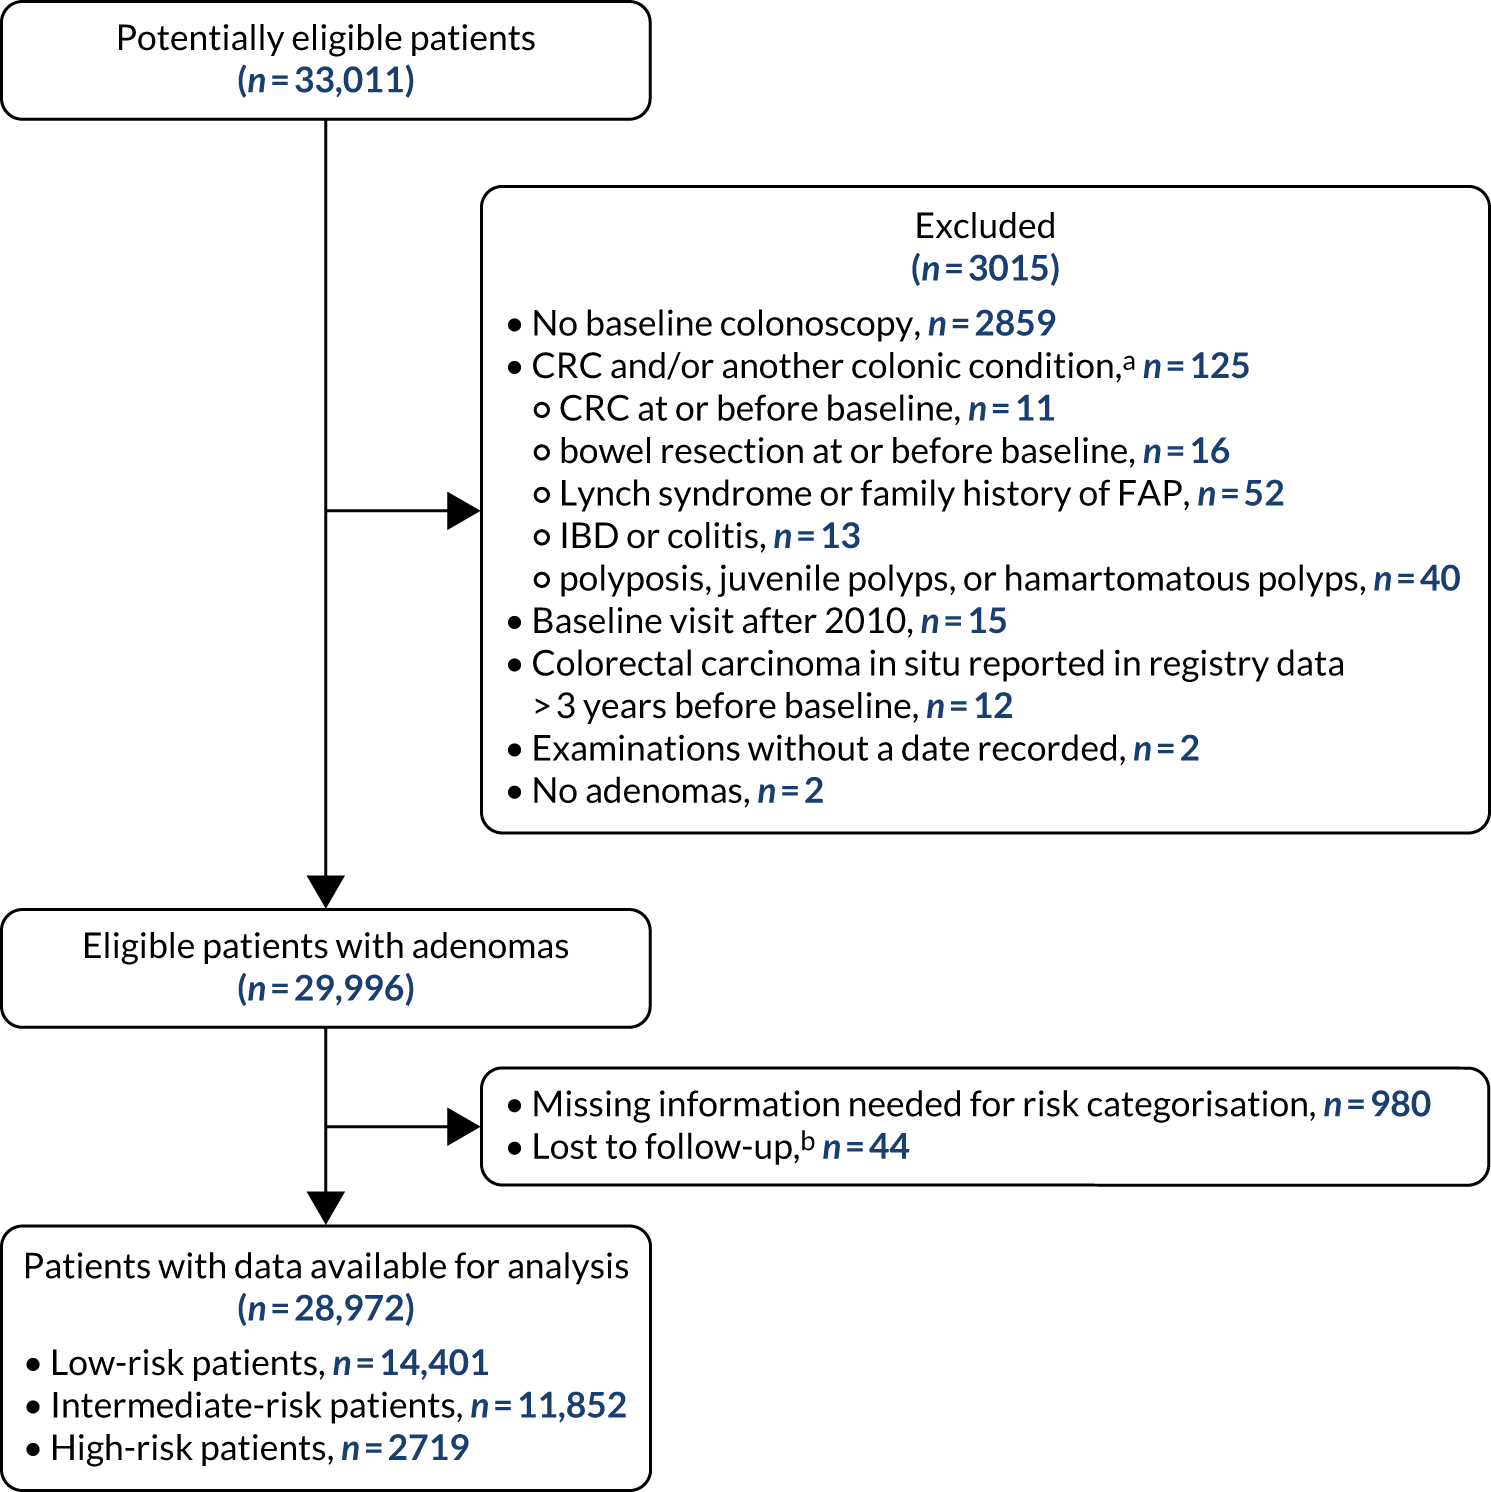
Of the 33,011 potentially eligible patients, we excluded 3015. The 3015 patients excluded included 2859 patients who did not have a baseline colonoscopy, 125 patients who had CRC at or before baseline and/or another colonic condition associated with increased CRC risk, 15 patients whose baseline visit occurred after 2010, 12 patients who had colorectal carcinoma in situ reported in registry data > 3 years before their baseline visit, two patients who had examinations with missing dates and two patients who did not in fact have an adenoma. A further 980 patients were missing information needed for risk group assignment and were excluded and 44 patients were lost to follow-up. This left 28,972 patients for analysis, of whom 14,401 (50%) were classed as low risk, 11,852 (41%) as intermediate risk and 2719 (9%) as high risk (Figure 1). Baseline colonoscopies in these patients were performed from 1984 to 2010, with most (87%) occurring between 2000 and 2010.
FIGURE 1.
Participant flow diagram. a, Not mutually exclusive; and b, patients lost to follow-up included 22 patients who could not be traced in national data sources and who had no surveillance, 19 patients who underwent all their examinations after emigrating and three patients whose date of birth was not known. FAP, familial adenomatous polyposis.
Baseline patient, procedural and polyp characteristics
The low-risk group
The median age of the low-risk group was 64 [interquartile range (IQR) 55–72] years, and 8019 (56%) patients were men. Approximately half of the group (n = 7194) were counted as having attended one or more surveillance visit in our analysis of long-term CRC incidence (Table 1). Patients who attended surveillance were younger and more likely to have had a baseline visit before 2005 or a baseline visit ≥ 6 months in length than those who did not attend surveillance. Non-attenders were more likely than attenders to have had an incomplete baseline colonoscopy and poor bowel preparation. Attenders were more likely to have had two adenomas (rather than one), an adenoma with tubulovillous or villous histology, an adenoma with high-grade dysplasia or hyperplastic polyps at baseline or to have a family history of cancer/CRC. The proportion of patients in whom data on adenoma histology, adenoma dysplasia, colonoscopy completeness and bowel preparation quality were missing was higher among attenders than among non-attenders (see Table 1).
| Baseline characteristic | All low-risk patients | Patients attending one or more surveillance visits | Patients not attending surveillance | p-valuea | |||
|---|---|---|---|---|---|---|---|
| n | % | n | % | n | % | ||
| Total | 14,401 | 100.0 | 7194 | 50.0 | 7207 | 50.0 | |
| Sex | 0.32 | ||||||
| Women | 6382 | 44.3 | 3218 | 44.7 | 3164 | 43.9 | |
| Men | 8019 | 55.7 | 3976 | 55.3 | 4043 | 56.1 | |
| Age (years) | < 0.0001 | ||||||
| < 55 | 3569 | 24.8 | 2147 | 29.8 | 1422 | 19.7 | |
| 55–64 | 3991 | 27.7 | 2339 | 32.5 | 1652 | 22.9 | |
| 65–74 | 4258 | 29.6 | 2007 | 27.9 | 2251 | 31.2 | |
| ≥ 75 | 2583 | 17.9 | 701 | 9.7 | 1882 | 26.1 | |
| Year of baseline visit | < 0.0001 | ||||||
| 1984–99 | 1640 | 11.4 | 1126 | 15.7 | 514 | 7.1 | |
| 2000–4 | 5168 | 35.9 | 2855 | 39.7 | 2313 | 32.1 | |
| 2005–10 | 7593 | 52.7 | 3213 | 44.7 | 4380 | 60.8 | |
| Length of baseline visit | 0.0075 | ||||||
| 1 day | 11,354 | 78.8 | 5688 | 79.1 | 5666 | 78.6 | |
| 2 days to 3 months | 1373 | 9.5 | 642 | 8.9 | 731 | 10.1 | |
| 3–6 months | 950 | 6.6 | 469 | 6.5 | 481 | 6.7 | |
| ≥ 6 months | 724 | 5.0 | 395 | 5.5 | 329 | 4.6 | |
| Colonoscopy completeness | < 0.0001 | ||||||
| Complete | 11,719 | 81.4 | 5570 | 77.4 | 6149 | 85.3 | |
| Incomplete | 1140 | 7.9 | 481 | 6.7 | 659 | 9.1 | |
| Unknown | 1542 | 10.7 | 1143 | 15.9 | 399 | 5.5 | |
| Bowel preparation quality | < 0.0001 | ||||||
| Excellent or good | 5145 | 35.7 | 2562 | 35.6 | 2583 | 35.8 | |
| Satisfactory | 2540 | 17.6 | 1122 | 15.6 | 1418 | 19.7 | |
| Poor | 968 | 6.7 | 388 | 5.4 | 580 | 8.0 | |
| Unknown | 5748 | 39.9 | 3122 | 43.4 | 2626 | 36.4 | |
| Number of adenomas | < 0.0001 | ||||||
| One | 11,762 | 81.7 | 5753 | 80.0 | 6009 | 83.4 | |
| Two | 2639 | 18.3 | 1441 | 20.0 | 1198 | 16.6 | |
| Adenoma histology | < 0.0001 | ||||||
| Tubular | 11,138 | 77.3 | 5430 | 75.5 | 5708 | 79.2 | |
| Tubulovillous | 2113 | 14.7 | 1149 | 16.0 | 964 | 13.4 | |
| Villous | 190 | 1.3 | 106 | 1.5 | 84 | 1.2 | |
| Unknown | 960 | 6.7 | 509 | 7.1 | 451 | 6.3 | |
| Adenoma dysplasia | < 0.0001 | ||||||
| Low grade | 13,242 | 92.0 | 6507 | 90.5 | 6735 | 93.5 | |
| High grade | 357 | 2.5 | 224 | 3.1 | 133 | 1.8 | |
| Unknown | 802 | 5.6 | 463 | 6.4 | 339 | 4.7 | |
| Proximal polyps | 0.065 | ||||||
| No | 8133 | 56.5 | 4008 | 55.7 | 4125 | 57.2 | |
| Yes | 6268 | 43.5 | 3186 | 44.3 | 3082 | 42.8 | |
| Hyperplastic polyps | < 0.0001 | ||||||
| No | 11,535 | 80.1 | 5597 | 77.8 | 5938 | 82.4 | |
| Yes | 2866 | 19.9 | 1597 | 22.2 | 1269 | 17.6 | |
| Hyperplastic polyp ≥ 10 mm in size | 0.39 | ||||||
| No | 14,263 | 99.0 | 7120 | 99.0 | 7143 | 99.1 | |
| Yes | 138 | 1.0 | 74 | 1.0 | 64 | 0.9 | |
| Family history of cancer/CRCb | < 0.0001 | ||||||
| No | 12,936 | 89.8 | 6106 | 84.9 | 6830 | 94.8 | |
| Yes | 1465 | 10.2 | 1088 | 15.1 | 377 | 5.2 | |
The intermediate-risk group
The median age of the intermediate-risk group was 66 (IQR 58–74) years, and 6581 (56%) were men. A total of 7169 (60%) patients attended one or more surveillance visit during the long-term CRC incidence analysis (Table 2). Compared with patients who did not attend surveillance, attenders included a higher proportion of men and patients aged < 75 years, and were more likely to have had a baseline visit before 2005 and to have had a longer baseline visit (> 1 day). Non-attenders were more likely than attenders to have had an incomplete colonoscopy or poor bowel preparation at baseline. Attenders were more likely to have had an adenoma ≥ 20 mm in size, with tubulovillous histology, or with high-grade dysplasia, hyperplastic polyps, a hyperplastic polyp ≥ 10 mm in size at baseline or to have a family history of cancer/CRC. A greater proportion of attenders than of non-attenders were missing data for adenoma histology, adenoma dysplasia, colonoscopy completeness and bowel preparation quality (see Table 2).
| Baseline characteristic | All intermediate-risk patients | Patients attending one or more surveillance visits | Patients not attending surveillance | p-valuea | |||
|---|---|---|---|---|---|---|---|
| n | % | n | % | n | % | ||
| Total | 11,852 | 100.0 | 7169 | 60.5 | 4683 | 39.5 | |
| Sex | 0.023 | ||||||
| Women | 5271 | 44.5 | 3128 | 43.6 | 2143 | 45.8 | |
| Men | 6581 | 55.5 | 4041 | 56.4 | 2540 | 54.2 | |
| Age (years) | < 0.0001 | ||||||
| < 55 | 2097 | 17.7 | 1537 | 21.4 | 560 | 12.0 | |
| 55–64 | 3158 | 26.7 | 2278 | 31.8 | 880 | 18.8 | |
| 65–74 | 3915 | 33.0 | 2460 | 34.3 | 1455 | 31.1 | |
| ≥ 75 | 2682 | 22.6 | 894 | 12.5 | 1788 | 38.2 | |
| Year of baseline visit | < 0.0001 | ||||||
| 1984–99 | 1870 | 15.8 | 1335 | 18.6 | 535 | 11.4 | |
| 2000–4 | 4222 | 35.6 | 2591 | 36.1 | 1631 | 34.8 | |
| 2005–10 | 5760 | 48.6 | 3243 | 45.2 | 2517 | 53.7 | |
| Length of baseline visit | 0.0001 | ||||||
| 1 day | 6697 | 56.5 | 3944 | 55.0 | 2753 | 58.8 | |
| 2 days to 3 months | 2343 | 19.8 | 1428 | 19.9 | 915 | 19.5 | |
| 3–6 months | 1403 | 11.8 | 897 | 12.5 | 506 | 10.8 | |
| ≥ 6 months | 1409 | 11.9 | 900 | 12.6 | 509 | 10.9 | |
| Colonoscopy completeness | < 0.0001 | ||||||
| Complete | 8967 | 75.7 | 5362 | 74.8 | 3605 | 77.0 | |
| Incomplete | 1321 | 11.2 | 605 | 8.4 | 716 | 15.3 | |
| Unknown | 1564 | 13.2 | 1202 | 16.8 | 362 | 7.7 | |
| Bowel preparation quality | < 0.0001 | ||||||
| Excellent or good | 3974 | 33.5 | 2392 | 33.4 | 1582 | 33.8 | |
| Satisfactory | 1903 | 16.1 | 995 | 13.9 | 908 | 19.4 | |
| Poor | 660 | 5.6 | 280 | 3.9 | 380 | 8.1 | |
| Unknown | 5315 | 44.8 | 3502 | 48.8 | 1813 | 38.7 | |
| Number of adenomas | 0.78 | ||||||
| One | 7793 | 65.8 | 4701 | 65.6 | 3092 | 66.0 | |
| Two | 3053 | 25.8 | 1863 | 26.0 | 1190 | 25.4 | |
| Three or four | 1006 | 8.5 | 605 | 8.4 | 401 | 8.6 | |
| Adenoma size (mm) | 0.0003 | ||||||
| < 10 | 1006 | 8.5 | 605 | 8.4 | 401 | 8.6 | |
| 10–19 | 6802 | 57.4 | 4018 | 56.0 | 2784 | 59.4 | |
| ≥ 20 | 4044 | 34.1 | 2546 | 35.5 | 1498 | 32.0 | |
| Adenoma histology | 0.0007 | ||||||
| Tubular | 4694 | 39.6 | 2762 | 38.5 | 1932 | 41.3 | |
| Tubulovillous | 5537 | 46.7 | 3395 | 47.4 | 2142 | 45.7 | |
| Villous | 1134 | 9.6 | 683 | 9.5 | 451 | 9.6 | |
| Unknown | 487 | 4.1 | 329 | 4.6 | 158 | 3.4 | |
| Adenoma dysplasia | < 0.0001 | ||||||
| Low grade | 9399 | 79.3 | 5596 | 78.1 | 3803 | 81.2 | |
| High grade | 1979 | 16.7 | 1236 | 17.2 | 743 | 15.9 | |
| Unknown | 474 | 4.0 | 337 | 4.7 | 137 | 2.9 | |
| Proximal polyps | 0.34 | ||||||
| No | 8254 | 69.6 | 5016 | 70.0 | 3238 | 69.1 | |
| Yes | 3598 | 30.4 | 2153 | 30.0 | 1445 | 30.9 | |
| Hyperplastic polyps | < 0.0001 | ||||||
| No | 9793 | 82.6 | 5783 | 80.7 | 4010 | 85.6 | |
| Yes | 2059 | 17.4 | 1386 | 19.3 | 673 | 14.4 | |
| Hyperplastic polyp ≥ 10 mm in size | 0.0006 | ||||||
| No | 11,668 | 98.4 | 7035 | 98.1 | 4633 | 98.9 | |
| Yes | 184 | 1.6 | 134 | 1.9 | 50 | 1.1 | |
| Family history of cancer/CRCb | < 0.0001 | ||||||
| No | 11,366 | 95.9 | 6790 | 94.7 | 4576 | 97.7 | |
| Yes | 486 | 4.1 | 379 | 5.3 | 107 | 2.3 | |
The high-risk group
The median age of the high-risk group was 67 (IQR 61–74) years, and 1920 (71%) patients were men. In total, 1808 (66%) patients attended one or more surveillance visit during the long-term CRC incidence analysis (Table 3). Patients who attended surveillance were, on average, younger than non-attenders and more likely to have had a baseline visit before 2000 and a longer baseline visit (≥ 3 months). Non-attenders were more likely than attenders to have had an incomplete colonoscopy or poor bowel preparation at baseline. Attenders were more likely to have had six or more adenomas or hyperplastic polyps at baseline, and were more likely to have a family history of cancer/CRC. The proportion of patients for whom data for colonoscopy completeness and bowel preparation quality were missing was higher among attenders than among non-attenders (see Table 3).
| Baseline characteristic | All high-risk patients | Patients attending one or more surveillance visits | Patients not attending surveillance | p-valuea | |||
|---|---|---|---|---|---|---|---|
| n | % | n | % | n | % | ||
| Total | 2719 | 100.0 | 1808 | 66.5 | 911 | 33.5 | |
| Sex | 0.46 | ||||||
| Women | 799 | 29.4 | 523 | 28.9 | 276 | 30.3 | |
| Men | 1920 | 70.6 | 1285 | 71.1 | 635 | 69.7 | |
| Age (years) | < 0.0001 | ||||||
| < 55 | 283 | 10.4 | 221 | 12.2 | 62 | 6.8 | |
| 55–64 | 750 | 27.6 | 602 | 33.3 | 148 | 16.2 | |
| 65–74 | 1065 | 39.2 | 719 | 39.8 | 346 | 38.0 | |
| ≥ 75 | 621 | 22.8 | 266 | 14.7 | 355 | 39.0 | |
| Year of baseline visit | 0.021 | ||||||
| 1984–99 | 329 | 12.1 | 241 | 13.3 | 88 | 9.7 | |
| 2000–4 | 874 | 32.1 | 575 | 31.8 | 299 | 32.8 | |
| 2005–10 | 1516 | 55.8 | 992 | 54.9 | 524 | 57.5 | |
| Length of baseline visit | < 0.0001 | ||||||
| 1 day | 1184 | 43.6 | 773 | 42.8 | 411 | 45.1 | |
| 2 days to 3 months | 562 | 20.7 | 334 | 18.5 | 228 | 25.0 | |
| 3–6 months | 442 | 16.3 | 316 | 17.5 | 126 | 13.8 | |
| ≥ 6 months | 531 | 19.5 | 385 | 21.3 | 146 | 16.0 | |
| Colonoscopy completeness | < 0.0001 | ||||||
| Complete | 2354 | 86.6 | 1574 | 87.1 | 780 | 85.6 | |
| Incomplete | 123 | 4.5 | 56 | 3.1 | 67 | 7.4 | |
| Unknown | 242 | 8.9 | 178 | 9.8 | 64 | 7.0 | |
| Bowel preparation quality | < 0.0001 | ||||||
| Excellent or good | 1119 | 41.2 | 768 | 42.5 | 351 | 38.5 | |
| Satisfactory | 411 | 15.1 | 246 | 13.6 | 165 | 18.1 | |
| Poor | 143 | 5.3 | 74 | 4.1 | 69 | 7.6 | |
| Unknown | 1046 | 38.5 | 720 | 39.8 | 326 | 35.8 | |
| Number of adenomas | 0.0015 | ||||||
| Three | 1227 | 45.1 | 788 | 43.6 | 439 | 48.2 | |
| Four | 557 | 20.5 | 367 | 20.3 | 190 | 20.9 | |
| Five | 454 | 16.7 | 297 | 16.4 | 157 | 17.2 | |
| Six or more | 481 | 17.7 | 356 | 19.7 | 125 | 13.7 | |
| Adenoma size (mm) | 0.13 | ||||||
| < 10 | 264 | 9.7 | 189 | 10.5 | 75 | 8.2 | |
| 10–19 | 1344 | 49.4 | 870 | 48.1 | 474 | 52.0 | |
| ≥ 20 | 1084 | 39.9 | 732 | 40.5 | 352 | 38.6 | |
| Unknown | 27 | 1.0 | 17 | 0.9 | 10 | 1.1 | |
| Adenoma histology | 0.95 | ||||||
| Tubular | 1038 | 38.2 | 684 | 37.8 | 354 | 38.9 | |
| Tubulovillous | 1293 | 47.6 | 867 | 48.0 | 426 | 46.8 | |
| Villous | 328 | 12.1 | 217 | 12.0 | 111 | 12.2 | |
| Unknown | 60 | 2.2 | 40 | 2.2 | 20 | 2.2 | |
| Adenoma dysplasia | 0.43 | ||||||
| Low grade | 2035 | 74.8 | 1340 | 74.1 | 695 | 76.3 | |
| High grade | 616 | 22.7 | 420 | 23.2 | 196 | 21.5 | |
| Unknown | 68 | 2.5 | 48 | 2.7 | 20 | 2.2 | |
| Proximal polyps | 0.35 | ||||||
| No | 663 | 24.4 | 431 | 23.8 | 232 | 25.5 | |
| Yes | 2056 | 75.6 | 1377 | 76.2 | 679 | 74.5 | |
| Hyperplastic polyps | < 0.0001 | ||||||
| No | 1929 | 70.9 | 1230 | 68.0 | 699 | 76.7 | |
| Yes | 790 | 29.1 | 578 | 32.0 | 212 | 23.3 | |
| Hyperplastic polyp ≥ 10 mm in size | 0.11 | ||||||
| No | 2650 | 97.5 | 1756 | 97.1 | 894 | 98.1 | |
| Yes | 69 | 2.5 | 52 | 2.9 | 17 | 1.9 | |
| Family history of cancer/CRCb | < 0.0001 | ||||||
| No | 2621 | 96.4 | 1724 | 95.4 | 897 | 98.5 | |
| Yes | 98 | 3.6 | 84 | 4.6 | 14 | 1.5 | |
Long-term colorectal cancer incidence after baseline
The low-risk group
In the low-risk group, 195 CRCs were diagnosed during 138,903 person-years of follow-up (median 9.6 years, IQR 7.2–12.4 years), giving an incidence rate of 140 per 100,000 person-years (95% CI 122 to 162 per 100,000 person-years). In multivariable regression analysis, number of surveillance visits, age, completeness of colonoscopy, adenoma histology and proximal polyps were independently associated with CRC incidence. Adjusting for these factors, one surveillance visit was associated with a 44% reduction in CRC incidence compared with no surveillance (HR 0.56, 95% CI 0.39 to 0.80). Even greater reductions in incidence were seen with attendance at two visits (HR 0.27, 95% CI 0.13 to 0.56) and three or more visits (HR 0.18, 95% CI 0.05 to 0.58) (Table 4).
| Variable | Number of patients (%) | Number of person-years | Number of CRCs | Incidence rate per 100,000 person-years (95% CI) | Unadjusted HR (95% CI) | p-valuea | Multivariable adjusted HR (95% CI)b | p-valuea |
|---|---|---|---|---|---|---|---|---|
| Total | 14,401 (100) | 138,903 | 195 | 140 (122 to 162) | ||||
| Number of surveillance visitsc | < 0.0001 | < 0.0001 | ||||||
| Zero | 7207 (50.0) | 84,591 | 143 | 169 (143 to 199) | 1 | 1 | ||
| One | 3959 (27.5) | 34,507 | 41 | 119 (87 to 161) | 0.55 (0.39 to 0.79) | 0.56 (0.39 to 0.80) | ||
| Two | 1943 (13.5) | 12,986 | 8 | 62 (31 to 123) | 0.26 (0.12 to 0.54) | 0.27 (0.13 to 0.56) | ||
| Three or more | 1292 (9.0) | 6818 | 3 | 44 (14 to 136) | 0.17 (0.05 to 0.57) | 0.18 (0.05 to 0.58) | ||
| Sex | 0.67 | 0.99 | ||||||
| Women | 6382 (44.3) | 63,337 | 92 | 145 (118 to 178) | 1 | 1 | ||
| Men | 8019 (55.7) | 75,567 | 103 | 136 (112 to 165) | 0.94 (0.71 to 1.25) | 1.00 (0.75 to 1.32) | ||
| Age (years) | < 0.0001 | < 0.0001 | ||||||
| < 55 | 3569 (24.8) | 40,422 | 21 | 52 (34 to 80) | 1 | 1 | ||
| 55–64 | 3991 (27.7) | 42,121 | 46 | 109 (82 to 146) | 2.12 (1.26 to 3.55) | 2.05 (1.22 to 3.44) | ||
| 65–74 | 4258 (29.6) | 38,799 | 76 | 196 (156 to 245) | 3.87 (2.38 to 6.28) | 3.52 (2.17 to 5.73) | ||
| ≥ 75 | 2583 (17.9) | 17,561 | 52 | 296 (226 to 389) | 6.12 (3.67 to 10.20) | 5.02 (3.00 to 8.39) | ||
| Year of baseline visit | 0.71 | 0.45 | ||||||
| 1984–99 | 1640 (11.4) | 23,185 | 32 | 138 (98 to 195) | 1 | 1 | ||
| 2000–4 | 5168 (35.9) | 56,134 | 86 | 153 (124 to 189) | 1.06 (0.69 to 1.62) | 0.93 (0.60 to 1.43) | ||
| 2005–10 | 7593 (52.7) | 59,585 | 77 | 129 (103 to 162) | 0.92 (0.59 to 1.44) | 0.77 (0.48 to 1.23) | ||
| Length of baseline visit | 0.74 | 0.64 | ||||||
| 1 day | 11,354 (78.8) | 110,143 | 152 | 138 (118 to 162) | 1 | 1 | ||
| 2 days to 3 months | 1373 (9.5) | 12,314 | 19 | 154 (98 to 242) | 1.12 (0.70 to 1.81) | 1.13 (0.70 to 1.84) | ||
| 3–6 months | 950 (6.6) | 9309 | 16 | 172 (105 to 281) | 1.24 (0.74 to 2.07) | 1.39 (0.82 to 2.33) | ||
| ≥ 6 months | 724 (5.0) | 7137 | 8 | 112 (56 to 224) | 0.81 (0.40 to 1.65) | 0.91 (0.45 to 1.87) | ||
| Colonoscopy completenessd | 0.17 | 0.027 | ||||||
| Complete | 11,719 (81.4) | 108,319 | 144 | 133 (113 to 157) | 1 | 1 | ||
| Incomplete | 1140 (7.9) | 10,674 | 26 | 244 (166 to 358) | 1.26 (0.91 to 1.74)d | 1.47 (1.05 to 2.04)d | ||
| Unknown | 1542 (10.7) | 19,910 | 25 | 126 (85 to 186) | 1.26 (0.91 to 1.74)d | 1.47 (1.05 to 2.04)d | ||
| Bowel preparation quality | 0.15 | 0.32 | ||||||
| Excellent or good | 5145 (35.7) | 52,129 | 84 | 161 (130 to 200) | 1 | 1 | ||
| Satisfactory | 2540 (17.6) | 22,051 | 30 | 136 (95 to 195) | 0.85 (0.56 to 1.29) | 0.81 (0.53 to 1.23) | ||
| Poor | 968 (6.7) | 7970 | 15 | 188 (113 to 312) | 1.18 (0.68 to 2.04) | 1.09 (0.63 to 1.88) | ||
| Unknown | 5748 (39.9) | 56,754 | 66 | 116 (91 to 148) | 0.72 (0.52 to 1.00) | 0.76 (0.55 to 1.05) | ||
| Number of adenomas | 0.30 | 0.69 | ||||||
| One | 11,762 (81.7) | 113,729 | 154 | 135 (116 to 159) | 1 | 1 | ||
| Two | 2639 (18.3) | 25,175 | 41 | 163 (120 to 221) | 1.20 (0.85 to 1.70) | 1.07 (0.76 to 1.53) | ||
| Adenoma histologye | 0.0093 | 0.0067 | ||||||
| Tubular | 11,138 (77.3) | 107,018 | 132 | 123 (104 to 146) | 1 | 1 | ||
| Tubulovillous | 2113 (14.7) | 20,130 | 44 | 219 (163 to 294) | 1.69 (1.21 to 2.37)e | 1.71 (1.21 to 2.40)e | ||
| Villous | 190 (1.3) | 1906 | 2 | 105 (26 to 420) | 1.69 (1.21 to 2.37)e | 1.71 (1.21 to 2.40)e | ||
| Unknown | 960 (6.7) | 9849 | 17 | 173 (107 to 278) | 1.39 (0.84 to 2.30) | 1.52 (0.92 to 2.52) | ||
| Adenoma dysplasia | 0.054 | 0.078 | ||||||
| Low grade | 13,242 (92.0) | 125,812 | 171 | 136 (117 to 158) | 1 | 1 | ||
| High grade | 357 (2.5) | 3469 | 11 | 317 (176 to 573) | 2.32 (1.26 to 4.28) | 2.20 (1.18 to 4.10) | ||
| Unknown | 802 (5.6) | 9623 | 13 | 135 (78 to 233) | 0.99 (0.56 to 1.74) | 0.93 (0.52 to 1.66) | ||
| Proximal polyps | 0.0046 | 0.0020 | ||||||
| No | 8133 (56.5) | 80,118 | 93 | 116 (95 to 142) | 1 | 1 | ||
| Yes | 6268 (43.5) | 58,785 | 102 | 174 (143 to 211) | 1.50 (1.13 to 1.99) | 1.57 (1.18 to 2.10) | ||
| Hyperplastic polyps | 0.34 | 0.17 | ||||||
| No | 11,535 (80.1) | 110,804 | 150 | 135 (115 to 159) | 1 | 1 | ||
| Yes | 2866 (19.9) | 28,099 | 45 | 160 (120 to 214) | 1.18 (0.84 to 1.65) | 1.27 (0.91 to 1.78) | ||
| Hyperplastic polyp ≥ 10 mm in size | 0.85 | 0.87 | ||||||
| No | 14,263 (99.0) | 137,656 | 193 | 140 (122 to 161) | 1 | 1 | ||
| Yes | 138 (1.0) | 1247 | 2 | 160 (40 to 641) | 1.14 (0.28 to 4.60) | 1.13 (0.28 to 4.54) | ||
| Family history of cancer/CRCf | 0.15 | 0.36 | ||||||
| No | 12,936 (89.8) | 121,702 | 177 | 145 (126 to 169) | 1 | 1 | ||
| Yes | 1465 (10.2) | 17,201 | 18 | 105 (66 to 166) | 0.71 (0.44 to 1.16) | 1.28 (0.77 to 2.11) | ||
Being aged ≥ 55 years and having an incomplete colonoscopy or colonoscopy of unknown completeness, an adenoma with tubulovillous or villous histology or proximal polyps at baseline were independent risk factors for CRC (see Table 4).
The intermediate-risk group
In the intermediate-risk group, 246 CRCs were diagnosed during 111,270 person-years of follow-up (median 9.1 years, IQR 6.6–12.4 years), giving an incidence rate of 221 per 100,000 person-years (95% CI 195 to 251 per 100,000 person-years). In multivariable regression analysis, number of surveillance visits, age, year of baseline visit, length of baseline visit, completeness of colonoscopy, adenoma dysplasia and proximal polyps were independently associated with CRC incidence. Adenoma histology was not included in the final multivariable model because the association between adenoma histology and CRC incidence was driven by the unknown histology category. Adjusting for the other factors, CRC incidence was 41% lower with attendance at one surveillance visit than with none (HR 0.59, 95% CI 0.43 to 0.81). Incidence rates did not fall much further with attendance at a second surveillance visit (HR 0.56, 95% CI 0.36 to 0.85), but fell again with attendance at three or more visits (HR 0.44, 95% CI 0.26 to 0.77) (Table 5).
| Variable | Number of patients (%) | Number of person-years | Number of CRCs | Incidence rate per 100,000 person-years (95% CI) | Unadjusted HR (95% CI) | p-valuea | Multivariable adjusted HR (95% CI)b | p-valuea |
|---|---|---|---|---|---|---|---|---|
| Total | 11,852 (100) | 111,270 | 246 | 221 (195 to 251) | ||||
| Number of surveillance visitsc | 0.0004 | 0.0009 | ||||||
| Zero | 4683 (39.5) | 53,927 | 135 | 250 (211 to 296) | 1 | 1 | ||
| One | 3343 (28.2) | 33,284 | 62 | 186 (145 to 239) | 0.58 (0.42 to 0.79) | 0.59 (0.43 to 0.81) | ||
| Two | 2279 (19.2) | 15,477 | 31 | 200 (141 to 285) | 0.53 (0.35 to 0.81) | 0.56 (0.36 to 0.85) | ||
| Three or more | 1547 (13.1) | 8582 | 18 | 210 (132 to 333) | 0.45 (0.26 to 0.77) | 0.44 (0.26 to 0.77) | ||
| Sex | 0.28 | 0.055 | ||||||
| Women | 5271 (44.5) | 51,049 | 105 | 206 (170 to 249) | 1 | 1 | ||
| Men | 6581 (55.5) | 60,221 | 141 | 234 (199 to 276) | 1.15 (0.89 to 1.48) | 1.28 (0.99 to 1.66) | ||
| Age (years) | < 0.0001 | < 0.0001 | ||||||
| < 55 | 2097 (17.7) | 24,995 | 28 | 112 (77 to 162) | 1 | 1 | ||
| 55–64 | 3158 (26.6) | 33,530 | 52 | 155 (118 to 204) | 1.44 (0.91 to 2.28) | 1.41 (0.89 to 2.24) | ||
| 65–74 | 3915 (33.0) | 35,391 | 98 | 277 (227 to 338) | 2.74 (1.80 to 4.19) | 2.66 (1.74 to 4.06) | ||
| ≥ 75 | 2682 (22.6) | 17,354 | 68 | 392 (309 to 497) | 4.25 (2.71 to 6.65) | 3.64 (2.31 to 5.74) | ||
| Year of baseline visit | 0.0044 | 0.0078 | ||||||
| 1984–99 | 1870 (15.8) | 25,329 | 83 | 328 (264 to 406) | 1 | 1 | ||
| 2000–4 | 4222 (35.6) | 42,957 | 92 | 214 (175 to 263) | 0.66 (0.48 to 0.90) | 0.63 (0.46 to 0.87) | ||
| 2005–10 | 5760 (48.6) | 42,983 | 71 | 165 (131 to 208) | 0.57 (0.40 to 0.80) | 0.59 (0.40 to 0.85) | ||
| Length of baseline visit | 0.018 | 0.0082 | ||||||
| 1 day | 6697 (56.5) | 63,453 | 117 | 184 (154 to 221) | 1 | 1 | ||
| 2 days to 3 months | 2343 (19.8) | 21,669 | 60 | 277 (215 to 357) | 1.53 (1.12 to 2.08) | 1.65 (1.20 to 2.26) | ||
| 3–6 months | 1403 (11.8) | 13,277 | 32 | 241 (170 to 341) | 1.32 (0.89 to 1.95) | 1.34 (0.90 to 1.99) | ||
| ≥ 6 months | 1409 (11.9) | 12,871 | 37 | 287 (208 to 397) | 1.57 (1.09 to 2.27) | 1.58 (1.08 to 2.30) | ||
| Colonoscopy completenessd | 0.0007 | 0.0022 | ||||||
| Complete | 8967 (75.7) | 80,572 | 150 | 186 (159 to 218) | 1 | 1 | ||
| Incomplete | 1321 (11.2) | 11,545 | 49 | 424 (321 to 562) | 1.58 (1.22 to 2.06)d | 1.55 (1.18 to 2.06)d | ||
| Unknown | 1564 (13.2) | 19,152 | 47 | 245 (184 to 327) | 1.58 (1.22 to 2.06)d | 1.55 (1.18 to 2.06)d | ||
| Bowel preparation quality | 0.13 | 0.14 | ||||||
| Excellent or good | 3974 (33.5) | 37,493 | 71 | 189 (150 to 239) | 1 | 1 | ||
| Satisfactory | 1903 (16.1) | 15,451 | 36 | 233 (168 to 323) | 1.28 (0.86 to 1.92) | 1.47 (0.98 to 2.22) | ||
| Poor | 660 (5.6) | 4840 | 17 | 351 (218 to 565) | 1.92 (1.13 to 3.25) | 1.67 (0.98 to 2.85) | ||
| Unknown | 5315 (44.8) | 53,485 | 122 | 228 (191 to 272) | 1.17 (0.88 to 1.57) | 1.13 (0.84 to 1.53) | ||
| Number of adenomas | 0.37 | 0.20 | ||||||
| One | 7793 (65.8) | 74,791 | 168 | 225 (193 to 261) | 1 | 1 | ||
| Two | 3053 (25.8) | 27,502 | 64 | 233 (182 to 297) | 1.06 (0.79 to 1.41) | 0.92 (0.68 to 1.25) | ||
| Three or four | 1006 (8.5) | 8977 | 14 | 156 (92 to 263) | 0.71 (0.41 to 1.23) | 0.61 (0.34 to 1.08) | ||
| Adenoma size (mm) | 0.087 | 0.18 | ||||||
| < 10 | 1006 (8.5) | 8977 | 14 | 156 (92 to 263) | 1 | 1 | ||
| 10–19 | 6802 (57.4) | 64,716 | 134 | 207 (175 to 245) | 1.30 (0.75 to 2.26) | 1.53 (0.87 to 2.70) | ||
| ≥ 20 | 4044 (34.1) | 37,577 | 98 | 261 (214 to 318) | 1.64 (0.94 to 2.88) | 1.69 (0.94 to 3.04) | ||
| Adenoma histology | < 0.0001 | 0.0025 | ||||||
| Tubular | 4694 (39.6) | 44,369 | 71 | 160 (127 to 202) | 1 | 1 | ||
| Tubulovillous | 5537 (46.7) | 51,211 | 114 | 223 (185 to 267) | 1.40 (1.04 to 1.88) | 1.29 (0.95 to 1.75) | ||
| Villous | 1134 (9.6) | 10,108 | 31 | 307 (216 to 436) | 1.93 (1.27 to 2.95) | 1.44 (0.93 to 2.24) | ||
| Unknown | 487 (4.1) | 5581 | 30 | 538 (376 to 769) | 3.23 (2.10 to 4.98) | 2.76 (1.64 to 4.64) | ||
| Adenoma dysplasia | 0.0002 | 0.0038 | ||||||
| Low grade | 9399 (79.3) | 87,581 | 166 | 190 (163 to 221) | 1 | 1 | ||
| High grade | 1979 (16.7) | 17,402 | 53 | 305 (233 to 399) | 1.62 (1.19 to 2.21) | 1.47 (1.07 to 2.02) | ||
| Unknown | 474 (4.0) | 6287 | 27 | 429 (295 to 626) | 2.11 (1.39 to 3.20) | 1.86 (1.21 to 2.86) | ||
| Proximal polyps | 0.028 | 0.0025 | ||||||
| No | 8254 (69.6) | 79,798 | 162 | 203 (174 to 237) | 1 | 1 | ||
| Yes | 3598 (30.4) | 31,471 | 84 | 267 (216 to 331) | 1.35 (1.04 to 1.76) | 1.54 (1.17 to 2.02) | ||
| Hyperplastic polyps | 0.63 | 0.66 | ||||||
| No | 9793 (82.6) | 91,902 | 204 | 222 (194 to 255) | 1 | 1 | ||
| Yes | 2059 (17.4) | 19,367 | 42 | 217 (160 to 293) | 0.99 (0.71 to 1.38) | 1.06 (0.75 to 1.49) | ||
| Hyperplastic polyp ≥ 10 mm in size | 0.95 | 0.75 | ||||||
| No | 11,668 (98.4) | 109,499 | 243 | 222 (196 to 252) | 1 | 1 | ||
| Yes | 184 (1.6) | 1771 | 3 | 169 (55 to 525) | 0.77 (0.25 to 2.39) | 0.78 (0.25 to 2.46) | ||
| Family history of cancer/CRCe | 0.31 | 0.78 | ||||||
| No | 11,366 (95.9) | 105,842 | 237 | 224 (197 to 254) | 1 | 1 | ||
| Yes | 486 (4.1) | 5428 | 9 | 166 (86 to 319) | 0.72 (0.37 to 1.40) | 1.10 (0.56 to 2.16) | ||
Independent risk factors for CRC included age ≥ 65 years, having a baseline visit before 2000 or a baseline visit that spanned between 2 days and 3 months or ≥ 6 months, and having an incomplete colonoscopy or colonoscopy of unknown completeness, an adenoma with high-grade dysplasia or proximal polyps at baseline (see Table 5).
The high-risk group
In the high-risk group, 84 CRCs were diagnosed during 22,961 person-years of follow-up (median 8.4 years, IQR 5.7–11.2 years), giving an incidence rate of 366 per 100,000 person-years (95% CI 295 to 453 per 100,000 person-years). In multivariable regression analysis, number of surveillance visits, completeness of colonoscopy and adenoma dysplasia were independently associated with CRC incidence. Adjusting for these factors, one surveillance visit was associated with a halving of CRC incidence (HR 0.49, 95% CI 0.29 to 0.82), compared with no surveillance. Attendance at subsequent surveillance visits was associated with further reductions in CRC incidence (HR 0.30, 95% CI 0.15 to 0.62 for two visits and HR 0.29, 95% CI 0.11 to 0.73 for three or more visits) (Table 6).
| Variable | Number of patients (%) | Number of person-years | Number of CRCs | Incidence rate per 100,000 person-years (95% CI) | Unadjusted HR (95% CI) | p-valuea | Multivariable adjusted HR (95% CI)b | p-valuea |
|---|---|---|---|---|---|---|---|---|
| Total | 2719 (100) | 22,961 | 84 | 366 (295 to 453) | ||||
| Number of surveillance visitsc | 0.0019 | 0.0009 | ||||||
| Zero | 911 (33.5) | 9243 | 44 | 476 (354 to 640) | 1 | 1 | ||
| One | 695 (25.6) | 7144 | 24 | 336 (225 to 501) | 0.51 (0.30 to 0.85) | 0.49 (0.29 to 0.82) | ||
| Two | 593 (21.8) | 4018 | 10 | 249 (134 to 463) | 0.32 (0.16 to 0.67) | 0.30 (0.15 to 0.62) | ||
| Three or more | 520 (19.1) | 2555 | 6 | 235 (105 to 523) | 0.31 (0.12 to 0.78) | 0.29 (0.11 to 0.73) | ||
| Sex | 0.32 | 0.56 | ||||||
| Women | 799 (29.4) | 6997 | 30 | 429 (300 to 613) | 1 | 1 | ||
| Men | 1920 (70.6) | 15,963 | 54 | 338 (259 to 442) | 0.79 (0.51 to 1.24) | 0.87 (0.56 to 1.37) | ||
| Age (years) | 0.012 | 0.083 | ||||||
| < 55 | 283 (10.4) | 3191 | 6 | 188 (84 to 418) | 1 | 1 | ||
| 55–64 | 750 (27.6) | 7082 | 20 | 282 (182 to 438) | 1.53 (0.61 to 3.81) | 1.68 (0.67 to 4.19) | ||
| 65–74 | 1065 (39.2) | 8735 | 34 | 389 (278 to 545) | 2.13 (0.89 to 5.09) | 2.17 (0.91 to 5.19) | ||
| ≥ 75 | 621 (22.8) | 3953 | 24 | 607 (407 to 906) | 3.42 (1.39 to 8.42) | 2.79 (1.13 to 6.89) | ||
| Year of baseline visit | 0.41 | 0.36 | ||||||
| 1984–99 | 329 (12.1) | 3948 | 10 | 253 (136 to 471) | 1 | 1 | ||
| 2000–4 | 874 (32.1) | 8250 | 34 | 412 (294 to 577) | 1.62 (0.78 to 3.38) | 1.65 (0.78 to 3.47) | ||
| 2005–10 | 1516 (55.8) | 10,762 | 40 | 372 (273 to 507) | 1.48 (0.70 to 3.13) | 1.65 (0.75 to 3.62) | ||
| Length of baseline visit | 0.60 | 0.88 | ||||||
| 1 day | 1184 (43.5) | 10,106 | 33 | 327 (232 to 459) | 1 | 1 | ||
| 2 days to 3 months | 562 (20.7) | 4556 | 18 | 395 (249 to 627) | 1.20 (0.68 to 2.14) | 1.02 (0.57 to 1.82) | ||
| 3–6 months | 442 (16.3) | 3738 | 12 | 321 (182 to 565) | 0.98 (0.51 to 1.89) | 0.89 (0.46 to 1.74) | ||
| ≥ 6 months | 531 (19.5) | 4561 | 21 | 460 (300 to 706) | 1.42 (0.82 to 2.45) | 1.19 (0.67 to 2.10) | ||
| Colonoscopy completenessd | 0.061 | 0.044 | ||||||
| Complete | 2354 (86.6) | 19,266 | 64 | 332 (260 to 424) | 1 | 1 | ||
| Incomplete | 123 (4.5) | 1009 | 7 | 694 (331 to 1456) | 1.66 (1.00 to 2.76)d | 1.73 (1.04 to 2.89)d | ||
| Unknown | 242 (8.9) | 2686 | 13 | 484 (281 to 833) | 1.66 (1.00 to 2.76)d | 1.73 (1.04 to 2.89)d | ||
| Bowel preparation quality | 0.89 | 0.89 | ||||||
| Excellent or good | 1119 (41.2) | 9788 | 35 | 358 (257 to 498) | 1 | 1 | ||
| Satisfactory | 411 (15.1) | 3106 | 12 | 386 (219 to 680) | 1.08 (0.56 to 2.08) | 1.03 (0.53 to 1.99) | ||
| Poor | 143 (5.3) | 980 | 5 | 510 (212 to 1226) | 1.46 (0.57 to 3.72) | 1.42 (0.55 to 3.64) | ||
| Unknown | 1046 (38.5) | 9086 | 32 | 352 (249 to 498) | 0.99 (0.61 to 1.59) | 0.95 (0.59 to 1.53) | ||
| Number of adenomas | 0.49 | 0.38 | ||||||
| Three | 1227 (45.1) | 10,577 | 38 | 359 (261 to 494) | 1 | 1 | ||
| Four | 557 (20.5) | 4704 | 13 | 276 (160 to 476) | 0.77 (0.41 to 1.45) | 0.81 (0.43 to 1.53) | ||
| Five | 454 (16.7) | 3697 | 18 | 487 (307 to 773) | 1.35 (0.77 to 2.36) | 1.45 (0.83 to 2.54) | ||
| Six or more | 481 (17.7) | 3983 | 15 | 377 (227 to 625) | 1.05 (0.58 to 1.92) | 1.24 (0.68 to 2.27) | ||
| Adenoma size (mm) | 0.30 | 0.69 | ||||||
| < 10 | 264 (9.7) | 2374 | 6 | 253 (114 to 562) | 1 | 1 | ||
| 10–19 | 1344 (49.4) | 11,361 | 36 | 317 (229 to 439) | 1.25 (0.53 to 2.97) | 1.08 (0.45 to 2.57) | ||
| ≥ 20 | 1084 (39.9) | 8951 | 41 | 458 (337 to 622) | 1.82 (0.77 to 4.28) | 1.41 (0.58 to 3.39) | ||
| Unknown | 27 (1.0) | 275 | 1 | 364 (51 to 2585) | 1.41 (0.17 to 11.76) | 1.22 (0.14 to 10.31) | ||
| Adenoma histology | 0.19 | 0.48 | ||||||
| Tubular | 1038 (38.2) | 8994 | 31 | 345 (242 to 490) | 1 | 1 | ||
| Tubulovillous | 1293 (47.6) | 10,701 | 36 | 336 (243 to 466) | 0.99 (0.61 to 1.59) | 0.89 (0.55 to 1.45) | ||
| Villous | 328 (12.1) | 2648 | 16 | 604 (370 to 986) | 1.77 (0.97 to 3.23) | 1.40 (0.75 to 2.61) | ||
| Unknown | 60 (2.2) | 619 | 1 | 162 (23 to 1147) | 0.47 (0.06 to 3.41) | 0.54 (0.07 to 4.09) | ||
| Adenoma dysplasia | 0.0027 | 0.0009 | ||||||
| Low grade | 2035 (74.8) | 17,109 | 51 | 298 (227 to 392) | 1 | 1 | ||
| High grade | 616 (22.7) | 5080 | 32 | 630 (445 to 891) | 2.12 (1.36 to 3.30) | 2.23 (1.43 to 3.47) | ||
| Unknown | 68 (2.5) | 772 | 1 | 130 (18 to 919) | 0.44 (0.06 to 3.21) | 0.35 (0.05 to 2.57) | ||
| Proximal polyps | 0.96 | 0.47 | ||||||
| No | 663 (24.4) | 5934 | 22 | 371 (244 to 563) | 1 | 1 | ||
| Yes | 2056 (75.6) | 17,027 | 62 | 364 (284 to 467) | 0.99 (0.61 to 1.61) | 1.21 (0.73 to 2.00) | ||
| Hyperplastic polyps | 0.40 | 0.24 | ||||||
| No | 1929 (70.9) | 16,037 | 55 | 343 (263 to 447) | 1 | 1 | ||
| Yes | 790 (29.1) | 6923 | 29 | 419 (291 to 603) | 1.22 (0.78 to 1.91) | 1.32 (0.84 to 2.07) | ||
| Hyperplastic polyp ≥ 10 mm in size | 0.94 | 0.93 | ||||||
| No | 2650 (97.5) | 22,388 | 82 | 366 (295 to 455) | 1 | 1 | ||
| Yes | 69 (2.5) | 573 | 2 | 349 (87 to 1395) | 0.95 (0.23 to 3.87) | 1.07 (0.26 to 4.36) | ||
| Family history of cancer/CRCe | 0.072 | 0.17 | ||||||
| No | 2621 (96.4) | 21,902 | 83 | 379 (306 to 470) | 1 | 1 | ||
| Yes | 98 (3.6) | 1059 | 1 | 94 (13 to 670) | 0.24 (0.03 to 1.76) | 0.32 (0.04 to 2.31) | ||
Independent risk factors for CRC included age (≥ 75 years) and having an incomplete colonoscopy, colonoscopy of unknown completeness or an adenoma with high-grade dysplasia at baseline (see Table 6).
In each of the three risk groups there were no significant interactions between the number of surveillance visits and age or sex. The results from the interaction analyses are presented in Appendix 2, Table 26.
Higher- and lower-risk subgroups
We then divided each risk group into higher- and lower-risk subgroups using the baseline CRC risk factors identified in each group.
The low-risk group
The higher-risk subgroup of the low-risk group comprised patients who had an incomplete colonoscopy or colonoscopy of unknown completeness, a tubulovillous or villous adenoma, or proximal polyps at baseline (n = 9166, 64%). Patients without any of these factors were assigned to the lower-risk subgroup (n = 5235, 36%). Patients in the higher-risk subgroup were older and more likely to have had their baseline visit before 2005 than those in the lower-risk subgroup. Higher-risk patients had more surveillance than lower-risk patients (see Appendix 2, Table 27).
The intermediate-risk group
The higher-risk subgroup of the intermediate-risk group comprised patients who had an incomplete colonoscopy or colonoscopy of unknown completeness, an adenoma with high-grade dysplasia or proximal polyps at baseline (n = 7114, 60%). The lower-risk subgroup comprised patients who had none of these factors (n = 4738, 40%). Patients in the higher-risk subgroup were older, more likely to have had their baseline visit before 2005 and attended more surveillance visits than patients in the lower-risk subgroup (see Appendix 2, Table 27).
The high-risk group
The higher-risk subgroup of the high-risk group comprised patients who had an incomplete colonoscopy or colonoscopy of unknown completeness, or an adenoma with high-grade dysplasia at baseline (n = 902, 33%). Patients without any of these factors were assigned to the lower-risk subgroup (n = 1817, 67%). Patients in the two subgroups were comparable in terms of sex, age and number of surveillance visits. Higher-risk patients were more likely to have had their baseline visit before 2005 than lower-risk patients (see Appendix 2, Table 27).
Incidence of colorectal cancer by risk subgroup and number of surveillance visits
The low-risk group
Among low-risk patients, attendance at one surveillance visit was associated with reduced CRC incidence in the higher-risk subgroup (HR 0.52, 95% CI 0.35 to 0.78) and even greater reductions were seen with attendance at two or more visits (HR 0.18, 95% CI 0.08 to 0.37). By comparison, in the lower-risk subgroup, surveillance was not associated with significantly reduced CRC incidence rates (HR 0.54, 95% CI 0.25 to 1.20, for one visit and HR 0.42, 95% CI 0.12 to 1.48, for two or more visits). However, it is important to note that the HR estimates for the lower-risk subgroup have wide 95% CIs, as few CRC cases occurred in each stratum (Table 7).
| Risk group/subgroup | Number of patients (%) | Number of person-years | Number of CRCs | Incidence rate per 100,000 person-years (95% CI) | Comparison of incidence in the presence and absence of surveillancea | |
|---|---|---|---|---|---|---|
| Unadjusted HR (95% CI) | p-valueb | |||||
| Low-risk group | ||||||
| Whole risk group | < 0.0001 | |||||
| Zero visits | 7207 (50.0) | 84,591 | 143 | 169 (143 to 199) | 1 | |
| One visit | 3959 (27.5) | 34,507 | 41 | 119 (87 to 161) | 0.55 (0.39 to 0.79) | |
| Two or more visits | 3235 (22.5) | 19,805 | 11 | 56 (31 to 100) | 0.23 (0.12 to 0.44) | |
| Total | 14,401 (100) | 138,903 | 195 | 140 (122 to 162) | ||
| Higher-risk subgroupc | < 0.0001 | |||||
| Zero visits | 4403 (48.0) | 51,688 | 112 | 217 (180 to 261) | 1 | |
| One visit | 2527 (27.6) | 23,097 | 33 | 143 (102 to 201) | 0.52 (0.35 to 0.78) | |
| Two or more visits | 2236 (24.4) | 14,332 | 8 | 56 (28 to 112) | 0.18 (0.08 to 0.37) | |
| Total | 9166 (63.6) | 89,118 | 153 | 172 (147 to 201) | ||
| Lower-risk subgroupc | 0.15 | |||||
| Zero visits | 2804 (53.6) | 32,903 | 31 | 94 (66 to 134) | 1 | |
| One visit | 1432 (27.4) | 11,410 | 8 | 70 (35 to 140) | 0.54 (0.25 to 1.20) | |
| Two or more visits | 999 (19.1) | 5472 | 3 | 55 (18 to 170) | 0.42 (0.12 to 1.48) | |
| Total | 5235 (36.4) | 49,785 | 42 | 84 (62 to 114) | ||
| Intermediate-risk group | ||||||
| Whole risk group | 0.0001 | |||||
| Zero visits | 4683 (39.5) | 53,927 | 135 | 250 (211 to 296) | 1 | |
| One visit | 3343 (28.2) | 33,284 | 62 | 186 (145 to 239) | 0.58 (0.42 to 0.79) | |
| Two or more visits | 3826 (32.3) | 24,059 | 49 | 204 (154 to 269) | 0.50 (0.34 to 0.73) | |
| Total | 11,852 (100) | 111,270 | 246 | 221 (195 to 251) | ||
| Higher-risk subgroupd | 0.0001 | |||||
| Zero visits | 2751 (38.7) | 30,690 | 102 | 332 (274 to 404) | 1 | |
| One visit | 1956 (27.5) | 20,133 | 46 | 228 (171 to 305) | 0.53 (0.37 to 0.76) | |
| Two or more visits | 2407 (33.8) | 15,977 | 36 | 225 (163 to 312) | 0.42 (0.27 to 0.65) | |
| Total | 7114 (60.0) | 66,800 | 184 | 275 (238 to 318) | ||
| Lower-risk subgroupd | 0.30 | |||||
| Zero visits | 1932 (40.8) | 23,237 | 33 | 142 (101 to 200) | 1 | |
| One visit | 1387 (29.3) | 13,151 | 16 | 122 (75 to 199) | 0.66 (0.35 to 1.23) | |
| Two or more visits | 1419 (30.0) | 8082 | 13 | 161 (93 to 277) | 0.63 (0.31 to 1.29) | |
| Total | 4738 (40.0) | 44,470 | 62 | 139 (109 to 179) | ||
| High-risk group | ||||||
| Whole risk group | 0.0006 | |||||
| Zero visits | 911 (33.5) | 9243 | 44 | 476 (354 to 640) | 1 | |
| One visit | 695 (25.6) | 7144 | 24 | 336 (225 to 501) | 0.51 (0.30 to 0.85) | |
| Two or more visits | 1113 (40.9) | 6574 | 16 | 243 (149 to 397) | 0.32 (0.17 to 0.60) | |
| Total | 2719 (100) | 22,961 | 84 | 366 (295 to 453) | ||
| Higher-risk subgroupe | 0.0006 | |||||
| Zero visits | 305 (33.8) | 3017 | 27 | 895 (614 to 1305) | 1 | |
| One visit | 221 (24.5) | 2378 | 12 | 505 (287 to 889) | 0.41 (0.20 to 0.82) | |
| Two or more visits | 376 (41.7) | 2535 | 7 | 276 (132 to 579) | 0.21 (0.08 to 0.51) | |
| Total | 902 (33.2) | 7929 | 46 | 580 (435 to 775) | ||
| Lower-risk subgroupe | 0.26 | |||||
| Zero visits | 606 (33.4) | 6226 | 17 | 273 (170 to 439) | 1 | |
| One visit | 474 (26.1) | 4766 | 12 | 252 (143 to 443) | 0.66 (0.31 to 1.41) | |
| Two or more visits | 737 (40.6) | 4039 | 9 | 223 (116 to 428) | 0.49 (0.20 to 1.18) | |
| Total | 1817 (66.8) | 15,032 | 38 | 253 (184 to 347) | ||
The intermediate-risk group
Among intermediate-risk patients, attendance at one surveillance visit was associated with reduced CRC incidence in the higher-risk subgroup (HR 0.53, 95% CI 0.37 to 0.76) and CRC incidence was even lower with attendance at two or more visits (HR 0.42, 95% CI 0.27 to 0.65). In the lower-risk subgroup of intermediate-risk patients, surveillance was not associated with reduced CRC incidence rates (HR 0.66, 95% CI 0.35 to 1.23 for one visit and HR 0.63, 95% CI 0.31 to 1.29 for two or more visits). As above, however, the HR estimates for the lower-risk subgroup are imprecise, as few CRC cases occurred in each stratum (see Table 7).
The high-risk group
Among high-risk patients, attendance at one surveillance visit was associated with reduced CRC incidence in the higher-risk subgroup (HR 0.41, 95% CI 0.20 to 0.82). Attendance at subsequent visits was associated with further reductions in CRC incidence in this higher-risk subgroup (HR 0.21, 95% CI 0.08 to 0.51 for two or more visits). By contrast, surveillance was not associated with reduced CRC incidence rates in the lower-risk subgroup of high-risk patients (HR 0.66, 95% CI 0.31 to 1.41 for one visit and HR 0.49, 95% CI 0.20 to 1.18 for two visits). However, estimates for the lower-risk subgroup again lack precision (see Table 7).
Cumulative incidence of colorectal cancer at 10 years
The low-risk group
Without surveillance, cumulative CRC incidence at 10 years was 1.7% (95% CI 1.4% to 2.1%) in the low-risk group overall, but differed significantly between the lower-risk subgroup, at 1.2% (95% CI 0.8% to 1.7%), and the higher-risk subgroup, at 2.1% (95% CI 1.7% to 2.6%). After one surveillance visit, cumulative CRC incidence at 10 years was 1.5% (95% CI 1.0% to 2.3%) in the low-risk group overall and was no longer significantly different in the lower-risk subgroup (0.6%, 95% CI 0.2% to 1.4%) when compared with higher-risk subgroup (2.0%, 95% CI 1.3% to 3.0%) (Table 8 and Figure 2).
| Risk group/subgroup | Number of patients (%) | Number of person-years | Questionnaire, n (%) | p-valuea | Number of observed CRCsb | Number of expected CRCsc | SIR (95% CI) | |||||
|---|---|---|---|---|---|---|---|---|---|---|---|---|
| 3 years | 5 years | 10 years | ||||||||||
| Number of CRCs | Cumulative incidence, % (95% CI) | Number of CRCs | Cumulative incidence, % (95% CI) | Number of CRCs | Cumulative incidence, % (95% CI) | |||||||
| Low-risk group | ||||||||||||
| After baseline, with no surveillanced | < 0.0001 | |||||||||||
| Whole risk group | 14,401 (100) | 84,591 | 45 | 0.4 (0.3 to 0.5) | 77 | 0.7 (0.6 to 0.9) | 124 | 1.7 (1.4 to 2.1) | 143 | 165 | 0.86 (0.73 to 1.02) | |
| Higher-risk subgroupe | 9166 (63.6) | 51,688 | 39 | 0.5 (0.4 to 0.7) | 66 | 1.0 (0.8 to 1.3) | 95 | 2.1 (1.7 to 2.6) | 112 | 105 | 1.07 (0.88 to 1.28) | |
| Lower-risk subgroupe | 5235 (36.4) | 32,903 | 6 | 0.1 (0.1 to 0.3) | 11 | 0.3 (0.2 to 0.5) | 29 | 1.2 (0.8 to 1.7) | 31 | 60 | 0.51 (0.35 to 0.73) | |
| After first surveillance, with one surveillance visitf | 0.069 | |||||||||||
| Whole risk group | 7194 (100) | 34,507 | 14 | 0.2 (0.1 to 0.4) | 27 | 0.6 (0.4 to 0.8) | 40 | 1.5 (1.0 to 2.3) | 41 | 69 | 0.60 (0.43 to 0.81) | |
| Higher-risk subgroupe | 4763 (66.2) | 23,097 | 9 | 0.2 (0.1 to 0.4) | 20 | 0.7 (0.4 to 1.0) | 32 | 2.0 (1.3 to 3.0) | 33 | 47 | 0.70 (0.48 to 0.98) | |
| Lower-risk subgroupe | 2431 (33.8) | 11,410 | 5 | 0.2 (0.1 to 0.6) | 7 | 0.4 (0.2 to 0.8) | 8 | 0.6 (0.2 to 1.4) | 8 | 21 | 0.38 (0.16 to 0.74) | |
| After second surveillance, with two or more surveillance visitsg | 0.90 | |||||||||||
| Whole risk group | 3235 (100) | 19,805 | 1 | 0.04 (0.01 to 0.3) | 4 | 0.2 (0.1 to 0.5) | 8 | 0.6 (0.3 to 1.3) | 11 | 42 | 0.26 (0.13 to 0.47) | |
| Higher-risk subgroupe | 2236 (69.1) | 14,332 | 1 | 0.1 (0.01 to 0.4) | 4 | 0.3 (0.1 to 0.7) | 6 | 0.6 (0.2 to 1.4) | 8 | 32 | 0.25 (0.11 to 0.50) | |
| Lower-risk subgroupe | 999 (30.9) | 5472 | 0 | 0 | 2 | 0.7 (0.2 to 3.0) | 3 | 10 | 0.29 (0.06 to 0.84) | |||
| Intermediate-risk group | ||||||||||||
| After baseline, with no surveillanced | < 0.0001 | |||||||||||
| Whole risk group | 11,852 (100) | 53,927 | 57 | 0.6 (0.5 to 0.8) | 88 | 1.3 (1.0 to 1.6) | 121 | 2.6 (2.1 to 3.3) | 135 | 117 | 1.16 (0.97 to 1.37) | |
| Higher-risk subgrouph | 7114 (60.0) | 30,690 | 44 | 0.8 (0.6 to 1.1) | 68 | 1.7 (1.3 to 2.2) | 94 | 3.7 (2.9 to 4.7) | 102 | 70 | 1.46 (1.19 to 1.78) | |
| Lower-risk subgrouph | 4738 (40.0) | 23,237 | 13 | 0.4 (0.2 to 0.6) | 20 | 0.7 (0.4 to 1.1) | 27 | 1.3 (0.8 to 2.1) | 33 | 47 | 0.70 (0.48 to 0.99) | |
| After first surveillance, with one surveillance visitf | 0.029 | |||||||||||
| Whole risk group | 7169 (100) | 33,284 | 17 | 0.3 (0.2 to 0.5) | 34 | 0.8 (0.6 to 1.2) | 57 | 2.6 (1.9 to 3.6) | 62 | 73 | 0.85 (0.65 to 1.08) | |
| Higher-risk subgrouph | 4363 (60.9) | 20,133 | 14 | 0.4 (0.2 to 0.7) | 26 | 1.0 (0.7 to 1.5) | 42 | 3.1 (2.2 to 4.5) | 46 | 46 | 1.00 (0.73 to 1.33) | |
| Lower-risk subgrouph | 2806 (39.1) | 13,151 | 3 | 0.1 (0.04 to 0.4) | 8 | 0.5 (0.2 to 1.0) | 15 | 1.9 (1.0 to 3.4) | 16 | 27 | 0.59 (0.34 to 0.96) | |
| After second surveillance, with two or more surveillance visitg | 0.39 | |||||||||||
| Whole risk group | 3826 (100) | 24,059 | 10 | 0.3 (0.2 to 0.6) | 19 | 0.7 (0.4 to 1.1) | 36 | 2.0 (1.4 to 2.9) | 49 | 56 | 0.87 (0.65 to 1.16) | |
| Higher-risk subgrouph | 2407 (62.9) | 15,977 | 7 | 0.3 (0.2 to 0.7) | 13 | 0.7 (0.4 to 1.2) | 26 | 2.2 (1.4 to 3.3) | 36 | 38 | 0.95 (0.67 to 1.31) | |
| Lower-risk subgrouph | 1419 (37.1) | 8082 | 3 | 0.3 (0.1 to 0.8) | 6 | 0.6 (0.3 to 1.5) | 10 | 1.7 (0.8 to 3.3) | 13 | 18 | 0.72 (0.38 to 1.22) | |
| High-risk group | ||||||||||||
| After baseline, with no surveillanced | 0.0001 | |||||||||||
| Whole risk group | 2719 (100) | 9243 | 17 | 1.0 (0.6 to 1.7) | 32 | 3.1 (2.1 to 4.4) | 41 | 5.7 (4.0 to 8.3) | 44 | 23 | 1.91 (1.39 to 2.56) | |
| Higher-risk subgroupi | 902 (33.2) | 3017 | 10 | 1.9 (1.0 to 3.6) | 19 | 5.6 (3.5 to 9.0) | 24 | 9.9 (6.2 to 15.7) | 27 | 8 | 3.55 (2.34 to 5.17) | |
| Lower-risk subgroupi | 1817 (66.8) | 6226 | 7 | 0.6 (0.3 to 1.4) | 13 | 1.9 (1.0 to 3.4) | 17 | 3.8 (2.1 to 6.8) | 17 | 15 | 1.10 (0.64 to 1.76) | |
| After first surveillance, with one surveillance visitf | 0.086 | |||||||||||
| Whole risk group | 1808 (100) | 7144 | 9 | 0.6 (0.3 to 1.2) | 16 | 1.8 (1.1 to 3.1) | 23 | 5.6 (3.1 to 9.8) | 24 | 18 | 1.34 (0.86 to 1.99) | |
| Higher-risk subgroupi | 597 (33.0) | 2378 | 4 | 0.9 (0.3 to 2.3) | 8 | 2.9 (1.4 to 6.1) | 12 | 7.8 (3.8 to 15.4) | 12 | 6 | 1.97 (1.02 to 3.44) | |
| Lower-risk subgroupi | 1211 (67.0) | 4766 | 5 | 0.5 (0.2 to 1.3) | 8 | 1.3 (0.6 to 2.9) | 11 | 4.4 (1.8 to 10.6) | 12 | 12 | 1.01 (0.52 to 1.76) | |
| After second surveillance, with two or more surveillance visitsg | 0.74 | |||||||||||
| Whole risk group | 1113 (100) | 6574 | 3 | 0.3 (0.1 to 1.0) | 9 | 1.2 (0.6 to 2.3) | 15 | 2.6 (1.5 to 4.4) | 16 | 18 | 0.91 (0.52 to 1.47) | |
| Higher-risk subgroupi | 376 (33.8) | 2535 | 2 | 0.6 (0.2 to 2.4) | 3 | 1.0 (0.3 to 3.1) | 6 | 2.7 (1.2 to 6.2) | 7 | 7 | 1.02 (0.41 to 2.09) | |
| Lower-risk subgroupi | 737 (66.2) | 4039 | 1 | 0.2 (0.02 to 1.2) | 6 | 1.3 (0.6 to 2.8) | 9 | 2.4 (1.2 to 4.7) | 9 | 11 | 0.83 (0.38 to 1.58) | |
FIGURE 2.
Kaplan–Meier estimates of cumulative CRC incidence after baseline in the low-risk group. (a) Cumulative CRC incidence after baseline with no surveillance (censoring at first surveillance) in the whole low-risk group; (b) cumulative CRC incidence after baseline with no surveillance (censoring at first surveillance) in the higher- and lower-risk subgroups; (c) cumulative CRC incidence with a single surveillance visit (censoring at second surveillance) in the whole low-risk group; (d) cumulative CRC incidence with a single surveillance visit (censoring at second surveillance) in the higher- and lower-risk subgroups; (e) cumulative CRC incidence with two or more surveillance visits (censoring at end of follow-up) in the whole low-risk group; and (f) cumulative CRC incidence with two or more surveillance visits (censoring at end of follow-up) in the higher- and lower-risk subgroups.
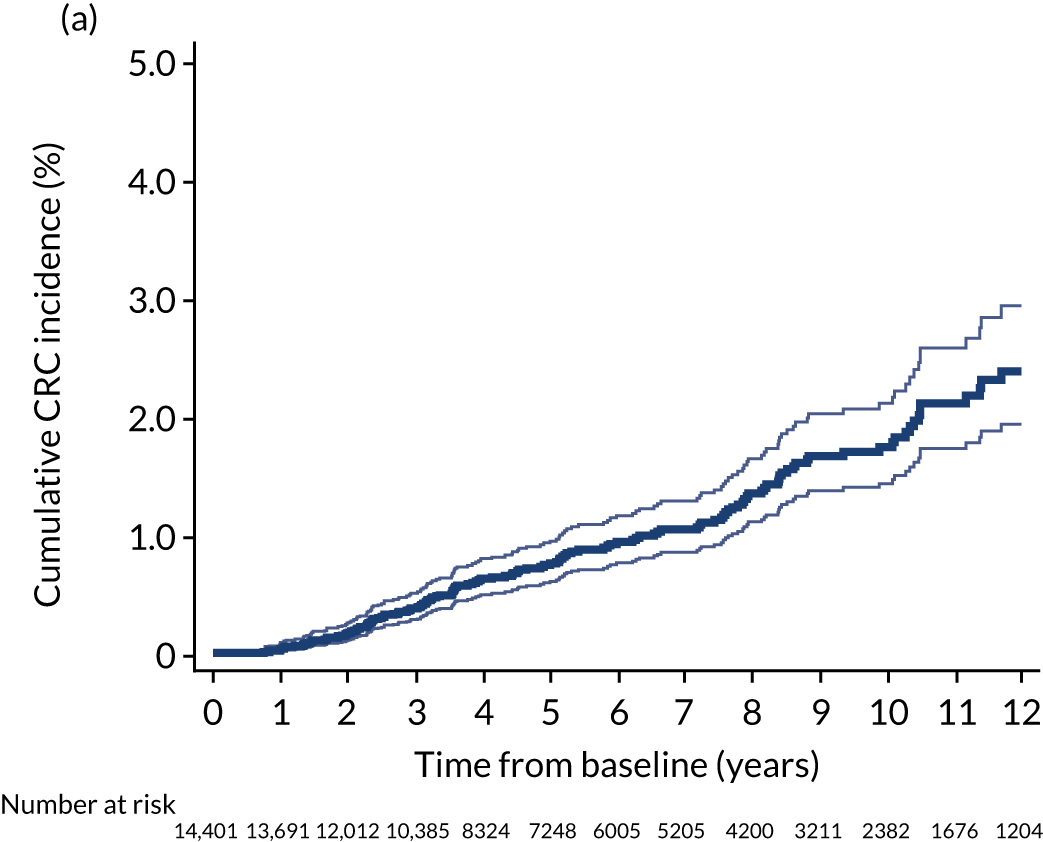
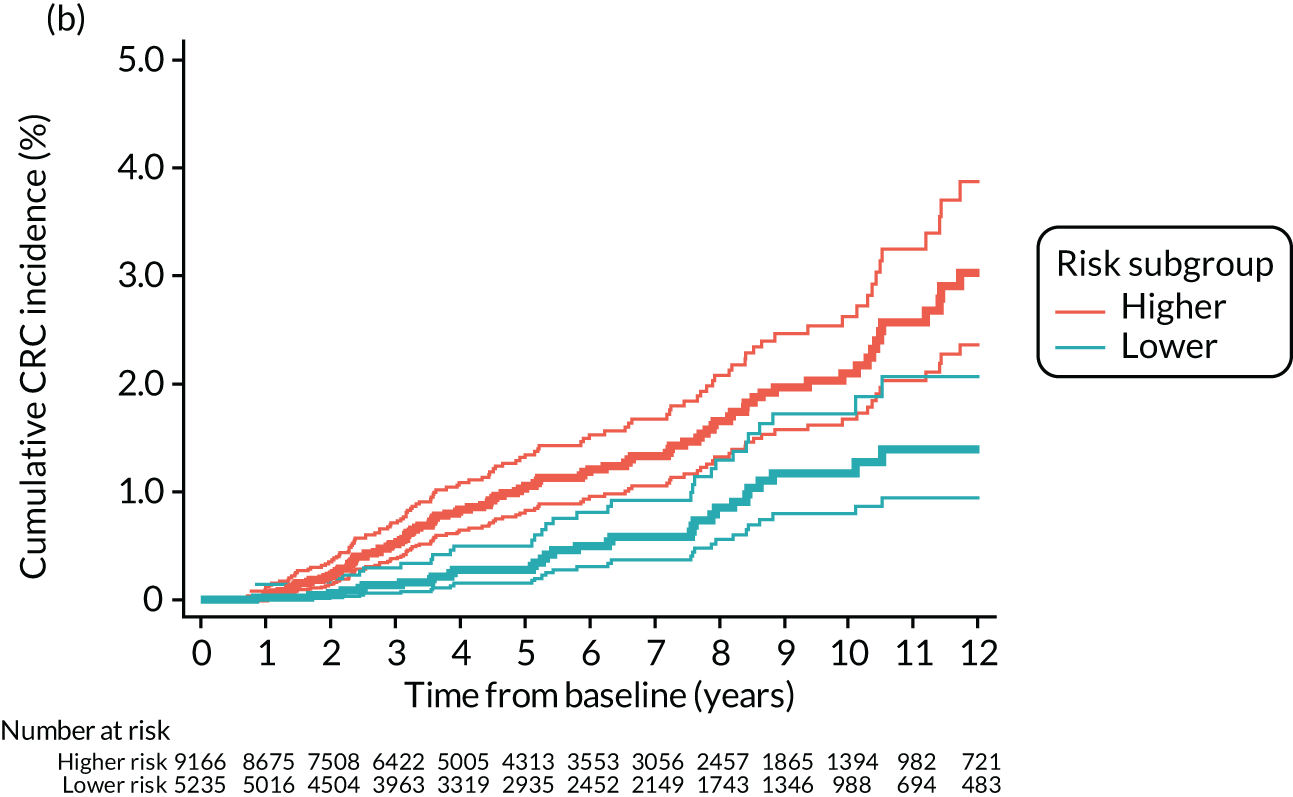
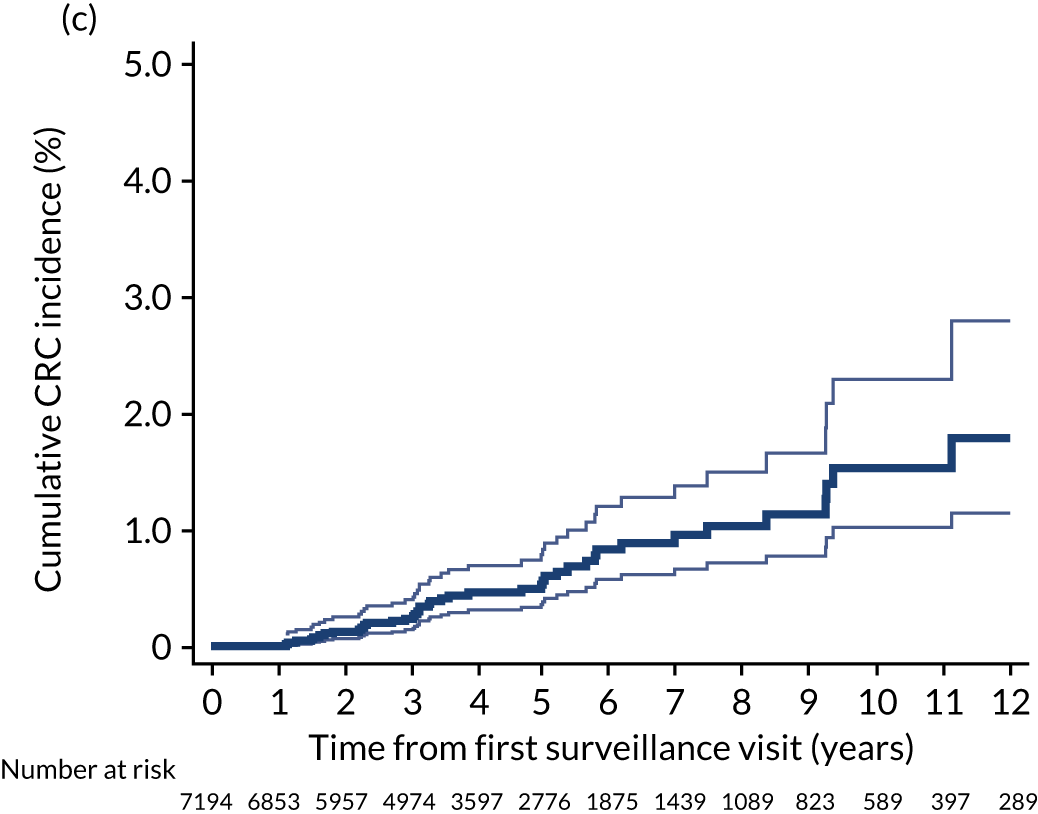
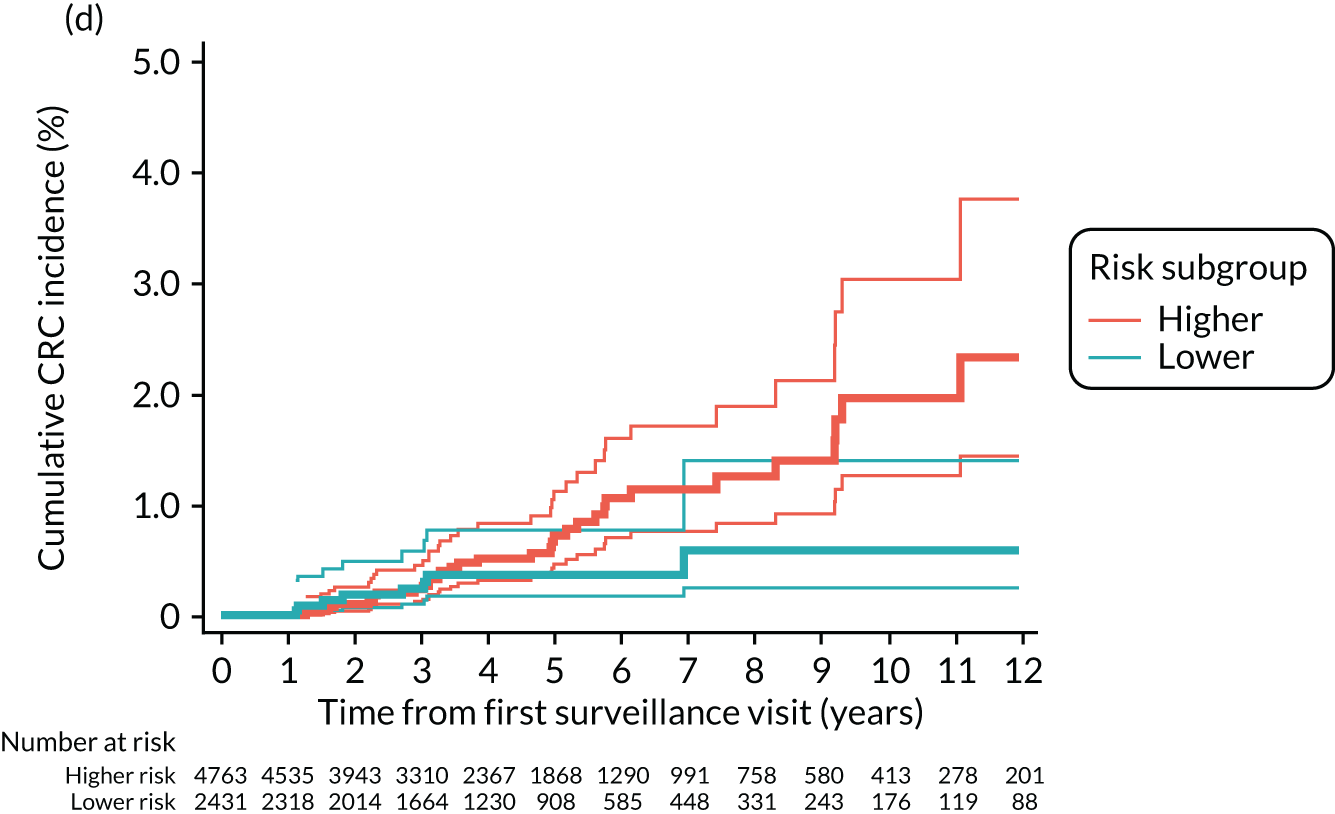
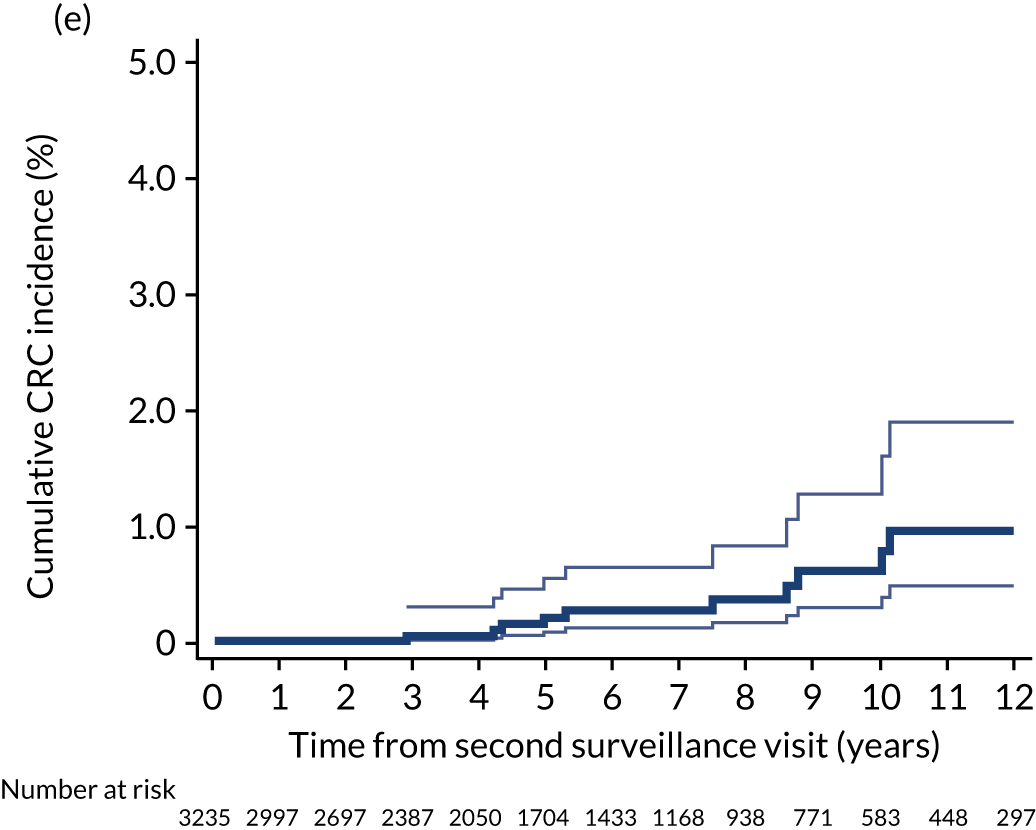
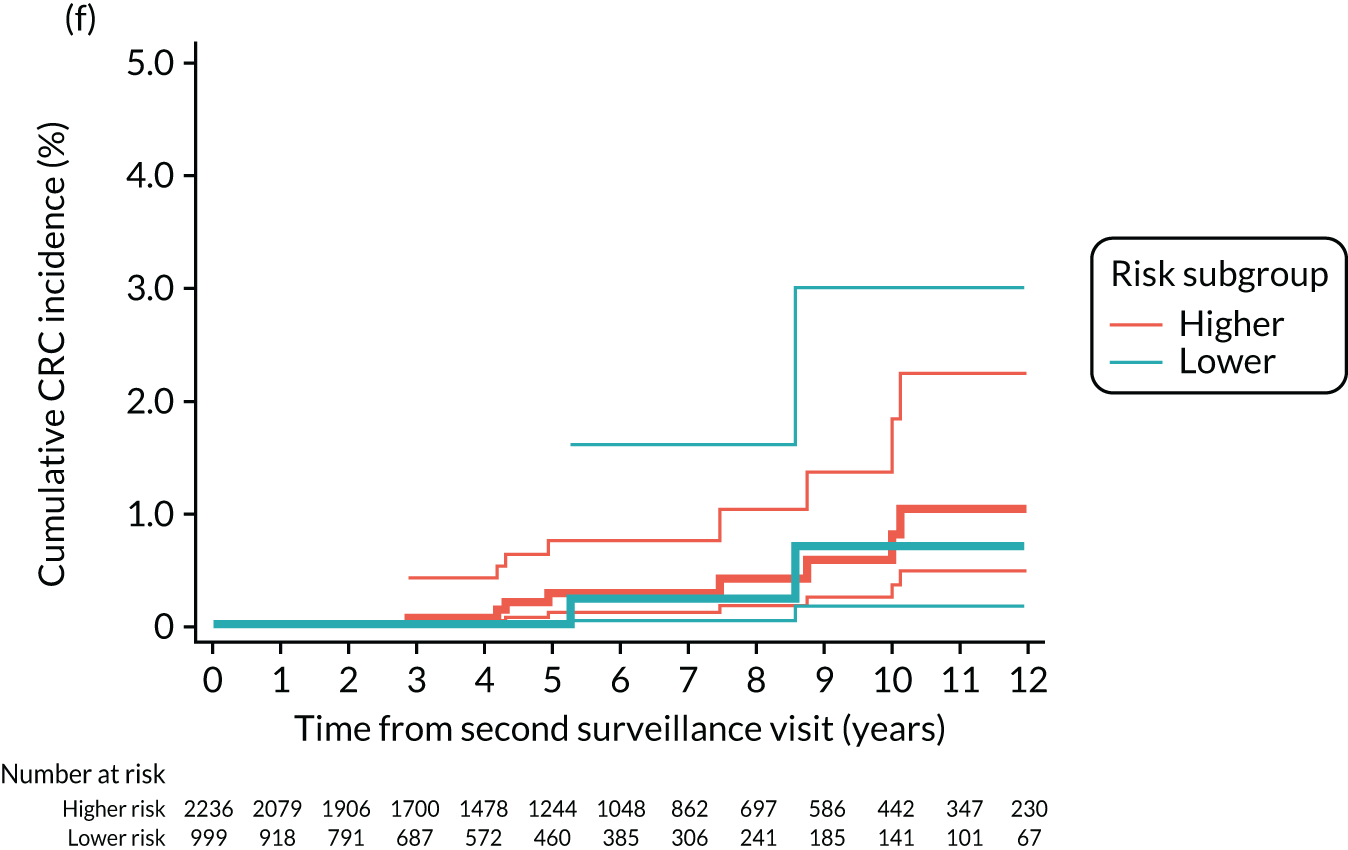
The intermediate-risk group
Without surveillance, cumulative CRC incidence at 10 years was 2.6% (95% CI 2.1% to 3.3%) in the intermediate-risk group overall, but differed significantly between the lower-risk subgroup, at 1.3% (95% CI 0.8% to 2.1%), and the higher-risk subgroup, at 3.7% (95% CI 2.9% to 4.7%). After one surveillance visit, cumulative CRC incidence at 10 years was 2.6% (95% CI 1.9% to 3.6%) in the intermediate-risk group overall, still differing significantly between the lower-risk subgroup (1.9%, 95% CI 1.0% to 3.4%) and the higher-risk subgroup (3.1%, 95% CI 2.2% to 4.5%) (Figure 3; see also Table 8).
FIGURE 3.
Kaplan–Meier estimates of cumulative CRC incidence after baseline in the intermediate-risk group. (a) Cumulative CRC incidence after baseline with no surveillance (censoring at first surveillance) in the whole intermediate-risk group; (b) cumulative CRC incidence after baseline with no surveillance (censoring at first surveillance) in the higher- and lower-risk subgroups; (c) cumulative CRC incidence with a single surveillance visit (censoring at second surveillance) in the whole intermediate-risk group; (d) cumulative CRC incidence with a single surveillance visit (censoring at second surveillance) in the higher- and lower-risk subgroups; (e) cumulative CRC incidence with two or more surveillance visits (censoring at end of follow-up) in the whole intermediate-risk group; and (f) cumulative CRC incidence with two or more surveillance visits (censoring at end of follow-up) in the higher- and lower-risk subgroups.
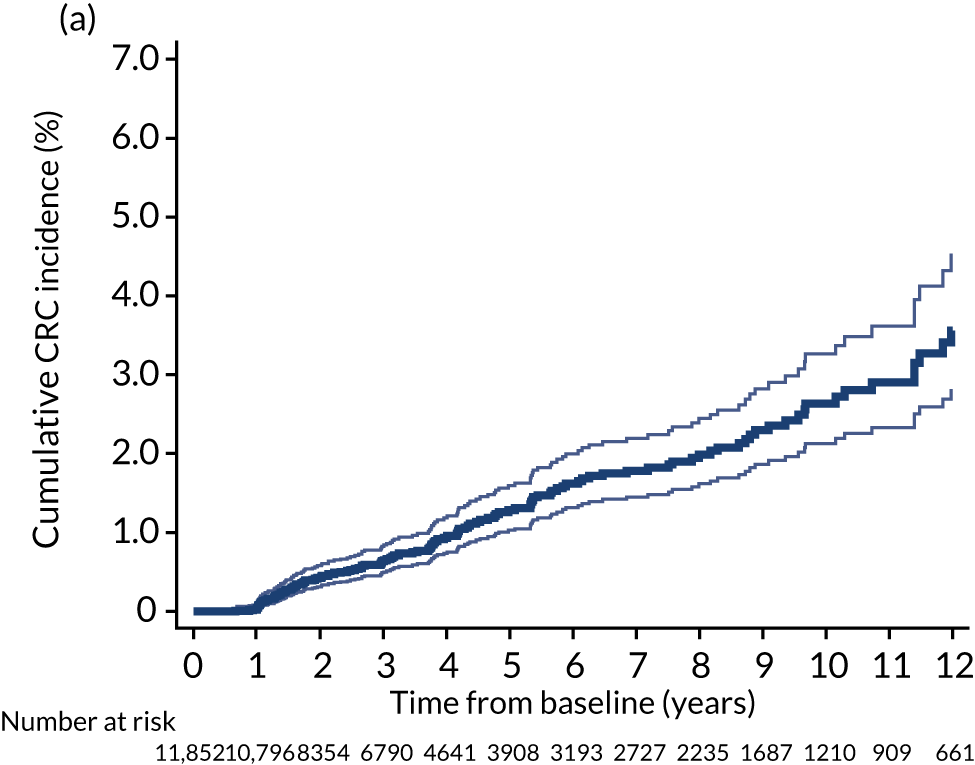
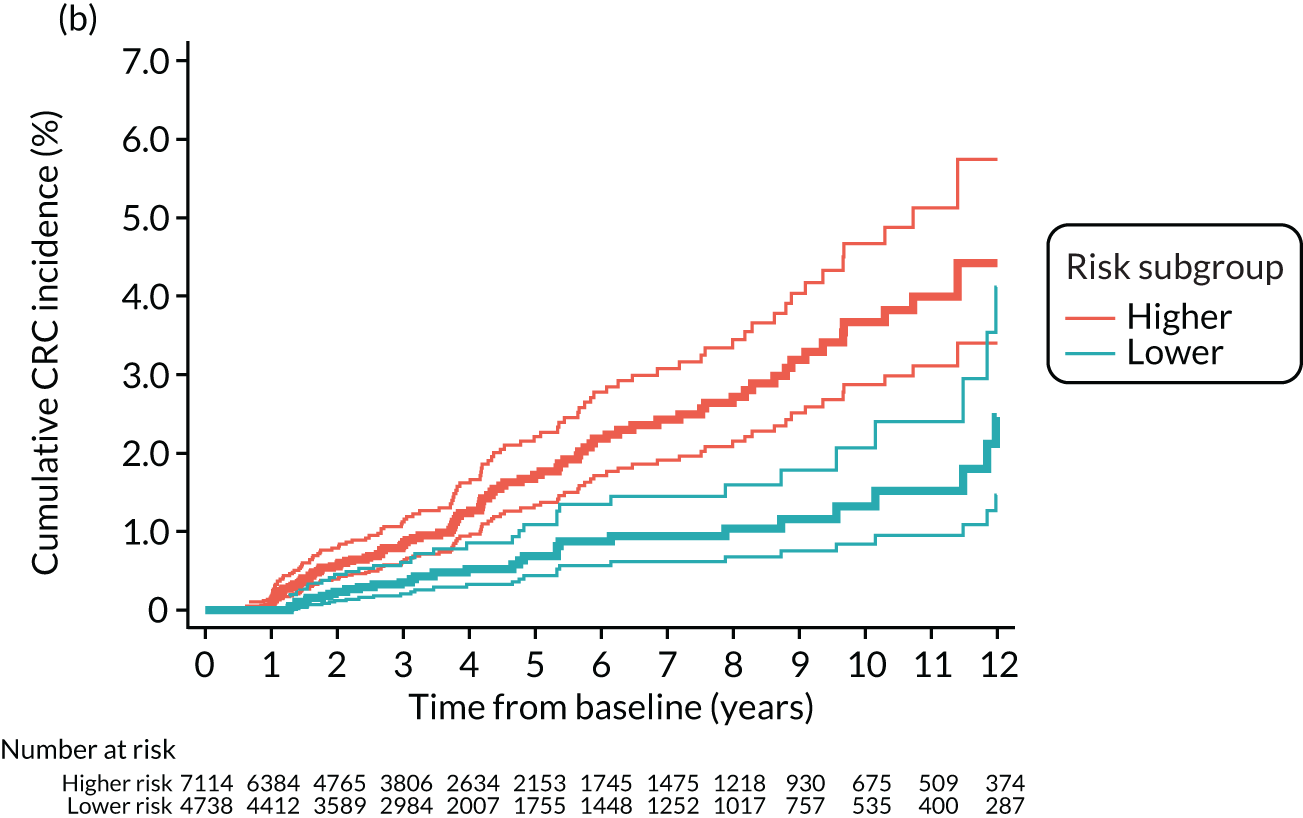
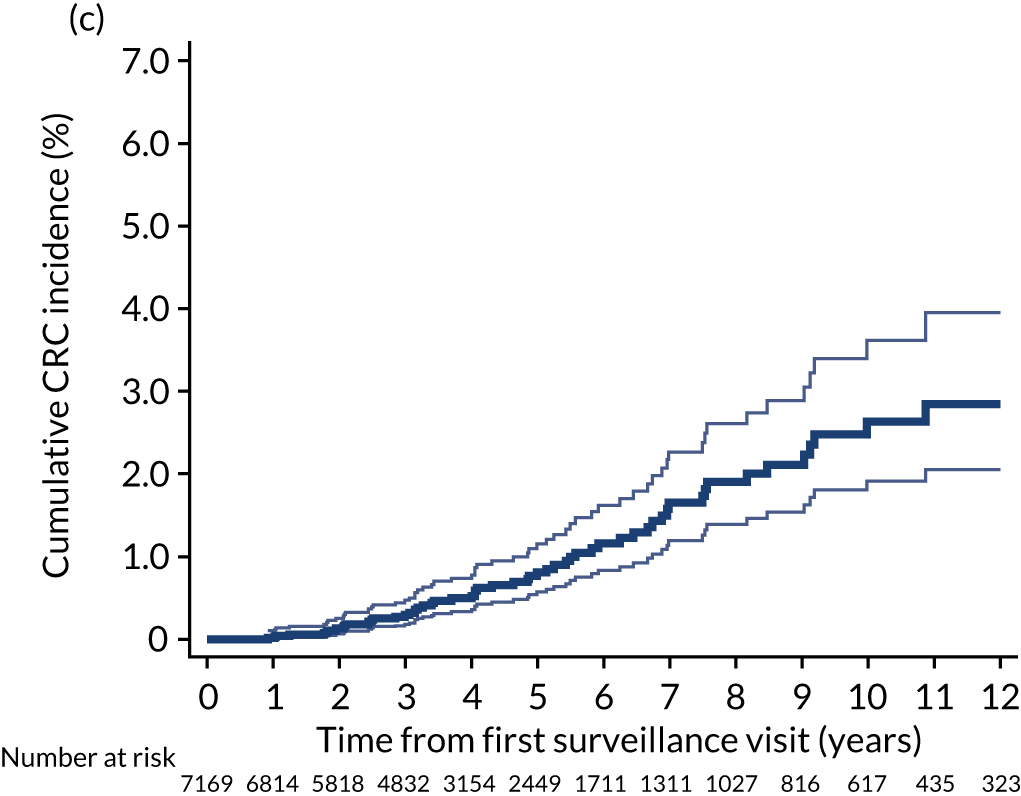
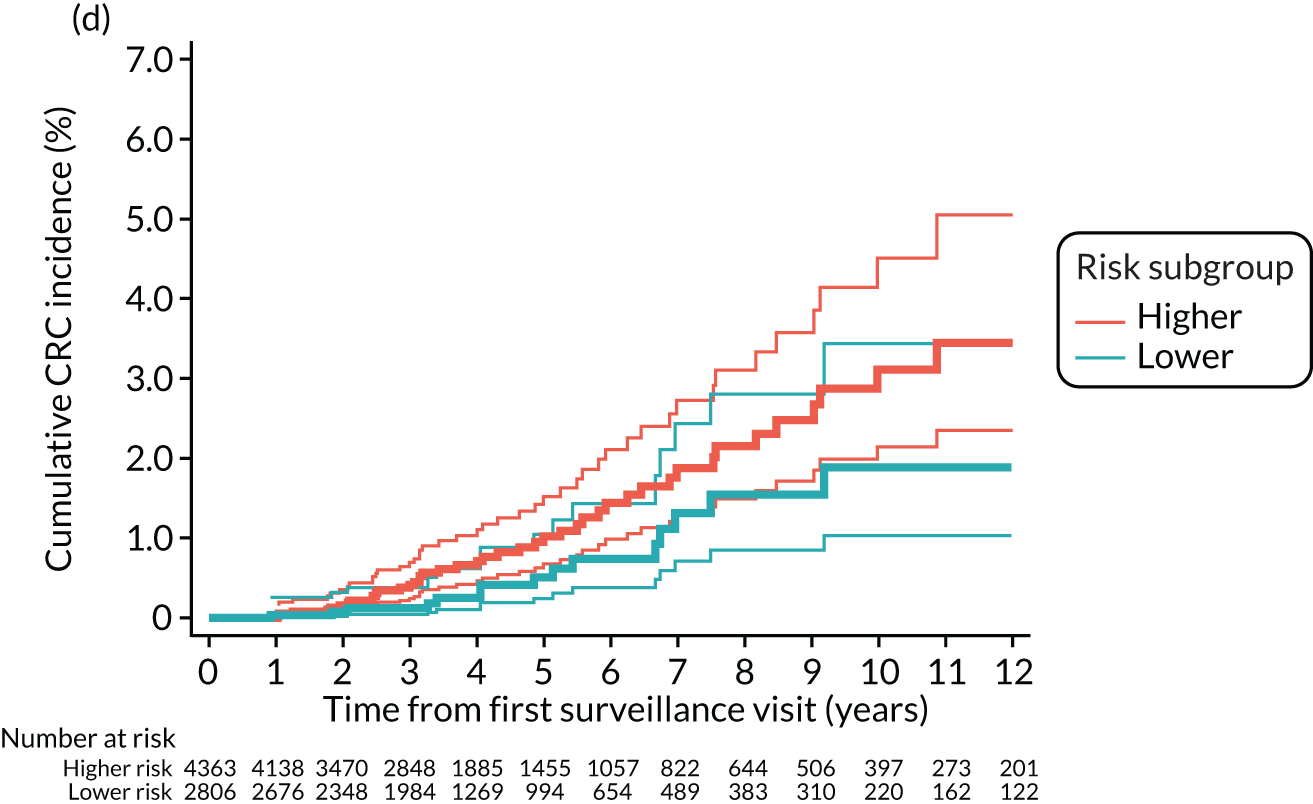
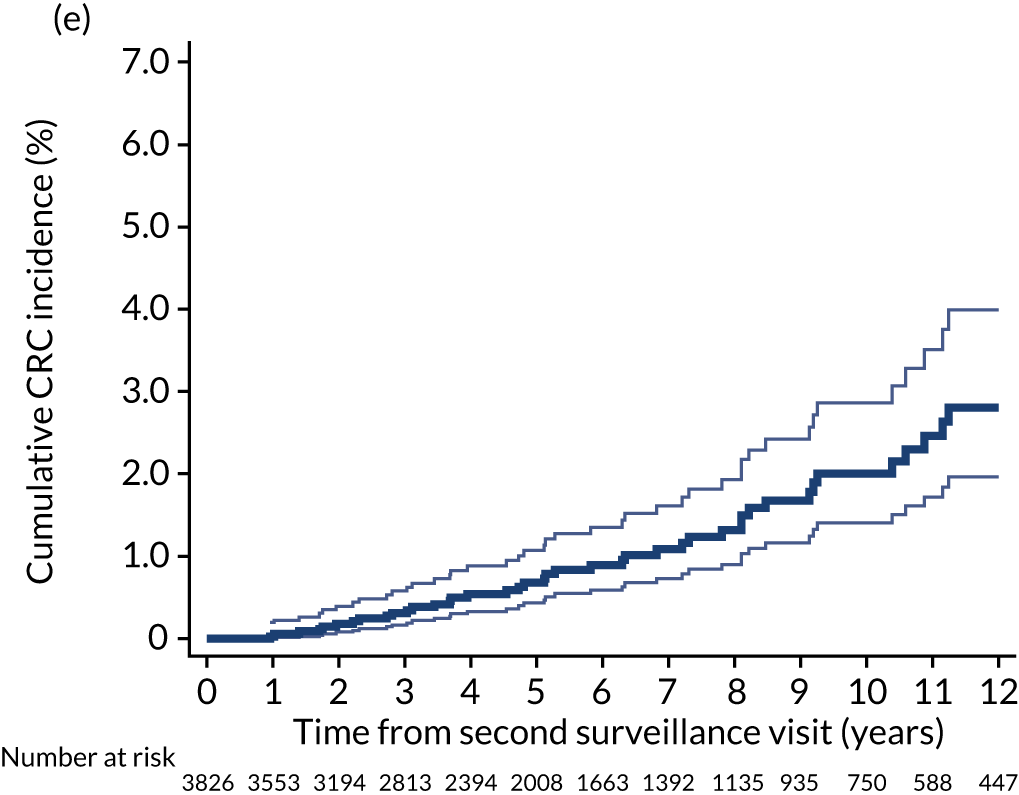
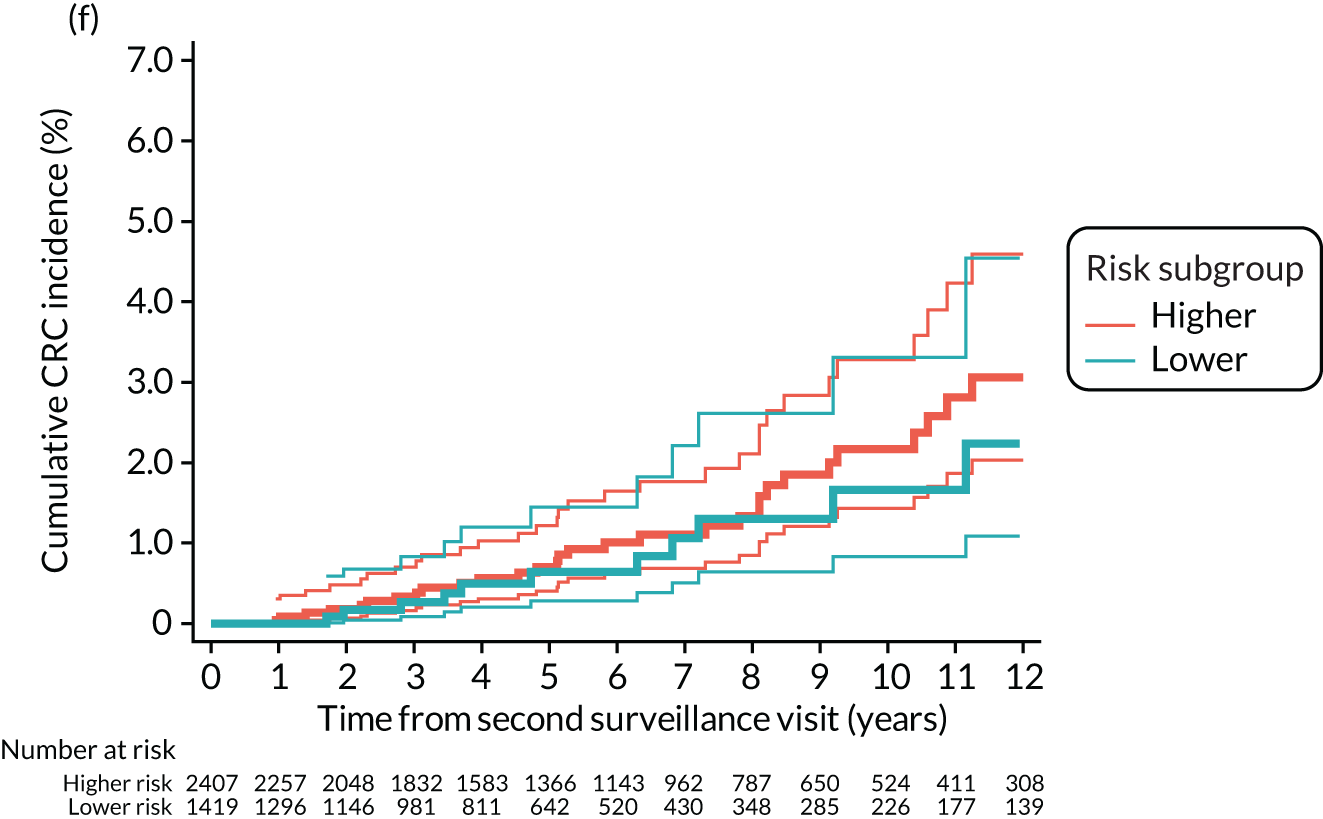
The high-risk group
Without surveillance, cumulative CRC incidence at 10 years was 5.7% (95% CI 4.0% to 8.3%) in the high-risk group overall, differing significantly between the lower-risk subgroup, at 3.8% (95% CI 2.1% to 6.8%), and the higher-risk subgroup, at 9.9% (95% CI 6.2% to 15.7%). After one surveillance visit, CRC incidence at 10 years was 5.6% (95% CI 3.1% to 9.8%) in the high-risk group overall and was no longer significantly different in the lower-risk subgroup (4.4%, 95% CI 1.8% to 10.6%) when compared with the higher-risk subgroup (7.8%, 95% CI 3.8% to 15.4%) (Figure 4; see also Table 8).
FIGURE 4.
Kaplan–Meier estimates of cumulative CRC incidence after baseline in the high-risk group. (a) Cumulative CRC incidence after baseline with no surveillance (censoring at first surveillance) in the whole high-risk group; (b) cumulative CRC incidence after baseline with no surveillance (censoring at first surveillance) in the higher- and lower-risk subgroups; (c) cumulative CRC incidence with a single surveillance visit (censoring at second surveillance) in the whole high-risk group; (d) cumulative CRC incidence with a single surveillance visit (censoring at second surveillance) in the higher- and lower-risk subgroups; (e) cumulative CRC incidence with two or more surveillance visits (censoring at end of follow-up) in the whole high-risk group; and (f) cumulative CRC incidence with two or more surveillance visits (censoring at end of follow-up) in the higher- and lower-risk subgroups.
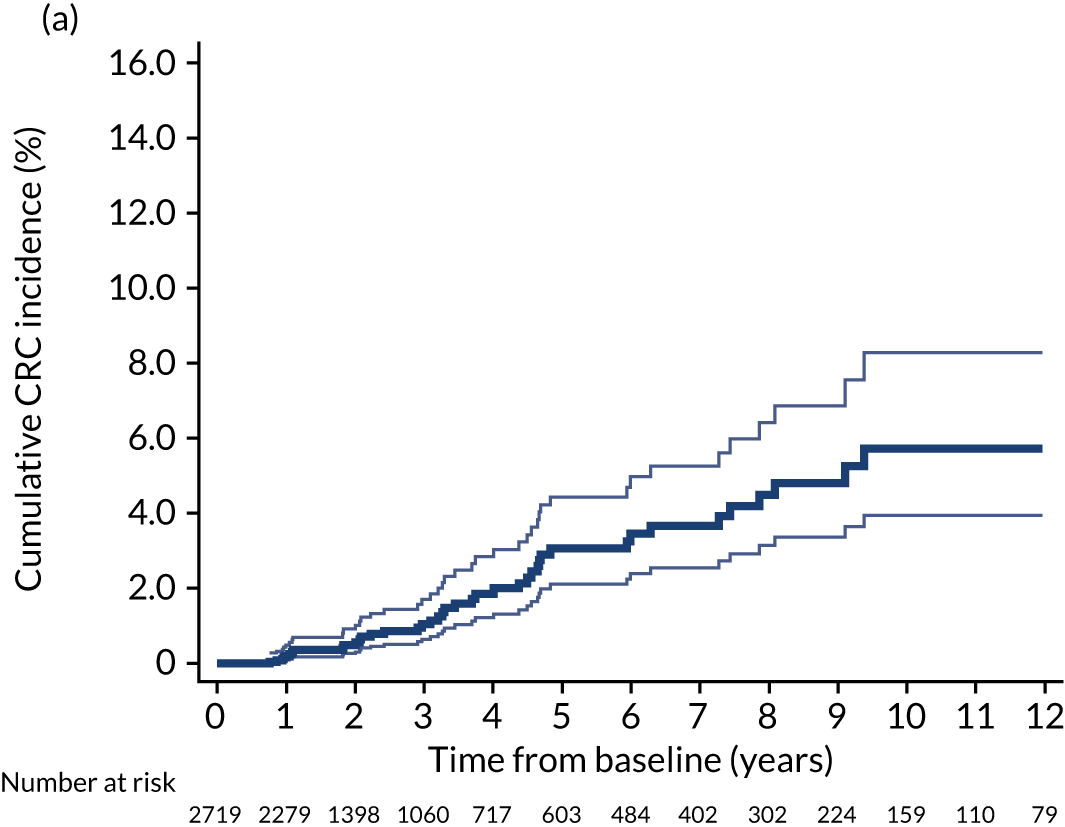
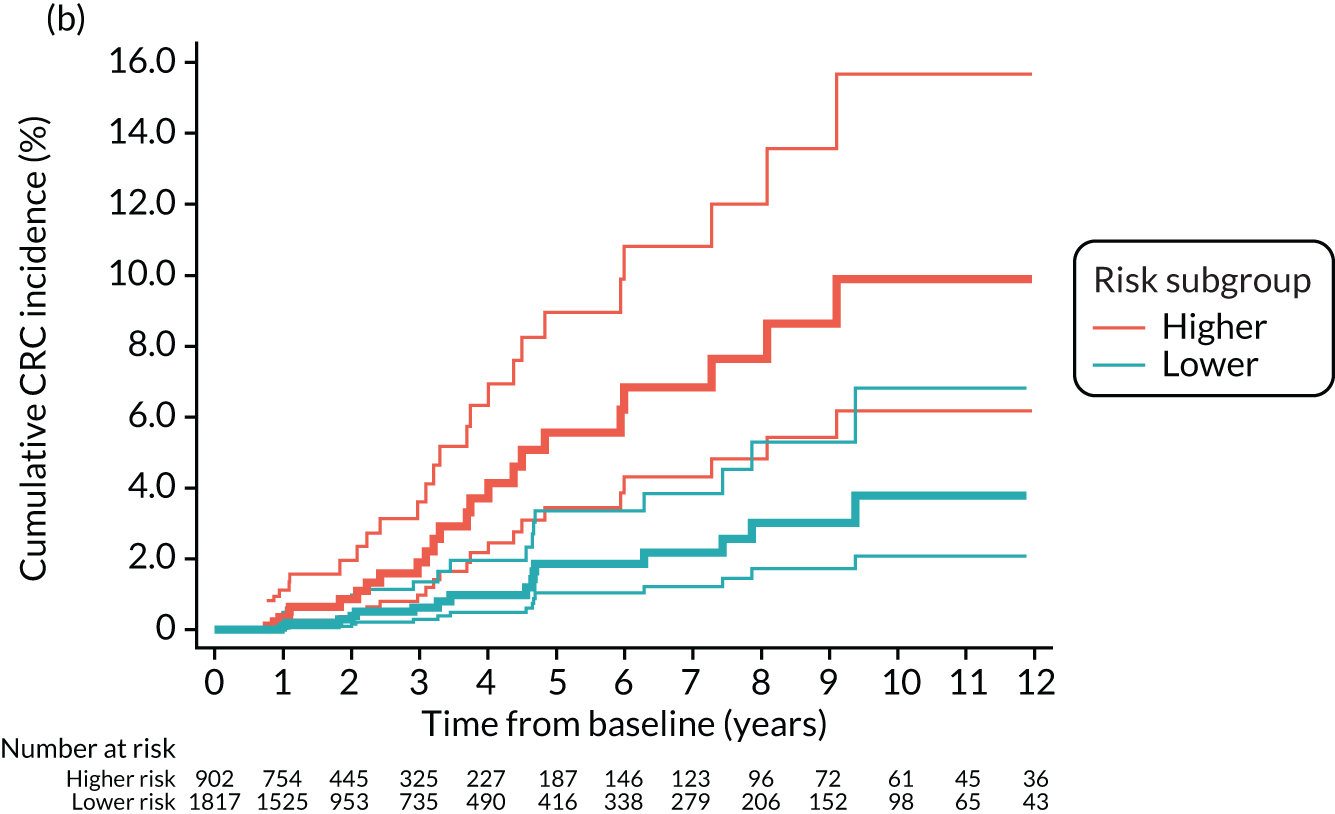
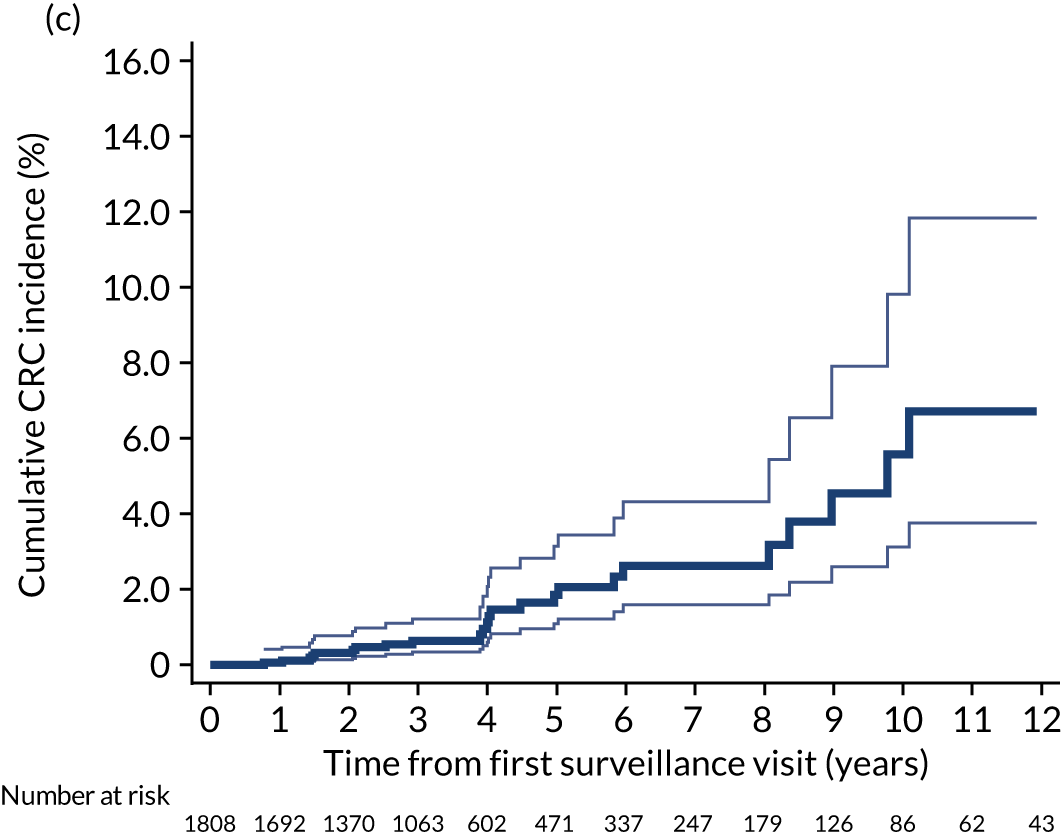
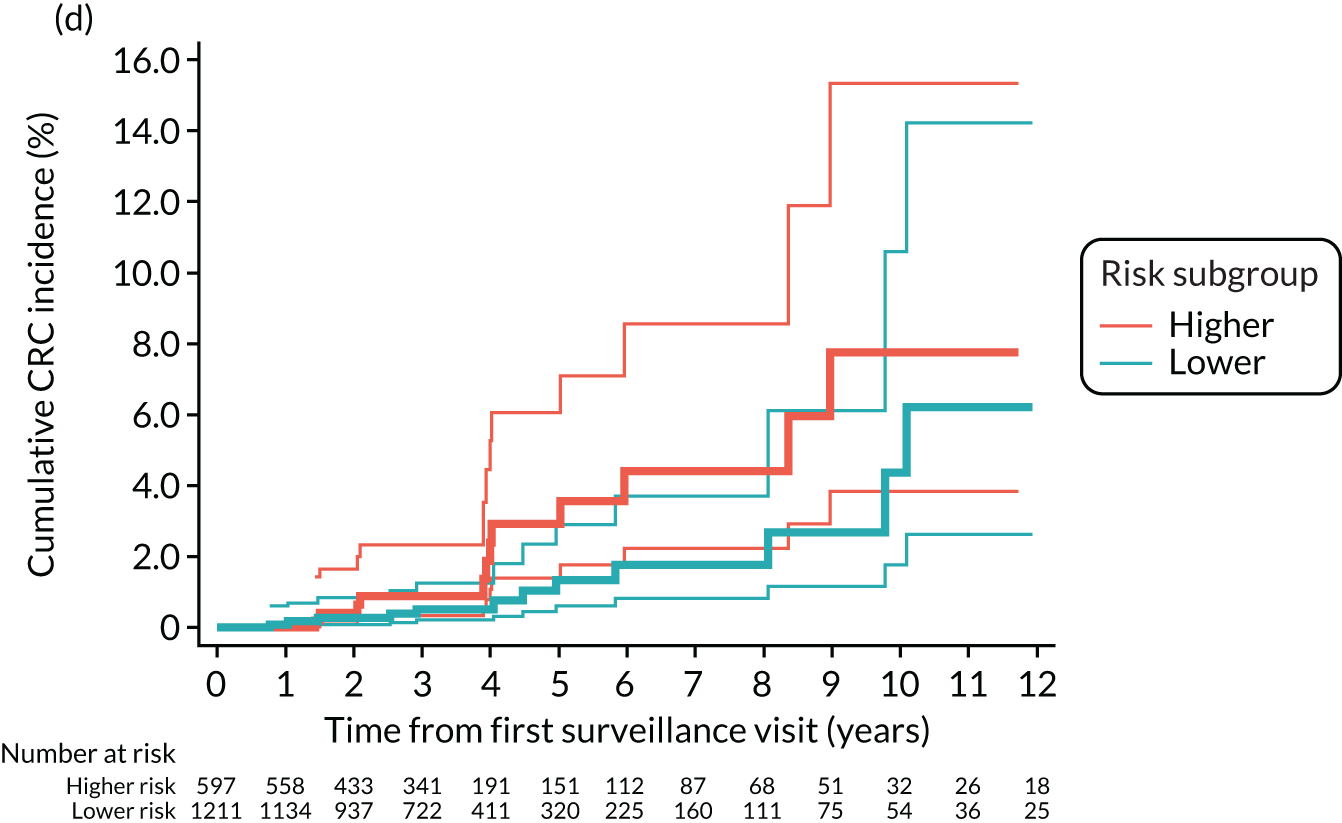
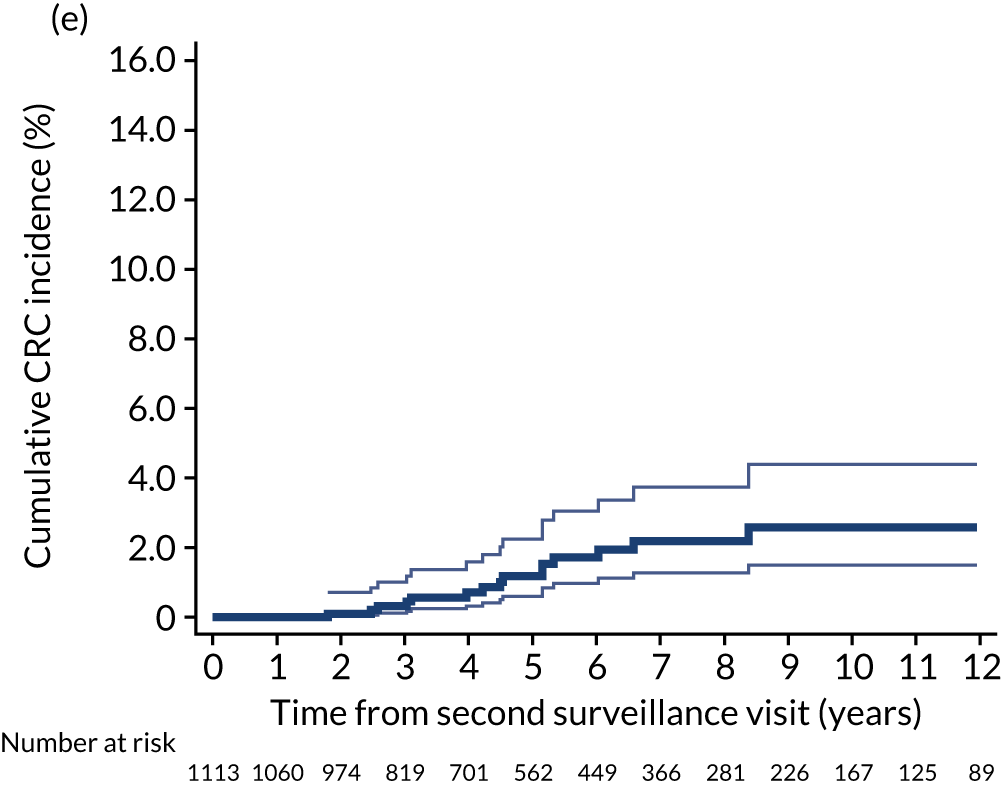
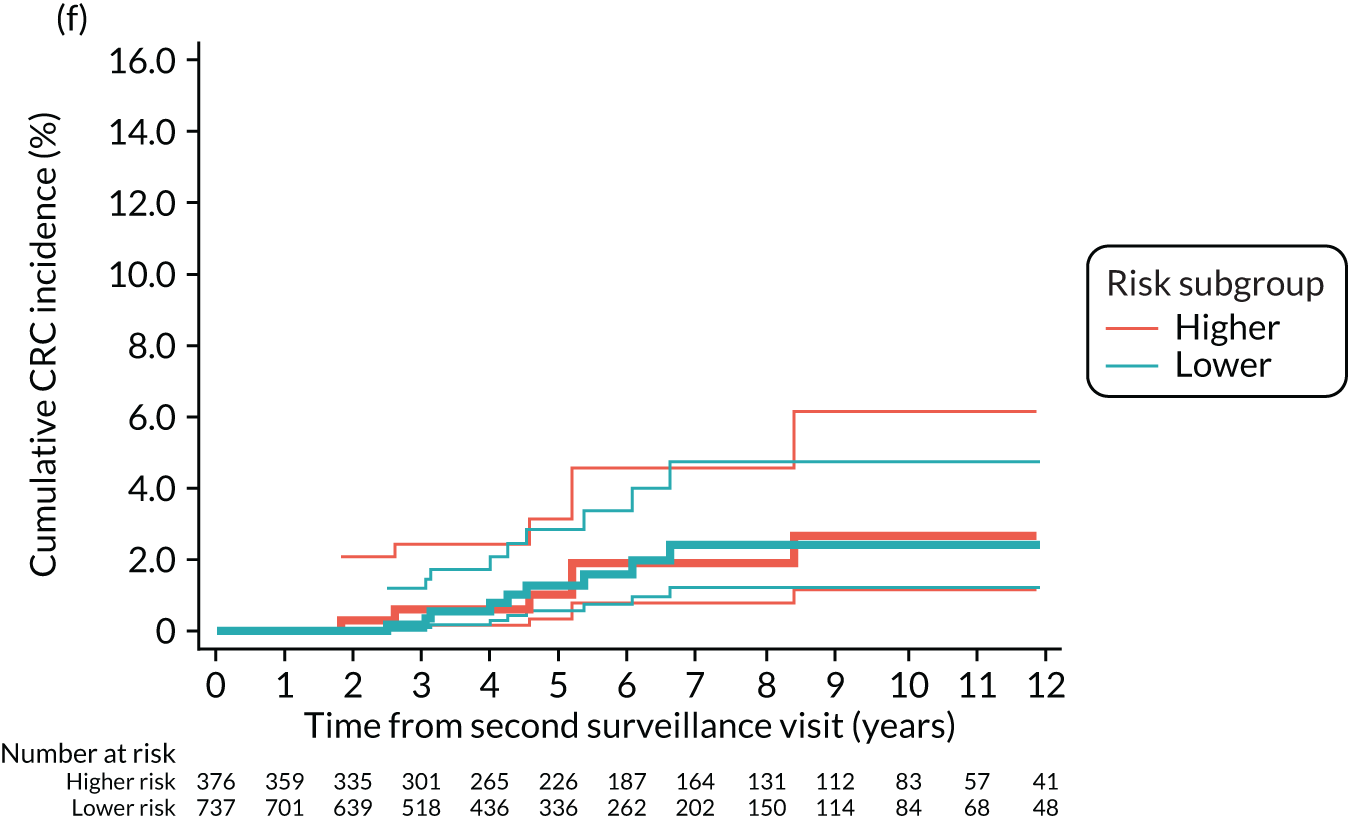
Comparisons with colorectal cancer incidence in the general population
The low-risk group
Compared with the general population, CRC incidence in the absence of surveillance was not significantly different in the low-risk group overall (SIR 0.86, 95% CI 0.73 to 1.02) or in the higher-risk subgroup (SIR 1.07, 95% CI 0.88 to 1.28), but was lower in the lower-risk subgroup (SIR 0.51, 95% CI 0.35 to 0.73). After one surveillance visit, CRC incidence was significantly lower in both subgroups than in the general population and SIRs were 0.38 (95% CI 0.16 to 0.74) and 0.70 (95% CI 0.48 to 0.98) for the lower- and higher-risk subgroups, respectively (see Table 8).
The intermediate-risk group
Without surveillance, CRC incidence was not significantly different in the intermediate-risk group overall (SIR 1.16, 95% CI 0.97 to 1.37) compared with the general population, but was lower in the lower-risk subgroup (SIR 0.70, 95% CI 0.48 to 0.99) and higher in the higher-risk subgroup (SIR 1.46, 95% CI 1.19 to 1.78). After one surveillance visit, CRC incidence was no longer higher in the higher-risk subgroup than in the general population (SIR 1.00, 95% CI 0.73 to 1.33) (see Table 8).
The high-risk group
Without surveillance, CRC incidence was higher in the high-risk group overall (SIR 1.91, 95% CI 1.39 to 2.56) and in the higher-risk subgroup (SIR 3.55, 95% CI 2.34 to 5.17) than in the general population, but was not significantly different in the lower-risk subgroup (SIR 1.10, 95% CI 0.64 to 1.76). After first surveillance, CRC incidence was not significantly different in the high-risk group overall (SIR 1.34, 95% CI 0.86 to 1.99) than in the general population, but remained higher in the higher-risk subgroup (SIR 1.97, 95% CI 1.02 to 3.44). Following a second surveillance visit, CRC incidence was no longer higher in the higher-risk subgroup than in the general population (SIR 1.02, 95% CI 0.41 to 2.09) (see Table 8). It is worth noting that the estimates from our analyses of the high-risk group have low precision because of the small number of CRC cases.
Comparison of colorectal cancer incidence in the presence of one surveillance visit compared with two or more visits
The low-risk group
In the whole low-risk group, CRC incidence was lower with attendance at two or more surveillance visits than with one visit (HR 0.31, 95% CI 0.15 to 0.63). This pattern was also observed in the higher-risk subgroup (HR 0.25, 95% CI 0.11 to 0.57). In the lower-risk subgroup, attendance at two or more surveillance visits was not associated with a reduction in CRC incidence compared with attendance at one visit (HR 0.74, 95% CI 0.14 to 3.81). However, the HR estimate for the lower-risk subgroup has a wide 95% CI, as there were only 11 CRC cases (Table 9).
| Risk group | Number of patients (%) | Number of person-years | Number of CRCs | Incidence rate per 100,000 person-years (95% CI) | Comparison of incidence in the presence of two or more vs. one surveillance visita | |
|---|---|---|---|---|---|---|
| Unadjusted HR (95% CI) | p-valueb | |||||
| Low-risk group | ||||||
| Whole risk group | 0.0007 | |||||
| One visit | 3959 (55.0) | 34,507 | 41 | 119 (87 to 161) | 1 | |
| Two or more visits | 3235 (45.0) | 19,805 | 11 | 56 (31 to 100) | 0.31 (0.15 to 0.63) | |
| Total | 7194 (100) | 54,312 | 52 | 96 (73 to 126) | ||
| Higher-risk subgroupc | 0.0003 | |||||
| One visit | 2527 (53.1) | 23,097 | 33 | 143 (102 to 201) | 1 | |
| Two or more visits | 2236 (47.0) | 14,332 | 8 | 56 (28 to 112) | 0.25 (0.11 to 0.57) | |
| Total | 4763 (66.2) | 37,429 | 41 | 110 (81 to 149) | ||
| Lower-risk subgroupc | 0.72 | |||||
| One visit | 1432 (58.9) | 11,410 | 8 | 70 (35 to 140) | 1 | |
| Two or more visits | 999 (41.1) | 5472 | 3 | 55 (18 to 170) | 0.74 (0.14 to 3.81) | |
| Total | 2431 (33.8) | 16,882 | 11 | 65 (36 to 118) | ||
| Intermediate-risk group | ||||||
| Whole risk group | 0.016 | |||||
| One visit | 3343 (46.6) | 33,284 | 62 | 186 (145 to 239) | 1 | |
| Two or more visits | 3826 (53.4) | 24,059 | 49 | 204 (154 to 269) | 0.60 (0.40 to 0.91) | |
| Total | 7169 (100) | 57,343 | 111 | 194 (161 to 233) | ||
| Higher-risk subgroupd | 0.019 | |||||
| One visit | 1956 (44.8) | 20,133 | 46 | 228 (171 to 305) | 1 | |
| Two or more visits | 2407 (55.2) | 15,977 | 36 | 225 (163 to 312) | 0.56 (0.34 to 0.91) | |
| Total | 4363 (60.9) | 36,110 | 82 | 227 (183 to 282) | ||
| Lower-risk subgroupd | 0.31 | |||||
| One visit | 1387 (49.4) | 13,151 | 16 | 122 (75 to 199) | 1 | |
| Two or more visits | 1419 (50.6) | 8082 | 13 | 161 (93 to 277) | 0.66 (0.30 to 1.46) | |
| Total | 2806 (39.1) | 21,233 | 29 | 137 (95 to 197) | ||
| High-risk group | ||||||
| Whole risk group | 0.017 | |||||
| One visit | 695 (38.4) | 7144 | 24 | 336 (225 to 501) | 1 | |
| Two or more visits | 1113 (61.6) | 6574 | 16 | 243 (149 to 397) | 0.43 (0.21 to 0.86) | |
| Total | 1808 (100) | 13,718 | 40 | 292 (214 to 397) | ||
| Higher-risk subgroupe | 0.046 | |||||
| One visit | 221 (37.0) | 2378 | 12 | 505 (287 to 889) | 1 | |
| Two or more visits | 376 (63.0) | 2535 | 7 | 276 (132 to 579) | 0.36 (0.13 to 0.99) | |
| Total | 597 (33.0) | 4913 | 19 | 387 (247 to 606) | ||
| Lower-risk subgroupe | 0.16 | |||||
| One visit | 474 (39.1) | 4766 | 12 | 252 (143 to 443) | 1 | |
| Two or more visits | 737 (60.9) | 4039 | 9 | 223 (116 to 428) | 0.50 (0.19 to 1.30) | |
| Total | 1211 (67.0) | 8805 | 21 | 238 (155 to 366) | ||
The intermediate-risk group
In the whole intermediate-risk group, attending two or more surveillance visits was associated with a reduction in CRC incidence compared with a single visit (HR 0.60, 95% CI 0.40 to 0.91). This was also observed in the higher-risk subgroup (HR 0.56, 95% CI 0.34 to 0.91), but not in the lower-risk subgroup (HR 0.66, 95% CI 0.30 to 1.46). However, as before, the HR estimate for the lower-risk subgroup is imprecise as there were few CRC cases (see Table 9).
The high-risk group
In the whole high-risk group, CRC incidence was lower with attendance at two or more surveillance visits than with one visit (HR 0.43, 95% CI 0.21 to 0.86). This was also observed in the higher-risk subgroup (HR 0.36, 95% CI 0.13 to 0.99). In the lower-risk subgroup, CRC incidence was not significantly lower with two or more surveillance visits than with one (HR 0.50, 95% CI 0.19 to 1.30), although the HR estimate lacks precision (see Table 9).
Findings at the first surveillance visit
We first examined detection rates of AAs and CRC at the first surveillance visit by interval length, considering all possible intervals from baseline to first surveillance. The results are shown in Table 10.
| Interval length to first surveillance | AAsa | CRC | ||||
|---|---|---|---|---|---|---|
| Number of patients (%) | Number of AAs (%) | Unadjusted OR (95% CI) | Number of patients (%) | Number of CRCs (%) | Unadjusted OR (95% CI) | |
| Low-risk group | ||||||
| Total | 7264 (100) | 546 (7.5) | 7407 (100) | 143 (1.9) | ||
| < 18 months | 1128 (15.5) | 65 (5.8) | 1 | 1142 (15.4) | 14 (1.2) | 1 |
| 2 yearsb | 1094 (15.1) | 63 (5.8) | 1.00 (0.70 to 1.43) | 1115 (15.1) | 21 (1.9) | 1.55 (0.78 to 3.06) |
| 3 yearsb | 1870 (25.7) | 113 (6.0) | 1.05 (0.77 to 1.44) | 1893 (25.6) | 23 (1.2) | 0.99 (0.51 to 1.93) |
| 4 yearsb | 925 (12.7) | 75 (8.1) | 1.44 (1.02 to 2.04) | 940 (12.7) | 15 (1.6) | 1.31 (0.63 to 2.72) |
| 5 yearsb | 1097 (15.1) | 96 (8.8) | 1.57 (1.13 to 2.17) | 1110 (15.0) | 13 (1.2) | 0.95 (0.45 to 2.04) |
| 6 yearsb | 441 (6.1) | 37 (8.4) | 1.50 (0.98 to 2.28) | 448 (6.0) | 7 (1.6) | 1.28 (0.51 to 3.19) |
| 7 yearsb | 229 (3.2) | 29 (12.7) | 2.37 (1.49 to 3.77) | 236 (3.2) | 7 (3.0) | 2.46 (0.98 to 6.17) |
| 8 yearsb | 161 (2.2) | 18 (11.2) | 2.06 (1.19 to 3.57) | 178 (2.4) | 17 (9.6) | 8.51 (4.11 to 17.59) |
| 9 yearsb | 118 (1.6) | 22 (18.6) | 3.75 (2.21 to 6.35) | 124 (1.7) | 6 (4.8) | 4.10 (1.55 to 10.86) |
| ≥ 9.5 years | 201 (2.8) | 28 (13.9) | 2.65 (1.65 to 4.24) | 221 (3.0) | 20 (9.0) | 8.02 (3.98 to 16.13) |
| Intermediate-risk group | ||||||
| Total | 7273 (100) | 720 (9.9) | 7408 (100) | 135 (1.8) | ||
| < 18 months | 1950 (26.8) | 153 (7.8) | 1 | 1975 (26.7) | 25 (1.3) | 1 |
| 2 yearsb | 1211 (16.7) | 106 (8.8) | 1.13 (0.87 to 1.46) | 1234 (16.7) | 23 (1.9) | 1.48 (0.84 to 2.62) |
| 3 yearsb | 2216 (30.5) | 204 (9.2) | 1.19 (0.96 to 1.48) | 2232 (30.1) | 16 (0.7) | 0.56 (0.30 to 1.06) |
| 4 yearsb | 680 (9.3) | 72 (10.6) | 1.39 (1.04 to 1.87) | 698 (9.4) | 18 (2.6) | 2.06 (1.12 to 3.81) |
| 5 yearsb | 554 (7.6) | 75 (13.5) | 1.84 (1.37 to 2.47) | 567 (7.7) | 13 (2.3) | 1.83 (0.93 to 3.60) |
| 6 yearsb | 285 (3.9) | 38 (13.3) | 1.81 (1.24 to 2.64) | 294 (4.0) | 9 (3.1) | 2.46 (1.14 to 5.33) |
| 7 yearsb | 123 (1.7) | 25 (20.3) | 3.00 (1.87 to 4.79) | 125 (1.7) | 2 (1.6) | 1.27 (0.30 to 5.42) |
| 8 yearsb | 100 (1.4) | 19 (19.0) | 2.76 (1.63 to 4.66) | 106 (1.4) | 6 (5.7) | 4.68 (1.88 to 11.67) |
| 9 yearsb | 62 (0.9) | 7 (11.3) | 1.49 (0.67 to 3.34) | 68 (0.9) | 6 (8.8) | 7.55 (2.99 to 19.06) |
| ≥ 9.5 years | 92 (1.3) | 21 (22.8) | 3.47 (2.08 to 5.81) | 109 (1.5) | 17 (15.6) | 14.41 (7.52 to 27.63) |
| High-risk group | ||||||
| Total | 1842 (100) | 286 (15.5) | 1886 (100) | 44 (2.3) | ||
| < 15 months | 735 (39.9) | 110 (15.0) | 1 | 742 (39.3) | 7 (0.9) | 1 |
| 1.5 yearsc | 287 (15.6) | 35 (12.2) | 0.79 (0.53 to 1.19) | 288 (15.3) | 1 (0.3) | 0.37 (0.04 to 2.99) |
| 2 yearsc | 170 (9.2) | 19 (11.2) | 0.71 (0.43 to 1.20) | 176 (9.3) | 6 (3.4) | 3.71 (1.23 to 11.17) |
| 2.5 yearsc | 85 (4.6) | 17 (20.0) | 1.42 (0.80 to 2.51) | 87 (4.6) | 2 (2.3) | 2.47 (0.51 to 12.08) |
| 3 yearsc | 246 (13.4) | 45 (18.3) | 1.27 (0.87 to 1.86) | 250 (13.3) | 4 (1.6) | 1.71 (0.50 to 5.88) |
| 3.5 yearsc | 100 (5.4) | 14 (14.0) | 0.92 (0.51 to 1.69) | 103 (5.5) | 3 (2.9) | 3.15 (0.80 to 12.38) |
| 4 yearsc | 47 (2.6) | 11 (23.4) | 1.74 (0.86 to 3.51) | 50 (2.7) | 3 (6.0) | 6.70 (1.68 to 26.75) |
| 4.5 yearsc | 27 (1.5) | 6 (22.2) | 1.62 (0.64 to 4.11) | 32 (1.7) | 5 (15.6) | 19.44 (5.80 to 65.22) |
| 5 yearsc | 47 (2.6) | 8 (17.0) | 1.17 (0.53 to 2.56) | 48 (2.5) | 1 (2.1) | 2.23 (0.27 to 18.54) |
| ≥ 5.25 years | 98 (5.3) | 21 (21.4) | 1.55 (0.92 to 2.62) | 110 (5.8) | 12 (10.9) | 12.86 (4.94 to 33.43) |
The numbers of patients with a surveillance visit in Table 10 are larger than the numbers of patients counted as having surveillance in our analyses of long-term CRC incidence (shown in Tables 1–9). This is because of the censoring of follow-up after first surveillance in some patients (reasons for which are outlined below).
In the low-risk group, 143 patients were diagnosed with CRC at first surveillance, 69 patients were diagnosed with colitis, IBD, hyperplastic polyposis, proctitis or volvulus, or had a bowel resection performed at first surveillance, and one patient’s last examination in first surveillance occurred after the date of final censoring.
Among intermediate-risk patients, 163 patients were diagnosed with CRC at first surveillance (28 CRCs were excluded from analysis as they were assumed to have developed from incompletely resected baseline lesions), 74 patients were diagnosed with colitis, IBD, hyperplastic polyposis, proctitis or volvulus, or had a bowel resection performed at first surveillance, one patient’s last examination in first surveillance occurred after the date of final censoring, and one patient had no further surveillance and could not be traced in national data sources.
In the high-risk group, 54 patients were diagnosed with CRC at first surveillance (10 CRCs were excluded from analysis as they were assumed to have developed from incompletely resected baseline lesions), 23 patients were diagnosed with colitis, IBD, hyperplastic polyposis, proctitis or volvulus, or had a bowel resection performed at first surveillance, and one patient had no further surveillance and could not be traced in national data sources.
For our analyses of long-term CRC incidence we compared baseline characteristics among patients with and without surveillance (see Tables 1–3). We repeated this comparison for patients included in our analyses of findings at first surveillance and found very similar results (data not shown).
Detection rates of advanced adenomas and colorectal cancer at first surveillance, considering all possible surveillance intervals
The low-risk group
In the low-risk group, AA detection rates were approximately 6% with intervals of < 18 months, 2 and 3 years, increasing to 8–9% with intervals of 4, 5 and 6 years. There was a jump in AA detection rates to 13% with an interval of 7 years and then again to 19% with an interval of 9 years. Detection rates of CRC fell between 1% and 2% with intervals of < 18 months through to 6 years, increasing to 3% with an interval of 7 years and to 10% with an interval of 8 years. When we applied our chosen cut-off point for interval length (i.e. 8.5 years), we captured 117 of 143 (82%) CRCs diagnosed among low-risk patients recorded as having had a ‘surveillance examination’ (see Table 10).
The intermediate-risk group
In the intermediate-risk group, AA detection rates were 8–9% with intervals of < 18 months through to 3 years, increasing to 11% with an interval of 4 years and to approximately 13% with intervals of 5 and 6 years. There was a jump in AA detection rates to 20% with an interval of 7 years. For CRC, detection rates were approximately 1–2% with intervals of < 18 months, 2 and 3 years, increasing to 3% with an interval of 4 years. There was a jump in CRC detection rates to 6% with an interval of 8 years. When we applied our selected interval length cut-off point (i.e. 6.5 years), we captured 104 of 135 (77%) CRCs diagnosed among intermediate-risk patients recorded as having had a ‘surveillance examination’ (see Table 10).
The high-risk group
In the high-risk group, AA detection rates varied between 11% and 23% at all interval lengths, with no discernible pattern. Detection rates of CRC increased from < 0.5% with an interval of 18 months to approximately 3% with an interval of 2 years. There was a jump in CRC detection rates to 6% with an interval of 4 years and a further jump to 16% with an interval of 4.5 years. When we applied our selected interval length cut-off point (i.e. 3.75 years), we captured 23 of 44 (52%) CRCs diagnosed among high-risk patients recorded as having had a ‘surveillance examination’ (see Table 10).
Detection rates of advanced adenomas and colorectal cancer at first surveillance, applying our surveillance interval length cut-off points
For our main analyses of findings at first surveillance we excluded patients whose first surveillance examination was performed after our selected interval length cut-off points (i.e. 8.5 years for the low-risk group, 6.5 years for the intermediate-risk group and 3.75 years for the high-risk group). We examined the effect of interval length on AA and CRC detection rates at first surveillance in the risk groups overall and by risk subgroup.
The low-risk group
Among low-risk patients, AAs were detected in 496 (7.1%) individuals at the first surveillance visit. There was a significant increasing trend in the detection rate of AAs at first surveillance with increasing interval length. Compared with an interval of < 18 months, detection rates of AAs at first surveillance were similar with an interval of 2 and 3 years (i.e. 6%), but increased with an interval of ≥ 4 years (i.e. ≥ 8%). AA detection rates remained similar with intervals of 5 and 6 years, but increased again with an interval of 7 years to approximately twice that of the three shortest intervals (Table 11).
| Interval length to first surveillance | AAsa | CRC | ||||||
|---|---|---|---|---|---|---|---|---|
| Patients attending one or more surveillance visits | Detection rate | Patients attending one or more surveillance visits | Detection rate | |||||
| n | % | n | % | n | % | n | % | |
| < 18 months | 1128 | 16.2 | 65 | 5.8 | 1142 | 16.2 | 14 | 1.2 |
| 2 yearsb | 1094 | 15.8 | 63 | 5.8 | 1115 | 15.8 | 21 | 1.9 |
| 3 yearsb | 1870 | 26.9 | 113 | 6.0 | 1893 | 26.8 | 23 | 1.2 |
| 4 yearsb | 925 | 13.3 | 75 | 8.1 | 940 | 13.3 | 15 | 1.6 |
| 5 yearsb | 1097 | 15.8 | 96 | 8.8 | 1110 | 15.7 | 13 | 1.2 |
| 6 yearsb | 441 | 6.3 | 37 | 8.4 | 448 | 6.3 | 7 | 1.6 |
| 7 yearsb | 229 | 3.3 | 29 | 12.7 | 236 | 3.3 | 7 | 3.0 |
| 8 yearsb | 161 | 2.3 | 18 | 11.2 | 178 | 2.5 | 17 | 9.6 |
| Total | 6945 | 100 | 496 | 7.1 | 7062 | 100 | 117 | 1.7 |
| p-valuec | < 0.0001 | < 0.0001 | ||||||
Among low-risk patients, 117 (1.7%) had CRC detected at first surveillance. There was a significant trend of increasing rates of detection of CRC at first surveillance with increasing interval length. The CRC detection rate was similar with interval lengths of < 18 months (1.2%) through to 6 years (1.6%), but increased with an interval of 7 years (3.0%) and was substantially higher with an interval of 8 years (9.6%) (see Table 11).
Findings at first surveillance by risk subgroup
We then examined findings at first surveillance by interval length in the lower- and higher-risk subgroups of low-risk patients. There was a significant trend of increased AA and CRC detection at first surveillance with longer interval lengths in both risk subgroups. In the lower-risk subgroup, AA detection rates increased from 3% with an interval of < 18 months through to 7% with intervals of 4 and 5 years and jumping to 11% with an interval of 6 years. In the higher-risk subgroup, AA detection rates started at a higher rate of 7% with an interval of < 18 months, increasing to approximately 9–10% with intervals of 4 and 5 years and jumping to 15% with an interval of 7 years. Comparing the detection rates of AAs in the higher- and lower-risk subgroups, the OR was 1.47 (95% CI 1.20 to 1.81) (Table 12).
| Interval length to first surveillance | AAsa | CRC | ||||||||||||||
|---|---|---|---|---|---|---|---|---|---|---|---|---|---|---|---|---|
| Lower-risk subgroupb | Higher-risk subgroupb | Lower-risk subgroupb | Higher-risk subgroupb | |||||||||||||
| Patients attending one or more surveillance visits | Detection rate | Patients attending one or more surveillance visits | Detection rate | Patients attending one or more surveillance visits | Detection rate | Patients attending one or more surveillance visits | Detection rate | |||||||||
| n | % | n | % | n | % | n | % | n | % | n | % | n | % | n | % | |
| < 18 months | 326 | 14.0 | 9 | 2.8 | 802 | 17.4 | 56 | 7.0 | 328 | 13.9 | 2 | 0.6 | 814 | 17.3 | 12 | 1.5 |
| 2 yearsc | 369 | 15.9 | 13 | 3.5 | 725 | 15.7 | 50 | 6.9 | 372 | 15.8 | 3 | 0.8 | 743 | 15.8 | 18 | 2.4 |
| 3 yearsc | 588 | 25.3 | 28 | 4.8 | 1282 | 27.8 | 85 | 6.6 | 590 | 25.1 | 2 | 0.3 | 1303 | 27.7 | 21 | 1.6 |
| 4 yearsc | 309 | 13.3 | 22 | 7.1 | 616 | 13.3 | 53 | 8.6 | 313 | 13.3 | 4 | 1.3 | 627 | 13.3 | 11 | 1.8 |
| 5 yearsc | 430 | 18.5 | 28 | 6.5 | 667 | 14.4 | 68 | 10.2 | 435 | 18.5 | 5 | 1.1 | 675 | 14.3 | 8 | 1.2 |
| 6 yearsc | 162 | 7.0 | 17 | 10.5 | 279 | 6.0 | 20 | 7.2 | 165 | 7.0 | 3 | 1.8 | 283 | 6.0 | 4 | 1.4 |
| 7 yearsc | 86 | 3.7 | 8 | 9.3 | 143 | 3.1 | 21 | 14.7 | 86 | 3.7 | 0 | 0.0 | 150 | 3.2 | 7 | 4.7 |
| 8 yearsc | 57 | 2.4 | 4 | 7.0 | 104 | 2.3 | 14 | 13.5 | 65 | 2.8 | 8 | 12.3 | 113 | 2.4 | 9 | 8.0 |
| Total | 2327 | 100 | 129 | 5.5 | 4618 | 100 | 367 | 7.9 | 2354 | 100 | 27 | 1.1 | 4708 | 100 | 90 | 1.9 |
| p-valued | < 0.0001 | 0.0002 | < 0.0001 | 0.0181 | ||||||||||||
| OR (95% CI) for higher vs. lower risk; p-valuee | 1.47 (1.20 to 1.81); 0.0002 | 1.68 (1.09 to 2.59); 0.014 | ||||||||||||||
In the lower-risk subgroup, CRC detection rates were approximately 1% with intervals of < 18 months through to 5 years, increasing to 2% with an interval of 6 years and jumping to 12% with an interval of 8 years. In the higher-risk subgroup, CRC detection rates varied between 1% and 2% with intervals of < 18 months through to 6 years, increasing to 5% with an interval of 7 years and 8% with an interval of 8 years. The OR for the comparison of CRC detection rates in the higher- and lower-risk subgroups was 1.68 (95% CI 1.09 to 2.59) (see Table 12).
The intermediate-risk group
Among intermediate-risk patients, AAs were detected in 648 (9.4%) patients at first surveillance. A significant trend of increasing AA detection rate at first surveillance was seen with increasing interval length. Compared with an interval of < 18 months, the detection rates of AAs at first surveillance were similar with intervals of 2 and 3 years (9%), but increased to 11% with an interval of 4 years and to > 13% for an interval of 5 or 6 years (Table 13).
| Interval length to first surveillance | AAsa | CRC | ||||||
|---|---|---|---|---|---|---|---|---|
| Patients attending one or more surveillance visits | Detection rate | Patients attending one or more surveillance visits | Detection rate | |||||
| n | % | n | % | n | % | n | % | |
| < 18 months | 1950 | 28.3 | 153 | 7.8 | 1975 | 28.2 | 25 | 1.3 |
| 2 yearsb | 1211 | 17.6 | 106 | 8.8 | 1234 | 17.6 | 23 | 1.9 |
| 3 yearsb | 2216 | 32.1 | 204 | 9.2 | 2232 | 31.9 | 16 | 0.7 |
| 4 yearsb | 680 | 9.9 | 72 | 10.6 | 698 | 10.0 | 18 | 2.6 |
| 5 yearsb | 554 | 8.0 | 75 | 13.5 | 567 | 8.1 | 13 | 2.3 |
| 6 yearsb | 285 | 4.1 | 38 | 13.3 | 294 | 4.2 | 9 | 3.1 |
| Total | 6896 | 100 | 648 | 9.4 | 7000 | 100 | 104 | 1.5 |
| p-valuec | < 0.0001 | 0.015 | ||||||
Among intermediate-risk patients, 104 (1.5%) patients had CRC detected at first surveillance. A significant trend of increasing detection rate of CRC at first surveillance was seen with increasing interval length. Compared with an interval of < 18 months, detection rates of CRC at first surveillance were similar with an interval of 2 or 3 years, but were two times greater with an interval of 4 years (see Table 13).
Findings at first surveillance by risk subgroup
We observed a significant trend of increased AA detection at first surveillance with increasing interval length within the lower-risk and higher-risk subgroups of intermediate-risk patients. Among lower-risk patients, AA detection rates were approximately 6–7% with intervals of < 18 months through to 3 years, increasing to 11% with an interval of 4 years. Among higher-risk patients, AA detection rates varied between 9% and 11% with intervals of < 18 months through to 4 years, increasing to approximately 18% with an interval of 5 years. The OR for the comparison of AA detection rates in the higher- and lower-risk subgroups was 1.58 (95% CI 1.33 to 1.89) (Table 14).
| Interval length to first surveillance | AAsa | CRC | ||||||||||||||
|---|---|---|---|---|---|---|---|---|---|---|---|---|---|---|---|---|
| Lower-risk subgroupb | Higher-risk subgroupb | Lower-risk subgroupb | Higher-risk subgroupb | |||||||||||||
| Patients attending one or more surveillance visits | Detection rate | Patients attending one or more surveillance visits | Detection rate | Patients attending one or more surveillance visits | Detection rate | Patients attending one or more surveillance visits | Detection rate | |||||||||
| n | % | n | % | n | % | n | % | n | % | n | % | n | % | n | % | |
| < 18 months | 642 | 24.0 | 35 | 5.5 | 1308 | 31.0 | 118 | 9.0 | 645 | 23.9 | 3 | 0.5 | 1330 | 30.9 | 22 | 1.7 |
| 2 yearsc | 399 | 14.9 | 24 | 6.0 | 812 | 19.3 | 82 | 10.1 | 407 | 15.1 | 8 | 2.0 | 827 | 19.2 | 15 | 1.8 |
| 3 yearsc | 1024 | 38.2 | 68 | 6.6 | 1192 | 28.3 | 136 | 11.4 | 1029 | 38.1 | 5 | 0.5 | 1203 | 28.0 | 11 | 0.9 |
| 4 yearsc | 255 | 9.5 | 29 | 11.4 | 425 | 10.1 | 43 | 10.1 | 256 | 9.5 | 1 | 0.4 | 442 | 10.3 | 17 | 3.8 |
| 5 yearsc | 241 | 9.0 | 20 | 8.3 | 313 | 7.4 | 55 | 17.6 | 247 | 9.1 | 6 | 2.4 | 320 | 7.4 | 7 | 2.2 |
| 6 yearsc | 117 | 4.4 | 15 | 12.8 | 168 | 4.0 | 23 | 13.7 | 118 | 4.4 | 1 | 0.8 | 176 | 4.1 | 8 | 4.5 |
| Total | 2678 | 100 | 191 | 7.1 | 4218 | 100 | 457 | 10.8 | 2702 | 100 | 24 | 0.9 | 4298 | 100 | 80 | 1.9 |
| p-valued | 0.0007 | 0.0002 | 0.28 | 0.014 | ||||||||||||
| OR (95% CI) for higher vs. lower risk; p-valuee | 1.58 (1.33 to 1.89); < 0.0001 | 2.12 (1.34 to 3.35); 0.0007 | ||||||||||||||
In the lower-risk subgroup, we did not observe a significant trend in CRC detection rates at first surveillance by interval length. The detection rates were between 0.5% and 2.4%. By comparison, in the higher-risk subgroup there was a significant increasing trend in CRC detection rates at first surveillance with increasing interval length. Detection rates were approximately 1–2% with intervals of < 18 months through to 3 years, increasing to 4% with an interval of 4 years. The OR for the comparison of CRC detection rates in the higher- and lower-risk subgroups was 2.12 (95% CI 1.34 to 3.35) (see Table 14).
The high-risk group
Among high-risk patients, AAs were detected at first surveillance in 240 (14.8%) and CRC was detected in 23 (1.4%). We did not detect a significant trend in AA detection rates at first surveillance with changing interval length. The AA detection rates were > 11% for all intervals. There was a significant trend in CRC detection rates with increasing interval length, with an increased detection of CRC with an interval of 2 years compared with an interval of < 15 months (Table 15). However, there were fewer than 10 CRC cases in each interval length category.
| Interval length to first surveillance | AAsa | CRC | ||||||
|---|---|---|---|---|---|---|---|---|
| Patients attending one or more surveillance visits | Detection rate | Patients attending one or more surveillance visits | Detection rate | |||||
| n | % | n | % | n | % | n | % | |
| < 15 months | 735 | 45.3 | 110 | 15.0 | 742 | 45.1 | 7 | 0.9 |
| 1.5 yearsb | 287 | 17.7 | 35 | 12.2 | 288 | 17.5 | 1 | 0.3 |
| 2 yearsb | 170 | 10.5 | 19 | 11.2 | 176 | 10.7 | 6 | 3.4 |
| 2.5 yearsb | 85 | 5.2 | 17 | 20.0 | 87 | 5.3 | 2 | 2.3 |
| 3 yearsb | 246 | 15.2 | 45 | 18.3 | 250 | 15.2 | 4 | 1.6 |
| 3.5 yearsb | 100 | 6.2 | 14 | 14.0 | 103 | 6.3 | 3 | 2.9 |
| Total | 1623 | 100 | 240 | 14.8 | 1646 | 100 | 23 | 1.4 |
| p-valuec | 0.32 | 0.0460 | ||||||
Findings at first surveillance by risk subgroup
In both risk subgroups of high-risk patients, AA detection rates at first surveillance varied between 10% and 21%, although there was no discernible trend with interval length. For CRC, detection rates at first surveillance in the lower-risk subgroup were between 0% and 3% and we did not detect a trend with interval length. In the higher-risk subgroup there was a significant trend in CRC detection rates with interval length, although the pattern was not linear as CRC detection rates increased from 2% with an interval of < 15 months to 4% with an interval of 2 years and 5% with an interval of 3 years (Table 16). Although statistical power was limited, the OR for the comparison of CRC detection rates in the higher- and lower-risk subgroups was 3.09 (95% CI 1.33 to 7.19).
| Interval length to first surveillance | AAsa | CRC | ||||||||||||||
|---|---|---|---|---|---|---|---|---|---|---|---|---|---|---|---|---|
| Lower-risk subgroupb | Higher-risk subgroupb | Lower-risk subgroupb | Higher-risk subgroupb | |||||||||||||
| Patients attending one or more surveillance visits | Detection rate | Patients attending one or more surveillance visits | Detection rate | Patients attending one or more surveillance visits | Detection rate | Patients attending one or more surveillance visits | Detection rate | |||||||||
| n | % | n | % | n | % | n | % | n | % | n | % | n | % | n | % | |
| < 15 months | 513 | 47.5 | 76 | 14.8 | 222 | 40.9 | 34 | 15.3 | 516 | 47.4 | 3 | 0.6 | 226 | 40.6 | 4 | 1.8 |
| 1.5 yearsc | 161 | 14.9 | 23 | 14.3 | 126 | 23.2 | 12 | 9.5 | 161 | 14.8 | 0 | 0.0 | 127 | 22.8 | 1 | 0.8 |
| 2 yearsc | 104 | 9.6 | 11 | 10.6 | 66 | 12.2 | 8 | 12.1 | 107 | 9.8 | 3 | 2.8 | 69 | 12.4 | 3 | 4.3 |
| 2.5 yearsc | 47 | 4.4 | 9 | 19.1 | 38 | 7.0 | 8 | 21.1 | 48 | 4.4 | 1 | 2.1 | 39 | 7.0 | 1 | 2.6 |
| 3 yearsc | 184 | 17.0 | 35 | 19.0 | 62 | 11.4 | 10 | 16.1 | 185 | 17.0 | 1 | 0.5 | 65 | 11.7 | 3 | 4.6 |
| 3.5 yearsc | 71 | 6.6 | 9 | 12.7 | 29 | 5.3 | 5 | 17.2 | 72 | 6.6 | 1 | 1.4 | 31 | 5.6 | 2 | 6.5 |
| Total | 1080 | 100 | 163 | 15.1 | 543 | 100 | 77 | 14.2 | 1089 | 100 | 9 | 0.8 | 557 | 100 | 14 | 2.5 |
| p-valued | 0.46 | 0.51 | 0.38 | 0.043 | ||||||||||||
| OR (95% CI) for higher vs. lower risk; p-valuee | 0.93 (0.69 to 1.25); 0.62 | 3.09 (1.33 to 7.19); 0.0077 | ||||||||||||||
Sensitivity analyses
Patients without a complete baseline colonoscopy
Our first sensitivity analysis involved the exclusion of patients who did not have a complete baseline colonoscopy (low-risk group, n = 2682; intermediate-risk group, n = 2885; high-risk group, n = 365). This had little effect on the results for the long-term CRC incidence analyses (see Appendix 2, Tables 28–32), although adenoma histology, adenoma dysplasia and age were no longer independently associated with CRC incidence in the low-, intermediate- and high-risk groups, respectively (see Appendix 2, Tables 28–30).
We also performed this sensitivity analysis for the detection rates of AAs and CRC at first surveillance by interval length and risk subgroup (see Appendix 2, Table 33) and the results were similar to those of the main analysis. A minor difference was that in the high-risk group there was no longer a significant trend of increasing CRC detection with increasing interval in the higher-risk subgroup, nor a significant difference in the odds of CRC detection between the two risk subgroups. However, the number of CRC cases in the high-risk group was low in this analysis.
Incompletely resected baseline lesions
We also performed a sensitivity analysis of the criteria used to decide whether or not a CRC had arisen from an incompletely resected baseline lesion, which we excluded from analyses. In the main analysis we excluded cancers that were found in the same or adjacent colonic segment to a baseline adenoma that was ≥ 15 mm in size and seen on two or more occasions within 5 years before cancer diagnosis (low-risk group, n = 0; intermediate-risk group, n = 38; high-risk group, n = 12). In the sensitivity analysis we excluded some additional cancers that met some but not all the criteria above, but that we thought were likely to have arisen from an incompletely resected baseline lesion (low-risk group, n = 6; intermediate-risk group, n = 29; high-risk group, n = 7).
These additional exclusions did not materially alter the results (see Appendix 2, Tables 34–37). In the analyses of long-term CRC incidence by baseline characteristics there were slight changes to the associated p-values for some variables, such that they crossed to the opposite side of the 0.05 significance threshold, although the HR point estimates did not change substantially (see Appendix 2, Tables 34–36). In the intermediate-risk group there were changes in significance for sex, year of baseline visit and length of baseline visit, although no such changes were seen for any of the variables used to classify the risk subgroups.
In addition, in all three risk groups the estimates for the comparison of CRC incidence in the presence and absence of surveillance were similar in the sensitivity analysis and the main analysis (see Appendix 2, Tables 34–36). We also observed little change in results when we performed this sensitivity analysis for the detection rates of AAs and CRC at first surveillance by interval and risk subgroup (see Appendix 2, Table 37).
Higher-risk classification criteria for the intermediate-risk group
In our sensitivity analysis of the risk classification criteria for intermediate-risk patients we additionally included poor bowel preparation and adenomas ≥ 20 mm in size in the classification of higher risk. As a result, the proportion of patients classified as higher risk increased from 60% to 74% in our analyses of long-term CRC incidence. This did not have much impact on CRC incidence rates, estimates for the comparison of CRC incidence in the presence and absence of surveillance or SIRs (see Appendix 2, Tables 38 and 39). In our analyses of findings at first surveillance the proportion of patients classified as higher risk increased from 61% to 76% and results by interval length within each risk subgroup were not materially altered (see Appendix 2, Table 40).
Surveillance interval length cut-off point for the low-risk group
In a fourth sensitivity analysis we changed our interval length cut-off point for the low-risk group from 8.5 years to 6.5 years. With this change in cut-off point there was still a significant trend of increasing detection of AAs at first surveillance with increasing interval length in both risk subgroups. Detection rates of AAs and CRC were also still significantly higher in the higher-risk subgroup than in the lower-risk subgroup. However, there was no longer a significant trend in CRC detection rates with interval length in either risk subgroup (see Appendix 2, Table 41).
Hospital attended
For our final sensitivity analysis we also considered the hospital that patients attended as a potential confounding variable. In the analyses of long-term CRC incidence the hospital attended was independently associated with incidence rates in the low- and intermediate-risk groups, but not in the high-risk group. When we additionally adjusted for hospital the multivariable HRs for the other variables changed very little, although adenoma histology was no longer significant in the low-risk group (see Appendix 2, Table 42).
Chapter 4 Economic evaluation assessing the cost-effectiveness of surveillance
Background and aims
Colorectal cancer costs the NHS > £1B each year. 41 Preventing or diagnosing this cancer earlier will reduce the costs associated with treatment and complications. Since the introduction of the national BCSP in 2006 there has been a marked increase in demand for NHS endoscopy services. Surveillance colonoscopies constitute a sizeable proportion of all colonoscopies carried out in the NHS. A national colonoscopy audit from 2011 estimated that surveillance colonoscopies accounted for approximately 20% of all colonoscopies performed in the UK over a 2-week period. 21 Therefore, the implications of changing surveillance for NHS resource use and costs are likely to be substantial.
The aim of this economic evaluation was to undertake a costing and cost-effectiveness analysis, comparing costs and outcomes of patients who underwent surveillance colonoscopy following baseline colonoscopy with those who did not. We follow the clinical analysis presented in this report by comparing a strategy of surveillance with no surveillance within the three main risk groups defined in the 2002 UK-ASG,7 each of which we additionally stratified into lower- and higher-risk subgroups on the basis of baseline CRC risk factors (as described in Chapter 3). However, unlike the clinical analysis, we make no comparison with the general population. (For an economic analysis this would require detailed information on resource use, as well as incidence rates of CRC.)
Methods
Form of evaluation
The economic analysis consists of both a within-study analysis using individual patient-level data recorded on the study database and a lifetime analysis using a Markov model. The study database provided resource use information on the number and type of colonic examinations. Both analyses included all 28,972 patients included in the clinical analysis (i.e. 14,401 low-risk patients, 11,852 intermediate-risk patients and 2719 high-risk patients).
For the within-study analysis an annual rate of total cost per person-year was calculated for each risk subgroup across a median follow-up of 9.3 years. As the study database did not include any information on QoL, it was not possible to estimate QALYs directly from the study data. The within-study analysis used the diagnosis of CRC as the main outcome measure, with cost-effectiveness expressed in terms of the incremental cost per CRC prevented.
An extrapolation model was then used to estimate the cost-effectiveness of each surveillance strategy over the lifetime of the cohort. Surveillance costs and transition probabilities for each risk subgroup were estimated using patient-level data on the study database. For this analysis to measure outcomes using QALYs, QoL data were obtained from the PHE PROMs survey of CRC patients known to the National Cancer Registration and Analysis Service37 and combined with survival data from the Northern and Yorkshire Cancer Registry and Information Service. 42
Estimation of costs
Table 17 shows the unit costs used in our analyses and the sources of these costs. Costs were applied to the resource use associated with both adenoma surveillance and cancer treatment. The analysis was undertaken from the perspective of the NHS, with costs reported in GBP using 2017/18 prices. Unit costs for surveillance procedures were taken from the NHS national schedule of reference costs for 2017–18. 33 Estimates for the lifetime cost of CRC treatment were taken from published estimates from a whole disease model of CRC. 44 These costs were inflated from 2012/13 prices to 2017/18 prices using the gross domestic product deflator.
| Resource category | Unit cost (2017/18 GBP/£) | Source |
|---|---|---|
| Diagnostic colonoscopy | 525 | NHS reference costs 2017/1833 |
| Colonoscopy with polypectomy | 641 | NHS reference costs 2017/1833 |
| Diagnostic flexible sigmoidoscopy | 402 | NHS reference costs 2017/1833 |
| Flexible sigmoidoscopy with polypectomy | 512 | NHS reference costs 2017/1833 |
| Rigid sigmoidoscopy (diagnostic or therapeutic) | 730 | NHS reference costs 2017/1833 |
| Pathology cost for adenoma | 84 | Murphy et al.43 Inflated to 2017/18 prices using GDP deflator |
| Pathology cost for CRC | 84 | Murphy et al.43 Inflated to 2017/18 prices using GDP deflator |
| CRC treatment | ||
| Lifetime cost by age (years) (Dukes’ stage A) | Whyte et al.44 Estimated using a whole disease model of CRC. Inflated to 2017/18 prices using GDP deflator | |
| 40–49 | 9085 | |
| 50–59 | 5928 | |
| 60–69 | 4798 | |
| 70–79 | 3298 | |
| 80–100 | 1432 | |
| Lifetime cost by age (years) (Dukes’ stage B) | ||
| 40–49 | 9071 | |
| 50–59 | 7281 | |
| 60–69 | 5554 | |
| 70–79 | 3585 | |
| 80–100 | 1604 | |
| Lifetime cost by age (years) (Dukes’ stage C) | ||
| 40–49 | 15,038 | |
| 50–59 | 10,058 | |
| 60–69 | 7534 | |
| 70–79 | 4655 | |
| 80–100 | 1620 | |
| Lifetime cost by age (years) (Dukes’ stage D) | ||
| 40–49 | 12,148 | |
| 50–59 | 8763 | |
| 60–69 | 6755 | |
| 70–79 | 4530 | |
| 80–100 | 837 | |
The definition of surveillance visits used in previous chapters is maintained in this chapter. Visits were costed by applying unit costs to each colonic examination. Costs were different for colonoscopies, flexible sigmoidoscopies and rigid sigmoidoscopies, and varied depending on whether the examination was diagnostic or therapeutic. The distinction between a diagnostic and a therapeutic examination was made using data on whether or not a polyp was removed or whether there was an associated biopsy or pathology report.
Within-study analysis
The within-study analysis compared patients who underwent surveillance with those who did not for each of the six risk subgroups (i.e. for the lower- and higher-risk subgroups within each of the low-, intermediate- and high-risk groups). Cost-effectiveness was measured in terms of the incremental cost per CRC prevented by adopting surveillance compared with no surveillance. This follows the approach of a recent cost-effectiveness study of post-polypectomy surveillance. 45
Total annual costs and CRC incidence rates were calculated for each of the three main risk groups and for the lower- and higher-risk subgroups within each risk group. Poisson models were used to estimate annual CRC incidence rates for each risk group across varying exposure time. Differences in CRC incidence rates were compared using the Wald test, with SEs being combined using the delta method. We calculated ICERs as the ratio between the difference in costs and the difference in CRC incidence rates.
Missing data were infrequent in the data set, with the exception of CRC staging information, which was missing for 32% of CRC cases. Logit models indicated that these missing data were significantly positively associated with age at baseline and negatively associated with the date of the surveillance visit (data not shown). Missing CRC staging data were handled by means of multiple imputation using an ordered logit model. The procedure was repeated to produce 40 imputed data sets, with Rubin’s rule used to summarise across imputations. 46 In the main analysis, total costs were then estimated based on the imputed data. Ten patients in the data were untraceable. These patients were treated as having had no surveillance visits and having not developed CRC. Both costs and number of CRC cases were discounted at a rate of 3.5% per year. The analysis was conducted in Stata®/SE 14 (StataCorp LP, College Station, TX, USA).
Extrapolation model
We designed a multistate Markov model to extrapolate the results from the within-study analysis over a lifetime horizon. Figure 5 shows the structure of the model. The model consisted of eight states: (1) no surveillance visits, (2) a positive count of surveillance visits, (3) Dukes’ stage A CRC, (4) Dukes’ stage B CRC, (5) Dukes’ stage C CRC, (6) Dukes’ stage D CRC, (7) death from CRC and (8) death from other causes. Time-homogeneous transition probabilities were estimated for each of the three main risk groups using state and time data from the main study database and using the msm package in R (The R Foundation for Statistical Computing, Vienna, Austria). SEs for each set of transition probabilities were calculated using an assumed multivariate normal distribution of the maximum likelihood estimates and covariance matrix.
FIGURE 5.
Markov model for our lifetime economic analysis.
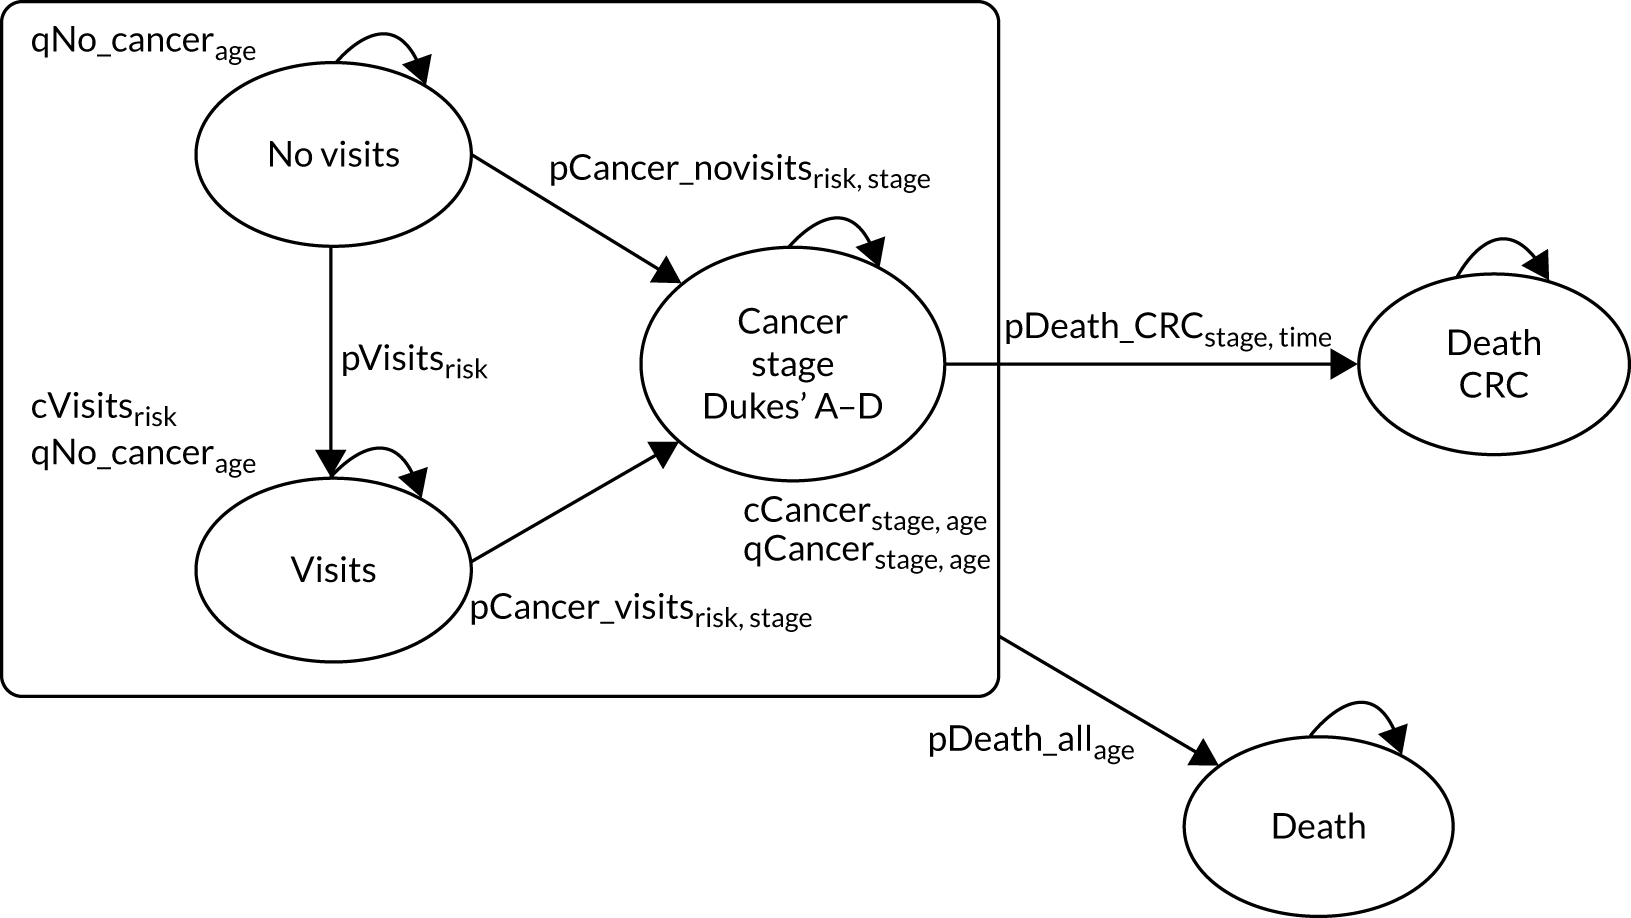
All patients begin the model in the ‘no visits’ state, having attended a baseline colonoscopy but having had no surveillance visits. In each cycle patients have a probability of attending a surveillance visit that is dependent on which risk group they are in. The patients also face a probability of developing CRC and having it diagnosed at Dukes’ stage A, B, C or D. A transition to the ‘visits’ state reduces the patient’s risk of CRC and this benefit is assumed to last for the remaining length of the model. The transition probabilities between the ‘no visits’ state and the ‘visits’ state, as well as the transitions to each of the cancer states, were estimated separately for each risk group.
The numbers of surveillance visits and intervals between them as observed within each risk subgroup in the study data were used to estimate a constant annual probability for each subgroup. The model does not explicitly model the impact of the number of surveillance visits as the surveillance strategies being compared are defined in terms of whether or not surveillance occurred. However, the impact of the number of surveillance visits on CRC cases diagnosed is captured in the probability of transitioning from the ‘visits’ state to each of the four cancer states.
Missing CRC staging data were handled using the imputed data from the within-study analysis. Transition probabilities were calculated for each of the 40 imputed data sets, with SEs estimated by combining the estimates using Rubin’s rule. 46 The sensitivity of the results to the use of the imputed CRC data were assessed by collapsing the model to a single cancer state for each of the risk subgroups.
A full set of transition probabilities and SEs could not be estimated for the higher-risk subgroup of the high-risk group because of a failure of model convergence. Therefore, a simplified version of the model was used for this group, in which the four cancer states were collapsed to a single state. QoL estimates, CRC treatment costs and CRC survival rates, which are separately estimated for each cancer state, were collapsed to mean values for this subgroup.
The probability of death from any cause, QoL estimates and costs associated with CRC are dependent on the age of the cohort. These parameters required an initial age to be specified for the model. The initial age used for the base-case analysis was 60 years, as this was the mean age of patients in the hospital cohort.
The main clinical study was not powered to identify differences in CRC-related mortality by stage and there were relatively few CRC deaths in each category when stratifying by stage, which would make extrapolation based on these data unreliable. Therefore, the probabilities of survival of CRC were sourced from the 2013 National Bowel Cancer Audit Annual Report. 35 The probability of death from any cause was taken from national lifetables published by the Office for National Statistics. 36
Resource use and costs
The extrapolation model includes costs for colonoscopy and lifetime costs associated with the diagnosis and treatment of CRC. A separate cost for adenoma surveillance was entered into the model for each risk subgroup. This cost was derived by estimating the mean annual cost of surveillance per patient during the within-study period and then applying that cost over the modelled duration of surveillance, from a starting age of 60 years through to 75 years, the upper age limit in the 2002 UK-ASG. 7 The lifetime cost of CRC was applied only to the first cycle in which CRC was diagnosed.
Quality of life
Quality-of-life data were not collected in the main clinical study. Therefore, the primary outcome measure in the within-study analysis was the incidence of CRC. The extrapolation model used estimated mean EQ-5D scores from a one-off study of CRC patients by a PHE PROMs survey. 37 This study collected QoL data from 21,802 patients who were diagnosed with CRC in England from 2010 to 2011 and were alive between 12 and 36 months after diagnosis, when they were sent a questionnaire including the EuroQol-5 Dimensions, five-level version. Responses were then scored using the ‘crosswalk’ mapping function developed by van Hout et al. 47 This allowed for comparison with the utility estimates derived from the EuroQol-5 Dimensions, three-level version (EQ-5D-3L), which was used for the non-cancer health states. The EQ-5D-3L scores for the non-cancer health states came from Ara and Brazier,38 who reported EQ-5D-3L scores from pooled responses in the Health Survey for England from people without cancer.
The Ara and Brazier38 scores and the estimates from the PROMs survey37 were combined with estimated survival from the lifetime model to calculate QALYs. The use of the PROMs survey for QoL data differs from recent studies examining the cost-effectiveness of CRC screening or surveillance strategies,23,43 which have mainly used estimates reported in Ara and Brazier. 38 The estimates from the PROMs survey37 were preferred over those from Ara and Brazier38 as the former is the largest UK survey of QoL for CRC patients currently available, and provides estimates by both CRC stage and age. Whyte et al. 48 estimated EQ-5D-3L scores by age and estimated CRC stage; however, these estimates are based on all cancer patients included in the Health Survey for England rather than only CRC patients. Therefore, the PROMs data were deemed more representative of the patients in our study cohort. The effect of using the estimates from Whyte et al. 48 on our model results was assessed in a sensitivity analysis. 48
Future QALYs and costs were discounted to present values at an annual rate of 3.5%. ICERs were then calculated as the ratio between the mean difference in QALYs and the mean difference in costs. Cost-effectiveness was evaluated assuming a willingness-to-pay threshold of £20,000 per QALY. 49
Sensitivity analyses
Uncertainty in the model estimates was characterised using a deterministic sensitivity analysis (DSA) and probabilistic sensitivity analysis (PSA). The DSA assessed the sensitivity of the model estimates to variation in individual parameters, whereas the PSA aimed to estimate the joint effect of uncertainty in all the parameters. For the DSA each parameter was both increased and decreased by 25% of its baseline value. The impact of these changes was measured in terms of the effect on the estimated ICER for each surveillance strategy. A sensitivity analysis was also used to assess the impact of using different strategies to handle the missing CRC staging data.
In the PSA all transition probabilities, costs and QoL estimates were varied, except for the survival probabilities. The PSA was carried out by sampling 2000 sets of the model parameters drawn at random from appropriate statistical distributions. Uncertainty around each cost estimate was characterised using a gamma distribution, whereas beta distributions were fitted to both the transition probabilities and QoL estimates. These replications were used to plot the cost-effectiveness plane50 and to construct cost-effectiveness acceptability curves that show the likelihood that the intervention is cost-effective as the willingness-to-pay changes. 51
Table 18 shows the estimated transition probabilities, costs and QoL estimates used in the model. The transition probabilities between the ‘no visit’ and ‘visit’ states differ between risk groups, with the lowest probability estimated for the lower-risk subgroup of the low-risk group and the highest probability estimated for the higher-risk subgroup of the high-risk group. For the whole low-risk group and the higher-risk subgroup of intermediate-risk patients the transition probabilities to the different CRC states were mostly lower with surveillance than without. In contrast, for the lower-risk subgroup of intermediate-risk patients and the lower-risk subgroup of high-risk patients the transition probabilities to CRC were mostly higher with surveillance than without. Mean EQ-5D scores were higher for patients with CRC than for people in the same age group without cancer.
| Parameter | Distribution for PSA | Risk group | |||||
|---|---|---|---|---|---|---|---|
| Low risk | Intermediate risk | High risk | |||||
| Lower-risk subgroup | Higher-risk subgroup | Lower-risk subgroup | Higher-risk subgroup | Lower-risk subgroup | Higher-risk subgroup | ||
| Annual transition probabilities | |||||||
| No visits: visits | Beta | 8.44 × 10⁻² | 1.08 × 10⁻¹ | 1.43 × 10⁻¹ | 1.72 × 10⁻¹ | 2.30 × 10⁻¹ | 2.36 × 10⁻¹ |
| No visits: Dukes’ stage A | Beta | 3.82 × 10⁻⁴ | 6.01 × 10⁻⁴ | 5.14 × 10⁻⁴ | 7.73 × 10⁻⁴ | 1.21 × 10⁻³ | |
| Visits: Dukes’ stage A | Beta | 2.75 × 10⁻⁴ | 3.00 × 10⁻⁴ | 5.30 × 10⁻⁴ | 5.66 × 10⁻⁴ | 5.87 × 10⁻⁴ | |
| No visits: Dukes’ stage B | Beta | 2.18 × 10⁻⁴ | 7.09 × 10⁻⁴ | 2.75 × 10⁻⁴ | 1.22 × 10⁻³ | 7.69 × 10⁻⁴ | |
| Visits: Dukes’ stage B | Beta | 1.49 × 10⁻⁴ | 3.07 × 10⁻⁴ | 3.11 × 10⁻⁴ | 6.48 × 10⁻⁴ | 9.23 × 10⁻⁴ | |
| No visits: Dukes’ stage C | Beta | 1.93 × 10⁻⁴ | 6.09 × 10⁻⁴ | 4.47 × 10⁻⁴ | 8.90 × 10⁻⁴ | 5.33 × 10⁻⁴ | |
| Visits: Dukes’ stage C | Beta | 2.18 × 10⁻⁴ | 3.86 × 10⁻⁴ | 2.83 × 10⁻⁴ | 9.09 × 10⁻⁴ | 6.29 × 10⁻⁴ | |
| No visits: Dukes’ stage D | Beta | 1.42 × 10⁻⁴ | 3.82 × 10⁻⁴ | 1.65 × 10⁻⁴ | 5.00 × 10⁻⁴ | 3.14 × 10⁻⁴ | |
| Visits: Dukes’ stage D | Beta | 5.90 × 10⁻⁵ | 1.39 × 10⁻⁴ | 3.38 × 10⁻⁴ | 2.87 × 10⁻⁴ | 3.45 × 10⁻⁴ | |
| No visits: CRC | Beta | 8.86 × 10⁻³ | |||||
| Visits: CRC | Beta | 4.50 × 10⁻³ | |||||
| Surveillance cost | |||||||
| Visits state | Gamma | 1049 | 1238 | 1193 | 1434 | 1573 | 1691 |
| Perforation treatment | Gamma | 5748 | 5748 | 5748 | 5748 | 5748 | 5748 |
| Cost of bleed | Gamma | 474 | 474 | 474 | 474 | 474 | 474 |
| Cost of CRC | Distribution for PSA | Dukes’ stage | |||||
| A | B | C | D | ||||
| Age 40–49 years | Gamma | £9085 | £9071 | £15,038 | £12,148 | ||
| Age 50–59 years | Gamma | £5928 | £7281 | £10,058 | £8763 | ||
| Age 60–69 years | Gamma | £4798 | £5554 | £7534 | £6755 | ||
| Age 70–79 years | Gamma | £3298 | £3585 | £4655 | £4530 | ||
| Age 80–100 years | Gamma | £1432 | £1604 | £1620 | £837 | ||
| Mean EQ-5D-5L scorea | Distribution for PSA | ||||||
| Non-cancer states | Beta | 0.80 | 0.80 | 0.80 | 0.80 | ||
| CRC states | Dukes’ stage | ||||||
| A | B | C | D | ||||
| Age < 55 years | Beta | 0.81 | 0.81 | 0.76 | 0.71 | ||
| Age 55–64 years | Beta | 0.85 | 0.83 | 0.79 | 0.72 | ||
| Age 65–74 years | Beta | 0.85 | 0.83 | 0.81 | 0.77 | ||
| Age 75–84 years | Beta | 0.80 | 0.79 | 0.78 | 0.72 | ||
| Age ≥ 85 years | Beta | 0.75 | 0.72 | 0.73 | 0.63 | ||
The below list summarises the main modelling assumptions made in the lifetime analysis:
-
The level of surveillance recorded in the study data set reflects practice under the 2002 UK-ASG. 7
-
The level of surveillance offered to each risk group is independent of the level of surveillance offered to the other risk groups.
-
Transition probabilities are time homogeneous.
-
Patients who did not attend surveillance are representative of patients who attended surveillance if their surveillance was withdrawn.
-
There is no age cut-off point for surveillance in either of the considered surveillance strategies.
-
There were no changes to the BCSP during the modelled period.
-
The probability of a bleed occurring during a surveillance procedure is independent of polypectomy being performed.
-
The probability of a bleed or bowel perforation occurring during a surveillance procedure is independent of risk group.
-
The costs and QoL estimates associated with surveillance can be captured by explicitly modelling the growth of polyps.
Although we assumed that the probability of a bleed occurring during a surveillance procedure is independent of polypectomy being performed, polypectomy does in fact increase the risk of a bleed. 52 However, a simplification of the model is that it does not distinguish between a polypectomy being performed or not. Therefore, when applying the probability of a bleed it was necessary that the probability was independent of a polypectomy being performed. To achieve this we used an average across all colonoscopies performed sourced from Rutter et al. 52
Results
Within-study analysis
Of the 525 CRCs in the study, 167 (32%) were missing CRC staging data. The proportion of missing CRC staging data varied between the risk groups. The highest proportion was 35% in the higher-risk subgroup of low-risk patients, whereas the lowest proportion was 24% in the lower-risk subgroup of intermediate-risk patients. However, the risk group was not a significant predictor of missing CRC staging data (data not shown).
The low-risk group
Table 19 shows the mean surveillance resources used and their associated cost in the lower- and higher-risk subgroups of the low-risk group over the full follow-up period.
| Surveillance resource use and costs | Risk subgroup, mean (SD)/count (SE) | |||
|---|---|---|---|---|
| Lower risk | Higher risk | |||
| No visits (n = 2804) | Visits (n = 2431) | No visits (n = 4403) | Visits (n = 4763) | |
| Surveillance resource use per patient | ||||
| Therapeutic colonoscopy | 0 | 0.63 (0.87) | 0 | 0.90 (1.13) |
| Diagnostic colonoscopy | 0 | 0.91 (0.85) | 0 | 0.92 (0.92) |
| Therapeutic flexible sigmoidoscopy | 0 | 0.05 (0.22) | 0 | 0.05 (0.29) |
| Diagnostic flexible sigmoidoscopy | 0 | 0.19 (0.48) | 0 | 0.18 (0.50) |
| Rigid sigmoidoscopy | 0 | 0 | 0 | 0 |
| Total | 0 | 1.78 (1.09) | 0 | 2.04 (1.45) |
| CRC casesa | ||||
| Dukes’ stage A | 12 (0.104) | 5 (0.166) | 29 (0.051) | 11 (0.084) |
| Dukes’ stage B | 7 (0.096) | 3 (0.144) | 34 (0.049) | 11 (0.080) |
| Dukes’ stage C | 7 (0.089) | 3 (0.154) | 30 (0.050) | 14 (0.088) |
| Dukes’ stage D | 5 (0.072) | 0 | 19 (0.041) | 5 (0.062) |
| Total | 31 | 11 | 112 | 41 |
| Person-years | 32,903 | 16,882 | 51,688 | 37,429 |
| Incidence per 1000 person-years | 0.94 | 0.65 | 2.17 | 1.10 |
| Mean (SD/SE) | Mean (SD/SE) | Mean (SD/SE) | Mean (SD/SE) | |
| Surveillance costs (£) | ||||
| Therapeutic colonoscopy | 0 (0) | 457 (632) | 0 (0) | 649 (816) |
| Diagnostic colonoscopy | 0 (0) | 479 (445) | 0 (0) | 481 (484) |
| Therapeutic flexible sigmoidoscopy | 0 (0) | 28 (134) | 0 (0) | 28 (175) |
| Diagnostic flexible sigmoidoscopy | 0 (0) | 77 (192) | 0 (0) | 73 (201) |
| Rigid sigmoidoscopy | 0 (0) | 0 (0) | 0 (0) | 0 (0) |
| Total | 0 (0) | 1041 (682) | 0 (0) | 1231 (921) |
| CRC costs (£) | ||||
| Dukes’ stage A | 10 (3.96) | 5 (3.74) | 18 (4.86) | 3 (1.57) |
| Dukes’ stage B | 6 (3.34) | 5 (3.66) | 20 (4.99) | 7 (2.49) |
| Dukes’ stage C | 6 (3.90) | 3 (4.43) | 17 (5.45) | 13 (4.57) |
| Dukes’ stage D | 5 (3.24) | 0 (0) | 14 (4.53) | 4 (2.25) |
| Total and discounted costs (£) | ||||
| Total CRC cost | 27 (6.19) | 13 (6.10) | 69 (8.84) | 26 (5.51) |
| Total cost per patient | 27 (6.19) | 1054 (15.14) | 69 (8.84) | 1258 (14.60) |
| Discounted total cost per patient | 22 (5.17) | 928 (13.79) | 58 (7.55) | 1116 (13.30) |
| Discounted total cost per 1000 person-years | 1906 (43.56) | 133,612 (168.87) | 4942 (66.94) | 142,023 (73.19) |
| Incremental costs (£) | ||||
| Incremental cost per 1000 person-years (95% CI); p-value | 131,706 (127,543 to 135,868); < 0.001 | 137,081 (133,552 to 140,609); < 0.001 | ||
| Incremental CRC per 1000 person-years (95% CI); p-value | –0.29 (–0.80 to 0.22); 0.262 | –1.07 (–1.59 to –0.55); < 0.001 | ||
| Incremental cost per CRC prevented | 453,221 | 127,945 | ||
Among those attending surveillance, the mean total number of surveillance examinations performed in the lower- and higher-risk subgroups was 1.78 and 2.04, respectively. The mean total cost of surveillance was £1041 in the lower-risk subgroup and £1231 in the higher-risk subgroup (see Table 19).
In the lower-risk subgroup of low-risk patients, the mean discounted total cost for patients attending surveillance was £133,612 per 1000 person-years, whereas the equivalent figure for patients not attending surveillance was £1906 per 1000 person-years. Therefore, in this subgroup, the total incremental cost for those with surveillance compared with those with no surveillance was £131,706 (see Table 19).
In the lower-risk subgroup of low-risk patients, more CRCs were diagnosed among those with no surveillance than among those with surveillance, at 0.94 and 0.65 per 1000 person-years, respectively. When we combined the difference in costs and CRC cases, the incremental cost per CRC prevented was £453,221 (see Table 19).
In the higher-risk subgroup of low-risk patients, the total incremental cost for those with surveillance compared with those with no surveillance was £137,081 per 1000 person-years, similar to that in the lower-risk subgroup. However, the difference in the CRC incidence rate among those with no surveillance and those with surveillance was greater than in the lower-risk subgroup, at 2.17 and 1.10 per 1000 person-years, respectively. Therefore, when we combined the difference in costs and CRC cases the incremental cost per CRC prevented was £127,945, which is far lower than in the lower-risk subgroup (see Table 19).
The intermediate-risk group
In the intermediate-risk group surveillance resource use was similar in the lower- and higher-risk subgroups (Table 20). The total incremental cost of surveillance per 1000 person years was £140,780 in the lower-risk subgroup and £153,409 in the higher-risk subgroup. As the incidence of CRC was lower in the lower- than higher-risk subgroup, the incremental cost per CRC prevented was higher in the lower-risk subgroup (i.e. £2,587,860) than in the higher-risk subgroup (i.e. £145,729) (see Table 20).
| Surveillance resource use and costs | Risk subgroup, mean (SD)/count (SE) | |||
|---|---|---|---|---|
| Lower risk | Higher risk | |||
| No visits (n = 1932) | Visits (n = 2806) | No visits (n = 2751) | Visits (n = 4363) | |
| Surveillance resource use per patient | ||||
| Therapeutic colonoscopy | 0 | 0.81 (1.01) | 0 | 1.11 (1.24) |
| Diagnostic colonoscopy | 0 | 0.97 (0.89) | 0 | 0.93 (0.96) |
| Therapeutic flexible sigmoidoscopy | 0 | 0.06 (0.29) | 0 | 0.09 (0.43) |
| Diagnostic flexible sigmoidoscopy | 0 | 0.15 (0.44) | 0 | 0.20 (0.60) |
| Rigid sigmoidoscopy | 0 | 0.00 (0.00) | 0 | 0.00 (0.03) |
| Total | 0 | 1.98 (1.32) | 0 | 2.33 (1.76) |
| CRC casesa | ||||
| Dukes’ stage A | 12 (0.090) | 10 (0.101) | 22 (0.051) | 20 (0.052) |
| Dukes’ stage B | 6 (0.077) | 7 (0.092) | 36 (0.056) | 22 (0.155) |
| Dukes’ stage C | 10 (0.088) | 5 (0.082) | 29 (0.052) | 30 (0.244) |
| Dukes’ stage D | 5 (0.063) | 6 (0.085) | 15 (0.041) | 10 (0.042) |
| Total | 33 | 29 | 102 | 82 |
| Person-years | 23,237 | 21,233 | 30,690 | 36,110 |
| Incidence per 1000 person-years | 1.42 | 1.37 | 3.32 | 2.27 |
| Mean (SD/SE) | Mean (SD/SE) | Mean (SD/SE) | Mean (SD/SE) | |
| Surveillance costs (£) | ||||
| Therapeutic colonoscopy | 0 (0) | 586 (729) | 0 (0) | 801 (901) |
| Diagnostic colonoscopy | 0 (0) | 507 (468) | 0 (0) | 490 (505) |
| Therapeutic flexible sigmoidoscopy | 0 (0) | 35 (172) | 0 (0) | 55 (256) |
| Diagnostic flexible sigmoidoscopy | 0 (0) | 59 (177) | 0 (0) | 80 (240) |
| Rigid sigmoidoscopy | 0 (0) | 0 (0) | 0 (0) | 1 (19) |
| Total surveillance cost | 0 (0) | 1187 (826) | 0 (0) | 1427 (1095) |
| CRC costs (£) | ||||
| Dukes’ stage A | 13 (5.29) | 6 (3.13) | 12 (4.83) | 6 (2.34) |
| Dukes’ stage B | 5 (4.13) | 5 (2.62) | 24 (6.55) | 14 (3.90) |
| Dukes’ stage C | 20 (10.13) | 8 (4.02) | 38 (10.35) | 21 (5.54) |
| Dukes’ stage D | 5 (3.50) | 10 (5.50) | 18 (6.87) | 5 (2.58) |
| Total and discounted costs (£) | ||||
| Total CRC cost | 44 (11.75) | 29 (7.59) | 92 (13.57) | 47 (7.14) |
| Total cost per patient | 44 (11.75) | 1216 (17.73) | 92 (13.57) | 1473 (18.09) |
| Discounted total cost per patient | 35 (8.91) | 1087 (15.84) | 79 (11.83) | 1328 (16.52) |
| Discounted total cost per 1000 person-years | 2891 (76.13) | 143,672 (100.16) | 7078 (104.23) | 160,488 (80.89) |
| Incremental costs (£) | ||||
| Incremental cost per 1000 person-years (95% CI); p-value | 140,780 (136,315 to 145,244); < 0.001 | 153,409 (149,822 to 157,996); < 0.001 | ||
| Incremental CRC per 1000 person-years (95% CI); p-value | –0.05 (–0.75 to 0.64); 0.878 | –1.05 (–1.86 to –0.24); 0.011 | ||
| Incremental cost per CRC prevented | 2,587,860 | 145,729 | ||
The high-risk group
The high-risk group had the greatest level of surveillance resource use and associated costs of any of the three risk groups (Table 21). The total incremental cost of surveillance per 1000 person-years was similar in the lower- and higher-risk subgroups of high-risk patients, at £196,436 and £186,212, respectively. However, because the subgroups had different CRC incidence rates, the incremental costs per CRC prevented differed significantly, being £568,719 in the lower-risk subgroup and £36,636 in the higher-risk subgroup (see Table 21).
| Surveillance resource use and costs | Risk subgroup, mean (SD)/count (SE) | |||
|---|---|---|---|---|
| Lower risk | Higher risk | |||
| No visits (n = 606) | Visits (n = 1211) | No visits (n = 305) | Visits (n = 597) | |
| Surveillance resource use per patient | ||||
| Therapeutic colonoscopy | 0 | 1.55 (1.39) | 0 | 1.59 (1.54) |
| Diagnostic colonoscopy | 0 | 0.68 (0.84) | 0 | 0.77 (0.83) |
| Therapeutic flexible sigmoidoscopy | 0 | 0.08 (0.36) | 0 | 0.11 (0.51) |
| Diagnostic flexible sigmoidoscopy | 0 | 0.11 (0.37) | 0 | 0.15 (0.44) |
| Rigid sigmoidoscopy | 0 | 0.00 (0.00) | 0 | 0.00 (0.00) |
| Total | 0 | 2.41 (1.63) | 0 | 2.62 (1.88) |
| CRC casesa | ||||
| Dukes’ stage A | 7 (0.142) | 5 (0.104) | 7 (0.103) | 3 (0.085) |
| Dukes’ stage B | 5 (0.130) | 8 (0.114) | 12 (0.107) | 8 (0.123) |
| Dukes’ stage C | 3 (0.187) | 5 (0.105) | 7 (0.102) | 4 (0.214) |
| Dukes’ stage D | 2 (0.092) | 3 (0.087) | 2 (.)b | 5 (0.242) |
| Total | 17 | 21 | 27 | 19 |
| Person-years | 6226 | 8805 | 3017 | 4913 |
| Incidence per 100,000 person-years | 273 | 239 | 895 | 387 |
| Mean (SD/SE) | Mean (SD/SE) | Mean (SD/SE) | Mean (SD/SE) | |
| Surveillance costs (£) | ||||
| Therapeutic colonoscopy | 0 (0) | 1120 (1006) | 0 (0) | 1149 (1115) |
| Diagnostic colonoscopy | 0 (0) | 357 (440) | 0 (0) | 405 (437) |
| Therapeutic flexible sigmoidoscopy | 0 (0) | 45 (213) | 0 (0) | 67 (302) |
| Diagnostic flexible sigmoidoscopy | 0 (0) | 43 (148) | 0 (0) | 61 (180) |
| Rigid sigmoidoscopy | 0 (0) | 0 (0) | 0 (0) | 0 (0) |
| Total surveillance cost | 0 (0) | 1565 (1087) | 0 (0) | 1682 (1248) |
| CRC costs (£) | ||||
| Dukes’ stage A | 28 (14.11) | 13 (6.66) | 59 (29.34) | 4 (6.81) |
| Dukes’ stage B | 18 (12.00) | 12 (6.07) | 72 (26.85) | 52 (21.35) |
| Dukes’ stage C | 17 (14.24) | 13 (7.24) | 48 (24.78) | 39 (22.86) |
| Dukes’ stage D | 15 (13.99) | 10 (6.57) | 0 (0) | 40 (22.58) |
| Total and discounted costs (£) | ||||
| Total CRC cost | 79 (23.80) | 48 (12.29) | 184 (45.00) | 135 (36.48) |
| Total cost per patient | 79 (23.80) | 1613 (33.89) | 184 (45.00) | 1817 (63.83) |
| Discounted total cost per patient | 69 (20.77) | 1477 (31.26) | 154 (37.87) | 1660 (57.90) |
| Discounted total cost per 1000 person-years | 6706 (175.33) | 203,144 (181.67) | 15,518 (229.97) | 201,731 (339.67) |
| Incremental costs (£) | ||||
| Incremental cost per 1000 person-years (95% CI); p-value | 196,436, (187,027 to 205,845); < 0.001 | 186,212 (169,741 to 202,682); < 0.001 | ||
| Incremental CRC per 1000 person-years (95% CI); p-value | –0.35 (–1.99 to 1.30); 0.681 | –5.08 (–8.84 to –1.32); 0.008 | ||
| Incremental cost per CRC prevented | 568,719 | 36,636 | ||
Appendix 3, Tables 43–45, report total costs for each baseline risk group when using only complete CRC staging data. These tables apply mean costs by age group to known CRC cases with unknown staging data. This change did not alter the main results to a large degree, as the lifetime cost of CRC care made up a relatively small proportion of the total cost.
Lifetime analysis
A comparison of observed and predicted percentage in each state from a single imputed data set showed that the model fitted the data reasonably well (see Appendix 3, Figures 9–14). The results from our lifetime model are shown in Table 22. For each of the three main risk groups ICERs were lower in the higher- than in the lower-risk subgroup.
| Estimates of cost-effectiveness | Risk subgroup | |||
|---|---|---|---|---|
| Lower risk | Higher risk | |||
| No visits | Visits | No visits | Visits | |
| Low-risk group | ||||
| Cost of surveillance (£) | 0 | 897 | 0 | 1091 |
| Total CRC cost (£) | 125 | 110 | 312 | 220 |
| Discounted total cost (£) | 83 | 742 | 207 | 971 |
| Life-years | 23 | 23 | 22 | 23 |
| Discounted QALYs | 12 | 12 | 12 | 12 |
| Incremental cost (£) | 660 | 764 | ||
| Incremental QALYs | 0.005 | 0.028 | ||
| ICER (£) | 136,496 | 27,341 | ||
| Probability of cost-effectiveness (%)a | 11 | 58 | ||
| Intermediate-risk group | ||||
| Cost of surveillance (£) | 0 | 1281 | 0 | 1522 |
| Total CRC cost (£) | 188 | 200 | 448 | 371 |
| Discounted total cost (£) | 124 | 1098 | 298 | 1406 |
| Life-years | 23 | 23 | 22 | 22 |
| Discounted QALYs | 12 | 12 | 12 | 12 |
| Incremental cost (£) | 974 | 1108 | ||
| Incremental QALYs | –0.008 | 0.024 | ||
| ICER (£) | Dominateda | 46,990 | ||
| Probability of cost-effectiveness (%)a | 4 | 34 | ||
| High-risk group | ||||
| Cost of surveillance (£) | 0 | 2144 | 0 | 2000 |
| Total CRC cost (£) | 343 | 358 | 1,077 | 694 |
| Discounted total cost (£) | 228 | 1877 | 726 | 2019 |
| Life-years | 22 | 22 | 22 | 22 |
| Discounted QALYs | 12 | 12 | 12 | 12 |
| Incremental cost (£) | 1649 | 1293 | ||
| Incremental QALYs | –0.018 | 0.165 | ||
| ICER (£) | Dominateda | 7821 | ||
| Probability of cost-effectiveness (%)b | 10 | 86 | ||
In the case of the low-risk group, the incremental cost of surveillance per patient was only slightly higher in the higher-risk subgroup than in the lower-risk subgroup. However, as the QALY benefit from surveillance was much larger in the higher-risk subgroup than in the lower-risk subgroup, the ICER was approximately five times lower in the higher- than in the lower-risk subgroup (see Table 22).
A similar pattern was found in the intermediate-risk group. In both the higher- and lower-risk subgroups of intermediate-risk patients, the incremental cost of surveillance was approximately £1000 per patient. However, as the higher-risk subgroup had a higher QALY gain from surveillance than the lower-risk subgroup, the ICER in the higher-risk subgroup was approximately £47,000, whereas surveillance in the lower-risk subgroup was dominated (i.e. more costly and less effective) (see Table 22).
The same pattern was observed in the high-risk group. Surveillance was dominated in the lower-risk subgroup, whereas the ICER in the higher-risk subgroup was £7821. This shows that surveillance was cost-effective in the higher-risk subgroup of high-risk patients when using a cost-effectiveness threshold of £20,000 per QALY gained (see Table 22).
Sensitivity analyses
The results of the DSA for the low-risk group are shown in Appendix 3, Figure 15. In both the lower- and higher-risk subgroups the results were most sensitive to variation in the cost of surveillance. In the case of the higher-risk subgroup, a 25% reduction in the cost of surveillance reduced the estimated ICER to below the £20,000 per QALY threshold. ICERs in the lower-risk subgroup did not fall below this threshold. Estimated ICERs for both subgroups were insensitive to changes in costs associated with CRC treatment.
The results of the DSA for the intermediate-risk group are shown in Appendix 3, Figure 16. The ICER for the lower-risk subgroup was most sensitive to variation in the transition probabilities between the ‘visits’ state and the Dukes’ stage D state, and between the ‘no visits’ state and the Dukes’ stage C state. The ICER in the higher-risk subgroup was most sensitive to variation in the QoL estimates for the non-cancer states. Variation in the cost of surveillance produced the largest increase in the ICER in the lower-risk subgroup and the largest decrease in the ICER in the higher-risk subgroup. In the case of the higher-risk subgroup, a 25% reduction in the cost of surveillance reduced the ICER to < £30,000 per QALY.
The results of the DSA for the high-risk group are shown in Appendix 3, Figure 17. For the lower-risk subgroup changes in the transition probability between the ‘visits’ state and the Dukes’ stage D state resulted in large changes in the ICER. In the case of the higher-risk subgroup, no variation in the analysis resulted in an ICER above the £20,000 per QALY threshold. The results for each risk group were relatively insensitive to changes in the estimates of CRC incidence.
The results from the PSA are shown in Figures 6 and 7. Figure 6 shows the cost-effectiveness plane for each of the three risk groups. The plane shows a similar spread of costs for each risk group and a great variability in QALYs. Figure 7 shows the cost-effectiveness acceptability curves for each risk group. In each risk group surveillance had a higher probability of being cost-effective in the higher-risk subgroup than in the lower-risk subgroup. For example, in the low-risk group the probabilities of surveillance being cost-effective were 11% and 58% in the lower- and higher-risk subgroups, respectively. In the intermediate-risk group the equivalent probabilities were 4% and 34% in the lower- and higher-risk subgroups, respectively. In the high-risk group surveillance had a 10% probability of being cost-effective in the lower-risk subgroup compared with an 86% probability in the higher-risk subgroup (see Figure 7).
FIGURE 6.
Cost-effectiveness plane showing the incremental costs and QALYs for surveillance compared with no surveillance from our PSA. (a) Low-risk group; (b) intermediate-risk group; and (c) high-risk group. The dashed line indicates a cost-effectiveness threshold of £20,000 per QALY. Points falling below the threshold are considered cost-effective.
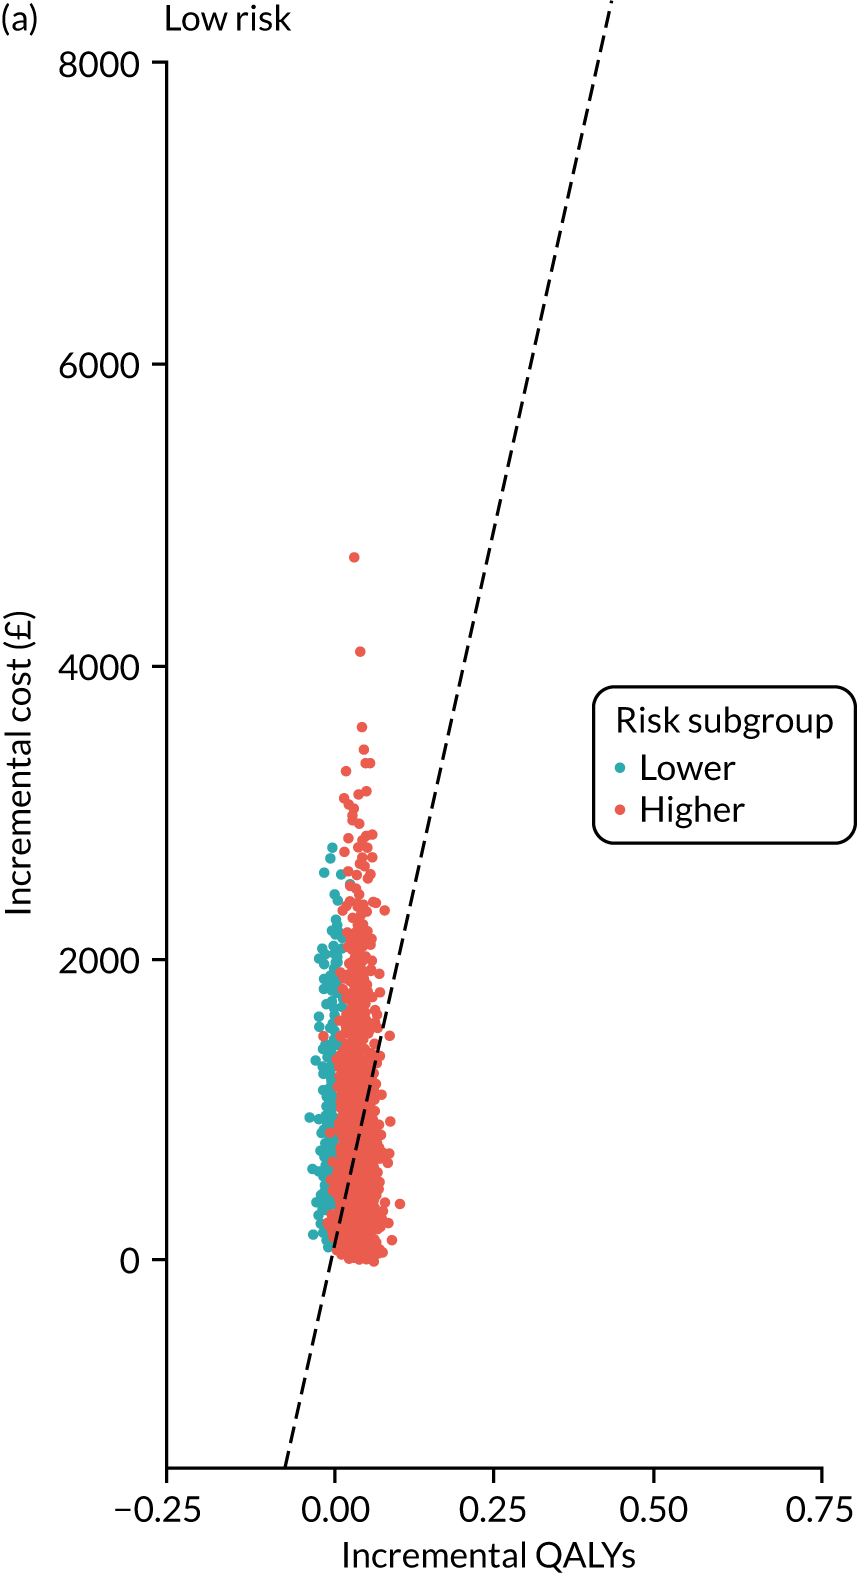
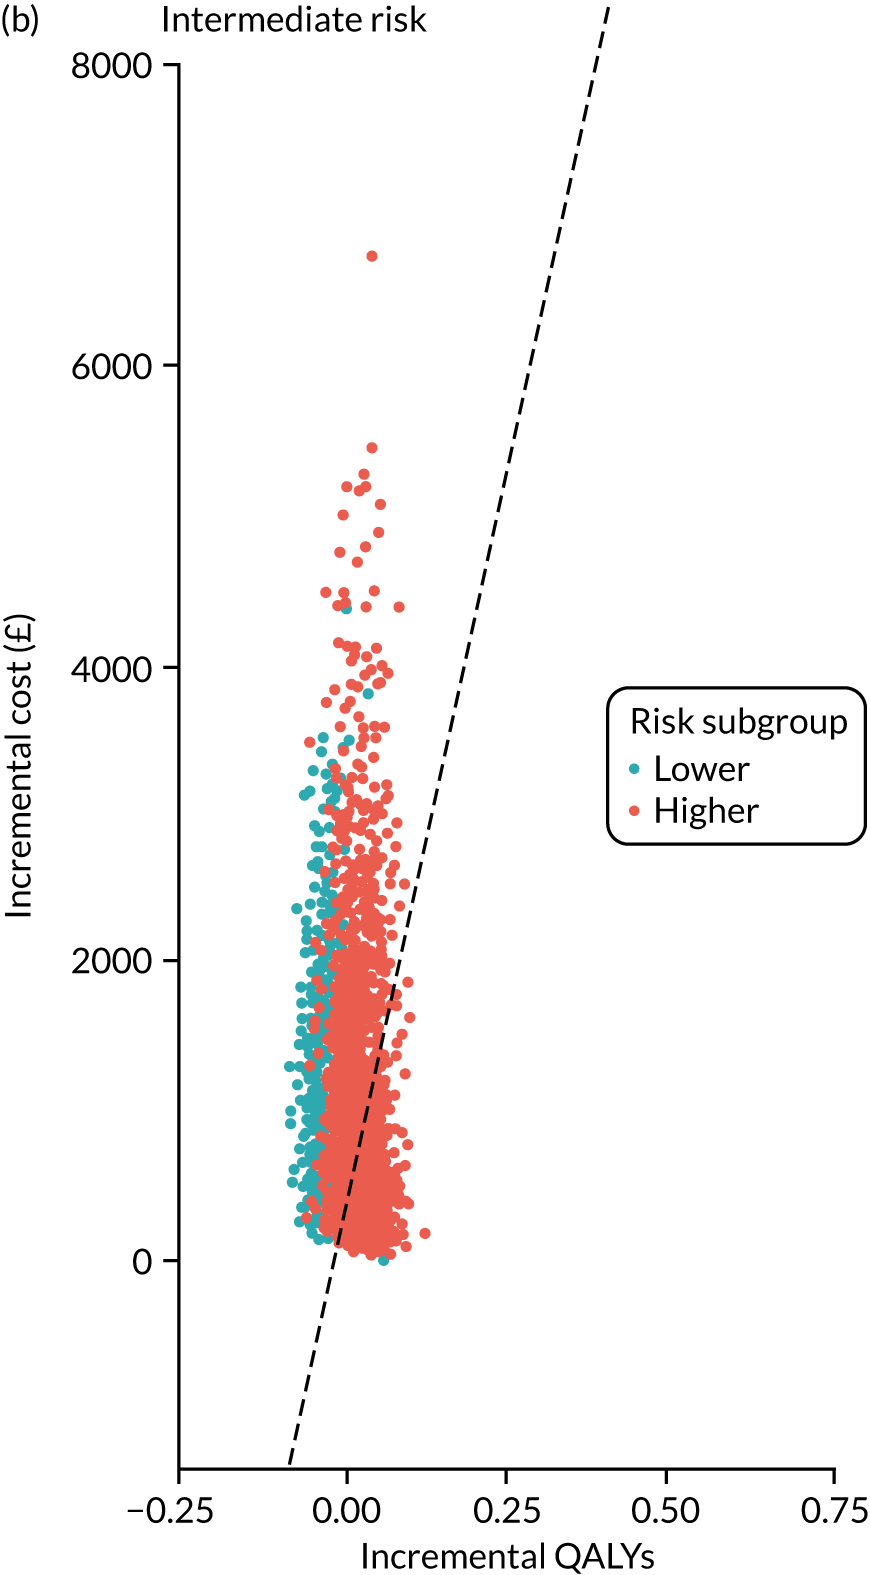
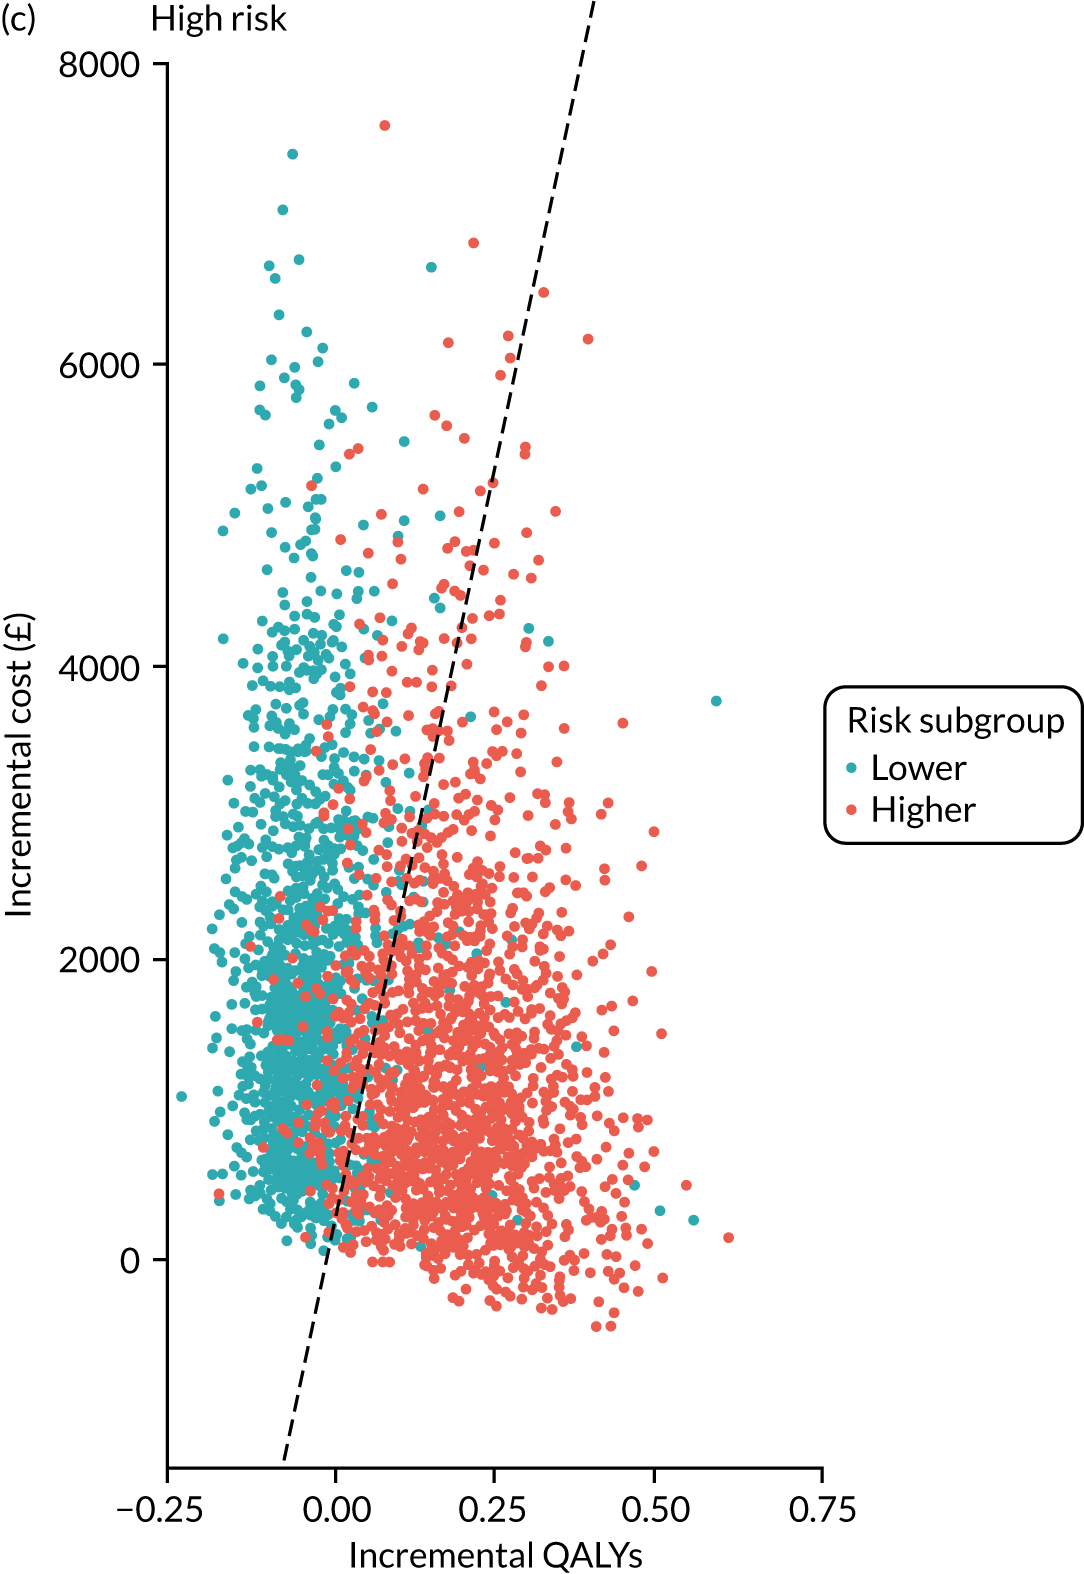
FIGURE 7.
Cost-effectiveness acceptability curves showing the probabilities of surveillance being cost-effective at different willingness-to-pay thresholds. (a) Low-risk group; (b) intermediate-risk group; and (c) high-risk group.
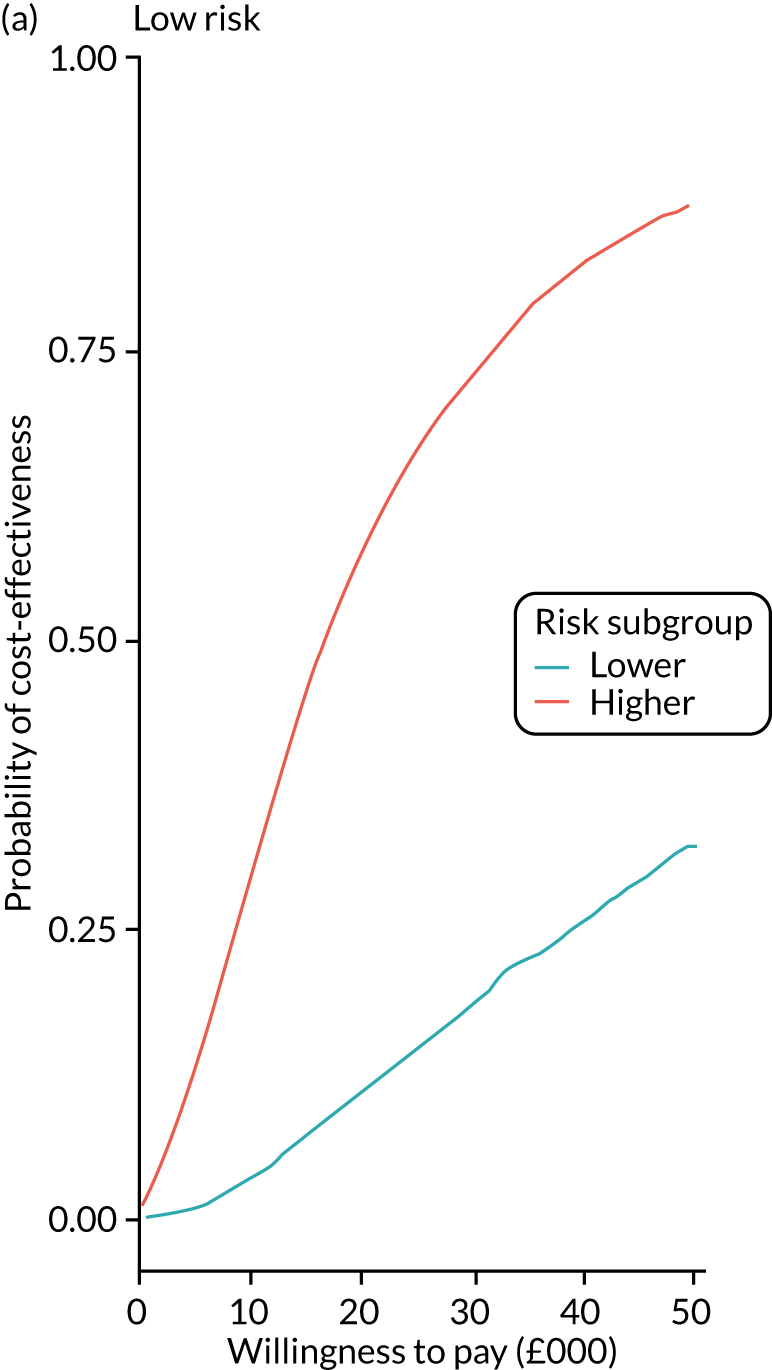
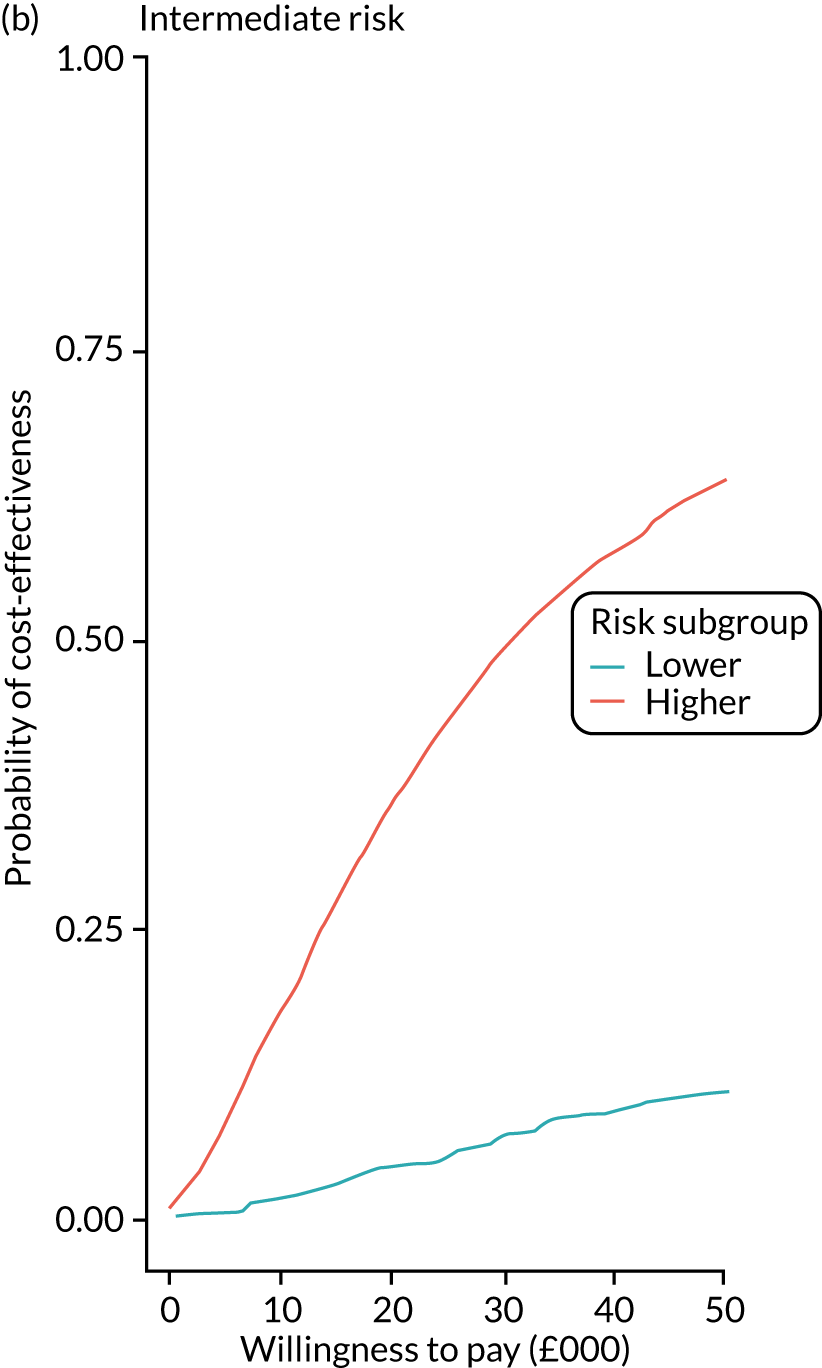
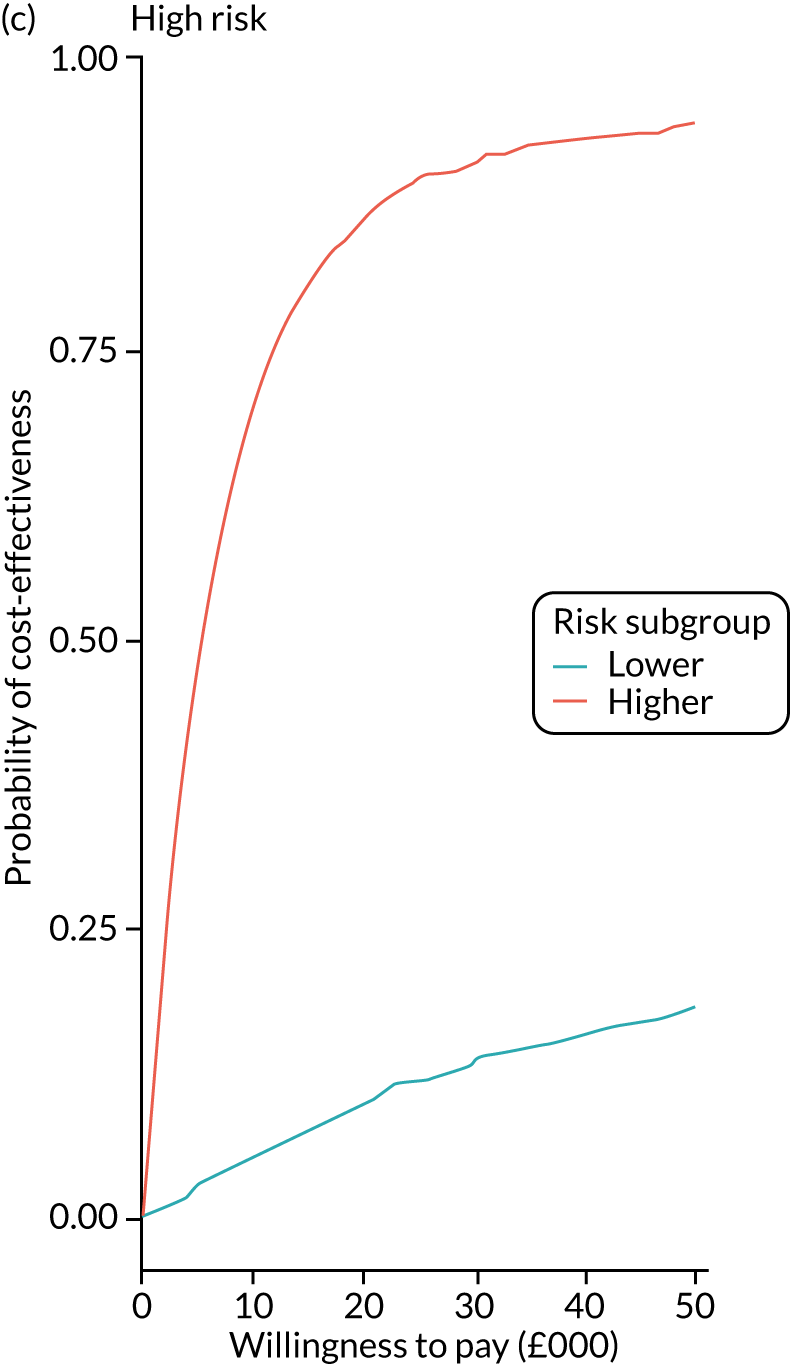
Figure 8 shows the expected value of perfect information (EVPI) for each risk group. The greatest value was attached to eliminating uncertainty around the estimates for the higher-risk subgroup of the low-risk group. The EVPI for this subgroup was £2,451,967 at a threshold of £20,000 per QALY, compared with an EVPI of just £18 in the lower-risk subgroup of the low-risk group.
FIGURE 8.
The EVPI for different willingness-to-pay thresholds. (a) Low-risk group; (b) intermediate-risk group; and (c) high-risk group.
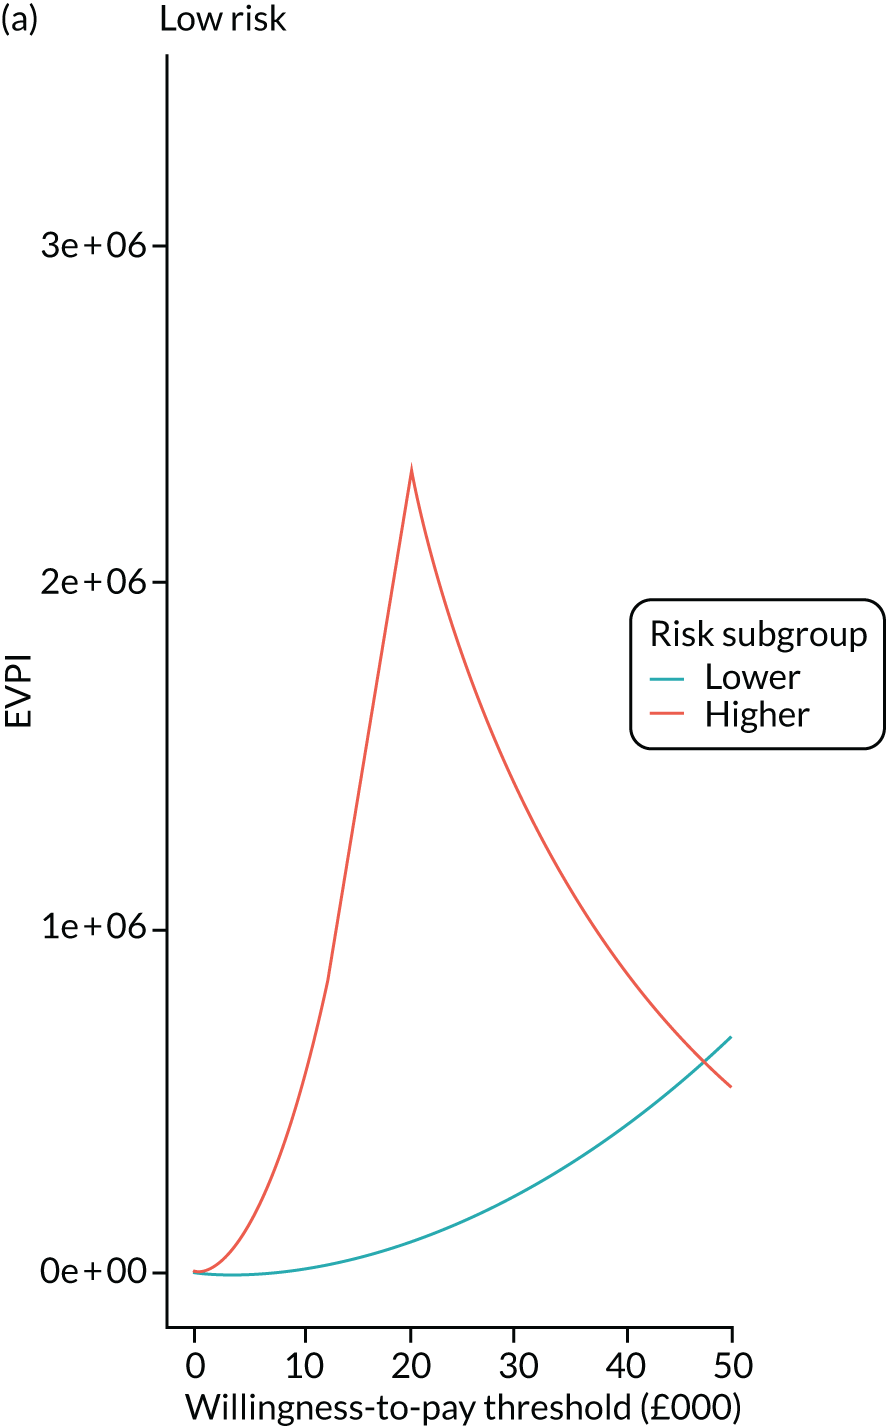
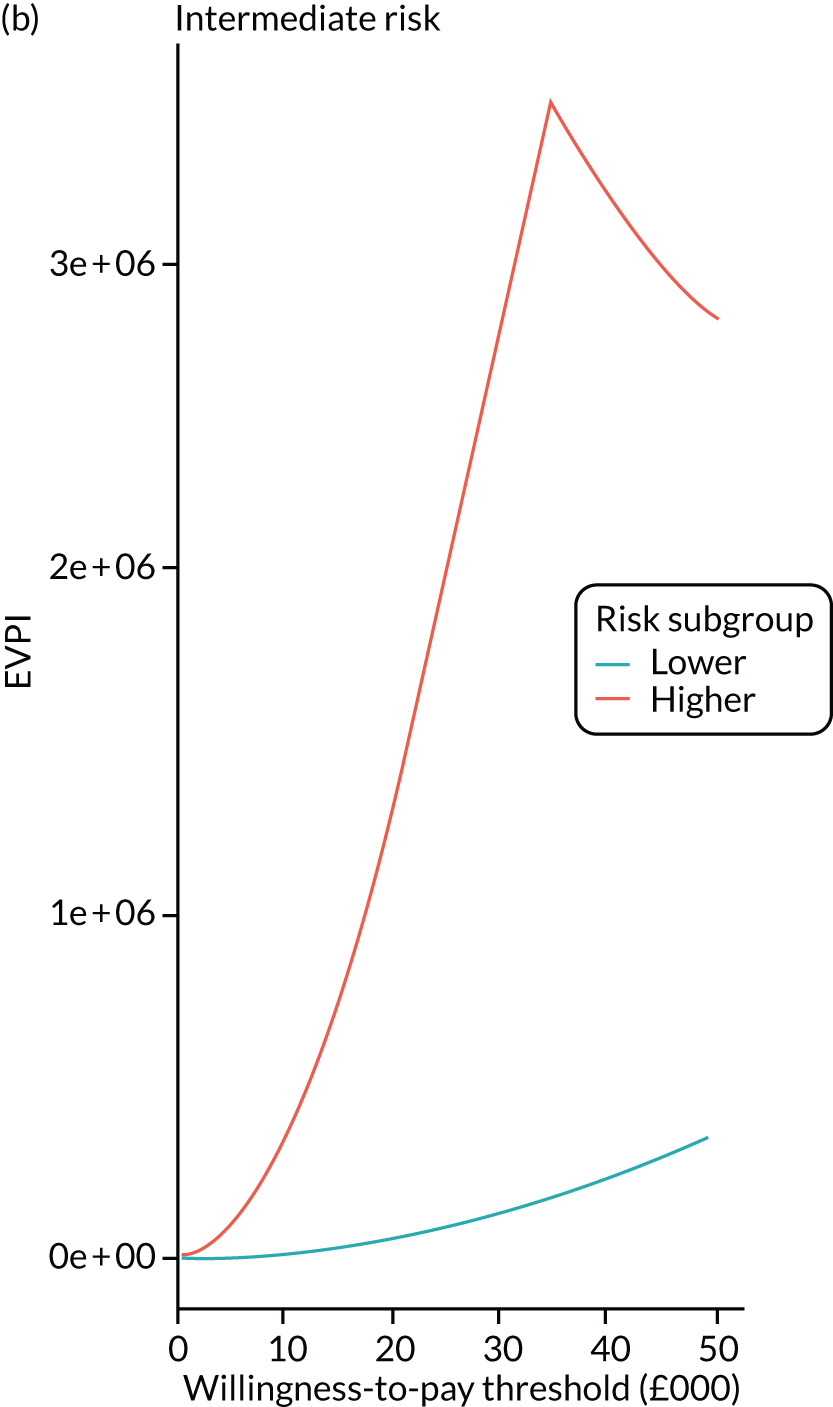
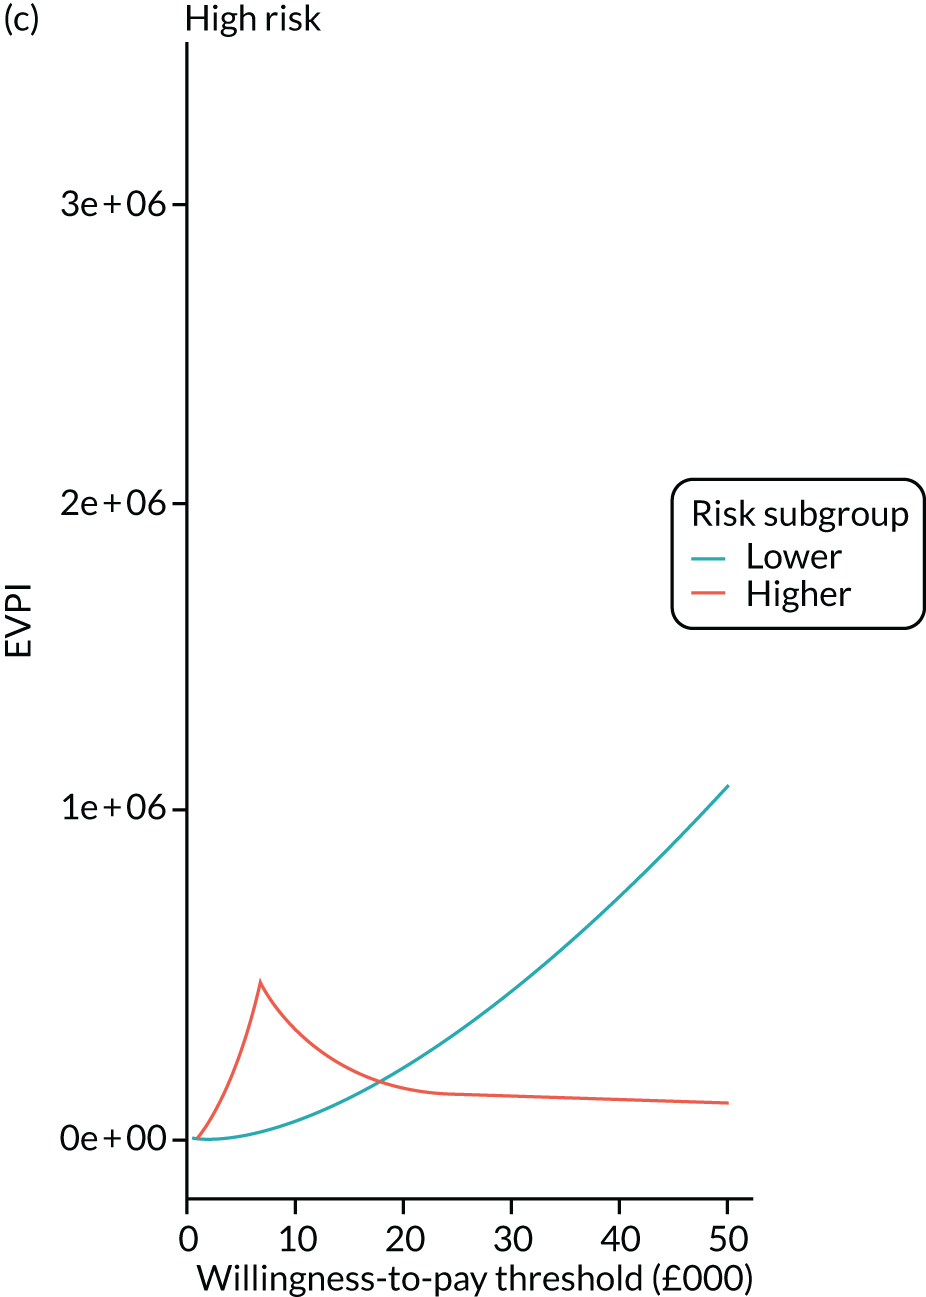
In additional sensitivity analyses we found that the results from the extrapolation model were robust to the use of different QoL estimates, from Whyte et al. 48 (see Appendix 3, Table 46), and to the use of a simplified model structure with the four cancer states collapsed to a single state (see Appendix 3, Table 47).
Discussion
The economic analysis presented in this chapter examined the cost-effectiveness of surveillance compared with no surveillance in patients in whom adenomas were detected and removed at baseline colonoscopy, considering the three risk groups defined in the 2002 UK-ASG. 7 To our knowledge, this is the first analysis of its kind.
The within-study analysis found a high degree of heterogeneity between the three risk groups. In each risk group costs per CRC diagnosis were lower in the higher-risk subgroup than in the lower-risk subgroup. The lack of QoL data for patients in the study meant that a full within-study cost–utility analysis was not feasible. We therefore developed an extrapolation model to estimate the cost-effectiveness of surveillance over a lifetime horizon. The model results showed that for each risk group surveillance was more cost-effective for patients in the higher-risk subgroup than for those in the lower-risk subgroup. However, the higher-risk subgroup of high-risk patients was the only subgroup to have an ICER below the cost-effectiveness threshold of £20,000 per QALY. The ICER in this subgroup was £7821.
The PSA found a relatively high degree of uncertainty at a willingness-to-pay threshold of £20,000 per QALY. This resulted in an EVPI of close to £2.5M over the length of the model. This high figure suggests that future research aimed at reducing this uncertainty is likely to be cost-effective. However, the DSA indicated that much of this variation results from the high degree of variability in the estimated costs of surveillance, which reflects heterogeneity in the treatment of individual patients rather than sampling uncertainty.
To our knowledge, this is the first study to estimate the cost-effectiveness of the surveillance recommendations in the 2002 UK-ASG. 7 The previous NIHR Health Technology Assessment report23 using this study database found 3-yearly surveillance with no age cut-off point to be highly cost-effective and the most cost-effective strategy for the intermediate-risk group. However, the results from this previous study address a different research question and are not directly comparable to the results reported here. The results are likely to differ because of differences in model structure. The previous report did not model CRC treatment by stage, whereas the model in this chapter applied EQ-5D scores and costs to CRC states by both stage and age. The analysis in this chapter also used a different source for the EQ-5D scores for the different CRC stages. These scores were higher than those used in the previous report.
The present analysis benefited from the high-quality data of the study database, drawn from 17 UK hospitals. There were few missing data and the follow-up period was long. The estimated transition probabilities for the lifetime model were therefore based on high-quality data.
The study data also allowed model parameters to be estimated separately for each baseline risk subgroup. This allowed the model to capture the heterogeneity between these groups, which have been collapsed in previous studies. 23,43,48 However, the model does not account for heterogeneity within these subgroups. For example, the cost of surveillance may be lower for a patient attending a single surveillance visit than for one attending five or more visits, but both patients may experience a similar reduction in CRC risk. The difficulty in modelling this is simultaneously estimating the probability of attending surveillance and the reduction in CRC risk, together with the uncertainty around these estimates. The lifetime analysis stratified patients by baseline risk subgroup and by CRC stage within each subgroup. Stratifying by further covariates, such as age, resulted in the model failing to converge. Even without stratifying further, there were insufficient data to estimate all model parameters for the higher-risk subgroup of high-risk patients. Instead, we estimated a simplified model for this subgroup. There is clear evidence from the clinical data and the simplified extrapolation model that surveillance in this subgroup is both highly clinically effective and cost-effective.
The analysis in this chapter has several limitations. First, both the within-study analysis and the lifetime model assumed that patients who did not attend surveillance were representative in terms of characteristics and outcomes of patients who attended surveillance if their surveillance was withdrawn. However, the findings from the main clinical study show that these groups are not well matched on several baseline characteristics. For example, non-attenders tended to be older than attenders. Age is a positive predictor of CRC risk and, therefore, unadjusted estimates of the difference between the groups may be upwardly biased. Adjusting estimates for this source of bias is not straightforward because the number of surveillance visits attended is a time-variant covariate. For the within-study analysis we examined this source of bias by estimating ICERs for a representative patient at the mean age for each risk subgroup (see Appendix 3, Table 48). These estimates show the results for the higher-risk subgroups to be relatively robust whereas the ICER for the lower-risk subgroups increased. For the lifetime model it is possible to estimate the effect of explanatory variables in a multistate model using a proportional intensities model. However, attempts at estimating age-dependent transition probabilities resulted in the model failing to converge.
Second, the PROMs survey is known to have a relatively high degree of non-response, which varies by both age group and cancer stage. However, the DSA found the results of the extrapolation model to be relatively insensitive to changes in the mean EQ-5D scores associated with the different cancer stages.
An additional limitation is that CRC staging data were missing for 32% of patients. We addressed this using multiple imputation in the main analysis and by using a simplified model structure in a sensitivity analysis, collapsing the four cancer states to a single state. The sensitivity analysis showed that the model results were robust to the use of the simplified model.
Further limitations include the fact that estimated costs of lifetime CRC treatment came from a source that is nearly 10 years old. 44 Other studies examining the cost-effectiveness of CRC screening and surveillance strategies have also used this source;23,43,48 however, given the age of the estimates, there is a need for more recent high-quality data on the cost of CRC treatment. This analysis could be extended by considering how a change in the UK surveillance guidelines could affect the BCSP, as it is likely that patients who are no longer offered surveillance would instead be offered a faecal immunochemical test (FIT) as part of routine screening.
Conclusion
In conclusion, the within-study analysis found that surveillance offered the greatest benefit to patients in the higher-risk subgroups of each of the three main risk groups. We found that the cost per CRC diagnosis by surveillance was surprisingly low in the higher-risk subgroup of low-risk patients. This suggests that surveillance might be cost-effective in this subgroup.
The extrapolation model found surveillance in the higher-risk subgroup of each risk group to be either cost-effective or have a high probability of being cost-effective at a threshold of £20,000 per QALY. However, missing CRC staging data and uncertainty around QoL estimates for both non-cancer and CRC states placed a high degree of uncertainty on our cost-effectiveness estimates. Further research is needed to provide greater evidence on the QoL benefits of adenoma surveillance. The results from both the within-study analysis and the extrapolation model suggest that the 2002 UK-ASG risk groups do not clearly differentiate patients by risk from a clinical effectiveness or cost-effectiveness perspective.
Chapter 5 Patient and public involvement
Patient and public involvement (PPI) for this study was integrated from the research proposal development stage through to the dissemination stage, with the aim of contributing to all aspects of the study from the perspective of patients and the public.
Formation of the patient and public involvement group
The PPI group included three endoscopy service users, with varying backgrounds and experiences of CRC and health services in the UK. Although the research idea and plan originated from the research team, we discussed the project with one of our patient representatives prior to the submission of the research proposal. Feedback helped shape the expression of interest application. This patient representative was on the Trial Steering Committee for our original study of the intermediate-risk group. 23
We recruited a further three PPI representatives for the study. Two members were recruited from the University of the Third Age (London, UK) and had no previous experience or involvement in research. One service user was already an active member of another study run by the research team.
To be able to contribute as a PPI representative each member of the group had to be aged within the current screening age range (i.e. 55–74 years) and have had a previous colonoscopy. Individuals who were interested in participating contacted the PPI lead (BP) by e-mail and were then sent an information sheet summarising the study and describing what participation as a representative would entail. Representatives were informed that they could choose to withdraw their involvement at any time. Reimbursement for time and travel to meetings, as well as electronic reviews of various study documents, were offered in line with the NIHR INVOLVE payment policy. 53 The members of the PPI group were contacted and kept up to date about the study by e-mail throughout their involvement.
Introduction to the study
The PPI group began meeting in March 2018. We conducted a total of two formal meetings and two workshops for this study, all held at the St Mary’s Hospital Medical School (London, UK). The first meeting involved an introduction to the study, as well as carefully planned ‘icebreaker’ activities to help facilitate members getting to know each other and the research team. The agenda for each meeting was set by the research team, and all materials and presentations were provided in advance. The PPI lead asked representatives for their evaluation at the end of each meeting. The feedback collected from representatives included comments on how useful and positive the meetings were and the different perspectives shared among the group were very informative, as outlined in this chapter.
Feedback on study results
Three representatives met to share their views on the results and findings in the data analysis phase of the study. One member of the group expressed concern about cost-cutting versus health benefit and risk and asked if the drive for our research was mostly about cutting NHS costs. There were longer discussions on the management of surveillance for each risk group. One member said that they would be happy for the lower-risk subgroup of the intermediate-risk patients to forgo surveillance if they were managed by the screening programme. Another member indicated that they would also be happy for the lower-risk subgroup of the intermediate-risk patients to be reclassified as low risk and not be referred for surveillance if these patients were picked up by the screening programme. Another member said that, personally, they would want surveillance if they fell into the lower-risk subgroup of the intermediate-risk patients; however, their views could be slightly biased given a personal history of CRC. Overall, the PPI group did reach a consensus that the focus of surveillance should be on the high-risk group and the higher-risk subgroup of the intermediate-risk patients, and that the lower-risk subgroup of the intermediate-risk patients could be reclassified as no longer requiring surveillance and could instead be managed by screening, together with the low-risk group.
For the final workshop the study representatives were joined by five more patients and members of the public to interpret the study results and to advise on appropriate methods for dissemination. The research team provided the new group members with a one-page information sheet summarising in lay English what had happened on the study so far. The group identified that a talk at the Maggie’s Centre at Charing Cross Hospital (London, UK) would be an appropriate place to present the study. Following this workshop, group members commented that the workshop was valuable, very interesting and enjoyable, and the new members felt that they had learnt a lot.
The PPI group were actively involved in electronic reviews of a number of important study documents, including a study summary for the research team’s website and drafts of the final manuscript.
Overall, the outcome of involving patients and the public has proved to be highly successful and a strength for members of the PPI group, the research team and the study. The research team were able to form links with people who had previous experience of working with researchers (experience which the team were able to gain useful information from) and people who were getting involved in PPI for the first time. On the whole, the group worked well together and felt that their contribution was mutually respected by the research team.
Chapter 6 Discussion
The aim of this study was to examine the need for, and clinical effectiveness and cost-effectiveness of, colonoscopy surveillance for patients who have adenomas detected and removed at baseline colonoscopy. We examined the surveillance recommendations given in the 2002 UK-ASG,7 which stratify patients with adenomas into three risk groups according to baseline adenoma characteristics. In low-risk patients [i.e. those with one or two small (< 10 mm in size) adenomas] no surveillance or surveillance at 5 years is recommended. In the case of intermediate-risk patients (i.e. those with three or four small adenomas or one or two adenomas of which at least one is ≥ 10 mm in size) 3-yearly surveillance is recommended. In high-risk patients (i.e. those with five or more small adenomas, or three or more adenomas of which at least one is ≥ 10 mm in size) surveillance is recommended at 1 year and then usually every 3 years.
We hypothesised that this recommended level of surveillance might no longer be necessary. This is because the 2002 UK-ASG7 were largely based on studies that predated improvements in colonoscopy quality and used detection rates of AAs at follow-up colonoscopy as a proxy for CRC risk. 11–14 Considering the enormous pressure placed on endoscopy resources by adenoma surveillance and the burden of invasive surveillance procedures on patients, it was seen as a priority to revise the 2002 UK-ASG7 to minimise the number of unnecessary colonoscopies being performed.
We developed a retrospective cohort study by obtaining data on 28,972 patients who underwent baseline colonoscopy and polypectomy at 17 UK hospitals and were followed up for a median of 9.3 years. Among this cohort, 50% were classed as low risk, 41% as intermediate risk and 9% as high risk. Our analyses revealed heterogeneity both between and within the risk groups in terms of long-term CRC risk, estimated effects of surveillance on CRC risk and cost-effectiveness of surveillance.
Need for and benefit of post-polypectomy surveillance
The low-risk group
We demonstrated that patients classed as low risk did indeed have a low risk of developing CRC following adenoma removal. Although we identified heterogeneity in CRC risk among low-risk patients, namely that two-thirds of patients had a higher CRC risk than the remaining one-third, the ‘higher-risk’ subgroup had a CRC risk no higher than the general population, even without surveillance. This subgroup included patients who had an incomplete colonoscopy, colonoscopy of unknown completeness, tubulovillous or villous adenoma, or proximal polyps at baseline. Among patients without these baseline characteristics, CRC risk without surveillance was lower than in the general population.
Interestingly, even though the low-risk group had a low CRC risk following baseline colonoscopy and polypectomy, colonoscopy surveillance suppressed this risk even further. Attendance at a single surveillance visit was associated with a 44% reduction in CRC risk compared with no surveillance. Although this demonstrates that low-risk patients can derive benefit from surveillance, it is important to remember that colonoscopy carries a risk of serious complications and that endoscopy resources are extremely overstretched. Considering these two factors, it is reasonable to suggest that surveillance should be directed towards patients who following adenoma removal remain at increased CRC risk compared with the general population. On this basis, surveillance may not be warranted for patients classed as low risk in the 2002 UK-ASG. 7
The intermediate-risk group
Our analyses of the intermediate-risk group supported the findings from our previous study,20,23 showing that intermediate-risk patients may be stratified into higher- and lower-risk subgroups. The higher-risk subgroup included patients whose baseline colonoscopy was incomplete or of unknown completeness, and those with an adenoma with high-grade dysplasia or proximal polyps at baseline, who together accounted for 60% of the whole risk group. In this subgroup, CRC risk without surveillance was higher than in the general population and a single surveillance visit substantially reduced this risk. By contrast, the remaining 40% of intermediate-risk patients (with none of these baseline risk factors) had a lower CRC risk than the general population before any surveillance. This finding suggests that surveillance may not be necessary for the lower-risk subgroup of intermediate-risk patients. The association between attendance at surveillance and CRC risk in this subgroup was not clear because the HR estimates had wide 95% CIs because of small numbers of CRC cases.
The high-risk group
We found that patients classed as high risk were indeed at high risk of CRC following baseline colonoscopy and polypectomy. Compared with the general population, CRC risk was two times higher among high-risk patients in the absence of surveillance, remaining higher in the presence of one surveillance visit. Only with two surveillance visits did CRC risk in this group fall to the level of risk in the general population. In addition, we found that cumulative incidence of CRC at 10 years was 6% without surveillance and with one surveillance visit, dropping to 3% with two surveillance visits. From these findings it seems likely that high-risk patients would benefit from attending two surveillance visits.
When we divided the high-risk group into higher- and lower-risk subgroups using the baseline characteristics identified as CRC risk factors (i.e. incomplete colonoscopies, colonoscopies of unknown completeness, adenomas with high-grade dysplasia), there were few CRC cases in each subgroup. As a result, our estimates from the subgroup analyses lacked precision, preventing clear conclusions from being drawn. Our findings suggest that all high-risk patients require surveillance to reduce their post-polypectomy CRC risk to that of the general population.
Our results suggest that surveillance is likely required for the whole high-risk group (n = 2719) and the higher-risk subgroup of the intermediate-risk group (n = 7114), who comprised 34% of our study cohort. By contrast, we have shown that surveillance might not be necessary for the low-risk group (n = 14,401) or the lower-risk subgroup of the intermediate-risk group (n = 4738), who accounted for 66% of our cohort. Patients who are not deemed to require surveillance could return to the BCSP when invited, which involves biennial stool-based screening with the FIT.
Surveillance intervals
Our results shed light on what surveillance intervals might be appropriate for each risk group. It is interesting to note that in the study the median time from baseline to first surveillance in the low-risk group was 3.2 years. This surveillance interval is shorter than the 5-year interval recommended in the 2002 UK-ASG. 7 This is consistent with other studies reporting inappropriately short surveillance intervals in low-risk patients. 54,55 Possible reasons for this include physician or patient concern about missed or recurring adenomas developing into CRC. The median surveillance intervals in the intermediate-risk group (i.e. 3 years) and high-risk group (i.e. 1.5 years) more closely aligned with the UK-ASG7 recommendations (i.e. 3 years and 1 year, respectively). 7
In the low-risk group, AA detection rates were < 9% and CRC detection rates were < 2% with intervals of < 18 months through to 6 years. Detection rates increased to 13% for AAs and 3% for CRC with an interval of 7 years. These results suggest that if surveillance is performed in low-risk patients it could be delayed until 7 years after baseline because detection rates of AAs and CRC are low during the first 6 years.
In the intermediate-risk group, detection rates of AAs and CRC remained relatively constant with intervals of < 18 months through to 3 years, at around 8–9% for AAs and 1–2% for CRC. Detection rates increased to 11% and 3% for AAs and CRC, respectively, with an interval of 4 years. These data suggest that for the intermediate-risk patients in our study surveillance at 4 years would have been worthwhile, as the yield of AAs was sufficient to justify performing colonoscopy.
Detection rates of AAs and CRC were approximately one and a half to two times greater in the higher- than in the lower-risk subgroup of intermediate-risk patients when we examined findings at first surveillance by risk subgroup. In the higher-risk subgroup, the detection rate of AAs was 11% with an interval of 3 years and CRC detection rates increased from approximately 1–2% to 4% when the interval extended beyond 3 years. This suggests that a 3-year interval might be appropriate for the higher-risk subgroup of intermediate-risk patients to avoid delays in the diagnosis of CRC.
In the high-risk group, AA detection rates at first surveillance were ≥ 11% for all intervals. Detection rates of CRC were < 1% with intervals of < 1.5 years, increasing to 3% with an interval of 2 years, with no further increases as the interval extended up to 3.5 years. The small numbers of CRCs in this analysis make it difficult to draw clear conclusions about an appropriate interval for high-risk patients.
Important baseline risk factors
When examining all three risk groups we identified several common important risk factors for CRC, including older age and having an incomplete colonoscopy, adenoma with high-grade dysplasia or proximal polyps at baseline. This is consistent with the findings from our previous study20 of the intermediate-risk group. These characteristics have also been identified as risk factors for advanced colorectal neoplasia at follow-up colonoscopy in other studies. 56,57
The increased CRC risk among patients with an adenoma with high-grade dysplasia or proximal polyps at baseline might have been due, at least in part, to incomplete resection. Support for this comes from a study58 that found advanced polyps and proximal polyps to be risk factors for incomplete resection. However, this study58 defined advanced polyps as adenomas with high-grade dysplasia, serrated adenomas or cancer, making it difficult to interpret the risk associated with high-grade dysplasia alone. It is possible that some proximal polyps in our study were serrated lesions, another important class of CRC precursors. 59 Serrated lesions are usually located in the proximal colon and are often flat and covered with mucus, making them difficult to detect and remove. 59 Unfortunately, we could not investigate the significance of these lesions as they were not recorded consistently in our data.
Overall, these findings highlight the importance of having a high-quality baseline colonoscopy (i.e. a complete examination with careful mucosal inspection and complete resection of detected lesions). In the UK, a national colonoscopy audit in 1999 revealed poor standards of practice, including low colonoscopy completion rates. 60 This led to the implementation of a national colonoscopy quality improvement programme that proved to be extremely effective. 61 More recent studies of colonoscopy in the UK have reported completion rates of 92–95%. 21,62,63 In our study, 80% of patients had a complete baseline colonoscopy. When we excluded the 20% without a complete baseline colonoscopy in a sensitivity analysis we saw little change in the results. We are therefore confident that our results are applicable in the current era of high-quality colonoscopy.
Attendance at surveillance
In the low-, intermediate- and high-risk groups, 50%, 60% and 66% of patients attended surveillance, respectively. Compared with patients who attended surveillance, non-attenders were older, and a higher proportion had an incomplete colonoscopy or poor bowel preparation at baseline. In the intermediate-risk group, the proportion of women was higher among non-attenders than among attenders. Similarly, in our previous study of the intermediate-risk group we found that surveillance attendance was lower among older patients, women and patients with an incomplete baseline colonoscopy or poor bowel preparation. 20,23 Another study64 has also reported that older age and female sex are associated with poor compliance with adenoma surveillance.
Our finding that 40% of the intermediate-risk group and 34% of the high-risk group did not attend surveillance is at odds with the UK-ASG,7 which recommends surveillance for both of these groups (at 3 years and 1 year for intermediate- and high-risk patients, respectively). 7 This suggests some underuse of surveillance colonoscopy in these patients. A study conducted in the USA found that surveillance colonoscopy was underused in patients classed as ‘high risk’ because of the presence of AAs or multiple adenomas at baseline. 65 Reasons for the underuse of surveillance in this previous study were not given, although the authors noted that ‘physician preference and patient request’ influence surveillance utilisation. In our study, we unfortunately did not have any information on why some patients failed to attend surveillance. It is possible that various factors played a role, including scheduling errors, patient objections to colonoscopy and patient comorbidities.
Comparison with previous studies of post-polypectomy colorectal cancer risk
Few high-quality data exist on the long-term risk of CRC among post-polypectomy patients. Apart from the present study and our previous study of the intermediate-risk group,20,23 to the best of our knowledge only two other studies6,66 have compared CRC risk following adenoma removal with that in the general population.
The first of these, by Atkin et al. ,6 included 1618 people who had adenomas removed during rigid sigmoidoscopy between 1957 and 1980 and were followed for a mean of 13.8 years. 6 Compared with the general population, CRC risk without surveillance was nearly four times greater among patients who had an adenoma ≥ 10 mm in size or with tubulovillous or villous histology at baseline, and seven times greater among patients who had more than one adenoma with such features. By contrast, CRC risk without surveillance was not significantly different among patients who had small (i.e. < 10 mm in size) tubular adenomas at baseline. The age of these data and the fact that rigid sigmoidoscopy rather than colonoscopy was performed at baseline limits the applicability of these findings in current practice.
The second study by Cottet et al. 66 examined 5779 patients who underwent baseline colonoscopy and polypectomy between 1990 and 1999 and were followed for a median of 7.7 years. Among patients who had an AA at baseline, CRC risk was four times higher than in the general population in the absence of surveillance and colonoscopy surveillance was associated with significant reductions in CRC risk. In comparison, among those with only non-AAs at baseline, CRC risk without surveillance was similar to that in the general population and surveillance did not have a significant effect on CRC risk. We cannot draw clear conclusions from these analyses, however, because the numbers of CRC cases were low and estimates imprecise. Furthermore, the study predated improvements in colonoscopy quality.
Cost-effectiveness of surveillance
The results from our economic evaluation indicate that for each risk group surveillance was more cost-effective for the higher-risk subgroup than for the lower-risk subgroup. In the within-study analysis, incremental costs per CRC prevented by adopting surveillance compared with no surveillance were lower in the higher-risk subgroups of each risk group. The lowest incremental cost per CRC prevented by adopting surveillance was seen for the higher-risk subgroup of the high-risk group (i.e. £36,636). This suggests that surveillance in the higher-risk subgroup of high-risk patients is more cost-effective than surveillance in any of the other risk subgroups.
We also performed a lifetime economic analysis in which we assessed cost-effectiveness in terms of the incremental cost per QALY gained. This is a more useful and comparable metric that is widely used to assess the cost-effectiveness of health interventions, including by the National Institute for Health and Care Excellence. 49 Our analyses revealed that the incremental cost per QALY gained by adopting surveillance was lower in the higher-risk subgroup of each risk group compared with the lower-risk subgroup. Similar to the within-study analysis, the lowest incremental cost per QALY gained with surveillance was seen for the higher-risk subgroup of the high-risk group (i.e. £7821). We deemed this to be highly cost-effective as we assumed a cost-effectiveness threshold of £20,000 per QALY, which is commonly used by National Institute for Health and Care Excellence. 49
Interestingly, surveillance was not found to be cost-effective for the lower-risk subgroup of high-risk patients or for either risk subgroup of intermediate-risk patients. This is worth noting because the results from our clinical analysis suggest that these patients likely require surveillance, given that they remain at an increased risk of CRC following adenoma removal, as compared with the general population. However, in a sensitivity analysis of our economic model we showed that the ICERs for these risk subgroups were sensitive to variation in the baseline parameter estimates, including the state transition probabilities and QoL estimates. When we varied our estimated parameters by ± 25%, large decreases were seen in some ICERs, with some approaching the £20,000 per QALY threshold. The results also suggest considerable heterogeneity within the 2002 UK-ASG7 risk groups. Future research aimed at improving the discrimination of risk grouping and reducing the uncertainty surrounding these estimates would be worthwhile.
Strengths and limitations
Our study has several strengths. To the best of our knowledge, it is the largest study to date to have examined the long-term risk of CRC following adenoma removal and the clinical effectiveness and cost-effectiveness of post-polypectomy surveillance. We created our data set by obtaining data from 17 NHS hospitals on approximately 30,000 patients who underwent baseline colonoscopy and polypectomy. The hospitals were located throughout the UK, providing a wide geographic coverage, and included both general and teaching hospitals. We obtained detailed data on baseline patient, procedural and polyp characteristics, and surveillance colonoscopies, and carried out extensive data cleaning. There were very few missing data. We were able to obtain complete follow-up data on CRC diagnoses and deaths for almost all patients (98%), as we used multiple national data sources and could follow up patients even if they migrated within the UK. Importantly, the vast majority (87%) of baseline colonoscopies were performed from 2000 to 2010, after the introduction of the national colonoscopy quality improvement programme following the 1999 UK colonoscopy audit. 61
In addition, we had the statistical power to perform multiple sensitivity analyses to assess the impact of various methodological choices on our results. In our first sensitivity analysis we excluded patients without a complete baseline colonoscopy (i.e. one-fifth of the cohort), finding that this had little impact on the results from our analyses of long-term CRC incidence and findings at first surveillance. This indicates that our results are likely to apply in the modern era of high-quality colonoscopy. Our second sensitivity analysis concerned the criteria used to decide whether or not a CRC had arisen from an incompletely resected baseline lesion and should therefore be excluded from analyses. When we relaxed the criteria, resulting in the exclusion of some additional cancers, we observed no material changes in the results.
In our third sensitivity analysis we showed that our results for the higher- and lower-risk subgroups of intermediate-risk patients were robust to changes in the risk classification criteria (i.e. when we applied the slightly different criteria from our previous study of the intermediate-risk group). 20,23 Similarly, for the low-risk group, results from our analyses of findings at first surveillance were robust when we changed the cut-off point for interval length from 8.5 to 6.5 years. For our final sensitivity analysis we also adjusted for hospital in our multivariable models for long-term CRC incidence and findings at first surveillance and noted little change in the results. Together, these sensitivity analyses demonstrate the robustness of our results in the presence of methodological and parameter uncertainty.
A limitation of this study is that it is observational and so we cannot assume a causal relationship between surveillance and the observed reductions in CRC incidence among patients attending surveillance. However, we made adjustments for several potential confounders and still observed a substantial reduction in CRC incidence with attendance at surveillance. A second limitation is that there is likely some misclassification in our data set because of our use of routinely collected data. In addition, it is possible that we incorrectly classed some examinations in our data set as surveillance examinations when they actually were being performed to investigate symptoms; however, we were unable to differentiate the purpose of the examination. Some patients in our study might also have undergone surveillance at other hospitals from which we did not collect data. Missing data were more common among patients who attended surveillance than among those who did not attend surveillance. This was particularly true for data on baseline examination quality, including colonoscopy completeness and bowel preparation quality. It is possible that this introduced bias into our data set. Finally, as we excluded CRCs deemed likely to have arisen from incompletely resected baseline lesions, it is possible that some of our estimates of CRC risk are underestimations because, even with current practice, not all lesions are detected and completely resected during colonoscopy.
Our economic evaluation had a number of limitations. Staging data were missing for 32% of patients with CRC, which placed uncertainty around our estimates of cost-effectiveness. Further uncertainty surrounded our QoL estimates for both non-cancer and CRC states. In addition, our estimated costs of lifetime CRC treatment came from a source that is nearly 10 years old. 44
Conclusions
Implications for health care
Our results suggest that a large proportion of patients in whom adenomas are detected and removed at baseline colonoscopy might not need to undergo surveillance colonoscopy. We found that, following a complete baseline colonoscopy, the long-term risk of CRC in the whole low-risk group and lower-risk subgroup of intermediate-risk patients (i.e. those without high-grade dysplasia or proximal polyps at baseline) was similar to or lower than that in the general population who undergo no surveillance. It is possible that routine screening with the FIT might be sufficient for these patients who, together, accounted for 66% of our cohort. Revision of the 2002 UK-ASG7 in the light of these findings could help to minimise the exposure of patients to unnecessary invasive surveillance procedures and alleviate pressures on endoscopy services.
In comparison, we showed that surveillance is probably warranted for the remaining 34% of patients, including the higher-risk subgroup of intermediate-risk patients (i.e. those without a complete colonoscopy or with high-grade dysplasia or proximal polyps at baseline) and the whole high-risk group. In our study, post-polypectomy CRC risk was higher among these patients than in the general population in the absence of surveillance, and surveillance was associated with substantial reductions in CRC risk. We showed that a 3-year surveillance interval is likely to be appropriate for the higher-risk subgroup of intermediate-risk patients, although further research is needed to confirm this and to define an optimal interval for high-risk patients.
In our economic evaluation we showed that surveillance is more cost-effective for the higher-risk subgroup than for the lower-risk subgroup of each risk group. We demonstrated that surveillance is highly cost-effective for the higher-risk subgroup of high-risk patients.
Recommendations for research
-
Randomised controlled trials of post-polypectomy patients and additional economic evaluations are needed to generate greater evidence about the requirements for, and clinical effectiveness and cost-effectiveness of, surveillance. Studies with large sample sizes and long-term follow-up would help determine the optimal number of, and interval between, surveillance visits for patients remaining at increased CRC risk post polypectomy.
-
Future studies should repeat the analyses performed in the present study without prior classification of patients into risk groups, according to baseline adenoma number and size. This would help elucidate the effects of individual baseline adenoma characteristics on findings at surveillance colonoscopy and long-term CRC incidence.
-
Further research is needed on the long-term CRC incidence and effects of surveillance on CRC incidence among patients who have serrated polyps detected and removed at baseline colonoscopy.
-
Additional research is needed to generate high-quality data on the QoL of patients with CRC.
-
Qualitative studies should assess patients’ attitudes towards, and experiences of, surveillance to help understand barriers to and facilitators of compliance with surveillance.
-
Future studies should examine alternative surveillance strategies based on FIT and other technologies, such as a multitarget stool deoxyribonucleic acid test. 67
Acknowledgements
The authors would like to acknowledge Professor Wendy Atkin who was the original chief investigator of the study, who sadly passed away in 2018. We would like to thank all of the people listed below for their involvement in the study. A special thank you to the patients who contributed data to the study.
Infrastructure support for this work was provided by the NIHR Imperial Biomedical Research Centre.
Trial Steering Committee
Andrew M Veitch (chairperson), Allan Hackshaw, Steve Morris, Colin Rees and Helen Watson (patient representative).
Cancer Screening and Prevention Research Group staff
Elizabeth Coles and Eilidh MacRae.
Patient and public representatives
We are grateful to Helen Watson, Lindy Berkman and John Sharkey for reviewing the study proposal and results, in addition to helping us run a workshop with other patients and members of the public to develop plans for wider dissemination of the results. We would also like to thank Karen Ma, Irene Fuchs, Paul Ewart, Angela Quilley and Lynne Wright who attended the workshop.
National Institute for Health and Care Research Health Technology Assessment grant co-applicants
Amanda J Cross (chief investigator), Alastair Gray (Health Economist), Kate Wooldrage (Statistician) and Stephen W Duffy (Statistician).
Participating hospitals
We would like to thank the principal investigators, consultant gastroenterologists, surgeons, endoscopists, nurses, pathologists, administrative staff, and information and communications technology staff at each of the participating hospitals named below. In addition, we would like to thank everyone who helped us collect endoscopy and pathology data for the study. A full list of those involved is given in the NIHR final report23 for our previous study of the intermediate-risk group:
Royal Sussex County Hospital, Brighton; Cumberland Infirmary, Carlisle; Imperial College Healthcare NHS Trust, Charing Cross Hospital, Hammersmith Hospital and St Mary’s Hospital, London; Glasgow Royal Infirmary, Glasgow; Leicester General Hospital, Leicester; Royal Liverpool University Hospital, Liverpool; New Cross Hospital, Wolverhampton; University Hospital of North Tees, Stockton-on-Tees; Queen Elizabeth Hospital, Woolwich; Queen Mary’s Hospital, Sidcup; Royal Shrewsbury Hospital, Shropshire; St George’s Hospital, Tooting; St Mark’s Hospital, Harrow; Royal Surrey County Hospital, Surrey; Torbay District General Hospital, Devon; and Yeovil District Hospital, Yeovil.
Data providers
NHS Digital, formerly the Health and Social Care Information Centre England: Copyright © 2019, data re-used with the permission of NHS Digital. All rights reserved.
NHS Central Register and NSS: we would like to acknowledge the support of the electronic Data Research and Innovation Service Team (NSS) for their involvement in obtaining approvals and provisioning and linking data.
This project involves data derived from patient-level information collected by the NHS as part of the care and support of cancer patients. The data are collated, maintained and quality assured by the National Cancer Registration and Analysis Service, which is part of PHE. Access to the data was facilitated by the PHE Office for Data Release.
Contributions of authors
Amanda J Cross (https://orcid.org/0000-0002-0893-2377) (Professor of Cancer Epidemiology) was the chief investigator for the study and was responsible for the design of the study and obtaining funding, had oversight of data analysis and interpretation, and contributed to the drafting and revision of the report.
Emma C Robbins (https://orcid.org/0000-0002-0828-8091) (Epidemiologist) interpreted the data and was responsible for writing the report.
Kevin Pack (https://orcid.org/0000-0002-6961-0101) (Senior Data Clerk) was responsible for data acquisition, cleaning and coding, and reviewed and edited the report.
Iain Stenson (https://orcid.org/0000-0001-7848-4154) (Software Developer/Data Analyst) was responsible for data acquisition, cleaning and coding, and reviewed and edited the report.
Paula L Kirby (https://orcid.org/0000-0002-2440-999X) (Project Manager) was responsible for the budget, project management and research governance, and reviewed and edited the report.
Bhavita Patel (https://orcid.org/0000-0002-9765-6182) (Clinical Trials Assistant) was responsible for data acquisition, cleaning and coding, organising, leading and writing up the findings from the PPI activities, and reviewed and edited the report.
Matthew D Rutter (https://orcid.org/0000-0001-9507-0295) (Professor of Gastroenterology, Consultant Gastroenterologist) critically evaluated the results, offered clinical insight, and reviewed and edited the report.
Andrew M Veitch (https://orcid.org/0000-0001-5418-2370) (Consultant Gastroenterologist) critically evaluated the results, offered clinical insight, and reviewed and edited the report.
Brian P Saunders (https://orcid.org/0000-0002-4190-7448) (Professor, Consultant Gastroenterologist, Specialist Gastrointestinal Endoscopist) critically evaluated the results, offered clinical insight, and reviewed and edited the report.
Matthew Little (https://orcid.org/0000-0001-8384-0256) (Health Economist) conducted and drafted the findings from the economic evaluation, and reviewed and edited the report.
Alastair Gray (https://orcid.org/0000-0003-0239-7278) (Professor of Health Economics) had oversight of the economic evaluation, and reviewed and edited the report.
Stephen W Duffy (https://orcid.org/0000-0003-4901-7922) (Professor of Cancer Screening) had oversight of data analysis, and reviewed and edited the report.
Kate Wooldrage (https://orcid.org/0000-0001-8209-3113) (Medical Statistician) was responsible for the design of the study and obtaining funding, had oversight of data analysis, performed the statistical analyses and interpreted the data, and contributed to the drafting and revision of the report.
Publications
Cafferty FH, Wong JM, Yen AM, Duffy S, Atkin WS, Chen TH. Findings at follow-up endoscopies in subjects with suspected colorectal abnormalities: effects of baseline findings and time to follow-up. Cancer J 2007;13:263–70.
Atkin W, Brenner A, Martin J, Wooldrage K, Shah U, Lucas F, et al. The clinical effectiveness of different surveillance strategies to prevent colorectal cancer in people with intermediate-grade colorectal adenomas: a retrospective cohort analysis, and psychological and economic evaluations. Health Technol Assess 2017;21(25).
Atkin W, Wooldrage K, Brenner A, Martin J, Shah U, Perera S, et al. Adenoma surveillance and colorectal cancer incidence: a retrospective, multicentre, cohort study. Lancet Oncol 2017;18:823–34.
Cross AJ, Robbins EC, Pack K, Stenson I, Kirby PL, Patel B, et al. Long-term colorectal cancer incidence after adenoma removal and the effects of surveillance on incidence: a multicentre, retrospective, cohort study. Gut 2020;69:1645–58.
Cross AJ, Robbins EC, Pack K, Stenson I, Rutter MD, Veitch AM, et al. Post-polypectomy surveillance interval and advanced neoplasia detection rates: a multicenter, retrospective cohort study [published online ahead of print April 12 2022]. Endoscopy 2022.
Data-sharing statement
All data requests should be submitted to the corresponding author for consideration. Access to available anonymised data may be granted following review and appropriate agreements being in place.
Patient data
This work uses data provided by patients and collected by the NHS as part of their care and support. Using patient data is vital to improve health and care for everyone. There is huge potential to make better use of information from people’s patient records, to understand more about disease, develop new treatments, monitor safety, and plan NHS services. Patient data should be kept safe and secure, to protect everyone’s privacy, and it’s important that there are safeguards to make sure that it is stored and used responsibly. Everyone should be able to find out about how patient data are used. #datasaveslives You can find out more about the background to this citation here: https://understandingpatientdata.org.uk/data-citation.
Disclaimers
This report presents independent research funded by the National Institute for Health and Care Research (NIHR). The views and opinions expressed by authors in this publication are those of the authors and do not necessarily reflect those of the NHS, the NIHR, the HTA programme or the Department of Health and Social Care. If there are verbatim quotations included in this publication the views and opinions expressed by the interviewees are those of the interviewees and do not necessarily reflect those of the authors, those of the NHS, the NIHR, the HTA programme or the Department of Health and Social Care.
References
- Atkin WS, Edwards R, Kralj-Hans I, Wooldrage K, Hart AR, Northover JM, et al. Once-only flexible sigmoidoscopy screening in prevention of colorectal cancer: a multicentre randomised controlled trial. Lancet 2010;375:1624-33. https://doi.org/10.1016/S0140-6736(10)60551-X.
- Segnan N, Armaroli P, Bonelli L, Risio M, Sciallero S, Zappa M, et al. Once-only sigmoidoscopy in colorectal cancer screening: follow-up findings of the Italian randomized controlled trial – SCORE. J Natl Cancer Inst 2011;103:1310-22. https://doi.org/10.1093/jnci/djr284.
- Schoen RE, Pinsky PF, Weissfeld JL, Yokochi LA, Church T, Laiyemo AO, et al. Colorectal-cancer incidence and mortality with screening flexible sigmoidoscopy. N Engl J Med 2012;366:2345-57. https://doi.org/10.1056/NEJMoa1114635.
- Holme Ø, Løberg M, Kalager M, Bretthauer M, Hernán MA, Aas E, . Effect of flexible sigmoidoscopy screening on colorectal cancer incidence and mortality: a randomized clinical trial. JAMA 2014;312:606-15. https://doi.org/10.1001/jama.2014.8266.
- Atkin W, Wooldrage K, Parkin DM, Kralj-Hans I, MacRae E, Shah U, et al. Long term effects of once-only flexible sigmoidoscopy screening after 17 years of follow-up: the UK Flexible Sigmoidoscopy Screening randomised controlled trial. Lancet 2017;389:1299-311. https://doi.org/10.1016/S0140-6736(17)30396-3.
- Atkin WS, Morson BC, Cuzick J. Long-term risk of colorectal cancer after excision of rectosigmoid adenomas. N Engl J Med 1992;326:658-62. https://doi.org/10.1056/NEJM199203053261002.
- Atkin WS, Saunders BP. British Society for Gastroenterology . Surveillance guidelines after removal of colorectal adenomatous polyps. Gut 2002;51:V6-9. https://doi.org/10.1136/gut.51.suppl_5.v6.
- Atkin WS, Valori R, Kuipers EJ, Hoff G, Senore C, Segnan N, et al. European guidelines for quality assurance in colorectal cancer screening and diagnosis. First edition – colonoscopic surveillance following adenoma removal. Endoscopy 2012;44:E151-63. https://doi.org/10.1055/s-0032-1309821.
- Lieberman DA, Rex DK, Winawer SJ, Giardiello FM, Johnson DA, Levin TR. Guidelines for colonoscopy surveillance after screening and polypectomy: a consensus update by the US Multi-Society Task Force on Colorectal Cancer. Gastroenterology 2012;143:844-57. https://doi.org/10.1053/j.gastro.2012.06.001.
- Hassan C, Quintero E, Dumonceau JM, Regula J, Brandão C, Chaussade S, et al. Post-polypectomy colonoscopy surveillance: European Society of Gastrointestinal Endoscopy (ESGE) Guideline. Endoscopy 2013;45:842-51. https://doi.org/10.1055/s-0033-1344548.
- van Stolk RU, Beck GJ, Baron JA, Haile R, Summers R. Adenoma characteristics at first colonoscopy as predictors of adenoma recurrence and characteristics at follow-up. Gastroenterology 1998;115:13-8. https://doi.org/10.1016/S0016-5085(98)70359-2.
- Noshirwani KC, van Stolk RU, Rybicki LA, Beck GJ. Adenoma size and number are predictive of adenoma recurrence: implications for surveillance colonoscopy. Gastrointest 2000;51:433-7. https://doi.org/10.1016/S0016-5107(00)70444-5.
- Martínez ME, Sampliner R, Marshall JR, Bhattacharyya AK, Reid ME, Alberts DS. Adenoma characteristics as risk factors for recurrence of advanced adenomas. Gastroenterology 2001;120:1077-83. https://doi.org/10.1053/gast.2001.23247.
- Winawer SJ, Zauber AG, O’Brien MJ, Ho MN, Gottlieb L, Sternberg SS, et al. Randomized comparison of surveillance intervals after colonoscopic removal of newly diagnosed adenomatous polyps. New Engl J Med 1993;328:901-6. https://doi.org/10.1056/NEJM199304013281301.
- Jørgensen OD, Kronborg O, Fenger C. A randomized surveillance study of patients with pedunculated and small sessile tubular and tubulovillous adenomas. The Funen Adenoma Follow-up Study. Scand J Gastroenterol 1995;30:686-92. https://doi.org/10.3109/00365529509096314.
- Veitch A, Rutter M. Improving quality in endoscopy: are we nearly there yet?. Frontline Gastroenterol 2015;6:127-31. https://doi.org/10.1136/flgastro-2015-100564.
- Valori R. Quality improvements in endoscopy in England. Tech Gastrointest Endosc 2012;14:63-72. https://doi.org/10.1016/j.tgie.2011.11.001.
- Morris EJ, Rutter MD, Finan PJ, Thomas JD, Valori R. Post-colonoscopy colorectal cancer (PCCRC) rates vary considerably depending on the method used to calculate them: a retrospective observational population-based study of PCCRC in the English National Health Service. Gut 2015;64:1248-56. https://doi.org/10.1136/gutjnl-2014-308362.
- National Institute for Health and Care Research . Frequency of Follow-Up for Patients With Intermediate Grade Colorectal Adenomas n.d. https://fundingawards.nihr.ac.uk/award/04/33/01 (accessed 11 March 2020).
- Atkin W, Wooldrage K, Brenner A, Martin J, Shah U, Perera S, et al. Adenoma surveillance and colorectal cancer incidence: a retrospective, multicentre, cohort study. Lancet Oncol 2017;18:823-34. https://doi.org/10.1016/S1470-2045(17)30187-0.
- Gavin DR, Valori RM, Anderson JT, Donnelly MT, Williams JG, Swarbrick ET. The national colonoscopy audit: a nationwide assessment of the quality and safety of colonoscopy in the UK. Gut 2013;62:242-9. https://doi.org/10.1136/gutjnl-2011-301848.
- Ko CW. Colonoscopy risks: what is known and what are the next steps?. Gastroenterology 2018;154:473-5. https://doi.org/10.1053/j.gastro.2018.01.010.
- Atkin W, Brenner A, Martin J, Wooldrage K, Shah U, Lucas F, et al. The clinical effectiveness of different surveillance strategies to prevent colorectal cancer in people with intermediate-grade colorectal adenomas: a retrospective cohort analysis, and psychological and economic evaluations. Health Technol Assess 2017;21. https://doi.org/10.3310/hta21250.
- World Health Organization (WHO) . International Classification of Diseases, Eighth Edition 1968.
- World Health Organization (WHO) . International Classification of Diseases, Ninth Edition 1979.
- World Health Organization (WHO) . International Classification of Diseases, Tenth Edition 1990.
- American Cancer Society . Manual of Tumor Nomenclature and Coding 1952.
- World Health Organization (WHO) . International Classification of Diseases for Oncology Revision 1 1976.
- World Health Organization (WHO) . International Classification of Diseases for Oncology Revision 2 1990.
- Lin OS. Performing colonoscopy in elderly and very elderly patients: risks, costs and benefits. World J Gastrointest Endosc 2014;6:220-6. https://doi.org/10.4253/wjge.v6.i6.220.
- Office for National Statistics . Cancer Registration Statistics, England 2007. www.ons.gov.uk/peoplepopulationandcommunity/healthandsocialcare/conditionsanddiseases/datasets/cancerregistrationstatisticscancerregistrationstatisticsengland (accessed 11 March 2020).
- Shenbagaraj L, Thomas-Gibson S, Stebbing J, Broughton R, Dron M, Johnston D, et al. Endoscopy in 2017: a national survey of practice in the UK. Frontline Gastroenterol 2019;10:7-15. https://doi.org/10.1136/flgastro-2018-100970.
- NHS Improvement . Archived Reference Costs. 2017 18 Reference Costs and Guidance n.d. https://improvement.nhs.uk/resources/reference-costs/ (accessed 11 March 2020).
- Whyte S, Chilcott J, Halloran S. Reappraisal of the options for colorectal cancer screening in England. Colorectal Dis 2012;14:e547-61. https://doi.org/10.1111/j.1463-1318.2012.03014.x.
- Scott N, Hill J, Smith J, Walker K, Kuryba A, van der Meulen J, et al. National Bowel Cancer Audit – 2013 n.d. https://digital.nhs.uk/data-and-information/publications/statistical/national-bowel-cancer-audit/national-bowel-cancer-audit-2013 (accessed 11 March 2020).
- Office for National Statistics . National Life Tables: UK 2019. www.ons.gov.uk/peoplepopulationandcommunity/birthsdeathsandmarriages/lifeexpectancies/datasets/nationallifetablesunitedkingdomreferencetables (accessed 11 June 2020).
- Downing A, Morris EJ, Richards M, Corner J, Wright P, Sebag-Montefiore D, et al. Health-related quality of life after colorectal cancer in England: a patient-reported outcomes study of individuals 12 to 36 months after diagnosis. J Clin Oncol 2015;33:616-24. https://doi.org/10.1200/JCO.2014.56.6539.
- Ara R, Brazier JE. Using health state utility values from the general population to approximate baselines in decision analytic models when condition-specific data are not available. Value 2011;14:539-45. https://doi.org/10.1016/j.jval.2010.10.029.
- Great Britain . Health and Social Care Act 2001 2001.
- Great Britain . NHS Act 2006 2006.
- Cancer Research UK . Bowel Cancer Statistics 2017.
- Aravani A, Thomas J, Day M, Forman D, Morris E, Tatarek-Gintowt R. Survival by Stage of Colorectal Cancer in England: Northern and Yorkshire Cancer Registry and Information Service. Leeds: Northern and Yorkshire Cancer Registry and Information Service; 2009.
- Murphy J, Halloran S, Gray A. Cost-effectiveness of the faecal immunochemical test at a range of positivity thresholds compared with the guaiac faecal occult blood test in the NHS Bowel Cancer Screening Programme in England. BMJ Open 2017;7. https://doi.org/10.1136/bmjopen-2017-017186.
- Whyte S, Harnan S, Scope A, Simpson E, Tappenden P, Duffy S, et al. Early Awareness Interventions for Cancer: Colorectal Cancer. Sheffield: Policy Research Unit in Economic Evaluation of Health and Care Interventions; 2012.
- Cross AJ, Wooldrage K, Robbins EC, Kralj-Hans I, MacRae E, Piggott C, et al. Faecal immunochemical tests (FIT) versus colonoscopy for surveillance after screening and polypectomy: a diagnostic accuracy and cost-effectiveness study. Gut 2019;68:1642-52. https://doi.org/10.1136/gutjnl-2018-317297.
- Rubin DB. Multiple Imputation for Nonresponse in Surveys. New York, NY: John Wiley & Sons; 2004.
- van Hout B, Janssen MF, Feng YS, Kohlmann T, Busschbach J, Golicki D, et al. Interim scoring for the EQ-5D-5L: mapping the EQ-5D-5L to EQ-5D-3L value sets. Value Health 2012;15:708-15. https://doi.org/10.1016/j.jval.2012.02.008.
- Whyte S, Thomas C, Kearns B, Webster M, Chilcott J. Optimising Bowel Cancer Screening. Phase 1: Optimising the Cost Effectiveness of Repeated FIT Screening and Screening Strategies Combining Bowel Scope and FIT Screening. Sheffield: The University of Sheffield; 2017.
- National Institute for Health and Care Excellence (NICE) . Developing NICE Guidelines: The Manual 2014. www.nice.org.uk/process/pmg20/chapter/incorporating-economic-evaluation (accessed 11 March 2020).
- Black WC. The CE plane: a graphic representation of cost-effectiveness. Med Decis Making 1990;10:212-14. https://doi.org/10.1177/0272989X9001000308.
- Fenwick E, O’Brien BJ, Briggs A. Cost-effectiveness acceptability curves – facts, fallacies and frequently asked questions. Health Econ 2004;13:405-15. https://doi.org/10.1002/hec.903.
- Rutter MD, Nickerson C, Rees CJ, Patnick J, Blanks RG. Risk factors for adverse events related to polypectomy in the English Bowel Cancer Screening Programme. Endoscopy 2014;46:90-7. https://doi.org/10.1055/s-0033-1344987.
- National Institute for Health and Care Research (NIHR) INVOLVE . National Institute for Health Research Programmes: Payment Rates for Public Involvement 2009. www.invo.org.uk/posttypepublication/national-institute-for-health-research-payment-rates-for-public-involvement/ (accessed 17 December 2020).
- Schreuders E, Sint Nicolaas J, de Jonge V, van Kooten H, Soo I, Sadowski D, et al. The appropriateness of surveillance colonoscopy intervals after polypectomy. Can J Gastroenterol 2013;27:33-8. https://doi.org/10.1155/2013/279897.
- Thomas RC, Selinger C, Rutter MD. Adherence to BSG adenoma surveillance guidelines will reduce colonoscopic workload. Gut 2005;54. https://doi.org/10.1136/gut.2004.049924.
- Saini SD, Kim HM, Schoenfeld P. Incidence of advanced adenomas at surveillance colonoscopy in patients with a personal history of colon adenomas: a meta-analysis and systematic review. Gastrointest Endosc 2006;64:614-26. https://doi.org/10.1016/j.gie.2006.06.057.
- Martínez ME, Baron JA, Lieberman DA, Schatzkin A, Lanza E, Winawer SJ, et al. A pooled analysis of advanced colorectal neoplasia diagnoses after colonoscopic polypectomy. Gastroenterology 2009;136:832-41. https://doi.org/10.1053/j.gastro.2008.12.007.
- Lee SP, Sung IK, Kim JH, Lee SY, Park HS, Shim CS. Risk factors for incomplete polyp resection during colonoscopic polypectomy. Gut Liver 2015;9:66-72. https://doi.org/10.5009/gnl13330.
- East JE, Vieth M, Rex DK. Serrated lesions in colorectal cancer screening: detection, resection, pathology and surveillance. Gut 2015;64:991-1000. https://doi.org/10.1136/gutjnl-2014-309041.
- Bowles CJ, Leicester R, Romaya C, Swarbrick E, Williamd CB, Epstein O. A prospective study of colonoscopy practice in the UK today: are we adequately prepared for national colorectal cancer screening tomorrow?. Gut 2004;53:277-83. https://doi.org/10.1136/gut.2003.016436.
- Rees CJ, Koo S, Anderson J, McAlindon M, Veitch AM, Morris AJ, et al. British society of gastroenterology Endoscopy Quality Improvement Programme (EQIP): overview and progress. Frontline Gastroenterol 2019;10:148-53. https://doi.org/10.1136/flgastro-2018-101073.
- Lee TJ, Rutter MD, Blanks RG, Moss SM, Goddard AF, Chilton A, et al. Colonoscopy quality measures: experience from the NHS Bowel Cancer Screening Programme. Gut 2012;61:1050-7. https://doi.org/10.1136/gutjnl-2011-300651.
- Rajasekhar PT, Rutter MD, Bramble MG, Wilson DW, East JE, Greenaway JR, et al. Achieving high quality colonoscopy: using graphical representation to measure performance and reset standards. Colorectal Dis 2012;14:1538-45. https://doi.org/10.1111/j.1463-1318.2012.03057.x.
- Brueckl WM, Fritsche B, Seifert B, Boxberger F, Albrecht H, Croner RS, et al. Non-compliance in surveillance for patients with previous resection of large (> or = 1 cm) colorectal adenomas. World J Gastroenterol 2006;12:7313-18. https://doi.org/10.3748/wjg.v12.i45.7313.
- Laiyemo AO, Pinsky PF, Marcus PM, Lanza E, Cross AJ, Schatzkin A, et al. Utilization and yield of surveillance colonoscopy in the continued follow-up study of the polyp prevention trial. Clin Gastroenterol Hepatol 2009;7:562-7. https://doi.org/10.1016/j.cgh.2008.12.009.
- Cottet V, Jooste V, Fournel I, Bouvier AM, Faivre J, Bonithon-Kopp C. Long-term risk of colorectal cancer after adenoma removal: a population-based cohort study. Gut 2012;61:1180-6. https://doi.org/10.1136/gutjnl-2011-300295.
- Imperiale TF, Ransohoff DF, Itzkowitz SH, Levin TR, Lavin P, Lidgard GP, et al. Multitarget stool DNA testing for colorectal-cancer screening. N Engl J Med 2014;370:1287-97. https://doi.org/10.1056/NEJMoa1311194.
Appendix 1 Supplementary information on methods
| Hospital | Reason for exclusion |
|---|---|
| Blackpool Victoria Hospital, Blackpool | Difficulties with data extraction |
| Bradford Royal Infirmary, Bradford | Difficulties with data extraction |
| Birmingham City Hospital, Birmingham | Difficulties in obtaining R&D approval |
| George Eliot Hospital, Nuneaton | Difficulties with data extraction |
| King George Hospital, Ilford | Difficulties with data extraction |
| Norfolk and Norwich University Hospital, Norwich | Missing data |
| Pinderfields Hospital, Wakefield | Missing data |
| Queen Alexandra Hospital, Portsmouth | Missing data |
| The University Hospital of North Staffordshire NHS Trust (now known as the Royal Stoke University Hospital) Stoke-on-Trent | Difficulties with data extraction |
| Stafford Hospital (now known as County Hospital), Stafford | Difficulties with data extraction |
| Category | Type |
|---|---|
| Benign lesion | Hyperplastic polyp |
| Unicryptal adenoma | |
| Adenoma | |
| Serrated adenoma | |
| Mixed polyp (hyperplastic and adenomatous features) | |
| Sessile serrated lesion | |
| Possible CRC | Possible cancer (suspicious features but might be non-adenomatous) |
| Cancer of unknown primary | |
| Cancer or adenoma with high-grade dysplasia (in dispute) | |
| CRC | Cancer |
| Cancer with remnant of adenoma | |
| Cancer with remnant of serrated adenoma | |
| Cancer with remnant of mixed adenoma | |
| Cancer with remnant of mixed/serrated adenoma | |
| Cancer with remnant of sessile serrated lesion |
| Colorectal segment | Position |
|---|---|
| Anus | 1 |
| Rectum | 2 |
| Rectosigmoid | 3 |
| Sigmoid colon | 4 |
| Descending colon | 5 |
| Splenic flexure | 6 |
| Transverse colon | 7 |
| Hepatic flexure | 8 |
| Ascending colon | 9 |
| Caecum | 10 |
| Ileum | 11 |
Appendix 2 Supplementary tables for the main clinical study
| Age/sex | Number of surveillance visits | Number of patients (%) | Number of person-years | Number of CRCs | Incidence rate per 100,000 person-years (95% CI) | Comparison of incidence in the presence and absence of surveillancea | |
|---|---|---|---|---|---|---|---|
| Multivariable adjusted HR (95% CI)b | p-valuec | ||||||
| Low-risk group | |||||||
| Age (years) | |||||||
| < 55 | Zero | 1422 (39.8) | 22,551 | 10 | 44 (24 to 82) | 1 | 0.21 |
| One or more | 2147 (60.2) | 17,872 | 11 | 62 (34 to 111) | 0.98 (0.41 to 2.32) | ||
| 55–64 | Zero | 1652 (41.4) | 23,744 | 29 | 122 (85 to 176) | 1 | |
| One or more | 2339 (58.6) | 18,377 | 17 | 93 (58 to 149) | 0.51 (0.27 to 0.94) | ||
| 65–74 | Zero | 2251 (52.9) | 24,518 | 59 | 241 (186 to 311) | 1 | |
| One or more | 2007 (47.1) | 14,280 | 17 | 119 (74 to 191) | 0.34 (0.19 to 0.58) | ||
| ≥ 75 | Zero | 1882 (72.9) | 13,779 | 45 | 327 (244 to 437) | 1 | |
| One or more | 701 (27.1) | 3782 | 7 | 185 (88 to 388) | 0.40 (0.18 to 0.89) | ||
| Sex | |||||||
| Women | Zero | 3164 (49.6) | 38,894 | 66 | 170 (133 to 216) | 1 | 0.49 |
| One or more | 3218 (50.4) | 24,443 | 26 | 106 (72 to 156) | 0.51 (0.32 to 0.82) | ||
| Men | Zero | 4043 (50.4) | 45,698 | 77 | 168 (135 to 211) | 1 | |
| One or more | 3976 (49.6) | 29,869 | 26 | 87 (59 to 128) | 0.41 (0.25 to 0.65) | ||
| Intermediate-risk group | |||||||
| Age (years) | |||||||
| < 55 | Zero | 560 (26.7) | 10,404 | 11 | 106 (59 to 191) | 1 | 0.34 |
| One | 583 (27.8) | 7410 | 7 | 94 (45 to 198) | 0.66 (0.26 to 1.72) | ||
| Two | 451 (21.5) | 4200 | 4 | 95 (36 to 254) | 0.49 (0.15 to 1.55) | ||
| Three or more | 503 (24.0) | 2980 | 6 | 201 (90 to 448) | 0.67 (0.24 to 1.89) | ||
| 55–64 | Zero | 880 (27.9) | 14,242 | 22 | 154 (102 to 235) | 1 | |
| One | 905 (28.7) | 10,529 | 17 | 161 (100 to 260) | 0.75 (0.39 to 1.42) | ||
| Two | 808 (25.6) | 5457 | 11 | 202 (112 to 364) | 0.73 (0.35 to 1.54) | ||
| Three or more | 565 (17.9) | 3303 | 2 | 61 (15 to 242) | 0.15 (0.03 to 0.65) | ||
| 65–74 | Zero | 1455 (37.2) | 17,031 | 55 | 323 (248 to 421) | 1 | |
| One | 1221 (31.2) | 11,463 | 24 | 209 (140 to 312) | 0.45 (0.28 to 0.73) | ||
| Two | 825 (21.1) | 4848 | 12 | 248 (141 to 436) | 0.45 (0.23 to 0.85) | ||
| Three or more | 414 (10.6) | 2049 | 7 | 342 (163 to 717) | 0.43 (0.19 to 0.97) | ||
| ≥ 75 | Zero | 1788 (66.7) | 12,251 | 47 | 384 (288 to 511) | 1 | |
| One | 634 (23.6) | 3881 | 14 | 361 (214 to 609) | 0.69 (0.38 to 1.26) | ||
| Two | 195 (7.3) | 972 | 4 | 411 (154 to 1096) | 0.63 (0.23 to 1.78) | ||
| Three or more | 65 (2.4) | 250 | 3 | 1202 (388 to 3727) | 1.33 (0.41 to 4.36) | ||
| Sex | |||||||
| Women | Zero | 2143 (40.7) | 25,511 | 55 | 216 (166 to 281) | 1 | 0.16 |
| One | 1532 (29.1) | 15,318 | 28 | 183 (126 to 265) | 0.71 (0.44 to 1.13) | ||
| Two | 962 (18.3) | 6718 | 12 | 179 (101 to 315) | 0.62 (0.33 to 1.19) | ||
| Three or more | 634 (12.0) | 3501 | 10 | 286 (154 to 531) | 0.79 (0.38 to 1.62) | ||
| Men | Zero | 2540 (38.6) | 28,415 | 80 | 282 (226 to 351) | 1 | |
| One | 1811 (27.5) | 17,965 | 34 | 189 (135 to 265) | 0.51 (0.33 to 0.77) | ||
| Two | 1317 (20.0) | 8759 | 19 | 217 (138 to 340) | 0.50 (0.29 to 0.84) | ||
| Three or more | 913 (13.9) | 5081 | 8 | 157 (79 to 315) | 0.26 (0.12 to 0.57) | ||
| High-risk group | |||||||
| Age (years) | |||||||
| < 55 | Zero | 62 (21.9) | 1158 | 1 | 86 (12 to 613) | 1 | 0.48 |
| One | 64 (22.6) | 944 | 3 | 318 (102 to 985) | 2.80 (0.29 to 27.02) | ||
| Two or more | 157 (55.5) | 1089 | 2 | 184 (46 to 734) | 1.32 (0.12 to 14.77) | ||
| 55–64 | Zero | 148 (19.7) | 2222 | 10 | 450 (242 to 836) | 1 | |
| One | 177 (23.6) | 2286 | 6 | 263 (118 to 584) | 0.38 (0.13 to 1.05) | ||
| Two or more | 425 (56.7) | 2574 | 4 | 155 (58 to 414) | 0.17 (0.05 to 0.57) | ||
| 65–74 | Zero | 346 (32.5) | 3516 | 16 | 455 (279 to 743) | 1 | |
| One | 275 (25.8) | 2777 | 11 | 396 (219 to 715) | 0.61 (0.28 to 1.32) | ||
| Two or more | 444 (41.7) | 2442 | 7 | 287 (137 to 601) | 0.37 (0.15 to 0.92) | ||
| ≥ 75 | Zero | 355 (57.2) | 2346 | 17 | 724 (450 to 1165) | 1 | |
| One | 179 (28.8) | 1138 | 4 | 351 (132 to 936) | 0.34 (0.11 to 1.01) | ||
| Two or more | 87 (14.0) | 469 | 3 | 640 (207 to 1985) | 0.48 (0.14 to 1.69) | ||
| Sex | |||||||
| Women | Zero | 276 (34.5) | 2880 | 15 | 521 (314 to 864) | 1 | 0.72 |
| One | 207 (25.9) | 2174 | 10 | 460 (248 to 855) | 0.62 (0.28 to 1.39) | ||
| Two or more | 316 (39.6) | 1943 | 5 | 257 (107 to 618) | 0.29 (0.10 to 0.83) | ||
| Men | Zero | 635 (33.1) | 6363 | 29 | 456 (317 to 656) | 1 | |
| One | 488 (25.4) | 4970 | 14 | 282 (167 to 476) | 0.43 (0.22 to 0.82) | ||
| Two or more | 797 (41.5) | 4630 | 11 | 238 (132 to 429) | 0.30 (0.14 to 0.63) | ||
| Variable | Risk group | ||||||||||||||
|---|---|---|---|---|---|---|---|---|---|---|---|---|---|---|---|
| Low risk | Intermediate risk | High risk | |||||||||||||
| Lower-risk subgroupa | Higher-risk subgroupa | p-value | Lower-risk subgroupb | Higher-risk subgroupb | p-value | Lower-risk subgroupc | Higher-risk subgroupc | p-value | |||||||
| n | % | n | % | n | % | n | % | n | % | n | % | ||||
| Total | 5235 | 36.4 | 9166 | 63.6 | 4738 | 40.0 | 7114 | 60.0 | 1817 | 66.8 | 902 | 33.2 | |||
| Number of surveillance visits | < 0.0001 | < 0.0001 | 0.24 | ||||||||||||
| Zero | 2804 | 53.6 | 4403 | 48.0 | 1932 | 40.8 | 2751 | 38.7 | 606 | 33.4 | 305 | 33.8 | |||
| One | 1432 | 27.4 | 2527 | 27.6 | 1387 | 29.3 | 1956 | 27.5 | 474 | 26.1 | 221 | 24.5 | |||
| Two | 661 | 12.6 | 1282 | 14.0 | 930 | 19.6 | 1349 | 19.0 | 407 | 22.4 | 186 | 20.6 | |||
| Three or more | 338 | 6.5 | 954 | 10.4 | 489 | 10.3 | 1058 | 14.9 | 330 | 18.2 | 190 | 21.1 | |||
| Sex | 0.97 | 0.050 | 0.21 | ||||||||||||
| Women | 2319 | 44.3 | 4063 | 44.3 | 2159 | 45.6 | 3112 | 43.7 | 520 | 28.6 | 279 | 30.9 | |||
| Men | 2916 | 55.7 | 5103 | 55.7 | 2579 | 54.4 | 4002 | 56.3 | 1297 | 71.4 | 623 | 69.1 | |||
| Age (years) | < 0.0001 | < 0.0001 | 0.079 | ||||||||||||
| < 55 | 1523 | 29.1 | 2046 | 22.3 | 984 | 20.8 | 1113 | 15.6 | 180 | 9.9 | 103 | 11.4 | |||
| 55–64 | 1452 | 27.7 | 2539 | 27.7 | 1310 | 27.6 | 1848 | 26.0 | 514 | 28.3 | 236 | 26.2 | |||
| 65–74 | 1442 | 27.5 | 2816 | 30.7 | 1513 | 31.9 | 2402 | 33.8 | 729 | 40.1 | 336 | 37.3 | |||
| ≥ 75 | 818 | 15.6 | 1765 | 19.3 | 931 | 19.6 | 1751 | 24.6 | 394 | 21.7 | 227 | 25.2 | |||
| Year of baseline visit | < 0.0001 | < 0.0001 | < 0.0001 | ||||||||||||
| 1984–99 | 441 | 8.4 | 1199 | 13.1 | 630 | 13.3 | 1240 | 17.4 | 175 | 9.6 | 154 | 17.1 | |||
| 2000–4 | 1761 | 33.6 | 3407 | 37.2 | 1461 | 30.8 | 2761 | 38.8 | 520 | 28.6 | 354 | 39.2 | |||
| 2005–10 | 3033 | 57.9 | 4560 | 49.7 | 2647 | 55.9 | 3113 | 43.8 | 1122 | 61.8 | 394 | 43.7 | |||
| Follow-up time (years), median (IQR) | 9.5 (7.3–11.9) | 9.6 (7.1–12.6) | 0.023 | 9.1 (7.0–11.9) | 9.2 (6.1–12.6) | 0.98d | 8.3 (6.0–10.6) | 8.5 (4.9–12.2) | 0.028d | ||||||
| Variable | Number of patients (%) | Number of person-years | Number of CRCs | Incidence rate per 100,000 person-years (95% CI) | Unadjusted HR (95% CI) | p-valuea | Multivariable adjusted HR (95% CI)b | p-valuea |
|---|---|---|---|---|---|---|---|---|
| Total | 11,719 (100) | 108,319 | 144 | 133 (113 to 157) | ||||
| Number of surveillance visitsc | < 0.0001 | 0.0001 | ||||||
| Zero | 6149 (52.5) | 69,666 | 108 | 155 (128 to 187) | 1 | 1 | ||
| One | 3222 (27.5) | 25,706 | 29 | 113 (78 to 162) | 0.54 (0.35 to 0.82) | 0.56 (0.36 to 0.85) | ||
| Two | 1515 (12.9) | 9055 | 5 | 55 (23 to 133) | 0.22 (0.09 to 0.56) | 0.24 (0.10 to 0.61) | ||
| Three or more | 833 (7.1) | 3893 | 2 | 51 (13 to 205) | 0.18 (0.04 to 0.77) | 0.20 (0.05 to 0.83) | ||
| Sex | 1.00 | 0.70 | ||||||
| Women | 5128 (43.8) | 48,698 | 65 | 133 (105 to 170) | 1 | 1 | ||
| Men | 6591 (56.2) | 59,621 | 79 | 133 (106 to 165) | 1.00 (0.72 to 1.39) | 1.07 (0.77 to 1.48) | ||
| Age (years) | < 0.0001 | < 0.0001 | ||||||
| < 55 | 2852 (24.3) | 30,666 | 14 | 46 (27 to 77) | 1 | 1 | ||
| 55–64 | 3268 (27.9) | 32,845 | 35 | 107 (77 to 148) | 2.37 (1.28 to 4.41) | 2.27 (1.22 to 4.22) | ||
| 65–74 | 3487 (29.8) | 30,653 | 60 | 196 (152 to 252) | 4.50 (2.51 to 8.07) | 4.00 (2.23 to 7.17) | ||
| ≥ 75 | 2112 (18.0) | 14,156 | 35 | 247 (178 to 344) | 6.10 (3.27 to 1.39) | 4.92 (2.62 to 9.22) | ||
| Year of baseline visit | 0.93 | 0.80 | ||||||
| 1984–99 | 941 (8.0) | 12,859 | 17 | 132 (82 to 213) | 1 | 1 | ||
| 2000–4 | 3839 (32.8) | 41,000 | 57 | 139 (107 to 180) | 1.09 (0.61 to 1.95) | 0.88 (0.49 to 1.57) | ||
| 2005–10 | 6939 (59.2) | 54,460 | 70 | 129 (102 to 162) | 1.12 (0.62 to 2.03) | 0.81 (0.45 to 1.48) | ||
| Length of baseline visit | 0.54 | 0.51 | ||||||
| 1 day | 9214 (78.6) | 85,093 | 112 | 132 (109 to 158) | 1 | 1 | ||
| 2 days to 3 months | 1118 (9.5) | 9808 | 16 | 163 (100 to 266) | 1.26 (0.74 to 2.12) | 1.33 (0.78 to 2.27) | ||
| 3–6 months | 781 (6.7) | 7455 | 11 | 148 (82 to 266) | 1.11 (0.60 to 2.07) | 1.27 (0.68 to 2.38) | ||
| ≥ 6 months | 606 (5.2) | 5963 | 5 | 84 (35 to 201) | 0.63 (0.26 to 1.54) | 0.71 (0.29 to 1.74) | ||
| Bowel preparation quality | 0.058 | 0.11 | ||||||
| Excellent or good | 3998 (34.1) | 38,324 | 66 | 172 (135 to 219) | 1 | 1 | ||
| Satisfactory | 2294 (19.6) | 19,860 | 26 | 131 (89 to 192) | 0.77 (0.49 to 1.22) | 0.74 (0.47 to 1.17) | ||
| Poor | 737 (6.3) | 5958 | 7 | 117 (56 to 246) | 0.70 (0.32 to 1.52) | 0.69 (0.31 to 1.49) | ||
| Unknown | 4690 (40.0) | 44,177 | 45 | 102 (76 to 136) | 0.59 (0.41 to 0.87) | 0.63 (0.43 to 0.92) | ||
| Number of adenomas | 0.21 | 0.55 | ||||||
| One | 9554 (81.5) | 88,674 | 112 | 126 (105 to 152) | 1 | 1 | ||
| Two | 2165 (18.5) | 19,646 | 32 | 163 (115 to 230) | 1.30 (0.88 to 1.92) | 1.13 (0.76 to 1.69) | ||
| Adenoma histology | 0.066 | 0.060 | ||||||
| Tubular | 9253 (79.0) | 85,190 | 103 | 121 (100 to 147) | 1 | 1 | ||
| Tubulovillous | 1587 (13.5) | 14,364 | 30 | 209 (146 to 299) | 1.65 (1.10 to 2.46)d | 1.67 (1.11 to 2.49)d | ||
| Villous | 124 (1.1) | 1230 | 1 | 81 (11 to 577) | 1.65 (1.10 to 2.46)d | 1.67 (1.11 to 2.49)d | ||
| Unknown | 755 (6.4) | 7536 | 10 | 133 (71 to 247) | 1.07 (0.56 to 2.06) | 1.15 (0.60 to 2.21) | ||
| Adenoma dysplasia | 0.36 | 0.38 | ||||||
| Low grade | 10,993 (93.8) | 100,640 | 132 | 131 (111 to 156) | 1 | 1 | ||
| High grade | 262 (2.2) | 2424 | 6 | 247 (111 to 551) | 1.86 (0.82 to 4.21) | 1.85 (0.81 to 4.25) | ||
| Unknown | 464 (4.0) | 5255 | 6 | 114 (51 to 254) | 0.84 (0.37 to 1.90) | 0.87 (0.38 to 2.00) | ||
| Proximal polyps | 0.0025 | 0.0050 | ||||||
| No | 6251 (53.3) | 59,177 | 61 | 103 (80 to 132) | 1 | 1 | ||
| Yes | 5468 (46.7) | 49,142 | 83 | 169 (136 to 209) | 1.66 (1.19 to 2.31) | 1.61 (1.15 to 2.24) | ||
| Hyperplastic polyps | 0.31 | 0.25 | ||||||
| No | 9318 (79.5) | 85,790 | 109 | 127 (105 to 153) | 1 | 1 | ||
| Yes | 2401 (20.5) | 22,530 | 35 | 155 (112 to 216) | 1.22 (0.83 to 1.79) | 1.26 (0.86 to 1.85) | ||
| Hyperplastic polyp ≥ 10 mm in size | 0.61 | 0.70 | ||||||
| No | 11,600 (99.0) | 107,284 | 142 | 132 (112 to 156) | 1 | 1 | ||
| Yes | 119 (1.0) | 1035 | 2 | 193 (48 to 772) | 1.48 (0.37 to 5.96) | 1.33 (0.33 to 5.39) | ||
| Family history of cancer/CRCe | 0.30 | 0.32 | ||||||
| No | 10,524 (89.8) | 95,162 | 130 | 137 (115 to 162) | 1 | 1 | ||
| Yes | 1195 (10.2) | 13,158 | 14 | 106 (63 to 180) | 0.76 (0.43 to 1.31) | 1.35 (0.76 to 2.38) | ||
| Variable | Number of patients (%) | Number of person-years | Number of CRCs | Incidence rate per 100,000 person-years (95% CI) | Unadjusted HR (95% CI) | p-valuea | Multivariable adjusted HR (95% CI)b | p-valuea |
|---|---|---|---|---|---|---|---|---|
| Total | 8967 (100) | 80,572 | 150 | 186 (159 to 218) | ||||
| Number of surveillance visitsc | 0.0041 | 0.0080 | ||||||
| Zero | 3605 (40.2) | 40,921 | 85 | 208 (168 to 257) | 1 | 1 | ||
| One | 2565 (28.6) | 24,087 | 41 | 170 (125 to 231) | 0.63 (0.43 to 0.93) | 0.64 (0.43 to 0.95) | ||
| Two | 1755 (19.6) | 10,462 | 16 | 153 (94 to 250) | 0.47 (0.27 to 0.83) | 0.50 (0.28 to 0.88) | ||
| Three or more | 1042 (11.6) | 5103 | 8 | 157 (78 to 313) | 0.36 (0.17 to 0.78) | 0.36 (0.16 to 0.79) | ||
| Sex | 0.80 | 0.38 | ||||||
| Women | 3874 (43.2) | 36,048 | 66 | 183 (144 to 233) | 1 | 1 | ||
| Men | 5093 (56.8) | 44,524 | 84 | 189 (152 to 234) | 1.04 (0.76 to 1.44) | 1.16 (0.83 to 1.61) | ||
| Age (years) | < 0.0001 | < 0.0001 | ||||||
| < 55 | 1573 (17.5) | 17,584 | 18 | 102 (64 to 162) | 1 | 1 | ||
| 55–64 | 2416 (26.9) | 24,093 | 25 | 104 (70 to 154) | 1.06 (0.58 to 1.94) | 1.04 (0.57 to 1.91) | ||
| 65–74 | 3013 (33.6) | 26,134 | 63 | 241 (188 to 309) | 2.64 (1.56 to 4.47) | 2.52 (1.48 to 4.28) | ||
| ≥ 75 | 1965 (21.9) | 12,761 | 44 | 345 (257 to 463) | 4.13 (2.36 to 7.21) | 3.49 (1.99 to 6.14) | ||
| Year of baseline visit | 0.061 | 0.020 | ||||||
| 1984–99 | 1044 (11.6) | 13,531 | 41 | 303 (223 to 412) | 1 | 1 | ||
| 2000–4 | 2805 (31.3) | 28,734 | 53 | 184 (141 to 241) | 0.63 (0.41 to 0.96) | 0.55 (0.36 to 0.86) | ||
| 2005–10 | 5118 (57.1) | 38,307 | 56 | 146 (113 to 190) | 0.59 (0.37 to 0.93) | 0.54 (0.33 to 0.86) | ||
| Length of baseline visit | 0.048 | 0.019 | ||||||
| 1 day | 5040 (56.2) | 44,805 | 67 | 150 (118 to 190) | 1 | 1 | ||
| 2 days to 3 months | 1766 (19.7) | 16,001 | 36 | 225 (162 to 312) | 1.52 (1.01 to 2.27) | 1.75 (1.16 to 2.64) | ||
| 3–6 months | 1083 (12.1) | 10,070 | 21 | 209 (136 to 320) | 1.39 (0.85 to 2.27) | 1.44 (0.88 to 2.37) | ||
| ≥ 6 months | 1078 (12.0) | 9695 | 26 | 268 (183 to 394) | 1.77 (1.13 to 2.79) | 1.79 (1.12 to 2.85) | ||
| Bowel preparation quality | 0.11 | 0.093 | ||||||
| Excellent or good | 3046 (34.0) | 27,581 | 46 | 167 (125 to 223) | 1 | 1 | ||
| Satisfactory | 1664 (18.6) | 13,640 | 28 | 205 (142 to 297) | 1.27 (0.79 to 2.03) | 1.34 (0.83 to 2.14) | ||
| Poor | 454 (5.1) | 3320 | 12 | 361 (205 to 636) | 2.24 (1.19 to 4.23) | 2.00 (1.05 to 3.78) | ||
| Unknown | 3803 (42.4) | 36,031 | 64 | 178 (139 to 227) | 1.02 (0.70 to 1.50) | 0.92 (0.62 to 1.37) | ||
| Number of adenomas | 0.24 | 0.40 | ||||||
| One | 5665 (63.2) | 52,222 | 92 | 176 (144 to 216) | 1 | 1 | ||
| Two | 2461 (27.5) | 21,306 | 48 | 225 (170 to 299) | 1.31 (0.92 to 1.86) | 1.05 (0.73 to 1.52) | ||
| Three or more | 841 (9.4) | 7044 | 10 | 142 (76 to 264) | 0.84 (0.44 to 1.62) | 0.67 (0.33 to 1.32) | ||
| Adenoma size (mm) | 0.21 | 0.21 | ||||||
| < 10 | 841 (9.4) | 7044 | 10 | 142 (76 to 264) | 1 | 1 | ||
| 10–19 | 5160 (57.5) | 46,777 | 80 | 171 (137 to 213) | 1.16 (0.60 to 2.24) | 1.43 (0.73 to 2.83) | ||
| ≥ 20 | 2966 (33.1) | 26,751 | 60 | 224 (174 to 289) | 1.52 (0.78 to 2.98) | 1.77 (0.87 to 3.57) | ||
| Adenoma histology | < 0.0001 | 0.0003 | ||||||
| Tubular | 3660 (40.8) | 33,091 | 41 | 124 (91 to 168) | 1 | 1 | ||
| Tubulovillous | 4204 (46.9) | 37,334 | 76 | 204 (163 to 255) | 1.67 (1.14 to 2.44) | 1.62 (1.10 to 2.38) | ||
| Villous | 768 (8.6) | 6812 | 15 | 220 (133 to 365) | 1.80 (1.00 to 3.25) | 1.39 (0.75 to 2.56) | ||
| Unknown | 335 (3.7) | 3334 | 18 | 540 (340 to 857) | 4.17 (2.39 to 7.28) | 4.28 (2.27 to 8.08) | ||
| Adenoma dysplasia | 0.11 | 0.20 | ||||||
| Low grade | 7251 (80.9) | 64,995 | 111 | 171 (142 to 206) | 1 | 1 | ||
| High grade | 1473 (16.4) | 12,621 | 29 | 230 (160 to 331) | 1.36 (0.90 to 2.05) | 1.23 (0.81 to 1.87) | ||
| Unknown | 243 (2.7) | 2956 | 10 | 338 (182 to 629) | 1.82 (0.95 to 3.49) | 1.80 (0.92 to 3.50) | ||
| Proximal polyps | 0.0009 | 0.0007 | ||||||
| No | 5781 (64.5) | 53,627 | 81 | 151 (121 to 188) | 1 | 1 | ||
| Yes | 3186 (35.5) | 26,945 | 69 | 256 (202 to 324) | 1.74 (1.26 to 2.40) | 1.77 (1.28 to 2.45) | ||
| Hyperplastic polyps | 0,74 | 0.66 | ||||||
| No | 7314 (81.6) | 65,673 | 121 | 184 (154 to 220) | 1 | 1 | ||
| Yes | 1653 (18.4) | 14,899 | 29 | 195 (135 to 280) | 1.07 (0.71 to 1.61) | 1.10 (0.72 to 1.67) | ||
| Hyperplastic polyp ≥ 10 mm in size | 0.63 | 0.50 | ||||||
| No | 8815 (98.3) | 79,111 | 148 | 187 (159 to 220) | 1 | 1 | ||
| Yes | 152 (1.7) | 1461 | 2 | 137 (34 to 547) | 0.73 (0.18 to 2.93) | 0.64 (0.16 to 2.59) | ||
| Family history of cancer/CRCd | 0.93 | 0.34 | ||||||
| No | 8564 (95.5) | 76,306 | 142 | 186 (158 to 219) | 1 | 1 | ||
| Yes | 403 (4.5) | 4266 | 8 | 188 (94 to 375) | 0.97 (0.48 to 1.98) | 1.45 (0.70 to 2.99) | ||
| Variable | Number of patients (%) | Number of person-years | Number of CRCs | Incidence rate per 100,000 person-years (95% CI) | Unadjusted HR (95% CI) | p-valuea | Multivariable adjusted HR (95% CI)b | p-valuea |
|---|---|---|---|---|---|---|---|---|
| Total | 2354 (100) | 19,266 | 64 | 332 (260 to 424) | ||||
| Number of surveillance visitsc | 0.012 | 0.0069 | ||||||
| Zero | 780 (33.1) | 7847 | 33 | 421 (299 to 592) | 1 | 1 | ||
| One | 623 (26.5) | 6181 | 19 | 307 (196 to 482) | 0.51 (0.29 to 0.91) | 0.50 (0.28 to 0.89) | ||
| Two | 518 (22.0) | 3303 | 7 | 212 (101 to 445) | 0.30 (0.13 to 0.70) | 0.28 (0.12 to 0.66) | ||
| Three or more | 433 (18.4) | 1935 | 5 | 258 (108 to 621) | 0.40 (0.14 to 1.09) | 0.37 (0.14 to 1.03) | ||
| Sex | 0.72 | 0.81 | ||||||
| Women | 669 (28.4) | 5648 | 20 | 354 (228 to 549) | 1 | 1 | ||
| Men | 1685 (71.6) | 13,618 | 44 | 323 (240 to 434) | 0.91 (0.54 to 1.54) | 0.94 (0.55 to 1.59) | ||
| Age (years) | 0.045 | 0.20 | ||||||
| < 55 | 224 (9.5) | 2445 | 4 | 164 (61 to 436) | 1 | 1 | ||
| 55–64 | 655 (27.8) | 5915 | 15 | 254 (153 to 421) | 1.56 (0.52 to 4.70) | 1.59 (0.53 to 4.79) | ||
| 65–74 | 942 (40.0) | 7580 | 27 | 356 (244 to 519) | 2.21 (0.77 to 6.34) | 2.13 (0.74 to 6.11) | ||
| ≥ 75 | 533 (22.6) | 3325 | 18 | 541 (341 to 859) | 3.45 (1.16 to 10.25) | 2.70 (0.90 to 8.05) | ||
| Year of baseline visit | 0.56 | 0.69 | ||||||
| 1984–99 | 221 (9.4) | 2610 | 5 | 192 (80 to 460) | 1 | 1 | ||
| 2000–4 | 685 (29.1) | 6383 | 24 | 376 (252 to 561) | 1.64 (0.63 to 4.31) | 1.50 (0.57 to 3.94) | ||
| 2005–10 | 1448 (61.5) | 10,273 | 35 | 341 (245 to 475) | 1.54 (0.59 to 4.01) | 1.41 (0.54 to 3.70) | ||
| Length of baseline visit | 0.79 | 0.96 | ||||||
| 1 day | 1021 (43.4) | 8406 | 25 | 297 (201 to 440) | 1 | 1 | ||
| 2 days to 3 months | 471 (20.0) | 3662 | 13 | 355 (206 to 611) | 1.20 (0.61 to 2.35) | 1.04 (0.53 to 2.04) | ||
| 3–6 months | 389 (16.5) | 3214 | 10 | 311 (167 to 578) | 1.05 (0.50 to 2.18) | 0.95 (0.45 to 2.00) | ||
| ≥ 6 months | 473 (20.1) | 3984 | 16 | 402 (246 to 656) | 1.37 (0.73 to 2.57) | 1.15 (0.60 to 2.20) | ||
| Bowel preparation quality | 0.64 | 0.68 | ||||||
| Excellent or good | 935 (39.7) | 7922 | 24 | 303 (203 to 452) | 1 | 1 | ||
| Satisfactory | 385 (16.4) | 2903 | 10 | 344 (185 to 640) | 1.13 (0.54 to 2.37) | 0.99 (0.47 to 2.07) | ||
| Poor | 129 (5.5) | 852 | 5 | 587 (244 to 1410) | 1.99 (0.76 to 5.21) | 1.88 (0.71 to 4.95) | ||
| Unknown | 905 (38.5) | 7588 | 25 | 329 (223 to 488) | 1.11 (0.64 to 1.95) | 1.09 (0.62 to 1.91) | ||
| Number of adenomas | 0.89 | 0.81 | ||||||
| Three | 1038 (44.1) | 8736 | 27 | 309 (212 to 451) | 1 | 1 | ||
| Four | 496 (21.1) | 4016 | 13 | 324 (188 to 557) | 1.05 (0.54 to 2.04) | 1.09 (0.56 to 2.12) | ||
| Five | 400 (17.0) | 3180 | 13 | 409 (237 to 704) | 1.31 (0.67 to 2.53) | 1.39 (0.72 to 2.71) | ||
| Six or more | 420 (17.8) | 3333 | 11 | 330 (183 to 596) | 1.07 (0.53 to 2.16) | 1.17 (0.57 to 2.37) | ||
| Adenoma size (mm) | 0.38 | 0.78 | ||||||
| < 10 | 225 (9.6) | 1893 | 5 | 264 (110 to 635) | 1 | 1 | ||
| 10–19 | 1168 (49.6) | 9566 | 28 | 293 (202 to 424) | 1.12 (0.43 to 2.90) | 0.99 (0.38 to 2.57) | ||
| ≥ 20 | 947 (40.2) | 7683 | 31 | 403 (284 to 574) | 1.55 (0.60 to 3.98) | 1.19 (0.45 to 3.14) | ||
| Unknown | 14 (0.6) | 123 | 0 | 0 | n/a | n/a | ||
| Adenoma histology | 0.24 | 0.49 | ||||||
| Tubular | 886 (37.6) | 7379 | 22 | 298 (196 to 453) | 1 | 1 | ||
| Tubulovillous | 1151 (48.9) | 9278 | 30 | 323 (226 to 462) | 1.10 (0.63 to 1.91) | 0.99 (0.57 to 1.73) | ||
| Villous | 277 (11.8) | 2197 | 12 | 546 (310 to 962) | 1.85 (0.92 to 3.74) | 1.49 (0.72 to 3.07) | ||
| Unknown | 40 (1.7) | 411 | 0 | 0 | n/a | n/a | ||
| Adenoma dysplasia | 0.0010 | 0.0005 | ||||||
| Low grade | 1783 (75.7) | 14,680 | 38 | 259 (188 to 356) | 1 | 1 | ||
| High grade | 537 (22.8) | 4234 | 26 | 614 (418 to 902) | 2.40 (1.46 to 3.95) | 2.51 (1.52 to 4.14) | ||
| Unknown | 34 (1.4) | 352 | 0 | 0 | n/a | n/a | ||
| Proximal polyps | 0.29 | 0.18 | ||||||
| No | 465 (19.8) | 3982 | 10 | 251 (135 to 467) | 1 | 1 | ||
| Yes | 1889 (80.3) | 15,284 | 54 | 353 (271 to 461) | 1.42 (0.72 to 2.79) | 1.56 (0.79 to 3.07) | ||
| Hyperplastic polyps | 0.32 | 0.22 | ||||||
| No | 1670 (70.9) | 13,503 | 41 | 304 (224 to 412) | 1 | 1 | ||
| Yes | 684 (29.1) | 5763 | 23 | 399 (265 to 601) | 1.30 (0.78 to 2.17) | 1.38 (0.83 to 2.31) | ||
| Hyperplastic polyp ≥ 10 mm in size | 0.82 | 0.78 | ||||||
| No | 2290 (97.3) | 18,752 | 62 | 331 (258 to 424) | 1 | 1 | ||
| Yes | 64 (2.7) | 514 | 2 | 389 (97 to 1555) | 1.18 (0.29 to 4.83) | 1.23 (0.30 to 5.04) | ||
| Family history of cancer/CRCd | 0.18 | 0.29 | ||||||
| No | 2269 (96.4) | 18,389 | 63 | 343 (268 to 439) | 1 | 1 | ||
| Yes | 85 (3.6) | 876 | 1 | 114 (16 to 810) | 1.33 (0.05 to 2.39) | 0.40 (0.06 to 2.90) | ||
| Risk group/subgroup | Number of patients (%) | Number of person-years | Number of CRCs | Incidence rate per 100,000 person-years (95% CI) | Comparison of incidence in the presence and absence of surveillancea | |
|---|---|---|---|---|---|---|
| Unadjusted HR (95% CI) | p-valueb | |||||
| Low-risk group | ||||||
| Whole risk group | < 0.0001 | |||||
| Zero visits | 6149 (52.5) | 69,666 | 108 | 155 (128 to 187) | 1 | |
| One visit | 3222 (27.5) | 25,706 | 29 | 113 (78 to 162) | 0.54 (0.35 to 0.82) | |
| Two or more visits | 2348 (20.0) | 12,948 | 7 | 54 (26 to 113) | 0.21 (0.10 to 0.47) | |
| Total | 11,719 (100) | 108,319 | 144 | 133 (113 to 157) | ||
| Higher-risk subgroupc | < 0.0001 | |||||
| Zero visits | 3345 (51.6) | 36,763 | 77 | 209 (168 to 262) | 1 | |
| One visit | 1790 (27.6) | 14,296 | 21 | 147 (96 to 225) | 0.50 (0.31 to 0.83) | |
| Two or more visits | 1349 (20.8) | 7475 | 4 | 54 (20 to 143) | 0.14 (0.05 to 0.39) | |
| Total | 6484 (55.3) | 58,534 | 102 | 174 (144 to 212) | ||
| Lower-risk subgroupc | 0.15 | |||||
| Zero visits | 2804 (53.6) | 32,903 | 31 | 94 (66 to 134) | 1 | |
| One visit | 1432 (27.4) | 11,410 | 8 | 70 (35 to 140) | 0.54 (0.25 to 1.20) | |
| Two or more visits | 999 (19.1) | 5472 | 3 | 55 (18 to 170) | 0.42 (0.12 to 1.48) | |
| Total | 5235 (44.7) | 49,785 | 42 | 84 (62 to 114) | ||
| Intermediate-risk group | ||||||
| Whole risk group | 0.0016 | |||||
| Zero visits | 3605 (40.2) | 40,921 | 85 | 208 (168 to 257) | 1 | |
| One visit | 2565 (28.6) | 24,087 | 41 | 170 (125 to 231) | 0.63 (0.43 to 0.93) | |
| Two or more visits | 2797 (31.2) | 15,565 | 24 | 154 (103 to 230) | 0.43 (0.26 to 0.71) | |
| Total | 8967 (100) | 80,572 | 150 | 186 (159 to 218) | ||
| Higher-risk subgroupd | 0.0006 | |||||
| Zero visits | 1673 (39.6) | 17,684 | 52 | 294 (224 to 386) | 1 | |
| One visit | 1178 (27.9) | 10,936 | 25 | 229 (154 to 338) | 0.58 (0.35 to 0.96) | |
| Two or more visits | 1378 (32.6) | 7482 | 11 | 147 (81 to 265) | 0.28 (0.14 to 0.56) | |
| Total | 4229 (47.2) | 36,102 | 88 | 244 (198 to 300) | ||
| Lower-risk subgroupd | 0.30 | |||||
| Zero visits | 1932 (40.8) | 23,237 | 33 | 142 (101 to 200) | 1 | |
| One visit | 1387 (29.3) | 13,151 | 16 | 122 (75 to 199) | 0.66 (0.35 to 1.23) | |
| Two or more visits | 1419 (30.0) | 8082 | 13 | 161 (93 to 277) | 0.63 (0.31 to 1.29) | |
| Total | 4738 (52.8) | 44,470 | 62 | 139 (109 to 179) | ||
| High-risk group | ||||||
| Whole risk group | 0.0046 | |||||
| Zero visits | 780 (33.1) | 17,847 | 33 | 421 (299 to 592) | 1 | |
| One visit | 623 (26.5) | 6181 | 19 | 307 (196 to 482) | 0.51 (0.29 to 0.91) | |
| Two or more visits | 951 (40.4) | 5238 | 12 | 229 (130 to 403) | 0.33 (0.16 to 0.68) | |
| Total | 2354 (100) | 19,266 | 64 | 332 (260 to 424) | ||
| Higher-risk subgroupe | 0.0030 | |||||
| Zero visits | 174 (32.4) | 1620 | 16 | 987 (605 to 1612) | 1 | |
| One visit | 149 (27.8) | 1414 | 7 | 495 (236 to 1038) | 0.34 (0.14 to 0.85) | |
| Two or more visits | 214 (39.9) | 1199 | 3 | 250 (81 to 776) | 0.15 (0.04 to 0.56) | |
| Total | 537 (22.8) | 4234 | 26 | 614 (418 to 902) | ||
| Lower-risk subgroupe | 0.26 | |||||
| Zero visits | 606 (33.4) | 6226 | 17 | 273 (170 to 439) | 1 | |
| One visit | 474 (26.1) | 4766 | 12 | 252 (143 to 443) | 0.66 (0.31 to 1.41) | |
| Two or more visits | 737 (40.6) | 4039 | 9 | 223 (116 to 428) | 0.49 (0.20 to 1.18) | |
| Total | 1817 (77.2) | 15,032 | 38 | 253 (184 to 347) | ||
| Risk group/subgroup | Number of patients (%) | Number of person-years | 3 years | 5 years | 10 years | p-valuea | Number of observed CRCsb | Number of expected CRCsc | SIR (95% CI) | |||
|---|---|---|---|---|---|---|---|---|---|---|---|---|
| Number of CRCs | Cumulative incidence, % (95% CI) | Number of CRCs | Cumulative incidence, % (95% CI) | Number of CRCs | Cumulative incidence, % (95% CI) | |||||||
| Low-risk group | ||||||||||||
| After baseline, with no surveillanced | < 0.0001 | |||||||||||
| Whole risk group | 11,719 (100) | 69,666 | 29 | 0.3 (0.2 to 0.4) | 52 | 0.6 (0.5 to 0.8) | 92 | 1.6 (1.3 to 2.1) | 108 | 137 | 0.79 (0.65 to 0.95) | |
| Higher-risk subgroupe | 6484 (55) | 36,763 | 23 | 0.4 (0.3 to 0.7) | 41 | 0.9 (0.7 to 1.2) | 63 | 2.1 (1.6 to 2.7) | 77 | 77 | 1.00 (0.79 to 1.26) | |
| Lower-risk subgroupe | 5235 (45) | 32,903 | 6 | 0.1 (0.1 to 0.3) | 11 | 0.3 (0.2 to 0.5) | 29 | 1.2 (0.8 to 1.7) | 31 | 60 | 0.51 (0.35 to 0.73) | |
| After first surveillance, with one surveillance visitf | 0.066 | |||||||||||
| Whole risk group | 5570 (100) | 25,706 | 12 | 0.3 (0.2 to 0.5) | 20 | 0.5 (0.3 to 0.8) | 28 | 1.4 (0.8 to 2.4) | 29 | 51 | 0.57 (0.38 to 0.82) | |
| Higher-risk subgroupe | 3139 (56) | 14,296 | 7 | 0.3 (0.1 to 0.6) | 13 | 0.6 (0.4 to 1.1) | 20 | 2.1 (1.1 to 3.9) | 21 | 30 | 0.70 (0.44 to 1.08) | |
| Lower-risk subgroupe | 2431 (44) | 11,410 | 5 | 0.2 (0.1 to 0.6) | 7 | 0.4 (0.2 to 0.8) | 8 | 0.6 (0.2 to 1.4) | 8 | 21 | 0.38 (0.16 to 0.74) | |
| After second surveillance, with two or more surveillance visitsg | 0.97 | |||||||||||
| Whole risk group | 2348 (100) | 12,948 | 0 | 1 | 0.1 (0.0 to 0.6) | 5 | 0.8 (0.3 to 1.9) | 7 | 27 | 0.26 (0.10 to 0.53) | ||
| Higher-risk subgroupe | 1349 (57) | 7475 | 0 | 1 | 0.2 (0.0 to 1.1) | 3 | 0.8 (0.2 to 2.6) | 4 | 17 | 0.24 (0.07 to 0.62) | ||
| Lower-risk subgroupe | 999 (43) | 5472 | 0 | 0 | 2 | 0.7 (0.2 to 3.0) | 3 | 10 | 0.29 (0.06 to 0.84) | |||
| Intermediate-risk group | ||||||||||||
| After baseline, with no surveillanced | 0.0004 | |||||||||||
| Whole risk group | 8967 (100) | 40,921 | 35 | 0.5 (0.4 to 0.7) | 55 | 1.1 (0.8 to 1.4) | 74 | 2.1 (1.6 to 2.7) | 85 | 88 | 0.97 (0.77 to 1.19) | |
| Higher-risk subgrouph | 4229 (47) | 17,684 | 22 | 0.7 (0.5 to 1.1) | 35 | 1.5 (1.1 to 2.2) | 47 | 3.1 (2.2 to 4.4) | 52 | 41 | 1.27 (0.95 to 1.66) | |
| Lower-risk subgrouph | 4738 (53) | 23,237 | 13 | 0.4 (0.2 to 0.6) | 20 | 0.7 (0.4 to 1.1) | 27 | 1.3 (0.8 to 2.1) | 33 | 47 | 0.70 (0.48 to 0.99) | |
| After first surveillance, with one surveillance visitf | 0.028 | |||||||||||
| Whole risk group | 5362 (100) | 24,087 | 10 | 0.2 (0.1 to 0.4) | 22 | 0.8 (0.5 to 1.2) | 39 | 2.9 (2.0 to 4.3) | 41 | 53 | 0.77 (0.55 to 1.05) | |
| Higher-risk subgrouph | 2556 (48) | 10,936 | 7 | 0.4 (0.2 to 0.7) | 14 | 1.1 (0.6 to 1.8) | 24 | 4.3 (2.6 to 7.3) | 25 | 26 | 0.96 (0.62 to 1.42) | |
| Lower-risk subgrouph | 2806 (52) | 13,151 | 3 | 0.1 (0.04 to 0.4) | 8 | 0.5 (0.2 to 1.0) | 15 | 1.9 (1.0 to 3.4) | 16 | 27 | 0.59 (0.34 to 0.96) | |
| After second surveillance, with two or more surveillance visitsg | 0.99 | |||||||||||
| Whole risk group | 2797 (100) | 15,565 | 6 | 0.3 (0.1 to 0.6) | 10 | 0.5 (0.3 to 1.0) | 18 | 1.7 (1.0 to 2.8) | 24 | 36 | 0.66 (0.42 to 0.98) | |
| Higher-risk subgrouph | 1378 (49) | 7482 | 3 | 0.3 (0.1 to 0.8) | 4 | 0.4 (0.1 to 1.0) | 8 | 1.7 (0.8 to 3.7) | 11 | 18 | 0.61 (0.30 to 1.09) | |
| Lower-risk subgrouph | 1419 (51) | 8082 | 3 | 0.3 (0.1 to 0.8) | 6 | 0.6 (0.3 to 1.5) | 10 | 1.7 (0.8 to 3.3) | 13 | 18 | 0.72 (0.38 to 1.22) | |
| High-risk group | ||||||||||||
| After baseline, with no surveillanced | < 0.0001 | |||||||||||
| Whole risk group | 2354 (100) | 7847 | 13 | 0.9 (0.5–1.6) | 23 | 2.6 (1.7 to 4.0) | 32 | 5.8 (3.8 to 8.9) | 33 | 20 | 1.68 (1.15 to 2.35) | |
| Higher-risk subgroupi | 537 (23) | 1620 | 6 | 2.1 (0.9 to 4.8) | 10 | 5.4 (2.7 to 10.4) | 15 | 14.4 (7.8 to 25.7) | 16 | 4 | 3.76 (2.15 to 6.11) | |
| Lower-risk subgroupi | 1817 (77) | 6226 | 7 | 0.6 (0.3 to 1.4) | 13 | 1.9 (1.0 to 3.4) | 17 | 3.8 (2.1 to 6.8) | 17 | 15 | 1.10 (0.64 to 1.76) | |
| After first surveillance, with one surveillance visitf | 0.12 | |||||||||||
| Whole risk group | 1574 (100) | 6181 | 8 | 0.6 (0.3 to 1.3) | 15 | 2.0 (1.2 to 3.5) | 18 | 4.4 (2.1 to 8.9) | 19 | 16 | 1.21 (0.73 to 1.89) | |
| Higher-risk subgroupi | 363 (23) | 1414 | 3 | 1.1 (0.3 to 3.2) | 7 | 4.5 (2.0 to 9.7) | 7 | 4.5 (2.0 to 9.7) | 7 | 4 | 1.82 (0.73 to 3.75) | |
| Lower-risk subgroupi | 1211 (77) | 4766 | 5 | 0.5 (0.2 to 1.3) | 8 | 1.3 (0.6 to 2.9) | 11 | 4.4 (1.8 to 10.6) | 12 | 12 | 1.01 (0.52 to 1.76) | |
| After second surveillance, with two or more surveillance visitsg | 0.91 | |||||||||||
| Whole risk group | 951 (100) | 5238 | 2 | 0.3 (0.1 to 1.0) | 7 | 1.1 (0.5 to 2.3) | 12 | 2.8 (1.5 to 5.2) | 12 | 14 | 0.85 (0.44 to 1.48) | |
| Higher-risk subgroupi | 214 (23) | 1199 | 1 | 0.5 (0.1 to 3.6) | 1 | 0.5 (0.1 to 3.6) | 3 | 3.7 (1.0 to 13.2) | 3 | 3 | 0.88 (0.18 to 2.58) | |
| Lower-risk subgroupi | 737 (78) | 4039 | 1 | 0.2 (0.02 to 1.2) | 6 | 1.3 (0.6 to 2.8) | 9 | 2.4 (1.2 to 4.7) | 9 | 11 | 0.83 (0.38 to 1.58) | |
| Interval length to first surveillance | AAsa | CRC | ||||||||||||||
|---|---|---|---|---|---|---|---|---|---|---|---|---|---|---|---|---|
| Lower-risk subgroupb | Higher-risk subgroupb | Lower-risk subgroupb | Higher-risk subgroupb | |||||||||||||
| Patients attending one or more surveillance visits | Detection rate | Patients attending one or more surveillance visits | Detection rate | Patients attending one or more surveillance visits | Detection rate | Patients attending one or more surveillance visits | Detection rate | |||||||||
| n | % | n | % | n | % | n | % | n | % | n | % | n | % | n | % | |
| Low-risk group | ||||||||||||||||
| < 18 months | 326 | 14.0 | 9 | 2.8 | 521 | 17.1 | 23 | 4.4 | 328 | 13.9 | 2 | 0.6 | 527 | 17.0 | 6 | 1.1 |
| 2 yearsc | 369 | 15.9 | 13 | 3.5 | 470 | 15.4 | 29 | 6.2 | 372 | 15.8 | 3 | 0.8 | 480 | 15.4 | 10 | 2.1 |
| 3 yearsc | 588 | 25.3 | 28 | 4.8 | 853 | 28.0 | 61 | 7.2 | 590 | 25.1 | 2 | 0.3 | 868 | 27.9 | 15 | 1.7 |
| 4 yearsc | 309 | 13.3 | 22 | 7.1 | 365 | 12.0 | 31 | 8.5 | 313 | 13.3 | 4 | 1.3 | 372 | 12.0 | 7 | 1.9 |
| 5 yearsc | 430 | 18.5 | 28 | 6.5 | 494 | 16.2 | 43 | 8.7 | 435 | 18.5 | 5 | 1.1 | 499 | 16.1 | 5 | 1.0 |
| 6 yearsc | 162 | 7.0 | 17 | 10.5 | 176 | 5.8 | 14 | 8.0 | 165 | 7.0 | 3 | 1.8 | 179 | 5.8 | 3 | 1.7 |
| 7 yearsc | 86 | 3.7 | 8 | 9.3 | 104 | 3.4 | 14 | 13.5 | 86 | 3.7 | 0 | 0.0 | 110 | 3.5 | 6 | 5.5 |
| 8 yearsc | 57 | 2.4 | 4 | 7.0 | 66 | 2.2 | 9 | 13.6 | 65 | 2.8 | 8 | 12.3 | 72 | 2.3 | 6 | 8.3 |
| Total | 2327 | 100 | 129 | 5.5 | 3049 | 100 | 224 | 7.3 | 2354 | 100 | 27 | 1.1 | 3107 | 100 | 58 | 1.9 |
| p-valued | < 0.0001 | < 0.0001 | < 0.0001 | 0.0067 | ||||||||||||
| OR (95% CI) for higher vs. lower risk; p-valuee | 1.35 (1.08 to 1.69); 0.0077 | 1.64 (1.04 to 2.60); 0.0307 | ||||||||||||||
| Intermediate-risk group | ||||||||||||||||
| < 18 months | 642 | 24.0 | 35 | 5.5 | 804 | 32.0 | 64 | 8.0 | 645 | 23.9 | 3 | 0.5 | 817 | 32.0 | 13 | 1.6 |
| 2 yearsc | 399 | 14.9 | 24 | 6.0 | 432 | 17.2 | 42 | 9.7 | 407 | 15.1 | 8 | 2.0 | 437 | 17.1 | 5 | 1.1 |
| 3 yearsc | 1024 | 38.2 | 68 | 6.6 | 801 | 31.9 | 93 | 11.6 | 1029 | 38.1 | 5 | 0.5 | 807 | 31.6 | 6 | 0.7 |
| 4 yearsc | 255 | 9.5 | 29 | 11.4 | 225 | 9.0 | 18 | 8.0 | 256 | 9.5 | 1 | 0.4 | 234 | 9.2 | 9 | 3.8 |
| 5 yearsc | 241 | 9.0 | 20 | 8.3 | 172 | 6.9 | 28 | 16.3 | 247 | 9.1 | 6 | 2.4 | 178 | 7.0 | 6 | 3.4 |
| 6 yearsc | 117 | 4.4 | 15 | 12.8 | 76 | 3.0 | 8 | 10.5 | 118 | 4.4 | 1 | 0.8 | 78 | 3.1 | 2 | 2.6 |
| Total | 2678 | 100 | 191 | 7.1 | 2510 | 100 | 253 | 10.1 | 2702 | 100 | 24 | 0.9 | 2551 | 100 | 41 | 1.6 |
| p-valued | 0.0007 | 0.0093 | 0.28 | 0.064 | ||||||||||||
| OR (95% CI) for higher vs. lower risk; p-valuee | 1.46 (1.20 to 1.78); 0.0001 | 1.82 (1.10 to 3.03); 0.0180 | ||||||||||||||
| High-risk group | ||||||||||||||||
| < 15 months | 513 | 47.5 | 76 | 14.8 | 150 | 44.8 | 24 | 16.0 | 516 | 47.4 | 3 | 0.6 | 153 | 44.7 | 3 | 2.0 |
| 1.5 yearsf | 161 | 14.9 | 23 | 14.3 | 77 | 23.0 | 8 | 10.4 | 161 | 14.8 | 0 | 0.0 | 77 | 22.5 | 0 | 0 |
| 2 yearsf | 104 | 9.6 | 11 | 10.6 | 35 | 10.4 | 5 | 14.3 | 107 | 9.8 | 3 | 2.8 | 37 | 10.8 | 2 | 5.4 |
| 2.5 yearsf | 47 | 4.4 | 9 | 19.1 | 20 | 6.0 | 5 | 25.0 | 48 | 4.4 | 1 | 2.1 | 20 | 5.8 | 0 | 0 |
| 3 yearsf | 184 | 17.0 | 35 | 19.0 | 38 | 11.3 | 9 | 23.7 | 185 | 17.0 | 1 | 0.5 | 39 | 11.4 | 1 | 2.6 |
| 3.5 yearsf | 71 | 6.6 | 9 | 12.7 | 15 | 4.5 | 2 | 13.3 | 72 | 6.6 | 1 | 1.4 | 16 | 4.7 | 1 | 6.3 |
| Total | 1080 | 100 | 163 | 15.1 | 335 | 100 | 53 | 15.8 | 1089 | 100 | 9 | 0.8 | 342 | 100 | 7 | 2.0 |
| p-valued | 0.46 | 0.51 | 0.38 | 0.35 | ||||||||||||
| OR (95% CI) for higher-risk vs. lower-risk; p-valuee | 1.06 (0.75 to 1.48); 0.75 | 2.51 (0.93 to 6.78); 0.080 | ||||||||||||||
| Variable | Number of patients (%) | Number of person-years | Number of CRCs | Incidence rate per 100,000 person-years (95% CI) | Unadjusted HR (95% CI) | p-valuea | Multivariable adjusted HR (95% CI)b | p-valuea |
|---|---|---|---|---|---|---|---|---|
| Total | 14,401 (100.0) | 138,903 | 189 | 136 (118 to 157) | ||||
| Number of surveillance visitsc | < 0.0001 | < 0.0001 | ||||||
| Zero | 7207 (50.0) | 84,591 | 139 | 164 (139 to 194) | 1 | 1 | ||
| One | 3959 (27.5) | 34,507 | 39 | 113 (83 to 155) | 0.53 (0.37 to 0.77) | 0.54 (0.38 to 0.79) | ||
| Two | 1943 (13.5) | 12,986 | 8 | 62 (31 to 123) | 0.26 (0.12 to 0.54) | 0.27 (0.13 to 0.57) | ||
| Three or more | 1292 (9.0) | 6818 | 3 | 44 (14 to 136) | 0.17 (0.05 to 0.57) | 0.18 (0.06 to 0.59) | ||
| Sex | 0.50 | 0.77 | ||||||
| Women | 6382 (44.3) | 63,337 | 91 | 144 (117 to 176) | 1 | 1 | ||
| Men | 8019 (55.7) | 75,567 | 98 | 130 (106 to 158) | 0.91 (0.68 to 1.21) | 0.96 (0.72 to 1.27) | ||
| Age (years) | < 0.0001 | < 0.0001 | ||||||
| < 55 | 3569 (24.8) | 40,422 | 21 | 52 (34 to 80) | 1 | 1 | ||
| 55–64 | 3991 (27.7) | 42,121 | 43 | 102 (76 to 138) | 1.98 (1.18 to 3.34) | 1.93 (1.14 to 3.25) | ||
| 65–74 | 4258 (29.6) | 38,799 | 76 | 196 (156 to 245) | 3.88 (2.39 to 6.29) | 3.54 (2.18 to 5.75) | ||
| ≥ 75 | 2583 (17.9) | 17,561 | 49 | 279 (211 to 369) | 5.81 (3.47 to 9.72) | 4.79 (2.85 to 8.04) | ||
| Year of baseline visit | 0.80 | 0.57 | ||||||
| 1984–99 | 1640 (11.4) | 23,185 | 30 | 129 (90 to 185) | 1 | 1 | ||
| 2000–4 | 5168 (35.9) | 56,134 | 83 | 148 (119 to 183) | 1.10 (0.71 to 1.71) | 0.96 (0.61 to 1.50) | ||
| 2005–10 | 7593 (52.7) | 59,585 | 76 | 128 (102 to 160) | 0.99 (0.63 to 1.58) | 0.81 (0.50 to 1.32) | ||
| Length of baseline visit | 0.84 | 0.71 | ||||||
| 1 day | 11,354 (78.8) | 110,143 | 148 | 134 (114 to 158) | 1 | 1 | ||
| 2 days to 3 months | 1373 (9.5) | 12,314 | 18 | 146 (92 to 232) | 1.10 (0.67 to 1.79) | 1.14 (0.69 to 1.87) | ||
| 3–6 months | 950 (6.6) | 9309 | 15 | 161 (97 to 267) | 1.19 (0.70 to 2.03) | 1.36 (0.80 to 2.33) | ||
| ≥ 6 months | 724 (5.0) | 7137 | 8 | 112 (56 to 224) | 0.83 (0.41 to 1.69) | 0.96 (0.47 to 1.97) | ||
| Colonoscopy completeness | 0.36 | 0.0672 | ||||||
| Complete | 11,719 (81.4) | 108,319 | 142 | 131 (111 to 155) | 1 | 1 | ||
| Incomplete | 1140 (7.9) | 10,674 | 25 | 234 (158 to 347) | 1.17 (0.84 to 1.64)d | 1.39 (0.99 to 1.95)d | ||
| Unknown | 1542 (10.7) | 19,910 | 22 | 110 (73 to 168) | 1.17 (0.84 to 1.64)d | 1.39 (0.99 to 1.95)d | ||
| Bowel preparation quality | 0.0782 | 0.18 | ||||||
| Excellent or good | 5145 (35.7) | 52,129 | 84 | 161 (130 to 200) | 1 | 1 | ||
| Satisfactory | 2540 (17.6) | 22,051 | 30 | 136 (95 to 195) | 0.85 (0.56 to 1.29) | 0.81 (0.53 to 1.23) | ||
| Poor | 968 (6.7) | 7970 | 14 | 176 (104 to 297) | 1.10 (0.63 to 1.94) | 1.02 (0.58 to 1.81) | ||
| Unknown | 5748 (39.9) | 56,754 | 61 | 107 (84 to 138) | 0.67 (0.48 to 0.93) | 0.71 (0.51 to 0.98) | ||
| Number of adenomas | 0.21 | 0.54 | ||||||
| One | 11,762 (81.7) | 113,729 | 148 | 130 (111 to 153) | 1 | 1 | ||
| Two | 2639 (18.3) | 25,175 | 41 | 163 (120 to 221) | 1.25 (0.89 to 1.77) | 1.12 (0.79 to 1.59) | ||
| Adenoma histology | 0.0744 | 0.0446 | ||||||
| Tubular | 11,138 (77.3) | 107,018 | 132 | 123 (104 to 146) | 1 | 1 | ||
| Tubulovillous | 2113 (14.7) | 20,130 | 38 | 189 (137 to 259) | 1.47 (1.03 to 2.10)e | 1.50 (1.05 to 2.15)e | ||
| Villous | 190 (1.3) | 1906 | 2 | 105 (26 to 420) | 1.47 (1.03 to 2.10)e | 1.50 (1.05 to 2.15)e | ||
| Unknown | 960 (6.7) | 9849 | 17 | 173 (107 to 278) | 1.39 (0.84 to 2.30) | 1.52 (0.92 to 2.52) | ||
| Adenoma dysplasia | 0.38 | 0.40 | ||||||
| Low grade | 13,242 (92.0) | 125,812 | 168 | 134 (115 to 155) | 1 | 1 | ||
| High grade | 357 (2.5) | 3469 | 8 | 231 (115 to 461) | 1.72 (0.85 to 3.49) | 1.69 (0.82 to 3.48) | ||
| Unknown | 802 (5.6) | 9623 | 13 | 135 (78 to 233) | 0.99 (0.56 to 1.74) | 0.94 (0.53 to 1.69) | ||
| Proximal polyps | 0.0019 | 0.0013 | ||||||
| No | 8133 (56.5) | 80,118 | 88 | 110 (89 to 135) | 1 | 1 | ||
| Yes | 6268 (43.5) | 58,785 | 101 | 172 (141 to 209) | 1.57 (1.18 to 2.09) | 1.62 (1.21 to 2.17) | ||
| Hyperplastic polyps | 0.24 | 0.12 | ||||||
| No | 11,535 (80.1) | 110,804 | 144 | 130 (110 to 153) | 1 | 1 | ||
| Yes | 2866 (19.9) | 28,099 | 45 | 160 (120 to 214) | 1.23 (0.88 to 1.72) | 1.31 (0.94 to 1.85) | ||
| Hyperplastic polyp ≥ 10 mm in size | 0.82 | 0.84 | ||||||
| No | 14,263 (99.0) | 137,656 | 187 | 136 (118 to 157) | 1 | 1 | ||
| Yes | 138 (1.0) | 1247 | 2 | 160 (40 to 641) | 1.18 (0.29 to 4.75) | 1.16 (0.29 to 4.67) | ||
| Family history of cancer/CRCf | 0.13 | 0.48 | ||||||
| No | 12,936 (89.8) | 121,702 | 172 | 141 (122 to 164) | 1 | 1 | ||
| Yes | 1465 (10.2) | 17,201 | 17 | 99 (61 to 159) | 0.69 (0.42 to 1.14) | 1.21 (0.72 to 2.03) | ||
| Variable | Number of patients (%) | Number of person-years | Number of CRCs | Incidence rate per 100,000 person-years (95% CI) | Unadjusted HR (95% CI) | p-valuea | Multivariable adjusted HR (95% CI)b | p-valuea |
|---|---|---|---|---|---|---|---|---|
| Total | 11,852 (100.0) | 111,270 | 217 | |||||
| Number of surveillance visitsc | 0.0053 | 0.0113 | ||||||
| Zero | 4683 (39.5) | 53,927 | 111 | 206 (171 to 248) | 1 | 1 | ||
| One | 3343 (28.2) | 33,284 | 59 | 177 (137 to 229) | 0.64 (0.46 to 0.89) | 0.65 (0.47 to 0.91) | ||
| Two | 2279 (19.2) | 15,477 | 29 | 187 (130 to 270) | 0.55 (0.36 to 0.86) | 0.59 (0.38 to 0.92) | ||
| Three or more | 1547 (13.1) | 8582 | 18 | 210 (132 to 333) | 0.49 (0.28 to 0.84) | 0.48 (0.27 to 0.84) | ||
| Sex | 0.0948 | 0.0215 | ||||||
| Women | 5271 (44.5) | 51,049 | 88 | 172 (140 to 212) | 1 | 1 | ||
| Men | 6581 (55.5) | 60,221 | 129 | 214 (180 to 255) | 1.26 (0.96 to 1.65) | 1.38 (1.05 to 1.82) | ||
| Age (years) | < 0.0001 | < 0.0001 | ||||||
| < 55 | 2097 (17.7) | 24,995 | 27 | 108 (74 to 158) | 1 | 1 | ||
| 55–64 | 3158 (26.6) | 33,530 | 47 | 140 (105 to 187) | 1.36 (0.85 to 2.19) | 1.33 (0.83 to 2.14) | ||
| 65–74 | 3915 (33.0) | 35,391 | 89 | 251 (204 to 310) | 2.64 (1.71 to 4.08) | 2.55 (1.65 to 3.95) | ||
| ≥ 75 | 2682 (22.6) | 17,354 | 54 | 311 (238 to 406) | 3.67 (2.29 to 5.88) | 3.20 (1.98 to 5.18) | ||
| Year of baseline visit | 0.0332 | 0.0676 | ||||||
| 1984–99 | 1870 (15.8) | 25,329 | 73 | 288 (229 to 363) | 1 | 1 | ||
| 2000–4 | 4222 (35.6) | 42,957 | 82 | 191 (154 to 237) | 0.69 (0.50 to 0.97) | 0.68 (0.48 to 0.96) | ||
| 2005–10 | 5760 (48.6) | 42,983 | 62 | 144 (112 to 185) | 0.62 (0.42 to 0.90) | 0.67 (0.44 to 1.00) | ||
| Length of baseline visit | 0.14 | 0.0547 | ||||||
| 1 day | 6697 (56.5) | 63,453 | 108 | 170 (141 to 206) | 1 | 1 | ||
| 2 days to 3 months | 2343 (19.8) | 21,669 | 50 | 231 (175 to 304) | 1.38 (0.99 to 1.94) | 1.52 (1.08 to 2.14) | ||
| 3–6 months | 1403 (11.8) | 13,277 | 28 | 211 (146 to 305) | 1.25 (0.83 to 1.90) | 1.30 (0.85 to 1.98) | ||
| ≥ 6 months | 1409 (11.9) | 12,871 | 31 | 241 (169 to 342) | 1.43 (0.96 to 2.13) | 1.50 (1.00 to 2.25) | ||
| Colonoscopy completeness | 0.0014 | 0.0024 | ||||||
| Complete | 8967 (75.7) | 80,572 | 131 | 163 (137 to 193) | 1 | 1 | ||
| Incomplete | 1321 (11.2) | 11,545 | 44 | 381 (284 to 512) | 1.58 (1.20 to 2.09)d | 1.59 (1.18 to 2.15)d | ||
| Unknown | 1564 (13.2) | 19,152 | 42 | 219 (162 to 297) | 1.58 (1.20 to 2.09)d | 1.59 (1.18 to 2.15)d | ||
| Bowel preparation quality | 0.14 | 0.18 | ||||||
| Excellent or good | 3974 (33.5) | 37,493 | 65 | 173 (136 to 221) | 1 | 1 | ||
| Satisfactory | 1903 (16.1) | 15,451 | 30 | 194 (136 to 278) | 1.19 (0.77 to 1.84) | 1.36 (0.88 to 2.12) | ||
| Poor | 660 (5.6) | 4840 | 16 | 331 (203 to 540) | 1.99 (1.15 to 3.45) | 1.77 (1.02 to 3.07) | ||
| Unknown | 5315 (44.8) | 53,485 | 106 | 198 (164 to 240) | 1.10 (0.81 to 1.50) | 1.09 (0.79 to 1.49) | ||
| Number of adenomas | 0.67 | 0.36 | ||||||
| One | 7793 (65.8) | 74,791 | 147 | 197 (167 to 231) | 1 | 1 | ||
| Two | 3053 (25.8) | 27,502 | 56 | 204 (157 to 265) | 1.07 (0.78 to 1.45) | 0.93 (0.67 to 1.29) | ||
| Three or four | 1006 (8.5) | 8977 | 14 | 156 (92 to 263) | 0.82 (0.48 to 1.42) | 0.67 (0.38 to 1.19) | ||
| Adenoma size (mm) | 0.22 | 0.28 | ||||||
| < 10 | 1006 (8.5) | 8977 | 14 | 156 (92 to 263) | 1 | 1 | ||
| 10–19 | 6802 (57.4) | 64,716 | 118 | 182 (152 to 218) | 1.14 (0.65 to 1.98) | 1.39 (0.79 to 2.46) | ||
| ≥ 20 | 4044 (34.1) | 37,577 | 85 | 226 (183 to 280) | 1.41 (0.80 to 2.49) | 1.57 (0.87 to 2.85) | ||
| Adenoma histology | 0.0003 | 0.0300 | ||||||
| Tubular | 4694 (39.6) | 44,369 | 69 | 156 (123 to 197) | 1 | 1 | ||
| Tubulovillous | 5537 (46.7) | 51,211 | 99 | 193 (159 to 235) | 1.26 (0.92 to 1.71) | 1.18 (0.86 to 1.61) | ||
| Villous | 1134 (9.6) | 10,108 | 22 | 218 (143 to 331) | 1.42 (0.88 to 2.29) | 1.11 (0.67 to 1.83) | ||
| Unknown | 487 (4.1) | 5581 | 27 | 484 (332 to 705) | 2.92 (1.86 to 4.58) | 2.38 (1.37 to 4.12) | ||
| Adenoma dysplasia | 0.0017 | 0.0134 | ||||||
| Low grade | 9399 (79.3) | 87,581 | 150 | 171 (146 to 201) | 1 | 1 | ||
| High grade | 1979 (16.7) | 17,402 | 41 | 236 (173 to 320) | 1.39 (0.98 to 1.96) | 1.28 (0.90 to 1.82) | ||
| Unknown | 474 (4.0) | 6287 | 26 | 414 (282 to 607) | 2.18 (1.42 to 3.33) | 1.94 (1.25 to 3.02) | ||
| Proximal polyps | 0.0161 | 0.0023 | ||||||
| No | 8254 (69.6) | 79,798 | 141 | 177 (150 to 208) | 1 | 1 | ||
| Yes | 3598 (30.4) | 31,471 | 76 | 241 (193 to 302) | 1.42 (1.07 to 1.88) | 1.58 (1.19 to 2.12) | ||
| Hyperplastic polyps | 0.75 | 0.56 | ||||||
| No | 9793 (82.6) | 91,902 | 178 | 194 (167 to 224) | 1 | 1 | ||
| Yes | 2059 (17.4) | 19,367 | 39 | 201 (147 to 276) | 1.06 (0.75 to 1.50) | 1.11 (0.78 to 1.59) | ||
| Hyperplastic polyp ≥ 10 mm in size | 0.81 | 0.84 | ||||||
| No | 11,668 (98.4) | 109,499 | 214 | 195 (171 to 223) | 1 | 1 | ||
| Yes | 184 (1.6) | 1771 | 3 | 169 (55 to 525) | 0.87 (0.28 to 2.73) | 0.89 (0.28 to 2.79) | ||
| Family history of cancer/CRCe | 0.33 | 0.94 | ||||||
| No | 11,366 (95.9) | 105,842 | 209 | 197 (172 to 226) | 1 | 1 | ||
| Yes | 486 (4.1) | 5428 | 8 | 147 (74 to 295) | 0.72 (0.35 to 1.46) | 1.03 (0.50 to 2.11) | ||
| Variable | Number of patients (%) | Number of person-years | Number of CRCs | Incidence rate per 100,000 person-years (95% CI) | Unadjusted HR (95% CI) | p-valuea | Multivariable adjusted HR (95% CI)b | p-valuea |
|---|---|---|---|---|---|---|---|---|
| Total | 2719 (100.0) | 22,961 | 77 | 335 (268 to 419) | ||||
| Number of surveillance visitsc | 0.0006 | 0.0003 | ||||||
| Zero | 911 (33.5) | 9243 | 40 | 433 (317 to 590) | 1 | 1 | ||
| One | 695 (25.6) | 7144 | 23 | 322 (214 to 484) | 0.49 (0.29 to 0.83) | 0.48 (0.28 to 0.81) | ||
| Two | 593 (21.8) | 4018 | 8 | 199 (100 to 398) | 0.26 (0.12 to 0.57) | 0.24 (0.11 to 0.53) | ||
| Three or more | 520 (19.1) | 2555 | 6 | 235 (105 to 523) | 0.30 (0.12 to 0.77) | 0.28 (0.11 to 0.72) | ||
| Sex | 0.56 | 0.85 | ||||||
| Women | 799 (29.4) | 6997 | 26 | 372 (253 to 546) | 1 | 1 | ||
| Men | 1920 (70.6) | 15,963 | 51 | 319 (243 to 420) | 0.87 (0.54 to 1.39) | 0.95 (0.59 to 1.53) | ||
| Age (years) | 0.012 | 0.0844 | ||||||
| < 55 | 283 (10.4) | 3191 | 5 | 157 (65 to 376) | 1 | 1 | ||
| 55–64 | 750 (27.6) | 7082 | 19 | 268 (171 to 421) | 1.76 (0.65 to 4.70) | 1.94 (0.72 to 5.23) | ||
| 65–74 | 1065 (39.2) | 8735 | 31 | 355 (250 to 505) | 2.37 (0.92 to 6.12) | 2.41 (0.93 to 6.22) | ||
| ≥ 75 | 621 (22.8) | 3953 | 22 | 557 (366 to 845) | 3.87 (1.46 to 10.29) | 3.08 (1.15 to 8.20) | ||
| Year of baseline visit | 0.38 | 0.31 | ||||||
| 1984–99 | 329 (12.1) | 3948 | 9 | 228 (119 to 438) | 1 | 1 | ||
| 2000–4 | 874 (32.1) | 8250 | 30 | 364 (254 to 520) | 1.63 (0.75 to 3.56) | 1.66 (0.75 to 3.68) | ||
| 2005–10 | 1516 (55.8) | 10,762 | 38 | 353 (257 to 485) | 1.66 (0.75 to 3.68) | 1.85 (0.80 to 4.24) | ||
| Length of baseline visit | 0.76 | 0.98 | ||||||
| 1 day | 1184 (43.5) | 10,106 | 30 | 297 (208 to 425) | 1 | 1 | ||
| 2 days to 3 months | 562 (20.7) | 4556 | 17 | 373 (232 to 600) | 1.25 (0.69 to 2.27) | 1.06 (0.58 to 1.93) | ||
| 3–6 months | 442 (16.3) | 3738 | 12 | 321 (182 to 565) | 1.08 (0.55 to 2.10) | 0.99 (0.50 to 1.95) | ||
| ≥ 6 months | 531 (19.5) | 4561 | 18 | 395 (249 to 626) | 1.34 (0.75 to 2.40) | 1.13 (0.61 to 2.07) | ||
| Colonoscopy completeness | 0.0984 | 0.0730 | ||||||
| Complete | 2354 (86.6) | 19,266 | 59 | 306 (237 to 395) | 1 | 1 | ||
| Incomplete | 123 (4.5) | 1009 | 6 | 595 (267 to 1324) | 1.60 (0.94 to 2.72)d | 1.67 (0.98 to 2.86)d | ||
| Unknown | 242 (8.9) | 2686 | 12 | 447 (254 to 787) | 1.60 (0.94 to 2.72)d | 1.67 (0.98 to 2.86)d | ||
| Bowel preparation quality | 0.80 | 0.82 | ||||||
| Excellent or good | 1119 (41.2) | 9788 | 32 | 327 (231 to 462) | 1 | 1 | ||
| Satisfactory | 411 (15.1) | 3106 | 11 | 354 (196 to 640) | 1.09 (0.55 to 2.17) | 1.02 (0.51 to 2.04) | ||
| Poor | 143 (5.3) | 980 | 5 | 510 (212 to 1226) | 1.61 (0.63 to 4.13) | 1.54 (0.60 to 3.98) | ||
| Unknown | 1046 (38.5) | 9086 | 29 | 319 (222 to 459) | 0.98 (0.59 to 1.61) | 0.94 (0.57 to 1.56) | ||
| Number of adenomas | 0.53 | 0.37 | ||||||
| Three | 1227 (45.1) | 10,577 | 33 | 312 (222 to 439) | 1 | 1 | ||
| Four | 557 (20.5) | 4704 | 13 | 276 (160 to 476) | 0.89 (0.47 to 1.69) | 0.94 (0.49 to 1.79) | ||
| Five | 454 (16.7) | 3697 | 17 | 460 (286 to 740) | 1.47 (0.82 to 2.64) | 1.58 (0.88 to 2.85) | ||
| Six or more | 481 (17.7) | 3983 | 14 | 351 (208 to 593) | 1.14 (0.61 to 2.12) | 1.36 (0.72 to 2.56) | ||
| Adenoma size (mm) | 0.44 | 0.83 | ||||||
| < 10 | 264 (9.7) | 2374 | 5 | 211 (88 to 506) | 1 | 1 | ||
| 10–19 | 1344 (49.4) | 11,361 | 35 | 308 (221 to 429) | 1.46 (0.57 to 3.74) | 1.25 (0.49 to 3.20) | ||
| ≥ 20 | 1084 (39.9) | 8951 | 36 | 402 (290 to 558) | 1.92 (0.75 to 4.89) | 1.48 (0.57 to 3.86) | ||
| Unknown | 27 (1.0) | 275 | 1 | 364 (51 to 2585) | 1.68 (0.20 to 14.38) | 1.45 (0.17 to 12.65) | ||
| Adenoma histology | 0.60 | 0.84 | ||||||
| Tubular | 1038 (38.2) | 8994 | 30 | 334 (233 to 477) | 1 | 1 | ||
| Tubulovillous | 1293 (47.6) | 10,701 | 34 | 318 (227 to 445) | 0.97 (0.59 to 1.58) | 0.87 (0.53 to 1.44) | ||
| Villous | 328 (12.1) | 2648 | 12 | 453 (257 to 798) | 1.38 (0.70 to 2.69) | 1.07 (0.54 to 2.14) | ||
| Unknown | 60 (2.2) | 619 | 1 | 162 (23 to 1147) | 0.47 (0.06 to 3.49) | 0.55 (0.07 to 4.15) | ||
| Adenoma dysplasia | 0.0058 | 0.0020 | ||||||
| Low grade | 2035 (74.8) | 17,109 | 47 | 275 (206 to 366) | 1 | 1 | ||
| High grade | 616 (22.7) | 5080 | 29 | 571 (397 to 821) | 2.09 (1.31 to 3.31) | 2.21 (1.39 to 3.51) | ||
| Unknown | 68 (2.5) | 772 | 1 | 130 (18 to 919) | 0.47 (0.07 to 3.44) | 0.38 (0.05 to 2.78) | ||
| Proximal polyps | 0.99 | 0.45 | ||||||
| No | 663 (24.4) | 5934 | 20 | 337 (217 to 522) | 1 | 1 | ||
| Yes | 2056 (75.6) | 17,027 | 57 | 335 (258 to 434) | 1.00 (0.60 to 1.67) | 1.22 (0.72 to 2.08) | ||
| Hyperplastic polyps | 0.25 | 0.13 | ||||||
| No | 1929 (70.9) | 16,037 | 49 | 306 (231 to 404) | 1 | 1 | ||
| Yes | 790 (29.1) | 6923 | 28 | 404 (279 to 586) | 1.32 (0.83 to 2.10) | 1.44 (0.90 to 2.30) | ||
| Hyperplastic polyp ≥ 10 mm in size | 0.95 | 0.82 | ||||||
| No | 2650 (97.5) | 22,388 | 75 | 335 (267 to 420) | 1 | 1 | ||
| Yes | 69 (2.5) | 573 | 2 | 349 (87 to 1395) | 1.04 (0.26 to 4.25) | 1.18 (0.29 to 4.82) | ||
| Family history of cancer/CRCe | ||||||||
| No | 2621 (96.4) | 21,902 | 83 | 379 (306 to 470) | ||||
| Yes | 98 (3.6) | 1059 | 0 | 0 | ||||
| Interval length to first surveillance | AAsa | CRC | ||||||||||||||
|---|---|---|---|---|---|---|---|---|---|---|---|---|---|---|---|---|
| Lower-risk subgroupb | Higher-risk subgroupb | Lower-risk subgroupb | Higher-risk subgroupb | |||||||||||||
| Patients attending one or more surveillance visits | Detection rate | Patients attending one or more surveillance visits | Detection rate | Patients attending one or more surveillance visits | Detection rate | Patients attending one or more surveillance visits | Detection rate | |||||||||
| n | % | n | % | n | % | n | % | n | % | n | % | n | % | n | % | |
| Low-risk group | ||||||||||||||||
| < 18 months | 326 | 14.0 | 9 | 2.8 | 803 | 17.4 | 56 | 7.0 | 328 | 13.9 | 2 | 0.6 | 814 | 17.3 | 11 | 1.4 |
| 2 yearsc | 369 | 15.9 | 13 | 3.5 | 726 | 15.7 | 50 | 6.9 | 372 | 15.8 | 3 | 0.8 | 743 | 15.8 | 17 | 2.3 |
| 3 yearsc | 588 | 25.3 | 28 | 4.8 | 1284 | 27.8 | 85 | 6.6 | 590 | 25.1 | 2 | 0.3 | 1303 | 27.7 | 19 | 1.5 |
| 4 yearsc | 309 | 13.3 | 22 | 7.1 | 616 | 13.3 | 53 | 8.6 | 313 | 13.3 | 4 | 1.3 | 627 | 13.3 | 11 | 1.8 |
| 5 yearsc | 430 | 18.5 | 28 | 6.5 | 667 | 14.4 | 68 | 10.2 | 435 | 18.5 | 5 | 1.1 | 675 | 14.3 | 8 | 1.2 |
| 6 yearsc | 162 | 7.0 | 17 | 10.5 | 279 | 6.0 | 20 | 7.2 | 165 | 7.0 | 3 | 1.8 | 283 | 6.0 | 4 | 1.4 |
| 7 yearsc | 86 | 3.7 | 8 | 9.3 | 143 | 3.1 | 21 | 14.7 | 86 | 3.7 | 0 | 0.0 | 150 | 3.2 | 7 | 4.7 |
| 8 yearsc | 57 | 2.4 | 4 | 7.0 | 104 | 2.3 | 14 | 13.5 | 65 | 2.8 | 8 | 12.3 | 113 | 2.4 | 9 | 8.0 |
| Total | 2327 | 100 | 129 | 5.5 | 4622 | 100 | 367 | 7.9 | 2354 | 100 | 27 | 1.1 | 4708 | 100 | 86 | 1.8 |
| p-valued | < 0.0001 | 0.0002 | < 0.0001 | 0.0072 | ||||||||||||
| OR (95% CI) for higher vs. lower risk; p-valuee | 1.35 (1.08 to 1.69); 0.0077 | 1.60 (1.04 to 2.48); 0.0273 | ||||||||||||||
| Intermediate-risk group | ||||||||||||||||
| < 18 months | 642 | 24.0 | 35 | 5.5 | 1311 | 31.0 | 118 | 9.0 | 645 | 23.9 | 3 | 0.5 | 1330 | 30.9 | 19 | 1.4 |
| 2 yearsc | 401 | 14.9 | 24 | 6.0 | 819 | 19.3 | 83 | 10.1 | 407 | 15.1 | 6 | 1.5 | 827 | 19.2 | 8 | 1.0 |
| 3 yearsc | 1024 | 38.2 | 68 | 6.6 | 1195 | 28.2 | 136 | 11.4 | 1029 | 38.1 | 5 | 0.5 | 1203 | 28.0 | 8 | 0.7 |
| 4 yearsc | 255 | 9.5 | 29 | 11.4 | 428 | 10.1 | 43 | 10.0 | 256 | 9.5 | 1 | 0.4 | 442 | 10.3 | 14 | 3.2 |
| 5 yearsc | 244 | 9.1 | 20 | 8.2 | 313 | 7.4 | 55 | 17.6 | 247 | 9.1 | 3 | 1.2 | 320 | 7.4 | 7 | 2.2 |
| 6 yearsc | 117 | 4.4 | 15 | 12.8 | 169 | 4.0 | 23 | 13.6 | 118 | 4.4 | 1 | 0.8 | 176 | 4.1 | 7 | 4.0 |
| Total | 2683 | 100 | 191 | 7.1 | 4235 | 100 | 458 | 10.8 | 2702 | 100 | 19 | 0.7 | 4298 | 100 | 63 | 1.5 |
| p-valued | 0.0007 | 0.0002 | 0.72 | 0.0063 | ||||||||||||
| OR (95% CI) for higher vs. lower risk; p-valuee | 1.58 (1.33 to 1.89); < 0.0001 | 2.10 (1.25 to 3.52); 0.0028 | ||||||||||||||
| High-risk group | ||||||||||||||||
| < 15 months | 516 | 47.6 | 76 | 14.7 | 222 | 40.8 | 34 | 15.3 | 516 | 47.4 | 0 | 0 | 226 | 40.6 | 4 | 1.8 |
| 1.5 yearsf | 161 | 14.9 | 23 | 14.3 | 127 | 23.3 | 13 | 10.2 | 161 | 14.8 | 0 | 0 | 127 | 22.8 | 0 | 0 |
| 2 yearsf | 104 | 9.6 | 11 | 10.6 | 66 | 12.2 | 8 | 12.1 | 107 | 9.8 | 3 | 2.8 | 69 | 12.4 | 3 | 4.3 |
| 2.5 yearsf | 47 | 4.3 | 9 | 19.1 | 38 | 7.0 | 8 | 21.1 | 48 | 4.4 | 1 | 2.1 | 39 | 7.0 | 1 | 2.6 |
| 3 yearsf | 184 | 17.0 | 35 | 19.0 | 62 | 11.4 | 10 | 16.1 | 185 | 17.0 | 1 | 0.5 | 65 | 11.7 | 3 | 4.6 |
| 3.5 yearsf | 71 | 6.6 | 9 | 12.7 | 29 | 5.3 | 5 | 17.2 | 72 | 6.6 | 1 | 1.4 | 31 | 5.6 | 2 | 6.5 |
| Total | 1083 | 100 | 163 | 15.1 | 544 | 100 | 78 | 14.3 | 1089 | 100 | 6 | 0.6 | 557 | 100 | 13 | 2.3 |
| p-valued | 0.44 | 0.53 | 0.035 | 0.030 | ||||||||||||
| OR (95% CI) for higher vs. lower risk; p-valuee | 0.94 (0.71 to 1.27); 0.70 | 4.31 (1.63 to 11.41); 0.0020 | ||||||||||||||
| Visits | Number of patients (%) | Number of person-years | Number of CRCs | Incidence rate per 100,000 person-years (95% CI) | Comparison of incidence in the presence and absence of surveillancea | |
|---|---|---|---|---|---|---|
| Unadjusted HR (95% CI) | p-valueb | |||||
| Whole intermediate-risk group | 0.0001 | |||||
| Zero | 4683 (39.5) | 53,927 | 135 | 250 (211 to 296) | 1 | |
| One | 3343 (28.2) | 33,284 | 62 | 186 (145 to 239) | 0.58 (0.42 to 0.79) | |
| Two or more | 3826 (32.3) | 24,059 | 49 | 204 (154 to 269) | 0.50 (0.34 to 0.73) | |
| Total | 11,852 (100) | 111,270 | 246 | 221 (195 to 251) | ||
| Higher-risk subgroupc | 0.0001 | |||||
| Zero | 3387 (38.6) | 38,286 | 117 | 306 (255 to 366) | 1 | |
| One | 2446 (27.9) | 24,957 | 54 | 216 (166 to 283) | 0.54 (0.39 to 0.76) | |
| Two or more | 2948 (33.6) | 19,167 | 45 | 235 (175 to 314) | 0.48 (0.32 to 0.71) | |
| Total | 8781 (74.1) | 82,411 | 216 | 262 (229 to 299) | ||
| Lower-risk subgroupc | 0.22 | |||||
| Zero | 1296 (42.2) | 15,641 | 18 | 115 (73 to 183) | 1 | |
| One | 897 (29.2) | 8327 | 8 | 96 (48 to 192) | 0.66 (0.28 to 1.60) | |
| Two or more | 878 (28.6) | 4892 | 4 | 82 (31 to 218) | 0.37 (0.11 to 1.21) | |
| Total | 3071 (25.9) | 28,859 | 30 | 104 (73 to 149) | ||
| Risk group/subgroup | Number of patients (%) | Number of person-years | 3 years | 5 years | 10 years | p-valuea | Number of observed CRCsb | Number of expected CRCsc | SIR (95% CI) | |||
|---|---|---|---|---|---|---|---|---|---|---|---|---|
| Number of CRCs | Cumulative incidence, % (95% CI) | Number of CRCs | Cumulative incidence, % (95% CI) | Number of CRCs | Cumulative incidence, % (95% CI) | |||||||
| After baseline, with no surveillanced | < 0.0001 | |||||||||||
| Whole intermediate-risk group | 11,852 (100.0) | 53,927 | 57 | 0.6 (0.5 to 0.8) | 88 | 1.3 (1.0 to 1.6) | 121 | 2.6 (2.1 to 3.3) | 135 | 117 | 1.16 (0.97 to 1.37) | |
| Higher-risk subgroupe | 8781 (74.1) | 38,286 | 49 | 0.7 (0.6 to 1.0) | 78 | 1.6 (1.3 to 2.1) | 107 | 3.3 (2.6 to 4.2) | 117 | 85 | 1.37 (1.13 to 1.64) | |
| Lower-risk subgroupe | 3071 (25.9) | 15,641 | 8 | 0.3 (0.2 to 0.7) | 10 | 0.5 (0.2 to 0.9) | 14 | 1.0 (0.5 to 2.0) | 18 | 31 | 0.58 (0.34 to 0.91) | |
| After first surveillance, with one surveillance visitf | 0.0296 | |||||||||||
| Whole intermediate-risk group | 7169 (100.0) | 33,284 | 17 | 0.3 (0.2 to 0.5) | 34 | 0.8 (0.6 to 1.2) | 57 | 2.6 (1.9 to 3.6) | 62 | 73 | 0.85 (0.65 to 1.08) | |
| Higher-risk subgroupe | 5394 (75.2) | 24,957 | 15 | 0.3 (0.2 to 0.6) | 30 | 1.0 (0.7 to 1.4) | 50 | 3.1 (2.2 to 4.4) | 54 | 56 | 0.96 (0.72 to 1.25) | |
| Lower-risk subgroupe | 1775 (24.8) | 8327 | 2 | 0.1 (0.03 to 0.5) | 4 | 0.4 (0.1 to 1.0) | 7 | 1.1 (0.5 to 2.6) | 8 | 17 | 0.47 (0.20 to 0.93) | |
| After second surveillance, with two or more surveillance visitsg | 0.0477 | |||||||||||
| Whole intermediate-risk group | 3826 (100.0) | 24,059 | 10 | 0.3 (0.2 to 0.6) | 19 | 0.7 (0.4 to 1.1) | 36 | 2.0 (1.4 to 2.9) | 49 | 56 | 0.87 (0.65 to 1.16) | |
| Higher-risk subgroupe | 2948 (77.1) | 19,167 | 9 | 0.3 (0.2 to 0.7) | 17 | 0.8 (0.5 to 1.2) | 32 | 2.2 (1.5 to 3.2) | 45 | 45 | 1.00 (0.73 to 1.34) | |
| Lower-risk subgroupe | 878 (22.9) | 4892 | 1 | 0.2 (0.02 to 1.2) | 2 | 0.4 (0.1 to 1.4) | 4 | 1.3 (0.4 to 3.9) | 4 | 11 | 0.36 (0.10 to 0.93) | |
| Interval length to first surveillance | AAsa | CRC | ||||||||||||||
|---|---|---|---|---|---|---|---|---|---|---|---|---|---|---|---|---|
| Lower-risk subgroupb | Higher-risk subgroupb | Lower-risk subgroupb | Higher-risk subgroupb | |||||||||||||
| Patients attending one or more surveillance visits | Detection rate | Patients attending one or more surveillance visits | Detection rate | Patients attending one or more surveillance visits | Detection rate | Patients attending one or more surveillance visits | Detection rate | |||||||||
| n | % | n | % | n | % | n | % | n | % | n | % | n | % | n | % | |
| < 18 months | 353 | 21.1 | 22 | 6.2 | 1600 | 30.5 | 131 | 8.2 | 354 | 21.0 | 1 | 0.3 | 1621 | 30.5 | 21 | 1.3 |
| 2 yearsc | 224 | 13.4 | 14 | 6.2 | 996 | 19.0 | 93 | 9.3 | 227 | 13.5 | 3 | 1.3 | 1007 | 18.9 | 11 | 1.1 |
| 3 yearsc | 684 | 40.8 | 37 | 5.4 | 1535 | 29.3 | 167 | 10.9 | 687 | 40.8 | 3 | 0.4 | 1545 | 29.1 | 10 | 0.6 |
| 4 yearsc | 162 | 9.7 | 18 | 11.1 | 521 | 9.9 | 54 | 10.4 | 163 | 9.7 | 1 | 0.6 | 535 | 10.1 | 14 | 2.6 |
| 5 yearsc | 178 | 10.6 | 16 | 9.0 | 379 | 7.2 | 59 | 15.6 | 179 | 10.6 | 1 | 0.6 | 388 | 7.3 | 9 | 2.3 |
| 6 yearsc | 74 | 4.4 | 7 | 9.5 | 212 | 4.0 | 31 | 14.6 | 75 | 4.5 | 1 | 1.3 | 219 | 4.1 | 7 | 3.2 |
| Total | 1675 | 100 | 114 | 6.8 | 5243 | 100 | 535 | 10.2 | 1685 | 100 | 10 | 0.6 | 5315 | 100 | 72 | 1.4 |
| p-valued | 0.067 | < 0.0001 | 0.62 | 0.0093 | ||||||||||||
| OR (95% CI) for higher vs. lower risk; p-valuee | 1.56 (1.26 to 1.92); < 0.0001 | 2.30 (1.18 to 4.47); 0.0065 | ||||||||||||||
| Interval length to first surveillance | AAsa | CRC | ||||||||||||||
|---|---|---|---|---|---|---|---|---|---|---|---|---|---|---|---|---|
| Lower-risk subgroupb | Higher-risk subgroupb | Lower-risk subgroupb | Higher-risk subgroupb | |||||||||||||
| Patients attending one or more surveillance visits | Detection rate | Patients attending one or more surveillance visits | Detection rate | Patients attending one or more surveillance visits | Detection rate | Patients attending one or more surveillance visits | Detection rate | |||||||||
| n | % | n | % | n | % | n | % | n | % | n | % | n | % | n | % | |
| < 18 months | 326 | 14.9 | 9 | 2.8 | 802 | 18.3 | 56 | 7.0 | 328 | 14.9 | 2 | 0.6 | 814 | 18.3 | 12 | 1.5 |
| 2 yearsc | 369 | 16.9 | 13 | 3.5 | 725 | 16.7 | 50 | 6.9 | 372 | 16.9 | 3 | 0.8 | 743 | 16.7 | 18 | 2.4 |
| 3 yearsc | 588 | 26.9 | 28 | 4.8 | 1282 | 29.3 | 85 | 6.6 | 590 | 26.8 | 2 | 0.3 | 1303 | 29.3 | 21 | 1.6 |
| 4 yearsc | 309 | 14.1 | 22 | 7.1 | 616 | 14.1 | 53 | 8.6 | 313 | 14.2 | 4 | 1.3 | 627 | 14.1 | 11 | 1.8 |
| 5 yearsc | 430 | 19.7 | 28 | 6.5 | 667 | 15.3 | 68 | 10.2 | 435 | 19.7 | 5 | 1.1 | 675 | 15.2 | 8 | 1.2 |
| 6 yearsc | 162 | 7.4 | 17 | 10.5 | 279 | 6.4 | 20 | 7.2 | 165 | 7.5 | 3 | 1.8 | 283 | 6.4 | 4 | 1.4 |
| Total | 2184 | 100 | 117 | 5.4 | 4371 | 100 | 332 | 7.6 | 2203 | 100 | 19 | 0.9 | 4445 | 100 | 74 | 1.7 |
| p-valued | < 0.0001 | 0.045 | 0.11 | 0.40 | ||||||||||||
| OR (95% CI) for higher vs. lower risk; p-valuee | 1.45 (1.17 to 1.80); 0.0006 | 1.95 (1.17 to 3.23); 0.0063 | ||||||||||||||
| Variable | Risk group | |||||
|---|---|---|---|---|---|---|
| Low risk | Intermediate risk | High risk | ||||
| Multivariable adjusted HR (95% CI)a | p-valueb | Multivariable adjusted HR (95% CI)c | p-valueb | Multivariable adjusted HR (95% CI)d | p-valueb | |
| Number of surveillance visitse | < 0.0001 | 0.0003 | 0.0002 | |||
| Zero | 1 | 1 | 1 | |||
| One | 0.54 (0.38 to 0.78) | 0.57 (0.41 to 0.78) | 0.46 (0.27 to 0.77) | |||
| Two | 0.26 (0.12 to 0.54) | 0.53 (0.35 to 0.82) | 0.25 (0.12 to 0.53) | |||
| Three or more | 0.18 (0.05 to 0.59) | 0.41 (0.24 to 0.72) | 0.25 (0.10 to 0.64) | |||
| Sex | 0.97 | 0.058 | 0.58 | |||
| Women | 1 | 1 | 1 | |||
| Men | 0.99 (0.75 to 1.32) | 1.28 (0.99 to 1.66) | 0.88 (0.56 to 1.38) | |||
| Age (years) | < 0.0001 | < 0.0001 | 0.071 | |||
| < 55 | 1 | 1 | 1 | |||
| 55–64 | 2.01 (1.20 to 3.38) | 1.41 (0.89 to 2.23) | 1.78 (0.71 to 4.48) | |||
| 65–74 | 3.44 (2.12 to 5.60) | 2.61 (1.70 to 4.00) | 2.27 (0.94 to 5.46) | |||
| ≥ 75 | 4.72 (2.82 to 7.90) | 3.64 (2.30 to 5.76) | 2.92 (1.18 to 7.23) | |||
| Year of baseline visit | 0.14 | 0.010 | 0.51 | |||
| 1984–99 | 1 | 1 | 1 | |||
| 2000–4 | 0.80 (0.51 to 1.25) | 0.63 (0.45 to 0.88) | 1.50 (0.69 to 3.24) | |||
| 2005–10 | 0.62 (0.38 to 1.02) | 0.56 (0.38 to 0.83) | 1.56 (0.70 to 3.51) | |||
| Length of baseline visit | 0.83 | 0.018 | 0.92 | |||
| 1 day | 1 | 1 | 1 | |||
| 2 days to 3 months | 1.03 (0.63 to 1.69) | 1.62 (1.18 to 2.24) | 0.93 (0.51 to 1.70) | |||
| 3–6 months | 1.26 (0.74 to 2.13) | 1.31 (0.88 to 1.95) | 0.87 (0.44 to 1.72) | |||
| ≥ 6 months | 0.87 (0.42 to 1.78) | 1.49 (1.02 to 2.18) | 1.10 (0.62 to 1.98) | |||
| Colonoscopy completeness | 0.0051 | 0.0006 | 0.0208 | |||
| Complete | 1 | 1 | 1 | |||
| Incomplete | 1.67 (1.18 to 2.37)f | 1.68 (1.25 to 2.26)f | 1.95 (1.14 to 3.34)f | |||
| Unknown | 1.67 (1.18 to 2.37).f Hospital was constrained to be included in the model | 1.68 (1.25 to 2.26)f | 1.95 (1.14 to 3.34)f | |||
| Bowel preparation quality | 0.25 | 0.50 | 0.62 | |||
| Excellent or good | 1 | 1 | 1 | |||
| Satisfactory | 0.67 (0.43 to 1.03) | 1.17 (0.77 to 1.78) | 1.04 (0.52 to 2.06) | |||
| Poor | 1.04 (0.59 to 1.82) | 1.49 (0.86 to 2.56) | 1.27 (0.49 to 3.33) | |||
| Unknown | 0.83 (0.52 to 1.32) | 1.02 (0.67 to 1.54) | 0.68 (0.33 to 1.40) | |||
| Number of adenomas | 0.65 | 0.49 | 0.30 | |||
| One | 1 | 1 | ||||
| Two | 1.09 (0.76 to 1.54) | 0.95 (0.70 to 1.29) | ||||
| Three | 0.71 (0.40 to 1.27)g | 1 | ||||
| Four | 0.71 (0.40 to 1.27)g | 0.83 (0.44 to 1.55) | ||||
| Five | 1.54 (0.87 to 2.73) | |||||
| Six or more | 1.29 (0.70 to 2.40) | |||||
| Adenoma size (mm) | 0.29 | 0.56 | ||||
| < 10 | 1 | 1 | ||||
| 10–19 | 1.30 (0.74 to 2.32) | 0.91 (0.37 to 2.20) | ||||
| ≥ 20 | 1.52 (0.84 to 2.75) | 1.28 (0.52 to 3.11) | ||||
| Unknown | 1.27 (0.15 to 10.91) | |||||
| Adenoma histology | 0.10 | 0.0021 | 0.28 | |||
| Tubular | 1 | 1 | 1 | |||
| Tubulovillous | 1.45 (1.01 to 2.08)h | 1.24 (0.91 to 1.69) | 0.78 (0.47 to 1.30) | |||
| Villous | 1.45 (1.01 to 2.08)h | 1.40 (0.89 to 2.20) | 1.42 (0.75 to 2.68) | |||
| Unknown | 1.36 (0.81 to 2.31) | 2.86 (1.70 to 4.82) | 0.53 (0.07 to 4.04) | |||
| Adenoma dysplasia | 0.082 | 0.0001 | 0.0024 | |||
| Low grade | 1 | 1 | 1 | |||
| High grade | 2.05 (1.10 to 3.84) | 1.49 (1.09 to 2.05) | 2.13 (1.36 to 3.33) | |||
| Unknown | 1.37 (0.73 to 2.54) | 2.66 (1.66 to 4.27) | 0.38 (0.05 to 2.81) | |||
| Proximal polyps | 0.0006 | 0.0003 | 0.36 | |||
| No | 1 | 1 | 1 | |||
| Yes | 1.67 (1.25 to 2.24) | 1.69 (1.28 to 2.23) | 1.27 (0.75 to 2.13) | |||
| Hyperplastic polyps | 0.16 | 0.61 | 0.27 | |||
| No | 1 | 1 | 1 | |||
| Yes | 1.28 (0.91 to 1.80) | 1.10 (0.78 to 1.54) | 1.30 (0.82 to 2.04) | |||
| Hyperplastic polyp ≥ 10 mm in size | 0.94 | 0.67 | 0.85 | |||
| No | 1 | 1 | 1 | |||
| Yes | 1.06 (0.26 to 4.27) | 0.79 (0.25 to 2.48) | 1.15 (0.28 to 4.69) | |||
| Family history of cancer/CRCi | 0.11 | 0.59 | 0.25 | |||
| No | 1 | 1 | 1 | |||
| Yes | 1.55 (0.93 to 2.57) | 1.21 (0.61 to 2.39) | 0.37 (0.05 to 2.70) | |||
| Hospitalj | 0.0058 | 0.0097 | 0.22 | |||
Appendix 3 Supplementary tables and figures for the economic evaluation
| Costs | Risk subgroup | |||
|---|---|---|---|---|
| Lower risk | Higher risk | |||
| No visits(n = 2804) | Visits (n = 2431) | No visits (n = 4403) | Visits (n = 4763) | |
| CRC cases, n | ||||
| Dukes’ stage A | 9 | 4 | 17 | 7 |
| Dukes’ stage B | 4 | 2 | 22 | 7 |
| Dukes’ stage C | 3 | 3 | 19 | 10 |
| Dukes’ stage D | 3 | 0 | 14 | 3 |
| Dukes’ stage unknown | 12 | 2 | 40 | 14 |
| Total | 31 | 11 | 112 | 41 |
| Person-years | 32,903 | 16,882 | 51,688 | 37,429 |
| Incidence per 1000 person-years | 0.94 | 0.65 | 2.17 | 1.10 |
| Costs | ||||
| CRC costs (£), mean (SD) | ||||
| Dukes’ stage A | 4 (108) | 4 (136) | 20 (307) | 6 (173) |
| Dukes’ stage B | 6 (214) | 7 (206) | 18 (360) | 14 (326) |
| Dukes’ stage C | 4 (124) | 0 (0) | 11 (239) | 3 (120) |
| Dukes’ stage D | 37 (407) | 23 (371) | 98 (707) | 43 (509) |
| Total and discounted costs (£), mean (SD) | ||||
| Total CRC cost | 13 (235) | 6 (155) | 16 (270) | 8 (225) |
| Total surveillance cost | 13 (235) | 6 (155) | 16 (270) | 8 (225) |
| Total cost per patient | 37 (407) | 1064 (793) | 98 (707) | 1274 (1090) |
| Discounted total cost per patient | 30 (328) | 937 (717) | 83 (607) | 1130 (988) |
| Discounted total cost per 1000 person-years | 2597 (8.88) | 134,873 (89.38) | 7029 (11.66) | 143,805 (61.98) |
| Incremental costs (£) | ||||
| Incremental cost per 1000 person-years (95% CI); p-value | 132,276 (127,853 to 136,700); < 0.001 | 136,775 (132,883 to 140,668); < 0.001 | ||
| Incremental CRC per 1000 person-years (95% CI); p-value | –0.29 (–0.80 to 0.22); 0.262 | –1.07 (–1.59 to –0.55); < 0.001 | ||
| Incremental cost per CRC prevented | 455,184 | 127,660 | ||
| Costs | Risk subgroup | |||
|---|---|---|---|---|
| Lower risk | Higher risk | |||
| No visits (n = 1932) | Visits (n = 2806) | No visits (n = 2751) | Visits (n = 4363) | |
| CRC cases, n | ||||
| Dukes’ stage A | 11 | 8 | 13 | 15 |
| Dukes’ stage B | 4 | 5 | 24 | 16 |
| Dukes’ stage C | 8 | 3 | 18 | 24 |
| Dukes’ stage D | 3 | 5 | 9 | 7 |
| Dukes’ stage unknown | 7 | 8 | 38 | 20 |
| Total | 33 | 29 | 102 | 82 |
| Person-years | 23,237 | 21,233 | 30,690 | 36,110 |
| Incidence per 1000 person-years | 1.42 | 1.37 | 3.32 | 2.27 |
| Costs | ||||
| CRC costs (£), mean (SD) | ||||
| Dukes’ stage A | 21 (295) | 11 (219) | 19 (294) | 11 (207) |
| Dukes’ stage B | 9 (193) | 4 (112) | 33 (380) | 12 (229) |
| Dukes’ stage C | 28 (499) | 6 (191) | 36 (496) | 29 (433) |
| Dukes’ stage D | 3 (109) | 9 (279) | 13 (309) | 4 (124) |
| Total and discounted costs (£), mean (SD) | ||||
| Total CRC cost | 73 (663) | 42 (472) | 143 (853) | 77 (644) |
| Total surveillance cost | 0 (0) | 1187 (826) | 0 (0) | 1427 (1095) |
| Total cost per patient | 73 (663) | 1229 (993) | 143 (853) | 1504 (1312) |
| Discounted total cost per patient | 61 (532) | 1099 (886) | 123 (743) | 1354 (1186) |
| Discounted total cost per 1000 person-years | 5039 (14.73) | 145,207 (82.70) | 10,994 (18.93) | 163,604 (67.31) |
| Incremental costs (£) | ||||
| Incremental cost per 1000 person-years (95% CI); p-value | 140,168 (135,276 to 145,059); < 0.001 | 152,610 (147,517 to 157,703); < 0.001 | ||
| Incremental CRC per 1000 person-years (95% CI); p-value | –0.05 (–0.75 to 0.64); 0.878 | –1.05 (–1.86 to –0.24); 0.011 | ||
| Incremental cost per CRC prevented | 2,576,614 | 144,970 | ||
| Costs | Risk subgroup | |||
|---|---|---|---|---|
| Lower risk | Higher risk | |||
| No visits (n = 606) | Visits (n = 1211) | No visits (n = 305) | Visits (n = 597) | |
| CRC cases, n | ||||
| Dukes’ stage A | 5 | 3 | 4 | 2 |
| Dukes’ stage B | 3 | 6 | 9 | 7 |
| Dukes’ stage C | 1 | 4 | 4 | 3 |
| Dukes’ stage D | 1 | 2 | 0 | 4 |
| Dukes’ stage unknown | 7 | 6 | 10 | 3 |
| Total | 17 | 21 | 27 | 19 |
| Person-years | 6226 | 8805 | 3017 | 4913 |
| Incidence per 1000 person-years | 273 | 239 | 895 | 387 |
| Costs | ||||
| CRC costs (£), mean (SD) | ||||
| Dukes’ stage A | 30 (346) | 10 (196) | 58 (519) | 11 (209) |
| Dukes’ stage B | 15 (221) | 20 (313) | 102 (636) | 46 (461) |
| Dukes’ stage C | 8 (192) | 22 (477) | 52 (478) | 28 (446) |
| Dukes’ stage D | 11 (278) | 8 (187) | 0 (0) | 36 (496) |
| Total and discounted costs (£), mean (SD) | ||||
| Total CRC cost | 110 (705) | 79 (696) | 279 (1015) | 144 (906) |
| Total surveillance cost | 0 (0) | 1565 (1087) | 0 (0) | 1682 (1248) |
| Total cost per patient | 110 (705) | 1643 (1361) | 279 (1015) | 1826 (1605) |
| Discounted total cost per patient | 95 (611) | 1505 (1262) | 235 (870) | 1668 (1453) |
| Discounted total cost per 1000 person-years | 9232 (38.51) | 207,013 (153.33) | 23,783 (88.79) | 202,672 (203.12) |
| Incremental costs (£) | ||||
| Incremental cost per 1000 person-years (95% CI); p-value | 197,781 (186,656 to 208,905); < 0.001 | 178,889 (160,796 to 196,982); < 0.001 | ||
| Incremental CRC per 1000 person-years (95% CI); p-value | –0.35 (–1.99 to 1.30); 0.681 | –5.08 (–8.84 to –1.32); 0.008 | ||
| Incremental cost per CRC prevented | 599,342 | 35,196 | ||
| Estimates of cost-effectiveness | Risk subgroup | |||
|---|---|---|---|---|
| Lower risk | Higher risk | |||
| No visits | Visits | No visits | Visits | |
| Low-risk group | ||||
| Cost of surveillance (£) | 0 | 897 | 0 | 1091 |
| Total CRC cost (£) | 125 | 110 | 312 | 220 |
| Discounted total cost (£) | 83 | 742 | 207 | 971 |
| Life-years | 23 | 23 | 22 | 23 |
| Discounted QALYs | 12 | 12 | 12 | 12 |
| Incremental cost (£) | 660 | 764 | ||
| Incremental QALYs | 0.005 | 0.028 | ||
| ICER (£) | 133,751 | 27,169 | ||
| Intermediate-risk group | ||||
| Cost of surveillance (£) | 0 | 1281 | 0 | 1522 |
| Total CRC cost (£) | 188 | 200 | 448 | 371 |
| Discounted total cost (£) | 124 | 1098 | 298 | 1406 |
| Life-years | 23 | 23 | 22 | 22 |
| Discounted QALYs | 12 | 12 | 12 | 12 |
| Incremental cost (£) | 974 | 1108 | ||
| Incremental QALYs | –0.008 | 0.024 | ||
| ICER (£) | Dominatedb | 45,417 | ||
| High-risk group | ||||
| Cost of surveillance (£) | 0 | 2144 | 0 | 2000 |
| Total CRC cost (£) | 343 | 358 | 1077 | 694 |
| Discounted total cost (£) | 228 | 1877 | 726 | 2019 |
| Life-years | 22 | 22 | 22 | 22 |
| Discounted QALYs | 12 | 12 | 11 | 11 |
| Incremental cost (£) | 1649 | 1293 | ||
| Incremental QALYs | –0.015 | 0.148 | ||
| ICER (£) | Dominatedb | 8745 | ||
| Estimates of cost-effectiveness | Risk subgroup | |||
|---|---|---|---|---|
| Lower risk | Higher risk | |||
| No visits | Visits | No visits | Visits | |
| Low-risk group | ||||
| Cost of surveillance (£) | 0 | 897 | 0 | 1092 |
| Total CRC cost (£) | 125 | 103 | 314 | 217 |
| Discounted total cost (£) | 83 | 739 | 208 | 970 |
| Life-years | 23 | 23 | 22 | 22 |
| Discounted QALYs | 12 | 12 | 12 | 12 |
| Incremental cost (£) | 657 | 762 | ||
| Incremental QALYs | 0.007 | 0.037 | ||
| ICER (£) | 90,666 | 20,423 | ||
| Intermediate-risk group | ||||
| Cost of surveillance (£) | 0 | 1281 | 0 | 1522 |
| Total CRC cost (£) | 179 | 200 | 452 | 368 |
| Discounted total cost (£) | 118 | 1098 | 301 | 1405 |
| Life-years | 23 | 23 | 22 | 22 |
| Discounted QALYs | 12 | 12 | 12 | 12 |
| Incremental cost (£) | 979 | 1104 | ||
| Incremental QALYs | –0.009 | 0.034 | ||
| ICER (£) | Dominatedb | 32,112 | ||
| High-risk group | ||||
| Cost of surveillance (£) | 0 | 2144 | 0 | 2000 |
| Total CRC cost (£) | 340 | 353 | 1077 | 694 |
| Discounted total cost (£) | 226 | 1875 | 726 | 2019 |
| Life-years | 22 | 22 | 22 | 22 |
| Discounted QALYs | 12 | 12 | 12 | 12 |
| Incremental cost (£) | 1649 | 1293 | ||
| Incremental QALYs | –0.005 | 0.165 | ||
| ICER (£) | Dominatedb | 7821 | ||
| Baseline risk subgroup | Age-adjusteda incremental cost (£) per 1000 person-years | Age-adjusteda incremental CRC per 1000 person-years | Age-adjusteda incremental cost (£) per CRC prevented | Unadjusted incremental cost (£) per CRC prevented |
|---|---|---|---|---|
| Low-risk group | ||||
| Lower-risk subgroup | 133,197 | –0.01 | 12,973,410 | 453,221 |
| Higher-risk subgroup | 138,598 | –0.76 | 182,799 | 127,945 |
| Intermediate-risk group | ||||
| Lower-risk subgroup | 142,383 | 0.11 | Dominatedb | 2,587,860 |
| Higher-risk subgroup | 156,564 | –0.57 | 274,042 | 145,729 |
| High-risk group | ||||
| Lower-risk subgroup | 196,221 | –0.15 | 1,286,287 | 568,719 |
| Higher-risk subgroup | 185,191 | –3.93 | 47,153 | 36,636 |
FIGURE 9.
Comparison of model predictions with observed data from a single imputation for the lower-risk subgroup of the low-risk group. (a) No visits state; (b) visits state; (c) Dukes’ stage A state; (d) Dukes’ stage B state; (e) Dukes’ stage C state; and (f) Dukes’ stage D state.
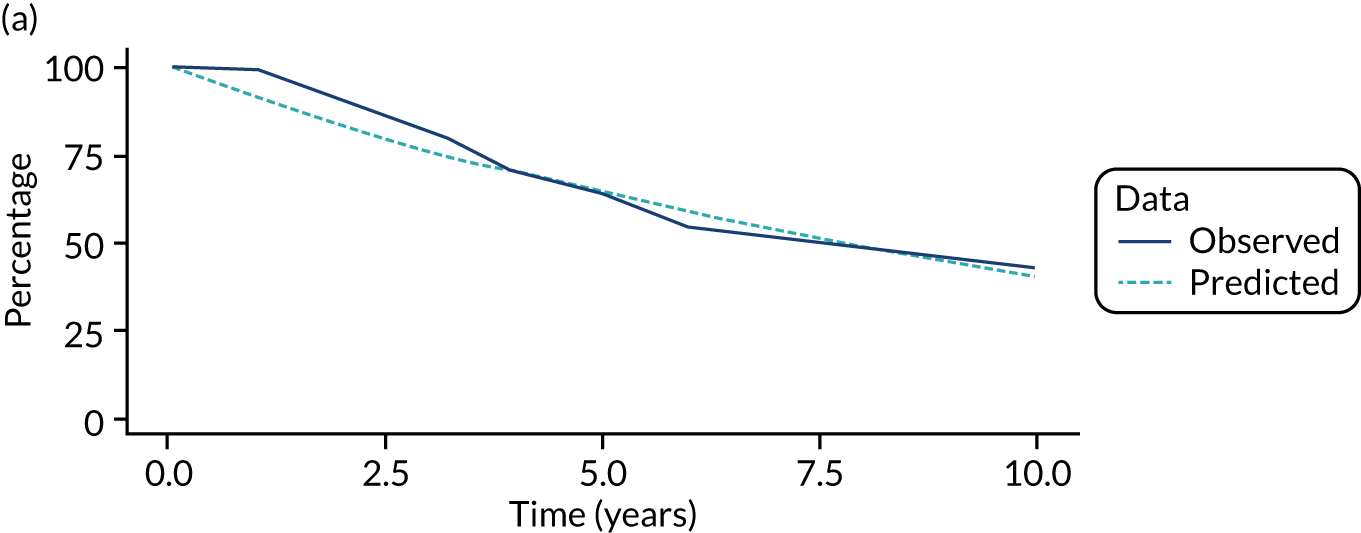
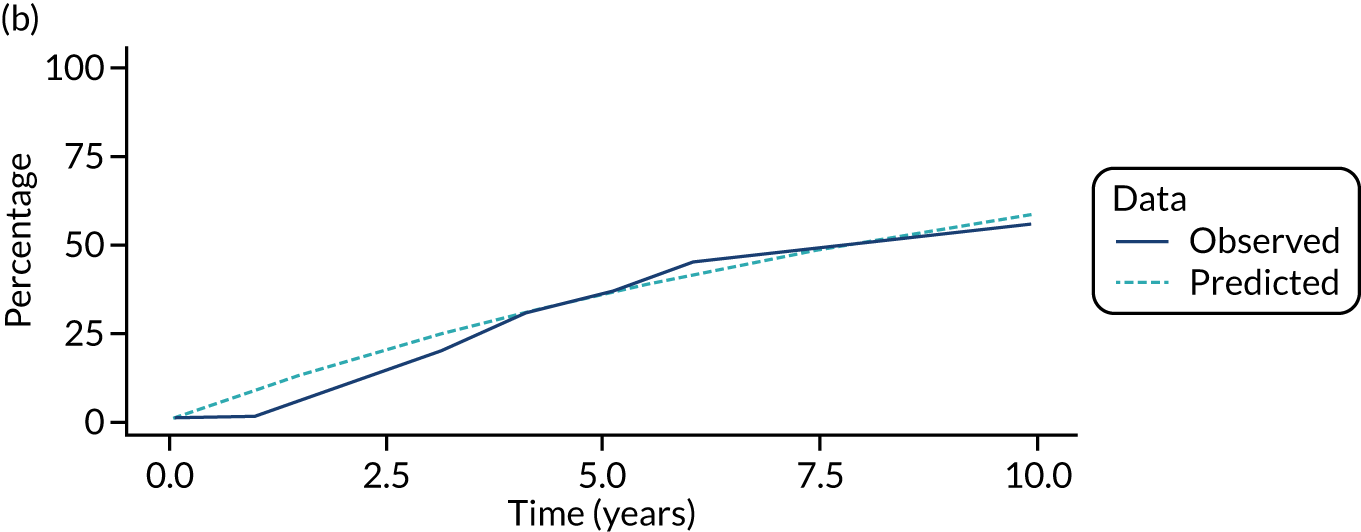
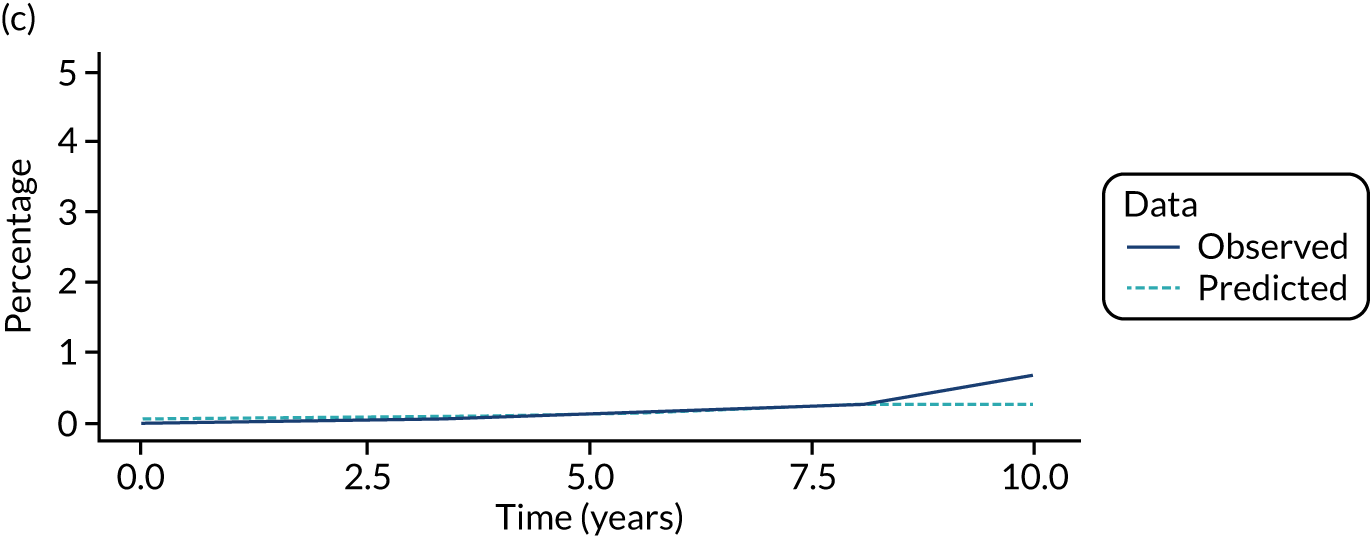
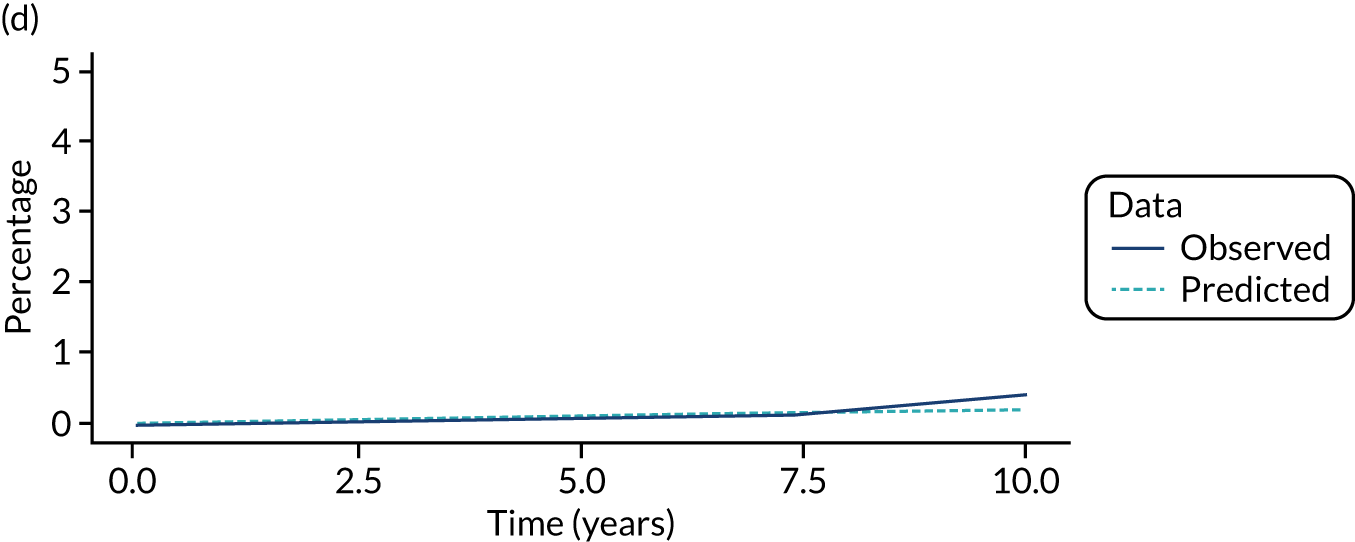
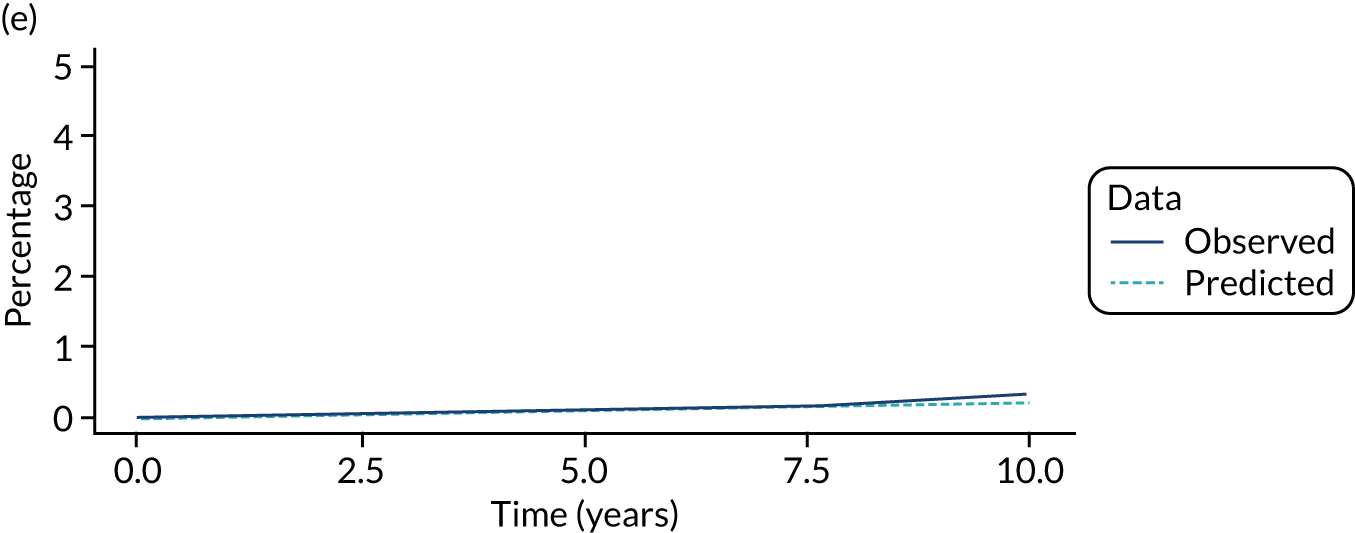
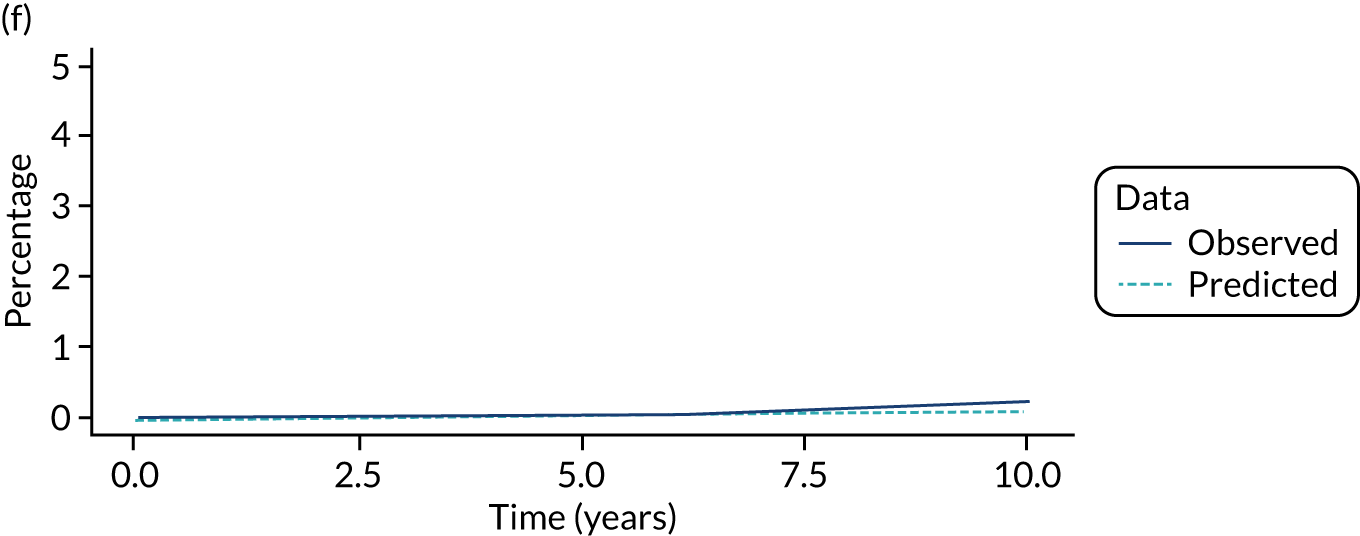
FIGURE 10.
Comparison of model predictions with observed data from a single imputation for the higher-risk subgroup of the low-risk group. (a) No visits state; (b) visits state; (c) Dukes’ stage A state; (d) Dukes’ stage B state; (e) Dukes’ stage C state; and (f) Dukes’ stage D state.
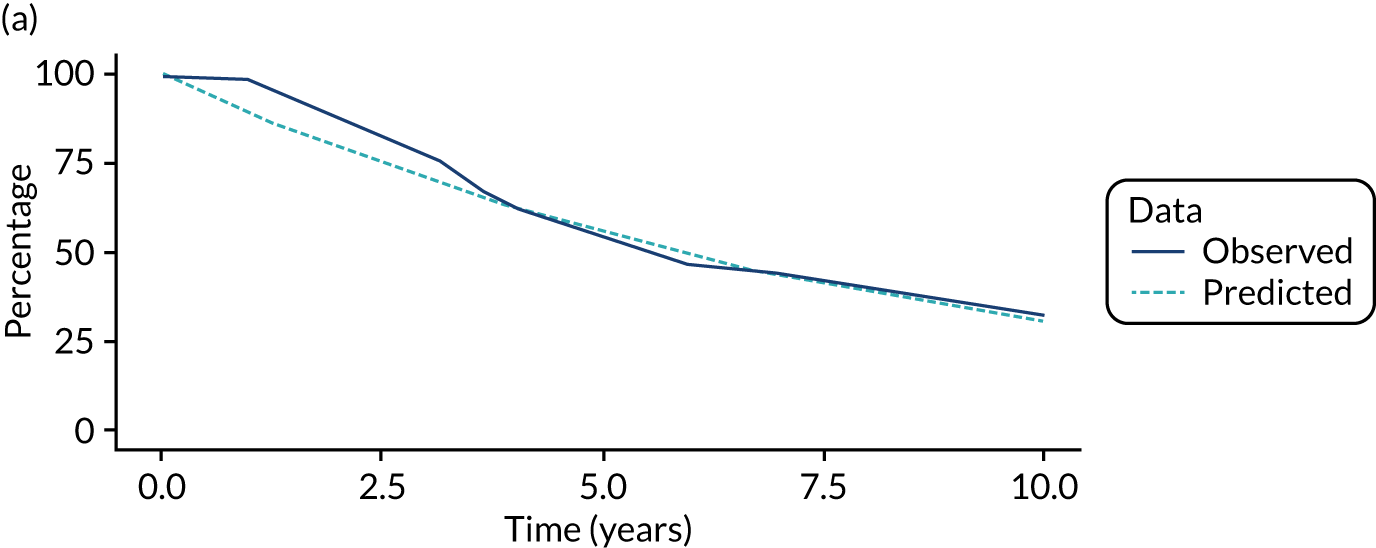
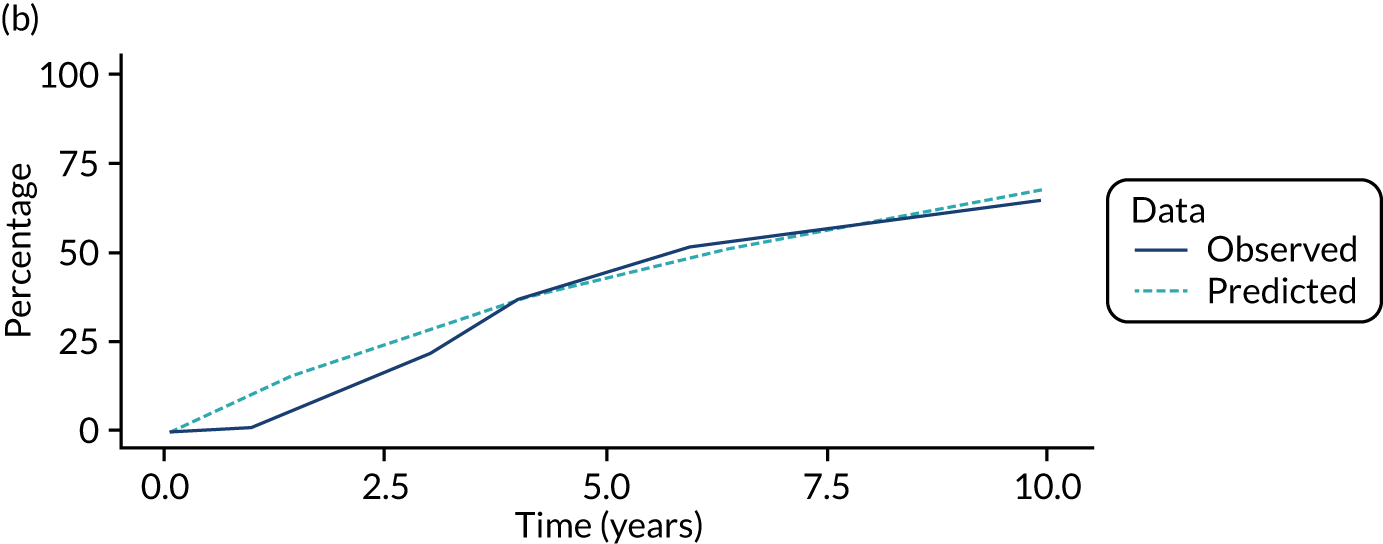
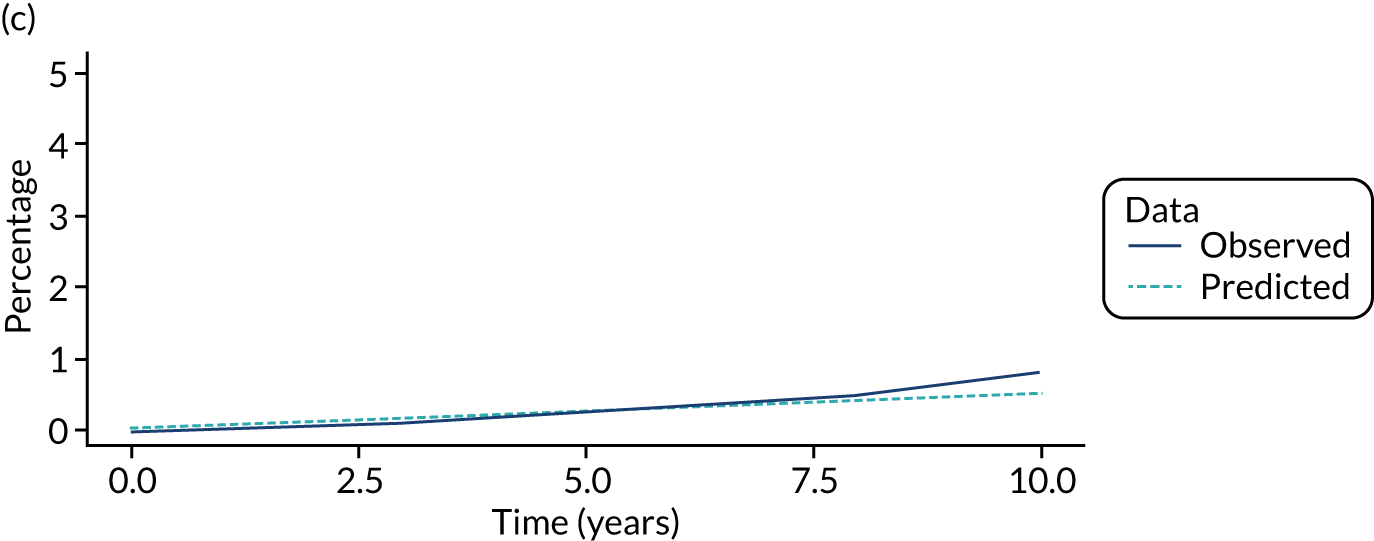
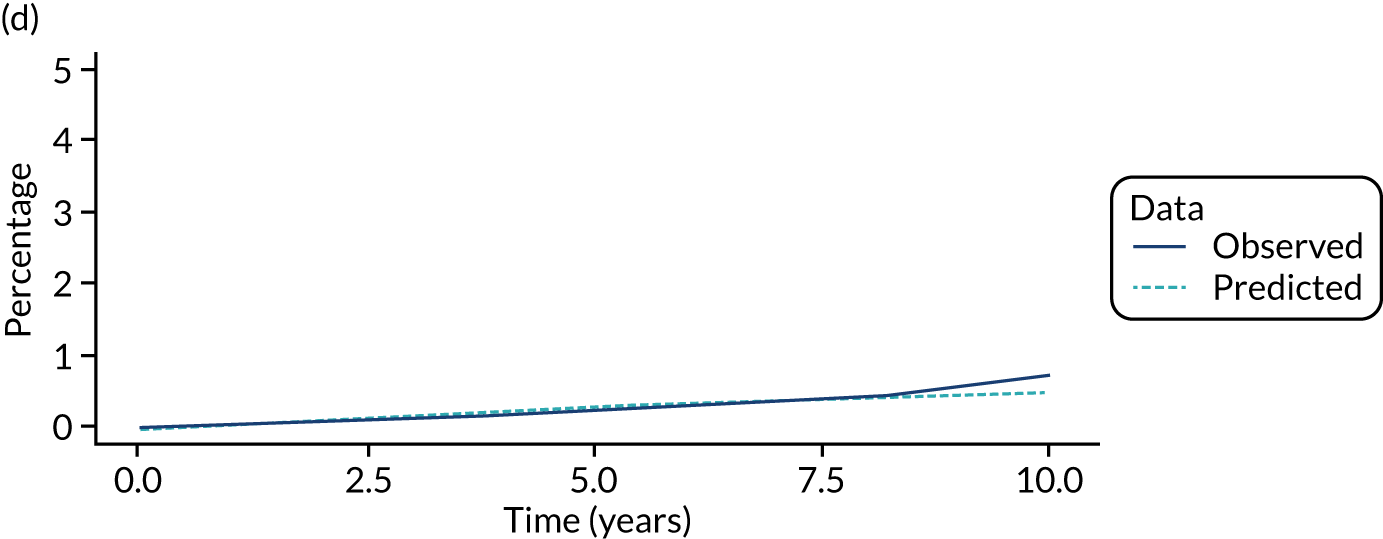
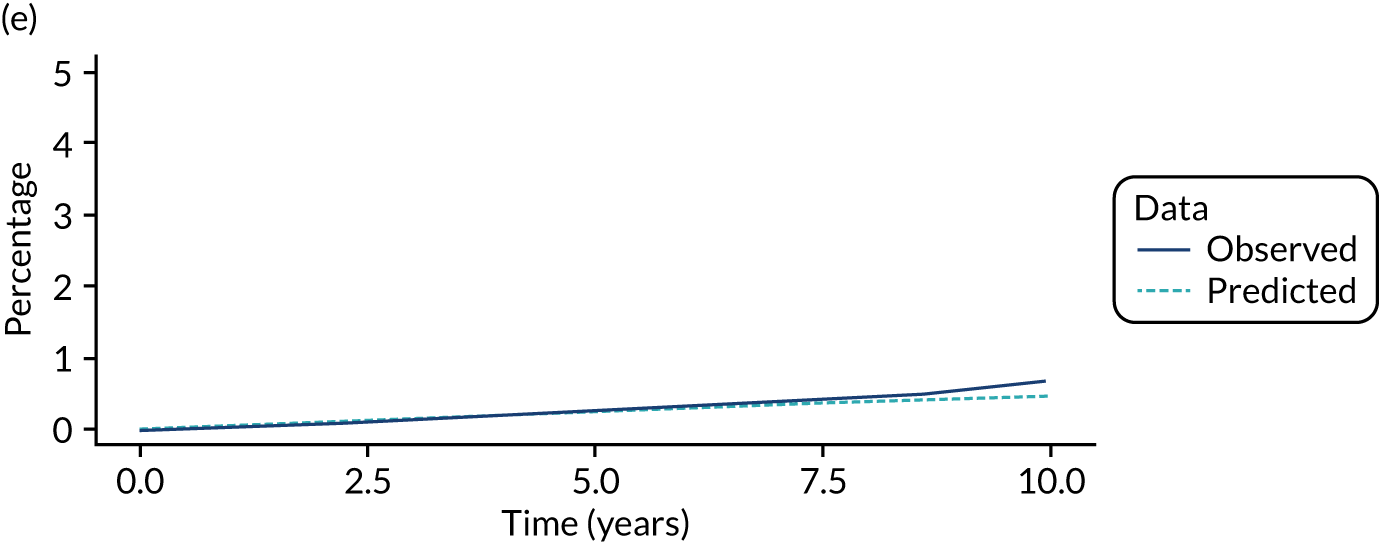
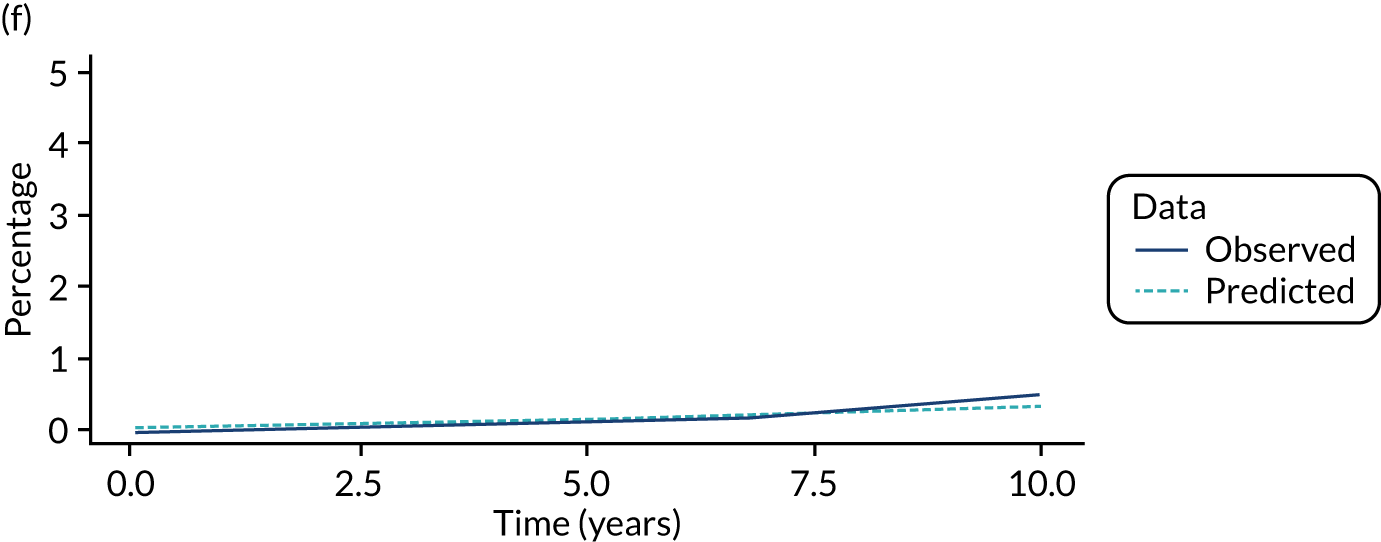
FIGURE 11.
Comparison of model predictions with observed data from a single imputation for the lower-risk subgroup of the intermediate-risk group. (a) No visits state; (b) visits state; (c) Dukes’ stage A state; (d) Dukes’ stage B state; (e) Dukes’ stage C state; and (f) Dukes’ stage D state.
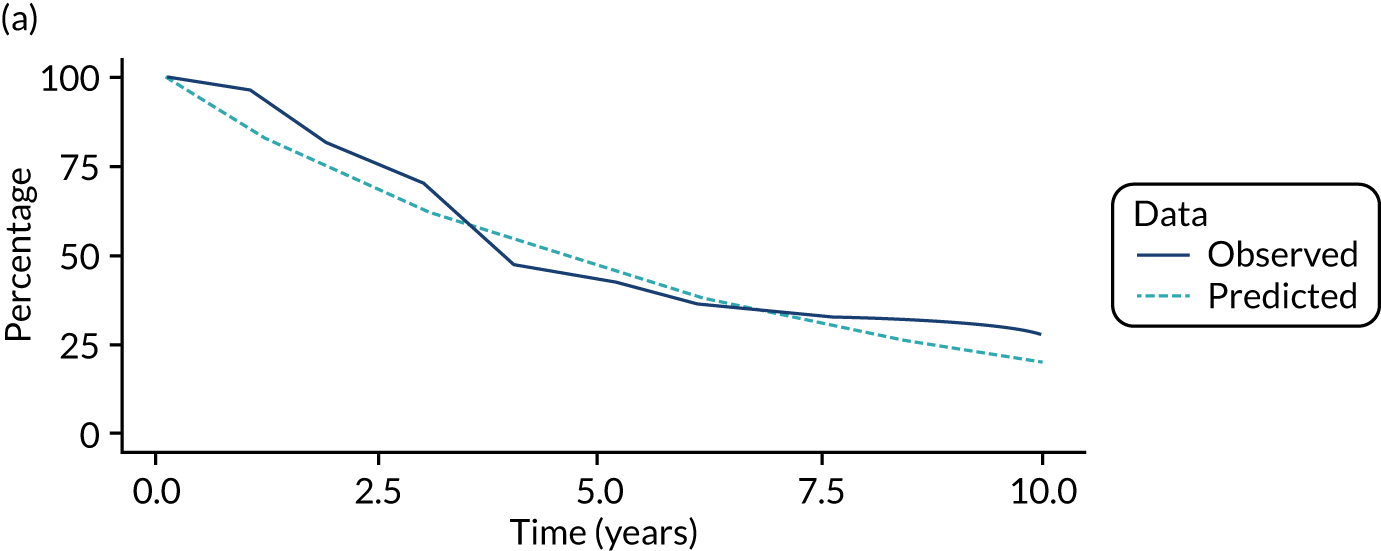
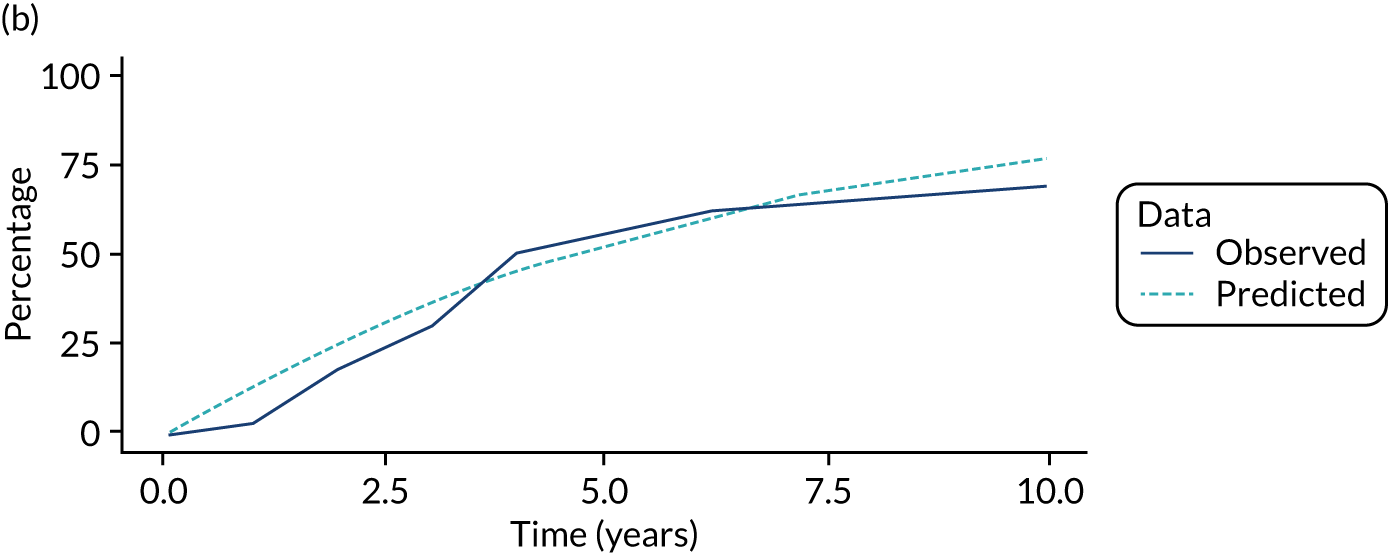
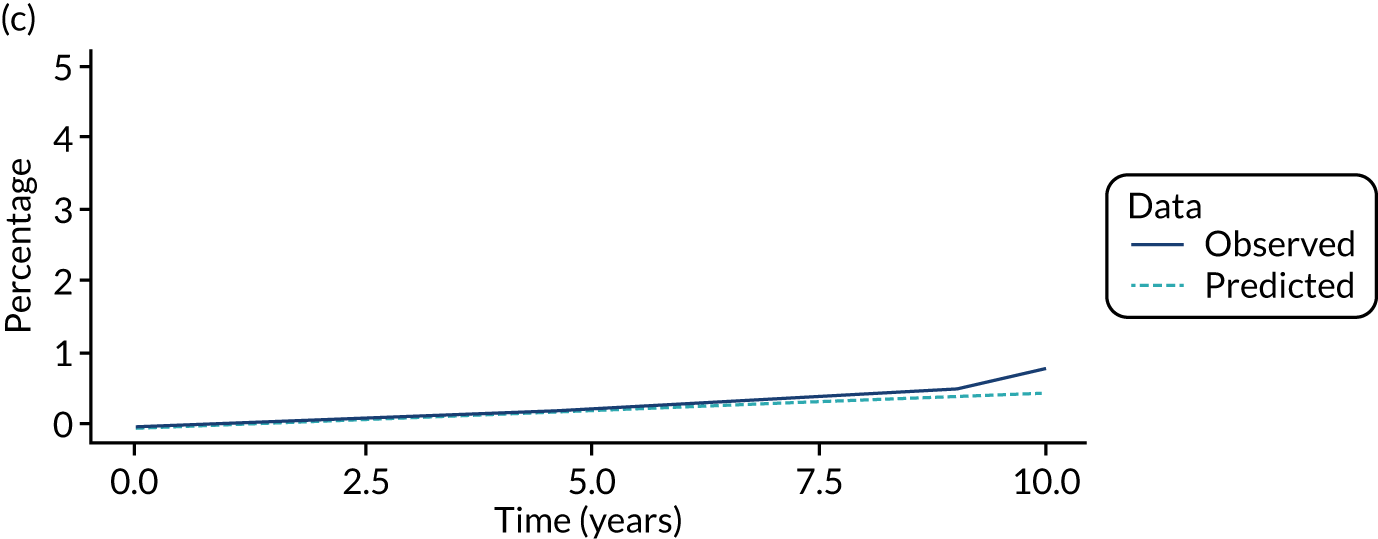
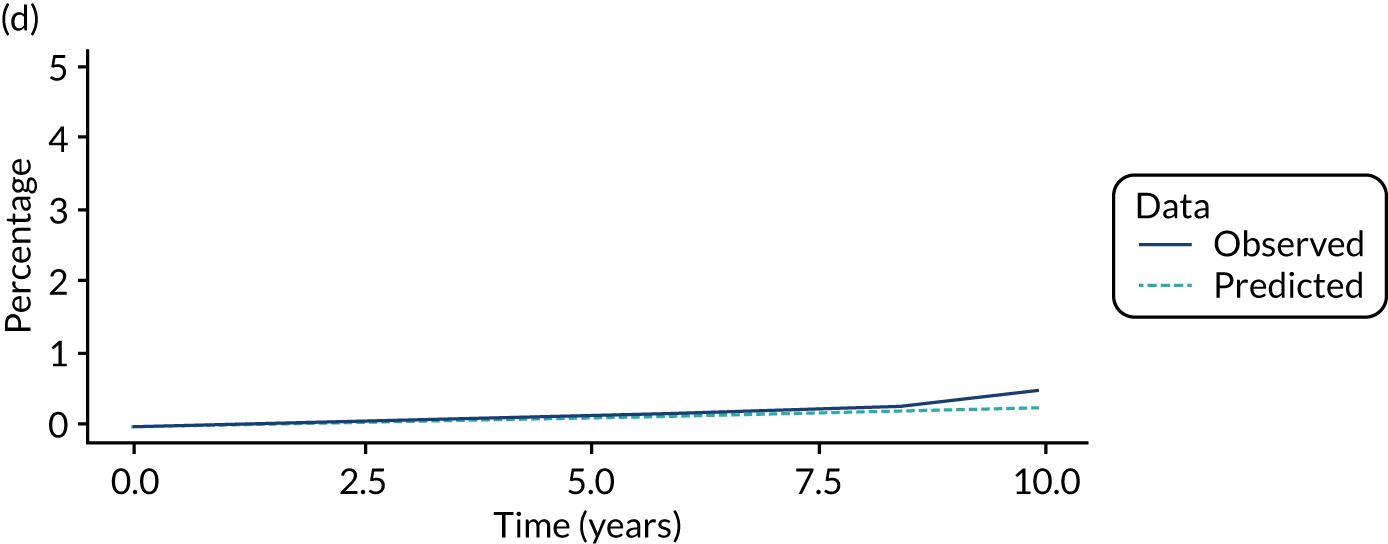
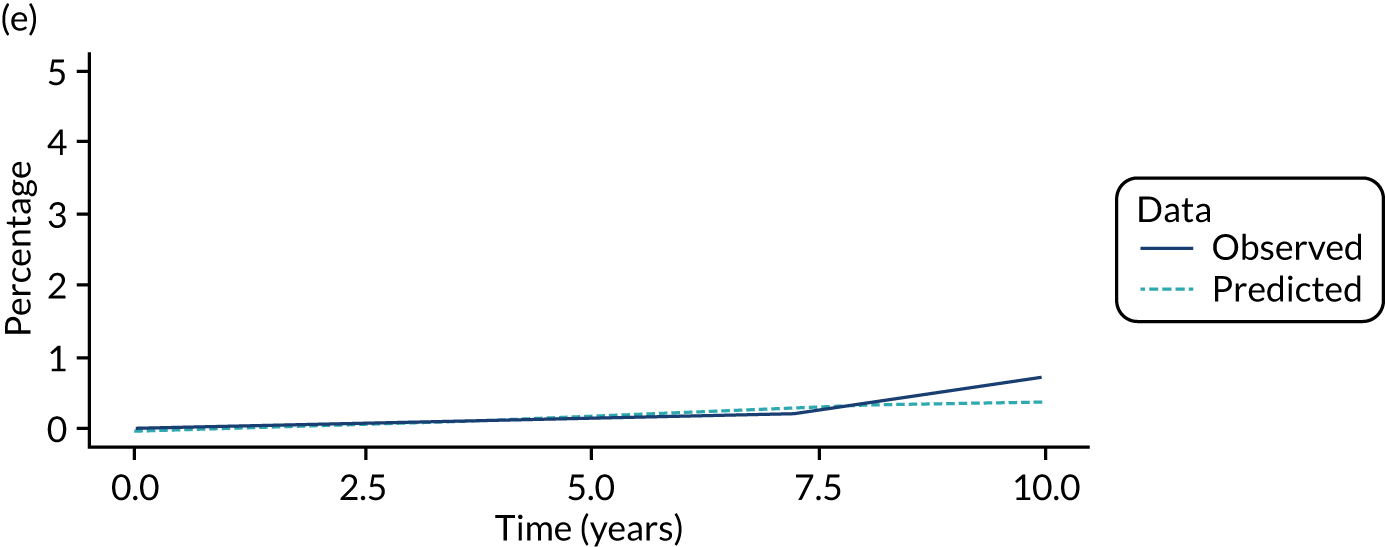
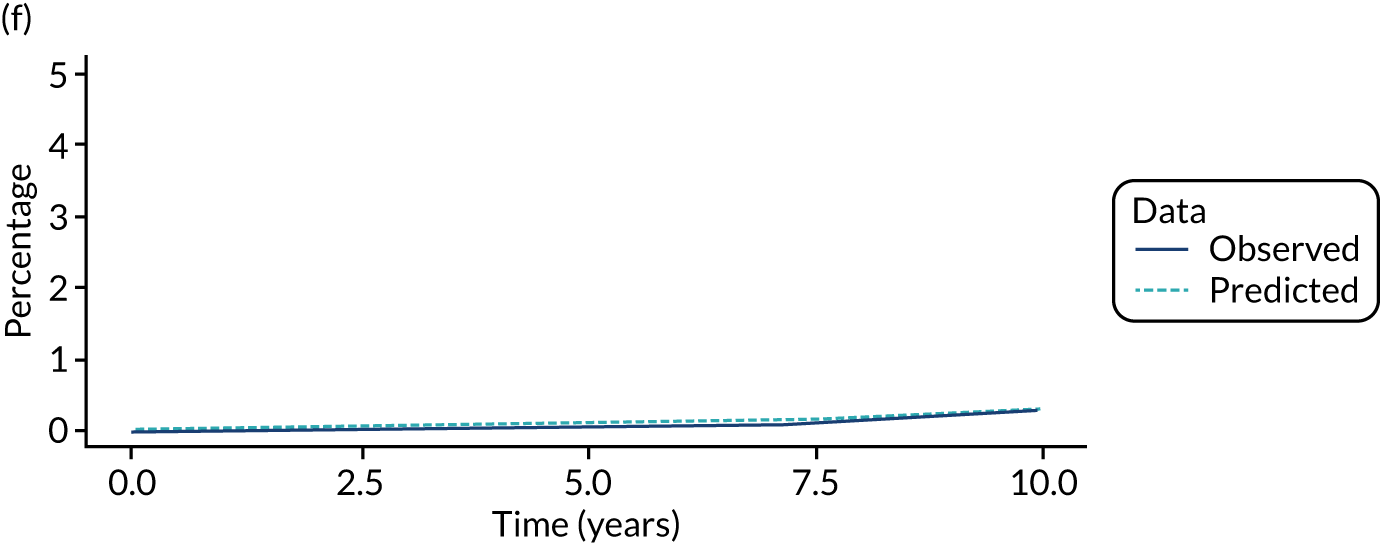
FIGURE 12.
Comparison of model predictions with observed data from a single imputation for the higher-risk subgroup of the intermediate-risk group. (a) No visits state; (b) visits state; (c) Dukes’ stage A state; (d) Dukes’ stage B state; (e) Dukes’ stage C state; and (f) Dukes’ stage D state.
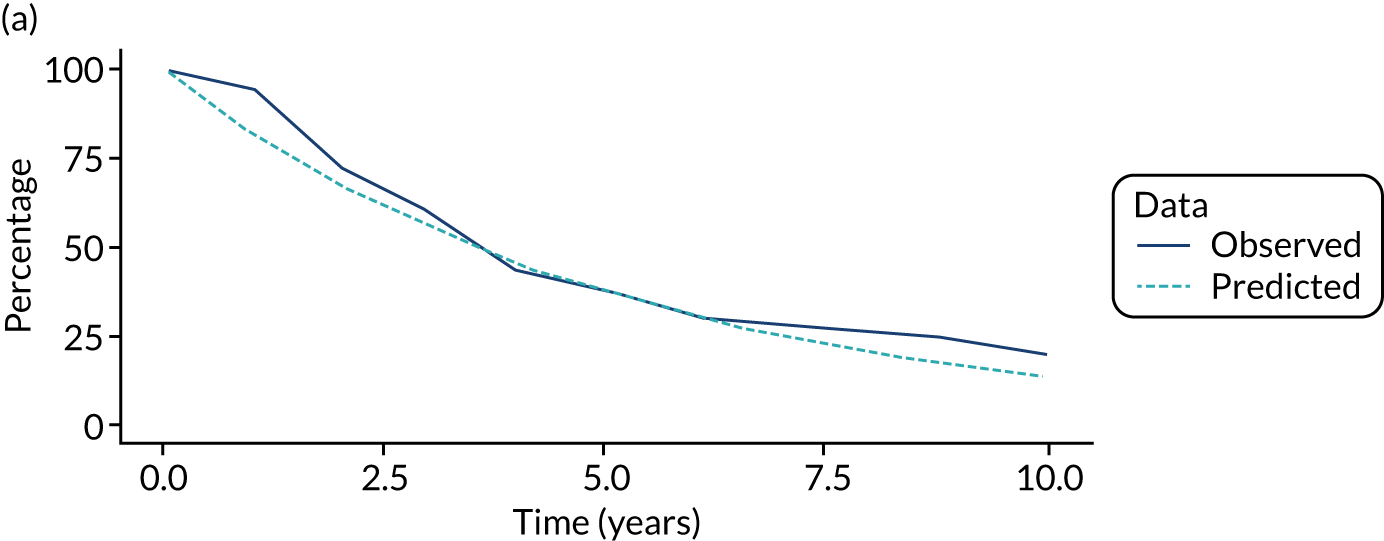
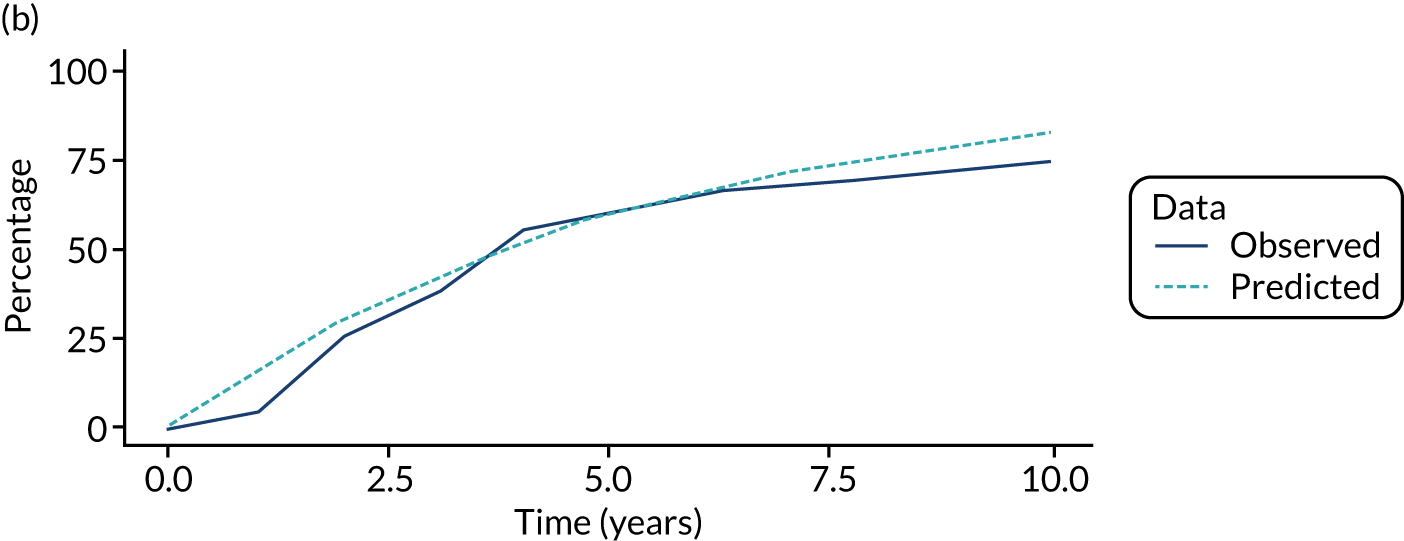
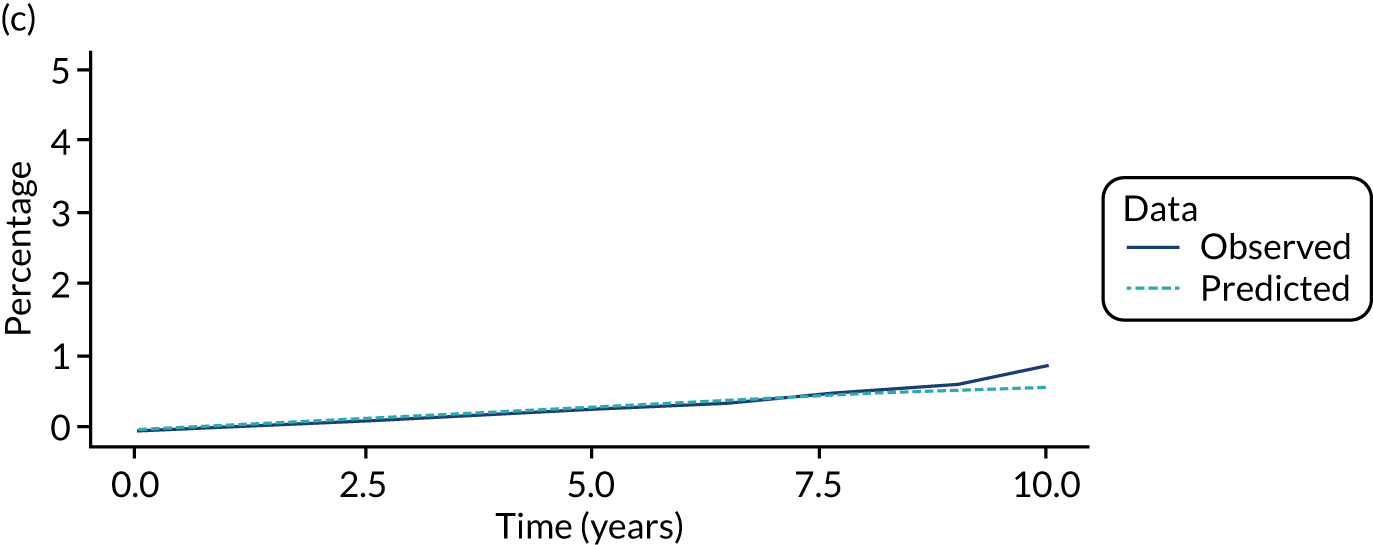
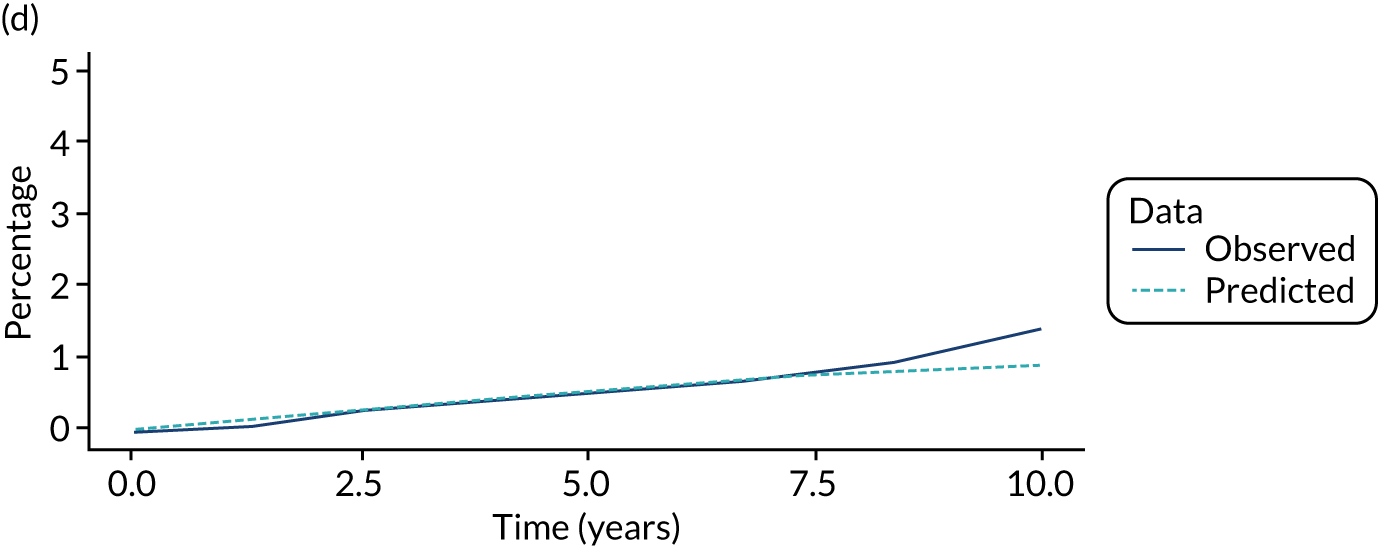
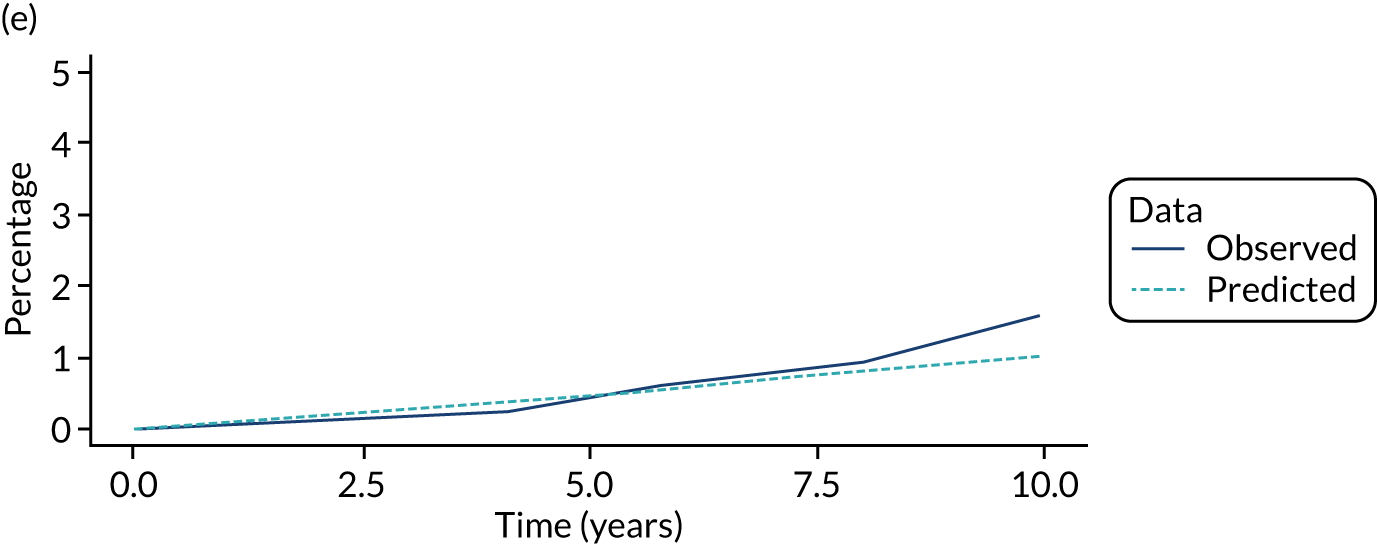
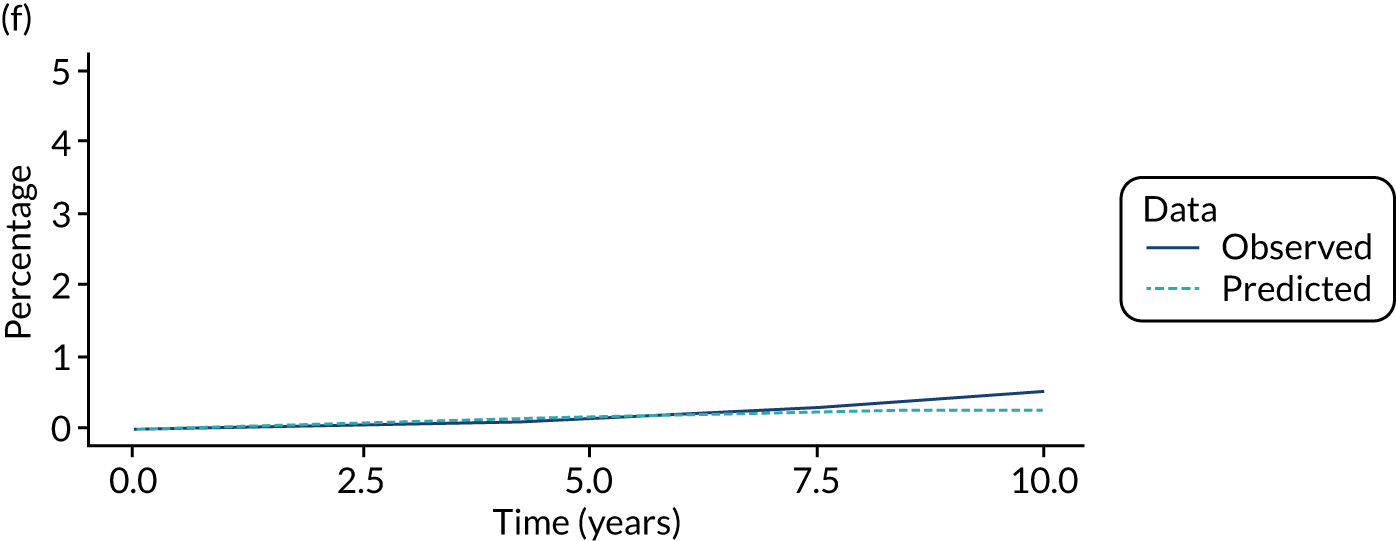
FIGURE 13.
Comparison of model predictions with observed data from a single imputation for the lower-risk subgroup of the high-risk group. (a) No visits state; (b) visits state; (c) Dukes’ stage A state; (d) Dukes’ stage B state; (e) Dukes’ stage C state; and (f) Dukes’ stage D state.
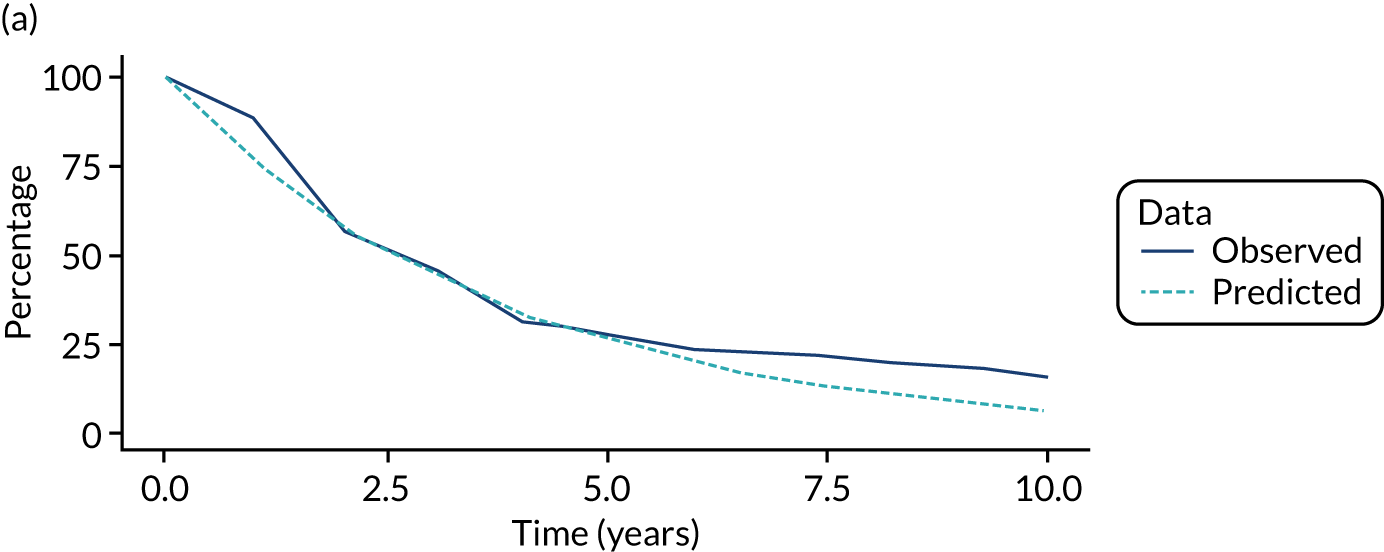
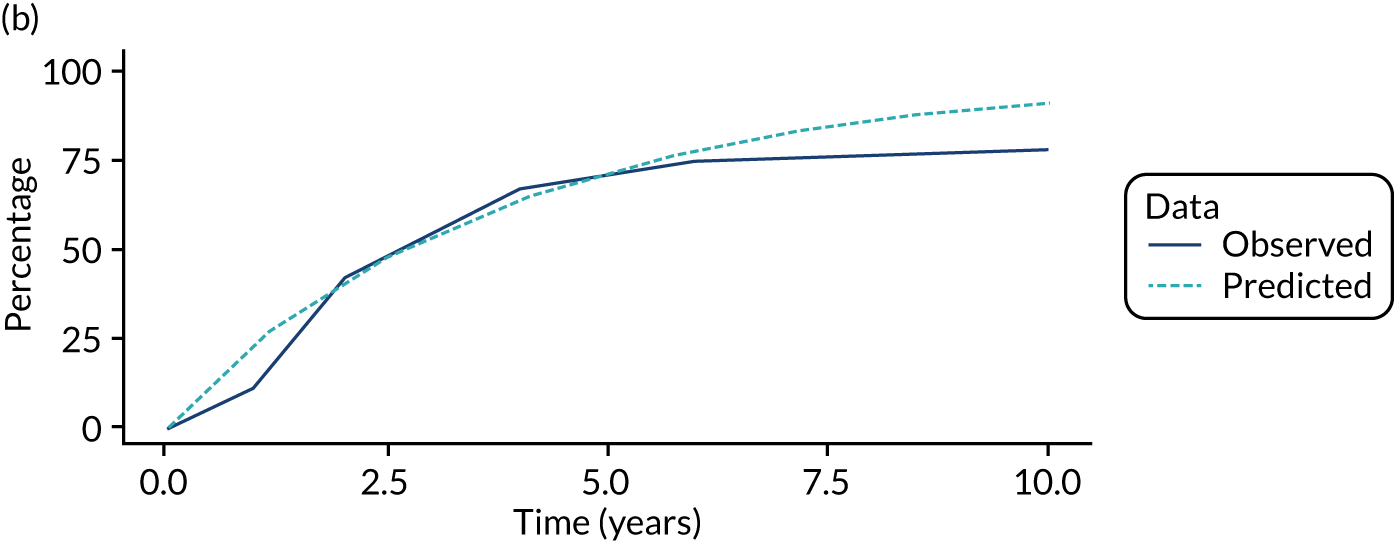
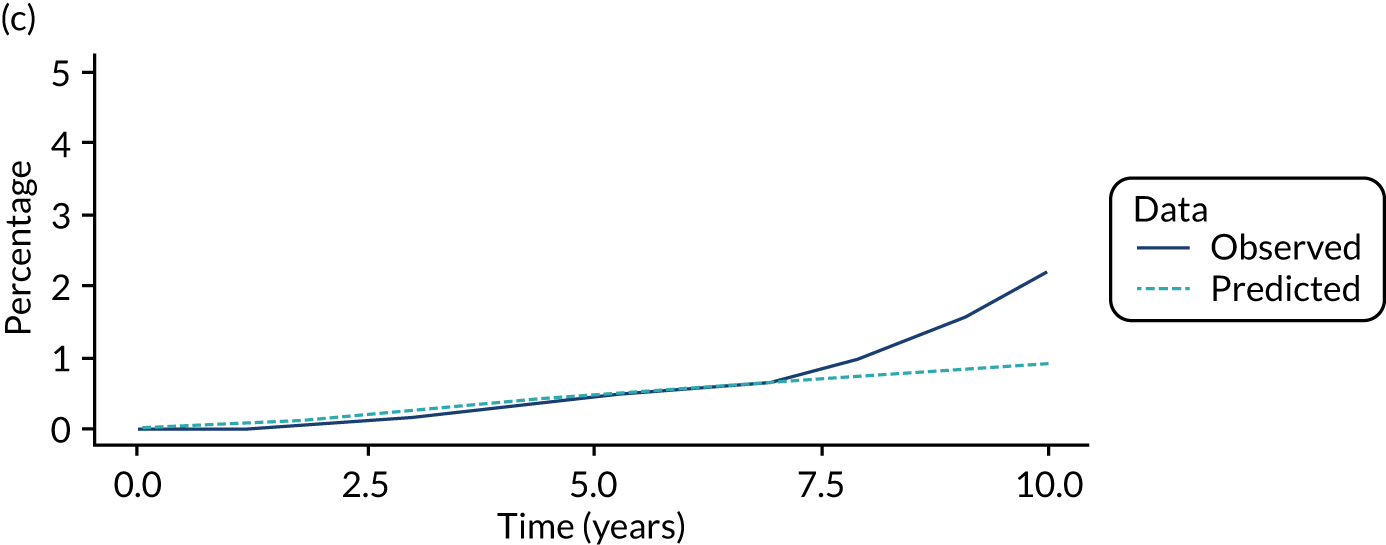
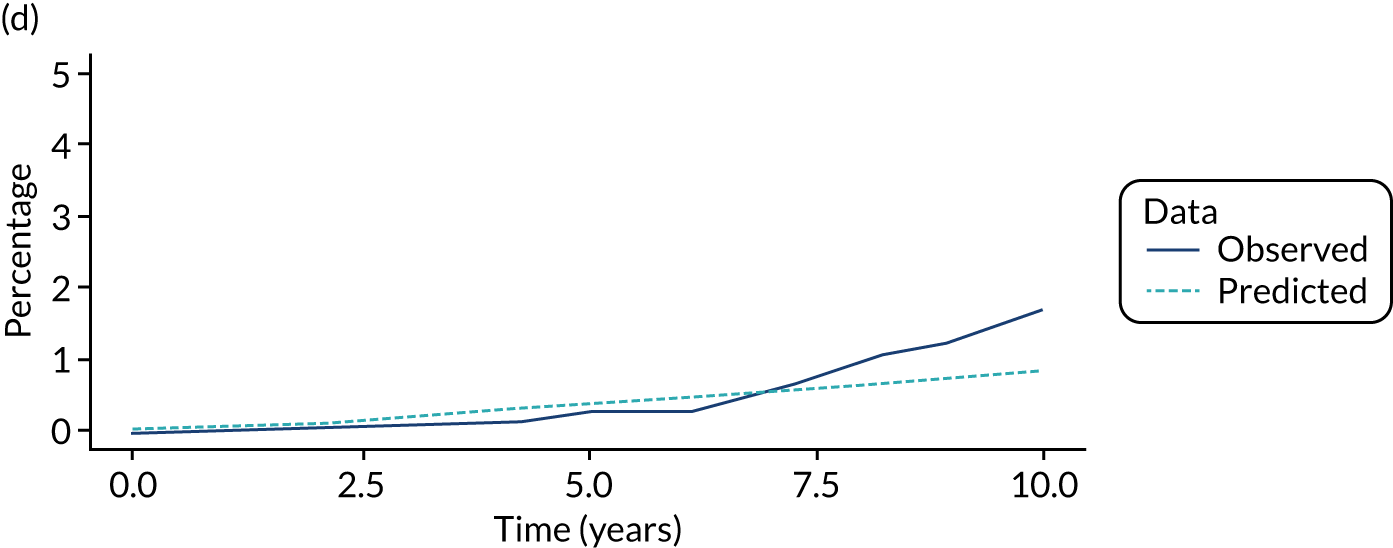
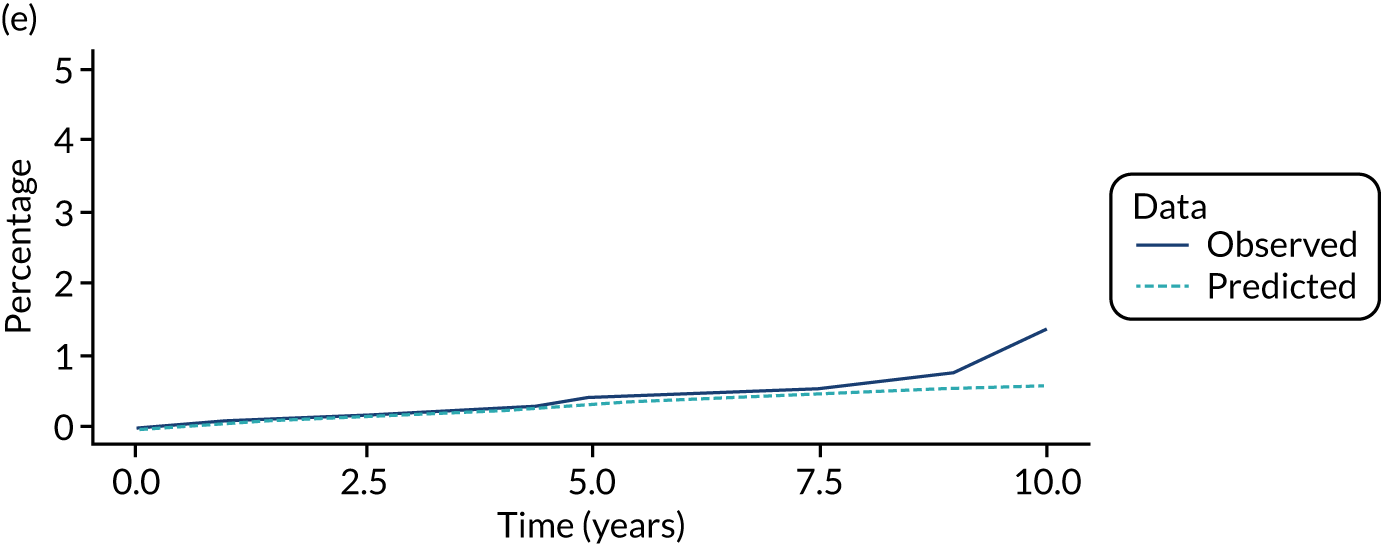
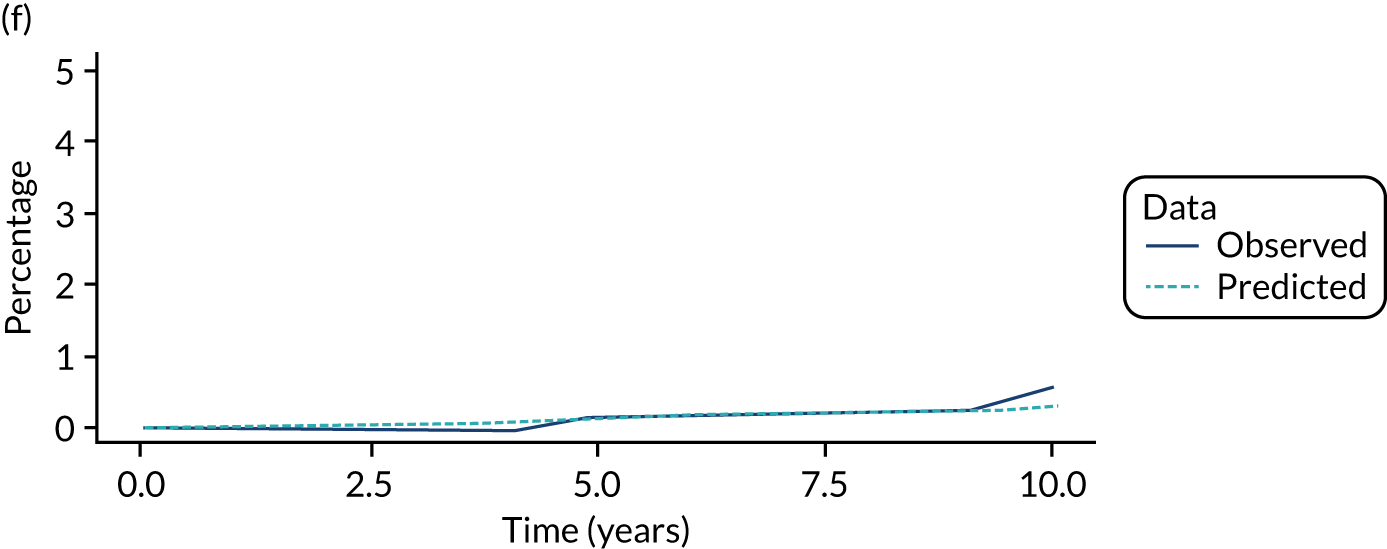
FIGURE 14.
Comparison of model predictions with observed data from a single imputation for the higher risk subgroup of the high-risk group. (a) No visits state; (b) visits state; and (c) CRC state.
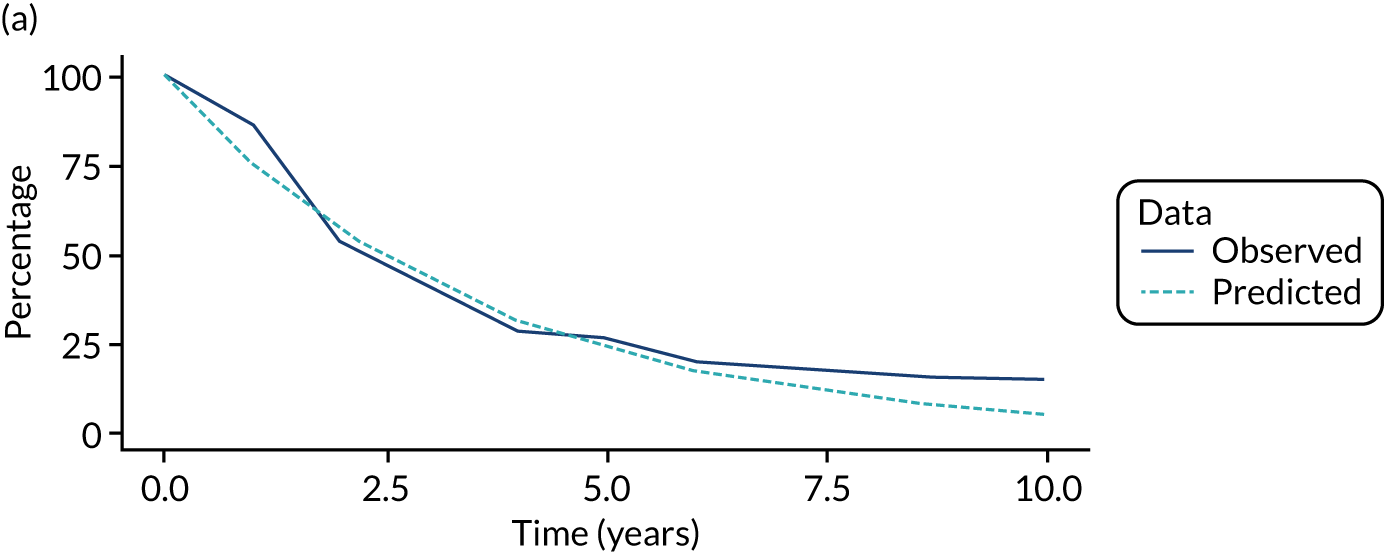
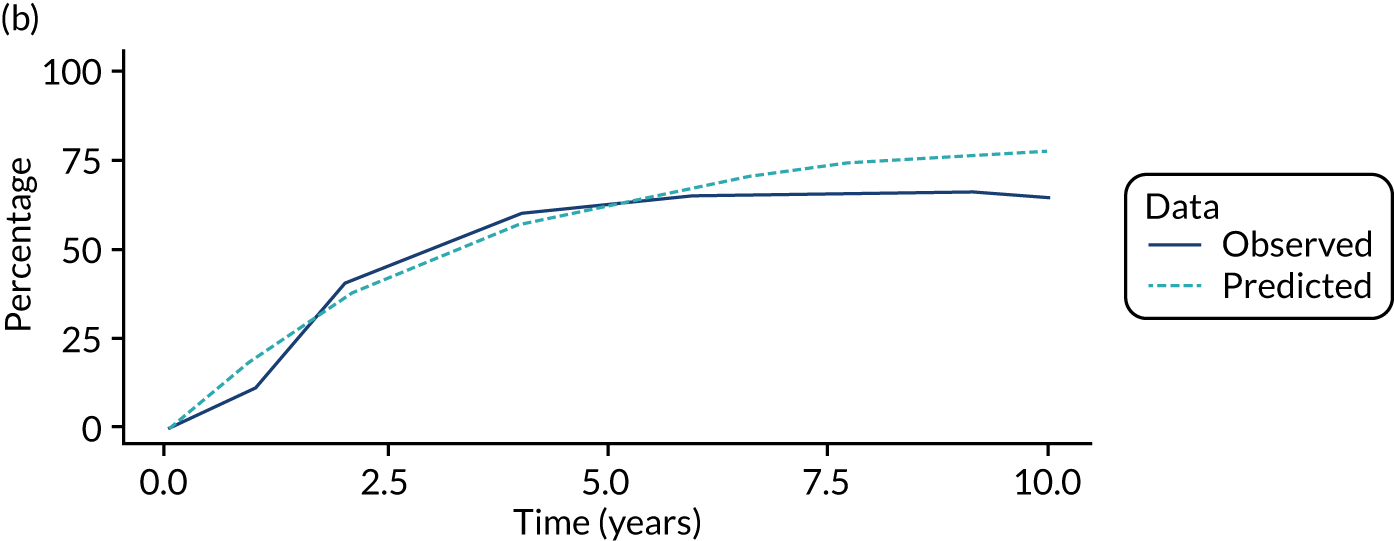
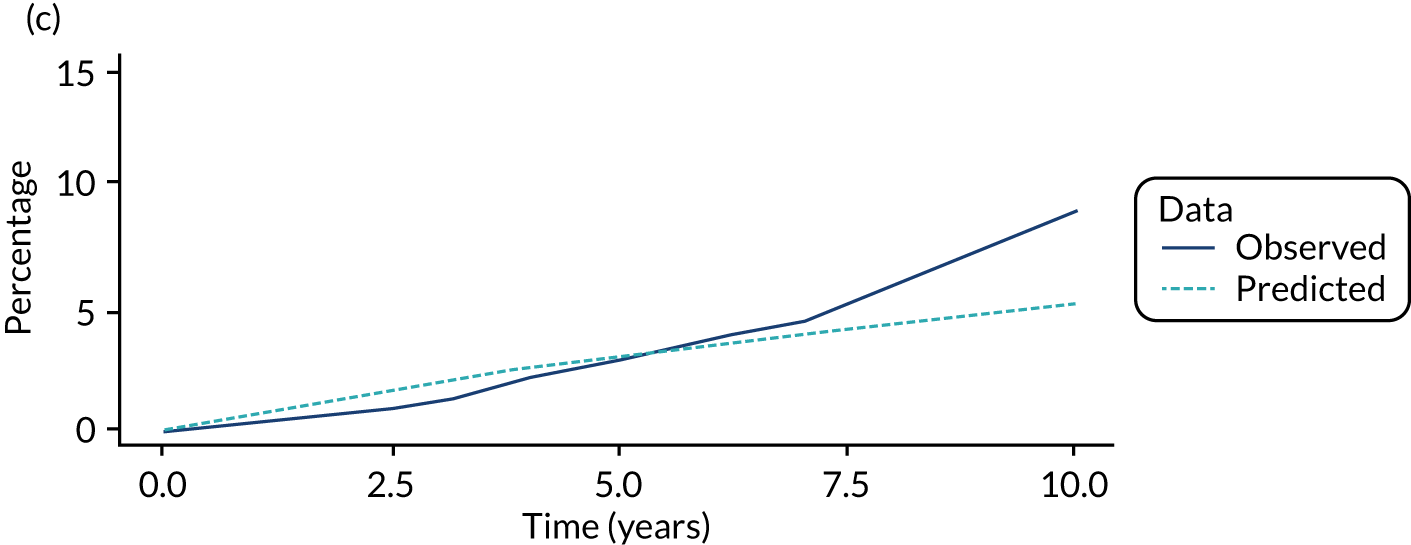
FIGURE 15.
Effect of varying baseline parameters in a DSA on ICERs in the low-risk group. (a) Lower-risk subgroup; and (b) higher-risk subgroup.
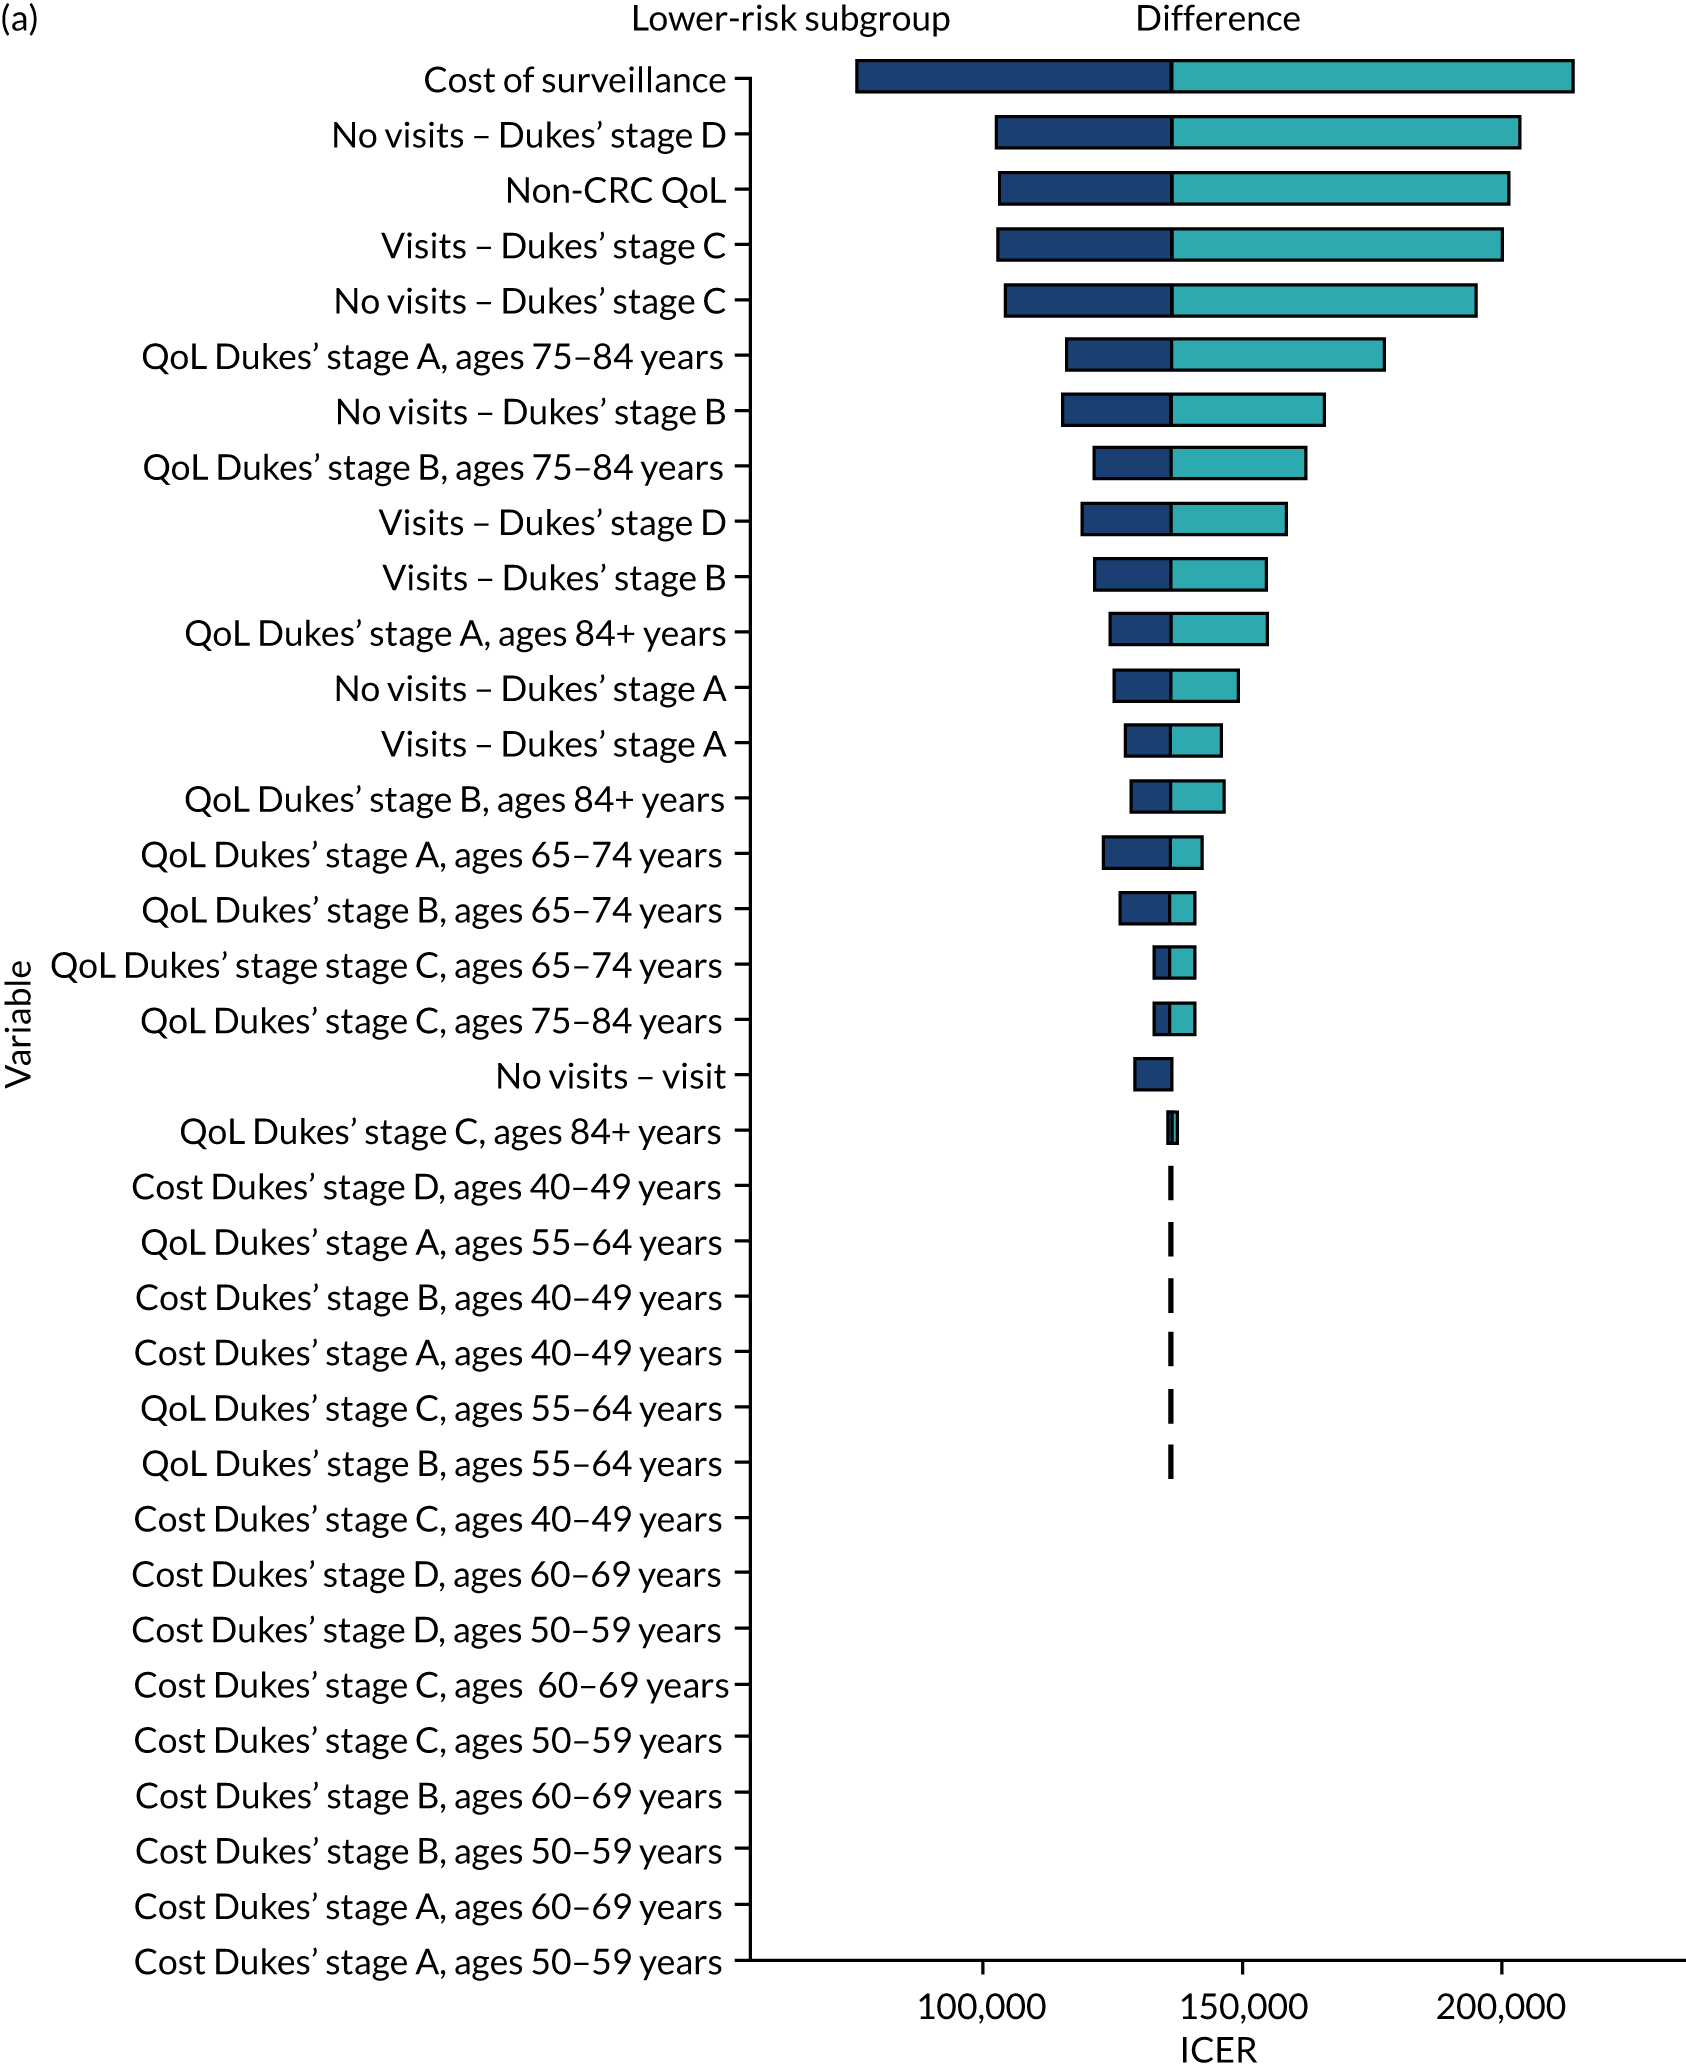
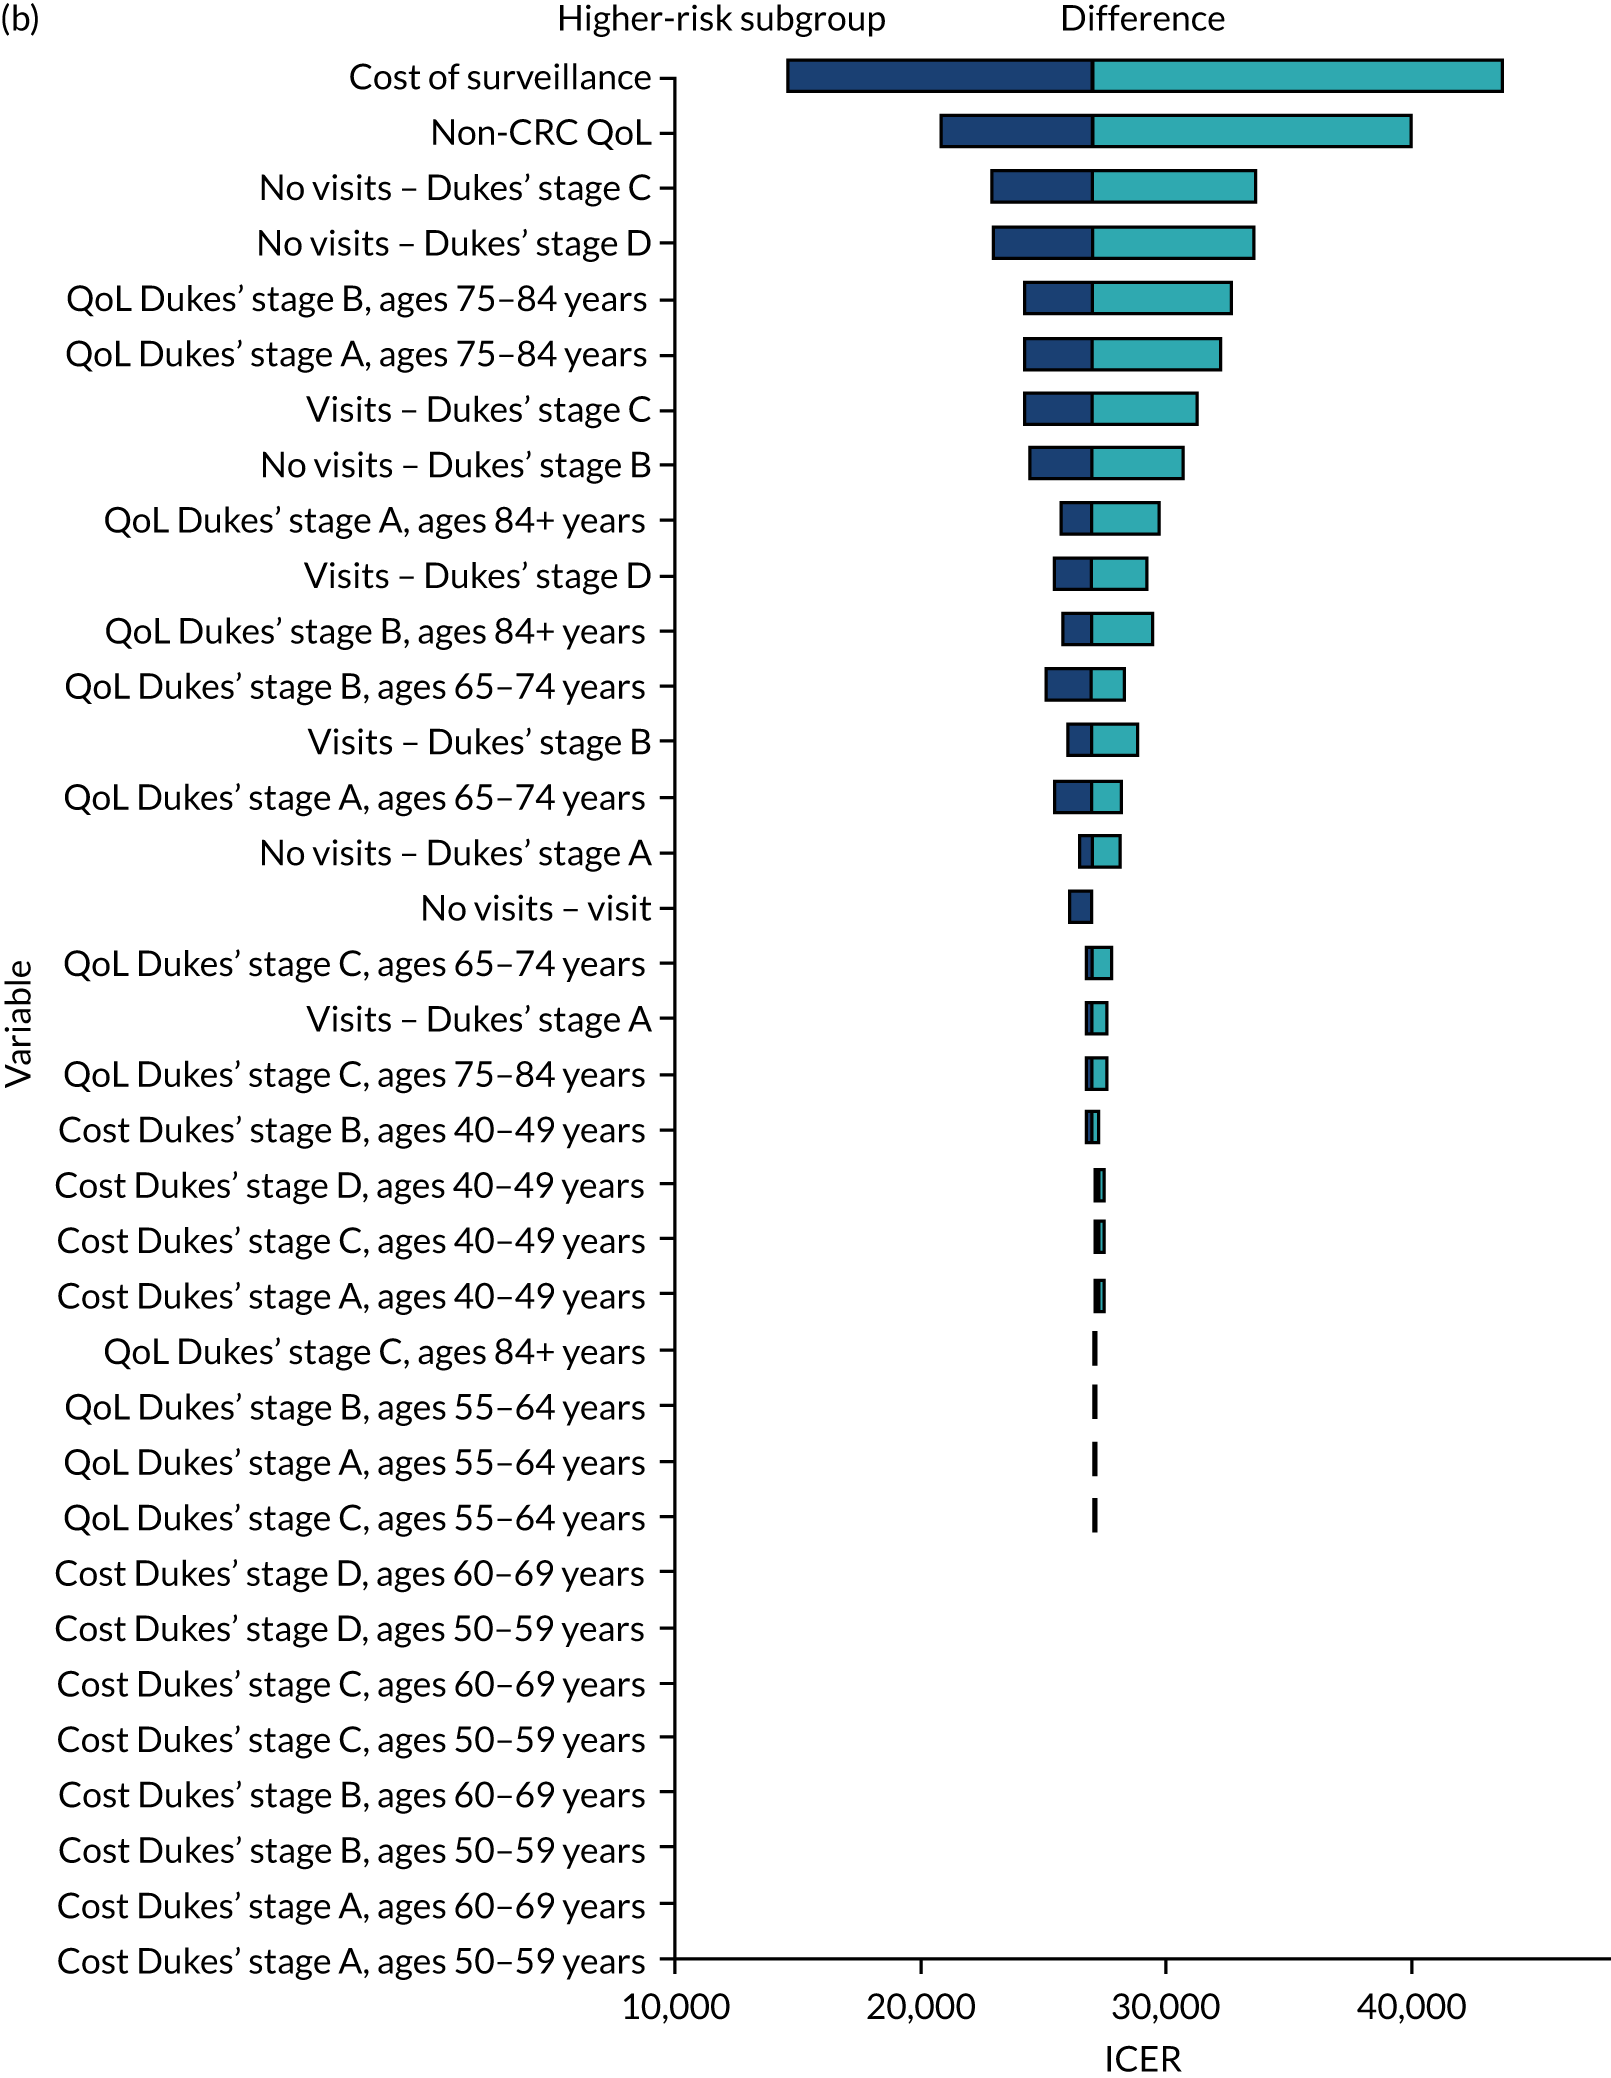
FIGURE 16.
Effect of varying baseline parameters in a DSA on ICERs in the intermediate-risk group. (a) Lower-risk subgroup; and (b) higher-risk subgroup.
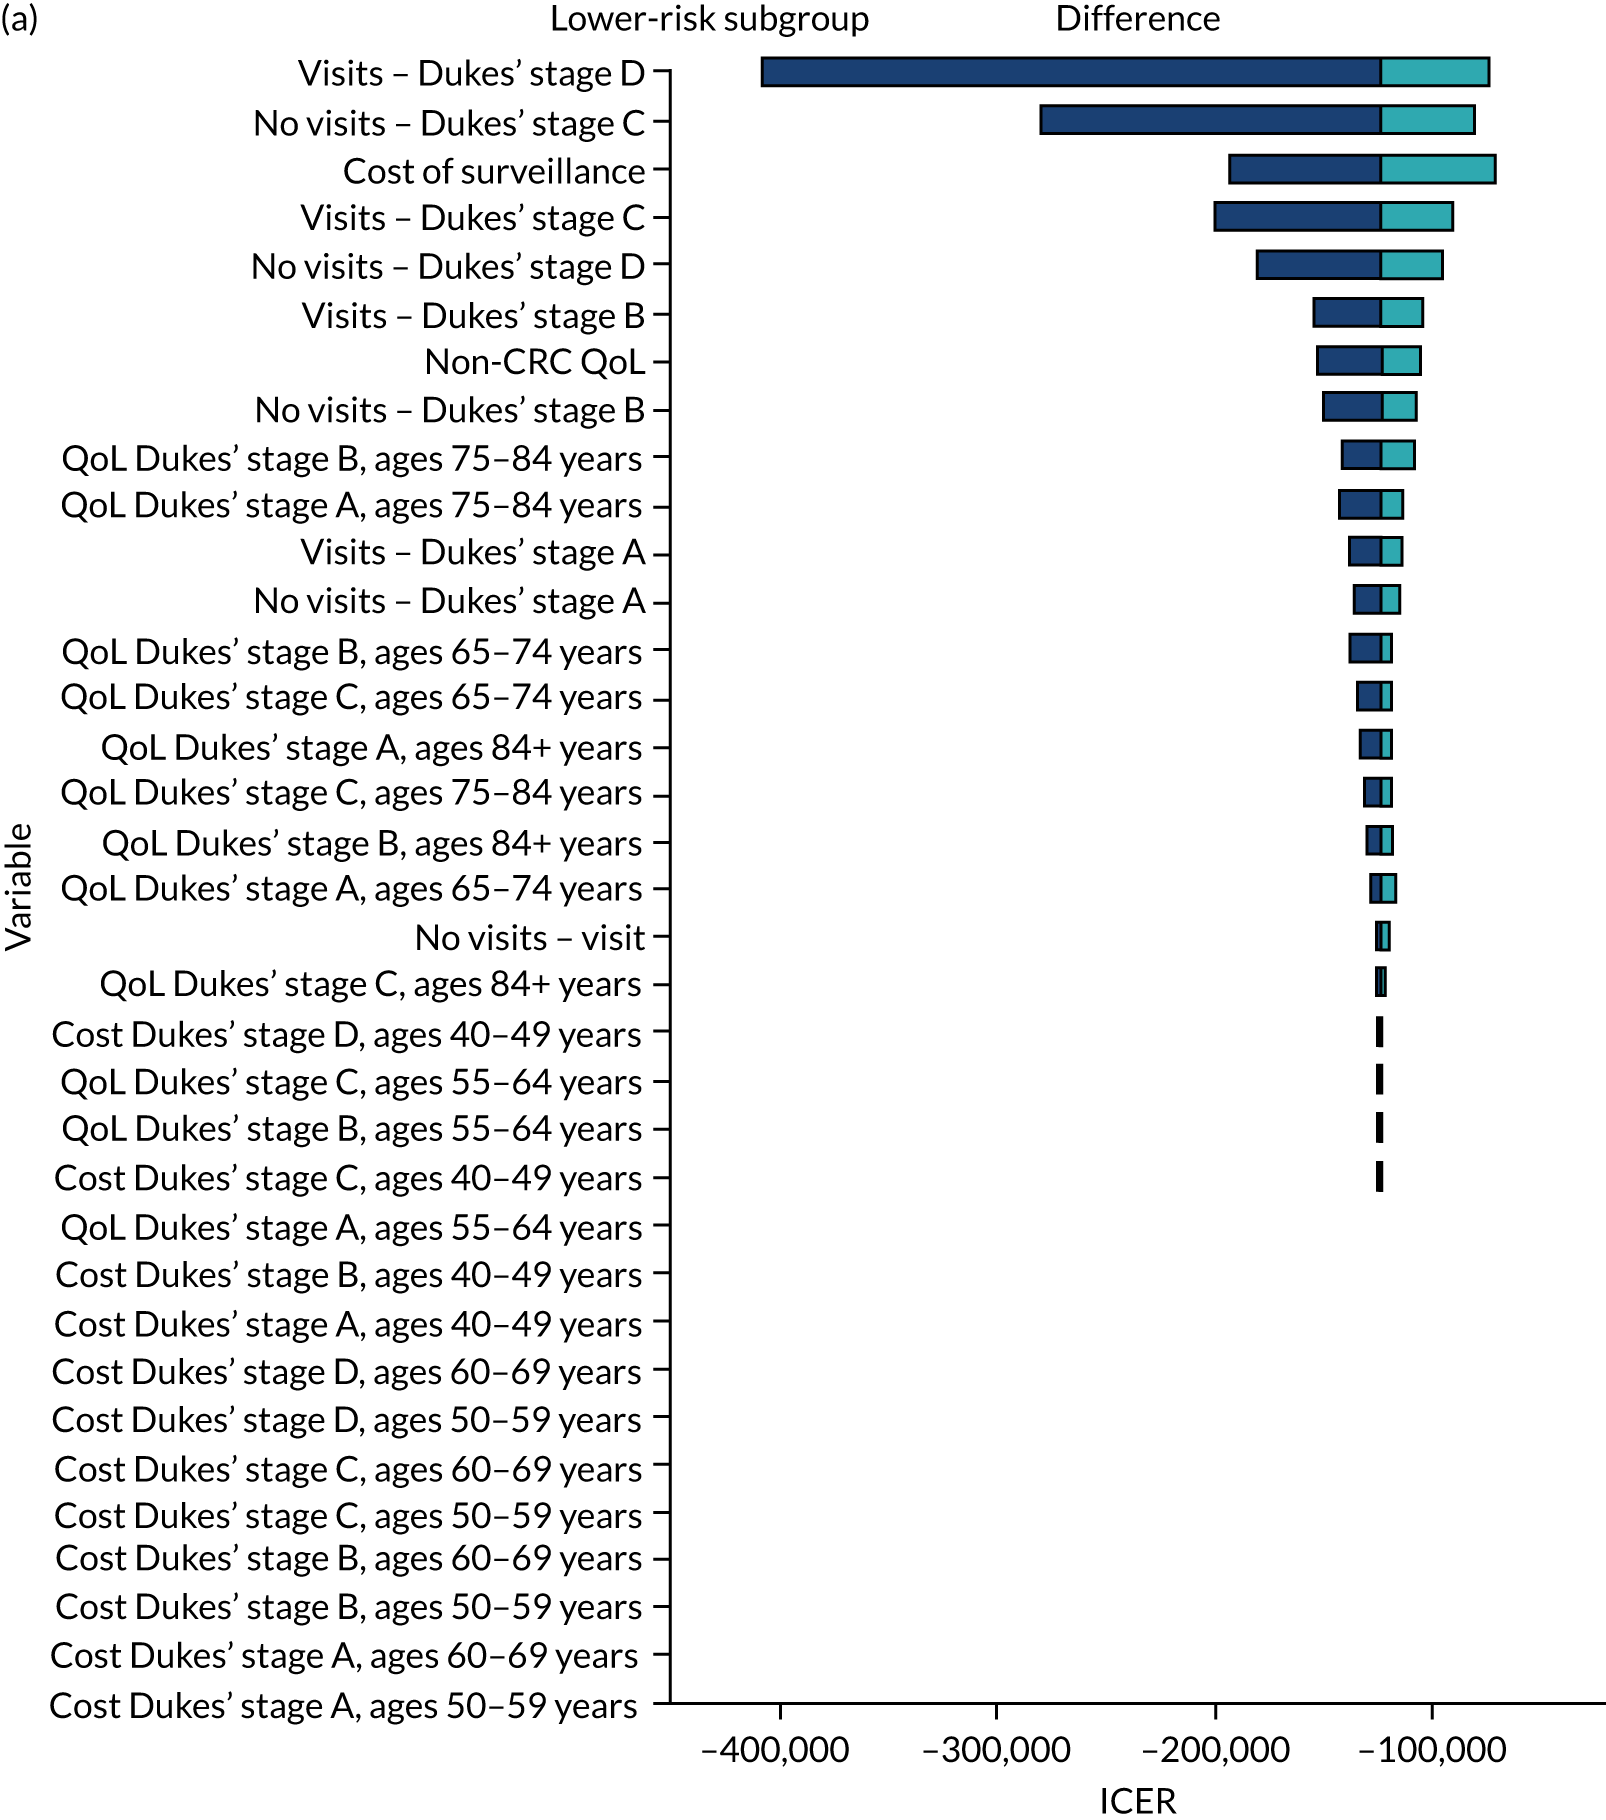
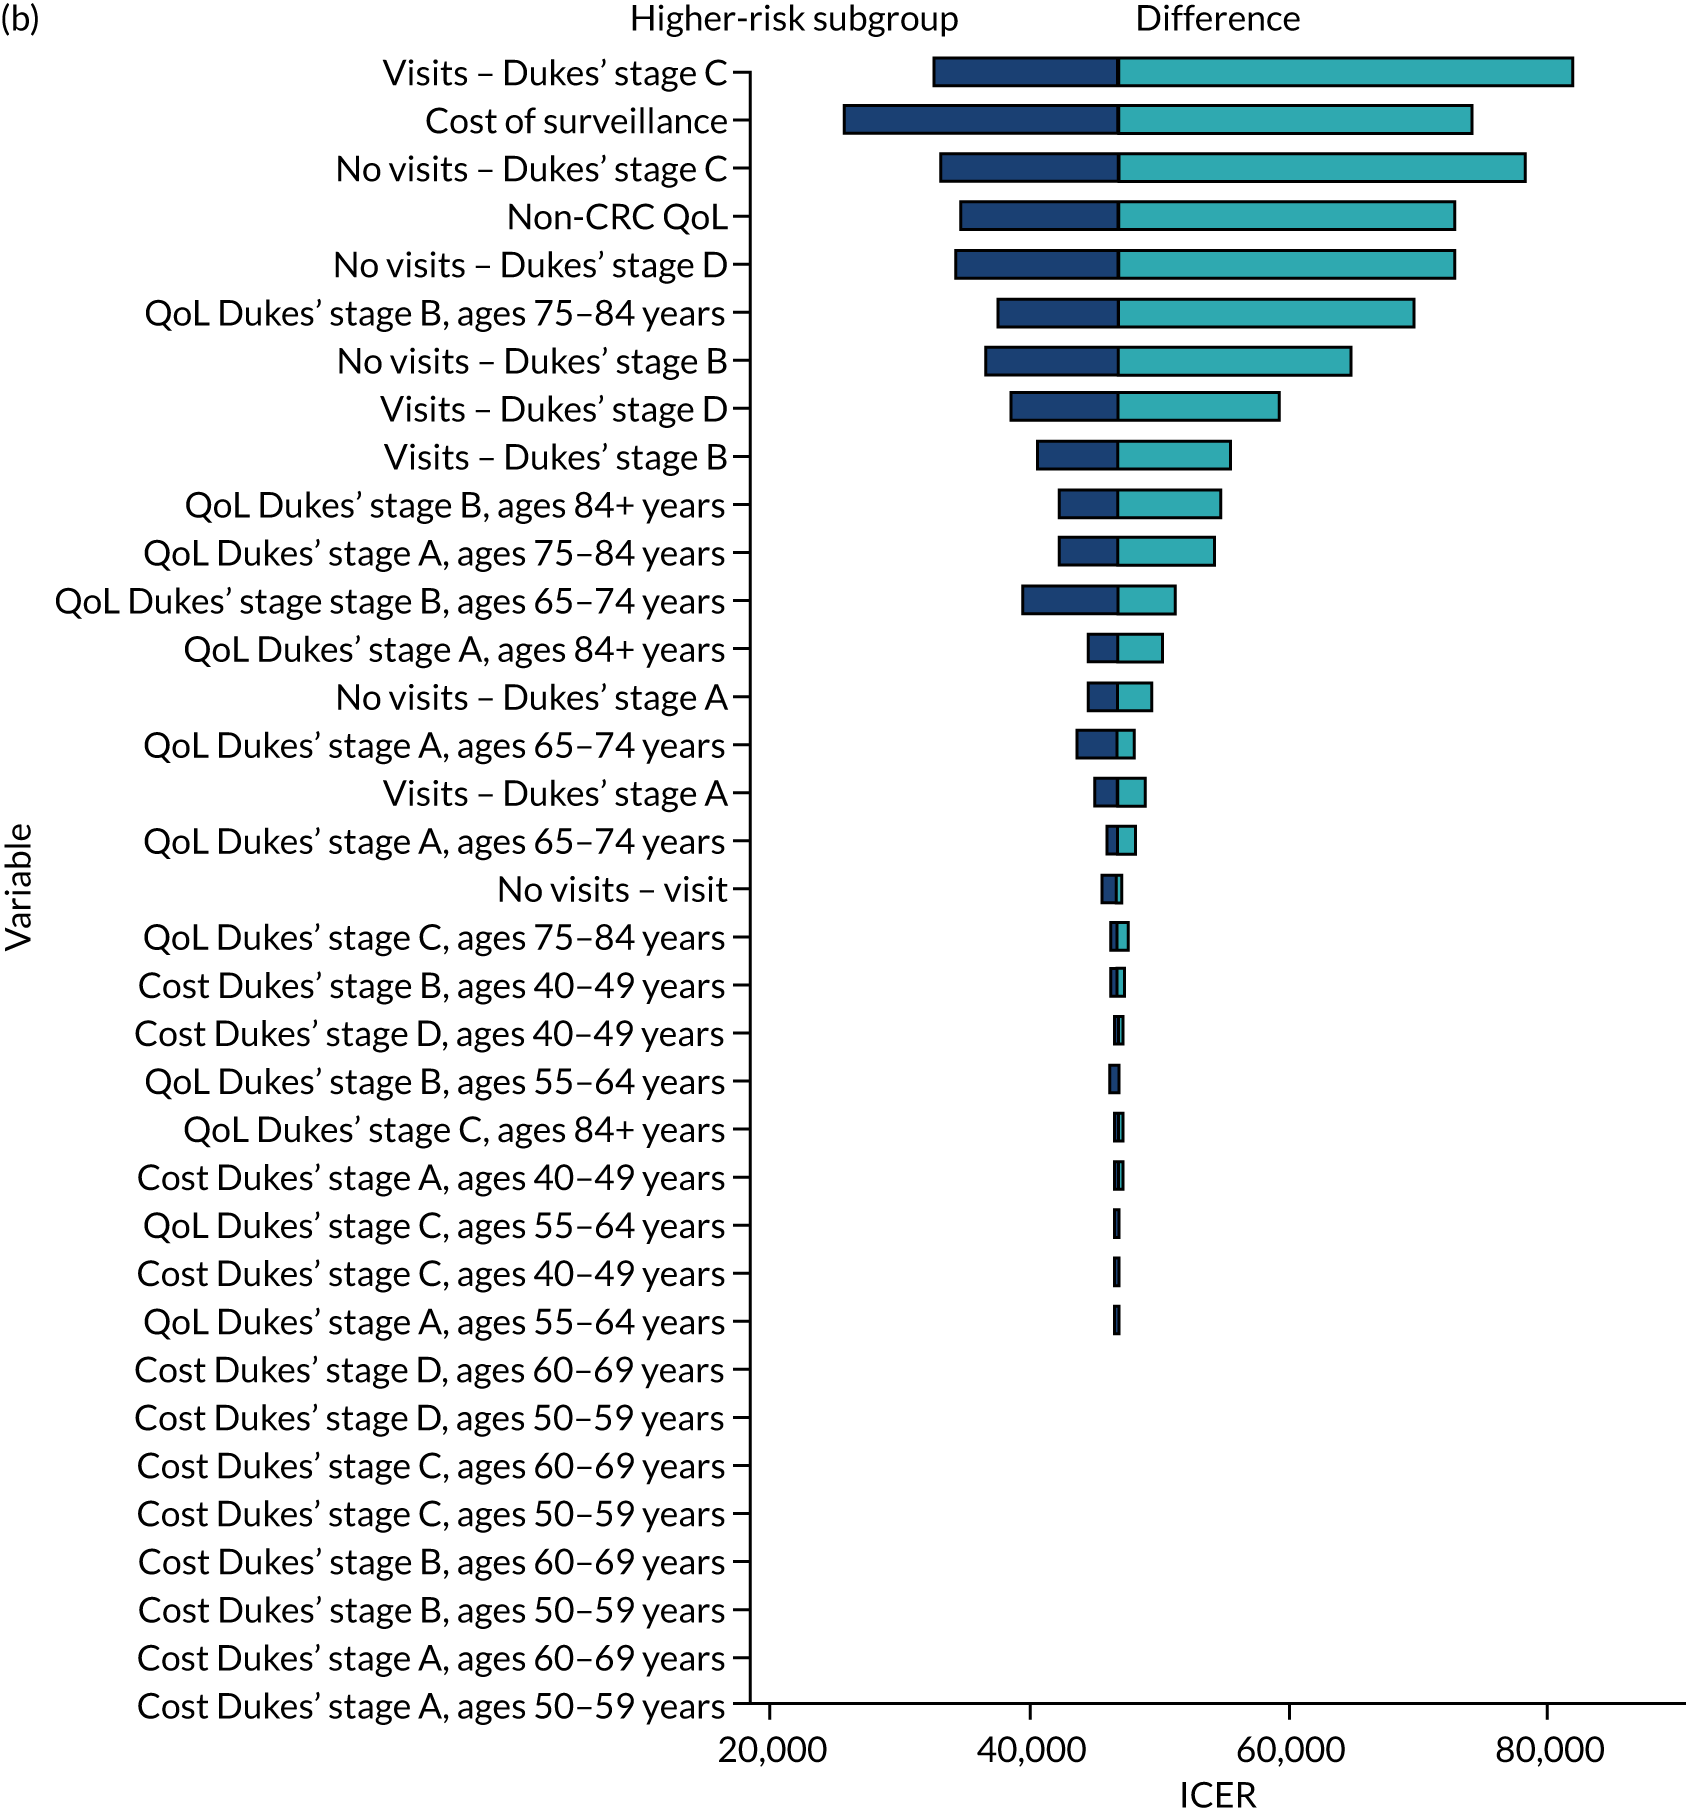
FIGURE 17.
Effect of varying baseline parameters in a DSA on ICERs in the high-risk group. (a) Lower-risk subgroup; and (b) higher-risk subgroup.
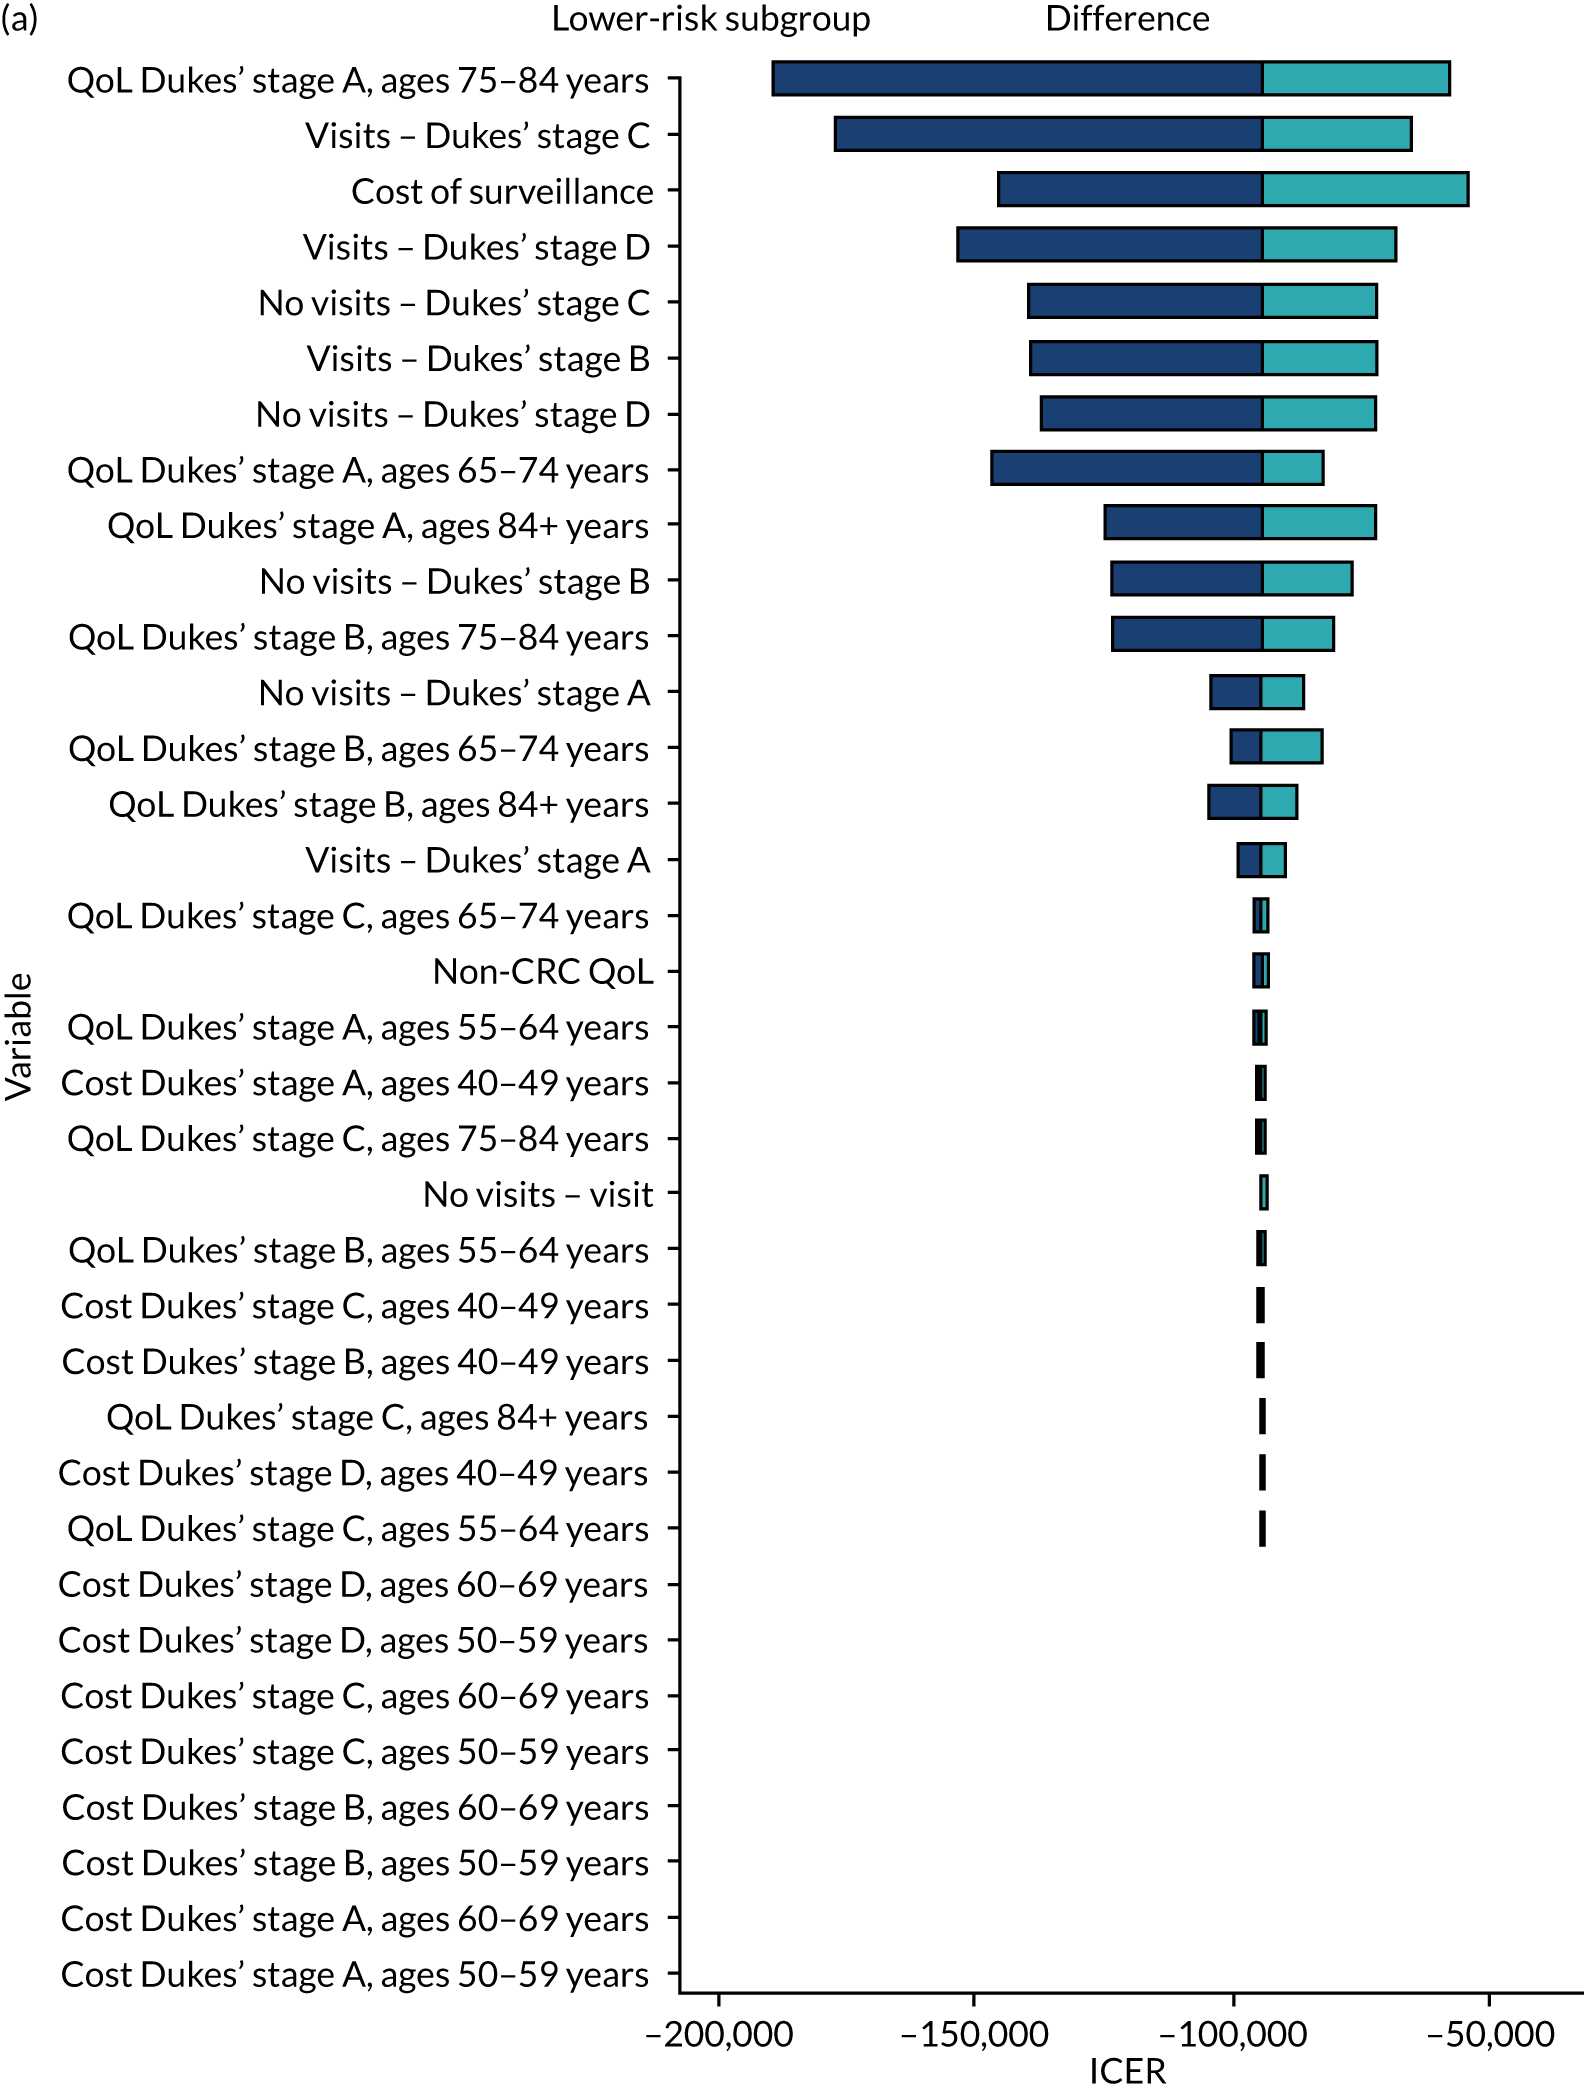
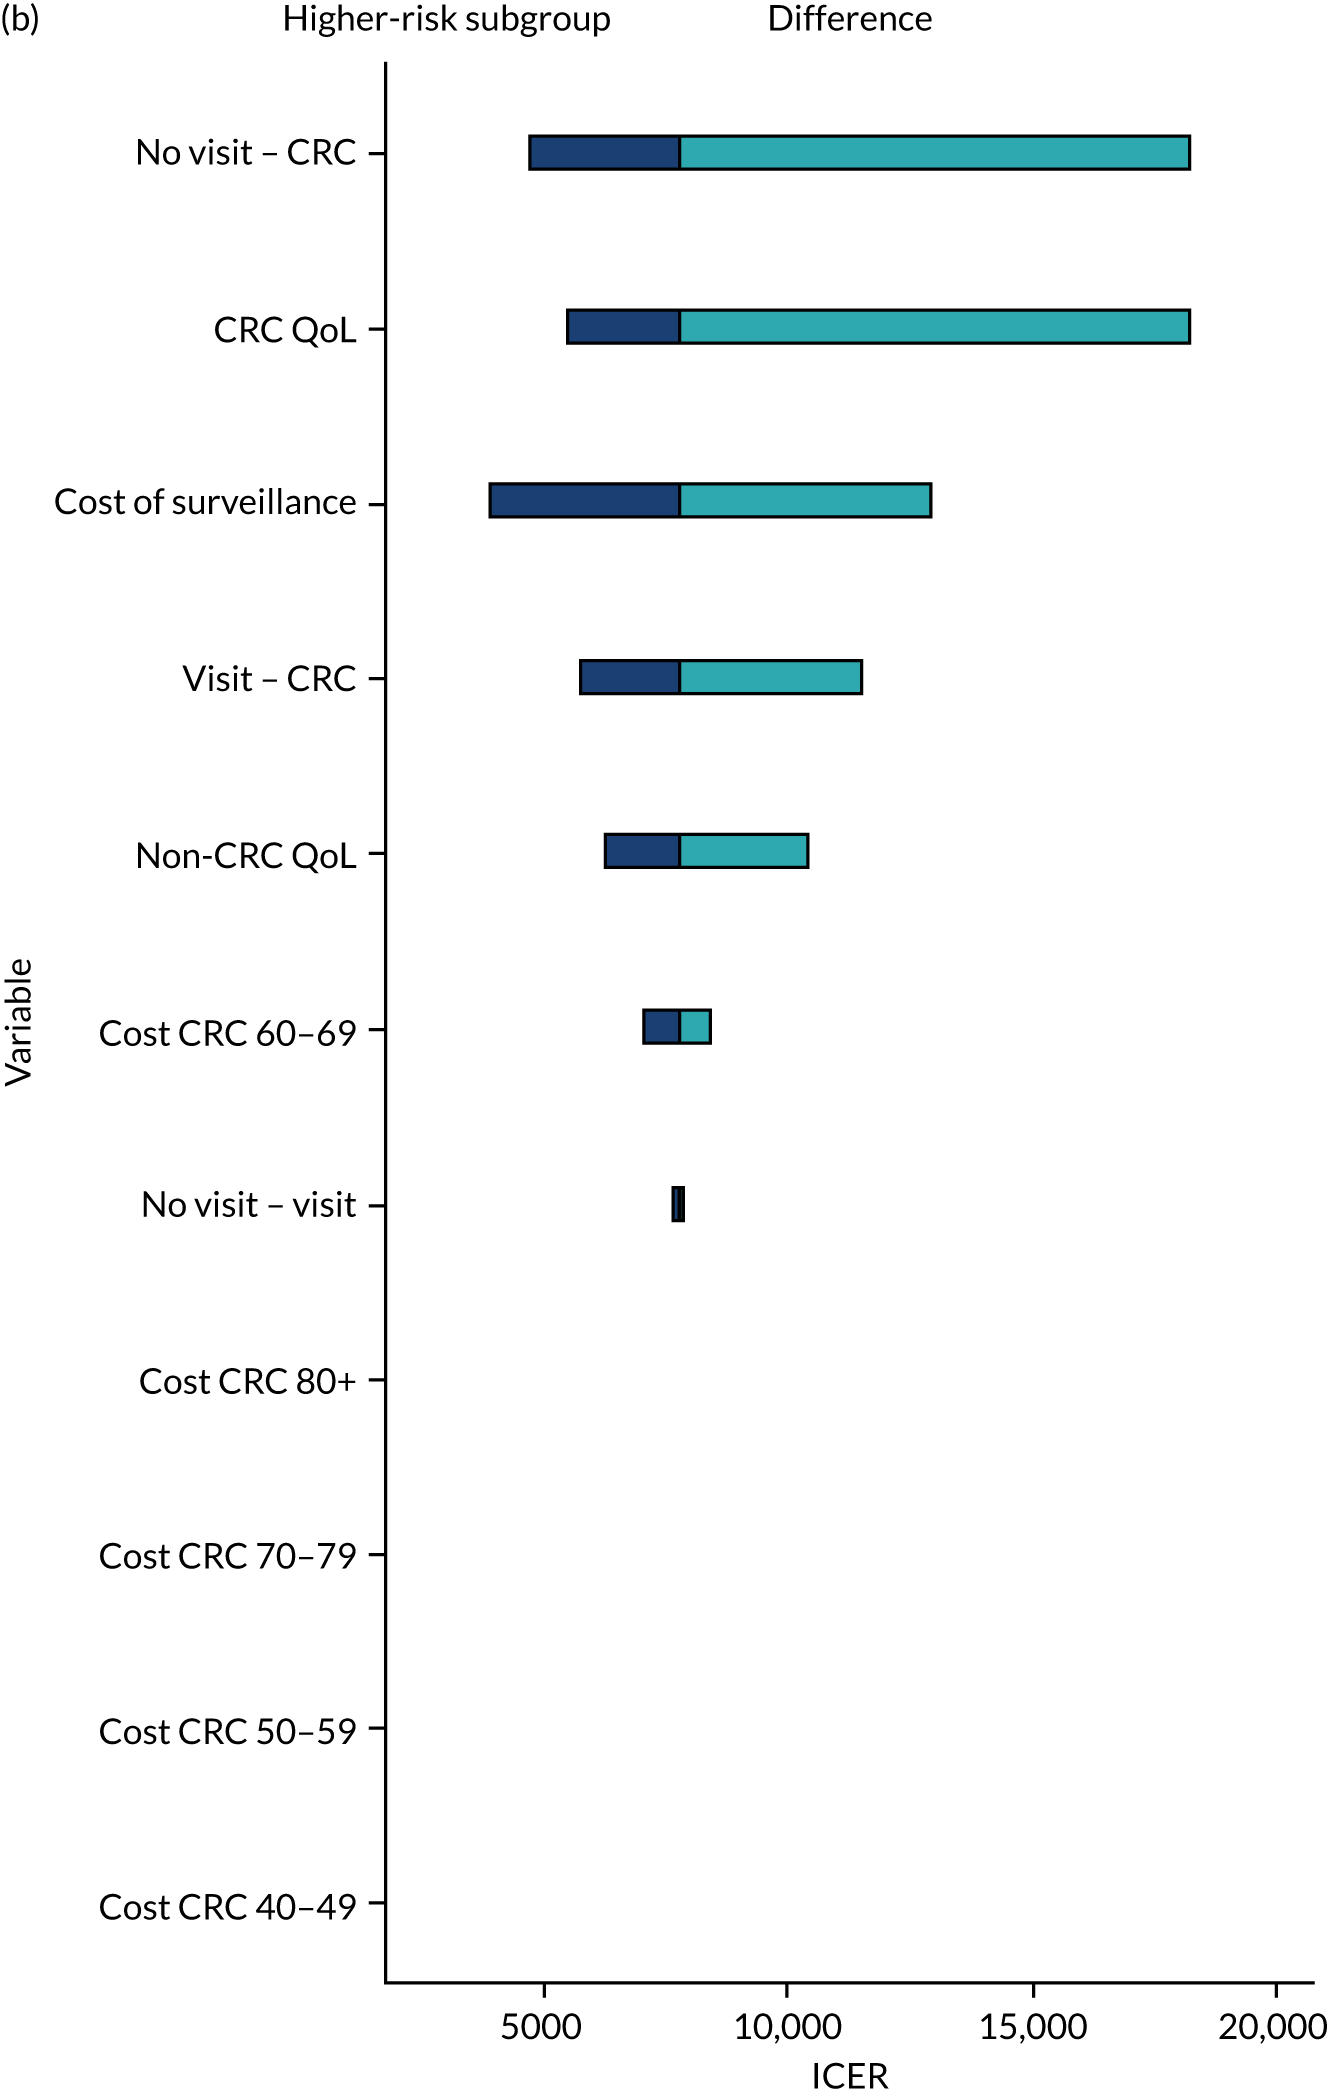
List of abbreviations
- AA
- advanced adenoma
- BCSP
- Bowel Cancer Screening Programme
- CI
- confidence interval
- CRC
- colorectal cancer
- DSA
- deterministic sensitivity analysis
- EQ-5D
- EuroQol-5 Dimensions
- EQ-5D-3L
- EuroQol-5 Dimensions, three-level version
- EVPI
- expected value of perfect information
- FIT
- faecal immunochemical test
- HR
- hazard ratio
- IBD
- inflammatory bowel disease
- ICER
- incremental cost-effectiveness ratio
- IQR
- interquartile range
- LRT
- likelihood ratio test
- NIHR
- National Institute for Health and Care Research
- NSS
- National Services Scotland
- OR
- odds ratio
- PHE
- Public Health England
- PIAG
- Patient Information Advisory Group
- PPI
- patient and public involvement
- PROM
- patient-reported outcome measure
- PSA
- probabilistic sensitivity analysis
- QALY
- quality-adjusted life-year
- QoL
- quality of life
- SE
- standard error
- SIR
- standardised incidence ratio
- UK-ASG
- UK adenoma surveillance guidelines
