Notes
Article history
The research reported in this issue of the journal was funded by the HTA programme as project number NIHR129020. The contractual start date was in January 2020. The draft report began editorial review in November 2021 and was accepted for publication in April 2022. The authors have been wholly responsible for all data collection, analysis and interpretation, and for writing up their work. The HTA editors and publisher have tried to ensure the accuracy of the authors’ report and would like to thank the reviewers for their constructive comments on the draft document. However, they do not accept liability for damages or losses arising from material published in this report.
Permissions
Copyright statement
Copyright © 2022 Elwenspoek et al. This work was produced by Elwenspoek et al. under the terms of a commissioning contract issued by the Secretary of State for Health and Social Care. This is an Open Access publication distributed under the terms of the Creative Commons Attribution CC BY 4.0 licence, which permits unrestricted use, distribution, reproduction and adaption in any medium and for any purpose provided that it is properly attributed. See: https://creativecommons.org/licenses/by/4.0/. For attribution the title, original author(s), the publication source – NIHR Journals Library, and the DOI of the publication must be cited.
2022 Elwenspoek et al.
Chapter 1 Objectives
The overall aim of this project was to define at-risk groups and determine the cost-effectiveness of active case-finding strategies in primary care.
We defined the following six objectives to address this overall aim:
-
systematic review of the accuracy of potential diagnostic indicators for coeliac disease (CD) (see Chapter 3)
-
routine data analysis to develop a prediction model to identify people who should be tested for CD (see Chapter 4)
-
systematic review of the accuracy of diagnostic tests for CD (see Chapter 5)
-
systematic review of the accuracy of genetic tests for CD (see Chapter 6)
-
online survey to identify diagnostic thresholds for testing, starting treatment and referral for biopsy (see Chapter 7)
-
economic modelling to identify the cost-effectiveness of different active case-finding strategies, informed by the findings of previous objectives (see Chapter 8).
Chapter 2 Background
Overview of coeliac disease
Coeliac disease is an autoimmune disorder triggered by the protein gluten, which is found in wheat, rye and barley. 1 Some people with CD may be asymptomatic; others present with non-specific symptoms, including gastrointestinal (GI) symptoms (e.g. diarrhoea, bloating, gassiness, constipation, vomiting or abdominal pain), fatigue and unexplained weight loss. CD is estimated to affect around 1% of people in the UK;2 however, only 30% of those with the condition are thought to be diagnosed. 3
The only currently available treatment for CD is lifetime adherence to a gluten-free diet, which can be difficult and restrictive, significantly affecting a person’s quality of life, meaning that it is important to be confident that a CD diagnosis is correct. If CD is not diagnosed promptly and the condition remains untreated, damage may be sustained to the surface of the small intestine and difficulty absorbing nutrients may lead to malnutrition, anaemia and/or osteoporosis. 4 In the long term, untreated CD may lead to a higher risk of serious complications, such as lymphoma, osteoporosis and small-bowel cancer. 5,6
New treatments are in the development pathway, but most are still in pre-clinical phases. These aim to allow people with CD to be able to eat gluten, or to prevent inadvertent gluten contamination, without becoming symptomatic or damaging the intestinal lining. 7
Diagnostic pathway
The diagnostic pathway for CD broadly involves the following steps:
-
identification of those at risk of CD who should be tested
-
serological testing to identify potential CD
-
biopsy confirmation of the diagnosis.
However, there is lack of consensus across different guidelines on the exact diagnostic pathway: who should be tested, what tests they should have and whether or not biopsy confirmation is required.
Identifying people at risk who should be tested
Within the current diagnostic pathway for CD, adults and children ‘at high risk’ of CD should be offered testing. However, there is a lack of consensus regarding who should be tested and whether or not certain groups of people are at sufficiently high risk to justify routine testing, or whether or not population-based screening may be appropriate. A 2021 cost-effectiveness analysis8 estimated that the cost of mass screening for CD at age 12 years was €40,105 per quality-adjusted life-year (QALY) gained; this is cost-effective at the commonly used threshold of €50,000 per QALY gained. If mass screening is not considered appropriate, it is not clear (1) what symptoms or conditions are suggestive of CD and (2) which of these should prompt testing, with recommendations varying across guidelines.
The National Institute for Health and Care Excellence (NICE) guidelines, published in 2015,9 recommend that people with any of the following symptoms or conditions be offered serological testing for CD:
-
persistent unexplained abdominal or GI symptoms
-
faltering growth (children only)
-
prolonged fatigue
-
unexpected weight loss
-
severe or persistent mouth ulcers
-
unexplained iron, vitamin B12 or folate deficiency
-
type 1 diabetes
-
autoimmune thyroid disease
-
irritable bowel syndrome (IBS) (adults only).
Furthermore, the guidelines recommend that first-degree relatives of people with CD be offered serological testing for CD.
The guidelines also suggest that serological testing for CD could be considered for people with any of the following symptoms or conditions:
-
metabolic bone disorder (reduced bone mineral density or osteomalacia)
-
unexplained neurological symptoms (particularly peripheral neuropathy or ataxia)
-
unexplained subfertility or recurrent miscarriage
-
persistently raised liver enzymes with unknown cause
-
dental enamel defects
-
Down syndrome
-
Turner syndrome.
Other guidelines vary in recommendations on who should be tested for CD. For example, the 2020 European Society for Paediatric Gastroenterology, Hepatology and Nutrition (ESPGHAN) guidelines10 for the diagnosis of paediatric CD suggest that children and adolescents with the following symptoms or conditions should be tested:
-
chronic or intermittent diarrhoea, constipation/abdominal pain, distended abdomen or recurrent nausea and/or vomiting
-
failure to thrive
-
delayed puberty, amenorrhoea
-
irritability
-
arthritis/arthralgia
-
recurrent aphthous stomatitis
-
dermatitis herpetiformis-type rash
-
Williams–Beuren syndrome
-
immunoglobulin A (IgA) deficiency
-
liver disease.
The European Society for the Study of Coeliac Disease (ESsCD) 2019 guidelines11 recommend testing in the following additional groups:
-
microscopic colitis
-
early menopause
-
acute or chronic pancreatitis
-
epilepsy
-
headaches, including migraines
-
mood disorders
-
attention deficit disorder/cognitive impairment
-
hyposplenism or functional asplenia, psoriasis or other skin lesions, pulmonary haemosiderosis, and IgA nephropathy.
Serological testing
There are a number of serological tests available for CD. These are summarised in Table 1. For all currently available serological tests, patients must continue to eat gluten daily for the 6 weeks prior to testing. Recommendations for serological testing for CD also vary across guidelines. Most guidelines recommend that people identified as potentially being at risk of having CD are first tested for IgA and IgA tissue transglutaminase (tTG). 9,10 Some guidelines also recommend IgA endomysial antibody (EMA) testing following tTG testing: NICE guidelines recommend that those with a weak positive IgA tTG should also be tested with IgA EMA. 9 In practice, EMA testing is often conducted following a positive tTG test to confirm the diagnosis. Testing for IgA deficiency is recommended, as the IgA-based serological tests will produce a reliable result only for those who are not IgA deficient. IgA deficiency affects around 0.5% of the general population, but is more common among those with CD, affecting around 2–3%. If IgA deficiency is detected, then an immunoglobulin G (IgG)-based test alternative is required; NICE9 and ESPGHAN10 guidelines recommend IgG EMA, IgG deamidated gliadin peptide (DGP) or IgG tTG. Gliadin antibodies (GAs) and reculin antibodies, which were previously recommended for serological testing for CD, are now no longer recommended, as the more recently developed assays are considered to have better accuracy. 11
| Serological test | Antibody type | Date available | Test type | Guidelines | UK cost (£) |
|---|---|---|---|---|---|
| tTG | IgA or IgG | 1997 | ELISA | NICE;9 ESPGHAN10 | 10.77 (SE 2.15) |
| EMA | IgA or IgG | ≈ 1990 | IFA | NICE;9 ESPGHAN10 | 14.92 (SE 1.87) |
| DGP | IgA or IgG | 1999 | ELISA | NICE;9 ESPGHAN10 | NA |
| Actin antibodies | IgA | ≈ 2000 | ELISA | Not recommended | NA |
| Reculin antibodies | IgA or IgG | 1977 | IFA (rat kidney) | Not recommended | NA |
| GAs | IgA or IgG | Early 1980s | Quantitative EIA | Not recommended | NA |
Previous systematic reviews of the accuracy of serological testing for diagnosing CD suggest that the tests are highly sensitive and specific among both adults and children. 12–15 However, these systematic reviews are out of date, and most have methodological limitations, including issues with the search strategy, how study quality was assessed and how results were synthesised.
Genetic testing
Coeliac disease has a strong genetic basis. Nearly all people with CD have variants of the human leucocyte antigen (HLA)-DQ alpha 1 (HLA-DQA1) and HLA-DQ beta 1 (HLA-DQB1) chains that encode the DQ2 and DQ8 heterodimer proteins. 16 The majority of people with CD (95%) carry the HLA-DQ2.5 heterodimer. The remaining people (5–10%) carry either the HLA-DQ8 or the HLA-DQ2.2 heterodimers. It is estimated that < 1% of those with CD do not have one of these genetic markers. However, around 50% of the general population also carry these markers, so presence of the marker does not equate to presence of CD. 17
The role of genetic testing in diagnosing CD is unclear. It has the potential to be used as a ‘rule-out’ test, as absence of either the HLA-DQ2 or the HLA-DQ8 genetic marker suggests that it is extremely unlikely that the person tested has CD. However, the presence of these markers does not imply presence of CD, and so it is less useful as a rule-in test. The cost of genetic testing is greater than the cost of serology and, therefore, guidelines do not currently recommend HLA-DQ2/-DQ8 testing as an initial screening test for CD diagnosis.
The NICE guidelines9 recommend against using HLA-DQ2/-DQ8 testing in the initial diagnosis of CD in non-specialist settings, but suggest that testing may be considered in certain situations, such as for children who are not having a biopsy or for people who have already stopped eating gluten and do not want to reintroduce it into their diet.
Biopsy confirmation
Biopsy is invasive, expensive, potentially distressing and burdensome, with risks of complications, particularly for children, who require general anaesthesia to undergo the procedure. NICE guidelines recommend biopsy to confirm a diagnosis of CD for all adults with positive serological test results, regardless of how strongly indicative their results are of CD. The guidance for children is less clear: NICE guidelines recommend that children with a positive serological test are referred to paediatric gastroenterology services for further investigation for CD. They do not specify that this should be biopsy confirmation. As with serological tests, patients must eat gluten daily in the 6 weeks prior to biopsy for the result to be reliable.
In its 2012 guidelines,18 ESPGHAN advised that children with IgA tTG ≥ 10 times the upper limit of normal for the assay who also test positive for IgA EMA and have a HLA genotype suggestive of CD do not need to undergo biopsy to confirm their CD diagnosis. 18 During the COVID-19 pandemic, the British Society of Gastroenterology published interim guidance including a COVID-19-specific non-biopsy protocol for adults with suspected CD. 19 This guidance allows a non-biopsy diagnosis to be made if the patient has a tTG level ≥ 10 times the upper limit of normal (the same as the non-biopsy protocol for children), is < 55 years of age, has a positive EMA test result and does not have any ‘alarm’ symptoms, although it is not clear what these are. 19
Some guidelines recommend biopsy even if serological tests for CD are negative in certain patient groups. For example, the ESsCD 2019 guidelines11 recommend biopsy for those with chronic diarrhoea, particularly with features of malabsorption, such as weight loss; iron-deficiency anaemia (IDA) without cause; GI symptoms with a family history of CD; GI symptoms and an autoimmune disease or IgA deficiency; or biopsy-proven dermatitis herpetiformis. They also recommend biopsy for ‘failure to thrive in children’. 11 NICE guidelines recommend referral of people with ‘negative serological test results to a gastrointestinal specialist for further assessment if coeliac disease is still clinically suspected’9 (© NICE 2015 Coeliac Disease: Recognition, Assessment and Management; available from www.nice.org.uk/guidance/ng20 All rights reserved. Subject to Notice of rights. NICE guidance is prepared for the National Health Service in England. All NICE guidance is subject to regular review and may be updated or withdrawn. NICE accepts no responsibility for the use of its content in this product/publication).
Chapter 3 Accuracy of diagnostic indicators for coeliac disease
Parts of this chapter have been reproduced from Elwenspoek et al. 20 This is an Open Access article distributed in accordance with the terms of the Creative Commons Attribution (CC BY 4.0) license, which permits others to distribute, remix, adapt and build upon this work, for commercial use, provided the original work is properly cited. See: https://creativecommons.org/licenses/by/4.0/. The text below includes minor additions and formatting changes to the original text.
We conducted a systematic review to assess the accuracy of various symptoms and risk factors in ‘diagnosing’ CD, considering the potential of these as initial screening tools prior to serological testing. In this chapter, we will refer to these symptoms and risk factors as ‘diagnostic indicators’. We defined diagnostic indicators as signs, symptoms and risk factors that may help clinicians identify patients for whom further testing for CD is warranted. We did not consider factors that are difficult to determine at an initial consultation, such as perinatal risk factors or age at gluten introduction, or experimental factors that are not measured in clinical practice [i.e. tests for susceptibility genes; these are currently not widely available to clinicians and therefore are not (yet) useful in aiding diagnosis].
The review was registered with the international prospective register of systematic reviews (PROSPERO) under the registration number CRD42020170766. We published the protocol for the review, which predefined the objectives and methods for this review. 21 This review followed the recommendations from the Centre for Reviews and Dissemination22 and the Cochrane Handbook for Systematic Reviews of Diagnostic Test Accuracy Version 1.0.0,23 and is reported in accordance with the Preferred Reporting Items for a Systematic Review and Meta-analysis of Diagnostic Test Accuracy Studies (PRISMA-DTA) statement. 24
Systematic review methods
Eligibility criteria
Studies were evaluated as diagnostic test accuracy (DTA) studies; the diagnostic indicator was considered to be the index test and CD serological tests and/or biopsy were considered the reference standard.
We included studies that met the following criteria:
-
Study design – diagnostic cohort/cross-sectional studies (also known as ‘one-gate design’)25 or diagnostic case–control studies (also known as ‘two-gate’ or ‘multigate’ designs). Prediction modelling studies were also eligible for inclusion.
-
Participants – adults and/or children representative of the general population. Studies restricted to specific disease populations without healthy participants were excluded.
-
Index test – any potential diagnostic indicator based on the definition provided previously.
-
Reference standard – CD diagnosis, detected by one or more serological tests, including IgA/IgG tTG, EMA or DGP, and/or duodenal biopsy. All participants had to be tested for CD, including the control group participants.
Studies were included only if sufficient data could be extracted to construct cross-tabulations of the number of people with and the number without the diagnostic indicator against the number of people with and the number without CD, according to the reference standard.
We excluded studies published before 1997 (the year in which tTG testing was developed) to reduce variation in CD diagnostic tests.
Search strategy
The following databases were searched from 1997 to April 2021:
-
MEDLINE® (National Library of Medicine, Bethesda, MD, USA)
-
Embase® (Elsevier, Amsterdam, the Netherlands)
-
Cochrane Library
-
Web of Science™ (Clarivate™, Philadelphia, PA, USA)
-
the World Health Organization (WHO) International Clinical Trials Registry Platform (ICTRP)
-
the National Institutes of Health (NIH) Clinical Trials database.
The search strategy incorporated three main elements:
-
conditions (CD) + prognostic/predictive research filter26,27
-
conditions (CD) + all physical diseases/signs/symptoms (based on medical subject headings, Emtree) + ‘CD’ diagnosis
-
terms for high-risk populations (see Appendix 1 for a detailed search strategy). 21
Animal studies, case reports, letters, editorials and coeliac artery/trunk research were filtered out and a sensitive study design filter was applied. We also screened reference lists of the latest guidelines on CD and recent systematic reviews.
The results of the searches were downloaded and saved to an EndNote X9 library (Clarivate).
Study selection
Study selection was conducted in two stages using forms developed in Microsoft Access® (Microsoft Corporation, Redmond, WA, USA) that were piloted before use. Search results were exported from EndNote in a format that could be imported into Microsoft Access. At stage 1 of study selection, titles and abstracts were screened against the inclusion criteria to exclude papers that were clearly irrelevant. At the second stage, full texts identified as possibly relevant in the initial screening were assessed in detail and reasons for exclusion were documented. Both stages of study selection were performed independently by two reviewers, and disagreements about study eligibility were resolved through discussion or by consulting a third member of the review team.
Data collection process
Standardised data extraction forms were developed using Microsoft Access. These were piloted on a small sample of papers and adapted as necessary before use. Data extraction was performed by one reviewer and checked by a second, with disagreements resolved through discussion or referral to a third reviewer.
We extracted the following data from each included study:
-
study characteristics
-
participant characteristics
-
details on the diagnostic indicator
-
CD diagnostic tests used.
The results data were extracted as 2 × 2 tables of test results (numbers of true positives, false negatives, false positives and true negatives) for each diagnostic indicator against the reference standard of serological tests or biopsy. Two-by-two data were extracted at the biopsy cut-off point of Marsh grade 3a, if available; otherwise, any reported biopsy threshold was accepted.
Risk of bias
Risk of bias was assessed separately for each diagnostic indicator reported, so, for studies reporting on multiple indicators, risk of bias was assessed multiple times. We used the quality assessment of diagnostic accuracy studies 2 (QUADAS-2) tool,28 which includes domains covering participants, index test, reference standard and flow and timing. If at least one of the domains was rated as ‘high risk’, the study results were considered to be at high risk of bias; if all domains were judged as ‘low risk’, the study was considered as having a low risk of bias; otherwise, the study was considered to have an ‘unclear’ risk of bias. The content of the tool was tailored to the review. The following modifications were made to the QUADAS-2 risk-of-bias signalling questions:
-
Owing to the broad research question and the expected heterogeneity between included studies, we did not formally assess applicability.
-
We removed the following signalling questions, as these were not considered relevant to diagnostic indicator studies because the ‘index test’ is not a test but a diagnostic indicator and the reference standard is a diagnosis of CD –
-
‘Were the index test results interpreted without knowledge of the results of the reference standard?’ (index test domain).
-
‘If a threshold was used, was it prespecified?’ (index test domain).
-
‘Were the reference standard results interpreted without knowledge of the results of the index test?’ (reference standard domain).
-
-
We added the following signalling question –
-
‘Was the aim of the study to investigate this diagnostic indicator?’ (index test domain).
-
The risk of bias was assessed by one reviewer and checked by a second as part of the data extraction process.
Synthesis of results
We present a narrative summary of the included studies, including a summary of the characteristics of the included studies that evaluated each diagnostic indicator (e.g. study design, population size, geographical location, year, population characteristics, diagnostic indicator details and CD diagnosis). We also describe the main methodological problems or biases that affected the studies.
The results were grouped by diagnostic indicator and age group. Diagnostic indicators were grouped based on discussion with clinical team members; for example, acid reflux symptoms included heartburn, dyspepsia and gastro-oesophageal reflux symptoms. If more than one indicator in each category was evaluated in one study (e.g. heartburn and dyspepsia), only one was included in the meta-analysis to avoid including the same individuals twice. In those cases, the broader term (e.g. dyspepsia over heartburn) or more prevalent diagnostic indicator was selected. Study populations were categorised as ‘children’ if the majority were children and none of the participants was aged > 21 years, and as ‘adults’ if the majority were adults with no participant aged < 15 years. All other populations were categorised as mixed-age groups.
We fitted a bivariate random-effects meta-analysis for each diagnostic indicator, in which we assumed binomial likelihoods for the numbers of true positives and true negatives. 29,30 Pooled estimates of sensitivity and specificity and estimates of the between-study standard deviation (SD) sensitivity and specificity on the logit scale (‘tau’) are reported. Per diagnostic indicator, we present study-specific and pooled estimates of sensitivity and specificity in coupled forest plots and summary receiver operating characteristic (SROC) plots, with 95% confidence ellipses and SROC curves. 20
Summary results from each meta-analysis were also used to estimate positive predictive values (PPVs), that is the probability of CD given that an individual has each diagnostic indicator. To calculate these values, we assumed a prevalence of 1% of CD in the general population. 31,32 The 95% confidence intervals (CIs) around PPVs were computed using Monte Carlo simulation, simulating from a bivariate normal distribution for summary sensitivity and specificity on the logit scale. Negative predictive values are not informative in this context, because a sign, symptom or risk condition cannot be used in clinical practice to exclude CD; therefore, these are not reported.
Sensitivity analyses and subgroup analyses
Because we expected heterogeneity across studies in sensitivity and specificity as a result of variability in age groups (children vs. adults), method of CD diagnosis (biopsy and/or serology vs. serology only), and study design (single gate vs. multigate), we performed subgroup and sensitivity analyses on these study characteristics if subgroups contained at least five studies.
All statistical analyses were performed in R33 (The R Foundation for Statistical Computing, Vienna, Austria) using lme434 and PropCIs35 packages; forestplot,36 flextable,37 ggplot2,38 mada39 and ellipse40 were used for tables and figures.
Deviations from the protocol
Owing to the size of the review and time constraints, it was not feasible to contact authors.
To make this review more manageable, we planned to extract data for diagnostic indicators with sufficient evidence only, which we defined as data on diagnostic indicators that are reported in five or more studies, unless our expert panel identified a diagnostic indicator as exceptionally promising. However, the expert panel agreed that most diagnostic indicators were potentially promising. To reduce bias in the process and to keep the review manageable, it was decided not to extract data on diagnostic indicators that were reported by fewer than five studies. We provide full references for all studies reporting on indicators for which we did not extract data. In addition, a post hoc sensitivity analysis was performed on the diagnostic indicator ‘family history of CD’ to restrict the analysis to first-degree relatives only.
As stated in the protocol,21 we explored the possibility of adjusting for the imperfect accuracy of the serological tests in a Bayesian statistical framework, using informative prior distributions for the sensitivity and specificity of these tests based on our systematic review of the accuracy of serology tests for CD (see Chapter 5). However, this was not feasible because of the considerable variation in reference standards, including thresholds for reference standards, used across studies.
Results of assessment of diagnostic accuracy of indicators
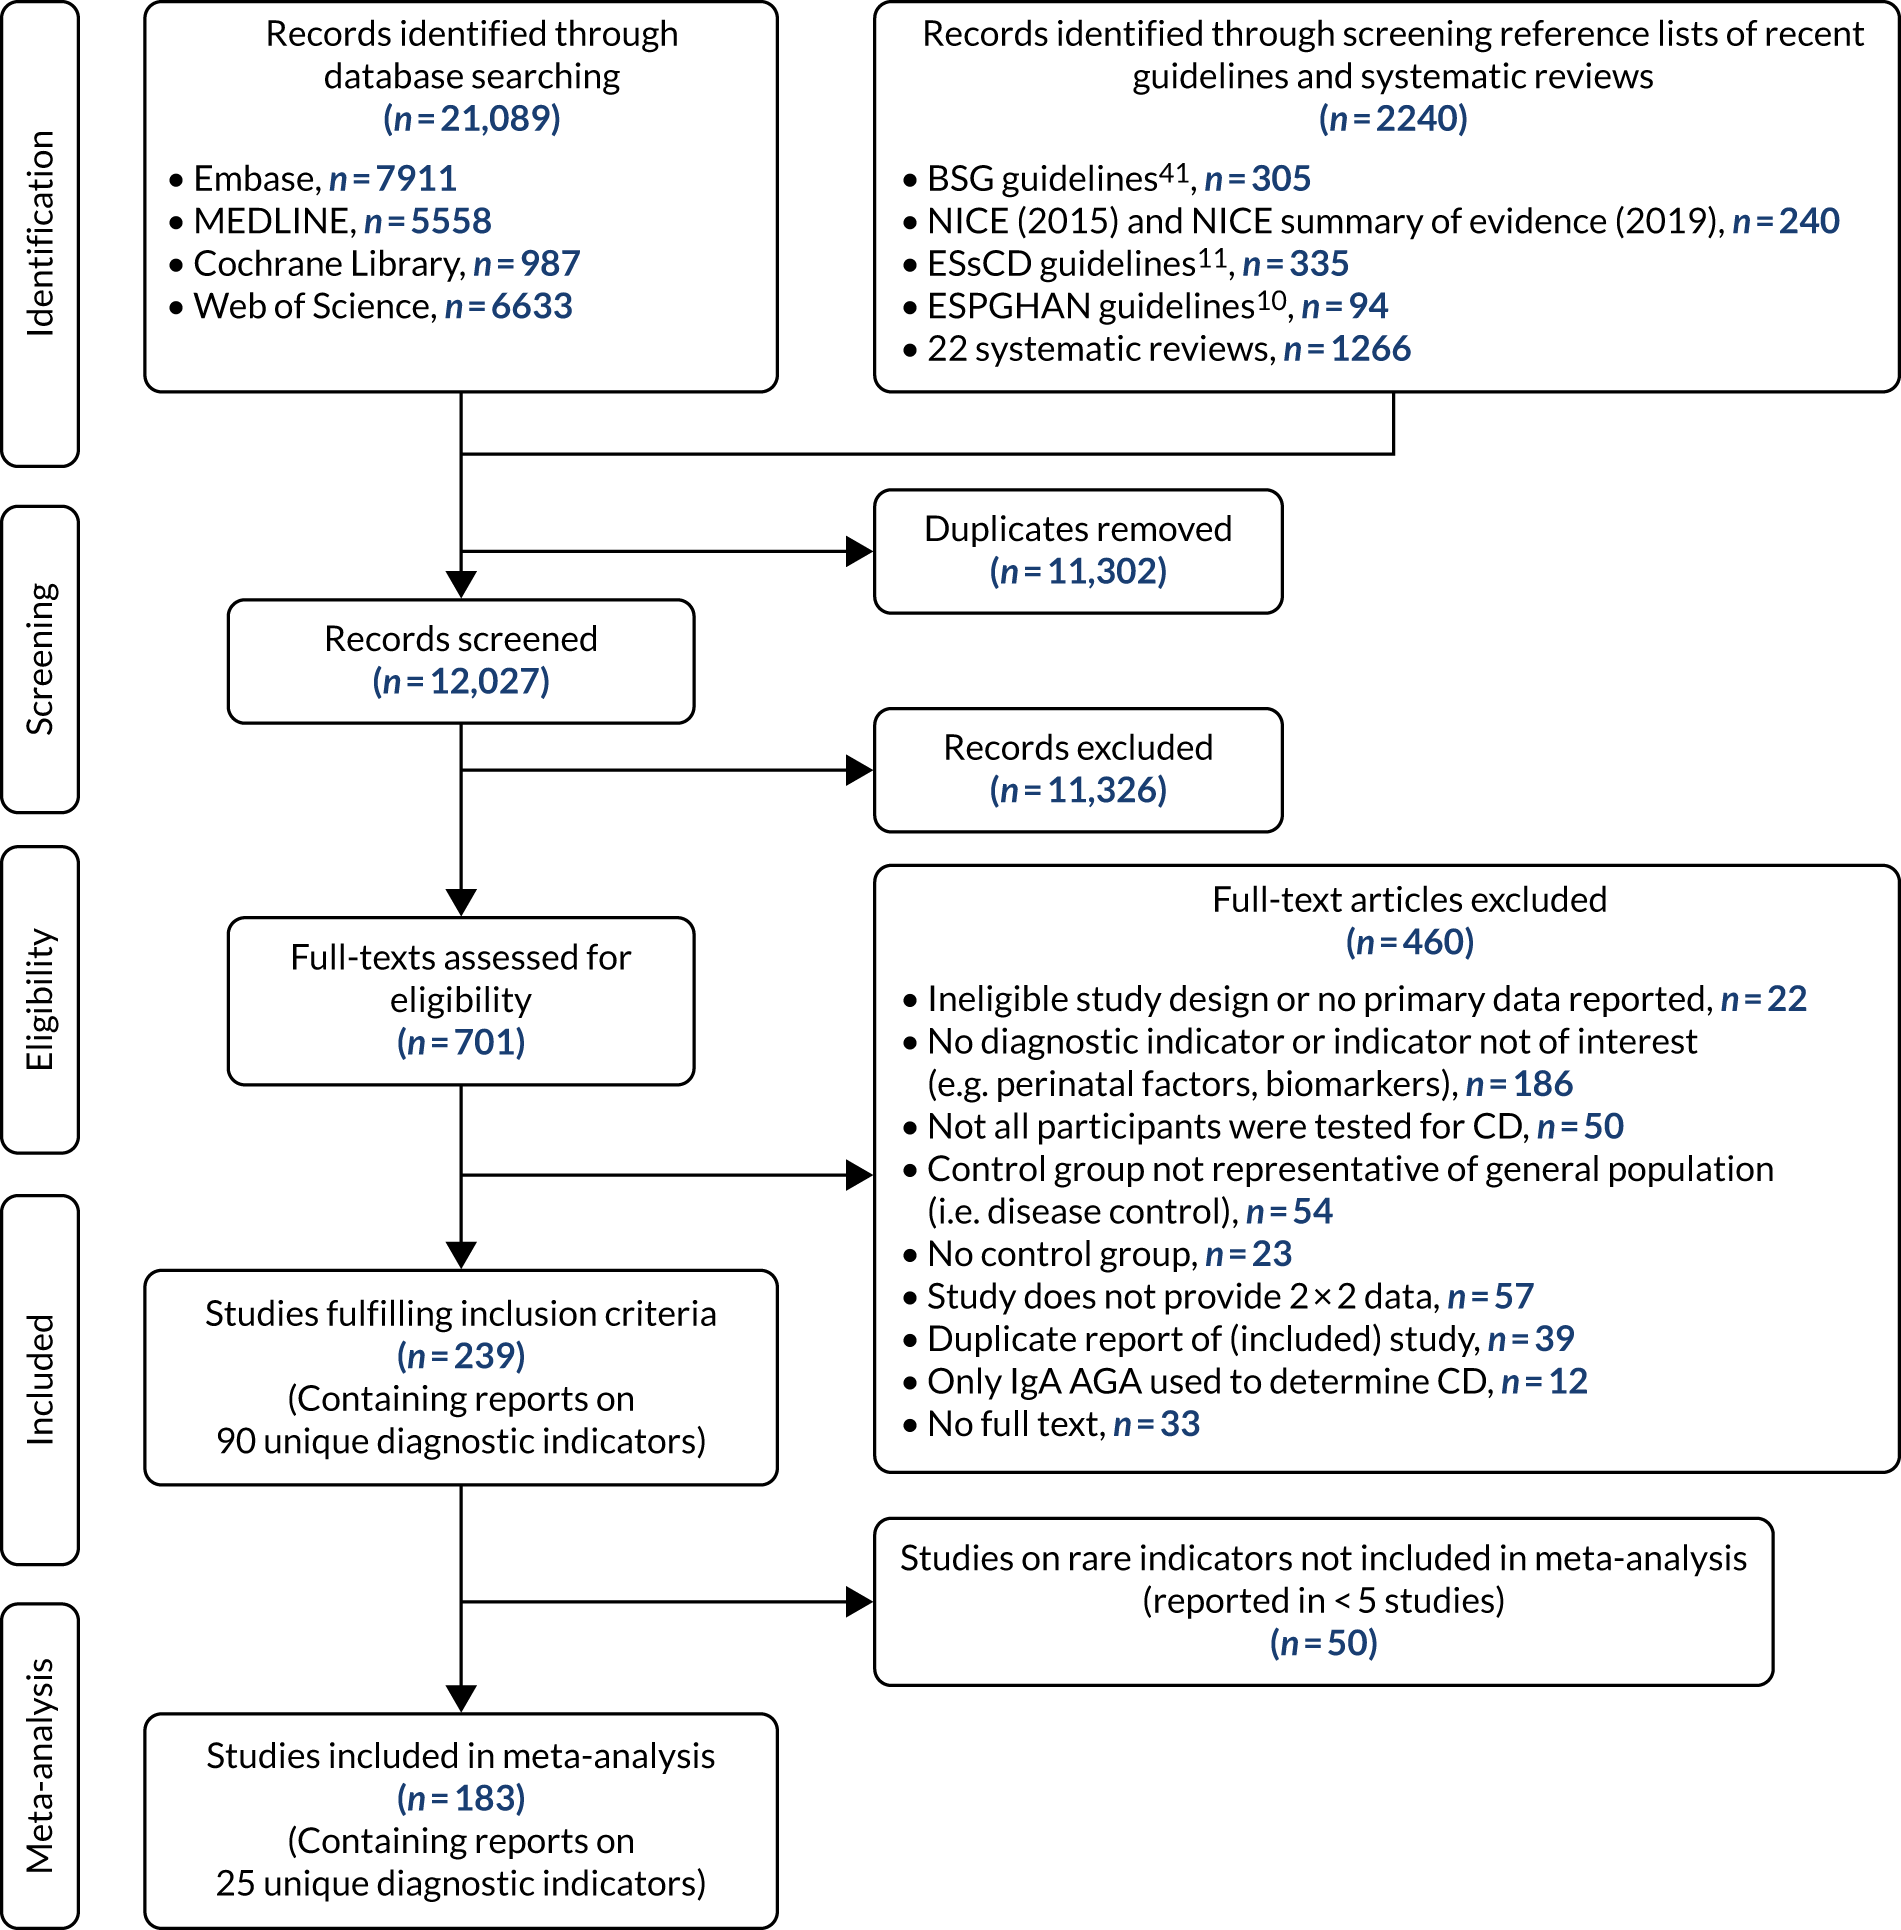
We identified 12,027 records, after deduplication, through searching scientific databases and screening the reference lists of four recent guidelines on CD9–11,41,42 and 22 systematic reviews. Of these, 709 records were selected for full-text assessment, of which 241 studies fulfilled the inclusion criteria. These studies contained 369 reports of 90 distinct diagnostic indicators. Table S1 (see Report Supplementary Material 1) provides a list of diagnostic indicators (including study references) for which we did not extract data because they reported on a rare indicator (reported by fewer than five studies). We included 183 studies reporting on 25 distinct indicators in our meta-analysis (see Appendix 2, Figure 26).
Study characteristics
The included diagnostic indicators consisted of seven symptoms, 17 risk conditions and family history (see Appendix 3, Table 25, and Appendix 4, Tables 26–51). The symptoms that were most often investigated as diagnostic indicators were abdominal pain (n = 12) and diarrhoea (n = 12), while type 1 diabetes (n = 31) and thyroid disease (n = 23) were the most commonly studied risk conditions. Studies investigating symptoms associated with CD predominantly used a cohort or cross-sectional design, using a serological test to detect CD. Studies looking at risk conditions mainly used case–control designs, that is, people with the diagnostic indicator were compared with a healthy control group without the diagnostic indicator. Most studies included adult participants, although many diagnostic indicators were also studied in a population of children or a mixed population.
Although sample sizes for each meta-analysis ranged between 1004 and 55,500 participants, some meta-analyses were based on a small number of CD participants, as prevalence was often low. For instance, in the case of multiple sclerosis and systemic lupus erythematosus, estimates of sensitivity are based on only 12 and nine people with CD, respectively.
Risk of bias
Several studies reported more than one diagnostic indicator, resulting in 281 risk-of-bias judgements. Most studies had methodological issues, and only one study was judged as having a low overall risk of bias (see Appendix 5, Figure 27). In total, only 19 study reports were judged to be at low risk of bias regarding patient selection. The main source of potential bias in patient selection was the use of a case–control study design. The index test domain was judged to be at low risk of bias if it was the study’s main aim to investigate the diagnostic indicator of interest, which was the case for most studies. In total, 167 study reports on diagnostic indicators were judged to have a high risk of bias for the reference standard. This was mainly driven by studies using serology tests without biopsy confirmation to determine whether or not participants had CD; this risks misclassifying participants as having or not having CD. Flow and timing were judged to be at high risk of bias in studies that did not use the same combination of diagnostic tests for CD for all participants (reference standard), for example in studies in which a biopsy was performed only in participants who had a positive serology test result.
Accuracy of diagnostic indicators to detect coeliac disease
We found large variation in sensitivity, specificity and PPV estimates between studies for most diagnostic indicators (Figure 1) (see Appendix 6, Figures 28–51; see also table S2 and figure S1 in Report Supplementary Material 1). Estimates of sensitivity were particularly variable, often ranging from 0% to almost 100%, owing to very small numbers of CD participants for some indicators.
FIGURE 1.
Sensitivity, specificity and PPVs. Meta-analysis results are shown per diagnostic indicator. PPVs were calculated for a population with a CD prevalence of 1% (red dotted line) using the estimated sensitivities and specificities from the meta-analyses. Diagnostic indicators are ordered from high to low PPV per diagnostic indicator group. The area of the box size is proportional to the total number of participants. Negative predictive values are not shown because these diagnostic indicators should not be used to rule out CD. FN, false negative; FP, false positive; TN, true negative; TP, true positive.
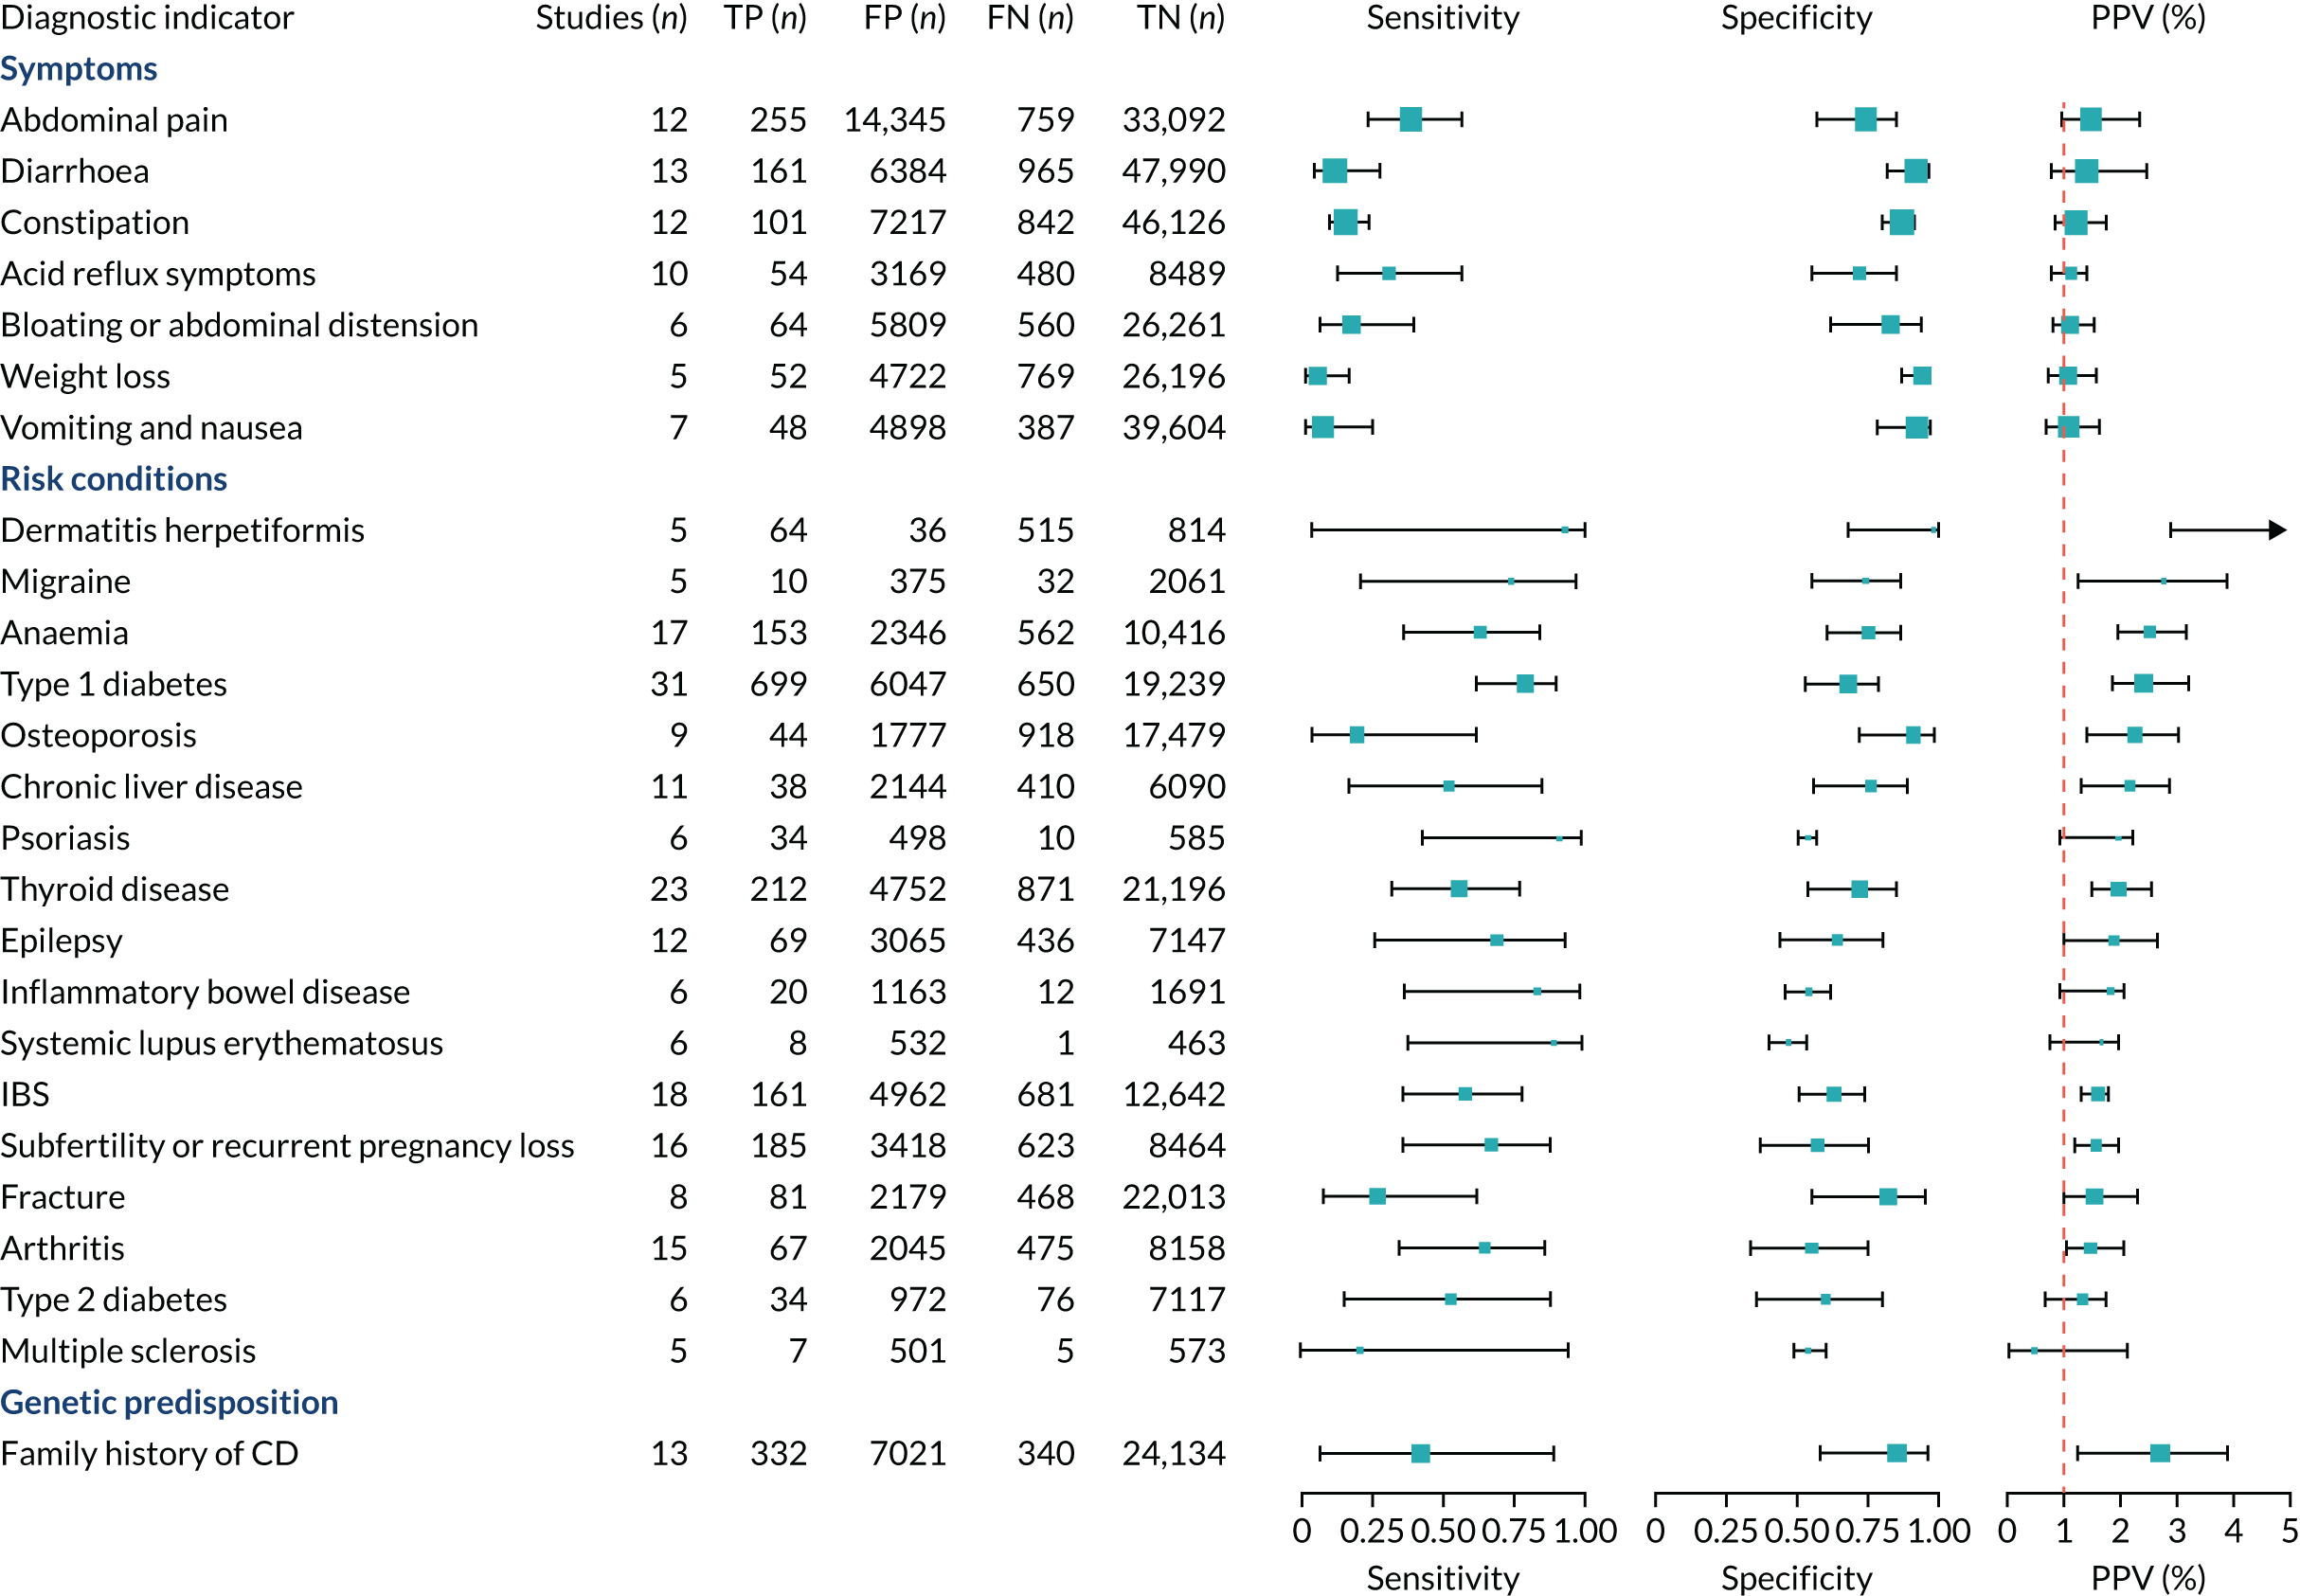
The PPVs for the symptoms included in this review are similar to the baseline CD prevalence, with 95% CIs providing no evidence that the presence of any of these symptoms increases the chance that an individual has CD beyond the levels found in the general population (see Figure 1).
Figure S1 (see Report Supplementary Material 1) shows meta-analysis results in receiver operating characteristic (ROC) space. A diagnostic indicator with a SROC curve closely following the diagonal line is no better at predicting CD than a coin toss, which is approximately the case for all symptoms.
Of the risk conditions, dermatitis herpetiformis had the highest estimated sensitivity, specificity and PPV (the estimated PPV at 1% prevalence of CD was 29%, 95% CI 3% to 72%). However, the uncertainty around these estimates was substantial, that is the 95% CIs were very wide. In addition, dermatitis herpetiformis is a rare condition, so it will be a clinically useful diagnostic indicator in only a minority of cases. We estimated PPVs of > 2% for migraine, anaemia, type 1 diabetes, osteoporosis and chronic liver disease. These estimates were relatively precise for anaemia, type 1 diabetes, osteoporosis and chronic liver disease, but there was considerable uncertainty for migraine. People with thyroid disease, subfertility or recurrent pregnancy loss, or IBS were 1.5–2 times more likely to have CD than the general population, with 95% CIs lying entirely above the population prevalence of 1%. Although the estimated PPVs of psoriasis, epilepsy, inflammatory bowel disease, systemic lupus erythematosus, fracture, arthritis and type 2 diabetes suggest an increased likelihood of CD among people with these conditions, there was considerable uncertainty in these estimates. The 95% CIs crossed or touched the line of population prevalence, indicating that the likelihood of CD may be similar to that of the general population. We found no evidence of an increased likelihood of CD among people with multiple sclerosis (see Figure 1).
Similarly, arthritis, fracture and type 2 diabetes appear to have no diagnostic ability when judging sensitivity and specificity in ROC space (see figure S1 in Report Supplementary Material 1). For multiple sclerosis, systemic lupus erythematosus, psoriasis and inflammatory bowel disease, there was not enough evidence to estimate a reliable SROC curve. For chronic liver disease, epilepsy, migraine, IBS, and dermatitis herpetiformis, there was substantial uncertainty in summary estimates because of a high level of variation between the study estimates. The SROC plots for type 1 diabetes, anaemia, subfertility or recurrent pregnancy loss, thyroid disease and osteoporosis suggest a greater accuracy in predicting CD than a coin toss.
People with a family history of CD were 2.7% (95% CI 1.2 to 3.0%) more likely to have CD than the general population.
Subgroup and sensitivity analyses
There were sufficient data on five diagnostic indicators to stratify the meta-analyses by age group (see Appendix 7, Figure 52; see also table S3 in Report Supplementary Material 1). Estimated PPVs were similarly low, at around 1%, for abdominal pain, arthritis, constipation and diarrhoea for adults and children. The results suggest that arthritis may be more predictive of CD in children than in adults, and abdominal pain and constipation may be more predictive of CD in adults than in children. The PPV for type 1 diabetes appeared to be higher for adults [3.4% (95% CI 1.9% to 5.6%)] than for children or mixed populations [1.8% (95% CI 1.4% to 2.3%) and 2.1% (95% CI 1.6% to 2.9%), respectively]. However, each of these differences should be interpreted with caution because the CIs overlap.
There were sufficient data on seven diagnostic indicators to stratify the analysis on CD diagnosis, comparing studies that used a serology-only approach with studies that included a confirmation duodenal biopsy (see Appendix 7, Figure 52; see also table S3 in Report Supplementary Material 1). Estimated PPVs were similar between the subgroups.
A sensitivity analysis was performed restricted to studies using a cohort or cross-sectional design for abdominal pain, anaemia, bloating or abdominal distension, constipation and diarrhoea (see Appendix 8, Figure 53; see also table S4 in Report Supplementary Material 1). Although case–control studies are more prone to bias than cohort studies, removing case–control studies did not affect the sensitivity, specificity or PPV estimates among these diagnostic indicators. It was not possible to perform a sensitivity analysis restricted to studies with a low risk of bias, because all included studies were judged to be at an overall high risk of bias.
Finally, a post hoc sensitivity analysis was performed on the diagnostic indicator ‘family history of CD’, restricted to studies that included only first-degree relatives. This increased the estimated PPV from 2.7% (95% CI 1.2% to 3.9%) to 3.0% (95% CI 1.6% to 3.7%), although the CIs overlap.
Chapter 4 Prediction rule for coeliac disease diagnosis
This chapter describes the development and internal validation of diagnostic prediction models for men, women and children in a routinely collected primary care data set to estimate the probability of having CD. We also describe the development of a model for children in a birth cohort, with external validation in the primary care data set. The aim of each prediction model is to help clinicians in primary care decide whether or not a patient should be offered a serological test for CD based on their pre-existing conditions and current/recent symptoms. To demonstrate the potential clinical usefulness of each model, we present the PPVs and percentage of CD patients missed at different thresholds.
Prediction modelling methods
Protocol
An analysis protocol was developed and published online. 43 We followed methodological recommendations from Steyerberg. 44 This chapter follows reporting guidelines for multivariable models described in the Transparent Reporting of a multivariable prediction model for Individual Prognosis Or Diagnosis (TRIPOD) statement. 45
Model development
Sources of data
Model development was performed in Clinical Practice Research Datalink (CPRD) GOLD. 46 CPRD GOLD contains anonymised patient electronic health records collected from UK general practices using the Vision® software system (In Practice Systems Ltd, London, UK), with > 20 million ‘acceptable’ patients currently (with research quality data based on CPRD metrics), of whom 9 million are eligible for linkage with hospital records and national statistics. 46,47 The included patients are broadly representative of the UK general population regarding age, sex and ethnicity. The CPRD GOLD data set was linked to Hospital Episode Statistics (HES) and the 2019 English Index of Multiple Deprivation (IMD). 48
The target population included permanently registered ‘acceptable’ patients, and only up-to-standard (UTS) follow-up time was considered. UTS is a practice-based quality metric based on the continuity of recording and the number of recorded deaths. 46 Patients from general practices that were UTS for at least 12 months prior to diagnosis were included.
The follow-up period was defined as the time between the study start and end dates. The study start was the latest of the start of linked data coverage, the date of patient registration with the practice and the UTS date of that practice; the study end was the earliest of the last date for linked data, the date of patient transfer-out from practice, the date of patient’s death (according to CPRD death date) or the last date of data collection from that practice.
Study design
We used a nested case–control design. Cases were defined as individuals with one or more clinical codes related to CD. 4 Table S5 (see Report Supplementary Material 1) shows the Read codes and medcodes used to identify patients with CD in CPRD GOLD. Read codes are a coded thesaurus of clinical terms that have been used in the NHS since 1985. Medcodes are specific to CPRD GOLD. Cases with a diagnosis of dermatitis herpetiformis were included, but not those with dermatitis herpetiformis alone. We assigned a date of diagnosis (the ‘index date’) to each case corresponding to the date of their first record of CD. For cases with more than one CD code, the earliest was considered as the date of disease diagnosis. All CD cases within the target population were included.
All remaining patients in the target population (individuals without any of the CD codes) were selected as potential controls. From these, we excluded patients with a record of gluten-free prescriptions, dermatitis herpetiformis or gluten sensitivity diagnosis to reduce the risk of including undiagnosed CD patients in the control group. 4,49,50
Cases and controls were matched using a 1 : 4 ratio on age group (aged < 18 or ≥ 18 years), general practice and availability of linkages. Controls inherited the index date of their matched case, and follow-up time between the case’s start and end dates only was considered. We matched by age group (adult vs. child) to ensure that there were sufficient child controls to allow an efficient study design.
The data set was split into separate data sets for children, women and men to develop three separate diagnostic prediction models. The next steps describing model development were performed separately for each data set.
We performed descriptive analyses of all variables and tested the statistical difference between cases and controls using Welch’s two-sample t-test for continuous variables and Pearson’s chi-squared test with Yates’ continuity correction for categorical variables.
Sample size
We performed a sample size calculation according to Riley et al. 51 To consider 40 candidate predictors in each model, we estimated a minimum total sample size of 4303.
Model specification
Identifying candidate diagnostic indicators
Diagnostic indicators identified in the systematic review presented in Chapter 4 were considered for inclusion in the prediction models. To avoid the effect of potential publication bias, we also included indicators suggested by our clinical experts and indicators listed in national and international guidelines for CD,9–11 which are based on both evidence and expert opinion. See Appendix 9, Table 52, for the list of candidate diagnostic indicators, their definitions and how they were identified. The International Classification of Primary Care, 2nd edition (ICPC-2), definitions were used when available. The ICPC-2 is an international classification for systematically capturing and ordering clinical information in primary care. It was developed by the World Organization of Family Doctors’ International Classification Committee and was last updated in 2015. 52 Dermatitis herpetiformis could not be included as an indicator because it was an exclusion criterion for the control cohort. Sex was considered as an indicator in the children’s model and age was considered in all models, because both are important demographic factors.
Code list development
When possible, existing code lists were used to define diagnostic indicators. If these were not available, code lists were developed with the clinicians on our team, who identified all relevant terms and synonyms for each indicator, and the CPRD code browser tool was used to identify all relevant codes. Each code list was checked by at least two clinicians (see table S6 in Report Supplementary Material 1).
Missing data
The presence of a diagnostic indicator was defined by the presence of one or more specific medical codes. It was not possible to determine whether or not a code was ‘missing’, because if these codes were absent from a patient record we assumed that the patient did not have the indicator, in the case of disease diagnoses, or that the indicator was not considered sufficiently important to have been recorded by the general practitioner (GP), in the case of symptoms. This will be correct for most indicators unless the indicator was either underdiagnosed or under-reported (such as symptoms). Missingness could be investigated only for sex, ethnicity and age; however, no data were missing for these variables.
Transformations and categorisations of variables
Age was included in the model as a linear term (in years), because the risk of being diagnosed (in adulthood) appears to decrease linearly with age. 53 All risk conditions were coded as 1 or 0 for having or not having the disease at any time point prior to the index date.
Diagnostic indicators that can resolve and return (including GI symptoms; weight loss; fatigue; abnormal liver function test results; mouth ulcers; irritability; iron, vitamin B12 or folate deficiency; fractures; and headaches or migraines) were included as binary variables, and coded as 1 if the event occurred within 10 years prior to the index date. Diagnostic indicators that could vary substantially over time (including GI symptoms, fatigue, irritability, mouth ulcers, fractures, and migraine or headaches) were also included as counts of the number of times these symptoms were recorded in the CPRD. Because these counts were highly skewed, we collapsed groups with the highest counts if they were higher than the third quantile (e.g. 0, 1, 2, 3+). For each of these indicators, we considered a count of the number of times these symptoms were recorded in the CPRD within 1, 2 and 10 years prior to the index date.
A variable for ‘first-degree relative with CD’ was created using the famnum variable in CPRD GOLD, which is a number assigned based on the first line of a patient’s home address at registration. Because famnum is not unique across all general practices, a unique variable was created combining famnum and general practice identification (ID). We counted people as a first-degree relative only if they had the same famnum and were registered at the same general practice as a case, and were either aged > 25 years and differed in age from the case by < 15 years (to include all children and students, assuming that students were still registered with their parents’ general practices) or differed in age from the case by > 15 years (to exclude spouses).
Model selection
We fitted a logistic regression model with CD as the outcome and all candidate diagnostic indicators as potential explanatory factors. We used the elastic net method combined with bootstrapping for variable selection. The elastic net logistic regression combines ridge and least absolute shrinkage and selection operator (LASSO) regressions (regression coefficients are estimated with a combination of L1 and L2 penalties) and performs both shrinkage and variable selection. 44 It does this by including a regularisation penalty (lambda) and a mixing parameter (alpha), whereby 0 results in ridge and 1 in LASSO regression. Optimal alpha and lambda values were determined by testing 100 different lambda values at 18 different alpha values (increasing from 0.1 to 0.9). For each combination of alpha and lambda, 20 fivefold cross-validations were performed. We selected the alpha–lambda combination that produced the model with the highest c-statistic [i.e. area under the receiver operating characteristic (AUROC)].
The model with optimised L1 and L2 penalties was performed on 200 bootstrap samples. Indicators were selected if their coefficient was non-zero in the majority of bootstrap samples. To be relatively inclusive at this stage, we set the threshold at 75%. If more than one of the three alternative counts for the same symptom was selected (frequency of indicator over the last 1, 2 or 10 years), the count with the highest median coefficient was included in the final model. As candidate diagnostic indicators had been selected based on some evidence of a positive relationship with CD, if we estimated an inverse relationship with CD in these data, we assumed that this was due to noise in this specific data set and excluded the indicator.
We did not allow indicators with strong prior evidence of an association with CD to drop out of the model during variable selection, regardless of their estimated coefficients and p-values. These were the following five indicators that were found to be most predictive in our meta-analyses (see Chapter 3): family history of CD, anaemia, type 1 diabetes, osteoporosis and thyroid disease.
Model estimation
We refitted the elastic net logistic regression model using the set of included indicator variables to determine the final coefficient estimates at the optimal alpha and lambda values.
To estimate the intercept, we adjusted for sampling frequency by recreating a population with the CD prevalence of the original cohort. 54,55 CD prevalence in the general population is estimated to be 1%, so we inflated the control group by random sampling to a case-to-control ratio of 1 : 99. We refitted the elastic net logistic regression model on this inflated data set to determine the intercept with the optimal alpha and lambda values.
Model performance
We estimated the model performance on the development data set (apparent model performance) using measures of both discrimination and calibration. 56
Discrimination is the ability of the model to distinguish between those with and those without CD, also known as the concordance or c-statistic, and is identical to the AUROC curve, in which sensitivity is plotted against 1 – specificity. If the c-statistic is 0.5, the model has no predictive ability; if the c-statistic is 1, the model has perfect prediction.
Calibration is the agreement between predictions and observed outcomes. Calibration was assessed graphically using the calibration plot, which plots the predicted risk against the observed risk using centile population groups. In the case of a perfect prediction, the intercept is 0 and the slope is 1. The calibration statistics were adjusted for sampling frequency.
We assessed amount of variability explained by model variables with the Nagelkerke R2 score and the overall (statistical) model fit with the Brier score. 44
Internal validation
We performed internal validation of the model using bootstrapping methods. 56 We fitted the final model using elastic net regression with the predefined optimal lambda and alpha values on 1000 bootstrap samples to estimate the median of each coefficient and calculate empirical CIs around the coefficients. The elastic net regression uses shrinkage to adjust for overfitting and optimism. Using the 1000 model fits, we calculated the median and empirical CIs for performance statistics (R2, Brier score and c-statistic). To estimate the median and empirical CIs for the intercept and calibration statistics, we inflated the control group by random sampling to a case-to-control ratio of 1 : 99 for each bootstrapped sample and then fitted the final model on this data set.
Sensitivity analyses
Data since 1997
We performed a sensitivity analysis restricted to patients diagnosed after 1997, because it was in this year that IgA tTG tests, which are now the preferred serological test for screening for CD, were first developed. Model development, as described previously, was repeated on this data set. We used the c-statistic to determine whether or not model performance was improved using this data set.
Linkages: including ethnicity and deprivation
Data sets were linked to HES and 2019 IMD48 data to consider ethnicity and deprivation, which are not measured in the CPRD, as additional candidate diagnostic indicators. We repeated the model development, as described previously, on the subset of patients who were successfully linked to HES and 2019 IMD48 data. Ethnicity was transformed to a binary variable (white or non-white). Deprivation deciles were used as deprivation score, where 1 represents the highest levels of deprivation and 10 the lowest. We used the c-statistic to determine whether or not model performance was improved by including ethnicity and deprivation.
Clinical usefulness
We calculated the sensitivity and specificity of the prediction models for different thresholds of predicted CD risk. The thresholds were chosen based on the PPVs of the prediction model and the percentage of CD patients missed at that threshold (i.e. the percentage of false negatives among CD patients). The pre-test probability for the general population is 1%, so we specified model thresholds that corresponded to PPVs of 1.5%, 2%, 5%, 10% and 20%. We also report the percentage of CD patients missed at each threshold, that is the percentage of people with CD who would not be picked up by the prediction model.
External validation
Sources of data
External validation was performed in CPRD Aurum,57 which is another primary care data set provided by the CPRD. This contains electronic health records from general practices in England using the EMIS Web software system (EMIS Health, Leeds, UK). CPRD Aurum is a larger data set than CPRD GOLD: it contains > 40 million research-acceptable patients, of whom 37 million are eligible for linkages with hospital records and national statistics. 58 The included patients are broadly representative of the UK general population regarding age, sex, deprivation and geographical spread.
The cohort was defined as described for CPRD GOLD, with the only difference that CPRD Aurum does not report UTS dates, so this could not be taken into account when defining study start and end dates. Patients with records in both the CPRD GOLD and the CPRD Aurum data sets, for instance because their general practice switched software systems or a patient moved to a different general practice that used another software, were removed from the Aurum data set.
Diagnostic indicators and code lists
The code lists developed for CPRD GOLD were mapped to medical codes used in Aurum (medcode ID) using the code browser tool from the CPRD; Read codes were mapped directly to medcode IDs, as well as indirectly via Systematized Nomenclature of Medicine Clinical Terms (SNOMED CT) concept IDs, to capture all codes related to the Read codes. The mapped lists were checked by hand before use (see table S7 in Report Supplementary Material 1).
The famnum variable that was used in CPRD GOLD to derive the first-degree relatives indicator does not exist in Aurum. To account for this, we present all model performance measures as a range for individuals with and individuals without a first-degree relative with CD.
Validation
Predictions were made for the patients in Aurum using the intercepts and coefficients from the models developed in CPRD GOLD. Model performance statistics were calculated as described previously.
Model development in the Avon Longitudinal Study of Parents and Children
Sources of data
We requested individual participant data from the Avon Longitudinal Study of Parents and Children (ALSPAC), a population-based cohort study established in 1990. 59–61 A substudy of the ALSPAC, published in 2004,2 involved serological testing for CD in 5470 children aged 7.5 years. Ethics approval for the study was obtained from the ALSPAC Ethics and Law Committee and the local Research Ethics Committees. Consent for biological samples has been collected in accordance with the Human Tissue Act (2004). 62 Informed consent for the use of data collected via questionnaires and clinics was obtained from participants following the recommendations of the ALSPAC Ethics and Law Committee at the time.
The ALSPAC has not collected information on all candidate diagnostic indicators that were considered in the CPRD model, so it was not possible to validate the CPRD model in this data set. The study website63 contains details of all the data that are available through a fully searchable data dictionary and variable search tool.
Model specification
Candidate diagnostic indicators for the ALSPAC model were selected based on the results from the final model developed in CPRD GOLD. The prevalence of indicators among children with and children without CD was compared using Fisher’s exact test (categorical indicators) and Welch’s two-sample t-test (continuous indicators). Univariable associations between candidate indicators and CD were estimated using Firth logistic regression for rare events to overcome problems of perfect prediction between outcome and indicators. 64,65 Owing to the small number of cases in this cohort, it was not considered appropriate to fit multivariable models.
Avon Longitudinal Study of Parents and Children: missing data
As it is possible for candidate indicators collected in the ALSPAC to be incomplete (e.g. because of non-response to questionnaire items), missingness was investigated in all indicators. If indicators were partially missing, when there were sufficient data, we considered imputing missing values using multiple imputation by chained equations, assuming values were missing at random conditional on observed covariates.
Deviations from protocol
In the CPRD model development, we used logistic regression instead of conditional logistic regression because cases and controls were matched on very few characteristics, namely being a child or an adult and general practice. Interaction terms were not considered as they are rarely important for clinical prediction models. 66
We planned to validate the CPRD model in children in the ALSPAC cohort. However, this was not possible because many of the selected indicators in the CPRD model were not recorded in the ALSPAC, and, among the indicators that were available, there was a lot of missingness.
Results
Clinical Practice Research Datalink participants
Appendix 10, Figure 54, shows the patient flow diagrams for the CPRD development data set and the external validation data set. Cases and controls had an average follow-up time of 7 years prior to CD diagnosis [median 7 years, interquartile range (IQR) 3–11 years, range 1–31 years].
Table 2 describes the characteristics of the participants and the prevalence of selected indicators in the development data set and the external validation data set for children, women and men. In both data sets, the prevalence of CD was significantly higher among girls than boys in the cohort of children, with almost two-thirds of CD patients being girls. The median age and age ranges were similar between CD patients and controls in the cohort of children in the development data set; however, in the validation data set, children with CD were, on average, 1 year younger than controls. In the development data set for women, the median age was 49 years for both cases and controls. In the external validation data set, the median age was similar, at 47 years, although cases were, on average, 1 year younger than controls. In contrast to the data sets for children and women, in both data sets for men, cases were significantly older than controls, with a median age of 55 years for cases and 47 years for controls. On average, CD male patients were 8 and 7 years older than controls in the development and validation data sets, respectively.
| Cohort and characteristic | Development data set (CPRD GOLD) | External validation data set (CPRD Aurum) | ||||||
|---|---|---|---|---|---|---|---|---|
| Control | CD | p-value | Overall | Control | CD | p-value | Overall | |
| Children | (N = 12,948) | (N = 3237) | (N = 16,185) | (N = 28,131) | (N = 7033) | (N = 35,164) | ||
| Age (years) | ||||||||
| Mean (SD) | 9.04 (4.62) | 8.89 (4.77) | 0.127 | 9.01 (4.65) | 8.96 (4.61) | 8.66 (4.74) | < 0.001 | 8.90 (4.64) |
| Median (minimum, maximum) | 9.00 (1.00, 17.0) | 9.00 (1.00, 17.0) | 9.00 (1.00, 17.0) | 9.00 (1.00, 17.0) | 8.00 (1.00, 17.0) | 9.00 (1.00, 17.0) | ||
| Sex, n (%) | ||||||||
| Male | 6862 (53.0) | 1249 (38.6) | < 0.001 | 8111 (50.1) | 15024 (53.4) | 2702 (38.4) | < 0.001 | 17,726 (50.4) |
| Female | 6086 (47.0) | 1988 (61.4) | 8074 (49.9) | 13107 (46.6) | 4331 (61.6) | 17,438 (49.6) | ||
| Ethnicity, n (%) | ||||||||
| Non-white | 438 (3.4) | 98 (3.0) | 0.004 | 536 (3.3) | 686 (2.4) | 156 (2.2) | < 0.001 | 842 (2.4) |
| White | 3816 (29.5) | 1205 (37.2) | 5021 (31.0) | 3478 (12.4) | 1103 (15.7) | 4581 (13.0) | ||
| Missing | 8694 (67.1) | 1934 (59.7) | 10,628 (65.7) | 23,967 (85.2) | 5774 (82.1) | 29,741 (84.6) | ||
| Deprivation (IMD 201567 quintiles), n (%) | ||||||||
| 1 | 1104 (8.5) | 385 (11.9) | 0.059 | 1489 (9.2) | 1532 (5.4) | 391 (5.6) | 0.057 | 1923 (5.5) |
| 2 | 896 (6.9) | 270 (8.3) | 1166 (7.2) | 1154 (4.1) | 310 (4.4) | 1464 (4.2) | ||
| 3 | 871 (6.7) | 264 (8.2) | 1135 (7.0) | 1000 (3.6) | 280 (4.0) | 1280 (3.6) | ||
| 4 | 742 (5.7) | 219 (6.8) | 961 (5.9) | 836 (3.0) | 188 (2.7) | 1024 (2.9) | ||
| 5 | 641 (5.0) | 165 (5.1) | 806 (5.0) | 858 (3.1) | 185 (2.6) | 1043 (3.0) | ||
| Missing | 8694 (67.1) | 1934 (59.7) | 10,628 (65.7) | 22,751 (80.9) | 5679 (80.7) | 28,430 (80.8) | ||
| Anaemia, n (%) | ||||||||
| Present | 46 (0.4) | 188 (5.8) | < 0.001 | 234 (1.4) | 25 (0.1) | 84 (1.2) | < 0.001 | 109 (0.3) |
| Arthritis, n (%) | ||||||||
| Present | 5 (0.0) | 7 (0.2) | 0.003 | 12 (0.1) | 5 (0.0) | 3 (0.0) | 0.426 | 8 (0.0) |
| Delayed puberty, n (%) | ||||||||
| Present | 1 (0.0) | 5 (0.2) | < 0.001 | 6 (0.0) | 2 (0.0) | 2 (0.0) | 0.382 | 4 (0.0) |
| Down syndrome, n (%) | ||||||||
| Present | 6 (0.0) | 18 (0.6) | < 0.001 | 24 (0.1) | 2 (0.0) | 15 (0.2) | < 0.001 | 17 (0.0) |
| Failure to thrive, n (%) | ||||||||
| Present | 52 (0.4) | 84 (2.6) | < 0.001 | 136 (0.8) | 21 (0.1) | 31 (0.4) | < 0.001 | 52 (0.1) |
| Fatigue, n (%) | ||||||||
| Present | 210 (1.6) | 253 (7.8) | < 0.001 | 463 (2.9) | 165 (0.6) | 150 (2.1) | < 0.001 | 315 (0.9) |
| Fatigue (count, 1 year), n (%) | ||||||||
| Once | 53 (0.4) | 130 (4.0) | < 0.001 | 183 (1.1) | 34 (0.1) | 48 (0.7) | < 0.001 | 82 (0.2) |
| Twice | 5 (0.0) | 17 (0.5) | 22 (0.1) | 8 (0.0) | 14 (0.2) | 22 (0.1) | ||
| Three times | 0 (0) | 11 (0.3) | 11 (0.1) | 2 (0.0) | 8 (0.1) | 10 (0.0) | ||
| First-degree relative with CD, n (%) | ||||||||
| Present | 98 (0.8) | 496 (15.3) | < 0.001 | 594 (3.7) | NR | NR | NR | |
| GI symptoms, n (%) | ||||||||
| Present | 3684 (28.5) | 1924 (59.4) | < 0.001 | 5608 (34.6) | 1371 (4.9) | 794 (11.3) | < 0.001 | 2165 (6.2) |
| GI symptoms (count, 1 year), n (%) | ||||||||
| Once | 785 (6.1) | 588 (18.2) | < 0.001 | 1373 (8.5) | 293 (1.0) | 218 (3.1) | < 0.001 | 511 (1.5) |
| Twice | 192 (1.5) | 294 (9.1) | 486 (3.0) | 82 (0.3) | 126 (1.8) | 208 (0.6) | ||
| Three times | 55 (0.4) | 154 (4.8) | 209 (1.3) | 24 (0.1) | 60 (0.9) | 84 (0.2) | ||
| Four times | 52 (0.4) | 203 (6.3) | 255 (1.6) | 39 (0.1) | 98 (1.4) | 137 (0.4) | ||
| IBS, n (%) | ||||||||
| Present | 20 (0.2) | 29 (0.9) | < 0.001 | 49 (0.3) | 6 (0.0) | 12 (0.2) | < 0.001 | 18 (0.1) |
| IgA deficiency, n (%) | ||||||||
| Present | 0 (0) | 4 (0.1) | < 0.001 | 4 (0.0) | 1 (0.0) | 4 (0.1) | 0.005 | 5 (0.0) |
| Iron, vitamin B12 or folate deficiency, n (%) | ||||||||
| Present | 8 (0.1) | 35 (1.1) | < 0.001 | 43 (0.3) | 8 (0.0) | 24 (0.3) | < 0.001 | 32 (0.1) |
| Mood disorders, n (%) | ||||||||
| Present | 256 (2.0) | 143 (4.4) | < 0.001 | 399 (2.5) | 91 (0.3) | 59 (0.8) | < 0.001 | 150 (0.4) |
| Type 1 diabetes, n (%) | ||||||||
| Present | 16 (0.1) | 275 (8.5) | < 0.001 | 291 (1.8) | 11 (0.0) | 87 (1.2) | < 0.001 | 98 (0.3) |
| Thyroid disorders, n (%) | ||||||||
| Present | 16 (0.1) | 61 (1.9) | < 0.001 | 77 (0.5) | 12 (0.0) | 21 (0.3) | < 0.001 | 33 (0.1) |
| Turner syndrome, n (%) | ||||||||
| Present | 0 (0) | 8 (0.2) | < 0.001 | 8 (0.0) | 1 (0.0) | 5 (0.1) | < 0.001 | 6 (0.0) |
| Weight loss, n (%) | ||||||||
| Present | 23 (0.2) | 93 (2.9) | < 0.001 | 116 (0.7) | 8 (0.0) | 22 (0.3) | < 0.001 | 30 (0.1) |
| Women | (N = 37,079) | (N = 12,051) | (N = 49,130) | (N = 77,422) | (N = 26,164) | (N = 103,586) | ||
| Age (years) | ||||||||
| Mean (SD) | 49.5 (17.0) | 49.7 (17.2) | 0.313 | 49.6 (17.0) | 48.5 (17.0) | 47.4 (17.6) | < 0.001 | 48.2 (17.2) |
| Median (minimum, maximum) | 49.0 (18.0, 111) | 49.0 (18.0, 104) | 49.0 (18.0, 111) | 47.0 (18.0, 108) | 46.0 (18.0, 99.0) | 47.0 (18.0, 108) | ||
| Ethnicity, n (%) | ||||||||
| Non-white | 807 (2.2) | 212 (1.8) | < 0.001 | 1019 (2.1) | 1262 (1.6) | 399 (1.5) | < 0.001 | 1661 (1.6) |
| White | 12,286 (33.1) | 4612 (38.3) | 16,898 (34.4) | 11,210 (14.5) | 4496 (17.2) | 15,706 (15.2) | ||
| Missing | 23,986 (64.7) | 7227 (60.0) | 31,213 (63.5) | 64,950 (83.9) | 21,269 (81.3) | 86,219 (83.2) | ||
| Deprivation (IMD 2015 quintiles), n (%) | ||||||||
| 1 | 3199 (8.6) | 1262 (10.5) | 0.174 | 4461 (9.1) | 4255 (5.5) | 1424 (5.4) | 0.276 | 5679 (5.5) |
| 2 | 2939 (7.9) | 1077 (8.9) | 4016 (8.2) | 3696 (4.8) | 1254 (4.8) | 4950 (4.8) | ||
| 3 | 2761 (7.4) | 1001 (8.3) | 3762 (7.7) | 2975 (3.8) | 991 (3.8) | 3966 (3.8) | ||
| 4 | 2292 (6.2) | 819 (6.8) | 3111 (6.3) | 2642 (3.4) | 966 (3.7) | 3608 (3.5) | ||
| 5 | 1902 (5.1) | 665 (5.5) | 2567 (5.2) | 2146 (2.8) | 702 (2.7) | 2848 (2.7) | ||
| Missing | 23,986 (64.7) | 7227 (60.0) | 31,213 (63.5) | 61,708 (79.7) | 20,827 (79.6) | 82,535 (79.7) | ||
| Anaemia, n (%) | ||||||||
| Present | 1038 (2.8) | 1969 (16.3) | < 0.001 | 3007 (6.1) | 484 (0.6) | 968 (3.7) | < 0.001 | 1452 (1.4) |
| Cardiovascular disease, n (%) | ||||||||
| Present | 1601 (4.3) | 883 (7.3) | < 0.001 | 2484 (5.1) | 602 (0.8) | 317 (1.2) | < 0.001 | 919 (0.9) |
| Chronic liver disease, n (%) | ||||||||
| Present | 376 (1.0) | 253 (2.1) | < 0.001 | 629 (1.3) | 233 (0.3) | 180 (0.7) | < 0.001 | 413 (0.4) |
| Down syndrome, n (%) | ||||||||
| Present | 5 (0.0) | 5 (0.0) | 0.132 | 10 (0.0) | 4 (0.0) | 4 (0.0) | 0.229 | 8 (0.0) |
| Epilepsy, n (%) | ||||||||
| Present | 194 (0.5) | 116 (1.0) | < 0.001 | 310 (0.6) | 109 (0.1) | 46 (0.2) | 0.24 | 155 (0.1) |
| Fatigue, n (%) | ||||||||
| Present | 4638 (12.5) | 3027 (25.1) | < 0.001 | 7665 (15.6) | 1755 (2.3) | 1165 (4.5) | < 0.001 | 2920 (2.8) |
| Fatigue (count, 1 year), n (%) | ||||||||
| Once | 945 (2.5) | 953 (7.9) | < 0.001 | 1898 (3.9) | 333 (0.4) | 341 (1.3) | < 0.001 | 674 (0.7) |
| Twice | 145 (0.4) | 174 (1.4) | 319 (0.6) | 86 (0.1) | 118 (0.5) | 204 (0.2) | ||
| Three times | 38 (0.1) | 73 (0.6) | 111 (0.2) | 56 (0.1) | 79 (0.3) | 135 (0.1) | ||
| First-degree relative with CD, n (%) | ||||||||
| Present | 108 (0.3) | 416 (3.5) | < 0.001 | 524 (1.1) | NR | NR | NR | |
| Fractures (count, 1 year), n (%) | ||||||||
| Once | 320 (0.9) | 202 (1.7) | < 0.001 | 522 (1.1) | 139 (0.2) | 65 (0.2) | < 0.001 | 204 (0.2) |
| Twice | 169 (0.5) | 84 (0.7) | 253 (0.5) | 92 (0.1) | 60 (0.2) | 152 (0.1) | ||
| GI symptoms, n (%) | ||||||||
| Present | 12,364 (33.3) | 6994 (58.0) | < 0.001 | 19,358 (39.4) | 4520 (5.8) | 2603 (9.9) | < 0.001 | 7123 (6.9) |
| GI symptoms (count, 1 year), n (%) | ||||||||
| Once | 2605 (7.0) | 2206 (18.3) | < 0.001 | 4811 (9.8) | 949 (1.2) | 774 (3.0) | < 0.001 | 1723 (1.7) |
| Twice | 773 (2.1) | 996 (8.3) | 1769 (3.6) | 310 (0.4) | 349 (1.3) | 659 (0.6) | ||
| Three times | 308 (0.8) | 507 (4.2) | 815 (1.7) | 126 (0.2) | 179 (0.7) | 305 (0.3) | ||
| Four times | 265 (0.7) | 679 (5.6) | 944 (1.9) | 162 (0.2) | 302 (1.2) | 464 (0.4) | ||
| Inflammatory bowel disease, n (%) | ||||||||
| Present | 160 (0.4) | 104 (0.9) | < 0.001 | 264 (0.5) | 82 (0.1) | 54 (0.2) | < 0.001 | 136 (0.1) |
| IBS, n (%) | ||||||||
| Present | 1716 (4.6) | 1346 (11.2) | < 0.001 | 3062 (6.2) | 757 (1.0) | 545 (2.1) | < 0.001 | 1302 (1.3) |
| IgA deficiency, n (%) | ||||||||
| Present | 2 (0.0) | 6 (0.0) | 0.004 | 8 (0.0) | 1 (0.0) | 7 (0.0) | < 0.001 | 8 (0.0) |
| Iron, vitamin B12 or folate deficiency, n (%) | ||||||||
| Present | 505 (1.4) | 938 (7.8) | < 0.001 | 1443 (2.9) | 235 (0.3) | 394 (1.5) | < 0.001 | 629 (0.6) |
| Mouth ulcers (count, 1 year), n (%) | ||||||||
| Once | 110 (0.3) | 121 (1.0) | < 0.001 | 231 (0.5) | 43 (0.1) | 32 (0.1) | < 0.001 | 75 (0.1) |
| Twice | 12 (0.0) | 38 (0.3) | 50 (0.1) | 11 (0.0) | 16 (0.1) | 27 (0.0) | ||
| Neuropathy or ataxia, n (%) | ||||||||
| Present | 84 (0.2) | 55 (0.5) | < 0.001 | 139 (0.3) | 56 (0.1) | 36 (0.1) | 0.003 | 92 (0.1) |
| Osteoporosis, n (%) | ||||||||
| Present | 915 (2.5) | 898 (7.5) | < 0.001 | 1813 (3.7) | 367 (0.5) | 305 (1.2) | < 0.001 | 672 (0.6) |
| Systemic lupus erythematosus, n (%) | ||||||||
| Present | 42 (0.1) | 40 (0.3) | < 0.001 | 82 (0.2) | 23 (0.0) | 18 (0.1) | < 0.001 | 41 (0.0) |
| Type 1 diabetes, n (%) | ||||||||
| Present | 99 (0.3) | 141 (1.2) | < 0.001 | 240 (0.5) | 223 (0.3) | 147 (0.6) | < 0.001 | 370 (0.4) |
| Thyroid disorders, n (%) | ||||||||
| Present | 2042 (5.5) | 1442 (12.0) | < 0.001 | 3484 (7.1) | 815 (1.1) | 623 (2.4) | < 0.001 | 1438 (1.4) |
| Turner syndrome, n (%) | ||||||||
| Present | 3 (0.0) | 5 (0.0) | 0.037 | 8 (0.0) | 0 (0) | 5 (0.0) | < 0.001 | 5 (0.0) |
| Weight loss, n (%) | ||||||||
| Present | 500 (1.3) | 672 (5.6) | < 0.001 | 1172 (2.4) | 105 (0.1) | 145 (0.6) | < 0.001 | 250 (0.2) |
| Men | (N = 35,264) | (N = 6035) | (N = 41,299) | (N = 76,775) | (N = 12,385) | (N = 89,160) | ||
| Age (years) | ||||||||
| Mean (SD) | 47.5 (16.4) | 53.9 (16.3) | < 0.001 | 48.4 (16.6) | 46.6 (16.5) | 52.4 (17.1) | < 0.001 | 47.4 (16.7) |
| Median (minimum, maximum) | 47.0 (18.0, 103) | 55.0 (18.0, 94.0) | 48.0 (18.0, 103) | 46.0 (18.0, 107) | 53.0 (18.0, 98.0) | 47.0 (18.0, 107) | ||
| Ethnicity, n (%) | ||||||||
| Non-white | 535 (1.5) | 94 (1.6) | 0.022 | 629 (1.5) | 976 (1.3) | 155 (1.3) | < 0.001 | 1131 (1.3) |
| White | 10,083 (28.6) | 2315 (38.4) | 12,398 (30.0) | 8967 (11.7) | 2100 (17.0) | 11,067 (12.4) | ||
| Missing | 24,646 (69.9) | 3626 (60.1) | 28,272 (68.5) | 66,832 (87.0) | 10,130 (81.8) | 76,962 (86.3) | ||
| Deprivation (IMD 2015 quintiles), n (%) | ||||||||
| 1 | 2563 (7.3) | 624 (10.3) | 0.005 | 3187 (7.7) | 4205 (5.5) | 682 (5.5) | 0.55 | 4887 (5.5) |
| 2 | 2389 (6.8) | 597 (9.9) | 2986 (7.2) | 3745 (4.9) | 625 (5.0) | 4370 (4.9) | ||
| 3 | 2264 (6.4) | 450 (7.5) | 2714 (6.6) | 3038 (4.0) | 478 (3.9) | 3516 (3.9) | ||
| 4 | 1852 (5.3) | 399 (6.6) | 2251 (5.5) | 2745 (3.6) | 431 (3.5) | 3176 (3.6) | ||
| 5 | 1550 (4.4) | 339 (5.6) | 1889 (4.6) | 2139 (2.8) | 316 (2.6) | 2455 (2.8) | ||
| Missing | 24,646 (69.9) | 3626 (60.1) | 28,272 (68.5) | 60,903 (79.3) | 9853 (79.6) | 70,756 (79.4) | ||
| Anaemia, n (%) | ||||||||
| Present | 208 (0.6) | 733 (12.1) | < 0.001 | 941 (2.3) | 104 (0.1) | 305 (2.5) | < 0.001 | 409 (0.5) |
| Cardiovascular disease, n (%) | ||||||||
| Present | 2081 (5.9) | 860 (14.3) | < 0.001 | 2941 (7.1) | 822 (1.1) | 321 (2.6) | < 0.001 | 1143 (1.3) |
| Chronic liver disease, n (%) | ||||||||
| Present | 421 (1.2) | 184 (3.0) | < 0.001 | 605 (1.5) | 311 (0.4) | 140 (1.1) | < 0.001 | 451 (0.5) |
| Down syndrome, n (%) | ||||||||
| Present | 6 (0.0) | 6 (0.1) | 0.002 | 12 (0.0) | 1 (0.0) | 4 (0.0) | < 0.001 | 5 (0.0) |
| Epilepsy, n (%) | ||||||||
| Present | 207 (0.6) | 69 (1.1) | < 0.001 | 276 (0.7) | 101 (0.1) | 45 (0.4) | < 0.001 | 146 (0.2) |
| Fatigue, n (%) | ||||||||
| Present | 1941 (5.5) | 881 (14.6) | < 0.001 | 2822 (6.8) | 710 (0.9) | 346 (2.8) | < 0.001 | 1056 (1.2) |
| Fatigue (count, 1 year), n (%) | ||||||||
| Once | 396 (1.1) | 288 (4.8) | < 0.001 | 684 (1.7) | 113 (0.1) | 87 (0.7) | < 0.001 | 200 (0.2) |
| Twice | 50 (0.1) | 63 (1.0) | 113 (0.3) | 28 (0.0) | 35 (0.3) | 63 (0.1) | ||
| Three times | 17 (0.0) | 22 (0.4) | 39 (0.1) | 15 (0.0) | 34 (0.3) | 49 (0.1) | ||
| First-degree relative with CD, n (%) | ||||||||
| Present | 103 (0.3) | 157 (2.6) | < 0.001 | 260 (0.6) | NR | NR | NR | |
| GI symptoms, n (%) | ||||||||
| Present | 7850 (22.3) | 3164 (52.4) | < 0.001 | 11,014 (26.7) | 2974 (3.9) | 1154 (9.3) | < 0.001 | 4128 (4.6) |
| GI symptoms (count, 1 year), n (%) | ||||||||
| Once | 1482 (4.2) | 1030 (17.1) | < 0.001 | 2512 (6.1) | 535 (0.7) | 306 (2.5) | < 0.001 | 841 (0.9) |
| Twice | 421 (1.2) | 483 (8.0) | 904 (2.2) | 170 (0.2) | 172 (1.4) | 342 (0.4) | ||
| Three times | 134 (0.4) | 247 (4.1) | 381 (0.9) | 60 (0.1) | 76 (0.6) | 136 (0.2) | ||
| Four times | 115 (0.3) | 272 (4.5) | 387 (0.9) | 100 (0.1) | 144 (1.2) | 244 (0.3) | ||
| IBS, n (%) | ||||||||
| Present | 597 (1.7) | 339 (5.6) | < 0.001 | 936 (2.3) | 288 (0.4) | 142 (1.1) | < 0.001 | 430 (0.5) |
| Iron, vitamin B12 or folate deficiency, n (%) | ||||||||
| Present | 193 (0.5) | 429 (7.1) | < 0.001 | 622 (1.5) | 104 (0.1) | 163 (1.3) | < 0.001 | 267 (0.3) |
| Mouth ulcers, n (%) | ||||||||
| Present | 331 (0.9) | 170 (2.8) | < 0.001 | 501 (1.2) | 142 (0.2) | 76 (0.6) | < 0.001 | 218 (0.2) |
| Mouth ulcers (count, 1 year), n (%) | ||||||||
| Once | 50 (0.1) | 42 (0.7) | < 0.001 | 92 (0.2) | 32 (0.0) | 19 (0.2) | < 0.001 | 51 (0.1) |
| Twice | 4 (0.0) | 9 (0.1) | 13 (0.0) | 3 (0.0) | 8 (0.1) | 11 (0.0) | ||
| Osteoporosis, n (%) | ||||||||
| Present | 118 (0.3) | 145 (2.4) | < 0.001 | 263 (0.6) | 42 (0.1) | 62 (0.5) | < 0.001 | 104 (0.1) |
| Psoriasis, n (%) | ||||||||
| Present | 722 (2.0) | 237 (3.9) | < 0.001 | 959 (2.3) | 290 (0.4) | 85 (0.7) | < 0.001 | 375 (0.4) |
| Type 1 diabetes, n (%) | ||||||||
| Present | 119 (0.3) | 126 (2.1) | < 0.001 | 245 (0.6) | 324 (0.4) | 150 (1.2) | < 0.001 | 474 (0.5) |
| Thyroid disorders, n (%) | ||||||||
| Present | 389 (1.1) | 287 (4.8) | < 0.001 | 676 (1.6) | 166 (0.2) | 130 (1.0) | < 0.001 | 296 (0.3) |
| Weight loss, n (%) | ||||||||
| Present | 340 (1.0) | 467 (7.7) | < 0.001 | 807 (2.0) | 85 (0.1) | 100 (0.8) | < 0.001 | 185 (0.2) |
Data on ethnicity and deprivation, through linkages with hospital records, were available for approximately one-third of the development data set and one-fifth of the validation data set. In all cohorts, of the patients with known ethnicity, 90–95% were white, and CD patients were more likely to be white than controls. People with CD in the development data set lived in more deprived areas (IMD quintiles 1 and 2) than the controls. This was not the case for CD patients in the validation data set.
All selected indicators were significantly different between cases and controls in all three cohorts of the development data set, except for Down syndrome among women. Although the prevalence of Down syndrome among women with CD was 4 in 10,000, compared with 1 in 10,000 among controls in both data sets, this difference did not reach statistical significance because of the small number of individuals with Down syndrome. In the validation data set for women, epilepsy was also more prevalent in the CD group, but this did not reach statistical significance because of small numbers. In the validation data set with children, arthritis and delayed puberty were not related to CD. In both data sets with men, all indicators were significantly more prevalent among people with CD than among controls.
The most important difference between the development and the validation data sets was that first-degree relatives with CD was not recorded in the validation data set. There are also small differences in prevalences of indicators, with most indicators being more prevalent in the development data set than in the validation data set. For instance, the most prevalent indicator was GI symptoms in all three cohorts. In the development data set, these prevalences ranged from 27% to 40%, whereas the prevalences in the validation data set ranged from 5% to 7%.
Diagnostic indicator selection
The following candidate diagnostic indicators (see Appendix 9, Table 52) could not be considered in the model because there were no observations with the relevant codes: hyposplenism or functional asplenia, raised liver enzymes, multiple sclerosis, pancreatitis, pulmonary haemosiderosis, subfertility and recurrent pregnancy loss among children; delayed puberty and pulmonary haemosiderosis in women; amenorrhoea and Turner syndrome among men. There were no observations of Williams–Beuren syndrome or dental enamel defects in any of the samples.
Table S8 (see Report Supplementary Material 1) presents the proportion of bootstrap samples that included each indicator and the median beta coefficient across all bootstrap samples.
The following indicators were dropped from the model because of an apparent inverse relationship with CD: amenorrhoea, arthritis, irritability, mood disorders, multiple sclerosis, subfertility and type 2 diabetes for women; and type 2 diabetes for men. Attention deficit hyperactivity disorder, headaches, migraines, hyposplenism or functional asplenia, IgA nephropathy, irritability, pancreatitis, type 2 diabetes and multiple sclerosis were not selected as important indicators in any of the models.
Model specification
The model intercepts and coefficients of the final prediction models are presented in Table 3. For children, having type 1 diabetes, Turner syndrome, IgA deficiency or a first-degree relative with CD were estimated to be the strongest diagnostic indicators (i.e. had the highest estimated coefficients). For women and men, the strongest predictors were having a first-degree relative with CD, and anaemia. All three models included first-degree relatives (with CD); anaemia; type 1 diabetes; iron, vitamin B12 or folate deficiency; thyroid disorders; weight loss; Down syndrome; GI symptoms; fatigue; IBS; and age. Epilepsy, cardiovascular disease, chronic liver disease, mouth ulcers and osteoporosis were estimated to be important indicators for adults, but not for children; arthritis, failure to thrive, mood disorders and delayed puberty were estimated to be predictive of CD in children, but not in adults. Fractures, inflammatory bowel disorder, systemic lupus erythematosus, and neuropathy or ataxia were selected indicators for women only. Appendix 11, Tables 53–55, report the effect of the applied shrinkage, showing coefficients with and coefficients without shrinkage, and report the adjusted and unadjusted odds ratios for each indicator for children, women and men, respectively.
| Selected diagnostic indicator | Children | Women | Men | ||||||
|---|---|---|---|---|---|---|---|---|---|
| Coefficient | Ranka | 200 bootstrapped samples, median (IQR) | Coefficient | Ranka | 200 bootstrapped samples, median (IQR) | Coefficient | Ranka | 200 bootstrapped samples, median (IQR) | |
| (Intercept) | –5.119 | –5.127 (–5.146 to –5.108) | –5.063 | –5.062 (–5.080 to –5.042) | –5.478 | –5.488 (–5.526 to –5.460) | |||
| Age | 0.011 | 19 | 0.011 (0.007–0.014) | –0.006 | 25 | –0.006 (–0.006 to –0.005) | 0.01 | 20 | 0.011 (0.010–0.011) |
| Anaemia | 2.645 | 5 | 2.618 (2.522–2.751) | 1.63 | 2 | 1.635 (1.605–1.661) | 2.685 | 1 | 2.689 (2.632–2.753) |
| Arthritis | 1.318 | 12 | 1.371 (0.949–1.738) | NS | NS | NS | NS | NS | NS |
| Cardiovascular disease | NS | NS | NS | 0.196 | 20 | 0.190 (0.139–0.222) | 0.253 | 18 | 0.243 (0.214–0.282) |
| Chronic liver disease | NS | NS | NS | 0.326 | 16 | 0.324 (0.245–0.383) | 0.321 | 16 | 0.321 (0.236–0.396) |
| Delayed puberty | 1.995 | 10 | 1.997 (1.537–2.577) | NS | NS | NS | NS | NS | NS |
| Down syndrome | 2.429 | 6 | 2.428 (2.096–2.763) | 1.163 | 5 | 1.269 (1.161–1.358) | 1.293 | 7 | 1.344 (0.856–1.813) |
| Epilepsy | NS | NS | NS | 0.258 | 17 | 0.252 (0.232–0.268) | 0.259 | 17 | 0.290 (0.147–0.384) |
| Failure to thrive | 1.382 | 11 | 1.398 (1.215–1.540) | NS | NS | NS | NS | NS | NS |
| Fatigue | 0.613 | 16 | 0.605 (0.500–0.698) | 0.153 | 22 | 0.151 (0.127–0.178) | 0.185 | 19 | 0.186 (0.136–0.233) |
| Fatigue (count 1 year) | 1.111 | 14 | 1.090 (0.967–1.233) | 0.545 | 14 | 0.544 (0.518–0.571) | 0.663 | 12 | 0.652 (0.592–0.714) |
| First-degree relative with CD | 3.1 | 4 | 3.109 (3.037–3.172) | 2.459 | 1 | 2.449 (2.378–2.517) | 2.347 | 2 | 2.362 (2.282–2.461) |
| Fractures (count 1 year) | NS | NS | NS | 0.196 | 19 | 0.203 (0.167–0.241) | NS | NS | NS |
| GI symptoms | 0.582 | 17 | 0.584 (0.550–0.613) | 0.249 | 18 | 0.251 (0.173–0.360) | 0.448 | 13 | 0.442 (0.414–0.472) |
| GI symptoms (count 1 year) | 0.794 | 15 | 0.792 (0.775–0.817) | 0.604 | 12 | 0.604 (0.594–0.615) | 0.787 | 10 | 0.789 (0.772–0.807) |
| IgA deficiency | 3.21 | 3 | 3.185 (2.287–3.563) | 1.127 | 6 | 1.170 (0.765–1.596) | NS | NS | NS |
| Inflammatory bowel disease | NS | NS | NS | 0.138 | 23 | 0.112 (0.000–0.227) | NS | NS | NS |
| Iron, vitamin B12 or folate deficiency | 2.016 | 9 | 2.013 (1.704–2.363) | 1.323 | 3 | 1.383 (0.554–2.113) | 1.81 | 3 | 1.828 (1.754–1.917) |
| IBS | 1.127 | 13 | 1.135 (0.934–1.377) | 0.478 | 15 | 0.474 (0.450–0.505) | 0.709 | 11 | 0.714 (0.651–0.776) |
| Mood disorders | 0.363 | 18 | 0.343 (0.250–0.448) | NS | NS | NS | NS | NS | NS |
| Mouth ulcers | NS | NS | NS | NS | NS | NS | 0.412 | 14 | 0.401 (0.305–0.514) |
| Mouth ulcers (count 1 year) | NS | NS | NS | 0.857 | 10 | 0.841 (0.767–0.907) | 0.934 | 8 | 0.919 (0.849–0.994) |
| Neuropathy or ataxia | NS | NS | NS | 0.179 | 21 | 0.178 (0.074–0.311) | – | – | – |
| Osteoporosis | NS | NS | NS | 1.028 | 8 | 1.040 (1.000–1.077) | 1.554 | 5 | 1.549 (1.433–1.673) |
| Psoriasis | NS | NS | NS | 0.048 | 24 | 0.047 (0.000–0.097) | 0.335 | 15 | 0.339 (0.265–0.401) |
| Sex (male) | –0.477 | 20 | –0.472 (–0.502 to –0.447) | NS | NS | NS | NS | NS | NS |
| Systemic lupus erythematosus | NS | NS | NS | 0.699 | 11 | 0.698 (0.532–0.856) | NS | NS | NS |
| Thyroid disorders | 2.144 | 8 | 2.185 (2.000–2.395) | 0.599 | 13 | 0.598 (0.563–0.629) | 0.91 | 9 | 0.913 (0.753–1.074) |
| Turner syndrome | 3.949 | 2 | 3.908 (3.715–4.084) | 1.08 | 7 | 1.057 (0.422–1.681) | NS | NS | NS |
| Type 1 diabetes | 4.153 | 1 | 4.182 (4.062–4.278) | 1.277 | 4 | 1.337 (1.293–1.375) | 1.746 | 4 | 1.749 (1.650–1.868) |
| Weight loss | 2.316 | 7 | 2.302 (2.142–2.485) | 0.91 | 9 | 0.895 (0.848–0.950) | 1.49 | 6 | 1.489 (1.431–1.552) |
Model performance
The amount of variability explained (R2), the overall model fit (Brier score), discrimination (c-statistic), and calibration measures (intercept and slope of calibration curve) are shown in Table 4.
| Data | Apparent model performance: original data set (CPRD GOLD) | Internally validated model performance: 200 bootstrapped samples of original data, median (IQR) | Externally validated model performance: independent data set (CPRD Aurum) |
|---|---|---|---|
| Children | |||
| R 2 | 0.407 | 0.408 (0.401–0.413) | 0.065 |
| Brier score | 0.167 | 0.167 (0.165–0.169) | Without FDR: 0.190 |
| With FDR: 0.156 | |||
| c-statistic | 0.821 | 0.821 (0.818–0.824) | 0.600 |
| Calibration intercepta | 0.147 | 0.161 (0.134–0.181) | Without FDR: 0.433 |
| With FDR: –2.676 | |||
| Calibration slopea | 0.964 | 0.986 (0.959–1.014) | 0.655 |
| Women | |||
| R 2 | 0.237 | 0.248 (0.242–0.254) | 0.032 |
| Brier score | 0.227 | 0.225 (0.223–0.227) | Without FDR: 0.245 |
| With FDR: 0.217 | |||
| c-statistic | 0.756 | 0.764 (0.761–0.767) | 0.551 |
| Calibration intercepta | –0.161 | –0.153 (–0.169 to –0.143) | Without FDR: 0.433 |
| –2.676 | |||
| Calibration slopea | 0.822 | 0.836 (0.817–0.855) | 0.655 |
| Men | |||
| R 2 | 0.286 | 0.284 (0.278–0.291) | 0.056 |
| Brier score | 0.122 | 0.124 (0.122–0.126) | Without FDR: 0.134 |
| With FDR: 0.118 | |||
| c-statistic | 0.798 | 0.796 (0.793;0.801) | 0.619 |
| Calibration intercepta | –0.505 | –0.515 (–0.534 to–0.497) | Without FDR: 0.112 |
| With FDR: –2.250 | |||
| Calibration slopea | 0.934 | 0.840 (0.817–0.867) | 0.668 |
The development model for children shows the best overall model fit and ability to discriminate between those with and those without CD, compared with the models for men and women. The calibration slope is < 1 for all three models, meaning that all three models overestimate the risk of CD, on average (see Appendix 12, Figure 55). For instance, the model for children estimates a 40% chance of CD, compared with a prevalence in the data set of 20%. At higher risks, the model performs better. The estimated model performance appears to be stable, as the internal model performance in 200 bootstrapped samples was similar, with narrow CIs (see Table 4).
External validation
The prevalence of each predictor was generally lower in the external validation data set. The models performed less well in the validation data set. The amount of variability explained by the model dropped to < 7% in all models. The c-statistics were > 0.5, suggesting that the models discriminated better than chance. Calibration intercepts were further away from 0 and calibration slopes further away from 1 than for the apparent model performance. The R2, c-statistic and calibration slope were not different for people with or people without a first-degree relative with CD.
Clinical usefulness
Table 5 shows the sensitivity and specificity of the prediction model at several thresholds to achieve a 1.5%, 2%, 5%, 10% or 20% PPV of the prediction model. This can also be considered as the pre-test probability for serological testing, the next stop on the diagnostic pathway. The lowest pre-test probability (1%) is the estimated prevalence of CD in the general population, so this strategy is the same as testing everyone. By definition, this strategy is 100% sensitive and 0% specific because a test is offered to anyone regardless of their diagnostic indicators. Currently in the UK, only one in three people with CD is believed to be diagnosed, so a prediction rule that picks up more than one in three (i.e. sensitivity of > 33%) might already improve case-finding. As can be see in Table 5, this can be achieved at a pre-test probability of > 20% for children, > 5% for women and > 10% for men. Table 6 shows examples of the combination of predictors among patients at these model thresholds.
| Population | PPV (%) | Threshold | TP (n) | FP (n) | FN (n) | TN (n) | Sensitivity (%) | Specificity (%) | NPV (%) | CD patients missed (%) |
|---|---|---|---|---|---|---|---|---|---|---|
| Children | 1 | 0 | 100 | 9900 | 0 | 0 | 100.0 | 0.0 | NA | 0 |
| 1.5 | 0.0038 | 88 | 5776 | 12 | 4124 | 88.2 | 41.7 | 99.7 | 11.8 | |
| 2 | 0.0042 | 81 | 3865 | 19 | 6035 | 80.7 | 61.0 | 99.7 | 19.3 | |
| 5 | 0.0077 | 67 | 1271 | 33 | 8629 | 66.7 | 87.2 | 99.6 | 33.3 | |
| 10 | 0.0170 | 53 | 478 | 47 | 9422 | 53.3 | 95.2 | 99.5 | 46.7 | |
| 20 | 0.0800 | 33 | 129 | 67 | 9771 | 33.1 | 98.7 | 99.3 | 66.9 | |
| Women | 1 | 0 | 100 | 9900 | 0 | 0 | 100.0 | 0.0 | NA | 0 |
| 1.5 | 0.0053 | 84 | 5468 | 16 | 4432 | 84.1 | 44.8 | 99.6 | 15.9 | |
| 2 | 0.0062 | 76 | 3687 | 24 | 6213 | 75.8 | 62.8 | 99.6 | 24.2 | |
| 5 | 0.0233 | 39 | 731 | 61 | 9169 | 38.7 | 92.6 | 99.3 | 61.3 | |
| 10 | 0.1070 | 11 | 96 | 89 | 9804 | 10.7 | 99.0 | 99.1 | 89.3 | |
| 20 | 0.7550 | 0 | 1 | 100 | 9899 | 0.2 | 100.0 | 99.0 | 99.8 | |
| Men | 1 | 0 | 100 | 9900 | 0 | 0 | 100.0 | 0.0 | NA | 0 |
| 1.5 | 0.007 | 87 | 5634 | 13 | 4266 | 87.0 | 43.1 | 99.7 | 13 | |
| 2 | 0.008 | 79 | 3858 | 21 | 6042 | 79.0 | 61.0 | 99.7 | 21 | |
| 5 | 0.0185 | 58 | 1095 | 42 | 8805 | 57.9 | 88.9 | 99.5 | 42.1 | |
| 10 | 0.0610 | 32 | 290 | 68 | 9610 | 32.2 | 97.1 | 99.3 | 67.8 | |
| 20 | 0.2820 | 11 | 43 | 89 | 9857 | 10.7 | 99.6 | 99.1 | 89.3 |
| Risk (%) | Children | Women | Men |
|---|---|---|---|
| > 1.5 | All female children | Fatiguea | |
| > 2 | |||
| > 5 |
|
|
|
| > 10 | |||
| > 20 |
|
|
The ROC curves in Figure 2 show that the model performs less well with the external data and the ROC curves are closer to the chance line, corresponding to a lower c-statistic. When applying the prediction rule in the external validation data sets, at the 20% threshold for children, 95% of people with CD are missed; at the 5% threshold for women, 86% of people with CD are missed; and at the 10% threshold for men, 94% of people with CD are missed. However, lower thresholds still appear to be able to pick up more than the one in three people with CD, which is how many people with CD are thought to currently have a CD diagnosis (see Appendix 13, Table 56).
FIGURE 2.
The ROC curves model development. (a) Children: development sample; (b) children: external validation; (c) women: development sample; (d) women: external validation; (e) men: development sample; and (f) men: external validation. Thresholds are shown that result in a 1%, 1.5%, 2%, 5%, 10% and 20% PPV. The same thresholds are applied on the external data. FPR, false-positive rate; TPR, true-positive rate.
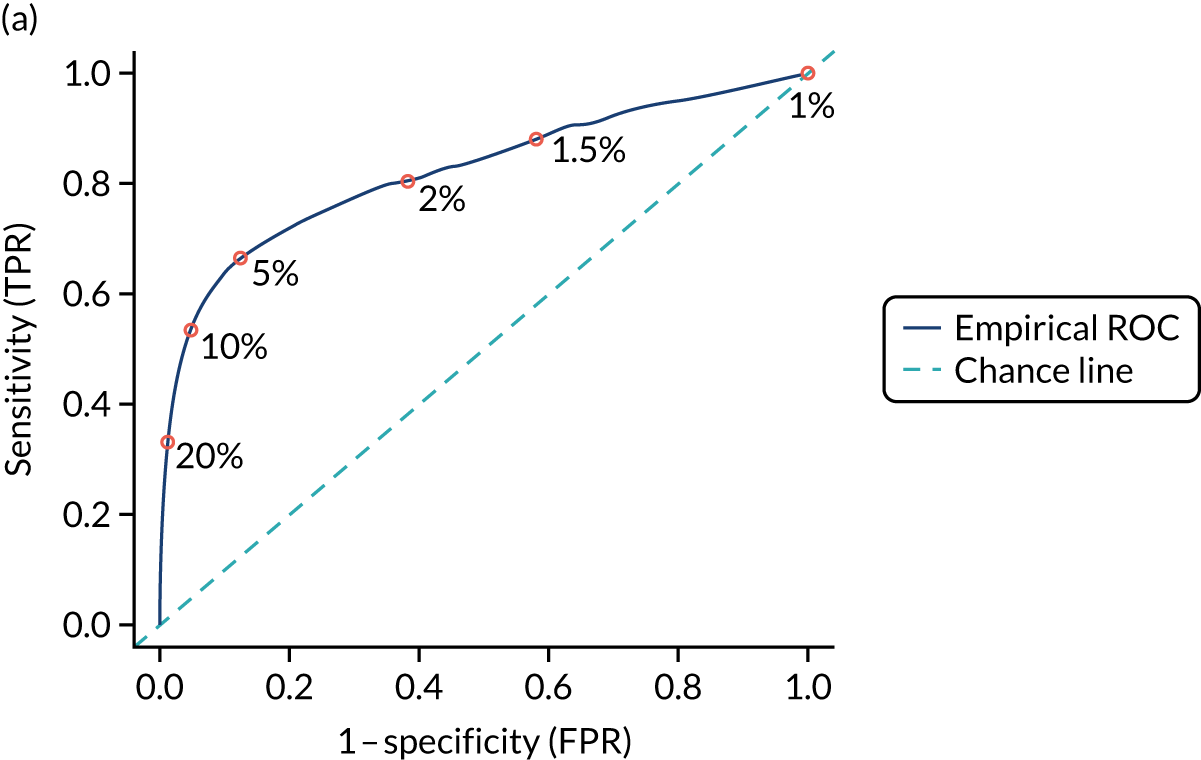
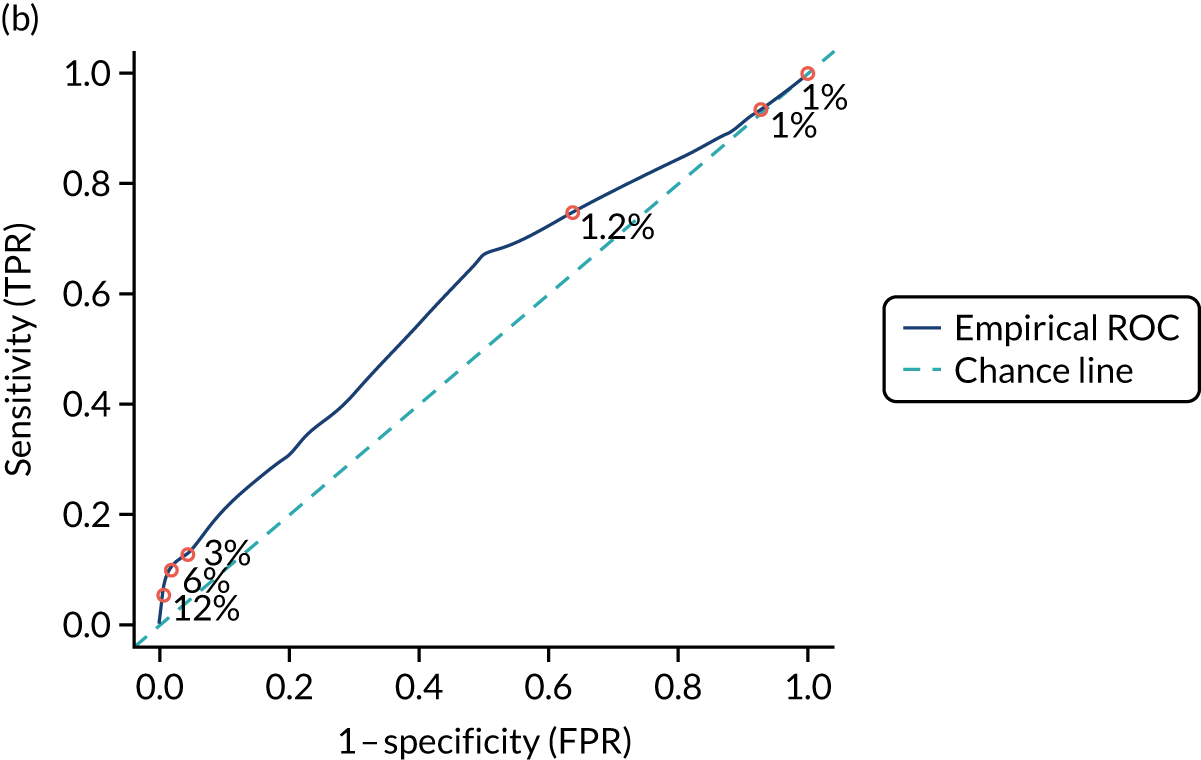
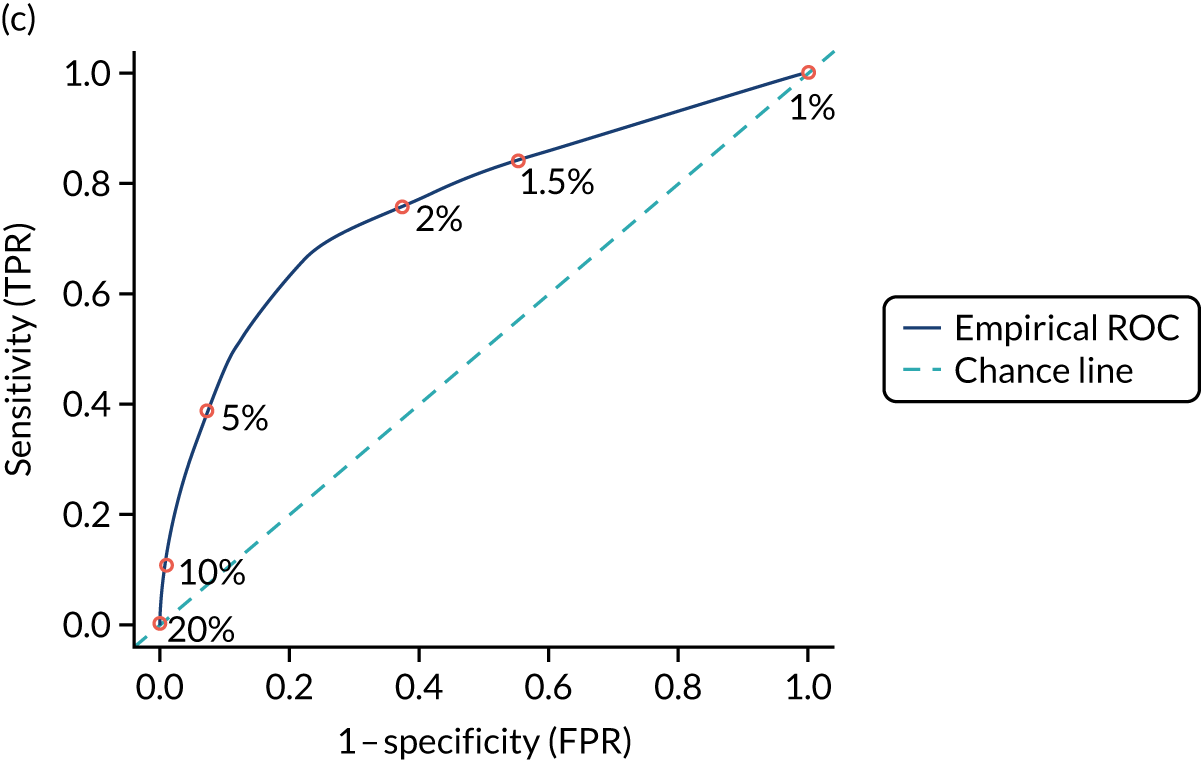
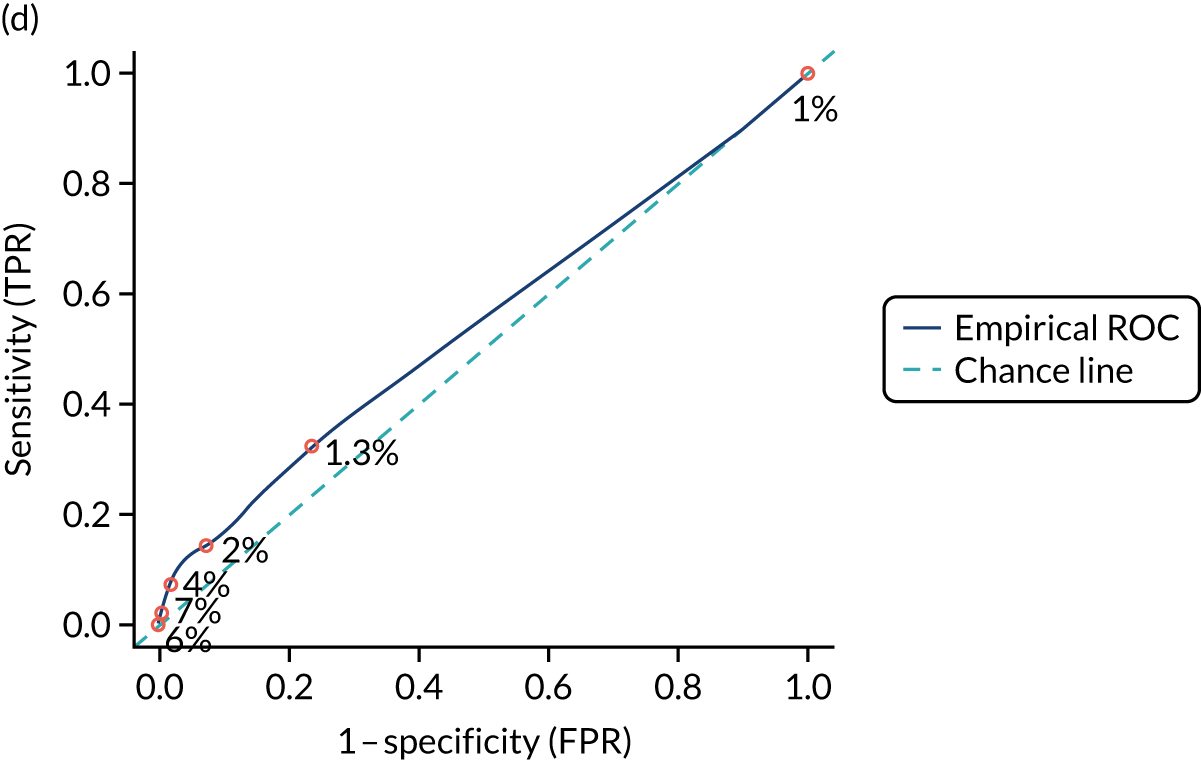
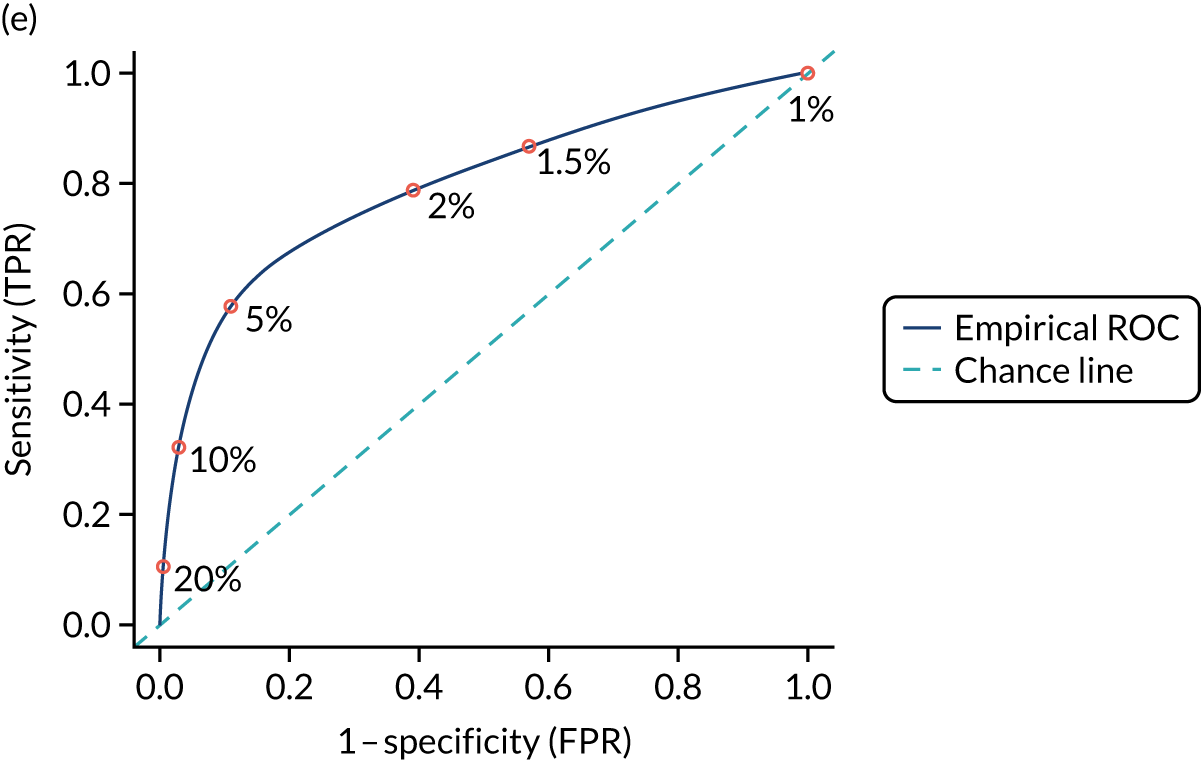
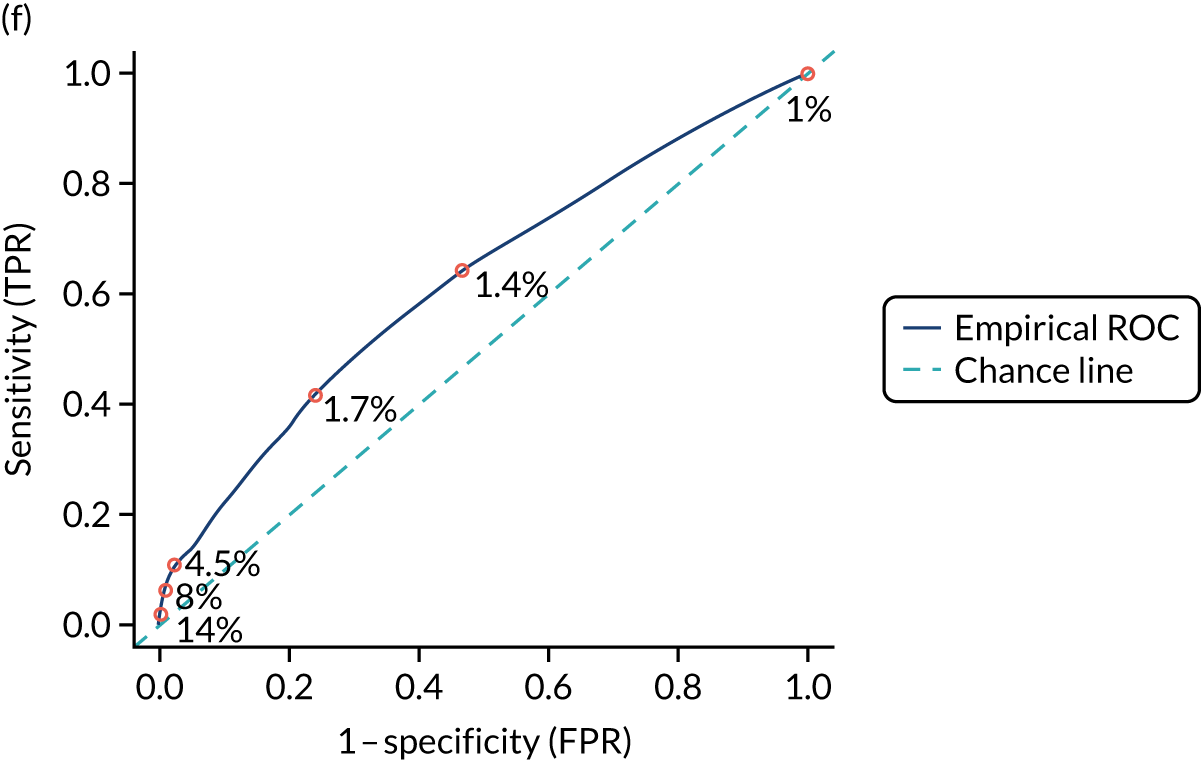
Sensitivity analysis on coeliac disease patients diagnosed after 1997
The vast majority of patients in the CPRD GOLD data set were diagnosed after 1997, so limiting the analysis to these patients did not make a big impact on sample size. For this sensitivity analysis, 495 (3%) children, 2039 (4%) women and 1591 (4%) men were removed from the development data sets. Although there were minor changes in variable selection and model performance measures, the new models did not perform substantially better or worse than the original models.
Children
The same predictors and two additional predictors, amenorrhoea and mouth ulcers (as count, 2 years prior to CD diagnosis), were included in the model. However, this did not seem to improve model performance: all performance measures were similar between the new and the original models (R2 = 0.415, Brier score = 0.166, c-statistic = 0.827, calibration intercept = 0.113 and calibration slope = 1.011).
Women
In the new model, inflammatory bowel disease, psoriasis, and neuropathy or ataxia were not included, following the same model selection criteria as for the original model. The new model performed similarly to the original model (R2 = 0.246, Brier score = 0.222, c-statistic = 0.763, calibration intercept = –0.162 and calibration slope = 0.814).
Men
The results were similar for men. With the same model selection procedure, epilepsy was not included in the new model, whereas abnormal liver function was included (which was not included in the original model). However, model performance was similar to that of the original model (R2 = 0.282, Brier score = 0.124, c-statistic = 0.797, calibration intercept = –0.543 and calibration slope = 0.829).
Sensitivity analysis including ethnicity and deprivation as predictions
Information on ethnicity and 2015 IMD67 was available for only one-third of the CPRD GOLD cohort. The linked data set consisted of 4254 controls and 1303 CD patients for children; 13,093 controls and 4824 CD patients for women; and 10,618 controls and 2409 CD patients for men. CD prevalence was higher in the linked data sets (at 23.4%, 26.9% and 18.5% for children, women and men, respectively) than in the original data sets (20%, 24.5%, and 14.6% for children, women and men, respectively). Although ethnicity and 2015 IMD67 quintiles were significantly associated with CD in all three samples, the updated model did not perform substantially better (see Appendix 14, Table 57).
The Avon Longitudinal Study of Parents and Children analysis
Table 7 describes the prevalence of candidate predictors among children with (n = 46) and children without CD (n = 5071). A significantly higher proportion of children with CD were female (67% female vs. 33% male); the mean age of children with and children without CD was similar (7.5 years). There were no significant differences in the prevalence of any of the other candidate predictors between children with and children without CD. The most prevalent predictors were male sex (52%), fatigue (23%), mood disorder (12%) and mouth ulcers (10%). With the exception of age, candidate predictors were missing for between 0.2% and 60% of children.
| Predictor | Children without CD (N = 5071) | Children with CD (N = 46) | p-valuea |
|---|---|---|---|
| Type 1 diabetes, n (%) | |||
| Absent | 2665 (52.6) | 30 (65.2) | 0.119 |
| Present | < 5 (< 0.01) | < 5 (< 10.9)b | |
| Missing | 2404 (47.4) | 16 (34.8) | |
| Anaemia, n (%) | |||
| Absent | 4881 (96.3) | 43 (93.5) | 0.326 |
| Present | 150 (3.0) | < 5 (< 10.9)b | |
| Missing | 40 (0.8) | < 5 (< 10.9)b | |
| Thyroid disorder, n (%) | |||
| Absent | 3297 (65.0) | 30 (65.2) | 1.000 |
| Present | 37 (0.7) | < 5 (< 10.9)b | |
| Missing | 1737 (34.3) | 16 (34.8) | |
| GI symptom count, n (%) | |||
| 0 | 3840 (75.7) | 40 (87.0) | 0.225 |
| 1 | 207 (4.1) | < 5 (< 10.9)b | |
| 2–4 | 79 (1.6) | < 5 (< 10.9)b | |
| Missing | 945 (18.6) | < 5 (< 10.9)b | |
| Sex, n (%) | |||
| Female | 2444 (48.2) | 31 (67.4) | 0.027 |
| Male | 2618 (51.6) | 15 (32.6) | |
| Missing | 9 (0.2) | < 5 (< 10.9)b | |
| Fatigue, n (%) | |||
| Absent | 2767 (54.6) | 25 (54.3) | 0.960 |
| Present | 1165 (23.0) | 10 (21.7) | |
| Missing | 1139 (22.5) | 11 (23.9) | |
| Mouth ulcers, n (%) | |||
| Absent | 1554 (30.6) | 16 (34.8) | 0.857 |
| Present | 497 (9.8) | < 5 (< 10.9)b | |
| Missing | 3020 (59.6) | 26 (56.5) | |
| GI symptoms, n (%) | |||
| Absent | 3840 (75.7) | 40 (87.0) | 0.235 |
| Present | 306 (6.0) | < 5 (< 10.9)b | |
| Missing | 925 (18.2) | < 5 (< 10.9)b | |
| Mood disorders, n (%) | |||
| Absent | 3573 (70.5) | 38 (82.6) | 0.229 |
| Present | 608 (12.0) | < 5 (< 10.9)b | |
| Missing | 890 (17.6) | 5 (10.9) | |
| Age (years), mean (SD) | 7.49 (0.19) | 7.45 (0.12) | 0.030 |
Among children for whom complete data for the outcome and each candidate predictor were available, univariable associations indicated that males were less likely to have CD than females (coefficient –0.78, 95% CI –1.39 to –0.17; see Appendix 15, Table 58) (Figure 3). Children with type 1 diabetes, anaemia, a thyroid disorder or two to four GI symptoms were more likely to have CD; however, the 95% CIs contain zero. None of the remaining candidate predictors showed evidence of association with an increased likelihood of CD.
FIGURE 3.
Coefficients and 95% CIs from complete-case univariable analysis of candidate predictors and CD.
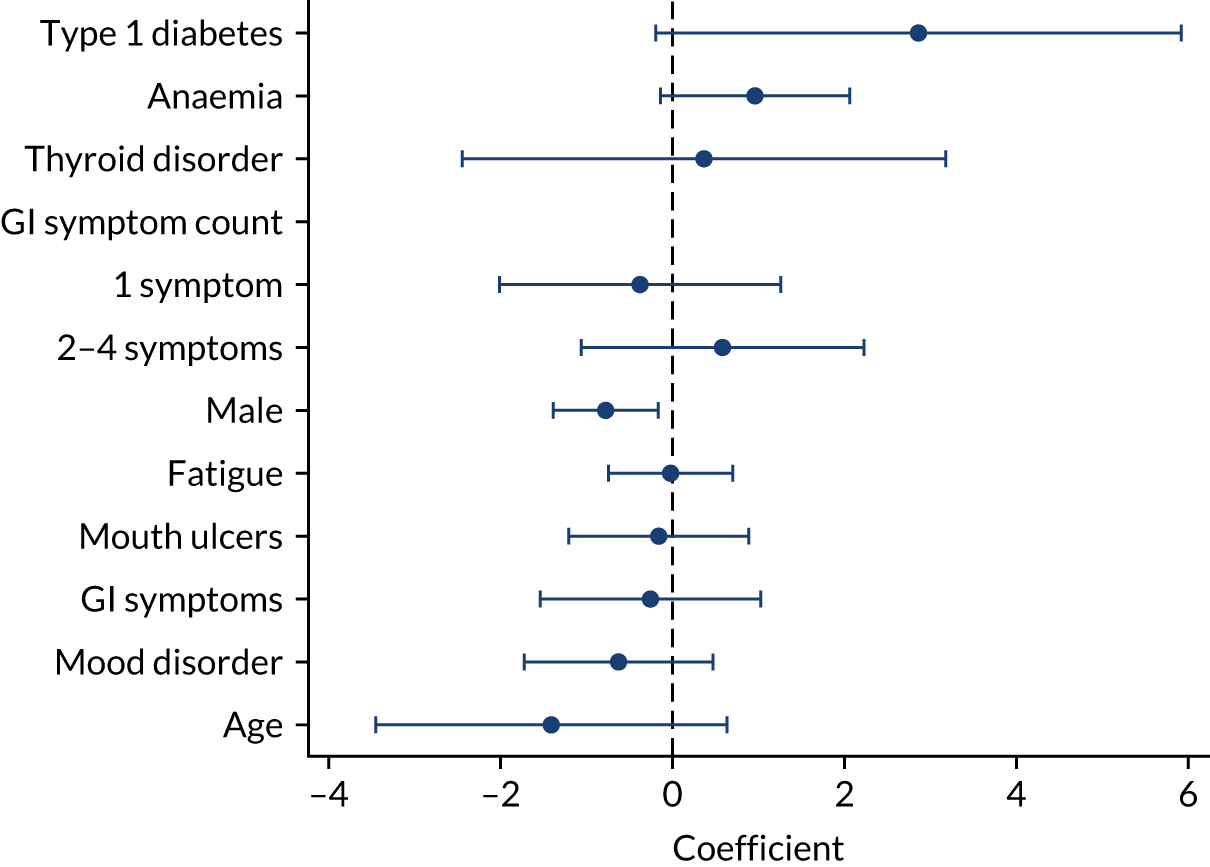
Male sex was the only predictor that showed evidence of an association with CD in the ALSPAC data set, with male children less likely than female children to be diagnosed with CD. This finding is consistent with the association between male sex and CD in the CPRD data. For the predictors age, mood disorder, fatigue, mouth ulcers, GI symptoms and GI symptom count of 1, the direction of effects estimated in the ALSPAC cohort contradicts the associations identified in the CPRD data; therefore, inclusion in the model is likely to result in inaccurate risk predictions. Low counts of children with type 1 diabetes and thyroid disorder precluded multiple imputation of these predictors and, because of the large number of missing data (34% and 47%, respectively), inclusion in the model would almost halve the sample size. A prediction model consisting of the remaining predictors (anaemia, two to four GI symptoms and male sex) would not be clinically useful; therefore, the decision was taken not to fit a prediction model in this data set.
Chapter 5 Accuracy of diagnostic tests for coeliac disease
We conducted a systematic review of the accuracy of serological tests for CD. The review was registered with the international prospective register of systematic reviews (PROSPERO): registration number CRD42019115506. The review followed the recommendations from the Centre for Reviews and Dissemination22 and the Cochrane Handbook for Systematic Reviews of Diagnostic Test Accuracy Version 1.0.0,23 and is reported according to the PRISMA-DTA statement. 24
Systematic review methods
Eligibility criteria
Inclusion criteria were defined during protocol development and piloted on a subset of 500 articles during title and abstract screening to ensure that they could be applied objectively. We included studies that met the following criteria.
Study design
Diagnostic cohort studies (also known as ‘one-gate design’) were included. Diagnostic case–control studies (also known as ‘two-gate’ designs) that enrolled a group of people with known CD and a group without CD were excluded, as this type of design has been associated with inflated estimates of accuracy. We anticipated a substantial evidence base from cohort studies and so restricted to this more methodologically robust design. 68
Participants
People presenting with symptoms of CD (e.g. diarrhoea, abdominal pain, fatigue) were included. After piloting the inclusion criteria, we decided to exclude studies conducted with healthy individuals (i.e. screening) or those restricted to single risk groups (e.g. people with diabetes) to ensure that the review was conducted in a clinically relevant population that would be eligible to be tested for CD.
Index test
Any of the following serological tests for CD were eligible: IgA tTG, IgG tTG, IgA EMA, IgG EMA, IgA DGP, IgG DGP and IgA actin antibodies. Combined serological tests, such as IgA/IgG tTG (which detect the presence of IgA tTG or IgG tTG in a serum sample) or IgA tTG followed by IgA EMA, were also eligible for inclusion. GAs were not considered in this review, as they are not recommended for use in the diagnosis of CD by NICE as their accuracy has been shown to be poor. 9 Point-of-care or rapid serological tests were excluded as a systematic review of their accuracy was published in 2019. 69
Reference standard
Studies had to use duodenal biopsy to confirm the diagnosis of CD; at least some seronegative patients had to have received biopsy for the study to be included. Studies in which serology formed part of the reference standard were excluded as this could lead to overestimation of test accuracy.
Search strategy
The following databases were searched from January 1990 to August 2020 for published studies and relevant reviews:
-
MEDLINE
-
Embase
-
Cochrane Library
-
Web of Science
-
Kleijnen Systematic Reviews (KSR) Evidence.
To identify completed and ongoing trials, we searched the following trial registries from January 1990 to August 2020:
-
WHO ICTRP
-
NIH Clinical Trials database.
Internet searches were carried out using terms such as ‘celiac’, ‘coeliac’ and ‘serological tests’. The reference lists of relevant systematic reviews identified during the literature search were used as sources of potentially relevant studies.
No language or publication restrictions were applied. Date restrictions were applied to limit searches to 1990 onwards, as serological tests for CD first became available in 1990. 70
We combined terms for ‘antibodies’ with terms for ‘coeliac disease’. Search strategies were adapted for each database searched. Full details of the search strategies are available in Appendix 16. Results of the searches were downloaded and saved to an EndNote X9 library.
Study selection
Titles and abstracts were uploaded to the Rayyan QCRI (Doha, Qatar; https://rayyan.qcri.org/) systematic review software platform71 and screened independently by two reviewers. Any discrepancies were discussed; where disagreement remained, articles were considered to be potentially relevant. Articles considered potentially relevant were obtained as full-text articles and assessed by one reviewer and checked by a second reviewer against the review inclusion criteria using a Microsoft Access form designed specifically for this review. Any discrepancies between reviewers were resolved through discussion or referral to a third reviewer.
Data collection process
Standardised data extraction forms were developed using Microsoft Access. These were piloted on a small sample of papers and adapted as necessary before use. Data extraction was performed by one reviewer and checked by a second. Disagreements were resolved through discussion or referral to a third reviewer when necessary.
We extracted data on the following from each included study:
-
participant characteristics – adults/children, reason for biopsy, number of participants
-
serological tests – test(s) evaluated, threshold(s) for positivity
-
biopsy procedures – definition of CD (biopsy threshold), proportion biopsied.
Results data were extracted as 2 × 2 tables of test results (numbers of true positives, false negatives, false positives and true negatives) for each index test against the biopsy reference standard. When reported, 2 × 2 tables for testing strategies involving combinations of serological tests were also extracted. When 2 × 2 data were reported at multiple thresholds within a study, data relating to the cut-off point prespecified by the manufacturer or author were extracted. Two-by-two data were extracted at a biopsy cut-off point of Marsh grade 3a, if available; otherwise, any reported biopsy threshold was accepted.
Risk of bias
Studies were assessed for methodological quality using the QUADAS-2 tool. This assesses the risk of bias and concerns regarding applicability across the following four domains: patient selection, index test, reference standard, and flow and timing. For this review, we omitted the assessment of applicability as the research question was defined such that any study meeting the inclusion criteria was applicable to the research question. We tailored the signalling questions to our review; the exact signalling questions used are reported in table S9 (see Report Supplementary Material 1). For comparative accuracy studies, we added additional signalling questions based on a draft version of the quality assessment of diagnostic accuracy studies–comparative (QUADAS-C) tool,72 which was under development at the time of our review, to assess the comparative nature of the studies. These are also summarised in table S9 (see Report Supplementary Material 1).
Each study was judged as having a ‘high’, ‘low’ or ‘unclear’ risk of bias in each risk-of-bias domain. If at least one of the domains was rated as having a ‘high’ risk of bias, the study was considered as being at high risk of bias; if all domains were judged as having a ‘low’ risk of bias, the study was considered as being at low risk of bias; otherwise, the study was considered as having an ‘unclear’ risk of bias.
When a study reported accuracy data for two or more tests, the ‘index test’ and ‘flow and timing’ domains were assessed separately for each. When a study reported accuracy data for adults and children separately, all domains were assessed separately for each patient group.
Synthesis of results
We grouped studies according to age group [adults aged > 16 years, children aged ≤ 16 years, mixed (adults and children) and age unspecified] and stratified all analyses by age group and serological test, or test combination. Meta-analyses were performed in Stata® version 16.0 (StataCorp LP, College Station, TX, USA) using the metandi command.
Primary analyses
For data sets that included at least four studies, a bivariate random-effects meta-analysis of sensitivity and specificity was performed,29 assuming binomial likelihoods for the numbers of true-positive and true-negative test results. 30 When there were fewer than four studies in a data set, univariate fixed-effect meta-analyses of sensitivity and specificity were performed. When only a single study was available, the sensitivity and specificity reported in that study are presented.
When the extracted data on a test relate to a range of thresholds, we report results from two separate meta-analyses. First, we fitted the bivariate model to studies reporting at the most commonly reported threshold only. From these models, we report summary estimates of sensitivity and specificity at that threshold. Second, we fitted the bivariate model to the full data set. From these models, we present the SROC curve, which represents the trade-off between sensitivity and specificity across thresholds.
The sensitivity and specificity reported in each study were plotted in ROC space, with colour-coding allowing comparisons to be made between different thresholds. Summary estimates of sensitivity and specificity with 95% CIs at the most commonly reported threshold and SROC curves across all reported thresholds are presented.
Summary PPVs were calculated from estimates of sensitivity and specificity, for a hypothetical prevalence of 1%, the estimated prevalence of CD in the UK population. We then used a hypothetical population of 10,000 people tested for CD, for a pre-test probability of 1%, to produce a test consequence graphic based on natural frequencies. 73 Values were estimated based on summary sensitivity and specificity from the meta-analyses restricted to the most commonly reported threshold for the most commonly evaluated tests.
Direct comparisons and test combinations
To investigate direct comparisons between tests, we performed additional analyses restricted to studies that reported accuracy estimates for multiple tests based on the same participants (comparative accuracy studies). These studies used the design outlined in Figure 4.
FIGURE 4.
Comparative accuracy study design.
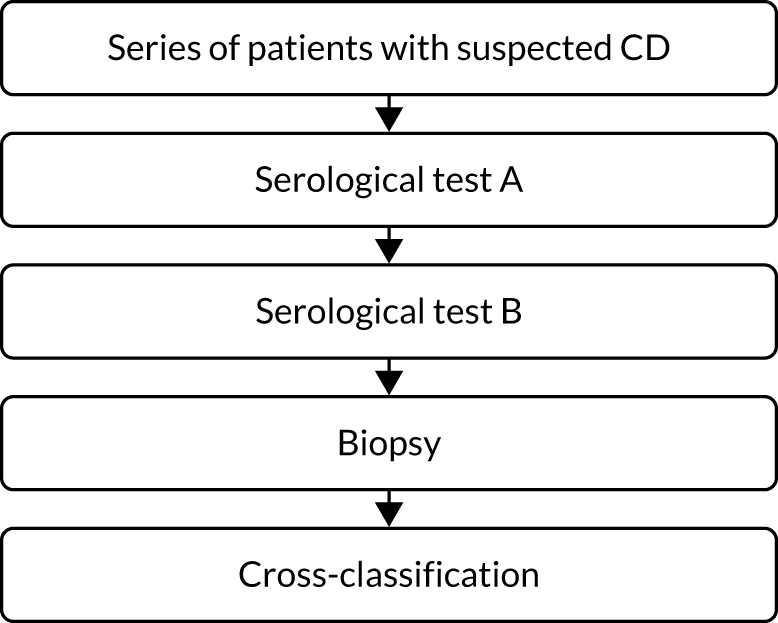
As all patients undergo both index tests and the reference standard, these studies provide more reliable estimates of the comparative accuracy of different tests. 74 For the two most commonly assessed tests, IgA tTG and IgA EMA, we estimated the relative sensitivity and specificity within each study, which are measures of the comparative accuracy of the two tests. Relative sensitivity is the ratio of two sensitivities; for example, if relative sensitivity is 1, then the sensitivity of the two tests is the same (similarly for specificity). We report the observed range of these measures across the set of studies that evaluated both of these tests in the same group of patients.
A subset of these studies also reported accuracy data for the combined accuracy of IgA tTG and IgA EMA. These provided estimates of the accuracy of considering an individual to be positive for CD if ‘both tests were positive’ (and negative otherwise) or of considering an individual to be positive for CD if ‘either test was positive’ (and negative only if both tests were negative). We tabulated estimates of sensitivity and specificity of these testing strategies, but did not pool across these studies using meta-analysis because of variation in the diagnostic thresholds used for each test.
To allow comparisons across the testing strategies that were under consideration for inclusion in the economic model (see Chapter 8), we performed additional analyses of the accuracy of IgA tTG in isolation and of IgA EMA in isolation, based on this same subset of comparative accuracy studies. This allowed us to make direct comparisons between the accuracy of singular tests and that of combined testing strategies. We then restricted to the most commonly reported threshold. These estimates of accuracy were selected for inclusion in the economic model (see Chapter 8).
Sensitivity analyses
We used sensitivity analyses to investigate whether or not estimates of accuracy varied according to study quality, patient spectrum and potential for partial verification bias. We restricted analyses to the following subsets of studies to investigate the impact of these variables:
-
studies judged to be at low risk of bias overall based on the QUADAS-2
-
studies that included only symptomatic patients
-
studies in which all patients received a biopsy to confirm whether or not they had CD.
Deviations from the protocol
-
In the protocol, we described our target population as ‘adults or children at risk of CD’. After piloting the inclusion criteria at title and abstract screening, we chose to exclude studies in healthy populations (i.e. screening) or single-risk groups only, as described in Eligibility criteria.
-
We described the intervention as ‘any serological test for CD’, including HLA-DQ typing. We decided not to include GAs as they are not recommended for use in the diagnosis of CD by NICE. 9 We did not include HLA-DQ typing in this chapter, as this is covered in a separate review (see Chapter 6). We did not include point-of-care or rapid serological tests as a systematic review of their accuracy was published in 2019. 69
-
We described our comparator as ‘any reported reference standard’. After piloting the exclusion criteria at title and abstract screening, we decided to exclude studies in which serology formed part or all of the reference standard, as this would lead to overinflation of test accuracy estimates.
In the strategy for data synthesis, we stated, ‘If a test is reported at a single threshold for test positivity across studies, summary operating points will be used to measure the test’s accuracy. If a test is reported at differing thresholds across studies, SROC curves showing the trade-off between sensitivity and specificity at the various thresholds will be produced’. 75 In the review, we produced both summaries of the evidence for completeness: a SROC curve across all reported thresholds and summary sensitivity/specificity at the most commonly reported threshold.
Results of the assessment of diagnostic accuracy of serological tests
The electronic search identified 15,170 articles. After removing duplicates, 7956 unique reports remained. Following title and abstract screening of these 7956 reports, 398 reports were considered potentially relevant and full-text reports were requested (see Appendix 17, Figure 56). We were unable to obtain full texts for four studies, and translation was not possible for a further five studies; this left 389 reports, which were assessed for inclusion. We included 113 studies (3351 participants) reported in 131 unique publications, with a total of 203 sets of 2 × 2 data reported in these studies.
Study characteristics
The included studies were published between 1990 and 2019. Studies were conducted in the UK (n = 19), Italy (n = 13), Argentina (n = 10), Spain (n = 9), Sweden (n = 8), the USA (n = 8), Canada (n = 6), India (n = 4), Pakistan (n = 4), Islamic Republic of Iran (n = 4), Ireland (n = 3), the Netherlands (n = 3), New Zealand (n = 2), Germany (n = 2), Brazil (n = 2) and Israel (n = 2), with single studies from Slovakia, Türkiye, Denmark, France, Finland, Australia, Czechia, Oman, Switzerland, Austria, Egypt, Poland, Lebanon and Serbia. Twenty-nine studies were conducted with adults, 48 with children and 33 with mixed populations of adults and children. Those that did not specify the age of included participants were assumed to have included a mixed population. A further three studies reported accuracy data separately for adults and children; these were treated as if they were two separate studies and data were extracted separately for adults and children. When reported, the mean age was 43.6 years (SD 13.9 years, range 13–94 years) for adults and 6.3 years (SD 4.4 years, range 2 months to 19 years) for children. On average, 66% of adults and 52% of children were female. Fifty-six studies were prospective and 57 were retrospective in design (see table S10 in Report Supplementary Material 1).
Risk of bias
A total of 137 sets of 2 × 2 data were judged to be at high risk of bias, 22 were judged to be at low risk of bias and 44 were judged to be at unclear risk of bias (see Appendix 18, Figure 57, and table S11 in Report Supplementary Material 1).
The main reason for sets of 2 × 2 data being judged as having a high risk of bias was because biopsy results were interpreted with knowledge of (or not explicitly blinded to) serology results; this was the case for 118 sets of 2 × 2 data. In 28 sets of 2 × 2 data, there was potential for partial verification bias because not all patients, particularly those with a negative test result, underwent biopsy to verify their true disease status. A further 23 sets of 2 × 2 data were judged as having a high risk of bias because of concerns about patient selection (e.g. through inappropriate study exclusions or patients not adhering to a gluten-free diet prior to testing) and 12 sets were judged as having a high risk of bias because of concerns about the index test (e.g. threshold not prespecified).
Twenty-four sets of 2 × 2 data were judged to be at an unclear risk of bias because of missing information on patient selection (e.g. study exclusion criteria), 23 sets were judged to be at an unclear risk of bias because details of serological testing (e.g. threshold for test positivity) were not reported and 40 sets were judged to be at an unclear risk of bias because information on flow and timing (e.g. interval between serology and biopsy, or whether or not patients maintained a gluten-free diet between tests) was not reported. The prevalence of CD varied greatly between studies, ranging from 1.8% to 92.6%.
Accuracy of serological tests for diagnosing coeliac disease
All thresholds
The raw 2 × 2 data extracted from each study, together with details on test and test positivity threshold, are summarised in table S10 (see Report Supplementary Material 1). The ranges in the estimates of sensitivity, specificity, and positive and negative predictive values are summarised in Table 8. The most commonly evaluated test was IgA tTG, which was evaluated in 27 studies with adults76–114 and in 37 studies with children. 115–151 The next most frequently evaluated test was IgA EMA, which was evaluated in 19 studies with adults77,81,83,87,88,90,91,93,97,100,107,108,110–112,152–162 and in 28 studies with children. 82,97,108,115,117,118,121–123,131–133,140,144,145,147,151,152,154–157,163–174
| Serological test | Studies (n) | Participants (N) (with CD, n) | Threshold | Sensitivity (range) (%) | Specificity (range) (%) |
|---|---|---|---|---|---|
| Adults | |||||
| IgA tTG | 27 | 11,355 (2566) | 5–25 U/ml | 35–100 | 0–100 |
| IgG tTG | 1 | 65 (14) | 10 U/ml | 71 | 96 |
| IgA EMA | 19 | 7122 (1028) | 1 : 5–1 : 20 | 61–100 | 88–100 |
| IgG EMA | 1 | 96 (28) | 1 : 20 | 39 | 99 |
| IgA DGP | 3 | 885 (154) | 10–20 U/ml | 86–98 | 92–96 |
| IgG DGP | 4 | 1046 (217) | 10–20 U/ml | 90–97 | 99–100.0 |
| IgA/IgG DGP | 4 | 1161 (280) | 20 U/ml | 86–98 | 96–98.8 |
| IgA/IgG tTG/DGP | 3 | 1849 (173) | 20 U/ml | 72–96 | 80–97.4 |
| IgA actin antibodies | 2 | 820 (140) | 25 U/ml | 80–86 | 92–95.1 |
| Children | |||||
| IgA tTG | 37 | 7944 (4164) | 3–100 U/ml | 29–100 | 8–100 |
| IgG tTG | 5 | 599 (278) | 3–7 U/ml | 31–97 | 71–100 |
| IgA/IgG tTG | 2 | 742 (282) | 6–45.1 U/ml | 94–96 | 86–99 |
| IgA EMA | 28 | 4974 (2472) | 1 : 5–1 : 40 | 40–100 | 29–100 |
| IgA/IgG EMA | 2 | 173 (131) | 1 : 2.5–1 : 5 | 95–96 | 74–91 |
| IgA DGP | 1 | 212 (109) | 20 U/ml | 85 | 88 |
| IgG DGP | 3 | 1135 (669) | 10–25 U/ml | 77–92 | 84–94 |
| IgA/IgG DGP | 6 | 941 (464) | 16–20 U/ml | 88–100 | 22–96 |
| IgA/IgG tTG/DGP | 4 | 986 (415) | 3–32.7 U/ml | 88–98 | 61–99 |
| Mixed or unspecified | |||||
| IgA tTG | 25 | 4564 (1414) | 2–89.5 U/ml | 38–100 | 9.5–100 |
| IgG tTG | 2 | 432 (122) | 10–18.9 U/ml | 41–85 | 78.0–89 |
| IgA/IgG tTG | 1 | 254 (26) | 7.8 U/ml | 92 | 82.9 |
| IgA EMA IgA DGP | 15 | 2884 (843) | 1 : 2.5–1 : 10 | 68–100 | 38.9–100 |
| IgG DGP | 2 | 561 (58) | 19.9 U/ml | 77–90 | 93.4–97 |
| IgA/IgG DGP | 2 | 562 (56) | 19.9 U/ml | 76–80 | 92.0–99 |
| IgA actin antibodies | 3 | 480 (48) | NR | 71–86 | 92.9–99 |
Study estimates of sensitivity and specificity at the most commonly reported thresholds are shown in ROC space in Figures 5 and 6. These plots also show SROC curves, which are based on all data (i.e. including studies reporting at other thresholds). There was substantial variation in estimates of accuracy across included studies, particularly for IgA tTG and IgA EMA, the most commonly evaluated tests. This made it difficult to draw conclusions regarding the accuracy of these tests. Owing to the range in thresholds used to define a positive test result, it was not appropriate to produce pooled estimates of sensitivity and specificity based on all studies.
FIGURE 5.
Study estimates of test sensitivity and specificity among adults plotted in ROC space. (a) IgA tTG; (b) IgA EMA; (c) IgA DGP; (d) IgG DGP; (e) IgA/IgG DGP; and (f) IgA/IgG tTG/DGP. SROC curves are estimated from a meta-analysis of all data, across thresholds. Summary point estimates are estimated from a meta-analysis of data reporting at the most commonly reported threshold only.
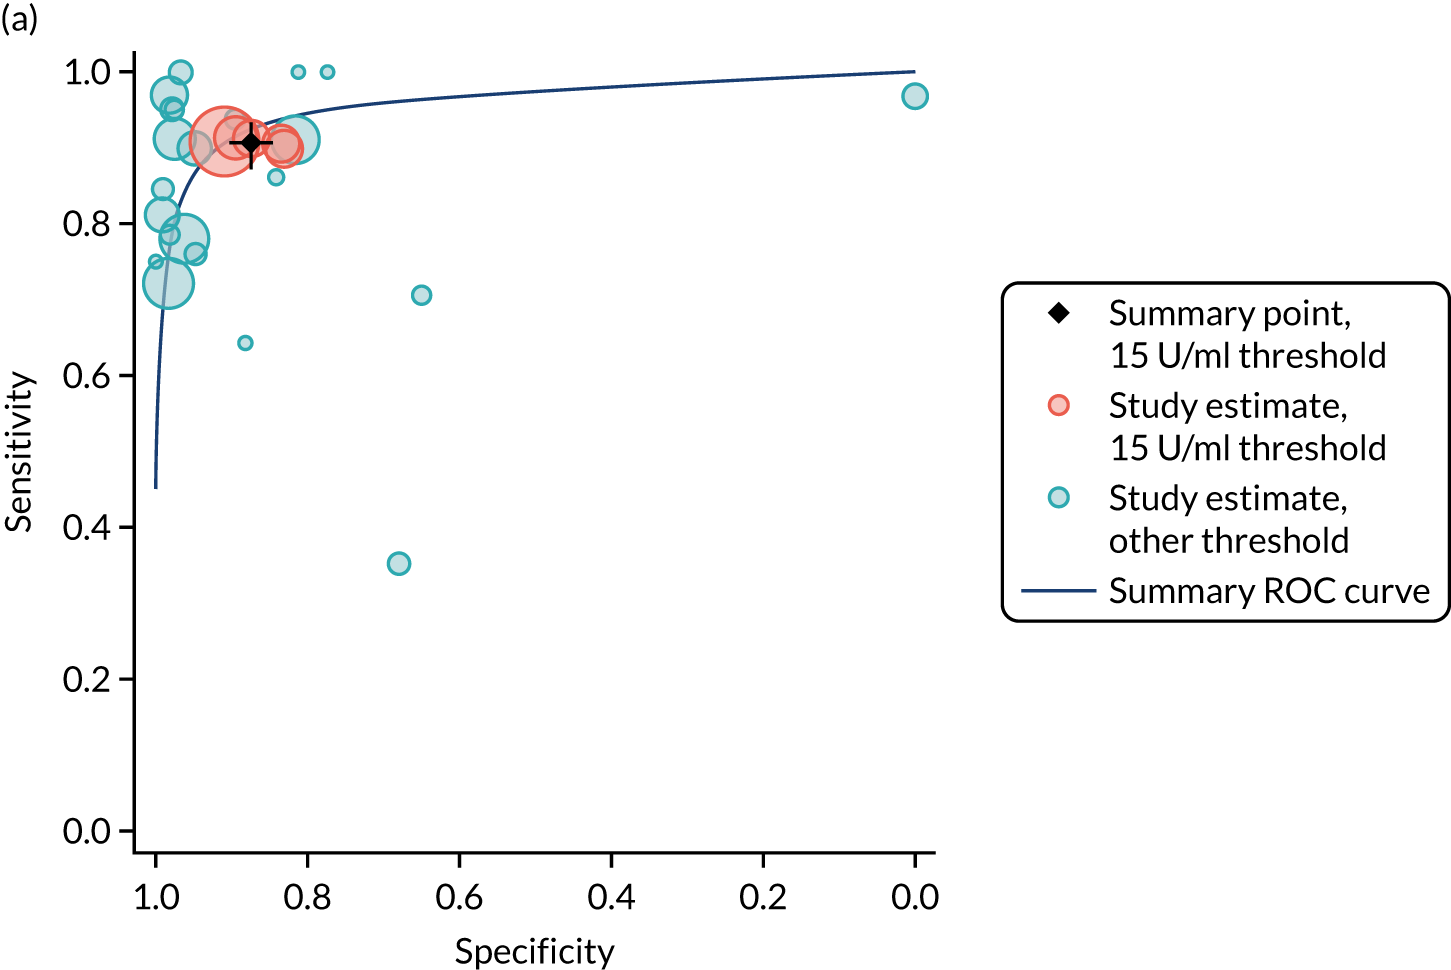
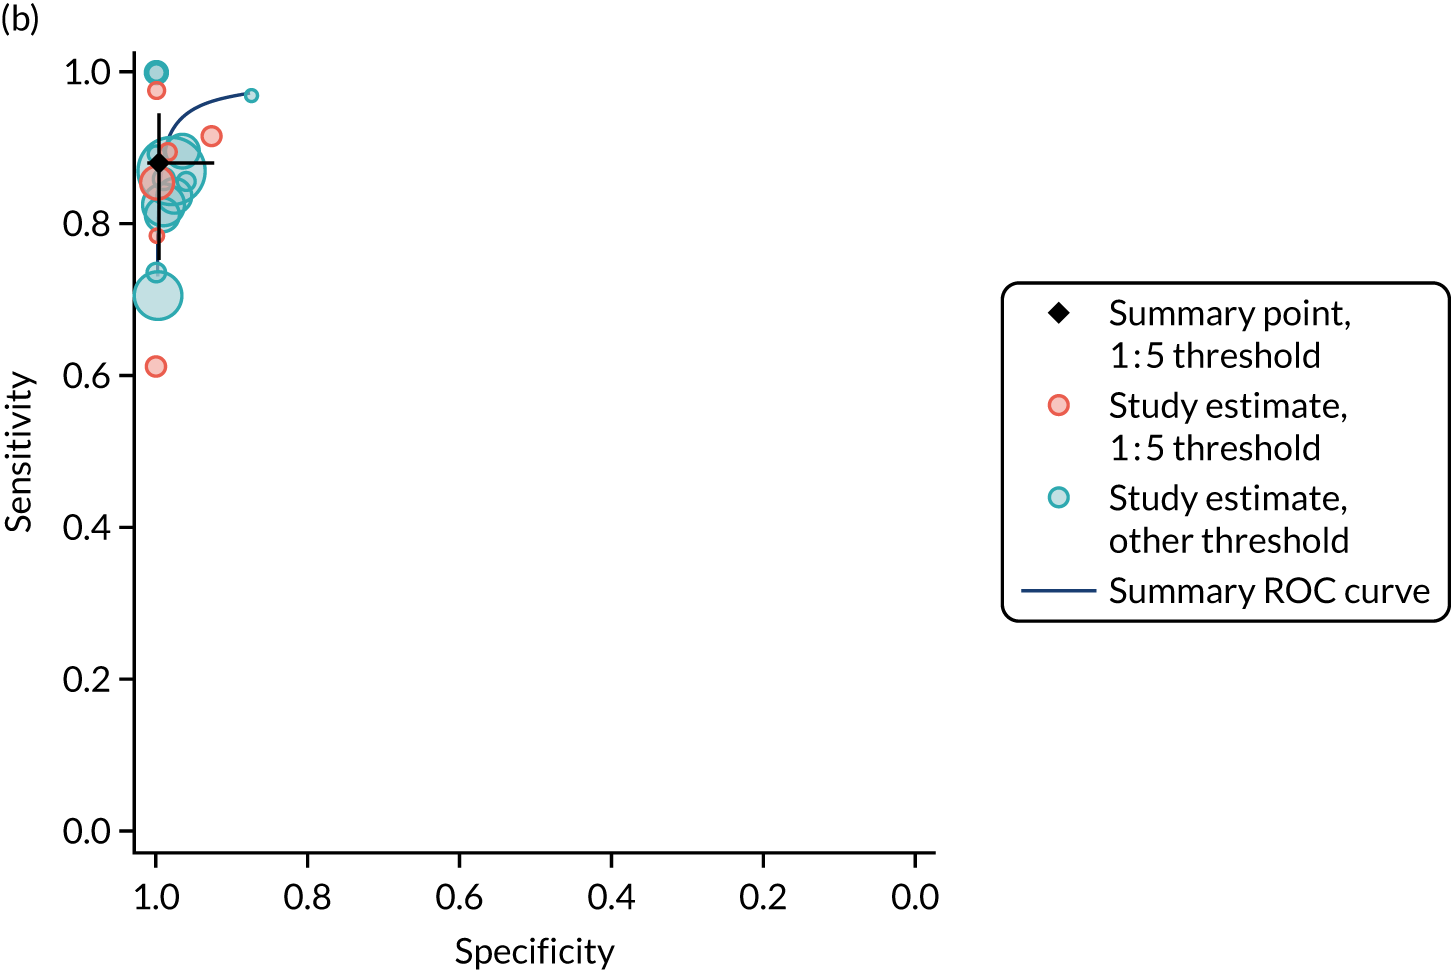
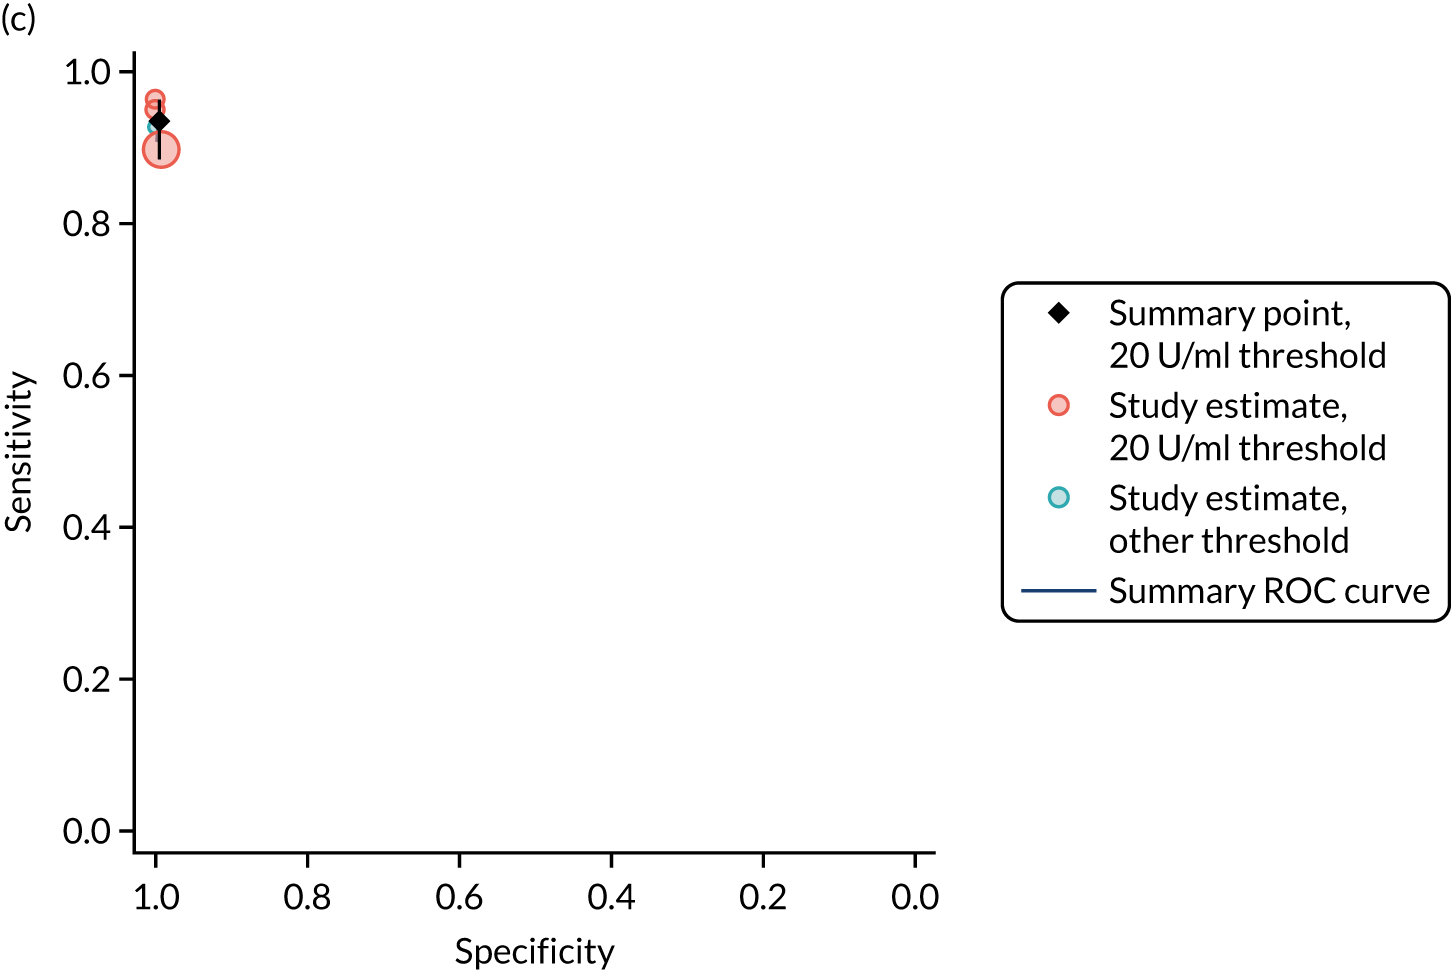
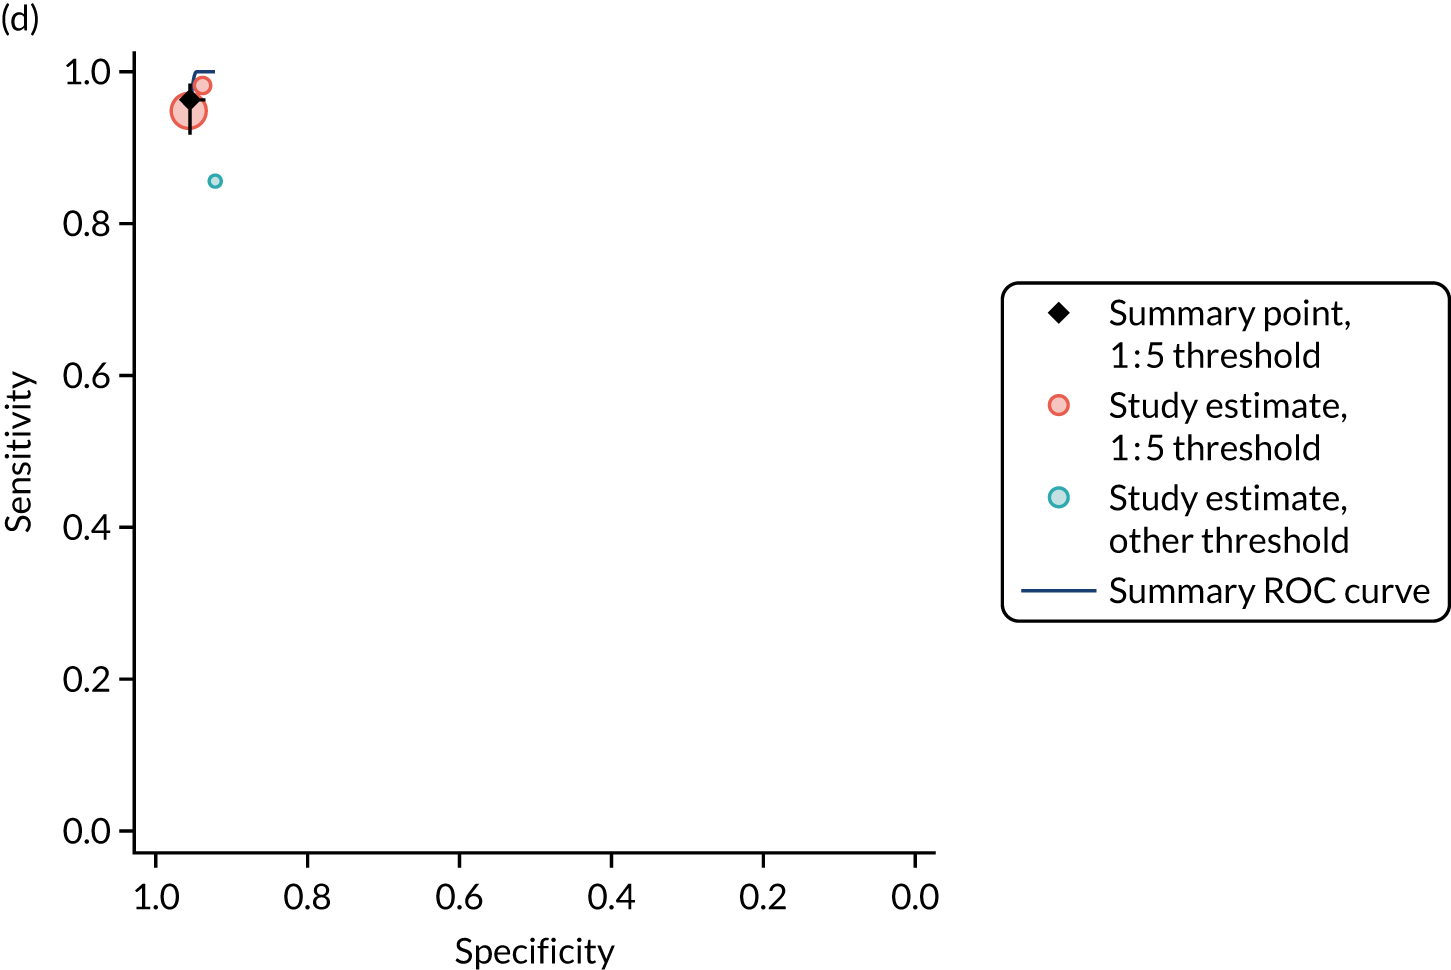
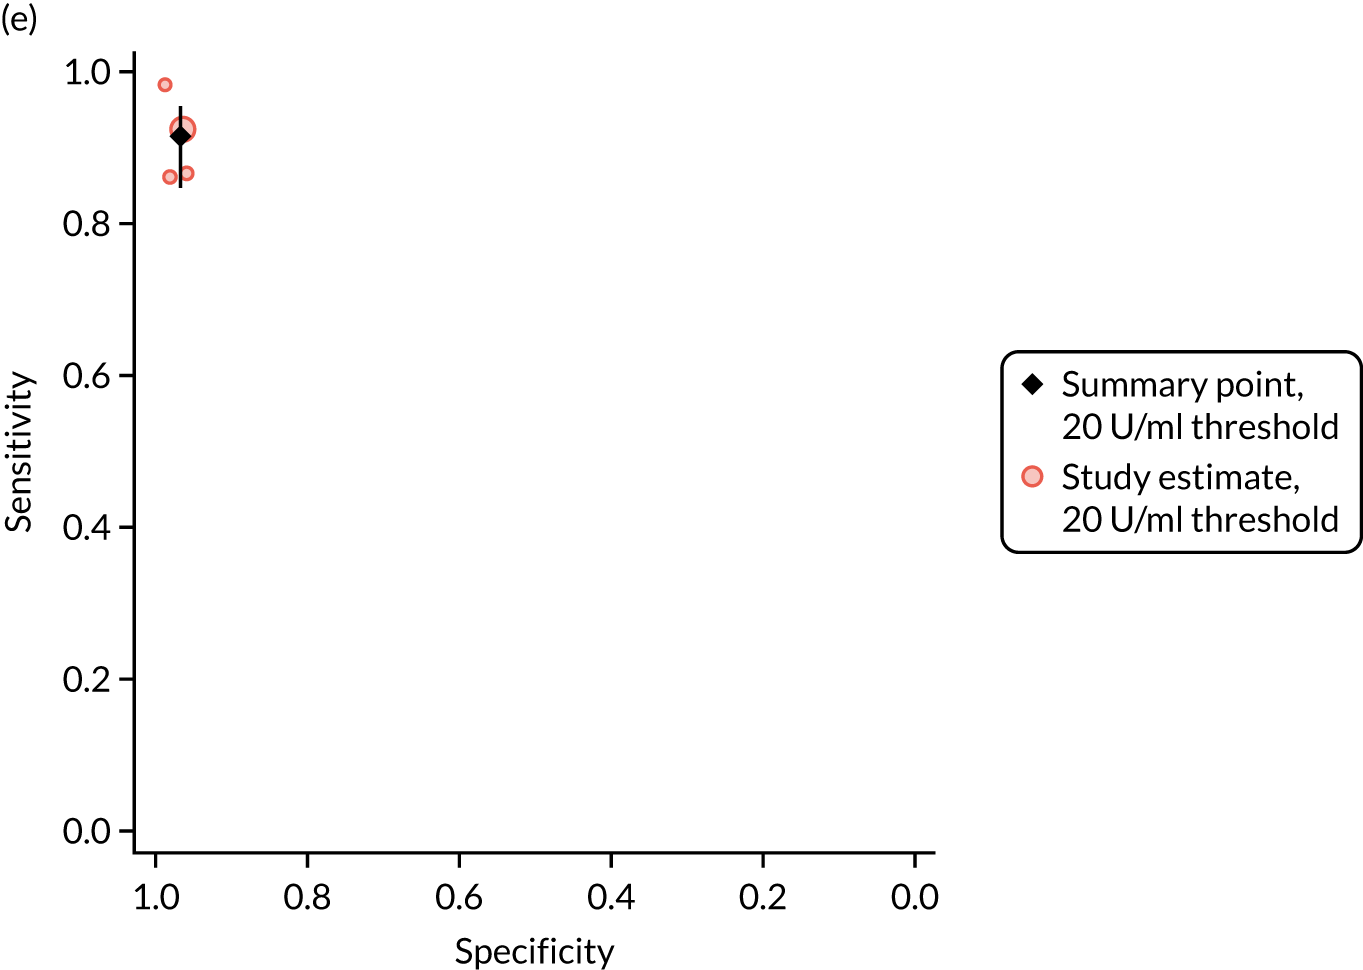
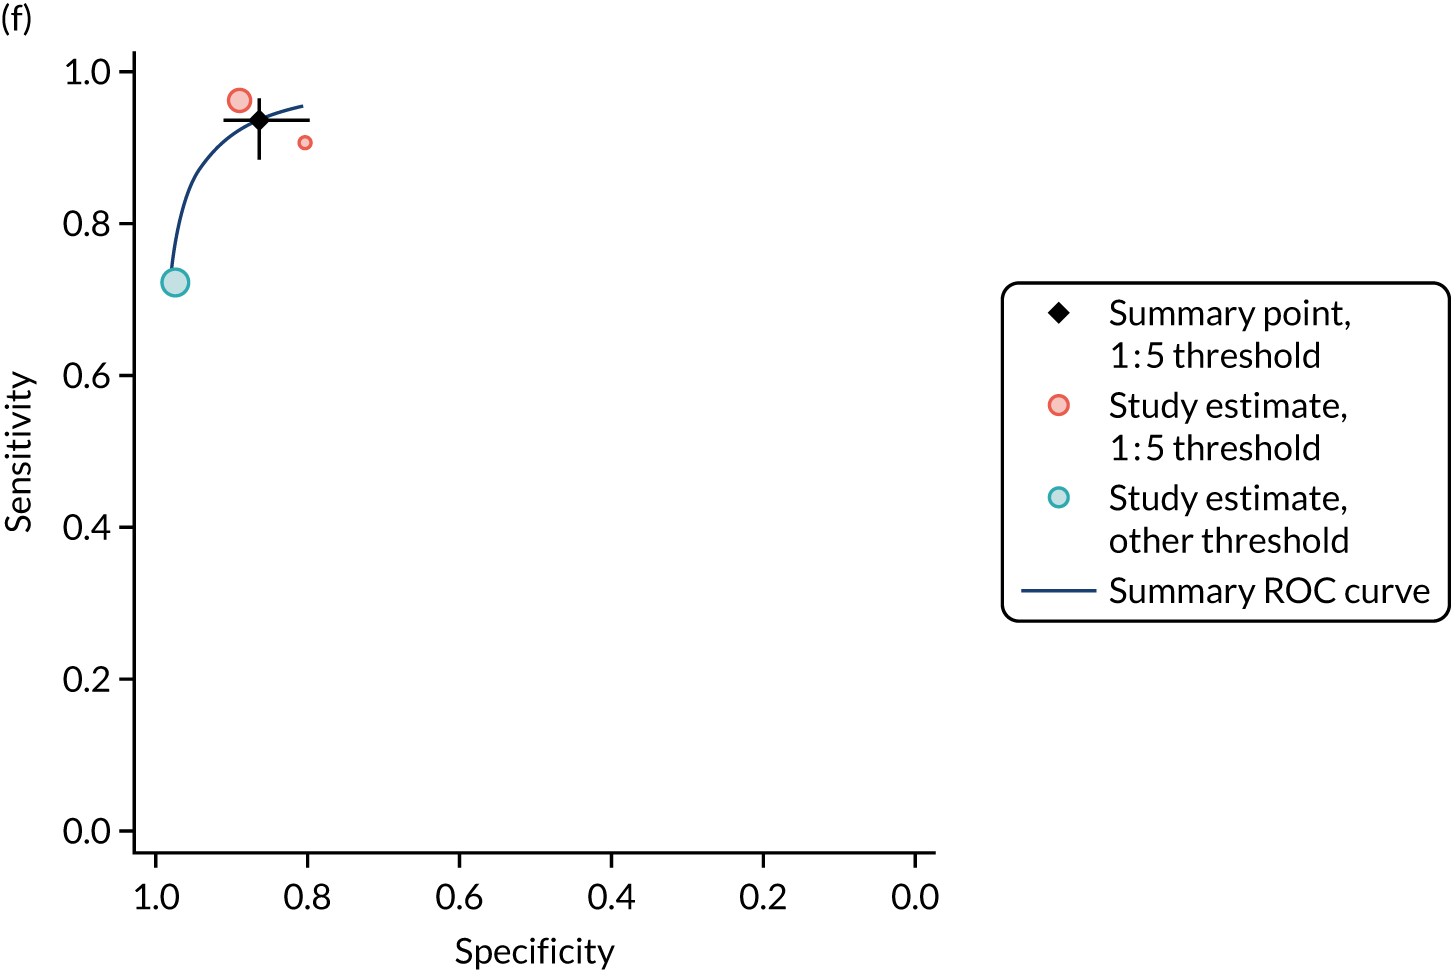
FIGURE 6.
Study estimates of test sensitivity and specificity among children plotted in ROC space. (a) IgA tTG; (b) IgG tTG; (c) IgA EMA; (d) IgG DGP; (e) IgA/IgG DGP; and (f) IgA/IgG tTG/DGP. SROC curves are estimated from a meta-analysis of all data, across thresholds. Summary point estimates are estimated from a meta-analysis of data reporting at the most commonly reported threshold only.
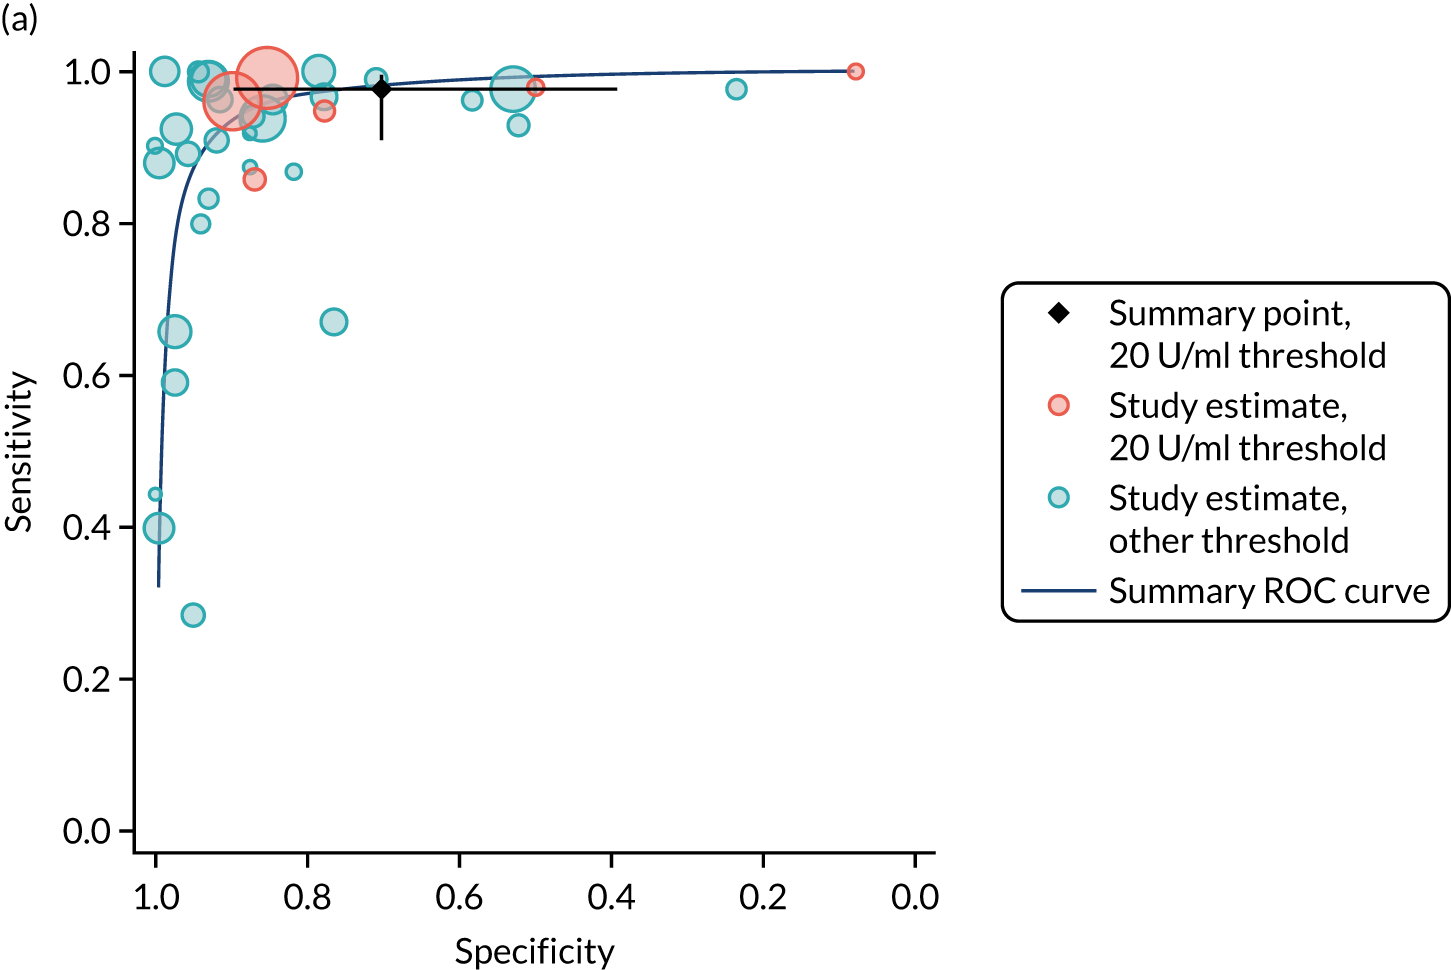
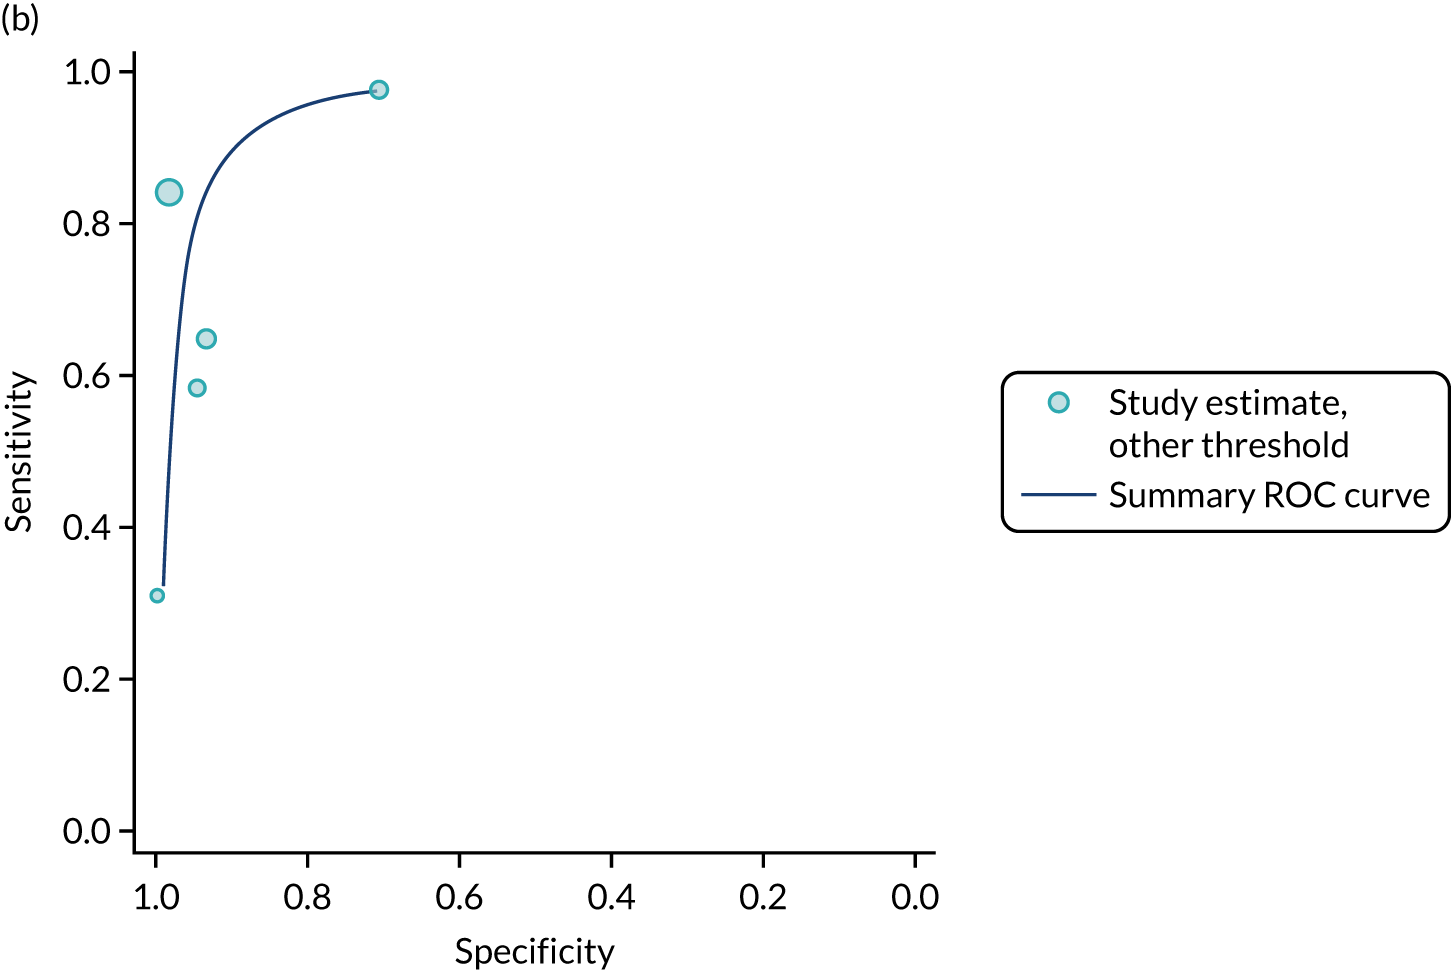
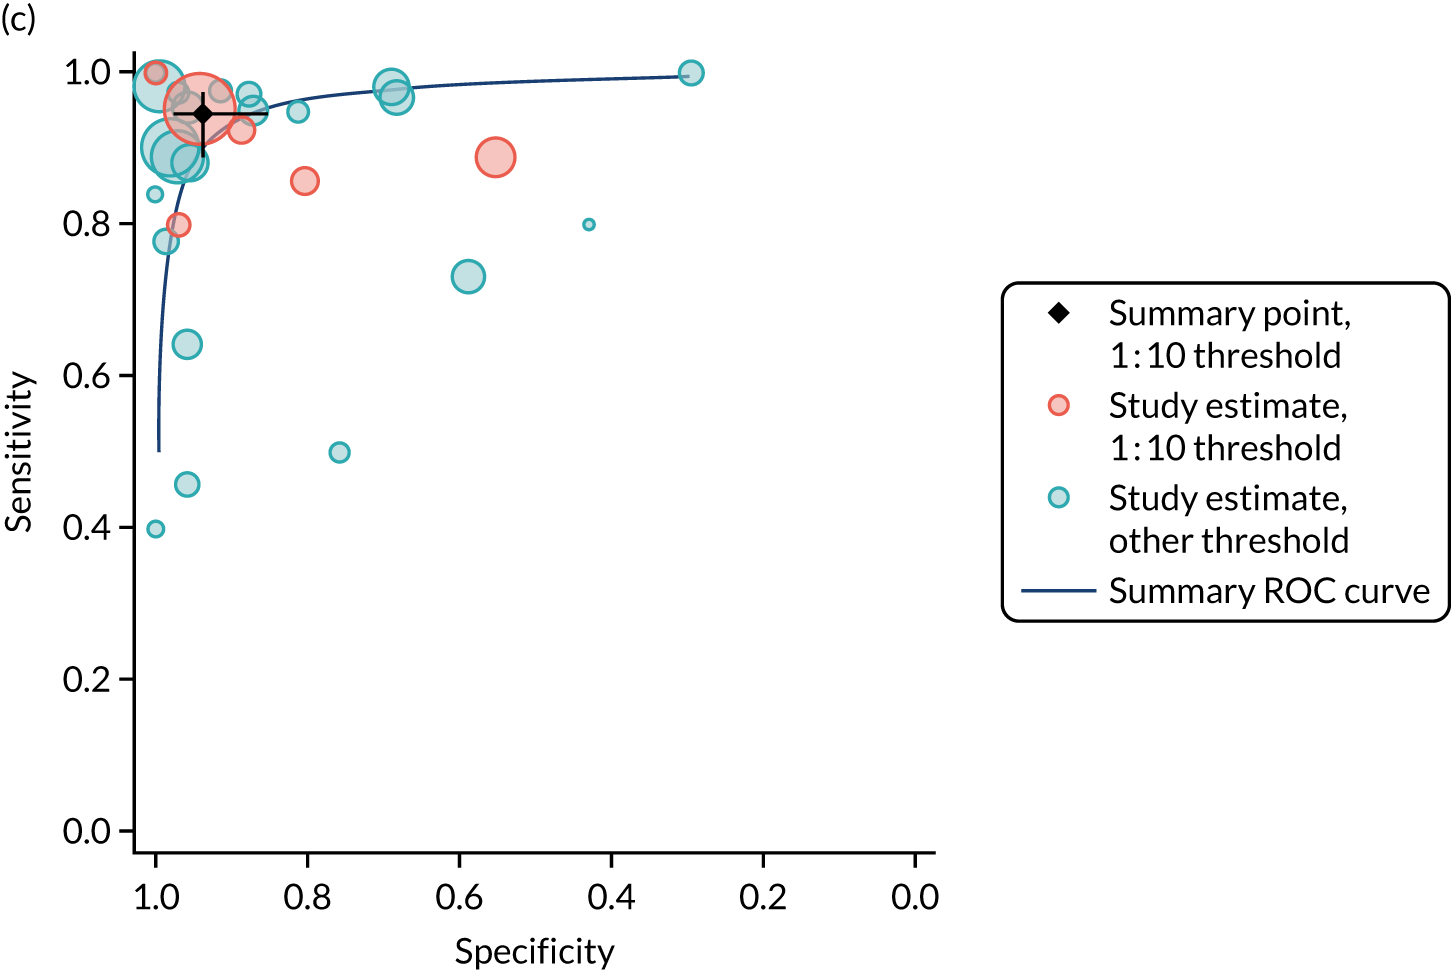
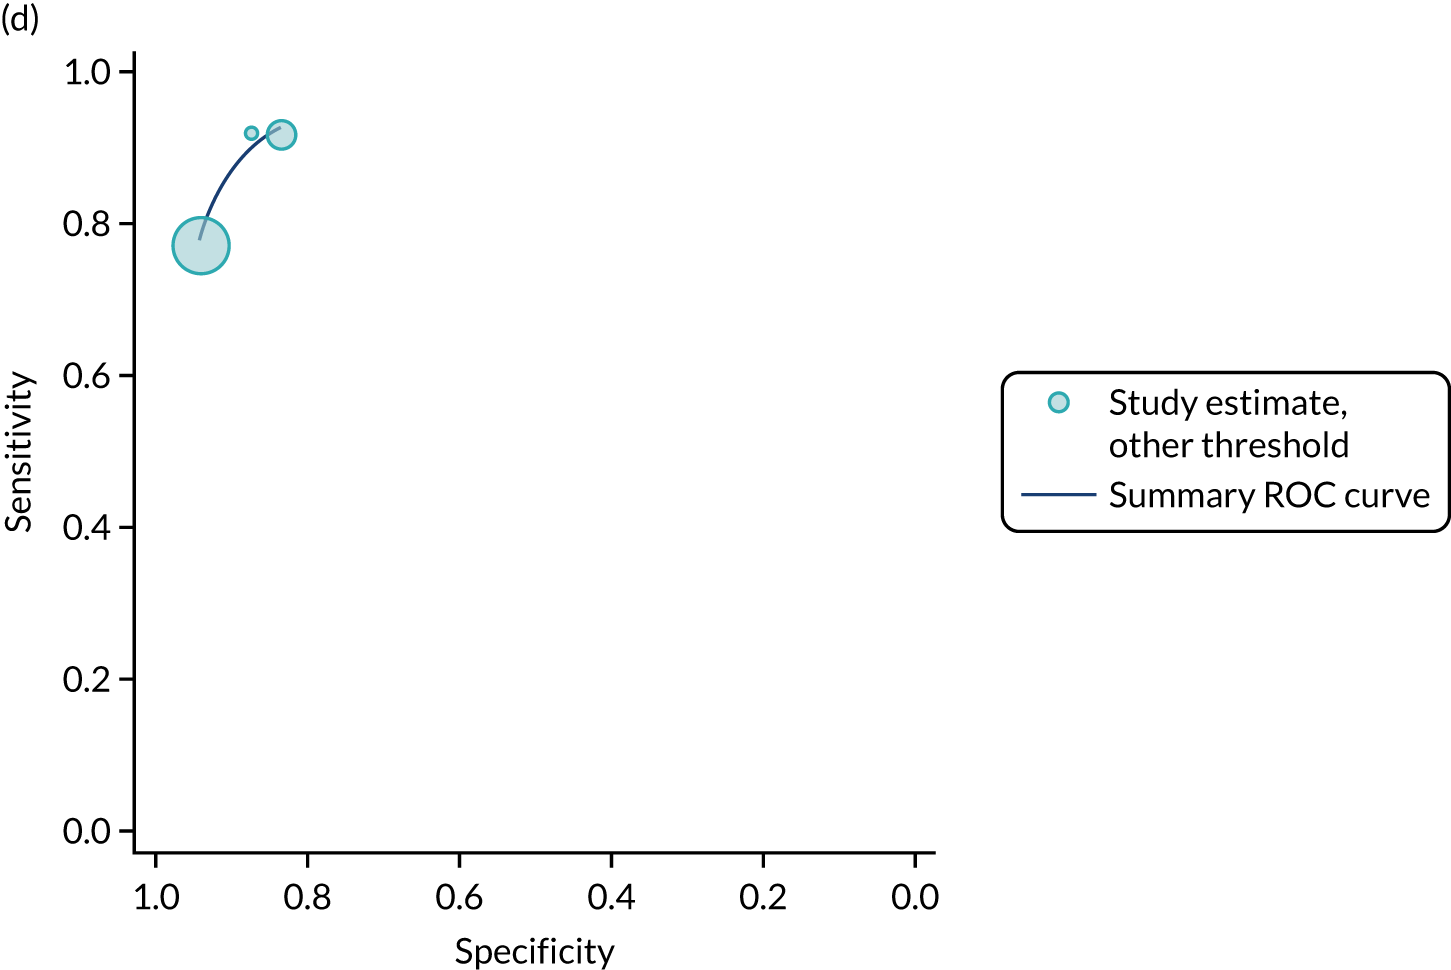
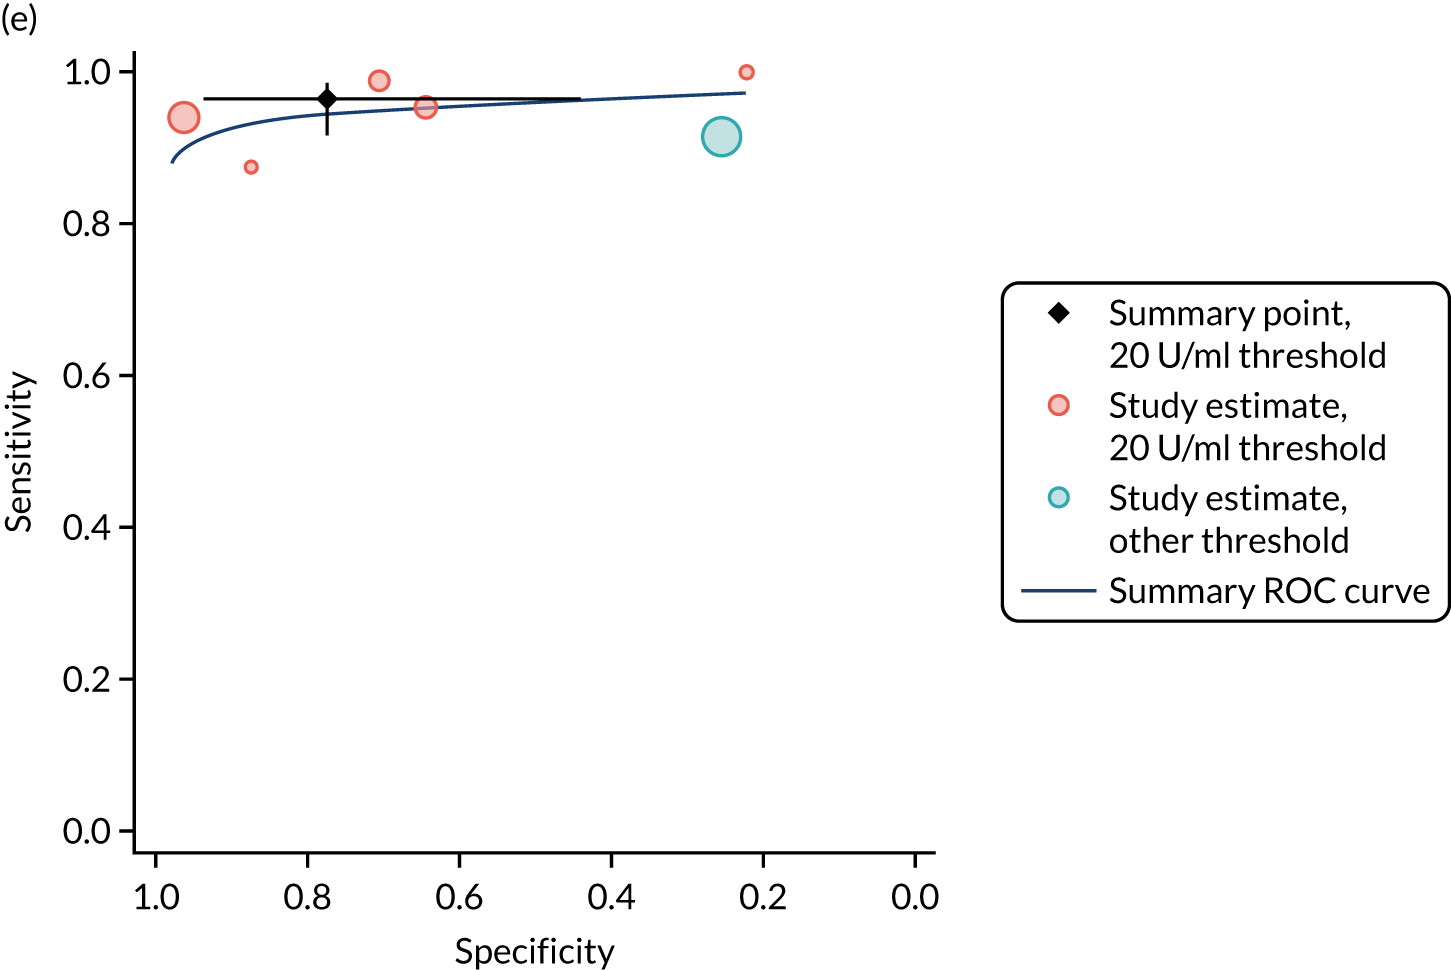
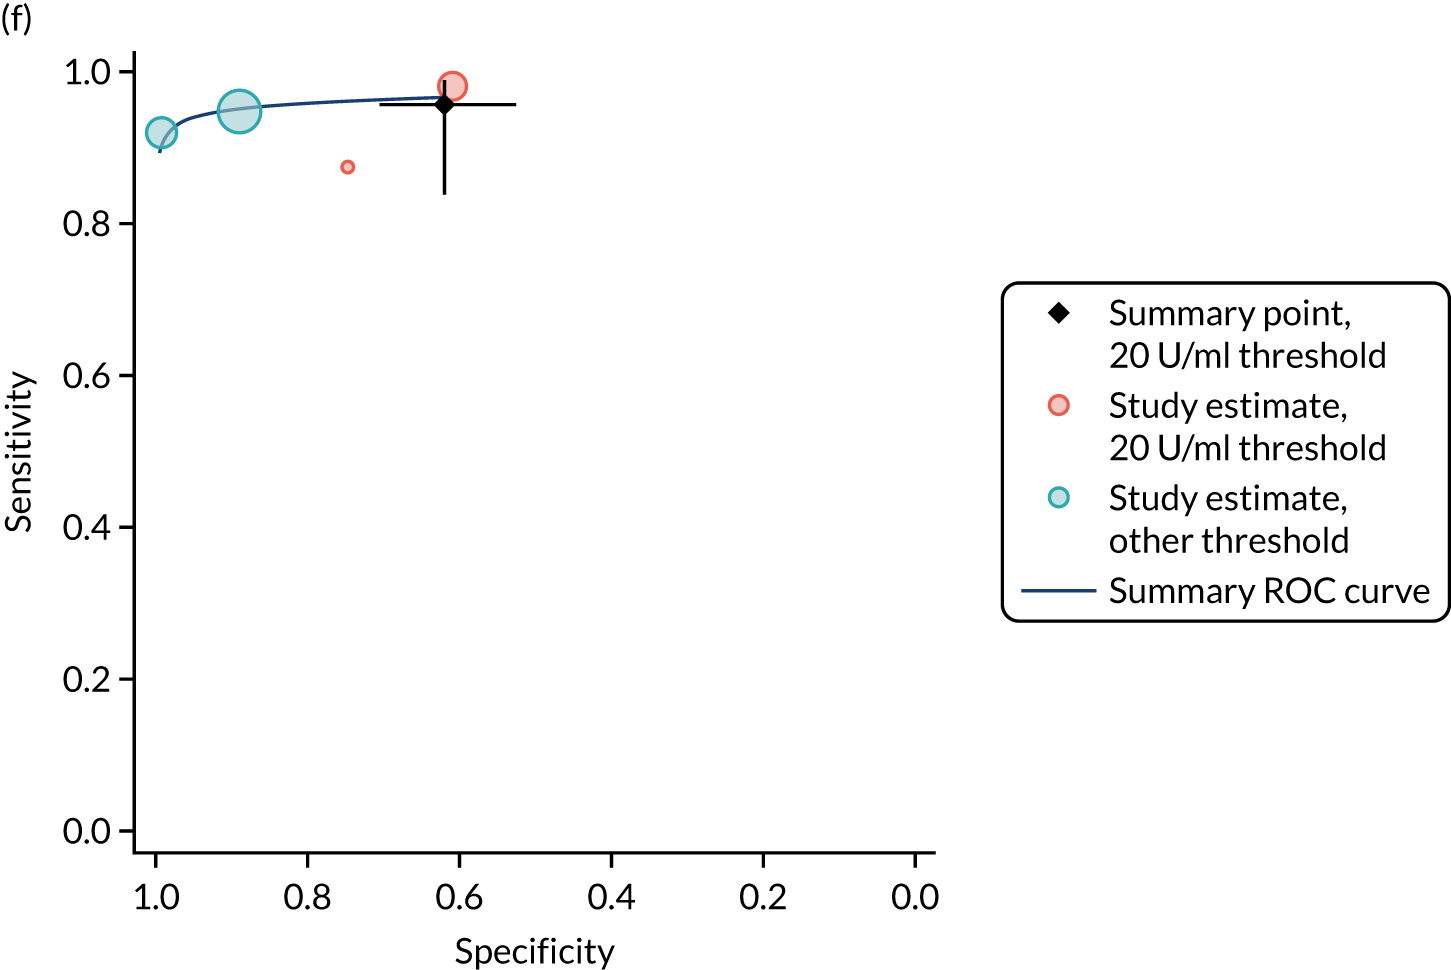
Accuracy of tests at the most commonly reported thresholds
Table 9 shows pooled estimates of the accuracy of each serological test evaluated at the most commonly reported threshold. Summary estimates restricted to the most common threshold are also shown in Figures 5 and 6.
| Serological test | Studies (n) | Participants (N) (with CD, n) | Threshold | Sensitivity (95% CI) (%) | Specificity (95% CI) (%) |
|---|---|---|---|---|---|
| Adults | |||||
| IgA tTG | 5 | 4310 (454) | 15 U/ml | 90.7 (87.3 to 93.2) | 87.4 (84.4 to 90.0) |
| IgA EMA | 5 | 927 (446) | 1 : 5 | 88.0 (75.2 to 94.7) | 99.6 (92.3 to 100.0) |
| IgA DGPa | 2 | 820 (140) | 20 U/ml | 96.4 (91.7 to 98.5) | 95.4 (93.6 to 96.8) |
| IgG DGPa | 3 | 981 (203) | 20 U/ml | 93.6 (88.6 to 96.5) | 99.4 (98.5 to 99.7) |
| IgA/IgG DGP | 4 | 1161 (280) | 20 U/ml | 91.5 (84.7 to 95.4) | 96.7 (95.3 to 97.7) |
| IgA/IgG tTG/DGPa | 2 | 851 (155) | 20 U/ml | 93.5 (88.4 to 96.5) | 86.3 (79.7 to 91.0) |
| IgA actin antibodiesa | 2 | 820 (140) | 25 U/ml | 82.9 (75.7 to 88.2) | 92.5 (90.3 to 94.3) |
| Children | |||||
| IgA tTG | 6 | 2232 (1051) | 20 U/ml | 97.7 (91.0 to 99.4) | 70.2 (39.3 to 89.6) |
| IgA EMA | 5 | 1257 (685) | 1 : 10 | 94.5 (88.9 to 97.3) | 93.8 (85.2 to 97.5) |
| IgA/IgG DGP | 5 | 533 (276) | 20 U/ml | 96.4 (91.7 to 98.5) | 77.4 (44.0 to 93.7) |
| IgA/IgG tTG/DGPa | 2 | 244 (133) | 20 U/ml | 95.6 (83.9 to 98.9) | 62.2 (52.8 to 70.7) |
Although tTG was evaluated in 27 studies with adults, only five studies reported at a common threshold of 15 U/ml. 90,100,110,175,176 At this threshold, IgA tTG had a summary sensitivity of 90.7% (95% CI 87.3% to 93.2%) and summary specificity of 87.4% (95% CI 84.4% to 90.0%) for CD among adults (see Table 9). Only 5 of the 19 studies of IgA EMA among adults reported accuracy data at a common threshold of 1 : 5. 83,93,107,111,112 These studies reported that the EMA was highly specific, with a summary specificity of 99.6% (95% CI 92.3% to 100%) in adults, but summary sensitivity was lower, at 88.0% (95% CI 75.2% to 94.7%). IgA and IgG DGP also showed very good sensitivity, with summary estimates for IgA, IgG and IgA/IgG DGP all > 90%, but these were evaluated in four or fewer studies. 91,101,109 Specificity for these tests was also high, with all estimates > 95%.
Six of the 37 studies with children reported data at a common threshold of 20 U/ml. 121,134,136,140,141,146 These studies found that IgA tTG was very sensitive, with a summary sensitivity of 97.7% (95% CI 91.0% to 99.4%), but summary specificity was lower, at 70.2% (95% CI 39.3% to 89.6%). Six of the 28 studies of EMAs with children reported data at a threshold of 1 : 10. 121,135,140,144,163,174 Summary sensitivity was 94.5% (95% CI 88.9% to 97.3%) and summary specificity was 93.8% (95% CI 85.2% to 97.5%). IgA/IgG DGP was also evaluated at a common threshold of 20 U/ml in five studies and showed good sensitivity (summary estimate 96.4%, 95% CI 91.7% to 98.5%), but poorer specificity (summary estimate 77.4%, 95% CI 44% to 93.7%). 124,128,136,138,145,150
Direct comparisons and test combinations
Comparative accuracy studies provided little evidence of differences in accuracy between tests (Table 10). Fourteen studies with adults and 16 studies with children provided direct comparison of IgA tTG and IgA EMA. There was a suggestion that IgA EMA was more specific than IgA tTG in adults, with similar estimates of sensitivity; estimates in children were similar for both tests. However, studies reported results at different thresholds and, therefore, formal statistical comparison was not appropriate.
| Serological test | Studies (n) | Participants (N) (with CD, n) | Threshold (range) | Sensitivity (range) (%) | Relative sensitivity (range) (%) | Specificity (range) (%) | Relative specificity (range) (%) |
|---|---|---|---|---|---|---|---|
| Adults | |||||||
| IgA tTG vs. IgA EMA | 14 | 6575 (881) | |||||
| IgA tTG | 5–25 U/ml | 64–100 | 81–99 | ||||
| IgA EMA | 1 : 5 | 61–100 | 0.81–1.22 | 88–100 | 1.00–1.17 | ||
| IgA tTG vs. IgA DGP | 3 | 885 (154) | |||||
| IgA tTG | 10–20 U/ml | 64–95 | 88–98 | ||||
| IgA DGP | 10–20 U/ml | 86–98 | 1.04–1.33 | 92–96 | 0.96–1.04 | ||
| IgA tTG vs. IgG DGP | 4 | 1046 (217) | |||||
| IgA tTG | 10–20 U/ml | 64–95 | 88–98 | ||||
| IgG DGP | 10–20 U/ml | 90–96 | 0.99–1.44 | 99–100 | 1.02–1.13 | ||
| IgA tTG vs. IgA/IgG DGP | 4 | 1161 (280) | |||||
| IgA tTG | 5–20 U/ml | 76–95 | 95–99 | ||||
| IgA/IgG DGP | 20 U/ml | 86–98 | 1.01–1.14 | 96–99 | 0.99–1.01 | ||
| Children | |||||||
| IgA tTG vs. IgA EMA | 16 | 3021 (1746) | |||||
| IgA tTG | 5.5–21 U/ml | 29–99 | 24–100 | ||||
| IgA EMA | 1 : 5 to 1 : 10 | 50–100 | 0.91–2.25 | 29–100 | 0.76–1.25 | ||
Other test pairs were compared directly in only three or four studies. IgG DGP and IgA/IgG DGP appeared to be slightly more sensitive and specific than IgA tTG; however, this difference was much smaller than indirect comparisons suggested (see Table 10). This suggests that studies providing a direct comparison between DGP and other serological tests may be subject to bias, resulting in overestimated accuracy for all tests evaluated in these studies.
A subset of the studies that provided a direct comparison of IgA tTG with IgA EMA also reported data that could be used to estimate the accuracy of these tests when used in combination. We identified six such studies with adults81,82,88,90,107,108 and six with children. 82,108,121,123,144,145 However, none of these reported accuracy estimates for the same thresholds. We therefore selected the studies that were judged to be at lowest risk of bias and that had the largest sample sizes. These were Hopper et al. 90 (n = 2000 adults) and Wolf et al. 121 (n = 949 children). Wolf et al. 121 was judged to be at low risk of bias for all domains; Hopper et al. 90 was judged to be at low risk of bias for all domains except the reference standard domain, as it was unclear whether or not the reference standard results were interpreted without knowledge of the index test results. We consider these studies to provide the most reliable comparative estimates of the accuracy of IgA tTG and IgA EMA, alone and in combination, among adults and among children. Table 11 summarises the accuracy data from these studies; these estimates of accuracy were selected for inclusion in the economic model (see Chapter 8). Among both adults and children, the IgA tTG test had the highest sensitivity, although estimates among children were very similar, and the IgA EMA test had the highest specificity. There was little improvement in either sensitivity or specificity when the tests were used in combination. Despite thresholds being the same as those used in the meta-analyses for the individual tTG and EMA tests, there were minor differences between estimates from these studies and summary estimates when all studies that reported at the same thresholds were pooled (Table 12).
| Study | Population | Participants with complete data (n) | Test | Threshold | Sensitivity (95% CI) (%) | Specificity (95% CI) (%) |
|---|---|---|---|---|---|---|
| Hopper et al.90 2008 | Adults | 2000 | Both positive |
|
86 (76 to 92) | 99 (98 to 99) |
| Either positive |
|
92 (84 to 96) | 90 (89 to 92) | |||
| tTG | 15 U/ml | 91 (82 to 95) | 91 (90 to 92) | |||
| EMA | 1 : 4 | 87 (78 to 93) | 98 (97 to 99) | |||
| Wolf et al.121 2017 | Children | 873 | Both positive |
|
95 (93 to 97) | 95 (92 to 97) |
| Either positive |
|
97 (95 to 98) | 89 (86 to 92) | |||
| tTG | 20 U/ml | 97 (95 to 98) | 89 (86 to 92) | |||
| EMA | 1 : 10 | 96 (94 to 97) | 94 (91 to 96) |
| Serological test | Studies (n) | Participants (N) (with CD, n) | Threshold (range) | Sensitivity (range) (%) | Specificity (range) (%) |
|---|---|---|---|---|---|
| Symptomatic patients only | |||||
| Adults | |||||
| IgA tTG | 7 | 4244 (325) | 5–20 U/ml | 64–100 | 88–98 |
| IgA EMA | 8 | 3786 (327) | 1 : 5–1 : 20 | 61–100 | 98–100 |
| Children | |||||
| IgA tTG | 8 | 1126 (615) | 4–20 U/ml | 40–100 | 8–100 |
| IgA EMA | 8 | 1327 (753) | 1 : 5–1 : 20 | 40–98 | 43–100 |
| All patients underwent biopsy | |||||
| Adults | |||||
| IgA tTG | 26 | 11,183 (2444) | 5–25 U/ml | 64–100 | 0–100 |
| IgA EMA | 18 | 7010 (1021) | 1 : 5–1 : 20 | 61–100 | 88–100 |
| Children | |||||
| IgA tTG | 31 | 5824 (3330) | 3–100 U/ml | 29–100 | 24–100 |
| IgA EMA | 22 | 3685 (2015) | 1 : 5–1 : 40 | 46–100 | 29–100 |
| Low risk of bias | |||||
| Adults | |||||
| IgA tTG | 5 | 1577 (426) | 5–20 U/ml | 76–100 | 88–98 |
| IgA EMA | 2 | 268 (103) | 1 : 5–1 : 20 | 61–89 | 100–100 |
| Children | |||||
| IgA tTG | 4 | 1319 (823) | 20–21 U/ml | 95–100 | 24–99 |
| IgA EMA | 1 | 873 (528) | 1 : 10 | 95 | 94 |
Sensitivity analyses
Table 12 shows results from the sensitivity analyses; further details are reported in Appendix 19 (see Figures 58–61). Estimates of sensitivity and specificity in analyses were restricted to studies of symptomatic patients, studies judged to be at low risk of bias overall on the QUADAS-2 tool and studies in which all patients received a biopsy to confirm whether or not they had CD were similar to the estimates of analyses that included all studies. There were insufficient studies to allow comparisons when analyses were restricted to those that reported a common threshold.
Chapter 6 Accuracy of genetic tests for coeliac disease
We conducted a systematic review of the accuracy of genetic tests for CD. We had originally planned to include this as part of the review of the accuracy of serological tests but decided that these tests were sufficiently different from serological tests that a separate review would be appropriate. The review followed recommendations from the Centre for Reviews and Dissemination22 and the Cochrane Handbook for Systematic Reviews of Diagnostic Test Accuracy Version 1.0.023 and is reported in accordance with the PRISMA-DTA statement. 24
Systematic review methods
Eligibility criteria
We included studies that met the following criteria:
-
Study design – diagnostic cohort/cross-sectional studies (also known as ‘one-gate design’)25 or diagnostic case–control studies (also known as ‘two-gate’ or ‘multigate’ designs).
-
Participants – adults and/or children representative of the general population. Studies restricted to specific disease populations without healthy participants were excluded.
-
Index test – HLA-DQ2 and HLA-DQ8 genetic tests. Studies had to evaluate both markers to be included.
-
Reference standard – CD diagnosis, detected by one or more serological tests, including IgA/IgG tTG, EMA or DGP and/or duodenal biopsy. All participants had to be tested for CD.
Studies were included only if sufficient data could be extracted to construct cross-tabulations of the number of people positive for either HLA-DQ2 or HLA-DQ8 against the number of people with and people without CD according to the reference standard.
We excluded studies published before 1997 (the year in which tTG was developed), to reduce the variation in CD diagnostic tests.
Search strategy
Studies were identified through the same search as used to identify diagnostic indicators (see Chapter 3). Full details of the search strategy are reported in Appendix 1.
Study selection
Study selection was conducted in two stages using forms developed in Microsoft Access that were piloted before use. Search results were exported from EndNote in a format that could be imported into Microsoft Access. At stage 1 of study selection, titles and abstracts were screened against the inclusion criteria to exclude papers that were clearly irrelevant. At the second stage, full texts identified as possibly relevant in the initial screening were assessed in detail and reasons for exclusion were documented. Both stages of study selection were performed independently by two reviewers, and disagreements about study eligibility were resolved through discussion or by consulting a third member of the review team.
Data collection process
Standardised data extraction forms were developed using Microsoft Access. These were piloted on a small sample of papers and adapted as necessary before use. Data extraction was performed by one reviewer and checked by a second, with disagreements resolved through discussion or referral to a third reviewer.
We extracted the following data from each included study:
-
study characteristics (design, location, setting)
-
participant characteristics (age, sex)
-
details on the HLA test
-
reference standard test used to confirm the diagnosis of CD.
Results data were extracted as 2 × 2 tables of test results (numbers of true positives, false negatives, false positives and true negatives) for the presence of either HLA-DQ2 or HLA-DQ8 against the reference standard of serological tests or biopsy (Table 13).
| HLA-DQ haplotypes | CD | No CD |
|---|---|---|
| HLA-DQ2 or HLA-DQ8 | True positive | False positive |
| Negative for HLA-DQ2 and HLA-DQ8 | False negative | True negative |
Risk of bias
Risk of bias was assessed using the QUADAS-2 tool. 28 We removed the index test domain signalling question (‘If a threshold was used, was it prespecified?’), as HLA genotyping does not involve a threshold. We also removed the flow and timing domain signalling question (‘Was there an appropriate interval between index test and reference standard?’), as the HLA genotyping result will not change over time: you are either born with or without a particular genotype. Therefore, test accuracy will not be influenced by time between genotyping and when the reference standard is performed.
Synthesis of results
We present a narrative summary of the included studies, including a summary of the characteristics of the included studies (e.g. study design, population size, geographical location, year, population characteristics, genetic test details and CD diagnosis). We also describe the main methodological problems or biases that affected the studies.
We had intended to stratify our analysis according to whether studies were conducted with adults or children, but there were no studies with adults. A bivariate random-effects meta-analysis was fitted, assuming binomial likelihoods for the numbers of true positives and true negatives in each study. 29,30 Pooled estimates of sensitivity and specificity and estimates of the between-study SD sensitivity and specificity on the logit scale (tau) are reported. We present study-specific and pooled estimates of sensitivity and specificity in coupled forest plots (see Figure 7). We conducted sensitivity analyses to restrict our analysis to studies judged to be at low risk of bias.
Results of assessment of diagnostic accuracy of indicators
Full details of the search results are reported in Chapter 3. We identified four studies reported in six publications (n = 12,087);177–182 one study, based on the Dutch Generation R birth cohort study, was reported in three publications. 180–182 Although none of these specifically aimed to evaluate the accuracy of HLA testing for CD, all reported data that could be used to estimate accuracy of HLA testing. We selected the most recent report, which also provided data on the greatest number of participants, for inclusion in the analysis. 180
Study characteristics
Table 14 provides an overview of the included studies. All studies were conducted with children. Two studies used a nested case–control design and two used a cohort design. The median age was 12 years in two studies,178,179 6 years in one study180 and 3 years in the remaining study. 177 Two studies were conducted in Sweden,177,179 one in Finland178 and one in the Netherlands. Three studies177–179 confirmed the diagnosis of CD by a combination of serology with biopsy of those who were positive on serology, the other used serology alone. 180
| Study | Population | Study design | Genetic test details | Total sample (N) (analysed, n) | Age (years) | Sex (% female) | Control group | Reference standard | Setting | Location | Risk of bias |
|---|---|---|---|---|---|---|---|---|---|---|---|
| Björck et al.177 (2010) | Children | Nested case–control | HLA-DQ2, HLA-DQ8 or both | 3435 (3435) | 3 | NR | Cases: HLA positive | Serology and only positive patients biopsied | Community | Sweden | Low |
| Controls: HLA negative | |||||||||||
| Mäki et al.178 (2003) | Children | Cohort | HLA-DQ2, HLA-DQ8 or both | 3654 (3617) | Median 12 (range 7–16) | NR | NA | Serology and only positive patients biopsied | Community | Finland | Low |
| Sandström et al.179 (2013) | Children | Nested case–control | HLA-DQ2, HLA-DQ8 or both | 1320 | 12 | 52 | Cases: serology positive, referred for biopsy | Serology and only positive patients biopsied | Community | Sweden | Low |
| Controls: serology negative | |||||||||||
| Wahab et al.180 (2019) | Children | Cohort | HLA-DQ2, HLA-DQ8 or both | 4442 (3715) | Median 6 (range 5–9) | 48 | NA | tTG positive | Community | The Netherlands | High |
Risk of bias
Three studies were judged to be at low risk of bias across all domains (see Appendix 20, Figure 62). 177–179 The other was judged to be at high risk of bias as CD diagnosis was based on serology alone. 180 This study was judged to be at low risk of bias for all other QUADAS-2 domains.
Accuracy of diagnostic indicators to detect coeliac disease
Results were broadly consistent across studies, with visual examination of the forest plot (Figure 7) and the SROC plot (Figure 8) suggesting little evidence of heterogeneity. The presence of either HLA-DQ2 or HLA-DQ8 had a very high summary sensitivity of 99.2% (95% CI 83.4% to 100%) and summary specificity of 55.6% (95% CI 50.2% to 60.9%). These figures were included in the economic model in Chapter 8.
FIGURE 7.
Forest plots of individual study and summary estimates of sensitivity and specificity. FN, false negative; FP, false positive; TN, true negative; TP, true positive.

FIGURE 8.
The SROC curve for HLA-DQ2/-DQ8 for diagnosing CD. FPR, false-positive rate; TPR, true-positive rate.
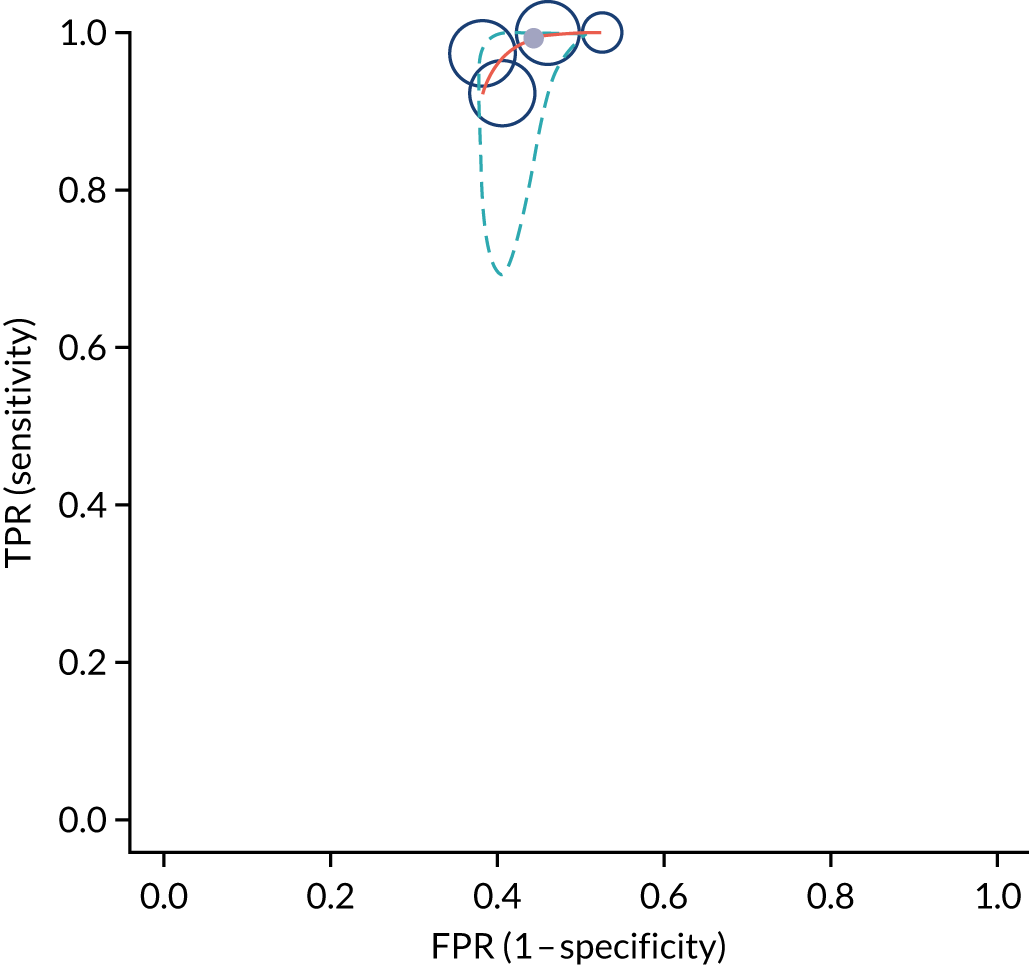
Chapter 7 Establishing diagnostic thresholds
This chapter describes the collaborative work with patients and the public through focus groups and an online survey to investigate how confident people want to be in their diagnosis before starting a gluten-free diet or undergoing a biopsy.
The aims of the survey were as follows:
-
to estimate at what level of diagnostic certainty people are willing to start a gluten-free diet without a confirmation biopsy if they are symptomatic
-
to estimate at what level of diagnostic certainty people are willing to start a gluten-free diet without a confirmation biopsy if they are asymptomatic
-
to understand what factors influenced their answers on the above
-
to estimate the quality of life among people with CD
-
to understand how strictly people with CD followed the gluten-free diet
-
to understand how difficult people with CD found it to follow a gluten-free diet
-
to understand the current assumptions and understandings of CD diagnosis and how that affects confidence in diagnosis before starting a gluten-free diet.
Survey development and dissemination methods
Survey development
Three scenarios (described in more detail in the following section) and the survey questions were drafted by a team of researchers and clinicians. The wording and format of the survey were developed in collaboration with the patient representatives on the trial team. The scenarios were turned into short videos, as suggested by the patient representatives, to make them more accessible, using online VideoScribe software (Sparkol Ltd, Bristol, UK). The videos can be accessed on YouTube (YouTube, LLC, San Bruno, CA, USA). 183–185 We organised a focus group with four patient representatives, who commented on the survey questions, the scenarios and the videos. The survey was adapted in accordance with their comments, and the focus group participants were given the opportunity to provide feedback on the revised material. Finally, the survey questions were tested and commented on by a plain-language panel to get the view of people who are less familiar with CD. The survey was amended accordingly.
We used OnlineSurveys (Jisc, London, UK) as the survey platform, which is an online survey tool designed for academic research. OnlineSurveys uses an ISO 27001-certified information security management system186 and complies with the General Data Protection Regulation. 187 The Faculty of Health Science Research Ethics Committee granted ethics approval for this study.
Survey questions
In the survey, respondents were shown three short videos. Each video explained a different scenario, in which the risk of having CD was different. In the first scenario (video 1), we asked respondents to imagine that they had been suffering from typical symptoms of CD; in the second scenario (video 2), they were asked to imagine that a first-degree relative had been diagnosed with CD; and in the third scenario (video 3), they were asked to imagine that they had been diagnosed with a condition that puts them at greater risk of having CD (see scenario descriptions in Appendix 21, Box 1). The videos were followed by three or four questions that asked respondents at which part of the diagnostic pathway they would have wanted to start a gluten-free diet: after the first appointment with the GP (low risk of CD based on symptoms or risk conditions alone), after getting a positive blood test result (higher risk of CD) or after a confirmation biopsy (CD diagnosis almost certain). Respondents were given the option to explain their answers in a free-text box. After the respondents went through the three scenarios, which were designed to help people think about disease risk and certainty of a diagnosis, they were asked what level of certainty of a CD diagnosis they would want from a blood test before they were willing to start a gluten-free diet (in a scenario with and a scenario without symptoms).
At the end of the survey, we asked for some general demographics (age, sex, ethnicity and socioeconomic status). We also asked if the respondents had (or believed they had) CD, and, if so, we had some follow-up questions about their diet and quality of life. Quality of life was assessed using the Coeliac Disease Quality of Life Measure 1.0 (CD-QOL), which is a validated questionnaire containing 20 items across four subscales: limitations, dysphoria, health concerns and inadequate treatment. Psychometric validation has indicated both convergent and discriminate validity of the CD-QOL, and it has been shown to have a high internal consistency and reliability. 188 Finally, respondents had the opportunity to leave any final comments or feedback about the survey in a free-text box. People of all ages could participate, and it was possible to fill out the survey on behalf of a child.
Survey distribution
A dissemination strategy was developed in collaboration with the communications manager at the National Institute for Health and Care Research (NIHR) Applied Research Collaboration (ARC) West. We developed copy for tweets, advertisements, newsletters and Facebook posts (Meta Platforms, Inc., Menlo Park, CA, USA). To encourage participation, we said that we would enter respondents into a prize draw for a £50 Amazon voucher (Amazon.com, Inc., Bellevue, WA, USA).
The survey was endorsed by the Coeliac UK charity, which helped promote the survey on its social media platforms.
Fifty-one Facebook groups were contacted, of which the following 20 agreed to promote our survey on their Facebook pages: Coeliacs in Bristol, Healthwatch Bristol, Healthwatch South Gloucestershire, Healthwatch Somerset, Up Your Street, Gluten Free Bristol, BS5 Connect, Bristol Parents Club, Gluten Free Vegans UK, Vegetarian Coeliacs UK, Osteoporosis UK, Wirral Coeliac Support Group, Coeliac in the Scottish Borders, Gluten Free Blogger Group, Grub without Gluten, Coeliac children UK (Plus allergies), Coeliac and Gluten Free in Essex, Healthy eating for kids and family, Coeliac Central and GUTs Group (Coeliac UK’s Gluten free Under Thirties). Diabetes UK, Bristol Healthwatch and Healthwatch North Somerset posted our advertisement on their websites.
We contacted 17 organisers of citizen panels, of whom three agreed to help. An advertisement was sent out to Healthier Together Panel, the NHS Lincolnshire Citizens’ Panel and the Leicester City Clinical Commissioning Group Citizens’ Panel, which are online groups, each of around 1000 people from the local area.
We sent three different tweets from the NIHR ARC West Twitter (Twitter, Inc., San Francisco, CA, USA) account that included the Twitter handles of relevant organisations. Bristol University, Coeliac UK, Healthcare Improvement Scotland – Community Engagement, Healthwatch Bristol and Healthwatch South Gloucestershire agreed to send tweets from their accounts.
The NIHR Centre for Engagement and Dissemination agreed to retweet from the @NIHRinvolvement and @NIHRtakepart accounts and add our survey to its public engagement newsletter. We also promoted our survey through the NIHR ARC West newsletter, the People in Health West of England monthly update Newsflash, and the Bristol Population Health Science Institute newsletter.
Finally, a news story was published on the NIHR ARC West website and the University of Bristol newsroom, and we developed a blog with a public contributor, which was published on the NIHR ARC West website and shared on Twitter.
The survey was live for 2 months, from January to March 2021.
Data analysis
The data were exported from the online survey tool. Ethnicity was summarised with a binary variable (white or non-white). Qualifications were recoded, keeping only the highest qualification, using the following order from high to low: college or university degree, Advanced Level or equivalent, Ordinary Level or General Certificate of Secondary Education or equivalent, or other (National Vocational Qualification/Higher National Diploma/Higher National Certificate, professional qualifications or Certificate of Secondary Education). Postcodes were used to link to IMD 2015 deprivation deciles for England,67 Scottish IMD 2020v2 deciles,189 Welsh IMD deciles190 and Northern Ireland deprivation rank converted to decile. 191 Respondents with postcodes indicating that they lived outside the UK were excluded.
Descriptive statistics, including percentages, medians and IQRs, were used to describe the sample. We calculated summary estimates with 95% CIs on the level of certainty respondents want from a blood test before committing to a lifelong gluten-free diet if they had or did not have symptoms. We performed an exploratory analysis to identify possible causes of variation in answers. We performed multiple linear regression to investigate whether or not having a CD diagnosis, being familiar with the gluten-free diet or ever having had a biopsy were associated with the level of certainty people chose. We accounted for age group in the model.
We performed a subset analysis, using descriptive statistics, on all respondents with CD to investigate how difficult they find adhering to the diet and how strictly they adhere to it, and to quantify their quality of life. Quality-of-life measures were calculated according to the standardised CD-QOL previously described. 188 In brief, questions are grouped into four domains: dysphoria, CD-related limitations, health concerns and inadequate treatment. A score is calculated by transforming the Likert scale to a number, summing up the scores per domain, and converting these to a score that ranges from 0 to 100 with formulas supplied by the developers.
To analyse the free-text answers in which respondents could explain their responses to each scenario, we used content analysis to identify themes and patterns as described by Hsieh and Shannon,192 whereby a bottom-up approach is used to explore qualitative data. Rachel O’Donnell coded the free-text answers and analysed the responses by identifying higher-level recurring themes.
Results
Respondent characteristics
The survey was completed by 472 people. Five respondents did not live in the UK and were removed from the analysis. A total of 244 (52%) respondents had CD, with the condition confirmed by a blood test and/or biopsy. An additional 36 respondents believed that they had CD, although this had not been confirmed by a test. These respondents were included in the group without confirmed CD (n = 223, 48%). Thirty-two (6.9%) respondents were children (aged < 18 years); either they filled out the questionnaire by themselves or it was done by a parent on their behalf. The majority of respondents were aged between 26 and 64 years (n = 310, 66.2%). Questions on sex, ethnicity, qualifications and postcode were optional; these were answered by most CD patients, whereas most respondents without CD did not answer these questions. Among those who answered the optional questions, the vast majority were white (n = 264, 95%) and female (n = 239, 86%). Most respondents went to university or college (n = 159, 58%). The highest proportion lived in south-west England (n = 98, 36%). Respondents tended to live in less deprived areas (median deprivation index of 7) than the national average; this was similar across respondents with and those without CD. A total of 304 (65%) respondents were following a gluten-free diet at the time of filling out the survey and 28 (6%) had done so in the past (see Appendix 22, Table 59).
Scenarios
The scenario questions were answered by 88.5–90.0% of respondents (Table 15). In scenario 1, in which respondents were asked to imagine having typical CD symptoms, 387 (92.8%) respondents opted for a blood test. If the blood test showed a negative result for CD, 223 (53.5%) respondents chose to follow a gluten-free diet anyway to find out if it reduced their symptoms, 93 (22.3%) respondents wanted further testing for CD and 101 (24.2%) accepted that it was unlikely that they had CD. The free-text answers revealed that some respondents misunderstood this question and believed that the negative test result followed two positive test results, which may have affected their answers.
| Scenario | Risk of CD (%) | Test result | Preferred option per scenario in response to risk of having CD, n (%) | ||
|---|---|---|---|---|---|
| Start GFD | Further testing | No further testing or diet | |||
| GI symptoms and fatigue | 1 | Negative | 223 (53.5) | 93 (22.3) | 101 (24.2) |
| GI symptoms and fatigue | 5 | Pre test | 21 (5) | 387 (92.8) | 12 (2.9) |
| GI symptoms and fatigue | 33 | Positive | 112 (26.9) | 295 (70.7) | 9 (2.2) |
| GI symptoms and fatigue | 75 | Strong positive | 184 (44.1) | 224 (53.7) | 6 (1.4) |
| First-degree relative | 10 | Pre test | 21 (5) | 369 (88.5) | 30 (7.2) |
| First-degree relative | 50 | Positive | 94 (22.5) | 297 (71.2) | 28 (6.7) |
| First-degree relative | 90 | Strong positive | 195 (46.8) | 207 (49.6) | 17 (4.1) |
| Osteoporosis | 2 | Pre test | 15 (3.6) | 376 (90.2) | 30 (7.2) |
| Osteoporosis | 15 | Positive | 51 (12.2) | 336 (80.6) | 33 (7.9) |
| Osteoporosis | 55 | Strong positive | 99 (23.7) | 311 (74.6) | 7 (1.7) |
If the test result showed a positive result for CD, corresponding to a 33% risk of having CD, the majority of respondents opted for a confirmation biopsy (n = 295, 70.7%), rather than starting a gluten-free diet immediately. If the blood test showed a strong positive result, increasing their risk of CD to 75%, 184 (44.1%) respondents chose to start a gluten-free diet without confirmation biopsy, whereas 224 (53.7%) respondents chose to wait for a biopsy appointment.
In scenario 2, in which respondents were asked to imagine that a first-degree relative had CD, the majority opted for a blood test (n = 369, 88.5%). If the test was positive and the risk of CD was 50%, 94 (22.5%) respondents would start a gluten-free diet without a confirmation biopsy, but most (n = 297, 71.2%) would opt for a confirmation biopsy. If the test was strongly positive and the risk of CD was 90%, 195 (46.8%) respondents would start the gluten-free diet, whereas 207 (49.6%) respondents still preferred to wait for a confirmation biopsy.
In scenario 3, in which the respondents were asked to imagine being diagnosed with risk conditions that increased their risk of CD to 2%, 376 (90.2%) respondents opted to have the blood test. At 15% and 55% risks of CD, after a positive or strongly positive test result, the majority opted for a confirmation biopsy [n = 336 (80.6%) and n = 311 (74.6%) for 15% and 55% risks, respectively], rather than starting a gluten-free diet immediately.
Certainty of coeliac disease diagnosis
When respondents were asked to imagine that they had symptoms, they wanted to be a median of 66% (IQR 33–90%) certain of the diagnosis before starting a gluten-free diet. Without symptoms, respondents wanted to be more certain (median 90%, IQR 66–99%) before committing to a gluten-free diet.
We found no evidence that age group or having had a biopsy affected the level of certainty of CD diagnosis that respondents would like before starting a gluten-free diet. However, respondents without CD and those familiar with a gluten-free diet accepted a lower certainty. In the scenario in which respondents were asked to imagine that they had symptoms, this was 20% lower for people without CD [standard error (SE) 3.8, t = –5.1; p < 0.001] and 15% lower for those familiar with a gluten-free diet (SE 4.0, t = –3.7; p < 0.001). In the scenario in which respondents were asked to imagine that they did not have symptoms, this was 13% lower for people without CD (SE 3.5, t = –3.7603.8; p < 0.001) and 12% lower for those familiar with a gluten-free diet (SE 3.6; t = –3.2; p = 0.001) (Figure 9).
FIGURE 9.
Preferred certainty of CD diagnosis before starting a GFD. GFD, gluten-free diet.
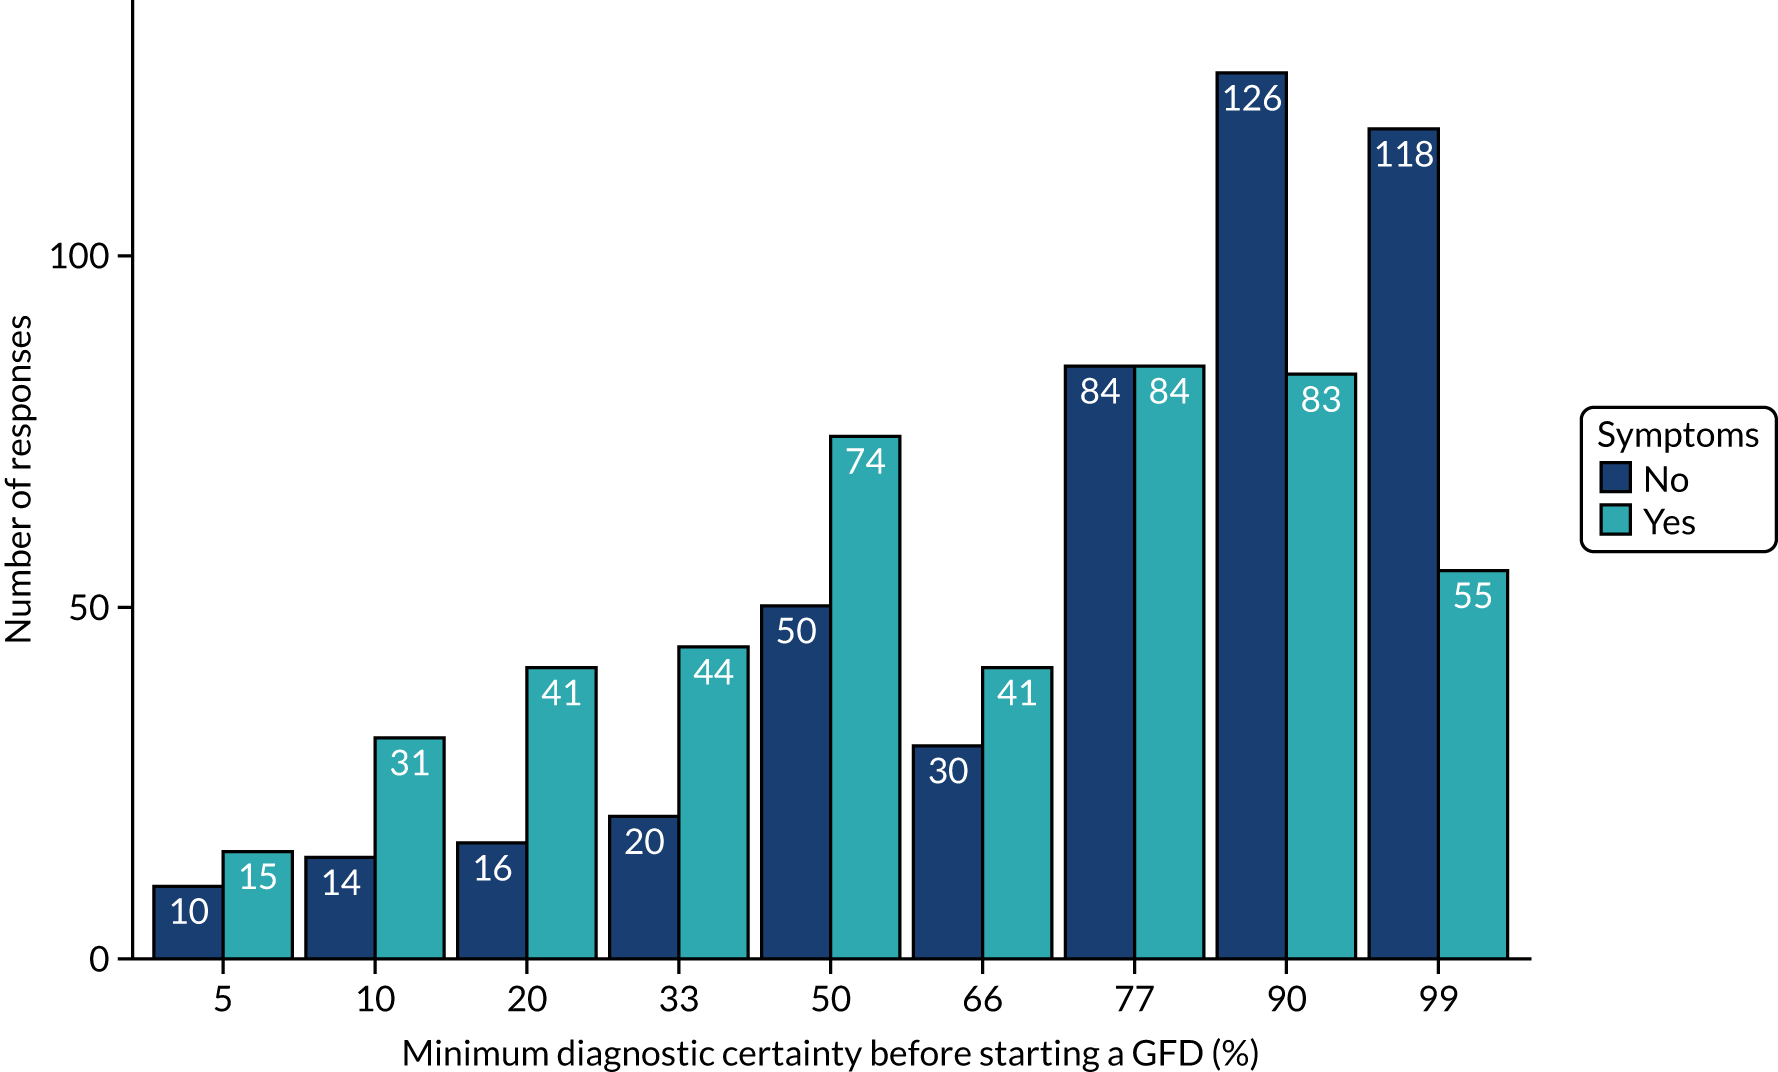
Gluten-free diet adherence and difficulty
Figure 10 shows the results from CD patients regarding the difficulty of following a gluten-free diet and how strictly they adhered to the diet. A total of 131 (53.5%) respondents found it easy or very easy to follow the gluten-free diet, whereas 69 (28.2%) respondents found it difficult or very difficult. Most respondents with confirmed CD reported that they were strict or very strict in their adherence to the gluten-free diet (n = 222, 90.6%).
FIGURE 10.
Gluten-free diet adherence and difficulty. (a) Difficulty following a GFD; and (b) adherence to a GFD. GFD, gluten-free diet.
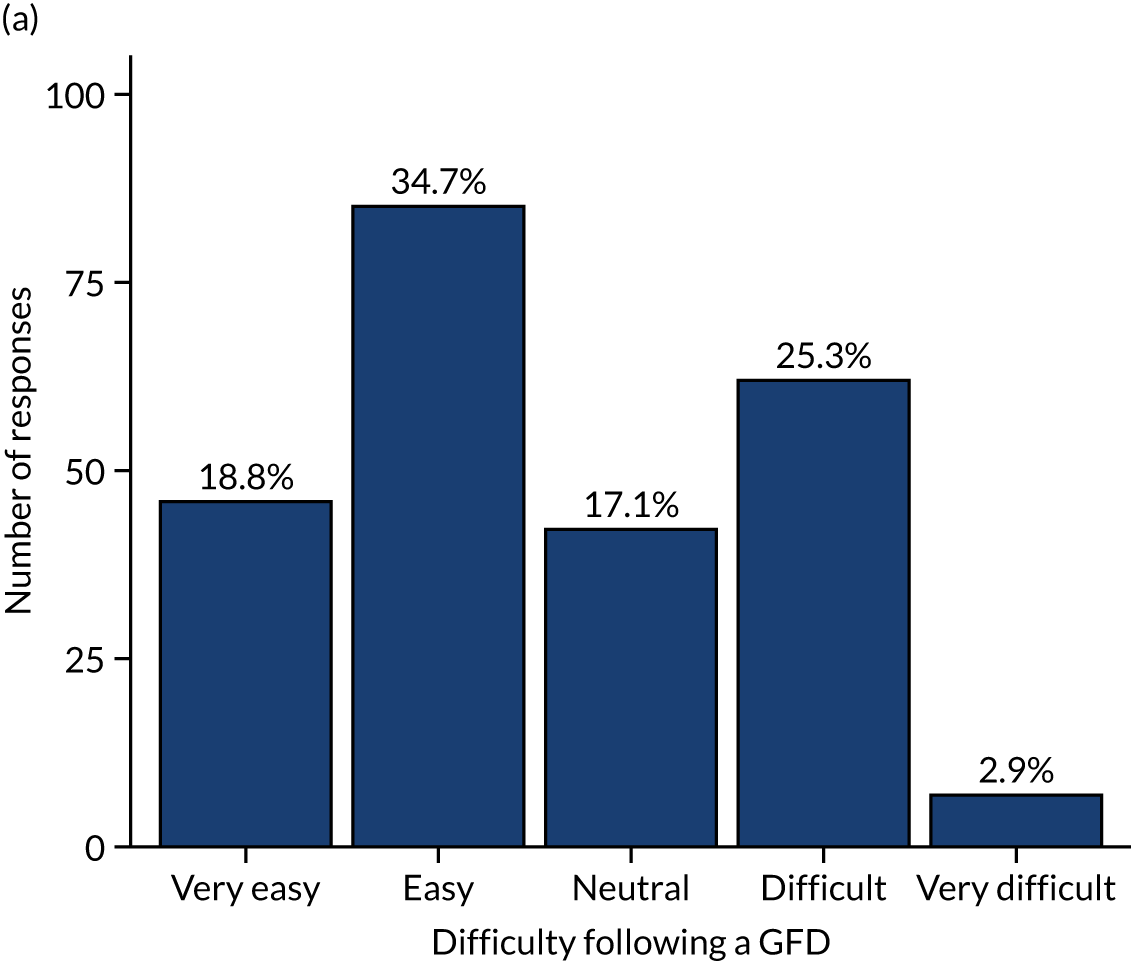
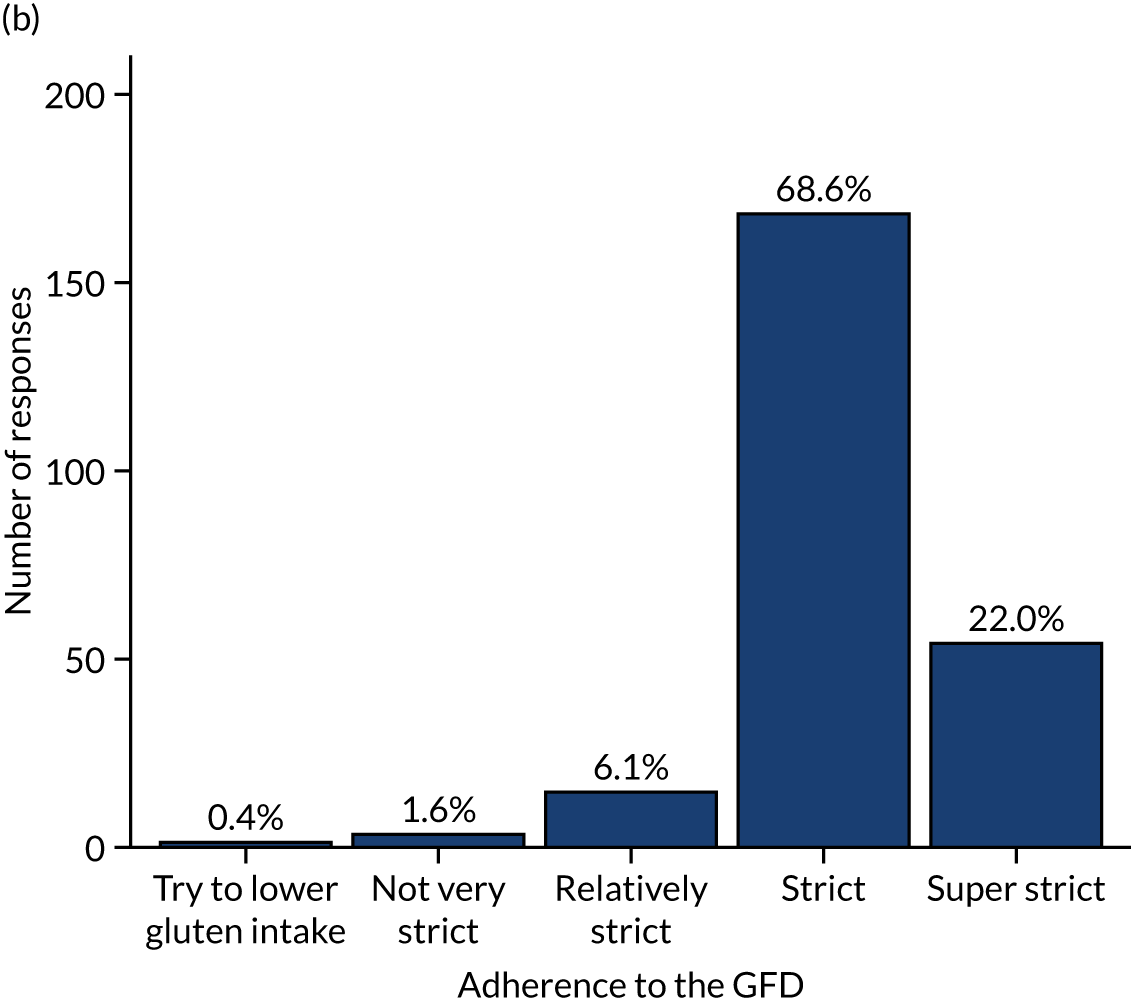
Quality of life among coeliac disease patients
The median overall quality-of-life score among CD patients was estimated at 59.38 (IQR 43.75–76.25), based on the CD-QOL. Quality of life is considered good when the score is > 59, medium when the score is 37–59 and poor when the score is < 37. Although there was large variation between CD patients’ quality-of-life scores, most scores indicated a good or medium quality of life (Figure 11). CD patients had a high score in the dysphoria domain (median 87.50, IQR 68.75–93.75), suggesting that dysphoria did not affect quality of life for the majority of respondents. CD patients also had a good score in the health concerns domain (median 60.0, IQR 35.0–80.0), although there was more variation, and some respondents felt that their quality of life was affected by health concerns. CD patients had a medium score for the domains ‘CD-related limitations’ (median 55.56, IQR 36.11–72.22) and ‘inadequate treatment’ (median 50.00, IQR 37.50–50.00). About one-quarter of the respondents with CD had a low score (associated with a poor quality of life) for the CD-related limitations and health concerns domains.
FIGURE 11.
Quality-of-life scores (CD-QOL).
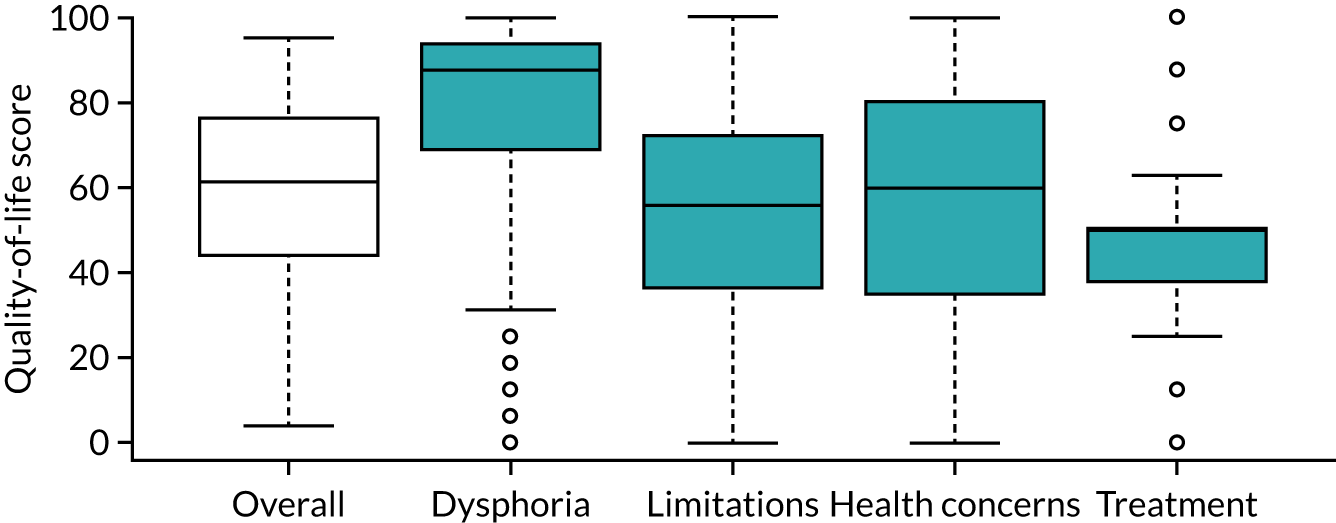
Qualitative analysis
Of the 468 respondents, 353 (75.4%) used at least one of the free-text boxes to explain their answer to a scenario question. Of these, 185 (52.4%) had a CD diagnosis confirmed by a blood test and/or biopsy and 167 (47.3%) did not. Of those who answered, the highest proportion fell into the 41–64 years age group (42.2%), followed by the 26–40 years age group (28.0%). Twenty-six children (aged < 18 years), or parents of children (7.4%), explained their answers to the scenario questions. The response rate was slightly higher for those with CD than for without [CD, n = 17/185 (9.2%); no CD, n = 9/167 (5.4%)] (see Appendix 22, Table 60).
Free-text analysis
Four key themes and 29 subthemes were identified in the explanations respondents gave. The four key themes were factors that prompt CD diagnosis, the diagnostic process, how to respond to a negative test result and opinions on the gluten-free diet (see Appendix 23, Table 61). Themes raised by adults and children were similar.
Factors that prompt coeliac disease diagnosis
The most frequently mentioned prompt for seeking CD diagnosis was being diagnosed with osteoporosis, with 44 (9.4%) respondents remarking that this would be a worrying development:
If a young man gets an old woman’s disease they’d be clutching at lots of straws to try and figure it out.
Thirty-seven (7.9%) respondents stated throughout the scenarios that the (more general) future risks of CD would prompt seeking or continuing testing for diagnosis. A total of 59 (12.6%) respondents said they would look into CD diagnosis immediately and rule it out early if it was suggested to them by their doctor. For 29 (6.2%) respondents, symptoms would decide whether or not they looked into getting or continuing a diagnosis. Twenty-four (5.1%) respondents said that family has affected them considering a CD diagnosis for themselves.
A total of 49 (10.5%) respondents said that having an official diagnosis is important to them, stating that there are benefits to having an official record:
If I have it, I want the diagnosis on my medical records so that I can be allowed DEXA [dual-energy X-ray absorptiometry] scans and flu jabs recommended for people with coeliac disease.
In contrast, only four (0.9%) respondents said that they felt that there is no point to an official diagnosis:
As the ‘benefit of having a diagnosis’ is irrelevant as gluten-free prescriptions aren’t allowed anymore and little no support or understanding from professionals.
The diagnostic process
A total of 184 (39.3%) respondents mentioned that they wanted or were happy to have a blood test for CD, as it is not invasive and is seen as easy to have:
It is easy and quick to get a blood test done which would give a much clearer idea of the situation.
As for opinion on biopsies, 116 (24.8%) respondents said they feel that a biopsy is necessary for confidence in their diagnosis, whereas 27 (5.8%) feel that biopsy is invasive or unpleasant and would want to avoid it. The majority of those who believe that a biopsy is necessary for certainty of their diagnosis are those with CD [CD, n = 77 (31.63%); no CD, n = 39 (17.5%)]. Forty-one (8.8%) respondents said they would continue a gluten diet for biopsy even if they did not have symptoms. A total of 76 (16.2%) respondents mentioned that, when having no symptoms, a biopsy was more important for confidence in diagnosis and they were more willing to continue a gluten-containing diet during the waiting time for a biopsy appointment.
Twenty-eight (6.0%) respondents stated that 6–8 weeks is an acceptable wait time for a biopsy, compared with 13 (2.8%) who stated that the wait time was unacceptable, and 76 (16.2%) respondents expressed that, if the blood test showed a > 50% chance of having CD, they would start a gluten-free diet without waiting for a biopsy:
This is a very high answer from a blood test. I feel I have got the answer I need without needing an invasive biopsy.
How to respond to a negative test result
When presented with a negative or low chance of having CD, 37 (7.9%) respondents said that they would try a gluten-free diet regardless of diagnosis:
If the gluten-free diet could potentially stop the pain or improve quality of life I would start the diet regardless of diagnosis.
Thirty-two (6.8%) respondents would ask for further testing or retesting if they had a negative result. A total of 26 (5.6%) respondents commented that their doctor’s guidance and opinion would be important to them, and 26 (5.6%) respondents would accept not having CD.
Opinions on a gluten-free diet
A total of 128 (27.4%) respondents stated that they would want a definitive diagnosis (through a biopsy) before starting a gluten-free diet, whereas 36 (7.7%) would start a gluten-free diet without a definitive diagnosis.
Twenty-seven (5.8%) respondents said that the lowest likelihood of having CD would not be enough for them to start a gluten-free diet, and 25 (5.3%) stated that a 50/50 likelihood would not be enough to start a gluten-free diet. However, 20 (4.3%) would start a gluten-free diet at the lowest likelihood (≤ 10% chance) of having CD. The majority of those who stated this were those without a CD diagnosis [CD, n = 1 (0.2%); no CD, n = 19 (8.5%)]:
I would want my symptoms to get better as soon as possible, so if the [gluten-free diet] helped to eliminate the uncomfortable symptoms, that would be good enough for me. I wouldn’t need the tests.
A total of 77 (16.5%) respondents said they would start a gluten-free diet and see if CD symptoms improved (even if not diagnosed with CD); of these, 22 (4.7%) also said that they may consider restarting a gluten diet and having a biopsy if a gluten-free diet did not work:
I could try the gluten-free diet and if my symptoms improve I would continue, if it makes no difference I may go back to eating gluten and then opt for a biopsy or other tests.
Thirty-five (7.5%) respondents have said that whether or not they live with another person who has CD would affect their gluten-free diet adherence, and 48 (10.3%) expressed a negative opinion on following a gluten-free diet or see a gluten-free diet as a big commitment. More of those with a CD diagnosis expressed negativity towards a gluten-free diet than those without CD [CD, n = 33 (13.5%); no CD, n = 15 (6.7%)]:
I have 30 years on a [gluten-free diet], I know what it is like. You would want to be sure before changing your diet for good. It isn’t much fun, long term.
Chapter 8 Assessment of cost-effectiveness of diagnostic strategies
This chapter describes the decision tree and Markov modelling to estimate the cost-effectiveness of screening strategies for CD among men, women and children. This builds substantially on previous chapters. Individual diagnostic indicators from Chapter 3 and combinations of diagnostic indicators from the prediction model in Chapter 4 are investigated in combination with serological and genetic tests. Serological test accuracies come from Chapter 5 and genetic test accuracy comes from Chapter 6. Results of the patient survey in Chapter 7 inform the key assumptions of the model. The objectives of this analysis were to determine the following:
-
the most cost-effective combination of sensitivity and specificity for a pre-test probability above which all patients should be screened
-
the most cost-effective screening strategy.
Results were based on a lifetime time horizon and take a UK NHS perspective.
Screening strategies to investigate
To examine the most cost-effective combination of sensitivity and specificity for a diagnostic indicator (or combinations of diagnostic indicators) above which all patients should be screened, we considered a theoretical selection of combinations of diagnostic indicator sensitivities and specificities. These were every 10% increment > 50% for both parameters. A desired threshold of 90% post-test probability before initiating a gluten-free diet was adopted following the results of the patient survey, described in Chapter 7. This survey found that those without symptoms required a median post-test probability of 90% (IQR 66–99%) before committing to a gluten-free diet, whereas those with symptoms required a median post-test probability of 66% (IQR 33–90%). We chose the maximum of these two as the desired level of certainty from testing strategies.
For each combination of sensitivity and specificity of diagnostic indicators, we modelled the following screening strategies:
-
serological testing (IgA tTG, IgA EMA, IgA tTG plus IgA EMA) with a confirmatory biopsy for those with a post-test probability of < 90%
-
a combination of serological testing with genetic testing (HLA before or after each serological test or test combination) with a confirmatory biopsy for those with a post-test probability of < 90%.
We also investigated ‘strategies of interest’, identified as the sensitivity and specificity of diagnostic indicator strategies described in Chapters 3 and 4, which are pre-test probabilities above which to test for CD. These diagnostic indicator strategies were combined with the serological and genetic testing strategies identified as cost-effective in the previous step.
We compared the strategies with one in which nobody is screened. No screening is equivalent to standard-of-care opportunistic screening, as the model allows diagnosis independently of screening strategies.
The analyses were stratified into adult men, adult women and children. Adults were assumed to be initially 18 years of age. The mean age of children was assumed to be 10 years in accordance with CPRD data on people with CD aged < 18 years. The proportion of children who were female was assumed to be 50%.
Methods for cost-effectiveness analysis
Our model development was based on a review of previously published models; the results of the diagnostic indicator review (see Chapter 3) and CPRD analysis of diagnostic indicators for CD (see Chapter 4), which identified important patient characteristics for modelling; the results of the meta-analysis on serological and genetic test accuracies (see Chapters 5 and 6), which identified tests to model; the survey of patient opinion (see Chapter 7); and discussion with our clinical and patient advisers.
Review of previous cost-effectiveness models
To identify important elements of CD to model, and potentially identify existing models we could adapt, we reviewed previously published models as a first step in our method of model development.
Search strategy
We searched Embase and combined terms for CD with an economic model filter. This identified 390 papers, which were screened independently by two reviewers. We identified 13 papers as relevant. Any studies that contained any type of decision-analysis model for CD were eligible for inclusion. We excluded economic evaluations not based on cost-effectiveness models. The full search strategy is provided in Appendix 24.
Summary of identified models
Of the 13 economic models identified, seven were decision trees, four were Markov models and two were decision trees followed by Markov models. Only the NICE 2015 model was in a UK setting. 193 Of the others, one was set in the Netherlands194 and the rest were based in the USA. 195–203,206,207 The studies are discussed in chronological order and details are shown in Appendix 25, Table 62.
Harewood and Murray195 developed a decision tree to compare the costs of different screening strategies for the detection of CD. This study found screening with EMA to be the less costly than both screening with GAs and small bowel biopsy in a low- to medium-risk population. We note, however, that GAs are not recommended by NICE because of their low accuracy. 193 Mein and Ladabaum196 used a decision tree to explore the cost-effectiveness of different screening strategies for CD in patients with IBS symptoms. They concluded that testing for tTG to diagnose CD in patients with a diagnosis of IBS is cost-effective at thresholds of US$50,000 (assuming a prevalence of CD in IBS patients of 2%) and US$100,000 (assuming a prevalence of CD in IBS patients of 1.1%) per QALY gained. Spiegel et al. 197 built a decision tree followed by a Markov model to evaluate different screening strategies for CD in IBS patients with predominant diarrhoea symptoms. They found that serological testing for CD resulted in 51.6% of the patients achieving symptomatic improvement at 10 years (at an average cost of US$4100 per patient treated). Starting IBS therapy without testing for CD resulted in 50.9% of the population achieving symptomatic improvement (at an average cost of US$4023 per patient treated). The incremental cost-effectiveness ratio (ICER) of CD testing, compared with IBS treatment alone, was US$11,000 to achieve one additional symptomatic improvement. Testing for CD was, therefore, considered cost-effective.
Shamir et al. 198 developed a lifetime Markov model to conduct a cost-effectiveness analysis comparing seven screening strategies for CD in the adult population. The ICER was US$44,941 per life-year gained for screening, compared with no screening, using an IgA EMA testing strategy. All remaining six strategies were dominated and thus excluded. Swigonski et al. 199 used a decision tree to evaluate the cost-effectiveness of screening for CD among asymptomatic children with Down syndrome to prevent lymphoma. They found that screening for CD among children with Down syndrome is more costly and less effective than not screening, and decreases quality of life.
Dorn and Matchar200 evaluated the cost-effectiveness of five strategies for diagnosing CD. The IgA tTG-alone strategy was the least costly (US$22 per person), but also the least accurate. IgA tTG then HLA then oesophagogastroduodenoscopy (OGD) cost US$2233 per additional correctly diagnosed case. IgA tTG followed by further IgA testing and then OGD biopsy was US$32,605 per additional correctly diagnosed case. OGD with biopsy alone had an ICER of > US$1M. Chang and Green201 developed a decision tree to evaluate the cost of genetic testing before serological screening among relatives of people with CD. The cost of initial screening with IgA tTG of relatives was US$434 per person. Genetic screening before serological screening of relatives was more costly, at US$750 per person. In terms of cost per correct diagnosis of CD, it would cost US$2668 per case in the initial IgA tTG branch, and US$4422 per case in the HLA branch. The incremental cost per additional case of CD diagnosed would be approximately US$449,000 for genetic testing when compared with IgA tTG alone.
Hershcovici et al. 202 developed a Markov model to estimate whether or not mass screening using serological tests followed by biopsy is cost-effective compared with no screening. The ICER of screening compared with no screening was US$48,960 per QALY gained. However, at a US$50,000 threshold, the probability of being cost-effective was 60%. Mohseninejad et al. 194 conducted a cost-effectiveness analysis of targeted screening for CD among IBS patients and compared serological screening with no screening. They concluded that screening patients with confirmed IBS symptoms for CD is cost-effective (ICER of €6200).
Park et al. 203 developed a Markov model to determine the cost-effectiveness of universal serological screening to prevent non-traumatic hip and vertebral fractures among patients with CD. They found that universal screening, compared with standard care (i.e. screening only symptomatic or at-risk patients), is not cost-effective. Standard care was associated with lower costs (US$8472) and more QALYs (25.515). Yang et al. 206 conducted a cost-effectiveness analysis of routine duodenal biopsy for CD during endoscopy for gastro-oesophageal reflux, compared with no biopsy, using a lifetime decision tree. They found that performing a biopsy to detect CD among patients with gastro-oesophageal reflux disease is not cost-effective (ICER of US$121,875 per QALY gained). Broide et al. 207 built a Markov model to determine the cost-effectiveness of routine duodenal biopsy to detect CD among patients with IDA. The intervention (biopsy during an OGD in all patients with IDA, irrespective of serological test results) resulted in 19.888 QALYs gained and an average cost of US$218.10, dominating the comparator (i.e. performing biopsy only in patients with a positive serological test), which had a gain of 19.887 QALYs at an average cost of US$234.17.
In 2015, NICE conducted a cost-effectiveness analysis using a decision tree followed by a Markov model to estimate which serological test is the most appropriate to diagnose CD among both children and adults. 193 For adults, the most effective strategy was the most sensitive: considering people serologically positive if they are positive on either IgA tTG or IgA EMA (17.6004 total QALYs). However, the ICER was £173,484 per QALY gained. The incremental analysis suggested that most benefits could be achieved at a lower cost by a strategy that tests IgA tTG in all people and reserves IgA EMA to classify cases in which IgA tTG results are weakly positive. All other strategies were strongly dominated. For children, the most effective strategy was IgA tTG plus IgA EMA plus HLA (a combination of serological tests for IgA tTG and IgA EMA and HLA-DQ2/-DQ8 genotyping), with a total QALY gain of 21.3823. The ICER of this strategy was £33,800 per QALY gained, compared with the next cheapest non-dominated option. NICE also conducted a health economic evaluation of active case-finding strategies. It found that screening first-degree relatives of people with CD was cost-effective among adults and children, that screening people with type 1 diabetes was cost-effective among adults and potentially cost-effective among children, and that screening those with autoimmune thyroid disease was not cost-effective among adults or children.
Implications for cost-effectiveness modelling in coeliac disease
A Markov model, rather than a decision tree, is most appropriate for modelling a long-term health-care condition such as CD, as comorbidities, including non-Hodgkin lymphoma (NHL), may not develop for a long time after the initial screening. 208,209 A decision tree is an appropriate structure to model the initial set of testing strategies, but must be combined with a Markov model to capture long-term impacts. 210,211 Only three of the Markov models considered mass screening, rather than screening focused on patients with fractures, IDA, IBS or Down syndrome. Shamir et al. 198 used states for CD undiagnosed, CD diagnosed on gluten-free diet and CD diagnosed but off gluten-free diet, while Hershcovici et al. 202 considered states related to whether patients were diagnosed, undiagnosed, adhered to a gluten-free diet, had IDA or had IBS. The NICE 2015 Markov model was the only model in the UK setting and its Markov model included states only for health conditions with a strong impact on costs and effects. 193 They used CD on gluten-free diet and CD not on gluten-free diet as primary states, with different levels of IDA, IBS and other symptoms in these states. They additionally included subfertility, osteoporosis, NHL and other cancers as health states. As the NICE model considered more events and had a richer evidence base than Shamir et al. 198 or Hershcovici et al. ,202 it was taken as the starting point for our model.
Model structure
As explained previously, we adopted a decision tree followed by a Markov model, as this can fully describe testing strategies and model long-term consequences of CD, and we largely follow the evidence-based model of NICE 2015. 193,211 Initial prevalence of CD is determined by a selected pre-test probability of CD, representing the target population for screening, and this drives the maximum number of true positives (i.e. diagnosed CD) that our testing strategy can identify. The decision tree captures the sensitivity and specificity of serological and genetic tests from Chapters 5 and 6, respectively, along with costs and impacts on health of these tests and the confirmatory biopsy. The Markov model captures the costs and health impacts of having diagnosed or undiagnosed CD, and thus measures the benefit of initially detecting CD with the decision tree. Modifications were made to the Markov model used by NICE following discussion with our clinical and patient advisers, and the results of our CPRD analysis of risk factors for CD (see Chapter 4); these are described in more in Structure of the Markov model.
Structure of the decision tree
The decision tree in which various serological and genetic test combinations are included is illustrated in Figure 12. Patients enter the tree either with CD (CD+) or without CD (CD–) and then follow one of three branches representing the three strategies: screening by serological testing, screening by serological and genetic testing, or no screening (representing standard of care). If a strategy combines serological and genetic testing, the second test is used only if post-test probability following the first was < 90% (see Chapter 7). In each case in which a person is tested, a confirmatory biopsy is used only if the post-test probability of having CD is < 90%. This does not apply to the combination of IgA tTG and IgA EMA, which were based on the results of joint testing, reported in Chapter 5. The model assumes that biopsy is perfectly accurate.
FIGURE 12.
Decision tree representing serological and genetic testing among patients with suspected CD. A test is judged to be positive if a patient’s post-test probability of having CD is > 90%; confirmatory biopsy is applied to all strategies if the post-test probability is below this threshold.
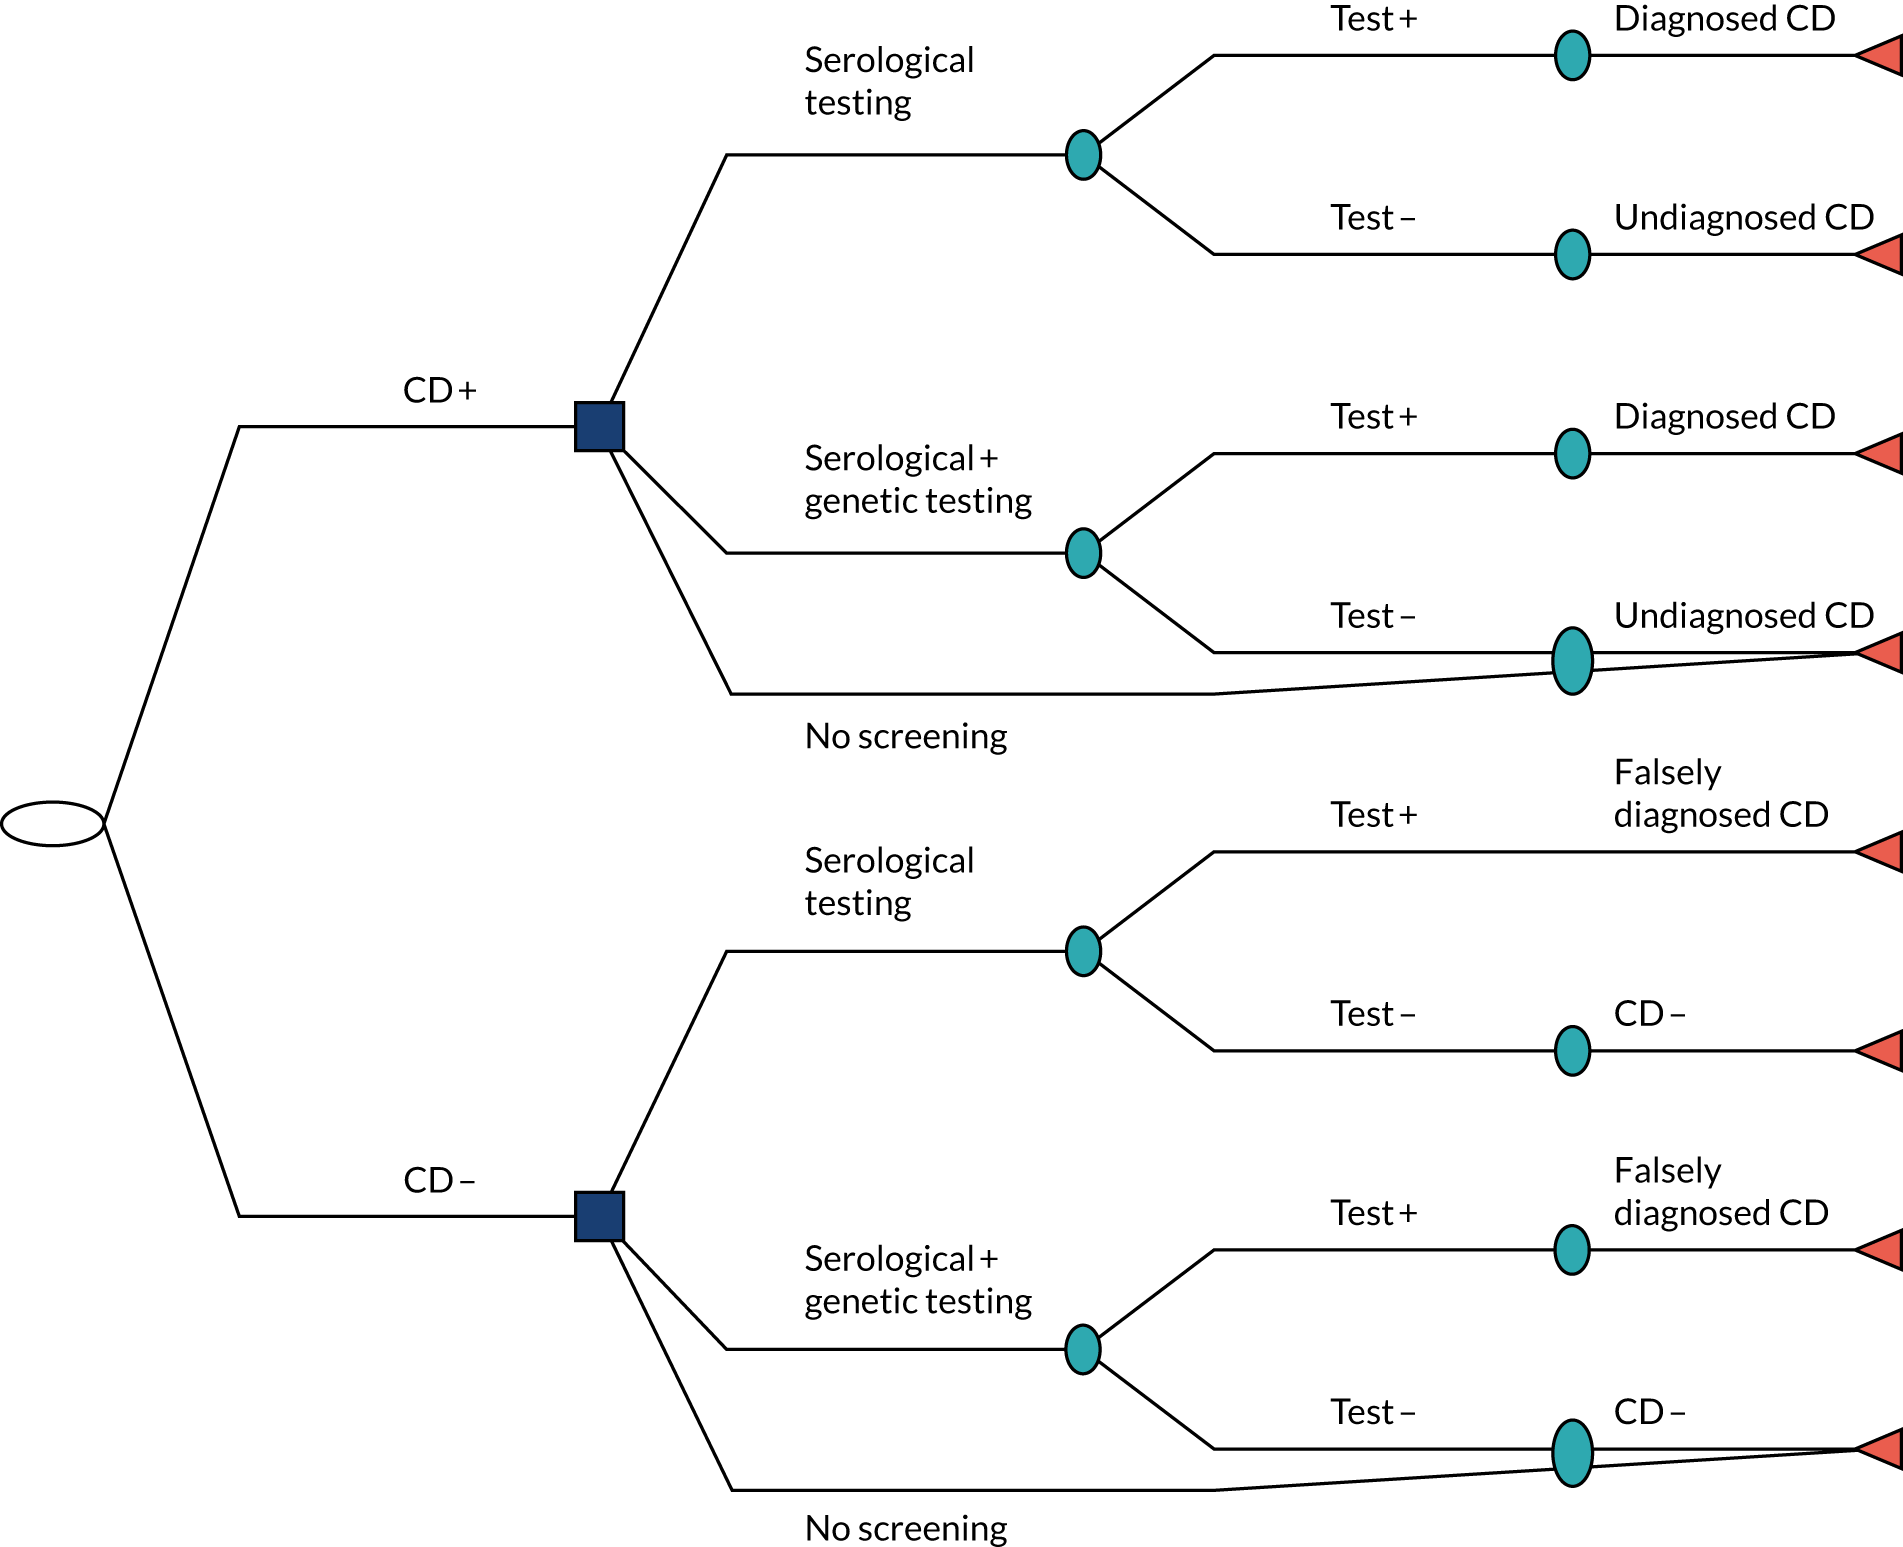
At the end of the decision tree, patients have either a positive or a negative result for CD or remain undiagnosed if they followed the no-screening strategy or had a false-negative test. If they are diagnosed with CD through the testing process, they would be advised to follow a gluten-free diet. It is assumed that, beyond the initial costs and disutility associated with testing, patients without CD who are tested will not have different costs or health outcomes from non-CD patients who were not screened. As a result, we model only the long-term consequences of patients who have diagnosed or undiagnosed CD. Costs and effects associated with false-positive CD patients are scaled by the ratio of false positives to true positives and false negatives (i.e. the number of CD patients who enter the cohort Markov model), so they are on the same scale as the diagnosed/undiagnosed CD cohort.
Structure of the Markov model
The decision tree is followed by a lifetime time-inhomogeneous discrete-time Markov model. 208,212 In this model, health states are assumed to be mutually exclusive. In other words, a patient can be in only one health state at a time. Costs and utilities are assigned to each health state, and are accrued for each year spent in that state. As in the NICE 2015 model,193 our model has annual cycles and a lifetime horizon.
Following the NICE model, complications from biopsy are not modelled, thus implicitly assuming that there is no elevated risk of major complications or death from biopsy, although a small disutility is included to represent the procedure and waiting time for diagnosis, during which an undiagnosed CD patient is less likely to be on a gluten-free diet. This assumption is supported by a 2018 study213 that looked at 13,233 patients undergoing outpatient OGD with biopsy over 5 years in the USA. The authors concluded that no patient was admitted because of complications that could be ascribed to conscious sedation, upper GI endoscopic access or mucosal biopsy and that these data confirm that OGD biopsy is safe. 213
Unlike the NICE 2015 model,193 our model does not distinguish between people with diagnosed CD following a gluten-free diet and people diagnosed with CD not following a gluten-free diet. We instead modelled CD patients as being diagnosed or undiagnosed, with different rates of complications in these states due to different levels of adherence to a gluten-free diet. This modelling choice is because of methodological challenges associated with assessing dietary adherence and a lack of reliable data on the health impacts of following a gluten-free diet or not. Reported gluten-free diet adherence rates vary substantially depending on how adherence is measured and the population studied. 214 Adherence to a gluten-free diet is affected by age at diagnosis, type and severity of symptoms, quality of counselling, mental health, local or societal support levels, and the cost and availability of gluten-free foods. 215 Biopsy is the gold standard when assessing adherence, but the procedure is invasive and costly. For this reason, various other methods are used including validated and non-validated questionnaires, serology, faecal or urine tests, dietitian’s assessment, interviews and patient-reported adherence. 215 Identifying and assigning an average adherence rate to a cohort of individuals is therefore very difficult. Even if this were possible, studies informing the risk of developing complications among those on a gluten-free diet, compared with those who are not, are based on cohorts of people with unknown, and presumably mixed, adherence.
A further distinction from the NICE model193 is that we do not include subfertility as a separate state. Our CPRD analysis found that the prevalence of subfertility among women is the same regardless of CD status; this is supported by a growing literature that there is no association between CD and subfertility. 216–219
Iron-deficiency anaemia was identified as important in our CPRD analysis, but, in line with NICE, was not modelled as a separate state as our patient and clinical advice was that costs were mostly for over-the-counter medications, and therefore not included from an NHS perspective. The impact of IDA was also captured in utility values in diagnosed and undiagnosed states, aligned with our modelling of the efficacy of a gluten-free diet, as major CD utility studies included large proportions of people with IDA.
Further risk factors of CD identified by the diagnostic indicator review (see Chapter 3) and the CPRD analysis (see Chapter 4) (1) are captured as general symptoms (e.g. fatigue, GI symptoms, IBS, mood disorders), (2) cannot be affected by a gluten-free diet and are thus unaffected by diagnosis (e.g. Down syndrome or having a first-degree relative with CD) or (3) are either rare or not plausibly caused by CD (e.g. thyroid disorders, Turner syndrome, type 1 diabetes).
Our final Markov model is illustrated in Figure 13.
FIGURE 13.
Markov model structure.
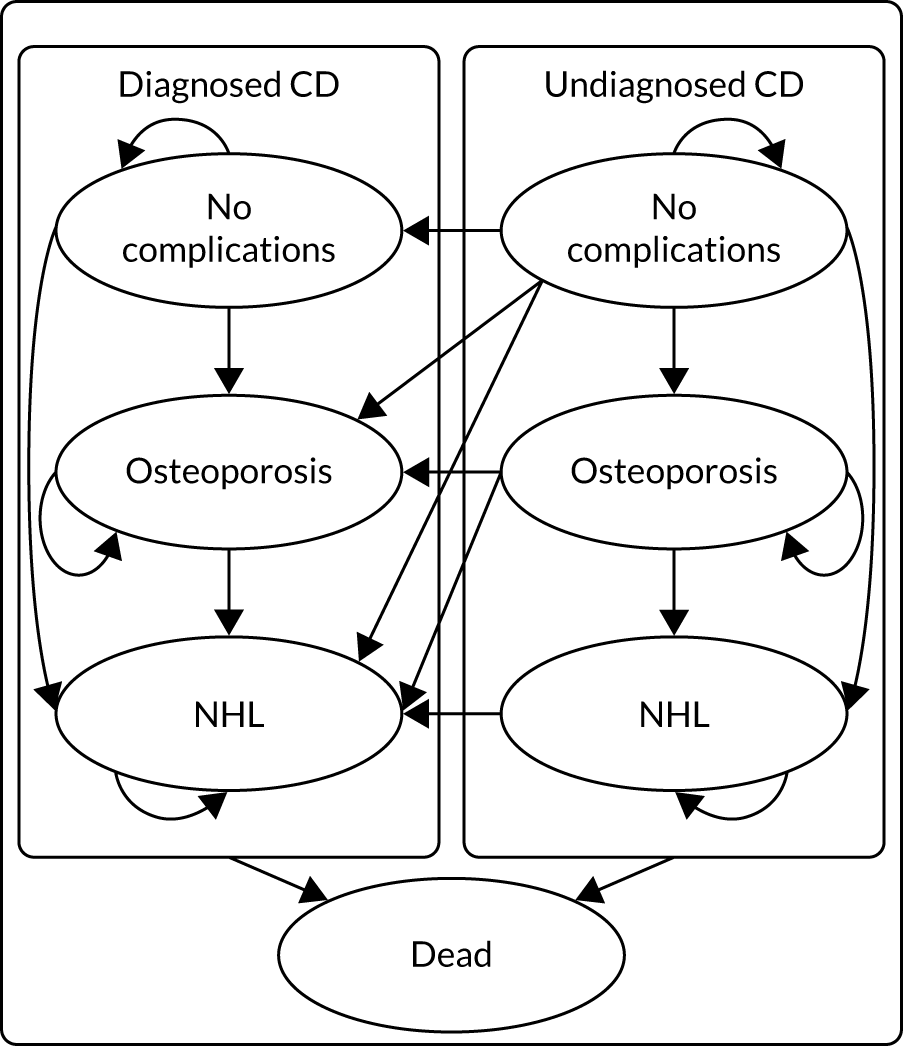
The initial distribution of patients between diagnosed and undiagnosed CD states is determined by the decision tree. People can transition to death from any state in the model. Patients have an annual probability of transitioning from no complications to health states representing osteoporosis, NHL and death. Patients can also be in any of these health states at diagnosis. As in the NICE model,193 and to avoid modelling multiple comorbidities on which CPRD evidence is limited, patients who develop osteoporosis can transition to NHL or death only, and no distinction is made between NHL patients with and NHL patients without prior osteoporosis. Patients who develop NHL are assumed to stay in this health state until death (i.e. they do not return to the less severe osteoporosis state). Patients with undiagnosed CD transition through the health states and can be diagnosed at any point, with a proportion receiving biopsy.
Input parameters
In this section we describe the parameters of the decision tree and Markov model. These are informed by the DTA meta-analysis (see Chapters 5 and 6), the literature review of coeliac screening cost-effectiveness models, UK CPRD analyses, estimates used in the NICE 2015 model193 or targeted literature searches. A summary of all parameters with evidence sources is shown in Table 18.
Prevalence of osteoporosis, non-Hodgkin lymphoma and iron-deficiency anaemia in a population with coeliac disease
The prevalence rates of NHL, osteoporosis and IDA were estimated using the CPRD Aurum data of patients with a CD diagnosis, linked to HES, and these rates were assumed to be age and gender dependent. Records of complications were identified in HES and the CPRD using the International Statistical Classification of Diseases and Related Health Problems, Tenth Revision (ICD-10), and Aurum medical codes (full details of the analysis and results are in tables S12–S16 in Report Supplementary Material 1). The initial proportions of people with each complication among newly diagnosed and undiagnosed CD patients in the Markov model are assumed to follow these prevalences. It is a limitation that CPRD data cannot generate prevalence rates of NHL, osteoporosis and IDA in those with undiagnosed CD; however, rates of developing each of these complications are modelled to be different from those in patients with a CD diagnosis (see Risk of developing osteoporosis, iron-deficiency anaemia and non-Hodgkin lymphoma). Patients without these complications begin in the no-complications state. IDA is modelled independently of NHL and osteoporosis, so an independent beta distribution is used to present the initial probability of having IDA. Although NHL and osteoporosis are separate states in the Markov model, the prevalence estimates are not mutually exclusive. The prevalence of NHL is low (< 2%), so overlap with osteoporosis is negligible and each prevalence is modelled by an independent beta distribution. Appendix 26, Table 63, includes estimates of the prevalence of each of these complications in a mixed-gender cohort of > 48,046 people with a CD diagnosis recorded in CPRD Aurum. This is stratified into men and women in Appendix 26, Tables 64 and 65, respectively. The adult men and adult women analyses use the stratified estimates whereas the children analyses use the mixed-gender estimates.
Percentage receiving biopsy
The percentage of patients with a delayed diagnosis assumed to require a confirmatory biopsy is 70%, based on clinical advice and in accordance with recent research indicating high diagnostic accuracy of tests alone. 70,89,220,221 This percentage is varied within a 95% credible interval (CrI) of 60% to 80%. The 60% lower bound is based on the findings of a retrospective study of 270 adult patients. 89 This study found that, at an IgA tTG antibody cut-off point of > 45 U/ml, the PPV for CD was 100%, and that 40% of cases were above this cut-off point.
Diagnostic accuracy of tests
The diagnostic accuracy parameters for IgA tTG, IgA EMA and IgA tTG plus IgA EMA were informed by the DTA meta-analysis (see Chapter 5). The diagnostic accuracy of HLA tests was informed by the genetic test accuracy meta-analysis (see Chapter 6). In the serological followed by HLA testing and HLA followed by serological testing combinations, the second test was used only with patients whose post-(first)-test probability was < 90%, aligning with the patient survey result that this was a threshold above which they would be willing to go on a gluten-free diet (see Chapter 7). Estimates of the test accuracy of serological tests were assumed to be independent of HLA test accuracy. All tests are followed by a confirmatory biopsy among those with a post-test probability that is still < 90%.
Costs
The model includes costs associated with diagnostic tests, biopsy, annual health-care resource use costs among diagnosed CD patients, and annual costs of osteoporosis and NHL. A price year of 2018/19 was assumed, aligning with NHS reference costs. 222 The cost of IgA tTG, IgA EMA and HLA tests were sourced from correspondence with hospitals and testing centres affiliated with the research team. The cost of biopsy was informed by NHS reference costs.
Along with test and biopsy costs, to get to a diagnosis, patients would also have nurse, GP and/or specialist consultations. Our clinical and patient team advised on the likely pathway to diagnosis. We assumed that a person’s first appointment is with either a nurse or a GP, at a cost of £10.85 or £39.23, respectively, with average £25.04, reported by the Personal Social Services Research Unit. 223 This is assumed to be followed by phlebotomy at a cost of £4, following NHS reference costs 2018/19, and then by a further GP appointment. 222 Following that, we assumed patients have, on average, one gastroenterology outpatient appointment costing £141 and two dietitian appointments at a cost of £85 each before diagnosis. 223 This gives a total cost of £379.27 (£25.04 + £4 + £39.23 + £141 + £170) for a patient to reach diagnosis. This cost is applied to both true positives and false positives in the model.
Annual health-care resource use costs for patients with CD were based on analysis of CPRD data, which updated the 2012 analysis of Violato et al. ;50 full details can be found in Report Supplementary Material 1, chapter 8. Following this earlier analysis, we quantified the volume of health-care resources in terms of primary care consultations, tests, referrals to outpatient hospital care and prescriptions used by individuals diagnosed with CD up to 10 years before and after diagnosis in a UK primary care setting. The volumes of resources, along with unit costs, have been used to estimate overall medical costs associated with a true-positive or false-negative diagnosis. A limitation of this analysis is that referrals to gastroenterology are likely to include only adult referrals, as children referred to gastroenterology are normally recorded under paediatrics. The unit costs used and a breakdown of costs are provided in tables S17 and S18 (see Report Supplementary Material 1).
The model assumed that patients falsely diagnosed with CD would follow a gluten-free diet for a limited time before stopping. Although such patients are not included in the Markov model, we count this short-term impact in the total costs (and total effects). Following input from clinicians and patient advisors on the likely time taken to decide that the diet is not of benefit, we assumed that this time would be 1 year with a log-normal distribution to reflect skew towards longer durations. The only additional cost incurred by people with a false-positive diagnosis of CD was the cost of non-NHS-reimbursed gluten-free products. We assumed that no other costs are incurred by people with a true-negative diagnosis.
The cost associated with NHL was based on a study by Wang et al. ,224 which followed all patients newly diagnosed with diffuse large B-cell lymphoma in the UK’s population-based Haematological Malignancy Research Network from 2007 to 2013 (n = 271). Mapped treatment pathways, alongside cost information derived from the National Tariff 2013/14,225 were incorporated into a patient-level simulation model to reflect heterogeneities in patient characteristics and treatment options. As treatment for NHL is usually complete within 5 years, most costs were estimated to fall within 5 years. The mean cost per patient was £18,096 (95% CI £18,078 to £18,114) over a 5-year time horizon and £18,396 (95% CI £18,377 to £18,415) over a lifetime time horizon. Using lifetime costs is problematic for a cohort Markov model as some patients may develop NHL at an advanced age and not have many additional years to incur costs. However, the NHL model factors in different survival times when estimating the treatment costs, so patients would incur less cost if they died within a shorter time. We therefore assumed a one-off cost of £18,396 (95% CI £18,377 to £18,415) with a log-normal distribution, relating to the lifetime cost estimated by Wang et al. 224
For the cost associated with osteoporosis, a similar approach to that of the NICE model193 was taken, with the cost being equal to the annual probability of hip, vertebral and wrist fracture multiplied by the cost of each type of fracture. Probabilities were estimated from Curtis et al. ,226 who used CPRD data to look at trends in fracture rates in the UK over a 24-year period from 1988 to 2012. 226 The rates of hip, clinical vertebral and carpus (wrist) fractures found among those aged 18–49 and ≥ 50 years are shown in Appendix 27, Table 66.
For the cost associated with hip fractures, Leal et al. 227 estimated hospital costs up to 2 years post fracture using a cohort of 33,152 patients aged > 60 years admitted with a hip fracture in a UK region between 2003 and 2013 who were identified from hospital records and followed until death or administrative censoring. The mean censor-adjusted 2-year hospital cost after index hip fracture was £16,302 (95% CI £16,097 to £16,515). 227 For costs associated with vertebral and wrist fractures, we used estimates from Dolan and Torgerson,228 who estimated the cost per annum to be £468 per wrist fracture and £479 per vertebral fracture. These were based on health and social care costs of fractures among women aged ≥ 50 years in the UK using a variety of data sources including published estimates, a survey of resource use among fracture patients before and after hip fracture and a case–control study using the General Practice Research Database. All costs are inflated to 2021 prices using the Composite Price Index published by the Office for National Statistics. 229 The overall assumed annual cost of osteoporosis is shown in Appendix 27, Table 67. Uncertainty was included by fitting gamma distributions to the cost of hip, vertebral and wrist fractures, with the SE set to one-tenth of the mean. 212
The cost of IDA is only that related to over-the-counter iron tablets, which incur no NHS cost.
Utilities
The model includes health-state utility values associated with undiagnosed CD and diagnosed CD, and disutilities associated with osteoporosis and NHL. As explained, we assume that some proportion of diagnosed CD patients will adhere to a gluten-free diet, so utilities for diagnosed CD should represent this mixed population. We assumed that the health-state utilities for osteoporosis and NHL are the same as for the general (i.e. not CD-specific) population. The model also includes disutilities associated with the biopsy procedure, with the waiting time associated with a biopsy and with a lifetime false-positive diagnosis.
Quality-adjusted life-year norms for the UK are used to reflect background age-specific quality of life, which decreases naturally with age. All state QALYs are multiplied by their norms to reflect this age reduction. The values used, sourced from Janssen and Szende,230 are shown in Appendix 28, Table 68.
The utility values for undiagnosed CD and diagnosed CD were sourced from Violato and Gray. 231 The values are based on 1584 EuroQol-5 Dimensions, three-level version (EQ-5D-3L), questionnaires retrospectively completed by people with CD in the UK. Participants rated their health using the validated questionnaire before and after their diagnosis. Not all of the diagnosed cohort adhered perfectly to a gluten-free diet, with 90.8% reporting adherence all of the time, 8.3% most of the time and 0.9% some/little/none of the time. The estimated utility values for diagnosed CD and undiagnosed CD were 0.65 (95% CI 0.63 to 0.67) and 0.85 (95% CI 0.84 to 0.86), respectively, in the total sample. In the subgroup aged < 18 years, the values were 0.57 (95% CI 0.51 to 0.64) for undiagnosed CD and 0.88 (95% CI 0.85 to 0.92) for diagnosed CD on gluten-free diet. An alternative source for utility in diagnosed and undiagnosed CD was identified in Casellas et al. ,232 who carried out a prospective study of 163 CD patients on a gluten-free diet and 177 newly diagnosed CD patients on a normal diet from seven hospitals in different areas of Spain, with all completing the EuroQol-5 Dimensions (EQ-5D). A similar pattern was found to our selected source, with the median EQ-5D value being 0.93 (95% CI 0.85 to 1.0) among gluten-free diet patients and 0.72 (95% CI 0.58 to 1.0) in the normal diet group.
For osteoporosis, a similar approach is taken as with costs, with total disutility being equal to the annual probability of hip, vertebral and wrist fractures multiplied by the disutility associated with each type of fracture. The results are presented in Appendix 28, Table 69. These disutilities are estimated from the Si et al. 233 study, which was a systematic review and meta-analysis of 62 studies reporting utility-based quality of life for osteoporosis-related conditions. Most of the studies used EQ-5D health-state utility values, followed by a visual analogue scale. Si et al. 233 calculated utilities for the first year after hip, vertebral and wrist fractures as 0.59 (95% CI 0.54 to 0.65), 0.55 (95% CI 0.50 to 0.60) and 0.78 (95% CI 0.72 to 0.84), respectively. These utilities are subtracted from the UK population norm of 0.817 for the group aged 55–64 years. Uncertainty was modelled by moment-matching beta distributions to the hip, vertebral and wrist fracture disutilities, with the SE for each set to one-tenth of their means. 212
The utility associated with NHL is based on an observational cross-sectional comparative study carried out by Fargier et al. 234 in three French teaching hospitals. In this study, 73 patients with follicular lymphoma were receiving either subcutaneous or intravenous rituximab maintenance monotherapy (73% as first-line treatment, 21% as second-line treatment and 6% as third-line treatment). Health-related quality of life was evaluated using the French version of the self-administered EQ-5D-3L questionnaire. The aim was to compare the impact of using subcutaneous rituximab with that of using intravenous rituximab as maintenance therapy. The mean EQ-5D score was 0.8 for intravenous rituximab and 0.7 for subcutaneous rituximab. 234 The average of these two values is subtracted from the French EQ-5D population norm for people in the 55–64 years age group (0.836230), giving a disutility of 0.086. The upper and lower bounds, of 0.8 (disutility 0.036) and 0.7 (disutility 0.136) respectively, are used to represent uncertainty in this parameter using a uniform distribution.
The disutility associated with a biopsy in adults is assumed to be equal to 1 quality-adjusted life-day. This is the same assumption made in the NICE model193 and aims to account for any anxiety associated with the biopsy as well as potential side effects. For children, the loss of 2 quality-adjusted life-days is assumed because of the need for general anaesthetic. The disutility associated with waiting for a biopsy is assumed to be equal to the difference between the utility of being diagnosed with CD and following a gluten-free diet and the utility of having undiagnosed CD. This disutility is assumed to last for 6 weeks in accordance with average waiting times for a biopsy.
In line with the NICE model,193 we assume an annual disutility for patients falsely diagnosed with CD of 0.009. This was based on an estimated change in social function score on the Short Form questionnaire-36 items of –8.3 (SE 3.83) and a mapping for this score to utility scale of 0.0011 (SE 0.0002). We modelled these uncertain factors with normal distributions and the mean of their product was –0.009 (SE 0.004). Note that we assume that any disutility from a gluten-free diet in the true CD population is captured by the Violato and Gray138 2019 survey.
For IDA, we assume that disutility is already captured in the utility values for undiagnosed CD and diagnosed CD sourced from Violato and Gray,138 as they reported that 64.8% of their population had anaemia prior to diagnosis and 14.5% after.
Probability of late detection of coeliac disease after false-negative diagnosis
All patients in the undiagnosed CD state have an annual probability of transitioning to the diagnosed CD state. Violato and Gray138 asked patients about the duration of their symptoms prior to diagnosis and found that the average duration was 12.8 years (SD 15.3 years), based on 1584 completed questionnaires. The average duration across the sample aged ‘< 18’ was shorter, at 3.3 years (SD 3.7 years). As our adult cohort begins at age 18 years, we need the time to diagnosis only as an adult. We use these figures to calculate this average duration in patients aged > 18 years of 10.9 [(12.8 – 3.3) × proportion aged < 18 years) × (proportion aged > 18 years ÷ 1584)]. Although our children cohort begins age 10 years, it was not reported what proportion of patients were under the age of 10 years, so the ‘< 18’ years figure had to be used. We model the average duration as a log-normal distribution moment matched to the reported mean and SE calculated using SD and sample size. Assuming a constant rate, λ, of diagnosis (i.e. an exponential survival model), the rate is the inverse of the sampled duration. This is used to calculate an annual probability of diagnosis by year of 1 – e–λt.
Risk of developing osteoporosis, iron-deficiency anaemia and non-Hodgkin lymphoma
Patients who are diagnosed have a lower risk of developing long-term complications than patients who are undiagnosed, owing to the greater likelihood of following a gluten-free diet and receiving improved care and medical advice. To inform the risk of developing long-term complications, we use rates in non-CD patients estimated using CPRD data (full details are in Report Supplementary Material 1, chapter 8), differences in rates between this general population and patients who are diagnosed with CD, and differences in rates between the general population and those with undiagnosed CD. Evidence on these differences primarily comes from the NICE 2015 model. 193 In each case, the literature was searched for more recent or higher-quality studies, but none was identified.
The NICE model193 based the risk of developing osteoporosis when following a gluten-free diet on Swedish data from a study by Ludvigsson et al. ,235 which comprised > 13,000 people diagnosed with CD and compared this group with a matched control group. This study did not distinguish between patients diagnosed with CD and on a gluten-free diet and those diagnosed but not on a gluten-free diet, so it represents our merged diagnosed CD state. The study reported an odds ratio of fractures of any type in the diagnosed CD population, compared with the controls, of 1.40 (95% CI 1.30 to 1.50). The NICE model193 based the risk of developing osteoporosis when not following a gluten-free diet on a study by Godfrey et al. ,236 who tested blood samples for CD and compared the medical records of 129 US people with not diagnosed with CD, but with positive coeliac serology, with those of seronegative individuals. They found an odds ratio for developing osteoporosis of 2.59 (95% CI 1.32 to 5.09) in the undiagnosed CD group, compared with those without CD, and this is the ratio we used in our model. This finding contradicts that of Ludvigsson et al. ,235 who found no association between date of diagnosis, used as a proxy for initiating gluten-free diet, and risk of osteoporosis. However, Ludvigsson et al. 235 did not have data on adherence to gluten-free diet in either diagnosed or undiagnosed states, and so is confounded in comparison with Godfrey et al. 236
The NICE model193 based the probability of patients developing NHL from CD when not on a gluten-free diet on a study of 1968 previously undiagnosed patients who were subsequently diagnosed with CD at 20 Italian gastroenterology referral centres. 237 The incidence ratio of NHL in the population with undiagnosed CD compared with the general population was found to be 4.7 (95% CI 2.9 to 7.3). The incidence ratio of NHL in the population with diagnosed CD (3.28, 95% CI 1.49 to 6.28), relative to the general population, was based on an analysis of a cohort of patients with diagnosed CD from a linked statistical database of hospital and mortality data in an area in southern England. 238
Normal distributions were used to model the log-odds ratios and incidence ratios of osteoporosis and NHL, respectively (i.e. log-normal distributions). We added these log ratios to the log of rates of developing long-term conditions among control (i.e. non-CD) patients from our CPRD analysis (Table 16). Rates were calculated from the number of outcome events divided by the person-time at risk stratified by decile of age at index date (date of CD diagnosis in matched case) for osteoporosis and IDA. For NHL we grouped patients into those aged < 18 years and those aged ≥ 18 years because of limited sample size. Time at risk was calculated from a patient’s index date to date of outcome event, date of death or the end date of HES coverage. The rates were used to calculate the annual probabilities of developing the conditions, with uncertainty based on a log-normal distribution of the rates mapped to a log scale, consistent with the ratios for osteoporosis and NHL.
| Age group (years) | Rate (95% CI) | ||
|---|---|---|---|
| Mixed gender | Men | Women | |
| NHL | |||
| < 18 | 0.03 (0.01 to 0.07) | 0.02 (0.01 to 0.09) | 0.04 (0.01 to 0.12) |
| ≥ 18 | 0.28 (0.25 to 0.32) | 0.30 (0.26 to 0.35) | 0.27 (0.23 to 0.32) |
| Osteoporosis | |||
| 0–9 | 0.02 (0.01 to 0.09) | 0.02 (0.00 to 0.15) | 0.02 (0.00 to 0.17) |
| 10–19 | 0.03 (0.01 to 0.10) | 0.04 (0.01 to 0.15) | 0.03 (0.00 to 0.18) |
| 20–29 | 0.16 (0.11 to 0.25) | 0.10 (0.05 to 0.21) | 0.24 (0.14 to 0.41) |
| 30–39 | 0.42 (0.34 to 0.52) | 0.17 (0.10 to 0.27) | 0.66 (0.52 to 0.83) |
| 40–49 | 1.40 (1.20 to 1.50) | 0.55 (0.43 to 0.70) | 2.20 (1.90 to 2.50) |
| 50–59 | 3.90 (3.60 to 4.20) | 1.20 (1.00 to 1.50) | 6.60 (6.10 to 7.10) |
| 60–69 | 7.50 (7.00 to 7.90) | 2.70 (2.30 to 3.10) | 12.00 (11.00 to 13.00) |
| 70–79 | 13.00 (12.00 to 14.00) | 4.80 (4.10 to 5.60) | 20.00 (19.00 to 22.00) |
| 80–89 | 21.00 (19.00 to 23.00) | 9.60 (7.50 to 12.00) | 29.00 (26.00 to 33.00) |
| 90–99 | 27.00 (19.00 to 38.00) | 5.90 (1.50 to 24.00) | 36.00 (25.00 to 51.00) |
Assuming that events occur at a constant rate r per unit of time t, the probability that an event will occur during time t is given by p = 1 –ert, equivalent to an exponential survival distribution. 239
Mortality
Mortality in the model is assumed to be equal to general population mortality, with excess mortality assigned to those patients who develop NHL or osteoporosis. Mortality in the general population came from the 2019 Office for National Statistics life tables. 240
Mortality from NHL is based on data from the Office for National Statistics on adults diagnosed with NHL between 2013 and 2017, which show that 1-year survival is 79.4% (95% CI 79.0% to 79.7%), 5-year survival is 65.6% (95% CI 65.0% to 66.3%) and 10-year survival is 54.7% (95% CI 53.2% to 56.3%). 241 The Markov model cannot allow the probability of NHL mortality to change over time, as patients may enter the NHL state at different times. These estimates are therefore used to calculate a single annual probability capturing average survival.
This synthesis was performed in the Bayesian software OpenBUGS. 242 We first converted observed probabilities to hazards under the assumption of constant hazards, using the following equation:
These hazards, ht, were then converted to a natural log scale (log-hazard yt) and the upper and lower bounds of the 95% reference range were used to estimate the SE (SEt) by assuming normality via the central limit theorem. We then treated them as independent observations of a common log-hazard λ:
with a vague prior distribution:
We fit this model in OpenBUGS using two chains, 50,000 burn-in iterations and 10,000 sampling iterations. This gave a posterior mean for λ of –2.092 (SE 0.006378). These are used in the economic model by sampling from a normal distribution with mean –2.092 and SD 0.006378.
This has the limitation that the hazards are changing over time (Table 17). This overestimates the hazard in later years and underestimates it in earlier years, but is the closest approximation possible. This is a necessary assumption for a cohort Markov model and, owing to the rarity of NHL, is unlikely to affect the conclusions.
| Year | Probability survival (95% reference range) | Hazard (95% reference range) | Log-hazard (SE) |
|---|---|---|---|
| 1 | 0.794 (0.79 to 0.797) | 0.231 (0.227 to 0.236) | –1.467 (0.00973) |
| 5 | 0.656 (0.650 to 0.663) | 0.084 (0.632 to 0.657) | –2.473 (0.009661) |
| 10 | 0.547 (0.532 to 0.653) | 0.06 (1.08 to 1.154) | –2.808 (0.016893) |
For mortality from hip fracture, we used the study by Klop et al. ,243 which used CPRD data to examine all-cause and cause-specific mortality post hip fracture among 31,495 patients with a first hip fracture, compared with general population mortality, from 2000 to 2010. The mean age was 74.1 ± 14.8 years for male hip fracture patients and 80.5 ± 10.5 years for female hip fracture patients. During the total study period, the hazard ratio for 1-year all-cause mortality was 3.5 times (95% CI 3.28 to 3.74 times) greater for male hip fracture patients than for control subjects after adjustment for age, comorbidities, medication use and lifestyle factors. For female patients, this risk was 2.4-fold (95% CI 2.31- to 2.50-fold) greater than that of controls.
Table of model inputs
A summary of all input parameters, assumed distributions and evidence sources is provided in Table 18.
| Parameter | Estimate | Distribution | Source |
|---|---|---|---|
| Decision tree and Markov initial probabilities | |||
| Probability of late detection of CD after FN diagnosis | Mean time (years) to diagnosis:
|
Normal | Violato et al.231 |
| Probability that confirmatory biopsy needed, mean (minimum, maximum) | 0.7 (0.6, 0.8) | Uniform | Studies on percentage needing biopsy.70,89,220,221 The 60% lower bound is based on the findings of a retrospective analysis of 270 adult patients89 |
| Proportion with osteoporosis, NHL or IDA at diagnosis | Age dependent (see table S13 in Report Supplementary Material 1) | Independent beta for each condition | CPRD age- and gender-stratified prevalence |
| Diagnostic accuracy of tests from Chapters 5 and 6 | |||
| Costs | |||
| Unit cost of IgA EMA test | £14.92 (SE £1.87) | Gamma | Personal communication with various laboratories offering CD testing in the UK |
| Unit cost of IgA tTG test | £10.77 (SE £2.15) | Gamma | Personal communication with various laboratories offering CD testing in the UK |
| Unit cost of HLA test | £122.34 (SE £24.47) | Gamma | Personal communication with various laboratories offering CD testing in the UK |
| Endoscopic biopsy, adults: diagnostic endoscopic upper GI tract procedures with biopsy, aged ≥ 19 years | £530 | Fixed | NHS reference costs (2018/19)222 FE21Z |
| Endoscopic biopsy, children: endoscopic or intermediate, upper GI tract procedures, aged between 5 and 18 years | £823 | Fixed | NHS reference costs (2018/19)222 FE23C |
| Other diagnosis costs (e.g. nurse, GP, gastroenterologist, dietitian appointments) | £379.27 (SE £37.93) | Gamma | NHS reference costs (2018/19),222 Unit Costs of Health and Social Care 2020223 |
| Annual health-care resource use costs by diagnosis – TP | Gamma | CPRD analysis based on update of Violato et al.50 | |
| Annual health-care resource use costs by diagnosis – FN | Gamma | CPRD analysis based on update of Violato et al.50 | |
| Treatment for NHL | £18,396 (95% CI £18,377 to £18,415) | Log-normal | Wang et al.224 One-off lifetime cost of treatment |
| Osteoporosis | £39.04 (SE £0.27) | Weighted average of gamma distributions (see Appendix 27, Table 67) | Curtis et al.,226 Leal et al.227 and Dolan and Torgerson228 |
| Anaemia | £0 under NHS (£17.89 if counting over-the-counter expenses) | Fixed | Cost of over-the-counter iron tablets. Costed as 200 mg of ferrous sulfate tablet twice per day; 1000-tablet pack = £17.89, BNF 2020244 |
| Utilities | |||
| Diagnosed CD |
|
Beta | Violato et al 2019231 |
| Undiagnosed CD |
|
Beta | Violato et al 2019231 |
| Osteoporosis (annual disutility) | 0.0008 (SE 0.000067) | Weighted average of beta distributions (see Appendix 27, Table 69) | Si et al.233 and Curtis et al.226 |
| NHL (annual disutility) | 0.086 (95% CI 0.036 to 0.136) | Uniform | Fargier et al.234 |
| Disutility associated with biopsy in adults | –0.003 (95% CI –0.005 to 0) | Triangular | NICE guideline193 |
| Disutility associated with biopsy in children | –0.006 (95% CI –0.010 to 0) | Triangular | NICE guideline193 |
| Disutility associated with waiting for a biopsy | –0.023 (95% CrI –0.0232 to –0.0227) | Combination | Assumed equal to difference between utility diagnosed CD and utility undiagnosed CD for 6 weeks |
| Disutility associated with false-positive diagnosis | –0.009 (SE 0.004) | Product of a normal distribution with a mean of –8.3 and a SE of 3.83, and a normal distribution with a mean of 0.0011 and a SE of 0.0002 | NICE guideline combination of social function and mapping to utility score193 |
| Disutility associated with anaemia | 0 | Fixed | Assumed already captured in overall health-state utility values |
| Transition probabilities | |||
| Probability of developing osteoporosis with undiagnosed CD | OR vs. general population, 2.59 (95% CI 1.32 to 5.09) | Log-normal on both OR and general population rate |
|
| General population rates in Table 16 | |||
| Probability of developing osteoporosis with diagnosed CD | OR vs. general population, 1.40 (95% CI 1.30 to 1.50) | Log-normal on both OR and general population rate |
|
| General population rates in Table 16 | |||
| Probability of developing NHL with undiagnosed CD | Incidence ratio vs. general population, 4.7 (95% CI 2.9 to 7.3) | Log-normal on both OR and general population rate |
|
| General population rates in Table 16, and in tables s14–16 (see Report Supplementary Material 1) | |||
| Probability of developing NHL with diagnosed CD | Incidence ratio vs. general population, 3.28 (95% CI 1.49 to 6.28) | Log-normal on both OR and general population rate |
|
| General population rates in Table 16 | |||
| Mortality probability from osteoporosis | Hazard ratio 3.5 (95% CI 3.28 to 3.74) times greater for male hip fracture patients than for controls and 2.4 (95% CI 2.31 to 2.50) times greater for female patients than for controls | Normal distributions on log-hazard ratios | Klop et al.243 |
| Mortality probability from NHL | Log-hazard 2.092 (SD 0.006378) | Normal | Office for National Statistics 2018241 |
Analyses
Cost–benefit analysis to identify the optimal screening strategy
The objective of the model was to calculate the expected costs and health outcomes over a patient’s lifetime for all screening strategies. Risk prediction strategies with sensitivity and specificity combinations of 0.5, 0.6, 0.7, 0.8, 0.9 and 1.0 were explored, followed by serological testing alone (IgA tTG alone, IgA tTG plus IgA EMA, and IgA EMA alone), combination of serological testing with genetic testing (HLA before or after the three serological testing strategies, with double-testing only for those with a 90% post-test probability after the first test) and no screening (routine diagnosis only) in adult men, adult women and children. Half-cycle corrections are applied to the Markov model; costs and QALYs were discounted at 3.5%, as recommended by NICE. 245 The analysis was fully probabilistic, with 1000 samples being generated for each population; no deterministic results are presented as the Markov model is non-linear. 246
The total costs and QALYs were calculated for each of these strategies, along with the net benefit at £20,000 per QALY (i.e. total QALYs multiplied by £20,000 per QALY minus the total costs). Incremental costs, QALYs and net benefit were calculated relative to no screening. The probabilistic samples were summarised by their means and Bayesian 95% CrIs. The probability of each decision being cost-effective, compared with no screening, at £20,000 per QALY was calculated by counting the proportion of samples for which the incremental net benefit was positive.
Further investigation was conducted in the testing combinations (e.g. IgA EMA plus HLA or IgA tTG) with the greatest net benefit and probability of being cost-effective for each population. If cost-effectiveness was similar to that of other tests, IgA tTG alone was selected because of its greater availability in UK laboratories. 247 These testing combinations were applied to the risk prediction strategies identified in Table 5. These were strategies with pre-test probabilities for blood test of 1%, 1.5%, 2%, 5%, 10% and 20%, with implied sensitivities (i.e. proportion of those with CD who have the diagnostic indicator combination) and specificities (i.e. proportion of those without CD who would have the diagnostic indicator combination) that can be run through the economic model. The cost-effectiveness of these strategies of interest were compared by total costs, QALYs and net benefits. The probability that each strategy has the greatest net benefit at various willingness-to-pay thresholds was also plotted, which is the cost-effectiveness acceptability curve (CEAC).
Value-of-information analysis to identify further research priorities
Decision uncertainty was quantified using a value-of-information analysis following the best-practice recommendations of the International Society for Pharmacoeconomics and Outcomes Research. 248–250 The total decision uncertainty was quantified using the expected value of perfect information (EVPI), whereas decision uncertainty related to a single parameter, or subset of parameters, was quantified using the expected value of partial perfect information (EVPPI). The ratio of the EVPPI for each parameter to the total EVPI was calculated to represent the relative importance of each parameter. 251 Generalised additive models were used to approximate the EVPPI for each parameter when calculating ratios with the EVPI. 252,253 As the exact values of the EVPPI may not be reliable, the EVPPI for parameters and parameter sets of interest were further estimated using multilevel Monte Carlo (MLMC) methods. 254
The EVPI and the EVPPI are per person and must be scaled to the size of the population of interest. For CD, this is the total population of the UK, or 67,081,000 as of 2020. 255 It was assumed that 79% are aged ≥ 18 years and that 50% are female. 256 The prevalence of CD was taken as 1%. 2 This gives a total population of 263,465 for adult men or adult women, and 140,070 for children.
The EVPI and the EVPPI must also be summed, with discounting at 3.5%, over a ‘technology horizon’, which is the length of time for which the screening strategy recommendations are likely to remain relevant before newer testing techniques emerge. The technology horizon was conservatively set at 10 years. This gives a 10-year discounted total population of 2,267,824 for adult men or adult women, and of 1,205,679 for children.
The total population EVPI over 10 years was calculated. The total population EVPPI was also calculated for all utilities and disutilities, all rates of osteoporosis and NHL, all parameters related to a gluten-free diet (i.e. utility and effects of a gluten-free diet on NHL and osteoporosis rates), sensitivity and specificity of tests used in selected strategies of interest, and the probability of late diagnosis.
Software
The model was implemented in the R statistical programming language; the lower-level C/C± programming language was used for optimisation. This has well-documented advantages of efficiency, transparency and flexibility over the more commonly employed Microsoft Excel® (Microsoft Corporation). 257 The R package ‘Bayesian cost-effectiveness analysis’ (BCEA) was used to generate CEACs and estimate EVPPI via generalised additive models for individual parameters. The BCEA package was also used to plot the ratios of EVPPI to EVPI for each parameter using the info.rank() function.
Summary of modelling assumptions
A summary of modelling assumptions is provided in Table 19.
| Assumption | Justification |
|---|---|
| Biopsy is not associated with any major complications or death | No recent studies give evidence of major complications or death. One recent study of 13,233 patients undergoing outpatient OGD with biopsy over 5 years in the USA concluded that no patient was admitted because of complications.213 A small disutility associated with the procedure and waiting time for diagnosis is assumed |
| Biopsy is perfectly accurate | In reality, a biopsy will not always provide perfect results; however, it is the current gold standard and people are treated on the basis of their biopsy results. The 2015 NICE health economic analysis193 of screening strategies also made this assumption |
| It is assumed that the percentage of patients being diagnosed with CD after screening (i.e. initially missed) requiring a confirmatory biopsy before diagnosis is 70% | Based on clinical advice that 30%, with a plausible range, of patients diagnosed with CD do not require a confirmatory biopsy. This is in accordance with recent research indicating high diagnostic accuracy of tests alone70,89,220,221 |
| The only additional cost incurred by people with a false-positive diagnosis of CD is the cost of a gluten-free diet for a short period of time | Patients without CD who are screened for CD are assumed not to have costs or health outcomes that are different from those of other non-CD patients who were not screened for CD. As such, we model only the long-term consequences of patients who have CD (whether diagnosed or undiagnosed) |
| No further costs are incurred by people with a true-negative diagnosis | |
| NHL is associated with a one-off lifetime cost of £18,396 (95% CI £18,377 to £18,415) with a log-normal distribution | Treatment for NHL is usually complete within 5 years, with most costs estimated to fall within 5 years. The model was used to estimate the cost factors of different survival times when estimating the treatment costs, so patients would incur fewer costs if they died within a shorter time |
| Annual cost/disutility of osteoporosis is equal to annual probability of hip, vertebral and wrist fractures multiplied by cost/disutility of each type of fracture | This is the approach taken in the NICE model.193 The cost and disutility of osteoporosis mainly relates to the risk of fracture, of which hip, vertebral and wrist are common types |
| Treatment for IDA among CD patients is by over-the-counter iron tablets only. | This was based on clinical opinion |
| IDA disutility is already captured in utility values for undiagnosed CD/diagnosed CD sourced from Violato and Gray231 | Violato and Gray231 reported that 64.8% of their population had anaemia prior to diagnosis and 14.5% had anaemia after |
| Mortality in model is equal to general population mortality, with excess mortality assigned to patients who develop NHL or osteoporosis | |
| To get to a diagnosis of CD, a person’s first appointment is with either a nurse or a GP, with a 50% chance of this being with one or the other. This is followed by an appointment with a phlebotomist/nurse and then by another GP appointment. Following that, a patient has, on average, one gastroenterologist and two dietitian appointments before diagnosis | This was the most common route to diagnosis, as agreed by clinicians and patients on the research team |
Results
In this section we present all the results of the cost-effectiveness analysis of case-finding strategies for adult men, adult women and children.
Adult men
We first compared a range of combinations of sensitivities and specificities for a hypothetical diagnostic indicator (or indicator combinations) in population of the adult men. Figure 14 plots the incremental net benefit at £20,000 per QALY of each sensitivity/specificity combination of an indicator combined with each serological testing strategy, compared with no screening, among adult men. The central estimates are the mean incremental net benefit, with the upper and lower Crls represented by the upper and lower lines.
FIGURE 14.
Incremental net benefit at £20,000 per QALY, compared with no screening, at each combination of sensitivity (x-axis) and specificity (line colour) among adult men. (a) IgA EMA; (b) IgA tTG plus EMA; (c) IgA tTG; (d) IgA EMA plus HLA; (e) IgA tTG plus EMA plus HLA; (f) IgA tTG plus HLA; (g) HLA plus IgA EMA; (h) HLA plus IgA tTG plus EMA; and (i) HLA plus IgA tTG. Note that thick lines indicate the mean and narrow lines indicate the 95% CrI.
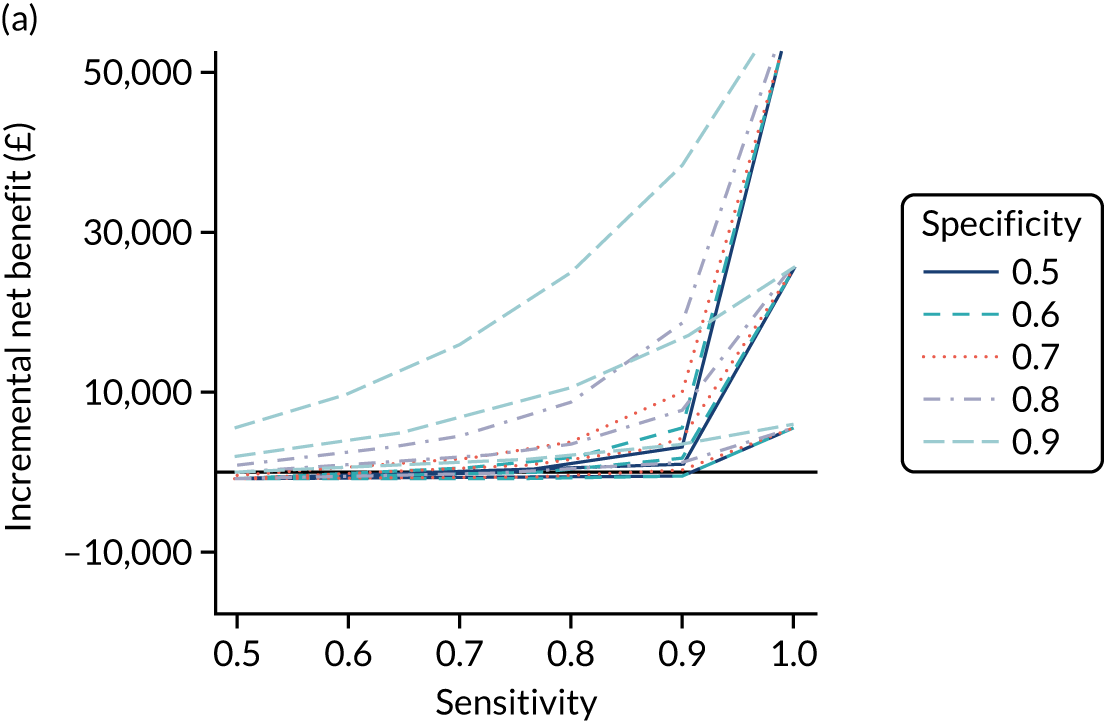
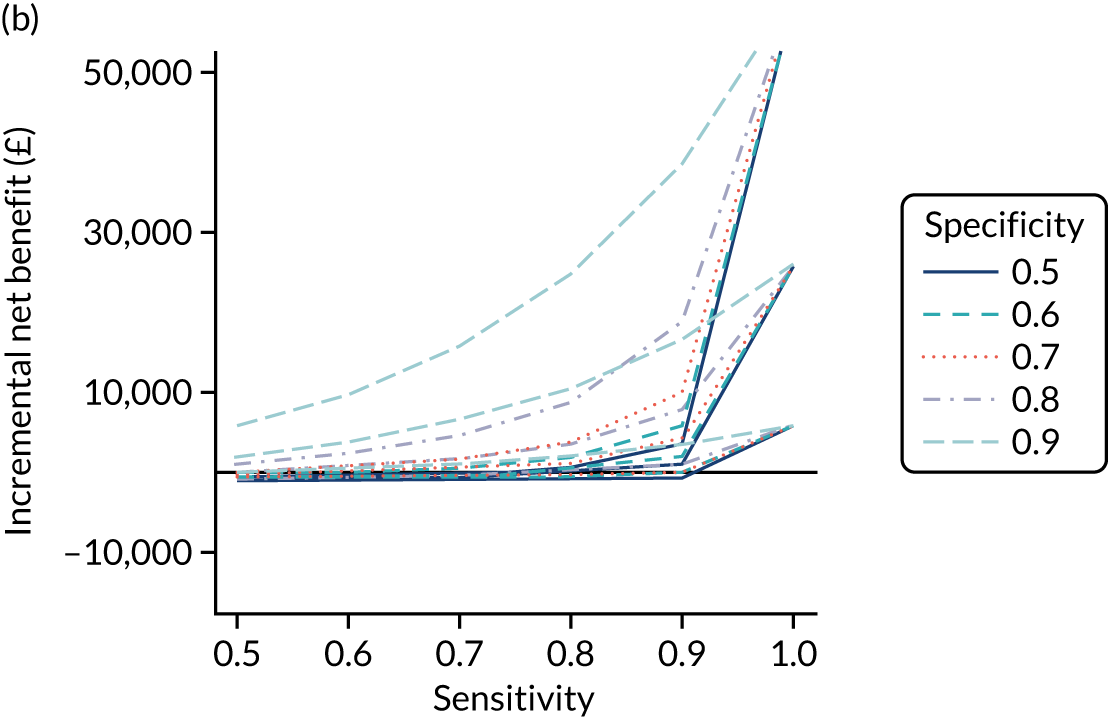
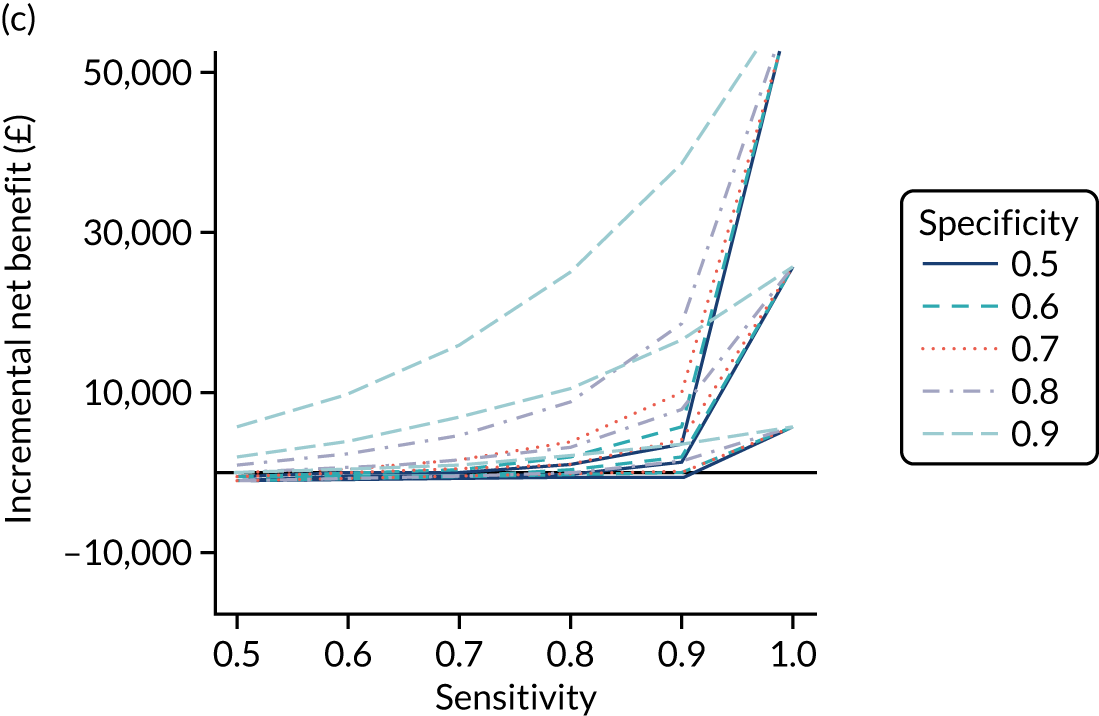
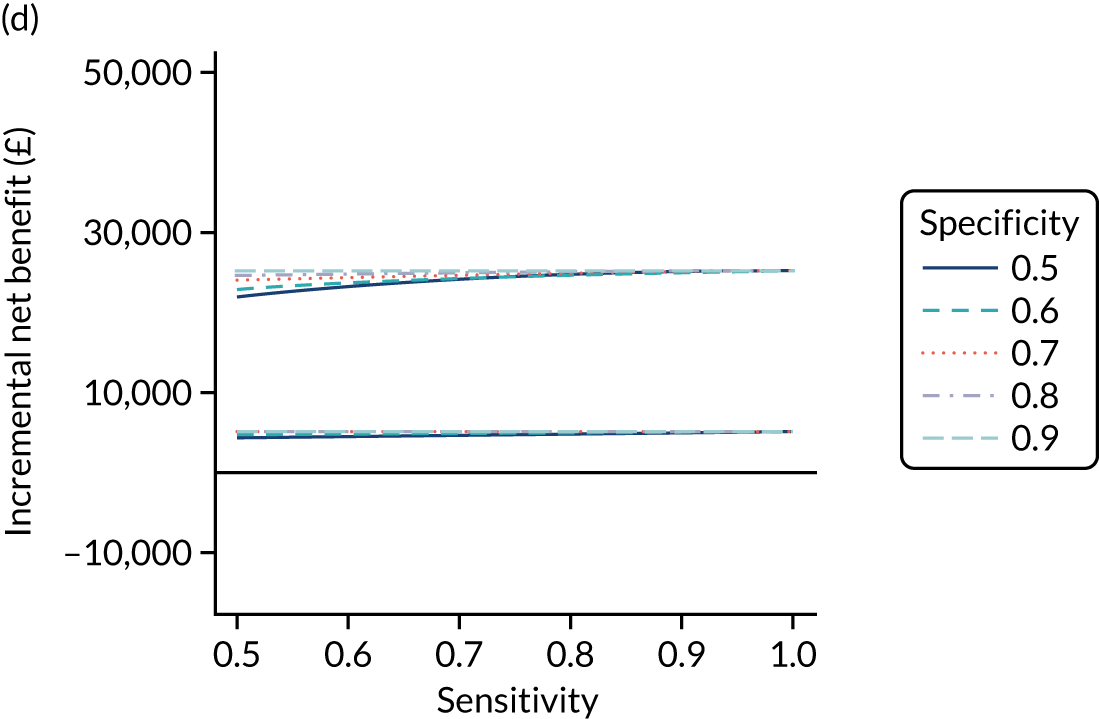
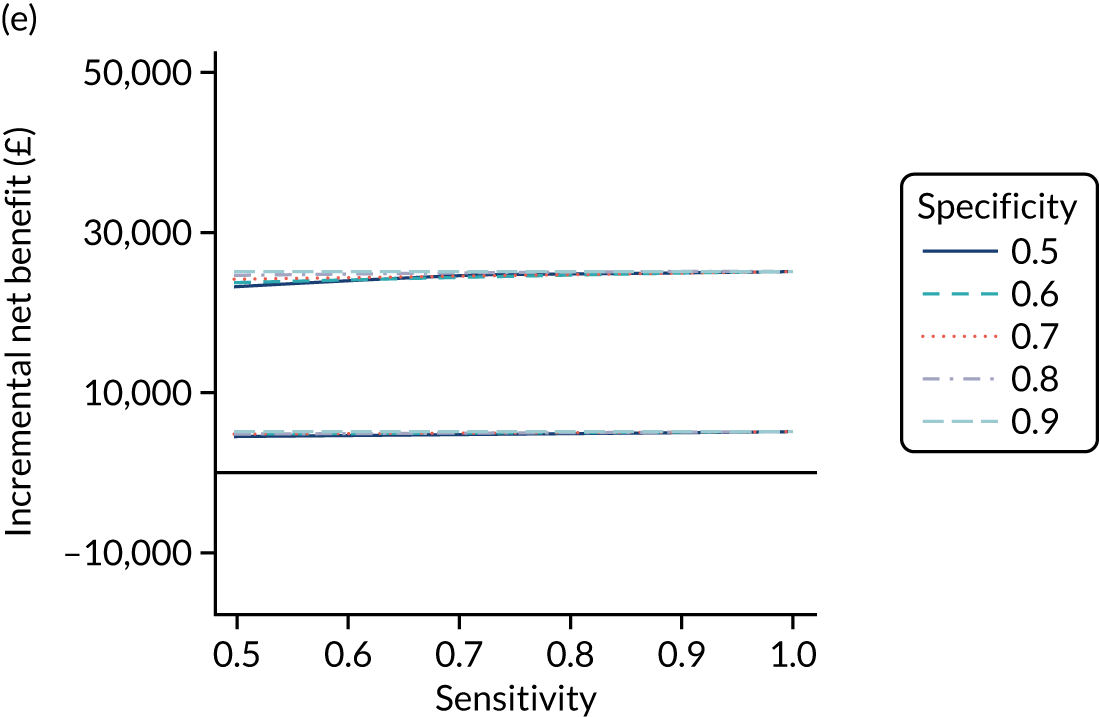
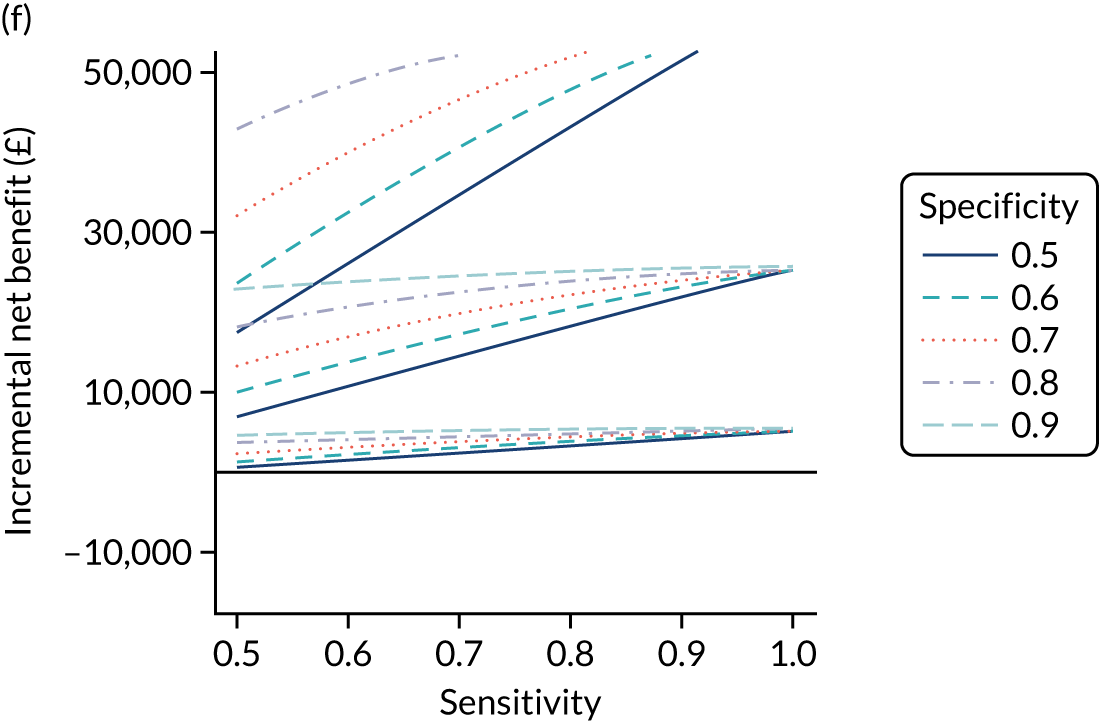
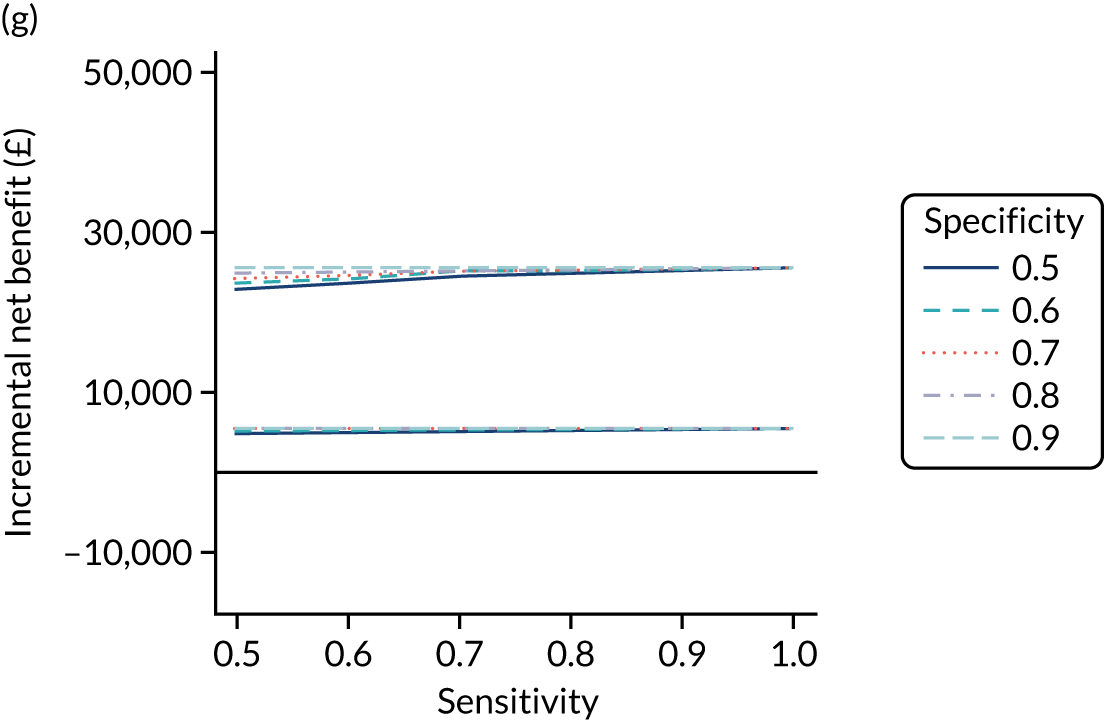
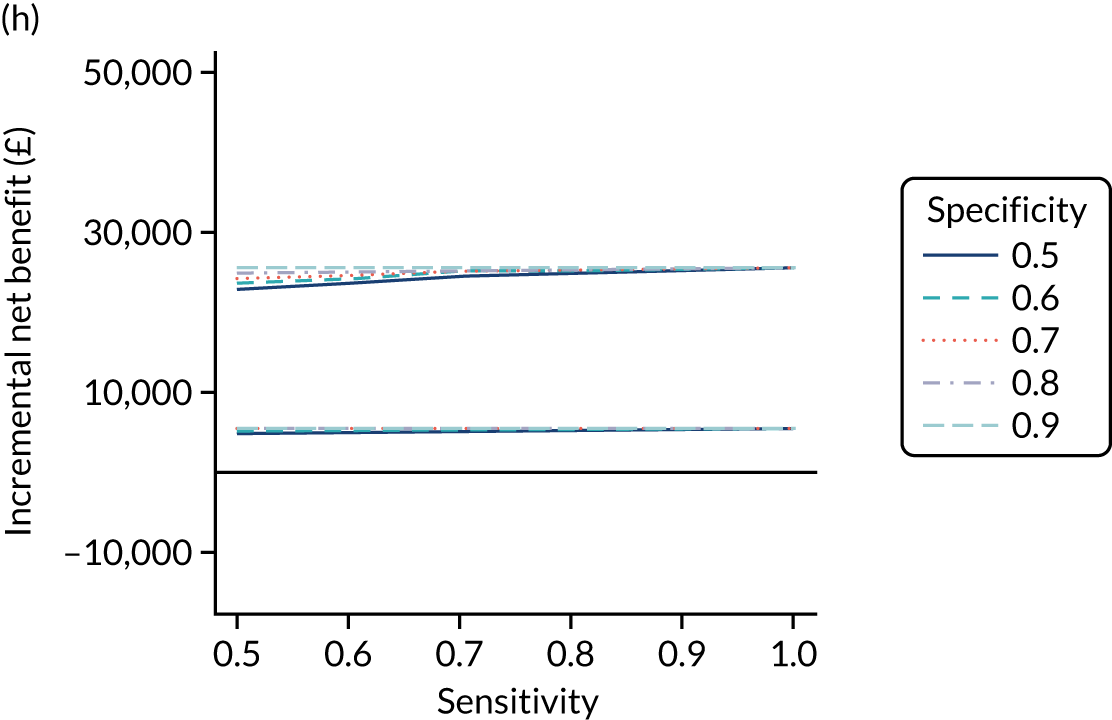
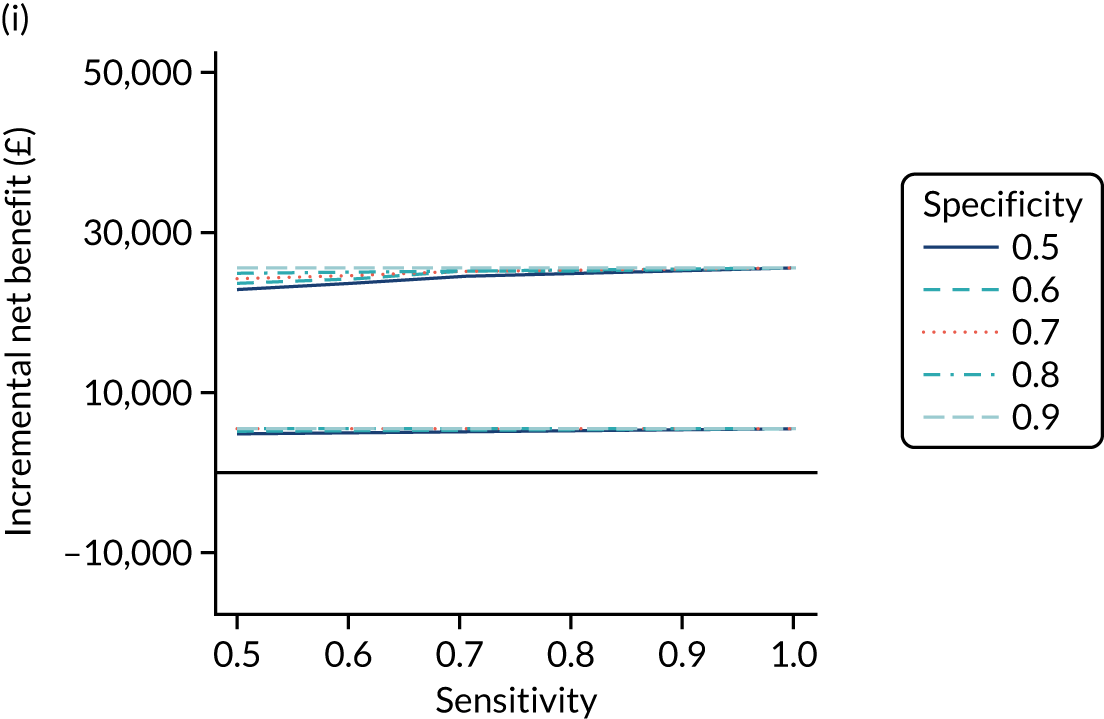
Figure 14 shows that, for strategies using only serological tests (i.e. without HLA), incremental net benefit is positive only when diagnostic indicator sensitivity is > 0.9 or both the specificity and sensitivity are > 0.8. For the serological tests including HLA, the incremental net benefit is positive regardless of the accuracy of the diagnostic indicator, although the lower limit of the 95% CrI shows that there is some uncertainty. The combinations using only the IgA EMA serological test plus HLA (i.e. IgA EMA plus HLA or HLA plus IgA EMA) are more cost-effective than strategies using IgA tTG plus HLA and comparable in cost-effectiveness to tests using all three of IgA EMA, IgA tTG and HLA. HLA being administered before or (as confirmation if post-test probability < 90%) after IgA EMA or IgA tTG plus EMA does not affect cost-effectiveness, but it is most cost-effective if used before IgA tTG.
Figure 15 plots the probability that each combination of diagnostic indicator sensitivity and specificity is cost-effective for each test combination at £20,000 per QALY (i.e. proportion of simulations having a positive incremental net benefit at £20,000 per QALY, compared with no screening). It again shows that the only strategies using serological tests alone that have a probability of > 50% of being cost-effective are those diagnostic indicators with a sensitivity of > 0.9 or both specificity and sensitivity of > 0.8. As expected, the combinations of tests with the highest probability of being cost-effective are those with a specificity of 0.9 and a sensitivity of 0.9 or 1. The serological tests including HLA have a high probability of being cost-effective regardless of the combination of sensitivity and specificity of the diagnostic indicator. Strategies using IgA EMA or IgA tTG alone with HLA have a probability of cost-effectiveness that is similar to that of combinations using all three of IgA EMA, HLA and IgA tTG.
FIGURE 15.
Probability of being cost-effective at £20,000 per QALY, compared with no screening, at each combination of sensitivity (x-axis) and specificity (line colour) among adult men. (a) IgA EMA; (b) IgA tTG plus EMA; (c) IgA tTG; (d) IgA EMA plus HLA; (e) IgA tTG plus EMA plus HLA; (f) IgA tTG plus HLA; (g) HLA plus IgA EMA; (h) HLA plus IgA tTG plus EMA; and (i) HLA plus IgA tTG.
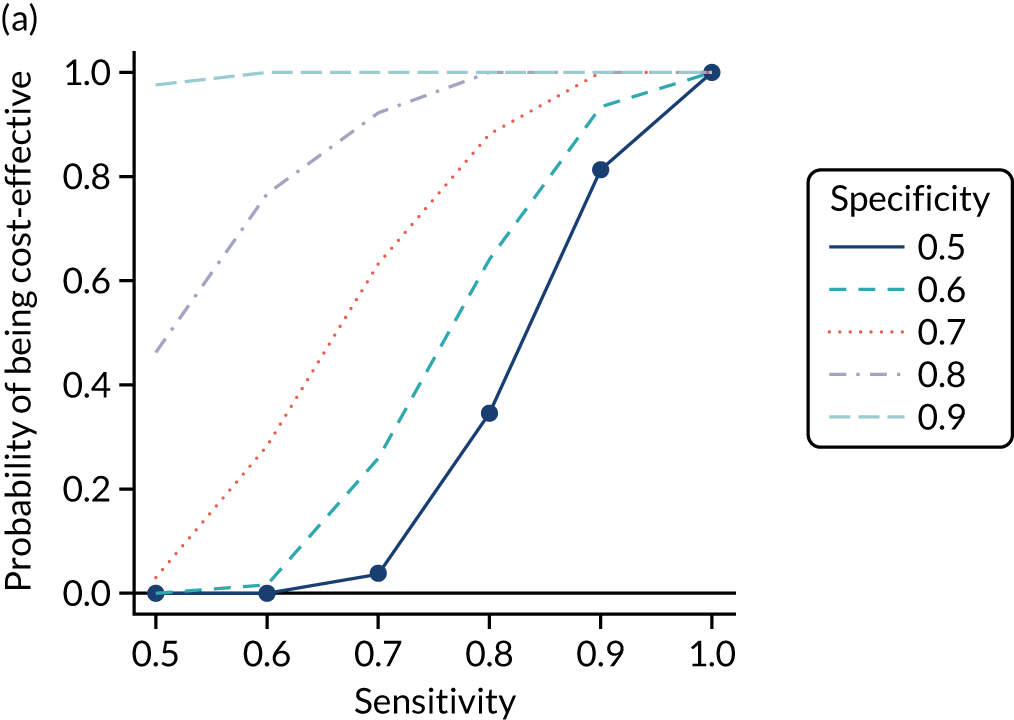
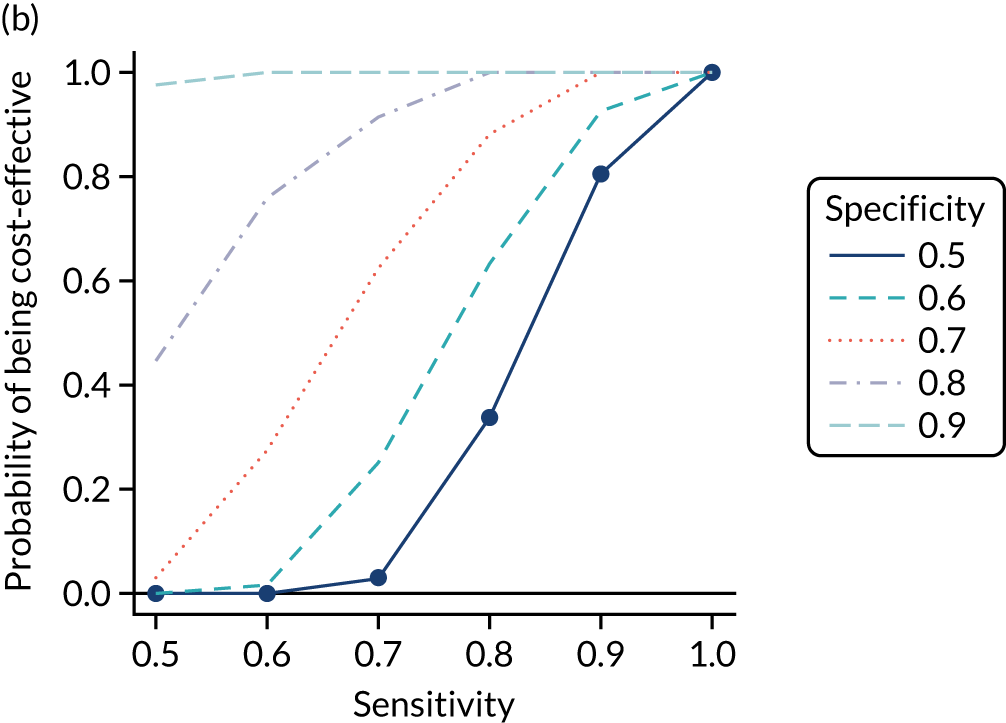
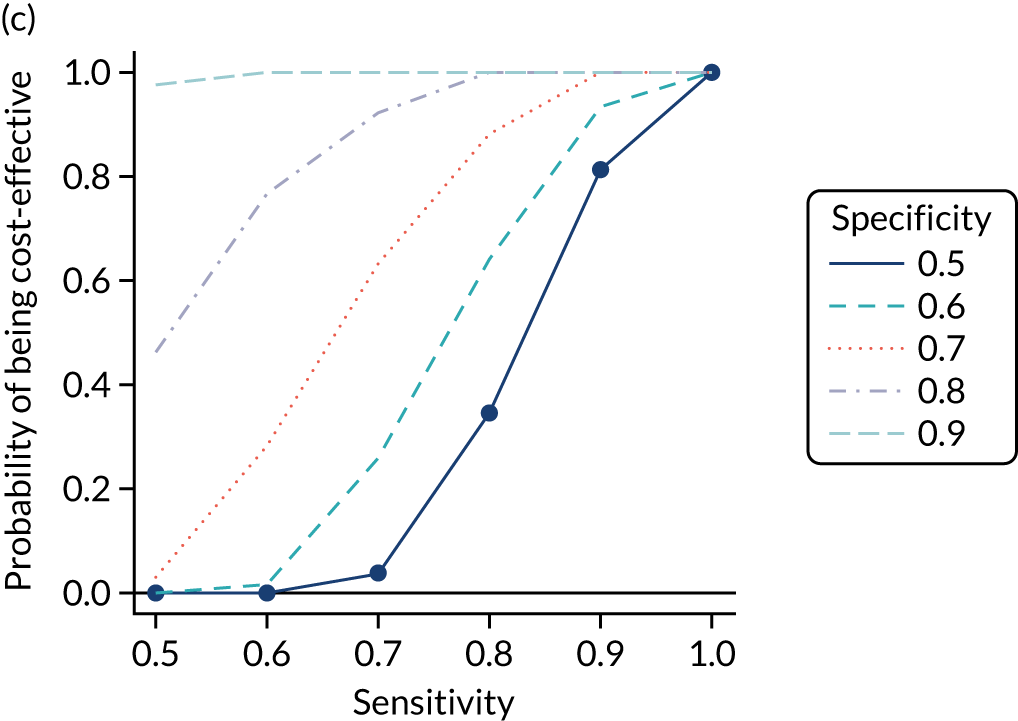
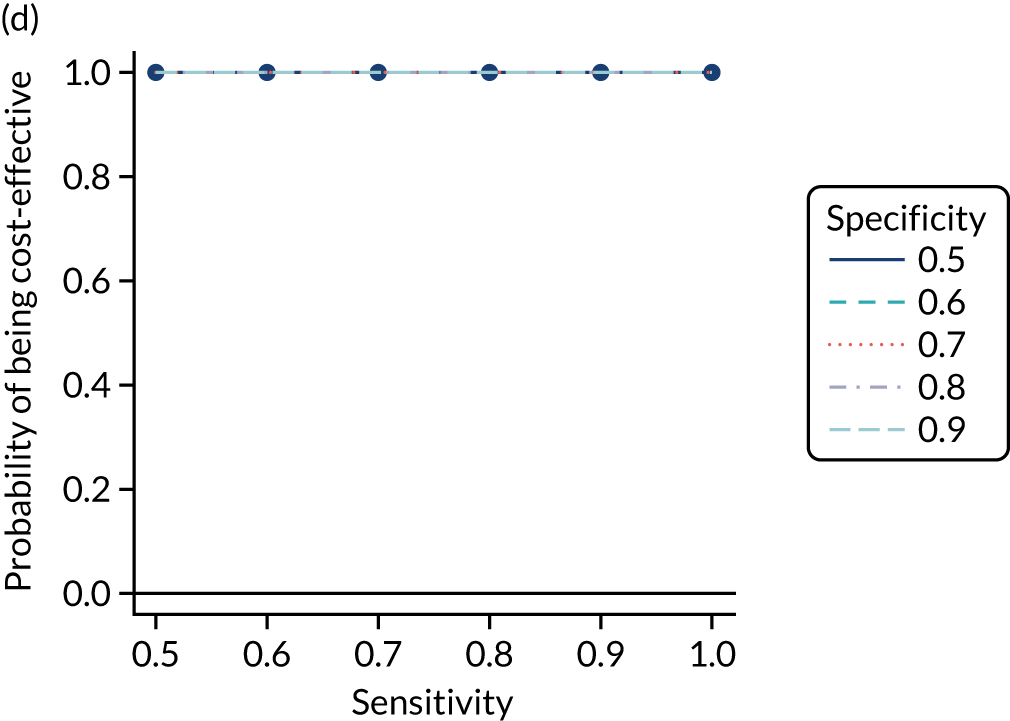
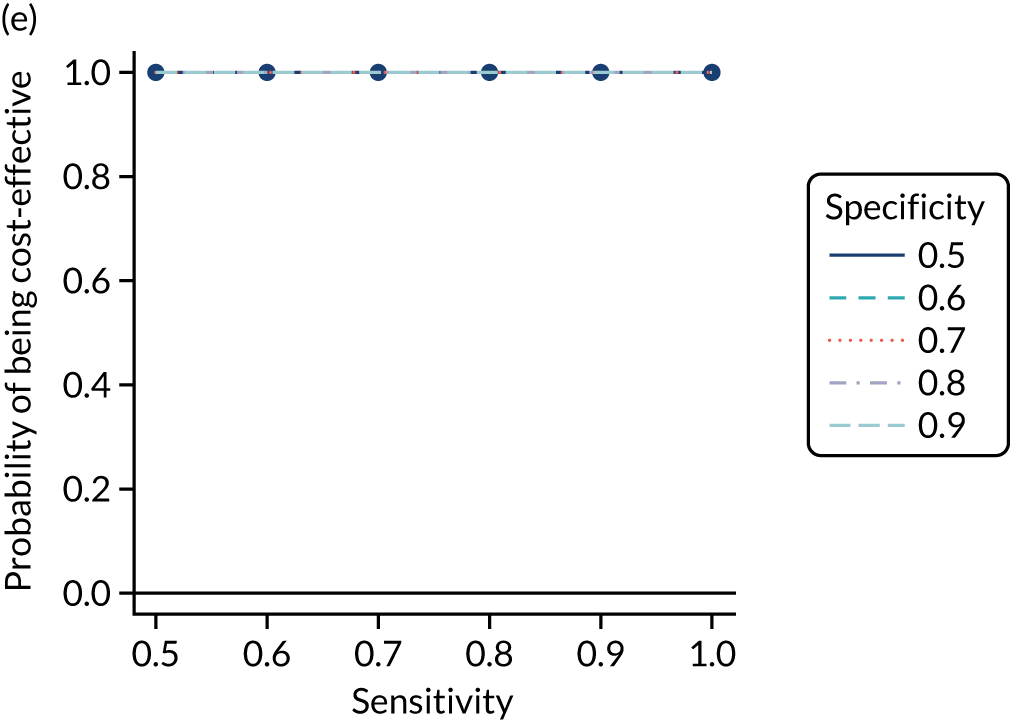
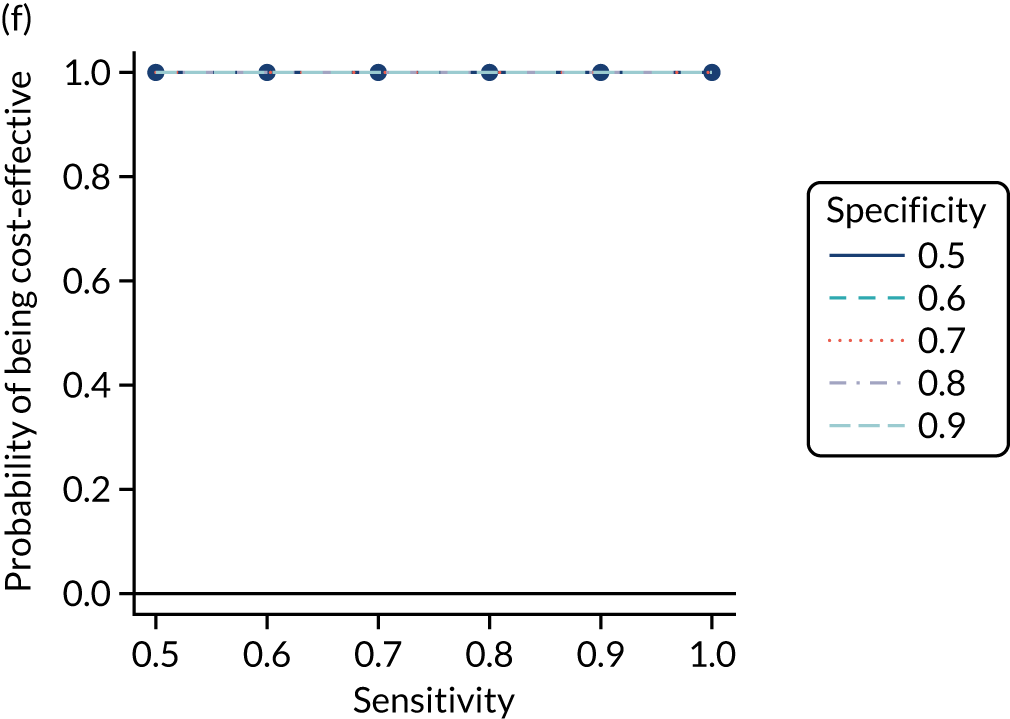
In general, strategies employing IgA tTG and IgA EMA have similar incremental net benefits and probabilities of being cost-effective; given the greater availability of IgA tTG in the UK, we chose this as one of our strategies of interest. 247 Although all strategies employing HLA have higher incremental net benefit and probability of cost-effectiveness, IgA tTG plus HLA performs worst. There is also limited benefit to adding IgA tTG to strategies using IgA EMA and HLA, and limited difference between using IgA EMA or HLA first, so we used IgA EMA followed by HLA for our second testing combination of interest. Again, owing to its wide availability and its having high incremental net benefit and probability of cost-effectiveness, we chose HLA plus IgA tTG as a final test of interest. These selections were combined with the risk prediction strategies of Table 5.
Table 20 shows the estimated costs, QALYs and incremental net benefit, compared with no screening, for each of these strategies of interest. All combinations have positive incremental net benefit compared with no screening. If using only the serological test IgA tTG, with a pre-test probability of 1%, it is the most cost-effective strategy (greatest incremental net benefit at £20,000 per QALY), with the highest costs but also the largest number of QALYs. The net benefits of the IgA EMA plus HLA and the HLA plus IgA tTG strategies are very similar to each other and to those of IgA tTG with a pre-test probability of 1%, and the 95% CrIs are completely overlapping. This indicates that there is little or no difference between these strategies in cost-effectiveness.
| Pre-test probability for blood test (%) | Sensitivity of indicator | Specificity of indicator | Strategy | Mean (95% Crl) | ||
|---|---|---|---|---|---|---|
| Costs (£) | QALYs | Incremental net benefit at £20,000 per QALY vs. no screening (£) | ||||
| No screening | 17,389 (14,011 to 19,332) | 18.31 (16.39 to 19.54) | 0 (0 to 0) | |||
| 1 | 1 | 0 | IgA tTG | 20,468 (20,152 to 20,778) | 19.68 (19.14 to 20.04) | 24,331 (5080 to 56,493) |
| 1.5 | 0.87 | 0.431 | IgA tTG | 18,325 (15,069 to 20,186) | 18.36 (16.52 to 19.56) | 161 (–676 to 1530) |
| 2 | 0.79 | 0.61 | IgA tTG | 18,236 (14,990 to 20,091) | 18.37 (16.53 to 19.56) | 355 (–549 to 1838) |
| 5 | 0.579 | 0.889 | IgA tTG | 18,270 (15,286 to 19,963) | 18.49 (16.83 to 19.6) | 2838 (187 to 7218) |
| 10 | 0.322 | 0.971 | IgA tTG | 18,567 (16,137 to 19,955) | 18.72 (17.37 to 19.66) | 7179 (1292 to 16,949) |
| 20 | 0.107 | 0.996 | IgA tTG | 19,267 (18,020 to 20,053) | 19.21 (18.43 to 19.82) | 16,114 (3482 to 37,161) |
| 1 | 1 | 0 | IgA EMA plus HLA | 20,841 (20,546 to 21,147) | 19.73 (19.19 to 20.1) | 25,060 (5050 to 58,568) |
| 1.5 | 0.87 | 0.431 | IgA EMA plus HLA | 20,535 (20,229 to 20,844) | 19.71 (19.17 to 20.08) | 24,884 (5204 to 57,564) |
| 2 | 0.79 | 0.61 | IgA EMA plus HLA | 20,430 (20,123 to 20,737) | 19.71 (19.17 to 20.08) | 24,981 (5300 to 57,672) |
| 5 | 0.579 | 0.889 | IgA EMA plus HLA | 20,330 (20,034 to 20,641) | 19.72 (19.18 to 20.09) | 25,262 (5415 to 58,394) |
| 10 | 0.322 | 0.971 | IgA EMA plus HLA | 20,350 (20,053 to 20,655) | 19.72 (19.18 to 20.09) | 25,237 (5331 to 58,488) |
| 20 | 0.107 | 0.996 | IgA EMA plus HLA | 20,412 (20,123 to 20,716) | 19.71 (19.18 to 20.09) | 25,135 (5186 to 58,444) |
| 1 | 1 | 0 | HLA plus IgA tTG | 20,837 (20,545 to 21,148) | 19.73 (19.19 to 20.1) | 25,059 (5055 to 58,561) |
| 1.5 | 0.87 | 0.431 | HLA plus IgA tTG | 20,541 (20,235 to 20,850) | 19.71 (19.18 to 20.08) | 24,957 (5217 to 57,825) |
| 2 | 0.79 | 0.61 | HLA plus IgA tTG | 20,437 (20,131 to 20,747) | 19.71 (19.18 to 20.08) | 25,048 (5311 to 57,918) |
| 5 | 0.579 | 0.889 | HLA plus IgA tTG | 20,338 (20,035 to 20,645) | 19.72 (19.18 to 20.09) | 25,273 (5409 to 58,467) |
| 10 | 0.322 | 0.971 | HLA plus IgA tTG | 20,358 (20,056 to 20,665) | 19.72 (19.18 to 20.09) | 25,231 (5316 to 58,506) |
| 20 | 0.107 | 0.996 | HLA plus IgA tTG | 20,417 (20,124 to 20,726) | 19.71 (19.18 to 20.09) | 25,126 (5176 to 58,438) |
Figure 16 plots the CEACs, which show the probability that each testing strategy is optimal (i.e. has the highest net benefit) at each willingness-to-pay threshold for an additional QALY. None of the probabilities is > 60%, suggesting limited certainty that any of the strategies is most cost-effective. At £10,000–30,000 per QALY, the strategy with greatest probability of being cost-effective is HLA plus IgA tTG at a pre-test probability of 5% (i.e. 5% HLA plus IgA tTG); above this range, 1% IgA EMA plus HLA has the greatest probability of being cost-effective. However, the CEAC does not account for the magnitude of differences between net benefits, which, as reported in Table 20, are negligible with overlapping 95% CrIs.
FIGURE 16.
Cost-effectiveness acceptability curves for strategies of interest for adult men.
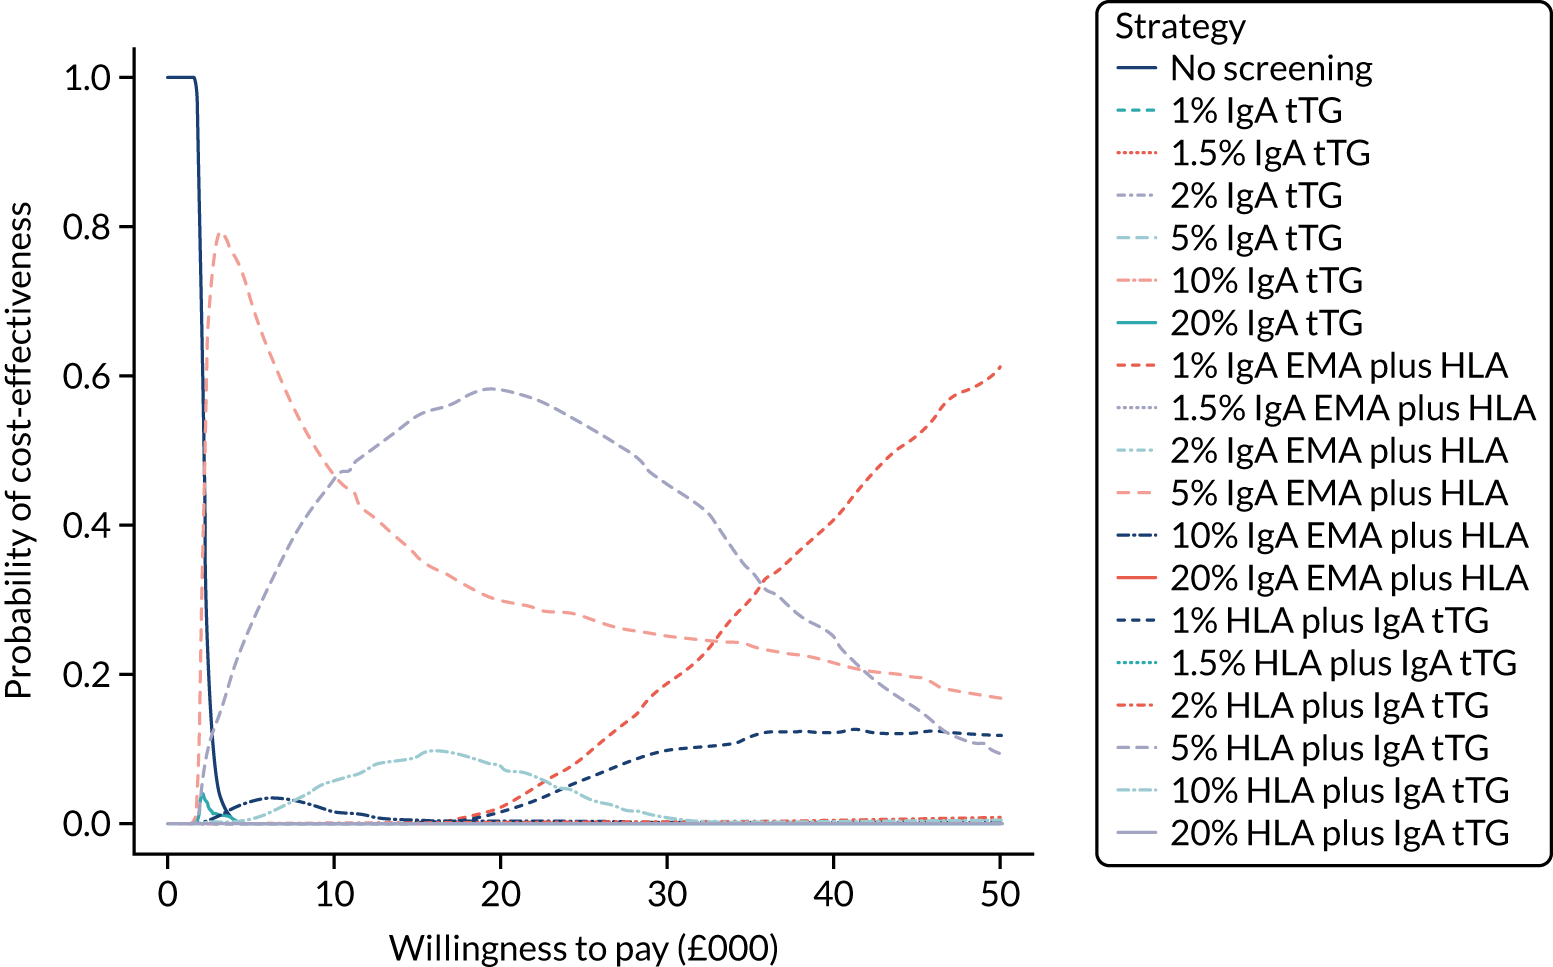
Table S19 (see Report Supplementary Material 1) provides the proportion of time spent in each state for adult men on the strategies of interest. Compared with other pre-test probability strategies with the same serological tests, the 1% IgA EMA strategy has the greatest proportion of time in the CD, gluten-free diet, no-complications state and the least time in the undiagnosed states. Osteoporosis appears to be the complication most patients spend time in, with NHL being up to six times less common. The HLA strategies have a greater proportion of time in the CD, gluten-free diet, no-complications state and less time in the undiagnosed states than any IgA EMA strategies. These strategies all have very similar proportions of time across the different pre-test probabilities, with only minor differences between the CD, gluten-free diet state and the undiagnosed CD, no-complications state. Overall, cost-effectiveness appears to be mostly driven by time spent in the CD, gluten-free diet, no-complications state; the CD, gluten-free diet, osteoporosis state; and the undiagnosed CD, osteoporosis state.
The ratio of EVPPI to EVPI for each parameter is illustrated in Figure 17. The probability of late diagnosis and the sensitivity of HLA testing are the most influential parameters. The impact of gluten-free diet on the probability of developing osteoporosis and the accuracy of IgA EMA testing have low influence, and all other parameters appear to have no influence, on the results.
FIGURE 17.
Ratio of EVPPI for each parameter to total EVPI among adult men. Only the 10 most influential parameters are included; the remaining parameters have minimal influence on the results. GFD, gluten-free diet; log_or_osteoporosis_noGFD, log-odds ratio of developing osteoporosis, not on a GFD, compared with being on a GFD; log_rr_NHL_noGFD, log-risk ratio of developing NHL, not on a GFD, compared with being on a GFD, for coeliac patients; probability_IDA_50, prevalence of IDA at age 50 years; probability_IDA_90, prevalence of IDA at age 90 years; sens, sensitivity; spec, specificity.
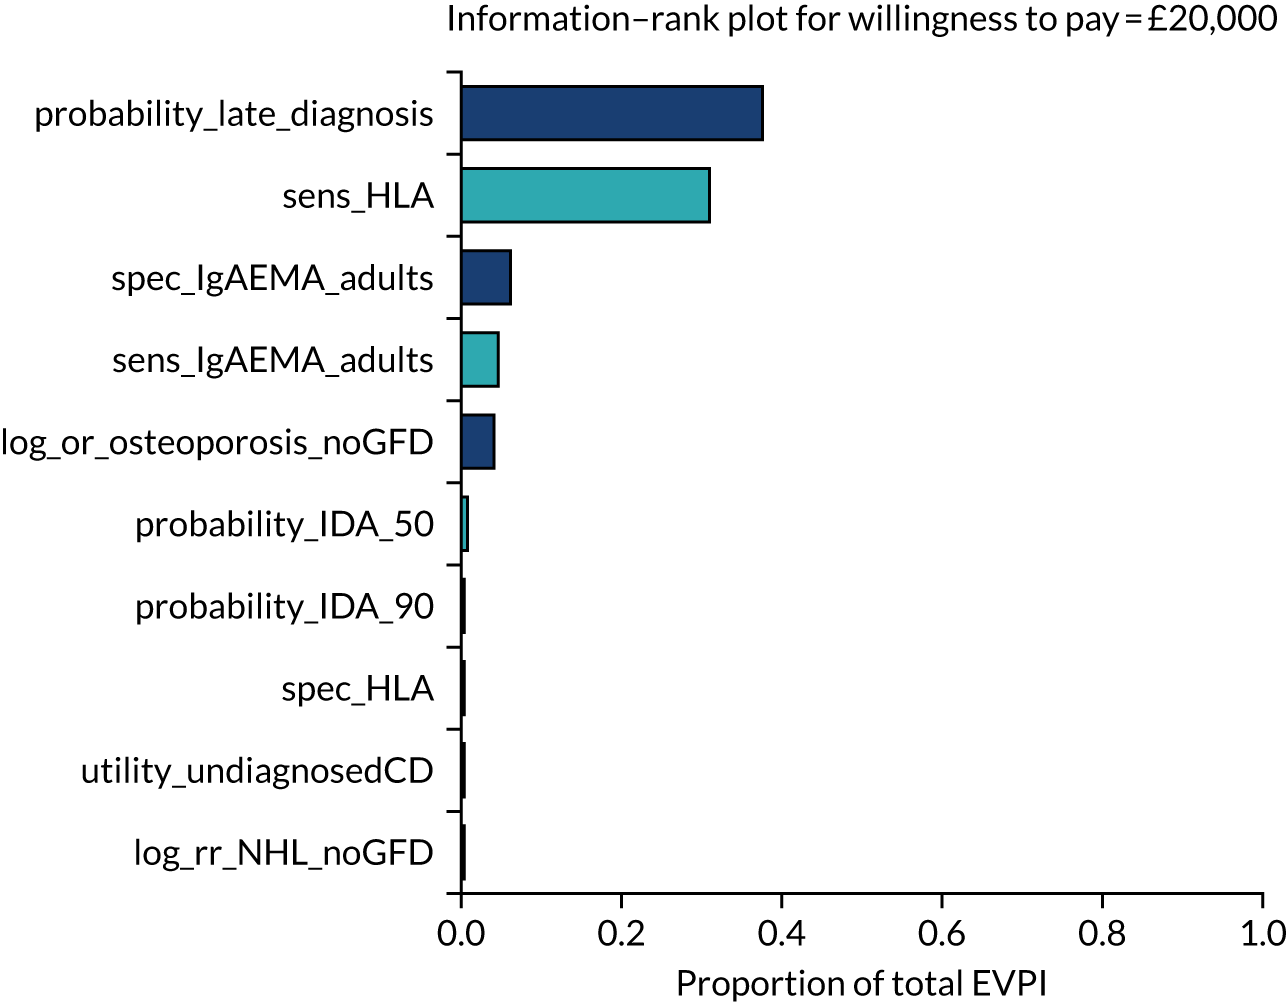
The total EVPI and EVPPI for parameter sets of interest are summarised in Table 21. The total population EVPI for men is £25.7M, indicating potential value in conducting further research. The EVPPI for parameter sets indicates that the greatest potential value lies in a study of probabilities of late diagnosis or on test-accuracy parameters. This aligns with the ranking in Figure 17.
| Parameter set | Men | Women | Childrena | |||
|---|---|---|---|---|---|---|
| Total population size (n) | 263,465 | 263,465 | 140,070 | |||
| Discounted population size (n) | 2,267,824 | 2,267,824 | 1,205,679 | |||
| Per person (£) | Population (£) | Per person (£) | Population (£) | Per person (£) | Population (£) | |
| Total EVPI | 11.32 | 25,679,685 | 34.85 | 79,040,182 | 15.28 | 18,420,293 |
| Utilities and disutilities | 3.72 | 8,425,612 | 1.62 | 3,663,585 | 0.93 | 1,117,066 |
| Rates of osteoporosis and NHL | 2.84 | 6,449,814 | 10.08 | 22,849,058 | 0.40 | 486,521 |
| GFD effect | 3.02 | 6,850,323 | 10.89 | 24,702,170 | 0.26 | 316,551 |
| Test accuracies | 6.81 | 15,447,753 | 18.98 | 43,035,778 | 6.48 | 7,812,603 |
| Probability of late diagnosis | 8.01 | 18,159,091 | 30.22 | 68,534,495 | 8.76 | 10,561,800 |
Adult women
Figure 18 plots the incremental net benefit of each sensitivity/specificity combination of a diagnostic indicator (or combination of indicators) combined with each serological test, compared with no screening, for adult women. The central estimates are the mean incremental net benefit, with the upper and lower Crls represented by the upper and lower lines.
FIGURE 18.
Incremental net benefit at £20,000 per QALY, compared with no screening, at each combination of sensitivity (x-axis) and specificity (line colour) for adult women. (a) IgA EMA; (b) IgA tTG plus EMA; (c) IgA tTG; (d) IgA EMA plus HLA; (e) IgA tTG plus EMA plus HLA; (f) IgA tTG plus HLA; (g) HLA plus IgA EMA; (h) HLA plus IgA tTG plus EMA; and (i) HLA plus IgA tTG. Note that thick lines indicate the mean and narrow lines represent the 95% CrI.
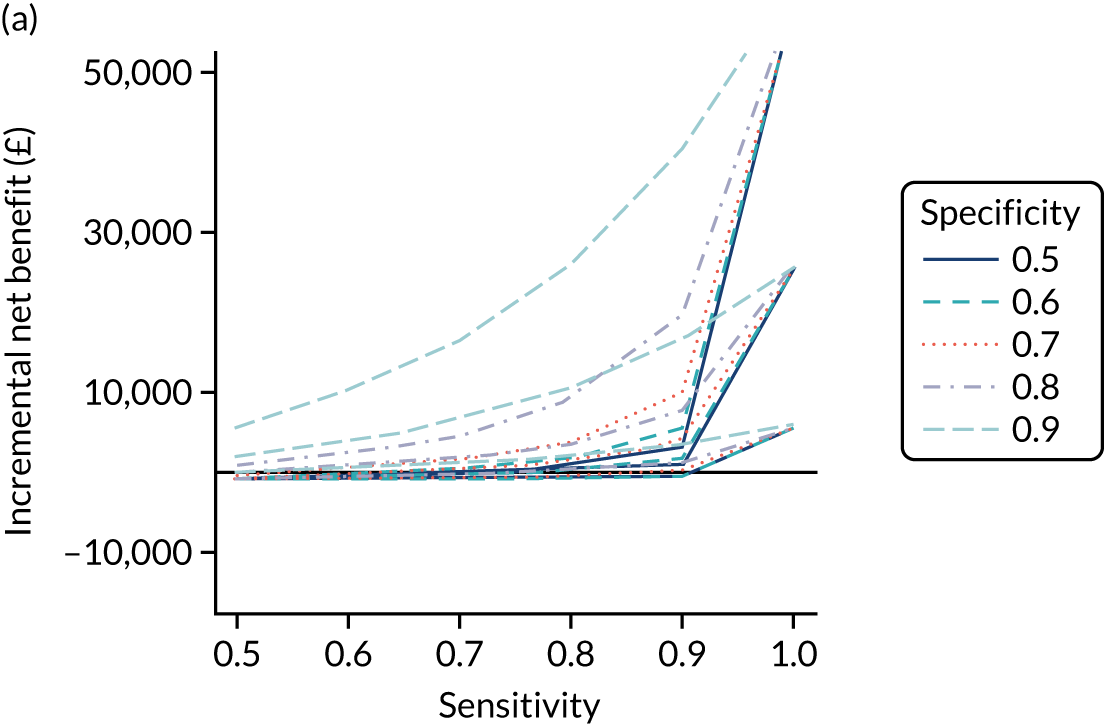
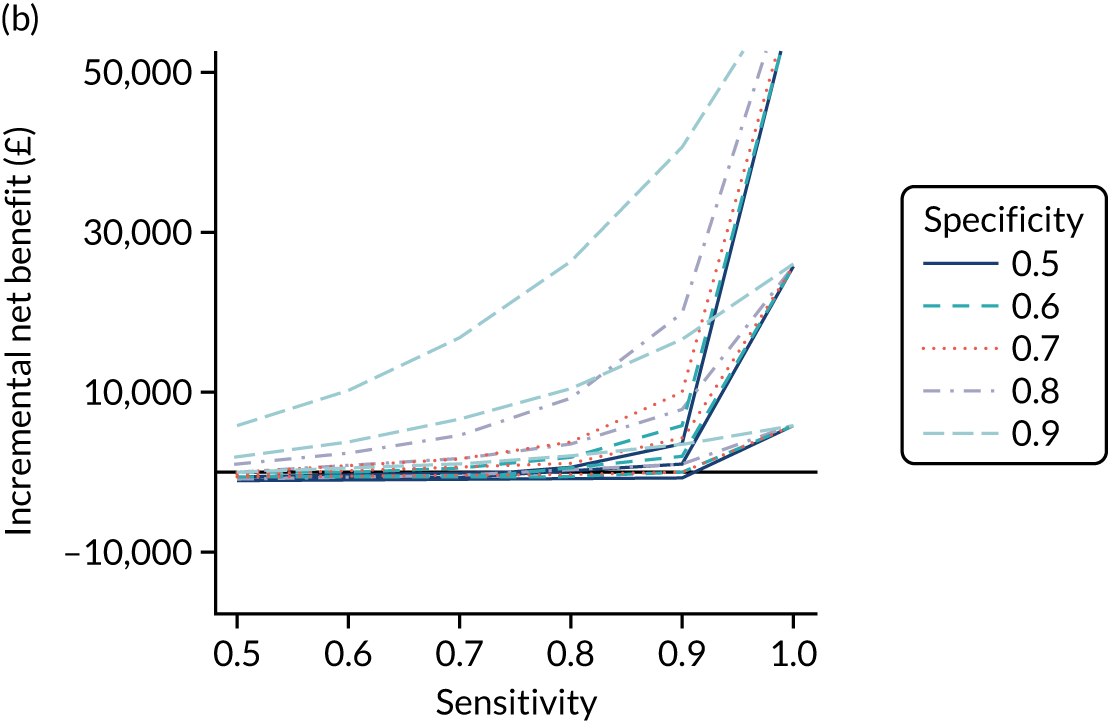
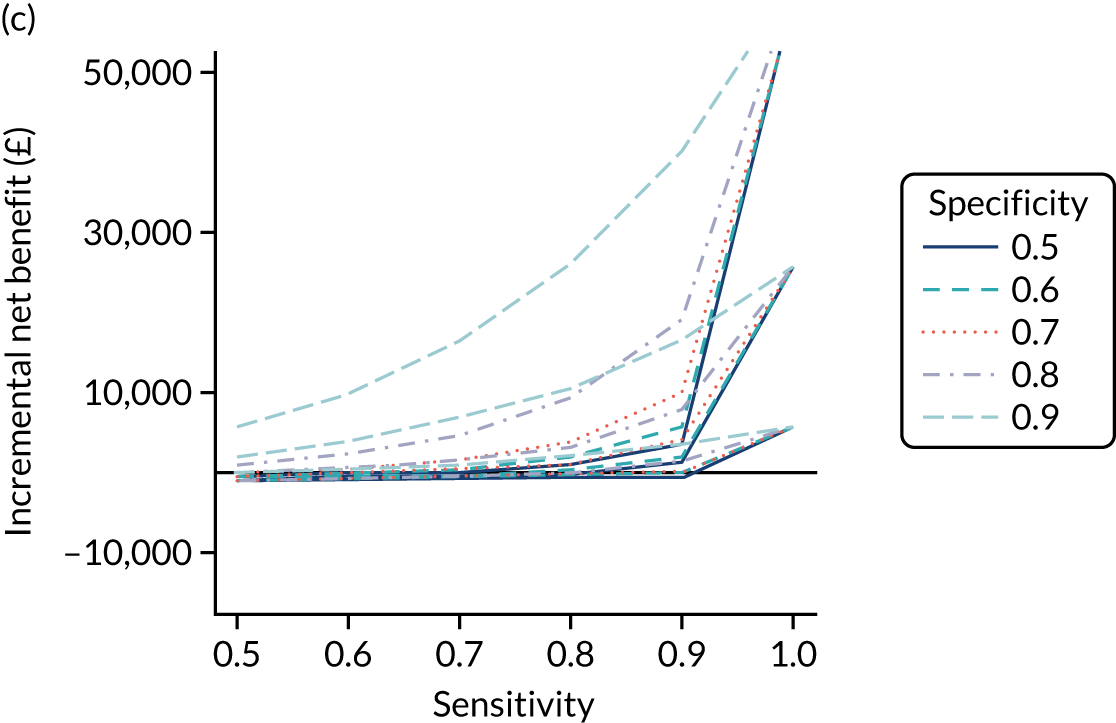
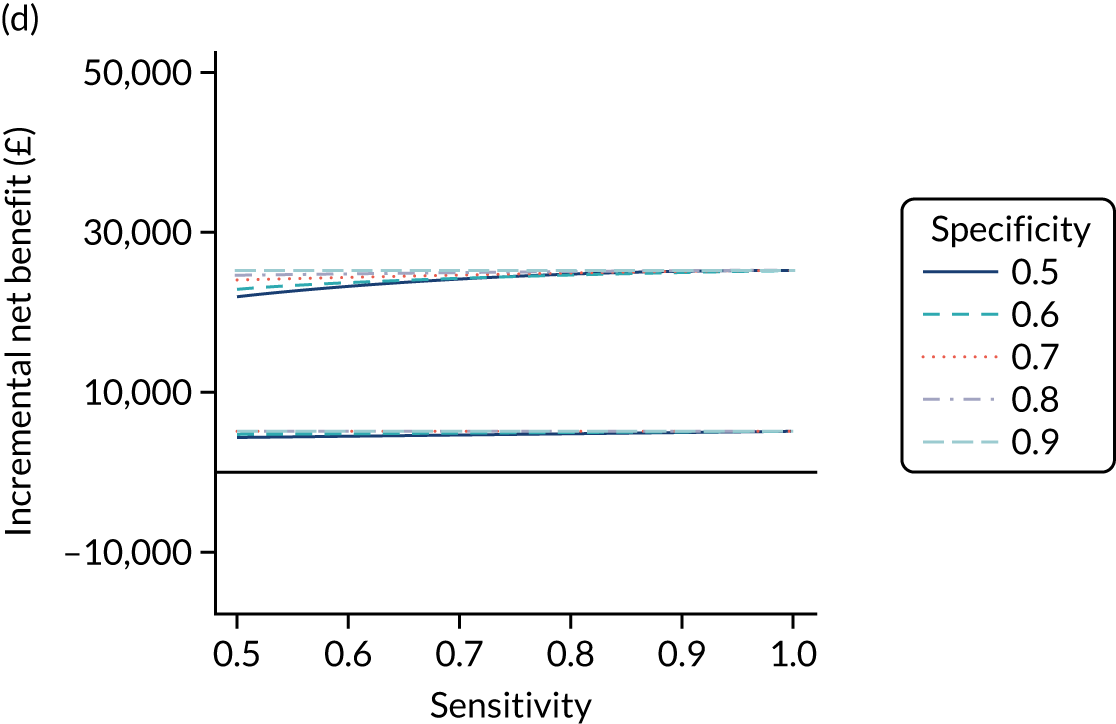
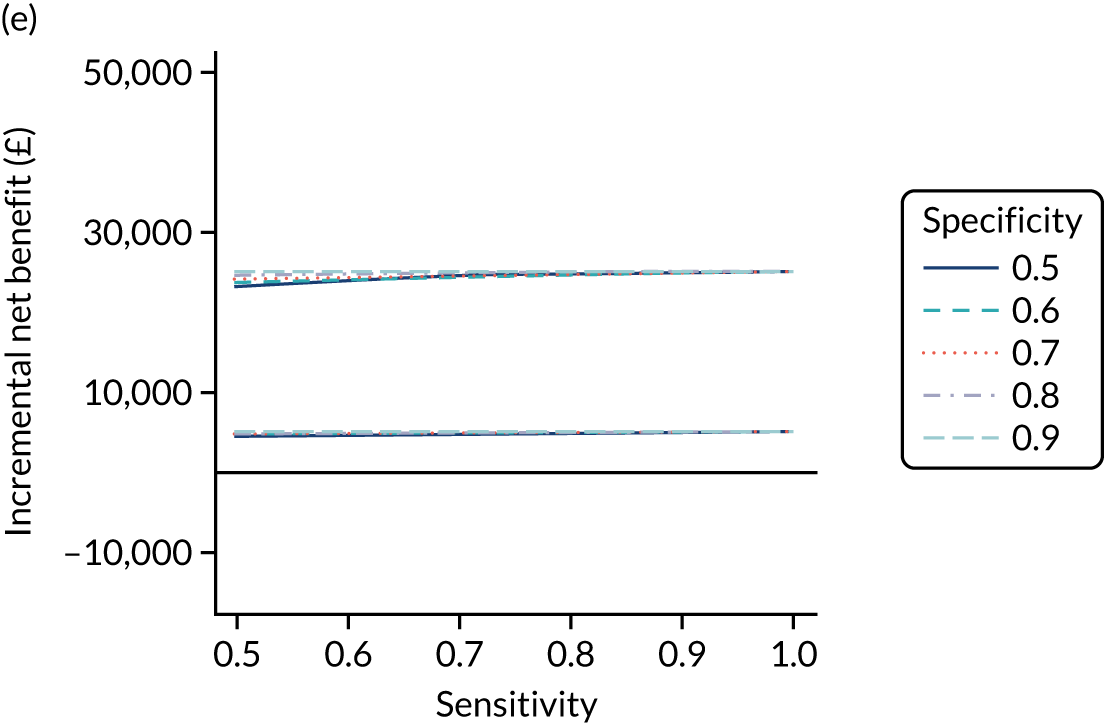
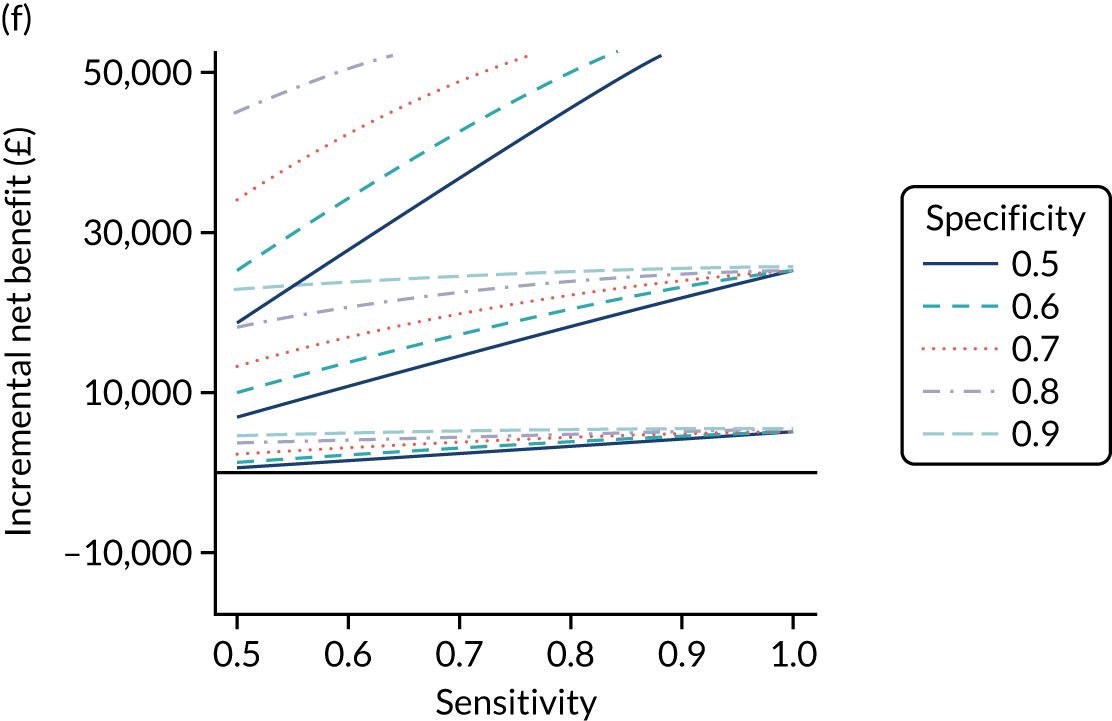
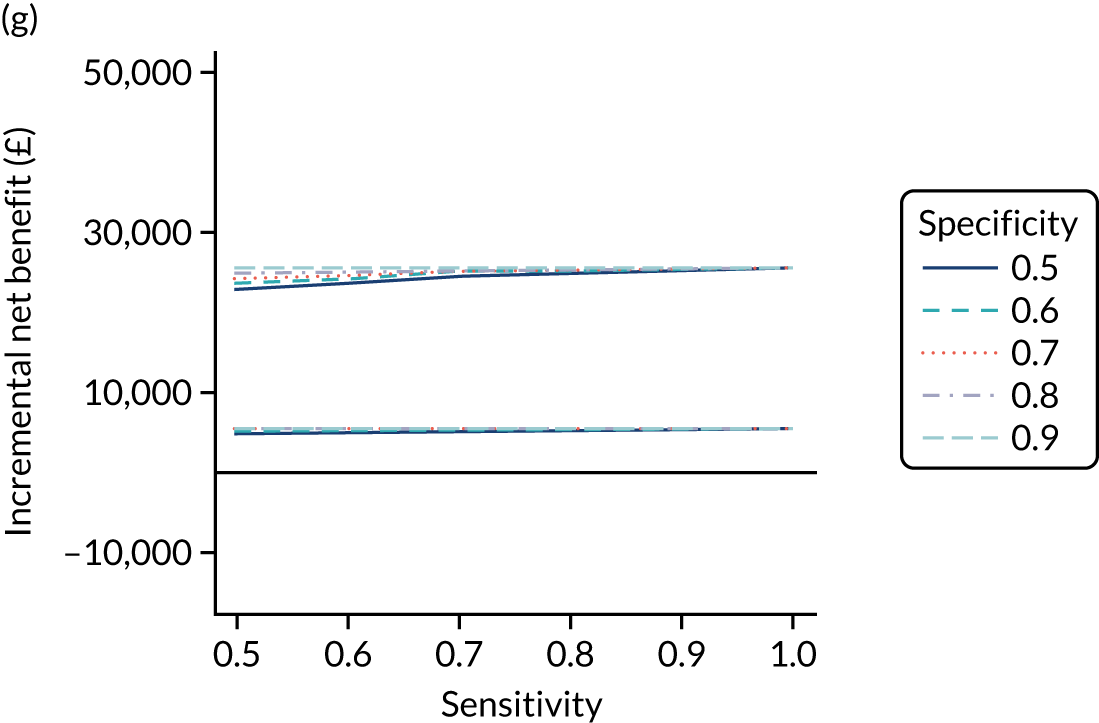
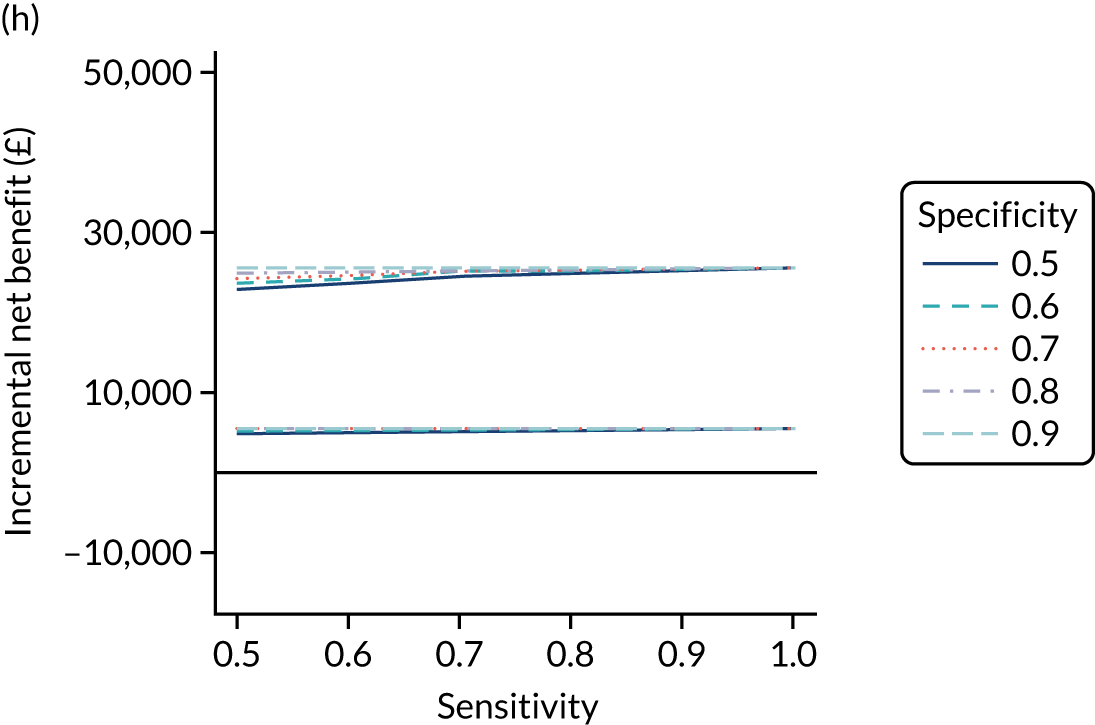
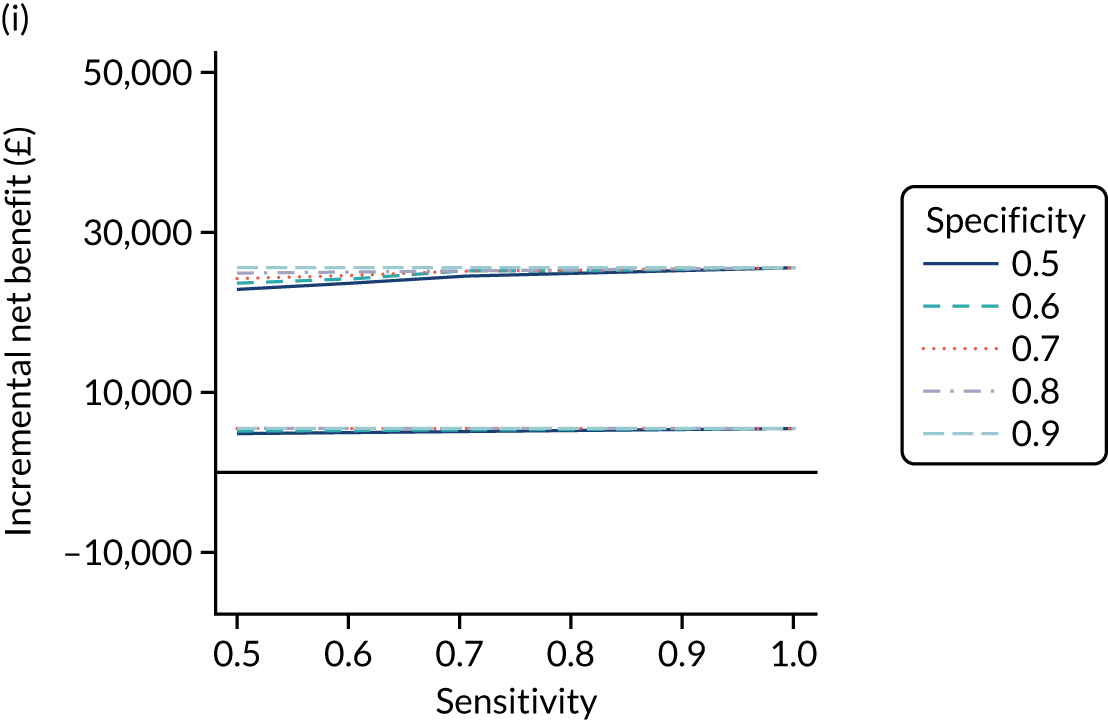
The results are extremely similar to those for adult men. Figure 18 shows that, for the serological tests without HLA, the incremental net benefit at £20,000 per QALY is positive only when the diagnostic indicator sensitivity is > 0.9 or both the specificity and sensitivity are > 0.8. For the serological tests including HLA, the incremental net benefit is positive regardless of the accuracy of the diagnostic indicator. The combinations using only the IgA EMA serological test plus HLA are more cost-effective than strategies using IgA tTG plus HLA and are comparable in cost-effectiveness to tests using all of EMA, tTG and HLA. Using HLA before or after EMA or tTG plus EMA does not affect cost-effectiveness, but it appears to be most cost-effective if used before IgA tTG alone.
Figure 19 plots the probability that each combination of diagnostic indicator sensitivity and specificity is cost-effective for each test combination. Results are again nearly identical to those for adult men. The serological tests including HLA have a high probability of being cost-effective regardless of the combination of sensitivity and specificity of the risk test. Strategies using IgA EMA or IgA tTG alone and HLA have a similar probability of cost-effectiveness to combinations using all three of IgA EMA, HLA and IgA tTG.
FIGURE 19.
Probability of being cost-effective at £20,000 per QALY, compared with no screening, at each combination of sensitivity (x-axis) and specificity (line colour) for adult women. (a) IgA EMA; (b) IgA tTG plus EMA; (c) IgA tTG; (d) IgA EMA plus HLA; (e) IgA tTG plus EMA plus HLA; (f) IgA tTG plus HLA; (g) HLA plus IgA EMA; (h) HLA plus IgA tTG plus EMA; and (i) HLA plus IgA tTG.
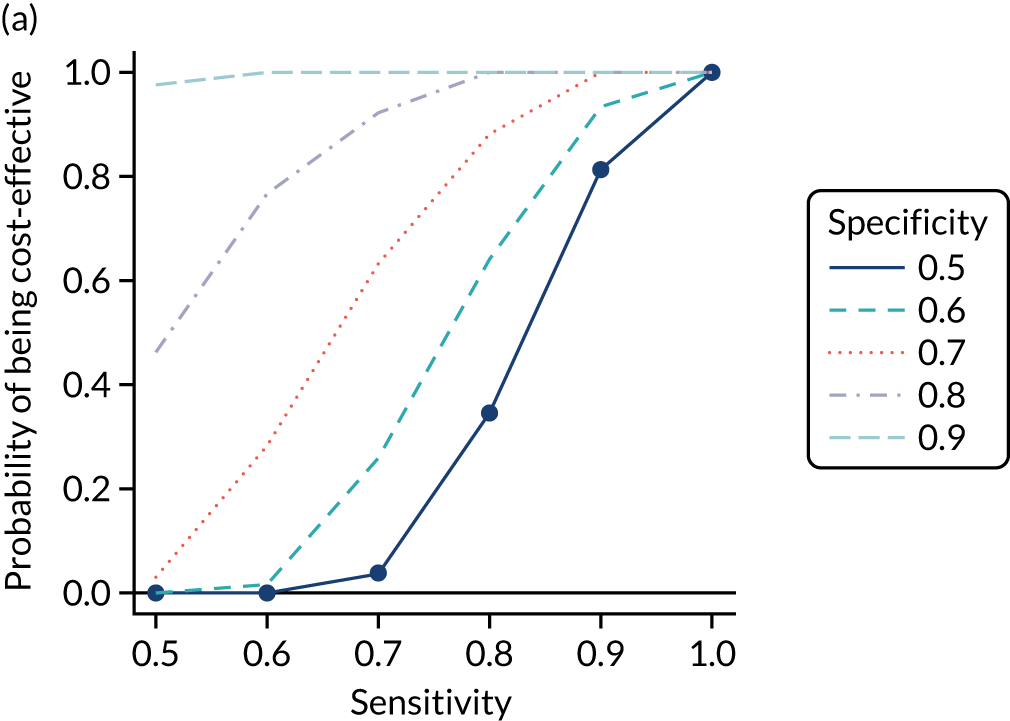
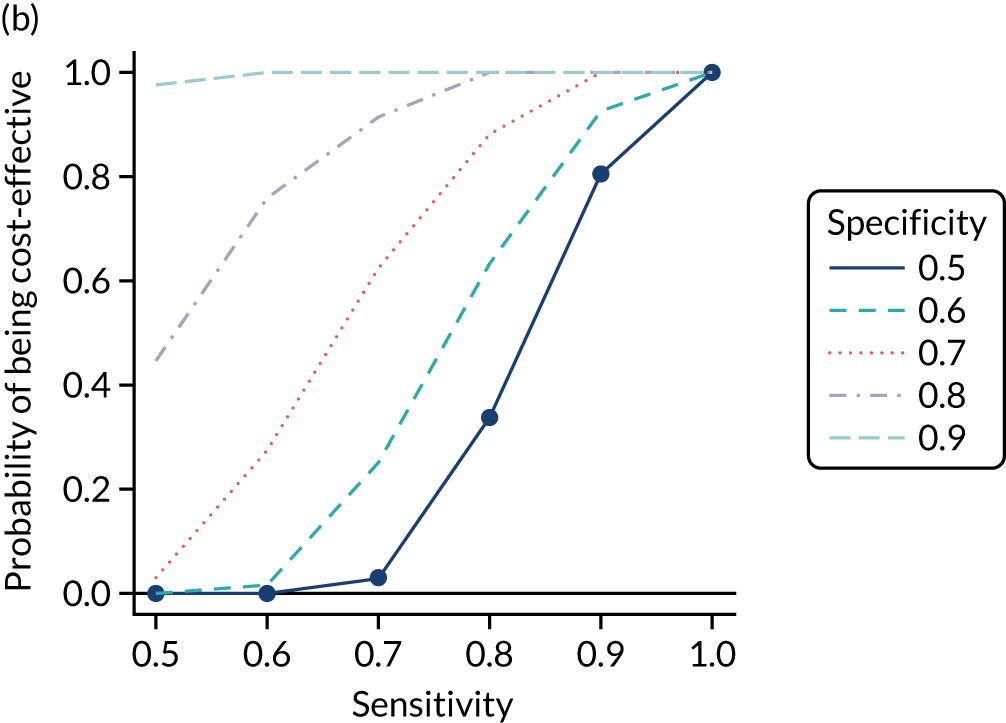
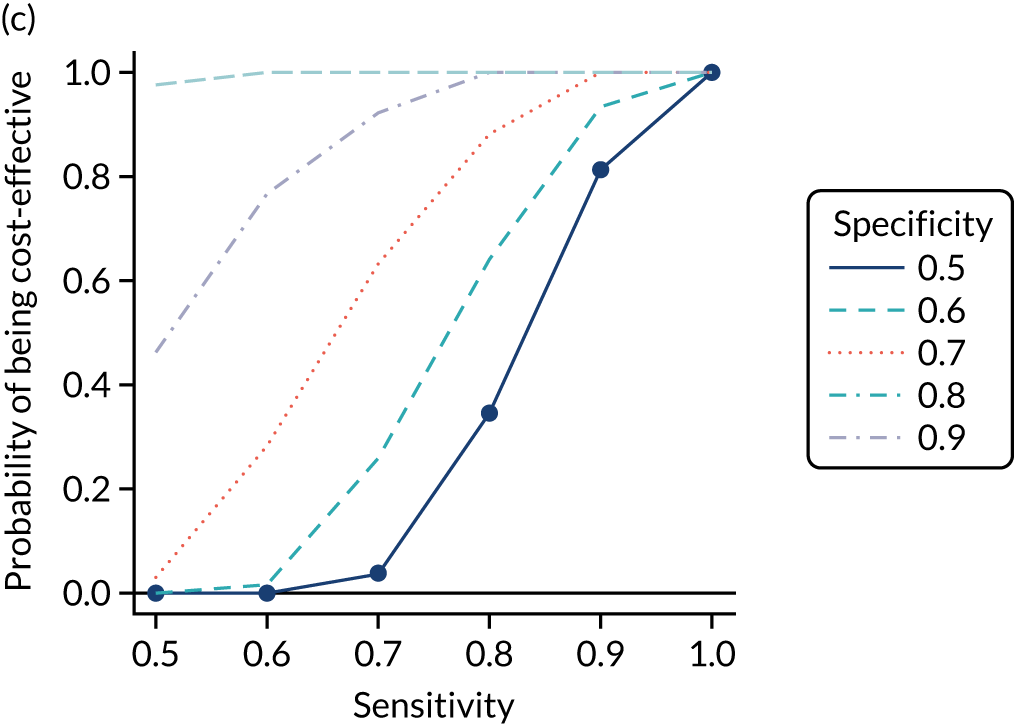
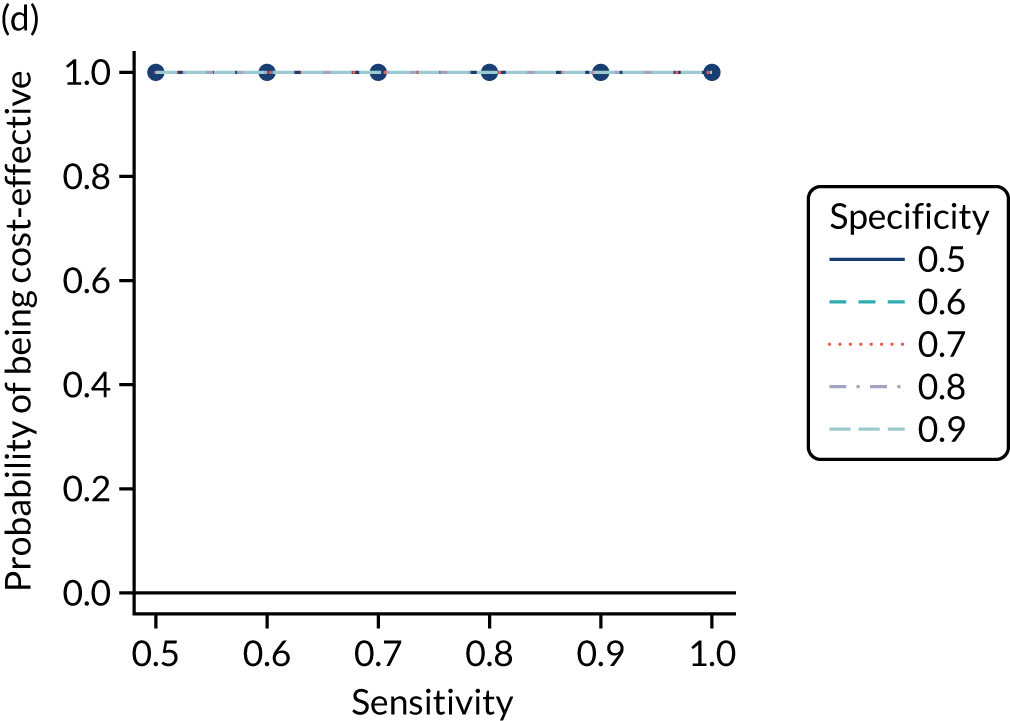
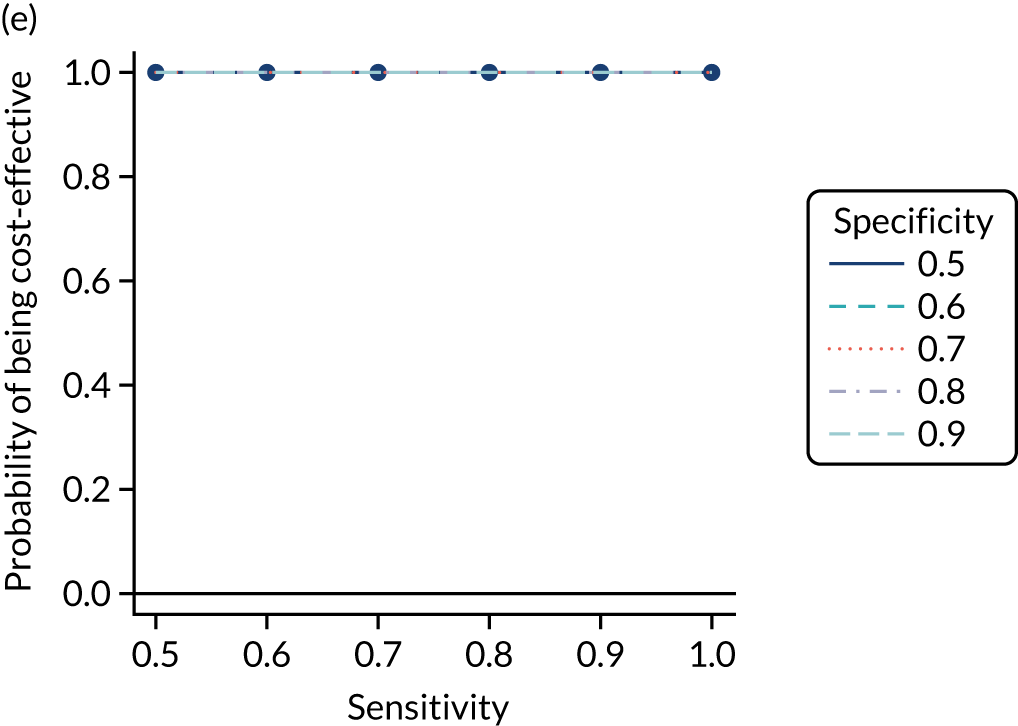
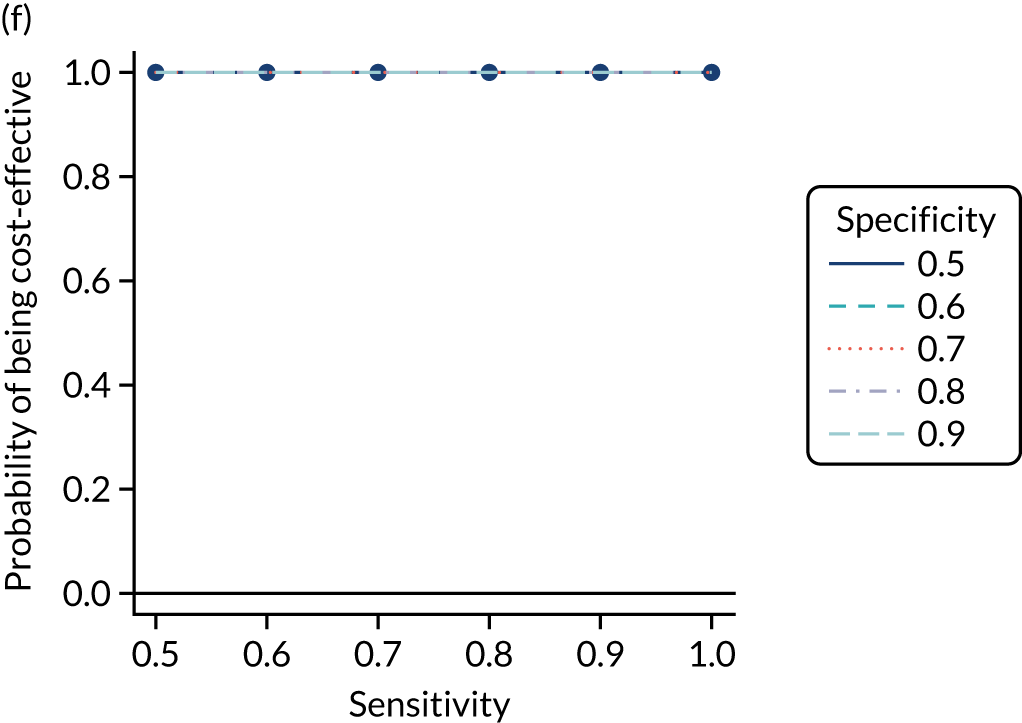
As for adult men, we select the testing strategies IgA tTG alone, IgA EMA plus HLA, and HLA plus IgA tTG to combine with the various risk prediction strategies of Table 5. This is again justified as strategies using IgA tTG and IgA EMA have similar incremental net benefits and probabilities of being cost-effective, IgA tTG plus HLA performs worst among strategies with HLA, there is limited difference between IgA tTG plus EMA plus HLA and IgA EMA plus HLA (i.e. not employing tTG), and HLA plus the widely available IgA tTG has similar cost-effectiveness to other strategies. There is also limited difference between strategies applying HLA before or after serological tests.
Table 22 shows the estimated costs, QALYs and incremental net benefit, compared with no screening, for each of these strategies of interest. All combinations, apart from pre-test probabilities of 1.5% with IgA tTG, have positive incremental net benefits, compared with no screening. If using only IgA tTG, a pre-test probability of 1% is the most cost-effective strategy (greatest incremental net benefit at £20,000 per QALY), with the highest costs but also the largest number of QALYs. As with men, the net benefits of all IgA EMA plus HLA and HLA plus IgA tTG strategies are very similar to each other and to those of IgA tTG with a pre-test probability of 1%, and the 95% CrIs are completely overlapping. This again indicates little difference between the cost-effectiveness of these strategies.
| Pre-test probability for blood test (%) | Sensitivity | Specificity | Strategy | Mean (95% Crl) | ||
|---|---|---|---|---|---|---|
| Costs (£) | QALYs | Incremental net benefit at £20,000 per QALY vs. no screening (£) | ||||
| No screening | 17,673 (14,159 to 19,645) | 18.68 (16.72 to 19.9) | 0 (0 to 0) | |||
| 1 | 1 | 0 | IgA tTG | 20,771 (20,469 to 21,082) | 20.05 (19.59 to 20.42) | 24,382 (4829 to 59,154) |
| 1.50 | 0.841 | 0.448 | IgA tTG | 18,585 (15,184 to 20,501) | 18.72 (16.84 to 19.91) | –27 (–716 to 1197) |
| 2 | 0.758 | 0.628 | IgA tTG | 18,500 (15,118 to 20,407) | 18.73 (16.86 to 19.91) | 228 (–575 to 1660) |
| 5 | 0.387 | 0.926 | IgA tTG | 18,458 (15,268 to 20,262) | 18.81 (17.05 to 19.93) | 1880 (–63 to 5360) |
| 10 | 0.107 | 0.99 | IgA tTG | 18,706 (15,970 to 20,247) | 19 (17.48 to 19.98) | 5428 (807 to 13,728) |
| 20 | 0.002 | 1 | IgA tTG | 19,214 (17,329 to 20,319) | 19.35 (18.28 to 20.1) | 11,835 (2322 to 28,874) |
| 1 | 1 | 0 | IgA EMA plus HLA | 21,143 (20,863 to 21,447) | 20.11 (19.62 to 20.46) | 25,115 (4766 to 61,286) |
| 1.50 | 0.841 | 0.448 | IgA EMA plus HLA | 20,817 (20,522 to 21,131) | 20.08 (19.6 to 20.44) | 24,844 (4934 to 60,463) |
| 2 | 0.758 | 0.628 | IgA EMA plus HLA | 20,714 (20,419 to 21,030) | 20.08 (19.6 to 20.44) | 24,981 (5033 to 60,663) |
| 5 | 0.387 | 0.926 | IgA EMA plus HLA | 20,598 (20,319 to 20,904) | 20.09 (19.61 to 20.44) | 25,244 (5118 to 61,069) |
| 10 | 0.107 | 0.99 | IgA EMA plus HLA | 20,629 (20,358 to 20,927) | 20.09 (19.61 to 20.45) | 25,259 (5033 to 61,175) |
| 20 | 0.002 | 1 | IgA EMA plus HLA | 20,683 (20,407 to 20,993) | 20.09 (19.61 to 20.44) | 25,210 (4927 to 61,189) |
| 1 | 1 | 0 | HLA plus IgA tTG | 21,139 (20,856 to 21,442) | 20.11 (19.62 to 20.46) | 25,114 (4770 to 61,277) |
| 1.50 | 0.841 | 0.448 | HLA plus IgA tTG | 20,824 (20,533 to 21,138) | 20.08 (19.61 to 20.44) | 24,935 (4951 to 60,666) |
| 2 | 0.758 | 0.628 | HLA plus IgA tTG | 20,722 (20,434 to 21,030) | 20.08 (19.61 to 20.44) | 25,058 (5043 to 60,805) |
| 5 | 0.387 | 0.926 | HLA plus IgA tTG | 20,607 (20,333 to 20,915) | 20.09 (19.61 to 20.45) | 25,268 (5110 to 61,127) |
| 10 | 0.107 | 0.99 | HLA plus IgA tTG | 20,638 (20,366 to 20,938) | 20.09 (19.61 to 20.45) | 25,259 (5018 to 61,192) |
| 20 | 0.002 | 1 | HLA plus IgA tTG | 20,690 (20,415 to 20,998) | 20.09 (19.61 to 20.44) | 25,203 (4914 to 61,189) |
Figure 20 plots the CEACs, which show the probability that each testing strategy is optimal (i.e. has the highest net benefit) at each willingness-to-pay threshold for an additional QALY. None of the probabilities exceeds 50%, indicating little certainty that the 1% IgA tTG, the IgA EMA plus HLA or the HLA plus IgA tTG strategies differ in cost-effectiveness. At £10,000–30,000 per QALY, the strategy with the greatest probability of being cost-effective is 5% HLA plus IgA tTG; above this range, 1% IgA tTG has the greatest probability of being cost-effective. However, the CEAC does not account for the magnitude of differences between net benefits, which, as reported in Table 22, are negligible, with overlapping 95% CrIs.
FIGURE 20.
Cost-effectiveness acceptability curves for strategies of interest for adult women.
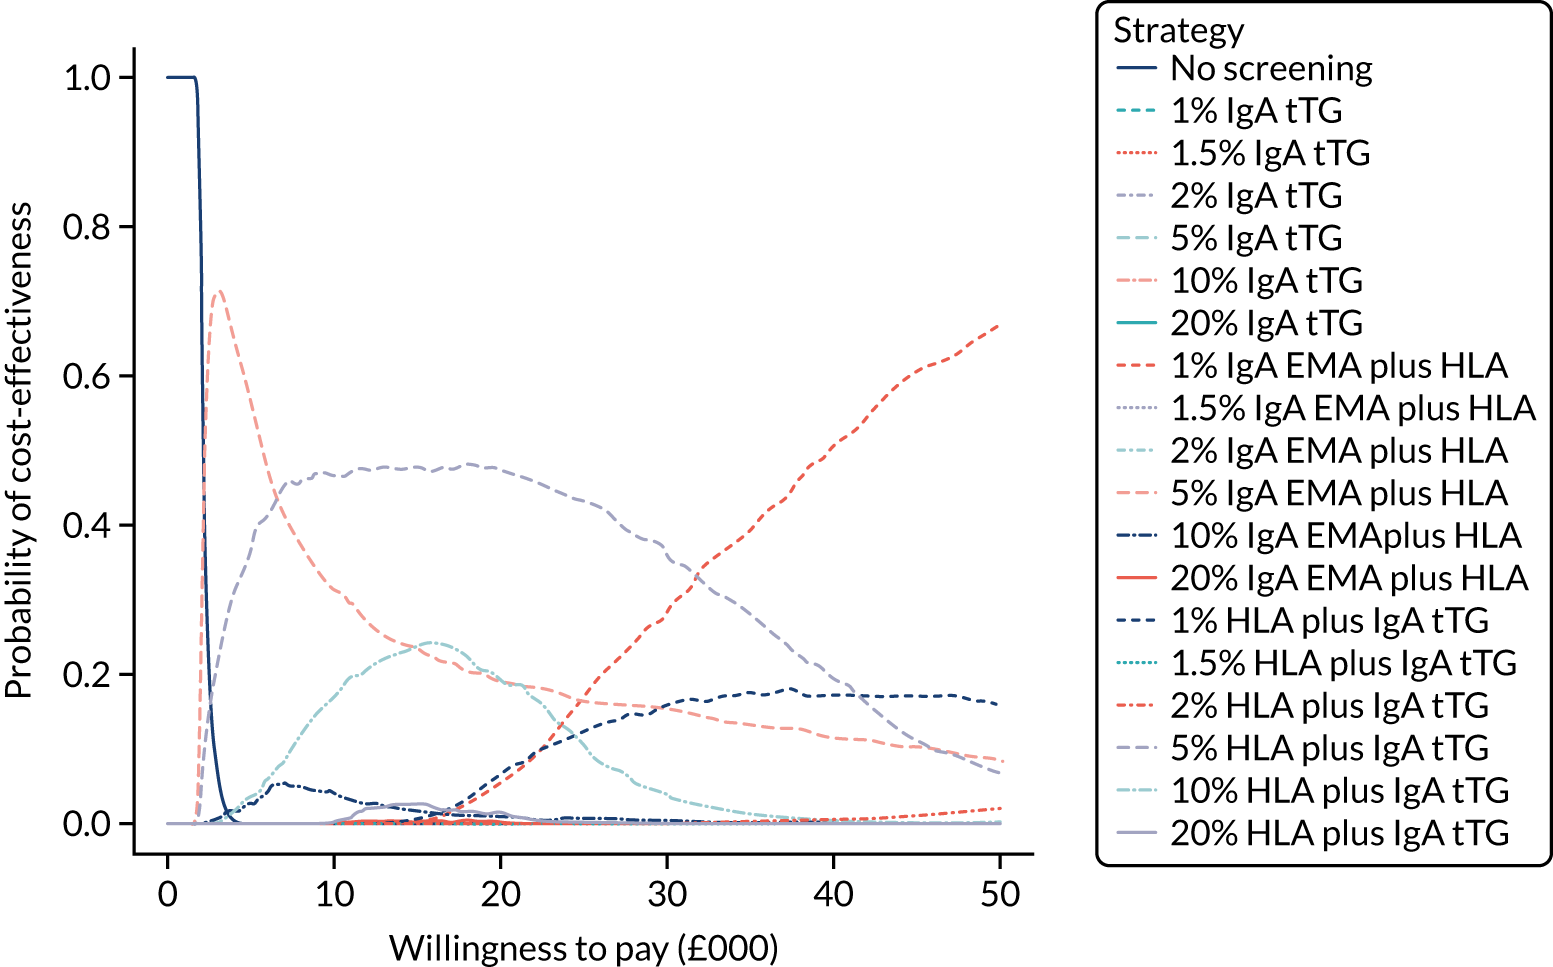
Table S20 (see Report Supplementary Material 1) provides the proportion of time spent in each state for adult women on the strategies of interest. Compared with other pre-test probability strategies with the same serological tests, the 1% IgA EMA strategy has the greatest proportion of time in the CD, gluten-free diet, no-complications state and the least time in the undiagnosed states. Osteoporosis appears to be the complication most patients spend time in; women appear to spend up to four times as much time with this complication as men. The HLA strategies have a greater proportion of time in the CD, gluten-free diet, no-complications state and less time in the undiagnosed states than any IgA EMA strategies. They have almost identical proportions of time in the states across the different pre-test probabilities, with only minor differences between the undiagnosed CD, no-complications state and the undiagnosed CD, osteoporosis state. Overall, cost-effectiveness appears to be mostly driven by time spent in the CD, gluten-free diet, no-complications state; the CD, gluten-free diet, osteoporosis state; and the undiagnosed CD, osteoporosis state.
The ratio of EVPPI to EVPI for each parameter is illustrated in Figure 21. As in the population of adult men, the probability of late diagnosis and the sensitivity of the HLA test are important parameters. However, the specificity of the IgA EMA test among adults is also important. The specificity of the HLA test, test cost of IgA tTG and cost of osteoporosis have low influence, and the remaining parameters have almost no influence on results.
FIGURE 21.
Ratio of EVPPI for each parameter to total EVPI for adult women. Only the 10 most influential parameters are included; the remaining parameters have minimal influence on the results. GFD, gluten-free diet; log_rr_NHL_noGFD, log-risk ratio of developing NHL, not on GFD, compared with being on GFD, for coeliac patients; death_log_hr_osteoporosis_female, log-hazard ratio of mortality with osteoporosis, compared with general population, for females; sens, sensitivity; spec, specificity.
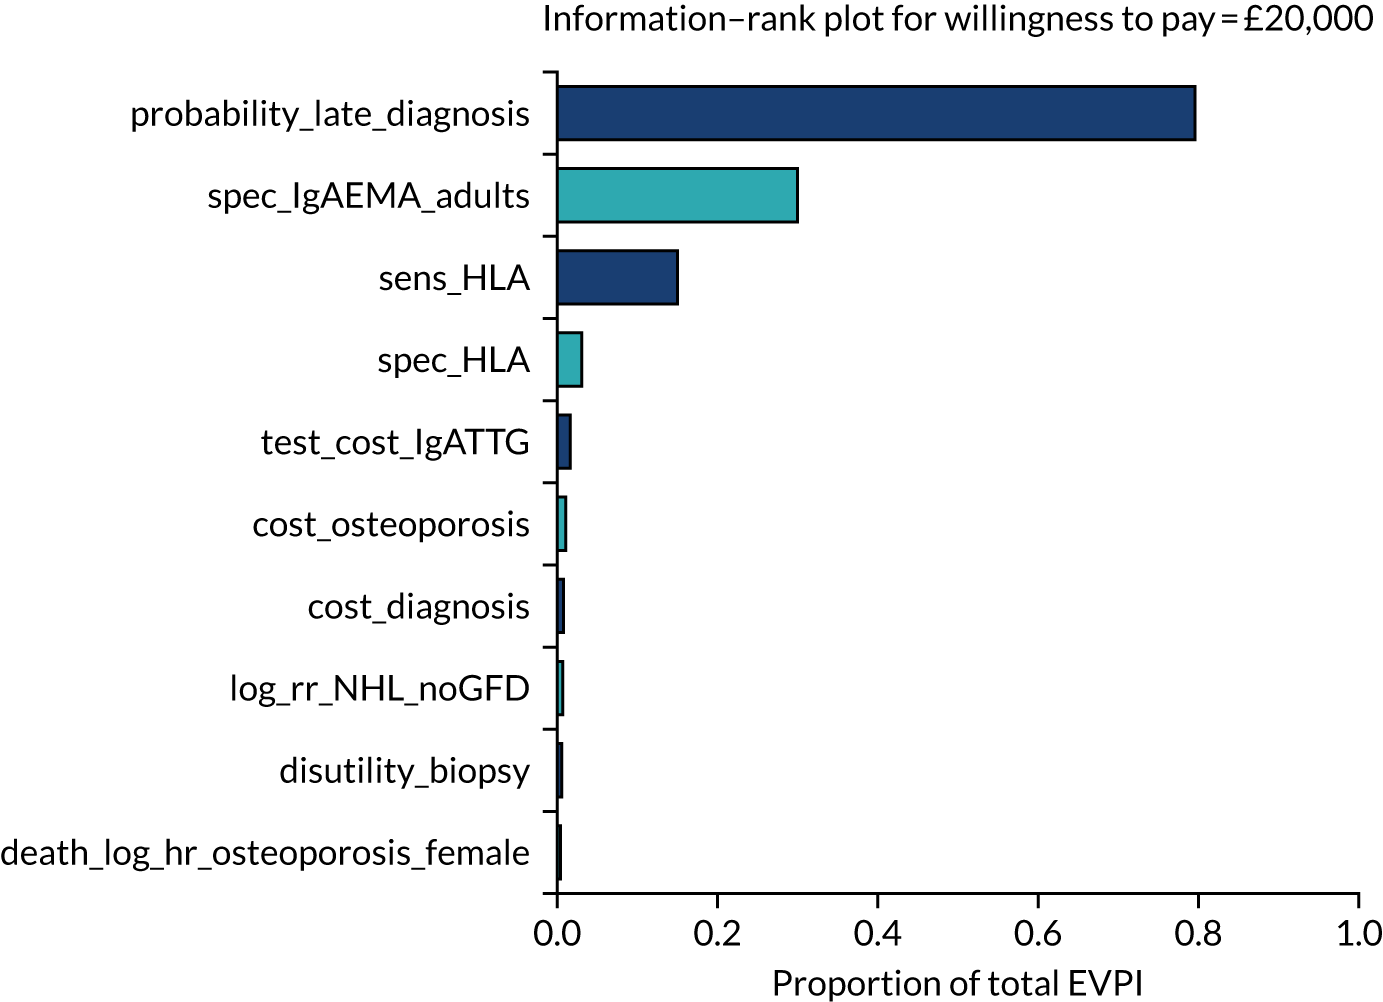
The total EVPI and EVPPI for parameter sets of interest are summarised in Table 21. The total population EVPI for women is £79.0M, indicating potential value in conducting further research. This is greater than the potential value for men (£25.7M). As with men, the EVPPI for parameter sets indicates that the greatest potential value lies in a study of probabilities of late diagnosis (£68.5M) and on test accuracies (£43M). These values are two to three times greater than the corresponding values for men, suggesting that research should be focused on the adult women population.
Children
Figure 22 plots the incremental net benefit at £20,000 per QALY for risk prediction strategies. Results are similar to those in adults, but uncertainty is greater as the 95% CrIs are wider and, for strategies without HLA, now include 0 (i.e. the strategy is not cost-effective when compared with no screening). Figure 22 shows that, for the serological tests without HLA, the incremental net benefit at £20,000 per QALY is positive only when the diagnostic indicator sensitivity is > 0.9 or if the specificity is > 0.9 and sensitivity is > 0.8. For the tests including HLA, the incremental net benefit is positive regardless of the accuracy of the diagnostic indicator, except for IgA tTG plus HLA, which requires both sensitivity and specificity of the diagnostic indicator to be > 0.6. Cost-effectiveness is the same if HLA is applied before or after EMA or tTG plus EMA, except when combined with IgA tTG alone, in which case only HLA plus IgA tTG (i.e. IgA tTG as confirmatory test after HLA) is cost-effective, compared with no screening.
FIGURE 22.
Incremental net benefit at £20,000 per QALY, compared with no screening, at each combination of sensitivity (x-axis) and specificity (line colour) for children. (a) IgA EMA; (b) IgA tTG plus EMA; (c) IgA tTG; (d) IgA EMA plus HLA; (e) IgA tTG plus EMA plus HLA; (f) IgA tTG plus HLA; (g) HLA plus IgA EMA; (h) HLA plus IgA tTG plus EMA; and (i) HLA plus IgA tTG. Note that thick lines indicate the mean and narrow lines indicate the 95% CrI.
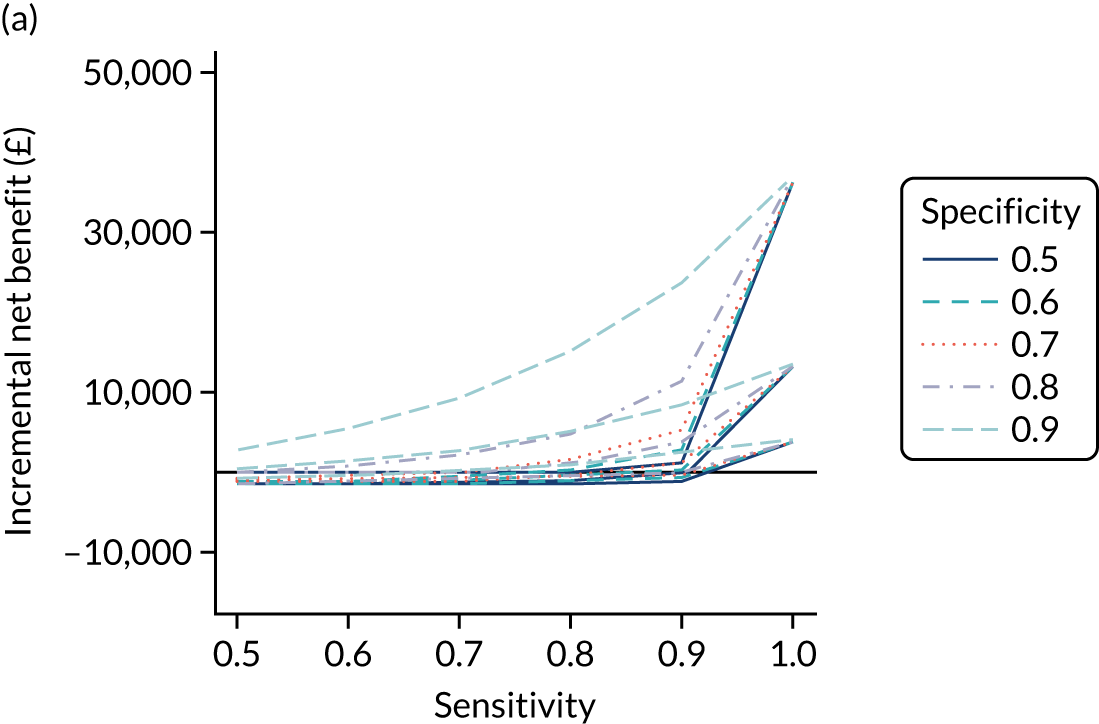
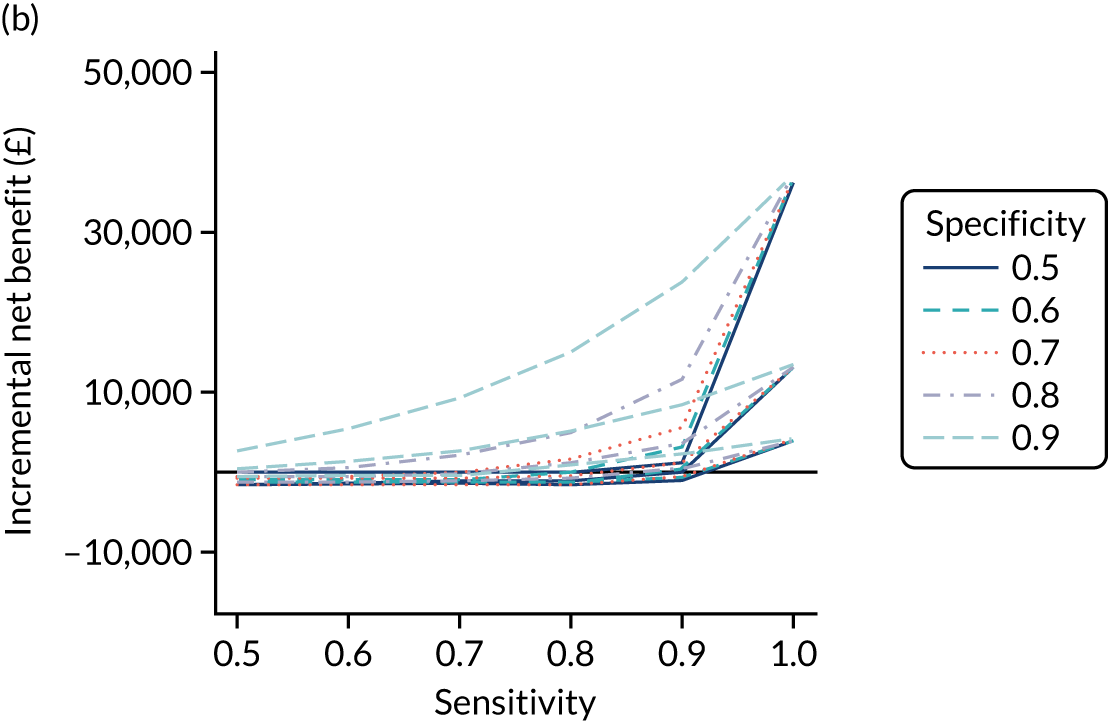
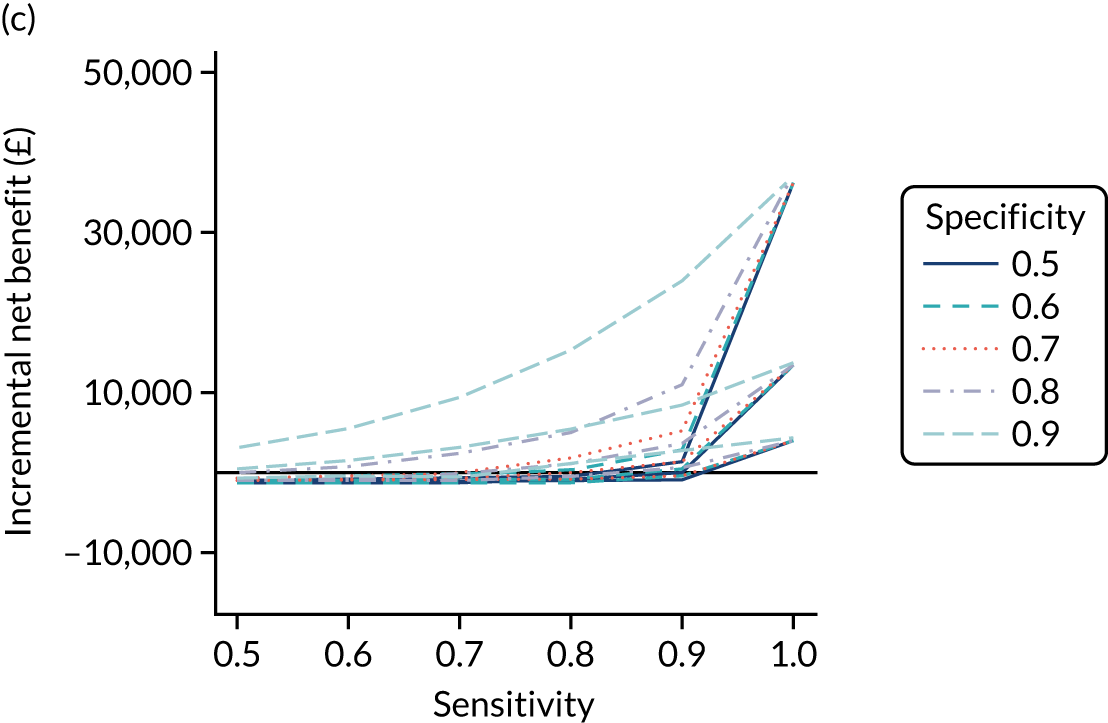
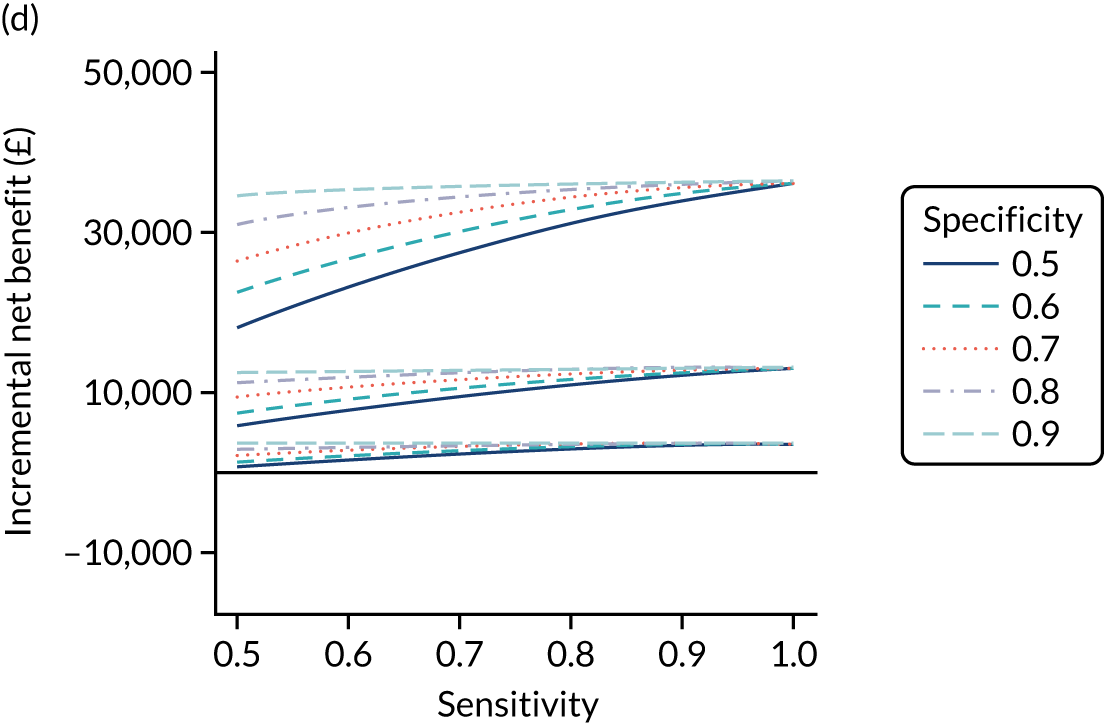
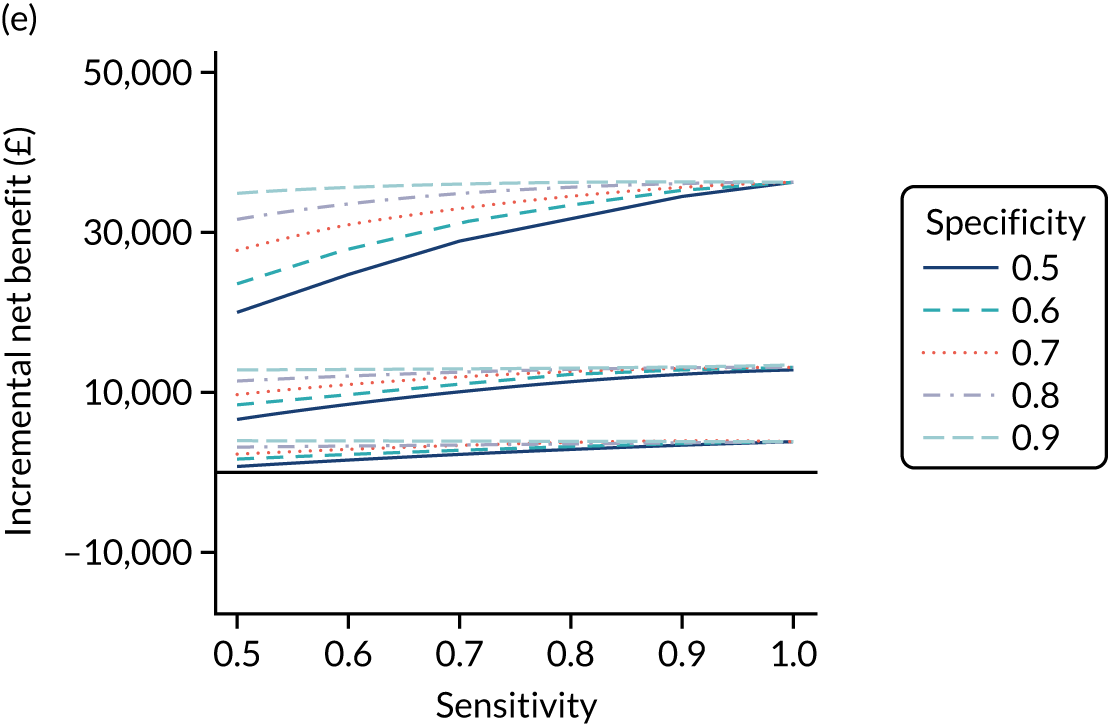
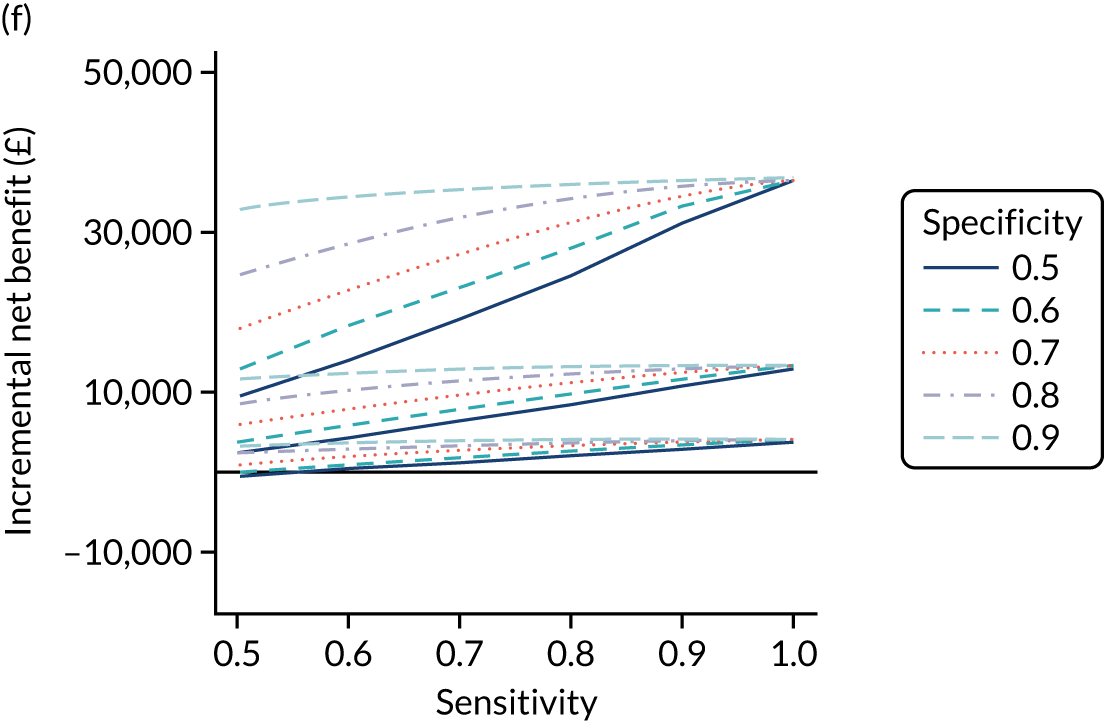
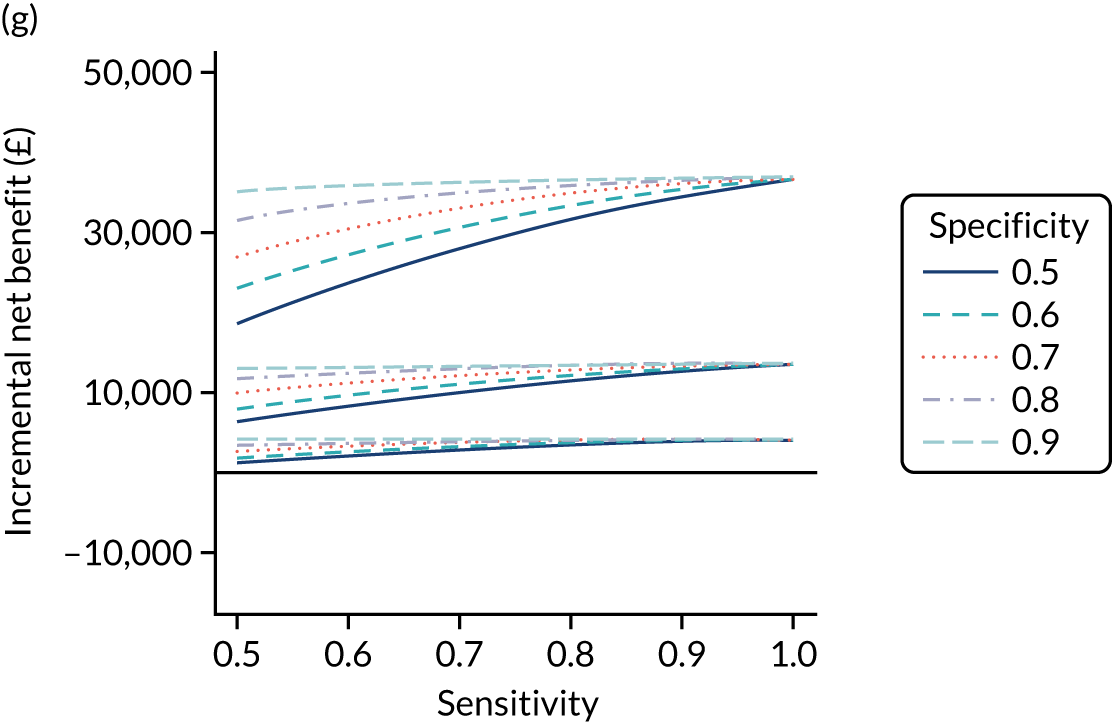
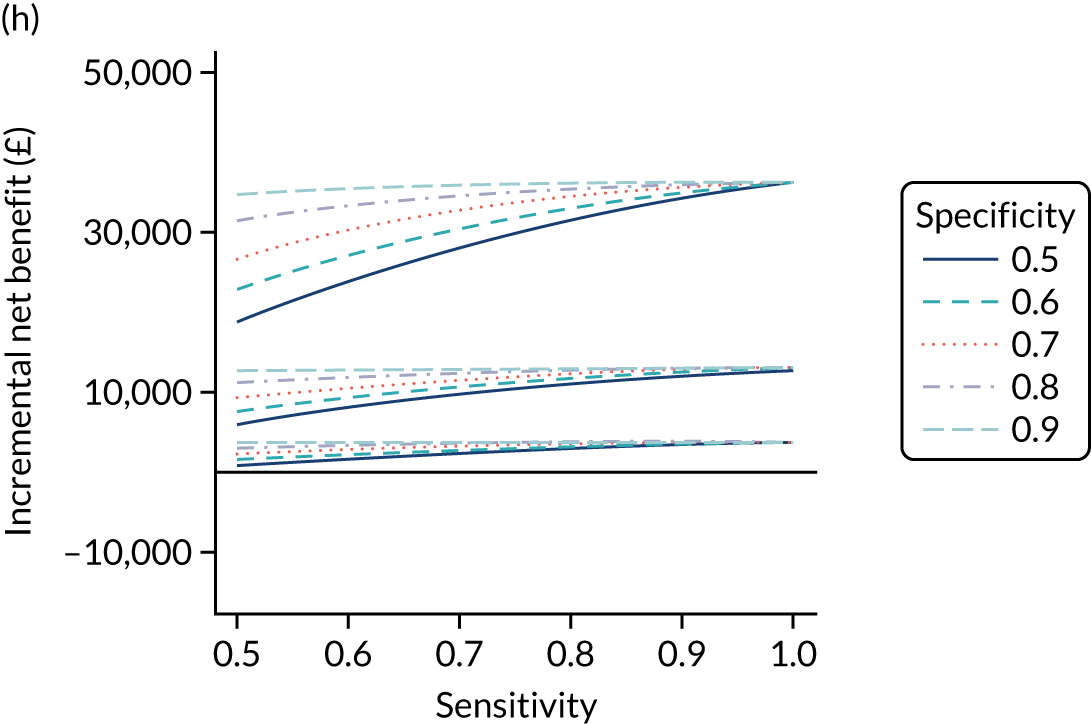
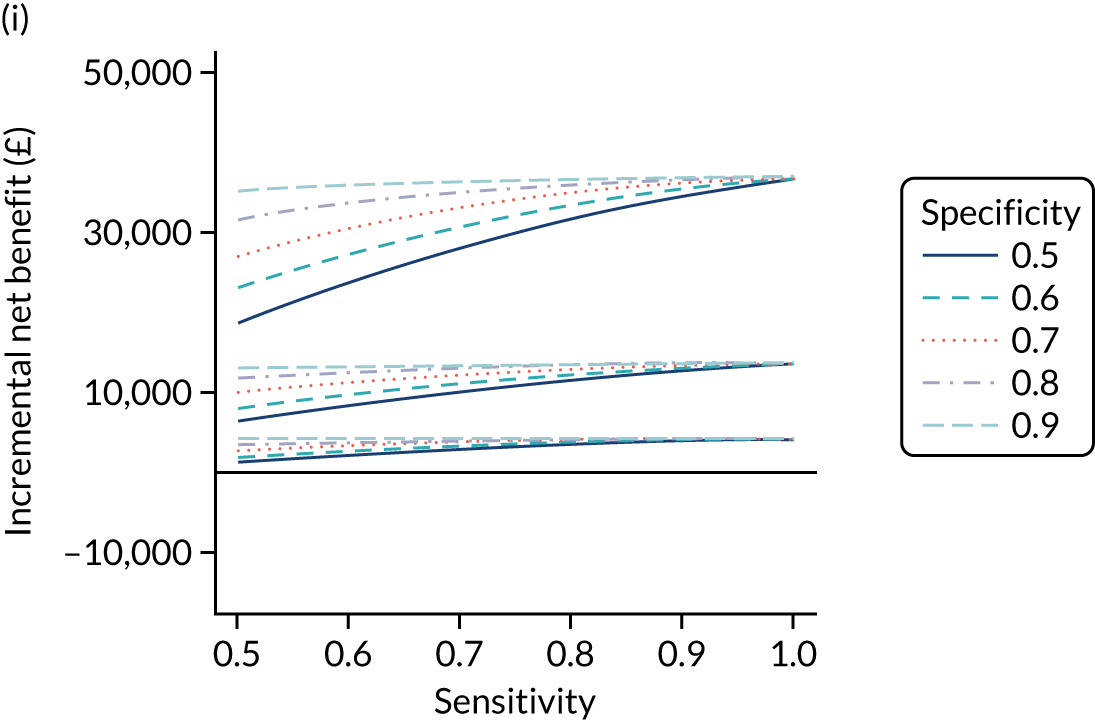
Figure 23 plots the probability that each combination of diagnostic indicator sensitivity and specificity is cost-effective for each serological test (i.e. the proportion of simulations that have a positive incremental net benefit, compared with no screening, at various willingness-to-pay thresholds). It shows that the only IgA EMA, IgA tTG plus EMA or IgA tTG strategies with probabilities of > 50% of being cost-effective are those with diagnostic indicator sensitivity of > 0.9 or both specificity and sensitivity of > 0.8. As expected, the combinations with the highest probabilities of being cost-effective are those with a specificity of 0.9 and a sensitivity of 0.9 or 1. The serological tests including HLA have a high probability of being cost-effective regardless of the combination of sensitivity and specificity of the risk test. The only exception is IgA tTG plus EMA, which requires a sensitivity of > 0.50 to have a high probability of being cost-effective.
FIGURE 23.
Probability of being cost-effective at £20,000 per QALY, compared with no screening, at each combination of sensitivity (x-axis) and specificity (line colour) for children. (a) IgA EMA; (b) IgA tTG plus EMA; (c) IgA tTG; (d) IgA EMA plus HLA; (e) IgA tTG plus EMA plus HLA; (f) IgA tTG plus HLA; (g) HLA plus IgA EMA; (h) HLA plus IgA tTG plus EMA; and (i) HLA plus IgA tTG.
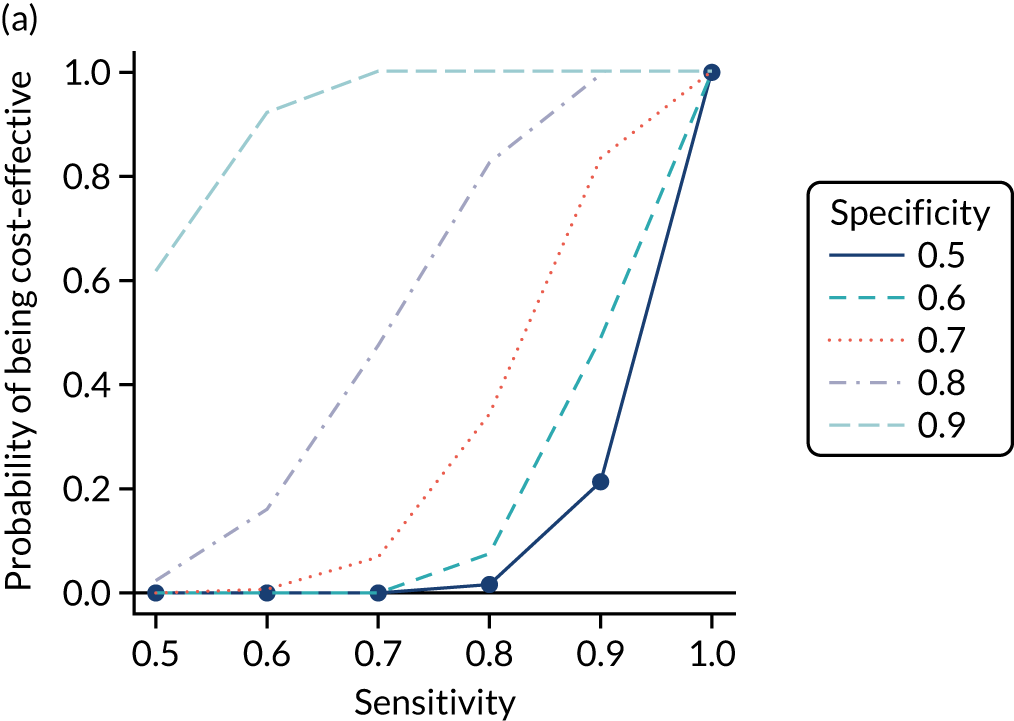
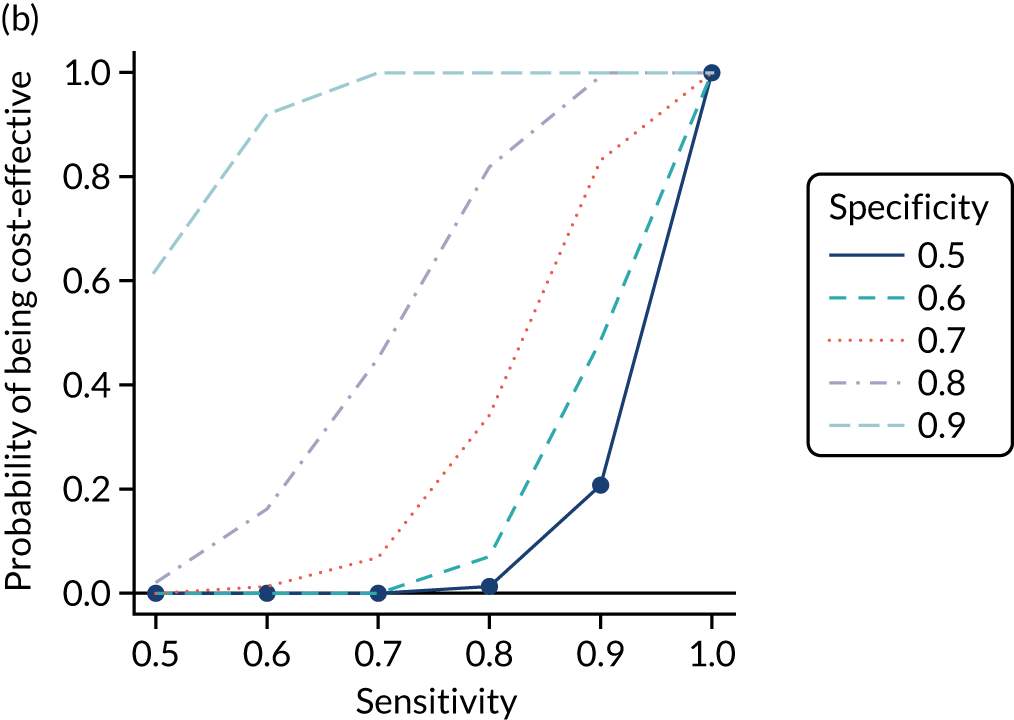
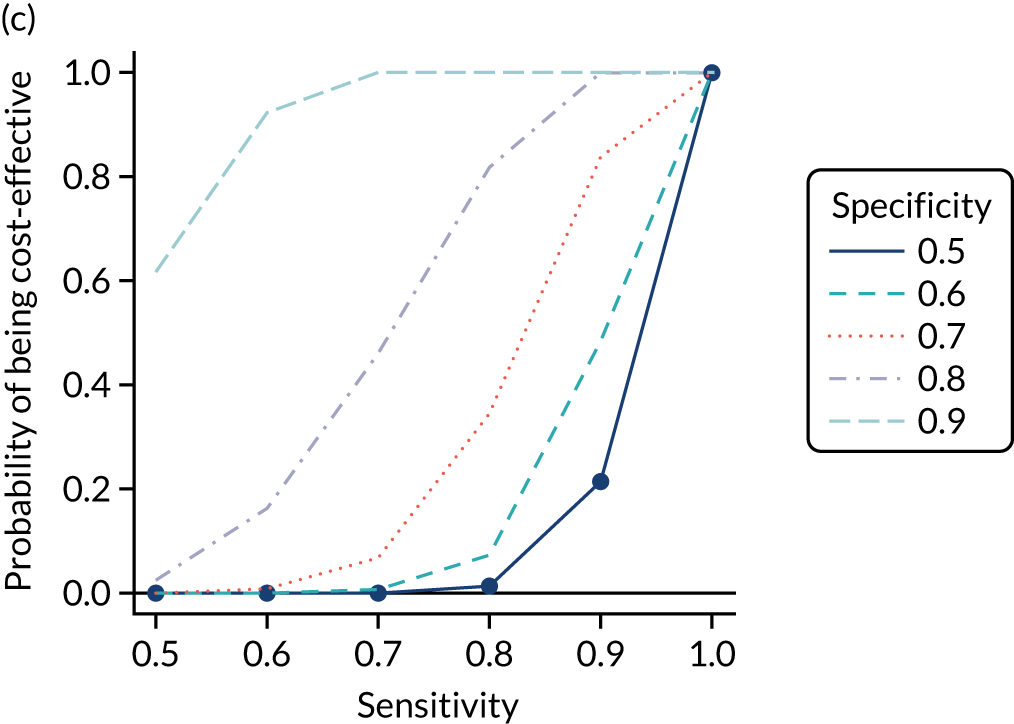
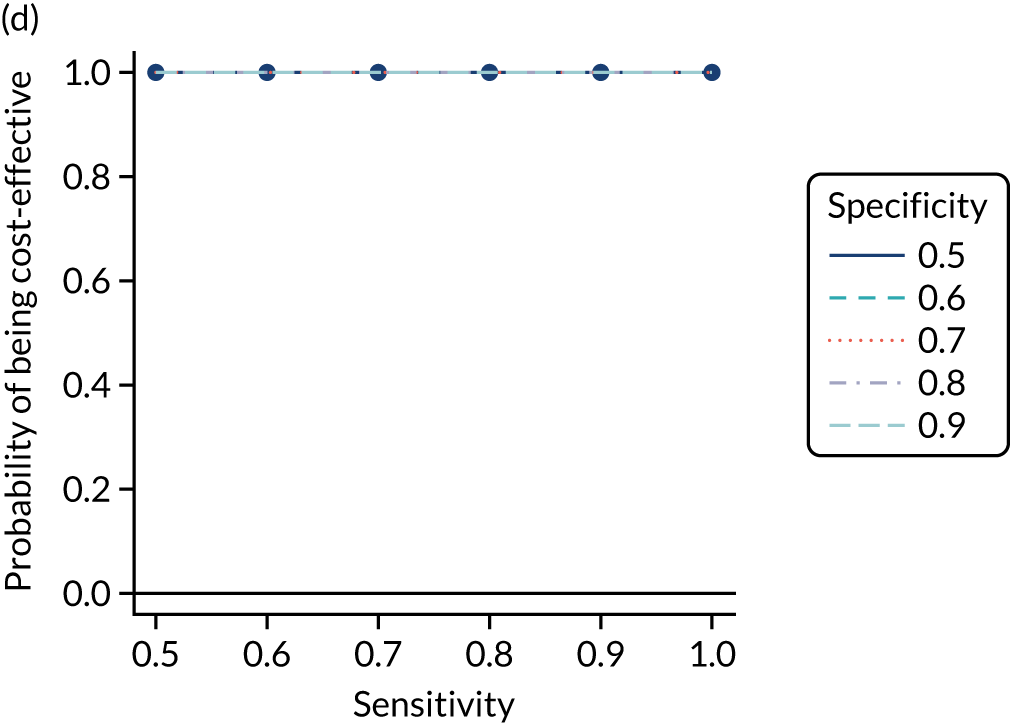
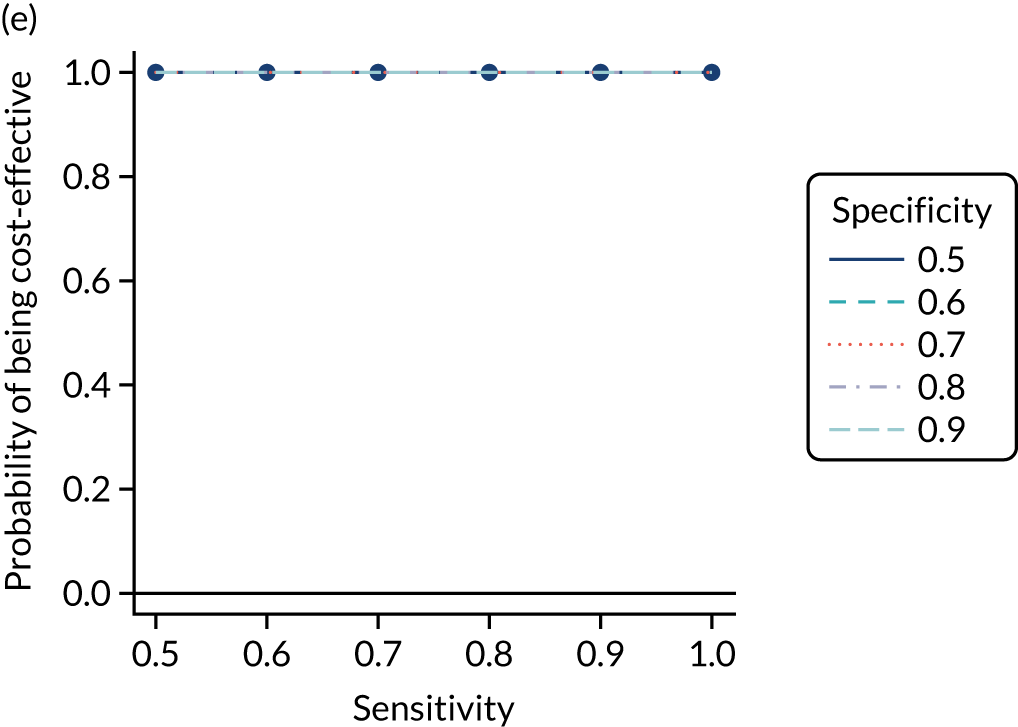
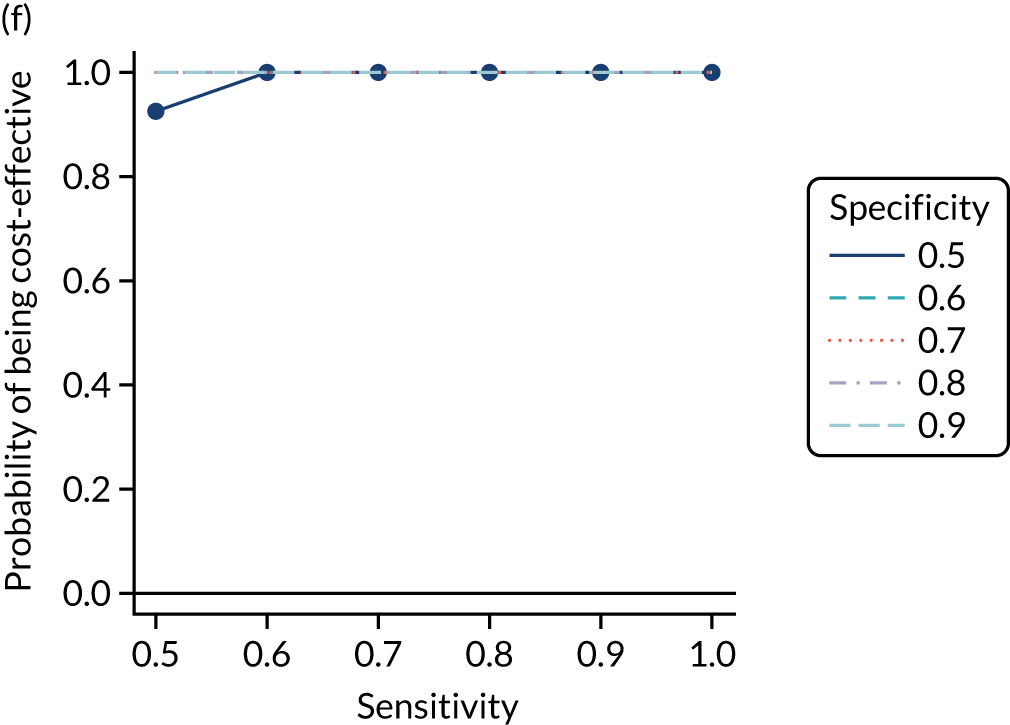
As with the adult population, we selected the testing strategies IgA tTG alone, IgA EMA plus HLA and HLA plus IgA tTG to combine with the various pre-test probabilities listed in Table 5. This is justified, as strategies using IgA tTG and IgA EMA have similar incremental net benefits and probabilities of being cost-effective, IgA tTG plus HLA performs worst among strategies with HLA, there is limited difference between IgA tTG plus EMA plus HLA and IgA EMA plus HLA (i.e. not employing tTG), the order in which HLA and EMA tests are conducted has little impact, and HLA plus IgA tTG has high cost-effectiveness and employs a widely available test.
Table 23 shows the estimated costs, QALYs and incremental net benefits, compared with no screening, for each of these strategies of interest. All combinations, apart from pre-test probabilities of 1.5% and 2% with IgA tTG, have a positive incremental net benefit at £20,000 per QALY, compared with no screening. If using only IgA tTG, a pre-test probability of 1% is the most cost-effective strategy (i.e. has greatest incremental net benefit at £20,000 per QALY), with highest costs but also the largest number of QALYs. If using IgA EMA plus HLA or HLA plus IgA tTG, the pre-test probability of 10% is the most cost-effective. As with the adult population, however, the net benefits of all IgA EMA plus HLA and HLA plus IgA tTG strategies are very similar to each other and to 1% IgA tTG, and the 95% CrIs overlap. This indicates little difference between the cost-effectiveness of these strategies, but the differences are greater than they are for adults.
| Pre-test probability for blood test (%) | Sensitivity | Specificity | Strategy | Mean (95% CI) | ||
|---|---|---|---|---|---|---|
| Costs (£) | QALYs | Incremental net benefit at £20,000 per QALY vs. no screening (£) | ||||
| No screening | 11,746 (10,204 to 12,966) | 20.6 (19.18 to 21.6) | 0 (0 to 0) | |||
| 1 | 1 | 0 | IgA tTG | 13,537 (12,558 to 14,637) | 21.29 (20.29 to 22.14) | 12,203 (3257 to 34,639) |
| 1.5 | 0.882 | 0.417 | IgA tTG | 13,074 (11,577 to 14,280) | 20.62 (19.25 to 21.61) | –841 (–1296 to 242) |
| 2 | 0.807 | 0.61 | IgA tTG | 12,914 (11,431 to 14,119) | 20.62 (19.27 to 21.62) | –574 (–1074 to 638) |
| 5 | 0.667 | 0.872 | IgA tTG | 12,713 (11,343 to 13,890) | 20.71 (19.48 to 21.67) | 1290 (–226 to 5072) |
| 10 | 0.533 | 0.952 | IgA tTG | 12,679 (11,477 to 13,793) | 20.87 (19.8 to 21.78) | 4517 (1002 to 13,401) |
| 20 | 0.331 | 0.987 | IgA tTG | 12,699 (11,686 to 13,797) | 21.09 (20.08 to 21.95) | 8896 (2610 to 24,765) |
| 1 | 1 | 0 | IgA EMA plus HLA | 13,808 (12,814 to 14,911) | 21.32 (20.32 to 22.16) | 12,502 (3202 to 35,895) |
| 1.5 | 0.882 | 0.417 | IgA EMA plus HLA | 13,403 (12,418 to 14,497) | 21.26 (20.25 to 22.1) | 11,577 (3050 to 33,066) |
| 2 | 0.807 | 0.61 | IgA EMA plus HLA | 13,226 (12,242 to 14,325) | 21.26 (20.26 to 22.12) | 11,878 (3293 to 33,524) |
| 5 | 0.667 | 0.872 | IgA EMA plus HLA | 13,018 (12,030 to 14,117) | 21.3 (20.29 to 22.14) | 12,872 (3840 to 35,630) |
| 10 | 0.533 | 0.952 | IgA EMA plus HLA | 12,994 (12,003 to 14,103) | 21.31 (20.31 to 22.14) | 13,085 (3919 to 36,248) |
| 20 | 0.331 | 0.987 | IgA EMA plus HLA | 13,034 (12,033 to 14,133) | 21.31 (20.31 to 22.15) | 13,040 (3820 to 36,375) |
| 1 | 1 | 0 | HLA plus IgA tTG | 13,800 (12,808 to 14,901) | 21.32 (20.32 to 22.16) | 12,509 (3210 to 35,884) |
| 1.5 | 0.882 | 0.417 | HLA plus IgA tTG | 13,397 (12,416 to 14,492) | 21.26 (20.26 to 22.1) | 11,618 (3029 to 33,293) |
| 2 | 0.807 | 0.61 | HLA plus IgA tTG | 13,221 (12,241 to 14,321) | 21.26 (20.27 to 22.12) | 11,914 (3273 to 33,675) |
| 5 | 0.667 | 0.872 | HLA plus IgA tTG | 13,014 (12,027 to 14,114) | 21.3 (20.29 to 22.14) | 12,885 (3844 to 35,682) |
| 10 | 0.533 | 0.952 | HLA plus IgA tTG | 12,991 (11,998 to 14,100) | 21.31 (20.31 to 22.14) | 13,090 (3929 to 36,260) |
| 20 | 0.331 | 0.987 | HLA plus IgA tTG | 13,032 (12,029 to 14,132) | 21.31 (20.31 to 22.15) | 13,042 (3835 to 36,372) |
Figure 24 plots the CEACs, which show the probability that each testing strategy is optimal (i.e. has the highest net benefit) at each willingness-to-pay threshold for an additional QALY. This shows that, at any threshold > £5000 per QALY, the strategy with the greatest probability of being cost-effective is 10% HLA plus IgA tTG. This probability is between 60% and 80%, which, although high, does not suggest certainty that any of the IgA EMA plus HLA or HLA plus IgA tTG strategies differ in cost-effectiveness.
FIGURE 24.
Cost-effectiveness acceptability curves for strategies of interest for children.
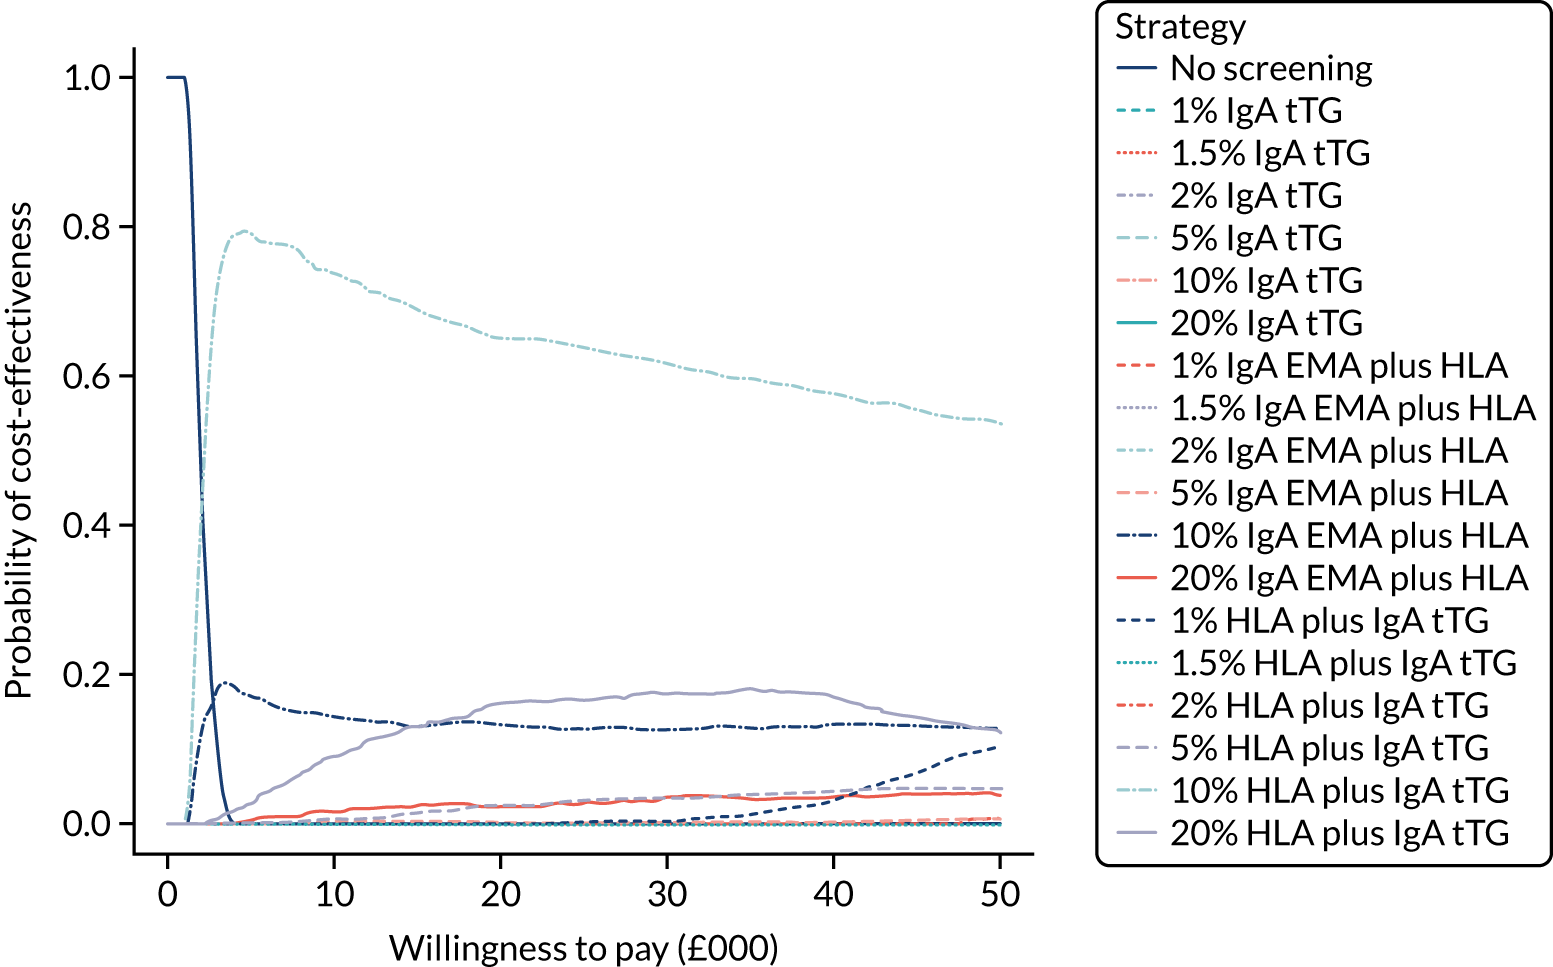
Table S21 (see Report Supplementary Material 1) provides the proportion of time spent in each state for children on the strategies of interest. Compared with other IgA tTG strategies, the 1% IgA tTG has the greatest proportion of time spent in the CD, gluten-free diet, no-complications state and the least time in the undiagnosed states, and similarly for the 5% HLA strategies compared with other HLA strategies. There is little difference in the proportions of time spent in the undiagnosed, complication states, as most child patients are eventually diagnosed. Time spent in the death state is the same across strategies for this reason. Overall, cost-effectiveness appears to be driven by time spent in the CD, gluten-free diet, no-complications state and the undiagnosed CD, no-complications state.
The total EVPI and EVPPI for parameter sets of interest are summarised in Table 21. The total population EVPI is £18.4M, indicating potential value in conducting further research. However, this potential value is less than that for adult men (£25.7M) and adult women (£79.0M). As with adults, the EVPPI is greatest for the probability of late diagnosis (£10.6M) and test accuracies (£7.8M). These are half of the corresponding values for adult men and about six times lower than for adult women, again suggesting that research should be focused on adult women.
The ratio of EVPPI to EVPI for each parameter is illustrated in Figure 25. As with the adult population, probability of late diagnosis, disutility of biopsy and specificity of IgA EMA are important parameters. Note that the effect of a gluten-free diet (i.e. being diagnosed with CD) on osteoporosis is picked out as highly influential, and actually its estimated EVPPI is greater than the total EVPI (note that proportion exceeds 1.00). This is due to an algorithm failure. The EVPPI estimated in Table 21 is based on MLMC methods, whereas the ratios in Figure 25 are based on generalised additive models, and the latter have been found to be unstable in comparison with the former in the literature. 254
FIGURE 25.
Ratio of EVPPI for each parameter to total EVPI for children. Only the 10 most influential parameters are included. Note that log_or_osteoporosis_GFD is high, but this is due to numerical failure of the algorithm. The remaining parameters have minimal influence on the results. GFD, gluten-free diet; log_or_osteoporosis_GFD, log-odds ratio of developing osteoporosis on GFD, compared with not on GFD, for coeliac patients; probability_IDA_20, prevalence of IDA at age 20 years; probability_IDA_10, prevalence of IDA at age 10 years; sens, sensitivity; spec, specificity.
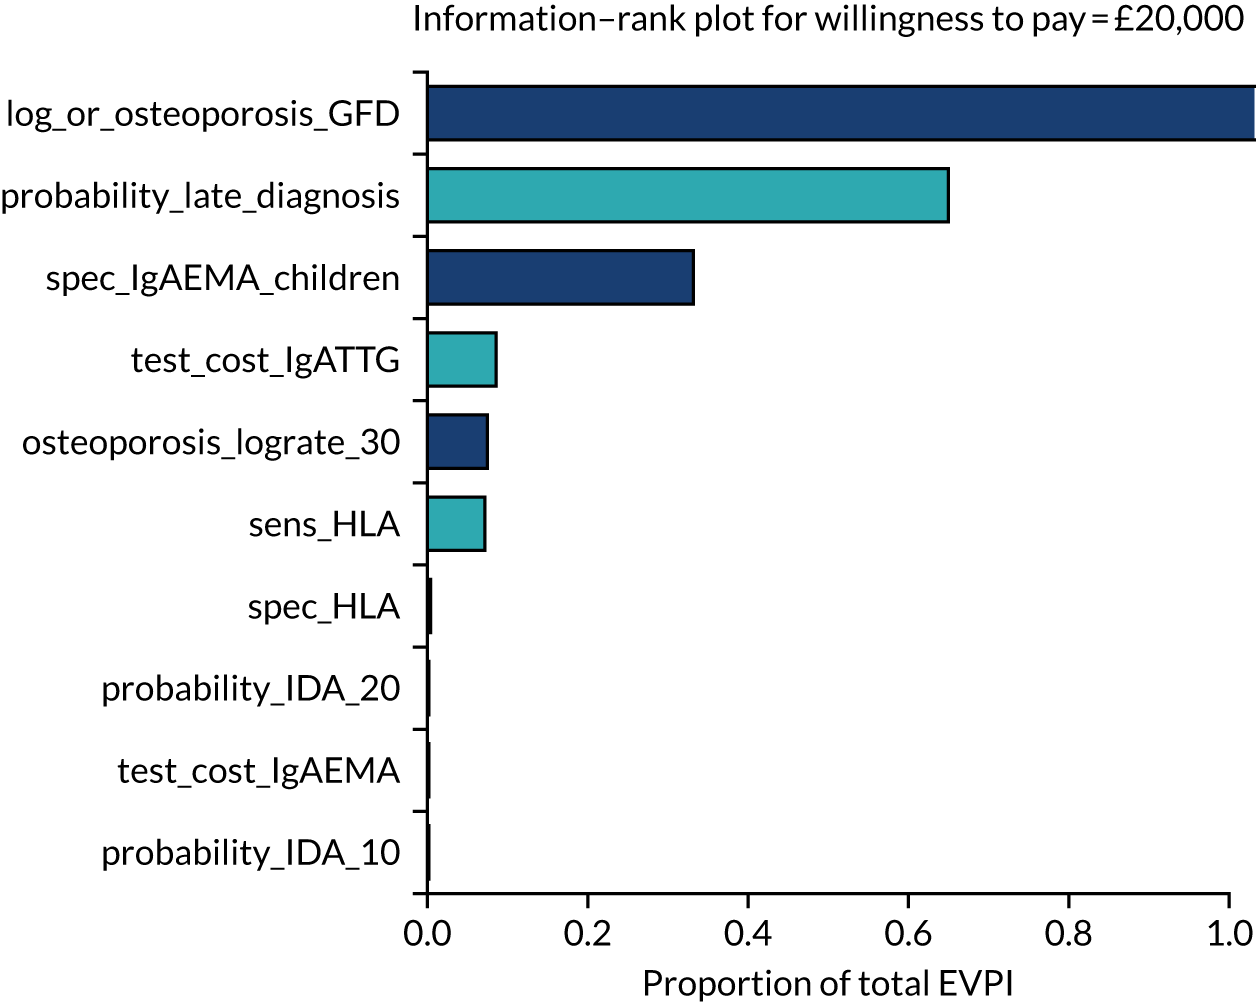
Chapter 9 Discussion
Parts of this chapter are reproduced from Elwenspoek et al. 20 This is an Open Access article distributed in accordance with the terms of the Creative Commons Attribution (CC BY 4.0) license, which permits others to distribute, remix, adapt and build upon this work, for commercial use, provided the original work is properly cited. See: https://creativecommons.org/licenses/by/4.0/. The text below includes minor additions and formatting changes to the original text.
Statement of principal findings
In Chapter 3, we identified diagnostic indicators and calculated summary estimates for their accuracy in identifying individuals at high risk of CD. None of the identified diagnostic indicators alone had good sensitivity for detecting CD; however, some showed promise in helping to identify patients who should be offered serological testing. The estimated PPVs for migraine, family history of CD, anaemia, type 1 diabetes, osteoporosis and chronic liver disease were all > 2%, with 95% CIs lying entirely above the population prevalence of 1%. These results suggest that individuals with these conditions are twice as likely to have CD as the general population. There was too little evidence to show an increased risk of CD among individuals with systemic lupus erythematosus or multiple sclerosis. Dermatitis herpetiformis showed the highest diagnostic accuracy; however, because dermatitis herpetiformis is rare and treatment is a gluten-free diet even in the absence of a CD diagnosis,258 it is unlikely to be helpful as a diagnostic indicator. GI symptoms showed poor diagnostic ability, whereas individuals with a first-degree relative with CD had a risk of CD that was three times higher than that of the general population.
In Chapter 4, we developed prediction models for children, women and men. The final models included 24, 24 and 21 predictors, respectively. For children, having type 1 diabetes, Turner syndrome, IgA deficiency or a first-degree relative with CD were estimated to be the strongest predictors (i.e. had the highest estimated coefficients). For women and men, the strongest predictors were having a first-degree relative with CD, and anaemia. In the development data set, the model showed good discrimination between patients with and patients without CD, as demonstrated by high c-statistics: 0.84 (95% CI 0.83 to 0.84) for children, 0.77 (95% CI 0.77 to 0.78) for women and 0.81 (95% CI 0.81 to 0.82) for men. The model discriminated less well between patients with and patients without CD in the external validation data set, in which the c-statistics reduced to 0.60 for children, 0.55 for women and 0.62 for men. However, the predictor first-degree relative with CD was not recorded in the validation data set, which was one of the most important predictors, leading to an underestimation of model performance in this data set. The models were poorly calibrated and tended to overestimate the risk of having CD in all three groups in the development data set and the validation data set. The models suggest that individuals with any of the selected predictors have an increased risk of CD of > 50% and thus warrant testing for CD.
In Chapter 5, we estimated the diagnostic accuracy of the most commonly used serological tests for CD: IgA tTG and IgA EMA. IgA tTG was found to have a summary sensitivity of 91% (95% CI 87% to 93%, threshold: 15 U/ml) among adults and 98% (95% CI 91% to 99%, threshold: 20 U/ml) among children, based on five90,100,110,175,176 and six121,134,136,140,141,146 studies, respectively. IgA tTG specificity was estimated at 87% (95% CI 84% to 90%) among adults and 70% (95% CI 39% to 90%) among children. IgA EMA showed a sensitivity of 88% (95% CI 75% to 95%, threshold: 1 : 5) among adults and 95% (95% CI 89% to 97%, threshold: 1 : 10) among children, based on five studies each. The specificity of IgA EMA was 99.6% (95% CI 92% to 100%, threshold: 1 : 5) among adults and 94% (95% CI 85% to 98%, threshold: 1 : 10) among children. To select estimates to inform the economic model, we restricted our analysis to studies that had evaluated the two main serological tests of interest (IgA tTG and IgA EMA, alone and in combination) at the same threshold. This was to ensure that estimates used in the economic model were directly comparable. None of the studies that evaluated both tests alone and in combination reported accuracy estimates for the same thresholds. We therefore selected the studies that were judged to be at the lowest risk of bias and that had the largest sample sizes. This means that evidence to inform the economic model is derived from two studies, one with adults and one with children, despite identifying > 100 studies that evaluated the accuracy of serological tests for CD. For both adults and children, IgA tTG had the highest sensitivity, although estimates for children were very similar, and EMA had the highest specificity. There was little improvement in either sensitivity or specificity when the tests were used in combination. Despite thresholds being the same as those used in the meta-analyses for the individual tTG and EMA tests, there were minor differences between estimates from these studies and summary estimates when all studies that reported at the same thresholds were pooled.
In Chapter 6, we estimated the accuracy of HLA-DQ2 and/or -DQ8 genotyping to diagnose CD. Summary sensitivity was very high, at 99% (95% CI 83% to 100%), and specificity was 56% (95% CI 50% to 61%). The high sensitivity suggests that HLA genotyping would be a useful test to rule out CD. However, because of the low specificity, this test needs to be used in combination with other tests to diagnose CD.
In Chapter 7, we used collaborative work with patients and an online survey to identify the level of diagnostic certainty people want to have for CD testing and starting treatment. Survey respondents wanted to be a median of 66% (IQR 33–90%) certain of the blood test result before starting a gluten-free diet if they were asked to imagine that they had CD symptoms. Without symptoms, respondents wanted to be more certain of the blood test result before committing to a gluten-free diet: median 90% (IQR 66–99%). However, a higher proportion of respondents opted to wait for a confirmation biopsy, if given the option, instead of starting a gluten-free diet immediately, even if a hypothetical blood test gave 75–90% certainty. The free-text answers revealed no barriers to a blood test. Reasons for opting for a confirmation biopsy were to feel more confident about the diagnosis or to get an official diagnosis. Barriers to a biopsy were that it was invasive and unpleasant. Waiting times did not emerge as an important barrier for having a biopsy. There was large variation in attitudes towards following a gluten-free diet. Some respondents were willing to start the diet only with high risk or great certainty of having CD, whereas others were happy to try it without having a diagnosis or when at very low risk of having CD.
The findings from all previous chapters informed the cost-effectiveness analysis presented in Chapter 8. We used a decision tree and discrete-time cohort Markov model to compare the cost-effectiveness of case-finding strategies at different levels of pre-test probability separately for men, women and children. For adult men and women, and using serological testing alone, a 1% pre-test probability (equivalent to population screening) had the highest net benefit at £20,000 per QALY, with an incremental net benefit, relative to no screening, of £24,331 (95% CrI £5080 to £56,493) for men and £24,382 (95% CrI £4829 to £59,154) for women. Serological tests (IgA EMA and IgA tTG) had similar cost-effectiveness and there was limited benefit to including both EMA and tTG. The 1% IgA tTG strategy had a nearly identical net benefit to, and a 95% CrI that overlapped with, those of strategies using both HLA and serological testing. Moreover, none of the strategies had a probability of being the most cost-effective of > 60% for men or > 50% for women, suggesting limited certainty that they differ in cost-effectiveness. Using IgA tTG alone with a 1% pre-test probability or any HLA plus IgA tTG strategy represents a practical combination of tests, as IgA tTG is routinely available in UK laboratories, is easier to interpret and also provides some indication of reversal of mucosal damage. 247
The 95% CrIs on net QALYs, costs and net benefits were very wide and differences between optimal strategies were not substantial. Our model was limited by a lack of data on the impact of gluten-free diet on rates of osteoporosis and NHL among coeliac patients, and on the routine diagnosis of CD regardless of screening. We used a value-of-information analysis to identify the most ‘important’ uncertainties, defined by their extent of uncertainty and impact on model conclusions. This identified the probability of being eventually diagnosed regardless of screening (i.e. probability of a late diagnosis) as the most important uncertainty for both adult men and women. For men, the sensitivity of HLA, the accuracy of IgA EMA and the impact of a gluten-free diet on the chance of developing osteoporosis among coeliac patients were also important uncertainties. For women, the only other important uncertainties were the specificity of IgA EMA and the sensitivity of HLA.
For children, a pre-test probability of 10% with HLA plus IgA tTG had the greatest net benefit at £20,000 per QALY, with an incremental net benefit of £13,090 (95% CrI £3929 to £36,260), relative to no screening. This also had a probability of 60–80% of being cost-effective at a willingness-to-pay threshold of > £10,000 per QALY. As with adults, the 95% CrIs were very wide, indicating substantial uncertainty in our results. The 20% HLA plus IgA tTG- and 2% IgA tTG-alone strategies also had probabilities of about 20% of being the most cost-effective. The greatest and most influential uncertainties for children, as identified by a value-of-information analysis, were the probability of being eventually diagnosed regardless of screening, and the specificity of IgA EMA.
For adults, the greatest difference between strategies was between the time in the undiagnosed CD, osteoporosis state and the time in the CD, gluten-free diet, no-complications state. This was supported by the EVPPI analysis, which found the probability of late diagnosis (i.e. the parameter that drives time in undiagnosed states) to be the most influential. For children, the time in the CD, gluten-free diet, no-complications state was, again, indicated to be important by both time in states and EVPPI. The effect of a gluten-free diet on osteoporosis rates was identified as important by the EVPPI analysis for children, which is likely to be explained by their greater time to benefit from a gluten-free diet and avoid subsequent osteoporosis.
The total population EVPI was £25.7M for men, £79.0M for women and £18.4M for children, indicating substantial potential value of further research. The EVPPI analyses for adults indicated up to three times as much value among women as men. However, in both populations there was substantial potential value in research on the probability of late diagnosis and the accuracy of serological and genetic tests. The population EVPPI estimates for children were lower than for adult men or women, but probability of late diagnosis and test accuracies again came out as most important for future research. To prioritise optimal further research, expected value of sample information should be calculated for suggested research designs. 259
Strengths and limitations
A key strength of the systematic reviews and meta-analyses was that we applied a robust methodological approach following internationally recognised systematic review guidance. We used sensitive literature search strategies, and study selection was performed by at least two reviewers independently. Data extraction was performed by one reviewer and checked by a second to ensure accuracy and completeness. We conducted detailed risk-of-bias assessments using a validated tool. 28 We applied stringent inclusion criteria to minimise bias. Syntheses of studies were carried out in line with Cochrane-recommended methods and sensitivity analyses were performed to explore heterogeneity. 22,23
For the diagnostic indicator (see Chapter 3) and accuracy of serological test reviews (see Chapter 5), the interpretation of meta-analyses results was limited by the substantial heterogeneity between the included studies, and most included studies were judged to be at high risk of bias. We investigated sources of variability in the diagnostic indicator review by performing stratified meta-analyses by age group, definition of CD and study design; only a small minority of diagnostic indicators were reported by enough studies to perform these analyses. Finally, we limited our review to diagnostic indicators that were reported by at least five studies; therefore, we may have missed other promising diagnostic indicators that are evaluated less often. Our broad inclusion criteria, such that any diagnostic indicator evaluated in an appropriately designed study was eligible for inclusion, mean that we had the potential to identify diagnostic indicators not currently recommended by guidelines.
In the review of the diagnostic accuracy of serological tests, a wide variety of thresholds for test positivity were reported across studies, with some not reporting the threshold at all. When threshold units differed between assays, we assumed that they represented the same arbitrary units and were comparable. However, as they do not measure absolute amounts of antibodies, there may be slight variation between different commercial assays and between laboratories. There was substantial variation in CD prevalence between studies, probably due to differences in patient recruitment. Some studies excluded patients with IgA deficiencies whereas others did not, which may have affected the accuracy estimates for tests that detected the presence of IgA in serum samples. Sources of heterogeneity were explored through sensitivity analyses; summary results were relatively robust to a number of exclusions. Very few studies provided direct comparison of the serological tests, and those that did reported accuracy at different thresholds. This means that, despite the review including 113 studies, estimates used for the economic model were based on single studies with adults and children. We considered it more appropriate to have directly comparable estimates of the accuracy of IgA EMA and IgA tTG, alone and in combination, than to take the estimates from the meta-analyses as different studies contributed to these.
A key strength of our prediction models (see Chapter 4) is that we preselected diagnostic indicators to consider in the model based on a review of the literature, as well as current practice guidelines and discussions with clinical experts. We avoided using traditional approaches for model selection, such as stepwise selection, which aim to include only the most significant predictors in a model. Disadvantages of this method are instability of the selection, biased testimation of coefficients (estimation bias), misspecification of variability and exaggeration of p-values. 44 We performed a second step in variable selection using elastic net regression and bootstrapping, to exclude predictors that have a very small or uncertain effect on the prediction of CD. The elastic net method is a modern approach to variable selection that uses shrinkage, which optimises the variance (precision) and bias (accuracy) trade-off. It minimises overfitting on development data, thereby creating a more robust model for use in the future. Another important strength of the models is that they were developed in a large primary care data set using robust definitions of predictors and were externally validated in another large UK primary care data set. We used the International Classification of Primary Care definitions where available. 52 The corresponding code lists were taken from publications when possible, and all code lists were checked by at least two clinicians. 260 This makes the model more applicable and generalisable, as the model is intended to be used in the primary care setting and GPs have access to the information needed for the model during consultation.
A major limitation of the prediction models is that, as CD is underdiagnosed, it is also under-reported in the CPRD. The prevalence of CD in both primary care data sets used in Chapter 5 was around 0.1%, which is 10 times lower than the estimated population prevalence in the UK. As a result, we may have selected undiagnosed CD patients in our control group, which could have led to an underestimation of the importance of indicators. To reduce the number of undiagnosed CD patients in the control group, we excluded patients with related conditions, such as dermatitis herpetiformis, and people receiving gluten-free prescriptions. What is more problematic is that diagnosed CD patients may have different characteristics from undiagnosed CD patients. We were, therefore, more likely to confirm predictors that are already in the guidelines because those indicators currently prompt testing. Different indicators may be important for undiagnosed CD patients; however, it was not possible to investigate this in this data sets. The results from the diagnostic indicator review were considered more robust for individual diagnostic indicators as we accepted only studies in which all participants were tested for CD; this may explain why some of the indicators identified by our review, such as migraine, were not found to be important indicators in the prediction models. Our recommendations on who should be tested are, therefore, based on both the results of the indicator review and the results of the prediction models.
A further limitation of using routine CPRD data to develop the prediction models is that we were able to investigate only diagnostic indicators that were recorded by GPs. We were, therefore, not able to evaluate some potentially important indicators, such as dental enamel defects, as these are not routinely recorded in primary care. We also relied on accurate recording of indicators by GPs and reporting by patients; non-specific symptoms such as GI symptoms and fatigue are likely to be under-reported and so cannot be fully evaluated using primary care data. Although we used large sample sizes, some indicators, such as Williams–Beuren syndrome, were too rare to be included in our models. This is a limitation of the model because these indicators are important according to several CD guidelines. 9–11
A further limitation in the study design for the prediction model is that we used a nested case–control design. A cohort design is recommended for prediction modelling and is necessary for reliable estimations of model calibration because it compares the indicators with the observed prevalence. We artificially inflated the control group to recreate a CD prevalence similar to the general population, which allowed us to estimate calibration statistics. This enabled us to calculate and compare all performance measures. This method may have inflated any bias present in the original control group and might explain the poor calibration shown in our models. However, we believe this risk was low because the control group had a large sample size (> 80,000 patients, large enough to reflect variation in all indicators) and controls had been randomly selected from a sample that is largely representative of the UK. We recreated a cohort with the estimated population prevalence of CD (1%), not the prevalence observed in the CPRD (0.1%), which is lower than the actual population prevalence as CD is underdiagnosed. Another limitation of this approach is that we have no information about the characteristics of those with CD who have not been diagnosed and therefore had to assume that they are similar to the characteristics of those who are diagnosed, which is likely to be incorrect.
We used an innovative form of patient involvement in this project that directly influenced our economic model. The survey (see Chapter 7) was developed in collaboration with CD patients and tested by people with and people without knowledge of CD. We developed videos to make the information more accessible. The qualitative analyses of free-text answers provided context and helped in interpreting the multiple-choice answers.
Although we used multiple routes of promoting the survey to get a variety of people to fill it out, the sample was not representative of the UK (the majority were highly educated white women), which is a common problem with online surveys. Another limitation was that we recruited participants online and the survey was available only in an online format, which may have excluded those who do not have access to internet or do not use social media. The free-text answers revealed that some respondents misunderstood questions, which may have skewed the results. We may have overestimated the adherence to a gluten-free diet because of non-responder biases, that is those with ‘poor adherence’ to a gluten-free diet may be less likely to respond to a questionnaire.
The cost-effectiveness analysis was based on a state-of-the-art cohort Markov model. We used the CPRD analysis and clinical advice to identify the most important comorbidities of CD, namely osteoporosis and NHL. The model is fully probabilistic, which means that it avoids assuming that uncertain parameters are fixed. The uncertainty in epidemiological and utility parameters was modelled with statistical distributions and this uncertainty was propagated to the final costs, QALYs and net benefits. We went further and conducted value-of-information analyses to identify the most influential uncertain parameters and quantify the value in further research. Furthermore, the model was implemented in the R statistical programming language and optimised using C/C±, which has extensive benefits in flexibility, transparency and efficiency over the more usual Microsoft Excel.
There are several important limitations of the cost-effectiveness analysis. The Markov model structure was a simplification of CD, for example not modelling a difference between symptomatic and asymptomatic CD or allowing patients to have osteoporosis and NHL. Using a cohort modelling approach did not permit modelling of individuals; thus, we modelled an average adult male, adult female and child with CD, rather than a more granular exploration of types of patients. A full individual-level model informed by the CPRD and including more of the indicators identified in Chapters 3 and 4 is possible. However, this would also require further research on state costs and utilities, and the impact of a gluten-free diet, none of which are guaranteed to have high-quality data, and may not lead to different recommendations. 261
The data informing our selected model also had limitations. All uncertainties regarding test accuracy from Chapters 5 and 6 carry through to the cost-effectiveness model. The costs of the IgA EMA, IgA tTG and HLA tests were uncertain; we informed these through quotations provided by laboratories affiliated with our team, but found them to vary even within this small sample. The CPRD analysis could estimate the prevalences of osteoporosis, NHL and IDA in a diagnosed CD cohort only, so the initial prevalences in the undiagnosed CD cohort were assumed to be the same as those of the newly diagnosed CD cohort. However, the prevalences eventually diverge because of the different rates of developing osteoporosis and NHL in diagnosed and undiagnosed CD cohorts. Evidence on routine diagnosis of CD was limited, so we relied on a survey on the duration of symptoms prior to diagnosis. 231 This is problematic, as it considers only patients who are eventually diagnosed and is estimating time from symptoms rather than time from developing CD, thus biasing towards lower times to diagnosis. In our model, we also assumed that time to eventual diagnosis is unaffected by an initial false-negative result from the screening programme; bias could be towards lower times to diagnosis if screening leads to greater awareness of CD or towards longer times if the negative result gives a patient a belief that they do not have CD.
The benefit of a gluten-free diet, in terms of either quality-of-life improvements or reduced rates of complications, was uncertain. Unlike the NICE 2015 model,193 our model does not distinguish between people with diagnosed CD following a gluten-free diet and people with diagnosed CD not following a gluten-free diet. This is because there are many methodological challenges associated with assessing dietary adherence and a lack of reliable data on the health impacts of following a gluten-free diet or not. Reported gluten-free diet adherence rates vary substantially depending on how adherence is measured and the population studied. 214 Violato et al. 231 reported a coefficient for the impact on quality of life of not adhering to a gluten-free diet of –0.14 (95% CI –0.31 to 0.03), compared with adhering all the time. 214 However, we could not use this without a reliable estimate for adherence.
Based on our survey of patients (see Chapter 7), we assumed that a confirmatory biopsy would be needed for patients with post-test probabilities of < 90%. This would lead to roughly 70% of patients having a confirmatory biopsy, in accordance with recent research indicating high diagnostic accuracy of tests alone. 70,89,220,221 In all cases of data uncertainty, we varied parameters and propagated uncertainty to the probabilistic results; this perhaps explains the lower probabilities that our optimal strategies were the most cost-effective. A further limitation of our analysis is that we did not consider the capital cost of laboratories across the UK having to establish capacity for IgA EMA or HLA testing. This was considered in the NICE model, which found the results to be insensitive to the inclusion of capital costs. 193 Furthermore, when not including HLA testing, our analyses did not favour IgA EMA or IgA tTG, or a combination thereof. With HLA testing, we found that IgA EMA plus HLA performed similarly to IgA tTG plus EMA plus HLA, meaning that it would be necessary to ensure capacity only for IgA EMA and HLA.
A further limitation of the economic analysis is that the model used the EQ-5D measure of quality of life to capture the effect on quality of life of following a gluten-free diet, which showed no effect, so the model assumes that following the diet causes no disutility. However, the EQ-5D is a very crude measure and does not capture the difficulty of following a strict lifelong diet and its social implications. The CD-QOL (part of the survey in Chapter 7) showed that quality of life among CD patients was mainly affected by CD-related limitations and health concerns. However, it is not currently possible to translate results from the CD-QOL to QALYs, making it impossible to use this tool to quantify quality of life in the model.
Finally, a limitation of the serological test accuracy review (see Chapter 5) and the economic models (see Chapter 8) is that we assumed a 100% accuracy of the biopsy procedure by treating it as a gold standard. No diagnostic procedure is 100% accurate; in clinical practice, the diagnosis of CD relies on a combination of clinical, serological and histopathological findings. There are many potential histopathological mimics that can cause false-positive biopsy results if CD serology is not taken into account, such as infections, other bowel diseases such as peptic ulcer disease or IBS, and certain medications. 11 The correct orientation and cutting procedure are essential for appropriate interpretation of histopathological findings. 10,11 Detecting mucosal architectural changes is further complicated by the fact that CD does not necessarily affect all parts of the small bowel, and the severity of coeliac lesions can vary between areas. 262 Thus, pathological findings in CD can be patchy, and multiple biopsies are needed to diagnose CD. 263 As a result, interobserver variability is high for the interpretation of biopsy results. 10
Comparison with other studies
Our estimates of the probability of CD for people with certain risk conditions, compared with the general population, are in agreement with previous reports on the prevalence of CD among individuals with those conditions. Meta-analyses estimated the prevalence of CD to be 3–16% among people with type 1 diabetes,264 1.6–3.8% (95% CIs) in studies that measured CD by serological tests only and 2.3–4.5% in studies that included biopsy-proven CD patients among people with IBS,265 2.6–3.9% among people with IDA,33 1.6–2.6% among people with epilepsy,266 1.4–3.5% among women with infertility,267 1.3–1.9% among people with autoimmune thyroid disease,268 1–7% among people with raised liver enzymes269 and 1.1–2.0% among people with osteoporosis. 270 A meta-analysis of nine studies found a pooled odds ratio of 1.7–2.7 for CD among individuals with psoriasis, compared with those without psoriasis,271 and another meta-analysis found a 2.2–7.0 relative risk of CD among patients with inflammatory bowel disease compared with controls. 272 A meta-analysis of 40 studies found that the prevalence of CD among children with migraine-like headaches is 1.5–3.7 times higher than in the general population, but no evidence was reported on adult populations. 273 Our analysis showed a similar increased risk of 2.8-fold, including one study with an adult population that showed similar results. 274
We found a lower risk than other studies of CD among people with a family history of CD. A meta-analysis of 54 studies showed that the prevalence of CD is 6.3–8.8 times higher among first-degree relatives and 1.3–3.8 times higher among second-degree relatives than in the general population,275 whereas we found a risk of 1.3 times higher among people with a family history of CD. Only six of our included studies focused specifically on first-degree relatives; the other six included second-degree relatives or did not specify, which can partly explain our lower estimate. When restricting our analysis to first-degree relatives, we estimated the PPV at 1.3–7.2%. Finally, some studies included as few as two individuals with a family history of CD and six individuals with CD in their study population,276,277 which is likely to have attenuated the estimated association as well.
Small differences between our results in Chapter 4 and results from previous meta-analyses can be explained by our stringent inclusion criteria. Most studies that used routinely collected data were excluded from our review because, in these studies, patients without a code for CD are assumed to not have the disease. This is problematic because CD is known to be underdiagnosed. Small differences between our estimates of PPV and estimates from meta-analyses of prevalence may also be explained by the fact that we included only studies that allowed estimation of both sensitivity and specificity (which requires some study participants to not have the diagnostic indicator).
To our knowledge, few previous studies have developed prediction models for CD and none has based the prediction rules on symptoms and risk factors alone. Genetic risk models have been developed using HLA and non-HLA variants as predictors of CD. A simple count model that included 10 non-HLA genes on top of the usual HLA risk genes showed better classification than HLA risk genes alone. 278 The same authors further improved their model by increasing the number of non-HLA genes to 57. This model showed good discrimination, with a c-statistic of 0.85 (compared with 0.82 for HLA only). 279 These models can help with assessing risk in at-risk groups, but these genetic tests are not readily available to GPs. Our model performed well in the development data set, in which the c-statistic ranged from 0.76 for women to 0.82 for children, which is in the same range as the Framingham Risk Score for coronary heart disease (c-statistic of 0.8), which is clinically useful. 280 Other examples of prediction rules that are in use in primary care are the QCancer® scores (ClinRisk Ltd, Leeds, UK), which showed good discrimination, with c-statistics ranging from 0.73 to 0.91 for different types of cancer among women281 and from 0.82 to 0.94 for different types of cancer among men. 282
Existing evidence on the accuracy of serology for diagnosing CD is mixed. Previous systematic reviews of the accuracy of serological testing for diagnosing CD suggest that the tests are highly sensitive and specific among both adults and children. 12–15 These systematic reviews, however, are out of date and/or have methodological limitations, including issues with the search strategy, how study quality was assessed and how results were synthesised. All reviews included case–control design studies, which have been shown to overestimate test accuracy measures, compared with cohort designs. 68 Rostom et al. 13 stratified their analyses by age, test and substrate. The summary sensitivity and specificity of IgA tTG (human recombinant) and IgA EMA tests were > 90% across all age groups. Giersiepen et al. 12 conducted a systematic review of antibody test accuracy among children. Meta-analyses were not performed because of between-study heterogeneity; the sensitivity and specificity ranged from 13% to 100% and from 78% to 100%, respectively, for the IgA tTG test and from 83% to 100% and from 95% to 100%, respectively, for the IgA EMA test. Schyum and Rumessen14 carried out a systematic review of serological test accuracy among adults. Study data were not meta-analysed, but the median sensitivity and specificity were estimated to be 93% and 95%, respectively, for the IgA tTG test and 84% and 100%, respectively, for the IgA EMA test. van der Windt et al. 15 estimated serological test accuracy among adults presenting to primary care with abdominal symptoms. The summary sensitivity and specificity were 89% and 98%, respectively, for IgA tTG and 90% and 99%, respectively, for IgA EMA. The sensitivity and specificity estimates for IgA tTG and IgA EMA in our review (see Chapter 5) were slightly lower than in previous reviews. Inclusion of case–control studies may have inflated previous accuracy estimates. Finally, a meta-analysis of six studies investigated the accuracy of HLA-DQ2 and -DQ8 genotyping for the detection of CD and found a pooled sensitivity of 97–99% and specificity of 41–48%,283 compared with 99% and 56%, respectively, in Chapter 6.
Our findings that IgA EMA, IgA tTG and HLA testing, alone or in combination, of at-risk patients is cost-effective, compared with no screening, are consistent with previously published models. These models used a similar framework of decision trees and Markov models, and most were in the US setting. For example, among patients with IBS symptoms, Main and Ladabaum196 found tTG to be cost-effective at US$50,000 per QALY gained if pre-test probability was 2%, and found it cost-effective at US$100,000 per QALY gained if pre-test probability was 1.1%. Shamir et al. 198 used a Markov model to find that screening the adult population for CD using IgA EMA was cost-effective, compared with no screening. Hershcovici et al. 202 used a Markov model to find that mass screening via serological test followed by biopsy was cost-effective, compared with no screening. Park et al. 203 used a Markov model to find that universal serological screening (i.e. a pre-test probability close to the CD prevalence of 1%) to prevent non-traumatic hip and vertebral fractures was not cost-effective. However, this model did not consider the impact of osteoporosis patients without fracture, NHL or symptomatic relief via gluten-free diet, so it is likely to have underestimated cost-effectiveness. In the Dutch setting, Mohseninejad et al. 194 used a Markov model to find that screening patients with IBS symptoms for CD was cost-effective. Our model was largely based on the 2015 UK NICE model. 193 Our analysis extends its evaluation of active case-finding strategies. The earlier NICE evaluation found that screening first-degree relatives of people with CD was cost-effective among adults and children, that screening people with type 1 diabetes was cost-effective among adults and potentially cost-effective among children, and that screening those with autoimmune thyroid disease was not cost-effective among adults or children.
Chapter 10 Conclusions
Implications for practice
Our cost-effectiveness analysis suggested that, if serological testing is used alone, the most cost-effective strategy for adults is likely to be population-based screening (i.e. testing all adults with at least a 1% pre-test probability) with either IgA tTG or IgA EMA, or with a combination of both tests. Given the wider availability of IgA tTG in UK laboratories, the more objective interpretation of the test and its potential value in showing response to a gluten-free diet, we would recommend IgA tTG as the serological test to be used. 247 However, there is uncertainty in these results, and there is value, particularly for adult women, in conducting further research, such as through a long-term randomised controlled trial of screening strategies. Furthermore, decisions to implement population-based screening cannot be made based on this economic analysis alone: the proposed screening programme must meet UK National Screening Committee Criteria. 284 Although a CD screening programme meets some of these criteria, it does not yet meet all criteria (see Appendix 29). Key criteria that would need to be met before such a programme could be implemented are consensus on an appropriate threshold for the screening test (IgA tTG), agreement on further diagnostic workup for those testing positive for IgA tTG and randomised trials showing the effectiveness of the screening programme.
The cost-effectiveness analysis found that serological testing combined with HLA testing strategies with 1–20% pre-test probability had very similar cost-effectiveness to each other and to IgA tTG with a 1% pre-test probability. Given that population screening is not considered appropriate without additional evidence, the advantages of IgA tTG testing over IgA EMA testing and the difficulty of identifying patients with 5–20% pre-test probability, we recommend a strategy that combines HLA testing with IgA tTG testing in those with at least a 1.5% pre-test probability in adults. The cost-effectiveness analysis suggested that it was more cost-effective to perform the HLA test prior to the IgA tTG test. For children, the most cost-effective testing strategy is testing those with a 10% pre-test probability of having CD (more cost-effective than population screening). Indicators that should prompt testing are therefore those that increase the risk of CD to at least 1.5% in adults and to 10% in children. These are summarised in Table 24. These are diagnostic indicators identified by our review of diagnostic indicators (see Chapter 3) and through the prediction model (see Chapter 4).
| Population | Indicator |
|---|---|
| All (men, women and children) |
|
| Adults only | |
| Children only |
|
| Women and children |
|
| Women only |
However, recommending a strategy that involves testing a large proportion of people for the presence of the HLA genes may have unintended costs and consequences not captured by the economic model. As this test has low specificity, a large proportion of those who test positive would receive false-positive results: they would not have CD. All of these would require follow-up calls from a GP to discuss their test results and would have to be told that they have a genetic risk factor that puts them at risk of CD and other autoimmune conditions such as type 1 diabetes and rheumatoid arthritis. This could cause unnecessary patient concern.
All strategies evaluated assumed that biopsy confirmation would be used if the post-test probability following positive test results remained < 90%. Whether or not this is the case will depend on the pre-test probability of disease, and so it may be difficult to implement such a strategy in practice. The variation among individuals in their preferred diagnostic certainty and attitudes towards having a biopsy or following a gluten-free diet suggests that shared decision-making in which patient preferences are taken into account is important in determining the ‘optimum’ diagnostic pathway.
Suggested research priorities
Given that the most cost-effective strategy based on the cost-effectiveness analysis was population-based screening, future work should consider whether or not population-based screening for CD could meet the UK National Screening Committee Criteria. 284 Key criteria that need further evaluation are the appropriate threshold for the screening test (IgA tTG), agreement on further diagnostic workup for those testing positive for IgA tTG and randomised trials showing the effectiveness of the screening programme. If the alternative strategy of IgA EMA plus HLA is recommended instead of population screening, then further research to measure the clinical effectiveness of these strategies is needed, in particular to consider the trade-off between improved sensitivity with using HLA first but with greater numbers of false-positive results.
The value-of-information analysis suggested that future research should focus on the probability of late (i.e. routine) diagnosis of CD and the accuracy of serological tests included in the model (IgA EMA and IgA tTG). The analysis also suggests that adult women should be the priority for research over adult men or children.
From a clinical perspective, further work to confirm thresholds above and below which we can confidently rule in or rule out CD would be of value, especially if population-based screening is being considered. The practice of dichotomising continuous test results may be an oversimplification of a complex disease with a wide range of clinical presentations. Identification of highly accurate serological testing strategies may allow for progressively more biopsy-avoidant pathways in the future. A meta-analysis based on individual patient data could be used to identify thresholds above and below which the risk of CD is sufficiently high to be ruled in or sufficiently low to be ruled out. Further testing, either additional serological testing, genetic testing or biopsy, could then be recommended for patients with results between those values. This could allow a more evidence-based non-biopsy strategy similar to the strategies recommended by ESPGHAN10 and the British Society of Gastroenterology,19 which suggest that, for a person with a tTG level of at least 10 times the upper limit of normal, and who also tests positive for EMA, CD be diagnosied without biopsy confirmation.
There are further tests in development for CD that will require evaluation, with research focused on rapid point-of-care tests and genetic tests such as the HLA-DQ-gluten tetramer test. 285
There is a need for large prospective cohort studies in which all participants receive accurate tests for CD to reduce bias in estimates of the diagnostic ability of indicators and to develop a more robust clinical prediction model. Accurate testing strategies that do not rely on invasive tests such as a duodenal biopsy would make this more feasible. It is important that diagnostic prediction models use data in which all patients have been tested for CD to reduce bias as a result of underdiagnosis. Prognostic cohort studies are also essential to identify predictors for CD for patients who are currently not diagnosed, because routinely collected data sets are biased as they depend on current testing practices and are more likely to pick up predictors that are already used to prompt testing.
Acknowledgements
We would like to thank James McKernon (Research Associate and CPRD Database Manager at the University of Bristol) and Tim Jones (Senior Research Associate in Quantitative Research and Health Economics at the University of Bristol) for extracting the CPRD data sets that were used in Chapters 4 and 8. We are grateful for Zoe Trinder-Widdess’ (Head of Communications at NIHR ARC West) and Lucy Cordon’s (Project Support Administrator at NIHR ARC West) help with recruiting survey participants for Chapter 7, and to Lucy Cordon for developing the videos for the survey (see Chapter 7) and for retrieving full texts for the review in Chapter 3. We would also like to thank Lauren J Scott (Senior Research Associate in Quantitative Research and Evidence Synthesis), Victoria Corfield (GP trainee) and Anthony Sinobas (medical student) who contributed to eligibility screening and data extraction for the systematic reviews in Chapters 3, 5 and 6. Finally, we would like to thank Jonathan Banks (Research Fellow in Qualitative Research at NIHR ARC West) for advising on the qualitative analysis in Chapter 7.
Avon Longitudinal Study of Parents and Children
We are extremely grateful to all the families who took part in the ALSPAC, the midwives for their help in recruiting them and the whole ALSPAC team, which includes interviewers, computer and laboratory technicians, clerical workers, research scientists, volunteers, managers, receptionists and nurses. The UK Medical Research Council and Wellcome (grant reference 217065/Z/19/Z) and the University of Bristol provide core support for the ALSPAC. This publication is the work of the authors who will serve as guarantors for the contents of this paper. A comprehensive list of grants funding is available on the ALSPAC website [www.bristol.ac.uk/alspac/external/documents/grant-acknowledgements.pdf (accessed 20 June 2022)].
Contributions of authors
Martha MC Elwenspoek (https://orcid.org/0000-0002-9824-9335) (Research Fellow in Test Evaluation) led on the diagnostic indicator review, prediction model, and survey, and wrote the first drafts of Chapters 3, 4, 7, 9 and 10.
Howard Thom (https://orcid.org/0000-0001-8576-5552) (Senior Lecturer in Health Economics) led on the cost-effectiveness analysis and wrote the first draft of Chapter 8.
Athena L Sheppard (https://orcid.org/0000-0003-1564-0740) (Postgraduate Researcher in Biostatistics) led on the systematic review of serological tests and wrote the first draft of Chapter 5.
Edna Keeney (https://orcid.org/0000-0002-4763-8891) (Senior Research Associate in Statistical and Health Economic Modelling) worked on the cost-effectiveness analysis (see Chapter 8).
Rachel O’Donnell (https://orcid.org/0000-0002-4354-8135) (Research Associate in Mixed-methods Research) performed eligibility screening and data extraction (see Chapter 3), and the qualitative analysis of the survey results (see Chapter 7).
Joni Jackson (https://orcid.org/0000-0003-2591-7395) (Research Associate in Quantitative Research) performed eligibility screening and data extraction (see Chapter 3), ALSPAC analysis (see Chapter 4) and CPRD analysis for the economic evaluation (see Chapter 8).
Cristina Roadevin (https://orcid.org/0000-0001-6279-6823) (Senior Research Associate in Health Economics) worked on the cost-effectiveness analysis (see Chapter 8).
Sarah Dawson (https://orcid.org/0000-0002-6682-063X) (Senior Research Associate in Information Retrieval) developed literature search strategies (see Chapters 3 and 5).
Deborah Lane and Jo Stubbs (patient representatives) provided patient perspectives (all chapters).
Hazel Everitt (https://orcid.org/0000-0001-7362-8403) (Professor of Primary Care Research), Jessica C Watson (https://orcid.org/0000-0002-8177-6438) (Clinical Lecturer in General Practice) and Alastair D Hay (https://orcid.org/0000-0003-3012-375X) (Professor of Primary Care) are academic GPs who provided clinical advice from a primary care perspective (all chapters) and checked code lists for CPRD analyses used in the prediction and economic models (see Chapters 4 and 8).
Peter Gillett (https://orcid.org/0000-0003-2294-4478) (Consultant Paediatric Gastroenterologist) and Gerry Robins (https://orcid.org/0000-0002-7249-4412) (Consultant Gastroenterologist) provided clinical advice from a secondary care perspective (all chapters), and checked code lists for CPRD analyses used in the prediction and economic models (see Chapters 4 and 8).
Hayley E Jones (https://orcid.org/0000-0002-4265-2854) (Senior Lecturer in Medical Statistics) offered statistical advice (all chapters).
Sue Mallett (https://orcid.org/0000-0002-0596-8200) (Professor in Diagnostic and Prognostic Medical Statistics) offered prediction modelling advice.
Penny F Whiting (https://orcid.org/0000-0003-1138-5682) (Professor of Clinical Epidemiology) led the project, conceptualisation and funding acquisition, and wrote Chapters 1, 2, 5 and 6.
All authors were involved in drafting and/or commenting on the report.
Publication
Elwenspoek MMC, Jackson J, O’Donnell R, Sinobas A, Dawson S, Everitt H, et al. The accuracy of diagnostic indicators for coeliac disease: a systematic review and meta-analysis. PLOS ONE 2021;16:e0258501.
Data-sharing statement
The data that support the findings of this study are available in the appendices and supplementary material. The data sets from the CPRD and ALSPAC are not publicly available because of data-sharing restrictions, but can be requested from the CPRD and the ALSPAC authors. All data requests should be submitted to the corresponding author for consideration.
Patient data
This work uses data provided by patients and collected by the NHS as part of their care and support. Using patient data is vital to improve health and care for everyone. There is huge potential to make better use of information from people’s patient records, to understand more about disease, develop new treatments, monitor safety, and plan NHS services. Patient data should be kept safe and secure, to protect everyone’s privacy, and it’s important that there are safeguards to make sure that it is stored and used responsibly. Everyone should be able to find out about how patient data are used. #datasaveslives You can find out more about the background to this citation here: https://understandingpatientdata.org.uk/data-citation.
Disclaimers
This report presents independent research funded by the National Institute for Health and Care Research (NIHR). The views and opinions expressed by authors in this publication are those of the authors and do not necessarily reflect those of the NHS, the NIHR, the HTA programme or the Department of Health and Social Care. If there are verbatim quotations included in this publication the views and opinions expressed by the interviewees are those of the interviewees and do not necessarily reflect those of the authors, those of the NHS, the NIHR, the HTA programme or the Department of Health and Social Care.
References
- BMJ Best Practice . Coeliac Disease n.d. https://bestpractice.bmj.com/topics/en-gb/636 (accessed 2 June 2022).
- Bingley PJ, Williams AJ, Norcross AJ, Unsworth DJ, Lock RJ, Ness AR, et al. Avon Longitudinal Study of Parents and Children Study Team. Undiagnosed coeliac disease at age seven: population based prospective birth cohort study. BMJ 2004;328:322-3. https://doi.org/10.1136/bmj.328.7435.322.
- West J, Otete H, Sultan AA, Crooks CJ. Changes in testing for and incidence of celiac disease in the United Kingdom: a population-based cohort study. Epidemiology 2019;30:e23-e24. https://doi.org/10.1097/EDE.0000000000001006.
- West J, Fleming KM, Tata LJ, Card TR, Crooks CJ. Incidence and prevalence of celiac disease and dermatitis herpetiformis in the UK over two decades: population-based study. Am J Gastroenterol 2014;109:757-68. https://doi.org/10.1038/ajg.2014.55.
- Green PH. Mortality in celiac disease, intestinal inflammation, and gluten sensitivity. JAMA 2009;302:1225-6. https://doi.org/10.1001/jama.281.24.2344.
- Green PH, Jabri B. Coeliac disease. Lancet 2003;362:383-91. https://doi.org/10.1016/S0140-6736(03)14027-5.
- Caio G, Ciccocioppo R, Zoli G, De Giorgio R, Volta U. Therapeutic options for coeliac disease: what else beyond gluten-free diet?. Dig Liver Dis 2020;52:130-7. https://doi.org/10.1016/j.dld.2019.11.010.
- Norström F, Myléus A, Nordyke K, Carlsson A, Högberg L, Sandström O, et al. Is mass screening for coeliac disease a wise use of resources? A health economic evaluation. BMC Gastroenterol 2021;21. https://doi.org/10.1186/s12876-021-01737-1.
- National Institute for Health and Care Excellence (NICE) . Coeliac Disease: Recognition, Assessment and Management 2015.
- Husby S, Koletzko S, Korponay-Szabó I, Kurppa K, Mearin ML, Ribes-Koninckx C, et al. European Society Paediatric Gastroenterology, Hepatology and Nutrition Guidelines for Diagnosing Coeliac Disease 2020. J Pediatr Gastroenterol Nutr 2020;70:141-56. https://doi.org/10.1097/MPG.0000000000002497.
- Al-Toma A, Volta U, Auricchio R, Castillejo G, Sanders DS, Cellier C, et al. European Society for the Study of Coeliac Disease (ESsCD) guideline for coeliac disease and other gluten-related disorders. United European Gastroenterol J 2019;7:583-61. https://doi.org/10.1177/2050640619844125.
- Giersiepen K, Lelgemann M, Stuhldreher N, Ronfani L, Husby S, Koletzko S, et al. ESPGHAN Working Group on Coeliac Disease Diagnosis. Accuracy of diagnostic antibody tests for coeliac disease in children: summary of an evidence report. J Pediatr Gastroenterol Nutr 2012;54:229-41. https://doi.org/10.1097/MPG.0b013e318216f2e5.
- Rostom A, Dubé C, Cranney A, Saloojee N, Sy R, Garritty C, et al. The diagnostic accuracy of serologic tests for celiac disease: a systematic review. Gastroenterology 2005;128:38-46. https://doi.org/10.1053/j.gastro.2005.02.028.
- Schyum AC, Rumessen JJ. Serological testing for celiac disease in adults. United European Gastroenterol J 2013;1:319-25. https://doi.org/10.1177/2050640613502788.
- van der Windt DAWM, Jellema P, Mulder CJ, Kneepkens CM, van der Horst HE. Diagnostic testing for celiac disease among patients with abdominal symptoms: a systematic review. JAMA 2010;303:1738-46. https://doi.org/10.1001/jama.2010.549.
- Lebwohl B, Sanders DS, Green PHR. Coeliac disease. Lancet 2018;391:70-81. https://doi.org/10.1016/S0140-6736(17)31796-8.
- Cecilio LA, Bonatto MW. The prevalence of HLA DQ2 and DQ8 in patients with celiac disease, in family and in general population. Arq Bras Cir Dig 2015;28:183-5. https://doi.org/10.1590/S0102-67202015000300009.
- Husby S, Koletzko S, Korponay-Szabó IR, Mearin ML, Phillips A, Shamir R, et al. European Society for Pediatric Gastroenterology, Hepatology, and Nutrition guidelines for the diagnosis of coeliac disease. J Pediatr Gastroenterol Nutr 2012;54:136-60. https://doi.org/10.1097/MPG.0b013e31821a23d0.
- British Society of Gastroenterology . BSG Interim Guidance: COVID-19 Specific Non-Biopsy Protocol for Those With Suspected Coeliac Disease 2020.
- Elwenspoek MMC, Jackson J, O’Donnell R, Sinobas A, Dawson S, Everitt H, et al. The accuracy of diagnostic indicators for coeliac disease: a systematic review and meta-analysis. PLOS ONE 2021;16. https://doi.org/10.1371/journal.pone.0258501.
- Elwenspoek MMC, Jackson J, Dawson S, Everitt H, Gillett P, Hay AD, et al. Accuracy of potential diagnostic indicators for coeliac disease: a systematic review protocol. BMJ Open 2020;10. https://doi.org/10.1136/bmjopen-2020-038994.
- Centre for Reviews and Dissemination . Systematic Reviews – CRD’s Guidance for Undertaking Reviews in Healthcare 2009.
- Deeks JJ, Bossuyt PM, Gatsonis C. Cochrane Handbook for Systematic Reviews of Diagnostic Test Accuracy Version 1.0.0. London: The Cochrane Collaboration; 2013.
- McInnes MDF, Moher D, Thombs BD, McGrath TA, Bossuyt PM, Clifford T, et al. Preferred Reporting Items for a Systematic Review and Meta-analysis of Diagnostic Test Accuracy Studies: the PRISMA-DTA statement. JAMA 2018;319:388-96. https://doi.org/10.1001/jama.2017.19163.
- Rutjes AW, Reitsma JB, Vandenbroucke JP, Glas AS, Bossuyt PM. Case–control and two-gate designs in diagnostic accuracy studies. Clin Chem 2005;51:1335-41. https://doi.org/10.1373/clinchem.2005.048595.
- Geersing GJ, Bouwmeester W, Zuithoff P, Spijker R, Leeflang M, Moons KG, et al. Search filters for finding prognostic and diagnostic prediction studies in MEDLINE to enhance systematic reviews. PLOS ONE 2012;7. https://doi.org/10.1371/journal.pone.0032844.
- Ingui BJ, Rogers MA. Searching for clinical prediction rules in MEDLINE. J Am Med Inform Assoc 2001;8:391-7. https://doi.org/10.1136/jamia.2001.0080391.
- Whiting PF, Rutjes AW, Westwood ME, Mallett S, Deeks JJ, Reitsma JB, et al. QUADAS-2: a revised tool for the quality assessment of diagnostic accuracy studies. Ann Intern Med 2011;155:529-36. https://doi.org/10.7326/0003-4819-155-8-201110180-00009.
- Reitsma JB, Glas AS, Rutjes AW, Scholten RJ, Bossuyt PM, Zwinderman AH. Bivariate analysis of sensitivity and specificity produces informative summary measures in diagnostic reviews. J Clin Epidemiol 2005;58:982-90. https://doi.org/10.1016/j.jclinepi.2005.02.022.
- Chu H, Cole SR. Bivariate meta-analysis of sensitivity and specificity with sparse data: a generalized linear mixed model approach. J Clin Epidemiol 2006;59:1331-2. https://doi.org/10.1016/j.jclinepi.2006.06.011.
- Ludvigsson JF, Leffler DA, Bai JC, Biagi F, Fasano A, Green PH, et al. The Oslo definitions for coeliac disease and related terms. Gut 2013;62:43-52. https://doi.org/10.1136/gutjnl-2011-301346.
- Singh P, Arora A, Strand TA, Leffler DA, Catassi C, Green PH, et al. Global prevalence of celiac disease: systematic review and meta-analysis. Clin Gastroenterol Hepatol 2018;16:823-36.e2. https://doi.org/10.1016/j.cgh.2017.06.037.
- R Core Team . R: A Language and Environment for Statistical Computing 2020.
- Bates D, Maechler M, Bolker B, Walker S. Fitting linear mixed-effects models using lme4. J Stat Softw 2015;67:1-48. https://doi.org/10.18637/jss.v067.i01.
- Scherer R. PropCIs: Various Confidence Interval Methods for Proportions. R Package Version 0.3-0 2018. https://CRAN.R-project.org/package=PropCIs (accessed 23 June 2022).
- Gordon M, Lumley T. Advanced Forest Plot Using ‘grid’ Graphics [R Package Version 1.10.1] 2020.
- Gohel D. Flextable: Functions for Tabular Reporting. R Package Version 0.5.11 2020.
- Wickham H. ggplot2: Elegant Graphics for Data Analysis. New York, NY: Springer-Verlag; 2016.
- Doebler P. Mada: Meta-Analysis of Diagnostic Accuracy. R Package Version 0.5.10 2020.
- Murdoch D, Chow ED. Ellipse: Functions for Drawing Ellipses and Ellipse-Like Confidence Regions. R Package Version 0.4.2 2020.
- Ludvigsson JF, Bai JC, Biagi F, Card TR, Ciacci C, Ciclitira PJ, et al. Diagnosis and management of adult coeliac disease: guidelines from the British Society of Gastroenterology. Gut 2014;63:1210-28. https://doi.org/10.1136/gutjnl-2013-306578.
- National Institute for Health and Care Excellence (NICE) . 2019 Surveillance of Coeliac Disease: Recognition, Assessment and Management (NICE Guideline NG20) n.d. www.nice.org.uk/guidance/ng20/resources/2019-surveillance-of-coeliac-disease-recognition-assessment-and-management-nice-guideline-ng20-pdf-9097196600005 (accessed 19 January 2021).
- Elwenspoek MMC, Jones HE, Thom H, Watson JC, Hay AD, Everitt H, et al. Prediction Model for Coeliac Disease Diagnosis: Statistical Analysis Plan (SAP) n.d. https://osf.io/egfr5/#! (accessed 25 May 2022).
- Steyerberg EW. Clinical Prediction Models. A Practical Approach to Development, Validation, and Updating. Cham: Springer Nature Switzerland; 2019.
- Collins GS, Reitsma JB, Altman DG, Moons KG. Transparent Reporting of a multivariable prediction model for Individual Prognosis Or Diagnosis (TRIPOD). Ann Intern Med 2015;162:735-6. https://doi.org/10.7326/L15-5093-2.
- Herrett E, Gallagher AM, Bhaskaran K, Forbes H, Mathur R, van Staa T, et al. Data Resource Profile: Clinical Practice Research Datalink (CPRD). Int J Epidemiol 2015;44:827-36. https://doi.org/10.1093/ije/dyv098.
- Clinical Practice Research Datalink . CPRD GOLD June 2021 (Version 2021.06.001) 2021. https://doi.org/10.48329/7308-xf35.
- Ministry of Housing, Communities and Local Government . National Statistics: English Indices of Deprivation 2019 n.d. www.gov.uk/government/statistics/english-indices-of-deprivation-2019 (accessed 30 May 2022).
- Abdul Sultan A, Crooks CJ, Card T, Tata LJ, Fleming KM, West J. Causes of death in people with coeliac disease in England compared with the general population: a competing risk analysis. Gut 2015;64:1220-6. https://doi.org/10.1136/gutjnl-2014-308285.
- Violato M, Gray A, Papanicolas I, Ouellet M. Resource use and costs associated with coeliac disease before and after diagnosis in 3,646 cases: results of a UK primary care database analysis. PLOS ONE 2012;7. https://doi.org/10.1371/journal.pone.0041308.
- Riley RD, Snell KIE, Ensor J, Burke DL, Harrell FE, Moons KGM, et al. Minimum sample size for developing a multivariable prediction model: PART II – binary and time-to-event outcomes. Stat Med 2019;38:1276-96. https://doi.org/10.1002/sim.7992.
- World Organization of Family Doctors’ International Classification Committee . International Classification of Primary Care (ICPC-2) 2015.
- Holmes GKT, Muirhead A. Epidemiology of coeliac disease in a single centre in Southern Derbyshire 1958–2014. BMJ Open Gastroenterol 2017;4. https://doi.org/10.1136/bmjgast-2017-000137.
- Biesheuvel CJ, Vergouwe Y, Oudega R, Hoes AW, Grobbee DE, Moons KG. Advantages of the nested case–control design in diagnostic research. BMC Med Res Methodol 2008;8. https://doi.org/10.1186/1471-2288-8-48.
- Moons KG. Criteria for scientific evaluation of novel markers: a perspective. Clin Chem 2010;56:537-41. https://doi.org/10.1373/clinchem.2009.134155.
- Moons KGM, Wolff RF, Riley RD, Whiting PF, Westwood M, Collins GS, et al. PROBAST: a tool to assess risk of bias and applicability of prediction model studies: explanation and elaboration. Ann Intern Med 2019;170:W1-W33. https://doi.org/10.7326/M18-1377.
- Wolf A, Dedman D, Campbell J, Booth H, Lunn D, Chapman J, et al. Data resource profile: Clinical Practice Research Datalink (CPRD) Aurum. Int J Epidemiol 2019;48:1740-1740g. https://doi.org/10.1093/ije/dyz034.
- Clinical Practice Research Datalink . CPRD Aurum June 2021 (Version 2021.06.001) 2021. https://doi.org/10.48329/pyc2-we97.
- Golding J, Pembrey M, Jones R, Team AS. ALSPAC – the Avon Longitudinal Study of Parents and Children. I. Study methodology. Paediatr Perinat Epidemiol 2001;15:74-87. https://doi.org/10.1046/j.1365-3016.2001.00325.x.
- Boyd A, Golding J, Macleod J, Lawlor DA, Fraser A, Henderson J, et al. Cohort profile: the ‘Children of the 90s‘ – the index offspring of the Avon Longitudinal Study of Parents and Children. Int J Epidemiol 2013;42:111-27. https://doi.org/10.1093/ije/dys064.
- Fraser A, Macdonald-Wallis C, Tilling K, Boyd A, Golding J, Davey Smith G, et al. Cohort profile: the Avon Longitudinal Study of Parents and Children: ALSPAC mothers cohort. Int J Epidemiol 2013;42:97-110. https://doi.org/10.1093/ije/dys066.
- Great Britain . Human Tissue Act 2004 2004.
- University of Bristol . Explore Data and Samples n.d. www.bristol.ac.uk/alspac/researchers/our-data/ (accessed November 2021).
- Heinze G, Schemper M. A solution to the problem of separation in logistic regression. Stat Med 2002;21:2409-19. https://doi.org/10.1002/sim.1047.
- Firth D. Bias reduction of maximum likelihood estimates. Biometrika 1993;80:27-38. https://doi.org/10.1093/biomet/80.1.27.
- Harrell FE. Regression Modeling Strategies: With Applications to Linear Models, Logistic and Ordinal Regression, and Survival Analysis. Cham: Springer International Publishing; 2015.
- Ministry of Housing, Communities and Local Government . National Statistics: English Indices of Deprivation 2015 n.d. www.gov.uk/government/statistics/english-indices-of-deprivation-2015 (accessed 27 May 2022).
- Whiting PF, Rutjes AW, Westwood ME, Mallett S. QUADAS-2 Steering Group . A systematic review classifies sources of bias and variation in diagnostic test accuracy studies. J Clin Epidemiol 2013;66:1093-104. https://doi.org/10.1016/j.jclinepi.2013.05.014.
- Singh P, Arora A, Strand TA, Leffler DA, Mäki M, Kelly CP, et al. Diagnostic accuracy of point of care tests for diagnosing celiac disease: a systematic review and meta-analysis. J Clin Gastroenterol 2019;53:535-42. https://doi.org/10.1097/MCG.0000000000001081.
- Holmes G, Ciacci C. The serological diagnosis of coeliac disease – a step forward. Gastroenterol Hepatol Bed Bench 2018;11:209-15.
- Ouzzani M, Hammady H, Fedorowicz Z, Elmagarmid A. Rayyan – a web and mobile app for systematic reviews. Syst Rev 2016;5. https://doi.org/10.1186/s13643-016-0384-4.
- Yang B, Mallett S, Takwoingi Y, Davenport CF, Hyde CJ, Whiting PF, et al. QUADAS-C: a tool for assessing risk of bias in comparative diagnostic accuracy studies. Ann Intern Med 2021;174:1592-9. https://doi.org/10.7326/M21-2234.
- Whiting P, Davenport C. Understanding test accuracy research: a test consequence graphic. Diagn Progn Res 2018;2. https://doi.org/10.1186/s41512-017-0023-0.
- Yuan J, Zhou C, Gao J, Li J, Yu F, Lu J, et al. Prevalence of celiac disease autoimmunity among adolescents and young adults in China. Clin Gastroenterol Hepatol 2017;15:1572-9.e1. https://doi.org/10.1016/j.cgh.2017.04.025.
- Sheppard A, Whiting P, Corfield V, Elwenspoek M, Richards A, Jones H, et al. What Is the Accuracy of Serological Testing for Diagnosing Coeliac Disease in Adults and Children? A Systematic Review n.d. www.crd.york.ac.uk/prospero/display_record.php?ID=CRD42019115506 (accessed 8 June 2022).
- Abrams JA, Brar P, Diamond B, Rotterdam H, Green PH. Utility in clinical practice of immunoglobulin A anti-tissue transglutaminase antibody for the diagnosis of celiac disease. Clin Gastroenterol Hepatol 2006;4:726-30. https://doi.org/10.1016/j.cgh.2006.02.010.
- Al Saidi SS, Al Harthi SO, Mula-Abed WA. Diagnostic utility of coeliac disease: a descriptive study in a tertiary care hospital, Oman. Oman Med J 2013;28:232-6. https://doi.org/10.5001/omj.2013.68.
- Ashorn S, Raukola H, Välineva T, Ashorn M, Wei B, Braun J, et al. Elevated serum anti-Saccharomyces cerevisiae, anti-I2 and anti-OmpW antibody levels in patients with suspicion of celiac disease. J Clin Immunol 2008;28:486-94. https://doi.org/10.1007/s10875-008-9200-9.
- Barada K, Habib RH, Malli A, Hashash JG, Halawi H, Maasri K, et al. Prediction of celiac disease at endoscopy. Endoscopy 2014;46:110-19. https://doi.org/10.1055/s-0033-1359200.
- Bayram Y, Parlak M, Aypak C, Bayram I, Yilmaz D, Cikman A. Diagnostic accuracy of IgA anti-tissue transglutaminase in celiac disease in Van – Turkey. East J Med 2015;20:20-3.
- Carroccio A, Vitale G, Di Prima L, Chifari N, Napoli S, La Russa C, et al. Comparison of anti-transglutaminase ELISAs and an anti-endomysial antibody assay in the diagnosis of celiac disease: a prospective study. Clin Chem 2002;48:1546-50. https://doi.org/10.1093/clinchem/48.9.1546.
- Carroccio A, Di Prima L, Pirrone G, Scalici C, Florena AM, Gasparin M, et al. Anti-transglutaminase antibody assay of the culture medium of intestinal biopsy specimens can improve the accuracy of celiac disease diagnosis. Clin Chem 2006;52:1175-80. https://doi.org/10.1373/clinchem.2005.061366.
- Dahle C, Hagman A, Ignatova S, Ström M. Antibodies against deamidated gliadin peptides identify adult coeliac disease patients negative for antibodies against endomysium and tissue transglutaminase. Aliment Pharmacol Ther 2010;32:254-60. https://doi.org/10.1111/j.1365-2036.2010.04337.x.
- Dutta AK, Chacko A, Avinash B. Suboptimal performance of IgG anti-tissue transglutaminase in the diagnosis of celiac disease in a tropical country. Dig Dis Sci 2010;55:698-702. https://doi.org/10.1007/s10620-009-0789-1.
- Emami MH, Karimi S, Kouhestani S, Hashemi M, Taheri H. Diagnostic accuracy of IgA anti-tissue transglutaminase in patients suspected of having coeliac disease in Iran. J Gastrointestin Liver Dis 2008;17:141-6.
- Eremic N, Deic M, Hadnadev L. Diagnostic accuracy of IGA anti-tissue transglutaminase antibody testing in celiac disease. J Med Biochem 2012;31:100-6. https://doi.org/10.2478/v10011-011-0047-x.
- Fernández ML, Vivas S, Ruiz de Morales JM, Marugán JM. Usefulness of anti-transglutaminase antibodies in the diagnosis of celiac disease. Gastroenterol Hepatol 2005;28:437-40. https://doi.org/10.1157/13078992.
- Hadithi M, von Blomberg BM, Crusius JB, Bloemena E, Kostense PJ, Meijer JW, et al. Accuracy of serologic tests and HLA-DQ typing for diagnosing celiac disease. Ann Intern Med 2007;147:294-302. https://doi.org/10.7326/0003-4819-147-5-200709040-00003.
- Holmes GKT, Forsyth JM, Knowles S, Seddon H, Hill PG, Austin AS. Coeliac disease: further evidence that biopsy is not always necessary for diagnosis. Eur J Gastroenterol Hepatol 2017;29:640-5. https://doi.org/10.1097/MEG.0000000000000841.
- Hopper AD, Hadjivassiliou M, Hurlstone DP, Lobo AJ, McAlindon ME, Egner W, et al. What is the role of serologic testing in celiac disease? A prospective, biopsy-confirmed study with economic analysis. Clin Gastroenterol Hepatol 2008;6:314-20. https://doi.org/10.1016/j.cgh.2007.12.008.
- Jarmi V, Cejas N, Kiener O, de Elías R, Balzola S, Cordoba C, et al. Diagnostic accuracy of antibodies to deamidated gliadin peptides. Acta Bioquim Clin Latinoam 2010;44:47-52.
- Javaeed A, Shah W, Akhtar R, Ghauri SK, Ghauri SK, Alvi AH. Diagnostic accuracy of IgA anti-tissue transglutaminase antibodies in comparison with histopathological findings in celiac disease in Pakistan. Medical Forum Mon 2014;25:15-9.
- Johnston SD, McMillan SA, Collins JS, Tham TC, McDougall NI, Murphy P. A comparison of antibodies to tissue transglutaminase with conventional serological tests in the diagnosis of coeliac disease. Eur J Gastroenterol Hepatol 2003;15:1001-4. https://doi.org/10.1097/00042737-200309000-00010.
- Kashif T, Kashif A, Kashif Z. Prevalence of celiac disease and role of anti-tissue transglutaminase antibodies in different types of intestinal damage in celiac disease according to Marsh classification. Pakistan J Medical Health Sci 2017;11.
- Kurien M, Johnston A, Avgerinos A, Sanders DS. Does IgA tissue transglutaminase antibody levels correlate with histological findings of coeliac disease (CD)?. United European Gastroenterol J 2013;1:A22-A3.
- Lau MS, Mooney PD, White WL, Rees MA, Wong SH, Hadjivassiliou M, et al. Office-based point of care testing (IgA/IgG-deamidated gliadin peptide) for celiac disease. Am J Gastroenterol 2018;113:1238-46. https://doi.org/10.1038/s41395-018-0143-3.
- Llorente MJ, Sebastián M, Fernández-Aceñero MJ, Serrano G, Villanueva S, Prieto G. IgA antibodies against tissue transglutaminase in the diagnosis of celiac disease: concordance with intestinal biopsy in children and adults. Clin Chem 2004;50:451-3. https://doi.org/10.1373/clinchem.2003.024976.
- Longarini GI, Sugai E, Hwang H, Nachman F, Vazquez H, Costa A, et al. How does specific serology match with esphgan serologic guidelines for diagnosis of celiac disease in a prospective cohort of adults with high pretest probability?. United European Gastroenterol J 2014;2.
- Mooney PD, Kurien M, Johnston AJ, Wong SH, Avgerinos A, Hadjivassiliou M, et al. Point of care testing for adult celiac disease: a novel role in endoscopy. Gastroenterology 2014;146:S-472. https://doi.org/10.1016/S0016-5085%2814%2961693-0.
- Mooney PD, Wong SH, Johnston AJ, Kurien M, Avgerinos A, Sanders DS. Increased detection of celiac disease with measurement of deamidated gliadin peptide antibody before endoscopy. Clin Gastroenterol Hepatol 2015;13:1278-84.e1. https://doi.org/10.1016/j.cgh.2015.01.010.
- Niveloni S, Sugai E, Cabanne A, Vazquez H, Argonz J, Smecuol E, et al. Antibodies against synthetic deamidated gliadin peptides as predictors of celiac disease: prospective assessment in an adult population with a high pretest probability of disease. Clin Chem 2007;53:2186-92. https://doi.org/10.1373/clinchem.2006.081364.
- Pallav K, Kabbani T, Tariq S, Vanga R, Kelly CP, Leffler DA. Clinical utility of celiac disease-associated HLA testing. Dig Dis Sci 2014;59:2199-206. https://doi.org/10.1007/s10620-014-3143-1.
- Previtali G, Licini L, D’Antiga L, Marseglia A, Ravasio R, Nembrini F, et al. Celiac disease diagnosis without biopsy: is a 10× ULN anti-transglutaminase result suitable for a chemiluminescence method?. J Pediatr Gastroenterol Nutr 2018;66:645-50. https://doi.org/10.1097/MPG.0000000000001773.
- Rahmati A, Shakeri R, Sohrabi M, Alipour A, Boghratian A, Setareh M, et al. Correlation of tissue transglutaminase antibody with duodenal histologic marsh grading. Middle East J Dig Dis 2014;6:131-6.
- Reeves GE, Squance ML, Duggan AE, Murugasu RR, Wilson RJ, Wong RC, et al. Diagnostic accuracy of coeliac serological tests: a prospective study. Eur J Gastroenterol Hepatol 2006;18:493-501. https://doi.org/10.1097/00042737-200605000-00006.
- Santaolalla R, Fernández-Bañares F, Rodríguez R, Alsina M, Rosinach M, Mariné M, et al. Diagnostic value of duodenal antitissue transglutaminase antibodies in gluten-sensitive enteropathy. Aliment Pharmacol Ther 2008;27:820-9. https://doi.org/10.1111/j.1365-2036.2008.03652.x.
- Sayed SK, Imam HM, Mahran AM, Refaiy AM. Diagnostic utility of deamidated gliadin peptide antibody in celiac disease compared to anti-tissue transglutaminase and IgA- endomysium antibodies. Egypt J Immunol 2012;19:41-52.
- Scoglio R, Di Pasquale G, Pagano G, Lucanto MC, Magazzu G, Sferlazzas C. Is intestinal biopsy always needed for diagnosis of celiac disease?. Am J Gastroenterol 2003;98:1325-31. https://doi.org/10.1111/j.1572-0241.2003.07455.x.
- Sugai E, Moreno ML, Hwang HJ, Cabanne A, Crivelli A, Nachman F, et al. Celiac disease serology in patients with different pretest probabilities: is biopsy avoidable?. World J Gastroenterol 2010;16:3144-52. https://doi.org/10.3748/wjg.v16.i25.3144.
- Swallow K, Wild G, Sargur R, Sanders DS, Aziz I, Hopper AD, et al. Quality not quantity for transglutaminase antibody 2: the performance of an endomysial and tissue transglutaminase test in screening coeliac disease remains stable over time. Clin Exp Immunol 2013;171:100-6. https://doi.org/10.1111/cei.12000.
- Tesei N, Sugai E, Vázquez H, Smecuol E, Niveloni S, Mazure R, et al. Antibodies to human recombinant tissue transglutaminase may detect coeliac disease patients undiagnosed by endomysial antibodies. Aliment Pharmacol Ther 2003;17:1415-23. https://doi.org/10.1046/j.1365-2036.2003.01595.x.
- Volta U, Granito A, Parisi C, Fabbri A, Fiorini E, Piscaglia M, et al. Deamidated gliadin peptide antibodies as a routine test for celiac disease: a prospective analysis. J Clin Gastroenterol 2010;44:186-90. https://doi.org/10.1097/MCG.0b013e3181c378f6.
- Whyte M, Smale S, Heil PM, Prasad P, Davis T, Sewell C, et al. IgA antibody to tissue transglutaminase is a highly sensitive predictor of adult onset coeliac disease in clinical practice. Gut 2001;48.
- Zanini B, Magni A, Caselani F, Lanzarotto F, Carabellese N, Villanacci V, et al. High tissue-transglutaminase antibody level predicts small intestinal villous atrophy in adult patients at high risk of celiac disease. Dig Liver Dis 2012;44:280-5. https://doi.org/10.1016/j.dld.2011.10.013.
- Pretto LE, Hernández MA, Eusebi SM, Tamagnini GA, Tibaldo AE, Pezzarini E, et al. Utility of Anti Deamidated Gliadin Peptides Antibodies in the Screening of Celiac Disease in Children n.d.
- Rabbani MW, Aziz MT, Basit A, Iqbal I. Diagnostic accuracy of serum anti-tissue transglutaminase IgA, in the diagnosis of celiac disease, taking small bowel biopsy as a gold standard. Pak Paediatr J 2015;39:203-8.
- Roca M, Donat E, Marco-Maestud N, Masip E, Hervás-Marín D, Ramos D, et al. Efficacy study of anti-endomysium antibodies for celiac disease diagnosis: a retrospective study in a Spanish pediatric population. J Clin Med 2019;8. https://doi.org/10.3390/jcm8122179.
- Saneian H, Gorgani AM. Diagnostic value of serologic tests in celiac screening. Int J Prev Med 2012;3:S58-63.
- Tronconi GM, Parma B, Bazzigaluppi E, Corsin P, Barera G. Antibodies against synthetic deamidated gliadin peptides for the diagnosis of childhood celiac disease: do they play a role?. Dig Liver Dis 2010;42. https://doi.org/10.1016/S1590-8658(10)60615-9.
- Weile B, Heegaard NH, Høier-Madsen M, Wiik A, Krasilnikoff PA. Tissue transglutaminase and endomysial autoantibodies measured in an historical cohort of children and young adults in whom coeliac disease was suspected. Eur J Gastroenterol Hepatol 2002;14:71-6. https://doi.org/10.1097/00042737-200201000-00012.
- Wolf J, Petroff D, Richter T, Auth MKH, Uhlig HH, Laass MW, et al. Validation of antibody-based strategies for diagnosis of pediatric celiac disease without biopsy. Gastroenterology 2017;153:410-19.e17. https://doi.org/10.1053/j.gastro.2017.04.023.
- Mubarak A, Houwen R. Tissue transglutaminase antibody levels ≥ 100 U/mL and celiac disease: the first prospective study. Gastroenterology 2012;142. https://doi.org/10.1016/S0016-5085(12)61048-8.
- Panetta F, Torre G, Colistro F, Ferretti F, Daniele A, Diamanti A. Clinical accuracy of anti-tissue transglutaminase as screening test for celiac disease under 2 years. Acta Paediatr 2011;100:728-31. https://doi.org/10.1111/j.1651-2227.2010.02124.x.
- Parizade M, Bujanover Y, Weiss B, Nachmias V, Shainberg B. Performance of serology assays for diagnosing celiac disease in a clinical setting. Clin Vaccine Immunol 2009;16:1576-82. https://doi.org/10.1128/CVI.00205-09.
- Pettie MJ, Levine JJ. The use of tissue transglutaminase IGG antibody (TTG-G) in the diagnosis of celiac disease. J Pediatr Gastroenterol Nutr 2009;49.
- Poddar U, Thapa BR, Nain CK, Singh K. Is tissue transglutaminase autoantibody the best for diagnosing celiac disease in children of developing countries?. J Clin Gastroenterol 2008;42:147-51. https://doi.org/10.1097/MCG.0b013e31802fc1e3.
- Polanco I, Esteban MM, Larrauri J. Relation of anti-tissue transglutaminase IgA antibodies with the morphology of the intestinal mucosa in children with celiac disease. Pediatrika 2001;21:9-20.
- Olen O, Gudjónsdóttir AH, Browaldh L, Hessami M, Elvin K, Liedberg AS, et al. Antibodies against deamidated gliadin peptides and tissue transglutaminase for diagnosis of pediatric celiac disease. J Pediatr Gastroenterol Nutr 2012;55:695-700. https://doi.org/10.1097/MPG.0b013e3182645c54.
- Nguyen CMT, Portolese O, Yazdani PA, . Validation of the ESPGHAN guidelines for the diagnosis of coeliac disease in a Canadian population. J Pediatr Gastroenterol Nutr 2019;130.
- Kutty JS, McDermott M, O’Sullivan M, Quinn S, Broderick A, Bourke B, et al. Coeliac serology testing in Irish children – a substitute for biopsy?. Arch Dis Child 2014;99:A3-A4. https://doi.org/10.1136/archdischild-2014-306237.7.
- Mubarak A, Gmelig-Meyling FH, Wolters VM, Ten Kate FJ, Houwen RH. Immunoglobulin G antibodies against deamidated-gliadin-peptides outperform anti-endomysium and tissue transglutaminase antibodies in children < 2 years age. APMIS 2011;119:894-900. https://doi.org/10.1111/j.1600-0463.2011.02817.x.
- Kabatova J, Hust’ak R, Blazickova S, Bosak V. Evaluation and applicability of nonbiopsy criteria in children and adolescents according to ESPGHAN for diagnosis of celiac disease. Gastroenterol Hepatol 2017;71:469-75. https://doi.org/10.14735/amgh2017csgh.info07.
- Iwańczak F, Iwanczak B, Matusiewicz K, Mowszet K. Assessment of serum antibodies against gliadin, endomysium and tissue transglutaminase in diagnosis of celiac disease in children. Gastroenterol Pol 2003;10:323-8.
- Jora R, Raghuvanshi V, Payal V, Sharma P, Vishnoi SK. Correlation of tissue transglutaminase with modified Marsh grading in celiac disease: a prospective cohort study. Indian J Pediatr 2017;84:515-20. https://doi.org/10.1007/s12098-017-2323-3.
- Hollén E, Farnebäck M, Forslund T, Magnusson KE, Sundqvist T, Fälth-Magnusson K. Evaluation of multiple diagnostic indicators in comparison to the intestinal biopsy as the golden standard in diagnosing celiac disease in children. Med Sci 2016;4. https://doi.org/10.3390/medsci4040020.
- Hojsak I, Mozer-Glassberg Y, Segal Gilboa N, Weinberger R, Hartman C, Shamir R. Celiac disease screening assays for children younger than 3 years of age: the performance of three serological tests. Dig Dis Sci 2012;57:127-32. https://doi.org/10.1007/s10620-011-1857-x.
- Clouzeau H, Taupin JL, Le Bail B, Michaud L, Bridoux-Henno L, Olives J, et al. Diagnostic value of HLA DQ2/DQ8 and antitransglutaminase antibodies for the diagnosis of coeliac disease: is jejunal biopsy still mandatory?. J Pediatr Gastroenterol Nutr 2007;44.
- Dahlbom I, Nyberg BI, Berntson L, Hansson T. Simultaneous detection of IgA and IgG antibodies against tissue transglutaminase: the preferred pre-biopsy test in childhood celiac disease. Scand J Clin Lab Invest 2016;76:208-16. https://doi.org/10.3109/00365513.2015.1137348.
- Diamanti A, Colistro F, Calce A, Devito R, Ferretti F, Minozzi A, et al. Clinical value of immunoglobulin A antitransglutaminase assay in the diagnosis of celiac disease. Pediatrics 2006;118:e1696-700. https://doi.org/10.1542/peds.2006-0604.
- Donaldson MR, Firth SD, Wimpee H, Leiferman KM, Zone JJ, Horsley W, et al. Correlation of duodenal histology with tissue transglutaminase and endomysial antibody levels in pediatric celiac disease. Clin Gastroenterol Hepatol 2007;5:567-73. https://doi.org/10.1016/j.cgh.2007.01.003.
- Gidrewicz D, Potter K, Trevenen CL, Lyon M, Butzner JD. Evaluation of the ESPGHAN celiac guidelines in a North American pediatric population. Am J Gastroenterol 2015;110:760-7. https://doi.org/10.1038/ajg.2015.87.
- Hashmi MA, Hussain T, Masood N, Younas M, Asghar RM, Shafi MS. Accuracy of anti-tissue transglutaminase IgA antibody in the diagnosis of paediatric celiac disease. J Coll Physicians Surg Pak 2016;26:263-6.
- Bozzato D, Rossi E, Pelloso M, Guariso G, Moz S, Padoan A, et al. Aeskulisa and H-TTG/DGP screen for celiac disease diagnosis. Clin Chem Lab Med 2011;49.
- Chan AW, Butzner JD, McKenna R, Fritzler MJ. Tissue transglutaminase enzyme-linked immunosorbent assay as a screening test for celiac disease in pediatric patients. Pediatrics 2001;107. https://doi.org/10.1542/peds.107.1.e8.
- Bishop J, Reed P, Austin P, Hurst M, Ameratunga R, Craigie A, et al. Prospective evaluation of the ESPGHAN guidelines for diagnosis of celiac disease in New Zealand children. J Pediatr Gastroenterol Nutr 2018;67:749-54. https://doi.org/10.1097/MPG.0000000000002065.
- Barker CC, Mitton C, Jevon G, Mock T. Can tissue transglutaminase antibody titers replace small-bowel biopsy to diagnose celiac disease in select pediatric populations?. Pediatrics 2005;115:1341-6. https://doi.org/10.1542/peds.2004-1392.
- Basso D, Gallo N, Guariso G, Pittoni M, Piva MG, Plebani M. Role of anti-transglutaminase (anti-tTG), anti-gliadin, and anti-endomysium serum antibodies in diagnosing celiac disease: a comparison of four different commercial kits for anti-tTG determination. J Clin Lab Anal 2001;15:112-15. https://doi.org/10.1002/jcla.1012.
- Alonso M, Saenz M, Echaniz P, Prada A, De Juan MD, Urreta I, et al. Evaluation of intraepithelial duodenal subsets, marsh pathological grades, and anti transglutaminase antibodies in diagnosis of celiac disease in a paediatric population. Eur J Immunol 2009;39.
- Ali Z, Hagglund K, Lyons A, Sheikh U, Lyons H. Is small intestinal biopsy always necessary to diagnose celiac disease in children?. Am J Gastroenterol 2012;107. https://doi.org/10.14309/00000434-201210001-01930.
- Aberg AK, Olcén P. Serologic screening for celiac disease in children: a comparison between established assays and tests with deamidated gliadin-derived peptides plus conjugates for both IgA and IgG antibodies. APMIS 2009;117:808-13. https://doi.org/10.1111/j.1600-0463.2009.02541.x.
- Abdollahi A, Mehrazma M, Talachian E. The diagnostic value of serum IGG-antigliadin, IGA anti-endomysial and IGA anti-tissue transglutaminase antibodies for pediatric celiac disease. Pediatr Res 2011;70. https://doi.org/10.1038/pr.2011.1000.
- Bowron A, Moorghen M, Morgan JE, Osborne JR, Stansbie D, Stone JE. Cost-effective strategy for the serological investigation of coeliac disease. Ann Clin Biochem 2000;37:467-70. https://doi.org/10.1177/000456320003700406.
- Corrao G, Corazza GR, Andreani ML, Torchio P, Valentini RA, Galatola G, et al. Serological screening of coeliac disease: choosing the optimal procedure according to various prevalence values. Gut 1994;35:771-5. https://doi.org/10.1136/gut.35.6.771.
- Atkinson K, Tokmakajian S, Watson W, Gregor J. Evaluation of the endomysial antibody for celiac disease: operating properties and associated cost implications in clinical practice. Can J Gastroenterol 1997;11:673-7. https://doi.org/10.1155/1997/813148.
- Dickey W, McMillan SA, McCrum EE, Evans AE. Association between serum levels of total IgA and IgA class endomysial and antigliadin antibodies: implications for coeliac disease screening. Eur J Gastroenterol Hepatol 1997;9:559-62. https://doi.org/10.1097/00042737-199706000-00002.
- Feighery C, Weir DG, Whelan A, Willoughby R, Youngprapakorn S, Lynch S, et al. Diagnosis of gluten-sensitive enteropathy: is exclusive reliance on histology appropriate?. Eur J Gastroenterol Hepatol 1998;10:919-25. https://doi.org/10.1097/00042737-199811000-00004.
- Kotze LM, Utiyama SR, Nisihara RM, de Camargo VF, Ioshii SO. IgA class anti-endomysial and anti-tissue transglutaminase antibodies in relation to duodenal mucosa changes in coeliac disease. Pathology 2003;35:56-60. https://doi.org/10.1097/01268031-200335010-00010.
- Lau MS, Mooney PD, Rees MA, White WL, Marks LJ, Hadjivassiliou M, et al. Gluten free diet adherence assessment using CDAT and BIAGI questionnaires in patients with coeliac disease. Gut 2018;67:A160-A1. https://doi.org/10.1136/gutjnl-2018-BSGAbstracts.318.
- McMillan SA, Haughton DJ, Biggart JD, Edgar JD, Porter KG, McNeill TA. Predictive value for coeliac disease of antibodies to gliadin, endomysium, and jejunum in patients attending for jejunal biopsy. BMJ 1991;303:1163-5. https://doi.org/10.1136/bmj.303.6811.1163.
- Mooney PD, Kurien M, Evans KE, Chalkiadakis I, Hale MF, Kannan MZ, et al. Point-of-care testing for celiac disease has a low sensitivity in endoscopy. Gastrointest Endosc 2014;80:456-62. https://doi.org/10.1016/j.gie.2014.02.009.
- Valdimarsson T, Franzen L, Grodzinsky E, Skogh T, Ström M. Is small bowel biopsy necessary in adults with suspected celiac disease and IgA anti-endomysium antibodies?. Dig Dis Sci 1996;41:83-7. https://doi.org/10.1007/BF02208588.
- Vogelsang H, Genser D, Wyatt J, Lochs H, Ferenci P, Granditsch G, et al. Screening for celiac disease: a prospective study on the value of noninvasive tests. Am J Gastroenterol 1995;90:394-8.
- Bhatnagar S, Gupta SD, Mathur M, Phillips AD, Kumar R, Knutton S, et al. Celiac disease with mild to moderate histologic changes is a common cause of chronic diarrhea in Indian children. J Pediatr Gastroenterol Nutr 2005;41:204-9. https://doi.org/10.1097/01.mpg.0000172261.24115.29.
- Bürgin-Wolff A, Gaze H, Hadziselimovic F, Lentze M, Nusslé D, Hadziselimovic F, et al. Inflammatory Bowel Disease and Coeliac Disease in Children. Dordrecht: Springer; 1990.
- Camarero C, Roldan B, Sebastian M, Barrio A, Alvarez I, Eiras P, et al. Predictive value of antigliadin, antireticulin, and antiendomysium antibodies in the diagnosis of gluten-associated enteropathy. Rev Esp Pediatr 1997;53:309-14.
- Del Rosario MA, Fitzgerald JF, Chong SK, Croffie JM, Gupta SK. Further studies of anti-endomysium and anti-gliadin antibodies in patients with suspected celiac disease. J Pediatr Gastroenterol Nutr 1998;27:191-5. https://doi.org/10.1097/00005176-199808000-00012.
- Fernández E, Riestra S, Rodrigo L, Blanco C, López-Vázquez A, Fuentes D, et al. Comparison of six human anti-transglutaminase ELISA-tests in the diagnosis of celiac disease in the Saharawi population. World J Gastroenterol 2005;11:3762-6. https://doi.org/10.3748/wjg.v11.i24.3762.
- Gandolfi L, Catassi C, Garcia S, Modelli IC, Campos D, Pratesi R. Antiendomysial antibody test reliability in children with frequent diarrhea and malnutrition: is it celiac disease?. J Pediatr Gastroenterol Nutr 2001;33:483-7. https://doi.org/10.1097/00005176-200110000-00013.
- Grodzinsky E, Jansson G, Skogh T, Stenhammar L, Fälth-Magnusson K. Anti-endomysium and anti-gliadin antibodies as serological markers for coeliac disease in childhood: a clinical study to develop a practical routine. Acta Paediatr 1995;84:294-8. https://doi.org/10.1111/j.1651-2227.1995.tb13631.x.
- Lindquist BL, Rogozinski T, Moi H, Danielsson D, Olcén P. Endomysium and gliadin IgA antibodies in children with coeliac disease. Scand J Gastroenterol 1994;29:452-6. https://doi.org/10.3109/00365529409096837.
- Mendez NI, Guastavino MA, Zacharzewski CL, Zapata PD, Sprang M. Autoantibodies: utility in coeliac disease. a study in Misiones province. Acta Bioquim Clin Latinoam 1998;32:55-61.
- Russo PA, Chartrand LJ, Seidman E. Comparative analysis of serologic screening tests for the initial diagnosis of celiac disease. Pediatrics 1999;104:75-8. https://doi.org/10.1542/peds.104.1.75.
- Vargas Pérez ML, Melero Ruiz J, Fernández de Mera J, González Roiz C, Catalina Fernández I, Romero Albillos A. Serological and genetic markers in the diagnosis and follow-up of coeliac disease. An Pediatr 2005;62:412-19. https://doi.org/10.1157/13074614.
- Wildfang S, Knauss M, Stern M. IgA endomysium antibodies. Detection in children with celiac disease. Monatsschr Kinderheilkd 1992;140:639-45.
- Kurien M, Johnston A, Avgerinos A, Sanders DS. Does IGA tissue transglutaminase antibody levels correlate with histological findings of coeliac disease (CD)?. Gut 2013;62:A26-A. https://doi.org/10.1136/gutjnl-2013-304907.059.
- Mooney PD, Kurien M, Wong S, Sanders DS. Point of care testing for adult coeliac disease: a potential role in endoscopy. United European Gastroenterol J 2014;2.
- Björck S, Brundin C, Lörinc E, Lynch KF, Agardh D. Screening detects a high proportion of celiac disease in young HLA-genotyped children. J Pediatr Gastroenterol Nutr 2010;50:49-53. https://doi.org/10.1097/MPG.0b013e3181b477a6.
- Mäki M, Mustalahti K, Kokkonen J, Kulmala P, Haapalahti M, Karttunen T, et al. Prevalence of celiac disease among children in Finland. N Engl J Med 2003;348:2517-24. https://doi.org/10.1056/NEJMoa021687.
- Sandström O, Rosén A, Lagerqvist C, Carlsson A, Hernell O, Högberg L, et al. Transglutaminase IgA antibodies in a celiac disease mass screening and the role of HLA-DQ genotyping and endomysial antibodies in sequential testing. J Pediatr Gastroenterol Nutr 2013;57:472-6. https://doi.org/10.1097/MPG.0b013e31829ef65d.
- Wahab RJ, Beth SA, Derks IPM, Jansen PW, Moll HA, Kiefte-de Jong JC. Celiac disease autoimmunity and emotional and behavioral problems in childhood. Pediatrics 2019;144. https://doi.org/10.1542/peds.2018-3933.
- Beth SA, Jansen MAE, Elfrink MEC, Kiefte-de Jong JC, Wolvius EB, Jaddoe VWV, et al. Generation R birth cohort study shows that specific enamel defects were not associated with elevated serum transglutaminase type 2 antibodies. Acta Paediatr 2016;105:e485-e91. https://doi.org/10.1111/apa.13533.
- Jansen MA, Kiefte-de Jong JC, Gaillard R, Escher JC, Hofman A, Jaddoe VW, et al. Growth trajectories and bone mineral density in anti-tissue transglutaminase antibody-positive children: the Generation R Study. Clin Gastroenterol Hepatol 2015;13:913-20.e5. https://doi.org/10.1016/j.cgh.2014.09.032.
- National Institute for Health and Care Research Applied Research Collaboration West . Coeliac Disease Survey, Video 1 n.d. https://youtube/M5tfW8-yLfM (accessed 7 February 2022).
- National Institute for Health and Care Research Applied Research Collaboration West . Coeliac Disease Survey, Video 2 n.d. https://youtu.be/_PVLGDVSL3E (accessed 7 February 2022).
- National Institute for Health and Care Research Applied Research Collaboration West . Coeliac Disease Survey, Video 3 n.d. https://youtu.be/GL8tzH4IxAk (accessed 7 February 2022).
- International Organization for Standardization . ISO/IEC/27001:/Information/Security/Management n.d. www.iso.org/isoiec-27001-information-security.html (accessed 27 May 2022).
- Information Commissioner’s Office . Guide to the UK General Data Protection Regulation (UK GDPR) n.d. https://ico.org.uk/for-organisations/guide-to-data-protection/guide-to-the-general-data-protection-regulation-gdpr/ (accessed 27 May 2022).
- Dorn SD, Hernandez L, Minaya MT, Morris CB, Hu Y, Leserman J, et al. The development and validation of a new coeliac disease quality of life survey (CD-QOL). Aliment Pharmacol Ther 2010;31:666-75. https://doi.org/10.1111/j.1365-2036.2009.04220.x.
- Scottish Government . Scottish Index of Multiple Deprivation 2020v2 Postcode Lookup File n.d. www.gov.scot/publications/scottish-index-of-multiple-deprivation-2020v2-postcode-look-up/ (accessed 27 May 2022).
- Welsh Government . Welsh Index of Multiple Deprivation (WIMD) Index Guidance, Technical Information and Background Documentation n.d. https://gov.wales/welsh-index-multiple-deprivation-index-guidance (accessed 27 May 2022).
- Northern Ireland Statistics and Research Agency . NI Multiple Deprivation Measures n.d. www.nisra.gov.uk/statistics/deprivation (accessed 27 May 2022).
- Hsieh HF, Shannon SE. Three approaches to qualitative content analysis. Qual Health Res 2005;15:1277-88. https://doi.org/10.1177/1049732305276687.
- National Institute for Health and Care Excellence (NICE) . Coeliac Disease. Full Health Economics Report 2015.
- Mohseninejad L, Feenstra T, van der Horst HE, Woutersen-Koch H, Buskens E. Targeted screening for coeliac disease among irritable bowel syndrome patients: analysis of cost-effectiveness and value of information. Eur J Health Econ 2013;14:947-57. https://doi.org/10.1007/s10198-012-0441-4.
- Harewood GC, Murray JA. Diagnostic approach to a patient with suspected celiac disease: a cost analysis. Dig Dis Sci 2001;46:2510-14. https://doi.org/10.1023/a:1012396408370.
- Mein SM, Ladabaum U. Serological testing for coeliac disease in patients with symptoms of irritable bowel syndrome: a cost-effectiveness analysis. Aliment Pharmacol Ther 2004;19:1199-210. https://doi.org/10.1111/j.1365-2036.2004.01958.x.
- Spiegel BM, DeRosa VP, Gralnek IM, Wang V, Dulai GS. Testing for celiac sprue in irritable bowel syndrome with predominant diarrhea: a cost-effectiveness analysis. Gastroenterology 2004;126:1721-32. https://doi.org/10.1053/j.gastro.2004.03.012.
- Shamir R, Hernell O, Leshno M. Cost-effectiveness analysis of screening for celiac disease in the adult population. Med Decis Making 2006;26:282-93. https://doi.org/10.1177/0272989X06289012.
- Swigonski NL, Kuhlenschmidt HL, Bull MJ, Corkins MR, Downs SM. Screening for celiac disease in asymptomatic children with Down syndrome: cost-effectiveness of preventing lymphoma. Pediatrics 2006;118:594-602. https://doi.org/10.1542/peds.2005-2123.
- Dorn SD, Matchar DB. Cost-effectiveness analysis of strategies for diagnosing celiac disease. Dig Dis Sci 2008;53:680-8. https://doi.org/10.1007/s10620-007-9939-5.
- Chang M, Green PH. Genetic testing before serologic screening in relatives of patients with celiac disease as a cost containment method. J Clin Gastroenterol 2009;43:43-50. https://doi.org/10.1097/MCG.0b013e318187311d.
- Hershcovici T, Leshno M, Goldin E, Shamir R, Israeli E. Cost effectiveness of mass screening for coeliac disease is determined by time-delay to diagnosis and quality of life on a gluten-free diet. Aliment Pharmacol Ther 2010;31:901-10. https://doi.org/10.1111/j.1365-2036.2010.04242.x.
- Park KT, Tsai R, Wang L, Khavari N, Bachrach L, Bass D. Cost-effectiveness of universal serologic screening to prevent nontraumatic hip and vertebral fractures in patients with celiac disease. Clin Gastroenterol Hepatol 2013;11:645-53. https://doi.org/10.1016/j.cgh.2012.12.037.
- Jönsson B, Christiansen C, Johnell O, Hedbrandt J. Cost-effectiveness of fracture prevention in established osteoporosis. Osteoporos Int 1995;5:136-42. https://doi.org/10.1007/BF01623315.
- Oleksik A, Lips P, Dawson A, Minshall ME, Shen W, Cooper C, et al. Health-related quality of life in postmenopausal women with low BMD with or without prevalent vertebral fractures. J Bone Miner Res 2009;15:1384-92. https://doi.org/10.1359/jbmr.2000.15.7.1384.
- Yang JJ, Thanataveerat A, Green PH, Lebwohl B. Cost effectiveness of routine duodenal biopsy analysis for celiac disease during endoscopy for gastroesophageal reflux. Clin Gastroenterol Hepatol 2015;13:1437-43. https://doi.org/10.1016/j.cgh.2015.03.022.
- Broide E, Matalon S, Kriger-Sharabi O, Richter V, Shirin H, Leshno M. Cost effectiveness of routine duodenal biopsies in iron deficiency anemia. World J Gastroenterol 2016;22:7813-23. https://doi.org/10.3748/wjg.v22.i34.7813.
- Siebert U, Alagoz O, Bayoumi AM, Jahn B, Owens DK, Cohen DJ, et al. State-transition modelling: a report of the ISPOR-SMDM Modelling Good Research Practices Task Force-3. Value Health 2012;15:812-20. https://doi.org/10.1016/j.jval.2012.06.014.
- Coeliac UK. Ongoing Symptoms and Complications n.d. www.coeliac.org.uk/healthcare-professionals/management/ongoing-symptoms-and-complications/ (accessed 25 January 2021).
- Welton NJ, McAleenan A, Thom HH, Davies P, Hollingworth W, Higgins JP, et al. Screening strategies for atrial fibrillation: a systematic review and cost-effectiveness analysis. Health Technol Assess 2017;21. https://doi.org/10.3310/hta21290.
- Iragorri N, Spackman E. Assessing the value of screening tools: reviewing the challenges and opportunities of cost-effectiveness analysis. Public Health Rev 2018;39. https://doi.org/10.1186/s40985-018-0093-8.
- Briggs AH, Claxton K, Sculpher MJ. Decision Modelling for Health Economic Evaluation. Oxford: Oxford University Press; 2006.
- Johnson B, Basson MD. Absence of complications after endoscopic mucosal biopsy. Dig Dis 2018;36:328-32. https://doi.org/10.1159/000489394.
- Hall NJ, Rubin G, Charnock A. Systematic review: adherence to a gluten-free diet in adult patients with coeliac disease. Aliment Pharmacol Ther 2009;30:315-30. https://doi.org/10.1111/j.1365-2036.2009.04053.x.
- Muhammad H, Reeves S, Jeanes YM. Identifying and improving adherence to the gluten-free diet in people with coeliac disease. Proc Nutr Soc 2019;78:418-25. https://doi.org/10.1017/S002966511800277X.
- Dhalwani NN, West J, Sultan AA, Ban L, Tata LJ. Women with celiac disease present with fertility problems no more often than women in the general population. Gastroenterology 2014;147:1267-74.e1. https://doi.org/10.1053/j.gastro.2014.08.025.
- Tata LJ, Card TR, Logan RF, Hubbard RB, Smith CJ, West J. Fertility and pregnancy-related events in women with celiac disease: a population-based cohort study. Gastroenterology 2005;128:849-55. https://doi.org/10.1053/j.gastro.2005.02.017.
- Zugna D, Richiardi L, Akre O, Stephansson O, Ludvigsson JF. A nationwide population-based study to determine whether coeliac disease is associated with infertility. Gut 2010;59:1471-5. https://doi.org/10.1136/gut.2010.219030.
- Hogen Esch CE, Van Rijssen MJ, Roos A, Koning F, Dekker FW, Mearin ML, et al. Screening for unrecognized coeliac disease in subfertile couples. Scand J Gastroenterol 2011;46:1423-8. https://doi.org/10.3109/00365521.2011.615858.
- Fuchs V, Kurppa K, Huhtala H, Laurila K, Mäki M, Collin P, et al. Serology-based criteria for adult coeliac disease have excellent accuracy across the range of pre-test probabilities. Aliment Pharmacol Ther 2019;49:277-84. https://doi.org/10.1111/apt.15109.
- Hill PG, Holmes GK. Coeliac disease: a biopsy is not always necessary for diagnosis. Aliment Pharmacol Ther 2008;27:572-7. https://doi.org/10.1111/j.1365-2036.2008.03609.x.
- NHS . National Schedule of NHS Costs 2019 n.d. www.england.nhs.uk/national-cost-collection/ (accessed 5 October 2021).
- Curtis L, Burns A. Unit Costs of Health and Social Care 2020. Canterbury: PSSRU, University of Kent; 2020.
- Wang HI, Smith A, Aas E, Roman E, Crouch S, Burton C, et al. Treatment cost and life expectancy of diffuse large B-cell lymphoma (DLBCL): a discrete event simulation model on a UK population-based observational cohort. Eur J Health Econ 2017;18:255-67. https://doi.org/10.1007/s10198-016-0775-4.
- Department of Health and Social Care . Payment by Results in the NHS: Tariff for 2013 to 2014 2013. www.gov.uk/government/publications/payment-by-results-pbr-operational-guidance-and-tariffs (accessed October 2021).
- Curtis EM, van der Velde R, Moon RJ, van den Bergh JP, Geusens P, de Vries F, et al. Epidemiology of fractures in the United Kingdom 1988–2012: variation with age, sex, geography, ethnicity and socioeconomic status. Bone 2016;87:19-26. https://doi.org/10.1016/j.bone.2016.03.006.
- Leal J, Gray AM, Prieto-Alhambra D, Arden NK, Cooper C, Javaid MK, et al. REFReSH study group. Impact of hip fracture on hospital care costs: a population-based study. Osteoporos Int 2016;27:549-58. https://doi.org/10.1007/s00198-015-3277-9.
- Dolan P, Torgerson DJ. The cost of treating osteoporotic fractures in the United Kingdom female population. Osteoporos Int 1998;8:611-17. https://doi.org/10.1007/s001980050107.
- Office for National Statistics . Consumer Price Inflation Tables n.d. www.ons.gov.uk/economy/inflationandpriceindices/datasets/consumerpriceinflation (accessed 11 November 2021).
- Janssen B, Szende A, Szende A, Janssen B, Cabases J. Self-Reported Population Health: An International Perspective Based on EQ-5D 2014:19-30. https://doi.org/10.1007/978-94-007-7596-1_3.
- Violato M, Gray A. The impact of diagnosis on health-related quality of life in people with coeliac disease: a UK population-based longitudinal perspective. BMC Gastroenterol 2019;19. https://doi.org/10.1186/s12876-019-0980-6.
- Casellas F, Rodrigo L, Vivancos JL, Riestra S, Pantiga C, Baudet JS, et al. Factors that impact health-related quality of life in adults with celiac disease: a multicenter study. World J Gastroenterol 2008;14:46-52. https://doi.org/10.3748/wjg.14.46.
- Si L, Winzenberg TM, de Graaff B, Palmer AJ. A systematic review and meta-analysis of utility-based quality of life for osteoporosis-related conditions. Osteoporos Int 2014;25:1987-97. https://doi.org/10.1007/s00198-014-2636-2.
- Fargier E, Ranchon F, Huot L, Guerre P, Safar V, Dony A, et al. SMABcare study: subcutaneous monoclonal antibody in cancer care: cost–consequence analysis of subcutaneous rituximab in patients with follicular lymphoma. Ann Hematol 2018;97:123-31. https://doi.org/10.1007/s00277-017-3147-y.
- Ludvigsson JF, Michaelsson K, Ekbom A, Montgomery SM. Coeliac disease and the risk of fractures – a general population-based cohort study. Aliment Pharmacol Ther 2007;25:273-85. https://doi.org/10.1111/j.1365-2036.2006.03203.x.
- Godfrey JD, Brantner TL, Brinjikji W, Christensen KN, Brogan DL, Van Dyke CT, et al. Morbidity and mortality among older individuals with undiagnosed celiac disease. Gastroenterology 2010;139:763-9. https://doi.org/10.1053/j.gastro.2010.05.041.
- Silano M, Volta U, Mecchia AM, Dessí M, Di Benedetto R, De Vincenzi M. Collaborating centers of the Italian registry of the complications of coeliac disease. Delayed diagnosis of coeliac disease increases cancer risk. BMC Gastroenterol 2007;7. https://doi.org/10.1186/1471-230X-7-8.
- Goldacre MJ, Wotton CJ, Yeates D, Seagroatt V, Jewell D. Cancer in patients with ulcerative colitis, Crohn’s disease and coeliac disease: record linkage study. Eur J Gastroenterol Hepatol 2008;20:297-304. https://doi.org/10.1097/MEG.0b013e3282f2a5e2.
- Fleurence RL, Hollenbeak CS. Rates and probabilities in economic modelling: transformation, translation and appropriate application. PharmacoEconomics 2007;25:3-6. https://doi.org/10.2165/00019053-200725010-00002.
- Office for National Statistics . National Life Tables, United Kingdom, 1980–1982 to 2017–2019 n.d. www.ons.gov.uk/peoplepopulationandcommunity/birthsdeathsandmarriages/lifeexpectancies/datasets/nationallifetablesunitedkingdomreferencetables (accessed 10 November 2020).
- Office for National Statistics . Cancer Survival in England: Adults Diagnosed Between 2013 and 2017 and Followed Up to 2018 2018.
- Lunn D, Jackson C, Best N, Thomas A, Spiegelhalter DJ. The BUGS Book : A Practical Introduction to Bayesian Analysis. Boca Raton, FL: CRC Press; 2013.
- Klop C, Welsing PM, Cooper C, Harvey NC, Elders PJ, Bijlsma JW, et al. Mortality in British hip fracture patients, 2000–2010: a population-based retrospective cohort study. Bone 2014;66:171-7. https://doi.org/10.1016/j.bone.2014.06.011.
- Joint Formulary Committee . British National Formulary n.d. www.medicinescomplete.com (accessed 11 November 2021).
- National Institute for Health and Care Excellence . Guide to the Methods of Technology Appraisal 2013 n.d. www.nice.org.uk/process/pmg9/chapter/foreword (accessed 27 May 2022).
- Wilson ECF. Methodological note: reporting deterministic versus probabilistic results of Markov, partitioned survival and other non-linear models. Appl Health Econ Health Policy 2021;19:789-95. https://doi.org/10.1007/s40258-021-00664-2.
- Paul SP, Harries SL, Basude D. Barriers to implementing the revised ESPGHAN guidelines for coeliac disease in children: a cross-sectional survey of coeliac screen reporting in laboratories in England. Arch Dis Child 2017;102:942-6. https://doi.org/10.1136/archdischild-2016-312027.
- Barton GR, Briggs AH, Fenwick EA. Optimal cost-effectiveness decisions: the role of the cost-effectiveness acceptability curve (CEAC), the cost-effectiveness acceptability frontier (CEAF), and the expected value of perfection information (EVPI). Value Health 2008;11:886-97. https://doi.org/10.1111/j.1524-4733.2008.00358.x.
- Fenwick E, Steuten L, Knies S, Ghabri S, Basu A, Murray JF, et al. Value of information analysis for research decisions – an introduction: report 1 of the ISPOR Value of Information Analysis Emerging Good Practices Task Force. Value Health 2020;23:139-50. https://doi.org/10.1016/j.jval.2020.01.001.
- Rothery C, Strong M, Koffijberg HE, Basu A, Ghabri S, Knies S, et al. Value of information analytical methods: report 2 of the ISPOR Value of Information Analysis Emerging Good Practices Task Force. Value Health 2020;23:277-86. https://doi.org/10.1016/j.jval.2020.01.004.
- Baio G, Dawid AP. Probabilistic sensitivity analysis in health economics. Stat Methods Med Res 2015;24:615-34. https://doi.org/10.1177/0962280211419832.
- Strong M, Oakley JE, Brennan A. Estimating multiparameter partial expected value of perfect information from a probabilistic sensitivity analysis sample: a nonparametric regression approach. Med Decis Making 2014;34:311-26. https://doi.org/10.1177/0272989X13505910.
- Strong M, Oakley JE, Brennan A, Breeze P. Estimating the expected value of sample information using the probabilistic sensitivity analysis sample: a fast, nonparametric regression-based method. Med Decis Making 2015;35:570-83. https://doi.org/10.1177/0272989X15575286.
- Fang W, Wang Z, Giles MB, Jackson CH, Welton NJ, Andrieu C, et al. Multilevel and quasi Monte Carlo methods for the calculation of the expected value of partial perfect information. Med Decis Making 2022;42:168-81. https://doi.org/10.1177/0272989X211026305.
- Office for National Statistics . Population Estimates n.d. www.ons.gov.uk/peoplepopulationandcommunity/populationandmigration/populationestimates (accessed 10 November 2021).
- UK Government . UK Population by Ethnicity: Age Groups n.d. www.ethnicity-facts-figures.service.gov.uk/uk-population-by-ethnicity/demographics/age-groups/latest (accessed 27 May 2022).
- Incerti D, Thom H, Baio G, Jansen JP. R You still using Excel? The advantages of modern software tools for health technology assessment. Value Health 2019;22:575-9. https://doi.org/10.1016/j.jval.2019.01.003.
- Antiga E, Caproni M. The diagnosis and treatment of dermatitis herpetiformis. Clin Cosmet Investig Dermatol 2015;8:257-65. https://doi.org/10.2147/CCID.S69127.
- Kunst N, Wilson ECF, Glynn D, Alarid-Escudero F, Baio G, Brennan A, et al. Computing the expected value of sample information efficiently: practical guidance and recommendations for four model-based methods. Value Health 2020;23:734-42. https://doi.org/10.1016/j.jval.2020.02.010.
- Watson J, Nicholson BD, Hamilton W, Price S. Identifying clinical features in primary care electronic health record studies: methods for codelist development. BMJ Open 2017;7. https://doi.org/10.1136/bmjopen-2017-019637.
- Davis S, Stevenson M, Tappenden P, Wailoo A. NICE DSU Technical Support Document 15: Cost-Effectiveness Modelling Using Patient-Level Simulation. London: National Institute for Health and Care Excellence; 2014.
- Ravelli A, Villanacci V, Monfredini C, Martinazzi S, Grassi V, Manenti S. How patchy is patchy villous atrophy? Distribution pattern of histological lesions in the duodenum of children with celiac disease. Am J Gastroenterol 2010;105:2103-10. https://doi.org/10.1038/ajg.2010.153.
- Lebwohl B, Kapel RC, Neugut AI, Green PH, Genta RM. Adherence to biopsy guidelines increases celiac disease diagnosis. Gastrointest Endosc 2011;74:103-9. https://doi.org/10.1016/j.gie.2011.03.1236.
- Cohn A, Sofia AM, Kupfer SS. Type 1 diabetes and celiac disease: clinical overlap and new insights into disease pathogenesis. Curr Diab Rep 2014;14. https://doi.org/10.1007/s11892-014-0517-x.
- Irvine AJ, Chey WD, Ford AC. Screening for celiac disease in irritable bowel syndrome: an updated systematic review and meta-analysis. Am J Gastroenterol 2017;112:65-76. https://doi.org/10.1038/ajg.2016.466.
- Julian T, Hadjivassiliou M, Zis P. Gluten sensitivity and epilepsy: a systematic review. J Neurol 2019;266:1557-65. https://doi.org/10.1007/s00415-018-9025-2.
- Singh P, Arora S, Lal S, Strand TA, Makharia GK. Celiac disease in women with infertility: a meta-analysis. J Clin Gastroenterol 2016;50:33-9. https://doi.org/10.1097/MCG.0000000000000285.
- Roy A, Laszkowska M, Sundström J, Lebwohl B, Green PH, Kämpe O, et al. Prevalence of celiac disease in patients with autoimmune thyroid disease: a meta-analysis. Thyroid 2016;26:880-90. https://doi.org/10.1089/thy.2016.0108.
- Sainsbury A, Sanders DS, Ford AC. Meta-analysis: coeliac disease and hypertransaminasaemia. Aliment Pharmacol Ther 2011;34:33-40. https://doi.org/10.1111/j.1365-2036.2011.04685.x.
- Laszkowska M, Mahadev S, Sundström J, Lebwohl B, Green PHR, Michaelsson K, et al. Systematic review with meta-analysis: the prevalence of coeliac disease in patients with osteoporosis. Aliment Pharmacol Ther 2018;48:590-7. https://doi.org/10.1111/apt.14911.
- Acharya P, Mathur M. Association between psoriasis and celiac disease: a systematic review and meta-analysis. J Am Acad Dermatol 2020;82:1376-85. https://doi.org/10.1016/j.jaad.2019.11.039.
- Pinto-Sanchez MI, Seiler CL, Santesso N, Alaedini A, Semrad C, Lee AR, et al. Association between inflammatory bowel diseases and celiac disease: a systematic review and meta-analysis. Gastroenterology 2020;159:884-903.e31. https://doi.org/10.1053/j.gastro.2020.05.016.
- Zis P, Julian T, Hadjivassiliou M. Headache associated with coeliac disease: a systematic review and meta-analysis. Nutrients 2018;10. https://doi.org/10.3390/nu10101445.
- Gabrielli M, Cremonini F, Fiore G, Addolorato G, Padalino C, Candelli M, et al. Association between migraine and celiac disease: results from a preliminary case–control and therapeutic study. Am J Gastroenterol 2003;98:625-9. https://doi.org/10.1111/j.1572-0241.2003.07300.x.
- Singh P, Arora S, Lal S, Strand TA, Makharia GK. Risk of celiac disease in the first- and second-degree relatives of patients with celiac disease: a systematic review and meta-analysis. Am J Gastroenterol 2015;110:1539-48. https://doi.org/10.1038/ajg.2015.296.
- Yap TW, Chan WK, Leow AH, Azmi AN, Loke MF, Vadivelu J, et al. Prevalence of serum celiac antibodies in a multiracial Asian population – a first study in the young Asian adult population of Malaysia. PLOS ONE 2015;10. https://doi.org/10.1371/journal.pone.0121908.
- Abu-Zeid YA, Jasem WS, Lebwohl B, Green PH, ElGhazali G. Seroprevalence of celiac disease among United Arab Emirates healthy adult nationals: a gender disparity. World J Gastroenterol 2014;20:15830-6. https://doi.org/10.3748/wjg.v20.i42.15830.
- Romanos J, van Diemen CC, Nolte IM, Trynka G, Zhernakova A, Fu J, et al. Analysis of HLA and non-HLA alleles can identify individuals at high risk for celiac disease. Gastroenterology 2009;137. https://doi.org/10.1053/j.gastro.2009.05.040.
- Romanos J, Rosén A, Kumar V, Trynka G, Franke L, Szperl A, et al. Improving coeliac disease risk prediction by testing non-HLA variants additional to HLA variants. Gut 2014;63:415-22. https://doi.org/10.1136/gutjnl-2012-304110.
- Wilson PW, D’Agostino RB, Levy D, Belanger AM, Silbershatz H, Kannel WB. Prediction of coronary heart disease using risk factor categories. Circulation 1998;97:1837-47. https://doi.org/10.1161/01.cir.97.18.1837.
- Hippisley-Cox J, Coupland C. Symptoms and risk factors to identify women with suspected cancer in primary care: derivation and validation of an algorithm. Br J Gen Pract 2013;63:e11-21. https://doi.org/10.3399/bjgp13X660733.
- Hippisley-Cox J, Coupland C. Symptoms and risk factors to identify men with suspected cancer in primary care: derivation and validation of an algorithm. Br J Gen Pract 2013;63:e1-10. https://doi.org/10.3399/bjgp13X660724.
- Díaz-Redondo A, Miranda-Bautista J, García-Lledó J, Gisbert JP, Menchén L. The potential usefulness of human leukocyte antigen typing for celiac disease screening: a systematic review and meta-analysis. Rev Esp Enferm Dig 2015;107:423-9. https://doi.org/10.17235/reed.2015.3758/2015.
- UK National Screening Committee . Criteria for Appraising the Viability, Effectiveness and Appropriateness of a Screening Programme n.d. www.gov.uk/government/publications/evidence-review-criteria-national-screening-programmes/criteria-for-appraising-the-viability-effectiveness-and-appropriateness-of-a-screening-programme (accessed 27 May 2022).
- Sarna VK, Lundin KEA, Mørkrid L, Qiao SW, Sollid LM, Christophersen A. HLA-DQ-gluten tetramer blood test accurately identifies patients with and without celiac disease in absence of gluten consumption. Gastroenterology 2018;154:886-96.e6. https://doi.org/10.1053/j.gastro.2017.11.006.
- Hopper AD, Azmy IA, Rahman N, Hurlstone DP, Leeds JS, George RR, et al. Association of adult coeliac disease with surgical abdominal pain: a case controlled study in patients referred to secondary care. Gastroenterology 2005;128:A255-A.
- Sanders DS, Hopper AD, Azmy IA, Rahman N, Hurlstone DP, Leeds JS, et al. Association of adult celiac disease with surgical abdominal pain: a case–control study in patients referred to secondary care. Ann Surg 2005;242:201-7. https://doi.org/10.1097/01.sla.0000171301.35513.cf.
- Choung RS, Rubio-Tapia A, Lahr BD, Kyle RA, Camilleri MJ, Locke GR, et al. Evidence against routine testing of patients with functional gastrointestinal disorders for celiac disease: a population-based study. Clin Gastroenterol Hepatol 2015;13:1937-43. https://doi.org/10.1016/j.cgh.2015.05.014.
- Oliveira RP, Sdepanian VL, Barreto JA, Cortez AJ, Carvalho FO, Bordin JO, et al. High prevalence of celiac disease in Brazilian blood donor volunteers based on screening by IgA antitissue transglutaminase antibody. Eur J Gastroenterol Hepatol 2007;19:43-9. https://doi.org/10.1097/01.meg.0000250586.61232.a3.
- Hujoel IA, Van Dyke CT, Brantner T, Larson J, King KS, Sharma A, et al. Natural history and clinical detection of undiagnosed coeliac disease in a North American community. Aliment Pharmacol Ther 2018;47:1358-66. https://doi.org/10.1111/apt.14625.
- Fitzpatrick KP, Sherman PM, Ipp M, Saunders N, Macarthur C. Screening for celiac disease in children with recurrent abdominal pain. J Pediatr Gastroenterol Nutr 2001;33:250-2. https://doi.org/10.1097/00005176-200109000-00004.
- Dalgic B, Sari S, Ozcan B, Basturk B, Ensari A, Egritas O, et al. The evaluation of factors and symptoms related to celiac disease in Turkish children. Turk Pediatri Arsivi 2011;46:314-21.
- Stahl MG, Geno Rasmussen C, Dong F, Waugh K, Norris JM, Baxter J, et al. Mass screening for celiac disease: the Autoimmunity Screening for Kids study. Am J Gastroenterol 2021;116:180-7. https://doi.org/10.14309/ajg.0000000000000751.
- Lasa J, Spallone L, Gandara S, Chaar E, Berman S, Zagalsky D. Celiac disease prevalence is not increased in patients with functional dyspepsia. Arq Gastroenterol 2017;54:37-40. https://doi.org/10.1590/s0004-2803.2017v54n1-07.
- Lecleire S, Di Fiore F, Antonietti M, Savoye G, Lerebours E, Ducrotte P. Endoscopic markers for screening of villous atrophy in patients with dyspepsia or high-risk of celiac disease: a prospective controlled study. Gastroenterology 2005;128:A257-A.
- Katz KD, Rashtak S, Lahr BD, Melton LJ, Krause PK, Maggi K, et al. Screening for celiac disease in a North American population: sequential serology and gastrointestinal symptoms. Am J Gastroenterol 2011;106:1333-9. https://doi.org/10.1038/ajg.2011.21.
- Lara-Carmona J, Amieva-Balmori M, Martinez-Conejo A, Jorge FJC, Garcia-Zermeno KR, Flores KH, et al. Prevalence of celiac disease (CD) in subjects with dyspeptic symptoms: a case–control study. Gastroenterology 2019;156:S-918. https://doi.org/10.1016/S0016-5085(19)39262-5.
- Tikkakoski S, Savilahti E, Kolho KL. Undiagnosed coeliac disease and nutritional deficiencies in adults screened in primary health care. Scand J Gastroenterol 2007;42:60-5. https://doi.org/10.1080/00365520600789974.
- Ludvigsson JF, Aro P, Walker MM, Vieth M, Agréus L, Talley NJ, et al. Celiac disease, eosinophilic esophagitis and gastroesophageal reflux disease, an adult population-based study. Scand J Gastroenterol 2013;48:808-14. https://doi.org/10.3109/00365521.2013.792389.
- Locke GR, Murray JA, Zinsmeister AR, Melton LJ, Talley NJ. Celiac disease serology in irritable bowel syndrome and dyspepsia: a population-based case–control study. Mayo Clin Proc 2004;79:476-82. https://doi.org/10.4065/79.4.476.
- Vivas S, Ruiz de Morales JM, Martinez J, González MC, Martín S, Martín J, et al. Human recombinant anti-transglutaminase antibody testing is useful in the diagnosis of silent coeliac disease in a selected group of at-risk patients. Eur J Gastroenterol Hepatol 2003;15:479-83. https://doi.org/10.1097/01.meg.0000059104.41030.1c.
- Alexander TS, Oshilaja O, Define L. The incidence of celiac disease antibodies in plasma specimens with low hemoglobin levels. Ann N Y Acad Sci 2009;1173:186-9. https://doi.org/10.1111/j.1749-6632.2009.04755.x.
- Javid G, Lone SN, Shoukat A, Khan BA, Yattoo GN, Shah A, et al. Prevalence of celiac disease in adult patients with iron-deficiency anemia of obscure origin in Kashmir (India). Indian J Gastroenterol 2015;34:314-19. https://doi.org/10.1007/s12664-015-0586-z.
- Uçardağ D, Güliter S, Ceneli O, Yakaryilmaz F, Atasoy P, Cağlayan O. Celiac disease prevalence in patients with iron deficiency anemia of obscure origin. Turk J Gastroenterol 2009;20:266-70. https://doi.org/10.4318/tjg.2009.0024.
- Lasa JS, Olivera P, Soifer L, Moore R. Iron-deficiency anemia as a subclinical celiac disease presentation in an Argentinian population. Rev Gastroenterol Mex 2017;82:270-3. https://doi.org/10.1016/j.rgmxen.2016.12.004.
- Cikrikcioglu MA, Halac G, Hursitoglu M, Erkal H, Cakirca M, Kinas BE, et al. Prevalence of gluten sensitive enteropathy antibodies in restless legs syndrome. Acta Neurol Belg 2011;111:282-6.
- Morawiec-Szymonik E, Foltyn W, Marek B, Głogowska-Szeląg J, Kos-Kudła B, Kajdaniuk D. Antibodies involved in the development of pernicious anemia and other autoimmune diseases. Pol Arch Intern Med 2020;130:31-7. https://doi.org/10.20452/pamw.15094.
- Ransford RA, Hayes M, Palmer M, Hall MJ. A controlled, prospective screening study of celiac disease presenting as iron deficiency anemia. J Clin Gastroenterol 2002;35:228-33. https://doi.org/10.1097/00004836-200209000-00006.
- Sanders DS, Patel D, Stephenson TJ, Ward AM, McCloskey EV, Hadjivassiliou M, et al. A primary care cross-sectional study of undiagnosed adult coeliac disease. Eur J Gastroenterol Hepatol 2003;15:407-13. https://doi.org/10.1097/00042737-200304000-00012.
- Greco L, Veneziano A, Di Donato L, Zampella C, Pecoraro M, Paladini D, et al. Undiagnosed coeliac disease does not appear to be associated with unfavourable outcome of pregnancy. Gut 2004;53:149-51. https://doi.org/10.1136/gut.53.1.149.
- Kalayci AG, Kanber Y, Birinci A, Yildiz L, Albayrak D. The prevalence of coeliac disease as detected by screening in children with iron deficiency anaemia. Acta Paediatr 2005;94:678-81. https://doi.org/10.1111/j.1651-2227.2005.tb01964.x.
- Shahriari M, Honar N, Yousefi A, Javaherizadeh H. Association of potential celiac disease and refractory iron deficiency anemia in children and adolescents. Arq Gastroenterol 2018;55:78-81. https://doi.org/10.1590/s0004-2803.201800000-15.
- Narang M, Natarajan R, Shah D, Puri AS, Manchanda V, Kotru M. Celiac disease in children with moderate-to-severe iron-deficiency anemia. Indian Pediatr 2018;55:31-4. https://doi.org/10.1007/s13312-018-1223-6.
- Ertekin V, Selimoglu MA, Kardas F, Aktas E. Prevalence of celiac disease in Turkish children. J Clin Gastroenterol 2005;39:689-91. https://doi.org/10.1097/01.mcg.0000174026.26838.56.
- Bizzaro N, Villalta D, Tonutti E, Doria A, Tampoia M, Bassetti D, et al. IgA and IgG tissue transglutaminase antibody prevalence and clinical significance in connective tissue diseases, inflammatory bowel disease, and primary biliary cirrhosis. Dig Dis Sci 2003;48:2360-5. https://doi.org/10.1023/b:ddas.0000007875.72256.e8.
- Feighery L, Collins C, Feighery C, Mahmud N, Coughlan G, Willoughby R, et al. Anti-transglutaminase antibodies and the serological diagnosis of coeliac disease. Br J Biomed Sci 2003;60:14-8. https://doi.org/10.1080/09674845.2003.11783671.
- Nisihara RM, Skare TL, Silva MB, Utiyama SR. Rheumatoid arthritis and anti-endomysial antibodies. Acta Reumatol Port 2007;32:163-67.
- Picarelli A, Di Tola M, Sabbatella L, Vetrano S, Anania MC, Spadaro A, et al. Anti-tissue transglutaminase antibodies in arthritic patients: a disease-specific finding?. Clin Chem 2003;49:2091-4. https://doi.org/10.1373/clinchem.2003.023234.
- Riente L, Chimenti D, Pratesi F, Delle Sedie A, Tommasi S, Tommasi C, et al. Antibodies to tissue transglutaminase and Saccharomyces cerevisiae in ankylosing spondylitis and psoriatic arthritis. J Rheumatol 2004;31:920-4.
- Luft LM, Barr SG, Martin LO, Chan EK, Fritzler MJ. Autoantibodies to tissue transglutaminase in Sjögren’s syndrome and related rheumatic diseases. J Rheumatol 2003;30:2613-19.
- Heikkilä K, Heliövaara M, Impivaara O, Kröger H, Knekt P, Rissanen H, et al. Celiac disease autoimmunity and hip fracture risk: findings from a prospective cohort study. J Bone Miner Res 2015;30:630-6. https://doi.org/10.1002/jbmr.2380.
- Gheita TA, Fawzy SM, Nour El-Din AM, Gomaa HE. Asymptomatic celiac sprue in juvenile rheumatic diseases children. Int J Rheum Dis 2012;15:220-6. https://doi.org/10.1111/j.1756-185X.2011.01681.x.
- Sahin Y, Sahin S, Barut K, Cokugras FC, Erkan T, Adrovic A, et al. The frequency of the celiac disease in patients with juvenile idiopathic arthritis. J Pediatr Gastroenterol Nutr 2017;64:222-3.
- Skrabl-Baumgartner A, Christine Hauer A, Erwa W, Jahnel J. HLA genotyping as first-line screening tool for coeliac disease in children with juvenile idiopathic arthritis. Arch Dis Child 2017;102:607-11. https://doi.org/10.1136/archdischild-2016-311544.
- Stagi S, Giani T, Simonini G, Falcini F. Thyroid function, autoimmune thyroiditis and coeliac disease in juvenile idiopathic arthritis. Rheumatology 2005;44:517-20. https://doi.org/10.1093/rheumatology/keh531.
- Robazzi TC, Adan LF, Pimentel K, Guimarães I, Magalhães Filho J, Toralles MB, et al. Autoimmune endocrine disorders and coeliac disease in children and adolescents with juvenile idiopathic arthritis and rheumatic fever. Clin Exp Rheumatol 2013;31:310-17.
- Taneja A, Prahalad S, Hersh AO, Ponder L, Chan LHK, Rouster-Stevens KA, et al. Prevalence of celiac antibodies and IgA deficiency in juvenile idiopathic arthritis. Arthritis Rheumatol 2017;69:22-3.
- Toğrol RE, Nalbant S, Solmazgül E, Ozyurt M, Kaplan M, Kiralp MZ, et al. The significance of coeliac disease antibodies in patients with ankylosing spondylitis: a case–controlled study. J Int Med Res 2009;37:220-6. https://doi.org/10.1177/147323000903700127.
- Nenna R, Tiberti C, Petrarca L, Lucantoni F, Mennini M, Luparia RP, et al. The celiac iceberg: characterization of the disease in primary schoolchildren. J Pediatr Gastroenterol Nutr 2013;56:416-21. https://doi.org/10.1097/MPG.0b013e31827b7f64.
- Çakir M, Cezaroğlu S, Çobanoğlu Ü. Celiac disease in children with chronic constipation. Turk J Med Sci 2016;46:651-6. https://doi.org/10.3906/sag-1502-130.
- Fifi AC, Velasco-Benitez C, Saps M. Celiac disease in children with functional constipation: a school-based multicity study. J Pediatr 2020;227:77-80. https://doi.org/10.1016/j.jpeds.2020.07.052.
- Kumar V, Jarzabek-Chorzelska M, Sulej J, Rajadhyaksha M, Jablonska S. Tissue transglutaminase and endomysial antibodies-diagnostic markers of gluten-sensitive enteropathy in dermatitis herpetiformis. Clin Immunol 2001;98:378-82. https://doi.org/10.1006/clim.2000.4983.
- Velikova T, Shahid M, Ivanova-Todorova E, Drenovska K, Tumangelova-Yuzeir K, Altankova I, et al. Celiac-related autoantibodies and IL-17A in Bulgarian patients with dermatitis herpetiformis: a cross-sectional study. Medicina 2019;55. https://doi.org/10.3390/medicina55050136.
- Smecuol E, Sugai E, Niveloni S, Vázquez H, Pedreira S, Mazure R, et al. Permeability, zonulin production, and enteropathy in dermatitis herpetiformis. Clin Gastroenterol Hepatol 2005;3:335-41. https://doi.org/10.1016/S1542-3565(04)00778-5.
- Imanzadeh F, Sayyari AA, Yaghoobi M, Akbari MR, Shafagh H, Farsar AR. Celiac disease in children with diarrhea is more frequent than previously suspected. J Pediatr Gastroenterol Nutr 2005;40:309-11. https://doi.org/10.1097/01.MPG.0000154012.10420.08.
- Ranua J, Luoma K, Auvinen A, Mäki M, Haapala AM, Peltola J, et al. Celiac disease-related antibodies in an epilepsy cohort and matched reference population. Epilepsy Behav 2005;6:388-92. https://doi.org/10.1016/j.yebeh.2005.01.007.
- Mavroudi A, Antigoni M, Xinias I, Papastavrou T, Theodouli P, Karatza E, et al. Increased prevalence of silent celiac disease among Greek epileptic children. Pediatr Neurol 2007;36:165-9. https://doi.org/10.1016/j.pediatrneurol.2006.11.011.
- Dalgiç B, Dursun I, Serdaroğlu A, Dursun A. Latent and potential celiac disease in epileptic Turkish children. J Child Neurol 2006;21:6-7. https://doi.org/10.1177/08830738060210010301.
- Dai AI, Akcali A, Varan C, Demiryürek AT. Prevalence of resistant occipital lobe epilepsy associated with celiac disease in children. Childs Nerv Syst 2014;30:1091-8. https://doi.org/10.1007/s00381-014-2387-6.
- Djurić Z, Nagorni A, Jocić-Jakubi B, Dimić M, Novak M, Milićević R, et al. Celiac disease prevalence in epileptic children from Serbia. Turk J Pediatr 2012;54:247-50.
- Giordano L, Valotti M, Bosetti A, Accorsi P, Caimi L, Imberti L. Celiac disease-related antibodies in Italian children with epilepsy. Pediatr Neurol 2009;41:34-6. https://doi.org/10.1016/j.pediatrneurol.2009.02.009.
- Işikay S, Hizli Ş, Yilmaz K. Prevalence of celiac disease in Turkish children with idiopathic epilepsy. Iran J Pediatr 2014;24:280-4.
- Işıkay S, Kocamaz H. Prevalence of celiac disease in children with idiopathic epilepsy in southeast Turkey. Pediatr Neurol 2014;50:479-81. https://doi.org/10.1016/j.pediatrneurol.2014.01.021.
- Lahat E, Broide E, Leshem M, Evans S, Scapa E. Prevalence of celiac antibodies in children with neurologic disorders. Pediatr Neurol 2000;22:393-6. https://doi.org/10.1016/S0887-8994(00)00129-6.
- Pratesi R, Gandolfi L, Martins RC, Tauil PL, Nobrega YK, Teixeira WA. Is the prevalence of celiac disease increased among epileptic patients?. Arq Neuropsiquiatr 2003;61:330-4. https://doi.org/10.1590/S0004-282X2003000300002.
- Soni S, Agarwal A, Singh A, Gupta V, Khadgawat R, Chaturvedi PK, et al. Prevalence of thyroid autoimmunity in first-degree relatives of patients with celiac disease. Indian J Gastroenterol 2019;38:450-5. https://doi.org/10.1007/s12664-019-00990-3.
- Choung RS, Horwath IE, Marietta E, Bublitz JT, Olson JE, Murray JA. Prevalence of celiac disease autoimmunity and associated morbid conditions in first-degree relatives of patients with celiac disease. Gastroenterology 2019;156:S-136. https://doi.org/10.1016/S0016-5085(19)37130-6.
- Fasano A, Berti I, Gerarduzzi T, Not T, Colletti RB, Drago S, et al. Prevalence of celiac disease in at-risk and not-at-risk groups in the United States: a large multicenter study. Arch Intern Med 2003;163:286-92. https://doi.org/10.1001/archinte.163.3.286.
- Beser OF, Gulluelli E, Cullu Cokugras F, Erkan T, Kutlu T, Yagci RV, et al. Prevalence and clinical features of celiac disease in healthy school-aged children. Dig Dis Sci 2019;64:173-81. https://doi.org/10.1007/s10620-018-5320-0.
- Cintado A, Sorell L, Galvan JA, Martinez L, Castaneda C, Fragoso T, et al. HLA DQA1*0501 and DQB 1*02 in Cuban celiac patients. Hum Immunol 2006;67:639-42. https://doi.org/10.1016/j.humimm.2006.04.009.
- Kotze LM, Utiyama SR, Nisihara RM, Zeni MP, de Sena MG, Amarante HM. Antiendomysium antibodies in Brazilian patients with celiac disease and their first-degree relatives. Arq Gastroenterol 2001;38:94-103. https://doi.org/10.1590/s0004-28032001000200004.
- Nass FR, Kotze LM, Nisihara RM, de Messias-Reason IJ. Ramos da Rosa Utiyama S. Serological and clinical follow-up of relatives of celiac disease patients from southern Brazil. Digestion 2011;83:89-95. https://doi.org/10.1159/000320451.
- Utiyama SR, Nass FR, Kotze LM, Nisihara RM, Ambrosio AR, Messias-Reason IT. Serological screening of relatives of celiac disease patients: antiendomysium antibodies, anti-tissue transglutaminase or both?. Arq Gastroenterol 2007;44:156-61. https://doi.org/10.1590/S0004-28032007000200014.
- Hjelle AM, Apalset E, Mielnik P, Nilsen RM, Lundin KEA, Tell GS. Positive IgA against transglutaminase 2 in patients with distal radius and ankle fractures compared to community-based controls. Scand J Gastroenterol 2018;53:1212-16. https://doi.org/10.1080/00365521.2018.1509122.
- Hjelle AM, Mielnik P, Apalset E, Tell GS. Celiac disease and positive IgA tissue transglutaminase in patients with distal radius or ankle fracture: interim analysis. Ann Rheum Dis 2014;73. https://doi.org/10.1136/annrheumdis-2014-eular.1238.
- LeBoff MS, Cobb H, Gao LY, Hawkes W, Yu-Yahiro J, Kolatkar NS, et al. Celiac disease is not increased in women with hip fractures and low vitamin D levels. J Nutr Health Aging 2013;17:562-5. https://doi.org/10.1007/s12603-013-0017-8.
- Potter MDE, Walker MM, Hancock S, Holliday E, Brogan G, Jones M, et al. A serological diagnosis of coeliac disease is associated with osteoporosis in older Australian adults. Nutrients 2018;10. https://doi.org/10.3390/nu10070849.
- Agardh D, Björck S, Agardh CD, Lidfeldt J. Coeliac disease-specific tissue transglutaminase autoantibodies are associated with osteoporosis and related fractures in middle-aged women. Scand J Gastroenterol 2009;44:571-8. https://doi.org/10.1080/00365520902718929.
- West J, Logan RF, Hill PG, Lloyd A, Lewis S, Hubbard R, et al. Seroprevalence, correlates, and characteristics of undetected coeliac disease in England. Gut 2003;52:960-5. https://doi.org/10.1136/gut.52.7.960.
- Choung RS, Larson SA, Khaleghi S, Rubio-Tapia A, Ovsyannikova IG, King KS, et al. Prevalence and morbidity of undiagnosed celiac disease from a community-based study. Gastroenterology 2017;152:830-9.e5. https://doi.org/10.1053/j.gastro.2016.11.043.
- Walker MM, Murray JA, Ronkainen J, Aro P, Storskrubb T, D’Amato M, et al. Detection of celiac disease and lymphocytic enteropathy by parallel serology and histopathology in a population-based study. Gastroenterology 2010;139:112-19. https://doi.org/10.1053/j.gastro.2010.04.007.
- Khudher SN, Mohammed KAS, Ali NH. Influence of HLA-DQ on clinical and serological biomarkers in patients with celiac disease. Ann Trop Med Public Health 2020;23. https://doi.org/10.36295/ASRO.2020.231617.
- Horoldt BS, Leeds JS, Sidhu R, Hopper AD, Robinson K, Toulson B, et al. Is there a relationship between coeliac disease and inflammatory bowel disease? A bidirectional prevalence study with controls. Gut 2006;55:A98-A.
- Leeds JS, Höroldt BS, Sidhu R, Hopper AD, Robinson K, Toulson B, et al. Is there an association between coeliac disease and inflammatory bowel diseases? A study of relative prevalence in comparison with population controls. Scand J Gastroenterol 2007;42:1214-20. https://doi.org/10.1080/00365520701365112.
- Watanabe C, Komoto S, Hokari R, Kurihara C, Okada Y, Hozumi H, et al. Prevalence of serum celiac antibody in patients with IBD in Japan. J Gastroenterol 2014;49:825-34. https://doi.org/10.1007/s00535-013-0838-6.
- El-Matary W, Fedorak RN, Senthilselvan A, Spady D. Celiac disease and inflammatory bowel disease in children: is there a link?. Gastroenterology 2012;142:S370-S1. https://doi.org/10.1016/S0016-5085(12)61398-5.
- Kull K, Uibo O, Salupere R, Metsküla K, Uibo R. High frequency of antigliadin antibodies and absence of antireticulin and antiendomysium antibodies in patients with ulcerative colitis. J Gastroenterol 1999;34:61-5. https://doi.org/10.1007/s005350050217.
- Mehdi Z, Sakineh E, Mohammad F, Mansour R, Alireza A. Celiac disease: serologic prevalence in patients with irritable bowel syndrome. J Res Med Sci 2012;17:839-42.
- Respondek W, Tomasiuk R, Jarosz M, Traczyk I, Mekus M. Is it reasonable to perform serological tests for celiac disease in patients with irritable bowel syndrome?. Prz Gastroenterol 2013;8:184-90. https://doi.org/10.5114/pg.2013.36333.
- Almazar AE, Talley NJ, Larson JJ, Atkinson EJ, Murray JA, Saito YA. Celiac disease is uncommon in irritable bowel syndrome in the USA. Eur J Gastroenterol Hepatol 2018;30:149-54. https://doi.org/10.1097/MEG.0000000000001022.
- Cash BD, Rubenstein JH, Young PE, Gentry A, Nojkov B, Lee D, et al. The prevalence of celiac disease among patients with nonconstipated irritable bowel syndrome is similar to controls. Gastroenterology 2011;141:1187-93. https://doi.org/10.1053/j.gastro.2011.06.084.
- Domżał-Magrowska D, Kowalski MK, Szcześniak P, Bulska M, Orszulak-Michalak D, Małecka-Panas E. The prevalence of celiac disease in patients with irritable bowel syndrome and its subtypes. Prz Gastroenterol 2016;11:276-81. https://doi.org/10.5114/pg.2016.57941.
- Kou GJ, Guo J, Zuo XL, Li CQ, Liu C, Ji R, et al. Prevalence of celiac disease in adult Chinese patients with diarrhea-predominant irritable bowel syndrome: a prospective, controlled, cohort study. J Dig Dis 2018;19:136-43. https://doi.org/10.1111/1751-2980.12587.
- Saito-Loftus Y, Brantner T, Zimmerman J, Talley N, Murray J. The prevalence of positive serologic tests for celiac sprue does not differ between irritable bowel syndrome (IBS) patients compared with controls. Am J Gastroenterol 2008;103. https://doi.org/10.14309/00000434-200809001-01208.
- Sánchez-Vargas LA, Thomas-Dupont P, Torres-Aguilera M, Azamar-Jacome AA, Ramírez-Ceervanes KL, Aedo-Garcés MR, et al. Prevalence of celiac disease and related antibodies in patients diagnosed with irritable bowel syndrome according to the Rome III criteria. A case–control study. Neurogastroenterol Motil 2016;28:994-1000. https://doi.org/10.1111/nmo.12799.
- Sanders DS, Carter MJ, Hurlstone DP, Pearce A, Ward AM, McAlindon ME, et al. Association of adult coeliac disease with irritable bowel syndrome: a case–control study in patients fulfilling ROME II criteria referred to secondary care. Lancet 2001;358:1504-8. https://doi.org/10.1016/S0140-6736(01)06581-3.
- Vargas LAS, Garces M, Dupont PT, Meixueiro A, Jacome AAA, Roesch FB, et al. Prevalence of antibodies related to celiac disease (CD) in patients with irritable bowel syndrome (IBS) according to ROME III criteria. A case–control study. Gastroenterology 2013;144. https://doi.org/10.1016/S0016-5085(13)60894-X.
- Wang H, Zhou G, Luo L, Crusius JBA, Yuan A, Kou J, et al. Serological screening for celiac disease in adult Chinese patients with diarrhea predominant irritable bowel syndrome. Medicine 2015;94. https://doi.org/10.1097/MD.0000000000001779.
- Khayyat YM. Undiagnosed celiac disease in patients presenting with irritable bowel syndrome symptoms. J Ayub Med Coll Abbottabad 2020;32:18-23.
- Olen O, Sandstrom O, Myleus A, Rosen A, Carlsson A, Hogberg L, et al. Functional gastrointestinal disorders and the association to celiac disease-a population based screening study in children. Gastroenterology 2014;146:S-173. https://doi.org/10.1016/S0016-5085(14)60611-9.
- Chatzicostas C, Roussomoustakaki M, Drygiannakis D, Niniraki M, Tzardi M, Koulentaki M, et al. Primary biliary cirrhosis and autoimmune cholangitis are not associated with coeliac disease in Crete. BMC Gastroenterology 2002;2. https://doi.org/10.1186/1471-230X-2-5.
- Durante-Mangoni E, Iardino P, Resse M, Cesaro G, Sica A, Farzati B, et al. Silent celiac disease in chronic hepatitis C: impact of interferon treatment on the disease onset and clinical outcome. J Clin Gastroenterol 2004;38:901-5. https://doi.org/10.1097/00004836-200411000-00014.
- Hernandez L, Johnson TC, Naiyer AJ, Kryszak D, Ciaccio EJ, Min A, et al. Chronic hepatitis C virus and celiac disease, is there an association?. Dig Dis Sci 2008;53:256-61. https://doi.org/10.1007/s10620-007-9851-z.
- Sjöberg K, Lindgren S, Eriksson S. Frequent occurrence of non-specific gliadin antibodies in chronic liver disease. Endomysial but not gliadin antibodies predict coeliac disease in patients with chronic liver disease. Scand J Gastroenterol 1997;32:1162-7. https://doi.org/10.3109/00365529709002997.
- Yuan J, Gao J, Yao Y, Chen H. Serologic testing for celiac disease in young people with elevated transaminases. Turk J Med Sci 2015;45:668-73. https://doi.org/10.3906/sag-1403-127.
- El-Shabrawi M, El-Karaksy H, Mohsen N, Isa M, Al-Biltagi M, El-Ansari M. Celiac disease in children and adolescents with autoimmune hepatitis: a single-centre experience. J Trop Pediatr 2011;57:104-8. https://doi.org/10.1093/tropej/fmq057.
- Oana B, Laura O, Ioan S, Tamara M, Otilia M. Celiac disease prevalence among children with autoimmune hepatitis and autoimmune thyroid disorders. A 10-years single centre experience. J Gastrointestin Liver Dis 2018;27.
- Germenis AE, Yiannaki EE, Zachou K, Roka V, Barbanis S, Liaskos C, et al. Prevalence and clinical significance of immunoglobulin A antibodies against tissue transglutaminase in patients with diverse chronic liver diseases. Clin Diagn Lab Immunol 2005;12:941-8. https://doi.org/10.1128/CDLI.12.8.941-948.2005.
- Villalta D, Girolami D, Bidoli E, Bizzaro N, Tampoia M, Liguori M, et al. High prevalence of celiac disease in autoimmune hepatitis detected by anti-tissue tranglutaminase autoantibodies. J Clin Lab Anal 2005;19:6-10. https://doi.org/10.1002/jcla.20047.
- Balci O, Yilmaz D, Sezer T, Hizli S. Is celiac disease an etiological factor in children with migraine?. J Child Neurol 2016;31:929-31. https://doi.org/10.1177/0883073816630088.
- Alehan F, Ozçay F, Erol I, Canan O, Cemil T. Increased risk for coeliac disease in paediatric patients with migraine. Cephalalgia 2008;28:945-9. https://doi.org/10.1111/j.1468-2982.2008.01630.x.
- Inaloo S, Dehghani SM, Farzadi F, Haghighat M, Imanieh MH. A comparative study of celiac disease in children with migraine headache and a normal control group. Turk J Gastroenterol 2011;22:32-5. https://doi.org/10.4318/tjg.2011.0153.
- Abolfazli R, Mirbagheri A, Rabbani Anari M, Samadzadeh S. The association of celiac disease with multiple sclerosis. J Neurol Sci 2009;285. https://doi.org/10.1016/S0022-510X(09)70816-0.
- Nicoletti A, Patti F, Lo Fermo S, Sciacca A, Laisa P, Liberto A, et al. Frequency of celiac disease is not increased among multiple sclerosis patients. Mult Scler 2008;14:698-700. https://doi.org/10.1177/1352458507087268.
- Rodrigo L, Hernández-Lahoz C, Fuentes D, Alvarez N, López-Vázquez A, González S. Prevalence of celiac disease in multiple sclerosis. BMC Neurol 2011;11. https://doi.org/10.1186/1471-2377-11-31.
- Roth EB, Theander E, Londos E, Sandberg-Wollheim M, Larsson A, Sjoberg K, et al. Pathogenesis of autoimmune diseases: antibodies against transglutaminase, peptidylarginine deiminase and protein-bound citrulline in primary Sjögren’s syndrome, multiple sclerosis and Alzheimer’s disease. Scand J Immunol 2008;67:626-31. https://doi.org/10.1111/j.1365-3083.2008.02115.x.
- Khoshbaten M, Farhoudi M, Nikanfar M, Ayromlou H, Shaafi S, Sadreddini SA, et al. Celiac disease and multiple sclerosis in the northwest of Iran. Bratisl Lek Listy 2012;113:495-7. https://doi.org/10.4149/bll_2012_109.
- Gusso L, Simoes MC, Skare TL, Nisihara R, Burkiewicz CC, Utiyama S. Celiac disease screening in Brazilian patients with osteoporosis. Arq Bras Endocrinol Metabol 2014;58:270-3. https://doi.org/10.1590/0004-2730000002919.
- Shahbazkhani B, Aletaha N, Khonche A, Farahvash B, Malekzadeh R. Is it necessary to screen for celiac disease in adult idiopathic osteoporosis?. Gastroenterol Hepatol Bed Bench 2015;8:140-5.
- Stenson WF, Newberry R, Lorenz R, Baldus C, Civitelli R. Increased prevalence of celiac disease and need for routine screening among patients with osteoporosis. Arch Intern Med 2005;165:393-9. https://doi.org/10.1001/archinte.165.4.393.
- Vanciková Z, Chlumecký V, Sokol D, Horáková D, Hamsíková E, Fucíková T, et al. The serologic screening for celiac disease in the general population (blood donors) and in some high-risk groups of adults (patients with autoimmune diseases, osteoporosis and infertility) in the Czech republic. Folia Microbiol 2002;47:753-8. https://doi.org/10.1007/BF02818684.
- Shen Y, Wang M, Martinez D. Celiac disease and low femoral bone density in a multiethnic US national survey. Osteoporos Int 2014;25.
- De Bastiani R, Gabrielli M, Lora L, Napoli L, Tosetti C, Pirrotta E, et al. Association between coeliac disease and psoriasis: Italian primary care multicentre study. Dermatology 2015;230:156-60. https://doi.org/10.1159/000369615.
- Akbulut S, Gür G, Topal F, Senel E, Topal FE, Alli N, et al. Coeliac disease-associated antibodies in psoriasis. Ann Dermatol 2013;25:298-303. https://doi.org/10.5021/ad.2013.25.3.298.
- Dhattarwal N, Mahajan VK, Mehta KS, Chauhan PS, Yadav RS, Sharma SB, et al. The association of anti-gliadin and anti-transglutaminase antibodies and chronic plaque psoriasis in Indian patients: preliminary results of a descriptive cross-sectional study. Australas J Dermatol 2020;61:e378-e382. https://doi.org/10.1111/ajd.13308.
- Montesu MA, Dessí-Fulgheri C, Pattaro C, Ventura V, Satta R, Cottoni F. Association between psoriasis and coeliac disease? A case–control study. Acta Derm Venereol 2011;91:92-3. https://doi.org/10.2340/00015555-0960.
- Nagui N, El Nabarawy E, Mahgoub D, Mashaly HM, Saad NE, El-Deeb DF. Estimation of (IgA) anti-gliadin, anti-endomysium and tissue transglutaminase in the serum of patients with psoriasis. Clin Exp Dermatol 2011;36:302-4. https://doi.org/10.1111/j.1365-2230.2010.03980.x.
- Singh S, Sonkar GK, Usha Singh S. Celiac disease-associated antibodies in patients with psoriasis and correlation with HLA Cw6. J Clin Lab Anal 2010;24:269-72. https://doi.org/10.1002/jcla.20398.
- Marai I, Shoenfeld Y, Bizzaro N, Villalta D, Doria A, Tonutti E, et al. IgA and IgG tissue transglutaminase antibodies in systemic lupus erythematosus. Lupus 2004;13:241-4. https://doi.org/10.1191/0961203304lu1004oa.
- Picceli VF, Skare TL, Nisihara R, Kotze L, Messias-Reason I, Utiyama SR. Spectrum of autoantibodies for gastrointestinal autoimmune diseases in systemic lupus erythematosus patients. Lupus 2013;22:1150-5. https://doi.org/10.1177/0961203313503911.
- Sahin Y, Sahin S, Adrovic A, Erkan T, Kutlu T, Barut K, et al. The frequency of celiac disease in Turkish children with systemic lupus erythematosus. J Pediatr Gastroenterol Nutr 2017;64.
- Cedíková M, Ulčová-Gallová Z, Bibková K, Mičanová Z. The incidence of latent asymptomatic celiac disease in women with decreased fertility. Ceska Gynekol 2013;78:247-51.
- Remes-Troche JM, Vargas LAS, Meixueiro A, Patino ED, Gonzalez-Sicilia E, Abreu JA, et al. Celiac disease screening in patients previously diagnosed with infertility. A prospective study in Mexican population. Gastroenterology 2014;146. https://doi.org/10.1016/S0016-5085(14)61677-2.
- Herraiz-Nicuesa L, Tejera-Alhambra M, Garcia-Segovia A, Ramos-Medina R, Alonso B, Gil-Pulido J, et al. Increasing prevalence of undiagnosed celiac disease in Spanish women with recurrent reproductive failure. Hum Reprod 2013;28:i139-49. https://doi.org/10.1093/humrep/det209.
- Kumar A, Meena M, Begum N, Kumar N, Gupta RK, Aggarwal S, et al. Latent celiac disease in reproductive performance of women. Fertil Steril 2011;95:922-7. https://doi.org/10.1016/j.fertnstert.2010.11.005.
- Kutteh MA, Abiad M, Norman GL, Kutteh WH. Comparison of celiac disease markers in women with early recurrent pregnancy loss and normal controls. Am J Reprod Immunol 2019;82. https://doi.org/10.1111/aji.13127.
- Sarikaya E, Tokmak A, Aksoy RT, Pekcan MK, Alisik M, Alkan A. The association between serological markers of celiac disease and idiopathic recurrent pregnancy loss. Fetal Pediatr Pathol 2017;36:373-9. https://doi.org/10.1080/15513815.2017.1346018.
- Shamaly H, Mahameed A, Sharony A, Shamir R. Infertility and celiac disease: do we need more than one serological marker?. Acta Obstet Gynecol Scand 2004;83:1184-8. https://doi.org/10.1111/j.0001-6349.2004.00592.x.
- Sharshiner R, Romero S, Silver R, Branch DW. Celiac disease serum markers and recurrent pregnancy loss. Am J Obstet Gynecol 2013;208:S75-S6. https://doi.org/10.1016/j.ajog.2012.10.316.
- Tiboni GM, de Vita MG, Faricelli R, Giampietro F, Liberati M. Serological testing for celiac disease in women undergoing assisted reproduction techniques. Hum Reprod 2006;21:376-9. https://doi.org/10.1093/humrep/dei314.
- Zahmatkeshan M. Prevalence of coeliac disease in infertile women. J Pediatr Gastroenterol Nutr 2019;68.
- Celdir MG, Choung RS, Rostamkolaei SK, Jansson-Knodell CL, King KS, Larson JJ, et al. Reproductive characteristics and pregnancy outcomes in hidden celiac disease autoimmunity. Am J Gastroenterol 2021;116:593-9. https://doi.org/10.14309/ajg.0000000000001148.
- Martinelli P, Troncone R, Paparo F, Torre P, Trapanese E, Fasano C, et al. Coeliac disease and unfavourable outcome of pregnancy. Gut 2000;46:332-5. https://doi.org/10.1136/gut.46.3.332.
- Mohammed MA, Elrabbat AM, Omar NM, Shebl AM, Mansour AH, Elmasry E, et al. Celiac disease prevalence and its HLA-genotypic profile in Egyptian patients with type 1 diabetes mellitus. Trends Medical Res 2014;9:81-97. https://doi.org/10.3923/tmr.2014.81.97.
- Picarelli A, Sabbatella L, Di Tola M, Vetrano S, Casale C, Anania MC, et al. Anti-endomysial antibody of IgG1 isotype detection strongly increases the prevalence of coeliac disease in patients affected by type I diabetes mellitus. Clin Exp Immunol 2005;142:111-15. https://doi.org/10.1111/j.1365-2249.2005.02866.x.
- Dagdelen S, Hascelik G, Bayraktar M. Simultaneous triple organ specific autoantibody profiling in adult patients with type 1 diabetes mellitus and their first-degree relatives. Int J Clin Pract 2009;63:449-56. https://doi.org/10.1111/j.1742-1241.2007.01619.x.
- Güvenç S, Kaymakoğlu S, Gürel N, Karşidağ K, Demir K, Dinçer D, et al. The prevalence of manifest and latent celiac disease in type 1 diabetes mellitus. Turk J Gastroenterol 2002;13:103-7.
- Hanukoglu A, Mizrachi A, Dalal I, Admoni O, Rakover Y, Bistritzer Z, et al. Extrapancreatic autoimmune manifestations in type 1 diabetes patients and their first-degree relatives: a multicenter study. Diabetes Care 2003;26:1235-40. https://doi.org/10.2337/diacare.26.4.1235.
- Kurien M, Leeds JS, Hopper AD, Wild G, Egner W, Tesfaye S, et al. Serological testing for coeliac disease in type 1 diabetes mellitus: is immunoglobulin A level measurement necessary?. Diabet Med 2013;30:840-5. https://doi.org/10.1111/dme.12163.
- Shivaprasad C, Kolly A, Pulikkal A, Kumar KMP. High prevalence of organ specific autoantibodies in Indian type 1 diabetic patients. J Pediatr Endocrinol Metab 2017;30:707-12. https://doi.org/10.1515/jpem-2017-0011.
- Zhao Z, Zou J, Zhao L, Cheng Y, Cai H, Li M, et al. Celiac disease autoimmunity in patients with autoimmune diabetes and thyroid disease among Chinese population. PLOS ONE 2016;11. https://doi.org/10.1371/journal.pone.0157510.
- Abu-Zekry M, Kryszak D, Diab M, Catassi C, Fasano A. Prevalence of celiac disease in Egyptian children disputes the east–west agriculture-dependent spread of the disease. J Pediatr Gastroenterol Nutr 2008;47:136-40. https://doi.org/10.1097/MPG.0b013e31815ce5d1.
- Adlercreutz EH, Svensson J, Hansen D, Buschard K, Lernmark Å, Mortensen HB, et al. Prevalence of celiac disease autoimmunity in children with type 1 diabetes: regional variations across the Øresund strait between Denmark and southernmost Sweden. Pediatr Diabetes 2015;16:504-9. https://doi.org/10.1111/pedi.12200.
- Aktay AN, Lee PC, Kumar V, Parton E, Wyatt DT, Werlin SL. The prevalence and clinical characteristics of celiac disease in juvenile diabetes in Wisconsin. J Pediatr Gastroenterol Nutr 2001;33:462-5. https://doi.org/10.1097/00005176-200110000-00008.
- Baptista ML, Koda YKL, Mitsunori R, Nisihara, Ioshii SO. Prevalence of celiac disease in Brazilian children and adolescents with type 1 diabetes mellitus. J Pediatr Gastroenterol Nutr 2005;41:621-4. https://doi.org/10.1097/01.mpg.0000181400.57884.c3.
- Djurić Z, Stamenković H, Stanković T, Milićević R, Branković L, Cirić V, et al. Celiac disease prevalence in children and adolescents with type 1 diabetes from Serbia. Pediatr Int 2010;52:579-83. https://doi.org/10.1111/j.1442-200X.2010.03085.x.
- Frohnert BI, Simmons K, Liu E, Taki I, Klingensmith GJ, McFann K, et al. Poor glycemic control and celiac disease autoimmunity are independently associated with reduced bone mineral density in children with type 1 diabetes. Diabetes 2015;64.
- Gurau G, Dobre M, Nechita A. Anti-tissue transglutaminase antibodies in patients with anti-glutamate dehydrogenase positive type 1 diabetes mellitus. Rev Romana De Medicina De Lab 2012;20:39-46.
- Hansson T, Dahlbom I, Tuvemo T, Frisk G. Silent coeliac disease is over-represented in children with type 1 diabetes and their siblings. Acta Paediatr 2015;104:185-91. https://doi.org/10.1111/apa.12823.
- Krause I, Anaya JM, Fraser A, Barzilai O, Ram M, Abad V, et al. Anti-infectious antibodies and autoimmune-associated autoantibodies in patients with type I diabetes mellitus and their close family members. Ann N Y Acad Sci 2009;1173:633-9. https://doi.org/10.1111/j.1749-6632.2009.04619.x.
- Soyucen E, Yilmaz S, Çeltık C, Vatansever U, Öner N, Karasalıhoğlu S. Seroprevalence of autoimmune thyroiditis and celiac disease in children with insulin-dependent diabetes mellitus in the Thrace region of Turkey. Turk J Gastroenterol 2010;21:231-5. https://doi.org/10.4318/tjg.2010.0093.
- Velasco C, Ortiz C, Ruiz A. HLA typing in healthy and diabetic children with celiac disease in Cali, Colombia. J Pediatr Gastroenterol Nutr 2016;63.
- Not T, Tommasini A, Tonini G, Buratti E, Pocecco M, Tortul C, et al. Undiagnosed coeliac disease and risk of autoimmune disorders in subjects with type I diabetes mellitus. Diabetologia 2001;44:151-5. https://doi.org/10.1007/s001250051593.
- Premawardhana LD, Wijeyaratne CN, Chen S, Wijesuriya M, Illangasekera U, Brooking H, et al. Islet cell, thyroid, adrenal and celiac disease related autoantibodies in patients with type 1 diabetes from Sri Lanka. J Endocrinol Invest 2006;29:968-74. https://doi.org/10.1007/BF03349209.
- Jaeger C, Hatziagelaki E, Petzoldt R, Bretzel RG. Comparative analysis of organ-specific autoantibodies and celiac disease – associated antibodies in type 1 diabetic patients, their first-degree relatives, and healthy control subjects. Diabetes Care 2001;24:27-32. https://doi.org/10.2337/diacare.24.1.27.
- Kanungo A, Shtauvere-Brameus A, Samal KC, Sanjeevi CB. Autoantibodies to tissue transglutaminase in patients from eastern India with malnutrition-modulated diabetes mellitus, insulin-dependent diabetes mellitus, and non-insulin-dependent diabetes mellitus. Ann N Y Acad Sci 2002;958:232-4. https://doi.org/10.1111/j.1749-6632.2002.tb02976.x.
- Sari S, Yeşilkaya E, Eğritaş O, Bideci A, Cinaz P, Dalgiç B. Prevalence of celiac disease in Turkish children with type 1 diabetes mellitus and their non-diabetic first-degree relatives. Turk J Gastroenterol 2010;21:34-8. https://doi.org/10.4318/tjg.2010.0045.
- Lampasona V, Bonfanti R, Bazzigaluppi E, Venerando A, Chiumello G, Bosi E, et al. Antibodies to tissue transglutaminase C in type I diabetes. Diabetologia 1999;42:1195-8. https://doi.org/10.1007/s001250051291.
- Sharifi N, Khoshbaten M, Aliasgarzade A, Bahrami A. Celiac disease in patients with type-1 diabetes mellitus screened by tissue transglutaminase antibodies in northwest of Iran. Int J Diabetes Dev Ctries 2008;28:95-9. https://doi.org/10.4103/0973-3930.44081.
- Sheikholeslami H, Boostani K, Hashemipoor S, Hadjmanoochehri F, Ziaee A. Prevalence of celiac disease in type1 diabetic patients comparing with nondiabetic healthy individuals. J Iran Diabetes Lipid 2005;4:49-55.
- Kizilgul M, Ozcelik O, Beysel S, Akinci H, Kan S, Ucan B, et al. Screening for celiac disease in poorly controlled type 2 diabetes mellitus: worth it or not?. BMC Endocr Disord 2017;17. https://doi.org/10.1186/s12902-017-0212-4.
- Szepietowska B, Wawrusiewicz-Kurylonek N, Krętowski A, Górska M, Szelachowska M. Endocrine autoimmunity in patients with latent autoimmune diabetes in adults (LADA) — association with HLA genotype. Endokrynol Pol 2016;67:197-201. https://doi.org/10.5603/EP.a2016.0017.
- Ravaglia G, Forti P, Maioli F, Volta U, Arnone G, Pantieri G, et al. Increased prevalence of coeliac disease in autoimmune thyroiditis is restricted to aged patients. Exp Gerontol 2003;38:589-95. https://doi.org/10.1016/S0531-5565(03)00037-8.
- Riseh SH, Farhang MA, Mobasseri M, Jafarabadi MA. The relationship between thyroid hormones, antithyroid antibodies, anti-tissue transglutaminase and anti-gliadin antibodies in patients with Hashimoto’s thyroiditis. Acta Endocrinol 2017;13:174-9. https://doi.org/10.4183/aeb.2017.174.
- Miskiewicz P, Gos-Zajac A, Kurylowicz A, Plazinska TM, Franaszczyk M, Bartoszewicz Z, et al. HLA DQ2 haplotype, early onset of Graves’ disease, and positive family history of autoimmune disorders are risk factors for developing celiac disease in patients with Graves’ disease. Endocr Pract 2015;21:993-1000. https://doi.org/10.4158/EP15700.OR.
- Berti I, Trevisiol C, Tommasini A, Città A, Neri E, Geatti O, et al. Usefulness of screening program for celiac disease in autoimmune thyroiditis. Dig Dis Sci 2000;45:403-6. https://doi.org/10.1023/a:1005441400107.
- Ch’ng CL, Biswas M, Benton A, Jones MK, Kingham JG. Prospective screening for coeliac disease in patients with Graves’ hyperthyroidism using anti-gliadin and tissue transglutaminase antibodies. Clin Endocrinol 2005;62:303-6. https://doi.org/10.1111/j.1365-2265.2005.02214.x.
- Guliter S, Yakaryilmaz F, Ozkurt Z, Ersoy R, Ucardag D, Caglayan O, et al. Prevalence of coeliac disease in patients with autoimmune thyroiditis in a Turkish population. World J Gastroenterol 2007;13:1599-601. https://doi.org/10.3748/wjg.v13.i10.1599.
- Volta U, Ravaglia G, Granito A, Forti P, Maioli F, Petrolini N, et al. Coeliac disease in patients with autoimmune thyroiditis. Digestion 2001;64:61-5. https://doi.org/10.1159/000048840.
- Metzger MH, Heier M, Mäki M, Bravi E, Schneider A, Löwel H, et al. Mortality excess in individuals with elevated IgA anti-transglutaminase antibodies: the KORA/MONICA Augsburg cohort study 1989–1998. Eur J Epidemiol 2006;21:359-65. https://doi.org/10.1007/s10654-006-9002-4.
- Marwaha RK, Garg MK, Tandon N, Kanwar R, Narang A, Sastry A, et al. Glutamic acid decarboxylase (anti-GAD) & tissue transglutaminase (anti-TTG) antibodies in patients with thyroid autoimmunity. Indian J Med Res 2013;137:82-6.
- Sahin Y, Evliyaoglu O, Erkan T, Cokugras FC, Ercan O, Kutlu T. The frequency of celiac disease in children with autoimmune thyroiditis. Acta Gastroenterol Belg 2018;81.
- Sari S, Yesilkaya E, Egritas O, Bideci A, Dalgic B. Prevalence of celiac disease in Turkish children with autoimmune thyroiditis. Dig Dis Sci 2009;54:830-2. https://doi.org/10.1007/s10620-008-0437-1.
- van der Pals M, Ivarsson A, Norström F, Högberg L, Svensson J, Carlsson A. Prevalence of thyroid autoimmunity in children with celiac disease compared to healthy 12-year olds. Autoimmune Dis 2014;2014. https://doi.org/10.1155/2014/417356.
- Risan FA. Association between autoimmune thyroiditis with gluten sensitive enteropathy patients in Baghdad. J Pharm Sci Res 2018;10:3307-9.
- de Melo FM, Cavalcanti MSM, dos Santos Severino B, Lopes AKBF, de Oliveira FAA. Association between serum markers for celiac and thyroid autoimmune diseases. Arq Bras Endocrinol Metabol 2005;49:542-7. https://doi.org/10.1590/S0004-27302005000400012.
- National Institute for Health and Care Excellence . Fertility Problems: Assessment and Treatment n.d. www.nice.org.uk/guidance/CG156 (accessed 27 June 2022).
Appendix 1 Search strategies for diagnostic indicator review
Embase
-
Celiac Disease/ (29,729)
-
c?eliac.ti,kw. (22,813)
-
c?eliac.af. and gastroenterology.ec. (22,352)
-
(celiac or coeliac).ab. /freq=3 (9328)
-
or/1-4 (39,462)
-
((detect* or diagnos* or identif* or decision* or predict* or prognos* or risk or risks or stratif* or validat*) adj3 (model* or factor* or algorithm? or scor* or system or technique? or aid? or rule or rules or index or variable* or tool? or panel or criteri* or characteristic? or history or finding* or value* or assay or stratif* or biomarker?)).ti,ab,kw. (2,855,495)
-
((detect* or diagnos* or identif* or decision* or predict* or prognos* or stratif* or validat*) adj3 (risk or risks or model* or factor* or algorithm? or scor* or system or technique? or aid? or rule or rules or index or variable* or tool? or panel or criteri* or characteristic? or history or finding* or value* or assay or stratif* or biomarker?)).ti,ab,kw. (2,225,766)
-
(clinic* adj3 (model* or algorithm? or scor* or risk or risks or rule or rules or predict* or index or tool? or panel or criteri* or decision* or stratif* or diagnos* or detect* or identif* or probabilit*)).ti,ab,kw. (632,961)
-
((multivaria* or multicomponent?) adj3 (model* or algorithm? or scor* or rule or rules or index or tool? or panel or criteri*)).ti,ab,kw. (110,662)
-
clinical decision making/ or statistical model/ or algorithm/ (444,594)
-
or/6-10 (3,678,637)
-
5 and 11 (6036)
-
*physical disease by body function/ or exp *abnormal blood pressure/ or exp *abnormal posture/ or *aerophagia/ or exp *appetite disorder/ or *asthenia/ or *asymptomatic disease/ or exp *autonomic dysfunction/ or exp *balance disorder/ or exp *blood clotting disorder/ or exp *body temperature disorder/ or exp *body weight disorder/ or exp *common cold symptom/ or exp *consciousness disorder/ or exp *constipation/ or exp *coughing/ or exp *cyanosis/ or exp *diarrhea/ or exp *disability/ or exp *“disorders of higher cerebral function”/ or exp *dysphagia/ or *eructation/ or exp *faintness/ or exp *fatigue/ or *functional disease/ or exp *growth disorder/ or exp *immunopathology/ or exp *incontinence/ or exp *infertility/ or *listlessness/ or *malaise/ or *meningism/ or exp *metabolic disorder/ or exp *micturition disorder/ or exp *motor dysfunction/ or exp *multiple organ failure/ or exp *“nausea and vomiting”/ or exp *nutritional disorder/ or exp *pain/ or *pallor/ or exp *pregnancy disorder/ or *qi deficiency/ or *qi stagnation/ or exp *reflex disorder/ or exp *respiratory function disorder/ or exp *salivation disorder/ or exp *sensory dysfunction/ or exp *sexual dysfunction/ or exp *shock/ or exp *sleep disorder/ or exp *speech disorder/ or *weakness/ or *yang deficiency/ or *yin deficiency/ (4,991,033)
-
*physical disease by anatomical structure/ or exp *abdominal disease/ or exp *abnormal body build/ or exp *breast disease/ or exp *cardiovascular disease/ or exp *connective tissue disease/ or exp *digestive system disease/ or exp *ear nose throat disease/ or exp *endocrine disease/ or exp *eye disease/ or exp *“head and neck disease”/ or exp *hematologic disease/ or exp *mouth disease/ or exp *mucosal disease/ or exp *musculoskeletal disease/ or exp *neurologic disease/ or exp *pelvic disease/ or exp *respiratory tract disease/ or exp *skin disease/ or exp *soft tissue disease/ or exp *thorax disease/ or exp *urogenital tract disease/ (11,959,905)
-
*“physical disease by composition of body fluids, excreta and secretions”/ or exp *abnormal feces composition/ or exp *abnormal substrate concentration in blood/ or exp *abnormal urine composition/ or *dehydration/ or *hypervolemia/ (344,197)
-
((addison* adj3 (disease* or disorder* or syndrom*)) or alopecia or baldness or amenorrhea* or amenorrhoea* or oligomenorrhea* or oligomenorrhoea* or anxiety disorder* or anorexia or adrenal insufficienc* or adrenocortical insufficienc* or allerg* or anemi* or anaemi* or angina or aneurysm or ankylosing spondylitis or arthropath* or arthriti* or arthrosis or arthroses or asthma* or asthenia or ataxia or atrial fibrillation or atrophy or autoimmune disorder* or (autoimmune adj (disease* or disorder* or syndrom*)) or ataxia or avitaminosis or bonnevie ullrich or back pain or (biliary adj3 (disease* or disorder* or syndrom*)) or (bipolar adj3 disorder*) or blindness or blind loop syndrom* or (blood adj3 poisoning) or brain atroph* or ((bone or bones) adj3 (broken or disease* or disorder* or syndrom*)) or (bone* adj3 (mineral* or densit* or soft* or decay*)) or (brain adj3 (disease* or disorder* or syndrom*)) or (bronchi* adj3 (disease* or disorder* or syndrom*)) or (bowel* adj3 (disease* or disorder* or syndrom*)) or calcinosis or cancer* or carcinoma* or adenocarcinoma* or neoplasm* or neoplastic or metasta* or malignan* or tumour or tumours or tumor or tumors or (cardiac adj3 (arrest or arrhythmia* or disease* or disorder* or surg* or syndrom*)) or cardiomyopath* or ((cardiovascular or coronary) adj3 (disease* or disorder* or event* or syndrom*)) or cachexia or ((cecal or colon* or duoden*) adj3 (disease* or disorder* or syndrom*)) or cerebral palsy or (cerebro* adj3 (degenerat* or disease* or disorder* or event* or syndrom*)) or chronic obstructive disease* or cirrhosis or claudication or colic or copd or ((coordination or co-ordination) adj3 (impair* or lack)) or congenital abnormalit* or (congential adj3 (disease* or disorder* or syndrom*)) or ((connective or collagen* or skin) adj3 (disease* or disorder* or syndrom*)) or collagenous sprue or colitis or colotides or coxarthrosis or crohn* or cushing* or cyanosis or cystic fibrosis or cystitis or deaf* or deformit* or delayed puberty or dental or depressive disorder* or dysphoria or dysthymia or disabled or (physical adj3 (deform* or disab* or impair*)) or dermatitis or dermato* or dorsopath* or diabet* or down* syndrom* or duhring* or duehring* or duhrig* or duehrig* or dyscoordination or dys-coordination or dys-coordination or dys-co-ordination or dysentery or dyssynergia or dys-synergia or emaciat* or enteritis or enterocolitis* or enteropathy or dystonia or eczema or edema or oedema or elfin face sydrom* or encephalopath* or (endocrine adj3 (disease* or disorder* or syndrom*)) or enuresis or enteropath* or epilep* or (eye adj3 (disease* or disorder* or manifestation* or syndrom*)) or fatigue syndrome or chronic fatigue or failure to thrive or fibromyalgia or fibrosis or food hypersensitivity or fractures or gammaglobulinemia or gammaglobulinaemia or (gardner* adj3 (syndrom* or disease* or disorder*)) or gastritis or gastroenteritis or gout or (glomerul* adj3 (disease* or disorder* or syndrom*)) or (gonodal adj3 dysgen*) or (growth adj3 (disease* or disorder* or syndrom*)) or headache* or ((hemic or haemic or lymph*) adj3 (disease* or disorder* or syndrom*)) or hematuria or haematuria or hemophili* or haemophili* or ((hearing or visual or vision or sight) adj3 (aid* or impair* or loss)) or (heart adj3 (disease* or disorder* or syndrom* or manifestation* or myopath*)) or hemiplegi* or hepatitis or hemodialysis or haemodialysis or (heart adj3 (disease* or disorder* or failure or syndrom*)) or hiv or human immunodeficiency virus or acquired immunodeficieny syndrom* or heerfordt waldenstrom* or hidroa or hydroa or hippel lindau* or hypertensi* or hypotensi* or hyperthyroidism or hypothyroidism or hypocortisolism or hypocorticism or hypoadrenalism or hyperthyroidism or hypothyroidism or incoordination or inco-ordination or in-coordination or in-co-ordination or infertility or subfertility or sub-fertility or sterility or inflammatory disease* or inflammatory bowel disease* or incontinen* or intestinal atresi* or intussusception or irritable bowel or ischemi* or ischaemi* or fistula* or (joint adj3 (disease* or disorder* or syndrom*)) or (jejunal adj3 (disease* or disorder* or syndrom*)) or kyphosis or lav-htlv* or leukemia or leukaemia or ((liver or hepatic) adj3 (disease* or disorder* or failure or syndrom*)) or lordosis or (lung adj3 (disease* or disorder*)) or lupus or lymphoma or lymphogranuloma* or lymphadenopath* or lymphotrop* or machado joseph* or macular degeneration or malnutrition or (mental adj2 (disorder* or disease* or health or illness*)) or mania or manic or (menstr* adj3 (ceas* or disturb* or disease* or disorder* or stop* or syndrom*)) or migraine* or (mitochondrial adj3 (disease* or disorder* or syndrom*)) or movement disorder* or mucinosis or musculoskeletal or narp syndrom* or necrotizing or nephrotic* or neuromuscular or non-hodgkin* or nonhodgkin* or multiple sclerosis or myeloma or myocarditis or myocardiopath* or myopath* or (myocardi* adj3 (deteri* or disease* or disorder* or syndrom* or manifestation*)) or nephrotic syndrome* or ((neurodegenerat* or neuro-degenerat) adj3 (disease* or disorder* or syndrom*)) or ((nutritional or metabolic) adj3 (disease* or disorder* or syndrom*)) or ((organ* or kidney or stem cell) adj3 (transplant* or recipient*)) or (nervous system adj3 (disease* or disorder* or syndrom*)) or (neurological adj3 (condition* or disease* or disorder* or syndrom*)) or neuropath* or neurosarcoido* or occlusion* or obesity or obese or orthopedic* or orthopaedic* or ((esophageal or oesophageal) adj3 (disease* or disorder* or syndrom*)) or ((oral or mouth) adj3 (disease* or disorder* or syndrom* or manifestation*)) or osteo* or otitis media or otorhinolaryngolog* or otosclerosis or (pancrea* adj3 (disease* or disorder* or syndrom*)) or papulosquamous or paraplegi* or parkinson* or (peripheral adj3 (arterial or vascular or disease* or disorder* or syndrom*)) or (peritoneal adj3 (disease* or disorder* or syndrom*)) or photodermato* or pick disease* or pneumo* or polio* or polyp* or polydipsia or polyarthropath* or polyarteritis or polyarthrosis or polyneuropath* or porphyrias or (pregnancy adj3 complicat*) or premature aging or proteostasis or pseudophakia or psoriasis or parapsoriasis or prolapse or (pulmonary adj3 (disease* or disorder* or syndrom*)) or purpur* or (recurren* adj3 (abortion* or miscarr*)) or (rect* adj3 (disease* or disorder* or syndrom*)) or ((renal or kidney) adj3 (disease* or disorder* or failure or syndrom*)) or (respiratory adj3 (disease* or disorder* or syndrom*)) or reticulocytosis or retinopathy or rheumat* or ricket* or sarcoido* or sepsis or septic* or seizure* or sclerosis or scoliosis or sickle cell or ((sjogren* or sjoegren* or sicca*) adj3 (syndrom* or disease* or disorder*)) or ((skin or connective tissue) adj3 (disease* or disorder* or syndrom*)) or sleep disorder* or sleep apnea or sleep apnoea or insomnia* or dyssomnia* or hypersomnia* or spina bifida or muscular atropy or short stature* or short bowel syndrom* or (spin* adj3 (degenerat* or disease* or disorder* or syndrom*)) or (spleen* adj3 (disease* or disorder* or syndrom*)) or spondylo* or stenosis* or stoma* or (stomach adj3 (disease* or disorder* or syndrom*)) or stroke or strokes or cerebral infarct* or tetraplegi* or thyroiditis* or (thyroid* adj3 (disease* or disorder* or dysfunction* or syndrom*)) or ((tooth or teeth or enamel) adj3 (decay* or discolo* or disease* or disorder* or dysfunction* or syndrom*)) or tropical sprue or tuberculosis or (systemic adj3 (disorder* or disease* or syndrom*)) or thrombocyto* or tremor or tremors or (turner* adj3 (syndrom* or disease* or disorder*)) or ulcer* or (urogenital adj3 (disease* or disorder* or syndrom*)) or vasculopath* or (vascular adj3 (disease* or disorder* or occlu* or syndrom*)) or vestibular or ((virus or viral or bacteri* or parasit*) adj3 (infection* or disease*)) or (wasting adj3 (disorder* or disease* or syndrom*)) or (whipple adj3 (disorder* or disease* or syndrom*)) or (william* adj3 (syndrom* or disease* or disorder*)) or zoster*).ti,ab,kw. (14,232,139)
-
((digestive system* or duoden* or gastr* or intestin* or nutrition* or malabsor* or metabolic*) adj3 (disease* or disorder* or syndrom* or manifestation*)).ti,ab,kw. (254,303)
-
(constipation or constipated or diarrhoea or diarrhea or (abdominal adj3 (disten* or pain or bloating or cramp or cramps)) or flatulence or meteorism or steatorrhoea or steatorrhea or ((acid base or calcium or cyanocobalamin* or electrolyte* or folate or folic acid or glucose or IgA or immunoglobulin A or iron or lactose or lipid* or phosph* or protein* or triglyceride* or vitamin* or mineral*) adj3 (disorder* or deficien* or imbalance* or insufficiency or intoleran*)) or fever* or febrile or malaise or fatigue or letharg* or exhaustion or vomiting or nausea or emesis or sickness or weight loss or wait gain or hot flashes or hot flushes or medically unexplained or unexplained symptoms or unexplained medical or (signs adj2 symptoms) or sleepiness or ((calciferol or cholecalciferol or colecalciferol or egocalciferol) adj3 (disorder* or deficien* or imbalance* or insufficiency or intoleran*)) or conditions linked or linked conditions).ti,ab,kw. (1,126,673)
-
(medical* morbid* or (medical* adj3 comorbid*) or (medical* adj3 co-morbid*) or multimorbid* or multi* morbid* or multi* comorbid* or multi* co-morbid* or multi* physical*).ti,ab,kw. (30,923)
-
first-degree relative/ (6249)
-
((first adj5 (relative* or relation?)) and c?eliac).ti,ab,kw. (452)
-
or/13-21 (18,446,309)
-
(((case? adj2 find*) or detect* or diagnos* or predict* or incidence or prevalence or seroprevalence* or risk or risk factor? or risk indicator? or screen* or test*) adj3 c?eliac*).ti,ab,kw. (7675)
-
(c?eliac and ((detect* or diagnos* or predict* or incidence or prevalence or seroprevalence* or risk or risk factor? or screen* or test*) adj2 CD)).ab. (3440)
-
(((association? or associated or indicator? or indicated or predict*) adj3 (risk? or symptom* or disease? or disorder? or histor*)) and c?eliac).ti,ab,kw. (4503)
-
((association between or relationship between) and c?eliac?).ti,ab,kw. (2279)
-
*celiac disease/di [Diagnosis] (5931)
-
celiac disease/ and (*diagnosis/ or *differential diagnosis/ or *seroprevalence/ or *screening/ or *screening test/ or *incidence/ or *prevalence/) (1064)
-
celiac disease/ and (“prediction and forecasting”/ or prediction/ or predictive validity/ or predictive value/) (755)
-
or/23-29 (16,111)
-
5 and 22 and 30 (15,090)
-
(((double* or dual*) adj5 diagnos* adj5 c?eliac?) or (comorbid* adj5 c?eliac)).ti,ab,kw. (85)
-
(high risk adj5 c?eliac?).ti,ab,kw. (103)
-
(famil* histor* adj2 c?eliac).ti,ab,kw. (93)
-
(children adj of* adj5 c?eliac).ti,ab,kw. (30)
-
celiac disease test kit/ (11)
-
or/32-36 (315)
-
12 or 31 or 37 (17,603)
-
limit 38 to embase status (11,243)
-
((celiac* or coeliac*) adj2 (asymptomatic or atypical or adolesc* or adult* or cases or cohort* or child* or disease* or family or families or familial or genetic predispos* or genetic pre-dispos* or heredit* or infant* or men or patient* or people or population* or subjects or symptomatic or syndrom* or sprue or women)).ti,ab,kw. (26,735)
-
limit 40 to (article-in-press status or in-process status) (372)
-
c?eliac.ti. (20,558)
-
limit 38 to conference abstract status (4569)
-
42 and 43 (2794)
-
39 or 41 or 44 (14,409)
-
((celiac* or coeliac*) adj (angiograp* or arter* or axis or plexus or trunk)).ti,ab,kw,hw. (12,186)
-
case report.ti. (283,693)
-
((case adj of*) and (patient or man or woman)).ti,ab. and case report.sh. (347,041)
-
(editorial or letter).pt. (1,747,770)
-
(exp experimental organism/ or animal tissue/ or animal cell/ or exp animal disease/ or exp carnivore disease/ or exp bird/ or exp experimental animal welfare/ or exp animal husbandry/ or animal behavior/ or exp animal cell culture/ or exp marine species/ or nonhuman/ or animal.hw.) not human/ (6,072,159)
-
((rat or rats or mouse or mice or rodent* or animal* or murine or porcine or feline or canine or dog or dogs or cat or cats or pig or pigs or monkey* or macaque*) not human*).ti. (1,957,387)
-
or/46-51 (8,620,748)
-
45 not 52 (12,083)
-
case control study/ or hospital based case control study/ or population based case control study/ or exp longitudinal study/ or prospective study/ or retrospective study/ (1,667,885)
-
case finding/ or cohort analysis/ or control group/ or correlational study/ or cross-sectional study/ (1,006,525)
-
seroepidemiology/ (3934)
-
(cohort or case control* or case finding or cross-sectional or longitudinal).ti,ab,kw. (1,661,606)
-
study.ti. (1,569,542)
-
(study and (analys* or cases or clinical or control* or compar* or correlat* or associat* or epidemiolog* or evaluat* or examin* or investigat* or observ* or population based or prospectiv* or retrospectiv* or serolog*)).ti,ab,kw. (8,983,424)
-
(case? and control*).ab. (657,067)
-
(controls or (control adj (group? or participants or patients))).ab. (1,656,326)
-
(groups or subgroup? or sub-group?).ab. (3,028,674)
-
(group? adj5 (analys* or compar* or control* or correlat* or associat*)).ab. (1,489,755)
-
exp regression analysis/ (434,324)
-
statistical model/ (158,724)
-
((analys* or logistic*) adj1 (model* or regression*)).ab. (661,228)
-
study.ab. /freq=2 (3,165,201)
-
or/54-67 (12,212,707)
-
53 and 68 (7566)
-
limit 69 to yr=“1997 –Current” (7032)
Ovid® (Wolters Kluwer, Alphen aan den Rijn, the Netherlands) MEDLINE and Epub Ahead of Print, In-Process & Other Non-Indexed Citations and Daily
Date range searched: 1946 to 5 February 2020.
-
Celiac Disease/ (19,693)
-
c?eliac.ti,ab,kf. (27,278)
-
or/1-2 (32,722)
-
((detect* or diagnos* or identif* or decision* or predict* or prognos* or risk or risks or stratif* or validat*) adj3 (model* or factor* or algorithm? or scor* or system or technique? or aid? or rule or rules or index or variable* or tool? or panel or criteri* or characteristic? or history or finding* or value* or assay or stratif* or biomarker?)).ti,ab,kf. (1,978,188)
-
((detect* or diagnos* or identif* or decision* or predict* or prognos* or stratif* or validat*) adj3 (risk or risks or model* or factor* or algorithm? or scor* or system or technique? or aid? or rule or rules or index or variable* or tool? or panel or criteri* or characteristic? or history or finding* or value* or assay or stratif* or biomarker?)).ti,ab,kf. (154,7617)
-
(clinic* adj3 (model* or algorithm? or scor* or risk or risks or rule or rules or predict* or index or tool? or panel or criteri* or decision* or stratif* or diagnos* or detect* or identif* or probabilit*)).ti,ab,kf. (420,165)
-
((multivaria* or multicomponent?) adj3 (model* or algorithm? or scor* or rule or rules or index or tool? or panel or criteri*)).ti,ab,kf. (69,716)
-
(clinical decision making or (decision and logistic models)).sh. (7874)
-
or/4-8 (2,337,727)
-
3 and 9 (3401)
-
Risk Factors/or Disease Predisposition/or Genetic Predisposition to Disease/(907,433)
-
exp “bacterial infections and mycoses”/or exp virus diseases/or exp parasitic diseases/or exp neoplasms/or exp musculoskeletal diseases/or exp stomatognathic diseases/or exp respiratory tract diseases/or exp otorhinolaryngologic diseases/or exp nervous system diseases/or exp eye diseases/or exp male urogenital diseases/or exp “female urogenital diseases and pregnancy complications”/or exp cardiovascular diseases/or exp “hemic and lymphatic diseases”/or exp “congenital, hereditary, and neonatal diseases and abnormalities”/or exp “skin and connective tissue diseases”/or exp endocrine system diseases/or exp immune system diseases/or exp “disorders of environmental origin”/or disease/or digestive system diseases/or exp biliary tract diseases/or exp digestive system abnormalities/or exp digestive system fistula/or exp digestive system neoplasms/or exp liver diseases/or exp pancreatic diseases/or exp peritoneal diseases/or gastrointestinal diseases/or exp esophageal diseases/or exp gastroenteritis/or exp gastrointestinal hemorrhage/or exp gastrointestinal neoplasms/or intestinal diseases/or exp cecal diseases/or exp colonic diseases/or exp duodenal diseases/or exp dysentery/or exp enteritis/or exp enterocolitis/or exp hiv enteropathy/or exp ileal diseases/or exp inflammatory bowel diseases/or exp intestinal atresia/or exp intestinal diseases, parasitic/or exp intestinal fistula/or exp intestinal neoplasms/or exp intestinal obstruction/or exp intestinal perforation/or exp intestinal polyposis/or exp jejunal diseases/or malabsorption syndromes/or blind loop syndrome/or collagenous sprue/or lactose intolerance/or short bowel syndrome/or sprue, tropical/or steatorrhea/or whipple disease/or mesenteric ischemia/or mesenteric vascular occlusion/or pneumatosis cystoides intestinalis/or protein-losing enteropathies/or exp rectal diseases/or zollinger-ellison syndrome/or exp stomach diseases/or exp tuberculosis, gastrointestinal/or exp visceral prolapse/or exp liver diseases/or exp pancreatic diseases/or exp peritoneal diseases/or “nutritional and metabolic diseases”/or metabolic diseases/or exp acid-base imbalance/or exp bone diseases, metabolic/or exp brain diseases, metabolic/or exp calcium metabolism disorders/or exp dna repair-deficiency disorders/or exp glucose metabolism disorders/or exp hyperlactatemia/or exp iron metabolism disorders/or exp lipid metabolism disorders/or malabsorption syndromes/or exp blind loop syndrome/or exp collagenous sprue/or exp hyperhomocysteinemia/or exp lactose intolerance/or exp sprue, tropical/or exp steatorrhea/or exp whipple disease/or exp metabolic syndrome/or exp metabolism, inborn errors/or exp mitochondrial diseases/or exp phosphorus metabolism disorders/or exp porphyrias/or exp proteostasis deficiencies/or exp skin diseases, metabolic/or exp wasting syndrome/or exp water-electrolyte imbalance/or exp nutrition disorders/or “SIGNS and SYMPTOMS”/or exp aging, premature/or exp asthenia/or exp body temperature changes/or exp body weight/or exp cardiac output, high/or exp cardiac output, low/or exp chills/or exp cyanosis/or exp edema/or exp eye manifestations/or exp failure to thrive/or exp fatigue/or exp feminization/or exp fetal distress/or exp heart murmurs/or exp hot flashes/or exp hypergammaglobulinemia/or exp hyperlactatemia/or exp hypertriglyceridemic waist/or exp intermittent claudication/or exp medically unexplained symptoms/or exp mobility limitation/or exp motion sickness/or exp myocardial stunning/or exp neurologic manifestations/or exp oral manifestations/or exp polydipsia/or exp prodromal symptoms/or exp pseudophakia/or exp renal colic/or exp reticulocytosis/or exp “signs and symptoms, digestive”/or exp “signs and symptoms, respiratory”/or exp skin manifestations/or exp sleepiness/or exp travel-related illness/or exp urological manifestations/or exp virilism/ (13,521,118)
-
exp “anatomy (non mesh)”/ab, pa [abnormalities, pathology] (1,686,610)
-
((addison* adj3 (disease* or disorder* or syndrom*)) or alopecia or baldness or amenorrhea* or amenorrhoea* or oligomenorrhea* or oligomenorrhoea* or anxiety disorder* or anorexia or adrenal insufficienc* or adrenocortical insufficienc* or allerg* or anemi* or anaemi* or angina or aneurysm or ankylosing spondylitis or arthropath* or arthriti* or arthrosis or arthroses or asthma* or asthenia or ataxia or atrial fibrillation or atrophy or autoimmune disorder* or (autoimmune adj (disease* or disorder* or syndrom*)) or ataxia or avitaminosis or bonnevie ullrich or back pain or (biliary adj3 (disease* or disorder* or syndrom*)) or (bipolar adj3 disorder*) or blindness or blind loop syndrom* or (blood adj3 poisoning) or brain atroph* or ((bone or bones) adj3 (broken or disease* or disorder* or syndrom*)) or (bone* adj3 (mineral* or densit* or soft* or decay*)) or (brain adj3 (disease* or disorder* or syndrom*)) or (bronchi* adj3 (disease* or disorder* or syndrom*)) or (bowel* adj3 (disease* or disorder* or syndrom*)) or calcinosis or cancer* or carcinoma* or adenocarcinoma* or neoplasm* or neoplastic or metasta* or malignan* or tumour or tumours or tumor or tumors or (cardiac adj3 (arrest or arrhythmia* or disease* or disorder* or surg* or syndrom*)) or cardiomyopath* or ((cardiovascular or coronary) adj3 (disease* or disorder* or event* or syndrom*)) or cachexia or ((cecal or colon* or duoden*) adj3 (disease* or disorder* or syndrom*)) or cerebral palsy or (cerebro* adj3 (degenerat* or disease* or disorder* or event* or syndrom*)) or chronic obstructive disease* or cirrhosis or claudication or colic or copd or ((coordination or co-ordination) adj3 (impair* or lack)) or congenital abnormalit* or (congential adj3 (disease* or disorder* or syndrom*)) or ((connective or collagen* or skin) adj3 (disease* or disorder* or syndrom*)) or collagenous sprue or colitis or colotides or coxarthrosis or crohn* or cushing* or cyanosis or cystic fibrosis or cystitis or deaf* or deformit* or delayed puberty or dental or depressive disorder* or dysphoria or dysthymia or disabled or (physical adj3 (deform* or disab* or impair*)) or dermatitis or dermato* or dorsopath* or diabet* or down* syndrom* or duhring* or duehring* or duhrig* or duehrig* or dyscoordination or dys-coordination or dys-coordination or dys-co-ordination or dysentery or dyssynergia or dys-synergia or emaciat* or enteritis or enterocolitis* or enteropathy or dystonia or eczema or edema or oedema or elfin face sydrom* or encephalopath* or (endocrine adj3 (disease* or disorder* or syndrom*)) or enuresis or enteropath* or epilep* or (eye adj3 (disease* or disorder* or manifestation* or syndrom*)) or fatigue syndrome or chronic fatigue or failure to thrive or fibromyalgia or fibrosis or food hypersensitivity or fractures or gammaglobulinemia or gammaglobulinaemia or (gardner* adj3 (syndrom* or disease* or disorder*)) or gastritis or gastroenteritis or gout or (glomerul* adj3 (disease* or disorder* or syndrom*)) or (gonodal adj3 dysgen*) or (growth adj3 (disease* or disorder* or syndrom*)) or headache* or ((hemic or haemic or lymph*) adj3 (disease* or disorder* or syndrom*)) or hematuria or haematuria or hemophili* or haemophili* or ((hearing or visual or vision or sight) adj3 (aid* or impair* or loss)) or (heart adj3 (disease* or disorder* or syndrom* or manifestation* or myopath*)) or hemiplegi* or hepatitis or hemodialysis or haemodialysis or (heart adj3 (disease* or disorder* or failure or syndrom*)) or hiv or human immunodeficiency virus or acquired immunodeficieny syndrom* or heerfordt waldenstrom* or hidroa or hydroa or hippel lindau* or hypertensi* or hypotensi* or hyperthyroidism or hypothyroidism or hypocortisolism or hypocorticism or hypoadrenalism or hyperthyroidism or hypothyroidism or incoordination or inco-ordination or in-coordination or in-co-ordination or infertility or subfertility or sub-fertility or sterility or inflammatory disease* or inflammatory bowel disease* or incontinen* or intestinal atresi* or intussusception or irritable bowel or ischemi* or ischaemi* or fistula* or (joint adj3 (disease* or disorder* or syndrom*)) or (jejunal adj3 (disease* or disorder* or syndrom*)) or kyphosis or lav-htlv* or leukemia or leukaemia or ((liver or hepatic) adj3 (disease* or disorder* or failure or syndrom*)) or lordosis or (lung adj3 (disease* or disorder*)) or lupus or lymphoma or lymphogranuloma* or lymphadenopath* or lymphotrop* or machado joseph* or macular degeneration or malnutrition or (mental adj2 (disorder* or disease* or health or illness*)) or mania or manic or (menstr* adj3 (ceas* or disturb* or disease* or disorder* or stop* or syndrom*)) or migraine* or (mitochondrial adj3 (disease* or disorder* or syndrom*)) or movement disorder* or mucinosis or musculoskeletal or narp syndrom* or necrotizing or nephrotic* or neuromuscular or non-hodgkin* or nonhodgkin* or multiple sclerosis or myeloma or myocarditis or myocardiopath* or myopath* or (myocardi* adj3 (deteri* or disease* or disorder* or syndrom* or manifestation*)) or nephrotic syndrome* or ((neurodegenerat* or neuro-degenerat) adj3 (disease* or disorder* or syndrom*)) or ((nutritional or metabolic) adj3 (disease* or disorder* or syndrom*)) or ((organ* or kidney or stem cell) adj3 (transplant* or recipient*)) or (nervous system adj3 (disease* or disorder* or syndrom*)) or (neurological adj3 (condition* or disease* or disorder* or syndrom*)) or neuropath* or neurosarcoido* or occlusion* or obesity or obese or orthopedic* or orthopaedic* or ((esophageal or oesophageal) adj3 (disease* or disorder* or syndrom*)) or ((oral or mouth) adj3 (disease* or disorder* or syndrom* or manifestation*)) or osteo* or otitis media or otorhinolaryngolog* or otosclerosis or (pancrea* adj3 (disease* or disorder* or syndrom*)) or papulosquamous or paraplegi* or parkinson* or (peripheral adj3 (arterial or vascular or disease* or disorder* or syndrom*)) or (peritoneal adj3 (disease* or disorder* or syndrom*)) or photodermato* or pick disease* or pneumo* or polio* or polyp* or polydipsia or polyarthropath* or polyarteritis or polyarthrosis or polyneuropath* or porphyrias or (pregnancy adj3 complicat*) or premature aging or proteostasis or pseudophakia or psoriasis or parapsoriasis or prolapse or (pulmonary adj3 (disease* or disorder* or syndrom*)) or purpur* or (recurren* adj3 (abortion* or miscarr*)) or (rect* adj3 (disease* or disorder* or syndrom*)) or ((renal or kidney) adj3 (disease* or disorder* or failure or syndrom*)) or (respiratory adj3 (disease* or disorder* or syndrom*)) or reticulocytosis or retinopathy or rheumat* or ricket* or sarcoido* or sepsis or septic* or seizure* or sclerosis or scoliosis or sickle cell or ((sjogren* or sjoegren* or sicca*) adj3 (syndrom* or disease* or disorder*)) or ((skin or connective tissue) adj3 (disease* or disorder* or syndrom*)) or sleep disorder* or sleep apnea or sleep apnoea or insomnia* or dyssomnia* or hypersomnia* or spina bifida or muscular atropy or short stature* or short bowel syndrom* or (spin* adj3 (degenerat* or disease* or disorder* or syndrom*)) or (spleen* adj3 (disease* or disorder* or syndrom*)) or spondylo* or stenosis* or stoma* or (stomach adj3 (disease* or disorder* or syndrom*)) or stroke or strokes or cerebral infarct* or tetraplegi* or thyroiditis* or (thyroid* adj3 (disease* or disorder* or dysfunction* or syndrom*)) or ((tooth or teeth or enamel) adj3 (decay* or discolo* or disease* or disorder* or dysfunction* or syndrom*)) or tropical sprue or tuberculosis or (systemic adj3 (disorder* or disease* or syndrom*)) or thrombocyto* or tremor or tremors or (turner* adj3 (syndrom* or disease* or disorder*)) or ulcer* or (urogenital adj3 (disease* or disorder* or syndrom*)) or vasculopath* or (vascular adj3 (disease* or disorder* or occlu* or syndrom*)) or vestibular or ((virus or viral or bacteri* or parasit*) adj3 (infection* or disease*)) or (wasting adj3 (disorder* or disease* or syndrom*)) or (whipple adj3 (disorder* or disease* or syndrom*)) or (william* adj3 (syndrom* or disease* or disorder*)) or zoster*).ti,ab,kf. (11,316,008)
-
((digestive system* or duoden* or gastr* or intestin* or nutrition* or malabsor* or metabolic*) adj3 (disease* or disorder* or syndrom* or manifestation*)).ti,ab,kf. (180,683)
-
(constipation or constipated or diarrhoea or diarrhea or (abdominal adj3 (disten* or pain or bloating or cramp or cramps)) or flatulence or meteorism or steatorrhoea or steatorrhea or ((acid base or calcium or cyanocobalamin* or electrolyte* or folate or folic acid or glucose or IgA or immunoglobulin A or iron or lactose or lipid* or phosph* or protein* or triglyceride* or vitamin* or mineral*) adj3 (disorder* or deficien* or imbalance* or insufficiency or intoleran*)) or fever* or febrile or malaise or fatigue or letharg* or exhaustion or vomiting or nausea or emesis or sickness or weight loss or wait gain or hot flashes or hot flushes or medically unexplained or unexplained symptoms or unexplained medical or (signs adj2 symptoms) or sleepiness or ((calciferol or cholecalciferol or colecalciferol or egocalciferol) adj3 (disorder* or deficien* or imbalance* or insufficiency or intoleran*)) or conditions linked or linked conditions).ti,ab,kf. (805,001)
-
(medical* morbid* or (medical* adj3 comorbid*) or (medical* adj3 co-morbid*) or multimorbid* or multi* morbid* or multi* comorbid* or multi* co-morbid* or multi* physical*).ti,ab,kf. (18,919)
-
(first-degree relative or family or family relation or family history or mother or father or parent or daughter or son).sh. or (brother or sister or sibling).hw. (83,159)
-
(first adj5 (relative* or relation?)).ti,ab,kf. (21,485)
-
(children adj of*).ti,ab,kf. (32,315)
-
or/11-20 (16,944,516)
-
(((case? adj2 find*) or detect* or diagnos* or predict* or incidence or prevalence or seroprevalence* or risk or risk factor? or risk indicator? or screen* or test*) adj3 c?eliac*).ti,ab,kf. (4839)
-
(c?eliac and ((detect* or diagnos* or predict* or incidence or prevalence or seroprevalence* or risk or risk factor? or screen* or test*) adj2 CD)).ab. (1782)
-
(((association? or associated or indicator? or indicated or predict*) adj3 (risk? or symptom* or disease? or disorder? or histor*)) and c?eliac).ti,ab,kf. (2819)
-
((association between or relationship between) and c?eliac?).ti,ab,kf. (1328)
-
celiac disease/di [Diagnosis] (5652)
-
celiac disease/and (diagnosis/or diagnosis, differential/or seroprevalence/or seroepidemiologic studies/or screening/or prediction/or prevalence/or incidence/) (2995)
-
or/22-27 (11,534)
-
3 and 21 and 28 (9724)
-
Celiac Disease/di and (atypical or extraintestinal or extra-intestinal or nonspecific or non-specific).mp. (490)
-
(((double* or dual*) adj5 diagnos* adj5 c?eliac?) or (comorbid* adj5 c?eliac)).ti,ab,kf. (42)
-
(high risk adj5 c?eliac?).ti,ab,kf. (67)
-
(famil* histor* adj2 c?eliac).ti,ab,kf. (33)
-
(children adj of* adj5 c?eliac).ti,ab,kw. (19)
-
or/30-34 (642)
-
10 or 29 or 35 (11,362)
-
((celiac* or coeliac*) adj2 (asymptomatic or atypical or adolesc* or adult* or cases or cohort* or child* or disease* or family or families or familial or genetic predispos* or genetic pre-dispos* or heredit* or infant* or men or patient* or people or population* or subjects or symptomatic or syndrom* or sprue or women)).ti,ab,kf. (18,800)
-
limit 37 to (“in data review” or in process or publisher) (605)
-
36 or 38 (11,704)
-
((celiac* or coeliac*) adj (angiograp* or arter* or axis or plexus or trunk)).ti,ab,kf,hw. (8461)
-
case report.ti. (230,986)
-
((case adj of*) and (patient or man or woman)).ti,ab. and case reports.pt. (252,275)
-
(comment or editorial or letter or newspaper article).pt. (1,825,467)
-
(exp Animals/or exp Animal Experimentation/or exp Models, Animal/or exp Animals, Laboratory/or exp rodentia/) not Humans/ (4,673,001)
-
((rat or rats or mouse or mice or rodent* or animal* or murine or porcine or feline or canine or dog or dogs or cat or cats or pig or pigs or monkey* or macaque*) not human*).ti. (1,856,683)
-
or/40-45 (7,137,365)
-
39 not 46 (9645)
-
exp epidemiologic studies/ (2,435,409)
-
(cohort or case control* or case finding or cross-sectional or longitudinal).ti,ab,kf. (1,114,977)
-
study.ti. (1,330,964)
-
(study and (analys* or cases or clinical or control* or compar* or correlat* or associat* or epidemiolog* or evaluat* or examin* or investigat* or observ* or population based or prospectiv* or retrospectiv* or serolog*)).ti,ab,kf. (6,665,955)
-
(case? and control*).ab. (448,997)
-
(controls or (control adj (group? or participants or patients))).ab. (1,189,049)
-
(groups or subgroup? or sub-group?).ab. (2,170,205)
-
(group? adj5 (analys* or compar* or control* or correlat* or associat*)).ab. (1,004,351)
-
exp Regression Analysis/ (416,341)
-
statistical model/ (89,771)
-
((analys* or logistic*) adj1 (model* or regression*)).ab. (456,097)
-
study.ab./freq=2 (2,157,950)
-
or/48-59 (9,618,005)
-
47 and 60 (5419)
-
limit 61 to yr=“1997 -Current” (4786)
Cochrane Library, Issue 2 of 12, 2020
-
#1 MeSH descriptor: [Celiac Disease] this term only (63)
-
#2 (“celiac disease” or “coeliac disease”): kw (338)
-
#3 ((celiac* or coeliac*) near/3 (asymptomatic or atypical or adolesc* or adult* or cases or cohort* or child* or disease* or family or families or familial or genetic predispos* or genetic pre-dispos* or heredit* or infant* or men or patient* or people or population* or subjects or symptomatic or syndrom* or sprue or women)):ti,ab (782)
-
#4 (#1 or #2 or #3) (886)
-
#5 ((celiac* or coeliac*) next (angiograp* or arter* or axis or plexus or trunk)):ti,ab,kw (276)
-
#6 #4 not #5 (n = 870) (870)
Web of Science: Science Citation Index Expanded® (Clarivate) (SCI-EXPANDED), Conference Proceedings Citation Index – Social Sciences Citation Index™ (Clarivate) (SSCI)
(Limit to celiac or coeliac in title/abstract, n = 6118.)
-
#28 (#26 not #27) (7430)
-
#27 (TI=(“case report” or “a case of” or “a rare case of”)) or (TS=((“a case of” or “a rare case of”) near (patient or man or woman or child or adolescent or “an adult”))) (202,526)
-
#26 (#25 AND #24) [7493]<br/>Indexes=SCI-EXPANDED, CPCI-S Timespan=1997-2020
-
#25 ((TS=(seroepidemiolog* or cohort or “case control*” or “case find*” or cross-sectional or longitudinal or “population based” or prospective* or retrospective*) or TI=(study) or TS=(study and (analys* or cases or clinical or control* or compar* or correlat* or associat* or epidemiolog* or evaluat* or examin* or investigat* or observ* or population based or prospectiv* or retrospectiv* or serolog*)) or TS=((case or cases) and control*) or TS=(controls or “control* group*” or “control* participant*” or “control* patient*” or groups or subgroup* or sub-group*) or TS=(group* near (analys* or compar* or control* or correlat* or associat*)) or TS=(“regression analysis” or “regression model*” or “statistical model*” or “logistic* model*”)) NOT (TI=(rat or rats or mouse or mice or rodent* or animal* or murine or porcine or feline or canine or dog or dogs or cat or cats or pig or pigs or monkey* or macaque* or nonhuman or “non human”))) (19,956,721)
-
Indexes=SCI-EXPANDED, SSCI, A&HCI, CPCI-S, CPCI-SSH, ESCI Timespan=1900-2020
-
#24 (#23 OR #22 OR #21 OR #8) (13,272)
-
#23 (TS=((“high risk” or “famil* histor*” or “child* of”) near (celiac or coeliac)) or TS=(“celiac disease test kit”)) (233)
-
Indexes=SCI-EXPANDED, SSCI, A&HCI, CPCI-S, CPCI-SSH, ESCI Timespan=1900-2020
-
#22 (TS=((double* or dual*) near diagnos* near (celiac or coeliac))) or (TS=(comorbid* near (celiac or coeliac))) (111)
Indexes=SCI-EXPANDED, SSCI, A&HCI, CPCI-S, CPCI-SSH, ESCI Timespan=1900-2020
-
#21 (#20 AND #15 AND #1) (12,140)
-
#20 (#19 OR #18 OR #17 OR #16) (18,586)
-
#19 (TS=((“association* between” or “relationship between”) and (celiac or coeliac))) (1458)
Indexes=SCI-EXPANDED, SSCI, A&HCI, CPCI-S, CPCI-SSH, ESCI Timespan=1900-2020
-
#18 ((TS=((association* or associated or indicator* or indicated or predict*) near (risk* or symptom* or disease* or disorder* or histor*))) and (TS=(celiac or coeliac))) (5833)
Indexes=SCI-EXPANDED, SSCI, A&HCI, CPCI-S, CPCI-SSH, ESCI Timespan=1900-2020
-
#17 (TS=((celiac or coeliac) and (“detect* CD” or “CD detect*” or “detect* of CD” or “detect* with CD” or “diagnos* CD” or “CD diagnos*” or “diagnos* of CD” or “diagnos* with CD” or “predict* CD” or “CD predict*” or “predict* of CD” or “predict* with CD” or “inciden* CD” or “CD inciden*” or “inciden* of CD” or “inciden* with CD” or “prevalen* CD” or “CD prevalen*” or “prevalen* of CD” or “ prevalen* with CD” or “seroprevalen* CD” or “CD seroprevalen*” or “seroprevalen* of CD” or “seroprevalen* with CD” or “CD risk*” or “risk* of CD” or “risk* for CD” or “risk* factor* of CD” or “risk factor* for CD” or “CD screen*” or “screen* for CD” or “CD test*” or “test* for CD”))) (1489)
Indexes=SCI-EXPANDED, SSCI, A&HCI, CPCI-S, CPCI-SSH, ESCI Timespan=1900-2020
-
#16 (TS=((“case finding” or detect* or diagnos* or predict* or incidence or prevalence or seroprevalence* or risk or “risk factor*” or “risk indicator*” or screen* or test*) and (celiac* or coeliac*))) (17,056)
Indexes=SCI-EXPANDED, SSCI, A&HCI, CPCI-S, CPCI-SSH, ESCI Timespan=1900-2020
-
#15 (#14 OR #13 OR #12 OR #11 OR #10 OR #9) (14,174,134)
-
#14 (TI=(manifestation*)) (51,353)
Indexes=SCI-EXPANDED, SSCI, A&HCI, CPCI-S, CPCI-SSH, ESCI Timespan=1900-2020
-
#13 (TS=(“first degree” near (related or relative* or relation*))) (11,114)
Indexes=SCI-EXPANDED, SSCI, A&HCI, CPCI-S, CPCI-SSH, ESCI Timespan=1900-2020
-
#12 (TS=(“medical* morbid*” or (medical* near (comorbid* or co-morbid*)) or multimorbid* or “multi* morbid*” or “multi* comorbid*” or “multi* co-morbid*” or “multi* physical*”)) (25,013)
Indexes=SCI-EXPANDED, SSCI, A&HCI, CPCI-S, CPCI-SSH, ESCI Timespan=1900-2020
-
#11 ((TS=(constipation or constipated or diarrhoea or diarrhea or (abdominal near (disten* or pain or bloating or cramp or cramps)) or flatulence or meteorism or steatorrhoea or steatorrhea)) or (TS=((“acid base” or calcium or cyanocobalamin* or electrolyte* or folate or “folic acid”or glucose or IgA or “immunoglobulin A” or iron or lactose or lipid* or phosph* or protein* or triglyceride* or vitamin* or mineral*) near (disorder* or deficien* or imbalance* or insufficiency or intoleran*))) or (TS=(fever* or febrile or malaise or fatigue or letharg* or exhaustion or vomiting or nausea or emesis or sickness or “weight loss” or “wait gain” or “hot flashes” or “hot flushes” or “medically unexplained” or “unexplained medical” or “unexplained symptom*” or “signs and symptoms” or “condition* linked” or “linked condition*” or “condition* associated with” or sleepiness)) or (TS=((calciferol or cholecalciferol or colecalciferol or egocalciferol) near (disorder* or deficien* or imbalance* or insufficiency or intoleran*)))) or (TS=((anxiety or depression or mood) near (celiac or coeliac))) (1,055,350)
Indexes=SCI-EXPANDED, SSCI, A&HCI, CPCI-S, CPCI-SSH, ESCI Timespan=1900-2020
-
#10 (TS=(“digestive system* disease*” or “digestive system* disorder*” or “digestive system* syndrom*” or “digestive system manifestation*” or “duoden* disease*” or “duoden* disorder*” or “duoden* syndrom*” or “duoden* manifestation*” or “gastr* disease*” or “gastr* disorder*” or “gastr* syndrom*” or “gastr* manifestation*” or “intestin* disease*” or “intestin* disorder*” or “intestin* syndrom*” or “intestin* manifestation*” or “malabsor* disease*” or “malabsor* disorder*” or “malabsor* syndrom*” or “malabsor* manifestation*”)) (29,189)
Indexes=SCI-EXPANDED, SSCI, A&HCI, CPCI-S, CPCI-SSH, ESCI Timespan=1900-2020
-
#9 (TS=((addison* near (disease* or disorder* or syndrom*)) or alopecia or baldness or amenorrhea* or amenorrhoea* or oligomenorrhea* or oligomenorrhoea* or “anxiety disorder*” or anorexia or “adrenal insufficienc*” or “adrenocortical insufficienc*” or allerg* or anemi* or anaemi* or angina or aneurysm or “ankylosing spondylitis” or arthropath* or arthriti* or arthrosis or arthroses or asthma* or asthenia or ataxia or “atrial fibrillation” or atrophy or “autoimmune disorders” or “autoimmune diseases” or “autoimmune syndrom*” or ataxia or avitaminosis or “bonnevie ullrich” or “back pain” or (biliary near (disease* or disorder* or syndrom*)) or (bipolar near disorder*) or blindness or “blind loop syndrom*” or (blood near poisoning) or “brain atroph*” or ((bone or bones) near (broken or disease* or disorder* or syndrom*)) or (bone* near (mineral* or densit* or soft* or decay*)) or (brain near (disease* or disorder* or syndrom*)) or (bronchi* near (disease* or disorder* or syndrom*)) or (bowel* near (disease* or disorder* or syndrom*)) or calcinosis or cancer* or carcinoma* or adenocarcinoma* or neoplasm* or neoplastic or metasta* or malignan* or tumour or tumours or tumor or tumors or (cardiac near (arrest or arrhythmia* or disease* or disorder* or surg* or syndrom*)) or cardiomyopath* or ((cardiovascular or coronary) near (disease* or disorder* or event* or syndrom*)) or cachexia or ((cecal or colon* or duoden*) near (disease* or disorder* or syndrom*)) or “cerebral palsy” or (cerebro* near (degenerat* or disease* or disorder* or event* or syndrom*)) or “chronic obstructive disease” or cirrhosis or claudication or colic or COPD or ((coordination or co-ordination) near (impair* or lack)) or “congenital abnormalit*” or (congential near (disease or disorder* or syndrom*)) or ((connective or collagen* or skin) near (disease or disorder* or syndrom*)) or “collagenous sprue” or colitis or colotides or coxarthrosis or crohn* or cushing* or cyanosis or “cystic fibrosis” or cystitis or deaf* or deformit* or “delayed puberty” or dental or “depressive disorder*” or dysphoria or dysthymia or disabled or (physical near (deform* or disab* or impair*)) or dermatitis or dermato* or dorsopath* or diabet* or “down* syndrom*” or duhring* or duehring* or duhrig* or duehrig* or dyscoordination or dys-coordination or dys-coordination or dys-co-ordination or dysentery or dyssynergia or dys-synergia or emaciat* or enteritis or enterocolitis* or dystonia or eczema or edema or oedema or “elfin face sydrom*” or encephalopath* or (endocrine near (disease* or disorder* or syndrom*)) or enuresis or enteropath* or epilep* or (eye near (disease* or disorder* or manifestation* or syndrome*)) or “fatigue syndrome” or “chronic fatigue” or “failure to thrive” or fibromyalgia or fibrosis or “food hypersensitivity” or fractures or gammaglobulinemia or gammaglobulinaemia or (gardner* near (syndrom* or disease* or disorder*)) or gastritis or gastroenteritis or gout or (glomerul* near (disease* or disorder* or syndrom*)) or “gonodal near dysgen*” or (growth near (disease* or disorder* or syndrom*)) or headache* or ((hemic or haemic or lymph*) near (disease* or disorder* or syndrom*)) or hematuria or haematuria or hemophili* or haemophili* or ((hearing or visual or vision or sight) near (aid* or impair* or loss)) or (heart near (disease* or disorder* or failure or syndrom* or manifestation* or myopathy*)) or hemiplegi* or hepatitis or hemodialysis or haemodialysis hiv or “human immunodeficiency virus” or “acquired immunodeficieny syndrom*” or “heerfordt waldenstrom*” or hidroa or hydroa or “hippel lindau*” or hypertensi* or hypotensi* or hyperthyroidism or hypothyroidism or hypocortisolism or hypocorticism or hypoadrenalism or incoordination or inco-ordination or in-coordination or in-co-ordination or infertility or subfertility or sub-fertil* or sterility or “inflammatory disease*” or “inflammatory bowel disease*” or incontinen* or “intestinal atresi*” or intussusception or “irritable bowel” or ischemi* or ischaemi* or fistula* or (joint near (disease* or disorder* or syndrom*)) or (jejunal near (disease* or disorder* or syndrom*)) or kyphosis or lav-htlv* or leukemia or leukaemia or ((liver or hepatic) near (disease* or disorder* or failure or syndrom*)) or lordosis or (lung near (disease* or disorder*)) or lupus or SLE or lymphoma or lymphogranuloma* or lymphadenopath* or lymphotrop* or “machado joseph*” or “macular degeneration” or malnutrition or (mental near (disorder* or disease* or health or illness*)) or mania or manic or (menstr* near (ceas* or disturb* or disease* or disorder* or stop* or syndrom*)) or migraine* or (mitochondrial near (disease* or disorder* or syndrom*)) or “movement disorder*” or mucinosis or musculoskeletal or “narp syndrom*” or necrotizing or nephrotic syndrom* or neuromuscular or non-hodgkin* or nonhodgkin* or “multiple sclerosis” or myeloma or myocarditis or myocardiopath* or myopath* or (myocardi* near (deteri* or disease* or disorder* or syndrom* or manifestation*)) or “nephrotic syndrome” or ((neurodegenerat* or neuro-degenerat) near (disease* or disorder* or syndrom)) or ((nutritional or metabolic) near (disease* or disorder* or syndrom*)) or ((organ* or kidney or “stem cell”) near (transplant* or recipient*)) or (“nervous system” near (disease* or disorder* or syndrom*)) or (neurological near (condition* or disease* or disorder* or syndrom*)) or neuropath* or neurosarcoido* or occlusion* or obesity or obese or orthopedic* or orthopaedic* or ((esophageal or oesophageal) near (disease* or disorder* or syndrom*)) or ((oral or mouth) near (disease* or disorder* or syndrom* or manifestation*)) or osteo* or “otitis media” or otorhinolaryngolog* or otosclerosis or (pancrea* near (disease* or disorder* or syndrom*)) or papulosquamous or paraplegi* or parkinson* or (peripheral near (arterial or vascular or disease* or disorder* or syndrom*)) or (peritoneal near (disease* or disorder* or syndrom*)) or photodermato* or “pick disease*” or pneumo* or polio* or polyp* or polydipsia or polyarthropath* or polyarteritis or polyarthrosis or polyneuropath* or porphyrias or (pregnancy near complicat*) or “premature aging” or proteostasis or pseudophakia or psoriasis or parapsoriasis or prolapse or (pulmonary near (disease* or disorder* or syndrom*)) or purpur* or (recurren* near (abortion* or miscarr*)) or ((rectum or rectal) near (disease* or disorder* or syndrom*)) or ((renal or kidney) near (disease* or disorder* or failure or syndrom*)) or (respiratory near (disease* or disorder* or syndrom*)) or reticulocytosis or retinopathy or rheumat* or ricket* or sarcoido* or sepsis or septic* or seizure* or sclerosis or scoliosis or “sickle cell” or ((sjogren* or sjoegren* or sicca*) near (syndrom* or disease* or disorder*)) or ((skin or “connective tissue”) near (disease* or disorder* or syndrom*)) or “sleep disorder*” or “sleep apnea” or “sleep apnoea” or insomnia* or dyssomnia* or hypersomnia* or “spina bifida” or “muscular atropy” or “short stature*” or “short bowel syndrom*” or (spin* near (degenerat* or disease* or disorder* or syndrom*)) or (spleen* near (disease* or disorder* or syndrom*)) or spondylo* or stenosis* or stoma* or (stomach near (disease* or disorder* or syndrom*)) or stroke or strokes or “cerebral infarct*” or tetraplegi* or thyroiditis* or (thyroid* near (disease* or disorder* or dysfunction* or syndrom*)) or ((tooth or teeth or enamel) near (decay* or discolo* or disease* or disorder* or dysfunction* or syndrom*)) or “tropical sprue” or tuberculosis or (systemic near (disorder* or disease* or syndrom*)) or thrombocyto* or tremor or tremors or (turner* near (syndrome* or disease* or disorder*)) or ulcer* or (urogenital near (disease* or disorder* or syndrom*)) or vasculopath* or (vascular near (disease* or disorder* or occlu* or syndrom*)) or vestibular or ((virus or viral or bacteri* or parasit*) near (infection* or disease*)) or (wasting near (disorder* or disease* or syndrom*)) or (whipple near (disorder* or disease* or syndrom*)) or (william* near (syndrom* or disease* or disorder*)) or zoster*)) (13,693,359)
Indexes=SCI-EXPANDED, SSCI, A&HCI, CPCI-S, CPCI-SSH, ESCI Timespan=1900-2020
-
#8 (#7 and #1) (5889)
-
#7 (#6 OR #5 OR #4 OR #3 OR #2) (6,827,636)
-
#6 (TS=(“clinical decision making” or “logistic model*” or “statistical model*”)) (81,189)
Indexes=SCI-EXPANDED, SSCI, A&HCI, CPCI-S, CPCI-SSH, ESCI Timespan=1900-2020
-
#5 (TS=((multivaria* or multicomponent*) NEAR (model* or algorithm* or score or scores or scoring or rule or rules or index or tool or tools or panel or criteri*))) (156,496)
Indexes=SCI-EXPANDED, SSCI, A&HCI, CPCI-S, CPCI-SSH, ESCI Timespan=1900-2020
-
#4 (TS=(clinic* NEAR (model* or algorithm* or score or scores or scoring or risk or risks or rule or rules or predict* or index or tool or tools or panel or criteri* or decision* or stratif* or diagnos* or detect* or identif* or probabilit*))) (1,061,406)
Indexes=SCI-EXPANDED, SSCI, A&HCI, CPCI-S, CPCI-SSH, ESCI Timespan=1900-2020
-
#3 (TS=((detect* or diagnos* or identif* or decision* or predict* or prognos* or stratif* or validat*) NEAR (risk or risks or model* or factor* or algorithm* or score or scores or scoring or system or technique* or aid or aids or rule or rules or index or variable* or tool or tools or panel or criteri* or characteristic* or history or finding* or value* or assay or stratif* or biomarker*))) (5,481,423)
Indexes=SCI-EXPANDED, SSCI, A&HCI, CPCI-S, CPCI-SSH, ESCI Timespan=1900-2020
-
#2 (TS=((detect* or diagnos* or identif* or decision* or predict* or prognos* or risk or risks or stratif* or validat*) NEAR (model* or factor* or algorithm* or score or scores or scoring or system or technique* or aid or aids or rule or rules or index or variable* or tool or tools or panel or criteri* or characteristic* or history or finding* or value* or assay or stratif* or biomarker*))) (6,133,858)
Indexes=SCI-EXPANDED, SSCI, A&HCI, CPCI-S, CPCI-SSH, ESCI Timespan=1900-2020
-
#1 TS=((celiac* OR coeliac*) NEAR (asymptomatic OR atypical OR adolesc* OR adult* OR cases OR cohort* OR child* OR disease* OR disorder* OR family OR families OR familial OR “genetic predispos*” OR “genetic pre-dispos*” OR heredit* OR infant* OR men OR patient* OR people OR population* OR subjects OR symptomatic OR syndrom* OR sprue OR women))) NOT (TS=((celiac* OR coeliac*) NEAR (angiography OR artery OR arteries OR axis OR plexus OR trunk))) (25,557)
Indexes=SCI-EXPANDED, SSCI, A&HCI, CPCI-S, CPCI-SSH, ESCI Timespan=1900-2020
Appendix 2 Flow diagram
Appendix 3 Study characteristics
| Diagnostic indicator | Diagnostic indicator details | Studies (n) | Total sample (n) | CD patients (n) | Age groups | Study designs | Control groups | Reference standards (CD diagnosis strategy) |
|---|---|---|---|---|---|---|---|---|
| Symptoms | ||||||||
| Abdominal pain | (Recurrent or acute) abdominal or stomach pain | 12 | 48,451 | 1014 |
|
|
|
|
| Acid reflux symptoms | Dyspepsia, functional dyspepsia, gastro-oesophageal reflux symptoms, heartburn | 10 | 12,192 | 534 |
|
|
|
|
| Bloating or abdominal distension | Bloating, abdominal distension | 6 | 32,694 | 624 |
|
|
|
|
| Constipation | (Chronic) constipation | 12 | 54,286 | 943 |
|
|
|
|
| Diarrhoea | Diarrhoea | 13 | 55,500 | 1126 |
|
|
|
|
| Vomiting and nausea | Vomiting, nausea, nausea after eating | 7 | 44,937 | 435 |
|
|
|
|
| Weight loss | Weight loss | 5 | 31,739 |
|
|
|
|
|
| Risk conditions | ||||||||
| Anaemia | IDA, low haemoglobin levels, pernicious anaemia of obscure origin or unspecified | 17 | 13,477 | 715 |
|
|
|
|
| Arthritis | RA, AS, juvenile idiopathic arthritis, psoriatic arthritis, juvenile rheumatic diseases | 15 | 10,745 | 542 |
|
|
|
|
| Chronic liver disease | Hepatic disease, hepatitis, PBC (unexplained) abnormal liver enzymes, ALD, chronic hepatitis C | 15 | 8682 | 448 |
|
|
|
|
| Dermatitis herpetiformis | Dermatitis herpetiformis | 5 | 1429 | 579 |
|
|
|
|
| Epilepsy | Epilepsy, ataxia | 12 | 10,717 | 505 |
|
|
|
|
| Fracture | Vertebra fracture, wrist fracture, fractures (unspecified) | 8 | 24,741 | 549 | Adults, n = 8 |
|
|
|
| Inflammatory bowel disease | Ulcerative colitis, Crohn’s disease | 6 | 2886 | 32 |
|
|
|
|
| IBS | IBS, functional GI disorder | 18 | 18,446 | 842 |
|
|
|
|
| Migraine | Migraine | 5 | 2478 | 42 |
|
|
|
|
| Multiple sclerosis | Multiple sclerosis | 5 | 1086 | 12 |
|
|
|
|
| Osteoporosis | Osteoporosis | 9 | 20,218 | 962 |
|
|
|
|
| Psoriasis | Psoriasis | 6 | 1127 | 44 |
|
|
|
|
| Subfertility or recurrent pregnancy loss | Idiopathic or immunological infertility; previous or recurrent miscarriages, or implantation failure | 16 | 12,690 | 808 |
|
|
|
|
| Systemic lupus erythematosus | Systemic lupus erythematosus | 6 | 1004 | 9 |
|
|
|
|
| Thyroid disease | Autoimmune thyroid disease, Graves’ disease, Hashimoto’s thyroiditis | 23 | 27,031 | 1083 |
|
|
|
|
| Type 1 diabetes | Type 1 diabetes | 31 | 26,635 | 1349 |
|
|
|
|
| Type 2 diabetes | Type 2 diabetes | 6 | 8199 | 110 |
|
|
|
|
| Family history | ||||||||
| Family history of CD | Relatives with CD (first or second degree, or unspecified) | 13 | 31,827 | 672 |
|
|
|
|
Appendix 4 Study characteristics per diagnostic indicator
| Population group | Study design | Indicator details | Sample size (n) | Sex (% female) | Control group | Reference standard | Care setting | Location | Reference |
|---|---|---|---|---|---|---|---|---|---|
| Adults | Case–control (DI) | Acute abdominal pain | 600 | NR | Healthy controls | Serology and only positive patients biopsied | Secondary | NR | Hopper et al.286 |
| Adults | Case–control (DI) | Acute abdominal pain | 600 | 26–50 | Healthy controls | Serology and only positive patients biopsied | Secondary | UK | Sanders et al.287 |
| Adults | Cohort | Abdominal pain | 3196 | NR | People without abdominal pain | Double positive for two antibodies | Community | USA | Choung et al.288 |
| Adults | Cohort | Abdominal pain | 2976 | 51–75 | People without abdominal pain | Serology and only positive patients biopsied | Community | Brazil | Oliveira et al.289 |
| Adults | Nested case–control (CD) | Recurrent abdominal pain | 800 | 51–75 | People without recurrent abdominal pain | Double positive for two antibodies | Primary and secondary | USA | Hujoel et al.290 |
| Adults | Nested case–control (CD) | Abdominal pain | 381 | 51–75 | People without abdominal pain | Double positive for two antibodies | Secondary | USA | Godfrey et al.236 |
| Children | Case–control (DI) | Recurrent abdominal pain | 173 | 51–75 | Healthy controls | EMA positive | Primary | Canada | Fitzpatrick et al.291 |
| Children | Cohort | Any stomach pains | 4327 | NR | Children without stomach pains | Double positive for two antibodies | Community | UK | Bingley et al.2 |
| Children | Cohort | Abdominal pain | 18,672 | 51–75 | Children without abdominal pain | Serology and only positive patients biopsied | Community | Türkiye | Dalgic et al.292 |
| Children | Cohort | Abdominal pain | 3093 | 26–50 | Children without abdominal pain | tTG positive | Community | The Netherlands | Jansen et al.182 |
| Children | Cohort | Abdominal pain | 3715 | 26–50 | Children without abdominal pain | tTG positive | Community | The Netherlands | Wahab et al.180 |
| Children | Cohort | Stomach aches | 9918 | 51–75 | Children without stomach aches | tTG positive | Secondary | USA | Stahl et al.293 |
| Population group | Study design | Indicator details | Sample size (n) | Sex (% female) | Control group | Reference standard | Care setting | Location | Reference |
|---|---|---|---|---|---|---|---|---|---|
| Adults | Case–control (DI) | Dyspepsia | 640 | 51–75 | Healthy controls | Other | Secondary | Argentina | Lasa et al.294 |
| Adults | Case–control (DI) | Dyspepsia | 105 | NR | Healthy controls | All patients biopsied – no serology | NR | NR | Lecleire et al.295 |
| Adults | Cohort | Dyspepsia | 3118 | NR | People without dyspepsia | Double positive for two antibodies | Community | USA | Choung et al.288 |
| Adults | Cohort | Heartburn | 3847 | 51–75 | People without heartburn | Double positive for two antibodies | Community | USA | Katz et al.296 |
| Adults | Cohort | Dyspepsia | 427 | 1–25 | Healthy controls | Serology and only positive patients biopsied | Unclear | Mexico | Lara-Carmona et al.297 |
| Adults | Cohort | Heartburn | 1886 | NR | People without heartburn | Other | Primary | Finland | Tikkakoski et al.298 |
| Adults | Nested case–control (CD) | Dyspepsia | 800 | 51–75 | People without dyspepsia | Double positive for two antibodies | Primary and secondary | USA | Hujoel et al.290 |
| Adults | Nested case–control (DI) | Gastro-oesophageal reflux symptoms | 1000 | 51–75 | People without gastro-oesophageal reflux symptoms | Serology and all patients biopsied | Community | Sweden | Ludvigsson et al.299 |
| Adults | Nested case–control (DI) | Dyspepsia | 112 | 26–50 | Healthy controls | tTG positive | Community | USA | Locke et al.300 |
| Mixed | Case–control (DI) | Functional dyspepsia | 257 | 26–50 | Healthy controls | Serology and only positive patients biopsied | Secondary | Spain | Vivas et al.301 |
| Population group | Study design | Indicator details | Sample size (n) | Sex (% female) | Control group | Reference standard | Care setting | Location | Reference |
|---|---|---|---|---|---|---|---|---|---|
| Adults | Case–control (DI) | Low haemoglobin levels | 174 | NR | People with normal haemoglobin levels | tTG positive | Unclear | USA | Alexander et al.302 |
| Adults | Case–control (DI) | IDA of obscure origin | 321 | NR | Healthy controls | Serology and only positive patients biopsied | Secondary | India | Javid et al.303 |
| Adults | Case–control (DI) | IDA of obscure origin | 196 | 51–75 | Healthy controls | Serology and only positive patients biopsied | Secondary | Türkiye | Uçardağ et al.304 |
| Adults | Case–control (DI) | IDA | 268 | 51–75 | Healthy controls | Serology and all patients biopsied | Secondary/community | Argentina | Lasa et al.305 |
| Adults | Case–control (DI) | IDA | 97 | 51–75 | Healthy controls | tTG positive | Secondary | Türkiye | Cikrikcioglu et al.306 |
| Adults | Case–control (DI) | Pernicious anaemia | 165 | 51–75 | Healthy controls | EMA positive | Unclear | Poland | Morawiec-Szymonik et al.307 |
| Adults | Cohort | Anaemia | 982 | NR | People without anaemia | Serology and only positive patients biopsied | Primary | UK | Ransford et al.308 |
| Adults | Cohort | Anaemia | 1197 | 26–50 | People without anaemia | Double positive for two antibodies | Community | The United Arab Emirates | Abu-Zeid et al.277 |
| Adults | Cohort | IDA | 1200 | 62.8 | People without anaemia | Serology and only positive patients biopsied | Primary | UK | Sanders et al.309 |
| Adults | Cohort | Anaemia/IDA | 527 | 51–75 | People without anaemia | Double positive for two antibodies | Secondary | Malaysia | Yap et al.276 |
| Adults | Cohort | Anaemia | 5060 | 100 | People without anaemia | Double positive for two antibodies | Secondary | Italy | Greco et al.310 |
| Adults | Nested case–control (CD) | Anaemia | 800 | 51–75 | People without anaemia | Double positive for two antibodies | Primary and secondary | USA | Hujoel et al.290 |
| Adults | Nested case–control (CD) | Anaemia | 381 | 51–75 | People without anaemia | Double positive for two antibodies | Secondary | USA | Godfrey et al.236 |
| Children | Case–control (DI) | IDA | 358 | 51–75 | Healthy controls | Serology and only positive patients biopsied | Secondary | Türkiye | Kalayci et al.311 |
| Children | Case–control (DI) | IDA | 184 | 26–50 | Healthy controls | Serology and only positive patients biopsied | Secondary | Islamic Republic of Iran | Shahriari et al.312 |
| Children | Case–control (DI) | IDA | 304 | 51–75 | Healthy controls | Serology and only positive patients biopsied | Secondary | India | Narang et al.313 |
| Children | Cohort | IDA | 1263 | 26–50 | Children without IDA | tTG positive | Community | Türkiye | Ertekin et al.314 |
| Population group | Study design | Indicator details | Sample size (n) | Sex (% female) | Control group | Reference standard | Care setting | Location | Reference |
|---|---|---|---|---|---|---|---|---|---|
| Adults | Case–control (DI) | RA | 220 | NR | Healthy controls | Serology and only positive patients biopsied | Unclear | Italy | Bizzaro et al.315 |
| Adults | Case–control (DI) | RA | 83 | NR | Healthy controls | EMA positive | Secondary | Ireland | Feighery et al.316 |
| Adults | Case–control (DI) | RA | 182 | 76–100 | Healthy controls | Serology and only positive patients biopsied | Secondary | Brazil | Nisihara et al.317 |
| Adults | Case–control (DI) | Arthritis (PsA, RA or AS) | 237 | 26–50 | Healthy controls | Double positive for two antibodies | Secondary | Italy | Picarelli et al.318 |
| Adults | Case–control (DI) | Arthritis (PsA, RA or AS) | 275 | 26–50 | Healthy controls | tTG positive | Secondary | Italy | Riente et al.319 |
| Adults | Cohort | RA | 100 | NR | Healthy controls | Serology and only positive patients biopsied | Secondary | USA | Luft et al.320 |
| Adults | Cohort | RA | 6919 | 51–75 | People without RA | Double positive for two antibodies | Community | Finland | Heikkilä et al.321 |
| Adults | Nested case–control (CD) | RA | 800 | 51–75 | People without RA | Double positive for two antibodies | Primary and secondary | USA | Hujoel et al.290 |
| Children | Case–control (DI) | Juvenile rheumatic diseases | 90 | 51–75 | Healthy controls | tTG positive | Secondary | Egypt | Gheita et al.322 |
| Children | Case–control (DI) | Juvenile idiopathic arthritis | 181 | 51–75 | Healthy controls | Serology and only positive patients biopsied | Unclear | Türkiye | Sahin et al.323 |
| Children | Case–control (DI) | Juvenile idiopathic arthritis | 205 | 51–75 | Healthy controls | Serology and only positive patients biopsied | Secondary | Austria | Skrabl-Baumgartner et al.324 |
| Children | Case–control (DI) | Juvenile idiopathic arthritis | 309 | 51–75 | Healthy controls | Serology and only positive patients biopsied | Secondary | Italy | Stagi et al.325 |
| Children | Cohort | Juvenile idiopathic arthritis | 70 | 26–50 | Healthy controls | Serology and only positive patients biopsied | Secondary | Brazil | Robazzi et al.326 |
| Mixed | Case–control (DI) | Juvenile idiopathic arthritis | 1025 | NR | Healthy controls | tTG positive | Secondary | USA | Taneja et al.327 |
| Mixed | Case–control (DI) | AS | 49 | 1–25 | Healthy controls | Serology and only positive patients biopsied | Secondary | Türkiye | Toğrol et al.328 |
| Population group | Study design | Indicator details | Sample size (n) | Sex (% female) | Control group | Reference standard | Care setting | Location | Reference |
|---|---|---|---|---|---|---|---|---|---|
| Adults | Cohort | Bloating | 1830 | NR | People without bloating | Double positive for two antibodies | Community | USA | Choung et al.288 |
| Adults | Cohort | Bloating | 3847 | 51–75 | People without bloating | Double positive for two antibodies | Community | USA | Katz et al.296 |
| Adults | Cohort | Bloating | 1886 | NR | People without bloating | Other | Primary | Finland | Tikkakoski et al.298 |
| Adults | Nested case–control (CD) | Bloating | 800 | 51–75 | People without bloating | Double positive for two antibodies | Primary and secondary | USA | Hujoel et al.290 |
| Children | Cohort | Abdominal distension | 18,598 | 51–75 | Children without abdominal distension | Serology and only positive patients biopsied | Community | Türkiye | Dalgic et al.292 |
| Children | Cohort | Abdominal distension | 5733 | 26–50 | People without abdominal extension | Serology and only positive patients biopsied | Community | Italy | Nenna et al.329 |
| Population group | Study design | Indicator details | Sample size (n) | Sex (% female) | Control group | Reference standard | Care setting | Location | Reference |
|---|---|---|---|---|---|---|---|---|---|
| Adults | Cohort | Constipation | 3196 | NR | People without constipation | Double positive for two antibodies | Community | USA | Choung et al.288 |
| Adults | Cohort | Constipation | 2976 | 51–75 | People without constipation | Serology and only positive patients biopsied | Community | Brazil | Oliveira et al.289 |
| Adults | Cohort | Constipation | 3847 | 51–75 | People without constipation | Double positive for two antibodies | Community | USA | Katz et al.296 |
| Adults | Cohort | Constipation | 1886 | NR | People without constipation | Other | Primary | Finland | Tikkakoski et al.298 |
| Adults | Nested case–control (CD) | Constipation | 800 | 51–75 | People without constipation | Double positive for two antibodies | Primary and secondary | USA | Hujoel et al.290 |
| Children | Case–control (DI) | Chronic constipation | 1303 | 51–75 | Healthy controls | Serology and only positive patients biopsied | Secondary | Türkiye | Çakir et al.330 |
| Children | Cohort | Constipation | 4327 | NR | Children without constipation | Double positive for two antibodies | Community | UK | Bingley et al.2 |
| Children | Cohort | Constipation | 18,576 | 51–75 | Children without constipation | Serology and only positive patients biopsied | Community | Türkiye | Dalgic et al.292 |
| Children | Cohort | Constipation | 3120 | 26–50 | Children without constipation | tTG positive | Community | The Netherlands | Jansen et al.182 |
| Children | Cohort | Constipation | 3715 | 26–50 | Children without constipation | tTG positive | Community | The Netherlands | Wahab et al.180 |
| Children | Cohort | Constipation | 9918 | 51–75 | Children without constipation | tTG positive | Secondary | USA | Stahl et al.293 |
| Children | Nested case–control (DI) | Functional constipation | 622 | NR | Children without functional GI disorders | Serology and only positive patients biopsied | Community | Colombia | Fifi et al.331 |
| Population group | Study design | Indicator details | Sample size (n) | Sex (% female) | Control group | Reference standard | Care setting | Location | Reference |
|---|---|---|---|---|---|---|---|---|---|
| Adults | Case–control (DI) | Dermatitis herpetiformis | 150 | NR | Healthy controls | Double positive for two antibodies | Secondary | Poland | Kumar et al.332 |
| Adults | Case–control (DI) | Dermatitis herpetiformis | 46 | NR | Healthy controls | Other | Secondary | Bulgaria | Velikova et al.333 |
| Adults | Nested case–control (CD) | Dermatitis herpetiformis | 381 | 51–75 | People without dermatitis herpetiformis | Double positive for two antibodies | Secondary | USA | Godfrey et al.236 |
| Adults | Nested case–control (CD) | Dermatitis herpetiformis | 800 | 51–75 | People without dermatitis herpetiformis | Double positive for two antibodies | Primary and secondary | USA | Hujoel et al.290 |
| Mixed | Case–control (DI) | Dermatitis herpetiformis | 52 | 26–50 | Controls | Serology and all patients biopsied | Secondary | Argentina | Smecuol et al.334 |
| Population group | Study design | Indicator details | Sample size (n) | Sex (% female) | Control group | Reference standard | Care setting | Location | Reference |
|---|---|---|---|---|---|---|---|---|---|
| Adults | Cohort | Diarrhoea | 1197 | 26–50 | People without diarrhoea | Double positive for two antibodies | Community | The United Arab Emirates | Abu-Zeid et al.277 |
| Adults | Cohort | Diarrhoea | 3186 | NR | People without diarrhoea | Double positive for two antibodies | Community | USA | Choung et al.288 |
| Adults | Cohort | Diarrhoea | 2976 | 51–75 | People without diarrhoea | Serology and only positive patients biopsied | Community | Brazil | Oliveira et al.289 |
| Adults | Cohort | Diarrhoea | 3847 | 51–75 | People without diarrhoea | Double positive for two antibodies | Community | USA | Katz et al.296 |
| Adults | Cohort | Diarrhoea | 1886 | NR | People without diarrhoea | Other | Primary | Finland | Tikkakoski et al.298 |
| Adults | Nested case–control (CD) | Diarrhoea | 800 | 51–75 | People without diarrhoea | Double positive for two antibodies | Primary and secondary | USA | Hujoel et al.290 |
| Adults | Nested case–control (CD) | Diarrhoea | 381 | 51–75 | People without diarrhoea | Double positive for two antibodies | Secondary | USA | Godfrey et al.236 |
| Children | Case–control (DI) | Diarrhoea | 1650 | 26–50 | Healthy controls | Serology and only positive patients biopsied | Secondary | Islamic Republic of Iran | Imanzadeh et al.335 |
| Children | Cohort | Diarrhoea | 4327 | NR | Children without diarrhoea | Double positive for two antibodies | Community | UK | Bingley et al.2 |
| Children | Cohort | Diarrhoea | 18,602 | 51–75 | Children without diarrhoea | Serology and only positive patients biopsied | Community | Türkiye | Dalgic et al.292 |
| Children | Cohort | Diarrhoea | 3015 | 26–50 | Children without diarrhoea | tTG positive | Community | The Netherlands | Jansen et al.182 |
| Children | Cohort | Diarrhoea | 3715 | 26–50 | Children without diarrhoea | tTG positive | Community | The Netherlands | Wahab et al.180 |
| Children | Cohort | Diarrhoea | 9918 | 51–75 | Children without diarrhoea | tTG positive | Secondary | USA | Stahl et al.293 |
| Population group | Study design | Indicator details | Sample size (n) | Sex (% female) | Control group | Reference standard | Care setting | Location | Reference |
|---|---|---|---|---|---|---|---|---|---|
| Adults | Case–control (DI) | Epilepsy | 1427 | 51–75 | Healthy controls | tTG positive | Community | Finland | Ranua et al.336 |
| Adults | Nested case–control (CD) | Epilepsy/ataxia | 800 | 51–75 | People without epilepsy/ataxia | Double positive for two antibodies | Primary and secondary | USA | Hujoel et al.290 |
| Children | Case–control (DI) | Epilepsy | 535 | 26–50 | Healthy controls | Serology and only positive patients biopsied | Secondary | Greece | Mavroudi et al.337 |
| Children | Case–control (DI) | Epilepsy | 535 | 26–50 | Healthy controls | Serology and only positive patients biopsied | Secondary | Greece | Mavroudi et al.337 |
| Children | Case–control (DI) | Epilepsy | 273 | 26–50 | Healthy controls | Serology and only positive patients biopsied | Secondary | Türkiye | Dalgiç et al.338 |
| Children | Case–control (DI) | Epilepsy | 190 | 26–50 | Healthy controls | Serology and only positive patients biopsied | Secondary | Türkiye | Dai et al.339 |
| Children | Case–control (DI) | Epilepsy | 275 | 51–75 | Healthy controls | Serology and only positive patients biopsied | Secondary | Serbia | Djurić et al.340 |
| Children | Case–control (DI) | Epilepsy | 572 | 26–50 | Healthy controls | tTG positive | Secondary | Italy | Giordano et al.341 |
| Children | Case–control (DI) | Epilepsy | 380 | 26–50 | Healthy controls | Serology and only positive patients biopsied | Secondary | Türkiye | Işikay et al.342 |
| Children | Case–control (DI) | Epilepsy | 1000 | 26–50 | Healthy controls | Serology and only positive patients biopsied | Secondary | Türkiye | Işıkay et al.343 |
| Children | Case–control (DI) | Epilepsy | 70 | 26–50 | Healthy controls | EMA positive | Secondary | Israel | Lahat et al.344 |
| Mixed | Case–control (DI) | Epilepsy | 4660 | 26–50 | Healthy controls | EMA positive | Secondary | Brazil | Pratesi et al.345 |
| Population group | Study design | Indicator details | Sample size (n) | Sex (% female) | Control group | Reference standard | Care setting | Location | Reference |
|---|---|---|---|---|---|---|---|---|---|
| Adults | Case–control (DI) | CD in family | 334 | NR | Healthy controls | tTG positive | Secondary | India | Soni et al.346 |
| Adults | Cohort | FDRs with CD | 1197 | 26–50 | People without FDRs with CD | Double positive for two antibodies | Community | The United Arab Emirates | Abu-Zeid et al.277 |
| Adults | Cohort | CD in family | 527 | 51–75 | People without a family history of CD | Double positive for two antibodies | Secondary | Malaysia | Yap et al.276 |
| Adults | Nested case–control (DI) | FDRs with CD | 2128 | NR | People without CD in family | tTG positive | Community | USA | Choung et al.347 |
| Adults | Case–control (DI) | FDRs with CD | 6059 | 51–75 | Healthy controls | EMA positive | Community/secondary | USA | Fasano et al.348 |
| Children | Cohort | CD in family | 3768 | 51–75 | People without family history of CD | Serology and only positive patients biopsied | Community | Cyprus | Beser et al.349 |
| Children | Cohort | CD in family | 4308 | 26–50 | Children without CD in family | tTG positive | Community | The Netherlands | Jansen et al.182 |
| Children | Case–control (DI) | FDRs with CD | 2575 | 51–75 | Healthy controls | EMA positive | Community/secondary | USA | Fasano et al.348 |
| Children | Cohort | FDRs with CD | 9973 | 51–75 | Children without a FDR with CD | tTG positive | Secondary | USA | Stahl et al.293 |
| Mixed | Case–control (DI and CD) | FDRs with CD | 114 | NR | Healthy controls | tTG positive | Unclear | Cuba | Cintando et al.350 |
| Mixed | Case–control (DI) | FDRs with CD | 241 | 51–75 | Healthy controls | EMA positive | Secondary | Brazil | Kotze et al.351 |
| Mixed | Case–control (DI) | FDRs and SDRs with CD | 333 | 51–75 | Healthy controls | Double positive for two antibodies | Unclear | Brazil | Nass et al.352 |
| Mixed | Case–control (DI) | FDRs and SDRs with CD | 270 | 26–50 | Healthy controls | Double positive for two antibodies | Unclear | Portugal | Utiyama et al.353 |
| Population group | Study design | Indicator details | Sample size (n) | Sex (% female) | Control group | Reference standard | Care setting | Location | Reference |
|---|---|---|---|---|---|---|---|---|---|
| Adults | Case–control (DI) | Acute distal radius or ankle fracture | 597 | 76–100 | Healthy controls | Serology and only positive patients biopsied | Secondary | Norway | Hjelle et al.354 |
| Adults | Case–control (DI) | Acute distal radius or ankle fracture | 228 | 76–100 | Healthy controls | tTG positive | Secondary | Norway | Hjelle et al.355 |
| Adults | Case–control (DI) | Hip fracture | 208 | 100 | Women without osteoporosis admitted for elective hip joint replacement | tTG positive | Community | USA | LeBoff et al.356 |
| Adults | Cohort | Non-traumatic fractures | 2121 | 51–75 | Healthy controls | tTG positive | Community | Australia | Potter et al.357 |
| Adults | Cohort | Fracture | 6480 | 100 | Women without fractures | tTG positive | Community | Sweden | Agardh et al.358 |
| Adults | Cohort | Vertebra fracture | 6919 | 51–75 | People without vertebra fracture | Double positive for two antibodies | Community | Finland | Heikkilä et al.321 |
| Adults | Cohort | Fracture of the wrist | 7345 | 51–75 | People without wrist fracture | EMA positive | Primary | UK | West et al.359 |
| Adults | Nested case–control (CD) | Fracture | 843 | 51–75 | People without fractures | Double positive for two antibodies | Community | USA | Choung et al.360 |
| Population group | Study design | Indicator details | Sample size (n) | Sex (% female) | Control group | Reference standard | Care setting | Location | Reference |
|---|---|---|---|---|---|---|---|---|---|
| Adults | Nested case–control (CD) | HLA-DQ2 | 97 | NR | Healthy controls | Serology and all patients biopsied | Secondary | Sweden | Walker et al.361 |
| Children | Case–control (CD) | HLA-DQ2, HLA-DQ8 or both | 1320 | 51–75 | Children without risk genotype | Serology and only positive patients biopsied | Secondary | Sweden | Sandström et al.179 |
| Children | Cohort | HLA-DQ2, HLA-DQ8 or both | 2781 | 26–50 | People without risk genotype | tTG positive | Community | The Netherlands | Beth et al.181 |
| Children | Cohort | HLA-DQ2, HLA-DQ8 or both | 4308 | 26–50 | Children without risk genotype | tTG positive | Community | The Netherlands | Jansen et al.182 |
| Children | Cohort | HLA-DQ2.2, HLA-DQ2.5 or HLA-DQ8 | 3715 | 26–50 | Children without risk genotype | tTG positive | Community | The Netherlands | Wahab et al.180 |
| Children | Cohort | HLA-DR4-DQ8, HLA-DR3-DQ2 or both | 3627 | 51–75 | Children not carrying HLA-DR3-DQ2 or HLA-DR4-DQ8 | Serology and only positive patients biopsied | Community | Finland | Mäki et al.178 |
| Children | Nested case–control (DI) | HLA-DQ2, HLA-DQ8 or both | 3435 | 26–50 | Newborns without risk genotype | Serology and only positive patients biopsied | Community | Sweden | Björck et al.177 |
| Mixed | Case–control (DI and CD) | HLA-DQ2 | 82 | NR | CD patients and healthy controls without risk genotype | tTG positive | Unclear | Cuba | Cintado et al.350 |
| Mixed | Case–control (CD) | HLA-DQ2 | 101 | NR | People without HLA-DQ2 | tTG positive | Secondary | Islamic Republic of Iraq | Khudher et al.362 |
| Population group | Study design | Indicator details | Sample size (n) | Sex (% female) | Control group | Reference standard | Care setting | Location | Reference |
|---|---|---|---|---|---|---|---|---|---|
| Adults | Case–control (DI) | Ulcerative colitis or Crohn’s disease | 865 | 51–75 | Healthy controls | Serology and only positive patients biopsied | Secondary | UK | Horoldt et al.363 |
| Adults | Case–control (DI) | Ulcerative colitis or Crohn’s disease | 955 | 51–75 | Healthy controls | Serology and only positive patients biopsied | Secondary | UK | Leeds et al.364 |
| Adults | Case–control (DI) | Ulcerative colitis or Crohn’s disease | 362 | 26–50 | Healthy controls | Double positive for two antibodies | Secondary | Japan | Watanabe et al.365 |
| Adults | Case–control (DI) | Ulcerative colitis or Crohn’s disease | 290 | NR | Healthy controls | Serology and only positive patients biopsied | Unclear | Italy | Bizzero et al.315 |
| Children | Case–control (DI) | Ulcerative colitis or Crohn’s disease | 328 | 26–50 | Healthy controls | tTG positive | Secondary | NR | El-Matary et al.366 |
| Mixed | Case–control (DI) | Ulcerative colitis | 86 | 51–75 | Healthy controls | EMA positive | Secondary | Estonia | Kull et al.367 |
| Population group | Study design | Indicator details | Sample size (n) | Sex (% female) | Control group | Reference standard | Care setting | Location | Reference |
|---|---|---|---|---|---|---|---|---|---|
| Adults | Case–control (DI) | IBS | 233 | 76–100 | Healthy controls | tTG positive | Secondary | Islamic Republic of Iran | Mehdi et al.368 |
| Adults | Case–control (DI) | IBS | 200 | 51–75 | Healthy controls | tTG positive | Secondary | Poland | Respondek et al.369 |
| Adults | Case–control (DI) | IBS | 1064 | 76–100 | Healthy controls | Double positive for two antibodies | Secondary | USA | Almazar et al.370 |
| Adults | Case–control (DI) | IBS | 950 | NR | Healthy controls | Serology and only positive patients biopsied | Secondary | USA | Cash et al.371 |
| Adults | Case–control (DI) | IBS | 68 | 51–75 | Healthy controls | tTG positive | NR | Poland | Domżał-Magrowska et al.372 |
| Adults | Case–control (DI) | IBS | 492 | 51–75 | Controls who underwent colonoscopy examination for colorectal cancer screening or polyp surveillance | tTG positive | Secondary | People’s Republic of China | Kou et al.373 |
| Adults | Case–control (DI) | IBS | 1121 | 76–100 | Healthy controls | Double positive for two antibodies | Secondary | USA | Saito-Loftus et al.374 |
| Adults | Case–control (DI) | IBS | 800 | 76–100 | Healthy controls | Serology and only positive patients biopsied | Secondary | Mexico | Sánchez-Vargas et al.375 |
| Adults | Case–control (DI) | IBS | 600 | 51–75 | Healthy controls | Serology and only positive patients biopsied | Secondary | UK | Sanders et al.376 |
| Adults | Case–control (DI) | IBS | 678 | 76–100 | Healthy controls | Serology and only positive patients biopsied | Secondary | Mexico | Vargas et al.377 |
| Adults | Case–control (DI) | IBS | 758 | 51–75 | Healthy controls | Serology and only positive patients biopsied | Secondary | People’s Republic of China | Wang et al.378 |
| Adults | Case–control (DI) | IBS | 509 | 26–50 | Healthy controls | tTG positive | Secondary | Saudi Arabia | Khayyat379 |
| Adults | Cohort | IBS | 1200 | 62.8 | People without IBS | Serology and only positive patients biopsied | Primary | UK | Sanders et al.309 |
| Adults | Cohort | IBS | 3196 | NR | People without IBS’ | Double positive for two antibodies | Community | USA | Choung et al.288 |
| Adults | Nested case–control (CD) | IBS | 800 | 51–75 | People without IBS | Double positive for two antibodies | Primary and secondary | USA | Hujoel et al.290 |
| Adults | Nested case–control (CD) | IBS | 381 | 51–75 | People without IBS | Double positive for two antibodies | Secondary | USA | Godfrey et al.236 |
| Adults | Nested case–control (DI) | IBS | 128 | 26–50 | Healthy controls | tTG positive | Community | USA | Locke et al.300 |
| Children | Cohort | Functional GI disorder | 5268 | NR | Healthy controls | Serology and only positive patients biopsied | Community | Sweden | Olen et al.380 |
| Population group | Study design | Indicator details | Sample size (n) | Sex (% female) | Control group | Reference standard | Care setting | Location | Reference |
|---|---|---|---|---|---|---|---|---|---|
| Adults | Case–control (DI) | PBC | 168 | NR | Healthy controls | Serology and only positive patients biopsied | Unclear | Italy | Bizarro et al.315 |
| Adults | Case–control (DI) | PBC | 162 | 76–100 | Healthy controls | Serology and only positive patients biopsied | Secondary | Greece | Chatzicostas et al.381 |
| Adults | Case–control (DI) | Chronic hepatitis C | 395 | 26–50 | Healthy controls | Double positive for two antibodies | Secondary | Italy | Durante-Mangoni et al.382 |
| Adults | Case–control (DI) | Chronic hepatitis C | 275 | 26–50 | Healthy controls | Serology and only positive patients biopsied | Secondary | USA | Hernandez et al.383 |
| Adults | Case–control (DI) | ALD, HCV, PBC, PSC, CH | 2002 | 26–50 | Healthy controls | Serology and only positive patients biopsied | Secondary | Sweden | Sjöberg et al.384 |
| Adults | Case–control (DI) | Abnormal liver function tests | 250 | 1–25 | Healthy controls | tTG positive | Secondary | People’s Republic of China | Yuan et al.385 |
| Adults | Cohort | Hepatitis | 1197 | 26–50 | People without hepatitis | Double positive for two antibodies | Community | The United Arab Emirates | Abu-Zeid et al.277 |
| Adults | Cohort | Hepatic diseases | 527 | 51–75 | People without hepatic diseases | Double positive for two antibodies | Secondary | Malaysia | Yap et al.276 |
| Adults | Nested case–control (CD) | Unexplained abnormal levels of AST/ALT | 800 | 51–75 | People without unexplained abnormal AST/ALT | Double positive for two antibodies | Primary and secondary | USA | Hujoel et al.290 |
| Children | Case–control (DI) | Autoimmune hepatitis | 46 | 26–50 | Healthy controls | Serology and only positive patients biopsied | Secondary | Egypt | El-Shabrawi et al.386 |
| Children | Case–control (DI) | Autoimmune hepatitis | 122 | NR | Healthy controls | Serology and only positive patients biopsied | NR | Romania | Oana et al.387 |
| Mixed | Case–control (DI) | HCV, HBV, AIH, PBC, PSC, NAFLD-ALD, NAFLD, and others | 2084 | 51–75 | Healthy controls | Serology and only positive patients biopsied | Secondary | Greece | Germenis et al.388 |
| Mixed | Case–control (DI) | Autoimmune hepatitis | 167 | NR | Healthy controls | Other | Secondary | Italy | Villalta et al.389 |
| Mixed | Case–control (DI) | Chronic hepatitis C | 267 | 26–50 | Healthy controls | Serology and only positive patients biopsied | Secondary | Spain | Vivas et al.301 |
| Mixed | Case–control (DI) | Chronic hepatitis C | 220 | NR | Healthy controls | Other | Secondary | Italy | Villalta et al.389 |
| Population group | Study design | Indicator details | Sample size (n) | Sex (% female) | Control group | Reference standard | Care setting | Location | Reference |
|---|---|---|---|---|---|---|---|---|---|
| Adults | Case–control (DI) | Migraine | 326 | 51–75 | Healthy controls | Serology and only positive patients biopsied | Secondary | Italy | Gabrielli et al.274 |
| Children | Case–control (DI) | Migraine | 257 | 51–75 | Healthy controls | Serology and only positive patients biopsied | Secondary | Türkiye | Balci et al.390 |
| Children | Case–control (DI) | Migraine | 220 | 51–75 | Healthy controls | tTG positive | Secondary | Türkiye | Alehan et al.391 |
| Children | Case–control (DI) | Migraine | 1600 | 26–50 | Healthy controls | Serology and only positive patients biopsied | Secondary | Islamic Republic of Iran | Inaloo et al.392 |
| Children | Case–control (DI) | Migraine headaches | 75 | 26–50 | Healthy controls | EMA positive | Secondary | Israel | Lahat et al.344 |
| Population group | Study design | Indicator details | Sample size (n) | Sex (% female) | Control group | Reference standard | Care setting | Location | Reference |
|---|---|---|---|---|---|---|---|---|---|
| Adults | Case–control (DI) | Multiple sclerosis | 68 | NR | Healthy controls | Serology and only positive patients biopsied | Unclear | Islamic Republic of Iran | Abolfazli et al.393 |
| Adults | Case–control (DI) | Multiple sclerosis | 417 | 51–75 | Healthy controls | tTG positive | Secondary | Italy | Nicoletti et al.394 |
| Adults | Case–control (DI) | Multiple sclerosis | 195 | 76–100 | Healthy controls | tTG positive | Secondary | Spain | Rodrigo et al.395 |
| Adults | Case–control (DI) | Multiple sclerosis | 185 | 51–75 | Healthy controls | Double positive for two antibodies | Secondary | Sweden | Roth et al.396 |
| Mixed | Case–control (DI) | Multiple sclerosis | 221 | 51–75 | Healthy controls | tTG positive | Secondary | Islamic Republic of Iran | Khoshbaten et al.397 |
| Population group | Study design | Indicator details | Sample size (n) | Sex (% female) | Control group | Reference standard | Care setting | Location | Reference |
|---|---|---|---|---|---|---|---|---|---|
| Adults | Case–control (DI) | Osteoporosis | 197 | 76–100 | Healthy controls | Serology and only positive patients biopsied | Secondary | Brazil | Gusso et al.398 |
| Adults | Case–control (DI) | Osteoporosis | 560 | 51–75 | Healthy controls | Serology and only positive patients biopsied | Secondary | Islamic Republic of Iran | Shahbazkhani et al.399 |
| Adults | Case–control (DI) | Osteoporosis | 840 | 76–100 | Healthy controls | Serology and only positive patients biopsied | Secondary | USA | Stenson et al.400 |
| Adults | Case–control (DI) | Osteoporosis | 1414 | 26–50 | Healthy controls | Double positive for two antibodies | Secondary | Czechia | Vanciková et al.401 |
| Adults | Cohort | Osteoporosis | 2121 | 51–75 | People without osteoporosis | tTG positive | Community | Australia | Potter et al.357 |
| Adults | Cohort | Osteoporosis | 6480 | 100 | Women without osteoporosis | tTG positive | Community | Sweden | Agardh et al.358 |
| Adults | Nested case–control (CD) | Osteoporosis | 800 | 51–75 | People without osteoporosis | Double positive for two antibodies | Primary and secondary | USA | Hujoel et al.290 |
| Adults | Nested case–control (CD) | Osteoporosis | 843 | 51–75 | People without osteoporosis | Double positive for two antibodies | Community | USA | Choung et al.360 |
| Mixed | Case–control (CD) | Osteoporosis | 6963 | NR | Patients without osteoporosis | Other | Secondary | USA | Shen et al.402 |
| Population group | Study design | Indicator details | Sample size (n) | Sex (% female) | Control group | Reference standard | Care setting | Location | Reference |
|---|---|---|---|---|---|---|---|---|---|
| Adults | Case–control (DI) | Psoriasis | 482 | 51–75 | General population | Serology and only positive patients biopsied | Primary | Italy | De Bastiani et al.403 |
| Adults | Case–control (DI) | Psoriasis | 87 | 51–75 | Healthy controls | Serology and only positive patients biopsied | Secondary | Türkiye | Akbulut et al.404 |
| Adults | Case–control (DI) | Chronic plaque psoriasis | 160 | 26–50 | Healthy controls | tTG positive | Unclear | India | Dhattarwal et al.405 |
| Mixed | Case–control (DI) | Psoriasis | 200 | 26–50 | Healthy controls | tTG positive | Secondary | Italy | Montesu et al.406 |
| Mixed | Case–control (DI) | Psoriasis | 82 | 26–50 | Healthy controls | tTG positive | Secondary | Egypt | Nagui et al.407 |
| Mixed | Case–control (DI) | Psoriasis | 116 | 26–50 | Healthy controls | tTG positive | Secondary | India | Singh et al.408 |
| Population group | Study design | Indicator details | Sample size (n) | Sex (% female) | Control group | Reference standard | Care setting | Location | Reference |
|---|---|---|---|---|---|---|---|---|---|
| Adults | Case–control (DI) | Systemic lupus erythematosus | 220 | 76–100 | Healthy controls | Serology and only positive patients biopsied | Secondary | Italy | Marai et al.409 |
| Adults | Case–control (DI) | Systemic lupus erythematosus | 220 | NR | Healthy controls | Serology and only positive patients biopsied | Unclear | Italy | Bizzaro et al.315 |
| Adults | Case–control (DI) | Systemic lupus erythematosus | 76 | NR | Healthy controls | EMA positive | Secondary | Ireland | Feighery et al.316 |
| Adults | Case–control (DI) | Systemic lupus erythematosus | 297 | 76–100 | Healthy controls | Double positive for two antibodies | Secondary | Brazil | Picceli et al.410 |
| Adults | Cohort | Systemic lupus erythematosus | 100 | NR | Healthy controls | Serology and only positive patients biopsied | Secondary | USA | Luft et al.320 |
| Children | Case–control (DI) | Systemic lupus erythematosus | 91 | 76–100 | Healthy controls | Serology and only positive patients biopsied | Unclear | Türkiye | Sahin et al.411 |
| Population group | Study design | Indicator details | Sample size (n) | Sex (% female) | Control group | Reference standard | Care setting | Location | Reference |
|---|---|---|---|---|---|---|---|---|---|
| Adults | Case–control (DI) | Recurrent miscarriages or implantation failure | 528 | 100 | Healthy controls | tTG positive | Secondary | Czechia | Cedíková et al.412 |
| Adults | Case–control (DI) | Unexplained infertility or recurrent miscarriages | 342 | 100 | Healthy controls | tTG positive | Secondary | Mexico | Remes-Troche et al.413 |
| Adults | Case–control (DI) | Recurrent miscarriages or implantation failure | 279 | 100 | Healthy controls | Serology and only positive patients biopsied | Secondary | Spain | Herraiz-Nicuesa et al.414 |
| Adults | Case–control (DI) | Unexplained infertility | 535 | 100 | Healthy controls | tTG positive | Secondary | India | Kumar et al.415 |
| Adults | Case–control (DI) | Recurrent pregnancy loss | 808 | 100 | Healthy controls | tTG positive | Secondary | USA | Kutteh et al.416 |
| Adults | Case–control (DI) | Recurrent pregnancy loss | 409 | 100 | Healthy controls | tTG positive | Secondary | India | Kumar et al.415 |
| Adults | Case–control (DI) | Recurrent pregnancy loss | 86 | 100 | Healthy controls | tTG positive | Secondary | Türkiye | Sarikaya et al.417 |
| Adults | Case–control (DI) | Unexplained infertility | 402 | 100 | Healthy controls | Serology and only positive patients biopsied | Secondary | Israel | Shamaly et al.418 |
| Adults | Case–control (DI) | Recurrent pregnancy loss | 232 | 100 | Healthy controls | tTG positive | Secondary | USA | Sharshiner et al.419 |
| Adults | Case–control (DI) | Infertility | 400 | 100 | Healthy controls | Serology and only positive patients biopsied | Secondary | Italy | Tiboni et al.420 |
| Adults | Case–control (DI) | Infertility | 297 | 100 | Healthy controls | tTG positive | Unclear | Islamic Republic of Iran | Zahmatkeshan421 |
| Adults | Case–control (DI) | Infertility | 1675 | 26–50 | Healthy controls | Double positive for two antibodies | Secondary | Czechia | Vanciková et al.401 |
| Adults | Cohort | Spontaneous abortion | 5060 | 100 | Women without spontaneous abortion | Double positive for two antibodies | Secondary | Italy | Greco et al.310 |
| Adults | Nested case–control (CD) | Infertility | 800 | 51–75 | People without infertility | Double positive for two antibodies | Primary and secondary | USA | Hujoel et al.290 |
| Adults | Nested case–control (CD) | Previous abortion | 619 | 100 | People without previous abortion | Double positive for two antibodies | Community | USA | Celdir et al.422 |
| Adults | Nested case–control (DI) | Previous miscarriage | 218 | 100 | Healthy controls | Serology and only positive patients biopsied | Secondary | Italy | Martinelli et al.423 |
| Population group | Study design | Indicator details | Sample size (n) | Sex (% female) | Control group | Reference standard | Care setting | Location | Reference |
|---|---|---|---|---|---|---|---|---|---|
| Adults | Case–control (DI) | Type 1 diabetes | 600 | 51–75 | Healthy controls | Serology and only positive patients biopsied | Secondary | Egypt | Mohammed et al.424 |
| Adults | Case–control (DI) | Type 1 diabetes | 177 | 51–75 | Healthy controls | Serology and only positive patients biopsied | Secondary | Italy | Picarelli et al.425 |
| Adults | Case–control (DI) | Type 1 diabetes | 130 | 26–50 | Healthy controls | Serology and only positive patients biopsied | Secondary | Türkiye | Dagdelen et al.426 |
| Adults | Case–control (DI) | Type 1 diabetes | 180 | 51–75 | Healthy controls | Serology and only positive patients biopsied | Secondary | Türkiye | Güvenç et al.427 |
| Adults | Case–control (DI) | Type 1 diabetes | 1680 | 26–50 | Healthy controls | Serology and only positive patients biopsied | Secondary | Israel | Hanukoglu et al.428 |
| Adults | Case–control (DI) | Type 1 diabetes | 2200 | 51–75 | Healthy controls | Serology and only positive patients biopsied | Secondary | UK | Kurien et al.429 |
| Adults | Case–control (DI) | Type 1 diabetes | 346 | NR | Healthy controls | tTG positive | Secondary | India | Shivaprasad et al.430 |
| Adults | Case–control (DI) | Type 1 diabetes | 280 | 51–75 | Healthy controls | tTG positive | Secondary | People’s Republic of China | Zhao et al.431 |
| Adults | Cohort | Type 1 diabetes | 527 | 51–75 | People without type 1 diabetes | Double positive for two antibodies | Secondary | Malaysia | Yap et al.276 |
| Adults | Cohort | Type 1 diabetes | 6919 | 51–75 | People without type 1 diabetes | Double positive for two antibodies | Community | Finland | Heikkilä et al.321 |
| Adults | Nested case–control (CD) | Type 1 diabetes | 800 | 51–75 | People without type 1 diabetes | Double positive for two antibodies | Primary and secondary | USA | Hujoel et al.290 |
| Children | Case–control (DI) | Type 1 diabetes | 1750 | 26–50 | Children without type 1 diabetes | Other | Secondary | Egypt | Abu-Zekry et al.432 |
| Children | Case–control (DI) | Type 1 diabetes | 971 | 26–50 | Healthy controls | Double positive for two antibodies | Community | Sweden | Adlercreutz et al.433 |
| Children | Case–control (DI) | Type 1 diabetes | 1363 | 26–50 | Healthy controls | Double positive for two antibodies | Community | Denmark | Adlercreutz et al.433 |
| Children | Case–control (DI) | Type 1 diabetes | 335 | 26–50 | Healthy controls | Serology and only positive patients biopsied | Secondary | USA | Aktay et al.434 |
| Children | Case–control (DI) | Type 1 diabetes | 209 | 26–50 | Healthy controls | Serology and only positive patients biopsied | Secondary | Brazil | Baptista et al.435 |
| Children | Case–control (DI) | Type 1 diabetes | 246 | 51–75 | Healthy controls | Serology and only positive patients biopsied | Secondary | Serbia | Djurić et al.436 |
| Children | Case–control (DI) | Type 1 diabetes | 394 | NR | Healthy controls | tTG positive | Unclear | USA | Frohnert et al.437 |
| Children | Case–control (DI) | Type 1 diabetes | 272 | 26–50 | Healthy controls | tTG positive | Secondary | Romania | Gurau et al.438 |
| Children | Case–control (DI) | Type 1 diabetes | 265 | 26–50 | Healthy controls | Serology and only positive patients biopsied | Secondary | Sweden | Hansson et al.439 |
| Children | Case–control (DI) | Type 1 diabetes | 197 | NR | Healthy controls | tTG positive | Secondary | Colombia | Krause et al.440 |
| Children | Case–control (DI) | Type 1 diabetes | 74 | 26–50 | Healthy controls | Serology and only positive patients biopsied | Secondary | Türkiye | Soyucen et al.441 |
| Children | Case–control (DI) | Type 1 diabetes | 446 | 51–75 | Healthy controls | tTG positive | Secondary | Colombia | Velasco et al.442 |
| Mixed | Case–control (DI) | Type 1 diabetes | 4491 | 26–50 | Healthy controls | Serology and only positive patients biopsied | Secondary | Italy | Not et al.443 |
| Mixed | Case–control (DI) | Type 1 diabetes | 219 | 26–50 | Healthy controls | tTG positive | Secondary | Democratic Socialist Republic of Sri Lanka | Premawardhana et al.444 |
| Mixed | Case–control (DI) | Type 1 diabetes | 347 | 51–75 | Healthy controls | tTG positive | Secondary | Germany | Jaeger et al.445 |
| Mixed | Case–control (DI) | Type 1 diabetes | 196 | NR | Healthy controls | tTG positive | Secondary | India | Kanungo et al.446 |
| Mixed | Case–control (DI) | Type 1 diabetes | 151 | 51–75 | Healthy controls | Serology and only positive patients biopsied | Secondary | Türkiye | Sari et al.447 |
| Mixed | Case–control (DI) | Type 1 diabetes | 500 | 26–50 | Healthy controls | tTG positive | Secondary | Italy | Lampasona et al.448 |
| Mixed | Case–control (DI) | Type 1 diabetes | 250 | 51–75 | Healthy controls | tTG positive | Secondary | Islamic Republic of Iran | Sharifi et al.449 |
| Mixed | Case–control (DI) | Type 1 diabetes | 120 | NR | Healthy controls | Serology and only positive patients biopsied | Secondary | Islamic Republic of Iran | Sheikholeslami et al.450 |
| Population group | Study design | Indicator details | Sample size (n) | Sex (% female) | Control group | Reference standard | Care setting | Location | Reference |
|---|---|---|---|---|---|---|---|---|---|
| Adults | Case–control (DI) | Type 2 diabetes | 250 | 51–75 | Healthy controls | Serology and only positive patients biopsied | Secondary | Türkiye | Kizilgul et al.451 |
| Adults | Case–control (DI) | Type 2 diabetes | 113 | 51–75 | Healthy controls | tTG positive | Secondary | Poland | Szepietowska et al.452 |
| Adults | Case–control (DI) | Type 2 diabetes | 247 | 51–75 | Healthy controls | tTG positive | Secondary | People’s Republic of China | Zhao et al.431 |
| Adults | Cohort | Type 2 diabetes | 6919 | 51–75 | People without diabetes | Double positive for two antibodies | Community | Finland | Heikkilä et al.321 |
| Mixed | Case–control (DI) | Type 2 diabetes | 338 | NR | Healthy controls | tTG positive | Secondary | India | Kanungo et al.446 |
| Mixed | Case–control (DI) | Type 2 diabetes | 332 | 26–50 | Healthy controls | tTG positive | Secondary | Italy | Lampasona et al.448 |
| Population group | Study design | Indicator details | Sample size (n) | Sex (% female) | Control group | Reference standard | Care setting | Location | Reference |
|---|---|---|---|---|---|---|---|---|---|
| Adults | Case–control (DI) | Thyroid autoimmunity | 1337 | NR | Healthy controls | Serology and only positive patients biopsied | Secondary | Italy | Ravaglia et al.453 |
| Adults | Case–control (DI) | Thyroid autoimmunity | 814 | NR | Healthy controls | Serology and only positive patients biopsied | Secondary | Italy | Ravaglia et al.453 |
| Adults | Case–control (DI) | Hashimoto’s thyroiditis | 82 | 100 | Healthy controls | tTG positive | Secondary | Islamic Republic of Iran | Riseh et al.454 |
| Adults | Case–control (DI) | Graves’ disease | 354 | 76–100 | Healthy controls | Serology and only positive patients biopsied | Secondary | Poland | Miskiewicz et al.455 |
| Adults | Case–control (DI) | Hashimoto’s thyroiditis or Graves’ disease | 4172 | 76–100 | Healthy controls | Serology and only positive patients biopsied | Secondary | Italy | Berti et al.456 |
| Adults | Case–control (DI) | Graves’ disease | 124 | NR | Healthy controls | EMA positive | Secondary | Ireland | Feighery et al.316 |
| Adults | Case–control (DI) | Graves’ disease | 226 | 76–100 | Healthy controls | Double positive for two antibodies | Secondary | UK | Ch’ng et al.457 |
| Adults | Case–control (DI) | Thyroid autoimmunity | 255 | 76–100 | Healthy controls | Serology and only positive patients biopsied | Secondary | Türkiye | Guliter et al.458 |
| Adults | Case–control (DI) | Hashimoto’s thyroiditis | 470 | NR | Healthy controls | Serology and only positive patients biopsied | Secondary | Italy | Volta et al.459 |
| Adults | Case–control (DI) | Autoimmune and non-autoimmune thyroid disease | 318 | 51–75 | Healthy controls | tTG positive | Secondary | People’s Republic of China | Zhao et al.431 |
| Adults | Cohort | Thyroid disorder | 1197 | 26–50 | People without thyroid disorder | Double positive for two antibodies | Community | The United Arab Emirates | Abu-Zeid et al.277 |
| Adults | Cohort | Thyroid disorder | 527 | 51–75 | People without thyroid disorder | Double positive for two antibodies | Secondary | Malaysia | Yap et al.276 |
| Adults | Cohort | Thyroid disorder | 4633 | 26–50 | Healthy controls | tTG positive | Community | Germany | Metzger et al.460 |
| Adults | Cohort | Thyroid disorder | 7339 | 51–75 | People without thyroid disease | EMA positive | Primary | UK | West et al.359 |
| Adults | Nested case–control (CD) | Thyroiditis, hypo- or hyperthyroidism | 800 | 51–75 | People without thyroid disease | Double positive for two antibodies | Primary and secondary | USA | Hujoel et al.290 |
| Adults | Nested case–control (DI) | TPOAbs | 682 | NR | Healthy controls | tTG positive | Community | India | Marwaha et al.461 |
| Children | Case–control (DI) | Thyroid autoimmunity | 132 | 51–75 | Healthy controls | Serology and only positive patients biopsied | Unclear | Türkiye | Sahin et al.462 |
| Children | Case–control (DI) | Thyroid autoimmunity | 204 | 51–75 | Healthy controls | Serology and only positive patients biopsied | Secondary | Türkiye | Sari et al.463 |
| Children | Case–control (DI) | Thyroid autoimmunity | 134 | NR | Healthy controls | Serology and only positive patients biopsied | NR | Romania | Oana et al.387 |
| Children | Nested case control (based on CD) | TPOAbs | 2030 | 26–50 | Healthy controls | Serology and only positive patients biopsied | Community | Sweden | van der Pals et al.464 |
| Children | Nested case–control (DI) | TPOAbs | 472 | NR | Healthy controls | tTG positive | Community | India | Marwaha et al.461 |
| Mixed | Case–control (DI) | Free T4 or TSH | 77 | 51–75 | Healthy controls | Double positive for two antibodies | Secondary | Iraq | Risan465 |
| Mixed | Case–control (DI) | Thyroid autoimmunity | 652 | 76–100 | Healthy controls | tTG positive | Community | Brazil | de Melo et al.466 |
| Population group | Study design | Indicator details | Sample size (n) | Sex (% female) | Control group | Reference standard | Care setting | Location | Reference |
|---|---|---|---|---|---|---|---|---|---|
| Adults | Cohort | Vomiting | 2843 | NR | People without vomiting | Double positive for two antibodies | Community | USA | Choung et al.288 |
| Adults | Cohort | Nausea | 3847 | 51–75 | People without nausea | Double positive for two antibodies | Community | USA | Katz et al.296 |
| Adults | Cohort | Vomiting | 3847 | 51–75 | People without vomiting | Double positive for two antibodies | Community | USA | Katz et al.296 |
| Children | Cohort | Vomiting | 4327 | NR | Children without vomiting | Double positive for two antibodies | Community | UK | Bingley et al.2 |
| Children | Cohort | Vomiting | 18,593 | 51–75 | Children without vomiting | Serology and only positive patients biopsied | Community | Türkiye | Dalgic et al.292 |
| Children | Cohort | Nausea | 1562 | 26–50 | Children without nausea (after eating) | tTG positive | Community | The Netherlands | Jansen et al.182 |
| Children | Cohort | Vomiting | 9918 | 51–75 | Children without vomiting | tTG positive | Secondary | USA | Stahl et al.293 |
| Population group | Study design | Indicator details | Sample size (n) | Sex (% female) | Control group | Reference standard | Care setting | Location | Reference |
|---|---|---|---|---|---|---|---|---|---|
| Adults | Cohort | Weight loss | 1960 | NR | People without weight loss | Double positive for two antibodies | Community | USA | Choung et al.288 |
| Adults | Nested case–control (CD) | Weight loss | 800 | 51–75 | People without unexplained weight loss | Double positive for two antibodies | Primary and secondary | USA | Hujoel et al.290 |
| Adults | Nested case–control (CD) | Weight loss | 381 | 51–75 | People without weight loss | Double positive for two antibodies | Secondary | USA | Godfrey et al.236 |
| Children | Cohort | Weight loss | 18,680 | 51–75 | Children without weight loss | Serology and only positive patients biopsied | Community | Türkiye | Dalgic et al.292 |
| Children | Cohort | Weight loss | 9918 | 51–75 | Children without weight loss | tTG positive | Secondary | USA | Stahl et al.293 |
Appendix 5 Risk of bias
FIGURE 27.
Summary graphs of risk of bias. (a) Symptom: acid reflux symptoms; (b) symptom: diarrhoea; (c) symptom: abdominal pain; (d) symptom: constipation; (e) symptom: bloating and abdominal distension; (f) symptom: vomiting and nausea; (g) symptom: weight loss; (h) risk condition: type 1 diabetes; (i) risk condition: thyroid disease; (j) risk condition: anaemia; (k) risk condition: IBS; (l) risk condition: chronic liver disease; (m) risk condition: arthritis; (n) risk condition: subfertility and pregnancy loss; (o) risk condition: epilepsy; (p) risk condition: osteoporosis; (q) risk condition: fracture; (r) risk condition: inflammatory bowel disease; (s) risk condition: systemic lupus erythematosus; (t) risk condition: type 2 diabetes; (u) risk condition: dermatitis herpetiformis; (v) risk condition: migraine; (w) risk condition: multiple sclerosis; (x) risk condition: psoriasis; and (y) family history of CD. Note that each of the bars represents 100% of the studies per indicator.


Appendix 6 Forest plots of sensitivity and specificity per diagnostic indicator
Symptoms
FIGURE 28.
Abdominal pain. FN, false negative; FP, false positive; TN, true negative; TP, true positive.
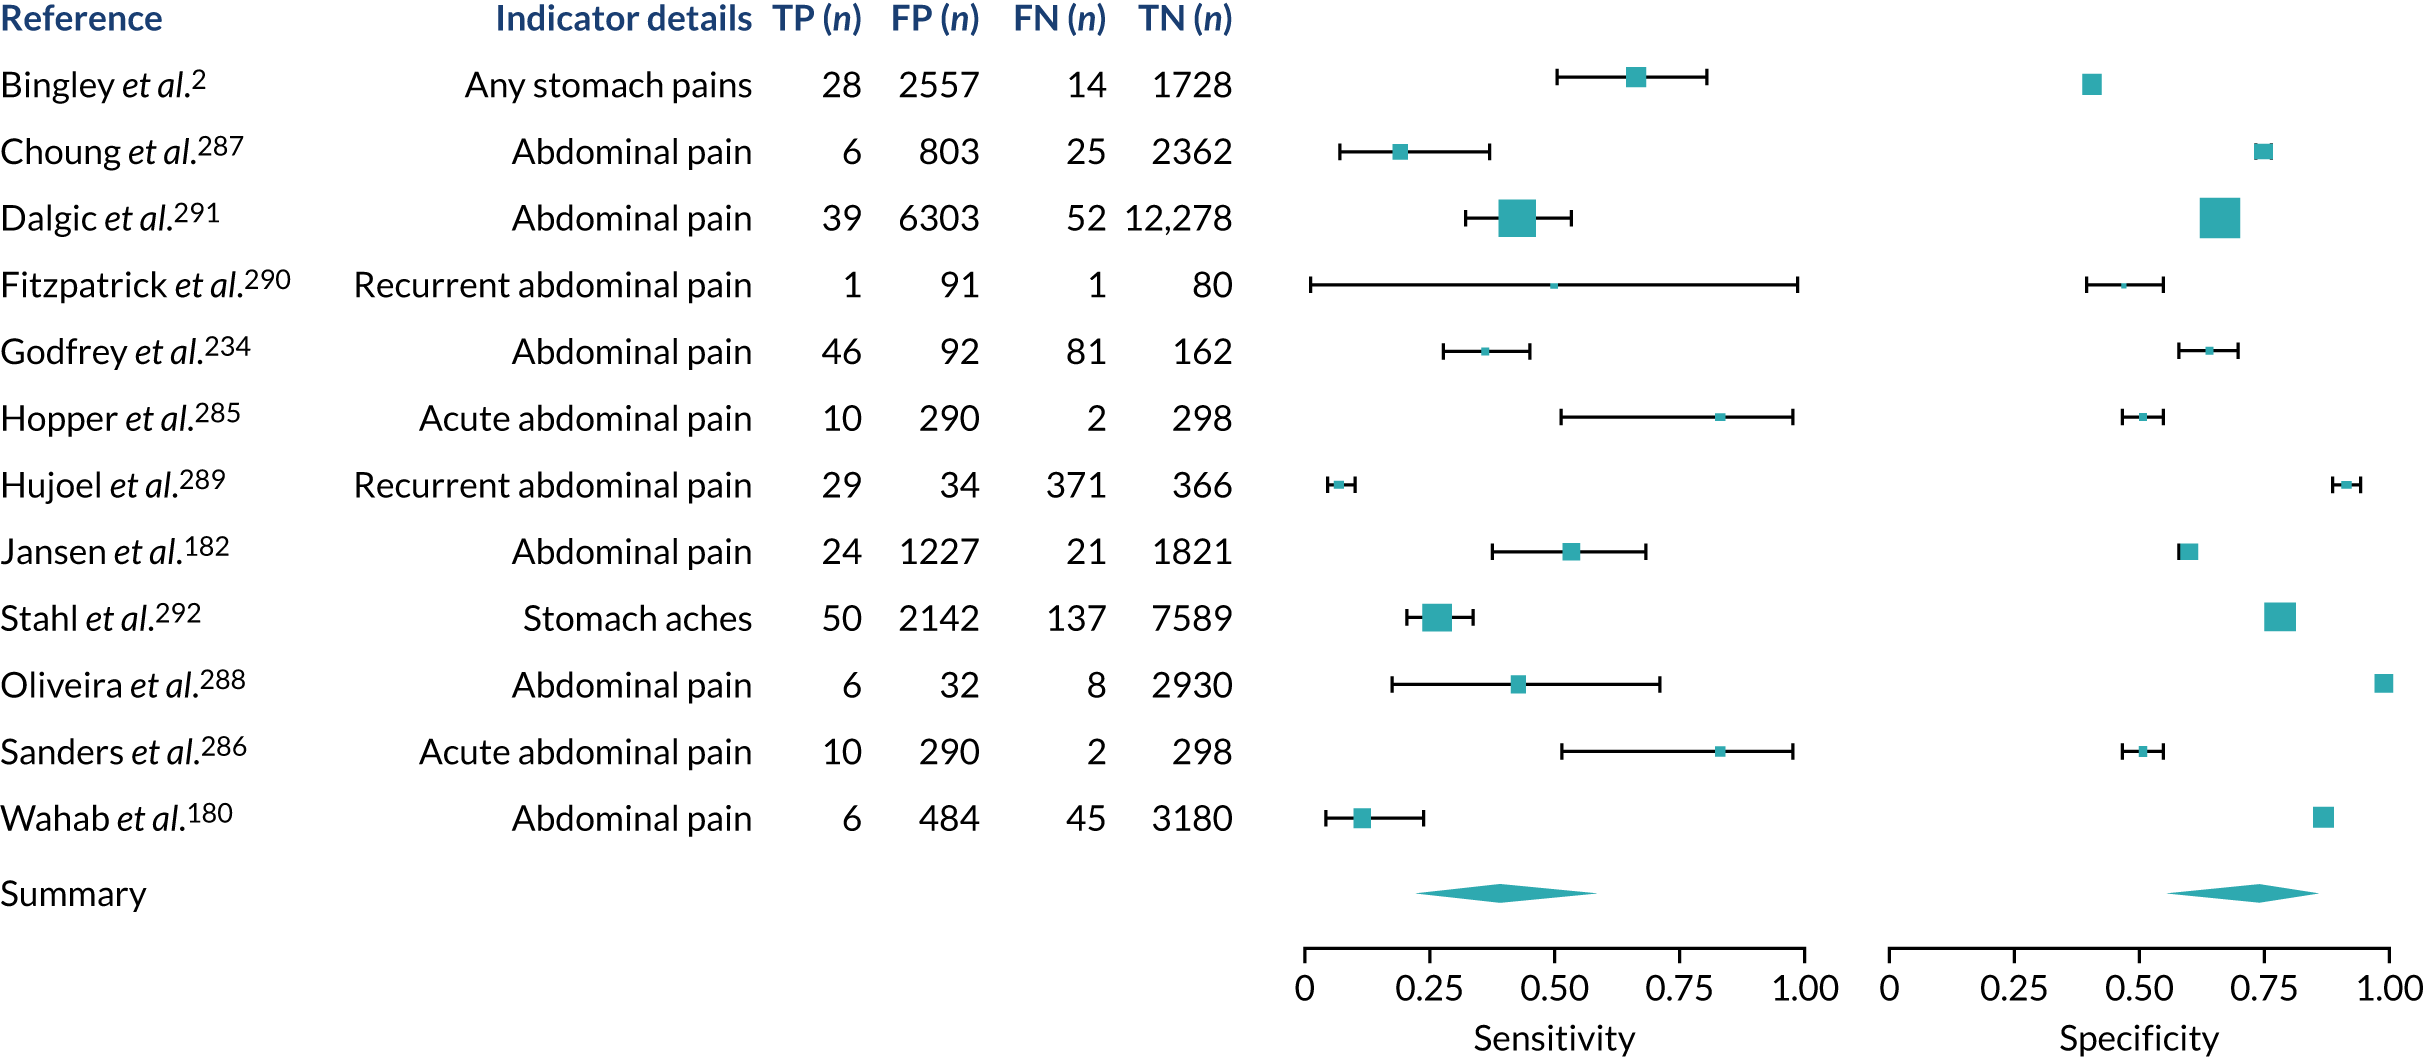
FIGURE 29.
Acid reflux symptoms. FN, false negative; FP, false positive; TN, true negative; TP, true positive.
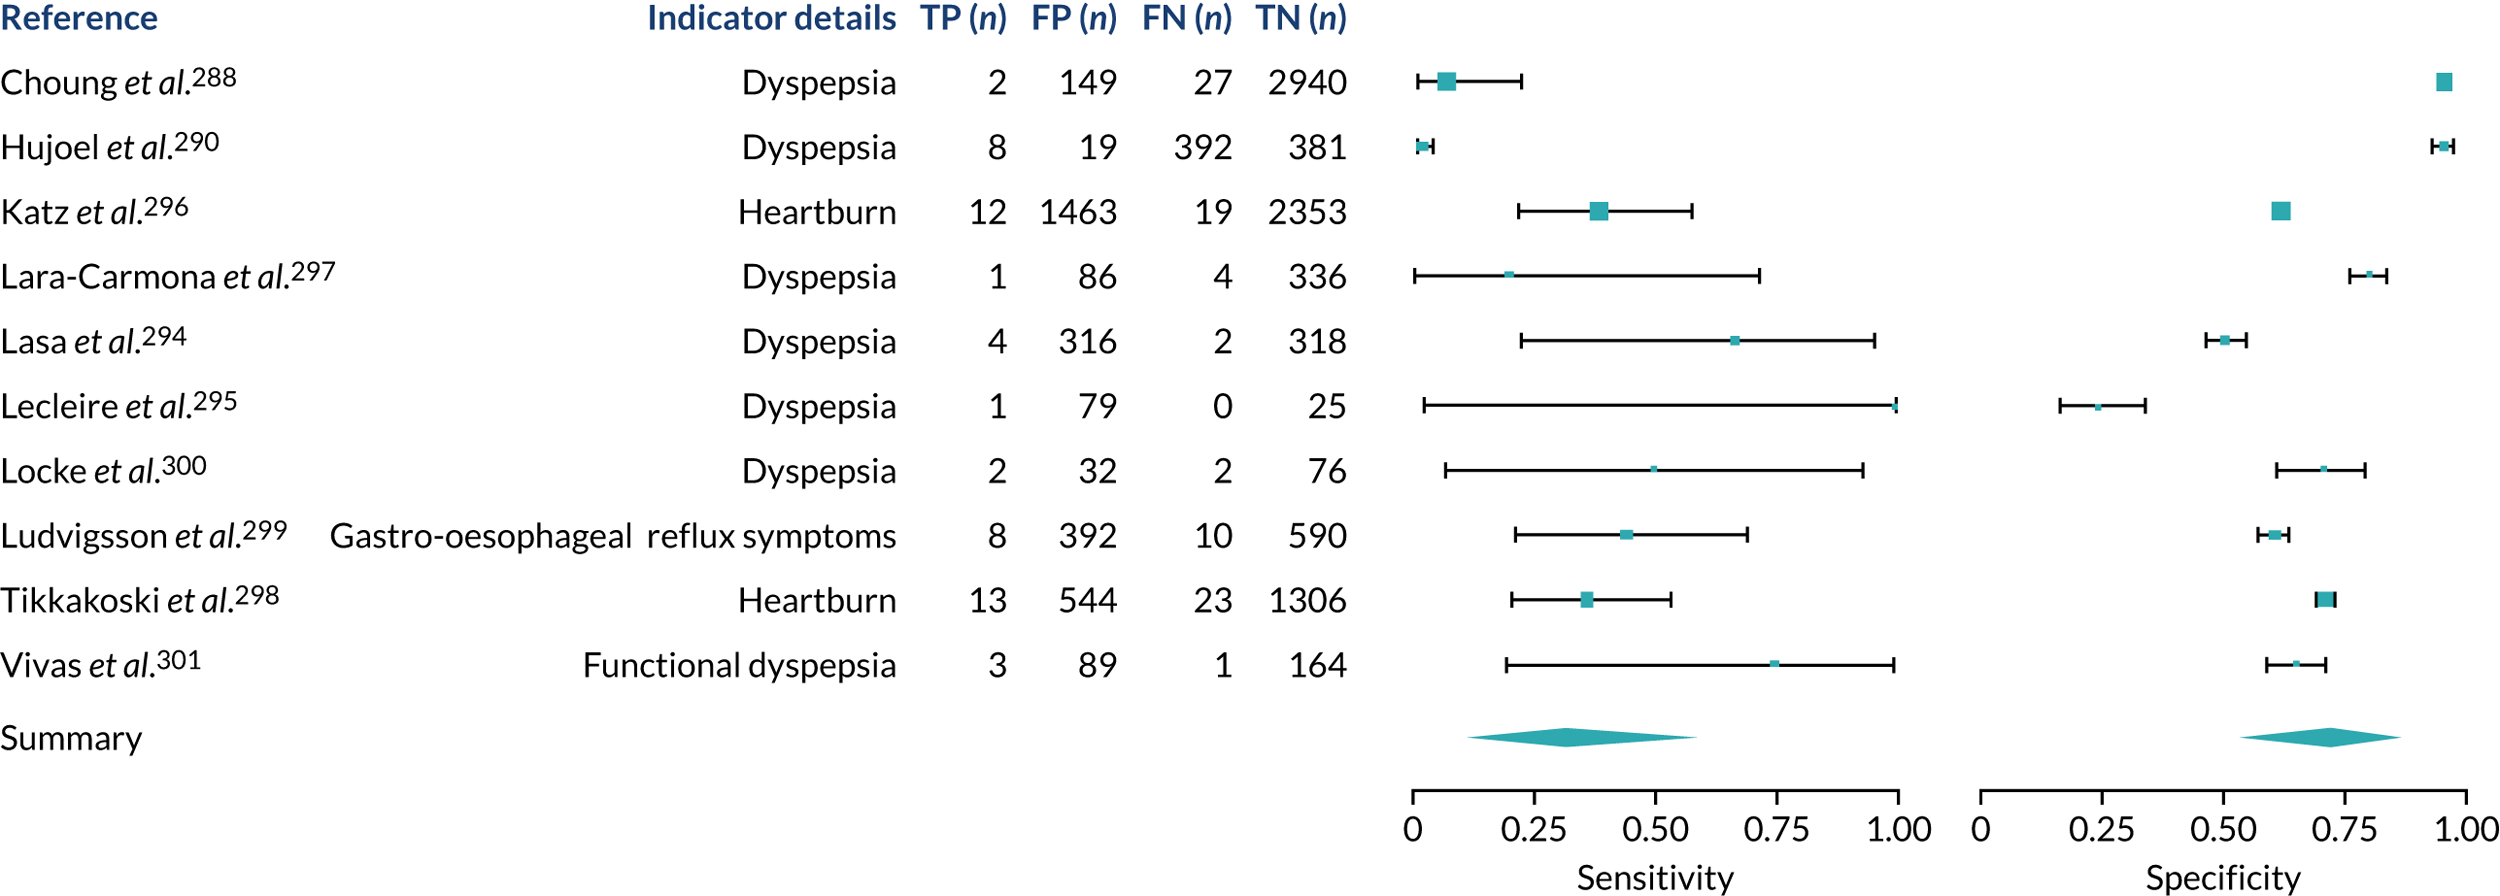
FIGURE 30.
Bloating or abdominal distension. FN, false negative; FP, false positive; TN, true negative; TP, true positive.

FIGURE 31.
Constipation. FN, false negative; FP, false positive; TN, true negative; TP, true positive.
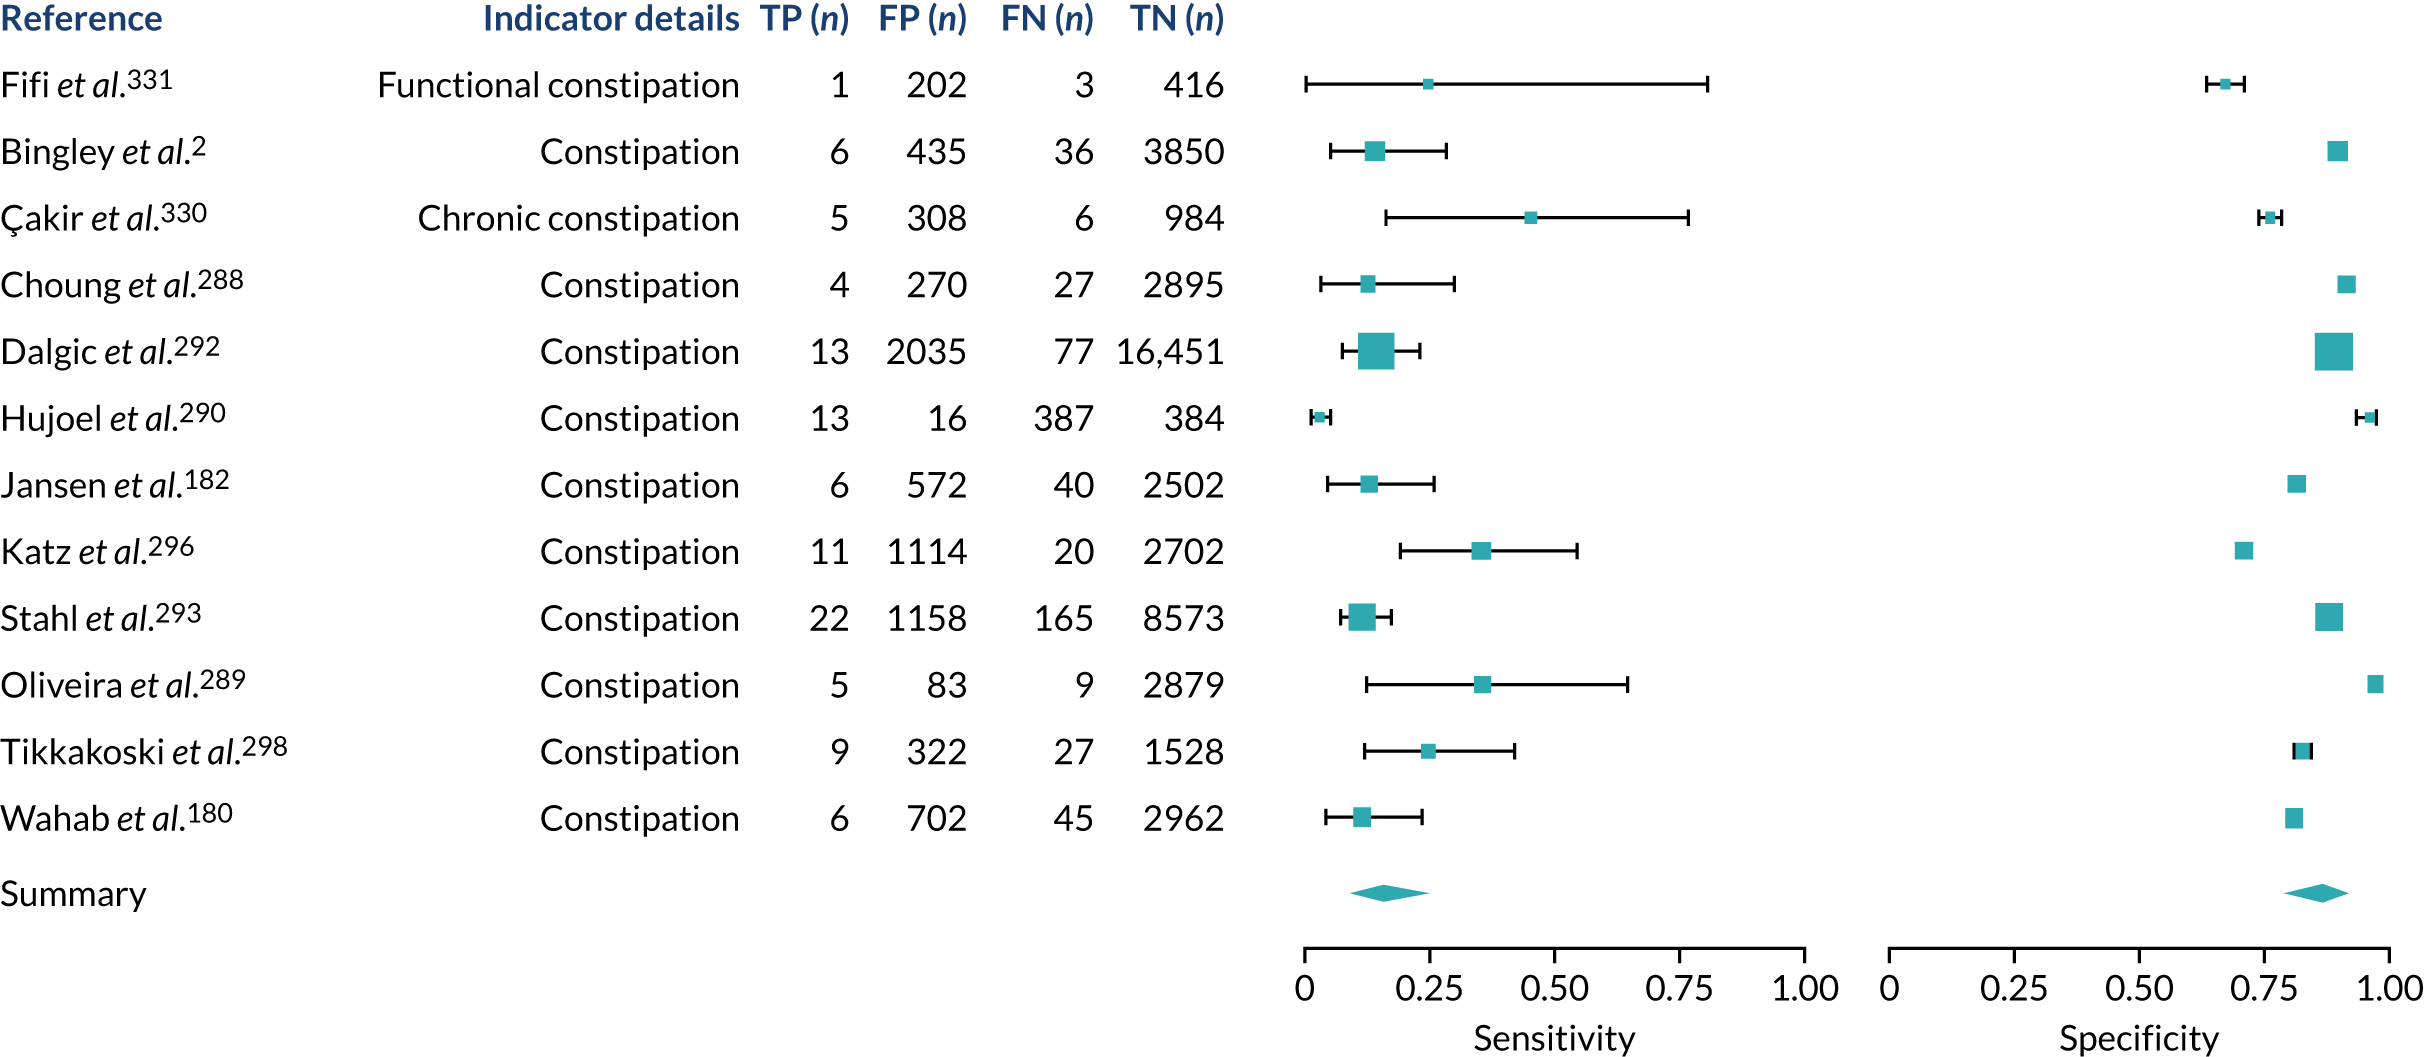
FIGURE 32.
Diarrhoea. FN, false negative; FP, false positive; TN, true negative; TP, true positive.
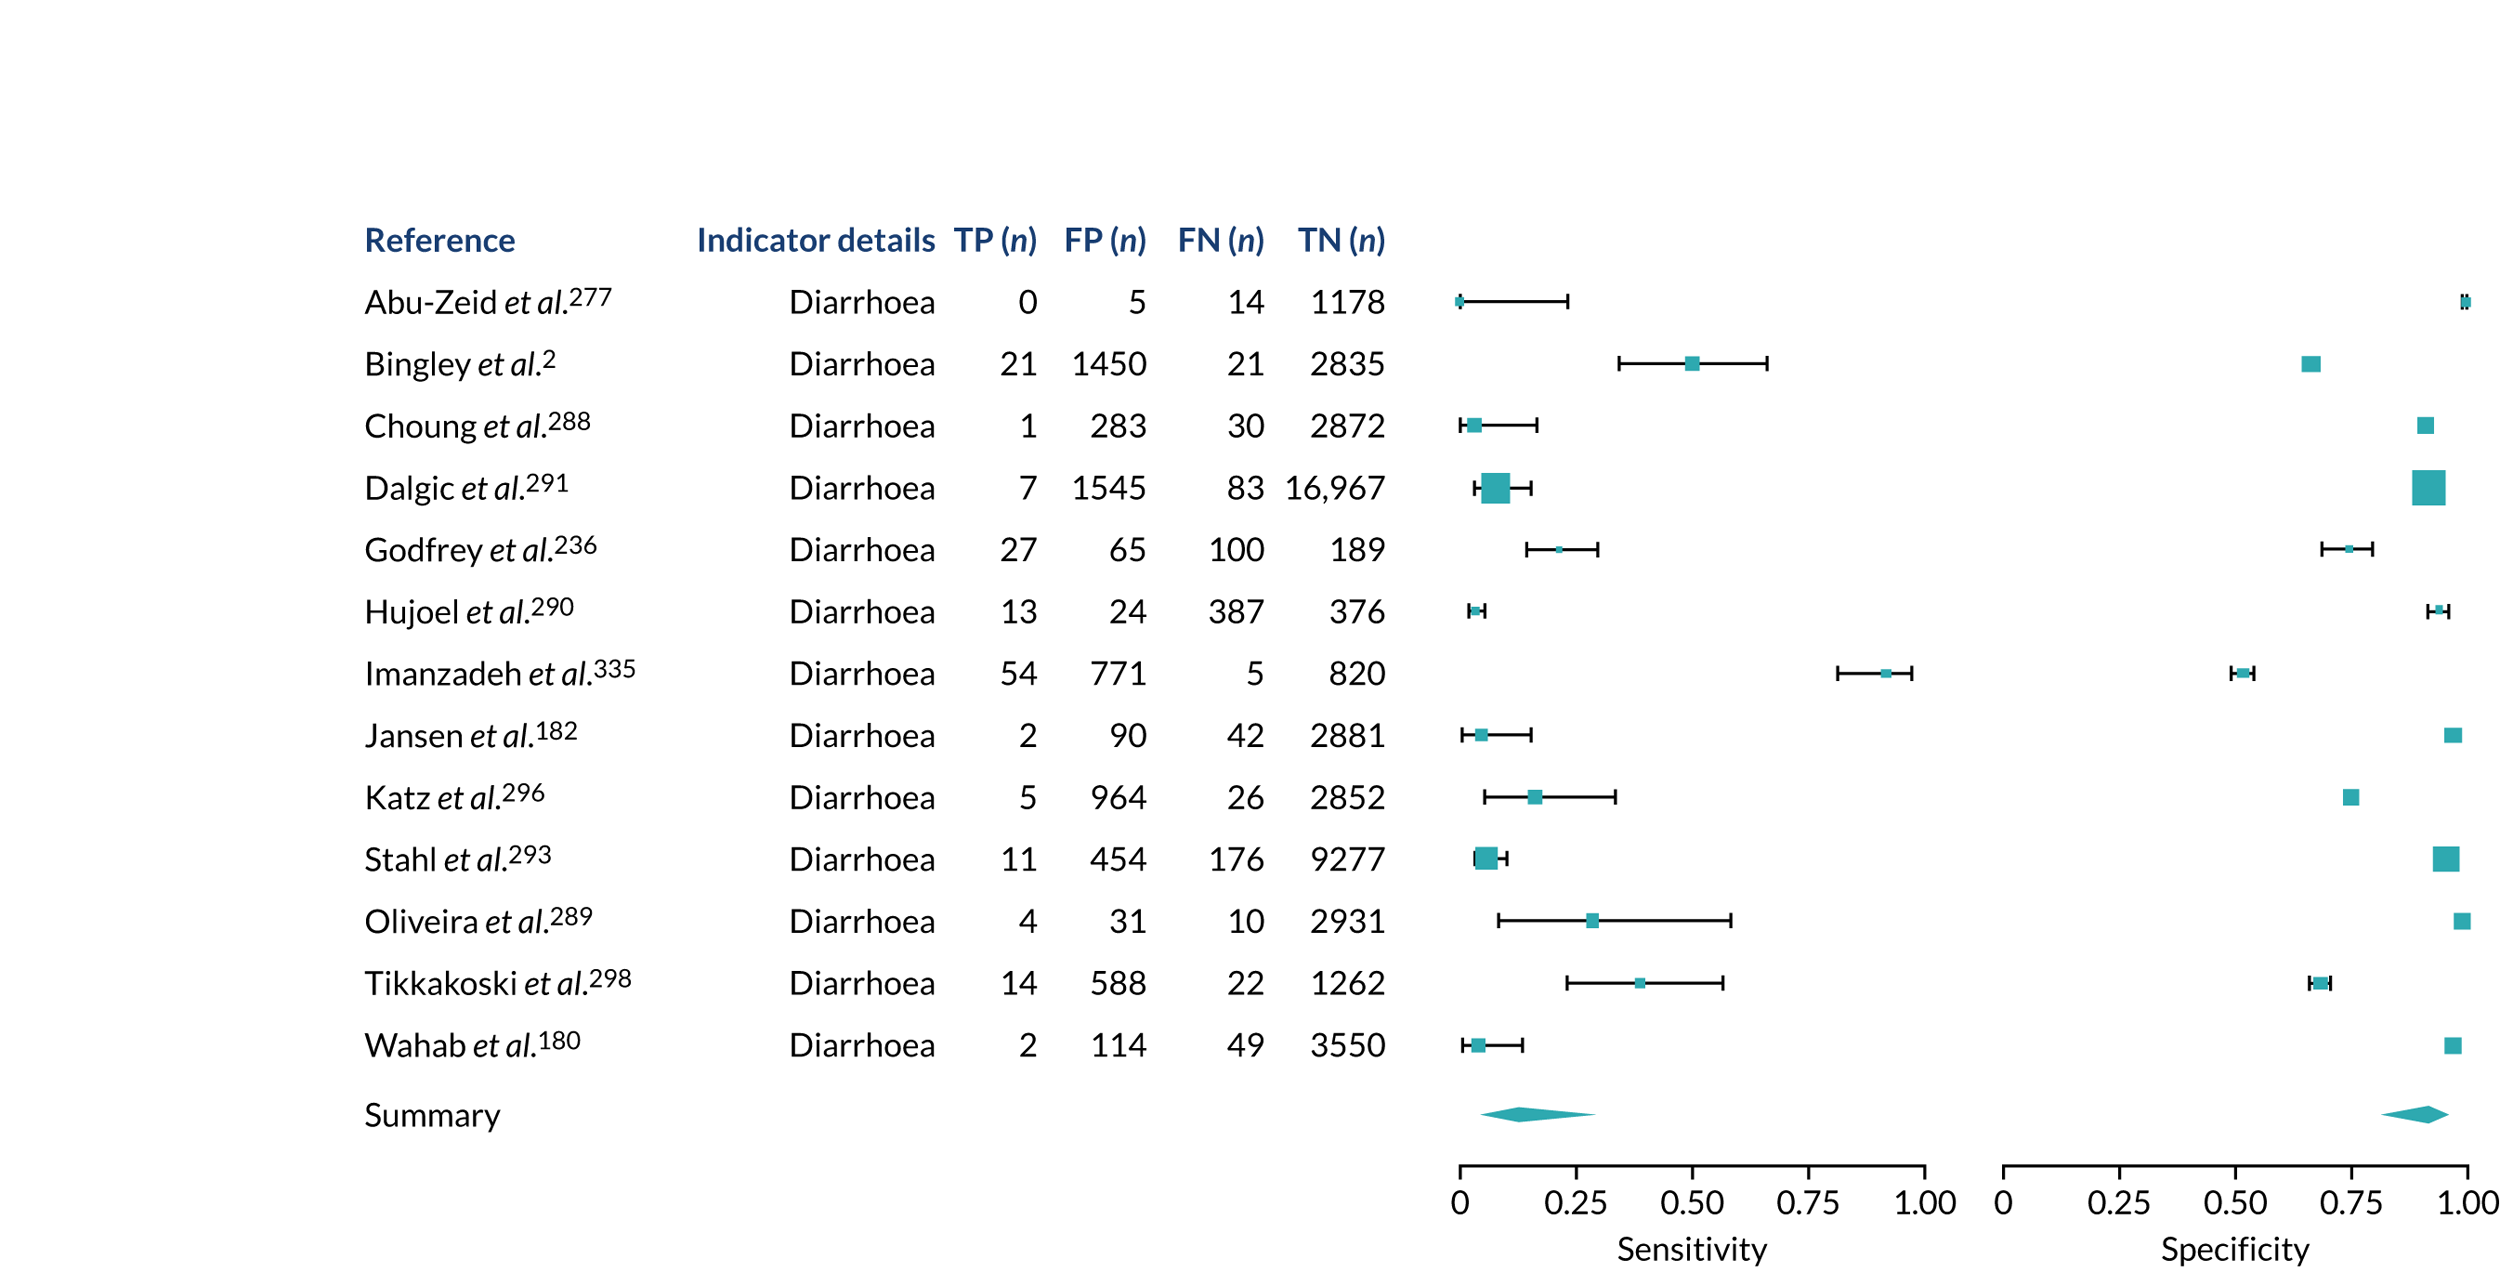
FIGURE 33.
Vomiting and nausea. FN, false negative; FP, false positive; TN, true negative; TP, true positive.

Risk conditions
FIGURE 34.
Anaemia. FN, false negative; FP, false positive; TN, true negative; TP, true positive.
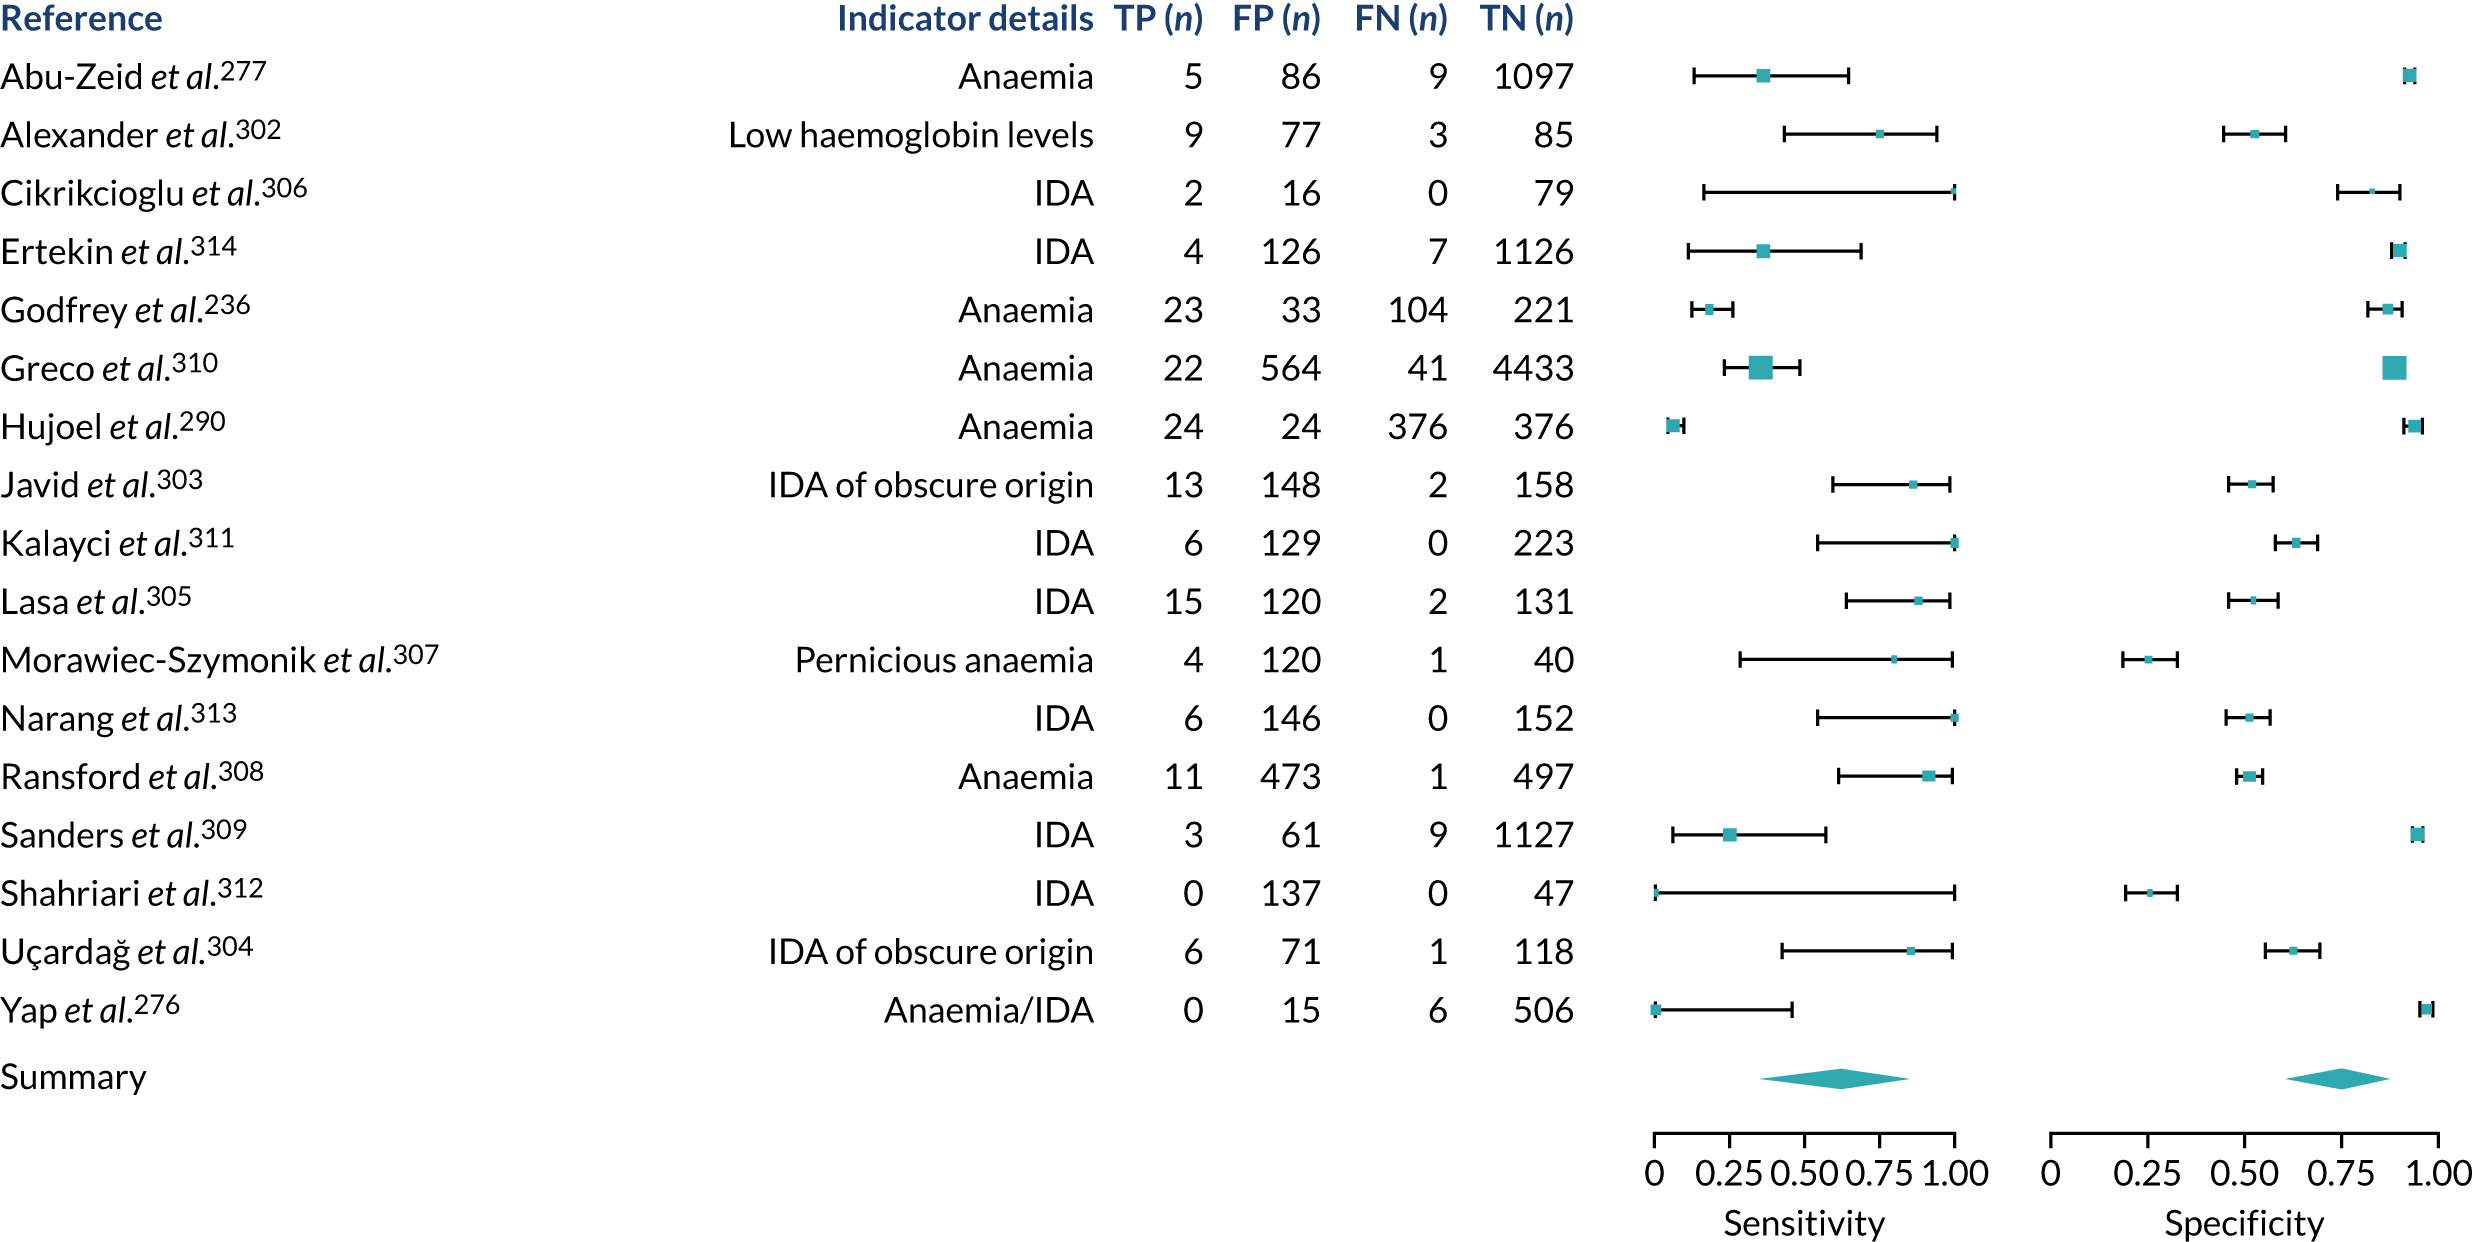
FIGURE 35.
Arthritis. AS, ankylosing spondylitis; FN, false negative; FP, false positive; PsA, psoriatic arthritis; RA, rheumatoid arthritis; TN, true negative; TP, true positive.
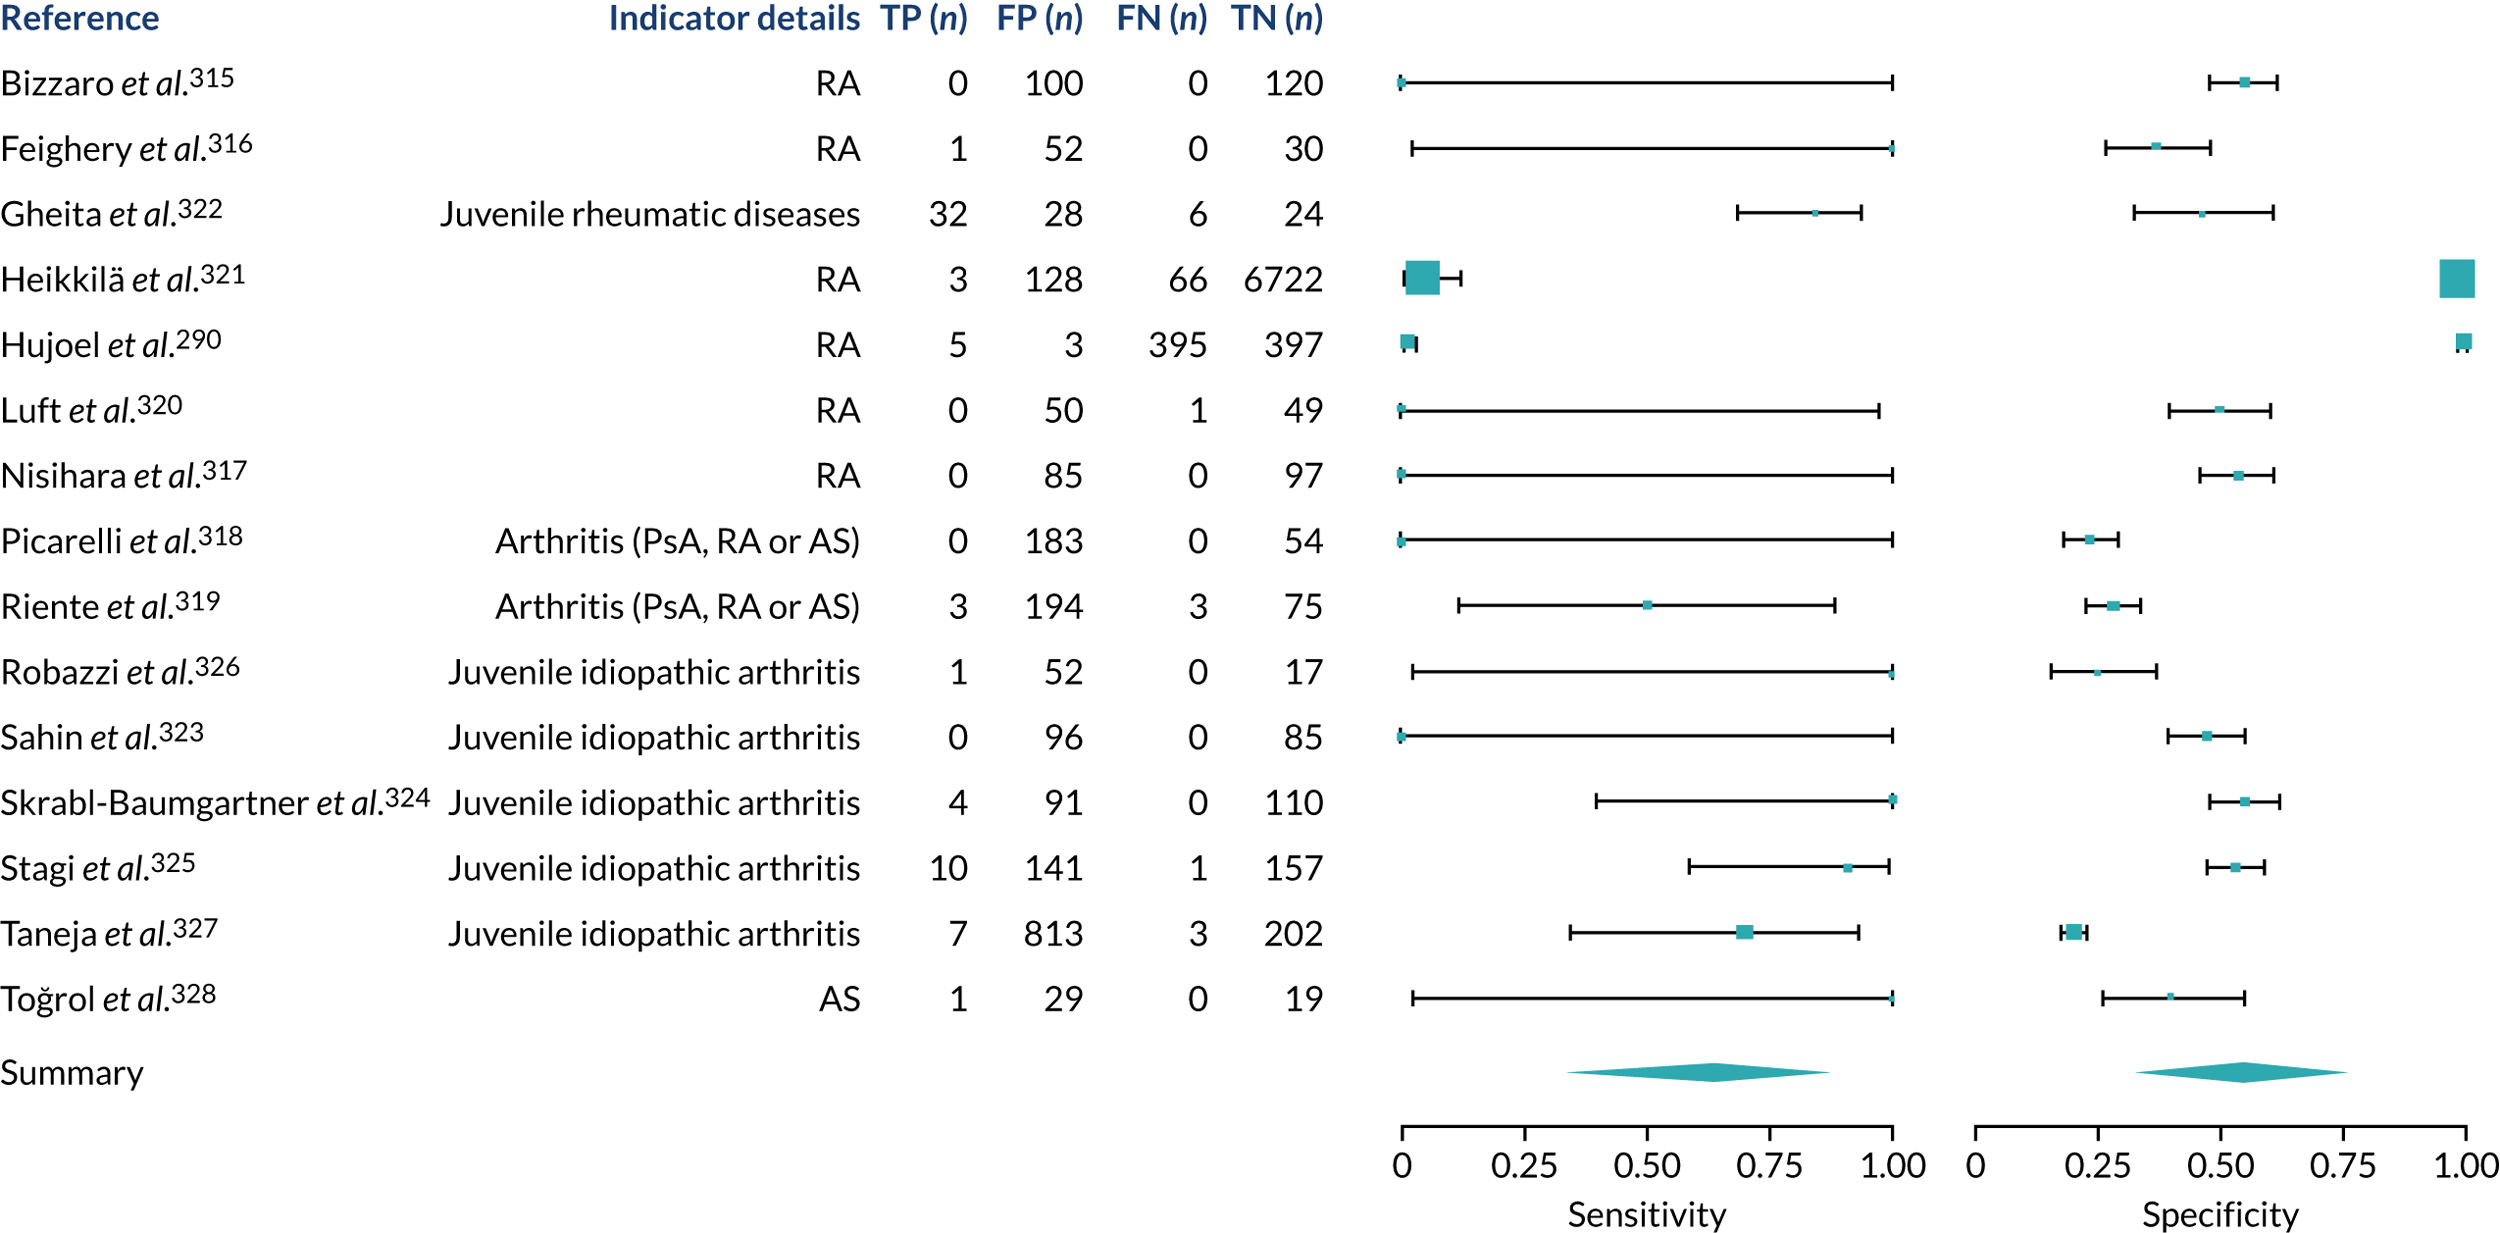
FIGURE 36.
Dermatitis herpetiformis. FN, false negative; FP, false positive; TN, true negative; TP, true positive.

FIGURE 37.
Epilepsy. FN, false negative; FP, false positive; TN, true negative; TP, true positive.
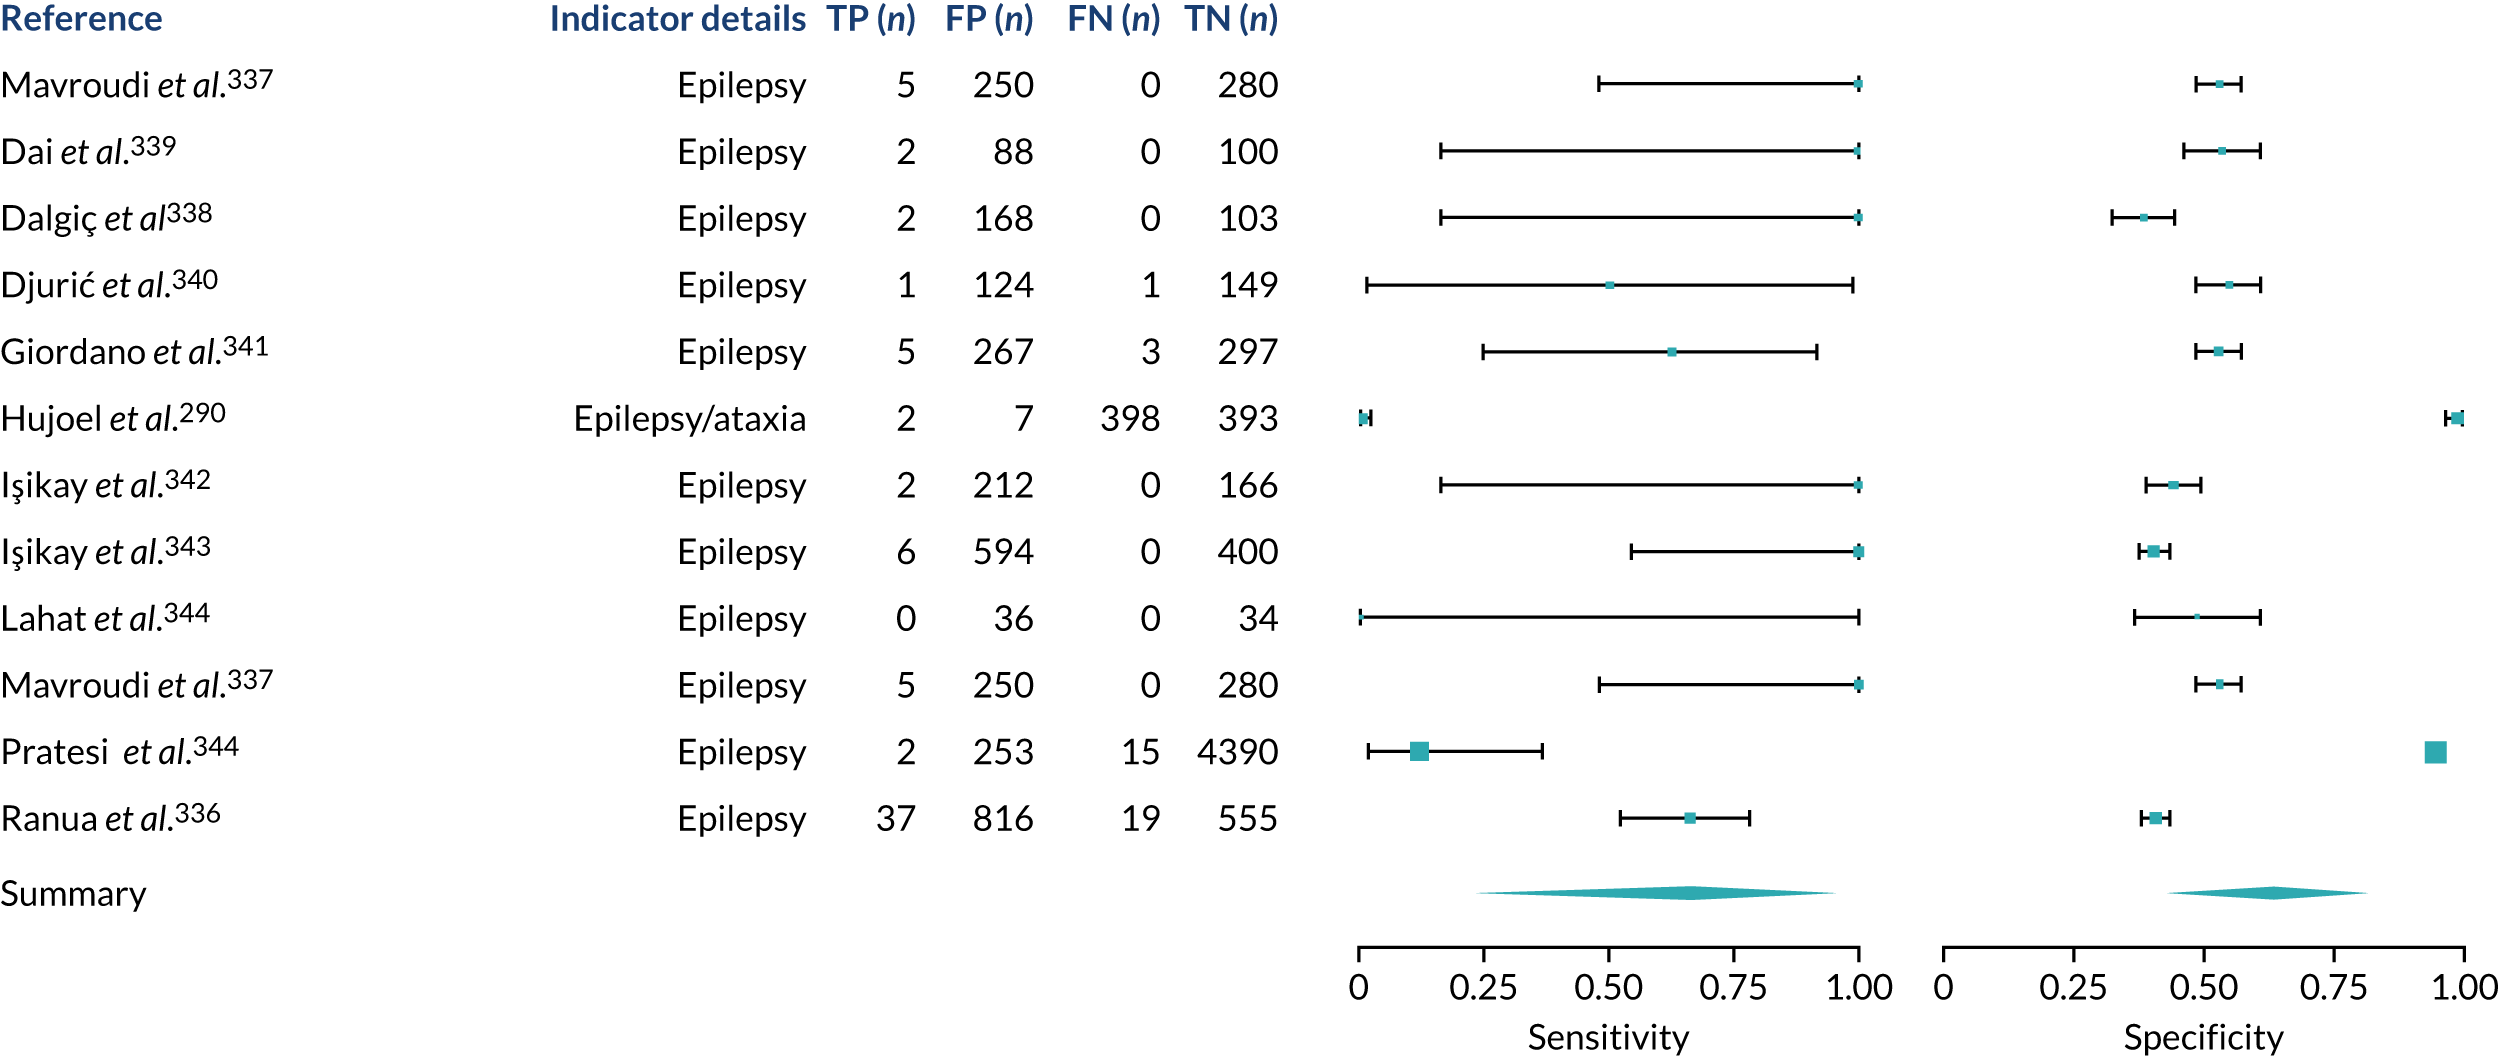
FIGURE 38.
Fracture. FN, false negative; FP, false positive; TN, true negative; TP, true positive.

FIGURE 39.
Inflammatory bowel disease. FN, false negative; FP, false positive; TN, true negative; TP, true positive.

FIGURE 40.
IBS. FN, false negative; FP, false positive; TN, true negative; TP, true positive.
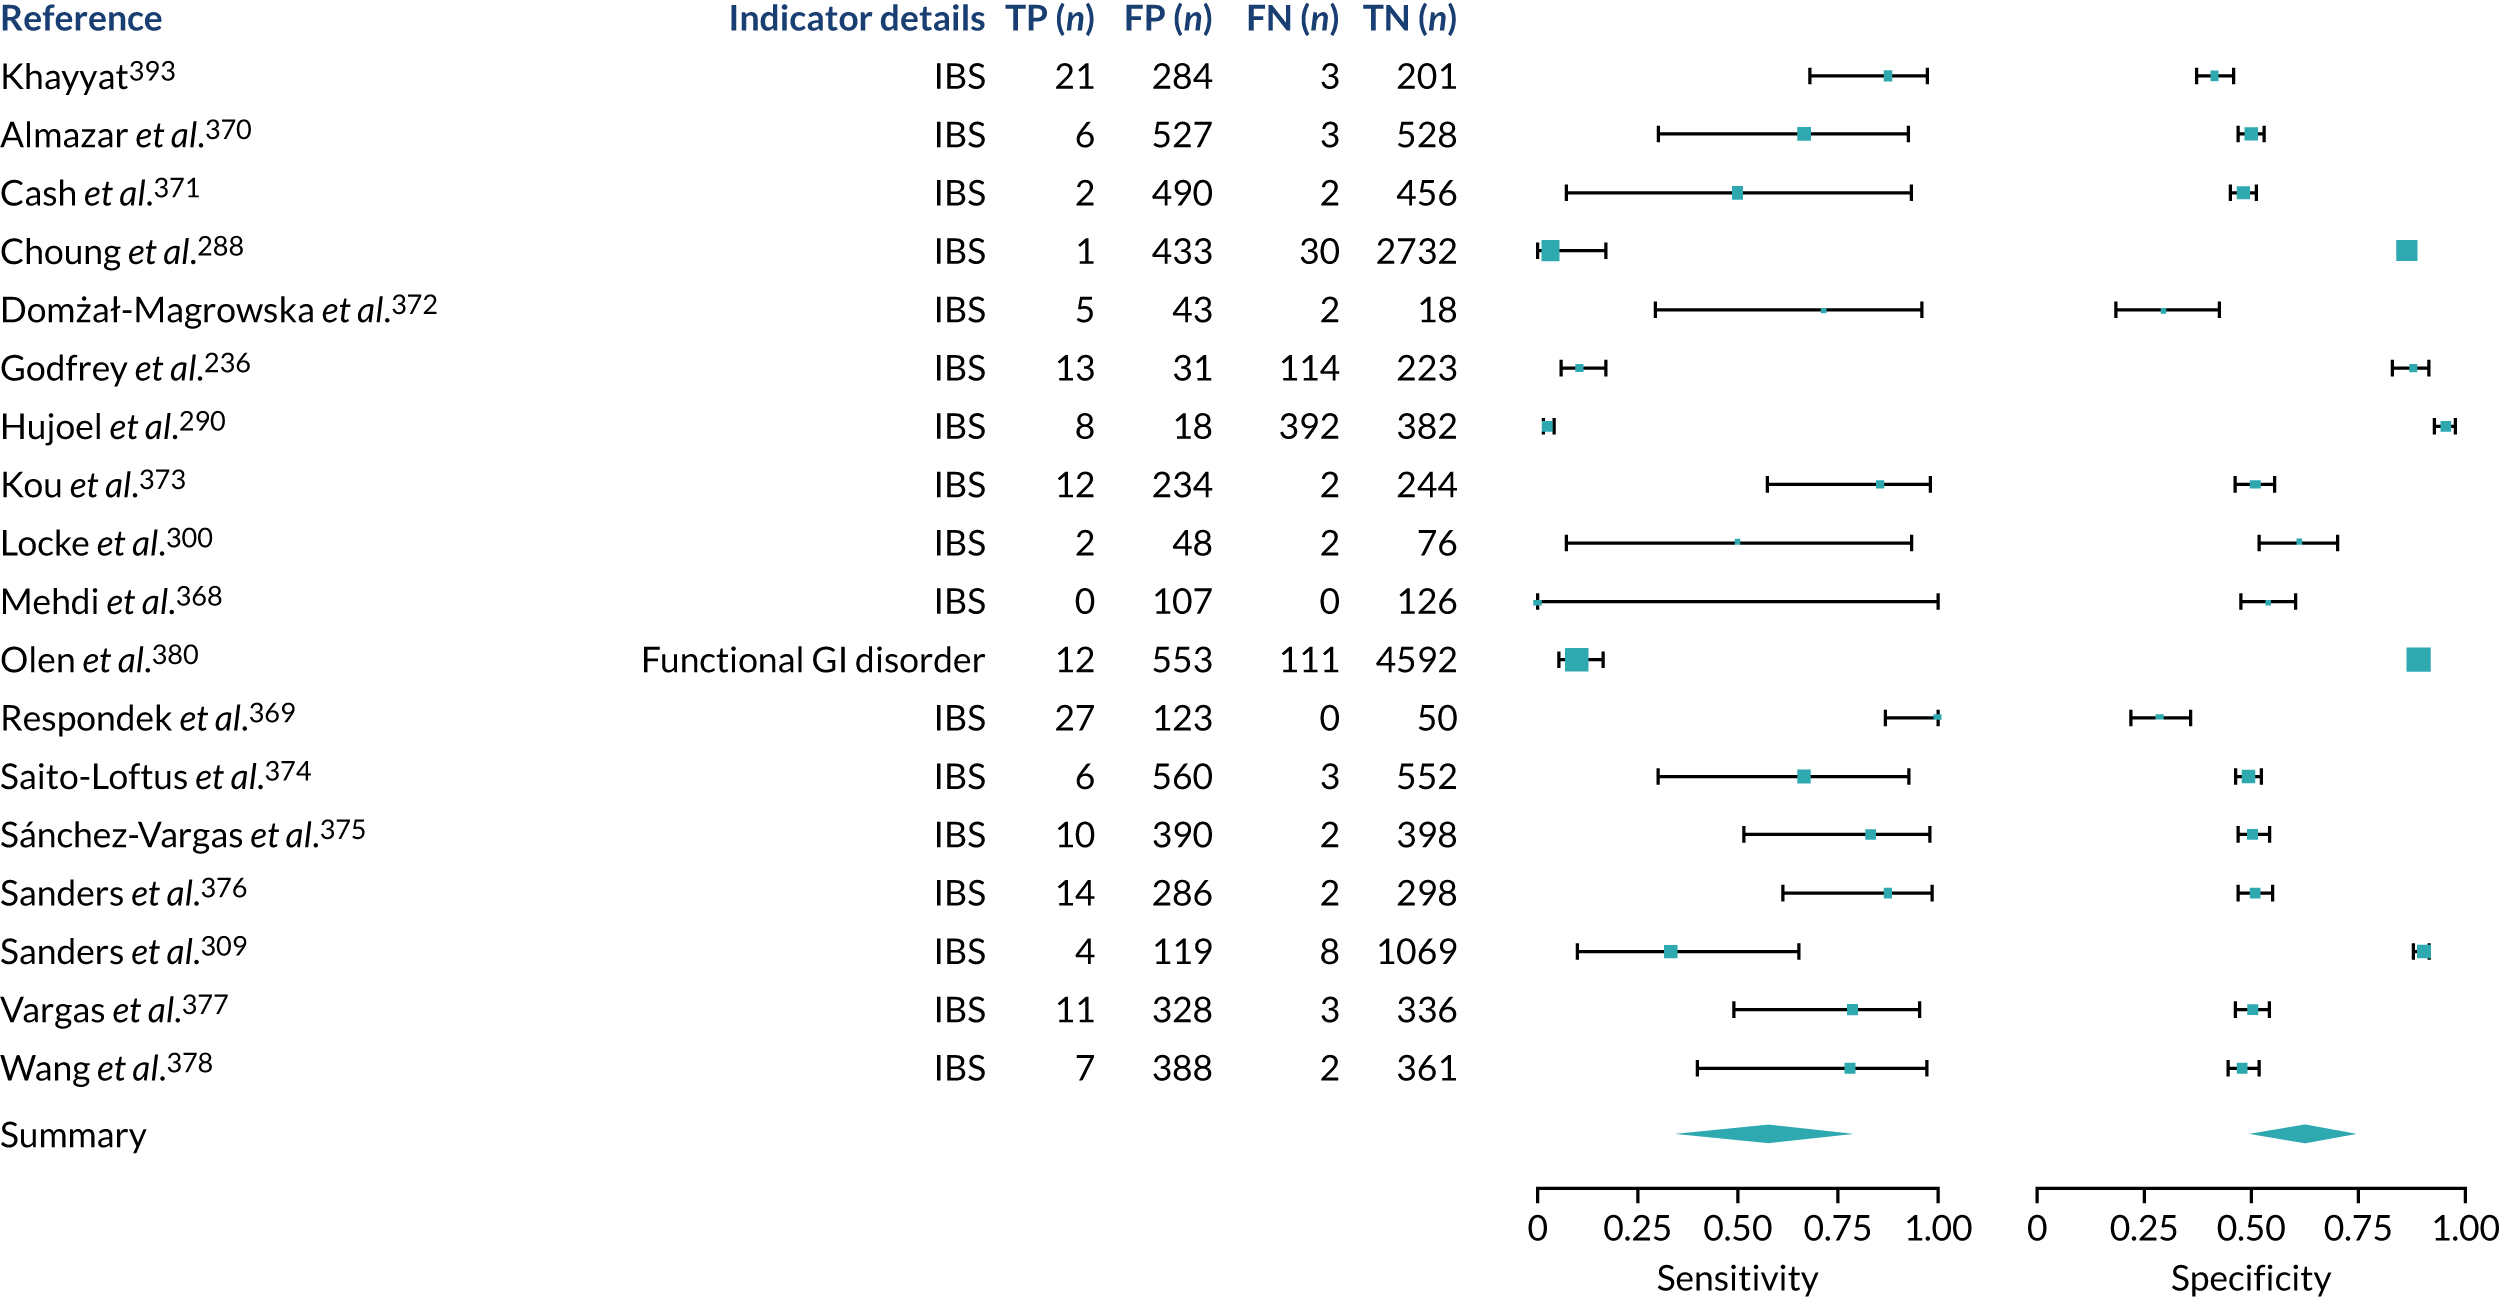
FIGURE 41.
Chronic liver disease. ALD, alcoholic liver disease; ALT, alanine transaminase; AST, aspartate transaminase; CH, chronic hepatitis; FN, false negative; FP, false positive; HBV, chronic hepatitis B virus; HCV, chronic hepatitis C virus; NAFLD, non-alcoholic fatty liver disease; PBC, primary biliary cirrhosis; PSC, primary sclerosing cholangitis; TN, true negative; TP, true positive.
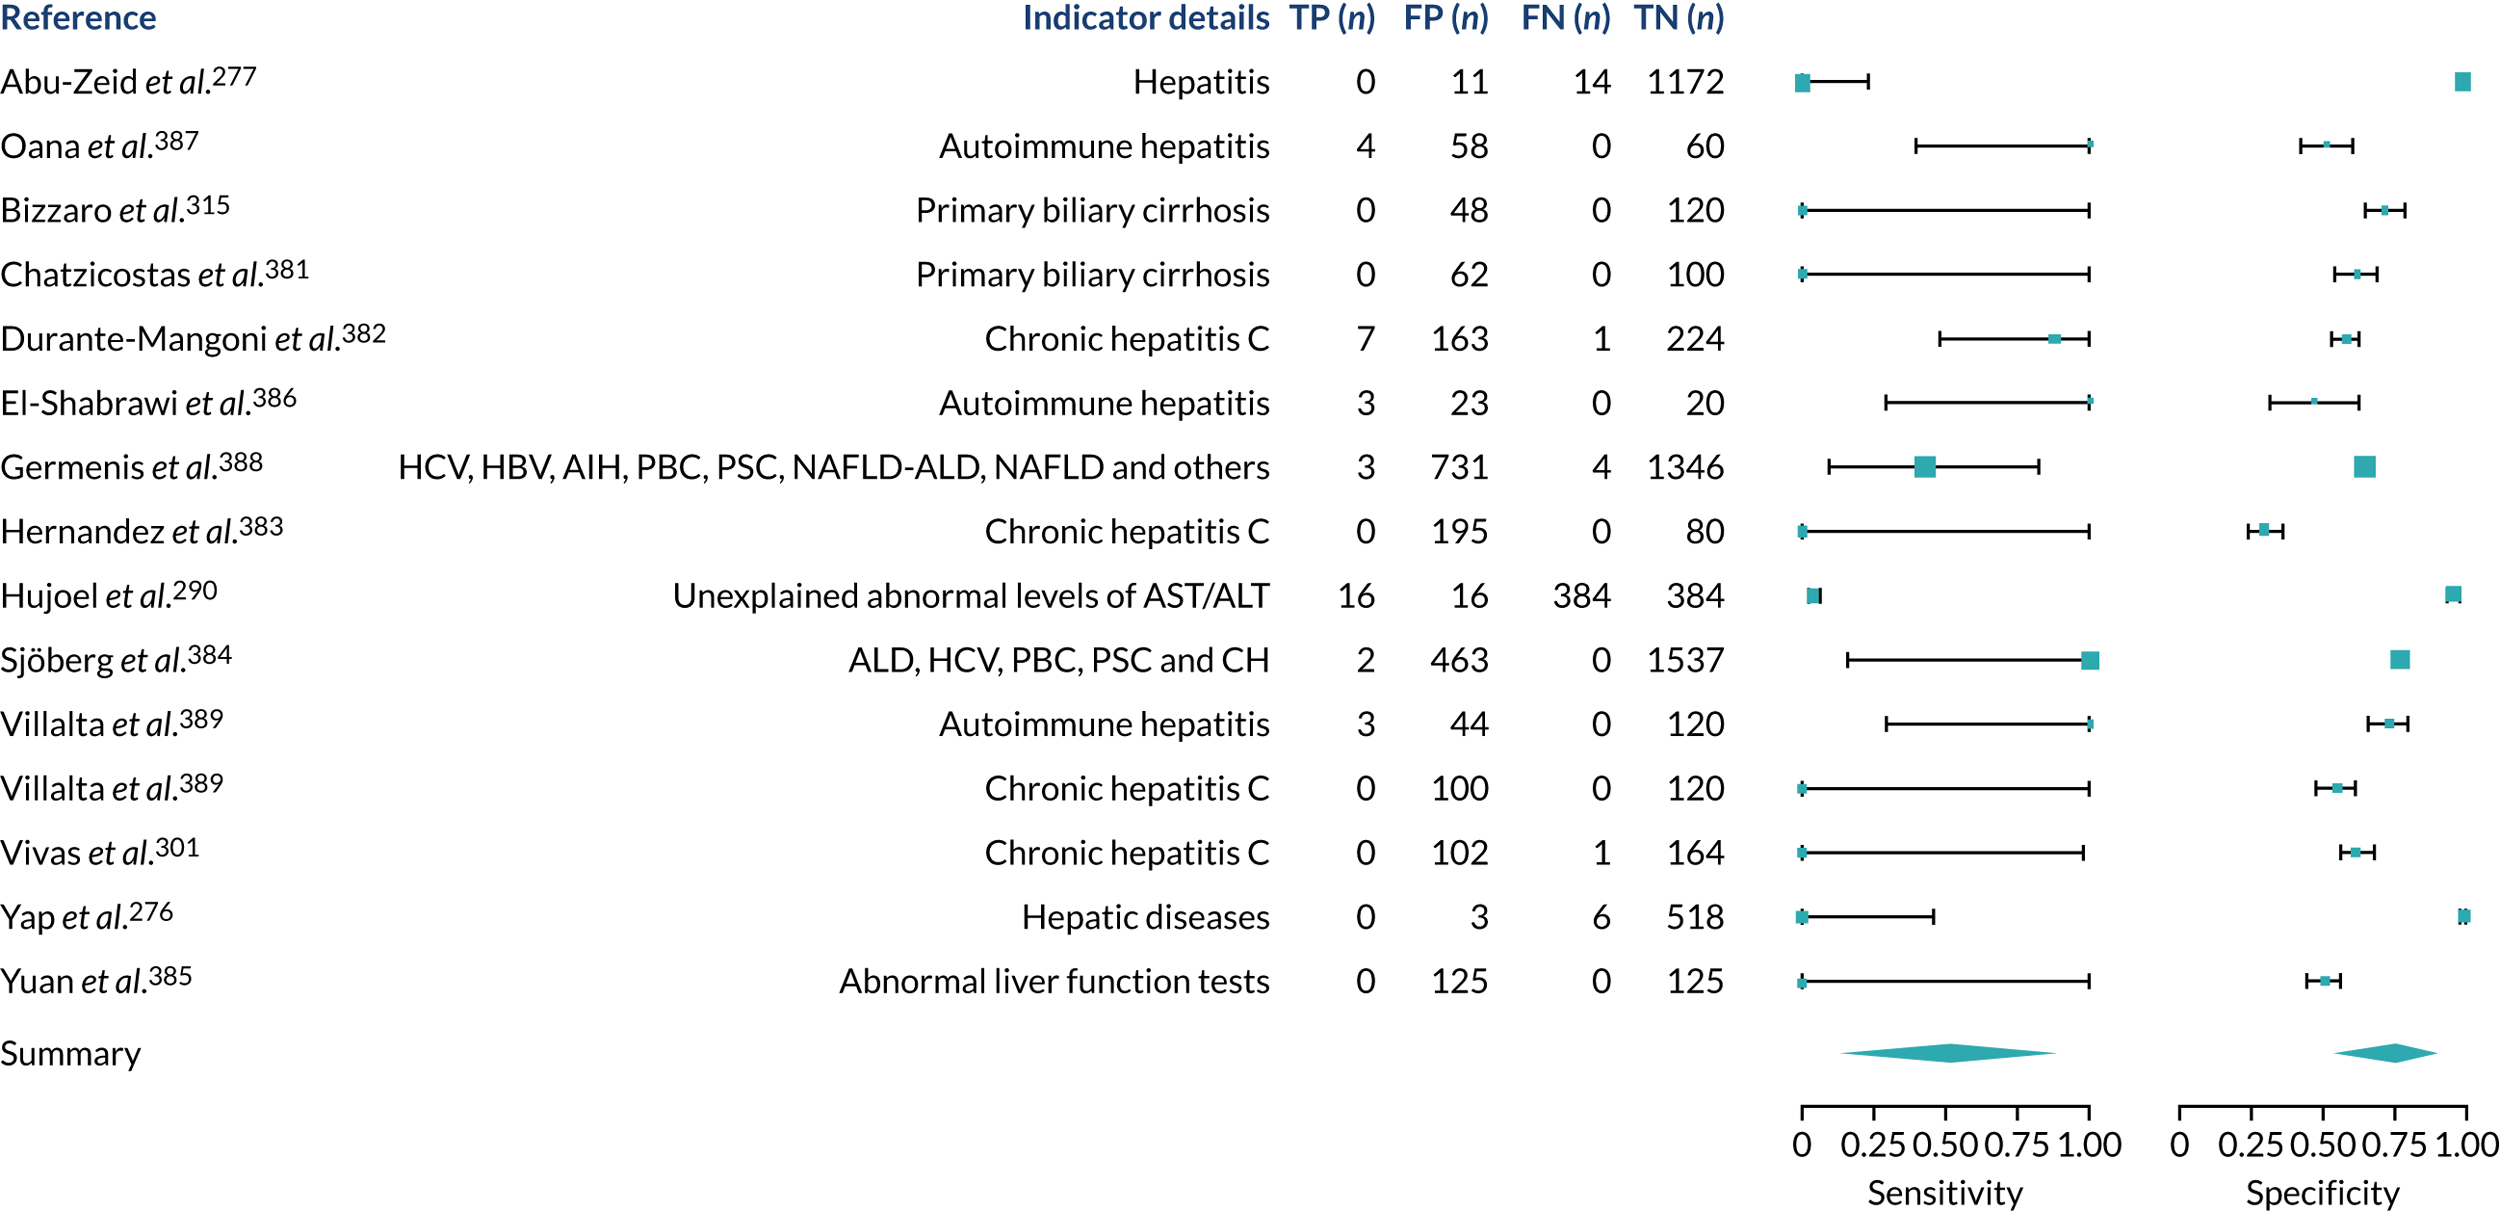
FIGURE 42.
Migraine. FN, false negative; FP, false positive; TN, true negative; TP, true positive.

FIGURE 43.
Multiple sclerosis. FN, false negative; FP, false positive; TN, true negative; TP, true positive.

FIGURE 44.
Osteoporosis. FN, false negative; FP, false positive; TN, true negative; TP, true positive.
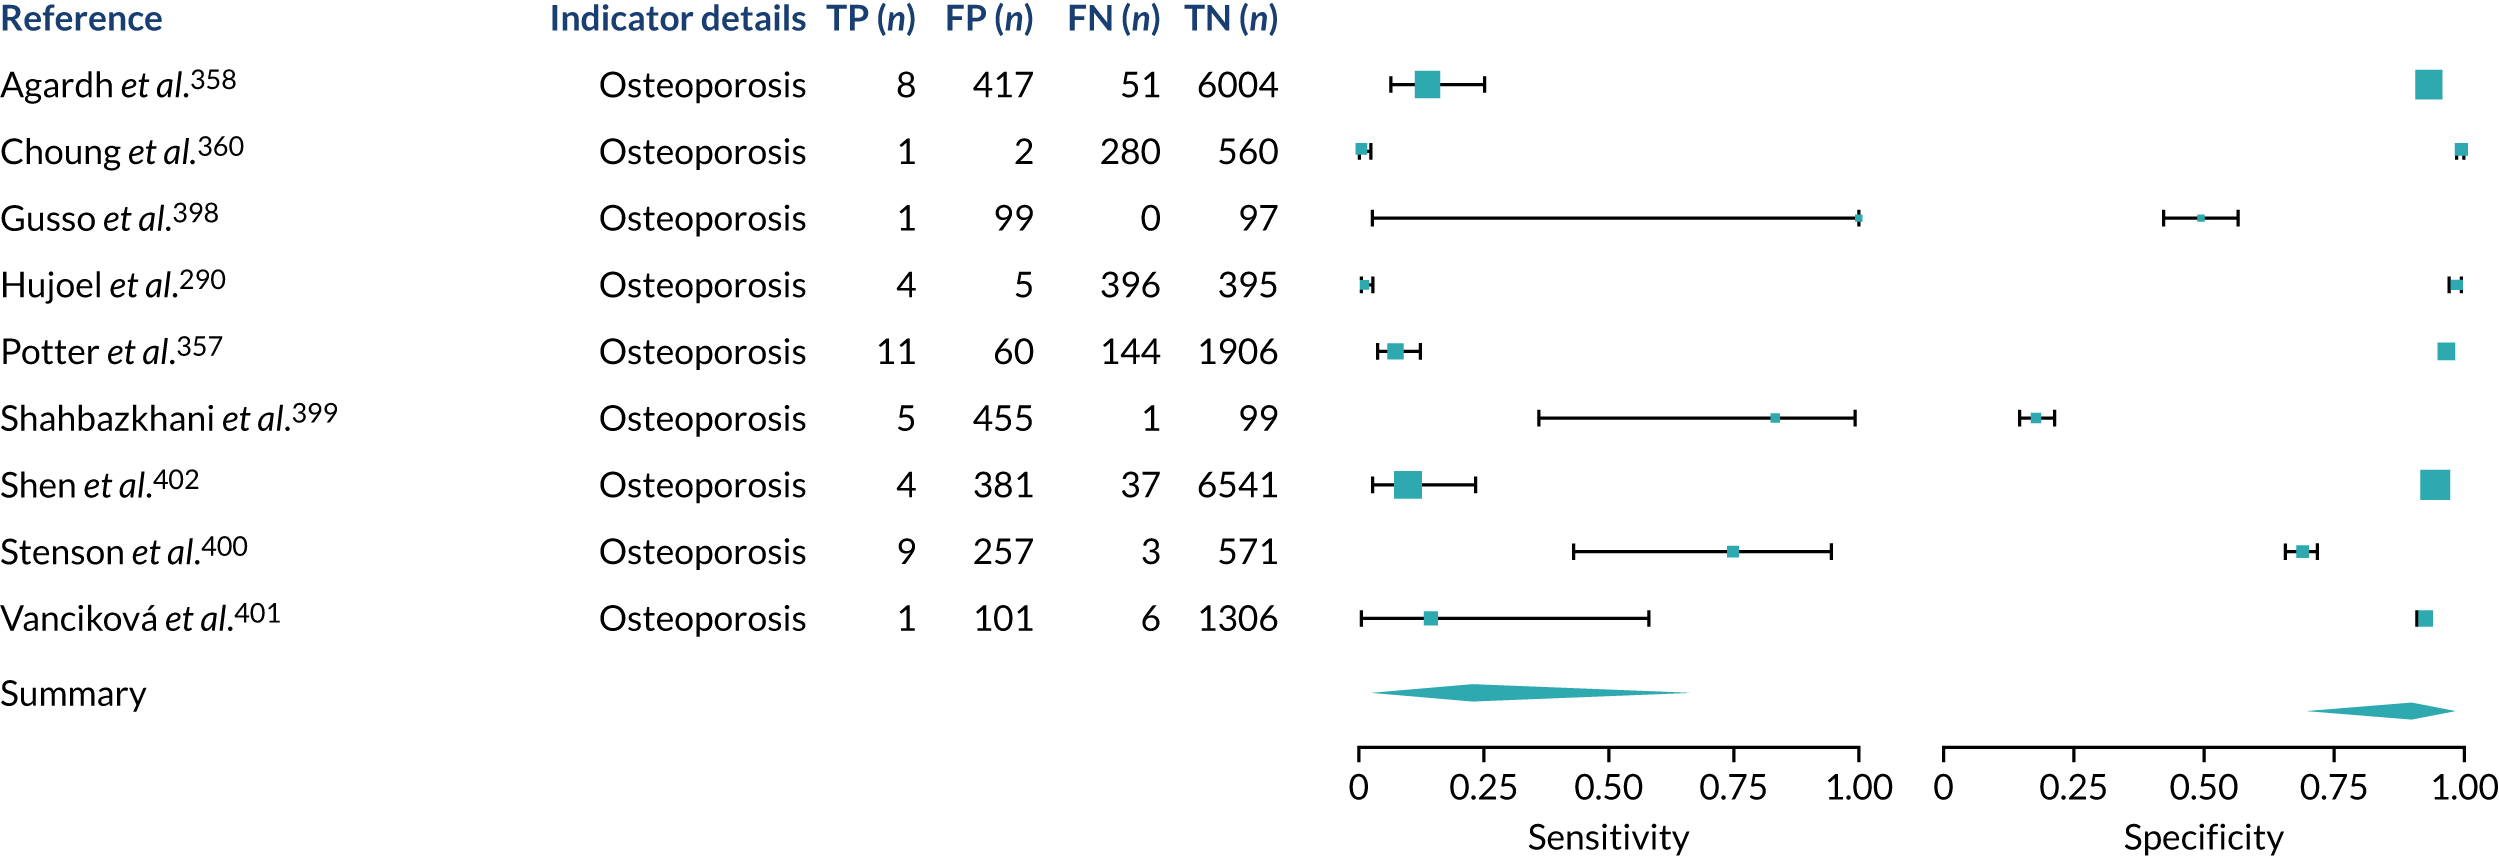
FIGURE 45.
Psoriasis. FN, false negative; FP, false positive; TN, true negative; TP, true positive.

FIGURE 46.
Systemic lupus erythematosus. FN, false negative; FP, false positive; TN, true negative; TP, true positive.

FIGURE 47.
Subfertility or recurrent pregnancy loss. FN, false negative; FP, false positive; TN, true negative; TP, true positive.
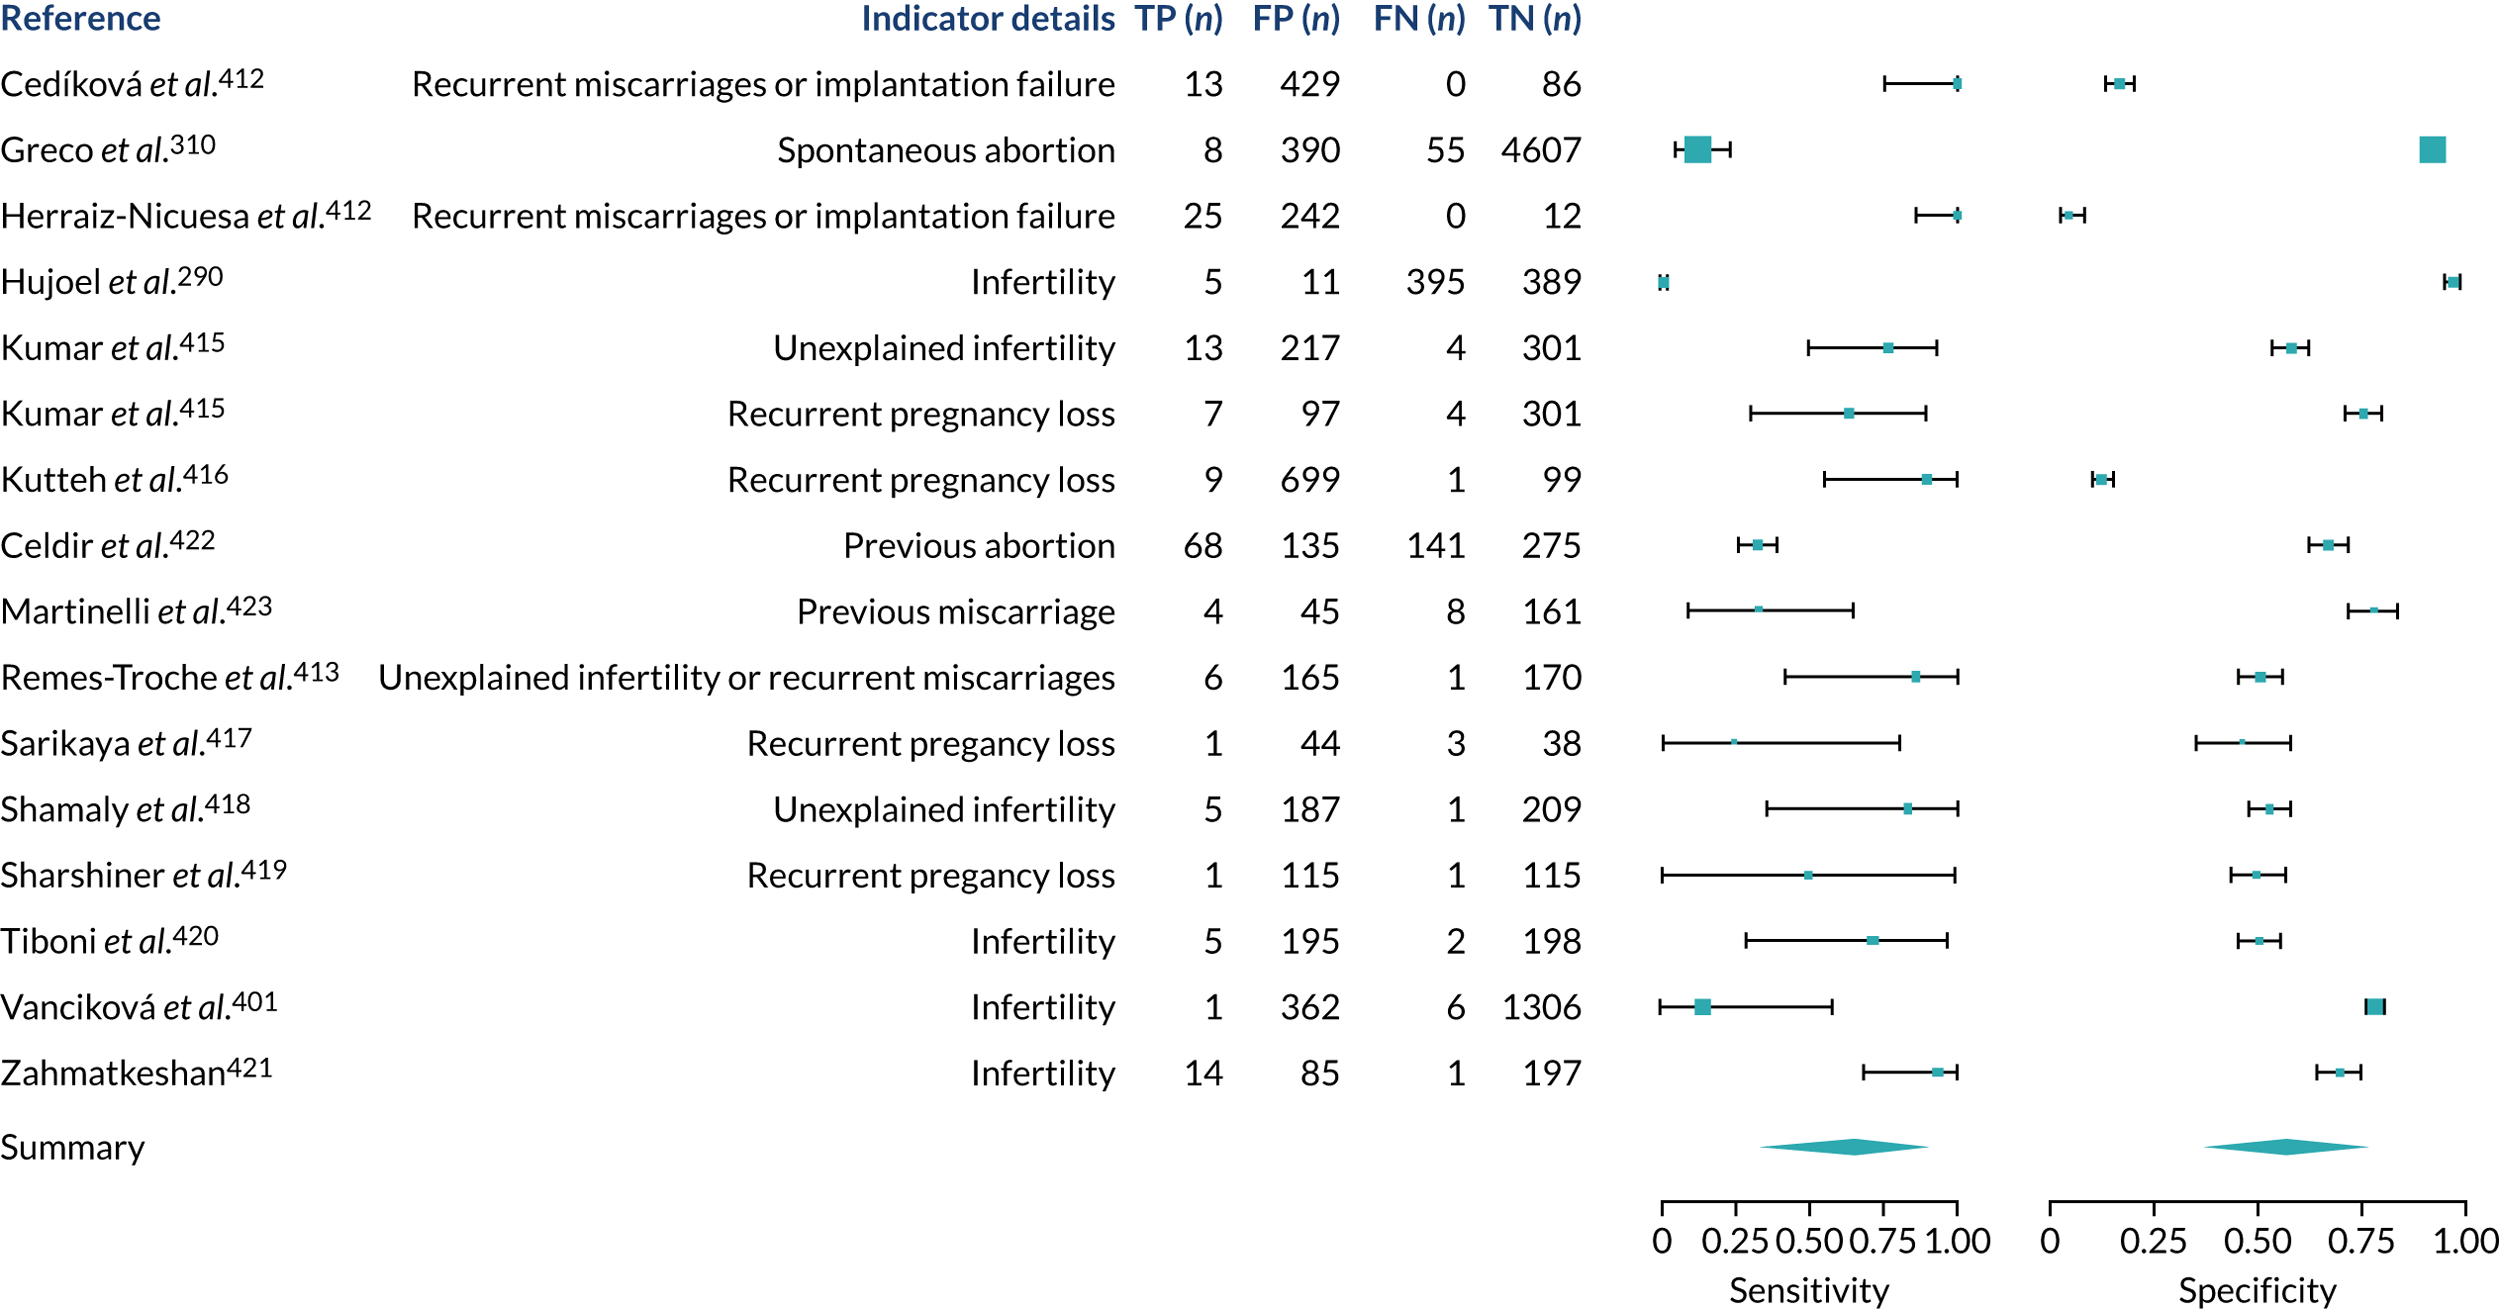
FIGURE 48.
Type 1 diabetes. FN, false negative; FP, false positive; TN, true negative; TP, true positive.
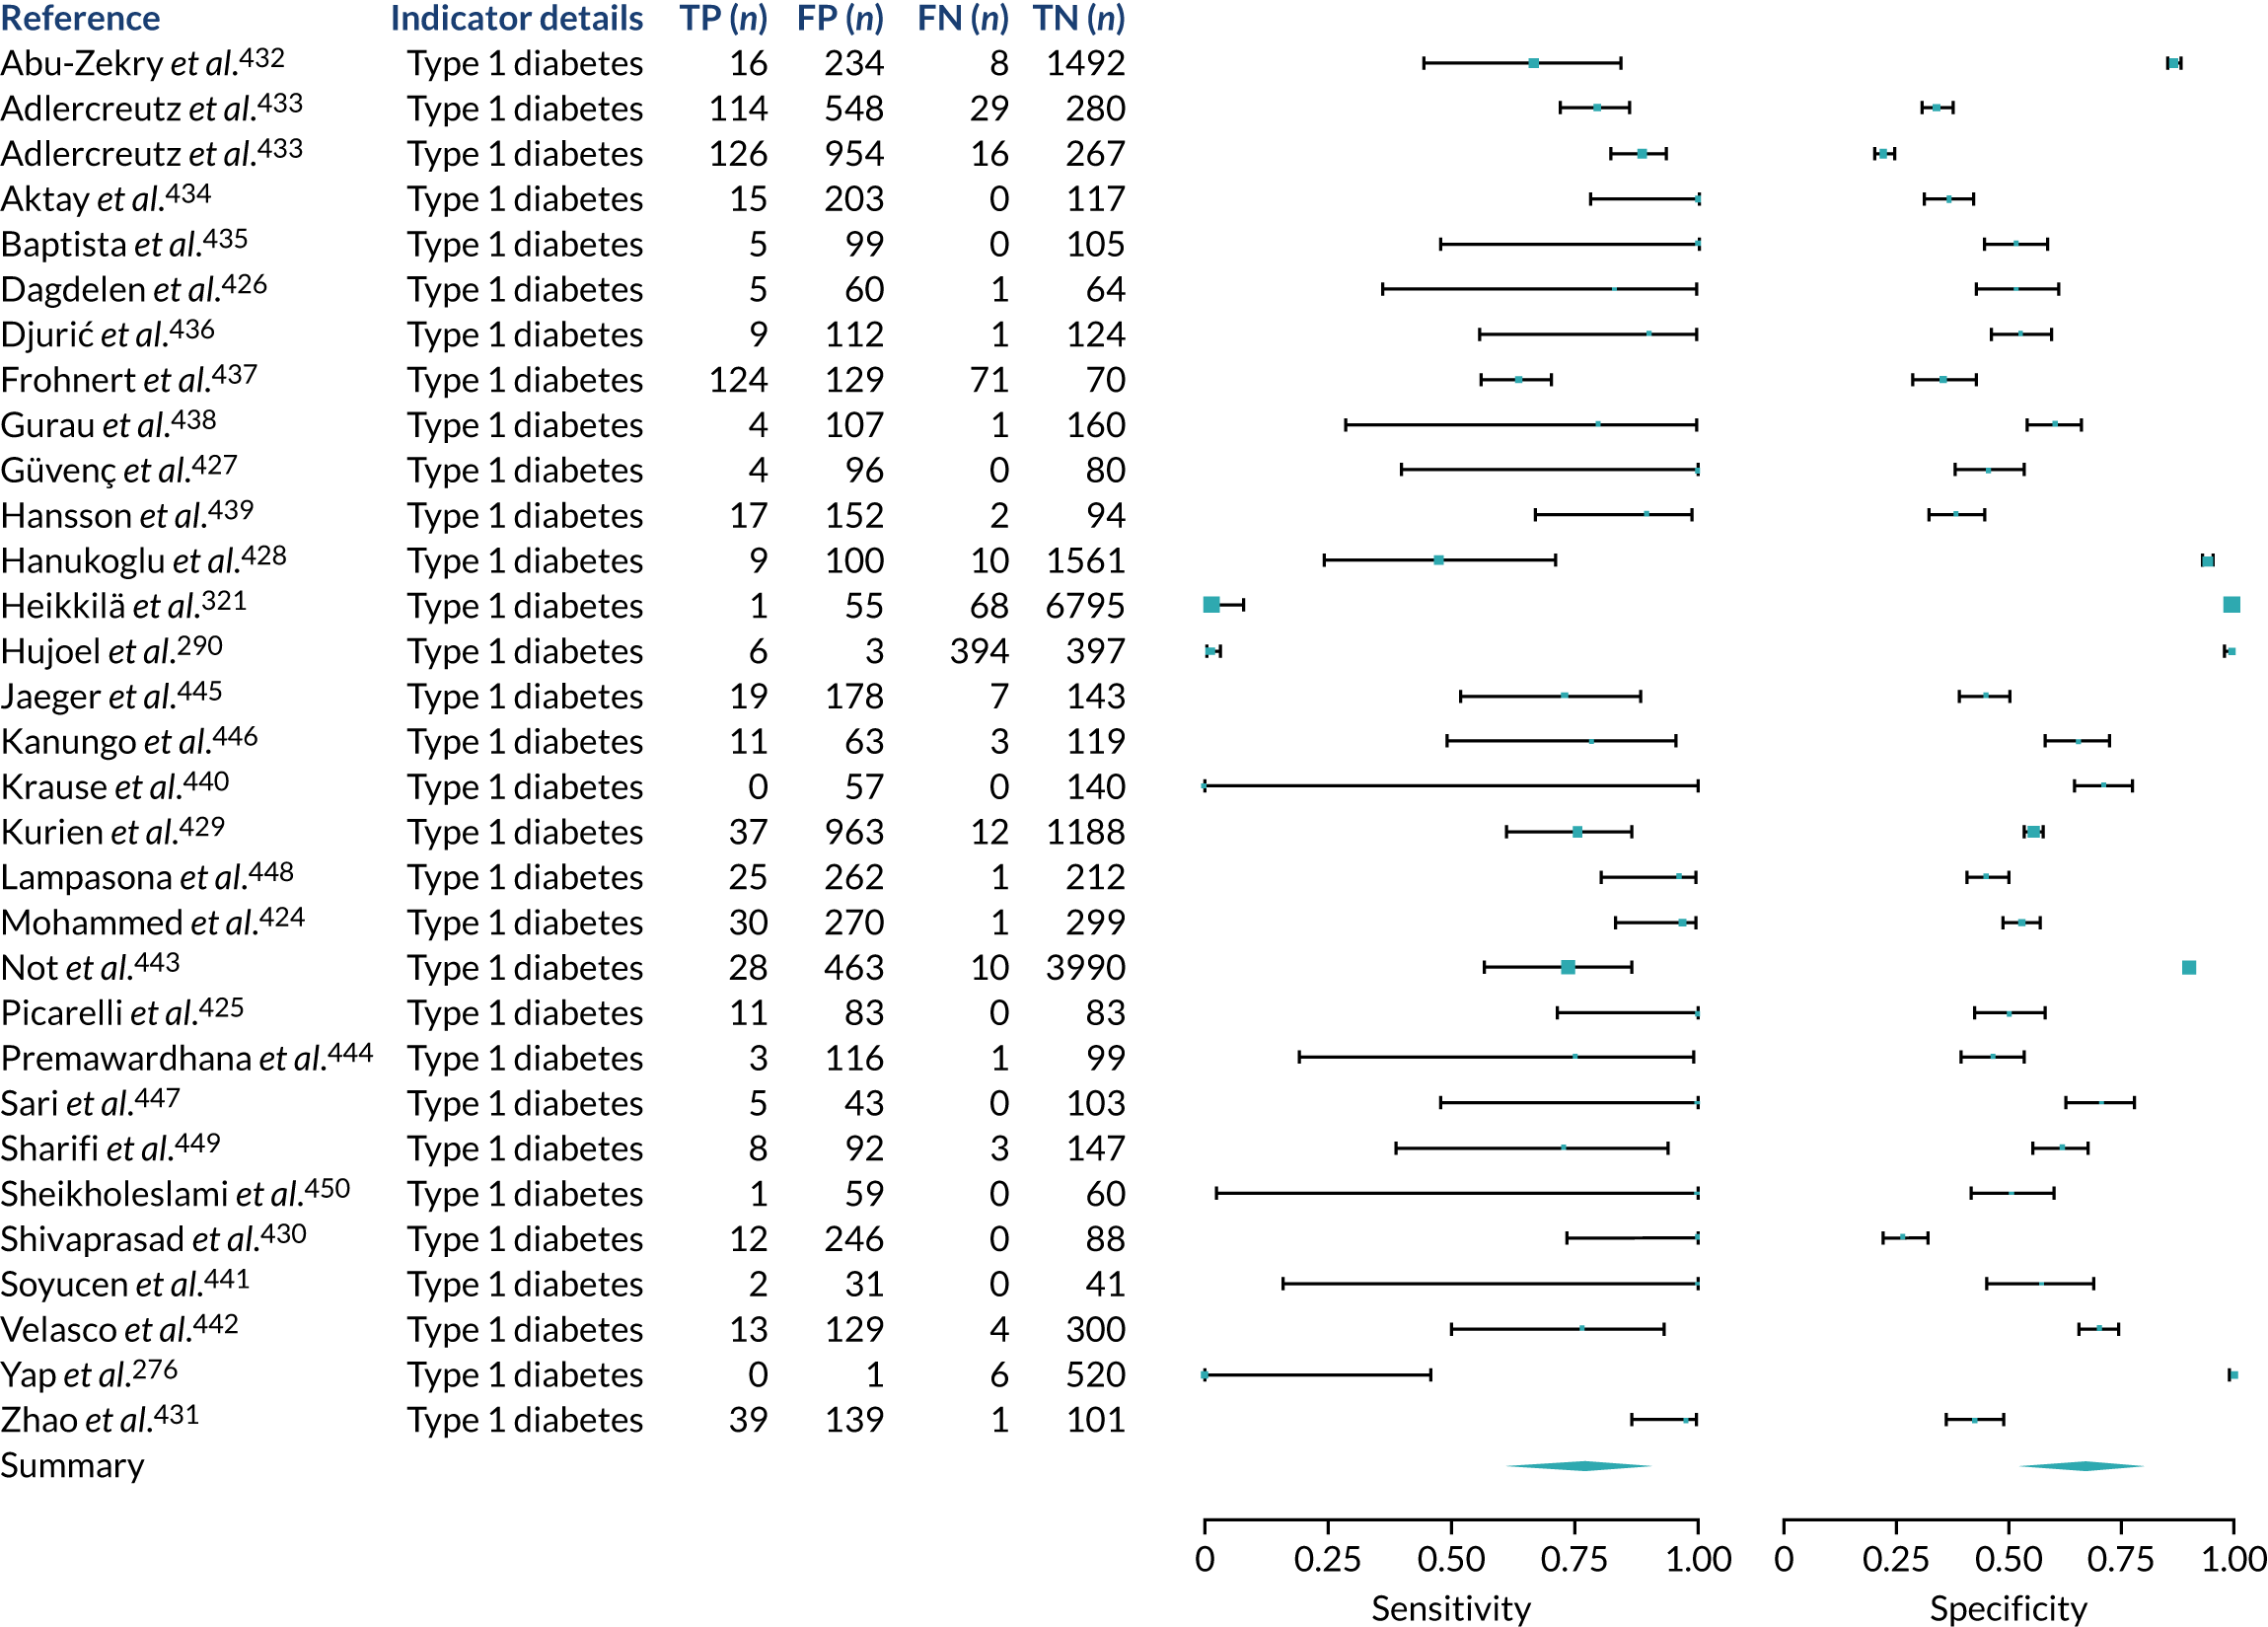
FIGURE 49.
Type 2 diabetes. FN, false negative; FP, false positive; TN, true negative; TP, true positive.

FIGURE 50.
Thyroid disease. FN, false negative; FP, false positive; TN, true negative; T4, thyroxine; TP, true positive; TPOAbs, thyroid peroxidase antibodies; TSH, thyroid-stimulating hormone.
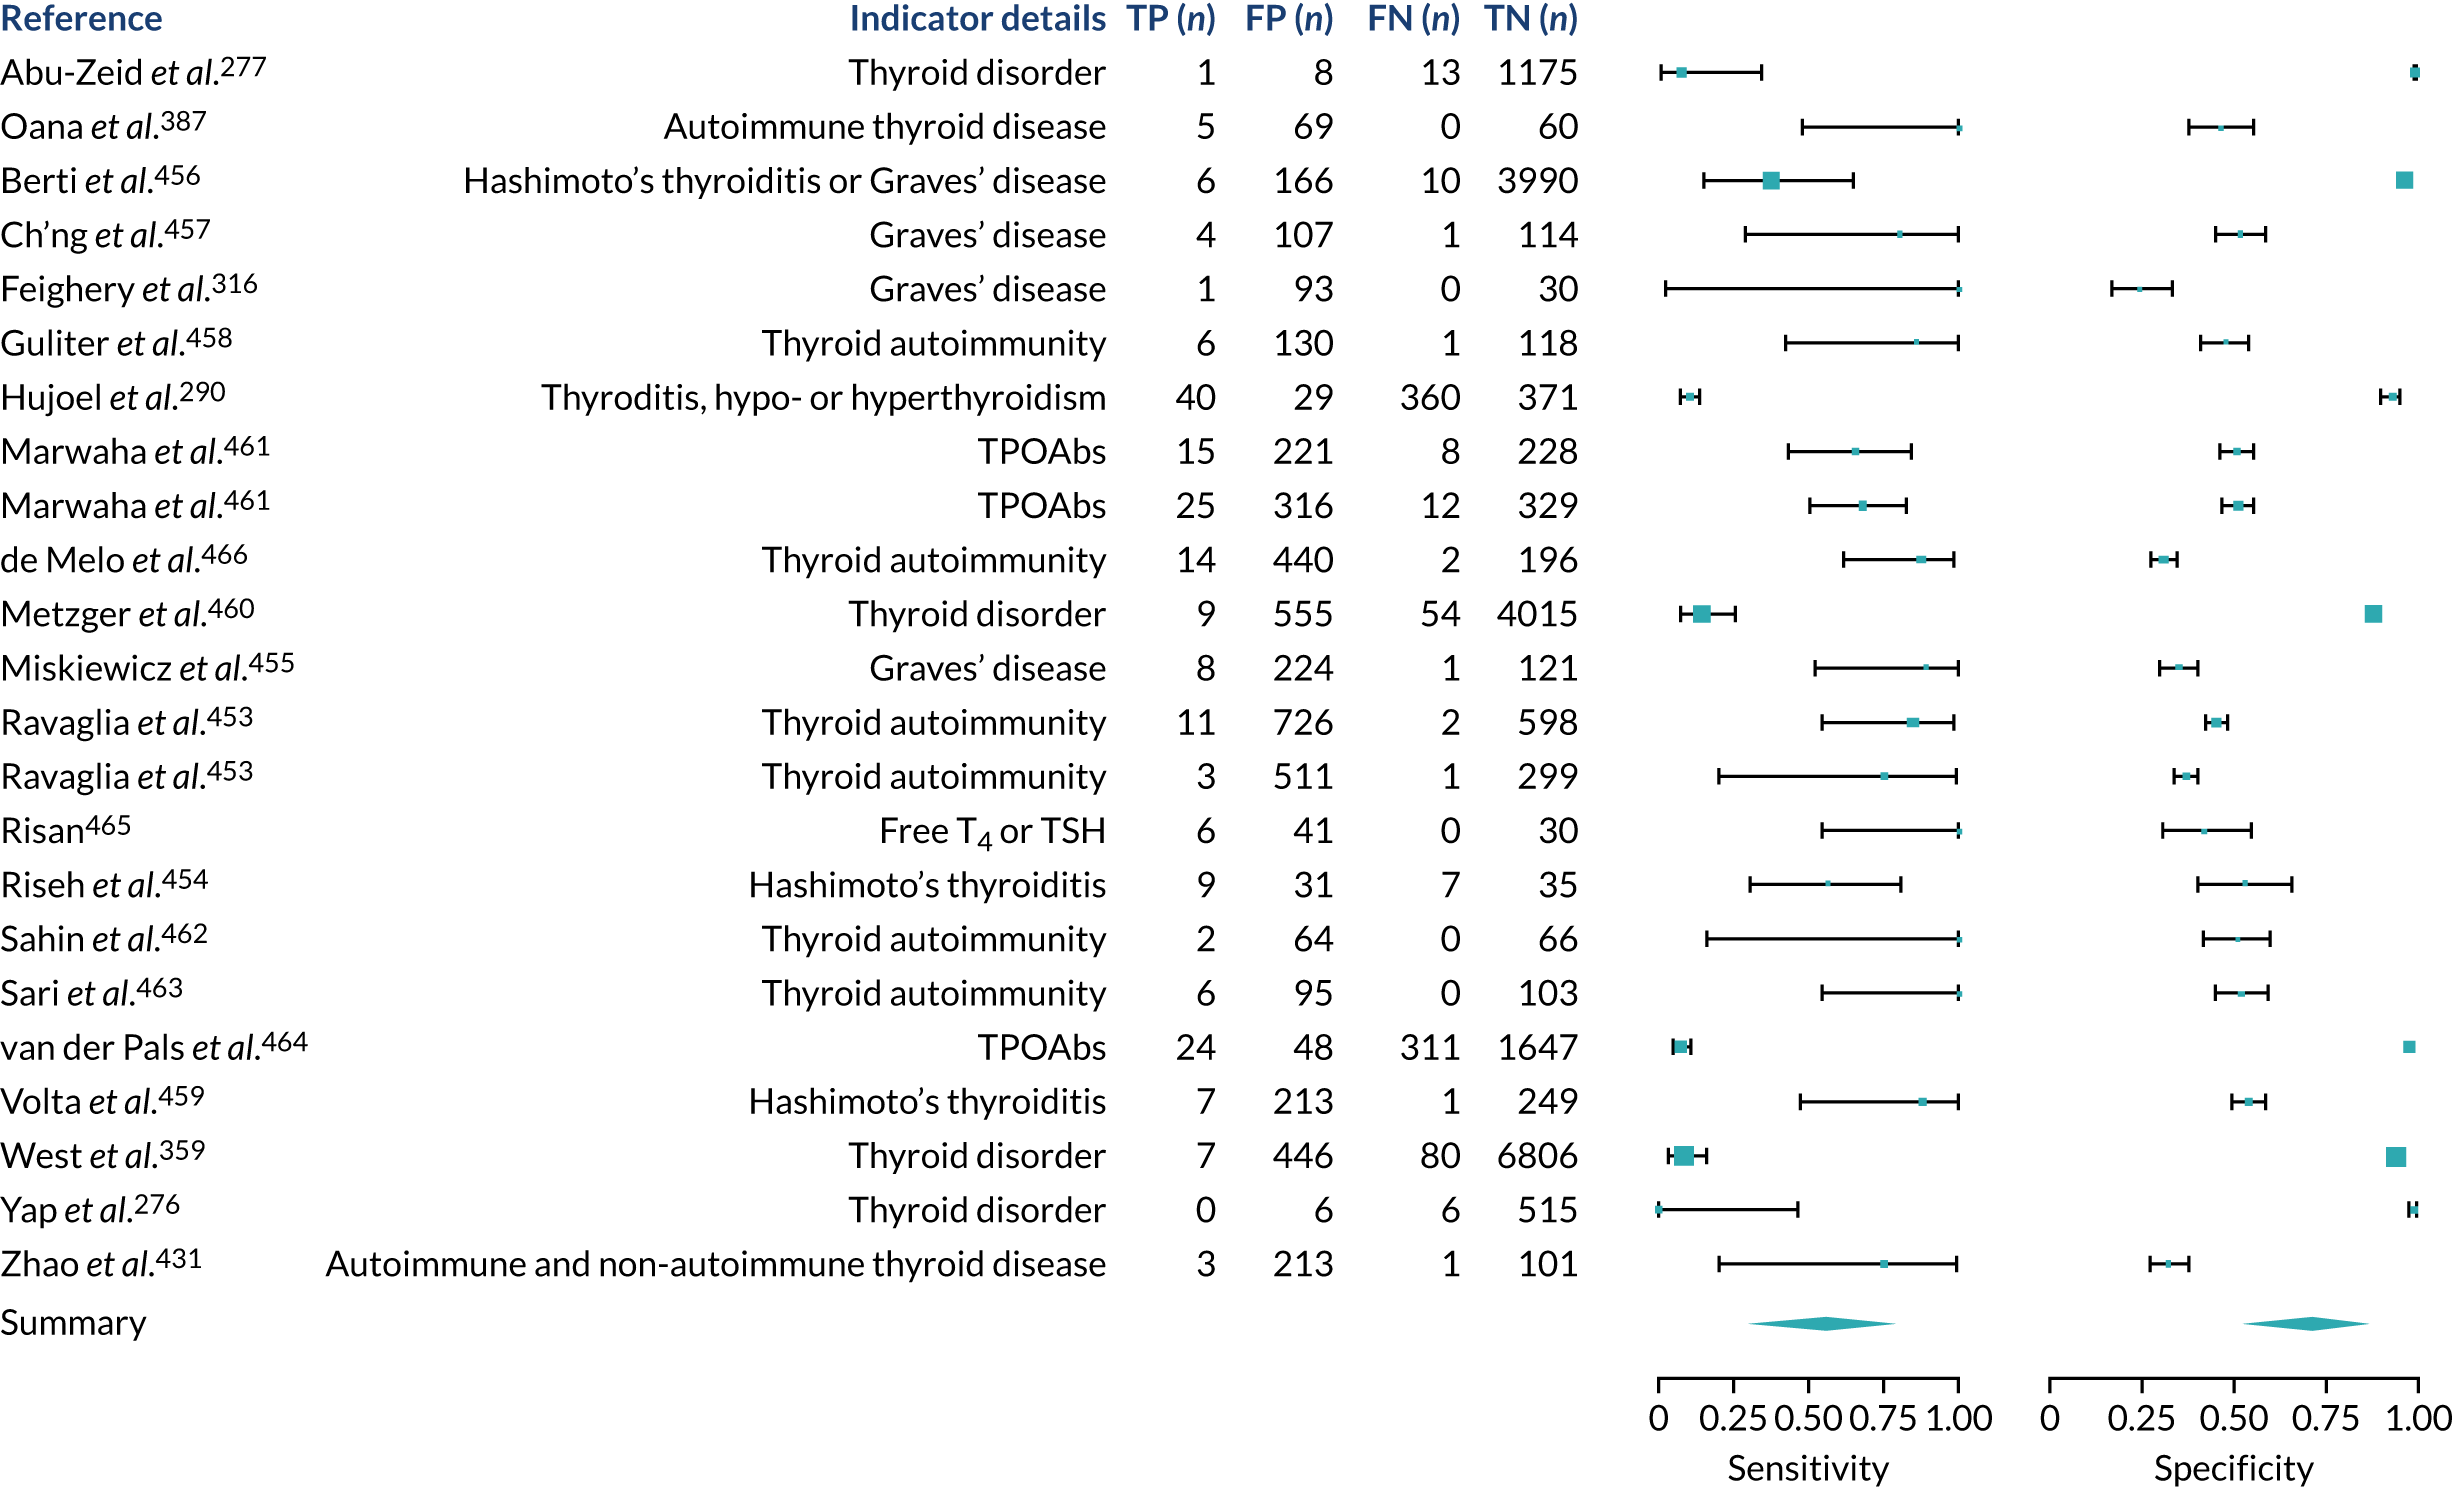
Family history
FIGURE 51.
Family history of CD. FDR, first-degree relative; FN, false negative; FP, false positive; SDR, second-degree relative; TN, true negative; TP, true positive.
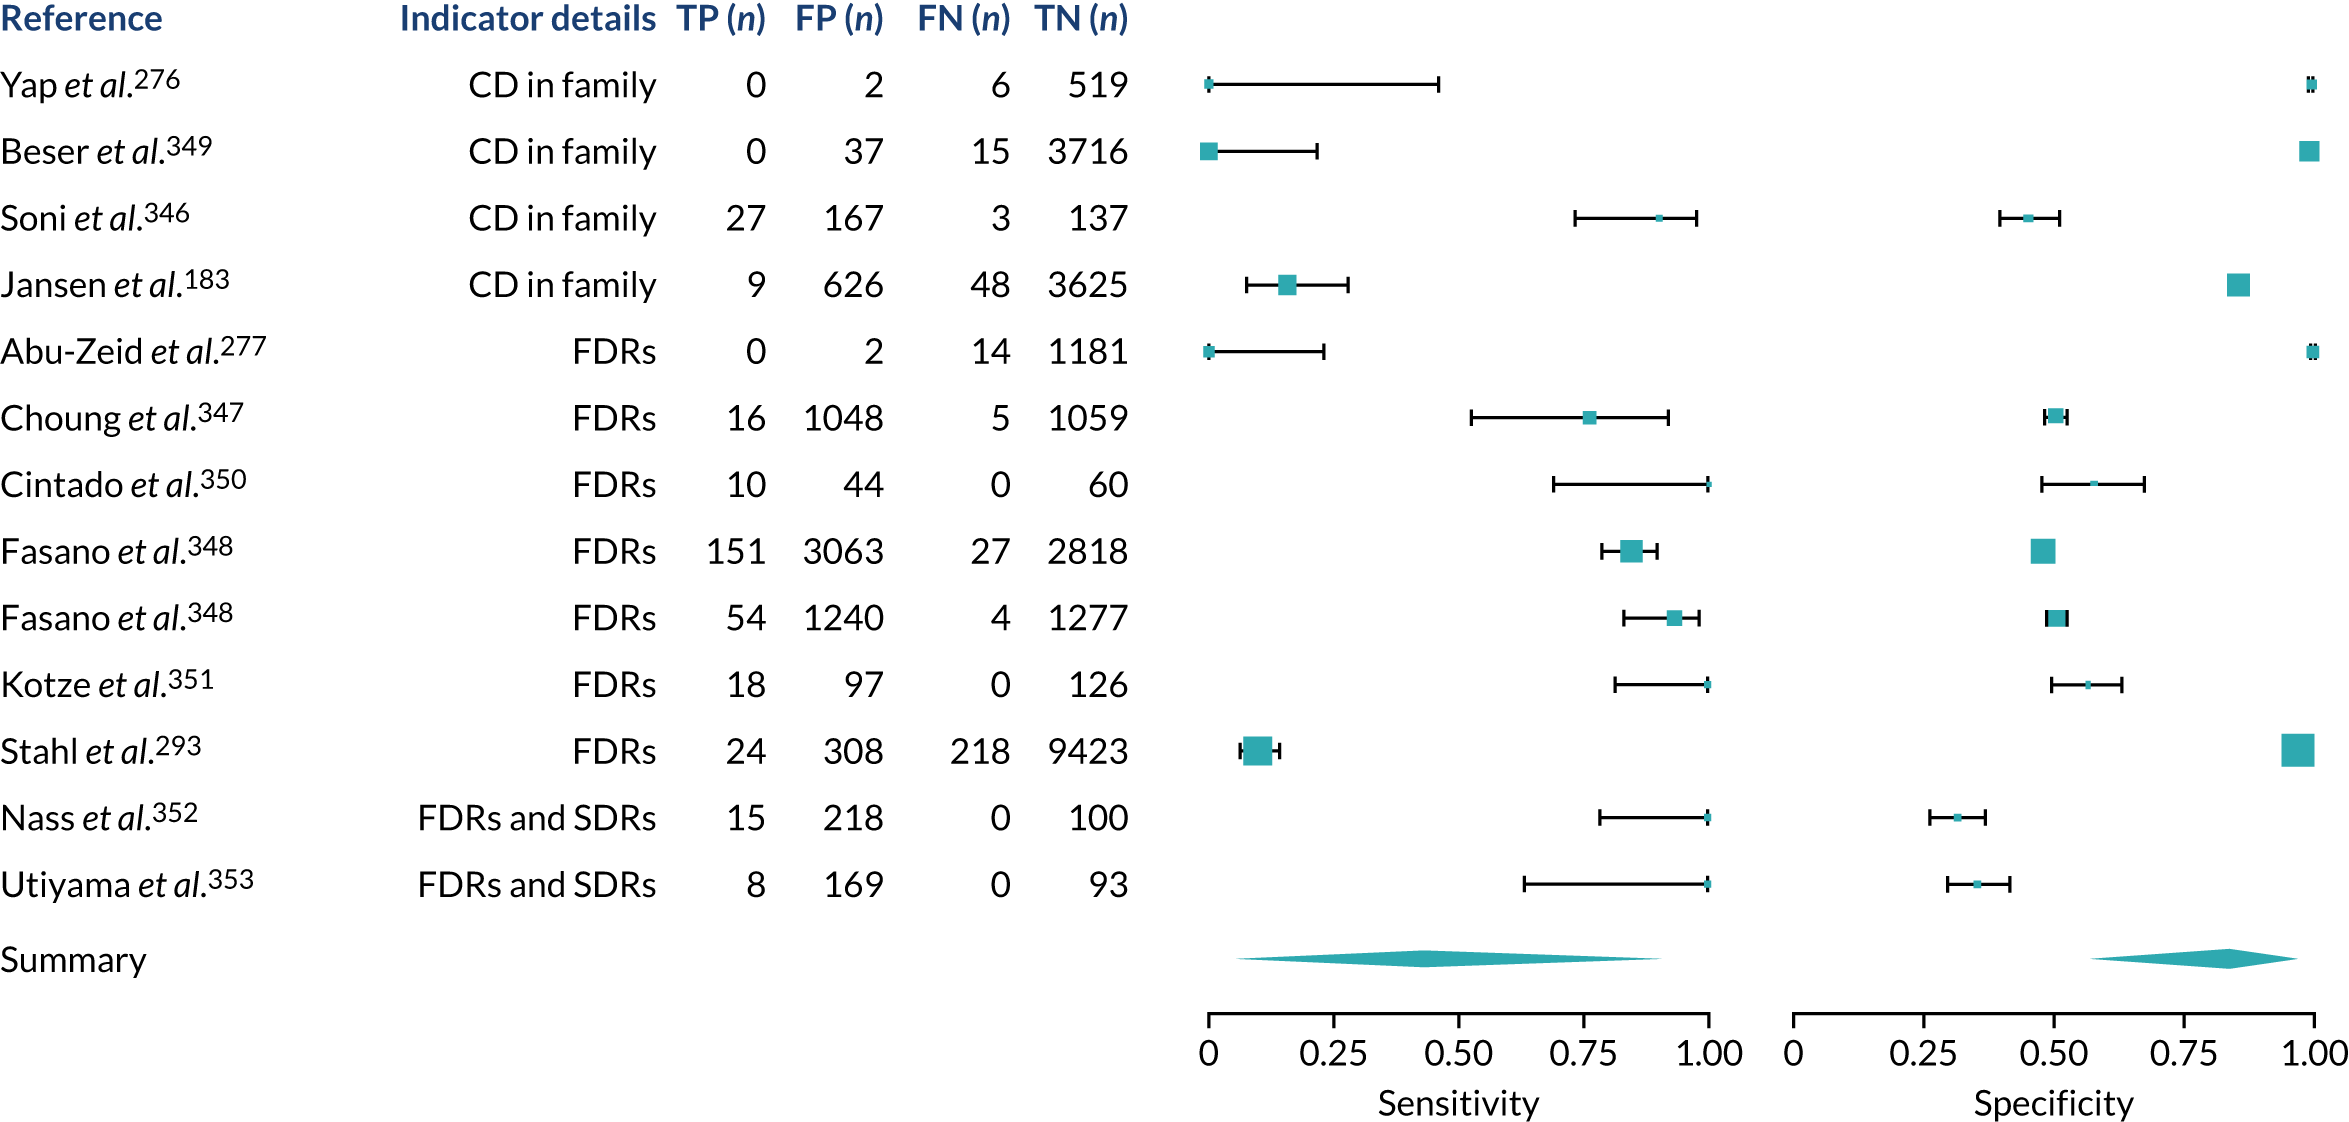
Appendix 7 Subgroup analysis
FIGURE 52.
Subgroup analysis stratified by age group and CD diagnosis. Note that stratified meta-analysis results are shown per diagnostic indicator. PPVs were calculated for a population with a CD prevalence of 1% (red dotted line) using the estimated sensitivities and specificities from the meta-analyses. The area of the box size is proportional to the total number of participants.
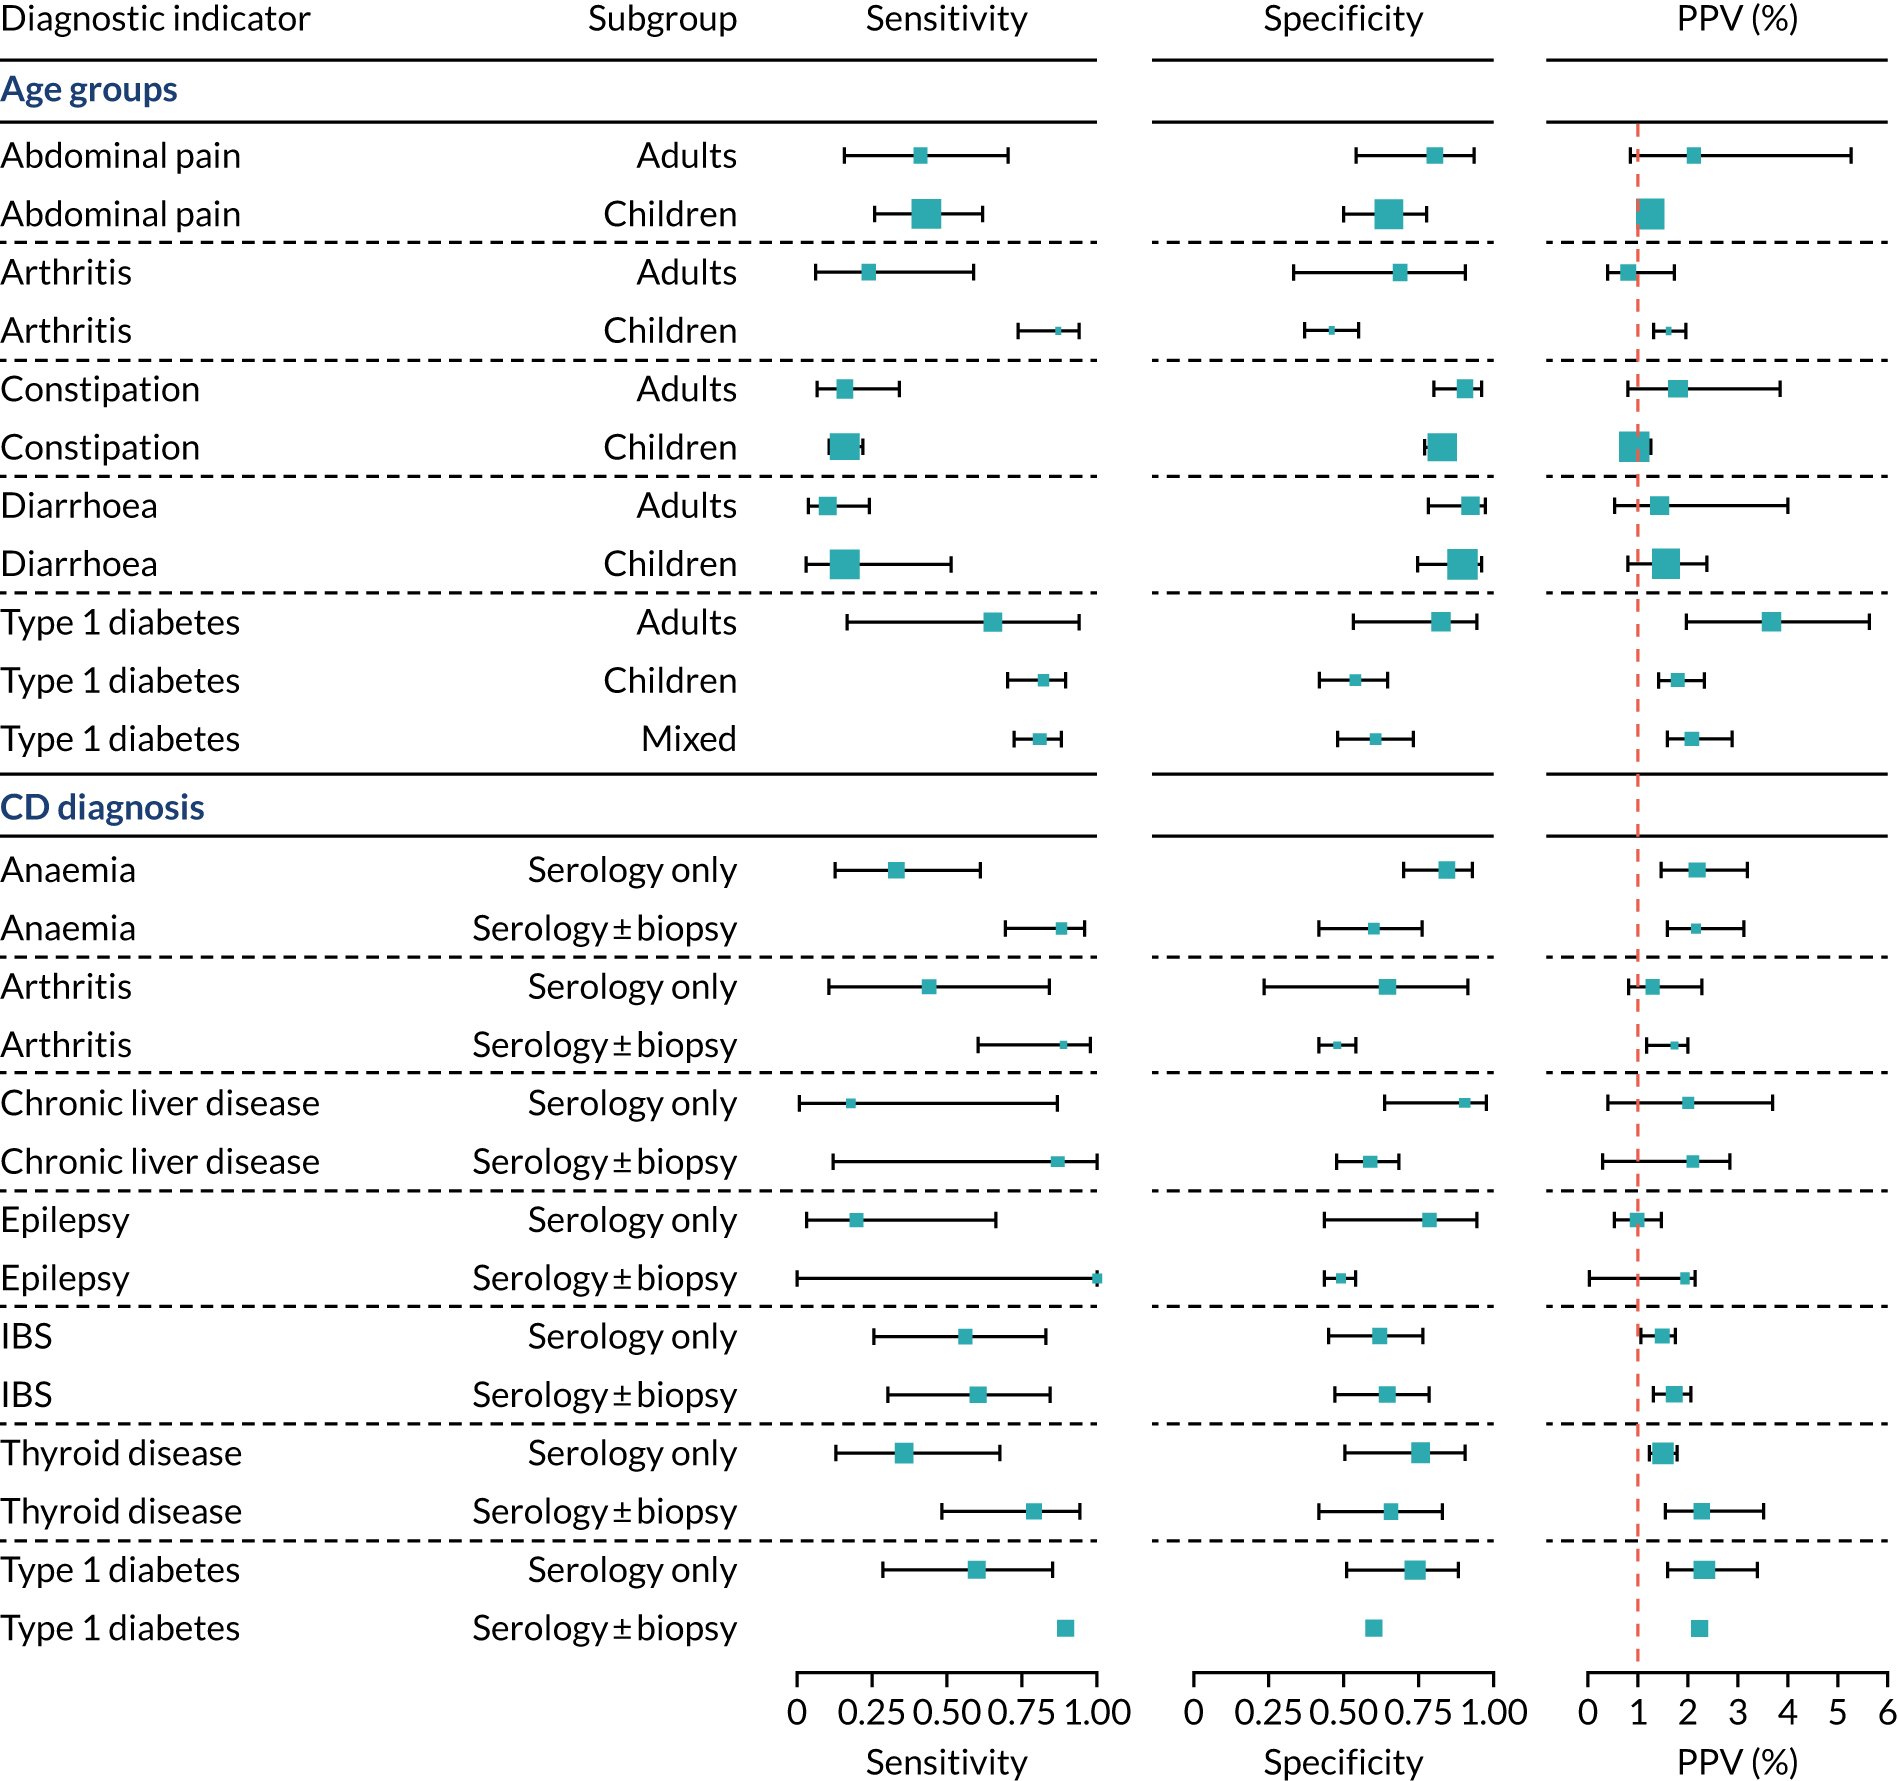
Appendix 8 Sensitivity analysis
FIGURE 53.
Sensitivity analysis restricted to cohort studies. PPVs were calculated for a population with a CD prevalence of 1% (red dotted line) using the estimated sensitivities and specificities from the meta-analyses. The area of the box size is proportional to the total number of participants.
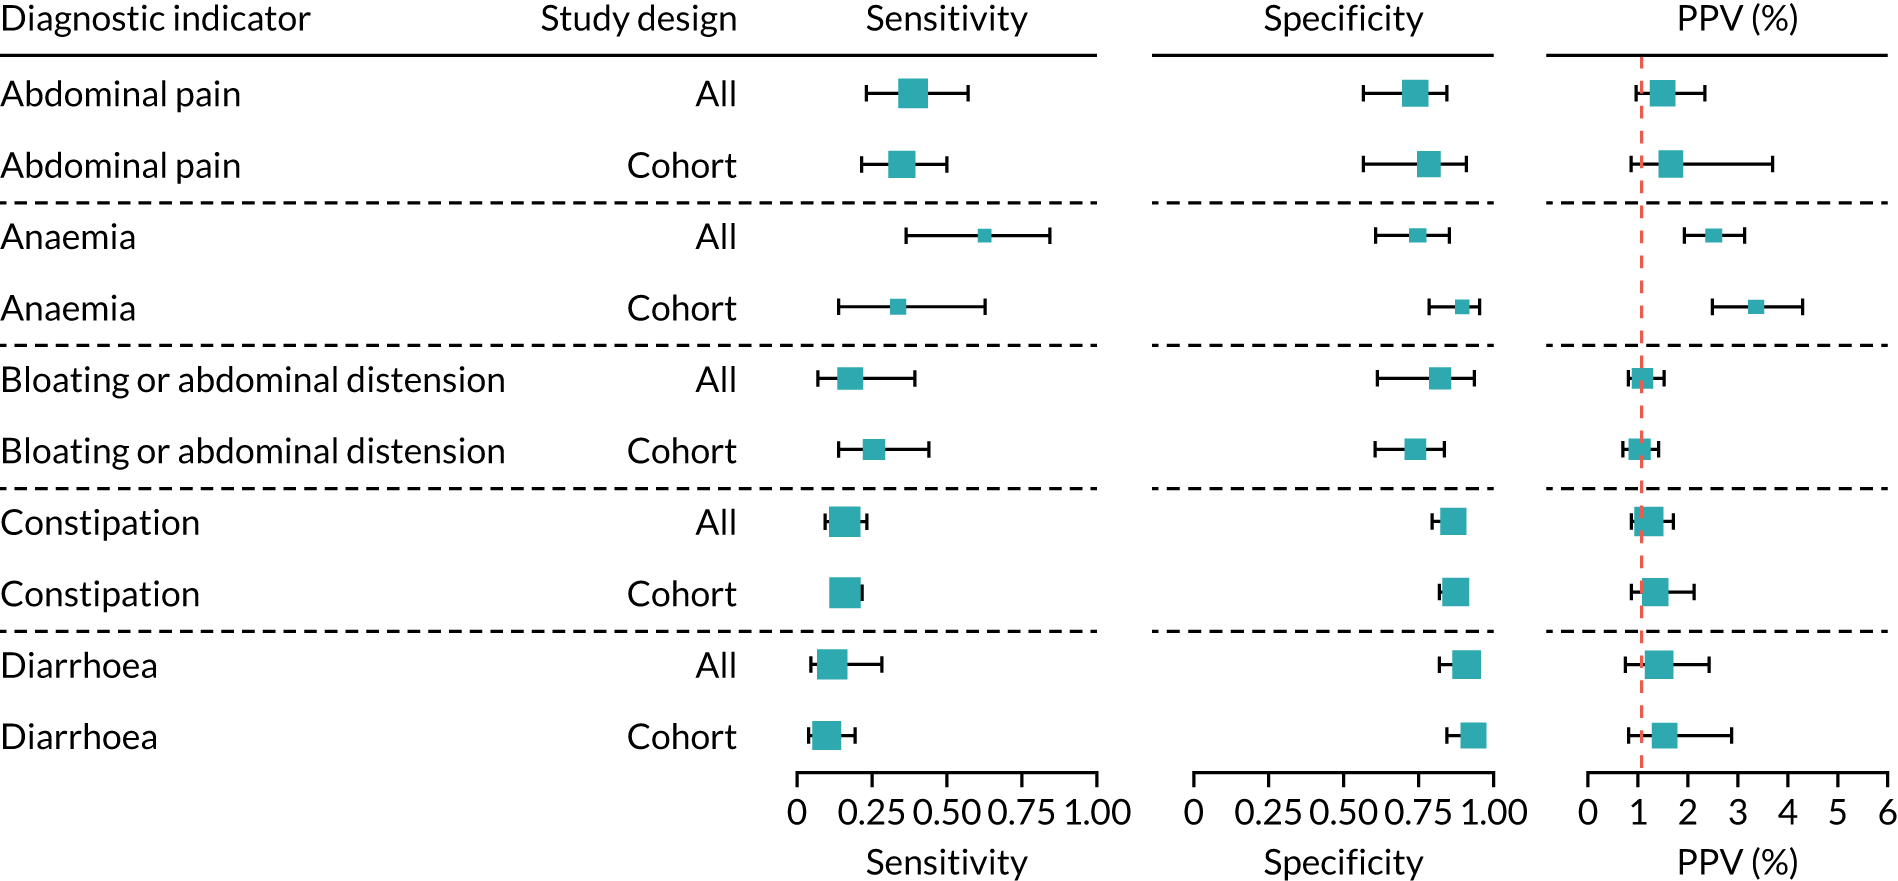
Appendix 9 Candidate diagnostic indicators
| Diagnostic indicator | Definition (ICPC-252 definition, if available) | Diagnostic indicator review | NICE 2015 guidelines9 | ESPGHAN 2020 guidelines10 | ESsCD 2019 guidelines11 |
|---|---|---|---|---|---|
| Amenorrhoea | Primary and secondary amenorrhoea (i.e. the absence or cessation of menstruation) | ✗ | ✗ | ||
| Anaemia | Any IDA (B80), including anaemia due to blood loss | ✗ | ✗ | ✗ | |
| Excludes iron deficiency without anaemia (T91) | |||||
| Arthritis | Includes rheumatoid/seropositive arthritis; allied condition: ankylosing spondylitis; allied condition: juvenile arthritis (L88) | ✗ | ✗ | ||
| Excludes psoriatic arthropathy (L99) | |||||
| Attention deficit disorder/cognitive impairment | Includes hyperkinetic disorder, attention deficit disorder, hyperactivity (P81), cognitive impairment | ✗ | |||
| Cardiovascular disease | Includes atherosclerosis/peripheral vascular disease, arterial embolism/thrombosis/stenosis; arteriosclerosis; atheroma; endarteritis; gangrene; intermittent claudication; limb ischaemia; Raynaud syndrome; vasospasm (K92); acute myocardial infarction (K75); ischaemic heart disease with angina, angina of effort; angina pectoris; angina with spasm; ischaemic chest pain; unstable angina (K74); ischaemic heart disease without angina, aneurysm of heart; arteriosclerotic/atherosclerotic heart disease; coronary artery disease; ischaemic cardiomyopathy; old myocardial infarction; silent myocardial ischaemia (K76); stroke/cerebrovascular accident, apoplexy; cerebral embolism/infarction/thrombosis/occlusion/stenosis/haemorrhage; cerebrovascular accident; subarachnoid haemorrhage (K90); transient cerebral ischaemia, basilar insufficiency; drop attacks; transient global amnesia; transient ischaemic attack (K89) | ✗ | |||
| Chronic liver disease | Includes liver disease NOS, alcohol hepatitis; cirrhosis; fatty liver; hepatitis NOS; liver failure; portal hypertension (D97); viral hepatitis (D72) | ✗ | ✗ | ✗ | |
| Delayed puberty | Delayed puberty is when boys have no signs of testicular development by 14 years of age, and when girls have not started to develop breasts by 13 years of age, or they have developed breasts, but their periods have not started by 15 years of age (NHS) | ✗ | |||
| Dental enamel defects | Enamel hypoplasia, dental enamel defects | ✗ | ✗ | ✗ | |
| Down syndrome | Down syndrome | ✗ | ✗ | ✗ | |
| Epilepsy | Includes all types of epilepsy, focal seizures; generalised seizures; grand mal; petit mal; status epilepticus (N88), convulsion (N0)7 | ✗ | ✗ | ||
| Failure to thrive | Includes failure to thrive, physiological delay growth (T10) | ✗ | ✗ | ✗ | |
| Excludes delayed milestones (P22); learning disorder (P24); mental retardation (P85); delayed puberty (T99) | |||||
| Fatigue | Includes weakness/tiredness general, chronic fatigue syndrome; exhaustion; fatigue; lassitude; lethargy; post viral fatigue (A04) | ✗ | ✗ | ✗ | |
| Excludes malaise/feeling ill (A05); drowsiness (A29); heat exhaustion (A88); jetlag (A88); systemic lupus erythematosus disturbance (P06) | |||||
| First-degree relatives with CD | Parent, sibling or child with CD | ✗ | ✗ | ✗ | ✗ |
| Fractures | Includes radius/ulna fracture (L72), tibia/fibula fracture (L73), hand/foot bone fracture (L74), femur fracture (L75), other fractures (76) | ✗ | ✗ | ||
| Excludes pathological fracture (osteoporosis) L95; pathological fracture NOS (L99); non-union (L99) | |||||
| GI symptoms | Includes abdominal colic; abdominal cramps/discomfort/pain NOS; infant colic (D01), heartburn, acidity, water brash (D03), epigastric pain (D02); dyspepsia/indigestion (D07); oesophagitis/reflux (D84), flatulence/gas/belching (D08), bloating; eructation; gas pains; gaseous distension; passing wind; abdominal distension (abdominal swelling without mass) (D25), constipation, faecal impaction (D12), diarrhoea, frequent/loose bowel movements; watery stools (D11), vomiting, emesis; hyperemesis; retching (D10); nausea (D09) | ✗ | ✗ | ✗ | ✗ |
| Excludes epigastric ache (D02); other localised abdominal pain (D06); biliary colic (D98); renal colic (U14); dysmenorrhoea (X02), abdominal mass (D24); ascites (D29), ileus (D99), melaena (D15); change in faeces/bowel movements (D18), haematemesis (D14); vomiting in pregnancy (W05), feelings of overeating (D02); alcohol-induced nausea (P16); loss of appetite (T03); nausea in pregnancy (W05) | |||||
| Hyposplenism or functional asplenia | Hyposplenism (reduced splenic functioning) or functional asplenia (absence of normal spleen function), including splenectomy | ✗ | |||
| IgA deficiency | IgA deficiency | ✗ | ✗ | ||
| IgA nephropathy | Also known as Berger’s disease | ✗ | |||
| Inflammatory bowel disease | Inflammatory bowel disease is a term for two conditions (Crohn’s disease and ulcerative colitis) that are characterised by chronic inflammation of the GI tract | ✗ | ✗ | ||
| Iron, vitamin B12 or folate deficiency | Includes anaemia, vitamin B12/folate deficiency, macrocytic anaemia, pernicious anaemia (B81); vitamin B12 deficiency without anaemia (T91), iron deficiency without anaemia | ✗ | |||
| Irritability | Includes feeling/behaving irritable/angry, agitation NOS; restlessness NOS (P04) | ✗ | |||
| Excludes overactive child (P22); irritability in partner (Z13) | |||||
| IBS | Includes IBS (D93), spastic colon | ✗ | ✗ | ✗ | |
| Excludes GI infection (D70); gastroenteritis-presumed infection (D73); regional enteritis (D94); allergic/dietetic/toxic gastroenteritis/colitis (D99); vascular insufficiency of gut (D99); psychogenic diarrhoea (P75) | |||||
| Migraine or headaches | Includes headache, post-traumatic headache (N01); migraine (N89); cluster headache (N90); tension headache (N95) | ✗ | ✗ | ||
| Excludes cervicogenic headache (L83); face pain (N03); atypical facial neuralgia (N99); sinus pain (R09); post-herpetic pain (S70) | |||||
| Mood disorders | Includes depressive disorder, depressive neurosis/psychosis; mixed anxiety and depression; puerperal/postnatal depression; reactive depression (P76); affective psychosis, bipolar disorder; hypomania; mania; manic depression (P73) | ✗ | |||
| Multiple sclerosis | Includes multiple sclerosis, disseminated sclerosis (N86) | ✗ | |||
| Neuropathy or ataxia | Includes peripheral neuritis/neuropathy, acute infective polyneuropathy; diabetic neuropathy (double code with T89, T90); Guillain–Barré syndrome; nerve lesion; neuropathy; phantom limb (N94); neurological symptom/complaint other, ataxia; gait abnormality; limping; meningism (N29) | ✗ | ✗ | ✗ | |
| Osteoporosis | Includes osteoporosis, pathological fracture due to osteoporosis (L95); osteomalacia, osteopenia, decreased bone mineralisation | ✗ | ✗ | ✗ | ✗ |
| Pancreatitis | Unexplained acute or chronic pancreatitis | ✗ | |||
| Psoriasis | Psoriasis (S91) | ✗ | ✗ | ||
| Pulmonary haemosiderosis | Pulmonary haemosiderosis | ✗ | |||
| Raised liver enzymes | Elevated liver enzymes (including alanine transaminase, aspartate transaminase, alkaline phosphatase, gamma-glutamyl transpeptidase | ✗ | ✗ | ✗ | ✗ |
| Severe or persistent mouth ulcers | Severe or persistent mouth ulcers including recurrent aphthous stomatitis | ✗ | ✗ | ✗ | |
| Subfertility or recurrent miscarriage | Includes abortion spontaneous, abortion complete/incomplete/missed/habitual, miscarriage (W82); infertility/subfertility female, primary and secondary sterility (W15) | ✗ | ✗ | ✗ | |
| Systemic lupus erythematosus | Systemic lupus erythematosus | ✗ | |||
| Thyroid disease | Thyroiditis, autoimmune thyroiditis, hypothyroidism, hyperthyroidism, Graves’ disease, goitre, Hashimoto’s thyroiditis, painless thyroiditis (silent thyroiditis), subacute thyroiditis, Graves’ disease excluding postpartum thyroiditis | ✗ | ✗ | ✗ | ✗ |
| Turner syndrome | Turner syndrome | ✗ | ✗ | ✗ | |
| Type 1 diabetes | Type 1 diabetes, includes juvenile diabetes or insulin-dependent diabetes (T89) | ✗ | ✗ | ✗ | |
| Type 2 diabetes | Type 2 diabetes, includes diabetes NOS; late-onset diabetes; type 2 diabetes (T90) | ✗ | |||
| Weight loss | Includes weight loss, cachexia (T08) | ✗ | ✗ | ✗ | ✗ |
| Excludes anorexia nervosa (P86) | |||||
| Williams–Beuren syndrome | Also known as Williams syndrome | ✗ |
Appendix 10 Patient flow diagrams
FIGURE 54.
Patient flow diagrams for the development (CPRD GOLD) and external validation (CPRD Aurum) data sets. a, This sensitivity analysis was restricted to patients diagnosed after 1997 because in this year IgA tTG tests were first developed, which are now the preferred serological test for screening for CD. a
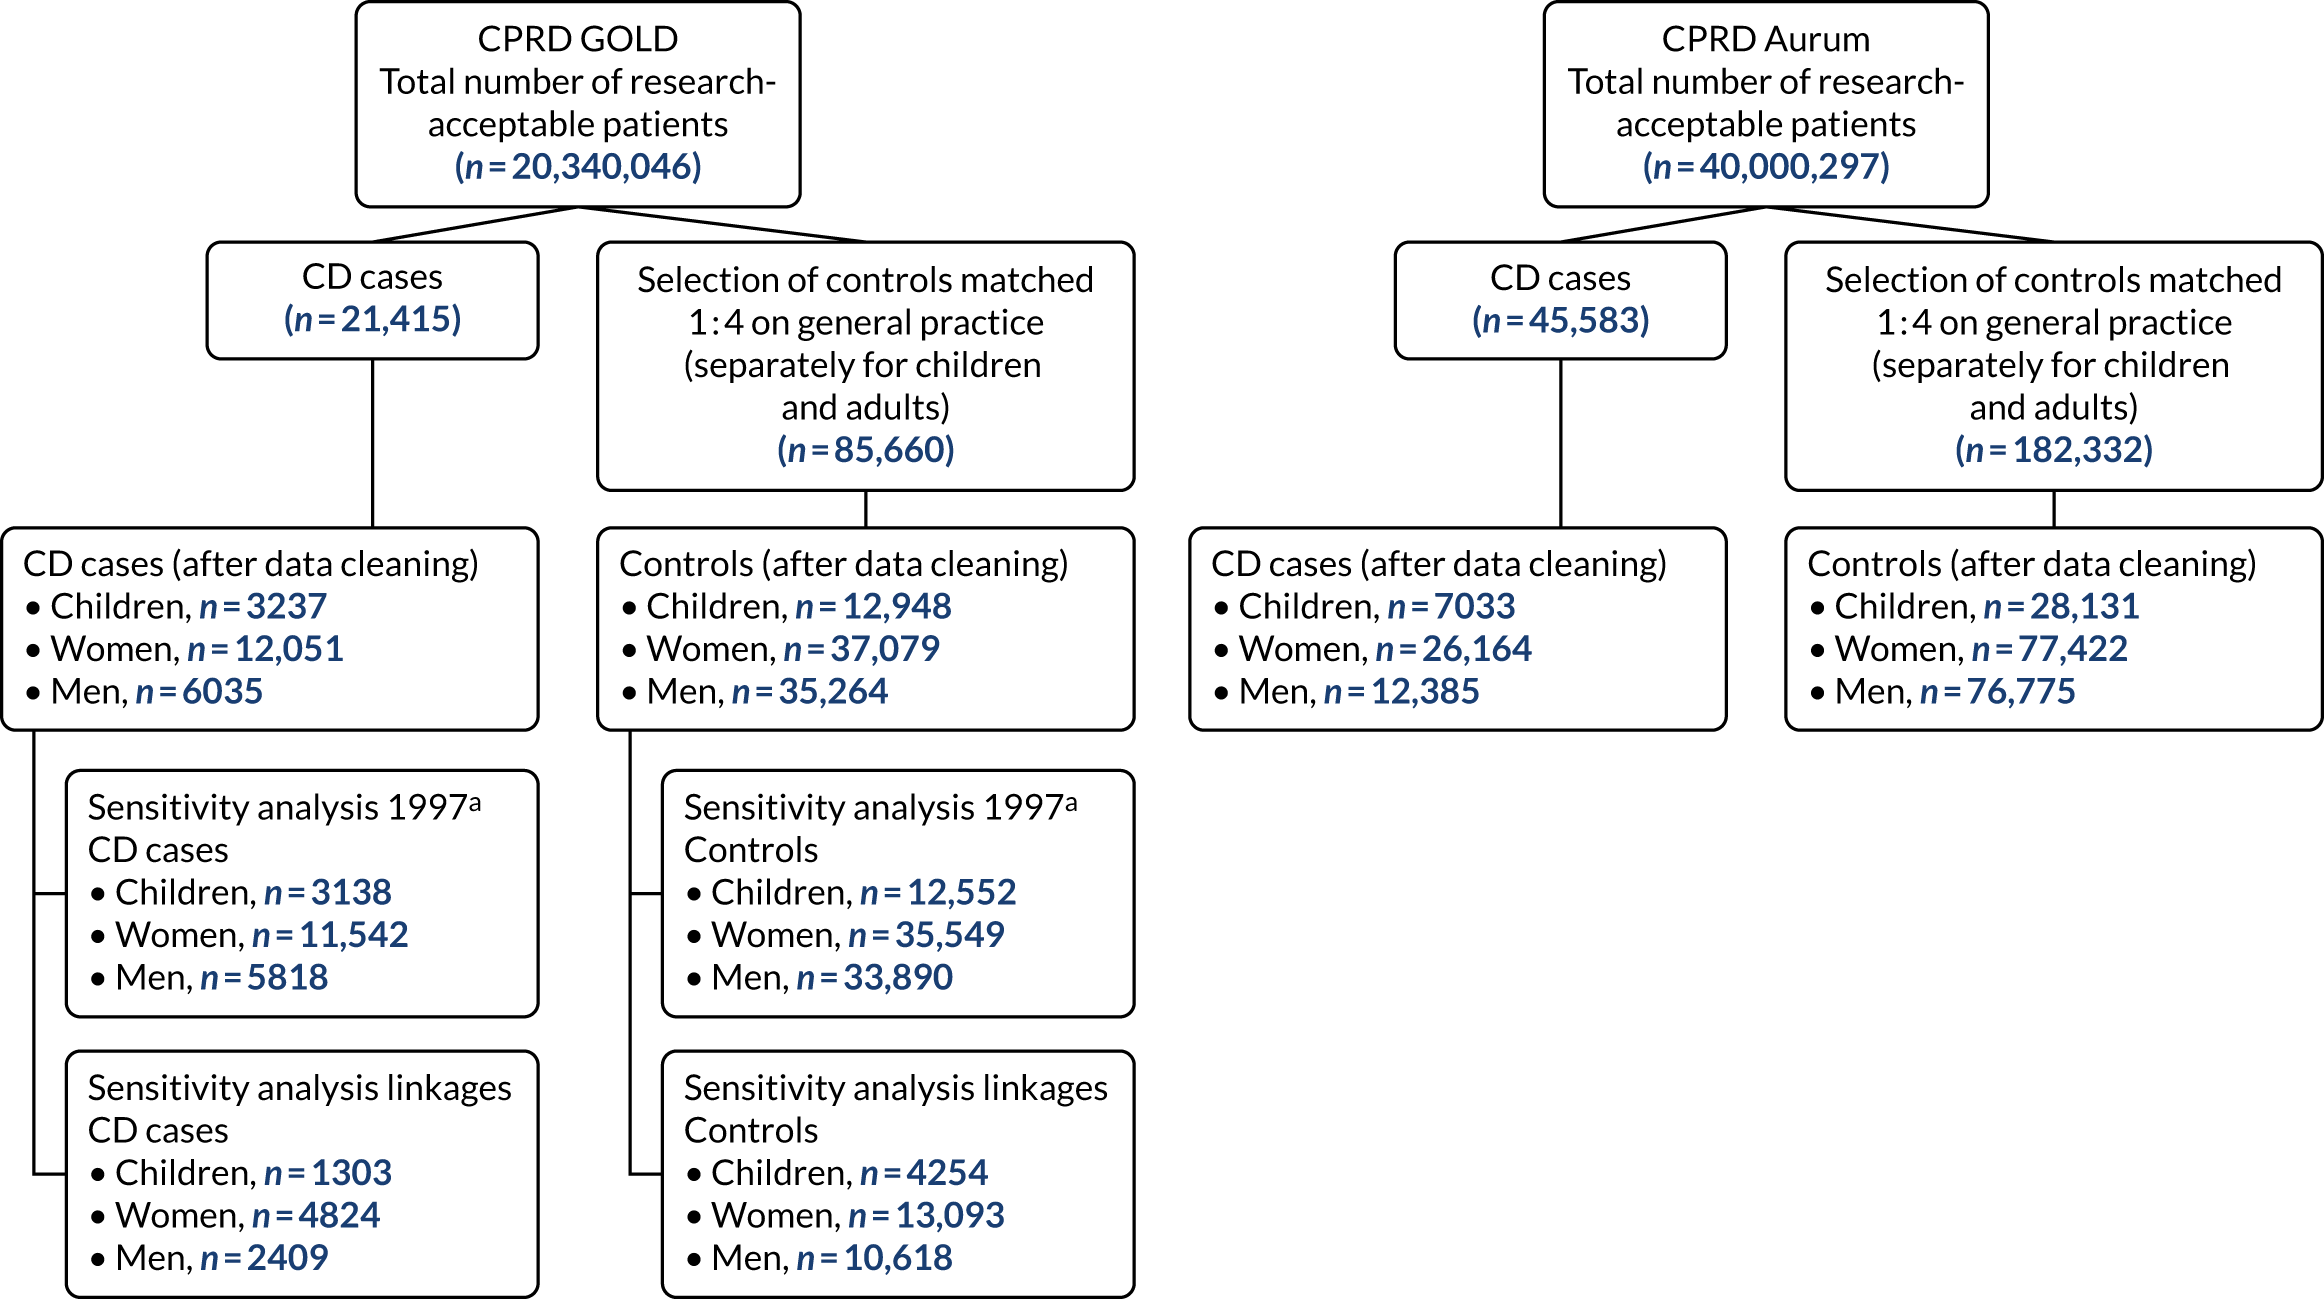
Appendix 11 Model coefficients and odds ratios
| Selected predictors | Coefficients (apparent model) | 200 bootstrapped samples, median (IQR) (internal validation) | Coefficients without shrinkage (apparent model) | Odds ratios (apparent model) | Unadjusted coefficients | Unadjusted odds ratios | |
|---|---|---|---|---|---|---|---|
| After shrinkage | Without shrinkage | ||||||
| (Intercept) | –5.119 | –5.127 (–5.146 to –5.108) | –5.119 | ||||
| Type 1 diabetes | 4.153 | 4.182 (4.062–4.278) | 4.794 | 63.648 | 120.796 | 4.318 | 75.038 |
| Turner syndrome | 3.949 | 3.908 (3.715–4.084) | 11.243 | 51.866 | 76,309.782 | 13.955 | 1,149,686.667 |
| IgA deficiency | 3.210 | 3.185 (2.287–3.563) | 10.770 | 24.789 | 47,560.457 | 12.954 | 422,523.354 |
| First-degree relatives with CD | 3.100 | 3.109 (3.037–3.172) | 3.361 | 22.196 | 28.808 | 3.167 | 23.736 |
| Anaemia | 2.645 | 2.618 (2.522–2.751) | 2.881 | 14.080 | 17.841 | 2.850 | 17.288 |
| Down syndrome | 2.429 | 2.428 (2.096–2.763) | 2.724 | 11.344 | 15.240 | 2.490 | 12.061 |
| Weight loss | 2.316 | 2.302 (2.142–2.485) | 2.563 | 10.135 | 12.972 | 2.811 | 16.627 |
| Thyroid disorders | 2.144 | 2.185 (2.000–2.395) | 2.361 | 8.536 | 10.601 | 2.742 | 15.518 |
| Iron, vitamin B12 or folate deficiency | 2.016 | 2.013 (1.704–2.363) | 2.288 | 7.508 | 9.860 | 2.872 | 17.672 |
| Delayed puberty | 1.995 | 1.997 (1.537–2.577) | 2.464 | 7.353 | 11.756 | 2.997 | 20.025 |
| Failure to thrive | 1.382 | 1.398 (1.215–1.540) | 1.517 | 3.981 | 4.558 | 1.888 | 6.606 |
| Arthritis | 1.318 | 1.371 (0.949–1.738) | 1.525 | 3.737 | 4.596 | 1.725 | 5.613 |
| IBS | 1.127 | 1.135 (0.934–1.377) | 1.246 | 3.087 | 3.476 | 1.765 | 5.842 |
| Fatigue (count 1 year) | 1.111 | 1.090 (0.967–1.233) | 1.249 | 3.036 | 3.487 | 2.139 | 8.491 |
| GI symptoms (count 1 year) | 0.794 | 0.792 (0.775–0.817) | 0.854 | 2.213 | 2.348 | 1.023 | 2.782 |
| Fatigue | 0.613 | 0.605 (0.500–0.698) | 0.603 | 1.846 | 1.827 | 1.638 | 5.145 |
| GI symptoms | 0.582 | 0.584 (0.550–0.613) | 0.603 | 1.790 | 1.828 | 1.304 | 3.684 |
| Mood disorders | 0.363 | 0.343 (0.250–0.448) | 0.389 | 1.437 | 1.476 | 0.829 | 2.291 |
| Age | 0.011 | 0.011 (0.007–0.014) | 0.014 | 1.011 | 1.014 | –0.007 | 0.993 |
| Sex (male) | –0.477 | –0.472 (–0.502 to –0.447) | –0.537 | 0.621 | 0.584 | –0.585 | 0.557 |
| Selected predictors | Coefficients (apparent model) | 200 bootstrapped samples, median (IQR) | Coefficients without shrinkage (apparent model) | Odds ratios (apparent model) | Unadjusted coefficients | Unadjusted odds ratios | |
|---|---|---|---|---|---|---|---|
| After shrinkage | Without shrinkage | ||||||
| (Intercept) | –5.063 | –5.062 (–5.080 to –5.042) | –5.057 | ||||
| First-degree relative with CD | 2.459 | 2.449 (2.378–2.517) | 2.519 | 11.689 | 12.413 | 2.505 | 12.244 |
| Anaemia | 1.630 | 1.635 (1.605–1.661) | 1.659 | 5.102 | 5.252 | 1.914 | 6.780 |
| Iron, vitamin B12 or folate deficiency | 1.323 | 1.383 (0.554–2.113) | 1.348 | 3.753 | 3.851 | 1.810 | 6.110 |
| Type 1 diabetes | 1.277 | 1.337 (1.293–1.375) | 1.312 | 3.584 | 3.714 | 1.487 | 4.424 |
| Down syndrome | 1.163 | 1.269 (1.161–1.358) | 1.256 | 3.198 | 3.512 | 1.124 | 3.077 |
| IgA deficiency | 1.127 | 1.170 (0.765–1.596) | 1.266 | 3.087 | 3.545 | 2.223 | 9.235 |
| Turner syndrome | 1.080 | 1.057 (0.422–1.681) | 1.186 | 2.944 | 3.275 | 1.635 | 5.129 |
| Osteoporosis | 1.028 | 1.040 (1.000–1.077) | 1.054 | 2.797 | 2.869 | 1.158 | 3.184 |
| Weight loss | 0.910 | 0.895 (0.848–0.950) | 0.929 | 2.485 | 2.533 | 1.463 | 4.319 |
| Mouth ulcers (count 1 year) | 0.857 | 0.841 (0.767–0.907) | 0.886 | 2.357 | 2.425 | 1.196 | 3.307 |
| Systemic lupus erythematosus | 0.699 | 0.698 (0.532–0.856) | 0.737 | 2.011 | 2.090 | 1.077 | 2.936 |
| GI symptoms (count 1 year) | 0.604 | 0.604 (0.594–0.615) | 0.616 | 1.829 | 1.852 | 0.760 | 2.138 |
| Thyroid disorders | 0.599 | 0.598 (0.563–0.629) | 0.614 | 1.821 | 1.848 | 0.847 | 2.333 |
| Fatigue (count 1 year) | 0.545 | 0.544 (0.518–0.571) | 0.559 | 1.725 | 1.748 | 0.923 | 2.517 |
| IBS | 0.478 | 0.474 (0.450–0.505) | 0.488 | 1.613 | 1.629 | 0.698 | 2.010 |
| Chronic liver disease | 0.326 | 0.324 (0.245–0.383) | 0.341 | 1.386 | 1.406 | 0.739 | 2.094 |
| Epilepsy | 0.258 | 0.252 (0.232–0.268) | 0.277 | 1.295 | 1.319 | 0.614 | 1.848 |
| GI symptoms | 0.249 | 0.251 (0.173–0.360) | 0.243 | 1.283 | 1.275 | 1.017 | 2.765 |
| Fractures (count 1 year) | 0.196 | 0.203 (0.167–0.241) | 0.205 | 1.217 | 1.228 | 0.561 | 1.752 |
| Cardiovascular disease | 0.196 | 0.190 (0.139–0.222) | 0.206 | 1.216 | 1.229 | 0.370 | 1.448 |
| Neuropathy or ataxia | 0.179 | 0.178 (0.074–0.311) | 0.203 | 1.196 | 1.225 | 0.703 | 2.020 |
| Fatigue | 0.153 | 0.151 (0.127–0.178) | 0.149 | 1.165 | 1.160 | 0.853 | 2.347 |
| Inflammatory bowel disease | 0.138 | 0.112 (0.000–0.227) | 0.153 | 1.148 | 1.165 | 0.952 | 2.591 |
| Psoriasis | 0.048 | 0.047 (0.000–0.097) | 0.058 | 1.050 | 1.060 | 0.299 | 1.349 |
| Age | –0.006 | –0.006 (–0.006 to –0.005) | –0.006 | 0.994 | 0.994 | 0.001 | 1.001 |
| Selected predictors | Coefficients (apparent model) | 200 bootstrapped samples, median (IQR) | Coefficients without shrinkage (apparent model) | Odds ratios (apparent model) | Unadjusted coefficients | Unadjusted odds ratios | |
|---|---|---|---|---|---|---|---|
| After shrinkage | Without shrinkage | ||||||
| (Intercept) | –5.478 | –5.488 (–5.526 to –5.460) | –5.481 | ||||
| Anaemia | 2.685 | 2.689 (2.632–2.753) | 2.727 | 14.656 | 15.293 | 3.148 | 23.289 |
| First-degree relatives with CD | 2.347 | 2.362 (2.282–2.461) | 2.395 | 10.456 | 10.969 | 2.210 | 9.116 |
| Iron, vitamin B12 or folate deficiency | 1.810 | 1.828 (1.754–1.917) | 1.841 | 6.112 | 6.302 | 2.632 | 13.902 |
| Type 1 diabetes | 1.746 | 1.749 (1.650–1.868) | 1.787 | 5.730 | 5.972 | 1.840 | 6.297 |
| Osteoporosis | 1.554 | 1.549 (1.433–1.673) | 1.588 | 4.730 | 4.892 | 1.992 | 7.330 |
| Weight loss | 1.490 | 1.489 (1.431–1.552) | 1.514 | 4.438 | 4.545 | 2.154 | 8.619 |
| Down syndrome | 1.293 | 1.344 (0.856–1.813) | 1.405 | 3.643 | 4.075 | 1.766 | 5.847 |
| Mouth ulcers (count year 1) | 0.934 | 0.919 (0.849–0.994) | 0.965 | 2.544 | 2.624 | 1.503 | 4.495 |
| Thyroid disorders | 0.910 | 0.913 (0.753–1.074) | 0.928 | 2.484 | 2.530 | 1.499 | 4.477 |
| GI symptoms (count year 1) | 0.787 | 0.789 (0.772–0.807) | 0.799 | 2.197 | 2.223 | 1.037 | 2.821 |
| IBS | 0.709 | 0.714 (0.651–0.776) | 0.728 | 2.032 | 2.072 | 1.240 | 3.456 |
| Fatigue (count year 1) | 0.663 | 0.652 (0.592–0.714) | 0.680 | 1.941 | 1.974 | 1.178 | 3.248 |
| GI symptoms | 0.448 | 0.442 (0.414–0.472) | 0.447 | 1.565 | 1.563 | 1.348 | 3.850 |
| Mouth ulcers | 0.412 | 0.401 (0.305–0.514) | 0.427 | 1.510 | 1.533 | 1.118 | 3.059 |
| Psoriasis | 0.335 | 0.339 (0.265–0.401) | 0.354 | 1.398 | 1.425 | 0.671 | 1.956 |
| Chronic liver disease | 0.321 | 0.321 (0.236–0.396) | 0.338 | 1.378 | 1.402 | 0.957 | 2.604 |
| Epilepsy | 0.259 | 0.290 (0.147–0.384) | 0.291 | 1.296 | 1.338 | 0.672 | 1.958 |
| Cardiovascular disease | 0.253 | 0.243 (0.214–0.282) | 0.257 | 1.288 | 1.293 | 0.975 | 2.651 |
| Fatigue | 0.185 | 0.186 (0.136–0.233) | 0.183 | 1.203 | 1.201 | 1.077 | 2.936 |
| Age | 0.010 | 0.011 (0.010–0.011) | 0.011 | 1.010 | 1.011 | 0.023 | 1.023 |
Appendix 12 Calibration curves
FIGURE 55.
Calibration curves model development and external validation. (a) Children: development sample; (b) children: external validation; (c) women: developmental sample; (d) women: external validation; (e) men: developmental sample; and (f) men: external validation. CL, confidence limits; RCS, restricted cubic splines.
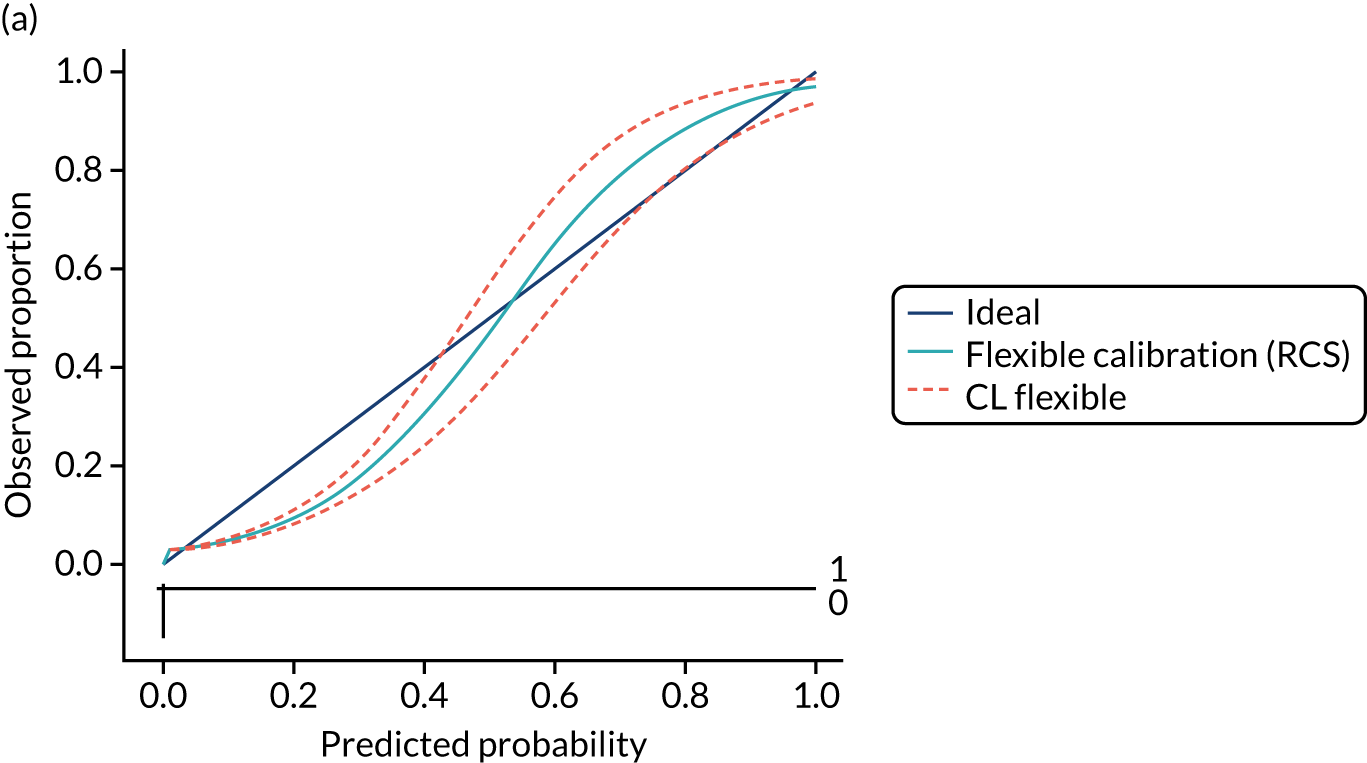
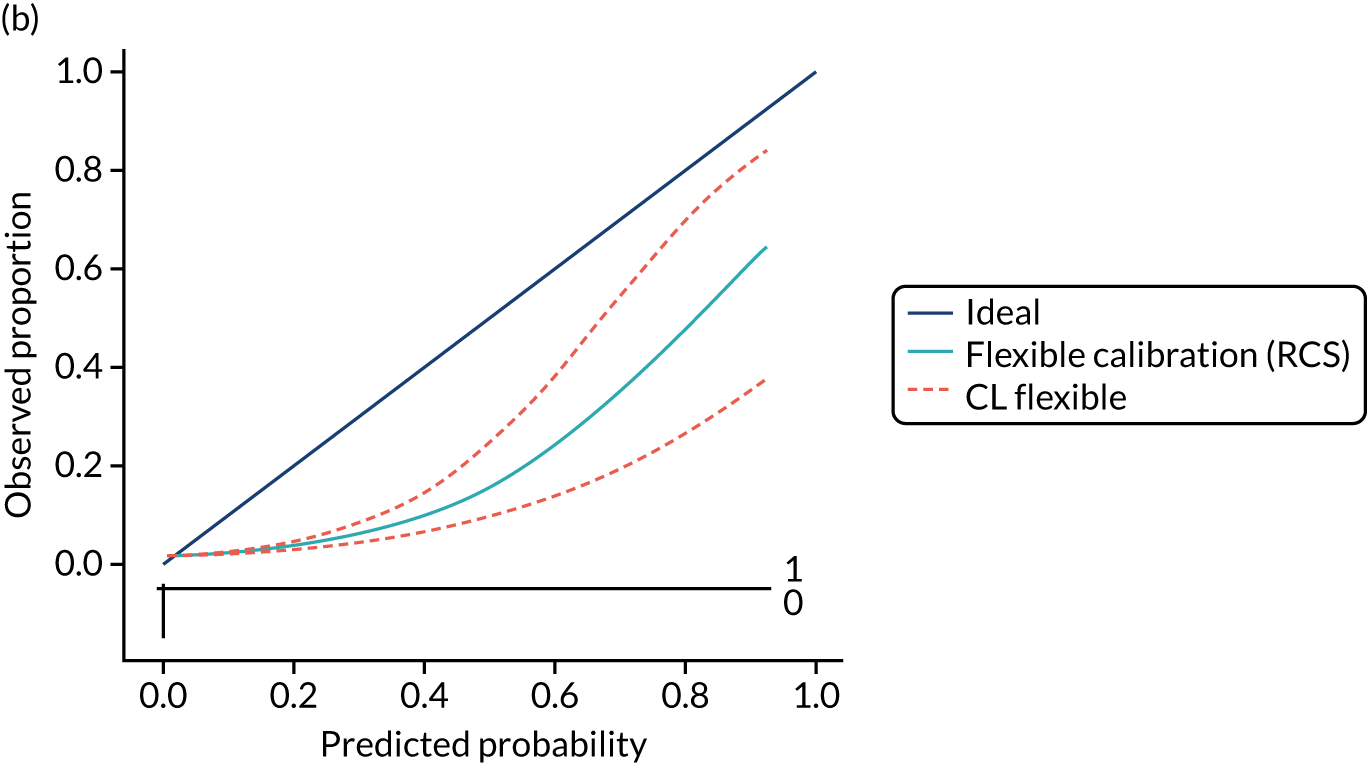
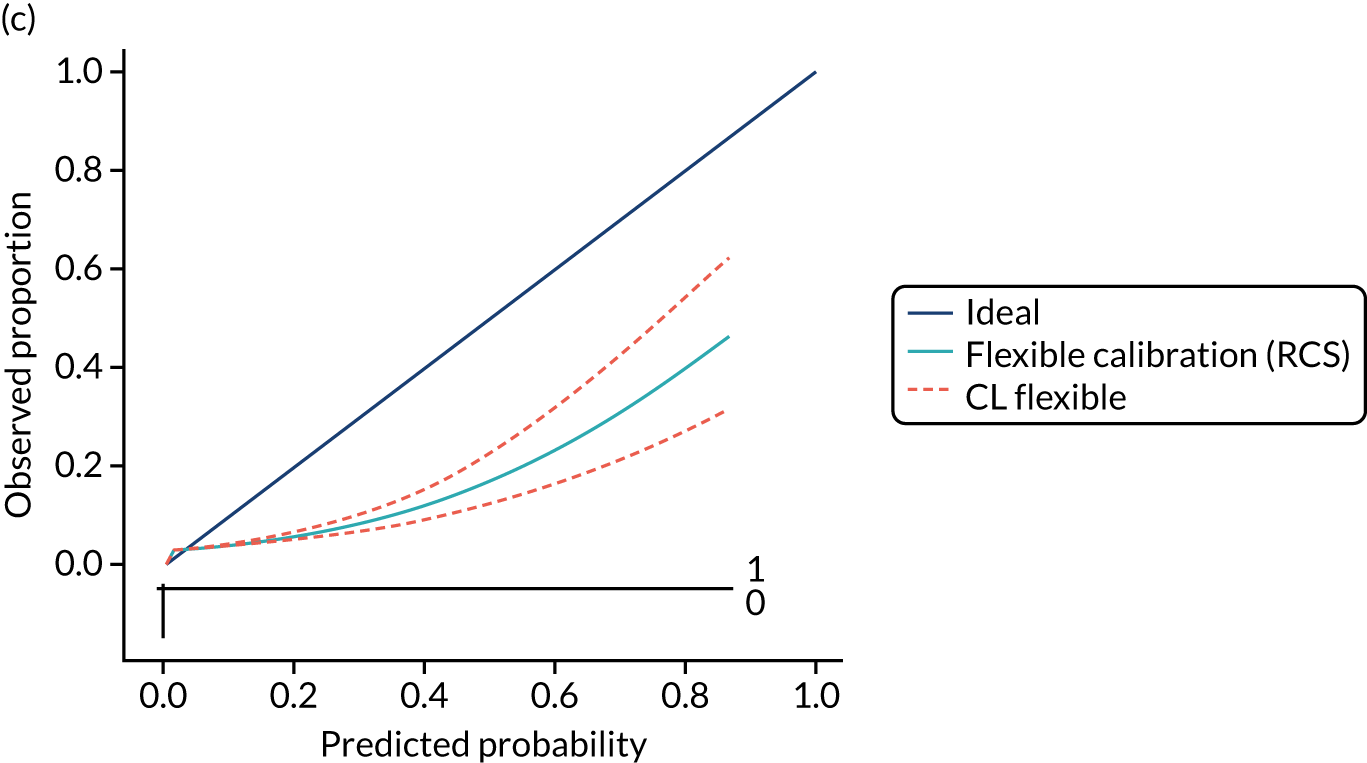
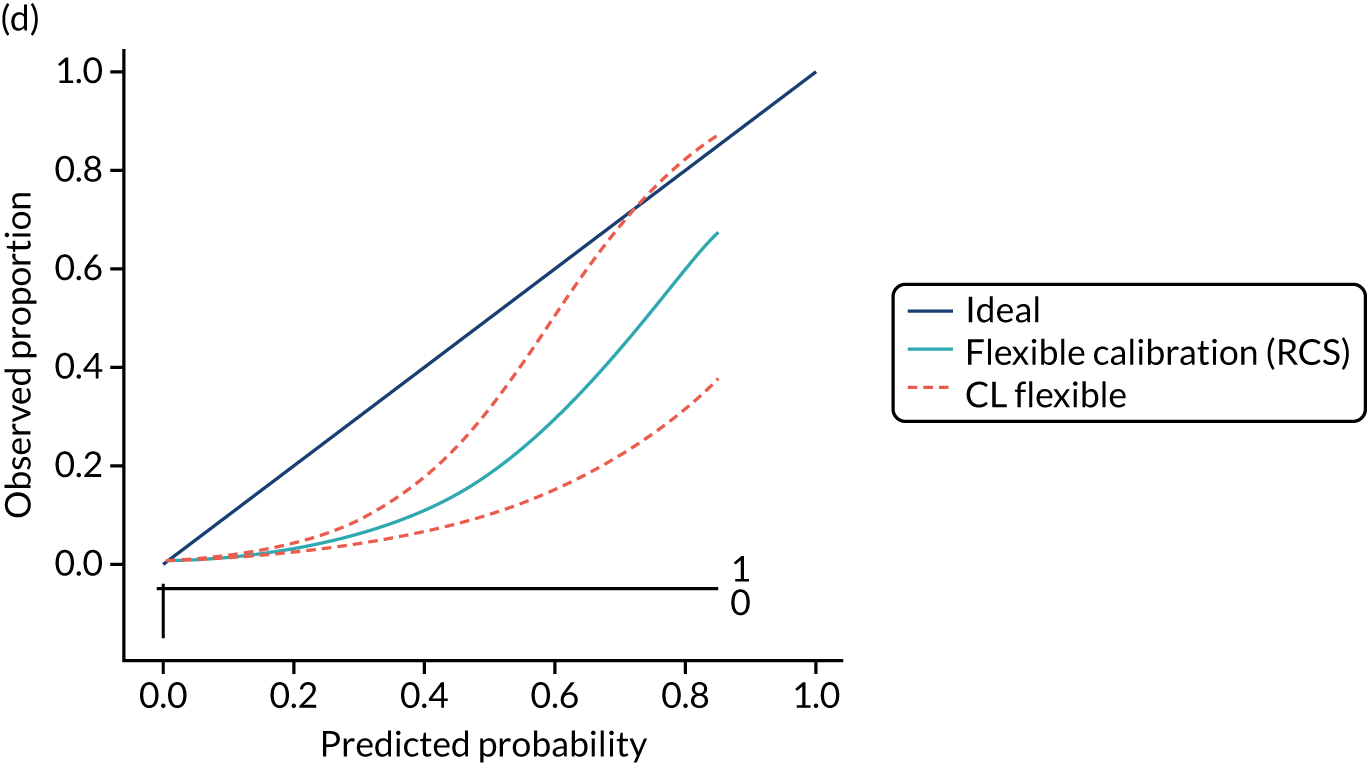
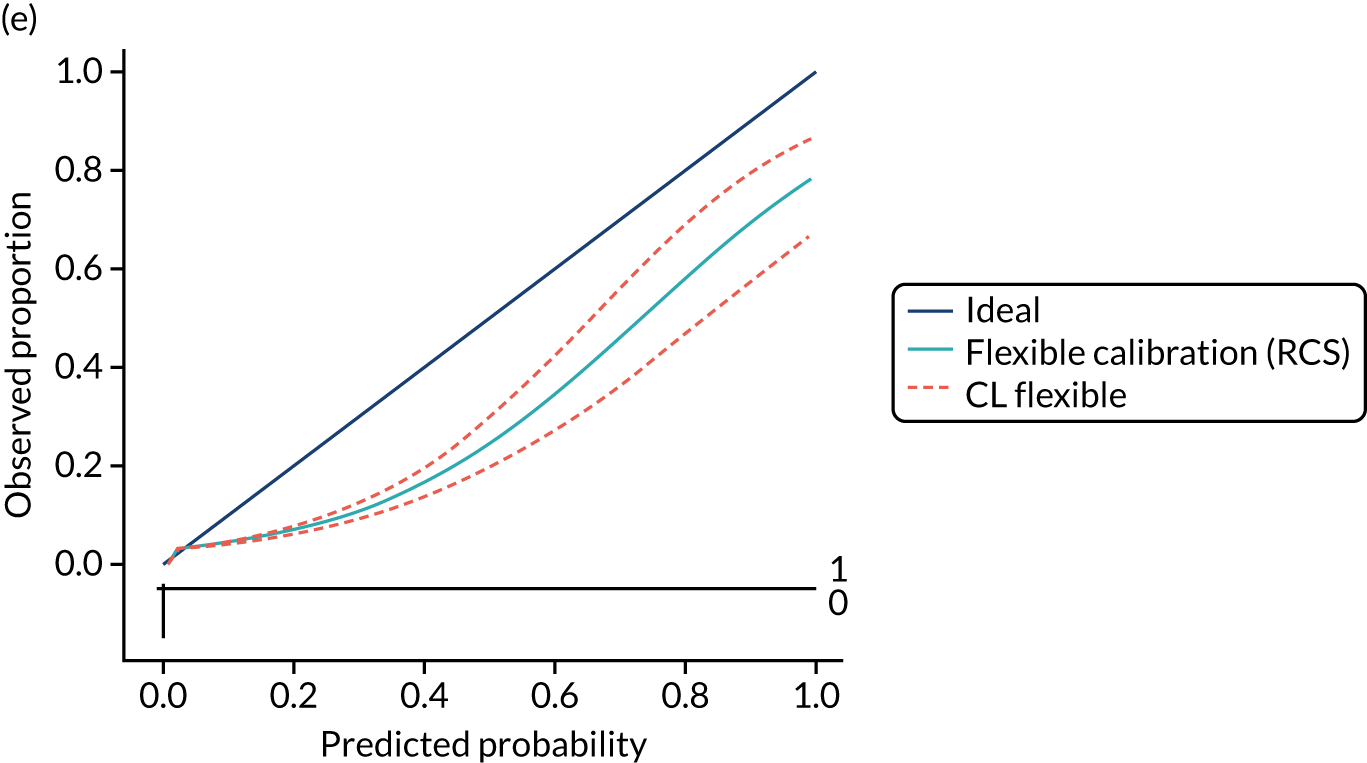
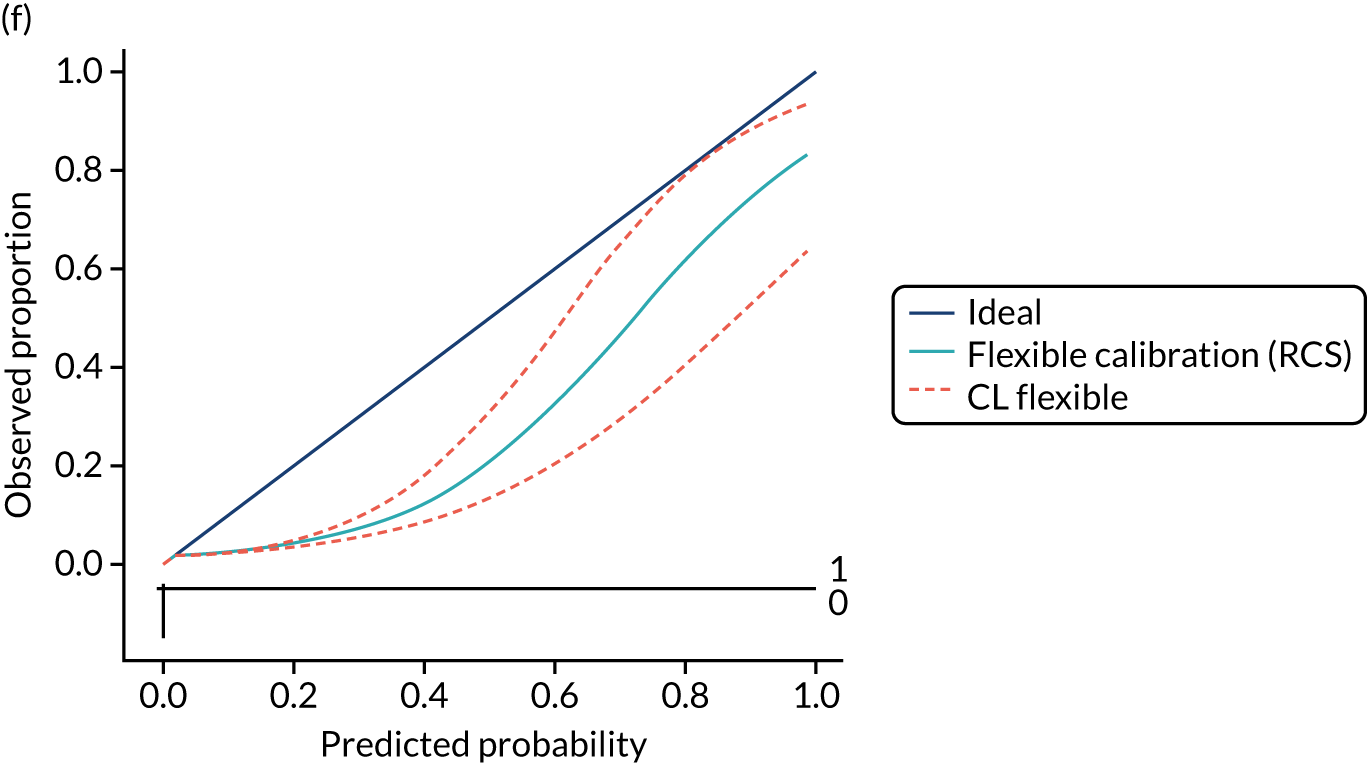
Appendix 13 Clinical usefulness in external validation data
| Population | Threshold | TP (n) | FP (n) | FN (n) | TN (n) | Sensitivity (%) | Specificity (%) | PPV (%) | NPV (%) | CD patients missed (%) |
|---|---|---|---|---|---|---|---|---|---|---|
| Children | 0 | 100 | 9900 | 0 | 0 | 100.0 | 0 | 1.0 | NA | 0 |
| 0.0038 | 94 | 9179 | 6 | 721 | 93.5 | 7.3 | 1.0 | 99.1 | 6.5 | |
| 0.0042 | 75 | 6297 | 25 | 3603 | 74.6 | 36.4 | 1.2 | 99.3 | 25.4 | |
| 0.0077 | 13 | 402 | 87 | 9498 | 12.6 | 95.9 | 3.0 | 99.1 | 87.4 | |
| 0.0170 | 10 | 159 | 90 | 9741 | 10.0 | 98.4 | 5.9 | 99.1 | 90 | |
| 0.0800 | 5 | 38 | 95 | 9862 | 5.2 | 99.6 | 12.1 | 99.0 | 94.8 | |
| Women | 0 | 100 | 9900 | 0 | 0 | 100.0 | 0 | 1.0 | NA | 0 |
| 0.0053 | 32 | 2327 | 68 | 7574 | 32.2 | 76.5 | 1.4 | 99.1 | 67.8 | |
| 0.0062 | 14 | 683 | 86 | 9217 | 14.3 | 93.1 | 2.0 | 99.1 | 85.7 | |
| 0.0233 | 7 | 158 | 93 | 9742 | 7.2 | 98.4 | 4.5 | 99.1 | 92.8 | |
| 0.1070 | 2 | 20 | 98 | 9880 | 1.7 | 99.8 | 7.1 | 99.0 | 98.3 | |
| 0.7550 | 0 | 0 | 100 | 9900 | 0.0 | 100.0 | 6.2 | 99.0 | 100 | |
| Men | 0 | 100 | 9900 | 0 | 0 | 100.0 | 0 | 1.0 | NA | 0 |
| 0.007 | 64 | 4623 | 36 | 5277 | 64.3 | 53.3 | 1.4 | 99.3 | 35.7 | |
| 0.008 | 42 | 2376 | 58 | 7524 | 41.6 | 76.0 | 1.7 | 99.2 | 58.4 | |
| 0.0185 | 11 | 228 | 89 | 9672 | 10.8 | 97.7 | 4.5 | 99.1 | 89.2 | |
| 0.0610 | 6 | 69 | 94 | 9831 | 6.3 | 99.3 | 8.2 | 99.1 | 93.7 | |
| 0.2820 | 2 | 10 | 98 | 9890 | 2.0 | 99.9 | 14.2 | 99.0 | 98 |
Appendix 14 Model performance after including ethnicity and deprivation as predictions
| Data | Apparent model performance | Updated model performance | |
|---|---|---|---|
| Original data set (CPRD GOLD) | CPRD GOLD linked with HES | CPRD GOLD linked with HES | |
| Children | |||
| R 2 | 0.407 | 0.422 | 0.426 |
| Brier score | 0.167 | 0.181 | 0.113 |
| c-statistic | 0.821 | 0.824 | 0.824 |
| Calibration intercepta | 0.147 | –0.467 | –3.483 |
| Calibration slopea | 0.964 | 0.978 | 0.941 |
| Women | |||
| R 2 | 0.237 | 0.272 | 0.276 |
| Brier score | 0.227 | 0.244 | 0.153 |
| c-statistic | 0.756 | 0.778 | 0.779 |
| Calibration intercepta | –0.161 | –0.307 | –3.729 |
| Calibration slopea | 0.822 | 0.816 | 0.818 |
| Men | |||
| R 2 | 0.286 | 0.300 | 0.301 |
| Brier score | 0.122 | 0.153 | 0.113 |
| c-statistic | 0.798 | 0.792 | 0.793 |
| Calibration intercepta | –0.505 | –0.768 | –3.228 |
| Calibration slopea | 0.934 | 0.802 | 0.843 |
Appendix 15 Association of candidate predictors with coeliac disease
| Candidate predictor | Coefficient (95% CI) | p-value | n |
|---|---|---|---|
| Type 1 diabetes | 2.86 (–0.20 to 5.92) | 0.067 | 2697 |
| Anaemia | 0.96 (–0.14 to 2.06) | 0.088 | 5077 |
| Thyroid disorders | 0.37 (–2.45 to 3.18) | 0.799 | 3364 |
| GI symptom count | |||
| 1 | –0.38 (–2.01 to 1.26) | 0.651 | 4168 |
| 2–4 | 0.58 (–1.06 to 2.23) | 0.488 | 4168 |
| Male | –0.78 (–1.39 to –0.17) | 0.013 | 5108 |
| Fatigue | –0.02 (–0.74 to 0.70) | 0.951 | 3967 |
| Mouth ulcers | –0.16 (–1.21 to 0.89) | 0.765 | 2071 |
| GI symptoms | –0.26 (–1.54 to 1.03) | 0.695 | 4188 |
| Mood disorders | –0.63 (–1.73 to 0.47) | 0.262 | 4222 |
| Age | –1.41 (–3.45 to 0.63) | 0.176 | 5117 |
Appendix 16 Search strategy for diagnostic accuracy review (see Chapter 5)
MEDLINE search strategy. This strategy was adapted to run on Embase. The Cochrane Library, KSR Evidence and Web of Science were also searched.
Date range searched: 1997 to April 2021.
-
Celiac Disease/
-
((coeliac or celiac) adj4 (disease or sprue or syndrome)).tw.
-
((nontropical or non tropical) adj4 sprue).tw.
-
((gluten or glutenin or gliadin) adj4 (sensitiv* or hypersensitiv* or intoleran*)).tw.
-
(gluten adj4 enteropath*).tw.
-
or/1-5
-
Serologic Tests/
-
((serologic or serological) adj4 test*).tw.
-
7 or 8
-
(endomysi* adj4 antibod*).tw.
-
(immunoglobulin adj4 (endomysi* or anti-endomysi* or antiendomysi* or anti endomysi*)).tw.
-
((anti-endomysi* or antiendomysi* or anti endomysi*) adj antibod*).tw.
-
((iga or igg) adj4 (endomysi* or anti-endomysi* or antiendomysi* or anti endomysi*)).tw.
-
(iga-ema or igg-ema).tw.
-
((EMA or AGA) and antibod*).tw.
-
or/10-15
-
transglutaminases/
-
(((anti-tissue or antitissue or anti tissue) adj4 transglutaminase) and antibod*).tw.
-
((iga or igg or immunoglobulin) adj4 transglutaminase).tw.
-
((anti-human or antihuman or anti human or tissue) adj4 transglutaminase adj4 antibod*).tw.
-
(anti-httg or anti-htg or tTg).tw.
-
or/17-21
-
((gliadin or antigliadin or anti-gliadin or anti gliadin) adj4 antibod*).tw.
-
((igg or iga or immunoglobulin) adj4 gliadin).tw.
-
((igg or iga or immunoglobulin) adj4 (antigliadin or anti-gliadin or anti gliadin)).tw.
-
(elisa adj4 test*).tw.
-
Gliadin/and Immunoglobulins/
-
or/23-27
-
HLA-DQ Antigens/or HLA-DR3 Antigen/
-
(human adj3 (leukocyte* or leucocyte*) adj3 antigen*).tw.
-
(hla adj3 typing).tw.
-
((dr3 or hla) adj4 dq2).tw.
-
((dr4 or hla) adj4 dq8).tw.
-
or/29-33
-
9 or 16 or 22 or 28 or 34
-
6 and 35
-
letter/
-
editorial/
-
news/
-
exp historical article/
-
Anecdotes as topic/
-
comment/
-
case report/
-
(letter or comment* or editorial or case report).ti.
-
or/37-44
-
exp animals/not humans/
-
exp Animals, Laboratory/
-
exp Animal Experimentation/
-
exp Models, Animal/
-
exp rodentia/
-
((rat or rats or mouse or mice or rodent* or animal* or murine or porcine or feline or canine or dog or dogs or cat or cats or pig or pigs or monkey* or macaque*) not human*).ti.
-
or/46-51
-
45 or 52
-
36 not 53.
Appendix 17 Preferred Reporting Items for Systematic Reviews and Meta-Analyses flow diagram
FIGURE 56.
Preferred Reporting Items for Systematic Reviews and Meta-Analyses flow diagram. AAA, anti-actin antibodies.
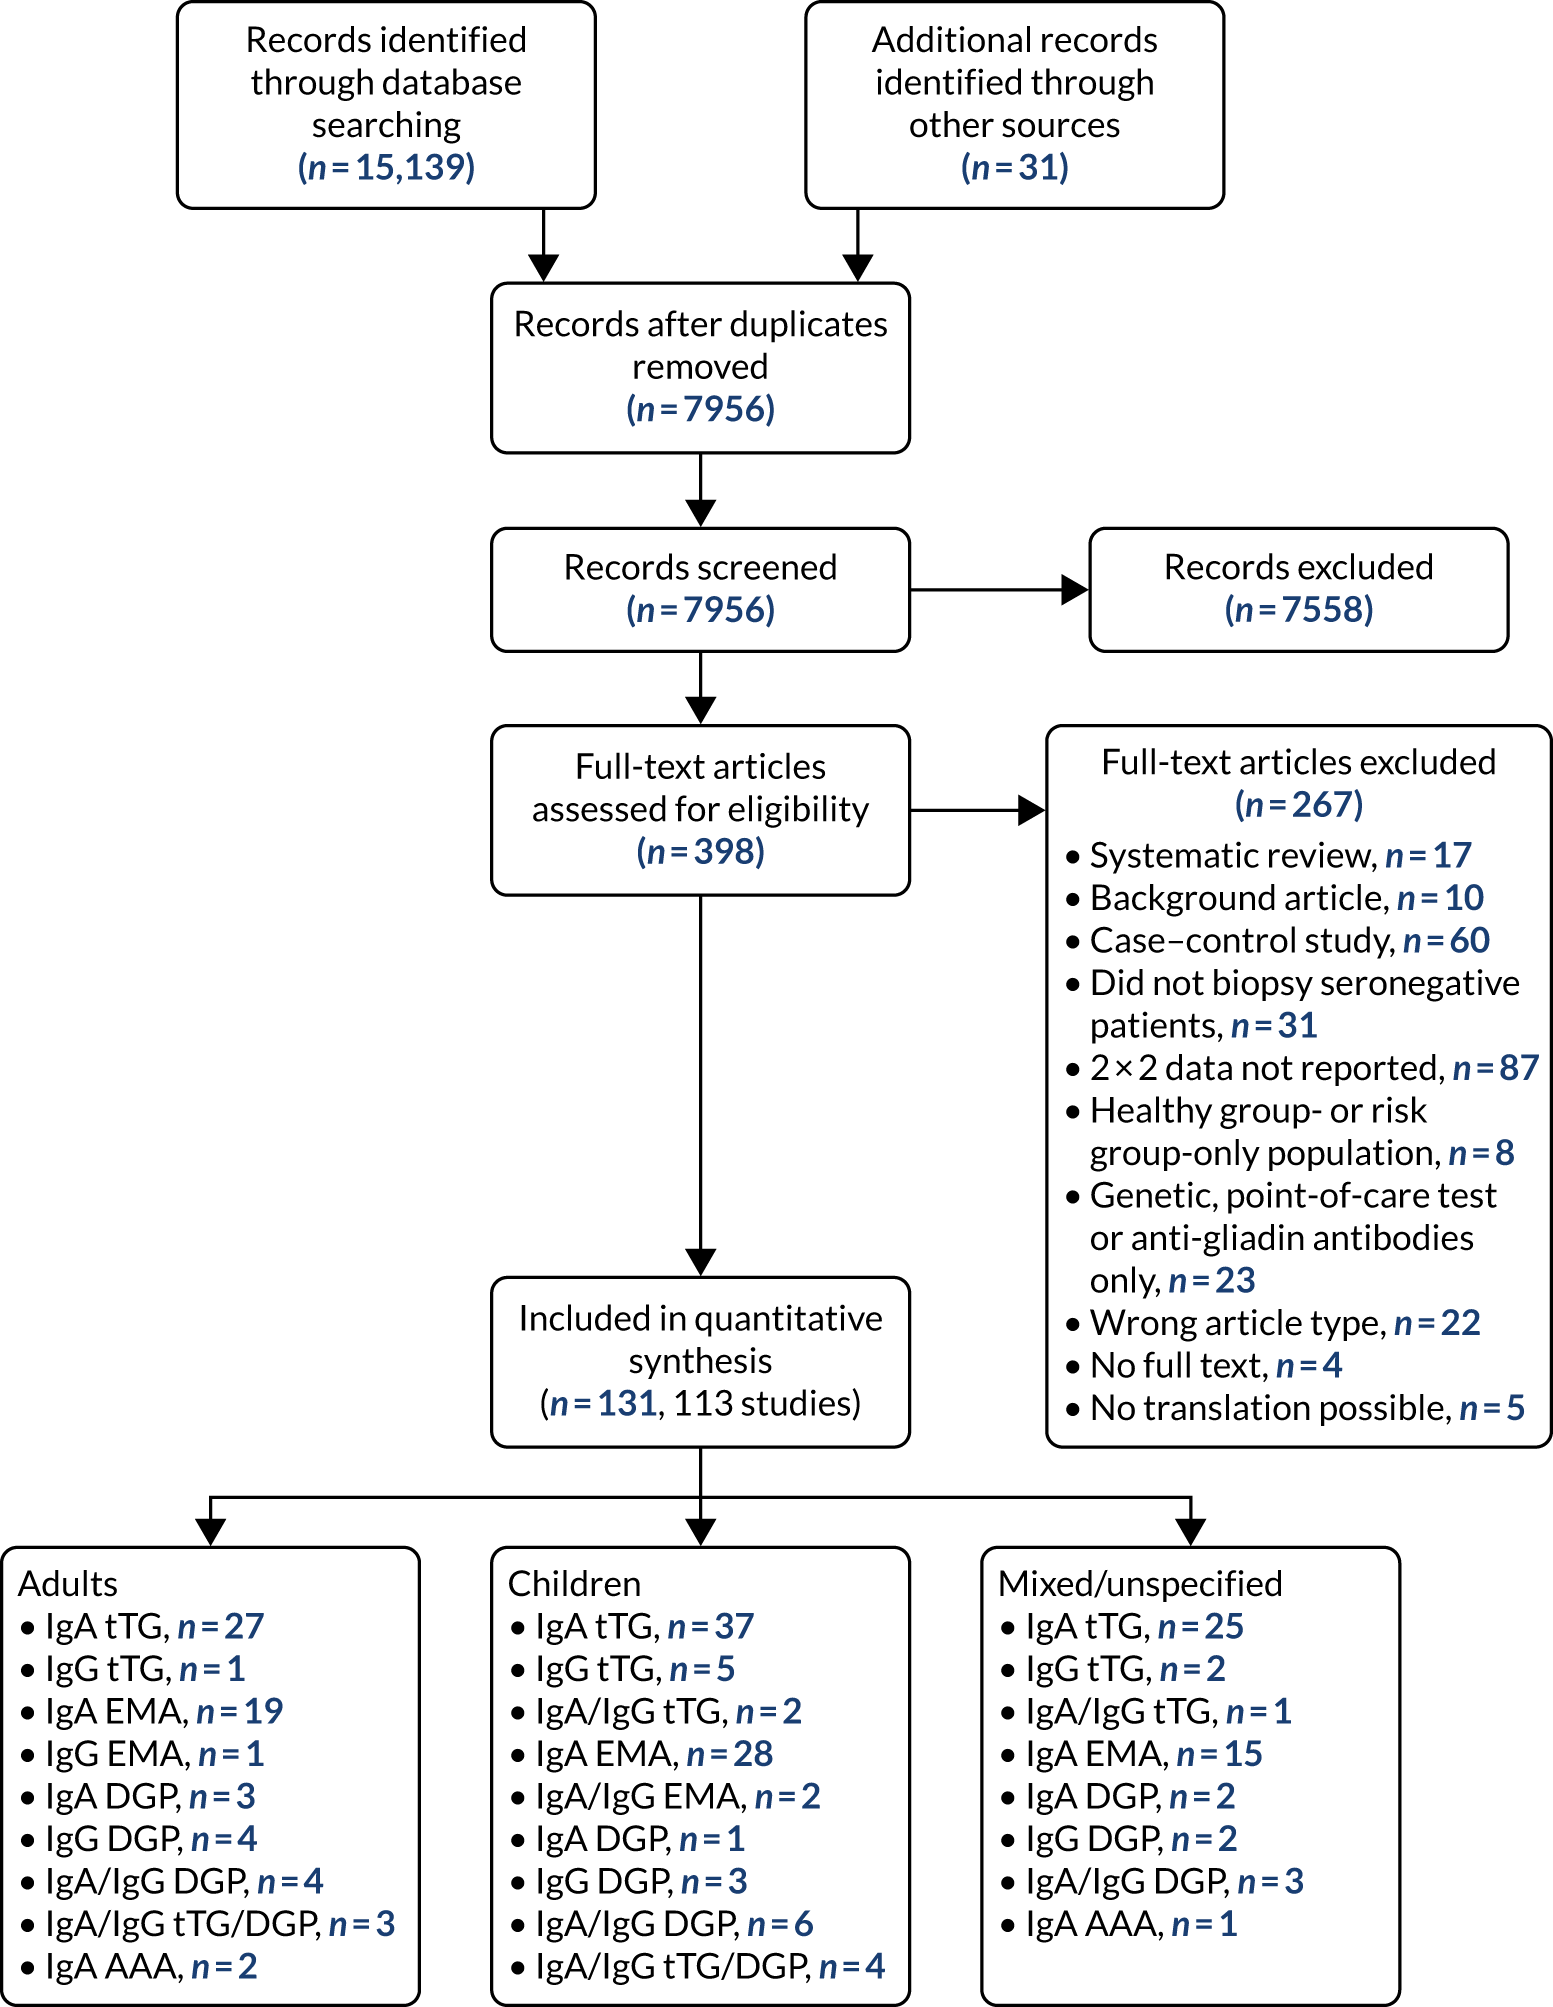
Appendix 18 Risk-of-bias plots
FIGURE 57.
Summary risk-of-bias plots for all studies combined, stratified according to age and according to test type. (a) All studies; (b) children; (c) adults; (d) IgA tTG; and (e) IgA EMA.


Appendix 19 Sensitivity and specificity estimates
FIGURE 58.
Study estimates of IgA tTG sensitivity and specificity for adults plotted in ROC space, stratified by reason for biopsy. SROC curves are estimated from a meta-analysis of all data, across thresholds.
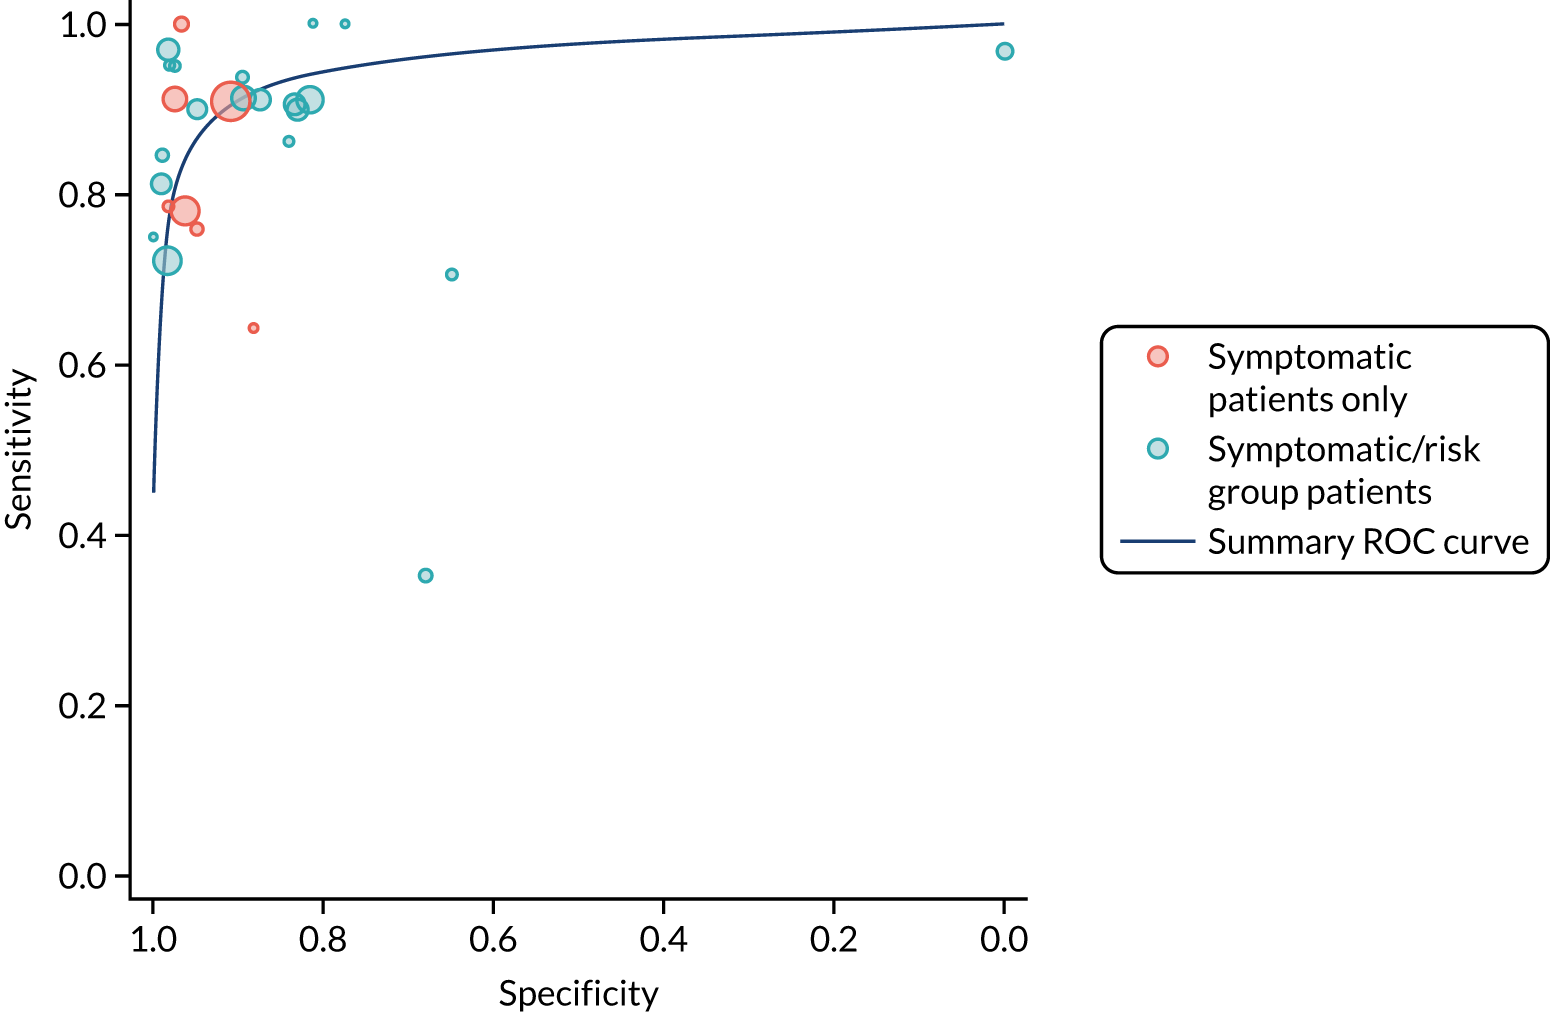
FIGURE 59.
Study estimates of IgA EMA sensitivity and specificity for adults plotted in ROC space, stratified by reason for biopsy. SROC curves are estimated from a meta-analysis of all data, across thresholds.
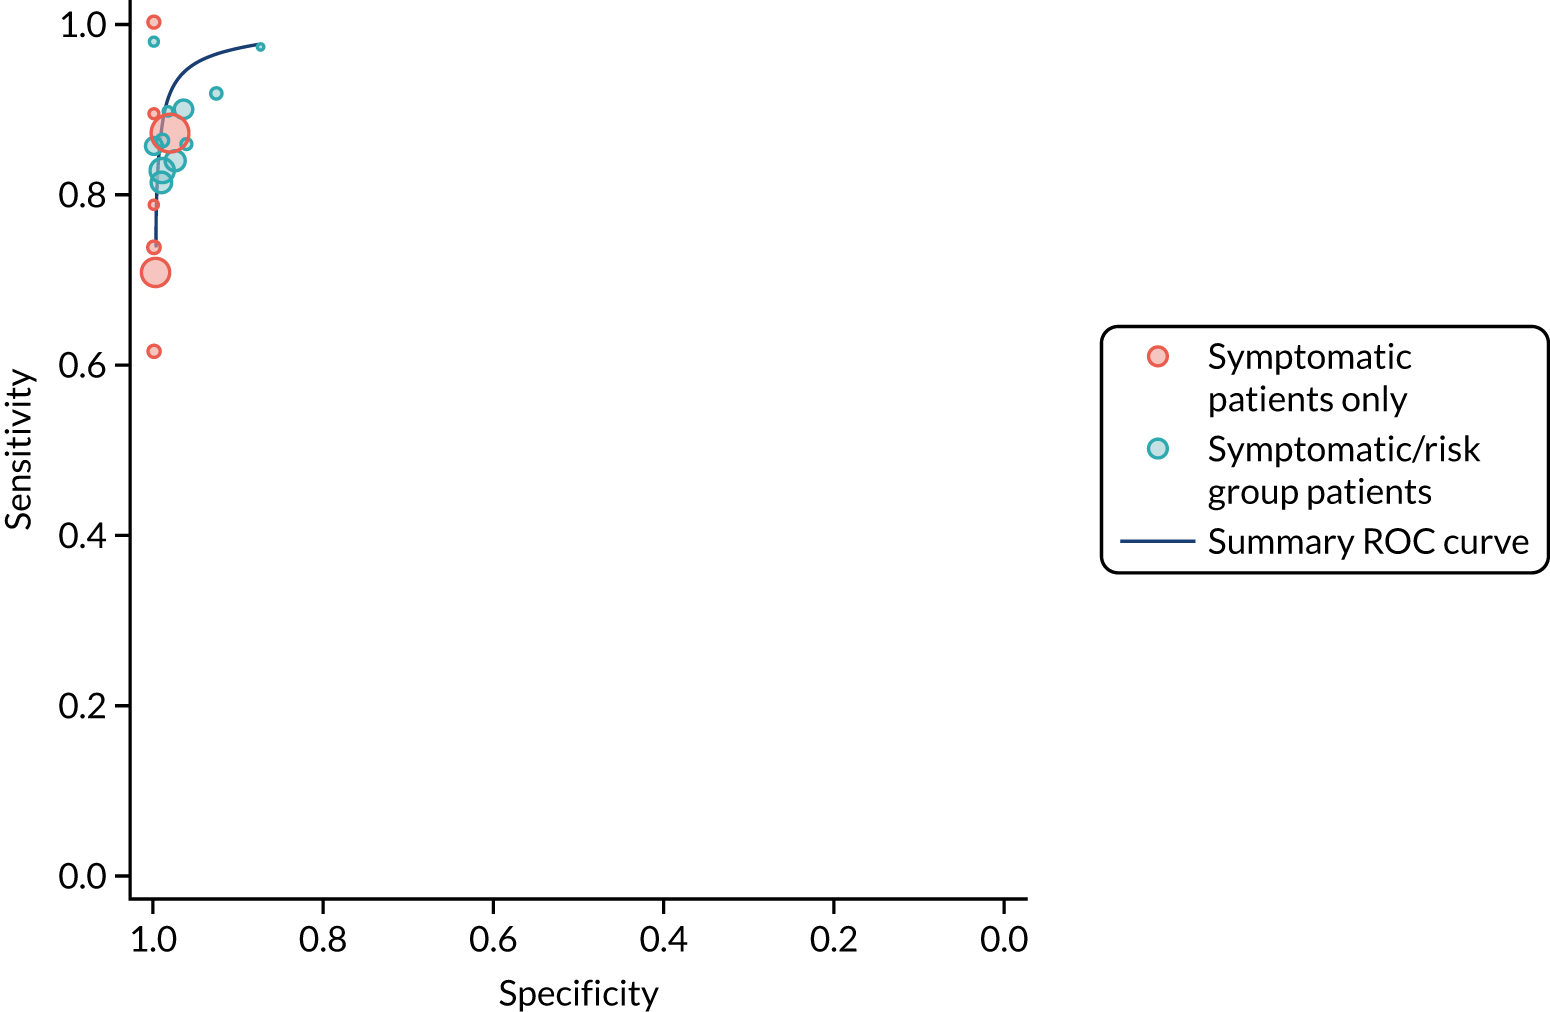
FIGURE 60.
Study estimates of IgA tTG sensitivity and specificity for children plotted in ROC space, stratified by reason for biopsy. SROC curves are estimated from a meta-analysis of all data, across thresholds.
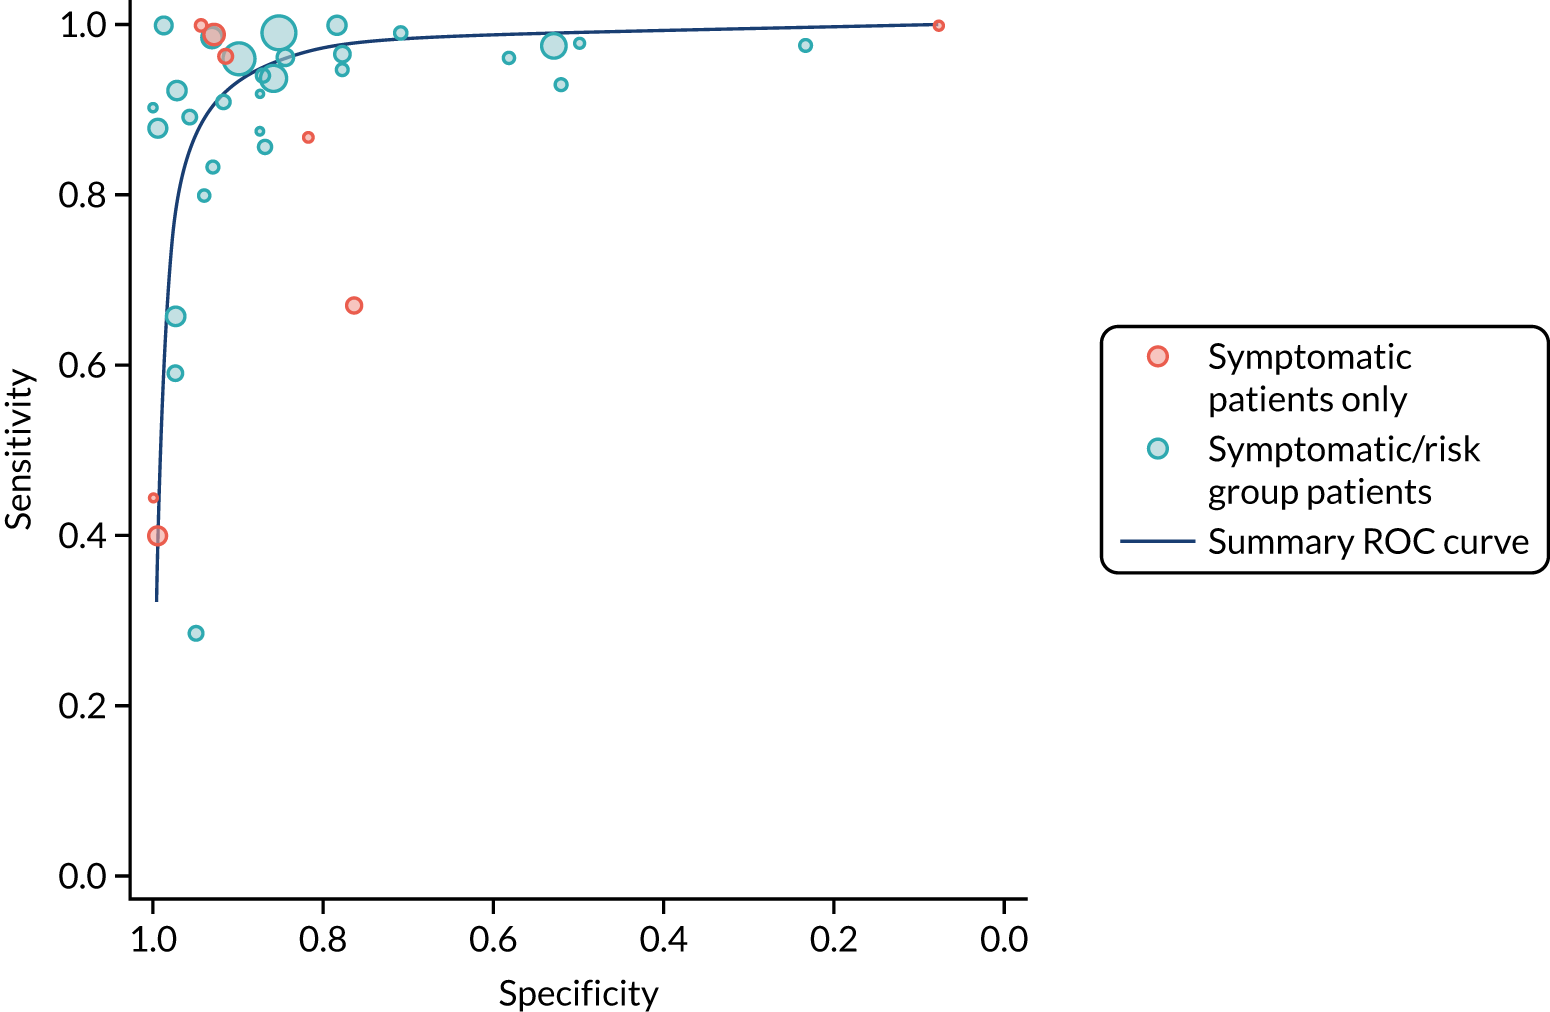
FIGURE 61.
Study estimates of IgA EMA sensitivity and specificity for children plotted in ROC space, stratified by reason for biopsy. SROC curves are estimated from a meta-analysis of all data, across thresholds.
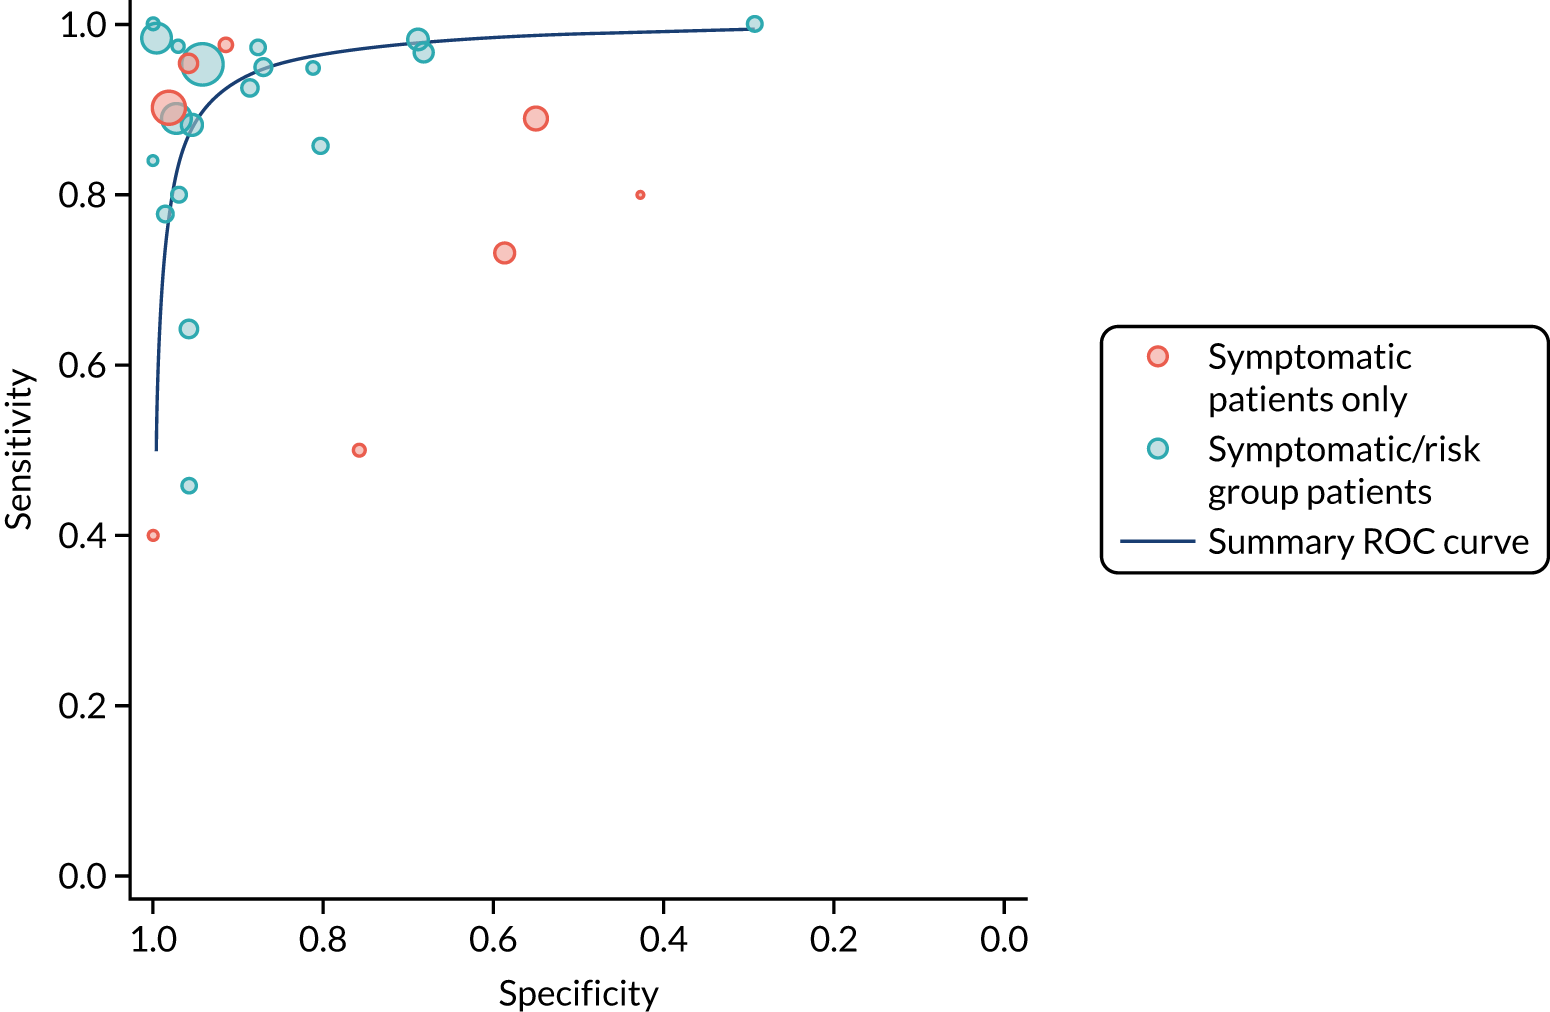
Appendix 20 Summary graph of risk of bias
FIGURE 62.
Summary risk-of-bias graph for studies evaluating HLA-DQ2 and/or -DQ8.

Appendix 21 Hypothetical scenarios and associated risks of having coeliac disease
You are suffering from episodes of stomach cramps, bloating, diarrhoea and fatigue several times a week over the last 5 years and you have been losing weight unintentionally over the past months. Your symptoms are interfering with your daily life.
-
Pre-test probability: 5%.
-
Risk of CD if blood test is
-
positive: 33%
-
strong positive (high levels of anti-gluten antibodies): 75%
-
negative: 1%.
-
Your 5-year-old son has been diagnosed with CD. You have no symptoms.
-
Pre-test probability: 10%.
-
Risk of CD if blood test is
-
positive: 50%
-
strong positive: 90%.
-
After a recent bone fracture and follow-up testing, you are diagnosed with osteoporosis. Osteoporosis is a health condition that weakens the bones, making them fragile and more likely to break and is a risk condition for CD.
-
Pre-test probability: 2%.
-
Risk of CD if blood test is
-
positive: 15%
-
strong positive: 55%.
-
You are suffering from episodes of stomach cramps, bloating, diarrhoea and fatigue several times a week over the last 5 months. These symptoms make it difficult to pay attention in school and to enjoy after-school activities.
-
Pre-test probability: 5%.
-
Risk of CD if blood test is
-
positive: 33%
-
strong positive: 75%
-
negative: 1%.
-
You have just found out that one of your parents has CD and needs to follow a lifelong gluten-free diet. You do not have any symptoms yourself.
-
Pre-test probability: 10%.
-
Risk of CD if blood test is
-
positive: 50%
-
strong positive: 90%.
-
After a recent bone fracture and follow-up testing, you are diagnosed with osteoporosis. Osteoporosis is a health condition that weakens the bones, making them fragile and more likely to break.
-
Pre-test probability: 2%.
-
Risk of CD if blood test is
-
positive: 15%
-
strong positive: 55%.
-
Appendix 22 Characteristics of survey respondents
| Characteristic | CDa (N = 244) | No CD (N = 223) | Total (N = 468) |
|---|---|---|---|
| Age range (years), n (%) | |||
| 0–5 | 4 (1.6) | 9 (4.0) | 13 (2.8) |
| 6–11 | 10 (4.1) | 5 (2.2) | 15 (3.2) |
| 12–17 | 15 (6.1) | 4 (1.8) | 19 (4.1) |
| 18–25 | 30 (12.3) | 22 (9.9) | 52 (11.1) |
| 26–40 | 66 (27.0) | 61 (27.4) | 127 (27.1) |
| 41–64 | 93 (38.1) | 90 (40.4) | 183 (39.1) |
| ≥ 65 | 26 (10.7) | 32 (14.3) | 59 (12.6) |
| Sex, n (%) | |||
| Male | 29 (11.9) | 7 (3.1) | 37 (7.9) |
| Female | 211 (86.5) | 28 (12.6) | 239 (51.1) |
| Other | 1 (0.4) | 0 (0) | 1 (0.2) |
| Prefer not to say | 2 (0.8) | 0 (0) | 2 (0.4) |
| Missing | 1 (0.4) | 188 (84.3) | 189 (40.4) |
| Ethnicity, n (%) | |||
| Asian/Asian British | 1 (0.4) | 0 (0) | 1 (0.2) |
| Black/African/Caribbean/black British | 1 (0.4) | 0 (0) | 2 (0.4) |
| Mixed/multiple ethnic groups | 6 (2.5) | 2 (0.9) | 8 (1.7) |
| Other | 3 (1.2) | 1 (0.4) | 4 (0.9) |
| White | 232 (95.1) | 32 (14.3) | 264 (56.4) |
| Missing | 1 (0.4) | 188 (84.3) | 189 (40.4) |
| Highest education, n (%) | |||
| College or university degree | 133 (54.5) | 26 (11.7) | 159 (34.0) |
| A Level or equivalent | 38 (15.6) | 4 (1.8) | 42 (9.0) |
| O Level or GCSE or equivalent | 33 (13.5) | 3 (1.3) | 37 (7.9) |
| Prefer not to say | 14 (5.7) | 0 (0) | 14 (3.0) |
| Other | 18 (7.4) | 2 (0.9) | 20 (4.3) |
| Missing | 8 (3.3) | 188 (84.3) | 196 (41.9) |
| Deprivation score | |||
| Mean (SD) | 6.51 (2.50) | 6.77 (2.53) | 6.52 (2.52) |
| Median (minimum, maximum) | 7.00 (1.00, 10.0) | 7.00 (1.00, 10.0) | 7.00 (1.00, 10.0) |
| Missing, n (%) | 42 (17.2) | 197 (88.3) | 239 (51.1) |
| Region, n (%) | |||
| East England | 21 (8.6) | 4 (1.8) | 25 (5.3) |
| East Midlands | 14 (5.7) | 2 (0.9) | 16 (3.4) |
| Greater London | 11 (4.5) | 1 (0.4) | 12 (2.6) |
| North East, Yorkshire and Humber | 16 (6.6) | 1 (0.4) | 17 (3.6) |
| North West | 20 (8.2) | 0 (0) | 20 (4.3) |
| Northern Ireland | 4 (1.6) | 1 (0.4) | 5 (1.1) |
| Scotland | 14 (5.7) | 1 (0.4) | 15 (3.2) |
| South East | 28 (11.5) | 5 (2.2) | 33 (7.1) |
| South West | 80 (32.8) | 17 (7.6) | 98 (20.9) |
| Wales | 11 (4.5) | 1 (0.4) | 12 (2.6) |
| West Midlands | 17 (7.0) | 0 (0) | 17 (3.6) |
| Missing | 8 (3.3) | 190 (85.2) | 198 (42.3) |
| Age range (years) | n (%) | ||
|---|---|---|---|
| CDa (N = 185) | No CD (N = 167) | Total (N = 353) | |
| 0–5 | 4 (2.2) | 6 (3.6) | 10 (2.8) |
| 6–11 | 5 (2.7) | 2 (1.2) | 7 (2.0) |
| 12–17 | 8 (4.3) | 1 (0.6) | 9 (2.6) |
| 18–25 | 19 (10.3) | 15 (9.0) | 34 (9.6) |
| 26–40 | 52 (28.1) | 47 (28.1) | 99 (28.0) |
| 41–64 | 77 (41.6) | 72 (43.1) | 149 (42.2) |
| ≥ 65 | 20 (10.8) | 24 (14.4) | 45 (12.8) |
Appendix 23 Themes and subthemes in the open-text answers
| Themes and subthemes | n (%) | |||
|---|---|---|---|---|
| CD (N = 244) | No CD (N = 223) | Free-text respondents (N = 353) | Total survey respondents (N = 468) | |
| Factors prompting CD diagnosis | ||||
| Osteoporosis would prompt a desire for testing | 21 (8.6) | 23 (10.3) | 44 (12.5) | 44 (9.4) |
| Would look into CD diagnosis immediately and rule it out early if it was suggested | 28 (11.5) | 31 (13.9) | 59 (16.7) | 59 (12.6) |
| Having an official diagnosis is important | 38 (15.6) | 11 (4.9) | 49 (13.9) | 49 (10.5) |
| Future risks prompt seeking or continuing testing for diagnosis | 20 (8.2) | 17 (7.6) | 37 (10.5) | 37 (7.9) |
| Symptoms decide or prompted getting or continuing seeking diagnosis | 16 (6.6) | 13 (5.8) | 29 (8.2) | 29 (6.2) |
| Family impacts looking into CD diagnosis | 13 (5.3) | 11 (4.9) | 24 (6.8) | 24 (5.1) |
| Does not feel an official diagnosis as important | 1 (0.4) | 3 (1.3) | 4 (1.1) | 4 (0.9) |
| The diagnostic process | ||||
| See blood tests as non-invasive or easy to have | 94 (38.5) | 90 (40.4) | 184 (52.1) | 184 (39.3) |
| Feels that a biopsy is necessary for certainty in their diagnosis | 77 (31.6) | 39 (17.5) | 116 (32.9) | 116 (24.8) |
| No symptoms means a biopsy is more necessary for certainty in diagnosis, or easier to have than to continue a GFD with no symptoms | 38 (15.6) | 38 (17.0) | 76 (21.5) | 76 (16.2) |
| If the blood test shows a > 50% chance of having CD, would start a GFD without biopsy | 31 (12.7) | 45 (20.2) | 76 (21.5) | 76 (16.2) |
| Would continue a gluten diet for biopsy | 27 (11.1) | 14 (6.3) | 41 (11.6) | 41 (8.8) |
| 6–8 weeks is an acceptable wait time for a biopsy | 9 (3.7) | 19 (8.5) | 28 (7.9) | 28 (6.0) |
| Feels that a biopsy is invasive or unpleasant and would want to avoid it | 11 (4.5) | 16 (7.2) | 27 (7.6) | 27 (5.8) |
| 6–8 weeks is unacceptable time to wait for a biopsy | 4 (1.6) | 9 (4.0) | 13 (3.7) | 13 (2.8) |
| How to respond to a negative test result | ||||
| Would try a GFD regardless of diagnosis | 12 (4.9) | 25 (11.2) | 37 (10.5) | 37 (7.9) |
| Would ask for further testing or retesting if negative result | 16 (6.6) | 16 (7.2) | 32 (9.1) | 32 (6.8) |
| Doctor’s guidance and opinion is important | 12 (4.9) | 14 (6.3) | 26 (7.4) | 26 (5.6) |
| Would accept not having CD | 10 (4.1) | 16 (7.2) | 26 (7.4) | 26 (5.6) |
| Opinions on GFD | ||||
| Want definitive diagnosis (biopsy) before starting GFD | 63 (25.8) | 65 (29.1) | 128 (36.3) | 128 (27.4) |
| See if CD symptoms improve with GFD (even if they do not have CD) | 23 (9.4) | 54 (24.2) | 77 (21.8) | 77 (16.5) |
| Have a negative opinion on GFD or see GFD as a big commitment | 33 (13.5) | 15 (6.7) | 48 (13.6) | 48 (10.3) |
| Would start a GFD without a definitive diagnosis | 19 (7.8) | 17 (7.6) | 36 (10.2) | 36 (7.7) |
| Whether or not they live with another who had CD would affect GFD adherence | 7 (2.9) | 28 (12.6) | 35 (9.9) | 35 (7.5) |
| Lowest likelihood (≤ 10% chance) not enough to start a GFD | 10 (4.1) | 17 (7.6) | 27 (7.6) | 27 (5.8) |
| A 50/50 likelihood not enough to start a GFD | 7 (2.9) | 18 (8.1) | 25 (7.1) | 25 (5.3) |
| May consider restarting gluten diet and biopsy if GFD does not work | 8 (3.3) | 14 (6.3) | 22 (6.2) | 22 (4.7) |
| Would start GFD at the lowest likelihood (≤ 10% chance) | 1 (0.4) | 19 (8.5) | 20 (5.7) | 20 (4.3) |
Appendix 24 Search strategy for targeted literature review of previous cost-effectiveness models in coeliac disease
Database: Ovid Embase.
Date range searched: 1974 to 2020 week 19.
-
Celiac Disease/ (30,110)
-
C?eliac?.ti,ab,kw. (39,478)
-
or/1-2 (45,026)
-
(c?eliac adj (angiograp* or arter* or axis or plexus or trunk)).ti,ab,kw,hw. (12,349)
-
3 not 4 (36,020)
-
economic evaluation/or “cost benefit analysis”/or “cost control”/or “cost effectiveness analysis”/or “cost minimization analysis”/or “cost of illness”/or “cost utility analysis”/ (303,574)
-
(economic* adj2 (analys* or benefit* or consequence* or effect* or evaluat* or minimi#ation or saving*)).ti,ab,kw. (47,258)
-
((cost or costs or costing*) adj2 (analys* or benefit* or consequence* or effective* or estimate* or minimi#ation or saving* or utility or variab*)).ti,ab,kw. (262,232)
-
(cba or cea or cua).ti,ab,kw. (48,623)
-
(budget* or unit cost).ti,ab,kw. (40,257)
-
(expenditure* not energy).ti,ab,kw. (40,404)
-
(value adj2 (money or monetary)).ti,ab,kw. (3249)
-
economic model/ (1993)
-
((economic? or econometric) adj2 model*).ti,ab,kw. (7359)
-
statistical model/and exp economic aspect/ (21,850)
-
stochastic model/ (14,561)
-
decision tree/ (12,592)
-
(markov* or monte carlo).ti,ab,kw,hw. (86,470)
-
(decision* adj2 (tree* or analy* or model*)).ti,ab,kw. (33,681)
-
((value adj2 information analysis) or (expected value adj3 perfect information) or (expected value adj3 sampl* information)).ti,ab,kw. (529)
-
(microsimulation? or micro-simulation?).mp. (2052)
-
discrete event? simulation?.mp. (1154)
-
or/6-22 (674,534)
-
5 and 23 (594)
-
limit 24 to conference abstract status (204)
-
24 not 25 (390)
-
from 26 keep 1-390 (390).
Appendix 25 Economic models
| Study | Country | Research question | Tests compared | Comparator | Population | Model type | Model structure | Time horizon | Relevant costs or QALYs | Conclusion |
|---|---|---|---|---|---|---|---|---|---|---|
| Harewood and Murray195 2001 | USA | To compare the costs of different screening strategies for the detection of CD | GA, EMA | OGD + SBB | Patients with suspected CD (age not reported); modelled three risk groups: low risk with 0.5% prevalence, medium risk with 5% prevalence and high risk with 40% prevalence | Decision tree | Three main branches of tree: GA first vs. EMA first vs. SBB. The GA-first arm modelled the decision to employ EMA following a positive GA test. A positive EMA test resulted in either OGD with SBB or a 2-month clinical trial of a GFD | Not reported | None | EMA is the most economical strategy, compared with the other options, in a low- to medium-risk population. It remains so in DSA provided the prevalence of CD in the tested population is < 42% |
| Mein and Ladabaum196 2004 | USA | To explore the cost-effectiveness of different screening strategies for CD among patients with IBS symptoms | tTG only, antibody panel (tTG, IgA GA, IgG GA and IgA deficiency test); upfront endoscopy with biopsy | No screening for CD/antibody panel | Patients with symptoms of IBS | Decision tree | Four strategies at decision node: no testing, tTG, antibody panel, endoscopy with biopsy | Not reported | Utilities for IBS state, treated CD state following GFD, derived from published SF-36 data in the USA | Serological testing to diagnose CD among patients with a diagnosis of IBS is cost-effective at thresholds of US$50,000 (prevalence of CD 2%) and US$100,000 per QALY gained (prevalence 1.1%) |
| Spiegel et al.197 2004 | USA | To evaluate different screening strategies for CD among IBS patients with predominant diarrhoea | Testing patients for CD | IBS treatment but no CD screening | Patients with IBS and diarrhoea; sensitivity analyses conducted in different populations with different prevalences | Decision tree followed by Markov model | Two strategies at decision node comparing treatment for IBS with screening for CD to estimate the number of patients receiving appropriate therapy for either IBS or CD; then Markov model with two health states (‘symptoms improve’ and ‘symptoms recur’) to estimate transitions between improvement and remission of symptoms once patients started treatment for either IBS or CD; 1-month cycle length for Markov model | 10 years | None | Testing for CD is cost-effective vs. IBS therapy among most patients with diarrhoea-predominant IBS (with a CD prevalence of 3.4%). The sensitivity analysis shows that the results are sensitive to the following variables: prevalence of underlying CD, specificity of diagnostic test for CD, probability that GFD improves the symptoms of CD and cost of IBS therapy |
| Shamir et al.198 2006 | USA | Cost-effectiveness analysis to compare screening strategies for CD among adult population | Screening for CD [(1) tTG followed by EMA. (2) tTG. (3) EMA. (4) If no IgA deficiency, tTG followed by EMA; otherwise antigliadin IgG 5. If no IgA deficiency, tTG; otherwise antigliadin IgG 6. If no IgA deficiency, EMA; otherwise antigliadin IgG] | No screening | Adult population (aged > 18 years) symptomatic and high-risk groups | Markov model | Five states in the model: no CD, CD but considered healthy, CD diagnosed but treatment failure (no GFD), CD diagnosed and on strict GFD, death. Cycle length 1 year. Life-years discounted at 3% | Lifetime | None | ICER of US$44,941 per life-year gained for screening, compared with no screening, using the EMA strategy. The results are highly sensitive to prevalence of CD: when prevalence is low, mass screening not justified because not cost-effective |
| Swigonski et al.199 2006 | USA | To evaluate the cost-effectiveness of screening for CD among asymptomatic children with Down syndrome to prevent lymphoma | Screening for CD | No screening | Asymptomatic children with Down syndrome | Decision tree | Two strategies at decision node: screening or no screening for CD | Not reported | Utility of GFD and lymphoma (from Mein and Ladabaum196) | Screening for CD among children with Down syndrome is not cost-effective. Screening is more costly and less effective than not screening, and it actually decreases quality of life. The results have not changed in sensitivity analyses. The intervention is never cost-effective at a US$50,000 threshold |
| Dorn and Matchar200 2008 | USA | To evaluate the cost-effectiveness of strategies for diagnosing CD | Screening for CD (five diagnostic strategies) | All screening strategies compared in incremental analysis with next-best alternative | Adult population with Western European origins for which there was moderate suspicion for CD | Decision tree | Five strategies at decision node: tTG, tTG then OGD, tTG then IgA then OGD, tTG then HLA then OGD, OGD alone. Complications from biopsy were also modelled | Not reported | None | The use of OGD alone in all cases of suspected CD is too costly. The tTG-alone strategy is very cost-effective, highly sensitive and highly specific, but with low PPV and large numbers of false positives. When the prevalence of CD is low, patients with positive tTG should undergo OGD with biopsy to confirm CD. As the prevalence of CD increases, the cost of avoiding false-positive diagnoses via OGD with biopsy increases dramatically |
| Chang and Green201 2009 | USA | To evaluate the cost of genetic testing before serological screening among relatives of patients with CD | Genetic screening (HLA) for CD | Serological screening with tTG | First- and second-degree relatives of patients with CD | Decision tree | Three diagnostic branches at decision node: tTG at time t0, tTG at time t0 and t1, HLA then tTG at time t0 and t1. All positive results will undertake biopsy to confirm diagnosis | None reported | None | Initial screening with tTG alone is the least costly, followed by repeat screening with tTG after some time; the most costly is HLA testing. The results are sensitive to costs of genetic test and prevalence of disease |
| Hershcovici et al.202 2010 | USA | To evaluate the cost-effectiveness of mass screening for CD | Mass screening (serological tests followed by biopsy) | No screening (diagnosis based on symptoms alone) | Young adult general population at 18 years | Markov | Health states: no CD; CD undiagnosed, but with symptoms – IBS-like symptoms, IDA or other symptoms; CD undiagnosed without symptoms; CD diagnosed and adherence to a GFD; CD diagnosed without adherence to a GFD; death. Cycle length 1 year. Discount rate on costs and utilities: 3% | Lifetime | The screening strategy resulted in a gain of 0.0027 QALYs. The ICER of screening vs. the no-screening strategy was US$48,960 per QALY gained | |
| Mohseninejad et al.194 2013 | The Netherlands | Cost-effectiveness analysis of targeted screening for CD among IBS patients | Serological screening (tTG and IgA) and biopsy after positive serology | No screening | IBS patients in the Netherlands (aged 34 years) | Decision tree | Two decision options: no screening and screening. In the no-screening intervention, patients may have IBS or CD. The intervention arm classifies patients by test results first and not by prevalence. Test results, if positive, are confirmed by biopsy. Discount rates: 1.5% for utilities and 4% for costs, net present value calculated for all future costs | Lifetime | Utility on a GFD: 0.98 (based on SF-36 scores); utility of IBS: 0.76 | Mass screening of young adults is cost-effective provided we assume that the utility of treated CD on a GFD is > 0.978. What drives the ICER: the time delay from symptom onset to diagnosis, the utility of adherence to a GFD, utility of treated CD and the prevalence of CD. Screening would be cost-effective if the time delay to diagnosis is > 6 years and utility of GFD adherence is > 0.978 |
| Park et al.203 2013 | USA | To determine the cost-effectiveness of universal serological screening to prevent non-traumatic hip and vertebral fractures among patients with CD | Universal serological screening (followed by biopsy) | Standard care (screening only symptomatic or at-risk patients) | Patients aged 12 years | Markov | Health states: CD, non-CD, fracture, disability, CD on GFD. Modelled males and females separately; different health states for the two interventions; 3% discount for costs and benefits, 1-year cycle | Lifetime | Standard care dominates the intervention. The intervention costs 59.66 more for males and 54.99 more for females than standard care, and it is associated with a QALY loss of –0.005 for males and –0.01 for females. Results are robust and the DSA did not affect the ICER | |
| Yang et al.206 2015 | USA | Cost-effectiveness of routine duodenal biopsy for CD during endoscopy for gastro-oesophageal reflux | Performing a duodenal biopsy to detect CD during an OGD for GORD | No biopsy for patients undergoing OGD to detect CD | Patients with GORD (aged 40 years) | Decision tree | Two strategies considered (biopsy vs. non-biopsy): patients who already undertake an OGD for GORD could either be tested for CD (biopsy) or not tested. Adherence to GFD and whether or not symptoms of GORD improve are also modelled. Costs and effects discounted at 3% | Lifetime | Utilities included GORD (0.94) and CD on GFD (0.98) | Performing biopsy to detect CD among patients with GORD is not cost-effective. The model results were sensitive to the following variables: utility of GORD, prevalence of CD among refractory GORD patients, specificity of biopsy, cost of GFD and cost of PPI therapy |
| Broide et al.207 2016 | USA | To determine the cost-effectiveness of routine duodenal biopsy to detect CD among patients with IDA | Performing a duodenal biopsy during an OGD among all patients with IDA, irrespective of serology CD result (even if CD results are negative) | Biopsy only in IDA patients with positive serology for CD | Adults with IDA, aged ≥ 45 years | Markov | Six health states in the model: (1) no CD; (2) CD but undiagnosed (i.e. considered healthy); (3) potential CD, defined as positive serology for CD; (4) CD under normal diet; (5) CD under strict GFD; and (6) death. Annual cycle length | Lifetime |
|
The intervention is cost-effective and dominates the comparator as it costs less and results in more QALYs. The parameters that most affected the QALY gain results were the prevalence of CD among IDA patients, the utility of CD and the probability of identifying CD because of symptoms |
| NICE193 2015 | UK | Which serological test is the most appropriate to diagnose CD and what patient group should be referred for screening? |
|
|
Adults and children with symptoms suggestive of CD (the age of the cohort at baseline is an assumption, with 30 years being used for the adult population and 5 years used when the cohort begins in childhood) | Decision tree followed by Markov model | Health states of the Markov model: CD on GFD, CD no GFD, no CD, subfertility, osteoporosis, NHL, other cancers, death. Annual cycles. Health outcomes and costs are discounted at a rate of 3.5% in line with the NICE reference case | Lifetime | The health-care resource use data associated with symptoms of CD are based on a study by Violato et al.50 Prescription costs are based on BNF chapters.244 Resource use associated with long-term complications is based on published evidence specific to each of the complications considered (see NICE 2015, appendix G, table 7). Resource use associated with subfertility is estimated from the NICE guideline on fertility (CG156).467 Resource use associated with osteoporosis was taken from Violato et al.50 Endoscopy and biopsy costs were based on NHS reference costs | The diagnostic strategies that are cost-effective differ between adult and child populations. For adults, how effective strategies are is correlated with how sensitive they are. This is because false-negative results are associated with fewer QALY gains; therefore, the fewer false-negative results a strategy has, the more QALYs it accrues. Strategies with many false-positive results incur additional costs as a result of unnecessary biopsies. However, it is much more important in terms of cost-effectiveness not to miss people with CD than exposing some people to an unnecessary biopsy. For children, the specificity is more important because of the increased cost of biopsy in children. DSA results show that prevalence does affect results (if prevalence is > 17.5%, an IgA tTG assay alone becomes optimal) |
| Evaluation of active case-finding strategies found screening first-degree relatives of people with CD was cost-effective among adults and children, that screening people with type 1 diabetes was cost-effective among adults and potentially cost-effective among children, and that screening those with autoimmune thyroid disease was not cost-effective among adults or children |
Appendix 26 Age-stratified prevalence of coeliac disease-related complications
| Age category (years)b | N | Complication, n (%) | ||
|---|---|---|---|---|
| NHL | Osteoporosis | IDA | ||
| 0–9 | 3419 | 2 (0.06) | 1 (0.03) | 371 (10.85) |
| 10–19 | 3803 | 0 (0) | 19 (0.5) | 544 (14.3) |
| 20–29 | 5106 | 4 (0.09) | 87 (1.7) | 795 (15.57) |
| 30–39 | 6005 | 8 (0.15) | 207 (3.45) | 1277 (21.27) |
| 40–49 | 7417 | 28 (0.46) | 594 (8.01) | 2027 (27.33) |
| 50–59 | 7778 | 49 (0.84) | 1401 (18.01) | 2116 (27.2) |
| 60–69 | 7046 | 70 (1.37) | 2199 (31.21) | 2081 (29.53) |
| 70–79 | 5153 | 60 (1.72) | 2124 (41.22) | 1957 (37.98) |
| 80–89 | 2063 | 19 (1.46) | 903 (43.77) | 888 (43.04) |
| 90–99 | 255 | 2 (1.41) | 100 (39.22) | 117 (45.88) |
| Age category (years)b | N | Complication, n (%) | ||
|---|---|---|---|---|
| NHL | Osteoporosis | IDA | ||
| 0–9 | 1299 | 1 (0.08) | 0 (0) | 149 (11.47) |
| 10–19 | 1417 | 1 (0.07) | 5 (0.35) | 132 (9.32) |
| 20–29 | 1190 | 2 (0.17) | 23 (1.93) | 83 (6.97) |
| 30–39 | 1603 | 2 (0.12) | 59 (3.68) | 137 (8.55) |
| 40–49 | 2149 | 15 (0.7) | 164 (7.63) | 298 (13.87) |
| 50–59 | 2652 | 27 (1.02) | 314 (11.84) | 568 (21.42) |
| 60–69 | 2696 | 42 (1.56) | 470 (17.43) | 816 (30.27) |
| 70–79 | 1993 | 36 (1.81) | 458 (22.98) | 772 (38.74) |
| 80–89 | 778 | 15 (1.93) | 208 (26.74) | 340 (43.7) |
| 90–99 | 79 | 1 (1.27) | 23 (29.11) | 36 (45.57) |
| Age category (years)b | N | Complication, n (%) | ||
|---|---|---|---|---|
| NHL | Osteoporosis | IDA | ||
| 0–9 | 2120 | 1 (0.05) | 1 (0.05) | 222 (10.47) |
| 10–19 | 2386 | 1 (0.04) | 14 (0.59) | 412 (17.27) |
| 20–29 | 3916 | 2 (0.05) | 64 (1.63) | 712 (18.18) |
| 30–39 | 4402 | 5 (0.11) | 148 (3.36) | 1140 (25.9) |
| 40–49 | 5268 | 12 (0.23) | 430 (8.16) | 1729 (32.82) |
| 50–59 | 5126 | 22 (0.43) | 1087 (21.21) | 1548 (30.2) |
| 60–69 | 4350 | 41 (0.94) | 1729 (39.75) | 1265 (29.08) |
| 70–79 | 3160 | 42 (1.33) | 1666 (52.72) | 1185 (37.5) |
| 80–89 | 1285 | 19 (1.48) | 695 (54.09) | 548 (42.65) |
| 90–99 | 176 | 3 (1.7) | 77 (43.75) | 81 (46.02) |
Appendix 27 Fracture rates and costs of osteoporosis
| Age range (years) | Hip fracture rate per 10,000 person-years | Number of cases | Vertebral fracture rate per 10,000 person-years | Number of cases | Wrist (carpus) fracture rate per 10,000 person-years | Number of cases |
|---|---|---|---|---|---|---|
| 18–49 | 0.5 | 1520 | 1.5 | 5027 | 20.7 | 65,244 |
| ≥ 50 | 19.6 | 52,609 | 7.1 | 19,232 | 12.5 | 32,983 |
| Parameter | Fracture | ||
|---|---|---|---|
| Hip | Vertebral | Wrist | |
| Probability of fracture among those aged ≥ 50 years | 0.00196 | 0.00071 | 0.00125 |
| Cost (£) | 16,302 × 1.17 = 19,073 | 479 × 1.80 = 862.20 | 468 × 1.80 = 842.40 |
| Total cost (£) | 37.38 | 0.61 | 1.05 |
| Overall cost | 39.04 (SE 0.27)a | ||
Appendix 28 Utilities
| Age group (years) | EQ-5D index population norms |
|---|---|
| 18–24 | 0.934 |
| 25–34 | 0.922 |
| 35–44 | 0.905 |
| 45–54 | 0.849 |
| 55–64 | 0.804 |
| 65–74 | 0.785 |
| ≥ 75 | 0.734 |
| Parameter | Hip | Vertebral | Wrist |
|---|---|---|---|
| Probability of fracture among those aged ≥ 50 years | 0.00196 | 0.00071 | 0.00125 |
| Disutility | 0.817 – 0.59 = 0.227 | 0.817 – 0.55 = 0.267 | 0.817 – 0.78 = 0.037 |
| Total disutility | 0.0004 | 0.000026 | 0.0003 |
| Overall disutility | 0.0004 (SE 0.00067)a | ||
Appendix 29 Application of UK National Screening Committee criteria to a hypothetical adult coeliac disease screening programme
| UK National Screening Committee criteria | Application to hypothetical adult CD screening programme |
|---|---|
| Condition | |
| 1. Must be important health problem judged on frequency/severity | CD is common, has severe impact on health and is underdiagnosed |
| 2. Primary prevention interventions should have been implemented | There are no primary prevention interventions for CD |
| 3. If the carriers of a mutation are identified as a result of screening the natural history of people with this status should be understood, including the psychological implications | Not applicable |
| Test | |
| 4. Should be a simple, safe, precise and validated screening test | IgA tTG fulfils these criteria |
| 5. Distribution of test values in the target population should be known and a suitable cut-off level defined and agreed | The distribution of test values is known, but the most appropriate threshold for screening has not been identified – this may be lower than for diagnosis to increase sensitivity |
| 6. Test should be acceptable to the target population | The test is a simple blood test and so likely to be acceptable |
| 7. Agreed policy on the further diagnostic investigation of individuals with a positive test result and on the choices available to those individuals | There are various options for the workup of those with a positive test that would need further work – this could include combinations of additional serological testing, genetic testing and biopsy |
| 8. If the test is for a particular mutation or set of genetic variants, the method for their selection and the means through which these will be kept under review in the programme should be clearly set out | Not applicable (unless HLA is recommended as part of the further workup of those testing positive) |
| Intervention | |
| 9. Should be an effective intervention for patients identified through screening, with evidence that intervention at a pre-symptomatic phase leads to better outcomes for the screened individual compared with usual care | Gluten-free diet is an effective intervention and starting this as early has possible has beneficial effects |
| 10. There should be agreed evidence-based policies covering which individuals should be offered interventions and the appropriate intervention to be offered | This is fairly straightforward for CD as the only treatment is a gluten-free diet, which is recommended for anyone with CD |
| Screening programme | |
| 11. Should be evidence from high-quality randomised controlled trials that the screening programme is effective in reducing mortality or morbidity | Not currently available |
| 12. Should be evidence that the complete screening programme (test, diagnostic procedures, treatment/intervention) is clinically, socially and ethically acceptable to health professionals and the public | Screening programme is likely to be acceptable, but further evidence on this may be required |
| 13. Benefit gained by individuals from the screening programme should outweigh any harms, for example from overdiagnosis, overtreatment, false positives, false reassurance, uncertain findings and complications | Our economic analysis provides evidence for this |
| 14. The opportunity cost of the screening programme (including testing, diagnosis and treatment, administration, training and quality assurance) should be economically balanced in relation to expenditure on medical care as a whole (value for money). Assessment against this criterion should have regard to evidence from cost–benefit and/or cost-effectiveness analyses and have regard to the effective use of available resources | Our economic analysis suggests that screening may be cost-effective |
List of abbreviations
- ALSPAC
- Avon Longitudinal Study of Parents and Children
- ARC
- Applied Research Collaboration
- AUROC
- area under the receiver operating characteristic
- BCEA
- Bayesian cost-effectiveness analysis
- CD
- coeliac disease
- CD-QOL
- Coeliac Disease Quality of Life Measure 1.0
- CEAC
- cost-effectiveness acceptability curve
- CI
- confidence interval
- CPRD
- Clinical Practice Research Datalink
- CrI
- credible interval
- DGP
- deamidated gliadin peptide
- DTA
- diagnostic test accuracy
- EMA
- endomysial antibody
- EQ-5D
- EuroQol-5 Dimensions
- EQ-5D-3L
- EuroQol-5 Dimensions, three-level version
- ESPGHAN
- European Society for Paediatric Gastroenterology, Hepatology and Nutrition
- ESsCD
- European Society for the Study of Coeliac Disease
- EVPI
- expected value of perfect information
- EVPPI
- expected value of partial perfect information
- GA
- gliadin antibody
- GI
- gastrointestinal
- GP
- general practitioner
- HES
- Hospital Episode Statistics
- HLA
- human leucocyte antigen
- IBS
- irritable bowel syndrome
- ICER
- incremental cost-effectiveness ratio
- ICPC-2
- International Classification of Primary Care, 2nd edition
- ICTRP
- International Clinical Trials Registry Platform
- ID
- identification
- IDA
- iron-deficiency anaemia
- IgA
- immunoglobulin A
- IgG
- immunoglobulin G
- IMD
- Index of Multiple Deprivation
- IQR
- interquartile range
- KSR
- Kleijnen Systematic Reviews
- LASSO
- least absolute shrinkage and selection operator
- MLMC
- multilevel Monte Carlo
- NHL
- non-Hodgkin lymphoma
- NICE
- National Institute for Health and Care Excellence
- NIH
- National Institutes of Health
- NIHR
- National Institute for Health and Care Research
- OGD
- oesophagogastroduodenoscopy
- PPV
- positive predictive value
- PRISMA-DTA
- Preferred Reporting Items for a Systematic Review and Meta-analysis of Diagnostic Test Accuracy Studies
- QALY
- quality-adjusted life-year
- QUADAS-2
- quality assessment of diagnostic accuracy studies 2
- ROC
- receiver operating characteristic
- SD
- standard deviation
- SE
- standard error
- SROC
- summary receiver operating characteristic
- tTG
- tissue transglutaminase
- UTS
- up to standard
- WHO
- World Health Organization
Notes
-
Identifying the optimum strategy for identifying adults and children with coeliac disease: systematic review and economic modelling – supplementary materials
Supplementary material can be found on the NIHR Journals Library report page (https://doi.org/10.3310/ZUCE8371).
Supplementary material has been provided by the authors to support the report and any files provided at submission will have been seen by peer reviewers, but not extensively reviewed. Any supplementary material provided at a later stage in the process may not have been peer reviewed.

