Notes
Article history
The research reported in this issue of the journal was funded by the HTA programme as project number 16/111/136. The contractual start date was in April 2018. The draft report began editorial review in February 2020 and was accepted for publication in July 2020. The authors have been wholly responsible for all data collection, analysis and interpretation, and for writing up their work. The HTA editors and publisher have tried to ensure the accuracy of the authors’ report and would like to thank the reviewers for their constructive comments on the draft document. However, they do not accept liability for damages or losses arising from material published in this report.
Corrections
-
This article was corrected in April 2022. See Gould DW, Doidge J, Sadique MZ, Borthwick M, Hatch R, Caskey FJ, et al. Erratum: Heparin versus citrate anticoagulation for continuous renal replacement therapy in intensive care: the RRAM observational study. Health Technol Assess 2022;26(13):85–86. https://doi.org/10.3310/ZXHI9396-c202204
Permissions
Copyright statement
© Queen’s Printer and Controller of HMSO 2022. This work was produced by Gould et al. under the terms of a commissioning contract issued by the Secretary of State for Health and Social Care. This issue may be freely reproduced for the purposes of private research and study and extracts (or indeed, the full report) may be included in professional journals provided that suitable acknowledgement is made and the reproduction is not associated with any form of advertising. Applications for commercial reproduction should be addressed to: NIHR Journals Library, National Institute for Health Research, Evaluation, Trials and Studies Coordinating Centre, Alpha House, University of Southampton Science Park, Southampton SO16 7NS, UK.
2022 Queen’s Printer and Controller of HMSO
Chapter 1 Introduction
Parts of this report have been reproduced with permission from Gould et al. 1
Background and rationale
Acute kidney injury (AKI) is common in critically ill patients. In the UK, in 2017–18, data from the Intensive Care National Audit & Research Centre (ICNARC) Case Mix Programme (CMP), the national clinical audit of adult critical care, showed that > 50% of all admissions to an adult general intensive care unit (ICU) had AKI in the 24 hours following admission. 2 Approximately 10% of all admissions require renal replacement therapy (RRT), which aims to prevent harm from electrolyte and metabolic disturbances as well as fluid overload. Whereas some countries use intermittent haemodialysis for acute RRT, in the UK, the majority (> 95%) of ICUs use continuous renal replacement therapy (CRRT) because of perceived improvements in haemodynamic stability. 3,4
A limitation of any system that passes blood around an extracorporeal circuit is the need for continuous anticoagulation to prevent the blood in the circuit from clotting. 5 Traditionally, systemic heparin anticoagulation (SHA) was the most commonly prescribed anticoagulant for CRRT. 6 During CRRT using SHA, heparin is added to the blood as it enters the circuit to prevent within-circuit clotting. Heparin is only partially removed by the filtration process, the remainder going to the patient. Considerable resource is required to check patient clotting status to prevent bleeding complications arising from systemic anticoagulation. 7
Regional citrate anticoagulation (RCA) is an alternative approach. RCA prevents blood clotting by chelating ionised calcium, which is necessary for the clotting process, using a citrate solution added to the patient’s blood as it enters the circuit. The citrate effect is reversed by infusing calcium chloride or calcium gluconate as the blood is returned to circulation, restoring the ability to clot and reducing bleeding risks. 8 However, other risks associated with citrate anticoagulation, such as hypercalcaemia and alterations in the blood’s acid–base balance, may lead to problems with muscle weakness, heart function, bone health and breathing. 7,8
In recent years, there has been a rapid shift in practice towards RCA during CRRT in ICUs. Data from small-scale randomised controlled trials (RCTs)9–12 and recent meta-analyses13–15 suggest that RCA may be superior to SHA in terms of reducing mortality and bleeding risk and improving circuit patency. However, the evidence is inconclusive and adoption of RCA into clinical practice is occurring without robust evidence from large-scale studies assessing both patient-centred clinical outcomes and cost-effectiveness. The Renal Replacement Anticoagulant Management (RRAM) study utilises existing national audit and routine health-care data sets to evaluate the clinical effectiveness and cost-effectiveness of changing from SHA to RCA for CRRT in UK ICUs.
Aim and objectives
To evaluate the clinical and health economic impacts of moving from SHA to RCA for CRRT in patients treated by non-specialist ICUs in England and Wales.
The study addresses the following objectives:
-
investigate the benefits, risks and costs of RCA compared with SHA
-
compare the long-term development of end-stage renal disease (ESRD) in patients treated with RCA and SHA
-
establish efficient research techniques that, if successful, could be used to track the effects of any change in critical care practice occurring in ICUs in England and Wales over a reasonably short timescale.
Chapter 2 Methods
Study design
The RRAM study was an observational comparative effectiveness study using interrupted time series analysis techniques of individual patient data. 16,17 Individual patient data were linked to extracted data from routinely collected data sets to provide information on ICU and hospital resource usage and outcome, longer-term mortality, subsequent hospitalisations and longer-term renal outcomes. These data were combined with a survey of CRRT anticoagulation practices of ICUs in England and Wales participating in the ICNARC CMP to separate the cohort according to the method of CRRT in use by the relevant ICU at the time of treatment.
Survey of anticoagulation practice
We conducted an online survey to identify adult general ICUs in England and Wales that had switched to RCA for CRRT and the dates corresponding to the start and completion of citrate transition and implementation.
Identification of intensive care units
We identified adult general ICUs among those participating in the ICNARC CMP, which covers 100% of adult general ICUs in England and Wales. We defined a general ICU as a stand-alone ICU or combined ICU–high-dependency unit (HDU). We excluded stand-alone HDUs, specialist ICUs (e.g. cardiothoracic ICUs and neuroscience ICUs) and ICUs in specialist centres (e.g. orthopaedic hospitals).
Survey of anticoagulation practice
The aim of the survey was to identify which ICUs had switched to RCA for CRRT and when that switch occurred. We used online software SurveyMonkey [SVMK Inc., San Mateo, CA, USA; www.surveymonkey.com (accessed 6 October 2020)] to create an online survey (see Report Supplementary Material 1). We asked respondents whether their ICU was using SHA, RCA or a combination of both anticoagulation modes for CRRT. Dependent on the response to this question, the total number of questions to be completed varied from 6 to 13 and covered the following:
-
for those using SHA
-
current effluent flow rate
-
which CRRT system is in operation
-
-
for those using RCA
-
dates corresponding to start and completion of RCA implementation
-
effluent flow rate before and after the switch to RCA
-
CRRT system in use before and after the switch to RCA
-
-
for those using both RCA and SHA
-
dates corresponding to start and completion of RCA implementation
-
effluent flow rate before and after the switch to RCA
-
CRRT system in use for both SHA and RCA
-
proportion of patients receiving SHA
-
conditions/indications that identify patients receiving SHA.
-
We piloted the survey among pharmacists and ICU clinicians to ensure that the questions could be understood and would provide the desired information.
Survey administration
The survey was administered via an e-mail containing a link to the online survey and instructions for completion. In June 2018, we sent simultaneous e-mails to clinical directors/lead clinicians of all identified ICUs (via ICNARC) and the UK Clinical Pharmacy Association critical care network. We asked e-mail recipients to complete the survey or forward the survey to the most relevant colleague to reply on behalf of their ICU. Respondents provided contact details and selected their ICU from a drop-down list of ICUs participating in the ICNARC CMP. This allowed identification of duplicate submissions for the same ICU.
Survey data management
Responses were entered directly into SurveyMonkey and subsequently downloaded into a Microsoft Excel® (Microsoft Corporation, Redmond, WA, USA) spreadsheet. Once downloaded, we checked individual responses for completeness and, where a survey had been initiated but abandoned before completion, we sent an e-mail to the respondent asking them to complete their entry or provide further information. In the case of contradictory submissions for the same ICU, we sent an e-mail to all respondents from the individual ICU requesting further clarification until agreement was reached.
Identification of intensive care units using regional citrate anticoagulation for continuous renal replacement therapy
In the case of ICUs completing the switch from CRRT to RCA before 1 January 2017, we confirmed the switch dates in one of two ways: we either requested purchase details of the consumables involved in CRRT (including anticoagulants and fluids) or asked the clinician to cross-check on computerised information systems.
Where consumables/confirmatory information conflicted with the original survey entry, we contacted sites for further clarification to allow resolution.
Data sets and linkage
A brief description of the data sets and the key variables is presented in Table 1.
| Data set | Description | Key variables |
|---|---|---|
| ICNARC CMP | National clinical audit of patient outcomes from adult general critical care units (intensive care and combined intensive care/HDUs) in England, Wales and Northern Ireland; contains validated pooled case-mix and outcome data from over 2 million critical care admissions. Since 2015, the ICNARC CMP has had 100% coverage of adult general ICUs | Patient-level information including patient identifiers required only for linkage; dates and methods of admission to hospital and ICU; patient case mix (including illness severity scores and mortality probability, derived using standard models for clinical audit); patient outcome at discharge from ICU and hospital; and ICU activity, including the number, duration and level (basic/advanced) of organs supported and LOS in the ICU and hospital |
| Civil Registrations (Mortality) data set (previously ONS) | Mortality information for all deaths registered in England and Wales | Data including date of death, cause of death and place of death |
| HES | Admission, emergency department attendances and outpatient appointment data at NHS hospitals in England | Patient-level information including patient information (age, gender and ethnicity); diagnoses and operations; dates and methods of hospital admission and discharge; and geographical information (where patients were admitted/treated and live)18 |
| PEDW | Admission and day case activity in NHS Wales hospitals data and for Welsh residents treated in trusts in England | Patient-level information including patient information (age, gender and ethnicity); diagnoses and operations; and dates and methods of hospital admission and discharge |
| UKRR | Data on all patients on RRT including patients receiving haemodialysis, peritoneal dialysis and kidney transplant for ESRD | Treatment data including date first seen by a renal physician; date of first-ever RRT and modality (for ESRD patients); data on treatment timelines and haemodialysis sessions; and transplant information |
NHS Digital, acting as a ‘trusted third party’, linked individual patient data from the ICNARC CMP with data held by the UK Renal Registry (UKRR), Hospital Episode Statistics (for England) (HES) and Civil Registrations (Deaths) data sets. We uploaded patient identifiers (with no associated clinical data) from the ICNARC CMP and UKRR clinical audits to secure servers at NHS Digital. In turn, NHS Digital used NHS numbers to match records between the ICNARC CMP, UKRR, HES and Civil Registrations data sets and return to each data provider their local identifier (a field that is unique to the records in that data set) together with a common key used to link all records of the same patient across data sets. Following linkage of the patient records, the UKRR and NHS Digital transferred the agreed pseudonymised data to the ICNARC CTU (including the common key) for successfully linked patients.
NHS Wales Informatics Service (NWIS), acting as a ‘trusted third party’, undertook data linkage between ICNARC CMP and Patient Episodes Data for Wales (PEDW) separately following a similar methodology. Following receipt of the data from the three data providers (NHS Digital, UKRR and NWIS), we created a final pseudonymised data set (using the common key) of linked patients for analysis.
Identification of patients exposed to regional citrate anticoagulation
The final linked data set was combined with the survey of CRRT anticoagulation practices to identify patients who were admitted during periods in which the treating ICU used either the exposure or the comparator. We identified exposed patients as patients who received CRRT in an ICU after the date (as reported by the ICU) on which the ICU had completed the transition from SHA to RCA. We identified comparator patients as patients who received CRRT in an ICU prior to the date (as reported by the ICU) that the ICU started to transition to RCA or in an ICU that reported using SHA throughout.
Participants
Critically ill adults who received at least 1 calendar day of CRRT while treated in an adult general ICU participating in the ICNARC CMP national clinical audit between 1 April 2009 and 31 March 2017.
The following initial inclusion criteria were used to select the patient records from the ICNARC CMP to include in the data extract sent to NHS Digital for linkage.
Inclusion criteria
-
Age ≥ 16 years.
-
Admitted to an adult general ICU in England or Wales participating in the ICNARC CMP between 1 April 2009 and 31 March 2017.
-
Receipt of CRRT in ICU, identified by the recording of renal support, as defined by the UK Department of Health and Social Care Critical Care Minimum Data Set (CCMDS),19 on at least 1 calendar day during the ICU stay.
Exclusion criteria
-
Pre-existing ESRD, identified by the recording of a requirement for CRRT in the ICNARC CMP data set (including, but not limited to, chronic haemodialysis, chronic haemodiafiltration and chronic peritoneal dialysis for irreversible renal disease, within 6 months prior to admission to the ICU).
-
Admitted to an ICU after kidney or multiorgan (including kidney) transplantation identified from the primary and secondary reasons for admission to ICU recorded in the ICNARC CMP data set.
-
Admitted with acute hepatic failure identified from the primary reason for admission to the ICU recorded in the ICNARC CMP data set.
The following additional exclusion criteria were applied to the linked data prior to analysis:
-
no linked records from HES/PEDW (because of either incomplete NHS numbers or application of the national data opt-out)
-
admitted to hospitals that did not complete the survey of anticoagulation practice, or responses to essential questions in the survey were incomplete
-
discrepant data for date of death from different sources (excluding discrepancies of a single day, which were accepted, with the date of death from the ICNARC CMP taken as the correct date)
-
pre-existing ESRD, prior transplant or nephrectomy, identified by having a record in the UKRR with a date of first ever RRT for ESRD or date of transplant prior to the date of admission to ICU, and/or presence of an International Statistical Classification of Diseases and Related Health Problems, Tenth Revision (ICD-10),20 code or Office of Population Censuses and Surveys (OPCS) procedure code indicating ESRD, kidney transplant or nephrectomy in any HES/PEDW episode prior to the date of admission to ICU (ICD-10 codes: I12.0, I12.9, N18.6, Z94.0, Z99.2; OPCS codes: M02.2, M02.3, M02.4, M02.5, M02.6, M02.7, M02.8, M02.9, M03.8, M03.9).
Interventions
Exposure
Patients receiving CRRT in an ICU after the date (as reported by the ICU) on which the ICU completed the transition from SHA to RCA.
Comparator
Patients receiving CRRT in an ICU before the date (as reported by the ICU) on which the ICU started to transition from SHA to RCA or receiving CRRT in an ICU that had not transitioned to RCA.
Outcomes
Primary clinical effectiveness outcome
The primary clinical effectiveness outcome was all-cause mortality 90 days after the first ICU admission at which CRRT was received.
Secondary clinical effectiveness outcomes
All-cause mortality at hospital discharge, 30 days and 1 year
Mortality at discharge from hospital was defined as death due to any cause before discharge from acute hospital. Mortality at 30 days and at 1 year were defined as death due to any cause within 30 days and 365 days, respectively, following the date of the index ICU admission.
Number of days of renal, advanced cardiovascular, and advanced respiratory support while in an intensive care unit
Renal, advanced cardiovascular and advanced respiratory support were defined according to the CCMDS and were obtained from the ICNARC CMP database. The duration of organ support was defined as the number of calendar days on which the organ support was received at any time during that day (00.00 to 23.59). Days of organ support were included from all ICU admissions during the acute hospital stay from the first ICU stay involving renal support until ultimate discharge from hospital.
Bleeding and thromboembolic episodes
Bleeding episodes during the ICU stay were identified using the following ICD-10 secondary field codes obtained from data linkage with HES/PEDW: ‘R04 Category – Hemorrhage from respiratory passages’, ‘I61 Category – Intracerebral hemorrhage’, ‘I62 Category – Other nontraumatic intracranial hemorrhage’, ‘K25.0 – Acute gastric ulcer with hemorrhage’, ‘K25.2 – Acute gastric ulcer with both hemorrhage and perforation’, ‘K25.4 – Chronic or unspecified gastric ulcer with hemorrhage’, ‘K25.6 – Chronic or unspecified gastric ulcer with both hemorrhage and perforation’, ‘K26.0 – Acute duodenal ulcer with hemorrhage’, ‘K26.2 – Acute duodenal ulcer with both hemorrhage and perforation’, ‘K26.4 – Chronic or unspecified duodenal ulcer with hemorrhage’, ‘K26.6 – Chronic or unspecified duodenal ulcer with both hemorrhage and perforation’, ‘K27.0 – Acute peptic ulcer, site unspecified, with hemorrhage’, ‘K27.2 – Acute peptic ulcer, site unspecified, with both hemorrhage and perforation’, ‘K27.4 – Chronic or unspecified peptic ulcer, site unspecified, with hemorrhage’, ‘K27.6 – Chronic or unspecified peptic ulcer, site unspecified, with both hemorrhage and perforation’, ‘K28.0 – Acute gastrojejunal ulcer with hemorrhage’, ‘K28.2 – Acute gastrojejunal ulcer with both hemorrhage and perforation’, ‘K28.4 – Chronic or unspecified gastrojejunal ulcer with hemorrhage’, ‘K28.6 – Chronic or unspecified gastrojejunal ulcer with both hemorrhage and perforation’, ‘K29.0 – Acute gastritis’, ‘K92.0 – Hematemesis’, ‘K92.1 – Melaena’ and ‘K92.2 – Gastrointestinal hemorrhage, unspecified’.
Thromboembolic episodes occurring within 90 days after ultimate hospital discharge were identified using the following ICD-10 secondary field codes obtained from data linkage with HES/PEDW: ‘I26.9 – Pulmonary embolism without mention of acute cor pulmonale’, ‘I26.0 – Pulmonary embolism with mention of acute cor pulmonale’, ‘I60 Category – Nontraumatic subarachnoid hemorrhage’, ‘I61.0 – Nontraumatic intracerebral hemorrhage in hemisphere, subcortical’, ‘I61.1 – Nontraumatic intracerebral hemorrhage in hemisphere, cortical’, ‘I61.2 – Nontraumatic intracerebral hemorrhage in hemisphere, unspecified’, ‘I61.3 – Nontraumatic intracerebral hemorrhage in brain stem’, ‘I61.4 – Nontraumatic intracerebral hemorrhage in cerebellum’, ‘I61.5 – Nontraumatic intracerebral hemorrhage, intraventricular’, ‘I61.6 – Nontraumatic intracerebral hemorrhage, multiple localized’, ‘I61.8 – Other nontraumatic intracerebral hemorrhage’, ‘I61.9 – Nontraumatic intracerebral hemorrhage, unspecified’, ‘I62.0 – Nontraumatic subdural hemorrhage’, ‘I62.1 – Nontraumatic extradural hemorrhage’, ‘I62.9 – Nontraumatic intracranial hemorrhage, unspecified’ and ‘I80 Category – Phlebitis and thrombophlebitis’.
Length of stay in intensive care unit and hospital
Length of ICU stay was calculated as the sum of the duration (in days) from the date of admission to ICU to the date of ultimate discharge from ICU or death in ICU, and included all continuous time spent in the ICU in the index hospitalisation. Length of hospital stay was calculated as the duration in days from the date of ultimate ICU discharge to the date of acute hospital discharge or death in acute hospital. Total hospital length of stay (LOS) was calculated as the duration in days from the date of admission to ICU to the date of acute hospital discharge or death in acute hospital.
Development of end-stage renal disease treated by renal replacement therapy at 90 days and 1 year
Development of ESRD treated by RRT was defined as having a record in the UKRR identified by the date of first ever RRT for ESRD. At the time of data linkage, data from the UKRR were available up to 31 March 2017 (the same as for admission to ICU) only. To maximise use of the available data, we elected to evaluate this outcome at both 90 days and 1 year (rather than the original plan of at 1 year only), excluding patients admitted to ICU in the last 90 days and 1 year, respectively, of the study cohort from the analysis cohorts for these outcomes.
Primary economic outcomes
The primary economic outcome was incremental net monetary benefit (INMB) gained at 1 year at a willingness-to-pay threshold of £20,000 per quality-adjusted life-year (QALY) associated with a change from SHA to RCA during CRRT.
Secondary economic outcomes
Estimated lifetime incremental net monetary benefit
The secondary economic outcome was estimated lifetime INMB associated with a change from SHA to RCA for CRRT.
Health economics and quality of life
Micro-costing task analysis
A micro-costing analysis of the set-up and running of CRRT using SHA and RCA was conducted at eight ICUs. To estimate the cost of delivering CRRT at individual ICU level, ICUs were chosen to represent the common manufacturer systems identified from the survey. At each ICU, we conducted cognitive ‘walk-throughs’ (including hierarchical task analysis; see Report Supplementary Material 2) of CRRT set-up with representative clinicians, which allowed staff time and consumables for each task element to be estimated. 22 Staff time costs were obtained from the Unit Costs of Health and Social Care 2018,23 unit costs of anticoagulation drugs were based on the NHS Business Services Authority Drug Tariff24 and CRRT fluid costs on the manufacturers’ quoted prices. NHS Supply Chain costs were used for consumables. 25
Continuous renal replacement therapy system set-up time and frequency
Continuous renal replacement therapy system set-up time and the frequency of system failures were estimated from anonymised electronically held individual patient data from the Post-Intensive Care Risk-Adjusted Alerting and Monitoring (PICRAM) study (containing anonymised electronically held records of all patients treated at both general ICUs in Oxford, UK, and the Royal Berkshire Hospital ICU in Reading from 2009 to 2015) and from the electronic clinical information system for patients treated in Oxford, UK, following completion of PICRAM (2015–17). From these data, the number and distribution of intervals between one CRRT system failing and the next being in place for periods in which RCA and SHA were in use were determined alongside the number of transfusion episodes in the two periods.
Intensive care unit, hospital and longer-term costs
Unit costs of ICU and hospital LOS and dialysis were obtained from NHS Reference Costs 2017–1826 calculated as total cost per patient to 1 year following the index ICU admission. The cost of RRT for ESRD was also estimated for patients identified from UKRR as having ESRD treated using RRT, based on an assumption of three dialysis sessions per week using unit costs of dialysis from NHS Reference Costs 2017–18. 26
Health-related quality of life and quality-adjusted life-years
EuroQol-3 Dimensions, three-level version (EQ-5D-3L), health-related quality-of-life (HRQoL) data for patients at 3 months and 1 year after ICU discharge were obtained from the 8000-patient UK Intensive Care Outcome Network (ICON) study. 27 Eligible patients meeting the inclusion criteria were identified and divided into quartiles of age. Averaged EQ-5D-3L-based utility weights were calculated by age quartile at 3 months and 1 year and used as the measure of HRQoL. All patients developing ESRD and requiring dialysis were assigned a decrement of 0.14 to their HRQoL based on European norms28 compared with the equivalent age group from the Health Survey for England 2016. 29 This decrement was applied from the date of first RRT for ESRD forward. HRQoL data at 3 months and 1 year were then combined with the survival data to calculate QALYs at 1 year, assuming zero HRQoL at baseline and death, and linear interpolation between the time points.
Governance, management and oversight
Ethics
An application for approval by the South Central – Oxford B Research Ethics Committee (REC) and Health Research Authority (HRA) was submitted on 23 March 2018. An application to the Confidentiality Advisory Group (CAG) was submitted at the same time to seek support for approval under Section 251 of the NHS Act 2006 to permit the use of identifiable patient data without consent. 30 Favourable opinions from the REC and CAG were received on 17 April 2018 and 21 June 2018, respectively (REC reference 18/SC/0204; CAG reference 18/CAG/0070). HRA approval was received on 22 June 2018.
Protocol amendments
Following receipt of initial favourable opinion, three non-substantial protocol amendments were submitted for REC approval, two of which also required CAG approval owing to amended access to patient identifiable data without consent. These were:
-
to include data linkage to the PEDW data set to allow for identification of admissions to Welsh hospitals following discharge from ICU (protocol version 2.0)
-
to obtain electronically held data from Oxford University Hospitals NHS Foundation Trust for the period following the completion of the PICRAM study (2015 to 31 March 2017), required for the health economic analysis (protocol version 2.1)
-
editorial changes and the addition of a prespecified subgroup and secondary outcome in line with the statistical analysis plan (protocol version 2.2).
Additional amendments to the initial HRA/REC approvals were submitted for the addition of the research sites for the micro-costing study.
Study registration
The RRAM study was prospectively registered on ClinicalTrials.gov, published online on 4 June 2018, as NCT03545750.
Study Steering Committee
The National Institute for Health Research (NIHR) convened an independently chaired and majority (at least 75%) independent Study Steering Committee (SSC). Dr Steve Harris chaired the SSC, which also included clinicians, methodologists and patient and public involvement (PPI) representatives.
Sponsorship
The RRAM study was sponsored by the ICNARC and managed by the ICNARC Clinical Trials Unit.
Patient and public involvement
Engagement with patients was vital to ensuring the successful delivery of the RRAM study. A former critical care patient was a co-investigator on the study and contributed to all aspects of the study, including design, conduct, management, analysis, interpretation of results and dissemination as members of the study management group. In addition, the SSC included an independent patient representative.
Statistics and data analysis
All statistical analyses were prespecified in a statistical analysis plan, which is publicly available on the ICNARC website. 31
Power calculation
Based on preliminary analysis of ICNARC CMP data, we anticipated a total available sample size of ≈ 85,000 patients from 184 ICUs. Prior to study commencement, UK suppliers indicated that 90 ICUs were currently using RCA. To assess the likely power of the available data to address the research question of interest, we simulated 1000 replications of the study using available ICNARC CMP data under the following assumptions:
-
Thirty-five changes from SHA to RCA will be observed within the available data. This was a conservative assumption from the 90 ICUs across the UK reported to be using RCA, to allow for use in ICUs outside England, specialist ICUs and changes that occurred when ICUs were not participating in the ICNARC CMP. In each simulation, 35 ICUs were selected at random to represent the observed changes.
-
Changes from SHA to RCA will be evenly distributed over the time period of the study. In the simulations, the changeover quarter for each of the 35 randomly selected ICUs was sampled from a uniform distribution from between their second and penultimate quarters.
-
Fifteen ICUs will have changed from SHA to RCA prior to the start of the study. In each simulation, 15 ICUs were selected at random to contribute data to the RCA group throughout. In the simulations, the indicator tij is used to indicate ICU i using RCA in quarter j.
-
The distribution of risk of 90-day mortality for patients receiving RRT in UK ICUs will follow that of the ICNARCH–2015 model for acute hospital mortality in critical care32 (with a mean of 50%). This model has excellent discrimination (area under the receiver operating characteristic curve ≈ 0.9) and calibration in this population. In the simulation, the patient-level risk of death for patient k admitted in quarter j to ICU i, pijk, was calculated using this model.
-
The between-ICU standard deviation (SD) for 90-day mortality will be 0.22. This value was estimated as the observed value for risk-adjusted acute hospital mortality in the ICNARC CMP among patients receiving RRT and corresponds to an intraclass correlation coefficient of 0.015. In each simulation, an ICU-level effect for ICU i, ui, was sampled from a normal distribution with a mean of 0 and a SD of 0.22. For the purpose of the simulations, no clustering of observations for patients within quarters in the same ICU was assumed.
-
Changing from SHA to RCA will be associated with an odds ratio (OR) for 90-day mortality of 0.9. For the purpose of simulation, a change in level was considered with no change in slope only.
In each simulation, the ‘observed’ outcome for each patient, yijk, was sampled from a Bernoulli distribution based on the following model:
The estimated treatment effect within each simulation was then estimated using a multilevel logistic regression with robust standard errors. Simulations were undertaken using Stata®/SE version 14.2 (StataCorp LP, College Station, TX, USA). The random number seed was set prior to analysis to ensure reproducibility of results.
The results of the simulations showed that this sample will have ≈ 81% power (p < 0.05) to detect a step change in 90-day mortality corresponding to an OR of 0.9.
Analysis of clinical effectiveness
An analysis of individual patient data, following techniques based on interrupted time series (ITS) analysis was used to assess clinical effectiveness, where the interruption corresponds to the change from SHA to RCA for CRRT. The analysis followed the eight quality criteria for ITS design and analysis described by Ramsay et al. 33
Random-effects multilevel generalised linear models (patients nested within ICUs) were used to estimate the ICU-level effect of transitioning to RCA on patient-level outcomes. Logistic models were used for binary outcomes and linear models for continuous outcomes. The study includes periods both before and after the switch from SHA to RCA in individual ICUs, and a comparator group of ICUs that did not change anticoagulation mode. The effect estimate is the within-ICU change in trends, with the control ICUs primarily improving estimates of patient-level confounders and the underlying secular trend. Models were fitted with robust standard errors to allow for model misspecification, including autocorrelation and heteroscedasticity.
The primary impact model for the effect of the change from SHA to RCA allowed for a change in both level and slope. Linear trends were assumed in both pre-intervention and post-intervention periods. The period of data from the start of the transition from SHA to RCA until 6 months later was omitted from the model to allow for potential imprecision in the reporting of the time of change and time to transition from one modality to the other in the initial survey, and to allow time for the new modality to be embedded into routine practice. As per the prespecified statistical analysis plan, the choice of 6 months was extended from the originally planned 3 months to account for the substantial number of ICUs taking > 3 months to transition (6 months was the 80th percentile of the time to transition). Where longer transition times occurred, these were accounted for by excluding the corresponding window. The results of the regression models are reported as the OR (or, for continuous outcomes, difference in means) with 95% confidence interval (CI) for the change in level and the OR per year (difference in means per year) with 95% CI for the change in slope associated with the change from SHA to RCA. The overall significance of the change from SHA to RCA was assessed by the joint test of the two parameters for the change in level and change in slope.
The models were adjusted for patient covariates selected based on importance in previous analyses of long-term outcomes following ICU, including acute hospital mortality,32 90-day mortality, 1-year mortality and development of ESRD. 34 The covariates included were:
-
age (linear)
-
comorbidities identified from HES/PEDW based on the Royal College of Surgeons adaptation of the Charlson Comorbidity Index
-
congestive cardiac failure
-
peripheral vascular disease
-
cerebrovascular disease
-
chronic pulmonary disease
-
chronic liver disease
-
malignancy
-
-
severe conditions in medical history recorded in the ICNARC CMP
-
haematological malignancy
-
immunocompromise [radiotherapy, chemotherapy or daily high-dose steroid treatment during the 6 months prior to ICU admission; recording of human immunodeficiency virus (HIV)/acquired immunodeficiency syndrome (AIDS) or a congenital immunohumoral or combined immune deficiency state]
-
severe liver disease (biopsy-proven cirrhosis, portal hypertension or hepatic encephalopathy)
-
metastatic disease
-
severe respiratory disease (shortness of breath with light activity or a requirement for home ventilation)
-
very severe cardiovascular disease (New York Heart Association functional class IV)
-
-
dependency prior to admission to acute hospital (no, some or total requirement for assistance with activities of daily living)
-
body mass index (restricted cubic splines with three knots)
-
location prior to admission to the ICU [emergency department or not in hospital, other hospital (not critical care), other critical care unit, planned admission from theatre following elective/scheduled surgery, unplanned admission from theatre following elective/scheduled surgery, admission from theatre following urgent/emergency surgery, ward or intermediate care area]
-
cardiopulmonary resuscitation (in or out of hospital) within 24 hours prior to ICU admission
-
primary reason for admission to ICU (body system)
-
receipt of mechanical ventilation during the first 24 hours in ICU
-
physiology recorded during the first 24 hours in the ICU
-
highest heart rate (restricted cubic splines with four knots)
-
lowest systolic blood pressure (restricted cubic splines with four knots)
-
highest central temperature, or highest non-central temperature + 1 °C if no central temperature recorded (restricted cubic splines with four knots)
-
lowest respiratory rate (right-restricted cubic splines with four knots)
-
total urine output (restricted cubic splines with four knots)
-
lowest total Glasgow Coma Scale score (3, 4–6, 7–13, 14, 15, or sedated for entirety of first 24 hours)
-
PaO2/FiO2 level from the arterial blood gas with the lowest PaO2 level (restricted cubic splines with four knots)
-
lowest pH level (restricted cubic splines with four knots)
-
PaCO2 level from the arterial blood gas with the lowest pH level (restricted cubic splines with three knots)
-
highest blood lactate level (restricted cubic splines with four knots)
-
highest creatinine level (right-restricted cubic splines with four knots)
-
highest urea level (restricted cubic splines with four knots)
-
highest sodium level (restricted cubic splines with three knots)
-
lowest white blood cell count (restricted cubic splines with four knots)
-
lowest platelet count (restricted cubic splines with four knots).
-
As a sensitivity analysis, all analyses were repeated using data from only those ICUs with data from both before and after a transition from SHA to RCA.
Handling of missing data
Intensive care units for which it was not possible to establish whether or not/when a change from SHA to RCA for CRRT occurred were excluded from the analysis. Missing values in individual patient covariates and outcomes were imputed using fully conditional specification, implemented using the multivariate imputation by chained equations algorithm. 35,36 The multiple imputation model included all covariates planned to be included in the substantive model, with the same functional form, plus the intervention and outcome measures. 37 To ensure reproducibility of results, the random number seed was set prior to producing the imputed data sets.
Assumptions
Other than handling of missing data, most assumptions of this approach are addressed in appendix A of the statistical analysis plan. 31 Assumptions not addressed at the design stage relate to appropriate specification of the statistical model. In line with recommendations,33 we prespecified the shape of the intervention effect, selecting a linear model for all trends both pre and post transition to RCA. The assumption of linearity was assessed by visual inspection of the predicted outcome overlaid on scatterplots of observed outcomes with 3-month binning.
Analysis of cost-effectiveness
The cost-effectiveness analysis (CEA) took a health services perspective and reports mean (95% CI) incremental costs and QALYs at 1 year associated with a change from SHA to RCA for CRRT, overall and for prespecified subgroups. The CEA used multilevel generalised linear models that allow for clustering of patients in ICUs. Separate multilevel models were fitted for costs and QALYs, adjusted for the same patient covariates as the models for clinical effectiveness. INMB at 1 year associated with a change from SHA to RCA was estimated valuing incremental QALYs according to a National Institute for Health and Care Excellence (NICE)-recommended willingness-to-pay threshold for a QALY gain (£20,000) and subtracting the incremental costs from this value. The INMB calculation assumed no correlation between costs and QALYs; a single-level, bivariate, seemingly unrelated regression model for costs and QALYs indicated that the impact of not accounting for correlation would be small and conservative (≈ 3% increase in standard error of INMB). Missing data were addressed as described in Handling of missing data and were assumed to be missing at random, conditional on baseline covariates, resource use and observed end points.
The economic analysis projected lifetime cost-effectiveness by summarising the relative effects of the alternative strategies on long-term survival and HRQoL, compared with that of the age- and gender-matched general population. 38,39 There is evidence to suggest that critical care survivors face a higher probability of death and lower quality of life after the critical care episode than the general population (age and gender matched). 40–42 However, there is no clear evidence on the duration of this excess mortality; the strongest evidence is in support of an excess mortality of up to 5 years. The long-term survival of each patient in the RRAM study was calculated from observed survival within 1 year and their predicted survival from age- and gender-matched general population survival by applying excess death rates for years 2 to 5, after which we assumed that all-cause death rates were those of the age- and gender-matched general population. The HRQoL of RRAM study patients at 1 year was approximately 73% of that of the age- and gender-matched general population. 43 We assumed that HRQoL would improve over 5 years to match the HRQoL of the age- and gender-matched general population. After 5 years, we applied HRQoL values for the age- and gender-matched general population. Lifetime QALYs were reported by combining life-years and HRQoL. Lifetime costs were projected by applying chronic morbidity costs associated with use of dialysis for ESRD over the lifetime. No further differential costs between the groups at 1 year were considered.
In addition to mirroring the subgroup and sensitivity analyses conducted for the analysis of clinical effectiveness, further sensitivity analyses tested the robustness of the results to the selection of sites for the micro-costing exercise. A ‘best-case’ scenario was constructed by combining the lowest treatment-related costs for CRRT with RCA from any unit participating in the cognitive walk-through with the highest treatment-related cost for CRRT with SHA from any unit. A ‘worst-case’ analysis combined the highest derived cost for CRRT with RCA from any unit with the lowest derived cost for CRRT with SHA.
Chapter 3 Results of the survey of anticoagulation practice
Survey response and anticoagulation practice for continuous renal replacement therapy
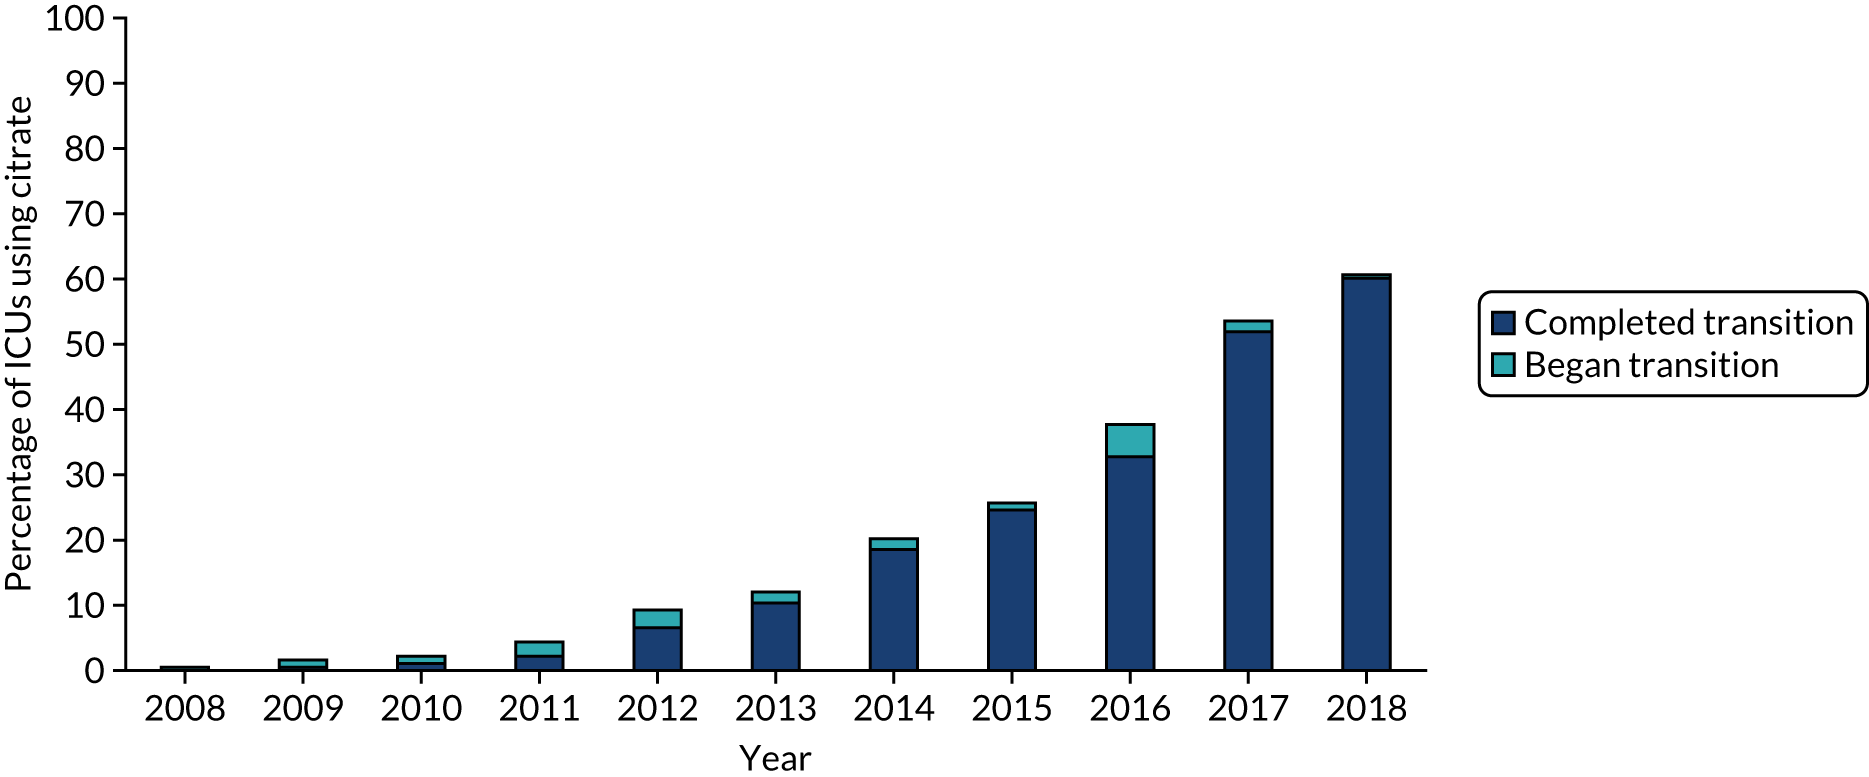
In September 2018, 200 adult general ICUs in England and Wales were identified as participating in the ICNARC CMP. Between September 2018 and March 2019, 188 of these ICUs completed the online survey, a response rate of 94.0%. Among these, 182 ICUs (96.8%) reported using CRRT, 111 (61.0%) of which reported changing from SHA to using RCA (Figure 1). Figure 2 shows the cumulative percentage of units switching to RCA for CRRT over time.
FIGURE 1.
Flow chart of the response to survey of anticoagulation practice.
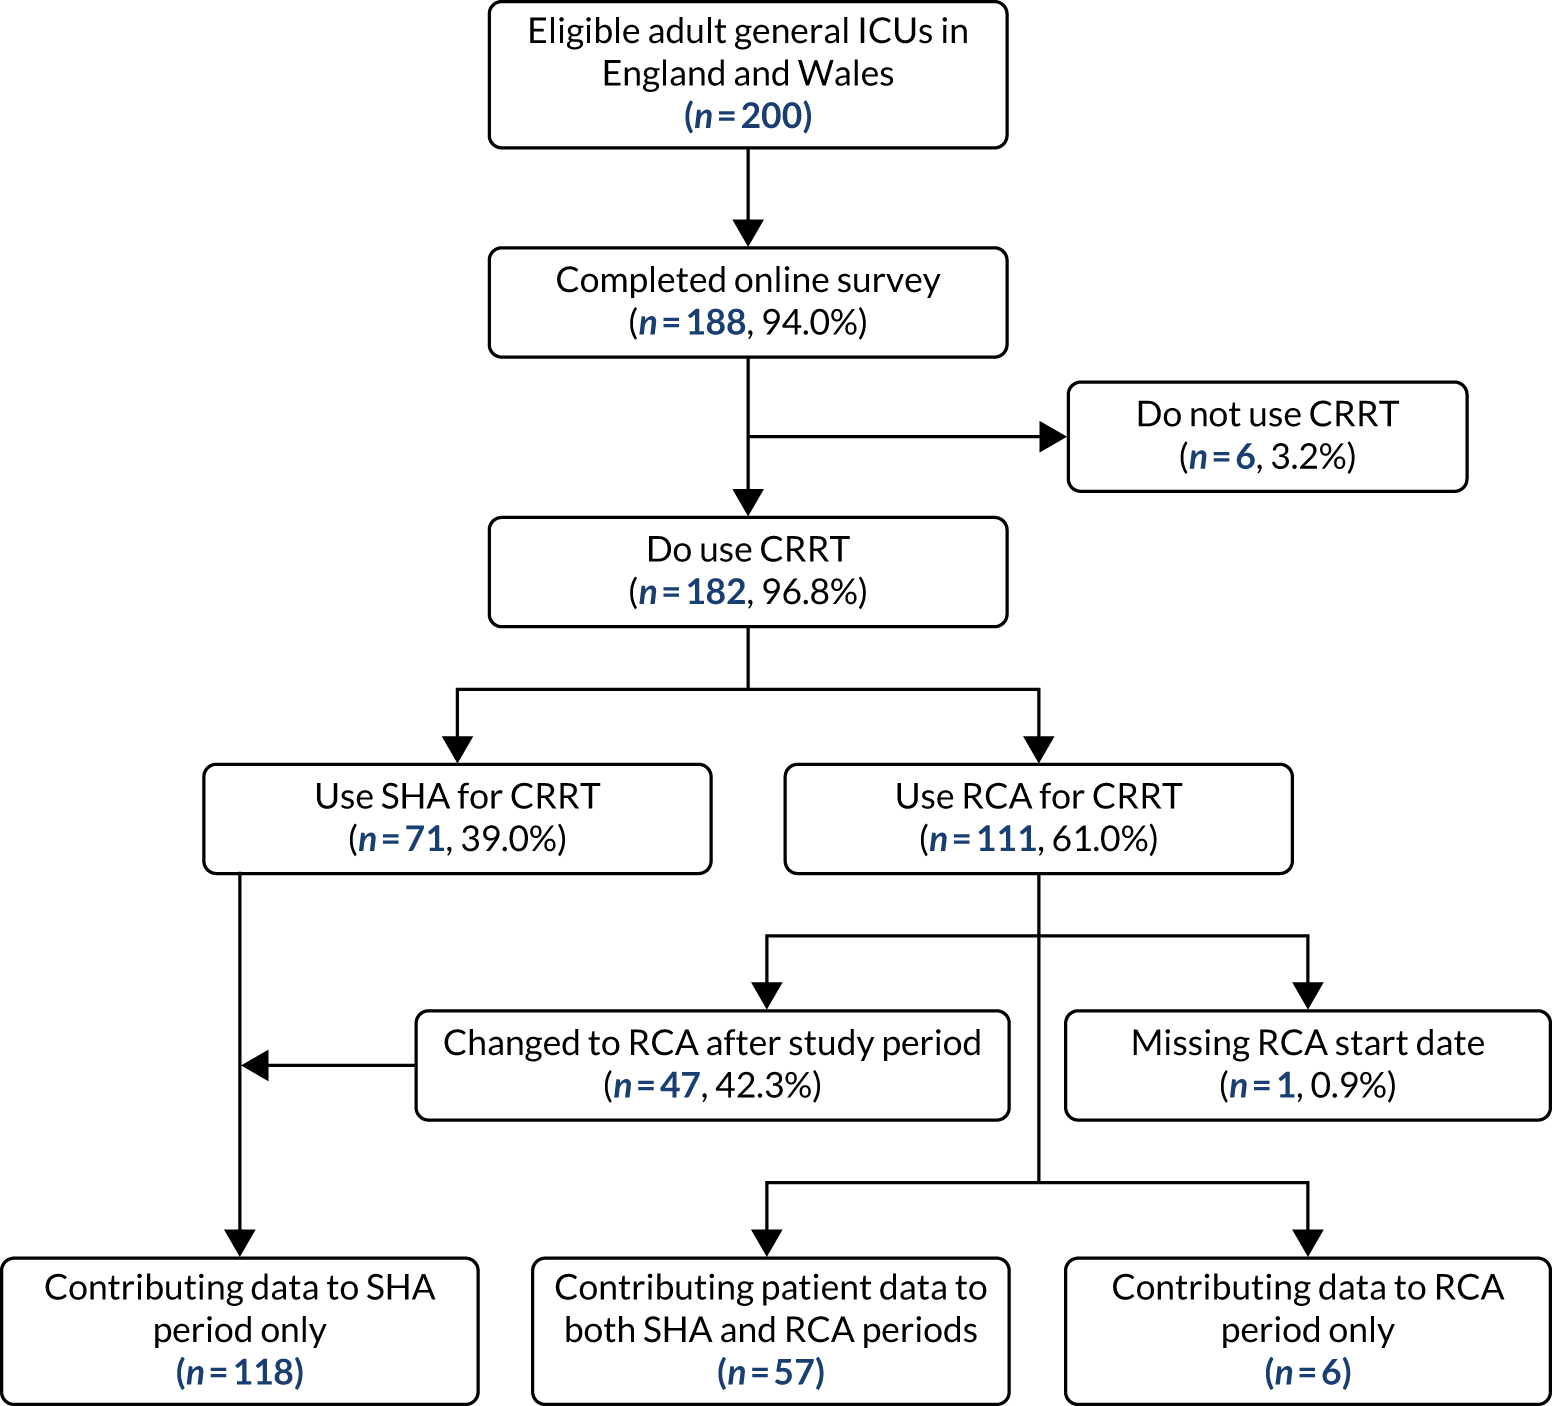
FIGURE 2.
Cumulative percentage of ICUs that reported switching to RCA over time.
Intensive care units contributing to systemic heparin anticoagulation and regional citrate anticoagulation groups
Out of the 182 ICUs that reported using CRRT (see Figure 1), 181 (99.5%) contributed data for at least one patient to the study cohort. One ICU did not provide a date corresponding to the start of the change to RCA and was, therefore, excluded. Out of the 181 ICUs with complete responses, 175 (96.7%) contributed patients for the period that SHA was in use (hereafter referred to as the SHA group) and 63 (34.8%) contributed patients for the period that RCA was in use (hereafter referred to as the RCA group). A total of 57 ICUs contributed patients to both SHA and RCA groups.
Unit characteristics
The characteristics of all ICUs that reported using CRRT are reported in Table 2 according to the mode of anticoagulation reported at the time of survey completion. The median number of beds was higher in units reporting the use of RCA (14 beds vs. 12 beds); however, the ratio of CRRT machines to beds was the same in both SHA and RCA units. The most commonly used CRRT system was the Prismaflex (Baxter International Inc., Deerfield, IL, USA), with > 60% of respondents reporting its use. The most commonly used effluent flow rate was lower in units that reported using RCA, with medians of 35 ml/kg/hour for SHA and 30 ml/kg/hour for RCA.
| Variable | Anticoagulation mode | |
|---|---|---|
| SHA (N = 71) | RCA (N = 111) | |
| Number of beds, median (IQR) | 12.0 (9.0–16.5) | 14.0 (10.0–18.0) |
| Number of CRRT machines, median (IQR)a | 4.0 (3.0–5.5) | 4.0 (3.0–6.0) |
| Machine to bed ratio, median (IQR)a | 0.3 (0.25–0.40) | 0.3 (0.25–0.40) |
| Number of CRT machines, n (%)a | ||
| 0–5 | 53 (74.6) | 79 (71.8) |
| 6–10 | 14 (19.7) | 27 (24.5) |
| 11–15 | 1 (1.4) | 2 (1.8) |
| 16–20 | 1 (1.4) | 2 (1.8) |
| > 20 | 2 (2.8) | 0 (0.0) |
| CRRT system in use, n (%)a | ||
| Prismaflex | 46 (65.7) | 66 (60.0) |
| multiFiltrate (Fresenius Medical Care AG & Co., Bad Homburg, Germany) | 6 (8.6) | 32 (29.1) |
| Aquarius™ (NIKKISO Europe GmbH, Langenhagen, Germany) | 15 (21.4) | 11 (10.0) |
| Other | 3 (4.3) | 1 (0.9) |
| Most frequent effluent flow rate (ml/kg/hour) in use, n (%)a | ||
| < 20 | 2 (2.9) | 2 (1.8) |
| 25 | 14 (20.0) | 43 (40.2) |
| 30 | 12 (17.1) | 22 (20.6) |
| 35 | 31 (44.3) | 29 (27.1) |
| 40 | 0 (0.0) | 3 (2.8) |
| 45 | 0 (0.0) | 1 (0.9) |
| > 45 | 0 (0.0) | 0 (0.0) |
| Other | 11 (15.7) | 7 (6.5) |
Units switching from systemic heparin anticoagulation to regional citrate anticoagulation
Across the 111 ICUs that reported changing to RCA, the median time taken to complete the transition to fully implementing RCA was 31 days [interquartile range (IQR) 0–91 days]. Among these ICUs, 32 (28.8%) reported that the effluent flow rate used during RCA was lower than that used during SHA, whereas six (5.4%) reported an increased effluent flow rate during RCA.
Residual systemic heparin anticoagulation use
Residual use of SHA was reported by 64 (57.7%) of the 111 ICUs that changed to RCA. In these ICUs, the median proportion of patients estimated to receive SHA was 10% (IQR 5–20%). The most commonly reported reason for patients receiving SHA in a unit that had switched to RCA was severe liver disease with a perceived inability to metabolise citrate. Other reasons reported for patients receiving SHA after changing to RCA are listed in Table 3.
| Reason | Units reporting, n (%) |
|---|---|
| Severe liver disease with inability to metabolise citrate | 58 (90.6) |
| Patient already receiving systemic heparin infusion | 33 (51.7) |
| Severe multiorgan failure | 6 (9.4) |
| Hepatorenal failure | 5 (7.8) |
| Other | 17 (26.6) |
| Alkalosis | 8 (47.1) |
| Chronic renal failure | 3 (17.6) |
| Short stay or need for high-volume filtration | 2 (11.8) |
| Use of PrismaLung (Baxter International Inc.) | 2 (11.8) |
| Hypercalcaemia | 2 (11.8) |
Confirmation of switch to regional citrate anticoagulation-based continuous renal replacement therapy
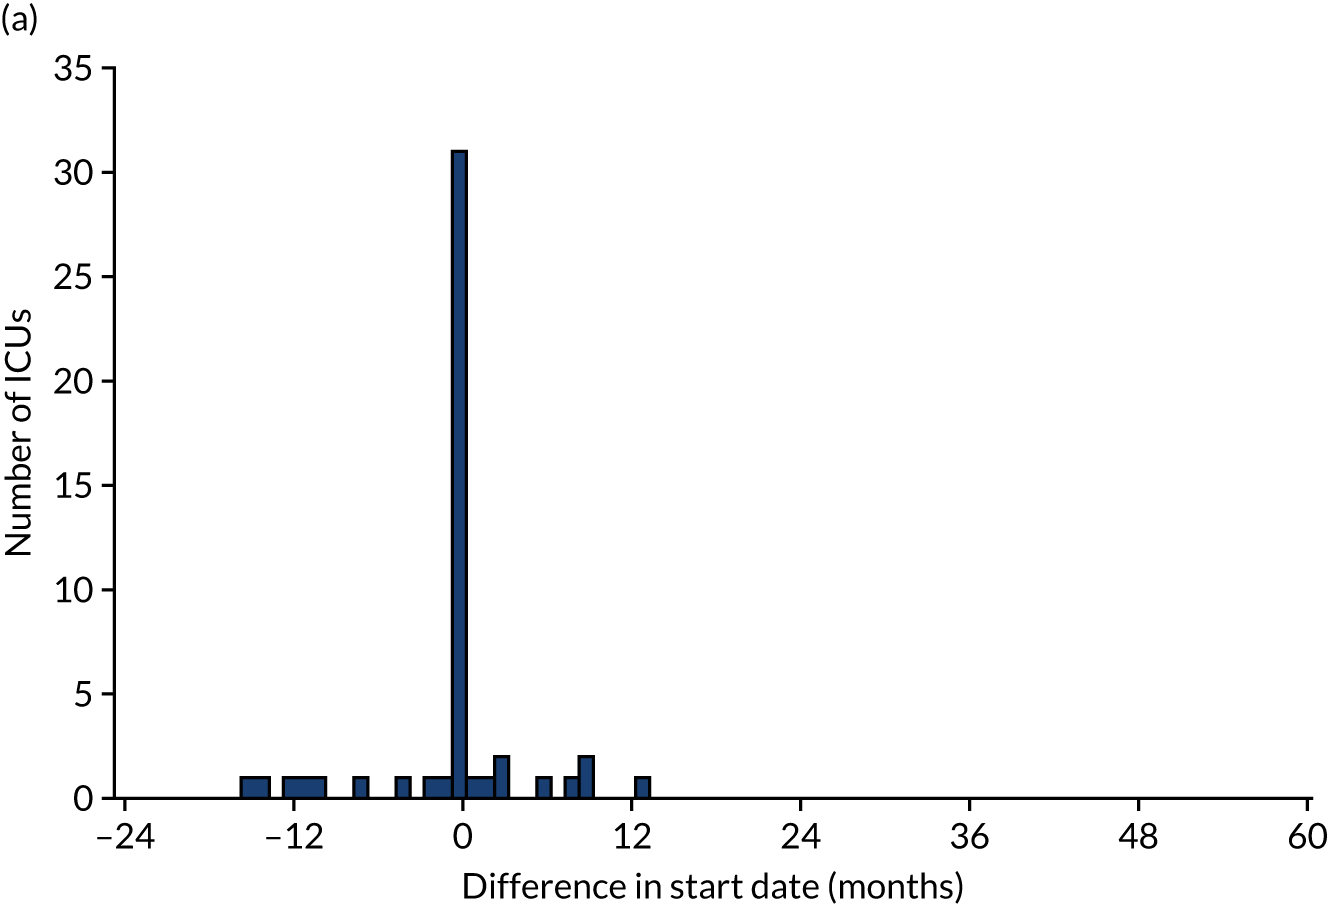
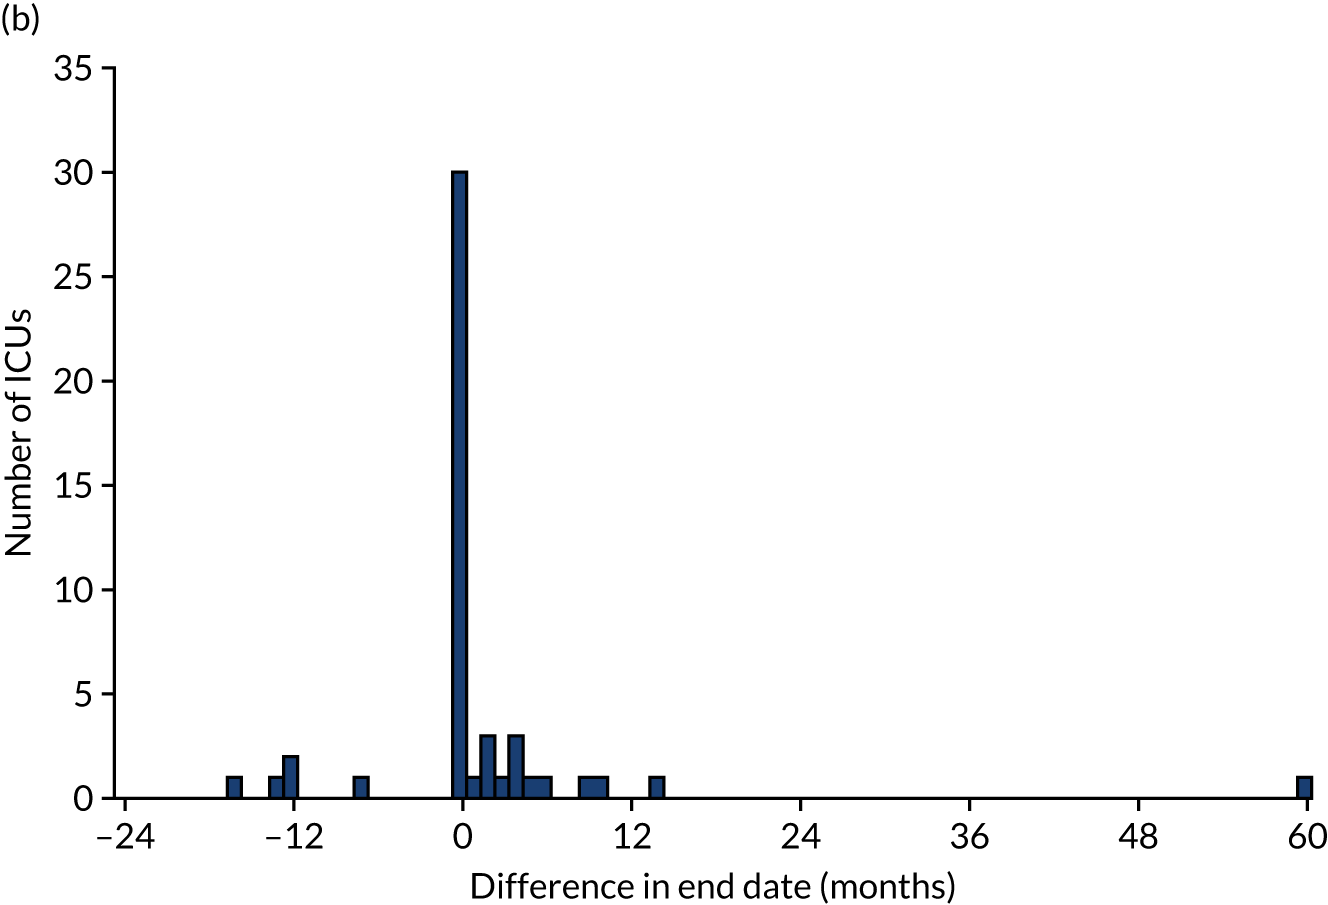
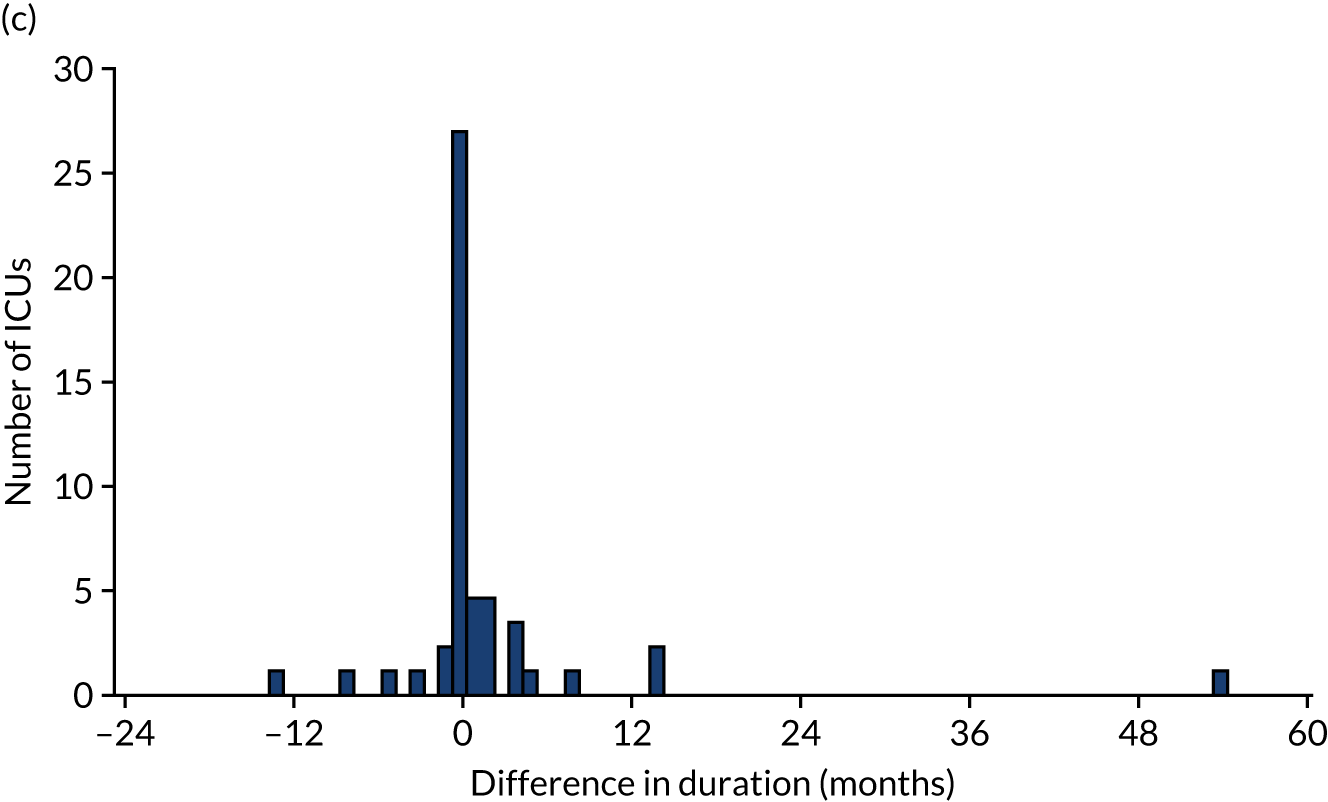
Of the 111 ICUs that reported changing to RCA, 60 (54.0%) reported completing the transition prior to 1 January 2017. We were able to obtain confirmatory consumables information from 50 (83.3%) of these ICUs, 24 (48.0%) of which provided consumables information indicating that the dates corresponding to the switch to RCA were different from those reported in the initial survey. As a result, 5 (10.0%) ICUs changed the date corresponding to the start of transitioning to RCA, 6 (12.0%) changed the date corresponding to the end of transitioning to RCA and 13 (26.0%) changed both dates. The differences between the dates reported in the online survey and the dates confirmed after receipt of consumable information are shown in Figure 3. The site reporting a 60-month difference in the date corresponding to the end of RCA implementation specified that this was because RCA was initially used for patients with contraindications to SHA, before becoming the first-choice anticoagulant.
FIGURE 3.
(a) Difference between the date reported in the survey and the date confirmed for the start of RCA implementation; (b) difference between the date reported in the survey and the date confirmed for the completion of RCA implementation; and (c) difference between the duration of transition period from dates reported in the survey and from confirmatory information.
Chapter 4 Results of the clinical effectiveness analysis
Data linkage
We submitted an application for third-party data linkage with NHS Digital on 5 July 2018 and signed a data-sharing agreement on 11 December 2018. Patient identifiers were securely uploaded to NHS Digital from the ICNARC CMP and the UKRR on 8 and 11 January 2019, respectively. NHS Digital returned the linkage files to the UKRR and the agreed data from HES and Civil Registrations (Deaths) data sets to ICNARC on 28 February 2019. Data from the UKRR were received on 2 April 2019. The separate linkage to the PEDW data set was agreed with NWIS on 19 November 2018. ICNARC securely uploaded identifiers from the ICNARC CMP cohort to NWIS on 10 January 2019 and the agreed data for linked patients were received on 22 January 2019.
Cohort identification
We identified 99,945 admissions to adult general ICUs in the ICNARC CMP between 1 April 2009 and 31 March 2017 that met the inclusion criteria. Using NHS numbers, we linked records for admissions in the HES (n = 89,463), PEDW (n = 7087), UKRR (n = 7391) and Civil Registrations (Deaths) (n = 67,844) data sets (Figure 4). Following data linkage, 23,395 (23.4%) of the 99,945 ICU admissions were excluded. Major reasons for exclusion (see Figure 4) included evidence of prior chronic RRT, nephrectomy or transplant identified from linkage to UKRR, HES or PEDW (11,484; 11.5%), the ICU did not take part in the survey (8038; 8.0%) and NHS number was missing (2783; 2.8%). After applying these secondary exclusions, 76,550 admissions for 72,401 patients met all of the eligibility criteria.
FIGURE 4.
Data linkage and cohort construction. a, See Cohort identification for details; b, the number of these records is consistent with application of national data opt-out by NHS Digital, which is the assumed explanation for these.
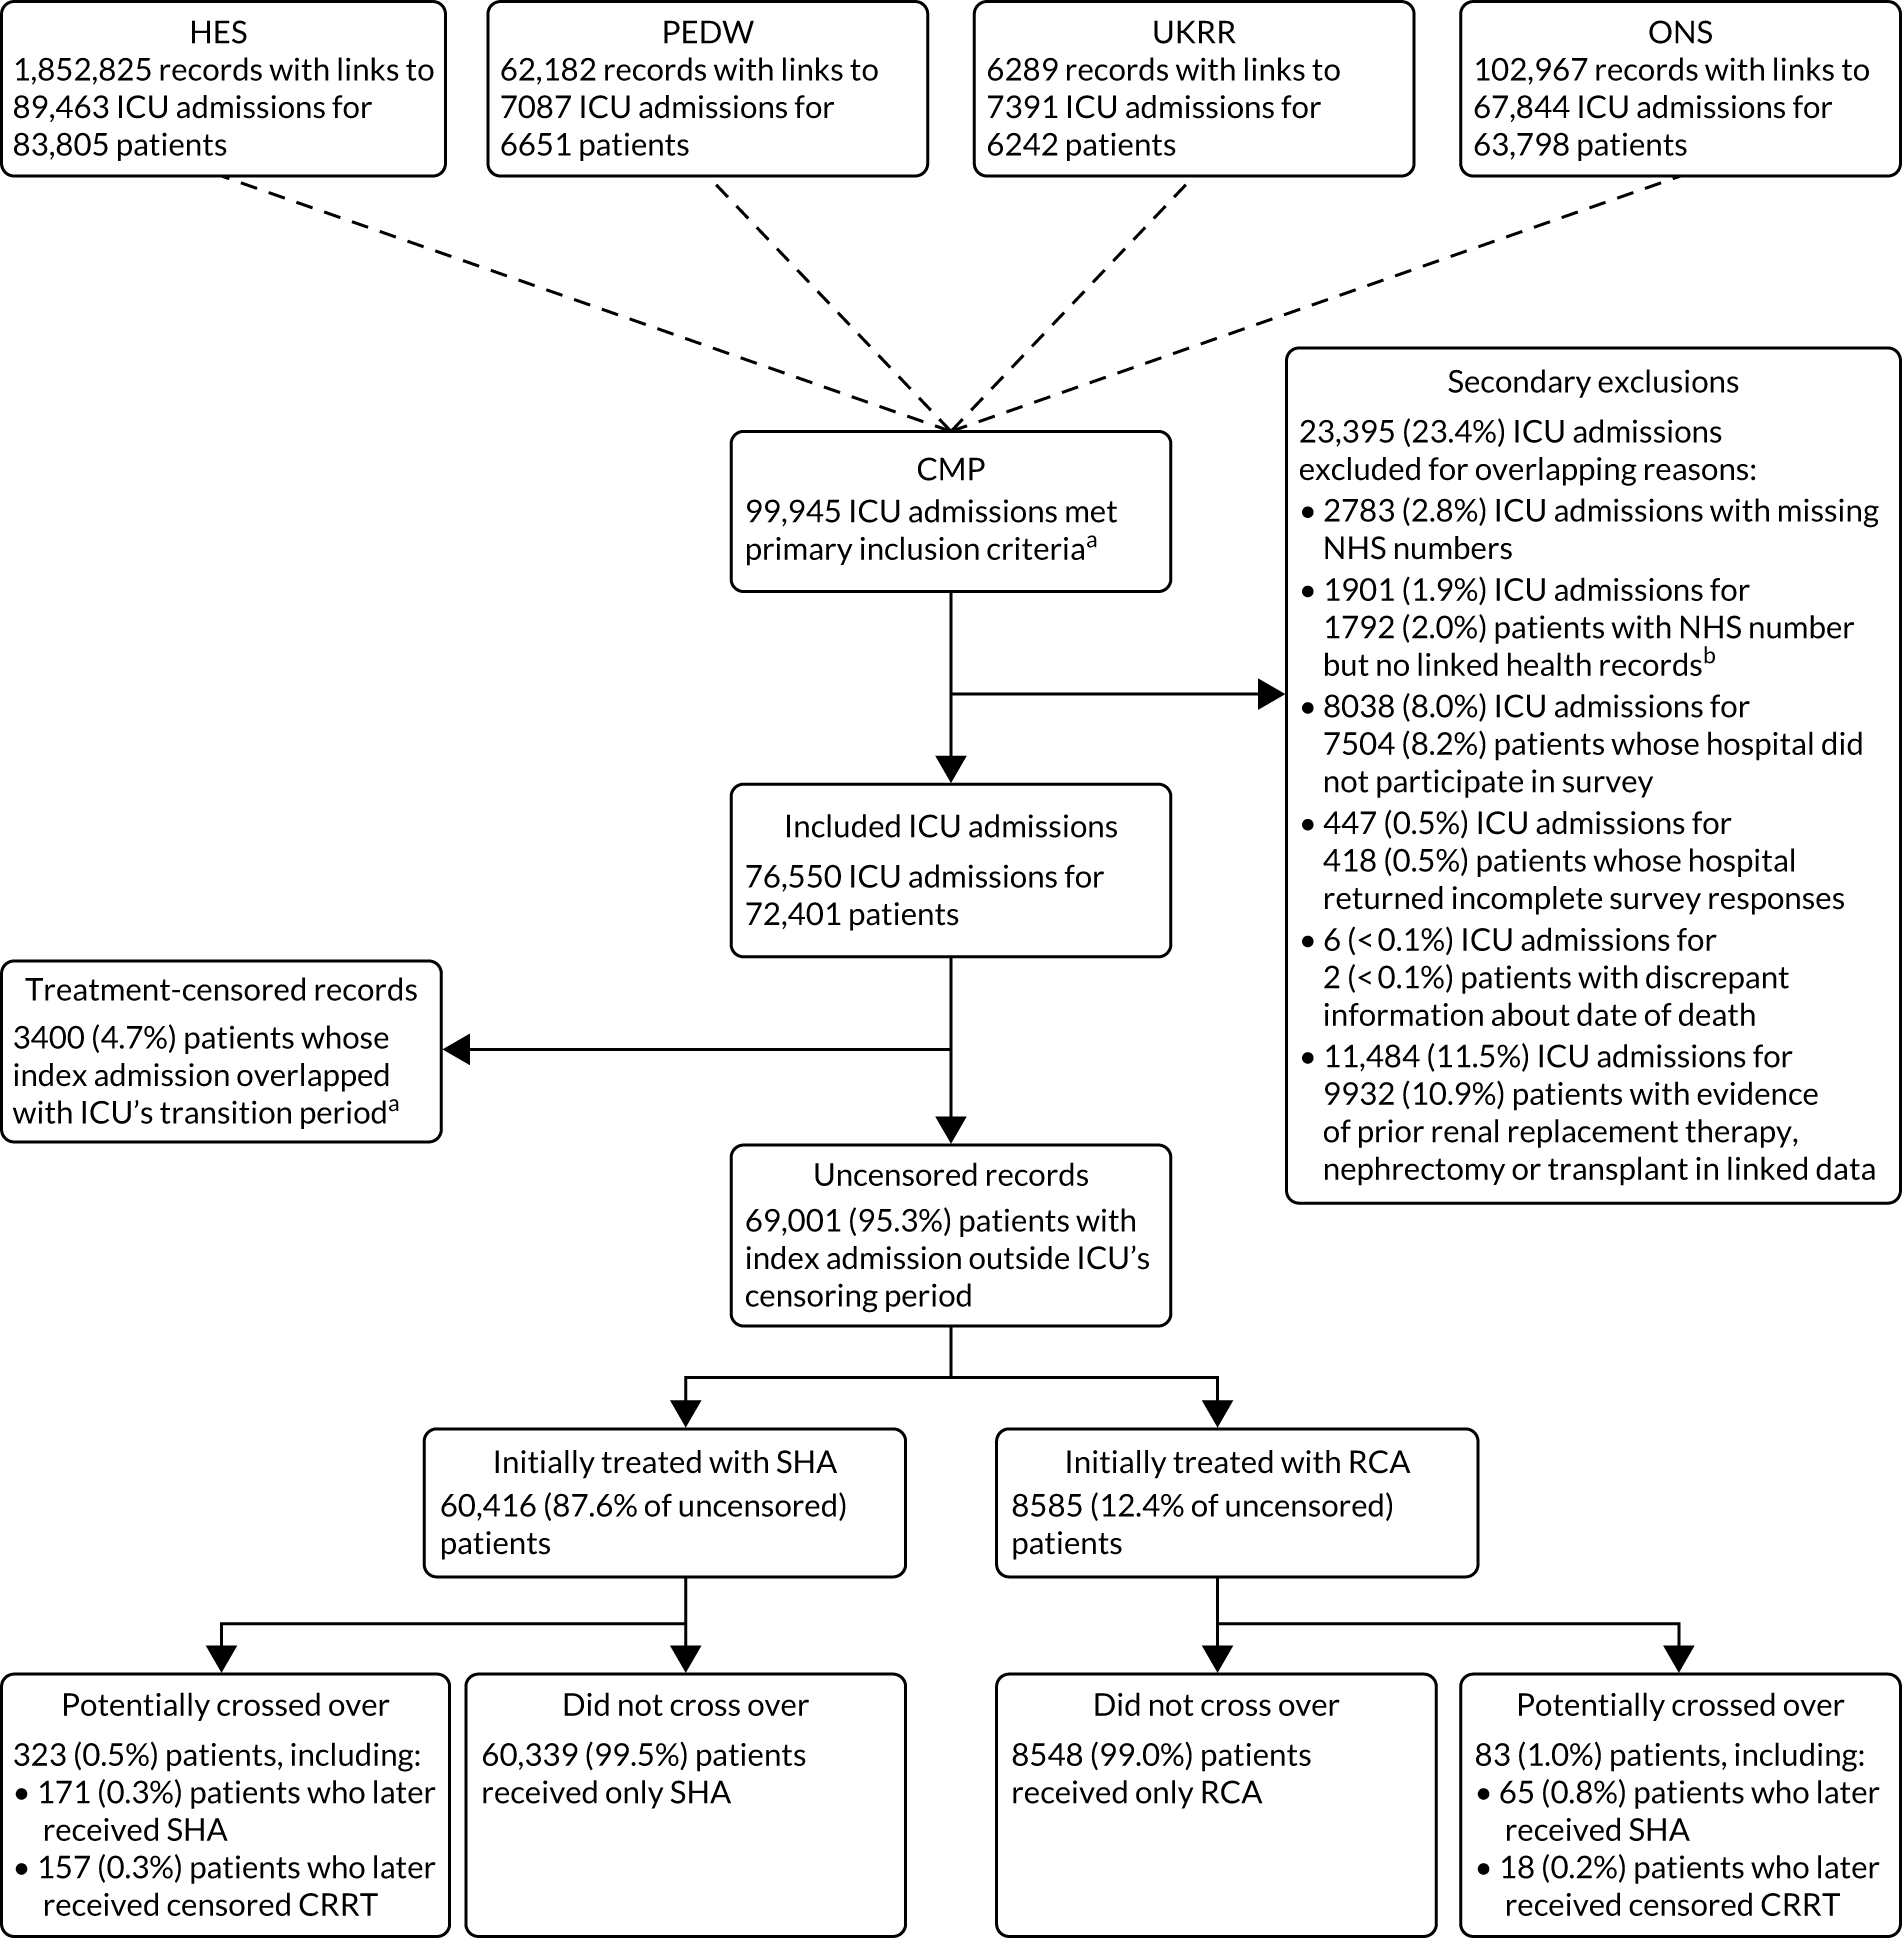
After applying the 6-month minimum transition period, we censored 3400 (4.7%) patients whose index admission overlapped with the ICUs transition period. Of the 69,001 (95.3%) uncensored patients, 60,416 (87.6%) were treated in an ICU while SHA was in use and 8585 (12.4%) were treated after the ICU had completed the switch to RCA. In both groups, the proportion of potential crossover – identified as subsequent patients meeting the study eligibility criteria admitted to ICUs that had reported using the alternative mode of anticoagulation or to ICUs that were transitioning from SHA to RCA – was small (see Figure 4).
Patient characteristics
The characteristics of patients in the SHA and RCA groups were similar (Table 4). In both groups, the median age was 67 years, ≈ 60% were male and > 80% were medical admissions. Illness severity scores during the first 24 hours of admission to the ICU were similar in both groups, and ≈ 47% of patients in both groups had sepsis. Patients in the RCA group, however, tended to have higher rates of comorbidities and a slightly higher predicted mortality.
| Characteristic | Treatment group | ||
|---|---|---|---|
| SHA (N = 60,416) | Censored (N = 3400) | RCA (N = 8585) | |
| Sex, n (%) | |||
| Female | 24,294 (40.2) | 1337 (39.3) | 3317 (38.6) |
| Male | 36,122 (59.8) | 2063 (60.7) | 5268 (61.4) |
| Age, median (IQR) | 67 (55–75) | 67 (55–76) | 67 (55–75) |
| Year of admission to ICU, n (%) | |||
| 2009 | 4668 (7.7) | 0 (0.0) | 0 (0.0) |
| 2010 | 7014 (11.6) | 207 (6.1) | 46 (0.5) |
| 2011 | 7802 (12.9) | 272 (8.0) | 73 (0.9) |
| 2012 | 8042 (13.3) | 530 (15.6) | 188 (2.2) |
| 2013 | 8100 (13.4) | 566 (16.6) | 650 (7.6) |
| 2014 | 7927 (13.1) | 703 (20.7) | 1393 (16.2) |
| 2015 | 7890 (13.1) | 322 (9.5) | 2333 (27.2) |
| 2016 | 7365 (12.2) | 584 (17.2) | 3018 (35.2) |
| 2017 | 1608 (2.7) | 216 (6.4) | 884 (10.3) |
| Type of admission, n (%)a | |||
| Medical | 49,512 (82.0) | 2817 (82.9) | 7155 (83.4) |
| Elective surgical | 2218 (3.7) | 156 (4.6) | 261 (3.0) |
| Emergency surgical | 8683 (14.4) | 427 (12.6) | 1168 (13.6) |
| Medical history, n (%) | |||
| Haematological malignancy | 2552 (4.2) | 179 (5.3) | 420 (4.9) |
| Immunocompromised | 4643 (7.7) | 314 (9.2) | 813 (9.5) |
| Metastatic disease | 1414 (2.3) | 103 (3.0) | 252 (2.9) |
| Severe liver disease | 2591 (4.3) | 148 (4.4) | 472 (5.5) |
| Severe respiratory disease or home ventilation | 1119 (1.9) | 51 (1.5) | 184 (2.1) |
| Sepsis | 28,743 (47.6) | 1477 (43.4) | 4029 (46.9) |
| Presentation | |||
| Mechanically ventilated during first 24 hours, n (%) | 36,174 (60.0) | 2062 (60.8) | 5117 (59.7) |
| APACHE II acute physiology score, mean (SD)a | 18.3 (6.2) | 17.4 (6.0) | 18.2 (6.1) |
| ICNARC model physiology score, mean (SD)a | 28.1 (8.9) | 27.3 (9.2) | 28.3 (9.3) |
| ICNARC model-predicted mortality probability, mean (SD)a | 0.568 (0.248) | 0.562 (0.256) | 0.577 (0.253) |
Clinical effectiveness
Primary outcome
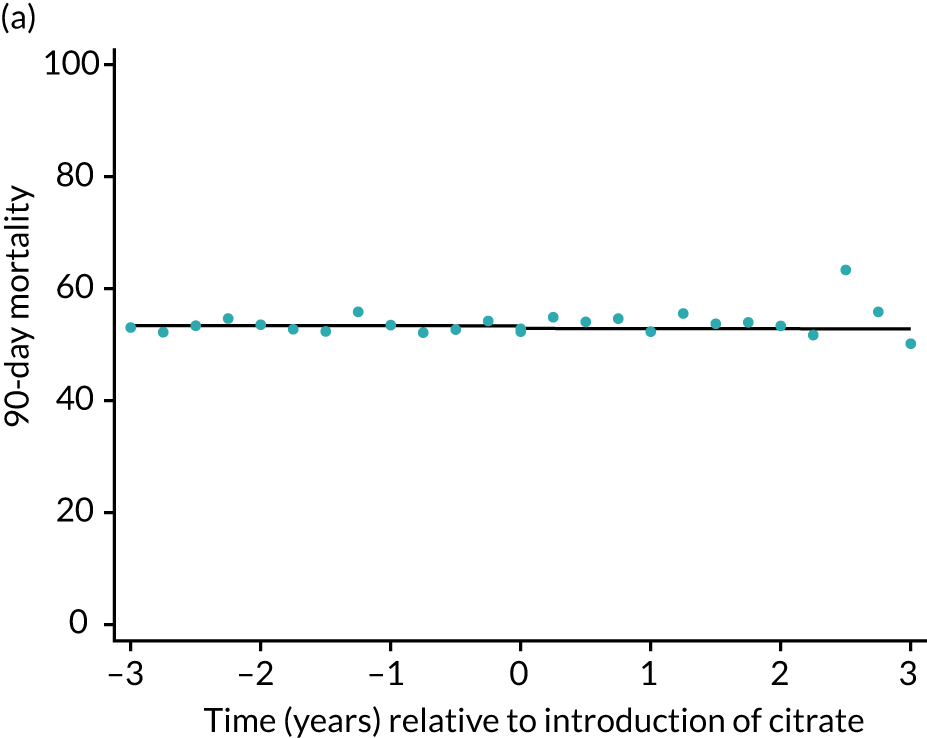
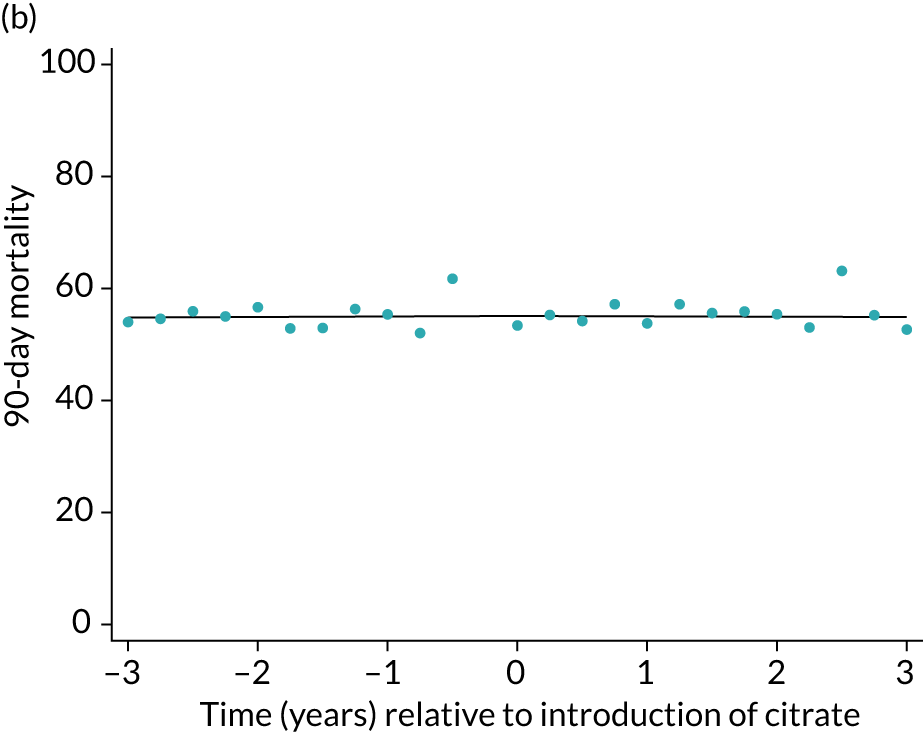
Unadjusted mortality at 90 days following the index admission to ICU was 53.3% among the SHA group and 54.0% among the RCA group (Table 5). There was no significant trend over time for 90-day mortality during either the SHA or RCA periods (OR 1.00, 95% CI 0.99 to 1.01, and OR 1.00, 95% CI 0.96 to 1.04, respectively). When adjusted for patient covariates, there was no step change associated with the change to RCA, OR of 0.98 (95% CI 0.89 to 1.08) for 90-day mortality (Figure 5 and Table 6).
| Outcome | Treatment group | Absolute difference (95% CI) | |
|---|---|---|---|
| SHA | RCA | ||
| Primary outcome | |||
| 90-day mortality, n (%) | 32,174 (53.3) | 4634 (54.0) | 0.7 (–0.4 to 1.9) |
| Secondary outcome | |||
| Calendar days of organ support, median (IQR) | |||
| Renal support | 3 (2–6) | 4 (2–7) | 0.6 (0.4 to 0.7) |
| Advanced cardiovascular support | 1 (0–4) | 1 (0–3) | –0.4 (–0.4 to –0.3) |
| Advanced respiratory support | 3 (0–10) | 3 (0–10) | –0.2 (–0.5 to 0.1) |
| LOS (days), median (IQR) | |||
| ICU | 8 (4–15) | 8 (4–17) | 0.8 (0.4 to 1.1) |
| Subsequent hospital | 4 (0–18) | 3 (0–16) | –1.1 (–1.7 to –0.4) |
| Total hospital | 16 (6–35) | 16 (6–34) | –0.5 (–1.3 to 0.3) |
| Adverse events, n (%) | |||
| Bleeding episodes in ICU | 3922 (6.5) | 550 (6.4) | 0.1 (–0.6 to 0.5) |
| Thromboembolic episodes up to 90 days post discharge | 2943 (4.9) | 448 (5.2) | 0.3 (–0.2 to 0.8) |
| ESRD treated by RRT at 90 daysa | 1310 (2.2) | 187 (2.4) | 0.2 (–0.2 to 0.6) |
| ESRD treated by RRT at 1 yearb | 1466 (2.7) | 162 (3.0) | 0.3 (–0.2 to 0.7) |
| Mortality, n (%) | |||
| Acute hospital | 30,953 (51.5) | 4494 (52.6) | 1.1 (–0.1 to 2.2) |
| 30 days | 28,304 (46.8) | 4108 (47.9) | 1.0 (–0.1 to 2.1) |
| 1 year | 35,700 (59.1) | 5125 (59.7) | 0.6 (–0.5 to 1.7) |
FIGURE 5.
Effect of introduction of citrate on the primary outcome of 90-day mortality in (a) all eligible patients; and (b) restricted to ICUs with data from both before and after a transition. Points are observed values plotted in 3-month intervals and lines are fitted values from models. Please note that observed and fitted values may not correspond because fitted values are adjusted for other covariates. For units that transitioned from SHA to RCA, time = 0 is set to 6 months after transition (the end of the censoring period). For units that did not transition, time = 0 is set to the end of the observation period.
| Outcome | SHA trend (per year) | RCA trend (per year) | Change in trend (per year) | Step change: RCA vs. SHA | p-valuea |
|---|---|---|---|---|---|
| Primary outcome | |||||
| 90-day mortality, OR (95% CI) | 1.00 (0.99 to 1.01) | 1.00 (0.96 to 1.04) | 1.00 (0.96 to 1.04) | 0.98 (0.89 to 1.08) | 0.89 |
| Secondary outcome | |||||
| Calendar days of organ support, difference in means (95% CI) | |||||
| Renal support | 0.06 (0.04 to 0.09) | –0.08 (–0.19 to 0.04) | –0.14 (–0.26 to –0.02) | 0.53 (0.28 to 0.79) | 0.00026 |
| Advanced cardiovascular support | –0.07 (–0.08 to –0.06) | –0.21 (–0.27 to –0.14) | –0.14 (–0.20 to –0.07) | 0.23 (0.09 to 0.38) | 0.00012 |
| Advanced respiratory support | –0.11 (–0.16 to –0.06) | –0.20 (–0.42 to 0.02) | –0.09 (–0.32 to 0.14) | 0.53 (0.03 to 1.03) | 0.099 |
| LOS (days), difference in means (95% CI) | |||||
| ICU | 0.03 (–0.03 to 0.09) | –0.16 (–0.14 to 0.12) | –0.20 (–0.48 to 0.09) | 0.86 (0.24 to 1.49) | 0.025 |
| Subsequent hospital | –0.29 (–0.40 to –0.18) | –0.45 (–0.96 to 0.05) | –0.17 (–0.68 to 0.34) | 0.41 (–0.71 to 1.54) | 0.75 |
| Total hospital | –0.26 (–0.39 to –0.12) | –0.69 (–1.32 to –0.07) | –0.44 (–1.08 to 0.20) | 1.26 (–0.14 to 2.66) | 0.2 |
| Adverse events, OR (95% CI) | |||||
| Bleeding episodes in ICU | 1.05 (1.03 to 1.06) | 1.00 (0.93 to 1.08) | 0.95 (0.88 to 1.03) | 0.90 (0.76 to 1.06) | 0.031 |
| Thromboembolic episodes up to 90 days post discharge | 1.04 (1.02 to 1.06) | 1.00 (0.92 to 1.08) | 0.96 (0.88 to 1.05) | 0.94 (0.78 to 1.13) | 0.21 |
| ESRD treated by RRT at 90 daysb | 1.02 (0.99 to 1.05) | 1.00 (0.87 to 1.15) | 0.98 (0.85 to 1.13) | 1.04 (0.77 to 1.14) | 0.96 |
| ESRD treated by RRT at 1 yearc | 1.05 (1.02 to 1.08) | 0.99 (0.84 to 1.17) | 0.94 (0.79 to 1.12) | 1.00 (0.74 to 1.36) | 0.69 |
| Mortality, OR (95% CI) | |||||
| Acute hospital | 0.99 (0.98 to 1.00) | 0.99 (0.95 to 1.03) | 1.00 (0.95 to 1.04) | 1.01 (0.92 to 1.12) | 0.97 |
| 30 days | 1.01 (1.00 to 1.02) | 1.02 (0.98 to 1.07) | 1.01 (0.97 to 1.06) | 0.94 (0.86 to 1.04) | 0.5 |
| 1 year | 1.01 (1.00 to 1.01) | 0.99 (0.95 to 1.04) | 0.99 (0.95 to 1.03) | 0.96 (0.87 to 1.06) | 0.34 |
Secondary outcomes
Calendar days of organ support
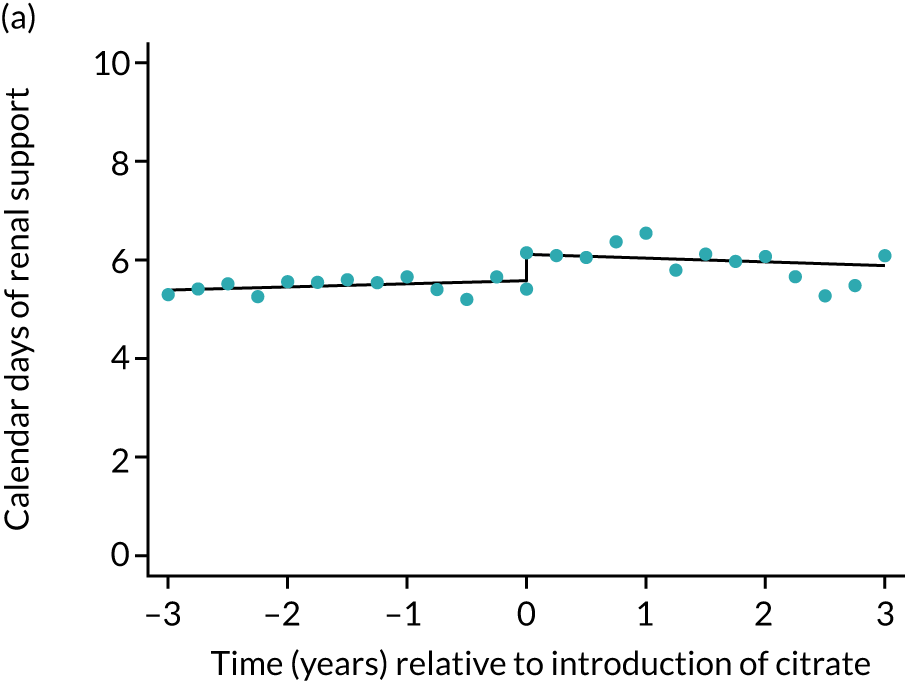
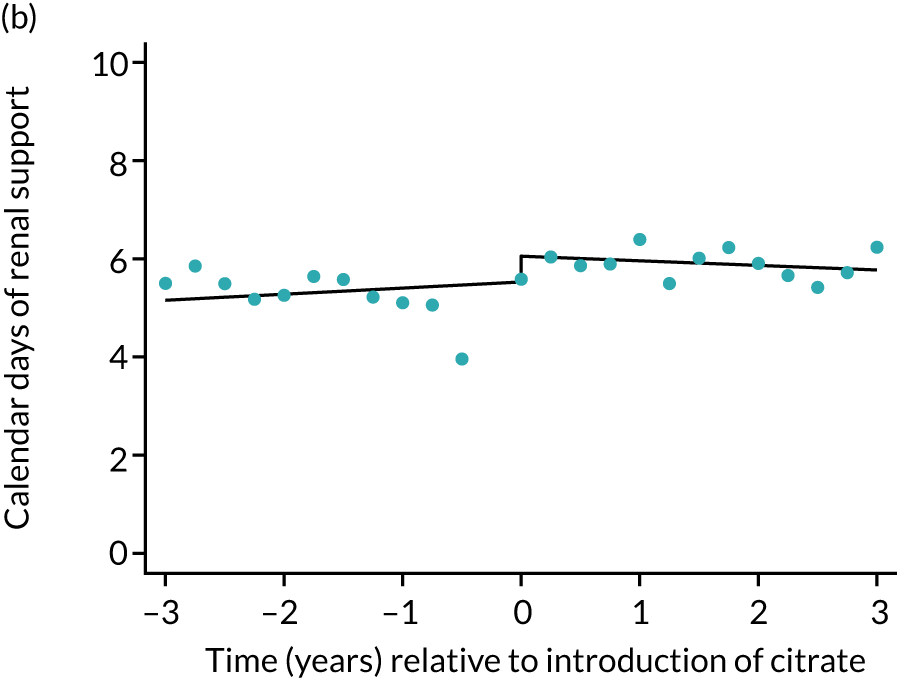
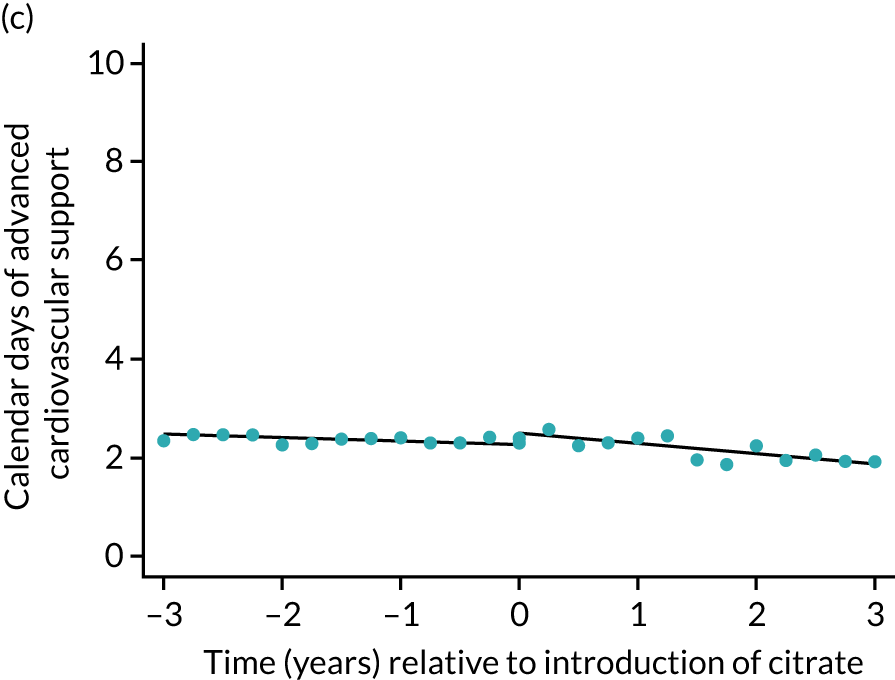
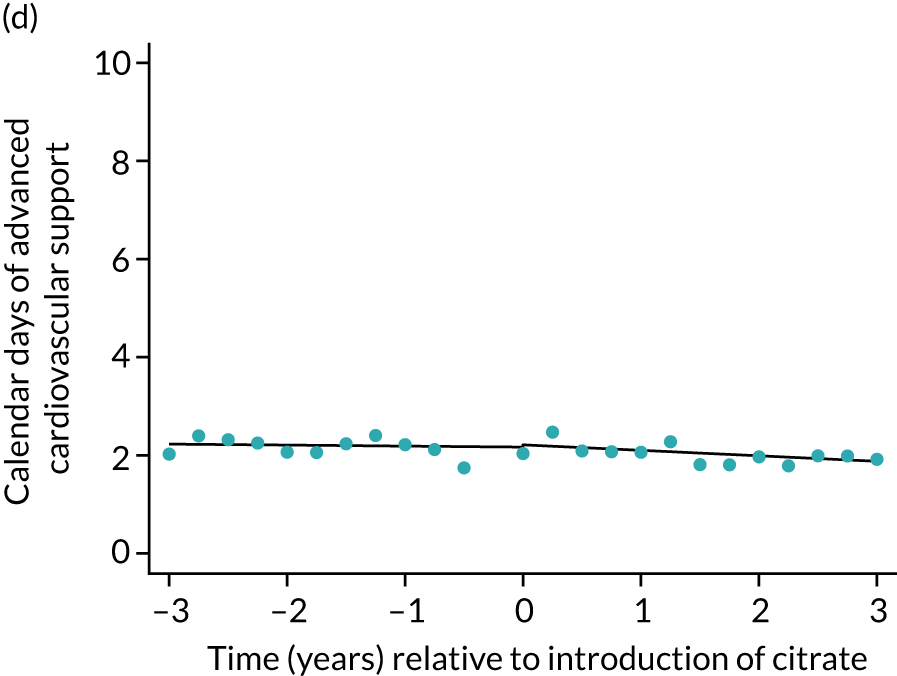
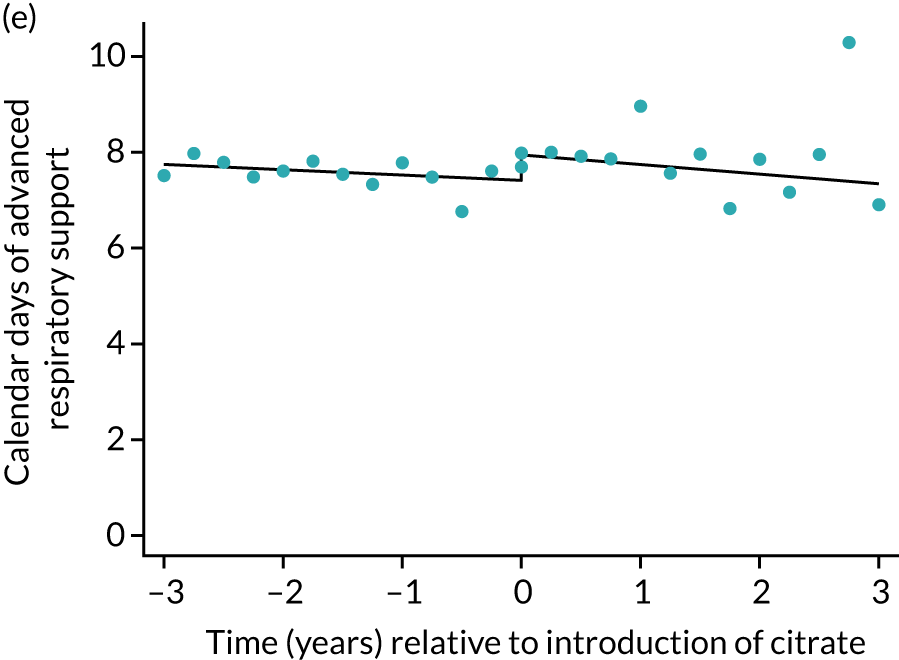
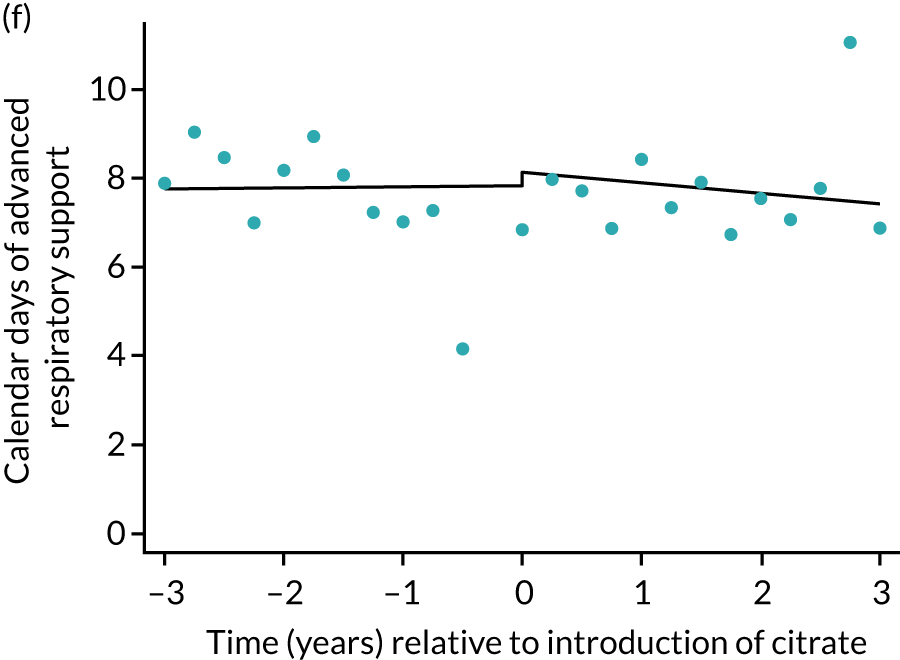
The median unadjusted number of days of renal support was 1 day higher in the RCA group (see Table 5). During the SHA period the trend was a small increase in the number of days of renal support (difference in means per year 0.06 days, 95% CI 0.04 to 0.09 days), whereas there was no trend over time during the RCA period (difference in means per year –0.08 days, 95% CI –0.19 to 0.04 days). The change to RCA was associated with a ≈ 0.5-day step change increase in the number of days of renal support (difference in means 0.53 days, 95% CI 0.28 to 0.79 days) when adjusted for patient covariates (see Table 6). Consistent with this, we observed similar step change increases in number of days of advanced cardiovascular support (difference in means 0.23 days, 95% CI 0.09 to 0.38 days) and advanced respiratory support (difference in means 0.53 days, 95% CI 0.03 to 1.03 days) (Figure 6).
FIGURE 6.
Effect of introduction of citrate on secondary outcomes: days of organ support. Days of renal support (a) for all eligible patients and (b) restricted to ICUs with data from both before and after a transition; days of advanced cardiovascular support (c) for all eligible patients and (d) restricted to ICUs with data from both before and after a transition; and days of advanced respiratory support (e) for all eligible patients and (f) restricted to ICUs with data from both before and after a transition. Points are observed values plotted in 3-month intervals and lines are fitted values from models. Please note that observed and fitted values may not correspond as fitted values are adjusted for other covariates. For units that transitioned from SHA to RCA, time = 0 is set to 6 months after transition (the end of the censoring period). For units that did not transition, time = 0 is set to the end of the observation period.
Lengths of stay
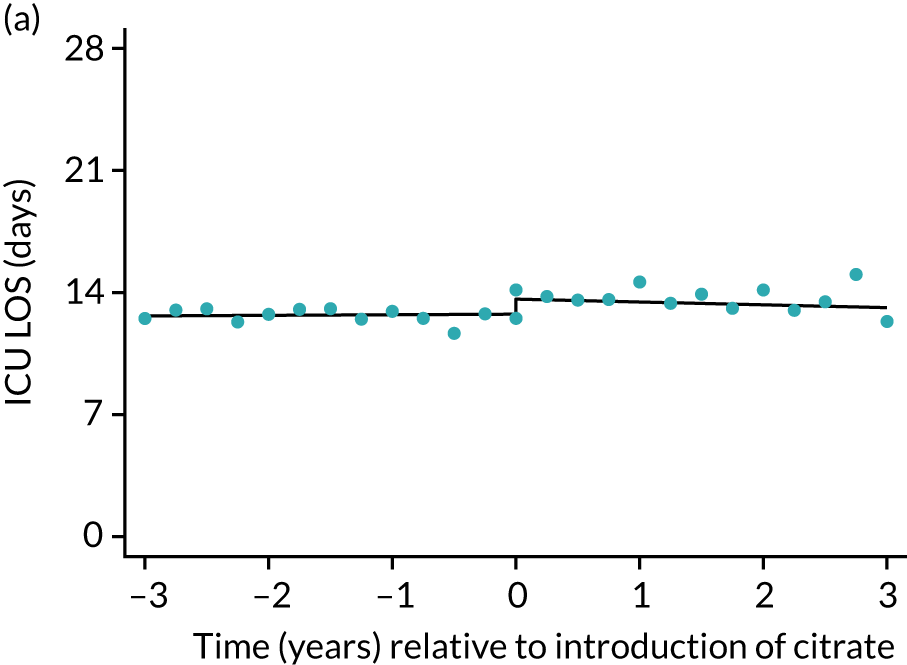
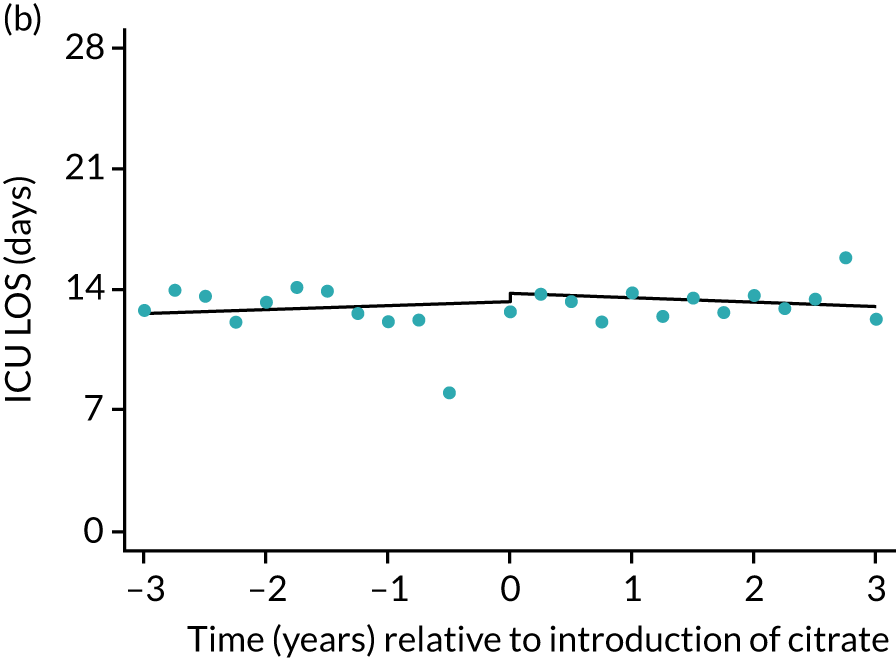
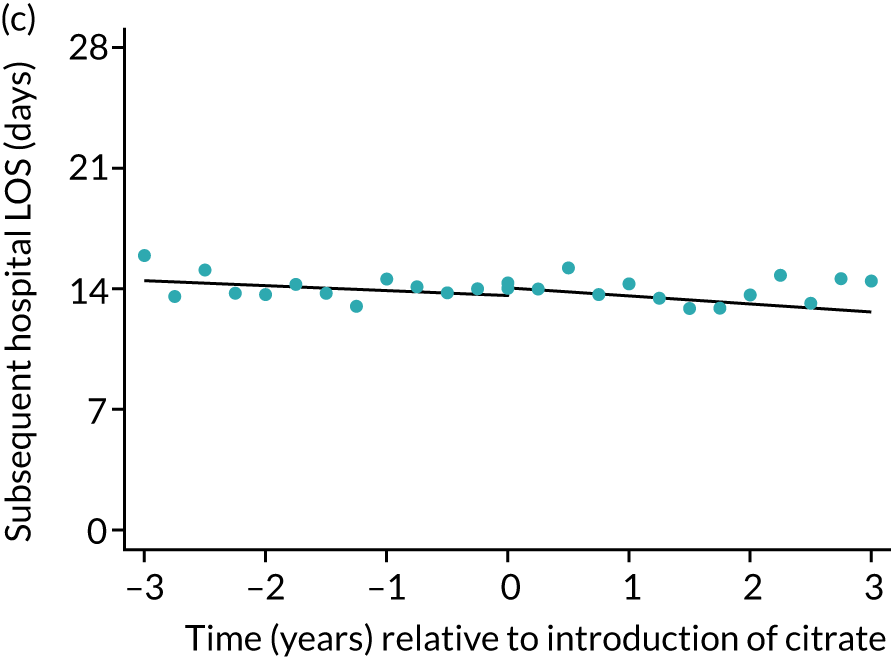
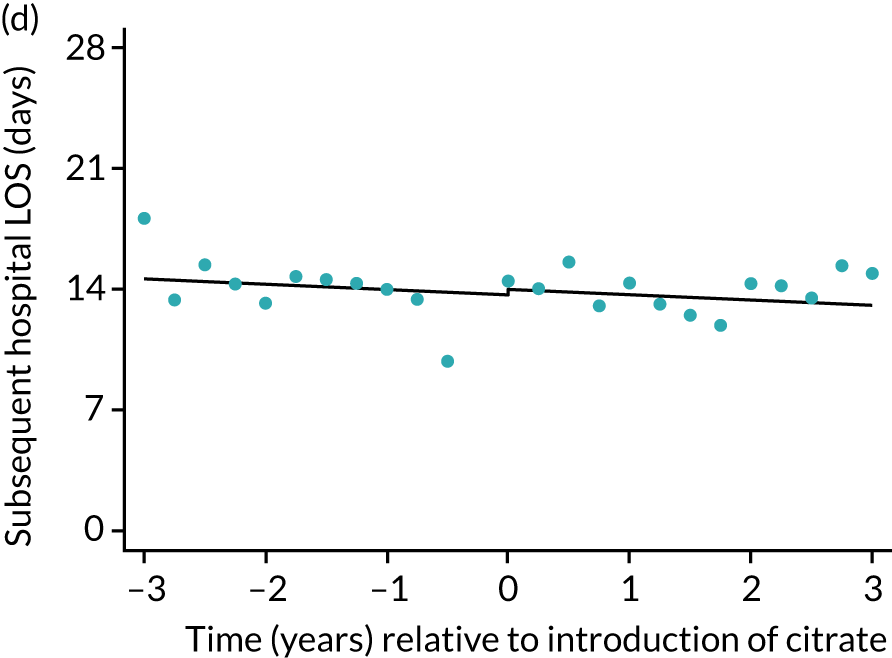
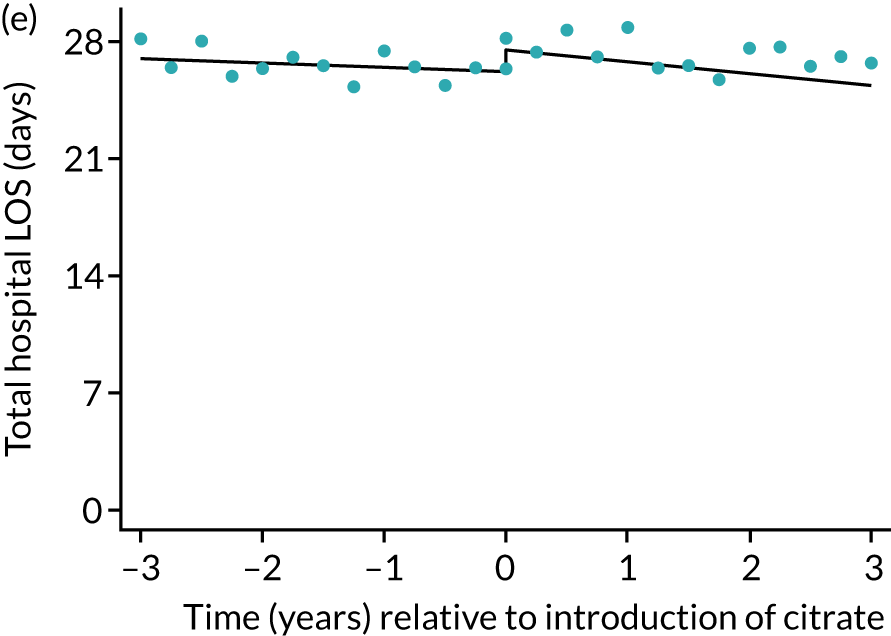
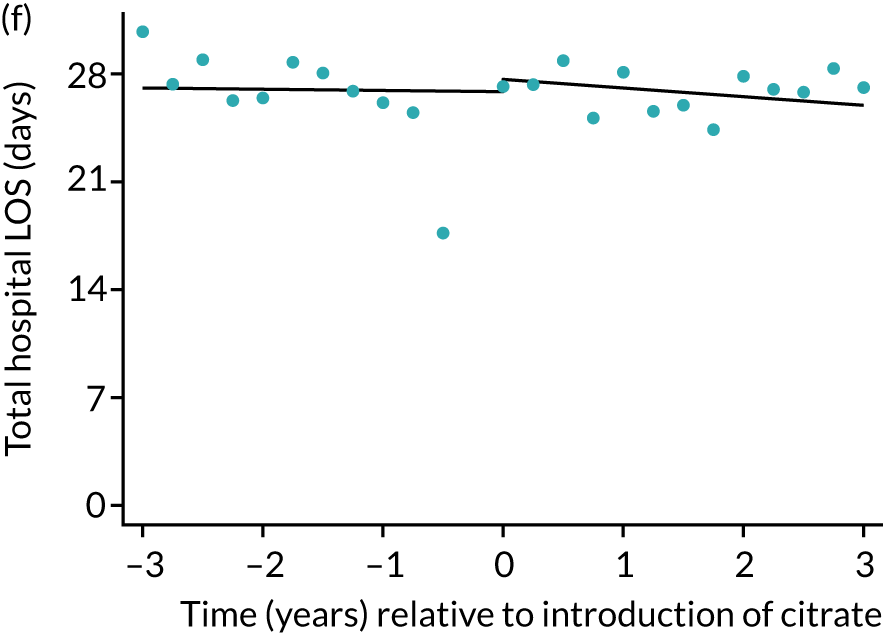
During the index hospital admission, unadjusted LOS in the ICU were longer in the RCA group but the number of subsequent days in hospital were shorter (see Table 5). In both groups, there were no significant trends over time for ICU LOS; however, both subsequent days in hospital and total hospital LOS showed downwards trends during both SHA and RCA periods (Figure 7). When adjusted for patient covariates, the change to RCA was associated with a step change increase in ICU length of stay (difference in means 0.86 days, 95% CI 0.24 to 1.49 days). Subsequent days in hospital or total hospital length of stay showed a non-significant step change increase (Table 6).
FIGURE 7.
Effect of introduction of citrate on secondary outcomes: days of treatment. Days of treatment in ICU (a) for all eligible patients and (b) restricted to ICUs with data from both before and after a transition; subsequent days in hospital (c) for all eligible patients and (d) restricted to ICUs with data from both before and after a transition; and total days in hospital for (e) all eligible patients and (f) restricted to ICUs with data from both before and after a transition. Points are observed values plotted in 3-month intervals and lines are fitted values from models. Please note that observed and fitted values may not correspond as fitted values are adjusted for other covariates. For units that transitioned from SHA to RCA, time = 0 is set to 6 months after transition (the end of the censoring period). For units that did not transition, time = 0 is set to the end of the observation period.
Adverse events
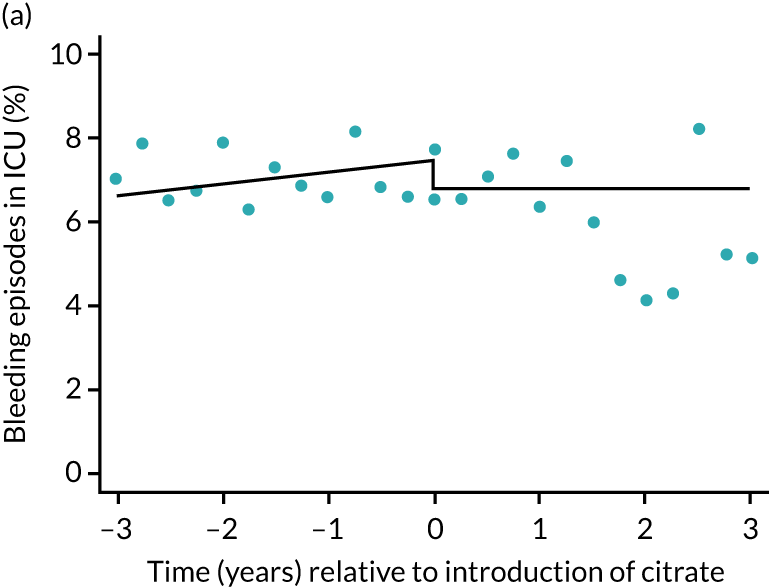
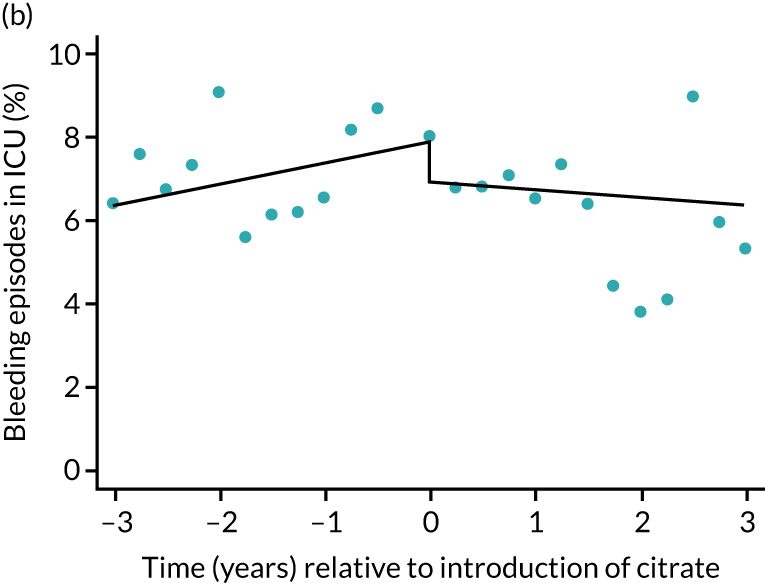
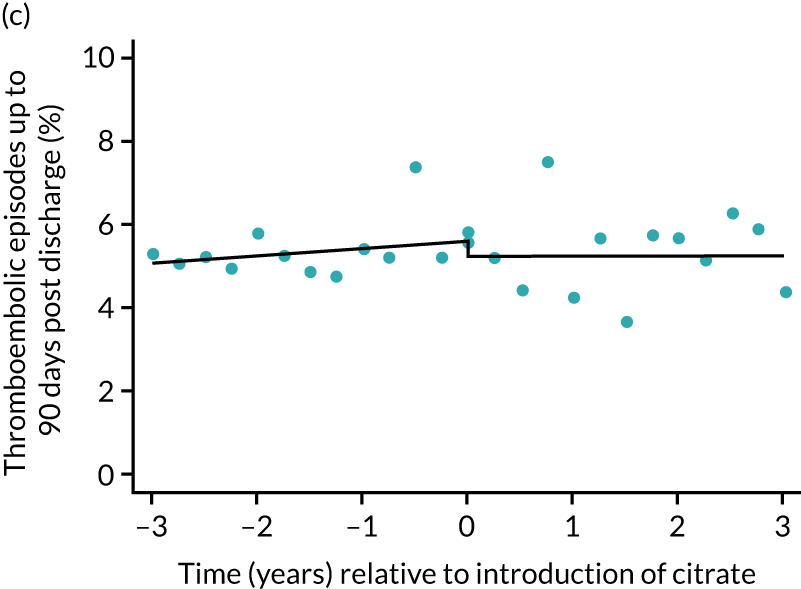
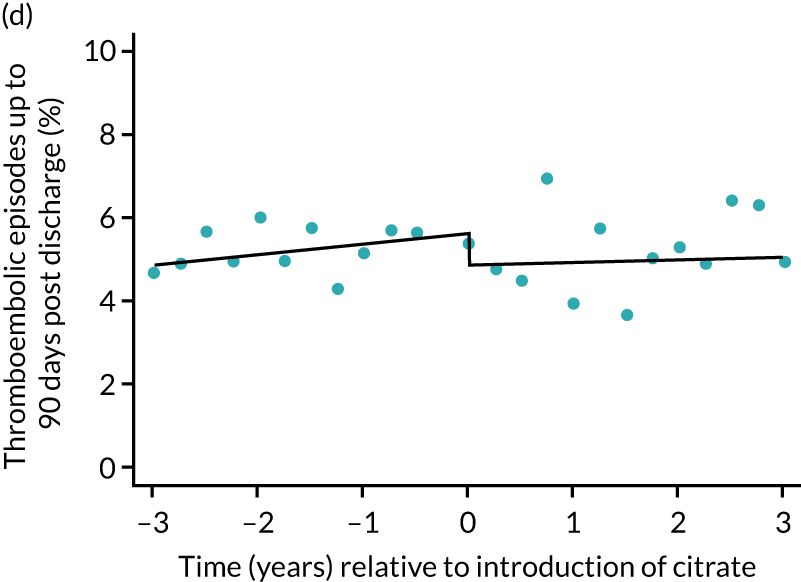
The unadjusted proportion of patients experiencing bleeding during the ICU stay was 6.5% and 6.4% for SHA and RCA, respectively (see Table 5). Trends over time showed increasing rates of bleeding during SHA; however, this was not apparent during the RCA period (Figure 8). When modelled adjusting for prespecified factors, the change to RCA was not associated with a non-significant step change towards fewer bleeding episodes (OR 0.90, 95% CI 0.76 to 1.06) (see Table 6). Similarly, trends over time suggest that thromboembolic rates were increasing over time with SHA, but this was not observed with RCA (see Figure 8). When adjusting for patient covariates, the change to RCA had no step effect on thromboembolic episodes (OR 0.94, 95% CI 0.78 to 1.13) (see Table 6).
FIGURE 8.
Effect of introduction of citrate on secondary outcomes: bleeding episodes, thrombolic events and dialysis-dependent renal disease or transplant. Bleeding during ICU stay (a) for all eligible patients and (b) restricted to ICUs with data from both before and after a transition; thrombolic events before 90 days after hospital discharge (c) for all eligible patients and (d) restricted to ICUs with data from both before and after a transition; dialysis-dependent renal disease or transplant within 90 days of ICU admission (e) for all eligible patients and (f) restricted to ICUs with data from both before and after a transition; and dialysis-dependent renal disease or transplant within 1 year of ICU admission (g) for all eligible patients and (h) restricted to ICUs with data from both before and after a transition. Points are observed values plotted in 3-month intervals and lines are the fitted values from models. Please note that observed and fitted values may not correspond as fitted values are adjusted for other covariates. For units that transitioned from SHA to RCA, time = 0 is set to 6 months after transition (the end of the censoring period). For units that did not transition, time = 0 is set to the end of the observation period.
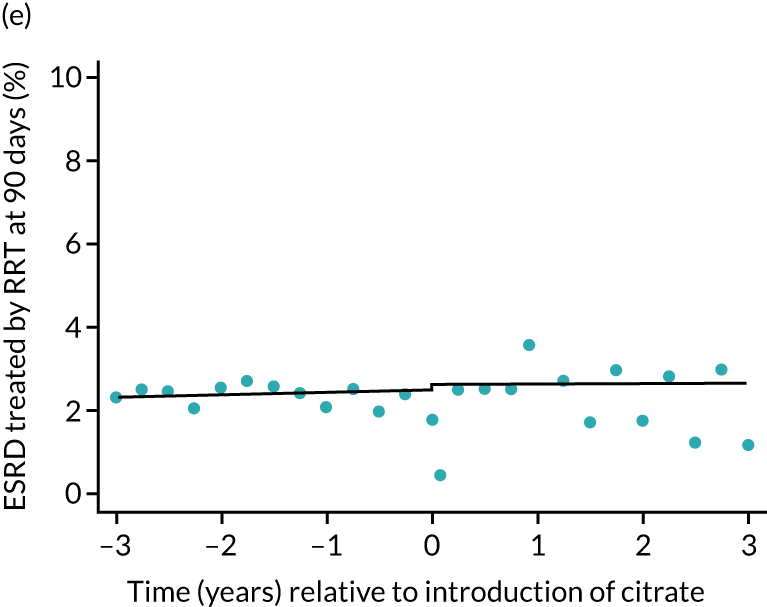
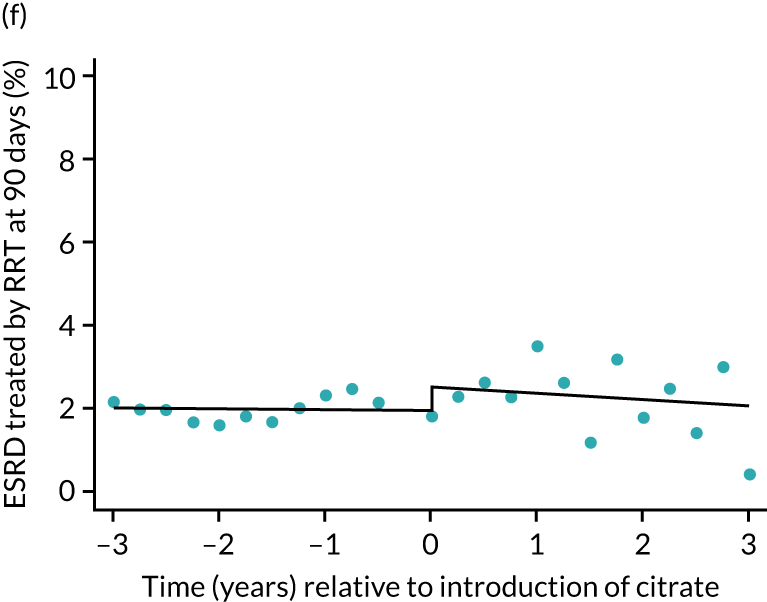
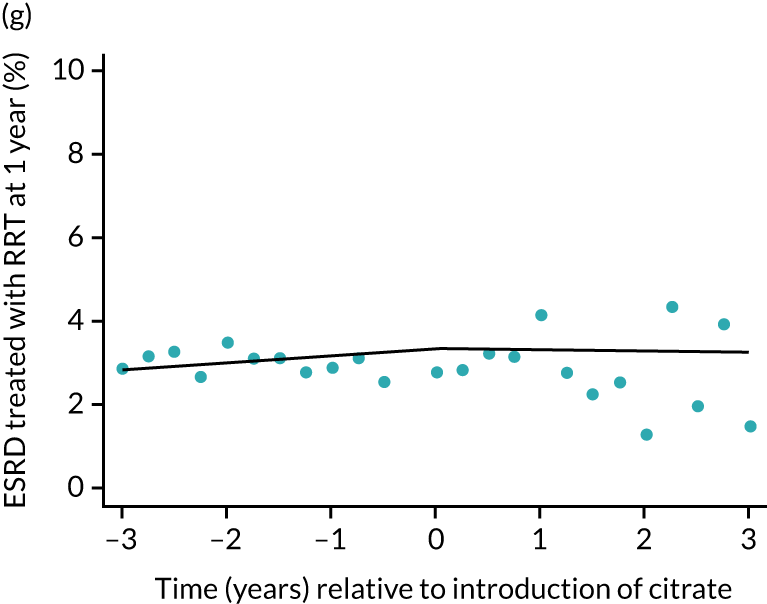
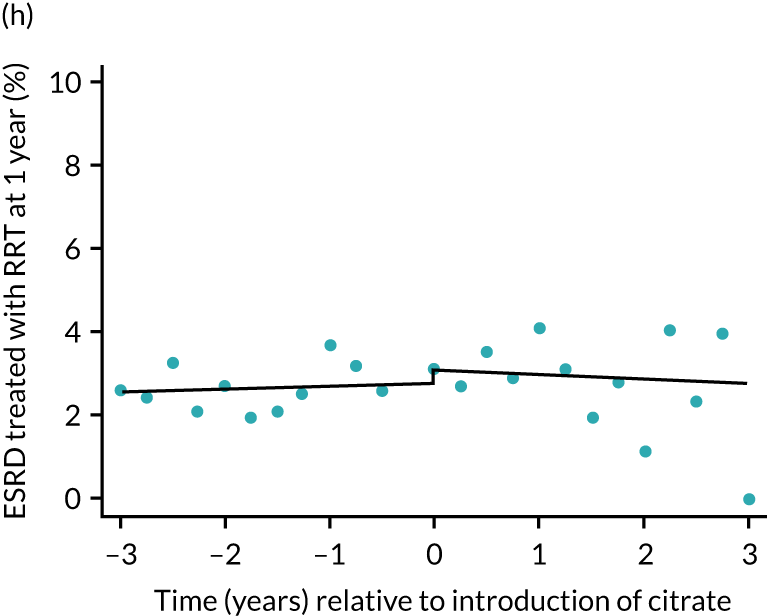
The unadjusted proportion of patients who developed ESRD treated by RRT at 1 year after the ICU admission was similar in both groups (see Table 5). There were no trends over time during both the SHA and the RCA periods except for a marginal increase in ESRD treated by RRT at 1 year (but not at 90 days) in the SHA period (see Figure 8 and Table 6). When adjusted for patient covariates, the change to RCA was not associated with a step change in the proportion of patients receiving RRT for ESRD at 1 year (OR 1.00, 95% CI 0.74 to 1.36) (see Table 6). Because 10,060 admissions were excluded for incomplete follow-up data in the UKRR at the 1-year time point, we conducted a post hoc analysis at 90 days (excluding 2497 patients with incomplete follow-up data) that produced results consistent with those seen at 1 year (see Table 6).
Subgroup analyses
The prespecified subgroup of patients meeting Sepsis-3 criteria in the first 24 hours following admission were less likely to be elective admissions, more likely to be mechanically ventilated at admission or during the first 24 hours, and had higher predicted mortality (Table 7). In line with the primary analysis, patients in the RCA group had more comorbidities and higher predicted mortality (Table 8). Unadjusted outcomes in the SHA and RCA groups were similar in terms of duration of organ support, length of stay, adverse events and mortality. Analyses of the primary outcome and secondary outcomes were consistent with the primary results (Table 9).
| Characteristic | Treatment group | ||
|---|---|---|---|
| SHA (N = 28,743) | Censored (N = 1477) | RCA (N = 4029) | |
| Sex, n (%) | |||
| Female | 12,367 (43.0) | 610 (41.3) | 1679 (41.7) |
| Male | 16,376 (57.0) | 867 (58.7) | 2350 (58.3) |
| Age, median (IQR) | 67 (56–75) | 67 (55–76) | 67 (57–75) |
| Year of admission to ICU, n (%) | |||
| 2009 | 2321 (8.1) | 0 (0.0) | 0 (0.0) |
| 2010 | 3520 (12.2) | 88 (6.0) | 21 (0.5) |
| 2011 | 3823 (13.3) | 92 (6.2) | 26 (0.6) |
| 2012 | 3836 (13.3) | 229 (15.5) | 80 (2.0) |
| 2013 | 3756 (13.1) | 249 (16.9) | 294 (7.3) |
| 2014 | 3703 (12.9) | 298 (20.2) | 671 (16.7) |
| 2015 | 3621 (12.6) | 150 (10.2) | 1084 (26.9) |
| 2016 | 3408 (11.9) | 268 (18.1) | 1413 (35.1) |
| 2017 | 755 (2.6) | 103 (7.0) | 440 (10.9) |
| Type of admission, n (%)a | |||
| Medical | 23,844 (83.0) | 1253 (84.8) | 3392 (84.2) |
| Elective surgical | 386 (1.3) | 23 (1.6) | 59 (1.5) |
| Emergency surgical | 4512 (15.7) | 201 (13.6) | 577 (14.3) |
| Medical history, n (%) | |||
| Haematological malignancy | 1448 (5.0) | 88 (6.0) | 220 (5.5) |
| Immunocompromised | 2548 (8.9) | 155 (10.5) | 437 (10.8) |
| Metastatic disease | 548 (1.9) | 31 (2.1) | 104 (2.6) |
| Severe liver disease | 973 (3.4) | 68 (4.6) | 180 (4.5) |
| Severe respiratory disease or home ventilation | 663 (2.3) | 33 (2.2) | 112 (2.8) |
| Presentation | |||
| Mechanically ventilated during first 24 hours, n (%) | 19,693 (68.6) | 997 (67.6) | 2652 (65.9) |
| APACHE II acute physiology score, mean (SD)a | 18.6 (6.1) | 17.5 (5.9) | 18.3 (6.1) |
| ICNARC model physiology score, mean (SD)a | 29.5 (8.5) | 28.3 (8.8) | 29.3 (8.9) |
| ICNARC model-predicted mortality probability, mean (SD)a | 0.609 (0.224) | 0.589 (0.229) | 0.611 (0.231) |
| Outcome | Treatment group | ||
|---|---|---|---|
| SHA | RCA | Absolute difference (95% CI) | |
| Primary outcome | |||
| 90-day mortality, n (%) | 16,444 (57.2) | 2341 (58.1) | 0.9 (–0.7 to 2.5) |
| Secondary outcome | |||
| Calendar days of organ support, median (IQR) | |||
| Renal support | 4 (2–7) | 4 (2–8) | 0.8 (0.5 to 1.0) |
| Advanced cardiovascular support | 2 (0–4) | 2 (0–4) | –0.5 (–0.6 to –0.4) |
| Advanced respiratory support | 5 (2–13) | 4 (1–12) | –0.5 (–0.9 to –0.1) |
| Lengths of stay (days), median (IQR)a | |||
| ICU | 9 (4–18) | 10 (4–19) | 0.6 (0.1 to 1.2) |
| Subsequent hospital | 1 (0–18) | 0 (0–16) | –1.4 (–2.4 to –0.4) |
| Total hospital | 17 (5–38) | 17 (5–36) | –0.9 (–2.1 to 0.3) |
| Adverse events, n (%) | |||
| Bleeding episodes in ICU | 1591 (5.5) | 216 (5.4) | –0.2 (–0.9 to 0.6) |
| Thromboembolic episodes up to 90 days post discharge | 1297 (4.5) | 184 (4.6) | 0.1 (–0.6 to 0.7) |
| ESRD treated by RRT at 90 daysa | 327 (1.2) | 50 (1.4) | 0.2 (–0.2 to 0.6) |
| ESRD treated by RRT at 1 yearb | 401 (1.6) | 43 (1.7) | 0.1 (–0.4 to 0.6) |
| Mortality, n (%) | |||
| Acute hospital | 16,119 (56.3) | 2309 (57.6) | 1.3 (–0.3 to 3.0) |
| 30 days | 14,719 (51.2) | 2102 (52.2) | 1.0 (–0.7 to 2.6) |
| 1 year | 17,801 (61.9) | 2531 (62.8) | 0.9 (–0.7 to 2.5) |
| Outcome | SHA trend (per year) | RCA trend (per year) | Change in trend (per year) | Step change: RCA vs. SHA | p-valuea |
|---|---|---|---|---|---|
| Primary outcome | |||||
| 90-day mortality, OR (95% CI) | 0.99 (0.98 to 1.00) | 0.98 (0.92 to 1.05) | 0.99 (0.93 to 1.06) | 1.05 (0.91 to 1.20) | 0.78 |
| Secondary outcome | |||||
| Calendar days of organ support, difference in means (95% CI) | |||||
| Renal support | 0.09 (0.05 to 0.12) | –0.10 (–0.27 to 0.07) | –0.19 (–0.36 to –0.02) | 0.56 (0.19 to 0.94) | 0.011 |
| Advanced cardiovascular support | –0.08 (–0.10 to –0.06) | –0.23 (–0.33 to –0.14) | –0.15 (–0.25 to –0.05) | 0.23 (0.02 to 0.44) | 0.0095 |
| Advanced respiratory support | –0.06 (–0.13 to 0.00) | –0.41 (–0.73 to –0.09) | –0.35 (–0.67 to –0.02) | 0.43 (–0.28 to 1.13) | 0.11 |
| LOS (days), difference in means (95% CI) | |||||
| ICU | 0.10 (0.01 to 0.18) | –0.46 (–0.86 to –0.06) | –0.55 (–0.96 to –0.14) | 0.90 (0.01 to 1.79) | 0.026 |
| Subsequent hospital | –0.25 (–0.41 to –0.10) | –0.47 (–1.19 to 0.25) | –0.22 (–0.95 to 0.52) | 0.43 (–1.19 to 2.06) | 0.83 |
| Total hospital | –0.16 (–0.36 to 0.03) | –0.96 (–1.88 to –0.03) | –0.80 (–1.74 to 0.15) | 1.20 (–0.87 to 3.27) | 0.25 |
| Adverse events, OR (95% CI) | |||||
| Bleeding episodes in ICU | 1.06 (1.04 to 1.09) | 0.99 (0.88 to 1.11) | 0.93 (0.82 to 1.05) | 0.90 (0.69 to 1.16) | 0.069 |
| Thromboembolic episodes up to 90 days post discharge | 1.04 (1.02 to 1.07) | 0.99 (0.87 to 1.13) | 0.95 (0.83 to 1.08) | 0.90 (0.68 to 1.19) | 0.22 |
| ESRD treated by RRT at 90 daysb | 1.06 (1.00 to 1.12) | 1.13 (0.88 to 1.45) | 1.07 (0.83 to 1.38) | 0.89 (0.51 to 1.56) | 0.86 |
| ESRD treated by RRT at 1 yearc | 1.11 (1.05 to 1.18) | 1.02 (0.74 to 1.41) | 0.92 (0.66 to 1.27) | 0.76 (0.43 to 1.36) | 0.23 |
| Mortality, OR (95% CI) | |||||
| Acute hospital | 0.98 (0.97 to 0.99) | 0.97 (0.91 to 1.03) | 0.99 (0.93 to 1.05) | 1.12 (0.98 to 1.28) | 0.22 |
| 30 days | 0.99 (0.98 to 1.01) | 1.00 (0.94 to 1.06) | 1.00 (0.94 to 1.07) | 1.04 (0.91 to 1.19) | 0.78 |
| 1 year | 0.99 (0.98 to 1.00) | 0.97 (0.92 to 1.04) | 0.98 (0.92 to 1.05) | 1.06 (0.92 to 1.22) | 0.7 |
Sensitivity analyses
The characteristics of patients (Table 10) included in the sensitivity analyses and unadjusted outcomes (Table 11) mirrored those of the overall cohort. Sensitivity analyses of the primary and secondary outcomes, restricted to the 57 ICUs contributing data from before and after the change to RCA, were consistent with the primary results (Table 12), although step changes in days of respiratory and cardiovascular support and ICU length of stay became non-significant. Figures 5–9 show the trends over time and the step changes in outcomes associated with the change to RCA for sensitivity analyses, alongside their counterparts in the primary analysis.
| Characteristic | Treatment group | ||
|---|---|---|---|
| SHA (N = 15,373) | Censored (N = 1922) | RCA (N = 7209) | |
| Sex, n (%) | |||
| Female | 6258 (40.7) | 770 (40.1) | 2787 (38.7) |
| Male | 9115 (59.3) | 1152 (59.9) | 4422 (61.3) |
| Age, median (IQR) | 67 (56–76) | 68 (56–76) | 67 (55–75) |
| Year of admission to ICU, n (%) | |||
| 2009 | 1632 (10.6) | 0 (0.0) | 0 (0.0) |
| 2010 | 2557 (16.6) | 0 (0.0) | 0 (0.0) |
| 2011 | 2877 (18.7) | 37 (1.9) | 0 (0.0) |
| 2012 | 2754 (17.9) | 283 (14.7) | 113 (1.6) |
| 2013 | 2376 (15.5) | 334 (17.4) | 567 (7.9) |
| 2014 | 1663 (10.8) | 433 (22.5) | 1255 (17.4) |
| 2015 | 1168 (7.6) | 272 (14.2) | 1929 (26.8) |
| 2016 | 346 (2.3) | 512 (26.6) | 2572 (35.7) |
| 2017 | 0 (0.0) | 51 (2.7) | 773 (10.7) |
| Type of admission, n (%)a | |||
| Medical | 12,564 (81.7) | 1569 (81.6) | 5983 (83.0) |
| Elective surgical | 599 (3.9) | 92 (4.8) | 217 (3.0) |
| Emergency surgical | 2210 (14.4) | 261 (13.6) | 1008 (14.0) |
| Past medical history, n (%) | |||
| Haematological malignancy | 667 (4.3) | 101 (5.3) | 376 (5.2) |
| Immunocompromise | 1439 (9.4) | 200 (10.4) | 720 (10.0) |
| Metastatic disease | 515 (3.4) | 59 (3.1) | 218 (3.0) |
| Severe liver disease | 617 (4.0) | 97 (5.0) | 420 (5.8) |
| Severe respiratory disease or home ventilation | 331 (2.2) | 31 (1.6) | 165 (2.3) |
| Sepsis | 7511 (48.9) | 912 (47.5) | 3426 (47.5) |
| Presentation | |||
| Mechanically ventilated during first 24 hours, n (%) | 9437 (61.5) | 1094 (57.1) | 4276 (59.4) |
| APACHE II acute physiology score, mean (SD)a | 18.1 (6.2) | 17.7 (6.3) | 18.3 (6.2) |
| ICNARC model physiology score, mean (SD)a | 28.0 (8.9) | 27.2 (9.1) | 28.4 (9.3) |
| ICNARC model-predicted mortality probability, mean (SD)a | 0.572 (0.247) | 0.556 (0.252) | 0.580 (0.252) |
| Outcome | Treatment group | Absolute difference (95% CI) | |
|---|---|---|---|
| SHA | RCA | ||
| Primary outcome | |||
| 90-day mortality, n (%) | 8289 (53.9) | 3977 (55.2) | 1.2 (–0.1 to 2.6) |
| Secondary outcome | |||
| Calendar days of organ support, median (IQR) | |||
| Renal support | 3 (2–6) | 4 (2–7) | 0.6 (0.5 to 0.8) |
| Advanced cardiovascular support | 1 (0–3) | 1 (0–3) | –0.2 (–0.3 to –0.1) |
| Advanced respiratory support | 3 (0–10) | 3 (0–9) | –0.3 (–0.7 to 0.0) |
| LOS (days), median (IQR) | |||
| ICU | 8 (4–16) | 8 (4–16) | 0.4 (–0.1 to 0.8) |
| Subsequent hospital | 4 (0–19) | 2 (0–16) | –1.6 (–2.5 to –0.8) |
| Total hospital | 16 (6–35) | 16 (5–34) | –1.3 (–2.4 to –0.3) |
| Adverse events, n (%) | |||
| Bleeding episodes in ICU | 974 (6.3) | 461 (6.4) | 0.1 (–0.6 to 0.7) |
| Thromboembolic episodes up to 90 days post discharge | 747 (4.9) | 369 (5.1) | 0.3 (–0.4 to 0.9) |
| ESRD treated by RRT at 90 daysa | 322 (2.1) | 149 (2.3) | 0.2 (–0.2 to 0.7) |
| ESRD treated by RRT at 1 yeara | 412 (2.7) | 131 (2.9) | 0.2 (–0.3 to 0.8) |
| Mortality, n (%) | |||
| Acute hospital | 8000 (52.2) | 3843 (53.5) | 1.3 (–0.1 to 2.7) |
| 30 days | 7260 (47.2) | 3527 (48.9) | 1.7 (0.3 to 3.1) |
| 1 year | 9241 (60.1) | 4373 (60.7) | 0.5 (–0.8 to 1.9) |
| Outcome | SHA trend (per year) | RCA trend (per year) | Change in trend (per year) | Step change: RCA vs. SHA | p-valuea |
|---|---|---|---|---|---|
| Primary outcome | |||||
| 90-day mortality, OR (95% CI) | 1.00 (0.98 to 1.03) | 1.00 (0.95 to 1.05) | 0.99 (0.94 to 1.05) | 1.00 (0.89 to 1.13) | 0.97 |
| Secondary outcome | |||||
| Calendar days of organ support, difference in means (95% CI) | |||||
| Renal support | 0.12 (0.07 to 0.18) | –0.09 (–0.22 to 0.03) | –0.22 (–0.35 to –0.08) | 0.53 (0.22 to 0.83) | 0.00036 |
| Advanced cardiovascular support | –0.02 (–0.05 to 0.01) | –0.11 (–0.18 to –0.05) | –0.09 (–0.16 to –0.02) | 0.05 (–0.11 to 0.21) | 0.031 |
| Advanced respiratory support | 0.02 (–0.08 to 0.13) | –0.24 (–0.49 to 0.01) | –0.26 (–0.54 to 0.01) | 0.31 (–0.32 to 0.94) | 0.16 |
| LOS (days), difference in means (95% CI) | |||||
| ICU | 0.23 (0.10 to 0.36) | –0.26 (–0.57 to 0.05) | –0.49 (–0.82 to –0.15) | 0.49 (–0.29 to 1.26) | 0.017 |
| Subsequent hospital | –0.30 (–0.56 to –0.04) | –0.29 (–0.90 to 0.32) | 0.01 (–0.65 to 0.67) | 0.27 (–1.24 to 1.79) | 0.93 |
| Total hospital | –0.07 (–0.38 to 0.24) | –0.55 (–1.27 to 0.18) | –0.47 (–1.26 to 0.31) | 0.76 (–1.05 to 2.57) | 0.45 |
| Adverse events, OR (95% CI) | |||||
| Bleeding episodes in ICU | 1.08 (1.04 to 1.12) | 0.97 (0.88 to 1.06) | 0.90 (0.81 to 0.99) | 0.87 (0.71 to 1.08) | 0.01 |
| Thromboembolic episodes up to 90 days post discharge | 1.05 (1.01 to 1.10) | 1.01 (0.92 to 1.12) | 0.96 (0.87 to 1.07) | 0.86 (0.68 to 1.09) | 0.23 |
| ESRD treated by RRT at 90 daysb | 0.99 (0.93 to 1.06) | 0.94 (0.79 to 1.12) | 0.95 (0.79 to 1.14) | 1.28 (0.86 to 1.89) | 0.47 |
| ESRD treated by RRT at 1 yearc | 1.03 (0.97 to 1.09) | 0.97 (0.77 to 1.21) | 0.94 (0.74 to 1.19) | 1.12 (0.75 to 1.66) | 0.83 |
| Mortality, OR (95% CI) | |||||
| Acute hospital | 0.99 (0.97 to 1.01) | 0.99 (0.94 to 1.04) | 1.00 (0.95 to 1.06) | 1.03 (0.91 to 1.16) | 0.88 |
| 30 days | 1.00 (0.98 to 1.03) | 1.02 (0.96 to 1.07) | 1.01 (0.96 to 1.07) | 0.98 (0.87 to 1.10) | 0.9 |
| 1 year | 1.01 (0.99 to 1.03) | 0.99 (0.94 to 1.04) | 0.98 (0.93 to 1.04) | 0.97 (0.86 to 1.09) | 0.59 |
FIGURE 9.
Effect of introduction of citrate on secondary outcomes: mortality. Mortality at acute hospital discharge (a) for all eligible patients and (b) restricted to ICUs with data from both before and after a transition; 30-day mortality (c) for all eligible patients and (d) restricted to ICUs with data from both before and after a transition; and 1-year mortality (e) for all eligible patients and (f) restricted to ICUs with data from both before and after a transition. Points are observed values plotted in 3-month intervals and lines are the fitted values from models. Please note that observed and fitted values may not correspond as fitted values are adjusted for other covariates. For units that transitioned from SHA to RCA, time = 0 is set to 6 months after transition (the end of the censoring period). For units that did not transition, time = 0 is set to the end of the observation period.
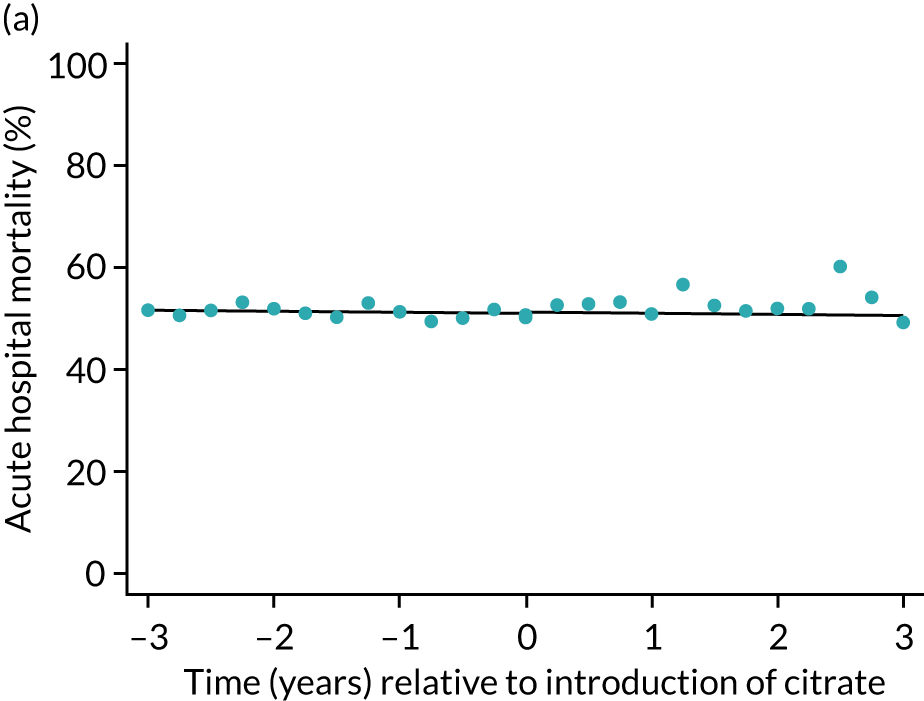
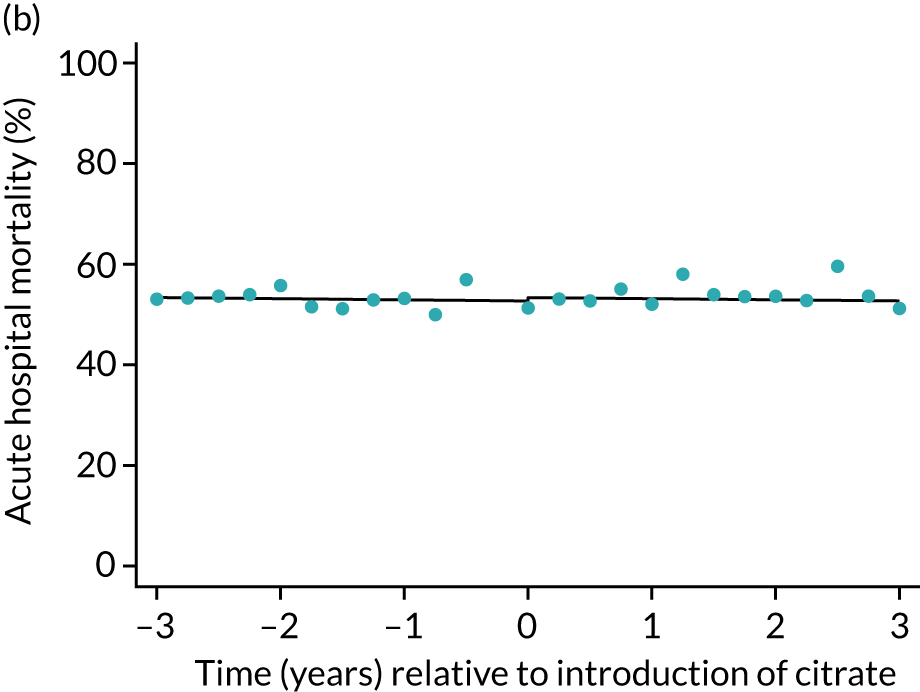
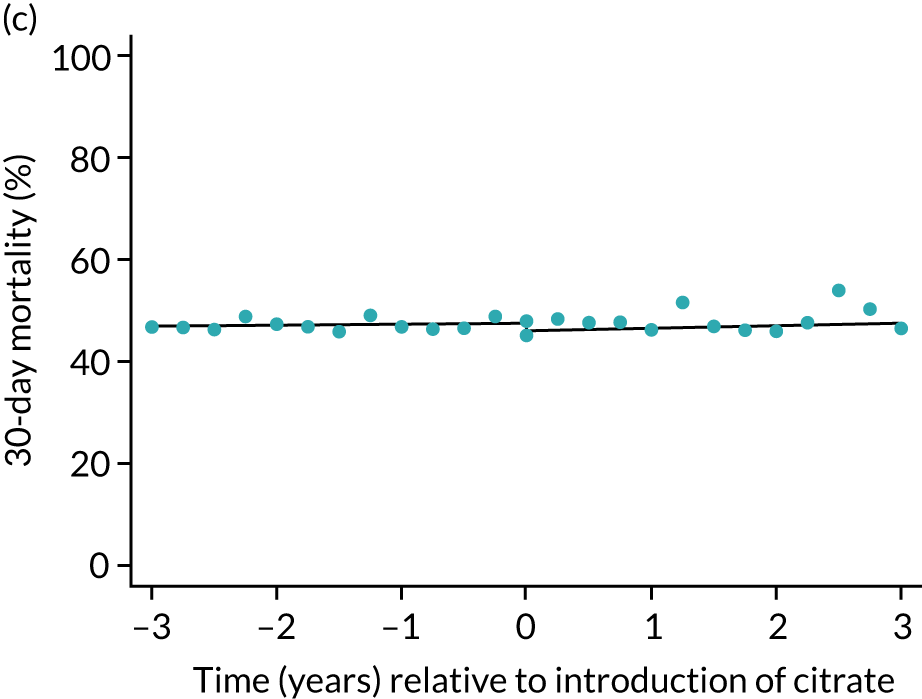
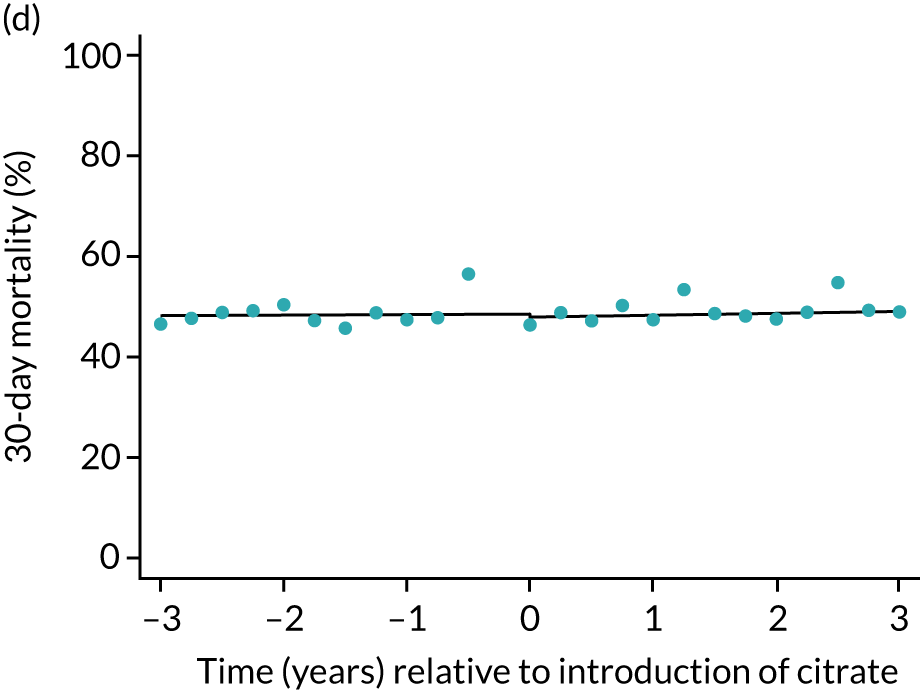
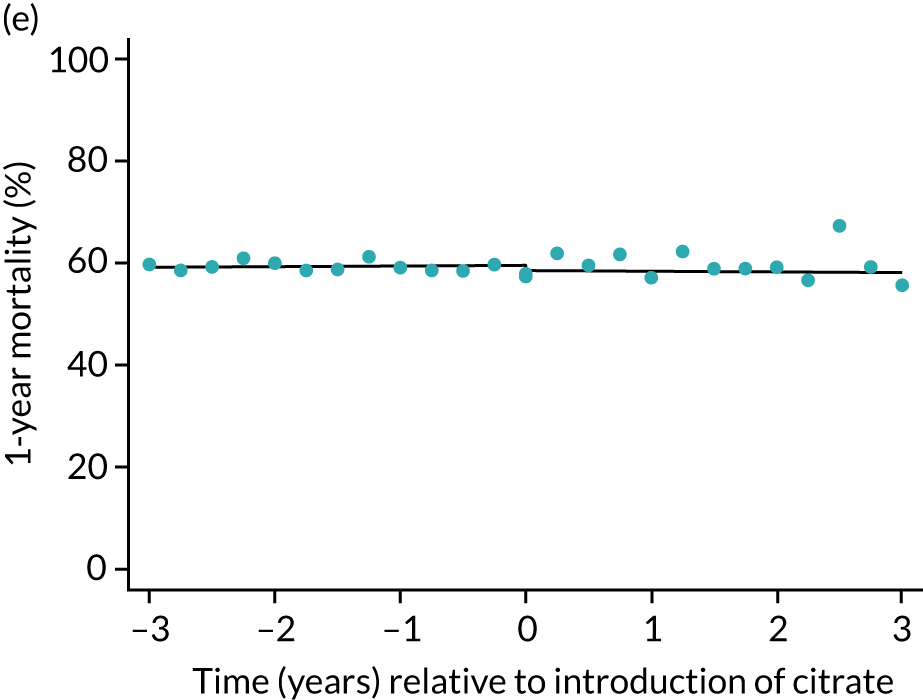
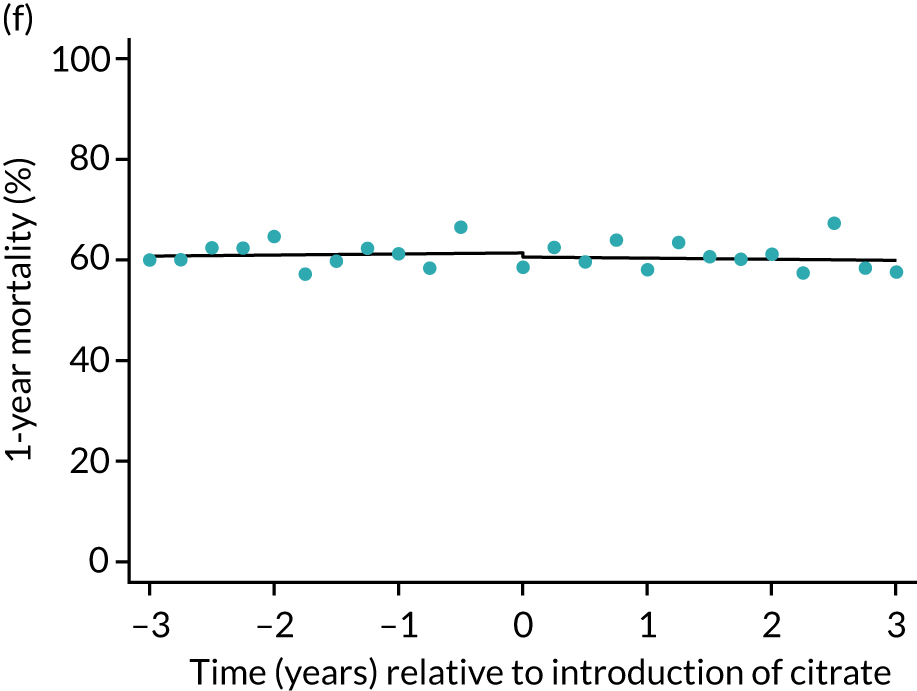
Chapter 5 Results of the health economic analysis
Analysis of the PICRAM database to estimate system ‘up time’
After application of the same selection criteria as were used to select records from the ICNARC CMP database for the clinical effectiveness analysis, the PICRAM database provided details for 746 patients treated with 3241 sessions of SHA between June 2008 and June 2016, and 199 patients treated with 911 sessions of RCA between October 2016 and August 2019. Exploration of the data indicated that the earliest year of data for SHA (2008) was an outlier in terms of the mean number of CRRT sessions per calendar day of CRRT (Figure 10). Because these data were also outside the range of data included in the clinical effectiveness analysis, data from 2008 were excluded from further analysis.
FIGURE 10.
Mean number of CRRT sessions per calendar day of CRRT, by method of anticoagulation.
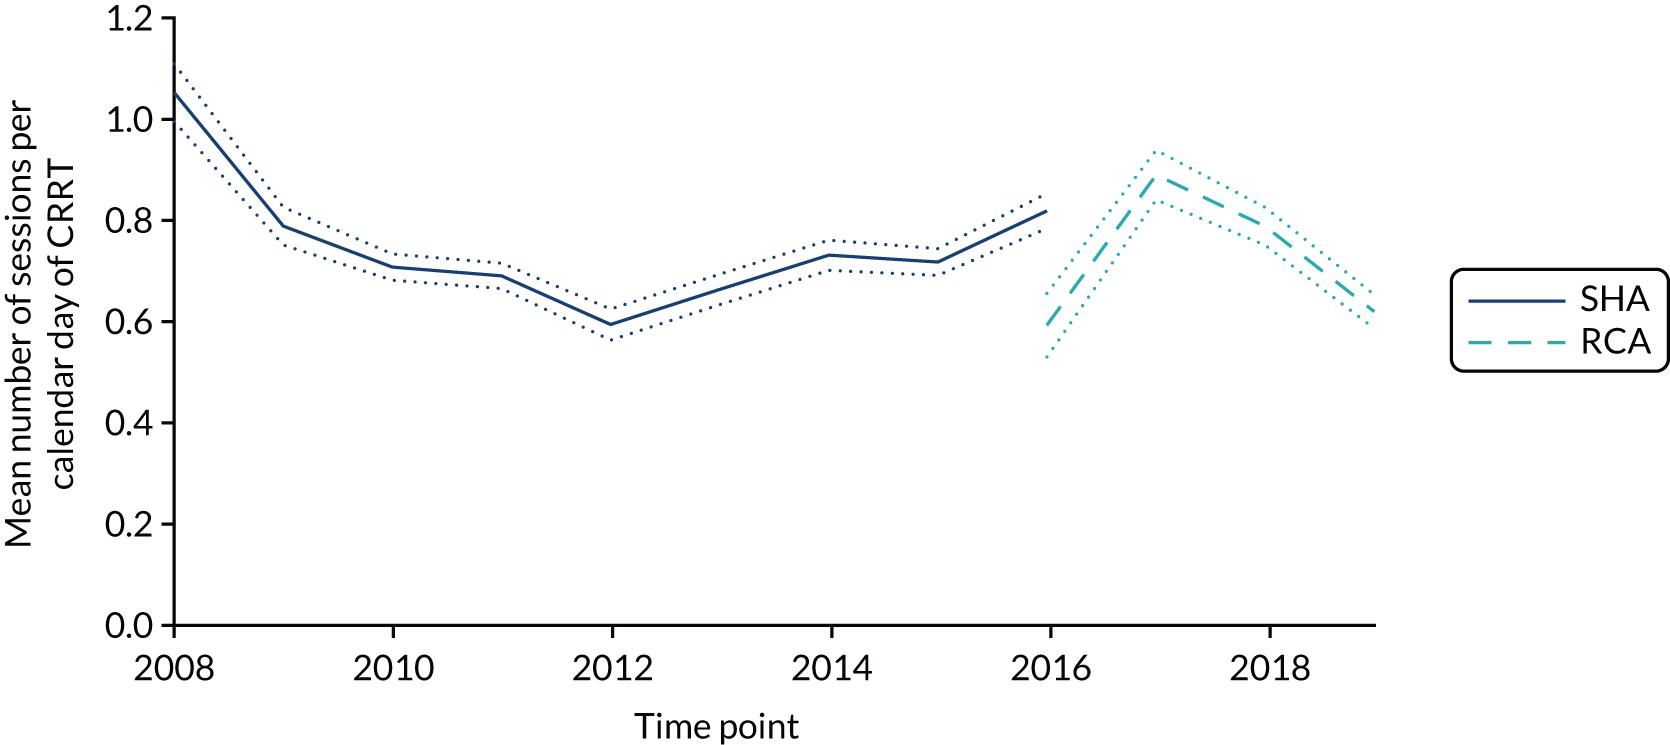
Exploring the number of hours of CRRT ‘up-time’ per calendar day of CRRT (Figure 11) indicated an increasing trend over time, with an apparent increase in slope after transitioning to RCA. To account for potential background trends, linear regression models were used to estimate both the mean number of CRRT sessions per calendar day of CRRT and the mean number of hours of CRRT per calendar day of CRRT, controlling for background trends in each over time.
FIGURE 11.
Mean number of hours of CRRT per calendar day of CRRT, by method of anticoagulation.
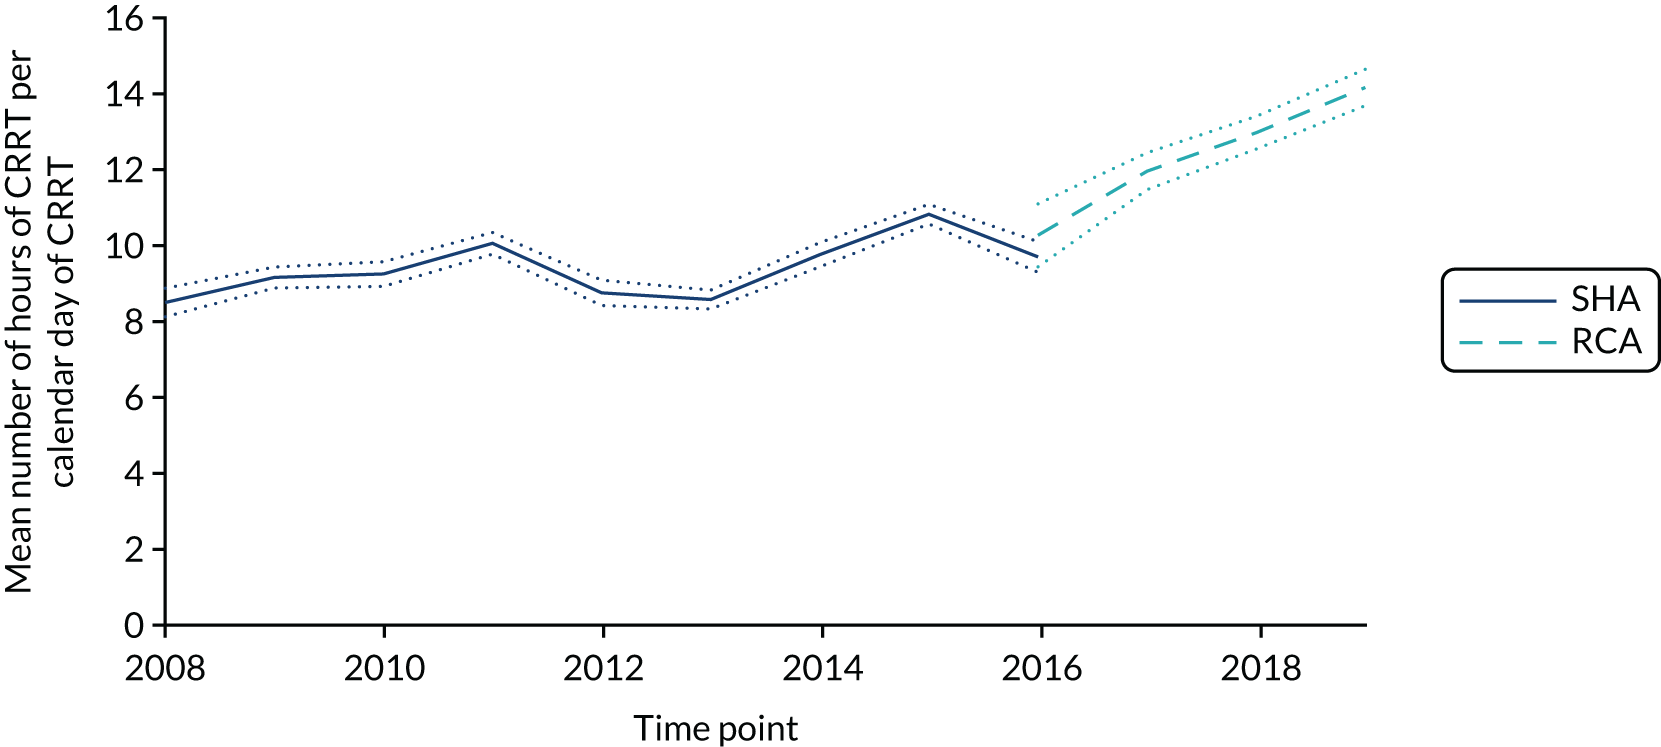
Despite graphical evidence of a possible step change or learning curve in the adoption of RCA with respect to number of sessions of CRRT per calendar day of CRRT, models evaluated at the earliest date of RCA use produced estimates of 0.705 CRRT sessions per calendar day of CRRT with SHA, and 0.736 CRRT sessions per calendar day of CRRT with RCA (difference in means 0.031 sessions, 95% CI –0.005 to 0.066 sessions). Because this difference was both small and non-significant, an equal average expectation of 0.721 was applied in the CEA.
In contrast, models evaluated at the earliest date of RCA use produced estimates of 10.4 hours of CRRT per calendar day of CRRT with SHA, and 12.4 hours of CRRT per calendar day of CRRT with RCA (difference in mean 2.1 hours, 95% CI 1.7 to 2.4 hours). Because this difference was considered both clinically important and statistically significant, these estimates of differences in per-day duration of CRRT were incorporated into the CEA.
Cognitive walk through exercise
Staff from seven units participated in the cognitive walk through exercise between April and July 2019. Four of the participating units used SHA (two of which used Prismaflex machines and two of which used multiFiltrate machines) and three units predominantly used RCA (two of which used Prismaflex machines and one of which used multiFiltrate machines). Cost items recorded during the cognitive walk through were categorised as per patient, per session of CRRT or per hour of CRRT and it was recorded whether the cost related to staff time or consumables. Costs were aggregated within units and the aggregated costs then averaged across units. The highest and lowest values were also retained for use in sensitivity analyses.
Results from the cognitive walk through are summarised in Table 13 and combined with results from the analysis of PICRAM and ICNARC CMP data to produce expected totals per patient (for illustration only; the CEA incorporated patient-level data on calendar days of CRRT provided). Estimated costs were more variable at the sites using SHA, but comparison of means and lowest and highest values between groups painted a consistent picture of slightly lower costs related to preparing the patient for RCA and substantially higher costs in terms of preparing and running the machine. Without factoring in any differences in the duration of CRRT provided to patients, RCA was estimated to cost an additional £509 per patient (or between £97 less and £1073 more, comparing minima with maxima). Factoring in the observed differences in duration of CRRT from analysis of PICRAM (hours of CRRT per calendar day of CRRT) and ICNARC CMP (calendar days of CRRT per admission) results in an expected additional cost of £897 per patient (or between £310 and £1432, comparing minima with maxima). The main driver of the overall difference in costs was the difference in cost of consumables required to prepare and run the machine.
| Cost component | Mean estimated cost (£)a (range) | |||
|---|---|---|---|---|
| SHA | RCA | |||
| Per admission | ||||
| Consumables | ||||
| Initial tests | 0.64 | (0.00–2.57) | 0.19 | (0.00–0.57) |
| Placing vascular access | 103.61 | (86.54–143.00) | 80.38 | (68.41–87.56) |
| Removing vascular access | 5.39 | (1.98–9.09) | 4.04 | (1.94–8.12) |
| Staff | ||||
| Initial tests | 1.12 | (0.00–4.50) | 1.50 | (0.00–4.50) |
| Placing vascular access | 26.19 | (24.39–28.89) | 32.25 | (25.36–41.64) |
| Removing vascular access | 6.97 | (4.50–8.99) | 5.99 | (4.50–8.99) |
| Subtotal | 143.92 | (123.95–184.20) | 124.35 | (121.36–126.17) |
| Per session of CRRT | ||||
| Consumables | ||||
| Preparing the machine | 176.37 | (111.93–263.17) | 246.44 | (226.71–274.99) |
| Connecting | 2.38 | (1.51–3.76) | 5.68 | (2.32–7.72) |
| Running (fixed) | 2.22 | (0.00–5.14) | 2.57 | (0.00–5.14) |
| Disconnecting | 5.33 | (0.00–9.64) | 4.43 | (3.73–4.96) |
| Staff | ||||
| Preparing the machine | 23.85 | (20.23–26.97) | 18.21 | (11.24–27.87) |
| Connecting | 4.16 | (2.25–5.42) | 5.11 | (4.50–5.42) |
| Running (fixed) | 2.25 | (0.00–4.50) | 3.00 | (0.00–4.50) |
| Disconnecting | 11.28 | (6.74–18.15) | 11.99 | (4.50–17.98) |
| Subtotal | 227.85 | (157.99–316.70) | 297.42 | (259.26–330.84) |
| Per hour | ||||
| Consumables | 8.85 | (7.75–10.85) | 13.23 | (10.52–14.63) |
| Staff | 4.44 | (2.25–6.54) | 3.90 | (2.70–4.50) |
| Subtotal | 13.30 | (10.00–15.34) | 17.13 | (15.02–19.04) |
| Expected total per patient, holding durations of CRRT constantb | ||||
| Consumables | 1435.94 | (1103.70–1913.60) | 1988.30 | (1767.18–2195.63) |
| Staff | 488.95 | (402.88–595.25) | 445.93 | (384.12–552.52) |
| Expected grand total | 1924.88 | (1506.58–2416.31) | 2434.22 | (2319.70–2579.75) |
| Expected total per patient, including observed differences in durations of CRRTb | ||||
| Consumables | 1318.80 | (1008.87–1760.29) | 2167.08 | (1918.95–2393.49) |
| Staff | 441.26 | (371.49–530.71) | 490.44 | (418.56–605.39) |
| Expected grand total | 1760.06 | (1380.36–2214.63) | 2657.52 | (2524.35–2812.05) |
Cost-effectiveness analysis
Absolute estimated costs and benefits
Analysis of age- and inclusion criteria-matched quartiles of ICON study participants provided HRQoL weights of 0.467 (ages 16–54 years), 0.525 (ages 55–66 years), 0.524 (ages 67–74 years) and 0.565 (ages > 75 years) at 3 months; and 0.552 (ages 16–54 years), 0.595 (ages 55–66 years), 0.581 (ages 67–74 years) and 0.577 (ages > 75 years) at 12 months. Unadjusted costs and QALYs are summarised in Table 14.
| Outcome | Treatment group | |
|---|---|---|
| SHA | RCA | |
| Cost (£), mean (SD) | ||
| CRRT | 1760 (1926) | 2656 (3089) |
| ICU bed-days | 24,126 (29,457) | 25,180 (30,109) |
| Non-ICU hospital bed-days | 7270 (14,445) | 6378 (13,373) |
| Dialysis | ||
| First year | 480 (3169) | 535 (3362) |
| Lifetime | 12,683 (100,819) | 14,942 (113,137) |
| Total | ||
| First year | 33,635 (36,327) | 34,749 (37,090) |
| Lifetime | 45,839 (108,860) | 49,157 (120,251) |
| Benefits, mean (SD) | ||
| QALYs | ||
| First year | 0.199 (0.227) | 0.196 (0.226) |
| Lifetime | 9.065 (11.470) | 9.003 (11.532) |
The main contributions to costs at 1 year were hospital bed-days, which corresponded to observed differences in mortality. Patients who died in hospital spent a mean of 9.7 days in ICU and 6.0 days in hospital post discharge from ICU, whereas patients who survived their hospital stay spent a mean of 12.7 days in ICU and 29.0 days in hospital post discharge from ICU. Patients admitted to units using RCA had longer lengths of stay in ICU and, therefore, higher costs relating to ICU bed-days, but also higher mortality, which translated to shorter lengths of stay post discharge from ICU and, therefore, lower costs relating to non-ICU hospital bed-days.
Despite only 2.8% of patients being alive and receiving dialysis at 1 year, dialysis was an additional driver of lifetime cost projections. Because patients admitted to units after transition to RCA had higher rates of dialysis at 1 year, the cost differential widened when projected to lifetime costs. When estimating QALYs, the absolute difference between groups was negligible at 1 year (bearing in mind that the 53.4% of participants who died within 90 days contributed zeros to the calculations of mean QALYs at 1 year), but widened slightly when projected over a lifetime and accounting for differences in age and dialysis outcomes.
Primary economic outcome: cost-effectiveness at 1 year
After adjustment for prespecified covariates, the cost-effectiveness models all consistently indicated increased costs associated with transition to citrate, with benefits centring on zero (Table 15). For the primary CEA, at 1 year, there was close to zero trend in costs during both SHA and RCA periods, but the transition to RCA was associated with estimated step-increase in costs of £2456 (95% CI £999 to £3912). Benefits in terms of QALYs at 1 year were estimated to be negligible and stable over time. The resulting estimated INMB at 1 year associated with a change to RCA was –£2376 (95% CI –£3841 to –£911). The estimated likelihood of cost-effectiveness at 1 year with a willingness-to-pay threshold of £20,000 per QALY was less than 0.1 (Figures 12 and 13), and this did not increase at higher willingness-to-pay thresholds.
| Outcome | Difference in means (95% CI) | p-valuea | |||
|---|---|---|---|---|---|
| SHA trend (per year) | RCA trend (per year) | Change in trend (per year) | Step change: RCA vs. SHA | ||
| Primary analysis at 1 year (n = 69,001) | |||||
| Costs (£) | –61 (–198 to 76) | –696 (–1350 to –42) | –635 (–1300 to 31) | 2456 (999 to 3912) | 0.0042 |
| QALYs | –0.000 (–0.001 to 0.000) | –0.000 (–0.004 to 0.003) | 0.000 (–0.003 to 0.004) | 0.004 (–0.004 to 0.012) | 0.44 |
| INMB (£)b | 53 (–85 to 191) | 692 (34 to 1350) | 639 (–31 to 1309) | –2376 (–3841 to –911) | |
| Extrapolation to lifetime (n = 69,001) | |||||
| Costs (£) | 533 (127 to 938) | –878 (–2761 to 1004) | –1411 (–3333 to 510) | 4714 (496 to 8933) | 0.09 |
| QALYs | –0.004 (–0.041 to 0.032) | 0.024 (–0.146 to 0.195) | 0.028 (–0.145 to 0.202) | 0.199 (–0.182 to 0.581) | 0.3 |
| INMB (£)b | –617 (–1455 to 221) | 1364 (–2528 to 5256) | 1981 (–1990 to 5951) | –724 (–9446 to 7997) | |
| Subgroup analysis: sepsis (n = 32,772) | |||||
| Costs (£) | 109 (–90 to 307) | –1067 (–2016 to –119) | –1176 (–2142 to –210) | 2633 (531 to 4735) | 0.025 |
| QALYs | 0.001 (–0.000 to 0.002) | 0.002 (–0.003 to 0.007) | 0.001 (–0.004 to 0.007) | –0.005 (–0.016 to 0.007) | 0.74 |
| INMB (£)b | –93 (–293 to 107) | 1112 (158 to 2066) | 1205 (234 to 2176) | –2725 (–4840 to –610) | |
| Sensitivity analysis (i): same 57 units throughout (n = 22,582) | |||||
| Costs (£) | 431 (116 to 747) | –835 (–1574 to –96) | –1266 (–2068 to –465) | 1759 (–84 to 3602) | 0.0058 |
| QALYs | –0.001 (–0.003 to 0.001) | 0.002 (–0.002 to 0.006) | 0.003 (–0.002 to 0.007) | 0.002 (–0.008 to 0.012) | 0.33 |
| INMB (£)b | –451 (–768 to –133) | 871 (128 to 1614) | 1321 (515 to 2128) | –1717 (–3572 to 137) | |
| Sensitivity analysis (ii): best casec (n = 69,001) | |||||
| Costs (£) | –57 (–195 to 81) | –689 (–1347 to –30) | –632 (–1302 to 38) | 1615 (150 to 3081) | 0.073 |
| INMB (£)b | 48 (–91 to 187) | 684 (22 to 1347) | 636 (–38 to 1310) | –1535 (–3010 to –61) | |
| Sensitivity analysis (iii): worst cased (n = 69,001) | |||||
| Costs (£) | –66 (–202 to 70) | –703 (–1353 to –53) | –637 (–1298 to 24) | 3236 (1789 to 4683) | 0.000051 |
| INMB (£)b | 58 (–80 to 195) | 699 (45 to 1353) | 641 (–24 to 1307) | –3156 (–4612 to –1700) | |
FIGURE 12.
Uncertainty in the mean cost (£) and QALY differences and their distribution for the step change from SHA to RCA (at 1 year following admission).
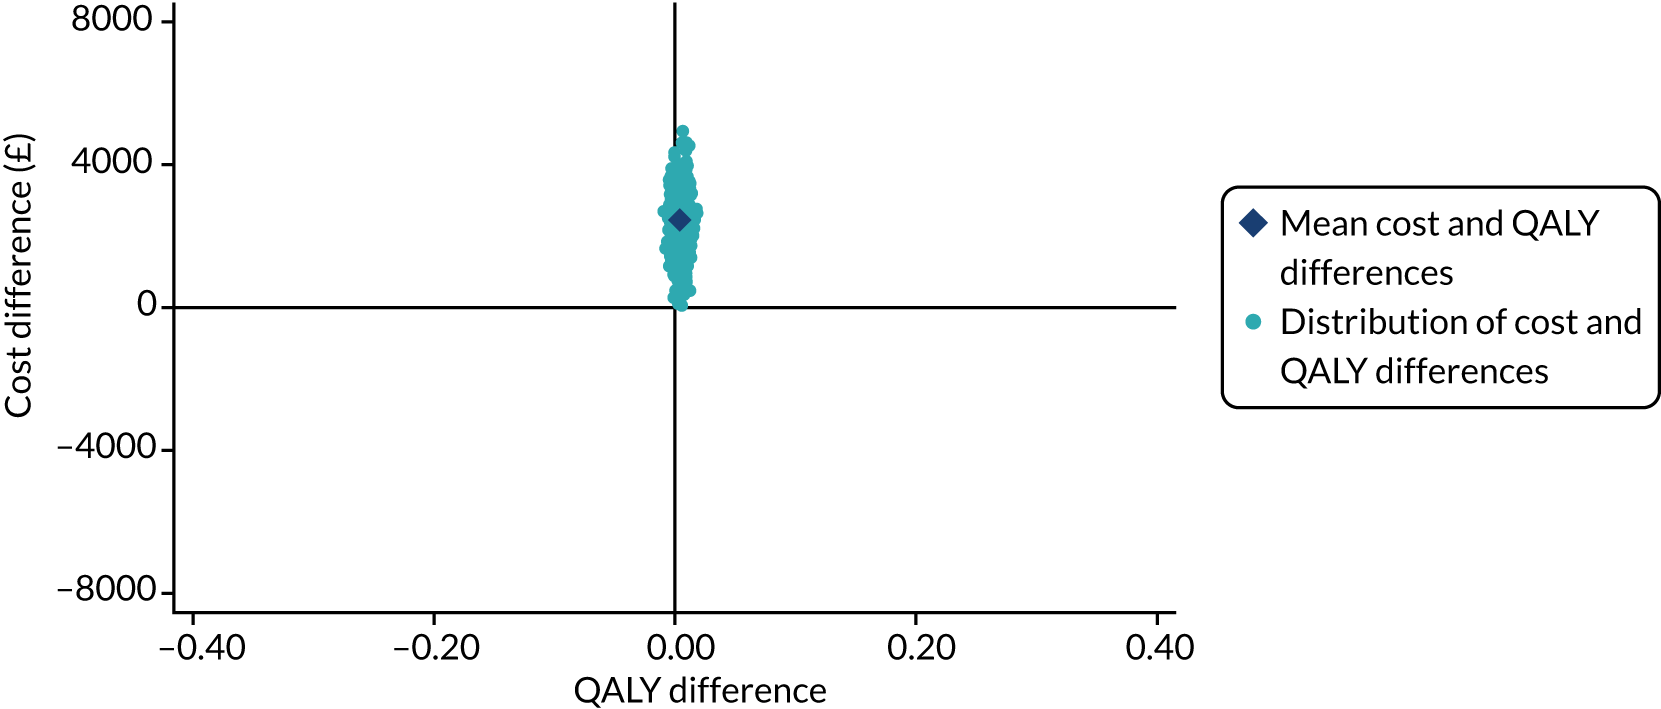
FIGURE 13.
Cost-effectiveness acceptability curve for the step change from SHA to RCA (at 1 year following admission).
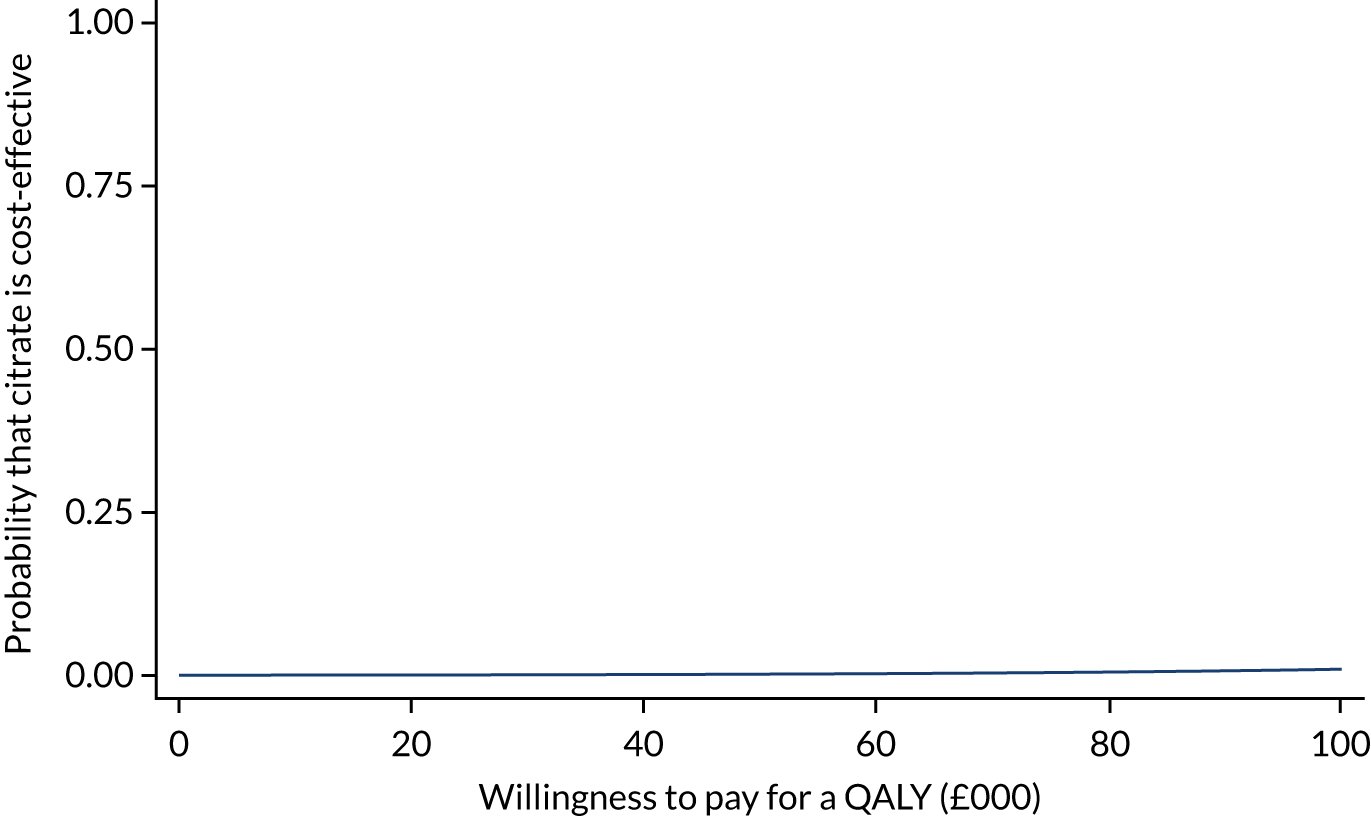
Secondary economic outcome: cost-effectiveness extrapolated to lifetime
Predicted long-term survival, HRQoL and costs beyond 1 year were pooled across treatment groups given that there was no statistically significant evidence of treatment effect on survival at 1 year. Trends in costs extrapolated to lifetime were similarly small during both SHA and RCA periods, but the transition to RCA was associated with a larger estimated step increase in costs of £4714 (95% CI £496 to £8933) (see Table 15). Trends for lifetime extrapolated benefits were close to zero during both SHA and RCA periods and the estimated step change during transition had a wide degree of uncertainty. The resulting estimated lifetime INMB associated with a change from SHA to RCA was –£724, with a corresponding wide degree of uncertainty (95% CI –£9446 to £7997). The wide degree of uncertainty resulted in estimated likelihood of cost-effectiveness of 44% at a willingness-to-pay threshold of £20,000 per QALY, increasing to 78% at a willingness-to-pay threshold of £100,000 per QALY (Figures 14 and 15).
FIGURE 14.
Uncertainty in the mean cost (£) and QALY differences and their distribution for the step change from SHA to RCA (extrapolation to lifetime).
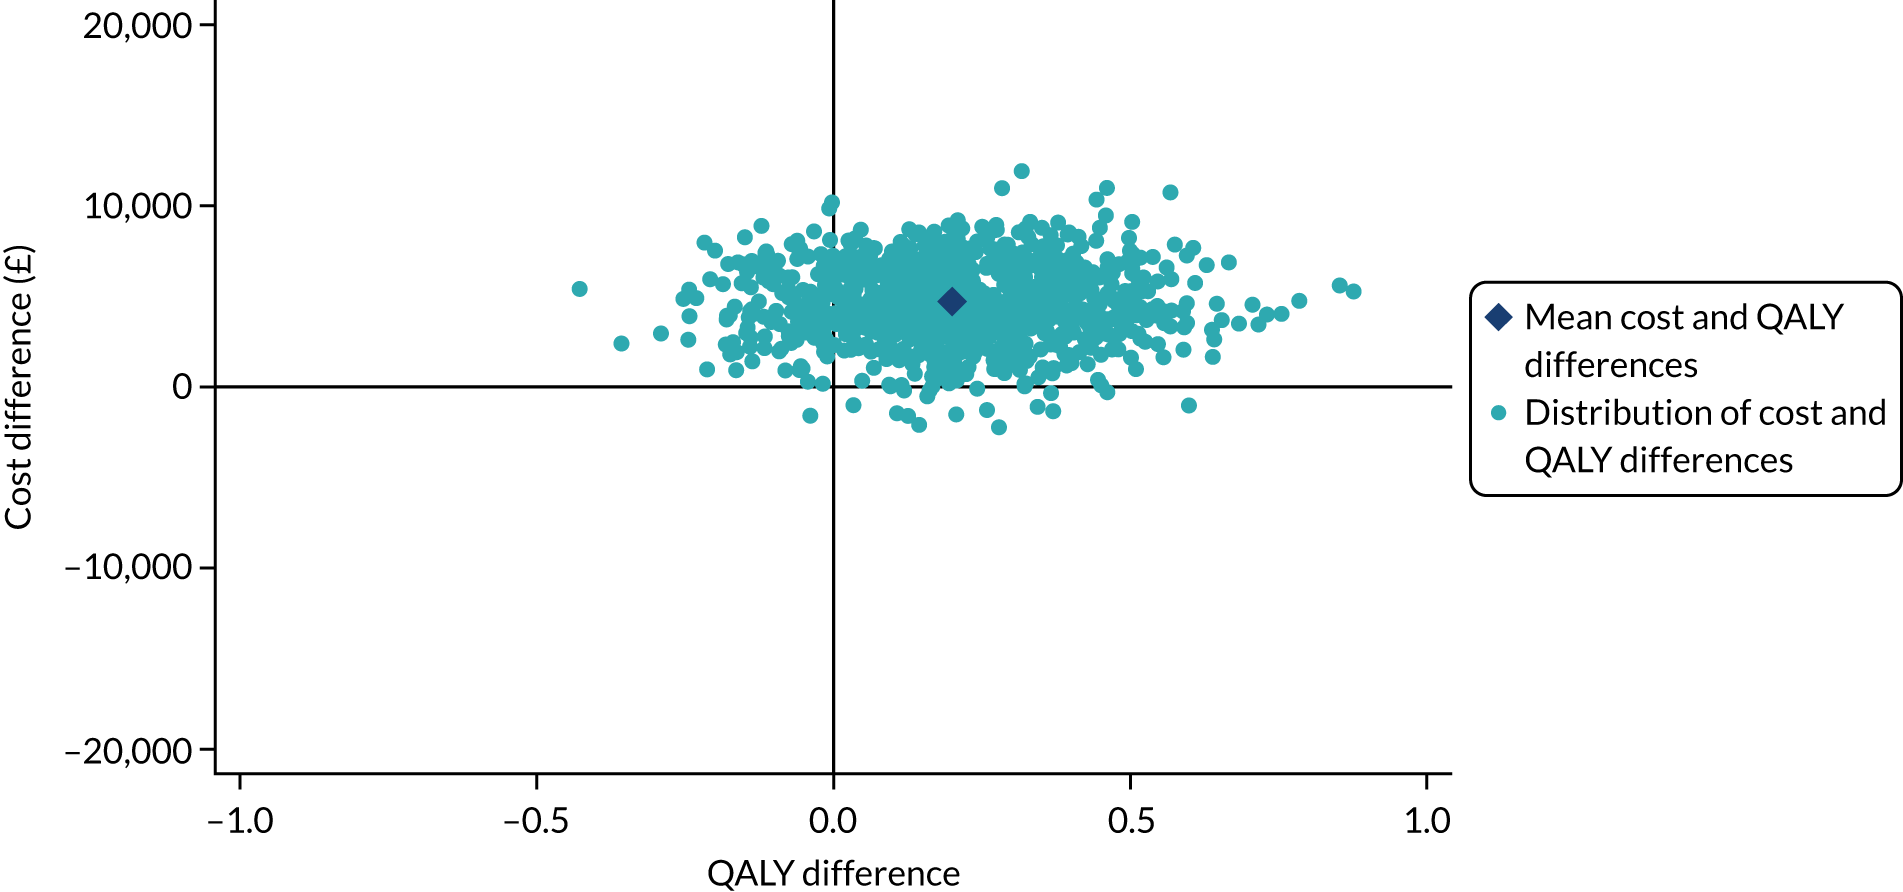
FIGURE 15.
Cost-effectiveness acceptability curve for the step change from SHA to RCA (extrapolation to lifetime).
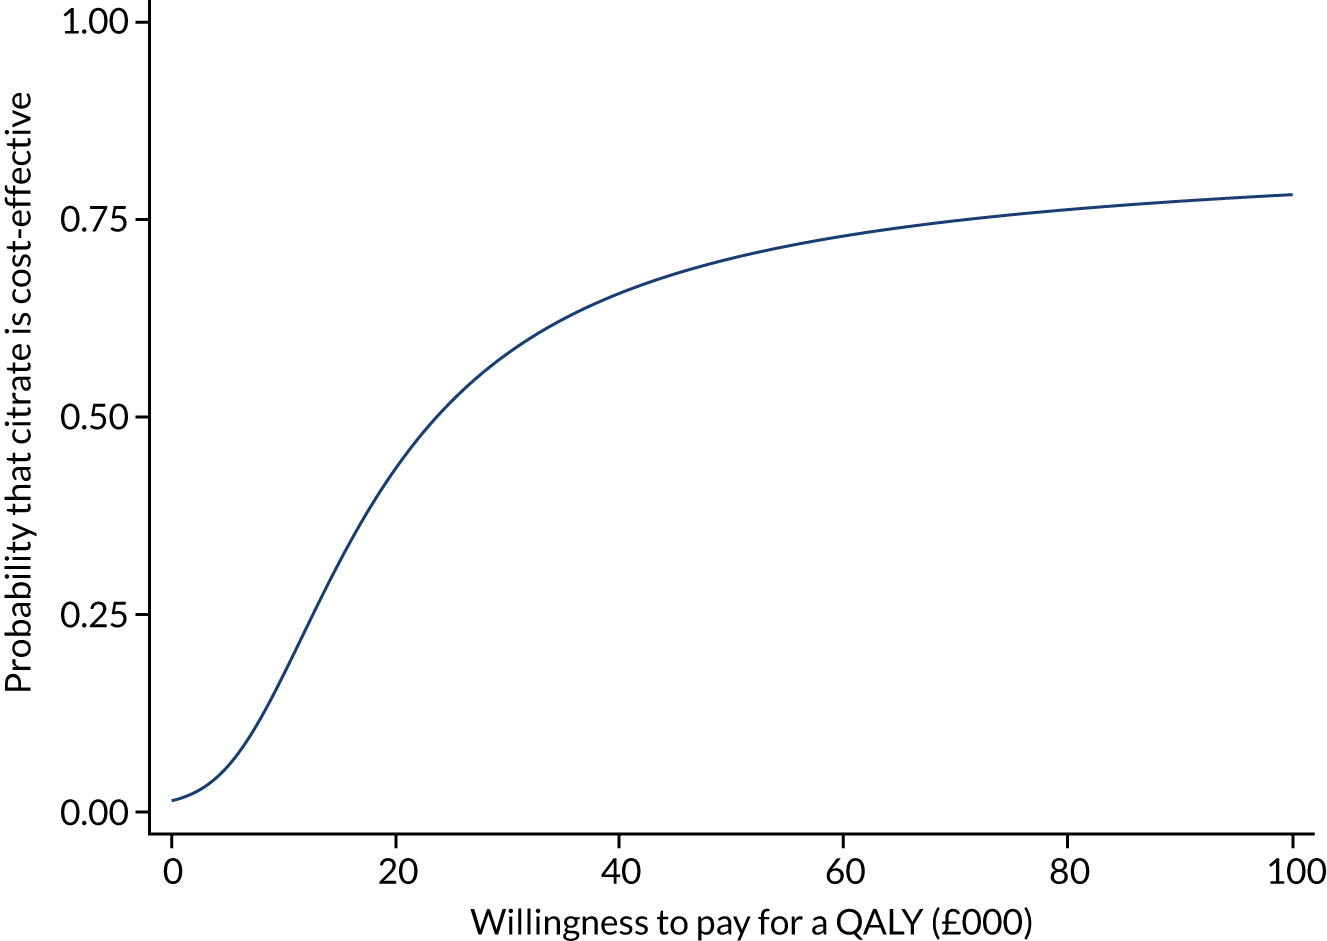
Subgroup analysis
Cost-effectiveness in the subgroup of patients with sepsis was consistent with the primary analysis, with an estimated INMB associated with transition from SHA to RCA of –£2725 (95% CI –£4840 to –£610) (see Table 15).
Sensitivity analyses
The results of the three sensitivity analyses [(i) restriction to using only data from ICUs contributing to both SHA and RCA periods, (ii) a best-case scenario employing the highest reported treatment-related costs of SHA and lowest treatment-related costs of RCA and (iii) a worst-case scenario employing the lowest reported treatment related costs for SHA and highest treatment-related costs for RCA] were each consistent with the primary analysis, with only differing levels of cost associated with transition from SHA to RCA (Table 15).
When restricting analysis to only units that completed transition during the study period, there was an increasing trend in costs during the RCA period (£423 per year, 95% CI £52 to £794) and, in contrast with the primary results, a positive INMB associated with transition to RCA of £1580 (95% CI –£1415 to £4574). When applying both best-case and worst-case estimates of treatment-related costs, results remained consistent with the primary economic analysis, with an estimate INMB at 1 year ranging from –£596 (95% CI –£3915 to £2723) to –£2286 (95% CI –£5554 to £981), respectively.
Chapter 6 Discussion and conclusions
Principal findings
In our study of nearly 70,000 patients who received CRRT while being treated in an ICU, moving from SHA to RCA was not associated with a significant change in step or trend in 90-day mortality, our primary clinical end point. However, RCA was more expensive for hospitals to deliver, was associated with more time receiving renal, respiratory and cardiovascular support and more time receiving care in an ICU. Our primary health economic outcome showed that moving from SHA to RCA was very unlikely to be cost-effective, instead substantially increasing health-care costs.
As a secondary aim, we wanted to discover how possible it was to efficiently track the effects of changes in critical care practice by linking routinely collected data. We have shown that tracking the effects of changes in critical care practice occurring in ICUs in England and Wales by linking routinely acquired data sets is an efficient research technique where large numbers of patients and ICUs can contribute to real-world outcomes. Although we have demonstrated feasibility of the approach, future research would benefit from further exploration of two methodological issues: (1) the appropriate modelling, statistical testing and interpretation of changes in trend versus changes in step in interrupted time series analysis of changes in critical care practice and (2) the potential influence of trends in the quality of routinely collected data on these.
Our findings in context
Prior to our work, 14 small RCTs comparing SHA and RCA had been summarised in a meta-analysis,45 although we could find no interrupted time series analyses. A recent RCT was terminated early on the basis of showing increased filter life, so was underpowered to detect differences in patient outcomes. 46 From these studies9–12,47–54 and opinion pieces,55 clinicians could conclude that, although the systems are equivalent for mortality (although these studies are likely underpowered to detect a realistic and clinically important difference in mortality), moving to RCA results in prolonged filter life (implying better therapy) and fewer bleeding episodes, suggesting that it is a more effective and cost-effective therapy for patients, but these publications are based on very limited analysis. 11,52 Our detailed health economic analysis shows that this is unlikely to be the case. Moving to RCA was estimated to result in substantially increased costs over the first year, along with increased days of renal support, with no evidence of other health economic benefits. We found that RCA resulted in longer circuit life (reflected by a higher proportion of machine ‘up time’), in agreement with previous work. 45 However, those completing our survey reported that they decreased the effluent rate when moving from SHA to RCA. Therefore, it is unclear whether the increased circuit life is a function of RCA or simply of reducing the effluent rate, as decreasing the effluent rate is known to prolong filter life, even when using SHA. 56
Mortality rates were > 50% in all groups by 90 days and were around 60% at 1 year. Our study agrees with previous work suggesting that mortality is not altered by the introduction of RCA. 45 These findings were consistent across both the primary and secondary analyses; therefore, it appears unlikely that RCA will be found to reduce mortality in any proposed RCTs.
In the primary cohort and sepsis-3 subgroup, the increased days or renal support associated with RCA was reflected increased days on ICU and of cardiovascular support, the latter likely to relate to the known cardiovascular instability associated with CRRT. 57 However, these changes, became non-significant in our sensitivity analysis.
Thromboembolus before 90 days following hospital discharge occurred in around 5% of cases. When sought prospectively (as opposed to coded for in health-care records, as in our analysis) while in ICU, thrombus rates of around 5–10% are found despite prophylaxis. 58 Many of these probably cause no clinical effect and so may not be coded. The incidence is known to be higher in those requiring vasopressors,59 which were common in our cohort. However, we could not find rates of routinely detected thrombus previously reported through to 90 days post discharge. Future work is needed to discover whether or not there are groups of ICU patients who would benefit from systemic anticoagulation during or following their ICU stay.
Bleeding events are generally thought to decrease after moving to RCA, although the numbers from RCTs underlying this statement are small, with a combined sample size of 1088 coming from 13 studies. 45 In these studies, bleeding is commonly ill-defined47 or relates primarily to minor episodes54 or small drops in haemoglobin,9 which may be unlikely to be routinely coded. These episodes may be of little relevance to patients. Work prior to the introduction of citrate anticoagulation suggested that bleeding events were associated with underlying patient conditions more than with the administration of heparin. 60 Our approach in this study differs. Because we accounted for coded bleeding during a patient’s ICU stay, the events are significant enough to be coded. We found no difference in these events associated with the change to RCA. However, bleeding before and after the ICU admission while in hospital will be included in this definition. Our results should, therefore, be interpreted with great caution. The borderline effect on bleeding events when moving away from a systemic anticoagulant initially seems counter-intuitive. However, RCA is shown to substantially increase the risk of hypocalcaemia. 45 Hypocalcaemia may induce coagulopathy and is associated with extent of intracranial haemorrhage. 61 Given the lack of data prior to our study, suggesting that RCA has no risk of increasing bleeding may be premature. 62
Strengths and limitations
Strengths
To the best of our knowledge, this study is by far the largest linked cohort study undertaken comparing SHA and RCA. Among the 200 general ICUs in England and Wales participating in the ICNARC CMP (which had 100% coverage of general ICUs in the two countries by the end of the study period), 94% completed responses to the survey, allowing us to identify whether or not units had changed from SHA to RCA during the study period. We checked these transition dates in multiple ways to ensure reliability. This high response rate to our survey allowed us to include individual patient data from 181 ICUs in England and Wales, of which 57 contributed patient data during both pre and post transition periods. We believe that this presents a clear picture of what happens in clinical practice across the two nations when RCA is introduced. Our micro-costing study is based on practice from seven geographically distinct ICUs. With EQ-5D-3L health-related quality-of-life data from the multicentre 8000-patient ICON study, we believe that our health economic analysis is relatively robust.
Our linkage to the UKRR, HES and national mortality data allowed us to present longer-term follow-up data on very large numbers of patients. This allows us to deliver real-world evidence on the clinical effectiveness and cost-effectiveness of the national moves towards RCA therapy. We chose to maximise the number of patients and ICUs that had received RCA by including patients up to 31 March 2017. We knew that this would mean that patients in the last year would have incomplete data in the UKRR, which meant having to censor ESRD outcomes for the last year of inclusion. Because most patients registered with UKRR within 1 year of admission were registered within 90 days, we undertook a post hoc analysis of ESRD at 90 days rather that at 1 year to maximise use of the available data. The post hoc analysis was consistent with the 1-year outcome.
The SHA and RCA groups were relatively well matched, but the RCA group tended to have slightly higher rates of severe comorbidity and predicted mortality. We accounted for comorbidities and the covariates underlying the predicted mortality in our adjustment models.
Limitations
Our study has some important limitations. Foremost is the lack of patient-level data on treatment; we have studied patient effects when an ICU changes to using RCA for the majority of patients. Although we excluded patients with the most common reason ICUs reported reverting to SHA (primary admissions with liver failure), some patients included in the RCA group will undoubtedly have received SHA rather than RCA. Our results are, therefore, better interpreted as a pragmatic analysis of what happens to renally replaced ICU populations when units change to RCA than as an analysis of what would happen to individual patients.
The ambiguities surrounding testing and interpretation of ITS analyses were highlighted by the fact that, for many outcomes, we observed competing changes in trend and level. The (prespecified) joint tests draw on the statistical power provided by both differences, and so are considerably more sensitive than the p-values that would have been obtained from tests of either the change in trend or the step change alone. However, they do not account for the concordance in meaningful direction of the two component changes, so changes that would have opposing interpretations of clinical value (i.e. one harmful and one beneficial) are considered of equal statistical significance to changes that have concordant clinical value (are both harmful or both beneficial). They are appropriate tests of an impact model in which the interruption (switching from SHA to RCA) results in causal effects on both the level at the point of transition and the trend moving forwards. 63 This may not be an appropriate impact model for the effects of a change in clinical practice in ICU.
As our analysis is of routinely collected data, one difficult-to-assess but potentially strong contributor to observed trends in outcomes is trends in data quality. These might include the propensity for events to be recorded, the population coverage of data sets and the accuracy of linkage over time. Nearly all administrative data are subject to improvements in quality over time. The ICNARC CMP, for example, is known to have less than complete coverage of adult general ICUs prior to 2015, but this variation in completeness was expected to limit statistical power only and not produce bias. The NHS patient identification numbers required for linkage were collected only from 2006 and increase in completeness over time, with similar implications. However, similar variation in completeness or linkage to Civil Registrations or UKRR over time would be expected to produce variation in derived clinical outcomes of (post discharge) mortality and ESRD, respectively, because an absence of link is meaningfully interpreted as implying the absence of the outcome. 64 Such variation in the quality of administrative data can strongly bias analysis of trends. 65 What implications it may have for the analysis of step changes in the context of trends in ITS analysis is much less clear; it is plausible that, by accounting for trends both pre and post interruption, the estimates of step changes are robust to the influence of trends in data quality.
Although most of our clinical effectiveness analyses are based on many ICUs, the difference in time between filtration periods, though based on large patient numbers, comes from a database of two ICUs, which may limit its generalisability. The numbers of units of blood transfused and other items relevant to treatment costs were obtained from a sample of seven ICUs that participated in the cognitive walk-through. Both of these parameters were used in our health economic analyses, but neither were drivers of overall costs differences.
Last, it is worth highlighting that our study contains very large numbers of patients (though smaller numbers of ICUs – the unit of change) on which we have undertaken multiple analyses. As a result, it is possible to achieve high levels of statistical significance with little clinical meaning. Our sensitivity, subgroup and sepsis-cohort results in particular should be interpreted in this light.
Implications for health-care practice
Our study indicates that the introduction of RCA to ICUs in the NHS has not improved outcomes for patients, but has substantially increased costs for the hospitals caring for them. Taken together, these findings suggest that the move to RCA may have been premature and should cause clinicians in ICUs that are still using SHA to pause before changing to RCA.
Summaries of key research recommendations
Recommendation 1: research prioritisation
Our study demonstrates the possibilities of tracking the effects of changes in ICU practice in England and Wales at scale across routinely collected databases. Our findings strongly support the need to do this for other significant changes in practice, provided that the methodological issues identified above can be addressed. We therefore recommend that review of practice changes be conducted to identify candidates for evaluation of clinical and cost-effectiveness evaluation using methods such as those employed here.
Recommendation 2: methodology and data quality
Methodological work is required to understand the most appropriate way of measuring and testing the effects of changes in clinical practice in ICU and other health-care services. This includes how to interpret information about step changes in the context of associated changes in trend; if and how to allow for non-linearity in trends; and the potential implications of misspecification of trend shape parameters for interpretation of step changes. Given that most such analyses are likely to be based on routinely collected administrative data and patient registries, the potential implications of trends in data quality need to be understood and appropriate methods for handling these identified or developed. When linking to registries such as ONS mortality and UKRR, there is generally no way of knowing when a patient or event has failed to be recorded or when the record has failed to be linked. Indirect measures and quantitative bias analysis (involving error models or simulations) are likely to be required.
Acknowledgements
We wish to thank the NIHR Health Technology Assessment programme for funding this study.
Critical care unit staff
We are very grateful to the clinicians and pharmacists at the critical care units that participated in the survey of anticoagulation practice and provided consumables information for the study. It is impossible to thank everyone personally; however, we would like to thank the following research and clinical staff at the micro-costing units.
Ben Attwood, Sophie Mason and Ian Purcell (Warwick Hospital); Catherine Snelson, Sarah Merrick and Fiona Wyton (Queen Elizabeth Hospital Birmingham); Rebecca Cusack, Clare Bolger and Richard Scott (Southampton General Hospital); Lidia Ramos, January Roque and Sarah Hierons (Royal United Hospital); Ian Rechner and Nicola Jaques (Royal Berkshire Hospital); Dan Martin and Helder Filipe (Royal Free Hospital); and David Parkinson and Jo-Anne Gilroy (Royal Marsden Hospital).
Investigators
Professor Peter J Watkinson (chief investigator), Professor J Duncan Young, Mr Mark Borthwick, Dr Clare MacEwen, Dr Fergus J Caskey, Dr Marlies Ostermann, Professor Lui Forni, Mr Robert F Lawrence, Dr M Zia Sadique, Mr Paul R Mouncey, Professor David A Harrison and Professor Kathryn M Rowan.
Study Steering Committee
Dr Steve Harris (independent chair), Dr Nick Selby (independent), Professor Christina Pagel (independent), Dr Roger Garrett (independent PPI representative) and Professor Peter J Watkinson (chief investigator).
Contributions of authors
Doug W Gould (https://orcid.org/0000-0003-4148-3312) (Senior Researcher) led the management of the study, contributed to the acquisition, analysis and interpretation of the data, and drafted and critically reviewed the manuscript.
James Doidge (https://orcid.org/0000-0002-3674-3100) (Senior Statistician) contributed to the acquisition, analysis and interpretation of the data, and drafted and critically reviewed the manuscript.
M Zia Sadique (https://orcid.org/0000-0001-5814-0258) (Assistant Professor) conceived the study, contributed to the design of the study and the analysis and interpretation of the data, and critically reviewed the manuscript.
Mark Borthwick (https://orcid.org/0000-0002-3249-1508) (Consultant Pharmacist) conceived the study, contributed to the design of the study and the analysis and interpretation of the data, and critically reviewed the manuscript.
Robert Hatch (https://orcid.org/0000-0002-8176-0831) (Registrar in Anaesthetics and Critical Care) contributed to the acquisition, analysis and interpretation of the data and critically reviewed the manuscript.
Fergus J Caskey (https://orcid.org/0000-0002-5199-3925) (Consultant Senior Lecturer) conceived the study, contributed to the design of the study and the analysis and interpretation of the data, and critically reviewed the manuscript.
Lui Forni (https://orcid.org/0000-0002-0617-5309) (Professor of Nephrology and Critical Care) conceived the study, contributed to the design of the study and the analysis and interpretation of the data, and critically reviewed the manuscript.
Robert F Lawrence (https://orcid.org/0000-0001-8641-2820) (Patient Representative) conceived the study, contributed to the design of the study and the analysis and interpretation of the data, and critically reviewed the manuscript.
Clare MacEwen (https://orcid.org/0000-0002-2196-6870) (Consultant in Critical Care) conceived the study, contributed to the design of the study and the analysis and interpretation of the data, and critically reviewed the manuscript.
Marlies Ostermann (https://orcid.org/0000-0001-9500-9080) (Consultant in Critical Care and Nephrology) conceived the study, contributed to the design of the study and the analysis and interpretation of the data, and critically reviewed the manuscript.
Paul R Mouncey (https://orcid.org/0000-0002-8510-8517) (Head of Research) conceived the study, contributed to the design of the study and the analysis and interpretation of the data, and drafted and critically reviewed the manuscript.
David A Harrison (https://orcid.org/0000-0002-9002-9098) (Head Statistician and Honorary Professor) conceived the study, contributed to the design of the study and the analysis and interpretation of the data, and drafted and critically reviewed the manuscript.
Kathryn M Rowan (https://orcid.org/0000-0001-8217-5602) (Director and Honorary Professor) conceived the study, contributed to the design of the study and the analysis and interpretation of the data, and drafted and critically reviewed the manuscript.
J Duncan Young (https://orcid.org/0000-0002-6838-4835) (Professor of Intensive Care Medicine) conceived the study, contributed to the design of the study and the analysis and interpretation of the data, and drafted and critically reviewed the manuscript.
Peter J Watkinson (https://orcid.org/0000-0003-1023-3927) (Chief Investigator and Professor of Intensive Care Medicine) conceived the study, led the grant application and design of the study, contributed to the acquisition, analysis and interpretation of the data, and drafted and critically reviewed the manuscript.
Publication
Gould DW, Doidge J, Sadique MZ, Borthwick M, Caskey FJ, Forni L, et al. Renal replacement anticoagulant management: protocol and analysis plan for an observational comparative effectiveness study of linked data sources [published online ahead of print April 2 2020]. J Intensive Care Soc 2020.
Data-sharing statement
All data requests should be submitted to the corresponding author for consideration. Access to available anonymised data or study materials may be granted following review.
Patient data
This work uses data provided by patients and collected by the NHS as part of their care and support. Using patient data is vital to improve health and care for everyone. There is huge potential to make better use of information from people’s patient records, to understand more about disease, develop new treatments, monitor safety, and plan NHS services. Patient data should be kept safe and secure, to protect everyone’s privacy, and it’s important that there are safeguards to make sure that it is stored and used responsibly. Everyone should be able to find out about how patient data is used. #datasaveslives You can find out more about the background to this citation here: https://understandingpatientdata.org.uk/data-citation.
Disclaimers
This report presents independent research funded by the National Institute for Health Research (NIHR). The views and opinions expressed by authors in this publication are those of the authors and do not necessarily reflect those of the NHS, the NIHR, NETSCC, the HTA programme or the Department of Health and Social Care. If there are verbatim quotations included in this publication the views and opinions expressed by the interviewees are those of the interviewees and do not necessarily reflect those of the authors, those of the NHS, the NIHR, NETSCC, the HTA programme or the Department of Health and Social Care.
References
- Gould DW, Doidge J, Sadique MZ, . Renal replacement anticoagulant management: protocol and analysis plan for an observational comparative effectiveness study of linked data sources [published online ahead of print April 2 2020]. J Intensive Care Soc 2020. https://doi.org/10.1177/1751143720913417.
- Intensive Care National Audit & Research Centre (ICNARC) . Case Mix Programme Summary Statistics 2017-18 2018. www.icnarc.org/Our-Audit/Audits/Cmp/Reports/Summary-Statistics (accessed 23 July 2019).
- Rabindranath K, Adams J, Macleod AM, Muirhead N. Intermittent versus continuous renal replacement therapy for acute renal failure in adults. Cochrane Database Syst Rev 2007;3. https://doi.org/10.1002/14651858.CD003773.pub3.
- Jones SL, Devonald MA. How acute kidney injury is investigated and managed in UK intensive care units – a survey of current practice. Nephrol Dial Transplant 2013;28:1186-90. https://doi.org/10.1093/ndt/gft015.
- Brandenburger T, Dimski T, Slowinski T, Kindgen-Milles D. Renal replacement therapy and anticoagulation. Best Pract Res Clin Anaesthesiol 2017;31:387-401. https://doi.org/10.1016/j.bpa.2017.08.005.
- Uchino S, Bellomo R, Morimatsu H, Morgera S, Schetz M, Tan I, et al. Continuous renal replacement therapy: a worldwide practice survey. The beginning and ending supportive therapy for the kidney (B.E.S.T. kidney) investigators. Intensive Care Med 2007;33:1563-70. https://doi.org/10.1007/s00134-007-0754-4.
- Oudemans-van Straaten HM, Kellum JA, Bellomo R. Clinical review: anticoagulation for continuous renal replacement therapy – heparin or citrate?. Crit Care 2011;15. https://doi.org/10.1186/cc9358.
- Morabito S, Pistolesi V, Tritapepe L, Fiaccadori E. Regional citrate anticoagulation for RRTs in critically ill patients with AKI. Clin J Am Soc Nephrol 2014;9:2173-88. https://doi.org/10.2215/CJN.01280214.
- Oudemans-van Straaten HM, Bosman RJ, Koopmans M, van der Voort PH, Wester JP, van der Spoel JI, et al. Citrate anticoagulation for continuous venovenous hemofiltration. Crit Care Med 2009;37:545-52. https://doi.org/10.1097/CCM.0b013e3181953c5e.
- Gattas DJ, Rajbhandari D, Bradford C, Buhr H, Lo S, Bellomo R. A randomized controlled trial of regional citrate versus regional heparin anticoagulation for continuous renal replacement therapy in critically ill adults. Crit Care Med 2015;43:1622-9. https://doi.org/10.1097/CCM.0000000000001004.
- Schilder L, Nurmohamed SA, Bosch FH, Purmer IM, den Boer SS, Kleppe CG, et al. Citrate anticoagulation versus systemic heparinisation in continuous venovenous hemofiltration in critically ill patients with acute kidney injury: a multi-center randomized clinical trial. Crit Care 2014;18. https://doi.org/10.1186/s13054-014-0472-6.
- Kutsogiannis DJ, Gibney RT, Stollery D, Gao J. Regional citrate versus systemic heparin anticoagulation for continuous renal replacement in critically ill patients. Kidney Int 2005;67:2361-7. https://doi.org/10.1111/j.1523-1755.2005.00342.x.
- Wu MY, Hsu YH, Bai CH, Lin YF, Wu CH, Tam KW. Regional citrate versus heparin anticoagulation for continuous renal replacement therapy: a meta-analysis of randomized controlled trials. Am J Kidney Dis 2012;59:810-18. https://doi.org/10.1053/j.ajkd.2011.11.030.
- Bai M, Zhou M, He L, Ma F, Li Y, Yu Y, et al. Citrate versus heparin anticoagulation for continuous renal replacement therapy: an updated meta-analysis of RCTs. Intensive Care Med 2015;41:2098-110. https://doi.org/10.1007/s00134-015-4099-0.
- Zhang Z, Hongying N. Efficacy and safety of regional citrate anticoagulation in critically ill patients undergoing continuous renal replacement therapy. Intensive Care Med 2012;38:20-8. https://doi.org/10.1007/s00134-011-2438-3.
- Kontopantelis E, Doran T, Springate DA, Buchan I, Reeves D. Regression based quasi-experimental approach when randomisation is not an option: interrupted time series analysis. BMJ 2015;350. https://doi.org/10.1136/bmj.h2750.
- Wagner AK, Soumerai SB, Zhang F, Ross-Degnan D. Segmented regression analysis of interrupted time series studies in medication use research. J Clin Pharm Ther 2002;27:299-30. https://doi.org/10.1046/j.1365-2710.2002.00430.x.
- Herbert A, Wijlaars L, Zylbersztejn A, Cromwell D, Hardelid P. Data resource profile: Hospital Episode Statistics Admitted Patient Care (HES APC). Int J Epidemiol 2017;46:1093-1093i. https://doi.org/10.1093/ije/dyx015.
- NHS Data Model and Dictionary . Critical Care Minimum Data Set Overview n.d. www.datadictionary.nhs.uk/data_dictionary/messages/supporting_data_sets/data_sets/critical_care_minimum_data_set_fr.asp?shownav=1; (accessed 23 July 2019).
- World Health Organization (WHO) . International Statistical Classification of Diseases and Related Health Problems 2010.
- Shankar-Hari M, Phillips GS, Levy ML, Seymour CW, Liu VX, Deutschman CS, et al. Developing a new definition and assessing new clinical criteria for septic shock: for the Third International Consensus Definitions for Sepsis and Septic Shock (Sepsis-3). JAMA 2016;315:775-87. https://doi.org/10.1001/jama.2016.0289.
- Lefrant JY, Garrigues B, Pribil C, Bardoulat I, Courtial F, Maurel F, et al. CRREA Study Group . The daily cost of ICU patients: a micro-costing study in 23 French intensive care units. Anaesth Crit Care Pain Med 2015;34:151-7. https://doi.org/10.1016/j.accpm.2014.09.004.
- Curtis L, Burns A. Unit Costs of Health and Social Care 2018. PSSRU, University of Kent; 2018.
- NHS Business Services Authority . Drug Tariff 2019. www.nhsbsa.nhs.uk/pharmacies-gp-practices-and-appliance-contractors/drug-tariff (accessed 19 September 2019).
- NHS Supply Chain . NHS Supply Chain n.d. https://my.supplychain.nhs.uk/Catalogue/browse/1/medical (accessed 19 September 2019).
- Department of Health and Social Care (DHSC) . NHS Reference Costs 2017–18 2018.
- Griffiths JA, Morgan K, Barber VS, Young JD. Study protocol: the Intensive Care Outcome Network (‘ICON’) study. BMC Health Serv Res 2008;8. https://doi.org/10.1186/1472-6963-8-132.
- Eriksson D, Goldsmith D, Teitsson S, Jackson J, van Nooten F. Cross-sectional survey in CKD patients across Europe describing the association between quality of life and anaemia. BMC Nephrol 2016;17. https://doi.org/10.1186/s12882-016-0312-9.
- NHS Digital . Health Survey for England, 2016 2017. https://digital.nhs.uk/data-and-information/publications/statistical/health-survey-for-england/health-survey-for-england-2016 (accessed 6 January 2021).
- Great Britain . National Health Service Act 2006 2006. www.legislation.gov.uk/ukpga/2006/41/contents (accessed January 2021).
- Intensive Care National Audit & Research Centre (ICNARC) . Statistical Analysis Plan 2019. www.icnarc.org/Our-Research/Studies/Rram/Study-Documents/Statistical-Analysis-And-Health-Economic-Plan (accessed 6 October 2020).
- Ferrando-Vivas P, Jones A, Rowan KM, Harrison DA. Development and validation of the new ICNARC model for prediction of acute hospital mortality in adult critical care. J Crit Care 2017;38:335-9. https://doi.org/10.1016/j.jcrc.2016.11.031.
- Ramsay CR, Matowe L, Grilli R, Grimshaw JM, Thomas RE. Interrupted time series designs in health technology assessment: lessons from two systematic reviews of behavior change strategies. Int J Technol Assess Health Care 2003;19:613-23. https://doi.org/10.1017/s0266462303000576.
- Harrison D, Caskey F, Soar J, Harris S, Webb S, Jenkins D, et al. Risk modelling for quality improvement in the critically ill: making best use of routinely available data 2020. www.journalslibrary.nihr.ac.uk/programmes/hsdr/141906/#/ (accessed 17 February 2020).
- Bartlett JW, Seaman SR, White IR, Carpenter JR. Multiple imputation of covariates by fully conditional specification: accommodating the substantive model. Stat Methods Med Res 2014;24:462-87. https://doi.org/10.1177/0962280214521348.
- White IR, Royston P, Wood AM. Multiple imputation using chained equations: issues and guidance for practice. Stat Med 2011;30:377-99. https://doi.org/10.1002/sim.4067.
- Moons KG, Donders RA, Stijnen T, Harrell FE. Using the outcome for imputation of missing predictor values was preferred. J Clin Epidemiol 2006;59:1092-101. https://doi.org/10.1016/j.jclinepi.2006.01.009.
- Dolan P, Gudex C, Kind P, Williams A. A Social Tariff for EuroQoL: Results from a UK General Population Survey – CHE Discussion Paper. York: Centre for Health Economics: University of York; 1999.
- Office for National Statistics . Interim Life Tables, 2011–2013 2013. https://ons.gov.uk/peoplepopulationandcommunity/birthsdeathsandmarriages/lifeexpectancies/bulletins/nationallifetablesunitedkingdom/2014-09-25 (accessed 17 February 2020).
- Wright JC, Plenderleith L, Ridley SA. Long-term survival following intensive care: subgroup analysis and comparison with the general population. Anaesthesia 2003;58:637-42. https://doi.org/10.1046/j.1365-2044.2003.03205.x.
- Cuthbertson BH, Roughton S, Jenkinson D, Maclennan G, Vale L. Quality of life in the five years after intensive care: a cohort study. Crit Care 2010;14. https://doi.org/10.1186/cc8848.
- Dowdy DW, Eid MP, Sedrakyan A, Mendez-Tellez PA, Pronovost PJ, Herridge MS, et al. Quality of life in adult survivors of critical illness: a systematic review of the literature. Intensive Care Med 2005;31:611-20. https://doi.org/10.1007/s00134-005-2592-6.
- Ara R, Brazier JE. Populating an economic model with health state utility values: moving toward better practice. Value Health 2010;13:509-18. https://doi.org/10.1111/j.1524-4733.2010.00700.x.
- National Institute of Health and Care Excellence . Guide to the Methods of Technology Appraisal 2013 2013.
- Liu C, Mao Z, Kang H, Hu J, Zhou F. Regional citrate versus heparin anticoagulation for continuous renal replacement therapy in critically ill patients: a meta-analysis with trial sequential analysis of randomized controlled trials. Crit Care 2016;20. https://doi.org/10.1186/s13054-016-1299-0.
- Zarbock A, Küllmar M, Kindgen-Milles D, Wempe C, Gerss J, Brandenburger T, et al. Effect of Regional citrate anticoagulation vs. systemic heparin anticoagulation during continuous kidney replacement therapy on dialysis filter life span and mortality among critically ill patients with acute kidney injury: a randomized clinical trial. JAMA 2020;324:1629-39. https://doi.org/10.1001/jama.2020.18618.
- Stucker F, Ponte B, Tataw J, Martin PY, Wozniak H, Pugin J, et al. Efficacy and safety of citrate-based anticoagulation compared to heparin in patients with acute kidney injury requiring continuous renal replacement therapy: a randomized controlled trial. Crit Care 2015;19. https://doi.org/10.1186/s13054-015-0822-z.
- Brain MJ, Roodenburg OS, Adams N, McCracken P, Hockings L, Musgrave S, et al. Randomised trial of software algorithm driven regional citrate anticoagulation versus heparin in continuous renal replacement therapy: the Filter Life in Renal Replacement Therapy pilot trial. Crit Care Resusc 2014;16:131-7.
- Monchi M, Berghmans D, Ledoux D, Canivet JL, Dubois B, Damas P. Citrate vs. heparin for anticoagulation in continuous venovenous hemofiltration: a prospective randomized study. Intensive Care Med 2004;30:260-5. https://doi.org/10.1007/s00134-003-2047-x.
- Lin X-M, Qin Z-M, Chen L. The comparing research of anticoagulation with sodium citrate or heparin in continuous venovenous hemodiafil-tration. Chin J Pract Internal Med 2007;27:194-6.
- Betjes MG, van Oosterom D, van Agteren M, van de Wetering J. Regional citrate versus heparin anticoagulation during venovenous hemofiltration in patients at low risk for bleeding: similar hemofilter survival but significantly less bleeding. J Nephrol 2007;20:602-8.
- Fealy N, Baldwin I, Johnstone M, Egi M, Bellomo R. A pilot randomized controlled crossover study comparing regional heparinization to regional citrate anticoagulation for continuous venovenous hemofiltration. Int J Artif Organs 2007;30:301-7. https://doi.org/10.1177/039139880703000404.
- Tiranathanagul K, Jearnsujitwimol O, Susantitaphong P, Kijkriengkraikul N, Leelahavanichkul A, Srisawat N, et al. Regional citrate anticoagulation reduces polymorphonuclear cell degranulation in critically ill patients treated with continuous venovenous hemofiltration. Ther Apher Dial 2011;15:556-64. https://doi.org/10.1111/j.1744-9987.2011.00996.x.
- Hetzel GR, Schmitz M, Wissing H, Ries W, Schott G, Heering PJ, et al. Regional citrate versus systemic heparin for anticoagulation in critically ill patients on continuous venovenous haemofiltration: a prospective randomized multicentre trial. Nephrol Dial Transplant 2011;26:232-9. https://doi.org/10.1093/ndt/gfq575.
- Kindgen-Milles D, Brandenburger T, Dimski T. Regional citrate anticoagulation for continuous renal replacement therapy. Curr Opin Crit Care 2018;24:450-4. https://doi.org/10.1097/MCC.0000000000000547.
- MacEwen C, Watkinson P, Winearls C. Circuit life versus bleeding risk: the impact of achieved activated partial thromboplastin time versus achieved filtration fraction. Ther Apher Dial 2015;19:259-66. https://doi.org/10.1111/1744-9987.12253.
- Douvris A, Zeid K, Hiremath S, Bagshaw SM, Wald R, Beaubien-Souligny W, et al. Mechanisms for hemodynamic instability related to renal replacement therapy: a narrative review. Intensive Care Med 2019;45:1333-46. https://doi.org/10.1007/s00134-019-05707-w.
- Cook D, Meade M, Guyatt G, Walter S, Heels-Ansdell D, Warkentin TE, et al. Dalteparin versus unfractionated heparin in critically ill patients. N Engl J Med 2011;364:1305-14. https://doi.org/10.1056/NEJMoa1014475.
- Cook D, Crowther M, Meade M, Rabbat C, Griffith L, Schiff D, et al. Deep venous thrombosis in medical-surgical critically ill patients: prevalence, incidence, and risk factors. Crit Care Med 2005;33:1565-71. https://doi.org/10.1097/01.CCM.0000171207.95319.B2.
- Cook D, Douketis J, Meade M, Guyatt G, Zytaruk N, Granton J, et al. Venous thromboembolism and bleeding in critically ill patients with severe renal insufficiency receiving dalteparin thromboprophylaxis: prevalence, incidence and risk factors. Crit Care 2008;12. https://doi.org/10.1186/cc6810.
- Morotti A, Charidimou A, Phuah CL, Jessel MJ, Schwab K, Ayres AM, et al. Association between serum calcium level and extent of bleeding in patients with intracerebral hemorrhage. JAMA Neurol 2016;73:1285-90. https://doi.org/10.1001/jamaneurol.2016.2252.
- Schneider AG, Journois D, Rimmelé T. Complications of regional citrate anticoagulation: accumulation or overload?. Crit Care 2017;21. https://doi.org/10.1186/s13054-017-1880-1.
- Bernal JL, Cummins S, Gasparrini A. Interrupted time series regression for the evaluation of public health interventions: a tutorial. Int J Epidemiol 2017;46:348-55. https://doi.org/10.1093/ije/dyw098.
- Doidge JC, Harron KL. Reflections on modern methods: linkage error bias. Int J Epidemiol 2019;48:2050-60. https://doi.org/10.1093/ije/dyz203.
- Doidge JC, Morris JK, Harron KL, Stevens S, Gilbert R. Prevalence of Down’s Syndrome in England, 1998–2013: comparison of linked surveillance data and electronic health records. Int J Popul Data Sci 2020;5. https://doi.org/10.23889/ijpds.v5i1.1157.
List of abbreviations
- AKI
- acute kidney injury
- CAG
- Confidentiality Advisory Group
- CCMDS
- Critical Care Minimum Data Set
- CEA
- cost-effectiveness analysis
- CI
- confidence interval
- CMP
- Case Mix Programme
- CRRT
- continuous renal replacement therapy
- EQ-5D-3L
- EuroQol-3 Dimensions, three-level version
- ESRD
- end-stage renal disease
- HDU
- high-dependency unit
- HES
- Hospital Episode Statistics (for England)
- HRA
- Health Research Authority
- HRQoL
- health-related quality of life
- ICD-10
- International Statistical Classification of Diseases and Related Health Problems, Tenth Revision
- ICNARC
- Intensive Care National Audit & Research Centre
- ICON
- Intensive Care Outcome Network
- ICU
- intensive care unit
- INMB
- incremental net monetary benefit
- IQR
- interquartile range
- ITS
- interrupted time series
- LOS
- length of stay
- NICE
- National Institute for Health and Care Excellence
- NIHR
- National Institute for Health Research
- NWIS
- NHS Wales Informatics Service
- OPCS
- Office of Population Censuses and Surveys
- OR
- odds ratio
- PEDW
- Patient Episodes Data for Wales
- PICRAM
- Post-Intensive Care Risk-Adjusted Alerting and Monitoring
- PPI
- patient and public involvement
- QALY
- quality-adjusted life-year
- RCA
- regional citrate anticoagulation
- RCT
- randomised controlled trial
- REC
- Research Ethics Committee
- RRAM
- Renal Replacement Anticoagulant Management
- RRT
- renal replacement therapy
- SD
- standard deviation
- SHA
- systemic heparin anticoagulation
- SSC
- Study Steering Committee
- UKRR
- UK Renal Registry
Notes
-
Survey of anticoagulation use for continuous renal replacement therapy in UK adult general intensive care units
-
Renal Replacement Anticoagulant Management micro-costing cognitive ‘walk through’ data collection form
Supplementary material can be found on the NIHR Journals Library report page (https://doi.org/10.3310/ZXHI9396).
Supplementary material has been provided by the authors to support the report and any files provided at submission will have been seen by peer reviewers, but not extensively reviewed. Any supplementary material provided at a later stage in the process may not have been peer reviewed.
