Notes
Article history
The research reported in this issue of the journal was funded by PGfAR as project number RP-PG-1210-12002. The contractual start date was in September 2013. The final report began editorial review in June 2020 and was accepted for publication in June 2021. As the funder, the PGfAR programme agreed the research questions and study designs in advance with the investigators. The authors have been wholly responsible for all data collection, analysis and interpretation, and for writing up their work. The PGfAR editors and production house have tried to ensure the accuracy of the authors’ report and would like to thank the reviewers for their constructive comments on the final report document. However, they do not accept liability for damages or losses arising from material published in this report.
Permissions
Copyright statement
Copyright © 2022 Howard et al. This work was produced by Howard et al. under the terms of a commissioning contract issued by the Secretary of State for Health and Social Care. This is an Open Access publication distributed under the terms of the Creative Commons Attribution CC BY 4.0 licence, which permits unrestricted use, distribution, reproduction and adaption in any medium and for any purpose provided that it is properly attributed. See: https://creativecommons.org/licenses/by/4.0/. For attribution the title, original author(s), the publication source – NIHR Journals Library, and the DOI of the publication must be cited.
2022 Howard et al.
SYNOPSIS
Parts of this report are reproduced or adapted with permission from Howard et al. 1 This is an Open Access article distributed in accordance with the terms of the Creative Commons Attribution (CC BY 4.0) license, which permits others to distribute, remix, adapt and build upon this work, for commercial use, provided the original work is properly cited. See: http://creativecommons.org/licenses/by/4.0/. The text includes minor additions and formatting changes to the original text.
Background and overview
Many women experience mental health problems during pregnancy and the year after birth (i.e. the perinatal period),2,3 and these are associated with adverse effects on the fetus and infant, and subsequent behavioural and emotional problems in the child and adolescent,4 with additional negative impacts for other family members. At the time we developed this programme, perinatal mental health (PMH) services in England were very fragmented, despite National Institute for Health and Care Excellence (NICE) guidance,5,6 and little was known about optimal PMH service configurations. The publication of Five Year Forward View For Mental Health,7 accompanied by NHS England’s commitment to women with PMH problems,8 meant that this research occurred during a time of considerable expansion of PMH services. A phased 5-year transformation programme, backed by £365M, was under way when we obtained approvals for our research. NHS England committed to increased access to the following by 2020/21:
. . . specialist perinatal mental health support in all areas of England, allowing at least an additional 30,000 women each year to receive evidence-based treatment, closer to home, when they need it . . . the right range of specialist community and inpatient care.
NHS England. 8
This had a positive and negative impact on our research programme.
Despite this expansion, relatively little was known about the prevalence of mental disorders in early pregnancy, or how best to identify and optimally treat disorders. By 2013, maternity services had introduced two depression screening questions at antenatal booking, and it was not clear whether or not the two questions were the optimal method of detection, which is the focus of work package (WP) 1(i).
Early identification of mental disorders is recommended to facilitate early evidence-based interventions to optimise maternal and child outcomes. The extent to which generic interventions, in comparison with specialist interventions and services, are clinically effective remains unclear. In line with stepped-care approaches for depression, guided self-help (GSH) delivered by psychological well-being practitioners (PWPs) in primary care was recommended by NICE, but, to the best of our knowledge, there have been no evaluations of GSH modified for pregnancy. Therefore, we aimed to develop such materials and carry out an exploratory trial of modified GSH [WP1(ii)].
Research into the experiences of the whole care pathway for women with PMH disorders was also important and could directly feed into the new services nationally. We investigated the experiences of women and their significant others, along with the experiences of health-care professionals (WP2).
Our National Institute for Health and Care Research (NIHR) programme development grant (PDG), RP-DG-1108-10012, explored methodological issues in evaluating services for women with severe acute postnatal disorders, including the need for modified tools [WP3(i)] and the best way to evaluate mother and baby units (MBUs) [WP3(ii)]. National guidance9 stated that women needing admission postnatally should be admitted to MBUs, but large parts of the country had little or no access to these units and women were cared for either by crisis resolution teams (CRTs) or in acute inpatients wards. This geographical inequity meant that some women cannot access MBUs. Therefore, we could not investigate the clinical effectiveness and cost-effectiveness of MBUs using a randomised controlled trial (RCT) and so we used a quasi-experimental design [WP3(ii)].
Our overarching aims were to investigate (1) the clinical effectiveness and cost-effectiveness of identification and treatment of antenatal depression and other disorders, and (2) which perinatal care pathways are optimal and cost-effective for women with common and severe mental disorders, their infants and partners/significant others.
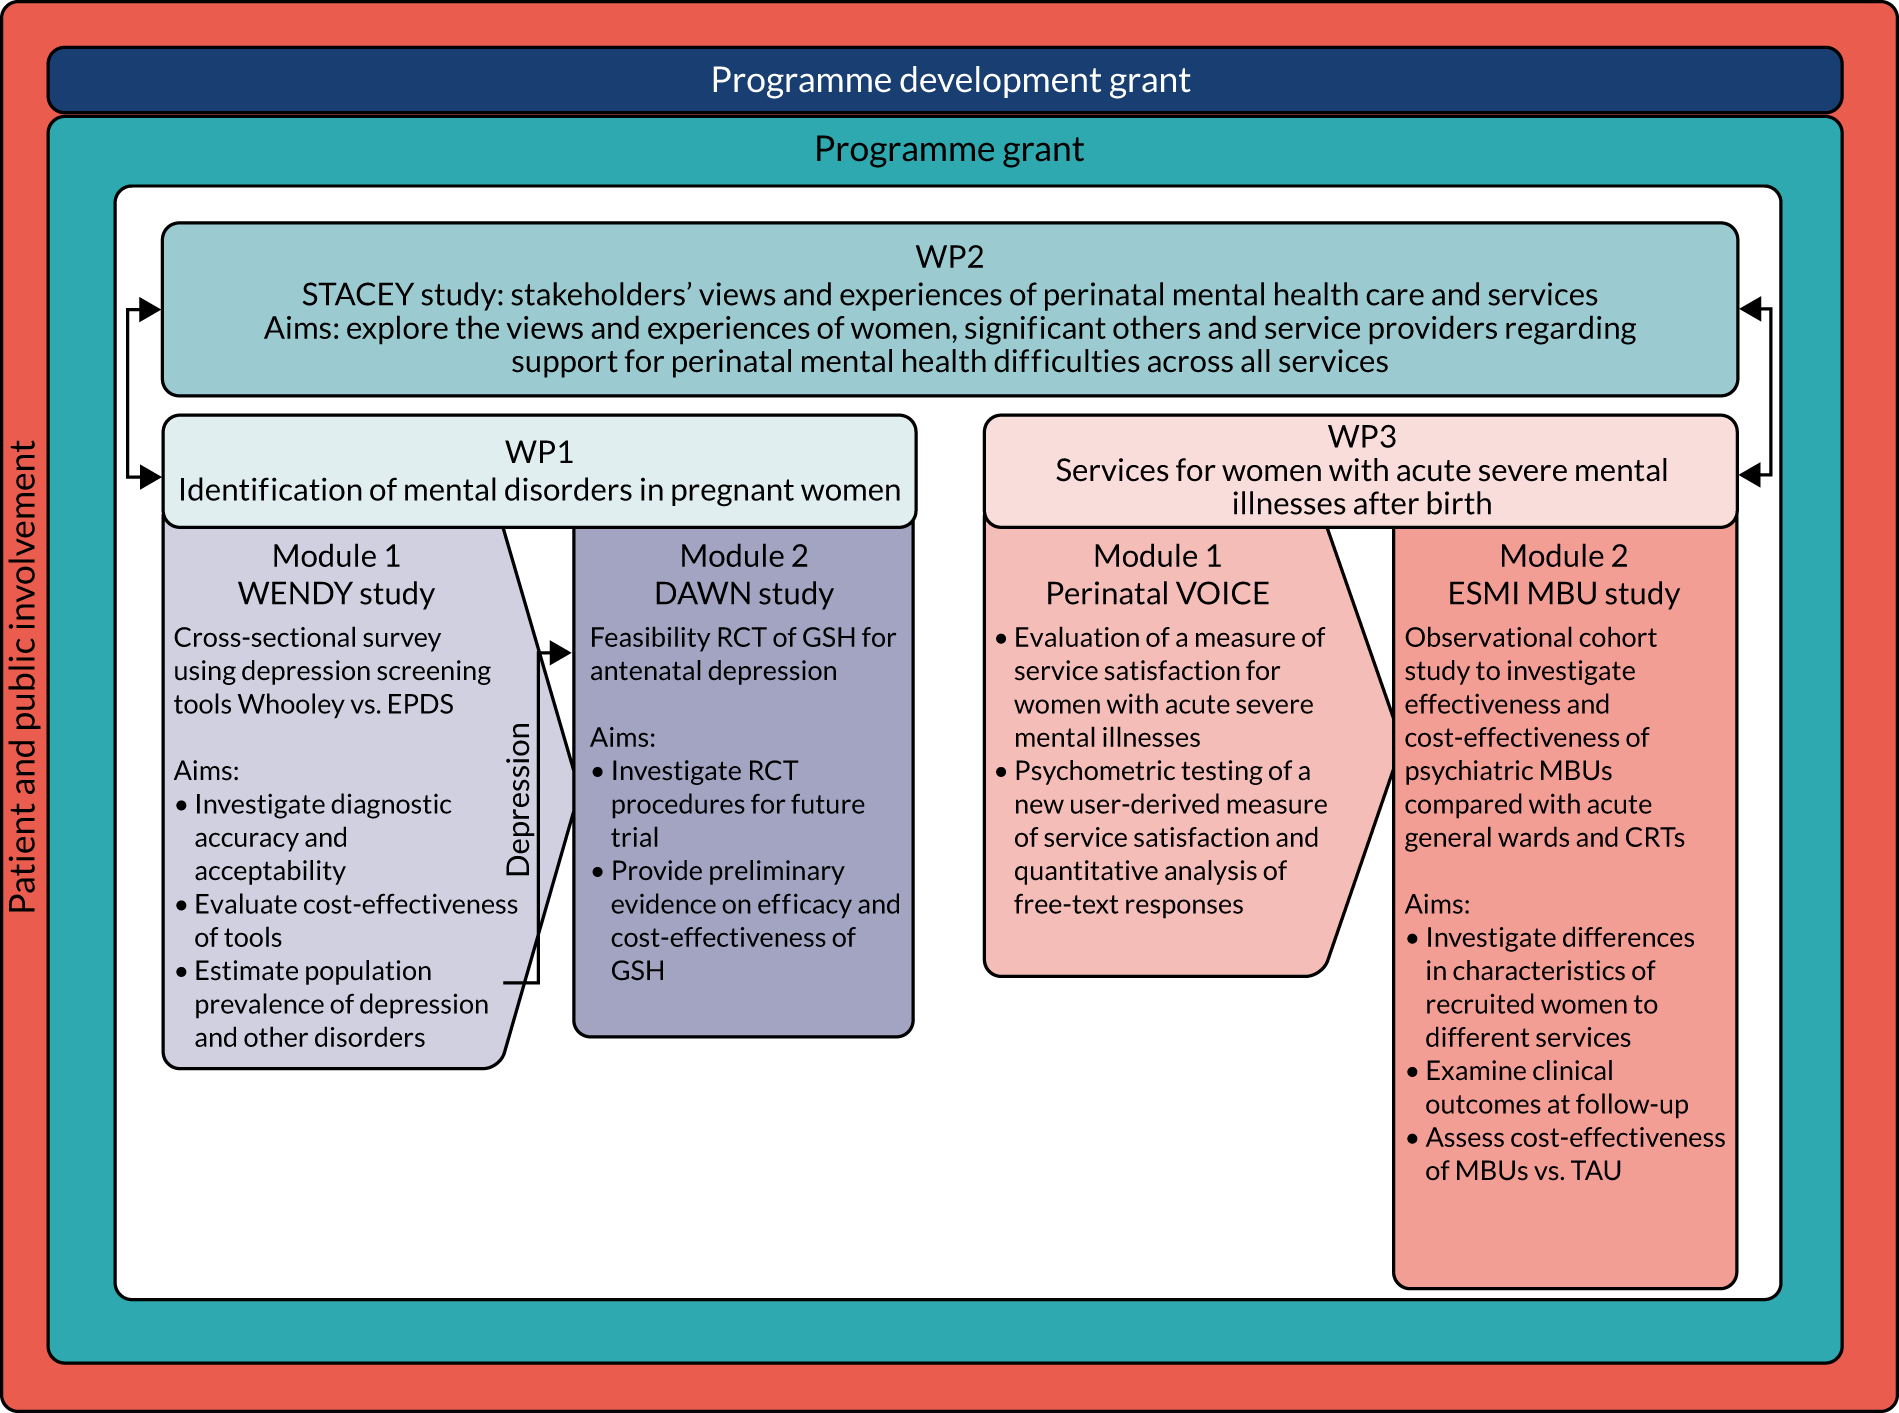
We consider that we have achieved both these aims in broad terms through a series of inter-related mixed-methods WPs (Figure 1).
FIGURE 1.
Research pathway diagram.
Patient and public involvement
Aim
We aimed to include the Perinatal Advisory Group (PAG) in all aspects of the research programme, including formulating the research questions within the PDG and providing substantial input throughout the programme.
Methods
During our earlier PDG, we set up an advisory group of service users and carers by advertising in antenatal clinics, in MBUs and via charity newsletters. We formed a PAG that met four times per year, and members were available by e-mail at other times. We included costs in the main budget to cover travel, child care and participation reimbursement. We costed in Clare Dolman’s time to run the patient and public involvement (PPI) group and help with dissemination (2 hours/week). 6
Results of patient and public involvement and extent of influence on the programme
During the grant application phase, the PAG emphasised the importance of evaluating MBUs, despite the methodological challenges. In addition, although low response rates from partners were obtained in the PDG, the PAG highlighted the importance of including partners’ experiences in our research. Data from partners/significant others were included in WP2, spanning experiences of services for mild to severe PMH disorders, and, as requested by the PAG, in WP3, on carer burden. The PAG explored ethics issues with the research team [e.g. what should be part of ‘treatment as usual’ (TAU) in WP1(ii)]. As a result, we monitored women’s symptom scores and, if they were indicative of severe illness, asked women for consent to inform their general practitioner (GP)/midwife. The PAG advised on sensitive ways to conduct interviews [e.g. on WP3 they advised researchers to refer to the ‘filmed’ mother–infant interactions as a ‘recording on an iPad’ (Apple Inc., Cupertino, CA, USA)], and this improved rates of consent for data collection. Similarly, we discussed with the PAG the replacement of the Childhood Experience of Care and Abuse Questionnaire with a briefer measure and using clinical diagnosis in WP3 instead of diagnostic assessments.
Our PAG contributed to our dissemination strategy. We held annual stakeholder events and published newsletters and policy briefs to engage professionals across the country in identifying potential study champions. We presented results regularly and included discussion panels with policy-makers, charities and PAG members. Our final stakeholder event was attended by > 100 people and resulted in > 400 tweets and > 10,000,000 Twitter impressions (URL: www.twitter.com; Twitter, Inc., San Francisco, CA, USA) [see URL: https://twitter.com/Mental_Elf/status/1176212535953035267?s=03 (accessed 10 August 2021)].
However, we struggled to increase diversity in our PAG, which comprised predominantly white women with histories of PMH problems across the diagnostic spectrum and carers. In retrospect, we should have focused on diversity earlier in the programme and actively recruited through relevant charities and ethnic minority organisations.
Work package 1(i): identification and prevalence of depression and other antenatal mental disorders – WENDY
Background
For further background reading please see Howard et al. 10 and Nath et al. 11
During pregnancy, women have frequent contact with health-care professionals, but, despite this, PMH disorders are unrecognised and untreated. 5 As these contacts provide a unique opportunity to identify PMH problems, it is important to establish the optimum case identification method. NICE5 has recommended that health-care professionals consider using the Whooley questions12 to identify depressive symptoms in the perinatal period (Box 1). Research in primary care with non-pregnant populations found that answering ‘yes’ to either or both Whooley questions detected most cases of depression. 12 Inclusion of these questions at the first antenatal appointment had been rolled out in most English maternity services by 2014. However, it was unclear whether or not use of the Whooley questions is the optimal method. The 10-item self-complete Edinburgh Postnatal Depression Scale (EPDS)13 is used internationally in maternity services and could be an alternative; however, antenatal validation has been primarily in the second and third trimesters. 14 The cost-effectiveness of the different approaches to case identification was also unclear.
-
During the past month, have you often been bothered by feeling down, depressed or hopeless? Yes/no.
-
During the past month, have you often been bothered by having little interest or pleasure in doing things? Yes/no.
Aims
The aims of the WEll-being in pregNancy stuDY (WENDY) were to:
-
investigate, at antenatal booking, the diagnostic accuracy and acceptability of the Whooley questions compared with the EPDS
-
estimate prevalence of depression and other disorders in early pregnancy
-
evaluate relative cost-effectiveness of the different tools.
Methods
Design
A cross-sectional survey was used, drawing a sample stratified by responses to the Whooley questions asked by midwives [i.e. Whooley questions positive (W+) and Whooley questions negative (W–)]. All women responding ‘yes’ to one or both questions and a random sample of women responding ‘no’ were invited to participate.
Measures
We planned to use the Clinical Interview Schedule – Revised,15 but it did not cover all disorders [e.g. post-traumatic stress disorder (PTSD)]. Therefore, we followed our Programme Steering Committee’s advice and used the Structured Clinical Interview for Diagnostic and Statistical Manual of Mental Disorders Axis I Disorders (SCID-I), a semistructured researcher-administered diagnostic interview. 16 (The Structured Clinical Interview for Diagnostic and Statistical Manual of Mental Disorders-5 was not available when the study began.) Other measures included the EPDS,13 Generalised Anxiety Disorder-2 (GAD-2),17 the Alcohol Use Disorders Identification Test (AUDIT),18 the Drug Use Disorders Identification Test (DUDIT),19 Short Form questionnaire-36 items (SF-36),20,21 EuroQol-5 Dimensions, five-level version (EQ-5D-5L),22 and a semistructured, short, audio-taped interview for acceptability of being asked about depression at the antenatal booking. 23
Sample size
A power calculation was undertaken using simulation with bootstrap estimation of confidence intervals (CIs) for the weighted estimators of sensitivity, specificity and prevalence that corrected for the sample stratification. We assumed an overall prevalence of depression of 9%, a Whooley sensitivity of 0.95 and a Whooley specificity of 0.89. Screening 6000 women, 66% of whom consent to participate, and sampling 54% of the W+ women (i.e. n = 400) and 6% of the W– women (i.e. n = 200), would result in 600 women for interview. In this sample of women, we would expect 185 to be depressed. Assuming a sensitivity of 0.80 and a specificity of 0.71, the width of the 95% CI for the EPDS sensitivity would be 0.19 and that for specificity would be 0.13. A conservative estimate of power based on the 185 women would have > 90% power for a 0.8 and 0.65 sensitivity and specificity difference, respectively (comparing Whooley and the EPDS).
Adjustments to sampling fractions were necessary, as fewer W+ women than anticipated were recruited. The original recruitment target of 200 W– women was reached. After discussion with the Data Monitoring and Ethics Committee, we aimed for 300 W+ women and 300 W– women so that both arms could be recruited over the same period, with random sampling of W– women of 1 : 6. A total of 545 women were recruited, which was within 10% of our target.
Analysis
We used inverse probability weights to provide population estimates of mental disorders that account for bias induced by stratified sampling and missing SCID-I diagnoses. We used bootstrap resampling of the weighted estimators for calculation of most CIs and p-values. 24
We planned to investigate use of multiple imputation methods, which can yield more efficient estimates. This was not possible because of changes at the maternity unit that resulted in comprehensive background data being unavailable.
Qualitative analysis was conducted using thematic and framework approaches25–27 and has been published. 23
Economic analysis
Economic modelling was used to explore the relative cost-effectiveness of the Whooley questions, the EPDS, and the Whooley followed by the EPDS, in comparison with a hypothetical ‘no-screen instrument’ cohort. A decision tree was developed to model possible identification and treatment pathways from the first antenatal appointment to 3 months post partum. Data on sensitivity and specificity of the tools were taken from our cohort. Parameters for the no-screen option were taken from relevant literature and supplemented by expert (co-investigator) consensus (see Appendix 2).
The economic analysis took the NHS and Personal Social Services perspective preferred by NICE,28 with outcome-measured quality-adjusted life-years (QALYs). Cost-effectiveness was assessed in terms of incremental cost per true-positive case detected and incremental cost per QALY. Model parameters were entered into the model with associated probability distributions to explore uncertainty using Monte Carlo simulation. Probabilistic sensitivity analysis explored robustness of the model and the impact of alternative model assumptions. See Appendix 2 for detailed methods.
Following discussion with the funding panel about limited evidence on the optimal tool for use in this population, we additionally explored the comparative psychometric properties29 of the EQ-5D-5L22 and Short Form questionnaire-6 Dimensions (SF-6D). 20
Results
Tables 1 and 2 provide key characteristics of participants. The flow of participants can be seen in Figure 2 (see Appendix 1 for the recruitment chart).
| Sociodemographic | Whooley status, n (%) | Total sample (N = 545), n (%) | |
|---|---|---|---|
| W+ (N = 287) | W– (N = 258) | ||
| Age (years) (n = 545) | |||
| 16–24 | 44 (15.3) | 12 (4.7) | 56 (5.6) |
| 25–29 | 53 (18.5) | 48 (18.6) | 101 (18.6) |
| 30–34 | 88 (30.7) | 91 (35.3) | 179 (34.9) |
| 35–39 | 78 (27.2) | 85 (33.0) | 163 (32.4) |
| ≥ 40 | 24 (8.4) | 22 (8.5) | 46 (8.5) |
| Ethnicity (n = 545) | |||
| White (including English, Welsh, Scottish, Irish, British, other white) | 140 (48.8) | 144 (55.8) | 284 (55.2) |
| Black (including British, Caribbean, African, other black) | 99 (34.5) | 78 (30.2) | 177 (30.6) |
| Mixed (including white and black Caribbean, white and black African, white and Asian, other mixed/multiple ethnicity) | 15 (5.2) | 8 (3.1) | 23 (3.3) |
| Asian (including British Indian, British Bangladeshi, British Pakistani, British Chinese, other Asian) | 14 (4.9) | 11 (4.3) | 25 (4.3) |
| Other (including Arab, gypsy/traveller, other) | 19 (6.6) | 17 (6.6) | 36 (6.6) |
| Born in UK (n = 545) | |||
| Yes | 154 (53.7) | 129 (50.0) | 262 (49.7) |
| Yearly household income (£) (n = 540) | |||
| 0–5475 | 34 (12.0) | 13 (5.1) | 47 (5.7) |
| 5476–14,999 | 17 (6.0) | 13 (5.1) | 30 (5.2) |
| 15,000–30,999 | 43 (15.1) | 28 (10.9) | 71 (11.3) |
| 31,000–45,999 | 27 (9.5) | 33 (12.9) | 60 (12.6) |
| 46,000–60,999 | 29 (10.2) | 34 (13.3) | 63 (13.0) |
| ≥ 61,000 | 60 (21.1) | 85 (33.2) | 145 (32.1) |
| Prefer not to say | 74 (26.1) | 50 (19.5) | 124 (20.1) |
| Highest qualification (n = 545) | |||
| GCSE or below | 46 (16.0) | 19 (7.4) | 65 (8.2) |
| A Levels or vocational training | 86 (30.0) | 68 (26.4) | 154 (26.7) |
| University or professional | 155 (54.0) | 171 (66.3) | 326 (65.2) |
| Employment status (n = 543) | |||
| Full-time work | 101 (35.4) | 123 (47.7) | 224 (46.6) |
| Part-time work | 71 (24.9) | 54 (20.9) | 125 (21.3) |
| Student | 11 (3.9) | 11 (4.3) | 22 (4.2) |
| Unemployed | 41 (14.4) | 23 (8.9) | 64 (9.4) |
| Not working (looking after home or because of illness) | 40 (14.0) | 36 (14.0) | 76 (14.0) |
| Other | 21 (7.4) | 11 (4.3) | 32 (4.5) |
| Relationship status (n = 545) | |||
| Single | 43 (15.0) | 19 (7.4) | 62 (8.1) |
| Partnered/married | 237 (82.6) | 237 (91.9) | 474 (91.0) |
| Separated/divorced/widowed | 7 (2.4) | 2 (0.8) | 9 (0.9) |
| Living status (n = 542) | |||
| Alone | 46 (16.1) | 25 (9.7) | 71 (10.3) |
| With spouse/partner | 175 (61.4) | 202 (78.6) | 377 (77.0) |
| With parents, friends or family | 38 (13.3) | 20 (7.8) | 58 (8.3) |
| Other | 26 (9.1) | 10 (3.9) | 36 (4.4) |
| Clinical characteristic | Whooley status | Total sample (N = 545) | |
|---|---|---|---|
| W+ (N = 287) | W– (N = 258) | ||
| EPDS score at baseline (n = 540), n (%) | |||
| < 13 | 165 (58.5) | 236 (91.5) | 401 (88.5) |
| ≥ 13 | 117 (41.5) | 22 (8.5) | 139 (11.5) |
| Late booking (> 12 weeks) (n = 545), n (%) | 58 (20.2) | 37 (14.3) | 95 (14.9) |
| Planned pregnancy (n = 545), n (%) | 164 (57.1) | 192 (74.4) | 356 (72.9) |
| Miscarriages/stillbirths (n = 543), n (%) | 84 (29.5) | 85 (33.0) | 169 (32.6) |
| Terminations (n = 544), n (%) | 96 (33.6) | 73 (28.3) | 169 (28.8) |
| Current smoker (n = 545), n (%) | 18 (6.3) | 4 (1.5) | 22 (2.0) |
| BMI (kg/m2) (n = 545), n (%) | |||
| Low (< 18.5) | 17 (5.9) | 12 (4.7) | 29 (4.8) |
| Normal (18.5–24.9) | 128 (44.6) | 139 (53.9) | 267 (53.0) |
| Overweight (25–29.9) | 48 (16.7) | 38 (14.7) | 86 (14.9) |
| Obese (> 30) | 94 (32.8) | 69 (26.7) | 163 (27.3) |
| AUDIT score (n = 512), mean (SD) | 2.68 (3.05) | 2.67 (3.14) | 2.68 (3.09) |
| DUDIT score (n = 529), mean (SD) | 0.59 (2.42) | 0.27 (1.33) | 0.43 (1.97) |
| Immigration status (n = 283), n (%) | |||
| UK national | 35 (22.7) | 33 (25.6) | 68 (25.3) |
| EEA citizen | 39 (25.3) | 38 (29.5) | 77 (29.1) |
| Indefinite leave to remain | 28 (18.2) | 21 (16.3) | 49 (16.5) |
| Exceptional leave to remain or temporary admission | 21 (13.6) | 11 (8.5) | 32 (9.0) |
| Awaiting initial decision or appealing initial refusal | 16 (10.4) | 3 (2.3) | 19 (3.1) |
| Other (family visas, temporary visas, unknown or overstayers) | 15 (9.7) | 23 (17.8) | 38 (17.1) |
FIGURE 2.
Flow chart of women: WENDY. DNA, did not attend.

Key findings
The weighted estimated population prevalence of mental disorders in early pregnancy are presented in Table 3.
| SCID-I mental disorder | Prevalence in WENDY sample (%) (95% CI) |
|---|---|
| Major depression | 11 (8 to 14) |
| Mild depression | 6 (4 to 9) |
| Moderate depression | 4 (3 to 8) |
| Severe depression | 0.1 (0 to 0.3) |
| Mixed anxiety/depression | 0.4 (0.2 to 0.6) |
| Any anxiety disorder | 15 (11 to 19) |
| Generalised anxiety disorder | 5 (3 to 6) |
| Panic disorder | 0.2 (0.03 to 0.3) |
| Agoraphobia without panic disorder | 0.4 (0 to 2) |
| Social phobia | 4 (2 to 6) |
| Specific phobia | 8 (5 to 11) |
| Obsessive–compulsive disorder | 2 (1 to 4) |
| PTSD | 0.8 (0 to 1) |
| Eating disorders | 2 (0.4 to 3) |
| Bipolar disorder type 1 | 0.03 (0 to 0.2) |
| Bipolar disorder type 2 | 0.03 (0 to 0.2) |
| Borderline personality disorder | 0.7 (0 to 1) |
| Any SCID-I mental disorder | 27 (22 to 32) |
The diagnostic accuracy of the Whooley questions was as follows: a weighted sensitivity of 0.41, a specificity of 0.95, a positive predictive value (PPV) of 0.45, a negative predictive value (NPV) of 0.93, a positive likelihood ratio of 8.2, a negative likelihood ratio of 0.62 and an area under the receiver operating characteristic curve of 0.37 (95% CI 0.34 to 0.40). For the EPDS, using a cut-off point score of 12 (out of 13), diagnostic accuracy was as follows: a weighted sensitivity of 0.59, a specificity of 0.94, a PPV of 0.52, a NPV of 0.95, a positive likelihood ratio of 9.8, a negative likelihood ratio of 0.44 and an area under the receiver operating characteristic curve of 0.89 (95% CI 0.88 to 0.90). For identification of depression, EPDS was more accurate than the Whooley questions. We also found that older age was associated with decreased diagnostic accuracy for the EPDS. 10
As the Whooley questions are the main mental health screen used by maternity services, we also examined the diagnostic accuracy of both the Whooley questions and the EPDS for ‘any mental disorder’, and found that both could be useful in detecting mental disorders, with a likelihood ratio of > 5 in each case. 10
Cost-effectiveness
In terms of detection of depression or any mental disorder, both the Whooley questions and the EPDS appeared to be cost-effective compared with a ‘no-screen’ option and the combined Whooley questions and EPDS option. The Whooley questions were the most cost-effective option at low values of willingness to pay per true-positive case detected (£0–250), and the EPDS was the most cost-effective option at higher willingness-to-pay values (> £250). The analysis for depression (but not for any mental disorder) was sensitive to assumptions and data inputs, such that the ‘no-screen’ option had the highest probability of being cost-effective at willingness-to-pay values of > £600. The Whooley questions remained the most cost-effective option at low values of willingness to pay and the EPDS was the most cost-effective option at willingness-to-pay values between £250 and £600.
In terms of cost per QALY, the ‘no-screen’ option was dominated by the other three options, and the Whooley questions, EPDS, and Whooley questions followed by the EPDS each had a probability of being cost-effective of around 30% at willingness-to-pay values of £0 to £50,000 per QALY. See Appendices 2 and 3 for detailed economic methods and results, respectively.
Psychometric comparison of the EQ-5D-5L and SF-6D
We found a lack of concordance between the EQ-5D-5L and the SF-6D. The EQ-5D-5L scores tended to be higher than SF-6D scores in individuals with better health states, whereas the SF-6D scores tended to be higher than EQ-5D-5L scores in individuals with poorer health states. Convergent and known-group validity were comparable between the two measures. Longitudinally, women who recovered showed larger increases in SF-6D utilities than those who did not recover at follow-up. With the EQ-5D-5L, this was not the case. In addition, ceiling effects were more apparent in the EQ-5D-5L. Therefore, the effectiveness of PMH interventions may be better captured by the SF-6D than by the EQ-5D-5L. See Heslin et al. 29 for further details.
Acceptability of the Whooley questions
Most women found the Whooley questions enquiry acceptable, although those with a history of or a current PMH problem and/or a history of abuse found enquiry less acceptable because of emotional responses triggered by the questions and response to disclosures. Women wanted to be asked simple questions about mental health, to have sufficient time to discuss issues and to receive normalising and well-informed responses from midwives. In addition, there were some reported concerns regarding the consequences of disclosure (e.g. information-sharing).
See Yapp et al. 23 for further details.
Strengths and limitations
We used a gold standard instrument for the diagnosis of depression and other disorders, with translated instruments and a language interpreter where required, making our study representative of the base population. Unlike most previous studies,5,30 our study established the diagnostic accuracy of the Whooley questions, as asked by midwives themselves, and the stratified sampling design enabled us to efficiently investigate the diagnostic accuracy of the tools. However, use of a single maternity site limits generalisability. We were unable to meet the recruitment target of one in every three women having a mental disorder (comparable with W– women) and, although the population was broadly representative, selection bias is likely. Limitations of the economic component include model assumptions, some parameters coming from expert clinical opinion (as no evidence existed to complete certain parameters) and questionable generalisability due to most screening tool sensitivity and specificity data coming from one study.
Additional studies included:
-
an examination of the effectiveness of the GAD-2 in detecting anxiety disorders31
-
a NIHR Biomedical Research Council-funded PhD (Doctor of Philosophy) on migration and antenatal mental health32
-
a study of PMH disorders in women aged < 25 years compared with women aged > 24 years33
-
a study of the history of self-harm and mental disorders in pregnancy34
-
a Nuffield Foundation-funded add-on study examining maternal personality traits, anxiety disorders, antenatal depressive symptoms and the post-partum mother–infant relationship35,36
-
international individual patient data meta-analyses examining diagnostic accuracy of the EPDS. 37,38
Recommendations for future work
Replications of our studies in other services are needed, particularly within the new service structures and, specifically, they should address whether or not those who are identified and referred in early pregnancy have better mental health and fetal/infant health outcomes postnatally.
Work package 1(ii): the DAWN study
See also study protocol39 and published results. 40
Background
In WP1(i) we found that ≈ 11% of women had depression in early pregnancy. 2,10 International guidelines5,41 for antenatal depression recommend that cognitive–behavioural therapy-based GSH should be offered as the first step in management of mild to moderate depression. GSH is usually delivered in England by PWPs in Improving Access to Psychological Therapies (IAPT) services. 42
Aims
-
To establish that the trial procedures worked so that a Phase III trial could follow.
-
To provide evidence on the efficacy of a GSH intervention delivered by PWPs for mild to moderate antenatal depression compared with TAU.
-
To provide preliminary evidence on whether or not other outcomes improve.
-
To explore if antenatal GSH is likely to be cost-effective compared with TAU.
Methods
The DAWN (Depression: an exploratory parallel-group randomised controlled trial of Antenatal guided self-help for WomeN) study was a Phase II exploratory RCT with two parallel groups and a primary end point of EPDS symptoms at 14 weeks post randomisation, initially based in one maternity unit in south-east London and then extended to five units.
Intervention
A GSH workbook was developed. The workbook was adapted from current materials for depression, supplemented with a literature review and input from an expert panel and PAG. Two half-time PWPs were seconded from local IAPT services trained and supervised by a perinatal clinical psychologist. The intervention included an initial face-to-face session, followed by up to eight 30-minute sessions and an additional session at 6–8 weeks post delivery.
Sample size calculation
Assuming a correlation of 0.4 between baseline and outcome symptom score and a two-arm parallel-group design with 52 women in each arm, the Stata® (StataCorp LP, College Station, TX, USA) procedure sampsi gave 79% power to detect a difference of 0.5 standard deviations (SDs) using analysis of covariance and a two-tailed test using a 95% significance level. For preliminary evidence on efficacy and RCT feasibility, we aimed to recruit 110 women. 43
Economic evaluation methods
A cost-effectiveness analysis was conducted at the 3-month post-delivery follow-up point, taking an NHS/Personal Social Services perspective that is preferred by NICE. 44 QALYs were calculated using the SF-6D. 45 We calculated area-under-the-curve (AUC) values for QALYs, with linear interpolation between assessments. 43 The intervention was calculated using a micro-costing approach (see Trevillion et al. 40 for details). Data on the use of all other health and social care services were collected using the Adult Service Use Schedule (AD-SUS). 46 Cost-effectiveness was explored with the net benefit approach. Uncertainty around costs and cost-effectiveness were explored using cost-effectiveness acceptability curves (CEACs). 47
A secondary analysis was performed, substituting the SF-6D with the EQ-5D-5L measure of health-related quality of life. 22
See the study protocol39 and published results40 for full details.
Results
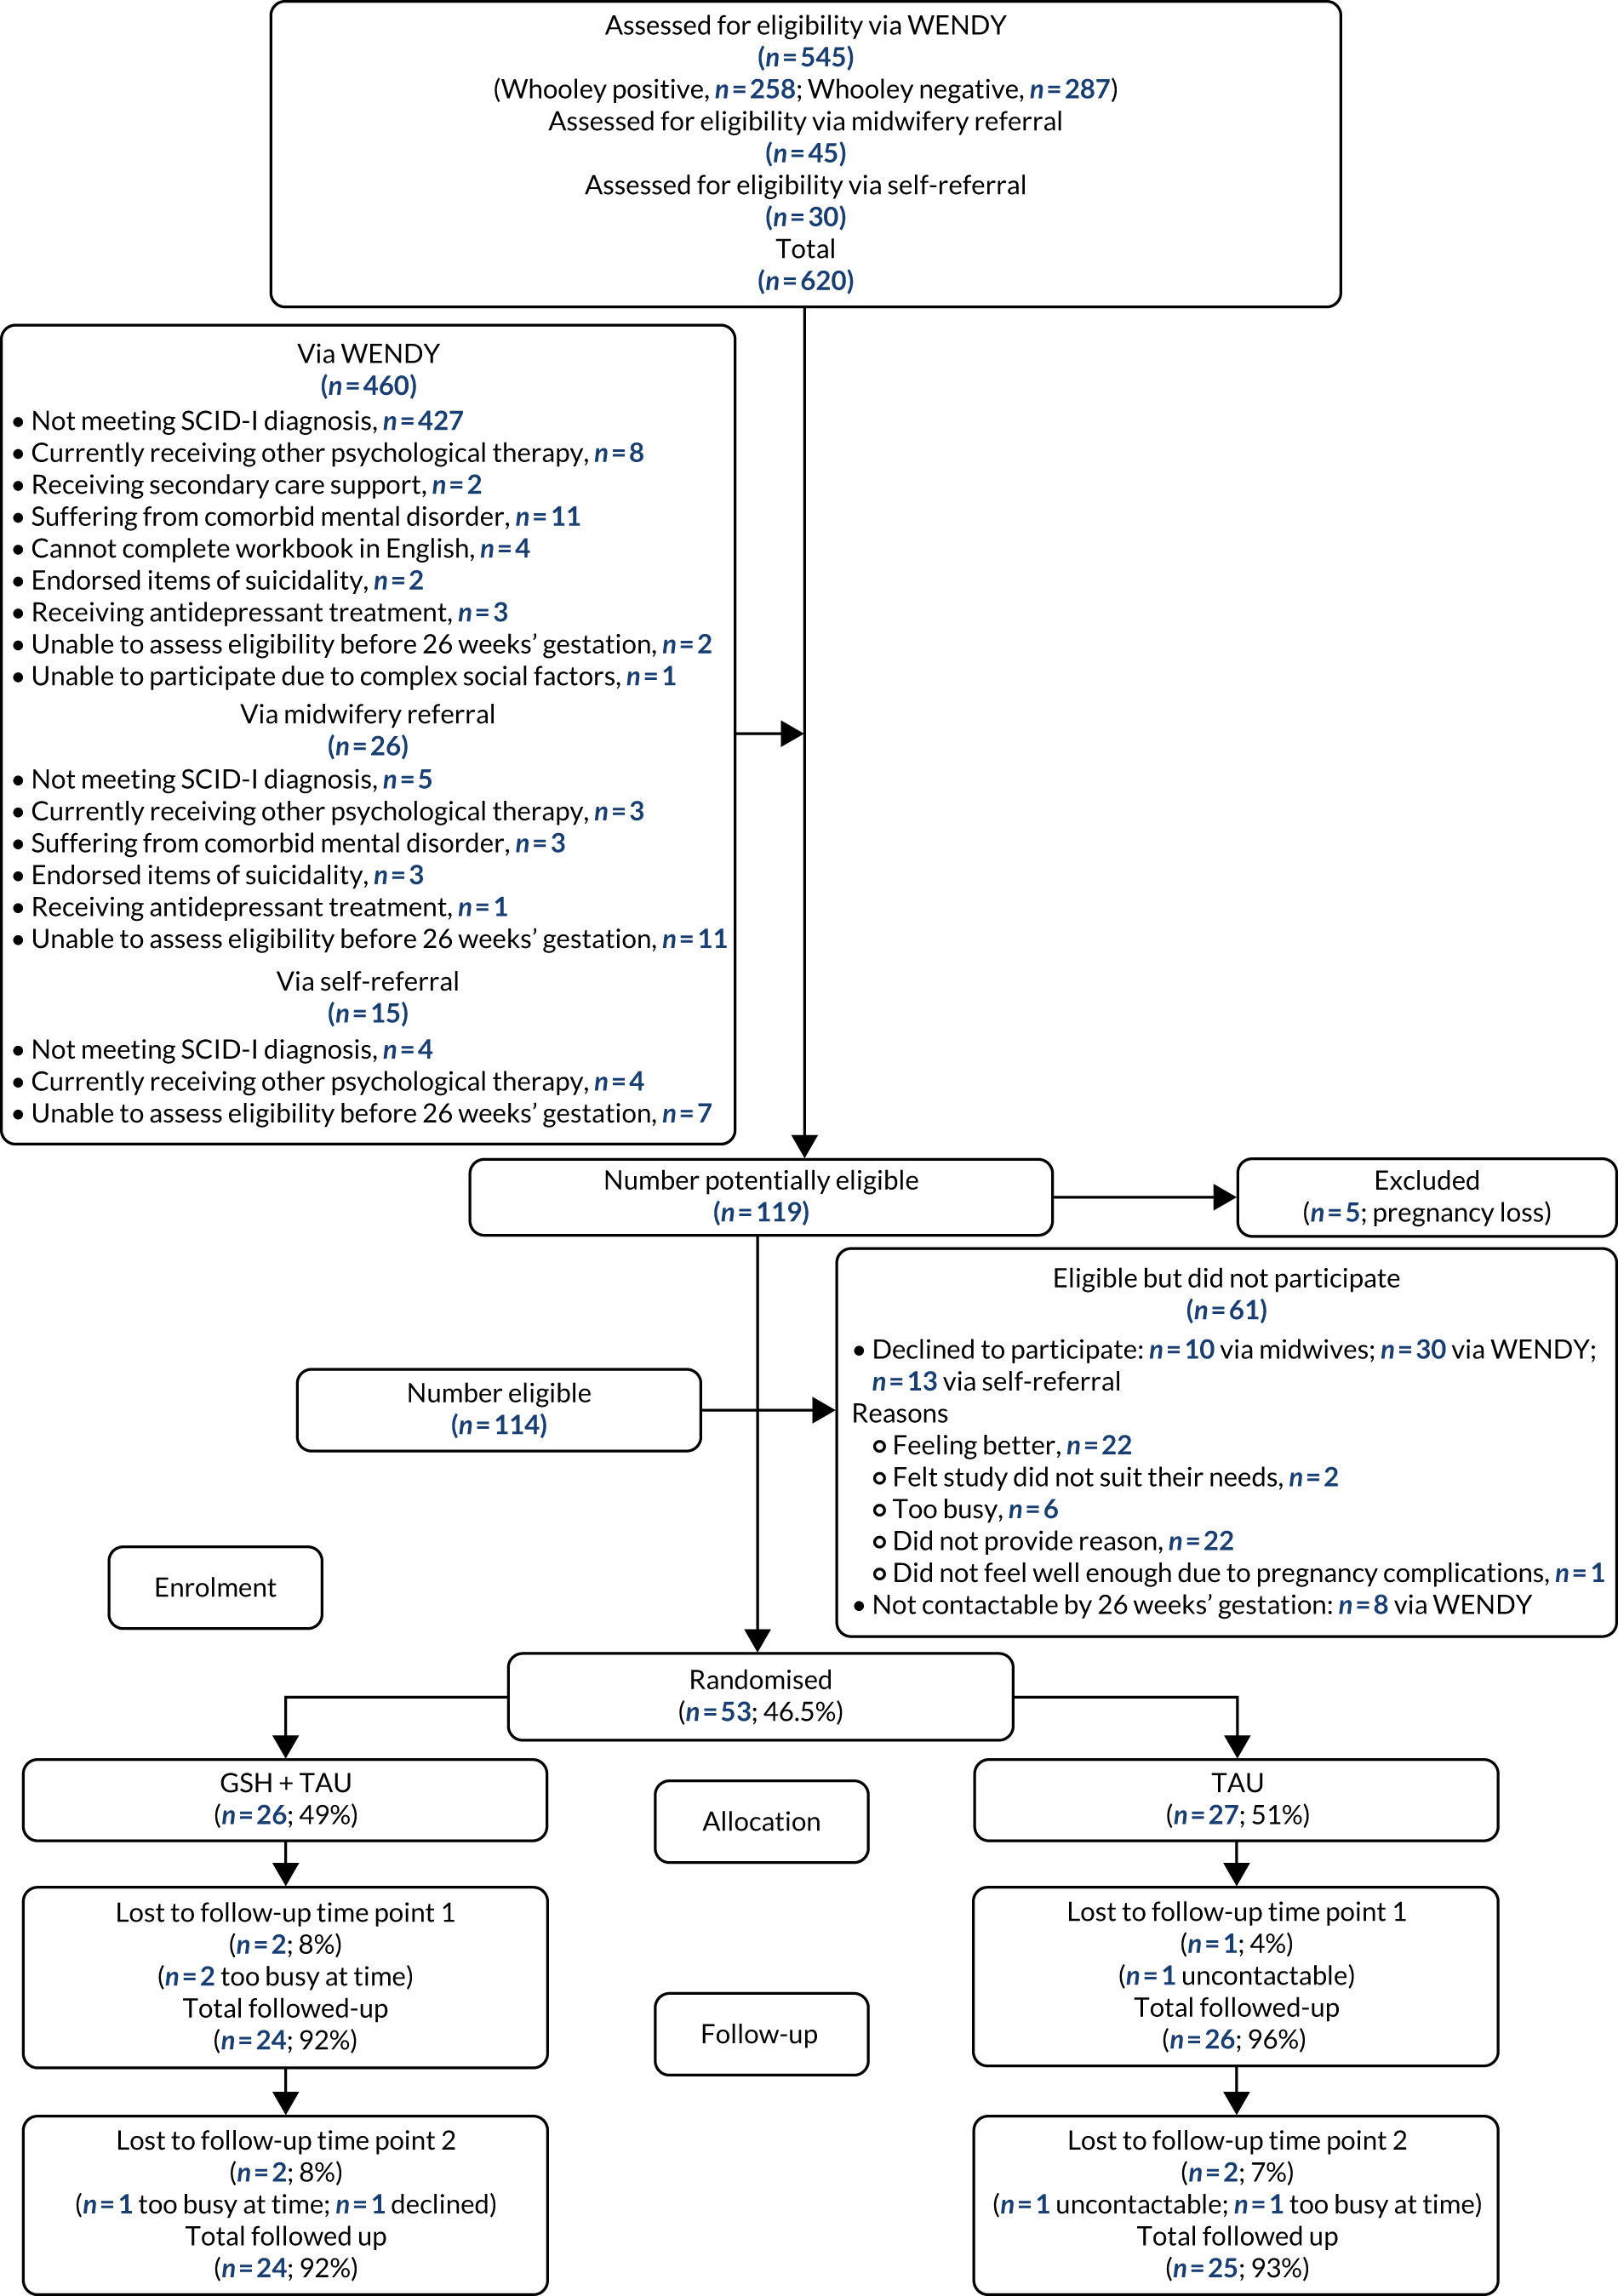
Fifty-three women (46.5%) were randomised, with 26 women receiving GSH and 27 women receiving TAU (Figure 3). We were unable to reach our recruitment target, despite offering home visits at evenings/weekends, attending workshops aimed at expectant parents and antenatal staff meetings to advertise the study, and extending the recruitment period and recruitment sites. During the trial recruitment period, new services led to midwives referring more women directly to IAPT. After discussion with the Trial Steering Committee and Independent Data Monitoring and Ethics Committee, we agreed that further extensions to the recruitment period would be unhelpful and costly (see Appendix 4). Demographic and clinical characteristics of participants are shown in Tables 4 and 5.
FIGURE 3.
Flow chart of women: the DAWN study.
| Demographic | Treatment arm | Overall | |
|---|---|---|---|
| GSH (plus usual care) | TAU | ||
| Age group (years) (N = 53), n (%) | |||
| < 25 | 3 (11.54) | 2 (7.41) | 5 (9.43) |
| 25–29 | 5 (19.23) | 3 (11.11) | 8 (15.09) |
| 30–39 | 18 (69.23) | 18 (66.67) | 36 (67.92) |
| ≥ 40 | 0 (0) | 4 (14.81) | 4 (7.55) |
| Ethnicity (N = 53), n (%) | |||
| White | 18 (69.23) | 17 (62.96) | 35 (66.04) |
| Black | 7 (26.92) | 7 (25.93) | 14 (26.42) |
| Asian/mixed/other | 1 (3.85) | 3 (11.11) | 4 (7.55) |
| Gestational age (weeks) at baseline visit (n = 49) | |||
| Mean (SD) | 10 (1.76) | 11.1 (2.19) | 10.6 (2.06) |
| Minimum, maximum | 7, 15 | 8, 17 | 7, 17 |
| Employment status (N = 53), n (%) | |||
| Working | 23 (88.46) | 21 (77.78) | 44 (83.02) |
| Student | 1 (3.85) | 0 (0) | 1 (1.89) |
| Unemployed/homemaker/not working because of illness/other | 2 (7.69) | 6 (22.22) | 8 (15.10) |
| Income (£) (N = 45), n (%) | |||
| < 15000 | 6 (24) | 1 (5) | 7 (15.56) |
| 15,000–30,999 | 5 (20) | 3 (15) | 8 (17.78) |
| 31,000–45,999 | 8 (32) | 2 (10) | 10 (22.22) |
| 46,000–60,999 | 0 (0) | 7 (35) | 7 (15.56) |
| ≥ 61,000 | 6 (24) | 7 (35) | 13 (28.89) |
| Living situation (N = 53), n (%) | |||
| Alone | 5 (19.23) | 5 (18.52) | 10 (18.87) |
| Spouse/partner | 19 (73.08) | 18 (66.67) | 37 (69.81) |
| Parents/family/other | 2 (7.69) | 4 (14.82) | 6 (11.32) |
| Relationship status (N = 53), n (%) | |||
| Single | 5 (19.23) | 4 (14.81) | 9 (16.98) |
| Partner not cohabiting | 3 (11.54) | 5 (18.52) | 8 (15.09) |
| Cohabiting/married | 18 (69.23) | 18 (66.67) | 36 (67.92) |
| Immigration status (N = 53), n (%) | |||
| UK national | 19 (73.08) | 17 (62.96) | 36 (67.92) |
| EEA citizen | 4 (15.38) | 3 (11.11) | 7 (13.21) |
| Leave to remain | 2 (7.69) | 4 (14.81) | 6 (11.32) |
| Temporary admission/awaiting initial decision | 1 (3.85) | 3 (11.11) | 4 (7.55) |
| Education (N = 53), n (%) | |||
| None/only school qualifications | 4 (15.38) | 4 (14.81) | 8 (15.09) |
| Training/higher certificate/diploma | 6 (23.08) | 8 (29.63) | 14 (26.42) |
| Degree/postgraduate | 16 (61.54) | 15 (55.56) | 31 (58.49) |
| Other children (N = 53), n (%) | |||
| None | 16 (61.54) | 11 (40.74) | 27 (50.94) |
| One | 6 (23.08) | 13 (48.15) | 19 (35.85) |
| Two or more | 4 (15.38) | 3 (11.11) | 7 (13.21) |
| Clinical characteristic | Treatment arm | Overall | |
|---|---|---|---|
| GSH (plus usual care) | TAU | ||
| EPDS score (N = 52) | |||
| Median (IQR) | 15 (11–18) | 15 (11–17) | 15 (11–17.5) |
| Minimum, maximum | 2, 25 | 4, 21 | 4, 25 |
| PHQ-9 depression (score ≥ 10) (N = 52), n (%) | 12 (46.15) | 15 (57. 69) | 27 (51.92) |
| GAD-7 anxiety (score ≥ 8) (N = 52), n (%) | 13 (52) | 16 (59.26) | 29 (55.77) |
| Smoking (ever) (N = 53), n (%) | 17 (65.38) | 14 (51.85) | 31 (58.49) |
| Smoking (since pregnant) (N = 53), n (%) | 2 (7.69) | 0 (0) | 2 (3.77) |
| Drinking (AUDIT scale score) (N = 51) | |||
| Median (IQR) | 2 (1–6) | 2 (0–4) | 2 (0–5) |
| Minimum, maximum | 0, 12 | 0, 9 | 0, 12 |
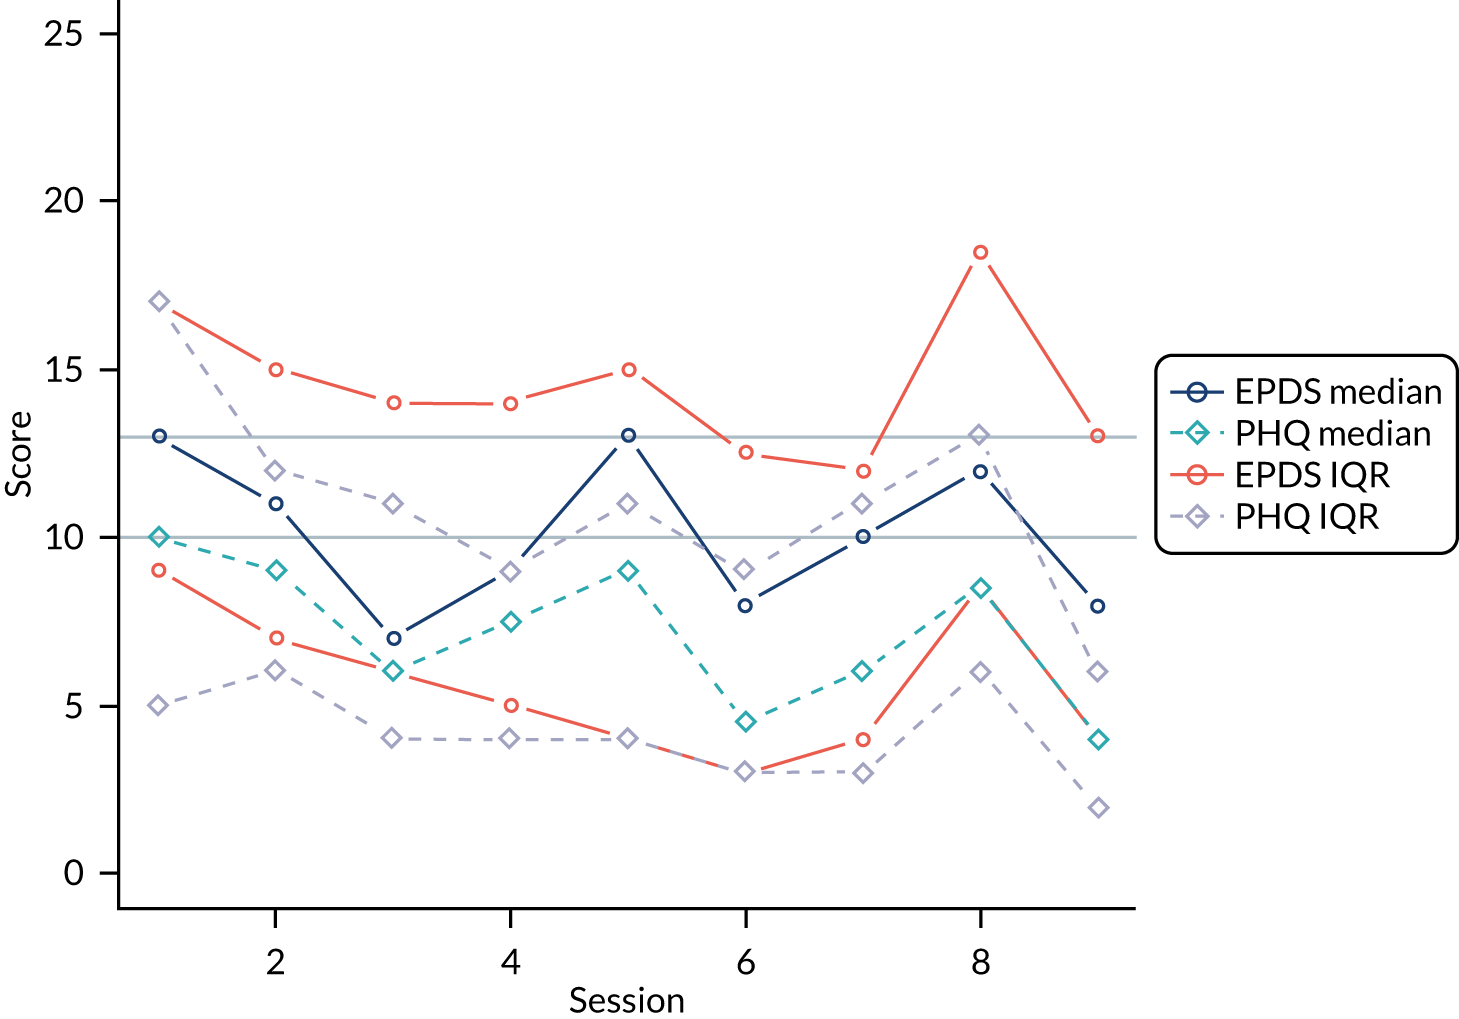
Sixty-nine per cent (n = 18) of women attended at least four sessions of GSH. The outcome measures collected by PWPs at each session delivered to women in the GSH group are summarised for each session in Figure 4.
FIGURE 4.
Patient Health Questionnaire-9 items and EPDS medians and interquartile ranges (IQRs) for each session for the GSH arm. Horizontal lines represent depression cut-off points for the Patient Health Questionnaire-9 items and the EPDS.
At 14 weeks post randomisation, median EPDS scores in the GSH and TAU groups were 8 and 12, respectively (effect size –0.64, 95% CI –1.30 to 0.06; p = 0.066), a clinically significant difference. No statistically significant differences were observed for the secondary outcomes.
Infant birth outcomes
As sample sizes were small, further analysis was not undertaken (Table 6).
| Outcome data | Treatment arm | |
|---|---|---|
| GSH (plus usual care) | TAU | |
| Babies delivered in this pregnancy (N = 51), n (%) | 24 (96) | 26 (100) |
| Birth weight (g) (N = 50) | ||
| Median (IQR) | 3175 (3005–3525) | 3485 (3155–3860) |
| Minimum, maximum | 2360, 4060 | 1810, 4160 |
| Sex (N = 51), n (%) | ||
| Male | 10 (38.46) | 9 (34.62) |
| Female | 16 (61.54) | 17 (65.38) |
| Gestational age, n (%) | ||
| < 37 weeks | 2 (8) | 1 (3.85) |
| ≥ 37 weeks | 23 (92) | 25 (96.15) |
| Apgar score at 1 minute (N = 43) | ||
| Median (IQR) | 9 (9–9) | 9 (7–9) |
| Minimum, maximum | 8, 9 | 3, 10 |
| Apgar score at 5 minutes (N = 43) | ||
| Median (IQR) | 10 (10–10) | 10 (9–10) |
| Minimum, maximum | 7, 10 | 6, 10 |
| Need for resuscitation, n (%) | ||
| Yes | 3 (11.54) | 6 (23.08) |
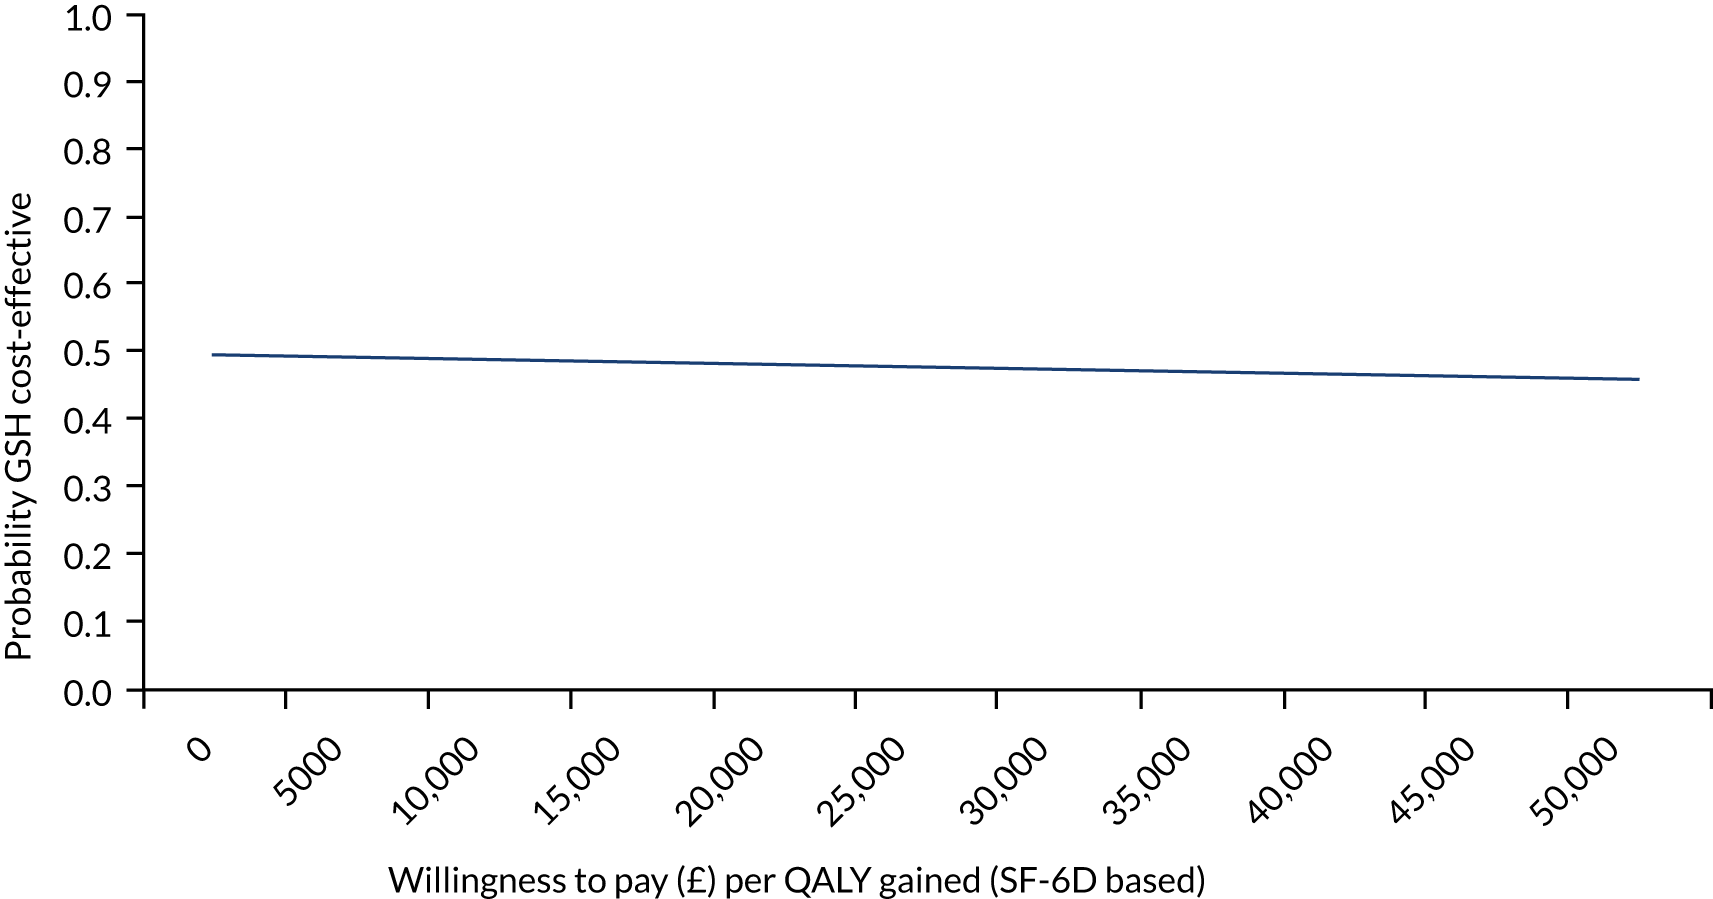
FIGURE 5.
A CEAC for GSH vs. TAU at 3 months post delivery from the health and social care perspective for SF-6D-based QALYs.
There were no adverse events in the study.
Economic findings
Costs and outcomes were similar between the groups (Table 7). CEACs showed that the probability of GSH being cost-effective compared with TAU was approximately 50% at the NICE preferred willingness-to-pay threshold of £20,000–30,000 per QALY (Figure 5). However, the results were sensitive to the assumptions made (i.e. health-care perspective, PWP indirect time and outliers and influential observations removed) and demonstrated large variation driven by the small sample size. Therefore, the cost-effectiveness of GSH remains uncertain. Please see the protocol39 and the results paper40 for full details of the economic evaluation methods and results.
| Outcome | Treatment arm | Unadjusted mean difference | 95% CI | p-value | Adjusted mean differencea | 95% CIa | p-valuea | |||
|---|---|---|---|---|---|---|---|---|---|---|
| GSH (plus usual care) | TAU | |||||||||
| Valid, n | Mean (SD) | Valid, n | Mean (SD) | |||||||
| Total costs (£): baseline to 3 months post delivery | 21 | 8251 (2909) | 25 | 8332 (6732) | –80 | –2976 to 2816 | 0.957 | –72 | –3045 to 2901 | 0.962 |
| SF-6D-based QALY: baseline to 3 months post delivery | 20 | 0.50 (0.08) | 23 | 0.49 (0.08) | 0.01 | –0.04 to 0.06 | 0.734 | –0.01 | –0.06 to 0.04 | 0.827 |
Discussion
This exploratory trial suggests that GSH can be successfully delivered, is acceptable, is associated with clinically significant decreases in depressive symptoms, does not lead to harm and does not show a cost-effective disadvantage. However, as no definitive trial is possible in England, we are not able to provide definitive evidence on its clinical effectiveness or cost-effectiveness.
Recommendations for future work
Our workbook is being used in many IAPT services nationally. Ideally, we would evaluate its use through routine online IAPT data. At the time of writing, however, this was not possible, as routine IAPT data does not include a pregnancy-specific identifier. We have had excellent feedback from practitioners, including, for example, ‘Fantastic . . . really helpful for the women’.
Work package 2: STACEY
For further background reading please see Lever Taylor et al. 48–50
Aims
In STAkeholders’ views and experiences of perinatal mental health CarE and services: a qualitative studY (STACEY) we aimed to explore key stakeholders’ views and experiences of support for PMH difficulties across services. We explored the perspectives of their partners and other family members (i.e. ‘significant others’), as well as practitioners.
Methods
We carried out qualitative, semistructured interviews with 52 women with babies aged 6–9 months and 32 significant others (Figure 6). Originally, the protocol proposed conducting 30 interviews with women and 20 interviews with significant others, but additional NIHR funding enabled us to capture more of the diversity of disorders and service experiences. We also carried out focus groups and interviews with 103 practitioners and commissioners. The characteristics of participating women and significant others are provided in Tables 7 and 8.
FIGURE 6.
Example timeline.
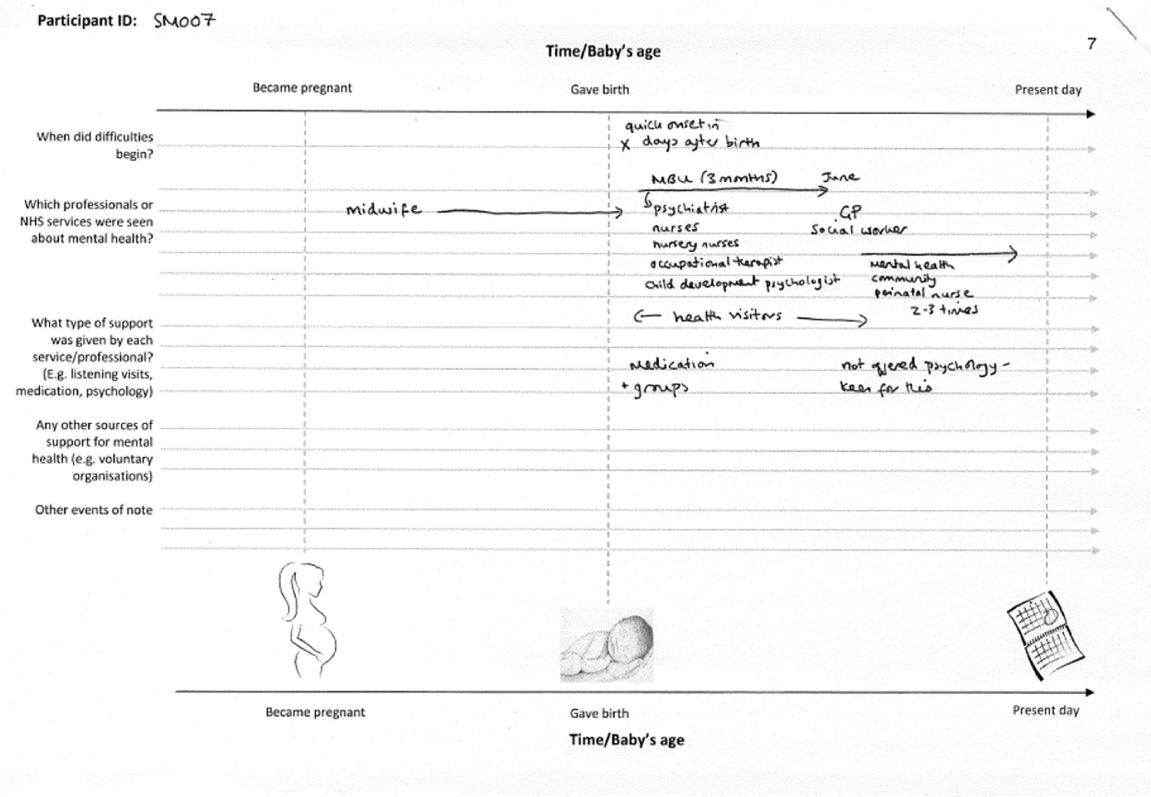
Women were recruited from 11 NHS trusts. Purposive sampling was used to obtain diversity of diagnosis, service use and sociodemographic background.
Analysis
Thematic analysis was used, with themes identified in a cyclical process of reading, coding and exploring the patterning of data. 26 Subsample data sets were created for key subgroups and separate analyses conducted (e.g. by type of service). To enhance validity, two researchers were involved in coding data for each data set.
Results
Tables 8 and 9 provide details of key characteristics of participating women and family members, respectively.
| Characteristic | Respondents |
|---|---|
| Primary diagnosis, n (%) | |
| Depression | 19 (37) |
| Psychosis/bipolar/schizophrenia | 13 (25) |
| Personality disorder | 11 (21) |
| Anxiety | 9 (17) |
| Perinatal service used (women could use more than one service), n (%) | |
| MBU | 10 (19) |
| Specialist perinatal community team | 18 (35) |
| Specialist health visitors/midwives | 12 (23) |
| Non-perinatal service used (women could use more than one service), n (%) | |
| General acute ward/crisis house | 11 (21) |
| CRT | 17 (33) |
| Community Mental Health Team | 15 (29) |
| Talking therapy service | 10 (19) |
| Early intervention in psychosis | 3 (6) |
| Previous service use for mental health, n (%) | |
| Yes | 42 (81) |
| No | 10 (19) |
| Age (years) | |
| Mean (range) | 32 (19–43) |
| ≤ 25, n (%) | 11 (21) |
| 26–29, n (%) | 7 (13) |
| 30–39, n (%) | 29 (56) |
| > 39, n (%) | 5 (10) |
| Ethnicity, n (%) | |
| White British | 28 (54) |
| White other | 6 (12) |
| Black Caribbean | 5 (10) |
| Black African | 4 (8) |
| Black other | 2 (4) |
| Asian | 4 (8) |
| Arab | 1 (2) |
| Mixed race | 2 (4) |
| Work status, n (%) | |
| Employed full time | 1 (2) |
| Self-employed part time | 2 (4) |
| Maternity leave | 22 (42) |
| Unemployed/homemaker | 23 (44) |
| Unable to work because of illness | 4 (8) |
| Level of education, n (%) | |
| No formal qualifications | 8 (15) |
| Secondary leaving qualifications | 22 (42) |
| Undergraduate degree | 10 (19) |
| Postgraduate degree | 12 (23) |
| Living with partner, n (%) | |
| Yes | 35 (67) |
| No | 17 (33) |
| Number of children, n (%) | |
| 1 | 26 (50) |
| 2 | 13 (25) |
| ≥ 3 | 13 (25) |
| Custody status, n (%) | |
| Retained custody of baby | 47 (90) |
| Not in custody of baby | 5 (10) |
| Characteristic | Respondents |
|---|---|
| Relationship to mother, n (%) | |
| Husband/partner | 22 (69) |
| Mother/father (‘grandparent’) | 7 (22) |
| Other relative (e.g. sister/child) | 3 (9) |
| Age (years) | |
| Mean age (range): partners | 34 (23–48) |
| Mean age (range): grandparents | 54 (39–67) |
| Mean age (range): other relatives | 21 (17–24) |
| < 25, n (%) | 4 (13) |
| 25–29, n (%) | 8 (25) |
| 30–39, n (%) | 10 (31) |
| > 39, n (%) | 10 (31) |
| Ethnicity, n (%) | |
| White British | 19 (59) |
| White other | 6 (19) |
| Black Caribbean | 2 (6) |
| Black African | 2 (6) |
| Asian | 3 (9) |
| Living with mother, n (%) | |
| Yes | 26 (81) |
| No | 6 (19) |
| Work status, n (%) | |
| Employed full time | 15 (47) |
| Employed part time | 1 (3) |
| Self-employed full time | 4 (13) |
| Self-employed part time | 1 (3) |
| Student | 3 (9) |
| Unemployed/retired/carer | 8 (25) |
| Level of education, n (%) | |
| No formal qualifications | 1 (3) |
| Secondary leaving qualifications | 19 (59) |
| Undergraduate degree | 6 (19) |
| Postgraduate degree | 5 (16) |
| Not recorded | 1 (3) |
Access/referral to services for perinatal mental health difficulties
Women and significant others whom we interviewed commonly expressed fear about the implications of seeking help, making disclosure difficult. In particular, they feared that their baby would be taken away or that they would be judged negatively. Women (and significant others) often reported receiving little information about PMH and available support. Some women received support quickly in a crisis, but others could not access specialist support because none was available locally.
Midwives and health visitors admitted that they sometimes avoided ‘delving’ too much if they were not confident and admitted that appointments could feel like ‘tick-box’ exercises. Many midwives and health visitors reported receiving little training, and some felt poorly supported after difficult encounters with distressed women. Commissioners emphasised the need for wider PMH training for midwives, GPs and health visitors, as well as for staff in general mental health services.
Midwives, health visitors, GPs and commissioners described difficulties referring women to support, with confusing ‘thresholds’ for referral procedures. In areas with better-developed services, midwives and health visitors valued being able to refer to specialist practitioners.
Provision of support: what works and where are the shortfalls?
Improving Access to Psychological Therapies
See also Millett et al. 51
Women reported positive experiences of IAPT, and valued having a normalising, non-judgemental therapist. Nevertheless, some women raised concerns about barriers to access and felt that there is a need to tailor therapy better to the perinatal context. IAPT therapists expressed frustration that the constraints of IAPT could prevent them from adapting treatment sufficiently.
Crisis resolution teams
See also Rubio et al. 52
Women sometimes found CRTs helpful, but they were often experienced as poorly tailored to their needs and those of their baby. Although some women valued regular daily visits, the majority of women viewed these visits as intrusive and disruptive, with inconvenient visiting times, a lack of staff continuity, excessive focus on risk and too little therapeutic support. In addition, women suggested that CRTs lacked perinatal expertise. However, some women valued remaining at home.
Specialist perinatal and general non-perinatal community mental health services
See also Lever Taylor et al. 53
Women whom we interviewed valued the high level of expertise that PMH teams offered, but some also valued support from generic services, particularly when practitioners drew on their own experiences of motherhood and liaised effectively with specialists. Generic services offer greater continuity of care, seeing women before, during and after pregnancy, and these services could sometimes offer a longer stretch of support than PMH teams. Women also wanted better access to psychological therapy, more practical support with infant care, greater focus on partners/families and better consideration of the needs of women who lose custody of their babies.
Inpatient care: mother and baby units compared with general psychiatric wards
See also Griffiths et al. 54
Women preferred the specialist perinatally focused MBUs and valued being co-admitted with their baby. Separation following admission to general psychiatric wards was experienced as distressing, a barrier to recovery and detrimental to the mother–baby relationship. Women also valued the peer support provided by MBUs. However, some women felt that MBUs could improve their provision of infant care advice, support for women with older babies and support for family members.
Social services intervention
See also Lever Taylor et al. 48
Women, particularly those for whom child protection concerns were high, had a predominantly negative view of social workers. The fear of being judged as an unfit mother overshadowed their encounters. Women felt misunderstood, set up to fail and that social workers often focused exclusively on the risks to the baby, rather than acknowledging and understanding the mother’s needs. Social work intervention could intensify pressure on women’s mental health, leading to escalating difficulties. Nevertheless, some women formed positive relationships with social workers.
Experiences of significant others
See also Lever Taylor et al. 49,50
Services were experienced in focusing on individual women (and their babies); however, they did not always engage in a meaningful way with families or in the interpersonal context. Professionals reported the complexity of balancing family inclusion with the need to protect and prioritise women and their babies.
Strengths and limitations
The strengths of WP2 include the diverse participants and range of services included. However, although we sought to include varied perspectives, participants in this qualitative workstream were not representative of the wider population of service users, significant others or practitioners and, therefore, some views may not have been captured. Recruitment to the study via clinical teams may have under-represented women/significant others who are less engaged with services. Only three women with schizophrenia/schizoaffective disorder were included. Likewise, the practitioner sample may under-represent clinicians with less interest in PMH. Focus groups included a wide variety of practitioners but may limit expression of views that conflict with those of colleagues. Interpretations of the findings should be understood with these limitations in mind and further research on the key themes identified is merited.
Work package 3(i): postnatal mental health services for women with acute severe mental disorders – evaluation of a quantitative measure to assess the acceptability and experience of perinatal services for acute severe illnesses from a service user perspective
Background and methods
See also Wykes et al. 55
A patient-reported outcome measure of perceptions of inpatient care [i.e. the perinatal VOICE (Views On Inpatient CarE) measure] was developed in the Patient Involvement in Improving Patient Care (PERCEIVE) programme. 55 A draft of the perinatal VOICE was developed and reviewed by women who had experienced acute care in the perinatal period and staff from PMH services to create the final perinatal VOICE measure. The perinatal VOICE measure contains five sections: (1) care and treatment (three items), (2) medication (two items), (3) staffing (seven items), (4) environment (five items) and (5) baby’s well-being (10 items). At the end of each section, respondents are encouraged to provide further comments.
The perinatal VOICE was included in WP3(ii) for each service experienced. A subsample of patients completed the questionnaire a second time within 6 weeks of first completion to examine test–retest reliability (see Appendix 5 for more details).
Results
A total of 267 patients completed at least one perinatal VOICE questionnaire (Table 10).
| Characteristic | Total number (%) of participants |
|---|---|
| Age (years) | |
| 16–19 | 4 (1.5) |
| 20–24 | 38 (14.2) |
| 25–29 | 67 (25.1) |
| 30–34 | 78 (29.2) |
| 35–39 | 61 (22.8) |
| 40–44 | 17 (6.4) |
| 45–49 | 2 (0.7) |
| Ethnicity | |
| White | 201 (75.3) |
| Black | 19 (7.1) |
| Asian | 25 (9.4) |
| Mixed/multiple ethnic groups | 11 (4.1) |
| Other | 11 (4.1) |
| Number of perinatal VOICE questionnaires completed | |
| 1 | 187 (70.0) |
| 2 | 69 (25.8) |
| 3 | 8 (3.0) |
| 4 | 3 (1.1) |
| Qualification | |
| No formal qualifications | 10 (3.7) |
| GCSE or equivalent | 40 (15.0) |
| A Level or equivalent | 38 (14.2) |
| NVQ level | 33 (12.4) |
| BTEC level | 7 (2.6) |
| Higher national certificate/diploma | 38 (14.2) |
| Bachelor’s degree | 62 (23.2) |
| Master’s degree | 25 (9.4) |
| Doctoral degree | 4 (1.5) |
| Relevant professional training | 10 (3.7) |
| Relationship status | |
| Single | 36 (13.5) |
| Partner but not cohabiting | 14 (5.2) |
| Married/cohabiting | 208 (77.9) |
| Separated/divorced/widowed | 9 (3.4) |
| Number of children | |
| 1 | 144 (53.9) |
| 2 | 69 (25.8) |
| 3 | 36 (13.5) |
| 4 | 9 (3.4) |
| 5 | 5 (1.9) |
| 6 | 2 (0.7) |
| 7 | 2 (0.7) |
| Allocation to service based on highest level of care | |
| HTT/CRT | 104 (39.0) |
| Acute ward | 60 (22.5) |
| MBU | 103 (38.6) |
| Number of services (MBU/ward/CRT) used | |
| 1 | 153 (57.3) |
| 2 | 92 (34.5) |
| 3 | 22 (8.2) |
Psychometric evaluation
Descriptive statistics and test–retest
A total of 267 women provided 361 questionnaires, one for each service type accessed. Twenty-nine questionnaires were completed by mothers in the test–retest study 4–17 days after completion of the first of two assessments (mode = 7 days, mean = 8 days).
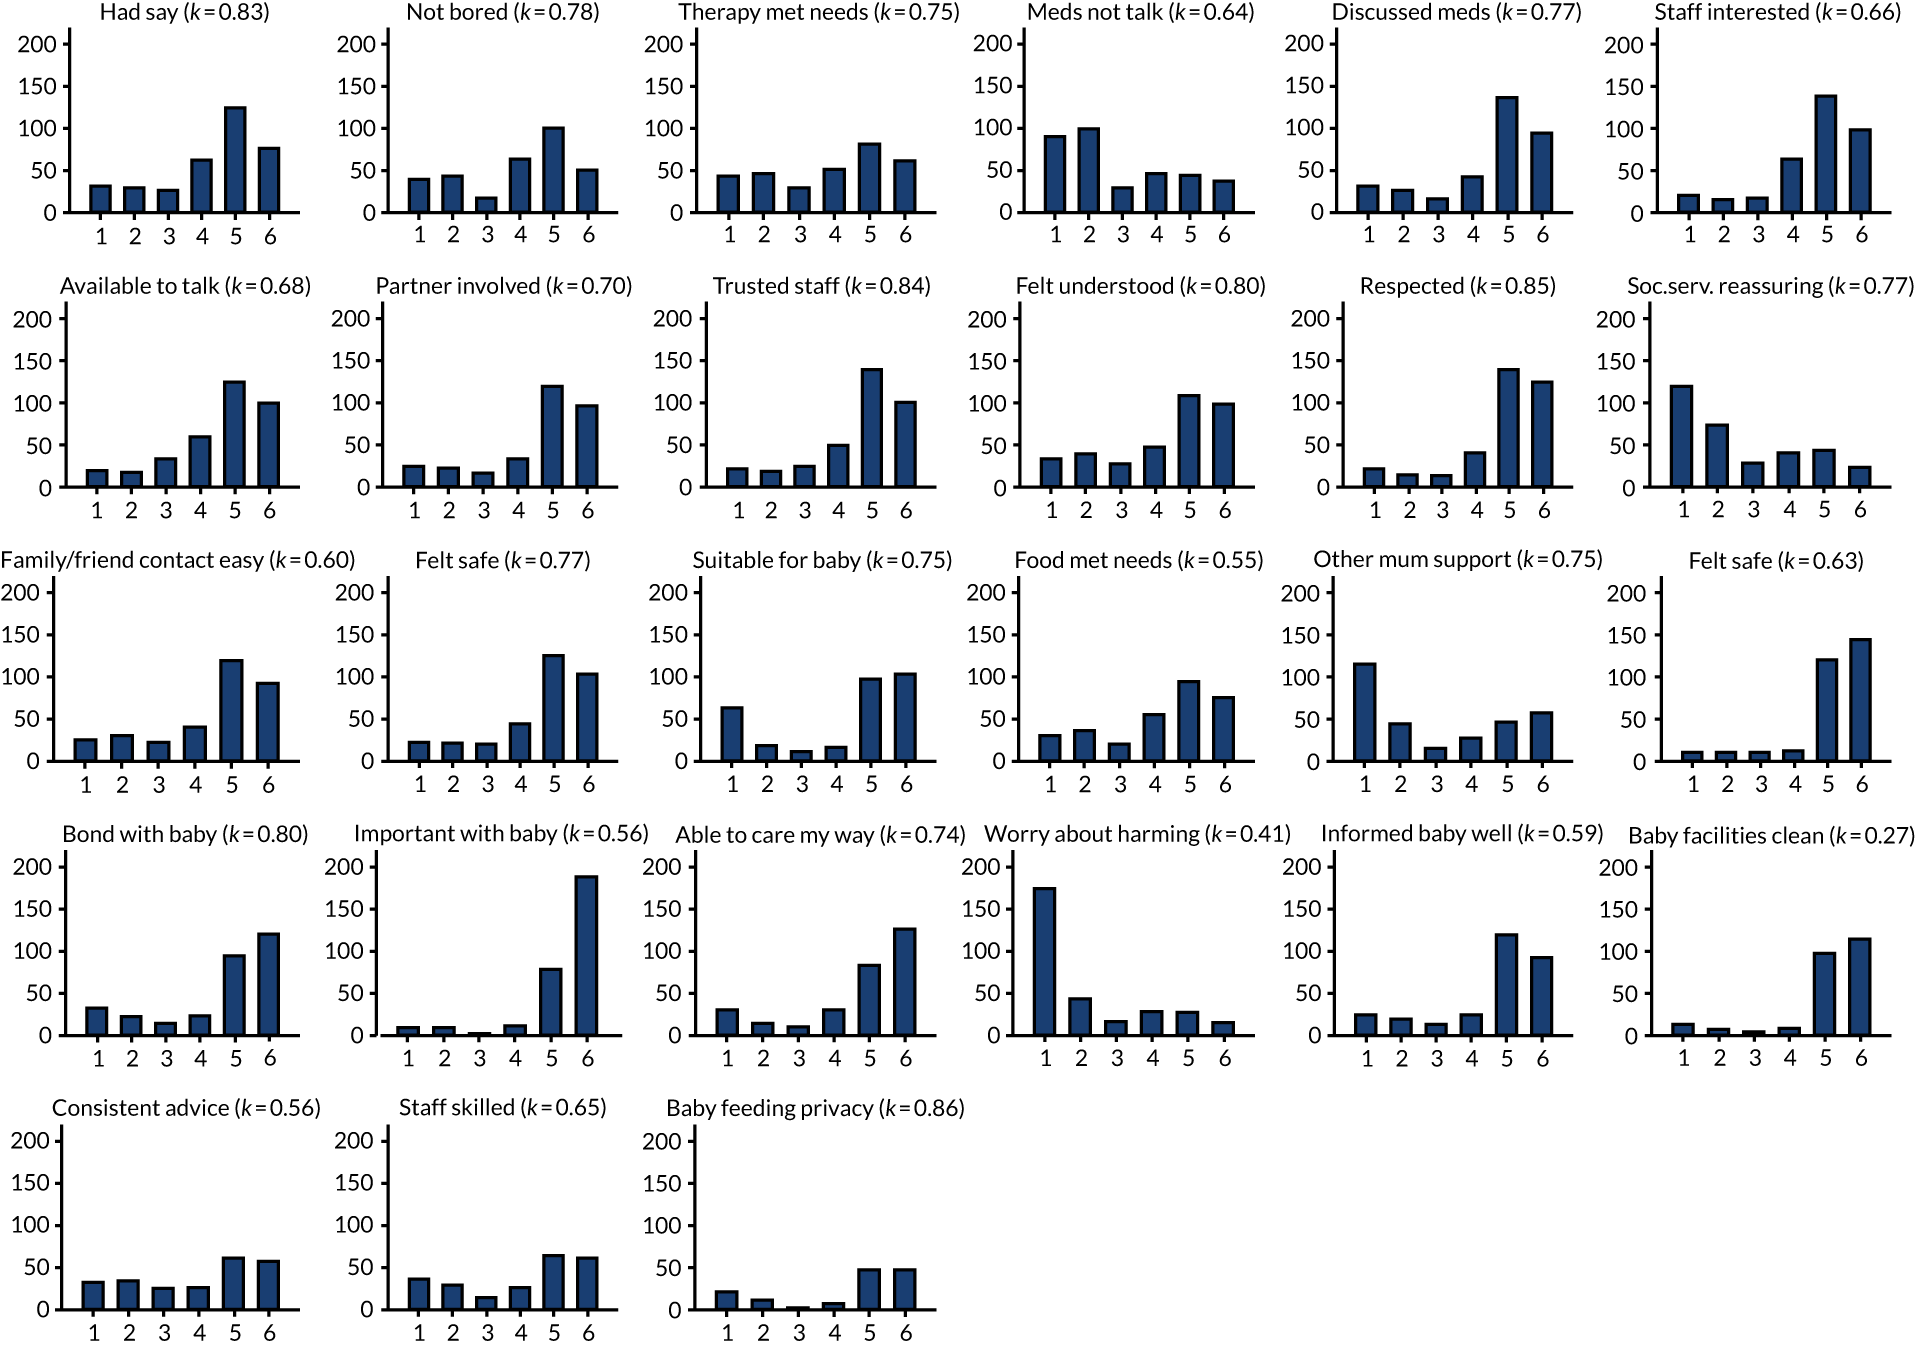
Figure 7 illustrates that response distributions for several items showed modal values at the bounds of the scale. With the exception of the generation of simple item total scores, our analyses treated the response set as ordinal categories to account for floor/ceiling effects. Figure 7 shows kappa statistics for item test–retest reliability. There was significant agreement in all cases except for the item relating to the cleanliness of the baby-changing facilities (p = 0.105). The remaining 26 items were significant. Twenty-two items showed good (> 0.6) agreement. Overall, the 27 items gave a test–retest intracluster correlation coefficient of 0.784 (95% CI 0.643 to 0.924).
FIGURE 7.
Response set and kappa for the perinatal VOICE items.
Factor analysis
Eigenvalues and goodness-of-fit measures from exploratory factor analysis (see Appendix 4) were equivocal, but suggested that two factors gave adequate fit (comparative fit index = 0.97). Those items concerned aspects of the service relating to care of the mother (and the baby) and the two factors were positively correlated at 0.49 (p < 0.0001).
Item response theory evaluation
Graded response models56 were used to examine item and test information functions. Models for single factors suggested that several items added little additional information and so a substantially shorter form might be adequate. Comparison of long and short forms suggested that the long form improved precision of estimation of the overall satisfaction dimension by ≈ 20%. Examining separately the items loading on each of the two factors suggested fewer items as contributing little information. As all items had received PPI support during development, no items were eliminated.
Construct validity
The box plot in Figure 8 shows that perinatal VOICE total scores were strongly associated with the service being received (2 degrees of freedom; p < 0.0001). Separated by factor (Figure 9), MBUs were rated as providing maternal care comparable to inpatient care, and support for caring for the baby comparable to the home treatment setting, with consistently lower scores for the inpatient service on both factors. Those in MBUs reported slightly higher scores for factor 2 (relating to care of baby) than those receiving CRT care.
FIGURE 8.
Box plot of perinatal VOICE scores by service.
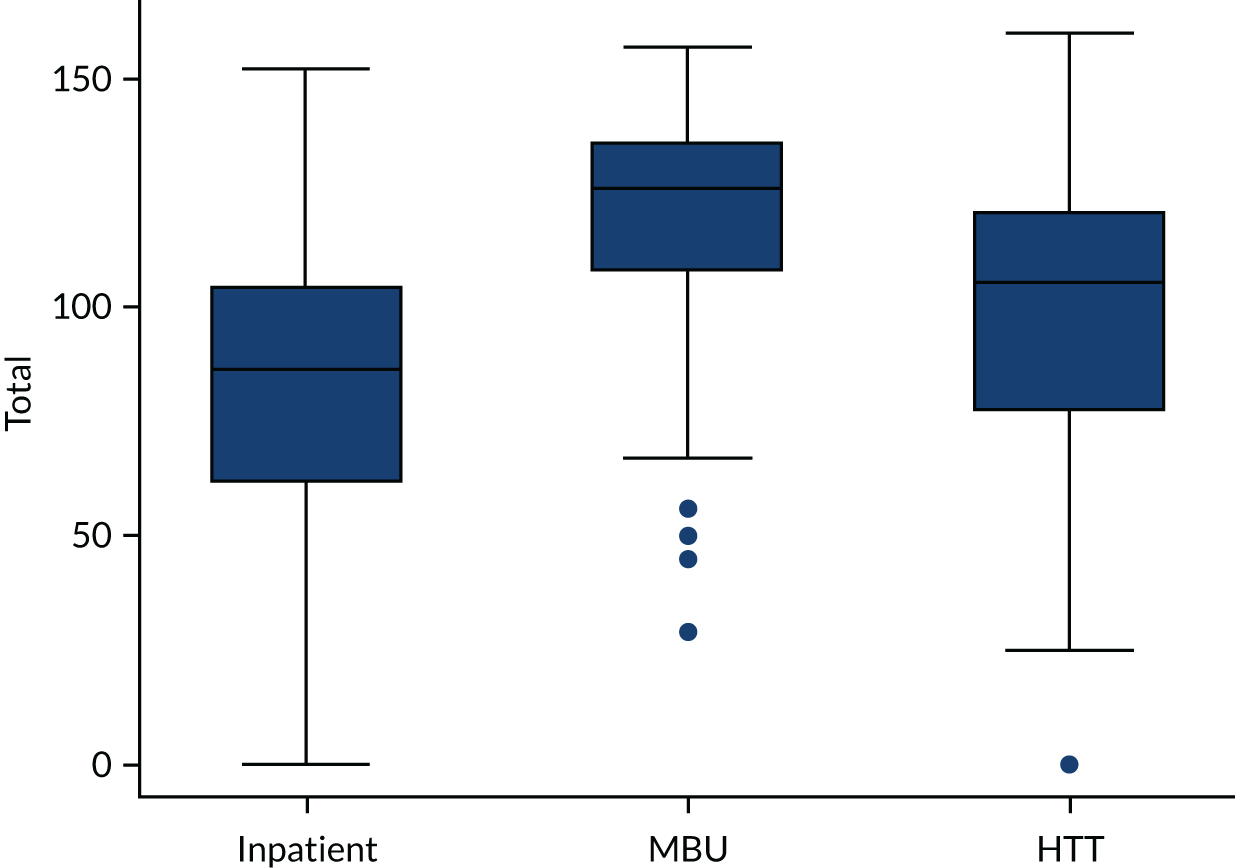
FIGURE 9.
Box plot of factor scores by treatment setting: (a) factor 1 scores; (b) factor 2 scores.
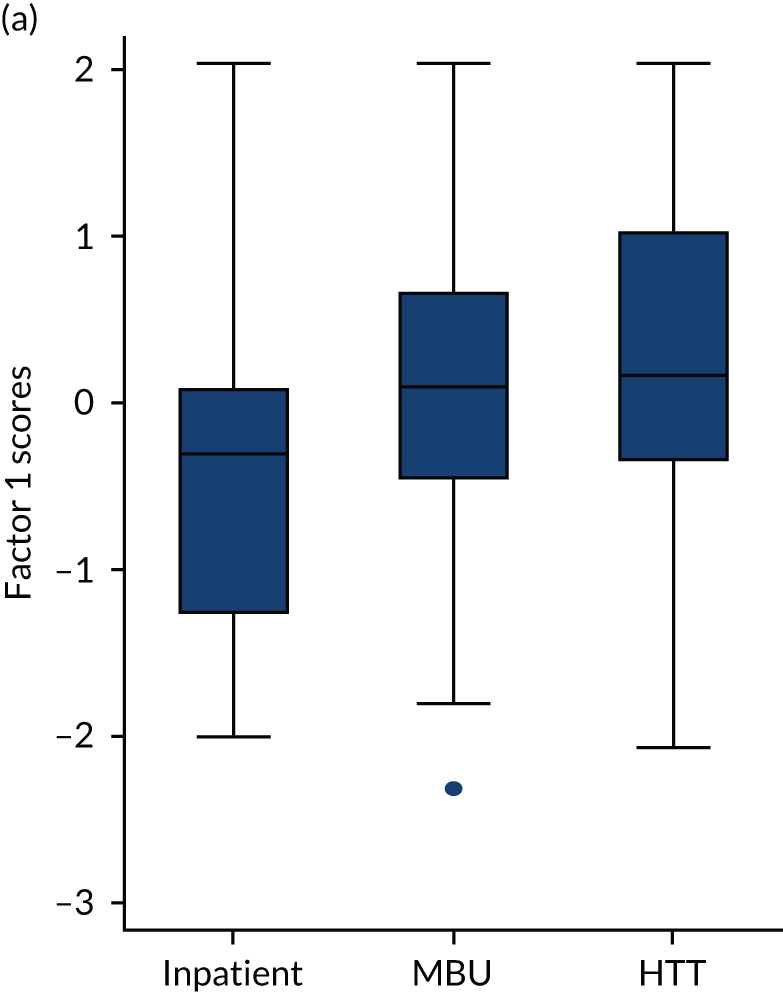
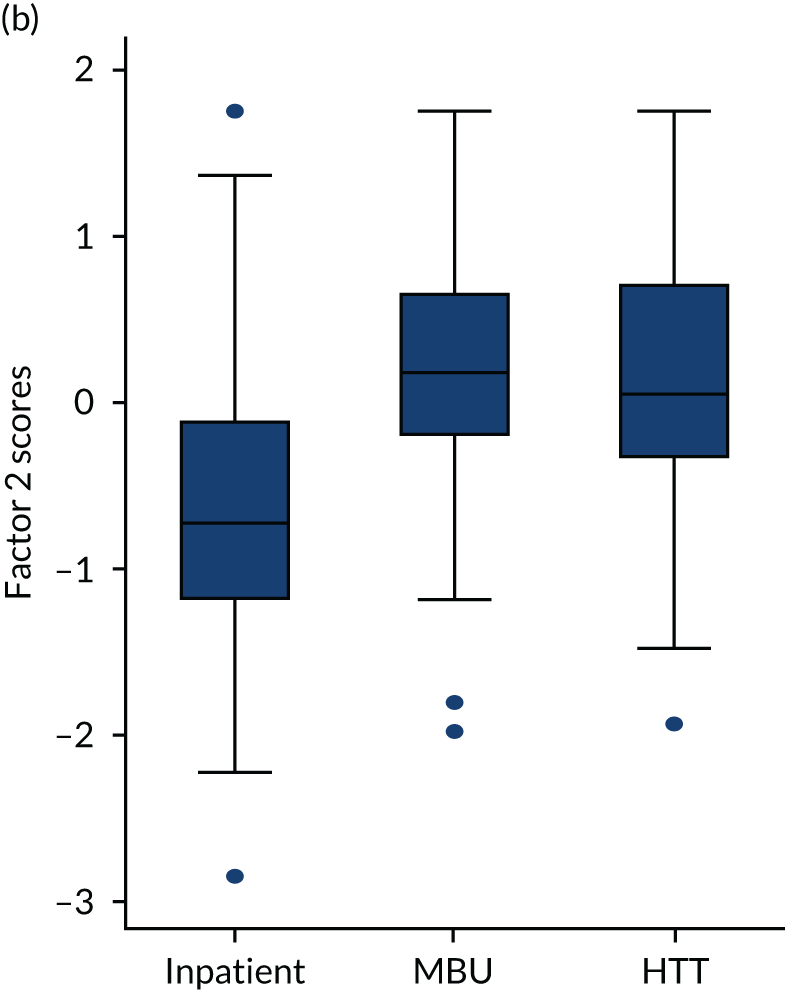
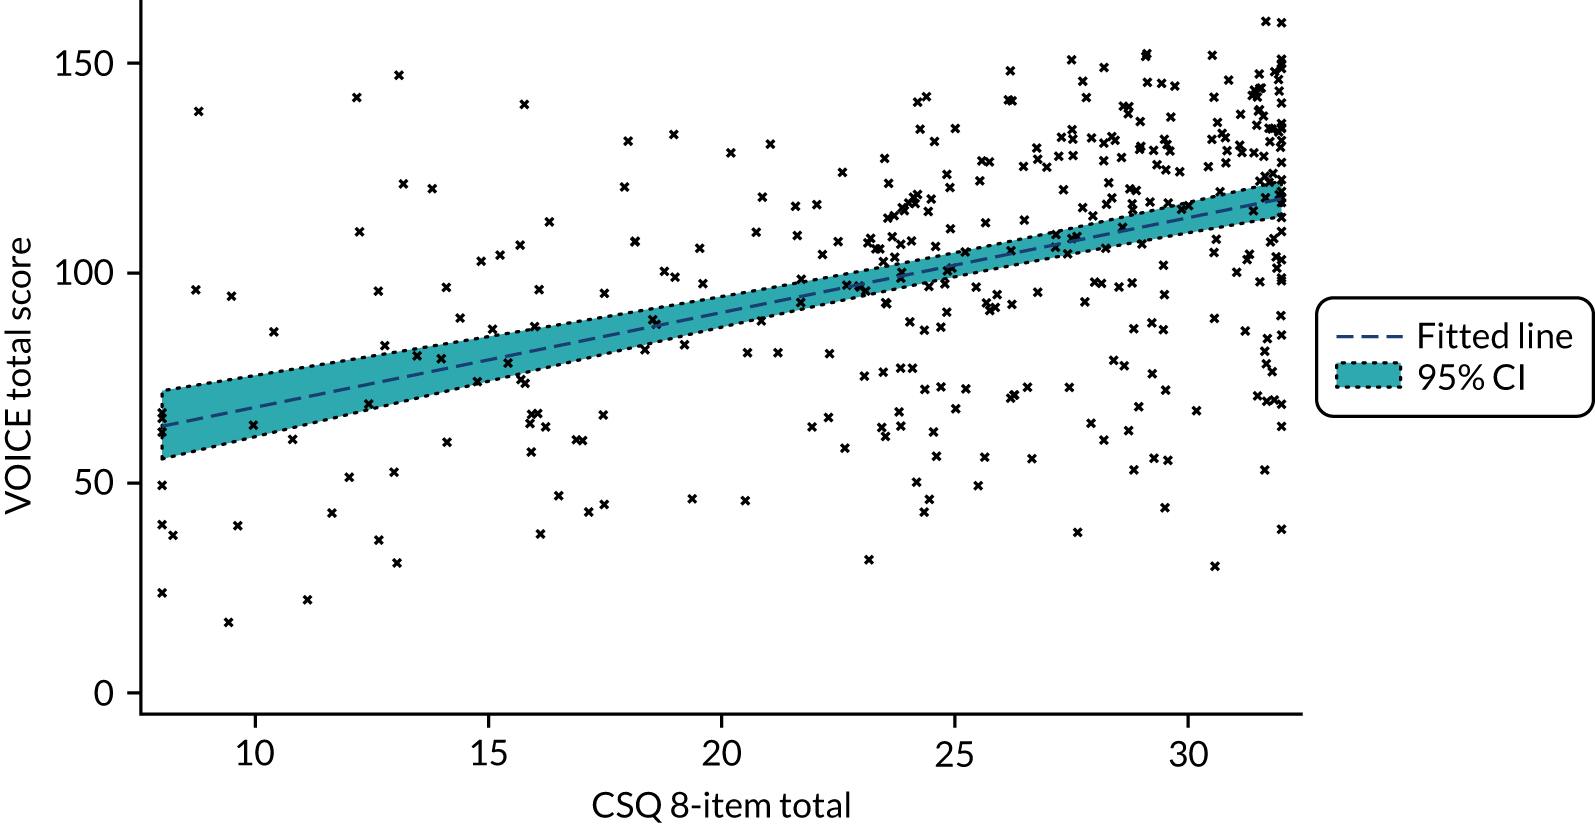
Figure 10 shows the total perinatal VOICE scores related to scores from the Client Satisfaction Questionnaire (CSQ) eight-item total score (p < 0.0001). When the two perinatal VOICE factors were considered jointly, only factor 1 scores predicted the CSQ total score (Table 11), which is consistent with the CSQ focusing on satisfaction with the service directly for the woman as patient, rather than as a service for the woman as parent.
FIGURE 10.
Perinatal VOICE scores and CSQ scores.
| Predictor | Coefficient | SE | t | p > t | 95% CI |
|---|---|---|---|---|---|
| Factor 1 | 4.583 | 0.322 | 14.23 | < 0.0001 | 3.949 to 5.217 |
| Factor 2 | 0.154 | 0.346 | 0.45 | 0.656 | –0.527 to 0.835 |
Comments provided by 139 women from 166 questionnaires respondents were analysed thematically. 57 Key themes were support networks and staff authority. In some services, women found baby support minimal or that parenting advice was too rigid. Lack of continuity of care was a particular issue in CRT support where repeated staff changes are common. Relationships with staff in all services were considered crucial, but could be compromised by understaffing and use of coercion. As in WP2, mothers reported difficulties involving their families in their care, including specific support for family members themselves. Peer support from other mothers was helpful.
Conclusions
The perinatal VOICE is an acceptable patient-reported outcome measure. Selection bias is likely and research on other samples is needed.
Work package 3(ii): the effectiveness and cost-effectiveness of psychiatric mother and baby units compared with acute general wards and crisis resolution teams (the ESMI mother and baby unit study)
See also Trevillion et al. 58
Background
The clinical effectiveness and cost-effectiveness of psychiatric MBUs compared with generic acute psychiatric wards or CRTs has, to the best of our knowledge, not been investigated. Our PDG demonstrated that a RCT was not possible for logistical reasons (including lack of beds and strong maternal and staff preferences for MBUs). The inequitable distribution of MBUs across England meant that a quasi-experimental observational study was possible.
Aims
In the Effectiveness and cost-effectivenesS of perinatal Mental health servIces (ESMI) MBU study we aimed to examine (1) differences in characteristics of recruited women at the point of admission to acute care, (2) clinical outcomes and (3) the cost-effectiveness of MBUs relative to TAU.
Women in our PAG discussed the choice of primary outcome and felt that a relapse after an episode of acute care would be devastating. Therefore, readmission to acute care was considered the most appropriate primary outcome. Women in our PAG also wanted us to measure quality of life, satisfaction with services, unmet needs and relationship with baby. Our primary objective was to test the hypothesis that women with PMH disorders who are admitted to MBUs are significantly less likely to be readmitted to acute care (i.e. MBU, CRT or a generic acute ward) in the year following discharge from acute care than women admitted to generic acute wards or CRTs. We also hypothesised that admission to MBUs would be cost-effective, compared with admission to generic wards or CRTs, for the period between index admission to 1 month post discharge.
We further hypothesised that, compared with women admitted to generic services, women admitted to a MBU in the first year after giving birth will:
-
have significantly fewer unmet health and social care needs 1 month post discharge
-
report significantly higher levels of service satisfaction 1 month post discharge
-
have better maternal adjustment 1 month post discharge
-
be significantly more sensitive and less unresponsive when interacting with their babies 1 month post discharge (and their babies will be more co-operative and less passive)
-
be more likely to retain custody of their child in the year following discharge.
Methods
Women were recruited at the point of, or within 4 weeks of, discharge so that all women were interviewed at around 4 weeks (time point 1). At this point, women provided retrospective baseline information about the admission [time point 0 (t0)]. If they consented to the research team accessing their medical records, we also obtained baseline information in the records (t0). Measures are detailed in Appendix 6. Therefore, baseline data refer to the time period when women were first admitted to acute care. Long-term outcome data refer to the time period from discharge to 1 year post discharge, collected from health and social care records and a brief telephone interview.
The Research Ethics Committee (REC) declined our request for minimum data set collection using Section 251 for all women under acute care. 59
Geographical scores
For each study participant, the driving distance from their home to the nearest MBU was determined (see Appendix 8 for further details).
Power calculation
Pilot data were analysed using the Clinical Record Interactive Search (an anonymised case register)60 for 20 perinatal women on generic wards, 20 women in MBUs and 20 women assigned to CRTs. Generic ward patients were most likely to be readmitted (with 95% of ward patients and 35% of MBU patients readmitted during the 12-month follow-up). CRT readmission rates were similar to MBU readmission rates. Therefore, assuming similar readmission rates nationally, we could detect a doubling of risk for ward patients (with 90% power and 47 women in each group). We aimed to recruit 100 women in each group. Therefore, even if we did not manage to follow up 20% of patients in each group or needed to exclude women for being beyond the ‘region of support’ (see Primary analysis), we still anticipated being able to detect these differences.
Statistical analyses
Defining the cohort groups
Limited availability of MBU beds means that it is likely that some women who were offered MBU admission were admitted to an acute ward while waiting for a bed. Similarly, many women could receive care from more than one type of service. We defined services by ‘highest level of care’ (i.e. most specialised level of care), and women were categorised based on this definition for our main analyses: MBUs were considered the ‘highest level of care’, followed by acute wards, followed by CRTs. Therefore, women who spent any time in a MBU were categorised under MBU. We ran two sensitivity analyses on the primary analysis for women who attended both MBU and ward services. One sensitivity analysis was based on the largest number of days spent within a specific inpatient service and the other sensitivity analysis was based on first service accessed. [Any admissions into intensive care units (ICUs) were classified as admissions to an acute ward.]
Missing data
Pro-rating was used to impute sporadic missing item-level data that contributed to scores. Any missing baseline data included in the propensity score were imputed using a single imputation from chained equations. The remaining covariates used in propensity scores were used in the imputation model. The primary outcome [i.e. readmission at 12 months (time point 2)] and secondary outcomes (measured at time point 1) and safeguarding status (measured at time point 2) were analysed using complete-case analysis.
Primary analysis
The primary outcome of readmission at 12 months post discharge was analysed using a logistic regression model. Propensity scores were used to account for systematic differences between MBU and non-MBU participants. This approach allowed specification of the covariate adjustment to be determined blind to the outcome data, thereby reducing risk of unintended bias.
The Stata command pscore was used to estimate the propensity score of the treatment (MBU or non-MBU service) on specified covariates (see Appendix 9), selected using problem knowledge and exploratory comparison of cohorts, using a probit model and stratified individuals into blocks according to the propensity score. The blocks were determined by a balancing algorithm, and the balancing property within each block was tested to ensure that sufficient blocks were used to adequately balance the covariates. Women with characteristics that placed them beyond the ‘region of support’ and, therefore, for whom there were no ‘matches’ (i.e. women with propensity scores either so high or so low that there were insufficient similar women receiving the alternative treatment to make a comparison) were defined at this stage.
Once we had evidence that the balance criterion could be met with a set of predictors that were considered to fully span the relevant domains where imbalance was likely, we included this predictor set within the effects procedure. This procedure recomputed the propensity scores, formed them into inverse probability of treatment weights and estimated the average treatment effect (i.e. the treatment difference for continuous outcomes or log-odds for binary outcomes) and the potential outcomes for the ‘treated’ and ‘untreated’. The computation of average treatment effects was restricted to the common region of support. The teffects procedure also allowed for the selective inclusion of covariates, making the accounting for imbalance doubly robust, and for the inclusion of baseline measures likely to increase power [i.e. baseline measure of outcome and symptom severity, presence or absence of a clinically diagnosed personality disorder as a primary or secondary International Statistical Classification of Diseases and Related Health Problems, Tenth Revision (ICD-10) diagnosis in case records (t0), ethnicity (other), learning disability, age of child at admission, living alone, partner, number of children, Composite Abuse Scale (CAS) binary cut-off point and detention under the Mental Health Act61]. CIs and significance tests were based on the sandwich estimator of the parameter covariance matrix.
Economic evaluation
We performed an economic evaluation at 1 month post discharge and a cost analysis at 1 year post discharge, as per the grant application. The economic evaluation took the NHS and Personal Social Services perspective preferred by NICE. 28 Service use data were combined with national published unit costs62–65 to calculate total cost of each participant over follow-up (see Appendix 13). Costs and outcomes were compared and presented as mean differences and 95% CIs obtained using bias-corrected non-parametric bootstrapping (i.e. repeat re-sampling). 66 Cost-effectiveness was assessed through the calculation of incremental cost-effectiveness ratios (ICERs)67 and were explored in terms of QALYs using the EQ-5D-5L (see Appendix 13 for an explanation of the change in primary outcome). Uncertainty around the cost and effectiveness estimates were represented by CEACs. 47 In addition, we examined readmissions rates, use of community mental health services and costs in the longer term using data collected from clinical records at 1 year post discharge. See Appendix 13 for full details on the economic methods.
Process evaluation
As service provision varies nationally, we collected detailed descriptions of the service components in participating provider organisations. We developed a structured process evaluation questionnaire, guided by the research literature and discussions within the research team and structured around service component types (e.g. interventions, facilities and staff).
Telephone contact was made with a senior member of each service type who completed the questionnaire over the telephone. The questionnaire was e-mailed ahead of the structured telephone interview so that the person could look at the forms to facilitate completion.
Significant others
We asked women to nominate a significant other who had supported them through their mental health crisis. (However, women did not have to allocate a significant other.) The nominated significant others completed a brief Involvement Evaluation Questionnaire,68 which was available online and/or in paper form at the woman’s home and includes the General Health Questionnaire-12 (GHQ-12). 69
Results
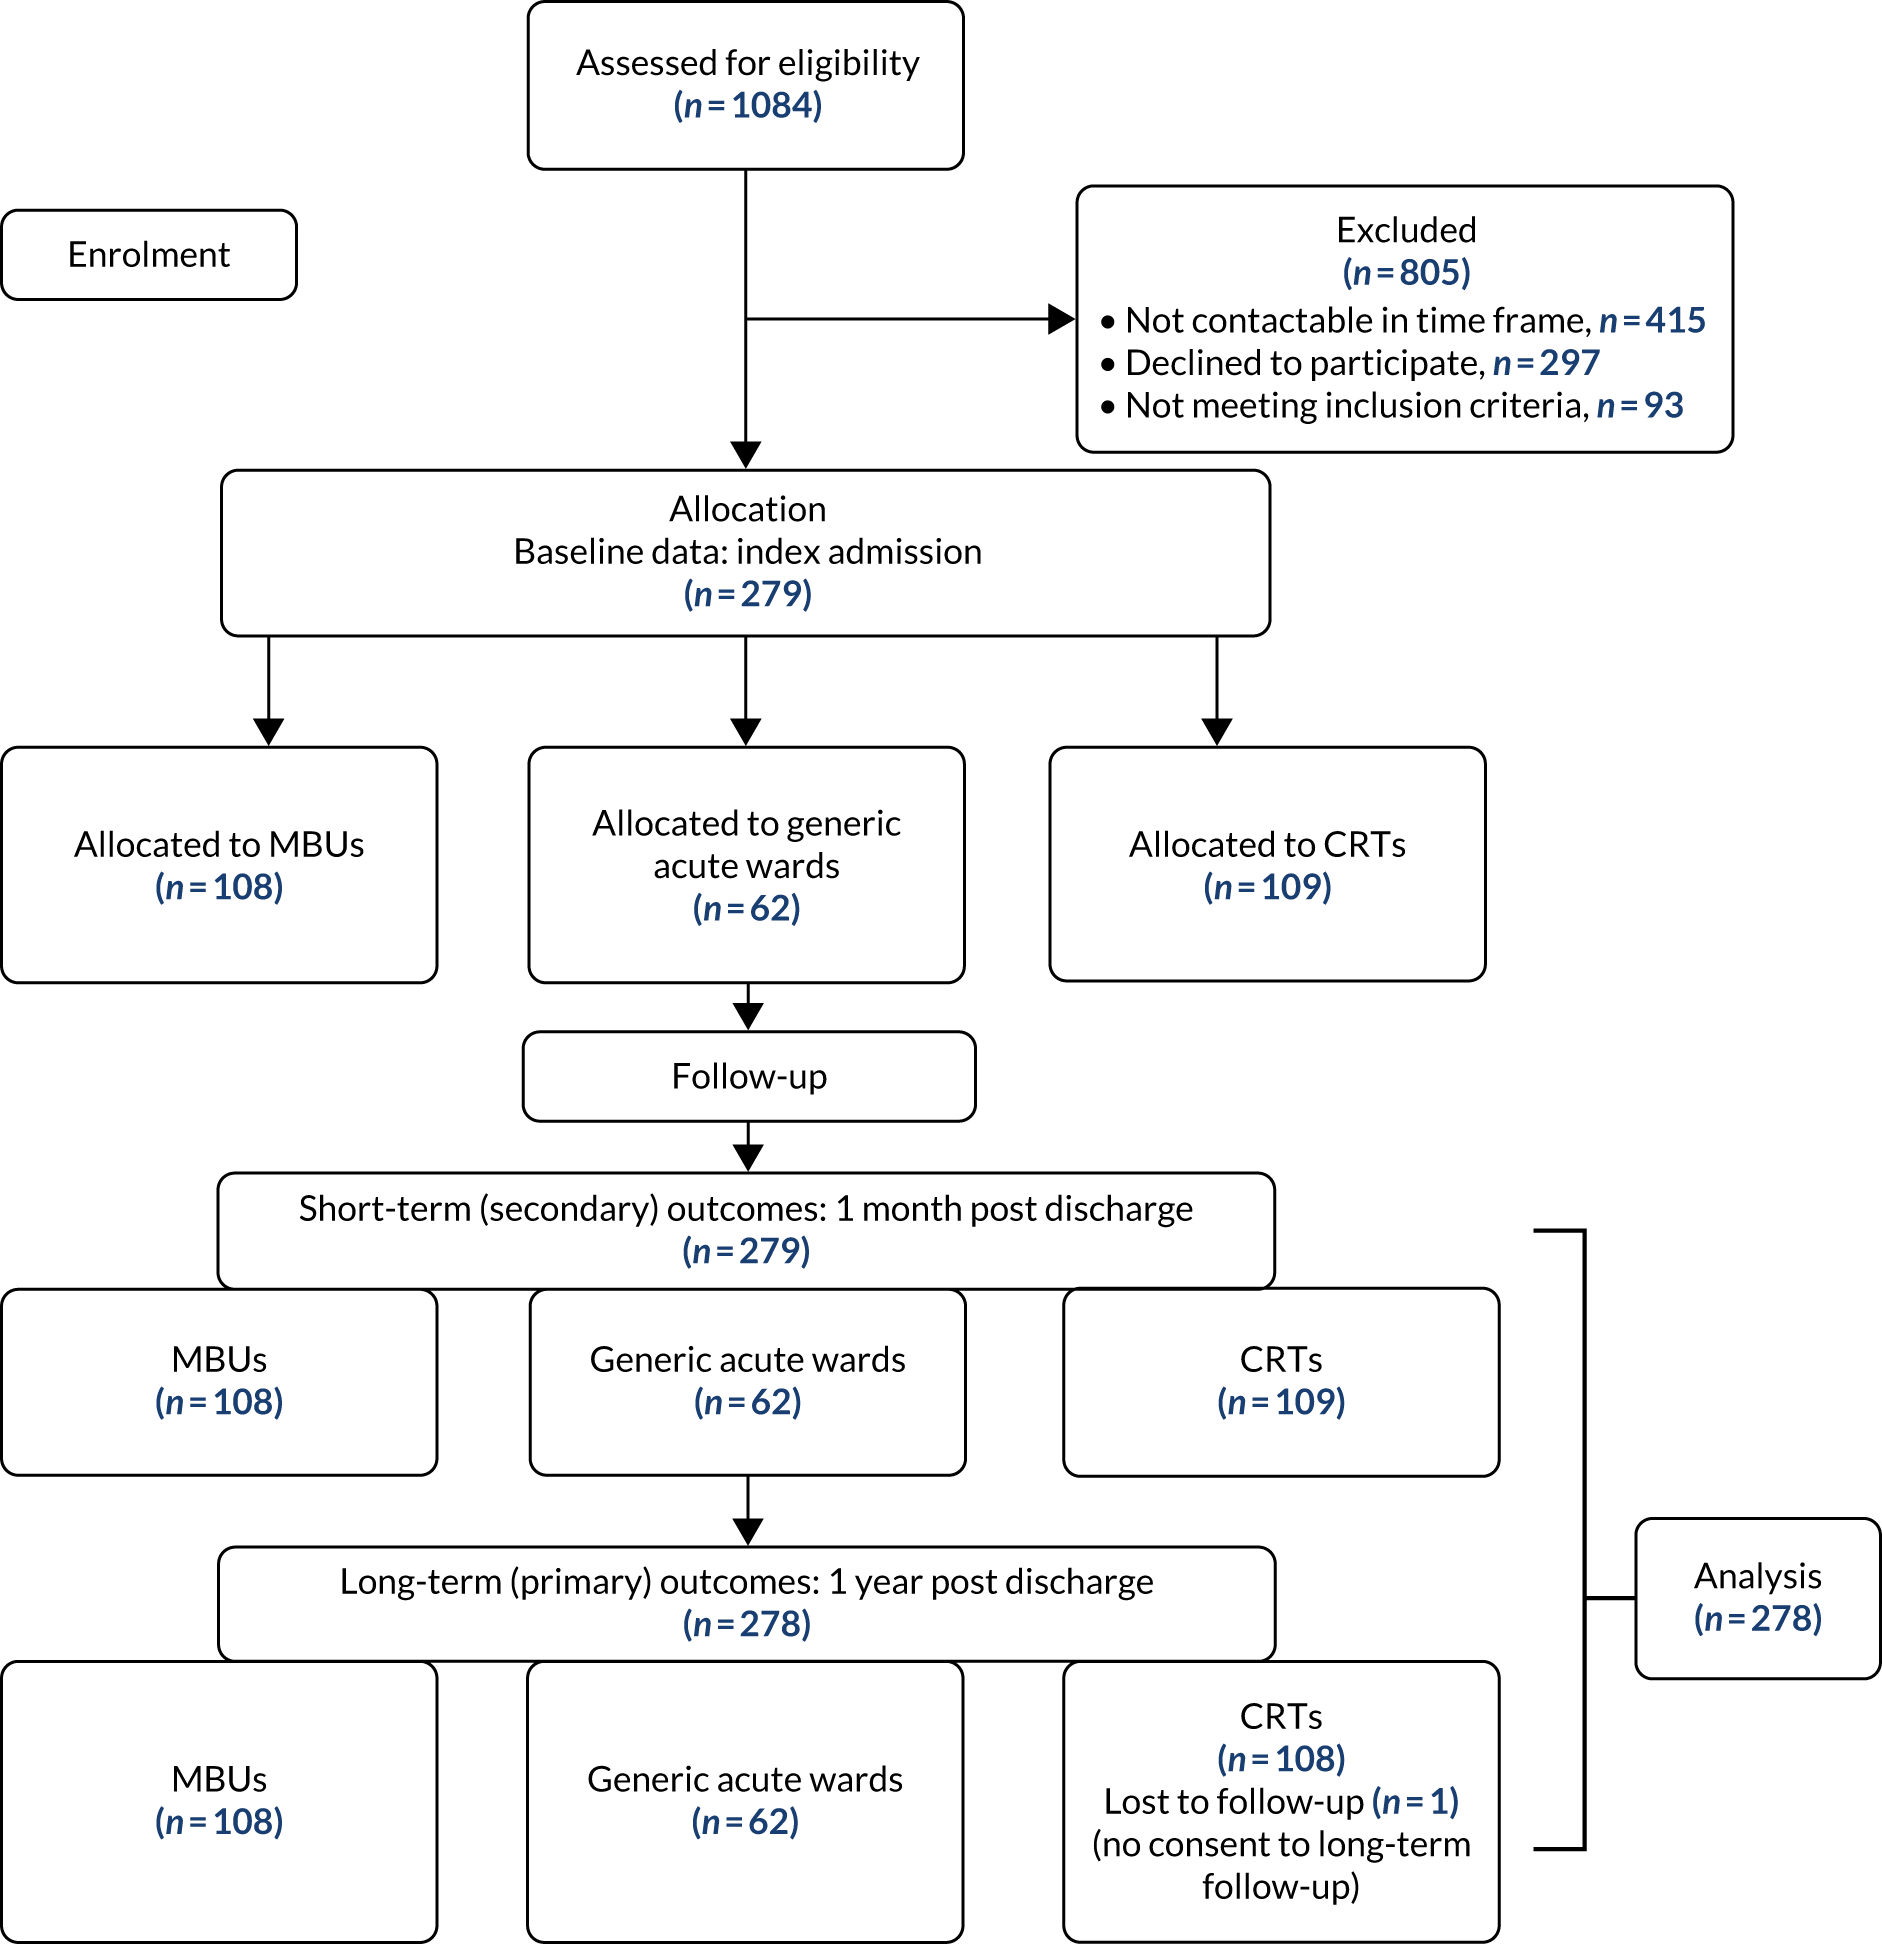
We initially recruited from 28 mental health trusts and then expanded recruitment to three Welsh health boards and 39 mental health trusts (Figure 11). A total of 279 mothers participated, of whom 108 (38.7%) received MBU care (the ‘higher’ level of care), 62 (22.2%) received generic ward (intermediate) care and 109 (39.1%) received CRT care (Figure 12) for the (index) admission to acute care after birth (see Appendix 10 for recruitment chart).
FIGURE 11.
Map of the 42 trusts/health boards recruited from in England and Wales (see Appendix 7 for further details).

FIGURE 12.
Flow chart of women participating in the ESMI MBU study.
Defining the cohort group
A total of 493 admissions occurred in 279 women recruited, with the number of admissions per participant ranging from one to seven. Women were categorised into a cohort group by highest level of care ever received. Therefore, women who spent any time in a MBU, regardless of when or for how long, were categorised as MBU. This resulted in 108 women categorised as MBU, 62 women categorised as acute ward and 109 women categorised as CRT.
Table 12 shows the number of services used, the total number of days in services and the percentage of time in the service of their cohort out of total time in all services by cohort allocation. Therefore, by our definition, 109 women (100%) in the CRT arm attended one service and spent 100% of their time under CRT services. Women in the MBU arm spent a longer time in services than women in the ward or CRT arms, which the highest level of care definition could have intensified. The total number of days in service by cohort group is presented in Figure 13 and the clinical symptoms for participants by cohort group is shown in Figure 14.
| Variable | Service, n (%) | Total, n (%) | ||
|---|---|---|---|---|
| CRT | Ward | MBU | ||
| Number of services (MBU/ward/CRT) used (N = 279) | ||||
| 1 | 109 (100.0) | 18 (29.0) | 33 (30.6) | 160 (57.3) |
| 2 | 0 (0.0) | 44 (71.0) | 50 (46.3) | 94 (33.7) |
| 3 | 0 (0.0) | 0 (0.0) | 25 (23.1) | 25 (9.0) |
| Total number of days in services (N = 279), median (IQR) | 25.0 (16.0–38.0) | 34.0 (18.0–53.0) | 75.5 (55.0–97.0) | 42.0 (21.0–76.0) |
| Percentage of time in cohort service out of the total time in all services (N = 279) | ||||
| < 25% | 0 (0.0) | 13 (21.0) | 10 (9.3) | 23 (8.2) |
| 25–49% | 0 (0.0) | 9 (14.5) | 8 (7.4) | 17 (6.1) |
| 50–74% | 0 (0.0) | 16 (25.8) | 22 (20.4) | 38 (13.6) |
| ≥ 75% | 109 (100.0) | 24 (38.7) | 68 (63.0) | 201 (72.0) |
FIGURE 13.
Histogram of total number of days in services by cohort group. (a) HTT/CRT; (b) acute ward; and (c) MBU.

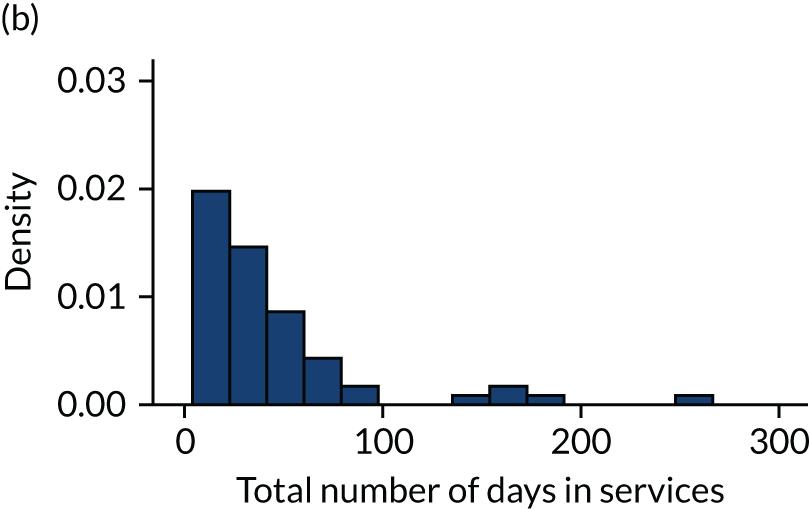

FIGURE 14.
Clinical symptoms for ESMI MBU participants by cohort group.
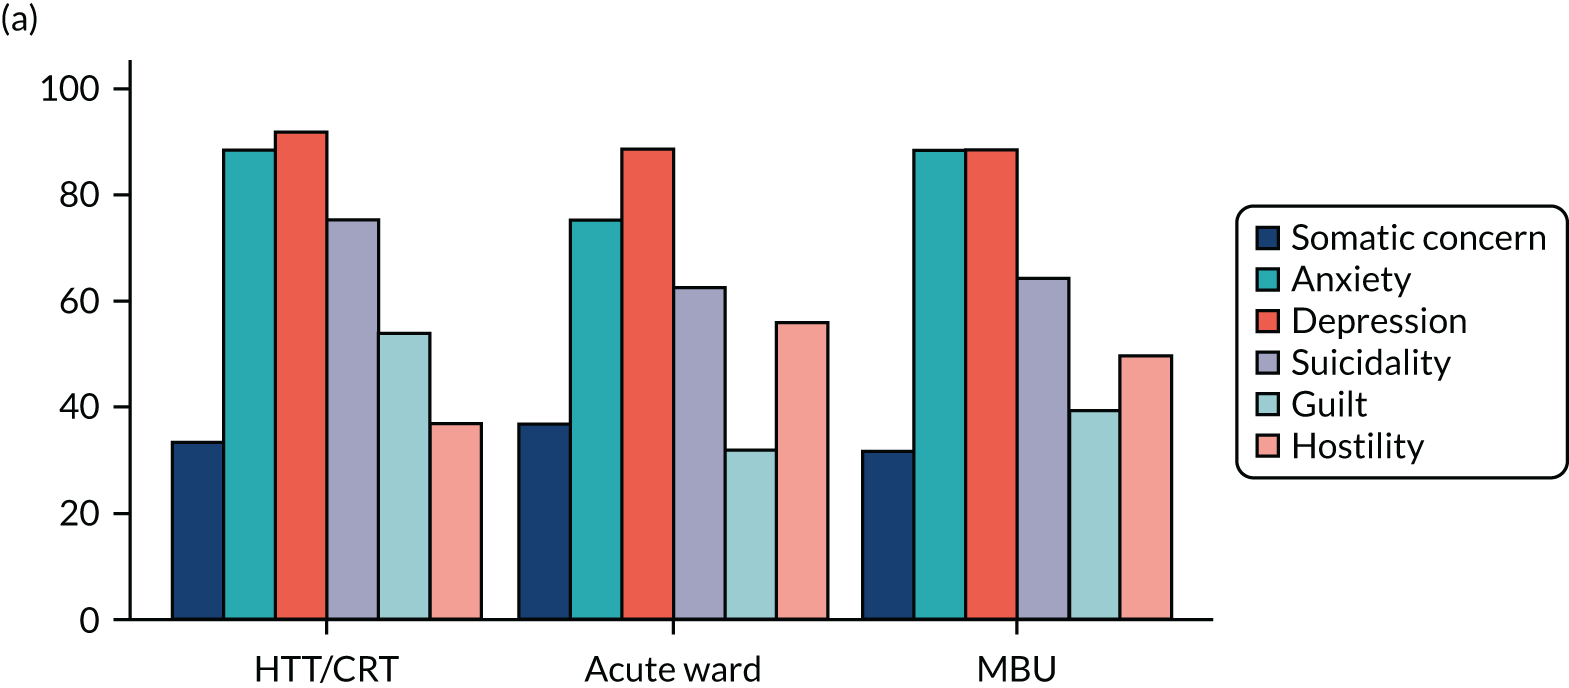
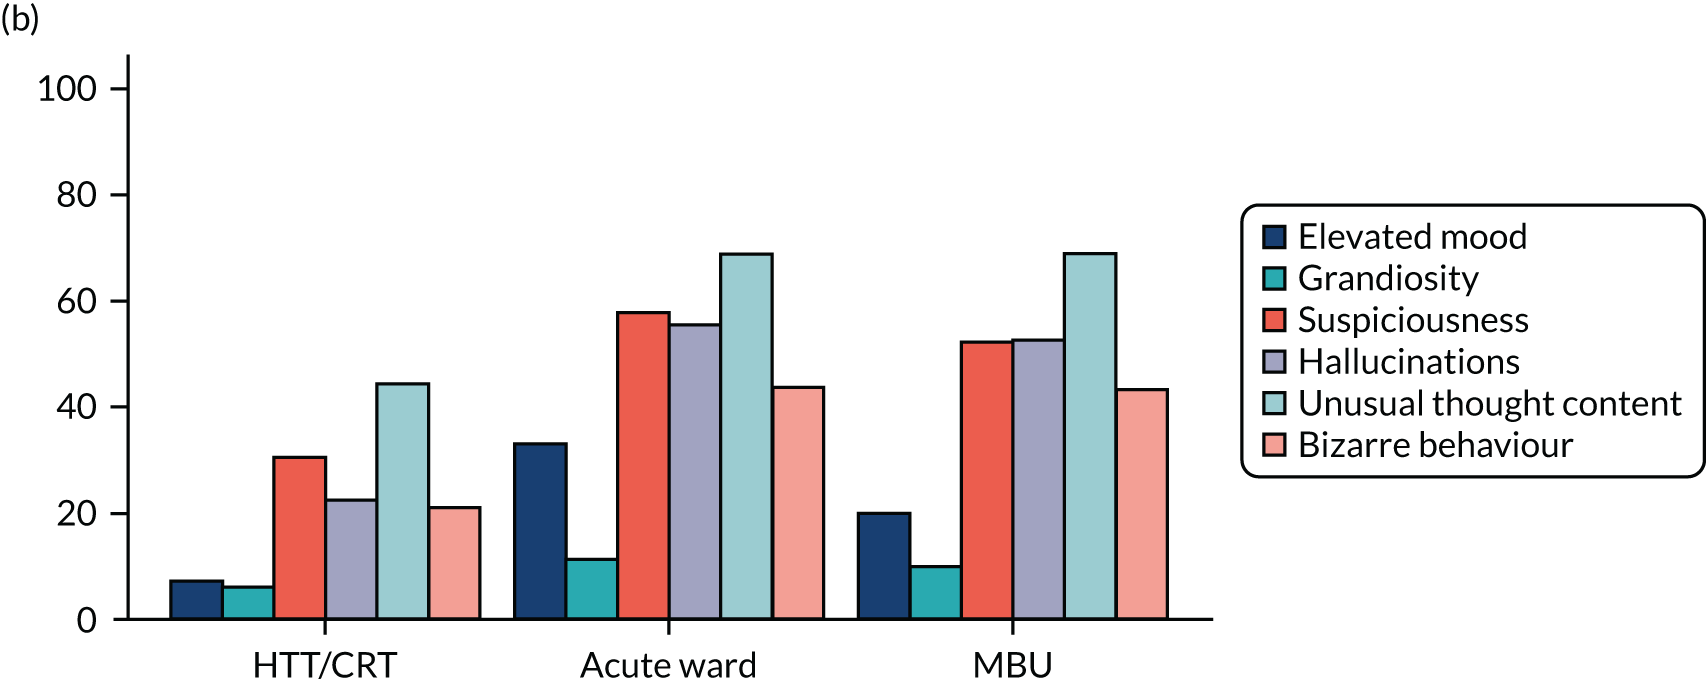

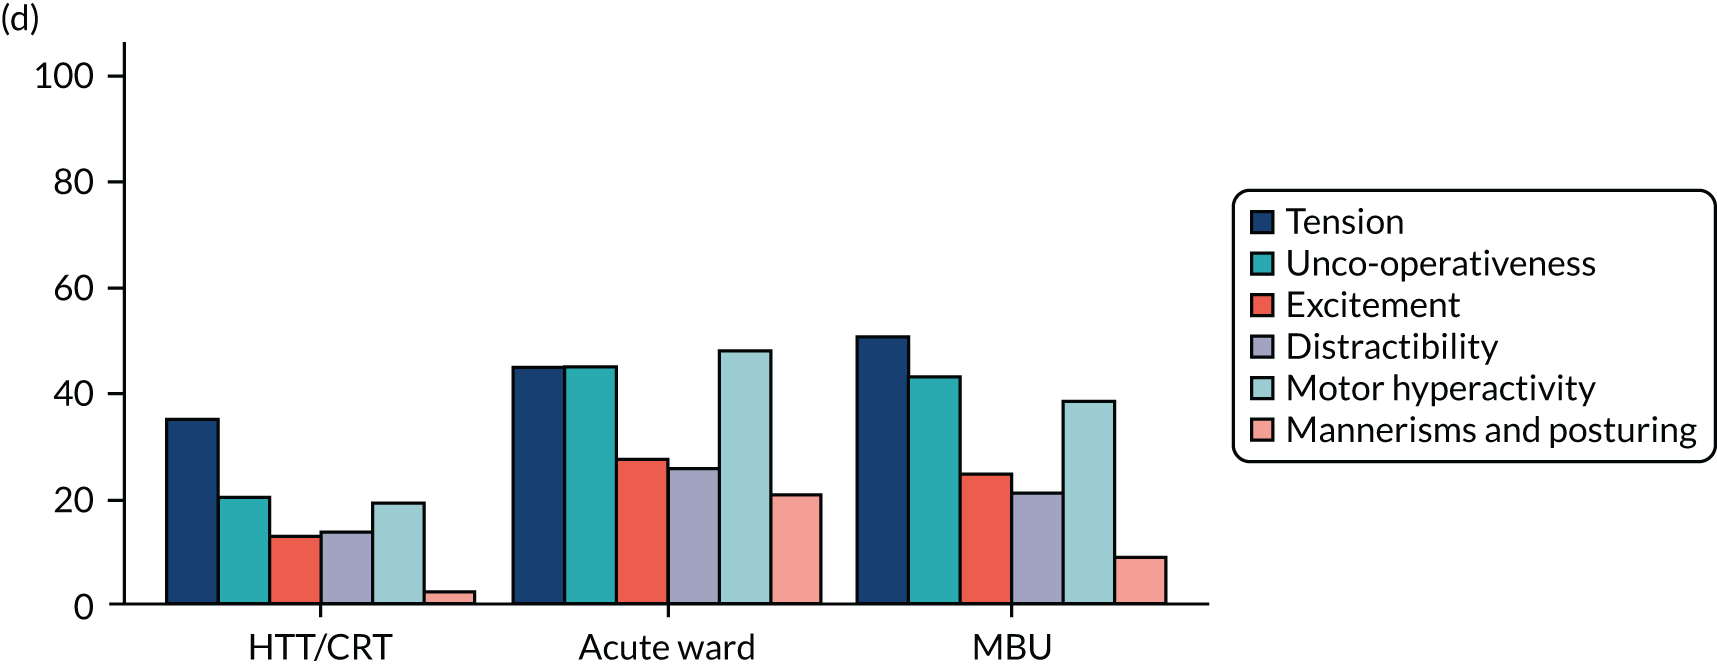
Table 13 summarises the length of each index admission by service type.
| Service | Number of participants | Number of days in admission index | |
|---|---|---|---|
| Median | IQR | ||
| Intensive care | 12 | 25.5 | 12.5–46.5 |
| Ward | 125 | 14.0 | 6.0–27.0 |
| MBU | 116 | 49.0 | 34.5–74.5 |
| CRT | 237 | 17.0 | 9.0–32.0 |
| Total | 493 | 21.0 | 9.0–42.0 |
Key findings
Baseline measures
Table 14 shows demographics of the recruited population at baseline. Participants who attended an acute ward as their highest level of care were, on average, younger (mean 30.5 years), more likely to be white, be single, have a learning disability, have no formal qualifications/General Certificates of Secondary Education (GCSEs), be unemployed at admission, be living alone and to have been adopted/fostered as a child.
| Variable | Service | Total | ||
|---|---|---|---|---|
| CRT | Ward | MBU | ||
| Age (years) at consent (N = 279), mean (SD) | 31.1 (5.8) | 30.5 (6.5) | 32.5 (5.8) | 31.5 (6.0) |
| Ethnicity (N = 279), n (%) | ||||
| White | 79 (72.5) | 50 (80.6) | 83 (76.9) | 212 (76.0) |
| Black | 5 (4.6) | 4 (6.5) | 11 (10.2) | 20 (7.2) |
| Asian | 14 (12.8) | 3 (4.8) | 8 (7.4) | 25 (9.0) |
| Mixed/multiple ethnic groups | 5 (4.6) | 3 (4.8) | 3 (2.8) | 11 (3.9) |
| Other | 6 (5.5) | 2 (3.2) | 3 (2.8) | 11 (3.9) |
| English as first language (N = 279), n (%) | ||||
| Yes | 94 (86.2) | 53 (85.5) | 80 (74.1) | 227 (81.4) |
| Place of birth (N = 279), n (%) | ||||
| UK | 94 (86.2) | 49 (79.0) | 71 (65.7) | 214 (76.7) |
| Other Europe | 2 (1.8) | 8 (12.9) | 11 (10.2) | 21 (7.5) |
| Africa | 2 (1.8) | 3 (4.8) | 12 (11.1) | 17 (6.1) |
| Asia | 9 (8.3) | 1 (1.6) | 8 (7.4) | 18 (6.5) |
| North America/Caribbean | 1 (0.9) | 0 (0.0) | 2 (1.9) | 3 (1.1) |
| Central America | 0 (0.0) | 1 (1.6) | 0 (0.0) | 1 (0.4) |
| South America | 1 (0.9) | 0 (0.0) | 1 (0.9) | 2 (0.7) |
| Australasia/Oceania | 0 (0.0) | 0 (0.0) | 3 (2.8) | 3 (1.1) |
| Difficulty reading own language (N = 278), n (%) | ||||
| Yes | 12 (11.1) | 7 (11.3) | 8 (7.4) | 27 (9.7) |
| Learning disability (N = 278), n (%) | ||||
| Yes | 2 (1.9) | 5 (8.1) | 4 (3.7) | 11 (4.0) |
| Highest qualification (N = 279), n (%) | ||||
| GCSE or no formal qualifications | 15 (13.8) | 16 (25.8) | 23 (21.3) | 54 (19.4) |
| A Level/NVQ/BTEC/HNC | 48 (44.0) | 28 (45.2) | 43 (39.8) | 119 (42.7) |
| Higher education/professional qualifications | 46 (42.2) | 18 (29.0) | 42 (38.9) | 106 (38.0) |
| Employment status prior to maternity leave (N = 279), n (%) | ||||
| Working | 85 (78.0) | 37 (59.7) | 68 (63.0) | 190 (68.1) |
| Not working | 24 (22.0) | 25 (40.3) | 40 (37.0) | 89 (31.9) |
| Gross yearly household income (£) (N = 276), n (%) | ||||
| 0–5475 | 2 (1.8) | 4 (6.6) | 5 (4.7) | 11 (4.0) |
| 5476–14,999 | 18 (16.5) | 15 (24.6) | 22 (20.8) | 55 (19.9) |
| 15,000–30,999 | 30 (27.5) | 14 (23.0) | 31 (29.2) | 75 (27.2) |
| 31,000–45,999 | 17 (15.6) | 10 (16.4) | 15 (14.2) | 42 (15.2) |
| 46,000–60,999 | 15 (13.8) | 5 (8.2) | 6 (5.7) | 26 (9.4) |
| ≥ 61,000 | 19 (17.4) | 5 (8.2) | 22 (20.8) | 46 (16.7) |
| Would rather not say | 8 (7.3) | 8 (13.1) | 5 (4.7) | 21 (7.6) |
| Current relationship status (N = 279), n (%) | ||||
| Single | 11 (10.1) | 15 (24.2) | 15 (13.9) | 41 (14.7) |
| Partner but not cohabiting | 7 (6.4) | 2 (3.2) | 6 (5.6) | 15 (5.4) |
| Married/cohabiting | 87 (79.8) | 40 (64.5) | 86 (79.6) | 213 (76.3) |
| Separated/divorced/widowed | 4 (3.7) | 5 (8.1) | 1 (0.9) | 10 (3.6) |
| Current partner history of mental health problems (N = 224), n (%) | ||||
| Yes | 10 (10.6) | 9 (23.7) | 14 (15.2) | 33 (14.7) |
| Currently living with (excluding children) (N = 279), n (%) | ||||
| Alone | 16 (14.7) | 18 (29.0) | 13 (12.0) | 47 (16.8) |
| Spouse/partner | 82 (75.2) | 36 (58.1) | 82 (75.9) | 200 (71.7) |
| Parent(s)/other | 11 (10.1) | 8 (12.9) | 13 (12.0) | 32 (11.5) |
| Adopted/fostered as a child (N = 233), n (%) | ||||
| Yes | 3 (3.1) | 6 (10.9) | 5 (6.1) | 14 (6.0) |
| Assigned a social worker as a child (N = 228), n (%) | ||||
| Yes | 10 (10.4) | 8 (14.5) | 5 (6.5) | 23 (10.1) |
| Social Provision Scale total score (N = 240), mean (SD) | 76.1 (12.3) | 72.0 (13.6) | 73.4 (11.3) | 74.2 (12.3) |
| Number of unmet needs (CAN-M) (N = 279), mean (SD) | 9.4 (4.3) | 10.6 (4.7) | 9.7 (4.6) | 9.8 (4.5) |
Table 15 and Figure 15 show clinical measures of population at baseline. Participants who attended an acute ward as their highest level of care had higher proportions of smoking at admission, substance misuse, psychotic symptoms, acts of self-injury in the 2 weeks prior to admission and a diagnosis of schizophrenia or related disorders. These women were, on average, younger at first admission and more likely to have had previous admissions in the past 2 years, and it was less likely that this was their first episode of a psychiatric disorder. In addition, they were more likely to have experienced emotional abuse, sexual abuse, emotional neglect and physical neglect as a child. These women also scored higher for the CAS, suggesting that they were experiencing higher levels of domestic abuse at point of admission.
| Variable | Service | Total | ||
|---|---|---|---|---|
| CRT | Ward | MBU | ||
| Initial help-seeker, n (%) | ||||
| Patient sought help | 46 (42.2) | 28 (45.2) | 32 (30.2) | 106 (38.3) |
| Patient’s family, friends or neighbours sought help on their behalf | 33 (30.3) | 23 (37.1) | 40 (37.7) | 96 (34.7) |
| Crisis was identified during a planned contact with the patient by mental health professionals (e.g. by the CMHT) | 10 (9.2) | 6 (9.7) | 10 (9.4) | 26 (9.4) |
| Police or court officials identified the need for mental health intervention | 0 (0.0) | 2 (3.2) | 3 (2.8) | 5 (1.8) |
| Health or social care staff outside the NHS mental health services sought help for the patient | 17 (15.6) | 2 (3.2) | 19 (17.9) | 38 (13.7) |
| Other | 3 (2.8) | 1 (1.6) | 2 (1.9) | 6 (2.2) |
| Previous admissions in last 2 years (N = 279), n (%) | ||||
| Yes | 12 (11.0) | 14 (22.6) | 22 (20.4) | 48 (17.2) |
| First episode of psychiatric disorder (N = 278), n (%) | ||||
| Yes | 33 (30.3) | 15 (24.6) | 35 (32.4) | 83 (29.9) |
| Age (years) at first contact with mental health services (N = 270), mean (SD) | 25.0 (8.2) | 23.1 (7.6) | 26.2 (8.1) | 25.0 (8.1) |
| Post-partum onset of episode (vs. earlier onset) (N = 277), n (%) | 61 (56.5) | 35 (56.5) | 62 (57.9) | 158 (57.0) |
| Detained (N = 279), n (%) | ||||
| Yes | 0 (0.0) | 22 (35.5) | 50 (46.3) | 72 (25.8) |
| Section type for admissions during index episode and previous 2 years61 (N = 148), n (%) | ||||
| Section 2 | 1 (100.0) | 24 (51.1) | 56 (56.0) | 81 (54.7) |
| Section 3 | 0 (0.0) | 18 (38.3) | 36 (36.0) | 54 (36.5) |
| Section 5 (2) | 0 (0.0) | 3 (6.4) | 5 (5.0) | 8 (5.4) |
| Section 5 (4) | 0 (0.0) | 0 (0.0) | 1 (1.0) | 1 (0.7) |
| Section 136 | 0 (0.0) | 2 (4.3) | 2 (2.0) | 4 (2.7) |
| Acts of self-injury in 2 weeks before admission (N = 272), n (%) | ||||
| Yes | 35 (33.0) | 22 (36.1) | 28 (26.7) | 85 (31.3) |
| Total HoNOS score (N = 163), mean (SD) | 12.8 (5.5) | 14.8 (5.2) | 14.1 (6.1) | 13.8 (5.7) |
| Psychotic symptoms (N = 278), n (%) | ||||
| Yes | 53 (49.1) | 50 (80.6) | 80 (74.1) | 183 (65.8) |
| Smoked at point of admission (N = 270), n (%) | ||||
| Yes | 18 (17.0) | 28 (45.2) | 24 (23.5) | 70 (25.9) |
| Substance misuse (N = 279), n (%) | ||||
| Yes | 14 (12.8) | 12 (19.4) | 4 (3.7) | 30 (10.8) |
| Chronic physical health condition (N = 279), n (%) | ||||
| Yes | 55 (50.5) | 33 (53.2) | 50 (46.3) | 138 (49.5) |
| Personality disorder and related disorders diagnosis (primary or secondary) (N = 278), n (%) | ||||
| Yes | 17 (15.7) | 18 (29.0) | 14 (13.0) | 49 (17.6) |
| Primary clinical diagnosis at admission (N = 278), n (%) | ||||
| Depression and other unipolar mood disorders (ICD-10 codes F32, F33, F34, F38 and F39) | 61 (56.5) | 15 (24.2) | 34 (31.5) | 110 (39.6) |
| Bipolar disorder (ICD-10 codes F30 and F31), including acute psychosis (due to the psychopathology of puerperal psychosis) | 17 (15.7) | 18 (29.0) | 38 (35.2) | 73 (26.3) |
| Schizophrenia and related disorders (ICD-10 codes F20–29, excluding acute psychotic episode) | 1 (0.9) | 7 (11.3) | 9 (8.3) | 17 (6.1) |
| Anxiety disorders (ICD-10 codes F40 and F41) | 20 (18.5) | 8 (12.9) | 11 (10.2) | 39 (14.0) |
| Eating disorders (ICD-10 code F50) | 0 (0.0) | 0 (0.0) | 1 (0.9) | 1 (0.4) |
| Severe mental and behavioural disorders associated with the puerperium (ICD-10 code F53) | 1 (0.9) | 1 (1.6) | 12 (11.1) | 14 (5.0) |
| Mental and behavioural disorder due to multiple/psychoactive drug use/cannabis/tobacco use (ICD-10 codes F10–19) | 0 (0.0) | 1 (1.6) | 0 (0.0) | 1 (0.4) |
| Personality and behaviour disorders (ICD-10 codes F60–69) | 6 (5.6) | 11 (17.7) | 3 (2.8) | 20 (7.2) |
| No diagnosis given | 2 (1.9) | 1 (1.6) | 0 (0.0) | 3 (1.1) |
| CTQ − emotional abuse (N = 268), n (%) | ||||
| Yes | 30 (28.3) | 25 (43.1) | 32 (30.8) | 87 (32.5) |
| CTQ − physical abuse (N = 266), n (%) | ||||
| Yes | 20 (18.7) | 9 (16.4) | 17 (16.3) | 46 (17.3) |
| CTQ − sexual abuse (N = 257), n (%) | ||||
| Yes | 19 (18.3) | 22 (40.0) | 22 (22.4) | 63 (24.5) |
| CTQ − emotional neglect (N = 265), n (%) | ||||
| Yes | 24 (22.4) | 15 (27.3) | 26 (25.2) | 65 (24.5) |
| CTQ − physical neglect (N = 269), n (%) | ||||
| Yes | 22 (20.6) | 19 (33.3) | 25 (23.8) | 66 (24.5) |
| Childhood maltreatment (N = 271), n (%) | ||||
| Yes | 46 (43.0) | 39 (67.2) | 52 (49.1) | 137 (50.6) |
| CAS total score (N = 249), mean (SD) | 6.0 (14.7) | 9.1 (18.8) | 5.3 (12.3) | 6.5 (15.0) |
| CAS total score > 3 (N = 249), n (%) | ||||
| Yes | 31 (31.3) | 21 (36.2) | 22 (23.9) | 74 (29.7) |
FIGURE 15.
A plot to show the mean of the binary variables in the propensity score before and after weighting by inverse of propensity score. (a) Before weighting by inverse of propensity score; and (b) after weighting by inverse of propensity score.
a, Sections for admissions in current episode and/or previous 2 years.


Please see Appendix 11 for the threshold assessment grid ratings.
Table 16 shows obstetric measures of the population at baseline. Participants whose highest level of care was on an acute ward were more likely than the women in other cohorts to have a pregnancy that ended in miscarriage or stillbirth or to experience a premature birth or a neonatal death. Women who attended a MBU or CRT as their highest level of care were more likely than women whose highest level of service was an acute ward to have had significant problems during the birth.
| Obstetric measure | Service, n (%) | Total, n (%) | ||
|---|---|---|---|---|
| CRT | Ward | MBU | ||
| Miscarriage or stillbirth (N = 278) | ||||
| Yes | 38 (34.9) | 16 (26.2) | 35 (32.4) | 89 (32.0) |
| Termination of pregnancy (N = 277) | ||||
| Yes | 28 (25.9) | 14 (23.0) | 29 (26.9) | 71 (25.6) |
| History of neonatal death (N = 278) | ||||
| Yes | 2 (1.8) | 2 (3.3) | 2 (1.9) | 6 (2.2) |
| Any child(ren) born at < 37 weeks’ gestation (N = 279) | ||||
| Yes | 15 (13.8) | 12 (19.4) | 18 (16.7) | 45 (16.1) |
| Significant problems during the birth (N = 279) | ||||
| Yes | 55 (50.5) | 29 (46.8) | 53 (49.1) | 137 (49.1) |
| Assisted conception (N = 276) | ||||
| Yes | 2 (1.9) | 1 (1.6) | 4 (3.7) | 7 (2.5) |
| Feeding mode (N = 276) | ||||
| Breast | 52 (47.7) | 29 (47.5) | 43 (40.6) | 124 (44.9) |
| Bottle | 30 (27.5) | 27 (44.3) | 28 (26.4) | 85 (30.8) |
| Mixed | 27 (24.8) | 5 (8.2) | 35 (33.0) | 67 (24.3) |
| Advised against breastfeeding because of psychiatric medication (N = 272) | ||||
| Yes | 18 (16.7) | 21 (34.4) | 36 (35.0) | 75 (27.6) |
| Advised against breastfeeding because of other medications (N = 258) | ||||
| Yes | 6 (5.7) | 3 (5.1) | 8 (8.5) | 17 (6.6) |
Table 17 shows child measures in the population at baseline. Women who attended an acute ward as their highest level of care were more likely than women from the other groups to give birth prematurely or very prematurely. These women also had, on average, more children and were more likely to have had children’s social services assessment or intervention. Compared with women who accessed a ward or MBU services, women who were admitted to CRT services were more likely to be admitted when their child was aged > 100 days and less likely to be admitted before birth.
| Child measure | Service, n (%) | Total, n (%) | ||
|---|---|---|---|---|
| CRT | Ward | MBU | ||
| Gestational age (weeks) (N = 249), mean (SD) | 38.2 (1.9) | 37.6 (2.3) | 38.2 (2.2) | 38.1 (2.1) |
| Term status (gestational age) (N = 249), n (%) | ||||
| Post term | 0 (0.0) | 1 (1.9) | 0 (0.0) | 1 (0.4) |
| Full term | 76 (76.0) | 31 (58.5) | 73 (76.0) | 180 (72.3) |
| < 37 weeks’ gestation (premature) | 23 (23.0) | 20 (37.7) | 21 (21.9) | 64 (25.7) |
| < 32 weeks’ gestation (very premature) | 1 (1.0) | 1 (1.9) | 2 (2.1) | 4 (1.6) |
| Number of children (N = 279), mean (SD) | 1.8 (1.2) | 2.0 (1.1) | 1.7 (1.1) | 1.8 (1.1) |
| Children’s social services assessment or intervention at baseline (N = 278), n (%) | ||||
| Yes | 27 (24.8) | 23 (37.1) | 36 (33.6) | 86 (30.9) |
| Age of child at date of first admission (N = 277), n (%) | ||||
| Admission before birth | 2 (1.9) | 3 (4.8) | 5 (4.7) | 10 (3.6) |
| 0–100 days | 58 (53.7) | 36 (58.1) | 79 (73.8) | 173 (62.5) |
| > 100 days | 48 (44.4) | 23 (37.1) | 23 (21.5) | 94 (33.9) |
Process evaluation results
We collected data from staff on 42 general wards, 42 CRTs and five MBUs in the participating provider organisations in England and Wales. No service declined participation.
Interventions
All MBUs reported providing some form of mother–infant relationship support. A number of variations in the provision of psychological interventions was found. Provision of family/relationship therapy was more limited, particularly in acute wards and CRTs. However, all MBUs reported routinely providing partner/carer support and carer groups. Acute wards and CRTs more often than MBUs reported providing substance misuse support. Most services were able to provide or arrange interventions that aimed to build support networks.
Facilities
All MBUs provided full access to a 24-hour crèche, bedrooms for mother and baby, specific children’s visiting areas equipped with toys, an adult’s visiting area, a quiet room and a kitchen for infant feeds. In 55% of acute wards, patients had full access to a designated children’s visiting area and 20% provided partial access. Most MBUs did not have overnight facilities for partners.
Staff
All MBUs had specialist nursery nurses and a perinatal psychiatrist. Sixty-two per cent of acute wards and CRTs had some limited access to a perinatal psychiatrist. All services provided access to a duty doctor, mental health nurses and a psychiatrist. Eighty per cent of MBUs had a psychologist on unit staff, compared with 52% of wards and 55% of CRTs.
Wards and CRT services that facilitated mother–infant support largely did so via PMH teams; however, 31% of CRT and inpatient staff reported either that they did not have, or that they were unsure if they had, access to a team.
Propensity score
The prespecified variables in the propensity scores were explored blind to outcome data. Two out of the 23 variables were continuous: age at consent, which was normally distributed [mean 31.5 (6.0 SD) years] (see Table 14), and number of children (between 1 and 7). The number of children was transformed by taking the square root so that a more continuous distribution was present. Some data were missing for 12 of 23 prespecified variables, with the number of missing values ranging from 1 to 46. Eleven of these variables were binary and one was categorical. Iterative chained equations were used to impute missing values on these 12 variables, together with the other 11 complete variables in the model. A single imputed data set (seed 123) with a burn-in of 10 cycles, logit models to impute the binary variables and mlogit to impute a categorical variable were used. The augment option was added to perform augmented regression in the presence of perfect prediction. One prespecified binary predictor with a high level of missingness and unstable imputation over multiple seeds was omitted (mother ever adopted/fostered).
With the complete set of variables, the propensity score for MBUs compared with non-MBU services was computed using pscore, rather than the teffects command, to check the region of common support and balance between groups blind to outcome. Initial analysis suggested the exclusion of 12 beyond the region of common support and that achieving convincing balance was non-trivial.
A weight was generated from the propensity score to examine if the propensity score reduced the imbalance of key variables across groups for participants in the region of common support. Each variable was summarised by group with and without the weighting (see Figure 15). From visual inspection, number of children, detention and CAS score were still slightly imbalanced after adjusting for propensity score, suggesting that additional covariate adjustment for the effects of these variables would be appropriate.
Primary outcome
Table 18 shows the primary outcome of readmission rates at 12 months post discharge for the cohort groups used in the primary analysis, that is MBUs compared with non-MBU services (acute wards readmission rate, 32.3%; CRT readmission rate, 21.3%).
| Group (N = 278) | Readmission rate at 12 months (%) |
|---|---|
| MBU (n = 108) | 22.2 |
| Non-MBU (n = 170) | 25.3 |
To maximise the power and robustness of the analysis, our key baseline variables (excluding and, therefore, still blind to, group allocation) were assessed for their ability to predict the primary outcome of readmission. Forward stepwise logistic regression was used with an entry criterion p-value < 0.15. This was also restricted to those in the region of common support. Significant predictors were personality disorder, ethnicity (other), learning disability, age of child at admission, partner and living alone. These six variables along with the three variables already identified as still unbalanced after propensity score weighting (i.e. number of children, section and CAS) were adjusted for in the teffects analysis model.
The teffects-augmented inverse probability weighting approach was used, as this gave scope for double-robustness and gains in power by the inclusion of some regression covariates in addition to propensity score weighting. We included the six variables that were associated with the outcome, as described above, and the three variables for which the propensity score did not visually achieve balance (all identified without reference to the outcome variable). teffects used a logistic regression model for both the propensity score and the analysis model estimating parameters of the outcome model. As in the pscore analysis, a region of common support criterion of 0.05 was specified, which, in this setting, under maximum likelihood, identified 15 women for exclusion (the 12 women previously identified plus an additional three women). The model was then re-estimated using the wnls algorithm and, as described below, reported achieving satisfactory balance. Results are presented in Table 19.
| Analysis model (n = 263) | Adjusted OR (95% CI) | p-value |
|---|---|---|
| MBUs vs. non-MBU services | 0.95 (0.86 to 1.04) | 0.29 |
A sensitivity analysis was performed with three different imputation model seeds (23,42,170). Estimates obtained all met the balancing criterion and yielded log-odds treatment effect estimates that varied by an odds ratio (OR) of ± 0.01. Robustness of the effect estimate to changes in estimator was also examined, by using block stratification, nearest neighbour and radius estimators (atts, attr and attn). Although yielding larger standard errors than teffects aipw, the effect estimates themselves changed little.
Our analysis showed that women who were admitted to MBUs had 0.95 times the odds of being readmitted at 12 months, compared with women who were not admitted to a MBU. If those in the MBU arm had not attended a MBU service, their readmission rate was estimated to have been 26.4% (95% CI 19.1% to 33.7%).
The analysed sample showed satisfactory overlap and a test for covariate balance after teffects inverse probability weighting gave no indication of imbalance (p = 0.9942) (see Appendix 12).
Secondary outcomes
Table 20 summarises the secondary outcome results.
| Secondary outcome | Participant group | Total | ||||
|---|---|---|---|---|---|---|
| Non-MBU | MBU | |||||
| N | Mean (SD)/n (%) | N | Mean (SD)/n (%) | N | Mean (SD)/n (%) | |
| Number of unmet needs (CAN-M) at 1 month post discharge | 171 | 4.1 (3.6) | 108 | 4.0 (3.3) | 279 | 4.0 (3.5) |
| CSQ total score at 1 month post discharge | 162 | 25.0 (6.6) | 100 | 26.9 (5.6) | 262 | 25.7 (6.3) |
| Perinatal VOICE total score at 1 month post discharge | 38 | 94.7 (21.2) | 89 | 126.8 (13.9) | 127 | 117.2 (22.0) |
| PBQ total score at 1 month post discharge | 161 | 15.7 (13.2) | 100 | 12.6 (12.5) | 261 | 14.5 (13.0) |
| Maternal sensitivity at 1 month post discharge | 123 | 3.9 (1.9) | 78 | 4.3 (2.4) | 201 | 4.0 (2.1) |
| Infant co-operativeness at 1 month post discharge | 123 | 2.9 (1.9) | 78 | 3.3 (2.4) | 201 | 3.0 (2.1) |
| Maternal unresponsiveness at 1 month post discharge | 123 | 7.1 (3.3) | 78 | 7.3 (2.8) | 201 | 7.2 (3.1) |
| Infant passivity at 1 month post discharge | 123 | 5.1 (3.8) | 78 | 4.9 (3.8) | 201 | 5.0 (3.8) |
| No custody of baby at 1 year post discharge | 129 | 9 (7.0%) | 97 | 6 (6.2%) | 226 | 15 (6.6%) |
Participants completed a CSQ and the perinatal VOICE for each service that they accessed. The secondary analysis associated with these measures used the CSQ/perinatal VOICE score relating to the service they are categorised under via highest level of care. For example, if a participant accessed MBU services, then they were categorised under MBU and their CSQ/perinatal VOICE score for their MBU experience was included in the analysis. Perinatal VOICE analysis included only women who accessed a MBU or an acute ward, as ‘environment themes’ on this questionnaire are not applicable to home treatment CRTs.
Table 21 shows the results for each secondary outcome. Simple linear models are used with propensity scores unless otherwise stated.
| Secondary outcome | Coefficient (95% CI) | p-value |
|---|---|---|
| Number of unmet needs (CAN-M) at 1 month post discharge:a n = 279b/n = 264c | –0.05 (–0.75 to 0.65) | 0.89 |
| CSQ total score at 1 month post discharge: n = 262b/n = 249c | 1.62 (0.20 to 3.05) | 0.03 |
| Perinatal VOICE total score at 1 month post discharge:d n = 127b/n = 117c | 34.08 (28.23 to 39.93) | < 0.001 |
| PBQ total score at 1 month post discharge: n = 261b/n = 249c | –1.59 (–5.20 to 2.02) | 0.39 |
| Maternal sensitivity at 1 month post discharge: n = 201b/n = 189c | 0.13 (–0.46 to 0.71) | 0.67 |
| Infant co-operation at 1 month post discharge: n = 201b/n = 189c | 0.10 (–0.51 to 0.70) | 0.75 |
| Maternal unresponsiveness at 1 month post discharge: n = 201b/n = 189c | 0.52 (–0.35 to 1.40) | 0.24 |
| Infant passivity at 1 month post discharge: n = 201b/n = 189c | –0.45 (–1.69 to 0.79) | 0.48 |
| No custody of baby at 1 year post discharge:a,e n = 226b/n = 211c | 0.01 (–0.04 to 0.06) | 0.72 |
The mean maternal sensitivity scores are in the range suggesting a need for parenting intervention and support.
Economic evaluation results
See also Appendix 14 for more details.
In adjusted analyses, total costs from admission to 1 month post discharge were significantly higher in the MBU group (£60,007) than in the non-MBU group (£13,673) (mean difference £44,049, 95% CI £36,638 to £51,461; p < 0.001) (Table 22). This was because of a combination of higher unit costs for MBUs (£707/day), than for generic acute wards (£385/day) and CRTs (£199/contact), and longer lengths of stay in MBUs. QALYs were not significantly different (adjusted mean difference 0.007, 95% CI –0.013 to 0.027; p = 0.496) (see Table 22). The CEACs suggest that there is a 0% probability of MBUs being cost-effective compared with non-MBUs over a willingness-to-pay range from £0 to £50,000 per QALY in complete-case and imputed analyses and using QALYs generated from both EQ-5D-5L and SF-6D. This was because of the high costs associated with the MBU group and similar outcomes between the groups in terms of QALYs.
| Cost/outcome | Participant group | Unadjusted mean difference (95% CI; p-value) | Adjusted mean differencea (95% CI; p-value) | |||
|---|---|---|---|---|---|---|
| MBU | Non-MBU | |||||
| n | Mean (SD) | n | Mean (SD) | |||
| Short-term analysis (1 month post discharge) | ||||||
| Costs (£) | ||||||
| Acute care costs in the 2 years prior to index admission | 67 | 1873 (7711) | 145 | 2038 (9353) | ||
| Total health and social care costs: admission to 1 month post discharge | 67 | 60,007 (32,065) | 145 | 13,673 (12,472) | 46,333 (38,380 to 54,286; p < 0.001) | 44,049 (36,638 to 51,461; p < 0.001) |
| Outcomes | ||||||
| EQ-5D-5L utility score at admission | 67 | 0.44 | 145 | 0.44 | ||
| EQ-5D-5L utility score at 1 month post admission | 67 | 0.825 (0.150) | 145 | 0.790 (0.168) | 0.036 (–0.010 to 0.081; p = 0.122) | 0.007 (–0.039 to 0.053; p = 0.752) |
| QALYs | 67 | 0.282 (0.237) | 145 | 0.224 (0.302) | 0.058 (–0.017 to 0.133; p = 0.130) | 0.007 (–0.013 to 0.027; p = 0.496) |
| Long-term analysis (12 months post discharge) | ||||||
| Total acute and community costs (£) | 47 | 2897 (4743) | 98 | 2147 (5338) | 750 (–979 to 2479; p = 0.395) | 632 (–1326 to 2589; p = 0.527) |
Use of acute care and other mental health services between discharge and 12-month follow-up was similar between the two groups. Total cost of these services was not significantly different between the groups (mean difference £632, 95% CI –£1326 to £2589; p = 0.527). Full details of the economic results are provided in Appendix 14.
Additional analyses
Analysis of Bayley Scales of Infant Development
Tables 23 and 24 show analysis of Bayley Scales of Infant Development.
| Bayley composite scale | Participant group | Total | ||||
|---|---|---|---|---|---|---|
| Non-MBU | MBU | |||||
| n | Mean (SD) | n | Mean (SD) | N | Mean (SD) | |
| Cognitive | 114 | 102.3 (14.4) | 72 | 104.6 (11.9) | 186 | 103.2 (13.5) |
| Language | 112 | 91.9 (11.2) | 70 | 92.4 (12.8) | 182 | 92.1 (11.8) |
| Motor | 108 | 97.4 (13.7) | 68 | 96.2 (11.2) | 176 | 96.9 (12.8) |
| Socioemotional | 110 | 102.9 (16.1) | 69 | 99.8 (15.2) | 179 | 101.7 (15.8) |
Bayley scale composite scores after propensity score adjustment, including adjustment for infant sex, were analysed using simple linear models.
| Bayley composite scale | Coefficient (95% CI) | p-value |
|---|---|---|
| Cognitive: n = 185a/n = 176b | 3.48 (–0.37 to 7.32) | 0.08 |
| Language: n = 181a/n = 171b | 1.07 (–3.24 to 5.38) | 0.63 |
| Motor: n = 175a/n = 166b | –2.04 (–5.75 to 1.66) | 0.28 |
| Socioemotional: n = 178a/n = 170b | –2.58 (–6.73 to 1.57) | 0.22 |
Instrumental variable analysis
The propensity score analysis provided our best estimate of the effects of service type adjusted for potential confounders that we had been able to assess. Nonetheless, there remained the possibility that there were additional unassessed confounders. These confounders might include unquantified and unreported concerns and intuitive judgements of the clinical referring team as to patient needs or patients’ domestic risk. The instrumental variable (IV) approach attempts to account for these additional unknown or unaccounted for confounders by examining the effect of variation in the proportion of women going to an MBU associated with some variables considered to be unlikely to be related to these other factors. Distance of the patient from a source of a particular service has often been used as such a variable (i.e. the patient is less likely to make use of a specialist service that is further away). Data regarding distance to MBU are available for 278 women; however, as readmission data were unavailable for one participant, our IV analysis included 277 women in total.
We implemented this approach within a bivariate probit framework, but began by replicating our previous results within this probit framework (as shown in the first column of results in Table 25). The second column of Table 25 shows the results of adding the IV of distance into the equation predicting MBU attendance. This shows a clear association of MBU use with distance from the service, one that is sufficiently strong and, therefore, avoids the problems associated with a weak instrument. More striking is the substantial change to the estimated effect of MBU attendance. This is now clearly significant (p = 0.001), estimating the readmission rate as falling from 44% to 9% with attendance at a MBU.
| Analysis | Basic probit | IV analysis | ||||||
|---|---|---|---|---|---|---|---|---|
| Coefficient | SE | z-statistic | p-value | Coefficient | SE | z-statistic | p-value | |
| Readmission | ||||||||
| MBU | –0.119 | 0.198 | –0.60 | 0.547 | –1.191 | 0.363 | –3.28 | 0.001 |
| pscore | 0.077 | 0.394 | 0.20 | 0.844 | 1.213 | 0.528 | 2.30 | 0.022 |
| MBU attendance | ||||||||
| pscore | 2.892 | 0.372 | 7.78 | <0.001 | ||||
| Distance | –0.899 | 0.230 | –3.92 | 0.001 | ||||
Just as the validity of the propensity score analysis rests on the assumption that all relevant confounders have been accounted for, the validity of this analysis, an assumption that is very hard to check, also rests on a number of assumptions that cannot be checked. One particular assumption (i.e. the exclusion restriction) is that the association of distance with readmission rates occurs only through its influence on MBU access. However, if greater distance to a MBU is also a proxy for poor access to other health-care services or services of poorer quality, then the exclusion restriction would not be met. 70 Therefore, we consider this IV analysis as a form of sensitivity analysis, one that suggests that the benefits of MBU admission could be substantially larger than our propensity score-based estimator suggested.
For more details of sensitivity analysis using different cohort definitions please see Appendix 12. These analyses did not change the overall direction of results.
Significant other outcomes
A total of 234 significant other questionnaires were given to participants (45 women did not participate), of which 98 (41.9%) were returned. Eighty (81.6%) significant others were men and most were in a long-term partnership/married (n = 93, 94.9%). Fourteen (14.3%) parents completed the questionnaires. Most significant others were, on average, in contact for over 32 hours per week (n = 61, 63.5%). As can be seen in Table 26, 51% of significant others met ‘caseness’ on the GHQ-12.
| Scale | Score |
|---|---|
| IEQ (N = 95), mean score (SD) | 23.9 (15.1) |
| GHQ-12 (N = 96), mean score (SD) | 3.7 (3.7) |
| GHQ-12 psychiatric caseness (score of ≥ 3) (N = 96), n (%) | |
| Yes | 49 (51.0) |
| No | 47 (49.0) |
Strengths and limitations
Acute severe post-partum disorders are uncommon, although they are more common in some groups of women, such as women with bipolar disorder. Despite the help of Clinical Research Network staff, and frequent regular telephone calls and e-mails to services, we found it difficult to identify women, particularly on acute wards, as admissions were often short, women did not have mental capacity to consent and staff were often too busy and changed too frequently for us to always feel sure that we had not missed any eligible women. Moreover, when women were identified and recruited from an acute ward, we would occasionally find that they had spent time on a MBU, sometimes a few months earlier. Where possible, we included these women in the study, as we were still able to gather sufficient baseline data from case notes and data regarding the primary outcome to include them. However, this could mean that the secondary outcome data for the correct time period could not be included and that the study was underpowered.
Most women accessed more than one type of acute care. Therefore, we had to best classify and analyse our data to reflect this in the context of our theoretical understanding of the important components of care. We agreed that MBUs are the most specialist and ‘highest’ level of care that is focused on mother–infant relationships and maternal illness. We debated if this should be compared with other forms of acute care or if the acute care that involved the mother staying with her baby (i.e. CRT) was an equivalent exposure to the MBU. We agreed to compare specialist with non-specialist acute care, but we would also carry out sensitivity analyses in which the exposure was defined in different ways.
Our other significant challenge was the lack of data in case notes for the primary outcome because women had moved or had been discharged back to primary care. Therefore, after REC approval, we added a telephone call at 1 year, during which we asked about acute care, current living circumstances (including care of infant) and EQ-5D-5L, and this enabled further economic evaluation.
Finally, our primary outcome has its limitations, as it could be argued that the primary objective of an admission to a MBU is not prevention of relapse and so the fact that it is not any different from other services is not surprising. The primary objective of MBU admission is to treat the presenting episode of severe mental illness while simultaneously promoting mother–infant interaction. It can take up to 2 years to completely recover from an episode of post-partum psychosis, and it is at this point that mothers (including in our PPI group) report how beneficial MBUs can be in having developed the relationship with the baby. However, a serious relapse leading to acute care could result in further potential disruption to the mother–child relationship (and it is well established from other research4,71 that it is persistence of symptoms that is most likely to be associated with adverse child outcomes). Furthermore, the challenge and resource-intensive nature of assessing the mother–child relationship again at 1 year post discharge (and even more so at retaining the cohort at 2 years) meant that it was not feasible to pursue this potential aspect of long-term outcome.
Summary
Our headline estimate for the adjusted OR for MBU reducing rates of admission is 0.95 (95% CI 0.86 to 1.04), implying a modest potential benefit and a small risk of increasing rates of readmission. This estimate was based on a comparison of women balanced (matched) across an extended list of measures describing their symptomatology and social and demographic characteristics, and on the fact that the result was robust to a range of analysis methods, and was not affected by changing how cohorts were determined, namely basing this on the service to which women were first admitted or in which they spent the majority of their time in care, rather than according to service providing the highest level of care. Nonetheless, imbalance in something excluded or unmeasured remains a possibility. The IV estimator approaches the analysis in an entirely different way, making quite different assumptions, and, in theory, can account for imbalance in these excluded and unmeasured variables. The IV analysis suggested that MBUs could reduce readmission rates by 70%, which is both much larger and strongly significant (p = 0.001), although the CI was wide. As the assumptions of the IV analysis, in particular the assumption of no correlation between quality of services with distance from MBU, cannot all be confirmed as met, we regard this estimate as a sensitivity analysis indicative of potential bias from unmeasured confounders in our headline effect estimate. Although this would provide encouragement that MBUs can cut readmission rates, and certainly reduce any concern that they could increase rates, our level of uncertainty as to the level of efficacy remains high.
Across all three services, more than one in five women were readmitted to acute care in the year after discharge, implying a significant relapse. As discussed at our 2019 stakeholder event, future research should examine the reasons for readmissions and how to reduce these relapse rates, as they are occurring at a time critical for mother and infant. The new NHS Long Term Plan72 advises commissioning of PMH services up to the age of 2 years, and our data support this recommendation. It was striking that, across services, mother–infant interactions, even after 1 month post discharge, were suboptimal. This suggests that more parenting and PMH support is needed for women after discharge.
Economic evaluation did not support the cost-effectiveness of MBUs, compared with acute wards and CRTs, in WP3 over the short term (i.e. to 1 month post discharge) because of long duration of index admissions and, therefore, the high cost of admissions in this cohort. However, if the IV analysis is valid, and MBUs are able to have a much greater impact on readmission rates than is implied by the primary analysis, cost-effectiveness advantages may exist, as the high initial cost of MBUs might be offset by savings from reduced subsequent admissions. However, as noted above, caution is required in coming to any firm conclusions, given that the assumptions of the IV analysis, in particular the assumption of no correlation between quality of services with distance from MBU, cannot be confirmed as met.
Conclusions from the programme
The programme demonstrated that there is a high prevalence of mental disorders in early pregnancy and it has shed light on women’s perceptions of better care (WPs 2 and 3) when the care provided is tailored to their needs [WP1(ii); WP3(ii)]. This was true of services for both mild and severe disorders. However, a consistent thread throughout the programme was the lack of involvement of partners and other family members, and, although this was somewhat better in MBUs than in other services, some women felt that family members’ needs were not met. In WPs 2 and 3(ii), it was also noted that domestic abuse was common and, therefore, PMH professionals need to identify abusive partners and respond to families in the broader context.
Reflections on what was and what was not successful
We had very high rates of follow-up in all WPs. This was the result of very hard work by outstanding field researchers, primary outcomes chosen on the basis of importance to women themselves (which were, therefore, meaningful for all participating women) and outcomes chosen on the basis of feasible data collection (e.g. telephone vs. face to face). We are not able to examine how representative the women recruited to WP3 were compared with women who were not recruited as, for WP3, we were not given ethics approval to record a minimum data set on all women approached. However, for WP1, at least, the base population was similar to the study population and other demographics. Although participants across all studies include very disadvantaged women, with high rates of childhood and adult abuse (WP3), selection bias remains likely. Moreover, women who lose custody, sometimes repeatedly (WP2), did not benefit from current service configurations. Our sensitivity analyses examined the effect of classifying women by the service they spent most time in or attended first and this did not change the direction of results.
Low response rates from partners is a methodological challenge, but recruiting significant others is important, and with persistence and resources can be achieved, as in WP2. This is particularly important, as the NHS Long Term Plan72 recommends that significant others are assessed for mental ill health. In addition, other guidance, for example the NICE public health guideline on domestic violence and abuse,73 recommends training for health-care professionals to safely identify and respond to domestic abuse.
Recommendations for future research
-
We established that the Whooley questions and EPDS can be used to identify depression or other mental disorders in pregnancy. Predictive modelling, using other risk factors, such as social support and a history of recent self-harm, routinely collected by midwives would enable more accurate identification to take place.
-
We do not know if identification of mental disorders in pregnancy improves outcomes for mother and child, although the new investment assumes that this is the case. Future research should examine whether or not the introduction of specialist services has improved outcomes, and if improvements have not been seen, then examine why. Future research should also examine the impact of interventions in the pre-conception period, as this may be an even more opportune time74 to benefit women and children.
-
Future research should focus on the extent of inequity of access of certain groups and how to reach out to these communities.
-
Continuity has been identified as an important component of maternity care and women emphasised its importance in WPs 1, 2 and 3. Future research could examine how best to deliver continuity of care when working with women under adult generic mental health services, PMH services and maternity and universal services.
-
Future research should explore how the wider system of care can optimise support for women with acute severe postnatal mental disorders.
-
It is difficult to carry out research when services are undergoing transformation, but this could not have been foreseen. In future, where services are changing dramatically, an interrupted time series using routine data may be more helpful and is planned in ESMI II [see NIHR Journals Library URL: www.journalslibrary.nihr.ac.uk/programmes/hsdr/174938/#/ (accessed 12 August 2021)]. In hindsight, our continued attempts to recruit to the exploratory GSH pilot trial [WP1(ii)], including opening new recruitment sites, should have stopped earlier, as changes in policy had occurred across England and recruitment was, therefore, likely to be difficult in the additional sites we opened. In retrospect, however, we could have added additional sites earlier in parts of the UK where admissions to MBUs were not possible, such as South Wales, as this may have facilitated recruitment of more participants to the acute ward arm; however, the governance procedures were lengthy and could have delayed progress. In addition, the cost of recruiting further away, including travel expenses and time, was also a concern. Since the pandemic, we have been carrying out recruitment remotely for new studies, such as ESMI II, and this recruitment strategy could be explored for future studies. At the time of this study, however, recruiting women with severe mental illness remotely may not have been approved by the REC. However, it is now appreciated that when carried out carefully, and with appropriate safeguards, this can be achievable.
Implications for practice and any lessons learnt
-
Care pathways providing perinatal tailored services were clearly associated with considerably higher levels of satisfaction across WPs, whether measured by our new perinatal VOICE measure, the CSQ or qualitative interviews. However, non-specialist staff (e.g. midwives, CRT staff, etc.) need PMH training.
-
The high levels of obstetric complications and poor pregnancy outcomes seen in WP3 need to be considered in terms of the broader health needs of women with mental illness. Staff training on comorbid health problems is needed.
-
The high prevalence of domestic violence and abuse experienced by participants means that PMH services need to ‘factor coercive partners into our thinking’ (stakeholder comment at our final event). Conversely, women and babies live in the context of wider family life, and services need to ensure that significant others are involved in maternal care and are supported themselves.
-
In view of the suboptimal maternal sensitivity seen at 1 month post discharge, aftercare needs to include parenting support, continuity of staff (where possible), interventions for maternal illness and assistance with other needs.
Acknowledgements
The study team acknowledges the study delivery support given by the NIHR South London Clinical Research Network and King’s Clinical Trials Unit. We would like to thank the many participants, trusts, local authorities, all our local collaborators and our study champions. We would also like to acknowledge the administrative help of Marzena Zdrojkowska.
Patient and Carer Advisory Group members
Amanda Grey, Sarah Spring, Ceri Rose, Eleanor O’Sullivan, Maria Bavetta, Jessie Hunt, Kathryn Grant, Dr Diana Rose, Liberty Moss, Henry Fay, Catherine Muhammad, Holly Wright and Antoaneta Sokolova.
Programme Steering Committee members
Professor Rona McCandlish (chairperson), Ms Rosie-Ann Jones, Dr Heather O’Mahen, Ms Ceri Rose, Professor Pauline Slade and Sarah Spring.
Trial Steering Committee members
Professor Cathy Creswell (chairperson), Professor Christine MacArthur, Juliette O’Donnell and Professor Vivette Glover.
Independent Data Monitoring and Ethics Committee members
Dr Roch Cantwell (chairperson), Dr Stephen Bremner, Dr Liz McDonald Clifford, Dr Ron Gray and Marian Knight.
Contributions of authors
Louise M Howard (https://orcid.org/0000-0001-9942-744X) (Consultant Psychiatrist) was chief investigator for this programme and conceived the studies with the help of other authors, supervised the London-based research team and took overall responsibility for the outputs. In addition, she led the writing of this final report.
Kathryn M Abel (https://orcid.org/0000-0003-3538-8896) (Consultant Psychiatrist) supervised research staff based at the University of Manchester, conceived the ideas for the studies with Louise M Howard and was involved in writing sections of the report.
Katie H Atmore (https://orcid.org/0000-0003-3012-4584) (Research Assistant) analysed data on significant others and assisted with the writing up of these data.
Debra Bick (https://orcid.org/0000-0002-8557-7276) (Professor of Evidence-based Midwifery) was midwifery lead for WP1 and provided expertise also for WP2.
Amanda Bye (https://orcid.org/0000-0002-9808-4956) (Research Associate) was involved in data collection for WP1, conceived analyses for eating disorders and was involved in the writing up of these data for publication.
Sarah Byford (https://orcid.org/0000-0001-7084-1495) (Professor of Health Economics) led the health economic component of the programme.
Lauren E Carson (https://orcid.org/0000-0002-7027-3077) (Postdoctoral Researcher) was involved in data collection for WP3 and the writing up of findings.
Clare Dolman (https://orcid.org/0000-0001-7466-1651) (Service User Researcher) led the PPI component of the programme.
Margaret Heslin (https://orcid.org/0000-0002-3094-9255) (Junior Health Economist) led analyses under Sarah Byford’s supervision.
Myra Hunter (https://orcid.org/0000-0002-0722-6761) (Professor of Health Psychology) contributed to study design, analyses and writing up of WP1(ii).
Stacey Jennings (https://orcid.org/0000-0002-1162-6370) (Research Associate) was involved in data collection and wrote the section on process evaluation.
Sonia Johnson (https://orcid.org/0000-0002-2219-1384) (Professor of Psychiatry) led WP2 and provided expertise on CRTs and acute care for WP3.
Ian Jones (https://orcid.org/0000-0001-5821-5889) (Consultant Perinatal Psychiatrist) conceived the idea for WP3(ii) and was involved in writing sections of the report.
Billie Lever Taylor (https://orcid.org/0000-0002-6865-3425) (Clinical Psychologist Researcher) was the researcher responsible for data collection for WP2.
Rebecca McDonald (https://orcid.org/0000-0003-3373-4943) (Temporary Programme Manager) led the construction of the geographical IV.
Jeannette Milgrom (https://orcid.org/0000-0002-4082-4595) (Professor of Perinatal Psychology) provided expertise for the development of the DAWN intervention in WP1(ii).
Nicola Morant (https://orcid.org/0000-0003-4022-8133) (Associate Professor) led the qualitative analysis of WP2.
Selina Nath (https://orcid.org/0000-0002-5976-1301) (Postdoctoral Researcher) was responsible for follow-up data collection in WP1, analysed data on the GAD-2 and assisted with the writing up of these data.
Susan Pawlby (https://orcid.org/0000-0001-9109-3457) (Developmental Psychologist) led the mother–infant interaction data collection and interpretation.
Laura Potts (https://orcid.org/0000-0002-2935-6532) (Junior Statistician) collated data and results of the programme and analysed WP3 data.
Claire Powell (https://orcid.org/0000-0002-6581-0165) (Research Associate) contributed to WP3 study design, data collection, and interpretation of results.
Diana Rose (https://orcid.org/0000-0002-6393-6389) (Professor of Service User Research) conceived the study for WP3(i) and chaired the PAG.
Elizabeth Ryan (https://orcid.org/0000-0002-6802-4194) (Junior Statistician) analysed data for WP1.
Gertrude Seneviratne (https://orcid.org/0000-0003-0793-3674) (Lead Clinician for PMH Services at South London and Maudsley NHS Foundation Trust) provided expertise in interpretation of results.
Rebekah Shallcross (https://orcid.org/0000-0003-4764-0411) (Researcher) contributed to writing of study protocols, collected data for WP3 and was involved in writing sections of the report.
Nicky Stanley (https://orcid.org/0000-0002-7644-1625) (Professor of Social Work) provided expertise from a social care perspective.
Kylee Trevillion (https://orcid.org/0000-0001-5865-4726) (Programme Manager 2013–17) was responsible for supervision of London-based research staff, wrote the pan-programme standard operating procedure with respect to safeguarding and led writing up of WP1(ii).
Angelika Wieck (https://orcid.org/0000-0002-5138-4898) (Consultant Perinatal Psychiatrist) helped write the grant, assisted with recruitment in northern trusts and was involved in developing protocols.
Andrew Pickles (https://orcid.org/0000-0003-1283-0346) (Senior Statistician) contributed to the design of the programme and oversaw the analysis and reporting.
Publications
Trevillion K, Domoney J, Pickles A, Bick D, Byford S, Heslin M, et al. Depression: an exploratory parallel-group randomised controlled trial of Antenatal guided self help for WomeN (DAWN): study protocol for a randomised controlled trial. Trials 2016;17:503. https://doi.org/10.1186/s13063-016-1632-6
Howard LM, Ryan EG, Trevillion K, Anderson F, Bick D, Bye A, et al. Accuracy of the Whooley questions and the Edinburgh Postnatal Depression Scale in identifying depression and other mental disorders in early pregnancy. Br J Psychiatry 2018;212:50–6. https://doi.org/10.1192/bjp.2017.9
Lever Taylor B, Billings J, Morant N, Johnson S. How do women’s partners view perinatal mental health services? A qualitative meta-synthesis. Clinical Psychol Psychother 2018;25:112–29. https://doi.org/10.1002/cpp.2133
Millet L, Lever Taylor B, Howard LM, Bick D, Stanley M, Johnson S. Experiences of improving access to psychological therapy services for perinatal mental health difficulties: a qualitative study of women’s and therapists’ views. Behav Cogn Psychother 2018;46:421–36. https://doi.org/10.1017/S1352465817000650
Nath S, Ryan EG, Trevillion K, Bick D, Demilew J, Milgrom J, et al. Prevalence and identification of anxiety disorders in pregnancy: the diagnostic accuracy of the two-item Generalised Anxiety Disorder scale (GAD-2). BMJ Open 2018;8:e023766. https://doi.org/10.1136/bmjopen-2018-023766
Anderson FM, Hatch SL, Ryan EG, Trevillion K, Howard LM. Impact of insecure immigration status and ethnicity on antenatal mental health among migrant women. J Clin Psychiatry 2019;80:18m12563. https://doi.org/10.4088/JCP.18m12563
Gordon H, Nath S, Trevillion K, Moran P, Pawlby S, Newman L, Howard LM, Molyneaux E. Self-harm, self-harm ideation, and mother–infant interactions: a prospective cohort study. J Clin Psychiatry 2019;80:18m12708. https://doi.org/10.4088/JCP.18m12708
Griffiths J, Lever Taylor B, Morant N, Bick D, Howard LM, Seneviratne G, Johnson S. A qualitative comparison of experiences of specialist mother and baby units versus general psychiatric wards. BMC Psychiatry 2019;19:401. https://doi.org/10.1186/s12888-019-2389-8
Heslin M, Chua KC, Trevillion K, Nath S, Howard LM, Byford S. Psychometric properties of the five-level EuroQol-5 dimension and Short Form-6 dimension measures of health-related quality of life in a population of pregnant women with depression. BJPsych Open 2019;5:e88. https://doi.org/10.1192/bjo.2019.71
Lever Taylor B, Billings J, Morant N, Bick D, Johnson S. Experiences of how services supporting women with perinatal mental health difficulties work with their families: a qualitative study in England. BMJ Open 2019;9:e030208. https://doi.org/10.1136/bmjopen-2019-030208
Lever Taylor B, Mosse L, Stanley N. Experiences of social work intervention among mothers with perinatal mental health needs. Health Soc Care Community 2019;27:1586–96. https://doi.org/10.1111/hsc.12832
Lockwood Estrin G, Ryan EG, Trevillion K, Demilew J, Bick D, Pickles A, Howard LM. Young pregnant women and risk for mental disorders: finding from an early pregnancy cohort. BJPsych Open 2019;5:e21. https://doi.org/10.1192/bjo.2019.6
MacLeod Hall C, Molyneaux E, Gordon H, Trevillion K, Moran P, Howard LM. The association between a history of self-harm and mental disorders in pregnancy. J Affect Disord 2019;258:159–62. https://doi.org/10.1016/j.jad.2019.06.062
Nath S, Pearson RM, Moran P, Pawlby S, Molyneaux E, Challacombe FL, Howard LM. The association between prenatal maternal anxiety disorders and postpartum perceived and observed mother-infant relationship quality. J Affect Disord 2019;68:102148. https://doi.org/10.1016/j.janxdis.2019.102148
Trevillion K, Shallcross R, Ryan E, Heslin M, Pickles A, Byford S, et al. Protocol for a quasi-experimental study of the effectiveness and cost-effectiveness of mother and baby units compared with general psychiatric inpatient wards and crisis resolution team services (the ESMI study) in the provision of care for women in the postpartum period. BMJ Open 2019;9:e025906. https://doi.org/10.1136/bmjopen-2018-025906
Yapp E, Howard LM, Kadicheeni M, Telesia LA, Milgrom J, Trevillion K. A qualitative study of women’s views on the acceptability of being asked about mental health problems at antenatal booking appointments. Midwifery 2019;74:126–33. https://doi.org/10.1016/j.midw.2019.03.021
Bye A, Nath S, Ryan EG, Bick D, Easter A, Howard LM, Micali N. Prevalence and clinical characterisation of pregnant women with eating disorders. Eur Eat Disord Rev 2020;28:141–55. https://doi.org/10.1002/erv.2719.
Challacombe FL, Nath S, Trevillion K, Pawlby S, Howard LM. Fear of childbirth during pregnancy: associations with observed mother–infant interactions and perceived bonding. Arch Womens Ment Health 2020;24:483–92. https://doi.org/10.1007/s00737-020-01098-w
Crowley G, Molyneaux E, Nath S, Trevillion K, Moran P, Howard LM. Disordered personality traits and psychiatric morbidity in pregnancy: a population-based study. Arch Womens Ment Health 2020;23:43–52. https://doi.org/10.1007/s00737-018-0937-8
Hazell Raine K, Nath S, Howard LM, Cockshaw W, Boyce P, Sawyer E, Thorpe K. Associations between prenatal maternal mental health indices and mother–infant relationship quality 6 to 18 months’ postpartum: a systematic review. Infant Ment Health J 2020;41:24–39. https://doi.org/10.1002/imhj.21825
Lever Taylor B, Kandiah A, Johnson S, Howard LM, Morant N. A qualitative investigation of models of community mental health care for women with perinatal mental health problems [published online ahead of print January 30 2020]. J Ment Health 2020. https://doi.org/10.1080/09638237.2020.1714006
Nath S, Busuulwa P, Ryan EG, Challacombe FL, Howard LM. The characteristics and prevalence of phobias in pregnancy. Midwifery 2020;82:102590. https://doi.org/10.1016/j.midw.2019.102590
Nath S, Pearson RM, Moran P, Pawlby S, Molyneaux E, Howard L. Maternal personality traits, antenatal depressive symptoms and the postpartum mother–infant relationship: a prospective observational study. Soc Psychiatry Psychiatr Epidemiol 2020;55:621–34. https://doi.org/10.1007/s00127-019-01790-y
Trevillion K, Ryan EG, Pickles A, Heslin M, Byford S, Nath S, et al. An exploratory parallel-group randomised controlled trial of antenatal guided self-help (plus usual care) versus usual care alone for pregnant women with depression: DAWN trial. J Affect Disord 2020;261:187–97. https://doi.org/10.1016/j.jad.2019.10.013
Powell C, Bedi S, Nath S, Potts L, Trevillion K, Howard LM. Mothers’ experiences of acute perinatal mental health services in England and Wales: a qualitative analysis [published online ahead of print September 3 2020]. J Reprod Infant Psychol 2020.
Kolk TA, Nath S, Howard LM, Pawlby S, Lockwood-Estrin G, Trevillion K. The association between maternal lifetime interpersonal trauma experience and perceived mother-infant bonding. J Affect Disord 2021;294:117–27. https://doi.org/10.1016/j.jad.2021.06.069
Lever Taylor B, Howard LM, Jackson K, Johnson S, Mantovani N, Nath S, et al. Mums alone: exploring the role of isolation and loneliness in the narratives of women diagnosed with perinatal depression. J Clin Med 2021;10:2271. https://doi.org/10.3390/jcm10112271
Nath S, Lewis LN, Bick D, Demilew J, Howard LM. Mental health problems and fear of childbirth: a cohort study of women in an inner-city maternity service. Birth 2021;48:230–41. https://doi.org/10.1111/birt.12532
Perkins A, Lever Taylor B, Morant N, Johnson S. Experiences of parent-infant teams among mothers diagnosed with perinatal mental health difficulties [published online ahead of print 30 September 2021]. J Reprod Infant Psychol 2021. https://doi.org/10.1080/02646838.2021.1983920
Rubio L, Lever Taylor B, Morant N, Johnson S. Experiences of intensive home treatment for a mental health crisis during the perinatal period: a UK qualitative study. Int J Ment Health Nurs 2021;30:208–18. https://doi.org/10.1111/inm.12774
Sweeney A, Lever Taylor B. Depathologising Motherhood. Russo J, Beresford P, editors. The Routledge Handbook of Mad Studies. London: Routledge; 2021.
Zacharia A, Lever Taylor B, Sweeney A, Morant N, Howard LM, Johnson S. Mental health support in the perinatal period for women with a personality disorder diagnosis: a qualitative study of women’s experiences. J Pers Disord 2021;35. https://doi.org/10.1521/pedi_2020_34_482
Howard LM, Trevillion K, Potts L, Heslin M, Pickles A, Byford S, et al. Effectiveness and cost-effectiveness of psychiatric mother and baby units: quasi-experimental study [published online ahead of print 4 May 2022]. Br J Psychiatry 2022.
Data-sharing statement
All available data from WPs 1 and 3 can be obtained from the corresponding author. WP2 data can be obtained from Professor Sonia Johnson.
Patient data
This work uses data provided by patients and collected by the NHS as part of their care and support. Using patient data is vital to improve health and care for everyone. There is huge potential to make better use of information from people’s patient records, to understand more about disease, develop new treatments, monitor safety, and plan NHS services. Patient data should be kept safe and secure, to protect everyone’s privacy, and it’s important that there are safeguards to make sure that it is stored and used responsibly. Everyone should be able to find out about how patient data are used. #datasaveslives You can find out more about the background to this citation here: https://understandingpatientdata.org.uk/data-citation.
Disclaimers
This report presents independent research funded by the National Institute for Health and Care Research (NIHR). The views and opinions expressed by authors in this publication are those of the authors and do not necessarily reflect those of the NHS, the NIHR, CCF, PGfAR or the Department of Health and Social Care. If there are verbatim quotations included in this publication the views and opinions expressed by the interviewees are those of the interviewees and do not necessarily reflect those of the authors, those of the NHS, the NIHR, the PGfAR programme or the Department of Health and Social Care.
References
- Howard LM, Trevillion K, Potts L, Heslin M, Pickles A, Byford S, et al. Effectiveness and cost-effectiveness of psychiatric mother and baby units: quasi-experimental study [published online ahead of print 4 May 2022]. Br J Psychiatry 2022. https://doi.org/10.1192/bjp.2022.48.
- Howard LM, Molyneaux E, Dennis CL, Rochat T, Stein A, Milgrom J. Non-psychotic mental disorders in the perinatal period. Lancet 2014;384:1775-88. https://doi.org/10.1016/S0140-6736(14)61276-9.
- Jones I, Chandra PS, Dazzan P, Howard LM. Bipolar disorder, affective psychosis, and schizophrenia in pregnancy and the post-partum period. Lancet 2014;384:1789-99. https://doi.org/10.1016/S0140-6736(14)61278-2.
- Stein A, Pearson RM, Goodman SH, Rapa E, Rahman A, McCallum M, et al. Effects of perinatal mental disorders on the fetus and child. Lancet 2014;384:1800-19. https://doi.org/10.1016/S0140-6736(14)61277-0.
- National Institute for Health and Care Excellence (NICE) . Antenatal and Postnatal Mental Health Guidelines. NICE Clinical Guideline CG192 2014.
- National Institute for Health and Care Excellence (NICE) . Antenatal and Postnatal Mental Health: Clinical Management and Service Guidance. NICE Clinical Guideline CG45 2007.
- The Independent Mental Health Taskforce to the NHS in England . The Five Year Forward View For Mental Health 2016. www.england.nhs.uk/wp-content/uploads/2016/02/Mental-Health-Taskforce-FYFV-final.pdf (accessed 7 April 2021).
- NHS England . Perinatal Mental Health 2018. www.england.nhs.uk/mental-health/perinatal/ (accessed 8 May 2018).
- Royal College of Psychiatrists . Perinatal Mental Health Services: Recommendations for the Provision of Services for Childbearing Women. College Report CR197 (Revision of CR88) 2015. https://www.rcpsych.ac.uk/docs/default-source/members/faculties/perinatal-psychiatry/perinatal-reports-cr197.pdf (accessed 13 October 2021).
- Howard LM, Ryan EG, Trevillion K, Anderson F, Bick D, Bye A, et al. Accuracy of the Whooley questions and the Edinburgh Postnatal Depression Scale in identifying depression and other mental disorders in early pregnancy. Br J Psychiatry 2018;212:50-6. https://doi.org/10.1192/bjp.2017.9.
- Nath S, Busuulwa P, Ryan EG, Challacombe FL, Howard LM. The characteristics and prevalence of phobias in pregnancy. Midwifery 2020;82. https://doi.org/10.1016/j.midw.2019.102590.
- Arroll B, Khin N, Kerse N. Two verbally asked questions are simple and valid. Br Med J 2003;327:1144-6. https://doi.org/10.1136/bmj.327.7424.1144.
- Cox JL, Holden JM, Sagovsky R. Detection of postnatal depression. Development of the 10-item Edinburgh Postnatal Depression Scale. Br J Psychiatry 1987;150:782-6. https://doi.org/10.1192/bjp.150.6.782.
- Gibson J, McKenzie-McHarg K, Shakespeare J, Price J, Gray R. A systematic review of studies validating the Edinburgh Postnatal Depression Scale in antepartum and postpartum women. Acta Psychiatr Scand 2009;119:350-64. https://doi.org/10.1111/j.1600-0447.2009.01363.x.
- Lewis G, Pelosi AJ, Araya R, Dunn G. Measuring psychiatric disorder in the community: a standardized assessment for use by lay interviewers. Psychol Med 1992;22:465-86. https://doi.org/10.1017/s0033291700030415.
- American Psychiatric Association . Diagnostic and Statistical Manual, Text Revision (DSM-IV-TRim, 2000) 2000.
- Spitzer RL, Kroenke K, Williams JB, Löwe B. A brief measure for assessing generalized anxiety disorder: the GAD-7. Arch Intern Med 2006;166:1092-7. https://doi.org/10.1001/archinte.166.10.1092.
- Babor F, Higgins-Biddle JC, Saunders JB, Monterio MG. AUDIT – The Alcohol Use Disorders Identification Test – Guidelines for Use in Primary Care. Geneva: World Health Organization; 2008.
- Berman AH, Bergman H, Palmstierna T, Schylter F. DUDIT – The Drug Use Disorder Identification Test. Stockholm: Karolinska Institutet, Department of Clinical Neuroscience; 2003.
- Brazier J, Roberts J, Deverill M. The estimation of a preference-based measure of health from the SF-36. J Health Econ 2002;21:271-92. https://doi.org/10.1016/S0167-6296(01)00130-8.
- Brazier JE, Harper R, Jones NM, O’Cathain A, Thomas KJ, Usherwood T, et al. Validating the SF-36 health survey questionnaire: new outcome measure for primary care. BMJ 1992;305:160-4. https://doi.org/10.1136/bmj.305.6846.160.
- Herdman M, Gudex C, Lloyd A, Janssen M, Kind P, Parkin D, et al. Development and preliminary testing of the new five-level version of EQ-5D (EQ-5D-5L). Qual Life Res 2011;20:1727-36. https://doi.org/10.1007/s11136-011-9903-x.
- Yapp E, Howard LM, Kadicheeni M, Telesia LA, Milgrom J, Trevillion K. A qualitative study of women’s views on the acceptability of being asked about mental health problems at antenatal booking appointments. Midwifery 2019;74:126-33. https://doi.org/10.1016/j.midw.2019.03.021.
- Pickles A, Dunn G, Vázquez-Barquero JL. Screening for stratification in two-phase (‘two-stage’) epidemiological surveys. Stat Methods Med Res 1995;4:73-89. https://doi.org/10.1177/096228029500400106.
- Attride-Stirling J. Thematic networks: an analytic tool for qualitative research. Qual Res 2001;1:385-40. https://doi.org/10.1177/146879410100100307.
- Braun V, Clarke V. Using thematic analysis in psychology. Qual Res Psychol 2006;3:77-101. https://doi.org/10.1191/1478088706qp063oa.
- Ritchie J, Spencer L. Qualitative Data Analysis for Applied Policy Research. London: Routledge; 1994.
- National Institute for Health and Care Excellence . Guide to the Methods of Technology Appraisal 2013 n.d. www.nice.org.uk/process/pmg9/chapter/foreword (accessed 13 August 2021).
- Heslin M, Chua K, Trevillion K, Nath S, Howard L, Byford S. Psychometric properties of the five-level EuroQoL-5 dimension and Short Form-6 dimension measures of health-related quality of life in a population of pregnant women with depression. BJPsych Open 2019;5. https://doi.org/10.1192/bjo.2019.71.
- Littlewood E, Ali S, Dyson L, Keding A, Ansell P, Bailey D, et al. Identifying perinatal depression with case-finding instruments: a mixed-methods study (BaBY PaNDA – Born and Bred in Yorkshire PeriNatal Depression Diagnostic Accuracy). Health Serv Deliv Res 2018;6. https://doi.org/10.3310/hsdr06060.
- Nath S, Ryan EG, Trevillion K, Bick D, Demilew J, Milgrom J, et al. Prevalence and identification of anxiety disorders in pregnancy: the diagnostic accuracy of the two-item Generalised Anxiety Disorder scale (GAD-2). BMJ Open 2018;8. https://doi.org/10.1136/bmjopen-2018-023766.
- Anderson FM, Hatch SL, Ryan EG, Trevillion K, Howard LM. Impact of insecure immigration status and ethnicity on antenatal mental health among migrant women. J Clin Psychiatry 2019;80. https://doi.org/10.4088/JCP.18m12563.
- Lockwood Estrin G, Ryan E, Trevillion K, Demilew J, Bick D, Pickles A, et al. Young pregnant women and risk for mental disorders: findings from an early pregnancy cohort. BJPsych Open 2019;5. https://doi.org/10.1192/bjo.2019.6.
- MacLeod Hall C, Molyneaux E, Gordon H, Trevillion K, Moran P, Howard LM. The association between a history of self-harm and mental disorders in pregnancy. J Affect Disord 2019;258:159-62. https://doi.org/10.1016/j.jad.2019.06.062.
- Nath S, Pearson RM, Moran P, Pawlby S, Molyneaux E, Howard L. Maternal personality traits, antenatal depressive symptoms and the postpartum mother–infant relationship: a prospective observational study. Soc Psychiatry Psychiatr Epidemiol 2020;55:621-34. https://doi.org/10.1007/s00127-019-01790-y.
- Nath S, Pearson RM, Moran P, Pawlby S, Molyneaux E, Challacombe FL, et al. The association between prenatal maternal anxiety disorders and postpartum perceived and observed mother-infant relationship quality. J Affect Disord 2019;68. https://doi.org/10.1016/j.janxdis.2019.102148.
- Levis B, McMillan D, Sun Y, He C, Rice DB, Krishnan A, et al. Comparison of major depression diagnostic classification probability using the SCID, CIDI, and MINI diagnostic interviews among women in pregnancy or postpartum: an individual participant data meta-analysis. Int J Methods Psychiatr Res 2019;28. https://doi.org/10.1002/mpr.1803.
- Levis B, Negeri Z, Sun Y, Benedetti A, Thombs BD. DEPRESsion Screening Data (DEPRESSD) EPDS Group . Accuracy of the Edinburgh Postnatal Depression Scale (EPDS) for screening to detect major depression among pregnant and postpartum women: systematic review and meta-analysis of individual participant data. BMJ 2020;371. https://doi.org/10.1136/bmj.m4022.
- Trevillion K, Domoney J, Pickles A, Bick D, Byford S, Heslin M, et al. Depression: an exploratory parallel-group randomised controlled trial of Antenatal guided self help for WomeN (DAWN): study protocol for a randomised controlled trial. Trials 2016;17. https://doi.org/10.1186/s13063-016-1632-6.
- Trevillion K, Ryan EG, Pickles A, Heslin M, Byford S, Nath S, et al. An exploratory parallel-group randomised controlled trial of antenatal guided self-help (plus usual care) versus usual care alone for pregnant women with depression: DAWN trial. J Affect Disord 2020;261:197-97. https://doi.org/10.1016/j.jad.2019.10.013.
- Beyond Blue . Clinical Practice Guidelines for Depression and Related Disorders – Anxiety, Bipolar Disorder and Puerperal Psychosis in the Perinatal Period. A Guideline for Primary Care Health Professionals 2011.
- Department of Health and Social Care (DHSC) . IAPT Three-Year Report: The First Million Patients 2012.
- Manca A, Hawkins N, Sculpher MJ. Estimating mean QALYs in trial-based cost-effectiveness analysis: the importance of controlling for baseline utility. Health Econ 2005;14:487-96. https://doi.org/10.1002/hec.944.
- National Institute for Health and Care Excellence (NICE) . Guide to Methods of Technology Appraisal 2008.
- Ware JE. SF-36 health survey update. Spine 2000;25:3130-9. https://doi.org/10.1097/00007632-200012150-00008.
- Howard L, Flach C, Leese M, Byford S, Killaspy H, Cole L, et al. Effectiveness and cost-effectiveness of admissions to women’s crisis houses compared with traditional psychiatric wards: pilot patient-preference randomised controlled trial. Br J Psychiatry 2010;197:s32-40. https://doi.org/10.1192/bjp.bp.110.081083.
- Fenwick E, Byford S. A guide to cost-effectiveness acceptability curves. Br J Psychiatry 2005;187:106-8. https://doi.org/10.1192/bjp.187.2.106.
- Lever Taylor B, Mosse L, Stanley N. Experiences of social work intervention among mothers with perinatal mental health needs. Health Soc Care Community 2019;27:1586-96. https://doi.org/10.1111/hsc.12832.
- Lever Taylor B, Billings J, Morant N, Johnson S. How do women’s partners view perinatal mental health services? A qualitative meta-synthesis. Clinical Psychol Psychother 2018;25:112-29. https://doi.org/10.1002/cpp.2133.
- Lever Taylor B, Billings J, Morant N, Bick D, Johnson S. Experiences of how services supporting women with perinatal mental health difficulties work with their families: a qualitative study in England. BMJ Open 2019;9. https://doi.org/10.1136/bmjopen-2019-030208.
- Millett L, Taylor BL, Howard LM, Bick D, Stanley N, Johnson S. Experiences of improving access to psychological therapy services for perinatal mental health difficulties: a qualitative study of women’s and therapists’ views. Behav Cogn Psychother 2018;46:421-36. https://doi.org/10.1017/S1352465817000650.
- Rubio L, Lever Taylor B, Morant N, Johnson S. Experiences of intensive home treatment for a mental health crisis during the perinatal period: a UK qualitative study. Int J Ment Health Nurs 2021;30:208-18. https://doi.org/10.1111/inm.12774.
- Lever Taylor B, Kandiah A, Johnson S, Howard LM, Morant N. A qualitative investigation of models of community mental health care for women with perinatal mental health problems [published online ahead of print January 30 2020]. J Ment Health 2020. https://doi.org/10.1080/09638237.2020.1714006.
- Griffiths J, Lever Taylor B, Morant N, Bick D, Howard LM, Seneviratne G, et al. A qualitative comparison of experiences of specialist mother and baby units versus general psychiatric wards. BMC Psychiatry 2019;19. https://doi.org/10.1186/s12888-019-2389-8.
- Wykes T, Csipke E, Rose D, Craig T, McCrone P, Williams P, et al. Patient involvement in improving the evidence base on mental health inpatient care: the PERCEIVE programme. Programme Grants Appl Res 2018;6. https://doi.org/10.3310/pgfar06070.
- Samejima F. Estimation of latent ability using a response pattern of graded scores. Psychometrika 1969;35. https://doi.org/10.1007/BF02290599.
- Powell C, Bedi S, Nath S, Potts L, Trevillion K, Howard LM. Mothers’ experiences of acute perinatal mental health services in England and Wales: a qualitative analysis [published online ahead of print September 3 2020]. J Reprod Infant Psychol 2020. https://doi.org/10.1080/02646838.2020.1814225.
- Trevillion K, Shallcross R, Ryan E, Heslin M, Pickles A, Byford S, et al. Protocol for a quasi-experimental study of the effectiveness and cost-effectiveness of mother and baby units compared with general psychiatric inpatient wards and crisis resolution team services (the ESMI study) in the provision of care for women in the postpartum period. BMJ Open 2019;9. https://doi.org/10.1136/bmjopen-2018-025906.
- Great Britain . National Service Health Act 2006 2006.
- Stewart R, Soremekun M, Perera G, Broadbent M, Callard F, Denis M, et al. The South London and Maudsley NHS Foundation Trust Biomedical Research Centre (SLAM BRC) case register: development and descriptive data. BMC Psychiatry 2009;9. https://doi.org/10.1186/1471-244X-9-51.
- Great Britain . Mental Health Act 1983 1983.
- Department of Health and Social Care (DHSC) . NHS Reference Costs 2015 to 2016 n.d. www.gov.uk/government/publications/nhs-reference-costs-2015-to-2016 (accessed 13 August 2021).
- Curtis L, Burns A. Unit Costs of Health and Social Care 2016. Canterbury: PSSRU, University of Kent; 2016.
- Curtis L, Burns A. Unit Costs of Health and Social Care 2012. Canterbury: PSSRU, University of Kent; 2012.
- Health and Social Care Information Centre . Prescription Cost Analysis, England – 2016 n.d. www.content.digital.nhs.uk/catalogue/PUB23631 (accessed 19 August 2021).
- Thompson SG, Barber JA. How should cost data in pragmatic randomised trials be analysed?. Brit Med J 2000;320:1197-200. https://doi.org/10.1136/bmj.320.7243.1197.
- Briggs AH. A Bayesian approach to stochastic cost-effectiveness analysis. Health Econ 1999;8:257-61. https://doi.org/10.1002/(SICI)1099-1050(199905)8:3<257::AID-HEC427>3.0.CO;2-E.
- van Wijngaarden B, Schene AH, Koeter M, Vázquez-Barquero JL, Knudsen HC, Lasalvia A, et al. Caregiving in schizophrenia: development, internal consistency and reliability of the Involvement Evaluation Questionnaire – European Version: EPSILON Study 4. Br J Psychiatry 2000;177:s21-7. https://doi.org/10.1192/bjp.177.39.s21.
- Goldberg DP. The Detection of Psychiatric Illness by Questionnaire. London: Oxford University Press; 1972.
- Rassen JA, Brookhart MA, Glynn RJ, Mittleman MA, Schneeweiss S. Instrumental variables I: instrumental variables exploit natural variation in nonexperimental data to estimate causal relationships. J Clin Epidemiol 2009;62:1226-32. https://doi.org/10.1016/j.jclinepi.2008.12.005.
- Netsi E, Pearson RM, Murray L, Cooper P, Craske MG, Stein A. Association of persistent and severe postnatal depression with child outcomes. JAMA Psychiatry 2018;75:247-53. https://doi.org/10.1001/jamapsychiatry.2017.4363.
- NHS England . Online Version of the NHS Long Term Plan 2019. www.longtermplan.nhs.uk/online-version/ (accessed 17 October 2019).
- National Institute for Health and Care Excellence (NICE) . Domestic Violence and Abuse: Multi-Agency Working. Public Health Guideline [PH50] 2014.
- Catalao R, Mann S, Wilson C, Howard LM. Preconception care in mental health services: planning for a better future. Br J Psychiatry 2019;216:180-1. https://doi.org/10.1192/bjp.2019.209.
- Dolan P, Gudex C, Kind P, Williams A. A Social Tariff for EuroQol: Results From a UK Population Survey. York: University of York, Centre for Health Economics; 1995.
- Petrou S, Cooper P, Murray L, Davidson LL. Economic costs of post-natal depression in a high-risk British cohort. Br J Psychiatry 2002;181:505-12. https://doi.org/10.1192/bjp.181.6.505.
- Hearn G, Iliff A, Jones I, Kirby A, Ormiston P, Parr P, et al. Postnatal depression in the community. Br J Gen Pract 1998;48:1064-6.
- Dennis CL, Hodnett E, Kenton L, Weston J, Zupancic J, Stewart DE, et al. Effect of peer support on prevention of postnatal depression among high risk women: multisite randomised controlled trial. BMJ 2009;338. https://doi.org/10.1136/bmj.a3064.
- Kessler D, Bennewith O, Lewis G, Sharp D. Detection of depression and anxiety in primary care: follow up study. BMJ 2002;325:1016-17. https://doi.org/10.1136/bmj.325.7371.1016.
- Radhakrishnan M, Hammond G, Jones PB, Watson A, McMillan-Shields F, Lafortune L. Cost of Improving Access to Psychological Therapies (IAPT) programme: an analysis of cost of session, treatment and recovery in selected primary care trusts in the East of England region. Behav Res Ther 2013;51:37-45. https://doi.org/10.1016/j.brat.2012.10.001.
- Johannesson M, Weinstein MC. On the decision rules of cost-effectiveness analysis. J Health Econ 1993;12:459-67. https://doi.org/10.1016/0167-6296(93)90005-Y.
- Hegarty K. Composite Abuse Scale Manual. Melbourne, VIC: Department of General Practice, The University of Melbourne; 2007.
- World Health Organization . The ICD-10 Classification of Mental and Behavioural Disorders: Diagnostic Criteria for Research 1993.
- Ventura J, Green MF, Shaner A, Liberman RP. Training and quality assurance with the Brief Psychiatric Rating Scale: ‘the drift busters’. Int J Methods IPsychiatr Res 1993;3:221-44.
- Slade M, Powell R, Rosen A, Strathdee G. Threshold Assessment Grid (TAG): the development of a valid and brief scale to assess the severity of mental illness. Soc Psychiatry Psychiatr Epidemiol 2000;35:78-85. https://doi.org/10.1007/s001270050011.
- Wing J, Beevor A, Curtis R, Park S, Hadden S, Burns A. Health of the Nation Outcome Scales (HoNOS). Research and development. Br J Psychiatry 1998;172:11-8. https://doi.org/10.1192/bjp.172.1.11.
- Crawford MJ, Killaspy H, Barnes TR, Barrett B, Byford S, Clayton K, et al. Group art therapy as an adjunctive treatment for people with schizophrenia: a randomised controlled trial (MATISSE). Health Technol Assess 2012;16. https://doi.org/10.3310/hta16080.
- Howard LM, Hunt K, Slade M, O’Keane SV, Leese M, Thornicroft G, et al. CAN-M: Camberwell Assessment of Need for Mothers. London: The Royal College of Psychiatrists; 2008.
- Trevillion K, Byford S, Cary M, Rose D, Oram S, Feder G, et al. Linking Abuse and recovery through advocacy: an observational study. Epidemiol Psychiatr Sci 2013;30:1-15. https://doi.org/10.1017/S2045796013000206.
- Cutrona CE, Russell DW, Jones WH, Perlman D. Advances in Personal Relationships. Greenwich, CT: JAI Press; 1987.
- Larsen DL, Attkisson CC, Hargreaves WA, Nguyen TD. Assessment of client/patient satisfaction: development of a general scale. Eval Program Plann 1979;2:197-20. https://doi.org/10.1016/0149-7189(79)90094-6.
- Brockington IF, Oates J, George S, Turner D, Vostanis P, Sullivan M, et al. A screening questionnaire for mother–infant bonding disorders. Arch Womens Ment Health 2001;3:133-40. https://doi.org/10.1007/s007370170010.
- Bernstein DP, Fink L. Childhood Trauma Questionnaire: A Retrospective Self-Report: Manual. 1998.
- Crittenden PM. CARE-Index: Infants Coding Manual. Miami, FL: Family Relations Institute; 2003.
- Bayley N. Bayley Scales of Infant and Toddler Development: Bayley-III. San Antonio, TX: Harcourt Assessment, Inc.; 2006.
- FreeMapTools 2019. www.freemaptools.com/download-uk-postcode-lat-lng.htm (accessed 16 April 2021).
- Howard LM. Effectiveness and Cost-Effectiveness of Perinatal Psychiatry Services. NIHR Programme Development Grant, Final Report 2011.
- Devlin N, Shah K, Feng Y, Mulhern B, van Hout B. Valuing Health-Related Quality of Life: An EQ-5D-5L Value Set for England. OHE Research Paper 16/01. London: Office of Health Economics; 2016.
- Manca A, Austin PC. Using Propensity Score Methods to Analyse Individual Patient Level Cost Effectiveness Data from Observational Studies. York: The University of York; Health Economics and Data Group Working Paper; 2008.
- Austin PC. The relative ability of different propensity score methods to balance measured covariates between treated and untreated subjects in observational studies. Med Decis Making 2009;29:661-77. https://doi.org/10.1177/0272989X09341755.
- Assmann SF, Pocock SJ, Enos LE, Kasten LE. Subgroup analysis and other (mis)uses of baseline data in clinical trials. Lancet 2000;355:1064-9. https://doi.org/10.1016/S0140-6736(00)02039-0.
Appendix 1 Work package 1(i): WENDY recruitment chart
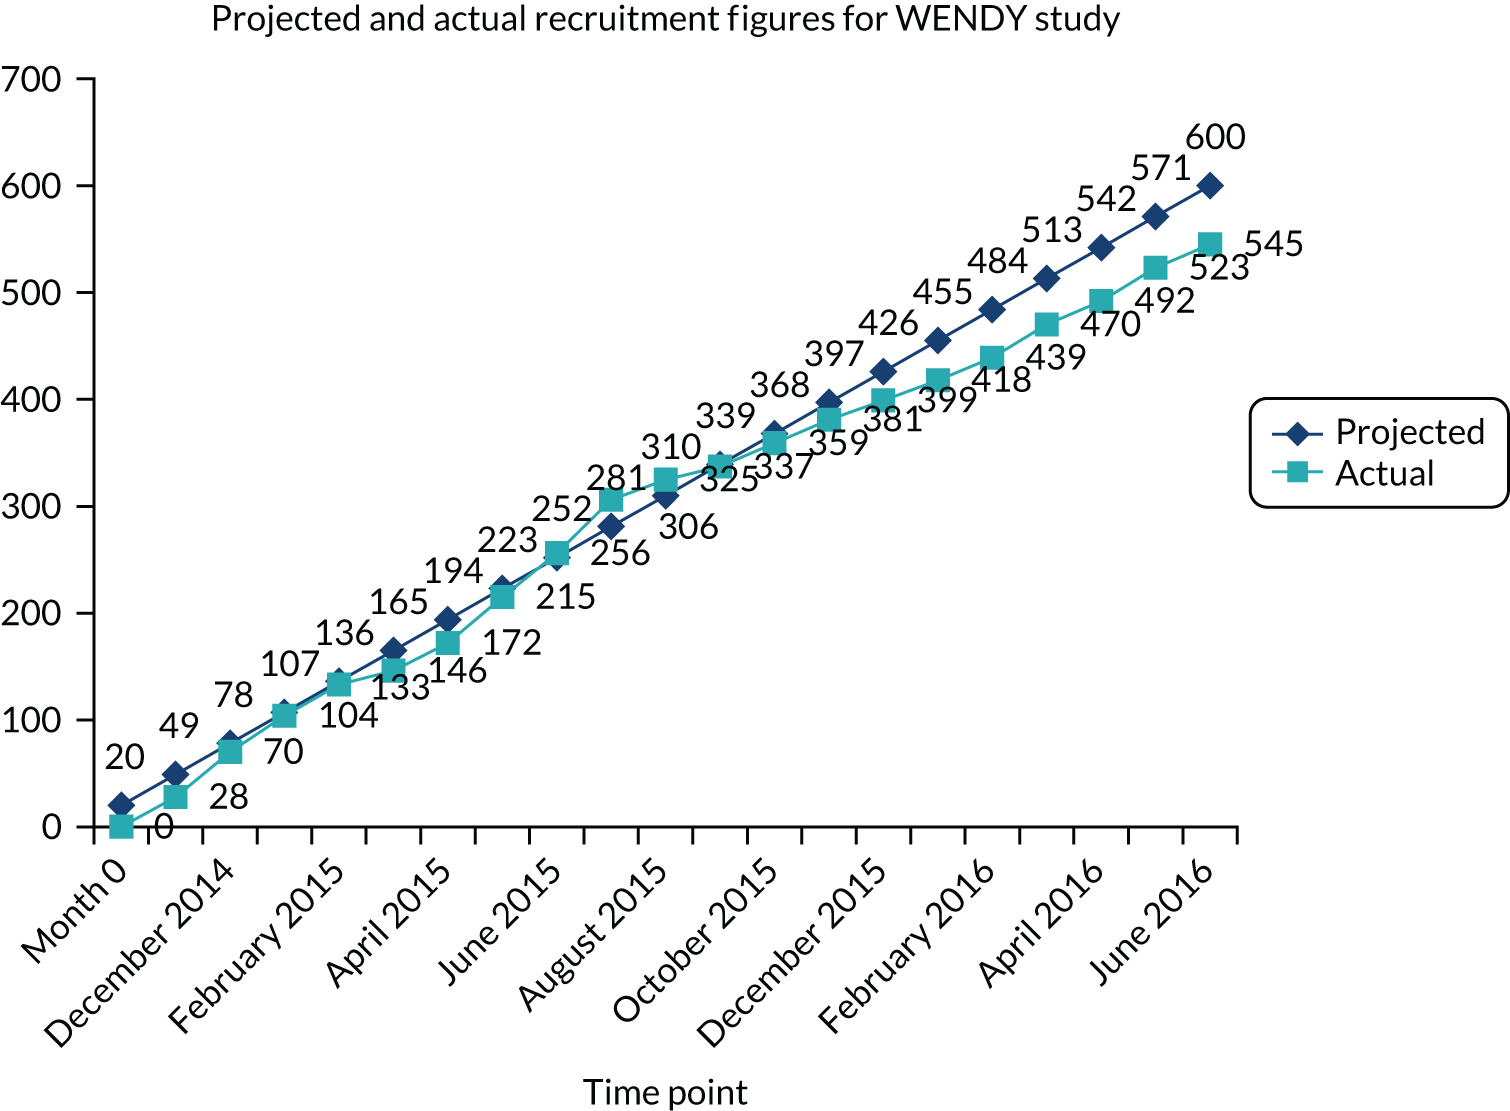
Appendix 2 Work package 1(i): WENDY economic modelling methods – cost-effectiveness of screening tools for identifying depression in early pregnancy (a decision tree model)
Aims
Economic decision-analytic modelling was used to explore the incremental cost per:
-
true-positive case of depression detected
-
QALY of depression screening.
The above aims were from the grant application, but we also added a third aim:
-
to explore the incremental cost per true-positive case of any mental disorder detected.
Methods
Screening strategies
-
Whooley only (positive screen = ‘yes’ to either or both questions).
-
EPDS only (positive screen = score of ≥ 13).
-
Whooley followed by EPDS for those who are Whooley positive.
-
No screening (routine clinical assessment with midwives at antenatal booking and identifying depression via discussion and clinical judgement).
Target population and setting
The target population was pregnant women aged ≥ 16 years attending their first antenatal appointment with midwifes, who did not have a miscarriage or termination. This is because NICE recommends screening for depression in all pregnant women and the first antenatal appointment is the first opportunity to screen the majority of women.
Time horizon
From the first antenatal booking appointment (8–12 weeks pregnant) to the 36-week follow-up appointment (approximately 3 months post birth).
Model structure
Two types of decision tree model structures were developed: (1) a screening model and (2) a screening and treatment pathway model. The screening model was used to evaluate incremental cost per true-positive case of depression (model 1) and per true-positive case of all mental disorders (model 2).
The screening model pathway used for Whooley questions, EPDS and no screening is shown in Figure 16 and the Whooley questions–EPDS pathway is shown in Figure 17. The detection and treatment model was used to evaluate the incremental cost per QALY (model 3) and was based on the detection model, but additionally modelled the impact of treatment (Figure 18). Treatment pathways consisted of being allocated to GSH in the case of mild to moderate depression or high-intensity psychological intervention for moderate to severe depression (as indicated by NICE guidance5). This is followed by response to treatment or not.
FIGURE 16.
Screening model pathway for Whooley questions, EPDS and no screening.
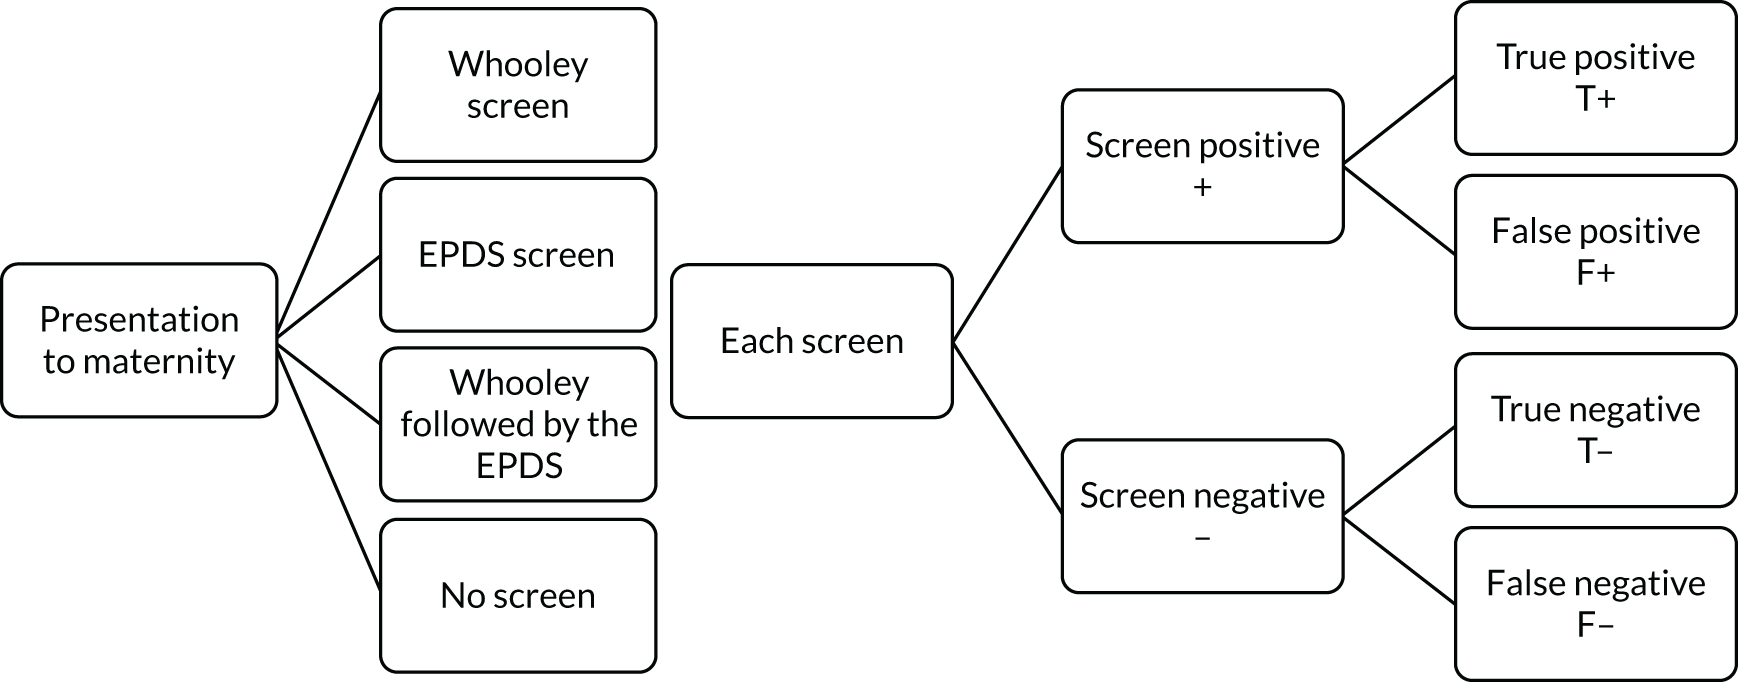
FIGURE 17.
Screening model pathway for Whooley questions followed by EPDS.
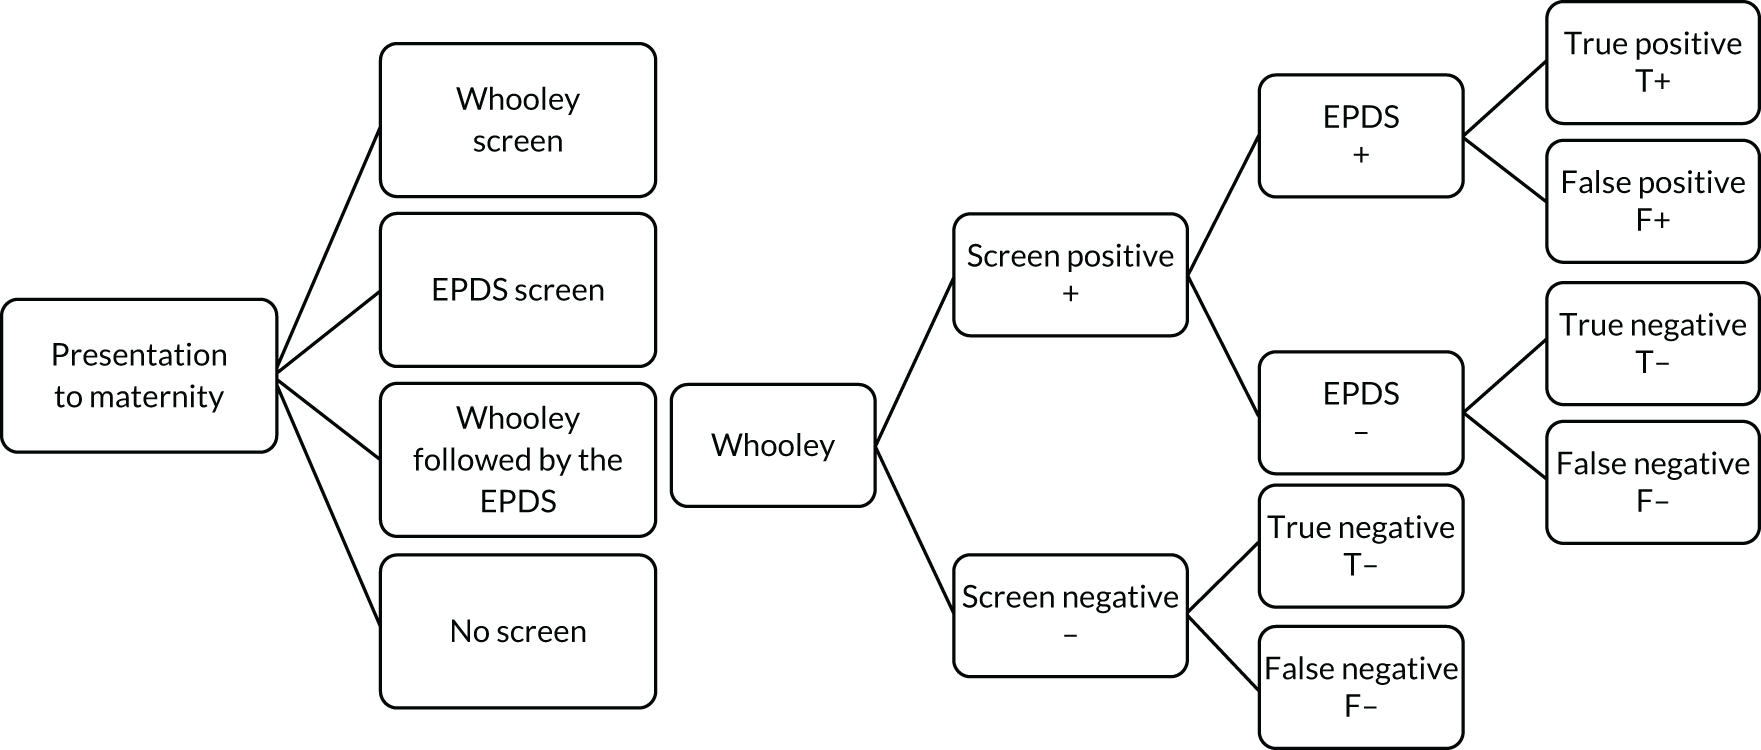
FIGURE 18.
Screening and treatment model. HIPI, high-intensity psychological intervention.
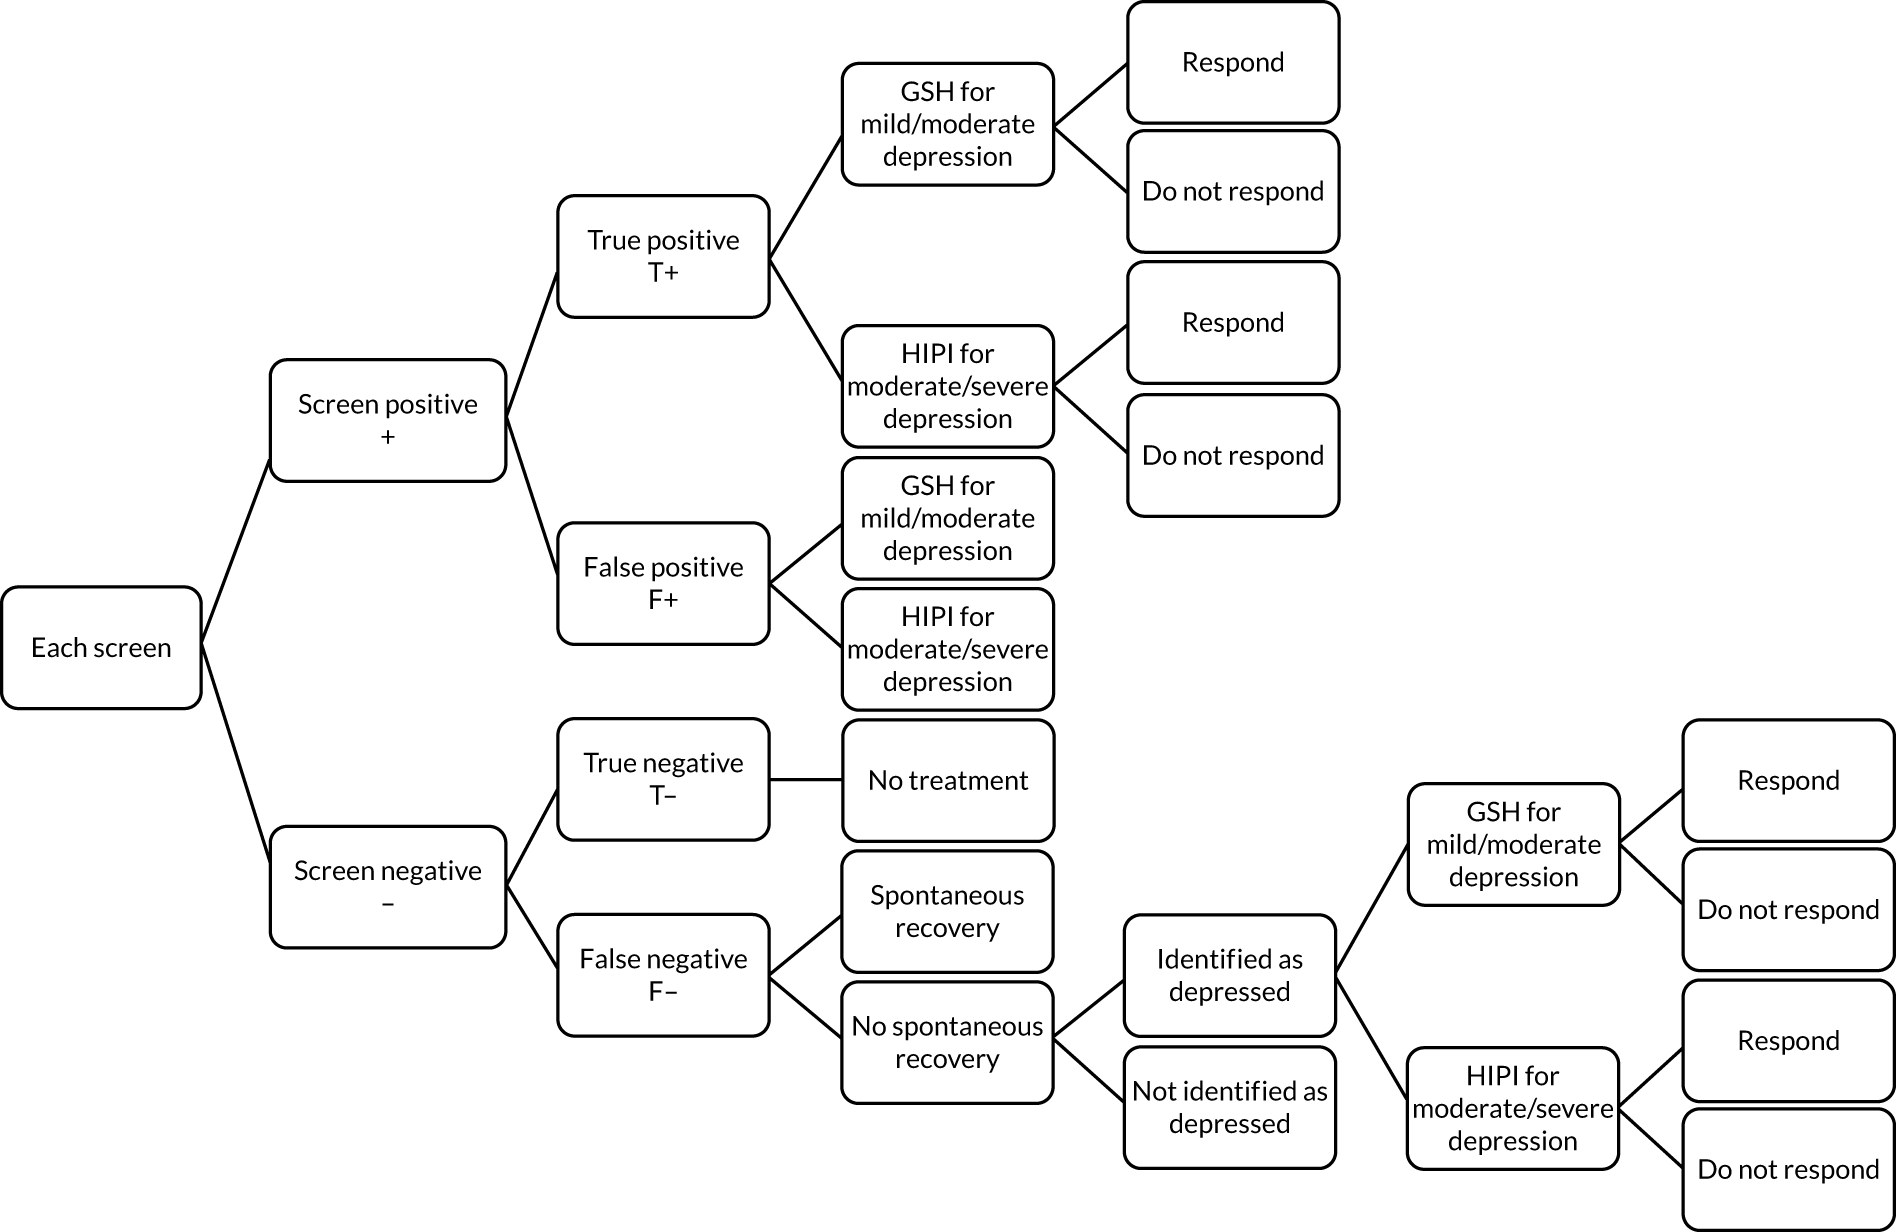
Clinical input parameters
Sensitivity and specificity were taken from WENDY cohort data. 10 The SCID-I was used as the ‘gold standard’ diagnostic instrument to determine diagnosis and, therefore, accuracy of each screening approach. Diagnosis of major depressive disorder included a mild, moderate or severe depressive episode and mixed anxiety/depression. SCID-I disorders included major depressive disorder, anxiety disorder, obsessive–compulsive disorder, PTSD, eating disorder, bipolar disorder type 1, bipolar disorder type 2 and borderline personality disorder.
Outcomes
Although we intended to use SF-6D-based utility data from the WENDY cohort, we could not use the data because of the very small numbers in subgroups needed to inform the outcomes of each arm of the model. Instead, we relied on published data identified through a rapid search of the literature (using keywords for perinatal, depression, psychological therapies and quality of life) and reference lists of related literature. No SF-6D-based utility data were identified for this population, but EuroQol-5 Dimensions, three-level version (EQ-5D-3L)-based utility values were identified in a study on women in the perinatal period in maternity services in England and these data were applied. 30 The EQ-5D-3L health states had UK tariffs75 attached to them to produce utility values. Utility values were converted into QALYs, taking the AUC approach. 43 Discounting was not used as the follow-up period did not exceed 12 months.
Costs
The economic evaluation took the NHS/Personal Social Services perspective preferred by NICE. 28 Data on the resources involved in screening were identified through a rapid search of the literature (using keywords for perinatal, depression, screening and cost) and reference lists of related literature. Only one study was identified that included the required data. Estimates on resource use involved in screening were taken from Littlewood et al. 30 and supplemented by expert clinical opinion where this was not available. This information was costed using NHS reference costs. 62
Although we intended to use data from the WENDY cohort on health and social service use, we could not use the data because of the very small numbers in subgroups needed to inform each arm of the model. Instead, we relied on published data identified through the same rapid review and reference list search as above. Costs were taken from Petrou et al. 76 All costs were in 2015/16 prices and reported in GBP. Discounting was not used as the follow-up period did not exceed 12 months.
Models 1 and 2: screening models for depression and for all mental disorders
Model parameters
Probabilities associated with screening for each detection model are summarised in Table 27. Data on the probability of screening positive/negative, and being a true or false positive/negative case, were taken from primary data collected in the WENDY cohort study [i.e. WP 1(i); Howard et al. 10], as planned in the grant application. Data were not available from the WENDY cohort study on the probabilities associated with the no-screen alternative. A rapid literature search was conducted (using keywords for perinatal, depression, screening and midwifery) and reference lists of relevant literature were searched to identify appropriate data. This identified one study with directly relevant data. Hearn et al. 77 presented data on midwives’ ability to detect mental health problems without a screening tool and these were used to inform the model.
| Parameter | Probability | Source | Data type | Distribution | |
|---|---|---|---|---|---|
| Model 1 | Model 2 | ||||
| Whooley questionsa | |||||
| W+ | 0.0909 | 0.0939 | Howard et al.10 | Binomial | Beta |
| W– | 0.9091 | 0.9061 | Howard et al.10 | Binomial | Beta |
| W+: true positive | 0.4530 | 0.6714 | Howard et al.10 | Binomial | Beta |
| W+: false positive | 0.5470 | 0.3286 | Howard et al.10 | Binomial | Beta |
| W–: true negative | 0.9341 | 0.7761 | Howard et al.10 | Binomial | Beta |
| W–: false negative | 0.0659 | 0.2239 | Howard et al.10 | Binomial | Beta |
| aEPDS10 | |||||
| EPDS positive | 0.1144 | 0.1234 | Howard et al.10 | Binomial | Beta |
| EPDS negative | 0.8856 | 0.8766 | Howard et al.10 | Binomial | Beta |
| EPDS positive: true positive | 0.5188 | 0.6744 | Howard et al.10 | Binomial | Beta |
| EPDS positive: false positive | 0.4813 | 0.3256 | Howard et al.10 | Binomial | Beta |
| EPDS negative: true negative | 0.9534 | 0.7916 | Howard et al.10 | Binomial | Beta |
| EPDS negative: false negative | 0.0466 | 0.2084 | Howard et al.10 | Binomial | Beta |
| Whooley questions–EPDSa | |||||
| W+ | 0.0895 | 0.0939 | Howard et al.10 | Binomial | Beta |
| W– | 0.9105 | 0.9061 | Howard et al.10 | Binomial | Beta |
| W+, EPDS positive | 0.4114 | 0.4294 | Howard et al.10 | Binomial | Beta |
| W+, EPDS negative | 0.5886 | 0.5706 | Howard et al.10 | Binomial | Beta |
| W+, EPDS positive: true positive | 0.7500 | 0.9327 | Howard et al.10 | Binomial | Beta |
| W+, EPDS positive: false positive | 0.2500 | 0.0673 | Howard et al.10 | Binomial | Beta |
| W+, EPDS negative: true negative | 0.7531 | 0.5252 | Howard et al.10 | Binomial | Beta |
| W+, EPDS negative: false negative | 0.2469 | 0.4748 | Howard et al.10 | Binomial | Beta |
| W–: true negative | 0.9341 | 0.7761 | Howard et al.10 | Binomial | Beta |
| W–: false negative | 0.0659 | 0.2239 | Howard et al.10 | Binomial | Beta |
| No screening | |||||
| No screening positive | 0.0438 | 0.0438 | Hearn et al.77 | Binomial | Beta |
| No screening negative | 0.9562 | 0.9562 | As above | Binomial | Beta |
| No screening positive: true positive | 0.6667 | 0.6667 | As above | Binomial | Beta |
| No screening positive: false positive | 0.3333 | 0.3333 | As above | Binomial | Beta |
| No screening negative: true negative | 0.8855 | 0.8855 | As above | Binomial | Beta |
| No screening negative: false negative | 0.1145 | 0.1145 | As above | Binomial | Beta |
Costs associated with screening are summarised in Table 28. This is described in more detail in Costs.
| Parameter | Cost (£) | Source | Notes | Data type | Standard error (%) |
|---|---|---|---|---|---|
| Whooley questions | 4.53 | NHS Reference Costs 2015 to 2016 62 | Based on 1.71 minutes to screen (Littlewood et al.30), with a midwife costing £2.65 per minute (£53 per midwife appointment, average of 20 minutes per appointment, based on clinical opinion) | Fixed value | 30 |
| EPDS | 9.38 | NHS Reference Costs 2015 to 2016 62 | Based on 3.54 minutes to screen (Littlewood et al.30), with a midwife costing £2.65 per minute (£53 per midwife appointment, average of 20 minutes per appointment, based on clinical opinion) | Fixed value | 30 |
| Whooley quesions–EPDS | 5.37 | NHS Reference Costs 2015 to 2016 62 | Weighted cost based on the above. Cost of Whooley screen for those who screen W– and cost of Whooley screen plus EPDS screen for those who screen W+, with proportions taken from the screening data in Table 27 | Fixed value | 30 |
| No screening | 7.95 | NHS Reference Costs 2015 to 2016 62 | Based on 3 minutes with a midwife (expert opinion that without a screening tool the midwife has a conversation about mental health of around 1–5 minutes) | Fixed value | 30 |
Model 3: screening and treatment model for depression
Model parameters
Probabilities associated with screening accuracy are the same as for model 1 (see Table 27). Data on treatment pathway, spontaneous recovery in cases of undetected depression, later identification of depression in cases of depression not being detected and response to treatment are outlined in Table 29. In terms of treatment pathways, we followed NICE guidance,5 which states that pregnant women with mild/moderate depression should be given GSH and pregnant women with moderate/severe depression should be given a high-intensity psychological intervention. For all other parameters, we carried out rapid literature searches and searched the reference lists of relevant literature to identify appropriate data. As the clinical guidance is ambiguous for moderate depression, we assumed that 50% of women with moderate depression would receive GSH and 50% would receive high-intensity psychological intervention.
| Parameter | Probability | Source | Notes | Data type | Distribution |
|---|---|---|---|---|---|
| Treatment | |||||
| GSH for mild/moderate depression | 0.7921 | Howard et al.10 | Assuming 50% of women with moderate depression receive this treatment | Binomial | Beta |
| High-intensity psychological therapy for moderate/severe depression | 0.2079 | Howard et al.10 | Assuming 50% of women with moderate depression receive this treatment | Binomial | Beta |
| Spontaneous recovery | |||||
| Spontaneous recovery | 0.3300 | Dennis et al.78 | Mid-point of spontaneous recovery rate (25–40% = 33%) | Binomial | Beta |
| No spontaneous recovery | 0.6700 | Dennis et al.78 | 1 minus mid-point of spontaneous recovery rate | Binomial | Beta |
| Later identification | |||||
| Identified as depressed following booking appointment | 0.1025 | Kessler et al.79 | Based on 41% of misdiagnoses identified over the following 3 years | Binomial | Beta |
| Not identified as depressed following booking appointment | 0.9000 | Kessler et al.79 | 1 minus rate of identification | Binomial | Beta |
| Response to treatment | |||||
| Response to GSH | 0.5109 | NICE5 | 1 minus probability of not responding | Binomial | Beta |
| No response to GSH | 0.4891 | NICE5 | Relative risk of no improvement (0.73) multiplied by absolute risk of no improvement78 | Binomial | Beta |
| Response to high-intensity psychological therapy | 0.6784 | NICE5 | 1 minus probability of not responding | Binomial | Beta |
| No response to high-intensity psychological therapy | 0.3216 | NICE5 | Relative risk of no improvement (0.48) multiplied by absolute risk of no improvement78 | Binomial | Beta |
The probability of spontaneous recovery was taken from a study by Dennis et al. ,78 which identified spontaneous recovery rates of 25–40% in postnatal depression. We assumed similar rates for antenatal and postnatal populations and applied the mid-point (33%), which is consistent with related models. 5,30
The probability of identification later in the pathway is based on data from a study by Kessler et al. ,79 which reported a detection rate of 41% over 3 years. We adjusted this to 9 months and applied a 10% detection, assuming a linear relationship between time and detection, which is consisent with related models. 5,30
Response to treatment was based on a meta-analysis reported by NICE. 5 The relative risk of no improvement was 0.73 for GSH. This was mulitplied by the absolute risk of no improvement reported by Dennis et al. 78 to give the probability of no improvement following GSH. The probability of responding to GSH was calculated as 1 minus the probability of no improvement following GSH. The probability of responding to high-intensity psychological therapy was calculated as the relative risk of no improvement of 0.485 multiplied by the absolute risk of no improvement reported by Dennis et al. ,78 and estimated as 1 minus the probability of no improvement.
The costs associated with administering each screening approach were the same as those in models 1 and 2 (see Table 28). Costs of treatment and other health and social care costs are presented in Table 30. Cost estimates for treatments were based on information from NICE. 5 For true-positive women, the full treatment cost was assigned. For false-positive women, it was assumed that women would receive the same treatments in the same proportions as true-positive women, but that they would stop treatment earlier and would consume only 20% of treatment-related health-care resources, based on information from NICE. 5 Data on other health and social care costs (i.e. ‘knock-on effects’)76 reported costs in mother–infant dyads over the first 18 months post birth. 76 Outcomes in model 3 are described in Table 31.
| Parameter | Cost (£) | Source | Notes | Distribution | Standard error (%) |
|---|---|---|---|---|---|
| Treatment | |||||
| GSH | 759 | Radhakrishnan et al.80 | Based on seven face-to-face sessions5 at £98.59 per session,80 based on 2009/10 prices and inflated to 2015/16 prices63 | Gamma | 30 |
| High-intensity psychological intervention | 3114 | Radhakrishnan et al.80 | Based on 16 sessions at £176.97 per session, based on 2009/10 prices and inflated to 2015/16 prices63 | Gamma | 30 |
| Other health and social care | |||||
| True-positive women who do not respond to treatment | 2005 | Petrou et al.76 | £2419 for women with depression over 18 months in 2000 prices inflated to 2015/16 prices,63 and interpolated to 9 months | Gamma | 30 |
| True-positive women who respond to treatment | 1680 | Petrou et al.76 | £2027 for women without depression over 18 months in 2000 prices inflated to 2015/16 prices,63 and interpolated to 9 months | Gamma | 30 |
| True negative | 1680 | Petrou et al.76 | £2027 for women without depression over 18 months in 2000 prices inflated to 2015/16 prices,63 and interpolated to 9 months | Gamma | 30 |
| False negative | 2005 | Petrou et al.76 | £2419 for women with depression over 18 months in 2000 prices inflated to 2015/16 prices,63 and interpolated to 9 months | Gamma | 30 |
| False positive | 1680 | Petrou et al.76 | £2027 for women without depression over 18 months in 2000 prices inflated to 2015/16 prices,63 and interpolated to 9 months | Gamma | 30 |
| Parameter | Utility/QALYs | Notes | Distribution | Standard error |
|---|---|---|---|---|
| Utilities30 | ||||
| Antenatal, depressed | 0.678 | Based on EQ-5D-3L | Gamma | 0.04 |
| Antenatal, not depressed | 0.888 | Based on EQ-5D-3L | Gamma | 0.01 |
| Postnatal, depressed | 0.771 | Based on EQ-5D-3L | Gamma | 0.03 |
| Postnatal, not depressed | 0.907 | Based on EQ-5D-3L | Gamma | 0.01 |
| QALYs | ||||
| Depressed to non-depressed | 0.6553 | Based on EQ-5D-3L | Gamma | 30% |
| Depressed to depressed | 0.5991 | Based on EQ-5D-3L | Gamma | 30% |
| Non-depressed to non-depressed | 0.7422 | Based on EQ-5D-3L | Gamma | 30% |
Assumptions for all models
The following assumptions were made, consistent with related models:5,30
-
All screening tools are used with all women at antenatal booking.
-
No women are receiving IAPT when they present to services and, therefore, all women who screen positive will be referred to IAPT.
-
Women with any level of depression (mild, moderate or severe) are referred to IAPT and no one is referred to secondary services.
-
No one who screened negative at the booking appointment becomes depressed following the appointment.
Analyses for all models
The models were developed in Microsoft Excel® (Microsoft Corporation, Redmond, WA, USA). Results are presented in three ways:
-
Cost and probability of detecting a true-positive case by screening approach reported for models 1 and 2 and average cost and average QALY gain reported for model 3.
-
ICERs are presented as the additional cost per true positive/QALY gain. When three or more alternatives are compared, ICERs were calculated using rules of dominance and extended dominance. 81
-
Monte Carlo simulations (5000 replications) were used in a probabilistic sensitivity analysis, which produced cost–outcome replications that were then used in a net-benefit approach67 to produce cost-effectiveness planes and CEACs. CEACs are an alternative to CIs around ICERs and show the probability that one intervention is cost-effective compared with another for a range of values that a decision-maker would be willing to pay for an additional unit of outcome.
Model structure uncertainty (deterministic sensitivity analysis)
The probabilities of the no-screen pathway were based on a study77 examining midwives’ ability to detect mental health problems without a screening tool. However, this paper is from 1998 and reported very low rates of detection. Therefore, consistent with related models,5,30 the probabilities associated with the no-screen pathway were replaced with those from a study on screening of depression by GPs, and the cost of a GP contact added (Table 32).
| Parameters | Probability | Source | Notes | Data type | Distribution |
|---|---|---|---|---|---|
| No screening positive | 0.2500 | Mitchell et al.82 | Binomial | Beta | |
| No screening negative | 0.7500 | Mitchell et al.82 | Binomial | Beta | |
| No screening positive: true positive | 0.4000 | Mitchell et al.82 | Binomial | Beta | |
| No screening positive: false positive | 0.6000 | Mitchell et al.82 | Binomial | Beta | |
| No screening negative: true negative | 0.8667 | Mitchell et al.82 | Binomial | Beta | |
| No screening negative: false negative | 0.1333 | Mitchell et al.82 | Binomial | Beta | |
| Costs | Cost (£) | Standard error | |||
| No screening | 31 | Curtis and Burns76 | One GP appointment lasting 9.22 minutes, including direct care staff, no qualification | Fixed | 30% |
Appendix 3 Work package 1(i): WENDY economic results
Model 1: incremental cost per true-positive depression case detected
Base case
The results of the model 1 base case (Table 33 and Figure 19) show that the probability of detecting a true-positive case was highest for EPDS (0.059), followed by Whooley questions (0.041), no screening (0.029) and Whooley questions–EPDS (0.028). The cost of screening was highest for EPDS (£9.38), followed by no screening (£7.95), Whooley questions–EPDS (£5.37) and Whooley questions (£4.53).
| Screening approach | Probability of being true positive | Cost per screen (£) | Status | ICER (£) |
|---|---|---|---|---|
| EPDS | 0.0594 | 9.38 | Trade-off | 267 |
| Whooley questions | 0.0412 | 4.53 | Trade-off | |
| No screening | 0.0292 | 7.95 | Dominated | |
| Whooley questions–EPDS | 0.0276 | 5.37 | Dominated |
FIGURE 19.
Model 1 base-case probability of detecting a true-positive depression case by cost per screen.

Using rules of dominance and extended dominance, no screening and Whooley questions–EPDS were dominated by Whooley questions, which was more clinically effective and less costly than both. A trade-off occurred between EPDS and Whooley questions, with EPDS costing more but being more clinically effective, resulting in an ICER of £267.
The cost-effectiveness plane for Whooley questions compared with EPDS (Figure 20) shows that all scatterpoints lie to the left of the x-axis where the Monte Carlo simulations represent points where Whooley questions is less clinically effective than EPDS, and the majority of scatterpoints lie below the x-axis where Whooley questions is less costly than EPDS. Figure 21 shows the associated CEACs. There is a higher probability (> 50%) of Whooley questions being cost-effective, compared with EPDS, at low values of willingness to pay (i.e. < £250) and EPDS being cost-effective at higher values (i.e. > £250). The four-way CEAC confirms these findings (Figure 22).
FIGURE 20.
Model 1 base-case cost-effectiveness plane for Whooley questions vs. EPDS in detecting a true depression case.
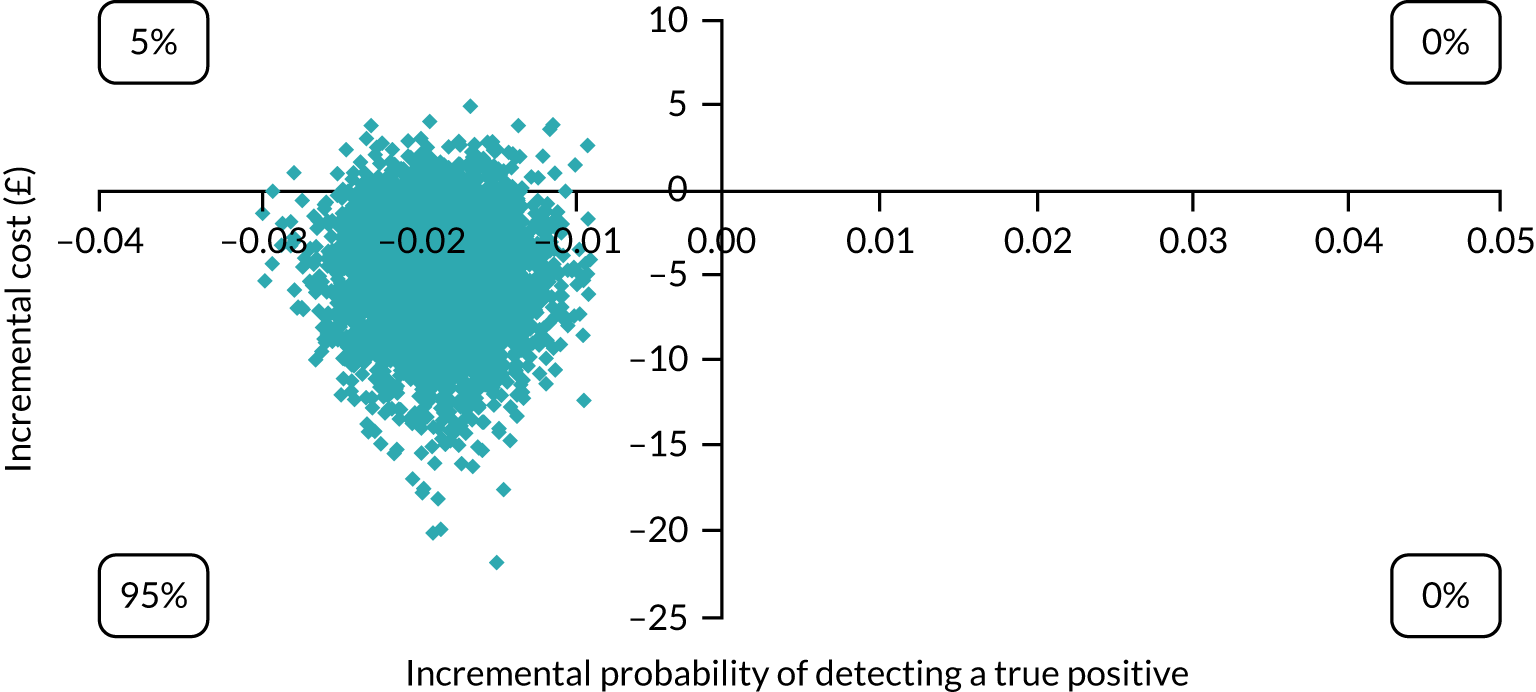
FIGURE 21.
Model 1 CEAC for Whooley questions vs. EPDS in detecting a true depression case.
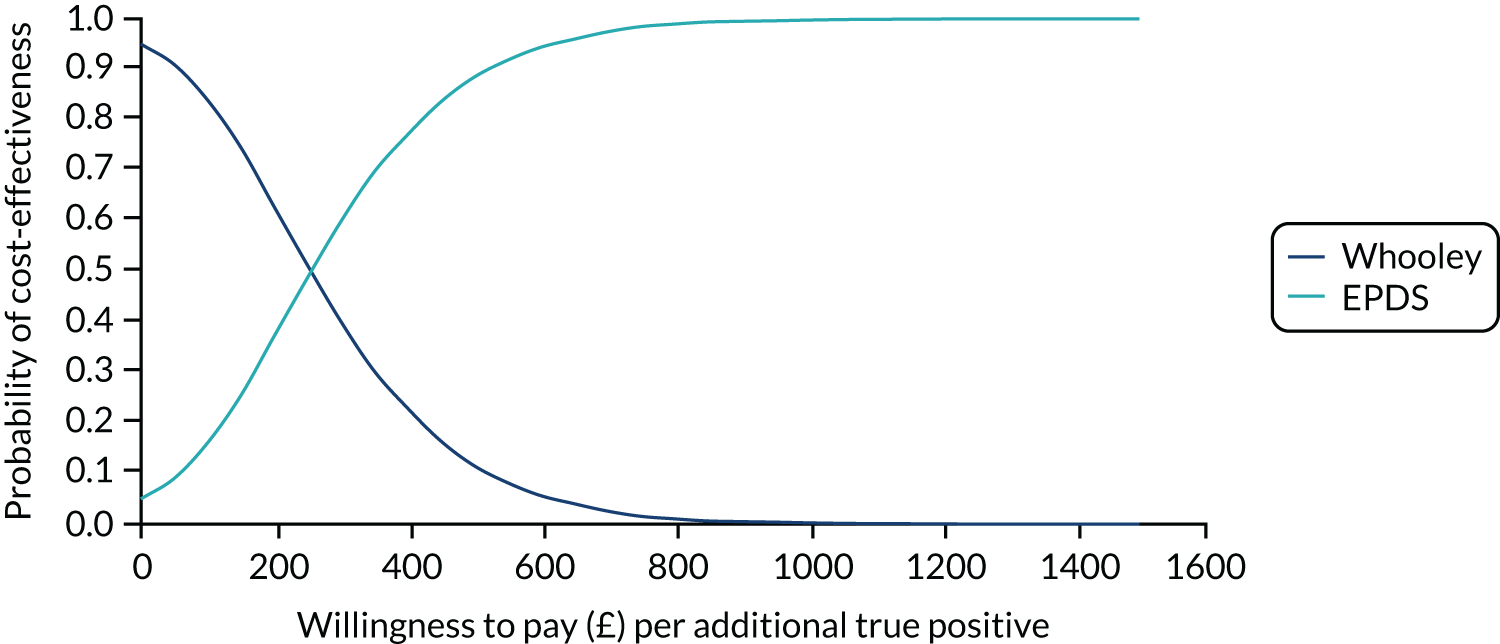
FIGURE 22.
Model 1 base-case CEAC for all screening options in detecting a true depression case.
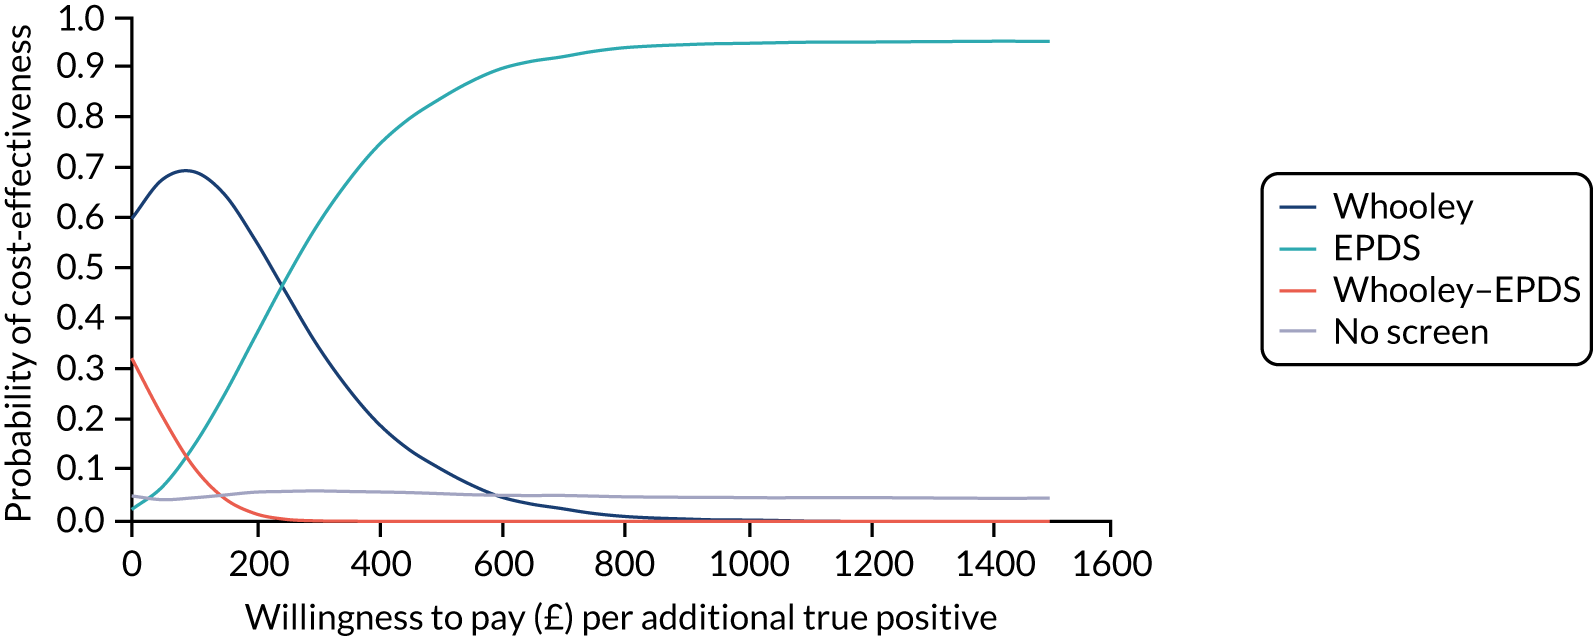
Sensitivity analysis
When model 1 was reanalysed using probabilities and costs from a study on the screening of depression by GPs (see Table 32), the probability of detecting a true-positive case was highest for no screening (0.100), followed by EPDS (0.059), Whooley questions (0.041) and Whooley questions–EPDS (0.028) (Table 34 and Figure 23). The cost of screening was highest for no screening because of inclusion of GP costs (£31), followed by EPDS (£9.38), Whooley questions–EPDS (£5.37) and Whooley questions (4.53).
| Screening approach | Probability of being true positive | Cost per screen (£) | Status | ICER (£) |
|---|---|---|---|---|
| No screening | 0.1000 | 31.00 | Trade-off | 532 |
| EPDS | 0.0594 | 9.38 | Trade-off | 267 |
| Whooley questions | 0.0412 | 4.53 | Trade-off | |
| Whooley questions–EPDS | 0.0276 | 5.37 | Dominated |
FIGURE 23.
Model 1 sensitivity analysis probability of detecting a true-positive depression case by cost per screen.

Using the rules of dominance and extended dominance, Whooley questions–EPDS was dominated by Whooley questions, which was more clinically effective and less costly. A trade-off occurred for no screening, EPDS and Whooley questions, with each alternative costing more but having a higher probability of detecting a true-positive case than the last. This resulted in an ICER of £267 for EPDS compared with Whooley questions and of £532 for no screening compared with EPDS.
Figures 24–26 present cost-effectiveness planes for each two-way comparison involving a trade-off. In Figures 23 and 24, the majority of scatterpoints lie to the left of the x-axis where the Monte Carlo simulations represent points where Whooley questions/EPDS are less clinically effective than no screening, and the majority of the scatterpoints lie below the x-axis, where Whooley questions/EPDS are less costly than no screening. In Figure 26, all scatterpoints lie to the left of the x-axis, where Whooley questions are less clinically effective than EPDS, and the majority of scatterpoints lie below the x-axis, where Whooley questions are less costly than EPDS.
FIGURE 24.
Model 1 sensitivity analysis cost-effectiveness plane for Whooley questions vs. no screening in detecting a true depression case.
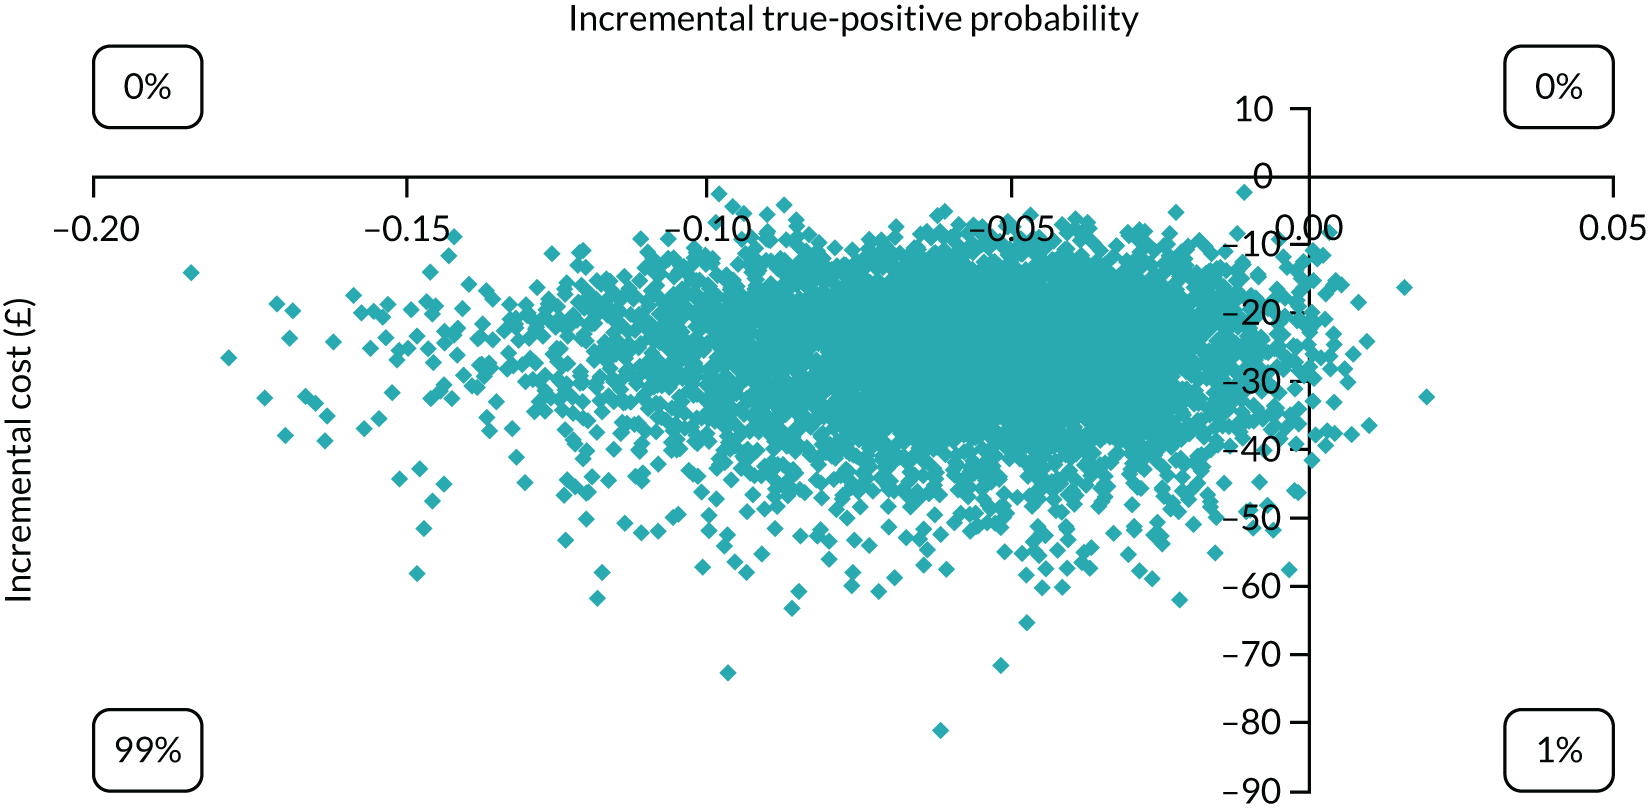
FIGURE 25.
Model 1 sensitivity analysis cost-effectiveness plane for EPDS vs. no screening in detecting a true depression case.
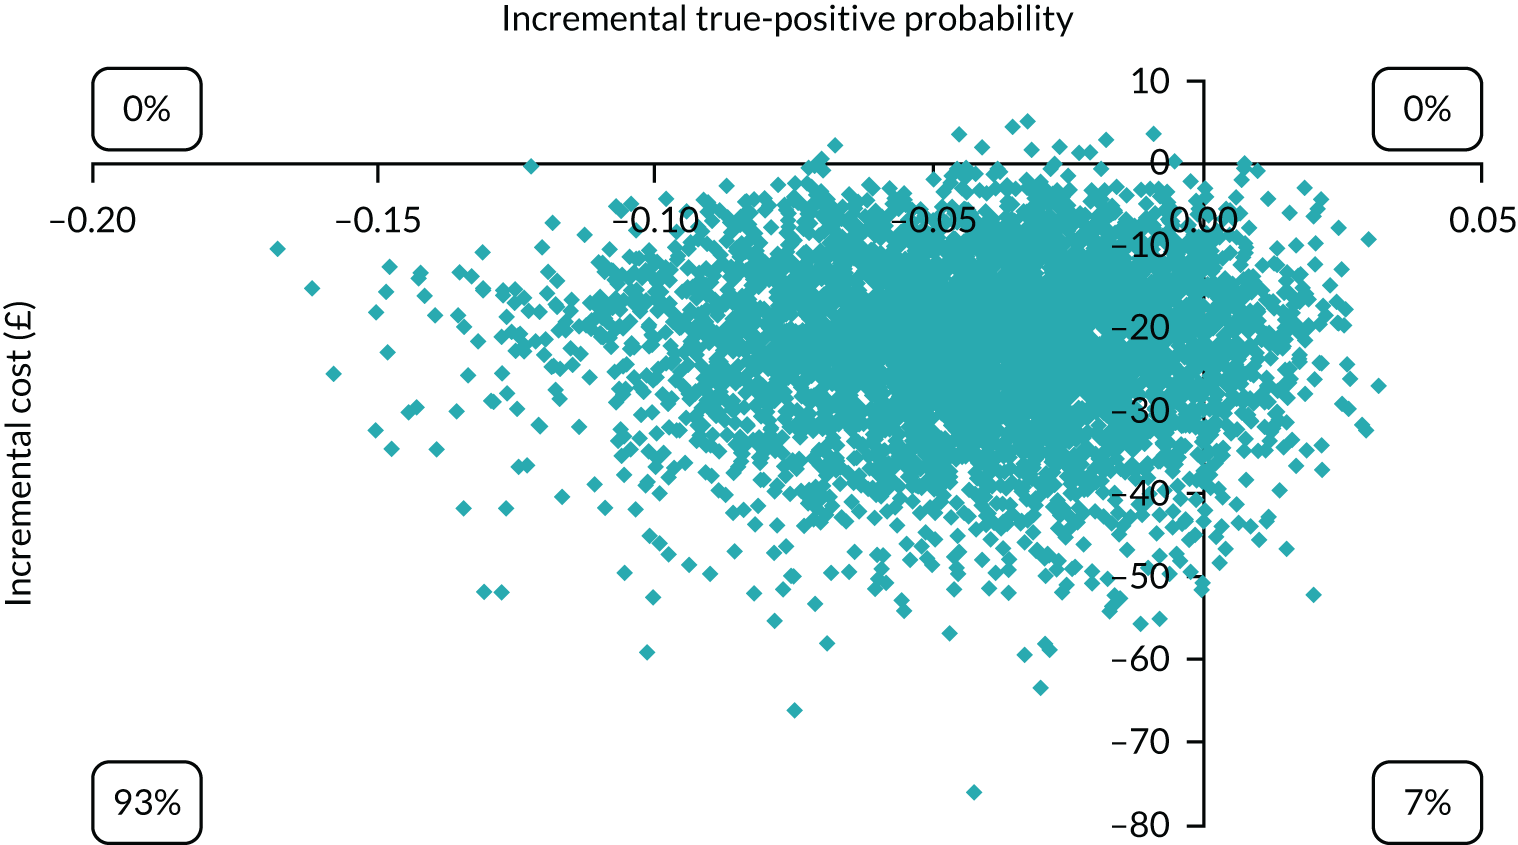
FIGURE 26.
Model 1 sensitivity analysis cost-effectiveness plane for Whooley questions vs. EPDS in detecting a true depression case.

Figure 27 shows the CEACs for Whooley questions, EPDS and no screening. The probability of being cost-effective is highest for Whooley questions at low levels of willingness to pay (i.e. < £250), for EPDS at willingness-to-pay levels of approximately £250–600 and for no screening at high levels of willingness to pay (i.e. > £600). The four-way CEAC confirms these findings (Figure 28).
FIGURE 27.
Model 1 sensitivity analysis CEAC for Whooley questions, EPDS and no screening in detecting a true depression case.
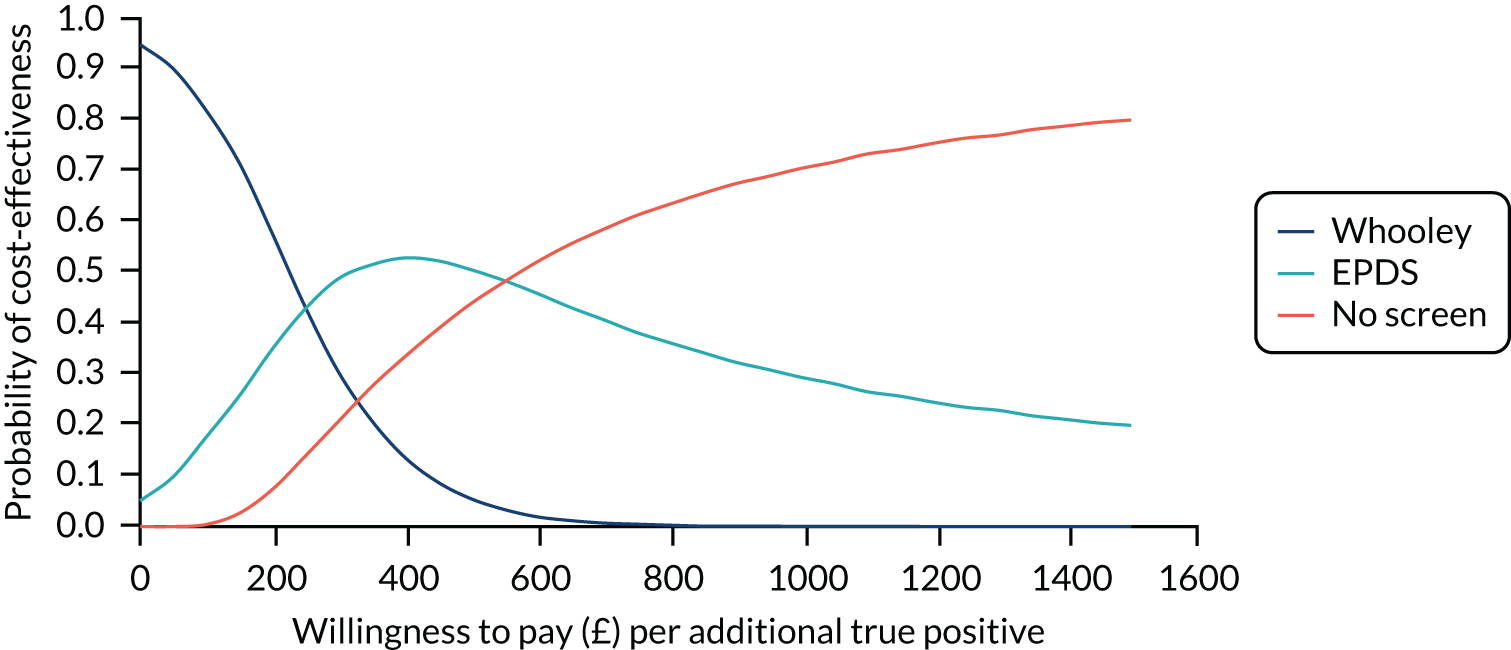
FIGURE 28.
Model 1 sensitivity analysis CEAC for all screening options in detecting a true depression case.

Model 2: incremental cost per true-positive case of any mental disorder detected
Base case
The results of the model 2 base case (Table 35 and Figure 29) show that the probability of detecting a true-positive case of any mental disorder was highest for EPDS (p = 0.083), followed by Whooley questions (0.063), Whooley questions–EPDS (0.038) and no screening (0.029). The cost of screening was highest for EPDS (£9.38), followed by no screening (£7.95), Whooley questions–EPDS (£5.37) and Whooley questions (£4.53).
| Screening approach | Probability of being a true positive | Cost per screen (£) | Status | ICER (£) |
|---|---|---|---|---|
| EPDS | 0.0832 | 9.38 | Trade-off | 241 |
| Whooley questions | 0.0631 | 4.53 | Trade-off | |
| Whooley questions–EPDS | 0.0376 | 7.95 | Dominated | |
| No screening | 0.0292 | 5.37 | Dominated |
FIGURE 29.
Model 2 base-case probability of detecting a true case of any mental disorder by cost per screen for each screening approach.
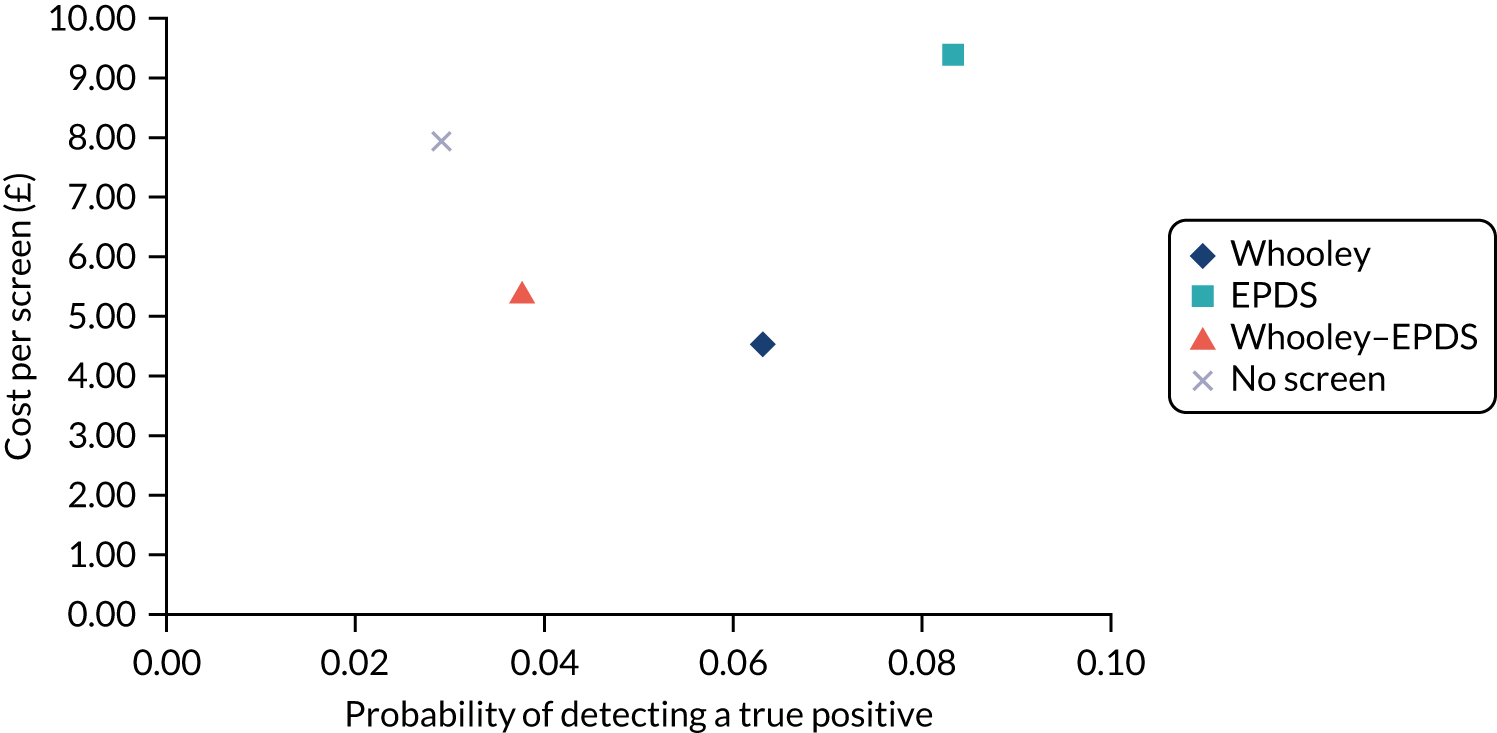
Using the rules of dominance and extended dominance, no screening and Whooley questions–EPDS were dominated by Whooley questions, which was more clinically effective and less costly than both. A trade-off occurred between EPDS and Whooley questions, with EPDS costing more but having a higher probability of detecting a true-positive case, resulting in an ICER of £241.
Figure 30 presents the cost-effectiveness plane for Whooley questions compared with EPDS. All scatterpoints lie to the left of the x-axis, where the Monte Carlo simulations represent points where Whooley questions are less clinically effective than EPDS, and the majority of the scatterpoints lie below the x-axis, where Whooley questions is less costly than EPDS. Figure 31 shows the CEACs for Whooley questions compared with EPDS. There is a higher probability (> 50%) of Whooley questions being cost-effective than EPDS at low values of willingness to pay (i.e. < £250) and EPDS being cost-effective at values beyond this. The four-way CEAC confirms these findings (Figure 32).
FIGURE 30.
Model 2 base-case cost-effectiveness plane for Whooley questions vs. EPDS in detecting a true case of any mental disorder.
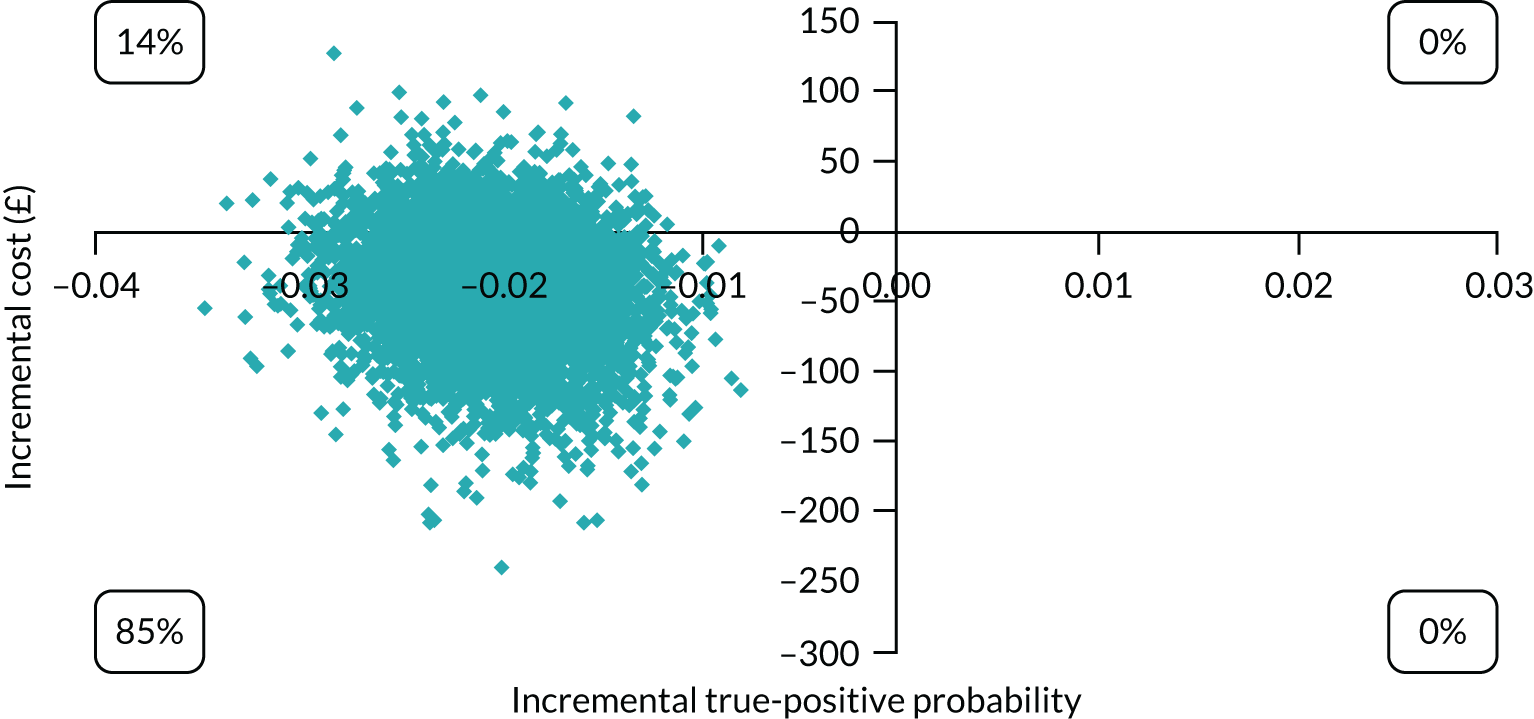
FIGURE 31.
Model 2 base-case CEAC for Whooley questions vs. EPDS in detecting a true case of any mental disorder.
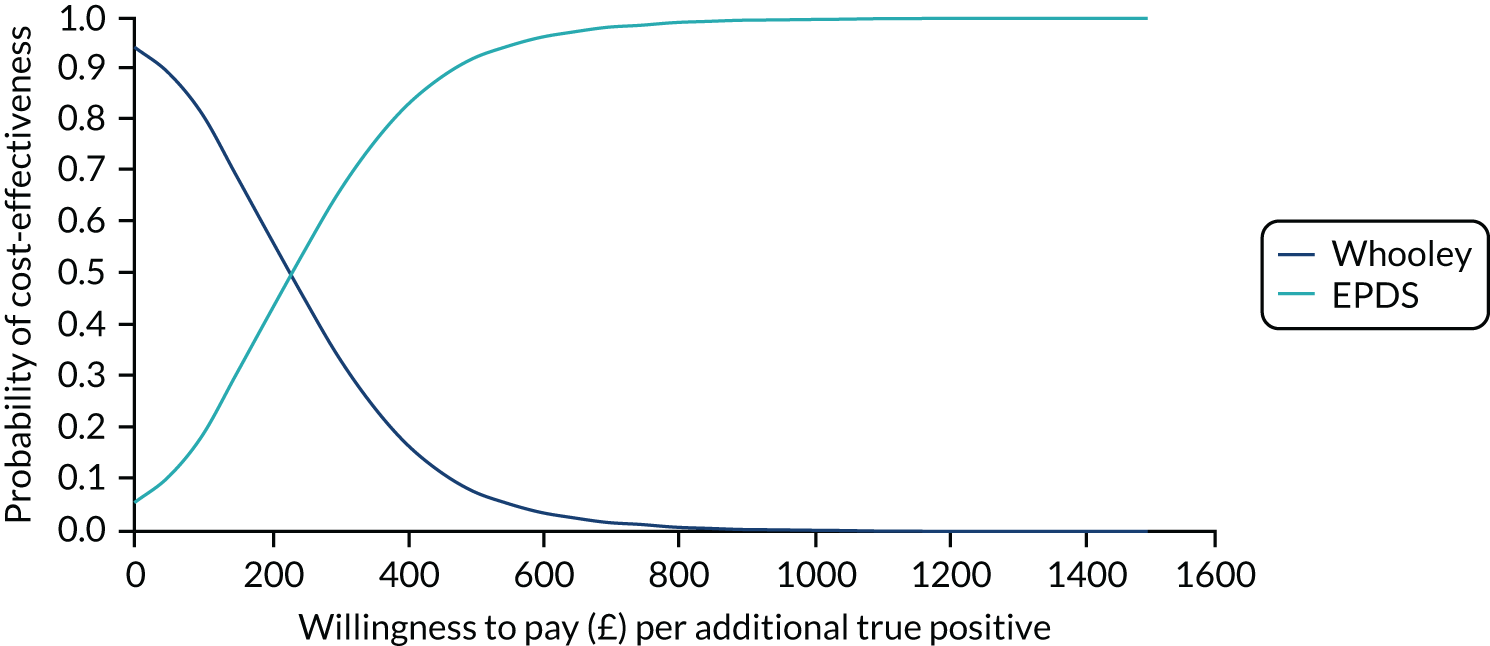
FIGURE 32.
Model 2 base-case CEAC for all screening options in detecting a true case of any mental disorder.
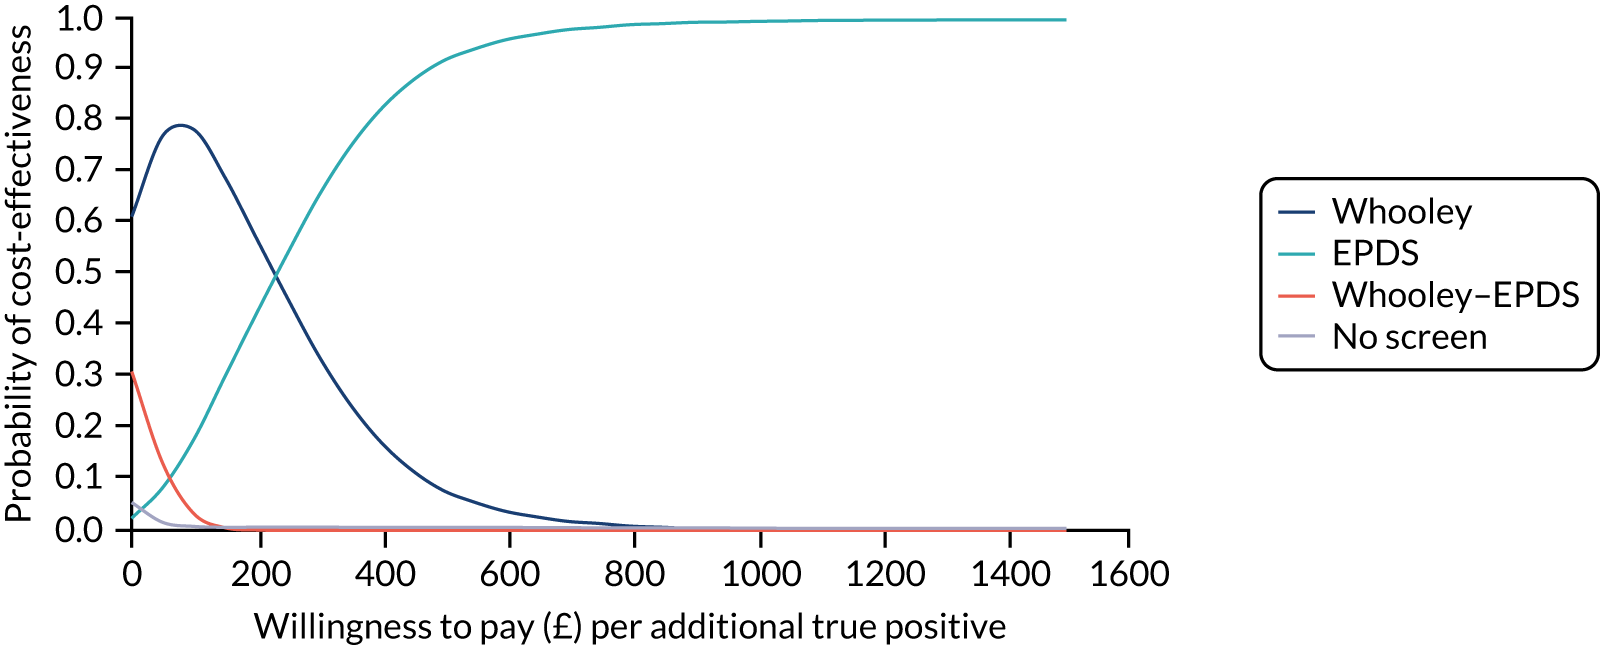
Sensitivity analysis
As for model 1, when the model was reanalysed using probabilities and costs from an alternative study on the screening of depression by GPs (see Table 32), the results changed (Table 36 and Figure 33). The probability of detecting a true-positive case was highest for no screening (0.1), followed by EPDS (0.083), Whooley questions (0.063) and Whooley questions–EPDS (0.038). The cost of screening was highest for no screening (£31), followed by EPDS (£9.38), Whooley questions–EPDS (£5.37) and Whooley questions (£4.53).
| Screening approach | Probability of being a true positive | Cost per screen (£) | Status | ICER (£) |
|---|---|---|---|---|
| No screening | 0.1000 | 31.00 | Trade-off | 1273 |
| EPDS | 0.0832 | 9.38 | Trade-off | 255 |
| Whooley questions | 0.0631 | 4.53 | Trade-off | |
| Whooley questions–EPDS | 0.0376 | 5.37 | Dominated |
FIGURE 33.
Model 2 sensitivity analysis probability of detecting a true case of any mental disorder by cost per screen for each screening approach.
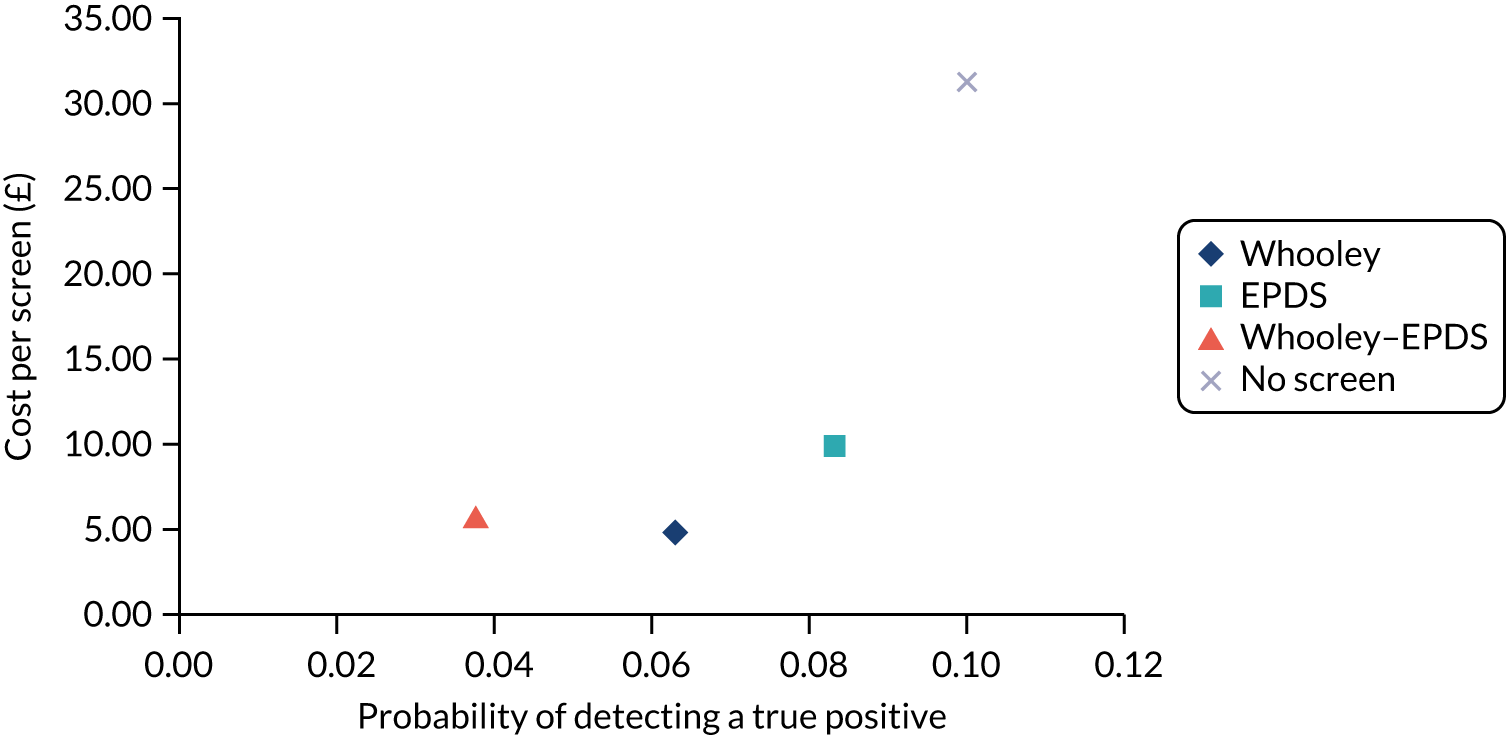
Using the rules of dominance and extended dominance, Whooley questions–EPDS was dominated by Whooley questions, which was more clinically effective and less costly. A trade-off occurred for no screening, EPDS and Whooley questions, with each alternative costing more but having a higher probability of detecting a true-positive case than the last. This resulted in an ICER of £255 for EPDS compared with Whooley questions and of £1273 for no screening compared with EPDS.
Figures 34–36 present cost-effectiveness planes for the two-way comparisons involving a trade-off. In Figures 34 and 35, the majority of scatterpoints lie to the left of the x-axis, where the Monte Carlo simulations represent points where Whooley questions/EPDS are less effective than no screening, and the majority of scatterpoints lie below the x-axis, where Whooley questions/EPDS are less costly than no screening. In Figure 36, all scatterpoints lie to the left of the x-axis where Whooley questions is less clinically effective than EPDS, and the majority of scatterpoints lie below the x-axis, where Whooley questions is less costly than EPDS.
FIGURE 34.
Model 2 sensitivity analysis cost-effectiveness plane for Whooley questions vs. no screening in detecting a true case of any mental disorder.
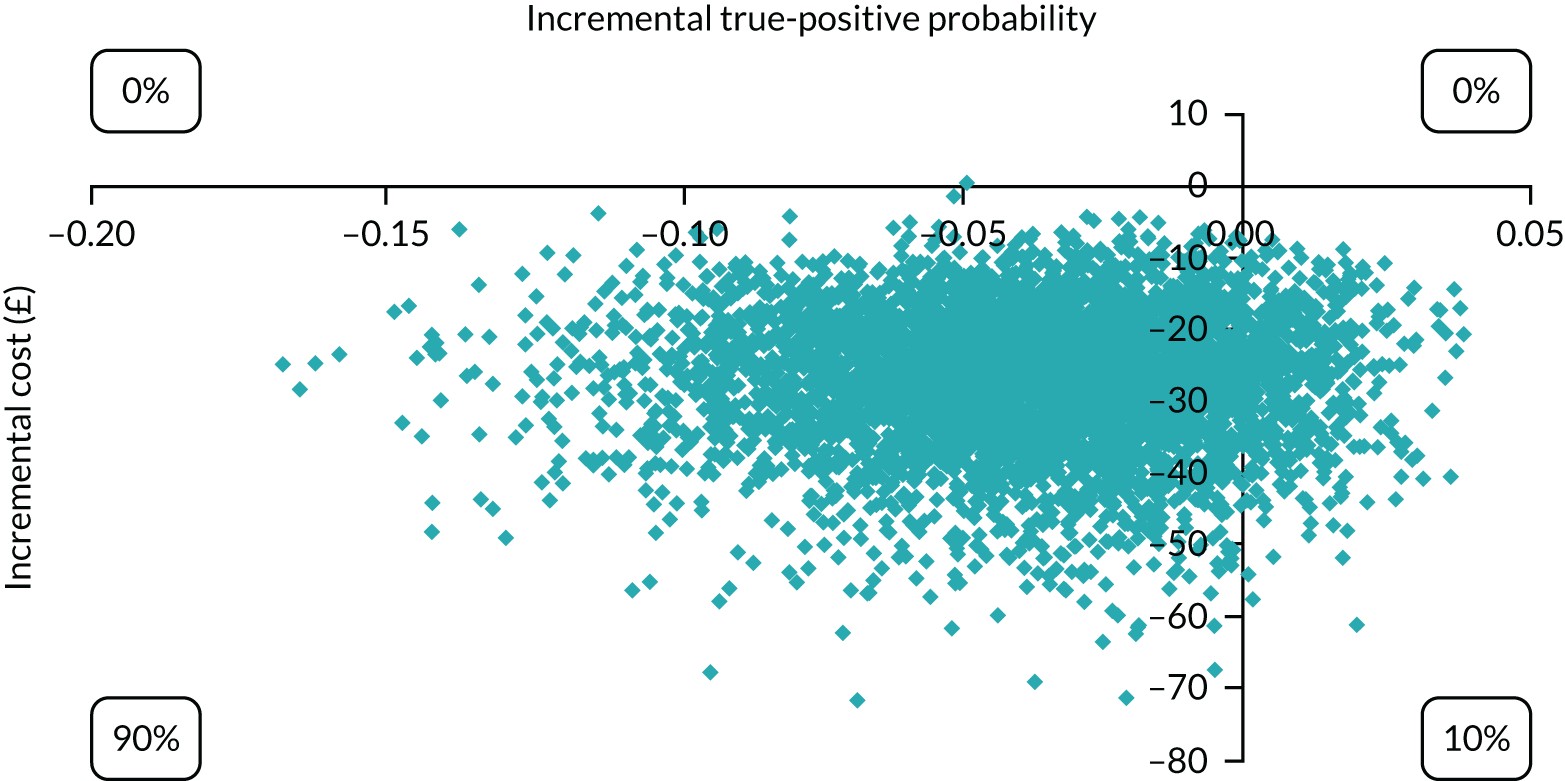
FIGURE 35.
Model 2 sensitivity analysis cost-effectiveness plane for EPDS vs. no screening in detecting a true case of any mental disorder.
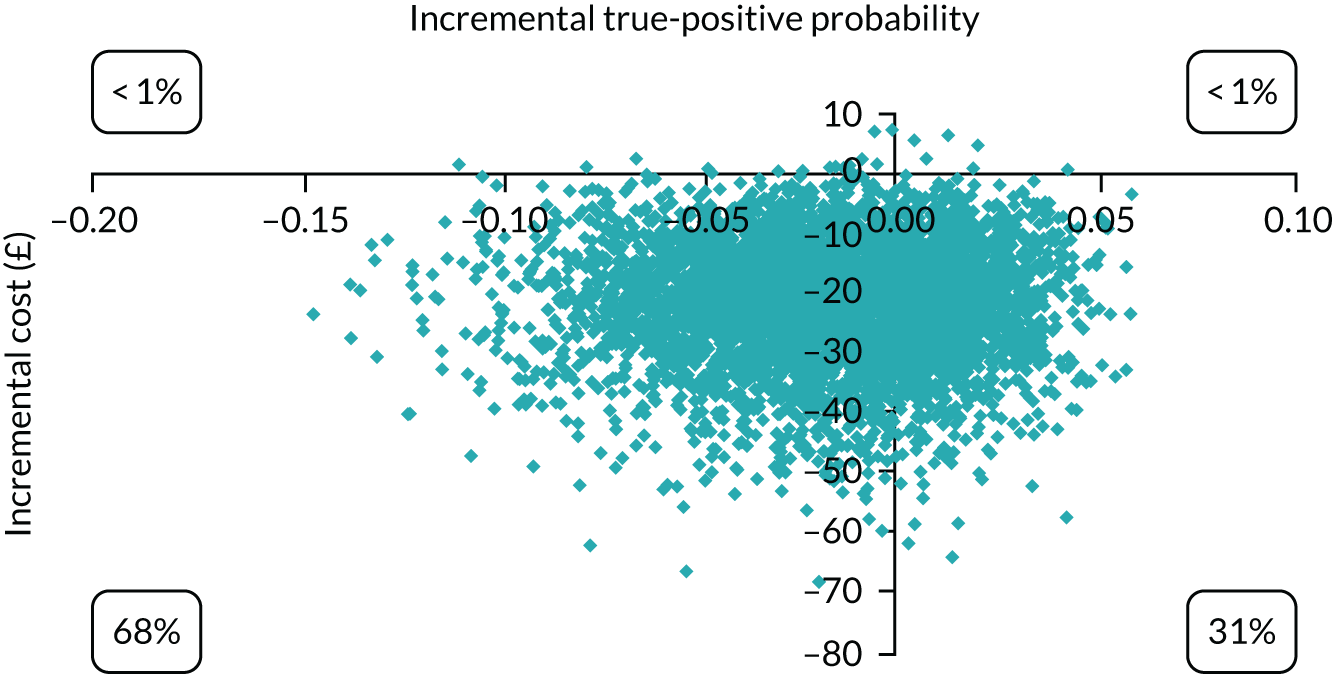
FIGURE 36.
Model 2 sensitivity analysis cost-effectiveness plane for Whooley questions vs. EPDS in detecting a true case of any mental disorder.

Figure 37 shows the CEAC for Whooley questions, EPDS and no screening. The probability of being cost-effective is highest for Whooley questions at low levels of willingness to pay (i.e. < £250) and for EPDS at higher levels of willingness to pay (i.e. > £250). The four-way CEAC confirms these findings (Figure 38).
FIGURE 37.
Model 2 sensitivity analysis CEAC for Whooley questions, EPDS and no screening in detecting a true case of any mental disorder.
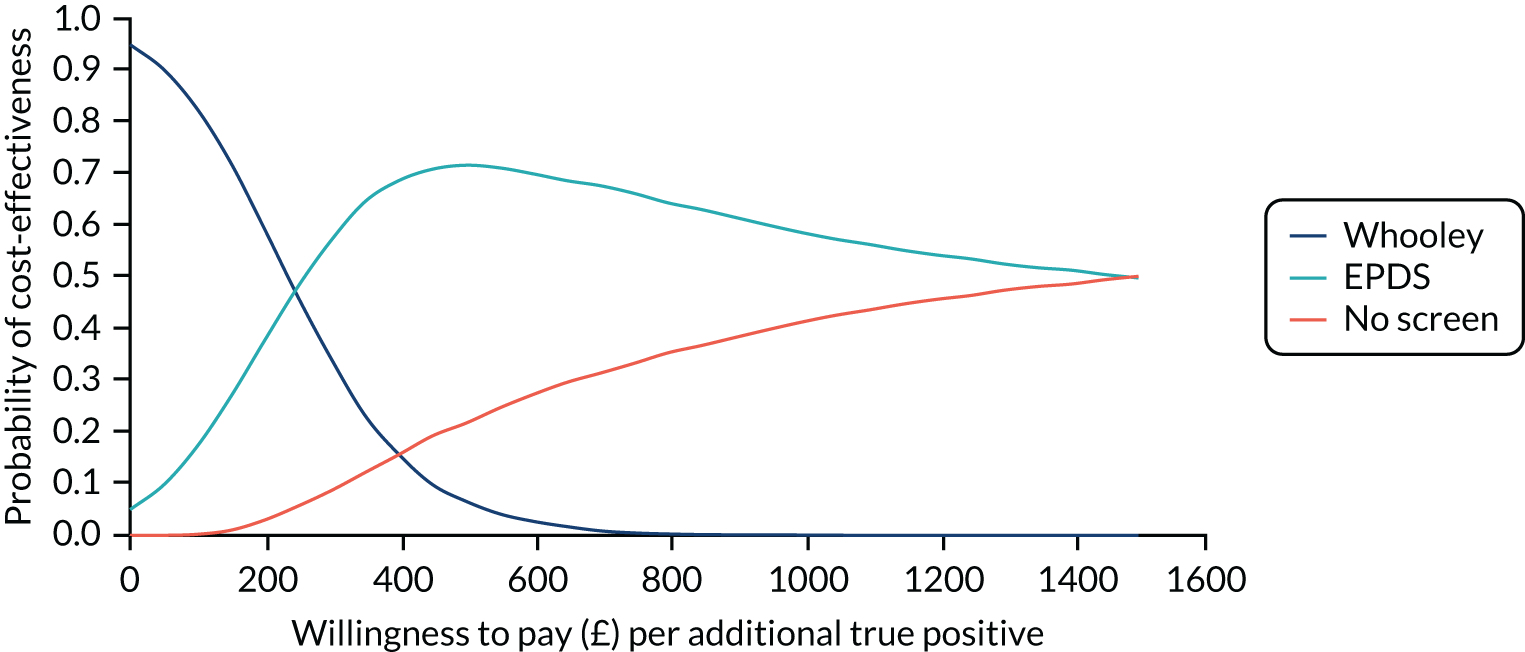
FIGURE 38.
Model 2 sensitivity analysis CEAC for all screening options in detecting a true case of any mental disorder.
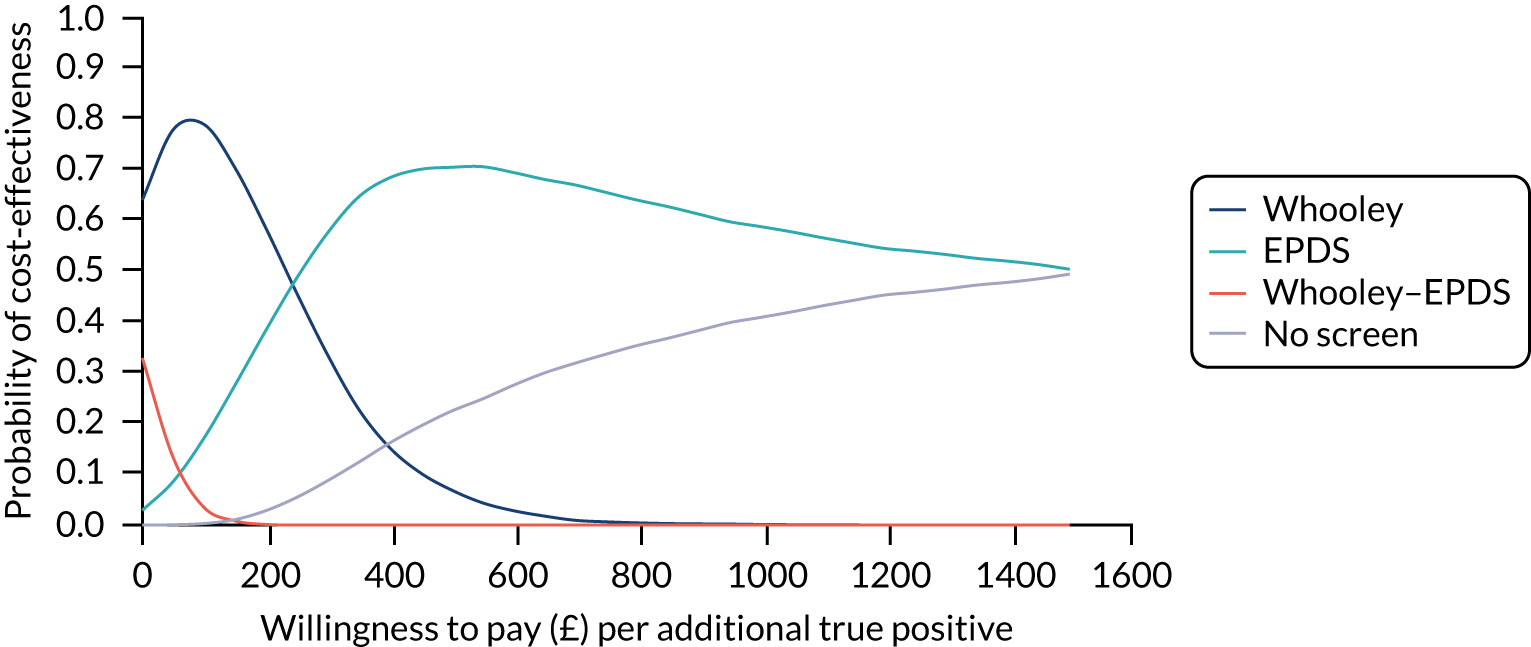
Model 3: incremental cost per quality-adjusted life-year
Base case
The results of the model 3 base case are presented in Table 37 and Figure 39. The mean QALY gain per person was highest for EPDS (0.7304), followed by Whooley questions (0.7302), Whooley questions–EPDS (0.7301) and no screening (0.7255). Total cost per person was highest for EPDS (£1799), followed by Whooley questions (£1772), no screening (£1765) and Whooley questions–EPDS (£1748).
| Screening approach | QALYs | Costs (£) | Status | ICER (£) |
|---|---|---|---|---|
| EPDS | 0.7304 | 1799 | Trade-off | 108,419 |
| Whooley questions | 0.7302 | 1772 | Trade-off | 312,181 |
| Whooley questions–EPDS | 0.7301 | 1748 | Trade-off | |
| No screening | 0.7255 | 1765 | Dominated |
FIGURE 39.
Model 3 base-case costs and QALYs for each screening option.

Using the rules of dominance and extended dominance, no screening was dominated by Whooley questions–EPDS, which was more clinically effective and less costly. A trade-off occurred for EPDS, Whooley questions and Whooley questions–EPDS, with EPDS costing more but producing more QALYs than the other strategies. Whooley questions–EPDS had the lowest cost of the remaining options, but also produced the lowest QALYs. The ICER was £108,419 per QALY for EPDS and £312,181 per QALY for Whooley compared with Whooley questions–EPDS.
Figure 40 presents the cost-effectiveness plane for Whooley questions compared with EPDS. Figure 40 shows that the scatterpoints are approximately equal in each quadrant, suggesting no advantage for either option in terms of costs or effects. This was similar for Whooley questions compared with Whooley questions–EPDS (Figure 41) and for EPDS compared with Whooley questions–EPDS (Figure 42).
FIGURE 40.
Model 3 base-case cost-effectiveness plane for Whooley questions vs. EPDS for cost per QALY.
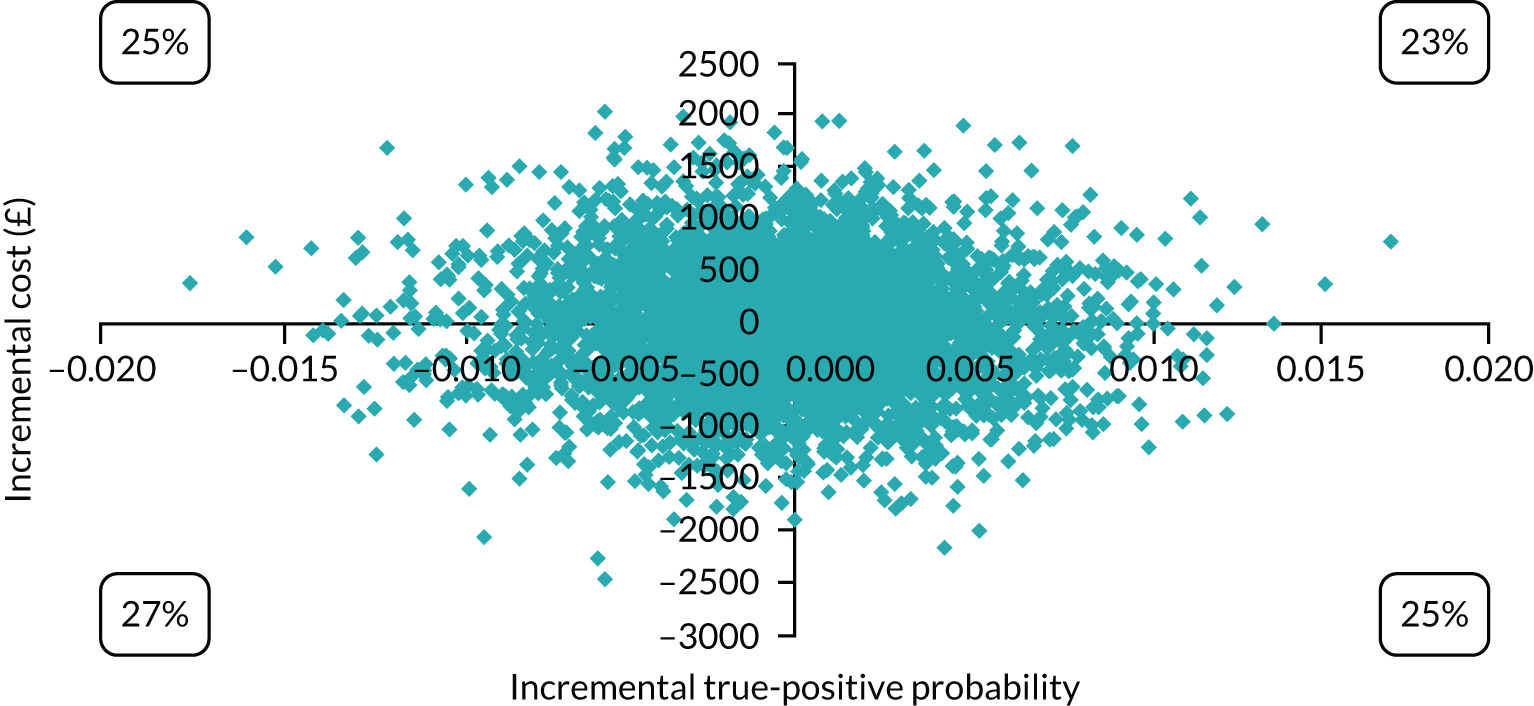
FIGURE 41.
Model 3 base-case cost-effectiveness plane for Whooley questions vs. Whooley questions–EPDS for cost per QALY.
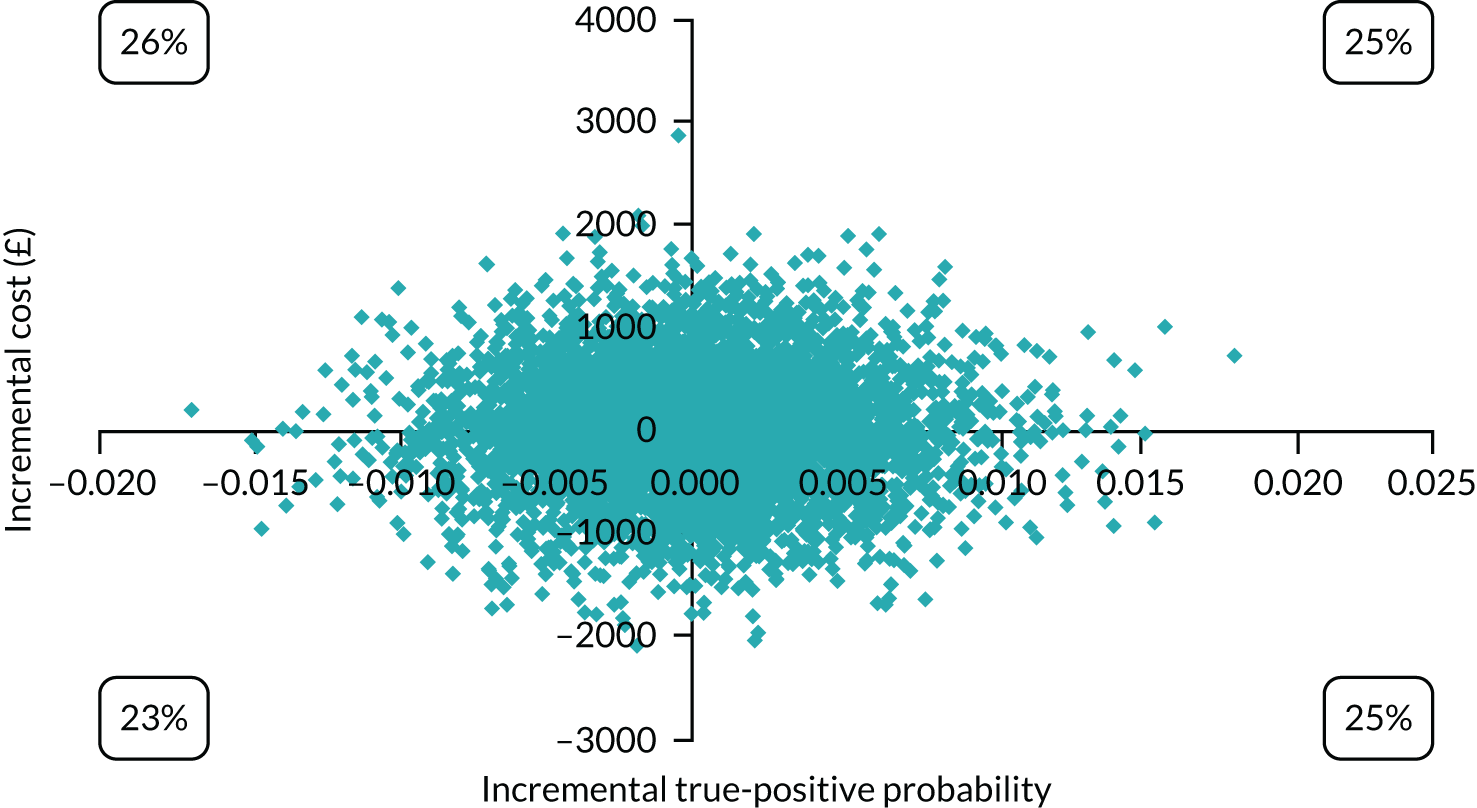
FIGURE 42.
Model 3 base-case cost-effectiveness plane for EPDS vs. Whooley questions–EPDS for cost per QALY.
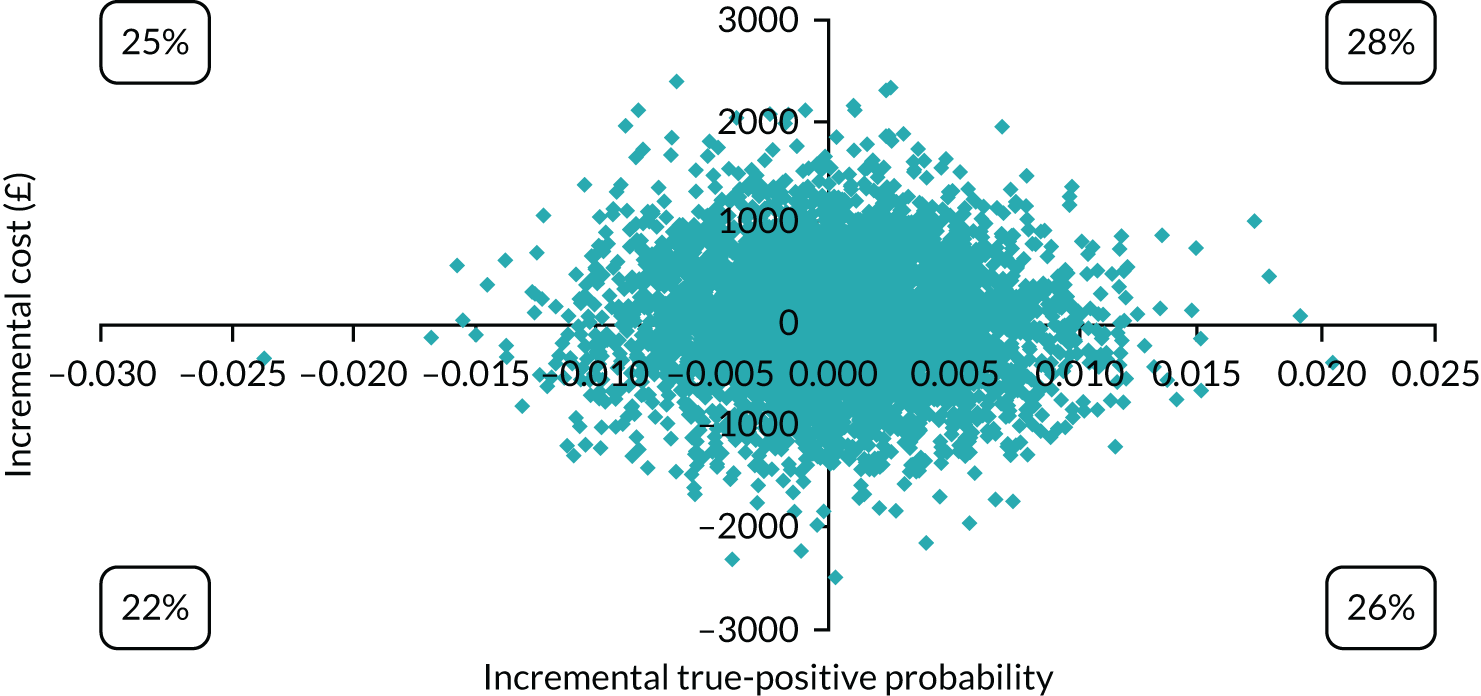
The four-way CEAC (Figure 43) indicates that, at a willingness to pay of £0, all options have a similar probability of being cost-effective. However, as willingness to pay increases, the probability of no screening being cost-effective falls, whereas the probability for all other options remains similar.
FIGURE 43.
Model 3 base-case CEAC for all screening options for cost per QALY.
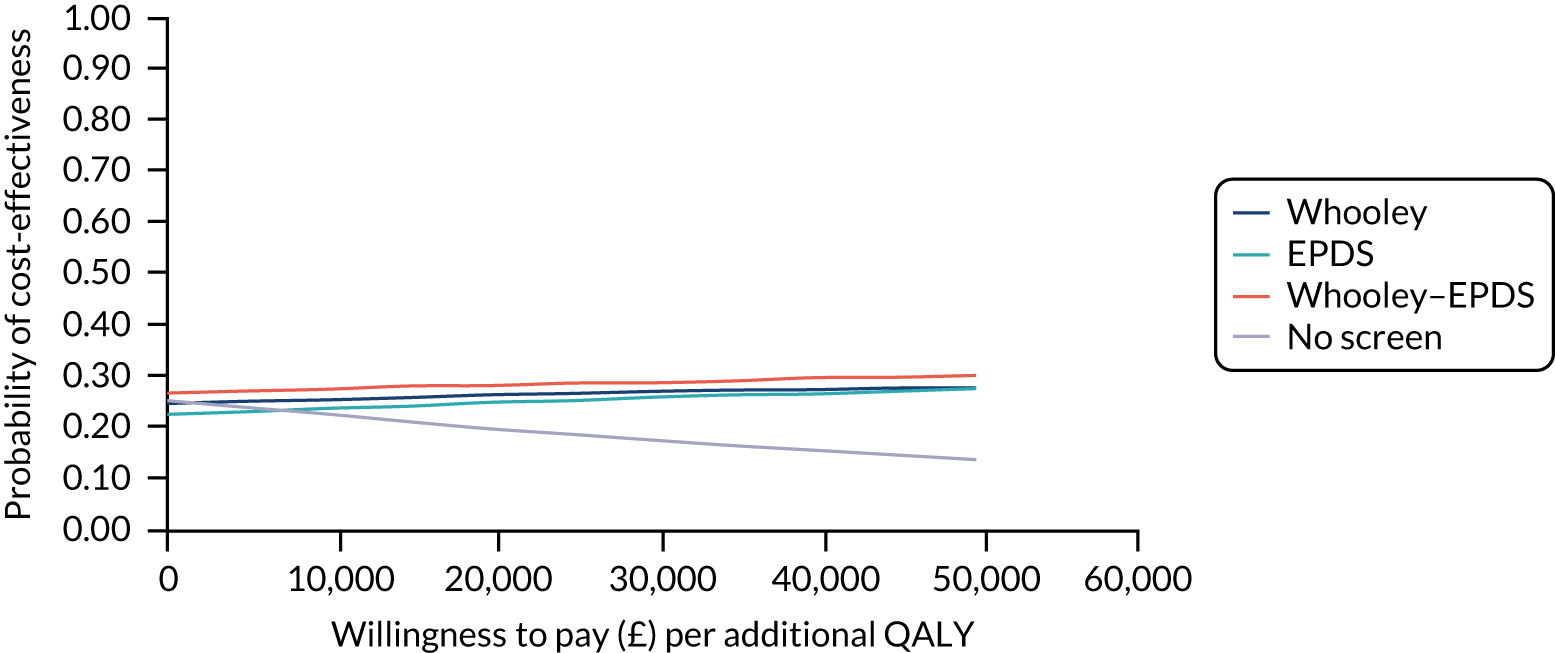
Sensitivity analysis
The results of the sensitivity analysis were similar to the base case, with no screening being dominated and the other screening options involving a trade-off. The four-way CEAC (Figure 44) confirms that Whooley questions, EPDS and Whooley questions–EPDS all have a similar probability of being cost-effective.
FIGURE 44.
Model 3 sensitivity analysis CEAC for all screening options for cost per QALY.

Strengths and limitations
This study included data from a cross-sectional survey specifically designed to compare the accuracy of alternative approaches to detecting depression in pregnant women at the first antenatal appointment. This is the earliest opportunity to systematically detect depression in pregnancy. Furthermore, this study assessed the accuracy of the Whooley questions when asked by midwives at a routine maternity contact rather than assessing responses to researchers and, therefore, the results are of relevance to usual clinical practice. Other strengths include the use of a robust diagnostic interview, an efficient and well-powered study design and a diverse study population.
A number of limitations that could have influenced the results should be considered. Although the Whooley questions were asked by midwives in clinical practice, the EPDS was administered by researchers. Therefore, the diagnostic accuracy of the EPDS may not reflect accuracy in clinical practice; however, as it is a self-complete instrument, its administration by researchers is unlikely to change its diagnostic accuracy. Furthermore, there was a 2- to 3-week delay in administering the EPDS and the SCID-I after the first antenatal appointment when the Whooley questions were asked and so changes in mental health state over this time period are possible.
The model is also limited by the need to make certain assumptions where data were unavailable. Key assumptions included that all women are screened, no women are receiving IAPT prior to presentation, all women who screen positive are referred to IAPT and no one who screened negative becomes depressed at a later point. However, assumptions are necessary in economic modelling, as models are a simplification of reality. Furthermore, these assumptions are consistent with related models. 5,30 Additionally, the resources, and therefore the costs of identifying depressed women in the no-screening option, were estimated based on the clinical opinion of a single consultant midwife (Jill Demilew). However, this midwife has over 40 years’ clinical experience and 20 years’ experience as a consultant midwife. In addition, this estimate was varied in sensitivity analyses to check the robustness of the results to this assumption.
The generalisability of the model must also be considered, as most data on the sensitivity and specificity of the screening tools came from one study based on one inner-city area,10 and screening data were available for only 33% of all eligible women. However, this is the first study to examine the cost-effectiveness of detecting and treating depression early in pregnancy informed by real-world data on screening tool accuracy, and there is flexibility in economic models to update the model parameters as additional data become available. Additionally, the timescale of this evaluation is limited to 3 months post birth and any longer-lasting impacts of screening and treatment of depression are therefore not captured.
Appendix 4 Work package 1(ii): DAWN recruitment chart

Appendix 5 Work package 3(i): perinatal VOICE – expanded methods and results
Psychometric characteristics of questionnaire
The response set over the 27 items of Box 2 was a six-category Likert scale, with response frequencies as shown in Figure 7. Response distributions for several items showed modal values at the bounds of the scale. Except in the generation of simple-item total scores, our analyses have treated the response set as ordinal categories throughout and, therefore, account for these item floor/ceiling effects. Item test–retest reliability was assessed using kappa statistics (quadratic weights) and intraclass correlation for the item total. Item covariance structure was investigated using exploratory factor analysis. The scope for scale abbreviation for estimation of scale and subscale totals was assessed by examination of the item and test information curves, estimated from an ordinal graded response model based on item response theory. 56 Validity of the scale and subscale scores was assessed by their association with the contemporaneous satisfaction scores from the CSQ. All analyses were undertaken in Stata 15, except for the exploratory factor analysis undertaken in Mplus (Muthén & Muthén, Los Angeles, CA, USA).
-
pv_01: Had say
-
pv_02: Not bored
-
pv_03: Therapy met needs
-
pv_04: Medications not talk
-
pv_05: Discussed meds
-
pv_06: Staff interested
-
pv_07: Available to talk
-
pv_08: Partner involved
-
pv_09: Trusted staff
-
pv_10: Felt understood
-
pv_11: Respected
-
pv_12: Social services reassuring
-
pv_13: Family/friend contact easy
-
pv_14: Felt safe
-
pv_15: Suitable for baby
-
pv_16: Food met needs
-
pv_17: Other mum support
-
pv_18: Felt safe
-
pv_19: Bond with baby
-
pv_20: Important with baby
-
pv_21: Able to care my way
-
pv_22: Worried about harming
-
pv_23: Informed baby well
-
pv_24: Baby facilities clean
-
pv_25: Consistent advice
-
pv_26: Staff skilled
-
pv_27: Baby feeding privacy
For examination of dimensional properties, participant response profiles with complete data or with up to six missing items were included in the analyses, the latter under an assumption of missing at random. This included missing responses for items where the response was ‘not applicable’, notably questions about a patient’s caring of her baby when treatment had required their separation.
Test–retest subsample
Kappa agreement statistics for each item obtained from the test–retest subsample are shown in Figure 7. All items except item 24, relating to the cleanliness of the baby-changing facilities (p = 0.105), gave significant agreement. Although all significant, the item relating to worry about harming baby also gave low agreement, and items 20, 23 and 25 gave modest agreement. All other items showed good (> 0.6) agreement. The overall item total over the 27 items gave a test–retest ICC of 0.784 (95% CI 0.643 to 0.924).
Factor analysis
In the light of the non-independence of repeated observations from the women reporting on multiple services, the exploratory factor analysis and item response theory models analysed the 267 first-completion responses (with non-applicable items treated as missing and assumed missing at random). We report the exploratory factor analysis using the goemin non-orthogonal rotation. Eigenvalues and goodness-of-it measures are shown in Table 38 and standardised factor loadings in Table 39.
| Number of factors | Eigenvalues | CFI | TLI | RMSEA |
|---|---|---|---|---|
| 1 | 11.4 | 0.932 | 0.927 | 0.190 |
| 2 | 11.4,3.0 | 0.973 | 0.968 | 0.125 |
| 3 | 11.4,3.0,1.8 | 0.987 | 0.984 | 0.090 |
| 4 | 11.4,3.0,1.8,1.3 | 0.990 | 0.986 | 0.082 |
| Item | One factor | Two factors | Three factors | Four factors | ||||||
|---|---|---|---|---|---|---|---|---|---|---|
| 1 | 2 | 1 | 2 | 3 | 1 | 2 | 3 | 4 | ||
| 1 | 0.665 | 0.606 | 0.145 | 0.583 | 0.158 | 0.066 | 0.551 | –0.055 | –0.030 | 0.245 |
| 2 | 0.732 | 0.662 | 0.167 | 0.620 | 0.024 | 0.448 | 0.774 | 0.538 | 0.064 | 0.042 |
| 3 | 0.699 | 0.684 | 0.094 | 0.646 | –0.053 | 0.430 | 0.794 | 0.514 | –0.011 | 0.026 |
| 4 | –0.497 | –0.574 | 0.052 | –0.584 | 0.000 | 0.147 | –0.564 | 0.119 | 0.005 | 0.061 |
| 5 | 0.645 | 0.701 | –0.014 | 0.692 | –0.009 | 0.041 | 0.645 | –0.082 | –0.198 | 0.225 |
| 6 | 0.866 | 0.856 | 0.061 | 0.839 | 0.096 | –0.004 | 0.891 | 0.063 | 0.112 | –0.070 |
| 7 | 0.838 | 0.858 | 0.017 | 0.843 | 0.050 | –0.006 | 0.903 | 0.077 | 0.089 | –0.104 |
| 8 | 0.711 | 0.625 | 0.183 | 0.612 | 0.235 | –0.060 | 0.620 | –0.066 | 0.177 | 0.031 |
| 9 | 0.887 | 0.916 | –0.007 | 0.902 | 0.034 | –0.031 | 0.898 | –0.042 | –0.053 | 0.058 |
| 10 | 0.898 | 0.925 | –0.007 | 0.911 | 0.015 | 0.013 | 0.920 | 0.010 | –0.068 | 0.065 |
| 11 | 0.861 | 0.937 | –0.077 | 0.939 | –0.019 | –0.135 | 0.955 | –0.049 | 0.008 | –0.123 |
| 12 | 0.076 | 0.154 | –0.078 | 0.134 | –0.138 | 0.204 | 0.198 | 0.255 | –0.121 | 0.016 |
| 13 | 0.394 | 0.185 | 0.299 | 0.175 | 0.383 | –0.162 | 0.107 | –0.286 | 0.268 | 0.115 |
| 14 | 0.615 | 0.382 | 0.358 | 0.348 | 0.375 | 0.096 | 0.276 | –0.160 | 0.091 | 0.406 |
| 15 | 0.667 | 0.065 | 0.730 | 0.016 | 0.761 | 0.107 | 0.063 | 0.021 | 0.606 | 0.229 |
| 16 | 0.530 | 0.373 | 0.257 | 0.338 | 0.269 | 0.101 | 0.356 | 0.031 | 0.167 | 0.150 |
| 17 | 0.441 | 0.172 | 0.360 | 0.126 | 0.277 | 0.348 | 0.088 | 0.059 | –0.057 | 0.543 |
| 18 | 0.549 | 0.086 | 0.581 | 0.098 | 0.671 | –0.286 | 0.047 | –0.365 | 0.607 | 0.023 |
| 19 | 0.763 | 0.028 | 0.866 | –0.003 | 0.905 | 0.027 | 0.032 | –0.073 | 0.734 | 0.227 |
| 20 | 0.409 | –0.228 | 0.707 | –0.208 | 0.749 | –0.167 | –0.062 | 0.053 | 0.911 | –0.294 |
| 21 | 0.660 | –0.076 | 0.822 | –0.089 | 0.878 | –0.092 | –0.010 | –0.045 | 0.828 | 0.014 |
| 22 | –0.084 | 0.003 | –0.109 | –0.031 | –0.173 | 0.274 | –0.128 | 0.011 | –0.412 | 0.432 |
| 23 | 0.574 | 0.282 | 0.414 | 0.250 | 0.461 | 0.017 | 0.080 | –0.430 | 0.091 | 0.538 |
| 24 | 0.643 | –0.030 | 0.773 | –0.080 | 0.838 | 0.015 | –0.054 | –0.079 | 0.683 | 0.211 |
| 25 | 0.948 | 0.014 | 0.967 | 0.045 | 0.611 | 0.661 | 0.032 | 0.162 | 0.049 | 0.915 |
| 26 | 0.946 | –0.056 | 0.991 | –0.028 | 0.618 | 0.691 | –0.044 | 0.169 | 0.051 | 0.933 |
| 27 | 0.696 | 0.070 | 0.735 | 0.013 | 0.763 | 0.150 | 0.107 | 0.162 | 0.652 | 0.172 |
Items 12 and 13 (social services involvement reassuring and family/friend contact easy, respectively) and possibly item 22 (worried about harming baby) were not strongly related to any factor. Although the eigenvalue criterion could be used to justify up to six factors, the step-down in eigenvalues, the comparative fit index and the simple division and spread of items loading on factors 1 and 2 all suggested the two-factor solution as parsimonious. Although closer-fitting models could be achieved with more factors, the adequate fit of the two-factor model, together with the broad consistency of the standardised factor loadings shown in Table 39 with those found for the non-perinatal population from whom this version has been adapted, suggested it for further investigation in addition to the single-factor/questionnaire total score. Face validity interpretation of the loading items suggest that factor 1 was concerned with women’s views about their own treatment, whereas factor 2 was concerned with women’s satisfaction in relation to baby care.
All items as a single dimension: informative items
Consistent with the factor loadings, the item information curves showed items 6, 7, 9, 10 and 11 as dominant, and items 2, 3 and 8 also exceed 1 (Figure 45).
FIGURE 45.
Item information curves for a unidimensional 27-item-graded response model.
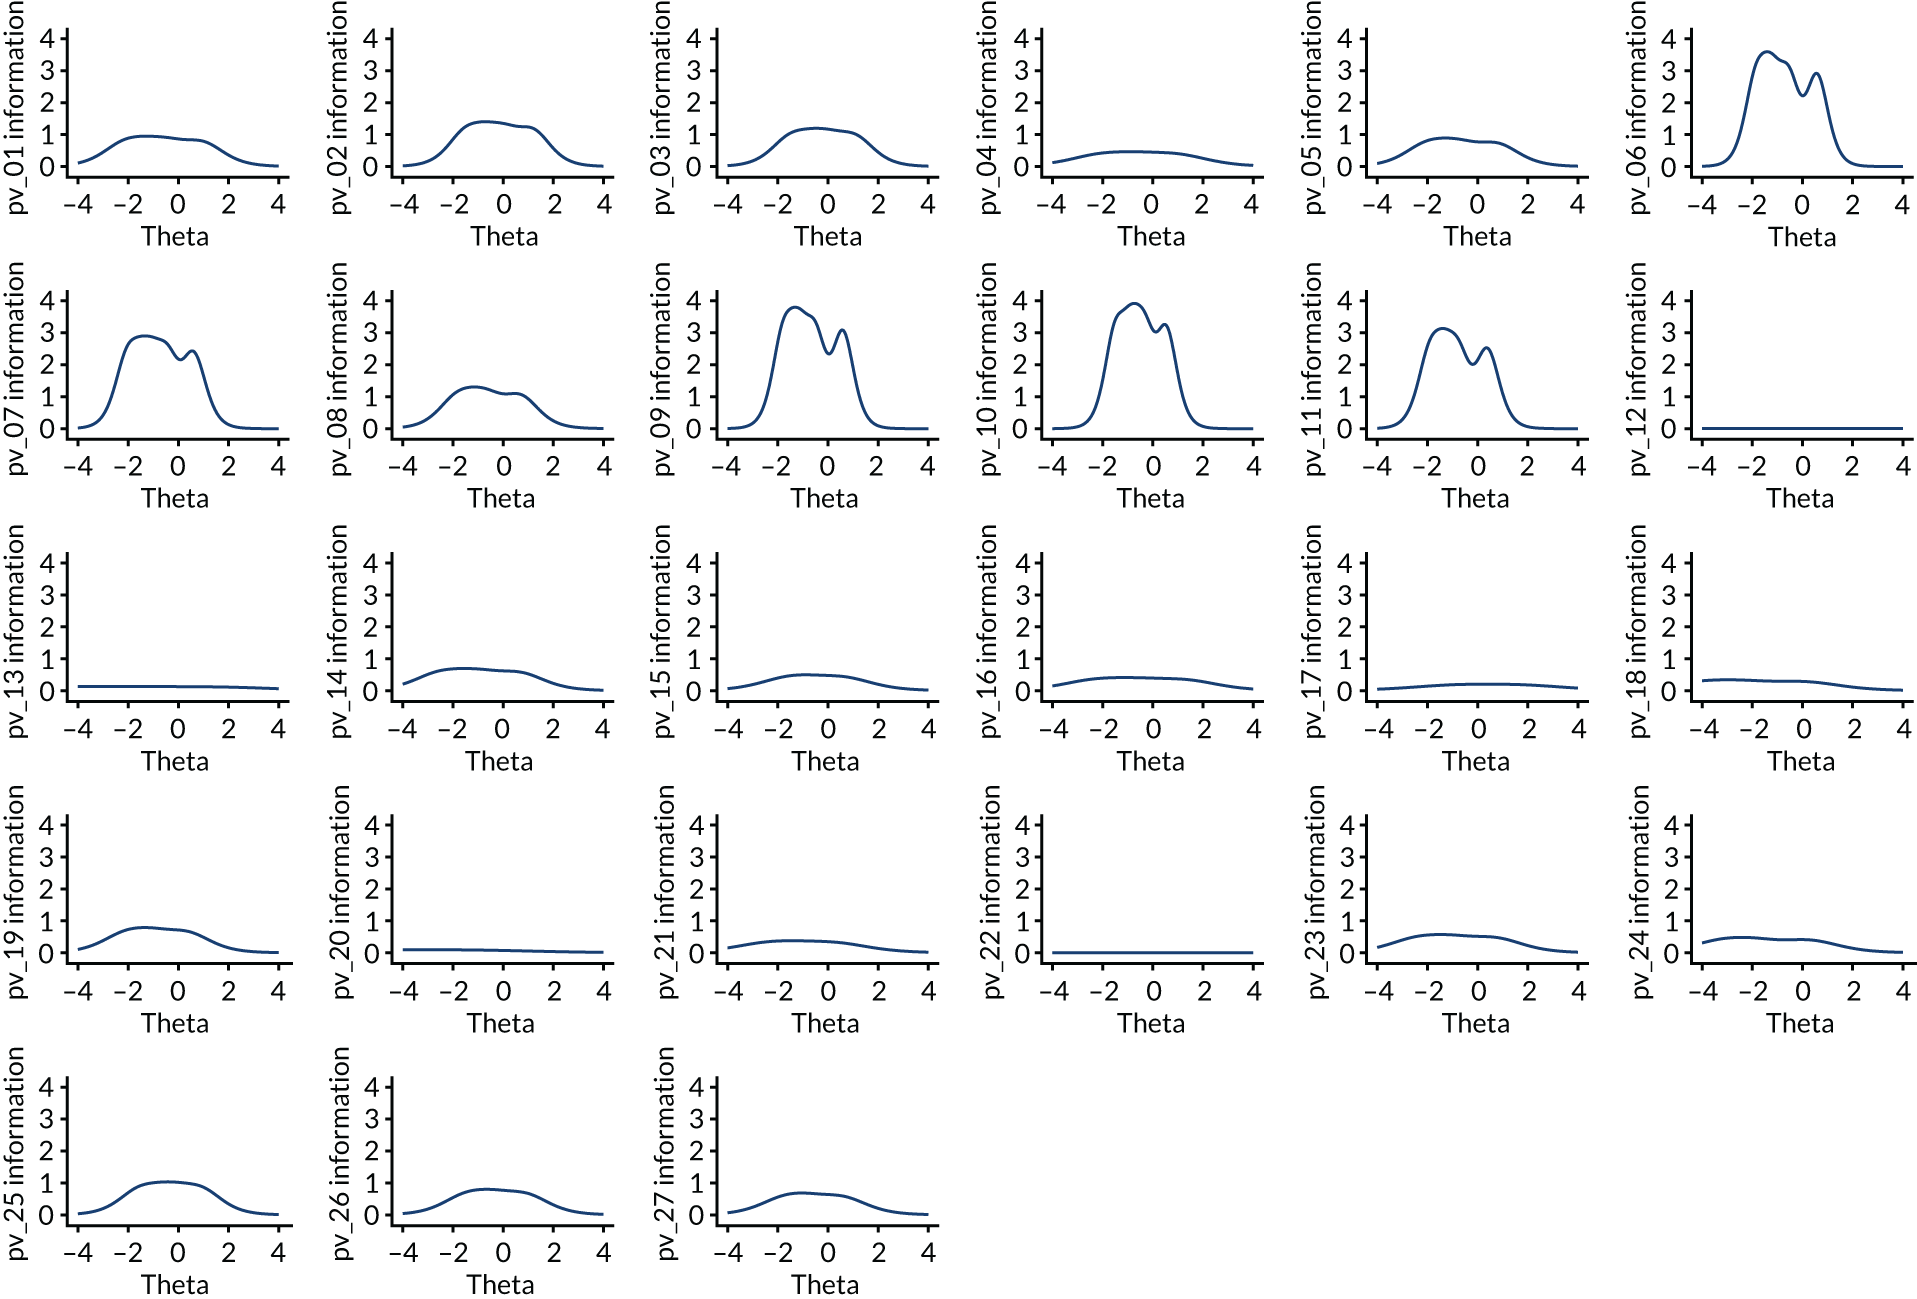
Forming a scale from just these eight items with higher information (i.e. items 2, 3 and 6–11) gave factor scores that correlated (0.96) with those from the full 27 items. However, the test information curves for all 27 items and for the reduced set of eight items nonetheless suggested that the full item set is valuable in achieving additional precision. The relative size of the standard error from the short and long forms is shown in Figure 46, with the standard error of the estimated factor being 20% smaller throughout much of its useful range (–2 to +2) for the full as compared with the short version.
FIGURE 46.
Short form (eight items) and long form (27 items) relative standard errors.
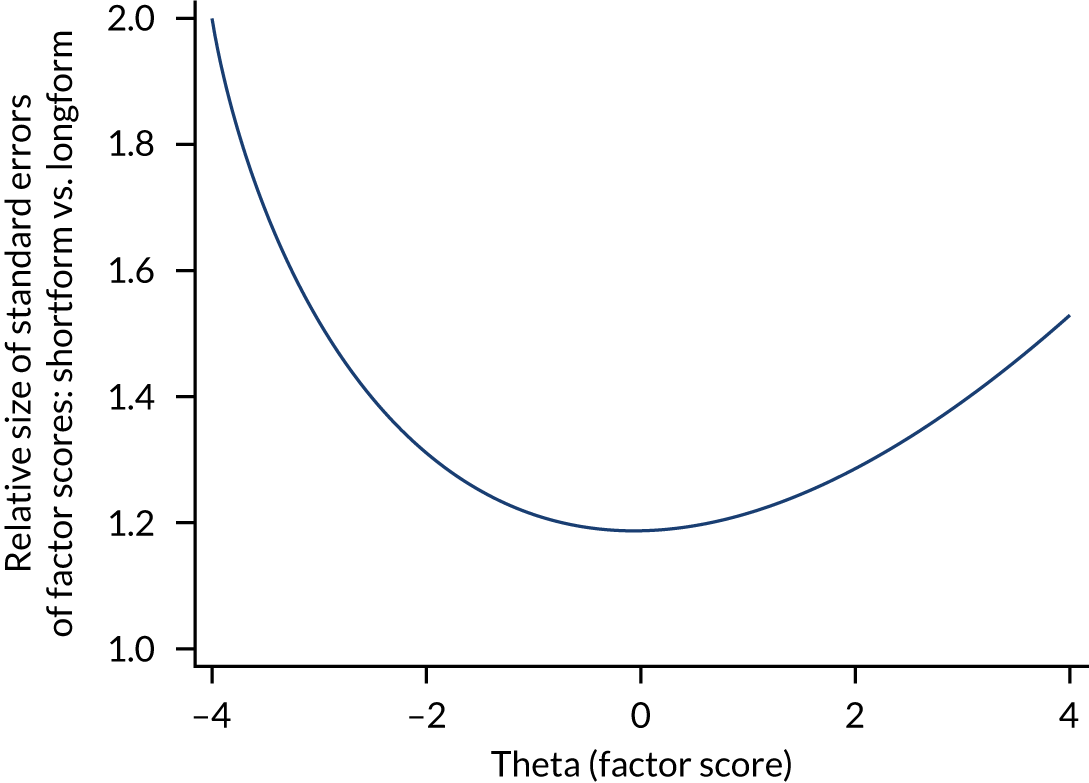
Two-dimensional analysis: informative items
When items are separated by factor, the item information curves for the 11 items loading on factor 1 appear more consistently informative, with only one item (item 4) having an information peak of < 1. Of the 10 items contributing to factor 2, there are three less informative items (items 18, 20 and 23) (Figure 47).
FIGURE 47.
Item information curves. The two factors are positively correlated 0.49 (p < 0.0001). (a) Factor 1; and (b) factor 2.

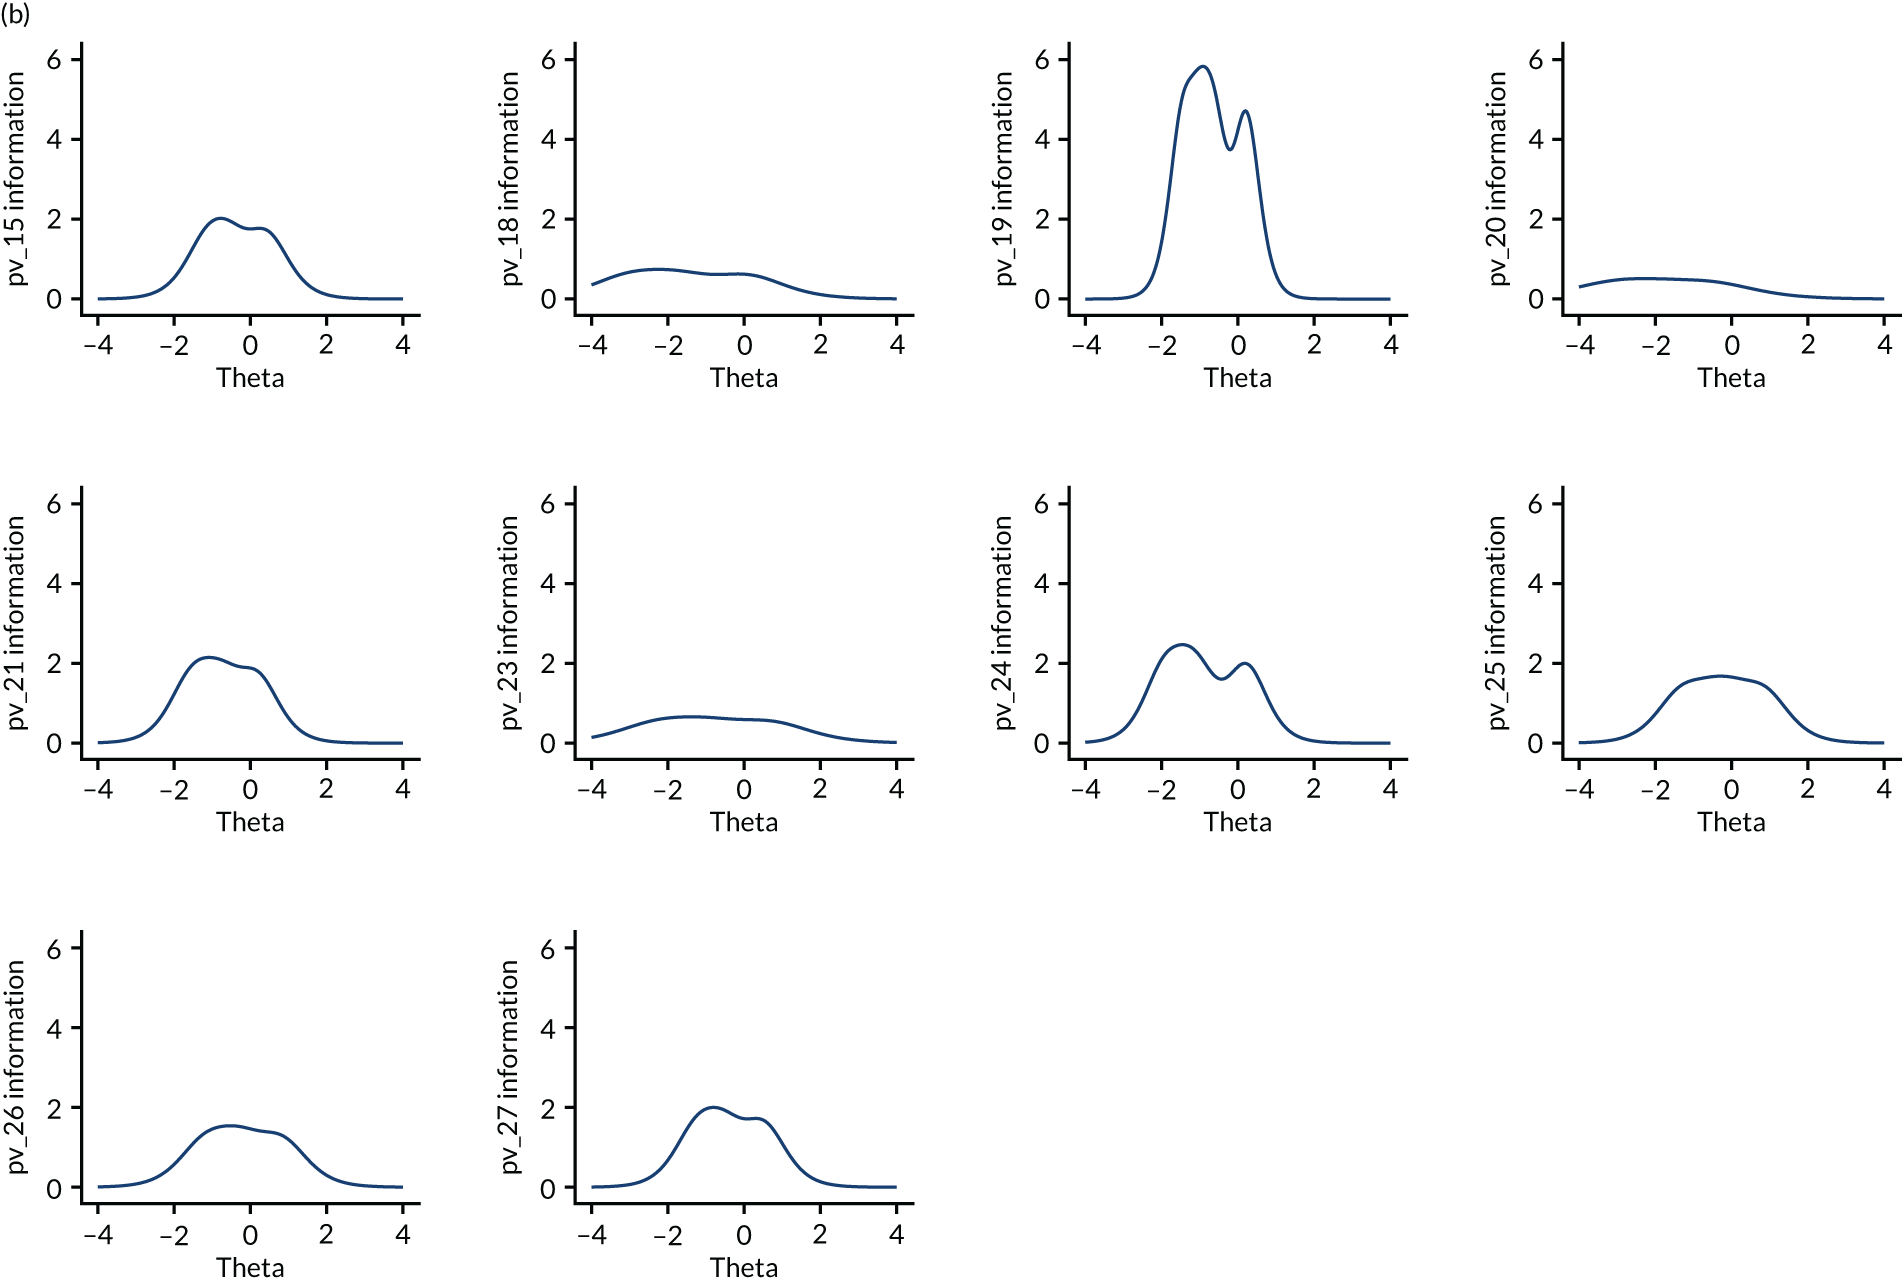
Construct validity
The distribution of factor scores and construct validity were assessed in Figure 9.
Appendix 6 Work package 3(ii): measures used for data collection in the ESMI MBU study
| Measure | Details of measure | Data relating to | ||
|---|---|---|---|---|
| Index admission | 1 month post discharge | 1 year post discharge | ||
| Clinical diagnosis (ICD-10)83 grouped using ICD-10 hierarchy other than acute psychosis not otherwise specified (NOS) (F23), which is included under F31 bipolar affective disorder (because of the underlying affective nature of post-partum psychosis) | Case record data on participants’ clinical diagnosesa | ✗ | ||
| BPRS-E | A 24-item measure that assesses positive, negative and affective symptoms.84 We use case record dataa and modified the scoring criteria so that responses are either ‘present’ or ‘absent’ (1 or 0) | ✗ | ||
| Mental Health Act61 detentions | Mental Health Act61 statusa,b | ✗ | ✗ | |
| TAG | A seven-item scale that assesses the severity of mental health problems and clinical risk,85 modified to include an item on safeguarding risks to children. Scores range from 0 to 28, with lower scores indicating less severe symptoms85 | ✗ | ||
| HoNOS | Clinician-rated scale86 of health and social functioning of people with severe mental illnessa | ✗ | ✗ (planned but rarely available in notes) | |
| Readmissions | Case record data on readmissions to MBUs or generic services in the year post dischargea,b | ✗ | ||
| Drug and alcohol misuse | Case record data on drug and alcohol misusea,c | ✗ | ||
| Safeguarding category of infant | Case record,a social care and self-report datac,d | ✗ | ✗ | ✗ |
| Sociodemographic and clinical factors | Self-reportb,c and case record data,a including age, ethnicity, income, partner status, previous parenting, current psychiatric diagnosis, previous psychiatric and medical history | ✗ | ✗ | ✗ |
| Modified pathways to admission questionnaire | Self-reportc and case record dataa questionnaire of pathways to care46 | ✗ | ||
| AD-SUS | A researcher-administeredc schedule87 that measures individual-level resource use, including service use by the infant and services related to the birth. The schedule records all-cause hospital and community-based health and social care services, plus mental health-related medication use. The AD-SUS was piloted within the PDG | ✗ | ||
| CAN-M(S) | A researcher-administeredc 26-item questionnaire,88 scored on a scale of 1 = ‘met need’, 2 = ‘unmet need’ or 0 = ‘no problem’. The sum of the ‘met need’ and ‘unmet need’ items generate a total score of number of needs | ✗ | ✗ | |
| Modified CAS | A self-reportedc 30-item questionnaire, assessing experiences of partner abuse.89 Items rated from 0 (never) to 5 (daily), with total scores of 0–150. Scores of > 2 indicate partner violence. The scale was modified to collect data covering the periods prior to admission and since discharge | ✗ | ✗ | |
| Modified Social Provisions Scale | A researcher-administeredc 24-item questionnaire that assesses the degree to which an individual’s social relationships provide various dimensions of social support.90 Items are rated on a four-point Likert scale from 1 (strongly disagree) to 4 (strongly agree).90 High scores indicate that the person is receiving that social provision | ✗ | ✗ | |
| SF-36 | A self-reportedc 36-item questionnaire that produces a preference-based single index measure of general health.20 The SF-36 measures health on eight multiitem dimensions21 and can be used to generate SF-6D scores for calculation of QALYs | ✗ | ||
| EQ-5D-5L | A self-reportedb,c preference-based measure of health-related quality of life used to calculate QALYs. Measured on five dimensions, each rated on five levels (no problems, slight problems, moderate problems, severe problems and extreme problems).22 The EQ-5D-5L can be used to calculate QALYs | ✗ | ✗ | |
| Perinatal VOICE questionnaire | A 27-item self-reportc questionnaire (see Work package 3(i): postnatal mental health services for women with acute severe mental disorders – evaluation of a quantitative measure to assess the acceptability and experience of perinatal services for acute severe illnesses from a service user perspective) | ✗ | ||
| CSQ | A self-reportedc questionnaire91 of experiences of health service use. The scale has eight items rated on a four-point scale, with higher scores indicating greater satisfaction | ✗ | ||
| PBQ | A self-reportedc 25-item questionnaire designed to provide an early indication of disorders within mother–infant relationships, through the assessment of a mother’s feelings and attitudes towards her infant.92 Individual items are rated on a six-point scale (from 0 to 5), with higher scores indicating increased difficulties | ✗ | ||
| CTQ | A self-reportedc 28-item questionnaire designed to assess five types of negative childhood experiences, including (1) emotional neglect, (2) emotional abuse, (3) physical neglect, (4) physical abuse and (5) sexual abuse.93 Items are rated on a five-point scale from ‘never true’ (1) to ‘very often true’ (5). Scores range from 5 to 25 | ✗ | ||
| Mother/infant measures | ||||
| Mother–infant interactions | Mother–infant interactions were captured in a 3-minute video clip taken during play at homec and subsequently assessed by a trained rater, unaware of participant service use, using the CARE-Index94 | ✗ | ||
| Bayley Scales of Infant Development | Researcher-administered scalesc of motor, language and cognitive development of infants95 | ✗ | ||
Appendix 7 Work package 3(ii): ESMI MBU – list of participating trusts (in alphabetical order)
-
2gether NHS Foundation Trust (Gloucester, UK).
-
Barnet, Enfield and Haringey Mental Health NHS Trust.
-
Berkshire Healthcare NHS Foundation Trust.
-
Bradford Teaching Hospitals NHS Foundation Trust.
-
Cambridge and Peterborough NHS Foundation Trust.
-
Camden and Islington NHS Foundation Trust.
-
Central and North West London NHS Foundation Trust.
-
Cheshire and Wirral Partnership NHS Foundation Trust.
-
Cumbria, Northumberland, Tyne and Wear NHS Foundation Trust.
-
Devon Partnership NHS Trust.
-
Dorset HealthCare University NHS Foundation Trust.
-
East London NHS Foundation Trust.
-
Greater Manchester Mental Health NHS Foundation Trust.
-
Humber Teaching NHS Foundation Trust.
-
Kent and Medway NHS and Social Care Partnership Trust.
-
Lancashire and South Cumbria NHS Foundation Trust.
-
Leicestershire Partnership NHS Trust.
-
Lincolnshire Partnership NHS Foundation Trust.
-
Livewell Southwest (Plymouth, UK).
-
Mersey Care NHS Foundation Trust.
-
Norfolk and Suffolk NHS Foundation Trust.
-
North East London NHS Foundation Trust.
-
Essex Partnership University NHS Foundation Trust.
-
North Staffordshire Combined Healthcare NHS Trust.
-
North West Boroughs Healthcare NHS Foundation Trust.
-
Northamptonshire Healthcare NHS Foundation Trust.
-
Oxford Health NHS Foundation Trust.
-
Oxleas NHS Foundation Trust.
-
Pennine Care NHS Foundation Trust.
-
Rotherham Doncaster and South Humber NHS Foundation Trust.
-
Sheffield Health and Social Care NHS Foundation Trust.
-
Solent NHS Trust.
-
Somerset Partnership NHS Foundation Trust.
-
South London and Maudsley NHS Foundation Trust.
-
South West London and St George’s Mental Health NHS Trust.
-
Surrey and Borders Partnership NHS Foundation Trust.
-
Sussex Partnership NHS Foundation Trust.
-
Tees, Eesk and Wear Valley NHS Foundation Trust.
-
Swansea Bay University Health Board.
-
Aneurin Bevan University Health Board.
-
Cardiff and Vale University Health Board.
-
West London NHS Trust.
Appendix 8 Work package 3(ii): ESMI MBU geographical methods
Geographical methods
For each study participant, the driving distance from their home to the nearest MBU (i.e. all MBUs open in England and Wales at the time of recruitment) was determined. This calculation was conducted in two steps: (1) the as-the-crow-flies distance, using the haversine formula (see below) and (2) the driving distance (as per as-the-crow-flies distance).
This involved the following:
-
The geolocation (latitude, longitude) was determined for each participant’s residence and each MBU using UK Postcode Geo data for the outward codes. 96
-
The ‘as-the-crow-flies’ distance in miles for each participant and each MBU was determined using Haversine formula, which is used to generate the distance between two points on a sphere based on their latitude and longitude):(1)Distance=ACOS(COS(RADIANS(90 – Lat1))×COS(RADIANS(90–Lat2))+SIN(RADIANS(90 – Lat1))×SIN(RADIANS(90–Lat2))×COS(RADIANS(Long1–Long2)))×6371.
-
For each participant, the shortest distance (i.e. ‘as the crow flies’) and corresponding MBU was subsequently identified by determining the minimum distance across MBUs per subject.
The driving distance was manually calculated for the MBU closest to each participant’s home residence. 96
Appendix 9 Work package 3(ii): ESMI MBU propensity score variables and post-estimation testing
Explored blind to service, the final step in the analysis, using the teffects command, estimated propensity scores jointly with the treatment effect of interest. Post-estimation commands were used to perform diagnostic checks. One assumption of this analysis was that each individual has a positive probability of receiving each treatment level (the overlap assumption). After exclusions through a region of support restriction, this assumption was not violated and can be seen in Figure 48. The balance of covariates over treatment groups was also checked using the ‘teffects summarise’ command. The table of results indicates that the propensity score balanced the covariates, as the weighted standardised differences were all close to zero and the weighted variance ratios were all close to 1. A test was also performed to check for covariate balance after estimation by a teffects inverse probability-weighted estimator and gave a very high p-value of 0.9942, which suggests that we cannot reject the null hypothesis that the inverse probability-weighted model balanced the covariates (Table 40).
FIGURE 48.
Overlap in distributions of propensity scores by service.
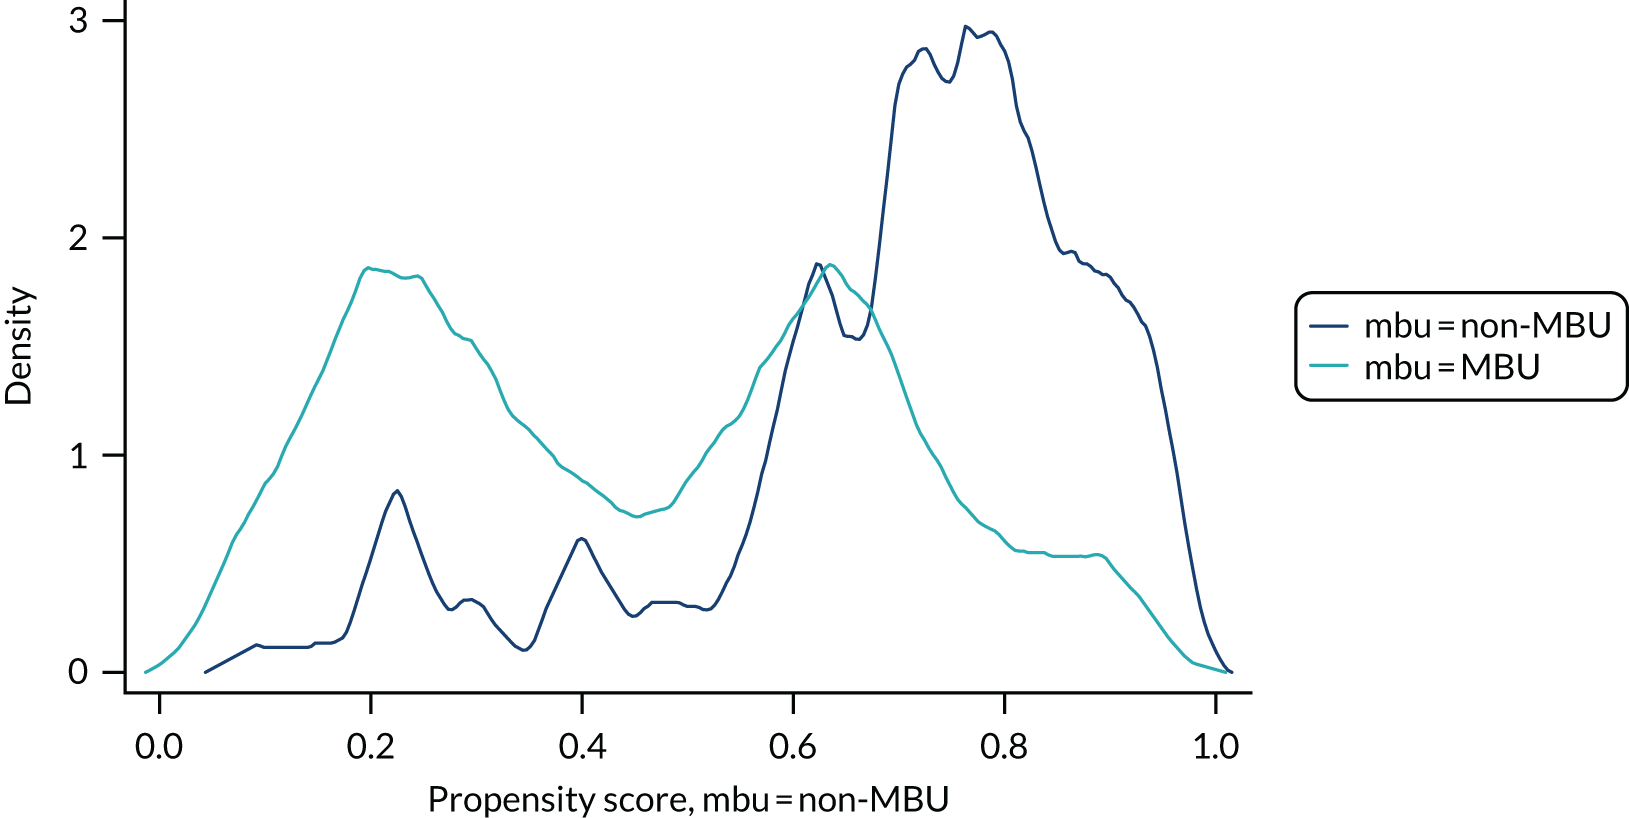
| Variable | Type | Missingness, n/N |
|---|---|---|
| Axis 1 diagnosis: schizophrenia and related disorders (ICD-10 F20–29) excluding acute psychotic episode, as in the post-partum period these are likely to represent affective psychosis | Binary yes/no | 278/279 |
| Personality disorder | Binary yes/no | 278/279 |
| Self-harm in the 2 weeks before admission | Binary yes/no | 272/279 |
| Previous admissions in last 2 years | Binary yes/no | 279/279 |
| Age at onset (i.e. contact with services) before age 18 years | Binary yes/no | 270/279 |
| Psychotic symptoms (composite variable of psychosis on BPRS (i.e. hallucinations item 10) or HoNOS (hallucinations and/or delusions item 6) or CAN-M item 9 all at t0 | Binary yes/no | 278/279 |
| Substance misuse (composite variable of CAN-M substance misuse unmet need or ICD-10 code or HoNOS substance misuse domain or yes to substance misuse within drug history form) | Binary yes/no | 279/279 |
| Smoking | Binary yes/no | 261/279 |
| Chronic physical health conditions | Binary yes/no | 279/279 |
| Detention under Mental Health Act61 | Binary yes/no | 279/279 |
| Childhood trauma (CTQ): yes or no for any domain for moderate to severe abuse/neglect | Binary yes/no | 271/279 |
| Intimate partner violence (total score on CAS of > 3) | Binary yes/no | 249/279 |
| Adopted/fostered as a childa | Binary yes/no | 233/279 |
| Living alone | Binary yes/no | 279/279 |
| Partner at admission | Binary yes/no | 278/279 |
| Age | Continuous | 279/279 |
| Ethnicity | Categorical | 279/279 |
| Insecure immigration status | Binary yes/no | 277/279 |
| English not the primary language | Binary yes/no | 279/279 |
| Highest qualification | Categorical | 279/279 |
| Learning disability or difficulty reading one’s own language | Binary yes/no | 278/279 |
| Number of children | Continuous (range 1–7) | 279/279 |
| Age of index child at index admission | Categorical | 277/279 |
Appendix 10 Work package 3(ii): ESMI MBU recruitment chart
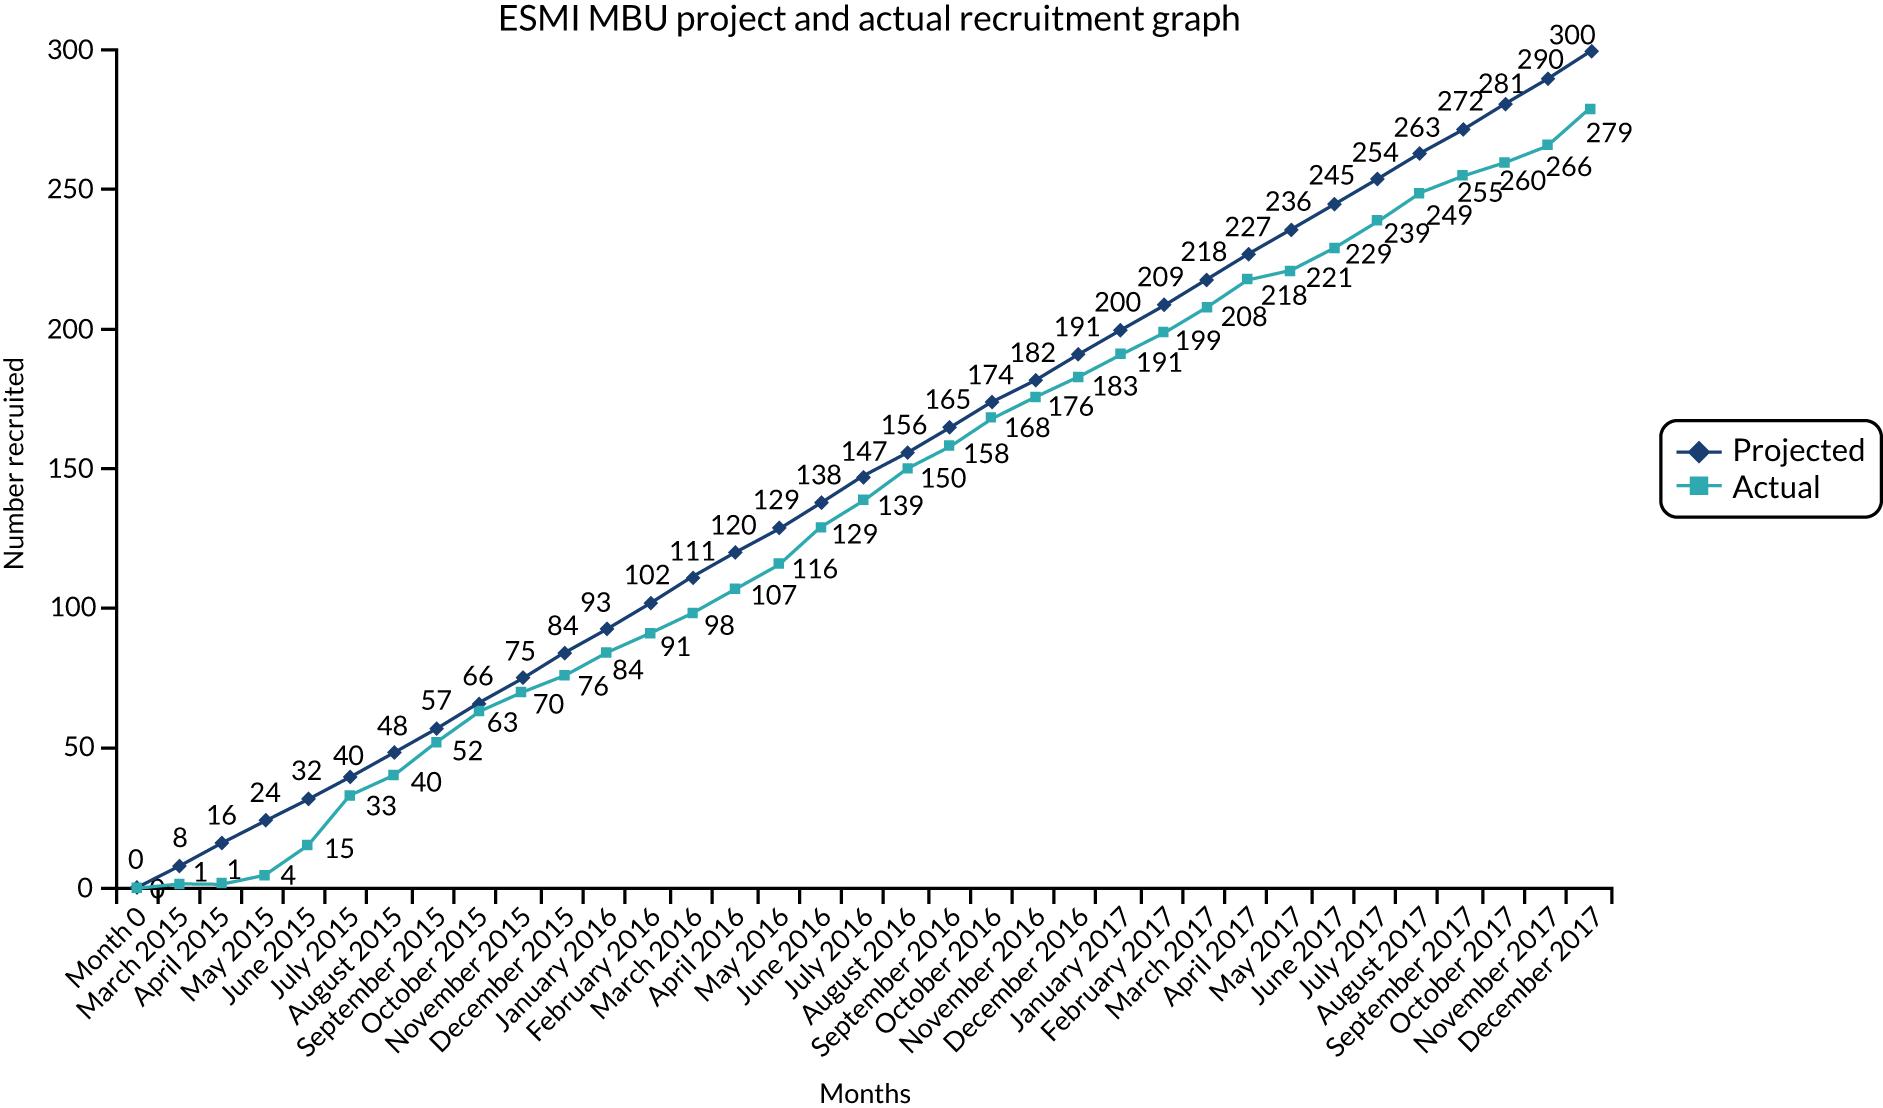
Appendix 11 Work package 3(ii): threshold assessment grid severity ratings
| TAG domain | Service, n (%) | Total (N = 278), n (%) | ||
|---|---|---|---|---|
| CRT | Ward | MBU | ||
| Domain 1: intentional self-harm | ||||
| 0: none rating – no concerns about risk of deliberate self-harm or suicide concept | 23 (21.3) | 17 (27.4) | 33 (30.6) | 73 (26.3) |
| 1: mild rating – minor concerns about risk of deliberate self-harm or suicide attempt | 34 (31.5) | 13 (21.0) | 21 (19.4) | 68 (24.5) |
| 2: moderate rating – definite indicators of risk of deliberate self-harm or suicide attempt | 29 (26.9) | 13 (21.0) | 25 (23.1) | 67 (24.1) |
| 3: severe rating – high risk to physical safety as a result of deliberate self-harm or suicide attempt | 9 (8.3) | 5 (8.1) | 13 (12.0) | 27 (9.7) |
| 4: very severe rating – immediate risk to physical safety as a result of deliberate self-harm or suicide attempt | 13 (12.0) | 14 (22.6) | 16 (14.8) | 43 (15.5) |
| Domain 2: unintentional self-harm | ||||
| 0: none rating – no concerns about unintentional risk to physical safety | 15 (13.9) | 5 (8.1) | 12 (11.1) | 32 (11.5) |
| 1: mild rating – minor concerns about unintentional risk to physical safety | 68 (63.0) | 25 (40.3) | 54 (50.0) | 147 (52.9) |
| 2: moderate rating – definite indicators of unintentional risk to physical safety | 22 (20.4) | 20 (32.3) | 32 (29.6) | 74 (26.6) |
| 3: severe rating – high risk to physical safety as a result of self-neglect, unsafe behaviour or inability to maintain a safe environment | 3 (2.8) | 12 (19.4) | 10 (9.3) | 25 (9.0) |
| Domain 3: risk from others | ||||
| 0: none rating – no concerns about risk of abuse or exploitation from other individuals or society | 68 (63.0) | 29 (46.8) | 58 (53.7) | 155 (55.8) |
| 1: mild rating – minor concerns about risk of abuse or exploitation from other individuals or society | 18 (16.7) | 17 (27.4) | 27 (25.0) | 62 (22.3) |
| 2: moderate rating – definite risk of abuse or exploitation from other individuals or society | 11 (10.2) | 4 (6.5) | 12 (11.1) | 27 (9.7) |
| 3: severe rating – positive evidence of abuse or exploitation from other individuals or society | 11 (10.2) | 12 (19.4) | 11 (10.2) | 34 (12.2) |
| Domain 4: risk to others | ||||
| 0: none rating – no concerns about risk to physical safety or property of others | 84 (77.8) | 31 (50.0) | 59 (54.6) | 174 (62.6) |
| 1: mild rating – antisocial behaviour | 15 (13.9) | 17 (27.4) | 16 (14.8) | 48 (17.3) |
| 2: moderate rating – risk to property and/or minor risk to physical safety to others | 7 (6.5) | 8 (12.9) | 15 (13.9) | 30 (10.8) |
| 3: severe rating – high risk to physical safety of others as a result of dangerous behaviour | 2 (1.9) | 5 (8.1) | 16 (14.8) | 23 (8.3) |
| 4: very severe rating – immediate risk to physical safety of others as a result of dangerous behaviour | 0 (0.0) | 1 (1.6) | 2 (1.9) | 3 (1.1) |
| Domain 5: risk to child(ren) | ||||
| 0: none rating – no concerns about risk to physical or emotional safety of child | 1 (0.9) | 0 (0.0) | 0 (0.0) | 1 (0.4) |
| 1: mild rating – minor concerns about unintentional risk to physical or emotional safety of child | 42 (38.9) | 17 (27.4) | 34 (31.5) | 93 (33.5) |
| 2: moderate rating – indicators of risk to physical or emotional safety of child | 38 (35.2) | 20 (32.3) | 38 (35.2) | 96 (34.5) |
| 3: severe rating – positive evidence of physical or emotional harm | 21 (19.4) | 5 (8.1) | 29 (26.9) | 55 (19.8) |
| 4: very severe rating – evidence of severe physical or emotional harm | 6 (5.6) | 20 (32.3) | 7 (6.5) | 33 (11.9) |
| Domain 6: survival | ||||
| 0: none rating – no concerns about basic amenities, resources or living skills | 74 (68.5) | 32 (51.6) | 71 (65.7) | 177 (63.7) |
| 1: mild rating – minor concerns about basic amenities, resources or living skills | 16 (14.8) | 12 (19.4) | 18 (16.7) | 46 (16.5) |
| 2: moderate rating – marked lack of basic amenities, resources or living skills | 9 (8.3) | 6 (9.7) | 15 (13.9) | 30 (10.8) |
| 3: severe rating – serious lack of basic amenities, resources or living skills | 8 (7.4) | 9 (14.5) | 3 (2.8) | 20 (7.2) |
| 4: very severe rating – life-threatening lack of basic amenities, resources or living skills | 1 (0.9) | 3 (4.8) | 1 (0.9) | 5 (1.8) |
| Domain 7: psychological | ||||
| 2: moderate rating – disabling or distressing problems with thinking | 82 (75.9) | 19 (30.6) | 45 (41.7) | 146 (52.5) |
| 3: severe rating – very disabling or distressing problems with thinking, feeling or behaviour | 26 (24.1) | 43 (69.4) | 63 (58.3) | 132 (47.5) |
| Domain 8: social | ||||
| 0: none rating – no disabling problems with activities or in relationships with other people | 31 (28.7) | 1 (1.6) | 1 (0.9) | 33 (11.9) |
| 1: mild rating – minor disabling problems with activities or in relationships with other people | 30 (27.8) | 17 (27.4) | 47 (43.5) | 94 (33.8) |
| 2: moderate rating – disabling problems with activities or in relationships with other people | 42 (38.9) | 31 (50.0) | 51 (47.2) | 124 (44.6) |
| 3: severe rating – very disabling problems with activities or in relationships with other people | 5 (4.6) | 13 (21.0) | 9 (8.3) | 27 (9.7) |
Appendix 12 Work package 3(ii): ESMI MBU sensitivity analyses
Sensitivity analyses
Sensitivity analyses were performed on alternative cohort definitions. Women who used both MBU and acute wards were redefined using the following definitions:
-
majority number of days
-
first service accessed.
Forty-five women were admitted to both a MBU and a ward during their index admission and were categorised as belonging to the MBU cohort (i.e. according to their highest level of care), of whom 20 used only MBU and ward services and 25 used all three services. CRT will remain under the definition of lowest level of care, and so this cohort includes only those women who used only CRT services.
Twelve of the 45 women who were admitted to both a MBU and a ward during the index admission spent more time in a ward. Four of these women were admitted to an ICU during their index admission period. Thirty-three women who were admitted to both a MBU and a ward during the index admission accessed a ward first. Seven women changed cohort service in both alternative definitions. These seven women spent more time in a ward and accessed the ward first, and two of these women were admitted to an ICU. One woman who attended a ward first but spent the majority of days in a MBU was admitted to an ICU.
Primary analysis using majority of days spent
The primary analysis was re-run using the definition of MBU as those who spent the majority of their days in service at a MBU (Table 41). The readmission rates at 12 months post discharge are presented in Table 42 by the new definition of MBU. These are very similar to those rates split by the MBU status defined by highest level of care.
| Service | Highest level of care (n) | Majority of days spent (n) | First service accessed (n) |
|---|---|---|---|
| MBU | 108 | 96 | 75 |
| Ward | 62 | 74 | 95 |
| CRT | 109 | 109 | 109 |
| Total | 279 | 279 | 279 |
| Group (N = 278) | Readmission rate at 12 months (%) |
|---|---|
| MBU (n = 96) | 21.9 |
| Non-MBU service (n = 182) | 25.3 |
The analysis was run using the same methods as the primary analysis (Table 43). Single imputation was performed, propensity scores were generated blind to the outcome and predictors were obtained excluding those out of the region of common support. Predictors in this case were personality disorder and ethnicity (other) only. These were adjusted for in addition to any covariates that visually had the potential to be imbalanced after propensity score adjustment (cas_binary).
| Analysis model | OR (95% CI) | p-value |
|---|---|---|
| MBUs vs. non-MBU services | 0.97 (0.88 to 1.06) | 0.49 |
Primary analysis using first service accessed
The primary analysis was re-run using the definition of MBU as those who accessed a MBU first out of their time in all services during the admission period. The readmission rates at 12 months post discharge are presented in Table 44 by the new definition of MBU. These are very similar to those rates split by the MBU status defined by highest level of care.
| Group (N = 278) | Readmission rate at 12 months (%) |
|---|---|
| MBU (n = 75) | 22.7 |
| Non-MBU service (n = 203) | 24.6 |
The analysis was run using the same methods as the primary analysis (Table 45). Single imputation was performed, propensity scores were formed blind to the outcome and predictors were obtained excluding those out of the region of common support. Predictors in this case were personality disorder, ethnicity (other), level of qualification and age of child at admission, which were adjusted for. There were no covariates that visually had the potential to be imbalanced after propensity score adjustment.
| Analysis model | OR (95% CI) | p-value |
|---|---|---|
| MBUs vs. non-MBU services | 0.99 (0.88 to 1.10) | 0.81 |
Other
Women outside region of common support
Fifteen women were excluded from the primary analysis because they were outside the region of common support (i.e. their propensity score was either so high or so low that there were not enough similar women receiving the alternative treatment to make a comparison). Of the 15 women, 13 had a low propensity score (i.e. a low probability of attending a MBU) and two had a very high propensity score.
Table 46 provides a baseline description for variables of interest, comparing women who were included in the analysis with women who were excluded from the analysis because of a very low propensity score. These data show that most women had suffered a previous episode of a psychiatric disorder, had first been admitted when they were younger than 18 years and had not been admitted in the previous 2 years. These women had a high probability of substance misuse, most had other physical health complications and all the women were admitted when their baby was more than 100 days old.
| Variable | Number of participants (%) | ||
|---|---|---|---|
| Included | Excluded | Total | |
| Any previous admissions in last 2 years (N = 277) | |||
| No | 217 (82.5) | 12 (92.3) | 230 (83.0) |
| Yes | 46 (17.5) | 1 (7.7) | 47 (17.0) |
| First episode of psychiatric disorder (N = 276) | |||
| No | 182 (69.5) | 11 (84.6) | 194 (70.3) |
| Yes | 80 (30.5) | 2 (15.4) | 82 (29.7) |
| Age at first contact with mental health services < 18 years (N = 268) | |||
| No | 208 (81.9) | 6 (46.2) | 215 (80.2) |
| Yes | 46 (18.1) | 7 (53.8) | 53 (19.8) |
| Placed under section during admissions (N = 277) | |||
| No | 185 (70.3) | 13 (100.0) | 199 (71.8) |
| Yes | 78 (29.7) | 0 (0.0) | 78 (28.2) |
| Smoked at point of admission (N = 268) | |||
| No | 190 (74.8) | 8 (61.5) | 199 (74.3) |
| Yes | 64 (25.2) | 5 (38.5) | 69 (25.7) |
| Substance misuse (N = 277) | |||
| No | 243 (92.4) | 3 (23.1) | 247 (89.2) |
| Yes | 20 (7.6) | 10 (76.9) | 30 (10.8) |
| Any chronic physical health conditions (N = 277) | |||
| No | 138 (52.5) | 2 (15.4) | 141 (50.9) |
| Yes | 125 (47.5) | 11 (84.6) | 136 (49.1) |
| Primary clinical diagnosis at admission (N = 276) | |||
| Depression and other unipolar mood disorders (ICD-10 codes F32–34, F38 and F39) | 103 (39.2) | 6 (46.2) | 109 (39.5) |
| Bipolar disorder (ICD-10 codes F30 and F31), including acute psychosis (due to psychopathology of puerperal psychosis) | 71 (27.0) | 1 (7.7) | 72 (26.1) |
| Schizophrenia and related disorders (ICD-10 codes F20–29, excluding acute psychotic episode) | 16 (6.1) | 1 (7.7) | 17 (6.2) |
| Anxiety disorders (ICD-10 codes F40 and F41) | 36 (13.7) | 3 (23.1) | 39 (14.1) |
| Eating disorders (ICD-10 code F50) | 1 (0.4) | 0 (0.0) | 1 (0.4) |
| Severe mental and behavioural disorders associated with the puerperium (ICD-10 code F53) | 14 (5.3) | 0 (0.0) | 14 (5.1) |
| Mental and behavioural disorder due to multiple/psychoactive drug use/cannabis/tobacco use (ICD-10 codes F10–19) | 1 (0.4) | 0 (0.0) | 1 (0.4) |
| Personality and behaviour disorders (ICD-10 codes F60–69) | 18 (6.8) | 2 (15.4) | 20 (7.2) |
| No diagnosis given | 3 (1.1) | 0 (0.0) | 3 (1.1) |
| Age of child at date of first admission (N = 275) | |||
| Admission before birth | 10 (3.8) | 0 (0.0) | 10 (3.6) |
| 0–100 days | 170 (64.9) | 1 (7.7) | 171 (62.2) |
| > 100 days | 82 (31.3) | 12 (92.3) | 94 (34.2) |
| CAS total score > 3 (N = 247) | |||
| No | 166 (70.6) | 6 (54.5) | 173 (70.0) |
| Yes | 69 (29.4) | 5 (45.5) | 74 (30.0) |
Appendix 13 Work package 3(ii): ESMI MBU economic evaluation methods – the cost-effectiveness of psychiatric mother and baby units compared with acute general wards and crisis resolution teams
Aims
Economic evaluation aimed to assess the cost-effectiveness of MBUs compared with generic acute wards and CRTs for the treatment of women with severe mental illness following birth within a quasi-experimental cohort study. The research questions were as follows:
-
Are MBUs cost-effective in the short term (from index admission to 1 month post discharge) in the treatment of women with severe mental illness following birth compared with generic acute wards and CRTs?
-
Are MBUs associated with a reduction in (1) readmission rates, (2) use of community mental health services and (3) costs in the year following discharge compared with generic acute wards and CRTs?
The planned comparisons were two two-way comparisons (MBUs vs. generic acute wards and MBUs vs. CRT services) plus a three-way comparison. However, owing to small sample sizes, comparison of MBUs with both other groups combined were conducted in line with clinical analyses.
Methods
Target population and setting
The target population was women with severe mental illness after giving birth in England.
Perspective
The economic evaluation at 1 month post discharge took the NHS/Personal Social Services perspective preferred by NICE. 28 Data relating to 1 year post discharge took a narrower mental health service perspective, as data were restricted to those available via mental health clinical records.
Data collection
An adapted version of the AD-SUS was used to measure individual-level resource use at 1 month post discharge. The AD-SUS was developed in previous research (e.g. Howard et al. 46,97 and Crawford et al. 87) for use with people with mental health problems and adapted for the purpose of this study to include service use by the infant and services related to the birth. The AD-SUS was adapted and piloted in the relevant population as part of the ESMI NIHR PDG. 97
The AD-SUS was administered in face-to-face interviews with participants and covered the period from the date of initial index admission to the 1-month post-discharge interview. It included all-cause hospital and community-based health and social care services for the woman and/or her index baby. This included accommodation provided by the NHS or local authorities, services for looked-after children (e.g. fostering, adoption, formal kinship, etc.), inpatient stays, outpatient appointments, day patient contacts, accident and emergency contacts and community health and social care contacts, plus mental health-related medication use.
As the index admission/acute care in this study was the intervention, and as the development work indicated that this can be difficult for women to recall, data on the index admission to the 1-month post-discharge interview were taken from clinical notes.
Resource use data for the period from the date of discharge from the index admission to 1 year post discharge were collated using a proforma created by the research team and collected from secondary mental health records. This included all contacts with secondary mental health services, including further periods in MBUs, generic acute wards or CRTs, plus any outpatient or community mental health contacts. A briefer version of the proforma was used to collect data on the use of key acute services (i.e. MBUs, generic acute wards or CRTs) in the 2-year period prior to the index admission.
Costs
All costs are reported in GBP at 2015/16 prices. Discounting was not relevant, as the follow-up did not exceed 12 months. Unit costs were applied to individual-level resource use data to calculate total costs per participant. In summary, the unit costs for most health and social care services were obtained from the NHS reference costs62 and unit costs of health and social care. 63 Full details are provided in Table 47.
| Resource | Unit | Cost (£) | Source | Notes |
|---|---|---|---|---|
| Birth-related costs | ||||
| Maternal assessment unit | Per day | 241 | NHS Reference Costs 2015 to 2016 62 | Day cases tab: antenatal routine observation (currency code NZ16Z) |
| Per night | 1054 | NHS Reference Costs 2015 to 2016 62 | Non-elective long stay tab: antenatal routine observation (currency code NZ16Z) | |
| Birth | ||||
| Normal delivery | ||||
| Hospital delivery, normal delivery | Per event | 2476 | NHS Reference Costs 2015 to 2016 62 | Non-elective long stay tab: normal delivery with a CC score of 0 (currency code NZ30C) |
| Hospital delivery, normal delivery, with epidural or induction | Per event | 2742 | NHS Reference Costs 2015 to 2016 62 | Non-elective long stay tab: normal delivery, with epidural or induction, with a CC score of 0 (currency code NZ31C) |
| Hospital delivery, normal delivery, with epidural and induction | Per event | 3093 | NHS Reference Costs 2015 to 2016 62 | Non-elective long stay tab: normal delivery, with epidural and induction, or with post-partum surgical intervention, with a CC score of 0 (currency code NZ32C) |
| Assisted delivery | ||||
| Hospital delivery, assisted delivery | Per event | 2777 | NHS Reference Costs 2015 to 2016 62 | Non-elective long stay tab: assisted delivery with a CC score of 0 (currency code NZ40C) |
| Hospital delivery, assisted delivery, with epidural or induction | Per event | 3131 | NHS Reference Costs 2015 to 2016 62 | Non-elective long stay tab: assisted delivery, with epidural or induction, with a CC score of 0 (currency code NZ41C) |
| Hospital delivery, assisted delivery, with epidural and induction | Per event | 3475 | NHS Reference Costs 2015 to 2016 62 | Non-elective long stay tab: assisted delivery, with epidural and induction, or with post-partum surgical intervention, with a CC score of 0 (currency code NZ42C) |
| Caesarean | ||||
| Hospital delivery, elective caesarean section | Per event | 3370 | NHS Reference Costs 2015 to 2016 62 | Non-elective long stay tab: planned caesarean section with a CC score of 0 or 1 (currency code NZ50C) |
| Hospital delivery, emergency caesarean section | Per event | 4244 | NHS Reference Costs 2015 to 2016 62 | Non-elective long stay tab: emergency caesarean section with a CC score of 0 or 1 (currency code NZ51C) |
| Home delivery | ||||
| Home delivery, normal delivery | Per event | 1514 | NHS Reference Costs 2015 to 2016 62 | Community health services tab: normal delivery with a CC score of 0 (currency code NZ30C) |
| Home delivery with transfer to hospital | ||||
| Home delivery, normal delivery plus transfer to hospital | Per event | 4226 | NHS Reference Costs 2015 to 2016 62 | Community health services tab: normal delivery with a CC score of 0 (currency code NZ30C) plus ambulance transfer – ambulance tab, see and treat and convey (currency code ASS02) plus hospital normal delivery, see above |
| Home delivery, normal delivery, with epidural or induction plus transfer to hospital | Per event | 4492 | NHS Reference Costs 2015 to 2016 62 | Community health services tab: normal delivery with a CC score of 0 (currency code NZ30C) plus ambulance transfer – ambulance tab, see and treat and convey (currency code ASS02) plus hospital normal delivery with epidural or induction, see above |
| Home delivery, normal delivery, with epidural and induction plus transfer to hospital | Per event | 4843 | NHS Reference Costs 2015 to 2016 62 | Community health services tab: normal delivery with a CC score of 0 (currency code NZ30C) plus ambulance transfer – ambulance tab, see and treat and convey (currency code ASS02) plus hospital normal delivery with epidural and induction, see above |
| Home delivery, assisted delivery plus transfer to hospital | Per event | 4527 | NHS Reference Costs 2015 to 2016 62 | Community health services tab: normal delivery with a CC score of 0 (currency code NZ30C) plus ambulance transfer – ambulance tab, see and treat and convey (currency code ASS02) plus hospital assisted delivery, see above |
| Post birth | ||||
| Maternity ward/postnatal ward (mother only) | Per night | 0 | NHS Reference Costs 2015 to 2016 62 | Non-elective long stay tab: post-natal disorders with a CC score of 0–1 (currency code NZ26B) |
| Maternity ward/postnatal ward (mother and baby) | Per night | 0 | NHS Reference Costs 2015 to 2016 62 | Non-elective long stay tab: post-natal disorders with a CC score of 0–1 (currency code NZ26B) |
| High-dependency unit: labour ward (mother) | Per night | 759 | NHS Reference Costs 2015 to 2016 62 | Critical care tab: non-specific, general adult critical care patients predominate, adult critical care, 0 organs supported (currency code XC07Z) |
| Intensive care: general hospital ward (mother) | Per night | 759 | NHS Reference Costs 2015 to 2016 62 | Critical care tab: non-specific, general adult critical care patients predominate, adult critical care, 0 organs supported (currency code XC07Z) |
| Neonatal special care: intensive treatment unit | Per night | 1218 | NHS Reference Costs 2015 to 2016 62 | Critical care tab: neonatal critical care, intensive care (currency code XA01Z) |
| Neonatal special care: high dependency | Per night | 872 | NHS Reference Costs 2015 to 2016 62 | Critical care tab: neonatal critical care, high dependency (currency code XA02Z) |
| Neonatal special care | Per night | 384 | NHS Reference Costs 2015 to 2016 62 | Critical care tab: neonatal critical care, special care, with external carer (currency code XA04Z) |
| Neonatal intervention: UV light jaundice postnatal ward | Per night | 384 | NHS Reference Costs 2015 to 2016 62 | Critical care tab: neonatal critical care, special care, with external carer (currency code XA04Z) |
| Neonatal intervention: i.v. antibiotics postnatal ward | Per night | 384 | NHS Reference Costs 2015 to 2016 62 | Critical care tab: neonatal critical care, special care, with external carer (currency code XA04Z) |
| Acute admission costs | ||||
| Index service | ||||
| MBU | Per night | 707 | NHS Reference Costs 2015 to 2016 62 | Mental health tab: specialist PMH services, admitted patient (currency code SPHMSMBUAPC) |
| General inpatient ward | Per night | 385 | NHS Reference Costs 2015 to 2016 62 | Non-elective long stay tab: bed-day calculated from all patients between 19 and 69 years with a Mental Health Primary Diagnosis, treated by a Non-Specialist Mental Health Service Provider (currency code WD22Z) |
| Low secure unit | Per night | 426 | NHS Reference Costs 2015 to 2016 62 | Mental health tab: low-level secure services (currency code SCU13) |
| Medium secure unit | Per night | 495 | NHS Reference Costs 2015 to 2016 62 | Mental health tab: medium-level secure services (currency code SCU14) |
| High secure unit | Per night | 885 | NHS Reference Costs 2015 to 2016 62 | Mental health tab: high-level secure unit, women’s services (currency code SCU11) |
| High-dependency unit | Per night | 742 | NHS Reference Costs 2015 to 2016 62 | Mental health tab: high-dependency secure provision, women’s service (currency code SCU07) |
| Home treatment team | Per contact | 199 | Unit Costs of Health and Social Care 2016 63 | Crisis resolution community contact (p. 71) |
| Crisis house | Per night | 205 | Professor Sarah Byford, King’s College London, 2018, personal communication | £177 2007/8 inflated to 2015/16 prices |
| Mother and baby day hospital | Per night | 353.3 | NHS Reference Costs 2015 to 2016 62 | Half the cost of a MBU inpatient |
| Day hospital | Per night | 398 | NHS Reference Costs 2015 to 2016 62 | Day cases tab: all patients aged between 19 and 69 years with a mental health primary diagnosis, treated by a non-specialist mental health service provider (currency code WD22Z) |
| Acute day houses | Per night | 398 | NHS Reference Costs 2015 to 2016 62 | Day cases tab: all patients aged between 19 and 69 years with a mental health primary diagnosis, treated by a non-specialist mental health service provider (currency code WD22Z) |
| Accommodation | ||||
| Staffed accommodation (staff day time only/visiting staff) | Per night | 41.14 | Unit Costs of Health and Social Care 2016 63 | Based on £288 per week, extra-care housing, including accommodation, housing management, support costs and living expenses (p. 30) |
| Staffed accommodation (staff 24 hours/resident staff) | Per night | 93 | Unit Costs of Health and Social Care 2016 63 | Private sector residential care, including establishment costs and personal living expenses (p. 26) |
| Bed and breakfast: look for report | Per night | 41.14 | Assumed to be similar to that for a staffed accommodation (staff day time only/visiting staff). This is similar to the lowest rates for B&Bs in UK cities | |
| Foster care | ||||
| Foster care | Per night | 84.43 | Unit Costs of Health and Social Care 2016 63 | Based on £591 per child per week (excluding social services support, but including education) |
| Friends/relatives | Per night | 0 | ||
| Other services | ||||
| Accommodation | ||||
| Staffed accommodation (staff day time only/visiting staff) | Per night | 41.14 | Unit Costs of Health and Social Care 2016 63 | Based on £288 per week, extra-care housing, including accommodation, housing management, support costs and living expenses (p. 30) |
| Staffed accommodation (staff 24 hours/resident staff) | Per night | 93 | Unit Costs of Health and Social Care 2016 63 | Private sector residential care, including establishment costs and personal living expenses (p. 26) |
| Foster care | ||||
| Foster care | Per night | 84.43 | Unit Costs of Health and Social Care 2016 63 | Based on £591 per child per week (excluding social services support, but including education) |
| Friends/relatives | Per night | 0 | ||
| Community services | ||||
| Midwife | Per contact | 53 | NHS Reference Costs 2015 to 2016 62 | Community health services tab: community midwife, antenatal visit (currency code N01A) |
| Midwifery support worker | Per contact | 53 | NHS Reference Costs 2015 to 2016 62 | Community health services tab: community midwife, antenatal visit (currency code N01A) |
| Health visitor | Per contact | 79 | NHS Reference Costs 2015 to 2016 62 | Community health services tab: health visitor, antenatal review (currency code N03A) |
| Nursery nurse (health visitor assistant) | Per contact | 53 | NHS Reference Costs 2015 to 2016 62 | Community health services tab: community midwife, antenatal visit (currency code N01A) |
| Examination of the newborn clinic | Per contact | 105 | NHS Reference Costs 2015 to 2016 62 | Community health services tab: health visitor, new baby review (currency code N03B) |
| GP | Per contact | 31 | Unit Costs of Health and Social Care 2016 63 | Per surgery consultation lasting 9.22 minutes, including direct care staff costs, without qualifications (p. 145) |
| Practice nurse | Per contact | 9.3 | Unit Costs of Health and Social Care 2016 63 | Based on £36 per hour, excluding qualifications and assuming a 15.5-minute appointment from Curtis and Burns64 |
| Community paediatrician | Per contact | 199 | Unit Costs of Health and Social Care 2016 63 | Paediatric outpatient attendances (p. 71) |
| Breastfeeding advisor | Per contact | 53 | NHS Reference Costs 2015 to 2016 62 | Community health services tab: community midwife, antenatal visit (currency code N01A) |
| Breastfeeding baby cafe | Per contact | 0 | ||
| Postnatal group | Per contact | 35 | NHS Reference Costs 2015 to 2016 62 | Community health services tab: parentcraft (currency code N03PC) |
| Low-intensity IAPT | Per contact | 109 | Professor Sarah Byford, personal communication | Based on £99 at 2009/10 prices, inflated to 2015/16 prices |
| High-intensity IAPT | Per contact | 196 | Professor Sarah Byford, personal communication | Based on £177 at 2009/10 prices, inflated to 2015/16 prices |
| Community psychiatric nurse | Per contact | 35.22 | Curtis and Burns64 | Based on mental health nurse (p. 176): £67 per hour of face-to-face contact, assuming a 30-minute appointment, without qualifications, inflated to 2015/16 prices |
| Clinical psychologist/counsellor | Per contact | 97 | Unit Costs of Health and Social Care 2016 63 | Based on a CBT session with a clinical psychologist (p. 77) |
| Community psychiatrist | Per contact | 280 | NHS reference costs62 | Consultant led tab: adult mental illness (currency code WF01A, service code 710) |
| Perinatal psychiatric/home treatment team | Per contact | 199 | Unit Costs of Health and Social Care 2016 63 | Crisis resolution community contact (p. 71) |
| Smoking cessation service | Per contact | 9.3 | Unit Costs of Health and Social Care 2016 63 | Based on £36 per hour, excluding qualifications and assuming a 15.5-minute appointment from Curtis and Burns64 |
| Social worker: children’s/family | Per contact | 27 | Unit Costs of Health and Social Care 2016 63 | Based on children’s social worker (p. 157): £54 per hour of client-related work, assuming a 30-minute appointment, without qualifications |
| Social worker: adult services | Per contact | 27.5 | Unit Costs of Health and Social Care 2016 63 | Based on adult social worker (p. 156): £55 per hour of client-related work, assuming a 30-minute appointment, without qualifications |
| Baby/family support worker | Per contact | 26 | Unit Costs of Health and Social Care 2016 63 | Based on family support worker (p. 162): £52 per hour of client-related work, assuming a 30-minute appointment, without qualifications |
| Drug/alcohol support worker | Per contact | 22.5 | Unit Costs of Health and Social Care 2016 63 | Based on an alcohol health worker/alcohol liaison nurse/substance misuse nurse (p. 53): £45 per hour, assuming a 30-minute appointment, without qualifications |
| Domestic violence advice/support | Per contact | 27.5 | Unit Costs of Health and Social Care 2016 63 | Based on an adult social worker (p. 156): £55 per hour of client-related work, assuming a 30-minute appointment, without qualifications |
| Housing/debt advice/Citizens Advice worker | Per contact | 27.5 | Unit Costs of Health and Social Care 2016 63 | Based on an adult social worker (p. 156): £55 per hour of client-related work, assuming a 30-minute appointment, without qualifications |
| Employment advice worker | Per contact | 27.5 | Unit Costs of Health and Social Care 2016 63 | Based on an adult social worker (p. 156): £55 per hour of client-related work, assuming a 30-minute appointment, without qualifications |
| Mother and baby day hospital | Per night | 353.3 | NHS Reference Costs 2015 to 2016 | Half the cost of a MBU inpatient |
| Other | ||||
| Sexual health clinic | Per contact | 117.9 | NHS Reference Costs 2015 to 2016 62 | Outpatient attendances tab: genitourinary medicine (service code 360) |
| Rehabilitation | Per contact | 125.2 | NHS Reference Costs 2015 to 2016 62 | Outpatient attendances tab: rehabilitation service (service code 314) |
| Ultrasound | Per contact | 125 | NHS Reference Costs 2015 to 2016 62 | Outpatient procedures tab: antenatal standard ultrasound scan (currency code NZ21Z) |
| Inpatient services | ||||
| Maternity | Per night | 528.16 | NHS Reference Costs 2015 to 2016 62 | Non-elective long stay tab: bed-day calculated from all non-elective long stay entries |
| Physical health | Per night | 528.16 | NHS Reference Costs 2015 to 2016 62 | Non-elective long stay tab: bed-day calculated from all non-elective long stay entries |
| Mental health: general inpatient | Per night | 385 | NHS Reference Costs 2015 to 2016 62 | Non-elective long stay tab: bed-day calculated from all patients between 19 and 69 years with a Mental Health Primary Diagnosis, treated by a Non-Specialist Mental Health Service Provider (currency code WD22Z) |
| Mental health: MBU | Per night | 707 | NHS Reference Costs 2015 to 2016 62 | Mental health tab: specialist PMH services, admitted patient (currency code SPHMSMBUAPC) |
| Mental health: crisis house | Per night | 205 | Professor Sarah Byford, personal communication | £177 at 2007/8 prices inflated to 2015/16 prices |
| Neonatal care/paediatrics | Per night | 622.1 | NHS Reference Costs 2015 to 2016 62 | Non-elective long stay tab: bed-day calculated from all paediatric non-elective long stay entries |
| Acute care | ||||
| Mother and baby day hospital | Per night | 353.3 | NHS Reference Costs 2015 to 2016 62 | Half the cost of a MBU inpatient |
| Other day hospital | Per night | 398 | NHS Reference Costs 2015 to 2016 62 | Day cases tab: all patients between 19 and 69 years with a Mental Health Primary Diagnosis, treated by a Non-Specialist Mental Health Service Provider (currency code WD22Z) |
| Day house | Per night | 398 | NHS Reference Costs 2015 to 2016 62 | Day cases tab: all patients between 19 and 69 years with a Mental Health Primary Diagnosis, treated by a Non-Specialist Mental Health Service Provider (currency code WD22Z) |
| Outpatient services | ||||
| Allergy | Per contact | 168.67 | NHS Reference Costs 2015 to 2016 62 | Total outpatient attendances tab: allergy service (service code 317) |
| Audiology | Per contact | 58.33 | NHS Reference Costs 2015 to 2016 62 | Total outpatient attendances tab: audiology (service code 840) |
| Cardiology | Per contact | 127.67 | NHS Reference Costs 2015 to 2016 62 | Total outpatient attendances tab: cardiology (service code: 320) |
| Dentistry | Per contact | 0 | ||
| Dermatology | Per contact | 101.63 | NHS Reference Costs 2015 to 2016 62 | Total outpatient attendances tab: dermatology (service code 330) |
| Diabetic medicine | Per contact | 159.31 | NHS Reference Costs 2015 to 2016 62 | Total outpatient attendances tab: diabetic medicine (service code 307) |
| Dietetics | Per contact | 71.17 | NHS Reference Costs 2015 to 2016 62 | Total outpatient attendances tab: dietetics (service code 654) |
| Endocrinology | Per contact | 157.74 | NHS Reference Costs 2015 to 2016 62 | Total outpatient attendances tab: endocrinology (service code 302) |
| ENT | Per contact | 96.87 | NHS Reference Costs 2015 to 2016 62 | Total outpatient attendances tab: ENT (service code: 120) |
| Gastroenterology | Per contact | 136.57 | NHS Reference Costs 2015 to 2016 62 | Total outpatient attendances tab: gastroenterology (service code 301) |
| General medicine | Per contact | 167.05 | NHS Reference Costs 2015 to 2016 62 | Total outpatient attendances tab: general medicine (service code 300) |
| Genetics | Per contact | 439.45 | NHS Reference Costs 2015 to 2016 62 | Total outpatient attendances tab: clinical genetics (service code 311) |
| Genitourinary medicine | Per contact | 117.9 | NHS Reference Costs 2015 to 2016 62 | Total outpatient attendances tab: genitourinary medicine (service code 360) |
| Gynaecology | Per contact | 133.01 | NHS Reference Costs 2015 to 2016 62 | Total outpatient attendances tab: gynaecology (service code 502) |
| Haematology | Per contact | 160.58 | NHS Reference Costs 2015 to 2016 62 | Total outpatient attendances tab: clinical haematology (service code 303) |
| Haemophilia | Per contact | 612.52 | NHS Reference Costs 2015 to 2016 62 | Total outpatient attendances tab: haemophilia service (service code 309) |
| Hepatology | Per contact | 255.35 | NHS Reference Costs 2015 to 2016 62 | Total outpatient attendances tab: hepatology (service code 306) |
| Immunology | Per contact | 295.31 | NHS Reference Costs 2015 to 2016 62 | Total outpatient attendances tab: clinical immunology (service code 316) |
| Mental health | Per contact | 287.57 | NHS Reference Costs 2015 to 2016 62 | Total outpatient attendances tab: adult mental illness (service code 710) |
| Neurology | Per contact | 175.6 | NHS Reference Costs 2015 to 2016 62 | Total outpatient attendances tab: neurology (service code 400) |
| Obstetrics | Per contact | 127.54 | NHS Reference Costs 2015 to 2016 62 | Total outpatient attendances tab: obstetrics (service code 501) |
| Occupational therapy | Per contact | 65.85 | NHS Reference Costs 2015 to 2016 62 | Total outpatient attendances tab: occupational therapy (service code 651) |
| Ophthalmology | Per contact | 90.64 | NHS Reference Costs 2015 to 2016 62 | Total outpatient attendances tab: ophthalmology (service code 130) |
| Paediatrics, including tongue-tie clinic | Per contact | 194.36 | NHS Reference Costs 2015 to 2016 62 | Total outpatient attendances tab: paediatrics (service code 420) |
| Pain management | Per contact | 139.12 | NHS Reference Costs 2015 to 2016 62 | Total outpatient attendances tab: pain management (service code 191) |
| Physiotherapy | Per contact | 48.33 | NHS Reference Costs 2015 to 2016 62 | Total outpatient attendances tab: physiotherapy (service code 650) |
| Respiratory medicine | Per contact | 154.77 | NHS Reference Costs 2015 to 2016 62 | Total outpatient attendances tab: respiratory medicine (service code 340) |
| Rheumatology | Per contact | 142.74 | NHS Reference Costs 2015 to 2016 62 | Total outpatient attendances tab: rheumatology (service code 410) |
| Surgery | Per contact | 130.06 | NHS Reference Costs 2015 to 2016 62 | Total outpatient attendances tab: general surgery (service code 100) |
| Trauma and orthopaedics | Per contact | 117.01 | NHS Reference Costs 2015 to 2016 62 | Total outpatient attendances tab: trauma and orthopaedics (service code 110) |
| Accident and emergency | ||||
| Accident and emergency | Per contact | 146.86 | NHS Reference Costs 2015 to 2016 62 | Total outpatient attendances tab: accident and emergency (service code 180) |
| Ambulance | Per contact | 236.44 | NHS Reference Costs 2015 to 2016 62 | Ambulance tab (AMB): see and treat and convey (currency code ASS02) |
| Medication | ||||
| Medication | Per drug per month | 8.34 | Prescription Cost Analysis, England – 2016 65 | Net ingredient cost per item for all items |
Outcomes
The primary economic measure of outcome was QALYs calculated using the EQ-5D-5L22 measure of health-related quality of life. The EQ-5D-5L was assessed via self-report at the 1-month post-discharge interview. In addition, the SF-3645 was self-administered at 1 month post discharge and the self-reported data were used to derive the SF-6D score.
Baseline EQ-5D-5L and SF-6D data were not collected, as participants were in crisis at the time of study entry and it was not appropriate to approach them for research purposes. Therefore, we applied published baseline utility values from a similar population. 46
Appropriate utility weights were attached to EQ-5D-5L and SF-6D health states20,98 and QALYs were calculated using the total AUC approach with linear interpolation between assessment points. 43 Discounting was not relevant, as the follow-up did not exceed 12 months.
Analysis
Data were analysed using Stata. In line with the clinical analyses, we made use of a propensity score approach. Propensity scores were used to account for systematic differences between MBU and non-MBU participants using the Stata command pscore. Participants with no ‘matches’ (i.e. women with propensity scores either so high or so low that there are insufficient numbers of similar women receiving either MBU or non-MBU treatment to make a comparison) were removed from the sample, again in line with the clinical analysis. This approach has been used in other economic evaluations99 and has been found to eliminate a greater degree of the systematic differences between treated and untreated subjects compared with stratification on the propensity score and adjusting for covariates using the propensity score. 100 As with the clinical analysis, 22 prespecified variables were used to create this cohort. Each economic analysis had a new propensity score created, as each economic analysis had a different number of participants because of missing data, and this influences the propensity scoring.
Missing data
Where the whole AD-SUS, EQ-5D-5L or SF-6D was missing, this remained missing and the participant was excluded from the complete-case analysis. Within the AD-SUS, where there were missing components on a particular resource category (e.g. accommodation, inpatient use, outpatient use, etc.) and, therefore, a cost for that category could not be calculated, the mean cost for that category of resource for the same group was used. This was carried out when at least 80% of the AD-SUS was complete. A single missing item on the EQ-5D-5L and SF-6D was replaced with the mean response for that item for the same group; however, where more than one item was missing, the participant was excluded from the complete-case analysis.
Analysis of costs and outcomes
Costs and outcomes were compared at 1 month post discharge and 1 year post discharge and presented as mean values with SDs by group. Mean differences and 95% CIs were obtained by non-parametric bootstrap regressions (10,000 repetitions, bias-corrected) to account for non-normally distributed data commonly found in economic data. To provide more relevant treatment–effect estimates,101 regressions to calculate mean differences were repeated with the inclusion of covariates for the baseline value of the relevant variable (where available), plus variables included in the main clinical analysis.
Cost-effectiveness analysis
The primary economic evaluation was a complete-case (i.e. excluding those lost to follow-up or with missing AD-SUS, EQ-5D-5L or SF-6D data) cost-effectiveness analysis based on EQ-5D-5L QALYs at 1 month post discharge. Cost-effectiveness analyses were conducted at 1 month post discharge. ICERs were calculated where either higher or equivalent costs and better or equivalent outcomes in either the intervention group or control group were demonstrated (note that it is unnecessary to calculate ICERs for any combinations where one group shows both lower costs and better outcomes, as it is then considered to ‘dominate’ the other group).
Uncertainty was explored using cost-effectiveness planes and CEACs based on the net benefit approach. 67 These curves are an alternative to CIs around ICERs and show the probability that one intervention is cost-effective compared with the other for a range of values that a decision-maker would be willing to pay for an additional unit of an outcome. A series of net benefits were calculated for each individual for a range of values for willingness to pay for a unit improvement on the outcome. After calculating net benefits for each participant for each value of willingness to pay, coefficients of differences in net benefits between the groups were obtained through a series of bootstrapped linear regressions (10,000 repetitions, bias-corrected). The resulting coefficients are then used to calculate the proportion of times that the intervention group had a greater net benefit than the control group for each value of willingness to pay. These proportions are then plotted to generate CEACs for all cost–outcome combinations. All cost-effectiveness analyses included covariates added to comparisons of costs and outcomes.
Sensitivity analyses
The primary analysis was a complete-case analysis (i.e. excluding those lost to follow-up or with missing AD-SUS, EQ-5D-5L or SF-6D data). To explore the potential impact of excluding non-responders, the base-case analysis was repeated including those lost to follow-up by imputing missing total costs and outcomes using simple imputation in Stata using single imputation. In addition, the 1-month post-discharge cost analyses were repeated, replacing the EQ-5D-5L-based QALYs with SF-6D-based QALYs.
Deviations from the grant application
The original grant application stated that the cost-effectiveness analysis would use EQ-5D-5L as the primary outcome measure at 1 month post discharge. Subsequently, it was recommended by reviewers that we change the EQ-5D-5L as the main outcome measure to the SF-6D. However, subsequent to the funding being received, a decision was made to add a telephone-based interview at 12 months (not part of the original grant application) and the research group made the decision to use the EQ-5D-5L in preference to the SF-6D, which was felt by the research team to be too onerous and complicated to collect by telephone interview. As a result, and for consistency across all time points, the research group made the decision to use the EQ-5D-5L as the main outcome measure for the economic evaluation. This change was documented in the health economic analysis plan (approved on 28 April 2017) and the EQ-5D-5L is stated as the primary outcome measure in the published protocol58 before data collection ended in spring 2019.
Appendix 14 Work package 3(ii): ESMI MBU economic evaluation results
Data availability
Data availability, summarised in Table 48, does not drop below 79% for any component at any time point. Availability of data was similar in both groups.
| Data availability | Group, n (%) | |
|---|---|---|
| MBU (N = 108) | Non-MBU service (N = 171) | |
| 2-year period prior to index admission | ||
| Acute care (MBU, acute ward, CRT) | 106 (98) | 169 (99) |
| Index admission to 1 month post discharge | ||
| Acute care (MBU, acute ward, CRT) | 107 (99) | 170 (99) |
| AD-SUS | 100 (93) | 162 (95) |
| EQ-5D-5L | 98 (91) | 162 (95) |
| SF-6D | 96 (89) | 161 (94) |
| Discharge to 1 year post discharge | ||
| Acute care (MBU, acute ward, CRT) | 105 (97) | 158 (92) |
| Community mental health | 85 (79) | 141 (82) |
Availability of full cost, outcome and covariate data necessary for inclusion in economic analyses is reported in Table 49. Full data for inclusion in the short-term EQ-5D-5L-based analysis were available for 220 (79%) participants [MBU, n = 75 (69%); non-MBU service, n = 145 (85%)]. Of these participants, eight were removed following propensity matching, leaving a total of 212 (76%) participants [MBU, n = 67 (62%); non-MBU service, n = 145 (85%)].
| Included data | Sample with . . . , n (%) | |||
|---|---|---|---|---|
| Full data | Full data after propensity matching | |||
| MBU (N = 108) | Non-MBU service (N = 171) | MBU (N = 108) | Non-MBU service (N = 171) | |
| Short term (index admission to 1 month post discharge) | ||||
| All data for EQ-5D-5L-based analysis | 75 (69) | 145 (85) | 67 (62) | 145 (85) |
| All data for SF-6D-based analysis | 74 (69) | 145 (85) | 67 (62) | 145 (85) |
| Longer term (discharge to 1 year post discharge) | ||||
| All data for cost analysis | 58 (54) | 98 (57) | 47 (44) | 98 (57) |
Full data for inclusion in the short-term SF-6D-based analysis were available for 219 (78%) participants [MBU, n = 74 (69%); non-MBU service, n = 145 (85%)]. Of these participants, seven were removed following propensity matching, leaving a total of 212 (76%) participants [MBU, n = 67 (62%); non-MBU service, n = 145 (85%)].
Full data for inclusion in the long-term analysis of service use and costs were available for 156 (56%) participants [MBU, n = 58 (54%); non-MBU service, n = 98 (57%)]. Of these participants, 11 were removed following propensity matching, leaving a total of 145 (52%) participants [MBU, n = 47 (44%); non-MBU service, n = 98 (57%)].
For the sensitivity analysis using imputation for missing data and, therefore, using the full sample, seven participants were removed following propensity matching, leaving a total of 272 participants [MBU, n = 101; non-MBU service, n = 171].
Short-term cost-effectiveness analysis using the EQ-5D-5L
Resource use
Table 50 presents service use at each time point by group. Acute secondary mental health care (i.e. MBU, acute ward and CRT) in the 2-year period prior to the index admission was used by 12% of the MBU group and 13% of the non-MBU group. Acute care was used by all participants in the period from index admission to 1 month post discharge, as this was part of the eligibility criteria. The use of each category of resource was similar between the two groups.
| Resource use | Group, n/N (%) | |
|---|---|---|
| MBU | Non-MBU service | |
| 2-year period prior to index admission | ||
| Acute care (MBU, acute ward, CRT) | 8/67 (12) | 19/145 (13) |
| Index admission to 1 month post discharge | ||
| Acute care (MBU, acute ward, CRT) | 67/67 (100) | 145/145 (100) |
| Maternal assessment unit prior to giving birth | 32/64 (50) | 70/145 (48) |
| Hospital stay following birth | 10/66 (15) | 22/145 (15) |
| Other inpatient | 4/67 (6) | 11/145 (8) |
| Day patient | 0/67 (0) | 2/145 (1) |
| Outpatient | 28/67 (42) | 45/145 (31) |
| Accident and emergency | 15/66 (23) | 35/145 (24) |
| Community-based services | 65/65 (100) | 140/141 (99) |
| Medication during index admission | 46/46 (100) | 95/95 (100) |
| Medication after index admission | 61/61 (100) | 107/107 (100) |
| Accommodation during acute treatment period | 0/67 (0) | 4/140 (3) |
| Accommodation following acute treatment period | 1/65 (2) | 5/145 (3) |
| Foster care | 1/67 (1) | 6/144 (4) |
Length of follow-up
Length of follow-up was variable, as follow-up covered the index admission, the length of which varied, plus 1 month post discharge. Mean follow-up for the cohort was 145 (range 31–1080) days [165 (range 55–819) days for MBU and 135 (range 31–1080) days for non-MBU services].
Costs and outcomes
Cost and outcome data are reported in Table 51. The cost of acute secondary mental health care in the 2 years prior to index admission was similar in both groups (£1873 for MBUs vs. £2038 for non-MBU services). The cost of all health and social care services from index admission to 1 month post discharge was significantly higher in the MBU group (£60,007) than in the non-MBU group (£13,673) in unadjusted analyses (mean difference £46,333, 95% CI £38,380 to £54,286; p < 0.001) and adjusted analyses (mean difference £44,049, 95% CI £36,638 to £51,461; p < 0.001). This was due to a combination of higher unit costs for MBUs (£707/day), compared with generic acute wards (£385/day) and CRT services (£199/contact), and longer MBU admissions.
| Cost and outcome data | Group | Unadjusted mean difference (95% CI; p-value) | Adjusted mean differencea (95% CI; p-value) | |||
|---|---|---|---|---|---|---|
| MBU | Non-MBU service | |||||
| n | Mean (SD) | n | Mean (SD) | |||
| Cost | ||||||
| Acute care costs in the 2 years prior to index admission | 67 | £1873 (£7711) | 145 | £2038 (£9353) | ||
| Total health and social care costs admission to 1 month post discharge | 67 | £60,007 (£32,065) | 145 | £13,673 (£12,472) | £46,333 (£38,380 to £54,286; < 0.001) | £44,049 (£36,638 to £51,461; < 0.001) |
| Outcome | ||||||
| EQ-5D-5L utility at admission | 67 | 0.44 | 145 | 0.44 | ||
| EQ-5D-5L utility 1 month post admission | 67 | 0.825 (0.150) | 145 | 0.790 (0.168) | 0.036 (–0.010 to 0.081; 0.122) | 0.007 (–0.039 to 0.053; 0.752) |
| QALYs | 67 | 0.282 (0.237) | 145 | 0.224 (0.302) | 0.058 (–0.017 to 0.133; 0.130) | 0.007 (–0.013 to 0.027; 0.496) |
At 1 month post discharge, utility was 0.825 in the MBU group and 0.790 in the non-MBU group. This difference was not statistically significant in unadjusted analyses (0.036, 95% CI –0.010 to 0.081; p = 0.122) or adjusted analyses (0.007, 95% CI –0.039 to 0.053; p = 0.752). EQ-5D-5L-based QALYs was 0.282 in the MBU group and 0.224 in the non-MBU group. This difference was not statistically significant in unadjusted analyses (0.058, 95% CI –0.017 to 0.133; p = 0.130) or adjusted analyses (0.007, 95% CI –0.013 to 0.027; p = 0.496).
Cost-effectiveness analysis
Based on adjusted costs and QALYs, the ICER was £6,292,714 (£44,049/0.007 QALYs). Figure 49 shows the bootstrapped replications for cost and effect pairs for MBUs compared with non-MBU services at 1 month post discharge. All scatterpoints lie above the x-axis where MBUs are more costly than non-MBU services. A greater proportion of scatterpoints lie to the right of the y-axis where MBUs are more effective than non-MBU services.
FIGURE 49.
Cost-effectiveness plane for MBUs vs. non-MBU services at 1 month post discharge using EQ-5D-5L-based QALYs.
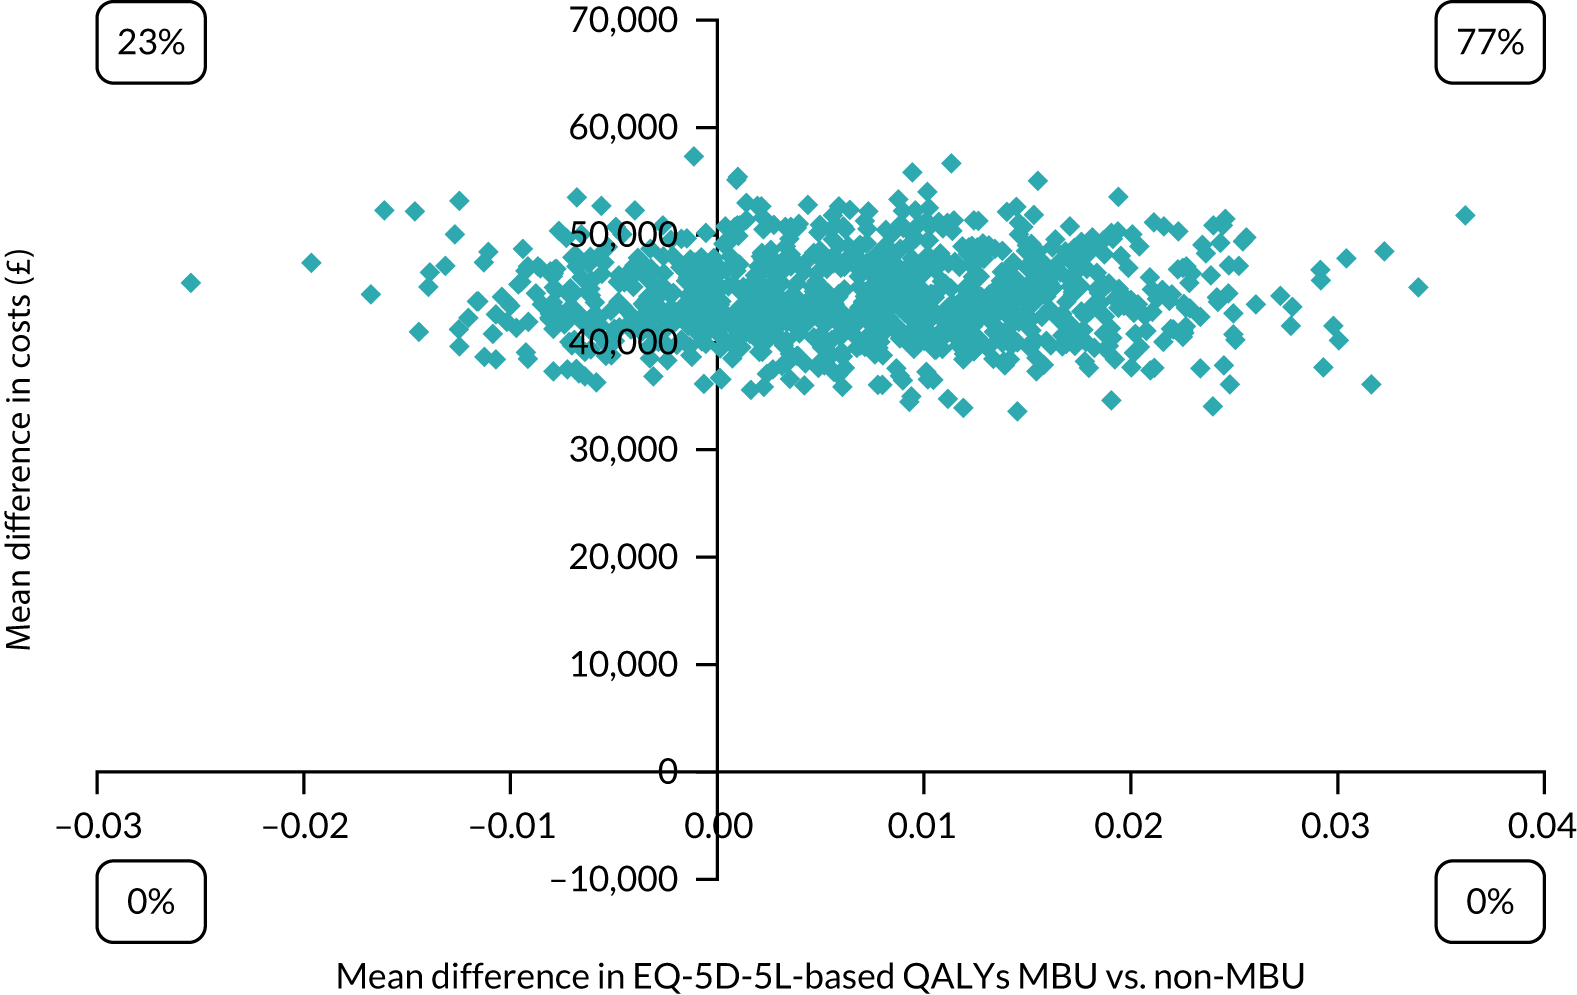
Figure 50 shows the CEAC for MBUs compared with non-MBU services. The probability of a MBU being cost-effective compared with a non-MBU service was 0% at all levels of willingness to pay between £0 and £50,000 per QALY.
FIGURE 50.
A CEAC for MBUs vs. non-MBU services at 1 month post discharge using EQ-5D-5L-based QALYs.
Analyses using imputation for missing data produced almost identical results and, therefore, are not reported here.
Short-term cost-effectiveness analysis using SF-6D
Follow-up time and length of admission
Mean follow-up time for the cohort was 147 (range 31–1080) days. This was 165 (range 55–819) days for MBUs and 139 (range 31–1080) days for non-MBU services.
Costs and outcomes
Cost and outcome data are reported in Table 52. The cost of acute secondary mental health care in the 2 years prior to index admission was similar in both groups (£1873 for MBUs vs. £2334 for non-MBU services). Total health and social care costs from index admission to 1 month post discharge were significantly higher in the MBU group than in the non-MBU group in unadjusted analyses (mean difference £46,070, 95% CI £38,129 to £38,129; p < 0.001) and adjusted analyses (mean difference £43,881, 95% CI £36,441 to £51,321; p < 0.001).
| Cost and outcome data | Group | Unadjusted mean difference (95% CI; p-value) | Adjusted mean differencea (95% CI; p-value) | |||
|---|---|---|---|---|---|---|
| MBU | Non-MBU service | |||||
| n | Mean (SD) | n | Mean (SD) | |||
| Cost | ||||||
| Acute care costs in the 2 years prior to index admission | 67 | £1873 (£7711) | 145 | £2334 (£9947) | ||
| Total health and social care costs admission to 1 month post discharge | 67 | £59,849 (£32,152) | 145 | £13,780 (£12,508) | £46,070 (£38,129 to £38,129; < 0.001) | £43,881 (£36,441 to £51,321; < 0.001) |
| Outcome | ||||||
| SF-6D utility at admission | 67 | 0.44 | 145 | 0.44 | ||
| SF-6D utility 1 month post admission | 67 | 0.674 (0.101) | 145 | 0.640 (0.119) | 0.035 (0.002 to 0.067; 0.035) | 0.001 (–0.033 to 0.034; 0.974) |
| QALYs | 67 | 0.251 (0.216) | 145 | 0.206 (0.287) | 0.045 (–0.025 to 0.115; 0.208) | < –0.001 (–0.012 to 0.011; 0.959) |
At 1 month post discharge, utility was 0.674 in the MBU group and 0.640 in the non-MBU group. This difference was statistically significant in unadjusted analyses (0.035, 95% CI 0.002 to 0.067; p = 0.035), but non-significant in adjusted analyses (0.001, 95% CI –0.033 to 0.011; p = 0.959). QALYs were 0.251 in the MBU group and 0.206 in the non-MBU group. This difference was not statistically significant in unadjusted analyses (0.045, 95% CI –0.025 to 0.115; p = 0.208) or adjusted analyses (< –0.001, 95% CI –0.012 to 0.011; p = 0.959).
Cost-effectiveness analysis
Based on adjusted costs and QALYs, the ICER was –£4,388,1000 (£43,881/–0.001 QALYs). Figure 51 shows the bootstrapped replications for cost and effect pairs for MBUs compared with non-MBU services at 1 month post discharge. All scatterpoints lie above the x-axis where MBUs are more costly than non-MBU services. Slightly more than half of the scatterpoints lie to the right of the y-axis where MBUs are more effective than non-MBU services.
FIGURE 51.
Cost-effectiveness plane for MBUs vs. non-MBU services at 1 month post discharge using SF-6D-based QALYs.
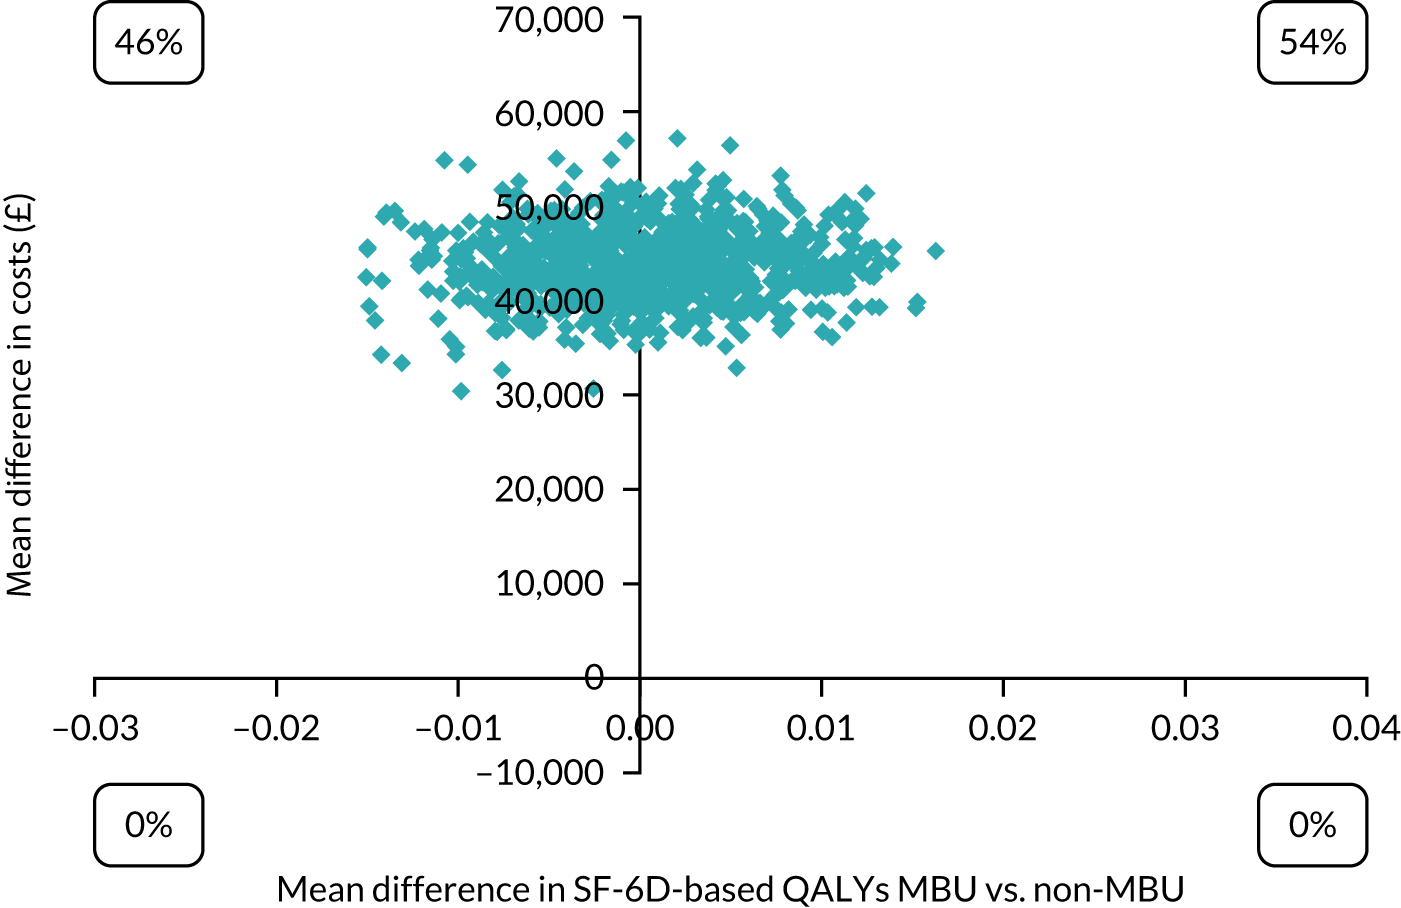
Figure 52 shows the CEACs for MBUs compared with non-MBU services at 1 month post discharge. The probability of MBUs being cost-effective compared with non-MBU services was 0% for all levels of willingness to pay between £0 and £50,000 per QALY.
FIGURE 52.
A CEAC for MBUs vs. non-MBU services at 1 month post discharge using SF-6D-based QALYs.
Analyses using imputation for missing data produced almost identical results and, therefore, are not reported here.
Long-term cost analysis
Acute care services (i.e. MBU, acute ward and CRT services), reported in Table 53, were used by 21% of the sample (30/145) between discharge and 1-year follow-up. This was similar between MBUs (19%) and non-MBU services (21%).
| Resource use | Group | |
|---|---|---|
| MBU | Non-MBU service | |
| Service use, n/N (%) | ||
| Acute care (MBU, acute ward, CRT) | 9/47 (19) | 21/98 (21) |
| Community services | 45/47 (96) | 83/98 (85) |
| Cost (SD) (£) | ||
| Acute care (MBU, acute ward, CRT) | 1463 (4581) | 1084 (4498) |
| Community services | 1433 (1319) | 1062 (1547) |
| Total acute and community costs | 2897 (4743) | 2147 (5338) |
Four (3%) participants were readmitted to MBUs in the year following discharge from index admission – three (6%) participants in MBUs and one (1%) participant in non-MBU services. Eleven (8%) participants were readmitted to generic acute wards – four (9%) participants in MBUs and seven (7%) participants in non-MBU services. Twenty-five (17%) participants were taken on by CRTs, six (13%) participants in MBUs and 19 (19%) participants in non-MBU services.
Contact with community services was common (88% of the cohort) following discharge from the index admission (96% of participants in MBUs vs. 81% of participants in non-MBU services).
The unadjusted bootstrap regression of total acute and community mental health service costs found no significant difference between the groups in unadjusted analyses (mean difference £750, 95% CI –£979 to £2479; p = 0.395) or adjusted analyses (mean difference £632, 95% CI –£1326 to £2589; p = 0.527).
List of abbreviations
- AD-SUS
- Adult Service Use Schedule
- AUC
- area under the curve
- AUDIT
- Alcohol Use Disorders Identification Test
- CAS
- Composite Abuse Scale
- CEAC
- cost-effectiveness acceptability curve
- CI
- confidence interval
- CRT
- crisis resolution team
- CSQ
- Client Satisfaction Questionnaire
- DAWN
- Depression: an exploratory parallel-group randomised controlled trial of Antenatal guided self-help for WomeN
- DUDIT
- Drug Use Disorders Identification Test
- EPDS
- Edinburgh Postnatal Depression Scale
- EQ-5D-3L
- EuroQol-5 Dimensions, three-level version
- EQ-5D-5L
- EuroQol-5 Dimensions, five-level version
- ESMI
- Effectiveness and cost-effectivenesS of perinatal Mental health servIces
- GAD-2
- Generalised Anxiety Disorder-2
- GCSE
- General Certificate of Secondary Education
- GHQ-12
- General Health Questionnaire-12
- GP
- general practitioner
- GSH
- guided self-help
- IAPT
- Improving Access to Psychological Therapies
- ICD-10
- International Statistical Classification of Diseases and Related Health Problems, Tenth Revision
- ICER
- incremental cost-effectiveness ratio
- ICU
- intensive care unit
- IQR
- interquartile range
- IV
- instrumental variable
- MBU
- mother and baby unit
- NICE
- National Institute for Health and Care Excellence
- NIHR
- National Institute for Health and Care Research
- NPV
- negative predictive value
- OR
- odds ratio
- PAG
- Perinatal Advisory Group
- PDG
- programme development grant
- PMH
- perinatal mental health
- PPI
- patient and public involvement
- PPV
- positive predictive value
- PTSD
- post-traumatic stress disorder
- PWP
- psychological well-being practitioner
- QALY
- quality-adjusted life-year
- RCT
- randomised controlled trial
- REC
- Research Ethics Committee
- SCID-I
- Structured Clinical Interview for Diagnostic and Statistical Manual of Mental Disorders Axis I Disorders
- SD
- standard deviation
- SF-36
- Short Form questionnaire-36 items
- SF-6D
- Short Form-6 Dimension
- STACEY
- STAkeholders’ views and experiences of perinatal mental health CarE and services: a qualitative studY
- t0
- time point 0
- TAU
- treatment as usual
- VOICE
- Views On Inpatient CarE
- W–
- Whooley questions negative
- W+
- Whooley questions positive
- WENDY
- WEll-being in pregNancy stuDY
- WP
- work package
