Notes
Article history
The research reported in this issue of the journal was funded by PGfAR as award number RP-PG-0613-20002. The contractual start date was in December 2015. The draft manuscript began editorial review in May 2021 and was accepted for publication in August 2023. As the funder, the PGfAR programme agreed the research questions and study designs in advance with the investigators. The authors have been wholly responsible for all data collection, analysis and interpretation, and for writing up their work. The PGfAR editors and production house have tried to ensure the accuracy of the authors’ manuscript and would like to thank the reviewers for their constructive comments on the draft document. However, they do not accept liability for damages or losses arising from material published in this article.
Permissions
Copyright statement
Copyright © 2024 Roman et al. This work was produced by Roman et al. under the terms of a commissioning contract issued by the Secretary of State for Health and Social Care. This is an Open Access publication distributed under the terms of the Creative Commons Attribution CC BY 4.0 licence, which permits unrestricted use, distribution, reproduction and adaptation in any medium and for any purpose provided that it is properly attributed. See: https://creativecommons.org/licenses/by/4.0/. For attribution the title, original author(s), the publication source – NIHR Journals Library, and the DOI of the publication must be cited.
2024 Roman et al.
Synopsis
Background
Population-based data are required to inform aetiological hypotheses, plan healthcare services and monitor the impact of therapeutic change in the general patient population. This need is particularly pertinent in fast-moving areas such as haemato-oncology, where treatments change rapidly and ‘gold-standard’ randomised controlled trials (RCTs) are absent or are restricted to specific subgroups (often younger patients with fewer comorbidities), to specific time points (commonly first-line treatment), or pragmatically by factors that effectively select patients on the basis of their socioeconomic status, gender or ethnicity. Such problems mean that ‘real-world’ observational data are increasingly being used to provide context for evaluating treatment effectiveness across the patient population.
Arising in blood and lymph-forming tissues, haematological malignancies (leukaemias, lymphomas and myelomas) are, collectively, the fourth most common cancer in men (after prostate, lung and colon/rectal) and women (after breast, lung and colon/rectal) in economically developed countries. 1,2 With diverse aetiologies, treatments and outcomes, more than 100 subtypes are currently recognised by the World Health Organization. 3 Importantly, although their incidence remains relatively stable in high-income countries such as the UK, their prevalence is increasing due to population ageing and the use of established and new treatments (e.g. chemotherapies, radiotherapy, stem cell transplants and an ever-lengthening list of costly novel targeted agents).
Currently, although some blood cancers are potentially curable with intensive chemotherapy [e.g. diffuse large B-cell lymphoma (DLBCL) and Hodgkin lymphoma], most (≈ 60%) are not; the majority of patients tend to follow a remitting–relapsing trajectory, requiring treatment at progression interspersed with periods of clinic monitoring/observation, in an approach known as ‘watch & wait’ (W&W). Typified by the cancers studied in this programme [chronic lymphocytic leukaemia (CLL), follicular lymphoma (FL) and myeloma], these chronic cancers can often be successfully treated, sometimes for many years. Nonetheless, as with many other incurable non-cancer conditions, marked variations are evident between patients in their need for (and response to) treatment, the most effective regimen(s), the time when treatment is required (and, for some, it is never required), and quality of life (QoL). 4 This situation clearly introduces uncertainty regarding individual trajectories, which often causes prolonged anxiety and distress for patients and families. 5–8
Over the last 20 years, UK policy has placed patients ‘at the heart of the NHS’, with ‘shared treatment decisions the norm: (and) no decision about me without me’. 9–11 This approach emphasised informed choice, with the patient as the final arbiter of the therapeutic approach, even if this is to decline treatment. 10 Steps in the shared decision-making process include information exchange, deliberation and implementation, thus requiring patient involvement and clinician willingness to explore priorities and incorporate these into treatment decisions. This model aimed to align decisions with patient values and preferences, whether these were to prioritise treatment efficacy, duration of survival and remission, QoL, disruption to daily life, cost, toxicity or logistical issues,12–15 in order to prevent ‘preference misdiagnosis’16 where clinicians’ perceptions are assumed to match those of patients, but may, in fact, differ.
Therapeutic decisions for chronic haematological malignancies tend to be based on multiple factors, including disease stage and rapidity of progression, along with the patient’s age, symptom burden, performance status, comorbidities and therapy tolerance, as well as treatment availability and previous therapies. Key to successful treatment decisions is access to robust, comprehensible information to enable patients to assess the acceptability of specific treatments with respect to their own physical health and their psychosocial and financial well-being, QoL, daily activities and survival. 14,17–19 Such material is scant, however, with considerable outstanding needs identified among patients and scope to improve information-sharing. 20–22
From a national perspective, although the number and combination of life-prolonging therapeutic options for haematological cancers are increasing, the UK Department of Health and Social Care acknowledges limitations in the granularity of the population-based evidence available to guide treatment decisions. 10 Increasing recognition of the biological heterogeneity of cancer also means that generic sources of information are often insufficient to assess particular therapies and their impact on individuals. While some progress has been made (e.g. establishment of the National Cancer Registration and Analysis Service, and various national data sets), these resources are presently insufficiently mature to guide treatment decisions. Furthermore, although findings from clinical trials can establish the efficacy of treatments, they are often restricted by patient characteristics (e.g. age, comorbidities, disease stage), making findings difficult to generalise to the patient population as a whole. 23–26 This programme sought to address the need for accessible, ‘real-world’, population-based evidence that could be mapped across the entire care pathway.
Research plan
The overarching aim was to generate high-quality evidence for patients and clinicians about the management of the general population of patients with chronic haematological malignancies, while examining costs and exploring patient preferences for information-sharing and engagement in treatment decisions. The specific objectives were as follows:
-
primary – to generate high-quality, longitudinal, real-world information on the care pathways of the general population of patients with chronic haematological malignancies, incorporating data on healthcare costs and patient preferences for information-sharing and engagement in treatment decisions
-
secondary – to produce accessible information resources suitable for testing in routine NHS practice.
To achieve this, the programme focused on the three commonest chronic haematological malignancies – CLL, FL and myeloma – which combined account for around 30% of all newly diagnosed blood cancers. 27
The programme was divided into five distinct, but inter-related, work packages (WPs):
-
in-depth exploration of patient experiences: information and treatment decisions
-
population-based analyses
-
health economics
-
development of information resources to support decision-making
-
patient well-being and decision-making survey.
This report describes programme development, key research elements and inter-related linkages. The setting is described (see Programme setting), followed by the research pathway diagram (see Research pathway) and a summary of work completed and WP alterations (see Summary of programme alterations). The WPs and their findings are described in Population-based data and analyses (WP2), Health economics (WP3), Patient well-being and involvement survey (WP5), In-depth exploration of patient experiences: information and treatment decisions (WP1), Development of information resources to support treatment decisions (WP4) and drawn together in Discussion and conclusions, with additional details in the appendices. WP numbers in the original application (WPs 1–5) not denoted not consecutive activities but rather distinct tranches of work often conducted simultaneously, with a view to merging findings. For clarity, WPs have been replaced with sections in this report and ordered more logically: Population-based data and analyses (WP2) sets the scene, providing the foundation for other parts of the programme, and is followed by Health economics (WP3), Patient well-being and involvement survey (WP5), In-depth exploration of patient experiences: information and treatment decisions (WP1) and Development of information resources to support treatment decisions (WP4).
Programme setting
The programme is predicated on the established expertise and infrastructure of Haematological Malignancy Research Network (HMRN: www.hmrn.org), which was initiated in 2004 with the aim of providing robust, generalisable data to inform research and clinical practice locally, nationally and internationally. 28,29 HMRN has ethics approval [Leeds West Research Ethics Committee (REC) 04/Q1205/69] and Section 251 support under the NHS Act 2006 [Patient Information and Advisory Group (PIAG) 1-05(h)2007]. These permissions provide the legal basis that allows HMRN to collect data directly from clinical records without explicit consent, and enables NHS Digital to provide nationwide information on deaths, cancer registrations and Hospital Episode Statistics (HES). Research projects that build on HMRN’s infrastructure and collect additional data require supplementary approvals, which for the present National Institute for Health and Care Research (NIHR) Programme Grants for Applied Research programme was granted by the London, City and East committee (REC 16/LO/0740) for the survey [see Patient well-being and involvement survey (WP5)] and qualitative work [see In-depth exploration of patient experiences: information and treatment decisions (WP1)], as depicted in Table 1.
| Section/WP | Title and tasks | Complete | Comments |
|---|---|---|---|
| Population-based data and analyses, WP2 objectives 1–5 | Population-based pathway analyses and prognostic models | ||
| Assembly of pathway data | Yes | ||
| Building, reliability testing and finalising models | Partial | FL complete (data for CLL and myeloma assembled) | |
| In-house software development of Patient Pathway Generator | Yes | ||
| Mapping clinical and biological data to pathways | Yes | Individual and aggregate pathways | |
| Health economics, WP3 objectives 1, 4 | Cost effectiveness/economic analysis and economic evaluation | ||
| Identify and cost healthcare resource use items | Yes | ||
| Analysis of individual clinical and EQ-5D-5L data | Yes | ||
| Development of patients’ strata-specific data | Yes | ||
| Probabilistic multistate modelling and application to pathways | Partial | Myeloma complete (data for CLL and FL assembled) | |
| Patient well-being and involvement survey, WP5 objectives 2–3, 5 | Patient experience survey and use of information resources in clinical practice | ||
| Development and testing of patient survey instruments | Yes | ||
| Finalisation of survey instrument and delivery methods | Yes | ||
| Distribution of patient survey instruments and data collection | Yes | ||
| Data processing, reporting and analysis | Yes | ||
| Trial protocol for testing information resources in NHS clinical practice | No | Not completed due to COVID-19 | |
| In-depth exploration of patient experiences: information and treatment decisions, WP1 objectives 2, 5 | In-depth exploration of patient experiences: information and decision-making | ||
| Patient in-depth interviews and analysis | Yes | ||
| Initial focus groups with practitioners | Yes | ||
| Clinical nurse specialist meetings | Yes | ||
| Development of information resources to support treatment decisions, WP4 objective 5 | Development of information resources to support decision-making | ||
| Merging information from all WPs | Yes | ||
| Iterative in-house visualisation and testing of pathway maps | Yes | ||
| Iterative co-design and refinement of information resources with patients and NHS staff | No | Not completed due to COVID-19 | |
| Other | Study approvals (IRAS, REC, HRA, Portfolio status) | Yes | |
| Online study information sites and social media | Yes | ||
| Peer-reviewed publications | Yes | Five published or in press |
Detailed information about HMRN’s configuration, data collection methods and ethics approvals has been published. 27–29 Briefly, set within the former adjacent Cancer Networks of Yorkshire and the Humber & Yorkshire Coast (Figure 1), HMRN combines the expertise of the University of York’s Epidemiology and Cancer Statistics Group (ECSG) with that of a unified clinical network, which is served by a single integrated haematopathology laboratory: the internationally recognised Haematological Malignancy Diagnostic Service (HMDS; www.hmds.info/). As a matter of policy, within HMRN all haematological cancers and precursor conditions (whether originating in the NHS or the private sector, and irrespective of age, prognosis and treatment intent) are diagnosed and coded by haematopathologists at HMDS using the latest International Classification of Diseases for Oncology classification. 28,30 Cited in the Department of Health and Social Care’s Cancer Reform Strategy as ‘the model for delivery of complex diagnostic services’,31 HMDS houses all of the relevant technology and expertise required to diagnose and monitor haematological cancers.
FIGURE 1.
Haematological Malignancy Research Network study area. MDT, multidisciplinary teams.
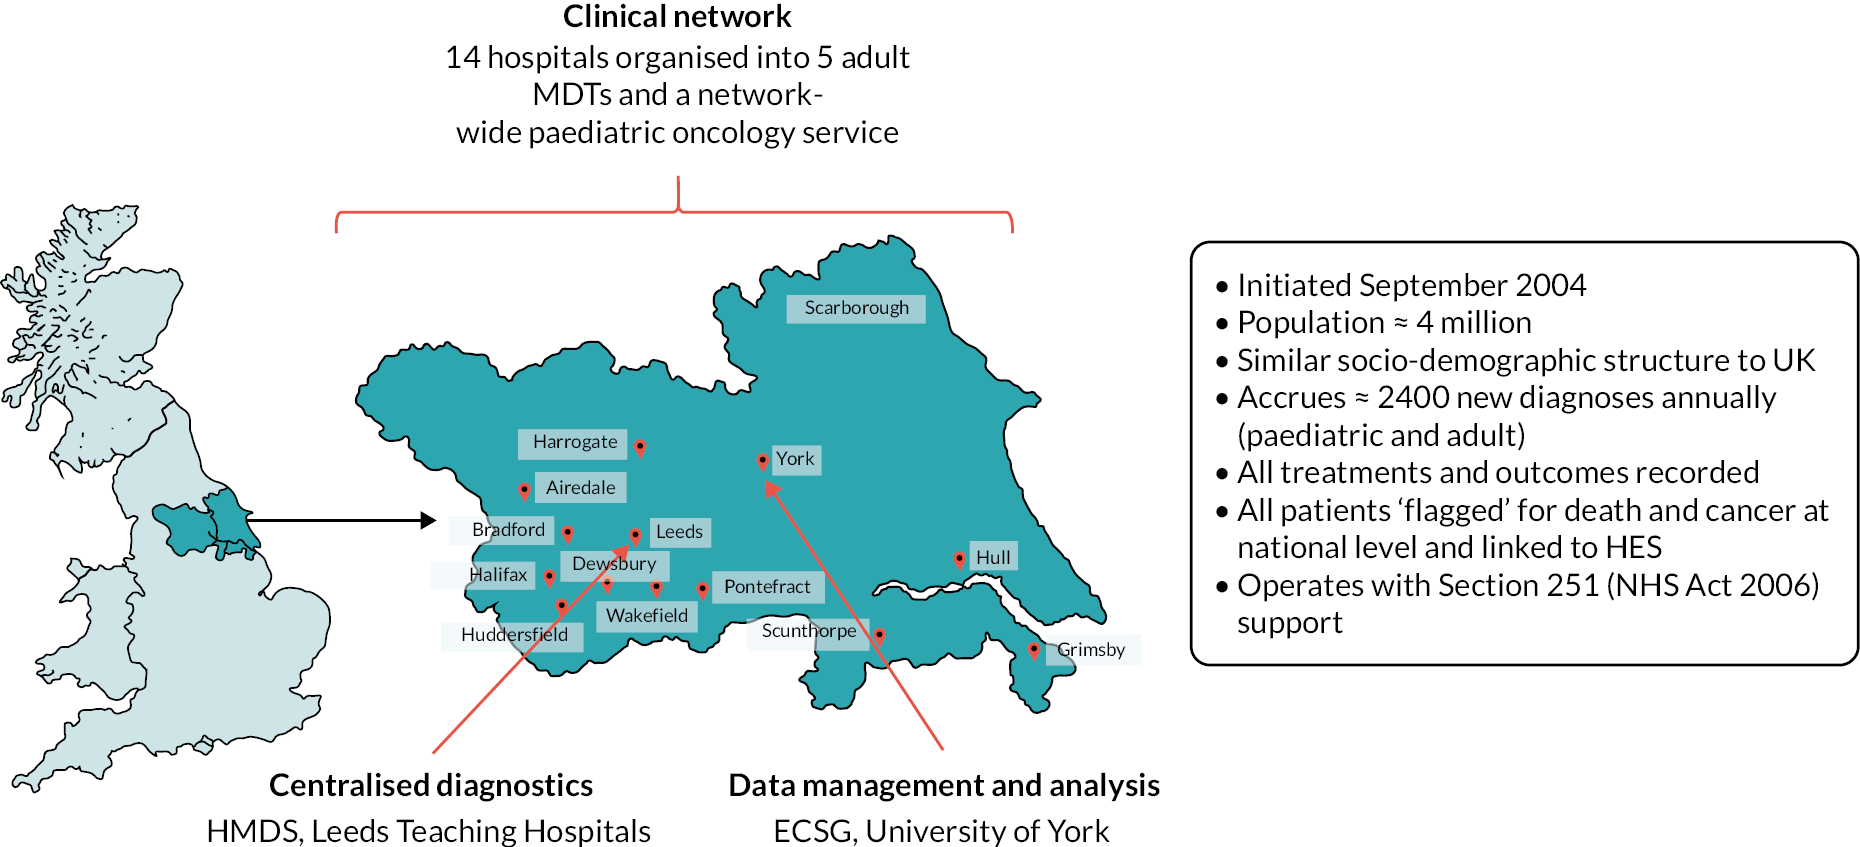
Haematological Malignancy Research Network’s catchment population of ≈ 4 million people has a comparable sex, age, urban/rural and area-based deprivation [Index of Multiple Deprivation (IMD), income domain] distribution to that of the UK as a whole. 27,28 Within HMRN, blood cancer patient care is provided by haematology teams operating across 9 NHS trusts (14 hospitals) organised into 5 multidisciplinary teams (MDTs). Acting as referral centres for other hospitals, Leeds and Hull NHS Trusts are large tertiary centre university teaching hospitals (Figure 1), with Leeds clinicians leading on several national treatment trials and other initiatives involving mature large B-cell cancers (e.g. references32–35). The clinical network works to national guidelines and the representative population-based nature of HMRN’s data means that they are widely used by organisations responsible for evidence-based commissioning, including the National Institute for Health and Care Excellence (NICE), which commented in its updated guidance on haematological cancers36 that ‘due to the incidence of haematological malignancies not being strongly influenced by social position or deprivation the incidence observed in the HMRN data for the Yorkshire region is likely to be representative of the national picture’, and ‘clinical networks within the HMRN area apply standard treatment protocols in the management of haematological malignancies and therefore regional outcomes are also of value in estimating likely survival patterns for England as a whole’.
Patient and public involvement and engagement
Haematological Malignancy Research Network has a strong reputation for meaningful patient and public involvement and engagement (PPIE), which is integral to ensuring that our research addresses areas we know people consider important and relevant to their care. Individuals are routinely involved in all research activities via the Patient Partnership, which was established in 2009 and is overseen by a Partnership Committee, comprising patients, relatives/carers and researchers. Members of the Partnership comprise many hundreds of people who had agreed they could be contacted by the HMRN team for research purposes, including developing and directing studies, as well as providing information via surveys, interviews and focus groups. A smaller group of patients regularly acts as a ‘sounding board’ for HMRN to ensure that our work is patient-centred and our approach is robust. HMRN’s PPIE is a key part of this report, and further programme-specific details can be found in Patient and public involvement and engagement in the programme.
Data infrastructure
Since September 2004, all patients newly diagnosed with a haematological malignancy or related disorder have entered the cohort on the day they are diagnosed (≈ 2500 each year). Around 7 months after diagnosis, ECSG’s research nurses abstract primary source clinical data from NHS medical records (paper and electronic), using procedures detailed in HMRN’s data manual (https://hmrn.org/resources/documentation). Information collected includes blood test results, performance scores, diagnostic imaging (e.g. X-rays, positron emission technology, computed tomography, magnetic resonance imaging) and cancer symptoms. All treatment, management and response data are also collected (e.g. observation/monitoring, initial and subsequent chemotherapy, radiotherapy, stem cell transplant, and supportive and palliative care). Clinical information is subsequently linked to HMDS’s molecular diagnostic and prognostic data. Additional data linkages and abstractions are triggered by changes in state (e.g. disease progression, relapse, treatment initiation, death) and subtype-specific data updates. Since September 2012, the EuroQol-5 Dimensions, five-level version (EQ-5D-5L),37 has been distributed by post to subgroups of patients at specific time points after diagnosis (6 months, 1 year and annually thereafter).
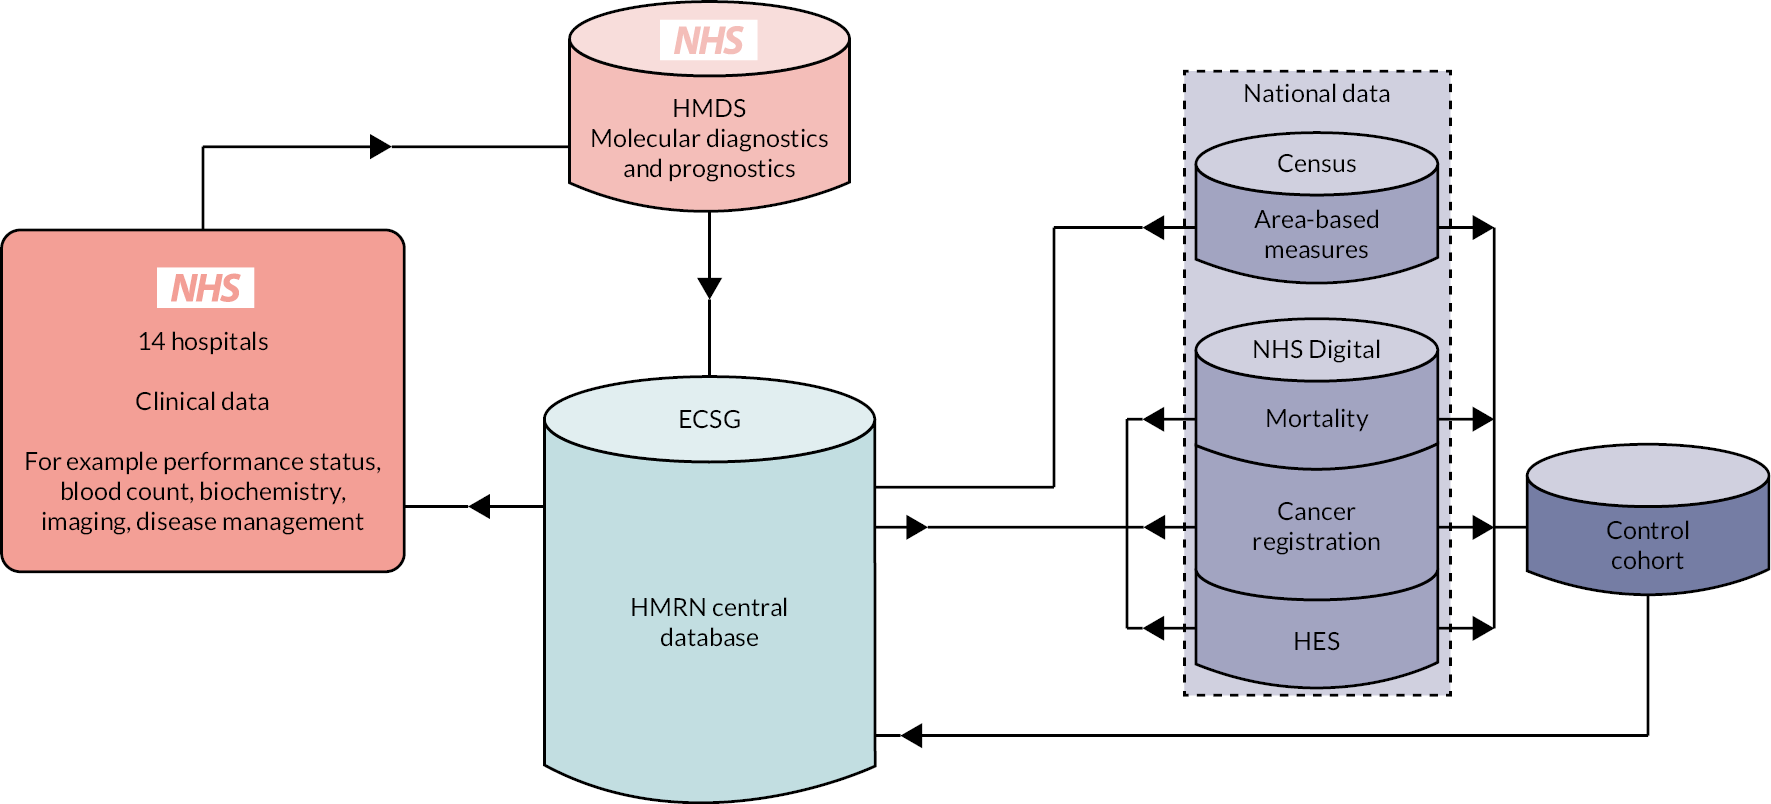
Haematological Malignancy Research Network patients are ‘flagged’ nationally for death and cancer by the Medical Research Information Service and linked by NHS Digital to nationwide health administrative databases (Figure 2). Deaths are notified monthly, and linkages to cancer registrations and inpatient and outpatient HES are notified annually. However, operational changes at NHS Digital following the implementation of the General Data Protection Regulations (GDPR) in May 2018 impacted on certain aspects of WPs 2 and 3 [see Summary of programme alterations, Population-based data and analyses (WP2), Health economics (WP3) and Patient well-being and involvement survey (WP5)].
FIGURE 2.
Haematological Malignancy Research Network’s core data sources and flows.
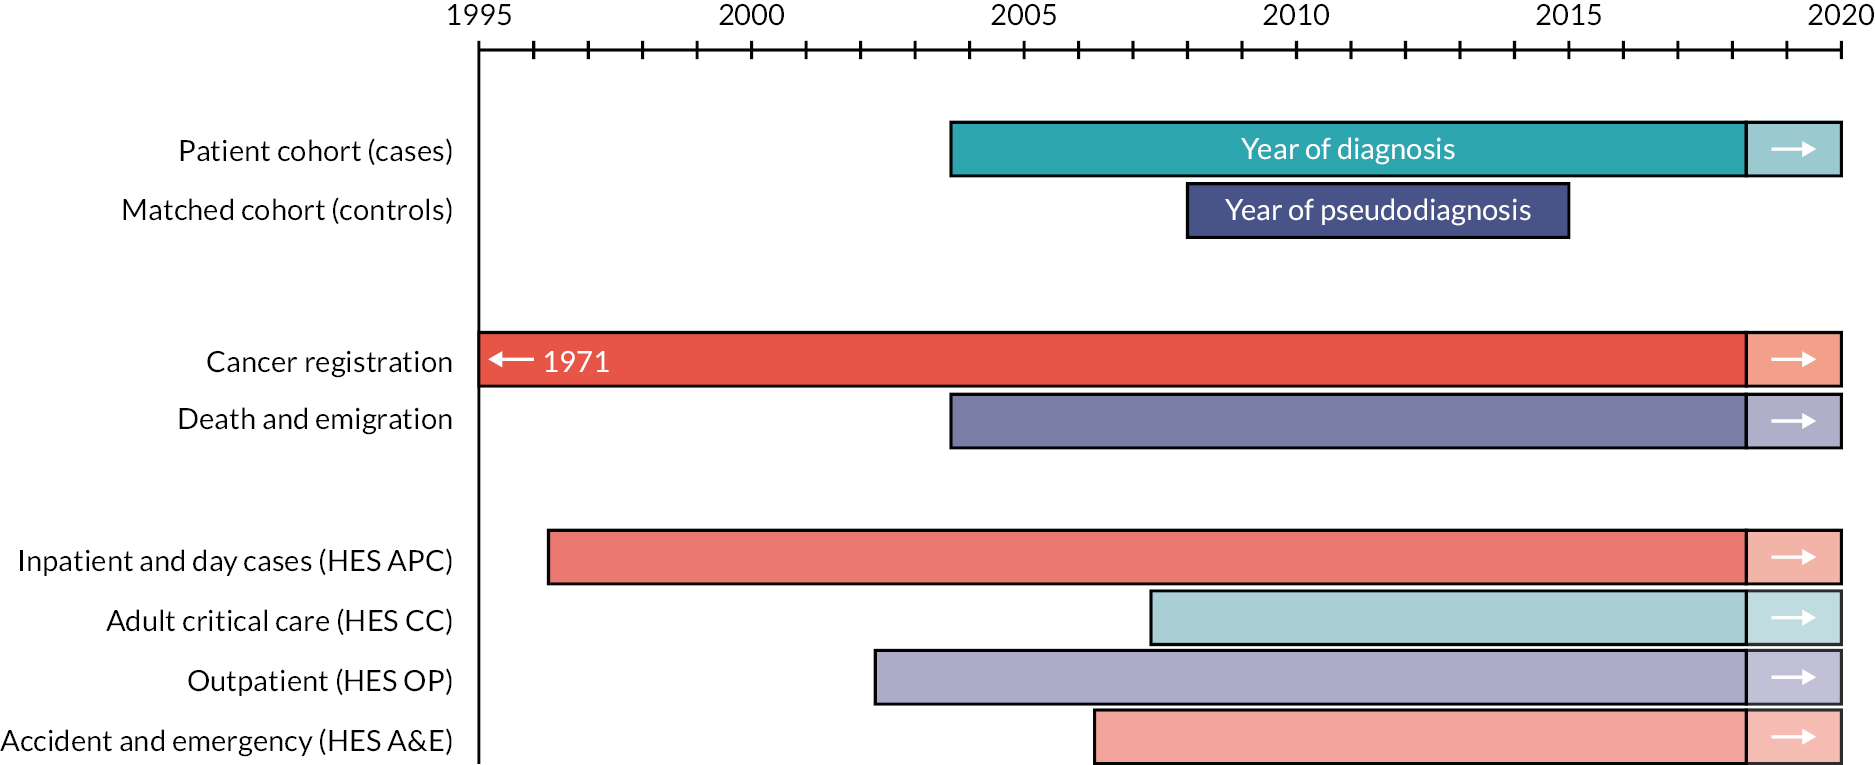
Haematological Malignancy Research Network also contains a general population cohort that is linked by NHS Digital to the same nationwide administrative databases as for members of the patient cohort (Figure 3). This facilitates epidemiological analyses that require comparisons to be made between people with haematological cancers (cases) and those without (controls). For this purpose, each case diagnosed between 2009 and 2015 (n = 18,127) was matched at the point of diagnosis on year of birth and sex to 10 randomly selected controls from the national population-based NHS Central Register by NHS Digital (https://digital.nhs.uk/). All comparison cohort members were resident in the HMRN region when their corresponding case was diagnosed (month/year). Controls were assigned a ‘pseudo-diagnosis’ date that corresponded to their matched case’s date of diagnosis (month and year), and all are linked (with annual updates) by NHS Digital to routinely compiled information on deaths, cancer registrations and HES. The years for which national data are available are summarised in Figure 3.
FIGURE 3.
National data availability: HMRN’s patient and comparison cohorts. APC, admitted patient care.
Research pathway
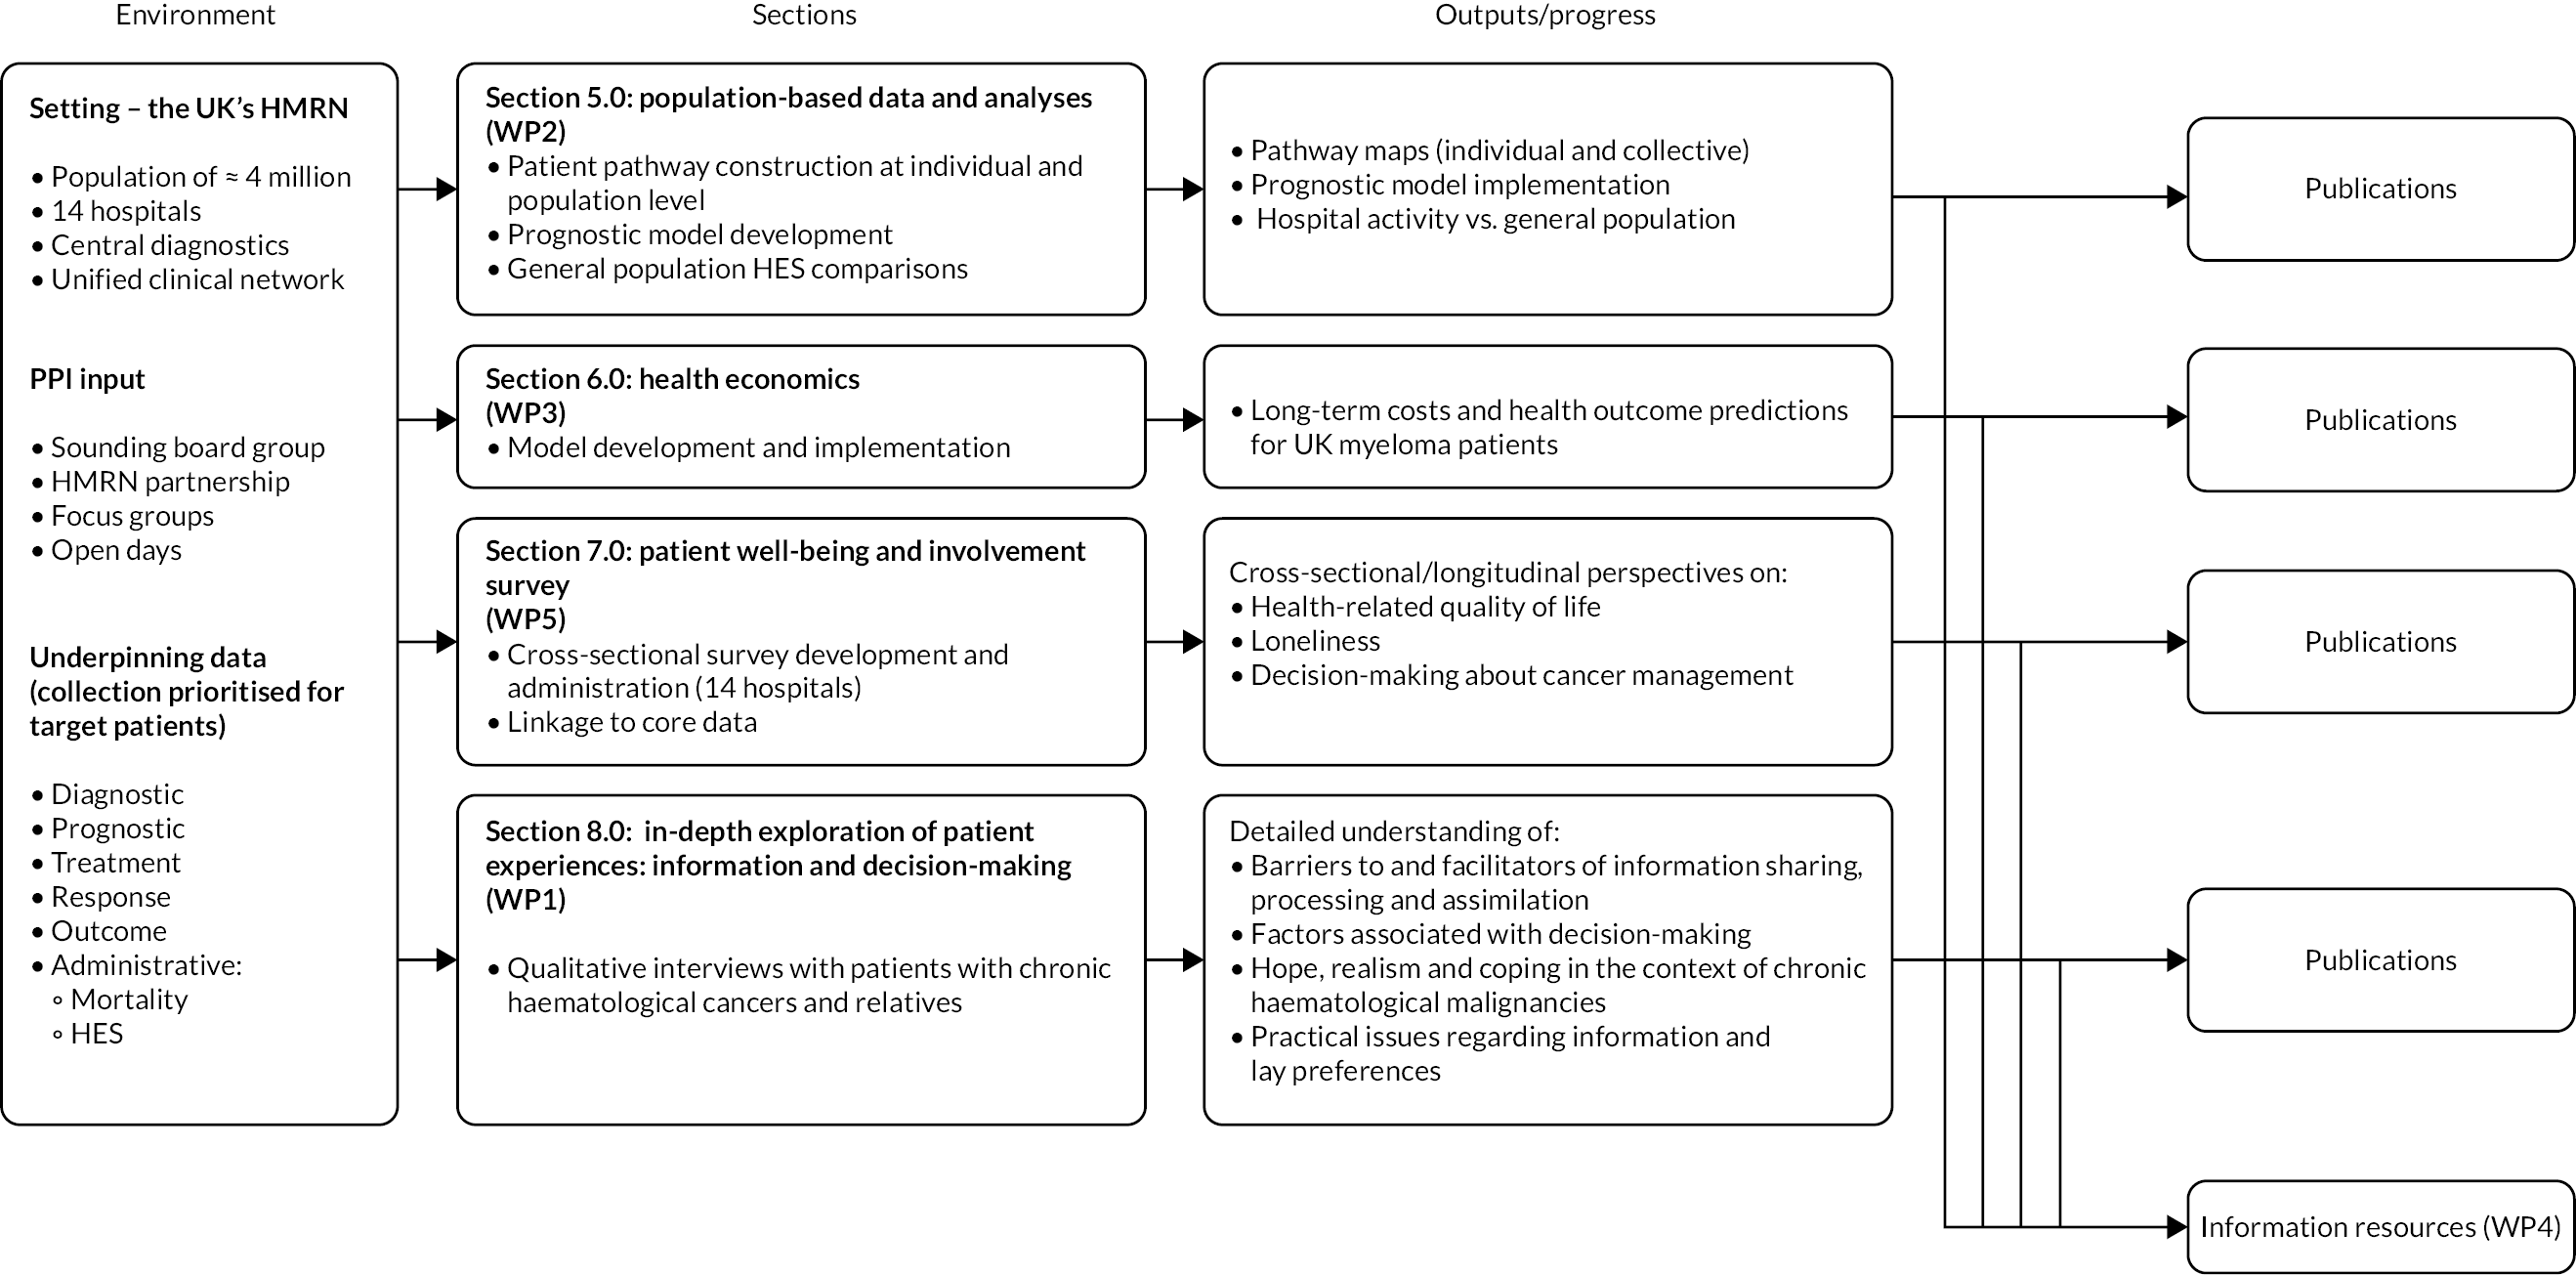
The main interlinked areas of activity are summarised in the research pathway diagram, shown in Figure 4. All activities were predicated on different elements of HMRN’s cohorts. Importantly, the onset of the COVID-19 pandemic in 2020 meant that Development of information resources to support treatment decisions (WP4) had to be curtailed part-way through, which is indicated in Figure 4 by greying-out, and parts of Patient well-being and involvement survey (WP5) could not begin. More information on elements of the programme that were affected is provided in Summary of programme alterations and Table 1.
FIGURE 4.
Research pathway diagram.
Summary of programme alterations
Refinements and changes to the programme were discussed, documented and supported by the Programme Steering Committee (PSC). Programme tasks required to deliver the research and their completion status are summarised in Table 1, which cross-references to Population-based data and analyses (WP2), Health economics (WP3), Patient well-being and involvement survey (WP5), In-depth exploration of patient experiences: information and treatment decisions (WP1) and Development of information resources to support treatment decisions (WP4) and to the original funding application’s interlinked objectives, reproduced below:
-
To develop/deliver patient-specific prognostic information to MDTs for use at diagnosis and key decision points thereafter. Using a range of patient and tumour-related characteristics, models will incorporate financial costs and forecast likely outcomes – including the frequency and duration of hospital inpatient/outpatient episodes, as well as overall and relative survival.
-
To develop improved information resources and timely decision support for use within clinician–patient consultations that will facilitate engagement of the patient and clinicians in shared decision-making, both around the time of diagnosis and at key decision points thereafter.
-
To test the feasibility of introducing patient-specific information resources on patient engagement in decision-making.
-
To provide preliminary models for the longer-term implications of providing evidence-based information (objectives 1–3) for population health outcomes and consequent economic outcomes, as well as the design and commissioning of future national services.
-
To develop accessible information resources suitable for testing in national routine practice.
In line with NIHR guidance, alterations to the programme are briefly discussed here in relation to these five overarching objectives, which thread through the five WPs but do not map directly on to them, each WP having its own defined list of tasks, aims and objectives (see Figure 4 and Table 1).
Alterations to the programme were made in response to four main factors:
-
patient feedback on the survey instrument included in the original application, and piloting of methods and procedures in clinical settings: impacting objectives 2, 3, 5
-
national reorganisation of the Health Research Authority (HRA): impacting objectives 2, 3, 5
-
reorganisations at NHS Digital due to changing data capture methods and implementation of the GDPR (2018): impacting objectives 1, 4
-
the COVID-19 pandemic: impacting objectives 1, 2, 3, 5.
As detailed in Patient well-being and involvement survey (WP5) and Table 1 (and point 1 above), the Patient Experience Survey underpins objectives 2, 3 and 5. A single survey instrument was originally proposed, combining the EQ-5D-5L,38 the Making Good Decisions in Practice: Shared Decision-Making Questionnaire (MAGIC-SDMQ),39–41 and the Control Preference Scale. 42 Following piloting with our patient ‘sounding board’ (see Patient and public involvement and engagement) at the start of the programme, a decision was made to enhance the scope of this WP by splitting the survey into two and modifying its content: questionnaire 1 focusing on QoL and completed pre clinic, and questionnaire 2 targeting treatment decisions and completed post clinic. The development of questionnaire 1 involved appraising various instruments, both generic and specific to chronic haematological malignancies (e.g. European Organisation for the Research and Treatment of Cancer, Quality of Life Questionnaire, Multiple Myeloma-20,43 Myeloma Palliative care Outcome Scale,44 EORTC QLQ-CLL1645 and Functional Assessment of Cancer Therapy – Lymphoma46). Generic measures with simple tick boxes that could be integrated into a single booklet were chosen and used across subtypes. Post piloting, the final version comprised EQ-5D-5L,38 General Anxiety Disorder-7,47 Physical Health Questionnaire-8,48 PHQ-1549 and the University of California, Los Angeles Short Loneliness Scale. 50 Refinements were also made to questionnaire 2 following patient feedback about wording and structure.
Objectives 2 and 5 involved developing and finalising information resources to the extent that these would be suitable for testing in routine NHS clinical practice [see In-depth exploration of patient experiences: information and treatment decisions (WP1); Development of information resources to support treatment decisions (WP4)]. Considerable qualitative data were collected to underpin these objectives, via interviews and initial focus groups, although some alterations were made. First, following preliminary focus groups with clinicians [see Development of information resources to support treatment decisions (WP4)], a decision was made to defer further meetings until information prototypes had been developed in order to facilitate co-working. Second, we closed recruitment after 35 interviews because, guided by the concept of ‘information power’,51,52 our purposeful sampling strategy (in which patients were intentionally selected based on personal/diagnostic characteristics) identified ‘rich’ sources who provided sufficient, relevant data. 53
Affecting all five objectives, directly or indirectly, the delays caused by HRA and NHS Digital reorganisations (2 and 3 above) resulted in a 1-year costed extension (2017) and a further 7-month no-cost extension (2019). Accordingly, the programme ended in June 2020 (total of 55 months). Although this ensured that most of the underpinning tasks occurred (see Table 1), their re-ordering nonetheless had longer-term consequences. Notably, the HRA issue delayed the start of the Patient Experience Survey, which led to patients participating whose core clinical data had not yet been abstracted; and NHS Digital delays meant that administrative data could not be linked to clinical data contemporaneously, as originally planned [see Population-based data and analyses (WP2) and Health economics (WP3)]. In practice, the delays and reordered tasks meant that the final months of the programme were tightly packed with the patient and clinicians focus group meetings required to complete objectives 2, 3 and 5. Unfortunately, however, the COVID-19 pandemic effectively ended the programme prematurely; its rapid onset precluded contingency planning and PSC discussion, although difficulties were outlined in an NIHR survey (May 2020). With further COVID-19 variants and pressures on the NHS, we remained unable to hold further focus groups to develop and finalise the information resources. Research is now required to refine the electronic material for use in MDT and patient settings (see Recommendations for future research).
Population-based data and analyses (WP2)
Most chronic haematological cancers, typified by CLL, FL and myeloma, tend to follow remitting–relapsing courses, with periods of treatment interspersed with monitoring/observation (W&W). Longitudinal data about the pathways of patients with these cancers are lacking, meaning that the number of patients passing through each treatment state (W&W, first-line, second-line, etc.) is unknown, as is the number in each state at any one time. Information about the patterns of healthcare activity (e.g. number of hospital episodes) associated with different clinical management is also scant. Redressing these evidence gaps was one of the major aims of this programme, and this section describes the underpinning work that fed into the other WPs (see Figure 4), as well as the development of prognostic models and visual patient pathway maps.
Patient characteristics and treatment pathways
Baseline characteristics of the 7975 patients newly diagnosed with CLL (n = 3110), FL (n = 1602) or myeloma (n = 3263) within HMRN over 13 years (2004–17) are presented in Table 2. Around half of the diagnoses occurred in patients attending hospitals in Leeds (16.9%), Hull (15.1%), York (10.9%) or Bradford (7.1%); the smallest number occurred in Pontefract (2.0%), usually prior to ongoing management via other Mid-Yorkshire NHS Trust hospitals (see Figure 1 for locations).
| Total, n (%) | CLL, n (%) | FL, n (%) | Myeloma, n (%) | |
|---|---|---|---|---|
| All patients | 7975 (100.0) | 3110 (100.0) | 1602 (100.0) | 3263 (100.0) |
| Diagnostic hospital | ||||
| St James, Leeds | 1349 (16.9) | 442 (14.2) | 273 (17.0) | 634 (19.4) |
| Castle Hill, Hull | 1208 (15.1) | 409 (13.2) | 267 (16.7) | 532 (16.3) |
| York | 868 (10.9) | 305 (9.8) | 198 (12.4) | 472 (14.5) |
| Bradford | 569 (7.1) | 189 (6.1) | 169 (10.5) | 211 (6.5) |
| Pinderfields, Wakefield | 518 (6.5) | 242 (7.8) | 85 (5.3) | 191 (5.9) |
| Diana Princess of Wales, Grimsby | 507 (6.4) | 191 (6.1) | 86 (5.4) | 230 (7.0) |
| Airedale | 488 (6.1) | 226 (7.3) | 73 (4.6) | 189 (5.8) |
| Scunthorpe | 416 (5.2) | 165 (5.3) | 78 (4.9) | 173 (5.3) |
| Huddersfield | 408 (5.1) | 184 (5.9) | 43 (2.7) | 181 (5.5) |
| Harrogate | 400 (5.0) | 183 (5.9) | 65 (4.1) | 152 (4.7) |
| Scarborough | 366 (4.6) | 211 (6.8) | 48 (3.0) | 107 (3.3) |
| Dewsbury | 363 (4.6) | 153 (4.9) | 77 (4.8) | 133 (4.1) |
| Calderdale Royal, Halifax | 352 (4.4) | 125 (4.0) | 120 (7.5) | 107 (3.3) |
| Pontefract | 163 (2.0) | 85 (2.7) | 20 (1.2) | 58 (1.8) |
| Sex | ||||
| Male | 4591 (57.6) | 1951 (62.7) | 747 (46.6) | 1893 (58.0) |
| Female | 3384 (42.4) | 1159 (37.3) | 855 (53.4) | 1370 (42.0) |
| Age at diagnosis (years) | ||||
| < 50 | 476 (6.0) | 114 (3.7) | 212 (13.2) | 150 (4.6) |
| 50–59 | 1130 (14.2) | 415 (13.3) | 327 (20.4) | 388 (11.9) |
| 60–69 | 2131 (26.7) | 844 (27.1) | 484 (30.2) | 803 (24.6) |
| 70–79 | 2570 (32.2) | 1056 (34.0) | 392 (24.5) | 1122 (34.4) |
| ≥ 80 | 1668 (20.9) | 681 (21.9) | 187 (11.7) | 800 (24.5) |
| Median (IQR) | 71.0 (62.1–78.6) | 71.8 (63.2–79.0) | 65.5 (56.3–74.0) | 72.6 (64.1–79.8) |
| IMD 2010 | ||||
| 1 (least deprived) | 1556 (19.5) | 576 (18.5) | 320 (20.0) | 660 (20.2) |
| 2 | 1845 (23.1) | 726 (23.3) | 370 (23.1) | 749 (23.0) |
| 3 | 1586 (19.9) | 622 (20.0) | 324 (20.2) | 640 (19.6) |
| 4 | 1409 (17.7) | 533 (17.1) | 272 (17.0) | 604 (18.5) |
| 5 (most deprived) | 1558 (19.5) | 641 (20.6) | 312 (19.5) | 605 (18.5) |
| Not known | 21 (0.3) | 12 (0.4) | 4 (0.2) | 5 (0.2) |
| First-line management | ||||
| W&W | 4115 (51.7) | 2633 (84.7) | 648 (40.6) | 834 (25.6) |
| Chemotherapy | 3098 (38.9) | 298 (9.6) | 677 (42.4) | 2123 (65.3) |
| Radiotherapy | 280 (3.5) | 3 (0.1) | 234 (14.7) | 43 (1.3) |
| Supportive/palliative | 430 (5.4) | 176 (5.7) | 29 (1.8) | 225 (6.9) |
| Competing comorbidity (observed) | 34 (0.4) | – | 7 (0.4) | 27 (0.8) |
| Awaiting updated follow-up | 18 (–) | – | 7 (–) | 11 (–) |
| 3-year relative survival, % (95% CI) | 78.6 (77.5 to 79.7) | 90.4 (88.8 to 91.8) | 92.6 (90.6 to 94.2) | 59.6 (57.5 to 61.5) |
| 5-year relative survival, % (95% CI) | 70.5 (69.2 to 71.9) | 84.1 (82.0 to 86.0) | 88.1 (85.5 to 90.3) | 47.7 (45.4 to 49.9) |
With a median diagnostic age around 71 years, CLL and myeloma occur more frequently in men than in women. By contrast, with a median age of 65.5 years, FL has a slight preponderance among female patients. No marked trends in deprivation (IMD, income domain) are evident for any of the three diagnostic categories. First-line management, however, varies markedly by diagnosis; 84.7% of CLL patients were monitored by W&W, compared with 40.6% with FL and 25.6% with myeloma. Furthermore, with a 5-year relative survival of 47.7%, patients with myeloma have much poorer outcomes than those with CLL (5-year relative survival 84.1%) or FL (5-year relative survival 88.1%).
As detailed in Background, the pathways of patients with chronic haematological malignancies are characterised by remissions and relapses, with variations seen between individuals with respect to their need for, and response to, different treatment regimens. With a view to quantifying and visualising the data, two software applications were developed during this programme. Using a tree-structured approach, the first produced outputs of the type are demonstrated in Appendix 1, Figures 16–18, which shows the initial treatment lines for patients diagnosed with CLL, FL or myeloma over 2004–10. The diversity is clearly evident; among those initially managed by W&W, 40.6% (419/1031) of patients with CLL, 38.4% (93/242) with FL and 26.5% (90/339) with myeloma were still being managed this way at the end of follow-up (5–11 years later), without having required treatment in the intervening period.
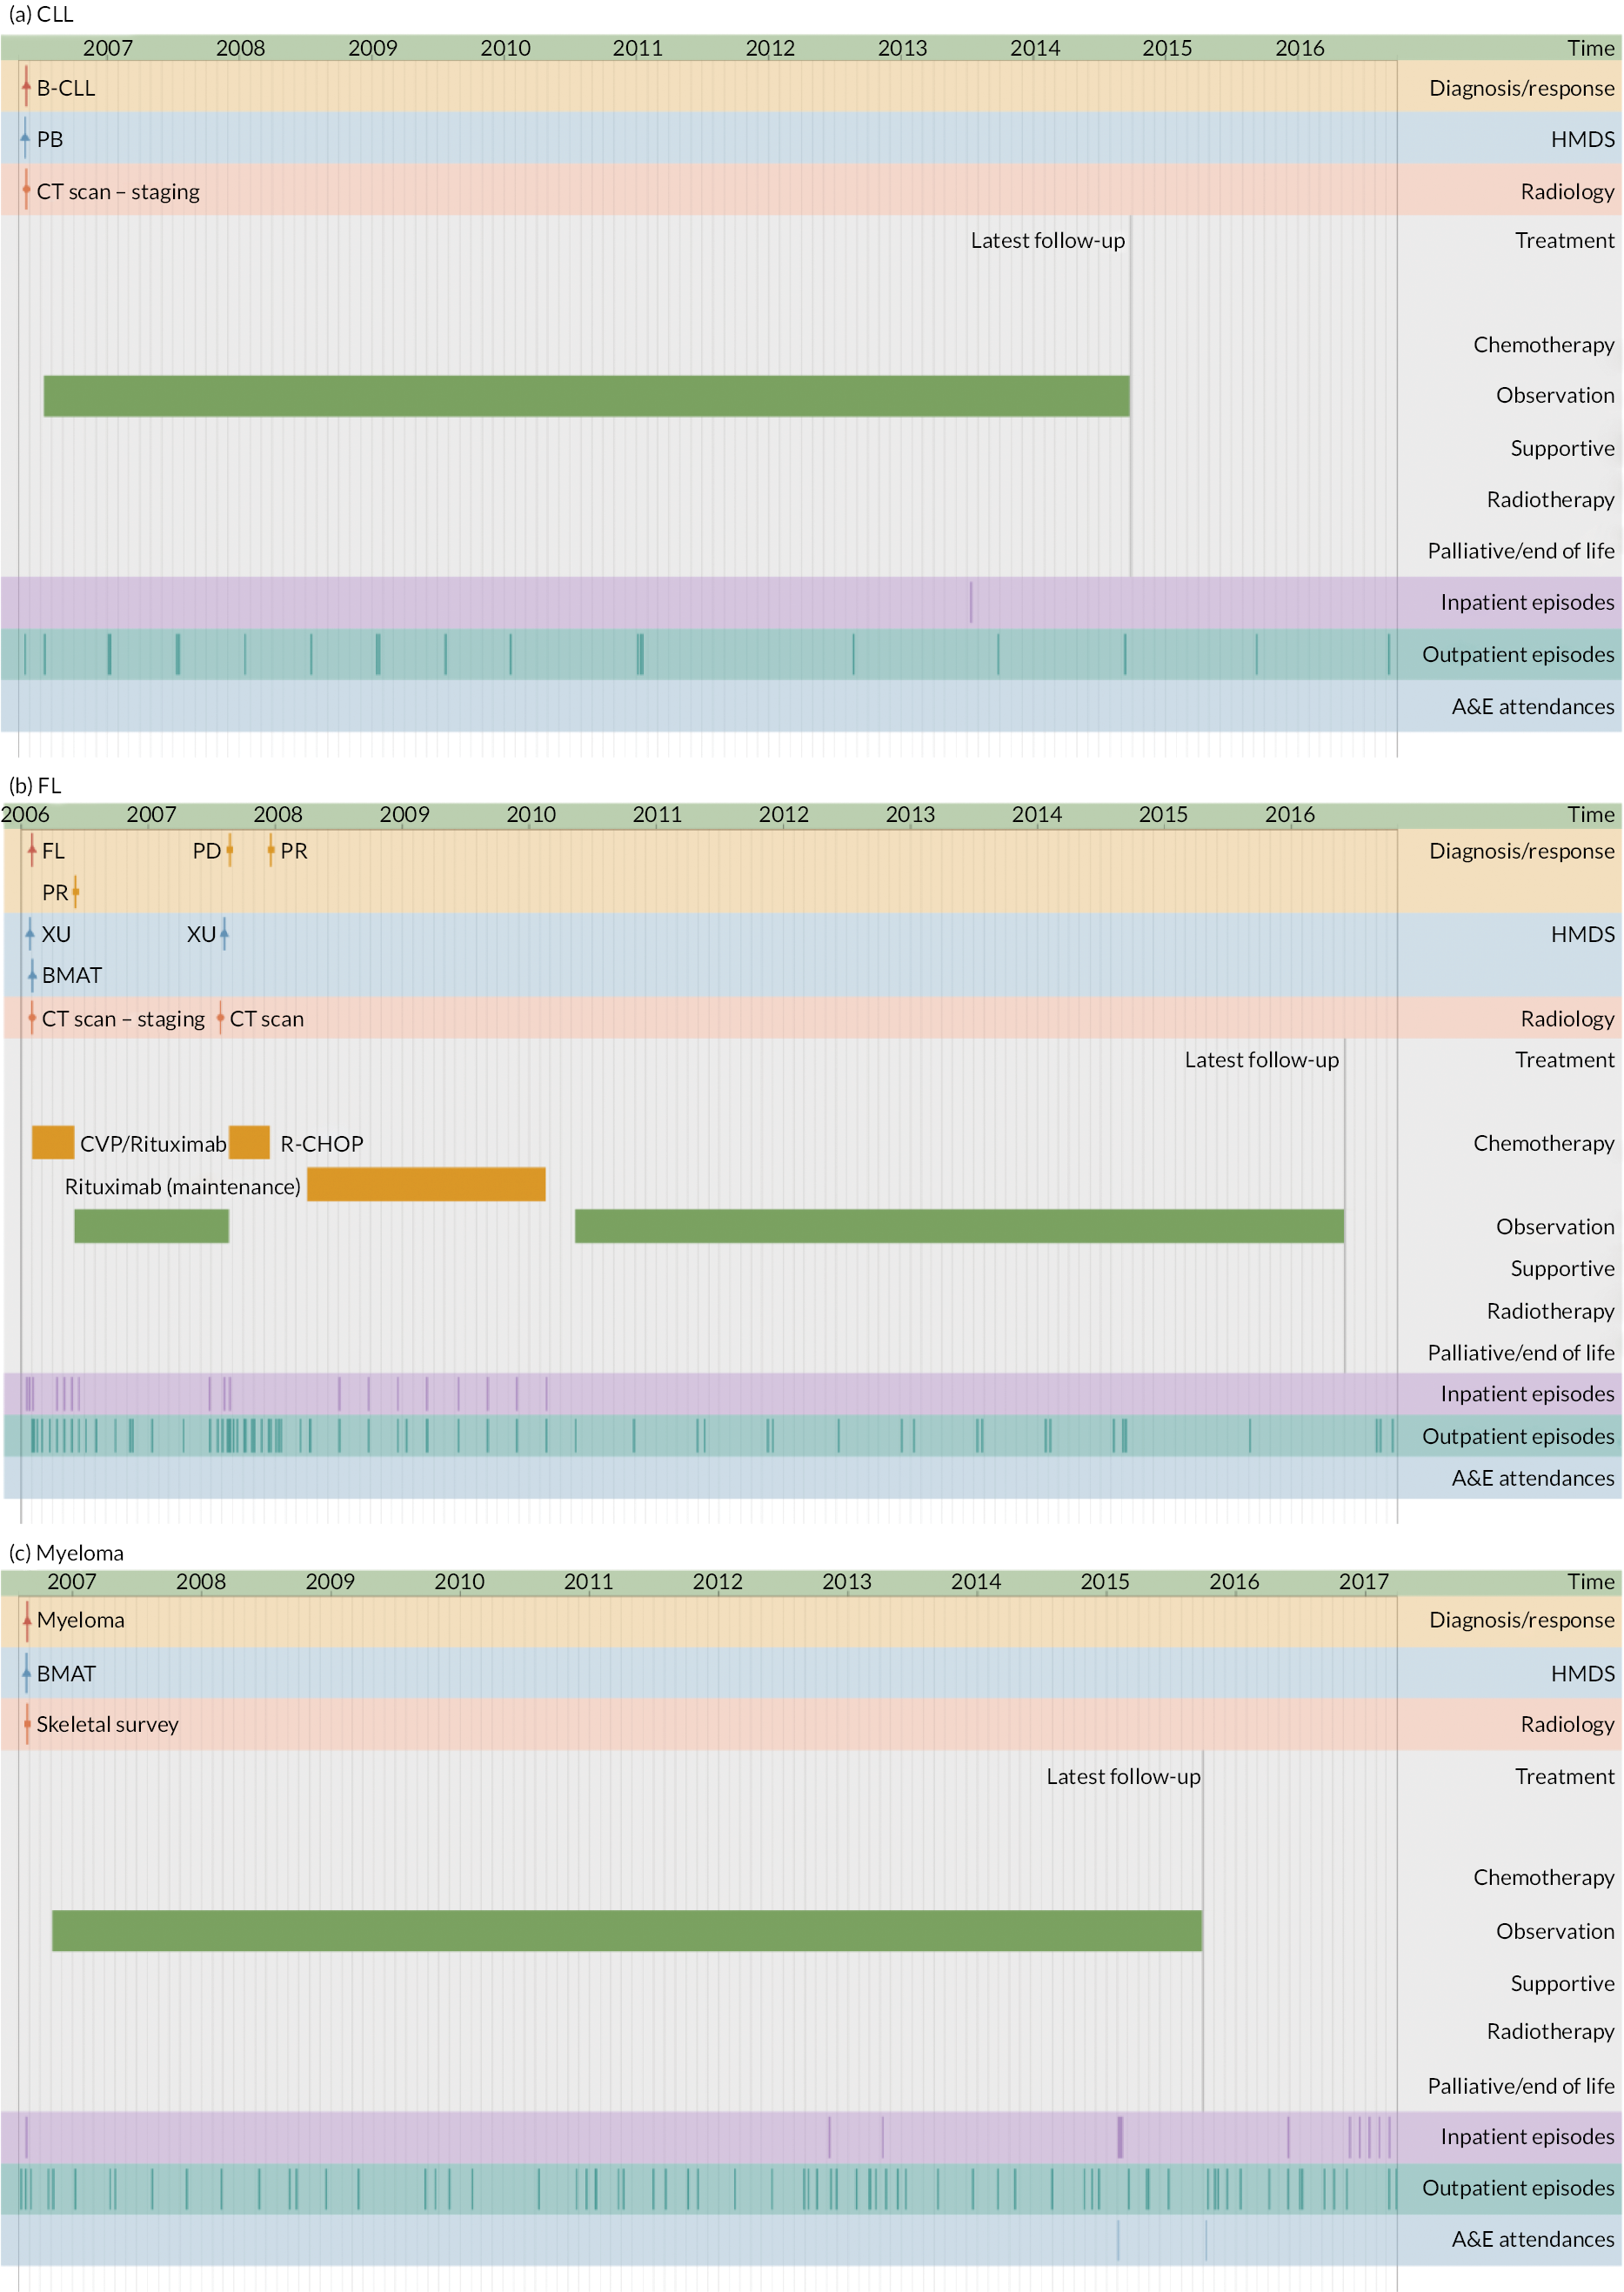
The second application illustrates the multifaceted nature of individual trajectories in more detail (Figures 5–8), showing the ‘real-time’ pathways of six patients with CLL, FL or myeloma in 2006 (Box 1 provides the key). Figures 5–7 depict data for three patients whose disease progressed over a 12-year time frame, resulting in complex trajectories with multiple lines of chemotherapy, clinical trials, stem cell transplant and radiotherapy, alongside intermittent/ongoing supportive care, including blood product transfusions, bisphosphonates and stem cell mobilisers. By contrast, Figure 8 shows the pathways of three patients whose condition remained relatively stable over the same time; these latter were notable for their long periods of monitoring/observation, even when interspersed with chemotherapy. For all pathways, hospital activity (bottom three rows) clearly corresponds with disease status: periods of relapse and treatment, for example, was associated with increased inpatient and outpatient events as well as emergency hospital admissions. These ‘real-time’ visualisations (generation < 1 second) were produced directly from the data via our Patient Pathway Generator, a JavaScript utility developed in-house, specifically within this programme.
FIGURE 5.
Patient diagnosed in 2006 with CLL who survived ≥ 12 years.
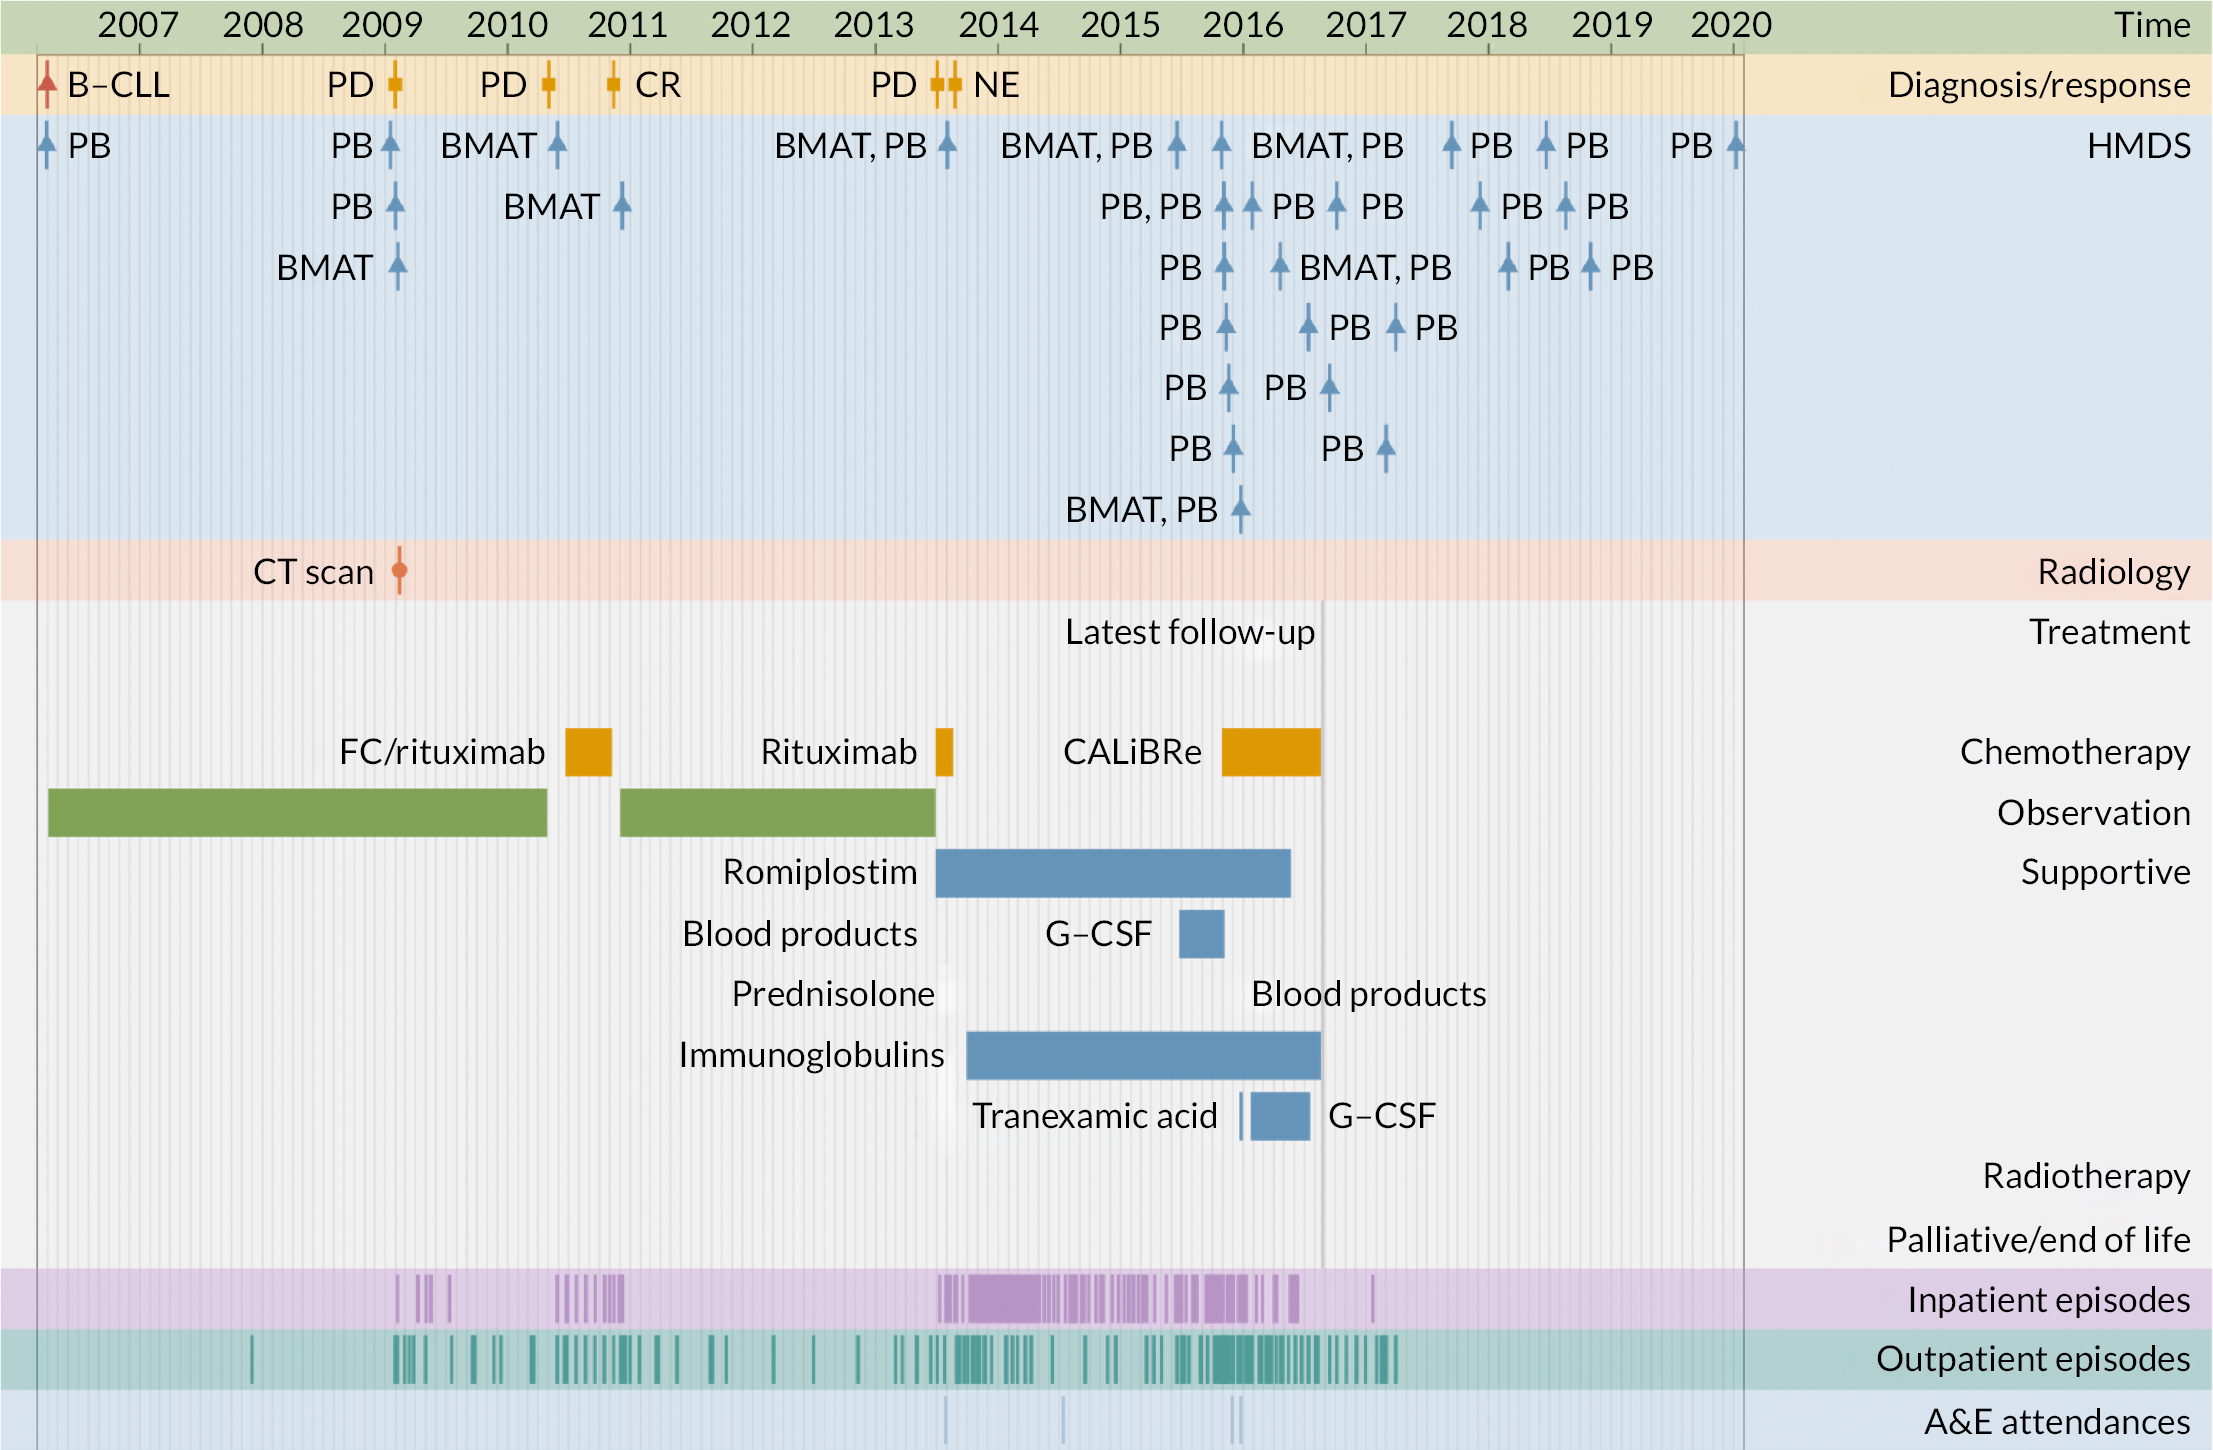
FIGURE 6.
Patient diagnosed with FL in 2006 who survived ≥ 12 years.
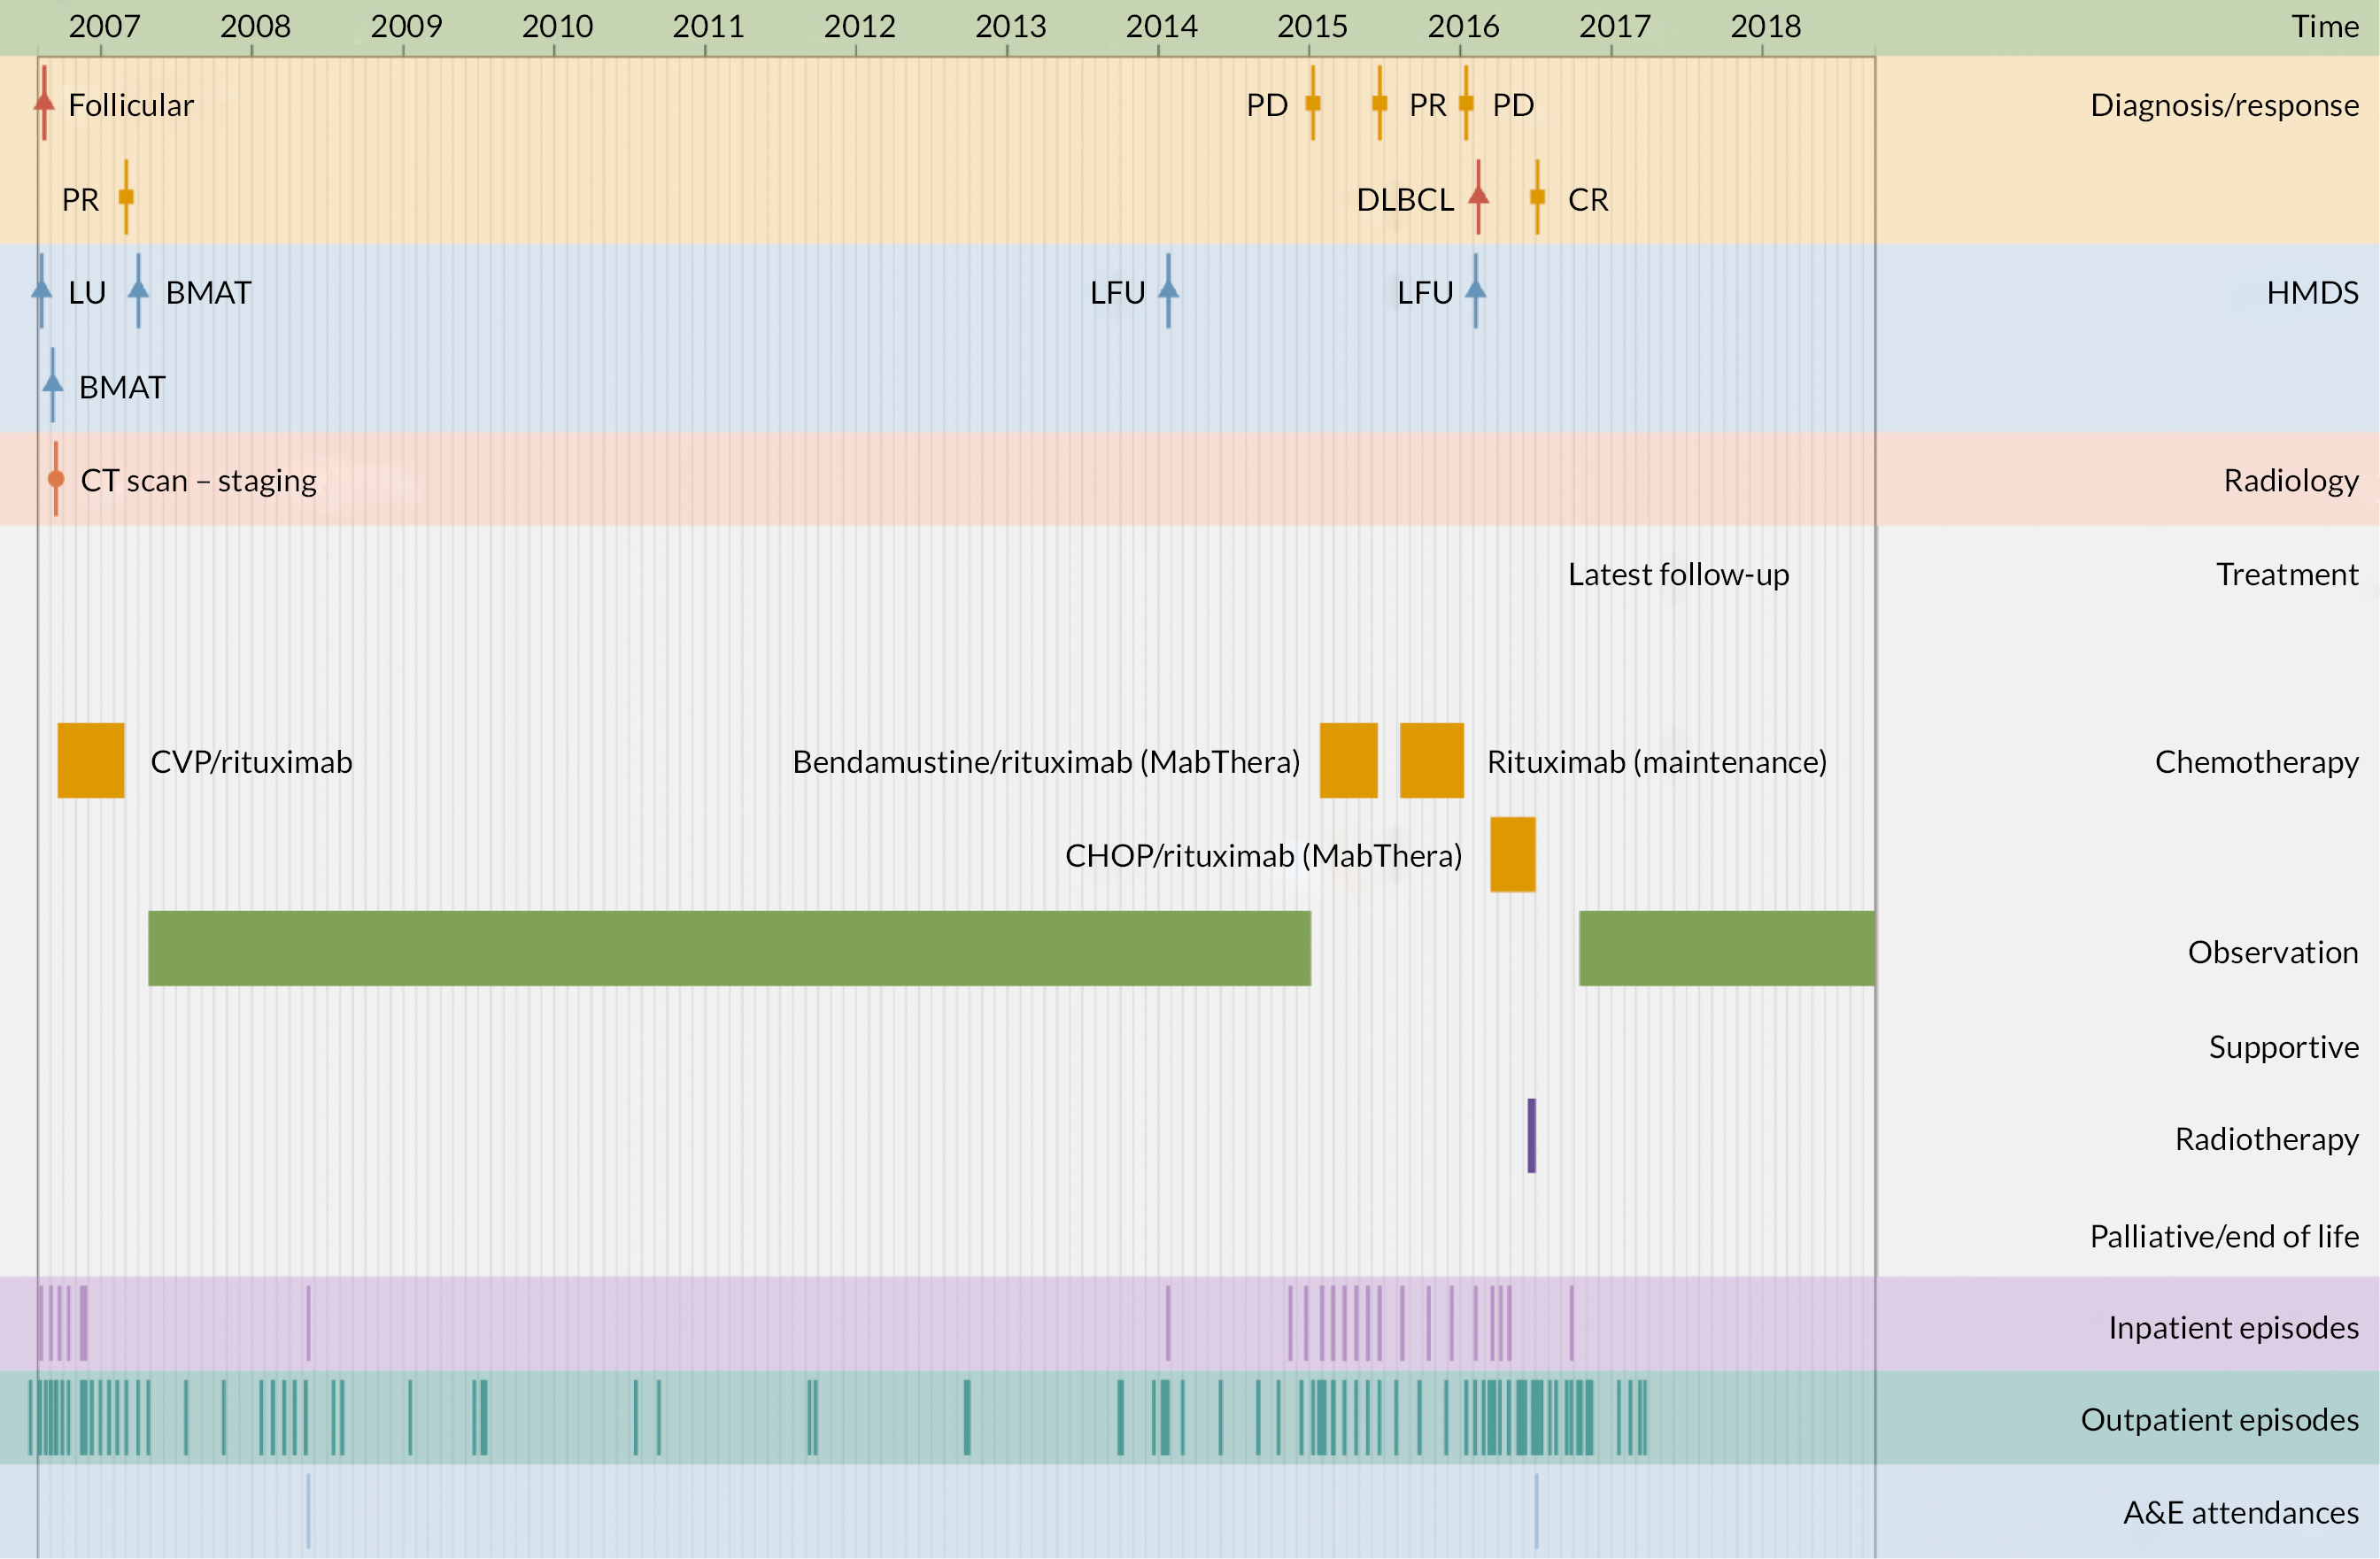
FIGURE 7.
Patient diagnosed with myeloma in 2006 who survived ≥ 12 years.
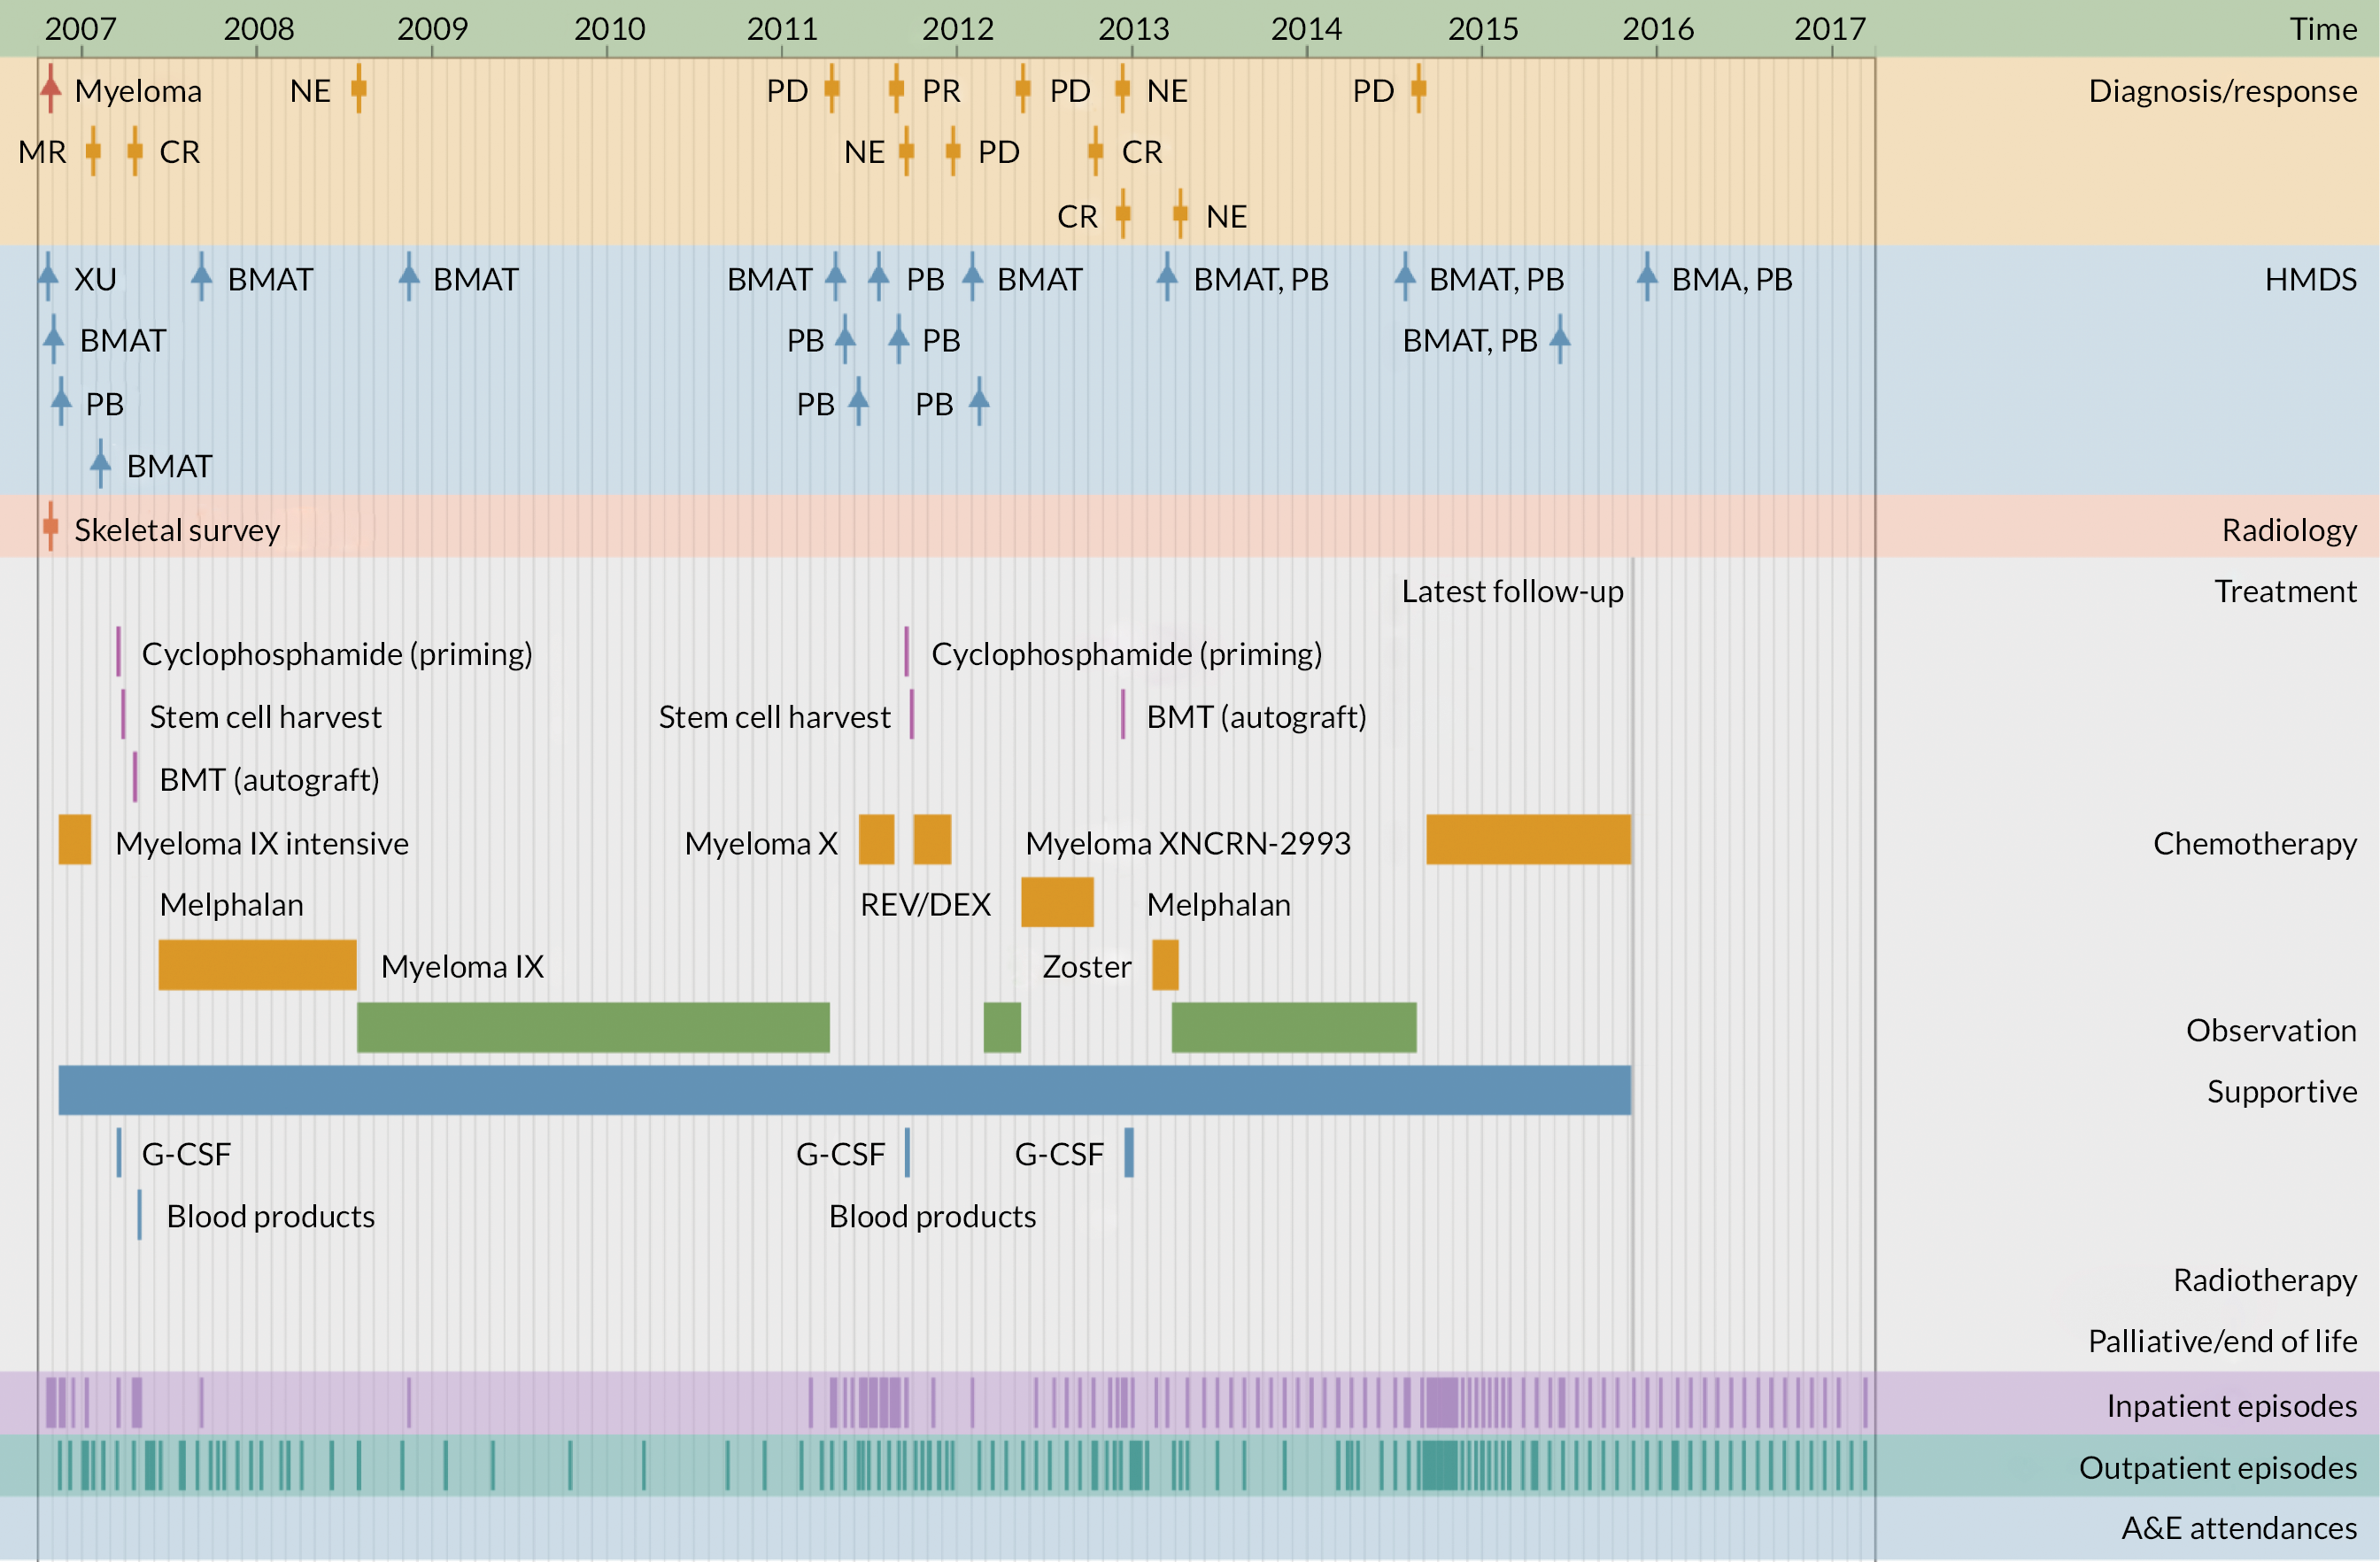
FIGURE 8.
Patients diagnosed in 2006 who survived ≥ 12 years: (a) CLL; (b) FL and (c) myeloma.
| Diagnosis/response | |
| B-CLL | B-cell chronic lymphocytic leukaemia |
| CLL | Chronic lymphocytic leukaemia |
| CR | Complete remission |
| DLBCL | Diffuse large B-cell lymphoma |
| FL/Follicular | Follicular lymphoma |
| MR | Molecular response |
| NE | Not evaluable |
| PD | Progressive disease |
| PR | Partial response |
| HMDS sample | |
| BMA/T | Bone marrow aspirate/trephine |
| LFU | Lymph node biopsy, fixed and unfixed |
| LU | Lymph node biopsy, unfixed |
| PB | Peripheral blood |
| XU | Miscellaneous tissue, unfixed |
| Treatment | |
| CALiBRe | Idelalisib |
| CHOP/R-CHOP | Cyclophosphamide, doxorubicin, vincristine, prednisolone/ rituximab |
| CVP | Cyclophosphamide, vincristine, prednisolone |
| FC | Fludarabine, cyclophosphamide |
| G-CSF | Granulocyte colony-stimulating factor |
| Myeloma IX | Cyclophosphamide, thalidomide, dexamethasone |
| Myeloma X | Bortezomib, doxorubicin, dexamethasone |
| NCRN-2993 | Daratumumab, revlimid, dexamethasone |
| Rev/Dex | Revlimid, dexamethasone |
| SCT | Stem cell transplant |
| Other | |
| A&E | Accident and emergency department |
Population-based analyses and prognostic model development
Traditionally stratifying patients into broad groups based on overall survival, prognostic models are generally designed to predict future outcomes. Commonly used indices for the cancers studied here are the RAI (Risk Assessment Index)54 or Binet55 for CLL, the FL International Prognostic Index (FLIPI) for FL and the International Staging System (ISS), as well as the CRAB (hyperCalcaemia, Renal dysfunction, Anaemia, Bone disease – indicative of end-organ damage) criteria, for myeloma;56 all of these are derived from commonly measured demographic, clinical and laboratory parameters collected within HMRN. As noted in Background, to inform discussions about clinical management at various points on the disease trajectory, we aimed to extend these conventional methods by developing models predictive of outcomes along the pathway. Using maximum data, this programme focused on FL for which, in addition to core information, we generated mutational data for the subset diagnosed 2004–12.
Details of methods, including (1) DNA extraction, sequencing processes and genes on the panel, and (2) the analyses, are now published. 57 In addition to the main findings, the report links to more detailed supplementary figures and tables; genetic data are available from European Genome-phenome Archive. 58 The molecular investigations undertaken in this research determined that aberrant somatic hypermutations played a leading role in the genetic substructure of FL, with a small number of key genetic mutations, including STAT6, having a marked impact on prognosis. However, despite being linked to apparent underlying mechanistic differences, separation of FL according to mutational status provided limited prognostic information in conventionally treated patients.
Hospital activity comparisons with the general population
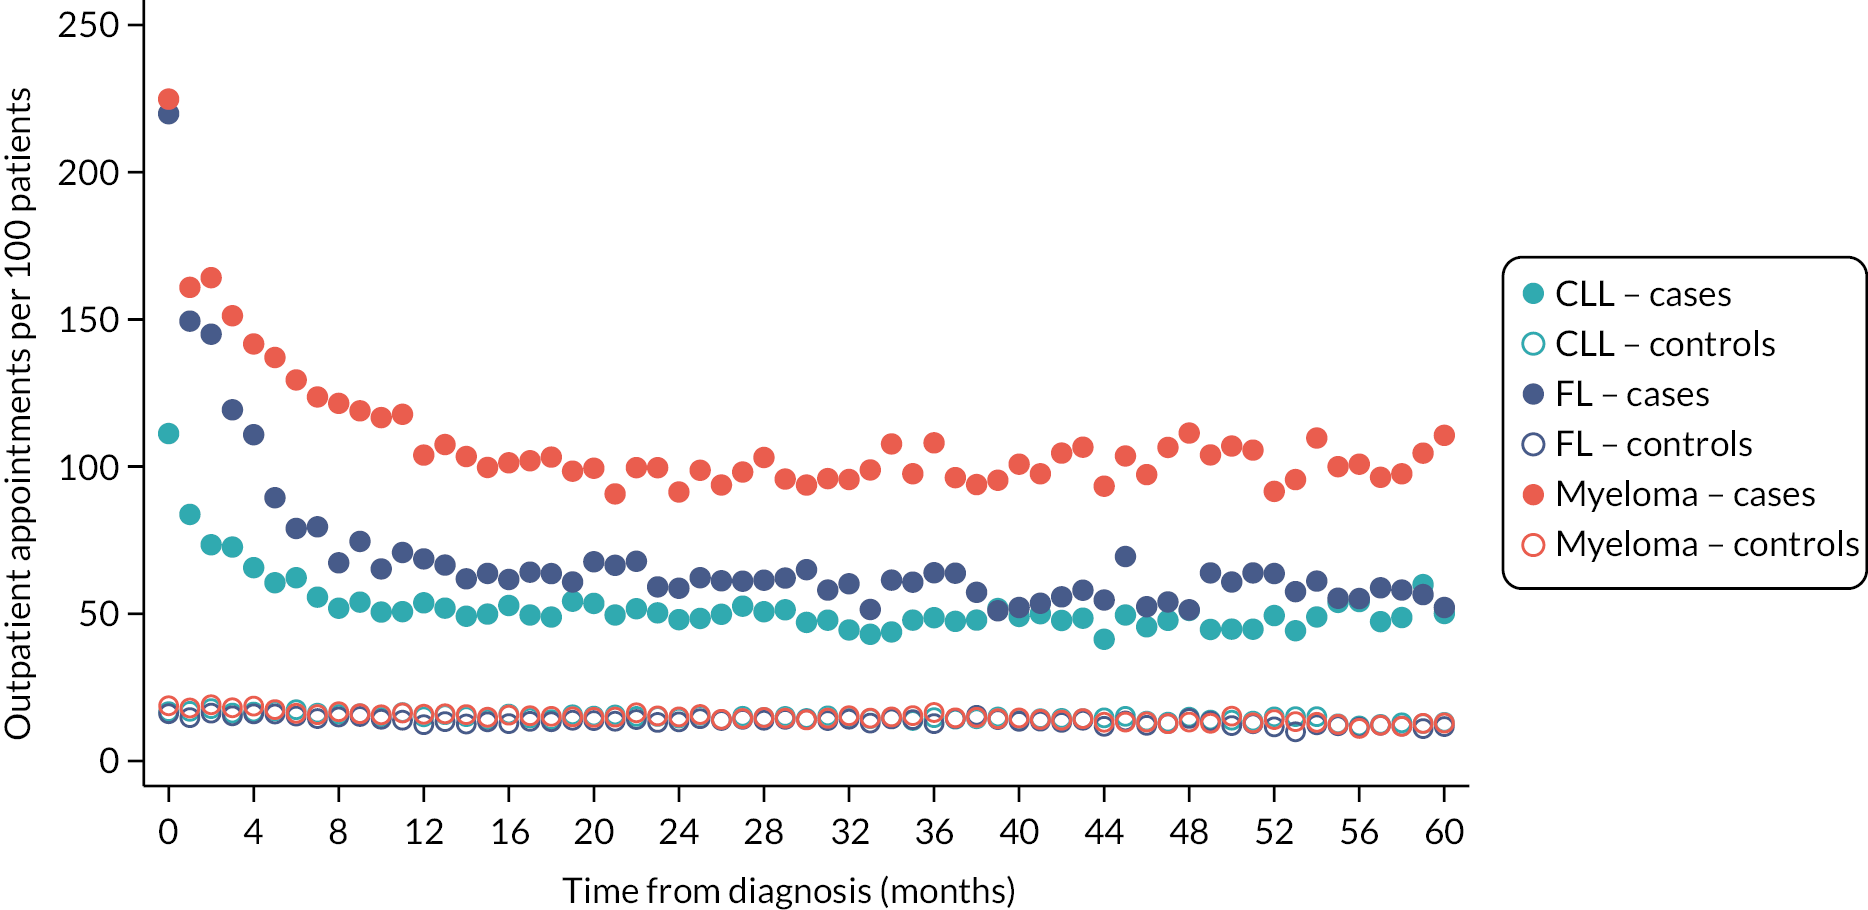
Patients often want to know what difference their diagnosis, or a particular treatment, is likely to make to them, not only in relation to their expected survival, but also in terms of future healthcare needs and QoL. As detailed (see Data infrastructure), HMRN contains a general population cohort (individually matched on age and sex) that was specifically assembled to help answer such questions, allowing mortality and morbidity (cancer and HES) comparisons to be made between groups of people with haematological cancers and groups without. As expected, inpatient and outpatient HES activity among patients following diagnosis is considerably higher than that of their general population counterparts (Figures 9 and 10), the largest differences being seen for myeloma. For all three diagnoses, hospital activity peaks around the time of diagnosis, outpatient activity remaining high but levelling around 12 months after diagnosis, and inpatient activity around 8 months post diagnosis for CLL and 36 months for FL.
FIGURE 9.
Inpatient admissions per month per 100 patients up to 5 years after diagnosis: CLL, FL and myeloma patients diagnosed 1 January 2009–31 December 2015 and their matched controls.
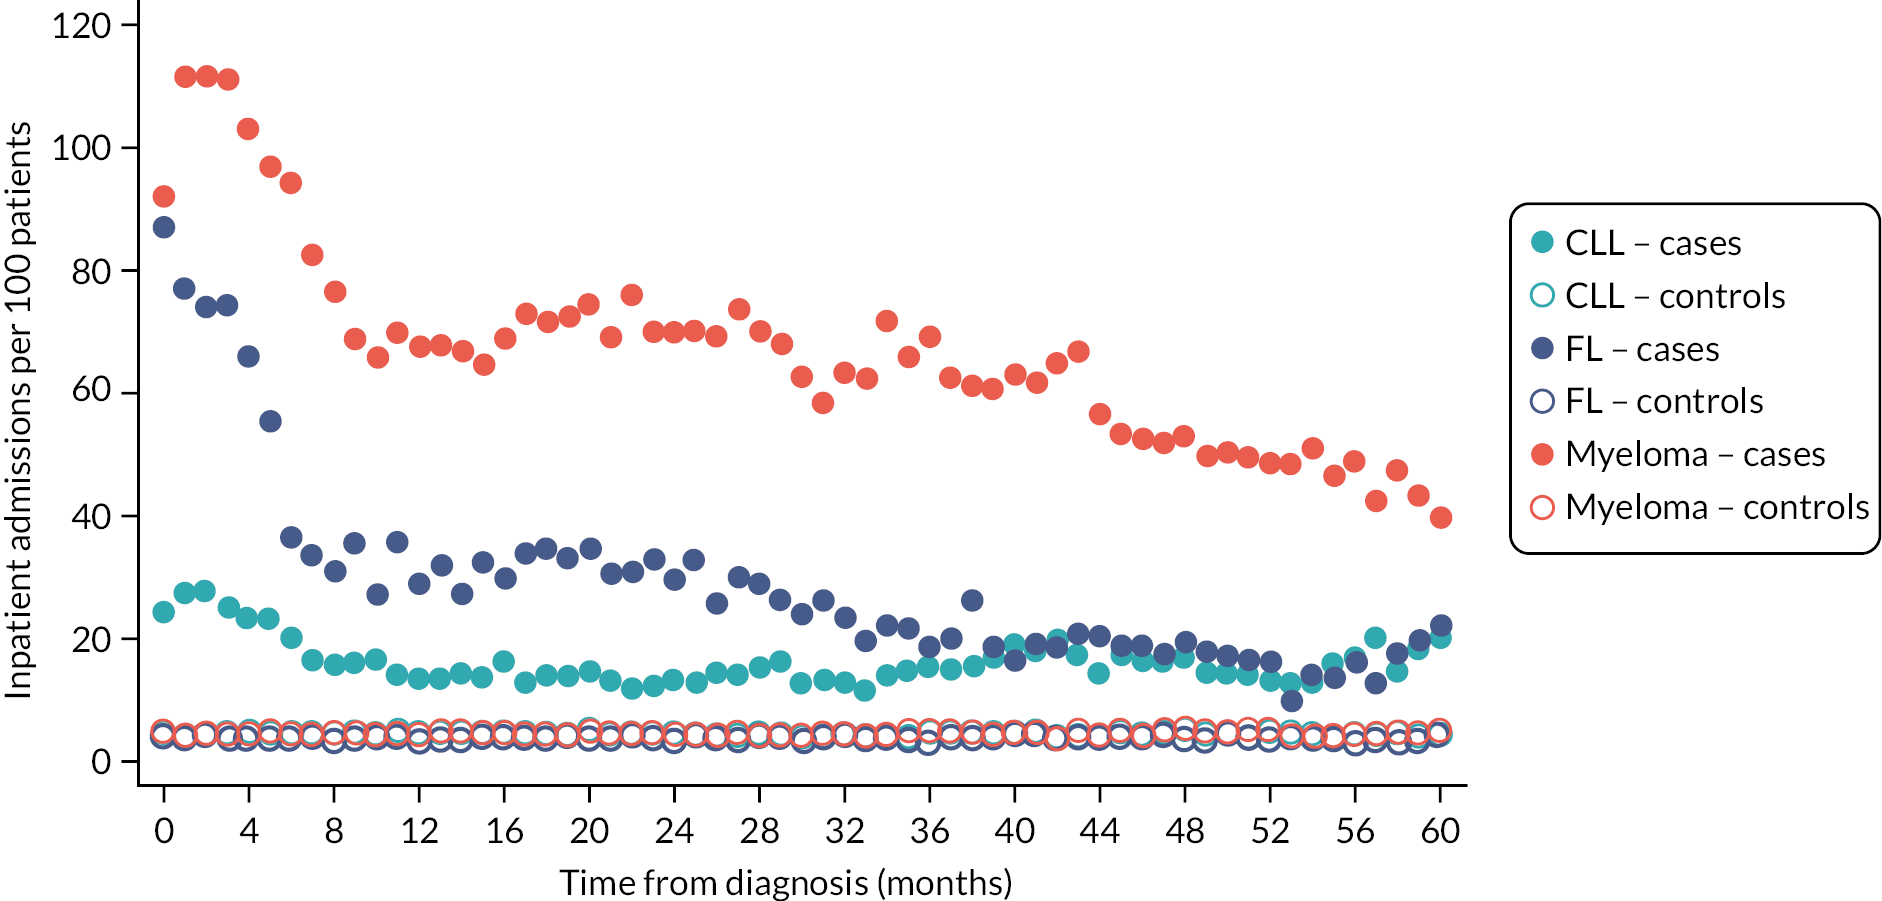
FIGURE 10.
Outpatient appointments per month per 100 patients up to 5 years after diagnosis: CLL, FL and myeloma patients diagnosed 1 January 2009–31 December 2015 and their matched controls.
Health economics (WP3)
Effective healthcare decisions at individual and population levels require information about diagnostic and treatment options, prognostic factors (see Population-based analyses and prognostic models), and potential risks and outcomes (and costs) a person may face due to their choices. In this context, questions about the best study design for collecting and evaluating information about prognostic factors, clinical outcomes, healthcare resource use and costs are often debated. 59 RCTs, which are typically designed to meet licensing (i.e. market-access) requirements, play a central role in evidence-based medicine but have limitations when the objective is to inform Health Technology Assessment (HTA) policy-making. 60 For example, it is well known that clinical practice and healthcare resource availability and use vary considerably between countries (and from study to routine practice), thereby limiting the transferability of the data and evidence generated in one setting to another. 61 Second, many RCTs have shorter follow-up durations than the time horizon policy-makers use when making funding decisions. Accordingly, NICE methods for HTAs stipulate that the time horizon of health economic analyses must capture the long-term impact of the technologies being evaluated,62 which for chronic conditions often coincides with the patient’s lifetime. Third, it is not uncommon for pharmaceutical RCTs involving haematological disorders, particularly those designed to satisfy licensing regulatory requirements, to have a placebo-controlled or single-arm design.
To address these challenges, a number of authors have proposed the use of mathematical modelling60,63 embedded within a decision-analytic framework that uses the available evidence to simulate long-term health outcomes and costs. These models, which have become the mainstream in many HTA jurisdictions, can use well-designed longitudinal population-based registry data to characterise disease natural history, patient outcomes, and costs (see Asaria et al. 64 for examples) and estimate the impact on survival, quality-adjusted life-years (QALYs) and costs of alternative interventions (see references65,66 for examples) using UK-relevant real-world data. Where relevant, these models can also combine evidence from both randomised and non-randomised studies.
Developing a health economics model
Individual-level data were used to derive the parameters to populate a microsimulation model designed to predict the longer-term costs and QALYs of myeloma patients. As detailed in Data infrastructure and Patient characteristics and treatment pathways, in addition to core longitudinal data, HMRN routinely collects individuals’ responses to the EQ-5D-5L (URL: https://euroqol.org/eq-5d-instruments/eq-5d-5l-about/; accessed 15 December 2023), a preference-based generic measure of health-related quality of life (HRQoL) typically used in healthcare economic evaluation studies. 67 Healthcare costs were derived from HES68 and calculated according to national tariff prices. 69 HES data were also used to derive other variables, including the main procedure and diagnosis groups required to estimate the costs for each care episode. The data were then grouped into spells and assigned to a Healthcare Resource Group (HRG), regardless of whether they were disease related or not, to prevent miscount. 70 Finally, the year-specific National Tariffs, a national ‘price list’ paid by commissioners to providers for care delivered, were used to price the spell HRGs. Zero costs were applied where appropriate, reflecting non-use by a non-trivial proportion of the population. All three settings [inpatient, outpatient and accident and emergency (A&E)] were summed for each patient and analysed in a series of cost regression models.
Model conceptualisation and structure
To inform the structure of the model, we followed an iterative process, involving a review of published health economics models’ conceptual structures, their data and assumptions. This was followed by meetings with epidemiologists and clinical experts in this disease area to determine a model structure that had face validity. Since we aimed to predict long-term survival, HRQoL and costs from diagnosis (rather than evaluating a specific technology-related decision problem) we developed a de novo model to represent the treatment pathway, using this to simulate outcomes. After several iterations, we posited the multistate model (MSM) (Figure 11).
FIGURE 11.
Multistate structure describing potential myeloma treatment pathways (individuals can transition between ‘ON TREATMENT’ and ‘OFF TREATMENT’ ≥ 6 times, to reflect HMRN pathways).
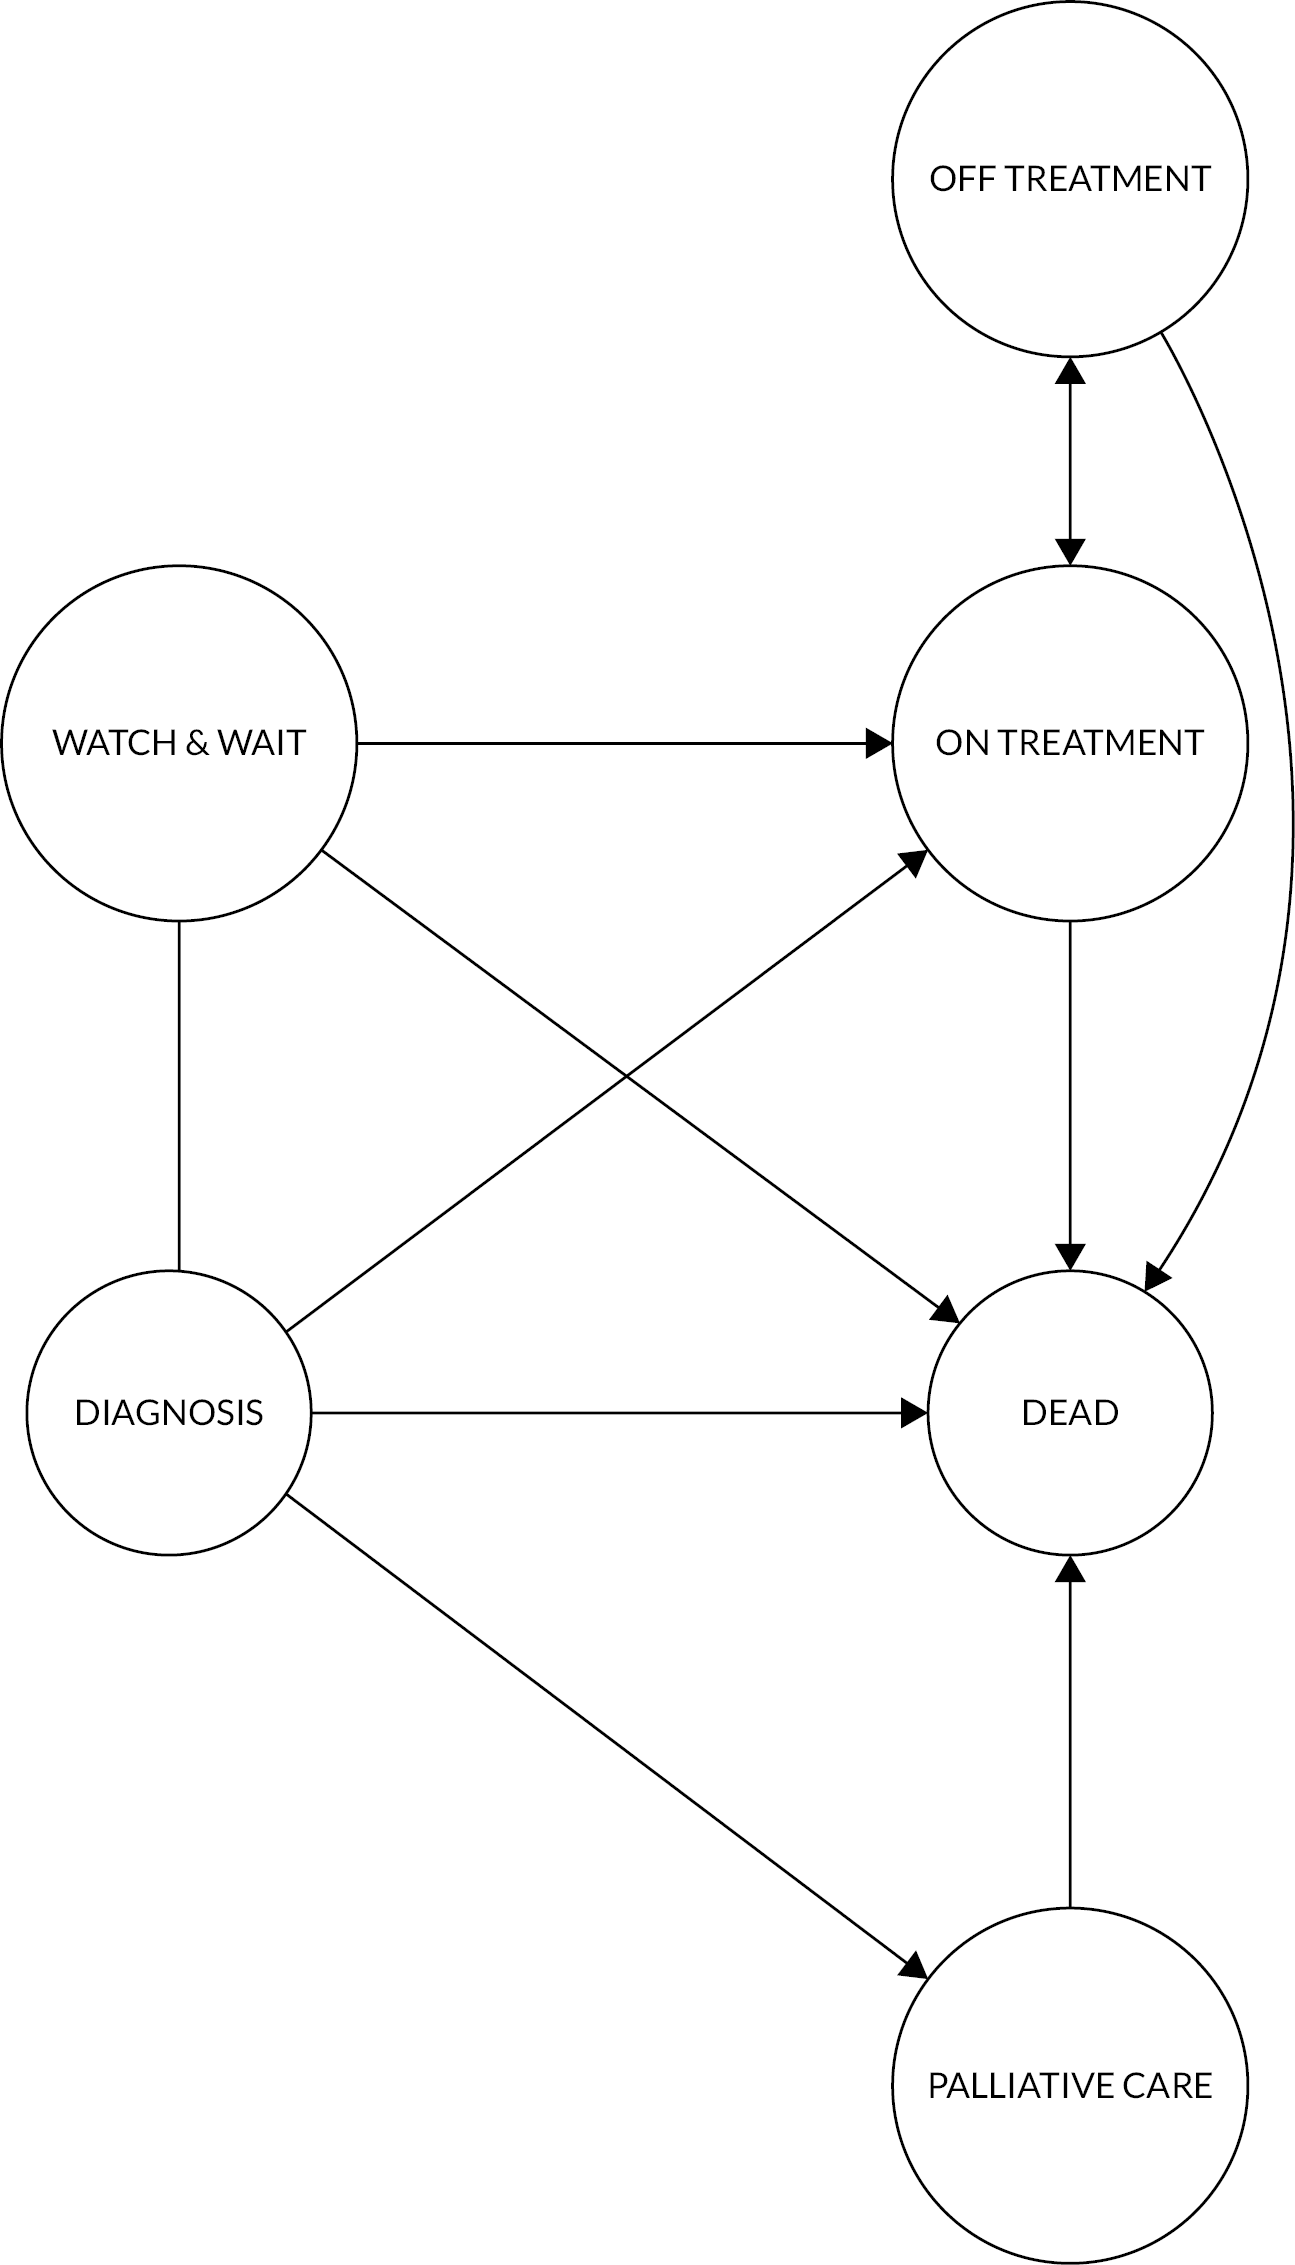
The following description assumes that subjects begin in the DIAGNOSIS state, after which, depending on a range of characteristics, they can be assigned to a W&W strategy if they are non-symptomatic, a PALLIATIVE/SUPPORTIVE MANAGEMENT state if they are too frail, or their disease is too advanced, to receive treatment, or first-line treatment (ON TREATMENT). These transitions are instantaneous, not time-to-event (TTE); thus, W&W, PALLIATIVE/SUPPORTIVE and ON TREATMENT are actual starting states in the model. At any time from W&W, individuals can make one of three transitions: to (first-line) ON TREATMENT (at disease progression/symptoms), remain on W&W, or experience a fatal event (DEATH).
Individuals can transit between ON TREATMENT and OFF TREATMENT for ≥ 6 treatment lines. Once a subject reaches OFF TREATMENT for the sixth time, the only transition allowed is towards the absorbing state (DEATH). Following a transition to OFF TREATMENT, individuals are considered to have responded (i.e. remission and observation, or maintenance) or to be too ill for treatment. The speed of the next transition and the costs and EQ-5D-5L values associated with state membership are informed by individual covariate values (including response status). Individuals in remission are expected to remain OFF TREATMENT longer and be offered second-line treatment if/when they experience progression. Patients remain at risk of death in ON TREATMENT, OFF TREATMENT and PALLIATIVE/SUPPORTIVE states at any time.
Statistical analysis
The trajectories in Figure 11 are governed by parameters estimated using MSM, a generalised framework to describe TTE data, in which subjects may transition between a number of possible states. 71 The R packages mstate71 and flexsurv72 were used to fit a range of models. Several parametric distributions were explored to model the baseline hazard (i.e. exponential, Weibull, Gompertz, log-logistic, log-normal, generalised gamma and generalised F), allowing separate distribution functions for each transition, where appropriate. Model selection was informed by visual inspection against the observed data. Results and predictions were compared against flexible parametric (spline) models. 73 Transitions from a given state were conditional on individual-level covariates (see Appendix 2, Table 10) whose effect was placed on the scale/location parameter of the parametric distribution used to model the TTE, with the analysis conducted on the accelerated-failure time scale. 74
Patients’ costs in each state were modelled as total hospital costs per day, with the analysis of costs for each state using a series of two-part models,75,76 with the first part, usually a logit regression, designed to estimate the conditional probability of observing a zero cost, while the second, often a generalised linear model for continuous outcomes, was designed to estimate the conditional mean cost for those with non-zero costs (see Appendix 2). The conditional mean predicted cost for a model state is derived as the product of these two parts.
Similarly, EQ-5D-5L data were analysed using a series of two-part beta-based regression models;77 the first part (usually a logit regression) estimated the conditional probability of observing a value of 1 (i.e. ‘full health’), and the second estimated the conditional mean value for those with a score of < 1. The product of the two conditional mean predictions produces an estimate of the conditional mean EQ-5D-5L for a given patient’s profile. The beta distribution used is a natural choice for this outcome variable given its ability to model left-skewed, heteroskedastic, bounded variables. Extensions of this approach that use a mixture of beta distributions have been proposed recently. 78
The multiple imputation79 by chained equation method as implemented in the R package mice80 was used in equations that included prognostic scores where component data could be missing.
Predicting longer-term costs and health outcomes of United Kingdom myeloma patients
The microsimulation model mimics the potential treatment pathway of a myeloma patient, predicting their survival, costs and QoL. The model comprises an individual-level discrete events simulation (see Appendix 2, Figure 19). Model predictions are obtained by drawing individuals from a synthetic cohort (see Appendix 2, Table 11) designed to match the observed data, propagating each synthetic individual through the simulation model, where her or his characteristics are combined with input parameters derived from the TTE, costs and EQ-5D-5L regressions described in Results. A description with an example of how TTE, EQ-5D-5L and costs are derived for a given patient profile are given in Boxes 2 and 3 (see Appendix 2). The model was evaluated over the expected maximum individual lifetime horizon of approximately 30 years.
The model reflects the variability that can be ascribed to heterogeneity and stochastic uncertainty at the present. Heterogeneity is the systematic variation in the value of the parameters used to predict individual-specific trajectories and outcomes. Stochastic uncertainty, on the other hand, refers to random variability in the model outcomes between identical patients that is caused by the fact that TTE for each individual is predicted combining the random draws from the TTE distributions with risk equations estimated in the MSM. 81
Results
The findings described below are based on 2687 patients diagnosed with myeloma between September 2004 and December 2015 and followed up until December 2017.
Time-to-event analyses
The results of the MSM regressions for a subset of transitions are reported in Table 3, namely transitions from W&W towards ON TREATMENT (first line) and DEATH, from ON TREATMENT towards OFF TREATMENT (post treatment line 1) and DEATH, and from OFF TREATMENT (post treatment line 1) towards ON TREATMENT (line 2) and DEATH.
| W&W | ||||||
| W&W → TREATMENT | W&W → DEATH | |||||
| Β | SE [β] | Β | SE [β] | |||
| μ | 0.125 | 0.768 | m | 8.154 | 0.611 | |
| Q | 0.639 | 0.210 | Q | 0.0069 | 0.086 | |
| σ | −3.732 | 1.461 | s | 0.430 | 0.194 | |
| Gender (male) | 0.074 | 0.149 | Gender (male) | −0.071 | 0.122 | |
| Age (years) | 0.005 | 0.008 | Age (years) | −0.074 | 0.008 | |
| ISSb | ||||||
| II | −0.163 | 0.226 | II | −0.492 | 0.161 | |
| III | −0.232 | 0.292 | III | −0.932 | 0.189 | |
| CRAB (yes) | −0.237 | 0.186 | CRAB | −0.392 | 0.157 | |
| ON TREATMENT (transition from treatment line 1) | ||||||
| ON TREATMENT → OFF TREATMENT | ON TREATMENT → DEATH | |||||
| β | SE [β] | β | SE [β] | |||
| γ 0 | −3.030 | 0.313 | γ 0 | 1.795 | 2.320 | |
| γ 1 | 0.485 | 0.101 | γ 1 | 1.971 | 0.638 | |
| γ 2 | −0.959 | 0.044 | γ 2 | 0.237 | 0.277 | |
| γ 3 | 1.053 | 0.047 | γ 3 | −0.536 | 0.613 | |
| γ 4 | – | – | γ 4 | 0.669 | 0.533 | |
| γ 5 | – | – | γ 5 | −0.375 | 0.176 | |
| Regime | Regime | |||||
| Thalidomide | 0.092 | 0.059 | Thalidomide | −0.161 | 0.235 | |
| Melphalan | 0.111 | 0.077 | Melphalan | 0.105 | 0.297 | |
| Bortezomib | 0.075 | 0.089 | Bortezomib | −0.813 | 0.451 | |
| OFF TREATMENT (transitions from OFF TREATMENT post line 1) | ||||||
| OFF TREATMENT → ON TREATMENT | OFF TREATMENT → DEATH | |||||
| β | SE [β] | β | SE [β] | |||
| γ 0 | 0.440 | 0.492 | ||||
| γ 1 | 1.090 | 0.138 | ||||
| γ 2 | 0.030 | 0.024 | ||||
| γ 3 | 0.089 | 0.071 | μ | 0.193 | 0.266 | |
| γ 4 | −0.509 | 0.134 | Q | −0.938 | 0.206 | |
| γ 5 | 0.482 | 0.097 | σ | 1.187 | 0.032 | |
| Radiotherapy | 0.352 | 0.127 | Radiotherapy | 0.929 | 0.366 | |
| Response | −0.394 | 0.095 | Response | 2.099 | 0.232 | |
| Palliative care | ||||||
| PALLIATIVE CARE → DEATH | ||||||
| β | SE [β] | |||||
| μ | −4.849 | 1.026 | ||||
| Q | 0.352 | 0.189 | ||||
| σ | 0.416 | 0.054 | ||||
| Age (years) | 0.038 | 0.013 | ||||
Transition times from W&W followed a generalised gamma distribution, while transition times from ON TREATMENT were modelled using a flexible parametric spline model. OFF TREATMENT transition times were modelled using a flexible parametric spline model (towards ON TREATMENT) and a generalised gamma (towards DEATH). Transition times from PALLIATIVE/SUPPORTIVE were modelled using a generalised gamma.
Each regression model uses different covariates (see Table 10), as reported in Table 3. Results are reported on the log-time scale and coefficients should be interpreted as having an additive impact on log TTE. For instance, transition from W&W to ON TREATMENT shows that older people (on average) have a marginally longer time to first treatment, as do males. Increased CRAB features and ISS are associated with shorter transition times towards ON TREATMENT, and age, ISS and CRAB were predictors of shorter transition from W&W to DEATH.
When ON TREATMENT, all regimens were associated with longer time towards OFF TREATMENT. Transition times towards DEATH (from ON TREATMENT) were shorter for two regimens. On average, individuals OFF TREATMENT experienced longer times to the next ON TREATMENT state, and DEATH, when receiving radiotherapy during that state. Similarly, those who responded to chemotherapy had shorter times to the next ON TREATMENT and considerably longer survival. Finally, for PALLIATIVE/SUPPORTIVE, age was associated with longer time to DEATH.
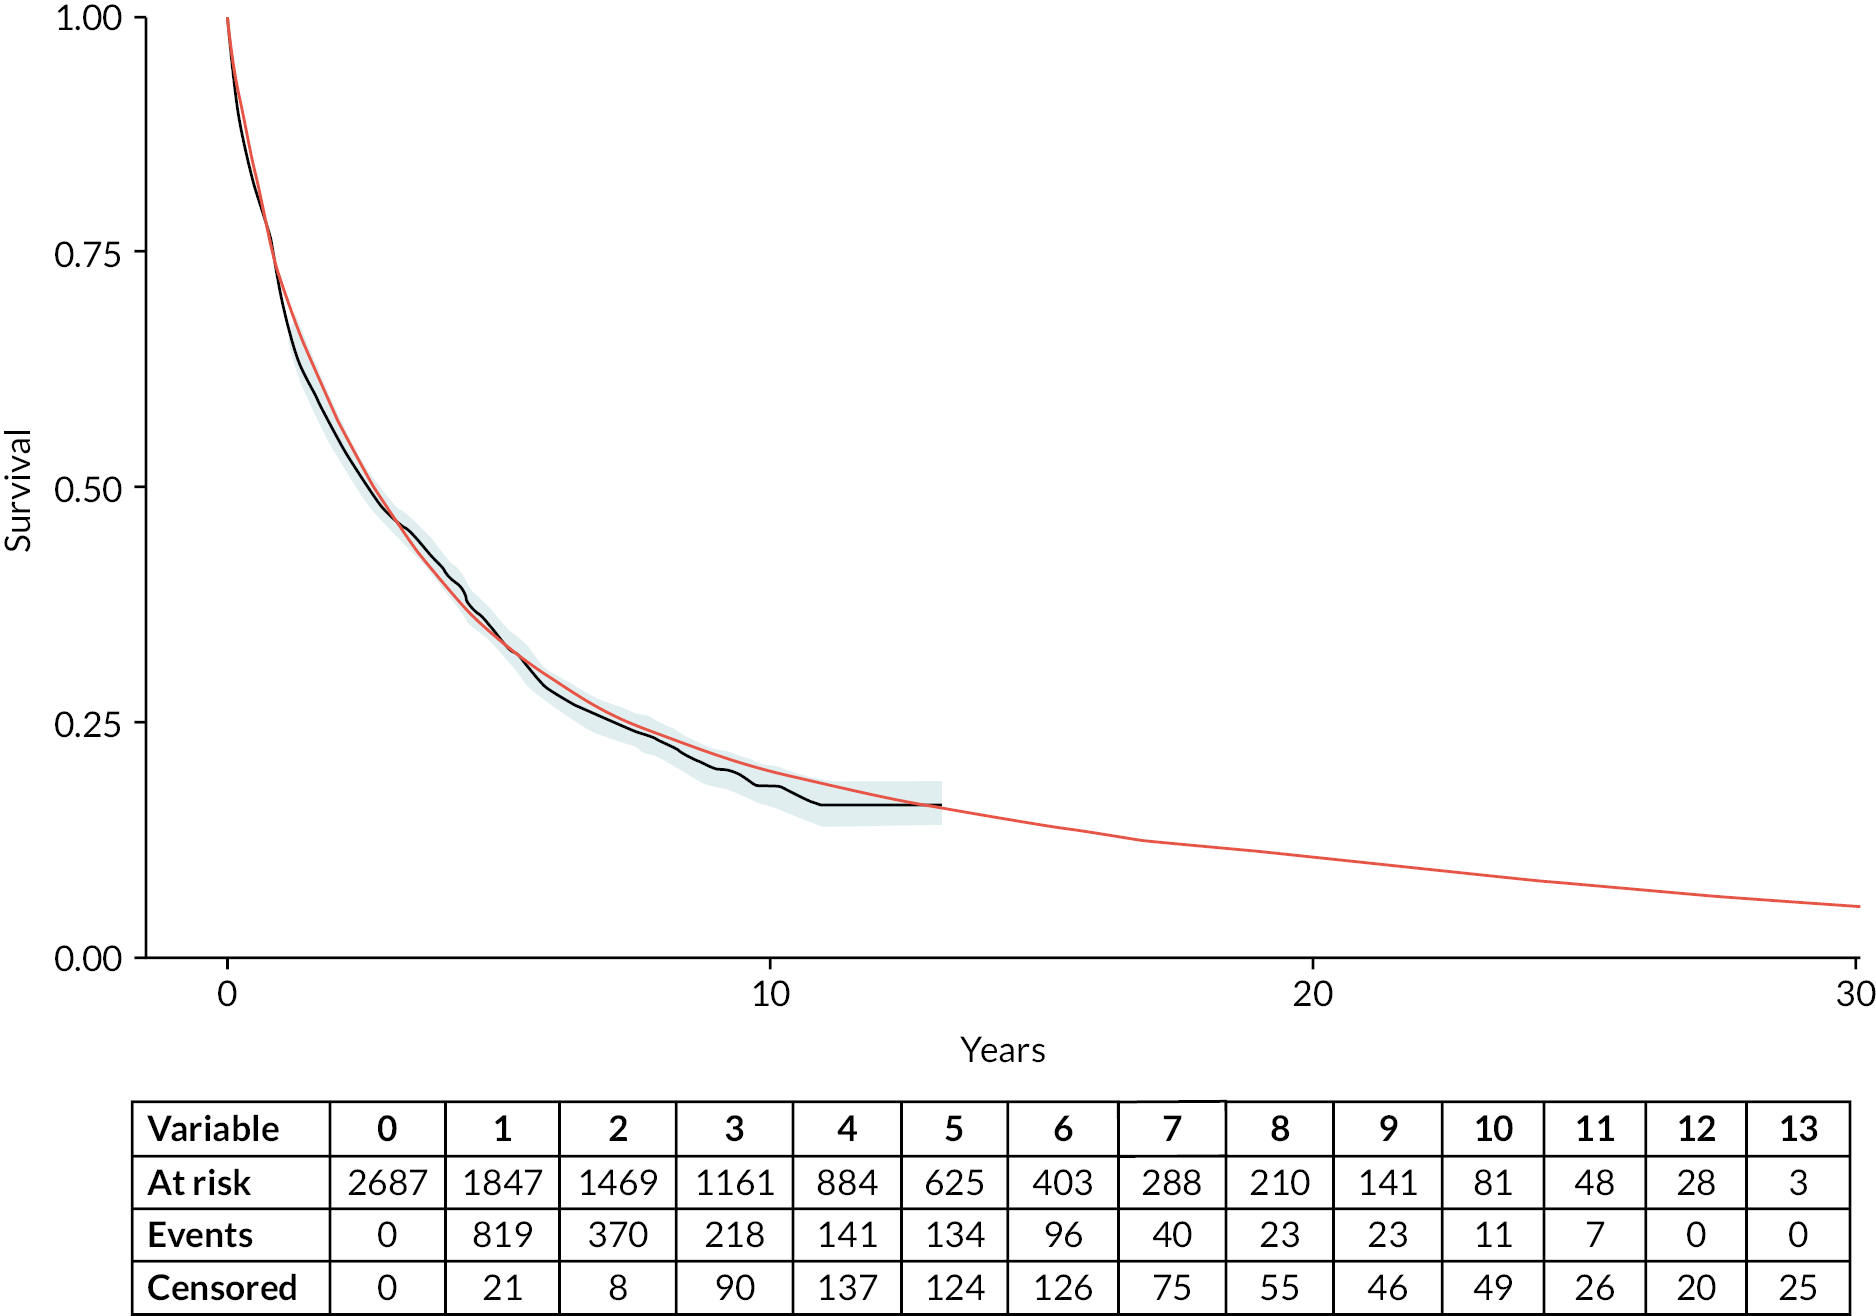
Figure 12 compares overall survival for the observed data (represented by the grey line) with that predicted by the DES model (represented by the smooth red line), together with an extrapolation of overall survival over the entire time horizon of the health economic model. This graph confirms that it is possible to develop good-quality TTE models from this population-based longitudinal registry; employ these models to predict TTE outcomes from complex data structures; and leverage their flexibility to inform the longer-term estimation of overall real-world survival of the population of interest.
FIGURE 12.
Observed (Kaplan–Meier – solid grey line) and predicted (DES – solid red line) overall survival: HMRN myeloma patients.
EuroQol-5 Dimensions, five-level version analyses
Table 4 reports the results of the two-part beta-based regression models for individuals in W&W, ON TREATMENT and OFF TREATMENT, assuming that the coefficients for ON TREATMENT and OFF TREATMENT apply regardless of treatment line. Consequently, the simulation assumes that the coefficients to estimate utility values for subsequent line of treatment remain the same.
| Covariates | W&W | ON TREATMENT | OFF TREATMENT | |||||||||
|---|---|---|---|---|---|---|---|---|---|---|---|---|
| Logit | Beta | Logit | Beta | Logit | Beta | |||||||
| β | SE [β] | β | SE [β] | β | SE [β] | β | SE [β] | β | SE [β] | β | SE [β] | |
| Intercept | −0.384 | 0.997 | 1.171 | 0.314 | −1.428 | 0.724 | 1.248 | 0.235 | −0.780 | 0.899 | 1.217 | 0.124 |
| Age | −0.028 | 0.015 | −0.003 | 0.004 | – | – | – | – | −0.014 | 0.014 | – | – |
| CRAB (yes) | −0.049 | 0.574 | – | – | −0.543 | 0.739 | – | – | – | – | −0.039 | 0.107 |
| Gender (male) | 1.168 | 0.378 | 0.463 | 0.104 | −1.283 | 0.668 | −0.023 | 0.162 | – | – | 0.104 | 0.076 |
| ISSb | ||||||||||||
| II | −0.471 | 0.412 | – | – | – | – | −0.310 | 0.237 | −0.660 | 0.328 | −0.044 | 0.104 |
| III | −0.169 | 0.935 | – | – | – | – | −0.473 | 0.246 | −1.078 | 0.401 | −0.055 | 0.105 |
| Regime | ||||||||||||
| Bortezomib | 0.263 | 0.203 | ||||||||||
| Thalidomide | −0.051 | 0.200 | ||||||||||
| Response | 0.047 | 0.083 | ||||||||||
For each of the states, the table reports the results of a logit regression to estimate the probability of observing an EQ-5D-5L = 1 (perfect health) and the results of a beta regression for those whose EQ-5D-5L ≤ 1; the reference subject is a female with age equal to the sample mean (73 years), diagnosed with stage I myeloma and asymptomatic.
Examining the W&W results, beta regression output (applied to observations with EQ-5D-5L < 1) indicates that individuals older than average tend to have marginally (non-statistically significant) lower EQ-5D-5L scores, with males reporting a higher index score. Further investigation may be warranted in individuals with more advanced stage who have greater chance of reporting EQ-5D-5L = 1, which could be due to fewer individuals (12% of the sample) and/or response bias. The results of the model suggest that CRAB ≥ 1 and more severe ISS reduced the probability of reporting perfect health.
Results for ON TREATMENT and OFF TREATMENT can be interpreted similarly to those for W&W, although each uses different covariates. Of interest is the inclusion of dummy variables representing regimen while ON TREATMENT (reference = melphalan), where individuals on bortezomib reported a better EQ-5D-5L score than those on thalidomide, where the score was marginally lower.
It is important to stress that disutilities cannot be directly calculated for the simulation from the beta regression coefficients,77 but they can be calculated, and expressed on the natural scale, from marginal effects of the two-part model. Conditional mean predictions from the two-part beta regression model are used to derive utility weights for each of the model states represented in Figure 11. Weighting each individual predicted survival time by predicted EQ-5D-5L yields an estimate of QALYs.
Cost data analyses
Table 5 reports the results of the two-part model for selected model states. The results of a logit regression are used to estimate the probability that a given individual has zero costs, while the results of a gamma regression estimate the conditional mean cost for those individuals with positive costs. The reference subject is the same as used in the EQ-5D-5L results table. The coefficients of the gamma regression can be interpreted directly as daily cost increase (decrease) as they are estimated on the natural scale.
| Covariates | W&W | ON TREATMENTa | OFF TREATMENTa | |||||||||
|---|---|---|---|---|---|---|---|---|---|---|---|---|
| Logit | Gamma | Logit | Gamma | Logit | Gamma | |||||||
| β | SE [β] | β | SE [β] | β | SE [β] | β | SE [β] | β | SE [β] | β | SE [β] | |
| Intercept | −1.98 | 1.51 | 0.04 | 3.06 | 2.54 | 0.13 | 78.96 | 7.32 | 4.56 | 0.69 | 40.39 | 6.96 |
| Age | 0.08 | 0.02 | 0.13 | 0.04 | – | – | – | – | −0.02 | 0.01 | – | – |
| CRAB (yes) | – | – | 5.64 | 1.76 | – | – | 15.39 | 4.47 | −0.29 | 0.25 | 7.32 | 6.10 |
| Gender (male) | 0.52 | 0.60 | 0.12 | 1.09 | 0.13 | 0.18 | 2.30 | 4.03 | −0.07 | 0.17 | −2.88 | 5.48 |
| ISSb | ||||||||||||
| II | – | – | 3.07 | 1.40 | – | – | – | – | −0.20 | 0.34 | 6.82 | 6.51 |
| III | – | – | 6.57 | 2.86 | – | – | – | – | −0.55 | 0.30 | 26.59 | 8.40 |
| Regime | ||||||||||||
| Bortezomib | – | – | – | – | – | – | 44.85 | 15.16 | – | – | – | – |
| Melphalan | – | – | – | – | – | – | −49.16 | 6.94 | ||||
| Thalidomide | – | – | – | – | – | – | −27.82 | 6.65 | ||||
| Response | – | – | – | – | – | – | – | – | 1.33 | 0.39 | −18.39 | 5.73 |
In W&W, being male and older than the sample average is associated (on average) with greater probability of zero costs in this state. Those with positive costs, older age, presence of CRAB features and more severe ISS had increased costs. Results for ON TREATMENT and OFF TREATMENT can be interpreted in the same way, although cost estimates in each state use different covariates. As expected, CRAB features influence the probability of receiving treatment, and costs.
Chemotherapy regimen (‘others’ = reference category) is an important determinant of cost while ON TREATMENT, being considerably higher for thalidomide and lower for melphalan or bortezomib. Finally, during observation, the probability of healthcare contacts while OFF TREATMENT is (on average) lower in older patients and symptomatic males (not statistically significant) with more advanced disease than in the reference. This is not contradictory when one realises that symptomatic individuals with more advanced disease will transition to the next ON TREATMENT more quickly than asymptomatic individuals with lower ISS. When having healthcare contact OFF TREATMENT, symptomatic individuals have higher costs, as do those with ISS II and III. Importantly, those who respond to chemotherapy have fewer healthcare contacts and considerably lower costs.
In the DES simulation, conditional mean costs for each individual going through the model are obtained combining the two parts of the regression model results.
Long-term costs and outcomes
The microsimulation model allows us to predict individual-specific trajectories and outcomes such as overall survival, QALYs and costs over the chosen time horizon. For example, Table 6 shows the microsimulation results over a 30-year time horizon, and Figure 13 illustrates the distribution of these outcomes across the various states in the model and over time. Each plot within the panel represents an ISS prognostic category, and the model is run until all patients in the synthetic cohort have reached the absorbing state.
| Predictions | ISS | Entire cohort | ||
|---|---|---|---|---|
| I | II | III | ||
| Life-years | 9.90 (10.22) | 5.58 (7.49) | 4.64 (6.91) | 6.29 (8.33) |
| Discounteda life-years | 7.35 (6.51) | 4.47 (5.07) | 3.75 (4.76) | 4.91 (5.54) |
| QALYs | 7.74 (8.49) | 4.11 (5.88) | 3.32 (5.28) | 4.71 (6.65) |
| Discounteda QALYs | 5.51 (5.63) | 3.14 (4.09) | 2.55 (3.72) | 3.50 (4.57) |
| Total hospital costsb | 95,924 (172,898) | 98,166 (209,312) | 118,007 (278,660) | 105,244 (231,364) |
| Discounted total hospital costs | 68,981 (132,205) | 74,718 (156,024) | 92,690 (200,676) | 80,208 (169,906) |
FIGURE 13.
Proportion of patients in each simplified model state (collapsing all ON TREATMENT and all OFF TREATMENT states) over time as predicted by the DES model. Each plot represents an ISS category. State membership is defined as: aqua, W&W; purple, ON TREATMENT; mid-blue, OFF TREATMENT; red, PALLIATIVE; coral, DEAD.
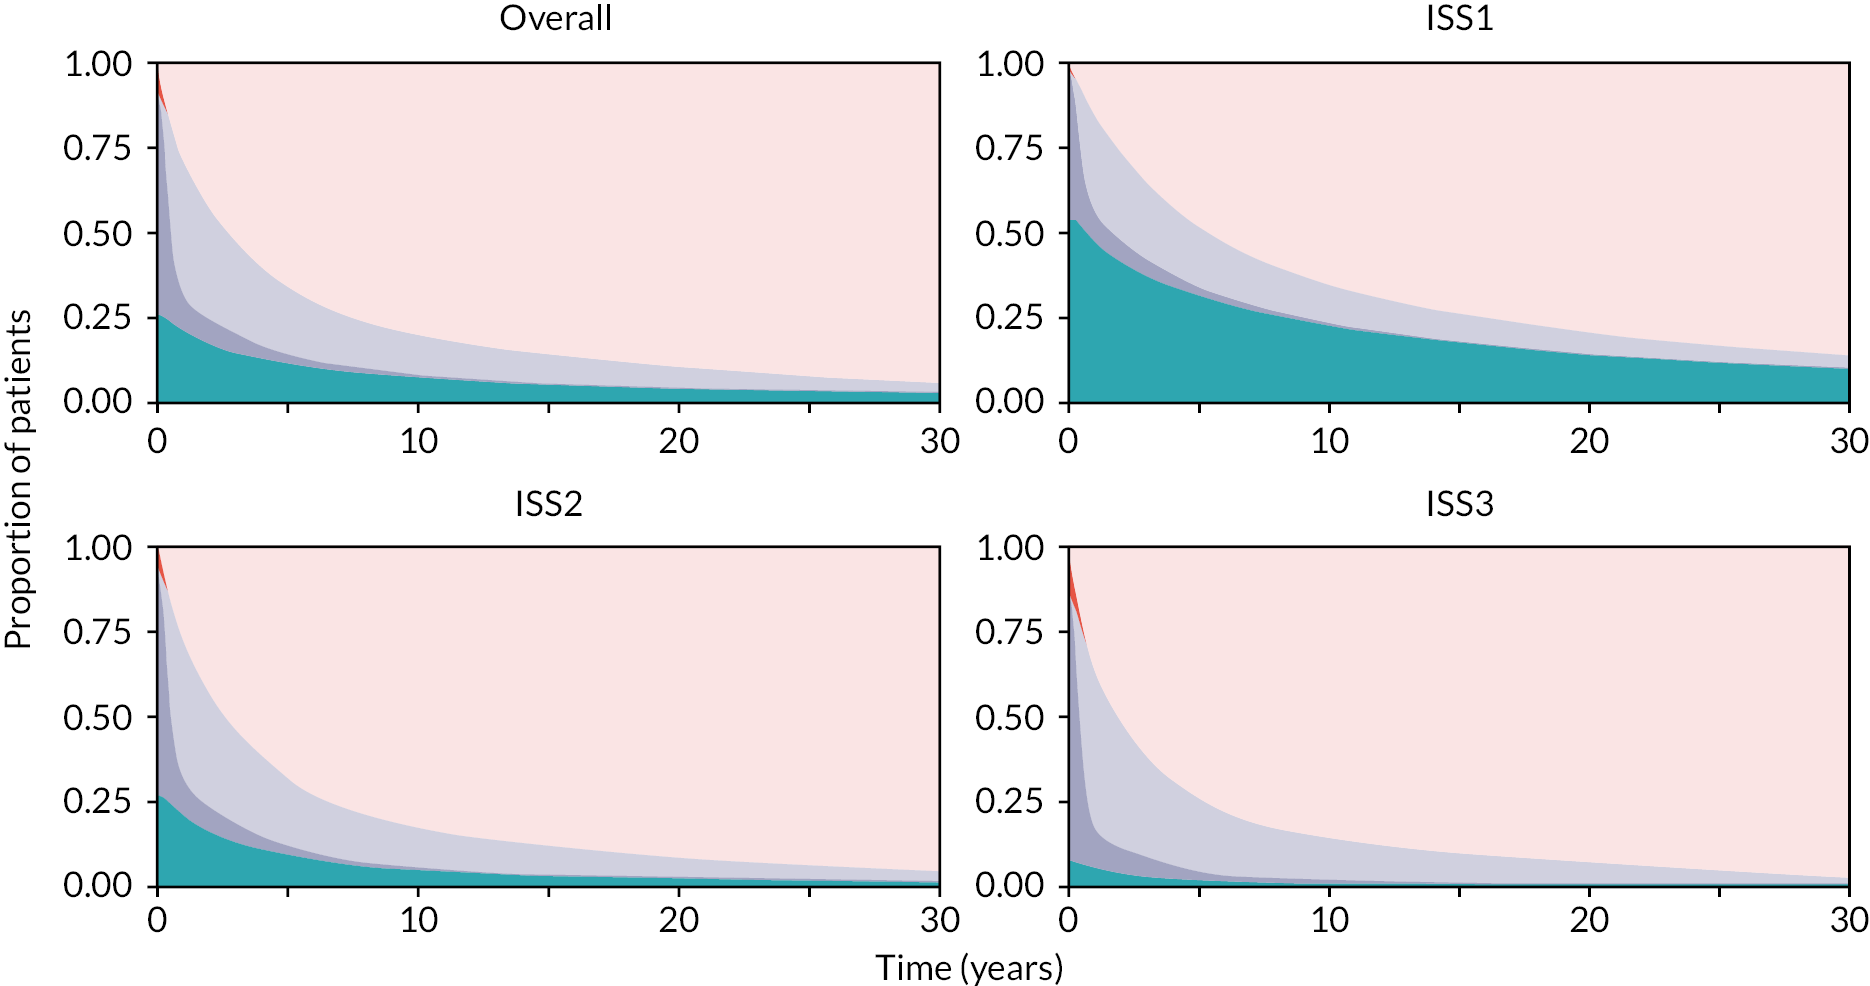
Individuals with a baseline ISS of 1 (lower risk) are predicted to live longer, have better QoL (greater QALYs) and accrue lower costs over the 30-year time horizon than individuals with a baseline ISS of 2 or 3. Individuals with ISS of 1 are predicted to spend a considerably longer period of time in the W&W state, which has associated lower cost per day and higher HRQoL.
Conclusions
We developed a microsimulation model to predict individual-level trajectories through multiple treatment lines, their associated overall survival, costs and QALYs. This information has multiple applications. First, commissioners and healthcare managers can use our model structure and inputs to predict outcomes relevant to their jurisdiction. To do so, they may need a data set containing myeloma patients and their characteristics from the catchment area of interest, thereby enabling estimation of the numbers of patients on each treatment line, OFF TREATMENT after each line, and receiving palliative care, etc. The model can also predict the costs of each line, quantify the impact of mortality by line, and be used to predict by subgroup using disease severity and other covariates to facilitate stratified medicine. The myeloma model has good predictive value compared with the observed survival curve and will remain relevant for commissioners and policy-makers provided that there are no major changes in clinical practice or cost of care. Should these occur, the methodology would remain valid, but the input values might need to be re-estimated using the methods described in Health economics and Appendix 2.
Future developments to our model include modules to facilitate ‘value for money’ assessment of alternative therapies within a given treatment line while taking account of the patient’s individual clinical history. It can also be extended to evaluate co-dependent health technologies, which are not easily studied within an RCT. These extensions are currently the subject of methodological research within the group.
Patient well-being and involvement survey (WP5)
This section explores the feasibility of routinely collecting self-completed data from patients attending haemato-oncology clinics about their HRQoL, general well-being and decision-making activities. Two questionnaires were developed and tested, and a cross-sectional survey was implemented in hospitals across the study area.
Survey instrument and paperwork
Final questionnaires (amended following piloting and patient feedback; see Summary of programme alterations) along with the patient information leaflet and consent form are shown in Appendix 3. The front page of both questionnaires was detachable and included the descriptive study title ‘Improving patient information’, completion instructions and the patient’s details (address and date of birth if handwritten; with hospital number and NHS number if provided in an addressograph). The back page of both questionnaires contained boxes for additional information and a signature and date, as well as contact details for the study team, including the Freephone number.
Study set-up and data management
An Integrated Research Application System (IRAS) application was submitted for ethics approval to collect additional information from patients (supplementary to data routinely collected in HMRN) and portfolio status. Portfolio status was confirmed by the National Institute for Health and Care Research Coordinating System Permission (NIHR CSP), meaning that NHS resource capacity (staff time for recruitment) was available to support the survey; REC approval was also granted (see Programme setting). Face-to-face meetings were held at each site with staff delivering the study, and recruitment targets agreed, based on the number of patients attending each clinic. HRA applications were submitted, with each site ratifying the study and targets. Hospital teams were provided with a ‘site file’ with study documentation and equipment, including:
-
advertising material (posters, pop-up poster stands)
-
a post-box for patients to return completed forms in clinic
-
packs containing an information leaflet, two questionnaires, a consent form and a pre-paid return envelope for patients not using the post-box
-
spare questionnaires for subsequent outpatient appointments (post consent).
Site initiation and recruitment was discussed at length with hospital staff, each deciding on individual approaches to managing their clinics and hence requiring different strategies for data collection. For example, although some hospitals (mostly smaller sites) tended to hold combined clinics (i.e. all lymphoid/myeloid cancers concurrently), others were separated by cell lineage (i.e. lymphoid or myeloid) or subtype (e.g. lymphoma clinics and myeloma clinics).
Generic and lineage-specific clinics formed the majority, and staff told us that in such instances it would not be practicable to target specific diagnoses (e.g. only patients with FL), as this would require pre-screening medical records. Hence, to promote optimal recruitment and ensure that staff were not overburdened, it was decided that packs would be distributed to all adults (aged ≥ 18 years) attending generic clinics, excluding only those whom clinical staff judged unable to take part for health reasons. As a result, data were collected from people with the targeted cancers (CLL, FL and myeloma), as well as from patients with other haematological malignancies.
Since most hospitals were involved in other research activities (predominately clinical trials), it was agreed that our survey would run in some clinics, but not all, according to site preferences. When operational, staff were asked to remind patients to complete the first questionnaire before the appointment and the second after the appointment, where practicable, and then deposit forms in the clinic post-box or return them in the Freepost envelope. Occasionally, patients returned the first questionnaire via the post-box and used the envelope for the second. Post-boxes were regularly emptied by members of the research team.
Standard operating procedures were written to guide data processing at the University of York (see Appendix 3). This involved matching returned forms to HMRN patient IDs, thereby enabling linkage to clinical data; detaching the front (named) section of each questionnaire and disposing of it using ethically approved procedures; adding the HMRN ID to the otherwise anonymised form; and then logging, inputting, scanning and filing forms. If the two questionnaires were returned separately, the first was retained until the second arrived, and the forms were then matched and processed together.
Recruitment
Recruitment began in August 2016 and continued for 2 years, with on-site clinic staff answering patients’ questions. Questionnaires could be completed once or multiply (e.g. at each clinic visit), but consent was obtained and counted on the first occasion only. In agreement with hospital staff, and to avoid overburdening patients, most clinics did not approach individuals more than once a month, unless patients specifically requested otherwise.
Recruitment was monitored on site and at the University of York throughout data collection, and the programme administrator liaised with hospital staff to address queries (e.g. discrepancies due to lags in receipt of questionnaires returned separately). With a view to maintaining engagement and providing an overview of activities, progress reports (e.g. recruitment tallies) were circulated to NHS staff at each hospital, and to the PSC.
As detailed (see Data infrastructure), this programme was predicated on a population-based cohort of patients with haematological malignancies, and eligibility for the survey required that patients were registered in this study. Information on survey participation across the region is provided in Table 7 by trust (the administrative unit used by the HRA); larger trusts are at the top and smaller ones are at the bottom, with corresponding hospitals listed in the second column.
| NHS/foundation trust | Hospital | Recruitment | |||
|---|---|---|---|---|---|
| Agreed target | Total participants (% of target) | HMRN eligiblea | |||
| All diagnoses | FL, CLL, myeloma (% of all diagnoses) | ||||
| Leeds Teaching Hospitals | St James | 600 | 190 (31.7) | 147 | 63 (42.9) |
| York Teaching Hospitals | York | 600 | 676 (113.7) | 579 | 293 (50.6) |
| Scarborough | |||||
| Hull University Teaching Hospitals | Castle Hill | 500 | 378 (75.6) | 335 | 195 (58.2) |
| Calderdale and Huddersfield | Calderdale | 300 | 245 (81.7) | 210 | 121 (57.6) |
| Huddersfield | |||||
| Mid Yorkshire Hospitals | Pinderfields | 300 | 351 (117.0) | 294 | 134 (45.6) |
| Pontefract | |||||
| Dewsbury | |||||
| Northern Lincolnshire and Goole | Diana Princess of Wales | 300 | 283 (94.3) | 216 | 118 (54.6) |
| Scunthorpe | |||||
| Bradford Teaching Hospitals | Bradford | 200 | 380 (190.0) | 310 | 144 (46.5) |
| Harrogate and District | Harrogate | 100 | 242 (242.0) | 193 | 78 (40.4) |
| Airedale | Airedale | 100 | 408 (408.0) | 367 | 136 (37.0) |
| Total | 3000 | 3153 (104.5) | 2651 | 1282 (48.4) | |
The total recruitment target specified in the HRA submission (n = 3000) was exceeded, with 3153 individuals participating. Of these, 2651 (84.1%) were eligible for inclusion, the remaining 502 (15.9%) comprising people (1) diagnosed with a haematological malignancy before September 2004; (2) resident outside the study region at diagnosis; and (3) undergoing tests, but found not to have a haematological malignancy.
Although the total recruitment target was met, there was considerable variation by trust (see Table 7). Several trusts performed well; in terms of absolute numbers, York Teaching Hospitals NHS Foundation Trust, with sites in York and Scarborough, recruited 21.4% (676/3153) of the total. In terms of relative numbers, Airedale NHS Foundation Trust recruited more than four times the agreed target (408 patients vs. 100), and Harrogate & District NHS Foundation Trust (242 vs. 100) and Bradford Teaching Hospitals NHS Foundation Trust (380 vs. 200) around twice as many. By comparison, recruiting less than one-third of its agreed target, Leeds Teaching Hospitals NHS Trust recruited poorly and stands apart from the rest.
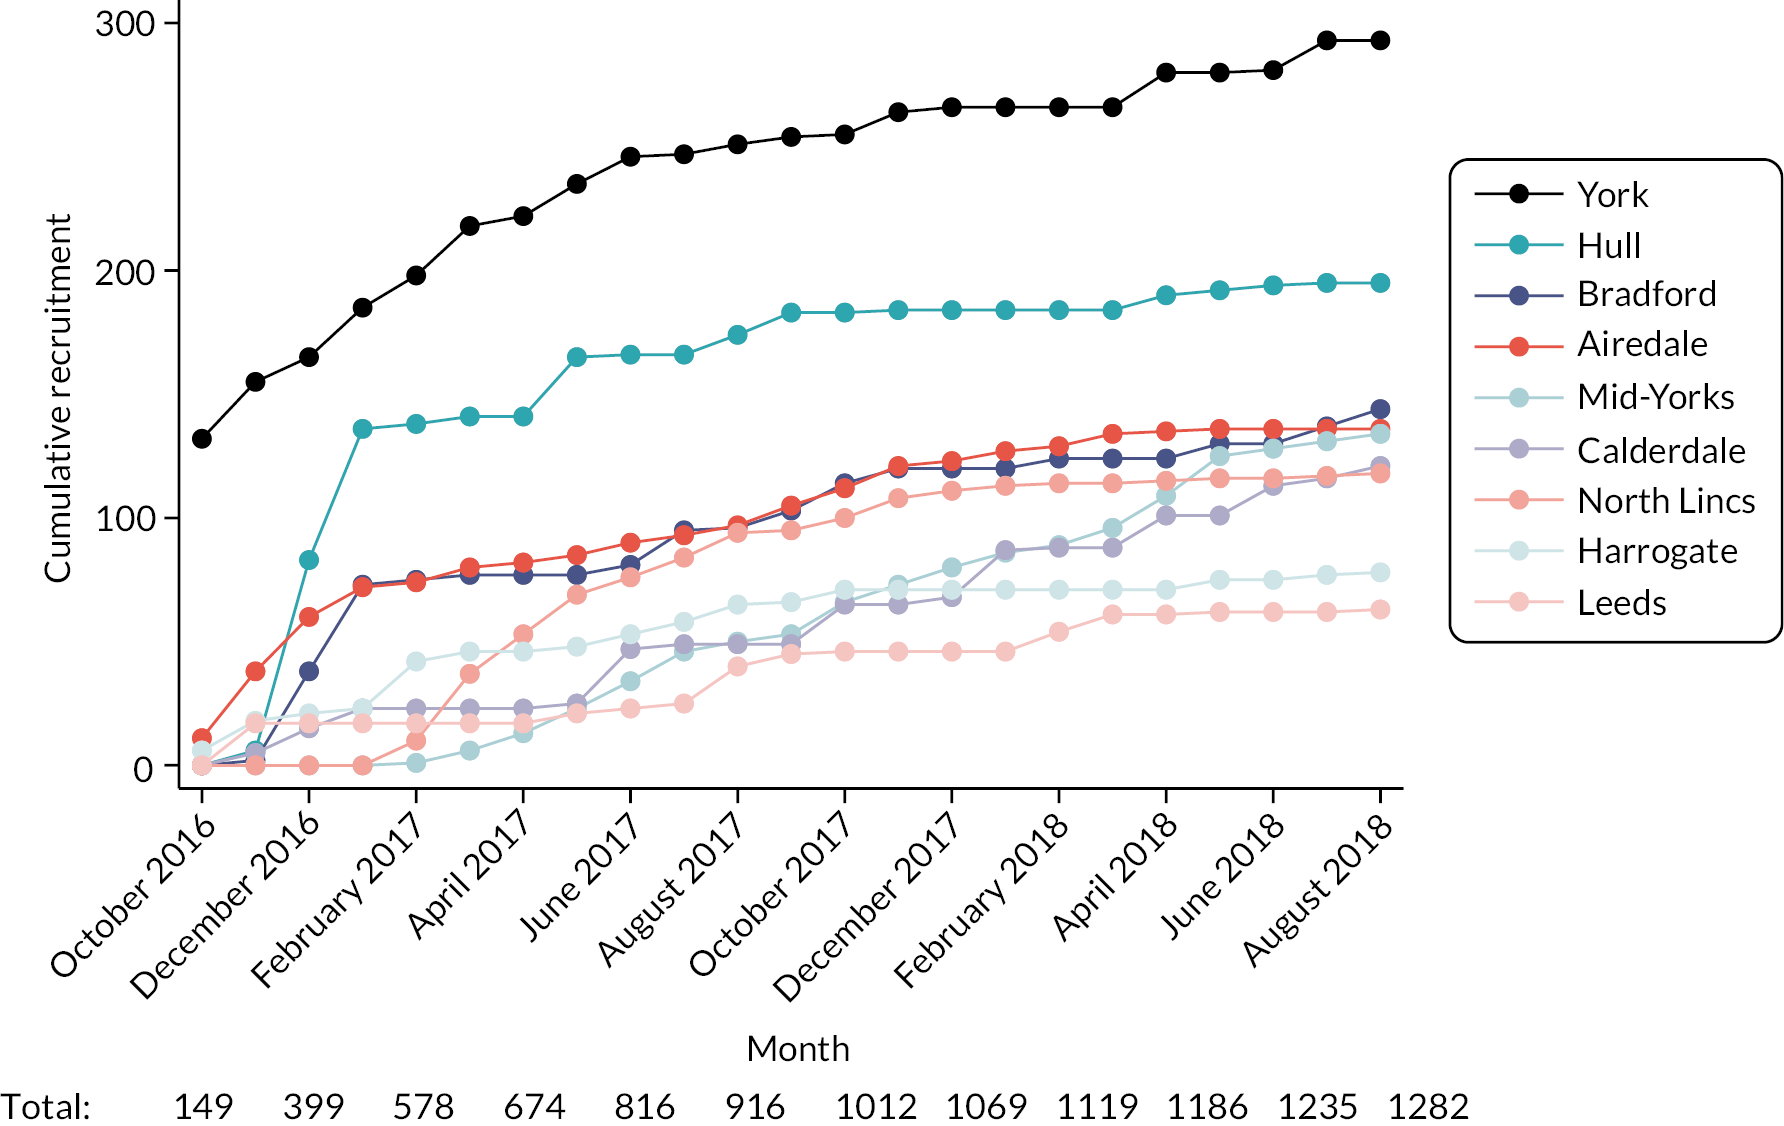
Cumulative monthly recruitment figures for the 2651 eligible patients are provided in Figure 14 and for the 1282 with CLL, FL or myeloma in Figure 15. Recruitment start/end dates varied slightly between trusts, reflecting, at least in part, differences in internal approval processes. As noted in Study set-up and data management, outpatient clinic systems varied between hospitals, some recruiting a higher proportion of patients with the targeted cancers than others (see Table 7). Recruiting around 120 patients with CLL, FL or myeloma in the first few months (see Figure 15), Hull & East Yorkshire Hospitals NHS Trust clearly had the capacity to target these groups – but recruitment trailed off after this due to initiation of another study, and the trust fell short of its target by 25% (see Table 7).
FIGURE 14.
Cumulative monthly recruitment by hospital trust: all patients registered within HMRN.
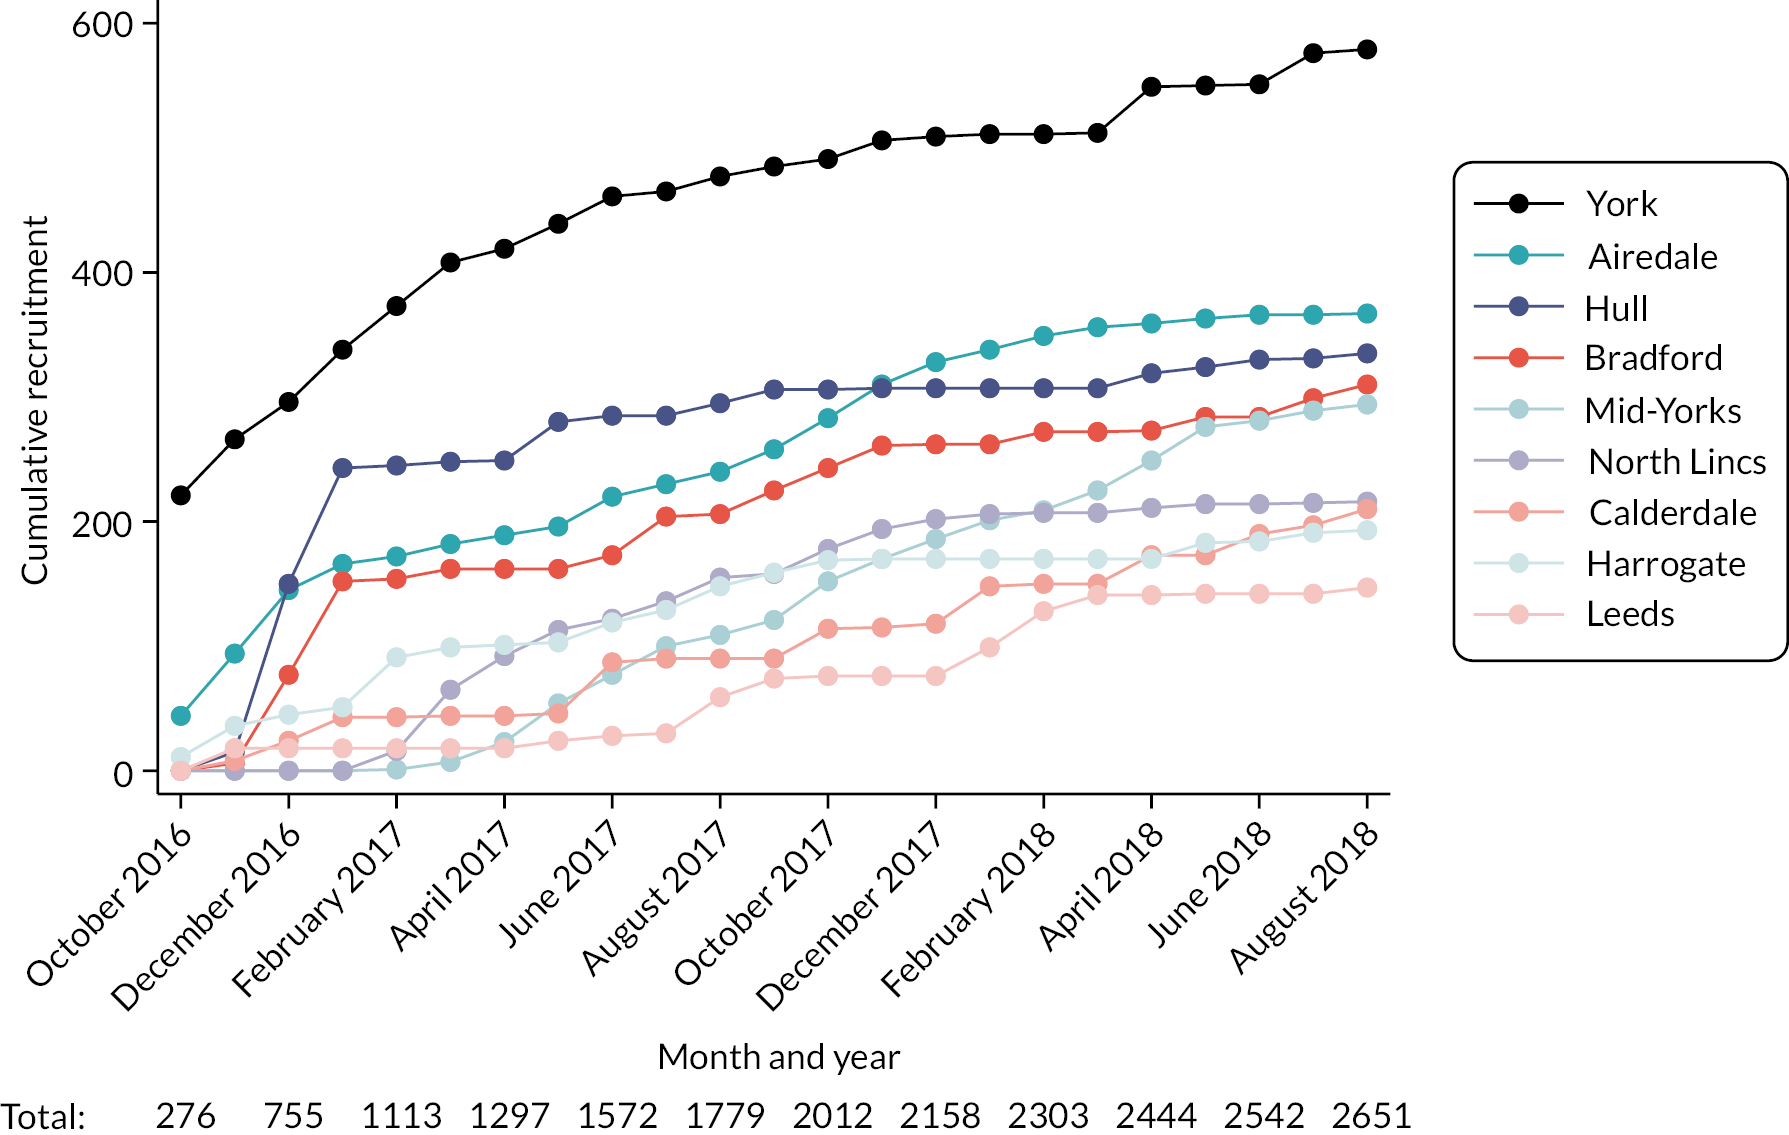
FIGURE 15.
Cumulative monthly recruitment by hospital trust: patients with CLL, FL or myeloma registered within HMRN.
Clearly this observational study suited some hospitals better than others. The nature of the investigation meant that, in contrast to treatment trials, clinic staff were not required to actively consent patients or monitor them through subsequent clinic visits. Furthermore, staff reported that pack distribution was straightforward and time efficient. The study was also generally popular with patients; several reported that they appreciated the opportunity to ‘give back’.
Unfortunately, poor recruitment due to patients not being invited to participate could not be overcome in some settings, notably St James Hospital in Leeds, which had the largest catchment (see Table 2) and was the host organisation administering this programme. Indeed, engagement with the study remained poor throughout, despite multiple contacts by the research team and offers of help and support, raising the issue at various clinical meetings (e.g. haematology audit committee meetings), and discussions with the PSC. Having the largest number of patients (see Table 2), Leeds has the most subtype-specific clinics, many of which have dedicated staff who are routinely involved in treatment trials. This focus, together with generally poor information flow between clinics, seemed to militate against involvement in observational studies such as ours.
Characteristics of survey participants
Of the 7975 patients diagnosed with CLL, FL or myeloma before 1 September 2017 (see Table 2), 4817 (60.9%) were alive when the survey began in August 2016; 4071 were diagnosed before the survey began and 746 were diagnosed during the survey period. As expected, those who died (n = 3158) were older and more likely to have been treated with first-line chemotherapy or a palliative approach (Table 8).
| All patients | Died before 1 August 2016 | Alive 1 August 2016 | |||
|---|---|---|---|---|---|
| Total | Survey participant | ||||
| No | Yes | ||||
| Total | 7975 (100) | 3158 (100) | 4817 (100) | 3661 (100) | 1156 (100) |
| Diagnostic hospital | |||||
| St James, Leeds | 1349 (16.9) | 570 (18.0) | 779 (16.2) | 712 (19.4) | 67 (5.8) |
| Castle Hill, Hull | 1208 (15.1) | 503 (15.9) | 705 (14.6) | 516 (14.1) | 189 (16.3) |
| York | 868 (10.9) | 316 (10.0) | 552 (11.5) | 363 (9.9) | 189 (16.3) |
| Bradford | 569 (7.1) | 231 (7.3) | 338 (7.0) | 216 (5.9) | 122 (10.6) |
| Pinderfields, Wakefield | 518 (6.5) | 188 (6.0) | 330 (6.9) | 257 (7.0) | 73 (6.3) |
| Diana Princess of Wales, Grimsby | 507 (6.4) | 184 (5.8) | 323 (6.7) | 294 (8.0) | 29 (2.5) |
| Airedale | 488 (6.1) | 200 (6.3) | 288 (6.0) | 157 (4.3) | 131 (11.3) |
| Scunthorpe | 416 (5.2) | 171 (5.4) | 245 (5.1) | 175 (4.8) | 70 (6.1) |
| Huddersfield | 408 (5.1) | 148 (4.7) | 260 (5.4) | 197 (5.4) | 63 (5.4) |
| Harrogate | 400 (5.0) | 133 (4.2) | 267 (5.5) | 199 (5.4) | 68 (5.9) |
| Scarborough | 366 (4.6) | 161 (5.1) | 205 (4.3) | 135 (3.7) | 70 (6.1) |
| Dewsbury | 363 (4.6) | 139 (4.4) | 224 (4.7) | 187 (5.1) | 37 (3.2) |
| Calderdale, Halifax | 352 (4.4) | 125 (4.0) | 227 (4.7) | 187 (5.1) | 40 (3.5) |
| Pontefract | 163 (2.0) | 89 (2.8) | 74 (1.5) | 66 (1.8) | 8 (0.7) |
| Sex | |||||
| Male | 4591 (57.6) | 1829 (57.9) | 2762 (57.3) | 2064 (56.4) | 698 (60.4) |
| Female | 3384 (42.4) | 1329 (42.1) | 2055 (42.7) | 1597 (43.6) | 458 (39.6) |
| Age at diagnosis (years) | |||||
| < 50 | 476 (6.0) | 74 (2.3) | 402 (8.3) | 279 (7.6) | 123 (10.6) |
| 50–59 | 1130 (14.2) | 242 (7.7) | 888 (18.4) | 631 (17.2) | 257 (22.2) |
| 60–69 | 2131 (26.7) | 618 (19.6) | 1513 (31.4) | 1102 (30.1) | 411 (35.6) |
| 70–79 | 2570 (32.2) | 1144 (36.2) | 1426 (29.6) | 1134 (31.0) | 292 (25.3) |
| ≥ 80 | 1668 (20.9) | 1080 (34.2) | 588 (12.2) | 515 (14.1) | 73 (6.3) |
| Median (IQR) | 71.0 (62.1–78.6) | 76.0 (67.9–82.3) | 67.6 (59.2–75.1) | 68.6 (60.0–76.2) | 65.0 (56.5–71.9) |
| IMD 2010 | |||||
| 1 (least deprived) | 1556 (19.5) | 591 (18.7) | 965 (20.0) | 701 (19.1) | 264 (22.8) |
| 2 | 1845 (23.1) | 679 (21.5) | 1166 (24.2) | 847 (23.1) | 319 (27.6) |
| 3 | 1586 (19.9) | 615 (19.5) | 971 (20.2) | 746 (20.4) | 225 (19.5) |
| 4 | 1409 (17.7) | 575 (18.2) | 834 (17.3) | 649 (17.7) | 185 (16.0) |
| 5 (most deprived) | 1558 (19.5) | 693 (21.9) | 865 (18.0) | 705 (19.3) | 160 (13.8) |
| Not known | 21 (0.3) | 5 (0.2) | 16 (0.3) | 13 (0.4) | 3 (0.3) |
| First-line management | |||||
| W&W | 4115 (51.7) | 1211 (38.4) | 2904 (60.4) | 2317 (63.5) | 587 (50.8) |
| Chemotherapy | 3098 (38.9) | 1506 (47.8) | 1592 (33.1) | 1091 (29.9) | 501 (43.3) |
| Radiotherapy | 280 (3.5) | 63 (2.0) | 217 (4.5) | 161 (4.4) | 56 (4.8) |
| Supportive/palliative | 430 (5.4) | 345 (10.9) | 85 (1.8) | 74 (2.0) | 11 (1.0) |
| Competing comorbidity (observed) | 34 (0.4) | 28 (0.9) | 6 (0.1) | 5 (0.1) | 1 (0.1) |
| Awaiting updated follow-up | 18 (–) | 5 (–) | 13 (-) | 13 (-) | – |
Of the 1282 survey participants with CLL, FL or myeloma (see Table 7), 1156 (93.3%) are included in Table 8 for comparative purposes; the remaining 86 were diagnosed during the survey period. Compared with the 3661 potentially eligible individuals not recruited to the study, the 1156 participants were more likely to be male (p < 0.05) and to have received first-line chemotherapy (p < 0.05), likely reflecting increased clinic attendance among individuals on therapy compared with initial W&W/observation between treatments. As expected from the recruitment data (see Recruitment), the hospital distribution of these 1156 patients (last column) differs markedly from that of the total 4817 who were potentially eligible. Thus, for example, 45.5% (131/288) of potentially eligible patients at Airedale Hospital completed questionnaires, compared with only 8.6% (67/779) at St James University Hospital in Leeds.
The characteristics of the 1282 participants with CLL, FL or myeloma are presented in Table 9; the full diagnostic distribution of all 2651 participants (see Table 7) is provided in Appendix 3, Table 12. During the survey period (August 2016–September 2018), research nurses working on the main cohort within which this programme is nested specifically targeted these cancers for follow-up, and information about first-line management is currently available for most. However, although many patients had their treatment pathways updated more than once, 800 (62.4%) of the 1282 patients completed their first survey after the date of last follow-up. Delayed by the COVID-19 pandemic (see Summary of programme alterations), at the time of writing 447 (34.9%) remain outstanding (see Table 9).
| Total, n (%) | CLL, n (%) | FL, n (%) | Myeloma, n (%) | |
|---|---|---|---|---|
| Total | 1282 (100.0) | 439 (100.0) | 354 (100.0) | 489 (100.0) |
| Sex | ||||
| Male | 776 (60.5) | 308 (70.2) | 170 (48.0) | 298 (60.9) |
| Female | 506 (39.5) | 131 (29.8) | 184 (52.0) | 191 (39.1) |
| Age at diagnosis (years) | ||||
| < 50 | 133 (10.4) | 27 (6.2) | 66 (18.6) | 40 (8.2) |
| 50–59 | 275 (21.5) | 98 (22.3) | 84 (23.7) | 93 (19.0) |
| 60–69 | 458 (35.7) | 167 (38.0) | 117 (33.1) | 174 (35.6) |
| 70–79 | 327 (25.5) | 113 (25.7) | 70 (19.8) | 144 (29.4) |
| ≥ 80 | 89 (6.9) | 34 (7.7) | 17 (4.8) | 38 (7.8) |
| Mean (SD) | 64.4 (10.9) | 65.5 (10.0) | 61.3 (11.8) | 65.7 (10.5) |
| Median (IQR) | 65.3 (57.3–72.0) | 66.0 (58.9–72.2) | 62.4 (52.5–69.8) | 66.7 (59.2–72.7) |
| IMD 2010 | ||||
| 1 (least deprived) | 289 (22.5) | 107 (24.4) | 83 (23.4) | 99 (20.2) |
| 2 | 349 (27.2) | 125 (28.5) | 99 (28.0) | 125 (25.6) |
| 3 | 250 (19.5) | 80 (18.2) | 60 (16.9) | 110 (22.5) |
| 4 | 210 (16.4) | 65 (14.8) | 57 (16.1) | 88 (18.0) |
| 5 (most deprived) | 181 (14.1) | 61 (13.9) | 53 (15.0) | 67 (13.7) |
| Not known | 3 (0.2) | 1 (0.2) | 2 (0.6) | - |
| First-line management | ||||
| W&W | 647 (51.7) | 381 (86.8) | 135 (39.8) | 131 (27.7) |
| Chemotherapy | 532 (42.5) | 49 (11.2) | 148 (43.7) | 335 (70.8) |
| Radiotherapy | 57 (4.6) | 0 (0.0) | 53 (15.6) | 4 (0.8) |
| Supportive/palliative | 14 (1.1) | 9 (2.1) | 2 (0.6) | 3 (0.6) |
| Competing comorbidity (observed) | 1 (0.1) | 0 (0.0) | 1 (0.3) | 0 (0.0) |
| Awaiting updated follow-up | 31 (–) | – | 15 (–) | 16 (–) |
| Management at time of survey | ||||
| W&W | 371 (28.9) | 209 (47.6) | 78 (22.0) | 84 (17.1) |
| Line 1 treatment | 103 (8.0) | 3 (0.7) | 38 (10.7) | 62 (12.7) |
| Remission 1 | 213 (18.0) | 7 (1.6) | 159 (44.9) | 65 (13.3) |
| Line 2+ treatment | 33 (2.6) | 1 (0.2) | 9 (2.5) | 23 (4.7) |
| Line 2+ remission | 66 (5.2) | 0 (0.0) | 51 (14.4) | 15 (3.1) |
| Line 2+ refractory | 31 (2.4) | 4 (0.9) | 19 (5.4) | 8 (1.6) |
| Awaiting updated follow-up | 447 (34.9) | 215 (48.9) | 0 (0.0) | 232 (47.4) |
Overall, 10% of participants completed questionnaires more than once, the maximum being seven times, at separate clinic visits. These survey data were entered and linked to individual patient data in the HMRN cohort. Regarding QoL, physical and mental well-being, and loneliness, this means it is possible to determine where individual patients were on their pathway when they completed each questionnaire. Consequently, health changes can be mapped and analysed over time by subject characteristics and disease point (e.g. diagnosis, W&W, disease progression, first/subsequent treatment and treatment cessation).
In-depth exploration of patient experiences: information and treatment decisions (WP1)
Chronic haematological malignancies often follow unpredictable trajectories with variable need for treatment and uncertain outcomes. W&W is a key management strategy that may (or not) be followed by one/multiple treatment episodes, interspersed with periods of observation (see Figures 5–8). Information is key in the context of such uncertainty, impacting on knowledge and understanding, coping and treatment decisions,22,82–84 yet preferences for information-sharing and engagement in decision-making are largely uncharacterised for these cancers.
Aim
The aim was to explore patient experiences of chronic haematological malignancies, with a focus on preferences for information-sharing and engagement in treatment decisions.
Identification of interviewees and sampling strategy
In-depth interviews were conducted with HMRN patients who had agreed to be contacted for research purposes, and several invited a relative to join them. A purposive sampling strategy based on demographic/diagnostic characteristics was used to identify ‘information-rich’ sources who could provide data that was relevant to the study aims. 53 Criteria included proximity to the median diagnostic age for each subtype (later broadened to other age groups), with variation by sex, and postcode, as well as time since diagnosis so that experiences at key points could be captured. The number of interviews was guided by the concept of ‘information power’. 51,52
Participants, consent and interview
After checking that patients were well enough to take part in the study with NHS collaborators, potential participants were sent information in the post (see Appendix 4) and invited to contact the research team if they wanted to take part. Interviews were conducted February to October 2019 after informed, written consent had been obtained (verbal assent from relatives). Interviews lasted ≈ 90 minutes and were digitally audio-recorded, with patients asked to recount their experiences from diagnosis, in their own words. A flexible topic guide, developed from published literature and expert advice, was used to ensure that relevant issues were addressed (see Appendix 4). Recordings were transcribed verbatim, checked, corrected and anonymised by the interviewer.
Interviews took place with 35 patients, 10 accompanied by relative(s), mostly in the patient’s home. Characteristics of participants and an overview of their pathways are shown in Appendix 4, Table 13. Sixteen interviewees were female; the majority were aged in their sixth/seventh decade, and three lived alone; most resided with a relative. Ten patients had CLL, 8 had FL, 12 had myeloma and 5 had marginal zone lymphoma. Patients had experienced varied pathways, with some starting and remaining on W&W, others having treatment at diagnosis/progression, and a few having multiple chemotherapies before stem cell transplant.
Methods and publications
Due to the richness and quantity of the material collected, four qualitative researchers worked on the interview data. Analytical methods varied somewhat but are fully described in each of the following published/in-press manuscripts:
Links to other parts of the programme
In-depth exploration of patient experiences: information and treatment decisions describes patient experiences with and preferences for information and decision-making. This feeds directly into Implications for practice and lessons learnt, which discusses how our findings could ensure that resources are developed according to patient preferences and will be useful to the people who shape NHS services and instigate change.
Development of information resources to support treatment decisions (WP4)
This section is concerned with assembling an overview of all the data collected, reviewing each WP’s findings, and determining how these could be integrated into information resources. Importantly, the data we aimed to generate during the programme (WPs 1–3 and WP5) were successfully amassed (see Summary of programme alterations, Table 1). Spanning the pathway from diagnosis, the detailed quantitative and qualitative evidence included data on treatment, hospital activity, survival, costs, physical and mental health, QoL, loneliness and patient experiences.
Furthermore, the statistical models and software developed demonstrated that high-quality, longitudinal, personalised information can be mapped, enabling entire individual care pathways to be visualised [see Population-based data and analyses (WP2), Figures 5–8] and/or aggregated and summarised (see Appendix 1, Figures 16–18). These crucial building blocks, which interrogate live databases, display the depth of information that might be shared with patients and clinicians. Findings from the in-depth interviews [see In-depth exploration of patient experiences: information and treatment decisions (WP1)] are also key to the future design and content of information resources for patients.
Aiming to provide background for the in-depth patient interviews and preliminary context for methods of information sharing in NHS settings, we held several early focus groups with clinical staff (haematologists and clinical nurse specialists). Regarding the utility and format of data for use by clinicians in MDT meetings, attendees suggested that rapid access was imperative, given the volume of patients routinely assessed. They also noted that both individual and aggregate data would be useful, individual data providing an overview that could be viewed and shared quickly and aggregated data being particularly useful for patients with rarer subtypes or multiply relapsed/refractory disease, where guidance on treatment was absent.
The final part of the programme should have involved further focus groups with clinical staff and patients to underpin prototype information resources and how data might be presented for the greatest utility, as part of an iterative co-design and refinement process. A feasibility trial to test the material in NHS MDT meetings and clinician–patient consultations was planned; however, these consultations were cancelled and the programme could not be completed, for reasons noted in Research pathway and Summary of programme alterations, Figure 4 and Table 1.
Discussion and conclusions
Why the programme was needed
Around 60% of haematological malignancies are currently incurable, and patients with these cancers often experience multiple remissions and relapses on complex, lengthy pathways. Prior to this programme, longitudinal real-world data were lacking about chronic blood cancers, including patients’ disease state/treatment (W&W, first-line, second-line, etc.) and associated hospitalisations. Little was also known about patient experiences or preferences. Empirical evidence was needed to facilitate patient understanding of trajectories, as well as information sharing and decision-making. Information about numbers of patients at each disease state was also required by health-service managers and commissioners, nationally and locally. Developing, validating and implementing new methods of data collection in the hospital setting, and exploring experiences via in-depth interviews, our research sought to address these deficits, producing high-quality evidence-based information to facilitate discussions about treatment and care.
Patient and public involvement and engagement in the programme
As noted (see Patient and public involvement and engagement), members of HMRN’s Patient Partnership were involved in the programme as applicants and participants. Prior to programme development, discussions took place with members of this group (e.g. focus groups, open days) about their experiences of living with blood cancer. One concern was coping with uncertainty about ‘if’ and ‘when’ treatment may be required among people with chronic subtypes. Widespread concern was expressed about the lack of information in this context, which had led many patients to rebrand ‘watch and wait’ as ‘wither and worry’. Two people from the Patient Partnership (one patient, one relative) were formally included in our application: one co-applicant (stages 1 and 2) who was involved in developing the initial proposal, and a collaborator (stage 2). Both were familiar with local and national PPIE groups/organisations, which enabled them to link to other stakeholder voices across the study area and nationwide. These individuals were considered members of the programme team, maintaining regular contact and attending PSC meetings. HMRN’s ‘sounding board’ also provided ongoing feedback, as did members of the Patient Partnership Steering Committee.
Strengths and limitations
A key strength of the programme is that it was set within an established population-based patient cohort (www.HMRN.org) that occupies a unique forefront position in the provision of generalisable evidence-based, ‘real-world’, contemporary data (see Programme setting). Clinicians within HMRN work to national guidelines, and all diagnoses are made centrally at a fully integrated laboratory; this, coupled with the fact that HMRN’s catchment population of ≈ 4 million people has a broadly similar sex, age, urban/rural and deprivation profile to that of the UK as a whole,27,28 means that findings can be extrapolated to the population as a whole. 36,89–95 Accordingly, the study’s descriptive statistics are routinely used by national bodies; and its maturing longitudinal data are often incorporated into clinical educational materials, as well as NICE appraisals, guidance and HTAs. 36,92–95 As such, covering care pathways from diagnosis onwards, HMRN’s infrastructure provided a strong foundation on which to advance knowledge about the chronic blood cancers studied within this programme. A major strength of the qualitative work [see In-depth exploration of patient experiences: information and treatment decisions (WP1)] was the richness of information shared about experiences, meaning that the aims of this WP were exceeded. The sampling framework ensured that ‘key informants’ were included and novel insights were gained into an important, under-researched area.
With respect to limitations, the survey [see Patient well-being and involvement survey (WP5)], although large, was not fully implemented at all sites, notably Leeds as a result of staffing issues and resources being focused on clinical trials. Survey responses also favoured younger patients who were more likely to have had first-line chemotherapy, and reside in more affluent areas; such selection biases affect all studies that rely on individual participation, including clinical trials. 96 Difficulties also arose with both the prognostic [see Population-based data and analyses (WP2)] and the economic [see Health economics (WP3)] modelling due to complex transitions that are subject to competing risks, and particularly subsequent treatment lines on which data may be sparse. One example relates to states subsequent to diagnosis where, unlike clinical trials, the components required to calculate time-varying covariates (e.g. performance status) are not always repeatedly measured in routine clinical practice. Given their predictive and prognostic potential for informing the modelling of dynamic remitting–relapsing conditions, the availability of such data would undoubtedly improve the granularity of the predicted trajectories and outcomes obtained.
Finally, although a considerable amount of new information to populate resources was collected, and strategies for development and testing of material were initiated, the major limitation is that the final part of the programme could not be completed due to the COVID-19 pandemic. This is, in fact, still having an impact, as many patients are not yet willing/able to participate in face-to-face interviews and focus groups (Section 4.0) and methods of delivering clinical care have changed for the foreseeable future, as is further amplified in Recommendations for future research.
Conclusions
This programme has accrued an abundance of new evidence to an extent not previously captured and has increased understanding of chronic haematological malignancies. Based on several thousand individuals, it clearly demonstrates that high-quality information on the pathways of the general population of patients with such cancers can be collated and successfully mapped, with the potential for use in clinical settings to improve care by facilitating information-sharing and decision-making. After developing data collection instruments and writing visualisation programmes, we established that it is possible to distribute questionnaires and collect longitudinal data in hospital settings, as well as assemble, summarise and view longitudinal pathways, including data on diagnostics, prognostics, treatments, transformations/progressions, hospital episodes, outcomes and costs, supplemented by in-depth interviews and evidence regarding patient experiences. Regarding health economics, we have also shown the utility of using longitudinal data to estimate how many patients are on each treatment line, post treatment after each line, receiving palliative care, and so on, thereby facilitating cost calculations and resource planning.
The visualisations developed in this programme reveal the full scope and heterogeneity of chronic blood cancer pathways [see Figures 5–8, Population-based data and analyses (WP2), and Appendix 1, Figures 16–18]. Demonstrating even more intricacy than expected, these complex figures evidence the often-protracted experiences, involving multiple treatments, changes in disease state and intermittent high levels of hospital activity (see Figures 9 and 10). In turn, these data, together with other sources, were incorporated into both the FL prognostic model and the myeloma economic model [see Population-based data and analyses (WP2) and Health economics (WP3), respectively]. The prognostic work clearly demonstrated that, when using all diagnostic workup data, outcomes could be predicted more efficiently and accurately than via the FL International Prognostic Index. Critically, additional molecular investigations showed that aberrant somatic hypermutations in the genetic substructure of FL are important, with a small number of key mutations affecting prognosis; such clusters have implications both for understanding pathogenesis and for potential future treatment strategies. Likewise, the success of the health economics component [see Health economics (WP3)], is that, as well as aiming to predict longer-term survival, QALYs and costs for individuals with myeloma in the UK, the microsimulation model can be used to simulate the impact of alternative policies and treatments before they are introduced into clinical practice. The models can also incorporate data and evidence from other sources, including RCTs, to facilitate more detailed assessment. Unlike traditional cohort models, microsimulation models can predict effectiveness and cost-effectiveness at a more granular level, thereby supporting a nuanced approach to treatment decisions and commissioning. Our model has good internal validity, as demonstrated by comparing predicted and observed overall survival, and is able to predict cost, survival and QALYs for different individual profiles.
With respect to QoL (also incorporated into the economic model) and decision-making, we developed and piloted two new survey instruments. Predicated on NHS infrastructures and collaborative relationships with clinical colleagues across the catchment, the survey was successfully introduced into routine clinical NHS practice across 14 hospitals [see Patient well-being and involvement survey (WP5)]. Sites included both specialist centres and smaller hospitals, meaning that patients attending disease-specific and generalist clinics could take part, as well as those with aggressive (referred to specialist centres) and indolent subtypes. Overall, the design worked well and participation exceeded expectation, meaning that the methods developed here could be adapted for use elsewhere.
Importantly, one of the key findings from the qualitative study [see In-depth exploration of patient experiences: information and treatment decisions (WP1)] was variability in the information patients wanted to receive, and when they wanted to access this, as well as a general reluctance to make treatment decisions, preferring clinician recommendations. Given this variability, the key implication for practice is that individual needs are regularly assessed to take account of changing preferences over time; and that information resources and healthcare services are developed and delivered to enable specific preferences to be met. It is also important that the extent to which uncertainty impacts patients is acknowledged, and that HCPs are enabled to identify and manage such difficulties, even if this would require additional support and resources.
Recommendations for future research
As the final part of the programme could not be completed due to COVID-19, the key future priority is translation of the data accrued into accessible information resources suitable for testing in routine NHS practice. Initial visualisation methods (exploration, analysis and synthesis) have been used in the programme, but further research is now required using participatory co-design methods in collaboration with stakeholder groups. The resources should be responsive to the rapidly changing haemato-oncology landscape, the varying needs of clinicians, and patient’ individual needs and preferences regarding different time points. Building on the present programme, and in collaboration with clinicians and patients, future research would include:
-
co-refinement of electronic visualisations for use in MDT settings
-
co-design of electronic/paper resources for use in clinician–patient consultations at key decision points
-
development of cluster randomised trial protocols to test resources developed in (1) and (2) across a single MDT area using the data collection instruments developed prior to further evaluation within/outside the region.
Looking more broadly, research on variations by ethnicity may be worth examining, as those of African heritage tend to be diagnosed with plasma cell disorders (e.g. myeloma) more frequently, at an earlier age, and with better survival than those in other groups. 97–99 However, whether and how patient trajectories vary is unknown. Ethnicity in the UK shows marked regional patterning; by far the most ethnically diverse region in England and Wales is London, with almost half of the city’s residents identifying as Asian, black, mixed or ‘other’, and only one-third identifying as White British. 100 The next most diverse local authority is the West Midlands, where almost one-quarter of residents identify as Asian, black, mixed or ‘other’, and around 70% identify as White British; at the other end of the spectrum, the North East of England and Wales are the least diverse, with over 90% of residents describing themselves as White British. 100 In terms of census-reported ethnic diversity, Yorkshire and the Humber, the setting for the present study, falls in the middle (English local authority rank 5/9), the overarching ethnic groups being White British (80.9%), Asian (8.9%), white other (4.5%), black (2.1%), mixed (2.1%) and other (1.4%). 100 Within regions, examination of more granular ethnic categories (e.g. Asian combines Bangladeshi, Chinese, Indian, Pakistani and Asian other) and their differing age and sex distributions further emphasises the ethnic diversity that exists across the across the UK, highlighting the consequent challenges of investigating this topic. 100–102
Chronic haematological malignancies are likely to have more in common with other long-term conditions than with curable cancers. For example, they are typically incurable and may require intermittent treatment due to progression/loss of response. Consequently, research exploring the feasibility of transferring the processes and findings from this programme to other chronic illnesses (benign and malignant) would be appropriate. Finally, the haematological malignancy treatment landscape changes rapidly, along with new tests able to identify those most likely to progress, and it is important that information-sharing research remains abreast of such changes.
Implications for practice and lessons learnt
Our rich data set, collated from multiple sources, can be used to address a range of research questions, particularly those arising in clinical practice. Outside this programme in the future, the data collected [diagnostics, prognostics, treatments, transformations, progressions, hospital episodes, outcomes and costs: see Population-based data and analyses (WP2) and Health economics (WP3)], as well as the pathway visualisations, could be incorporated into information resources. These could be used in MDTs, and patient–clinician consultations, to facilitate information-sharing and engagement in decision-making, a process that would involve collaboration between haematology clinicians, patients, relatives and researchers.
Varied preferences for information [content, depth, format and timing: see In-depth exploration of patient experiences: information and treatment decisions (WP1)] mean that the challenge is to ensure that material can meet the differing needs of individuals across their pathways. A reasonable approach would be to ensure that information can meet preferences in terms of depth (from a basic overview to detailed possibilities), complexity (from simple terminology to complex graphs) and methods of sharing (verbal, written or electronic). Having as much information available would have practical benefits, so that patients could access what they wanted to know, when they chose to do so. As some preferred to share a computer screen with their clinician, there is no reason why material should not be available in this format in clinic settings. In terms of decision-making, although preferences were seen for recommendations from clinical staff, some people wanted to be fully involved in this process; hence, various strategies should also be available to meet the range of likely needs.
It is important that strategies for information-sharing and engagement in treatment decisions are tailored (intellectually and emotionally) to the needs of individuals at any particular time point [see In-depth exploration of patient experiences: information and treatment decisions (WP1)]. Regularly monitoring preferences over time would enable adaptations to be made to facilitate the desired extent of participation, and this is supported in other studies, with caution suggested against predicting likely preferences based on patient characteristics, such as age and educational attainment. 103 Furthermore, studies of myeloma and lymphoma identified variations in the factors that individuals consider most important when making treatment decisions, including efficacy, likely duration of remission, survival, QoL, disruption to daily activities, cost, toxicity and logistical issues. 12–15 Clinicians might also determine the social infrastructure and support network available to patients, so they are aware of gaps that could be addressed directly themselves, indirectly via signposting (e.g. support groups) or formally, with NHS referrals (e.g. to psycho-oncology for cancer-related anxiety and distress, which was common among our interviewees).
Enabling patients to engage with the process and flagging-up of issues of concern, the clinic survey [see Patient well-being and involvement survey (WP5)] successfully demonstrated that it is possible to routinely distribute questionnaires and collect longitudinal data in clinical settings, as part of routine practice. HCPs reported that the distribution process was straightforward, required little resource and could be performed by reception staff when patients arrived for their appointment. Importantly, patients said that they welcomed the opportunity to feedback on their health and experiences and were pleased to be asked. This success suggests that similar systems could be routinely implemented in haematology and other clinics in the future, both beyond and within the study region.
With respect to health economics [see Health economics (WP3)], commissioners and healthcare managers could use models, such as those developed in this programme, to estimate how many patients are on each treatment line, OFF TREATMENT after each line, receiving palliative care, and so on, thereby facilitating cost calculations as well as resource planning and allocation. The model could also be used to simulate the impact of novel policies, treatments and pathway changes prior to their introduction.
Additional information
Acknowledgements
HMRN (www.hmrn.org) is an ongoing collaboration between university researchers, NHS staff and patients/relatives. We are grateful to lay-contributors (research participants, co-investigators and collaborators) who shared their personal experiences and the NHS staff who facilitate HMRN.
Contributions of authors
Eve Roman (https://orcid.org/0000-0001-7603-3704) (Professor, Epidemiology): study concept/design, oversight of activities, progress and adverse event management, survey, reporting.
Debra Howell (https://orcid.org/0000-0002-7521-7402) (Professor, Health Services Research): study concept/design, oversight of activities, progress and adverse-event management, survey, PPI, qualitative work, reporting.
Alexandra Smith (https://orcid.org/0000-0002-1111-966X) (Professor, Cancer Epidemiology): study concept/design, HMRN data management and analysis, data provision for modelling, survey.
Simon Crouch (https://orcid.org/0000-0002-3026-2859) (Associate Professor, Bio-statistics): prognostic modelling.
Timothy Bagguley (https://orcid.org/0000-0002-6150-3467) (Research Fellow): data analysis.
Daniel Painter (https://orcid.org/0000-0002-3936-7569) (Research Fellow): pathway visualisation.
Rebecca Sheridan (https://orcid.org/0000-0002-7715-1224) (Research Fellow): data analysis (survey/qualitative).
Dorothy McCaughan (https://orcid.org/0000-0001-5388-2455) (Research Fellow): qualitative work.
John Blase (https://orcid.org/0000-0001-5373-0216) (Research Fellow): design aspects.
William Curson (https://orcid.org/0000-0003-1508-3331) (Web Developer): data access.
Han-I Wang (https://orcid.org/0000-0002-3521-993X) (Research Fellow): data analysis (health economics).
Andrea Manca (https://orcid.org/0000-0001-8342-8421) (Professor, Health Economics): data analysis (health economics).
Alastair Bennett (https://orcid.org/0000-0003-0042-480X) (Research Fellow): data analysis (health economics).
Vijay S Gc (https://orcid.org/0000-0003-0365-2605) (Research Fellow): data analysis (health economics).
Carol Miller (Patient): programme relevance/oversight.
Karl Atkin (https://orcid.org/0000-0003-1070-8670) (Professor): medical sociology.
Richard Thompson (Professor): decision-making.
Barbara Hanratty (https://orcid.org/0000-0002-3122-7190) (Professor): primary care, qualitative methods.
Cathy Burton (https://orcid.org/0000-0003-4506-6436) (Haematologist): clinical advice.
John Ashcroft (https://orcid.org/0000-0002-9252-4180) (Haematologist): clinical advice.
Russell Patmore (https://orcid.org/0000-0002-0925-9014) (Haematologist): study concept/design, clinical lead, application oversight, study conduct, reporting.
Disclosure of interests
Full disclosure of interests: Completed ICMJE forms for all authors, including all related interests, are available in the toolkit on the NIHR Journals Library report publication page at https://doi.org/10.3310/TKNQ7004.
Primary conflicts of interest: Karl Atkin reports grants from the National Institute for Health and Care Research (NIHR) during conduct of the study and that he was a member of the NIHR Advanced Fellowship Panel and the NIHR Public Health Research Research Funding Board 2010–16. Andrea Manca reports that he was a member of the NIHR Doctoral Fellowships Panel (2013–present) during the conduct of the study. Eve Roman and Alexandra Smith are supported in part by the NIHR Leeds Biomedical Research Centre: (BRC) (NIHR203331). HMRN is funded by CRUK (www.cancerresearchuk.org/: 18362 and A29685) and Blood Cancer UK (www.bloodwise.org.uk:15037).
Patient data statement
This work uses data provided by patients and collected by the NHS as part of their care and support. Using patient data is vital to improve health and care for everyone. There is huge potential to make better use of information from people’s patient records, to understand more about disease, develop new treatments, monitor safety and plan NHS services. Patient data should be kept safe and secure, to protect everyone’s privacy, and it is important that there are safeguards to make sure that they are stored and used responsibly. Everyone should be able to find out about how patient data are used. #datasaveslives You can find out more about the background to this citation here: https://understandingpatientdata.org.uk/data-citation.
Data-sharing statement
Data-sharing is restricted by ethical permissions and agreements with national data providers, meaning potentially identifiable data cannot be transferred or accessed off-site. To collaborate with HMRN, e-mail enquiries@hmrn.org. Qualitative data cannot be shared as sensitive issues were discussed and entire accounts could be identifiable. Further information can be obtained from ER or DH.
Ethics statement
HMRN has ethics (Leeds West REC 04/Q1205/69) and R&D approval from relevant NHS trusts, and Section 251 support under the NHS Act 2006 [PIAG 1-05(h)2007]. Supplementary approval for this programme was granted by the London, City and East committee (REC 16/LO/0740).
Information governance statement
The University of York is committed to handling all personal information in line with the UK Data Protection Act (2018) and the General Data Protection Regulation (EU GDPR) 2016/679. Under the Data Protection legislation, the University of York is the Data Controller, and you can find out more about how we handle personal data, including how to exercise your individual rights and the contact details for our Data Protection Officer here (https://www.york.ac.uk/records-management/dp/).
Department of Health and Social Care disclaimer
This publication presents independent research commissioned by the National Institute for Health and Care Research (NIHR). The views and opinions expressed by authors in this publication are those of the authors and do not necessarily reflect those of the NHS, the NIHR, MRC, NIHR Coordinating Centre, the PGfAR programme or the Department of Health and Social Care. This monograph was published based on current knowledge at the time and date of publication. NIHR is committed to being inclusive and will continually monitor best practice and guidance in relation to terminology and language to ensure that we remain relevant to our stakeholders.
Publications
Crouch S, Painter D, Barrans SL, Roman E, Beer P, Cooke SL, et al. Molecular subclusters of follicular lymphoma: a report from the United Kingdom’s Haematological Malignancy Research Network. Blood Adv 2022;6:5716–31. https://doi.org/10.1182/bloodadvances.2021005284
Howell DA, McCaughan D, Smith AG, Patmore R, Roman E. Incurable but treatable: understanding, uncertainty and impact in chronic blood cancers – a qualitative study from the UK’s Haematological Malignancy Research Network. PLOS ONE 2022;17:e0263672. https://doi.org/10.1371/journal.pone.0263672
McCaughan D, Roman E, Sheridan R, Hewison A, Smith AG, et al. Patient perspectives of ‘Watch and Wait’ for chronic haematological cancers: findings from a qualitative study. Eur J Oncol Nurs 2023;65:102349. https://doi.org/10.1016/j.ejon.2023.102349
McCaughan D, Roman E, Smith A, Patmore R, Howell D. Treatment decision making (TDM): a qualitative study exploring the perspectives of patients with chronic haematological cancers. BMJ Open 2022;12:e050816. https://doi.org/10.1136/bmjopen-2021-050816
Sheridan R, McCaughan D, Hewison A, Roman E, Smith A, Patmore R, Howell D. Experiences and preferences for psychosocial support: a qualitative study exploring the views of patients with chronic haematological cancers. BMJ Open 2023;13:e070467. https://doi.org/10.1136/bmjopen-2022-070467
Howell DA, McCaughan D, Sheridan R, Patmore R, Roman E. Qualitative insights into the factors impacting information sharing in people with chronic haematological malignancies. Eur J Can Care 2024:9999977. https://doi.org/10.1155/2024/9999977
Since the study closed, and the pandemic ended, we have been able to update our data set. Papers from this larger data set will form the basis of future publications, within which this summary report will be cited.
Disclaimers
This article presents independent research funded by the National Institute for Health and Care Research (NIHR). The views and opinions expressed by authors in this publication are those of the authors and do not necessarily reflect those of the NHS, the NIHR, CCF, PGfAR or the Department of Health and Social Care. If there are verbatim quotations included in this publication the views and opinions expressed by the interviewees are those of the interviewees and do not necessarily reflect those of the authors, those of the NHS, the NIHR, the PGfAR programme or the Department of Health and Social Care.
References
- Public Health England . Cancer Registration Statistics, England: Final Release 2018. www.gov.uk/government/publications/cancer-registration-statistics-england-2018-final-release/cancer-registration-statistics-england-final-release-2018 (accessed 5 July 2020).
- Cronin KA, Lake AJ, Scott S, Sherman RL, Noone AM, Howlader N, et al. Annual report to the nation on the status of cancer, Part I: National Cancer Statistics. Cancer 2018;124:2785-800. https://doi.org/10.1002/cncr.31551.
- Swerdlow S, Campo E, Harris N, Jaffe E, Pileri S, Stein H, et al. WHO Classification of Tumours of Haematopoietic and Lymphoid Tissues. Lyon: IARC Press; 2017.
- Freedman A, Jacobsen E. Follicular lymphoma: 2020 update on diagnosis and management. Am J Hematol 2020;95:316-27. https://doi.org/10.1002/ajh.25696.
- Evans J, Ziebland S, Pettitt AR. Incurable, invisible and inconclusive: watchful waiting for chronic lymphocytic leukaemia and implications for doctor-patient communication. Eur J Cancer Care (Engl) 2012;21:67-7. https://doi.org/10.1111/j.1365-2354.2011.01278.x.
- Maher K, de Vries K. An exploration of the lived experiences of individuals with relapsed multiple myeloma. Eur J Cancer Care (Engl) 2011;20:267-75. https://doi.org/10.1111/j.1365-2354.2010.01234.x.
- Horn J, Campbell K. Support needs of patients with a diagnosis of follicular lymphoma. Cancer Nurs Practice 2010;9:34-7.
- Poe JK, Hayslip JW, Studts JL. Decision making and distress among individuals diagnosed with follicular lymphoma. J Psychosoc Oncol 2012;30:426-45. https://doi.org/10.1080/07347332.2012.684853.
- Department of Health and Social Care (DHSC) . Equity and Excellence: Liberating the NHS 2010.
- Department of Health and Social Care (DHSC) . Improving Outcomes: A Strategy for Cancer 2011.
- National Institute for Health and Care Excellence . Patient Experience in Adult NHS Services: Improving the Experience of Care for People Using Adult NHS Services 2012.
- Jen WY, Yoong J, Liu X, Tan MSY, Chng WJ, Chee YL. Qualitative study of factors affecting patient, caregiver and physician preferences for treatment of myeloma and indolent lymphoma. Patient Prefer Adherence 2020;14:301-8. https://doi.org/10.2147/PPA.S241340.
- Fifer SJ, Ho KA, Lybrand S, Axford LJ, Roach S. Alignment of preferences in the treatment of multiple myeloma – a discrete choice experiment of patient, carer, physician, and nurse preferences. BMC Cancer 2020;20. https://doi.org/10.1186/s12885-020-07018-6.
- Crawford R, Sully K, Conroy R, Johnson C, Doward L, Bell T, et al. Patient-centered insights on treatment decision making and living with acute myeloid leukemia and other hematologic cancers. Patient 2020;13:83-102. https://doi.org/10.1007/s40271-019-00384-9.
- Tariman JD, Doorenbos A, Schepp KG, Becker PS, Berry DL. Patient, physician and contextual factors are influential in the treatment decision making of older adults newly diagnosed with symptomatic myeloma. Cancer Treat Commun 2014;2:34-47. https://doi.org/10.1016/j.ctrc.2014.08.003.
- Mulley AG, Trimble C, Elwyn G. Stop the silent misdiagnosis: patients’ preferences matter. BMJ 2012;345. https://doi.org/10.1136/bmj.e6572.
- Collée GE, van der Wilk BJ, van Lanschot JJB, Busschbach JJ, Timmermans L, Lagarde SM, et al. Interventions that facilitate shared decision-making in cancers with active surveillance as treatment option: a systematic review of literature. Curr Oncol Rep 2020;22. https://doi.org/10.1007/s11912-020-00962-3.
- Elwyn G, Frosch D, Thomson R, Joseph-Williams N, Lloyd A, Kinnersley P, et al. Shared decision making: a model for clinical practice. J Gen Intern Med 2012;27:1361-7. https://doi.org/10.1007/s11606-012-2077-6.
- Schubbe D, Scalia P, Yen RW, Saunders CH, Cohen S, Elwyn G, et al. Using pictures to convey health information: a systematic review and meta-analysis of the effects on patient and consumer health behaviors and outcomes. Patient Educ Couns 2020;103:1935-60. https://doi.org/10.1016/j.pec.2020.04.010.
- Rood JAJ, Nauta IH, Witte BI, Stam F, van Zuuren FJ, Manenschijn A, et al. Shared decision-making and providing information among newly diagnosed patients with hematological malignancies and their informal caregivers: not ‘one-size-fits-all’. Psychooncology 2017;26:2040-7. https://doi.org/10.1002/pon.4414.
- Rood JA, Van Zuuren FJ, Stam F, van der Ploeg T, Huijgens PC, Verdonck-de Leeuw IM. Cognitive coping style (monitoring and blunting) and the need for information, information satisfaction and shared decision making among patients with haematological malignancies. Psychooncology 2015;24:564-71. https://doi.org/10.1002/pon.3699.
- Watson R, Bryant J, Sanson-Fisher R, Turon H, Hyde L, Herrmann A. Do haematological cancer patients get the information they need about their cancer and its treatment? Results of a cross-sectional survey. Support Care Cancer 2019;27:1509-17. https://doi.org/10.1007/s00520-018-4525-2.
- Rothwell PM. Commentary: external validity of results of randomized trials: disentangling a complex concept. Int J Epidemiol 2010;39:94-6. https://doi.org/10.1093/ije/dyp305.
- Elting LS, Cooksley C, Bekele BN, Frumovitz M, Avritscher EB, Sun C, et al. Generalizability of cancer clinical trial results: prognostic differences between participants and nonparticipants. Cancer 2006;106:2452-8. https://doi.org/10.1002/cncr.21907.
- Arts LPJ, Oerlemans S, Posthuma EFM, Issa DE, Oosterveld M, van der Griend R, et al. Web-based self-management for patients with lymphoma: assessment of the reach of intervention of a randomized controlled trial. J Med Internet Res 2020;22. https://doi.org/10.2196/17018.
- Cook JA, Hislop J, Adewuyi TE, Harrild K, Altman DG, Ramsay CR, et al. Assessing methods to specify the target difference for a randomised controlled trial: DELTA (Difference ELicitation in TriAls) review. Health Technol Assess 2014;18:1-175. https://doi.org/10.3310/hta18280.
- Smith A, Howell D, Patmore R, Jack A, Roman E. Incidence of haematological malignancy by sub-type: a report from the Haematological Malignancy Research Network. Br J Cancer 2011;105:1684-92. https://doi.org/10.1038/bjc.2011.450.
- Smith A, Howell D, Crouch S, Painter D, Blase J, Wang HI, et al. Cohort profile: the Haematological Malignancy Research Network (HMRN): a UK population-based patient cohort. Int J Epidemiol 2018;47. https://doi.org/10.1093/ije/dyy044.
- Roman E, Kane E, Howell D, Lamb M, Bagguley T, Crouch S, et al. Cohort profile update: the Haematological Malignancy Research Network (HMRN) UK population-based cohorts. Int J Epidemiol 2022;51:e87-94. https://doi.org/10.1093/ije/dyab275.
- Smith A, Roman E, Howell D, Jones R, Patmore R, Jack A. Haematological Malignancy Research Network . The Haematological Malignancy Research Network (HMRN): a new information strategy for population based epidemiology and health service research. Br J Haematol 2010;148:739-53. https://doi.org/10.1111/j.1365-2141.2009.08010.x.
- Department of Health and Social Care (DHSC) . Cancer Reform Strategy 2007.
- Byrd JC, Hillmen P, Ghia P, Kater AP, Chanan-Khan A, Furman RR, et al. Acalabrutinib versus ibrutinib in previously treated chronic lymphocytic leukemia: results of the first randomized Phase III trial. J Clin Oncol 2021;39:3441-52. https://doi.org/10.1200/JCO.21.01210.
- Auner HW, Brown SR, Walker K, Kendall J, Dawkins B, Meads D, et al. Ixazomib with cyclophosphamide and dexamethasone in relapsed or refractory myeloma: MUKeight phase II randomised controlled trial results. Blood Cancer J 2022;12. https://doi.org/10.1038/s41408-022-00626-4.
- Coulson AB, Royle KL, Pawlyn C, Cairns DA, Hockaday A, Bird J, et al. Frailty-adjusted therapy in Transplant Non-Eligible patients with newly diagnosed Multiple Myeloma (FiTNEss (UK-MRA Myeloma XIV Trial)): a study protocol for a randomised phase III trial. BMJ Open 2022;12. https://doi.org/10.1136/bmjopen-2021-056147.
- Davies A, Cummin TE, Barrans S, Maishman T, Mamot C, Novak U, et al. Gene-expression profiling of bortezomib added to standard chemoimmunotherapy for diffuse large B-cell lymphoma (REMoDL-B): an open-label, randomised, phase 3 trial. Lancet Oncol 2019;20:649-62. https://doi.org/10.1016/S1470-2045(18)30935-5.
- National Institute for Health Care Excellence . Addendum to Haematological Cancers: Improving Outcomes (Update) 2015.
- van Hout B, Janssen MF, Feng YS, Kohlmann T, Busschbach J, Golicki D, et al. Interim scoring for the EQ-5D-5L: mapping the EQ-5D-5L to EQ-5D-3L value sets. Value Health 2012;15:708-15. https://doi.org/10.1016/j.jval.2012.02.008.
- Herdman M, Gudex C, Lloyd A, Janssen M, Kind P, Parkin D, et al. Development and preliminary testing of the new five-level version of EQ-5D (EQ-5D-5L). Qual Life Res 2011;20:1727-36. https://doi.org/10.1007/s11136-011-9903-x.
- King E, Taylor J, Williams R, Vanson T. The MAGIC Programme: Evaluation an Independent Evaluation of the MAGIC (Making Good Decisions in Collaboration) Improvement Programme. 2013.
- The Health Foundation . Implementing Shared Decision Making 2013. www.health.org.uk/publications/implementing-shared-decision-making (accessed 6 August 2020).
- National Cancer Institute . GEM: Measure Information n.d. www.gem-measures.org/Public/MeasureDetail.aspx?mid=1597&cat=2 (accessed 6 August 2020).
- Degner LF, Sloan JA, Venkatesh P. The Control Preferences Scale. Can J Nurs Res 1997;29:21-43.
- EORTC – Quality of Life . Multiple Myeloma n.d. https://qol.eortc.org/questionnaire/qlq-my20/ (accessed 6 August 2020).
- Cicely Saunders Institute . Palliative Care Outcome Scale (POS) – MyPOS n.d. https://pos-pal.org/maix/mypos.php (accessed 6 August 2020).
- EORTC – Quality of Life . Chronic Lymphocytic Leukaemia n.d. https://qol.eortc.org/questionnaire/qlq-cll17/ (accessed 6 August 2020).
- FACIT Group . Questionnaires n.d. www.facit.org/FACITOrg/Questionnaires (accessed 6 August 2020).
- Spitzer RL, Kroenke K, Williams JB, Löwe B. A brief measure for assessing generalized anxiety disorder: the GAD-7. Arch Intern Med 2006;166:1092-7. https://doi.org/10.1001/archinte.166.10.1092.
- Kroenke K, Strine TW, Spitzer RL, Williams JB, Berry JT, Mokdad AH. The PHQ-8 as a measure of current depression in the general population. J Affect Disord 2009;114:163-73. https://doi.org/10.1016/j.jad.2008.06.026.
- Kroenke K, Spitzer RL, Williams JBW. The PHQ-15: validity of a new measure for evaluating the severity of somatic symptoms. Psychosom Med 2002;64:258-66.
- Hays RD, DiMatteo MR. A short-form measure of loneliness. J Pers Assess 1987;51:69-81. https://doi.org/10.1207/s15327752jpa5101_6.
- Braun V, Clarke V. To saturate or not to saturate? Questioning data saturation as a useful concept for thematic analysis and sample-size rationales. Qual Res Sport Exerc Health 2021;13:201-16. https://doi.org/10.1080/2159676X.2019.1704846.
- Malterud K, Siersma VD, Guassora AD. Sample size in qualitative interview studies: guided by information power. Qual Health Res 2016;26:1753-60. https://doi.org/10.1177/1049732315617444.
- Patton MQ. Qualitative Research and Evaluation Methods: Integrating Theory and Practice. Thousand Oaks, CA: SAGE Publications Ltd; 2015.
- Rai KR, Sawitsky A, Cronkite EP, Chanana AD, Levy RN, Pasternack BS. Clinical staging of chronic lymphocytic leukemia. Blood 1975;46:219-34. https://doi.org/10.1182/blood-2016-08-737650.
- Binet JL, Auquier A, Dighiero G, Chastang C, Piguet H, Goasguen J, et al. A new prognostic classification of chronic lymphocytic leukemia derived from a multivariate survival analysis. Cancer 1981;48:198-206. https://doi.org/10.1002/1097-0142(19810701)48:1<198::aid-cncr2820480131>3.0.co;2-v.
- Greipp PR, Miguel JS, Durie BGM, Crowley JJ, Barlogie B, Bladé J, et al. International staging system for multiple myeloma. J Clin Oncol 2005;23:3412-20. https://doi.org/10.1200/JCO.2005.04.242.
- Crouch S, Painter D, Barrans SL, Roman E, Beer PA, Cooke SL, et al. Molecular subclusters of follicular lymphoma: a report from the United Kingdom’s Haematological Malignancy Research Network. Blood Adv 2022;6:5716-31. https://doi.org/10.1182/bloodadvances.2021005284.
- Freeberg MA, Fromont LA, D’Altri T, Romero AF, Ciges JI, Jene A, et al. The European Genome-phenome Archive in 2021. Nucleic Acids Res 2022;50:D980-7. https://doi.org/10.1093/nar/gkab1059.
- Frieden TR. Evidence for health decision making – beyond randomized, controlled trials. N Engl J Med 2017;377:465-75. https://doi.org/10.1056/NEJMra1614394.
- Sculpher MJ, Claxton K, Drummond M, McCabe C. Whither trial-based economic evaluation for health care decision making?. Health Econ 2006;15:677-87. https://doi.org/10.1002/hec.1093.
- Manca A, Willan AR. ‘Lost in translation’: accounting for between-country differences in the analysis of multinational cost-effectiveness data. PharmacoEconomics 2006;24:1101-19. https://doi.org/10.2165/00019053-200624110-00007.
- National Institute for Health and Care Excellence . NICE Health Technology Evaluations: The Manual 2013. www.nice.org.uk/process/pmg36/resources/nice-health-technology-evaluations-the-manual-pdf-72286779244741 (accessed 15 December 2023).
- Buxton MJ, Drummond MF, Van Hout BA, Prince RL, Sheldon TA, Szucs T, et al. Modelling in economic evaluation: an unavoidable fact of life. Health Econ 1997;6:217-27. https://doi.org/10.1002/(sici)1099-1050(199705)6:3<217::aid-hec267>3.0.co;2-w.
- Asaria M, Walker S, Palmer S, Gale CP, Shah AD, Abrams KR, et al. Using electronic health records to predict costs and outcomes in stable coronary artery disease. Heart 2016;102:755-62. https://doi.org/10.1136/heartjnl-2015-308850.
- Brennan A, Meier P, Purshouse R, Rafia R, Meng Y, Hill-Macmanus D, et al. The Sheffield Alcohol Policy Model – a mathematical description. Health Econ 2015;24:1368-88. https://doi.org/10.1002/hec.3105.
- Pennington M, Grieve R, Black N, van der Meulen JH. Cost-effectiveness of five commonly used prosthesis brands for total knee replacement in the UK: a study using the NJR dataset. PLOS ONE 2016;11. https://doi.org/10.1371/journal.pone.0150074.
- Devlin NJ, Shah KK, Feng Y, Mulhern B, van Hout B. Valuing health-related quality of life: an EQ-5D-5L value set for England. Health Econ 2018;27:7-22. https://doi.org/10.1002/hec.3564.
- NHS Digital . Hospital Episode Statistics (HES) n.d. https://digital.nhs.uk/data-and-information/data-tools-and-services/data-services/hospital-episode-statistics (accessed 15 December 2023).
- NHS England . 2020/21/National/Cost/Collection/Data/Publication n.d. www.england.nhs.uk/publication/2020-21-national-cost-collection-data-publication/ (accessed 15 December 2023).
- NHS Digital . National Casemix Office Team n.d. https://digital.nhs.uk/services/secondary-uses-service-sus/payment-by-results-guidance/sus-pbr-reference-manual/hrg-grouping (accessed 29 May 2024).
- Putter H, Fiocco M, Geskus RB. Tutorial in biostatistics: competing risks and multi-state models. Stat Med 2007;26:2389-430. https://doi.org/10.1002/sim.2712.
- Jackson CH, Bojke L, Thompson SG, Claxton K, Sharples LD. A framework for addressing structural uncertainty in decision models. Med Decis Making 2011;31:662-74. https://doi.org/10.1177/0272989X11406986.
- Royston P, Parmar MKB. Flexible parametric proportional-hazards and proportional-odds models for censored survival data, with application to prognostic modelling and estimation of treatment effects. Stat Med 2002;21:2175-97. https://doi.org/10.1002/sim.1203.
- Orbe J, Ferreira E, Núñez-Antón V. Comparing proportional hazards and accelerated failure time models for survival analysis. Stat Med 2002;21:3493-510. https://doi.org/10.1002/sim.1251.
- Mihaylova B, Briggs A, O’Hagan A, Thompson SG. Review of statistical methods for analysing healthcare resources and costs. Health Econ 2011;20:897-916. https://doi.org/10.1002/hec.1653.
- Gelman A, Hill J. Data Analysis Using Regression and Multilevel/Hierarchical Models. Cambridge: Cambridge University Press; 2006.
- Basu A, Manca A. Regression estimators for generic health-related quality of life and quality-adjusted life-years. Med Decis Making 2012;32:56-69. https://doi.org/10.1177/0272989X11416988.
- Gray L, Alva M. A command for fitting mixture regression models for bounded dependent variables using the beta distribution. Stata J 2018;18:51-75. https://doi.org/10.1177/1536867X1801800105.
- Rubin DB. Multiple Imputation for Nonresponse in Surveys. John Wiley & Sons; 2004.
- Buuren S, Groothuis-Oudshoorn K. mice: Multivariate Imputation by Chained Equations in R. J Stat Softw 2011;45:1-67. https://doi.org/10.18637/jss.v045.i03.
- Corro Ramos I, Hoogendoorn M, Rutten-van Mölken MPMH. How to address uncertainty in health economic discrete-event simulation models: an illustration for chronic obstructive pulmonary disease. Med Decis Making 2020;40:619-32. https://doi.org/10.1177/0272989X20932145.
- Rood JA, van Zuuren FJ, Stam F, van der Ploeg T, Eeltink C, Verdonck-de Leeuw IM, et al. Perceived need for information among patients with a haematological malignancy: associations with information satisfaction and treatment decision-making preferences. Hematol Oncol 2014;33:85-98. https://doi.org/10.1002/hon.2138.
- Rider T, Malik M, Chevassut T. Haematology patients and the Internet – the use of on-line health information and the impact on the patient-doctor relationship. Patient Educ Couns 2014;97:223-38. https://doi.org/10.1016/j.pec.2014.06.018.
- Laurent MR, Cremers S, Verhoef G, Dierickx D. Internet use for health information among haematology outpatients: a cross-sectional survey. Inform Health Soc Care 2012;37:62-73. https://doi.org/10.3109/17538157.2011.606481.
- Howell DA, McCaughan D, Smith AG, Patmore R, Roman E. Incurable but treatable: understanding, uncertainty and impact in chronic blood cancers – a qualitative study from the UK’s Haematological Malignancy Research Network. PLOS ONE 2022;17. https://doi.org/10.1371/journal.pone.0263672.
- McCaughan D, Roman E, Smith A, Patmore R, Howell D. Treatment decision making (TDM): a qualitative study exploring the perspectives of patients with chronic haematological cancers. BMJ Open 2022;12. https://doi.org/10.1136/bmjopen-2021-050816.
- McCaughan D, Roman E, Sheridan R, Hewison A, Smith AG, Patmore R, et al. Patient perspectives of ‘Watch and Wait’ for chronic haematological cancers: findings from a qualitative study. Eur J Oncol Nurs 2023;65. https://doi.org/10.1016/j.ejon.2023.102349.
- Sheridan R, McCaughan D, Hewison A, Roman E, Patmore R, Howell D. Experiences and preferences for psychosocial support: a qualitative study exploring the views of patients with chronic haematological cancers. BMJ Open 2023.
- Roman E, Smith A, Appleton S, Crouch S, Kelly R, Kinsey S, et al. Myeloid malignancies in the real-world: occurrence, progression and survival in the UK’s population-based Haematological Malignancy Research Network 2004–15. Cancer Epidemiol 2016;42:186-98. https://doi.org/10.1016/j.canep.2016.03.011.
- Smith A, Crouch S, Lax S, Li J, Painter D, Howell D, et al. Lymphoma incidence, survival and prevalence 2004–2014: sub-type analyses from the UK’s Haematological Malignancy Research Network. Br J Cancer 2015;112:1575-84. https://doi.org/10.1038/bjc.2015.94.
- National Cancer Registration and Analysis Service . Registration for Blood Cancers in England: Comparison of Routine Data With a Specialist Population-Based Register n.d. www.ncin.org.uk/publications/data_briefings/registration_for_blood_cancers_in_england_comparison_of_routine_data_with_a_specialist_population_based_register (accessed 5 March 2022).
- National Institute for Health and Care Excellence . Overview: Midostaurin for Untreated Acute Myeloid Leukaemia 2018. www.nice.org.uk/guidance/ta523 (accessed 5 March 2022).
- National Institute for Health and Care Excellence . Letermovir for Preventing Cytomegalovirus Disease After a Stem Cell Transplant 2018.
- National Institute for Health and Care Excellence . Axicabtagene Ciloleucel for Treating Diffuse Large B-Cell Lymphoma and Primary Mediastinal B-Cell Lymphoma After 2 or More Systemic Therapies 2018.
- National Institute for Health and Care Excellence . Overview: Non-Hodgkin’s Lymphoma: Diagnosis and Management 2016. www.nice.org.uk/guidance/ng52 (accessed 5 March 2022).
- Lash TL, VanderWeele TJ, Haneause S, Rothman K. Modern Epidemiology. Philadelphia, PA: Lippincott Williams & Wilkins; 2020.
- Samy EF, Ross J, Bolton E, Morris EJ, Oliver SE. Variation in incidence and survival by ethnicity for patients with myeloma in England (2002–2008). Leuk Lymphoma 2015;56:2660-7. https://doi.org/10.3109/10428194.2014.1003060.
- Marinac CR, Ghobrial IM, Birmann BM, Soiffer J, Rebbeck TR. Dissecting racial disparities in multiple myeloma. Blood Cancer J 2020;10:1-8. https://doi.org/10.1038/s41408-020-0284-7.
- Farswan A, Gupta A, Sriram K, Sharma A, Kumar L, Gupta R. Does ethnicity matter in multiple myeloma risk prediction in the era of genomics and novel agents? Evidence from real-world data. Front Oncol 2021;11. https://doi.org/10.3389/fonc.2021.720932.
- Office for National Statistics . Regional Ethnic Diversity 2018. www.ethnicity-facts-figures.service.gov.uk/uk-population-by-ethnicity/national-and-regional-populations/regional-ethnic-diversity/latest (accessed 1 July 2022).
- Office for National Statistics . Population of England and Wales 2018. www.ethnicity-facts-figures.service.gov.uk/uk-population-by-ethnicity/national-and-regional-populations/population-of-england-and-wales/latest (accessed 5 March 2022).
- Office for National Statistics . Socioeconomic Status 2018. www.ethnicity-facts-figures.service.gov.uk/uk-population-by-ethnicity/demographics/socioeconomic-status/latest (accessed 5 March 2022).
- Loh KP, Tsang M, LeBlanc TW, Back A, Duberstein PR, Mohile SG, et al. Decisional involvement and information preferences of patients with hematologic malignancies. Blood Adv 2020;4:5492-500. https://doi.org/10.1182/bloodadvances.2020003044.
- National Institute for Health and Care Excellence . Position Statement on Use of the EQ-5D-5L Value Set for England (Updated October 2019) 2018. www.nice.org.uk/about/what-we-do/our-programmes/nice-guidance/technology-appraisal-guidance/eq-5d-5l (accessed 4 March 2022).
- Le-Rademacher JG, Peterson RA, Therneau TM, Sanford BL, Stone RM, Mandrekar SJ. Application of multi-state models in cancer clinical trials. Clin Trials 2018;15:489-98. https://doi.org/10.1177/1740774518789098.
- Barber J, Thompson S. Multiple regression of cost data: use of generalised linear models. J Health Serv Res Policy 2004;9:197-204. https://doi.org/10.1258/1355819042250249.
- Bongers ML, de Ruysscher D, Oberije C, Lambin P, Uyl-de Groot CA, Coupé VMH. Multistate statistical modeling: a tool to build a lung cancer microsimulation model that includes parameter uncertainty and patient heterogeneity. Med Decis Making 2016;36:86-100. https://doi.org/10.1177/0272989X15574500.
- Krijkamp EM, Alarid-Escudero F, Enns EA, Jalal HJ, Hunink MGM, Pechlivanoglou P. Microsimulation modeling for health decision sciences using R: a tutorial. Med Decis Making 2018;38:400-22. https://doi.org/10.1177/0272989X18754513.
Appendix 1 Population-based data and analyses
-
Outputs from the Paver programme.
-
Genes included on the haematological malignancy panel.
Outputs from the Paver programme
Paver processes CSV files containing data, with each row representing an individual patient pathway and each column representing a single treatment line. The first line of data in the CSV file is reserved for the headings of the treatment lines. While it was primarily designed to process and render treatment data, it can handle any data that can be structured into staged records.
To build the final pathway visualisation, the data must be processed in a number of steps. In the first step, the CSV file is parsed into a data structure that directly represents the CSV data. The second step is to turn the many individual pathways contained in the raw data from the CSV into a tree structure. This is done by combining the common lines of each individual pathway and keeping a running total of patients on each distinct branch of the tree, as it is built. The completed tree data structure is then used in the third step, to build a matrix of data nodes and node connectors to represent each block of the pathway. Last, in the fourth stage, this matrix of pathway blocks is then rendered into the final pathway visualisation.
FIGURE 16.
Chronic lymphocytic leukaemia patients diagnosed 1 September 2004–31 August 2010 followed up for survival to 31 December 2018, treatment to at least December 2015 and initially managed by (a) W&W; (b) chemotherapy; and (c) supportive/palliative care.
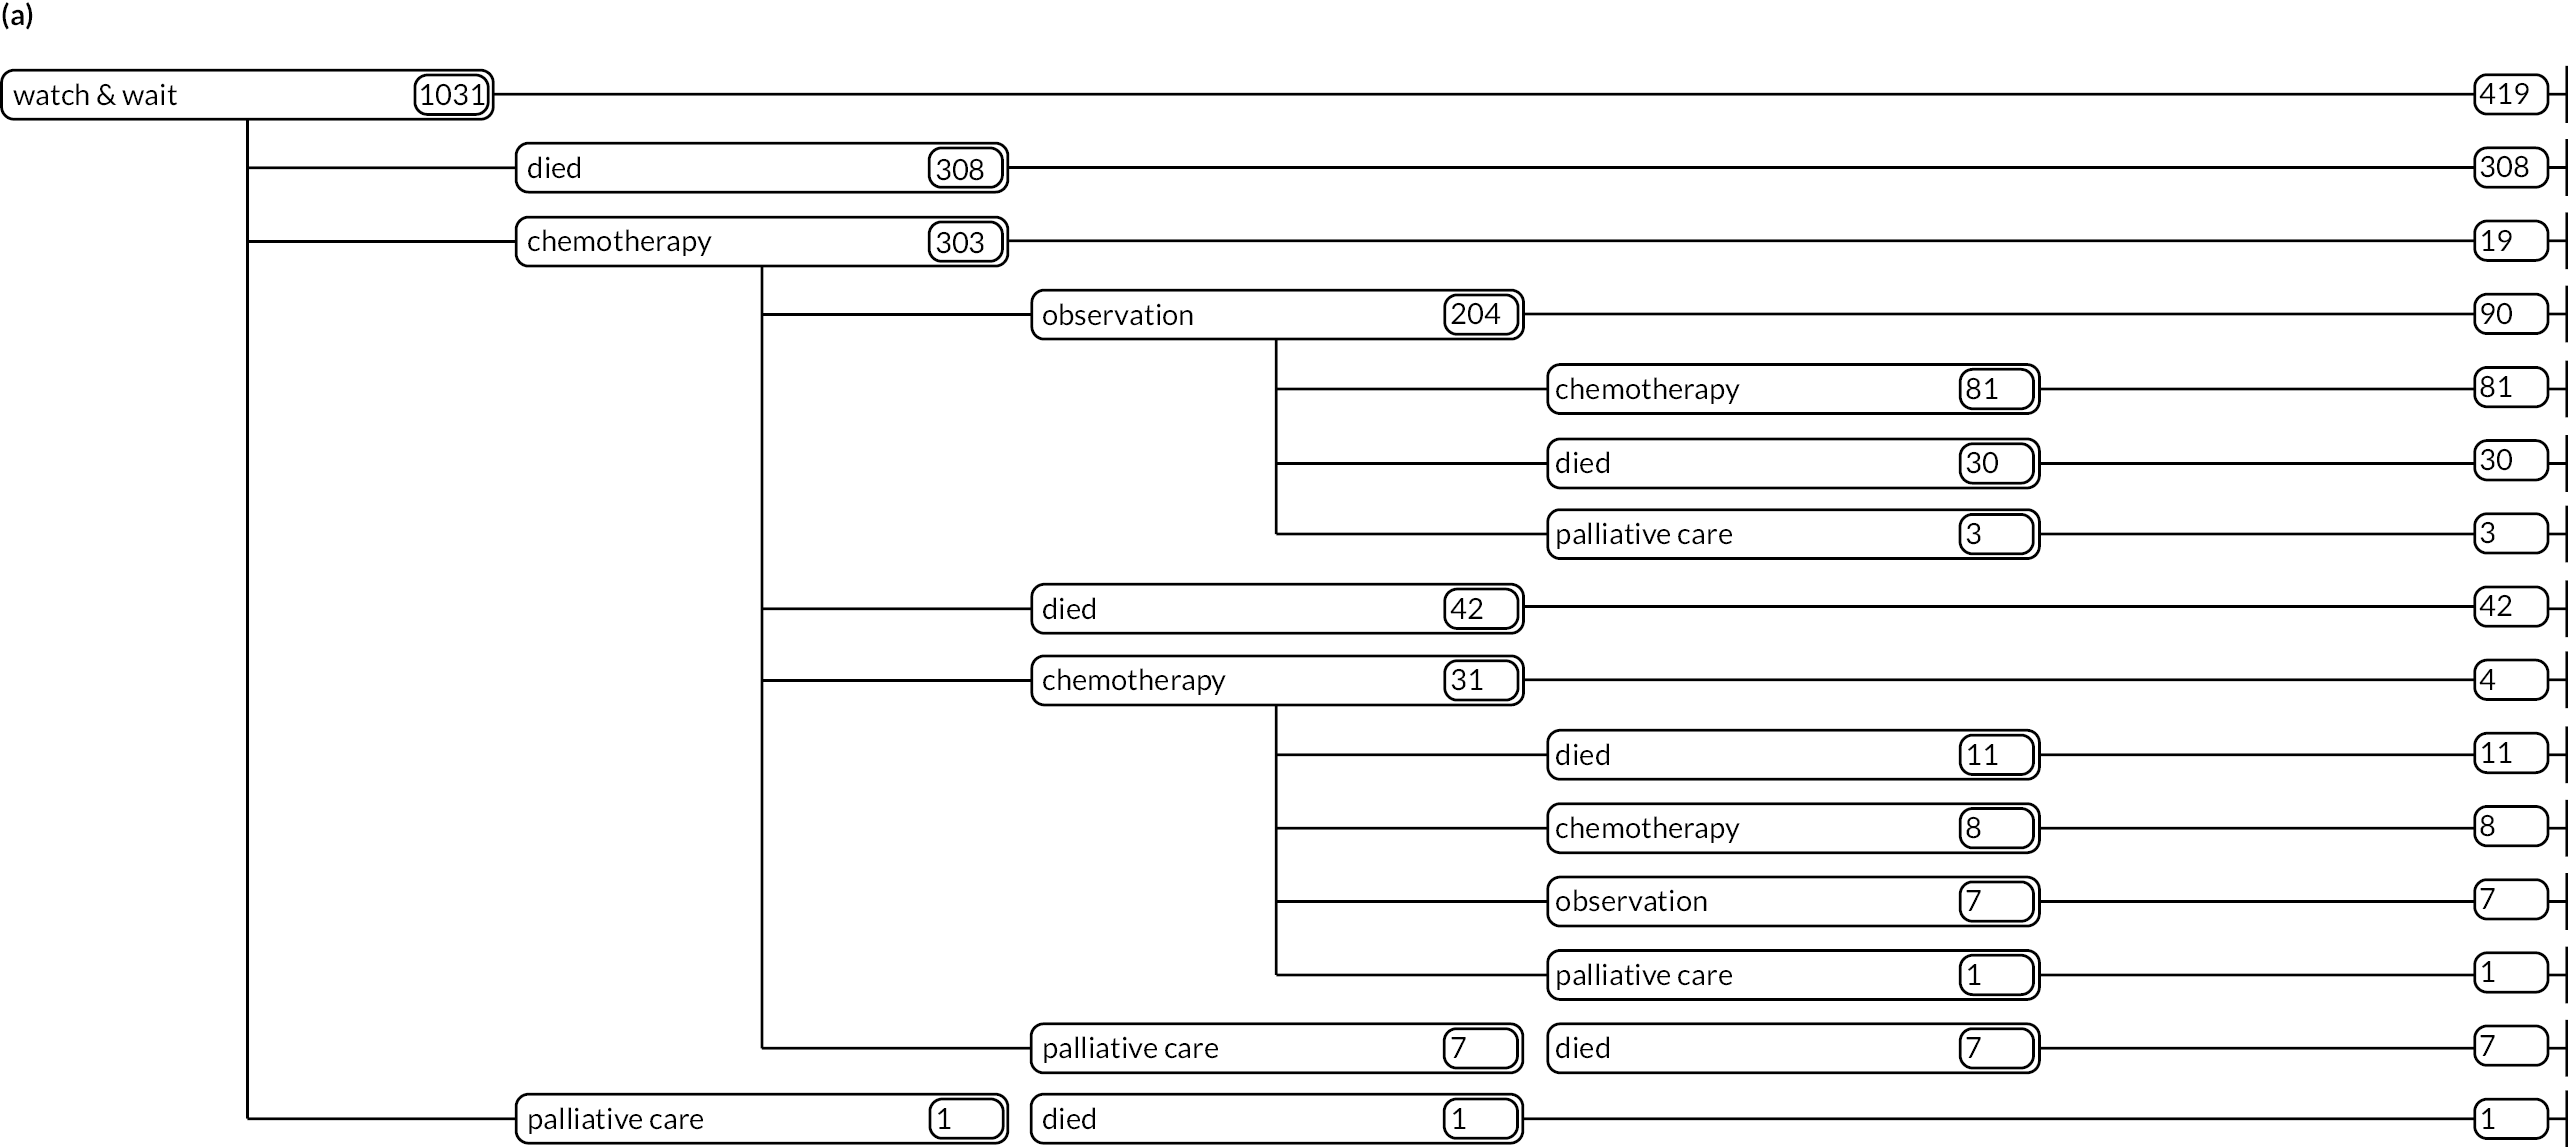
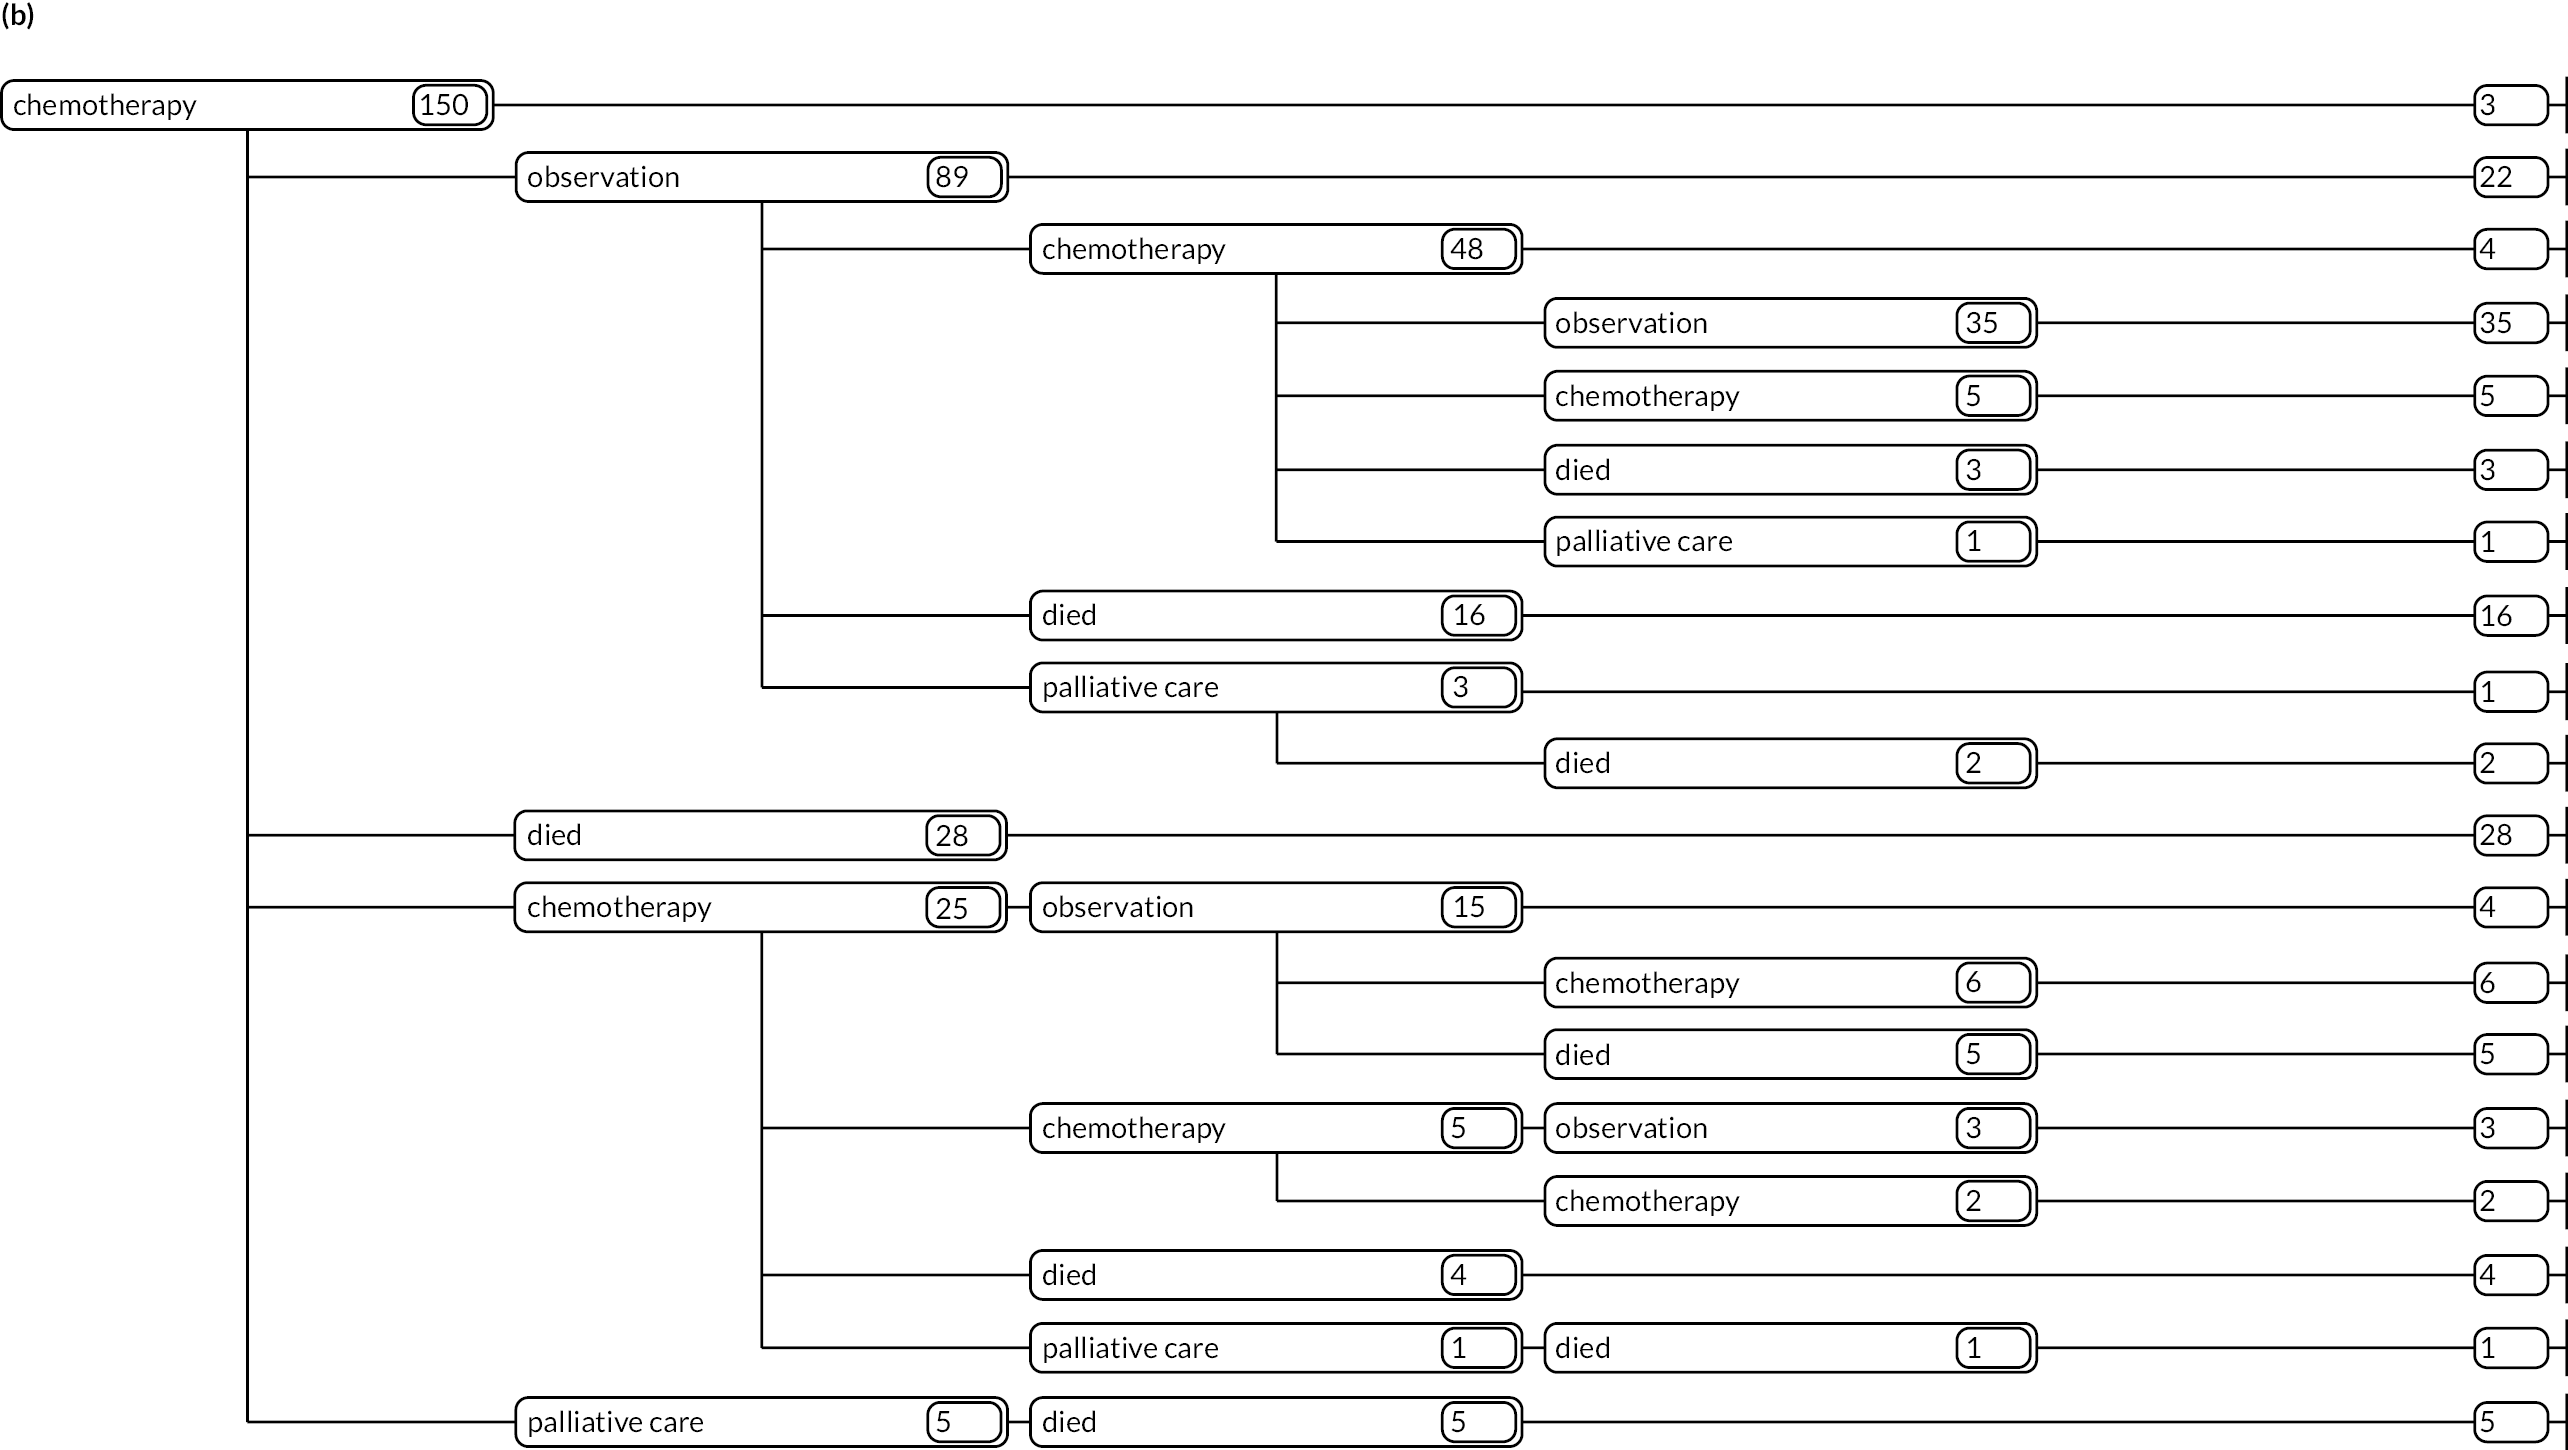

FIGURE 17.
Follicular lymphoma patients diagnosed 1 September 2004–31 August 2010 followed up for survival to 31 December 2018, treatment to at least December 2015 and initially managed by (a) W&W; (b) chemotherapy; and (c) radiotherapy.
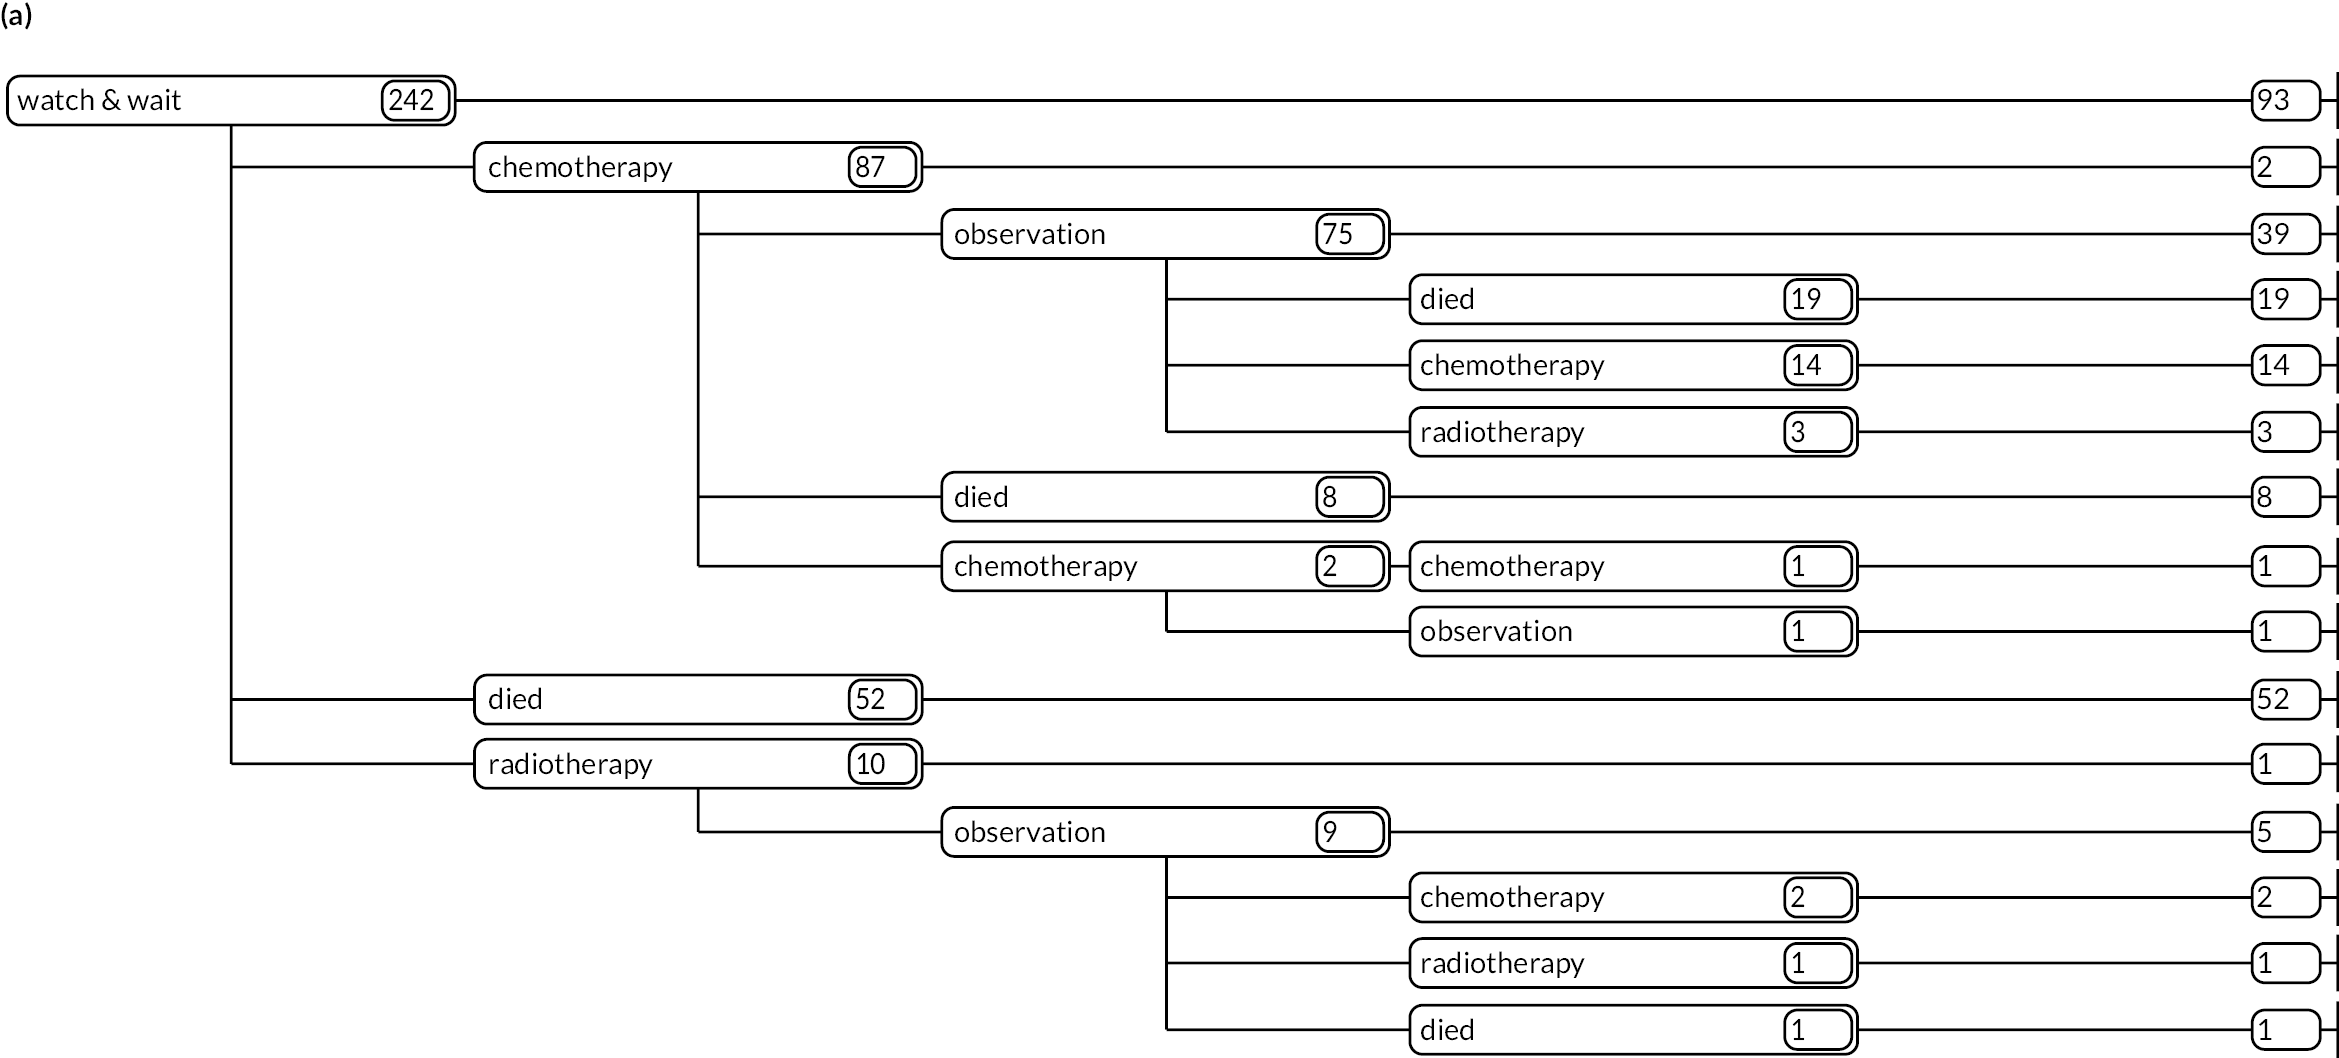
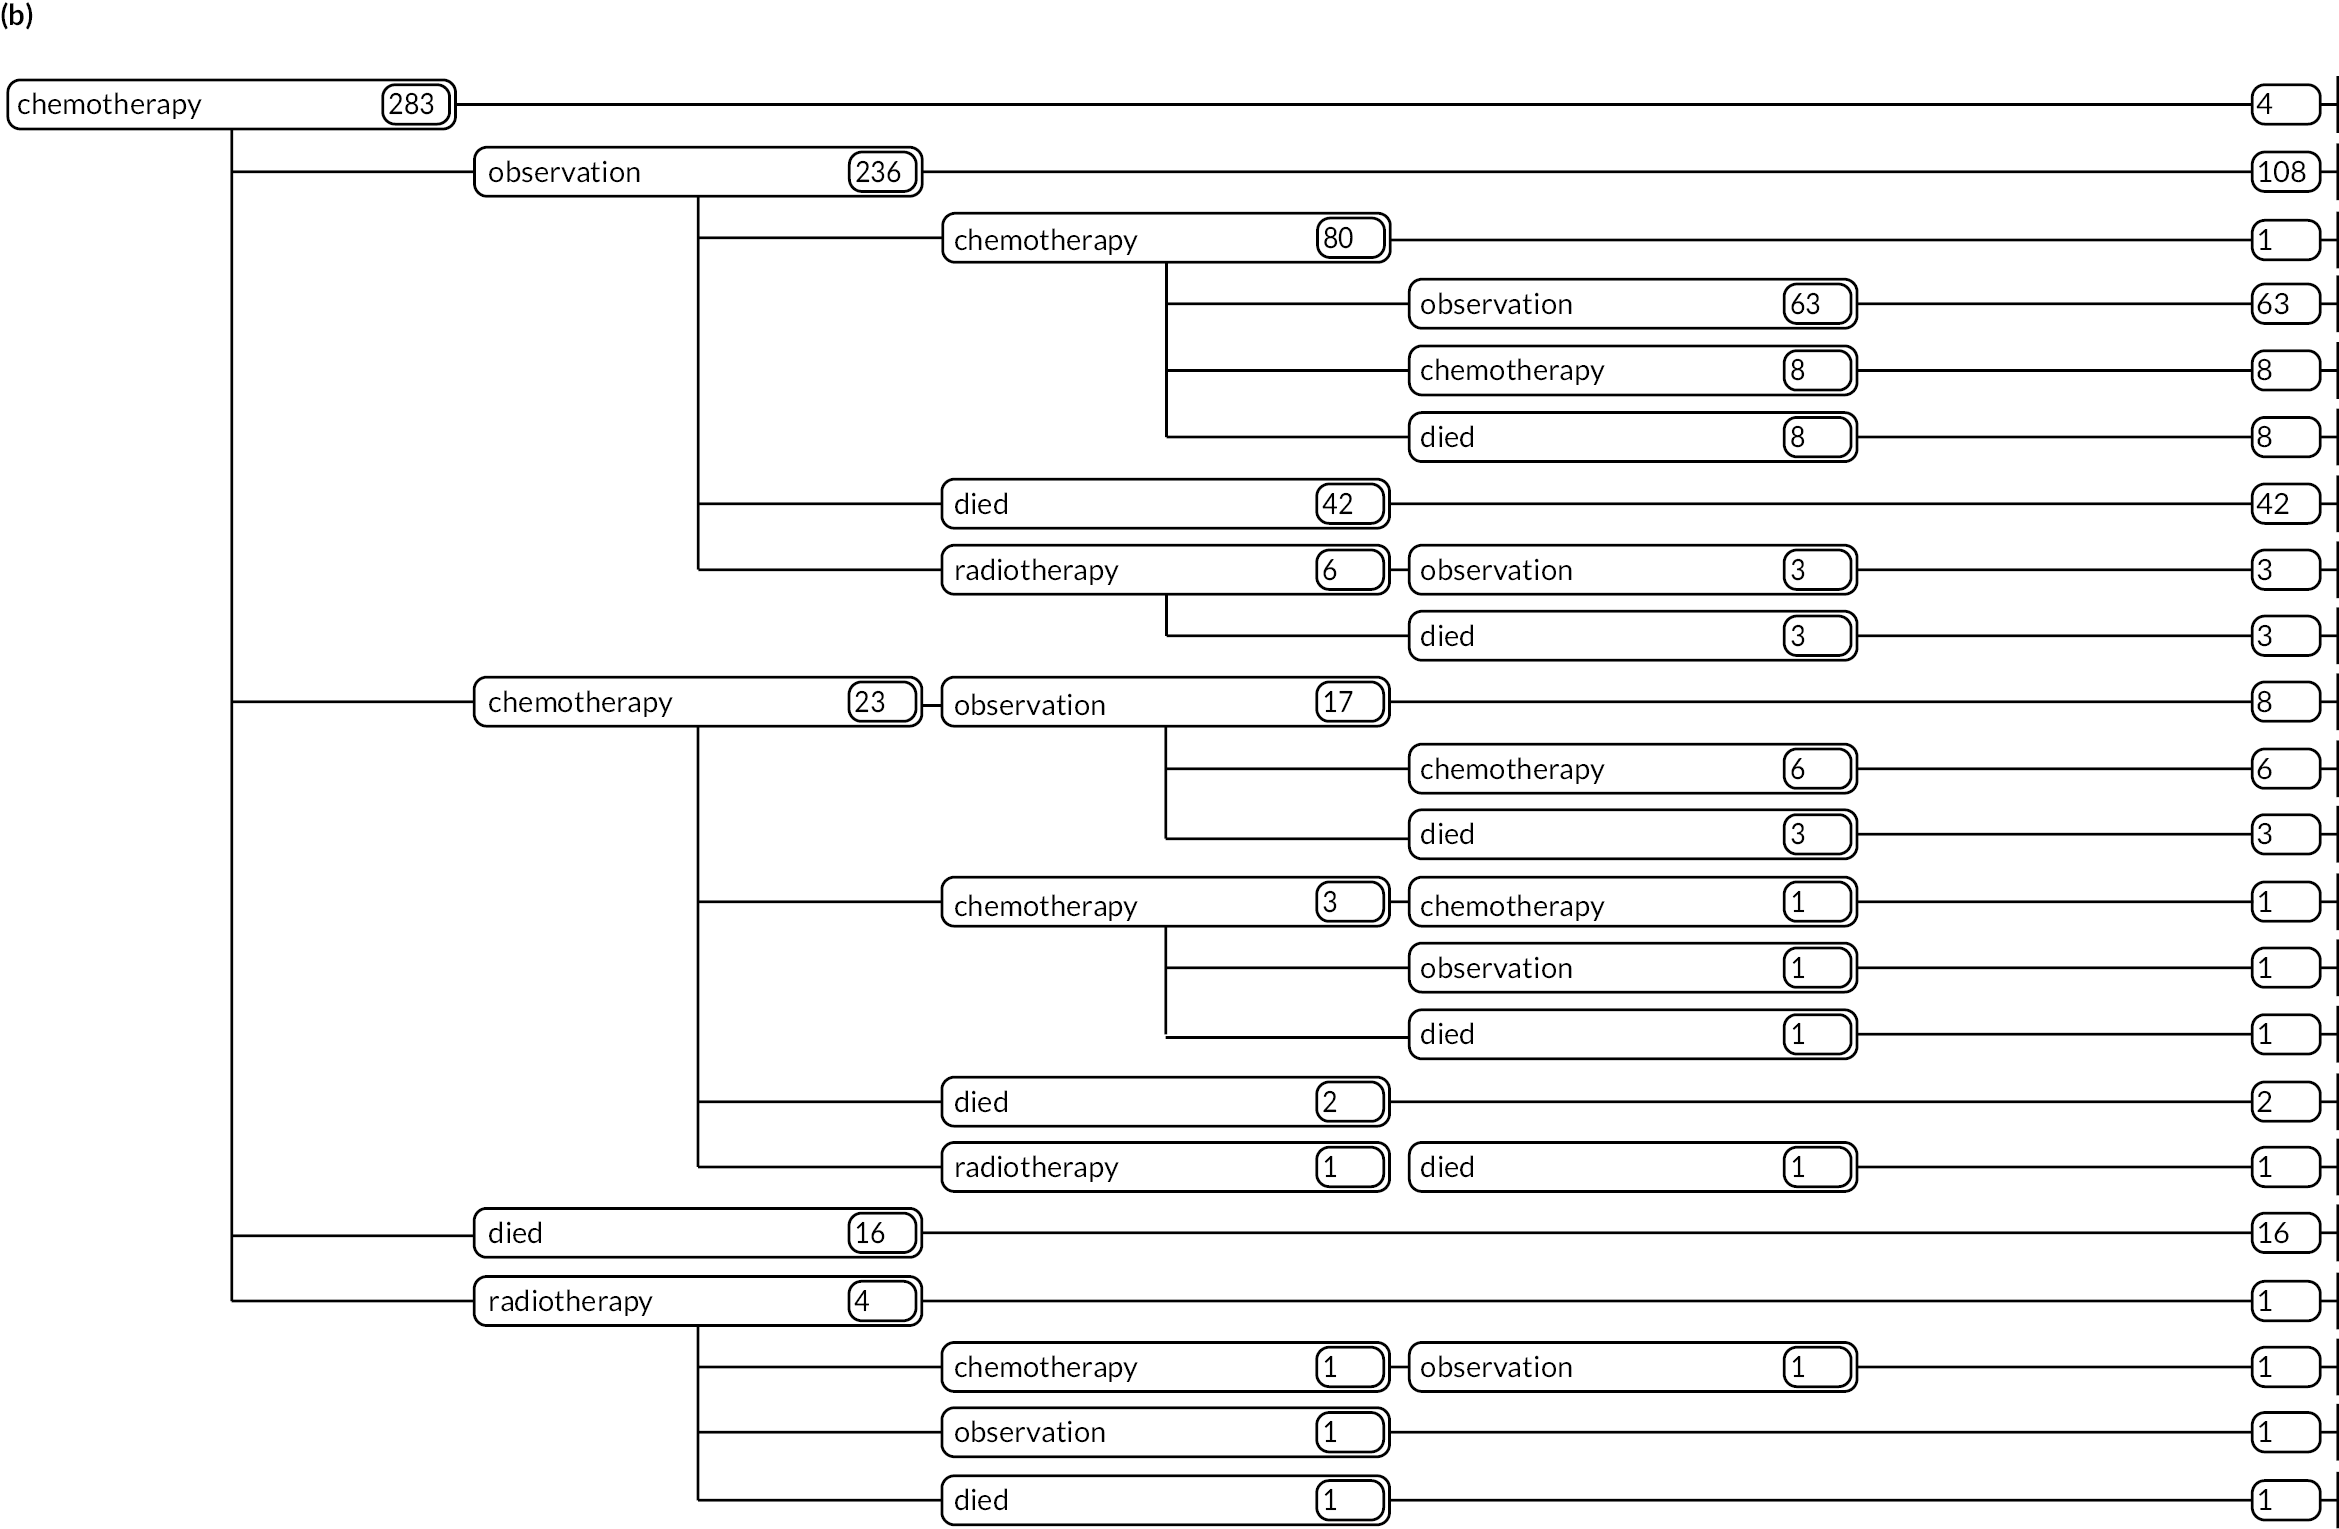
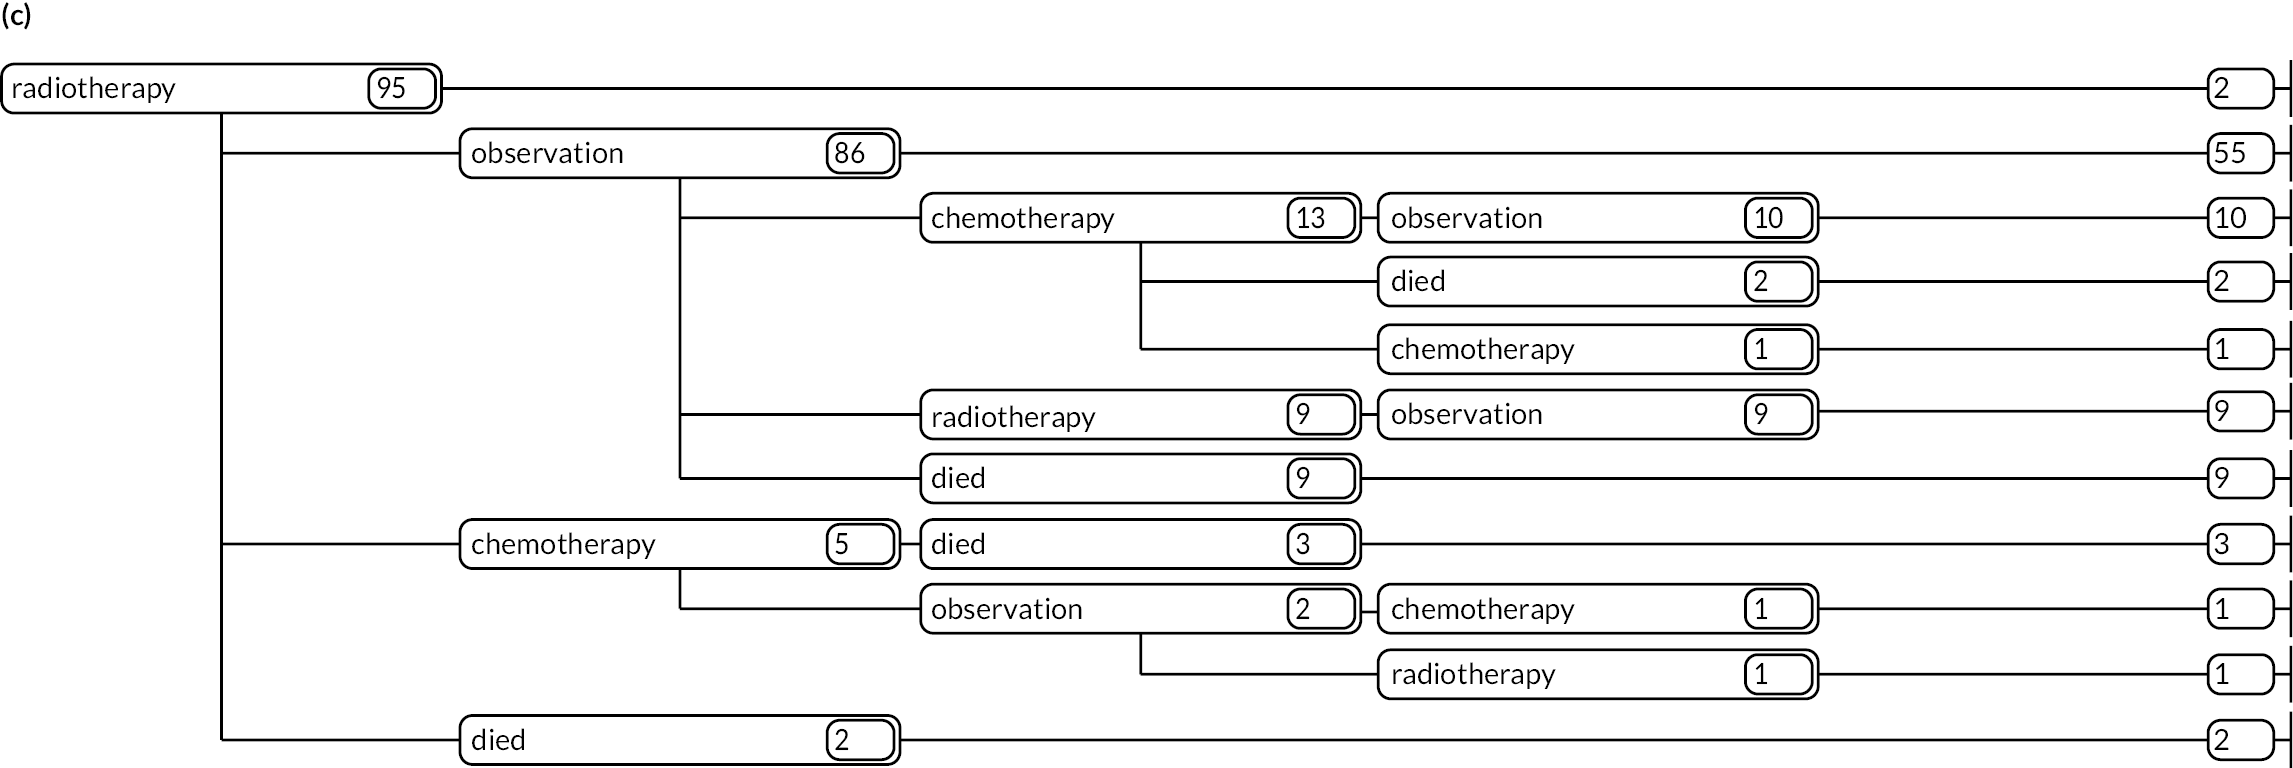
FIGURE 18.
Myeloma patients diagnosed 1 September 2004–31 August 2010 followed up for survival to 31 December 2018, treatment to at least 2015 and initially managed by (a) W&W; (b) chemotherapy; (c) radiotherapy; and (d) supportive/palliative care.
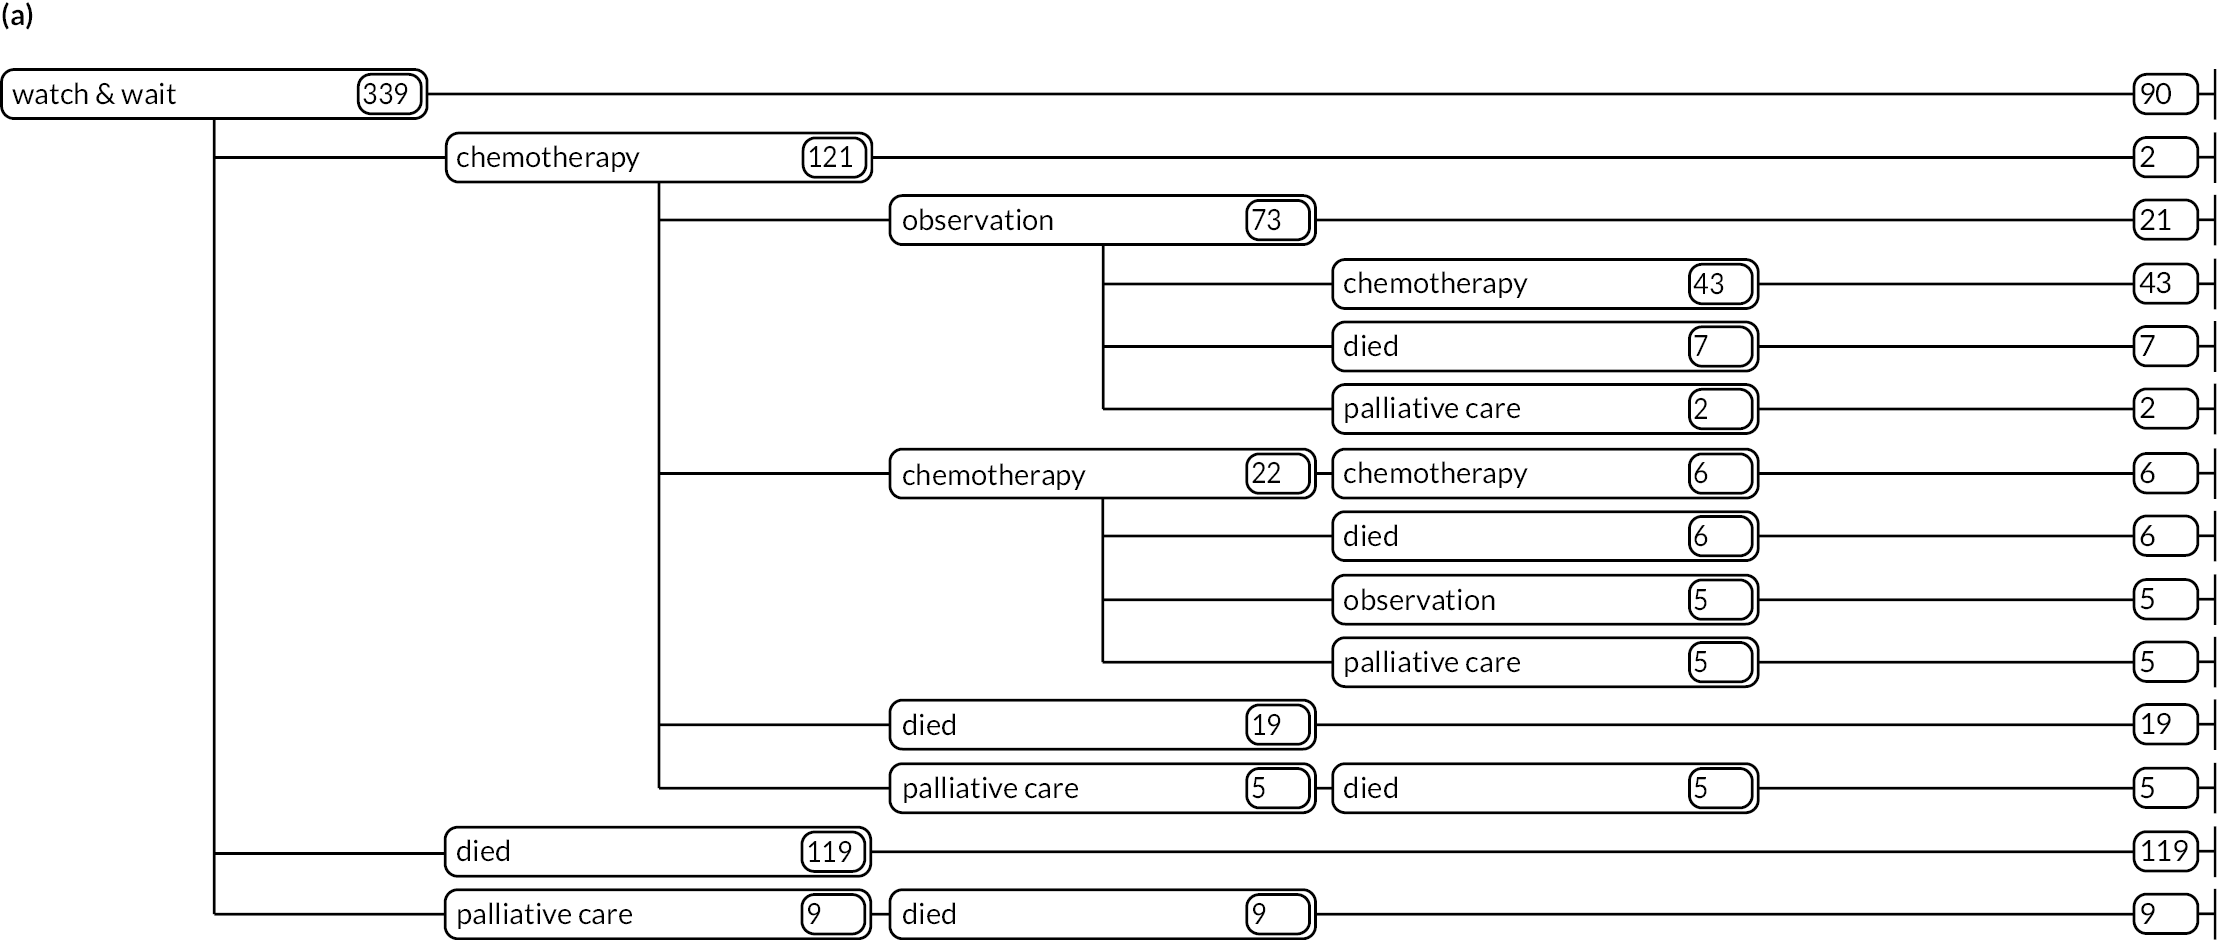
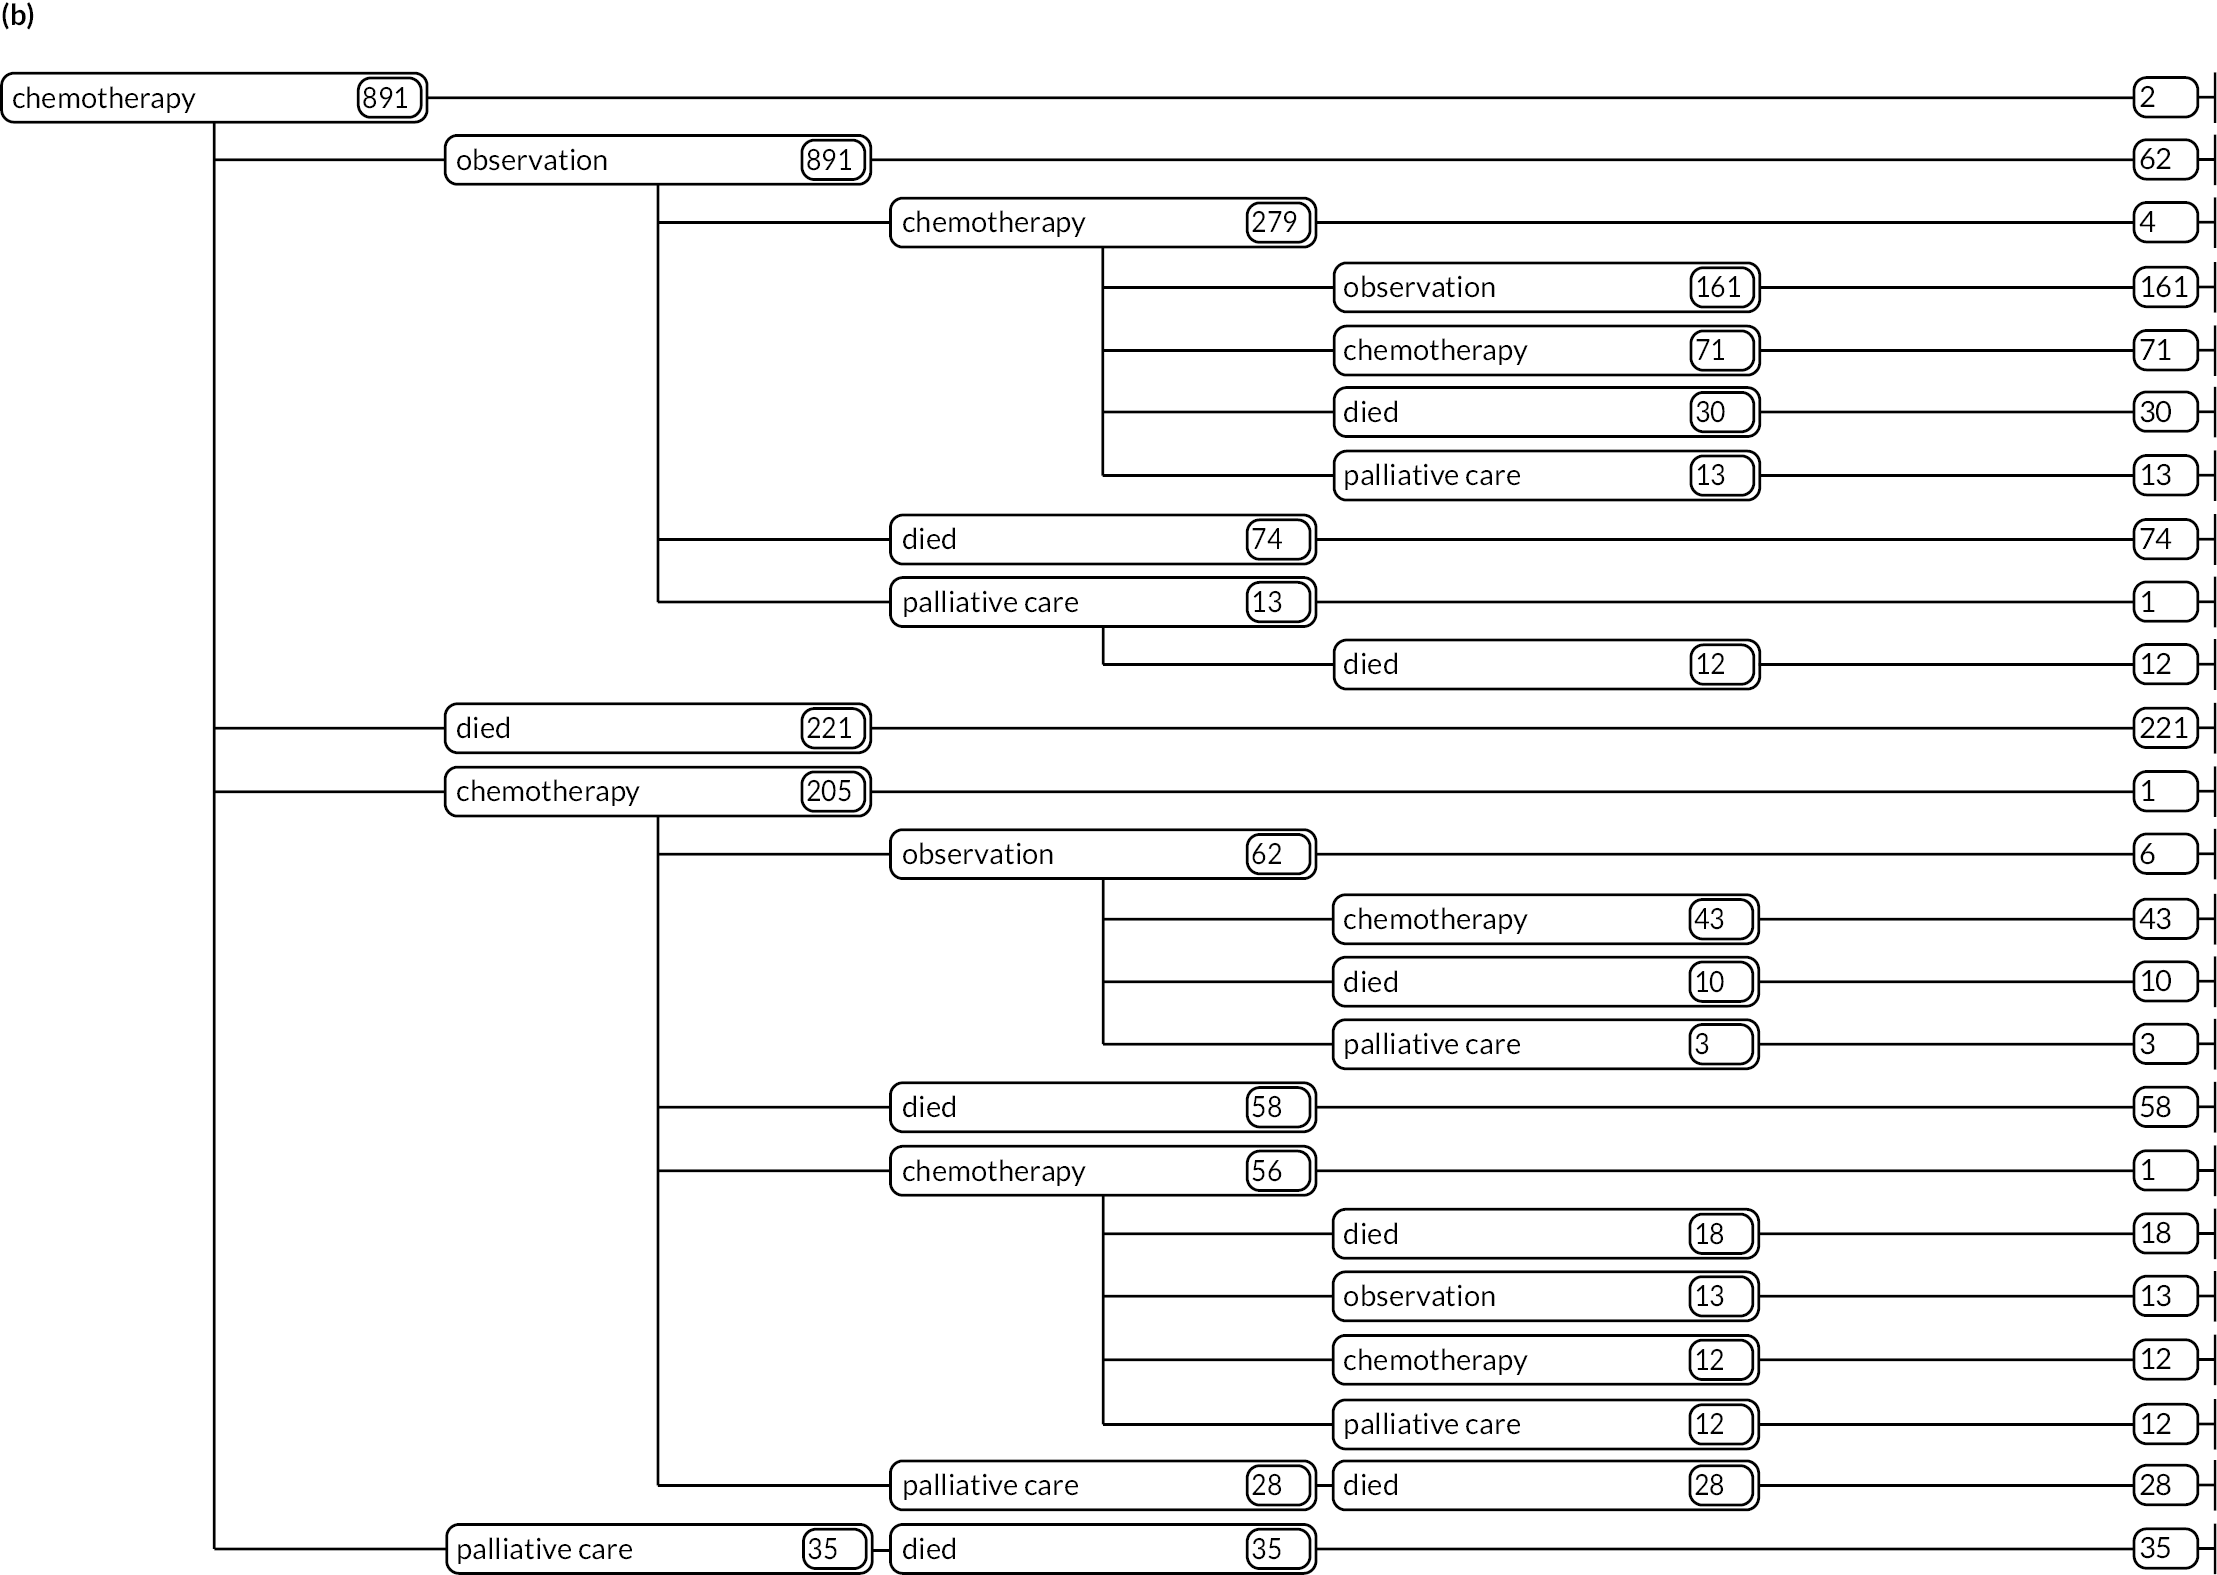
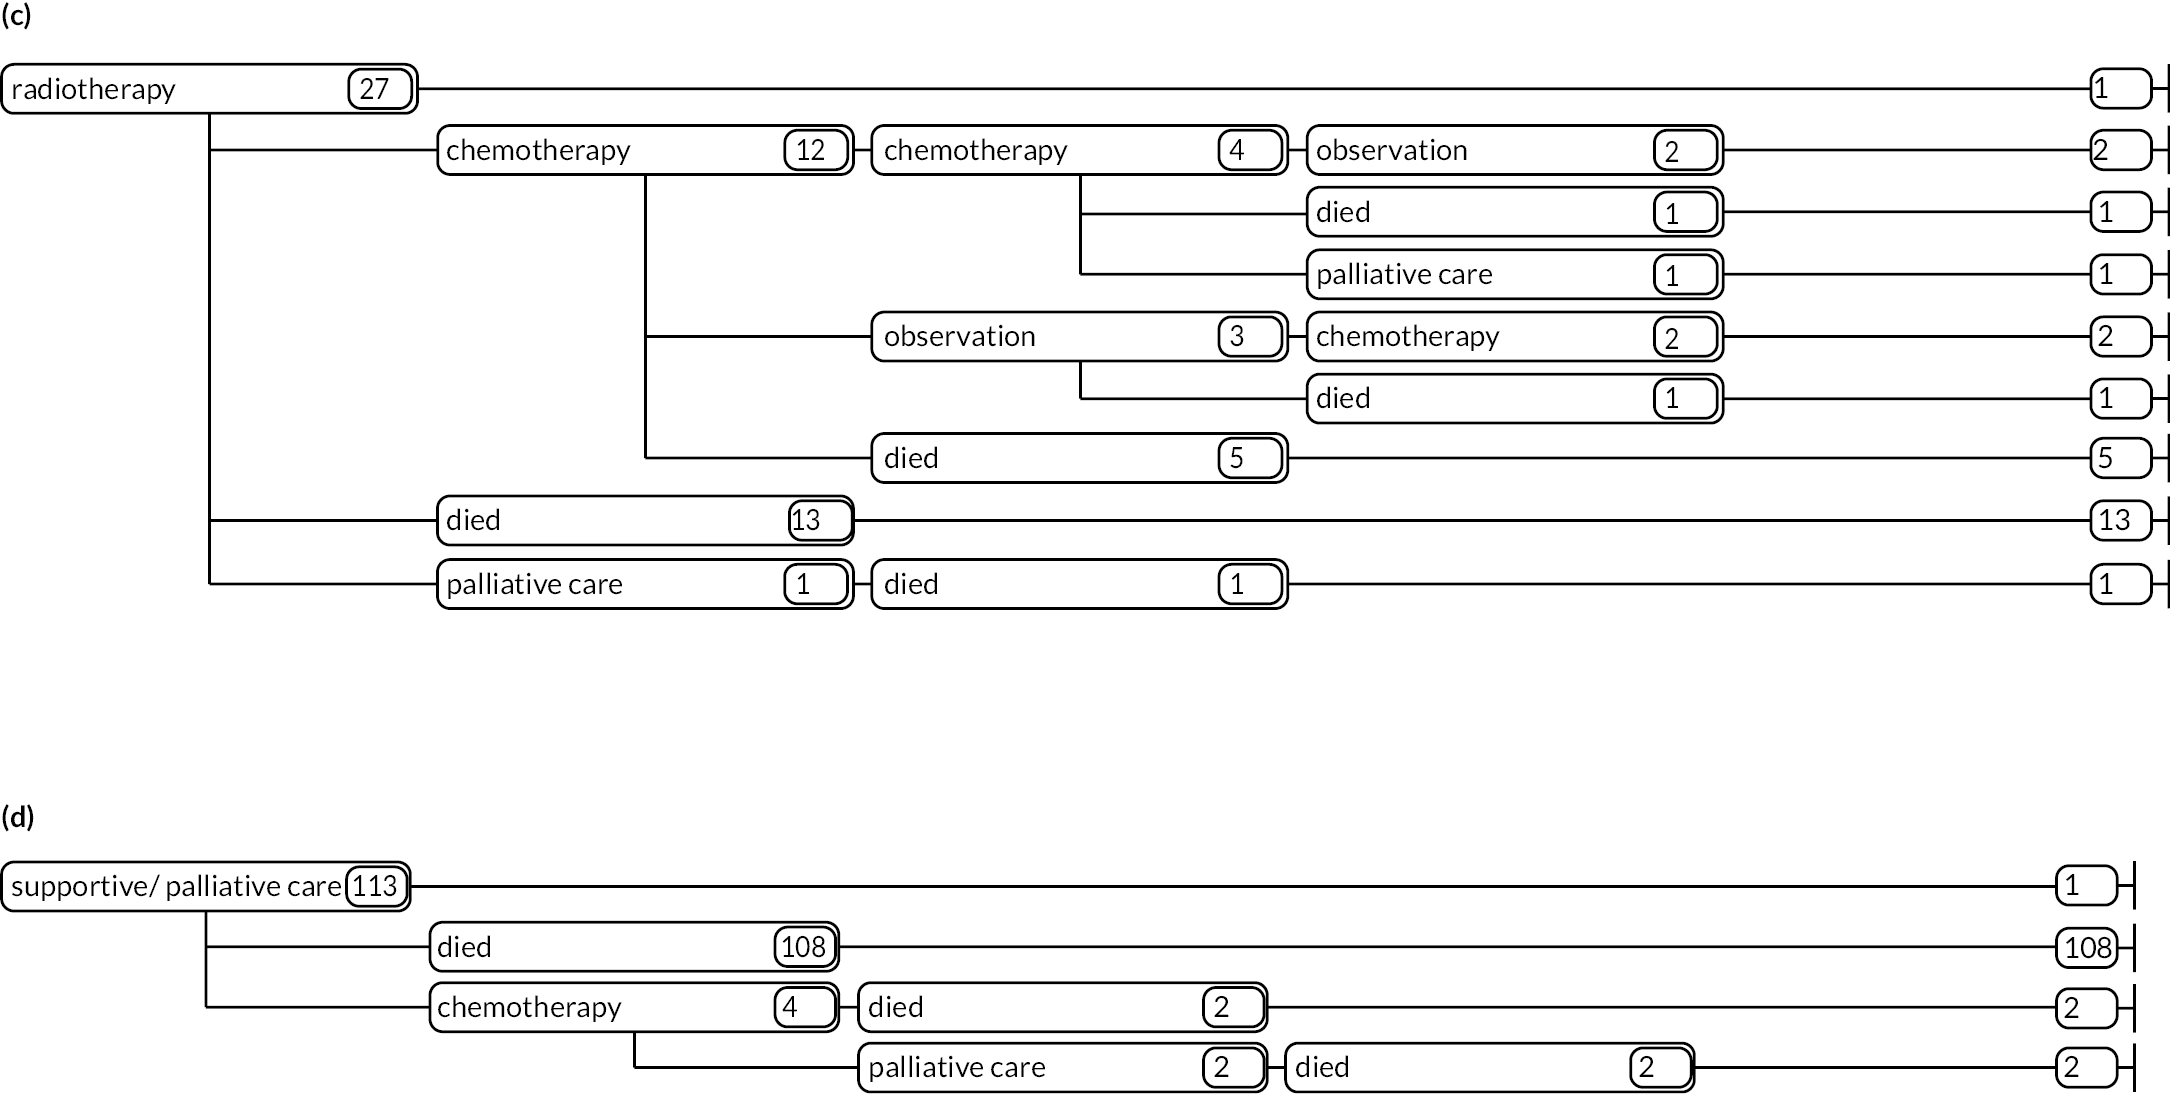
Appendix 2 Health economics
Developing a health economics model to predict long-term costs and health outcomes for myeloma: methods and results
The data set used to inform the parameter estimates in the health economics model [see Health economics (WP3)] included baseline information (age, gender, CRAB, ISS), clinical history (e.g. diagnosis date, treatment initiation/cessation, disease progression), HRQoL using the EQ-5D-5L,67 and date of death. UK valuation studies to estimate societal preferences for EQ-5D-5L states are published,67 but, as methods to derive the value set are controversial, we followed NICE’s recommendation,104 converting EQ-5D-5L responses to the EQ-5D-3L scale using van Hout et al.’s37 mapping function.
Healthcare costs were derived using HES data and national tariffs. HES includes information about inpatient, outpatient, critical care and A&E activities; and ECSG holds linked outpatient and inpatient HES from 2003–4, and A&E from 2007–8. Inpatient records were assessed using ICD-10 (International Classification of Diseases and Related Health Conditions, Tenth Revision) codes and outpatient were assessed with department codes, while A&E activities were considered non-disease related. Data were grouped into spells and assigned a HRG. To aggregate episodes into standardised person-based spells, we used a hierarchy of care (diagnoses, treatments and procedures) within spells and year of care, adjusting for demographics. Inpatient records have a department code; for the core code, unbundled costs were linked via respective HRG codes, the department code and the year of admission. Unbundles were costed based on reference guidance. Excess bed-days for each inpatient was calculated and linked to respective excess bed-day unit cost, with the costs for each inpatient HES record added to the individual-specific inpatient cost.
For outpatient and A&E attendance, where HRG codes existed but could not be matched to a unit cost (i.e. incomplete or mistyped code), weighted average unit costs were derived. Unlinked HRG codes that did not match within a given year were linked to the closest year available. Zero costs were applied where appropriate, reflecting non-use by a non-trivial proportion of the population. Information about inpatient, outpatient and A&E were then summed and assigned to the simulation model state the admission/attendance occurred in. Indicator variables (1 = yes, 0 = no) were created to assign individuals to mutually exclusive states in the simulation model at any given time. Variables were created for radiotherapy given post chemotherapy. Chemotherapy regimens were grouped into five categories, reflecting the most frequently used for any given treatment line: bortezomib, lenalidomide, melphalan, thalidomide and ‘other’. Treatment response variables for each line were derived (1 = complete/partial response; 0 = otherwise).
Statistical analysis
Time-to-event data
Transitions between states (Figure 10, Synopsis 6) are governed by parameters estimated using MSM, a framework to describe a stochastic process whereby subjects may transit from one or more initial states, through intermediate states, until they reach an absorbing state(s). 71 Patients not experiencing an event/transition remain in their state until follow-up ends and their TTE is right censored. 105 Further adaptations occur for modelling events with competing risks.
Transitions from a given state were conditional on a set of individual-level covariates and disease/treatment history (Table 10). Analysis of TTE data was conducted on the accelerated-failure timescale.
| Transition | Covariates (where applicable) |
|---|---|
| Diagnosis→ W&W | – |
| Diagnosis→ ON TREATMENT | – |
| Diagnosis→ Palliative | – |
| Diagnosis→ Death | – |
| W&W→ ON TREATMENT | Age at diagnosis, gender, ISS, CRAB |
| W&W→ Death | Age at diagnosis, gender, ISS, CRAB |
| ON TREATMENT→ OFF TREATMENTa | Drug regimen: thalidomide (treatment lines 1–5), melphalan (lines 1–2), lenalidomide (lines 3–5), bortezomib (lines 1–5), other |
| ON TREATMENT→ Death | Drug regimen: thalidomide (lines 1–5), melphalan (lines 1–2), lenalidomide (lines 3–5), bortezomib (lines 1–5), other |
| OFF TREATMENT→ ON TREATMENTb | Response to treatment (CR/MRD), radiotherapy while OFF TREATMENT |
| OFF TREATMENT→ Death | Response to treatment (CR/MRD), radiotherapy while OFF TREATMENT |
| Palliative→ Death | Age when palliative care starts |
Analysis of cost data
We developed a series of two-part models for each state. 75,76 First, a logit model was designed to estimate the conditional probability of observing a zero cost; second, a generalised linear model for continuous outcomes was used to estimate the conditional mean cost for those with non-zero costs; this produces an estimate of the conditional mean cost for the entire sample. There are several specifications for the second part of the model, and our analysis tested the performance of a range of specifications within the generalised linear model’s family,106 describing the outcome of interest using a Gaussian or gamma family distribution, and the function describing the relationship between the covariates and the mean outcome modelled as a linear (i.e. identity) or a log link.
Analysis of EuroQol-5 Dimensions, five-level version data
Individual EQ-5D-3L37 derived data were analysed using a series of two-part beta-based regression models,77 designed to account for the idiosyncrasies of the EQ-5D-3L outcome variable, which is typically left-skewed, often multimodal (with a gap between 1 and 0.843, using the UK scoring algorithm), heteroskedastic and bounded at both ends. A logit model was used to estimate the conditional probability of observing an EQ-5D-3L value = 1 (‘full health’), while the second part was used to estimate the conditional mean value for those with a score of < 1, the product producing a conditional mean utility estimate for the entire sample. There are several specifications for the second part of the model, depending on the characteristics of the empirical distribution of the outcome variable. The beta distribution is a natural choice for this outcome, given its ability to model left-skewed, heteroskedastic, bounded variables.
Predicting long-term costs and outcomes
We developed an individual patient-level simulation (microsimulation) model to represent the stochastic process associated with the occurrence of various events/transitions that characterise myeloma treatment pathways in the real world, to predict survival, clinical management costs and lifetime QoL. The key input parameters are based on TTE analyses of individual-level data (HMRN), costs (HES) and EQ-5D; therefore, an NHS hospital perspective. The model uses a synthetic cohort designed to closely match the characteristics of the study sample (Table 11).
| Sample (N = 2687) | Synthetic cohort (N = 100,000) | |
|---|---|---|
| Diagnosis state | ||
| Gender (% male) | 57.3 | 57.6 |
| Age (years), mean (SD) | 71.4 (11.2) | 71.4 (11.0) |
| ISS (%) | ||
| I | 26.2 | 24.9 |
| II | 37.4 | 36.3 |
| III | 36.4 | 38.8 |
| CRAB (%) | ||
| Yes | 70.6 | 72.9 |
| No | 29.4 | 27.1 |
| W&W state | ||
| Gender (% male) | 56.5 | 57.5 |
| Age (years), mean (SD) | 72.9 (11.2) | 73.2 (11.4) |
| ISS (%) | ||
| I | 50.8 | 51.6 |
| II | 37.4 | 37.2 |
| III | 11.8 | 11.2 |
| CRAB (%) | ||
| Yes | 30.3 | 30.1 |
| No | 67.7 | 69.9 |
| Treatment line 1 | ||
| Regimen (%) | ||
| Thalidomide | 51.2 | 51.4 |
| Melphalan | 15.4 | 15.2 |
| Bortezomib | 10.2 | 10.4 |
| Others | 23.1 | 23.0 |
| Radiotherapy while OFF TREATMENT (%) | 5.8 | 5.9 |
| Response (%) | 16.5 | 16.1 |
| Treatment line 2 | ||
| Regimen (%) | ||
| Thalidomide | 21.9 | 22.4 |
| Melphalan | 6.7 | 7.4 |
| Bortezomib | 58.9 | 57.0 |
| Others | 12.5 | 13.1 |
| Radiotherapy while OFF TREATMENT (%) | 8.6 | 8.2 |
| Response (%) | 16.1 | 14.5 |
| Treatment line 3 | ||
| Regimen (%) | ||
| Thalidomide | 22.4 | 21.6 |
| Lenalidomide | 50.1 | 49.1 |
| Bortezomib | 17.2 | 17.7 |
| Others | 10.3 | 11.6 |
| Radiotherapy while OFF TREATMENT (%) | 6.8 | 5.8 |
| Response (%) | 8.0 | 7.0 |
| Treatment line 4 | ||
| Regimen (%) | ||
| Thalidomide | 30.4 | 30.9 |
| Melphalan | 35.6 | 35.5 |
| Bortezomib | 13.1 | 12.2 |
| Others | 20.9 | 21.4 |
| Radiotherapy while OFF TREATMENT (%) | 4.1 | 4.2 |
| Response (%) | 31.6 | 26.7 |
| Treatment line 5 | ||
| Regimen (%) | ||
| Thalidomide | 31.6 | 26.6 |
| Melphalan | 24.0 | 24.5 |
| Bortezomib | 17.7 | 18.8 |
| Others | 26.6 | 30.0 |
| Response (%) | 1.4 | 1.3 |
| Treatment line 6 | ||
| ON TREATMENT line 6 | 65.4 (12.1) | 76.7 (11.1) |
| OFF TREATMENT line 6 | 65.2 (12.4) | 76.0 (11.0) |
| Palliative care | 79.6 (8.4) | 78.7 (9.0) |
Methods for these analyses are described elsewhere. 107,108 Transition to the next state is governed by estimated TTE (failure time), predicted on each individual’s characteristics, event history and the regression parameters. Figure 19 shows the logical structure of the DES.
FIGURE 19.
Model simulation process. Note: I represents the ith individual in the synthetic of size N; t simulation time; T maximum time horizon.
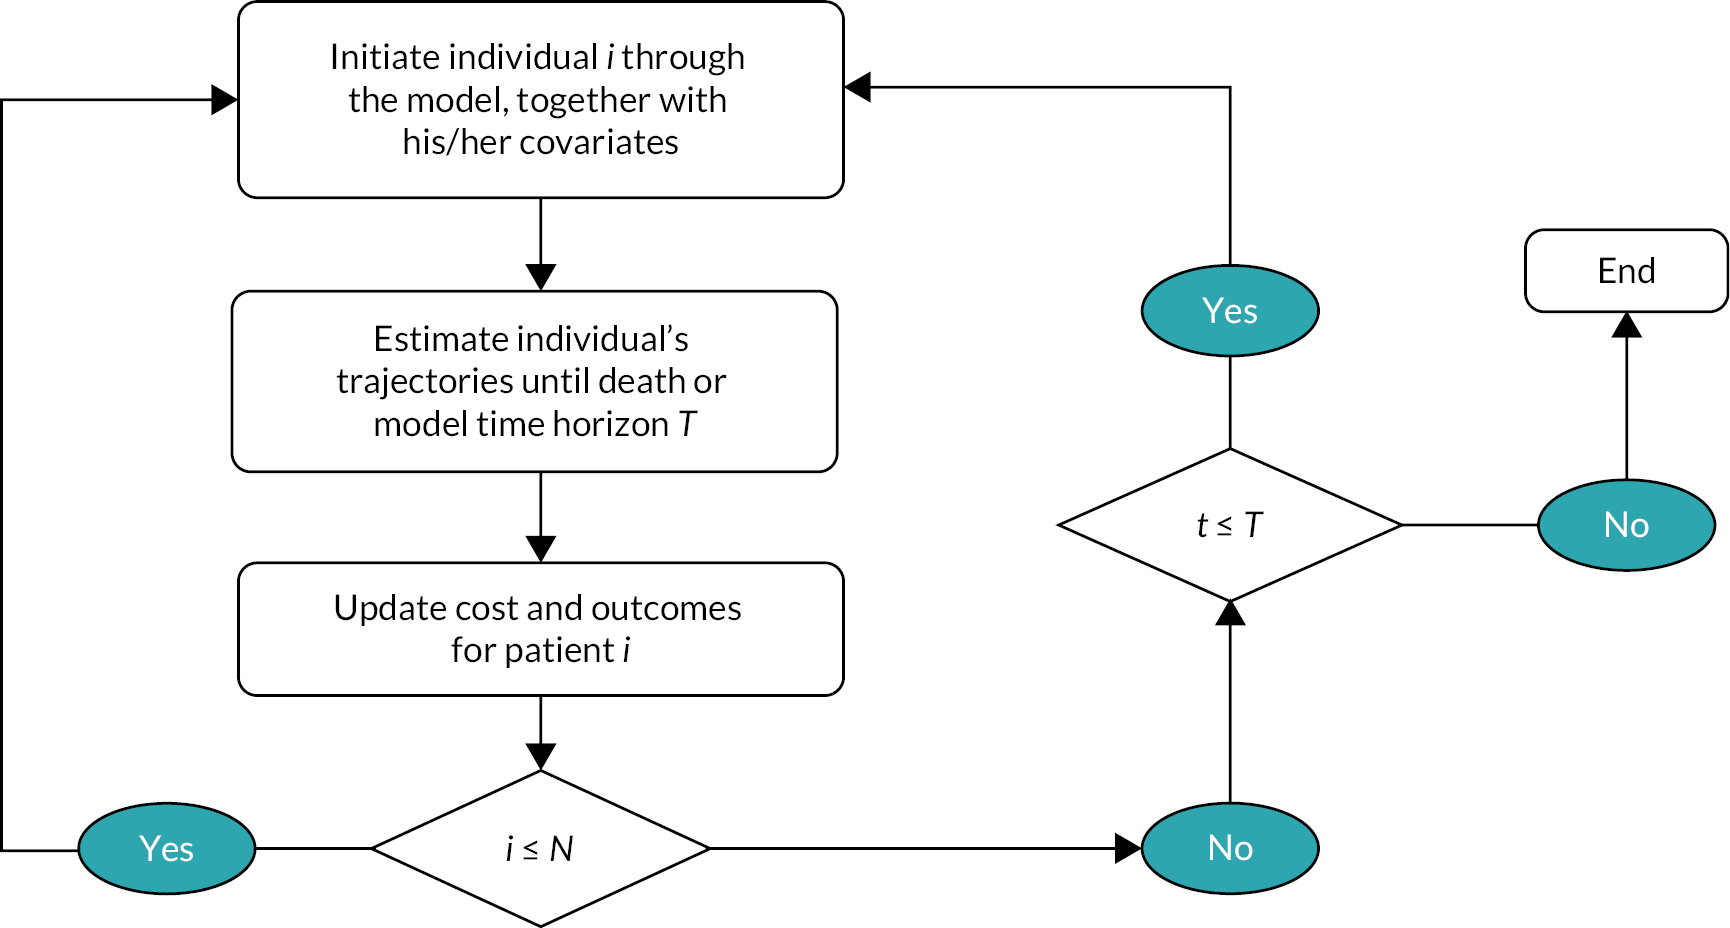
Model development and microsimulation was conducted in R and evaluated over the average lifetime horizon of ≈ 30 years. Those in the synthetic cohort were simulated through the DES model to predict their distribution through initial model states (i.e. ON TREATMENT, W&W, PALLIATIVE/SUPPORTIVE). Age at diagnosis, gender and ISS were used as initial covariates. Treatment assignment was predicted using multinomial logit regression estimated against these initial covariates. Whether an individual received radiotherapy OFF TREATMENT, and response, was predicted using logistic regression models based on initial covariates and regimen as predictors.
Results
Sample
The sample was individuals newly diagnosed with myeloma, September 2004–December 2015. After data cleaning, 2687 subjects were available for analysis (see Table 8).
Analyses of time-to-event data
Transition times from W&W followed a generalised gamma distribution, while transition times from ON TREATMENT were modelled using a flexible parametric spline model. OFF TREATMENT transition times were modelled using a flexible parametric spline model (towards ON TREATMENT) and a generalised gamma (towards DEATH). Transition times from PALLIATIVE/SUPPORTIVE were modelled using a generalised gamma.
Each regression model uses different covariates (see Table 7), as reported in Table 3. Results are reported on the log-time scale and coefficients should be interpreted as having an additive impact on log TTE. For instance, the transition from W&W to ON TREATMENT shows that older people (on average) have a marginally longer time to first treatment, as do males. Increased CRAB features and ISS are associated with shorter transition times towards ON TREATMENT, and age, ISS and CRAB are predictors of shorter transition from W&W to DEATH.
When ON TREATMENT, all regimens were associated with longer time towards OFF TREATMENT. Transition times towards DEATH (from ON TREATMENT) were shorter for two regimens. On average, individuals OFF TREATMENT experienced longer times to the next ON TREATMENT state, and DEATH, when receiving radiotherapy during that state. Similarly, those who responded to chemotherapy had shorter times to the next ON TREATMENT and considerably longer survival. Finally, for PALLIATIVE/SUPPORTIVE, age was associated with longer time to DEATH.
Step 1. Select one individual from the synthetic cohort.
Step 2. Plug the covariates values for the individual selected in step 1 into the regression equation results from tables 13–15.
Step 3. Take a random draw from the probability density function used to model the occurrence of the event from the transition and obtain a time to event realisation.
Step 4. Compare competing transition realisations and select minimum time, and repeat until individual dies or time horizon is reached (note the selected minimum time is the time in health state).
Step 5. For QoL realisations, plug the patient’s covariates values into the relevant regression equations to predict conditional mean EQ-5D-5L values for the model state of interest.
Step 6. Similarly, take a random draw from the probability density function used to model the probability of the utility being 1 (logistic regression) and the probability that utility given utility is not 1 (beta regression) and combine their conditional means to obtain a realisation EQ-5D-5L in each state the selected patient is alive.
Step 7. For costs, plug the patient’s covariates into the cost-per-day regression output to predict conditional mean cost-per-day values for the model state of interest
Step 8. Similarly, take a random draw from the probability density function used to model the probability of the cost per day being 0 (logistic regression) and the probability of cost per day given the cost is not 0 (beta regression) and combine to obtain a realisation cost per day in each state the selected patient is alive.
Step 9. Combine the cost per day and time in state to obtain cost in health state.
For illustrative purposes, W&W has been selected as the state of interest. In the simulation, patients are randomly assigned to a starting state.
Estimating long-term costs and outcomes
After all patients reached the absorbing state in the MSM, longer-term costs and QALYs for individuals in the synthetic cohort were estimated. Table 6 [see Health economics (WP3)] reports undiscounted and discounted (using a 3.5% annual rate) predicted life-years, QALYs and costs for this cohort. Figure 13 illustrates the distribution of these outcomes across various states and over time.
Appendix 3 Patient well-being and involvement survey resources
-
Questionnaire 1a (QoL and health).
-
Questionnaire 2a (treatment decisions).
-
Information leaflet. a
-
Consent form. a
-
Standard operating procedures.
-
Diagnostic distribution of survey participants.

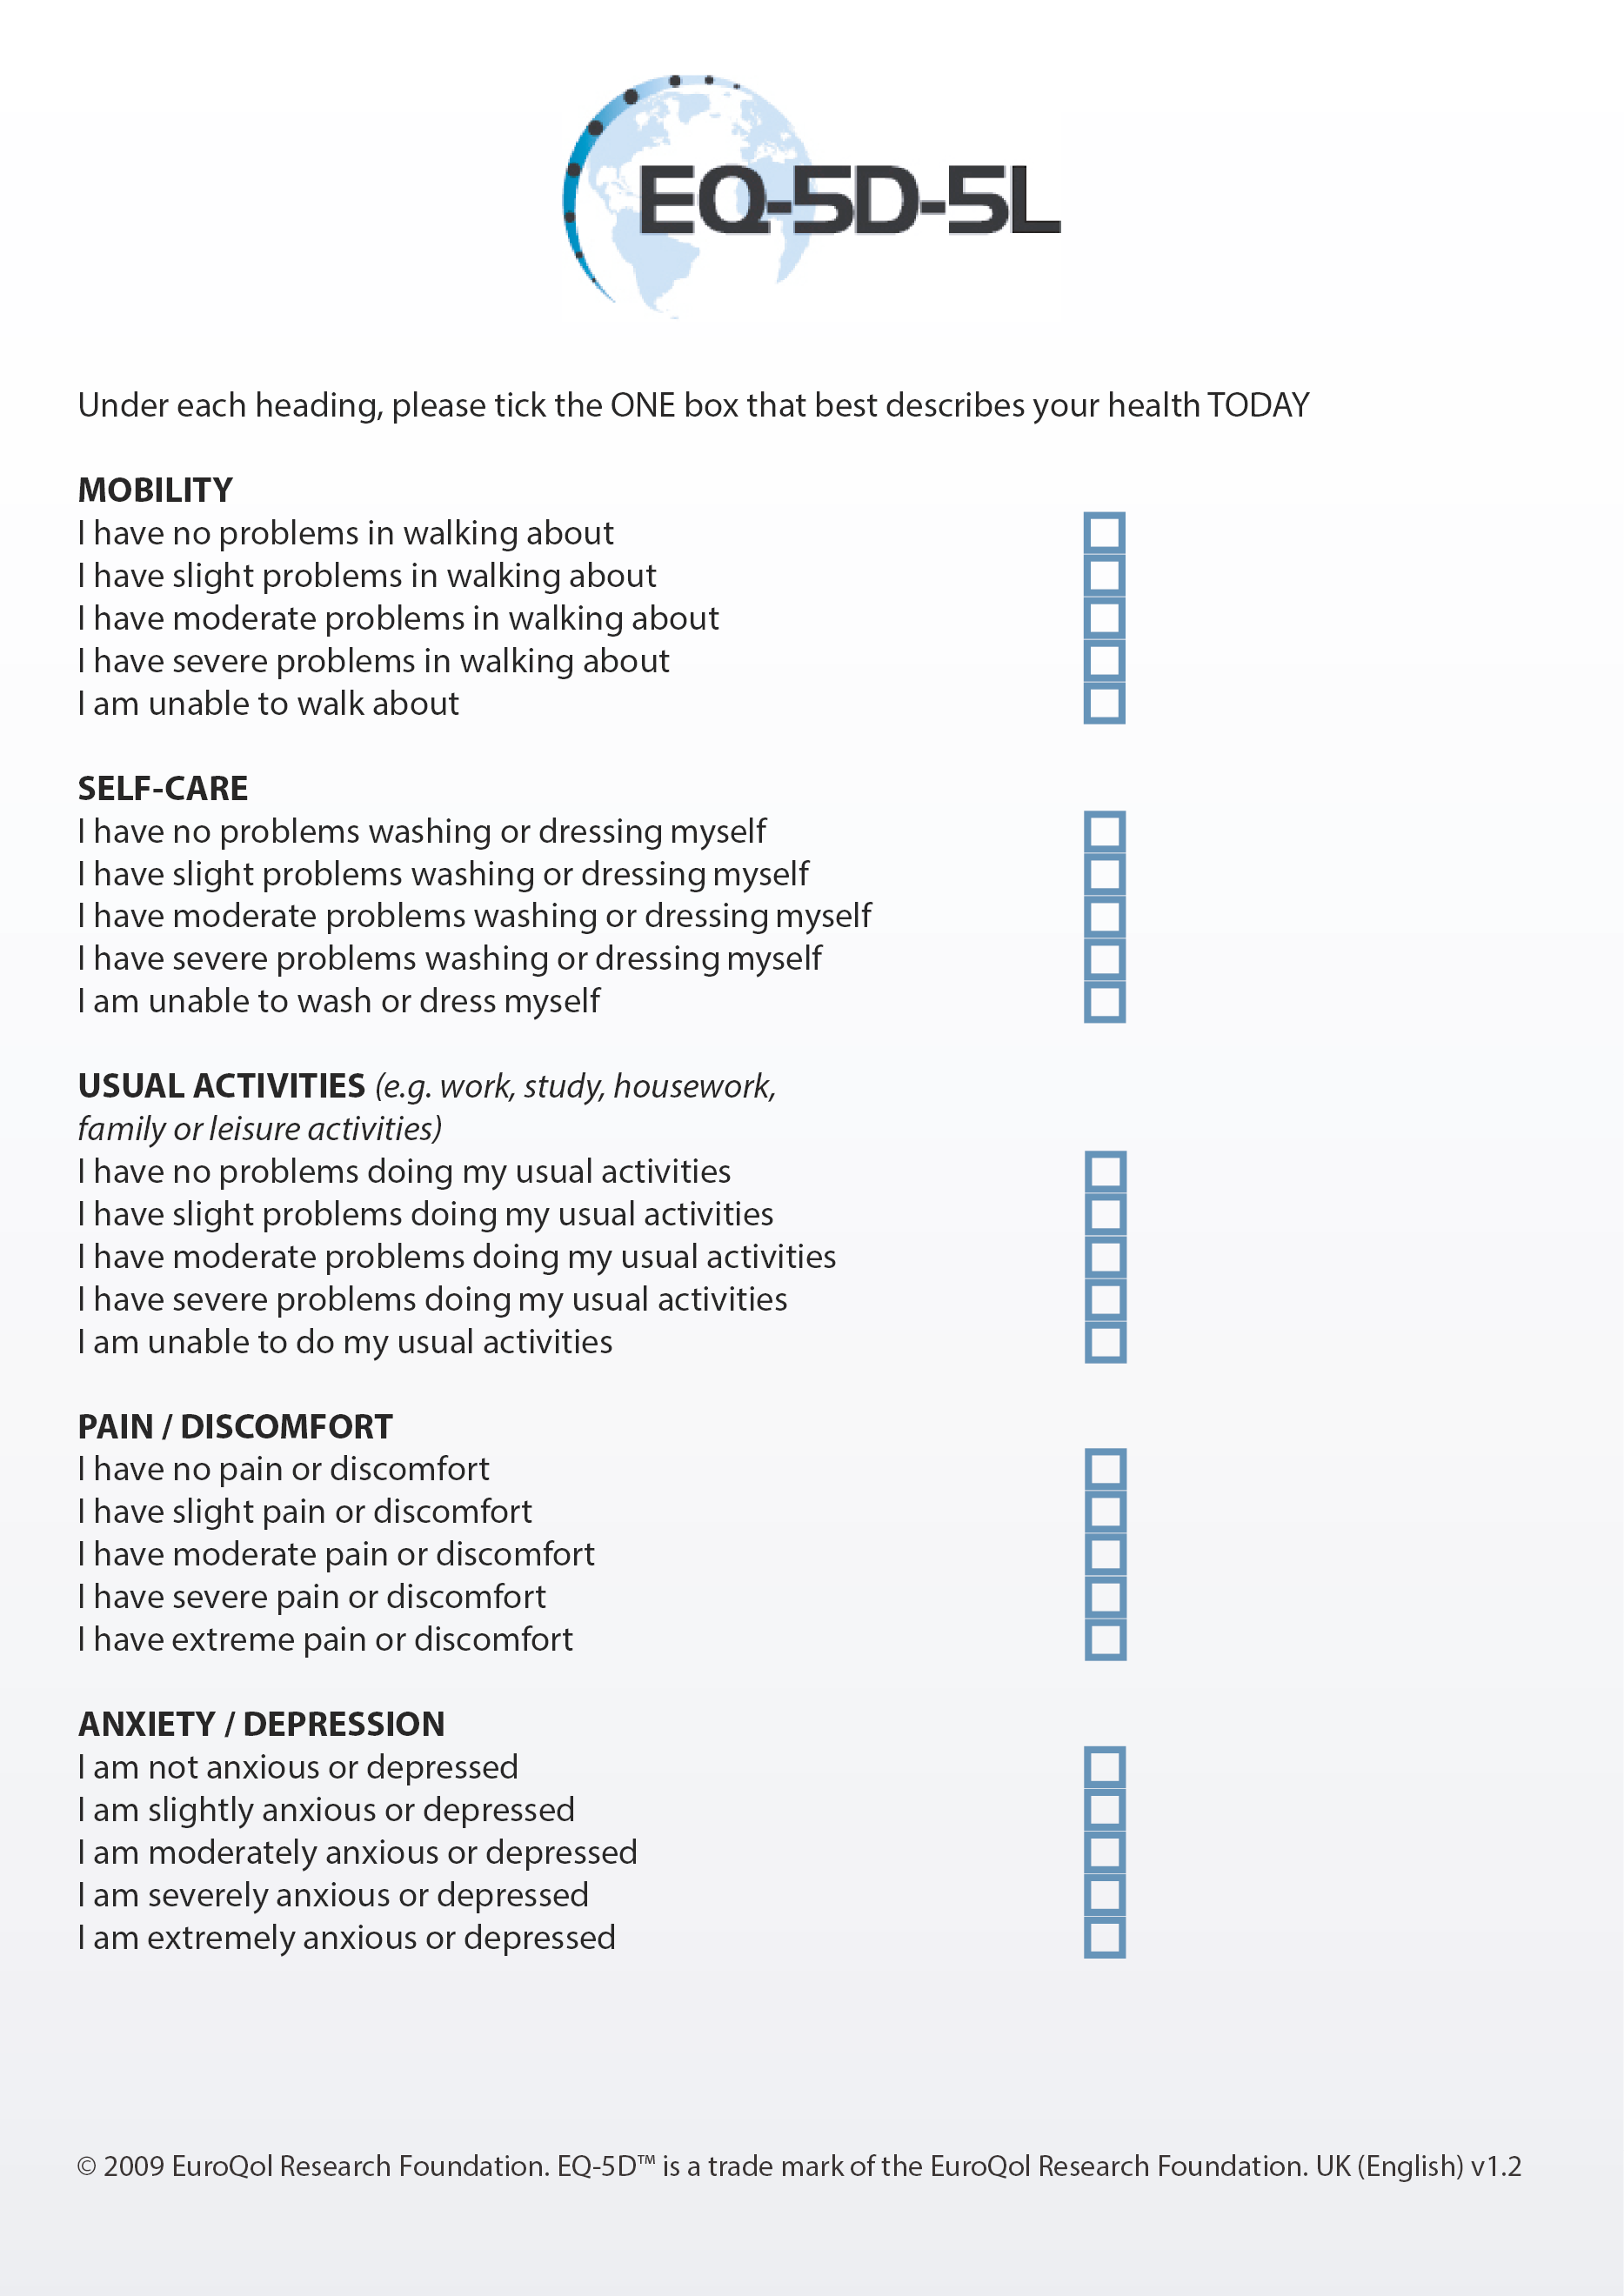
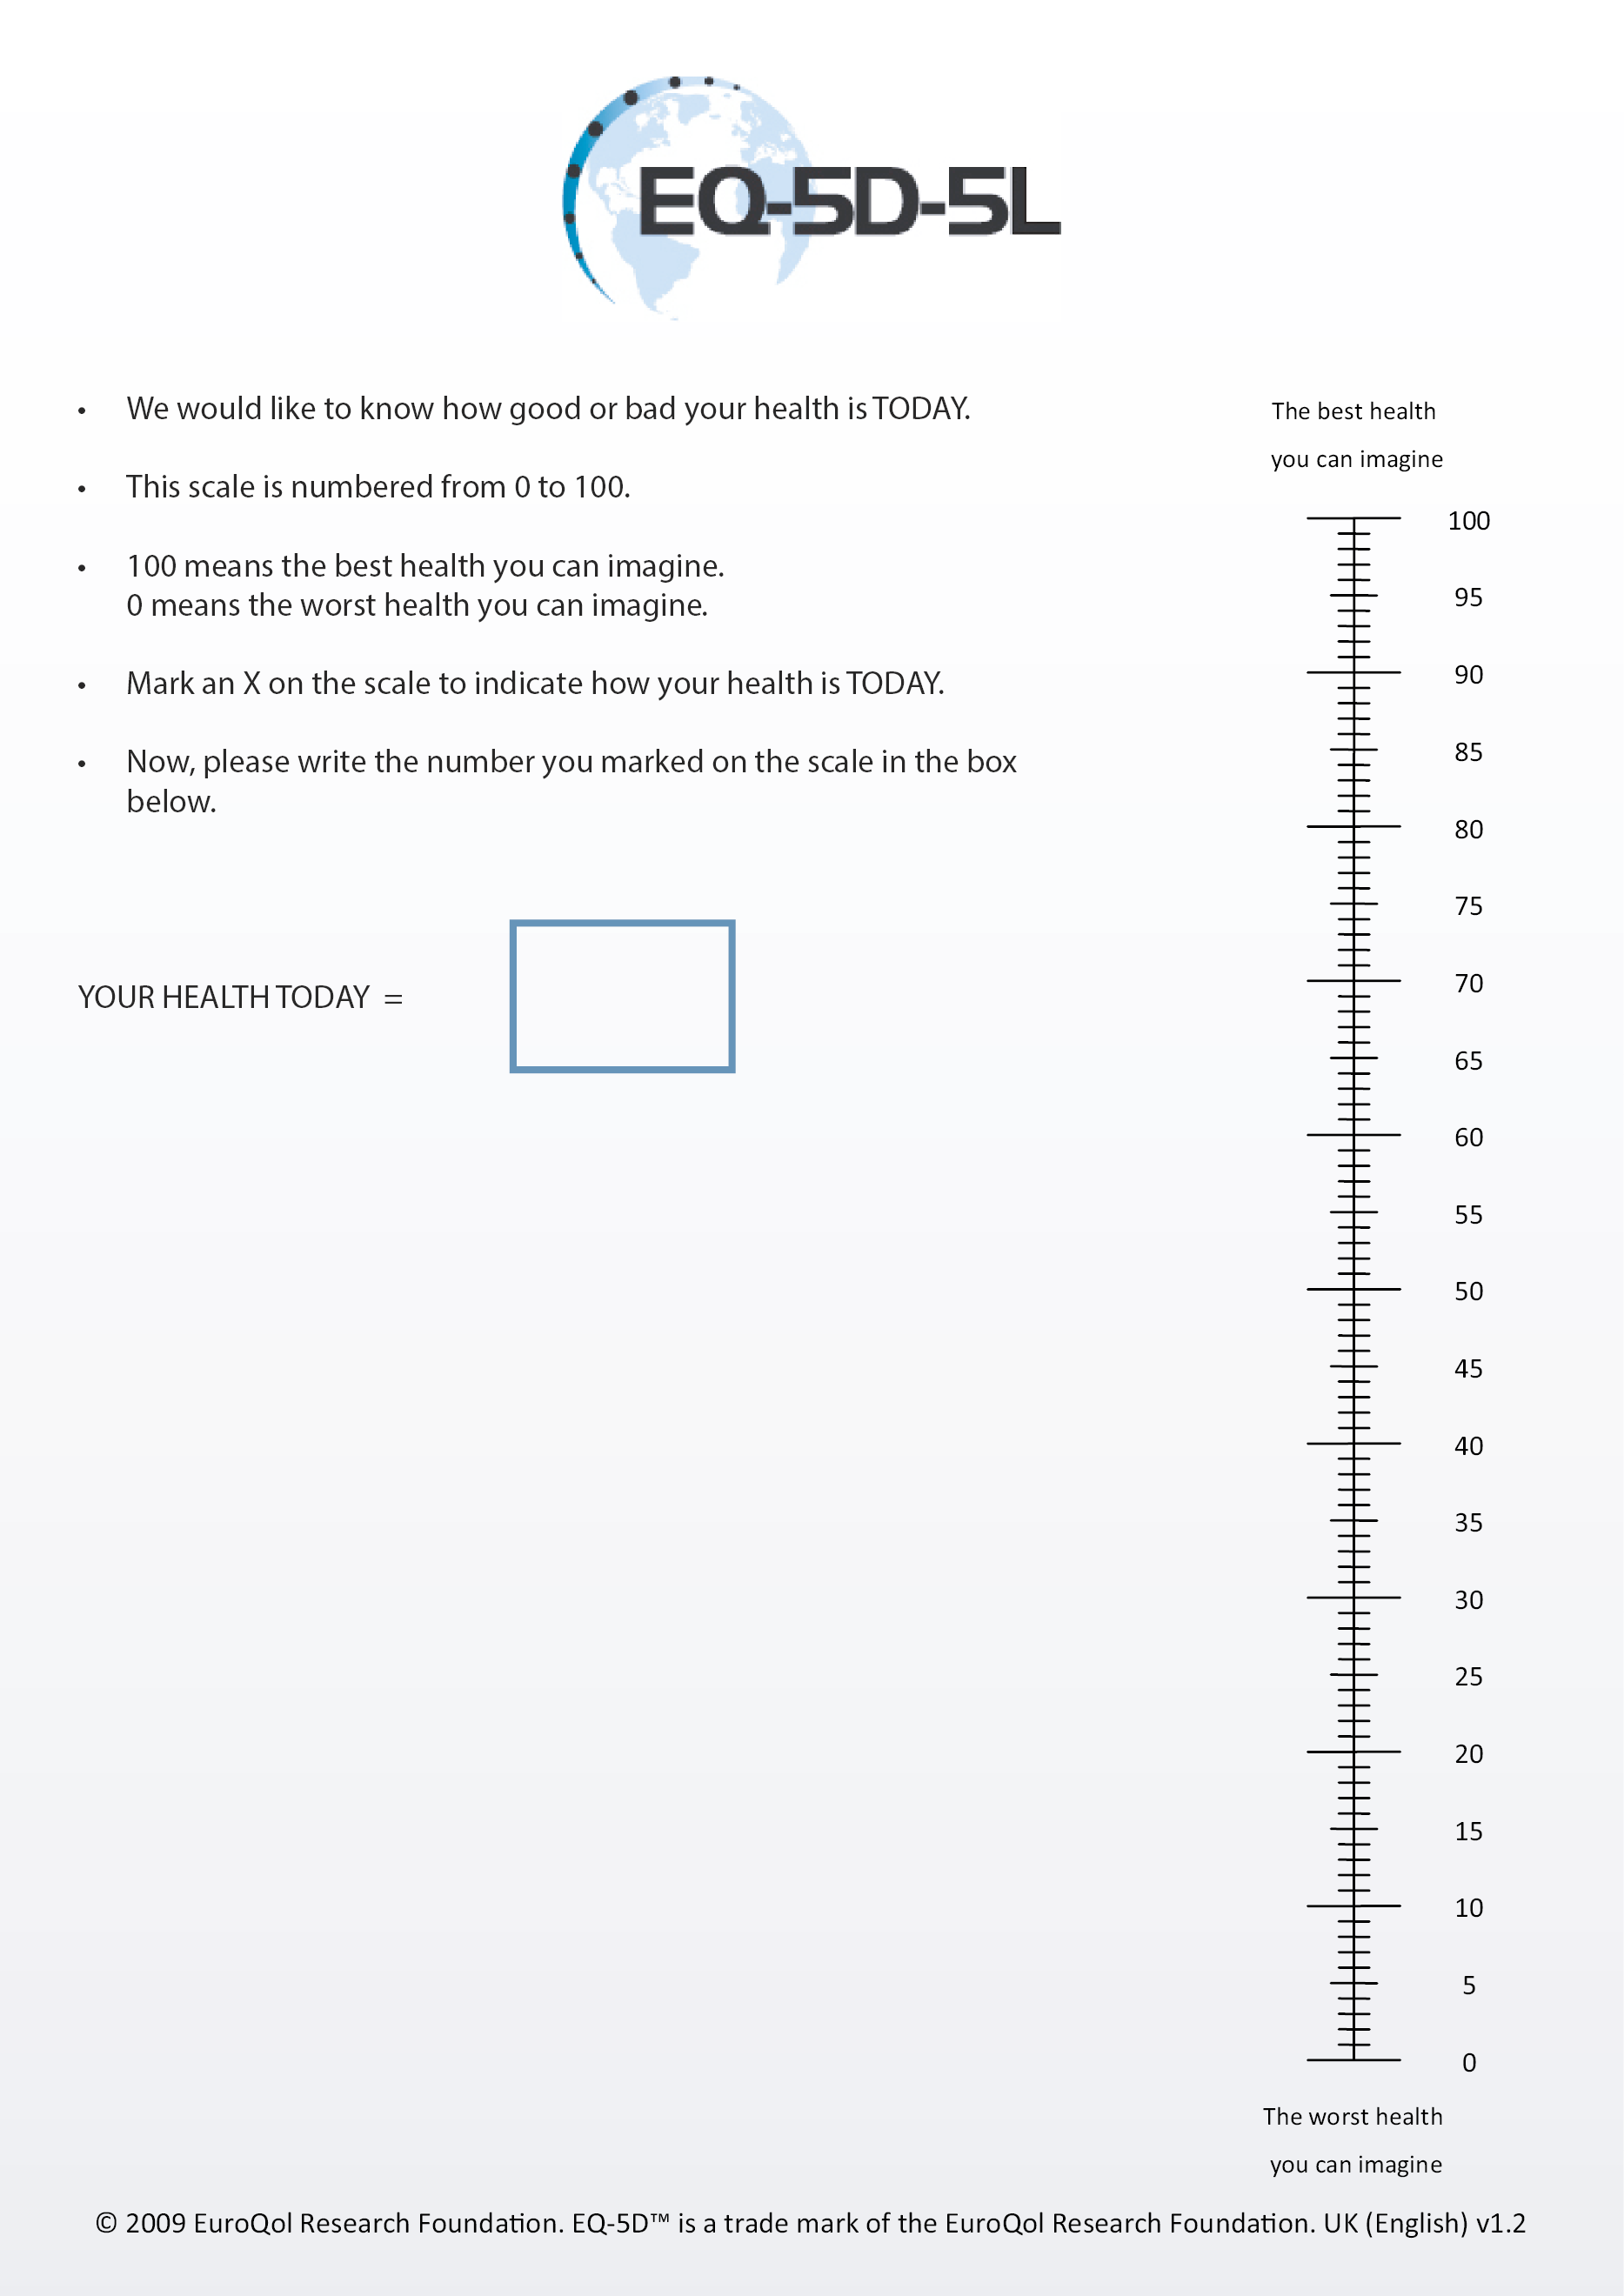
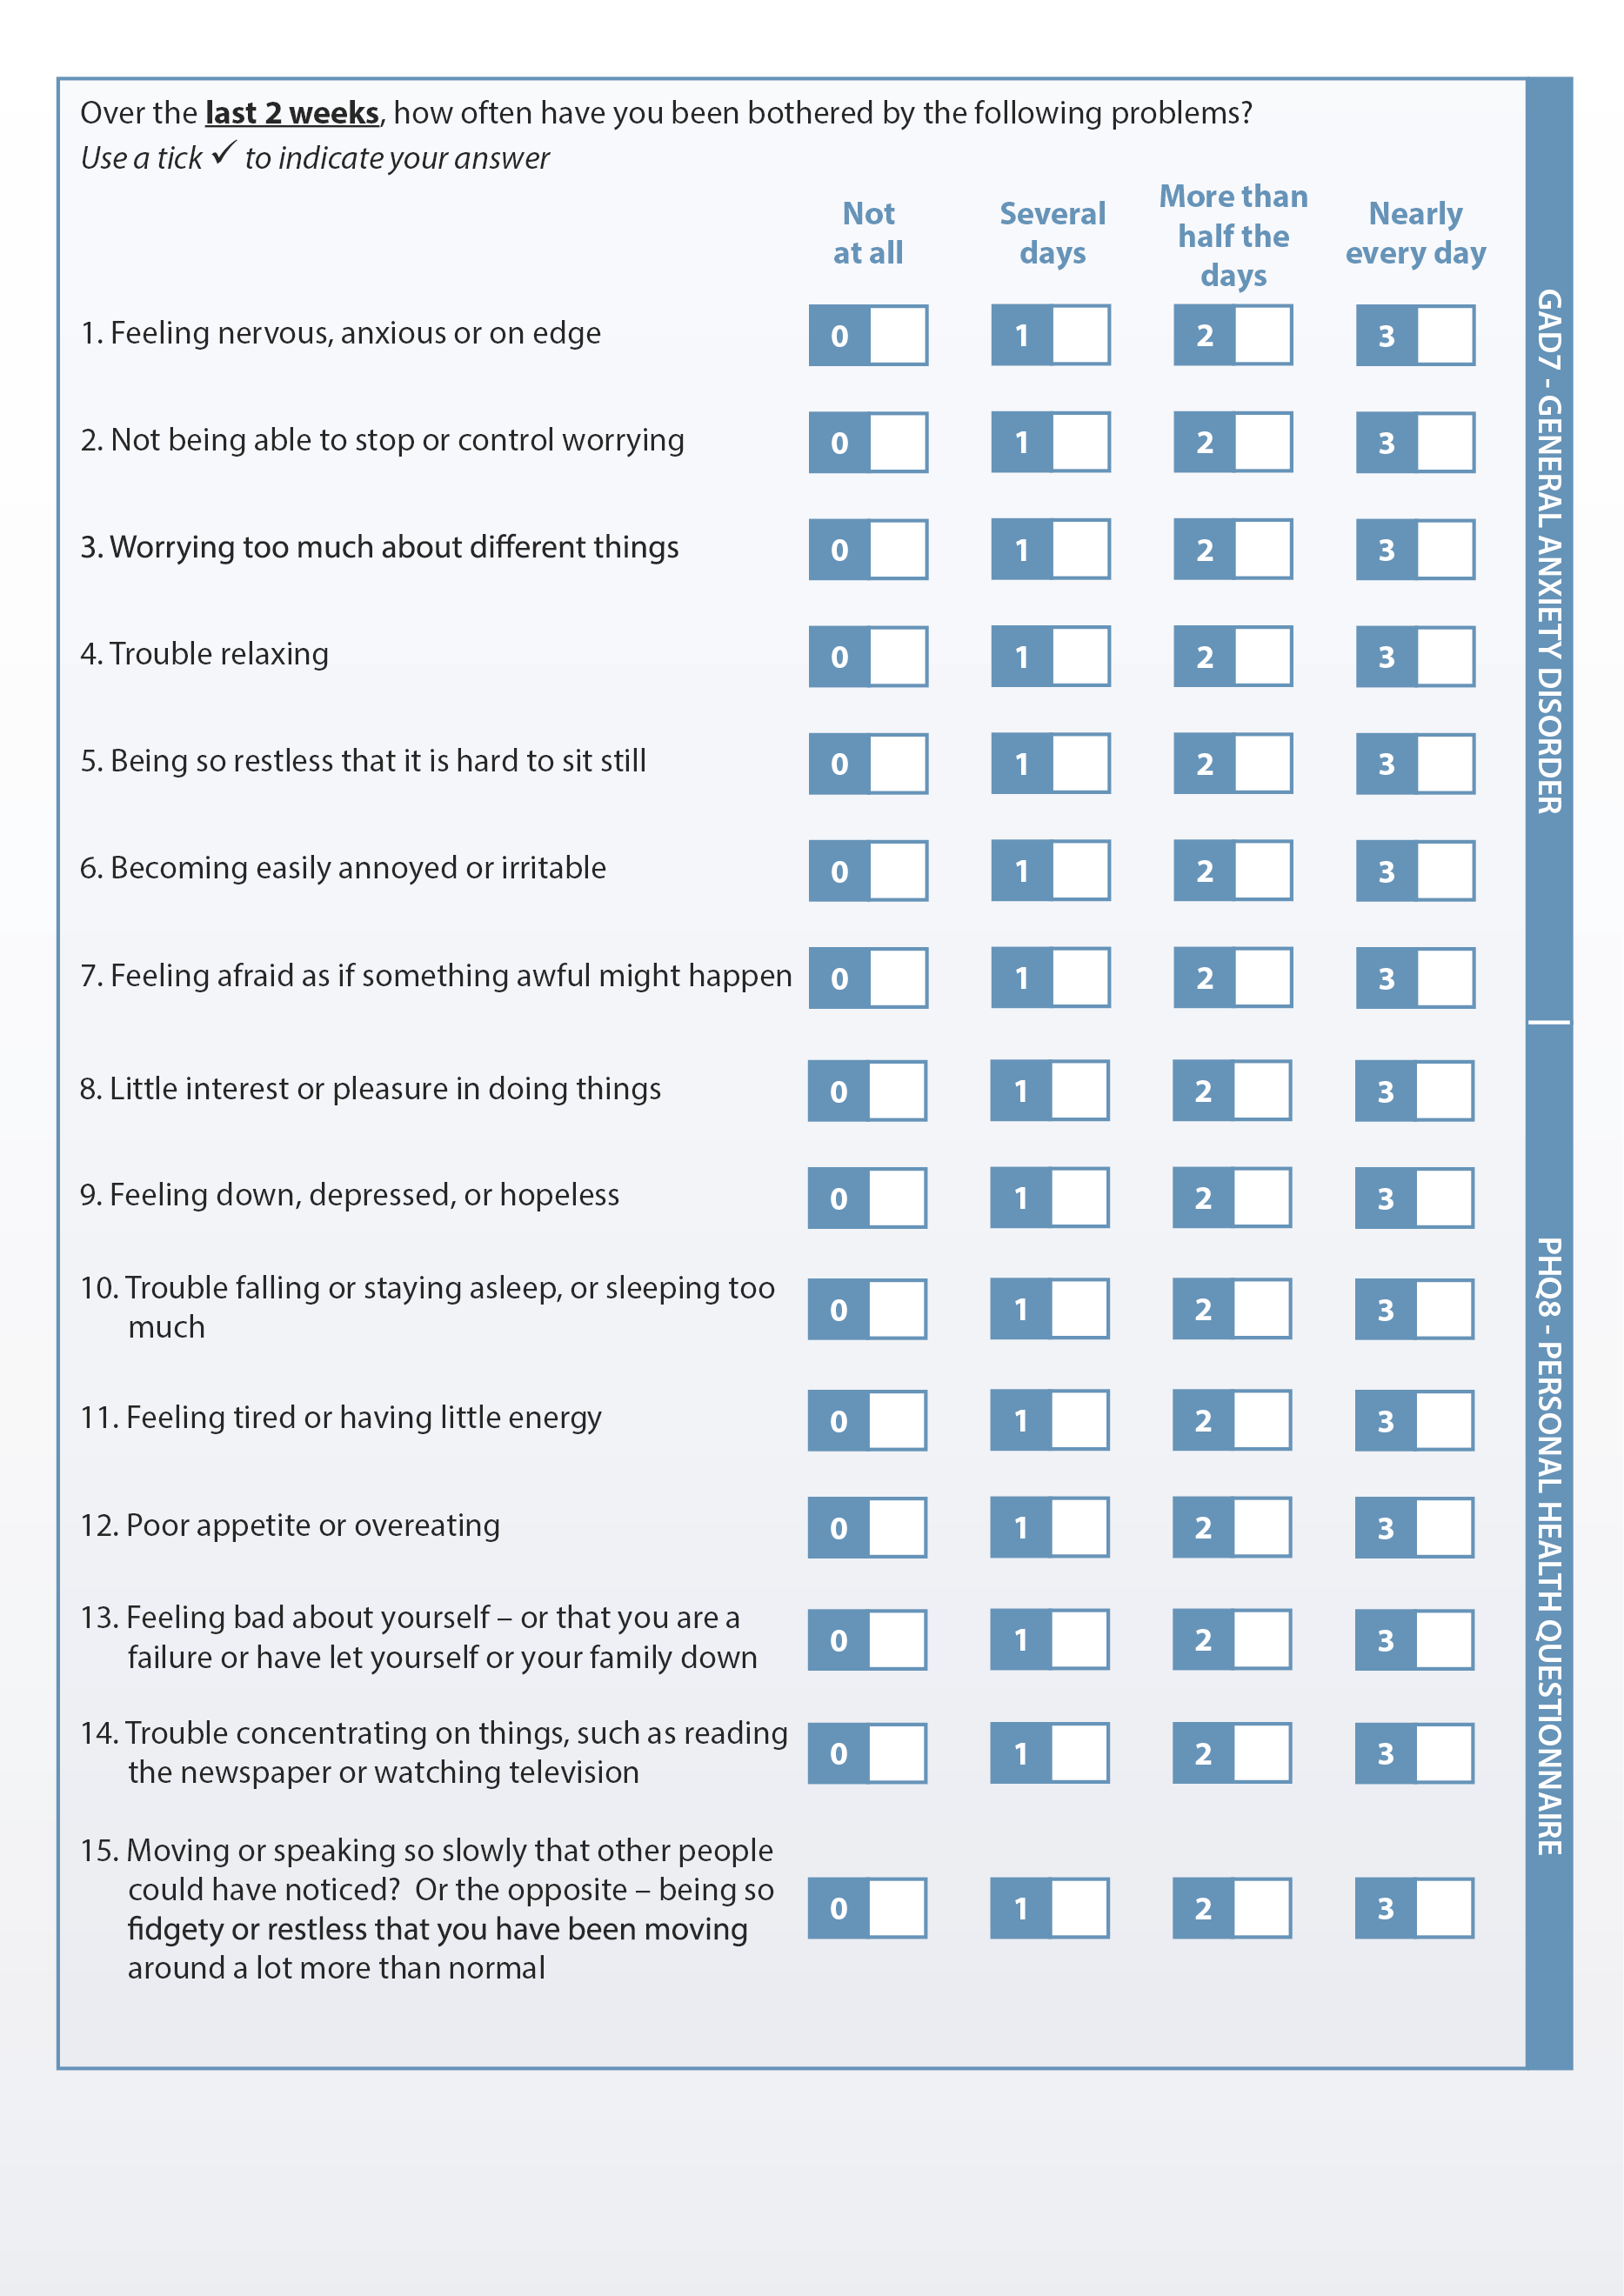
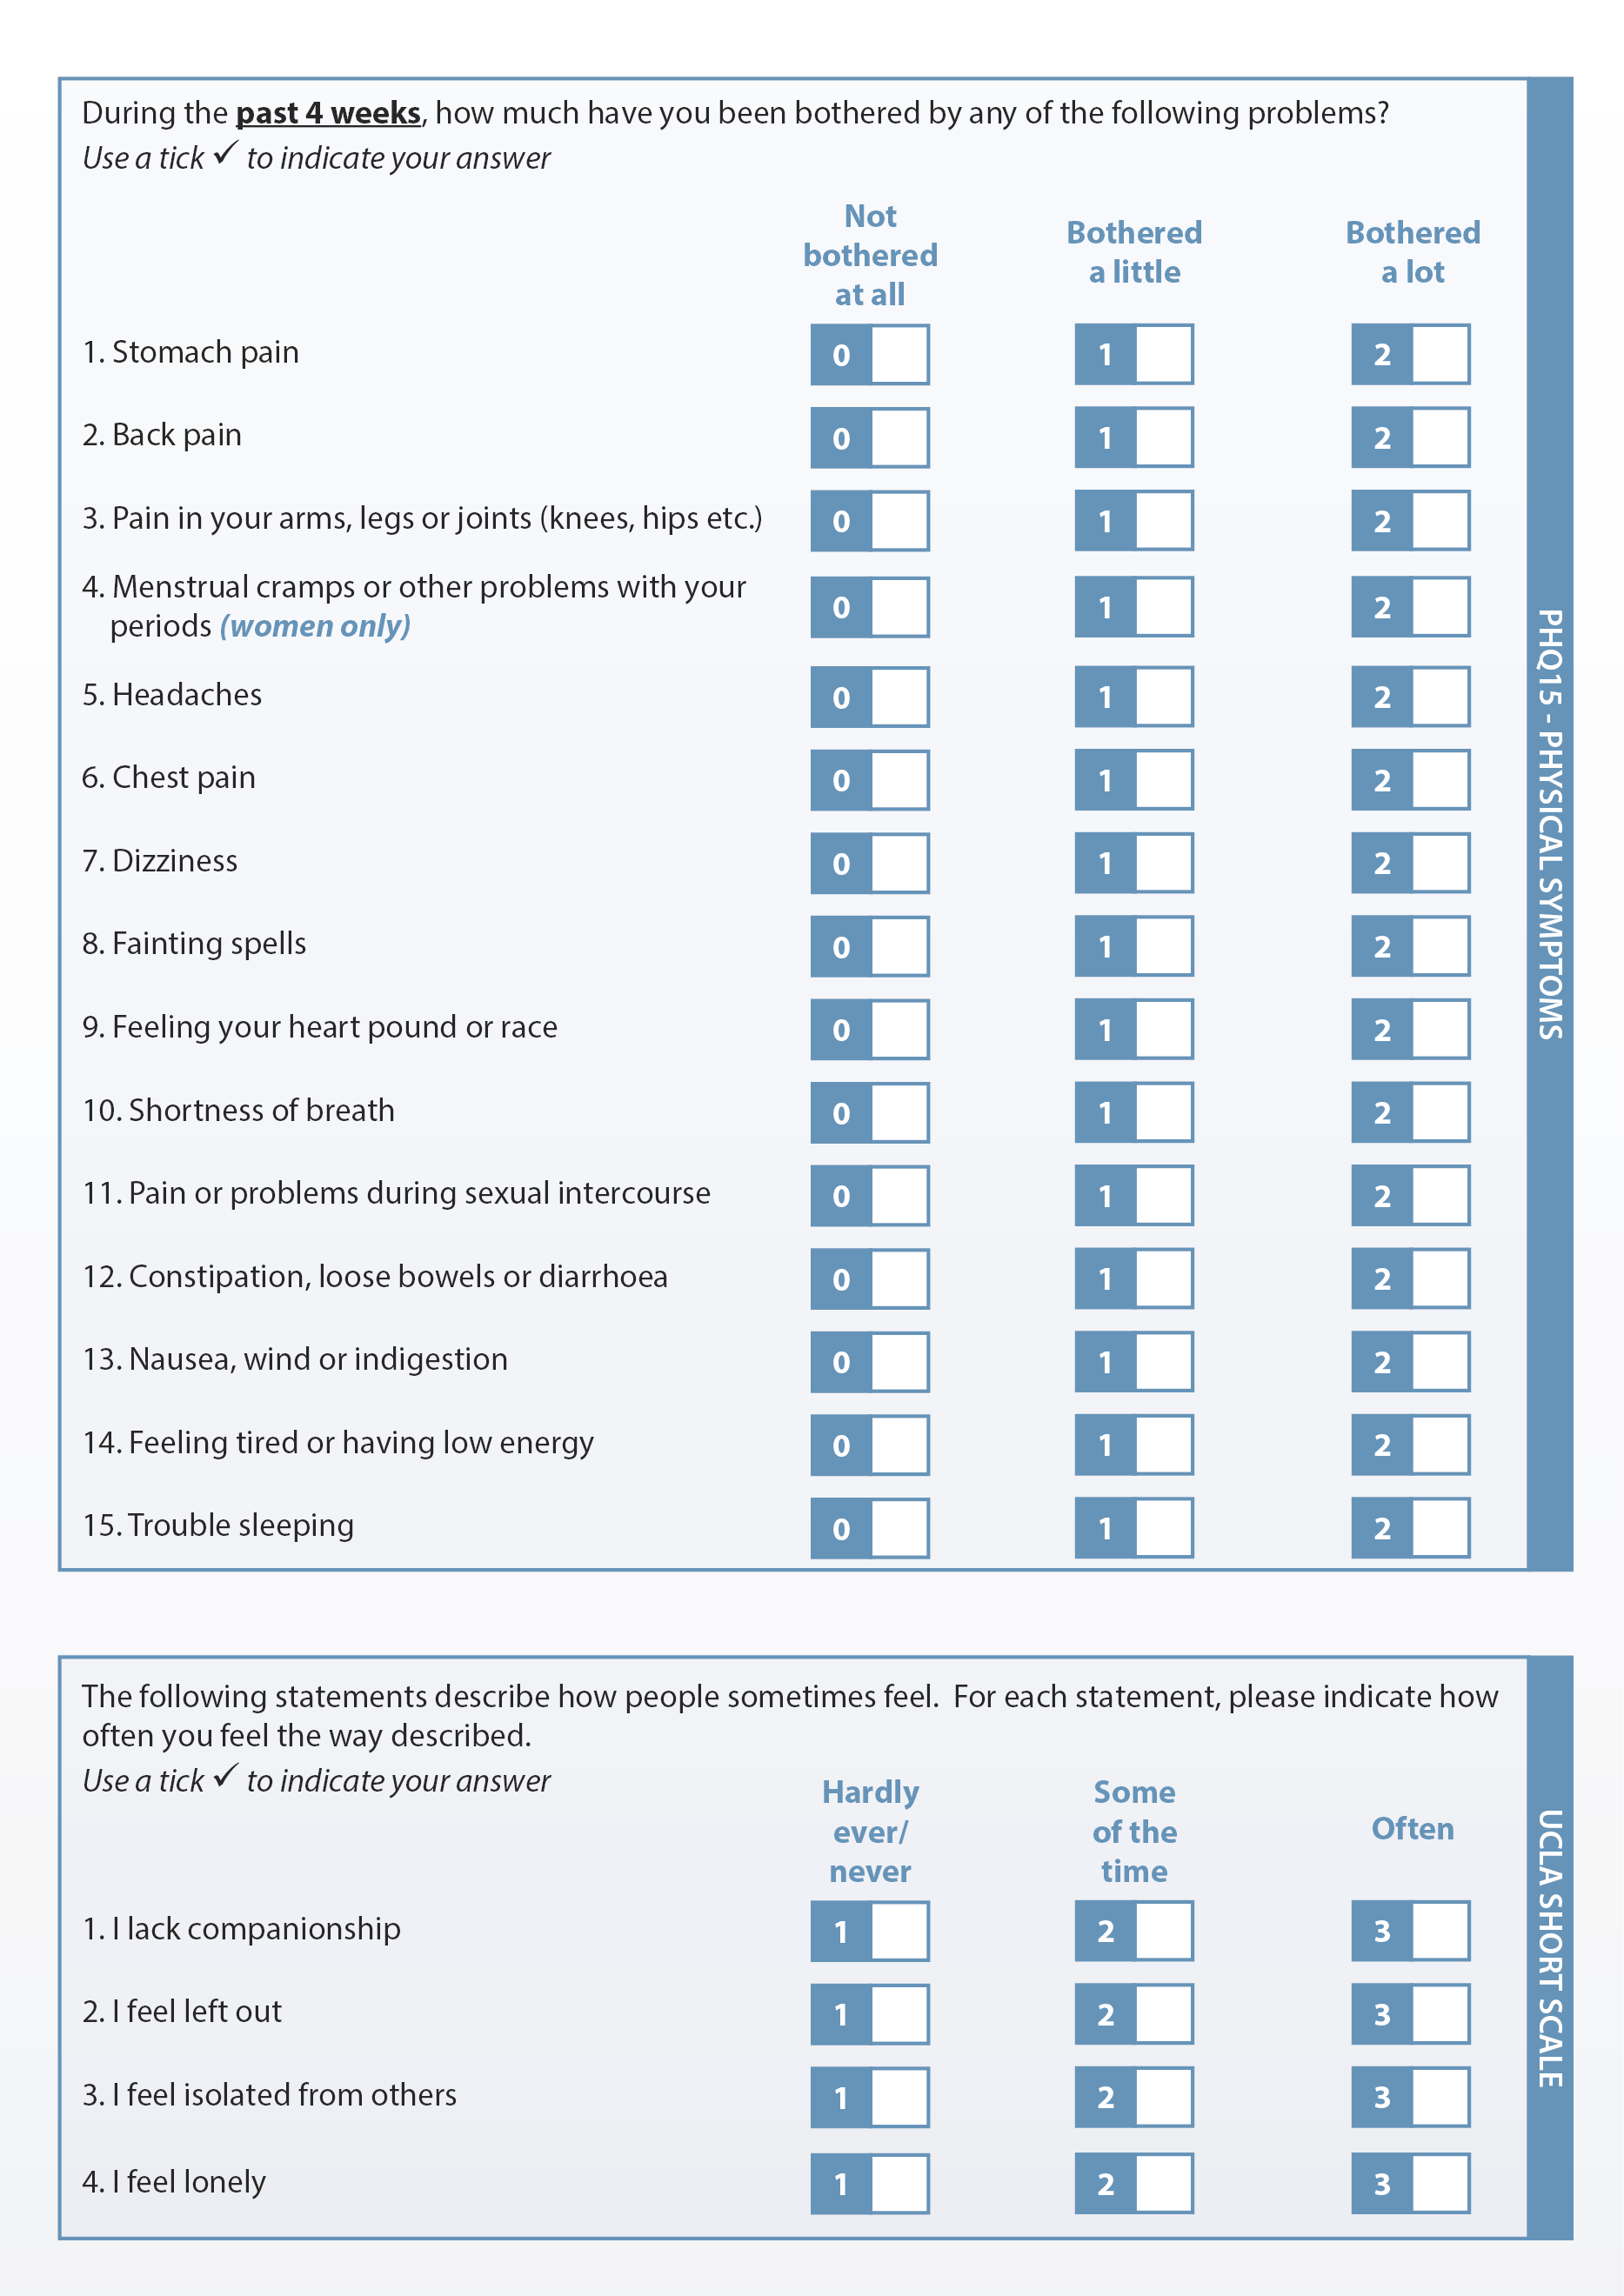

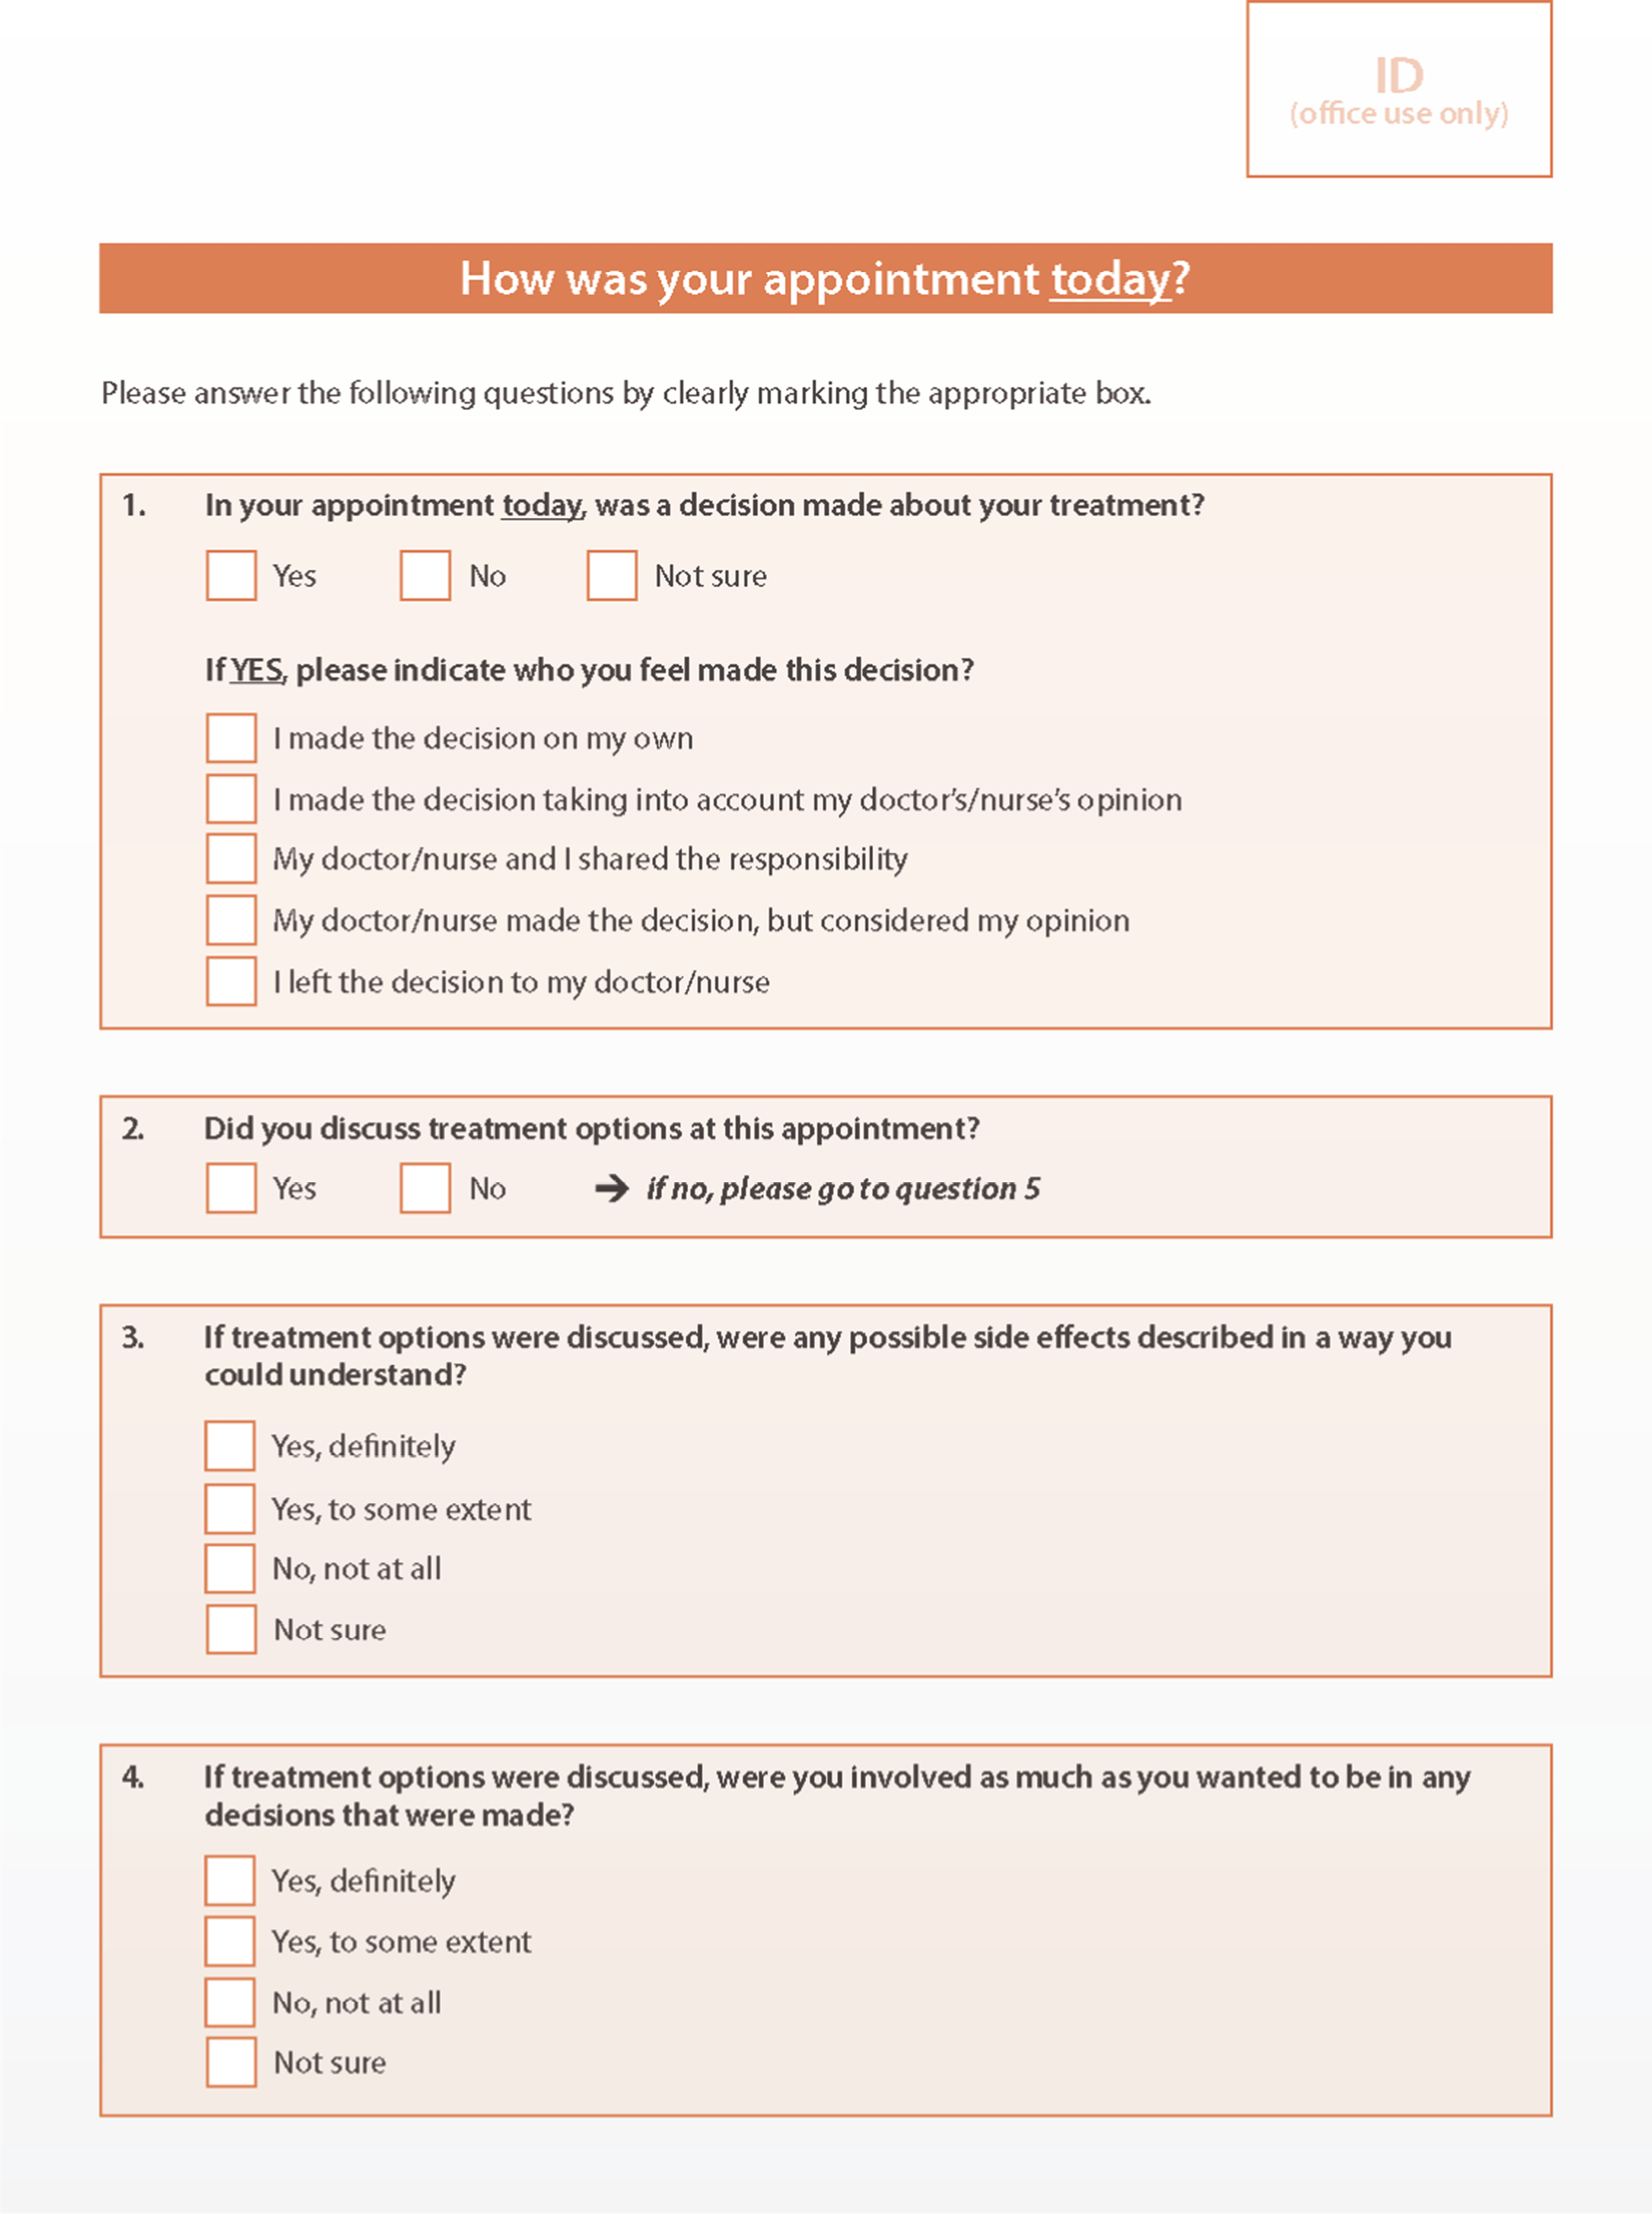
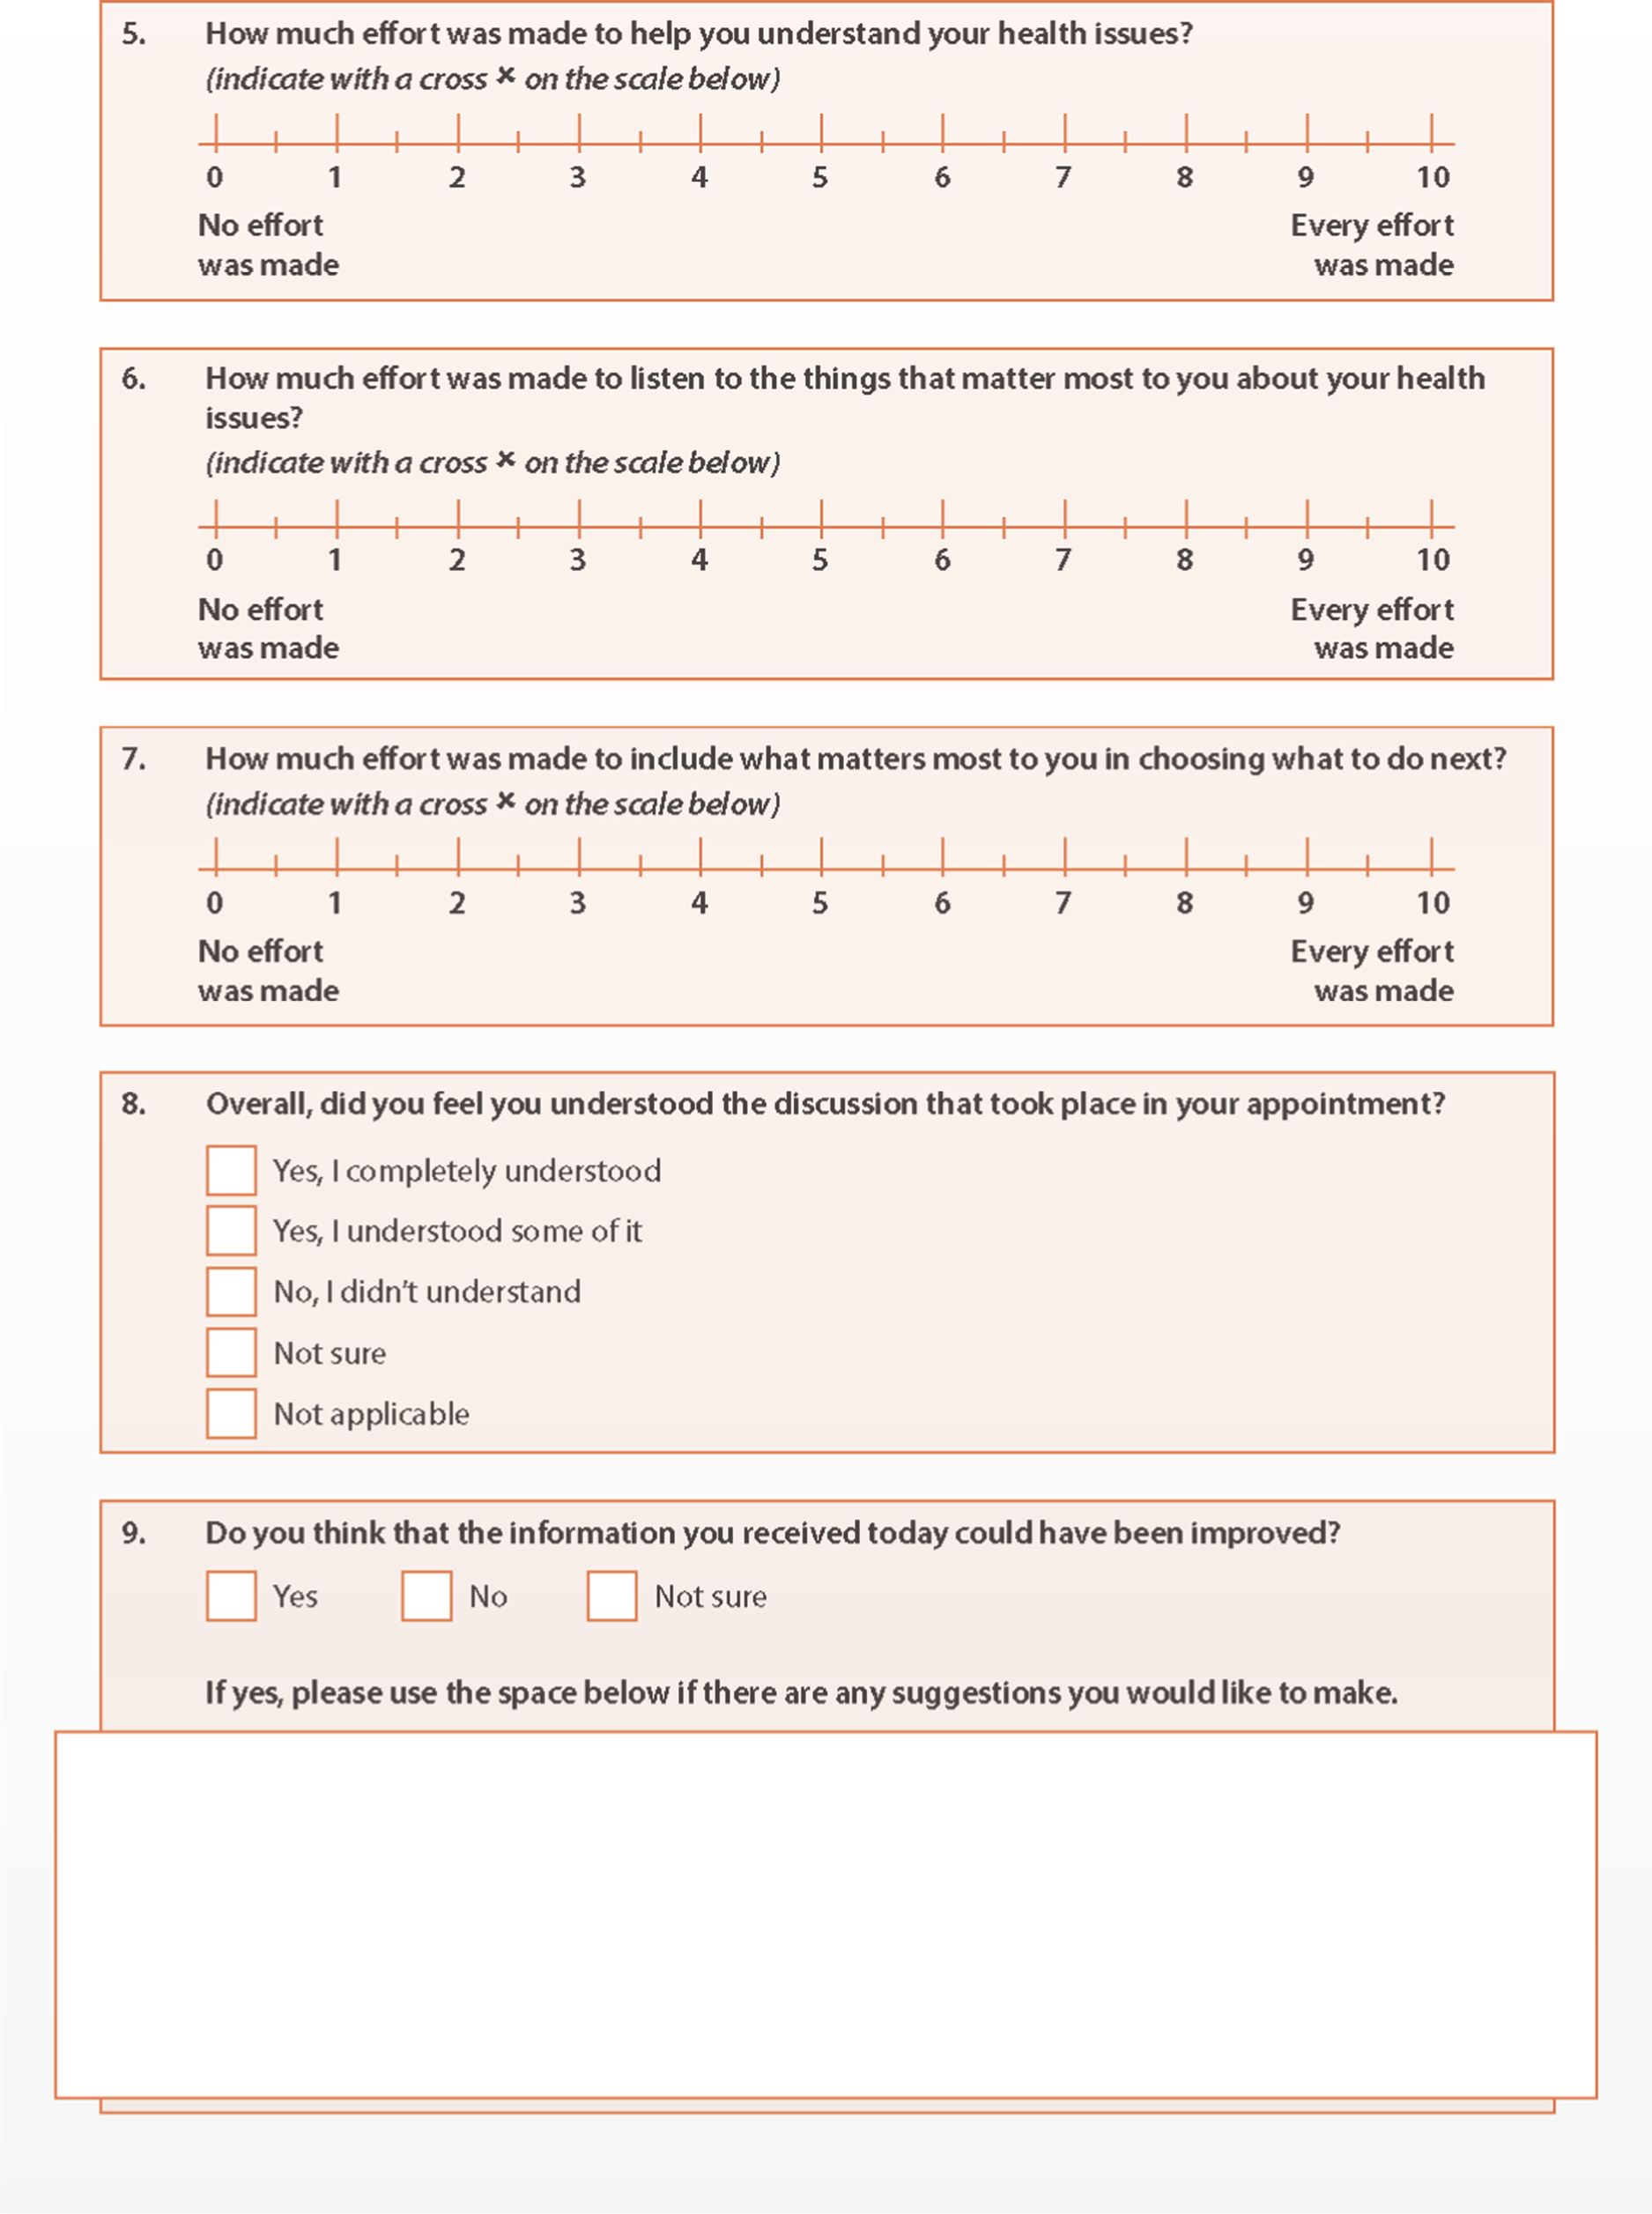
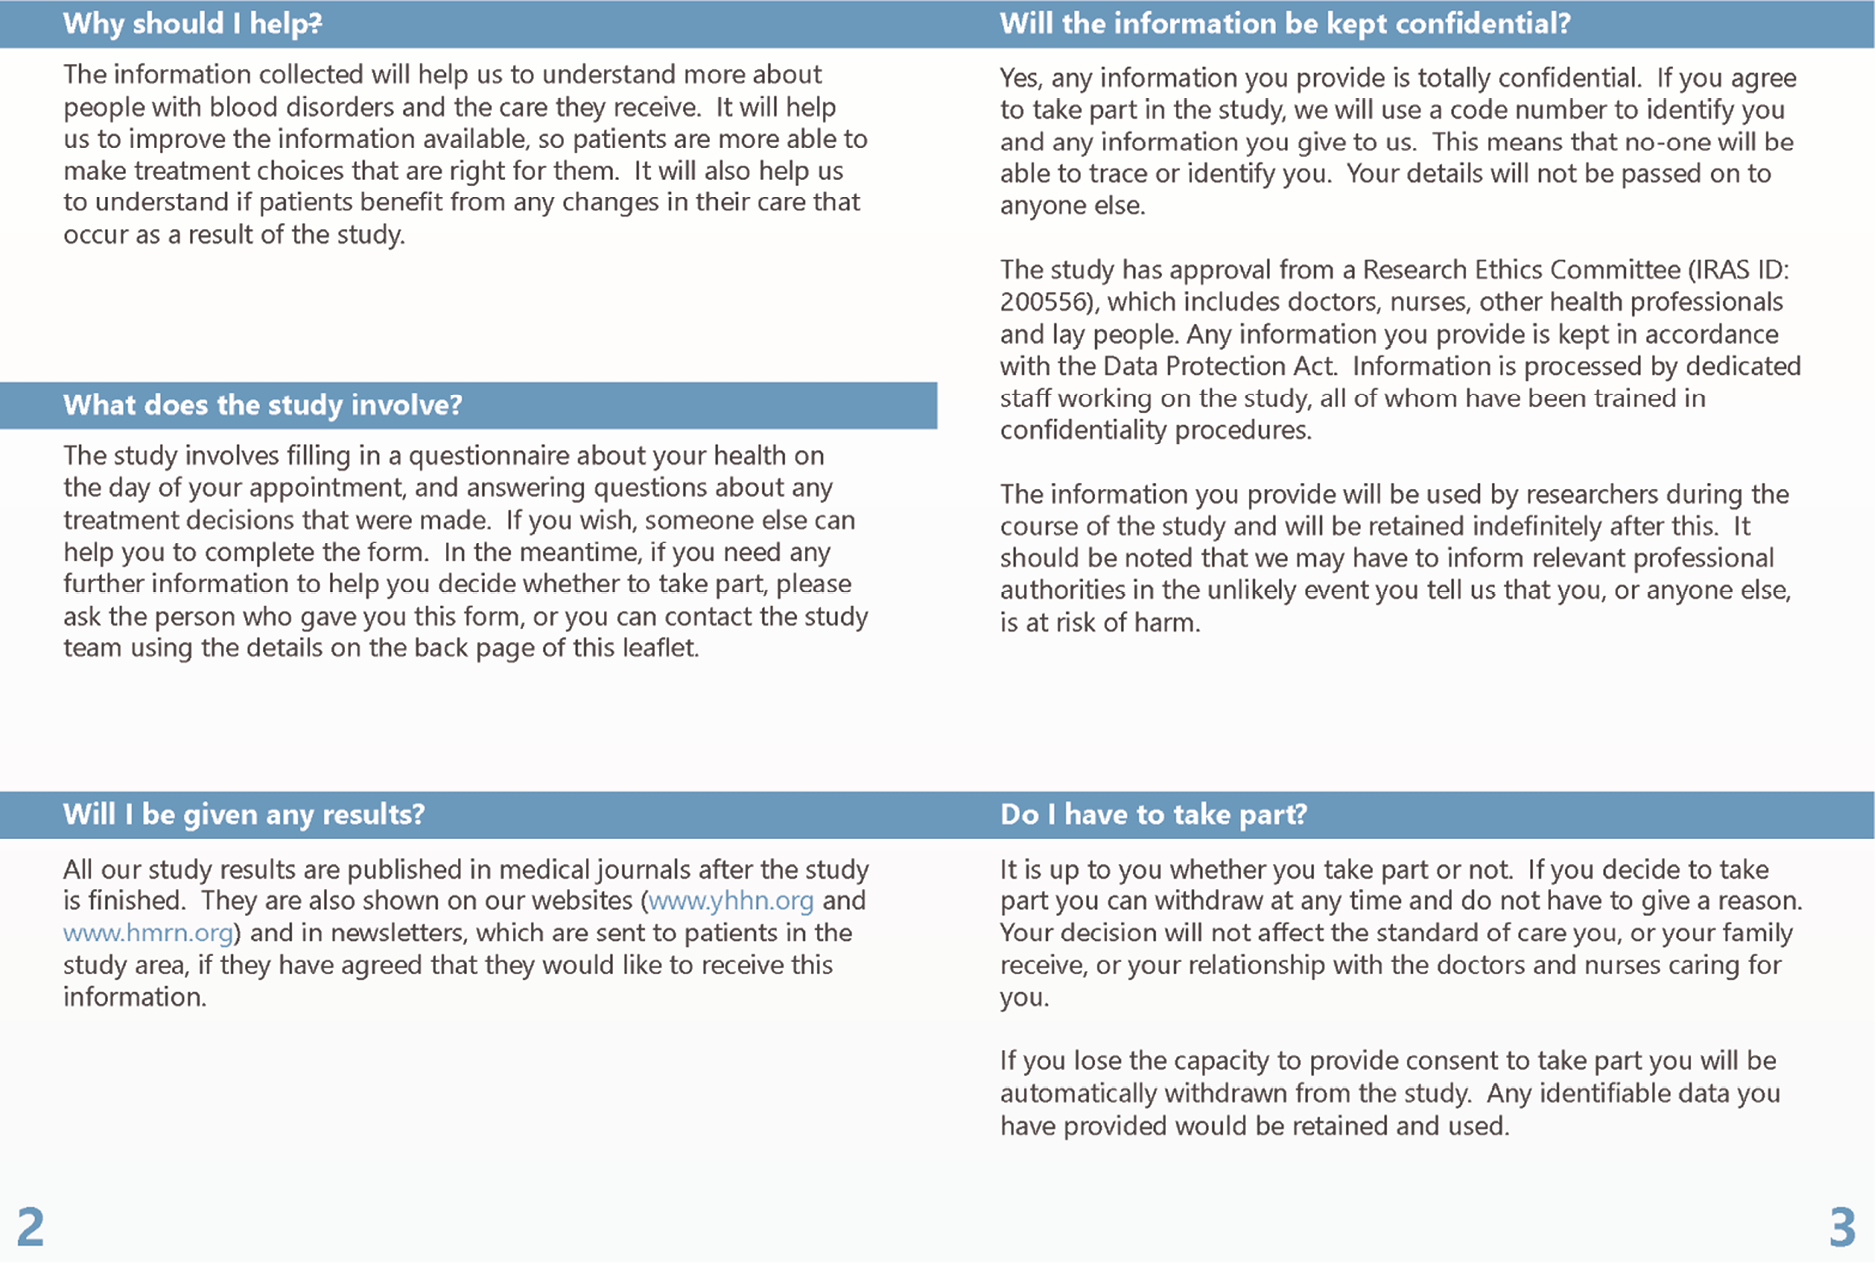
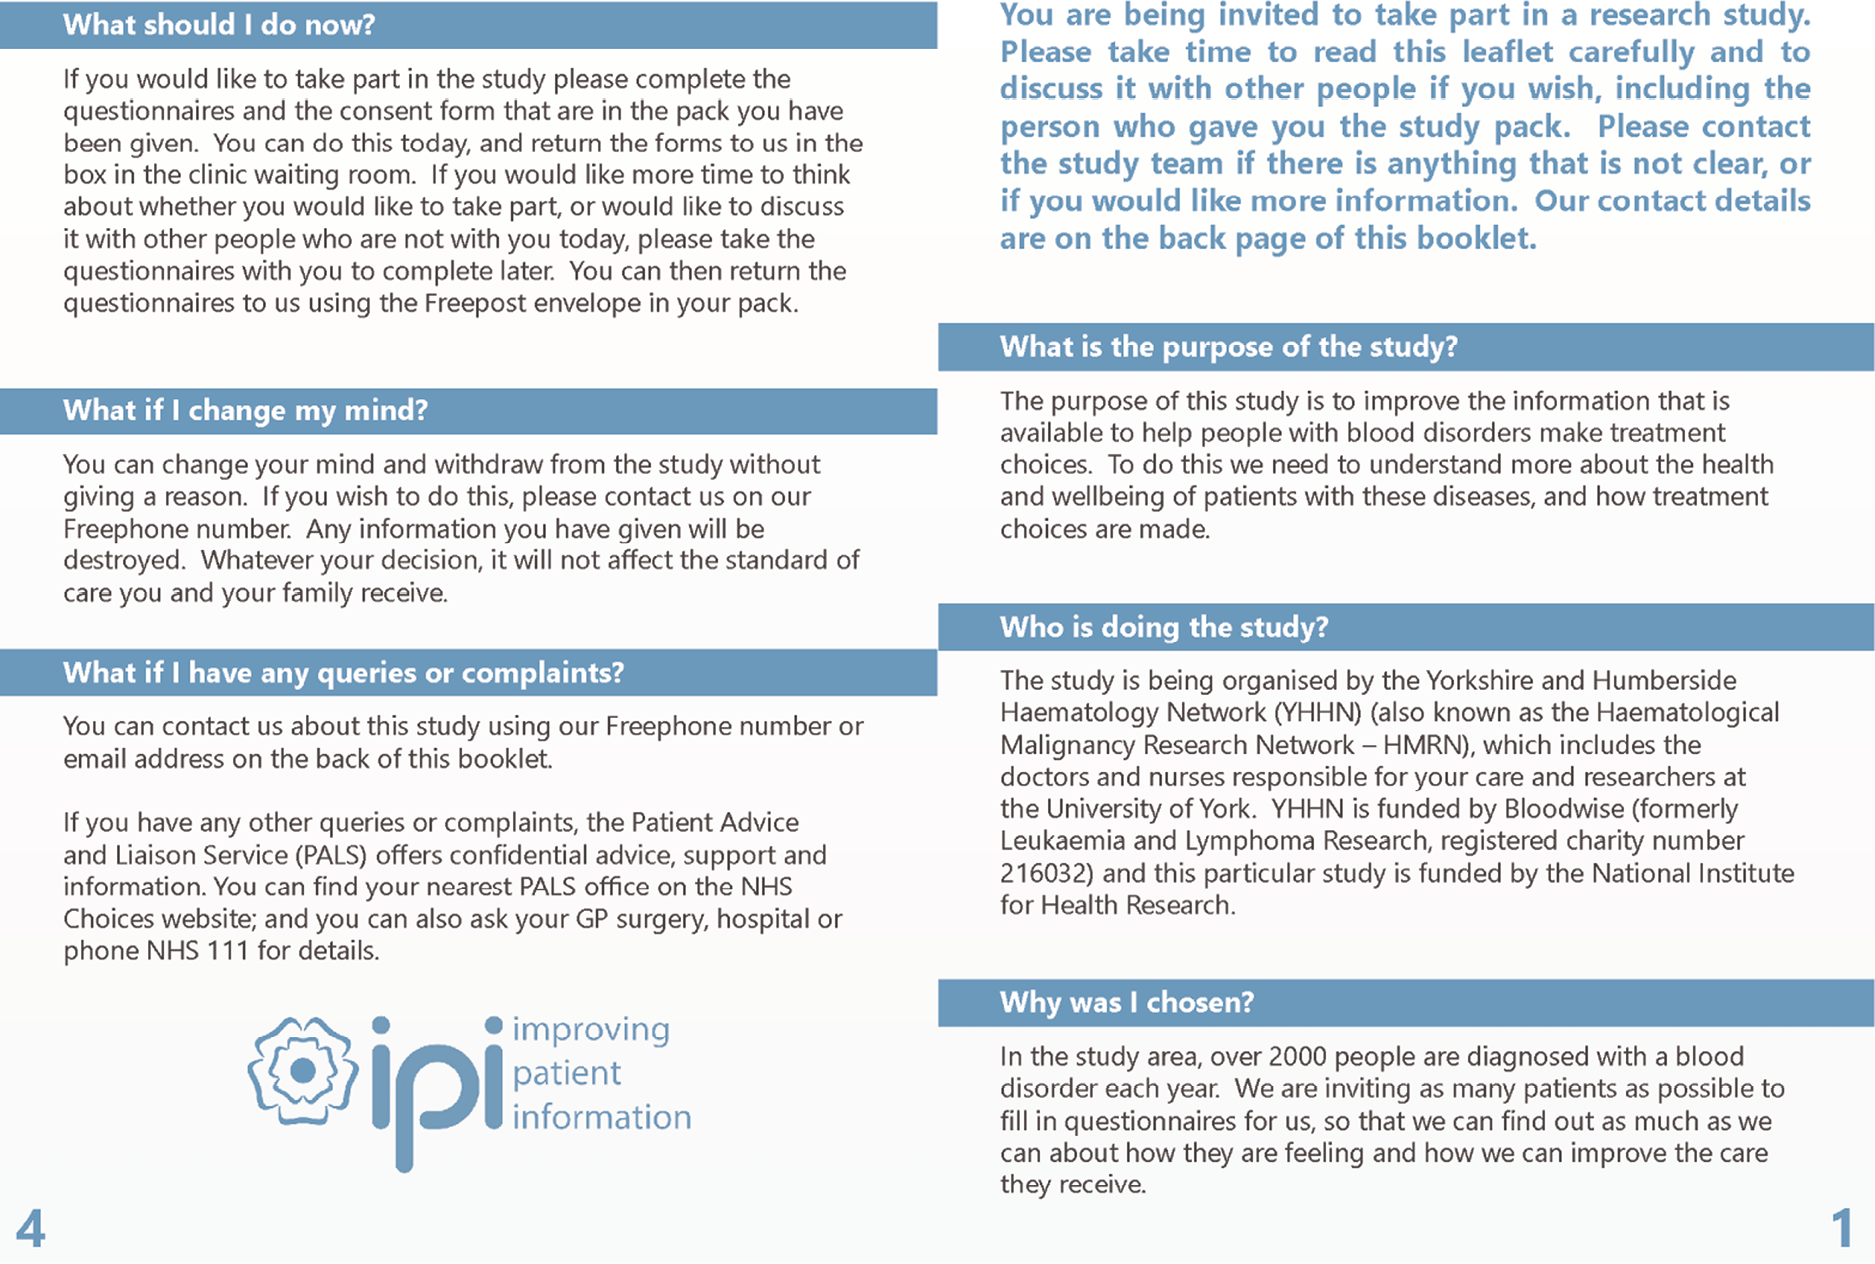
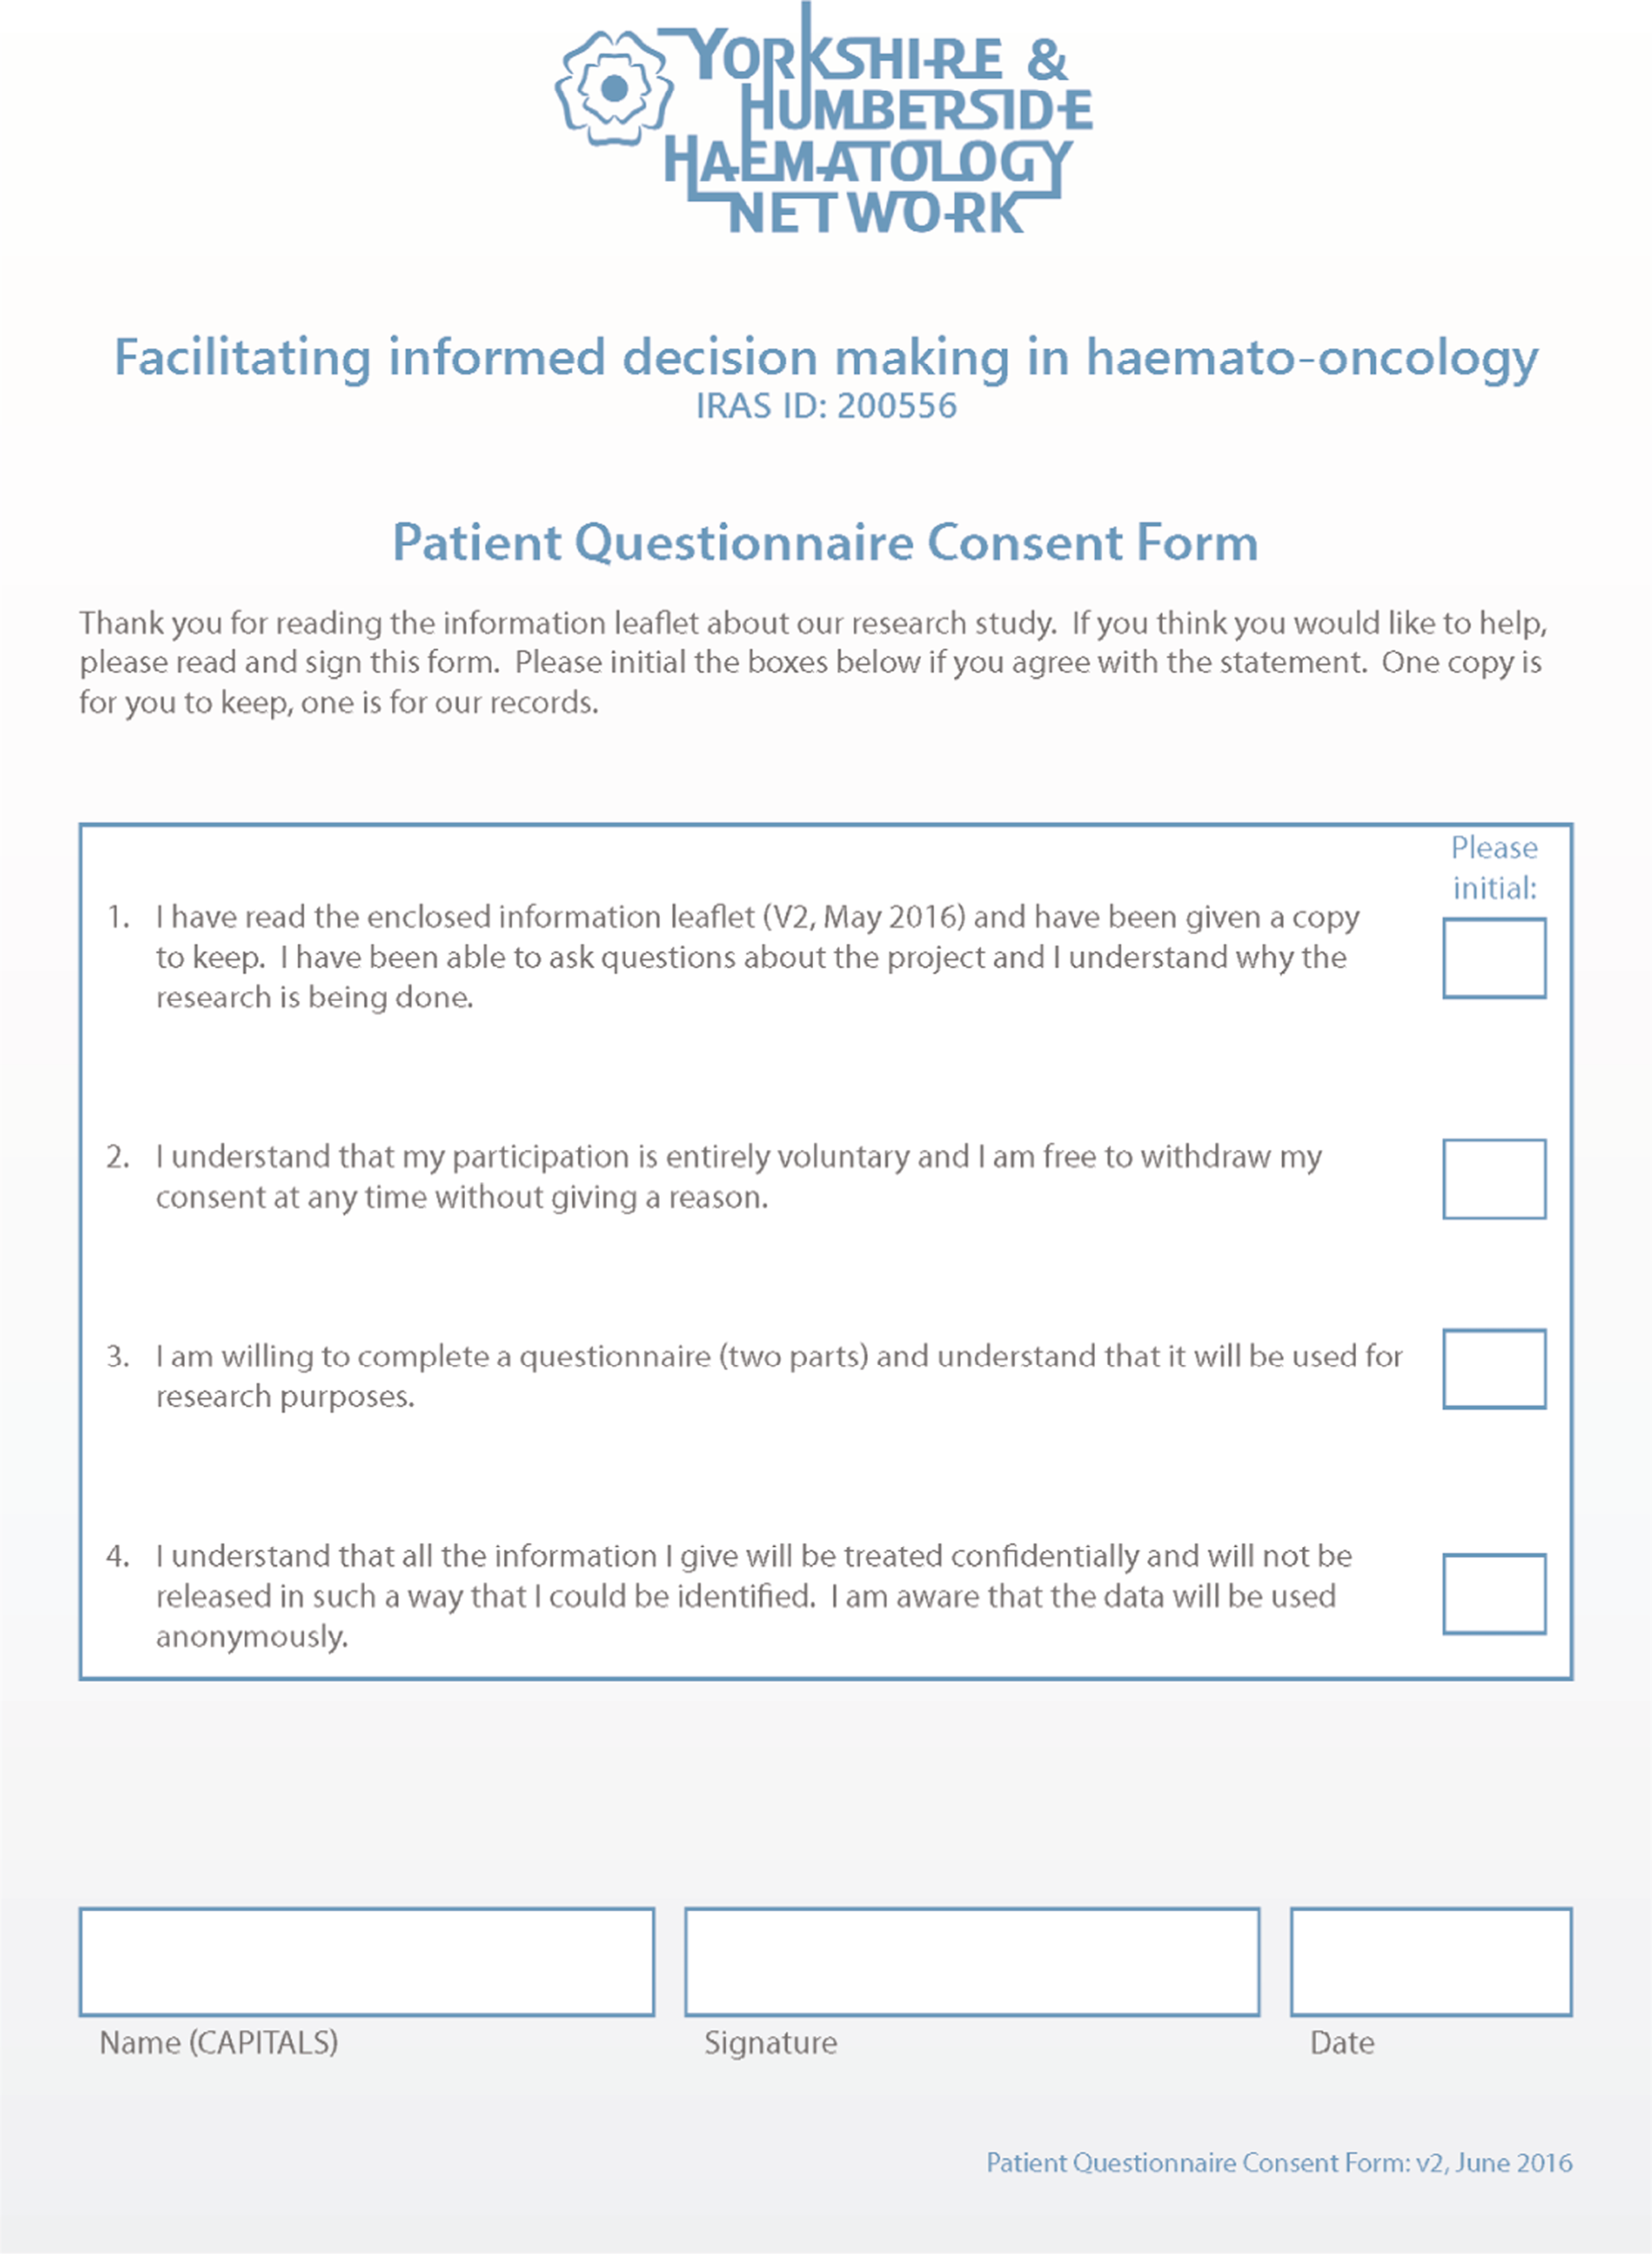
Standard operating procedures
This standard operating procedure describes the process of preparing IPI study packs, distributing them to research staff at the 14 participating hospitals in the HMRN area, processing returned forms and assigning study IDs.
-
Preparing IPI study packs
Prepare IPI study packs within a single envelope, containing:
-
1 × QoL questionnaire (BLUE)
-
1 × decision-making and preferences questionnaire (ORANGE)
-
1 × IPI patient information leaflet
-
1 × consent form
-
1 × Freepost return envelope.
Patients are asked to complete the questionnaires each time they attend clinic (or no sooner than every 4 weeks at certain sites). In some hospitals, patients are asked to complete the consent form every time they fill in a questionnaire; in others they are asked to complete the consent form the first time only and then sign the questionnaire in the box provided. Consequently, some hospitals may request ‘follow-up’ packs without consent forms.
-
Distributing IPI study packs to hospital contact
-
Packs are sent to hospitals as requested, by post or via the HMRN research nurse working at that site. Exceptions are:
-
Mid-Yorkshire Hospitals (Pinderfields, Dewsbury and Pontefract) – all packs are sent to Pinderfields
-
Huddersfield and Halifax – all packs are sent to Huddersfield.
-
-
The consent form and questionnaires within each pack contain the name of the hospital the pack has been sent to, so it is clear (if questionnaires/consent forms are returned by post) which hospital distributed each pack.
-
-
Returning completed consent forms and questionnaires
Forms may be returned to the study team in two ways:
-
Via the post-box set up for this purpose in the haematology clinic. A HMRN research nurse will collect the forms directly from the post-box or from an NHS employee, if the box has already been emptied and by post in the prepaid envelope if some (or all) of the forms are completed at home.
-
Receiving completed consent forms and questionnaires
-
The consent form and questionnaires may be returned at the same time, or separately.
-
Consent forms should contain the patient’s name and signature and the date of completion.
-
Questionnaires should have a hospital sticker attached containing details of the patient’s name, DOB, address, NHS number and hospital number, or handwritten details.
-
If no details are included on the form, use the hospital identifier (see 2b) to ascertain where the pack was distributed, and then call the hospital contact to identify the patient.
-
Search for the individual on the HMRN registration database, find their EGU-ID and write this on the front of each form.
-
If the patient cannot be found on the HMRN database (i.e. no EGU-ID), check to see if an IP (inpatient) number needs to be assigned and notify the study co-ordinator.
-
-
Identifying patients who might require an IP number to be assigned
Most patients will already be on the HMRN database and will have an EGU-ID. Some will not and may require an IP number to be assigned. The following information should be considered to determine if an IP number is needed:
-
Double check the HMRN registration database (i.e. using name, DOB, NHS number) to ensure that the patient does not already have a record.
-
Check HILIS for information about the patient. For those with a HILIS record, try to ascertain why the patient doesn’t have an EGU-ID. Reasons are:
-
first diagnosis on HILIS occurred before HMRN started (September 2004)
-
first diagnosis HILIS was made outside HMRN area
-
the HILIS report shows ‘see comments’ or is negative.
-
-
If there is no HILIS record, the HMRN research nurse at the patient’s hospital can check the records to ascertain why. Ask the IPI study co-ordinator to arrange this.
It is important to bear in mind the following:
-
HILIS holds records from around 2002, but not before this date.
-
The ‘Data Files’ section of the patient record (on HILIS) holds the sample request form. This often holds patient information that may be relevant in ascertaining eligibility.
-
An algorithm can be used to check the validity of NHS numbers.
-
Patients may have a HILIS record, but not an EGU-ID. The HILIS record must have an ICD-03 code to appear on the new patient list as a ‘new diagnosis’. It is then uploaded to the registration database and assigned an EGU-ID. If an ICD-03 code has not been assigned (e.g. HILIS says ‘see comments’ or a negative result) the patient will not appear on the list for uploading. Check such patients with the co-ordinator before assigning an IP number.
-
Patients may have a HILIS record and an EGU-ID but be ineligible for the NIHR study. This is because a patient was uploaded to the registration database and assigned an EGU-ID but was found to be ineligible (i.e. diagnosed outside the area, before the study, or had a previous diagnosis). This evidence may come from HILIS or routine HMRN data collection.
-
Processing patients without an EGU-ID, who may need an IP to be assigned
-
To add an IP, go to the online and click ‘Open’. A record will be automatically created in the HMRN Registration database.
-
The reason an IP number has been assigned should be entered in the comments section of the database, based on the information from HILIS or the research nurse who checked the hospital records, as follows:
-
Diagnosed < September 2004.
-
Diagnosed out of area.
-
Not on HILIS (if the reason is unknown).
-
-
-
Processing completed forms
-
Match all forms (consent and both questionnaires for each person).
-
Stored non-matching forms until they can be matched.
-
Once the consent form and at least one questionnaire has arrived, the form can be input.
-
Three pieces of information are required before data entry: name, date of birth and NHS number.
-
-
Patient identification and data entry
-
Open the data entry template.
-
Select the NIHR – IPI database.
-
Enter your username/password.
-
Click on the ID box and enter the patient’s EGU-ID, or assign an IP number if necessary.
-
Enter the data from the consent form under ‘IPI Consent’ section.
-
Under the ‘IPI Time Point’, insert the date and click on ‘Add’.
-
Input the questionnaire forms.
-
-
Filing forms
-
File forms in the designated locked cabinets in the locked office.
-
File forms numerically according to EGU-ID or IP number.
-
File all forms for each individual patient together in a plastic sleeve.
-
| Diagnosis | Number (%) |
|---|---|
| Total | 2651 (100.0) |
| Myeloma | 489 (18.4) |
| CLL | 439 (16.6) |
| FL | 354 (13.4) |
| DLBCL | 372 (14.0) |
| Marginal zone lymphoma | 228 (8.6) |
| Classical Hodgkin lymphoma | 132 (5.0) |
| Chronic myeloid leukaemia | 130 (4.9) |
| Myeloproliferative neoplasms | 104 (3.9) |
| Lymphoproliferative disorder NOS | 56 (2.1) |
| Mantle cell lymphoma | 53 (2.0) |
| Acute myeloid leukaemia | 45 (1.7) |
| T-cell lymphoma | 35 (1.3) |
| Myelodysplastic syndromes | 32 (1.2) |
| Monoclonal gammopathy of undetermined significance | 30 (1.1) |
| Monoclonal B-cell lymphocytosis | 27 (1.0) |
| Myelodysplastic/myeloproliferative neoplasms | 23 (0.9) |
| Lymphocyte predominant nodular Hodgkin lymphoma | 20 (0.8) |
| Hairy cell leukaemia | 18 (0.7) |
| T-cell leukaemia | 13 (0.5) |
| Plasmacytoma | 11 (0.4) |
| Burkitt lymphoma | 8 (0.3) |
| T-lymphoblastic leukaemia | 8 (0.3) |
| Myelofibrosis | 6 (0.2) |
| Acute promyelocytic leukaemia | 6 (0.2) |
| B-lymphoblastic leukaemia | 6 (0.2) |
| B-cell lymphoma, intermediate between DLBCL and classical HL | 5 (0.2) |
| PTLD | 1(0.2) |
Appendix 4 In-depth exploration of patient experiences: information and treatment decisions
-
Information leaflet
-
Topic guide.
-
Characteristics of interviewees.
Topic guide
Questions to be asked with reference to the context of chronic cancer, watch and wait (W&W) and uncertainty. Focus to be on the time of diagnosis, treatment decisions, change in disease state, and treatment cessation.
Information-sharing and assimilation
-
How important is it to you that you receive information about your cancer? (why is that?)
-
How do you feel about the information given to you at diagnosis/start of treatment?
-
How do you feel about getting information from HCPs? (time constraints; overwhelming; difficult to understand/take in; use of language/terminology)
-
Do you feel the information given applies specifically to you? (personalised, tailored, specific)
-
How do healthcare practitioners (HCPs) ascertain your information needs?
-
Is the information you received explained in a way you can understand? (technical language; too detailed; not detailed enough)
-
What do HCPs do to check if you understand the information they give you?
-
How do you feel about asking questions? Are your questions always answered?
-
Do you feel that your information needs are usually met? What worked well, and what could have been better? (diagnosis; treatment initiation/cessation – examples)
-
What do you think about the timing of information from HCPs? When is the right time? (at diagnosis; during clinic appointments; when disease status changes; at other times)
-
How do/did you feel about discussing the risks and benefits of different types of treatment with your consultant?
-
What are your feelings about discussing prognosis? (definition: “a statement about expectations that refers to the likely course of the cancer and/or what the outcome might be”) (want to know/not; timing; language)
-
What strategies do you use to absorb information? (in general, how bad news is processed)
Practical issues
-
How do you feel about the amount of information you get? (would you like more/less – why; information overload; issues with absorbing/retaining information)
-
What do you want information/more information about? (investigations; treatments; care pathway; prognosis; side effects; impact on quality of life)
-
Where/who do you prefer to get information from and why? [Internet; doctors/nurses; family members; leaflets; patient support group; other source(s)]
-
What do you think about different sources of information available to you? (opportunities for explanation; credibility of information)
-
How do you prefer to see information about risks and benefits – why? (words/numbers; figures/percentages; diagrams/graphs)
Decision-making about treatment
-
How do you feel about being involved in making decisions with HCPs about your treatment?
-
Have you been asked you if you want to be involved in making decisions about treatment?
-
Do you want to be involved in treatment decisions? (preference for patient solely; clinician solely; patient/clinician shared)
-
What kinds of things do you think should be considered when treatment decisionss are being made? (effectiveness of treatment; side effects; prognosis; patient goals, values, preferences; impact on quality-of-life)
-
What might make it easier or harder for you to be involved in making decisions about your treatment? (time; style of HCP communication; how information is conveyed; explanations)
-
Are there particular time-points when it is harder to be involved in making decisions about treatment? (diagnosis; treatment initiation/change; treatment cessation)
| ID | Diagnosisa | Year of diagnosis | Gender | Age at diagnosis (years) | Age at interview (years) | Lived with relative or alone | Relative present at interview | Treatment line(s) preceding interviewb,c | |||||
|---|---|---|---|---|---|---|---|---|---|---|---|---|---|
| First | Second | Third | Fourth | Fifth | Sixth | ||||||||
| P1 | CLL | 2015 | F | 64 | 67 | Relative | – | Observation | – | – | – | – | – |
| P2 | MZL | 2004 | M | 55 | 69 | Relative | – | Observation | Chemotx | Observation | – | – | – |
| P3 | CLL | 1997d | M | 40 | 62 | Relative | – | Observation | Chemotx | Observation | – | – | – |
| P4 | MZL | 2016 | F | 57 | 60 | Alone | – | Observation | Chemotx | – | – | – | – |
| P5 | MZL | 2017 | F | 54 | 56 | Alone | – | HPE | Observation | – | – | – | – |
| P6 | CLL | 2011 | F | 68 | 75 | Relative | Yes | Observation | Chemotx | Observation | – | – | – |
| P7 | CLL | 2013 | M | 63 | 68 | Relative | Yes | Observation | Chemotx | Observation | – | – | – |
| P8 | FL | 2016 | F | 70 | 72 | Alone | – | Chemotx | Radiotx | Observation | – | – | – |
| P9 | CLL | 2014 | M | 80 | 86 | Relative | – | Observation | Chemotx | – | – | – | – |
| P10 | FL | 2011 | M | 66 | 73 | Relative | – | Observation | Chemotx | Chemotx | Chemotx | – | – |
| P11 | Myeloma | 2014 | M | 56 | 65 | Relative | – | Observation | Chemotx | Observation | – | – | – |
| P12 | MZL | 2014 | M | 69 | 73 | Relative | – | Observation | Chemotx | – | – | – | – |
| P13 | CLL | 2018 | F | 56 | 57 | Relative | – | Observation | – | – | – | – | – |
| P14 | Myeloma | 2015 | M | 56 | 60 | Relative | – | Steroids | Radiotx | Chemotx | Chemotx | Chemotx | SCT |
| P15 | FL | 2016 | F | 72 | 75 | Relative | – | Observation | Chemotx | – | – | – | – |
| P16 | Myeloma | 2017 | M | 64 | 66 | Relative | – | Chemotx | Chemotx | Chemotx | SCT | Observation | – |
| P17 | FL | 2016 | F | 64 | 67 | Relative | Yes | Observation | – | – | – | – | – |
| P18 | Myeloma | 2016 | M | 60 | 63 | Relative | – | Chemotx | Chemotx | Chemotx | SCT | Observation | |
| P19 | FL | 2016 | F | 51 | 54 | Relative | – | Steroids | Chemotx | Chemotx | Observation | – | – |
| P20 | CLL | 2015 | M | 71 | 74 | Relative | Yes | Observation | – | – | – | – | – |
| P21 | Myeloma | 2016 | M | 67 | 70 | Relative | Yes | Steroids | Chemotx | Chemotx | Chemotx | SCT | – |
| P22 | CLL | 2016 | M | 69 | 72 | Relative | Yes | Observation | Clinical trial | Observation | – | – | – |
| P23 | Myeloma | 2016 | F | 52 | 63 | Relative | – | Observation | – | – | – | – | – |
| P24 | FL | 2015 | M | 53 | 57 | Relative | – | Steroids | Chemotx | Radiotx | Observation | – | – |
| P25 | FL | 2015 | F | 63 | 67 | Relative | – | Chemotx | Chemotx | – | – | – | – |
| P26 | Myeloma | 2015 | F | 68 | 72 | Relative | – | Observation | – | – | – | – | – |
| P27 | CLL | 2015 | M | 71 | 75 | Relative | Yes | Chemotx | Observation | – | – | – | – |
| P28 | Myeloma | 2015 | M | 59 | 63 | Relative | – | Steroids | Chemotx | Chemotx | SCT | Clinical trial | Chemotx |
| P29 | CLL | 2016 | F | 70 | 73 | Relative | – | Clinical trial | Observation | – | – | – | – |
| P30 | Myeloma | 2017 | M | 70 | 72 | Relative | Yes | Observation | – | – | – | – | – |
| P31 | Myeloma | 2017 | M | 71 | 73 | Relative | Yes | Radiotx | Steroids | Chemotx | Observation | – | – |
| P32 | MZL | 2017 | F | 60 | 62 | Relative | Yes | Observation | Chemotx | Observation | – | – | – |
| P33 | Myeloma | 2016 | F | 53 | 55 | Relative | – | Chemotx | Chemotx | SCH | Observation | – | – |
| P34 | FL | 2015 | M | 53 | 57 | Relative | – | Steroids | Chemotx | Chemotx | Chemotx | – | – |
| P35 | Myeloma | 2017 | F | 55 | 57 | Relative | – | Chemotx | Chemotx | Chemotx | Chemotx | SCT | Observation |
List of abbreviations
- A&E
- accident and emergency
- APC
- admitted patient care
- CLL
- chronic lymphocytic leukaemia
- CRAB
- hyperCalcaemia, Renal dysfunction, Anaemia, Bone disease
- DLBCL
- diffuse large B-cell lymphoma
- ECSG
- Epidemiology and Cancer Statistics Group
- EQ-5D-5L
- EuroQol-5 Dimensions, five-level version
- FL
- follicular lymphoma
- GDPR
- General Data Protection Regulations
- HES
- Hospital Episode Statistics
- HMDS
- Haematological Malignancy Diagnostic Service
- HMRN
- Haematological Malignancy Research Network
- HRA
- Health Research Authority
- HRG
- Healthcare Resource Group
- HRQoL
- health-related quality of life
- HTA
- Health Technology Assessment
- IMD
- Index of Multiple Deprivation
- ISS
- International Staging System
- MDT
- multidisciplinary team
- MSM
- multistate model
- NICE
- National Institute for Health and Care Excellence
- NIHR
- National Institute for Health and Care Research
- OP
- outpatient
- PPIE
- patient and public involvement and engagement
- PSC
- Programme Steering Committee
- QALY
- quality-adjusted life-year
- QoL
- quality of life
- RCT
- randomised controlled trial
- REC
- Research Ethics Committee
- TTE
- time-to-event
- WP
- work package
- W&W
- watch and wait
