Notes
Article history
The research reported in this issue of the journal was funded by the PHR programme as project number 10/3009/06. The contractual start date was in May 2012. The final report began editorial review in May 2014 and was accepted for publication in March 2015. The authors have been wholly responsible for all data collection, analysis and interpretation, and for writing up their work. The PHR editors and production house have tried to ensure the accuracy of the authors’ report and would like to thank the reviewers for their constructive comments on the final report document. However, they do not accept liability for damages or losses arising from material published in this report.
Declared competing interests of authors
none
Disclaimer
The views and opinions expressed herein are those of the authors and do not necessarily reflect those of the National Institute for Health Research Public Health Research programme or the Department of Health.
Permissions
Copyright statement
© Queen’s Printer and Controller of HMSO 2015. This work was produced by Elliott et al. under the terms of a commissioning contract issued by the Secretary of State for Health. This issue may be freely reproduced for the purposes of private research and study and extracts (or indeed, the full report) may be included in professional journals provided that suitable acknowledgement is made and the reproduction is not associated with any form of advertising. Applications for commercial reproduction should be addressed to: NIHR Journals Library, National Institute for Health Research, Evaluation, Trials and Studies Coordinating Centre, Alpha House, University of Southampton Science Park, Southampton SO16 7NS, UK.
Chapter 1 Falls and stair negotiation in older people and their relationship with vision
The prevalence and morbidity of falls
Falls are a common and very serious problem for older adults, with approximately one-third of community-dwelling, healthy adults aged 65 years and over falling at least once per year, and with up to half of these people experiencing multiple falls. 1 Annual falls rates increase to about 50% in people aged 85 years and over. Approximately 25% of falls result in an injury ranging from minor bruising to hip fracture. 1 Hip fractures are a particularly severe consequence of falling, with the 1-year mortality rate following hip fracture being about 25%. 2 In addition, 80% of surveyed older women suggested that they would rather be dead than experience the loss of independence and quality of life that results from a hip fracture and subsequent admission to a nursing home. 3 Falls and hip fractures are mentioned as a contributing factor in 40% of admissions to long-term nursing and residential home care. 4 Furthermore, even non-injurious falls have significant consequences, as they can lead to a fear of falling, which, in turn, results in a self-imposed restriction of functional activity, decreased mobility and independence, social isolation, deteriorating health, depression and reduced quality of life. 5 Incidences of falling in older people have been consistently linked to problems with step or stair negotiation. 6–8 In the UK, approximately 290,000 people are seriously injured and over 500 people die every year as a result of a fall on steps or stairs. 7 Injuries are particularly associated with descending stairs, with associated injuries being about three times more frequent than stair ascent injuries. 6 As Templer8 dramatically phrased it: ‘To fall down stairs is not only to fall off a cliff, but to fall on rocks below, for the nosing of steps presents a succession of sharp edges’.
The multifactorial nature of falls
Falls in older people are not random, chance events or ‘accidents’ but, rather, are typically multifactorial events with risk factors that include increasing age, female sex, lower-limb disabilities, impaired muscle strength, hypotension, stroke, arthritis, diabetes, cognitive impairment, Parkinson’s disease, visual impairment, sedative use, polypharmacy (taking more than four prescription medications per day) and a history of falls. 4,9 The greater the number of risk factors, the more likely it is that a fall will occur, with about an 8% falls rate with no risk factors and then a 15–20% increased risk for each additional risk factor, up to 78% for four or more risk factors. 9 The most common causes of fall-related injuries in older adults are trips, slips and stumbles (57%; from 2001–3 US data), with 27% being attributable to loss of balance, dizziness, fainting or a seizure. 10
Visual input to balance control and mobility
Balance (or postural) control is the ability to keep the body’s centre of mass above the base of support, with inputs from the visual, vestibular and somatosensory systems being integrated centrally and instructions sent to the motor system to maintain balance. Visual input is important for both standing and dynamic balance, with optical flow providing information about anteroposterior body sway (standing)11 and heading and speed control (when walking). In addition, eye movements provide information about lateral body sway and/or lateral head movements (because lateral movement of the retinal image is automatically corrected by the vestibuloocular reflex moving the eyes in the opposite direction to the head and at the same speed). 11 Vision plays a bigger part in postural control when input from the somatosensory and/or vestibular systems is disrupted. 12,13 Given the importance of both central and peripheral vision plus eye movements to the control of balance, it is not surprising that balance control has been shown to be poorer with reductions in central vision, such as those caused by refractive error, cataract and age-related macular degeneration; with reduced visual field, such as that caused by glaucoma and retinitis pigmentosa; and with a variety of eye movement disorders. 12–17
Vision is also used to adapt gait to enable safe travel though the environment, avoiding obstacles and negotiating steps and stairs. 18 Typically, vision is used to scan the travel pathway for obstacles and changes in terrain, with greater amounts of visual sampling used as the task becomes more challenging. 19 This is a feed-forward or planning system and is typically used to scan one to two steps ahead20,21 with the information being kept in short-term visual memory. In addition, an online ‘fine tuning’ of gait is provided by exproprioception information (position of the lower limbs relative to the environment) from the peripheral visual system21,22 and, particularly, the lower peripheral visual field. 20,22
Visual impairment and falls
Most epidemiological studies have shown that visual impairment, typically defined as binocular visual acuity worse than a Snellen score of 6/12 or 6/18 [0.30 or 0.50 logarithm of the minimum angle of resolution (logMAR)], is a significant and independent risk factor for falls, with an odds ratio of about 2.5. 23 This association may be even higher given the variability that is introduced by the dependence of visual acuity scores on spectacle wear. For example, visual acuity in older people will be significantly reduced if spectacles are not worn or the wrong spectacles are worn (e.g. reading spectacles worn when walking about24); however, most epidemiological studies do not determine whether or not the participants were wearing spectacles at the time of their fall. Conversely, visual acuity can be significantly improved with updated spectacles and cataract surgery, yet there is typically no determination of whether spectacles have been updated or cataract surgery performed during most epidemiological falls studies. Such changes would reduce any link between visual acuity and falls if it occurs after initial measurements and before a fall in a prospective study or after a fall but before vision measurements in a retrospective study. Finally, changes in visual acuity may be more associated with falls than the actual level of visual acuity,25 and other aspects of vision (such as visual field assessments,26,27 contrast sensitivity and stereoacuity28) are likely to be more important risk factors than visual acuity for falls.
Clinical studies have shown that people who fall or needed hip fracture surgery have particularly poor vision. Studies have found the prevalence of visual impairment (either binocular visual acuity of 6/1229 or 6/1830,31) in older fallers attending accident and emergency (A&E) clinics to be 59%29 and 76%30 and in older people who had undergone hip fracture surgery to be 46%. 31 Using estimates of older people’s A&E attendances owing to falls in 1999, Scuffham and colleagues32 estimated that these falls cost the UK government approximately £981M annually. In another publication, these authors suggested that £128M was directly attributable to falls occurring as a result of visual impairment. 33 Given the increased admission rate for falls in recent years, these data are very likely to be an underestimate of the actual financial cost.
The role of vision in stairs negotiation
Typically with central vision loss, there are minimal changes seen in simple walking tasks, but caution-based movement strategies are used when task difficulty is increased and there is a greater chance of falling. 34 Vision is known to have a major role in successful stair and steps negotiation,6,8,35,36 and, hence, stairs and kerbs are the most common environmental hazard associated with a fall in older people with visual impairment (30% of all hazard-related falls). 37 Locating the first step edge position may be particularly problematic for older adults when lighting levels are low and/or the stair covering is patterned and/or if their vision is blurred because of visual impairment or because of viewing through part of a corrective lens used for reading. 6,8,35,36,38,39 In addition to good contrast sensitivity and visual acuity, good stereoacuity may also be important to determine accurately the first step edge position. For example, improvements in stereoacuity due to cataract surgery have been found to be correlated with the change in lead-limb toe clearance when negotiating an obstacle. 40
When stepping down from a raised block with blurred vision, step execution time increased, knee flexion and ankle plantar flexion increased, vertical stiffness decreased and the amount of body weight being supported by the contralateral leg increased. 41 These findings suggest that, under conditions of blurred vision, participants are more cautious and attempted to ‘feel’ their way to the floor rather than ‘drop’ onto it. This may be an adaptation to increase the kinaesthetic information from the lower limb to make up for the unreliable or incomplete visual information. 41 When stepping onto a raised block, blurred vision as a result of a cataract simulation has been shown to lead to a threefold safety-driven adaptation. First, to increase dynamic stability, horizontal movements of the body’s centre of mass are reduced to ensure that it is kept well within the limits of the base of support. Second, vertical toe clearance is increased to reduce the risk of tripping. 38,42 Third, participants slow their forward movement, which is seen as a strategy to increase the likelihood of recovering balance should a trip occur. However, these adaptations are not straightforward. For example, although the increase in stepping time with blurred vision for both stepping up and down appears to be safety driven, it also means that the duration of single support time (the time during which the person is supported by only one limb as the other limb is swung over the step edge), which is the most dangerous period of the gait cycle, is increased. This can lead to decreases in medial–lateral stability during single-limb support, particularly with larger steps and when stepping down. 43 This may help to explain why sideways falls on stairs are common in older adults, particularly with higher step heights. A sideways fall will increase the likelihood of a hip fracture. Further discussion of the role of vision in stair negotiation is provided in Chapters 2 (stair descent) and 3 (stair ascent).
Chapter 2 Influence of a tread edge highlighter and its position on gait control and safety
Introduction
Vision is known to play a major part in successful stair negotiation,6,8 in terms of the initial visual scan to check for: objects on the stairs, the regularity of step size and shape, other people, possibly choices of route and the position and height of the first step. 8 Looking at the first step is very important in successful negotiation of stair descent44 and fixations are aimed at step tread edges. 45 However, fixation of every step tread edge is not required,45 presumably because of information from the somatosensory system; when the lead foot is first placed on the first step tread and the trail foot remains on the stair landing, somatosensory information about the position of the feet/limbs provides additional information about the height of the step. Further information about the anteroposterior position of the step edge could also be provided by somatosensory information about forefoot overhang. During stair descent, foot clearances become progressively smaller,35,36 presumably from the combination of occasional central vision fixations, peripheral vision exproprioceptive input and somatosensory information providing increasingly accurate assessments of the step riser and tread dimensions (plus the underlying assumption that all step dimensions are the same or similar size). 6,8 This strategy of progressively reducing foot clearances conserves energy and is important given that negotiating stairs is tiring work, particularly for older people. 6
Vision is particularly important on the first step(s) and the last few bottom steps of a flight of stairs when a transition to a floor surface is required. 6 Fall-related accidents in older adults are three times more likely to occur during stair descent than stair ascent,6,8 with a higher incidence occurring on either the top three or bottom three stairs, when vision is increasingly relied on. 6,8 Reduced heel clearances, greater clearance variability over the stair edge and misjudgements in foot placement when descending surface-level changes or flights of stairs are factors that are reported to increase the falls risk35,36 In addition, clearance over steps and surface-height changes becomes even more variable when wearing bifocal or varifocal spectacles,39,46 which are the most common types of everyday spectacles worn by older people. Accident and epidemiological studies have shown that these multifocal lenses double the risk of falling in older adults, particularly on stairs and steps. 24,47
Building standards for stairs
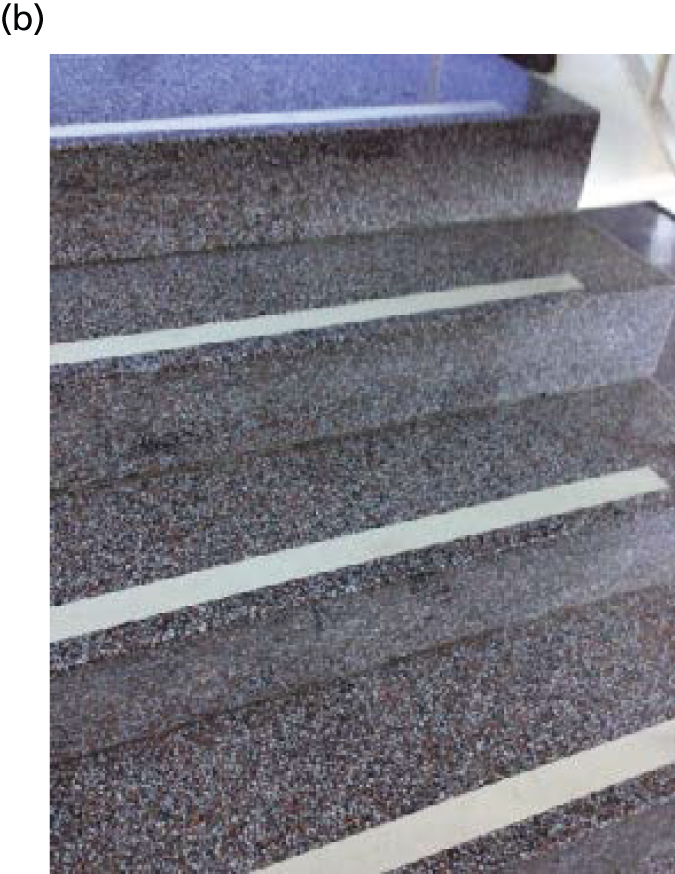
British Standards for stair construction have existed since 1944 and the current code of practice is incorporated in British Standard 5395-1, which was updated in 2010. 48 This provides guidelines for the construction of stairs in terms of the riser, going, pitch, headroom and handrails, and it is likely that improved stair design has improved stair safety. 7 In addition, various approved documents in UK Building Regulations pertain to stair design, including approved documents K,49 M50 and B. 51 Several recommendations have been made regarding improving safety on stairs to reduce the number of falls, particularly in the USA,44 but the majority of them are not evidence based and, importantly, little attention has been paid to whether or not these general guidelines are optimal for the older stair user. 6 Because of the important role of vision in the successful negotiation of stairs (see Chapter 1), several recommended safety modifications44 have included changes to the appearance of stairs. These include making the tread surface a uniform colour and adding a single-contrast strip that is 2.5–3.8 cm (1–1.5 inches) wide and mounted flush with the surface and placed close to the edge of the step44 or that it is 5.0–7.5 cm wide with 30% luminance contrast and not set back more than 1.5 cm from the nosing (Australian Standard 1428);52 and a guideline for stair nosings (in this case, referring to a shield that covers the edge of a step or stair tread) to be 5.5 cm wide on both tread and riser with a luminance contrast of at least 30% compared with the rest of the step (UK Building Regulations). 50 Slip-resistant strips (friction strips) are also commonly used on the tread surface; these increase the friction between the foot and stair and can provide tactile feedback regarding foot position in relation to the tread edge. Although slip-resistant ‘nosings’ will be positioned at the tread edge, there are no standards/guidelines regarding the location of other slip-resistant strips. Slip-resistant strips may be a source of visual ambiguity when positioned away from the tread edge (as is not uncommon; Figure 1).
FIGURE 1.
(a) From the perspective of the stair user, it is difficult to distinguish clearly the tread edge from the tread surface on the step below; and (b) the separation (≈ 3 cm) between the slip-resistant strip and physical tread edge is noticeable, however, when viewing the stairs from close up.

Two previous studies failed to determine any significant changes in stair descent stepping behaviour when edge highlighters have been used. 35,53 However, these two studies reported gait parameters for the mid-stair portion of a five-step stairway only, when somatosensory information from negotiating the previous steps would probably have been used to judge riser height, rather than relying on accurate visual information, and participants were relatively young (mean age 61 years),35 low in numbers (n = 7)53 and predominantly female. The edge highlighters that were used (in these previous studies) were < 38 mm wide (i.e. conforming with US stair guidelines, but less than the width recommended by UK standards) and positioned flush with the edge of each step.
Study aims
Given that there is no evidence that edge highlighters can change gait/stepping behaviour during descent of steps or stairs, and no formal guidelines regarding the location of edge highlighters exist, the present study had two aims:
-
to determine the effects of changes in the relative positioning of a step edge highlighter band on foot placement/clearance and the number of accidental foot contacts during descent of a 3-step staircase or a surface-level change
-
to determine whether having an edge highlighter present would have the same or greater effect on stair descents in those with poor vision.
Separate groups of older participants with habitual visual correction either completed stair descent trials (experiment 1) or descended a surface-level change (experiment 3), whereas a group of young participants with simulated visual impairment completed stair descent trials only (experiment 2). In all three experiments, edge highlighter positioning relative to the step edge was manipulated across the repeated trials. In experiment 2, we used young participants with simulated visual impairment rather than older participants with age-related visual impairment because pilot work had suggested that manipulating the position of a step edge highlighter could have a significant effect on stair descent safety, which we thought would make the risk of tripping and falling in such individuals too great.
Materials and methods
Participants
The characteristics of the participants for each experiment are presented in Table 1. The tenets of the Declaration of Helsinki54 were observed, the experiments gained institutional ethics approval and all participants gave written, informed consent. Community-dwelling, older participants were recruited for experiments 1 and 3 from a group of 50 retired volunteers who regularly sit as patients in undergraduate optometry clinics at the University of Bradford’s Eye Clinic and from a group of 200 older people on the mailing list of Bradford Older People’s Forum. The younger patients in experiment 2 were recruited from the student population of the University of Bradford and the sample size of eight was based on a previous study of stair descent (in older people and with a less dense cataract simulation). 41
| Characteristics of participants | Experiment 1 | Experiment 2 | Experiment 3 |
|---|---|---|---|
| Number of participants, n (n female) | 16 (8) | 8 (3) | 15 (6) |
| Age (years), mean (SD) | 71 (7) | 24 (4) | 70 (7) |
| Height (m), mean (SD) | 1.69 (0.12) | 1.73 (0.10) | 1.70 (0.11) |
| Mass (kg), mean (SD) | 77 (19) | 72 (17) | 78 (19) |
All participants were independently mobile, able to follow simple instructions and, according to self-report, suffered no significant neurological, musculoskeletal or cardiovascular disorders that could interfere with balance control or stepping. Those with vestibular disturbances or diabetes, or a history of falling in the previous year, were excluded, as were those taking medications that could affect balance or vision. Participants had normal healthy eyes, determined by a full eye examination, including ocular screening using slit-lamp biomicroscopy, tonometry, indirect ophthalmoscopy, central visual field screening and binocular vision assessment. Corrected visual acuity was equal to or better than the logMAR score of 0.1 (Snellen score of 6/7.5 or decimal Snellen 0.80) in either eye. All participants engaged in light to moderate physical activities for at least 30 minutes, 5 days a week, including gardening, light housework and dancing. Participants wore their own shorts, t-shirts and low-heeled shoes during the trials and were asked to refrain from alcohol intake from the evening prior to testing. Participants wore their own spectacles if they were typically worn when walking outdoors for ecological validity reasons. This included bifocal or varifocal spectacles, which would lead to gait adaptations and increased variability of adaptive gait. 39,46 Three participants wore bifocals and three wore varifocals in experiment 1, and four participants wore varifocals and three wore bifocals in experiment 3.
Sample size calculations
To estimate required sample size, we used a paired t-test calculation. Although the main analysis will incorporate a repeated measures design, the effective power is likely to be similar to that using a simple t-test but will depend on unknown parameters that are difficult to estimate prospectively. A primary outcome measure was the increase in vertical toe clearance (step ascent) or horizontal heel clearance (step descent) with the illusion compared with no illusion. For experiments 1 and 3, using data from previous studies of step descent and ascent,38,41,42,55 and assuming a 50% increase in variance for older participants compared with younger ones for step ascent,55 a minimum effect of importance of 5%, an estimated standard deviation (SD) of 7% and using a two-sided alpha of 0.05, for a paired t-test a sample size of 21 would result in a power of 90% and a sample size of 16 would result in a power of 80%. Because of improved sensitivity and reliability of the motion analysis system provided by a newly developed marker-based event detection algorithms (see Appendix 1) plus the effect of increasing the number of cameras by 25% to 10, we estimated that the sample size could be reduced to 16 for experiment 1.
Vision measurements and cataract simulation
Binocular distance visual acuity was measured with the participant’s habitual correction for distance (distance spectacles if worn) using an Early Treatment Diabetic Retinopathy Study (ETDRS) logMAR chart at a working distance of 4 m and a chart luminance of 160 cd/m2. A by-letter scoring rule and a four-letter termination rule were used. 56 The ETDRS chart is the current standard for visual acuity determination and provides substantially more reliable measurements than the traditionally used Snellen chart. 56
Visual acuity and contrast sensitivity were measured for each participant in experiment 2 while wearing cataract simulation glasses (Stereo Optical Co., Inc., Chicago, IL, USA) over the top of their spectacles or contact lenses, if worn. These glasses scatter light (blurred vision) in the same way as age-related cataract in proportion to the inverse of the squared glare angle. 38,41,42,57 They particularly reduce contrast sensitivity, which is a much better indicator of vision for everyday tasks than the more traditionally measured visual acuity. 57 Binocular contrast sensitivity was measured using the Pelli–Robson letter chart, which includes 16 triplets of letters that reduce in 0.15 log-steps of contrast sensitivity (the inverse of the contrast threshold). 58 The chart was used at 1 m with a luminance of 120 cd/m2. A by-letter scoring rule was used, with the miscalling of the letters C and O being counted as correct identification to balance letter legibility. Participants were given at least 20 seconds at threshold to be able to identify additional letters. 58
Stair design and safety issues
Experiments 1 and 2
The stairs used, consisting of three steps, were 1 m wide with the top step consisting of a landing area measuring 1.5 m in length (Figure 2). Each tread/going measured 28.5 cm and the step risers ranged between 16.7 cm and 17.5 cm. The stairs, including step treads and risers, were all painted a uniform grey colour and a 94.5-cm-high (above going) handrail was attached to the right side of the stairs (as viewed during descent), and crash mats were positioned on the left side and in front of the participants for safety. In addition, an assistant was always present next to the stairway during all trials to help steady a participant should they stumble or trip (this did not occur across any of the trials and none of the participants used the handrail at any time). Safety concerns have meant that seven-step stairway studies have protected participants using a safety harness during trials. 35 However, these harnesses inevitably mean that a rather unnatural gait may be used. For these reasons, we used a three-step stairway, with safety features such as a handrail, crash mats and nearby assistant, as used by other gait laboratories. Safety concerns were also the reason why we recruited only participants who were fit and healthy and negotiated steps and stairs on a regular basis, typically in the home environment. Older participants were asked about any concerns with the three-step stairway during pilot studies and all responded that they felt perfectly safe, did not need the handrail and were used to using stairs on a regular basis. We therefore felt satisfied that negotiation of our custom-built stairs would be safe and relatively natural for all participants.
FIGURE 2.
(a) Staircase used in experiments 1 and 2; and (b) single-level raised surface used in experiment 3. The gait parameters assessed in each study are shown.


Experiment 3
Two raised walkways of differing heights (henceforth referred to as walkways) that were 1 m wide with a landing area measuring 2 m in length were used (see Figure 2). The two walkways heights (16.5 cm and 19.5 cm) represented surface-level changes typically encountered during activities of daily living such as when stepping down from a kerb or alighting from public transport. Both walkways were painted a uniform grey colour. Crash mats were positioned on the right and left sides of the walkways for safety. During all experiments a research team member was positioned close to the walkways to aid participants if they lost balance or stumbled during the trial (this did not occur across any of the trials).
Tread edge highlighter
Repeated trials were undertaken in each experiment under four experimental tread edge highlighter conditions:
-
plain: no edge highlighter on the tread.
Three conditions involved a high-contrast, 5.5-cm-wide black strip being placed on the tread going in the following locations (Figure 3):
-
abutting: placed flush with the leading edge of the tread
-
away1: placed 1 cm from the leading edge of the tread
-
away3: placed 3 cm from the leading edge of the tread.
FIGURE 3.
The four stair edge highlighter conditions used for each experiment. (a) Plain; (b) abutting: strip placed flush with leading tread edge; (c) away1: strip placed 1 cm from leading edge; and (d) away3: strip placed 3 cm from leading edge.
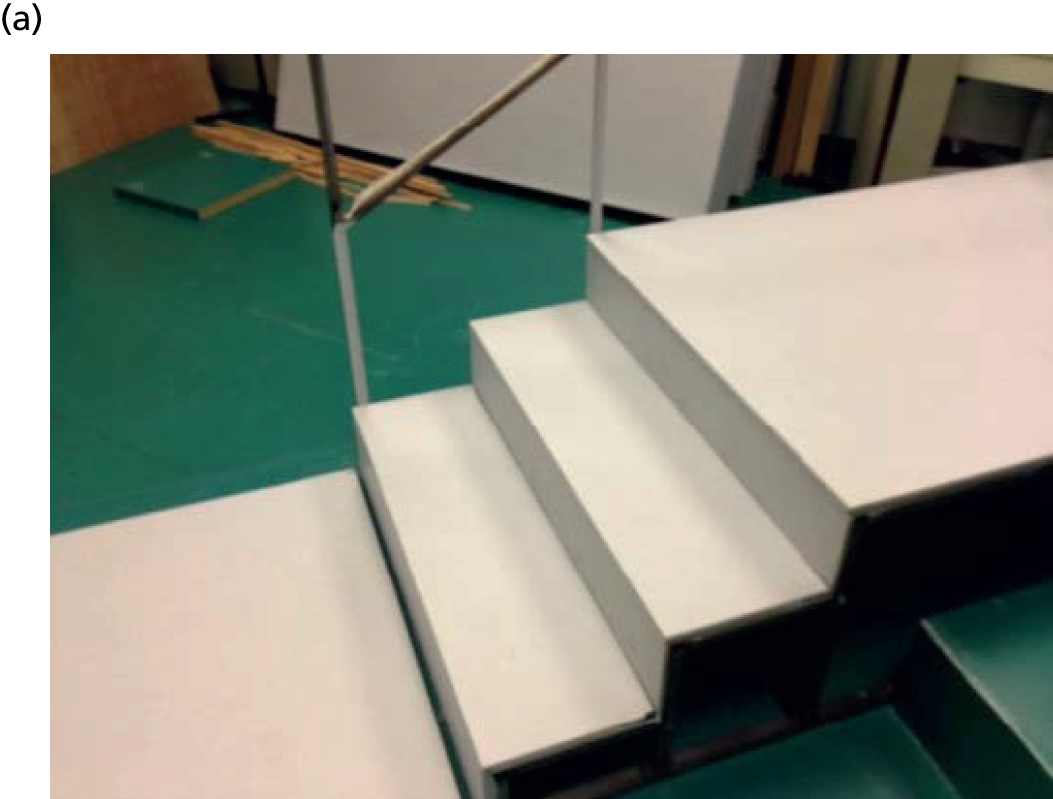


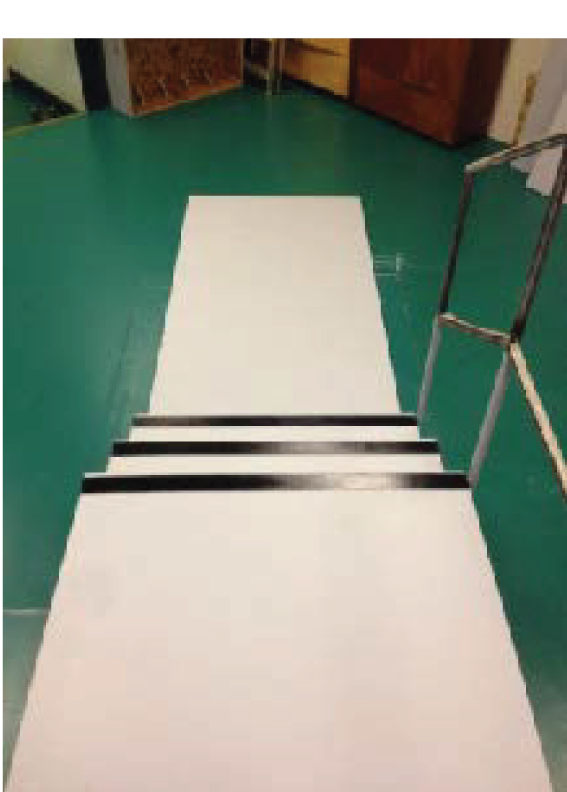

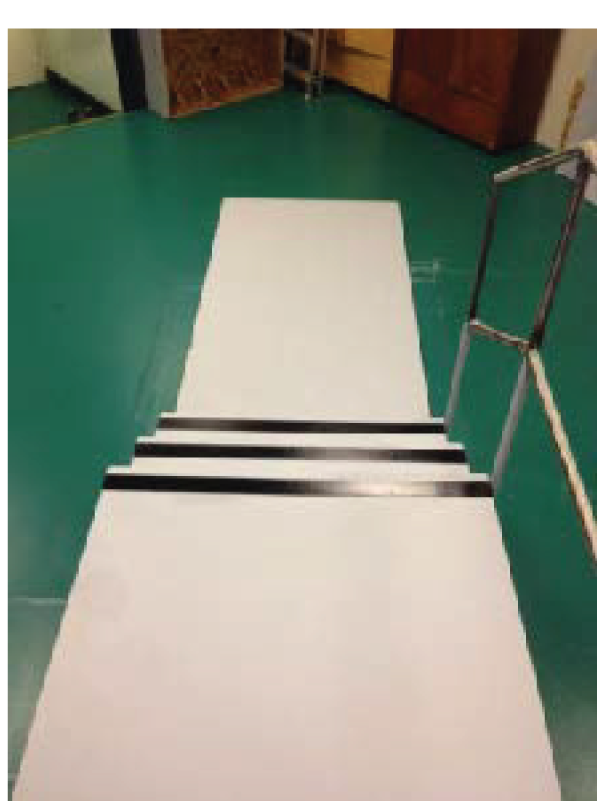
For experiments 1 and 2, edge highlighters were placed on all three steps (i.e. across the entirety of the top, middle and bottom step edges), and in experiment 3 an edge highlighter was placed across the entirety of the edge of the walkway. The width of the black strip adhered to UK (building) standards for edge highlighters (between 5 cm and 6.5 cm). 48 The mean Weber contrast of the black strip against the grey tread background was 95% [luminance measured with a CS-100 Chroma meter (Minolta Camera Co., Ltd, Japan)], and the laboratory was well lit with an ambient illuminance of 400 lux.
General protocol
Older adults (experiments 1 and 3) and young adults (experiment 2) completed three and five trials of each highlighter condition, respectively. Highlighter conditions were presented in a randomised order (using a random number generator). Participants started from a standing position two-and-a-half walking steps away from the edge of the first step or the edge of the raised surface. The stairs were negotiated by all participants using a ‘step-over-step’ gait (i.e. alternative limb lead on each step). The same self-selected leading limb was used to begin each trial and participants were instructed to use their vision throughout the trial to help negotiate the stairs/walkway. Each experiment took between 1.5 hours and 2 hours and included 20–30 minutes for informed consent, initial vision measurements and marker attachment. Experiment 1 consisted of 15 trials (four conditions and three repetitions plus three ‘dummy’ trails); experiment 2 consisted of 26 trials (four conditions and five repetitions plus six ‘dummy’ trails) and experiment 3 consisted of 30 trials (four conditions, two step heights and three repetitions plus six ‘dummy’ trails).
As per the University of Bradford’s Code of Practice, all participant identification information was locked in secure facilities and kept separate from the research data. All research data were anonymised by attributing a subject code (i.e. subject 1, subject 2, etc.) to all data collected from the participants, and these data were stored on a personal computer with controlled access.
Reducing the repetition or memorisation effect
As discussed previously, an energy-conservation strategy means that during stair descent, foot clearances become progressively smaller35,36 owing, in part, to somatosensory information providing increasingly accurate assessments of the step riser and tread dimensions. In research studies assessing the contribution of vision on gait and movement control, the multiple measures that are required to provide valid mean values of gait parameters, plus sensible assessments of variability, will mean that there is a trade-off between the numbers of repetitions and the likelihood of intrusion of somatosensory system inputs. Clearly, if a large number of trials were used and participants began to rely more on the somatosensory inputs, then any effects of visual influence on gait, although present in the initial few trials, might be lost/negated among the much larger number of somatosensory system-influenced data.
Several strategies were used to attempt to counter possible increase in reliance on somatosensory information. These included:
-
limiting the number of trials to three in most cases or five when a relatively small number of interventions are used (to keep the total number of trails typically below 30)
-
varying the participant’s starting location by ± 5 cm (in randomised order)59
-
using custom-built ‘stepping stones’ (square wooden blocks) of varying height, which participants step on (in random order as indicated by the experimenter) to return to the top of the stairs (Figure 4)
-
using ‘dummy trials’ after every third stair descent trial, with changes to the riser height (± 1 cm) and tread depth (1 cm or 2 cm) of step middle, bottom or both. 39,59
FIGURE 4.
Stepping stones used to return the participant to the top of the stairway. These were used in a random order to help limit somatosensory information regarding the height of the staircase steps.

In addition to providing participants with steps of a different height to perceive, and thus with inconsistent somatosensory information about riser height, this allowed us to inform participants that the height/tread depth and appearance of the steps would vary between some trials (this was done at regular intervals during the protocol). Data were not collected during dummy trials.
Kinematic data
A 10-camera motion-capture system (Vicon MX, Vicon, Oxford, UK) was used to record (at 100 Hz) segmental kinematics (in these studies: movement of pertinent parts of the body, particularly the lower limbs) as participants completed each trial. Cameras were wall- or ceiling-mounted at approximately 2.3 m above the floor. Participants were asked to wear sensible/comfortable flat-soled shoes and comfortable clothing, and used their habitual vision correction throughout each trial. Note that participants in experiment 2 wore the cataract simulation glasses over the top of any corrective lenses that they typically used. Reflective markers (1.4 cm in diameter) were placed on the lower body and thorax segments directly onto the skin, clothing, or shoes in accordance with the guidelines that are defined in Vicon’s ‘plug-in-gait’ full-body marker set. Markers were placed on the left and right greater trochanter, second metatarsal heads and distal phalange of the second toes, and a (non-rigid) cluster of four markers was placed on the sacrum. Virtual markers were created at each shoe’s heel and toe inferior tips (heel and toe tip), by constructing their positions relative to the heel and toe markers, respectively. 22 Markers were also placed on each tread edge or raised surface edge in order to determine its location within the laboratory co-ordinate system.
Vicon MX cameras were carefully positioned for each step/stair protocol. An important condition during data collection is that each marker must be seen by a minimum of two cameras in order to provide three-dimensional coordinates in the capture volume. The height of the stairway was much greater than the raised single-level surface (the landing area of the stairway was 54 cm above the ground; the raised surface was a maximum of 20 cm above the ground), which meant that a larger capture volume was required during stair negotiation compared with single-step descent. For stair negotiation, cameras were positioned so that they covered a volume of 2.5 m (height) × 1 m (width) × 4 m (length), which allowed all markers placed on the participant to be visible throughout the trial. For single-step descent, cameras were positioned so that they covered a volume of 2.2 m × 1 m × 4 m. The camera calibration process describes the intended data-capture volume to the Vicon system and was carried out prior to data collection. A 39-cm wand with three markers of known separation was moved around the intended movement-capture volume to calibrate the volume. A clinical L-frame was subsequently used to define the local co-ordinate system of the laboratory.
Data analysis
Labelling and gap filling of marker trajectories were undertaken within Vicon Nexus (Vicon, Oxford, UK) and the resultant co-ordinate three-dimensional (C3D) files were then uploaded to Visual 3D (C-Motion, Inc., Germantown, MD, USA) for further analysis. Marker trajectory data were filtered using a fourth-order, zero-lag Butterworth filter with a 6-Hz cut-off. Instants of foot touchdown and foot-off in each trial were determined using marker-based event detection algorithms (see Appendix 1). 60 The following variables were then exported:
-
Penultimate foot placement: the horizontal distance from the leading-limb’s shoe tip to the edge of the top stair or edge of raised walkway when the foot was placed on the landing area during approach (see Figure 2).
-
Final foot placement: the horizontal distance from the trailing limb’s shoe tip to the edge of the top stair or edge of raised walkway when the foot was placed on the landing area during approach (see Figure 2). Negative placement values indicated that the foot was placed before/prior to the edge of the stair/walkway, and positive values indicated that the shoe tip was beyond the edge of the top stair/walkway.
-
Middle-step foot placement (experiments 1 and 2): the horizontal distance from the leading-limb’s shoe tip to the edge of the middle step when the foot was placed on the tread surface of the middle step (see Figure 2). Positive values indicated that the shoe tip was beyond the edge of the step and negative values meant it was placed before/prior to the edge of the step.
-
Heel placement (experiment 3): the horizontal distance from the lead limb’s heel to edge of the raised walkway when the foot was placed on the ground (see Figure 2).
-
Horizontal heel clearance: the horizontal distance from the leading limb’s heel to the edge of the top/middle step of the stairs or edge of raised walkway as the leading limb passed over it (swing phase) (see Figure 2).
-
Vertical heel clearance: the vertical distance from the leading-limb’s heel to the edge of the top/middle step of the stairs or edge of raised walkway as the leading limb passed over it (swing phase) (see Figure 2).
-
Descent duration: stairs/walkway descent duration was determined from the instant of leading limb foot-off prior to stepping over the top step of stairs or edge of raised walkway to the instant of leading limb touch-down on the ground (see Figure 2).
-
Heel scuff/catches: the number of times a participant’s heel scuffed/caught the tread edge/going or riser during stair/walkway descent. Each heel scuff was only recorded if agreed on by the two experimenters present.
-
Horizontal heel clearance < 5 mm: the number of times horizontal heel clearance fell below 5 mm. It has previously been determined that there is a greater risk of catching the heel on the tread edge/going if heel clearance falls below 5 mm, especially on flights of stairs where riser height varies between one riser and another. 36
It has previously been reported that stride length during the stair-to-floor transition is significantly increased when compared with mid-stair descent,61 suggesting that gait/stepping behaviour is significantly different when stepping onto the ground compared with stepping onto the stairs. Therefore, the effects of tread edge highlighter condition on foot placement, heel clearance and number of heel scuffs were only considered on/over the top and middle step.
Statistical analysis
Penultimate and final foot placement, middle-step foot placement and descent duration for experiments 1 and 2 were analysed using two-way repeated measures analysis of variance (ANOVA; Statistica 5.5, StatSoft, Inc., Tulsa, OK, USA) with edge highlighter (plain, abutting, away1, away3) and repetition (three and five trials, respectively) as repeated factors. Horizontal heel clearance and vertical heel clearance for experiments 1 and 2 were analysed using three-way repeated measures ANOVA with step (top/middle step), edge highlighter condition (plain, abutting, away1, away3) and repetition (three and five trials, respectively) as repeated factors. Penultimate and final foot placement, heel placement, horizontal heel clearance and vertical heel clearance for experiment 3 were analysed using three-way repeated measures ANOVA with walkway height (16.5 cm/19.5 cm), edge highlighter (plain, abutting, away1, away3) and repetition (1, 2, 3) as repeated factors. All interactions between step number/walkway height, edge highlighter and repetition were found to be of no consequence to the findings of the study and thus are not reported in the results section. Post-hoc analyses were performed using Tukey’s honest significance difference test and the alpha level of significance was set at p = 0.05.
Results
The mean (1 SD) binocular visual acuity was –0.02 (SD 0.06; Snellen score of ≈ 6/6, decimal 1.0) for experiments 1 and 3 and binocular contrast sensitivity was 1.84 (SD 0.14). For experiment 2, mean (1 SD) binocular visual acuity was 0.16 (SD 0.16; Snellen score of ≈ 6/9, decimal 0.67), and binocular contrast sensitivity was reduced to 0.75 log-units. Tabulation of mean gait parameter data is provided in Table 2. 62
| Stair descent parameters, mean (SD) | Plain | Abutting | Away1 | Away3 |
|---|---|---|---|---|
| Descent duration (seconds) | 2.05 (0.37) | 2.06 (0.37) | 2.11 (0.37) | 2.08 (0.41) |
| Penultimate foot placement (cm) | –46.7 (7.3) | –46.5 (6.2) | –46.8 (6.9) | –47.4 (6.9) |
| Final foot placement (cm) | –2.3 (4.3) | –2.4 (4.6) | –4.1 (4.4) | –4.6 (4.3) |
| Middle step: foot placement (cm) | 0.0 (2.9) | 0.4 (2.9) | –0.8 (2.7) | –1.3 (2.6) |
| Top step: horizontal heel clearance in cm | 4.6 (1.8) | 4.7 (1.4) | 4.2 (1.5) | 3.2 (1.9) |
| Middle step: horizontal heel clearance in cm | 4.1 (1.7) | 3.9 (1.6) | 3.9 (1.4) | 3.5 (1.7) |
| Top step: vertical heel clearance (cm) | 2.5 (1.2) | 2.5 (1.1) | 2.5 (1.3) | 1.9 (1.5) |
| Middle step: vertical heel clearance (cm) | 3.0 (2.0) | 3.0 (1.6) | 2.9 (2.0) | 2.4 (1.7) |
Main effect of edge highlighter
Experiment 1 (stair descent in older adults under habitual vision)
There was a statistically significant effect of highlighter condition on final foot placement [F(3,45) = 11.97; p-value = 0.001], but not on penultimate foot placement (p-value < 0.71). Final foot placement was further back from the tread edge for away1 and away3 than for abutting (post hoc; p-value = 0.005 and p-value < 0.001, respectively) or plain (post hoc; p-value = 0.003 and p-value < 0.001, respectively) (Figure 5). There was a statistically significant effect of highlighter condition on middle-step foot placement [F(3,45) = 15.67; p-value < 0.001]; placement was further back from the tread edge for away1 and away3 than for abutting (post hoc; p-value < 0.001 and p-value < 0.001, respectively) or plain (post hoc; p-value = 0.029 and p-value < 0.001, respectively).
FIGURE 5.
The effect of highlighter condition on (a) final foot placement relative to the top stair edge; and (b) horizontal heel clearance over the top stair edge in older adults during stair descent. Final foot placement was significantly further back from the stair edge when the edge highlighter was set back by 1 cm or 3 cm. Horizontal heel clearance was significantly closer to the stair edge when the edge highlighter was set back by 3 cm.


There was a statistically significant effect of highlighter condition on horizontal heel clearance [F(3,45) = 17.3, p-value < 0.001] and vertical heel clearance [F(3,45) = 8.38, p-value < 0.001 over the top step edge]; clearance values were smaller for away3 than for plain (post hoc; p-value < 0.001 and p-value = 0.001, respectively), abutting (post hoc; p-value < 0.001 and p-value = 0.001, respectively) or away1 (post hoc; p-value = 0.002 and p-value < 0.001, respectively; see Figure 5). There were no main effects of highlighter condition on the horizontal or vertical heel clearance over the middle-step edge (p-value > 0.13). There was no effect of highlighter condition on descent duration (p-value = 0.37). There were no statistically significant differences in within-subject variability between highlighter conditions in any of the outcome parameters analysed (penultimate and final foot placement, horizontal or vertical heel clearance over the top- and middle-step edge, descent duration).
Experiment 2 (stair descent in young adults with simulated age-related impaired vision)
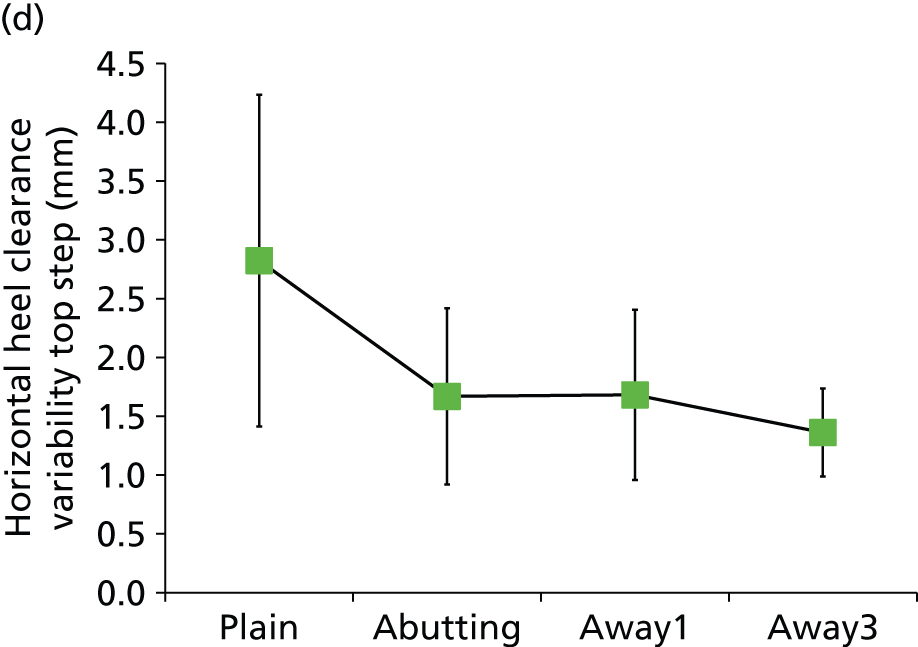
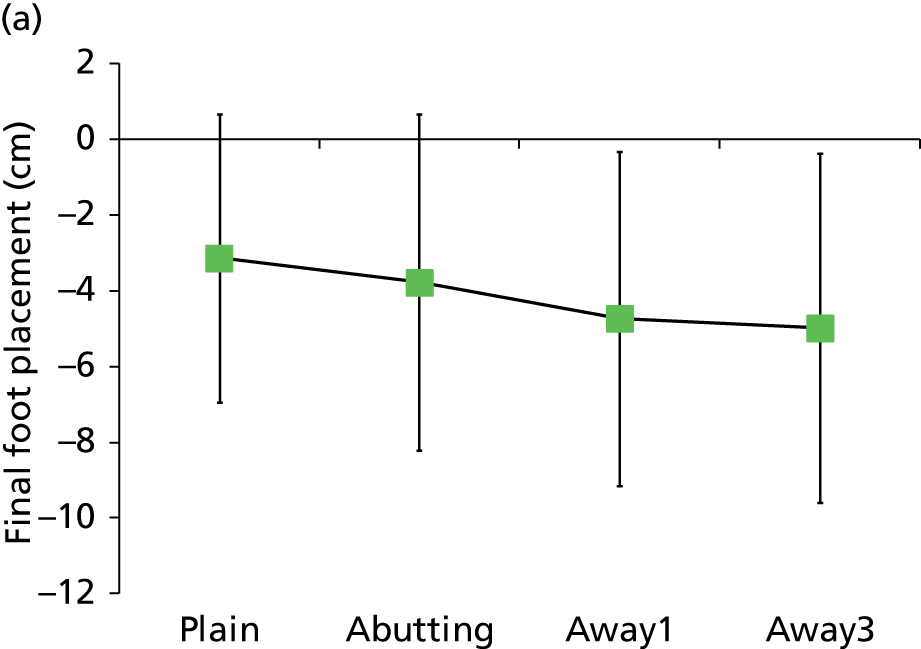
There was a statistically significant effect of highlighter condition on final foot placement [F(3,21) = 5.88, p-value = 0.004], but not on penultimate foot placement (p-value = 0.60). Final foot placement was significantly further behind the tread edge for plain in comparison with abutting (p-value = 0.004) or away1 (p-value = 0.019) (Figure 6). There was a statistically significant main effect of highlighter condition on middle-step foot placement [F(3,21) = 3.09, p-value = 0.049], but a post-hoc analysis indicated there were no statistically significant differences between highlighter conditions. There was a statistically significant effect of highlighter condition on final foot placement and middle step foot placement within-subject variability [F(3,21) = 3.11, p-value = 0.048; and F(3,21) = 3.84, p-value = 0.025, respectively]. Final foot placement within-subject variability was reduced for the plain condition compared with away3 (post hoc; p-value = 0.038) (see Figure 6). Middle-step foot placement within-subject variability was reduced for the abutting condition, compared with away1 (p-value = 0.039) or plain (p-value = 0.035). There was a statistically significant effect of highlighter condition on horizontal and vertical heel clearance over the top step edge [F(3,21) = 3.8, p-value = 0.002; and F(3,21) = 4.14, p-value = 0.019, respectively]: clearance values were smaller for the away3 compared with abutting (post hoc; p-value = 0.001 and p-value = 0.026, respectively). There was a statistically significant effect of highlighter condition on horizontal heel clearance within-subject variability [F(3,21) = 6.25, p-value = 0.003]. Horizontal heel clearance within-subject variability was increased in the plain condition compared with abutting (p-value = 0.022), away1 (p-value = 0.024) or away3 (p-value = 0.003) (see Figure 6). There was a statistically significant effect of highlighter condition on vertical heel clearance over the middle-step edge [F(3,21) = 4.99, p-value = 0.009], but no effect on horizontal heel clearance (p-value = 0.06); vertical heel clearance was significantly closer to the edge in away3 compared with plain (post hoc; p-value = 0.005).
FIGURE 6.
The effect of highlighter condition on (a) final foot placement; (b) final foot placement within-subject variability; (c) descent duration; and (d) horizontal heel clearance within-subject variability in young adults with a simulated visual impairment. Final foot placement was significantly further behind the stair edge in the plain condition. Final foot placement within-subject variability and horizontal heel clearance within-subject variability increased significantly when presented with the plain condition, whereas descent duration was significantly longer in the plain condition.

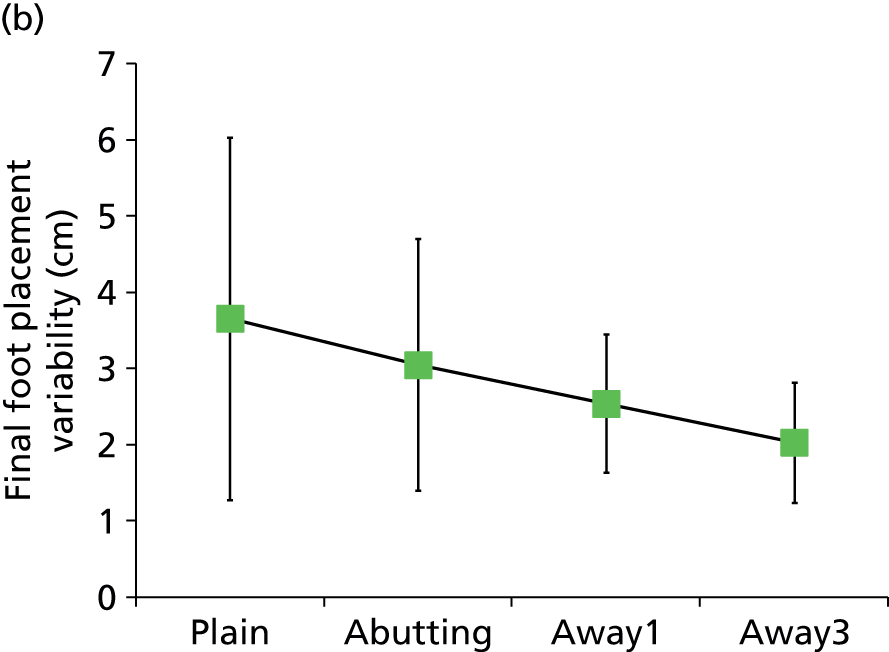
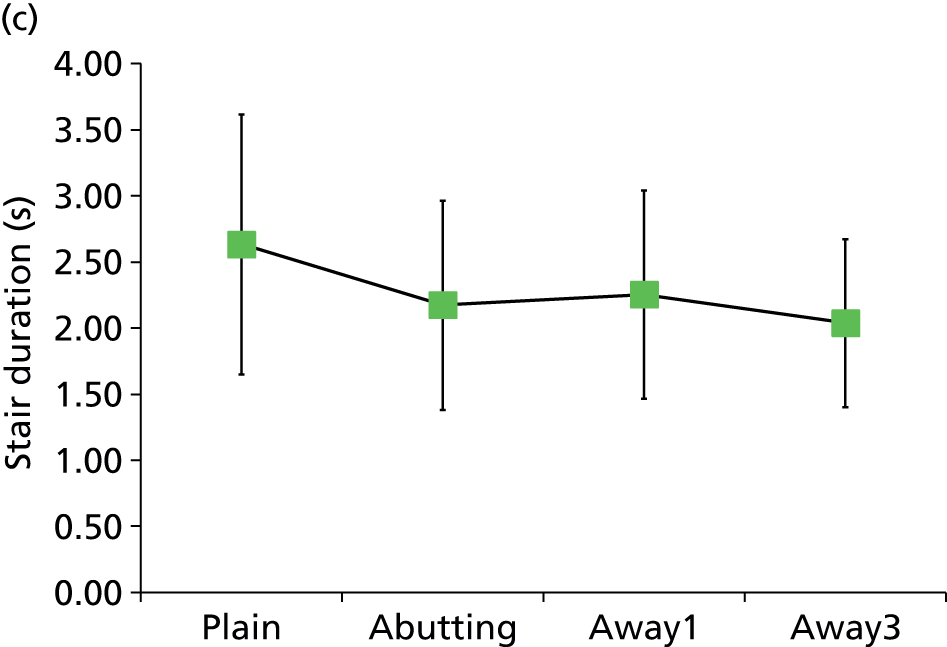
There was a statistically significant effect of highlighter condition on descent duration [F(3,21) = 7.86, p-value = 0.001], and on descent duration within-subject variability [F(3,21) = 4.88, p-value = 0.001]. Descent duration was significantly longer for the plain condition compared with abutting (p-value = 0.009), away1 (p-value = 0.036) or away3 (p-value = 0.001) (see Figure 6). Descent duration within-subject variability was also significantly longer in the plain condition compared with away3 (post hoc; p-value = 0.006).
Experiment 3 [walkway descent (across both heights) by older adults under habitual vision conditions]
There was a statistically significant effect of highlighter condition on final foot placement [F(3,42) = 8.90, p-value < 0.001]; placement was further behind the tread edge for away1 than for plain (p-value = 0.002), and for away3 than for abutting (p-value = 0.025) or plain (p-value < 0.001) (Figure 7). There was a statistically significant effect of highlighter condition on heel placement [F(3,42) = 5.36, p-value = 0.003]; placement was closer to the tread edge in the away3 condition than in the abutting condition (p-value = 0.016) or plain (p-value = 0.015).
FIGURE 7.
The effect of highlighter condition on (a) final foot placement; and (b) horizontal heel clearance in older adults during walkway descent. Final foot placement was significantly further back from the stair edge when the edge highlighter was set back by 1 cm or 3 cm. Horizontal heel clearance was significantly closer to the stair edge when the edge highlighter was set back by 3 cm.

There was a statistically significant effect of highlighter condition on horizontal [F(3,42) = 17.70, p-value < 0.001] and vertical heel clearance [F(3,42) = 12.12, p-value < 001]. Clearance values (see Figure 7) were smaller for away3 than for plain (p-value < 0.001 and p-value < 0.001, respectively), abutting (p-value < 0.001 and p-value < 0.001, respectively) or away1 (p-value < 0.001 and p-value < 0.001, respectively).
There was a statistically significant effect of highlighter condition on descent duration [F(3,42) = 3.14, p-value = 0.035], but a post-hoc analysis indicated there were no statistically significant differences between highlighter conditions (p-value > 0.064).
There were no statistically significant differences in within-subject variability between highlighter conditions in any of the outcome parameters analysed (penultimate and final foot placement, horizontal or vertical heel clearance, heel placement or descent duration).
Main effect of repetition
In all three experiments, stair/walkway descent duration was significantly reduced in the last trial compared with the first trial. For example, in experiment 1, descent duration in trial 1 [2.10 seconds (SD 0.39 seconds)] was significantly longer than in trial 3 [2.01 seconds (SD 0.39 seconds); p-value = 0.019]. In experiments 1 and 2, final foot placement and middle-step foot placement were closer to the tread edge in the last trial than in the first trial (p-value < 0.05).
Heel scuffs and horizontal heel clearance ≤ 5 mm
The numbers of trials that resulted in a heel scuff or horizontal heel clearance falling below 5 mm in all three experiments are shown (as a percentage) in Table 3. In all three experiments the number of trials in which horizontal heel clearance fell below 5 mm was highest for the away3 highlighter.
| Stair edge highlighter conditions | Experiment 1 (%) | Experiment 2 (%) | Experiment 3 (%) |
|---|---|---|---|
| Heel scuff | |||
| Plain | 0 | 15 | 2.2 |
| Abutting | 0 | 2.5 | 0 |
| Away1 | 0 | 5 | 0 |
| Away3 | 2.1 | 10 | 2.2 |
| Horizontal heel clearance < 5 mm | |||
| Plain | 8.3 | 7.5 | 0 |
| Abutting | 2.1 | 0 | 0 |
| Away1 | 2.1 | 2.5 | 0 |
| Away3 | 16.7 | 10 | 2.2 |
Discussion
Vision measurements
The mean binocular visual acuity for the older participants in experiments 1 and 3 was –0.02 (SD 0.06; Snellen score of ≈ 6/6, decimal 1.0) and the worst binocular visual acuity was 0.10 (Snellen score of 6/7.5, decimal acuity 0.80); as none of the participants had eye disease, these participants represent people of this age with excellent vision. However, many older people have some level of visual impairment. For experiment 2, mean binocular visual acuity was 0.16 (SD 0.16; Snellen score of ≈ 6/9, decimal 0.67), with contrast sensitivity being reduced to 0.75 log contrast sensitivity. Although visual acuity is good, the low level of contrast sensitivity means that vision is clearly impaired and represents the level of vision at the other end of the spectrum to that in experiments 1 and 3.
Presence of a tread edge highlighter
All stepping parameters in experiments 1 and 3 were unaffected by the presence of an edge highlighter that was placed flush with the leading edge of the tread in comparison with when there was no highlighter present. This finding agrees with previous research regarding the influence of edge highlighters on stairs,35,53 and is likely to be a consequence of the older adults who took part having very good binocular visual acuity, which suggests that they would have been able to delineate the edge of the treads when there was no edge highlighter present. However, the results of all three experiments indicate that the location of a tread edge highlighter relative to the tread edge can significantly affect foot placement and heel clearance when descending stairs or a raised surface and, notably, the location of the highlighter strip relative to the tread edge influences risk of tripping in visually normal adults and more so in adults with a visual impairment.
For young adults with simulated visual impairment, within-subject variability in final foot placement and in horizontal heel clearance over the top step was increased for the plain condition compared with all highlighter conditions. This, and the increased time it took participants to negotiate the stairs for the plain condition, suggests that there was uncertainty in determining the exact location of the top/first step edge when there was no edge highlighter present. There also appeared to be an increased risk of tripping in the plain condition, as evidenced by the high number of trials where participants caught their heel (15% of trials), or where horizontal heel clearance fell below 5 mm (7.5%), although no actual trips resulted from the scuff incidences. These results agree with a previous report indicating that minimum heel clearance within-subject variability increased when older adults were uncertain about the location of the tread edge, and that the percentage of heel clearances below 5 mm increased from 0.56% in good lighting conditions to 6% under poor lighting conditions. 36
Position of the tread edge highlighter
For older adults with habitual visual correction (experiment 1), final foot placement, middle-step foot placement, horizontal heel clearance and vertical heel clearance were significantly reduced for the away3 condition compared with the plain and abutting conditions. Final- and middle-step foot placements were also significantly reduced for the away1 condition compared with plain or abutting. Furthermore, for the away3 condition, horizontal heel clearance was reduced to 3.2 cm (SD 1.9 cm) from 4.7 cm (SD 1.4 cm), showing a large effect size of 1.07 [calculated as the difference between the intervention and control horizontal heel clearance divided by the SD of the control value (4.7 – 3.2)/1.4]. The away3 condition horizontal heel clearance was below 5 mm for 16.7% of all trials, suggesting that there was a greater risk of tripping when the definition of the edge of the tread was misleading. There was less risk of tripping associated with negotiating the walkway (experiment 3), although foot placement and heel clearance altered in a similar manner to that on the stairs. However, the magnitude of the change in both variables was much greater than evident on the stairs and, hence, this meant that there was less risk of participants catching their heel on the edge of the tread, as evidenced by the low percentage of horizontal heel clearances that fell below 5 mm.
Tread edge highlighter relative location was also seen to alter stepping parameters in young participants with simulated impaired vision (experiment 2). Horizontal heel clearance over the top step was significantly reduced for the away3 condition [3.8 cm (SD 1.8 cm)] compared with the control abutting condition [5.8 cm (SD 1.7 cm)], a reduction of 2 cm, giving a large effect size of 1.18 (5.8 – 3.8/1.7). This would have increased the risk of catching the heel on the step, and this is emphasised by the high percentage of trials for the away3 condition where scuffs occurred (10%) or where horizontal heel clearance fell below 5 mm (10%). In experiment 3, horizontal heel clearances from the raised-level walkway were much larger, but were significantly reduced for the away3 condition [7.8 cm (SD 2.6 cm) and 6.4 cm (SD 2.8 cm) compared with abutting 10.0 cm (SD 3.1 cm) and 8.2 cm (SD 2.9 cm)] for the 16.5-cm and 19.5-cm raised-level walkways, respectively, giving reductions of 2.2 cm and 1.8 cm and effect sizes of 0.71 and 0.62. These findings suggest that the location of an edge highlighter is important to consider for stair design and improving safety on stairs.
Comparison with previous work
It is known that foot placement and heel clearance when crossing obstacles or descending a kerb are determined/planned using visual information acquired during the approach to an obstacle or kerb edge. 21,63 The results from the present study suggest that the visual information provided by a tread highlighter during the approach to the stair/walkway contributes to determining foot placement and heel clearance. When the highlighter was placed further away from the tread edge, final foot placement was placed further behind the edge of the tread. Similarly, when the highlighter was set back by 1 cm (away1), final foot placement was placed behind the tread edge by a similar amount (i.e. ≈ 1 cm). Interestingly, for the away3 condition, foot placement was ≈ 1.5–2.0 cm behind the tread edge and, as a consequence of this, horizontal heel clearance was significantly reduced, thus reducing stair safety. Thus, increasing the distance between the highlighter and the actual edge of the tread will be likely to increase the risk of a trip incident occurring on stairs or when stepping down from a kerb, although further study is required to confirm this.
The findings presented here suggest that a high-contrast edge highlighter placed flush with the tread edge (abutting) rather than being placed back from the tread edge could reduce the risk of a trip incident occurring, particularly in high-risk older adults with uncorrected visual impairment or in those not using their corrective spectacles. Use of such highlighters could also improve stair safety for multifocal lens wearers, who are affected by blur in the lower visual field, which can lead to impaired contrast sensitivity and depth perception at critical distances required for detecting objects in the environment. 39,46
Although the number of low heel clearances and heel scuffs increased when the tread edge highlighters were positioned away from the tread edge in both young and older adults, the amount of foot overhang (when the most anterior portion of the foot is placed beyond the tread edge) on the middle step was decreased. Although there are no formal reports on the amount of foot overhang that would probably lead to a loss of balance, we estimate that stair users are at an increased risk if 50–60% of the shoe plantar surface (i.e. the part of foot distal to the metatarsophalangeal joint line) is hanging over the tread edge. In such a scenario, it is likely that controlling the body centre of mass in the forwards–downwards direction during the lowering phase would be difficult because of the reduced base of support. In the present study, the largest foot overhang experienced by younger and older adults accounted for, on average, 17% and 1.5% of the shoe plantar surface, respectively (based on an average shoe length of 28 cm and 27 cm, respectively), with a margin for error (95% CI) of < 29% and 23% respectively. This suggests that when the edge highlighter was set back from the tread edge there was less risk of a fall/trip as a result of foot overhang than there was of catching the heel on the step.
It is important to consider the implications of the present study’s results in the context of stair safety. UK and US (building) standards clearly state what the desired thickness of the tread edge highlighter should be, but fail to specify the preferred positioning of the edge highlighter on the tread or the desired contrast between the highlighter and the rest of the tread surface. A high contrast (95%) existed between the black highlighter and grey tread surface in the present study. Clearly, if the contrast of the highlighter is reduced, it is less likely to be seen by older participants, which could be predicted from their contrast sensitivity and visual acuity scores. The results from the present study could, therefore, be used to inform existing building regulations regarding the use, positioning and contrast of edge highlighters on stairs, with the aim of improving safety on stairs and ultimately reducing the number of falls on stairs. This is likely to impact directly on the associated health-care costs of falls in older adults, which is considerable. 32,33
Study limitations
There were limitations with the present study. Most notably, the number of steps on the stairs could have been increased to replicate more representative real-world stair negotiation. However, it is possible that participants would receive increased somatosensory feedback from an increased number of steps, thus potentially confounding the actual effects of how edge highlighters influence stair descent gait characteristics. Increased somatosensory feedback is an unavoidable complication of adaptive gait studies59,64 that needs to be considered; a number of aspects of the protocol were manipulated in the present study which aimed at reducing such effects (see General protocol).
Conclusion
In summary, the findings of the present study suggest that the provision of an edge highlighter, particularly on the top step, may increase the precision of heel clearance over the tread edge and potentially reduce the number of heel scuffs and low clearances (< 5 mm) when descending stairs, particularly for older people with visual impairment for whom tread edges would otherwise be difficult to see. In addition, highlighter strip location relative to the step edge is something that warrants careful consideration; when the edge highlighter was set back from the leading edge of the step/walkway by 1–3 cm, heel clearance reduced and the number of accidental foot contacts increased. These findings suggest that having high-contrast tread edge highlighters present on steps and stairs and positioned flush with the edge of the tread or as near to this as possible is likely to improve stairs safety in older people. Ultimately, further research is required to monitor if fewer falls do indeed occur based on the recommendation of positioning an edge highlighter flush with the tread edge. Based on these findings, consideration should be given to changing current building regulation specifications to include guidelines/recommendations for the relative positioning of step edge highlighters.
These step edge highlighter studies link with the step ascent studies that we assess in the following chapters as the step edge highlighter on the step tread is visible during step/stair ascent and forms the horizontal component of the horizontal–vertical (H–V) illusion.
Chapter 3 Influence of a horizontal–vertical illusion on stair ascent
Increased foot clearance to prevent falls on stairs
A simple safety strategy that is often adopted to try to avoid tripping on a step or stairs is to increase foot clearance over the step or stair edge, and this has been shown to occur when vision is blurred by age-related cataract,40 cataract simulation38,41,42 or multifocals39,46 and when depth perception40 or light levels (in young subjects) are reduced. 36 If people are unable to determine accurately the position of a step edge, raising the foot higher to ensure that they are unlikely to hit the step and trip seems a logical strategy. However, both stair descent and, particularly, stair ascent are tiring activities, especially for older people,6 and increasing foot clearance further increases energy consumption. Indeed, using feedback about step height from the somatosensory system means that foot clearance is typically reduced on consecutive steps as people ascend or descend stairs35,36,59 as a way of conserving energy. Anecdotally, people report trips on stair ascent when feeling tired or unwell, suggesting that energy conservation strategies can be overused in such circumstances and highlighting the need to promote adequate foot clearance.
Making steps look taller
Falls typically occur on the first or last few steps on a stairway. 6,8 For these steps, vision is particularly important, as locating the first step edge position exactly can be difficult, as can be making the transition from stairs to landing area. Visually highlighting the first step in particular may be an advantage, as video analysis has indicated that one of the differences between fallers and non-fallers on stairs is that fallers do not sufficiently scan the first steps on a stairway. 8
In addition, changing the appearance of a step to make it look taller and to make people raise their foot higher may be another advantage. In a pilot study we showed that a visual illusion, the H–V illusion (Figure 8),65 can provide a perceived increase in a step’s riser height and lead to an accompanying increase in foot elevation. 55 The study used a surface-level change only (i.e. one step); used sine-wave gratings to complete the illusion; compared a H–V illusion to its reverse (see Figure 8); and used young adults as participants. For the purposes of determining its usefulness on public stairways, the main study needed to be repeated using stairs, using a square-wave grating illusion (more easily manufactured), making the comparison with a plain step, and using older adults as participants. Given that promoting increased foot clearance over the middle steps of a stairway seems undesirable (and is likely to be ineffectual given the greater dependence on the somatosensory system over these steps64), adding a H–V illusion to the first and last steps only seemed appropriate.
FIGURE 8.
Examples of the H–V illusion. 31 (a) Simplest example: the physical length of both lines is identical, yet the vertical line appears longer; (b) part of a version of the illusion similar to that used. The horizontal line appeared on the step tread with the vertical lines on the step riser; and (c) the two versions of the illusion used in a pilot study55 using a vertical sine-wave grating with relatively high spatial frequency (54 cycles per metre) and a horizontal grating of relatively low spatial frequency (20 cycles per metre).


Potential unbalancing effects of a visual illusion on steps
A potential negative effect of the H–V illusion was whether or not the mismatch of information from the visual system (gained prior to the step and indicating that the step was ≈ 9 cm plus the effect of the illusion) and the somatosensory system (gained once one foot was on the first step tread and indicating that the step was ≈ 19 cm high) would be identified by participants and, furthermore, whether or not it could cause problems. Could it cause temporary confusion and possible balance problems? Furthermore, if the illusion was used on the first step and led to a raised foot clearance, but then the somatosensory system was used to determine step height in the ‘middle’ step(s), would the illusion still lead to increased foot clearance on the last step of a stairway? Or would the visual information then be ignored and the somatosensory information be used instead?
Parameters for the horizontal–vertical illusion
The extent to which the H–V illusion increases perceived height depends on the parameters used. 65 In terms of steps and stairs, a simple ‘T’ version of the illusion is clearly insufficient and a version of the illusion needed to be presented across the whole step. Given the usefulness of an abutting tread edge highlighter in improving safety during step descent, plus the fact that this highlighter could also be seen during step ascent, we decided to use the highlighter as the horizontal part of the illusion. To ensure that they are seen by older people, including those with visual impairment attributable to eye disease or out-dated glasses, both horizontal and vertical strips need to be of high contrast and of sufficient thickness with sufficient spacing to be resolvable.
Study aims
-
To determine an optimal version of the H–V visual illusion55,65 for older individuals that when superimposed on a step makes it appear taller. In particular, we needed to determine the thickness of the horizontal grating and the spatial frequency (thickness of the lines and their spacing) of the vertical lines.
-
To determine whether or not increased perceived step height leads to increases in toe clearance for older adults. We needed to determine a spatial frequency for the illusion that would provide sufficiently useful increase in foot clearance, but not one that might cause a potentially negative mismatch between sensory inputs from the visual and somatosensory systems.
-
To determine if the use of an optimised H–V illusion on either the bottom or top step or both the top and bottom steps of a three-step stairway improves the safety of adaptive gait.
Experiment 4: psychophysical determination of optimum parameters for the illusion
Several psychophysical experiments were performed to determine the appropriate parameters for the H–V illusion which was to be superimposed onto the step riser and edge of the tread. The parameters to be determined included the location and thickness of the horizontal line (nosing) that is placed on the tread/riser to complete the H–V illusion and the spatial frequency of the vertical lines on the step riser. Psychophysical experimentation was used as it can be performed relatively easily and quickly and allowed a larger number of parameters to be compared. Such experimentation is often performed with small sample sizes to determine whether an effect is either present or absent. 66 Seven subjects [mean age 37 years (SD 14 years)] were recruited from the staff and postgraduate students of the Department of Optometry at the University of Bradford, Bradford, UK. All had normal, healthy eyes and binocular visual acuity of 0.0 logMAR (Snellen score of 6/6, decimal 1.0) or better.
Experiment 4a: spatial frequency of the vertical lines
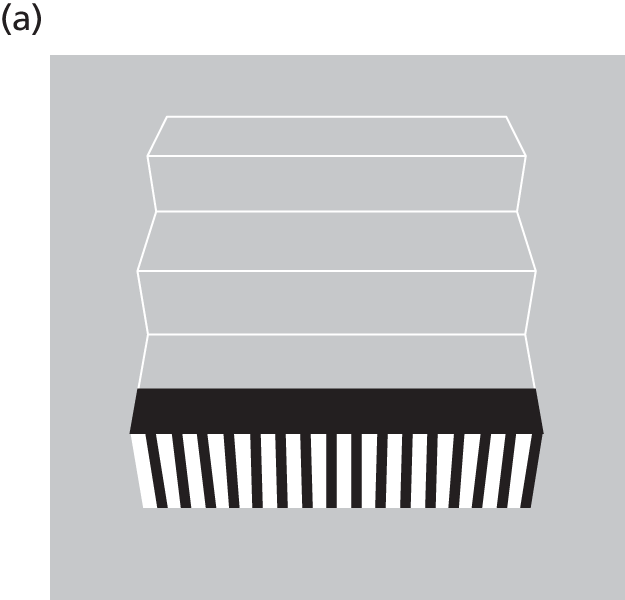
The first experiment aimed to determine the optimum spatial frequency of the vertical lines on the step riser that was required to increase perceived riser height. Images of a three-step sequence were produced and displayed on a Macintosh Cinema Display under the control of a G4 PowerMac (Apple Inc., Cupertino, CA, USA). When viewed from 33 cm, the geometry of the image was equivalent to that of actual steps viewed from a distance of 1.4 m (two steps) at an eye height of 160 cm, approximating to that of an average elderly person. Test stimuli had one of five different square-wave spatial frequencies (i.e. black and white gratings of the following thicknesses: 4, 8, 12, 16 and 20 cycles per step) placed on the bottom step riser whose height was equivalent to 190 mm (Figure 9).
FIGURE 9.
The varying square-wave spatial frequencies placed on the step riser when determining the optimum spatial frequency of vertical lines required to increase perceived riser height. (a) Four cycles per step; (b) eight cycles per step; (c) 12 cycles per step; (d) 16 cycles per step; and (e) 20 cycles per step.
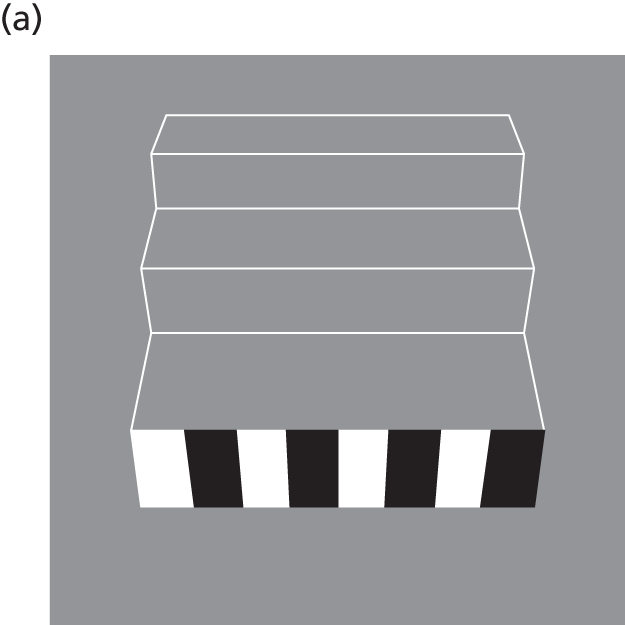
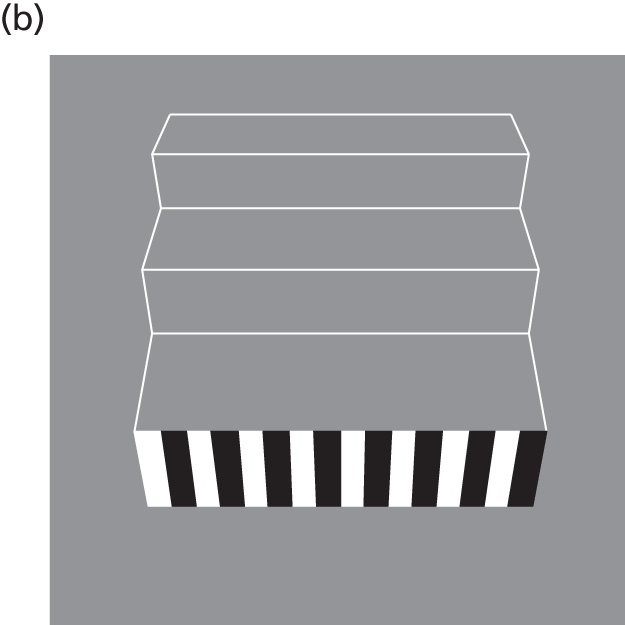


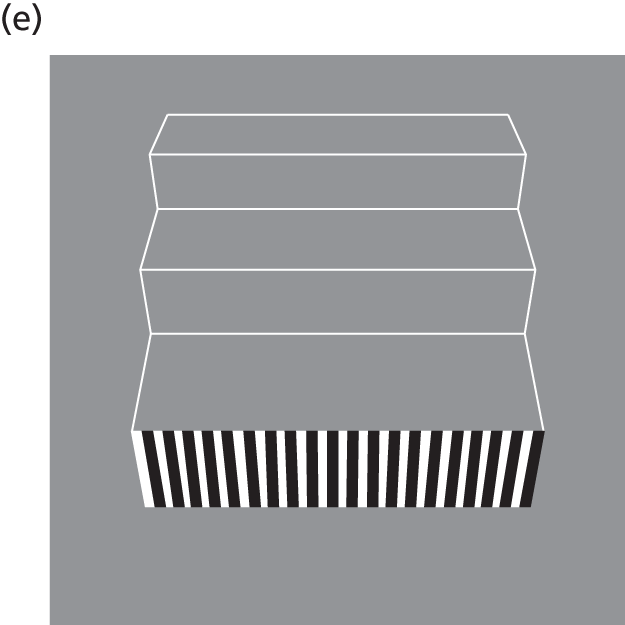
On any single trial the perceived height of the chosen test stimulus was compared with a reference stimulus that contained no square-wave pattern, but in which the actual height of the bottom step could be chosen from one of seven heights spanning a range from physically smaller to physically taller (Figure 10). The height of riser on these seven reference stimuli ranged from 180 mm to 240 mm in 10-mm steps.
FIGURE 10.
Reference stimuli provided during the psychophysical determination of the optimum spatial frequency, which contain no square-wave pattern. The bottom step reference ranged between (a) 180 mm and (b) 240 mm.
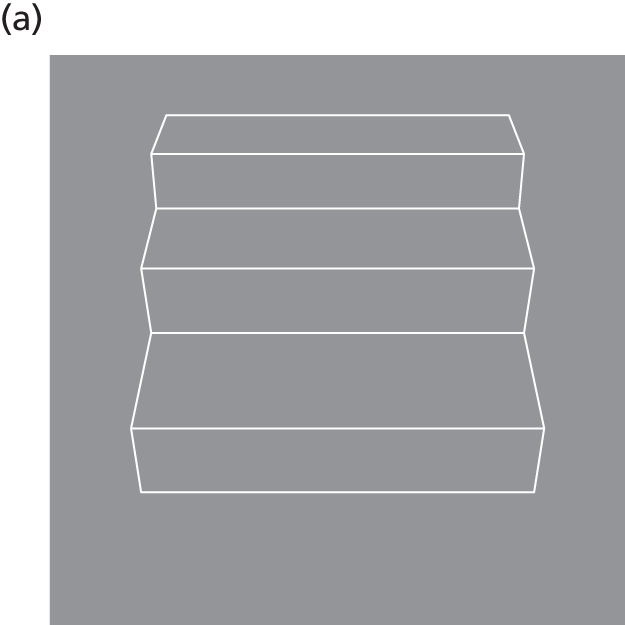

The task of the observer on each trial was to decide whether the riser on the test (striped) step was smaller or taller than that on the reference step and to respond via the keyboard. Images were presented in succession for 500 milliseconds each and the order of the test and reference stimulus was randomised. A total of 20 responses were obtained (in pseudorandom order) for each test spatial frequency (thickness of the black and white gratings) at each of the seven reference step heights, making a total of 700 responses. Data were gathered across a number of sittings.
Psychometric functions were produced by plotting the percentage of ‘test step taller’ responses against reference step height (180 mm, 190 mm, etc.) and performing a least-squares logistic regression to find the reference step height that matched the perceived height of the test step (the point at which the test step was judged ‘taller’ on 50% of trials).
Following initial pilot data it was decided to introduce a nosing onto the landing portion of the first step. This was either 5.5 cm or 11 cm in width (Figure 11).
FIGURE 11.
The nosing provided on the landing portion of the first step. (a) 5.5 cm; and (b) 11 cm.

Experiment 4a: results
Figure 12 represents data from each the seven participants, showing perceived height of the patterned step as a function of the spatial frequency of the square wave.
FIGURE 12.
Perceived riser height as a function of square-wave spatial frequency. Error bars represent the SD of the estimates. Results are shown for the two step highlighters (5.5 cm in black or 11 cm in green). (a) Participant 1; (b) participant 2; (c) participant 3; (d) participant 4; (e) participant 5; (f) participant 6; and (g) participant 7.

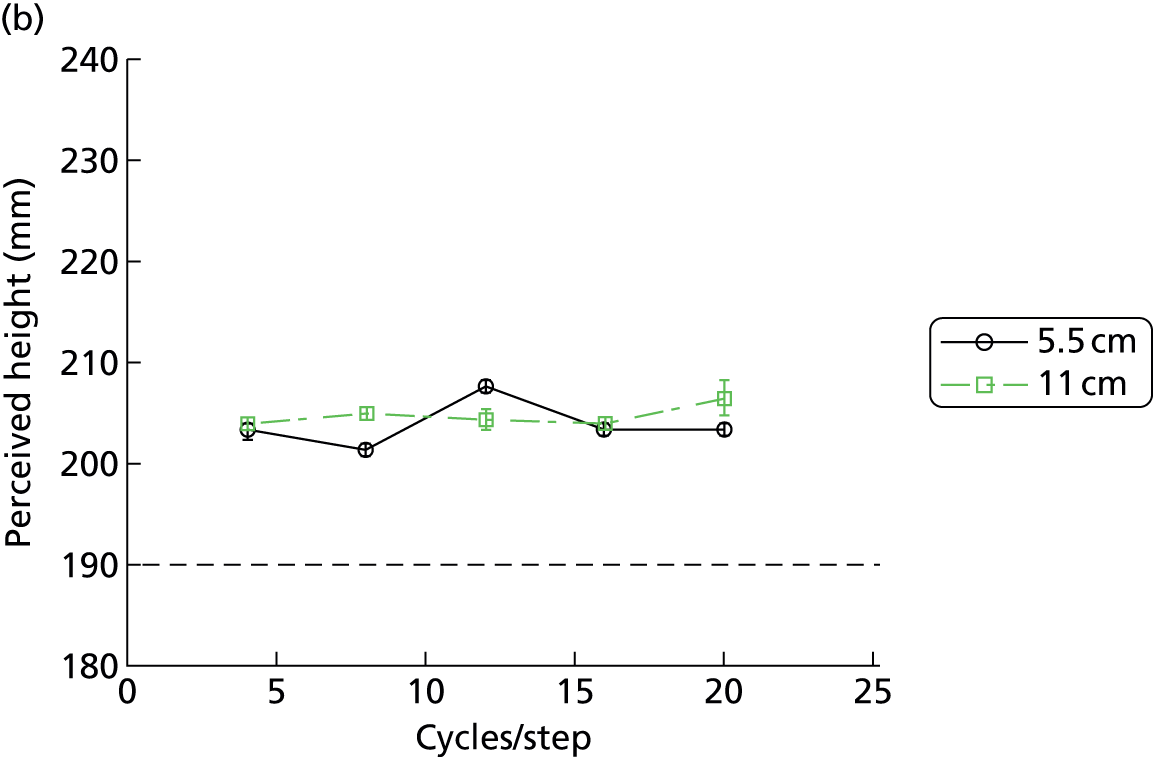
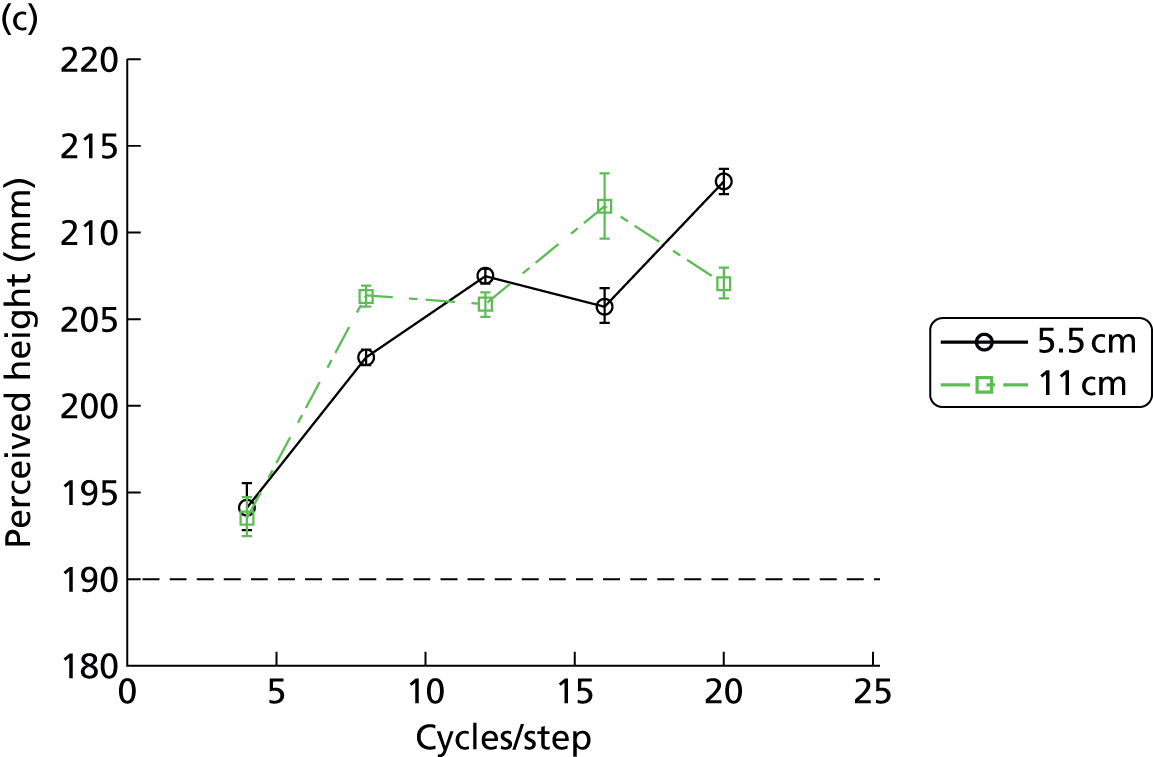

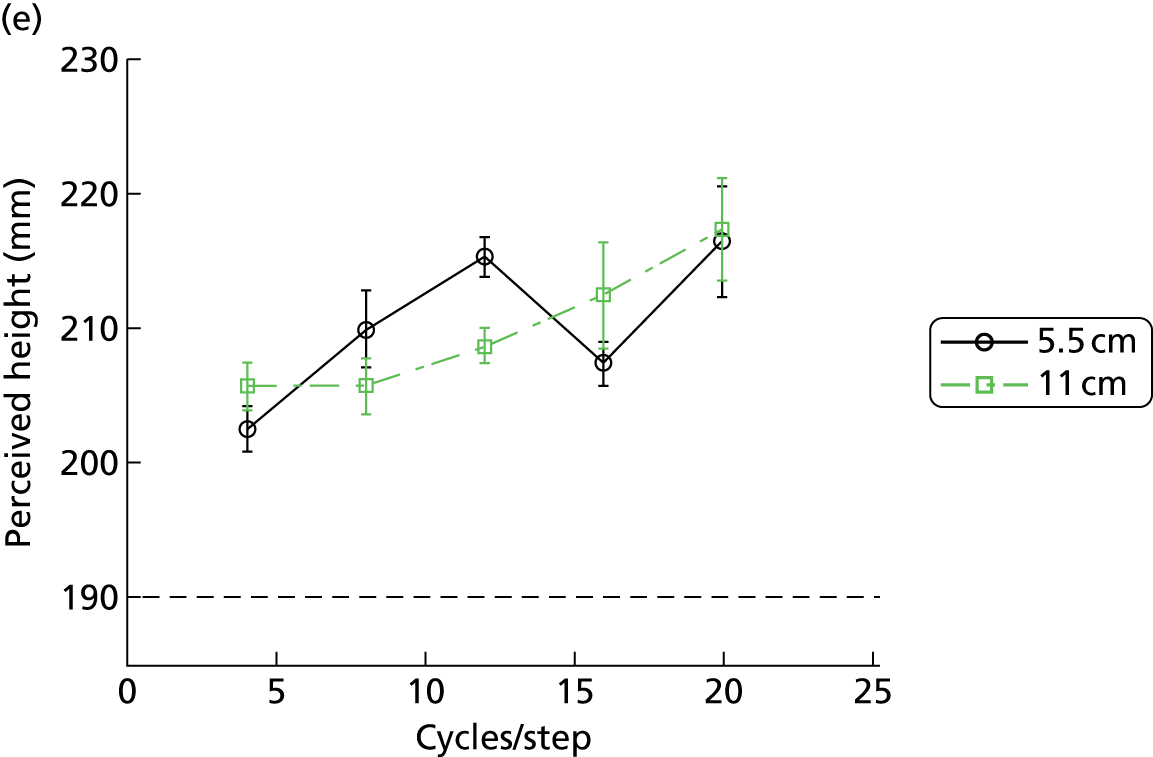
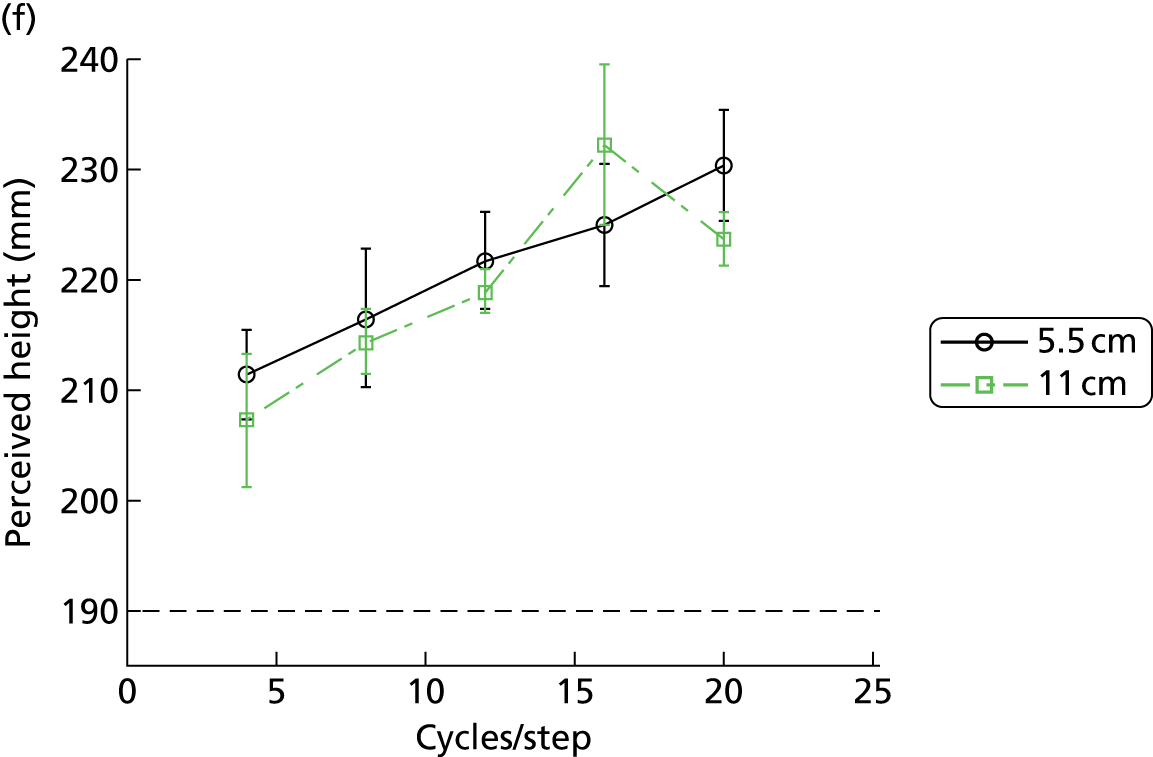
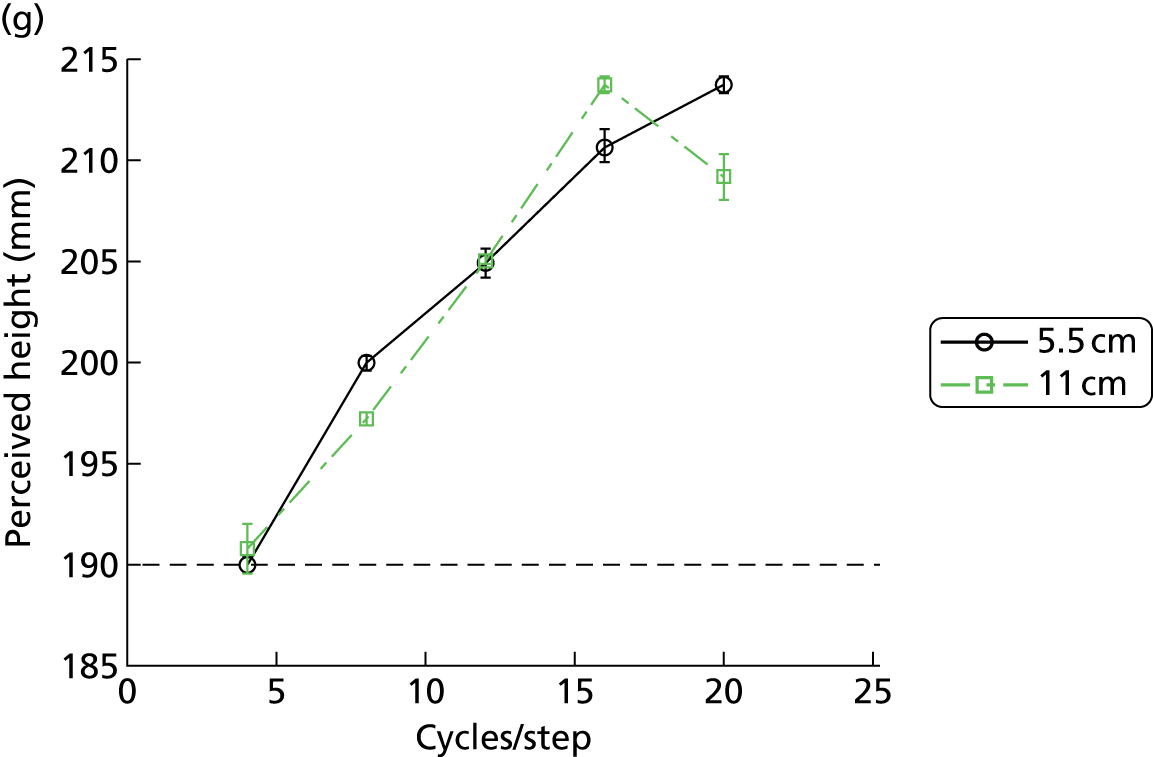
All observers show statistically significant overestimations of the true height of the step (190 mm) and, for all but one observer, the magnitude of this overestimation increased with spatial frequency (i.e. the H–V effect was greater as the black and white gratings became thinner). Several of the observers were veridical in height judgement at the lowest spatial frequency (they judged the height of the step correctly when the black and white gratings were relatively thick) but overestimation of height increased rapidly with spatial frequency (as the gratings became thinner). The magnitude of this illusory percept is substantial, with overestimations approaching 25% for some observers. The width of the nosing appears to have little effect.
Experiment 4a: discussion
The results suggest that for the majority of participants, higher spatial frequencies (thinner and, thus, more frequent gratings) show the highest perceived height increase, and if we wish to obtain a range of foot clearances, a range of spatial frequencies on a step riser should be used, with lower frequencies (thicker gratings) likely to provide lower foot clearances and vice versa.
Experiment 4b: location and thickness of the nosing
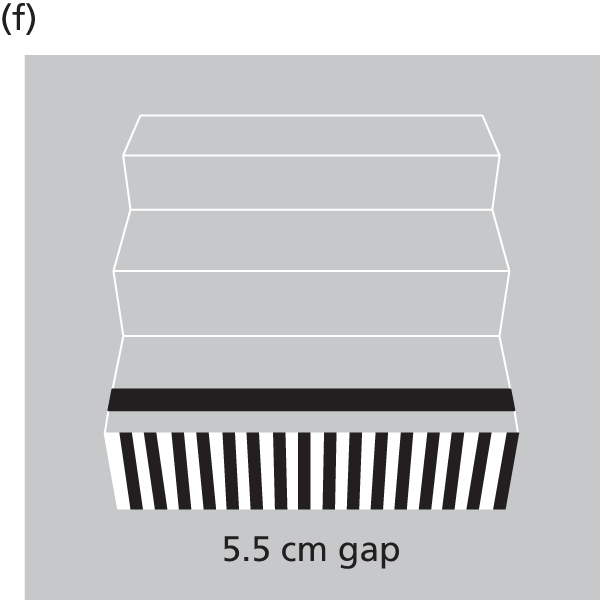
In experiment 4a, we found little effect of the thickness of the nosing, but in experiment 4b we wanted to look more closely at the effect of its presence or position. To do this we chose a single spatial frequency on the step riser of 16 cycles per step on the basis of the results of experiment 1a. The horizontal line thickness of 5.5 cm was chosen as it is the guideline for stair nosings in UK Building Regulations. 50 We used an 11-cm-wide horizontal line thickness to determine whether or not changes in the thickness of the horizontal line would alter the size of the effect. We also used an illusion with the horizontal line set back from the tread edge, as provided on stairways with friction strips and as assessed previously (see Chapter 2). Four participants (aged 24, 28, 52 and 55 years) with healthy eyes and normal vision (visual acuity better than 0.0 logMAR or 6/6 or 20/20 on the Snellen scale) took part in the experiment.
Experiment 4b: results
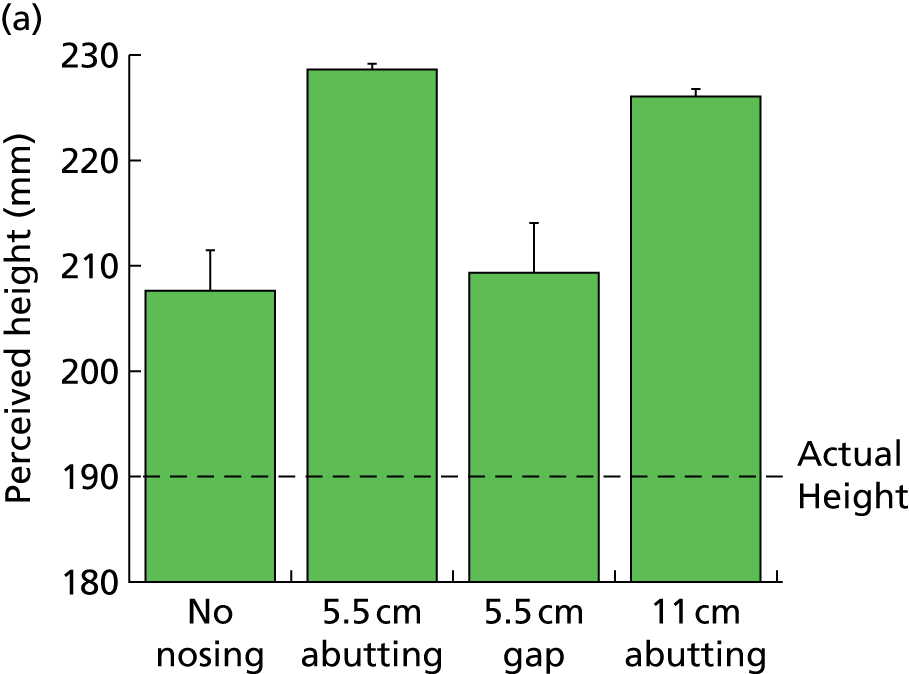
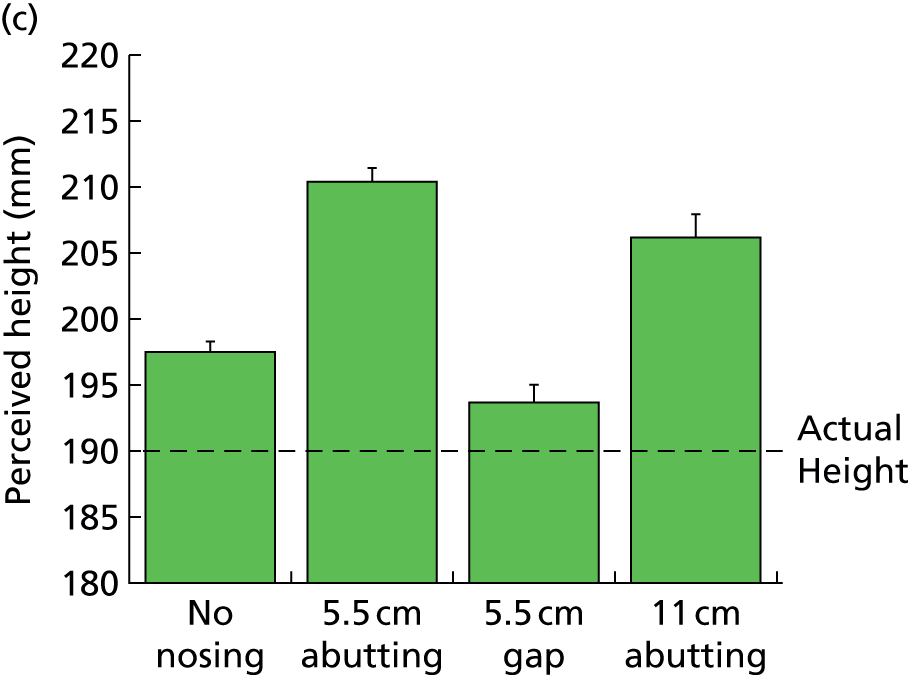
All four observers show a consistent pattern of results, with the most significant overestimation of riser height (up to 20%) occurring for the abutting nosing condition (Figure 13). Absence of a nosing, or the presence of a gap between step edge and the nosing, reduced (but did not eliminate) the illusion.
FIGURE 13.
Perceived riser height increases in response to manipulations to the location and thickness of the nosing. (a–b) No nosing; (c–d) 5.5 cm abutting; (e–f) 5.5 cm gap; and (g–h) 11 cm abutting.





Experiment 4b: discussion
The results suggest that the presence of an abutting nosing reinforces the H–V illusion and produces the greatest magnitude of riser height overestimation. If a step edge highlighter is to be used as part of the H–V illusion, then it would seem to be important for the highlighter to be abutting the step edge. It is serendipitous that the data in Chapter 2 indicate that having the tread edge highlighter abutting the step edge also improves the safety of stair descent compared with highlighters set back from the tread edge (typically when used as friction strips).
Experiment 5: spatial frequency variation on the horizontal–vertical illusion effect during single step ascent
In this experiment, we assessed the value of a H–V illusion in terms of its ability to increase foot clearance over the edge of a raised walkway (such as a kerb). We also compared adaptive gait changes for three H–V illusions. They all had the same horizontal component of a 5.5-cm, black, high-contrast edge highlighter as determined in previously described experiments (see experiment 4 and Chapter 2) and as recommended in the UK Building Regulation guidelines. They differed in the spatial frequency content (the thickness of the black and white lines) of the vertical stripes on the step riser, being either 4, 12 or 20 cycles per step (step width was 1 m). These were chosen to provide a range of perceived increases in step height (as suggested by the results of experiment 4). The highest spatial frequency (thinnest black and white lines), at 20 cycles per step, would still be easily seen by the vast majority of older people, even those with visual impairment. Viewed from two walking steps away (about 1.4 m42), which is the distance from which most steps and obstacles are viewed,21 from an eye height of about 1.60 m,42 a resolution of approximately 1.60 logMAR (6/240 or 1.5/60 on the Snellen scale, 0.025 decimal acuity) is required. This would probably be seen by some people registered as sight impaired (previously termed ‘partially sighted’) and severely sight impaired (previously termed ‘legally blind’), as visual acuity in such people is typically worse than 6/60 (1.00 logMAR) and worse than 3/60 on the Snellen scale (1.30 logMAR), respectively.
Participants
Eleven participants were randomly recruited from the same pool as described previously (see Chapter 2) and we used the same inclusion and exclusion criteria. The mean age was 70 years (SD 7 years) and three participants were female. Mean height and mass were 1.73 m (SD 0.10 m) and 81.3 kg (SD 17.4 kg), respectively. Mean distance binocular visual acuity was –0.07 (SD 0.08; Snellen scale equivalent of approximately 6/5, decimal 0.83) and binocular Pelli–Robson letter contrast sensitivity was 1.85 log-units (SD 0.14 log-units). Some of the participants from the experiments discussed in Chapter 2 participated again, although they must have completed those experiments more than 3 months previously. Because of improved sensitivity and reliability of the motion analysis system as shown by the results of the Chapter 2 experiments and as provided by newly developed algorithms of detecting important events in the gait cycle (see Appendix 1),60 plus the effect of increasing the number of cameras from 8 to 10, we estimated that the sample size should be reduced to 11 for these experiments. Participants included four varifocal or progressive lens wearers and three bifocal wearers, two distance single-vision lens wearers and three people who did not wear spectacles when walking.
Experimental details
The tenets of the Declaration of Helsinki were observed,54 the experiments gained institutional ethical approval and all participants gave written, informed consent. Visual acuity and contrast sensitivity was measured as previously described (see Chapter 2). A raised walkway of uniform grey colour, with a width of 1 m, a height of 16.5 cm and a landing area measuring 2 m in length was used (Figure 14). This represents a surface-level change typically encountered when stepping up onto a kerb. Crash mats were positioned on the right and left sides of the walkways for safety, and during all experiments a research team member was positioned close to the walkways to aid participants if they lost balance or stumbled during the trial (although this did not occur across any of the trials).
FIGURE 14.
Single-level raised surfaced used in experiment 5. The gait parameters assessed are shown in the respective parts of the figure.

Adaptive gait parameters were assessed as 11 older subjects took two walking paces before stepping up onto the raised walkway. Participants came to a standstill after stepping up onto the raised walkway. The step riser and tread was either plain (control); plain apart from an abutting 5.5-cm, high-contrast, black step edge highlighter (see Chapter 2); or included one of three versions of the H–V illusion superimposed onto the step (Figure 15). The mean Weber contrast of the black strips against the grey tread background was 95% (luminance measured with a CS-100 Chroma meter), and the laboratory was well lit with an ambient illuminance of 400 lux. Each of the five riser conditions was repeated three times and the 15 trials were presented in a randomised order.
FIGURE 15.
The three sets of gratings placed on the step riser as part of the H–V illusion. The gratings had a spatial frequency of (a) four cycles per step; (b) 12 cycles per step; or (c) 20 cycles per step. They were all accompanied by a 5.5-cm, horizontal, black, high-contrast strip along the tread edge (a tread edge highlighter) to complete the H–V illusion.


Because of the many repetitions of stair ascent involved in the experiment, subjects can become familiar with the step heights owing to somatosensory information from the feet. This is not the same situation as when ascending stairs outside the home and is an experimental problem that may dilute the effect of the visual illusion. Several strategies were used to attempt to counter possible increase in reliance on somatosensory information, including limiting the number of repetitions for each condition to three; varying the participant’s starting location by ± 5 cm (in randomised order); using custom-built ‘stepping stones’ (square wooden blocks) of varying height, which participants step on (in random order as indicated by the experimenter) to return to the floor and using ‘dummy trials’ after every third stair ascent trial, with changes to the riser height (± 1 cm or 2 cm). 59 Participants were asked to wear their own, comfortable, flat-soled shoes and were allowed to lead with whichever foot they felt most comfortable with. They were then asked to lead with that foot in all subsequent trials. The kinematic data were collected using the same system described previously (see Chapter 2), except that a digitising wand (C-Motion, Inc., Germantown, MD, USA) determined virtual landmarks at the anterior inferior point of each shoe (shoe-tip), and also determined the tread edge of the raised walkway. All measurements, including 19 trials (five-step appearance variables with three repetitions each, plus four ‘dummy’ trials),were captured within a 1.5-hour time period.
Data analysis
Labelling and gap filling of marker trajectories were undertaken within Vicon Nexus and the resultant C3D files were then uploaded to Visual 3D for further analysis. Marker trajectory data were filtered using a fourth-order, zero-lag Butterworth filter with a 6-Hz cut-off. Instants of foot touchdown and foot-off in each trial were determined using marker-based event detection algorithms (see Appendix 1). 60 The following variables were then exported:
-
Penultimate and final foot placements: the horizontal distance from the leading limb’s (penultimate) or trailing limb’s (final) shoe tip to the edge of the bottom stair or edge of the raised walkway when the foot was placed on the ground during approach (see Figure 14).
-
Vertical toe clearance: the vertical distance from the leading limb’s shoe-tip to the edge of the raised walkway as the leading limb passed over it (swing phase; see Figure 14).
-
Ascent duration: walkway ascent duration was determined from the instant of leading limb foot-off prior to stepping over the edge of the raised walkway to the instant of the leading limb’s touch-down on the raised walkway. 60
In addition, to determine whether or not the H-V illusions may have disrupted balance owing to a mismatch of information from the visual and somatosensory systems, the variation in mediolateral displacement of the swing-limb foot and trunk during single-limb support were assessed.
All variables were analysed using a two-way repeated measures ANOVA with illusion (plain, abutting, spatial frequency four cycles per step, spatial frequency 12 cycles per step, spatial frequency 20 cycles per step) and repetition (three trials) as repeated factors.
Results
Vertical toe clearance was significantly increased by the H–V illusions [F(4,40) = 13.74, p-value < 0.0001] (Figure 16). There was an increase in vertical toe clearance for each H–V illusion in comparison with plain and abutting (post hoc; p-value < 0.0007 and p-value < 0.004 respectively). There were no statistically significant differences between each H–V illusion, or between plain and abutting conditions (p-value > 0.05). Between-subject variability was reduced for the 12 cycles per step spatial frequency illusion (SD 1.9 cm) in comparison with the four cycles per step spatial frequency illusion (SD 2.5 cm) and the 20 cycles per step spatial frequency illusion (SD 2.4 cm), although differences in within-subject variability did not reach statistical significance (p-value = 0.41).
FIGURE 16.
Vertical toe clearance (VTC) was significantly increased by each H–V illusion in comparison to the plain and abutting visual conditions. Spfr4, four cycles per step spatial frequency; spfr12, 12 cycles per step spatial frequency; spfr20, 20 cycles per step spatial frequency.

The presence of the H–V illusions did not appear to disrupt other aspects of the gait cycle. The H–V illusions had no statistically significant effect on penultimate or final foot placement and step ascent negotiation time (p-value > 0.05) or mediolateral displacement of the foot and trunk during single-limb support (p-value > 0.05). There were also no statistically significant differences for within-subject variability across all dependent variables (p-value > 0.05).
Discussion
All three H–V illusions led to highly statistically significant increases in vertical toe clearance of the walkway edge from approximately 7.04 cm to 8.48 cm (20% increase) for the four cycles per step and 12 cycles per step spatial frequency illusions and to 8.93 cm (27% increase) for the 20 cycles per step spatial frequency illusion. The increases in toe clearance are much larger than those found in the pilot study of 0.52 cm (3.4% increase) and this is most likely to be the result of the multifactorial nature of the illusory effect used in the pilot study (see Figure 8), in which the effects of the Helmholtz square illusion, which are probably included in the H–V illusion used in that study, resulted in objects appearing to expand in a direction orthogonal to the striped texture within them and the opposite effect to that which we attempted to create. 55 The level of toe clearance increase at 1.4–1.9 cm in the current study may seem small, but, given that these represent 20%+ levels of increase and dangerous levels of toe clearance are reported when they are within 0.5 cm of the step edge,36 these figures actually represent relatively large changes in adaptive gait. They certainly suggest that the use of this illusion on surface-level changes such as kerbs would lead to increased foot clearances and much less chance of tripping.
There was no indication that the H–V illusions lead to changes in other measures of adaptive gait, and there was no change in penultimate or final foot placement, step ascent negotiation time or within-subject variability across all dependent variables. In addition, the mismatch of information from the ‘tricked’ visual system and the somatosensory system did not appear to cause any problems, with no statistically significant mediolateral displacement of the foot and trunk during single-limb support for example. It is possible, that such effects may be seen with a multiple step system, but there did not appear to be any problems with the one-step walkway used in this study.
In terms of which spatial frequency illusion to take forward into future studies, it may be that the 12 cycles per step spatial frequency illusion is preferred. The four cycles per step and 12 cycles per step spatial frequency illusions, providing 20% increases in toe clearance, are preferred to the 20 cycles per step spatial frequency illusion (27% increase) for further study as the larger increased toe clearance has more potential to provide mismatches with the information from the somatosensory system that could potentially disrupt the balance and gait controls systems. In addition, there may be an advantage that the 12 cycles per step illusion would be seen by more visually impaired people given that when it is viewed from two walking steps away it would require a lower resolution (≈ 1.80 logMAR, Snellen score of 6/380) compared with the 20 cycles per step illusion (1.60 logMAR, Snellen score of 6/240). The 12 cycles per step spatial frequency illusion may be preferred to the four cycles per step illusion given the reduced intersubject variability in vertical toe clearance (SD 1.9 cm compared with SD 2.5 cm, respectively; a 24% decrease), plus the apparent lack of an effect for the four cycles per step illusion for a small number of participants in the psychophysical experiments.
Experiment 6: the effect of a horizontal–vertical illusion on multiple step ascent
In this experiment, we assessed the value of a H–V illusion in terms of its ability to increase foot clearance over the edge of individual steps on a three-step stairway. A three-step stairway was used as it allowed us to assess adaptive gait without a safety harness (which can influence the gait cycle) as long as other safety precautions were made. The H–V illusion used had the same horizontal component of a 5.5-cm, black, high-contrast edge highlighter (see Chapter 2). In addition, we used black, high-contrast vertical stripes of 12 cycles per step on the step riser to complete the illusion, as suggested by the results of experiment 5. Because falls on stairways typically occur on the bottom or top few steps, the illusion was positioned on the bottom step only in one condition, the top step only in another and on both the top and bottom steps in a third condition. The control condition included a plain stairway apart from the horizontal 5.5-cm, black, high-contrast edge highlighter, which was found to be the safest condition for stair descent in experiments 1, 2 and 3. The ‘bottom step only’ and ‘top step only’ conditions were used to give as much information about whether the illusions would change adaptive gait in the steps leading to the illusion or those after the illusion. We also wished to determine if the mismatch of information from the ‘tricked’ visual system and the somatosensory system would cause any problems to adaptive gait and safety.
Participants
Fourteen participants were randomly recruited from the same pool as described previously (see Chapter 2), and we used the same inclusion and exclusion criteria. Some of the participants from Chapter 2 experiments participated again, although they must have completed those experiments more than 3 months previously. There were nine females, with characteristics as follows: age (mean 69 years, SD 7 years), height (mean 1.66 m, SD 0.09 m), mass (mean 68.8 kg, SD 14.3 kg) and binocular visual acuity (mean –0.08, SD 0.07 logMAR; Snellen scale equivalent 6/5, decimal 1.2).
Experimental details
The tenets of the Declaration of Helsinki were observed, the experiments gained institutional ethical approval and all participants gave written, informed consent. 54 Visual acuity and contrast sensitivity was measured as previously described (see Chapter 2). A three-step stairway was used, which was 1 m wide, with the top step consisting of a landing area measuring 1.5 m long (Figure 17). Each tread/going measured 28.5 cm and the step risers ranged between 16.7 cm and 17.5 cm.
FIGURE 17.
Dimensions of the stairs used in experiment 6. The gait parameters assessed are shown in the respective parts of the figure.

The stairs, including step treads and risers, were all painted a uniform grey colour and a 95-cm-high handrail was attached to the left side of the stairs (as viewed during ascent), and crash mats were positioned on the right side of the stairway. In addition, an assistant was always present next to the stairway during all trials to help steady a participant should they stumble or trip (this did not occur across any of the trials and none of the participants used the handrail at any time). Adaptive gait parameters were assessed as subjects took three walking paces before ascending the three-step stairway. The step conditions assessed were:
-
plain with an abutting 5.5-cm, high-contrast, black step edge highlighter on each tread edge (control condition, Figure 18a)
-
plain with an abutting 5.5-cm, high-contrast, black step edge highlighter on each tread edge plus the H–V illusion superimposed onto the bottom step riser (the first step, Figure 18b)
-
plain with an abutting 5.5-cm, high-contrast, black step edge highlighter on each tread edge plus the H–V illusion superimposed onto the top step riser (the last step, Figure 18c)
-
plain with an abutting 5.5-cm, high-contrast, black step edge highlighter on each tread edge plus the H–V illusion superimposed onto the bottom and top step risers simultaneously (Figure 18d).
FIGURE 18.
Four visual conditions were provided in experiment 6. (a) Abutting: 5.5-cm edge highlighter placed flush with the leading tread edge; (b) H–V illusion superimposed on the bottom step riser only; (c) H–V illusion superimposed on the top step riser only; and (d) H–V illusion superimposed on the bottom and top step riser.
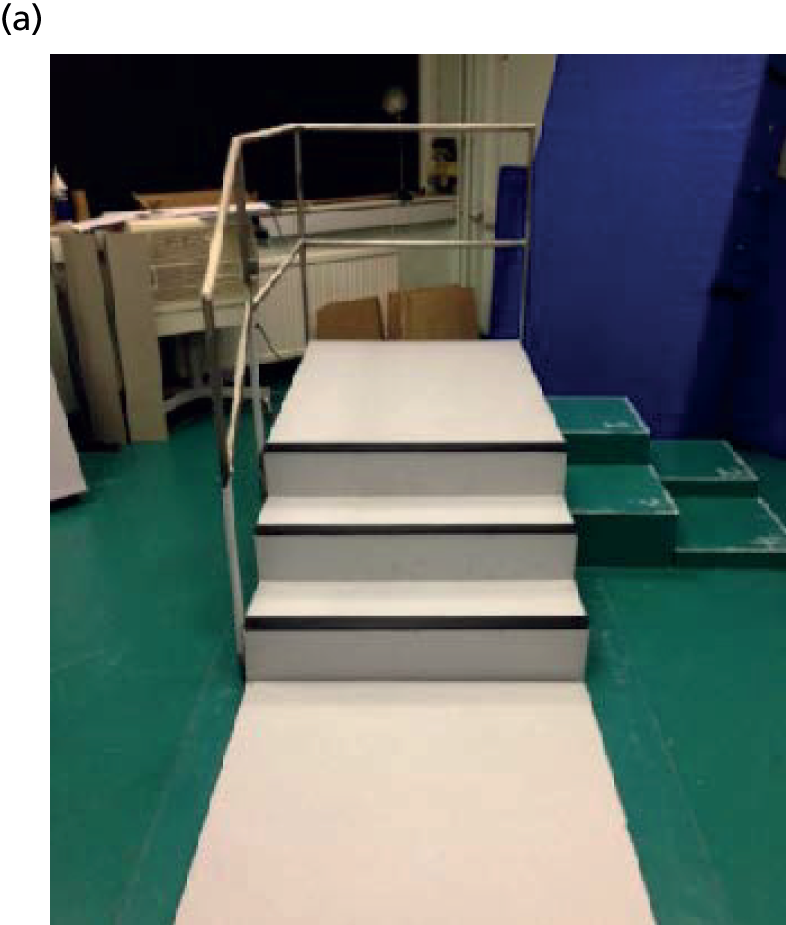
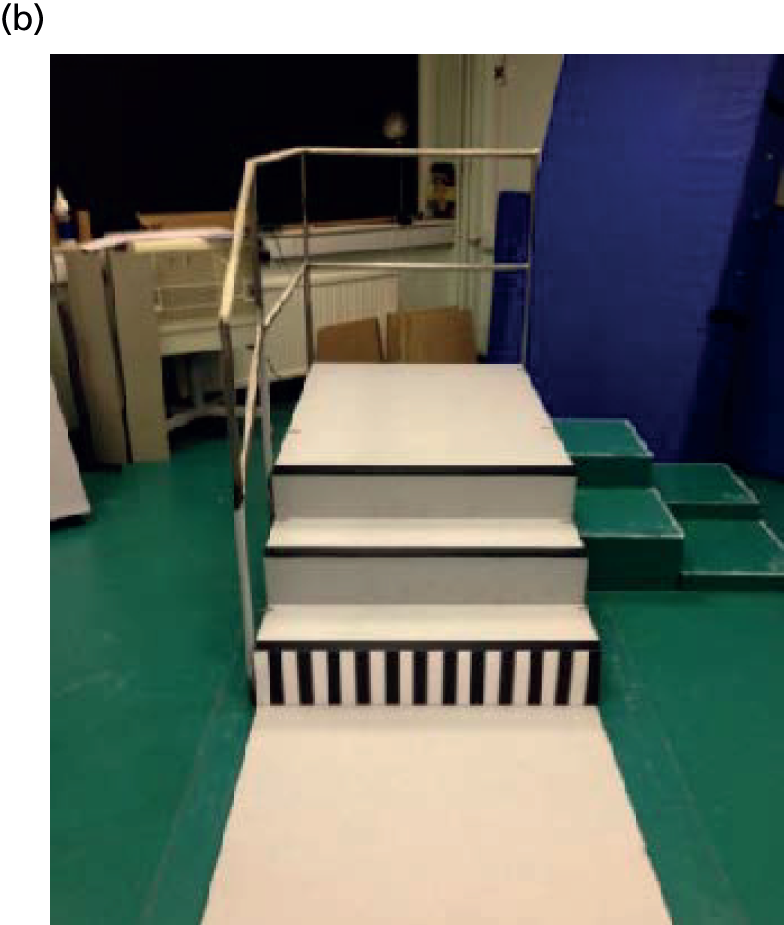
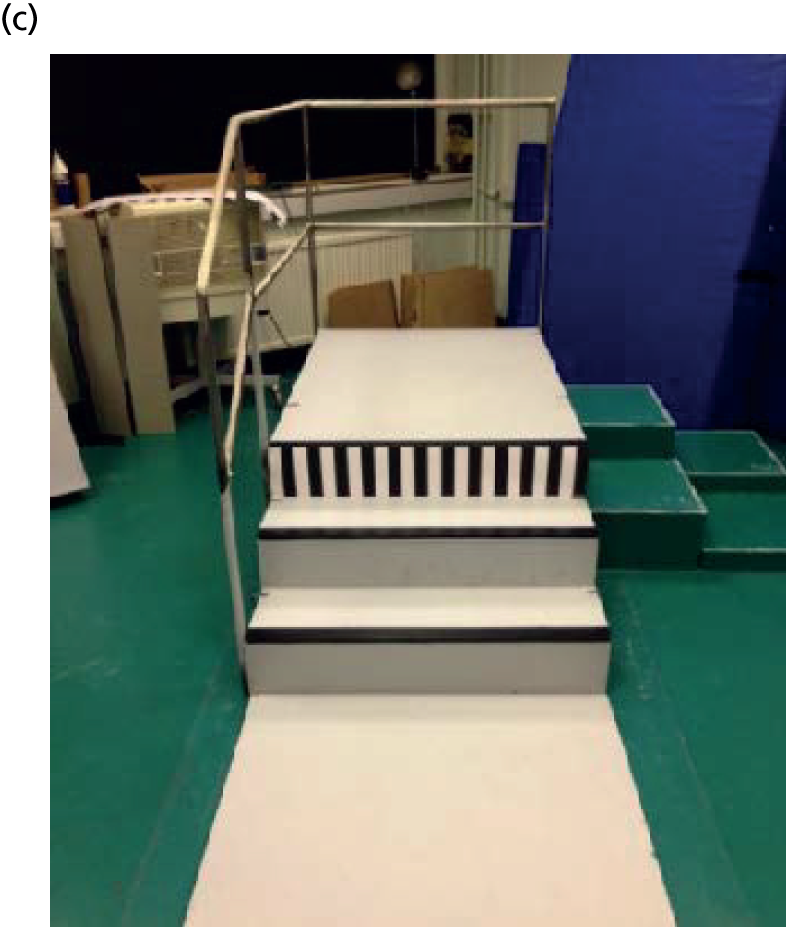

The H–V illusion consisted of black vertical gratings of 12 cycles per step (see Figure 15) on the step riser plus the 5.5-cm black tread edge highlighter previously described (see Chapter 2). The mean Weber contrast of the black strips against the grey tread background was 95% (luminance measured with a CS-100 Chroma meter), and the laboratory was well lit with an ambient illuminance of 400 lux. Each of the four step conditions was repeated three times and the 12 trials were presented in a randomised order. Several strategies were used to attempt to counter possible increase in reliance on somatosensory information, as described previously (see Chapter 2). 59 Participants were asked to wear their own, comfortable, flat-soled shoes and were allowed to lead with whichever foot they felt most comfortable with; they were then asked to lead with that foot in all subsequent trials. The kinematic data were collected using the same system described previously (see Chapter 2), except that a digitising wand determined virtual landmarks at the anterior inferior and posterior inferior point of each shoe (shoe tip/heel tip), and also determined the tread edge for each stair. All measurements, including 15 trials, were made within a 1.0-hour time period.
Data analysis
Labelling and gap filling of marker trajectories were undertaken within Vicon Nexus and the resultant C3D files were then uploaded to Visual 3D for further analysis. Marker trajectory data were filtered using a fourth-order, zero-lag Butterworth filter with a 6-Hz cut-off. Instants of foot touchdown and foot-off in each trial were determined using marker-based event detection algorithms (see Appendix 1). 60 The following variables were then exported for each step (bottom, middle and top):
-
Penultimate and final foot placements: the horizontal distance from the leading limb (penultimate) or trailing limb (final) shoe tip to the edge of the bottom stair edge when the foot was placed on the ground during approach (see Figure 17).
-
Vertical toe clearance: the vertical distance from the leading-limb shoe tip to the edge of the bottom/middle/top step as the leading limb passed over it (swing phase; see Figure 17).
The following variables were chosen to determine whether or not any changes in adaptive gait owing to the H–V illusion lead to increases in instability:
-
Ascent duration: walkway ascent duration was determined from the instant of leading limb foot-off prior to stepping over the bottom step of the stairs to the instant of leading limb touch-down on the landing of the stairs. 60
-
Single-limb support: single-limb support was defined from the instant of leading limb foot-off prior to stepping to the instant of leading limb touch-down on the raised walkway or step above.
-
Variability in mediolateral displacement of the foot: the variation in mediolateral leading limb foot displacement during single-limb support on the trailing limb for single-step ascent. Variation in mediolateral leading limb foot displacement during single-limb support on the ground, bottom and middle step for three-step ascent.
-
Variability in mediolateral displacement of the trunk: the variation in mediolateral trunk displacement during single-limb support on the trailing limb for single-step ascent. The variation in mediolateral trunk displacement during single-limb support on the ground, bottom and middle step for three-step ascent.
Data were analysed using a random-effects regression model with maximum likelihood estimating, using Stata Release 13.0 (StataCorp LP, College Station, TX, USA). Owing to the exploratory nature of the study, a ‘type I’ error adjustment of the alpha level was not deemed necessary and the level of significance was set at a p-value of < 0.05. Factors of interest were incorporated sequentially and their statistical significance were tested using a likelihood ratio (LR) test. Factors with a p-value of < 0.1 were provisionally retained, whereas those above 0.1 were dropped. The final model adopted was the most parsimonious one that was felt to explain the data adequately. The p-values quoted in the text of the paper are those associated with the specific terms in the final regression model, which were:
-
step appearance: a fixed factor with four levels: plain (the control condition), or the H–V illusion placed on the top and bottom steps, bottom step only, or top step only
-
step position: a fixed factor with three levels, (bottom, middle and top step)
-
repetition: a fixed factor with three levels, (trials 1, 2 and 3).
Results
Vertical toe clearance data for each visual condition and for each step are shown in Figure 19. Vertical toe clearances varied with the four different appearances of the steps for the bottom [LR χ2 = 53.6, degrees of freedom (df) = 3; p-value < 0.0001] and top steps (LR χ2 = 41.0, df = 3; p-value < 0.0001), but were the same for the middle step (LR χ2 = 1.4, df = 3; p-value = 0.71). For the bottom step, vertical toe clearance was increased when the illusion was placed on the bottom step only (z-value = 4.2; p-value < 0.0001) or on both the top and bottom step (z-value = 4.9; p-value < 0.0001), but was similar to the control (showing a trend to be slightly reduced) (z-value = –1.9; p-value = 0.063) when on the top step only. For the top step, vertical toe clearance was increased when the illusion was placed on the top step only (z-value = 5.3; p-value < 0.0001) or on both the top and bottom step (z-value = 4.2; p-value < 0.0001), but was similar to the control (z-value = –0.1; p-value = 0.92) when on the bottom step only.
FIGURE 19.
Box-and-whisker plot of vertical toe clearance data for each visual condition. 1, control condition with horizontal step edge highlighter on step tread only; 2, illusion on top and bottom steps; 3, illusion on bottom step only; and 4, illusion on top step only (for bottom, middle and top step).
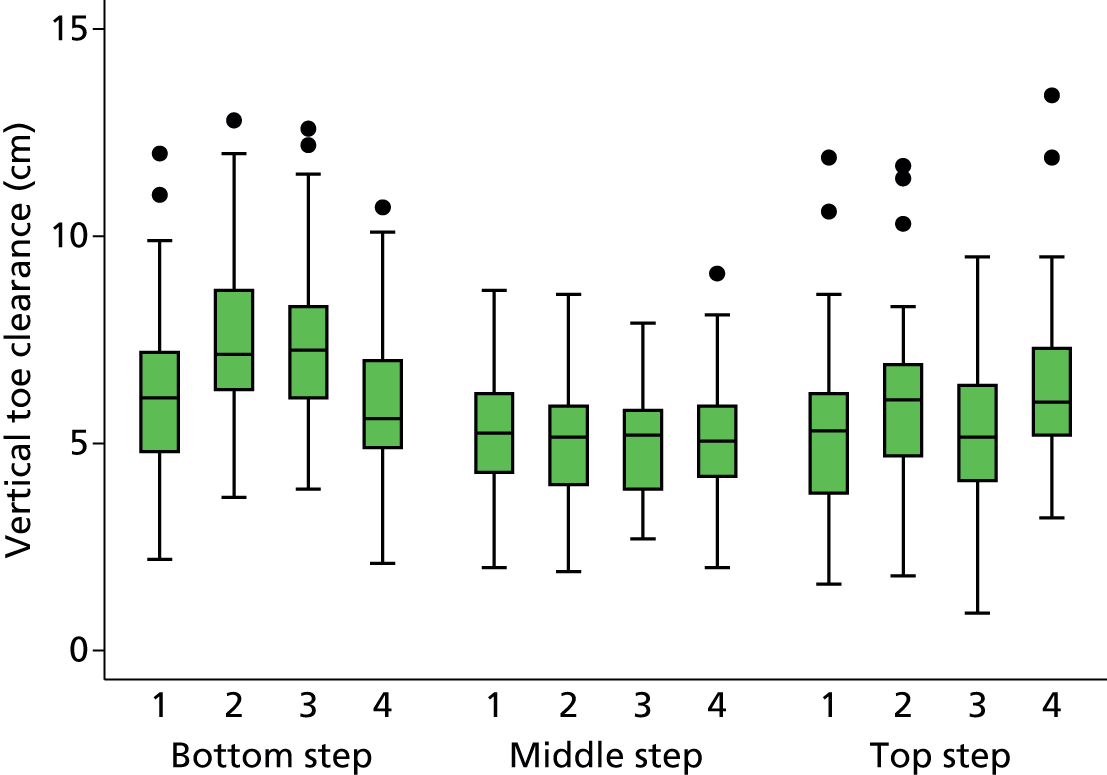
The most parsimonious model for vertical toe clearance (LR χ2 = 313.8, df = 17; p-value < 0.0001) indicated statistically significant effects of step number, appearance and repetition, with statistically significant interaction terms of step × appearance and step × repetition. The full model is displayed below.
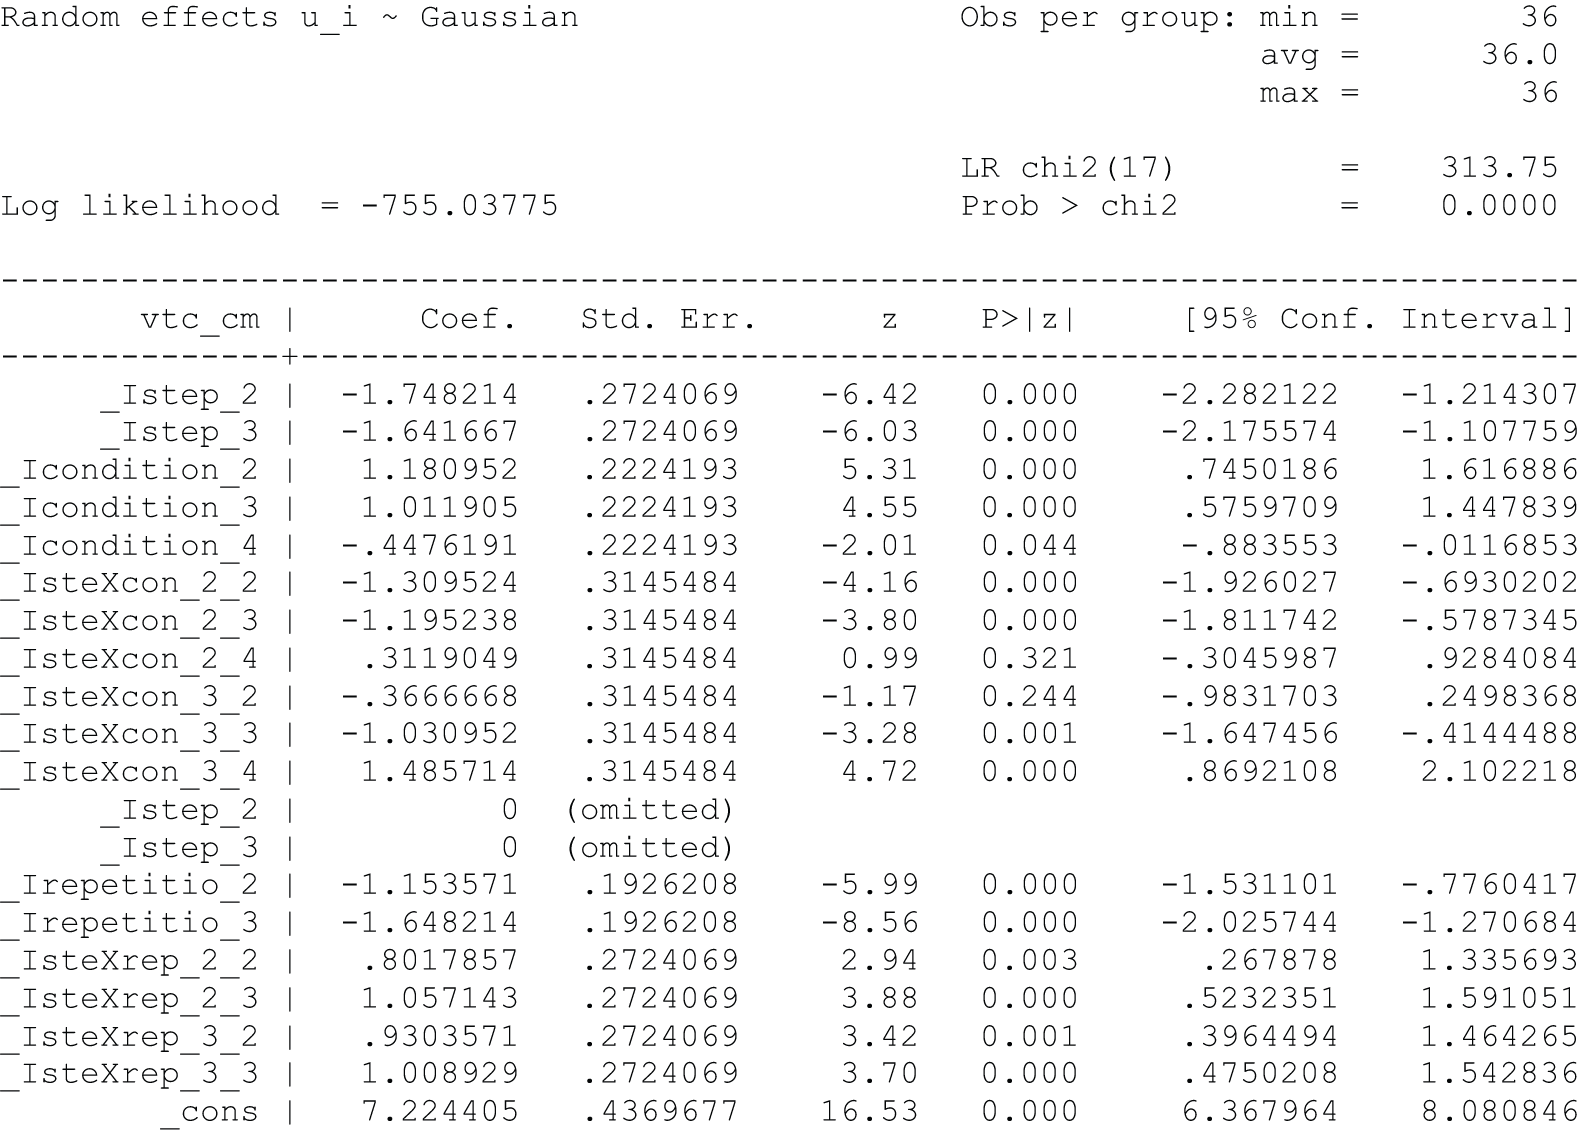
There was no statistically significant appearance × repetition effect (LR χ2 = 2.1, df = 6; p-value = 0.91). Vertical toe clearance was significantly reduced on the middle [–1.75 cm, standard error (SE) 0.27 cm; z-value = –6.4; p-value < 0.001] and top steps (–1.64 cm, SE 0.27 cm; z-value = –6.0; p-value < 0.0001) compared with the bottom step across all conditions.
Penultimate and final foot placements were unaffected by step appearance or repetition (LR χ2 = 3.1, df = 5; p-value = 0.68; LR χ2 = 3.9; p-value = 0.56). All measures of potentially increased instability did not change with step appearance. Single-limb support (LR χ2 = 4.0, df = 3; p-value = 0.26), ascent duration (LR χ2 = 5.3, df = 3; p-value = 0.15), medial–lateral variability of foot movement (LR χ2 = 2.7, df = 3; p-value = 0.44), medial–lateral variability of trunk movement (LR χ2 = 0.7, df = 3; p-value = 0.86), cumulative distance of the foot (LR χ2 = 2.9, df = 3; p-value = 0.41) and cumulative distance of the trunk (LR χ2 = 2.2, df = 3; p-value = 0.53) did not show any change with the appearance of the steps. The variability of vertical toe clearance is shown in Figure 19. Inspection of the box plot suggests that there was no systematic difference in variation across steps and conditions. Inspection of the box plots for penultimate foot position, final foot position, single-limb support, ascent duration, medial–lateral variability of foot movement, medial–lateral variability of trunk movement, cumulative distance of the foot and cumulative distance of the trunk all showed no systematic difference in variation across steps and conditions.
Discussion
The H–V illusions led to highly statistically significant increases in vertical toe clearance of the pertinent step edge, with average increases of 1.0 cm representing an increase of 17.5% over the control step mean toe clearance of 5.8 cm. Despite these increases in vertical toe clearance with the illusions on the bottom only, top only or top and bottom steps, there were no changes in vertical toe clearance for the middle step, which remained at about 5.0 cm for all visual illusion conditions. Thus, with the illusion on the bottom step only, vertical toe clearance increased over the bottom step to 7.3 cm (SD 1.6 cm) [control 6.3 cm (SD 2.1 cm)], yet returned to near control values of 5.0 cm (1.3 cm) and 5.3 cm (1.9 cm) for the middle and top steps [control 5.2 cm (SD 1.4 cm) and 5.3 cm (SD 2.0 cm)]. This provided an effect size of 0.48 [(7.3 – 6.3)/2.1]. With the illusion on the top step only, vertical toe clearance was similar to control values at 5.8 cm (SD 1.9 cm) and 5.0 cm (SD 1.4 cm) for the bottom and middle steps [control 6.3 cm (SD 2.1 cm) and 5.2 cm (SD 1.4 cm)], but then increased over the top step to 6.3 cm (SD 1.9 cm) (control 5.3 cm, SD 2.0 cm). This provided an effect size of 0.53 [(6.3 – 5.3)/1.9]. With the illusion on both the bottom and top steps, vertical toe clearance was increased over the bottom step [7.5 cm (SD 1.9 cm) vs. 6.3 cm (SD 2.1 cm) control], then returned to near control levels of vertical toe clearance of 5.0 cm (SD 1.4 cm) [control 5.2 cm (SD 1.4 cm)], then increased again over the top step to 6.1 cm (SD 1.9 cm) [control 5.3 cm (SD 2.0 cm)]. These provide effect sizes of 0.57 [(7.5 – 6.3)/2.1] for the bottom step, which is reduced to 0.40 [(6.1 – 5.3/2.0] for the top step.
There was a statistically significant repetition effect during the study, with vertical toe clearance becoming smaller with increased repetition, despite several aspects of the study design being aimed at reducing this effect. This is probably caused by the increased familiarity with the step heights provided by the somatosensory system leading to reduced vertical toe clearance to conserve energy and, to some degree, this is unavoidable in these adaptive gait studies. Certainly, the repetition effect did not obscure the effect of the H–V illusions on vertical toe clearance, which was relatively large. As previously discussed, the level of toe clearance increase at 1.0 cm in the current study represents a 17.5% level of increase and dangerous levels of toe clearance are reported when they are within 0.5 cm of the step edge,36 so that these figures actually represent relatively large changes in adaptive gait. They certainly suggest that the use of this illusion on stairways could lead to increased foot clearances and much less chance of tripping.
There was no indication that the H–V illusions lead to changes in other measures of adaptive gait and there was no change in penultimate or final foot placement, step ascent duration or within-subject variability across all dependent variables. In addition, the mismatch of information from the ‘tricked’ visual system and the somatosensory system did not appear to cause any problems, with no statistically significant mediolateral displacement of the foot and trunk during single-limb support for example. This suggests that the addition of the illusions to the steps does not appear to have in any way caused unsafe gait adaptations.
The results are very positive as they indicate that these relatively simple modifications to step appearance can significantly increase foot clearance over step edges during stair ascent by about 1.0 cm (≈17.5%), which could possibly make the difference between clearing a step edge or hitting it and potentially tripping. In addition, there appeared to be no other changes in significant aspects of adaptive gait plus no obvious indication of problems caused by different inputs from the somatosensory system and the ‘tricked’ visual system. Given that falls typically occur on the first and last few steps of a stairway, the use of the H–V illusion on the top and bottom step or steps seems the most useful.
Limitations of the study include the small sample size (although the very clear effect of the illusion has somewhat overcome this), the fact that the study only used a three-step stairway, whereas most stairways include significantly more steps, and that all participants were fit and healthy older adults, whereas most fallers are frail with several risk factors for falls. Although the results are very encouraging, to determine whether or not the illusions actually prevent falls on stairways, an assessment of falls rate on stairways with and without the illusions would need to be performed.
Chapter 4 Overall discussion
In this series of studies we investigated whether or not modifications to the appearance of steps and stairs could help make them safer for older people to negotiate. This overall discussion chapter will summarise the results from all six studies, highlight the differences in the studies reported to those described in the National Institute for Health Research (NIHR) grant protocol, highlight the limitations of the studies and make recommendations for further research.
Summary of the surface-level change and staircase descent studies
We assessed the usefulness of a step edge highlighter and its position relative to the edge of a surface-level change or each tread of a three-step staircase in Chapter 2. In two experiments, older participants showed no differences in their gait between descending the surface-level change or the staircase when they appeared with a plain surface or with a high-contrast, 5.5-cm-wide horizontal strip along the surface or stair tread edge. We assumed that this was attributable to the very good vision of all participants, which allowed them to see the edges of the surface or each stair without the need for a step edge highlighter, and these findings are similar to previous studies. 35,53 In experiment 2, we investigated stair descent in young adult participants with simulated visual impairment and found that when participants had difficulty seeing each stair edge, there was uncertainty in determining the exact location of the top/first stair tread edge when there was no edge highlighter present. There was also an increased risk of tripping in the plain condition, as evidenced by the high number of trials in which participants caught their heel (15% of trials), or where horizontal heel clearance fell below 5 mm (7.5%). Of course, these findings are from young adults with induced ‘acute’ visual impairment and may not be representative of how older people with ‘chronic’ visual impairment, who may have adapted to their condition, may fare. Although it seems unlikely, older visually impaired people may find no benefit to their gait control from having step edge highlighters present on surface-level changes, kerbs and stairs and this needs further investigation.
What seems to be clear from all three experiments is that if step edge highlighters are used, their position is important. With edge highlighters set 1 cm or 3 cm back from the surface or stair tread edge, the participants changed their gait as though they thought that the border of the edge highlighter was the surface or stair tread edge. This led to a number of very low heel clearances (< 5 mm) and heel scuffs increased when the step edge highlighter was placed away from the edge, even in participants with good vision. Indeed, in experiment 2, in which we assessed stair descent in young adults with simulated visual impairment, measurements of gait safety were improved from the plain condition if the edge highlighter abutted each stair edge, but gait safety was similar to the plain condition when the edge highlighter was placed 3 cm away from each stair tread edge (see Table 2). Current guidelines suggest that edge highlighters should be at or close to the step edge. In the UK, stair nosings (referring to a shield that covers the edge of a step or stair tread) should be 5.5 cm wide on both tread and riser with a luminance contrast of at least 30% compared with the rest of the step (UK Building Regulations). 50 In Australia, the recommended edge highlighters are 5.0–7.5 cm wide with 30% luminance contrast and should not be set back more than 1.5 cm from the nosing (Australian Standard 1428)52 and in the USA, recommendations include adding a single-contrast strip of 2.5–3.8 cm (1–1.5 inches) wide that is mounted flush with the surface and placed close to the edge of the step. 44 However, the results of Chapter 2 suggest that the safest position for step edge highlighters should be flush with the surface or stair tread edge and allowing it to be set back 1.5 cm or set close to the surface/stair edge (and ‘close’ is obviously open to interpretation) does not appear to have any logical rationale. There are plenty of examples where ‘step edge’ highlighters are set back from the step edge. Figure 1 shows a friction strip set 3 cm back from the tread edge of stairs that are regularly used by thousands of people in a public building. The New York Times recently published a very useful article about falls in older people67 that included several excellent video clips of how everyday objects look to older people with poor vision. The carpeted stairs used in one video clip have a white stripe added for increased visibility on the top and bottom stairs, but this is clearly set back 1.5–2.0 cm from the tread edge. We suggest that building recommendations and regulations should be clear that step edge highlighters should be placed flush with the surface or tread edge and not ‘close’ or near to it (or that ‘close’ or ‘near’ are defined as ‘as close as possible to the tread edge and at most 1 cm away’).
Summary of the step ascent studies
A safety precaution that is commonly used during stair ascent when vision is impaired is to increase foot clearance to avoid tripping. In another series of experiments described in Chapter 3, we investigated the usefulness of several versions of the H–V illusion to make the perceived appearance of stair risers look taller so that participants might increase foot clearance over the stair edge. The H–V illusion was provided by a horizontal edge highlighter on the tread (as used in the stair descent studies discussed in Summary of the surface-level change and staircase descent studies) and vertical stripes on the stair risers. A psychophysical (experiment 4) and a gait analysis study (experiment 5) determined the optimum parameters for the H–V illusion, with the horizontal stripe on the tread edge being 5.5 cm (the same as UK Building Regulations) and situated abutting the tread edge (so that it can be used as an ideal step edge highlighter in stair descent as determined in Chapter 2) and the thickness of both the black and white vertical stripes being 4.2 cm each (producing 12 black stripes and 12 white stripes on each 1 m stair riser). When this optimised illusion was positioned on the bottom and top steps of a three-step stairway (most falls on stairs occur on the first and last steps) it was found to increase vertical toe clearance significantly, without causing an increase in clearance variability and/or a change in body centre of mass balance or stability when negotiating the stairway. The results suggest that using the optimised H–V illusion superimposed on step/stair risers may be a useful modification on a raised walkway (e.g. kerbs) and/or the first and last steps of stairways to help avoid trips and falls during walkway/stair ascent. Visual illusions, such as the H–V illusion, are processed in the visual cortex of the brain so are unlikely to be affected by common age-related ocular diseases such as cataract, macular degeneration and glaucoma, although they could be affected by dementia and other conditions affecting the visual cortex. However, even if the illusion does not work with some older people so that the step/stair riser does not appear taller than it actually is, the stripes on the stair riser and horizontal edge highlighter on the stair tread will still provide additional visual information (compared with a plain step) about the stair edge’s position and height. Future work is discussed in Recommendations for further work.
Amendments to the National Institute for Health Research grant protocol
Experiments 1, 3, 5 and 6 described here were as described in the grant protocol (although numbered as experiments 1, 2, 4 and 5 in the protocol), except for the use of a non-instrumented, custom-built, three-step stairway rather than the planned use of an Advanced Mechanical Technology Inc. [(AMTI) Watertown, MA, USA] three-step system and use of slightly smaller sample sizes than planned. After using the AMTI three-step system in another laboratory (Clinical Gait Analysis Service, University of Salford, Salford, UK) and discussing its pros (force-plate data on all three steps) and cons (difficult to change the going and riser dimensions), plus assessing our movement laboratory set-up and its sensitivity and reliability, we determined that a more sensible approach was to use our existing three-step staircase (used as part of the pilot study) but improve the functionality and reliability of our camera system by acquiring additional cameras. For the same cost as an AMTI three-step system, two additional Vicon MX cameras were purchased and their incorporation into our existing set-up reduced the number of times/instances that motion-capture markers were undetected (unseen) during data collection. This can occur when markers go outside a camera’s field of view because limb movements either occlude the view of a marker located on another limb or body segment, or move the limb to a position where it becomes difficult for cameras to see certain markers. The two additional cameras were used to focus directly on the stairway during data capture, and ensured that markers that may have previously been occluded owing to limb movements or insufficient camera coverage could be tracked successfully. The decision not to use an AMTI three-step system meant that vertical ground reaction forces (provided by the AMTI system) could not be used to determine gait events such as touchdown and foot-off during stair ambulation. These events are typically used to calculate the periods of the stance and swing phases of gait, which are important spatiotemporal parameters. Hence, without having ground reaction force data we had to devise a reliable method of determining instants of touchdown and foot-off from the motion capture data we would collect. Using previously collected data using a force instrumented staircase (collected in another laboratory), touch-down and foot-off events determined from the vertical ground reaction forces were compared with the same events determined using algorithms based on analysing segmental kinematics. These algorithms were developed (by ourselves) within Visual 3D software. The results indicated good agreement between touch-down and foot-off events for both stair descent and stair ascent, determined using the ground reaction forces and the newly defined event detection algorithms, indicating that these algorithms can be used in future testing protocols when force plates are unavailable and particularly for all stair negotiation protocols conducted in our laboratory. These findings were published in the journal Gait & Posture60 as they could be of value to other researchers who use non-instrumented stairways. Because of improved functionality and reliability of the motion-capture set-up provided by increasing the number of cameras from 8 to 10, plus the validity of using the newly developed event detection algorithms (see Appendix 1),60 the sample sizes needed for each experiment were slightly reduced. The results of our initial experiment supported the decision to use smaller sample sizes, although we note that with smaller sizes there is less confidence about estimates (i.e. less precision). The above rationale and the change in experimental set-up were agreed with NIHR prior to conducting our planned experiments.
Experiment 2 was an additional experiment and not described in the NIHR grant protocol, but seemed a very useful addition to guide future work. The use of young adults with simulated visual impairment meant that the experiment could be conducted under the general ethical approval provided to the laboratory and did not need additional ethical approval (unlike the recruitment of visually impaired patients, which would have necessitated obtaining NHS ethical approval). In addition, we conducted pilot work on ourselves (age range 25–55 years) and found that inducing visual impairment had a profound effect on our gait when negotiating the laboratory staircase, which would have meant that if we recruited elderly visually impaired patients we would have had to use a safety harness system. Setting-up a harness system would have probably delayed the research, as well as changed participants’ gaits because it would hinder normal movement. Young adults were readily available and the visual impairment simulation was available from previous studies. As such, we were able to run the experiment quickly, alongside other experiments and within the 2-year period of the grant.
Experiment 4’s psychophysical experiments were used to determine some of the parameters needed for the H–V illusion, and the approach differed from that described in the NIHR grant protocol as experiment 3. In the grant protocol, we indicated that we would use a visuomotor-based assessment of perceived step height by asking participants to raise their foot to the approximate height of a single step. A number of such measurements were undertaken to determine if perceived step height would be affected by the H–V illusion. Unfortunately, this measurement approach did not work well, returning relatively large and unacceptable measurement variability. Hence, we decided that we would be able to determine the appropriate parameters for the H–V illusion better using psychophysical methods; an experiment type for which Professor Whitaker has great experience. Given that psychophysical methods are lengthy and somewhat difficult for naive participants, and because we did not suspect a significant age effect for the H–V illusion, we recruited staff and postgraduate students for these experiments, rather than older participants.
Study limitations
Limitations of the studies include the following:
-
It would be ideal to assess whether or not these modifications to stair appearance actually reduce falls on stairs. This is the next step in the research process and is discussed in the following section. In the studies described here, we have assessed adaptations in gait and made assumptions from previous research about what constitutes safe and unsafe gait adaptations. 34–36,38–43 Of course, these assumptions could be incorrect. For example, increasing toe clearance is widely used as a safety precaution during step ascent and this gait adaptation makes sense if the position of the step edge cannot be judged precisely as a result of poor vision. 36,38–42,46 In addition, slowing gait means that a trip is less likely to become a fall68 and so it makes sense for a person to slow gait if they are unsure of their physical surroundings. However, these two adaptations can increase single support time (the time during the stepping process when the body is supported on one foot), which is potentially dangerous and can lead to increases in medial–lateral instability. 43 A compromise appears to be needed.
-
The number of steps on the stairs could have been increased to replicate more representative real-world stair negotiation. However, most gait labs that use a step stairway system with seven or more steps use harnesses for safety reasons,35 and those harnesses can alter participants’ gaits. Pilot work with fit and healthy older people indicated that our three-step system with a handrail (and crash mats on the floor) was perfectly safe, but we did not feel confident about using step stairways with seven or more steps without using a harness system and felt that the drawbacks of using a harness system outweighed the usefulness of a stairway of seven or more steps.
-
Somatosensory feedback from repeated measurements is a common complication of adaptive gait studies. 59,64 As soon as a participant places one foot on a step tread, they gain somatosensory information from plantar-receptors in the feet and/or joint-receptors of the lower limb about the height of the step. The more repetitions performed, the greater the potential effect this can have. This could limit the importance of vision to the adaptive gait process as we have found in previous studies. 59 Of course, one could argue that this must occur in real life situations and that is correct. However, it is on the first or last steps of a stairway when most falls occur and this is when vision is most used in step negotiation. We tried to limit this ‘repetition’ or ‘somatosensory’ effect by manipulating a number of aspects of the experiments based on our experience in previous studies (see Chapter 2, General protocol). Alternatively, we could have limited the number of repetitions to one, but this would have required a significant increase in participant numbers to provide the same effect sizes as those found using repeated trials. There are obvious ethical (and small cost) issues with over-recruitment, and given that we have developed strategies that have allowed us to minimise the repetition effect,59 we feel that the three- or five-repetition strategy used here is preferable. The outcome of the main studies, which showed highly significant effects, suggests that this strategy was appropriate.
-
Participant numbers were relatively small and all participants were fit and healthy older adults, whereas most fallers are frail with several risk factors for falls. The results may not thus be representative for the typical older population who are likely to fall. It seems unlikely that increasing our sample sizes for any of the experiments would have led to different conclusions; the main effects were relatively large (effect sizes were approximately 1.0 for the effect of the position of the edge highlighter on horizontal heel clearance in step descent and 0.50 for the effect of the H–V illusion on vertical toe clearance during step ascent) and clinically relevant. However, although the results are very encouraging, to determine whether or not the illusions actually prevent falls on stairways, an assessment of falls rate on stairways with and without the illusions would need to be performed (see Recommendations for further work).
-
Experiment 2 used a simulation of visual impairment. Clearly, the results of the study may not be representative of older people with real visual impairment who may have developed useful adaptations over time. For example, in a previous study, we found that patients with macular degeneration seemed to have developed a strategy of lifting their toes slightly when stepping over an obstacle (unlike age-matched controls whose toes were angled slightly downwards), which may be a strategy to prevent a potential ‘hit’ of an obstacle becoming a trip and subsequent fall. 69 Again, this issue is discussed further in Recommendations for further work.
Recommendations for further work
The high prevalence and morbidity of falls in older people is highlighted in Chapter 1. Chapter 1 also highlights the multifactorial nature of falls, which suggests that a large number of interventions targeting different aspects of falls risk are likely needed. In this series of laboratory-based studies, analyses of gait on stairs have suggested that edge highlighters (placed at the step edge) may improve safety during stair descent and an optimised H–V illusion may improve safety in stair ascent. However, these studies are clearly limited in that they assess gait (not falls) and inferences are made about falls based on a change in gait safety. These gait studies could be repeated with participants who are visually impaired or frail older patients (at greater risk of falls than our fit and healthy participants), but there are safety issues that make these experiments difficult as discussed in Study limitations. In addition, replicating these studies with such participants will still not answer the question of whether or not these stair appearance manipulations actually reduce falls on stairs.
-
To follow up the current studies, what seems to be required is a study examining fall prevalence on steps and stairs, perhaps in a public building(s), with and without these modifications in appearance. Perhaps the study could be set up in a new build containing two sets of identical stairs with similar flows of people, so that one set of stairs could have the appearance modifications added with the other acting as a control condition. Alternatively, a stairway could be sourced that is known to cause difficulties for older people and the modifications could be added, with fall prevalence accessed before and after the addition. The stairways would need to be video-recorded and software developed that could identify falls (and perhaps trips and near falls).
Modifying the appearance of steps and stairs is just one way that falls attributable to visual problems could be reduced. Given that visual impairment is a well-known risk factor for falls4 and that the older population in the UK includes many people with visual impairment that could be corrected with updated spectacles and cataract surgery,70 more work is also needed to determine why these people are not getting their vision improved, as well as what the best refractive correction to prescribe is and what type of spectacle is best. 71
-
Low-powered addition multifocal lenses: the role of the spectacle type in falls needs further investigation as, although it has been shown that providing distance single-vision spectacles to active long-term multifocal wearers for outdoor use reduces fall rate, compliance with this intervention was poor and other options need to be considered. 72 A low addition multifocal lens could provide a useful option. 71 The low addition would give the reading section perfect focus at about 1 m and sufficiently good vision of steps and stairs to help avoid falls (typical multifocals provide perfect focus at about 30–40 cm, so they are ideal for reading, but they provide a blurred and magnified view of the lower visual field, including the feet and steps and stairs). The low power would also reduce the image jump provided in bifocal lenses and the distortion in progressive or varifocal lenses. 39,46,47,72 At the same time, the low addition would provide sufficient ability to ‘spot read’ (wearers would be able to read most text for short periods of time: labels on food in supermarkets, menus in restaurants, the time on their watch or mobile phone, etc.) so that they would be more likely to be worn particularly when outside the home. Laboratory-based studies of these low addition multifocals have suggested safer gait than with full powered lenses and a randomised controlled trial (RCT) to determine fully their efficacy is the next obvious step.
-
Partially prescribed changes in refractive correction: a RCT hypothesising that improved refractive correction would reduce falls surprisingly found the opposite result. Large changes in refractive correction may actually increase falls. 73 It has been suggested that this was attributable to relatively large changes in refractive correction causing visual ‘swimming’ sensations because patients had not adapted their vestibuloocular reflex to the change in spectacle magnification. 71 Changes in spectacle magnification may also have caused difficulties negotiating surface changes such as kerbs and stairs. 74 This study led to suggestions that clinicians should be conservative in their prescribing and only make relatively small changes in refractive correction. 71 Work is needed to determine whether or not partial correction of large changes in refractive correction improve falls rates, and a RCT to assess such an approach seems the obvious next step.
Acknowledgements
The authors would like to acknowledge Mike Roys (Building Research Establishment Ltd, Watford, UK) for helpful comments during the experiments and on parts of the manuscript. We also acknowledge the help of the following members of an advisory committee, particularly during the grant application process: Claire Elener, lead nurse/advanced nurse practitioner for Bradford and the Bradford South & West Alliance Board nurse member; Louise Johnson, Lecturer, Division of Physiotherapy and Occupational Therapy, University of Bradford; Darren Shickle, Professor of Public Health, University of Leeds; Maggie Nicol, Professor of Occupational Therapy, Queen Margaret University, Edinburgh; Keith Oakes, Technical Director, Gradus Ltd; and Sonal Rughani, Eye Health Development Advisor, Royal National Institute for the Blind.
Contributions of authors
David B Elliott (Professor of Clinical Vision Science, University of Bradford) led the study, contributed to all aspects of study design and data interpretation and co-authored the final report.
Richard J Foster (Lecturer/Senior Lecturer in Biomechanics, Nottingham Trent University) contributed to day-to-day project management, research study design, data collection, data analysis and interpretation, and statistical analysis for experiments 1–5 while employed as a Postdoctoral Research Assistant at the University of Bradford. He also contributed to manuscript preparation and the final report.
David Whitaker (Professor of Vision Science, University of Bradford) led on the H–V illusion components of the study and the psychophysics experiment (experiment 3) and contributed to the final report.
Andrew J Scally (Senior Lecturer in Radiography, University of Bradford) advised on the research design of the study and on statistical analysis and interpretation of the data from experiments 4–6 and contributed to the final report.
John G Buckley (Reader in Movement Biomechanics, University of Bradford) led on the gait analysis components of the study, contributed to study design, data analysis and interpretation and to the final report.
Publications
Full papers in peer-reviewed journals
Foster RJ, De Asha AR, Reeves ND, Maganaris CN, Buckley JG. Stair-specific algorithms for identification of touch-down and foot-off when descending or ascending a non-instrumented staircase. Gait Posture 2014;39:816–21.
Foster RJ, Hotchkiss J, Buckley JG, Elliott DB. Safety on stairs: Influence of a tread edge highlighter and its position. Exp Gerontol 2014;55:152–8.
Elliott DB, Foster RJ, Whitaker D, Scally A. Buckley JG. What you see is what you step: The horizontal-vertical illusion increases toe clearance in older adults during stair ascent. Invest Ophthalmol Visual Sci 2015;56:2950–7.
Conference presentations
Foster RJ, Hotchkiss J, Buckley JG, Elliott DB. Safety on stairs: influence of a tread edge highlighter and its position. World Conference of the International Society for Posture & Gait Research (ISPGR), Vancouver, BC, 29 June–3 July 2014.
Foster RJ, De Asha AR, Reeves ND, Maganaris CN, Buckley JG. Stair-specific algorithms for identification of touch-down and foot-off when descending or ascending a non-instrumented staircase. World Conference of ISPGR, Vancouver, BC, 29 June–3 July 2014.
Data sharing statement
All available data can be obtained from the corresponding author.
Disclaimers
This report presents independent research funded by the National Institute for Health Research (NIHR). The views and opinions expressed by authors in this publication are those of the authors and do not necessarily reflect those of the NHS, the NIHR, NETSCC, the PHR programme or the Department of Health. If there are verbatim quotations included in this publication the views and opinions expressed by the interviewees are those of the interviewees and do not necessarily reflect those of the authors, those of the NHS, the NIHR, NETSCC, the PHR programme or the Department of Health.
References
- Blake AJ, Morgan K, Bendall MJ, Dallosso H, Ebrahim SB, Arie TH, et al. Falls by elderly people at home: prevalence and associated factors. Age Ageing 1998;17:365-72. http://dx.doi.org/10.1093/ageing/17.6.365.
- Braithwaite RS, Col NF, Wong JB. Estimating hip fracture morbidity, mortality and costs. J Am Geriatr Soc 2003;51:364-70. http://dx.doi.org/10.1046/j.1532-5415.2003.51110.x.
- Salkeld G, Cameron ID, Cumming RG, Easter S, Seymour J, Kurrle SE, et al. Quality of life related to fear of falling and hip fracture in older women: a time trade off study. BMJ 2000;320:341-6. http://dx.doi.org/10.1136/bmj.320.7231.341.
- Rubinstein LZ, Josephson KR, Robbins AS. Falls in the nursing home. Ann Int Nursing 1994;121:442-51. http://dx.doi.org/10.7326/0003-4819-121-6-199409150-00009.
- Arfken CL, Lach HW, McGee SA. Visual acuity, visual disturbances and falling in the elderly. J Aging Health 1994;6:38-50. http://dx.doi.org/10.1177/089826439400600103.
- Startzell JK, Owens DA, Mulfinger LM, Cavanagh PR. Stair negotiation in older people: a review. J Am Geriatr Soc 2000;48:567-80. http://dx.doi.org/10.1111/j.1532-5415.2000.tb05006.x.
- Roys M, Haslam R, Stubbs D. Understanding and Preventing Falls. London: CRC Press; 2005.
- Templer JA. The Staircase: Studies of Hazards, Falls and Safer Design. Cambridge, MA: MIT Press; 1992.
- Tinetti ME, Speechley M, Ginter SF. Risk factors for falls among elderly people living in the community. N Engl J Med 1988;319:1701-7. http://dx.doi.org/10.1056/NEJM198812293192604.
- Schiller JS, Kramarow EA, Dey AN. Fall injury episodes among noninstitutionalized older adults: United States, 2001–3. Advance Data from Vital and Health Statistics 2007;392. www.cdc.gov/nchs/data/ad/ad392.pdf (accessed 30 January 2014).
- Guerraz M, Bronstein AM. Ocular versus extraocular control of posture and equilibrium. Neurophysiol Clin 2008;38:391-8. http://dx.doi.org/10.1016/j.neucli.2008.09.007.
- Anand V, Buckley JG, Scally A, Elliott DB. Postural stability in the elderly during sensory perturbations and dual tasking: the influence of refractive blur. Invest Ophthalmol Vis Sci 2003;44:2885-91. http://dx.doi.org/10.1167/iovs.02-1031.
- Kotecha A, Chopra R, Fahy RT, Rubin GS. Dual tasking and balance in those with central and peripheral vision loss. Invest Ophthalmol Vis Sci 2013;54:5408-15. http://dx.doi.org/10.1167/iovs.12-12026.
- Schwartz S, Segal O, Barkana Y, Schwesig R, Avni I, Morad Y. The effect of cataract surgery on postural control. Invest Ophthalmol Vis Sci 2005;46:920-4. http://dx.doi.org/10.1167/iovs.04-0543.
- Paulus WM, Straube A, Brandt T. Visual stabilization of posture. Physiological stimulus characteristics and clinical aspects. Brain 1984;107:1143-63. http://dx.doi.org/10.1093/brain/107.4.1143.
- Matheron E, Kapoula Z. Vertical heterophoria and postural control in nonspecific chronic low back pain. PLOS ONE 2011;6. http://dx.doi.org/10.1371/journal.pone.0018110.
- Straube A, Krafczyk S, Paulus W, Brandt T. Dependence of visual stabilization of postural sway on the cortical magnification factor of restricted visual fields. Exp Brain Res 1994;99:501-6. http://dx.doi.org/10.1007/BF00228986.
- Patla AE. Understanding the roles of vision in the control of human locomotion. Gait Posture 1997;5:54-69. http://dx.doi.org/10.1016/S0966-6362(96)01109-5.
- Marigold DS, Patla AE. Gaze fixation patterns for negotiating complex ground terrain. Neuroscience 2007;144:302-13. http://dx.doi.org/10.1016/j.neuroscience.2006.09.006.
- Marigold DS. Role of peripheral visual cues in online visual guidance of locomotion. Exerc Sport Sci Rev 2008;36:145-51. http://dx.doi.org/10.1097/JES.0b013e31817bff72.
- Patla AE, Vickers JN. How far ahead do we look when required to step on specific locations in the travel path during locomotion?. Exp Brain Res 2003;148:133-8. http://dx.doi.org/10.1007/s00221-002-1246-y.
- Graci V, Elliott DB, Buckley JG. Utility of peripheral visual cues in planning and controlling adaptive gait. Optom Vis Sci 2010;87:21-7. http://dx.doi.org/10.1097/OPX.0b013e3181c1d547.
- Rubenstein LZ, Josephson KR. The epidemiology of falls and syncope. Clin Geriatr Med 2002;18:141-58. http://dx.doi.org/10.1016/S0749-0690(02)00002-2.
- Davies JC, Kemp GJ, Stevens G, Frostick SP, Manning DP. Bifocal/varifocal spectacles, lighting and missed-step accidents. Safety Sci 2001;38:211-26. http://dx.doi.org/10.1016/S0925-7535(01)00002-9.
- Coleman AL, Stone K, Ewing SK, Nevitt M, Cummings S, Cauley JA, et al. Higher risk of multiple falls among elderly women who lose visual acuity. Ophthalmology 2004;111:857-62. http://dx.doi.org/10.1016/j.ophtha.2003.09.033.
- Freeman EE, Muñoz B, Rubin G, West SK. Visual field loss increases the risk of falls in older adults: the Salisbury eye evaluation. Invest Ophthalmol Vis Sci 2007;48:4445-50. http://dx.doi.org/10.1167/iovs.07-0326.
- Patino CM, McKean-Cowdin R, Azen SP, Allison JC, Choudhury F, Varma R. Los Angeles Latino Eye Study Group. Central and peripheral visual impairment and the risk of falls and falls with injury. Ophthalmology 2010;117:199-206. http://dx.doi.org/10.1016/j.ophtha.2009.06.063.
- Lord SR, Dayhew J. Visual risk factors for falls in older people. J Am Geriatr Soc 2001;49:508-15. http://dx.doi.org/10.1046/j.1532-5415.2001.49107.x.
- Close J, Ellis M, Hooper R, Glucksman E, Jackson S, Swift C. Prevention of falls in the elderly trial (PROFET): a randomised controlled trial. Lancet 1999;353:93-7. http://dx.doi.org/10.1016/S0140-6736(98)06119-4.
- Jack CI, Smith T, Neoh C, Lye M, McGalliard JN. Prevalence of low vision in elderly patients admitted to an acute geriatric unit in Liverpool: elderly people who fall are more likely to have low vision. Gerontology 1995;41:280-5. http://dx.doi.org/10.1159/000213695.
- Cox A, Blaikie A, Macewen CJ, Jones D, Thompson K, Holding D, et al. Optometric and ophthalmic contact in elderly hip fracture patients with visual impairment. Ophthalmic Physiol Opt 2005;25:357-62. http://dx.doi.org/10.1111/j.1475-1313.2005.00307.x.
- Scuffham P, Chaplin S, Legood R. Incidence and costs of unintentional falls in older people in the United Kingdom. J Epidemiol Community Health 2003;57:740-4. http://dx.doi.org/10.1136/jech.57.9.740.
- Scuffham PA, Legood R, Wilson ECF, Kennedy-Martin T. The incidence and cost of injurious falls associated with partial sight and blindness in the UK. Vis Impair Res 2002;4:1-14. http://dx.doi.org/10.1076/vimr.4.1.1.15635.
- Timmis MA, Pardhan S. Patients with central visual field loss adopt a cautious gait strategy during tasks that present a high risk of falling. Invest Ophthalmol Vis Sci 2012;53:4120-9. http://dx.doi.org/10.1167/iovs.12-9897.
- Simoneau GG, Cavanagh PR, Ulbrecht JS, Leibowitz HW, Tyrrell RA. The influence of visual factors on fall-related kinematic variables during stair descent by older women. J Gerontol 1991;46:M188-95. http://dx.doi.org/10.1093/geronj/46.6.M188.
- Hamel KA, Okita N, Higginson JS, Cavanagh PR. Foot clearance during stair descent: effects of age and illumination. Gait Posture 2005;21:135-40. http://dx.doi.org/10.1016/j.gaitpost.2004.01.006.
- La Grow SJ, Robertson MC, Campbell AJ, Clarke GA, Kerse NM. Reducing hazard related falls in people 75 years and older with significant visual impairment: how did a successful program work?. Inj Prev 2006;12:296-301. http://dx.doi.org/10.1136/ip.2006.012252.
- Heasley K, Buckley JG, Scally A, Twigg P, Elliott DB. Stepping up to a new level: effects of blurring vision in the elderly. Invest Ophthalmol Vis Sci 2004;45:2122-8. http://dx.doi.org/10.1167/iovs.03-1199.
- Johnson L, Buckley JG, Scally AJ, Elliott DB. Multifocal spectacles increase variability in toe clearance and risk of tripping in the elderly. Invest Ophthalmol Vis Sci 2007;48:1466-71. http://dx.doi.org/10.1167/iovs.06-0586.
- Elliott DB, Patla AE, Furniss M, Adkin A. Improvements in clinical and functional vision and quality of life after second eye cataract surgery. Optom Vis Sci 2000;77:13-24. http://dx.doi.org/10.1097/00006324-200001000-00009.
- Buckley JG, Heasley KJ, Twigg P, Elliott DB. The effects of blurred vision on the mechanics of landing during stepping down by the elderly. Gait Posture 2005;21:65-71. http://dx.doi.org/10.1016/j.gaitpost.2003.12.001.
- Heasley K, Buckley JG, Scally A, Twigg P, Elliott DB. Falls in older people: Effects of age and blurring vision on the dynamics of stepping. Invest Ophthalmol Vis Sci 2005;46:3584-8. http://dx.doi.org/10.1167/iovs.05-0059.
- Buckley JG, Heasley K, Scally A, Elliott DB. The effects of blurring vision on medio-lateral balance during stepping up or down to a new level in the elderly. Gait Posture 2005;22:146-53. http://dx.doi.org/10.1016/j.gaitpost.2004.08.006.
- Archea J, Collins BL, Stahl FI. Guidelines for Stair Safety. Washington, DC: US Government Print Office; 1979.
- Den Otter AR, Hoogwerf M, Van Der Woude LH. The role of tread fixations in the visual control of stair walking. Gait Posture 2011;34:169-73. http://dx.doi.org/10.1016/j.gaitpost.2011.04.004.
- Beschorner KE, Milanowski A, Tomashek D, Smith RO. Effect of multifocal lens glasses on the stepping patterns of novice wearers. Gait Posture 2013;38:1015-20. http://dx.doi.org/10.1016/j.gaitpost.2013.05.014.
- Lord SR, Dayhew J, Howland A. Multifocal glasses impair edge-contrast sensitivity and depth perception and increase the risk of falls in older people. J Am Geriatr Soc 2002;50:1760-6. http://dx.doi.org/10.1046/j.1532-5415.2002.50502.x.
- British Standards Institution . BS 5395-1:2010. Stairs. Code of Practice for the Design of Stairs With Straight Flights and Winders n.d. http://shop.bsigroup.com/ProductDetail/?pid=000000000030140175 (accessed 22 May 2015).
- Her Majesty’s Government . The Building Regulations 2010. Protection from Falling, Collision and Impact n.d. www.planningportal.gov.uk/uploads/br/BR_PDF_AD_K_2013.pdf (accessed 18 May 2015).
- Her Majesty’s Government . The Building Regulations 2010. Access to and Use of Buildings n.d. www.planningportal.gov.uk/buildingregulations/approveddocuments/partm/approved (accessed 18 May 2015).
- Her Majesty’s Government . The Building Regulations 2010. Fire Safety. Vol. 1: Dwelling Houses n.d. www.planningportal.gov.uk/buildingregulations/approveddocuments/partb/bcapproveddocumentsb/bcapproveddocbvol1/ (accessed 18 May 2015).
- Australian Network for Universal Housing Design . Australian Standard 1428 n.d. www.anuhd.org/resources/standards-and-guidelines (accessed 17 May 2015).
- Zietz D, Johannsen L, Hollands M. Stepping characteristics and centre of mass control during stair descent: Effects of age, fall risk and visual factors. Gait Posture 2011;34:279-84. http://dx.doi.org/10.1016/j.gaitpost.2011.05.017.
- World Medical Association . Declaration of Helsinki: Ethical Principles for Medical Research Involving Human Subjects n.d. www.wma.net/en/30publications/10policies/b3/index.html (accessed 18 May 2015).
- Elliott DB, Vale A, Whitaker D, Buckley J. Does my step look big in this? A visual illusion leads to safer stepping behaviour. PLOS ONE 2009;4. http://dx.doi.org/10.1371/journal.pone.0004577.
- Ferris FL, Bailey I. Standardizing the measurement of visual acuity for clinical research studies: Guidelines from the Eye Care Technology Forum. Ophthalmology 1996;103:181-2. http://dx.doi.org/10.1016/S0161-6420(96)30742-2.
- Elliott DB, Bullimore MA, Patla AE, Whitaker D. Effect of a cataract simulation on clinical and real world vision. Br J Ophthalmol 1996;80:799-804. http://dx.doi.org/10.1136/bjo.80.9.799.
- Elliott DB, Bullimore MA, Bailey IL. Improving the reliability of the Pelli–Robson contrast sensitivity test. Clin Vision Sci 1991;6:471-5. www.researchgate.net/publication/246438668_Improving_the_realibility_of_the_Pelli-Robson_contrast_sensitivity_test.
- Chapman GJ, Vale A, Buckley J, Scally AJ, Elliott DB. Adaptive gait changes in long-term wearers of contact lens monovision correction. Ophthalmic Physiol Opt 2010;30:281-8. http://dx.doi.org/10.1111/j.1475-1313.2010.00725.x.
- Foster RJ, De Asha AR, Reeves ND, Maganaris CN, Buckley JG. Stair-specific algorithms for identification of touch-down and foot-off when descending or ascending a non-instrumented staircase. Gait Posture 2014;39:816-21. http://dx.doi.org/10.1016/j.gaitpost.2013.11.005.
- Lee H-J, Chou L-S. Balance control during stair negotiation in older adults. J Biomech 2007;40:2530-6. http://dx.doi.org/10.1016/j.jbiomech.2006.11.001.
- Foster RJ, Hotchkiss J, Buckley JG, Elliott DB. Safety on stairs: Influence of a tread edge highlighter and its position. Exp Gerontol 2014;55:152-8. http://dx.doi.org/10.1016/j.exger.2014.04.009.
- Buckley JG, Timmis MA, Scally AJ, Elliott DB. When is visual information used to control locomotion when descending a kerb?. PLOS ONE 2011;6. http://dx.doi.org/10.1371/journal.pone.0019079.
- Shinya M, Popescu A, Marchak C, Maraj B, Pearson K. Enhancing memory of stair height by the motor experience of stepping. Exp Brain Res 2012;223:405-14. http://dx.doi.org/10.1007/s00221-012-3269-3.
- Avery GC, Day RH. Basis of the horizontal–vertical illusion. J Exp Psychol 1969;81:376-80. http://dx.doi.org/10.1037/h0027737.
- Anderson AJ, Vingrys AJ. Small samples: does size matter?. Invest Ophthalmol Vis Sci 2001;42:1411-13. http://iovs.arvojournals.org/Article.aspx?articleid=2199953.
- Hafner K. Bracing for the Falls of an Aging Nation 2014. www.nytimes.com/interactive/2014/11/03/health/bracing-for-the-falls-of-an-aging-nation.html?_r = 1 (accessed 19 May 2015).
- Pavol MJ, Owings TM, Foley KT, Grabiner MD. Mechanisms leading to a fall from an induced trip in healthy older adults. J Gerontol A Biol Sci Med Sci 2001;56:M428-37. http://dx.doi.org/10.1093/gerona/56.7.M428.
- Spaulding S, Patla AB, Elliott DB, Flanagan JG, Rietdyk S, Brown S. The Waterloo vision and mobility study: Gait adaptations to altered surfaces in individuals with age-related maculopathy. Optom Vision Sci 1994;71:770-7. http://dx.doi.org/10.1097/00006324-199412000-00007.
- Evans BJ, Rowlands G. Correctable visual impairment in older people: a major unmet need. Ophthalmic Physiol Opt 2004;24:161-80. http://dx.doi.org/10.1111/j.1475-1313.2004.00197.x.
- Elliott DB. The Glenn A. Fry Award lecture 2013: Blurred vision, spectacle correction, and falls in older adults. Optom Vision Sci 2014;91:593-601. http://dx.doi.org/10.1097/OPX.0000000000000268.
- Haran MJ, Cameron ID, Ivers RQ, Simpson JM, Lee BB, Tanzer M, et al. Effect on falls of providing single lens distance vision glasses to multifocal glasses wearers: VISIBLE randomised controlled trial. BMJ 2010;340. http://dx.doi.org/10.1136/bmj.c2265.
- Cumming RG, Ivers R, Clemson L, Cullen J, Hayes MF, Tanzer M, et al. Improving vision to prevent falls in frail older people: a randomized trial. J Am Geriatr Soc 2007;55:175-81. http://dx.doi.org/10.1111/j.1532-5415.2007.01046.x.
- Elliott DB, Chapman GJ. Adaptive gait changes due to spectacle magnification and dioptric blur in older people. Invest Ophthalmol Vis Sci 2010;51:718-22. http://dx.doi.org/10.1167/iovs.09-4250.
Appendix 1 New algorithms to determine important stair-specific events
The study reported in Foster and colleagues,60 and summarised briefly below, provided evidence for the usefulness of new algorithms to determine important stair-specific event detection on non-instrumented stairways. All references can be found in that publication. The findings allowed us to use a non-instrumented stairway rather than purchase the AMTI three-step system as planned in the original grant application. Instead, we purchased two additional Vicon MX cameras, which brought our system up to a 10-camera system. The two additional cameras focus directly on the stairway during data capture and capture markers that had previously been occluded owing to participant clothing or poor camera positioning. A secondary benefit of improving data capture was the reduction of repeated trials required by elderly participants during testing sessions. In this way, we were able to improve the reliability and sensitivity of our system and potentially decrease the sample sizes required for our studies.
Many existing studies investigating stair ambulation have used non-instrumented staircases or partially instrumented staircases (force plate located in only one of multiple steps). Using such staircases, other methods of event detection are required to calculate important parameters such as stance and swing phases. Although kinematic algorithms for overground gait exist, they are unlikely to be as accurate for event detection when applied to stair ambulation because of the differences in segmental kinematics between each mode of gait. There are no formal reports regarding the use of kinematically derived algorithms for the detection of touchdown and foot-off in stair ambulation, and given the sparse use and/or availability of force-instrumented staircases, such algorithms could have wide appeal.
Considering stair ambulation specifically, ascent and descent require completely different kinematic strategies; thus, event detection algorithms used for stair descent are unlikely to be suitable for stair ascent and vice versa. The present study introduces event detection algorithms defining touch-down and foot-off based on segmental kinematics for both stair ascent and stair descent. The performance of these algorithms was assessed by determining the agreement in kinematically derived touchdown and foot-off events with those determined from ground reaction forces (i.e. gold-standard method). In addition, to highlight the need for stair-specific event detection algorithms we compared the performance of the new algorithms to that achieved when using existing kinematic overground gait event detection algorithms to determine the same stair ambulation touchdown and foot-off events.
Details regarding the methods and results are provided in Foster and colleagues. 60 The study formally introduced and validated four event detection algorithms for detecting touchdown and foot-off during stair descent and stair ascent using segmental kinematics. The results of the study revealed that use of these algorithms identified touch-down and foot-off events with acceptable agreement compared with force-derived touch-down and foot-off, and all performed better at detecting stair ambulation touch-down and foot-off events than existing overground gait event detection algorithms did. These findings indicate that the new algorithms can be used to detect touchdown and foot-off events in stair ambulation studies that use non-instrumented staircases. Furthermore, these algorithms performed equally well in both younger and older adults and across differing stair riser height conditions, suggesting that they can be used.
Appendix 2 Public involvement in the research
We regularly use members of the public to help direct our research. A group of about 50 retired volunteers regularly act as volunteer patients for our undergraduate optometry students to perform eye exams and this group is added to on a regular basis, particularly from the 200-strong Bradford Older People’s Forum. Volunteers from these groups are regularly asked to help in pilot studies and focus groups (we are also involved in questionnaire-based quality-of-life studies). For this particular series of studies, we asked several volunteers to help determine the safety and feasibility of using a three-step system for step ascent and descent as most of our previous adaptive gait experiments had mainly used one step. 38,39,41–43 Other laboratories have used a multistep stairway, but this has necessitated the use of a harness system to ensure participant safety,35,36 which can make the experimental set-up less like using stairs in the ‘real world’. Given that one-third of accidents tend to occur on the first or last step and 70% occur in the first three or last three steps,6,8 we considered the use of a three-step system without safety harness for the proposed studies. The pilot study included 15 participants (eight women, mean age 72.1 years, range 61–84 years) with a mean height of 1.70 m (SD 0.1 m), a mean mass of 71.9 kg (SD 14.2 kg) and a mean timed-up-and-go score of 7.9 seconds (range 4.3–13.8 seconds). The three-step stair had a 1.0 m × 1.5 m top landing, with a step width of 1.0 m, step risers of 167 mm, a step going of 285 mm and a pitch of 30.6° and was fitted with a handrail on the right-hand side of the stairs. All participants found the task easy to perform and deemed it very safe, although an 84-year-old participant with the highest timed-up-and-go test of 13.8 seconds descended the steps using a both-feet-on-each-step strategy. The handrail did not seem to be necessary for the majority of the subjects and the only discussion about it was to remind participants to use it. This was often followed by the subjects saying that they would not normally hold a rail for such as a task. This may have been attributable to the good health of the participants recruited or the relatively low number of steps, or a combination of the two. The majority of subjects felt that the three-step ascent and descent used in the pilot was comparable to a three-step stair that they might find in the community when shopping, etc. The biggest issue with the set-up lay in the protocol of the subjects always having to lead with the same foot. This approach was used in previous one-step descent studies and made the analysis somewhat easier. Some indicated that there was ‘too much thinking’ with this type of approach and that ‘it didn’t feel natural’. Therefore, to make the scenario as ‘real world’ as possible the data analysis system was rewritten to cope with both right- and left-foot leads. In addition, the pilot study participants suggested that they should not be forced to use the handrail in experiments, but that they should be informed that they could use it if they wish. In addition, we felt that it would not have been appropriate to use participants who felt they needed to use a both-feet-on-each-step strategy.
Glossary
- Abutting
- Edge highlighter flush with leading edge of stair tread.
- Away1
- Edge highlighter placed 1 cm from leading edge of stair tread.
- Away3
- Edge highlighter placed 3 cm from leading edge of stair tread.
- Going
- The horizontal part of a stairway that is stepped on.
- Heel scuff
- Accidental contact between the heel and tread edge/going or riser during stair descent.
- Nosing
- A shield that covers both the front-edge portion of a tread and top portion of the step riser.
- Observer
- Participant in psychophysics experiment.
- Plain
- No edge highlighter present.
- Riser
- The vertical portion between each tread on the stair.
- Walkway
- Single-level raised surface.
List of abbreviations
- A&E
- accident and emergency
- AMTI
- Advanced Mechanical Technology Inc.
- ANOVA
- analysis of variance
- C3D
- co-ordinate three-dimensional
- df
- degrees of freedom
- ETDRS
- Early Treatment Diabetic Retinopathy Study
- H–V
- horizontal–vertical
- logMAR
- logarithm of the minimum angle of resolution
- LR
- likelihood ratio
- NIHR
- National Institute for Health Research
- RCT
- randomised controlled trial
- SD
- standard deviation
- SE
- standard error