Notes
Article history
The research reported in this issue of the journal was funded by the PHR programme as project number 11/3005/31. The contractual start date was in April 2013. The final report began editorial review in November 2016 and was accepted for publication in September 2017. The authors have been wholly responsible for all data collection, analysis and interpretation, and for writing up their work. The PHR editors and production house have tried to ensure the accuracy of the authors’ report and would like to thank the reviewers for their constructive comments on the final report document. However, they do not accept liability for damages or losses arising from material published in this report.
Declared competing interests of authors
Zaid Chalabi reports grants from the National Institute for Health and Care Excellence (NICE), the Natural Environment Research Council and the Department of Energy and Climate Change during the conduct of the study. Michael Davies reports grants from the Wellcome Trust, the European Commission, the Engineering and Physical Sciences Research Council (EPSRC), NICE, the Department of Energy and Climate Change and the Department for Communities and Local Government during the conduct of the study. Ian Hamilton reports grants from Research Councils UK during the conduct of the study. Emma Hutchinson reports grants from the Irish Government (Department of Communications, Climate Action and Environment) outside the submitted work. Anna Mavrogianni reports frants from the Natural Environment Research Council (NERC); the Engineering and Physical Sciences Research Council (EPSRC); the National Institute for Health Research (NIHR); the Adaptation and Resilience in the Context of Change (ARCC) network; the Energy Technologies Institute (ETI); the Department for Communities and Local Government (DCLG); and the Department for Environment, Food and Rural Affairs (DEFRA). She also reports personal fees from the Zero Carbon Hub (ZCH); the Greater London Authority (GLA); the Department for International Development (DfID); Vivid Economics; the Energy Saving Trust (EST); the Carbon Trusts; and non-financial support from Arup Group (London, UK) during the conduct of the study, outside the submitted work. James Milner reports grants from the Irish Government (Department of Communications, Climate Action and Environment) outside the submitted work. Christophe Sarran reports grants from the Medical Research Council, NERC and NIHR outside the submitted work. Phil Symonds reports grants from EPSRC and NIHR outside the submitted work. Jonathon Taylor reports grants from the Wellcome Trust and NIHR during the conduct of the study. Paul Wilkinson reports grants from NIHR (the Policy Research Programme) during the conduct of the study and grants from the Irish Government (Department of Communications, Climate Action and Environment), Wellcome Trust, EPSRC Global Challenges Research Fund, (former) Department of Energy and Climate Change, NICE, European Climate Foundation and Natural Environment Research Council outside the submitted work.
Permissions
Copyright statement
© Queen’s Printer and Controller of HMSO 2018. This work was produced by Armstrong et al. under the terms of a commissioning contract issued by the Secretary of State for Health and Social Care. This issue may be freely reproduced for the purposes of private research and study and extracts (or indeed, the full report) may be included in professional journals provided that suitable acknowledgement is made and the reproduction is not associated with any form of advertising. Applications for commercial reproduction should be addressed to: NIHR Journals Library, National Institute for Health Research, Evaluation, Trials and Studies Coordinating Centre, Alpha House, University of Southampton Science Park, Southampton SO16 7NS, UK.
2018 Queen’s Printer and Controller of HMSO
Chapter 1 Context
This report describes several strands of research examining the connection between winter- and cold-related mortality/morbidity, and the energy efficiency (thermal insulation) properties of the housing stock in England. Our purpose was to address current knowledge gaps and to strengthen the evidence base for appraisal of policy options in the housing sector, which could see large investments over the coming decades that are partly motivated by climate change goals.
It has long been recognised that the UK has a large and unacceptable burden of excess winter mortality and morbidity1–3 (around 25,000 excess winter deaths each year depending on the definition used), which is greater than that of many comparable northern European countries with colder climates. Although part of the winter excess is attributable to influenza and other seasonal infections, time-series studies suggest that the major part of the seasonal burden is related to exposure to cold. 1,4,5 Theoretical considerations and some direct evidence from the UK, New Zealand and elsewhere suggest that housing may play an important role in determining vulnerability,6–11 although it is recognised that exposure to cold through outdoor excursions may also be important. Therefore, there has been much interest in, and debate about, the contribution that interventions on housing quality may make to winter- and cold-related mortality and morbidity, especially in the context of fuel poverty (FP). 8,9
Over the next few decades, there are likely to be major investments in the housing sector driven by (1) policies aimed at reducing household energy use and greenhouse gas (GHG) emissions to meet the legally binding obligations of the Climate Change Act 2008,12 and (2) considerations of health, in particular the assumed benefits of improved insulation and energy efficiency for winter- and cold-related deaths and illness. However, these investments may be very costly and have potential for adverse as well as positive effects on health,13 especially if achieved in part through reduced ventilation. Therefore, it is important that policies are informed by quantitative evidence on the impacts of home energy efficiency (HEE) investments on health and that decision-makers have tools needed to assess likely health and other costs and benefits. We have attempted to contribute such evidence both by exploiting opportunities for using national data on HEE interventions [specifically the Homes Energy Efficiency Database (HEED)14] and by the development and application of models and tools.
Energy efficiency and health
The energy efficiency of dwellings relates to four main parameters: the insulation properties of the building fabric (its walls, roof, floor and windows); the control of ventilation; the efficiency of the heating, cooking, lighting and other power-consuming devices within the home; and the sources of energy.
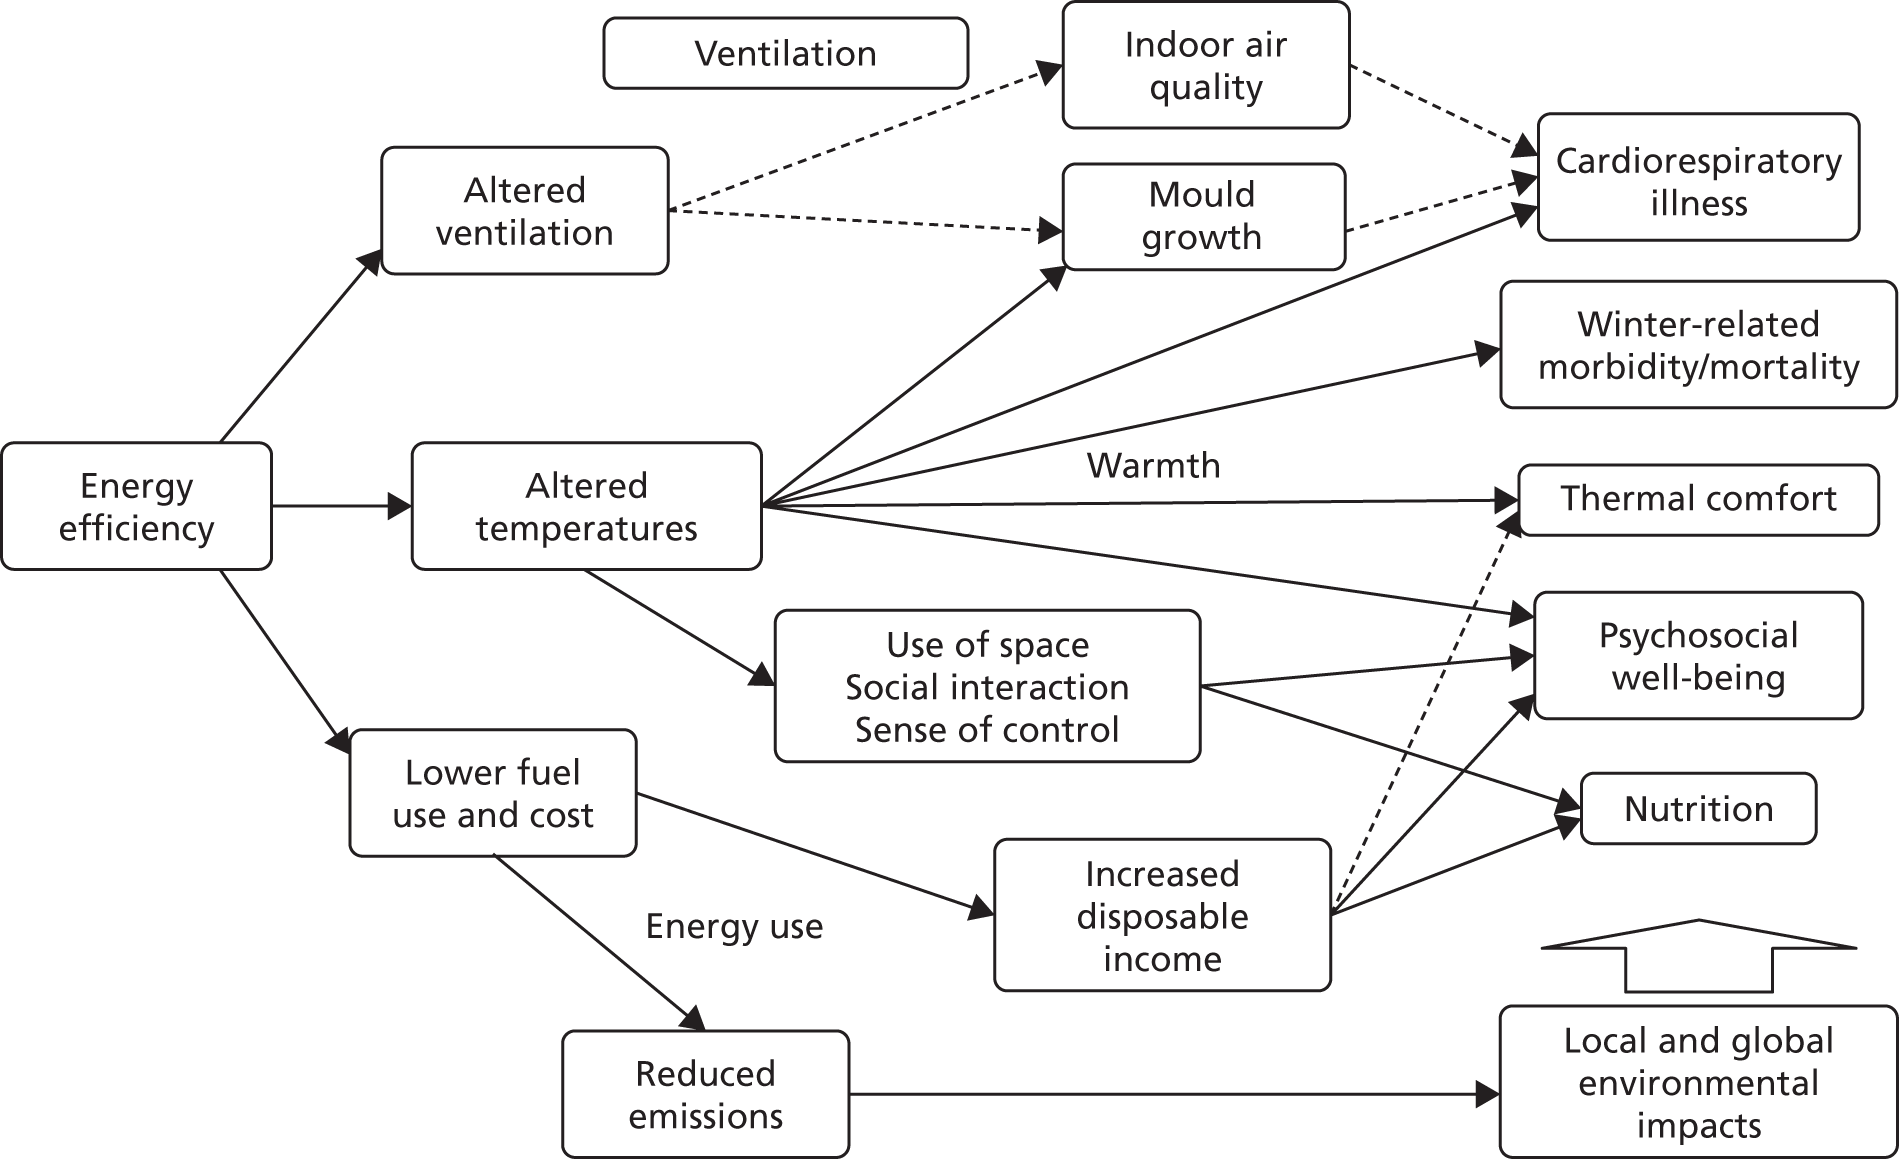
Figure 1 summarises the principal pathways by which energy efficiency affects health. There are four main sets of pathways. The first is the thermal control of the indoor environment, especially protection against cold in winter months but also, potentially, against heat exposure during warmer weather. Cold is important not only because of its physical effects but also because of its bearing on mental well-being and social interactions within families and with friends and neighbours. Second, energy efficiency typically entails a tighter control of ventilation to avoid heat loss through the poorly controlled escape of heated air. The consequences of such reduced permeability may be positive or negative. Greater airtightness protects against the ingress of harmful pollutants from the external environment but acts to increase pollutants generated inside the home, including second-hand tobacco smoke (STS), volatile organic compounds from materials inside the home, and radon. Third, there are emissions to the external environment that can contribute to ambient pollution but other emissions to the external environment include GHGs which are an increasingly important factor in global environmental change and, thus, in future planetary and human health, even if they are not directly toxic. Finally, there are consequences relating to the cost of meeting energy needs that may be especially important for families on low incomes.
FIGURE 1.
Diagrammatic representation of the main direct and indirect pathways by which energy efficiency measures affect health.
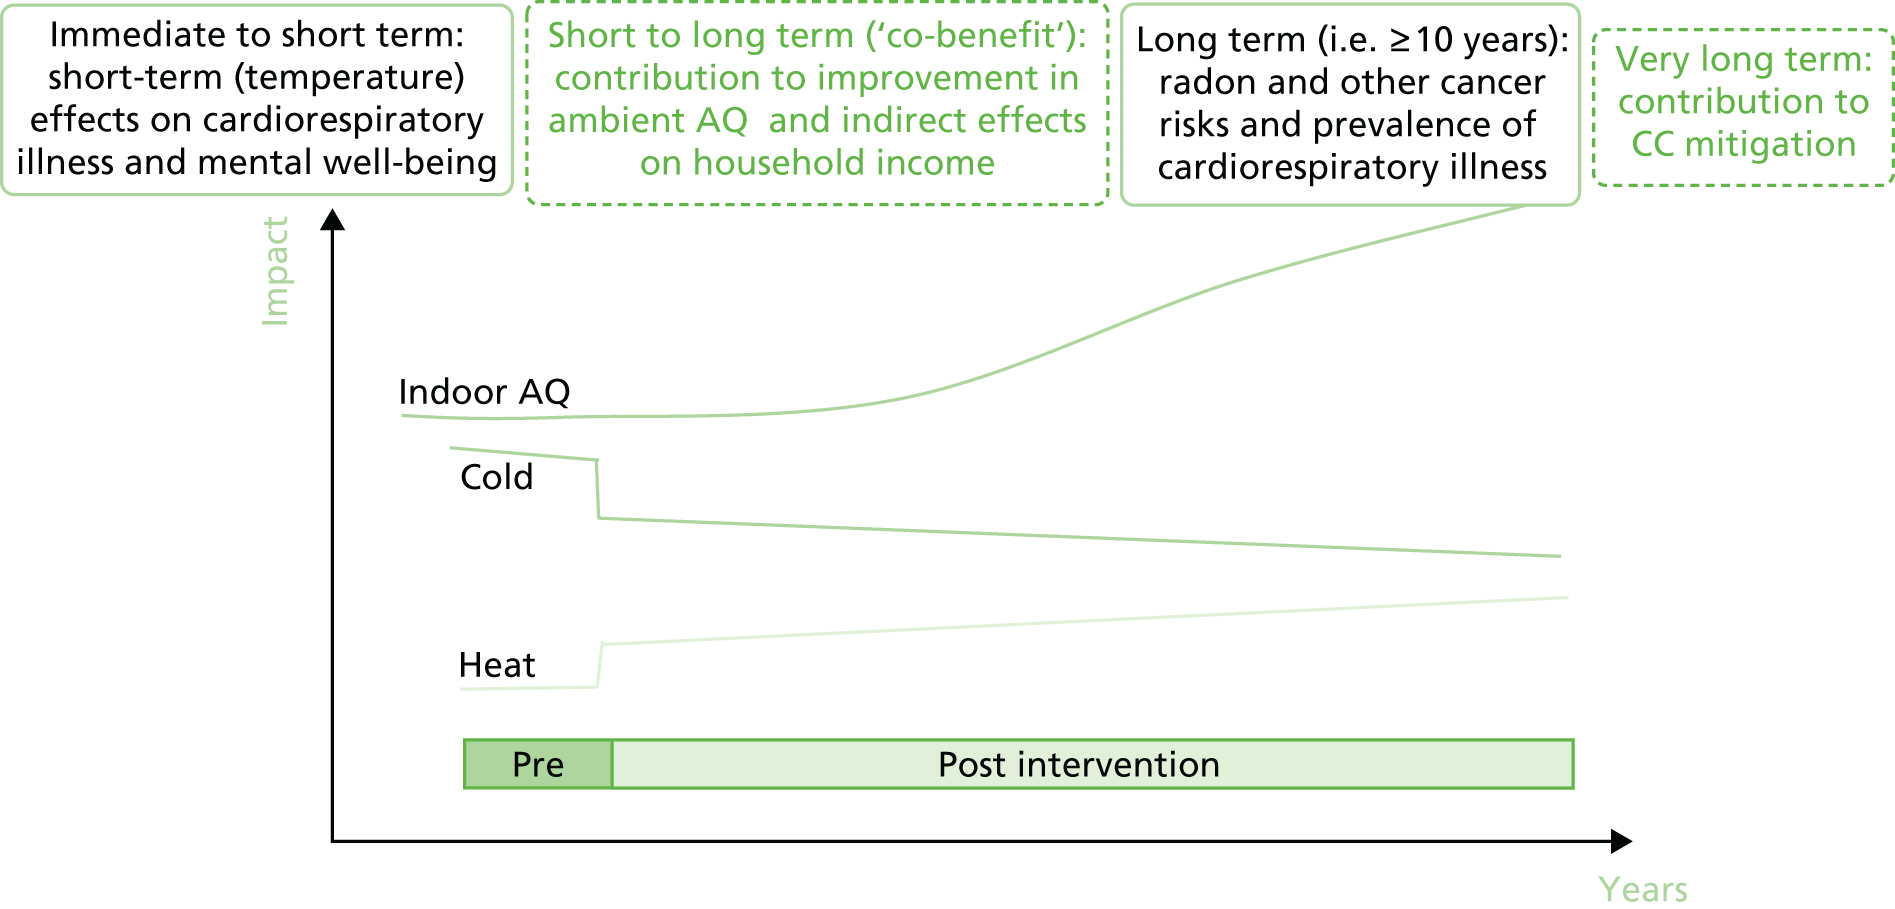
These four sets of pathways give rise to potentially innumerable forms of health impact, many of which are not sufficiently well understood to attempt quantification, such as those relating to more distant climate change effects or to cost savings. Figure 2 also schematically shows that the timing of these impacts varies. The effects of cold or heat are fairly immediate in terms of both physical and mental well-being. However, changes to indoor air quality have effects that may take years or even decades to evolve even if the change in pollution concentrations is immediate. This means that the assessment of the health effects depends not only on which pathways are considered but also on the time window.
FIGURE 2.
Diagrammatic representation of the evolution of the main categories of health impact consequent to changes in the energy efficiency properties of a dwelling. AQ, air quality; CC, climate change.
Although it should be an aspiration to be as inclusive as possible with regard to the spectrum of exposures and outcomes and the time horizon, all studies are necessarily restricted. The study that we report here is no exception. However, as we have a partial focus on the development of modelling methods, we have begun to consider the medium- to long-term effects of energy efficiency measures in more depth than originally intended. This has been useful because of the insight that it has given into HEE interventions, which should not be viewed as dominated by issues relating to the effects of cold. As we will show, other forms of health impact may be of equal, if not greater, importance, and when assessing practical choices it may often be instructive to consider multiple consequences of actions.
Chapter 2 Aims and objectives
The project aim was to evaluate the impact that HEE interventions have on winter- and cold-related mortality/morbidity in England, including assessing the impact of fuel costs and subsidies.
The specific objectives of the study were to:
-
use the HEED data for England, 2000–10, combined with national mortality and hospital admissions data sets and location-specific meteorological data, to quantify the effect that the HEE interventions have on cold-related mortality/morbidity and other outcomes
-
use a 35-year series of data for the major conurbations of England to assess interannual variations in cold-related mortality/morbidity and the degree to which they are influenced by fluctuations in fuel price and the winter fuel payments (WFPs), especially for vulnerable population groups that were defined on the basis of socioeconomic status, age and other parameters
-
conduct in-depth interviews with householders and households to document long-term experiences and behavioural changes associated with HEE interventions, with a focus on the pathways linking HEE, well-being and aspects of FP, and to explore how health evidence of HEE interventions is, and could be, utilised in policy and advocacy activities, including evidence of inequalities
-
use the evidence of objectives 1–3, in combination with evidence of costs and existing epidemiological evidence, to elaborate a model of health impact and to present and test policy options using a formal multicriteria decision analysis (MCDA) framework.
We also aimed to maximise knowledge transfer and impact through engagement with major stakeholders throughout the research process.
Our initial plan relating to objective 1 had been to carry out a postcode linkage of mortality and Hospital Episode Statistics data to the HEED to attempt a direct epidemiological analysis of the degree to which HEE interventions modify cold-related health risks. However, a subsequent analysis of HEED data combined with modelling of temperature changes suggested that the average HEE intervention was associated with an increase in indoor temperature of < 0.1 °C, an unexpectedly small effect for which the observable association with health outcomes would be further diluted with data aggregated to postcode level (see The impact of home energy efficiency interventions: 2002–10, Temperature changes). This seemed to place such health effects beyond the limits of detection using the proposed methods of data linkage and analysis. Therefore, with regard to objective 1, we altered our analysis plan to use an indirect approach in which assessed changes to the indoor environment were combined with more general epidemiological functions to derive impact estimates. In parallel, however, and with the support of the Administrative Data Research Centre for England, we continue to explore linkage analysis at the level of individual dwellings. This work will be completed and reported separately.
What this report contains
The report describes three main sets of quantitative analyses and the results of the interview (qualitative) study. The quantitative analyses include (1) epidemiological analyses, (2) studies of exposure and health impact and (3) the MCDA.
The three epidemiological analyses are described in Chapters 3 and 4. All are based on time-series (i.e. statistical regression) analyses of data for England, which allow the quantification of temperature-related mortality. The first analysis (see Chapter 3, Epidemiological studies) looks at the change in the burden of cold-related mortality over time since the 1970s and some of the reasons for change. The second analysis (see Chapter 4, Modelling) uses a longer time-series to explore the degree of life shortening in cold-related death. The third analysis (see Chapter 4, Modelling) examines evidence that dwelling characteristics determine, in part, vulnerability to heat-related death. All three analyses use daily or weekly empirical data on deaths and temperature.
The exposure and health impact modelling studies are also divided between Chapters 3 and 4. In Chapter 3, the analyses concentrate on changes to indoor temperature and air quality from energy efficiency. They are in part empirical [using housing data from such sources as the HEED and the English Housing Survey (EHS)] but also use building physics and other models to characterise the effect of HEE interventions on the indoor environment. These analyses specifically include a modelled estimate of the changes to indoor temperature and air quality as a result of the HEE interventions that have been installed in the period 2000–10 and also an estimate of the effect of those changes on health by using additional evidence on the links between temperatures, air quality and health. In Chapter 4, the health impact model is further developed and applied in a case study to compare the impact that HEE measures have with that of fuel subsidies.
Chapter 5 then considers the use of the MCDA as a decision support tool. The MCDA makes use of the outputs from the health impact model as its criteria for comparing policy options. It is a method of formalising the weight (value) given to different effects of HEE measures when deciding between forms of intervention.
The qualitative study is reported as a standalone analysis in Chapter 6.
Literature searches
Throughout the text, we describe background evidence that is germane to the various analyses and modelling methods. Literature on temperature-related mortality, and its relationships with housing, was obtained by a non-systematic search of the epidemiological literature through PubMed and MEDLINE In-Process & Other Non-Indexed Citations, with backward searches of references of recent papers. Separate searches were made of the buildings and energy efficiency literature for publications that were relevant to the indoor environment and for papers that were relevant to the methods and applications of the MCDA. In each case, the literature search was not aimed at a wider review of the state of current evidence but was targeted at specific analytical questions relevant to the chapter.
Public involvement
For this project, public involvement took two forms: (1) the involvement of organisations and agencies representing a range of stakeholder interests, including non-governmental and governmental organisations, to reflect their perspectives at local, national and international level; and (2) dialogue with selected members of the public through in-depth interviews.
Stakeholder groups were established that contributed to discussions of the design of the project and to the interpretation of its results through several workshops and other contacts. The groups’ input was sought, in particular, on policy focus, including questions relevant to the development of the MCDA. They included people from charities (including the Noncommunicable Diseases Alliance, Age UK, the Zero Carbon Hub, Energy Bill Revolution and the Joseph Rowntree Foundation), governments agencies [including the Department of Energy and Climate Change (DECC)] and the World Health Organization. These groups will also be engaged to assist in the dissemination strategy, as will members of the Advisory Group through representatives of local government and Public Health England. Age UK are assisting in dissemination through its nationwide network of local groups.
In addition, as part of the qualitative component of the study, we carried out interviews with local authority housing policy officers and councillors to understand councils’ activities with regard to HEE during recent years. Specifically, we sought to understand their role in local HEE uptake, the major HEE initiatives carried out by councils, factors facilitating/inhibiting uptake in the local area from their perspective, housing stock issues, tenure issues, vulnerable group issues, priorities regarding FP, sustainability and health, historical local spikes of interest in HEE and their collaboration with other organisations. We held extensive discussions with the directors at the following organisations to understand their roles in shaping HEE uptake and to understand the issues that they face: Groundwork, Care & Repair, Easton Energy Group and Bristol Energy Network, Talking Money, Green Doors, Centre for Sustainable Energy, Roundhay Environmental Action Project and Trading Standards.
Chapter 3 Epidemiological studies
Long-term trends in cold mortality
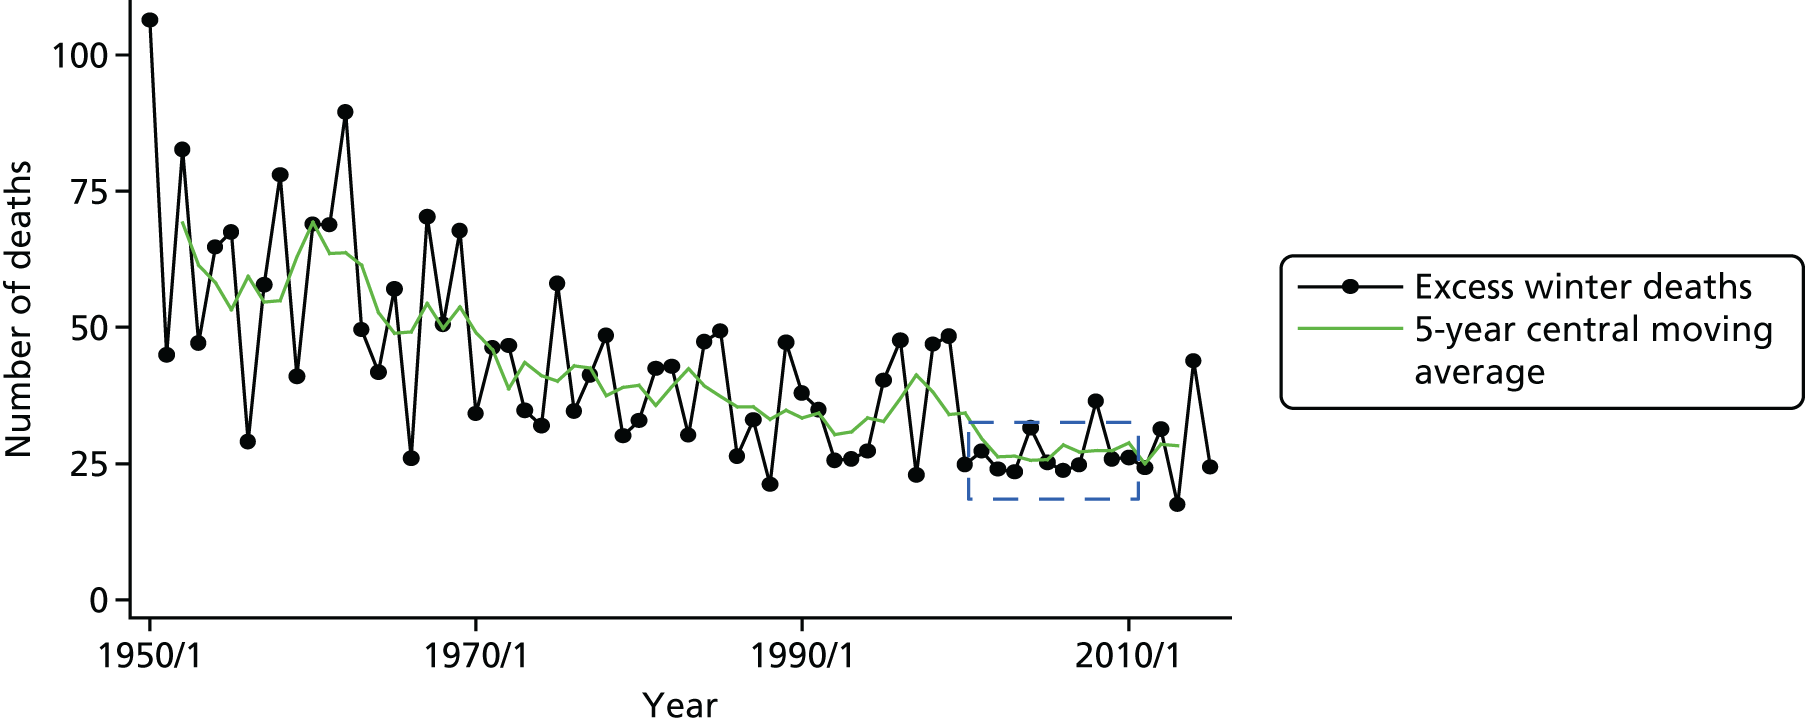
Winter-related mortality, based on the proportionate excess in death rate during December to March compared with other months of the year, has been falling in England and Wales since at least the 1950s (Figure 3). 15 There is evidence that cold-related mortality burden has been falling for, most probably, the last century or so. 16 This may be a result of a wide range of factors associated with socioeconomic development, including improvements in housing, infrastructure, technology, underlying population health and health care.
FIGURE 3.
Number of excess winter deaths and 5-year central moving average, England and Wales: 1950/51–2015/16. The dashed box indicates the years corresponding to those used in the analyses in this report. Based on data from the Office for National Statistics (ONS). 15
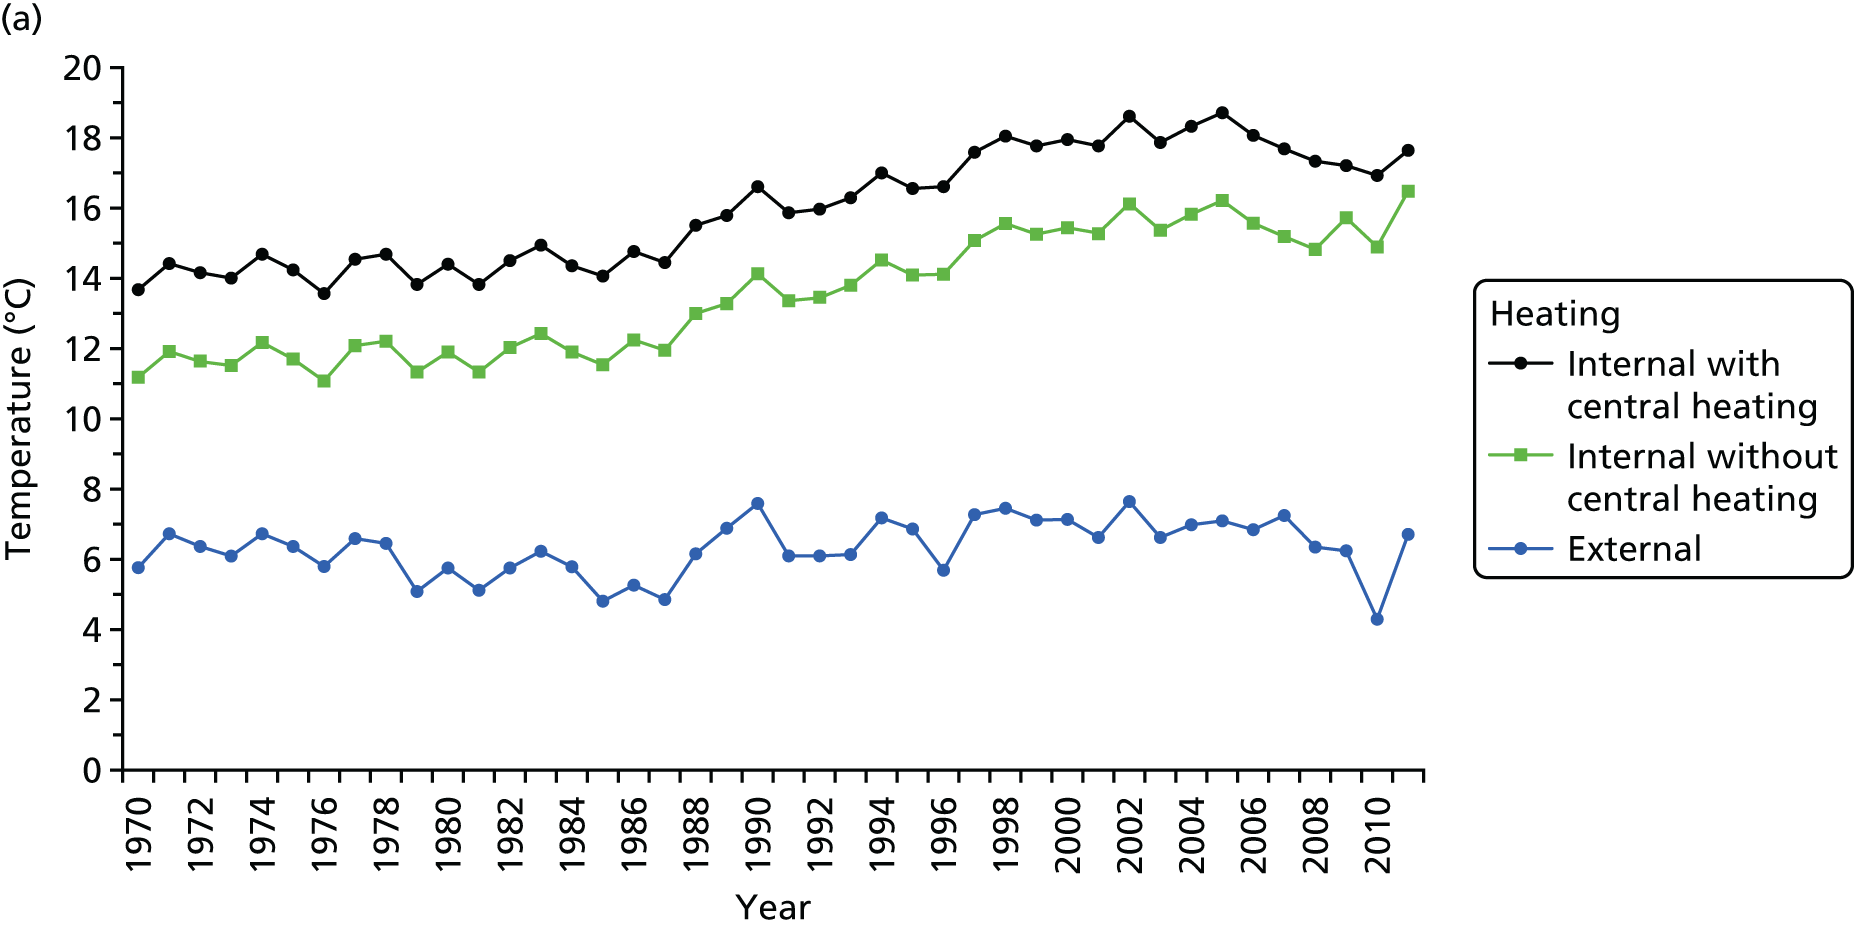
In a first set of analyses, we examined the pattern of changes in annual burden of cold-related deaths since the mid-1970s. Over that time, evidence from the United Kingdom Housing Energy Fact File 201317 indicates a steady rise in winter indoor temperatures in homes, especially since the mid-1980s (Figure 4). This rise has been seen in parallel in dwellings with and without central heating, but average winter temperatures in homes with central heating have been around 1.5 °C greater than in homes without it. The proportion of homes with central heating (mainly gas) has also risen substantially (see Figure 4b). By 2010, only around 9% of homes were still without central heating.
FIGURE 4.
Changes over time in home heating and household costs and expenditure on fuel. (a) Trend in winter indoor temperatures; (b) homes with and without central heating; (c) average (UK) fuel prices (2011 prices); and (d) average weekly expenditure. Based on data tables from the United Kingdom Housing Energy Fact File 2013. 17

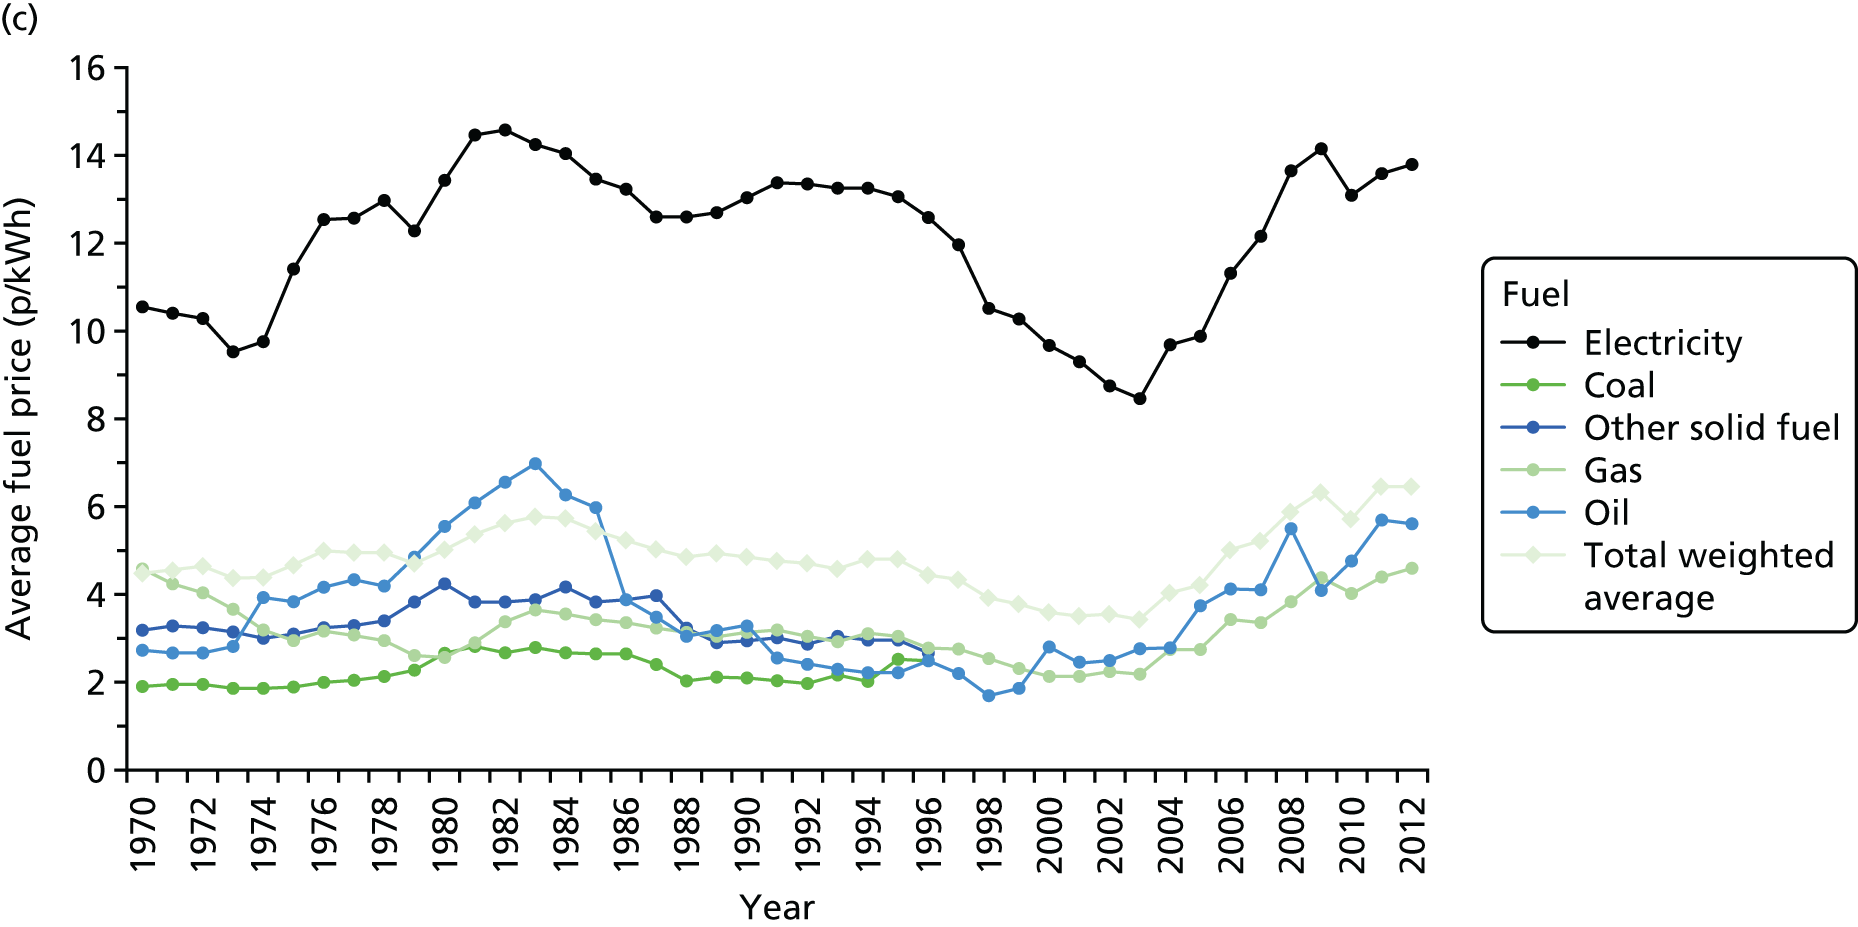
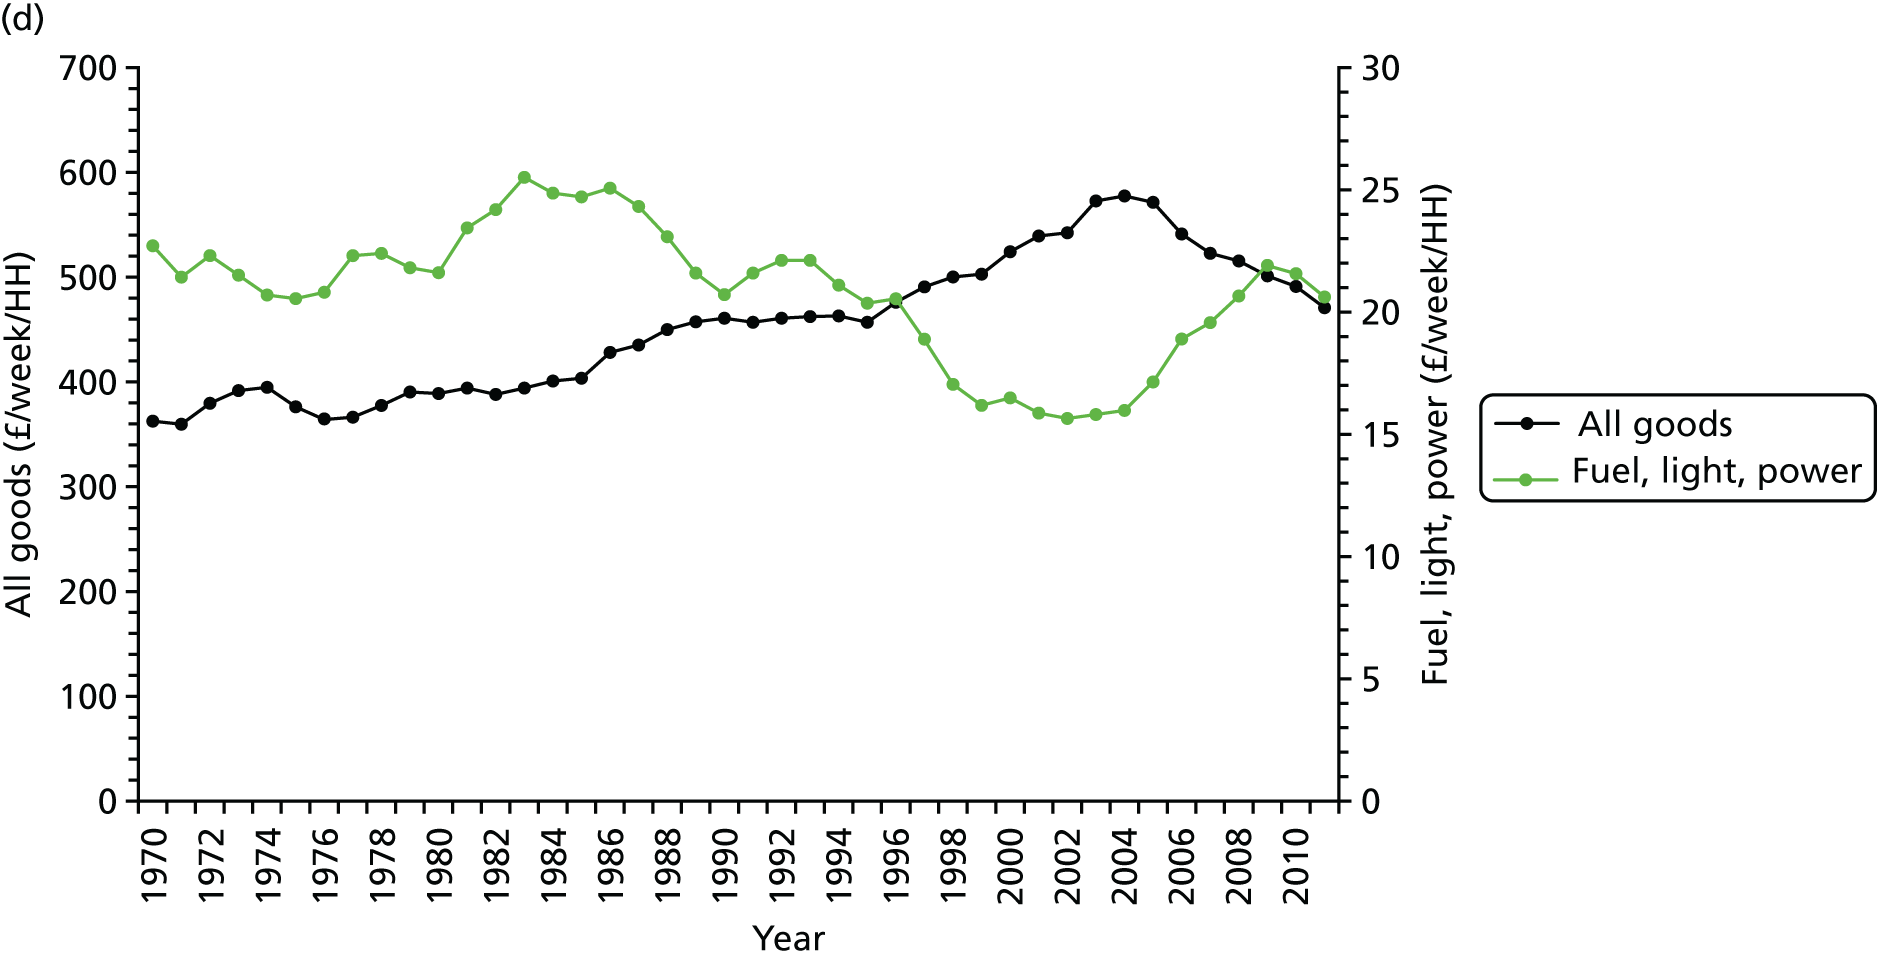
The cost of fuel (expressed in terms of pence per kilowatt hour at 2011 prices) has fluctuated somewhat, especially for electricity and oil, but overall household expenditure on fuel, lighting and power had been in gradual decline until the early 2000s when there was then a relatively sharp increase (see Figures 4c and d). By 2010/11, household expenditure on fuel was broadly in line with the long-term trend of the last four decades.
Our primary focus was to determine the impact of WFPs as well as fluctuations in fuel price. The WFP is a non-means-tested, tax-free annual cash payment, first introduced in 1997, which is paid to individuals who are in receipt of the State Pension or other qualifying benefits. 18 It is paid at £200 per eligible household in which the oldest person is aged < 80 years and £300 for households containing a person aged ≥ 80 years.
Methods
For the period 1975–2012, we based analyses on the following data sets:
-
regional (government office region – a standard administrative region) time series of counts of death by day, stratified by age group and by broad cause-of-death group
-
meteorological data, specifically including daily minimum and maximum temperatures and relative humidity
-
regional weekly data of influenza A and B cases reported to the Public Health Laboratory Service, as well as annual survey-based estimates of influenza vaccine coverage for people aged ≥ 65 years
-
national data on domestic fuel costs, adjusted to 2011 prices, as well as data on trends in home heating, including the proportion of homes with central heating and indoor temperatures, derived from the United Kingdom Housing Energy Fact File 201317
-
year indicators as markers of the periods covered by WFPs (first introduced from the winter of 1999/2000).
The association between daily mortality rates and outdoor temperature was analysed using Poisson regression methods, adjusted for long-term trend and seasonality, day of the week and reported influenza cases. Model parameterisations were informed by recent research. 1,3,19 Adjustment for trend and seasonality was based on use of cubic spline curves generated using an adaptation of Stata®’s (StataCorp LP, College Station, TX, USA) frencurv command, specifying seven knots per year in keeping with previous studies, as a compromise between providing adequate control for unmeasured confounders and leaving sufficient information from which to estimate temperature effects. 19 The (non-linear) temperature mortality function was fitted using natural cubic spline functions of temperature, implemented using Stata’s mkspline command with specification of two internal and two boundary knots. This function was applied to the mean of the maximum daily temperature over a lag period of 0–13 days (a single term of the mean of the daily maximum temperatures over this period), a lag structure chosen to capture the typical lags of the effect of cold exposure on mortality. 1,19,20 Maximum temperature was chosen as the index providing the best fit in analyses of all-cause mortality in the UK.
To test for change in the association between low temperature and mortality we fitted a simplified model in which the (log) risk of mortality at lags 0–13 days was assumed to be a linear function of temperature below a fixed cold temperature threshold assumed to be at 10 °C, a temperature chosen following inspection of plots of the temperature-related mortality function as a convenient reference point close to the minimum mortality temperature for lags of 0–13 days.
Attributable deaths ni on each day i were computed using the formula ni = Ni × (RRi − 1)/RRi, where RRi = exp[β × (ti − t0)], Ni is the total number of deaths on day i, RR is the relative risk on day i and t0 is the ‘no-cold-effect’ baseline temperature. Daily attributable deaths were then summed over days for the year to compute the annual burden of cold-related deaths. For this, years were defined to run from July to June to capture cold-related deaths during whole winters.
Results
The regression results confirmed the well-established relationship between low outdoor temperature (over lags 0–13 days) and mortality risk.
Figure 5 plots the annual estimates of (all-cause) cold-related mortality for the London region for the period of analysis. In both plots, points indicated by black dots represent data for the years before the introduction of the government’s WFPs and the green dots data for the years after the introduction of WFPs.
FIGURE 5.
The annual estimates of (all-cause) cold-related mortality for the London region. (a) Changes over time in cold-related deaths and mean of daily maximum temperatures in winter (December, January, February, March); and (b) the relationship between cold-related deaths and mean winter temperature, 1975–2011.
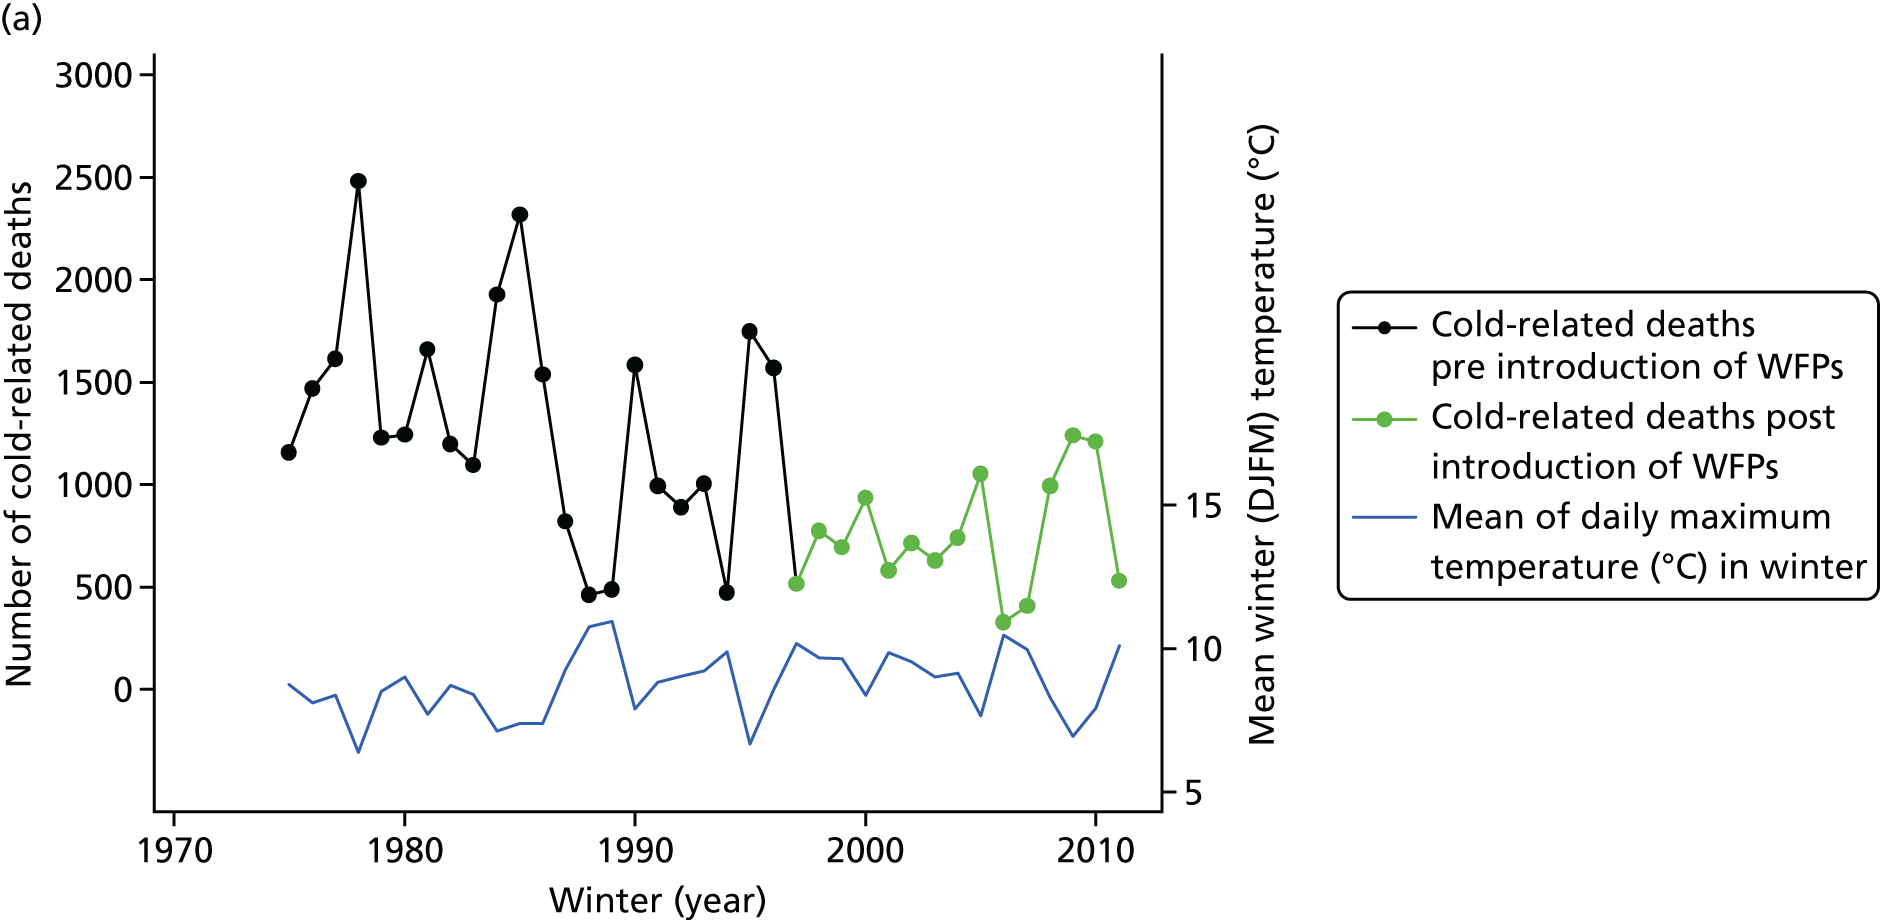
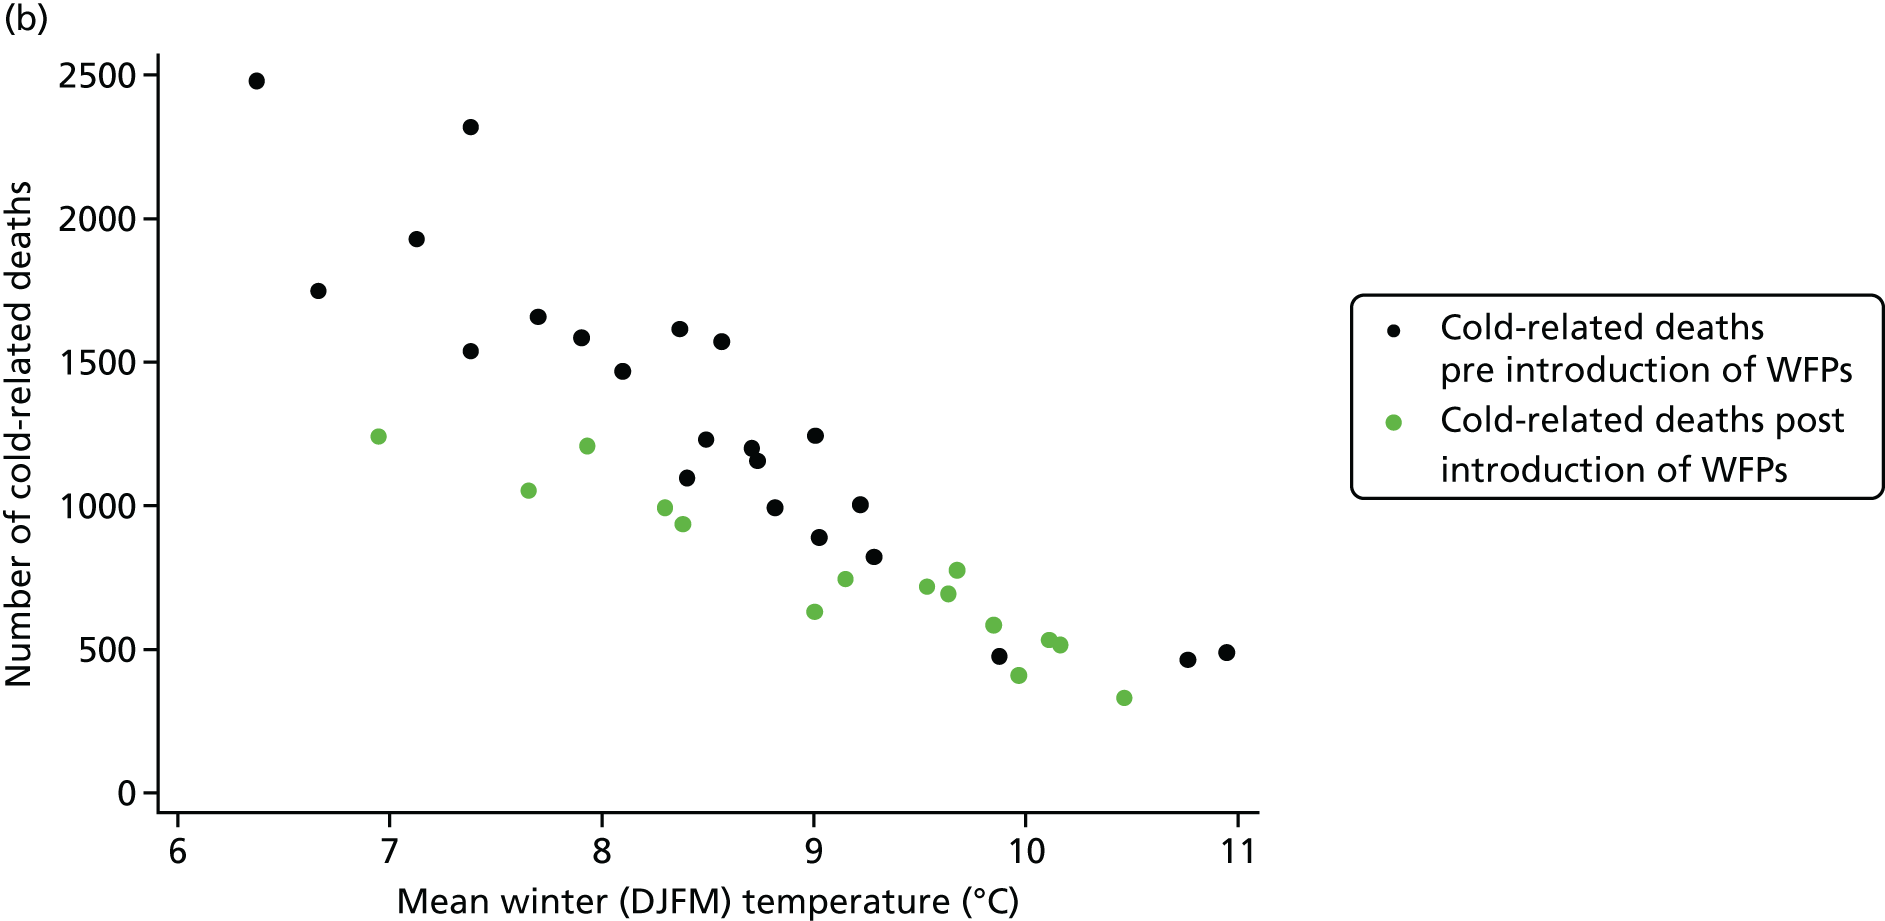
It is apparent that there has been a steady but progressive reduction in the annual number of cold-related deaths over time, an observation that is broadly consistent with analyses of the trend in the Excess Winter Mortality Index15 published by the Office for National Statistics (ONS) (see Figure 3). Although it is not possible to make a robust interpretation of the exact pattern of the decline in cold-related deaths, the reduction appears to have been relatively greater over the period leading up to the year 2000 than in subsequent years.
As suggested by Figure 5b, the annual burden of cold-related deaths is directly related to mean winter temperature, with higher burdens in colder years. Thus, the overall decline in cold-related deaths over time is in part, but not wholly, explained by the gradual rise in mean winter (December, January, February, March) temperatures during the period of analysis (see Figure 5a), remembering that the computation of cold-attributable deaths was made by reference to the fixed cold temperature threshold of 10 °C.
Table 1 shows the results of analyses of the variation in the gradient of association between outdoor temperature and mortality in relation to both the introduction of WFPs and the annual domestic fuel price. We found evidence that since the introduction of WFPs in 1997 the gradient of association has been somewhat weaker than in earlier years (p = 0.02 for the test of statistical interaction). The period since 1997 has also been accompanied by higher indoor temperatures (see Figure 4).
| Variable | Per cent increase in mortality per degree Celsiusa (95% CI) | p-value for statistical interaction |
|---|---|---|
| Period of WFPs | ||
| Pre introduction of WFP | 2.37 (2.22 to 2.53) | p = 0.02 |
| Post introduction of WFP | 2.00 (1.74 to 2.28) | |
| Domestic fuel cost | ||
| Below-average cost for study period | 1.97 (1.77 to 2.18) | p < 0.001 |
| Above-average cost for study period | 2.49 (2.32 to 2.66) | |
There is also evidence that years with higher than average domestic fuel prices have a somewhat stronger relationship between low outdoor temperatures and mortality [per cent increase in mortality per degree Celsius fall in temperature of 2.49%, 95% confidence interval (CI) 2.32% to 2.66%] than years with below-average fuel prices (1.97%, 95% CI 1.77% to 2.18%). This is compatible with high fuel prices having a detrimental effect on cold-related deaths.
Discussion
The analyses presented in this section reflect year-to-year changes in cold mortality. The analyses are also dependent on a number of assumptions about model parameterisation and the temperature baseline used to define cold-attributable mortality in a given year.
These appear to indicate a slight weakening of the relationship between low outdoor temperature and mortality since the introduction of the WFPs in 1997, a result that is compatible with an econometric analysis by Iparraguirre. 21 However, the period since 1997 has also been accompanied by changes in many other factors that may have reduced the risk of cold-related death. These include the efficiency of the thermal insulation of houses, improved heating systems (which are more likely to account for the temporal increase in indoor temperatures shown in Figure 4) and the reduced incidence/fatality of important ‘temperature-sensitive’ diseases, such as ischaemic heart disease, whose rates have declined rapidly in recent years. Therefore, it is not possible to conclude with certainty that the contribution of WFPs to the cost of heating the home has been the main contributory factor in this decline, although it is likely to have had some benefit if families chose to spend at least part of the WFP on warmer indoor temperatures.
The result for fuel prices is consistent with what might be predicted if the cost of fuel is a constraint on the temperature to which people choose to heat their home, the presumption being that after years of higher fuel prices people have used less fuel than they would otherwise do. Fuel prices rose appreciably from 2004 onwards, largely as a result of changes in wholesale prices and energy suppliers recouping the cost of renewable investments, but the years of high fuel prices do not occur in one block throughout the period of analysis. As with the WFP analysis, a cautious interpretation is needed because of the possibility that there are other factors than high fuel price that have been contributory factors.
The analyses suggest that there has been a progressive decline in the annual burden of cold-related deaths since the mid-1970s, which probably reflects the continuation of a trend of reducing winter-/cold-related mortality going back many decades, a trend that has occurred despite the gradual rise in the proportion of people aged > 65 years, who are known to be more vulnerable to the effects of low temperatures. The factors contributing to this decline cannot be determined with confidence but are likely to include a wide range of factors associated with improving socioeconomic conditions, including improving population health and health care and more effective health protection measures,16 for example the introduction in recent years of the Cold Weather Plan22 for England.
Improvements in housing, specifically in the effectiveness of home heating and winter indoor temperatures, are also likely to be contributory. If ambient temperatures also increase as a consequence of climate change, this would be expected to lead to a gradual reduction in cold-related deaths over time, although there is unlikely to be an appreciable reduction over the next decade or so. The next section examines evidence that is relevant to this question.
The impact of home energy efficiency interventions: 2002–10
In this section, evidence relating to the uptake and impact of HEE interventions in England over the period 2002–10 is described.
The core data items used in this analysis are shown in Figure 6. Central to the analysis is HEED, which provides data on the energy performance and installation of energy efficiency retrofits in England since 1993, and is managed by the Energy Saving Trust as a repository of energy efficiency activities in the UK. It includes data from installers, industry accreditation bodies, energy suppliers, government-funded programmes, local authorities and home surveys on a range of dwelling and energy efficiency parameters. 23 The data are collected at the dwelling level but were available for linkage in our analyses at the level of the full-unit (seven-digit) postcode. In the UK, the unit postcode relates, on average, to around 14 households or approximately 40 individuals.
FIGURE 6.
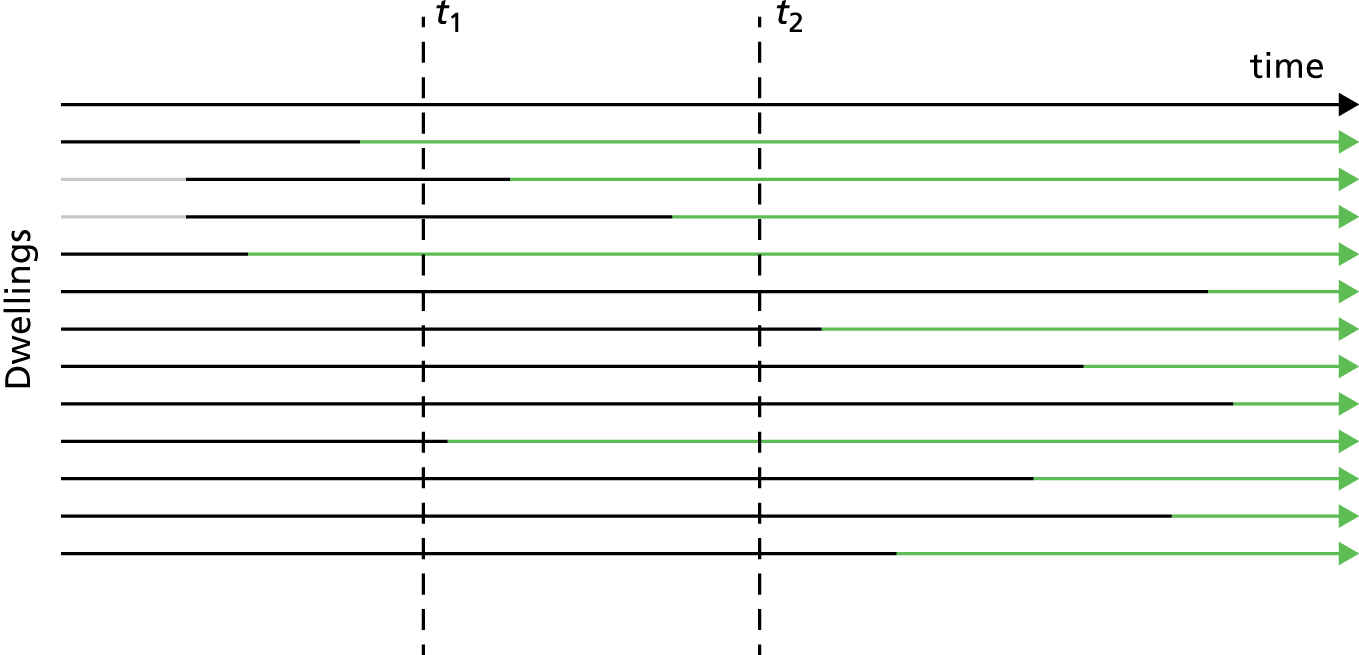
Simplified diagrammatic representation of the implementation of energy efficiency measures for a small number of English dwellings. Black signifies pre-intervention dwellings and green signifies post-intervention dwellings. The change in intervention status of individual dwellings provides a theoretical basis for comparisons before and after intervention or cross-sectionally across dwellings with and without HEE interventions. The HEED now contains data on approximately 16 million dwellings that have undergone energy efficiency improvements.
The database is broadly representative of the English stock in terms of size and dwelling type, although flats are somewhat under-represented, and it has wide geospatial coverage. It has been estimated to contain data on 90% of the energy efficiency interventions that took place between 2002 and 2007. 24
As shown diagrammatically in Figure 6, having data from HEED that are reasonably complete for interventions across the English housing stock provided the opportunity to study the impact that HEE interventions have as a natural experiment, because of the potential to examine differences in health outcomes based on multiple before-after comparisons and/or cross-sectional comparisons between dwellings with and without HEE improvements as might be done at time points t1 and t2 (dotted lines), for example.
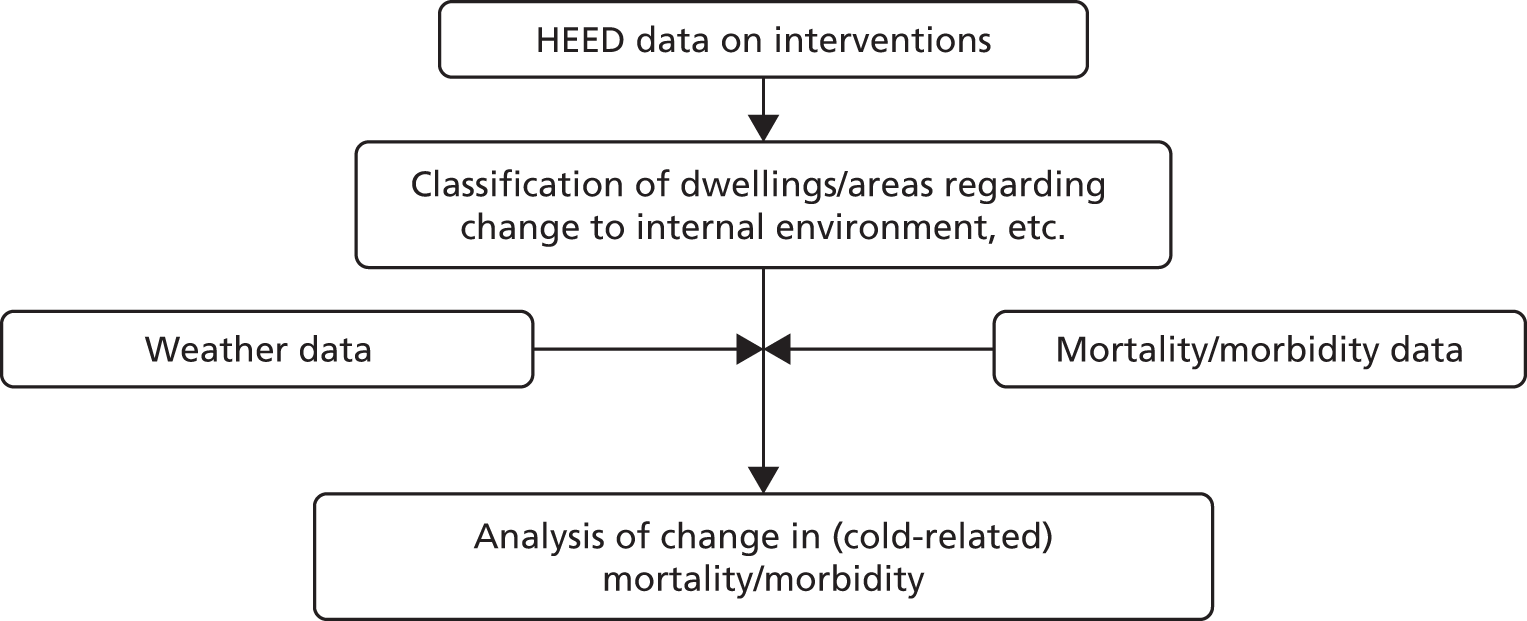
The approach that was proposed had two principal elements (Figure 7):
-
use of the HEED in combination with empirical data and building physics modelling to characterise the timing of energy efficiency interventions and their effect on the indoor environment of dwellings (changes in winter indoor temperatures and indoor air quality)
-
linkage of data on those interventions with weather and mortality/morbidity data to assess the impact that HEE interventions have had on health.
FIGURE 7.
Diagram of the principal data linkages for examining the impact of HEE interventions on health.
However, it transpired that the estimates of changes to the indoor environment consequent to these energy efficiency interventions were very small, making it very unlikely that impacts on health would be detectable by direct observation of changes in routine health statistics aggregated at postcode level (see Temperature changes, Changes in permeability and air quality. Therefore, the assessment of the impact of these HEE improvements on health was based on an indirect approach rather than by direct linkage of health records to intervention data.
Defining intervention-related changes to the indoor environment
Installing energy efficiency retrofits to improve the energy performance of dwellings (Figure 8) has a number of positive and negative consequences for the indoor and outdoor environment and for households more generally.
FIGURE 8.
The uptake of energy efficiency measures in England: 1997–2012. The HEED sample representative of the EHS (n = 168,998 dwellings). a, Data on glazing, boiler or heating system replacement were available only to 2007. For further details see Hamilton et al. 25

Our focus here was limited to changes to the indoor environment, specifically winter indoor temperatures and air quality, although the impacts that this has on the energy needs and cost of space heating are briefly considered in the section on health impact modelling (see Energy use).
Because of the range of different energy efficiency measures installed across the English stock [including, but not limited to, insulation of the roof space, cavity walls, solid walls, double (triple) glazing and improvements to heating system/boiler], we classified the impact of each in terms of change in winter indoor temperatures and air quality [specifically the change in concentrations of fine particulate matter (PM2.5) of both indoor and outdoor origin, radon, STS and mould risk] using a combination of empirical data and building physics modelling.
It should be noted that physics-based energy simulation models provide evidence on the ‘technical potential’ for energy savings and temperature change of energy efficiency interventions, which may differ from actual changes that reflect the effect of complex sociotechnical interactions of the dwelling occupier, the building and responses to the external and indoor environment. Poor installation, technical limits, environmental factors, changes in user preferences or practices and allowing for unmet needs to be satisfied, such as ‘temperature take-back’,26 may all give rise to appreciable variations in the actual changes in indoor conditions from dwelling to dwelling and from those predicted by the ‘idealised’ assumptions of building physics models. Therefore, our preference has been to base estimates of change on empirical data whenever possible.
Temperature changes
It has been shown that the energy performance levels of English dwellings has a significant influence on temperatures6,27,28 and that changing the energy performance characteristics of the dwelling through retrofits affects temperatures. 29 It has also been shown that our indoor temperatures during wintertime are associated with risk of mortality, especially from cardiovascular disease. 6
To classify dwellings with regard to winter indoor temperatures, we used a modification of a method described by Oreszczyn et al. 2006. 27 It entailed two principal steps:
-
defining the empirical relationship between the energy efficiency characteristics of a dwelling and winter indoor temperatures measured under standardised conditions
-
determining the pre- and post-intervention energy efficiency characteristics of intervention dwellings using recorded data on dwelling type, age and other parameters in combination with building physics simulations.
Applying the results from step 2 to the relationships defined in step 1 provides the estimate of change in indoor temperature resulting from specific energy efficiency upgrades.
Central to these analyses is the concept of the standardised indoor temperature (SIT). The SIT is a marker of winter indoor temperature under standardised measurement conditions that has been used in the analysis of two data sets of indoor temperature monitoring in dwellings of known energy efficiency characteristics in the English stock. These data sets were from the previously published evaluation of the Warm Front energy efficiency scheme27 and the more recent Energy Follow-Up Survey (EFUS)30 (which is linked to the EHS).
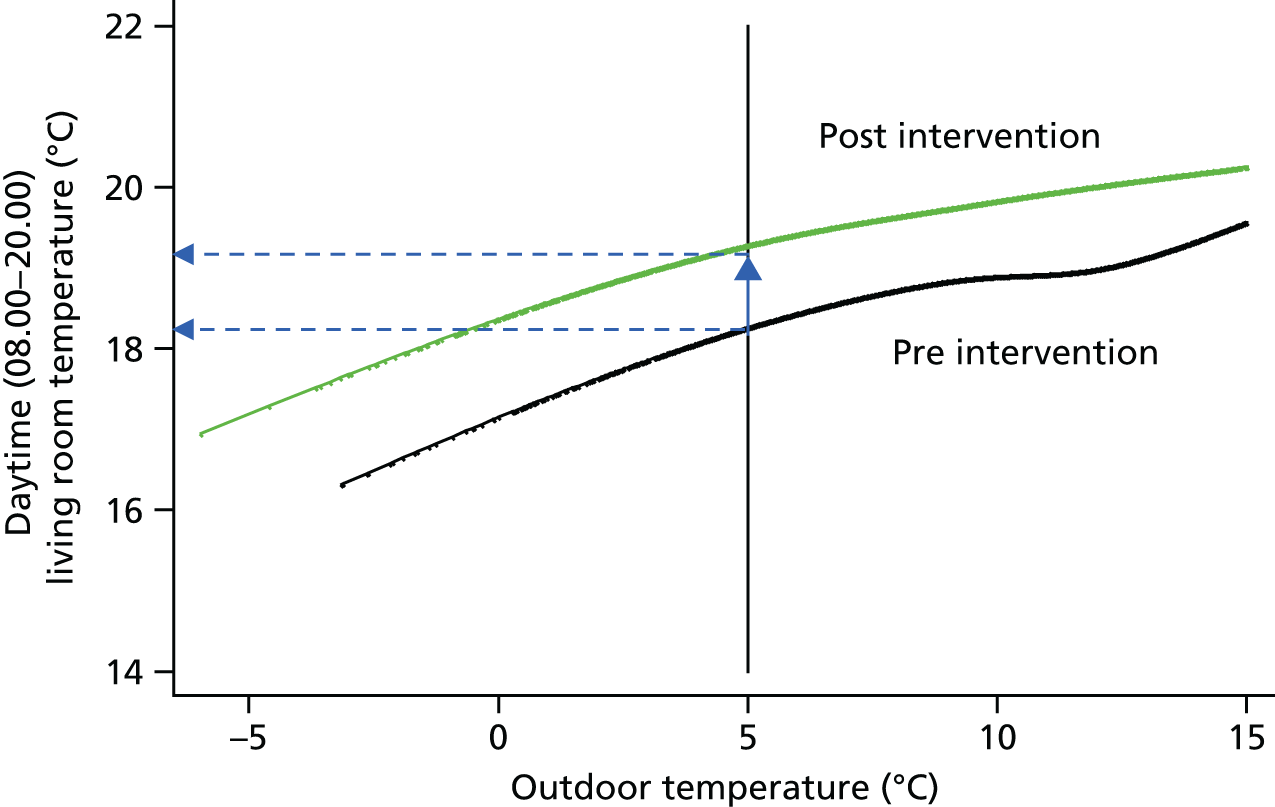
Both data sets contain multiple serial measurements of indoor (living room and bedroom) temperatures during the heating season. For each dwelling in these surveys, regressing the indoor temperature on outdoor temperature (as a polynomial function) and adjusting for time of day allowed for the estimation of the mid-afternoon indoor temperature when the outdoor temperature was 5 °C, as illustrated in Figure 9. This is the SIT. At the same time, each dwelling was classified with respect to its energy efficiency using a measure of thermal performance known as the E-value. The E-value represents the heating power (in watts) required for the whole house to increase the temperature difference between indoor and outdoor environments by 1 kelvin (1 °C).
FIGURE 9.
The derivation of the SIT: dwelling-specific regression analyses of the relationship between indoor and outdoor temperature was used to define a living room temperature on the day with a maximum outdoor temperature of 5 °C (the SIT). Data from across multiple dwellings of different energy efficiency levels were then used to define the general relationship between SIT and energy efficiency as reflected by the dwelling E-value (see Figure 10).
Using results of SIT and E-value across multiple dwellings provided the empirical relationship shown in Figure 10. This is the core function used to estimate changes in indoor temperature of intervention dwellings in the HEED as energy efficiency interventions alter dwelling energy efficiency characteristics defined in terms of its E-value.
FIGURE 10.
The relationship between SIT and whole house E-value [the number of watts required to maintain a temperature difference of 1 Kelvin (1 °C) between indoor and outdoor environments]. Improving the energy efficiency of the dwelling from E to E – δE results in an increase in SIT from T to T + δT.
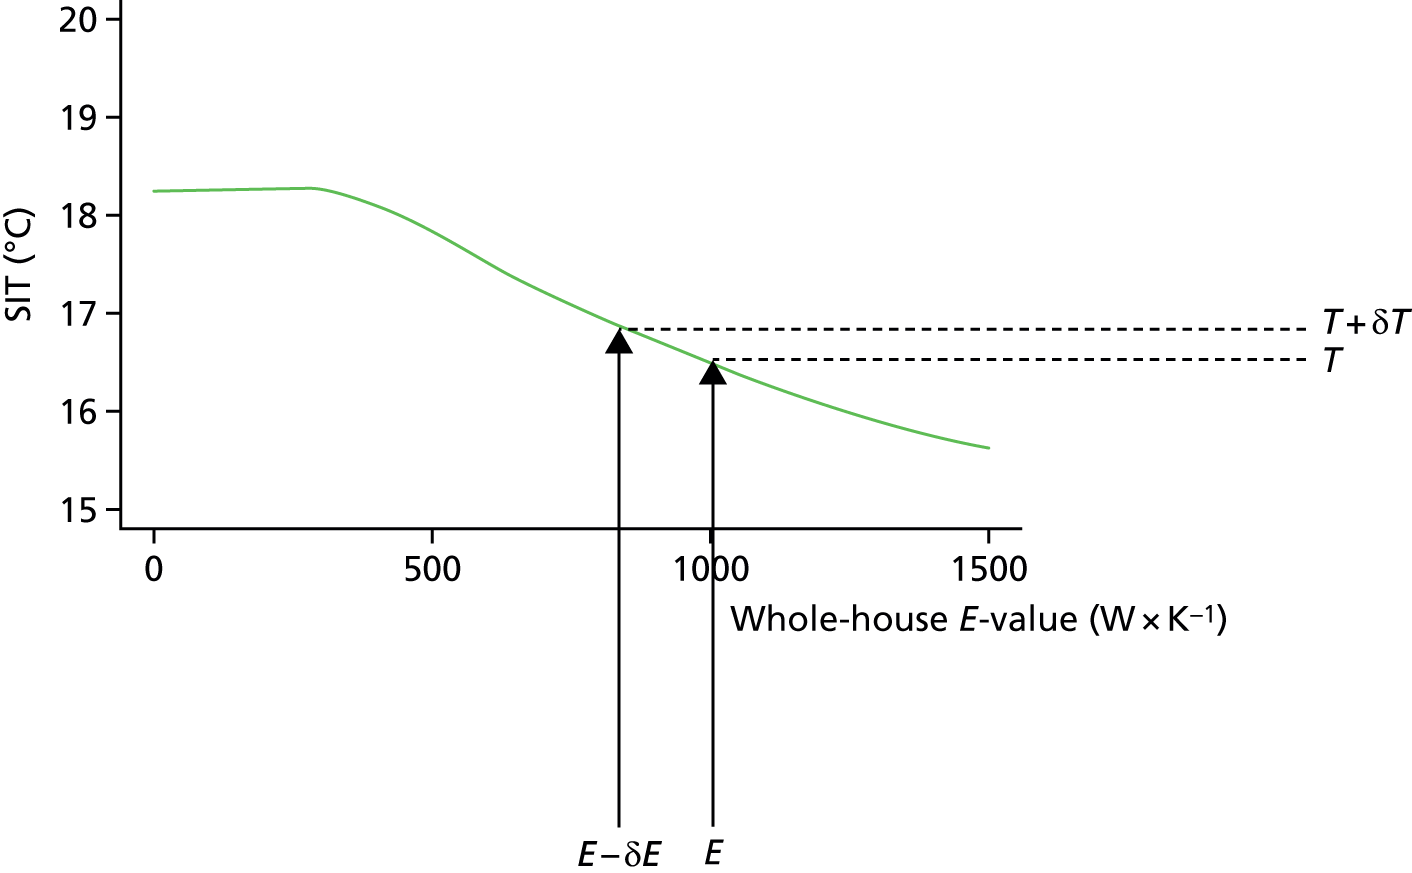
Improving the energy efficiency of the dwelling from E to E – δE results in an increase in SIT from T to T + δT.
The approach was used to estimate the potential change in indoor temperatures following retrofits that would affect the notional thermal performance of the dwelling31 and subsequent impact that it has on cold-related mortality/morbidity. 32
To estimate the likely indoor temperatures experienced during winter conditions, a detailed building physics model was used to estimate the SITs of the English dwelling stock for different energy performance levels. 33 Dwelling characteristics in the EHS were used to characterise the energy performance of the dwelling (i.e. its E-value), which was then used to predict the SIT at 5 °C in the living room and bedroom. Two model runs were conducted to estimate indoor temperatures: one run modelled the energy performance of the dwellings as described in the EHS (i.e. ‘baseline’), whereas the second run included the introduction of all available energy efficiency retrofits and the corresponding changes in E-value and SITs (i.e. ‘modified’). The retrofits included loft insulation to 250 mm, cavity wall insulation, solid wall insulation, double-glazing installation, condensing boiler installation and draught proofing.
Two metamodels were constructed from the detailed baseline and modified Health Impact of Domestic Energy Efficiency Measures (HIDEEM) model runs using the regression model of the average (living room and bedroom) SIT as a function of dwelling age, dwelling type, number of bedrooms and loft insulation level. These variables corresponded to those available within HEED. Model 1 predicts the baseline energy performance of the dwellings as described in the EHS, whereas model 2 includes the installation of all eligible retrofits for the UK housing stock. Because HEED provided only limited information on the dwelling, the meta-models included only a limited number of independent variables to predict the SIT.
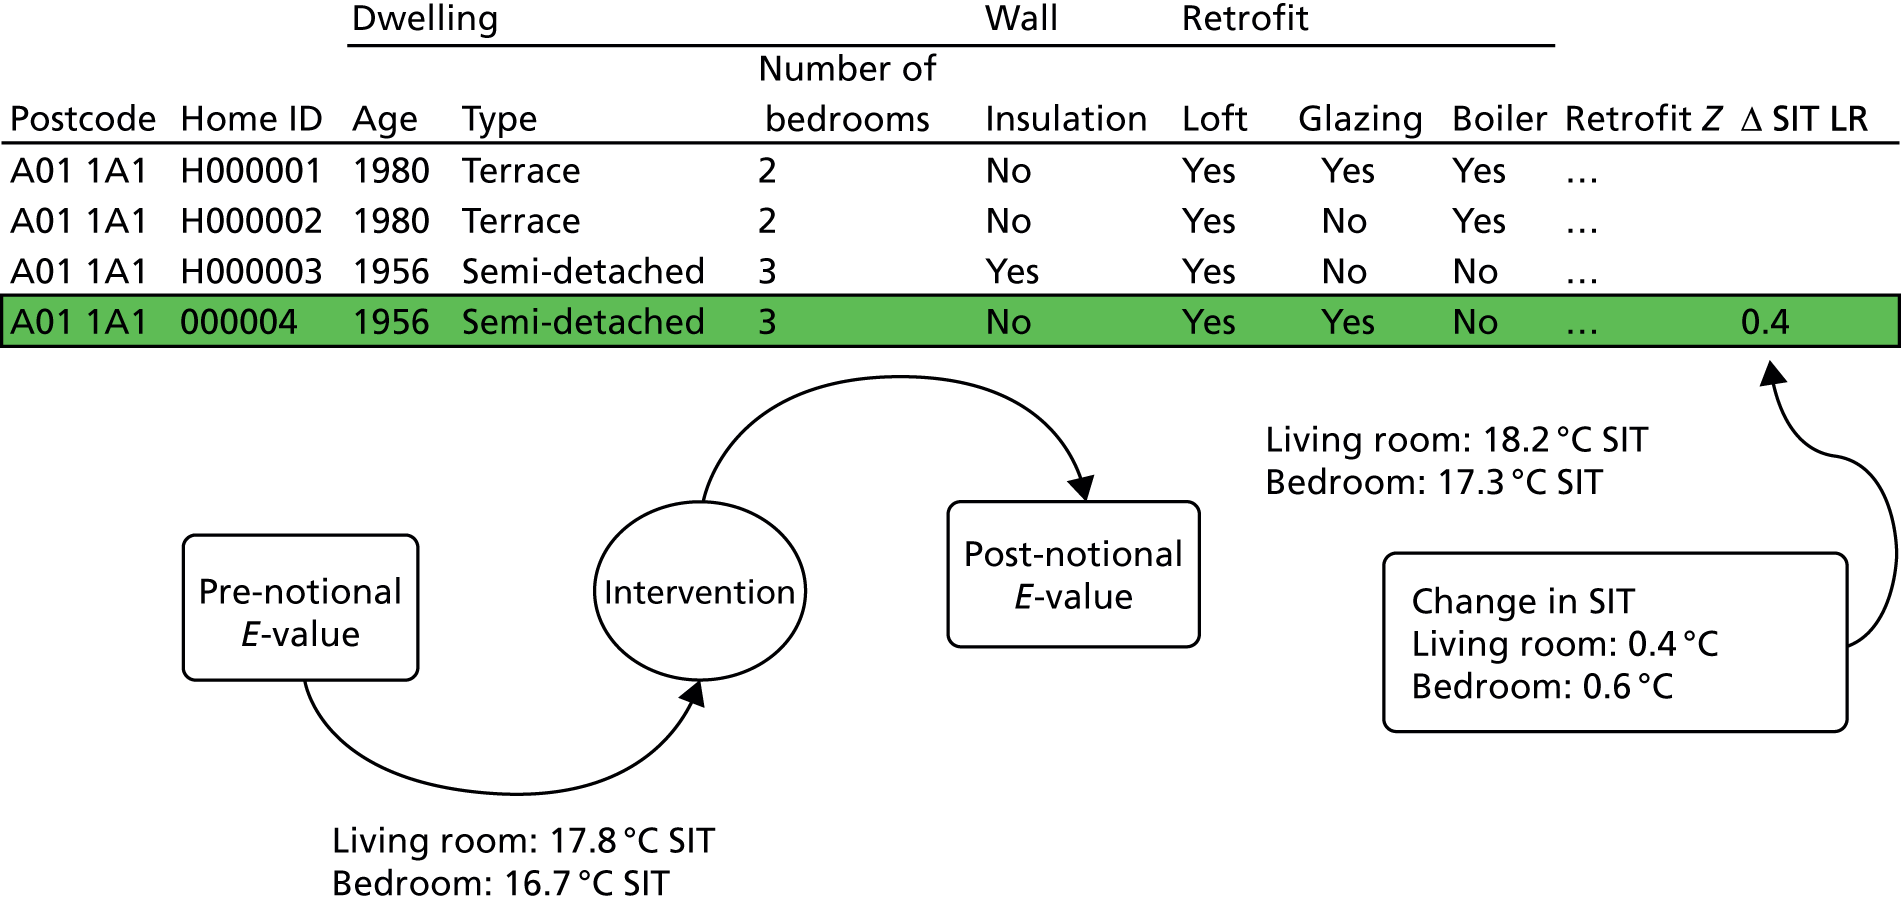
The result of this classification is shown in Figure 11. A notional pre-intervention E-value is assigned on the basis of dwelling characteristics and, similarly, a post-intervention E-value is assigned reflecting the effect of the specific form of energy efficiency change. From these E-values, the empirical relationships are used to determine the corresponding SITs and hence the overall change in SIT. It is this change in temperature that is used as the basis for the calculation of the temperature-related impact on mortality and morbidity.
FIGURE 11.
The classification of dwellings with regard to energy efficiency (E-value) and SIT. ID, identifier; LR, living room.
Changes in permeability and air quality
Intervention-related changes in dwelling permeability, ventilation characteristics and consequent pollutant levels were characterised using CONTAM version 2.4c (National Institute of Standards and Technology, US Department of Commerce, Gaithersburg, MA, USA), a validated multizone airflow and pollutant transport simulation tool. 33 Five contaminants were modelled: STS, PM2.5 from internal sources, PM2.5 from external sources, radon and moisture (as a precursor of mould). A series of pollutant sources and sinks were placed within appropriate building zones. External concentrations of pollutants were specified when relevant. The CONTAM models then predict the concentrations of the pollutants within each building zone every 15 minutes for a year. In modelling the indoor environment, we assumed that occupants opened windows during summer daytime hours (i.e. 09.00 to 17.00), trickle vents were open at all times and extract fans were used whenever present in the kitchen or bathroom.
From the CONTAM model outputs, annual average indoor pollutant concentrations (weighted to reflect exposure levels experienced around the home with 45% of the occupant’s time spent in the living room, 45% spent in the bedroom and 10% spent in the kitchen) within the archetype dwellings for a range of permeabilities (in the range 0.5 to 30 m3m–2hour–1). Interpolation using a fourth-order polynomial was used to estimate concentrations for permeabilities that were not directly modelled in CONTAM. The permeability for each EHS dwelling was calculated using a physics-based method that uses details that are relevant to air infiltration, that is openings and cracks in the fabric (walls, windows, flues, vents, etc.), and normalises this using a fabric-to-volume ratio. Each EHS dwelling was matched into one of the 16 × 4 archetype and ventilation categories and the exposure concentrations were calculated using the pollutant models. The heat loss owing to overall permeability for each dwelling is calculated by using the infiltration level, building volume and heat capacity of air. 34
Changes in household fuel costs
The impact that HEE measures had on energy use was studied in a sample of dwellings with a gas connection (approximately 90% of all dwellings). To do this, the HEED was linked to the Energy Supplier Meter Point data, a database of annualised gas and electricity energy supplier data for the years 2004–7. This linkage was carried out at address level by the DECC and provided for analysis in an anonymised form with only lower-layer super output area identifiers.
The annualised gas demand data were derived from two meter readings at least 6 months apart and corrected for seasonal normal demand (i.e. annual weather correction) and end-user climate sensitivity. The annualising method provides a means of comparing total gas demand between years that removes the effect of cold or warm weather (described fully in Ofgem 201335). The electricity demand data are also derived from meter readings and annualised using a process that allocates meters to domestic annual demand profiles. Electricity data are not corrected for interannual weather.
A nationally representative subsample of approximately 168,998 dwellings with gas and electricity meters was drawn for analysis using the 2011 EHS,36 which is a cross-sectional survey representative of English dwellings and households. The EHS sample frame was constructed to be representative of gas-heated English dwellings and aligned with HEED data using dwelling age, dwelling type, number of bedrooms, government region and household tenure, from which a sample was selected using a simple random sampling.
Health impacts
For calculation of health impacts, we based calculations on changes in indoor air and SIT in relation to outcomes for which there is reasonably clear epidemiological evidence of a link6 (Table 2). Cause-specific mortality was modelled using life table methods based on the IOMLIFET model45 but applied to individuals in the EHS36 based on their age, sex and specific exposure changes. Life tables were set up using a 2010 age-specific population and (disease-specific and all-cause) mortality data for England and Wales from ONS, with separate life tables set up for men and women. For each intervention, we calculated changes in years of life lost (YLL) by comparing life tables with and without the relative risks (RRs) for the corresponding exposure change and using lag functions shown in Appendix 4. Impacts that these same outcomes had on morbidity were approximated from the mortality estimates by applying age-specific and cause-specific ratios of years of healthy life lost because of disability (years of life list because of disability; YLD) to the overall YLL derived from the World Health Organization’s Global Burden of Disease data. 31 Further details are given in Hamilton et al. 32
| Exposure | Health outcome | Exposure–response relationship (RR) | Reference |
|---|---|---|---|
| Mortality | |||
| Standardised internal temperature | Winter excess cardiovascular (including excess cerebrovascular accident and myocardial infarction) | 0.98 per °C | Derived from Wilkinson et al.6 |
| Environmental tobacco smoke | Cerebrovascular accident | 1.25 (if in the same dwelling as smoker) | Lee and Forey37 |
| Myocardial infarction | 1.30 (if in the same dwelling as smoker) | Law et al. 199738 | |
| PM2.5 | Cardiopulmonary | 1.082 per 10 µg/m3 | Pope et al.,39 Krewksi et al.40 |
| Lung cancer | 1.059 per 10 µg/m3 | Pope et al.,39 Krewksi et al.40 | |
| Radon | Lung cancer | 1.16 per 100 Bq/m3 | Darby et al.41 |
| Morbidity | |||
| Standardised internal temperature (°C) | COPD | 0.90 per °C | Estimate based on studies from UK (Osman et al.11) and New Zealand (Howden-Chapman et al.42) |
| Common mental disorder (12-item General Health Questionnaire score of ≥ 4) | 0.90 per °C | Based on Warm Front (Gilbertson et al.43) | |
| Mould (% MSI > 1) | Asthma | ||
| Harm class II (hospital admission) | 1.53 per 100% | Based on Fisk et al.44 and used in the Home Health and Safety Rating System | |
| Harm class III (general practitioner consultation) | 1.53 per 100% | Based on Fisk et al.44 and used in the Home Health and Safety Rating System | |
| Harm class IV (minor symptoms) | 1.83 per 100% | Based on Fisk et al.44 and used in the Home Health and Safety Rating System | |
Results
The uptake of specific forms of energy efficiency interventions by dwelling type, urban–rural status and decile of socioeconomic deprivation, as well as changes in SIT, is summarised graphically in Figure 12.
FIGURE 12.
The uptake of specific forms of HEE interventions. (a) HEE retrofits by dwelling type; (b) HEE retrofits by urban–rural area; (c) HEE retrofits (number of interventions) by neighbourhood deprivation decile group; and (d) mean baseline SIT (°C) for different dwelling archetypes.
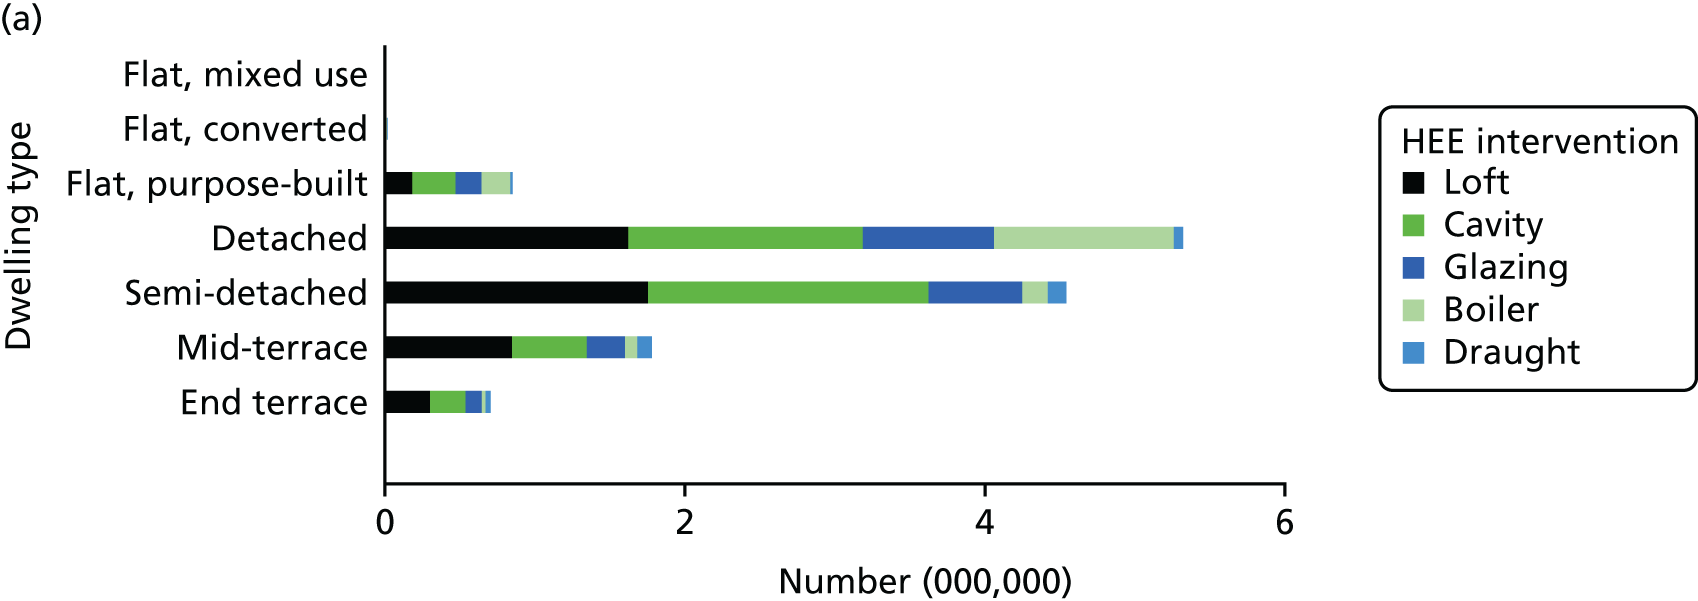
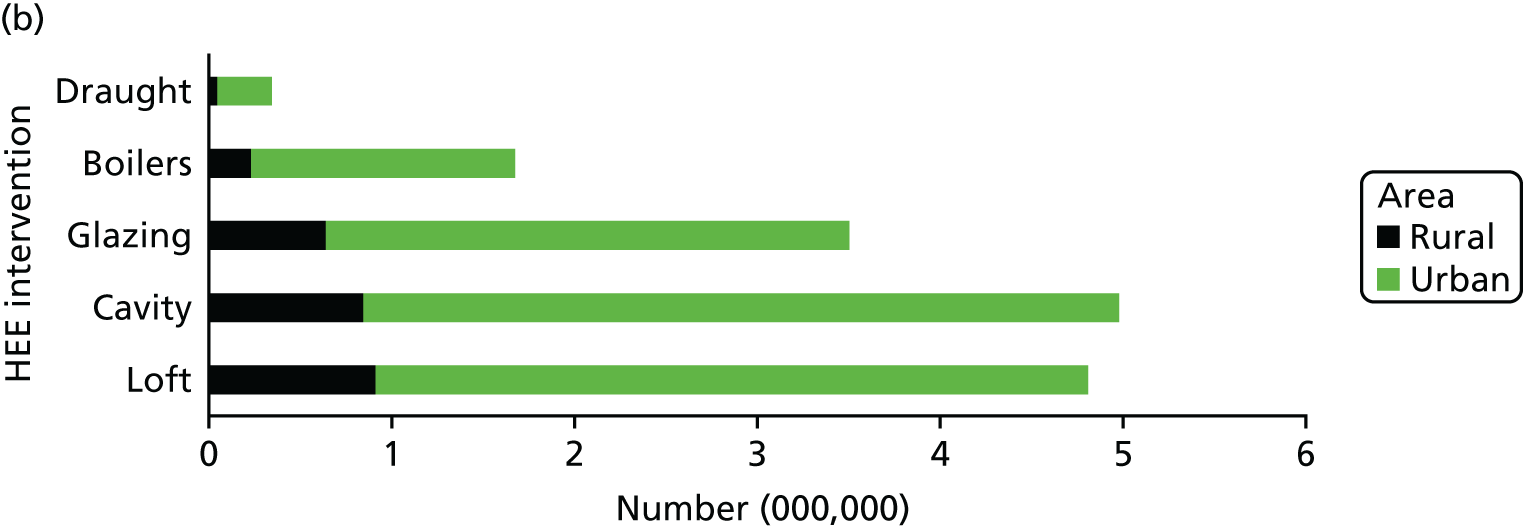
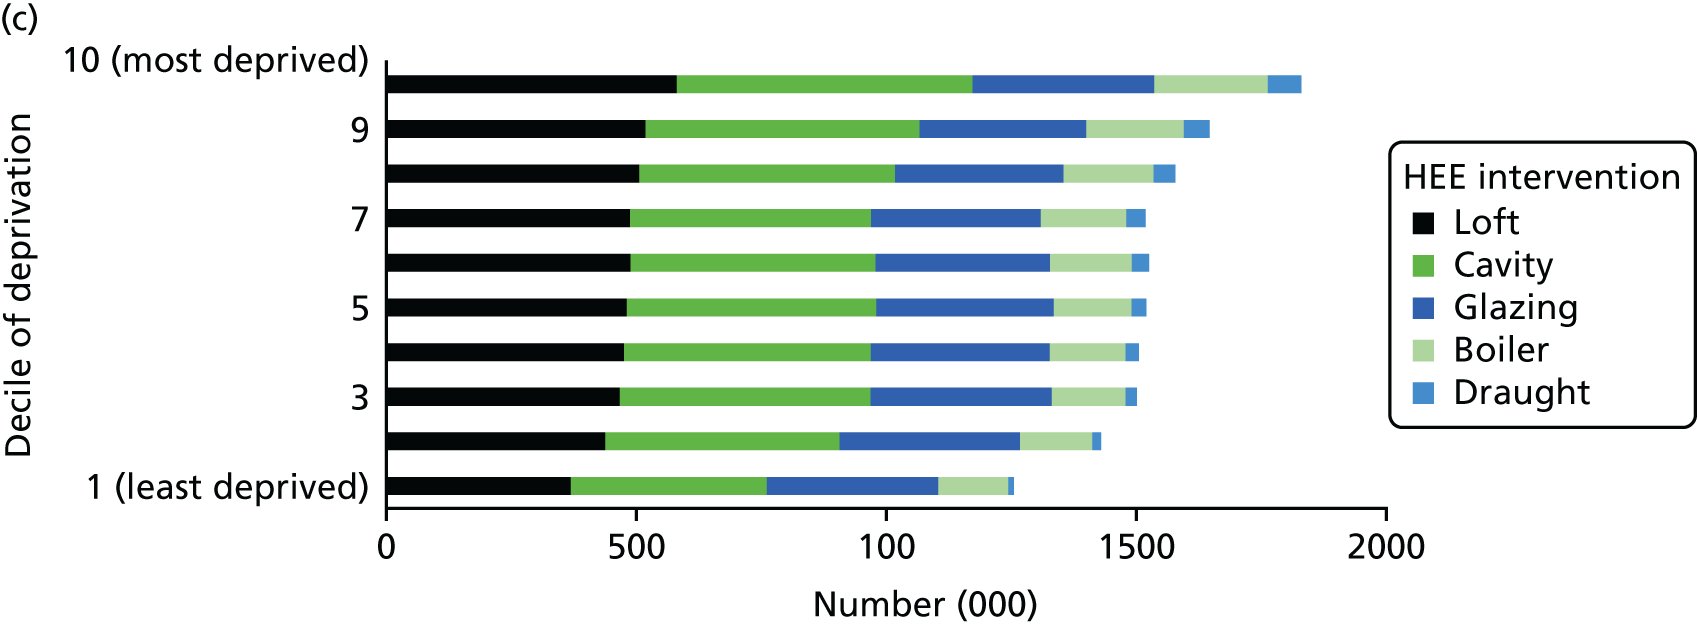
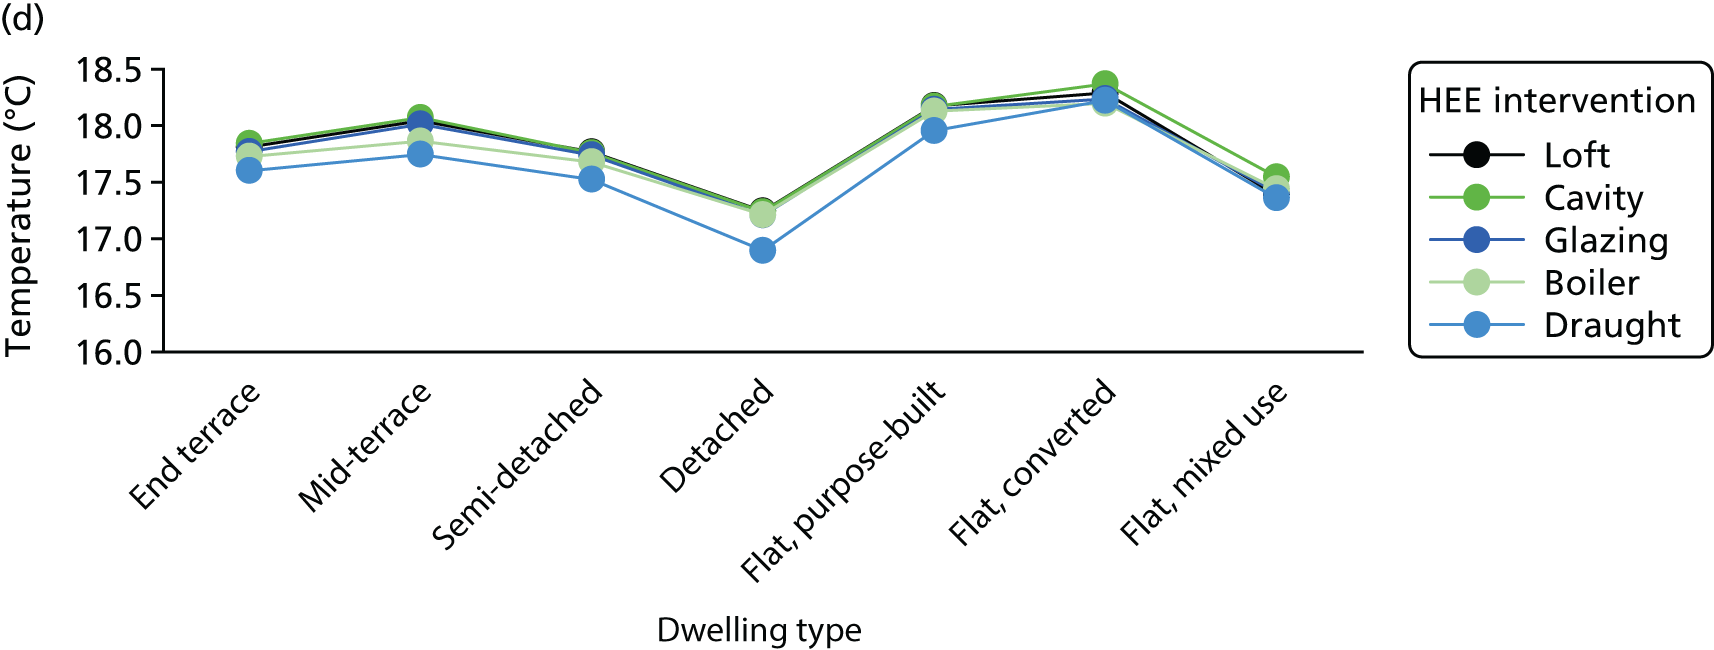
Table 3 tabulates the change in SIT for the main categories of intervention by dwelling age, type and housing tenure. As this shows, for most forms of energy efficiency upgrade the change in temperature is modest but is dependent on property age and type in particular. The increases in temperature are generally greatest for dwellings that are older and, thus, less energy efficient. Loft insulation is associated with very modest increases in temperature, whereas much greater changes are seen for cavity and solid wall insulation.
| Dwelling household characteristics | HEE intervention | |||||||||
|---|---|---|---|---|---|---|---|---|---|---|
| Loft insulation to 250 mm | Cavity wall filling | Solid wall insulation | Double glazing | Boiler replacement | ||||||
| Median | Mean | Median | Mean | Median | Mean | Median | Mean | Median | Mean | |
| Dwelling age | ||||||||||
| Pre 1919 | 0.11 | 0.1 | 0.48 | 0.46 | 0.44 | 0.41 | 0.22 | 0.22 | 0.31 | 0.31 |
| 1919–44 | 0.1 | 0.09 | 0.43 | 0.44 | 0.45 | 0.48 | 0.25 | 0.27 | 0.31 | 0.33 |
| 1945–64 | 0.09 | 0.09 | 0.36 | 0.36 | 0.27 | 0.23 | 0.21 | 0.22 | 0.27 | 0.26 |
| 1965–80 | 0.09 | 0.08 | 0.25 | 0.17 | 0.09 | 0.06 | 0.12 | 0.11 | 0.24 | 0.22 |
| 1981–90 | 0.05 | 0.07 | 0.1 | 0.08 | 0.02 | 0 | 0.12 | 0.11 | 0.22 | 0.21 |
| Post 1990 | 0.05 | 0.05 | 0.11 | 0.09 | 0 | 0 | 0.14 | 0.09 | 0.19 | 0.16 |
| Dwelling type | ||||||||||
| End terrace | 0.09 | 0.06 | 0.27 | 0.25 | 0.59 | 0.62 | 0.26 | 0.26 | 0.3 | 0.29 |
| Mid-terrace | 0.08 | 0.07 | 0.11 | 0.09 | 0.25 | 0.23 | 0.19 | 0.2 | 0.16 | 0.13 |
| Semi-detached | 0.1 | 0.1 | 0.36 | 0.36 | 0.6 | 0.61 | 0.27 | 0.27 | 0.29 | 0.28 |
| Detached | 0.11 | 0.1 | 0.48 | 0.45 | 0.7 | 0.78 | 0.3 | 0.3 | 0.41 | 0.42 |
| Purpose built | 0.02 | 0.01 | 0.01 | –0.01 | 0.05 | 0.02 | 0.05 | 0.05 | 0.04 | 0.04 |
| Converted | 0.06 | 0.08 | 0.11 | 0.09 | 0.17 | 0.11 | 0.14 | 0.12 | 0.15 | 0.12 |
| Non-residential | 0.26 | 0.25 | 0 | 0.08 | 0.73 | 0.74 | 0.22 | 0.42 | 0.37 | 0.22 |
| Tenure | ||||||||||
| Owner-occupied | 0.1 | 0.09 | 0.34 | 0.3 | 0.48 | 0.5 | 0.25 | 0.26 | 0.31 | 0.3 |
| Privately rented | 0.08 | 0.09 | 0.17 | 0.11 | 0.29 | 0.24 | 0.16 | 0.16 | 0.22 | 0.2 |
| Local authority | 0.03 | 0.02 | 0.09 | 0.07 | 0.13 | 0.08 | 0.07 | 0.07 | 0.12 | 0.1 |
| RSL | 0.05 | 0.04 | 0.07 | 0.03 | 0.18 | 0.11 | 0.1 | 0.09 | 0.11 | 0.08 |
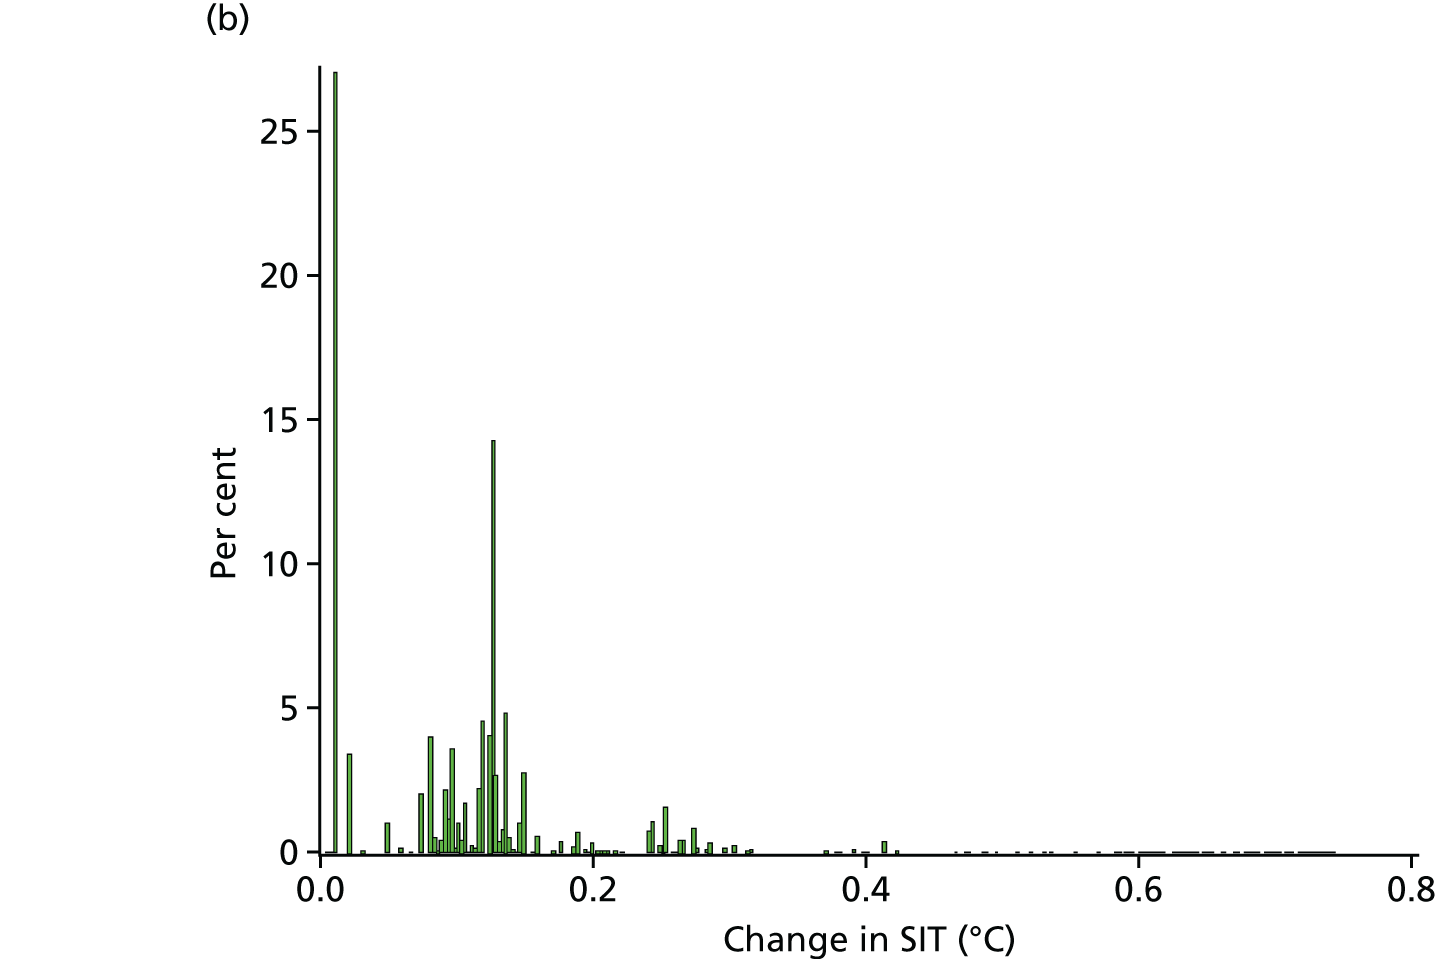
Across all energy efficiency interventions (Figure 13), the change in the distribution of SITs is modest and averages at just 0.09 °C.
FIGURE 13.
Distribution of (a) the pre- and post-intervention SITs; and (b) the difference in post- and pre-intervention SITs.
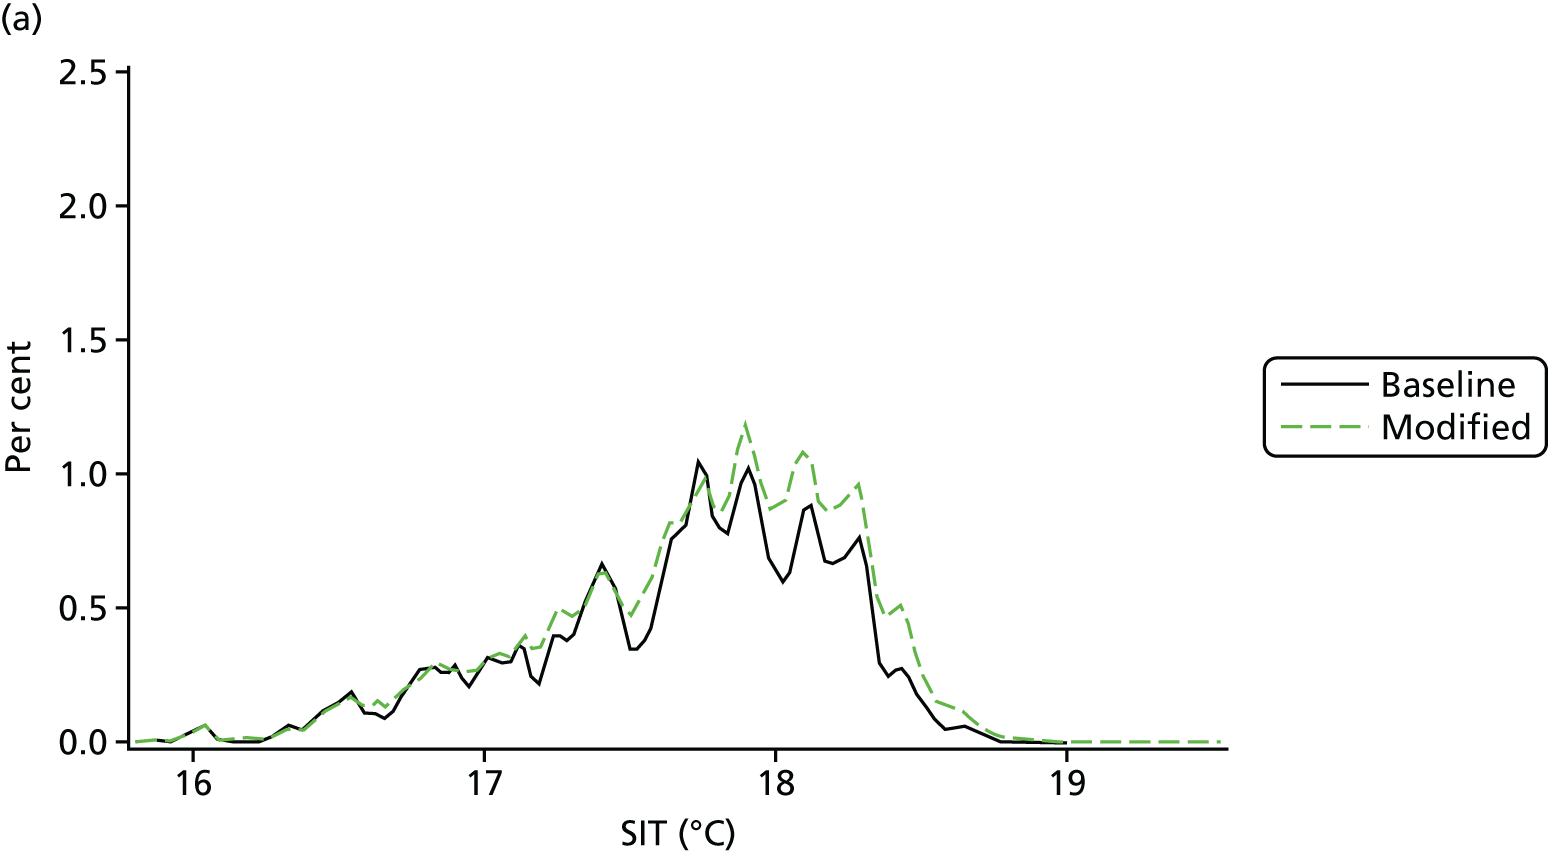
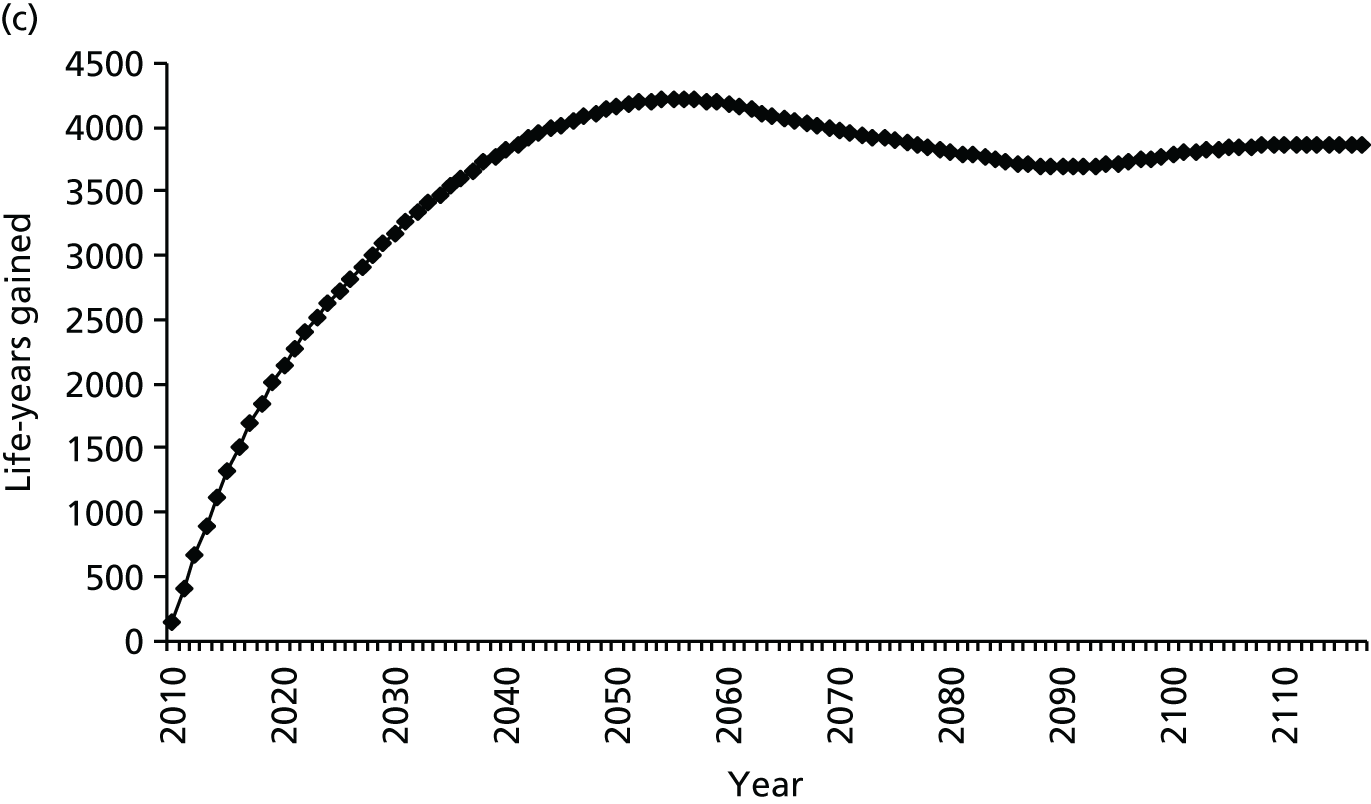
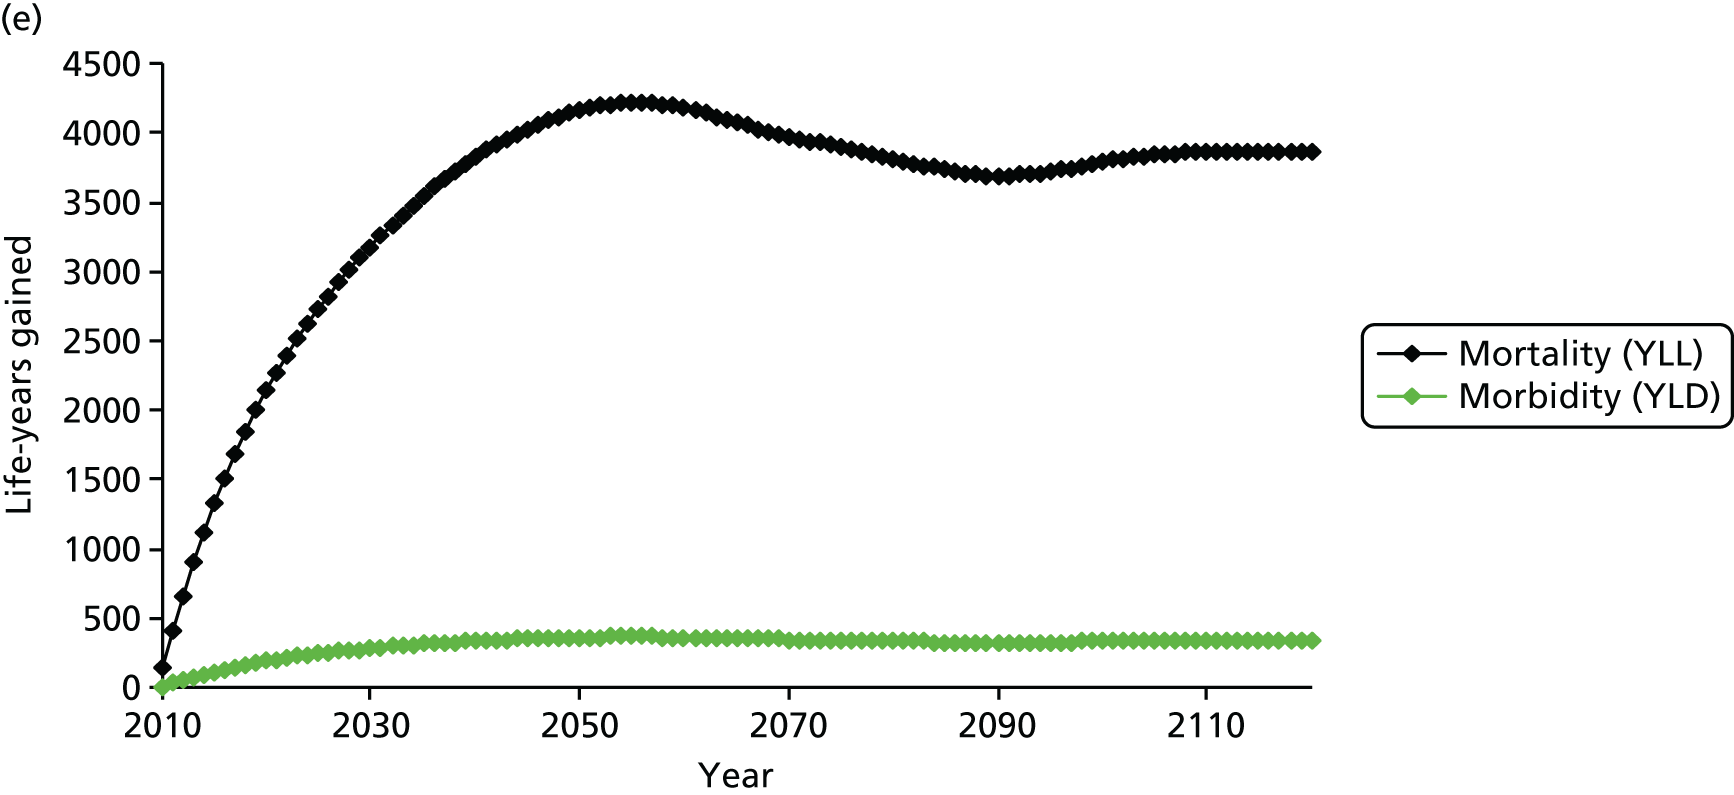
The associated change in health impacts (deaths, life-years and YLDs) is illustrated in Figure 14. The plots show the evolution of the impact that the changes have had over time, noting that the number of overall deaths saved (around 280 deaths in year 1) eventually returns to baseline level but with a reduction in deaths at younger age and an eventual increase in the number of deaths at older age. The annual gain in life-years saved takes several decades to be fully realised and plateaus at over 4000 life-years per year. The morbidity impacts (as YLDs) are approximately 10% of the mortality impacts.
FIGURE 14.
Modelled change in deaths saved and life-years gained. Deaths saved (a) overall; and (b) by age group and life-years gained (c) overall; (d) by age group; and (e) a combination of mortality and morbidity impacts summarised as YLLs and YLDs.



A summary of the intervention-related change in quality-adjusted life-years (QALYs) per 100,000 population (averaged over a 50-year time horizon) is shown in Table 4 separately for temperature-related health impacts and those owing to change in indoor air quality. In each case, a range is shown to reflect results for different assumptions about ventilation characteristics (whether or not installations have associated purpose-provided vents in order to maintain ‘adequate’ ventilation). Note that the health impacts associated with the ventilation may be negative or positive (depending on assumptions about ventilation changes) and may be as much as an order of magnitude greater than those related to temperature change.
| HEE intervention-related change | Change in QALYs per 100,000 population aged over 50 years (range depending on ventilation changes) |
|---|---|
| Winter mortalitya | 250 to 400 |
| Air quality-related impacts | –2800b to 7250 |
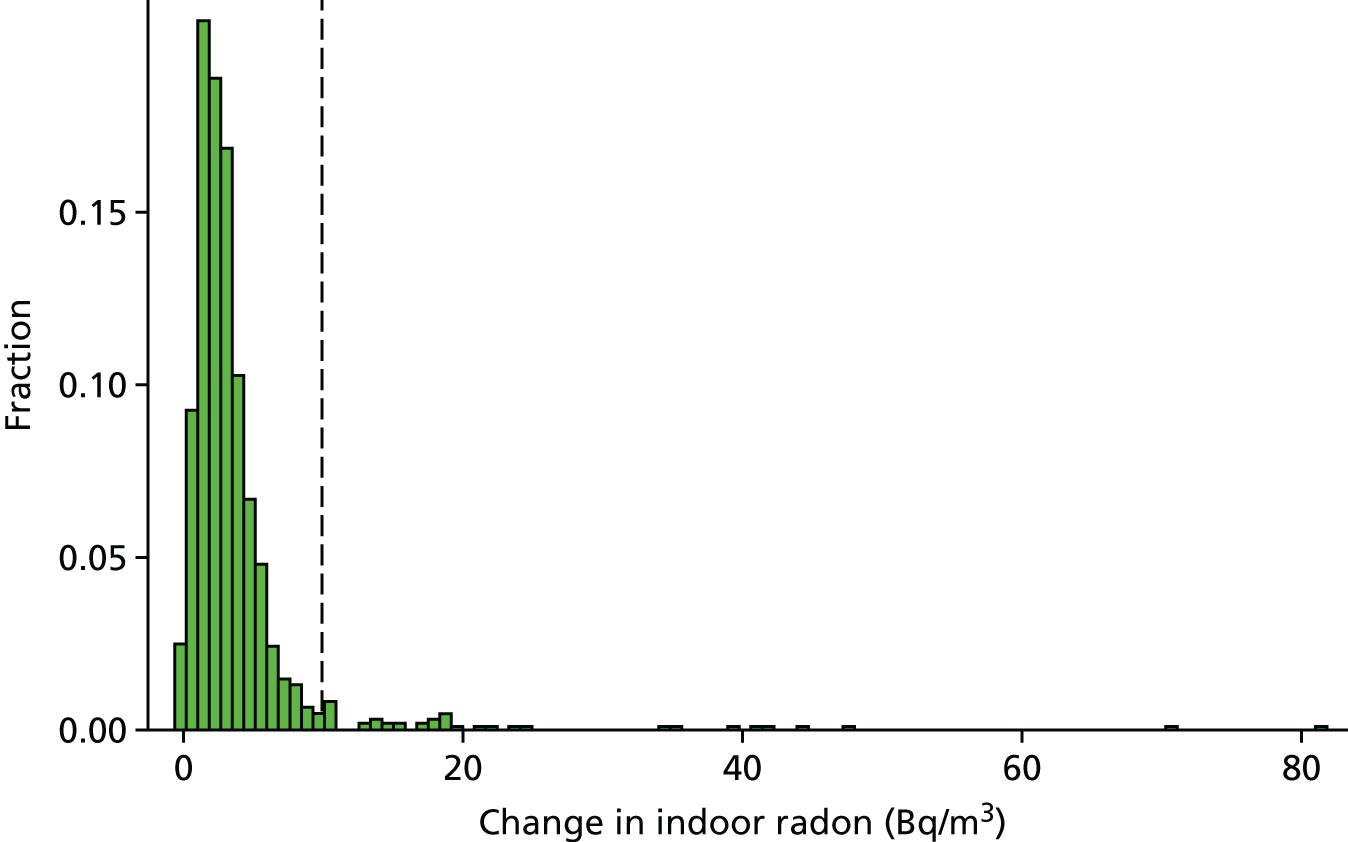
These air quality-related impacts reflect a balance of changes affecting pollutants with outdoor and indoor sources. Unless there is purpose-provided compensatory ventilation (such as trickle vents), energy efficiency measures tend to reduce dwelling permeability and, thus, ventilation. This is beneficial, especially in high outdoor pollution areas, as it reduces the ingress of particle pollution PM2.5 from the outdoor environment [as shown in Figure 15, which shows a negative shift (reduction) in PM2.5 derived from outdoor air after intervention], as well as contributing to improved energy efficiency (reduced loss of heated air). However, reduced permeability, and hence reduced air exchange, acts to increase the concentration of pollutants derived from indoor sources, including indoor PM2.5, radon, second-hand cigarette smoke, humidity/mould, and such pollutants as volatile organic compounds. Again this is illustrated in Figures 16 and 17, which show increases in concentrations of PM2.5 of indoor origin, and Figure 18, which shows the increase in radon concentrations from (in this case) solid wall insulation. (The effect of volatile organic compounds has not been quantified in any of the results shown here because of the lack of clear evidence of exposure–response relationships.) Note the relatively large impacts in converted flats and selected other dwelling types.
FIGURE 15.
Changes in indoor concentration (µg/m3) of PM2.5 of outdoor origin as a result of different forms of energy efficiency intervention. (a) Loft insulation; (b) cavity wall insulation; (c) improved glazing; and (d) solid wall insulation. The dashed line indicates a reference point of a change of –1 µg/m3.
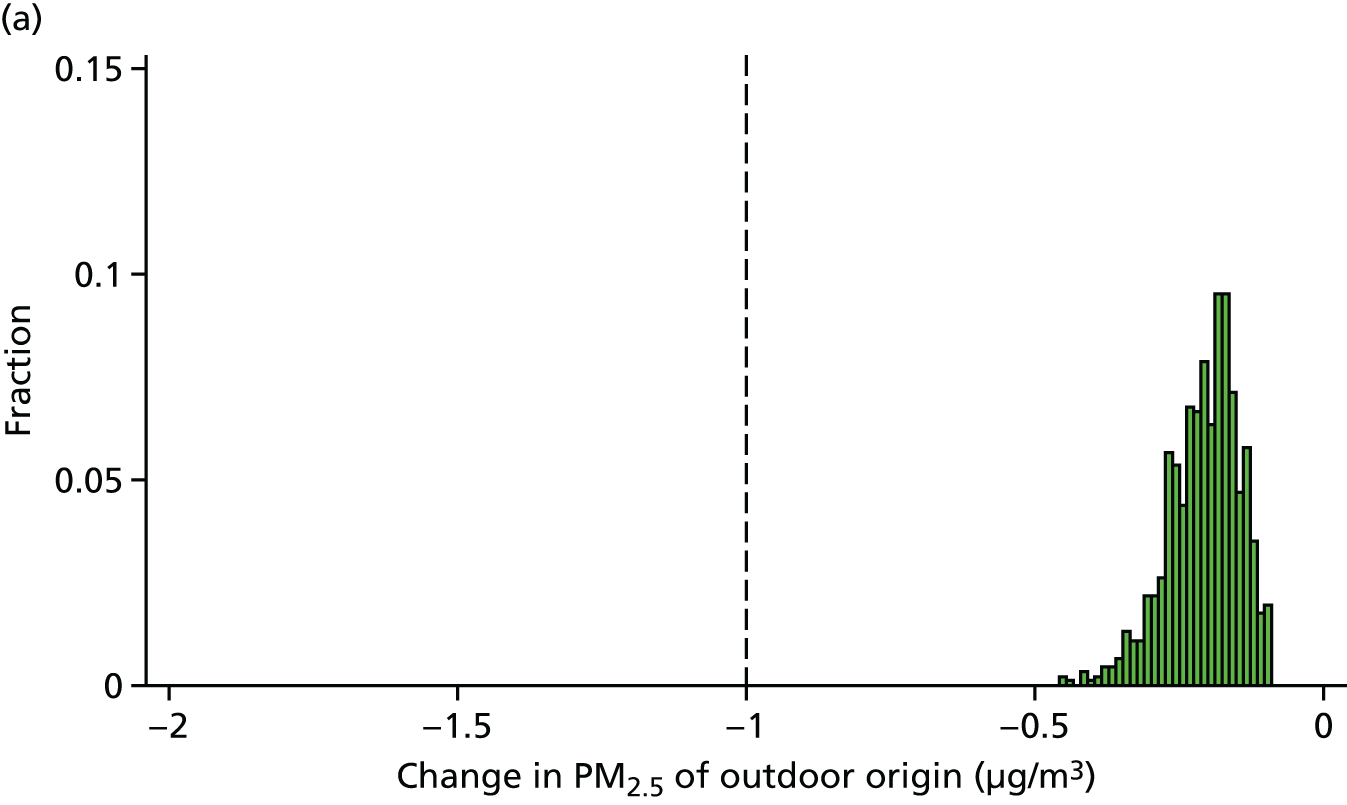
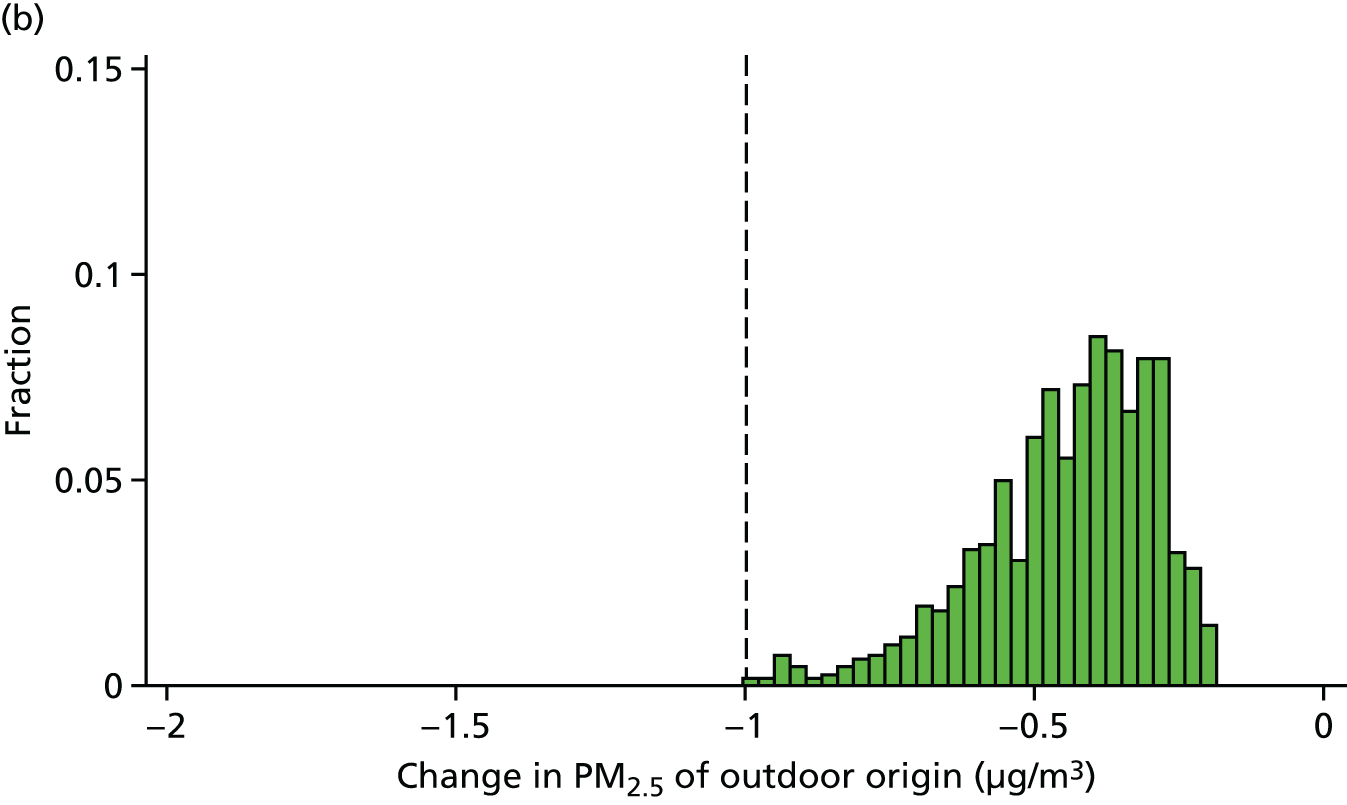
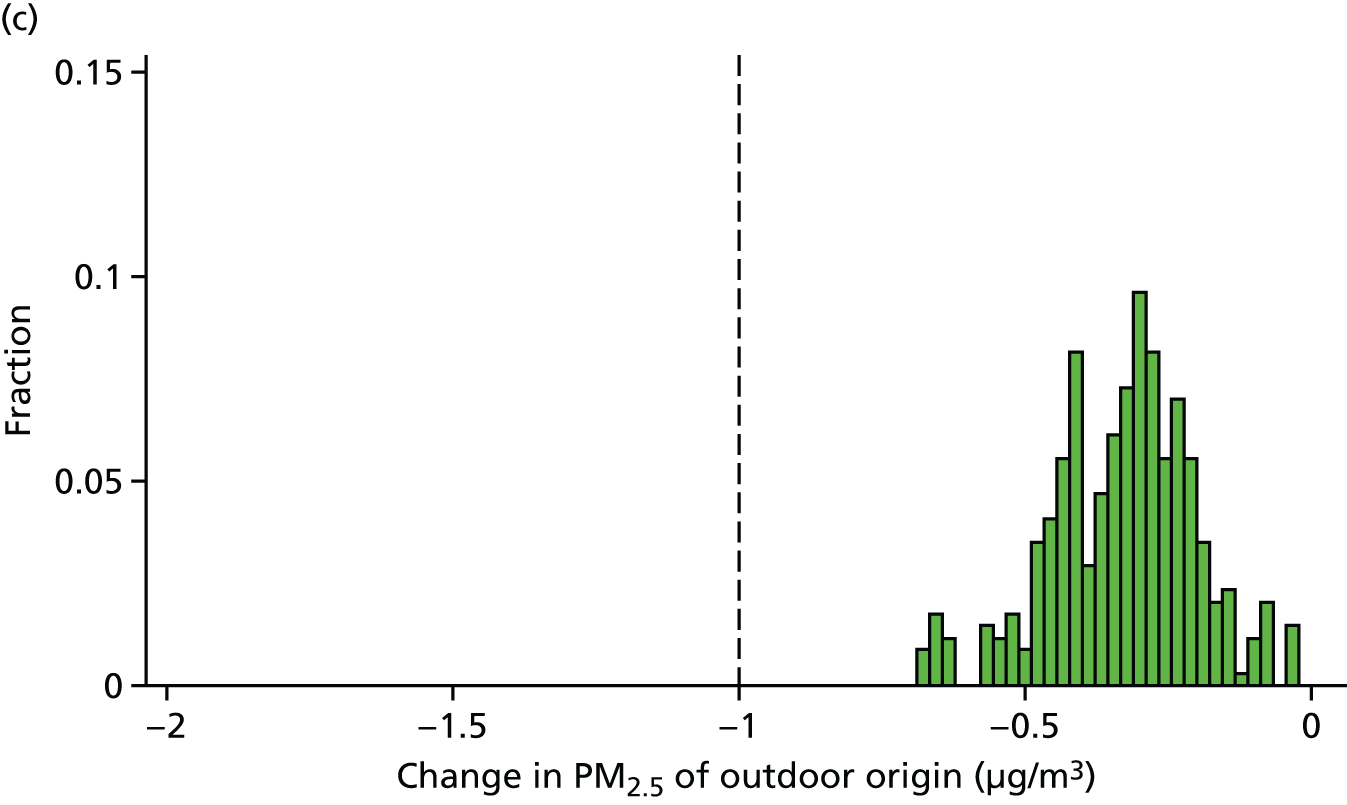

FIGURE 16.
Changes in indoor concentration (µg/m3) of PM2.5 of indoor origin as a result of different forms of energy efficiency intervention. (a) Loft insulation; (b) cavity wall insulation; (c) improved glazing; and (d) solid wall insulation. The dashed line indicates a reference point of a change of 1 µg/m3.
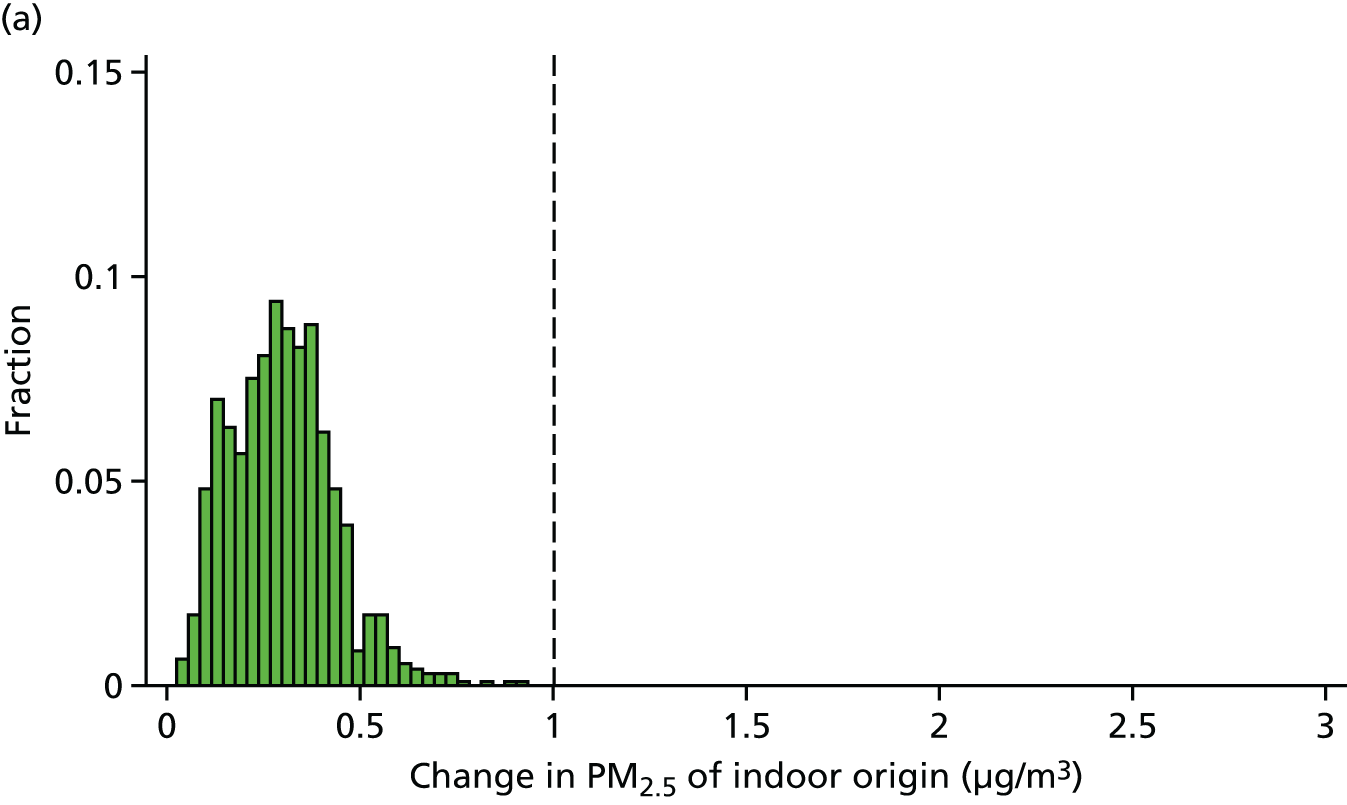

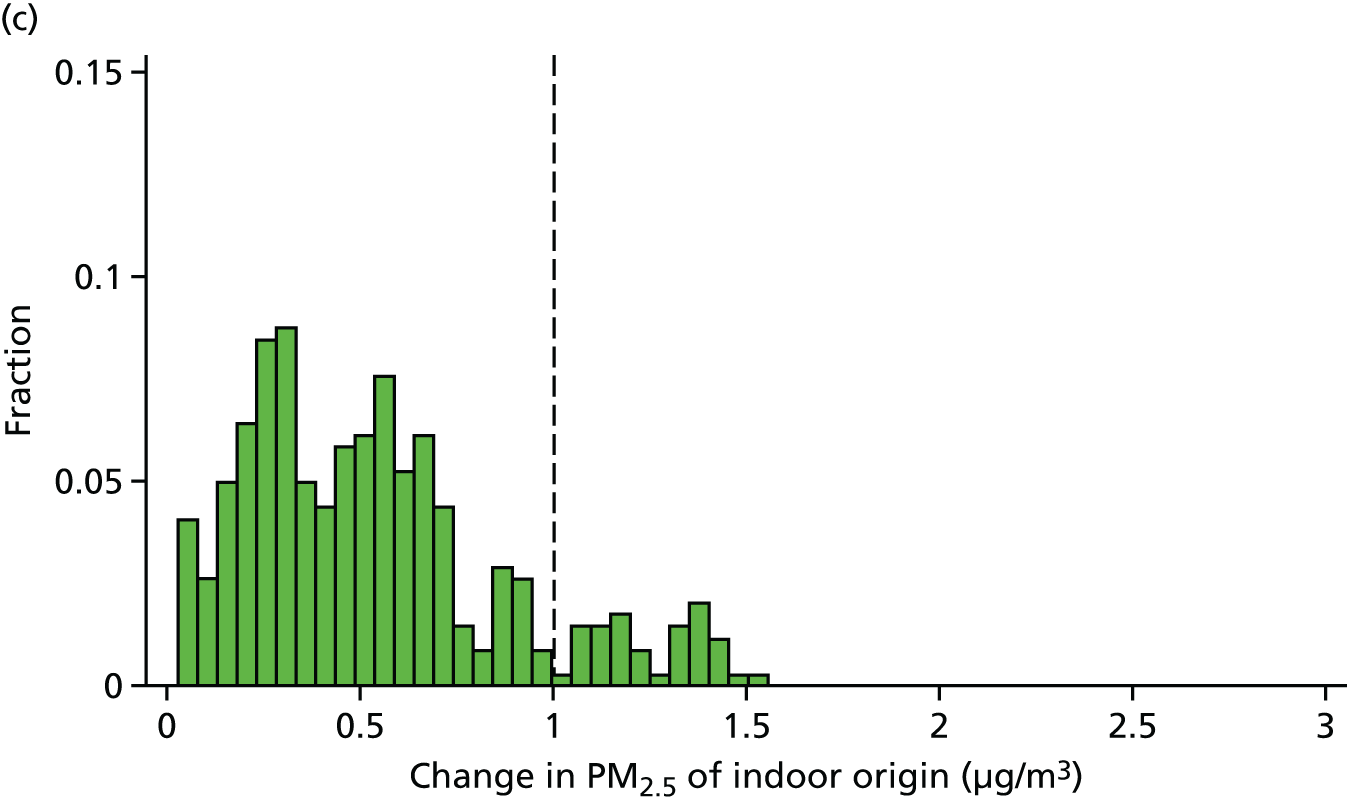
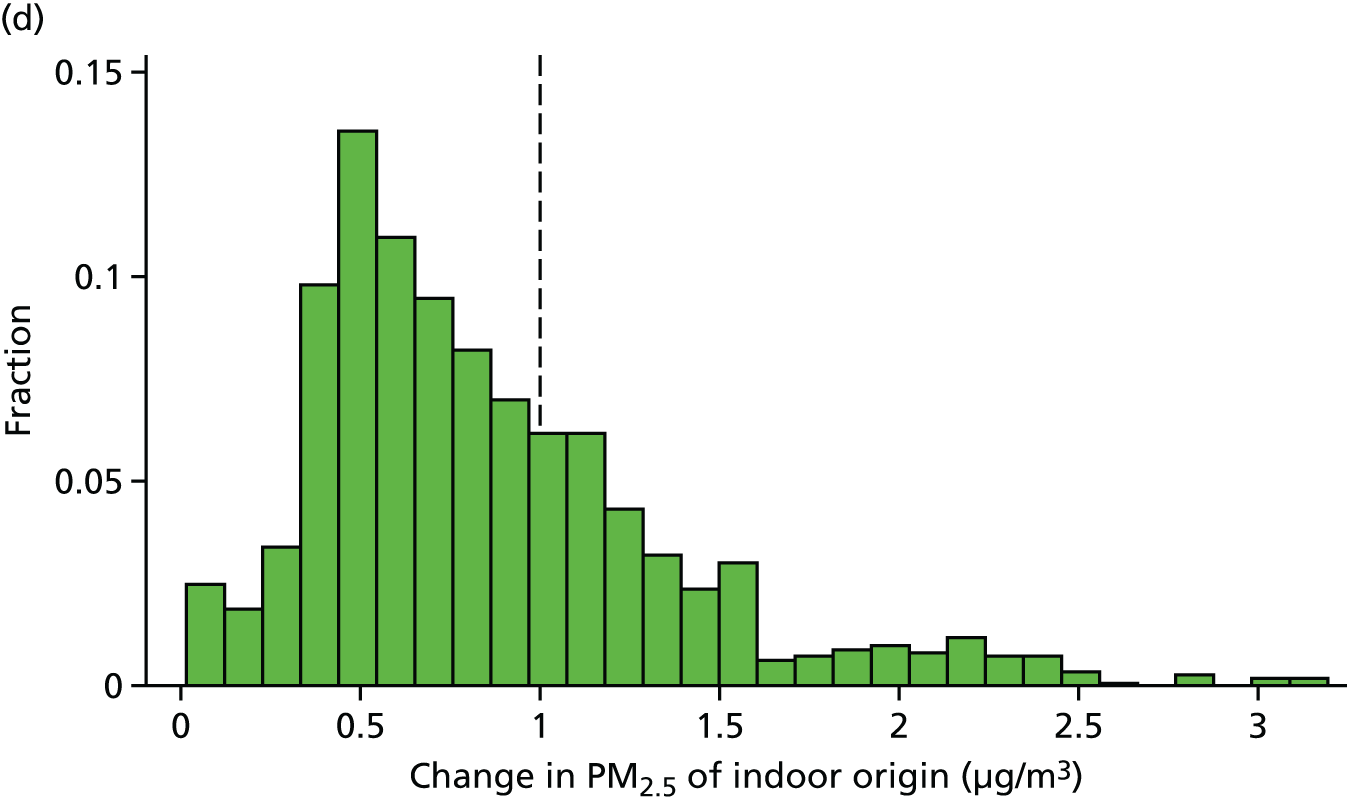
FIGURE 17.
Modelled changes in the concentration of indoor PM2.5 of outdoor (y-axis) and indoor (x-axis) origin following selected energy efficiency interventions. (a) Indoor concentrations of PM2.5 of outdoor and indoor origin; (b) changes with loft insulation; (c) changes with improved glazing; and (d) changes with cavity wall insulation.
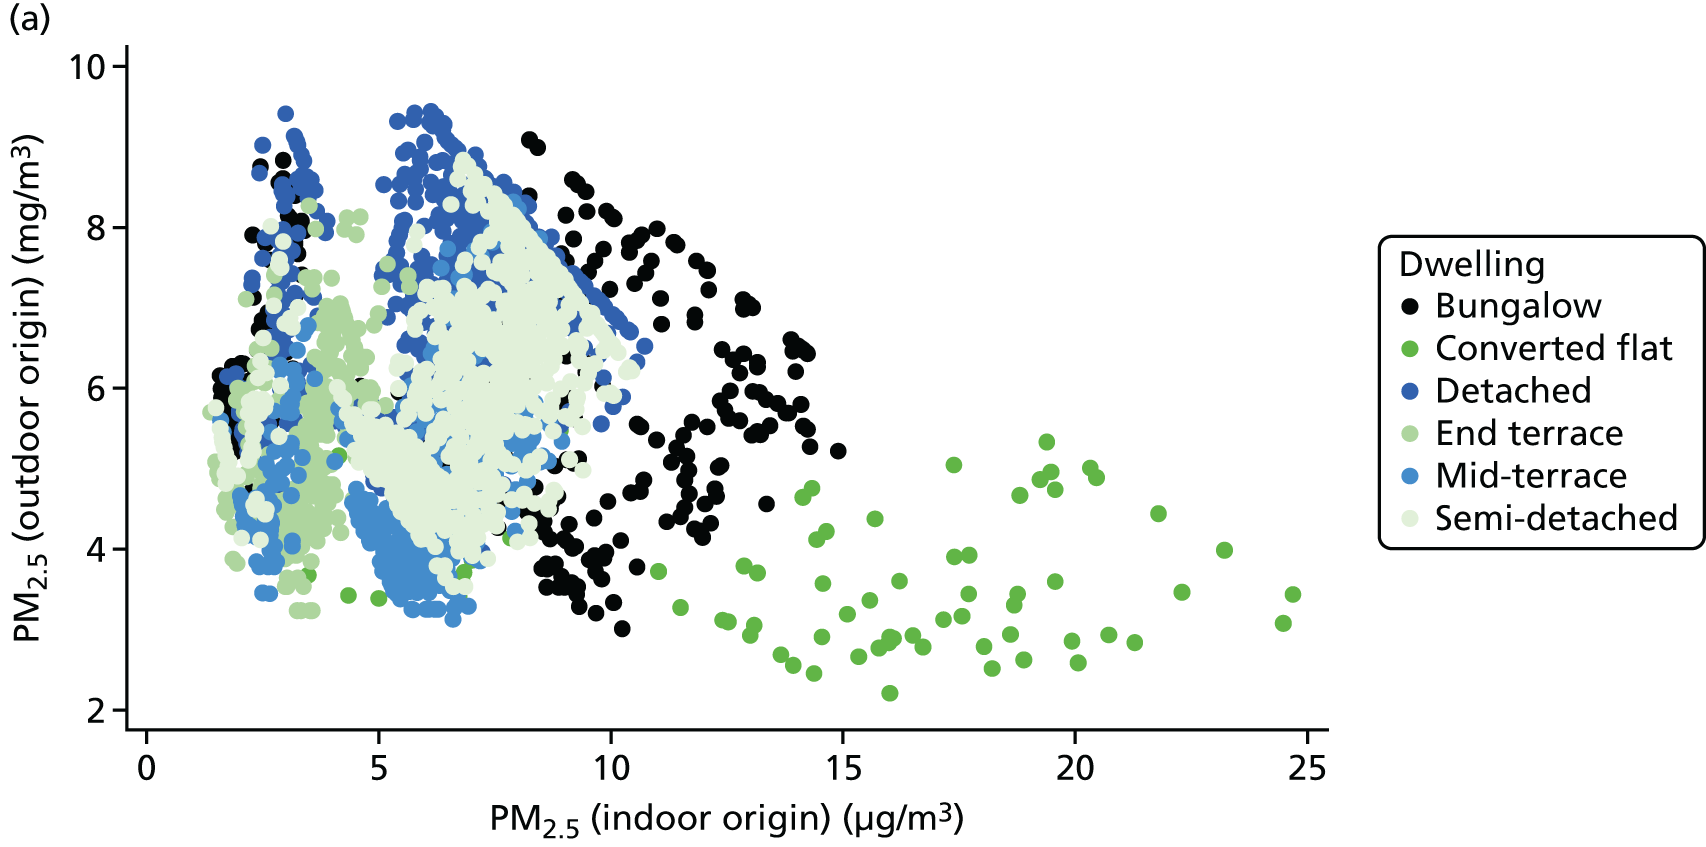
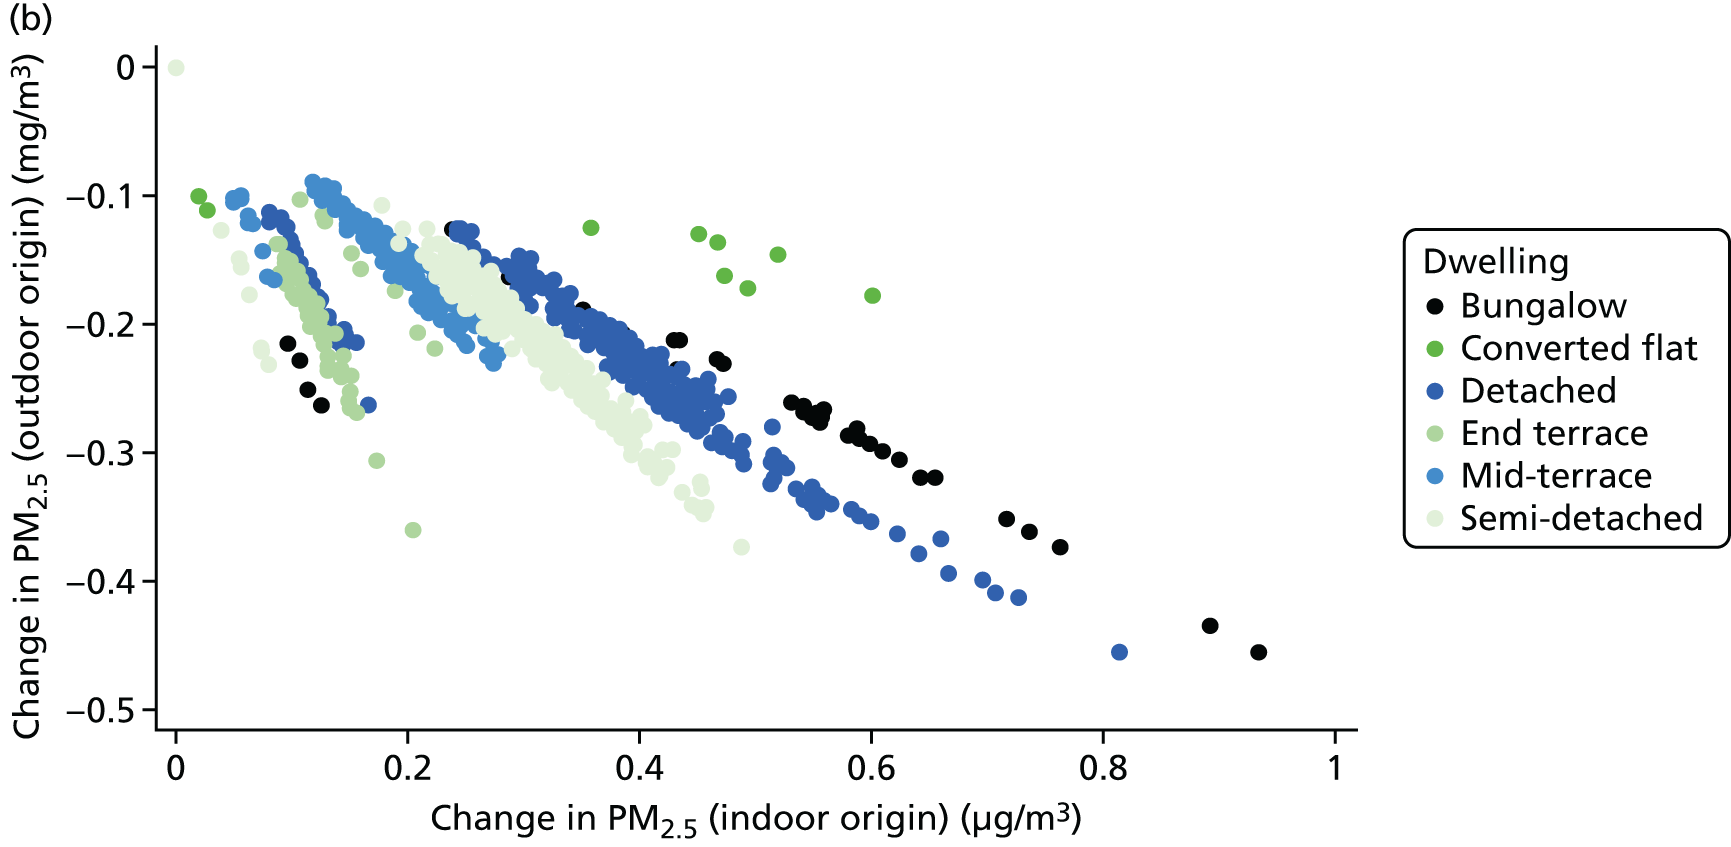
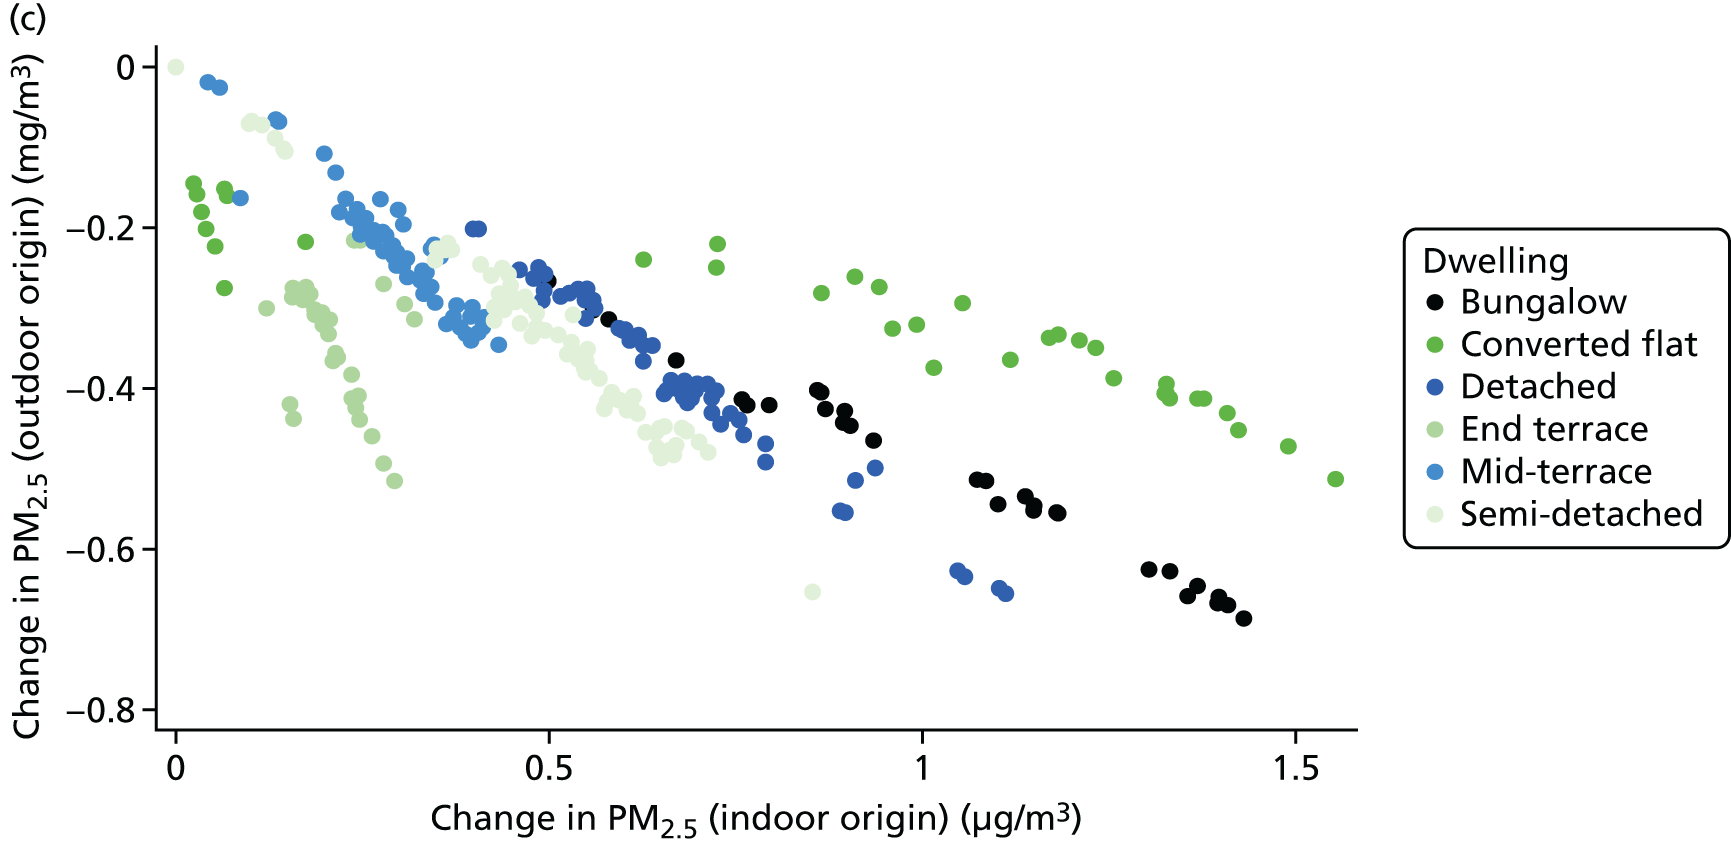
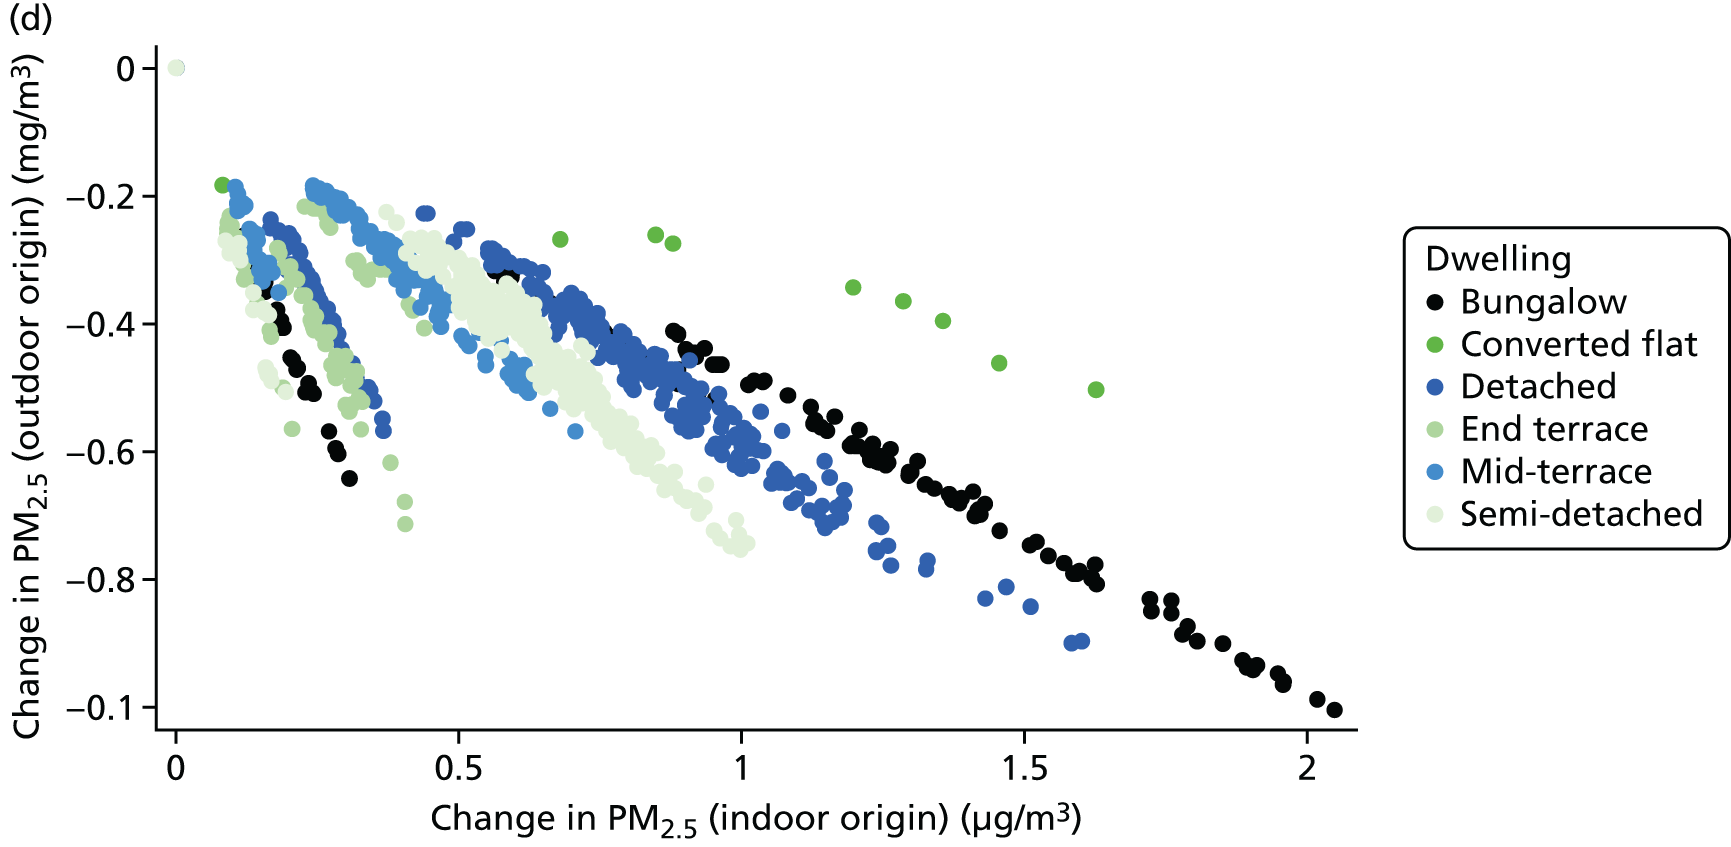
FIGURE 18.
Distribution of changes in indoor radon concentration consequent to the installation of solid wall insulation.
Unfortunately, the available data do not allow for the change in ventilation characteristics and, consequently, for indoor air quality to be modelled with precision and certainty. It is, for example, a matter of choice whether or not trickle vents are installed at the same time as other energy efficiency measures and whether or not householders subsequently choose, or even know how, to use them. Therefore, all quantified changes in indoor air quality are based on ‘best reasonable’ assumptions, informed by published empirical data. However, different assumptions about installed measures and household behaviour, as well as about local environment conditions (e.g. outdoor PM2.5, radon levels), can appreciably alter the balance of positive and negative effects from alterations to the ventilation characteristics of a dwelling.
Energy use
Article extract reproduced from Hamilton et al. 25 Copyright © 2016 The Authors. Published by Elsevier B.V. This is an Open Access article distributed in accordance with the terms of the Creative Commons Attribution (CC BY 4.0) license, which permits others to distribute, remix, adapt and build upon this work, for commercial use, provided the original work is properly cited. See: http://creativecommons.org/licenses/by/4.0/. The text below includes minor additions and formatting changes to the original text.
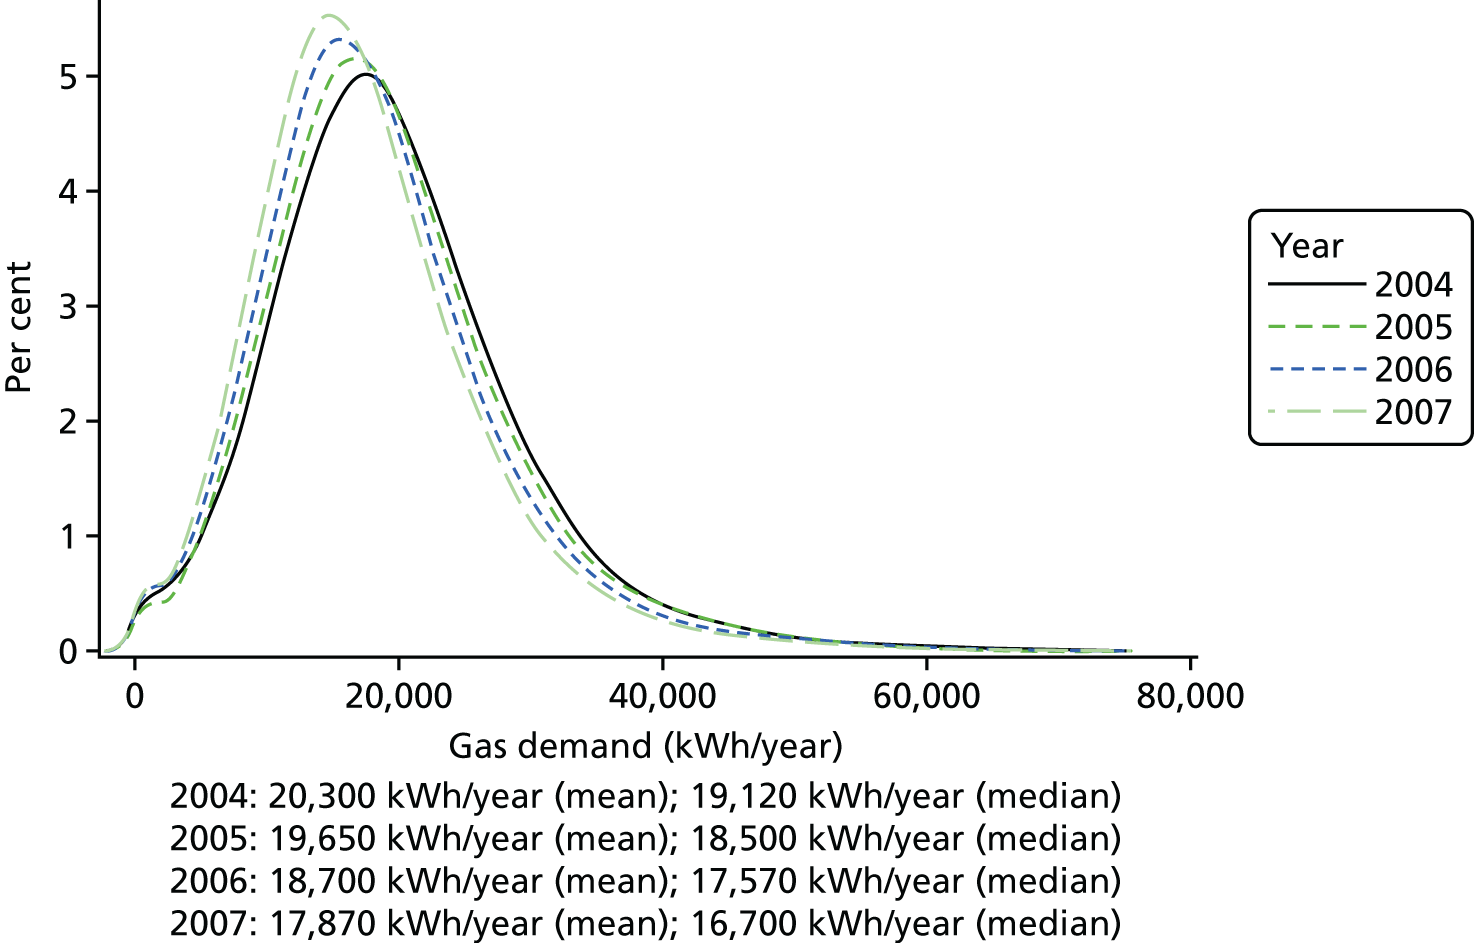
The results for the 168,998 English dwellings included in the analysis are shown in Figure 19 and Table 5. Overall, 39% received a major energy efficiency measure, 36% received a fabric (i.e. insulation) measure and 9% received a heating measure. The annual average change in energy demand across the stock over the period of analysis was –810 kWh/year (with individual year changes of –740 kWh/year in 2004/5, –860 kWh/year in 2005/6 and –830 kWh/year in 2006/7). These are equivalent to percentage changes of –3.6% for 2004/5, –4.4% for 2005/6 and –4.4% for 2006/7 (see Figure 19).
FIGURE 19.
Distribution of annual gas demand (kWh/year) per dwelling in study sample (n = 145,885), 2004–7.
| HEE intervention | n | Proportional change in demand, adjusteda regression coefficient (standard error) | |
|---|---|---|---|
| Gas | Gas and electricity | ||
| Cavity insulation | 104,623 | –0.049* (0.003) | –0.042* (0.003) |
| Loft insulation | 103,615 | 0.009 (0.004) | 0.008 (0.004) |
| Double-glazing installation | 101,391 | 0 (0.008) | 0.003 (0.008) |
| Boiler installation | 101,897 | –0.055* (0.006) | –0.045* (0.006) |
| Cavity and loft insulation | 102,661 | –0.057* (0.005) | –0.052* (0.005) |
| Boiler, cavity and loft insulation | 101,061 | –0.112* (0.012) | –0.1* (0.011) |
| Glazing, boiler, cavity and loft insulation | 100,771 | –0.1 (0.033) | –0.131 (0.004) |
| Glazing, cavity and loft insulation | 101,160 | –0.034 (0.01) | –0.034 (0.01) |
| Glazing, boiler and loft insulation | 100,778 | –0.099 (0.014) | –0.104 (0.007) |
| Glazing and cavity wall insulation | 101,474 | –0.031* (0.008) | –0.019 (0.007) |
In regression analyses that allow for differences in dwelling type, age, tenure, size, region and median neighbourhood income, we estimate that the presence of an installed fabric energy efficiency retrofit, on average, was associated with a –790 kWh/year change in energy demand, or a 3.9% reduction from the stock mean gas demand in 2006. The presence of a heating energy efficiency retrofit was on average associated with a –1950 kWh/year (10.4%) change. When installed together, the average change in energy demand was –2290 kWh/dwelling/year, or a 11.7% reduction.
The proportional change in gas demand in 2005–7 associated with specific forms of energy efficiency intervention adjusted for dwelling type, age, tenure, size, region and neighbourhood income is shown in Table 5. (See Appendix 1 for further details by energy efficiency measure.)
Cavity wall insulation and condensing boiler installations were associated with reductions in demand of 4.9% and 5.5%, respectively, whereas loft insulation and double-glazing installation showed almost no associated change. Larger reductions were achieved with combinations of measures, especially those that included condensing boiler and cavity insulation installations (e.g. cavity wall and loft insulation combined with a condensing boiler was associated with an estimated –11.2% change in demand).
These findings are very similar to those of a study by Hong et al. 46 on the impact that the Warm Front energy efficiency scheme had on British houses, which found that loft and full cavity wall insulation reduced demand during a 1-year period by 10–17%. Although these changes in energy demand are lower than notional ‘savings’ or those of the Hong et al. study,46 it is important to bear in mind that they are based on estimates that control for physical, household and area factors. Controlling for physical factors, for example, means that the effect of number and area of exposed walls or the age of the dwelling is removed, whereas control of household effects adjusts for such factors as: ability to afford larger areas to heat and demand for greater thermal comfort.
It is noteworthy that in our adjusted estimates neither loft insulation nor double glazing was associated with appreciable energy savings over the 3-year period, suggesting that the effect of these interventions is, on average, fairly small and/or cannot easily be detected using annualised energy data. Glazing is one of the thermally weakest elements of the building fabric, and replacement with more thermally efficient glazing should have an effect on energy use. However, because of the way the data were reported, it was not possible to account for the area of glazing that was replaced, so the small estimate of impact may, in part, reflect the fact that, in many cases, only a small proportion of the glazed area of the dwelling was replaced. For loft insulation, many installations were top-ups of around 5–75 mm and the expected change in gas demand would be minimal.
There were variations in the savings associated with certain household/dwelling characteristics (see Appendix 1). For example, dwelling age appears to have an inconsistent effect on changes in gas demand, with the 1967–75 age group having much greater reduction in demand for all single retrofit measures than other age bands. It is not simply that older dwellings have greater energy savings than newer dwellings. Such variation may, in part, be explained by the eligibility and type of retrofits installed. Cavity wall filling is mostly relevant to dwellings built in the mid-century: earlier builds (pre-1950) tend not to have a wall cavity, and those built after 1990 tend to have higher specification. The impact that boilers among this mid-century group had was also greater (after controlling for size), perhaps reflecting a number of building design features, such as the prevalence of gas central heating. 47
Changes in energy demand were also generally lower among renting households or those living in areas of lower income, supporting the hypothesis that those on lower incomes are less likely than higher-income households to realise energy savings. This observation may in part be because lower-income households have higher levels of energy utility (i.e. greater need for the amount used). 48 Both social renting and living in lower-income neighbourhoods were associated with reduced energy demand, even after controlling for type and age of dwelling,6 which may also suggest that these households have a greater potential for increasing demand if energy efficiency retrofits are made. The differences could also be construed as ‘comfort taking’, whereby these households in areas of lower income reduce the potential ‘energy savings’ by taking the savings in the form of temperature increases, an effect that has been shown in a study of vulnerable households in England. 29
The impact of energy efficiency retrofits demonstrates a broad dose–response effect in which combined packages of retrofits are associated with greater (negative) changes in energy demand. Larger increases in reductions in gas demand were associated with boilers and cavity wall insulation, with only minor additional effects from lofts and glazing. The largest change in gas demand was associated with the combined installation of a condensing boiler, and cavity and loft insulation at –10.8%.
In some cases, the effect of combinations of measures appear ‘super-additive’, that is, to have an effect greater than the simple sum of the component measures. For example, the individual change attributable to cavity insulation (–3.8%), condensing boiler installation (–5.2%) and loft insulation (1.2%) ought to result in a change of –7.8%, but the combined estimate was a reduction of around 11%. This may reflect true advantages of combining retrofits into single package (which may have benefits in achieving energy demand reduction and potential cost savings of installation, e.g. wall scaffolding is set up only once), or that there is a ‘take-back’ threshold after which rebound related to thermal comfort is lessened (i.e. the potential rebound has been met).
Realising the potential energy savings set out in the DECC energy efficiency strategy would require a ‘whole-house’ retrofit package for every home in England. If an average energy saving of 10% (e.g. ≈2300 kWh reduction) was achieved from the average UK dwelling, it would take approximately 9,565,000 ‘whole-house’ retrofits (40% of the whole UK stock) to achieve the estimated 22 terawatt hours (TWh) of energy savings by 2020; to achieve a 10% reduction in 2006 levels by 2020 (i.e. 54 TWh) through energy efficiency alone would take the equivalent of every home in the UK being refurbished (i.e. 23,500,000 dwellings). Although further efficiencies might be gained from water heating and appliances, space-heating accounts for the bulk of residential demand. Thus, achieving such savings (to meet climate change targets and to realise the ancillary public health benefits) would require substantial acceleration of the historical rate of retrofit uptake, which is challenging but achievable using widely available technologies and insulating techniques that rely on an existing deployment system and skill base.
In summary, energy efficiency retrofits (although not clearly for loft insulation or double glazing) result in observable reductions in space-heating energy demand (with resultant cost savings for the householders). These savings are part of the gain from energy efficiency measures that are taken instead of increases in temperature. They may have indirect (but unquantified) benefits for the health of householders, especially those on low incomes, because of change in disposable income, and are additional to the health impacts relating to change in the indoor environment (changes in winter indoor temperature and air quality).
Discussion
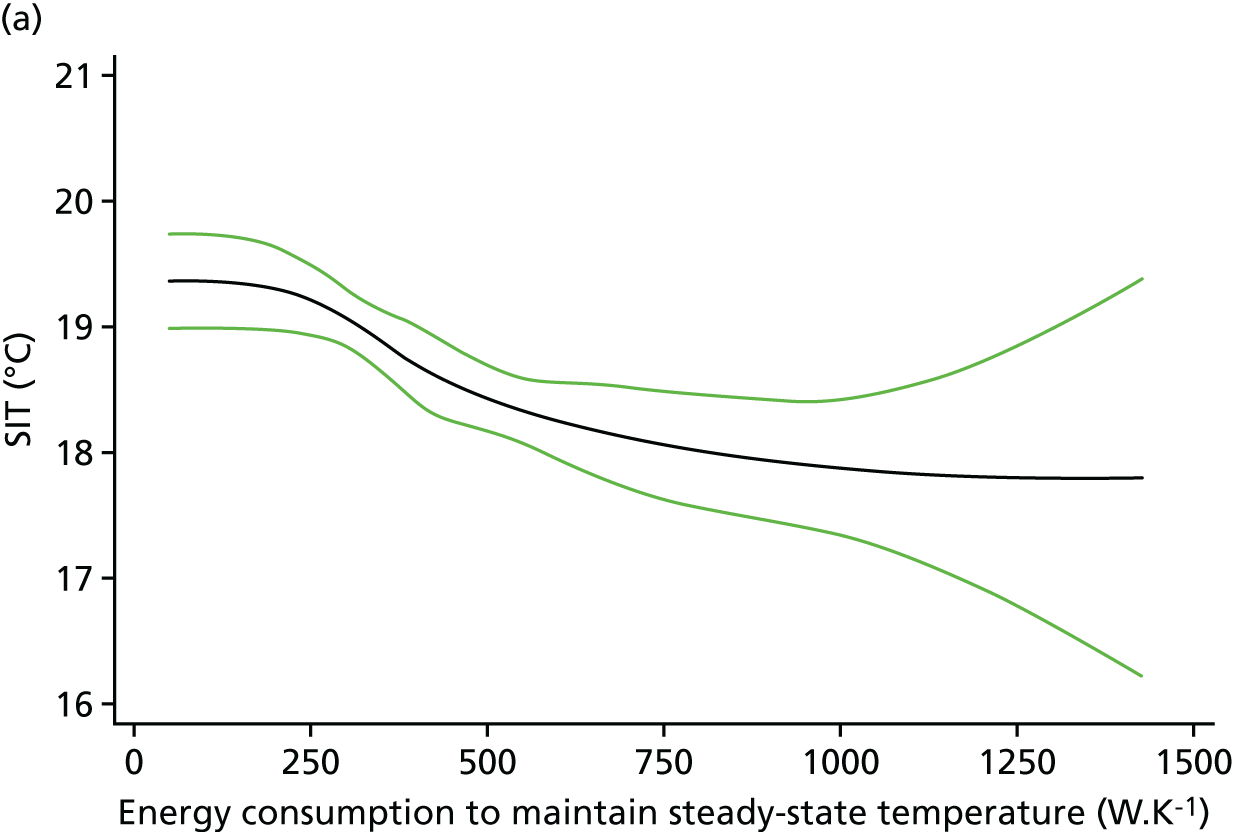
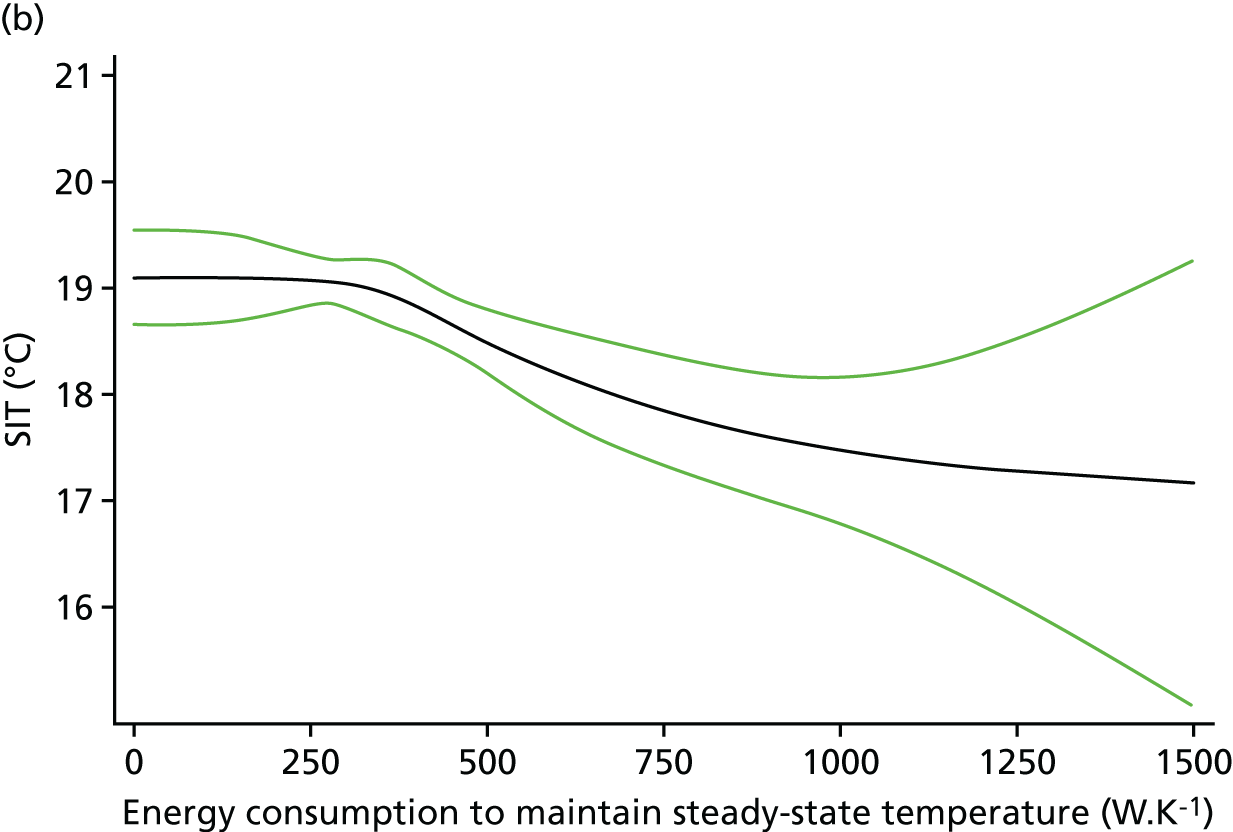
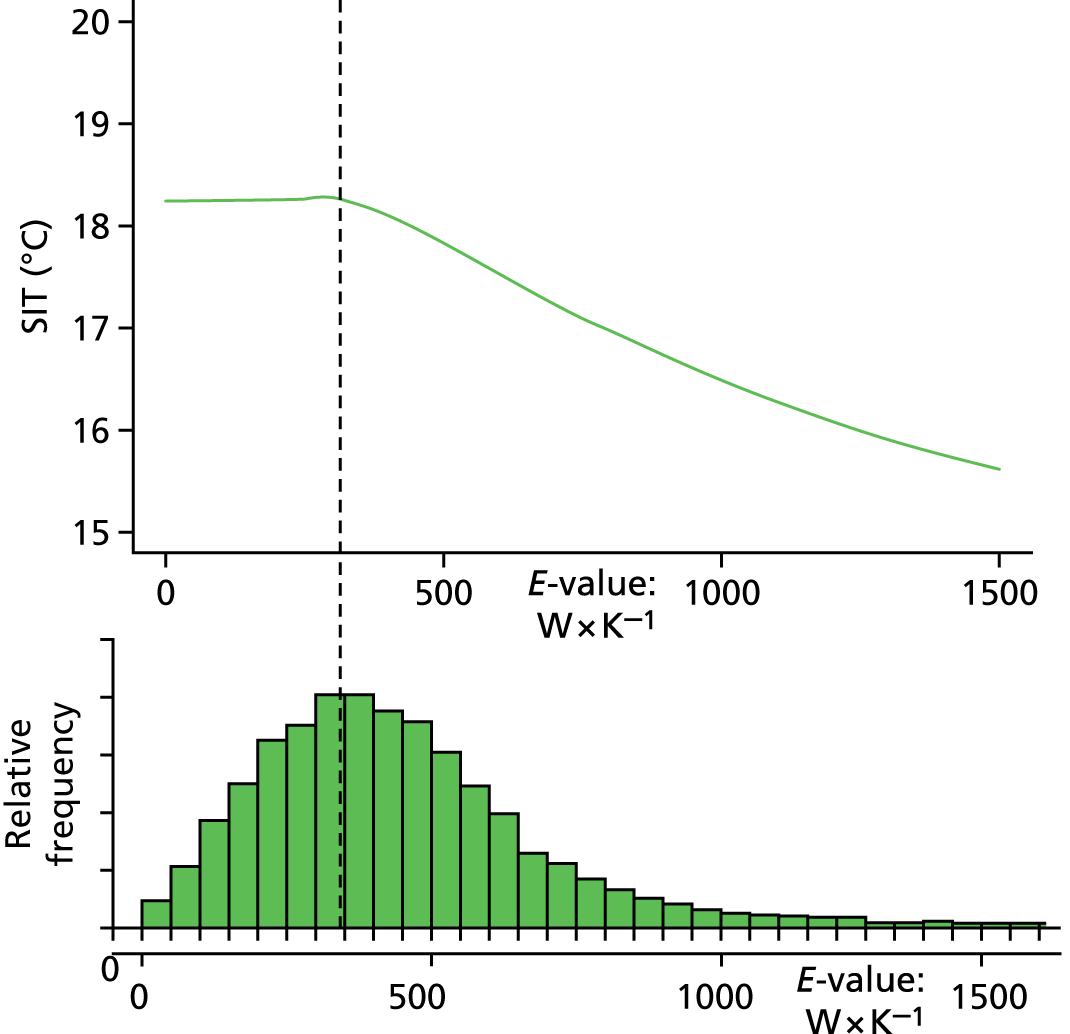
Several features of these results are noteworthy. First is the relatively small size of the effect of energy efficiency interventions on indoor temperatures and, consequently, on health. This appears to be a result of two principal factors: (1) the modest nature of most individual energy efficiency upgrades and (2) the shape of the function relating to indoor temperature to dwelling E-value. As shown in Figure 20, not only is there a relatively shallow gradient of increasing temperature with improving energy efficiency at E-values above around 300 W per Kelvin, but that gradient flattens to close to zero (i.e. plateaus) at values to the left of this point. This point is very close to the middle of the distribution of dwelling E-values for the English stock (as shown in the bottom part of Figure 20). In other words, around half of the housing stock is already at a point where further increases in energy efficiency would not, on average, result in any increase in indoor temperatures (as represented by the SIT). It is also worth noting that this SIT versus E-value relationship is based on empirical data from two independent data sets (EFUS 2010/1130 and Warm Front 2006/527) that appear to generate very similar functional forms (Figure 21). The broad agreement of the results from these different data sets gives greater confidence that the underlying relationship is essentially correct.
FIGURE 20.
Relationship between SIT and dwelling E-value above the distribution of E-values. The dotted line indicates the approximate location of the inflexion point at which further improvement in energy efficiency (positions to the left on the x-axis) result in no additional gain in SIT.
A second important observation is the fact that impacts on health related to air quality may be just as great as, and probably greater than, those from improvements in winter temperatures. Even though there are uncertainties in quantifying these impacts because of limited empirical data, the broad patterns of change are predictable given reasonable assumptions about intervention types, householder behaviour and other factors. These impacts are especially important because they arise over the medium to longer term and hence are not usually observable or even measured in short-term evaluation studies. Therefore, it seems probable that they have not been given sufficient attention in the development of policies relating to energy efficiency interventions and in building regulation. This is an area of research need.
As discussed at the outset of this report, there are pathways of health impact that are additional to those operating through changes to the indoor environment (i.e. temperature and air quality). The analysis here confirms that improvements in energy efficiency as expected are accompanied by observable changes in energy demand. It is a simple fact that the benefits of energy efficiency can be taken either as reduced energy consumption or as increased temperature, or as some combination of the two. It is this balance that lies behind the shape of the relationship between SIT and dwelling E-value, with relatively more of the gain being taken as increased temperature when the energy efficiency is low and almost none being taken as increased temperature when energy efficiency is already good. What individual families choose to do will be determined by their own preferences and circumstances and is almost certainly influenced in part by their disposable income. We do not yet have a method that allows even a broad quantification of the impacts had on health of energy and hence cost savings, especially for those in or near to FP.
Chapter 4 Modelling
This chapter describes selected aspects of the development of a model for quantifying the health impacts of HEE improvements. This development has built on preceding research by the authors and other teams and has, in part, been described elsewhere. 32 In this chapter two pieces of epidemiological research (methods studies) are reported that have been important in helping to improve the model and its parameterisation and illustrate its application for a policy analysis. The methods studies relate to the quantification of the loss of life expectancy in cold-related death (given questions about the possibility of short-term mortality displacement) and the impact that housing adaptations (and specifically energy efficiency measures) may have on heat risk.
Methods study 1: quantifying life lost as a result of cold and heat
Article extract reproduced from Rehill et al. 49 This is an Open Access article distributed in accordance with the terms of the Creative Commons Attribution (CC BY 4.0) license, which permits others to distribute, remix, adapt and build upon this work, for commercial use, provided the original work is properly cited. See: http://creativecommons.org/licenses/by/4.0/http://bmjopen.bmj.com/content/5/4/e005640.
The objective of this methodological analysis was to clarify the degree to which deaths in England associated with hot and cold days are confined to frail people who would have died anyway in the next few weeks or months.
The context is well known. There is ample evidence that mortality increases on and immediately after hot or cold days,3,50–52 and such evidence is used to support public health action. 53,54 However, what is less clear is the degree to which life is shortened in temperature-related mortality. This has some importance, as it is possible that the excess of deaths might occur wholly or partly among very frail people who are approaching the end of their life. If so, the degree of shortening of life would be small,55 a phenomenon commonly referred to as ‘harvesting or mortality displacement’, and the excess of deaths sometimes referred to as ‘deaths brought forward’.
There is some evidence to support the occurrence of harvesting, particularly with respect to heat-related deaths. 2,56,57 It may also be relevant that the effect of temperature on mortality is greatest among the elderly50,56,58 and perhaps also among those with existing comorbidities,50 both are groups who would be expected to have a relatively short life expectancy. However, the extent to which harvesting accounts for the excess of temperature-attributable deaths remains unclear.
Some daily time-series studies have used distributed lag and related approaches to estimate very short-term harvesting (roughly ≤ 1 month) by looking for mortality decreases in the weeks after hot spells. Estimates from such studies suggest that harvesting may account for around 70% of all heat-associated deaths in 15 European cities59 to fewer than 10% of deaths during the 2003 heatwave in France. 60 The proportion may depend on a variety of factors, including the severity of the heatwave.
There is less evidence of short-term mortality displacement for cold-associated deaths, possibly because the longer lag associated with cold effects makes the distributed lag approach to estimating harvesting problematic. 55 There is also the methodological issue that it is difficult with daily studies to identify harvesting beyond a month or so61 because of noise and the need to control for seasonal and other temporal variation that is not a result of temperature.
Some studies have demonstrated that higher than average overall deaths in winter lead to lower daily temperature effects on mortality the following summer62,63 (a phenomenon that might be interpreted as indicating a relatively finite pool of individuals who are vulnerable to temperature-related mortality). A cohort study found that years of high summer temperature variability were associated with high mortality. 55 These studies bring indirect evidence that some temperature-related deaths are displaced by at least several months but not direct evidence of the extent of displacement as a result of heat and cold.
Estimates of the seasonal excess of mortality in winter are less affected by short-term mortality displacement. The Excess Winter Deaths Index approach used by the UK’s ONS identifies excess mortality over the 4 months of ‘winter’ (defined as December to March), compared with the preceding 4, and following 4 months. However, these excesses could still be biased by displacement from winter to non-winter in the same year. Moreover, an appreciable fraction of the excess winter deaths may be attributable to seasonal factors other than temperature, such as respiratory infections, influenza and behavioural changes.
Given the limited evidence on the extent of mortality displacement as a result of heat and cold from previous studies, this study set out to avoid some of the limitations of current techniques by applying time-series methods to investigate if annual death counts have been associated with annual summaries of temperature extremes, an analysis that that would find association only if those deaths would not otherwise occur in the same year (as the year of high or low temperatures) and so provide evidence on a lower limit of the degree to which temperature-associated deaths represent short-term displacement.
Methods
The study was based on deaths among London residents from all natural causes from September 1949 to September 2006 using two sources of mortality data to cover the whole study period. For 1949–75, we used digitised weekly counts of death registrations published in print by the Registrar General,64 supplementing 1950–64 data from a previous study. 16 For 1976–2006, we used daily counts of death collated for other studies65,66 and originally obtained from ONS. The data were for the London Administrative County for 1949–65, and for the larger Greater London thereafter. For all years, we retrieved deaths as a result of all natural causes, cardiovascular causes and respiratory causes. The daily counts were collapsed into weeks to create a complete series of weekly mortality for the entire 57 years of study, starting from 2 October 1949.
Weekly counts were aggregated into years commencing in autumn (which we defined to begin in the first week of October), rather than using conventional calendar years, so as to align temperature and mortality data for the same winter season (instead of artificially splitting winter at 1 January and noting that cold can be delayed by as long as 3 weeks2). Heat-related mortality effects are predominantly seen within 1–3 days,50 so the October boundary would mean that each year included most deaths resulting from hot weather in the warm season months up to and including September. Weeks were numbered sequentially from the start date and organised into years of 52 or 53 weeks, with each year starting in early October, but then dropping all weeks numbered as the 53rd to leave summed counts of deaths for 57 52-week years, for simplicity in the regression model.
Boundary and International Classification of Diseases classification changes
The change in the administrative definition of London in 1966 led to a sharp artificial jump in death counts, which we modelled using two indicator variables to make ‘steps’ going into 1965–6 and 1966–7. Other, smaller discontinuities considered in sensitivity analyses were similarly allowed for, as were discontinuities in International Classification of Diseases67 classifications (affecting only cause-specific analyses) for which no bridging code was available.
Meteorological data
Daily temperature data were derived from the Heathrow Airport meteorological monitoring station (the only station with data available for the whole period), which were downloaded from the British Atmospheric Data Centre (now the Centre for Environmental Data Analysis; see artefacts.ceda.ac.uk/badc_datadoes/index_test.html). To capture heat or cold exposures in one annual summary statistic, we first computed daily measures of ‘heat’ and ‘cold’ [i.e. degrees Celsius above (below) the heat (cold) threshold]. For simplicity, we assumed a V-shaped temperature–mortality model common in daily time-series studies in which there is a common threshold for heat and cold effects. To inform the choice of the minimum mortality temperature (apex of the V; common cold and heat threshold) we reviewed 11 previous studies examining temperature and mortality in London, but found no clear consensus among studies, probably because of differences in methods (e.g. lags, shape of model). For our primary analysis we chose a value of 18 °C of daily mean temperature as a common threshold both for cold and heat, as it approximated the mean over the reviewed studies. These ‘heat-degrees’ for each day were the number of degrees Celsius above 18 °C of the daily mean temperature, whereas ‘cold-degrees’ was the number of degrees below 18 °C of the daily mean temperature. The annual means of these measures, ‘annual-heat’ and ‘annual-cold’, were used in our analyses. Owing to uncertainty over the common threshold temperature, the choice of threshold was prioritised for exploration using sensitivity analyses.
Statistical analysis
We carried out a quasi-Poisson time-series regression analysis, with yearly all-cause natural deaths as the outcome, and the main exposures of interest being annual-heat degree days and annual-cold degree days. We undertook a primary analysis based on a model informed by a priori judgement but explored sensitivity to assumptions in that model.
We used indicator variables to account for steps in the mortality series in 1965–6 and 1966–7 owing to a boundary change (discussed in Boundary and International Classification of Diseases classification changes). In the cause-specific analyses we also included four further indicator variables to reflect steps expected because of International Classification of Diseases classification changes. To control for long-term trends in the model, we included a natural cubic spline function assuming 1 degree of freedom for every 10 years of data (5 degrees of freedom in total), equating to a roughly 10-year moving average. We chose this degree of flexibility by judgement to allow control for gradual changes in population size, age structure and death rates, while leaving enough variability to use in analyses.
We adjusted for influenza epidemics by including as explanatory variable the proportion of deaths each year that were classified as caused by influenza.
Alternative model assumptions, including different degrees of confounder control, were considered in sensitivity analyses.
For comparison with the annual time-series estimates, we also undertook a simple time-series regression of weekly counts following conventional methods, using the same heat-degrees and cold-degrees daily measures aggregated to weeks (‘week-heat’ and ‘week-cold’). We controlled confounding by seasonal and other time-varying risk factors by stratifying by year and month (344 strata) and using a conditional quasi-Poisson model (equivalent to a time-stratified case crossover). Because of the known lag between cold and mortality excess, the cold variable included in the model was the mean of the daily cold-degrees over that week and the previous one.
All analyses were performed in Stata, version 11.2. The annual data set and core code are available from the Dryad Digital Repository (URL: http://dx.doi.org/10.5061/dryad.02k83). 49
Results
There were a total of 3,530,280 deaths from natural causes in the 57 years of our analysis: 1949–50 to 2005–6. Allowing for the sharp increase in the annual count of London deaths attributable to the change in the definition of London’s administrative boundary in January 1966, there was evidence of a gradual decline in counts of death from about 1970.
Mean daily temperature exceeded the threshold of 18 °C on 11.1% of days and was below this threshold on 88.7% of days. For each year during the study period, the mean cold-degrees over the year (degrees below 18 °C) was, on average, 7.4 °C and varied between 6.2 and 9.0 °C; the mean heat-degrees (degrees above 18 °C) was much lower (0.2 °C) and varied only from 0 to 0.6 °C.
The results for the estimated increase in mortality for each degree of cold and heat across the year, as determined by the regression model, are shown in Table 6. Cold years were associated with increased deaths from all causes. For each additional degree of cold across the year, all-cause mortality increased by 2.3% (95% CI 0.7% to 3.8%), after adjustment for influenza and secular trend. The effect of cold was greater in those aged ≥ 65 years, and for deaths from cardiovascular disease (2.9% per degree) and respiratory disease (7.6% per degree), but the CIs for each of these subgroup analyses were wide.
| Age (years) | Increase in mortality per °C, % (95% CI) | |
|---|---|---|
| Main (annual data) | Comparative (week data) | |
| Cold | ||
| All causes | ||
| All | 2.3 (0.7 to 3.8) | 2.0 (2.0 to 2.1) |
| ≥ 65 years | 2.4 (0.6 to 4.3) | 2.2 (2.1 to 2.3) |
| < 65 years | 1.9 (–0.0 to 3.9) | 1.5 (1.3 to 1.6) |
| Cardiovascular | ||
| All | 2.9 (0.9 to 5.0) | 2.4 (2.3 to 2.5) |
| Respiratory | ||
| All | 7.6 (2.7 to 12.8) | 3.6 (3.4 to 3.8) |
| Heat | ||
| All causes | ||
| All | 1.7 (–2.9 to 6.5) | 3.9 (3.6 to 4.1) |
| ≥ 65 years | 1.0 (–4.4 to 6.8) | 4.5 (4.2 to 4.8) |
| < 65 years | 3.0 (–3.2 to 9.7) | 2.0 (1.5 to 2.5) |
| Cardiovascular | ||
| All | –0.1 (–5.9 to 6.1) | 3.9 (3.5 to 4.3) |
| Respiratory | ||
| All | 3.3 (–10.3 to 19.0) | 7.9 (7.2 to 8.6) |
The estimated increase in mortality with heat (1.7% per degree) was also very imprecise (95% CI 2.9% to 6.5%), as were the age- and cause-specific heat-related mortality estimates, which makes comparisons unreliable.
A range of sensitivity analyses (reported in Appendix 2) showed that only when the spline used to allow for mortality trends over time was very inflexible (three knots) did the association of mortality with cold change substantially (losing statistical significance). This model, however, fitted the data appreciably less well by Akaike information criterion. The association of heat with mortality was more sensitive to model choices but estimates of mortality increment because of heat remained very imprecise in all models. Residual analysis of the main model did not suggest problems of poor model fit.
The comparative conventional month-stratified time-series analyses on weekly data for the same period gave all-cause estimated cold and heat effects as 2.0% (95% CI 2.0% to 2.1%) and 3.9% (95% CI 3.6% to 4.1%) per degree Celsius below and above the 18 °C threshold, respectively. CIs were much narrower than for the annual data estimates and point estimates for age- and cause-specific deaths showed clear pattern of higher RRs in the elderly and in deaths owing to cardiovascular and, in particular, respiratory disease.
Discussion
These analyses provide evidence on a central question for interpreting the public health importance of temperature-related mortality, namely the degree to which heat- and cold-related deaths can be attributed to a very limited shortening of life of perhaps just days or weeks. If the majority of temperature-related deaths were explained by such harvesting, most observers would consider temperature-related mortality to be much less concerning than if there were evidence for a reduction of life by months or years. This analysis does not provide a full answer to this question but suggests a lower limit. Specifically, we found that, over six decades in London, colder years were associated with increased mortality, with 2.3% (95% CI 0.7% to 3.8%) more deaths occurring per degree of cold during the year. This suggests that cold-related deaths were brought forward by at least around half a year. Had the excess of daily deaths associated with preceding weeks of cold weather (which typically occurs in the UK between December and March) been ‘due to occur’ within the same year as defined in this study – that is, before the following October – no association between cold and mortality would have been detected. Our findings were generally robust to variations in the modelling assumptions and regression techniques used.
To our knowledge, no other studies have looked at long-term mortality in relation to long-term temperature defined on an annual basis. The results of our analysis for heat are broadly supported by the cohort analyses that show that years of high summer temperature variability are associated with high mortality. 68
It is instructive also to compare our estimates with those from published daily time-series and related studies. Two London studies57,69 used the same cold threshold as us (18 °C). If all the excess deaths in these daily studies had been displaced from beyond the next October and there were no longer lag effects, they should reveal the same increments of risk as in the annual studies, setting aside the slightly different time periods of the studies (1988–92 and 1993–6). The daily studies both found increments of daily mortality of 1.4% per degree below 18 °C, broadly similar to the estimates based on our subsidiary weekly analysis (2.0% per degree Celsius). The fact that our estimate from analysis of annual data was positive, and also similar to our own weekly and the other published estimates, strongly suggests that (most of) the excesses in the daily and weekly studies are, indeed, displaced from beyond October (i.e. from the next year). The fact that the annually-based estimate is somewhat larger might also be interpreted as giving some suggestion that there may be adverse mortality effects operating at much longer lags than were detectable in the daily studies (lags of 3 days and 2 weeks), although the difference could be a result of chance, as 1.4% and 2% falls within the wide CI for this study (95% CI 0.7% to 3.8%).
Estimates for the impact that heat had from this study were, unfortunately, very imprecise. In particular, the CI for increase in mortality per degree above 18 °C (95% CI –2.9 to 6.5%) includes all of the estimates made in daily studies, including the one found in the one daily study57 using the same 18 °C threshold (1.3%), and also the estimate presented in the current study from weekly data (3.9%). This limit in precision precludes making any conclusion from this analysis on the presence of absence of short-term harvesting for heat-related deaths. The precision limitation is a result of the limited number and variation of hot days annually in London. Annual studies in cities with more days above their heat thresholds would probably have more power.
As in all epidemiological studies, our study was potentially subject to residual confounding by uncontrolled risk factors that change over time, including, for example, changes in the size and demographic structure of the London population, as well as declining age-specific deaths rates owing to changes in health care and risk factors (e.g. smoking). In common with other time-series regression studies,20 we relied mainly on a smooth (spline) function of time to control for these, under the assumption that changes in such time-varying confounders would probably be smooth. Although we cannot rule out residual confounding, it is reassuring that increasing the flexibility of the spline or adding further ‘step’ functions changed the estimated cold effect very little. The much lower estimate for cold when using a less flexible spline (see Appendix 2) has little credibility given the much poorer fit of this model (Akaike information criterion).
How and whether or not to control for influenza is problematic, as it is possible that it might be on the causal pathway between cold and death, although there is no direct evidence that cold is a direct cause of influenza. Our approach, using the proportion of total deaths resulting from influenza as covariate in the regression is, we believe, conservative.
Air pollution is an established risk factor and also changes over time. We were unable to control for this, as we were unable to assemble consistent data for the complete period. However, data on black smoke for the period 1976–2003 were available,70 and an analysis revealed a weak negative correlation between mean annual cold and black smoke during this time, after accounting for year (r = –0.25). This suggests that confounding from air pollution is unlikely to have been substantial, and control for it would be more likely to increase estimates of cold effects.
Despite the large population of London and the long duration of our series, power and precision was limited for some analyses, especially for heat effects, and for age- and cause-specific analyses, the results of which were too imprecise to allow much interpretation, even if point estimates followed broadly the expected pattern. 50,71,72 The more precisely estimated patterns that we found in the weekly analysis match those found by others.
Finally, our approach to summarising cold and heat in each year is not the only one possible. We chose it so as to maximise the link between this study and daily studies. However, in fact, the annual measure of cold adopted (degrees below 18 °C) was very highly negatively correlated, in temperate London, with the annual mean temperature (r = –0.97). The heat measure was also correlated, but less strongly so (r = 0.81). Thus, analyses using mean annual temperature would have resulted in very similar estimates of cold effects and broadly similar heat effects.
The importance of this evidence is that it suggests that, in the UK, most people who die as a result of cold in daily time-series studies lose at least 6 months of life expectancy, and possibly much more. Our methods do not allow us to derive an estimate of the actual degree of life shortening, but rather they help to define a lower limit for it. The fact that it appears to be no less than around 6 months strengthens the case that cold-related deaths are a serious public health problem and hence that policies aimed at reducing vulnerability to cold through such measures as home insulation have important benefits to health and specifically to life expectancy. This has a bearing on the quantification and valuation (monetisation) of the health gains from improved protection against cold-related mortality.
Methods study 2: dwelling characteristics as determinants of heat risks to health
This second methods study examined the relationship between dwelling characteristics and the risk of heat-related death. The context here is that energy efficiency measures that improve the thermal performance of a dwelling in protecting against outdoor cold are also likely to influence indoor temperatures during hot weather. Previous analyses have examined indoor heat risk assuming the same relationship between temperature and mortality as observed with outdoor temperature. 73 This suggests that dwelling characteristics are as, if not more, important, for health [e.g. the urban heat island effect, the name given to the increment of temperatures in urban centres compared with surrounding areas resulting the thermal properties (heat absorption, capacity, conductance and albedo) of the surfaces and materials found in urban landscapes, the reduced evapotranspiration from reduced natural vegetation, and the waste heat produced from anthropogenic activities]. 74
Methods
Analyses were based on mortality records (n = 322,840) of people aged ≥ 65 years dying in the summer months (June, July, August, September) of the years 2001–6. These records were linked to dwelling characteristics by the full unit (seven-digit) postcode of residence (212,110 postcodes) and to outdoor temperature data (daily maximum temperature in degree Celsius at lags of 0–1 days) using data from a national-scale Weather Research and Forecasting (see www.mmm.ucas.edn/weather-research-and-forcasting-model) weather model with spatial resolution of 5 × 5 km. The association between mortality and maximum daily temperature was based on a time-stratified case crossover design. There were two status analyses: conditional logistic regression to estimate region-specific heat slopes and their interaction with a dwelling overheating index, and subsequent meta-analysis of the results with random effects across regions.
Overheating index
The derivation of the dwelling-type specific overheating index was based on building physics simulation using the validated modelling software EnergyPlus version 8.3 (US Department of Energy, Washington, DC, USA). Using input data from the EHS,47 this was used to calculate a temperature anomaly for representative dwelling archetypes. The anomaly was defined as the difference between the mean indoor temperature [mean (Tindoor)] and the mean outdoor temperature [mean (Toutdoor)] on days when the 2-day average of daily maximum temperatures, Tmax0–1, outdoor was above the 97.5th centile of the temperatures distribution (the anomaly for ‘extreme heat’) and on days when the 2-day average of daily maximum temperatures Tmax0–1, outdoor was between the 93 and the 97.5 centile (‘moderate heat’). For each of 16 dwelling types, eight indices of anomaly were computed, reflecting 2 × 2 × 2 combinations of moderate/extreme heat, daytime/night-time and bedroom/living room temperature.
These archetype-specific temperature anomalies were then linked to (geographically-referenced) Address Point Data Ordnance Survey, Southampton, UK; see www.ordnancesurvey.co.uk/business-and-support/productsaddress-point.html accessed 3 August 2018) to classify dwellings by postcode location, to which mortality data were also linked. This enabled postcode locations and, thus, mortality data to be classified with respect to the overheating potential (temperature anomaly indices) for their place of residence (Figure 22). The mortality data so classified were analysed for the association between mortality risk and outdoor temperature and the statistical interaction with the overheating index.
FIGURE 22.
Illustration of the classification of postcode locations with respect to dwelling type and overheating indices (temperature anomalies). Orange and red dwellings have positive temperature anomalies. Based on data from OS MasterMap® Building Heights [FileGeoDatabase geospatial data], Scale 1 : 2500, Updated: 29 November 2014, Ordnance Survey (GB), Using: EDINA Digimap Ordnance Survey Service, <http://digimap.edina.ac.uk>, Downloaded: 2016–09–15 12:27:53.213 and Versik Analytics® UK Buildings [FileGeoDatabase geospatial data], Updated: 1 November 2014.
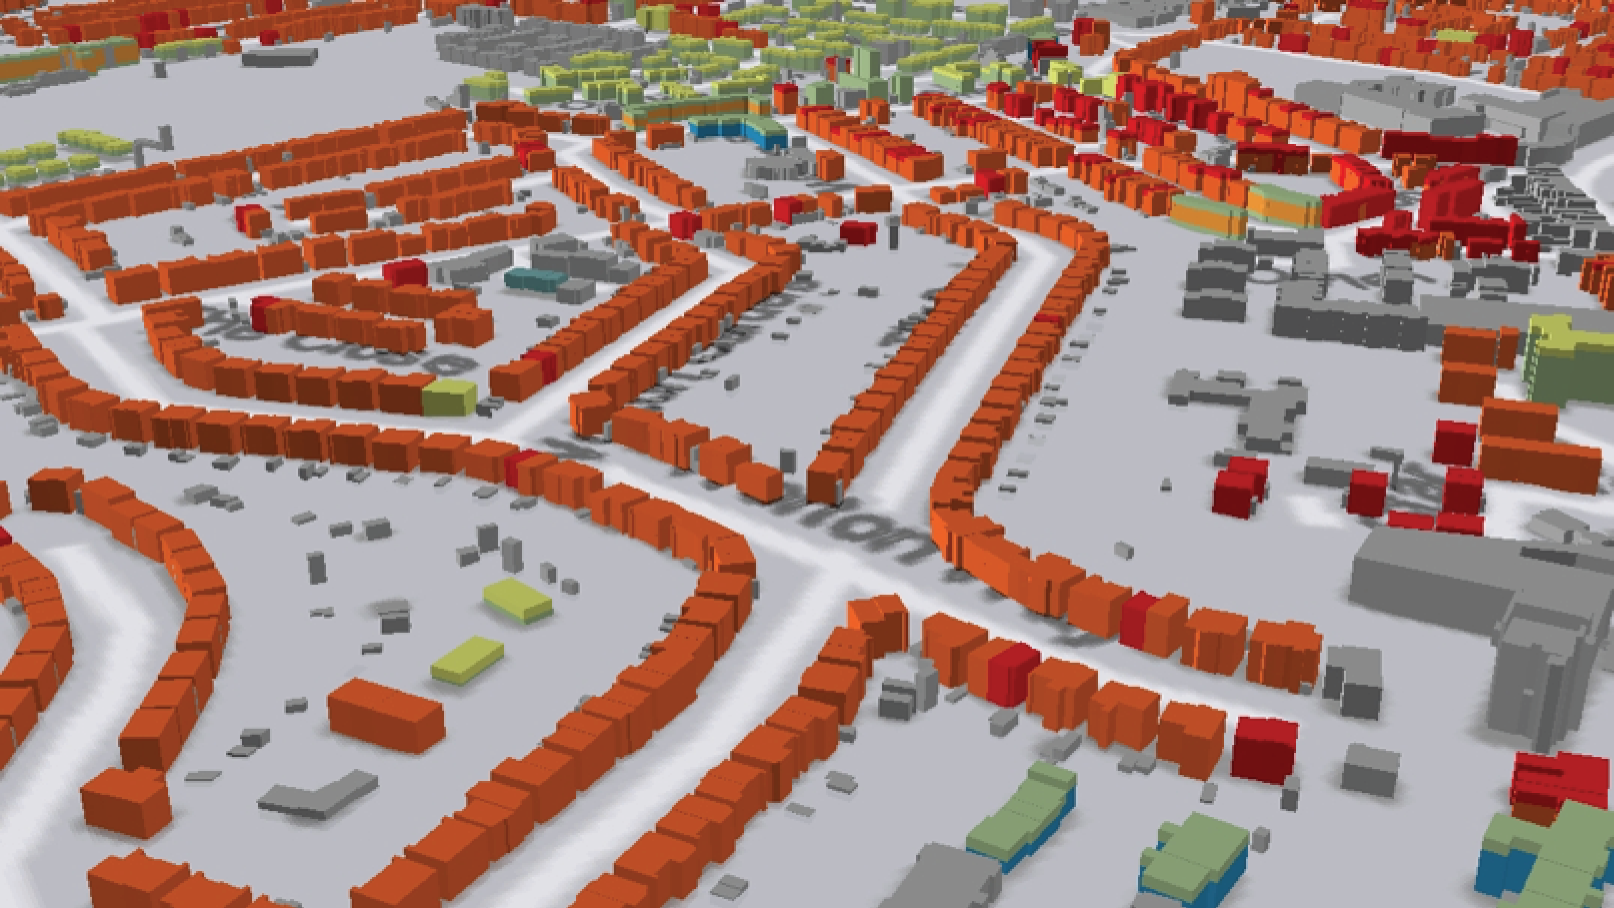
Results
The overall (regionally ‘averaged’) slope for the association between high temperature and mortality was a 3.3% (95% CI 2.5% to 4.0%) increase in mortality risk for each 1 °C rise in temperature (lags of 0,1 days).
Table 7 shows the summary results of the modification of this relationship with each of the eight temperature anomaly indices. The pattern of results is mixed. Only one coefficient for effect modification was nominally statistically significant, namely that relating to the temperature anomaly for the daytime bedroom temperature on very hot days. This indicates a 1.34% (95% CI of 0.37% to 2.32%) increase in the temperature–mortality slope for each degree Celsius increase in temperature anomaly. Therefore, this suggests that people living in dwellings that are likely to develop higher bedroom temperatures during the daytime in very hot weather are more vulnerable to heat-related death.
| Time of day | Room type, % change in temperature–mortality slopea (95% CI) | |
|---|---|---|
| Living room | Bedroom | |
| Very hot days | ||
| Daytime | –0.13 (–0.82 to 0.56) | 1.34 (0.37 to 2.32) |
| Night-time | –0.18 (–0.69 to 0.32) | 1.18 (–0.26 to 2.63) |
| (Moderately) hot days | ||
| Daytime | –0.09 (–0.48 to 0.31) | 0.53 (–0.52 to 1.56) |
| Night-time | –0.08 (–0.37 to 0.21) | –0.74 (–2.05 to 0.57) |
However, it should be noted that across all eight coefficients the pattern of results does not seem consistent. The point estimates for five out of the eight effect modification coefficients are negative (although with CIs including zero).
Discussion
This analysis was an attempt to obtain direct empirical evidence that people living in dwellings that are more likely to overheat during hot weather would have greater risk of heat-related death. Overall, its results provide only weak, although plausible, evidence that such modification of risk does occur, and specifically that those living in houses in which the bedroom temperature increases more than in most other houses during periods of very hot weather are more vulnerable to heat-related death.
It is not possible to draw a very robust conclusion from this result, especially given that only one out of eight different coefficients examined showed evidence of effect that was clearly different from the null. The overall pattern of results suggests that the evidence for modification of heat risk by dwelling characteristics is greater on very hot days and on hot days and for markers relating to bedroom rather than living room temperatures and for daytime rather than night-time anomalies. Arguably this is a mismatch with expected time–activity patterns. Given the rooms that people are most likely to occupy different times of day, a priori prediction would suggest that the most sensitive markers would be those reflecting daytime living room temperatures or night-time bedroom temperatures.
Nonetheless, it seems very probable on physiological grounds that the risk of heat-related mortality would be greater in dwellings that are likely to exhibit higher indoor temperatures during hot weather. It is also worth remembering that this analysis depends on indirect methods of classification for heat exposure, specifically using building physics models to classify the overheating propensity of different dwelling types and then to assign dwelling types to postcode locations to which mortality data were linked using the postcode of residence. All of the steps entail an imperfect link and hence there is likely to be a degree of misclassification, which is likely to introduce a conservative bias (i.e. against finding a modification effect using such indirect markers). This, and the plausibility of genuine effect modification, adds some weight to the interpretation that the observed association reflects a true causal mechanism, even if it is imprecise.
Therefore, the evidence is far from conclusive but does offer a weak indication of effects that would be entirely compatible with reasonable expectation. The evidence needs to be further strengthened and made more precise if it is to be truly useful in helping to inform assessments of the role of building characteristics as determinants of heat-related health risk. Its importance is perhaps more qualitative. Energy efficiency measures more often act to increase, rather than decrease, the propensity to overheating and, thus, could represent a potentially important unintended adverse consequence of retrofit energy efficiency upgrades that may come to have increasing significance in the context of increasing temperatures under climate change. At present, our best judgement is that level of increased risk is relatively modest, at least while summer temperature distributions are not much more extreme than the present-day average. Helping to improve the empirical evidence on this risk would, however, be an important goal for future research, and an immediate precautionary practical step would be to consider the additional measures that might be included alongside energy efficiency upgrades to help protect the indoor environment against high temperatures in summer. This would be an important adaptation in any case, given the likely increase in summer temperatures as this century progresses.
Model application: comparison of winter fuel payments and home energy efficiency interventions
To illustrate an application of the health model, we present a model-based analysis comparing the current policy on WFPs with subsidised HEE investments in terms of health and other outcomes.
Among the UK’s most formidable long-term challenges, shared by many countries, are the public health burdens of an overconsuming and increasingly ageing population and arguably the ‘biggest global health threat of the 21st century’ climate change. 75 Step changes will be needed to achieve vital policy goals, especially in the transition to a low carbon economy,76 but they present major opportunities for improving population health, particularly if synergies between policy areas can be exploited.
Nowhere is this better exemplified than in the housing sector, an important focus of public policy, both because of the probable contribution of inadequate home heating to the large and persisting burdens of winter-related mortality and morbidity8 and because of its central importance to the abatement of GHG emissions. 76 Substantial net benefits for health could be achieved if an accelerated programme of HEE were widely implemented,13 assuming appropriate safeguards. 77 However, progress to date has not kept pace with stated objectives.
We examined how such benefits could be more rapidly realised. Specifically, we compare two strategies that seek to have a similar impact on health and household incomes but through methods that, on environmental grounds, are diametrically opposed: (1) a policy of WFPs, introduced as part of the government’s initiative to tackle FP among pensioners, and whose inevitable consequence is to increase use of heating fuels through subsidy; and (2) an expanded programme of HEE improvements. Our intention is to test the potential to accelerate the attainment of health and environment goals at acceptable cost by more efficient alignment of policy approaches.
Methods
We compared two specific forms of policy:
-
A policy of fuel subsidy based on the 2014/15 entitlement of the UK government’s Winter Fuel Allowance scheme: £200 per household per year for households containing someone born on or before 5 January 1952 or £300 per household per year for households containing someone over the age of 80 years. The £200 WFP is equivalent of 4000 kWh of heating energy at our assumed 2015 price of £0.05 per unit,78 if all were spent on improving indoor temperatures.
-
An expanded programme of HEE improvement, installing in each qualifying dwelling all energy efficiency interventions (including loft insulation, double glazing, solid and cavity wall insulation, boiler replacement and gas central heating) when such measures are currently (2011 data) absent or suboptimal. We assumed that ‘qualifying households’ were the same as those entitled to receive the Winter Fuel Allowance (policy 1), ensuring the same target households and, thus, direct comparability of the two strategies.
We considered timetables for the HEE improvements based on reinvesting savings from WFPs, entitlement to which was assumed to lapse once a dwelling had undergone a full energy efficiency upgrade. However, even with substantial seed money in year 1 of £0.7B, half of the current WFP annual budget for England, simple calculations showed that the investment programme would not be complete until after 2090. Therefore, we assumed a substantial upfront capital investment of £20B to allow the upgrade to all 4.5 million target dwellings over 5 years. This equates to a rate of upgrades of around one dwelling per minute over 5 years, which is the rate required for the whole stock to 2050 to meet climate change abatement targets. The annualised cost of this capital investment over the lifetime of the upgrades is very similar to that of current WFPs, assuming continuing very low rates of interest.
The impact had on the indoor environment and health
The impact that the outlined policies had on health and other outcomes was estimated by refinement of a model, HIDEEM,31 originally developed for use by the DECC to assess the impact had on health of energy efficiency investments in the housing sector. Core to the model is the 2010/11 EHS,79 which contains data on 16,000 dwellings in England and their 31,000 occupants. The indoor environment (temperatures, indoor pollutants) and energy performance [heating energy and carbon dioxide (CO2) emissions] of EHS dwellings were modelled by linking their data with that of simulations carried out in a validated building physics and airflow model, CONTAM, developed at the US National Institute of Standards and Technology. 33 Simulations were carried out for 16 representative archetypes of dwelling forms (seven types of houses, nine types of flats), under a range of assumptions about air permeability (‘building leakiness’) and ventilation regimens, and the results were matched to the 2010/11 EHS on the basis of dwelling type, floor area and notional permeability. The result was a (modelled) distribution of indoor environmental conditions (indoor temperature and air pollutants) for a representative sample of English dwellings, which was then ‘perturbed’ to estimate changes in personal exposures following policy interventions.
Changes in winter indoor temperature and fuel use were determined by a method based on the empirical relationship between indoor temperature and the E-value of the home, as described in Hamilton et al. 26 and previously applied in modelling for the National Institute for Health and Care Excellence. 80 The E-value is the heating power input (watts) required to maintain a 1-kelvin temperature difference between the indoor and outdoor environments and is, thus, an indication of whole-house energy efficiency. This empirical relationship, shown in Figure 2, was derived from temperature measurements of dwellings that underwent energy efficiency upgrades as part of the Warm Front scheme. 26 A very similar functional form has more recently been obtained by the authors from data in the 2011 EFUS,30 as yet unpublished. The gradient of the relationship between the SIT and E-value indicates the degree to which the benefits of energy efficiency are taken as having higher indoor temperatures and how much as energy/cost saving. With an assumed average cost for heating energy of £0.05 per kWh, the relationship provides a basis for calculating the change in (winter) indoor temperature associated with WFPs, depending on the E-value of the dwelling (but see also Beatty et al. 81).
Quantification of health impact
The health impact that changes in indoor air quality and temperature had was modelled using life table methods similar to those of the IOMLIFET model,45 which estimates patterns of survival in the population over time using age- and cause-specific mortality rates. Life tables were set up using 2010 age-specific population and (disease-specific and all-cause) mortality data for England and Wales from ONS, with separate life tables for men and women. We modelled changes in five exposures (indoor temperature, STS, indoor and outdoor sources of PM2.5, radon and mould) and the selected mortality outcomes listed in Table 2. Morbidity impacts for these same outcomes were estimated from the mortality estimates by applying age- and cause-specific ratios of years of healthy life lost owing to disability (YLD) to the overall YLL derived from the World Health Organization’s Global Burden of Disease data.
Capital costs for HEE improvements and the costs of energy for home heating were based on data published by the Department for Communities and Local Government (now the Ministry of Housing, Communities and Local Government). 82 We did not include costs associated with modelled changes in contacts with the NHS.
From the models we determined four parameters of impact that are associated with the WFP and HEE policies: health (the sum of QALYs for all modelled health effects relating to changes in temperature and indoor air quality), CO2 emissions (based on assumed trends in the carbon intensity of domestic fuel use), energy costs adjusted for projected trends in domestic fuel mix and price and a measure of socioeconomic differentials in impact. These were assessed over time horizons of 5 years and 20 years, with discounting of costs and benefits at 3% per annum.
Results
Across England as whole, we estimated that a total of 4.5 million dwellings were occupied by households qualifying for WFPs. The comparison of the effects of the two policies is summarised in Table 8. For all of the parameters listed, the HEE programme appears more beneficial than using equivalent funding to perpetuate the WFPs.
| Parameters | Over 20 years | |
|---|---|---|
| WFP | HEE | |
| Exposures | ||
| Standardised internal temperature (°C) | +0.22 | +0.39 |
| Mould risk (%) | –0.37 | –0.64 |
| Health benefits (QALYs) | ||
| Cardiovascular | 9441 | 13,018 |
| COPD | 22,818 | 26,279 |
| Common mental disorders | 5278 | 7709 |
| Total | 37,537 | 47,006 |
| Energy use and CO2 | ||
| Cost saving to householders (£B) | 6.875 | 6.858 |
| Change in stock energy demand (GWh) | +31,808 | –167,757 |
| Change in CO2 emissions (Mt CO2e) | +6.6 | –34.9 |
Our scenario proposes fairly full implementation of all reasonably straightforward retrofit HEE measures, which would probably achieve close to 0.4 °C increase in SIT, which is nearly twice the temperature increase achieved even if WFP recipients spend that money on additional heating.
In terms of health benefits (measured as QALYs), again the HEE programme appears to offer greater gains than those attributable to WFPs. However, one of the clearest and very obvious differences is that the HEE programme reduces the stock energy demand and associated CO2 emissions, whereas the WFPs act to increase them by encouraging householders to burn more (or effectively subsidise) fuel.
Not everyone would win by comparison with regard to status quo, as illustrated by the plot of the expected distribution of temperature changes comparing HEE and WFP programmes (Figure 23). The premise here is that the universal WFPs would be withdrawn as dwellings receive full energy efficiency upgrades.
FIGURE 23.
Distribution of change in SIT with the HEE relative to WFPs on the assumption that currently universal WFPs would be withdrawn following the installation of HEE measures.
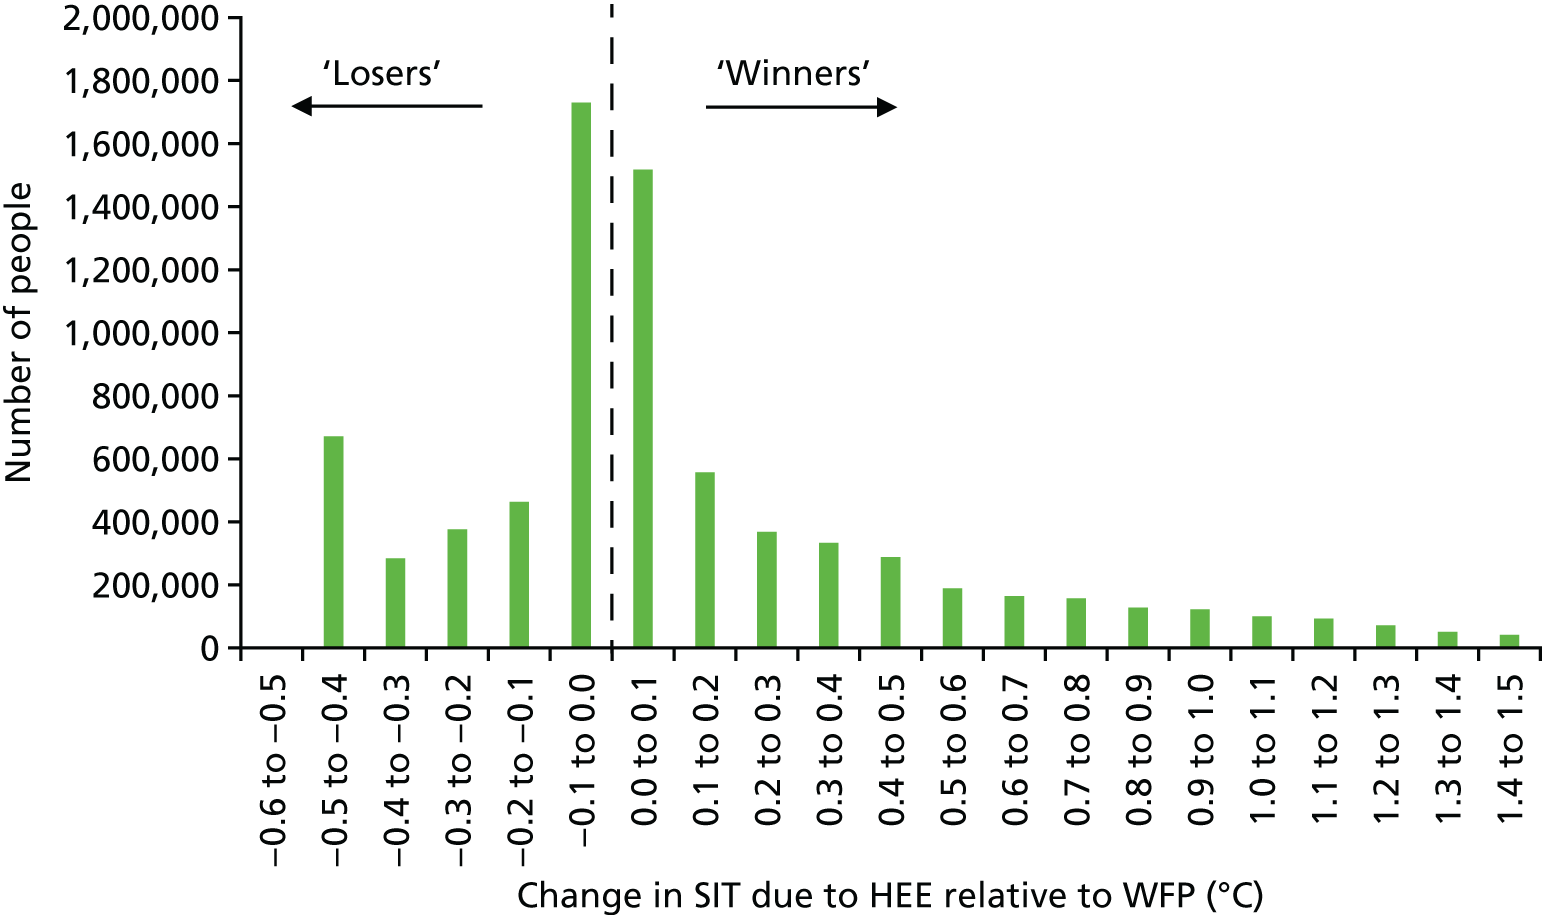
Discussion
Comparing the effect on health and GHG emissions of WFPs and HEE investments is seemingly very specific, but it illustrates an important point of principle. Burdens of winter- and cold-related mortality and morbidity remain a major problem for the UK. At the same time, by almost any objective measure, the collective global response to climate change, and that of the UK specifically, has been inadequate. No government has yet succeeded in implementing policies of the scale and ambition needed to alter this, which is doubtless in part because of the perceived economic cost to the Treasury, or to society as a whole, of doing so.
However, the analyses that we present here suggest that, for one major section of the UK population, namely elderly people, the UK Treasury already commits expenditure to combat FP at a very similar annualised cost to that needed to transform the energy efficiency of all homes currently occupied by the same population. Moreover, our models indicate that energy efficiency upgrades would have a greater impact on health than WFPs and would decrease rather than increase CO2 emissions. In other words, redirecting the WFP budget to HEE interventions would achieve all of the avowed aims for which the WFP is provided and also meet the UK’s HEE investment targets for GHG reduction in this part of the housing sector. Admittedly, such a policy would entail an upfront capital investment, but the debt repayments would be almost the same as the current WFP budget if (possibly appreciable) additional administrative costs are ignored. Moreover, as already noted, the accelerated speed of retrofit installations that this would achieve is needed for the whole period up to 2050 to meet climate change mitigation targets. Therefore, in effect, it represents no more than a prioritisation of the elderly in a programme of investment that should already be occurring and continued for 35 years.
Our comparison of the relative benefits of HEE investment is based on the results of a model, and all models are uncertain. In our judgement, however, it is unlikely that those uncertainties materially affect the general conclusion. The need/opportunity for HEE investment is based on analysis of data from a recent EHS. The current cost of WFPs is known, and although estimates of the capital costs of HEE investment vary somewhat, we used reasonably authoritative figures published by DECC. The estimates of the change in winter indoor temperature for both policies were at least in part based on the same empirical relationship and appear consistent with published before-and-after measurements. 27 There is also increasing evidence about the health benefits of HEE interventions,9,83,84 even if our estimated changes to the indoor environment are imprecise. It is unlikely that we have so overestimated the relative advantage of HEE interventions in terms of health or energy costs as to reverse the sign, and it seems quite consistent with expectation that HEE investments decrease CO2 emissions whereas WFPs do the opposite.
Redeploying WFPs would raise various practical and ethical issues. Even if there are more winners than losers, safeguarding some categories of loser (e.g. the poorest households) would seem important. It is likely that there would be additional administrative costs with HEE investments, which we have not attempted to estimate; neither have we taken account of the fact that a proportion of elderly people will move home or suggested what approach to use for subsequent cohorts of people who reach pension age after the 5-year programme. In addition, of course, there are questions of equity and fairness, including the fact that larger homes, generally occupied by wealthier families, would need, and thus receive, more investment (unless capped) and the fact that private landlords would be potential beneficiaries unless the government prescribed this as a mandatory investment cost that private landlords should bear themselves.
The views of potential target householders show that the policy choice would have different importance for and impact on different households. Climate change objectives are not a priority, and poorer families in particular value, and even depend on, the WFP as a universal entitlement. However, there appears to be a degree of acceptance that HEE improvements could offer relative advantages for health, well-being, security and even pride in one’s home.
Whether the intention is to protect health, to ease household budgets or to limit CO2 emissions, our estimates suggest that more can be achieved through HEE. Even though the argument is more complex with regard to equity, there is a case to favour HEE over WFP if consideration is given to the responsibility of current to future generations.
In conclusion, for most households, HEE improvements of similar annualised cost to current WFPs achieve greater improvements in indoor temperatures and health, and reduce rather than increase CO2 emissions. Replacing policies that incentivise additional fuel consumption for home heating with a rapid full-scale programme of energy efficiency could help transform the UK stock to achieve important benefits for health and crucial climate change abatement targets without imposing undue additional financial burdens.
Chapter 5 Multicriteria decision analysis
In this chapter, the MCDA as a tool for option comparison is illustrated.
There are various HEE interventions that can be used to decrease household energy use for heating while helping to maintain or improve internal temperature control for thermal comfort and well-being. Examples include loft insulation, double glazing, cavity wall insulation, solid wall insulation, or a combination of such measures. The decision on which intervention or package of interventions is ‘optimal’ depends on the objectives of the policy and the criteria by which it is to be measured. Pertinent criteria might include, for example, benefits to health, NHS cost savings associated with avoided health burdens and energy savings.
Our aim was to develop and apply a method for comparing choices of HEE interventions in the UK.
Methods
The MCDA is a method that allows the comparative evaluation of interventions or policy options across multiple criteria. Of the several MCDA methods that can be used for this purpose [e.g. multiattribute/multiutility theory, Analytical Hierarchy Process, outranking methods and Simple Multiattribute Rating Techniques (SMART)], we used the SMART method implemented in the Annalisa software (Maldaba Ltd, London, UK), which we chose because it is easy to use in interactions with stakeholders and it is transparent. 85,86
The SMART MCDA procedure has five steps, which are shown schematically in the diagram (Figure 24). The first step defines the set of feasible HEE interventions for comparative evaluation [shown in the diagram as a set of three interventions (I), I1, I2 and I3].
FIGURE 24.
Schematic diagram of the MCDA process. C, criteria; H, normalised impact; I, intervention; W, weight.
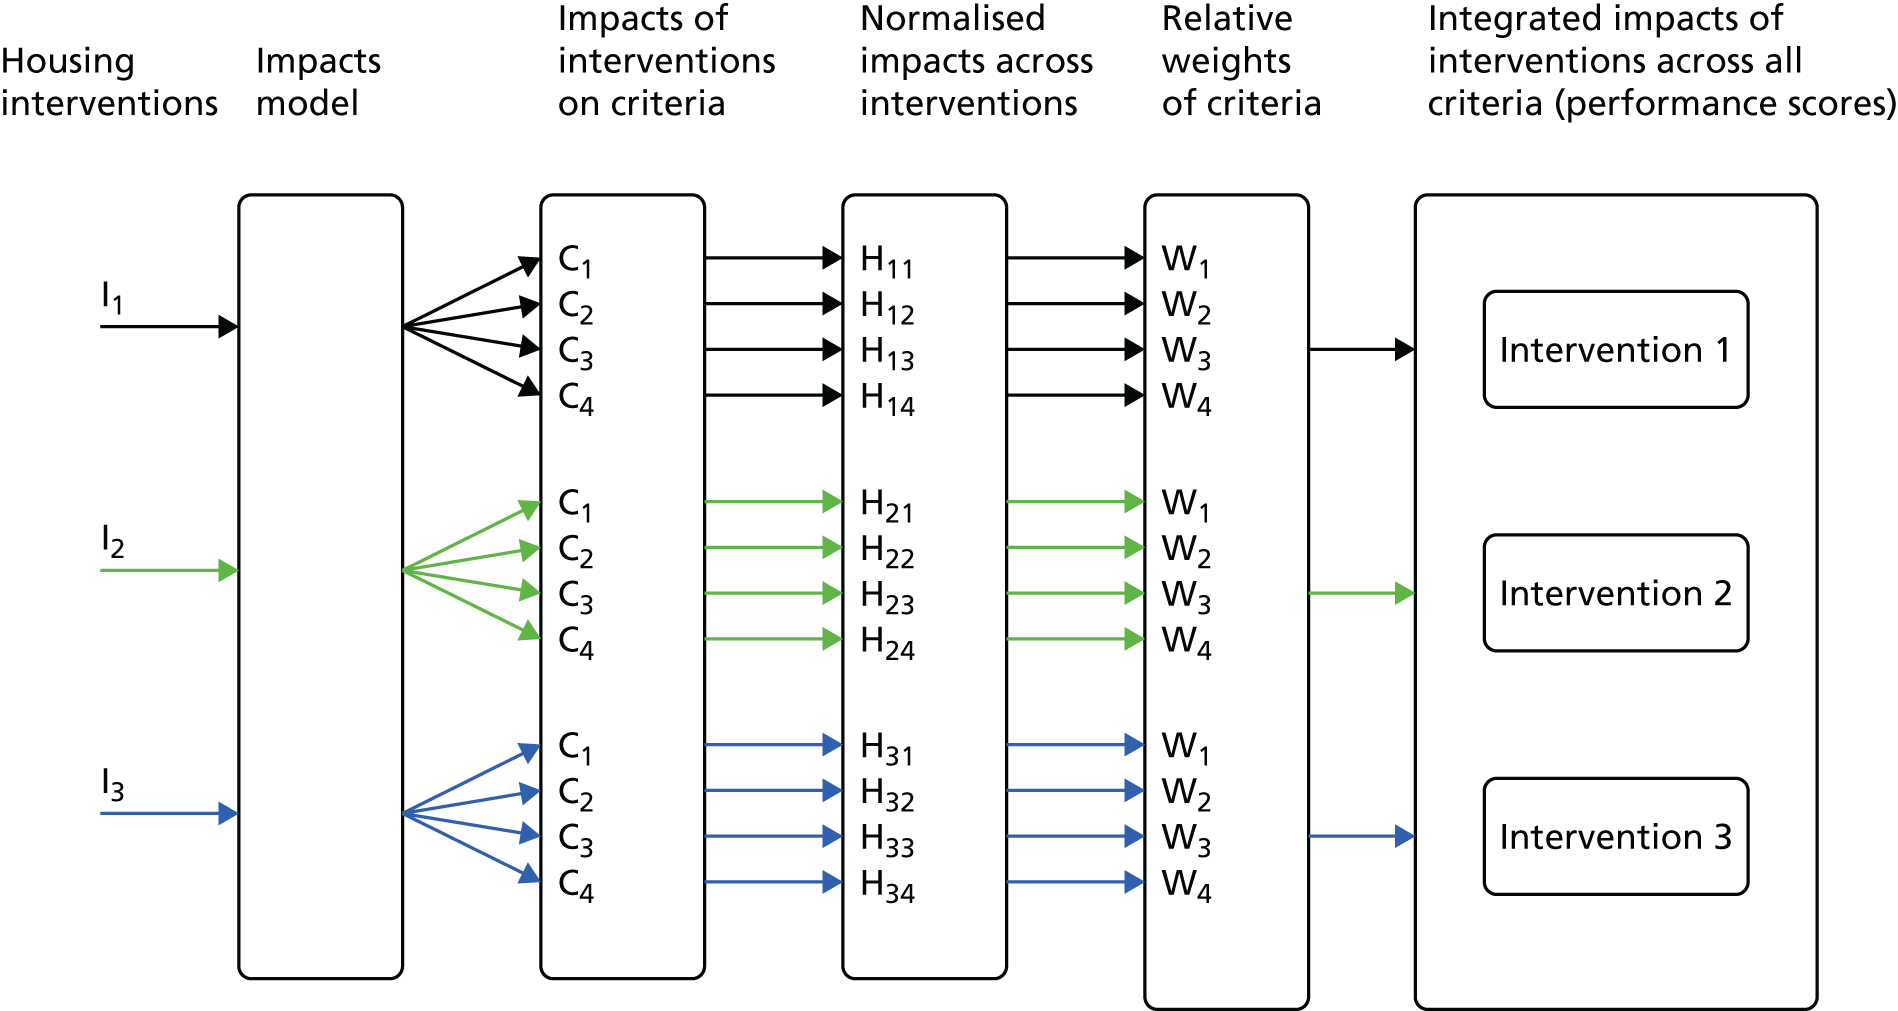
The second step defines the criteria (C) that are used to compare them (C1, C2, C3 and C4 in Figure 24), which ideally should be independent. These criteria should also be defined in the same way, in the sense that either they are all ‘gains’ or they are all ‘losses’. In our analysis, they are defined them as gains.
The third step uses a model (or a set of models) to calculate the impacts that each intervention had on each criterion. The impacts model used in this MCDA is the same as that described in the preceding sections for modelling the impact of housing energy efficiency interventions on the indoor environment and health.
The different criteria of impact naturally have different units of measurement. For example, C1 might be the NHS cost saving measured in pounds (£) and C2 health gains might be measured in QALYs. To ensure that they can be more readily combined for analysis, all impacts are normalised to dimensionless quantities with a range of possible values between zero and unity. The method that we used for normalisation is detailed in Appendix 3. In Figure 24, H11, H21 and H31 are the normalised impacts that interventions I1, I2 and I3 had on criterion C1; H12, H22 and H23 are the normalised impacts that interventions I1, I2 and I3 had on criterion C2, and so on.
The fourth step assigns the relative importance (weight) to be attached to the criteria (W1, W2, W3 and W4 in the diagram, corresponding, respectively, to criteria C1, C2, C3 and C4). These weights should add up to unity. They can be interpreted as indicating the ratio of importance of one criterion against another. For example, if three criteria C1, C2 and C3 have weights 0.1, 0.3 and 0.6 (which sum to 1) then criterion C2 is considered three times more important than C1 and half as important as C3. C3 is deemed to be six times more important than C1. The relative weights are ideally elicited from policy-makers or stakeholders.
The fifth step combines the normalised impacts with the relative weights to produce a performance score for each intervention. If the impacts are gains, then the intervention with the highest performance score is the ‘optimal’ intervention across all the selected criteria; if the impacts are losses, then the intervention with the lowest performance score is the optimal intervention.
Different sets of weights and normalisation procedures can be explored to determine the sensitivity of the optimal intervention determined from them.
Impacts model
The impacts model provides estimates of the health impact, as well as costs of changes in health, that arises from installing energy efficient interventions in domestic dwellings. Informed by discussion with stakeholders, we selected the following criteria for comparing housing interventions:
-
mortality gain (QALYs)
-
morbidity gain (QALYs)
-
NHS costs (£)
-
space heating (kWh)
-
impact on inequalities, measured in relation to:
-
socioeconomic deprivation (quartile of the Index of Multiple Deprivation) – the difference in the change in health (Δ health) in the most deprived compared with the least deprived: Δ health (most deprived) – Δ health (least deprived)
-
age (those aged < 65 years and those aged ≥ 65 years) – the difference in the change in health in those ≥ 65 years compared with those < 65 years: Δ health (≥ 65 years) – Δ health (< 65 years)
-
FP (yes/no) – the difference in the change in health for those in FP compared with those not in FP (≈ FP): Δ health (FP) – Δ health (≈FP).
-
A description of the building physics (exposure) model used to estimates of intervention-related changes to the indoor environment, as well as the method for estimating the health impacts arising from them, is summarised in Hamilton et al. 32 The changes to indoor exposures related to changes to the thermal, ventilation and heating performance of the dwelling and related energy expenditure. These exposures were temperature (cold and overheating), particle air pollution (PM2.5), second-hand (environmental) tobacco smoke, radon and moisture (as a precursor of mould growth). The impacts that these exposures had on health were estimated (with time lags when relevant) for outcomes whose current disease rates were determined from published sources. These outcomes included mortality from cerebrovascular and cardiopulmonary disease, lung cancer and winter mortality, and morbidity for the same causes, with the addition of common mental disorder (related to winter cold) and asthma in children. These impacts were quantified using life table methods applied to individuals within the EHS data, combined with more direct estimates of changes in disease prevalence, to derive estimates of change in QALYs.
The impact that these had on NHS health-care services was assessed by deriving estimates of the costs of associated changes in NHS contacts, following the method described by Stafford. 87 The categories that the NHS uses as a framework for estimating NHS expenditure across health-care conditions (NHS programme budgeting categories, and their published aggregate primary care trust expenditure figures) were based on data for the period 2012–13 (latest available data). These were used to derive total aggregate costs for selected health outcomes for England for primary care, secondary care, emergency care and social and community care. Estimates of national prevalence in 2012–13 for the selected disease outcomes were then used to derive the total unit NHS contact costs. Unit costs for each health outcome were estimated by dividing the total expenditure for each disease outcome for England from these budgetary categories by the total number of people on each disease outcome register for England. The health impacts (owing to changes in exposures), in terms of QALYs, estimated by the impact model were then converted into annual NHS contacts, and the NHS treatment unit costs were applied to hospital contacts for the selected diseases.
Using these criteria, we compared the following specific energy efficiency measures: loft, cavity wall and solid wall insulation, double-glazing replacement, boiler/heating system upgrade and draft stripping. These were assessed with and without installation of additional ventilation measures (i.e. installation of trickle vents and/or extraction fans intended to provide additional (controllable) ventilation that partly offsets the reduced air exchange created by other measures). The assessment with and without compensatory ventilation was done as energy efficiency measures that increase airtightness partly protect against the ingress of pollutants of outdoor origin but also tend to increase exposure to pollutants of indoor origin (including some particles, STS and radon) and may adversely affect mould growth. 88 Boiler replacements, which are not considered to alter airtightness, were modelled without additional ventilation.
Results
The results of the health impacts, NHS cost savings, energy savings and the difference in health impacts between the three measures of inequality (socioeconomic status, FP and older age) are given in Table 9 for interventions with additional ventilation and in Table 10 for interventions without additional ventilation. The corresponding results of the MCDA for the scenarios with and without compensatory ventilation are shown in Figures 25 and 26, respectively: the summary scores are the horizontal bars in the top panel of each set of results, with the ‘optimal’ intervention shown by a darker orange bar.
| Housing intervention | Number of | Households in which intervention possible (%) | QALYs per persona | Δ NHS cost (£ per person)a | Δ energy use (kWh per household per year)a | Δ health (most deprived) – Δ health (least deprived) per persona | Δ health (FP) – Δ health (≈FP) per persona | Δ health (≥ 65 years) – Δ health (< 65 years) per persona | ||
|---|---|---|---|---|---|---|---|---|---|---|
| Individuals | Households | Δ mortality | Δ morbidity | |||||||
| All | 2951 | 1226 | 88.1 | 0.0511784 | 0.005425 | –12.300903 | 5826.737 | –7.57E-03 | 0.0189454 | 0.0503219 |
| Boiler replacement, no vent | 1812 | 752 | 54.1 | 0.0033478 | 0.0008324 | –5.1395139 | 3757.217 | –1.82E-03 | 0.0014719 | 0.0034235 |
| Cavity wall insulation | 1182 | 475 | 34.2 | 0.0502524 | 0.0049787 | –9.6232232 | 3195.245 | –0.0100879 | 0.0243723 | 0.0644305 |
| Draught-proofing | 651 | 282 | 20.3 | 0.0546025 | 0.0049474 | –5.8292516 | 363.3097 | 0.00778 | 0.0313941 | 0.0592654 |
| Double glazing | 406 | 176 | 12.7 | 0.0615746 | 0.0057827 | –9.5959563 | 1619.961 | –0.0253785 | –0.0009222 | 0.0606318 |
| Loft insulation | 919 | 380 | 27.3 | 0.0551109 | 0.0049745 | –6.6684997 | 447.4282 | –0.0259415 | 0.0115138 | 0.0501861 |
| Solid wall insulation | 986 | 410 | 29.5 | 0.0577638 | 0.0059214 | –12.9775943 | 4661.272 | –0.0284782 | 0.0078481 | 0.0600758 |
| Housing intervention | Number of | Percentage of households in which intervention possible | QALYs per person in households eligible for intervention | Per person (in households eligible for intervention) | ||||||
|---|---|---|---|---|---|---|---|---|---|---|
| Saving | Δ health (most deprived)-Δ Health (least deprived) | Δ health (FP)-Δ Health (non-FP) | Δ health (E)-Δ health (non-E) | |||||||
| Individuals | Households | Δ mortality | Δ morbidity | Δ NHS cost (£ per person in households eligible for intervention) | Δ energy use (kWh per household eligible for intervention) | |||||
| All | 2951 | 1226 | 88.14 | –0.00135 | 0.0007994 | –7.013951 | 6508.056 | 3.88E-04 | 0.00014 | 0.0012241 |
| Boiler replacement | 1812 | 752 | 54.06 | 0.0033478 | 0.0008324 | –5.1395139 | 3757.217 | –1.82E-03 | 0.0014719 | 0.0034235 |
| Cavity wall insulation | 1182 | 475 | 34.15 | –0.000269 | 0.0005306 | –4.4173684 | 3965.831 | 0.00011121 | 0.0007557 | –0.0019874 |
| Draught-proofing | 651 | 282 | 20.27 | –0.0052646 | –0.0002533 | –0.5207956 | 1065.631 | 0.0008522 | –0.0026572 | –0.0041235 |
| Double glazing | 406 | 176 | 12.65 | –0.0011816 | 0.0003094 | –3.2182421 | 2467.554 | 0.0014018 | 0.0003796 | –0.0012677 |
| Loft insulation | 919 | 380 | 27.32 | –0.0006373 | 0.0001293 | –1.3877314 | 1184.343 | 0.0010302 | 0.0003913 | –6.1E-06 |
| Solid wall insulation | 986 | 410 | 29.475 | –9.87E-05 | 0.0008291 | –6.8263826 | 5573.592 | 0.0010629 | 0.002004 | 0.0029399 |
FIGURE 25.
The MCDA scores results. (a) Equal weighting; and (b) non-equal weighting.
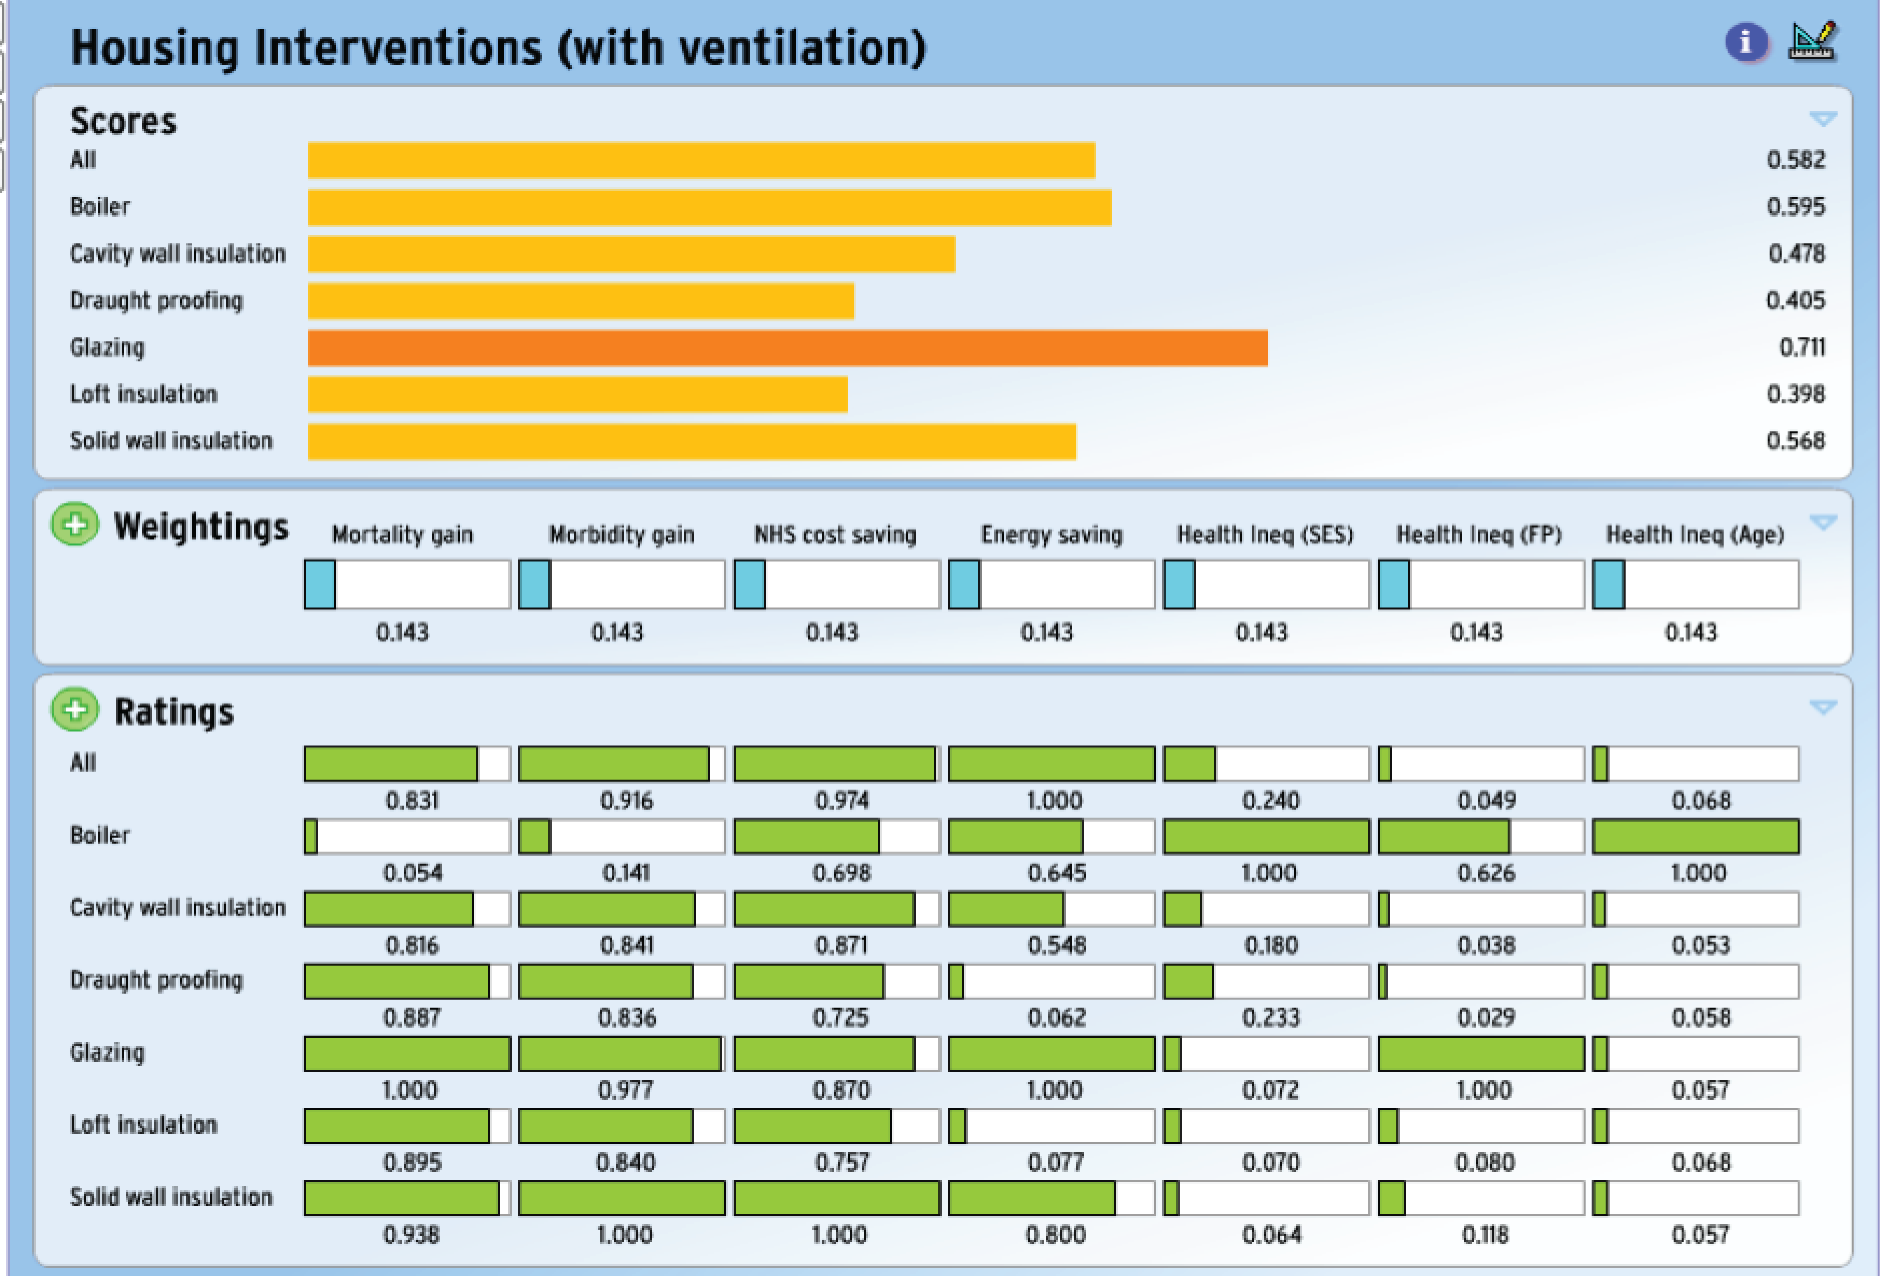
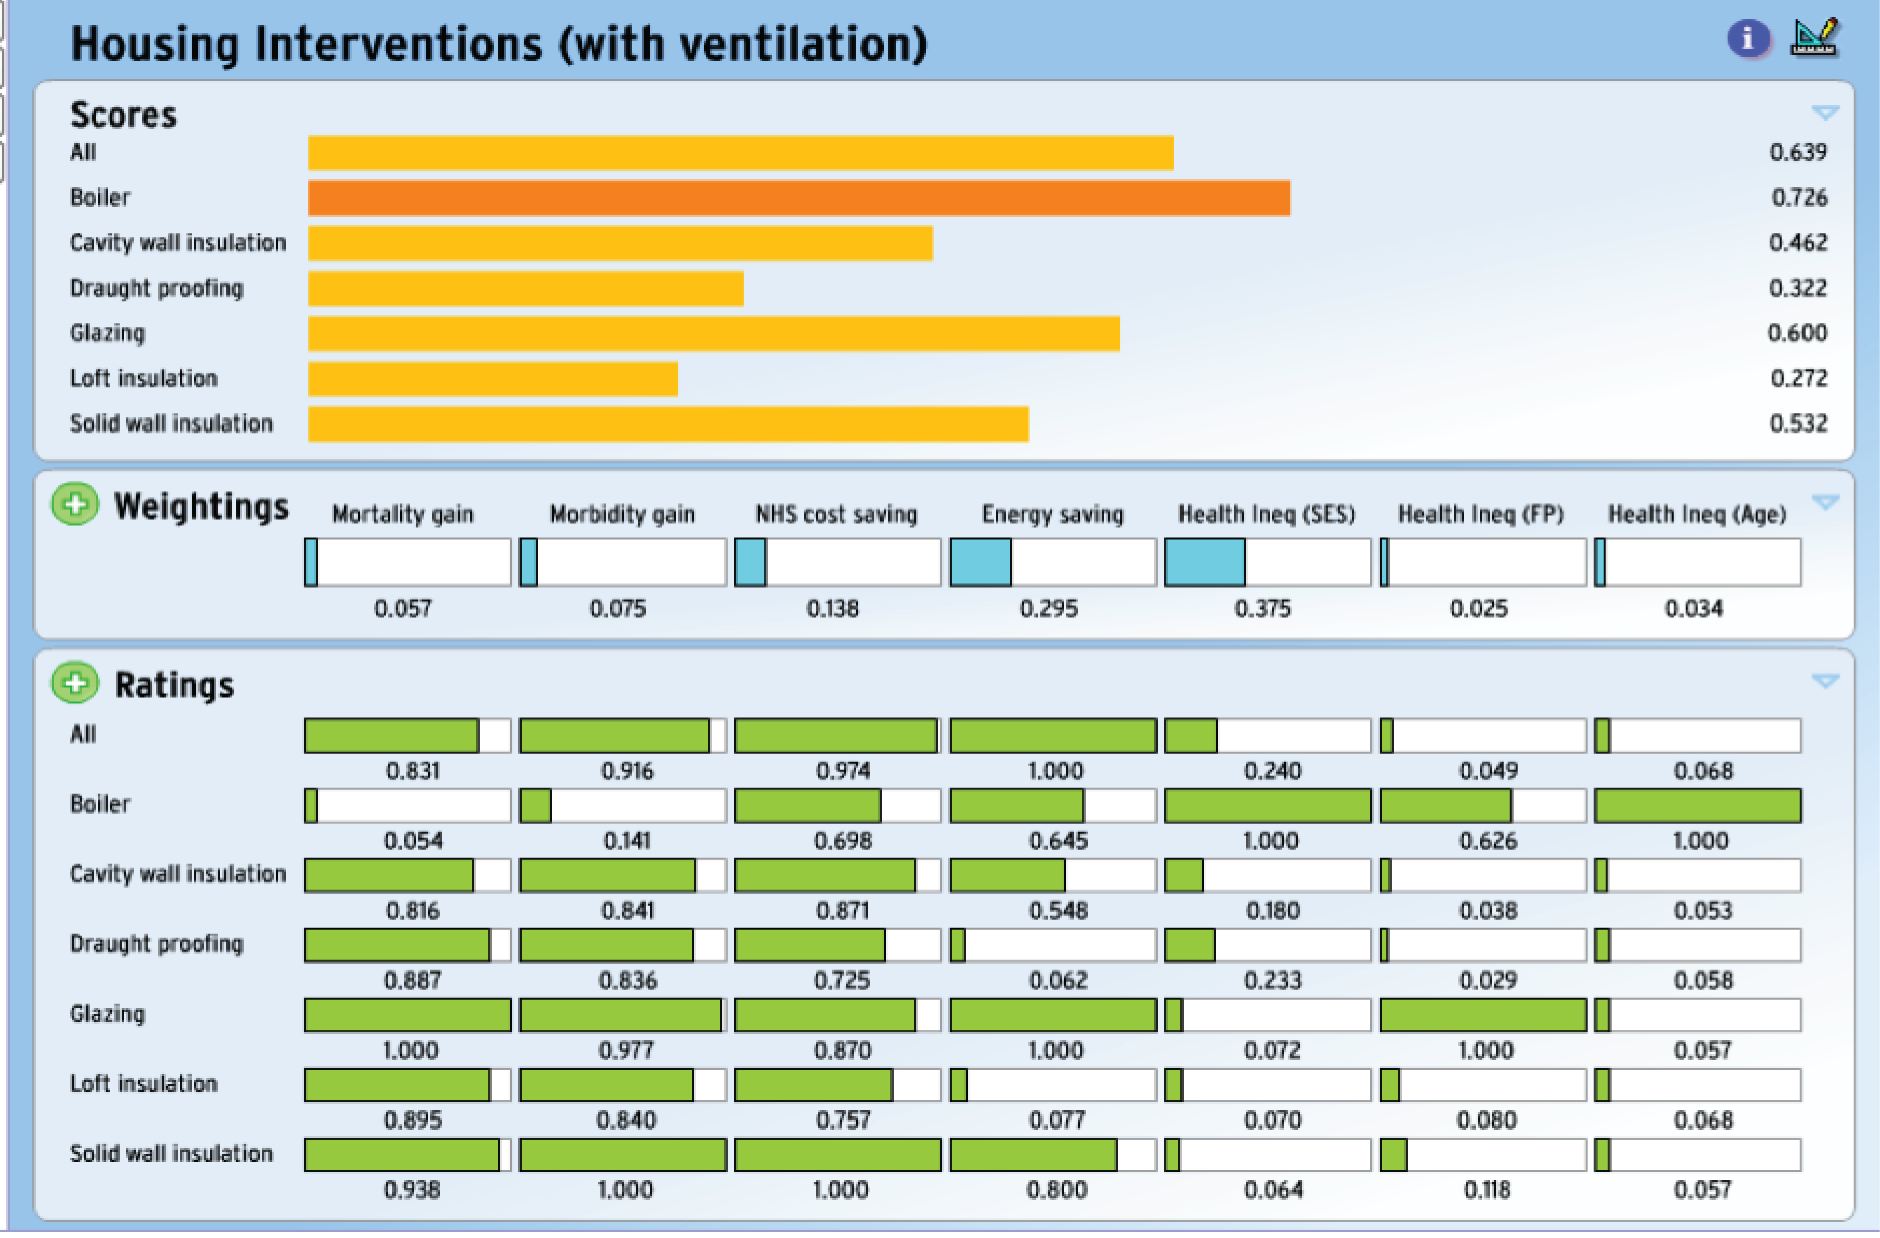
FIGURE 26.
The MCDA scores results (without ventilation). (a) Equal weighting; and (b) non-equal weighting (but different from Figure 25).
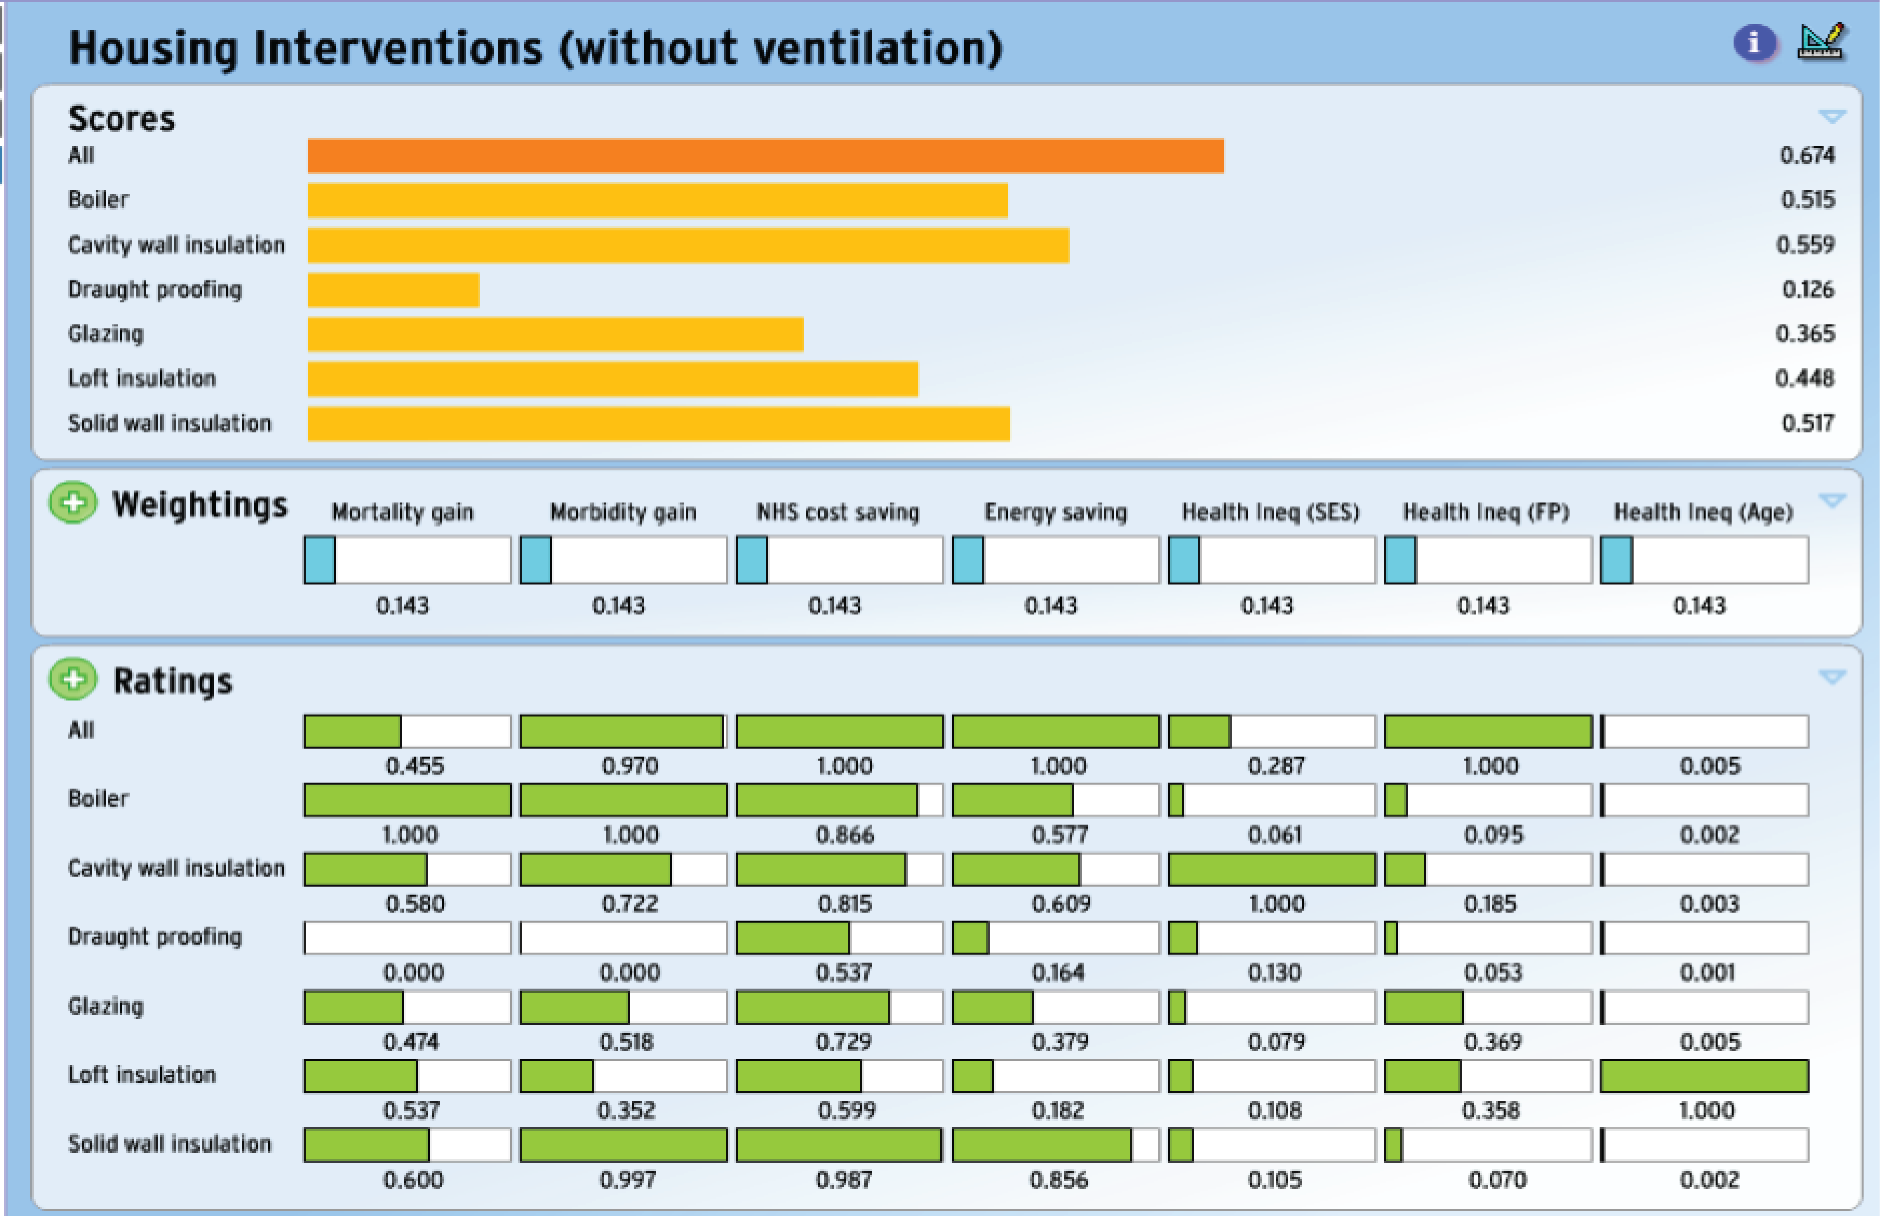
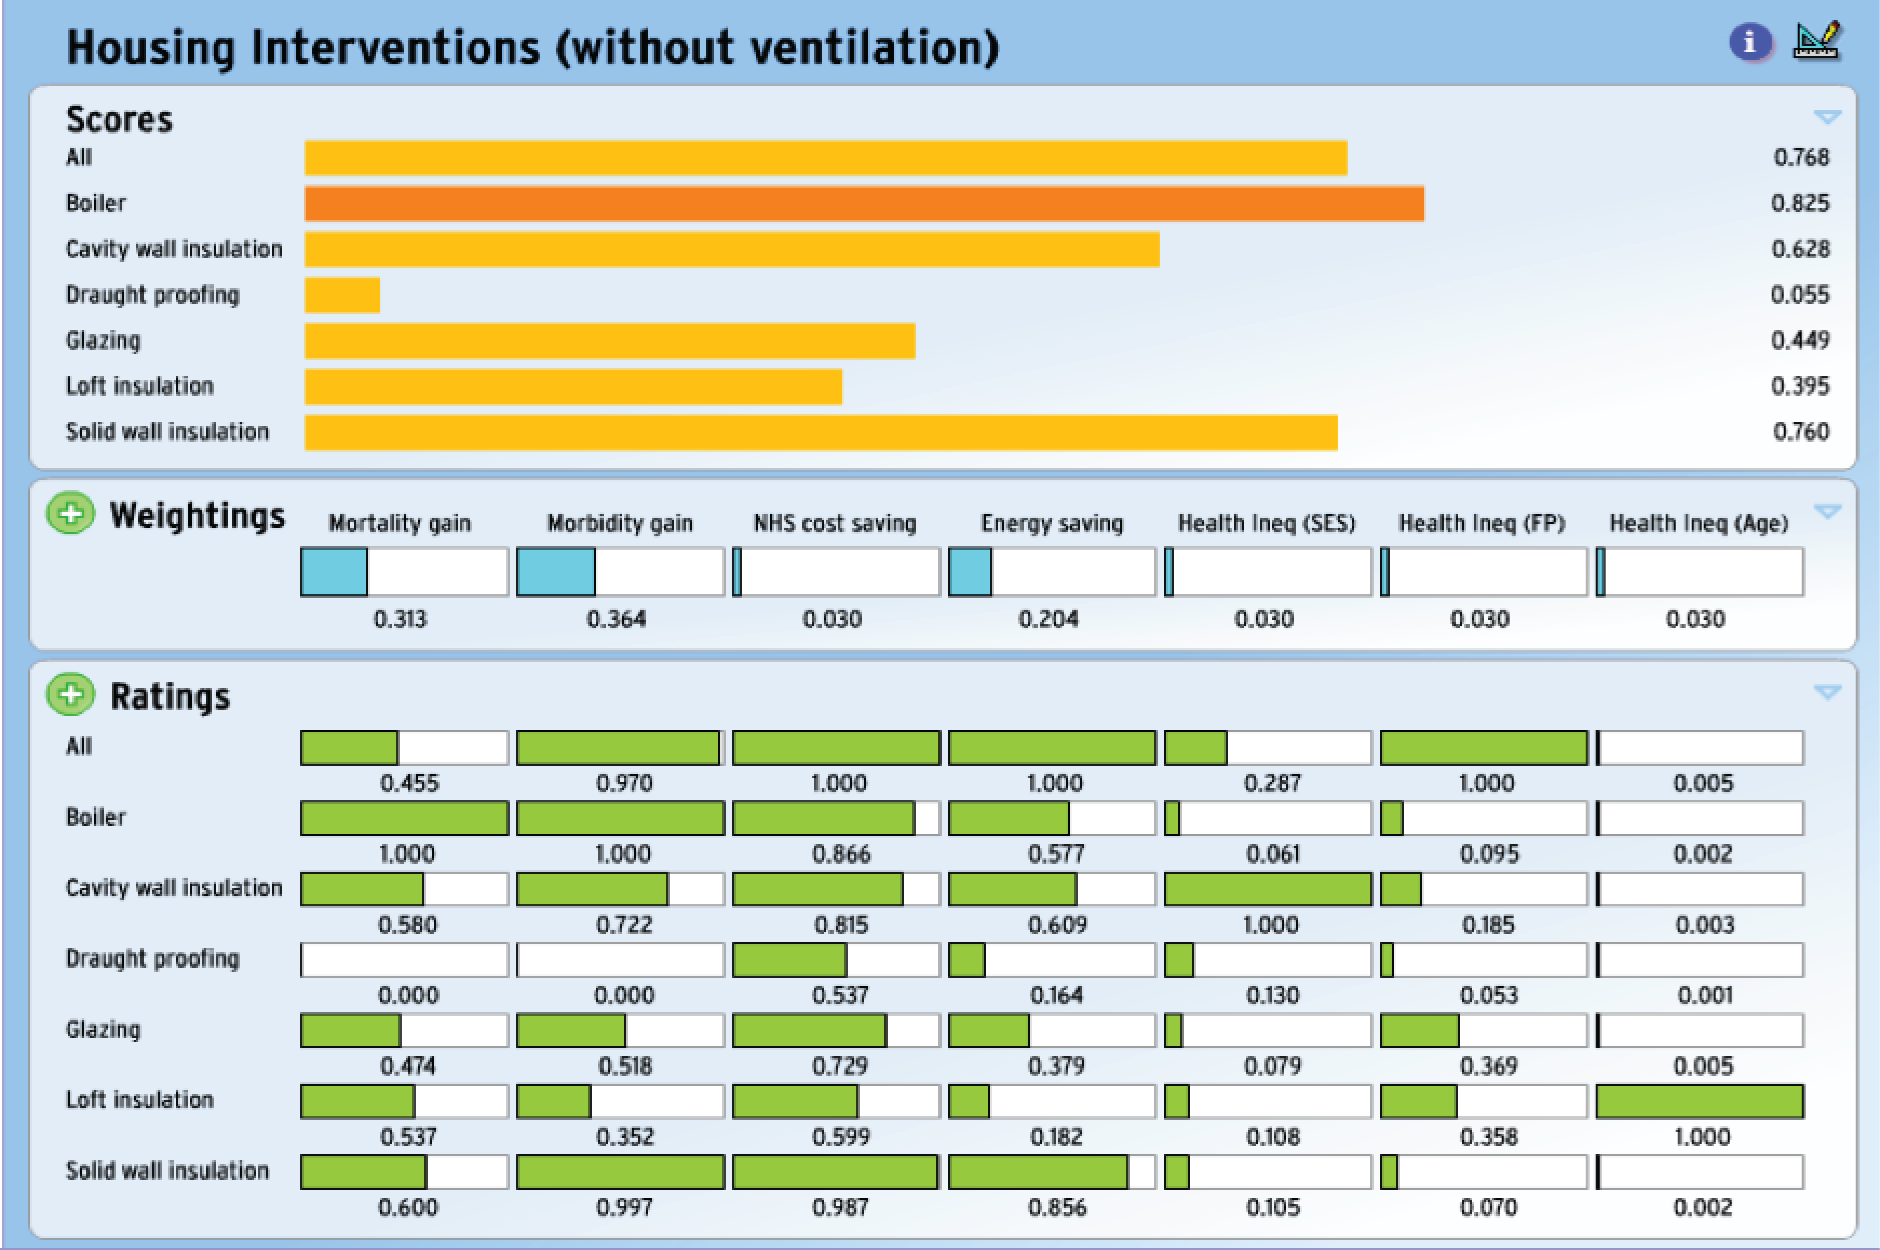
For scenarios with additional ventilation and using equal weighting for each criterion (as shown in Figure 25b), the optimum intervention was double glazing. However, when greater weight was given to NHS cost savings, energy savings and the reduction of health inequalities (in terms of socioeconomic group), boiler replacement was identified as the optimal intervention – ahead of intervention based on all measures combined.
In the absence of compensatory ventilation, the MCDA analysis identified ‘all possible interventions’ as being optimal when based on criteria with equal weightings, but the optimal choice was, again, replacement boilers when the weights were altered to give more emphasis to health impacts and energy savings.
The absence of additional ventilation to compensate for any reduction in air exchange resulting from the energy efficiency measures leads to an increase in the indoor concentration of pollutants of indoor origin with a net negative effect for health. This can be seen by the generally negative figures for mortality impacts in Table 10 and the larger NHS costs savings associated with interventions when compensatory ventilation is applied (see Table 9). With compensatory ventilation, the size of health impacts is higher, with a positive (i.e. beneficial) change in terms of QALYs gained from improved mortality and morbidity.
As expected, the energy saving is considerably less for interventions with added ventilation; however, there is still an appreciable saving when compared with no intervention (with the smallest gain being for draught proofing, followed by loft insulation, and the largest gain for ‘all possible interventions’). With regard to measures of inequality, the intervention (except for draught-proofing) had a slightly lower positive health impact for people living in a more deprived area but had a greater impact for all measures for those aged ≥ 65 years than for those aged < 65 years and, similarly, for the FP than for non-FP households (with the exception of double glazing).
Workshop
We elicited inputs to the MCDA work through three workshops: two (one small and one larger) held at the London School of Hygiene & Tropical Medicine (LSHTM) and one hosted by Age UK. In each case, we invited a range of stakeholders from non-governmental organisations, local and national government departments, academia and others. In the first workshops (10 participants: four academic, four from charities and two housing organisations), we discussed plans for applying the MCDA method and asked for inputs on the policy comparisons and the proposed criteria for their assessments, which were further elaborated in a more general stakeholder workshop (26 participants: 11 academic, five from charities, two from housing organisations, four from national or local government, five from Public Health England/National Institute for Health and Care Excellence and one from an international organisation). In the last workshop (formed of 24 participants: 11 academic, three from charities, three from housing organisations/consultancies, three from national or local government and three from Public Health England), we showed the use of the MCDA tool in a ‘live’ demonstration and sought inputs on the interpretation of its results. We initially showed results using analyses performed ‘offline’ ahead of the workshop using equal relative weightings for the selected criteria but then used it live to explore the results interactively. This showed how the results (in terms of the overall intervention scores and, hence, the choice of which intervention performs best) are sensitive to the values of the relative weights and the normalised impacts.
The stakeholders were broadly in agreement with the choice of intervention options to compare, but the choice of the criteria and how they altered the option comparisons generated considerable debate. The main issue of discussion was the extent to which the overall performance scores changed with different choice of criteria weightings and hence the potential variation that could arise given the different perspectives/priorities of different stakeholders. Our criteria reflected several important perspectives, including public health (reduction in mortality and morbidity), NHS (increasing cost savings associated with diseases averted), climate change mitigation (reduction in energy use) and inequality (reduction in health inequality between FP vs. non-FP, least deprived vs. most deprived and pensioners vs. non-pensioners). However, we discussed that an alternative set or a subset of criteria could have been chosen, would have been equally valid and would have produced different performance scores for the interventions. There was discussion that the value of the MCDA approach is, therefore, not so much the single headline ‘answer’ that any one analysis generates but that it may yield understanding (if used as an interactive tool) about the importance of different factors in reaching particular results.
We showed online how the performance of the interventions in terms of their ranking depend on the weights assigned to the criteria and the values of the normalised impacts. The participants appreciated the transparency that the MCDA tool brings, particularly in relation to the influence of the relative weights attached to different criteria (which reflects the clear meaning attached to the changes in the weights). However, they were more concerned with the sensitivity of the results to the estimates of normalised impacts, the calculations of which are model-dependent and more opaque. This emphasised the potential value to decision-makers not just of the results but of understanding how different exposures and outcomes are affected by different interventions.
In summary, participants engaged actively with the MCDA tool because the evidence of impacts, the importance attached to the specific criteria (relative weights) and the overall performance scores were clearly displayed and the changes in performance scores could be tested against changes to the criteria weightings. This provided insight into how the results of the optimal choice depend on the priority given to different criteria. There was some desire also to have further detail on how interventions result in the specific exposure changes and outcomes.
Discussion
The results of these MCDAs provide indication of how specific HEE intervention measures, or all interventions combined, compare with each other when assessed against agreed criteria and criteria weightings.
They suggest that the optimal intervention depends not only on the criteria weightings but also on the presence or absence of compensatory ventilation to offset part of the reduced air exchange that would otherwise accompany most interventions. Without compensatory ventilation, many health impacts are negative and the gains for morbidity and NHS cost savings are lower than with compensatory intervention (an effect driven by net changes to indoor air quality).
When there is compensatory ventilation, and the particular set of equally weighted criteria relating to health, environment and health inequalities are used the results suggest double glazing to be the optimal intervention, while without compensatory ventilation, ‘all possible interventions’ combined appeared optimal. However, the results are sensitive to changes to the priority (weights) given to particular criteria and, potentially, to the set of criteria used.
However, the MCDA should not be viewed as a process providing a single answer but rather as an interactive engagement tool to help decision processes. Its use helps the transparency of decision-making in that it shows how priorities depend on the assessment criteria and their weightings and on evidence of impacts. It allows stakeholders to be more engaged with the process so that they have greater sense of ownership of the decision proposed. Its use is encouraged by the UK Government. 89
Information needs for improved decision support
The analyses suggest areas in which better evidence would be helpful to improved decisions on HEE interventions. One of those is evidence on the consequences of interventions for air exchange. For example, as Figures 25 and 26 show, in circumstances where there is compensatory ventilation, the six insulation measures [cavity wall insulation, draught proofing, (double) glazing, loft insulation, solid wall insulation] were broadly similar with regard to the impact that they had on mortality, morbidity and NHS cost savings and were appreciably better than that of boiler replacement for these criteria, although the impact had on inequalities was generally worse. However, the situation is almost reversed when there is no compensatory ventilation, with boiler replacement having a mostly greater impact with respect to mortality, morbidity and NHS cost savings.
Therefore, the accuracy and validity of evidence on ventilation changes appear central to the assessment of the relative position of intervention options, and indeed to the overall benefit of intervention measures. However, there remains uncertainty over the quantification of ventilation changes associated with each form of intervention. Hence, obtaining improved empirical evidence on the consequences of interventions for ventilation, and how those consequences may vary with occupant behaviour, is important and merits further research, especially as adverse effects on ventilation may be detrimental to health.
A second area relates to criteria weightings. The outputs of the MCDA are sensitive to the weights given to each criterion (and also to the criteria chosen), as illustrated by altered patterns when alternative weights were used. For example, in analyses that assume compensatory ventilation, the optimal choice was double glazing when equal weight was assigned to each criterion, but replacement boilers were favoured when there was heavier weighting on energy savings (e.g. as might be appropriate for stakeholders with greater concern with carbon impact or FP). As the workshop discussions emphasised, the question of perspective (i.e. whose views) is potentially very important. But there are also complexities here, because the benefits and costs of interventions potentially accrue for different sections of society and government, and so the framing of the options is also important. If the MCDA is used to support ‘real-life’ decision-making, it would be valuable to develop through participatory processes, greater shared understanding of the ultimate objectives of HEE programmes (e.g. in relation to such outcomes such as health, FP, climate change and inequalities) and to elicit criteria weights appropriate for balancing those objectives. In the analyses presented in this report, we focused on the health, environment and inequality impacts from a broadly societal perspective.
A third area needing improved evidence is the transparency and empirical basis of evidence on the normalised impacts (on health and other criteria). This was an issue of some discussion among workshop participants because many of the relevant data were generated by models. Discussants generally wanted to understand more about how model results were derived and the underlying assumptions so that they could judge the reasonableness of suggested impacts. To some extent this can be addressed by showing intermediate model outputs and underlying empirical relationships, but there is a wider issue of needing more empirical evidence on the relationship between housing characteristics and dwelling performance, to provide both further scientific validation and greater transparency for non-expert stakeholders.
A further issue is the characterisation and presentation of uncertainty. For this work, we used only simple sensitivity analyses to explore the effect of variation in preferences. Methods to represent uncertainty in model and other outputs is desirable but also complex because of the many factors (both structural and parametric) that potentially contribute to the uncertainties in these MCDAs. Conventional Monte Carlo methods are difficult to implement with the fairly complex sets of model-based outputs needed for assessing HEE interventions against multiple criteria. Again, this is an area that would benefit from further research.
In conclusion, the MCDA provides an analytical framework of potential value as a tool to support decisions on HEE interventions, especially if used in iterative fashion to explore options with relevant stakeholder groups. The robustness of those comparisons would be improved by strengthened empirical evidence, specifically on the effect of interventions on ventilation changes, but also by participatory engagements with stakeholders on the framing of the objectives of intervention programmes and the criteria by which they should be judged.
Chapter 6 Study of householders’ views and perceptions
Household framings of home energy efficiency: challenges and links to climate change policy
This component of the study aimed to explore how households make decisions to adopt HEE installations and what consequences these decisions have for health. We interviewed 12 households and 41 individual householders living in one of three areas of England. Interviews were transcribed and analysed to identify the role of HEE in everyday lives. In general, householders did not think about HEE as a specific issue, and neither health nor environmental consequences were primary considerations when selecting or installing HEE interventions. Rather, HEE installations came about when there was some disruption, such as cold draughts, high bills or damp walls. When changes were made to address these issues, householders made decisions within four framings. First was home improvement, in which adding to the (financial or aesthetic) value of the house was the primary goal. Second, home maintenance entailed HEE as a practical necessity. Third, HEE could be conceived as part of a public good to improve housing stock, and could rightfully be subsidised. Finally, a minority of households framed HEE as part of environmental sustainability. Although policy and promotion that resonated with home improvement and home maintenance frames might improve the uptake of HEE, we suggest that this might have some costs as it would further undermine the framing that sees HEE as a common good that has benefits for the public health beyond those that accrue from aggregating individual gains at the household level.
Abstract
Increasing the uptake of HEE technologies is key to multiple policy objectives, including meeting carbon reduction targets, ensuring energy security, reducing excess winter mortality and morbidity and eliminating FP. However, framings focusing on ecology and health improvement do not dovetail neatly with how householders think about HEE installations. The qualitative component of this project drew on interviews with households in three areas of England to better understand why and what HEEs were adopted, how decisions about uptake were made, how HEEs were managed post installation and what impacts HEE-related practices had on health. In analysing the data, we identify four distinct framings of HEE, which have different implications for future uptake rates and for potential health gains: home improvement, home maintenance, subsidised public goods and contributions to sustainability. Although policy framing of HEE more explicitly in consumerist terms might improve rates of uptake (and public health), at least in the short term, this might have costs in terms of eroding the ‘common good’ of commitment to environmental sustainability.
Introduction
Home energy efficiency technologies include measures that improve the thermal characteristics of the home, through roof, wall and floor insulation, double or triple glazing of windows, and draught exclusion, as well as measures that improve the efficiency of devices for heating, cooking and lighting. These mundane technologies, as well as home microgeneration systems, such as photovoltaic cells and solar thermal water heating, have become the object of considerable policy concern over recent years in the UK, as in many other high-income countries. Reducing fuel consumption and GHG emissions at the household level is a crucial objective for climate change mitigation. 76 Achieving this goal is also anticipated to have co-benefits90 across a number of other policy domains, including FP91 and reducing excess winter mortality and morbidity. 92 As in many countries, the governance of these problems in the UK involves inter-relations between public, private and third-sector institutions across sociospatial scales. At the household level, motivations for installing HEE interventions may be framed differently from policy initiatives, with incentives such as reducing fuel bills, improving property values, or aesthetics. 93 The ways in which different householders understand and frame these goals, and how they understand the role of HEE within them, are crucial to any problem response. It is, therefore, essential to understand how household-level framings relate to those at the policy level, and the implications that this is likely to have on national strategies for addressing climate change.
Policy shifts in energy problem framing in the UK
Different ways of framing policy have implications for ‘setting agendas, defining goals; characterizing options; posing questions; prioritising issues; deciding context; setting baselines; drawing boundaries; discounting time; choosing methods; including disciplines, expertise or informal knowledge, and handling uncertainties’. 94 Which solutions are considered legitimate, and which actors are brought into the policy process, depends on how those policies are framed. Thus, framing is key to how particular actions, strategies and policies are likely to be selected, prioritised and implemented.
Background: energy policy in the UK
Energy policy relating to domestic energy use seeks to manipulate dynamics between a complex network of actors, including householders, homeowners, building regulators and materials, energy suppliers, and government. In the UK, there have been shifts in how these elements have been highlighted in policy, as policy framings of energy problems and HEE technologies have changed over time. 95,96 The first major political intervention in energy issues came in the light of the 1973 Organization of the Petroleum Exporting Countries (OPEC) oil crisis, when the 1974–9 Labour government framed the issue as one of ‘energy conservation’, emphasising that energy should be saved and rationed. This led to the design of a 4-year programme to reduce energy demand by 10%, starting in 1977, including measures to bring housing up to basic standards of insulation. However, by the mid-1980s this narrative was reframed by a Conservative government for which ‘energy conservation’ implied saving, which was at odds with its neoliberal commitment to a consumer-led economy. The government instead framed the issue as one of ‘energy efficiency’, as this could represent enhanced productivity, warmer indoor temperatures and lower bills. 96 Energy efficiency was initially debated in the context of market liberalisation, rather than reducing carbon emissions. 95
However, a concern for climate change at the end of the 1980s prompted the Conservative government to make energy efficiency a key mechanism for reducing CO2 emissions, and hence it was incorporated into environmental sustainability policy. Although the HEE scheme, launched in 1991, gave grants to low-income households to install insulation and central heating, many criticised the Conservative government’s free-market policies for delivering energy efficiency, and, subsequently, the Labour governments of 1997–2010 resurrected an interventionist strategy. Although the notion of ‘fuel poverty’ has been around since the 1980s,97 Conservative governments did not use the term,98 and the first government FP strategy was not published until 2001, after the 2000 Warm Homes and Energy Conservation Act was passed. 99 FP has continued to be pressing political issue, with those affected increasing from 1.2 million households in 2004 to 4 million in 2009100 and tackling it has been problematic in the context of rapidly rising fuel prices. 101,102 Labour rebranded the HEE scheme as ‘Warm Front’ and introduced energy performance regulations for social housing (the Decent Homes Standard). After its 2003 White Paper, Our Energy Future – Creating a Low Carbon Economy,103 set out a 60% CO2 reduction target by 2050, while also framing the issue in terms of market competitiveness, energy security and affordability, the Labour government introduced the Climate Change Act 2008. 12 This Act targets ‘at least’ an 80% reduction of CO2 by 2050, compared with 1990 levels. Given that the UK’s housing stock accounts for approximately 27% of its total CO2 emissions,104,105 it has been framed as an important site for intervention, especially in terms of space and water heating.
Current policy context
The 2010–15 Conservative government fundamentally reoriented domestic energy policy by advancing the Green Deal, a market-based policy launched in 2013 targeted to improve HEE by providing loans to homeowners for energy efficient installations, repaid via energy savings. The Energy Act 2011106 provided the legal basis for the Green Deal and Energy Company Obligation107 (provision for poorer communities and higher cost installations). It also set out the ban of ‘inefficient’ rental properties, which in 2015 were defined as those with an energy performance certificate rating of F or below. The rhetoric of ‘energy efficiency’ remains, with a UK National Energy Efficiency Action Plan linking UK policy to a European Energy Efficiency Directive. Energy efficiency is framed as central to low carbon growth, reducing CO2, reducing bills for consumers, increasing productivity through ‘energy efficiency’ investment and securing energy supply. 108
Current political framings of HEE propose solutions in terms of aggregate household installations. Improving the ‘installation per year’ rate is key to meeting internationally agreed targets, and removing impediments to these installations is crucial to its success. Numerical targets and aggregate solutions go hand in hand. Such policies are utilitarian, acting in the service of liberal political philosophy and market dynamics; they aim towards a ‘total good’; that is, benefits at a population level are seen to accrue from scaling individual decisions, made in the interests of those who can benefit from either the purchase of HEE installations, or those who live in homes where they have the direct decision-making authority (i.e. owner-occupiers) to take part in ‘free’ HEE installation schemes. Other groups, especially those in privately rented accommodation who cannot make decisions on behalf of their landlords, those not meeting criteria/outside catchment areas for free installation despite HEE problems, and those for whom installation would involve high upfront costs, potentially miss out because of this framing and its market-oriented solution. This ‘total good’ approach sidesteps the fostering of a ‘common good’: in this case, an orientation to improvement of the housing stock as something that benefits the whole population, irreducible to the aggregation of individual benefits. Common goods are antiutilitarian and their effect is to produce widespread advantages for a community, for example a sustainable environment or trust. By understanding householders’ own narratives about HEE technologies and by exploring HEE installation as part of everyday household practices, we can begin to understand connections to ‘total’ and ‘public’ goods and infer implications for political and social framings. 109
Home energy efficiency and health
Home energy efficiency has become a public health issue in terms of direct health outcomes for households from inefficiently heated homes, indirect outcomes arising from resulting FP and also the public health impacts of how such homes mediate the impacts of cold weather. HEE is, then, a fundamental element of policies aiming to reduce cold-related mortality and morbidity. 92
To date, the evaluative literature on how housing improvements have an impact on public health is limited. A recent systematic review indicated that few studies have reported statistically significant improvements in health following housing improvement,84 given that most studies have not been powered to detect clinical changes110 and are often focused on short-term evaluations. 111 However, the review concluded that HEE interventions that improve thermal comfort can lead to health gains, especially when houses were previously inadequately warm or when residents have chronic respiratory disease. A recent meta-analysis also concluded that HEE had a small positive impact on health. 83 The pathways through which inefficient housing relates to health, however, are little understood, representing a ‘black box’ of mediating factors between intervention and impact. 112 Reduced fuel bills113 may lead to increased disposable income, which could be used to improve diet. 114 Increased thermal comfort and control over heating/hot water114–116 may lead to both increased use of indoor space and emotional security,113–115 potentially benefiting privacy and interpersonal relationships. 114,116 HEE items may give householders more pride in and positive feelings about their homes, serving a positive well-being effect. 114 Health benefits from HEE installations may also reduce time taken off work or school117 and reduce sleep disturbances in children caused by wheeze and dry cough. 118 Yet complex mechanisms remain unclear. There are gaps in the literature about how salient these pathways are across different population groups (e.g. through the lifecourse) and how far preferences for open windows, indoor temperatures or reducing fuel use are rooted in personal circumstances or more deeply seated beliefs relating to health, climate change or other framings. Day and Hitchings119 found that heating was the last thing that older householders would compromise on in terms of sustainability, but it is not known how far such trade-offs between sustainability and comfort might be affected by future changes in householders’ attitudes to sustainability or in younger cohorts.
The decision about whether or not to prioritise fuel use reduction or temperature increases is one example of the variable responses possible to HEE improvements in the household. Previous research identifies a range of responses to HEE interventions, and to advice on cold-weather related health in general, but has not gone much beyond noting that there are differences. Harrington et al. ,113 for instance, identified a range of views in households in the Warm Homes Project and a range of coping strategies used by older citizens but only suggested that these were likely to be cultural and historically specific. Psychological factors are also likely to modify pathways. Critchley et al. 120 looked specifically at those households that maintained cold temperatures post installation of heating improvement interventions, distinguishing those who preferred such temperatures and those for whom constraints had limited temperature increases; cold, they suggest, may well have different health effects for those who psychologically adapt to or who prefer colder temperatures and for those who perceive little choice over their indoor temperatures. If we take the issue of comfortable temperature being a subjective measure seriously, then feelings of control over it are likely to be as important as objective temperature in the pathways linking HEE and health. This suggests potentially complex pathways linking HEE improvements and health, with possible feedback mechanisms such as cultural norms relating to ‘normal’ indoor temperature rise.
‘Barriers’ to and ‘motivations’ for home energy efficiency installation
Despite attempts to frame the importance of domestic energy problems and the effects of energy inefficient homes on health, uptake of HEE technologies by homeowners has been slow. Reticence has typically been framed in terms of ‘barriers’ and ‘motivators’ by both applied energy researchers and government. A paper by Wilson et al. 104 shows that cited ‘barriers’ are often financial (upfront costs and capital availability), informational (lack of information, low salience, social ‘invisibility’, trust issues and outcome uncertainties) and decisional (opportunity costs, cognitive burden and hassle and irreversibility) (see also Stiess and Dunkelberg121). The UK government cites four barriers to HEE take-up. 108 These, in their terminology, are embryonic markets, lack of access to trusted and appropriate information, misaligned financial incentives between owners and tenants and the undervaluing of energy efficiency as an investment opportunity. The last barrier can be seen as the belief that the home is already in a decent state of energy efficiency121,122 or as a lack of ‘energy awareness’ among consumers,105 but this would perhaps lead to the erroneous suggestion that the problem is one of information deficit, when members of the public are often critical of information they receive. 123,124 Other barriers include household characteristics, social norms, housing fabric, negative perceptions of government125,126 and loan mechanisms. Private landlords are largely disengaged with the energy efficiency of their tenanted houses, principally because they do not benefit directly from any improvements and the Green Deal offers little incentive to change this. 127 Moreover, evidence from New Zealand indicates that they also underestimate how cold their properties are in winter given the reported discomfort from tenants. 128
A German study by Stiess and Dunkelberg121 suggests that ‘motivators’ for HEE uptake among households that are installing minor energy efficiency measures are primarily functional and include aesthetics, home maintenance or increasing the market value of the home. In contrast, householders conducting more extensive retrofits have more comprehensive concerns to save energy, reduce costs and decarbonise society. A motivator common to both groups was increasing indoor temperature. Several studies have noted the motivational importance of social networks (friends, family and colleagues) as trusted, impartial sources of information during deliberation on HEE, compared with experts and companies. 121,129 Balcombe et al. 130 found that the most important motivators to microgeneration were earnings potential, energy independence and security against future energy price increases, while barriers were mainly financial, especially in terms of losing house-resale value. However, homeowners often do not seize apparent opportunities to install HEE, for example, when moving house. 93,121
Relatively enduring barriers and motivators at the level of householder behaviour provide an important checklist of factors that policy-makers can use in their decision-making. However, these factors centre on the technology and are decontextualised from ongoing practices within which householders are situated. 131 As in many other areas of behaviour change, there are likely to be diminishing returns from interventions based on addressing barriers and fostering motivators. 132 Given the urgent need to increase the rate of uptake, it is timely to consider how other approaches might shed light on the adoption, or not, of HEE installations. Rather than treating decisions to take up HEE as being the result only of individual calculations, here we adopt a more relational approach; that is, rather than focusing on ‘motivators’ and ‘barriers’, and assuming a rational model of householder actions,133 we focus primarily on which framings include HEE, and how they do this.
Aims
This chapter has three aims. First, we aim to understand which different framings intersect with and are coproduced by householders as they install, or forgo the installation of, HEE technologies. Explication of these helps foreground our second aim, which is to shed light on the (blocked) pathways and mechanisms between HEE installations and health improvements, which have hitherto been ‘black boxed’. Third, we consider the consequences for health improvement by showing the summative and relational conceptions of the social framing that are invoked in policy and householder discourses.
Methods
To meet these aims, we draw on qualitative accounts of how home energy practices are integrated into everyday household decisions across a range of household types. These are derived from 12 household interviews, each comprising 2–4 participants, and 41 individual interviews, which were purposively sampled across three geographical regions in the UK. Household interviews were included to provide insights into the ways in which decisions might be taken collaboratively, and to observe, when possible, HEE interventions in situ. 134 When practical, householders demonstrated their use of HEE artefacts and sometimes led a tour of the house to allow observations to be made. The sampling strategy aimed to generate enough data to provide analytical comparisons across the following factors: local norms about HEE interventions (indicated by high/low density of take-up), type of HEE adopted and length of time since adoption (no installation/1 year post/3 years post), household type (working age, no children/family with children/older citizens), area deprivation, geographical region and those with the more extensive HEE upgrades likely to be necessary in the future.
Households were recruited at local festivals and by invitations to participate mailed with a stamped addressed envelope to addresses within three UK postcode areas (north, south east and south west) identified as having high levels of HEE uptake in the last 3 years by the HEED. Within these areas, households were sampled purposively to include a range of housing and household type, tenure, age and income level.
Interviews used a topic guide to explore the experience of applying for and organising the interventions (or decisions about not to install); narratives of how life in the home was before, immediately after and now in relation to the (considered) intervention; the impact had on physical and mental health; the impact on fuel costs; comparisons with neighbours/family members in similar homes without energy interventions; views on the importance of energy efficiency interventions compared with other potential benefits to improve health and well-being; and underlying values and beliefs relating to domains such as indoor temperature, ventilation, fuel use and responsibilities for climate change.
All interviews except one were recorded and part-transcribed after participants’ consent was obtained. All early interviews and selected later ones were transcribed in full, and analysed qualitatively using methods from the constant comparative method for inductive analysis as well as a more deductive content analysis around (1) the key themes of interest related to well-being and (2) the relative importance users placed on these interventions in the context of health, well-being, costs and climate change. All data have been anonymised, with pseudonyms assigned to participants and places.
Results
Overview
In talking about decisions to consider, buy or install HEE interventions, participants framed their accounts in terms of a complex network that included the members of the household, the physical structures of the house and its embedded technological artefacts, and the proximal and distal external environment in which the house was situated. This network could be considered a relational complex that was foundational to their framing of HEE. This ‘foundational relation’ differed from one household to the next, and a certain degree of fluidity existed between components, but the complex was typically invoked whenever HEE issues were described by householders. Although antecedent to virtually all framings, it was rarely a key framing in itself. Indeed, problems emerging from the complex were typically tolerated in everyday practice by householders, often for a number of years; tolerated, that is, until issues of cost, ‘waste’, comfort or aesthetics shifted the framing into one of the four key frames we identified in the data (home improvement, home maintenance, public goods or environmental sustainability).
Home improvement and home maintenance are consumerist framings, centred on managing the foundational relation. The distinction between the two is that home improvement enhances some aspect of the home and so connects to and reproduces parochial framings of HEE that pertain to the valorisation of some kind of private aspiration or benefit. Home maintenance lacks this overt social aspiration but nonetheless concerns private interests. To this extent, both of these respond to policy framings that evoke HEE as a problem of individuals, or householders, as the primary beneficiary.
In contrast to the two consumerist framings, the subsidised public good and environmental sustainability framings invoke the common good or social relations oriented to collective betterment. A minority act on the foundational relation by framing the issue as an ethical commitment to climate change mitigation. In addition, some renting households and those with awareness of their eligibility for government schemes frame the issue in terms of public goods.
Although dominant framings within any household could change temporally, a key finding is that HEE itself is largely absent from all framings – or is merely incidental when present. ‘HEE’ was never the guiding framing of the issue. We briefly flesh out the ‘foundational relation’, and how it comes to be disrupted such that HEE is considered, before describing dominant householder framings of HEE in greater detail.
The householder–house–external environment complex
The relationship between householders, their houses and the external environment is at its optimum when experienced as a subconscious practice; it is a relationship constantly in flux, but most harmonious when it intrudes little in the daily reflections of householders. When it does intrude, it can signal a subjectively positive or negative discrepancy of some kind in its smooth running. It is this foundational complex on which householders’ HEE framings are constructed and enacted as the HEE technology’s effectiveness principally serves to mediate it. The complex was, of course, differently articulated across the households in the sample. However, conceptualised pragmatically, this complex can come to householders’ attention through, for example, a draught from outside the home during winter (external environment) or via a gap in a window frame (house) that can create physiological discomfort (householder); a state of relaxation (householder) facilitated by watching a south-facing garden bathed in sunlight (external environment) through a new window (house); or the exposure of one side of the house to frequent gusts (external environment) creating colder temperatures in certain rooms (house) causing sleeplessness and discomfort (householder):
I’ve had a spray coating on the wall, which was also supposed to help insulation, but that’s only at the front of the house, which is the weather side, because the south-west weather comes in that way mostly.
Alf, area 2
We spent 5 years here with no radiators in the back bedrooms where the girls sleep but we’re south-facing and it’s very warm, even in the middle of winter.
Alec, area 2
Elements of multiple frames: comfort, cost, ‘waste’ and security
Problems with the foundational relation may lead to waste, discomfort, increased costs and security concerns. Comfort, cost and waste, especially, were common issues that cross-cut the dominant framings of HEE outlined below. Thermal comfort – whether this meant staying warm or keeping cool – often held an unassailable position in relation to other HEE considerations:
The heating thing came up last winter when Maude said she was getting cold and so I started to investigate what I could do.
Ray, area 2
For those in FP, maintaining comfortable temperatures could mean considerable expenditure on fuel:
I’ll sacrifice anything just to heat my house, I like my house to be really hot. I keep the heating constantly on, most of the time.
How much of your income do you think is spent on gas?
About 30%.
Area 3
Low ambient temperatures in the home could also be tolerated for long periods, especially if householders had normalised such conditions across several houses they had rented or owned. Keeping bills down was a significant concern among many. High upfront costs of certain HEE interventions meant that such items were either not installed or delayed until savings could facilitate their purchase. Indeed, spreading the adoption of HEE installations out over time allowed ‘maintenance’ and ‘improvement’ works to be more manageable.
Furthermore, many householders repeatedly mentioned the need to reduce ‘wastage’. This could be in terms of reducing wasted energy within the home, reducing bills, reducing wasted energy resources and decreasing environmental impacts. The use of ‘waste’ appeared to unify all framings of HEE:
There’s a number of reasons [why energy conservation is important to me]. I think obviously energy wastage and the cost of that, the environmental impact of that, burning fuel when you don’t necessarily need to.
Iris, area 1
Finally, security concerns could influence the type and extent of HEE adopted. Expression of this concern could relate to perceived high levels of crime in local areas or the presence of single-occupant households, and related primarily to choices on whether or not and where to install double glazing:
Our kitchen door and the cellar door were done a couple of years previous to that just to beef up security really. We were burgled, so.
Tracy, area 2
We’ve had people climbing through our window and stealing stuff before, but the one upstairs, I don’t think there’s a way of reaching it.
Tim, area 2
Framing 1: home improvement
Home improvement was a key overall framing within which HEE technologies became domesticated and, thus, incorporated into household practices. HEE itself was generally considered merely incidental to the main concern of home improvement:
You know something, I think I started thinking about [replacing the windows] when we wanted to start doing the sitting room up to get it the way we wanted it.
Sandra, area 1
A number of inter-related elements can contribute to this framing. First, home improvements can enact householders’ visions of the future. If households consider their current properties as ‘forever homes’ – or ones they want to make a profit on – then HEE technologies are more likely to be incorporated in the course of home improvement activities as part of long-term investments. Although the cost-efficiency of potential installations in terms of upfront costs and anticipated effects on bills was also common to maintenance frames, it was mainly those framing HEE in terms of home improvement who portrayed the issue as principally one of ‘return on investment’.
The potential and purpose of space is also crucial to this framing, in terms of both the internal layout of properties and the expanding building envelope via extensions and loft conversions, in the context of neighbourhood norms. Home improvements can often involve small or large changes to the internal layout of properties, which have implications for HEE adoption. For instance, some householders replaced conventional boilers with combi-boilers to free up room space or enable (planned) extensions to be built. In addition, there can be a trade-off between HEE technologies and room space, which relates to both concerns over a property’s resale value and current and projected use of rooms and space:
So, the internal insulation that I’ve done, to give you an idea: I guessed the U-values, worked them out as accurately as I can and they were somewhere probably a standard brick wall a U-value of 2.2 is around there. I think I’ve got them down to about .45. Now I know you’re supposed to get them down to .3. And I’ve failed on that but it’s just, it’s a space consideration.
Paul, area 2
Householders’ awareness of local norms relating to home improvement were often signalled by visiting neighbours, witnessing changes and continuities in the building fabric in their local areas and by observing internal layout and house price changes in estate agents’ windows:
I look in the estate agents sometimes . . . a huge number of houses around here have either turned their garages into a room or just built on the side. A lot of them now have got three sections at the front but none of them had them originally, it’s all addition.
Rachel, area 1
Aesthetic and decorative tastes, which situate householders within the social norms of friendship groups, neighbourhoods or class positions, are integral to home improvement framings. Younger families in particular, moving into houses previously occupied by older people, often expressed the desire to ‘modernise’ properties. However, even within the same street, householders’ modernisation-conservation strategies could be oriented to different norms, affecting the uptake of HEE technologies.
Some HEE technologies can be fetishised for their gadgetry and become part of individual consumer lifestyle choices. In this sense, energy efficiency is ‘built in’ to certain socially valorised goods (e.g. some wood burners, windows and radiators). Visible installations (e.g. windows, external wall insulation and solar panels) are, therefore, given greater aesthetic consideration than those such as loft or cavity wall insulation, with their adoption more readily influenced by local norms and linked to house resale value:
We did think of putting solar panels on the garage. You can do it east and west rather than south, but then we both said, well, if you have all these solar panels at that level, some people, when we eventually sell the house, they won’t like it. I’m not sure we would have liked it.
Stephen, area 3
Many home improvement framings can invoke building regulations; the multifaceted, large-scale or idiosyncratic nature of home improvements can mean that regulations are seen as either unavoidable or integral to HEE domestication. For some (see the previous quotation from Paul), this extended to an almost fanatical level of curiosity with efficiency measures and the monitoring of things such as U-values or watts consumed. When viewed as unavoidable, householders admitted that they would not have installed certain HEE technologies unless compelled to by their local authorities:
To get planning permission we had to upgrade the thermal efficiency. [Local authority] is the only city in country that insists that you do things like solar panels. So it was a statutory requirement [that the energy efficiency measures were installed].
John, area 2
Several householders viewing HEE within the home improvement frame were more concerned with aesthetics than regulations and neglected to seek approval for structural changes from their local authorities:
I think probably we should have had someone come round, thinking about it, looking at it now, but this wall we took out and then there was a wall here that we took out, as well. But we, I have a feeling that probably building control would say you need a door here because of fire or something like that, but we haven’t done anything like that.
Peter, area 2
Do home improvements lead to health improvements?
In general, participants recounted experiences of increased warmth following home improvements, with some older participants happily reporting a reduced need to wear thermal clothing indoors. However, health pathways within households installing HEE technologies via home improvement framings were not straightforward, and the mixed effects on thermal comfort and ventilation within any house make generalisation difficult:
It’s hard to isolate what’s related to the property and what’s related to just being a bit more sorted in general. The upheaval, again as I say, of doing up a house you end up feeling quite stressed and run down but you don’t know if that’s because of your job or because of your house or because of your health or because of any other number of underlying factors. So it’s hard to say whether it’s improved directly because of the house and the health of the house.
Dani, Area 3
Given that multiple installations are often installed in a relatively short space of time in the context of wider, sometimes snowballing, structural changes to the house, a number of problems can occur. First, protracted installation processes can worsen health pathways in the short term. For example, dust can accumulate – often as an indirect consequence of HEE adoption – presenting respiratory health risks. Similarly, installations may be delayed, for example by renovation errors or prioritising the completion of communal living spaces before bedrooms. Indeed, inadequate installation of heating systems and insulation during extension works can increase fuel costs, diverting funds from things such as nutrition:
It was just a complete shambles. At that stage [after the initial installation of a new heating system and insulation] our energy bills were massive. Our direct debit was very high. It was going up relentlessly and I thought ‘this isn’t right’.
Colin, area 1
Second, householders often have to develop new practical relationships with technomaterial artefacts to benefit from any savings on bills. However, this can be difficult to achieve or can be seen as unimportant, even a few years after home improvements have taken place:
I have to admit that I haven’t got round to looking – there’s an option of keeping a reservoir of water warm and it might be advantageous, I don’t know. Because, if you don’t do that, a lot of water is wasted every time you switch on the hot tap to get it up to temperature.
John, area 2
Third, home improvement framings can also influence the installation of HEE technologies that subjectively serve cultural rather than efficiency aims, leading to greater expenditure on energy than is entirely necessary, which may have indirect effects on health through reduction in disposable income. Fourth, prioritising aesthetic, decorative and functional changes to internal layouts in the course of home improvements, and conducting improvements in stages, can potentially lead to negative pathways in terms of thermal discomfort, decreased ventilation, worsening draughts and higher bills than might be necessary:
Once it started getting cold around Christmas, I did feel that the warmth from in [the kitchen] was being, because it’s all open plan, being sucked up the stairs and so I was tending to be a little bit chilly, and I also don’t think I’ve got the thermostat in the right place, because I think it’s a bit too sheltered there, and so then the heating goes off but the heat’s all gone upstairs and then I’m cold. So . . . I’ve got a blanket [pinned up] at the top of the stairs.
Rachel, area 1
Peter decided against getting external wall insulation partly because he was prioritising improvement costs elsewhere in the home and partly owing to aesthetic reasons, but this meant that his daughter’s bedroom remained damp:
It does make you feel awful as a parent, that your daughter is sleeping in a room that has mould growing in it. You don’t really want that, necessarily. But it’s, I think the problem, and it’s been a particularly wet autumn and winter, which has been, it hasn’t happened before in her room, which makes me think it won’t happen again if we’re, with a combination of the radiator and the weather, I think, proper weather, hopefully it will sort it.
Peter, area 2
Negative health pathways, of course, may be passed on to future owners or tenants. When local authorities have more effective building regulation enforcement methods, this can be somewhat tempered.
When home improvement frames are entirely enacted by homeowners through their do-it-yourself activities, limitations on potential health improvements can follow when a householder does not consider a potential HEE issue to be within their limited expertise or because of the amount of disruption envisaged and, hence, it is something that will not be done.
However, well-being may improve, as HEE technology installed during the course of home improvements can enable relaxation, foster a sense of social identity and home-making, and provide ontological security in respect of managing and enhancing the foundational relation and improve social relations in the home. Moreover, satisfaction and pride can follow on from realising ambitious improvements that incorporate HEE:
I can see that it gives him [husband] pride and I’m very proud of him having achieved this and giving us a home like this.
Tracy, area 2
I had the bi-fold doors put in and I can now sit on my settee and see my garden and before [when an inefficient window was in its place] all you could see was sky. That is a big plus in my life.
Rachel, area 1
Furthermore, significantly reduced bills can provide a well-being effect because of a sense of victory against the perceived ‘oligopolistic’ energy market.
Unintended positive consequences for health pathways may also occur. For instance, internal wall insulation installed for thermal comfort reasons or double glazing installed to eliminate draughts may also provide sound insulation from traffic and pedestrians outside the home, thereby aiding sleep and relaxation:
Like, the windows, because we could hear noise as well from outside, so it [the window replacement] stopped the noise.
Kirsty, area 1
Lower bills can also be a positive unintended consequence, alongside contributions to broader public health outcomes by lowering one’s carbon footprint.
Framing 2: home maintenance
Home maintenance framings seek to incorporate HEE technologies to maintain specific aspects of the foundational relation. The function of HEE here is constructed as one of practical necessity. As such, the technologies domesticated are typically like-for-like replacements (boilers, re-rendering) or small additions to bring the home up to regulations or smooth interpersonal relations. Such framings can be adopted because householders may be considering moving in the not too distant future and, therefore, consider that the improvements are unnecessary for themselves, which is a consumerist framing that is oriented to private satisfaction rather than the common good of improving the national housing stock. Some people were older and reluctant to undergo improvement activities at their time of life, had less disposable income to consider ‘improvements’ affordable or lived in conservative residential areas in which certain, more visible, HEE technologies are normatively discouraged or legally prevented:
Potentially, in 8 months’ time, I can retire, and for the last couple of years now there’s always been a thought – in actual fact, do I want to stay here? I could put in a brand new kitchen and the person who comes along and views the house might turn round and say ‘God, will you look at that!’
Iris, area 1
Well I shan’t bother now [with further HEE installations], I don’t think at my age [80s] it’s worth going into that.
Harry, area 2
Several factors could play a part in home maintenance framings. First were factors that, left unmanaged, negatively affect householders’ physiology (e.g. a boiler failing to heat the home despite being on constantly) or prompt concerns about the encroachment of the external environment into the home (e.g. cold or cracked walls, or damp patches), for example. This could engender both thermal discomfort and concerns about escalating fuel bills:
There was intermittent hot water, then it would come up to winter time and there wasn’t any heating. We had problems for about the last 2 or 3 years with that boiler.
Melinda, area 1
Second, information from installers, energy companies or the local authority could help frame the issue as one of maintenance, or arrive during householder deliberations about such decisions, which could combine to prompt action. In this respect, participants considered local area norms to be less influential on their maintenance framings.
British Gas said that because of the age of the boiler we ought to get carbon monoxide monitors and then we just thought, well, look it’s a 20-plus-year-old boiler and because when they came to service it they said it was a model that they didn’t make any more, we decided to take advantage of their offer.
Fred, area 1
Householders adopting a maintenance framing were more content than those framing HEE in terms of home improvement to stick with inefficient technology or ‘bodge jobs’ – a term frequently used by a range of participants – than to install more efficient technologies.
Health pathways from home maintenance
The framing of HEE as necessary for home maintenance was often related to warmth, ventilation and hygiene to a much greater extent than the home improvement framings. In this way, specific aspects of health pathways could be affected leading to greater thermal comfort, improved mental health (e.g. peace of mind at having more reliable technology, fewer interpersonal grumbles and not having to worry about basic needs of warmth and sanitation, which could otherwise niggle at them), the increased use of rooms and fewer worries about specific health hazards such as carbon monoxide poisoning.
Compared with installations carried out during home improvements, there was the potential for greater generation of relational goods pertaining to shared well-being, such as reciprocity, neighbourliness and interpersonal care. For instance, some householders co-ordinated their maintenance with neighbours, sharing the cost of scaffolding and external insulation installations, thereby enhancing interhousehold relations.
However, the specific rather than more holistic action on the foundational relation can leave other health pathways unattended. The slower processes of HEE domestication in cases of home maintenance framing were a result of lack of capital, cluttered lofts or simply not seeing it as a pressing priority. There were few negative health pathways created by this framings of HEE; however, pre-existing negative pathways within a household could continue unabated, for example lingering dampness or draughts in certain rooms:
It’s damp and dampness that used to be there.
It’s like damp in the air and getting, like, condensation.
Has that ceased to be a problem?
It’s still a little bit, still there sometimes.
Area 1
Furthermore, the socioeconomic context of increasing fuel prices meant that the few HEE technologies installed during maintenance seemed to have little effect on reducing bills compared with holistic changes carried out in home improvement framings.
Framing 3: home energy efficiency framed as a public good
Similar concerns with managing the foundational relation prompted ‘public good’ framings: indeed, this framing often co-existed with maintenance framings. However, home improvement seems to conflict with it; for instance, one household was aware of recent external cladding installation on local authority housing on their road, but as homeowners they rejected the opportunity to have it themselves for aesthetic reasons.
Framings of HEE as a public good incorporated two orientations. The first was the emphasis on the household as one that could potentially benefit from the notion that HEE was a public good, in that it could, or should, be subsidised. This framing was most common among older participants, those in more socioeconomically deprived areas and households who were renting. This was often because they had been targeted by local installers, energy companies or local authorities who had advertised government HEE schemes for which they might be eligible. On the whole, these framings appeared to be more marginal within the overall sample.
Intermediaries were important in framing HEE as a public good, as most people in the sample expressed surprise that they were or might be eligible for ‘free’ HEE technologies:
It was a couple of neighbours who had had people knocking at their door offering energy assessments, free insulation, that type of thing, and they said, ‘oh there are grants’ and I’d said, ‘oh I don’t know that I’d qualify because I work obviously’ and they said, ‘oh no there’s a, you know if you’re on a lower income’.
Philippa, area 3
As a result, this framing had been adopted most commonly through collective rather than individual reflexivity. Householders typically became aware of these schemes through leaflets, local newsletters and papers, doorstepping by companies acting on behalf of local authorities and through word of mouth. In some cases, the absence of the intermediary would have meant the householder would not have acted on the foundational relation. That said, when future issues with the foundational relation arose for householders who had previously used such schemes, a subsidised public good framing was again invoked, but this time autonomously. An influential mechanism for adopting this framing came through intermediaries explaining technologies in terms of bringing the property in line with regulations, especially in terms of insulation, which coincided with participants’ feeling of being responsible homeowners.
Reducing fuel bills and maximising health and thermal comfort was of slightly more concern among people adopting this framing than among others:
It’s those little things sometimes that stress you out more than anything and I didn’t want to sleep in a draughty bedroom and it [the newly insulated loft] also gives me the option of moving my daughter’s room to the attic room at some point, which I’d quite like to do. And so it just gives me more flexibility with my home and makes it more comfortable.
Philippa, area 3
A second sense in which a public good framing was invoked was that of the household contribution to the common good of improved housing stock. In this sense, installing HEE was seen as ‘the right thing to do’ (Tim, area 2) in terms of moral imperatives to participate in schemes for public benefit. This was, to an extent, evident in some privately renting households that had sought to install loft insulation through these schemes and who expressed dismay at their landlords’ disengagement. Participants speculated that part of the problem was that the landlords viewed their houses as commodities rather than homes or as part of a communal housing stock. Indeed, landlords’ apparent short-term ‘firefighting’ was frequently juxtaposed with some owner-occupiers’ long-term home improvement framings within the sample:
[The previous landlord] had 12 properties and he firefights. There was no long-term view, there was no concern about the cost of fuel or anything like that, or health.
Alec, area 2
Even so, renters were reluctant to press the issue with their landlords, with whom they wanted to remain on cordial terms.
Health pathways from public good framings
Framings that led to installations within public good framings could have similar health pathways to other framings; ‘free’ loft insulation could improve thermal comfort and aid ontological security, and subsidised windows could improve air quality and warmth and reduce damp:
I think it was warmer [during the winter after window installation], because we also used to put the heating on but we didn’t need to put it on as much, I don’t think.
Ellen, area 1
Cavity wall insulation often had an imperceptible effect on thermal comfort. Indeed, occasionally householders said that, before the interview, they had not thought to connect the increase in thermal comfort they experienced with the HEE installation.
Publicly funded schemes also offer mechanisms that bypass the delay in HEE technology adoption forced by financing issues, thereby tackling any underlying health problems or risks posed by the foundational relation more quickly:
We would have done it inevitably anyway.
Oh yeah, it was on, we were getting close anyway.
It was on our hit list, it just made it happen a lot quicker.
Made it much more affordable.
Area 2
Some households found that they needed the heating on less after they had loft insulation installed. However, it was suspected that some older people failed to change long-term thermostatic regulation practices after the loft installation, with the result that they found conditions too hot. Although persisting dispositions may partly account for this, other reasons can include the way that householders are often removed from the installation process and, therefore, lack knowledge about the nature and function of the installed measure while simultaneously having little interest in the technology itself.
When HEE was framed as a matter of public intervention but such intervention was not forthcoming, health pathways could be exacerbated by a lack of funds to pay for a higher-cost HEE intervention. An elderly couple, for instance, hoped for a subsidised solution to connect them to mains gas or provide them with more efficient electric night storage heaters. This was needed because one of them was experiencing the early stages of dementia and beginning to feel increasingly cold at home during the evenings. As a solution could not be found, the consequence for them was persisting discomfort and increased fuel expenditure.
Indeed, when HEE was installed through this framing, energy bills were reported as showing only marginal reductions, if at all. Hence, there were no significant increases in disposable income that could be redirected to improve things such as nutrition, even after long-term adoption. Similar to participants framing HEE in other ways, these participants were also uncertain about effects on energy bills from general increases in fuel prices. Hence, there may be more potential for dissatisfaction with the financial effects of HEE post installation among people framing HEE in this way than among others.
Framing 4: environmental sustainability
Householders did not typically frame their HEE installations or daily energy practices in terms of environmental sustainability or climate change mitigation, the responsibility for which was perceived to lie away from the household and in the hands of governments:
I tend not to think about that sort of thing to be honest, that’s for the politicians and the scientists to worry about. If they say to us we’ve got to stop using gas so much, then you’d sort of try other ways wouldn’t you?
David, area 1
Most often, if environmental sustainability entered the frame, it constituted a post-rationalised benefit of HEE adoption. It could also serve a purpose of setting examples to children in the household. Occasionally it was connected to local norms, with some participants aware of local community groups advocating ‘green’ energy technologies. As such, householders could experience well-being effects from tangentially being part of a common good. Home improvement framings could, to an extent, compromise such environmental framings in which the technologies installed were not efficient in relation to household practices. In this sense, environmental framings were relegated in importance or removed from HEE framings entirely.
A small minority took environmental sustainability as a dominant framing, usually related to specific HEE technologies such as solar panels and biomass boilers. Moreover, these were connected to wider changes that they were trying to implement in their daily lives:
The solar panels don’t make the house any warmer but at least you have a feeling that you are trying to put something back. There’s something about looking at the size of our carbon footprint, and saying we’re extremely privileged: we live in a nice big house, we have lots of things which are not carbon friendly, and perhaps recognising that we do need to cut down how big is our carbon footprint, start to reduce things. So I’ve started using the bus far more than I ever used to, just do a lot more walking.
Luke, area 3
Those advocating environmental sustainability as a frame through which to incorporate HEE also often utilised other frames, especially maintenance. The key feature of this frame was an ethical urge that led to them adopting HEE technologies.
Discussion
An Energy and Climate Change Committee report135 recommended ‘that DECC set out a robust framework through which the (now superseded) Green Deal can be assessed’ (p. 18). Such ‘robust’ assessments are framed in quantitative terms of ‘plans sold and CO2 saved through measures installed under Green Deal’ (p. 36). This is indicative of current political framings of home energy problems that increasingly envisage solutions as summative rather than relational, positing progress in terms of ‘total’ rather than ‘common’ goods. However, householder framings of their home energy problems – and the ‘motivators’ of and ‘barriers’ to installing new HEE technologies – are, by contrast, contextually embedded in what matters within household and community relations. These can lead to both total and common-good framings of HEE, with different consequences for environmental policy.
We concur with several studies129,135 that there is a need for energy efficiency research and policy to be situated within the wider considerations of renovation and domestic daily life. Qualitative methods such as those used in this paper – which are less common in energy research136 – can aid our understanding of this. By understanding the dominant frames through which HEE becomes domesticated, we can begin to both understand the everyday social role of HEE and more realistically infer pathways to environmental sustainability.
Energy efficiency, costs, health, security and comfort, by themselves, do not constitute framings that will encourage practice change to meet policy goals. On the one hand, continuing to develop the nascent home improvement policy framing may have several benefits, as it overlaps with several political concerns. Developing liberal economic frames that resonate with lifestyle, aesthetics and consumption can clearly act as good catalysts for HEE uptake when financing is not an issue. In theory, this can lead to improved carbon reduction pathways for those with the disposable income, time and opportunities to undertake such activities. However, this is not always achievable in practice. Given that HEE technologies are installed among a range of artefacts in the process of home improvement, there are likely to be wider benefits for the economy. This framing seems key in the context of meeting legally binding ‘targets’, especially in the short term.
At the same time, there are potential costs of continuing to pursue such a framing. Not every householder frames HEE in terms of home improvement or sees the government as responsible for intervening in such decisions. Furthermore, there are potential risks of exacerbating social and health inequalities unless financial mechanisms are easy to access and, in the case of the private-rent sector, landlords are mandated to install such items.
The Energy and Climate Change Committee report135 suggested that behaviour change might be facilitated by changing the framing of energy efficiency so that it is ‘integrated within a wider spectrum of home improvements’ (p. 16). To some extent, the home improvement framing is not entirely oriented to low carbon practices in the long term, as it plays to private interests, with aesthetic tastes (e.g. deciding against installing certain HEE items) and comfort (e.g. keeping heating on and windows open) serving to conflict with environmental sustainability (see Reid137). Indeed, common goods constituted by shared concerns about the environment are not fostered, undermining the potential power of corporate agency in producing more radical social change. Large-scale home improvements can also have unintended negative consequences on health and well-being, some of which are difficult to reverse, such as external cladding.
Home maintenance frames are perhaps difficult to argue for from a target perspective, as they are not ‘aspirational’, and householders show slow progress in moving from an awareness of problems with the foundational relation to the consumption of HEE – and sometimes even longer to subsequently master the technology to utilise its efficiency powers. Maintenance framings also fail to develop relational goods, as they are oriented to the interests of private property owners rather than to the common good of improving the housing stock. Consumerist actions do not create common goods, as the individualised acts of consumption, aggregated as a total good, serve to dissolve social bonds connecting householders with the wider community.
However, framing the issue as a subsidised public good, which, from the householder’s perspective, is more closely related to maintenance rather than personal aspiration (i.e. home improvement), is a key framing to prevent inequalities. Improving material conditions for the poor and groups unable to take advantage of current public HEE schemes can be overcome only through structural means and the provision of public goods. This means utilising tax and redistribution mechanisms, lessening wage inequality, developing non-credit HEE-financing options, improving regulations around residential letting (private and public) and creating more opportunities for local groups to have charitable status so that they can organise around these issues for the benefit of their communities, including the channelling of HEE information and technologies. Indeed, mechanisms of HEE delivery could usefully use local authorities and community groups, especially as they are trusted more than energy companies. 138 Furthermore, there is potential for policy-makers to utilise social networks as a mode of information and technology diffusion.
Framing the issue in terms of climate change or environmental sustainability would most likely result in the slow adoption of HEE, which would compromise legal targets and reduce the total good. Currently, only a small minority principally frame HEE technologies in this way. However, similar to HEE, this framing has the potential to generate common goods that may be more beneficial in the long run to ensure both sustainability and equality goals.
In conclusion, a relational approach, rather than one given to the identification of motivations and barriers, shows that policy objective framings of HEE do not dovetail neatly with those of householders. Householders do not have an individualised, decontextualised checklist of factors they weigh up before deciding to install or forgo HEE technologies. Instead, these technologies are subsidiary artefacts within broader framings of home improvement, home maintenance, subsidised public goods and environmental sustainability. Promoting the former two framings might foster installation rates in the short term but this puts at risk the relational, common goods engendered by the last two framings.
Chapter 7 Discussion
This project provides research relevant to the effect of (routine) HEE improvements on health in the population and complements evidence from more in-depth assessments of specific intervention programmes targeted at high-risk groups. Through its different components and analyses, it provides a number of new insights and implications for policy.
As with all research in this area, it provides evidence on a relatively selected subset of pathways/connections to health. Its primary focus has been on the consequences of HEE interventions operating through changes to the indoor environment, specifically changes in (primarily winter) indoor temperatures and indoor air quality.
There were two chief surprises from the study’s findings. The first was the apparently small impact that ‘routine’ HEE interventions have had on indoor temperatures (and hence on cold-related mortality/morbidity) across the housing stock in England. Our estimate is that, on average, such interventions (specifically those installed between 2002 and 2007) achieved an increase in SIT of only around 0.1 °C and have reduced the annual burden of cold-related mortality by around 300 deaths. This is, of course, a welcome benefit, but smaller than many might hope for and appreciably less than is theoretically achievable if all dwellings, particularly those for the most vulnerable people, received the full range of retrofit energy efficiency upgrades that could be installed in them.
As these changes were small, this presented a practical difficulty in the epidemiological investigation of the impact that such interventions had on mortality and morbidity. We concluded that direct empirical observation of pre–post change in mortality risk with data aggregated to the level of postcodes (which would further ‘dilute’ the effect of intervention-related changes made in an individual dwelling) would be beyond the limits of detection using national routine data, especially given other sources of imprecision in the classification of exposure changes. Although we are continuing to pursue studies to examine methods for linkage at the level of individual households, our assessment of intervention-related changes to the indoor environment and health for this project was based on an indirect approach.
Such indirect methods necessarily entail a range of uncertainties, and it is therefore worth considering the degree of confidence in our estimates and conclusions. For reasons already outlined above (see Chapter 3,The impact of home energy efficiency interventions: 2002–10) we believe that the estimate of change in indoor temperature, although not as robust or precise as might be obtained from direct empirical measurement, is nonetheless a reasonably accurate estimate of the average change associated with the different forms of energy efficiency interventions. As indoor temperature monitoring has mainly been undertaken only in the context of relatively small-scale surveys, there is no data source that provides measurements of temperature change following retrofits for even a sizeable minority of dwellings across England. Rarely have measurements been made both before and after the installation of energy efficiency measures. However, the general relationship between housing characteristics and temperature can be obtained from the data of those surveys and extrapolated to classify the changes likely to have occurred in other dwellings. It is noteworthy that the relationship we used for that classification is based on an empirical relationship that appears to be very similar in two independent data sources: the previously published evaluation of the Warm Front HEE scheme27 and our new analyses of data from the EFUS. 30
What we learn from that relationship is that large changes in the engine efficiency characteristics of a dwelling are needed to achieve appreciable change in indoor temperatures, and that there is a plateau effect beyond which no further increase in temperature occurs with further energy efficiency improvement. This plateau begins at energy efficiency levels close to the average for the English stock. Thus, the shape of this relationship and the relatively modest nature of most HEE improvements are the principal reasons for the small temperature impact that energy efficiency improvements had. Furthermore, this evidence also suggests that appreciable temperature increases are likely to be seen only in the future following measures applied to dwellings with below-average energy efficiency levels. These are the dwellings in which there is potential for reduction of cold-related health impacts. For all other dwellings, the improvements in energy efficiency are taken as energy and cost savings (and consequent reductions of emissions to the environment).
The second surprise was the potential relative magnitude of health effects relating to changes in indoor air quality compared with those of temperature change. Almost all assessments to date have focused primarily on the short-term effects of energy efficiency improvements on temperature. Indeed, this was the intended primary focus of the current study. However, our analyses suggest that the impact of indoor air quality has the potential to be appreciably larger than that of changes in temperature, and that it might be negative as well as positive for health, depending on such factors as location (high radon area, area of high outdoor air pollution, etc.); the characteristics of household occupants; their behaviours and time activity patterns and the type of energy efficiency intervention. Risk may be further modified if interventions are not properly installed, operated and maintained. We have previously published on the potential risks for radon exposure,77 but similar considerations apply to a range of pollutants of both well-characterised (PM2.5 of indoor origin, STS) and less well-characterised (e.g. volatile organic compounds) risks to health. The risks associated with these exposures may take years or even decades to evolve fully and, thus, are not mainly visible as short-term changes in health (although some forms of impact may occur very quickly) but rather are expected to emerge over the medium to long term.
One of the difficulties of assessing these risks is the uncertainty about what changes to ventilation occur in practice. Building regulation gives guidance on the need to ensure adequate ventilation,139 but it is not clear how that guidance is followed. Energy efficiency interventions usually entail a reduction in air exchange because improving insulation normally cuts down air leakage through gaps in the building fabric and it is also often a deliberate objective to reduce uncontrolled ventilation and hence energy losses through the escape of heated air. An important note of caution is that such reduction will inevitably alter not only the dynamics of the entry of pollutants from the outdoor to the indoor environment but also the escape of pollutants from the indoor to the outdoor environment. Whether or not the net effect is beneficial or harmful depends on the relative balance of the changes across the range of pollutants. Although greater control over ventilation can be beneficial from an air quality perspective, if appropriate measures are implemented, operated and maintained, there is significant risk that the air quality may be made poorer by allowing the build-up of pollutants derived from indoor sources. In the worst circumstances, these risks appear more than sufficient to offset the benefits of improved winter indoor temperatures.
At present, there is insufficient research on the changes to indoor air quality associated with energy efficiency measures and how best to protect health. However, from our analyses, it would appear that health effects relating to air quality should be treated as being as important as, if not more important than, those of changes in temperature.
A further outcome of energy efficiency improvement is, of course, altered requirement and demand for energy. The metered energy use data suggest that, in addition to the modest effect of interventions on indoor temperatures, improved insulation of the dwelling fabric reduces heating energy use on average by around 4%, while improvement to the heating system may save around 10%. It is difficult to know how to translate these benefits into health terms. For very low income families living in FP, there may be some psychosocial benefit associated with a degree of alleviation of concern about managing the household budget, as well as the possibility that some of those cost savings may be translated into such things as a more varied (and hence healthier) diet – although they might equally be spent on unhealthy or health-neutral items.
Developing a model of the health impacts of energy efficiency interventions is useful not only because it can provide evidence to help inform policy decisions, but also because it provides a framework to explore an extended set of pathways of exposure and health impact, including ones that emerge over long time horizons (as with various air quality-related impacts). The model that we have implemented is still limited to effects relating to the indoor environment, and there are many areas in which further model development would be very desirable. There will always be value in more empirical studies to underpin and validate the functional relationships used in the model. The methodological work that we undertook has helped to reduce one key area of uncertainty, namely the degree of life shortening in cold- and heat-related mortality, although only as far as to provide evidence that the degree of life shortening in cold-related deaths is unlikely to be less than 6 months or so (and hence cannot be attributed to harvesting). It still remains unclear whether or not those who die of cold have a life expectancy similar to the average among the population of their age and hence lose a corresponding number of life-years. This is the implicit assumption if the RR of cold-related death derived from time-series studies is applied to the annual hazard of mortality in life table calculations. However, the probability is that those who are vulnerable to cold-related death are vulnerable because of underlying disease processes (such as atherosclerosis), which would leave them with a shorter life expectancy than average. Thus, some correction would be appropriate in calculations of YLL, but in the absence of clear evidence of what this correction should be, we can do little better than to test results using a range of assumptions. Until there are analyses of data from large cohort studies to compare survival in populations exposed to different temperature distributions (adjusting for all other major risk factors), it is unlikely that there will be substantial further clarification of this area of uncertainty.
Our evidence with regard to heat risk was not sufficient to suggest a clear basis for quantifying heat-related health burdens associated with housing characteristics but it does suggest a need to give greater weight to this issue, both because of the potential importance of housing adaptations as a response to climate change and because in many cases energy efficiency interventions appear to exacerbate the risk of overheating. For the moment, arguably the ‘best guess’ approach to estimating the mortality risk associated with overheating in dwellings is to assume that the well-established relationships between outdoor temperature and mortality also apply to the indoor environment. 73 Thus, the temperature anomaly of one dwelling compared with the average for the region might suggest the degree to which an individual’s heat risk moves to the left or right on the (population-average) outdoor temperature–mortality function. As far as we can tell, the additional level of risk for heat-related death associated with improved energy efficiency is modest, but it may not remain so if ambient temperatures rise because of global warming. Therefore, it would be prudent to ensure that measures to limit overheating risk are built into housing improvement plans at the same time as those for improving energy efficiency.
We recognise that our modelling methods are also currently limited because they do not incorporate any quantification of the possible impacts that changes in fuel use would have on outdoor air quality (although this could be done using, for example, emission dispersion models). Neither do they explicitly consider health effects relating to climate change. However, the model can yield estimates of change in energy use and CO2 emissions that are potentially important outputs in their own right as markers of progress towards climate change mitigation targets and, in the case of the costs of energy, as a measure of action towards the alleviation of FP for disadvantaged groups. 100
Multicriterion decision analysis is a framework that can usefully allow a range of parameters (criteria) to be considered in any decision process of policy choices. This seems particularly apposite with regard to HEE, the rationale for which is driven by more than one policy objective. Recently The Lancet commissions have emphasised the increasingly urgent need to address responsibilities for global health in all facets of policy development140 and, in the case of housing policy, those responsibilities can be met at the same time as addressing important local public health objectives relating to winter mortality and energy security. Indeed, there is a commonly applicable principle that actions aimed at the transition towards a low carbon economy (which includes the improvement of the energy efficiency of the housing stock) have the potential for substantial cobenefits for health. 13,141,142 Thus, there is potential value in attempting to align policy objectives and to consider the value of policy actions not in terms of single outcomes but using multiple criteria of costs and benefits, as the MCDA process does. Policies that may not be justified in terms of the impact on a single criterion may be more persuasive when several criteria are considered, such as the potential impact that housing could have on health, health inequalities, FP, GHG emissions and energy security. The value attached to the attainment of each of those criteria, and how they might influence policy choices, can be usefully explored using the MCDA, although our experience in engaging decision-makers and other stakeholders in project workshops suggests that it is best applied as a tool for discussion and iterative exploration of options rather than as a method for arriving at a ‘single best choice’.
This alignment of policy objectives was behind our illustrative comparison of the consequences of perpetuation of WFPs compared with similar value investments in HEE improvements. This was intended not as a challenge to government policy, but simply to illustrate the possibilities of alternative strategies. In the example we presented there are reasons to favour energy efficiency investments if judged against multiple outcomes including health and contribution towards environmental sustainability. From both a health perspective and to meet climate change mitigation goals, there is a need for transformative change in the UK housing stock.
The evidence from our qualitative study provides insights on how this might be approached in terms of the factors most likely to motivate householders. Framing the issue in terms of climate change or environmental sustainability would most likely result in slow adoption of HEE upgrades. Only a small minority of householders principally frame HEE technologies in this way. However, similar to subsidised HEE, this framing has the potential to generate common goods that may be more beneficial in the long run to ensure both sustainability and equality goals. Although consumerist framings might improve short-term uptake rates, they might have significant costs in the longer term of eroding the ‘common good’ of commitment to environmental sustainability.
Study limitations
This research attempted to address questions of considerable methodological complexity relating to the multiple pathways by which HEE interventions may have an impact on health. Numerous factors make this endeavour challenging including, but not limited to, the relatively modest effect of most HEE interventions on the indoor environment, the consequent small changes in health risks at an individual level, the rarity of attributable health outcomes (e.g. mortality), the different (sometimes very long) time courses for the development of different health outcomes, the complexity of gathering data of sufficient detail to characterise the timing, type and consequences of interventions for specific dwellings or groups of dwellings, the quantification of the associated changes to human exposures, the modifying effect of variations in human behaviour and the fact that data have to be combined from different data sources with different spatial units.
The small risks and rarity of attributable outcomes was the main reasoning for a study based on data from a very large number of dwellings. A brief consideration of cold-related mortality as one of the outcomes of interest illustrates the challenge. Mortality is a rare outcome and cold-related mortality is rarer still, but our particular interest was in the potential impact that small/modest intervention-related changes have on the indoor environment as a modifier of the risk of cold-related mortality. To study this, very large data sets are needed with linkage across dwellings for which we have not only health data but also evidence on the intervention and its effect on the indoor environment.
The changes attributable to HEE interventions appear to be so small that analysis without robust exposure classification and one-to-one data linkage (rather than by small spatial units) is very unlikely to be fruitful. Unsurprisingly, data on ideal detail, specificity and precision about the dwelling and energy efficiency interventions are not available from routine sources and so exposure classification, in particular, has to be based on building physics and other models using imperfect data to predict changes. Moreover, such models predict only ‘average’ patterns and not individual-level responses, which may be modified by, for example, personal behaviours (e.g. variations in choice about home heating). Such behavioural influences may mean that intervention changes may vary appreciably from one dwelling to another, even if the dwelling characteristics and interventions are otherwise identical and this also adds complexity to model validation, as any empirical data gathered to test model predictions has to recognise such variations.
This means that there are limits to what can be tested using existing data and it places greater dependence on the evidence of models to address important research questions: models to characterise the effect of interventions on dwelling performance, models of occupant exposures, models of the associated health risks and so on. All entail assumptions and uncertainties, even when there are good empirical data, but sometimes the evidence is limited and/or indirect. To make the evidence more interpretable, we have tried to use models that are based on fairly simple clear empirical relationships, such as the relationship between HEE U-value and (population-average) SIT. As already discussed, the evidence of two completely independent data sets appears fairly consistent with regard to this relationship, which helps to strengthen inferences based on it. But it is just a model and hence is in some degree inaccurate. The evidence underpinning other important relationships is subject to similar uncertainties. We have referred already to the evidence relating to ventilation changes, which is arguably less robust than that for temperature but is clearly important for health.
Therefore, to draw inferences about the impacts that HEE measures have requires considerable care and expertise in interpreting empirical and model data, but also the putting together of an evidence jigsaw, in which the pieces come from research in different disciplinary domains (building physics, mathematical modelling, exposure science, epidemiology, etc). This makes for a complex synthesis that can be difficult to judge by someone from any one disciplinary background and difficult to present transparently to decision-makers.
Despite these many challenges, we believe that the analyses that we and others have produced do make it possible to draw defensible conclusions about the impacts that HEE interventions have and at least to define some of the important questions that need to be considered in any programme development. The evidence is not beyond doubt, but it is reasonable to conclude, for example, that, on average, individual energy efficiency interventions achieve only modest changes to winter indoor temperatures, that ventilation changes are important (and need to be further studied) and that HEE improvement represents an important (and integrated) way to help achieve multiple benefits relating to areas such as health, FP, climate change and inequalities – even if there are uncertainties about the magnitude of effects and about potential risks if programmes are not carefully designed and implemented.
For many questions about HEE impacts, model evidence is, therefore, likely to remain a core element of research, even in observational studies. This has implications for future research agendas but also for the presentation of evidence to decision-makers, because of the indirect nature of some part of such evidence and the additional uncertainties it entails. This is an aspect of the evidence that we had only limited capacity to explore in our engagements with stakeholder groups, including in the MCDA discussions.
Further research
The comments of the preceding section suggest a very large research agenda spanning multiple disciplinary areas. Without attempting a comprehensive analysis, the following as principal categories of research need are suggested:
-
Further empirical evidence on the basic relationships between dwelling characteristics, interventions, indoor environment and human exposures. This is needed to strengthen the understanding of the ‘chain of causation’ linking HEE interventions to health and especially to improve the development of models of impact.
-
Continued efforts to develop, validate and iteratively improve models that reflect those causal links through to health. Validation is always a challenge because of the data requirements, which may be costly to meet, but it is important for model credibility; for example, validation of models of ventilation and indoor air would require detailed surveys of dwelling characteristics as well as the monitoring of air exchange characteristics and pollutant levels for large samples of dwellings sufficient to test model results across a range of archetypes and occupant behaviours.
-
Monitoring of before-and-after changes in a large sample of dwellings that undergo energy efficiency interventions to strengthen the observational evidence on the consequences of those interventions. Given the scale of proposed changes to the housing stock to meet health and environmental objectives, such monitoring would seem crucial to ensure that programmes of energy efficiency upgrades are well designed and implemented and to avoid the potential risks of unintended adverse consequences.
-
Further exploration of data linkage studies between health and housing data, but recognising the importance of accurate exposure classification and high resolution linkage as a complement to primary intervention studies and trials.
-
Further participatory research with stakeholders on their evidence needs for policy development, especially in the context of uncertainties, so as to improve specific evidence provision and the form and methods of presentation of greatest value to user groups.
-
Further qualitative and quantitative research into the motivations and behaviours of householders in relation to the uptake of HEE interventions given the potential value of accelerated expansion of such measures to help achieve health, environmental (climate mitigation) and energy security goals.
In summary, this study has provided new insights into the relationship between HEE interventions, the indoor environment and health. Despite various difficulties and limitations, it has yielded important messages for policy, including the need for much larger-scale action if the full potential benefits are to be realised for reducing cold-related burdens, the need for much greater focus on the potential implications for indoor air quality, the value for decision-making of considering the impact that interventions have with regard to multiple criteria, and the potential value of framing of national policies to capitalise on the goodwill of people to contribute to actions in support of environmental sustainability.
Chapter 8 Conclusions and recommendations
-
There has been a progressive decline in the annual burden of cold-related deaths since the mid-1970s, which probably reflects the continuation of a trend of reducing winter-/cold-related mortality going back over many decades – a trend that has occurred despite the gradual rise in the proportion of people aged > 65 years who are known to be more vulnerable to the effects of low temperatures. The factors contributing to this decline are not understood in detail but are likely to include a wide range of factors associated with improving socioeconomic conditions, including improving population health and health care and more effective health protection measures.
-
There is evidence that since the introduction of WFPs in 1997 the gradient of association between winter cold and mortality is somewhat weaker than in earlier years. This is consistent with WFPs having had a beneficial effect in helping to reduce cold mortality, but interpretation must also recognise that many other potentially relevant factors have changed over a similar period. These include improvements in housing quality and winter indoor temperatures, and advances in the clinical management and prevention of disease, especially ‘temperature-sensitive’ diseases such as ischaemic heart disease, whose rates have declined rapidly in recent years. Therefore, it is not possible to conclude with certainty that the contribution of WFPs to the cost of heating the home has been the primary, or indeed even a contributory, factor in this decline, although it seems likely that it has had at least some moderate benefit for health and well-being, particularly for families in FP. There is also evidence that years with higher than average domestic fuel prices have shown a somewhat stronger relationship between low outdoor temperatures and mortality than years of below-average fuel prices, a result compatible with high fuel prices having a negative impact with regard to cold-related deaths.
-
HEE measures installed across the English housing stock during the first decade of this century have had a relatively modest impact in improving the indoor environment, specifically with respect to winter indoor temperatures and air quality. The small gains in winter temperatures (estimated to be around 0.1 °C) arise because most of the energy efficiency interventions have been relatively modest and because of the shape of the empirical relationship between energy efficiency and indoor temperature (as reflected by the SIT). This relationship suggests a relatively shallow increase in SIT as energy efficiency is improved and, importantly, a plateau effect at around 300 watts/K E-value, a value that is close to the average energy efficiency of the English stock. Further improvement of energy efficiency beyond this point appears to result in little or no change in average winter indoor temperatures and hence, on average, in little or no reduction in exposure to cold in the home.
-
As a consequence of the small average improvements in indoor temperatures from energy efficiency interventions, the impact that has been had on reducing the burden of cold-related deaths appears to be correspondingly limited. Our best estimate is a reduction of around 300 cold-related deaths per year attributable to the energy efficiency improvements installed between 2002 and 2007. This figure is broadly consistent with our own and other published evidence on the change in annual burden of cold-related deaths based on seasonal or daily time-series analyses of mortality data over the longer term.
-
Energy efficiency-related changes in the ventilation characteristics of dwellings may be more important for health risks than the direct effect of temperature. The actual changes in indoor air quality resulting from typical energy efficiency interventions in the English stock cannot be defined with precision because of the lack of direct empirical data. Nonetheless, building physics models of expected changes in ventilation characteristics associated with such interventions suggest that the impacts had on health could be positive or negative and potentially greater, by as much as an order of magnitude, than those related to the improvement in indoor temperatures. The balance of harms and benefits from ventilation changes (protection against the ingress of pollution, especially PM2.5 from the outdoor environment and potential increase of pollutants, including PM2.5, radon and STS of indoor origin) depend on many assumptions and vary by area, dwelling type and occupants. Ventilation can be controlled with appropriate design, implementation and maintenance of control measures (including, for some, mechanical ventilation with heat recovery), but in formulating policies it would be prudent to assume substantial failure/suboptimal operation as the norm.
-
Although heat is currently less important than cold, there is evidence that energy efficiency characteristics of dwellings determine indoor temperatures during hot weather and may, thus, affect heat risks to health. This may become increasingly important to take into account, particularly in the context of rising global temperatures with climate change. For many homes, energy efficiency improvement appears to act to increase indoor temperatures during hot weather.
-
Energy efficiency retrofits, although not clearly loft insulation or double glazing, result in observable reductions in space-heating energy demand (with resultant cost savings for the householders). On average, the presence of an installed dwelling fabric energy efficiency retrofit is associated with a reduction of 790 kWh/year in gas energy use, or a 3.9% reduction from the stock mean gas demand in 2006, and the presence of a heating energy efficiency retrofit is associated with a reduction of 1950 kWh/year (10.4% reduction). These savings are part of the gain from energy efficiency measures that are taken instead of increases in temperature. These savings may have indirect (but unquantified) benefits for the health of householders, especially those on low incomes, because of the improvement to disposable income.
-
Evaluating the full range of impacts of HEE interventions on health necessarily involves some element of health modelling, given the relatively modest impact that most forms of intervention have and the need to take into account the long-time course for their evolution, such as changes in the risk of radon-related lung cancer and the progression of cardiopulmonary diseases related to changes in long-term exposure to indoor pollutants. Modelling methods now allow the estimation of most such impacts, both physical and mental, relating to changes to the indoor environment (including impacts relating to cold and heat risks and those of a range of air pollutants and mould risk) and would be useful to guide policy development. An example assessment suggests that HEE improvements of similar annualised cost to current WFPs achieve greater improvements in health and that they reduce, rather than increase, CO2 emissions. Replacing policies that incentivise additional fuel consumption for home heating with a rapid full-scale programme of energy efficiency could help transform the UK stock, which is important for health and essential for climate change mitigation, without substantial financial burdens to government.
-
The MCDA provides a useful framework for comparing policy options relating to HEE programmes using a suite of criteria, which potentially includes health, health inequalities, environmental and cost parameters. Critical to any such assessment is the transparency and robustness of evidence relating in particular to impacts that result from changes in ventilation characteristics. The use of the MCDA is most helpful as a tool for iteratively explorating the reasons that stakeholders support specific policy choices, rather than as a method to identify optimal choices based on predefined criteria.
-
Much larger-scale changes are required to the housing stock in England if the full potential benefits for improving health and for reaching increasingly important climate change mitigation targets are to be realised. This will require efforts to dovetail national and local policy objectives with those of householders. Householders consider HEE technologies as subsidiary artefacts within broader framings of home improvement, home maintenance, subsidised public goods and environmental sustainability. Promoting the first two framings might foster installation rates in the short term but this puts at risk the relational, common goods engendered by the last two framings.
-
Given the relevance of housing to several key strategic objectives (winter- and cold-related mortality/morbidity, climate change mitigation, energy security), it would be prudent to seek the greater integration of policy development across all relevant policy domains. This may be important not only for efficiency of actions, but also to ensure that specific policy initiatives are aligned towards the same strategic goals and do not, in part, act against each other.
-
There remain important areas of uncertainty with regard to the impact that housing and housing improvement has on health, particularly with respect to cold-related illness. These uncertainties, in part, reflect the complexity of the causal linkages and the methodological challenges of bringing together data and research methods from across different sources and disciplinary domains. There is a need to strengthen empirical evidence on basic relationships between dwelling characteristics, interventions, the indoor environment and human exposures, to improve models of exposure and impact, and to explore record linkage and primary intervention studies. Although many research questions remain, a key uncertainty that has potentially very important bearing on health is the impact that HEE changes have on the ventilation characteristics of dwellings, which could have either positive or negative effects depending on context and the specific forms of intervention. This is an area that merits further research as a matter of priority given the scale of housing improvements planned for the coming decades. Specifically, there is need for further empirical research to understand the impact that energy efficiency interventions have on indoor air quality, and the consequences for health. Such research should include a large-scale programme of monitoring to record changes to the indoor environment following the installation of routine energy efficiency measures. This would provide a very important input to help improve current health impact models of HEE interventions as a guide for policy development.
Acknowledgements
Contributions of authors
Ben Armstrong (co-investigator, Professor of Statistics, LSHTM) supervised the epidemiological analyses.
Oliver Bonnington (Research Fellow in Sociology, LSHTM) carried out the qualitative study.
Zaid Chalabi (Associate Professor in Mathematical Modelling, LSHTM) led work on the MCDA framework.
Michael Davies [Professor of Building Physics and the Environment, University College London (UCL)] supervised the analyses and modelling of the built environments.
Yvonne Doyle (Regional Director, Public Health England) advised on implications for public health policy.
James Goodwin (co-investigator, Visiting Professor James Goodwin, Loughborough University and Chief Scientist, Age UK) advised on design and policy implications and liaison with Age UK.
Judith Green (Professor of Sociology of Health, LSHTM) supervised the qualitative study and co-ordinated engagement activities through Age UK.
Shakoor Hajat (Associate Professor in Epidemiology and Medical Statistics, LSHTM) supervised the epidemiological analyses.
Ian Hamilton (Lecturer, UCL Energy Institute) carried out analyses and modelling of the built environment for HEED energy use data and development of the health impact model.
Emma Hutchinson (Assistant Professor in Environmental Epidemiology, LSHTM) undertook epidemiological analyses and supported work on the MCDA framework.
Anna Mavrogianni (Lecturer, UCL Institute of Environmental Design and Engineering) undertook epidemiological analyses, specifically leading the analyses for the modification of heat-related mortality and carried out analyses and modelling of the built environment for simulations of dwelling overheating.
James Milner (Assistant Professor, LSHTM) undertook epidemiological analyses.
Ai Milojevic (Assistant Professor in Epidemiology, LSHTM) undertook epidemiological analyses of mortality in relation to indoor tempreture.
Roberto Picetti (Research Assistant, LSHTM) undertook epidemiological analyses.
Nirandeep Rehill (LSHTM and London Kent Surrey & Sussex Public Health Training Programme, London) undertook epidemiological analyses, specifically leading the analyses on life shortening in cold death.
Christophe Sarran (co-investigator, Health Research Scientist, Met Office) led work on meteorological data.
Clive Shrubsole (Research Associate, UCL Institute of Environmental Design and Engineering) carried out analyses and modelling of the built environment for impact modelling.
Phil Symonds (Research Associate, UCL Institute of Environmental Design and Engineering) carried out analyses and modelling of the built environment for impact modelling.
Jonathon Taylor (Senior Research Associate, UCL Institute of Environmental Design and Engineering) carried out analyses and modelling of the built environment for simulations of dwelling overheating.
Paul Wilkinson (Principal Investigator and Professor of Environmental Epidemiology, LSHTM) co-ordinated the project and report, supervised the epidemiological analyses.
All authors contributed to the study design or writing of the text or provided editorial comments.
Publications
Bonnington O. The indispensability of reflexivity to practice: the case of home energy efficiency. J Crit Realism 2015;14:461–84.
Rehill N, Armstrong B, Wilkinson P. Clarifying life lost due to cold and heat: a new approach using annual time series. BMJ Open 2015;5:e005640.
Hamilton IG, Summerfield AJ, Shipworth D, Steadman P, Oreszczyn T, Lowe RJ. Energy efficiency uptake and energy savings in English houses: a cohort study. Energy Buildings 2016;118:259–76.
Data-sharing statement
All data requests should be submitted to the corresponding author for consideration. Access to available anonymised data may be granted following review.
Patient data
This work uses data provided by patients and collected by the NHS as part of their care and support. Using patient data is vital to improve health and care for everyone. There is huge potential to make better use of information from people’s patient records, to understand more about disease, develop new treatments, monitor safety, and plan NHS services. Patient data should be kept safe and secure, to protect everyone’s privacy, and it’s important that there are safeguards to make sure that it is stored and used responsibly. Everyone should be able to find out about how patient data are used. #datasaveslives You can find out more about the background to this citation here: https://understandingpatientdata.org.uk/data-citation.
Disclaimers
This report presents independent research funded by the National Institute for Health Research (NIHR). The views and opinions expressed by authors in this publication are those of the authors and do not necessarily reflect those of the NHS, the NIHR, NETSCC, the PHR programme or the Department of Health and Social Care. If there are verbatim quotations included in this publication the views and opinions expressed by the interviewees are those of the interviewees and do not necessarily reflect those of the authors, those of the NHS, the NIHR, NETSCC, the PHR programme or the Department of Health and Social Care.
References
- Hajat S, Chalabi Z, Wilkinson P, Erens B, Jones L, Mays N. Public health vulnerability to wintertime weather: time-series regression and episode analyses of national mortality and morbidity databases to inform the Cold Weather Plan for England. Public Health 2016;137:26-34. https://doi.org/10.1016/j.puhe.2015.12.015.
- Analitis A, Katsouyanni K, Biggeri A, Baccini M, Forsberg B, Bisanti L, et al. Effects of cold weather on mortality: results from 15 European cities within the PHEWE project. Am J Epidemiol 2008;168:1397-408. https://doi.org/10.1093/aje/kwn266.
- Gasparrini A, Guo Y, Hashizume M, Lavigne E, Zanobetti A, Schwartz J, et al. Mortality risk attributable to high and low ambient temperature: a multicountry observational study. Lancet 2015;386:369-75. https://doi.org/10.1016/S0140-6736(14)62114-0.
- Wilkinson P, Pattenden S, Armstrong B, Fletcher A, Kovats RS, Mangtani P, et al. Vulnerability to winter mortality in elderly people in Britain: population based study. BMJ 2004;329. https://doi.org/10.1136/bmj.38167.589907.55.
- Hajat S, Kovats RS, Lachowycz K. Heat-related and cold-related deaths in England and Wales: who is at risk?. Occup Environ Med 2007;64:93-100. https://doi.org/10.1136/oem.2006.029017.
- Wilkinson P, Landon M, Armstrong B, Stevenson S, McKee M, Fletcher T. Cold Comfort: The Social and Environmental Determinants of Excess Winter Death in England, 1986–1996. York: Joseph Rowntree Foundation; 2001.
- Jackson G, Thornley S, Woolston J, Papa D, Bernacchi A, Moore T. Reduced acute hospitalisation with the healthy housing programme. J Epidemiol Community Health 2011;65:588-93. https://doi.org/10.1136/jech.2009.107441.
- Milner J, Chalibi Z, Armstrong B, Das P, Davies M, Eggen B, et al. Evidence Review and Economic Analysis of Excess Winter Deaths. Review 1. Factors Determining Vulnerability to Winter-and Cold-related Mortality/Morbidity. London: National Institute for Health and Care Excellence; 2015.
- Milner J, Chalibi Z, Armstrong B, Das P, Davies M, Eggen B, et al. Evidence Review and Economic Analysis of Excess Winter Deaths. Review 2. Interventions and Economic Studies. London: National Institute for Health and Care Excellence; 2015.
- Osman LM, Ayres JG, Garden C, Reglitz K, Lyon J, Douglas JG. Home warmth and health status of COPD patients. Eur J Public Health 2008;18:399-405. https://doi.org/10.1093/eurpub/ckn015.
- Osman LM, Ayres JG, Garden C, Reglitz K, Lyon J, Douglas JG. A randomised trial of home energy efficiency improvement in the homes of elderly COPD patients. Eur Respir J 2010;35:303-9. https://doi.org/10.1183/09031936.00187708.
- Climate Change Act 2008. London: The Stationery Office; 2008.
- Wilkinson P, Smith KR, Davies M, Adair H, Armstrong BG, Barrett M, et al. Public health benefits of strategies to reduce greenhouse-gas emissions: household energy. Lancet 2009;374:1917-29. https://doi.org/10.1016/S0140-6736(09)61713-X.
- Homes Energy Efficiency Database (HEED) – DECC Data Frameworks Residential Pilot: Final Report to Department of Energy & Climate Change. London: Energy Saving Trust; 2009.
- ONS . Excess Winter Mortality in England and Wales: 2015 16 (Provisional) and 2014 15 (Final). Increased Deaths During Winter Months by Sex, Age, Region and Cause, Including Figures on Temperature and Influenza 2016. www.ons.gov.uk/peoplepopulationandcommunity/birthsdeathsandmarriages/deaths/bulletins/excesswintermortalityinenglandandwales/201415provisionaland201314final (accessed 3 July 2017).
- Carson C, Hajat S, Armstrong B, Wilkinson P. Declining vulnerability to temperature-related mortality in London over the 20th century. Am J Epidemiol 2006;164:77-84. https://doi.org/10.1093/aje/kwj147.
- DECC . United Kingdom Housing Energy Fact File 2013 2014. www.gov.uk/government/statistics/united-kingdom-housing-energy-fact-file-2013 (accessed 16 September 2016).
- Kennedy S, Parkin E. Winter Fuel Payments Update. London: House of Commons Library; 2016.
- Bhaskaran K, Hajat S, Haines A, Herrett E, Wilkinson P, Smeeth L. Short term effects of temperature on risk of myocardial infarction in England and Wales: time series regression analysis of the Myocardial Ischaemia National Audit Project (MINAP) registry. BMJ 2010;341. https://doi.org/10.1136/bmj.c3823.
- Bhaskaran K, Gasparrini A, Hajat S, Smeeth L, Armstrong B. Time series regression studies in environmental epidemiology. Int J Epidemiol 2013;42:1187-95. https://doi.org/10.1093/ije/dyt092.
- Iparraguirre J. Have winter fuel payments reduced excess winter mortality in England and Wales?. J Public Health (Oxf) 2015;37:26-33. https://doi.org/10.1093/pubmed/fdu063.
- Cold Weather Plan for England. London: Public Health England; 2015.
- HEED Online 2 – Full Technical Guide 2.0. London: Energy Saving Trust; 2011.
- Hamilton IG, Shipworth D, Summerfield AJ, Steadman P, Oreszczyn R, Lowe R. Uptake of energy efficiency interventions in English dwellings. BRI 2014;42:255-75. https://doi.org/10.1080/09613218.2014.867643.
- Hamilton IG, Summerfield AJ, Shipworth D, Steadman JP, Oreszczyn T, Lowe RJ. Energy efficiency uptake and energy savings in English houses: a cohort study. Energy Build 2016;118:259-76. https://doi.org/10.1016/j.enbuild.2016.02.024.
- Hamilton I, Davies M, Ridley I, Oreszczyn T, Barrett M, Lowe R, et al. The impact of housing energy efficiency improvements on reduced exposure to cold – the ‘temperature take back factor’. Build Serv Eng Res Technol 2011;32:85-98. https://doi.org/10.1177/0143624410394532.
- Oreszczyn T, Hong SH, Ridley I, Wilkinson P. Determinants of winter indoor temperatures in low income households in England. Energy Build 2006;38. https://doi.org/10.1016/j.enbuild.2005.06.006.
- Vadodaria K, Loveday DL, Haines V. Measured winter and spring-time indoor temperatures in UK homes over the period 1969–2010: a review and synthesis. Energy Policy 2014;64:252-62. https://doi.org/10.1016/j.enpol.2013.07.062.
- Hong SH, Gilbertson JM, Oreszczyn T, Green G, Ridley I. A field study of thermal comfort in low income dwellings in England before and after energy efficient refurbishment. Build Environ 2009;44:1228-36. https://doi.org/10.1016/j.buildenv.2008.09.003.
- The Energy Follow-Up Survey (2011): Summary of Findings. London: DECC; 2013.
- Hamilton I, Milner J, Chalabi Z, Davies M, Wilkinson P. Quantifying Comfort and Monetizing the Health Impact of Household Energy Efficiency Improvements. The HI-DEEM (Health Impact of Domestic Energy Efficiency Measures) Model. London: DECC; 2011.
- Hamilton I, Milner J, Chalabi Z, Das P, Jones B, Shrubsole C, et al. Health effects of home energy efficiency interventions in England: a modelling study. BMJ Open 2015;5. https://doi.org/10.1136/bmjopen-2014-007298.
- Emmerich S. Validation of multizone IAQ modeling of residential-scale buildings: a review. ASHRAE Trans 2001;107.
- The Government’s Standard Assessment Procedure (SAP) for Energy Rating of Dwellings. Garston: BRE; 2012.
- Joint Office of Gas Transporters . Uniform Network Code – Transportation Principal Document Section H – Demand Estimation and Demand Forecasting n.d. www.gasgovernance.co.uk/tpd (accessed 24 September 2018).
- English Housing Survey Technical Advice Note. Survey Overview and Methodology: 2011–12 Update. London: Ministry for Housing, Communities and Local Government; 2013.
- Lee PN, Forey BA. Environmental tobacco smoke exposure and risk of stroke in nonsmokers: a review with meta-analysis. J Stroke Cerebrovasc Dis 2006;15:190-201. https://doi.org/10.1016/j.jstrokecerebrovasdis.2006.05.002.
- Law MR, Morris JK, Wald NJ. Environmental tobacco smoke exposure and ischaemic heart disease: an evaluation of the evidence. BMJ 1997;315:973-80. https://doi.org/10.1136/bmj.315.7114.973.
- Pope CA, Burnett RT, Thun MJ, Calle EE, Krewski D, Ito K, et al. Lung cancer, cardiopulmonary mortality, and long-term exposure to fine particulate air pollution. JAMA 2002;287:1132-41. https://doi.org/10.1001/jama.287.9.1132.
- Krewski D, Burnett R, Jerrett M, Pope CA, Rainham D, Calle E, et al. Mortality and long-term exposure to ambient air pollution: ongoing analyses based on the American Cancer Society cohort. J Toxicol Environ Health Part A 2005;68:1093-109. https://doi.org/10.1080/15287390590935941.
- Darby S, Hill D, Auvinen A, Barros-Dios JM, Baysson H, Bochicchio F, et al. Radon in homes and risk of lung cancer: collaborative analysis of individual data from 13 European case-control studies. BMJ 2005;330. https://doi.org/10.1136/bmj.38308.477650.63.
- Howden-Chapman P, Matheson A, Crane J, Viggers H, Cunningham M, Blakely T, et al. Effect of insulating existing houses on health inequality: cluster randomised study in the community. BMJ 2007;334. https://doi.org/10.1136/bmj.39070.573032.80.
- Gilbertson J, Grimsley M, Green G. Psychosocial routes from housing investment to health: evidence from England’s home energy efficiency scheme. Energy Policy 2012;49:122-33. https://doi.org/10.1016/j.enpol.2012.01.053.
- Fisk WJ, Lei-Gomez Q, Mendell MJ. Meta-analyses of the associations of respiratory health effects with dampness and mold in homes. Indoor Air 2007;17:284-96. https://doi.org/10.1111/j.1600-0668.2007.00475.x.
- Miller BG, Hurley JF. Life table methods for quantitative impact assessments in chronic mortality. J Epidemiol Community Health 2003;57:200-6. https://doi.org/10.1136/jech.57.3.200.
- Hong SH, Oreszczyn T, Ridley I. The impact of energy efficient refurbishment on the space heating fuel consumption in English dwellings. Energy Build 2006;38:1171-81. https://doi.org/10.1016/j.enbuild.2006.01.007.
- English Housing Survey, 2010: Housing Stock Data. London: Her Majesty’s Stationery Office; 2013.
- Meier H, Rehdanz K. Determinants of residential space heating expenditures in Great Britain. Energy Econ 2010;32:949-59. https://doi.org/10.1016/j.eneco.2009.11.008.
- Rehill N, Armstrong B, Wilkinson P. Clarifying life lost due to cold and heat: a new approach using annual time series. BMJ Open 2015;5. https://doi.org/10.1136/bmjopen-2014-005640.
- Basu R, Samet JM. Relation between elevated ambient temperature and mortality: a review of the epidemiologic evidence. Epidemiol Rev 2002;24:190-202. https://doi.org/10.1093/epirev/mxf007.
- Basu R. High ambient temperature and mortality: a review of epidemiologic studies from 2001 to 2008. Environ Health 2009;8. https://doi.org/10.1186/1476-069X-8-40.
- Yu W, Mengersen K, Wang X, Ye X, Guo Y, Pan X, et al. Daily average temperature and mortality among the elderly: a meta-analysis and systematic review of epidemiological evidence. Int J Biometeorol 2012;56:569-81. https://doi.org/10.1007/s00484-011-0497-3.
- 2009 Annual Report of the Chief Medical Officer. London: Department of Health and Social Care; 2010.
- Heatwave Plan for England 2013 – Making the Case: the Impact of Heat on Health – Now and in the Future. London: Public Health England; 2013.
- Zanobetti A, Schwartz J. Mortality displacement in the association of ozone with mortality: an analysis of 48 cities in the United States. Am J Respir Crit Care Med 2008;177:184-9. https://doi.org/10.1164/rccm.200706-823OC.
- Braga AL, Zanobetti A, Schwartz J. The time course of weather-related deaths. Epidemiology 2001;12:662-7. https://doi.org/10.1097/00001648-200111000-00014.
- Pattenden S, Nikiforov B, Armstrong BG. Mortality and temperature in Sofia and London. J Epidemiol Community Health 2003;57:628-33. https://doi.org/10.1136/jech.57.8.628.
- Rey G, Jougla E, Fouillet A, Pavillon G, Bessemoulin P, Frayssinet P, et al. The impact of major heat waves on all-cause and cause-specific mortality in France from 1971 to 2003. Int Arch Occup Environ Health 2007;80:615-26. https://doi.org/10.1007/s00420-007-0173-4.
- Baccini M, Biggeri A, Accetta G, Kosatsky T, Katsouyanni K, Analitis A, et al. Heat effects on mortality in 15 European cities. Epidemiology 2008;19:711-19. https://doi.org/10.1097/EDE.0b013e318176bfcd.
- Toulemon L, Barbieri M. The mortality impact of the August 2003 heat wave in France: investigating the ‘harvesting’ effect and other long-term consequences. Popul Stud 2008;62:39-53. https://doi.org/10.1080/00324720701804249.
- Schwartz J. Harvesting and long term exposure effects in the relation between air pollution and mortality. Am J Epidemiol 2000;151:440-8. https://doi.org/10.1093/oxfordjournals.aje.a010228.
- Rocklov J, Forsberg B, Meister K. Winter mortality modifies the heat-mortality association the following summer. Eur Respir J 2009;33:245-51. https://doi.org/10.1183/09031936.00037808.
- Stafoggia M, Forastiere F, Michelozzi P, Perucci CA. Summer temperature-related mortality: effect modification by previous winter mortality. Epidemiology 2009;20:575-83. https://doi.org/10.1097/EDE.0b013e31819ecdf0.
- The Registrar General’s Weekly Returns for England and Wales. London: HMSO; 1976.
- Armstrong BG, Chalabi Z, Fenn B, Hajat S, Kovats S, Milojevic A, et al. Association of mortality with high temperatures in a temperate climate: England and Wales. J Epidemiol Community Health 2011;65:340-5. https://doi.org/10.1136/jech.2009.093161.
- Hajat S, Kovats RS, Atkinson RW, Haines A. Impact of hot temperatures on death in London: a time series approach. J Epidemiol Community Health 2002;56:367-72. https://doi.org/10.1136/jech.56.5.367.
- International Classification of Diseases 10. Geneva: WHO; 2016.
- Zanobetti A, O’Neill MS, Gronlund CJ, Schwartz JD. Summer temperature variability and long-term survival among elderly people with chronic disease. Proc Natl Acad Sci USA 2012;109:6608-13. https://doi.org/10.1073/pnas.1113070109.
- The Eurowinter group . Cold exposure and winter mortality from ischaemic heart disease, cerebrovascular disease, respiratory disease, and all causes in warm and cold regions of Europe. Lancet 1997;349:1341-6. https://doi.org/10.1016/S0140-6736(96)12338-2.
- Hajat S, Armstrong B, Baccini M, Biggeri A, Bisanti L, Russo A, et al. Impact of high temperatures on mortality: is there an added heat wave effect?. Epidemiology 2006;17:632-8. https://doi.org/10.1097/01.ede.0000239688.70829.63.
- Kunst AE, Looman CW, Mackenbach JP. Outdoor air temperature and mortality in the Netherlands: a time-series analysis. Am J Epidemiol 1993;137:331-41. https://doi.org/10.1093/oxfordjournals.aje.a116680.
- Anderson BG, Bell ML. Weather-related mortality: how heat, cold, and heat waves affect mortality in the United States. Epidemiology 2009;20:205-13. https://doi.org/10.1097/EDE.0b013e318190ee08.
- Taylor J, Wilkinson P, Davies M, Armstrong B, Chalabi Z, Mavrogianni A, et al. Mapping the effects of urban heat island, housing, and age on excess heat-related mortality in London. Urban Health 2015;14:517-28. https://doi.org/10.1016/j.uclim.2015.08.001.
- Milojevic A, Armstrong BG, Gasparrini A, Bohnenstengel SI, Barratt B, Wilkinson P. Methods to estimate acclimatization to urban heat island effects on heat- and cold-related mortality. Environ Health Perspect 2016;124:1016-22. https://doi.org/10.1289/ehp.1510109.
- Costello A, Abbas M, Allen A, Ball S, Bell S, Bellamy R, et al. Managing the health effects of climate change: Lancet and University College London Institute for Global Health Commission. Lancet 2009;373:1693-733. https://doi.org/10.1016/S0140-6736(09)60935-1.
- Meeting Carbon Budgets – The Need for a Step Change. London: Committee on Climate Change; 2009.
- Milner J, Shrubsole C, Das P, Jones B, Ridley I, Chalabi Z, et al. Home energy efficiency and radon related risk of lung cancer: modelling study. BMJ 2014;348. https://doi.org/10.1136/bmj.f7493.
- Department for Business Enterprise Investment Scheme . Quarterly Energy Prices n.d. www.gov.uk/government/collections/quarterly-energy-prices (accessed 7 October 2016).
- English Housing Survey: Homes. Annual Report on England’s Housing Stock, 2010. London: Ministry for Housing, Communities and Local Government; 2012.
- Milner J, Hamilton I, Chalabi Z, Cairns J, Das P, Davies M, et al. Evidence Reviews and Economic Modelling of Excess Winter Death. Economic Modelling Report. London: National Institute for Health and Care Excellence; 2014.
- Beatty TKM, Blow L, Crossley TF, O’Dea C. Cash by any Other Name? Evidence on Labelling from the UK Winter Fuel Payment. London: Institute of Fiscal Studies; 2011.
- Ministry for Housing, Communities and Local Government . Energy Efficiency in Buildings n.d. www.gov.uk/government/policies/energy-efficiency-in-buildings (accessed 20 October 2017).
- Maidment CD, Jones CR, Webb TL, Hathway EA, Gilbertson JM. The impact of household energy efficiency measures on health: a meta-analysis. Energy Policy 2014;65:583-93. https://doi.org/10.1016/j.enpol.2013.10.054.
- Thomson H, Thomas S, Sellstrom E, Petticrew M. Housing improvements for health and associated socio-economic outcomes. Cochrane Database Syst Rev 2013;2. https://doi.org/10.1002/14651858.CD008657.pub2.
- Cunich M, Salkeld G, Dowie J, Henderson J, Bayram C, Britt H, et al. Integrating evidence and individual preferences using a web-based multi-criteria decision analytic tool: an application to prostate cancer screening. Patient 2011;4:153-62. https://doi.org/10.2165/11587070-000000000-00000.
- Dowie J, Kaltoft M, Salkfield G, Cunich M. Towards generic online multicriteria decision support in patient-centred health care. Health Expect 2015;18:689-702. https://doi.org/10.111/hex.12111.
- Stafford B. The social cost of cold homes in an English city: developing a transferable policy tool. J Public Health 2015;37:251-7. https://doi.org/10.1093/pubmed/fdu053.
- Bone A, Murray V, Myers I, Dengel A, Crump D. Will drivers for home energy efficiency harm occupant health?. Perspect Public Health 2010;130:233-8. https://doi.org/10.1177/1757913910369092.
- Green Book Supplementary Guidance: Multi-Criteria Decision Analysis. London: HM Treasury; 2013.
- Mayrhofer JP, Gupta J. The science and politics of co-benefits in climate policy. Environ Sci Pol 2016;57:22-30. https://doi.org/10.1016/j.envsci.2015.11.005.
- Marmot M. Health Impacts of Cold Homes and Fuel Poverty. London: Friends of the Earth and the Marmot Review Team; 2011.
- Cold Weather Plan for England: Protecting Health and Reducing Harm from Severe Cold Weather. London: Department of Health and Social Care; 2011.
- Trigger Points: A Convenient Truth: Promoting Energy Efficiency in the Home. London: Energy Saving Trust; 2015.
- Leach M, Scoones I, Stirling A. Governing epidemics in an age of complexity: narratives, politics and pathways to sustainability. Glob Environ Change 2010;20:369-77. https://doi.org/10.1016/j.gloenvcha.2009.11.008.
- Rosenow J. Energy savings obligations in the UK – a history of change. Energy Policy 2012;49:373-82. https://doi.org/10.1016/j.enpol.2012.06.052.
- Mallaburn PS, Eyre N. Lessons from energy efficiency policy and programmes in the UK from 1973 to 2013. Energy Efficiency 2014;7:23-41. https://doi.org/10.1007/s12053-013-9197-7.
- Caldwell J, McGowan S, McPhail J, McRae C, Morris G, Murray K, et al. Glasgow Warm Homes Study: Final Report. Glasgow: Glasgow City Council Housing Services; 2001.
- Boardman B. Fixing Fuel Poverty: Challenges and Solutions. London: Routledge; 2013.
- Warm Homes and Energy Conservation Act 2000. London: The Stationery Office; 2000.
- Hills J. Getting the Measure of Fuel Poverty. Final Report of the Fuel Poverty Review. CASE report 72. London: LSE Centre for Analysis of Social Exclusion; 2012.
- Rosenow J. Different Path of Change: Home Energy Efficiency Policy in Britain and Germany. Stockholm: European Council for an Energy Efficient Economy; 2011.
- Annual Report on Fuel Poverty Statistics 2013. London: DECC; 2013.
- Our Energy Future – Creating a Low Carbon Economy. London: The Stationery Office; 2003.
- Wilson C, Crane L, Chryssochoidis G. Why do homeowners renovate energy efficiently? Contrasting perspectives and implications for policy. Energy Res Soc Sci 2015;7:12-2. https://doi.org/10.1016/j.erss.2015.03.002.
- Vassileva I, Campillo J. Increasing energy efficiency in low-income households through targeting awareness and behavioral change. Renewable Energy 2014;67:59-63. https://doi.org/10.1016/j.renene.2013.11.046.
- Energy Act 2011. London: The Stationery Office; 2011.
- Green Deal and Energy Company Obligation. London: National Audit Office; 2016.
- The UK’s National Energy Efficiency Action Plan and Building Renovation Strategy. London: DECC; 2014.
- Donati P. Relational Sociology: A New Paradigm for the Social Sciences. Oxford: Routledge; 2010.
- Liddell C, Morris C. Fuel poverty and human health: a review of recent evidence. Energy Policy 2010;38:2987-97. https://doi.org/10.1016/j.enpol.2010.01.037.
- Thomson H, Morrison D, Petticrew M. The health impacts of housing-led regeneration: a prospective controlled study. J Epidemiol Community Health 2007;61:211-14. https://doi.org/10.1136/jech.2006.049239.
- Thomson H, Thomas S. Developing empirically supported theories of change for housing investment and health. Soc Sci Med 2015;124:205-14. https://doi.org/10.1016/j.socscimed.2014.11.043.
- Harrington BE, Heyman B, Merleau-Ponty N, Stockton H, Ritchie N, Heyman A. Keeping warm and staying well: findings from the qualitative arm of the Warm Homes Project. Health Soc Care Community 2005;13:259-67. https://doi.org/10.1111/j.1365-2524.2005.00558.x.
- Gilbertson J, Stevens M, Stiell B, Thorogood N. Warm Front Study Group . Home is where the hearth is: grant recipients’ views of England’s home energy efficiency scheme (Warm Front). Soc Sci Med 2006;63:946-56. https://doi.org/10.1016/j.socscimed.2006.02.021.
- Basham M, Shaw S, Barton A, Torbay H. Central Heating: Uncovering the Impact on Social Relationships and Household Management. Exeter: Peninsula Medical School at the Universities of Exeter and Plymouth; 2004.
- Shortt N, Rugkåsa J. ‘The walls were so damp and cold’ fuel poverty and ill health in Northern Ireland: results from a housing intervention. Health Place 2007;13:99-110. https://doi.org/10.1016/j.healthplace.2005.10.004.
- Thomson H, Thomas S, Sellstrom E, Petticrew M. The health impacts of housing improvement: a systematic review of intervention studies from 1887 to 2007. Am J Public Health 2009;99:681-92. https://doi.org/10.2105/AJPH.2008.143909.
- Howden-Chapman P, Crane J, Chapman R, Fougere G. Improving health and energy efficiency through community-based housing interventions. Int J Public Health 2011;56:583-8. https://doi.org/10.1007/s00038-011-0287-z.
- Day R, Hitchings R. Older People and Their Winter Warmth Behaviours: Understanding the Contextual Dynamics. London: Nuffield Foundation; 2009.
- Critchley R, Gilbertson J, Grimsley M, Green G. Living in cold homes after heating improvements: evidence from Warm Front, England’s home energy efficiency scheme. Applied Energy 2007;84:147-58. https://doi.org/10.1016/j.apenergy.2006.06.001.
- Stiess BK, Dunkelberg E. Objectives, barriers and occasions for energy efficient refurbishment by private homeowners. J Clean Prod 2013;48:250-9. https://doi.org/10.1016/j.jclepro.2012.09.041.
- Nair G, Gustavsson L, Mahapatra K. Factors influencing energy efficiency investments in existing Swedish residential buildings. Energy Policy 2010;38:2956-63. https://doi.org/10.1016/j.enpol.2010.01.033.
- Winther T, Ericson T. Matching policy and people? Household responses to the promotion of renewable electricity. Energy Efficiency 2013;6:369-85. https://doi.org/10.1007/s12053-012-9170-x.
- Hobson K. Competing discourses of sustainable consumption: Does the ’rationalisation of lifestyles’ make sense?. Environ Politics 2002;11:95-120. https://doi.org/10.1080/714000601.
- Pelenur MJ, Cruickshank HJ. Closing the energy efficiency gap: a study linking demographics with barriers to adopting energy efficiency measures in the home. Energy 2012;47:348-57. https://doi.org/10.1016/j.energy.2012.09.058.
- Caird S, Roy R, Herring H. Improving the energy performance of UK households. Results from surveys of consumer adoption and use of low- and zero-carbon technologies. Energy Efficiency 2008;1:149-66. https://doi.org/10.1007/s12053-008-9013-y.
- Hope AJ, Booth A. Attitudes and behaviours of private sector landlords towards the energy efficiency of tenanted homes. Energy Policy 2014;75:369-78. https://doi.org/10.1016/j.enpol.2014.09.018.
- Phillips Y. Landlords versus tenants: information asymmetry and mismatch preferences for home energy efficiency. Energy Policy 2012;45:112-21. https://doi.org/10.1016/j.enpol.2012.01.067.
- Darby S. Social learning and public policy: lessons from an energy-conscious village. Energy Policy 2006;34:2929-40. https://doi.org/10.1016/j.enpol.2005.04.013.
- Balcombe P, Rigby D, Azapagic A. Investigating the importance of motivations and barriers related to microgeneration uptake in the UK. Applied Energy 2014;130:403-18. https://doi.org/10.1016/j.apenergy.2014.05.047.
- Shove E, Pantzar M, Watson M. The Dynamics of Social Practice: Everyday Life and How it Changes. London: Sage; 2012.
- Nettleton S, Green J. Thinking about changing mobility practices: how a social practice approach can help. Sociol Health Illn 2014;36:239-51. https://doi.org/10.1111/1467-9566.12101.
- Maller CJ, Horne RE. Living lightly: how does climate change feature in residential home improvements and what are the implications for policy?. Urban Pol Res 2011;29:59-72. https://doi.org/10.1080/08111146.2011.539514.
- Carter S, Green J, Thorogood N. The domestication of an everyday health technology: a case study of electric toothbrushes. Soc Theory Health 2013;11:344-67. https://doi.org/10.1057/sth.2013.15.
- The Green Deal: Watching Brief (Part 2). London: Energy & Climate Change Committee; 2014.
- Sovacool BK. What are we doing here? Analyzing fifteen years of energy scholarship and proposing a social science research agenda. Energy Res Soc Sci 2014:11-29.
- Reid L. ‘Deal or no deal?’: assessing the UK’s new Green Deal. Open House Int 2014;39:25-33.
- Bale CS, McCullen NJ, Foxon TJ, Rucklidge AM, Gale WF. Harnessing social networks for promoting adoption of energy technologies in the domestic sector. Energy Policy 2013;63:833-44. https://doi.org/10.1016/j.enpol.2013.09.033.
- Building Regulations 2000 Approved Document F. Ventilation. London: National Building Specification; 2010.
- Whitmee S, Haines A, Beyrer C, Boltz F, Capon AG, de Souza Dias BF, et al. Safeguarding human health in the Anthropocene epoch: report of The Rockefeller Foundation-Lancet Commission on planetary health. Lancet 2015;386:1973-2028. https://doi.org/10.1016/S0140-6736(15)60901-1.
- Haines A, McMichael AJ, Smith KR, Roberts I, Woodcock J, Markandya A, et al. Public health benefits of strategies to reduce greenhouse-gas emissions: overview and implications for policy makers. Lancet 2009;374:2104-14. https://doi.org/10.1016/S0140-6736(09)61759-1.
- Rydin Y, Bleahu A, Davies M, Dávila JD, Friel S, De Grandis G, et al. Shaping cities for health: complexity and the planning of urban environments in the 21st century. Lancet 2012;379:2079-108. https://doi.org/10.1016/S0140-6736(12)60435-8.
Appendix 1 Table of changes in gas demand
| Factors | Coefficient estimatea (standard error) | |||
|---|---|---|---|---|
| Cavity insulation (n = 106,753) | Loft insulation (n = 105,759) | Double-glazing installation (n = 103,478) | Condensing boiler replacement (n = 104,014) | |
| Model 1: unadjusted | ||||
| Intercept | –0.074b (0.001) | –0.074b (0.001) | –0.074b (0.001) | –0.074b (0.001) |
| Measure in 2006 | –0.052b (0.003) | 0.006 (0.004) | 0.001 (0.008) | –0.056b (0.006) |
| No measure 2005–7 | – | – | – | – |
| Model 2: fully adjusted | ||||
| Intercept | –0.063b (0.005) | –0.064b (0.005) | –0.064b (0.005) | –0.063b (0.005) |
| Measure in 2006 | –0.049b (0.003) | 0.009 (0.004) | 0 (0.008) | –0.055b (0.006) |
| No measure 2005–7 | – | – | – | – |
| Dwelling type | ||||
| Detached | –0.002 (0.002) | –0.002 (0.002) | –0.001 (0.002) | –0.002 (0.002) |
| Semi-detached | 0.003 (0.003) | 0.004 (0.003) | 0.004 (0.003) | 0.003 (0.003) |
| Flat, all | –0.001 (0.002) | –0.001 (0.002) | 0 (0.002) | 0 (0.002) |
| Terrace | – | – | – | – |
| Dwelling age | ||||
| Pre-1900 | –0.003 (0.002) | –0.002 (0.002) | –0.003 (0.002) | –0.003 (0.002) |
| 1900–49 | 0.003 (0.003) | 0.003 (0.003) | 0.003 (0.003) | 0.003 (0.003) |
| 1950–66 | –0.001 (0.002) | –0.001 (0.002) | –0.002 (0.002) | –0.002 (0.002) |
| 1967–75 | –0.009 (0.003) | –0.007 (0.003) | –0.007 (0.003) | –0.007 (0.003) |
| 1976–82 | –0.008 (0.003) | –0.008 (0.003) | –0.009 (0.003) | –0.009 (0.003) |
| 1983–90 | 0.004 (0.003) | 0.003 (0.003) | 0.003 (0.003) | 0.003 (0.003) |
| Post-1990 | – | – | – | – |
| Dwelling tenure | ||||
| Owner-occupied | 0 (0.002) | 0 (0.002) | 0.001 (0.002) | 0 (0.002) |
| Privately rented | –0.004 (0.003) | –0.004 (0.003) | –0.003 (0.003) | –0.004 (0.003) |
| Socially rented | – | – | – | – |
| Number of bedrooms | ||||
| 1 | –0.002 (0.005) | 0 (0.005) | 0 (0.005) | –0.002 (0.005) |
| 2 | –0.002 (0.004) | 0 (0.004) | –0.001 (0.004) | –0.002 (0.004) |
| 3 | –0.003 (0.004) | –0.002 (0.004) | –0.003 (0.004) | –0.004 (0.004) |
| 4 | –0.003 (0.004) | –0.001 (0.004) | –0.002 (0.004) | –0.002 (0.004) |
| ≥ 5 | – | – | – | – |
| Region | ||||
| East England | 0 (0.003) | 0 (0.003) | –0.001 (0.003) | –0.001 (0.003) |
| East Midlands | –0.005 (0.003) | –0.005 (0.003) | –0.005 (0.003) | –0.005 (0.003) |
| London | 0.002 (0.003) | 0 (0.003) | 0.001 (0.003) | 0 (0.003) |
| North East | 0.002 (0.003) | 0.002 (0.003) | 0.003 (0.004) | 0.002 (0.004) |
| North West | 0.001 (0.003) | –0.001 (0.003) | 0 (0.003) | –0.001 (0.003) |
| South East | 0.011b (0.003) | 0.01b (0.003) | 0.01 (0.003) | 0.01 (0.003) |
| South West | –0.011b (0.003) | –0.011b (0.003) | –0.012a (0.003) | –0.012b (0.003) |
| West Midlands | 0.002 (0.003) | 0.001 (0.003) | 0.001 (0.003) | 0.001 (0.003) |
| Yorkshire | ||||
| Income quintiles | ||||
| 1 | –0.013b (0.002) | –0.013b (0.002) | –0.013b (0.003) | –0.012b (0.003) |
| 2 | –0.01b (0.002) | –0.011b (0.002) | –0.01b (0.002) | –0.01b (0.002) |
| 3 | –0.007 (0.002) | –0.008 (0.002) | –0.008 (0.002) | –0.007 (0.002) |
| 4 | –0.003 (0.002) | –0.003 (0.002) | –0.003 (0.002) | –0.003 (0.002) |
| 5 | ||||
Appendix 2 Sensitivity analyses, temperature-related mortality
| Model specification | Mortality increment (%) per degree below/above 18 °C (95% CI) | AICa | |
|---|---|---|---|
| Cold | Heat | ||
| Main model | 2.3 (0.7 to 3.8) | 1.7 (–2.9 to 6.5) | 1943.7 |
| Alternative distributional assumptions (main = overdispersed Poisson) | |||
| Simple regression | 2.1 (0.5 to 3.7) | 1.8 (–2.5 to 6.4) | N/A |
| Negative binomial | 2.5 (1.1 to 3.8) | 1.5 (–2.9 to 6.2) | N/A |
| Alternative time spline (main = 6) | |||
| Three-knot spline | 1.1 (–0.9 to 3.1) | –0.2 (–6.2 to 6.2) | 3043.8 |
| Nine-knot spline | 2.3 (0.8 to 3.9) | 2.8 (–1.9 to 7.6) | 1824.0 |
| Additional step for smaller discontinuities | |||
| Years starting 57 and 58 | 2.6 (1.0 to 4.2) | 2.4 (–2.4 to 7.4) | 1903.8 |
| Year starting 64 | 2.4 (0.8 to 3.9) | 1.6 (–3.0 to 6.4) | 1909.5 |
| Years starting 75 and 76 | 2.4 (0.9 to 3.9) | 2.2 (–2.9 to 7.4) | 1812.6 |
| Alternative heat/cold threshold (main = 18) | |||
| Threshold 15 °C | 2.2 (0.5 to 4.0) | –0.2 (–2.8 to 2.4) | 1966.5 |
| Threshold 21 °C | 2.1 (0.8 to 3.5) | 8.4 (–4.8 to 23.4) | 1938.0 |
| Influenza control | |||
| No adjustment for influenza | 3.0 (0.9 to 5.2) | 6.3 (–0.2 to 13.2) | 3152.1 |
Appendix 3 The multicriteria decision analysis calculation of performance scores
This appendix gives the equation for calculating the performance score for each intervention. Assuming that the impacts are normalised the performance score is given by:
where si is the performance score of intervention i, n is the total number of criteria, wk is the weight of criteria k and fi,k is the normalised impact of intervention i on criterion k.
Normalisation of impacts
This appendix describes a procedure to normalise the impacts across all interventions for each criterion. We assume that all the criteria are defined as gains. There are three scenarios to consider.
Scenario 1
In this scenario, all of the calculated impacts are gains (i.e. the impacts have positive values). Say that we are evaluating five interventions (for one of the criteria) that result in the following gains (nominal values):
where 2 is the gain corresponding to the first intervention, 4 is the gain corresponding to the second intervention, etc. The highest impact in absolute term is 6 and so the normalised impacts are:
Scenario 2
In this scenario all the interventions result in losses for the criterion (i.e. the impacts have negative values), for example:
Here the highest impact is ‘–1’. We first employ a linear transformation so that this number becomes 1. This is done in two steps: first shift all the numbers by +6 so that –6 represents the lowest impact (i.e. 0):
and then normalise in the usual way:
Therefore, ‘–1’, which represents the highest impact, has the normalised value of 1. Other impacts are transformed accordingly.
Scenario 3
In the third scenario there is a mixture of positive impacts (i.e. gains) and negative impacts (i.e. losses):
The highest impact here is 6. We should apply a transformation to make it 1. Here, we shift first the values by the absolute value of the lowest negative impact (i.e. 4):
and then normalise in the usual way:
Appendix 4 Lag functions used in health impact model
FIGURE 27.
Assumed time lag functions for modelled causes of mortality related to changes in ventilation. (a) Lung cancer; (b) cerebrovascular accident; (c) myocardial infarction; and (d) cardiopulmonary.


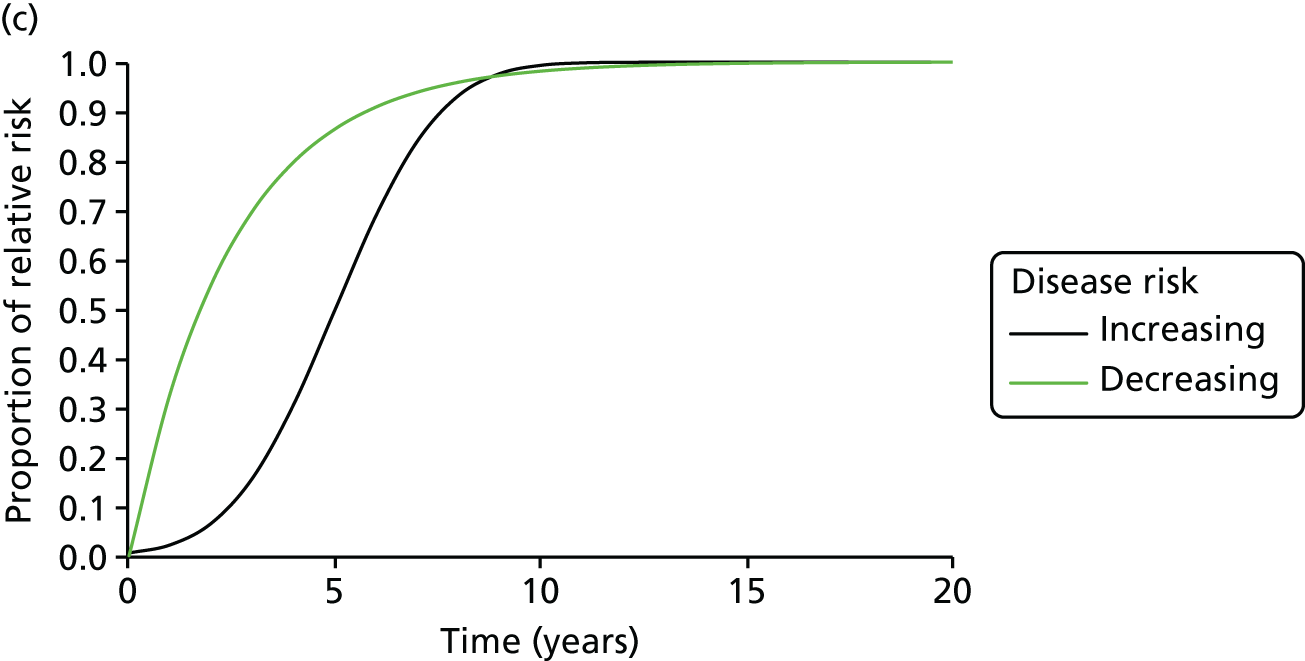
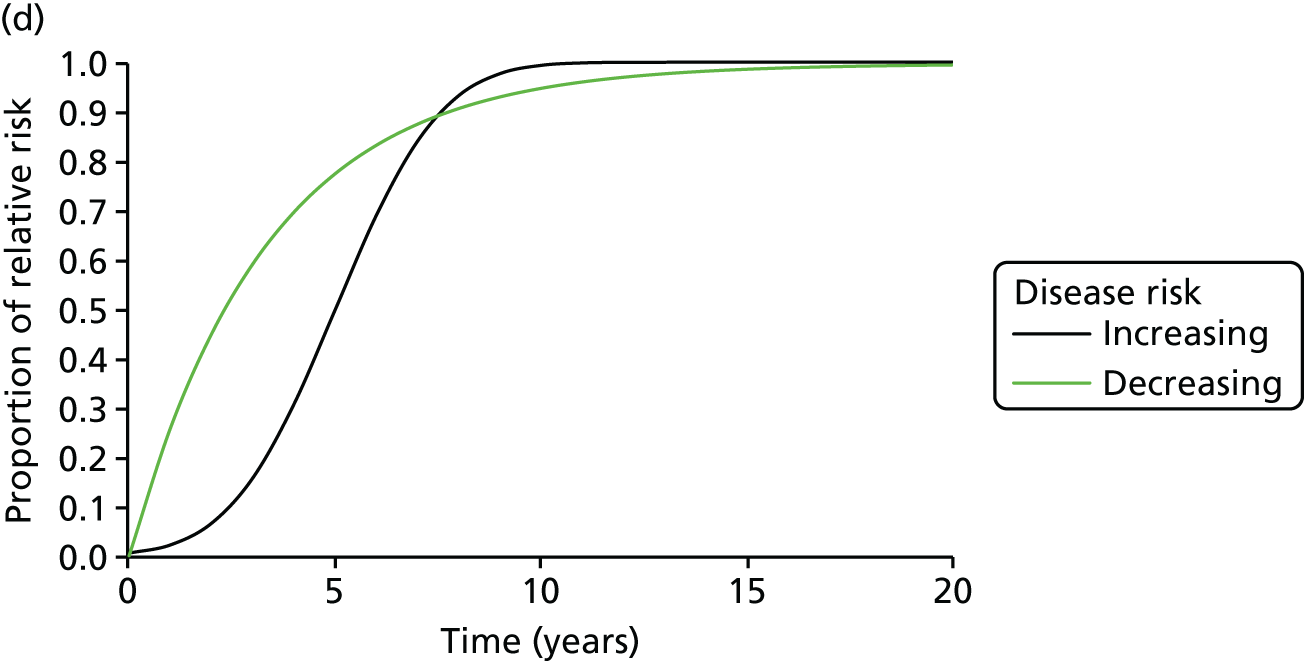
Glossary
- Akaike information criterion
- A measure that reflects the goodness of fit of statistical models.
- Climate-active pollutant
- A pollutant gas or particle constituent of the atmosphere that contributes to global warming.
- Delta (Δ)
- Used as a prefix in formulas to indicate ‘change in’.
- Energy Follow-Up Survey
- A survey commissioned by the former Department of Energy and Climate Change of the energy characteristics of dwellings and indoor temperatures.
- Energy Performance Certificate
- A confirmation of the energy performance of a dwelling that is required whenever a UK dwelling is built, sold or rented.
- E-value
- A whole-house measure of energy efficiency, reflecting the required rate of heat input (power in watts) to increase the temperature differential between the indoor and outdoor environment of 1 kelvin (1 °C).
- Fuel poverty
- Qualitatively, the condition of being unable to afford to keep one’s home adequately heated. Various technical definitions have been used. In England this is currently measured by the Department of Business, Energy and Industrial Strategy using the Low Income High Costs (LIHC) indicator. Under the LIHC indicator, a household is considered to be fuel poor if they have required fuel costs that are above the average (the national median level) and if they were to spend that amount, would be left with a residual income below the official poverty line [Department for Business Energy and Industrial Strategy (BEIS). Fuel Poverty Methodology Handbook. London: BEIS; 2018. URL: http://assets.publishing.service.gov.uk/government/uploads/system/uploads/attachment_data/file/719133/Fuel_Poverty_Methodology_Handbook_2018.pdf (accessed 12 September 2018)].
- Green Deal
- A UK government initiative, no longer active, that was designed to help business and home owners to employ more green technologies in their properties.
- Home Health and Safety Rating System
- A system for assessing the health and safety characteristics of a dwelling.
- Index of Multiple Deprivation
- An area-based marker of socioeconomic deprivation.
- Kilowatt-hour (kWh)
- A unit of energy consumption.
- Lower-layer census output area
- An area of census geography that includes, on average, around 1500 residents and 650 households.
- Mechanical ventilation and heat recovery
- A mechanically driven ventilation system in which heat exchangers recover heat from air being vented to the outside.
- Microgram per cubic metre (µg · m–3)
- A unit of measurement of air pollutant concentrations.
- Multicriteria decision analysis
- A form of analysis that is used as a decision support, in which the relative merits of alternative options are compared using (weighted) impacts on several assessment criteria.
- Office for National Statistics
- The national statistical agency for the UK.
- Particulate matter (PM2.5)
- An air pollutant of maximum aerodynamic diameter of 2.5 µm. It is often referred to as fine particles. It can penetrate into the gas exchange regions of the lung (the alveoli) and is a size fraction of particle pollution that is thought to be particularly damaging to health.
- Quality-adjusted life-year
- A generic measure of disease burden, reflecting both the quality and the quantity of life lived. It is used in economic evaluation to assess the monetised value of health impacts. One quality-adjusted life-year equates to 1 year in perfect health.
- Relative risk
- A relative measure of disease occurrence comparing the rate in exposed to unexposed groups.
- Second-hand tobacco smoke
- (sometimes known as environmental tobacco smoke) Smoke that is exhaled by smokers or given off by burning tobacco and inhaled by persons nearby.
- Standardised indoor temperature
- A marker of winter indoor temperature adjusted to standardised measurement conditions on a day with a daily maximum outdoor temperature of 5 °C.
- Volatile organic compound
- An organic compound of high vapour pressure at room temperature that includes compounds such as formaldehyde, aliphatic hydrocarbons, benzene and toluene. It includes compounds that are emitted to the indoor environment by the ‘off-gassing’ of solvents used in furniture, furnishings, paints, wall coverings and equipment used in the home.
- Weather Research and Forecasting
- A next-generation mesoscale numerical weather prediction system designed for both atmospheric research and operational forecasting needs.
- Winter Fuel Payment
- A UK government scheme providing an annual payment to households containing someone of pensionable age that is aimed to assist with fuel costs in winter.
List of abbreviations
- BRE
- Building Research Establishment
- CI
- confidence interval
- CO2
- carbon dioxide
- DECC
- Department of Energy and Climate Change
- EFUS
- Energy Follow-Up Survey
- EHS
- English Housing Survey
- EPSRC
- Engineering and Physical Sciences Research Council
- FP
- fuel poverty
- GHG
- greenhouse gas
- HEE
- home energy efficiency
- HEED
- Homes Energy Efficiency Database
- HIDEEM
- Health Impact of Domestic Energy Efficiency Measures
- LSHTM
- London School of Hygiene & Tropical Medicine
- MCDA
- multicriteria decision analysis
- NERC
- Natural Environment Research Council
- NICE
- National Institute for Health and Care Excellence
- NIHR
- National Institute for Health Research
- ONS
- Office for National Statistics
- PM2.5
- time particulate matter
- QALY
- quality-adjusted life-year
- RR
- relative risk
- SIT
- standardised indoor temperature
- SMART
- Simple Multiattribute Rating Techniques
- STS
- second-hand tobacco smoke
- TWh
- terawatt hour
- UCL
- University College London
- WFP
- winter fuel payment
- YLD
- disability-adjusted life-year
- YLL
- years of life lost

