Notes
Article history
The research reported in this issue of the journal was funded by the HS&DR programme or one of its preceding programmes as project number 11/2003/56. The contractual start date was in October 2012. The final report began editorial review in February 2015 and was accepted for publication in July 2015. The authors have been wholly responsible for all data collection, analysis and interpretation, and for writing up their work. The HS&DR editors and production house have tried to ensure the accuracy of the authors’ report and would like to thank the reviewers for their constructive comments on the final report document. However, they do not accept liability for damages or losses arising from material published in this report.
Declared competing interests of authors
Elaine McColl is an editor for the National Institute for Health Research Journals Library (Programme Grants for Applied Research) and her institution receives a fee for this work.
Permissions
Copyright statement
© Queen’s Printer and Controller of HMSO 2015. This work was produced by Wright et al. under the terms of a commissioning contract issued by the Secretary of State for Health. This issue may be freely reproduced for the purposes of private research and study and extracts (or indeed, the full report) may be included in professional journals provided that suitable acknowledgement is made and the reproduction is not associated with any form of advertising. Applications for commercial reproduction should be addressed to: NIHR Journals Library, National Institute for Health Research, Evaluation, Trials and Studies Coordinating Centre, Alpha House, University of Southampton Science Park, Southampton SO16 7NS, UK.
Chapter 1 Introduction
In July 2010, the White Paper Equity and Excellence: Liberating the NHS set out a vision for the NHS that was ‘genuinely centred on patients and carers’ (p. 8) and would ‘include much wider use of effective tools like . . . patient experience data and real-time feedback’ (p. 14). 1 In addition, the NHS Outcome Framework 2011/12 recognised ‘ensuring that people have a positive experience of care’ as one of the five key domains of quality, reflecting ‘the importance of providing a positive experience of care for patients, service users and carers’ (p. 24). 2 In drawing up this framework, the Department of Health noted that the National Quality Board identified urgent and emergency care as an important area for the development of quality standards related to experiences of care.
Historically, the patient had no real voice and professionals judged the quality of health-care services; now, the patient is central in the hope that this will contribute to quality improvement. Patients offer a complementary perspective to that of clinicians, providing unique information and insights into both the humanity and the effectiveness of health care. National surveys of patients’ experiences of health care have become a feature of NHS regulation. Patients’ views are no longer deemed optional in achieving high-quality care3 but their use is not without some challenges. 4
Gaining patients’ insights into adult intensive care, however, poses an additional challenge. Each year, over 100,000 adults are admitted to adult general intensive care units (ICUs) in the NHS and approximately one-quarter do not survive to leave hospital (yet the quality of the dying process is an important aspect of the humanity of intensive care). In addition, predominantly because of the acute severity of their illness, but also because of the treatments used to support them, patients who survive often are unable to participate in discussions regarding their care, as they have little recollection of the experience in the ICU. 5 Families, therefore, play a vital role. 6 Rather than restricting insights to a select subgroup of surviving patients who remember their intensive care experience and relying on family to act as proxy respondents for those who do not, an alternative approach has been pursued: to seek the views of family members directly, thus ensuring coverage for both surviving and non-surviving patients.
With greater recognition and acceptance of the contribution of patients, since the middle of the 1990s, there has been a large increase in the development of instruments (questionnaires) and a burgeoning research literature on their uses and benefits. Some have described family satisfaction with intensive care as an abstract concept, while others have gone on to describe it in some detail. The latter indicate that it reflects the extent to which perceived needs and expectations of the family members of critically ill patients are met by health-care professionals, and that it may be influenced by many factors including families’ expectations, information and communication, family-related factors (such as attitudes towards life and death, social, cultural and religious background, etc.), hospital infrastructure and process of care. 7 A number of tools have been developed but the most widely validated is the Family Satisfaction in the Intensive Care Unit questionnaire (FS-ICU)8 (see Appendix 1), which assesses family satisfaction and purports to measure two main conceptual domains: satisfaction with care and satisfaction with decision-making.
The original FS-ICU, developed in Canada, consisted of 34 items, which were generated from conceptual frameworks of patient satisfaction, quality end-of-life care, existing research on needs of critically ill families, existing literature on family satisfaction or dissatisfaction with medical decision-making, existing validated satisfaction surveys and a pilot study. 8 The questionnaire was designed with two conceptual sections. The first section broadly assessed overall quality of care (18 items) and the second section assessed satisfaction with decision-making (16 items). Following initial validation in a single hospital setting in Ontario, Canada, it was subsequently validated in a multicentre study in six sites across Canada. 9,10
Further studies have addressed the face/content, construct, sensitivity and responsiveness of the FS-ICU. 11 In 2007, it underwent further refinement, including reduction of the number of items from 34 to 24 by identifying items with poor response, poor discrimination (floor/ceiling effects) or redundancy (high Cronbach’s alpha) and those measuring another construct (identified by principal component analysis). The 24-item version (FS-ICU-24) increases its feasibility for future administration and performed well in head-to-head comparisons with other measures of ICU quality. 11
It is widely acknowledged that cultural and linguistic differences between, and even within, countries means that an instrument developed and validated in one place cannot simply be used in another without careful cross-cultural adaptation and checking of psychometric properties. The most common approach to developing cross-cultural instruments is the sequential approach,12 in which an instrument is initially developed and the psychometric properties are validated in one culture; it is subsequently translated (if necessary) and the properties re-established in other cultures. This approach is exemplified by the International Quality of Life Assessment project, which produced cross-cultural adaptations of the Short Form questionnaire-36 items (SF-36). 13 By showing that minimum standards (e.g. application of recognised criterion values, replication of original factor structures and tests of discriminant validity) are met across a range of cross-cultural adaptations, and that performance in a new adaptation is similar to that of the original version, one can have greater confidence that the instrument can be considered to have international applicability. 13 The SF-36 has been established as a valid measure for use in the UK following cross-cultural validation and extensive psychometric testing14,15 and population norms have been derived from large cohorts. 16
Cross-cultural validation of the FS-ICU has been conducted in North America11 and Switzerland17 but has not been undertaken in the UK. The measurement properties of the instrument need to be fully understood, including interpretation of the scores and what constitute clinically or socially meaningful differences in scores, as an important and necessary prerequisite before its introduction into quality improvement programmes in the NHS. In the UK, the feasibility and acceptability of using the FS-ICU has been assessed in a single-centre pilot study and, of 146 questionnaires distributed, 95 were returned (response rate 66%), with 71 (75%) rating the acceptability of the questionnaire as ‘very good’ to ‘excellent’. 18 In addition, if meaningful comparisons of providers are going to be made, then other issues need to be addressed: representativeness of the family members included; the sampling frame and sample size required; and the relationship between family experience and patient outcome.
The Department of Health has indicated that patients’ views are essential to achieving high-quality care. 1–3 The Family-Reported Experiences Evaluation (FREE) study directly addresses the challenges of incorporating patients’ views in intensive care by incorporating family members’ views (in recognition of the fact that a representative sample of patients’ views is unachievable) into improving the quality of adult intensive care services. There is no doubt that the benefits of gaining information and insights from family members could revolutionise quality improvement in adult intensive care and there is considerable evidence that the need to continue to involve patients/family members will be sustained within policy for the future. The FREE study is a necessary precursor to any direct incorporation of routine surveying of family members’ views into a quality improvement programme for adult intensive care services in the UK.
The overall aim of the FREE study was to inform valid, representative and cost-effective future use of the FS-ICU questionnaire into quality improvement programmes for adult intensive care services in the NHS in the UK. The objectives are:
-
to test the face and content validity and the comprehensibility of the FS-ICU
-
to establish the internal consistency, construct validity and reliability of the FS-ICU
-
to describe family satisfaction using the FS-ICU and explore how family satisfaction, measured with the FS-ICU, varies by
-
family member characteristics
-
patient characteristics
-
unit/hospital characteristics
-
other contextual factors
-
country
-
-
to model approaches to sampling to achieve representative sampling for feasible, cost-effective future use of the FS-ICU in quality improvement in the NHS.
The FREE study was a mixed-methods study divided into two phases directly related to the objectives as follows:
-
phase 1 – a preliminary, qualitative study to address the first objective above
-
phase 2 – a cohort study to address the remaining objectives.
Chapter 2 Phase 1 of the Family-Reported Experiences Evaluation study
Introduction
Phase 1 of the FREE study was a preliminary, qualitative study with the following objectives:
-
to test the face and content validity and the comprehensibility of the original FS-ICU-24 questionnaire11 (see Appendix 1)
-
to modify the FS-ICU-24, if required, for the UK setting/use in phase 2.
This chapter reports the methods and results of phase 1 of the FREE study.
Methods
The FS-ICU-24 is divided into sections as follows:
-
demographics – six questions asking for information about the respondent and their relationship to the patient
-
part 1: satisfaction with care – 14 items that contribute to the overall family satisfaction score and the satisfaction with care domain score
-
part 2: family satisfaction with decision-making around the care of critically ill patients – 10 items that contribute to the overall family satisfaction score and the satisfaction with decision-making domain score.
In addition to the above, the following questions are included at the end of part 2: family satisfaction with decision-making around the care of critically ill patients:
-
three questions for family members of patients who died in the ICU, asking for their views on the end-of-life care of the patient
-
three questions providing the respondent with an opportunity to provide comments to the ICU on how to make care provided in the ICU better and things that were done well; and suggestions that the respondent feels might be helpful to the ICU staff.
To test the face and content validity and the comprehensibility of the FS-ICU-24, this qualitative study comprised:
-
focus group discussions with health-care professionals and with representatives from the charity Intensive Care Unit Support Teams for Ex-Patients (ICUsteps)
-
cognitive interviews with family members of critically ill patients.
Research governance
The FREE study was sponsored by the Intensive Care National Audit & Research Centre (ICNARC) and phase 1 was co-ordinated by the Newcastle Clinical Trials Unit (CTU). An ethics application was made to the National Research Ethics Service Yorkshire and the Humber Research Ethics Committee on 14 August 2012 and received a favourable opinion on 17 October 2012.
The National Institute for Health Research (NIHR) Clinical Research Network (CRN) Portfolio details high-quality clinical research studies that are eligible for support from the NIHR CRN in England. The FREE study was adopted onto the NIHR CRN Portfolio on 14 September 2012.
Global NHS permissions were obtained from the lead comprehensive local research network (CLRN) – Northumberland, Tyne and Wear – and local NHS permissions were obtained for the two NHS hospital trusts that participated in phase 1. A study site agreement, based on the model agreement for non-commercial research in the health service, was signed by each participating NHS hospital trust and the sponsor (ICNARC).
Study management
Phase 1 of the study was led by EM (coinvestigator) and SW (lead clinical investigator) with support from the Study Management Group (SMG), which comprised the chief investigator (KR) and other coinvestigators (DAH, SH, DKH, LH, AR, MR). An experienced research associate was employed to conduct, transcribe and analyse the focus group discussions and cognitive interviews.
Recruitment of NHS hospital trusts
Two NHS hospital trusts were recruited to take part in the study: one in Newcastle upon Tyne and one in London.
Focus groups
Four focus group discussions were conducted with:
-
health-care professionals involved in the delivery of intensive care (to inform whether or not the FS-ICU-24 covered all dimensions relevant to the quality of intensive care in the NHS and on which a family member might be expected to have a view and the relevance and redundancy of items)
-
representatives from ICUsteps (for a further perspective on the face and content validity of the FS-ICU).
Recruitment of health-care professionals
An invitation was sent by e-mail to health-care professionals working in ICUs within the North of England Critical Care Network and within the participating NHS hospital trust in London for expressions of interest to take part in a focus group discussion. Two focus group discussions were held; one was held in Newcastle upon Tyne and the other was held in London. The aim was to recruit between 8 and 12 participants for each focus group discussion, ensuring a representative sample of the multidisciplinary intensive care team including doctors, nurses, physiotherapists and other allied health-care professionals of varying grades of seniority.
Recruitment of representatives from Intensive Care Unit Support Teams for Ex-Patients
The charity ICUsteps circulated an invitation among its membership (which includes ex-patients, their family members and health-care professionals working in intensive care) for expressions of interest to take part in a focus group discussion. Two focus group discussions were held; one was held in Milton Keynes and the other was held in South Tyneside. The aim was to recruit between 8 and 12 participants representing patients, family members and health-care professionals working in intensive care.
Informed consent
Before focus group discussions commenced, participants were provided with written information about the study and informed that the focus group discussion would be recorded using a digital voice recorder and transcribed. Participants were informed that any information that could identify themselves, patients, hospitals or health-care professionals would be removed during the transcription process and that, following transcription of the discussion, the digital recording would be destroyed. Participants were invited to sign a consent form, which was countersigned in their presence by the research associate. One copy was given to the participant and one copy was filed in the investigator site file.
Conduct of the focus groups
The focus group discussions were facilitated by the research associate. At the beginning of each discussion, ground rules (e.g. that all views were welcome, that one participant should speak at a time and that confidentiality should be observed by all participants) were established and agreed by the group.
Health-care professionals
The focus group discussions started with a free-ranging discussion on the quality of intensive care. The participants were then presented with the FS-ICU-24 and asked to comment on the relevance and redundancy of each of the items. Participants were also asked to consider whether or not the FS-ICU-24 covered all dimensions they considered relevant to the quality of intensive care and on which a family member might be expected to have a view.
Representatives from Intensive Care Unit Support Teams for Ex-Patients
The focus group discussions started with a general discussion on participants’ experiences of intensive care. The participants were then presented with the FS-ICU-24 and asked to comment on whether or not the questions were relevant and important to their experience and whether or not all the main themes related to their views of family satisfaction with intensive care were covered, and, if not, what was omitted.
Transcription
The digital recordings of the focus group discussions were transcribed by the research associate. All identifiable information, such as names (e.g. of patients, family members or intensive care staff members), was removed. Once transcriptions were complete, the digital recordings were destroyed (confidentially).
Data analysis
Data from the focus group discussions were analysed by FS-ICU-24 item. The key themes and comments from each of the discussions were summarised for each of the FS-ICU-24 items by the research associate and reviewed by EM and SW in consultation with DKH. Any potential changes to the questionnaire that were indicated following the focus group discussions were discussed with the wider SMG before any changes were made.
Cognitive interviews
Up to three rounds of cognitive interviews were planned, each involving four to eight participants. 19 At the end of each round of interviews, the findings were reviewed by the research associate with EM and SW. The wording of items was modified, if necessary, and then tested in subsequent rounds of interviews. Interviews continued until no fresh insights emerged.
Participants: family members
Family members for the cognitive interviews were purposively selected to ensure a spread across sociodemographic factors likely to influence understanding of the FS-ICU-24, including age, sex, relationship to the patient, level of education, socioeconomic status and whether or not English was the first language (while translation was used in phase 2 of the FREE study, phase 1 was restricted to English speakers only).
Family members of patients admitted to three ICUs within the NHS hospital trust in Newcastle upon Tyne were invited to take part. As planned for phase 2 of the FREE study, a family member was defined as a person who had a close familial, social or emotional relationship to the patient and was not restricted solely to next of kin. Family members of patients who had spent 24 hours or more in a participating ICU were eligible to take part in the study if they were aged 16 years or more, unless they:
-
were unable to speak and read English
-
were considered by the research nurse to lack capacity to provide informed consent or the cognitive ability to complete and discuss the FS-ICU-24
-
were considered by the research nurse to be too distressed to be approached about a research study
-
had previously taken part in the study.
Screening and recruitment
Trained intensive care research staff identified and approached potentially eligible family members about participating. Verbal information about the study was provided to the family member, which included the purpose of the study, the consequences of participating, data security and funding. This information was also provided in a participant information sheet, along with the name and contact details of the lead investigators for phase 1 of the FREE study (EM and SW).
Family members were given at least 24 hours to consider whether or not they wished to participate. Once the research nurse was satisfied that the family member had read and understood the participant information sheet and that all of their questions about the study had been answered, the family member was invited to complete and sign the expression of interest form, which was passed on to the research associate. The expression of interest form requested the following demographic information to inform the purposive sampling: full name and contact details; age; sex; relationship to the patient; level of education; occupation; whether or not English was their first language; and ethnicity. The original completed expression of interest form was filed in the investigator site file, a copy was given to the participant and a copy was given to the research associate.
The research nurse notified the research associate of the patient’s discharge from, or death in, the ICU. If the family member met the purposive sampling criteria, the research associate telephoned them 3 weeks later to invite them to participate in a cognitive interview. If the family member agreed, then a meeting was arranged at a mutually convenient time and location: either the family member’s home or a quiet interview room at one of the hospitals within the NHS hospital trust or at Newcastle University.
Of the family members who expressed an interest in taking part in the study, there were some who were not needed for interview, either because the patient was still in the ICU when the study ended or because interviews had already been conducted with family members from their demographic group. In these cases, the research associate contacted the family member to explain and thank them for their interest in the study.
Conduct of the cognitive interviews
Before the interview started, the participant was asked by the research associate for permission to record the interview using a digital voice recorder and for the interview to be transcribed. Participants were informed that any information that could identify themselves, the patient, the hospital or health-care staff would be removed during the transcription process and that, following transcription of the interview, the digital recording would be destroyed. Participants were invited to sign a consent form, which was countersigned in their presence by the research associate. One copy was given to the participant and one copy was filed in the investigator site file.
The cognitive interviews were conducted by the research associate. Participants were asked to complete the FS-ICU-24 in ‘think aloud’ mode, indicating, as they completed it, how they were interpreting each item and formulating their response. If participants struggled with concurrent ‘think aloud’, then a cognitive debriefing approach was adopted instead. In these instances, the participants self-completed the FS-ICU-24 and were then probed by the research associate about their interpretation of each item and how and why they chose the response option they did. At the end of each interview, the participants were asked:
-
if they considered each of the questions in the FS-ICU-24 to be relevant and important to their experience
-
if, in their opinion, all the main themes related to family satisfaction with intensive care had been covered and, if not, then what had been omitted.
Transcription
The digital recordings of the cognitive interviews were transcribed by the research associate. All identifiable information, such as names (e.g. of patients, family members or intensive care staff members), were removed. Once the transcriptions were complete, the digital recordings were destroyed (confidentially).
Data analysis
Data from the cognitive interviews were analysed by FS-ICU-24 item. The key themes and comments from each of the cognitive interview participants were summarised for each question and reviewed by EM and SW in consultation with DKH. Any potential changes to the questionnaire that were indicated following each round of cognitive interviews were discussed with the wider SMG before any changes were made.
Results
Participating NHS hospital trusts
Local research and development (R&D) approval was obtained at the NHS hospital trust in London for the London-based focus group discussion (with health-care professionals) and at the NHS hospital trust in Newcastle for the Newcastle-based focus group discussion (with health-care professionals) and for recruitment of family members for the cognitive interviews.
Participants
Focus group discussions: health-care professionals
The first focus group discussion was held in Newcastle on 28 November 2012 with seven participants comprising two consultant doctors, two junior doctors, one sister/charge nurse, one staff nurse and one allied health-care professional.
The second focus group discussion was held in London on 16 January 2013 with seven participants comprising two consultant doctors, one junior doctor, two sister/charge nurses and two staff nurses.
Focus group discussions: representatives from Intensive Care Unit Support Teams for Ex-Patients
The first focus group discussion was held in Milton Keynes on 2 December 2012 with nine participants comprising five former intensive care patients, two family members of former intensive care patients and two health-care professionals involved in delivery of intensive care, of whom one was also a family member of a former intensive care patient.
The second focus group discussion was held in South Tyneside on 28 February 2013 with six participants comprising two former intensive care patients, three family members of former intensive care patients and one health-care professional involved in delivery of intensive care.
Cognitive interviews
Eighty-three family members of patients admitted to the three ICUs within the NHS hospital trust in Newcastle were approached about taking part in a cognitive interview. Of these, 41 (49.4%) expressed an interest in taking part and were given a participant information sheet and, of these, 30 (73.2%) completed and signed the expression of interest form.
Twelve family members of nine patients were successfully contacted and cognitive interviews were conducted with them. The 12 cognitive interviews were conducted in three rounds as follows: four interviews conducted between 11 and 15 January 2013; six interviews conducted between 26 and 30 January 2013; and two interviews conducted on 8 February 2013.
Characteristics of cognitive interview participants
Of the 12 participants, 11 were white British and one was Asian British. They ranged in age from 32 to 66 years, with a mean age of 48 years, and two-thirds (n = 8) were female. The average age at which participants left full-time education was 18 years, ranging from 15 to 21 years (Table 1).
| Round | Date of interview (2013) | Sex | Age (years) | Age on leaving full-time education (years) | Relationship to the patient |
|---|---|---|---|---|---|
| 1 | 11 January | Male | 66 | 15 | Husband |
| 14 January | Female | 63 | 16 | Wife | |
| 15 January | Female | 32 | 18 | Daughter | |
| 15 January | Male | 32 | 21 | Stepson | |
| 2 | 26 January | Female | 36 | 18 | Daughter-in-law |
| 26 January | Male | 43 | 16 | Son | |
| 26 January | Female | 52 | 17 | Daughter | |
| 29 January | Female | 62 | 15 | Sister | |
| 29 January | Female | 52 | 21 | Mother | |
| 30 January | Male | 33 | 16 | Husband | |
| 3 | 8 February | Female | 38 | 21 | Daughter |
| 8 February | Female | 61 | 16 | Wife |
Thematic analysis
Themes that emerged from the focus group discussions and cognitive interviews have been combined and are presented for each of the FS-ICU-24 items below.
Demographics
The first section of the FS-ICU-24 comprises six questions asking for information about the respondent and their relationship to the patient.
Sex (response options: Male/Female)
There were no issues identified by participants and no changes were made.
Age (response required age to be indicated)
There were no issues identified by participants and no changes were made.
I am the patient’s (response options include: Wife/Husband/Son/Daughter/etc.)
Participants suggested adding relationship options, such as ‘friend’, ‘neighbour’ and ‘son/daughter-in-law’. It was acknowledged that it would be impossible to have a comprehensive list of options and that the response option of ‘other’ with a free-text space to enter the details would suffice. Additional relationship options were added.
Before this most recent event, have you been involved as a family member of a patient in ICU (Intensive Care Unit)? (response options: Yes/No)
There were no major issues identified and no changes were made. It is of note that a number of participants in the cognitive interviews took some time to recall the information required to respond to this question and one participant (during an interview with the 61-year-old wife and the 38-year-old daughter of an ICU patient) asked if this meant ‘any ICU ever?’
Do you live with the patient? If no, then on average how often do you see the patient? (response options: More than weekly/Weekly/Monthly/Yearly/Less than once a year)
Although this question was considered easy to answer, it generated debate during the focus group discussions about its purpose and what it implied about the strength of the relationship to the patient. There were discussions about how often a relative might visit the patient (if they did not share a home). Participants in the cognitive interviews who did not live with their relative (the patient) mentioned telephoning them to keep in touch. There was general agreement that perhaps the response categories were not sufficiently discriminating to capture the range of likely experiences; in particular, the gap between seeing someone ‘monthly’ and ‘yearly’. The SMG agreed to add additional response options: ‘every 2 to 3 months’ and ‘every 4 to 6 months’.
During the first round of cognitive interviews, participants also queried the purpose of this question. DKH confirmed that it was to gauge how well the family member knew the patient and their health and other issues. In response to participants’ comments, a new question was proposed to further tap into this construct as follows: ‘How would you rate your knowledge of the patient and their health issues? (response options: excellent/very good/good/fair/poor)’.
This question was tested in the second round of cognitive interviews. Further feedback indicated there was some confusion about the time frame of reference for this new item vis-à-vis the patient’s admission to ICU. The question was amended to ‘how would you rate your knowledge of the patient’s health issues prior to them coming to the ICU?’ This was then tested in the third round of cognitive interviews. No further issues with comprehensibility of the question were raised and the question was retained.
Where do you live? (response options: In the city where the hospital is located/Out of town)
A number of participants found the response option ‘out of town’ to be an imprecise term and hard to interpret. The majority of cognitive interview participants considered that they were from ‘out of town’, a pattern of response which could be related to the recruiting NHS hospital trust being a tertiary referral centre within the north-east of England.
At the focus group held with health-care professionals in London, there was discussion about the possibility that the difficulty in travelling across a large city was comparable with coming from ‘out of town’. Participants suggested that this question should ask more directly about the ease of travel to the ICU for family members, which DKH confirmed was the intention of the question. A replacement question was proposed as follows: ‘How would you rate the ease of travelling from your home to the hospital? (response options: excellent/very good/good/fair/poor)’. This was tested in subsequent cognitive interviews and discussed at the final focus group (held in South Tyneside with representatives from ICUsteps) and found to work well. The reworded question was retained.
Part 1: satisfaction with care
The second section of the FS-ICU-24 comprises 14 items that contribute to the overall family satisfaction score and to the satisfaction with care domain score. The 14 items were divided up under six subheadings: ‘how did we treat your family member (the patient)?’ (four items); ‘how did we treat you?’ (four items); ‘nurses’ (two items); ‘physicians (all doctors, including residents)’ (one item); ‘the ICU’ (one item); and ‘the waiting room’ (two items).
Response options to the first 13 of the 14 items were ‘excellent/very good/good/fair/poor’, with a further option of ‘not applicable’. The response options to the last item were ‘very dissatisfied/slightly dissatisfied/mostly satisfied/very satisfied/completely satisfied’.
How did we treat your family member (the patient)?
Q1: Concern and caring by ICU staff [the courtesy, respect and compassion your family member (the patient) was given]
During one of the focus group discussions and during the first round of cognitive interviews the concept of ‘dignity’ was mentioned and participants commented that a lot of NHS literature and posters refer to ‘dignity’. In the later rounds of cognitive interviews, participants were specifically asked about the construct of dignity. Participants thought that courtesy, respect and compassion were all important characteristics. One participant commented that courtesy, respect and compassion are separate characteristics and that it would be possible for a member of ICU staff to exhibit courtesy and respect but without showing compassion. It was suggested that this question could potentially be split into two, with one question asking about courtesy and respect and a separate question asking about compassion.
The SMG considered whether to substitute (with ‘dignity’) or drop the word ‘courtesy’ but it was concluded that this might alter the sense of the item and have an adverse impact on the validity of the FS-ICU-24. These decisions took into account advice from DKH and the intent of the item, which was to obtain the family member’s overall assessment of the constructs of concern and caring, and the words ‘courtesy’, ‘respect’ and ‘compassion’ were simply to orient family members to this construct. No changes were made.
Symptom management (how well the ICU staff assessed and treated your family member’s symptoms)
Q2: Pain
There were no issues identified by participants and no changes were made.
Q3: Breathlessness
There were no issues identified by participants and no changes were made.
It is of note that some participants suggested that a family member’s assessment of breathlessness could be subjective, which was deemed reasonable.
Q4: Agitation
There were no major issues identified by participants and no changes were made.
It is of note that participants commented on the different types of agitation they had witnessed in their family members (the patients). For example, one participant noted that the patient had been agitated because the bed was uncomfortable, while two others (a 52-year-old mother of an ICU patient and a 32-year-old male relative of an ICU patient) noted it was because the patient was unable to speak because of the ‘breathing tube’. Participants also commented that it is common for patients to panic on waking up but acknowledged that the word ‘panic’ would not work as an alternative to the word ‘agitation’.
How did we treat you?
Q5: Consideration of your needs (how well the ICU staff showed an interest in your needs)
There were no major issues identified by participants and no changes were made.
None of the participants in either the focus group discussions or the cognitive interviews suggested there was any need for changes to this item. It is of note that the health-care professionals (who participated in the focus group discussions) interpreted the needs of family members as being around facilities at the hospital/ICU such as car parking or availability of refreshments. In contrast, family members (who were interviewed) considered that their own material needs were secondary and indicated that they were more concerned with communication and being kept informed of the patient’s progress. Although these differing perspectives provided interesting insights, it was not felt that any changes to this item were indicated.
Q6: Emotional support (how well the ICU staff provided emotional support)
There were no major issues identified by participants and no changes were made.
It is of note that participants in the focus groups discussed how ‘needs’ of family members (referred to in Q5 above) and ‘emotional support’ could be regarded as being similar or the same, as the principal need of some family members is emotional support. Participants in the cognitive interviews who identified themselves as the next of kin felt that this concept of emotional support was important; however, they felt it was likely to be less important or relevant to more distant relatives, such as a son-in-law/daughter-in-law.
Q7: Co-ordination of care (the teamwork of all the ICU staff who took care of your family member)
Some participants in the cognitive interviews talked about poor handovers between staff, and good and poor teamwork, and made comparisons with their previous experiences at other ICUs and hospitals. This was considered likely to amplify responses from family members rather than indicative of a need to change the wording of this item.
Some participants in the focus group discussions asked why this item was included under the heading of ‘how did we treat you?’ They suggested that this item should be moved or placed under a separate subheading. The item was moved to come under a new subheading, ‘teamwork’, which was added.
Q8: Concern and caring by ICU staff (the courtesy, respect and compassion you were given)
Participants in one focus group commented that this question seemed to be returning to the issue of emotional support, which had already been addressed in Q6. It also prompted further discussion about how ‘courtesy’, ‘respect’ and ‘compassion’ differ. Participants in the cognitive interview reiterated that a nurse can be polite without being compassionate. As for Q6, participants also mentioned the concept of dignity being an important consideration.
In response to the feedback from participants, a change to the wording of this item was considered. It was decided, however, that the original wording should be retained to facilitate comparison with other studies that have used the FS-ICU-24. Furthermore, there was no other wording of the item that was universally preferred.
Nurses
Q9: Skill and competence of ICU nurses (how well the nurses cared for your family member)
There were no major issues identified by participants and no changes were made.
It is of note that, during the focus group discussions, some of the health-care professionals questioned whether or not family members can judge the skill and competence of the nurses. In addition, one of the participants in the cognitive interviews commented that they did not feel that they could make this judgement.
Q10: Frequency of communication with ICU nurses (how often nurses communicated to you about your family member’s condition)
The item was regarded as a potential problem by some of the cognitive interview participants. Participants recruited from the same ICU provided responses to this question that ranged from ‘excellent’ to ‘poor’. Some participants commented that they felt that the nurse should approach them and provide information about the patient. If this had not happened, then they tended to provide a negative response such as ‘poor’. Family members who were not the patient’s immediate next of kin tended to respond more negatively to this item, possibly reflecting the fact that they were less likely to have received the same amount of information as, for example, the patient’s immediate next of kin.
Health-care professionals participating in the focus group discussions commented that doctors tend not to volunteer information immediately upon meeting a family member. One participant (an ICU nurse who worked in a follow-up clinic) noted ‘You would introduce yourself and establish who they are and use discretion if they want information.’
The SMG agreed that the comments from participants provided useful insight into why responses might vary within and across ICUs and between different family members for the same patient, but no changes were made to this item. It was noted that one of the objectives of phase 2 of the FREE study was to explore how family satisfaction varied by family member and ICU/hospital characteristics (see Chapter 7).
Doctors
Q11: Skill and competence of ICU doctors (how well doctors cared for your family member)
There were no issues identified by participants and no changes were made.
The ICU
Q12: The atmosphere of the ICU was?
During the first round of cognitive interviews, participants commented that they found the word ‘atmosphere’ to be ambiguous. Their responses to this question indicated that they were variously thinking about concepts ranging from the temperature of the ICU to the friendliness of the ICU. Participants suggested that the word ‘mood’ or ‘environment’ might be better alternatives. DKH confirmed that the intent of the question was to capture family members’ impression of the general ‘feel’ of the ICU. For subsequent rounds of cognitive interviews, ‘atmosphere’ was replaced with ‘mood’. However, participants found ‘mood’ ambiguous and suggested that the (original) word ‘atmosphere’ would be better. The SMG concluded, therefore, that the word ‘atmosphere’ should be retained but with the word ‘mood’ in parentheses to convey the sense of what was meant by ‘atmosphere’ as follows: ‘The atmosphere (mood) of the ICU was?’
The waiting room
Q13: The atmosphere in the Waiting Room was?
During the cognitive interviews, there were similar comments as for Q12 relating to the word ‘atmosphere’. DKH confirmed that the intent of the question was to capture family members’ impression of the general ‘feel’ of the waiting room. This question was therefore worded along similar lines to Q12, as follows: ‘The atmosphere (mood) in the ICU waiting room was?’
Q14: Some people want everything done for their health problems while others do not want a lot done (how satisfied were you with the LEVEL or amount of health care your family member received in the ICU?)
Participants felt that this was an important item; however, many of the participants in the cognitive interviews commented on the phrasing of the question and found it difficult to interpret the meaning of the question. Participants said that they felt that family members would want as much as possible done for their relative in the ICU. One participant asked if the question was about end-of-life care. Some of the health-care professionals, who took part in the focus group discussions, considered the first sentence of this question to be patronising. Other focus group participants disagreed with the reversal of the response options for this item, ranging from ‘very dissatisfied’ to ‘completely satisfied’ as opposed to the response options ranging from ‘excellent’ to ‘poor’ for the previous items.
Based on comments from participants during the first two focus group discussions and the initial round of cognitive interviews, the wording of the question was modified for the subsequent round of cognitive interviews to ‘how satisfied were you with the LEVEL or amount of health care your family member received in the ICU bearing in mind their likely wishes?’ The intention was to focus the question on the patient and what they might want rather than what the family member might want for the patient.
Participants who took part in subsequent rounds of cognitive interviews did not find the revised wording of the question to be any clearer than the original. This view was echoed during the final focus group discussion. In particular the rider ‘bearing in mind their likely wishes’ was not considered to be helpful.
The SMG was concerned that removing the introductory sentence might change the meaning of this item. Furthermore, DKH noted that studies in Canada11 had found this item correlated well with overall family satisfaction. Given this, combined with the feedback from participants, the SMG agreed the question should not be modified. The order of the response options (i.e. reversed) was also retained because of concerns that any change would affect the factorial validity of the FS-ICU-24; however, a rider was added to alert the respondent to the order of the responses.
Part 2: family satisfaction with decision-making around the care of critically ill patients
The third section of the FS-ICU-24 comprises 10 items that contribute to the overall family satisfaction score and to the satisfaction with decision-making domain score. The 10 items were divided up under two subheadings: ‘information needs’ (six items) and ‘process of making decisions’ (four items).
Response options to the first six items were ‘excellent/very good/good/fair/poor’ with a further option of ‘not applicable’. The response options to the remaining items are provided below with the item.
Comments from participants in the cognitive interviews indicated that the instructions for this part of the FS-ICU-24 were clear; however, several participants stated that they had had no involvement in decision-making relating to the patient’s (their family member’s) health care. Clinical members of the SMG (DKH, AR, SW) noted that, although in both Canada and the UK the aim is to involve family members as much as possible in the decision-making process in an intensive care setting, there are contextual differences with respect to legal frameworks. In Canada, if an adult loses the mental capacity to make decisions about their health care, a substitute decision-maker is appointed, who is usually the next of kin. This is in contrast to the situation in England, where doctors, working under the Mental Capacity Act 2005,20 make decisions in the patient’s best interests, taking into account the views of family members.
Information needs
Q1: Frequency of communication with ICU doctors (how often doctors communicated to you about your family member’s condition)
There were no major issues identified by participants and no changes were made.
Notably, many of the participants in the cognitive interview commented that they had little contact with the doctors. It was noted that more distant relatives (i.e. not the immediate next of kin) would be likely to have less contact with doctors and might, therefore, give a more negative response to this question. Participants suggested that this item should be moved to follow the item asking about communication with the nurses (Q10 in part 1: satisfaction with care). This was considered by the SMG and rejected because of the impact that reordering items might have on the construct validity of the FS-ICU-24; DKH indicated that the item asking about communication with the nurses was designed to address the construct ‘process of care’ whereas this item asking about communication with doctors was designed to address the construct ‘process of decision-making’.
Q2: Ease of getting information (willingness of ICU staff to answer your questions)
There were no issues identified by participants and no changes were made.
It is of note that some of the participants in the cognitive interviews commented that the ease of getting information depended on whether communication was face to face or by telephone. That is to be expected; it is generally easier to get information face to face than by telephone.
Q3: Understanding of information (how well ICU staff provided you with explanations that you understood)
There were no issues identified by participants and no changes were made.
Q4: Honesty of information (the honesty of information provided to you about your family member’s condition)
There were no issues identified by participants and no changes were made.
It is of note that the health-care professionals who took part in the focus group discussions did not like the word ‘honesty’ used in this context because the antonym is ‘dishonesty’ and they felt that the wording of the question ‘implies we would lie’ (ICU nurse). Participants suggested the words ‘openness’ or ‘transparency’ as alternatives to ‘honesty’. However, participants in the cognitive interviews and in the focus groups with representatives from ICUsteps had no concerns with the word ‘honesty’. In the light of this, the SMG agreed no changes should be made.
Q5: Completeness of information (how well the ICU staff informed you what was happening to your family member and why things were being done)
There were no issues identified by participants and no changes were made.
Q6: Consistency of information (the consistency of information provided to you about your family member’s condition – did you get a similar story from the doctor, nurse, etc.)
There were no issues identified by participants and no changes were made.
It is of note that the health-care professionals disliked the rider ‘did you get a similar story from the doctor, nurse, etc.’ They specifically disliked the word ‘story’, which implies that information given to family members is not honest. Participants in the cognitive interviews raised no issues with this item. The SMG agreed that this item should remain unchanged.
Process of making decisions
Q7: Did you feel included in the decision-making process? (response options: I felt very excluded/I felt somewhat excluded/I felt neither included nor excluded/I felt somewhat included/I felt very included)
Some participants in the cognitive interviews felt that this question was not applicable to them because, for example, the patient’s admission to the ICU had been planned following elective surgery. In these instances, participants had commented that the patient had usually been conscious and had retained the mental capacity to make their own decisions throughout their stay in the ICU.
Other cognitive interview participants commented that, although they were kept informed about the decisions being taken by the intensive care staff, they were not actively involved in the decision-making process. More distant family members (i.e. not the immediate next of kin) reported having had less communication with the intensive care staff and not being involved in the decision-making process. In the light of these comments, the SMG agreed a ‘not applicable’ response option should be added.
Q8: Did you feel supported during the decision-making process? (response options: I felt totally overwhelmed/I felt slightly overwhelmed/I felt neither overwhelmed nor supported/I felt supported/I felt very supported)
In considering the response options to this item (listed above), participants who took part in the early round of cognitive interviews commented that one could be ‘totally overwhelmed’ but still be ‘well supported’. Participants suggested that the word ‘overwhelmed’ should be replaced by the word ‘unsupported’ in the response options to this item. The revised response options were tested and performed well in the subsequent round of cognitive interviews and at the final focus group discussion. This change to the response options was therefore retained. The SMG agreed that a ‘not applicable’ response option should be added.
Q9: Did you feel you had control over the care of your family member? (response options: I felt really out of control and that the health care system took over and dictated the care my family member received/I felt somewhat out of control and that the health care system took over and dictated the care my family member received/I felt neither in control nor out of control/I felt I had some control over the care my family member received/I felt that I had good control over the care my family member received)
Most of the participants in the cognitive interviews felt that this item did not apply to them, while others expressed uncertainty whether or not they would have expected to have good control over the care their family member received. Similar views were expressed by participants who took part in the focus group discussions.
The SMG discussed the background to this question and the differences in the legal frameworks between Canada and the UK as regards adults who lose the mental capacity to make decisions about their health care (see above). The SMG acknowledged that contextual and cultural differences might result in lower scores for this item in a UK setting but there were no compelling reasons to drop it. A ‘not applicable’ response option was added.
It was agreed, however, that a new question should be added to assess satisfaction with the amount of control the respondent (family member) felt they had over the care of their family member (patient) as follows: ‘How satisfied were you with the amount of control you had over the care of your family member? (response options: excellent/very good/good/fair/poor)’.
Q10: When making decisions, did you have adequate time to have your concerns addressed and questions answered? (response options: I could have used more time/I had adequate time)
Many of the cognitive interview participants commented that in an intensive care setting decisions often need to be made very quickly and therefore felt that a ‘not applicable’ option was needed for this question. The SMG agreed this option should be added.
For family members of patients who died in the intensive care unit
Three questions are included in the third section of the FS-ICU-24 for family members of patients who died in the ICU. These questions do not contribute to the overall family satisfaction score or to the satisfaction with care and satisfaction with decision-making domain scores.
If your family member died during the ICU stay, please answer the following questions (11–13). If your family member did not die, please skip to question 14.
The health-care professionals expressed concern about the appropriateness of these questions and potential distress to bereaved family members, particularly as, during phase 2 of the FREE study, family members would receive the questionnaire 3 weeks after the patient had died in the ICU. However, participants in the cognitive interviews, who were all family members, were less concerned about the 3-week time frame. The questions were considered to be important and some participants suggested that they might be better in a separate questionnaire. Given concerns about potential distress to bereaved family members, participants commented that consideration needed to be given to how these questions were introduced to make them more acceptable. To this end, the SMG agreed that a rider should be added to orient respondents to the theme of the three questions and to explain the reason for asking the questions as follows:
If your family member died in the ICU, we would like to ask your opinion on how things went in those final days. We know it may be difficult to answer these questions but we would greatly value your input so we can improve the care we provide dying patients.
Q11: Which of the following best describes your views? (response options: I felt my family member’s life was prolonged unnecessarily/was slightly prolonged unnecessarily/was neither prolonged nor shortened unnecessarily/was slightly shortened unnecessarily/was shortened unnecessarily)
Many of the health-care professionals felt uncomfortable with this question and the response options. They talked about the Liverpool Care Pathway and the negative publicity around its application in the NHS. Many were concerned that some of the response options might precipitate the start of a complaints procedure. Similarly, some cognitive interview participants commented that if a family member selected the response option ‘I felt my family member’s life was slightly shortened unnecessarily’ or ‘I felt my family member’s life was shortened unnecessarily’ it might trigger the start of legal action against the NHS hospital trust. DKH noted that the experience in Canada has been that most respondents have tended to choose the response option ‘I felt my family member’s life was neither prolonged nor shortened unnecessarily’.
Q12: During the final hours of your family member’s life, which of the following best describes your views? (response options: I felt that he/she was very uncomfortable/was slightly uncomfortable/was mostly comfortable/was very comfortable/was totally comfortable)
There were no major issues identified by participants and no changes were made.
It is of note that the health-care professionals were generally comfortable with this question and the response options. Participants in the cognitive interviews commented that this would be an important question for some family members.
Q13: During the last few hours before your family member’s death, which of the following best describes your views? (response options: I felt very abandoned by the health care team/I felt abandoned by the health care team/I felt neither abandoned nor supported by the health care team/I felt supported by the health care team/I felt very supported by the health care team)
There were no major issues identified by participants and no changes were made.
It is of note that the word ‘abandoned’ was considered to be emotive by many participants (both family members and health-care professionals) but there were no suggestions for an alternative word apart from ‘unsupported’. However, participants acknowledged the concept of abandonment and felt that it was important.
Summary of changes to the 24-item Family Satisfaction in the Intensive Care Unit questionnaire
The changes, agreed by the SMG, to the original FS-ICU-24 are summarised below. KR and EW led on implementing the agreed changes and on the reformatting/redesign of the questionnaire to enhance response.
About you
The section heading ‘demographics’ in the original FS-ICU-24 was changed to ‘about you’ to simplify the language. Changes made to this section were as follows:
-
Additional response options were provided for the question asking about the respondent’s relationship to the patient.
-
A question asking ‘are you the patient’s next of kin?’ was added to ascertain if the respondent considered themselves the patient’s next of kin.
-
Additional response options were provided for the question asking about how frequently the respondent saw the patient if they did not live with them.
-
A question ‘how would you rate your knowledge of the patient’s health issues prior to them coming to the ICU?’ was added, with five response options ranging from ‘excellent’ to ‘poor’.
-
The question ‘where do you live?’ on the original questionnaire was replaced with the question ‘how would you rate the ease of travelling from your home to the hospital?’ with five response options ranging from ‘excellent’ to ‘poor’.
Satisfaction with care
The section heading in the original FS-ICU-24 was kept. Changes made to this section were as follows:
-
The item asking about co-ordination of care (originally one of four items under the subheading ‘how did we treat you?’) was moved to come under a new subheading, ‘teamwork’, and follows ‘how did we treat you?’
-
The subheading ‘physicians’ was replaced with ‘doctors’, as this term was more familiar to a UK population.
-
The item ‘the atmosphere of the ICU was?’ was modified to read ‘the atmosphere (mood) of the ICU was?’
-
The item ‘the atmosphere in the ICU waiting room was?’ was modified to read ‘the atmosphere (mood) in the ICU waiting room was?’
-
A rider ‘please pay attention to the order of responses’ was added to the item asking about satisfaction with the level or amount of health care the patient received, to alert respondents to the order of the response options (in reverse order), and a new subheading, ‘level/amount of health care’, was added.
Satisfaction with decision-making
The section heading in the original FS-ICU-24 was kept. Changes made to this section were as follows:
-
For items 7–10 under the subheading ‘the process of decision-making’, the following sentence was added to the guidance notes: ‘If your family member was able to make decisions for themselves while in the ICU, then some questions may not be applicable to you; in that case, please tick not applicable’.
-
A response option of ‘not applicable’ was added to the items related to the process of making decisions.
-
The response options for the item about how supported the respondent felt during the decision-making process were modified slightly – the word ‘overwhelmed’ was replaced with ‘unsupported’.
Additional questions
In addition to the 24 items that contribute to the satisfaction with care and satisfaction with decision-making domain scores, there are three questions for family members of patients who died in the ICU, which ask for their views on the end-of-life care of their family member (the patient).
The following change was made to the guidance notes: ‘If your family member died during the ICU stay, please answer the following questions (11–13)’ was replaced with ‘if your family member died in the ICU, we would like to ask you your opinion on how things went in those final days. We know it may be difficult to answer these questions but we would greatly value your input so we can improve the care we provide to dying patients.’
Following the three questions above, a question was added for all family members, as follows: ‘How satisfied were you with the amount of control you had over the care of your family member?’, with five response options ranging from ‘very dissatisfied’ to ‘completely satisfied’.
Finally, for consistency, the word ‘hospital’ was replaced by the word ‘ICU’ for the last question, asking for comments and suggestions that the family member felt might be helpful to staff.
In addition, a cover page was created with three additional questions (not included in the original FS-ICU-24) as follows:
-
‘today’s date’, to establish when the questionnaire was completed in relation to the patient’s discharge from, or death in, the ICU
-
‘did you complete the questionnaire alone/with help?’, to establish whether the questionnaire had potentially been completed by one or more family members
-
‘approximately how many times did you visit your family member in the ICU?’, to establish the frequency with which the family member visited the patient in the ICU.
In addition, a reminder of the definition of a family member was provided.
General formatting
The UK FS-ICU-24 was designed in the form of a booklet and titled ‘The FREE Study Questionnaire’ to ensure that family member participants in the cohort study (described in Chapter 3) identified the questionnaire as related to the FREE study. The FREE study logo was incorporated and the colours of headings, page borders and questionnaire item numbers were selected to reflect the logo colour scheme and to enhance the aesthetics of the questionnaire. Headings and subheadings were enlarged to varying degrees to help respondents navigate the questionnaire. The guidance notes were presented in the form of bullet points (rather than paragraphs of text) to make the information easier to read and understand. Phrases such as ‘check the box’ were translated to the UK English equivalent, for instance ‘tick the box’. For each item, a tick box was provided for each of the response options to clearly signpost how the response should be provided, as well as being aesthetically pleasing.
The UK 24-item Family Satisfaction in the Intensive Care Unit questionnaire
The final version of the UK FS-ICU-24 questionnaire (see Appendix 2), adapted from the original Canadian FS-ICU-24 questionnaire, is outlined below. The questionnaire comprised three parts: demographic information about the family member completing the questionnaire (under the heading About you), satisfaction with care and satisfaction with decision-making.
The first part of the questionnaire asked for information about the family member completing the questionnaire as follows:
Part 1: about you
Q1: I am . . . (Response options: male/female.)
Q2: I am . . . (Response: age in years.)
Q3: I am the patient’s . . . (Response options include wife/husband/mother/father/etc.)
Q4: Are you the patient’s next of kin? (Response options: yes/no.)
Q5: Before this most recent event, have you been involved as a family member of a patient in an ICU (intensive care unit)? (Response options: yes/no.)
Q6: Do you live with the patient? (If the patient has died, did you live with the patient?) (Response options: yes/no.)
If NO, then on average how often do you see the patient? (If the patient has died, how often did you see the patient?) (Response options: ranging from more than once a week to less than once a year.)
Q7: How would you rate your knowledge of the patient’s health issues prior to them coming to the ICU? (Response options: excellent/very good/good/fair/poor.)
Q8: How would you rate the ease of travelling from your home to the hospital? (Response options: excellent/very good/good/fair/poor.)
Part 2: satisfaction with care
Fourteen items covered satisfaction with care; note that item 2 (Q2) was split into three parts, all asking about symptom management. For 13 of the 14 items, the response options were ‘excellent/very good/good/fair/poor’ with an additional option of ‘N/A’ (not applicable). For item 12, about satisfaction with the level or amount of health care, the response options were ‘very dissatisfied/slightly dissatisfied/mostly satisfied/very satisfied/completely satisfied’.
How did we treat your family member (the patient)?
Q1: concern and caring by ICU staff [the courtesy, respect and compassion your family member (the patient) was given].
Q2: Symptom management (how well the ICU staff assessed and treated your family member’s symptoms):
-
pain
-
breathlessness
-
agitation.
How did we treat you?
Q3: consideration of your needs (how well the ICU staff showed an interest in your needs).
Q4: emotional support (how well the ICU staff provided emotional support).
Q5: concern and caring by ICU staff (the courtesy, respect and compassion you were given).
Teamwork
Q6: co-ordination of care (the teamwork of all the ICU staff who took care of your family member).
Nurses
Q7: skill and competence of ICU nurses (how well the nurses cared for your family member).
Q8: frequency of communication with ICU nurses (how often nurses communicated to you about your family member’s condition).
Q9: skill and competence of ICU doctors (how well doctors cared for your family member).
The intensive care unit
Q10: the atmosphere (mood) of the ICU was . . .?
The waiting room
Q11: the atmosphere (mood) in the ICU waiting room was . . .?
Level/amount of health care
Q12: some people want everything done for their health problems while others do not want a lot done. How satisfied were you with the LEVEL or amount of health care your family member received in the ICU?
Part 3: satisfaction with decision-making
This part of the questionnaire included 17 questions. All family members were asked to complete the first 10 items, which cover satisfaction with decision-making around the care of the critically ill patient. For 6 of the 10 items the response options were ‘excellent/very good/good/fair/poor’ with an additional option of ‘N/A’. For the remaining four items, the response options are provided with the item.
Family satisfaction with decision-making around care of critically ill patients
Information needs
Q1: frequency of communication with ICU doctors (how often doctors communicated to you about your family member’s condition).
Q2: ease of getting information (willingness of ICU staff to answer your questions).
Q3: understanding of information (how well ICU staff provided you with explanations that you understood).
Q4: honesty of information (the honesty of information provided to you about your family member’s condition).
Q5: completeness of information (how well ICU staff informed you what was happening to your family member and why things were being done).
Q6: consistency of information [the consistency of information provided to you about your family member’s condition (did you get a similar story from the doctor, nurse, etc.)].
The process of making decisions
Q7: did you feel included in the decision-making process?
-
I felt very excluded.
-
I felt somewhat excluded.
-
I felt neither included nor excluded.
-
I felt somewhat included.
-
I felt very included.
-
Not applicable.
Q8: did you feel supported during the decision-making process?
-
I felt totally unsupported.
-
I felt slightly unsupported.
-
I felt neither supported nor unsupported.
-
I felt supported.
-
I felt very supported.
-
Not applicable.
Q9: did you feel you had control over the care of your family member?
-
I felt really out of control and that the health-care system took over and dictated the care my family member received.
-
I felt somewhat out of control and that the health-care system took over and dictated the care my family member received.
-
I felt neither in control nor out of control.
-
I felt I had some control over the care my family member received.
-
I felt that I had good control over the care my family member received.
-
Not applicable.
Q10: when making decisions, did you have adequate time to have your concerns addressed and questions answered?
-
I could have used more time.
-
I had adequate time.
-
Not applicable.
Family members of patients who died were asked to complete the questions listed below. Family members of survivors were asked to go to question 14.
Q11: which of the following best describes your views?
-
I felt my family member’s life was prolonged unnecessarily.
-
I felt my family member’s life was slightly prolonged unnecessarily.
-
I felt my family member’s life was neither prolonged nor shortened unnecessarily.
-
I felt my family member’s life was slightly shortened unnecessarily.
-
I felt my family member’s life was shortened unnecessarily.
Q12: during the final hours of your family member’s life, which of the following best describes your views?
-
I felt that he/she was very uncomfortable.
-
I felt that he/she was slightly uncomfortable.
-
I felt that he/she was mostly comfortable.
-
I felt that he/she was very comfortable.
-
I felt that he/she was totally comfortable.
Q13: during the last few hours before your family member’s death, which of the following best describes your view?
-
I felt very abandoned by the health-care team.
-
I felt abandoned by the health-care team.
-
I felt neither abandoned nor supported by the health-care team.
-
I felt supported by the health-care team.
-
I felt very supported by the health-care team.
All family members are asked to complete question 14 as follows:
Q14: how satisfied were you with the amount of control you had over the care of your family member (response options: very dissatisfied/slightly dissatisfied/mostly satisfied/very satisfied/completely satisfied)?
The last three questions have free-text responses, providing an opportunity for family members to make comments and suggestions on the care provided in the ICU.
Q15: do you have any suggestions on how to make care provided in the ICU better?
Q16: do you have comments on things we did well?
Q17: please add any comments or suggestions that you feel may be helpful to the staff of this ICU.
Scores
The domain scores and the overall family satisfaction score are derived from the 14 items that comprise the domain satisfaction with care and the 10 items that comprise the domain satisfaction with decision-making. Each item response is scored on a scale from 0 (least satisfied) to 100 (most satisfied) as follows: poor/very dissatisfied, 0; fair/slightly dissatisfied, 25; good/mostly satisfied, 50; very good/very satisfied, 75; and excellent/completely satisfied, 100. Responses to items 7, 8, 9 and 10 in the domain satisfaction with decision-making are scored as follows:
Q7: did you feel included in the decision-making process?
-
I felt very excluded, 0.
-
I felt somewhat excluded, 25.
-
I felt neither included nor excluded, 50.
-
I felt somewhat included, 75.
-
I felt very included, 100.
Q8: did you feel supported during the decision-making process?
-
I felt totally unsupported, 0.
-
I felt slightly unsupported, 25.
-
I felt neither supported nor unsupported, 50.
-
I felt supported, 75.
-
I felt very supported, 100.
Q9: did you feel you had control over the care of your family member?
-
I felt really out of control and that the health care system took over and dictated the care my family member received, 0.
-
I felt somewhat out of control and that the health care system took over and dictated the care my family member received, 25.
-
I felt neither in control nor out of control, 50.
-
I felt I had some control over the care my family member received, 75.
-
I felt that I had good control over the care my family member received, 100.
Q10. when making decisions, did you have adequate time to have your concerns addressed and questions answered?
-
I could have used more time, 0.
-
I had adequate time, 100.
Summary overall family satisfaction scores and domain scores (satisfaction with care and satisfaction with decision-making) are calculated by averaging the item responses for the items included overall and within each domain, provided at least 70% of items are complete (i.e. 17 out of 24 for the overall family satisfaction score, 10 out of 14 for satisfaction with care, 7 out of 10 for satisfaction with decision-making). 21
Discussion
In summary, the face and content validity and comprehensibility of the FS-ICU-24 was good and adaptation to the UK setting required relatively minor edits. These included changes to section heading titles, clarification of wording of questions, addition to existing guidance, clarification of North American English to UK English, general formatting and enhanced design of the layout.
Chapter 3 Set-up and delivery of the cohort study
Introduction
Phase 2 of the FREE study comprised a cohort study, which collected data on family satisfaction with intensive care using the UK FS-ICU-24. This chapter reports the methods and results of the set-up of the study, recruitment of adult general ICUs, recruitment of family members and administration of, and response to, the FS-ICU-24.
Methods
The cohort study was a multicentre study nested in the Case Mix Programme (CMP), the national clinical audit of adult general ICUs in England, Wales and Northern Ireland, established in 1995 and co-ordinated by ICNARC (Scotland has its own separate national clinical audit). Since 2010/11, the National Advisory Group on Clinical Audit and Enquiries has listed the CMP in the Department of Health’s ‘Quality Accounts’ as a recognised national audit. 22
Nesting the FREE study in the CMP ensured an efficient design (with respect to participating units and data collection) and facilitated efficient management of the study, including monitoring recruitment and adherence to the protocol at participating units.
An initial psychometric assessment of the UK FS-ICU-24 was incorporated into the design of the cohort study based on returned questionnaires received from family members recruited during the first month of the 12-month recruitment period. This was to assess quickly whether or not substantive changes to the UK FS-ICU-24 were required, so that, if necessary, these could be incorporated and recruitment of family members could recommence using the revised UK FS-ICU-24. As part of the initial psychometric assessment, the criterion validity of the UK FS-ICU-24 among family members of critical care non-survivors was assessed by comparison with the Quality of Dying and Death (QODD) questionnaire23 (see Appendix 3). Family members of non-survivors recruited during the first month of recruitment were also sent the QODD questionnaire. No well-validated measure existed that would enable a validity analysis of the UK FS-ICU-24 among family members of ICU survivors. The methods and results of both the initial and full (based on 12 months’ data) psychometric assessments of the UK FS-ICU-24 are described in Chapter 4.
Research governance
The FREE study was sponsored by ICNARC and phase 2 was co-ordinated by the ICNARC CTU. An ethics application was made to the National Research Ethics Service Committee South Central – Berkshire B on 21 December 2012 and a favourable opinion was received on 20 February 2013.
The CMP has approval under Regulation 5 of the Health Service (Control of Patient Information) Regulations 200224 to process patient identifiable information without consent [approval: PIAG 2–10(f)/2005]. Patient identifiable information processed includes NHS number, date of birth, postcode and sex. A satisfactory Information Governance Toolkit score is required for this approval. A legal agreement is made between ICNARC and the participating units ensuring that the identity of the source of all data (of the hospital, of the unit, of the staff and of the patient) shall remain confidential.
The NIHR CRN Portfolio details high-quality clinical research studies that are eligible for support from the NIHR CRN in England. The study was adopted onto the NIHR CRN Portfolio on 28 January 2013.
Following central R&D approval, site-specific information forms were submitted for each NHS hospital trust. A study site agreement, based on the model agreement for non-commercial research in the health service, was signed by each participating NHS hospital trust and the sponsor (ICNARC).
To ensure transparency, the study was registered for an ISRCTN number. Registration was confirmed on 28 May 2013 (ISRCTN47363549).
Following guidelines from the NIHR, a Study Steering Committee (SSC), with a majority of independent members, was convened to oversee the study on behalf of the funder (the NIHR Health Services and Delivery Research programme) and the sponsor (ICNARC). The SSC met annually during the study. It was chaired by an independent member and comprised lay members (representing patient and family member perspectives), clinicians (critical care nurses and doctors) and methodologists [the chief investigator (KR) and lead clinical investigator (SW) representing the SMG].
Management of phase 2
EW was responsible for the day-to-day management of phase 2 of the FREE study with support from the study administrators, the study statistician and the SMG.
Study management group
The SMG was responsible for overseeing day-to-day management of the study and comprised the chief investigator (KR), lead clinical investigator (SW) and coinvestigators (DAH, SH, DKH, LH, EM, AR, MR). The SMG met regularly throughout the study to ensure adherence to the study protocol and to monitor the conduct and progress of the study.
NHS support costs
Resources equivalent to 0.39 whole-time equivalent of a Band 6 research nurse for each participating unit were agreed with the lead CLRN on 26 February 2013. This was based on an average of 385 patient admissions per year, staying in critical care for 24 hours or more, with an estimated average of 2.5 family members per patient. Participating units, assisted by the ICNARC CTU, negotiated resources required locally for the study with their respective R&D departments and CLRNs.
Changes to the protocol
Following favourable opinion of the study protocol from the research ethics committee on 20 February 2013, four non-substantial amendments were submitted and given favourable opinions. In summary these were:
-
amendment 1 (April 2013) – minor semantic changes and formatting to the consent form, UK FS-ICU-24 (see Appendix 2) and QODD (see Appendix 3) questionnaire
-
amendment 2 (July 2013) – further minor semantic changes to the consent form
-
amendment 3 (October 2013) – further minor semantic changes made to the UK FS-ICU-24
-
amendment 4 (February 2014) – revision to the estimated sample size (see Sample size) and a change to the chair of the SSC.
Patient and public involvement
Engagement with patients and their family members was vital to ensuring the success of the cohort study. A former critical care patient (LH) and a family member of a former critical care patient (MR) were coinvestigators on the FREE study proposal and as such contributed to the design, conduct, analysis and interpretation of the study. Both were members of the SMG and were closely involved in the conduct and monitoring of the study and are coauthors of this report. The charity ICUsteps provided assistance in identifying family members to be independent members of the SSC.
Intensive care unit recruitment
The study aimed to recruit a representative sample of 20 adult general ICUs from England, Wales and Northern Ireland. Adult general ICUs were defined as ICUs or combined intensive care/high-dependency units. Stand-alone high-dependency units and specialist ICUs (e.g. neurosciences, cardiothoracic) were not eligible for participation in the study. The criteria for inclusion were:
-
active participation in the CMP, defined as submission of data no later than 6 weeks after the end of each quarter and returning corrected data validation reports no later than 6 weeks after receipt
-
agreement from the local principal investigator (PI) to recruit up to four eligible family members of consecutive patients staying in the unit for 24 hours or more
-
provision of timely data on recruited family members entered onto a secure, dedicated, web-based data entry system (web portal)
-
commitment to recruit participants for a minimum of 12 months.
All units actively participating in the CMP were invited to express interest in taking part in the study. A stratified random sampling process was chosen to select 20 representative adult general ICUs and to minimise selection bias.
Intensive care units that expressed an interest in taking part in the study were divided by geographical location: England, Wales and Northern Ireland. England, as the largest country, was subdivided into four regions: north-east, north-west, south-east and south-west. Within each country/region, ICUs were divided into those located in university and non-university hospitals and then into large and small ICUs (based on the median number of beds of all ICUs in the CMP). One ICU and one reserve ICU were randomly selected from each group (Table 2). Then the 20 randomly selected ICUs were formally invited to take part in the study and asked to sign a confirmation of participation agreement before submission of the site-specific information form to the local R&D. If an ICU declined the invitation to take part in the study, then the reserve ICU was invited.
| Country | Region | Hospital type | Unit size | Units (n) |
|---|---|---|---|---|
| England | North-east | University | Large | 1 |
| Small | 1 | |||
| Non-university | Large | 1 | ||
| Small | 1 | |||
| North-west | University | Large | 1 | |
| Small | 1 | |||
| Non-university | Large | 1 | ||
| Small | 1 | |||
| South-east | University | Large | 1 | |
| Small | 1 | |||
| Non-university | Large | 1 | ||
| Small | 1 | |||
| South-west | University | Large | 1 | |
| Small | 1 | |||
| Non-university | Large | 1 | ||
| Small | 1 | |||
| Wales | – | University | Small | 1 |
| Non-university | Large | 1 | ||
| Northern Ireland | – | University | Large | 1 |
| Non-university | Small | 1 |
Given that intensive care nurses interact daily with patients and their family members, participating ICUs were encouraged, where possible, to appoint a senior critical care nurse as the local PI to lead and oversee the conduct of the study.
Intensive care unit initiation meeting
Before the study was opened to recruitment, a unit initiation meeting was held on 1 May 2013 in London. Local PIs and research staff from the 20 participating ICUs were invited to attend the meeting. The purpose of the meeting was to present the background and rationale for the FREE study and to discuss delivery of the protocol, which included screening and recruiting eligible family members and data collection and validation. The operational challenges of recruiting (including obtaining informed consent) visiting family members of patients in the ICU were discussed in detail at the meeting.
The PI from each participating ICU was required to attend the meeting; however, if a PI was unable to attend, a teleconference meeting was arranged.
Investigator site file
An investigator site file was provided to each participating unit. This contained all essential documents for the conduct of the study, which included the approved study protocol; the delegation of responsibilities log; copies of the approved participant information sheet and consent form; and all standard operating procedures, for example for screening participants, for obtaining informed consent and for collecting and entering data onto the secure web portal. The local PI was responsible for maintaining the investigator site file.
Intensive care unit management
Communication
The study co-ordinator maintained close contact with the local PI and study team at participating ICUs by telephone and e-mail throughout the study.
Teleconferences were held, initially every month, and then every 2 months, with study teams at participating units. The purpose of these was to provide updates on study progress and to provide a forum for ICU study teams to ask questions, discuss local barriers and challenges to the conduct of the study, and share successes and best practice. Notes, including ‘hints and tips’, from the teleconferences were distributed to all participating ICUs.
Teleconferences were also held with individual unit teams, as required, to address unit-specific issues in the conduct of the study and/or to support training new staff.
Maintenance and motivation
During the study, quarterly newsletters were sent to all participating ICUs. These provided an opportunity to clarify any issues related to the conduct of the study and to share ideas for maximising recruitment, as well as to maintain motivation and involvement through regular updates on progress.
To maintain the profile of the study and motivation at participating ICUs, posters were displayed in staff areas, pocket cards, summarising the eligibility criteria, were distributed, and certificates were given to clinical staff in recognition of their contribution to the study.
Family member recruitment
The study procedures for recruitment and follow-up of family members are summarised in Figure 1.
FIGURE 1.
Summary of study procedures for recruitment and follow-up of family members.

Eligibility criteria
A family member was defined as a person who had a close familial, social or emotional relationship to the patient and was not restricted solely to next of kin. Family members of patients who had spent ≥ 24 hours in a participating ICU were eligible to take part in the study if they:
-
were aged ≥ 18 years
-
had physically visited the patient at the bedside at least once after 24 hours
-
had a UK postal address
-
had not already been recruited into the FREE study.
Family members of patients who were readmitted to the unit (within the same hospital stay) were not eligible during any of the patient’s subsequent admissions to the unit. Up to four eligible family members per patient could be invited to take part in the study.
Screening and recruitment
Following the initiation meeting, or teleconference, screening and recruitment was commenced at participating ICUs once the site research agreement had been signed and all necessary approvals were in place. The recruitment period was 12 months, chosen to avoid potential bias from seasonal variation. Family members of patient admissions after the ICU opened to recruitment were eligible to take part in the study; that is, family members of patients already in the ICU on the day the study opened were not eligible to take part.
To promote awareness of the study and facilitate recruitment, posters and information leaflets providing information about the FREE study were displayed in the unit and in family/visitor waiting rooms (see Appendix 4).
To minimise selection bias, the first four family members to visit the patient after 24 hours, during their first admission to a participating ICU, were identified and approached by an authorised member of staff about taking part in the study. Information about the study was provided to the family member, which included the purpose of the study, the consequences of taking part or not, data security and funding of the study. This information was also provided in a participant information sheet (see Appendix 5), along with the name and contact details of the local PI. This was given to the family member to read before making their decision to take part, or not, in the study. Family members were provided an opportunity to ask questions before being invited to sign the consent form.
Informed consent
Staff members who had received training on the background, rationale and purpose of the FREE study and on the principles of the International Conference on Harmonisation Good Clinical Practice guidelines, specifically in relation to informed consent, were authorised to take informed consent from eligible family members. To support local PIs with staff training, a slide set, approved by the lead CLRN, was provided to all participating ICUs.
Informed consent was a two-stage process: the first was at the time the eligible family member was invited to take part in the study and the second was on receipt of the questionnaire pack.
Stage 1
Once the staff member taking informed consent was satisfied that the family member had read and understood the participant information sheet (see Appendix 5) and all their questions about the study had been answered, the family member was asked to give consent for their name and postal address to be entered onto the secure web portal, to enable a questionnaire pack (see Appendix 6) to be sent to them asking about their satisfaction with care and decision-making in the ICU 3 weeks after the patient (their relative/friend/etc.) had been discharged from the ICU. The family member was informed that, on receipt of the questionnaire pack, they could opt to withdraw from the study. The family member was invited to sign the consent form, which was countersigned, in their presence, by the authorised staff member. One copy of the signed consent form was provided to the family member and one placed in the investigator site file.
For family members who did not speak English, ICU staff were advised to seek assistance from translation services within the hospital trust. Non-English-speaking family members had the option, at the time of giving informed consent, to ask for the UK FS-ICU-24 and all accompanying documents to be translated (see Translation of the UK FS-ICU-24).
Stage 2
On receipt of the questionnaire pack, the family member was invited to complete the questionnaire but also given the option to withdraw from the study by completing and returning the ‘do not wish to participate’ form (see Appendix 6). A blank UK FS-ICU-24 returned to the ICNARC CTU was considered to be a refusal. Contact details for the study team at ICNARC were provided in the questionnaire pack (see Appendix 6) for family members who had further questions or wished to discuss their participation in the study.
Follow-up
Patients for whom at least one family member had been recruited were followed up until discharge from the ICU. Approximately 3 weeks after the patient had been discharged from, or had died in, the ICU, a questionnaire pack (see Appendix 6) was sent from the ICNARC CTU, by post, to the family member(s). Following evidence-based practice25 for maximising responses to postal surveys, the questionnaire pack included a cover letter, the participant information sheet (see Appendix 5), the UK FS-ICU-24 (see Appendix 2), a ‘do not wish to participate’ form, a stamped addressed return envelope and a pen. During the first month of recruitment, family members of non-surviving patients were additionally sent the QODD questionnaire23 (see Appendix 3).
If no response was received within 4 weeks after the first questionnaire was posted, a reminder letter was sent with another questionnaire pack. In consultation with the research ethics committee, there was no further follow-up of family members thereafter. For questionnaire packs returned indicating that the recipient was not known at the address, the postal address was checked with the study team at the recruiting ICU.
Follow-up of family members ended on receipt of a completed (or blank) questionnaire, a completed ‘do not wish to participate’ form or notification to the ICNARC CTU by telephone or e-mail that the family member wished to withdraw from the study, or once the second questionnaire pack had been sent.
Translation of the UK 24-item Family Satisfaction in the Intensive Care Unit questionnaire
Translation of the UK FS-ICU-24 was conducted, on request, using a global language solution provider. The full text of the UK FS-ICU-24 and accompanying documents were translated into the required language and typeset. It was then checked for errors and proofread by a second translator. If translation to another language required a change to how a question was phrased (e.g. it was not possible to translate the question directly from English), then this was discussed with the study team and checked with a second translator to ensure that the meaning of the question had not changed.
Data collection
A secure web portal, hosted by ICNARC, was set up to enable staff at participating ICUs to enter patient and family member data. Data for the FREE study were collected to:
-
enable identification of patients staying in the ICU for 24 hours or more during the study period
-
record the name and postal address of family members who had consented to take part in the study
-
enable a questionnaire pack to be sent to family members 3 weeks following the patient’s discharge from, or death in, the ICU
-
describe the sociodemographic profile of family members who consented to take part in the study
-
enable linkage to the CMP database to monitor recruitment to the study and adherence to the protocol at participating ICUs.
Patient data
In order to link data from family members to patients in participating ICUs, minimal patient data, routinely collected for the CMP, were entered onto the secure web portal as follows:
-
NHS number, CMP admission number and date of birth – to enable linkage of the FREE study database to the CMP database
-
date of admission to the ICU – to confirm that the patient had been in the ICU for 24 hours or more
-
date of discharge from the ICU and status at discharge from the ICU – to enable the questionnaire pack to be sent to the family member(s) 3 weeks after the patient had been discharged from, or had died in, the ICU.
In addition, participation (yes/no) of the patient in a clinical research study during their ICU stay was recorded. The rationale for this was that it could potentially affect whether or not family members agreed to take part in the study (if they had already been approached about the patient taking part in a clinical research study) or their satisfaction with the ICU (e.g. if the clinical research study necessitated additional investigations and/or monitoring of the patient).
Case Mix Programme data
Data for the CMP are collected by trained data collectors to precise rules and definitions. The data then undergo extensive local and central validation for completeness, illogicalities and inconsistencies prior to pooling.
Data collected for the CMP take the form of patient identifiers, demographics, acute severity of illness, outcome and activity for admissions to each ICU. All admissions are followed up for the entire length of their acute hospital stay, both within the hospital housing the CMP ICU and to their ultimate discharge from acute hospital. Raw data are collected for all variables, rather than categorised, derived or aggregated data or scores.
The following data were extracted from the CMP database:
-
demographics:
-
date of birth
-
gender
-
postcode – to enable linkage to census data to score deprivation
-
-
case mix:
-
Acute Physiology and Chronic Health Evaluation (APACHE) II score and predicted risk of hospital death26
-
ICNARC physiology score and predicted risk of hospital death27
(note: raw physiology data are submitted to ICNARC and the scores and predicted risk of hospital death are calculated centrally using standard algorithms to avoid any bias)
-
source of admission to the ICU
-
location immediately prior to the source of admission
[note: if either of these is theatre and recovery in the hospital housing the ICU, data are collected on the type of surgery (elective or emergency) using the classification of the National Confidential Enquiry into Perioperative Deaths]
-
-
outcomes:
-
status (alive/dead) at discharge from the ICU
-
status (alive/dead) at discharge from acute hospital
-
-
activity:
-
length of stay in the ICU – calculated (in fractions of days) from the dates and times of admission to and discharge from the ICU
-
length of stay in hospital – calculated (in whole days) from the dates of admission and of discharge
-
readmissions to the ICU within the same hospital stay – identified from the postcode, date of birth and gender, and confirmed by the participating ICUs.
-
Family member data
At the time of providing consent, family members were asked to complete a short data collection form (see Appendix 7), which asked for contact and sociodemographic information as follows:
-
contact information:
-
name – title, initial(s) and surname
-
full postal address, including postcode
-
relationship to the patient – e.g. husband, wife, brother, sister, son, daughter
-
whether or not they lived with the patient
-
first language
-
whether or not translation of the UK FS-ICU-24 and accompanying documents was required and, if so, the language
-
-
sociodemographic information:
-
age group (18–29 years/30–39 years/40–49 years/50–59 years/60–69 years/70–79 years/≥ 80 years)
-
gender (male/female)
-
ethnicity (white/mixed/Asian or Asian British/black or black British/other)
-
highest level of education [NVQ (National Vocational Qualification)] levels 1 or 2, equivalent to GCSE or O-level/NVQ level 3, equivalent to A-level, AS-level or Higher School Certificate/NVQ Level 4 or 5, equivalent to degree, Higher degree, HNC (Higher National Certificate), HND (Higher National Diploma)/other].
-
These data were entered onto the secure web portal, along with whether or not the family member was documented by the ICU staff as the nominated next of kin.
The questionnaire pack sent to family members included the UK FS-ICU-24 (see Appendix 2 and description in Chapter 2) and, for family members of non-survivors recruited during the first month of recruitment, the QODD questionnaire23 (see Appendix 3). The QODD questionnaire (version 3.2A) is a 25-item questionnaire about the patient’s experiences at the end of life that was developed and validated in North America. Only very minor changes were made to the questionnaire, for example translating words from US English to UK English. One question, asking about health-care costs, was removed, as this is not applicable in the UK. The questionnaire was formatted in the same style as the UK FS-ICU-24.
Screening log
To enable full and transparent reporting for the study, the CMP admission number and the date of ICU admission for patients who stayed in the ICU for 24 hours or more and for whom no family members were recruited were recorded in the screening log. The reason for no family member(s) being recruited was also recorded, which included no eligible family members visited; no eligible family member(s) approached to take part in the study (i.e. missed); family member(s) refused to take part in the study; and eligible family member(s) were recruited but subsequently withdrew from the study. No patient or family identifiers were recorded in the screening log.
Monitoring recruitment of family members
Recruitment of family members was closely monitored. Data entered onto both the secure web portal and the ICU screening logs were checked weekly against the estimated number of patient admissions to the ICU based on CMP data. The number of family members recruited in the previous 7 days was compared with the weekly average recruited. Any discrepancies or other concerns relating to recruitment were discussed with the local PI and ICU study team.
Every month, an ICU recruitment report, based on data entered onto the secure web portal and the ICU screening log, was produced and reviewed with the local PI. The report included the total number of patient admissions (who stayed for 24 hours or longer) and the total number of eligible family members who were and were not recruited during the previous month and how these compared with the monthly averages. The percentage of patients for whom no family member was recruited, particularly where family members had been missed (i.e. not approached about the study), was highlighted and discussed with the local PI.
Data management
Data management was an ongoing process. Data collected for the study were monitored and checked throughout the recruitment period to ensure that data were as complete and accurate as possible. The secure web portal was monitored daily by the study team at the ICNARC CTU to ensure that data entry at participating ICUs was timely, both to enable questionnaire packs to be sent out on time to family members and to allow time for translation of the UK FS-ICU-24 and accompanying documents, where required. Details of family members (name and postal address) recruited were checked for completeness to avoid unnecessary delays in sending out questionnaires.
Every quarter, data entered on the secure web portal and the ICU screening logs were linked to data in the CMP database. Any queries relating to discrepancies in the number of patient admissions (who stayed for 24 hours or more) during the previous quarter or any issues with data linkage were investigated and resolved in consultation with the ICU study team.
Data from completed questionnaires were entered centrally into a secure database at the ICNARC CTU following a standard operating procedure. All identifiable information, such as names (e.g. of patients, family members or critical care staff members), were removed. If a family member provided a comment rather than ticking one of the response options, the comment was recorded and reviewed by two members of the SMG. All queries relating to data entry were reviewed by two members of the SMG (SH/EW) and any disagreement was reviewed and discussed with a third (KR).
Quality checks of data entered were conducted every 2 months. A 20% random sample of questionnaires entered was checked for accuracy of data entry and any issues with data quality were addressed with the ICNARC CTU team. All fields in the database with missing data were checked against the paper UK FS-ICU-24.
Network support
To maintain the profile of the study, regular updates on study progress were provided at quarterly meetings of the NIHR CRN Critical Care Specialty Group and at local CLRN meetings. In addition, updates were provided at national meetings, such as the Annual Meeting of the CMP and the UK Critical Care Research Forum.
Sample size
The duration of recruitment was 1 year, chosen to avoid bias from seasonal variation. Data from the CMP database indicated that an average of 520 patients are admitted per ICU per year. Of these, 74% (385 patients per ICU per year) stayed at least 24 hours, corresponding to approximately 7700 patients across 20 ICUs. No data existed on the average number of family members per patient who visit the ICU. It was assumed that, with an average of 2.5 family members per patient, approximately 19,250 family members would be recruited over a 12-month recruitment period. Assuming a 66% response rate to the postal questionnaire,18 it was estimated that a total sample of approximately 12,700 responses associated with 6700 patients would be received. Using available FS-ICU-24 data, published and unpublished, mean baseline satisfaction domain scores of 80 with standard deviation (SD) 20 were expected. This sample size would therefore give > 90% power to detect (p < 0.01) a binary patient factor present in 10% of the patient population associated with an increase or decrease in domain score of 4 points.
The estimated sample size was revised following completion of the first full quarter of recruitment. Revised targets were calculated for each site based on recruitment of an average of two family members for 80% of patients staying at least 36 hours in the ICU, allowing that on average 10% of patients may have no family members visit. For the purpose of the revised estimate, 36 hours was chosen, instead of 24 hours, to allow for family members of short-term patients who might not have an opportunity to visit during the period of 24–36 hours. Based on the revised ICU targets, it was expected that 14,200 family members (of 7100 patients) would be recruited. Assuming a 60% response rate, it was estimated that a total sample of approximately 8500 responses associated with 5500 patients would be achieved. This sample size would retain > 90% power to detect (p < 0.01) a binary patient factor present in 10% of the patient population associated with an increase or decrease in domain score of 4 points.
Statistical analysis
A descriptive analysis was conducted to describe the:
-
representativeness of ICUs that participated in the study (ICU characteristics)
-
duration of participation of ICUs in the study
-
recruitment and follow-up of family members, overall and by participating ICU
-
patient characteristics and outcomes associated with recruitment and non-recruitment of family members, overall and by participating ICU
-
patient characteristics and outcomes associated with the number of family members per patients recruited, overall and by participating ICU
-
characteristics of family members recruited
-
time taken from first mailing of the questionnaire pack to receipt of a completed questionnaire
-
response rate from family members to the questionnaire, overall and by ICU
-
patient characteristics and outcomes associated with the response, or non-response, of family members to the questionnaire
-
family member characteristics associated with response, or non-response, to the questionnaire.
Discrete variables were summarised as numbers and percentages, which were calculated according to the number of ICUs for which, or individuals for whom, data were available; where values were missing, the denominator is stated in the table. Continuous variables were summarised by standard measures of central tendency and dispersion: mean and SD and/or median and interquartile range (IQR).
Results
Adult general intensive care units
Of the 210 adult general ICUs participating in the CMP in November 2012, 142 (67.6%) expressed an interest in taking part in the study. Twenty ICUs, plus 20 reserve ICUs, were randomly selected to ensure a representative sample of ICUs with respect to geographical location, hospital type (university/non-university) and size of ICU. The 20 ICUs were formally invited to take part in the study and 19 of them accepted. One ICU declined to take part and the corresponding reserve ICU was contacted and accepted the invitation.
Of the 20 ICUs, 19 obtained local R&D approval and the study opened to recruitment on 28 May 2013. One ICU withdrew from the study on 5 July 2013, as it was unable to secure adequate resources (NHS support costs) from its CLRN for the study. The corresponding reserve ICU accepted the invitation to take part and opened to recruitment on 4 September 2013. The remaining 19 ICUs opened to recruitment between 28 May and 8 July 2013 (Figure 2). Delays to opening included issues relating to confirmation of NHS support costs from the CLRN, delays in obtaining R&D approval and delays in local set-up, such as staff training.
FIGURE 2.
Duration of participation of critical care ICUs.
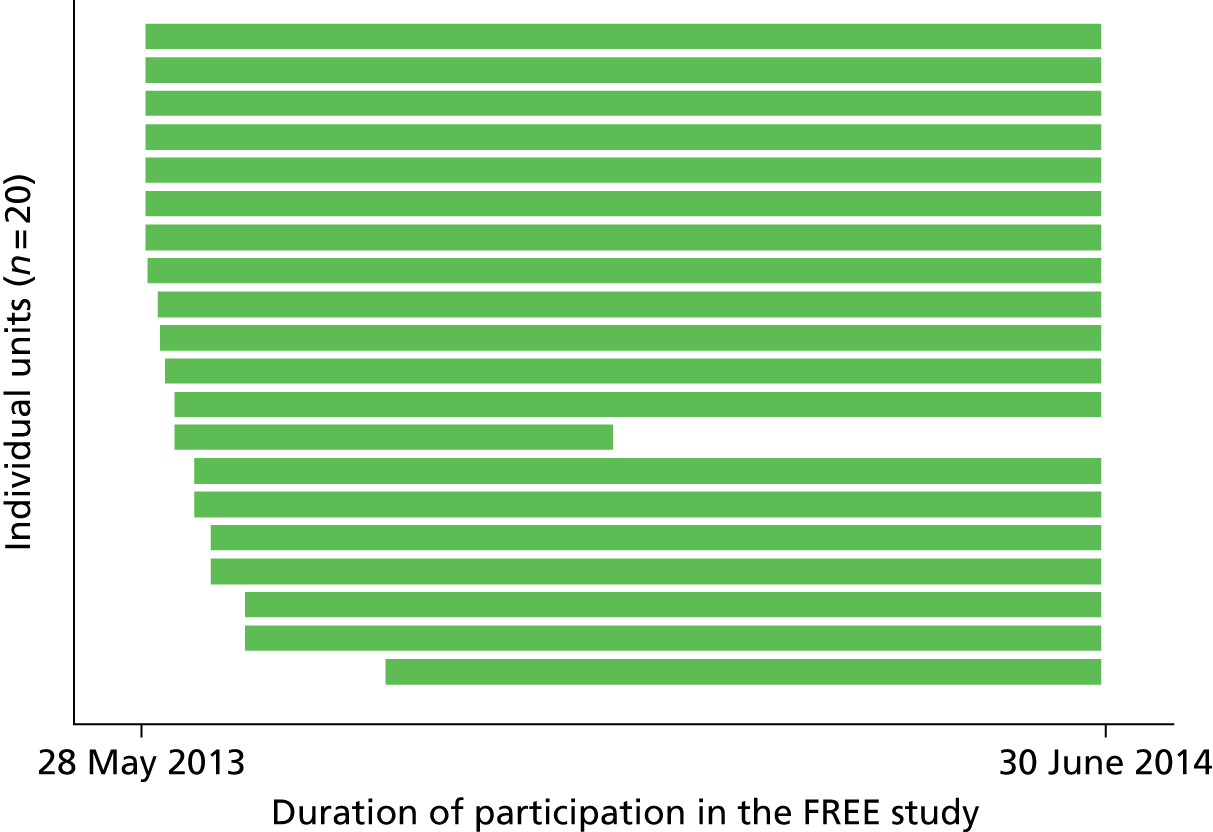
One ICU closed to recruitment on 10 December 2013 because local resource issues meant that the ICU had to withdraw temporarily from participation in the CMP. As a result, no CMP data from this ICU were available for the study analysis. The remaining 19 ICUs continued recruiting family members of patients admitted to the ICU up to 30 June 2014 (Figure 2). The last family member was recruited on 29 July 2014. Complete CMP data for the period 28 May 2013 to 30 June 2014 were received from the 19 ICUs.
Representativeness of intensive care units
The characteristics of the 20 ICUs that participated in the FREE study compared with all (n = 210) adult general ICUs in the CMP are presented in Table 3. Compared with all ICUs in the CMP, there was a higher proportion of large ICUs (more than 14 beds) and a higher proportion of ICUs located in Wales and Northern Ireland in the FREE study. The proportions of ICUs located in university and non-university hospitals were similar (see Table 3).
| Characteristic | CMP ICUs, n (%) | FREE ICUs, n (%) |
|---|---|---|
| Total, N | 210 | 20 |
| Region | ||
| South-east | 60 (28.6) | 4 (20.0) |
| South-west | 33 (15.7) | 4 (20.0) |
| North-east | 48 (22.9) | 4 (20.0) |
| North-west | 47 (22.4) | 4 (20.0) |
| Wales | 13 (6.2) | 2 (10.0) |
| Northern Ireland | 9 (4.3) | 2 (10.0) |
| Type of hospital | ||
| Non-university | 112 (53.3) | 10 (50.0) |
| University | 98 (46.7) | 10 (50.0) |
| Size of ICU | ||
| Small (< 14 beds) | 142 (67.6) | 10 (50.0) |
| Large (≥ 14 beds) | 68 (32.4) | 10 (50.0) |
The characteristics and outcomes of all admissions to 19 of the 20 ICUs that participated in the FREE study, during the period 28 May 2013 to 30 June 2014, were similar to admissions to all CMP ICUs during the same period (Table 4). The mean age of patients was 61.5 years and more than half were male (56.5% in FREE study ICUs; 55.0% in CMP ICUs). The proportion of patients admitted following either elective (26.1% in FREE study ICUs; 22.9% in CMP ICUs) or emergency surgery (19.0% in FREE study ICUs; 18.4% in CMP ICUs) was similar in the two groups of ICUs. Admissions were similar with respect to severity of illness, based on the ICNARC model predicted risk of death [median (IQR) 0.09 (0.03–0.30) for FREE study ICUs; 0.11 (0.03–0.33) for CMP ICUs). Approximately 14% (14.0% in FREE study ICUs; 14.4% in CMP ICUs) of patients died in the ICU and around 21% (20.6% and 21.3%, respectively) died before leaving hospital. The ICU median length of stay was the same for ICU survivors in all CMP ICUs and FREE study ICUs [2.2 (IQR 1.0–4.9) days] and similar for non-survivors [1.9 (IQR 0.7–5.1) days in FREE study ICUs; 2.1 (IQR 0.7–5.7) days in CMP ICUs].
| Parameter | CMP | FREE study |
|---|---|---|
| Total number of ICUs | 209a | 19a |
| Total number of admissions | 149,779 | 18,270 |
| Mean age (years) (SD) | 61.5 (18.0) | 61.5 (18.0) |
| Sex male (%) | 82,444 (55.0) | 10,316 (56.5) |
| Ethnicity, n (%) | ||
| White | 135,767 (90.6) | 16,439 (90.0) |
| Asian | 4815 (3.2) | 439 (2.4) |
| Black | 3250 (2.2) | 327 (1.8) |
| Other | 2434 (1.6) | 445 (2.4) |
| Not stated | 3513 (2.3) | 620 (3.4) |
| Mean distance (km) from patient home to hospital (SD), median (IQR) [N] | 25.0 (54.2), 8.7 (3.9–19.3) [128,169] | 31.7 (64.5), 9.2 (4.2–20.8) [18,090] |
| APACHE II severe comorbidities, n (%) | ||
| 0 | 123,437 (82.4) | 14,742 (80.7) |
| 1 | 20,906 (14.0) | 2648 (14.5) |
| 2 | 5053 (3.4) | 793 (4.3) |
| ≥ 3 | 383 (0.3) | 87 (0.5) |
| Admission type, n (%) | 149,765 | 18,270 |
| Medical | 87,940 (58.7) | 10,039 (54.9) |
| Elective surgery | 34,284 (22.9) | 4761 (26.1) |
| Emergency surgery | 27,541 (18.4) | 3470 (19.0) |
| Surgical status of surgical admissions, n (%) | 61,825 | 8231 |
| Planned surgery | 28,267 (45.7) | 3985 (48.4) |
| Unplanned surgery | 33,558 (54.3) | 4246 (51.6) |
| Mean ICNARC physiology score (SD) | 16.9 (9.3) | 16.5 (9.2) |
| Median ICNARC predicted risk of death (IQR) [N] | 0.10 (0.03–0.33) [142,654] | 0.09 (0.03–0.30) [17,261] |
| Mean APACHE II acute physiology score (SD) | 11.4 (6.1) | 11.3 (5.9) |
| Mean APACHE II score (SD) | 15.7 (7.0) | 15.6 (6.9) |
| Median APACHE II predicted risk of death (IQR) [N] | 0.12 (0.04–0.29) [132,197] | 0.11 (0.04–0.28) [16,193] |
| Mechanical ventilation during first 24 hours, n (%) [N] | 58,687 (39.4) [148,975] | 7008 (38.5) [18,187] |
| ICU mortality, n (%) [N] | 21,505 (14.4) [149,779] | 2560 (14.0) [18,270] |
| Acute hospital mortality, n (%) [N] | 29,945 (21.0) [142,670] | 3550 (20.6) [17,266] |
| ICU length of stay (days), mean (SD), median (IQR) [N] | ||
| Overall | 4.7 (8.0), 2.2 (1.0–5.0) [149,741] | 4.6 (7.8), 2.1 (1.0–4.9) [18,270] |
| Survivors | 4.7 (7.9), 2.2 (1.0–4.9) [128,236] | 4.6 (7.9), 2.2 (1.0–4.9) [15,710] |
| Non-survivors | 5.0 (9.0), 2.1 (0.7–5.7) [21,505] | 4.4 (7.6), 1.9 (0.7–5.1) [2560] |
| Acute hospital length of stay (days), mean (SD), median (IQR) [N] | ||
| Overall | 21.1 (29.8), 12.0 (6.0–25.0) [142,176] | 22.1 (30.5), 12.0 (6.0–26.0) [17,207] |
| Survivors | 22.5 (30.6), 13.0 (7.0–26.0) [112,292] | 23.5 (30.7), 14.0 (7.0–27.0) [13,662] |
| Non-survivors | 16.0 (26.1), 7.0 (2.0–19.0) [29,884] | 16.6 (29.3), 7.0 (2.0–19.0) [3545] |
The characteristics and outcomes of patients who stayed in the ICU for more than 24 hours were also similar in the two groups of ICUs (Table 5).
| Parameter | CMP | FREE study |
|---|---|---|
| Total number of ICUs | 209a | 19a |
| Total number of patients | 106,284 | 12,328 |
| Mean age (years) (SD) | 62.0 (17.4) | 62.1 (17.4) |
| Sex male (%) | 59,029 (55.5) | 6999 (56.8) |
| Ethnicity, n (%) | ||
| White | 96,349 (90.7) | 11,094 (90.0) |
| Asian | 3482 (3.3) | 302 (2.4) |
| Black | 2258 (2.1) | 223 (1.8) |
| Other | 1744 (1.6) | 293 (2.4) |
| Not stated | 2451 (2.3) | 416 (3.4) |
| Mean distance (km) from patient home to hospital (SD), median (IQR) [N] | 25.5 (55.3), 8.5 (3.8–19.2) [91,485] | 31.3 (64.9), 9.0 (4.1–19.6) [12,199] |
| APACHE II severe comorbidities, n (%) | ||
| 0 | 87,232 (82.1) | 10,013 (81.2) |
| 1 | 15,098 (14.2) | 1765 (14.3) |
| 2 | 3677 (3.5) | 495 (4.0) |
| ≥ 3 | 277 (0.3) | 55 (0.4) |
| Admission type, n (%) | 106,275 | 12,328 |
| Medical | 65,900 (62.0) | 7078 (57.4) |
| Elective surgery | 20,505 (19.3) | 2838 (23.0) |
| Emergency surgery | 19,870 (18.7) | 2412 (19.6) |
| Surgical status of surgical admissions, n (%) | 40,375 | 5250 |
| Planned surgery | 16,833 (41.7) | 2368 (45.1) |
| Unplanned surgery | 23,542 (58.3) | 2882 (54.9) |
| Mean ICNARC physiology score (SD) | 17.5 (8.5) | 17.1 (8.5) |
| Median ICNARC predicted risk of death (IQR) [N] | 0.13 (0.04–0.35) [105,629] | 0.12 (0.03–0.33) [12,221] |
| Mean APACHE II acute physiology score (SD) | 11.9 (5.7) | 11.7 (5.6) |
| Mean APACHE II score (SD) | 16.2 (6.6) | 16.1 (6.5) |
| Median APACHE II predicted risk of death (IQR) [N] | 0.15 (0.05–0.32) [101,232] | 0.14 (0.05–0.31) [11,846] |
| Mechanical ventilation during first 24 hours, n (%) [N] | 46,199 (43.5) [106,095] | 5240 (42.6) [12,312] |
| ICU mortality, n (%) [N] | 13,825 (13.0) [106,284] | 1570 (12.7) [12,328] |
| Acute hospital mortality, n (%) [N] | 21,861 (20.7) [105,632] | 2502 (20.5) [12,221] |
| ICU length of stay (days), mean (SD), median (IQR) [N] | ||
| Overall | 5.9 (8.4), 3.2 (1.9–6.4) [106,251] | 5.7 (7.9), 3.1 (1.9–6.2) [12,328] |
| Survivors | 5.8 (8.1), 3.1 (1.9–6.1) [92,426] | 5.7 (7.9), 3.1 (1.9–6.1) [10,758] |
| Non-survivors | 7.1 (10.1), 3.9 (2.0–8.1) [13,825] | 6.1 (7.7), 3.7 (1.9–6.9) [1570] |
| Acute hospital length of stay (days), mean (SD), median (IQR) [N] | ||
| Overall | 24.1 (31.4), 14.0 (7.0–29.0) [105,546] | 24.7 (30.6), 15.0 (7.0–29.0) [12,206] |
| Survivors | 25.4 (32.3), 15.0 (8.0–30.0) [83,704] | 26.1 (31.3), 16.0 (8.0–31.0) [9706] |
| Non-survivors | 19.3 (27.5), 10.0 (4.0–23.0) [21,842] | 19.0 (26.9), 10.0 (4.0–22.0) [2500] |
Patients
Between 28 May 2013 and 30 June 2014 there were 18,757 admissions to the 20 participating ICUs, of which 1677 were readmissions to the ICU during the same hospital stay. Of the 17,080 patients admitted to critical care during the study period, 4341 (25.4%) stayed for less than 24 hours. Of the remaining 12,739 patients (74.6%), who stayed in the ICU for 24 hours or more, nine were excluded from the study because they were discharged from the ICU after 1 August 2014. This was because there was insufficient time before the database was closed (on 12 September 2014) for a questionnaire to be posted to and completed by their family members. In total, data from 12,730 patients were included in the analysis.
Of these 12,730 patients, there were 5788 (45.5%) for whom no family member was recruited because there were no eligible family members or no eligible family members visited the patient during their stay in the ICU (n = 2200 patients); or the family members were not approached about the study or were approached but not recruited because, for example, they did not visit the patient again in the ICU (n = 3588). Family members of 6942 (54.5%) patients were invited to take part in the study. Of these, the family members of 547 patients refused the invitation. For 15 patients, family members were recruited but subsequently withdrew because they no longer wished to take part or were withdrawn because they were found to be ineligible for the study (Figure 3).
FIGURE 3.
Flow of patient admissions.
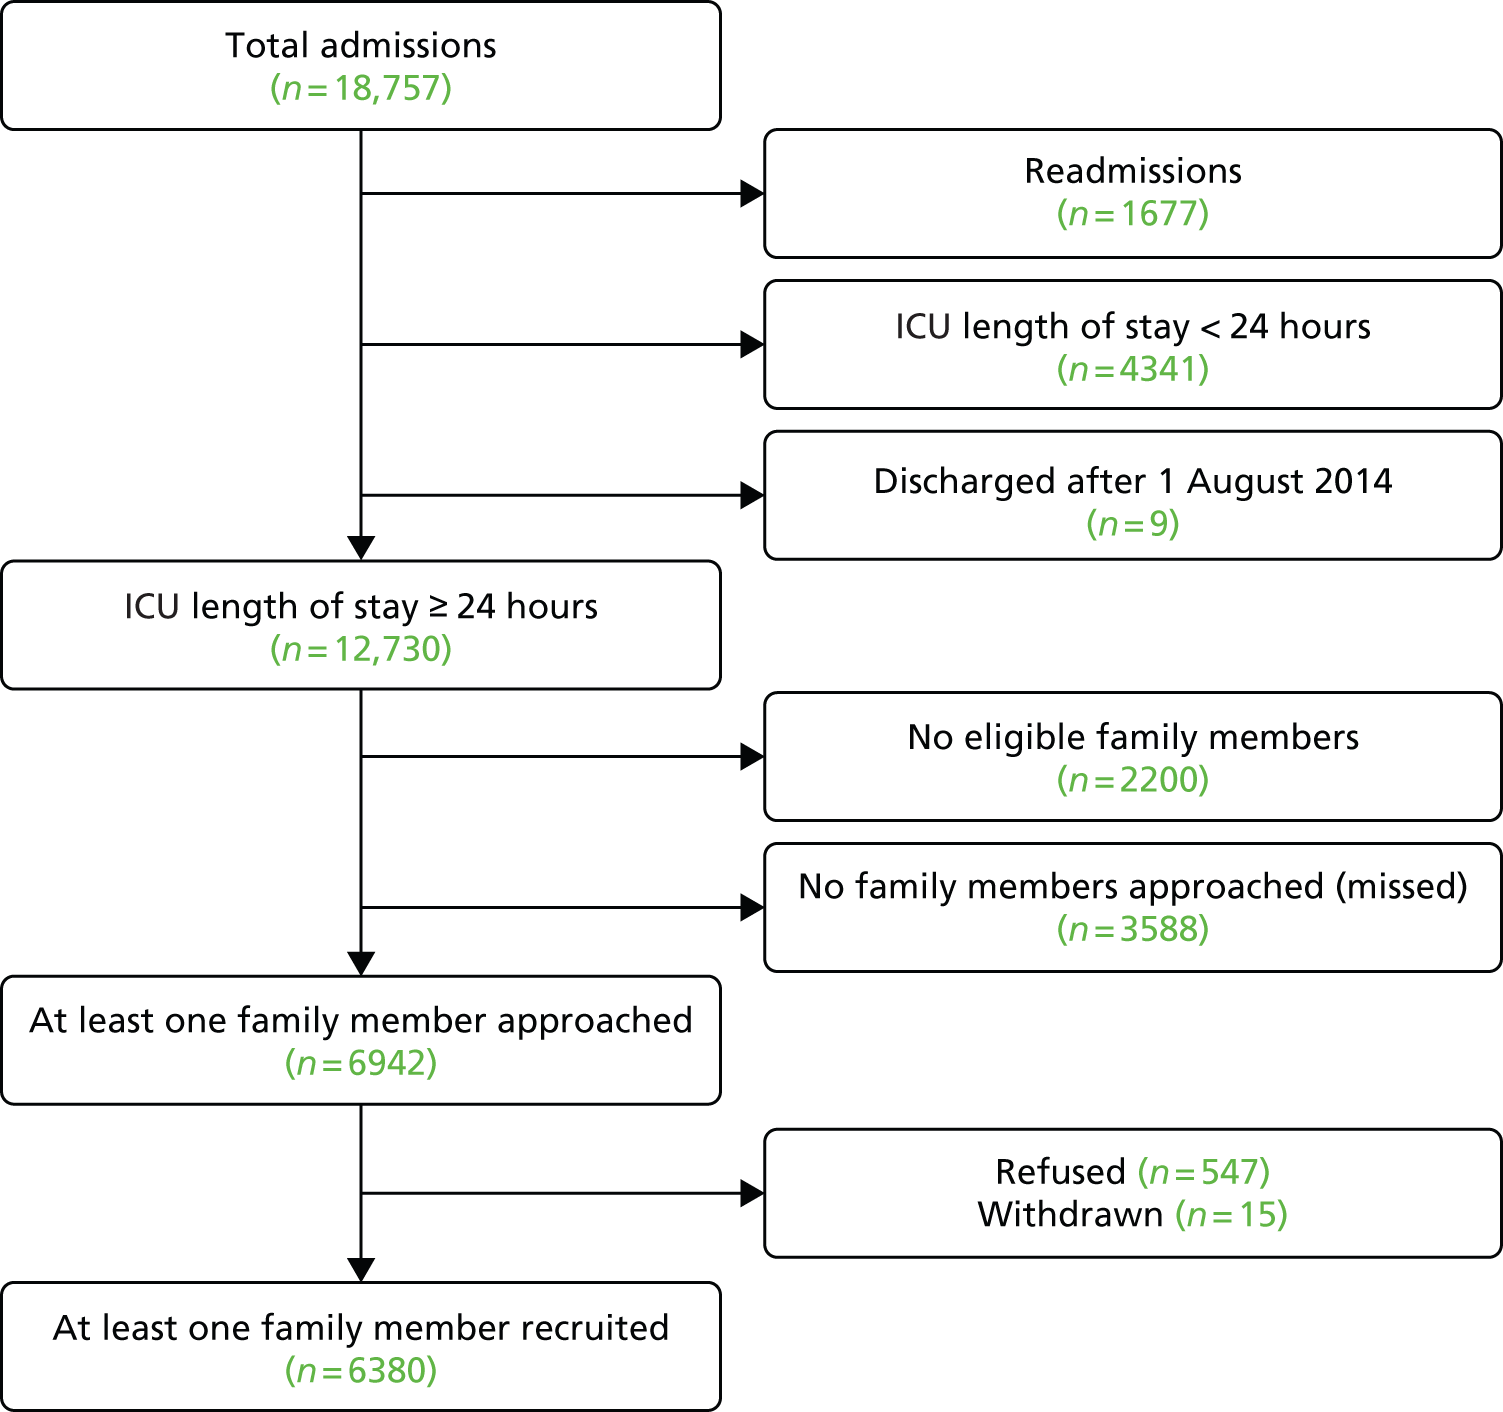
Overall, at least one family member was recruited for 60.6% (n = 6380) of the 10,530 patients who stayed in the ICU for 24 hours or more and who were visited in the ICU by one or more eligible family members. Recruitment varied across ICUs, ranging from 41.2% to 79.4% of patients with one or more eligible family members recruited (Table 6).
| ICU | Total | Patients with at least one family member recruited (%) | Patients with no family members recruited (%) |
|---|---|---|---|
| A | 613 | 393 (64.1) | 220 (35.9) |
| B | 288 | 212 (73.6) | 76 (26.4) |
| C | 484 | 232 (47.9) | 252 (52.1) |
| D | 354 | 281 (79.4) | 73 (20.6) |
| E | 370 | 254 (68.6) | 116 (31.4) |
| F | 822 | 475 (57.8) | 347 (42.2) |
| G | 967 | 611 (63.2) | 356 (36.8) |
| H | 353 | 278 (78.8) | 75 (21.2) |
| I | 261 | 141 (54.0) | 120 (46.0) |
| J | 315 | 229 (72.7) | 86 (27.3) |
| K | 498 | 239 (48.0) | 259 (52.0) |
| L | 469 | 209 (44.6) | 260 (55.4) |
| M | 639 | 384 (60.1) | 255 (39.9) |
| N | 767 | 498 (64.9) | 269 (35.1) |
| O | 242 | 179 (74.0) | 63 (26.0) |
| P | 901 | 519 (57.6) | 382 (42.4) |
| Q | 350 | 256 (73.1) | 94 (26.9) |
| R | 686 | 460 (67.1) | 226 (32.9) |
| S | 357 | 147 (41.2) | 210 (58.8) |
| T | 794 | 383 (48.2) | 411 (51.8) |
| Total | 10,530 | 6380 (60.6) | 4150 (39.4) |
No family member(s) were recruited for 39.4% of patients because eligible family members were not approached (n = 3588, 34.1%), the family member(s) refused the invitation to take part (n = 547, 5.2%) or the family member(s) withdrew or were withdrawn from the study (n = 15, 0.1%). There was considerable variation across ICUs in the reasons reported for non-recruitment of family members (Table 7). For example, the proportion of patients whose family members were not approached ranged from 15.7% to 56.9% of patients.
| ICU | One or more family members recruited (%) | Reasons for non-recruitment | ||
|---|---|---|---|---|
| Not approached (%) | Refused (%) | Withdrawn (%) | ||
| A | 393 (64.1) | 160 (26.1) | 60 (9.8) | – |
| B | 212 (73.6) | 71 (24.7) | 5 (1.7) | – |
| C | 232 (47.9) | 234 (48.3) | 17 (3.5) | 1 (0.2) |
| D | 281 (79.4) | 62 (17.5) | 11 (3.1) | – |
| E | 254 (68.6) | 109 (29.5) | 6 (1.6) | 1 (0.3) |
| F | 475 (57.8) | 296 (36.0) | 50 (6.1) | 1 (0.1) |
| G | 611 (63.2) | 325 (33.6) | 29 (3.0) | 2 (0.2) |
| H | 278 (78.8) | 57 (16.1) | 18 (5.1) | – |
| I | 141 (54.0) | 108 (41.4) | 11 (4.2) | 1 (0.4) |
| J | 229 (72.7) | 77 (24.4) | 9 (2.9) | – |
| K | 239 (48.0) | 207 (41.6) | 52 (10.4) | – |
| L | 209 (44.6) | 234 (49.9) | 26 (5.5) | – |
| M | 384 (60.1) | 218 (34.1) | 36 (5.6) | 1 (0.2) |
| N | 498 (64.9) | 224 (29.2) | 43 (5.6) | 2 (0.3) |
| O | 179 (74.0) | 38 (15.7) | 22 (9.1) | 3 (1.2) |
| P | 519 (57.6) | 313 (34.7) | 66 (7.3) | 3 (0.3) |
| Q | 256 (73.1) | 94 (26.9) | – | – |
| R | 460 (67.1) | 176 (25.7) | 50 (7.3) | – |
| S | 147 (41.2) | 203 (56.9) | 7 (2.0) | – |
| T | 383 (48.2) | 382 (48.1) | 29 (3.7) | – |
| Overall | 6380 (60.6) | 3588 (34.1) | 547 (5.2) | 15 (0.1) |
The characteristics and outcomes of patients for whom at least one family was recruited, compared with those of patients for whom no family member was recruited, are presented in Table 8. Patients with no family members recruited were more likely to have been admitted to ICU following elective surgery (27.7%) than patients for whom at least one family member was recruited (18.5%) and were less likely to have been mechanically ventilated during their first 24 hours in the ICU (36.9% vs. 48.1%, respectively). In addition, their median (IQR) ICNARC predicted risk of death was 0.08 (0.03–0.28) compared with 0.16 (0.05–0.37) for patients for whom at least one family member was recruited. Even so, the ICU mortality rate for patients for whom no family members were recruited was higher than patients for whom at least one family member was recruited (14.7% vs. 10.9%). This is probably because the group of patients for whom no family members were recruited included a mix of low-risk patients (e.g. admitted following elective surgery), who tend to have a short stay (24 hours or less) in the ICU, and very sick (high-risk) patients, whose family members were not approached about the study because of the severity of their illness. During the study, ICU staff reported that family members of very sick patients, particularly those who were clearly distressed, were often not approached about taking part.
| Parameter | One or more family members recruited | No family members recruited |
|---|---|---|
| Total, N | 6233a | 6095b |
| Mean age (years) (SD) | 62.2 (17.2) | 62.0 (17.5) |
| Sex male (%) | 3492 (56.0) | 3507 (57.5) |
| Ethnicity, n (%) | ||
| White | 5688 (91.3) | 5406 (88.7) |
| Asian | 145 (2.3) | 157 (2.6) |
| Black | 84 (1.3) | 139 (2.3) |
| Other | 134 (2.1) | 159 (2.6) |
| Not stated | 182 (2.9) | 234 (3.8) |
| Median distance (km) from patient home to hospital (IQR) [N] | 9.0 (4.2–19.5) [6182] | 8.9 (4.1–19.7) [6017] |
| APACHE II severe comorbidities, n (%) | ||
| 0 | 5058 (81.1) | 4955 (81.3) |
| 1 | 897 (14.4) | 868 (14.2) |
| 2 | 253 (4.1) | 242 (4.0) |
| ≥ 3 | 25 (0.4) | 30 (0.5) |
| Admission type, n (%) | 6233 | 6095 |
| Medical | 3851 (61.8) | 3227 (52.9) |
| Elective/scheduled surgery | 1150 (18.5) | 1688 (27.7) |
| Emergency/urgent surgery | 1232 (19.8) | 1180 (19.4) |
| Surgical status of surgical admissions n (%) | 2382 | 2868 |
| Planned surgery | 951 (39.9) | 1417 (49.4) |
| Unplanned surgery | 1431 (60.1) | 1451 (50.6) |
| Mean ICNARC physiology score (SD) | 18.1 (8.3) | 16.0 (8.6) |
| Median ICNARC predicted risk of death (IQR) [N] | 0.16 (0.05–0.37) [6160] | 0.08 (0.03–0.28) [6061] |
| Mean APACHE II acute physiology score (SD) | 12.1 (5.5) | 11.2 (5.7) |
| Mean APACHE II score (SD) | 16.6 (6.4) | 15.6 (6.6) |
| Median APACHE II predicted risk of death (IQR) [N] | 0.17 (0.06–0.34) [5952] | 0.11 (0.04–0.27) [5894] |
| Mechanical ventilation during first 24 hours, n (%) [N] | 2995 (48.1) [6225] | 2245 (36.9) [6087] |
| ICU mortality, n (%) [N] | 677 (10.9) [6233] | 893 (14.7) [6095] |
| Acute hospital mortality, n (%) [N] | 1180 (19.2) [6160] | 1322 (21.8) [6061] |
| ICU length of stay (days), mean (SD), median (IQR) [N] | ||
| Overall | 7.9 (9.7), 4.8 (2.8–8.9) [6233] | 3.5 (4.7), 2.1 (1.5–3.8) [6095] |
| Survivors | 7.7 (9.7), 4.7 (2.7–8.8) [5556] | 3.5 (4.6), 2.1 (1.5–3.7) [5202] |
| Non-survivors | 9.1 (9.4), 6.0 (3.7–10.7) [677] | 3.8 (4.9), 2.3 (1.5–4.2) [893] |
| Acute hospital length of stay (days), mean (SD), median (IQR) [N] | ||
| Overall | 28.4 (32.2), 18.0 (10.0–35.0) [6150] | 20.8 (28.3), 12.0 (6.0–23.0) [6056] |
| Survivors | 29.8 (33.3), 19.0 (10.0–36.0) [4972] | 22.2 (28.6), 13.0 (7.0–25.0) [4734] |
| Non-survivors | 22.7 (26.6), 13.0 (7.0–27.0) [1178] | 15.7 (26.7), 7.0 (3.0–16.0) [1322] |
Overall, an average of two family members per patient were recruited. The first family member was recruited within a median (IQR) of 2 (1–3) days of the patient’s admission to the ICU. However, there was considerable variation across ICUs in the number of family members per patient recruited (Table 9).
| ICU | Mean number of family members recruited per patient | Number of family members recruited per patient (%) | Median days from patient admission to recruitment of first family member (IQR) | |||
|---|---|---|---|---|---|---|
| 1 | 2 | 3 | 4 | |||
| A | 1.8 | 196 (49.9) | 125 (31.8) | 46 (11.7) | 26 (6.6) | 2 (1–3) |
| B | 2.6 | 35 (16.5) | 66 (31.1) | 54 (25.5) | 57 (26.9) | 1 (1–3) |
| C | 1.9 | 94 (40.5) | 80 (34.5) | 37 (15.9) | 21 (9.1) | 2 (1–3) |
| D | 2.3 | 79 (28.1) | 91 (32.4) | 59 (21.0) | 52 (18.5) | 2 (1–3) |
| E | 1.9 | 106 (41.7) | 89 (35.0) | 39 (15.4) | 20 (7.9) | 2 (1–2) |
| F | 1.8 | 195 (41.1) | 187 (39.4) | 68 (14.3) | 25 (5.3) | 2 (1–3) |
| G | 1.7 | 283 (46.3) | 235 (38.5) | 73 (11.9) | 20 (3.3) | 2 (1–4) |
| H | 2.6 | 54 (19.4) | 87 (31.3) | 65 (23.4) | 72 (25.9) | 2 (1–3) |
| I | 2.2 | 41 (29.1) | 51 (36.2) | 29 (20.6) | 20 (14.2) | 2 (1–3) |
| J | 2.1 | 86 (37.6) | 71 (31.0) | 42 (18.3) | 30 (13.1) | 3 (2–4) |
| K | 1.7 | 129 (54.0) | 71 (29.7) | 29 (12.1) | 10 (4.2) | 2 (1–3) |
| L | 1.8 | 103 (49.3) | 65 (31.1) | 27 (12.9) | 14 (6.7) | 2 (1–4) |
| M | 2.1 | 146 (38.0) | 120 (31.3) | 69 (18.0) | 49 (12.8) | 2 (1–2) |
| N | 2.0 | 190 (38.2) | 159 (31.9) | 96 (19.3) | 53 (10.6) | 2 (1–3) |
| O | 1.8 | 80 (44.7) | 68 (38.0) | 15 (8.4) | 16 (8.9) | 1 (1–2) |
| P | 2.0 | 205 (39.5) | 175 (33.7) | 75 (14.5) | 64 (12.3) | 2 (1–2) |
| Q | 1.6 | 142 (55.5) | 83 (32.4) | 24 (9.4) | 7 (2.7) | 2 (1–3) |
| R | 1.6 | 246 (53.5) | 150 (32.6) | 50 (10.9) | 14 (3.0) | 2 (1–2) |
| S | 1.7 | 68 (46.3) | 56 (38.1) | 17 (11.6) | 6 (4.1) | 2 (1–3) |
| T | 2.0 | 160 (41.8) | 114 (29.8) | 60 (15.7) | 49 (12.8) | 2 (1–4) |
| Total | 2.0 | 2638 (41.3) | 2143 (33.6) | 974 (15.3) | 625 (9.8) | 2 (1–3) |
Family members
Characteristics of family members
A total of 12,346 family members were recruited into the study between 29 May 2013 and 29 July 2014. The largest group (44.8%) of family members who took part in the study were aged between 40 and 60 years of age and approximately two-thirds (63.3%) were female. Approximately one-third (33.9%) of family members reported being the patient’s child and a quarter (25.2%) reported being the patient’s partner. Just over one-third (39.4%) were reported by the ICU to be the nominated next of kin. A similar proportion (33.1%) of family members reported that they lived with the patient (Table 10).
| Characteristic | Family members recruited |
|---|---|
| Total number of family members recruited | 12,346 |
| Age group (years), n (%) | 12,068 |
| < 30 | 1429 (11.8) |
| 30–39 | 1590 (13.2) |
| 40–49 | 2760 (22.9) |
| 50–59 | 2646 (21.9) |
| 60–69 | 2131 (17.7) |
| 70–79 | 1211 (10.0) |
| ≥ 80 | 301 (2.5) |
| Sex, n (%) | 12,145 |
| Female | 7687 (63.3) |
| Male | 4458 (36.7) |
| Ethnicity, n (%) | 12,346 |
| White | 11,379 (92.2) |
| Asian | 355 (2.9) |
| Black | 161 (1.3) |
| Other | 195 (1.6) |
| Not stated | 256 (2.1) |
| Deprivation, n (%) | 11,740 |
| 1 (least deprived) | 2113 (18.0) |
| 2 | 2406 (20.5) |
| 3 | 2415 (20.6) |
| 4 | 2545 (21.7) |
| 5 (most deprived) | 2261 (19.3) |
| Median distance (km) from family member home to hospital (IQR) [N] | 11.6 (5.1–30.7) [11,803] |
| Relationship, n (%): ‘I am the patient’s . . .’ | 12,343 |
| Partner | 3105 (25.2) |
| Child | 4186 (33.9) |
| Parent | 1054 (8.5) |
| Sibling | 1271 (10.3) |
| Other relative | 1973 (16.0) |
| Other non-relative | 754 (6.1) |
| Next of kin, n (%) | 11,702 |
| No | 7086 (60.6) |
| Yes | 4616 (39.4) |
| Lives with patient, n (%) | 12,343 |
| No | 8255 (66.9) |
| Yes | 4088 (33.1) |
| Education level, n (%) | |
| NVQ 1 or 2 | 3147 (25.5) |
| NVQ 3 | 2086 (16.9) |
| NVQ 4 or 5 | 2936 (23.8) |
| Other | 2124 (17.2) |
| Not stated | 2053 (16.6) |
| First language, n (%) | |
| Not English | 335 (2.7) |
| English | 12,011 (97.3) |
Patient characteristics and outcomes associated with recruitment of family members
Tables 11 and 12 show the patient characteristics and outcomes associated with recruitment and non-recruitment of family members, respectively. The proportion of patients for whom no eligible family members were recruited was higher for patients admitted to the ICU on a Thursday (53.8%) or Friday (54.7%) than on other days of the week (e.g. Monday, 42.5%) (see Table 12). This probably reflects the lack of research staff available at weekends, when these patients would have been in the period from 24 to 48 hours in the ICU, thereby triggering their family members to be screened for eligibility. As expected, the longer the patient spent in the ICU, the more likely it was that at least one family member was recruited into the study; 55% of patients who stayed between 48 hours and 7 days and 79% of patients who stayed for ≥ 7 days had one or more family members recruited, compared with 14.3% of patients who stayed between 24 and 36 hours. Although numbers were small, recruitment of family members was lowest for patients who were of black ethnicity compared with other ethnic groups; 37.7% of patients who were of black ethnicity had one or more family members recruited, compared with 51.3% who were of white ethnicity and 48.0% who were of Asian ethnicity. Patients in the least deprived group (based on postcode) were more likely to have at least one family member recruited (53.4%) than the most deprived group (47.4%) (see Table 11). A higher proportion of patients admitted following elective surgery had no family members recruited (59.5%) than either patients admitted following emergency surgery (48.9%) or patients who were medical (non-surgical) admissions (45.6%) (see Table 12). These patients were less sick and would have had a shorter length of stay in the ICU and therefore less opportunity for family members to be recruited. The number of family members recruited per patient was generally higher with increasing severity of illness, based on the ICNARC physiology score and predicted risk of death,27 as these patients tend to stay longer in the ICU, thereby providing greater opportunity for family members to be recruited. However, patients who did not survive the ICU were less likely to have had a family member recruited (43.1%) than patients who survived the ICU (51.6%) (see Table 12), suggesting that family members of the sickest patients were less likely to have been approached.
| Parameter | Number of family members recruited | Total | |||
|---|---|---|---|---|---|
| 1 | 2 | 3 | 4 | ||
| Total, N (%)a | 2570 (20.8) | 2087 (16.9) | 957 (7.8) | 619 (5.0) | 6233 (50.6) |
| Day of admission, n (%) | |||||
| Sunday | 293 (22.5) | 241 (18.5) | 125 (9.6) | 88 (6.8) | 747 (57.5) |
| Monday | 431 (22.3) | 325 (16.8) | 147 (7.6) | 96 (5.0) | 999 (51.7) |
| Tuesday | 449 (23.1) | 341 (17.6) | 142 (7.3) | 84 (4.3) | 1016 (52.3) |
| Wednesday | 386 (20.0) | 339 (17.6) | 142 (7.4) | 94 (4.9) | 961 (49.8) |
| Thursday | 338 (17.7) | 312 (16.3) | 133 (7.0) | 99 (5.2) | 882 (46.2) |
| Friday | 363 (18.7) | 279 (14.4) | 151 (7.8) | 84 (4.3) | 877 (45.3) |
| Saturday | 310 (22.5) | 250 (18.1) | 117 (8.5) | 74 (5.4) | 751 (54.5) |
| ICU length of stay, n (%) | |||||
| 24–30 hours | 104 (8.4) | 50 (4.1) | 17 (1.4) | 6 (0.5) | 177 (14.3) |
| 30–36 hours | 61 (10.8) | 42 (7.4) | 10 (1.8) | 6 (1.1) | 119 (21.0) |
| 36–48 hours | 319 (16.6) | 151 (7.9) | 61 (3.2) | 25 (1.3) | 556 (28.9) |
| 48 hours to 7 days | 1430 (24.2) | 1166 (19.7) | 420 (7.1) | 234 (4.0) | 3250 (55.0) |
| ≥ 7 days | 656 (24.3) | 678 (25.1) | 449 (16.6) | 348 (12.9) | 2131 (79.0) |
| Age group (years), n (%) | |||||
| < 30 | 149 (20.3) | 116 (15.8) | 56 (7.6) | 44 (6.0) | 365 (49.7) |
| 30–39 | 169 (22.0) | 112 (14.6) | 61 (8.0) | 35 (4.6) | 377 (49.2) |
| 40–49 | 278 (21.7) | 180 (14.0) | 100 (7.8) | 68 (5.3) | 626 (48.8) |
| 50–59 | 395 (21.1) | 309 (16.5) | 127 (6.8) | 111 (5.9) | 942 (50.3) |
| 60–69 | 604 (21.3) | 528 (18.6) | 215 (7.6) | 132 (4.6) | 1479 (52.1) |
| 70–79 | 611 (20.5) | 510 (17.1) | 266 (8.9) | 146 (4.9) | 1533 (51.5) |
| ≥ 80 | 364 (19.6) | 332 (17.9) | 132 (7.1) | 83 (4.5) | 911 (49.1) |
| Sex, n (%) | |||||
| Female | 1163 (21.8) | 891 (16.7) | 408 (7.6) | 284 (5.3) | 2746 (51.5) |
| Male | 1407 (20.1) | 1196 (17.1) | 549 (7.8) | 335 (4.8) | 3487 (49.9) |
| Ethnicity, n (%) | |||||
| White | 2340 (21.1) | 1897 (17.1) | 878 (7.9) | 573 (5.2) | 5688 (51.3) |
| Asian | 61 (20.2) | 52 (17.2) | 20 (6.6) | 12 (4.0) | 145 (48.0) |
| Black | 36 (16.1) | 31 (13.9) | 12 (5.4) | 5 (2.2) | 84 (37.7) |
| Other | 66 (22.5) | 41 (14.0) | 16 (5.5) | 11 (3.8) | 134 (45.7) |
| Not stated | 67 (16.1) | 66 (15.9) | 31 (7.5) | 18 (4.3) | 182 (43.8) |
| Median distance (km) from patient home to hospital (IQR) [N] | 9.1 (4.2–20.3) [2542] | 9.6 (4.4–21.2) [2073] | 8.6 (4.0–17.2) [954] | 7.8 (3.8–16.0) [613] | 9.0 (4.2–19.5) [6182] |
| Deprivation, n (%) | 2538 | 2069 | 954 | 612 | 6173 |
| 1 (least deprived) | 411 (22.2) | 347 (18.8) | 147 (8.0) | 83 (4.5) | 988 (53.4) |
| 2 | 503 (22.6) | 378 (17.0) | 193 (8.7) | 109 (4.9) | 1183 (53.2) |
| 3 | 502 (20.3) | 430 (17.4) | 204 (8.3) | 124 (5.0) | 1260 (51.0) |
| 4 | 588 (21.0) | 444 (15.9) | 213 (7.6) | 147 (5.3) | 1392 (49.8) |
| 5 (most deprived) | 534 (18.8) | 470 (16.5) | 197 (6.9) | 149 (5.2) | 1350 (47.4) |
| Admission type, n (%) | |||||
| Medical | 1470 (20.8) | 1279 (18.1) | 654 (9.2) | 448 (6.3) | 3851 (54.4) |
| Elective surgery | 573 (20.2) | 393 (13.8) | 134 (4.7) | 50 (1.8) | 1150 (40.5) |
| Emergency surgery | 527 (21.8) | 415 (17.2) | 169 (7.0) | 121 (5.0) | 1232 (51.1) |
| Surgical status, n (%) | |||||
| Planned surgery | 475 (20.1) | 335 (14.1) | 108 (4.6) | 33 (1.4) | 951 (40.2) |
| Unplanned surgery | 625 (21.7) | 473 (16.4) | 195 (6.8) | 138 (4.8) | 1431 (49.7) |
| ICNARC physiology score quartile, n (%) | |||||
| 1 (low) | 747 (20.6) | 482 (13.3) | 160 (4.4) | 79 (2.2) | 1468 (40.6) |
| 2 | 617 (20.9) | 481 (16.3) | 201 (6.8) | 114 (3.9) | 1413 (48.0) |
| 3 | 646 (23.1) | 553 (19.8) | 258 (9.2) | 167 (6.0) | 1624 (58.0) |
| 4 (high) | 560 (18.9) | 571 (19.3) | 338 (11.4) | 259 (8.7) | 1728 (58.3) |
| ICNARC predicted risk of death quartile, n (%) | |||||
| 1 (low) | 637 (20.7) | 371 (12.0) | 145 (4.7) | 49 (1.6) | 1202 (39.0) |
| 2 | 659 (21.4) | 505 (16.4) | 167 (5.4) | 136 (4.4) | 1467 (47.6) |
| 3 | 694 (22.5) | 613 (19.9) | 288 (9.3) | 182 (5.9) | 1777 (57.7) |
| 4 (high) | 580 (18.8) | 598 (19.4) | 357 (11.6) | 252 (8.2) | 1787 (58.0) |
| ICU outcome, n (%) | |||||
| Survived | 2351 (21.9) | 1857 (17.3) | 821 (7.6) | 527 (4.9) | 5556 (51.6) |
| Died | 219 (13.9) | 230 (14.6) | 136 (8.7) | 92 (5.9) | 677 (43.1) |
| Parameter | No family members recruited (total)a | No eligible family members | Eligible family members not approached |
|---|---|---|---|
| Total, N (%) | 6095 (49.4)b | 2155 (17.5)c | 3380 (27.4)d |
| Day of admission, n (%) | |||
| Sunday | 553 (42.5) | 195 (15.0) | 290 (22.3) |
| Monday | 934 (48.3) | 307 (15.9) | 527 (27.3) |
| Tuesday | 925 (47.7) | 343 (17.7) | 483 (24.9) |
| Wednesday | 967 (50.2) | 363 (18.8) | 518 (26.9) |
| Thursday | 1029 (53.8) | 395 (20.7) | 566 (29.6) |
| Friday | 1060 (54.7) | 324 (16.7) | 657 (33.9) |
| Saturday | 627 (45.5) | 228 (16.5) | 339 (24.6) |
| ICU length of stay, n (%) | |||
| 24–30 hours | 1057 (85.7) | 586 (47.5) | 452 (36.6) |
| 30–36 hours | 448 (79.0) | 207 (36.5) | 226 (39.9) |
| 36–48 hours | 1367 (71.1) | 526 (27.4) | 775 (40.3) |
| 48 hours to 7 days | 2656 (45.0) | 710 (12.0) | 1654 (28.0) |
| ≥ 7 days | 567 (21.0) | 126 (4.7) | 273 (10.1) |
| Age group (years), n (%) | |||
| < 30 | 370 (50.3) | 124 (16.9) | 220 (29.9) |
| 30–39 | 390 (50.8) | 150 (19.6) | 188 (24.5) |
| 40–49 | 657 (51.2) | 249 (19.4) | 344 (26.8) |
| 50–59 | 932 (49.7) | 333 (17.8) | 520 (27.7) |
| 60–69 | 1360 (47.9) | 466 (16.4) | 751 (26.5) |
| 70–79 | 1443 (48.5) | 515 (17.3) | 791 (26.6) |
| ≥ 80 | 943 (50.9) | 318 (17.2) | 566 (30.5) |
| Sex, n (%) | |||
| Female | 2588 (48.5) | 903 (16.9) | 1436 (26.9) |
| Male | 3507 (50.1) | 1252 (17.9) | 1944 (27.8) |
| Ethnicity, n (%) | |||
| White | 5406 (48.7) | 1856 (16.7) | 3065 (27.6) |
| Asian | 157 (52.0) | 45 (14.9) | 86 (28.5) |
| Black | 139 (62.3) | 63 (28.3) | 59 (26.5) |
| Other | 159 (54.3) | 76 (25.9) | 70 (23.9) |
| Not stated | 234 (56.3) | 115 (27.6) | 100 (24.0) |
| Median distance (km) from patient home to hospital (IQR) [N] | 8.9 (4.1–19.7) [6017] | 8.6 (3.9–19.8) [2118] | 9.4 (4.3–20.1) [3344] |
| Deprivation, n (%) | 6013 | 2117 | 3341 |
| 1 (least deprived) | 861 (46.6) | 303 (16.4) | 491 (26.6) |
| 2 | 1042 (46.8) | 354 (15.9) | 598 (26.9) |
| 3 | 1210 (49.0) | 426 (17.2) | 684 (27.7) |
| 4 | 1402 (50.2) | 474 (17.0) | 778 (27.8) |
| 5 (most deprived) | 1498 (52.6) | 560 (19.7) | 790 (27.7) |
| Admission type, n (%) | |||
| Medical | 3227 (45.6) | 1060 (15.0) | 1796 (25.4) |
| Elective surgery | 1688 (59.5) | 708 (24.9) | 909 (32.0) |
| Emergency surgery | 1180 (48.9) | 387 (16.0) | 675 (28.0) |
| Surgical status, n (%) | |||
| Planned surgery | 1417 (59.8) | 595 (25.1) | 763 (32.2) |
| Unplanned surgery | 1451 (50.3) | 500 (17.3) | 821 (28.5) |
| ICNARC physiology score quartile, n (%) | |||
| 1 (low) | 2152 (59.4) | 884 (24.4) | 1157 (32.0) |
| 2 | 1533 (52.0) | 558 (18.9) | 842 (28.6) |
| 3 | 1175 (42.0) | 394 (14.1) | 643 (23.0) |
| 4 (high) | 1235 (41.7) | 319 (10.8) | 738 (24.9) |
| ICNARC predicted risk of death quartile, n (%) | |||
| 1 (low) | 1880 (61.0) | 798 (25.9) | 988 (32.1) |
| 2 | 1615 (52.4) | 599 (19.4) | 891 (28.9) |
| 3 | 1305 (42.3) | 424 (13.8) | 723 (23.5) |
| 4 (high) | 1295 (42.0) | 334 (10.8) | 778 (25.2) |
| ICU outcome, n (%) | |||
| Survived | 5202 (48.4) | 1946 (18.1) | 2834 (26.3) |
| Died | 893 (56.9) | 209 (13.3) | 546 (34.8) |
Response rate
Of the 12,346 family members recruited, 12,303 (99.7%) were sent a questionnaire pack between 21 and 50 days following the patient’s discharge or death (allowing for delays in this information being entered onto the secure web portal).
The remaining 43 (0.3%) family members were not sent a questionnaire pack because either information (e.g. postal address) provided was incomplete or the date the patient was discharged from the ICU was not provided by the ICU staff or was provided more than 50 days after the patient had been discharged from, or had died in, the ICU.
Of the 12,303 family members who were sent a questionnaire pack, no response was received from 4634 (37.7%) family members, the pack was returned as ‘not known at this address’ (and no further contact information was available from the ICU) for 55 (0.4%) family members and 441 (3.6%) family members refused the invitation to complete the questionnaire. A total of 7173 (58.3%) family members completed and returned the questionnaire (Figure 4).
FIGURE 4.
Family members’ response to postal questionnaire.

A total of 55 family members requested that the questionnaire and accompanying documents be translated (Table 13). Of these 55 family members, 14 (25.5%) completed the questionnaire, 1 (1.8%) refused, 40 (72.7%) did not respond and for 3 (5.5%) the questionnaire was returned as ‘not known at this address’.
| Language | Number of requests |
|---|---|
| Urdu | 14 |
| Welsh | 8 |
| Punjabi | 5 |
| Polish | 4 |
| Tamil | 4 |
| Gujarati | 3 |
| Romanian | 3 |
| Bengali | 2 |
| Chinese (Cantonese) | 2 |
| Lithuanian | 2 |
| Portuguese | 2 |
| Arabic | 1 |
| Greek | 1 |
| Slovakian | 1 |
| Spanish | 1 |
| Thai | 1 |
| Turkish | 1 |
The time, in days, from the questionnaire pack being sent to receipt of a completed questionnaire is presented in Figure 5. Overall, questionnaires were returned within a median of 10 (IQR 6–31) days. Most were returned after the first questionnaire pack was sent, although there was a modest increase in the response rate after the second questionnaire pack was posted; a second questionnaire pack was sent to just over half (54.9%) of family members 4 weeks after the first questionnaire pack.
FIGURE 5.
Time taken (in days) from first mailing to receipt of a completed questionnaire.
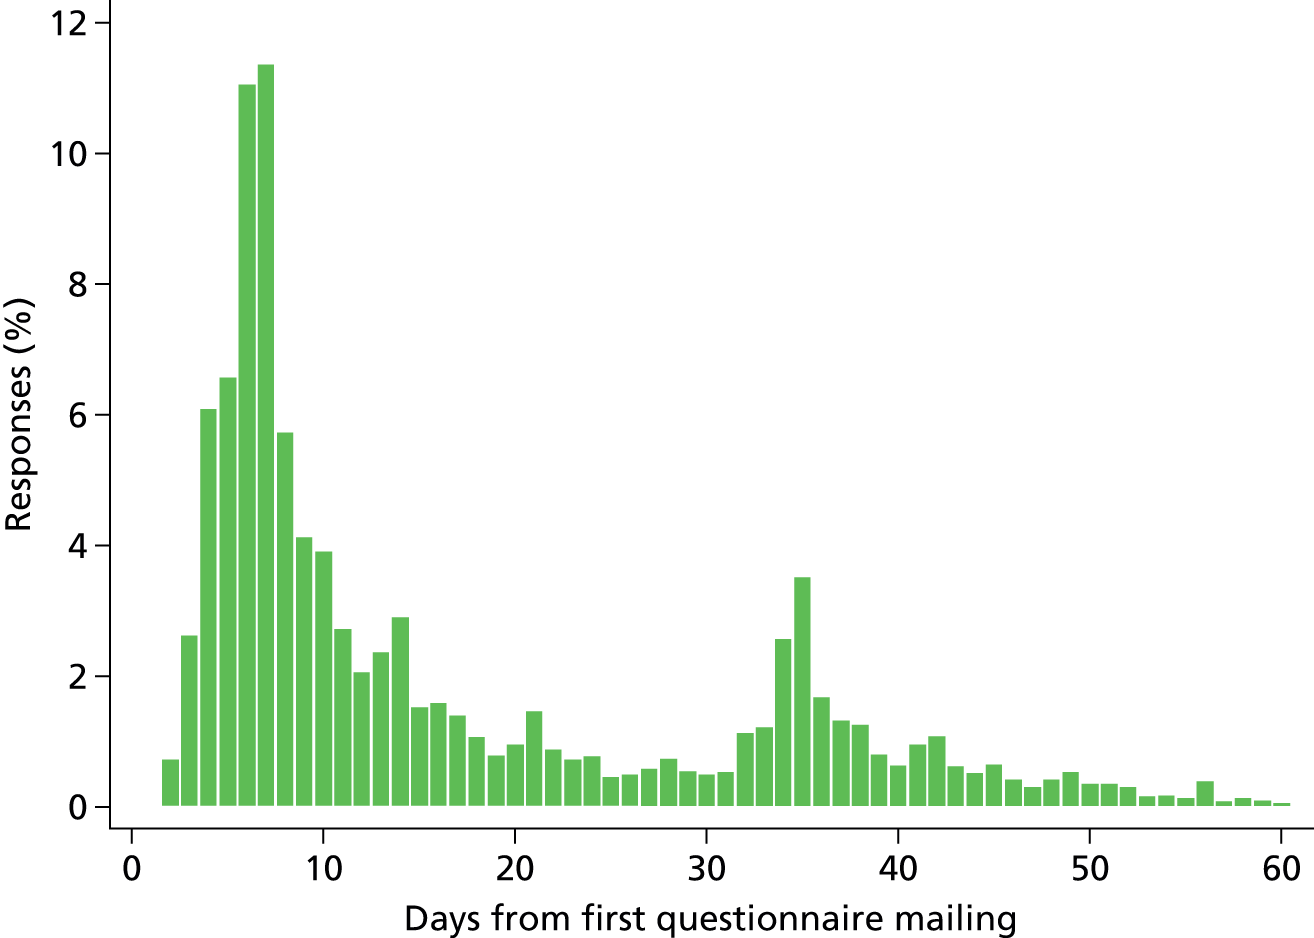
There was variation across ICUs in the proportion of family members who completed the questionnaire, ranging from 48.9% to 73.8% of the family members recruited. Although the overall rate of refusal was low (3.6%), there was some variation across ICUs, ranging from 1.2% to 5.2% of family members refusing to complete the questionnaire (Table 14).
| ICU | Questionnaire pack 1 sent (%) | Questionnaire pack 2 sent (%) | Completed UK FS-ICU-24 received (%) | Reason for no UK FS-ICU-24 received | Time taken (days) for receipt of UK FS-ICU-24, mean (SD), median (IQR) [N] | ||
|---|---|---|---|---|---|---|---|
| No response (%) | Return to sender (not delivered) (%) | Refusal (%) | |||||
| A | 682 (99.1) | 375 (54.5) | 386 (56.6) | 265 (38.9) | 4 (0.6) | 27 (4.0) | 18.1 (18.0), 10.0 (6.0–29.0) [386] |
| B | 531 (95.3) | 281 (50.4) | 327 (61.6) | 184 (34.7) | 2 (0.4) | 18 (3.4) | 18.2 (19.9), 10.0 (6.0–30.0) [327] |
| C | 449 (100.0) | 239 (53.2) | 258 (57.5) | 172 (38.3) | 3 (0.7) | 16 (3.6) | 18.2 (17.5), 11.0 (7.0–25.0) [258] |
| D | 646 (100.0) | 376 (58.2) | 354 (54.8) | 261 (40.4) | 4 (0.6) | 27 (4.2) | 19.2 (20.0), 10.5 (7.0–30.0) [354] |
| E | 481 (100.0) | 224 (46.6) | 321 (66.7) | 138 (28.7) | 2 (0.4) | 20 (4.2) | 17.3 (16.7), 10.0 (6.0–24.0) [321] |
| F | 873 (100.0) | 469 (53.7) | 510 (58.4) | 315 (36.1) | 3 (0.3) | 45 (5.2) | 17.4 (17.2), 9.0 (6.0–29.0) [508] |
| G | 1051 (99.9) | 639 (60.7) | 554 (52.7) | 464 (44.1) | 5 (0.5) | 28 (2.7) | 18.9 (18.6), 10.0 (6.0–33.0) [554] |
| H | 711 (100.0) | 437 (61.5) | 369 (51.9) | 314 (44.2) | 4 (0.6) | 24 (3.4) | 19.8 (20.2), 12.0 (7.0–33.0) [369] |
| I | 310 (100.0) | 135 (43.5) | 200 (64.5) | 94 (30.3) | – | 16 (5.2) | 15.5 (15.2), 9.0 (6.0–18.0) [200] |
| J | 474 (100.0) | 229 (48.3) | 303 (63.9) | 153 (32.3) | 3 (0.6) | 15 (3.2) | 17.7 (17.5), 10.0 (6.0–26.0) [302] |
| K | 392 (98.5) | 189 (47.5) | 265 (67.6) | 116 (29.6) | 1 (0.3) | 10 (2.6) | 20.1 (24.6), 10.0 (6.0–28.0) [265] |
| L | 370 (100.0) | 169 (45.7) | 273 (73.8) | 88 (23.8) | – | 9 (2.4) | 19.2 (17.5), 11.0 (7.0–34.0) [272] |
| M | 789 (100.0) | 434 (55.0) | 474 (60.1) | 281 (35.6) | 3 (0.4) | 31 (3.9) | 19.6 (19.3), 11.0 (7.0–33.0) [473] |
| N | 1008 (100.0) | 585 (58.0) | 540 (53.6) | 436 (43.3) | 9 (0.9) | 23 (2.3) | 18.3 (18.9), 10.0 (6.0–30.0) [539] |
| O | 325 (100.0) | 180 (55.4) | 202 (62.2) | 112 (34.5) | – | 11 (3.4) | 19.9 (18.5), 11.5 (6.0–33.0) [202] |
| P | 1034 (99.8) | 641 (61.9) | 506 (48.9) | 471 (45.6) | 5 (0.5) | 52 (5.0) | 20.6 (19.4), 13.0 (6.0–34.0) [504] |
| Q | 408 (100.0) | 223 (54.7) | 251 (61.5) | 148 (36.3) | 3 (0.7) | 6 (1.5) | 19.6 (19.9), 10.0 (7.0–33.0) [250] |
| R | 750 (99.7) | 410 (54.5) | 442 (58.9) | 268 (35.7) | – | 40 (5.3) | 19.2 (22.1), 9.0 (7.0–31.0) [442] |
| S | 255 (100.0) | 150 (58.8) | 154 (60.4) | 96 (37.6) | 2 (0.8) | 3 (1.2) | 21.9 (21.9), 13.0 (6.0–34.0) [154] |
| T | 764 (100.0) | 397 (52.0) | 484 (63.4) | 258 (33.8) | 2 (0.3) | 20 (2.6) | 19.4 (22.8), 10.0 (6.0–30.0) [483] |
| Total | 12,303 (99.7) | 6782 (54.9) | 7173 (58.3) | 4634 (37.7) | 55 (0.4) | 441 (3.6) | 18.9 (19.5), 10.0 (6.0–31.0) [7163] |
Patient characteristics associated with family member response
Family members of older patients were more likely to complete the questionnaire (e.g. for patients < 30 years old, a completed questionnaire was received from 52.9% of family members compared with 64.6% of family members of patients > 80 years), as were family members of male patients (60.4% vs. 56.4% for female patients). The response rate from family members of patients of white ethnicity (59.8%) was higher than other ethnic groups such as Asian (44.2%) and black (38.2%) ethnicity. There was an association between the level of deprivation (based on the patient’s postcode) and completion of a questionnaire: family members of patients in the least deprived group were more likely to complete the questionnaire than were family members of patients in the most deprived group (63.9% vs. 52.7%). The response from family members of the sickest patients (based on the ICNARC predicted risk of death) was slightly higher than from family members of the least sick patients (62.2% vs. 55.5%), although the response was similar for family members of critical care survivors and non-survivors (58.4% and 60.2%, respectively) (Table 15).
| Parameter | No response (%) | Refusal (%) | Full response (%) |
|---|---|---|---|
| Total | 4515a | 438b | 7019c |
| Patient age group (years) | |||
| < 30 | 326 (45.4) | 12 (1.7) | 380 (52.9) |
| 30–39 | 337 (47.8) | 14 (2.0) | 354 (50.2) |
| 40–49 | 534 (44.9) | 31 (2.6) | 623 (52.4) |
| 50–59 | 774 (42.6) | 46 (2.5) | 997 (54.9) |
| 60–69 | 1017 (36.3) | 93 (3.3) | 1691 (60.4) |
| 70–79 | 1005 (33.5) | 145 (4.8) | 1846 (61.6) |
| ≥ 80 | 522 (29.9) | 97 (5.6) | 1128 (64.6) |
| Critical care length of stay | |||
| 24–30 hours | 107 (39.2) | 13 (4.8) | 153 (56.0) |
| 30–36 hours | 74 (37.2) | 8 (4.0) | 117 (58.8) |
| 36–48 hours | 318 (35.6) | 35 (3.9) | 540 (60.5) |
| 48 hours to 7 days | 2230 (37.8) | 215 (3.6) | 3452 (58.5) |
| ≥ 7 days | 1786 (37.9) | 167 (3.5) | 2757 (58.5) |
| Sex | |||
| Female | 2096 (39.8) | 200 (3.8) | 2968 (56.4) |
| Male | 2419 (36.1) | 238 (3.5) | 4051 (60.4) |
| Ethnicity | |||
| White | 3994 (36.5) | 412 (3.8) | 6546 (59.8) |
| Asian | 146 (54.3) | 4 (1.5) | 119 (44.2) |
| Black | 93 (61.2) | 1 (0.7) | 58 (38.2) |
| Other | 130 (54.6) | 7 (2.9) | 101 (42.4) |
| Not stated | 152 (42.1) | 14 (3.9) | 195 (54.0) |
| Deprivation | 4476 | 430 | 6962 |
| 1 (least deprived) | 606 (32.6) | 65 (3.5) | 1190 (63.9) |
| 2 | 764 (33.9) | 85 (3.8) | 1405 (62.3) |
| 3 | 855 (35.0) | 102 (4.2) | 1488 (60.9) |
| 4 | 1078 (40.4) | 104 (3.9) | 1488 (55.7) |
| 5 (most deprived) | 1173 (44.5) | 74 (2.8) | 1391 (52.7) |
| Admission type | |||
| Medical | 2943 (38.2) | 260 (3.4) | 4509 (58.5) |
| Elective/scheduled surgery | 679 (34.9) | 93 (4.8) | 1174 (60.3) |
| Emergency/urgent surgery | 893 (38.6) | 85 (3.7) | 1336 (57.7) |
| Surgical status of surgical admissions | |||
| Planned surgery | 530 (33.3) | 76 (4.8) | 984 (61.9) |
| Unplanned surgery | 1042 (39.0) | 102 (3.8) | 1526 (57.2) |
| ICNARC physiology score quartiles | |||
| 1 (low) | 1336 (39.4) | 116 (3.4) | 1941 (57.2) |
| 2 | 1109 (38.9) | 113 (4.0) | 1628 (57.1) |
| 3 | 1008 (36.5) | 85 (3.1) | 1667 (60.4) |
| 4 (high) | 1062 (35.8) | 124 (4.2) | 1783 (60.1) |
| ICNARC predicted risk of death quartiles | |||
| 1 (low) | 1227 (41.0) | 106 (3.5) | 1661 (55.5) |
| 2 | 1156 (38.6) | 101 (3.4) | 1735 (58.0) |
| 3 | 1122 (37.5) | 111 (3.7) | 1760 (58.8) |
| 4 (high) | 1010 (33.7) | 120 (4.0) | 1863 (62.2) |
| Critical care ICU outcome | |||
| Survived | 4019 (38.2) | 360 (3.4) | 6149 (58.4) |
| Died | 496 (34.3) | 78 (5.4) | 870 (60.2) |
| Participating in a research study | |||
| No | 4026 (38.0) | 385 (3.6) | 6197 (58.4) |
| Yes | 263 (35.2) | 23 (3.1) | 461 (61.7) |
| Not stated | 226 (36.6) | 30 (4.9) | 361 (58.5) |
Family member characteristics associated with response
The characteristics of family members (collected in the ICU following informed consent) who did and did not complete a questionnaire are presented in Table 16. Generally, the response rate was higher among family members in the older age groups than in the younger age groups. For example, the response rate in family members under 30 years of age was 37.7% compared with 74.6% for the 60- to 69-year-old age group. A higher proportion of females (61.6%) than males (53.8%) completed the questionnaire. Family members of white ethnicity were more likely to complete the questionnaire than family members of Asian or black ethnicity (59.9%, 40.8% and 35.0%, respectively). There was a trend of lower response rates with increasing level of deprivation (based on postcode): 52.7% of family members in the most deprived group completed the questionnaire compared with 63.9% in the least deprived group. There was also a trend for higher response rates with increasing level of education. With respect to the family member’s relationship to the patient, the highest response rates were observed among family members who described themselves as the patient’s partner (70.0%) or parent (64.1%). In addition, family members who were documented in the hospital records as the next of kin or who lived with the patient were more likely to complete the questionnaire (66.1% and 65.0%, respectively) than those who were not the documented next of kin or did not live with the patient (53.4% and 55.6%, respectively). Family members for whom English was their first language were more likely to complete the questionnaire (59.1%) than those for whom it was not (42.7%).
| Parameter | No response | Refusal | Full response |
|---|---|---|---|
| Total, N | 4611 | 441 | 7173 |
| Age group (years), n (%) | |||
| < 30 | 861 (61.2) | 16 (1.1) | 530 (37.7) |
| 30–39 | 827 (52.6) | 23 (1.5) | 721 (45.9) |
| 40–49 | 1208 (44.2) | 63 (2.3) | 1465 (53.5) |
| 50–59 | 886 (33.8) | 80 (3.1) | 1654 (63.1) |
| 60–69 | 440 (20.8) | 97 (4.6) | 1580 (74.6) |
| 70–79 | 220 (18.3) | 117 (9.8) | 862 (71.9) |
| ≥ 80 | 58 (19.5) | 32 (10.8) | 207 (69.7) |
| Not stated | 111 (39.9) | 13 (4.7) | 154 (55.4) |
| Sex, n (%) | |||
| Female | 2663 (35.0) | 261 (3.4) | 4689 (61.6) |
| Male | 1866 (42.3) | 172 (3.9) | 2373 (53.8) |
| Not stated | 82 (40.8) | 8 (4.0) | 111 (55.2) |
| Ethnicity, n (%) | |||
| White | 4111 (36.5) | 415 (3.7) | 6747 (59.9) |
| Asian | 196 (56.3) | 10 (2.9) | 142 (40.8) |
| Black | 101 (64.3) | 1 (0.6) | 55 (35.0) |
| Other | 97 (50.8) | 5 (2.6) | 89 (46.6) |
| Not stated | 106 (41.4) | 10 (3.9) | 140 (54.7) |
| Deprivation, n (%) | 4370 | 420 | 6832 |
| 1 (least deprived) | 634 (30.3) | 84 (4.0) | 1376 (65.7) |
| 2 | 803 (33.6) | 84 (3.5) | 1502 (62.9) |
| 3 | 851 (35.6) | 98 (4.1) | 1443 (60.3) |
| 4 | 1045 (41.6) | 86 (3.4) | 1380 (55.0) |
| 5 (most deprived) | 1037 (46.4) | 68 (3.0) | 1131 (50.6) |
| Median distance (km) from family member home to hospital (IQR) [N] | 10.7 (4.6–29.4) [4394] | 10.7 (5.4–25.3) [424] | 12.3 (5.3–33.2) [6867] |
| Relationship, n (%): ‘I am the patient’s . . .’ | |||
| Partner | 786 (25.6) | 137 (4.5) | 2151 (70.0) |
| Child | 1780 (42.9) | 78 (1.9) | 2292 (55.2) |
| Parent | 338 (32.6) | 34 (3.3) | 665 (64.1) |
| Sibling | 480 (38.3) | 56 (4.5) | 717 (57.2) |
| Other relative | 898 (45.7) | 80 (4.1) | 987 (50.2) |
| Other non-relative | 329 (44.1) | 56 (7.5) | 361 (48.4) |
| Next of kin, n (%) | |||
| No | 3009 (42.9) | 258 (3.7) | 3747 (53.4) |
| Yes | 1380 (30.2) | 167 (3.7) | 3023 (66.1) |
| Not stated | 222 (34.6) | 16 (2.5) | 403 (62.9) |
| Living with patient, n (%) | |||
| No | 3357 (41.1) | 275 (3.4) | 4543 (55.6) |
| Yes | 1252 (30.9) | 166 (4.1) | 2629 (65.0) |
| Not stated | 2 (66.7) | 0 (0.0) | 1 (33.3) |
| Education level, n (%) | |||
| NVQ 1 or 2 | 1284 (41.2) | 104 (3.3) | 1731 (55.5) |
| NVQ 3 | 870 (42.1) | 49 (2.4) | 1149 (55.6) |
| NVQ 4 or 5 | 1032 (35.6) | 49 (1.7) | 1819 (62.7) |
| Other | 702 (33.4) | 128 (6.1) | 1272 (60.5) |
| Not stated | 723 (35.5) | 111 (5.5) | 1202 (59.0) |
| First language n (%) | |||
| Not English | 182 (55.5) | 6 (1.8) | 140 (42.7) |
| English | 4429 (37.2) | 435 (3.7) | 7033 (59.1) |
Discussion
In summary, a representative sample of 20 adult general ICUs participated in phase 2 of the FREE study. Overall, at least one family member was recruited for 60.6% (n = 6380) of the 10,530 patients who stayed in the ICU for 24 hours or more and who were visited in the ICU by one or more eligible family members. Recruitment varied across the ICUs, ranging from 41.2% to 79.4%. Overall, an average of two family members per patient were recruited and the first family member was recruited within a median of 2 (IQR 1–3) days of the patient’s admission to ICU. Of the family members who were sent a questionnaire pack, a total of 7173 (58.3%) family members completed and returned the questionnaire.
Family member responses varied by:
-
Age – 37.7% of family members under 30 years of age responded, compared with 74.6% for the 60- to 69-year old age group.
-
Gender – 61.6% of females responded, compared with 53.8% of males.
-
Ethnicity – 59.9% of white family members responded, compared with 40.8% of Asian ethnicity and 35.0% of black ethnicity.
-
Level of deprivation (based on postcode) – 52.7% in the most deprived responded, compared with 63.9% in the least deprived.
-
Education – there was a trend for higher response rates with increasing level of education.
-
Relationship to the patient – the highest response rates were observed for family members who described themselves as the patient’s partner (70.0%) or parent (64.1%). Family members documented as the next of kin or who lived with the patient were more likely to respond (66.1% and 65.0%, respectively) than those who were not the documented next of kin or did not live with the patient (53.4% and 55.6%, respectively).
-
Language – family members for whom English was the first language were more likely to respond (59.1%) than those for whom it was not (42.7%).
Chapter 4 Psychometric assessment of the UK 24-item Family Satisfaction in the Intensive Care Unit questionnaire
Introduction
This chapter reports the psychometric assessment of the UK FS-ICU-24 in the FREE study. The psychometric assessment comprised an initial psychometric assessment, using data from an internal pilot study, to establish if any changes to the questionnaire were required, and a full psychometric assessment, conducted using the final FREE study data set.
Methods
Initial psychometric assessment
The initial psychometric assessment was conducted using responses from family members of patients who were discharged from, or died in, the ICU between the start of the study and 12 July 2013 (i.e. to whom initial questionnaires were sent out up to 2 August 2013) and with a returned questionnaire received by the ICNARC CTU by 9 September 2013.
Only one family member response per patient was used in the initial psychometric assessment. Where multiple family member responses associated with the same patient had been received, the first family member (according to the order entered on the FREE study secure, web-based data entry system, corresponding to the order in which they visited the patient after 24 hours) was used in the analysis.
Item responses were rescaled and, where relevant, reversed, according to the developer’s rules, so that each response was on a scale from 0 (least satisfied) to 100 (most satisfied). The overall family satisfaction score and domain scores (satisfaction with care and satisfaction with decision-making) were calculated by averaging the item responses for the items included overall/within each domain, provided at least 70% of items had been completed (i.e. 17 out of 24 for the overall family satisfaction score, 10 out of 14 for satisfaction with care and 7 out of 10 for satisfaction with decision-making). Code for processing of FS-ICU-24 responses was translated from SPSS (Statistical Package for the Social Sciences, version not known, IBM Corporation, Armonk, NY, USA) syntax files available from www.thecarenet.ca.
Patients with a family member included in the initial psychometric assessment were described by their age in years (mean with SD, and number and percentage by decade of age), sex, surgical status (elective/scheduled surgery, emergency/urgent surgery or non-surgical), ICNARC physiology score (mean and SD),27 APACHE II score (mean and SD),26 ICU outcome (alive or dead) and ICU length of stay (median and quartiles for survivors and non-survivors). Family members included in the initial psychometric assessment were described by their age in years (mean with SD, and number and percentage by decade of age), sex and relationship to the patient (partner, parent, child, sibling, other relative or other non-relative).
The following descriptive statistics were reported for each individual item on the UK FS-ICU-24:
-
number and percentage of missing responses
-
number and percentage of responses in each category
-
median and quartiles of item response.
The following descriptive statistics were reported for the overall family satisfaction score and for each domain score (satisfaction with care and satisfaction with decision-making):
-
number and percentage of missing scores (response to fewer than 70% of items)
-
number and percentage with floor (0) and ceiling (100) scores
-
median, quartiles, minimum and maximum of score.
The following criteria were used to flag items for possible removal:
-
items with high rates of non-response or ‘not applicable’ responses (> 10%), suggesting irrelevance or lack of comprehensibility or acceptability
-
items with poorer discrimination (> 70% selecting the lowest or highest category)
-
redundant items (item to own scale correlation > 0.8, corrected for overlap)
-
items measuring a construct other than that intended (component loading < 0.4 in confirmatory principal components analysis).
Principal components analysis was performed using expectation-maximisation estimation of the covariance matrix to account for missing data28 with columnwise average nominal sample size. 29
Items meeting the above criteria were discussed among the SMG (including DKH, as representative of the original FS-ICU authors) before a final decision on removal.
Internal consistency (reliability) was evaluated through calculation of the item to own scale correlations and Cronbach’s alpha for each domain. 30 Item to own scale correlations < 0.4 or Cronbach’s alpha < 0.8 were taken as indicative of lack of internal consistency.
Confirmatory factor analysis techniques were used to test the goodness of fit of the two-factor solution for the FS-ICU-24 – that is, the division into the domains of satisfaction with care and satisfaction with decision-making – developed in the North American validation study. 11 Structural equation models were used to estimate the factor loadings for the two-factor solution, using full information maximum likelihood assuming data were missing at random. 31 Goodness of fit was assessed by the likelihood ratio chi-squared statistic versus the saturated model, root mean-squared-error of approximation (RMSEA), comparative fit index (CFI), Tucker–Lewis index (TLI) and coefficient of determination (CD). Values of RMSEA < 0.08, CFI > 0.9 and TLI > 0.9 were taken to indicate a good fit. 32
The criterion validity of the UK FS-ICU-24 among family members of non-survivors was assessed by comparison with the QODD questionnaire. The hypotheses tested were that higher values for the overall family satisfaction score and the two domain scores of the UK FS-ICU-24 would be highly correlated (Pearson correlation coefficients > 0.6) with the overall QODD score, and that scores on four specific items in the QODD (pain control, breathing comfort, care by doctors, care by all providers) would be moderately correlated (Spearman’s rank correlation coefficients 0.4–0.6) with the satisfaction with care domain score. Finally, responses to specific items on the QODD were compared with specific items on the UK FS-ICU-24 (assessed by Spearman’s rank correlation coefficients), as detailed in Table 17.
| UK FS-ICU-24 item | QODD item | Hypothesis |
|---|---|---|
| Concern and caring by ICU staff? The courtesy, respect and compassion your family member (the patient) was given | How often did your loved one appear to keep his/her dignity and self-respect? | Similar question, expect weak to moderate correlation (0.2–0.6) |
| How well the ICU staff assessed and treated your family member’s symptoms: pain | How often did your loved one appear to have his/her pain under control? | Very similar question, expect high correlation (> 0.6) |
| How well the ICU staff assessed and treated your family member’s symptoms: breathlessness | How often did your loved one appear to breathe comfortably? | Very similar question, expect high correlation (> 0.6) |
| Skill and competence of ICU nurses? How well the nurses cared for your family member | Rate the care your loved one received from all doctors and other health care providers (including nurses, caseworkers, and other health care professionals) during the last several days of his or her life while in the ICU | Similar question but not identical staff groups, expect moderate correlation (0.4–0.6) |
| Skill and competence of ICU doctors? How well the doctors cared for your family member | Rate the care your loved one received from his or her doctor during the last several days of his or her life while in the ICU | Very similar question, expect high correlation (> 0.6) |
| During the final hours of your family member’s life, which of the following best describes your views: I felt he/she was very uncomfortable, slightly uncomfortable, etc. | How often did your loved one appear to have his/her pain under control? | Similar question, expect weak to moderate correlation (0.2–0.6) |
| How often did your loved one appear at peace with dying? | Similar question, expect weak to moderate correlation (0.2–0.6) | |
| How often did your loved one appear unafraid of dying? | Similar question, expect weak to moderate correlation (0.2–0.6) |
Full psychometric assessment
The full psychometric assessment was conducted on the final FREE study data set. As with the initial psychometric assessment, only one family member response per patient was used in the full psychometric assessment; however, the approach to selecting the family member was revised to prioritise those most likely to give complete and informative responses. Where multiple family member responses associated with the same patient had been received, priority was given to the family member(s) identified by the site as the patient’s next of kin, followed by the patient’s spouse or partner, then parents or children and finally other family members. Where more than one family member was given equal highest priority, the first family member to visit (according to the order entered on the FREE study secure, web-based data entry system, corresponding to the order in which they visited the patient after 24 hours) was used in the analysis.
Completed questionnaires were coded and scored as for the initial psychometric assessment. However, following the results of the initial psychometric assessment, an alternative, lower, threshold of 60% of items having been completed (i.e. 15 out of 24 for the overall family satisfaction score, 9 out of 14 for satisfaction with care and 6 out of 10 for satisfaction with decision-making) was considered for calculation of the scores. This lower threshold was considered to permit family members who did not answer the four questions relating to involvement in decision-making to be included in the analysis.
The patients, family members, item responses and scores were described as for the initial psychometric assessment. Items with high item non-response rates (> 10%) were taken as indicative of possible irrelevance or lack of comprehensibility or acceptability. Items with poorer discrimination (> 70% selecting the lowest or highest category) were taken as indicative of possible floor/ceiling effects. Item to own scale correlation > 0.8, corrected for overlap, was taken as indicative of possible redundancy. Component loadings < 0.4 in a confirmatory principal components analysis, conducted using the same methods as for the initial psychometric assessment, were taken as indicative of an item measuring a construct other than intended.
Internal consistency was evaluated through calculation of the item to own scale correlations and Cronbach’s alpha for each domain. 30 Item to own scale correlations < 0.4 or Cronbach’s alpha < 0.8 were taken as indicative of lack of internal consistency.
Confirmatory factor analysis techniques were used to test the goodness of fit of the two-factor solution for the FS-ICU-24 developed in the North American validation study11 using the same methods as for the initial psychometric assessment.
Exploratory factor analysis was undertaken using polychoric correlations, which assume that ordinal data are representative of an underlying continuous distribution,33 considering models with two or three principal factors. Initially orthogonal (varimax) rotations34 were applied and subsequently oblique (promax, power 3) rotations were considered to allow for correlation between dimensions. 35 Multiple imputation using fully conditional specification36 was used to account for item-level non-response.
Performance-importance plots were used to identify items that may form likely candidates for quality improvement. 37 Each point in the performance-importance plot corresponds to one item on the UK FS-ICU-24. The Spearman’s rank correlation between each item and the overall family satisfaction score or domain score is plotted on the y-axis against the percentage of respondents rating the item as ‘excellent’ on the x-axis. The plot is divided into quadrants at the mean values on the x- and y-axes. Points in the upper left quadrant correspond to items that are highly correlated with overall satisfaction but have a lower than average proportion of ‘excellent’ ratings and therefore show potential for improvement.
Results
Initial psychometric assessment
At the point of data lock for the initial psychometric assessment, 992 family members had been consented for 481 patients who were discharged from, or died in, 19 participating ICUs between 28 May 2013 and 12 July 2013. Of these, 565 (57%) family members had returned questionnaires, representing 357 (74%) patients from 18 units (the one unit to have no questionnaires returned started the study only on 8 July 2013 and had only two consented family members). The first family member for each patient (based on the order in which sites identified them) was included in the analysis (n = 357).
Characteristics of the patients and family members included in the initial psychometric assessment are reported in Table 18.
| Characteristic | Patients (n = 357) | Family members (n = 357) |
|---|---|---|
| Mean agea (years) (SD) | 64.3 (15.7) | 55.7 (15.5) |
| Ageb (years), n (%) | ||
| < 30 | 12 (3.4) | 23 (6.5) |
| 30–39 | 14 (3.9) | 33 (9.4) |
| 40–49 | 35 (9.8) | 62 (17.6) |
| 50–59 | 50 (14.0) | 88 (25.0) |
| 60–69 | 91 (25.5) | 75 (21.3) |
| 70–79 | 98 (27.5) | 52 (14.8) |
| ≥ 80 | 57 (16.0) | 19 (5.4) |
| Sex,c n (%) | ||
| Female | 137 (42.8) | 243 (68.1) |
| Male | 183 (57.2) | 114 (31.9) |
| Relationship to patient, n (%) | ||
| Partner | N/A | 147 (41.2) |
| Parent | 28 (7.8) | |
| Child | 97 (27.2) | |
| Sibling | 29 (8.1) | |
| Other relative | 35 (9.8) | |
| Other non-relative | 21 (5.9) | |
| Surgical status,c n (%) | ||
| Elective/scheduled surgery | 68 (21.3) | N/A |
| Emergency/urgent surgery | 55 (17.2) | |
| Non-surgical | 197 (61.6) | |
| Mean ICNARC physiology scorec (SD) | 18.1 (8.2) | N/A |
| Mean APACHE II scorec (SD) | 17.0 (6.2) | N/A |
| ICU outcome, n (%) | ||
| Alive | 313 (87.7) | N/A |
| Dead | 44 (12.3) | |
| Median ICU length of stayc (days) (IQR) | ||
| All patients | 3.8 (2.2–6.1) | N/A |
| ICU survivors | 3.7 (2.1–6.2) | |
| ICU non-survivors | 4.1 (2.4–5.6) | |
Responses to individual items on the UK FS-ICU-24 are reported in Table 19 (satisfaction with care), Table 20 (satisfaction with decision-making) and Table 21 (satisfaction with decision-making, if your family member died in the ICU). Characteristics of the UK FS-ICU-24 overall family satisfaction score and domain scores are summarised in Table 22, and the distributions of the scores are shown in Figure 6. Among the 284 (80%) family members for whom both domain scores could be calculated, correlation between the two domains was 0.790 (Figure 7).
| Item | No response (%) | N/A (%) | Response (%) | Median (IQR) | Mean (SD) | Item to own scale correlation | Cronbach’s alpha if item removed | ||||
|---|---|---|---|---|---|---|---|---|---|---|---|
| Excellent | Very good | Good | Fair | Poor | |||||||
| How did we treat your family member (the patient)? | |||||||||||
| Concern and caring by ICU staff? | 2 (0.6) | 0 (0) | 247 (69.2) | 82 (23.0) | 20 (5.6) | 4 (1.1) | 2 (0.6) | 100 (75–100) | 90 (17) | 0.805 | 0.941 |
| Symptom management? | |||||||||||
| Pain | 3 (0.8) | 10 (2.8) | 200 (58.1) | 102 (29.7) | 32 (9.3) | 5 (1.5) | 5 (1.5) | 100 (75–100) | 85 (21) | 0.741 | 0.942 |
| Breathlessness | 7 (2.0) | 46 (12.9) | 171 (56.3) | 89 (29.3) | 34 (11.2) | 6 (2.0) | 4 (1.3) | 100 (75–100) | 84 (21) | 0.716 | 0.942 |
| Agitation | 7 (2.0) | 43 (12.0) | 148 (48.2) | 97 (31.6) | 45 (14.7) | 13 (4.2) | 4 (1.3) | 75 (75–100) | 80 (23) | 0.764 | 0.941 |
| How did we treat you? | |||||||||||
| Consideration of your needs? | 2 (0.6) | 5 (1.4) | 181 (51.7) | 102 (29.1) | 50 (14.3) | 10 (2.9) | 7 (2.0) | 100 (75–100) | 81 (24) | 0.844 | 0.939 |
| Emotional support? | 4 (1.1) | 31 (8.7) | 143 (44.4) | 100 (31.1) | 47 (14.6) | 22 (6.8) | 10 (3.1) | 75 (75–100) | 77 (27) | 0.826 | 0.940 |
| Concern and caring by ICU staff? | 2 (0.6) | 6 (1.7) | 184 (52.7) | 104 (29.8) | 44 (12.6) | 10 (2.9) | 7 (2.0) | 100 (75–100) | 82 (23) | 0.837 | 0.939 |
| Teamwork | |||||||||||
| Co-ordination of care? | 3 (0.8) | 4 (1.1) | 189 (54.0) | 112 (32.0) | 42 (12.0) | 4 (1.1) | 3 (0.9) | 100 (75–100) | 84 (20) | 0.820 | 0.940 |
| Nurses | |||||||||||
| Skill and competence of ICU nurses? | 1 (0.3) | 1 (0.3) | 239 (67.3) | 89 (25.1) | 20 (5.6) | 7 (2.0) | 0 (0) | 100 (75–100) | 89 (17) | 0.814 | 0.941 |
| Frequency of communication with ICU nurses? | 3 (0.8) | 12 (3.4) | 170 (49.7) | 102 (29.8) | 40 (11.7) | 23 (6.7) | 7 (2.0) | 75 (75–100) | 80 (25) | 0.796 | 0.940 |
| Doctors | |||||||||||
| Skill and competence of ICU doctors? | 2 (0.6) | 13 (3.6) | 200 (58.5) | 101 (29.5) | 32 (9.4) | 5 (1.5) | 4 (1.2) | 100 (75–100) | 86 (20) | 0.762 | 0.942 |
| The ICU | |||||||||||
| The atmosphere (mood) of the ICU was? | 2 (0.6) | 1 (0.3) | 156 (44.1) | 129 (36.4) | 53 (15.0) | 12 (3.4) | 4 (1.1) | 75 (75–100) | 80 (22) | 0.731 | 0.942 |
| The waiting room | |||||||||||
| The atmosphere (mood) in the ICU waiting room was? | 5 (1.4) | 35 (9.8) | 67 (21.1) | 101 (31.9) | 82 (25.9) | 49 (15.5) | 18 (5.7) | 75 (50–75) | 62 (29) | 0.446 | 0.951 |
| Level/amount of health care | Completely satisfied | Very satisfied | Mostly satisfied | Slightly dissatisfied | Very dissatisfied | ||||||
| How satisfied were you with the LEVEL or amount of health care your family member received in the ICU? | 1 (0.3) | – | 174 (48.9) | 114 (32.0) | 44 (12.4) | 8 (2.2) | 16 (4.5) | 75 (75, 100) | 80 (26) | 0.431 | 0.951 |
| Question | No response (%) | N/A (%) | Response (%) | Median (IQR) | Mean (SD) | Item to own scale correlation | Cronbach’s alpha if item removed | ||||
|---|---|---|---|---|---|---|---|---|---|---|---|
| Information needs | Excellent | Very good | Good | Fair | Poor | ||||||
| Frequency of communication with ICU doctors? | 3 (0.8) | 30 (8.4) | 93 (28.7) | 94 (29.0) | 70 (21.6) | 38 (11.7) | 29 (9.0) | 75 (50–100) | 64 (32) | 0.741 | 0.931 |
| Ease of getting information? | 2 (0.6) | 12 (3.4) | 153 (44.6) | 108 (31.5) | 45 (13.1) | 26 (7.6) | 11 (3.2) | 75 (75–100) | 77 (27) | 0.821 | 0.927 |
| Understanding of information? | 2 (0.6) | 14 (3.9) | 145 (42.5) | 114 (33.4) | 58 (17.0) | 18 (5.3) | 6 (1.8) | 75 (75–100) | 77 (24) | 0.811 | 0.928 |
| Honesty of information? | 3 (0.8) | 12 (3.4) | 160 (46.8) | 109 (31.9) | 52 (15.2) | 14 (4.1) | 7 (2.0) | 75 (75–100) | 79 (24) | 0.804 | 0.928 |
| Completeness of information? | 2 (0.6) | 10 (2.8) | 145 (42.0) | 115 (33.3) | 48 (13.9) | 24 (7.0) | 13 (3.8) | 75 (75–100) | 76 (27) | 0.857 | 0.925 |
| Consistency of information? | 3 (0.8) | 19 (5.3) | 119 (35.5) | 122 (36.4) | 56 (16.7) | 24 (7.2) | 14 (4.2) | 75 (50–100) | 73 (27) | 0.836 | 0.926 |
| The process of making decisions | I felt very included | I felt somewhat included | I felt neither included nor excluded | I felt somewhat excluded | I felt very excluded | ||||||
| Did you feel included in the decision-making process? | 6 (1.7) | 91 (25.5) | 112 (43.1) | 47 (18.1) | 64 (24.6) | 19 (7.3) | 18 (6.9) | 75 (50–100) | 71 (31) | 0.641 | 0.935 |
| I felt very supported | I felt supported | I felt neither supported nor unsupported | I felt slightly unsupported | I felt totally unsupported | |||||||
| Did you feel supported during the decision-making process? | 5 (1.4) | 100 (28.0) | 94 (37.3) | 71 (28.2) | 57 (22.6) | 8 (3.2) | 22 (8.7) | 75 (50–100) | 71 (30) | 0.686 | 0.933 |
| I felt that I had good control | I felt I had some control | I felt neither in control nor out of control | I felt somewhat out of control | I felt really out of control | |||||||
| Did you feel you had control over the care of your family member? | 4 (1.1) | 77 (21.6) | 77 (27.9) | 55 (19.9) | 91 (33.0) | 20 (7.2) | 33 (12.0) | 50 (50–100) | 61 (32) | 0.643 | 0.935 |
| I had adequate time | I could have used more time | ||||||||||
| When making decisions, did you have adequate time to have your concerns addressed and questions answered? (note: two options) | 6 (1.7) | 150 (42.0) | 177 (88.1) | – | – | – | 24 (11.9) | 100 (100–100) | 88 (33) | 0.566 | 0.938 |
| Question | No response (%) | N/A (%) | Response (%) | Median (IQR) | Mean (SD) | ||||
|---|---|---|---|---|---|---|---|---|---|
| I felt my family member’s life was prolonged unnecessarily | I felt my family member’s life was slightly prolonged unnecessarily | I felt my family member’s life was neither prolonged nor shortened unnecessarily | I felt my family member’s life was slightly shortened unnecessarily | I felt my family member’s life was shortened unnecessarily | |||||
| Which of the following best describes your views?a | 2 (4.5) | 0 (0) | 2 (4.8) | 1 (2.4) | 36 (85.7) | 1 (2.4) | 2 (4.8) | 100 (100–100) | 88 (31) |
| I felt that he/she was totally comfortable | I felt that he/she was very comfortable | I felt that he/she was mostly comfortable | I felt that he/she was slightly uncomfortable | I felt that he/she was totally uncomfortable | |||||
| During the final hours of your family member’s life, which of the following best describes your views | 2 (4.5) | 0 (0) | 11 (26.2) | 17 (40.5) | 8 (19.0) | 1 (2.4) | 5 (11.9) | 75 (50–100) | 67 (31) |
| I felt very supported by the health-care team | I felt supported by the health-care team | I felt neither abandoned nor supported by the health-care team | I felt abandoned by the health-care team | I felt very abandoned by the health-care team | |||||
| During the last few hours before your family member’s death, which of the following best describes your views | 2 (4.5) | 0 (0) | 26 (61.9) | 10 (23.8) | 2 (4.8) | 0 (0) | 4 (9.5) | 100 (75–100) | 82 (30) |
| Score | Not scored (< 70% response) | Scored (≥ 70% response) | Floor (0%) | Ceiling (100%) | Range | Median (IQR) | Mean (SD) | Skewness | Cronbach’s alpha |
|---|---|---|---|---|---|---|---|---|---|
| Overall family satisfaction | 18 (5.0) | 339 (95.0) | 0 (0) | 16 (4.7) | 10–100 | 83 (70–93) | 79 (19) | –1.2 | 0.964 |
| Satisfaction with care domain | 9 (2.5) | 348 (97.5) | 0 (0) | 43 (12.4) | 14–100 | 86 (73–95) | 82 (17) | –1.4 | 0.946 |
| Satisfaction with decision-making domains | 71 (19.9) | 286 (80.1) | 1 (0.3) | 30 (10.5) | 0–100 | 78 (60–93) | 73 (23) | –0.9 | 0.937 |
FIGURE 6.
Distribution of UK FS-ICU-24 overall family satisfaction score and domain scores in the initial psychometric assessment.

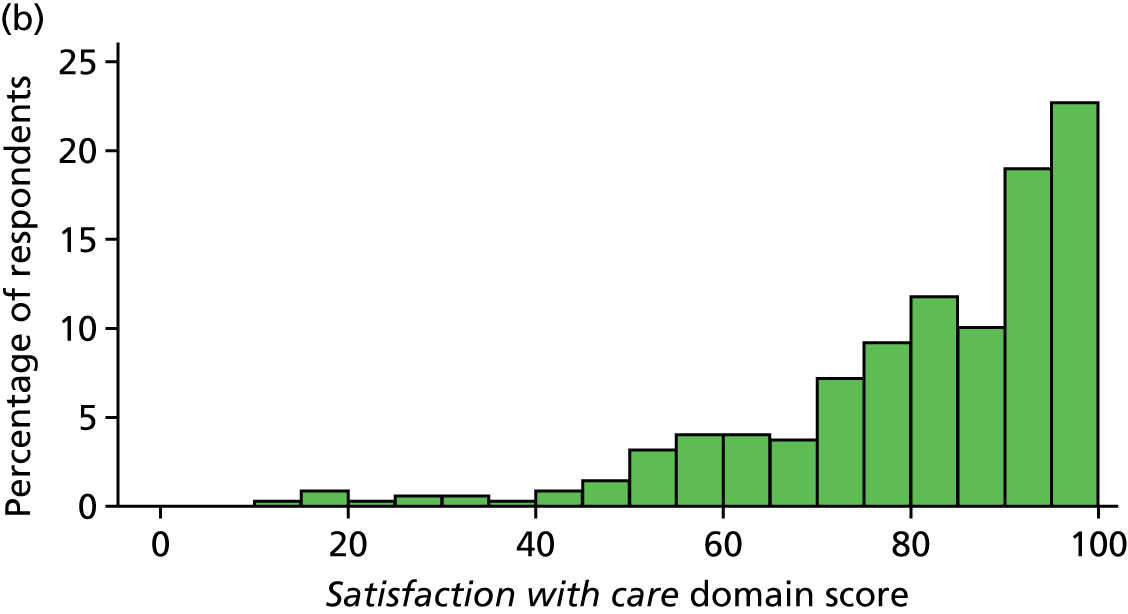
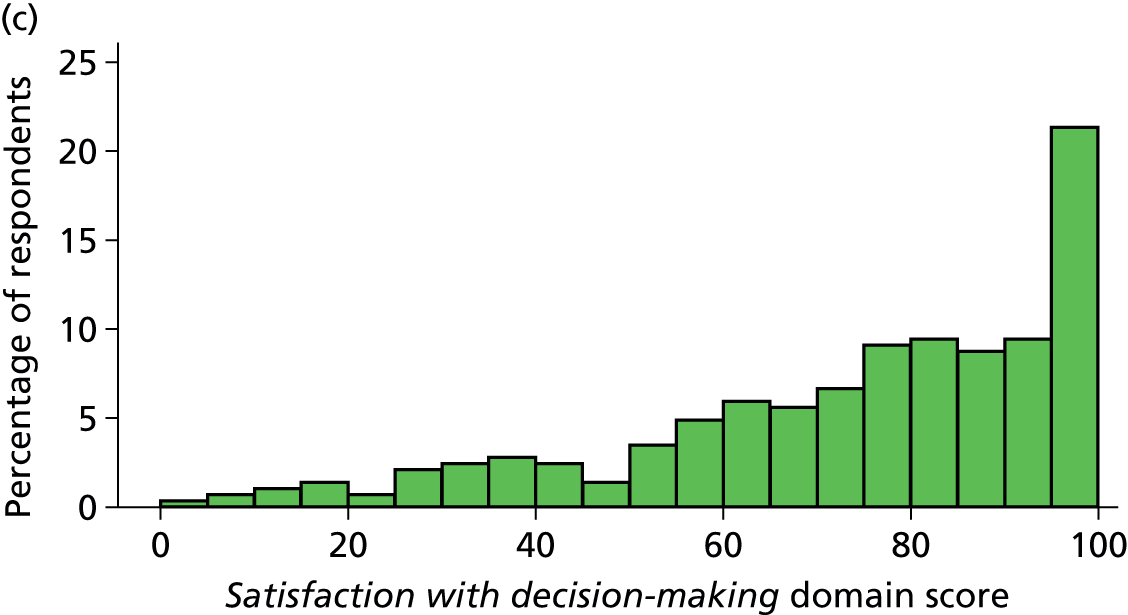
FIGURE 7.
Correlation between UK FS-ICU-24 domain scores in the initial psychometric assessment (n = 284). The size of circle is proportional to the number of respondents.
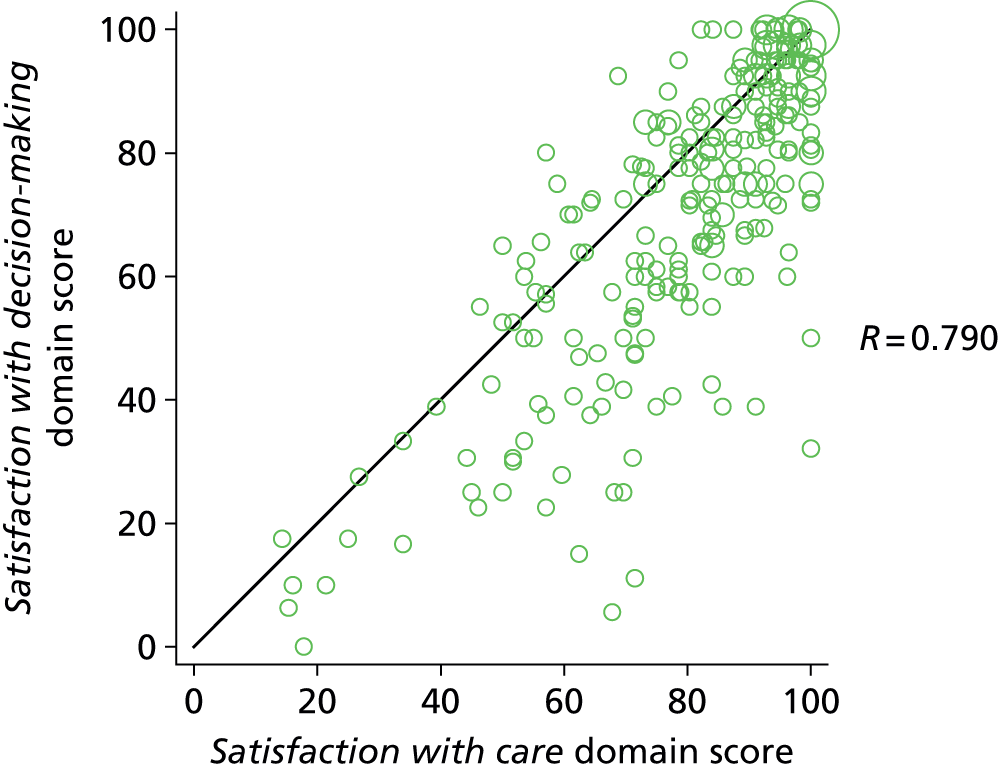
A total of seven items were flagged for discussion because of high levels of ‘not applicable’ responses or non-response:
-
three items from satisfaction with care:
-
symptom management – breathlessness (12.9% not applicable, 2.0% no response)
-
symptom management – agitation (12.0% not applicable, 2.0% no response)
-
the atmosphere (mood) in the ICU waiting room (9.8% not applicable, 1.4% no response)
-
-
and four items from satisfaction with decision-making:
-
Did you feel included in the decision-making process? (25.5% not applicable, 1.7% no response)
-
Did you feel supported during the decision-making process? (28.0% not applicable, 1.4% no response)
-
Did you feel you had control over the care of your family member? (21.6% not applicable, 1.1% no response)
-
When making decisions, did you have adequate time to have your concerns addressed and questions answered? (42.0% not applicable, 1.7% no response).
-
Following discussion among the SMG, it was agreed that there were good reasons to expect ‘not applicable’ responses for these items – some patients would not have experienced particular symptoms, some family members would not have used the waiting room and some family members would not have been involved in the decision-making process – and consequently that these did not represent a lack of comprehensibility or acceptability and that the items were relevant to a substantial proportion of family members. All these items were therefore retained in the questionnaire.
Only one item, ‘when making decisions, did you have adequate time to have your concerns addresses and questions answered?’, had > 70% of respondents selecting either the highest or lowest option. However, this was the only binary item on the questionnaire and therefore it was not considered to represent a lack of discrimination.
Eleven items were flagged for discussion for potential redundancy:
-
six items from satisfaction with care:
-
concern and caring by ICU staff [towards the patient] (item to own scale correlation 0.805)
-
consideration of the family member’s needs (0.844)
-
emotional support [for the family member] (0.826)
-
concern and caring by ICU staff [towards the family member] (0.837)
-
co-ordination of care (0.820)
-
skill and competence of ICU nurses (0.814)
-
-
and five items from satisfaction with decision-making:
-
ease of getting information (0.821)
-
understanding of information (0.811)
-
honesty of information (0.804)
-
completeness of information (0.857)
-
consistency of information (0.836).
-
All of these items were only just over the threshold for discussion (0.8) and it was felt that all items were capturing sufficiently different aspects of satisfaction for all to be retained.
Only one item, ‘the atmosphere (mood) in the ICU waiting room’ had a component loading of < 0.4 in the confirmatory principal components analysis (Table 23). This was only just below the threshold and was considered an important area of potential lower satisfaction.
| UK FS-ICU-24 item | Component loadings | |
|---|---|---|
| Component 1 | Component 2 | |
| Satisfaction with care | ||
| Concern and caring by ICU staff (towards the patient) | 0.825 | 0.214 |
| Symptom management: pain | 0.801 | 0.151 |
| Symptom management: breathlessness | 0.793 | 0.171 |
| Symptom management: agitation | 0.810 | 0.190 |
| Consideration of family member’s needs | 0.742 | 0.447 |
| Emotional support | 0.685 | 0.510 |
| Concern and caring by ICU staff (towards the family member) | 0.707 | 0.501 |
| Co-ordination of care | 0.789 | 0.335 |
| Skill and competence of ICU nurses | 0.845 | 0.193 |
| Frequency of communication with ICU nurses | 0.696 | 0.494 |
| Skill and competence of ICU doctors | 0.771 | 0.261 |
| Atmosphere (mood) of the ICU | 0.666 | 0.355 |
| Atmosphere (mood) in the ICU Waiting Room | 0.336 | 0.374 |
| The LEVEL or amount of health care | 0.479 | 0.133 |
| Satisfaction with decision-making | ||
| Frequency of communication with ICU doctors | 0.406 | 0.675 |
| Ease of getting information | 0.563 | 0.653 |
| Understanding of information | 0.590 | 0.611 |
| Honesty of information | 0.612 | 0.602 |
| Completeness of information | 0.595 | 0.666 |
| Consistency of information | 0.553 | 0.678 |
| Included in decision-making process | 0.106 | 0.773 |
| Supported during decision-making process | 0.139 | 0.792 |
| Control over the care of family member | 0.194 | 0.691 |
| Adequate time to have concerns addressed and questions answered | 0.199 | 0.628 |
| Explained variation | ||
| Proportion of variation explained by component | 0.387 | 0.259 |
| Cumulative proportion of variation explained | 0.387 | 0.646 |
No concerns were identified over the reliability (internal consistency) of the UK FS-ICU-24. All item to own scale correlations were greater than 0.4 (see Tables 19 and 20) and Cronbach’s alpha exceeded 0.8 for the overall family satisfaction score (0.96) and for both domain scores (0.95 and 0.94 for satisfaction with care and satisfaction with decision-making, respectively; see Table 22).
The confirmatory factor analysis (Table 24 and Figure 8) indicated that the North American two-factor solution for the FS-ICU-24 (corresponding to the two underlying constructs of satisfaction with care and satisfaction with decision-making) was not a good fit to the FREE study data (RMSEA > 0.08 and CFI and TLI < 0.9).
| Goodness of fit statistic | Value | p-value |
|---|---|---|
| Chi-squared statistic (degrees of freedom) vs. saturated model | 1073 (251) | < 0.001 |
| RMSEA | 0.096 | – |
| CFI | 0.884 | – |
| TLI | 0.872 | – |
| CD | 0.995 | – |
FIGURE 8.
Confirmatory factor analysis: structural model and factor loadings from the initial psychometric assessment.

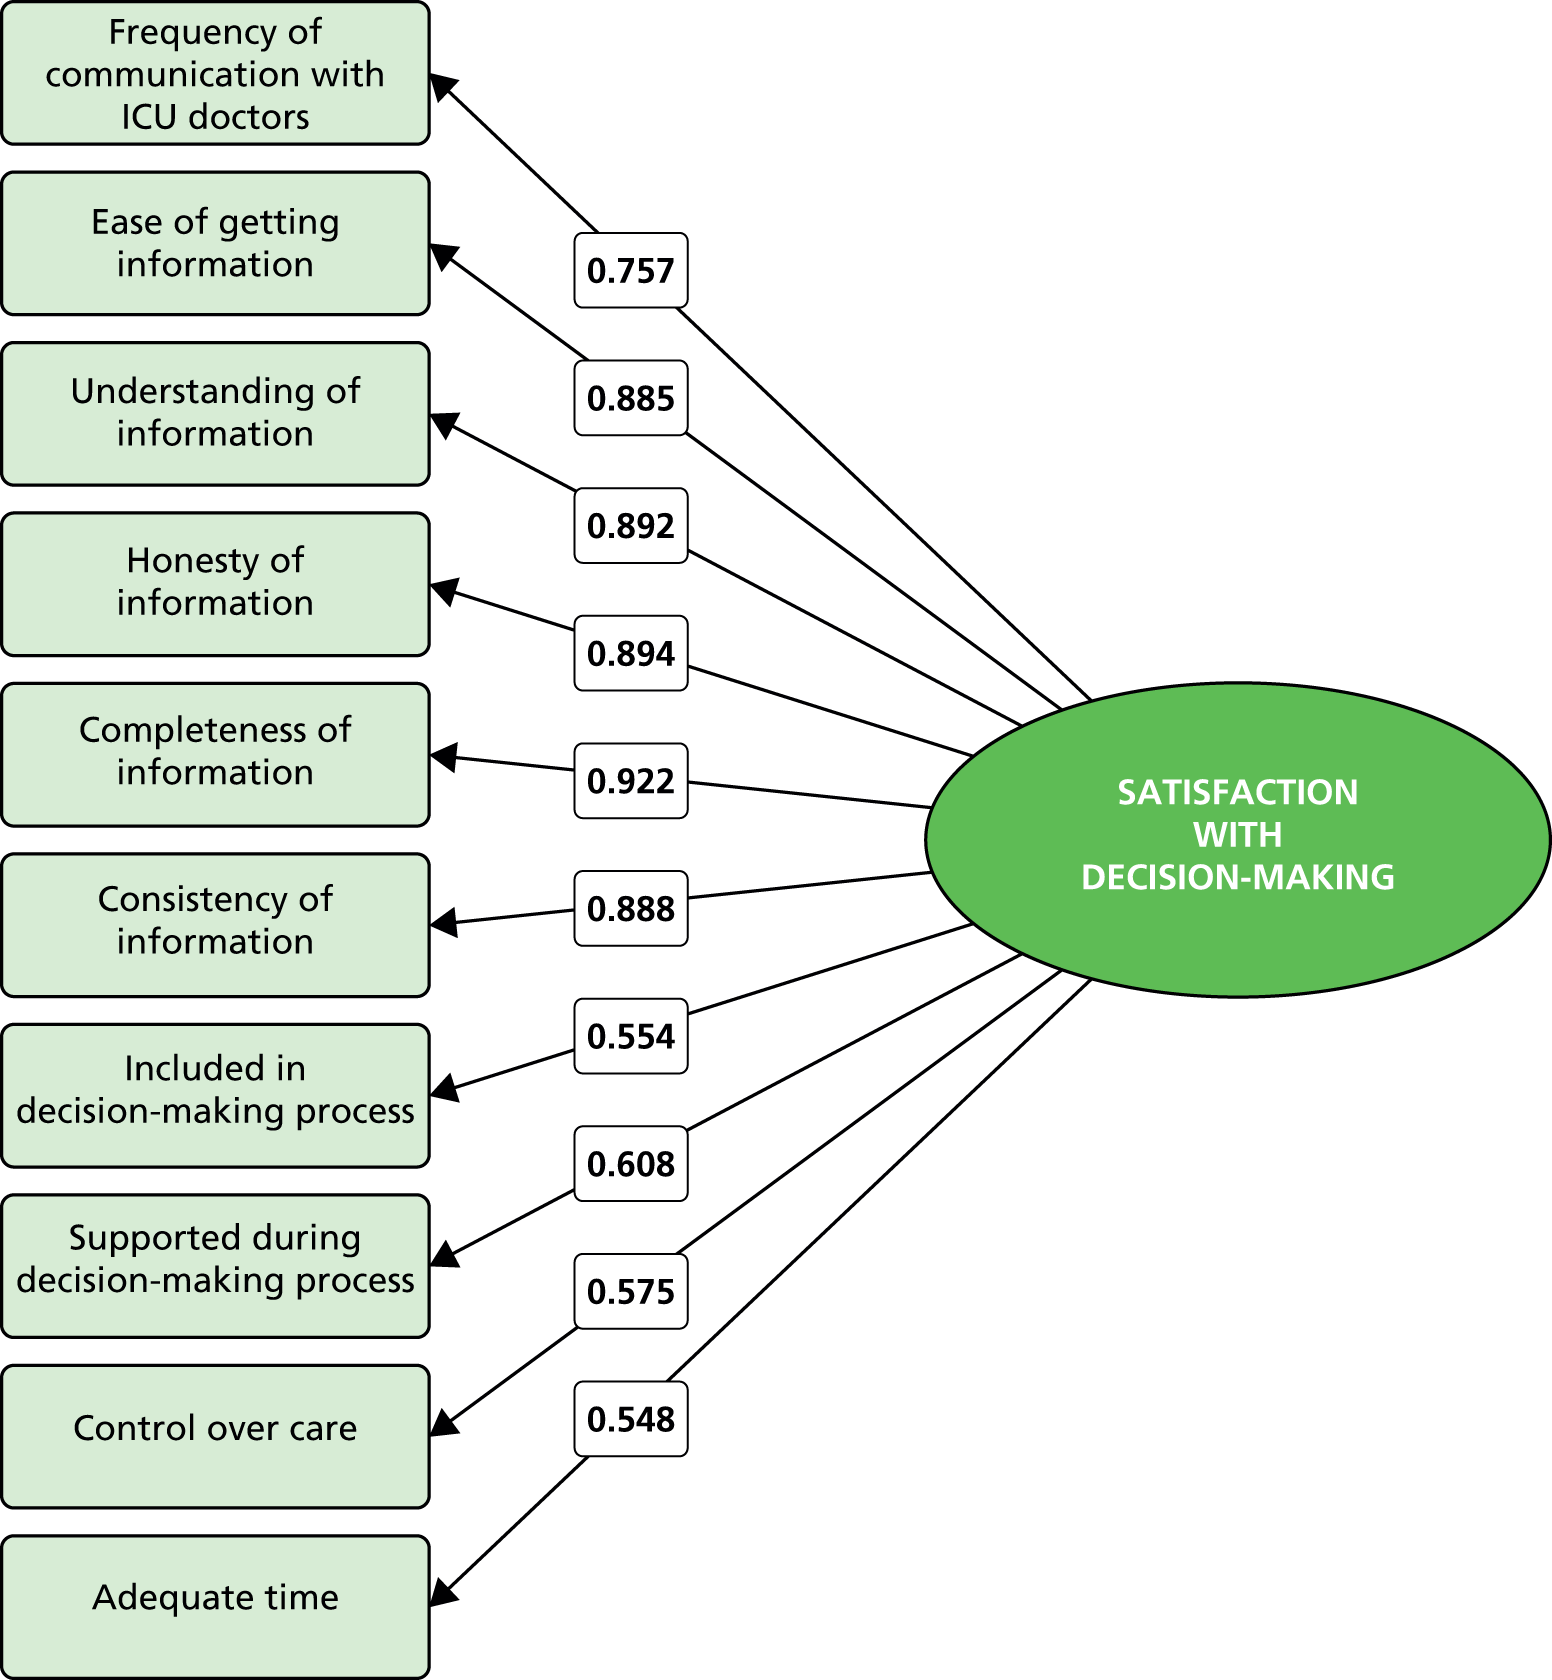
Of 44 included family members of a patient who died in the ICU, 36 (82%) returned a completed or partially completed QODD questionnaire and were included in the validity analysis. No concerns were identified over the validity of the UK FS-ICU-24 among family members of patients who died in the ICU. The majority of hypothesised relationships between the scores and individual items of the two instruments were supported by the data (Table 25). In particular, the overall family satisfaction score and both domain scores of the UK FS-ICU-24 correlated with the QODD total score (correlation coefficients 0.614, 0.622 and 0.641 for the overall family satisfaction score, satisfaction with care domain score and satisfaction with decision-making domain score, respectively; Figure 9).
| UK FS-ICU-24 item or score | QODD item or score | n | Correlation coefficient | p-value | Hypothesised value of correlation coefficient |
|---|---|---|---|---|---|
| Overall family satisfaction score | Total score | 23 | 0.614a | 0.002 | > 0.6 |
| Satisfaction with care domain score | Total score | 23 | 0.622a | 0.002 | > 0.6 |
| Satisfaction with decision-making domain score | Total score | 22 | 0.641a | 0.001 | > 0.6 |
| Satisfaction with care domain score | How often did your loved one appear to have his/her pain under control? How would you rate this aspect of your loved one’s dying experience? | 33 | 0.354 | 0.043 | 0.4–0.6 |
| Satisfaction with care domain score | How often did your loved one appear to breathe comfortably? How would you rate this aspect of your loved one’s dying experience? | 31 | 0.332 | 0.068 | 0.4–0.6 |
| Satisfaction with care domain score | Rate the care your loved one received from all doctors and other health care providers (including nurses and other health care professionals) during the last several days of his/her life while in the ICU | 35 | 0.685 | < 0.001 | 0.4–0.6 |
| Satisfaction with care domain score | Rate the care your loved one received from his/her doctor during the last several days of his/her life while in the ICU | 33 | 0.700 | < 0.001 | 0.4–0.6 |
| Concern and caring by ICU staff? The courtesy, respect and compassion your family member (the patient) was given | How often did your loved one appear to keep his/her dignity and self-respect? | 30 | 0.332 | 0.073 | 0.2–0.6 |
| How well the ICU staff assessed and treated your family member’s symptoms: pain | How often did your loved one appear to have his/her pain under control? | 28 | 0.464 | 0.013 | > 0.6 |
| How well the ICU staff assessed and treated your family member’s symptoms: breathlessness | How often did your loved one appear to breathe comfortably? | 28 | 0.084 | 0.67 | > 0.6 |
| Skill and competence of ICU nurses? How well the nurses cared for your family member | Rate the care your loved one received from all doctors and other health care providers (including nurses and other health care professionals) during the last several days of his/her life while in the ICU | 35 | 0.807 | < 0.001 | 0.4–0.6 |
| Skill and competence of ICU doctors? How well the doctors cared for your family member | Rate the care your loved one received from his/her doctor during the last several days of his/her life while in the ICU | 33 | 0.635 | < 0.001 | > 0.6 |
| During the final hours of your family member’s life, which of the following best describes your views: I felt he/she was very uncomfortable, slightly uncomfortable, mostly comfortable, very comfortable, totally comfortable | How often did your loved one appear to have his/her pain under control? | 29 | 0.578 | 0.001 | 0.2–0.6 |
| During the final hours of your family member’s life, which of the following best describes your views: I felt he/she was very uncomfortable, slightly uncomfortable, mostly comfortable, very comfortable, totally comfortable | How often did your loved one appear at peace with dying? | 21 | 0.592 | 0.005 | 0.2–0.6 |
| During the final hours of your family member’s life, which of the following best describes your views: I felt he/she was very uncomfortable, slightly uncomfortable, mostly comfortable, very comfortable, totally comfortable | How often did your loved one appear unafraid of dying? | 17 | 0.103 | 0.69 | 0.2–0.6 |
FIGURE 9.
Correlation between UK FS-ICU-24 scores and QODD total score.
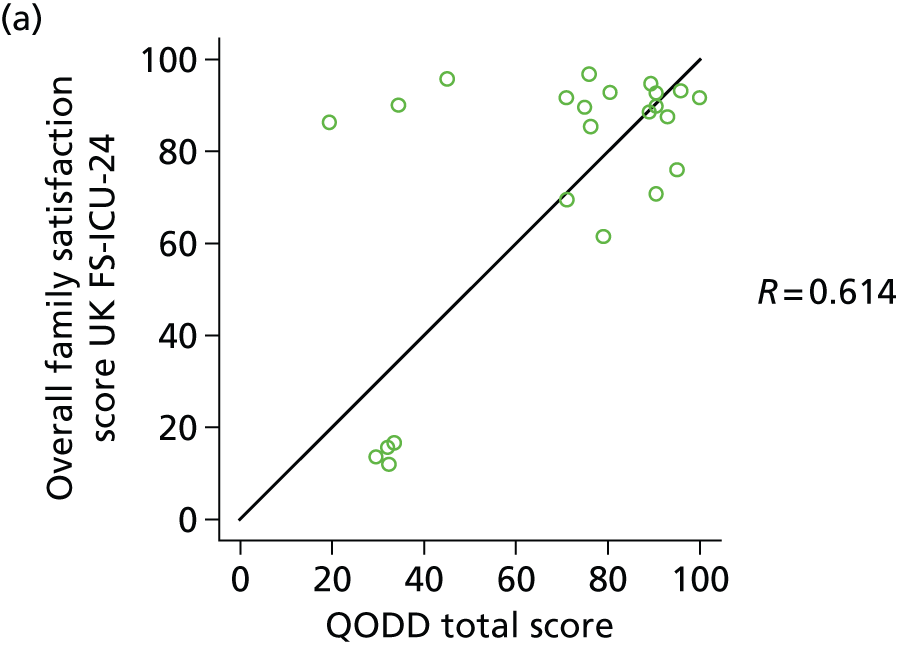


Full psychometric assessment
From the final FREE study data set, selecting one family member per patient following the priority order as set out above resulted in a cohort of 4615 family members for the full psychometric assessment. Characteristics of the included patients and family members were similar to those from the initial psychometric assessment, although the revised approach to selecting the family member (to allow for patients with more than one responding family member) resulted in a higher proportion of partners and parents and lower proportions of other relatives and non-relatives (Table 26).
| Characteristic | Patients (n = 4615) | Family members (n = 4615) |
|---|---|---|
| Mean agea (years), (SD) | 63.2 (16.9) | 56.5 (14.3) |
| Ageb (years), n (%) | ||
| < 30 | 259 (5.6) | 201 (4.4) |
| 30–39 | 233 (5.0) | 356 (7.7) |
| 40–49 | 423 (9.2) | 837 (18.2) |
| 50–59 | 650 (14.1) | 1129 (24.5) |
| 60–69 | 1134 (24.6) | 1200 (26.0) |
| 70–79 | 1195 (25.9) | 695 (15.1) |
| ≥ 80 | 721 (15.6) | 190 (4.1) |
| Sex,c,d n (%) | ||
| Female | 1945 (43.2) | 3097 (67.1) |
| Male | 2561 (56.8) | 1516 (32.9) |
| Relationship to patient, n (%) | ||
| Partner | N/A | 2101 (45.5) |
| Parent | 461 (10.0) | |
| Child | 1199 (26.0) | |
| Sibling | 389 (8.4) | |
| Other relative | 294 (6.4) | |
| Other non-relative | 171 (3.7) | |
| Surgical status,c n (%) | ||
| Elective/scheduled surgery | 829 (18.4) | N/A |
| Emergency/urgent surgery | 869 (19.3) | |
| Non-surgical | 2808 (62.3) | |
| Mean ICNARC physiology scorec (SD) | 18.4 (8.3) | N/A |
| Mean APACHE II scorec (SD) | 16.8 (6.3) | N/A |
| ICU outcome, n (%) | ||
| Alive | 4105 (88.9) | N/A |
| Dead | 510 (11.1) | |
| Median ICU length of stayc (days) (IQR) | ||
| All patients | 4.9 (2.9, 9.1) | N/A |
| ICU survivors | 4.8 (2.8, 9.0) | |
| ICU non-survivors | 6.0 (3.6, 10.6) | |
Responses to individual items on the UK FS-ICU-24 are reported in Table 27 (satisfaction with care), Table 28 (satisfaction with decision-making) and Table 29 (satisfaction with decision-making, if your family member died in the ICU). Table 30 reports the results of a question added to the original FS-ICU questionnaire, ‘how satisfied were you with the amount of control you had over the care of your family member?’. There was moderate correlation with the original FS-ICU question, ‘did you feel you had control over the care of your family member?’ (Spearman’s rank correlation 0.529, p < 0.001). However, there was some notable discordance. For example, almost one-third of family members who indicated that they ‘felt really out of control’ indicated that they were either ‘completely satisfied’ or ‘very satisfied’ with the amount of control they had.
| Items | No response (%) | N/A (%) | Response (%) | Median (IQR) | Mean (SD) | Item to own scale correlation | Cronbach’s alpha if item removed | ||||
|---|---|---|---|---|---|---|---|---|---|---|---|
| How did we treat your family member (the patient)? | Excellent | Very good | Good | Fair | Poor | ||||||
| Concern and caring by ICU staff? | 32 (0.7) | 0 (0.0) | 3320 (72.4) | 1024 (22.3) | 188 (4.1) | 38 (0.8) | 13 (0.3) | 100 (75–100) | 91 (16) | 0.790 | 0.932 |
| Symptom management? | |||||||||||
| Pain | 39 (0.8) | 109 (2.4) | 2829 (63.3) | 1253 (28.1) | 307 (6.9) | 53 (1.2) | 25 (0.6) | 100 (75–100) | 88 (18) | 0.773 | 0.932 |
| Breathlessness | 84 (1.8) | 538 (11.7) | 2482 (62.2) | 1046 (26.2) | 342 (8.6) | 78 (2.0) | 45 (1.1) | 100 (75–100) | 87 (21) | 0.720 | 0.934 |
| Agitation | 98 (2.1) | 445 (9.6) | 2192 (53.8) | 1189 (29.2) | 499 (12.3) | 141 (3.5) | 51 (1.3) | 100 (75–100) | 83 (23) | 0.774 | 0.932 |
| How did we treat you? | |||||||||||
| Consideration of your needs? | 35 (0.8) | 31 (0.7) | 2455 (54.2) | 1362 (30.1) | 503 (11.1) | 161 (3.6) | 45 (1.0) | 100 (75–100) | 83 (22) | 0.833 | 0.930 |
| Emotional support? | 39 (0.8) | 327 (7.1) | 1995 (47.0) | 1297 (30.5) | 634 (14.9) | 236 (5.6) | 87 (2.0) | 75 (75–100) | 79 (25) | 0.827 | 0.931 |
| Concern and caring by ICU staff? | 31 (0.7) | 45 (1.0) | 2565 (56.5) | 1308 (28.8) | 477 (10.5) | 148 (3.3) | 41 (0.9) | 100 (75–100) | 84 (22) | 0.839 | 0.930 |
| Teamwork | |||||||||||
| Co-ordination of care? | 27 (0.6) | 30 (0.7) | 2624 (57.6) | 1409 (30.9) | 424 (9.3) | 70 (1.5) | 31 (0.7) | 100 (75–100) | 86 (19) | 0.815 | 0.931 |
| Nurses | |||||||||||
| Skill and competence of ICU nurses? | 17 (0.4) | 5 (0.1) | 3203 (69.7) | 1101 (24.0) | 236 (5.1) | 40 (0.9) | 13 (0.3) | 100 (75–100) | 91 (16) | 0.807 | 0.932 |
| Frequency of communication with ICU nurses? | 26 (0.6) | 70 (1.5) | 2302 (50.9) | 1366 (30.2) | 548 (12.1) | 212 (4.7) | 91 (2.0) | 100 (75–100) | 81 (24) | 0.787 | 0.932 |
| Doctors | |||||||||||
| Skill and competence of ICU doctors? | 36 (0.8) | 86 (1.9) | 2706 (60.2) | 1263 (28.1) | 404 (9.0) | 76 (1.7) | 44 (1.0) | 100 (75–100) | 86 (20) | 0.741 | 0.933 |
| The ICU | |||||||||||
| The atmosphere (mood) of the ICU was? | 26 (0.6) | 11 (0.2) | 2182 (47.7) | 1617 (35.3) | 625 (13.7) | 129 (2.8) | 25 (0.5) | 75 (75–100) | 82 (21) | 0.775 | 0.932 |
| The waiting room | |||||||||||
| The atmosphere (mood) in the ICU waiting room was? | 39 (0.8) | 386 (8.4) | 953 (22.7) | 1347 (32.1) | 1139 (27.2) | 582 (13.9) | 169 (4.0) | 75 (50–75) | 64 (28) | 0.587 | 0.941 |
| Level/amount of health care | Completely satisfied | Very satisfied | Mostly satisfied | Slightly dissatisfied | Very dissatisfied | ||||||
| How satisfied were you with the LEVEL or amount of health care your family member received in the ICU? | 33 (0.7) | – | 2446 (53.4) | 1470 (32.1) | 442 (9.6) | 47 (1.0) | 177 (3.9) | 100 (75–100) | 83 (23) | 0.571 | 0.940 |
| Item | No response (%) | N/A (%) | Response (%) | Median (IQR) | Mean (SD) | Item to own scale correlation | Cronbach’s alpha if item removed | ||||
|---|---|---|---|---|---|---|---|---|---|---|---|
| Information needs | Excellent | Very good | Good | Fair | Poor | ||||||
| Frequency of communication with ICU doctors? | 45 (1.0) | 288 (6.2) | 1236 (28.9) | 1320 (30.8) | 944 (22.0) | 450 (10.5) | 332 (7.8) | 75 (50–100) | 66 (30) | 0.808 | 0.916 |
| Ease of getting information? | 35 (0.8) | 95 (2.1) | 1959 (43.7) | 1531 (34.1) | 667 (14.9) | 236 (5.3) | 92 (2.1) | 75 (75–100) | 78 (25) | 0.846 | 0.913 |
| Understanding of information? | 36 (0.8) | 116 (2.5) | 1891 (42.4) | 1624 (36.4) | 697 (15.6) | 190 (4.3) | 61 (1.4) | 75 (75–100) | 79 (23) | 0.849 | 0.913 |
| Honesty of information? | 41 (0.9) | 117 (2.5) | 2157 (48.4) | 1452 (32.6) | 601 (13.5) | 182 (4.1) | 65 (1.5) | 75 (75–100) | 81 (23) | 0.843 | 0.913 |
| Completeness of information? | 36 (0.8) | 103 (2.2) | 2054 (45.9) | 1472 (32.9) | 602 (13.4) | 233 (5.2) | 115 (2.6) | 75 (75–100) | 79 (25) | 0.873 | 0.911 |
| Consistency of information? | 42 (0.9) | 205 (4.4) | 1711 (39.2) | 1474 (33.7) | 745 (17.1) | 299 (6.8) | 139 (3.2) | 75 (50–100) | 75 (29) | 0.855 | 0.912 |
| The process of making decisions | I felt very included | I felt somewhat included | I felt neither included nor excluded | I felt somewhat excluded | I felt very excluded | ||||||
| Did you feel included in the decision-making process? | 76 (1.6) | 1004 (21.8) | 1682 (47.6) | 717 (20.3) | 773 (21.9) | 190 (5.4) | 173 (4.9) | 75 (50–100) | 75 (29) | 0.714 | 0.922 |
| I felt very supported | I felt supported | I felt neither supported nor unsupported | I felt slightly unsupported | I felt totally unsupported | |||||||
| Did you feel supported during the decision-making process? | 74 (1.6) | 1096 (23.7) | 1307 (37.9) | 1099 (31.9) | 765 (22.2) | 113 (3.3) | 161 (4.7) | 75 (50–100) | 74 (27) | 0.734 | 0.920 |
| I felt that I had good control | I felt I had some control | I felt neither in control nor out of control | I felt somewhat out of control | I felt really out of control | |||||||
| Did you feel you had control over the care of your family member? | 81 (1.8) | 862 (18.7) | 1056 (28.8) | 838 (22.8) | 1119 (30.5) | 379 (10.3) | 280 (7.6) | 75 (50–100) | 64 (30) | 0.666 | 0.926 |
| I had adequate time | I could have used more time | ||||||||||
| When making decisions, did you have adequate time to have your concerns addressed and questions answered? (note: 2 options) | 95 (2.1) | 1864 (40.4) | 2329 (87.7) | – | – | – | 327 (12.3) | 100 (100–100) | 88 (33) | 0.513 | 0.928 |
| Item | No response (%) | N/A (%) | Response (%) | Median (IQR) | Mean (SD) | ||||
|---|---|---|---|---|---|---|---|---|---|
| Which of the following best describes your viewsa | I felt my family member’s life was prolonged unnecessarily | I felt my family member’s life was slightly prolonged unnecessarily | I felt my family member’s life was neither prolonged nor shortened unnecessarily | I felt my family member’s life was slightly shortened unnecessarily | I felt my family member’s life was shortened unnecessarily | ||||
| 14 (2.7) | 0 (0) | 13 (2.6) | 14 (2.8) | 448 (90.3) | 14 (2.8) | 7 (1.4) | 100 (100–100) | 93 (22) | |
| During the final hours of your family member’s life, which of the following best describes your views | I felt that he/she was totally comfortable | I felt that he/she was very comfortable | I felt that he/she was mostly comfortable | I felt that he/she was slightly uncomfortable | I felt that he/she was totally uncomfortable | ||||
| 11 (2.2) | 0 (0) | 171 (34.3) | 157 (31.5) | 131 (26.3) | 18 (3.6) | 22 (4.4) | 75 (50–100) | 72 (27) | |
| During the last few hours before your family member’s death, which of the following best describes your views | I felt very supported by the health-care team | I felt supported by the health-care tem | I felt neither abandoned nor supported by the health-care team | I felt abandoned by the health-care team | I felt very abandoned by the health-care team | ||||
| 13 (2.5) | 0 (0) | 301 (60.6) | 147 (29.6) | 32 (6.4) | 8 (1.6) | 9 (1.8) | 100 (75–100) | 86 (21) | |
| Question/response | Response (%) | Median (IQR) | Mean (SD) | ||||||
|---|---|---|---|---|---|---|---|---|---|
| No response (%) | N/A | Completely satisfied | Very satisfied | Mostly satisfied | Slightly dissatisfied | Very dissatisfied | |||
| How satisfied were you with the amount of control you had over the care of your family member? | 391 (8.5) | – | 1349 (31.9) | 1430 (33.9) | 1172 (27.7) | 178 (4.2) | 95 (2.2) | 75 (50–100) | 72 (24) |
| Responses to additional question by response to ‘Did you feel you had control over the care of your family member?’ | |||||||||
| I felt that I had good control (n = 1056) | 41 (3.9) | – | 646 (63.6) | 313 (30.8) | 38 (3.7) | 0 (0) | 18 (1.8) | – | – |
| I felt I had some control (n = 838) | 31 (3.7) | – | 148 (18.3) | 417 (51.7) | 231 (28.6) | 8 (1.0) | 3 (0.4) | – | – |
| I felt neither in control nor out of control (n = 1119) | 79 (7.1) | – | 190 (18.3) | 334 (32.1) | 472 (45.4) | 35 (3.4) | 9 (0.9) | – | – |
| I felt somewhat out of control (n = 379) | 12 (3.2) | – | 32 (8.7) | 64 (17.4) | 202 (55.0) | 64 (17.4) | 5 (1.4) | – | – |
| I felt really out of control (n = 280) | 16 (5.7) | – | 43 (16.3) | 40 (15.2) | 77 (29.2) | 59 (22.3) | 45 (17.0) | – | – |
Using a 60% response threshold for inclusion in the overall family satisfaction score and domain scores made minimal difference to the characteristics of the scores but permitted an additional 508 respondents (11%) to be included in the domain score for satisfaction with decision-making and small increases in the numbers of respondents included in the other scores. Results are therefore presented using the 60% threshold. Characteristics of the UK FS-ICU-24 overall family satisfaction score and domain scores are summarised in Table 31, and the distributions of the scores are shown in Figure 10. Among the 4319 (94%) family members for whom both domain scores could be calculated, correlation between the two domains was 0.770 (Figure 11).
| Score | Not scored (< 60% response) | Scored (≥ 60% response) | Floor (0%) | Ceiling (100%) | Range | Median (IQR) | Mean (SD) | Skewness | Cronbach’s alpha |
|---|---|---|---|---|---|---|---|---|---|
| Overall family satisfaction | 150 (3.3) | 4465 (96.7) | 1 (0.0) | 268 (6.0) | 0–100 | 84 (71–94) | 80 (17) | –1.1 | 0.957 |
| Satisfaction with care domain | 54 (1.2) | 4561 (98.8) | 1 (0.0) | 595 (13.0) | 0–100 | 88 (75–96) | 83 (16) | –1.3 | 0.938 |
| Satisfaction with decision-making domain | 274 (5.9) | 4341 (94.1) | 11 (0.3) | 541 (12.5) | 0–100 | 80 (63–93) | 75 (21) | –1.0 | 0.925 |
FIGURE 10.
Distribution of UK FS-ICU-24 overall family satisfaction score and domain scores in the full psychometric assessment.
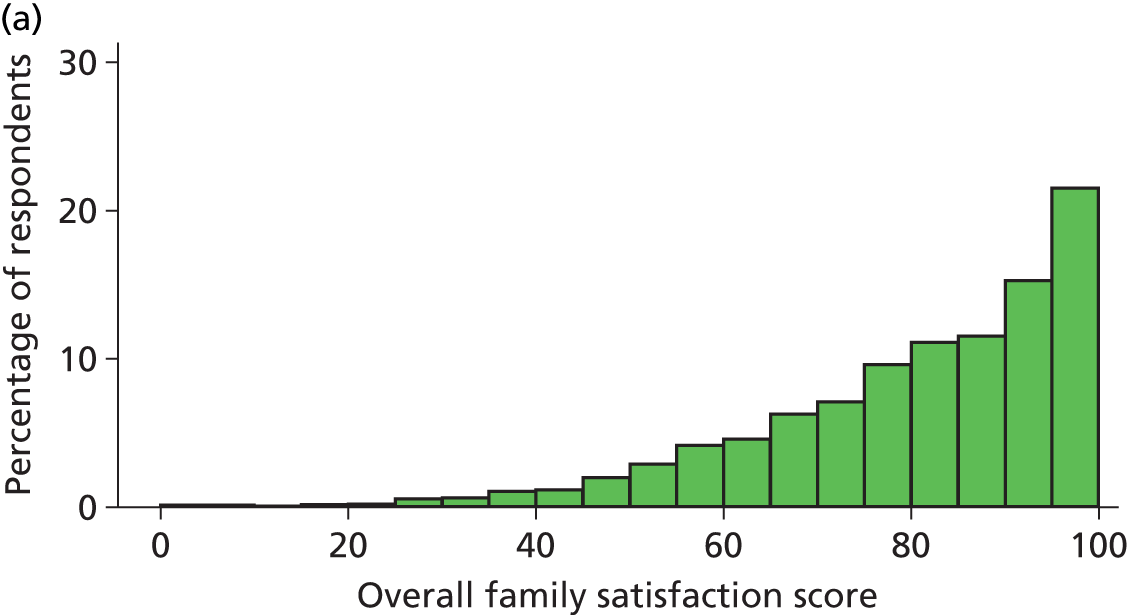
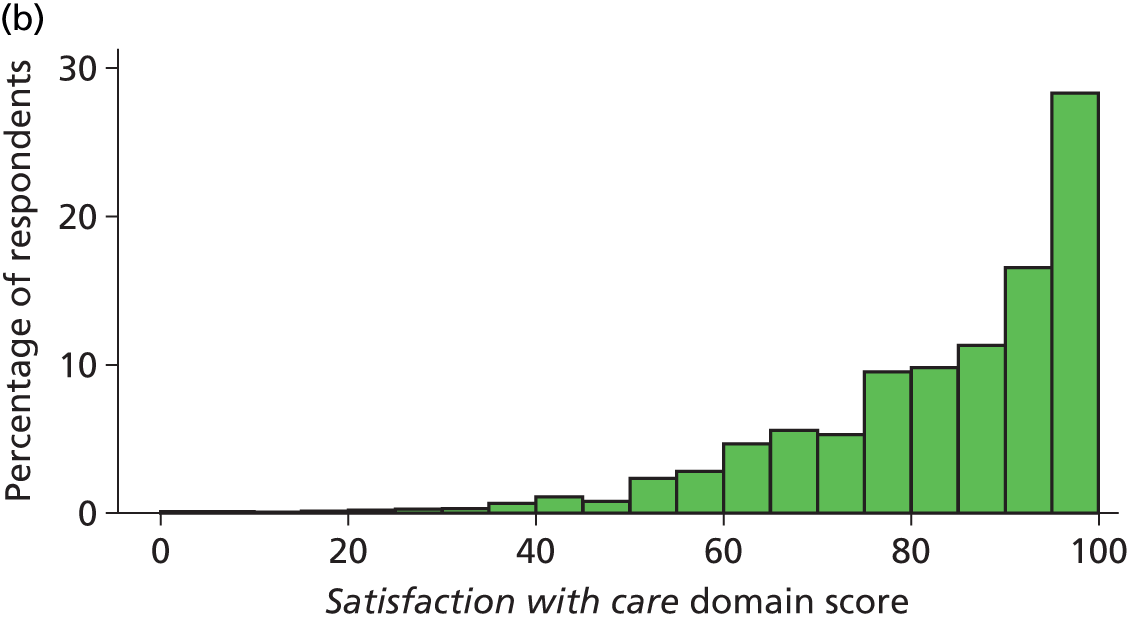
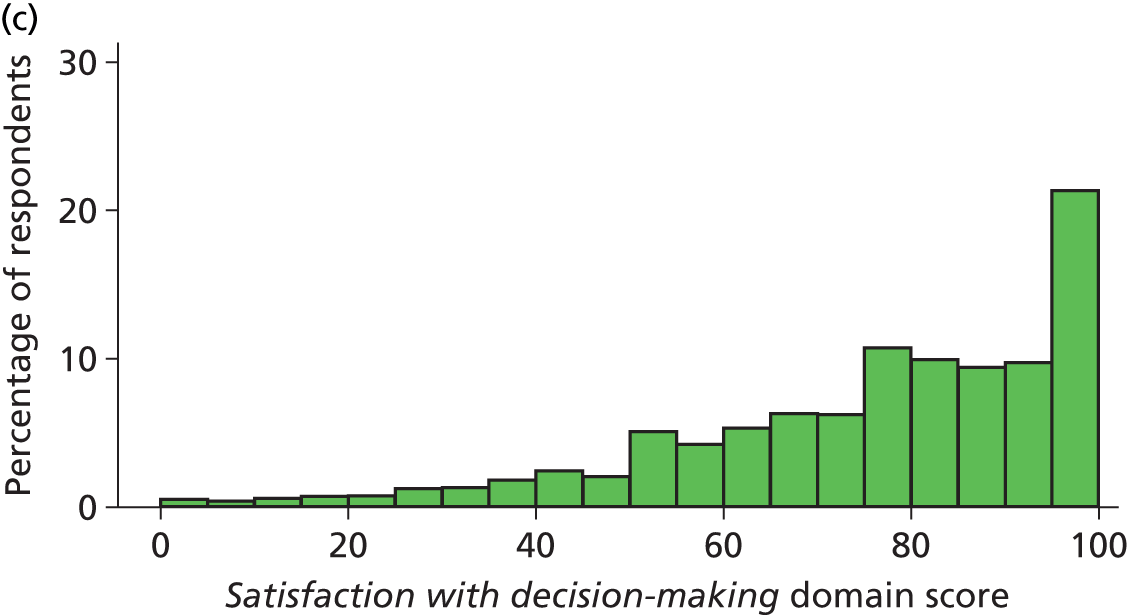
FIGURE 11.
Correlation between UK FS-ICU-24 domain scores in the full psychometric assessment (n = 4319). Size of circle proportional to number of respondents.
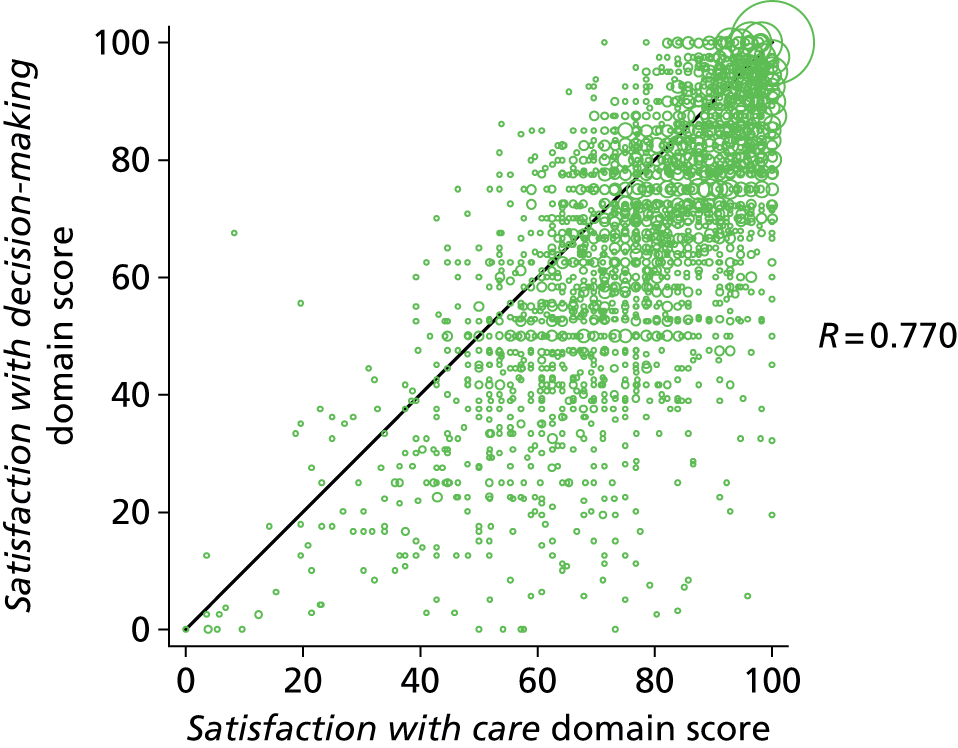
Levels of non-response or ‘not applicable’ responses were slightly lower in the full psychometric assessment than in the initial psychometric assessment, because the selection process was revised to prioritise family members who were more likely to provide complete responses. However, the same items were identified as having higher levels of non-response, although ‘the atmosphere (mood) in the ICU waiting room’ no longer reached the 10% threshold. The item ‘concern and caring by ICU staff’ was identified as having a possible ceiling effect, with 72% of respondents rating this as ‘excellent’. The same items as in the initial psychometric assessment were identified as having possible redundancy (item to own scale correlation > 0.8).
All component loadings were ≥ 0.4 in the confirmatory principal components analysis (Table 32). However, a number of items were loading on both components, suggesting either correlation between the components and/or the presence of additional important components.
| UK FS-ICU-24 item | Component loadings | |
|---|---|---|
| Component 1 | Component 2 | |
| Satisfaction with care | ||
| Concern and caring by ICU staff (towards the patient) | 0.792 | 0.214 |
| Symptom management: pain | 0.795 | 0.170 |
| Symptom management: breathlessness | 0.763 | 0.117 |
| Symptom management: agitation | 0.782 | 0.184 |
| Consideration of family member’s needs | 0.684 | 0.454 |
| Emotional support | 0.644 | 0.510 |
| Concern and caring by ICU staff (towards the family member) | 0.687 | 0.475 |
| Co-ordination of care | 0.768 | 0.309 |
| Skill and competence of ICU nurses | 0.806 | 0.220 |
| Frequency of communication with ICU nurses | 0.618 | 0.519 |
| Skill and competence of ICU doctors | 0.654 | 0.375 |
| Atmosphere (mood) of the ICU | 0.686 | 0.332 |
| Atmosphere (mood) in the ICU Waiting Room | 0.416 | 0.348 |
| The LEVEL or amount of health care | 0.502 | 0.212 |
| Satisfaction with decision-making | ||
| Frequency of communication with ICU doctors | 0.377 | 0.702 |
| Ease of getting information | 0.555 | 0.639 |
| Understanding of information | 0.556 | 0.641 |
| Honesty of information | 0.542 | 0.641 |
| Completeness of information | 0.552 | 0.674 |
| Consistency of information | 0.516 | 0.671 |
| Included in decision-making process | 0.096 | 0.763 |
| Supported during decision-making process | 0.163 | 0.755 |
| Control over the care of family member | 0.072 | 0.715 |
| Adequate time to have concerns addressed and questions answered | 0.160 | 0.609 |
| Explained variation | ||
| Proportion of variation explained by component | 0.352 | 0.263 |
| Cumulative proportion of variation explained | 0.352 | 0.614 |
No concerns were identified over the reliability (internal consistency) of the UK FS-ICU-24. All item to own scale correlations were > 0.4 (see Tables 27 and 28) and Cronbach’s alpha exceeded 0.8 for the overall family satisfaction score (0.957) and for both domain scores (0.938 and 0.925 for satisfaction with care and satisfaction with decision-making, respectively; see Table 31), similarly to the initial psychometric assessment.
Substituting the alternative question on satisfaction with the amount of control increased Cronbach’s alpha for the overall family satisfaction score from 0.957 to 0.959 and for the satisfaction with decision-making domain score from 0.925 to 0.930.
The confirmatory factor analysis (Table 33 and Figure 12) confirmed the findings from the initial psychometric assessment that the North American two-factor solution for the FS-ICU-24 was not a good fit to the FREE study data (RMSEA > 0.08 and CFI and TLI < 0.9).
| Goodness of fit statistic | Value | p-value |
|---|---|---|
| Chi-squared statistic (degrees of freedom) vs. saturated model | 10777 (251) | < 0.001 |
| RMSEA | 0.095 | – |
| CFI | 0.873 | – |
| TLI | 0.860 | – |
| CD | 0.994 | – |
FIGURE 12.
Confirmatory factor analysis: structural model and factor loadings from the full psychometric assessment.
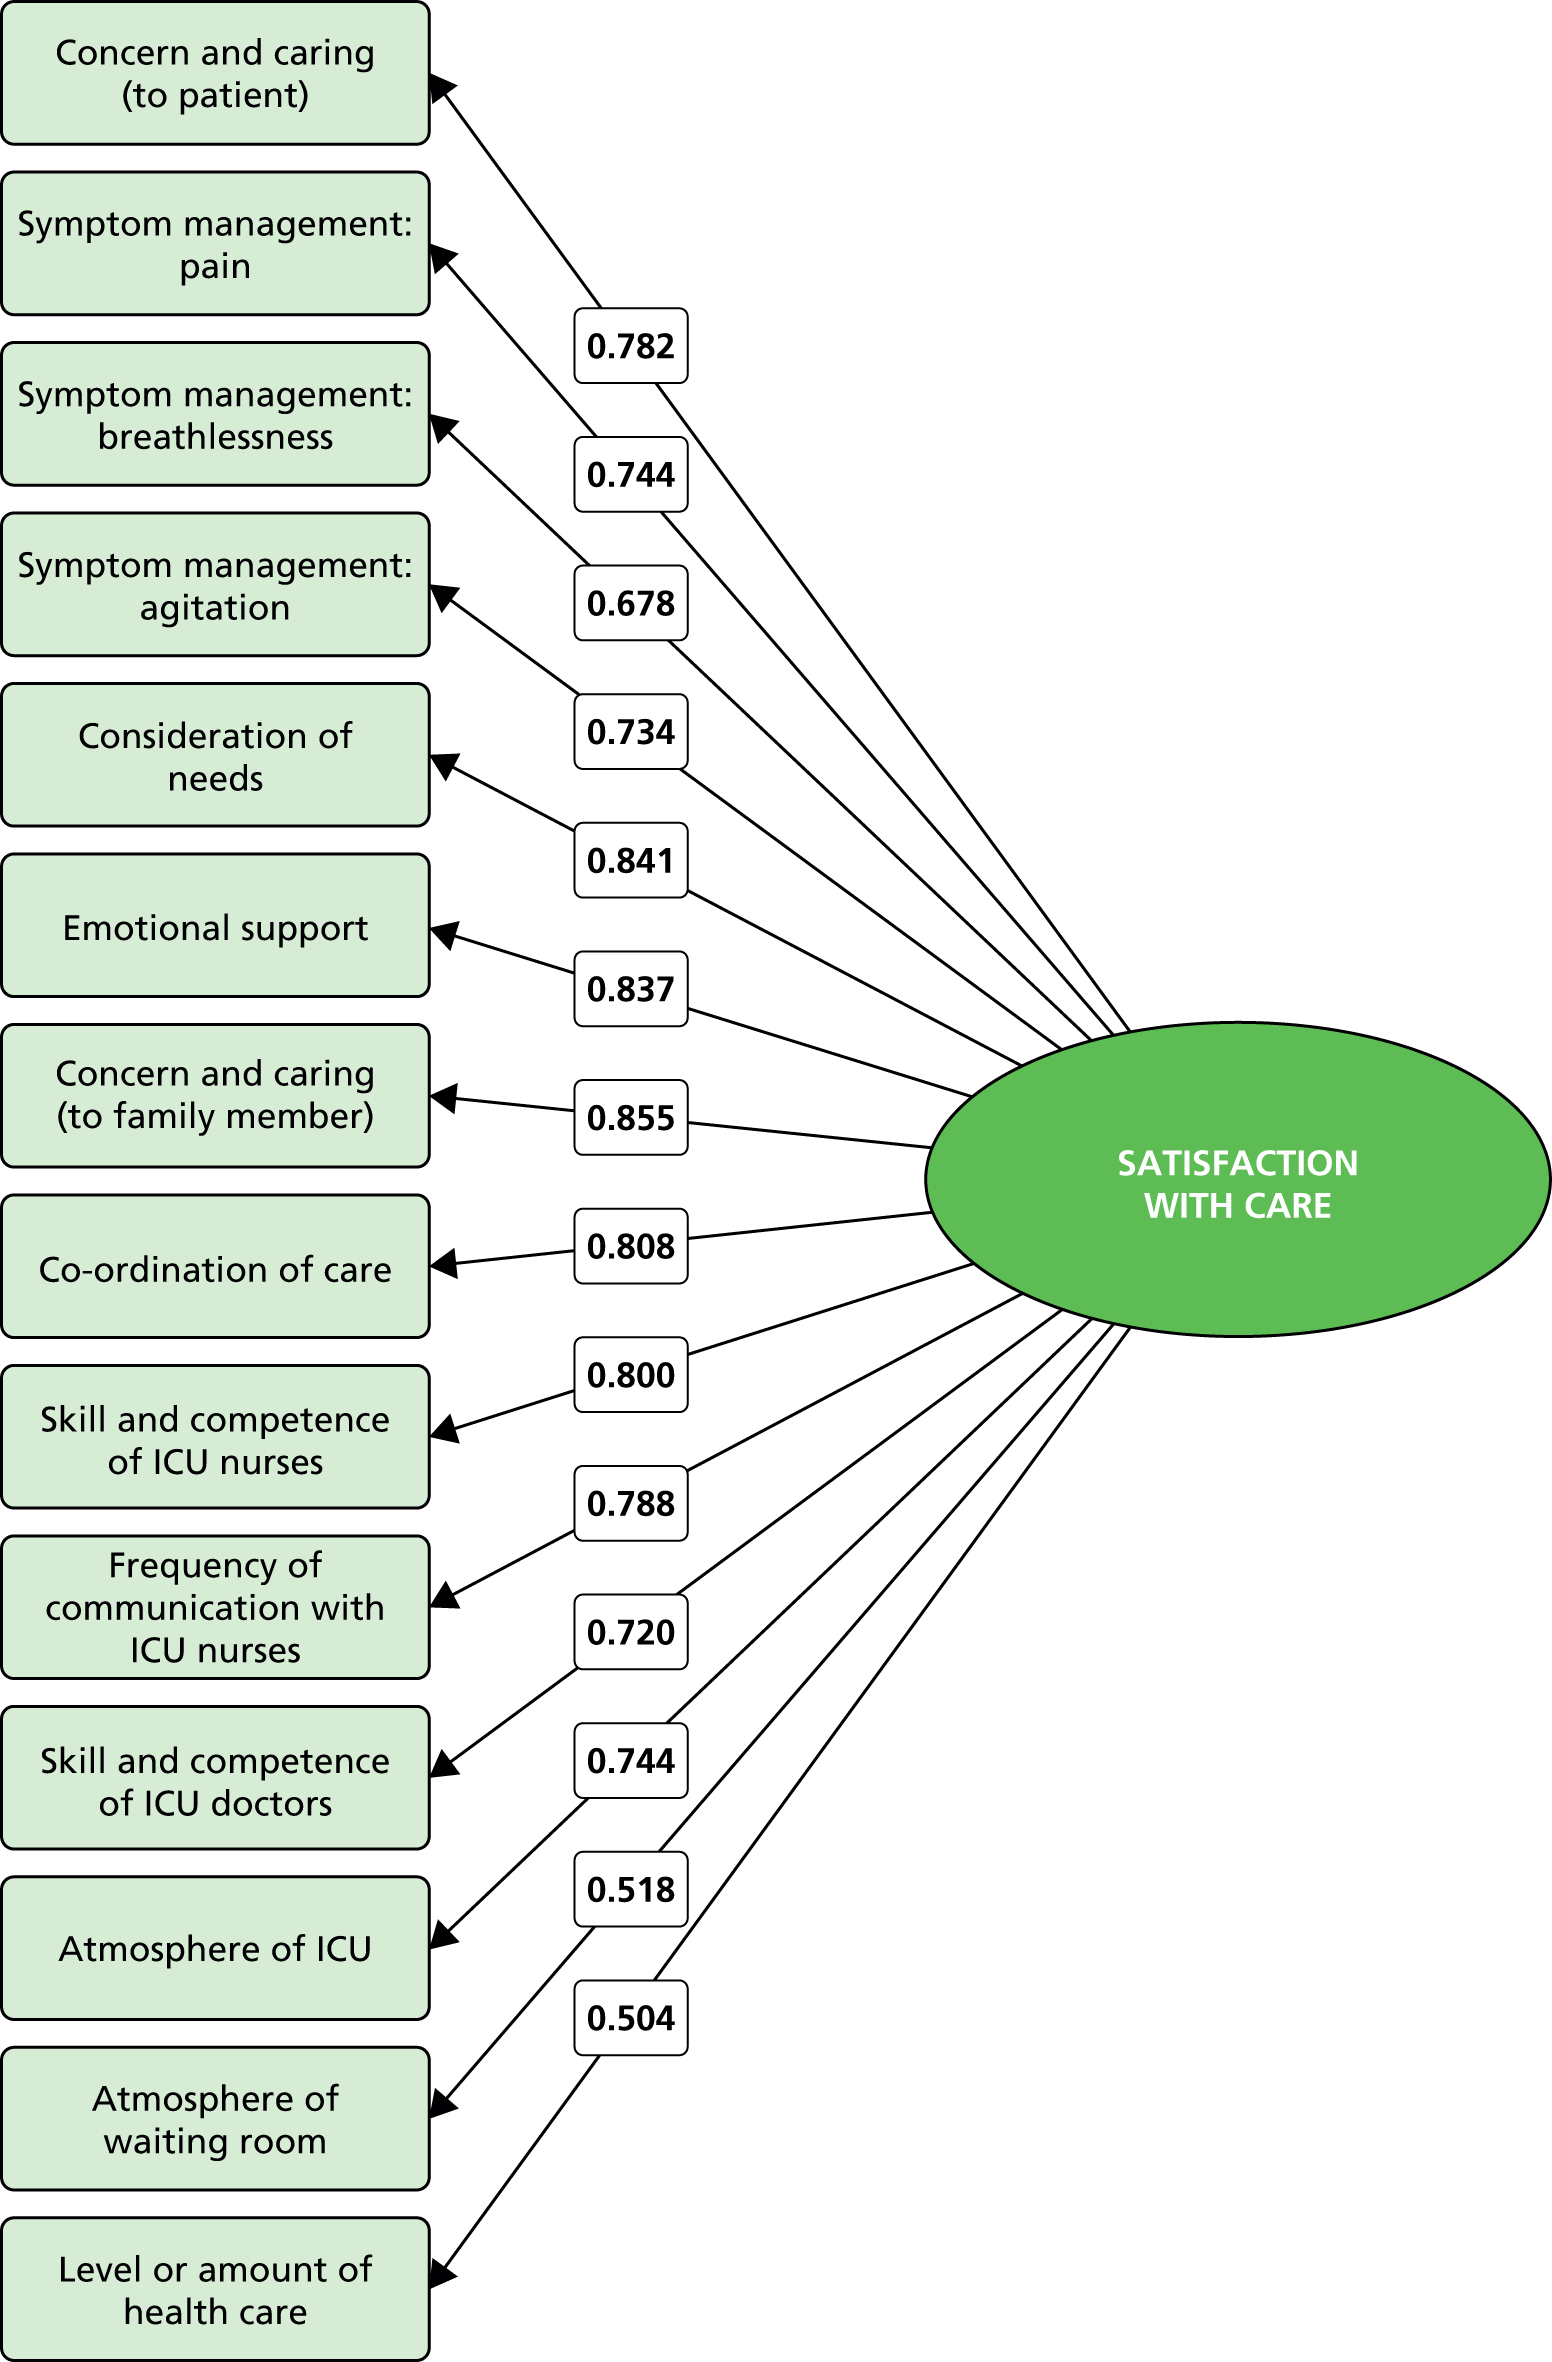
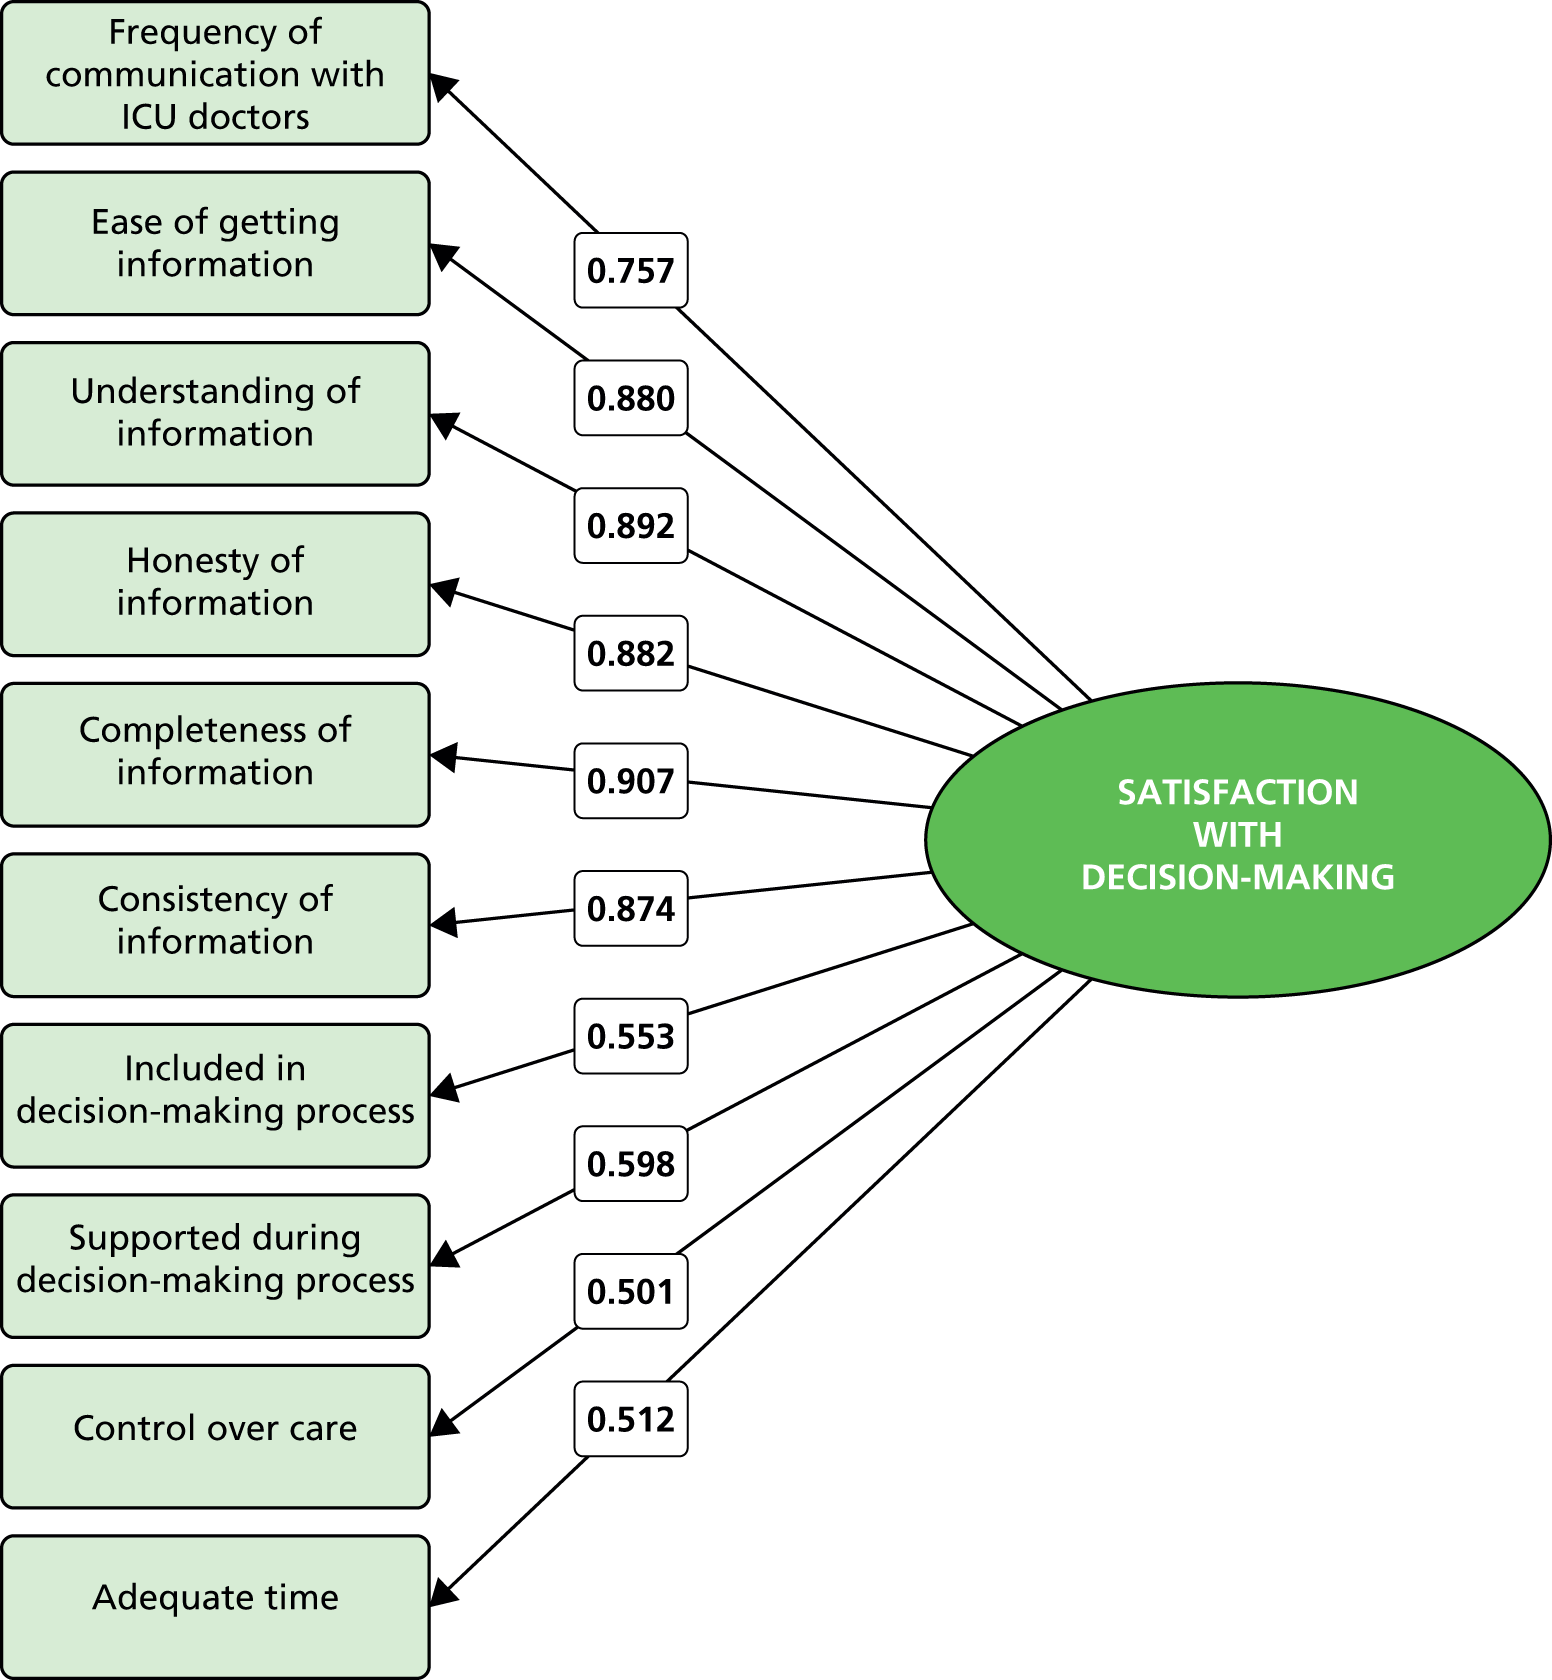
The exploratory factor analysis (Table 34) identified a three-factor solution, which was a better fit to the FREE study data when validated in a structural equation model (Table 35 and Figure 13) than the North American two-factor solution (RMSEA < 0.08; CFI and TLI > 0.9). This comprised the same domain of satisfaction with care, but the domain of satisfaction with decision-making was split into two separate factors: satisfaction with information (corresponding to the first six items) and satisfaction with the decision-making process (final four items). There was considerable correlation between the dimensions; consequently the best-fitting model used an oblique rotation and correlated error terms were permitted in the structural equation model. Correlations between the domain scores for the three domains are shown in Figure 14.
| UK FS-ICU-24 item | Factor loadings | ||
|---|---|---|---|
| Factor 1 | Factor 2 | Factor 3 | |
| Satisfaction with care | |||
| Concern and caring by ICU staff (towards the patient) | 0.872 | ||
| Symptom management: pain | 0.885 | ||
| Symptom management: breathlessness | 0.876 | ||
| Symptom management: agitation | 0.896 | ||
| Consideration of family member’s needs | 0.625 | ||
| Emotional support | 0.592 | ||
| Concern and caring by ICU staff (towards the family member) | 0.606 | ||
| Co-ordination of care | 0.740 | ||
| Skill and competence of ICU nurses | 0.832 | ||
| Frequency of communication with ICU nurses | 0.462 | ||
| Skill and competence of ICU doctors | 0.492 | 0.402 | |
| Atmosphere (mood) of the ICU | 0.641 | ||
| Atmosphere (mood) in the ICU Waiting Room | 0.365 | ||
| The LEVEL or amount of health care | 0.521 | ||
| Satisfaction with decision-making | |||
| Frequency of communication with ICU doctors | 0.667 | ||
| Ease of getting information | 0.832 | ||
| Understanding of information | 0.863 | ||
| Honesty of information | 0.840 | ||
| Completeness of information | 0.807 | ||
| Consistency of information | 0.795 | ||
| Included in decision-making process | 0.901 | ||
| Supported during decision-making process | 0.828 | ||
| Control over the care of family member | 0.735 | ||
| Adequate time to have concerns addressed and questions answered | 0.518 | ||
| Explained variation | |||
| Proportion of variation explained by factora | 0.703 | 0.690 | 0.452 |
| Goodness of fit statistic | Value | p-value |
|---|---|---|
| Chi-squared statistic (degrees of freedom) vs. saturated model | 7086 (248) | < 0.001 |
| RMSEA | 0.077 | – |
| CFI | 0.918 | – |
| TLI | 0.908 | – |
| CD | 0.998 | – |
FIGURE 13.
Structural equation model: structure and factor loadings for the FREE study three-factor solution.
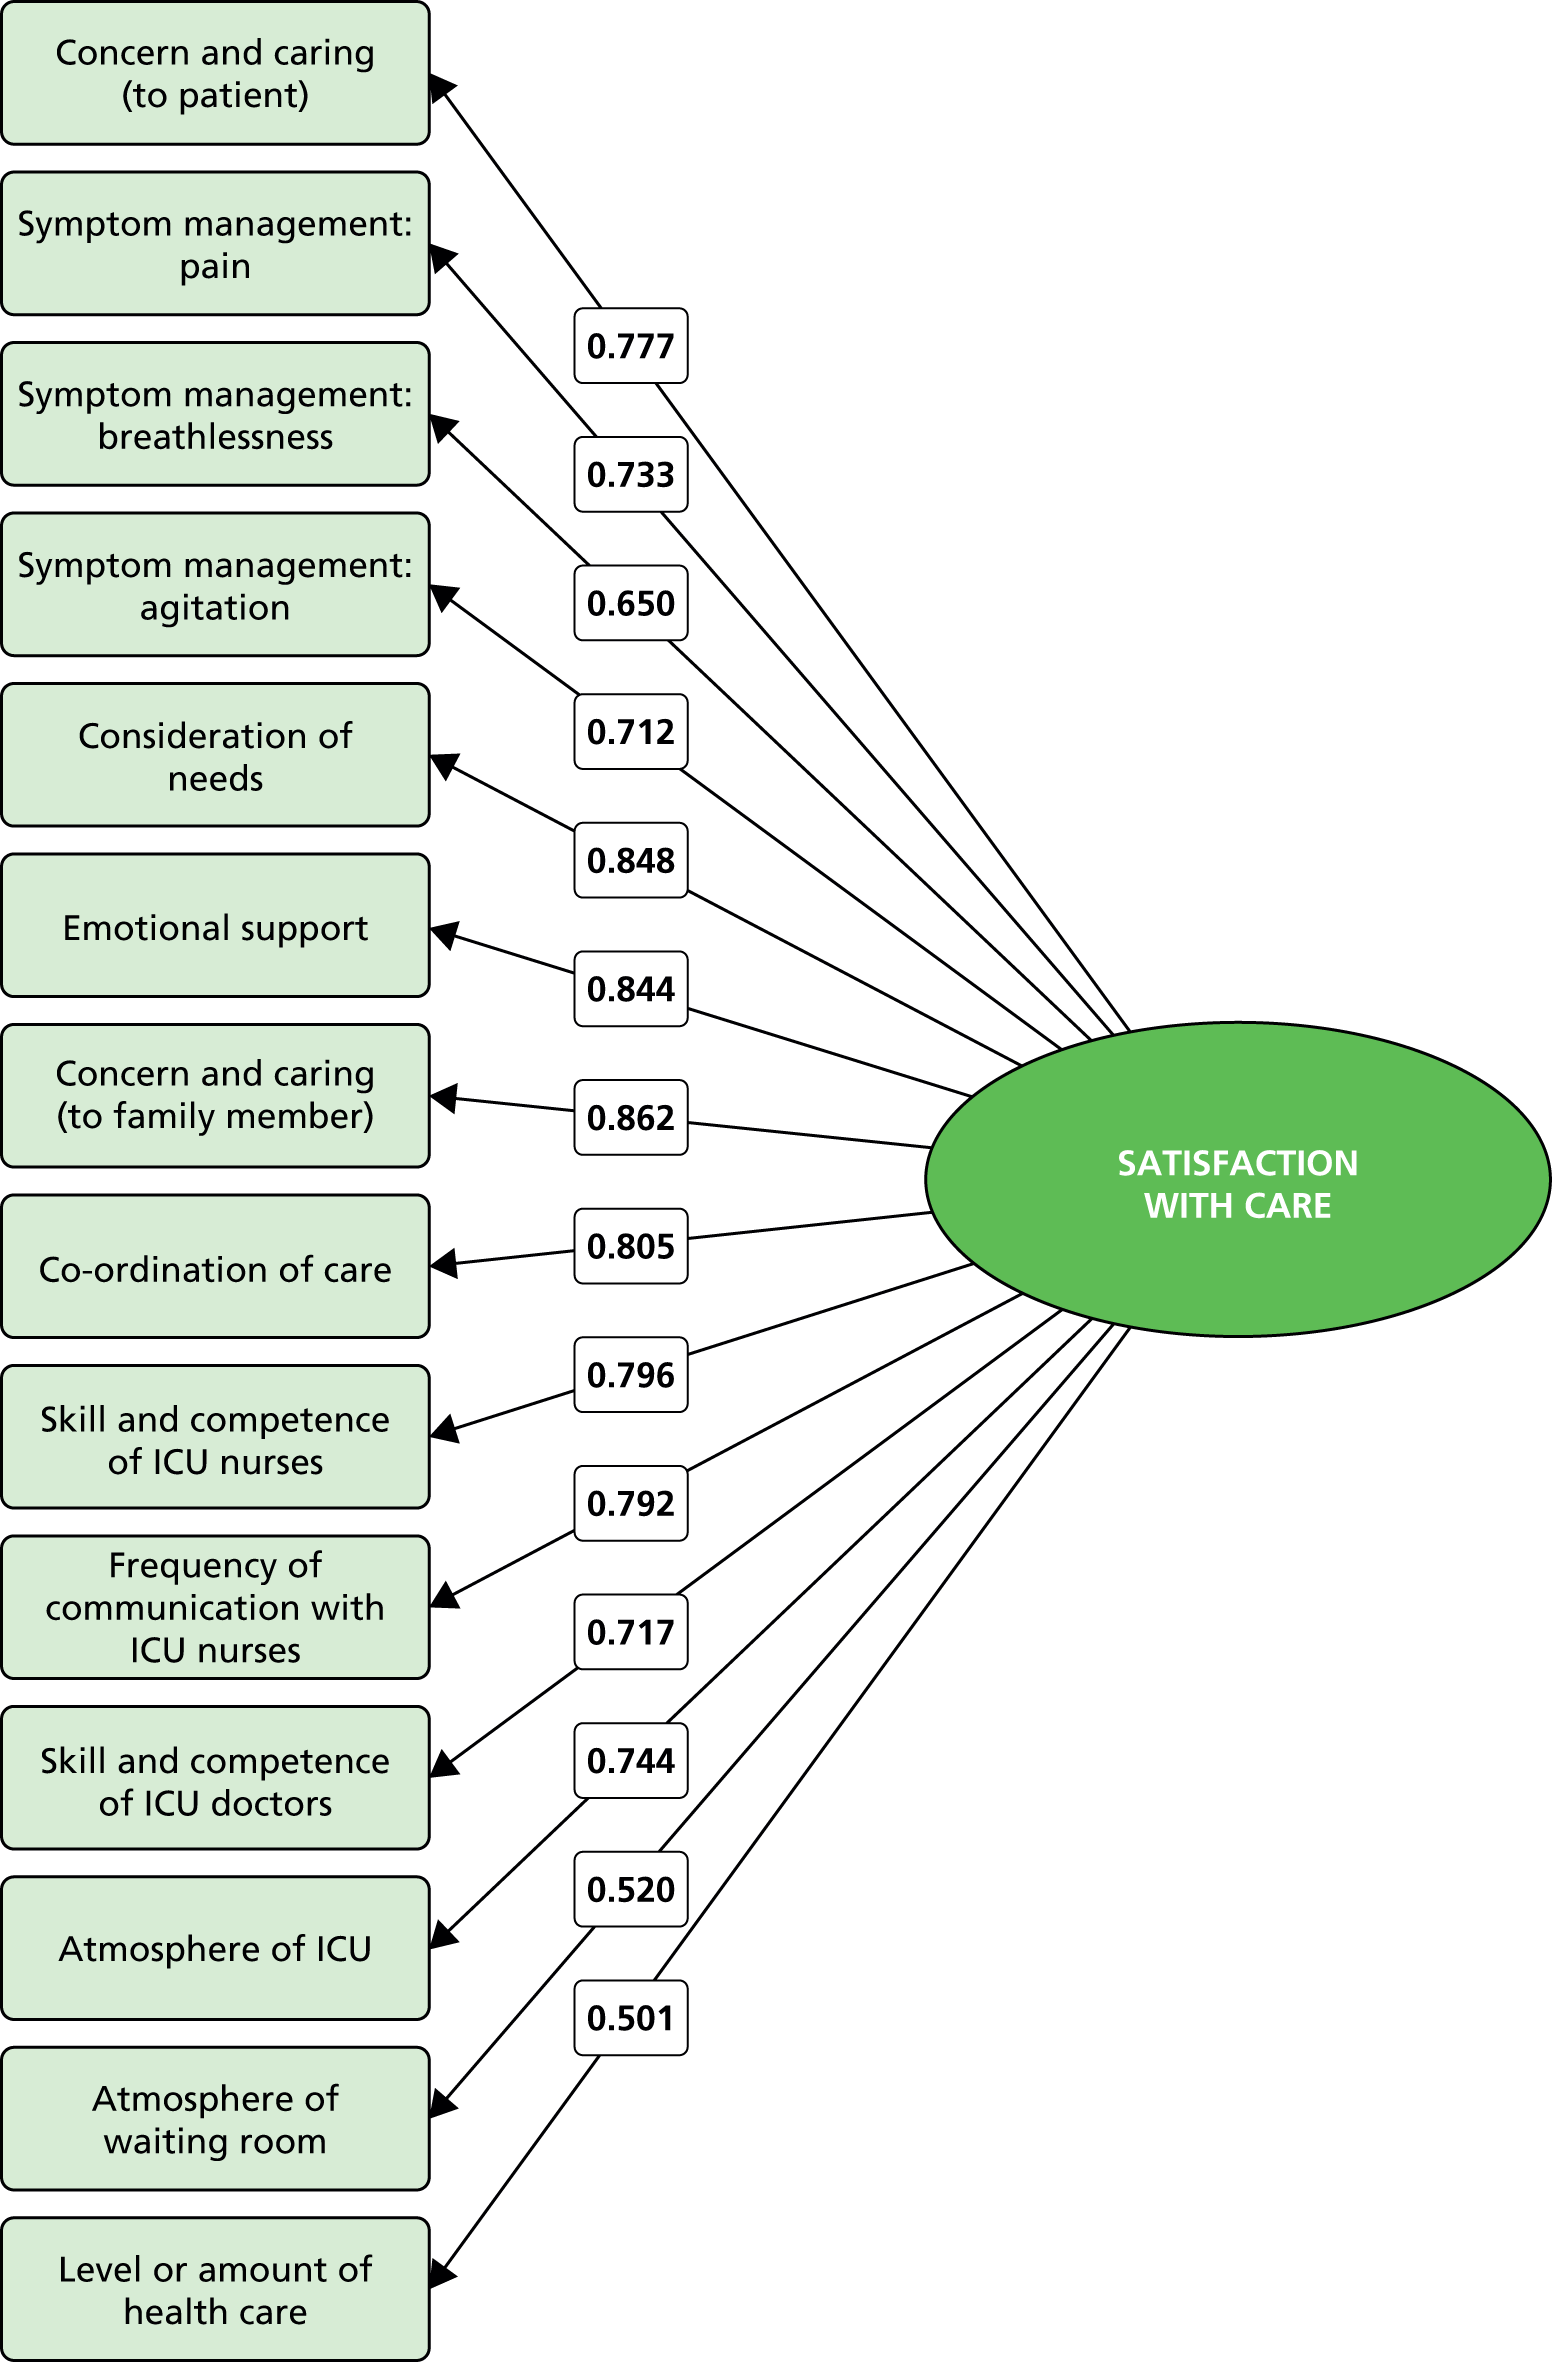
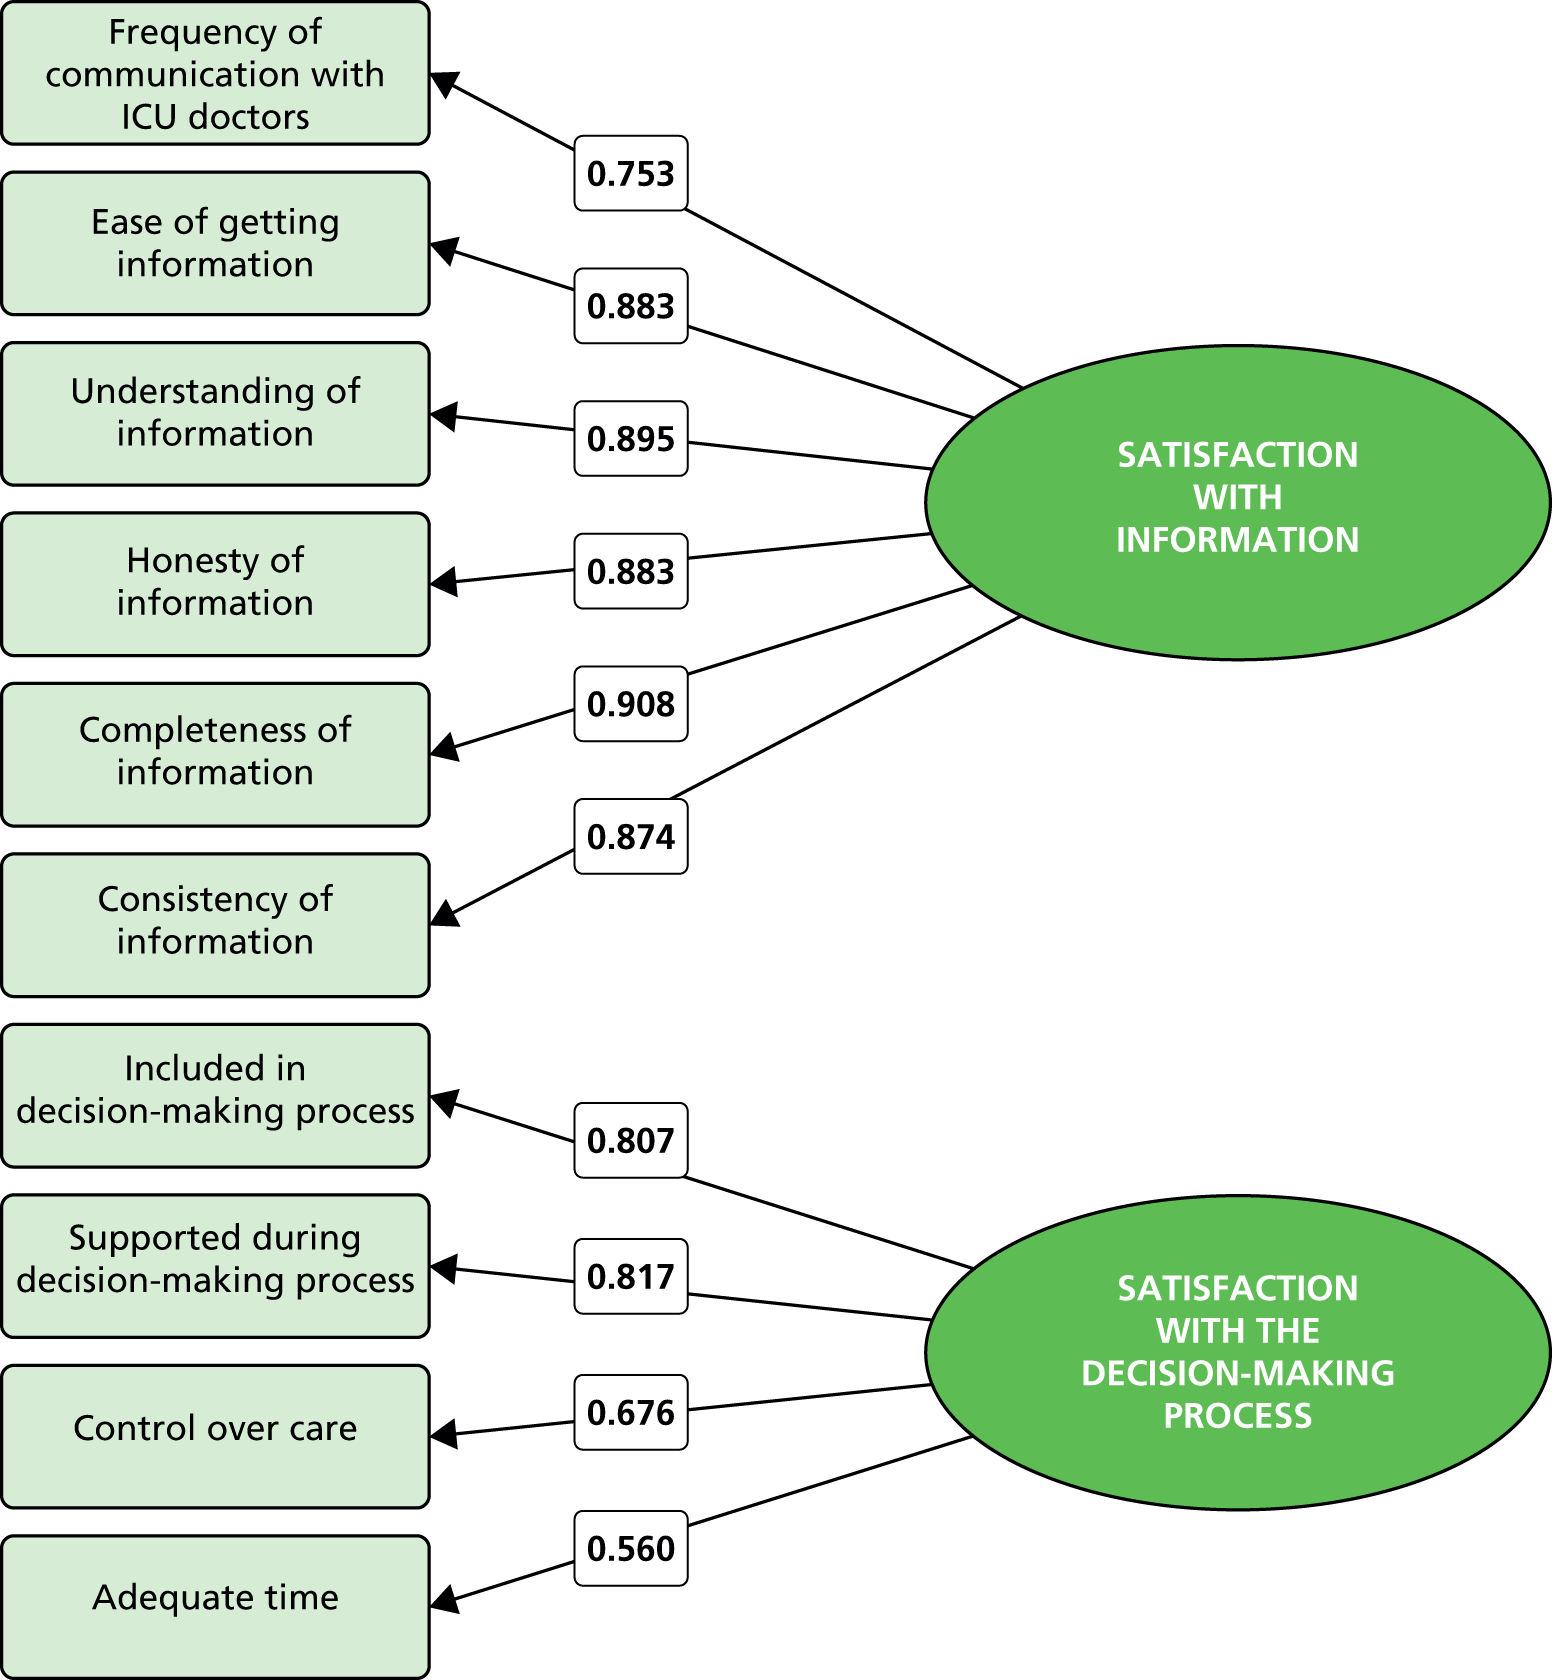
FIGURE 14.
Correlation between domain scores for the FREE study three-factor solution.

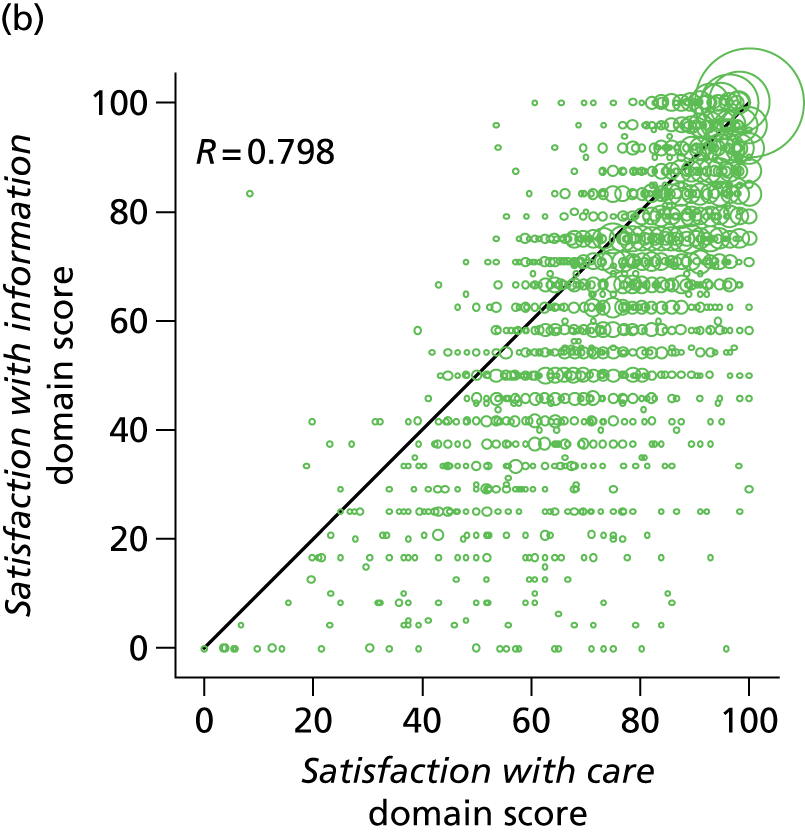

Performance-importance plots for the overall family satisfaction score and the two original domain scores are shown in Figures 15–17. The performance-importance plot for the overall family satisfaction score suggests that the highest-priority items for quality improvement relate to the provision of information (items 1–6 from the satisfaction with decision-making domain) and how well the ICU staff provide emotional support to the family member (item 4 from the satisfaction with care domain). The item relating to the atmosphere (mood) in the ICU waiting room (item 11 from the satisfaction with care domain) had the lowest proportion of ‘excellent’ ratings, but was ranked a lower priority for quality improvement because of its lower correlation with the overall family satisfaction score and the satisfaction with care domain score.
FIGURE 15.
Performance-importance plot for the UK FS-ICU-24 overall family satisfaction score. Cx denotes item x from the satisfaction with care domain; Dx denotes item x from the satisfaction with decision-making domain.

FIGURE 16.
Performance-importance plot for the UK FS-ICU-24 satisfaction with care domain score. Cx denotes item x from the satisfaction with care domain.

FIGURE 17.
Performance-importance plot for the UK FS-ICU-24 satisfaction with decision-making domain score. Dx denotes item x from the satisfaction with decision-making domain.
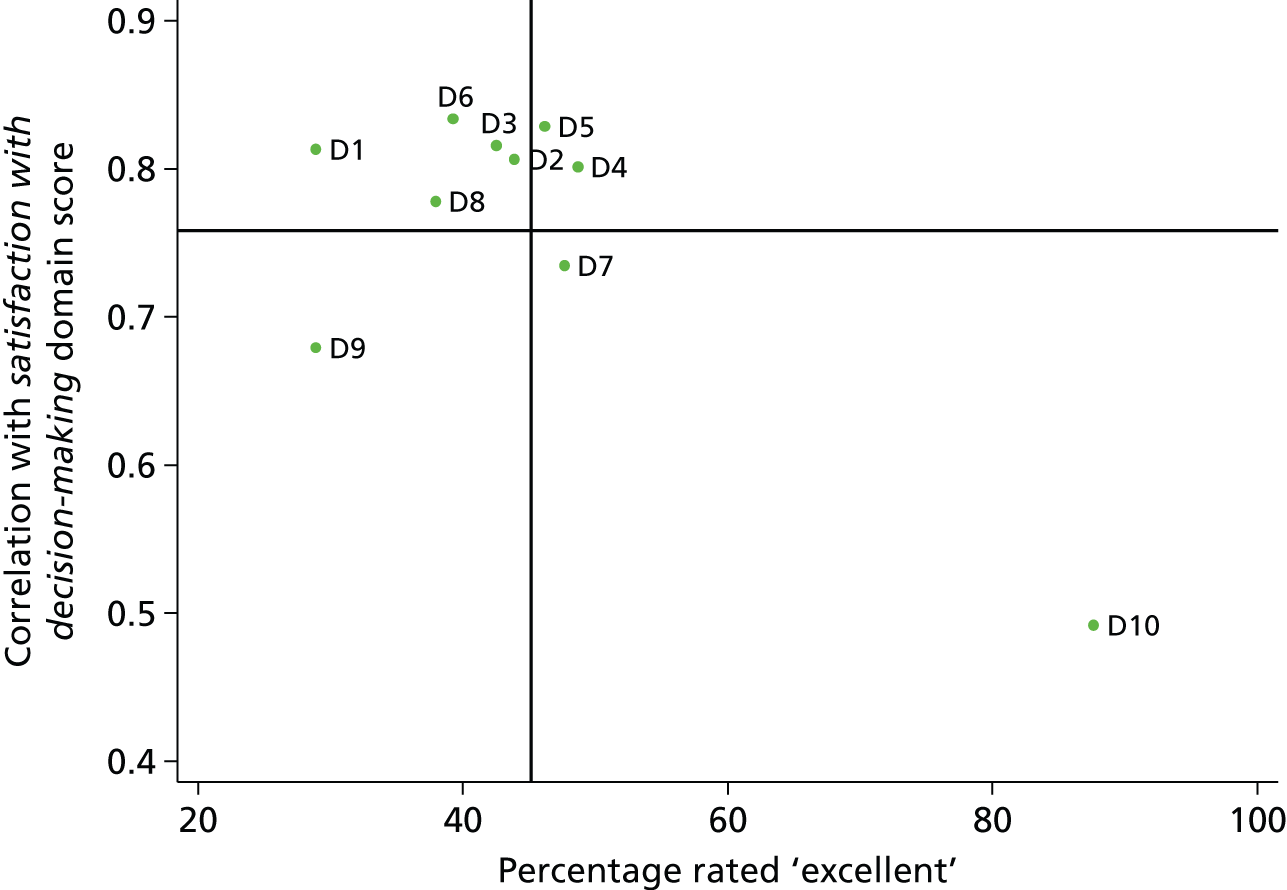
Discussion
The psychometric assessment of the UK FS-ICU-24 using data from the FREE study has established that the questionnaire has a high degree of internal consistency in the UK setting, demonstrated by Cronbach’s alpha > 0.9 for the overall family satisfaction score and for both domain scores, and has criterion validity among family members of non-survivors (no suitable instrument was available to establish criterion validity among family members of survivors). Although response rates were lower for some items within the questionnaire, there was no evidence that this represented a lack of comprehensibility or acceptability of the questionnaire. There was some evidence of redundancy among the items within each domain; however, the detail of knowing which particular items scored higher or lower was considered to be important for the applicability of the UK FS-ICU-24 responses to drive quality improvement. Substituting an alternative question on satisfaction with the amount of control led to only a minor increase in Cronbach’s alpha for the overall family satisfaction score and the satisfaction with decision-making domain score. The two-factor solution for the original FS-ICU-24, with domains of satisfaction with care and satisfaction with decision-making, was not a good fit to the FREE study data, and exploratory factor analysis suggested that the domain of satisfaction with decision-making encompassed two separate constructs, which we have termed satisfaction with information and satisfaction with the decision-making process.
The finding of high internal consistency is consistent with both the original study that derived the FS-ICU-24 in North America (Cronbach’s alpha 0.94 for the overall family satisfaction score, 0.92 for satisfaction with care and 0.88 for satisfaction with decision-making)11 and subsequent single-hospital validations in the Philippines (among family members of non-survivors only, 0.96 for the overall family satisfaction score and 0.94 for both satisfaction with care and satisfaction with decision-making),38 Germany (≥ 0.88 for all three scores),39 Turkey (0.95 for the overall family satisfaction score)40 and three studies from Greece (0.9–0.96 for the overall family satisfaction score41–43 and 0.90–0.92 for satisfaction with care42).
The three-factor solution identified in the FREE study is similar in structure to a three-factor solution recently reported from a single-centre study in Turkey. 40 Its structure of care, information and decision-making corresponded to our three constructs of care, information and the decision-making process, with the following exceptions: the item for communication by nurses loaded on information rather than care; the item for level or amount of health care loaded on decision-making rather than care; and the item for willingness of ICU staff to answer questions loaded on care rather than information. However, our structure has more in common with the original two-factor solution,11 retaining an identical domain of satisfaction with care and subdividing the second domain of satisfaction with decision-making. In this respect, the FS-ICU-24 demonstrates a degree of construct validity across the studies that have conducted factor analyses.
Chapter 5 UK 24-item Family Satisfaction in the Intensive Care Unit questionnaire: satisfaction scores and received questionnaires
Introduction
This chapter reports the overall family satisfaction score and domain scores from the UK FS-ICU-24 across populations based on the completeness of returned questionnaires.
Methods
The original FS-ICU scores – overall family satisfaction score and the two domain scores satisfaction with care and satisfaction with decision-making – were generated and reported across five different populations of received questionnaires (listed below). Two further domain scores, informed by the results of the full psychometric assessment (see Chapter 4) and reflecting a further subdivision of the decision-making domain into two separate domain scores – termed satisfaction with information and satisfaction with the decision-making process – were also generated and reported across the five different populations.
Three initial populations were identified, defined by:
-
all returned questionnaires (any items answered for a given score)
-
complete returned questionnaires (all items answered for a given score)
-
incomplete returned questionnaires (any items unanswered for a given score).
Two further populations were identified, defined by:
-
returned questionnaires with ≥ 70% items answered for a given score
-
returned questionnaires with ≥ 60% items answered for a given score.
The first reflected the traditional approach to scoring the FS-ICU questionnaire (as provided by the developers), defined by a response rate of ≥ 70% to items for a given score. The second, a modification on the traditional approach, informed by the results of the full psychometric assessment (see Chapter 4), was identified and defined by a response rate of ≥ 60% to items for a given score. Note: both ‘no response’ and ‘not applicable’ were considered as unanswered.
Results
Sample sizes for each population for each score are presented in Table 36.
| Population | Overall family satisfaction score | Satisfaction with care domain score | Satisfaction with decision-making domain score | Satisfaction with information domain score | Satisfaction with the decision-making process domain score |
|---|---|---|---|---|---|
| All | 7017 | 7016 | 6848 | 6807 | 5752 |
| Complete | 2898 | 5008 | 3476 | 6238 | 3520 |
| Incomplete | 4119 | 2008 | 3372 | 569 | 2232 |
| ≥ 70% complete | 6607 | 6872 | 5605 | 6577 | 4786 |
| ≥ 60% complete | 6800 | 6937 | 6463 | 6705 | 5301 |
Overall family satisfaction score
Across the five populations (Table 37), the median overall family satisfaction score varied from 81.3 for incomplete questionnaires to 87.5 for complete questionnaires. All scores showed skewed distributions towards higher scores (Figure 18).
| Population of returned questionnaires | Median | IQR | Mean (SD) | 95% confidence interval |
|---|---|---|---|---|
| All | 83.8 | 70.8–93.4 | 80.3 (16.8) | 79.9 to 80.7 |
| Complete | 87.5 | 76.0–95.8 | 83.4 (15.8) | 82.8 to 84.0 |
| Incomplete | 81.3 | 67.9–91.7 | 78.1 (17.2) | 77.5 to 78.6 |
| ≥ 70% complete | 84.4 | 71.4–93.8 | 80.5 (16.7) | 80.1 to 80.9 |
| ≥ 60% complete | 84.2 | 71.3–93.8 | 80.4 (16.8) | 80.0 to 80.8 |
FIGURE 18.
Distribution of overall family satisfaction scores across populations of questionnaires: (a) all returned questionnaires; (b) complete returned questionnaires; (c) incomplete returned questionnaires; (d) ≥ 70% complete returned questionnaires (traditional approach); and (e) ≥ 60% complete returned questionnaires (modified traditional approach).


Satisfaction with care domain score
Across the five populations (Table 38), the median satisfaction with care domain score varied from 83.3 for incomplete questionnaires to 89.3 for complete questionnaires. All scores showed skewed distributions towards higher scores (Figure 19).
| Population of returned questionnaires | Median | IQR | Mean (SD) | 95% confidence interval |
|---|---|---|---|---|
| All | 87.5 | 75.0–96.4 | 83.2 (16.0) | 82.8 to 83.6 |
| Complete | 89.3 | 76.8–96.4 | 84.4 (15.5) | 84.0 to 84.8 |
| Incomplete | 83.3 | 70.6–93.8 | 80.2 (16.9) | 79.4 to 80.9 |
| ≥ 70% complete | 87.5 | 75.0–96.4 | 83.3 (16.0) | 82.9 to 83.7 |
| ≥ 60% complete | 87.5 | 75.0–96.4 | 83.3 (16.0) | 82.9 to 83.6 |
FIGURE 19.
Distribution of satisfaction with care domain scores across populations of questionnaires: (a) all returned questionnaires; (b) complete returned questionnaires; (c) incomplete returned questionnaires; (d) ≥ 70% complete returned questionnaires (traditional approach); and (e) ≥ 60% complete returned questionnaires (modified traditional approach).


Satisfaction with decision-making domain score
Across the five populations (Table 39), the median satisfaction with decision-making domain score varied from 75.0 for incomplete questionnaires to 85.0 for complete questionnaires. Scores showed skewed distributions towards higher scores, although there was more variability in the score for incomplete questionnaires (Figure 20).
| Population of returned questionnaires | Median | IQR | Mean (SD) | 95% confidence interval |
|---|---|---|---|---|
| All | 80.0 | 63.9–92.5 | 75.4 (21.0) | 74.9 to 75.9 |
| Complete | 85.0 | 70.0–95.0 | 79.7 (19.4) | 79.1 to 80.4 |
| Incomplete | 75.0 | 57.1–87.5 | 70.9 (21.8) | 70.2 to 71.7 |
| ≥ 70% complete | 80.0 | 64.3–92.5 | 75.5 (20.7) | 75.0 to 76.1 |
| ≥ 60% complete | 80.0 | 64.3–92.5 | 75.7 (20.8) | 75.2 to 76.2 |
FIGURE 20.
Distribution of satisfaction with decision-making domain scores across populations of questionnaires: (a) all returned questionnaires; (b) complete returned questionnaires; (c) incomplete returned questionnaires; (d) ≥ 70% complete returned questionnaires (traditional approach); and (e) ≥ 60% complete returned questionnaires (modified traditional approach).


Satisfaction with information domain score
Across the five populations (Table 40), the median satisfaction with information domain score was 79.2 for all populations of questionnaires except for the incomplete questionnaires, which had a median score of 75.0. Scores generally showed skewed distributions towards higher scores but there was variability in the scores, particularly for the incomplete questionnaires (Figure 21).
| Population of returned questionnaires | Median | IQR | Mean (SD) | 95% confidence interval |
|---|---|---|---|---|
| All | 79.2 | 66.7–95.8 | 76.3 (22.2) | 75.8 to 76.9 |
| Complete | 79.2 | 66.7–95.8 | 76.9 (21.9) | 76.4 to 77.4 |
| Incomplete | 75.0 | 55.0–90.0 | 70.2 (24.8) | 68.1 to 72.2 |
| ≥ 70% complete | 79.2 | 66.7–95.8 | 76.6 (22.0) | 76.1 to 77.1 |
| ≥ 60% complete | 79.2 | 66.7–95.8 | 76.5 (22.1) | 76.0 to 77.1 |
FIGURE 21.
Distribution of satisfaction with information domain scores across populations of questionnaires: (a) all returned questionnaires; (b) complete returned questionnaires; (c) incomplete returned questionnaires; (d) ≥ 70% complete returned questionnaires (traditional approach); and (e) ≥ 60% complete returned questionnaires (modified traditional approach).


Satisfaction with the decision-making process domain score
Across the five populations (Table 41), the median satisfaction with the decision-making process domain score varied from 58.3 for incomplete questionnaires to 87.5 for complete questionnaires. There was variability in the distribution of scores for incomplete questionnaires and, although the distribution of scores was generally skewed towards higher scores for the other populations of questionnaires, this was most pronounced for the complete questionnaires (Figure 22).
| Population of returned questionnaires | Median | IQR | Mean (SD) | 95% confidence interval |
|---|---|---|---|---|
| All | 75.0 | 50.0–93.4 | 72.7 (24.8) | 72.0 to 73.3 |
| Complete | 87.5 | 68.8–100.0 | 79.7 (21.9) | 79.0 to 80.4 |
| Incomplete | 58.3 | 50.0–83.3 | 61.6 (25.2) | 60.6 to 62.7 |
| ≥ 70% complete | 81.3 | 58.3–93.4 | 74.3 (23.9) | 73.6 to 74.9 |
| ≥ 60% complete | 81.3 | 58.3–93.4 | 74.3 (23.9) | 73.6 to 74.9 |
FIGURE 22.
Distribution of satisfaction with the decision-making process domain scores across population of questionnaires: (a) all returned questionnaires; (b) complete returned questionnaires; (c) incomplete returned questionnaires; (d) ≥ 70% complete returned questionnaires (traditional approach); and (e) ≥ 60% complete returned questionnaires (modified traditional approach).


Discussion
In general, scores from complete questionnaires provided the highest mean and median values for the overall family satisfaction score and domain scores. Overall and domain scores were high (mean values ranging from 76 to 88 across overall and domain scores) and all showed a left-skewed distribution. Values from the traditional approach to scoring, defined by a response of ≥ 70% to items, did not differ when defined by a modified response rate of ≥ 60%.
Chapter 6 Missing data and imputation
Introduction
The approaches for handling missing data in questionnaire-based scales vary. Alternative approaches include deleting the items that have missing responses, using complete case data (i.e. removing respondents with missing responses) and imputing either the missing responses or the final scale. For the first approach, if the item that has missing data is crucial for the assessment, deleting that item may cause a violation of the content validity of the scale. For the second approach, because of the reduced sample size, the reliability of the estimated scale values will be underestimated. Therefore, the third approach, imputing the missing responses using the available data, is more appealing than the other approaches in terms of validity and reliability. This chapter describes the missing data in UK FS-ICU-24 responses and the approach to imputation employed in the FREE study.
Methods
Selection of data
Completed questionnaires were received from 7173 family members. Of these, 154 family members of patients admitted to one ICU were excluded from further analyses because CMP data were not available for the patients admitted to this ICU. This resulted in a data set of 7019 family member responses for analysis.
Family members who did not return a questionnaire are referred to as ‘non-responders’, those who returned a questionnaire but with missing or ‘not applicable’ responses to one or more of the 24 items as ‘partial responders’ and those who returned a questionnaire with all 24 items completed as ‘complete responders’, used as the reference category.
Statistical analysis
Responses to each individual item in the UK FS-ICU-24 were summarised, with particular attention to ‘not applicable’ and missing responses. The numbers and patterns of missing items were also explored within each domain (satisfaction with care and satisfaction with decision-making) and overall.
Logistic regression models including family member, patient and ICU/hospital characteristics were constructed to identify the determinants that may be associated with (mutually exclusive) patterns of missing items as well as the pattern of any missing item. The outcome for each model was a binary indicator of family members having the particular pattern of missing items.
Methods of imputation were used to complete non- and partial responses. This allows observations with missing items to be included, to address the potential bias and loss of precision that could result from complete case analysis. The imputation of family member characteristics and outcomes is complicated by several issues: the variables are hierarchical in nature, with a small number of family members (level 1) for each patient (level 2) and a large number of patients in each ICU/hospital (level 3). This could complicate the application of traditional approaches to dealing with missing data, taking into account the multilevel structure in the imputation model. In addition, several variables of various types (categorical, continuous and ordinal) at level 1 needed to be imputed. All variables to be included in the analysis were 100% complete at the ICU/hospital and patient level.
When applying multiple imputation to incomplete questionnaire data, one can either impute the incomplete items prior to computing scores (item level) or impute the scores directly from the available scores (scale level). The latter approach imputes satisfaction scores for both partial and non-responders, including the average response to the completed questions as an auxiliary variable for partial responders in an attempt to recapture much of the item-level information that a scale-level approach ignores. Previous work addressing this question44 found that item-level imputation is preferable to scale-level imputation in that it provides eventual estimates that are consistently more reliable. In addition, one of the problems when imputing the scores at the scale level was the asymmetric distribution of the scores and, although transforming is recommended45 to get better imputed values, transformation can yield substantial bias if the transformed variable is not close to normal. 46
We therefore considered two alternative approaches to how the outcome of family satisfaction was imputed:
-
scale-level, following standard rules to average item responses for partial responders with at least 60% of items completed and using multiple imputation to impute satisfaction scores for non-responders (including partial responders completing fewer than 60% of items)
-
item-level, using multiple imputation to impute individual missing items for both partial and non-responders and using the imputed items to calculate satisfaction scores.
Multilevel multiple imputation was used to complete non- and partial responses for outcomes and family member characteristics. Given the natural structure of the data and the planned analysis (a multilevel approach), it was necessary to account for the multilevel structure in the imputation phase to avoid biasing parameter estimates. 47 The imputation model was an extension of the joint modelling approach to mixed numerical and categorical data with a multilevel structure. We used Stata/SE 13.0 (StataCorp LP, College Station, TX, USA) with REALCOM-Impute, a MLwiN 2.15 (MLwiN, Centre for Multilevel Modelling, Bristol, UK) macro supported by Stata that generates imputations for hierarchical data, to generate the multiply imputed datasets. 48
Currently, only two-level hierarchical structures can be handled in REALCOM-Impute, and the FREE study data have a three-level structure. We therefore substituted fixed for random effects at the ICU/hospital level,49 collapsing the data to a two-level structure with a dummy variable for each ICU. Ten completed data sets were imputed and the model of interest was fitted to each of these data sets. The results from the 10 imputed data sets were combined using Rubin’s rule. 50
Results
Satisfaction with care
Of the 14 items that constitute the original satisfaction with care domain score, 13 all had the same response options, ‘excellent/very good/good/fair/poor’, with a further response option of ‘not applicable’. The response options for the final item (satisfaction with the level or amount of health care) were ‘very dissatisfied/slightly dissatisfied/mostly satisfied/very satisfied/completely satisfied’, with no response option for ‘not applicable’. The distributions of responses to each of the 14 items are presented in Figure 23.
FIGURE 23.
Responses to the 14 items constituting the satisfaction with care domain score. N/A, not applicable. (a) How did we treat your family member (the patient)? Q1. Concern and caring by ICU staff? [The courtesy, respect and compassion your family member (the patient) was given.] (b) Q2. Symptom management? (How well the ICU staff assessed and treated your family member’s symptoms) Pain. (c) Breathlessness. (d) Agitation. (e) How did we treat you? Q3. Consideration of your needs? (How well the ICU staff showed an interest in your needs.) (f) Q4. Emotional support? (How well the ICU staff provided emotional support.) (g) Q5. Concern and caring by ICU staff? (The courtesy, respect and compassion you were given.) (h) Teamwork. Q6. Co-ordination of care? (The teamwork of all the ICU staff who took care of your family member.) (i) Nurses. Q7. Skill and competence of ICU nurses? (How well the nurses cared for your family member.) (j) Q8. Frequency of communication with ICU nurses? (How often nurses communicated to you about your family member’s condition.) (k) Doctors. Q9. Skill and competence of ICU doctors? (How well doctors cared for your family member.) (l) The ICU. Q10. The atmosphere (mood) of the ICU was? (m) The waiting room. Q11. The atmosphere (mood) in the ICU waiting room was? (n) Level/amount of health care. Q12. Some people want everything done for their health problems while others do not want a lot done. How satisfied were you with the LEVEL or amount of health care your family member received in the ICU?
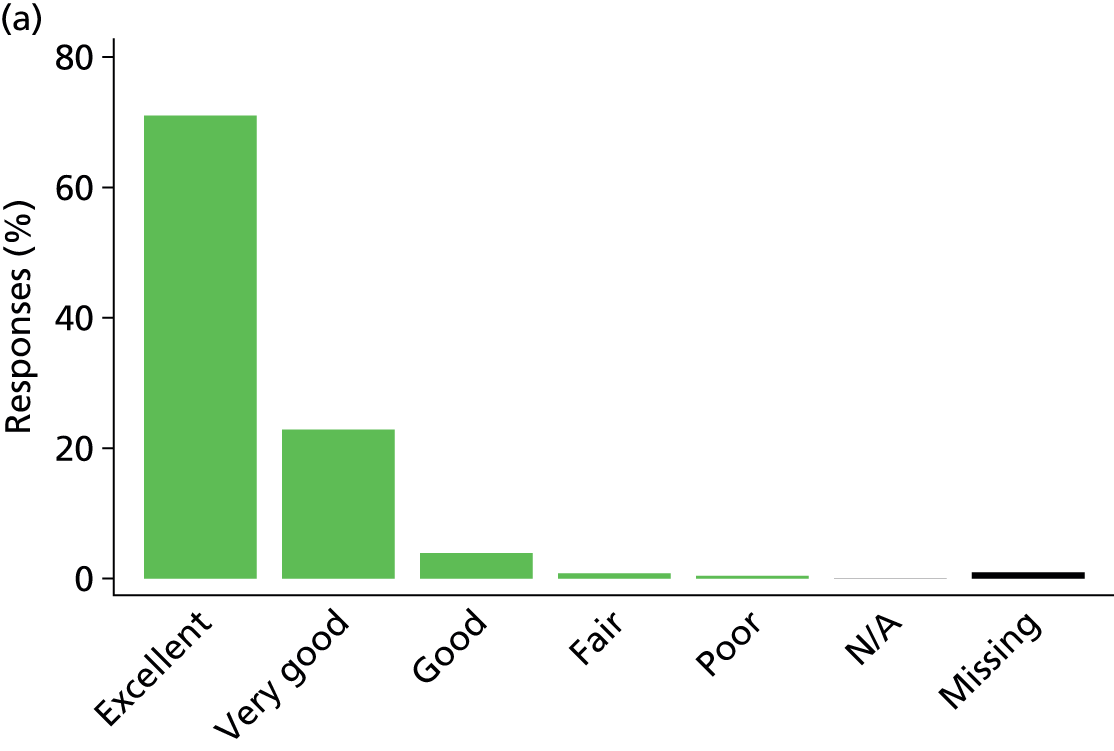
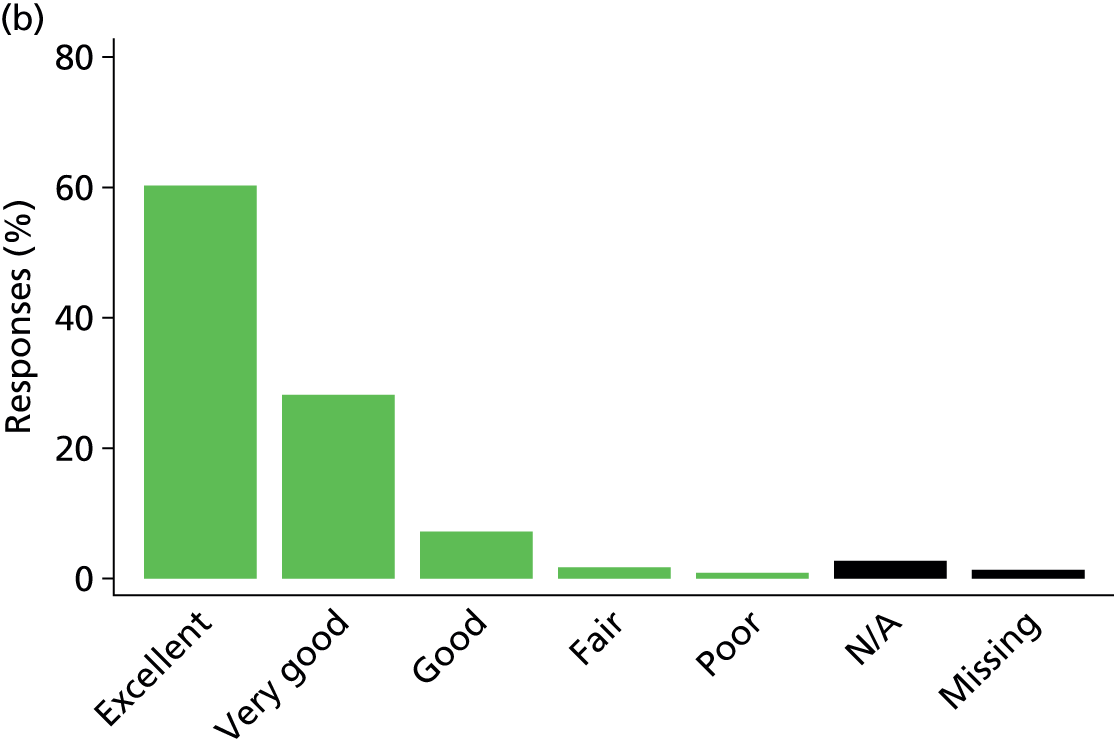
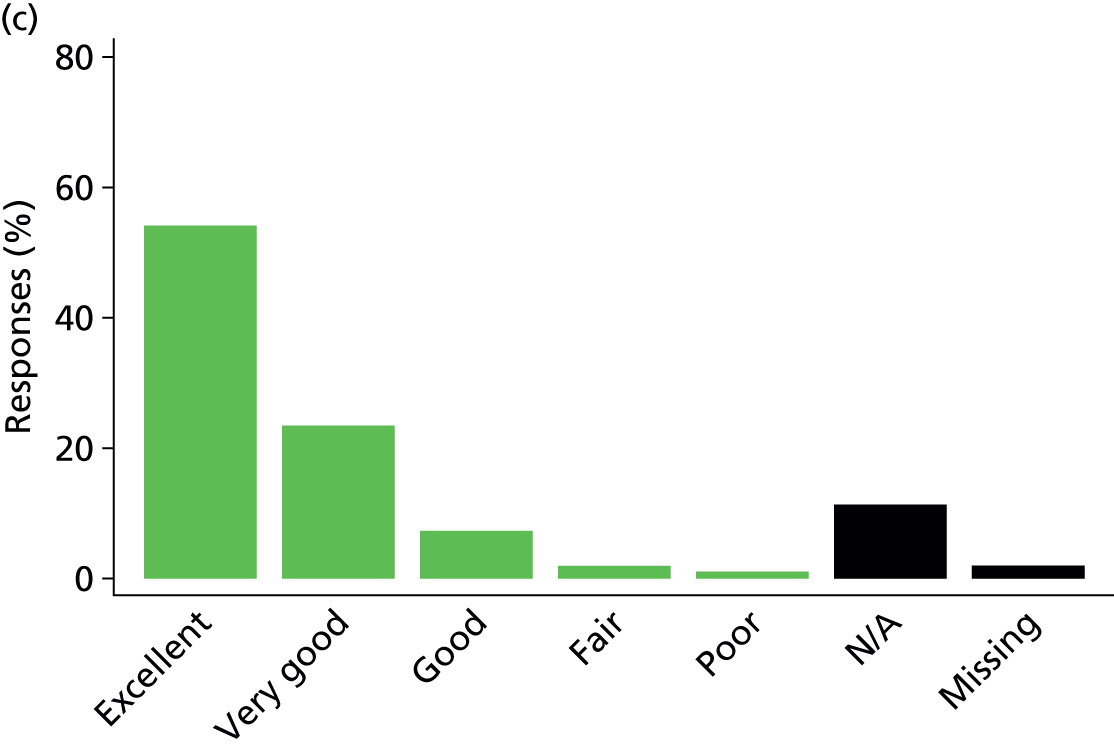


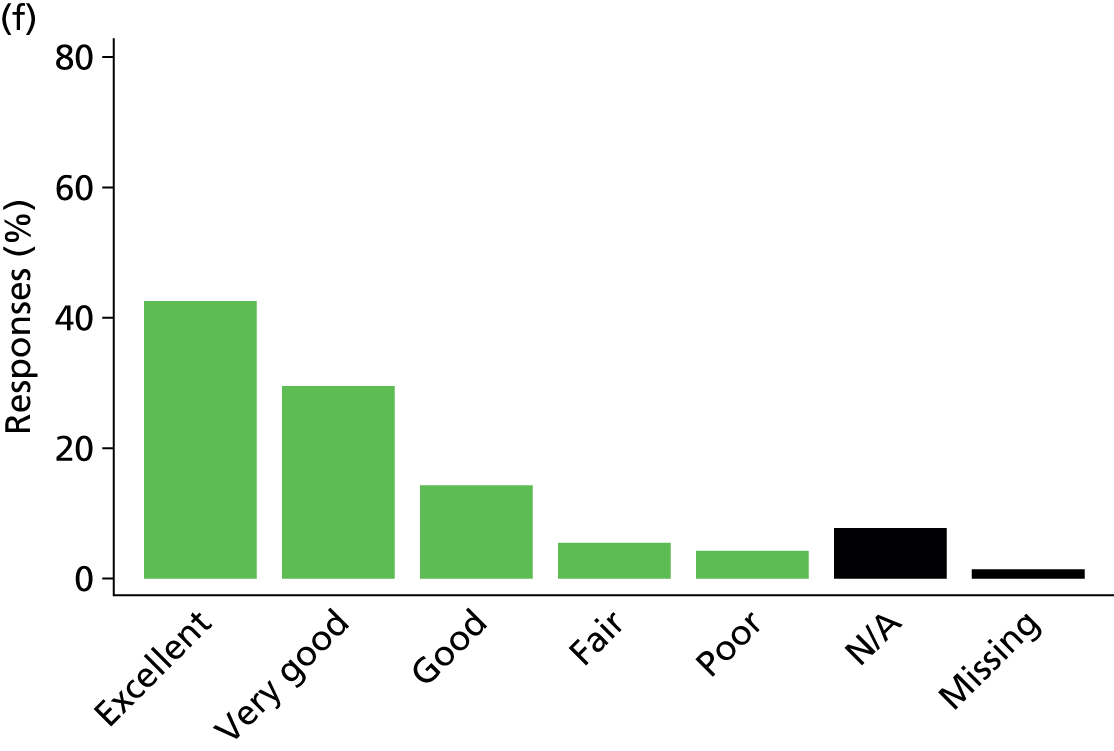

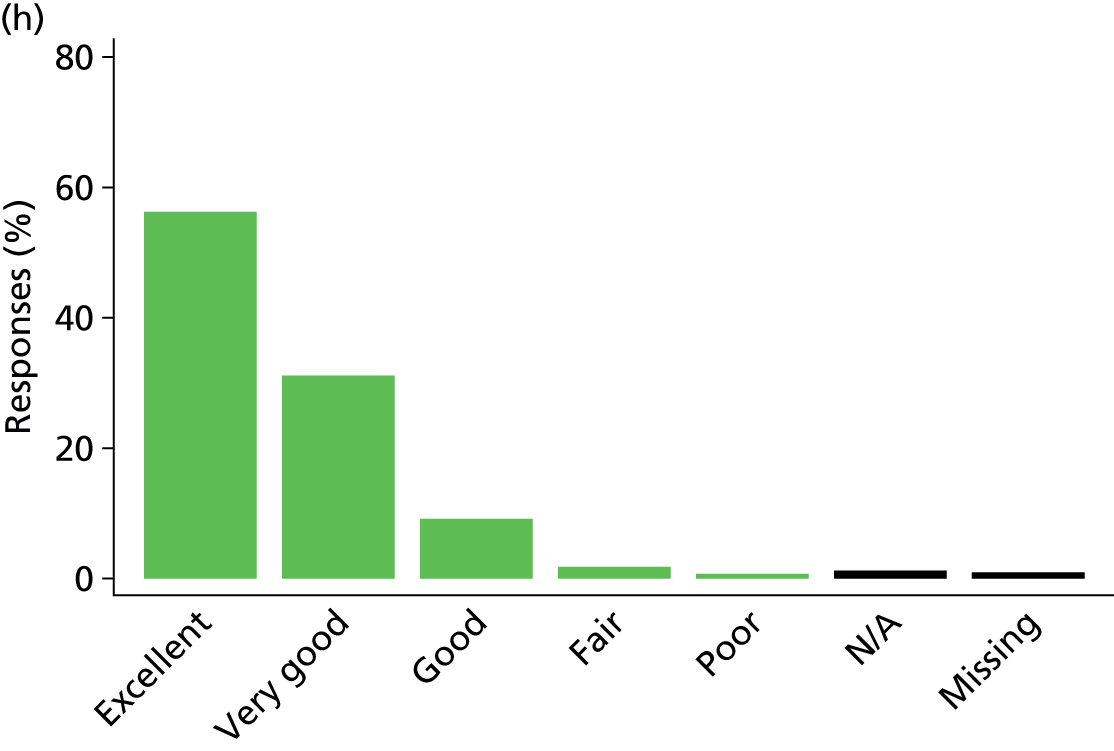
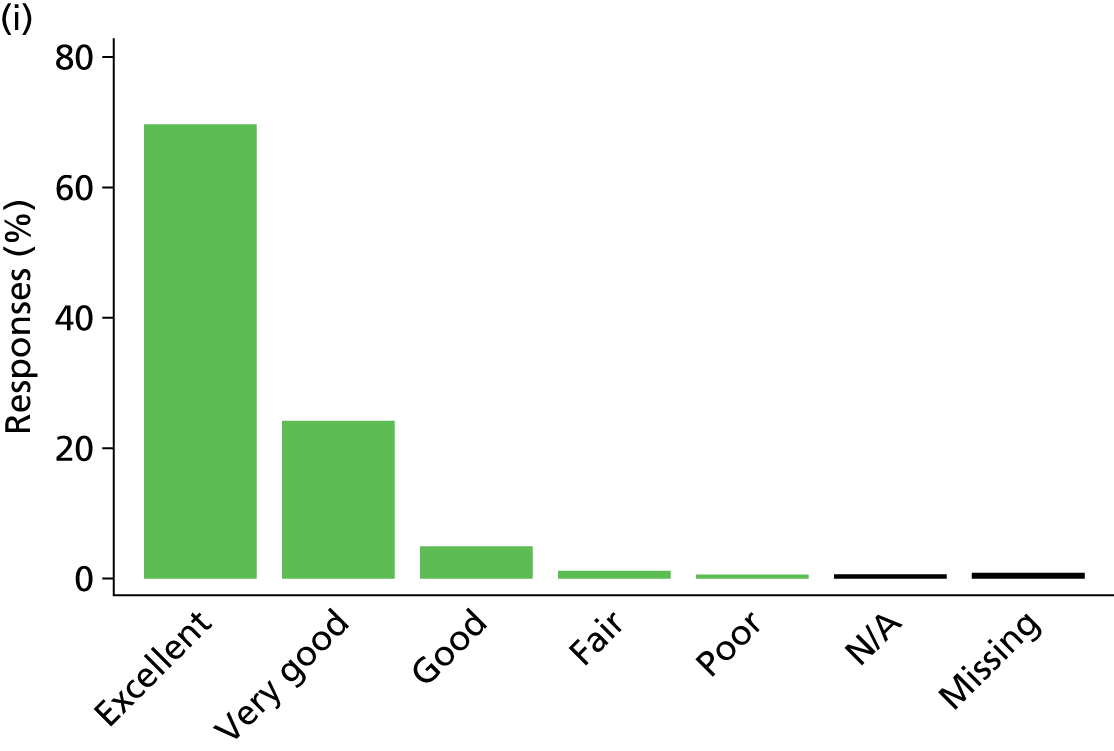
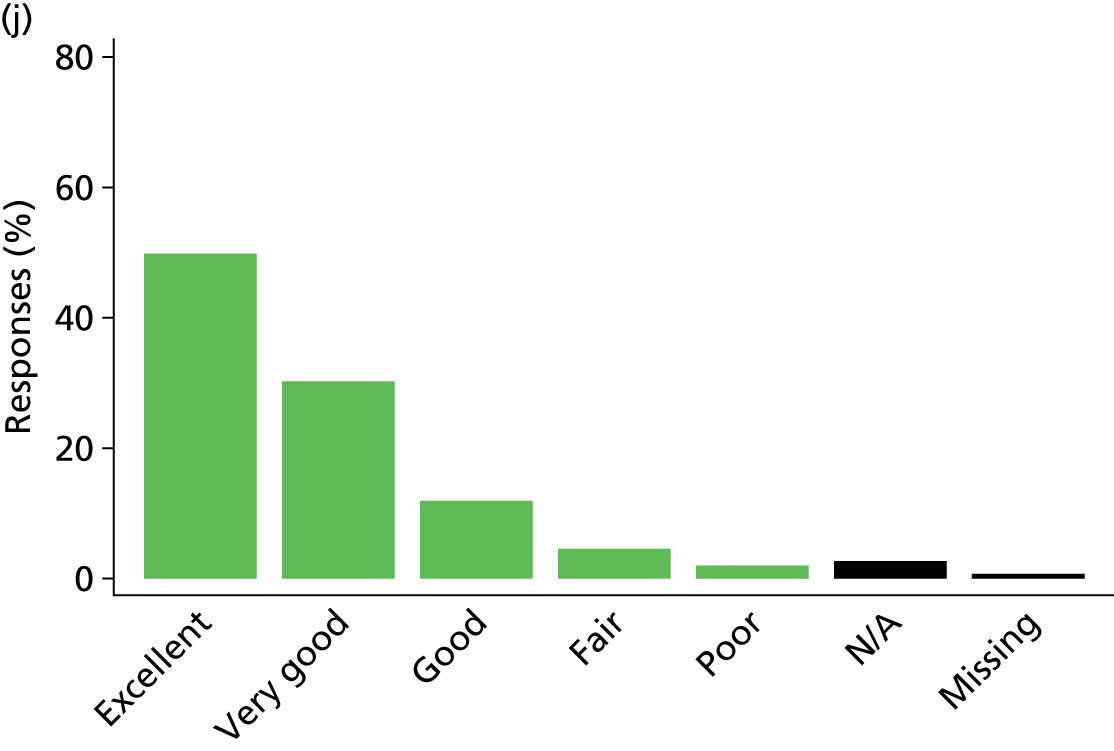
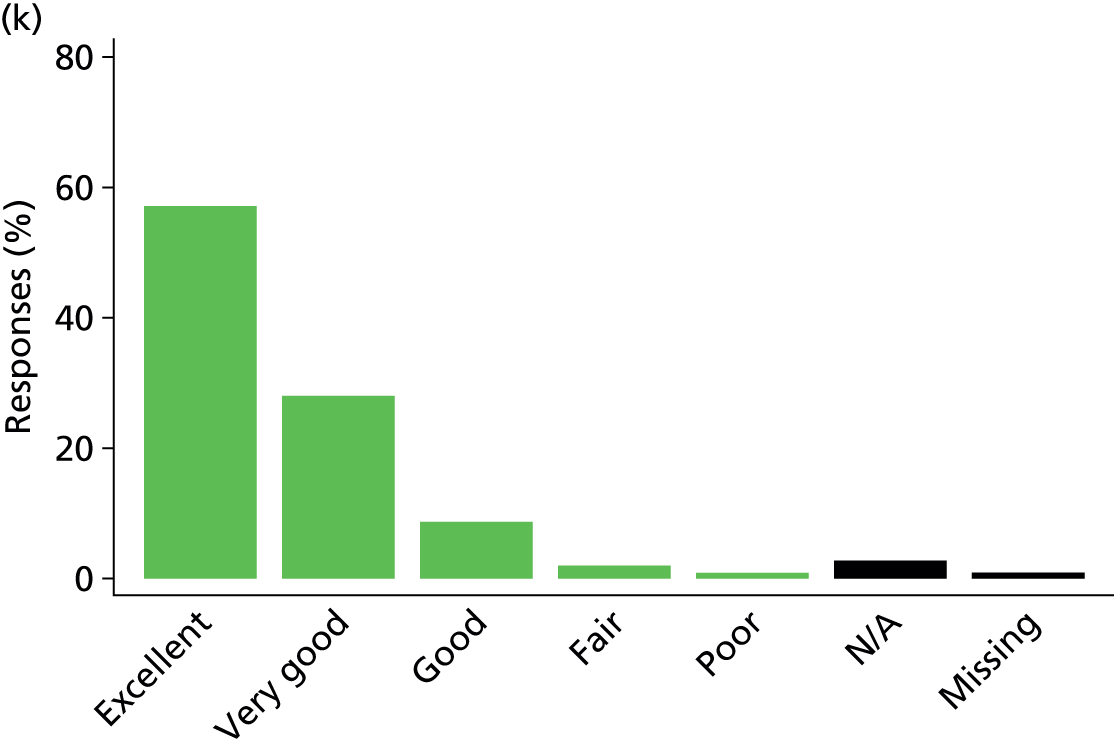
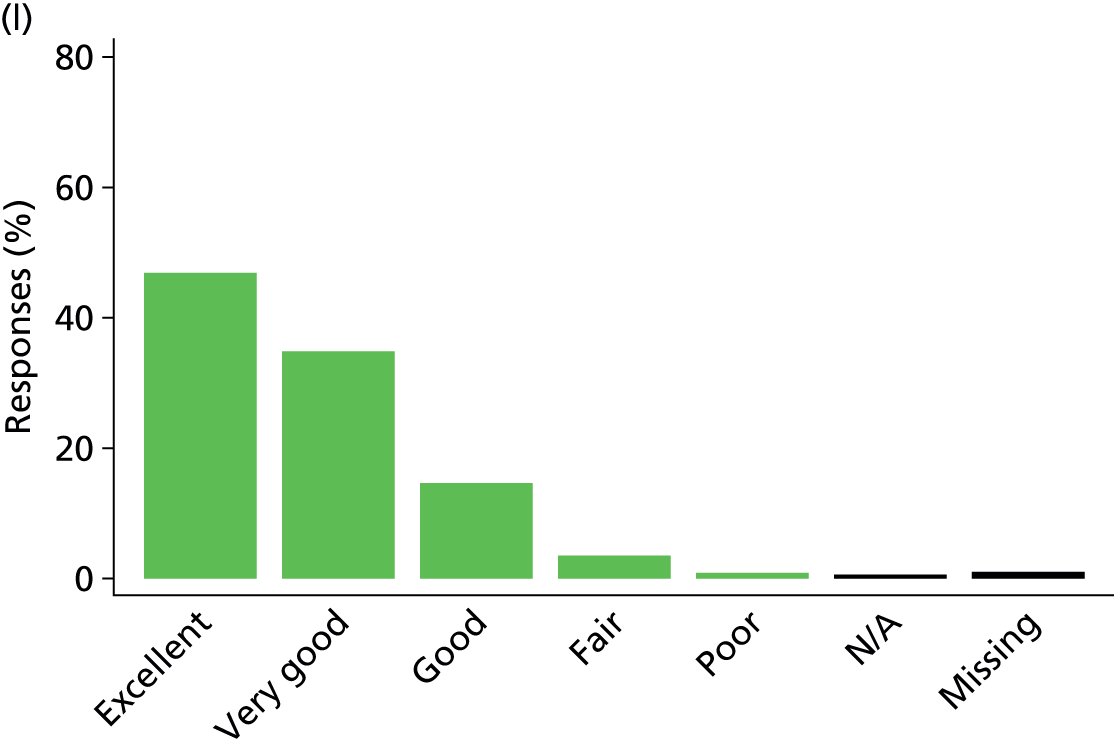

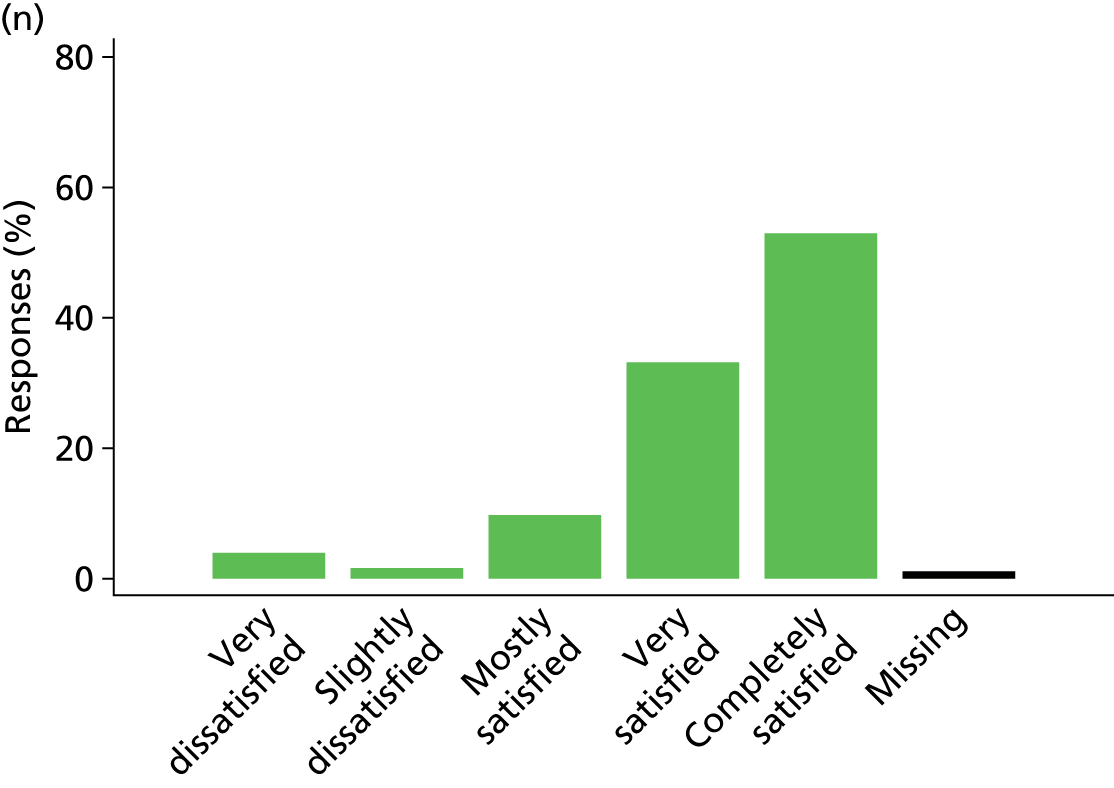
Of the 7019 questionnaires received, 5008 (71.4%) had complete responses to all 14 items constituting the satisfaction with care domain. The proportion of missing data (no response) for all items was low but was highest for the items relating to symptom management of the patient (agitation, 1.9%; breathlessness, 1.8%; pain, 0.9%). When combined with a response of ‘not applicable’ – considered as missing when generating the score – the proportion of missing data was higher – again, highest for two of the items about symptom management of the patient (breathless, 12.9%; agitation, 10.7%), followed by the item on atmosphere/mood of the waiting room (8.7%) and the item about emotional support of the family member (8.1%).
When we examined patterns of missing data (Figure 24), we found that most frequently a response was missing for item C2b only (symptom management: breathlessness), item C11 only (the atmosphere/mood of the ICU waiting room) or a combination of items C2b (symptom management: breathlessness) and C2c (symptom management: agitation).
FIGURE 24.
Common patterns of missing data for the satisfaction with care domain.
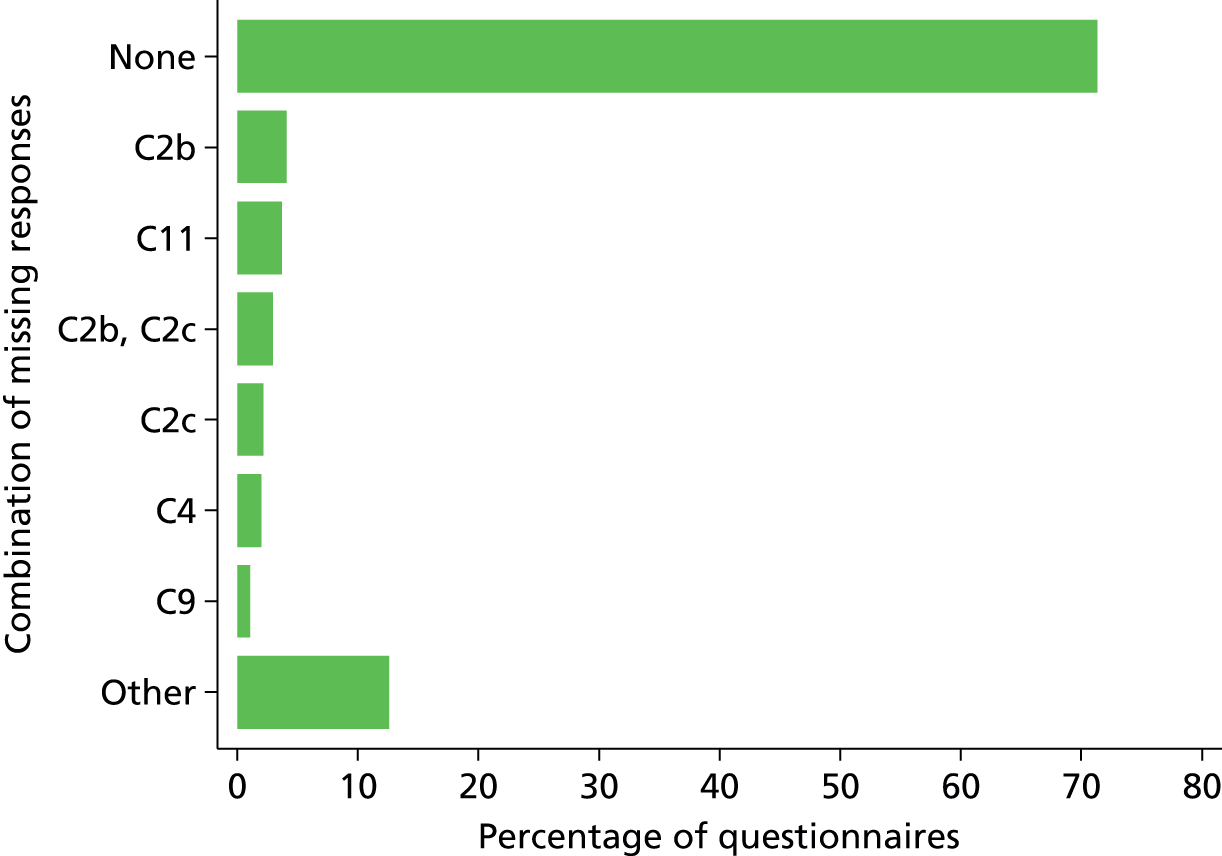
The distribution of the numbers of items with missing responses is presented in Figure 25.
FIGURE 25.
Distribution of the number of items with missing responses for the satisfaction with care domain.
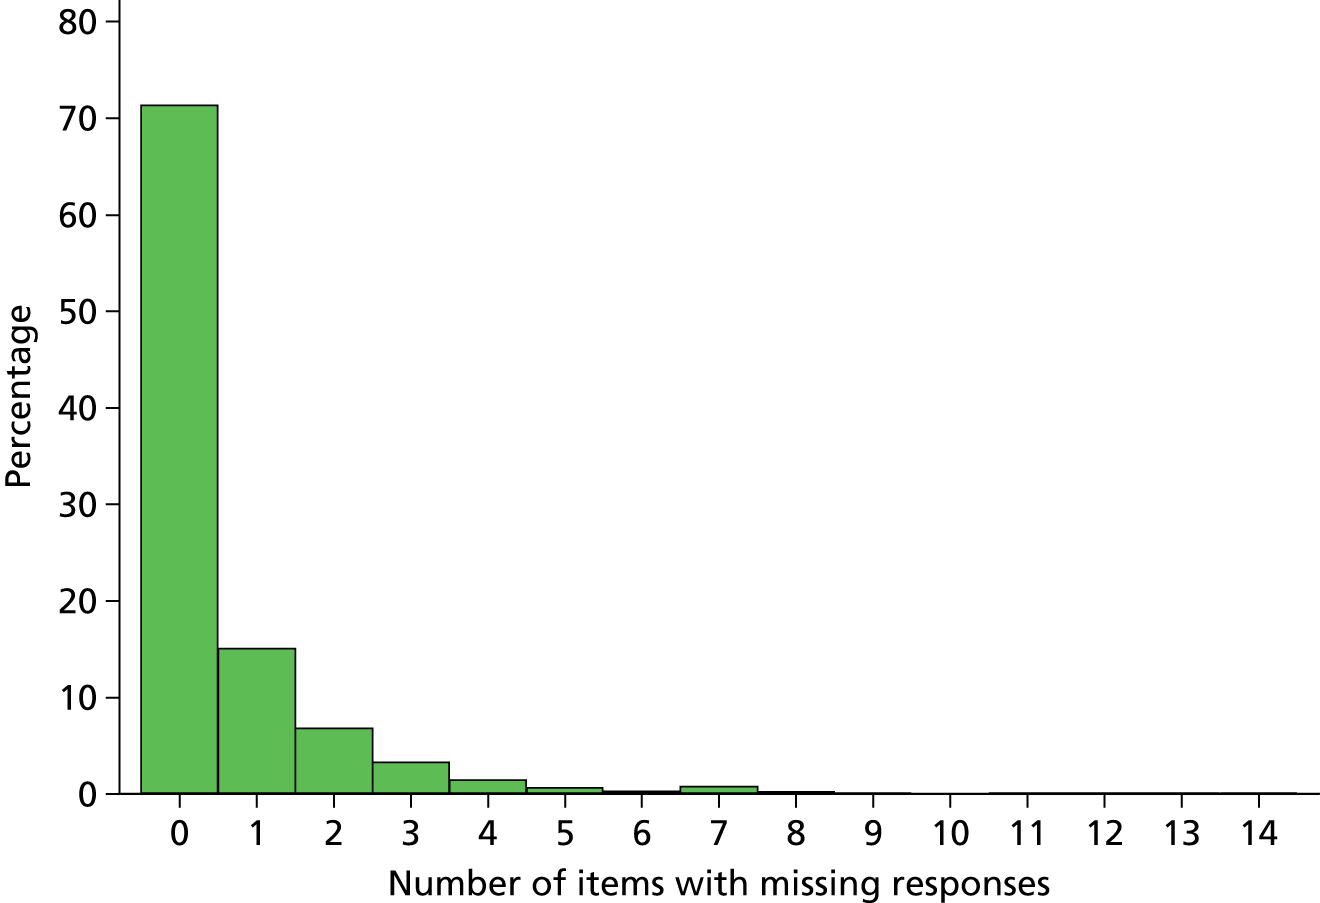
Satisfaction with decision-making
Six of the 10 items that constitute the original satisfaction with decision-making domain score all had the same response options, ‘excellent/very good/good/fair/poor’, with a further response option of ‘not applicable’. The response options for the remaining four items were as follows:
-
Q7 (being included in the decision-making process) – I felt very excluded/I felt somewhat excluded/I felt neither included nor excluded/I felt somewhat included/I felt very included
-
Q8 (feeling supported during the decision-making process) – I felt totally unsupported/I felt slightly unsupported/I felt neither supported nor unsupported/I felt supported/I felt very supported
-
Q9 (control over the care of the patient) – I felt really out of control and that the health care system took over and dictated the care my family member received/I felt somewhat out of control and that the health care system took over and dictated the care my family member received/I felt neither in control nor out of control/I felt I had some control over the care my family member received/I felt that I had good control over the care my family member received
-
Q10 (adequate time for making decisions and to have concerns addressed and questions answered) – I could have used more time/I had adequate time
-
Q7–10 all had a further response option of ‘not applicable’.
The distributions of responses to each of the 10 items are presented in Figure 26.
FIGURE 26.
Responses to the 10 items constituting the satisfaction with decision-making domain score. N/A, not applicable. (a) Information needs. Q1. Frequency of communication with ICU doctors? (How often doctors communicated to you about your family member’s condition.) (b) Q2. Ease of getting information? (Willingness of ICU staff to answer your questions.) (c) Q3. Understanding of information? (How well ICU staff provided you with explanations that you understood.) (d) Q4. Honesty of information? (The honesty of information provided to you about your family member’s condition.) (e) Q5. Completeness of information? (How well ICU staff informed you what was happening to your family member and why things were being done.) (f) Q6. Consistency of information? [The consistency of information provided to you about your family member’s condition (did you get a similar story from the doctor, nurse, etc.)]. (g) The process of making decisions. Q7. Did you feel included in the decision-making process? (h) Q8. Did you feel supported during the decision-making process? (i) Q9. Did you feel you had control over the care of your family member? (j) Q10. When making decisions, did you have adequate time to have your concerns addressed and questions answered?
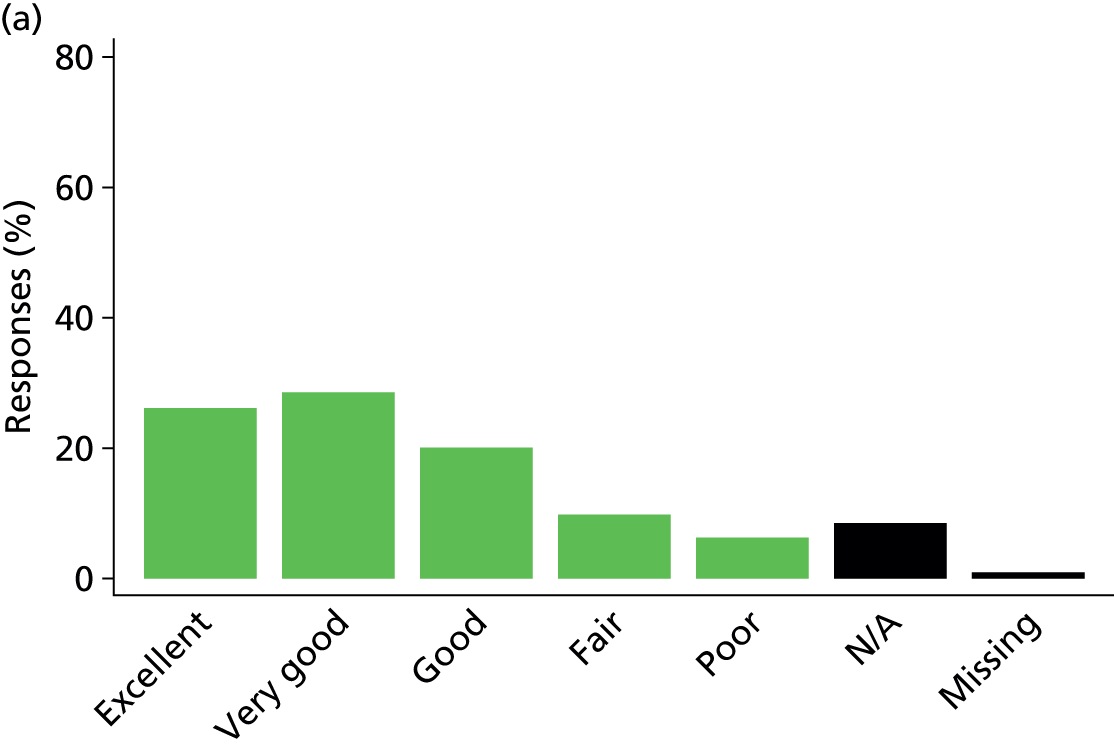
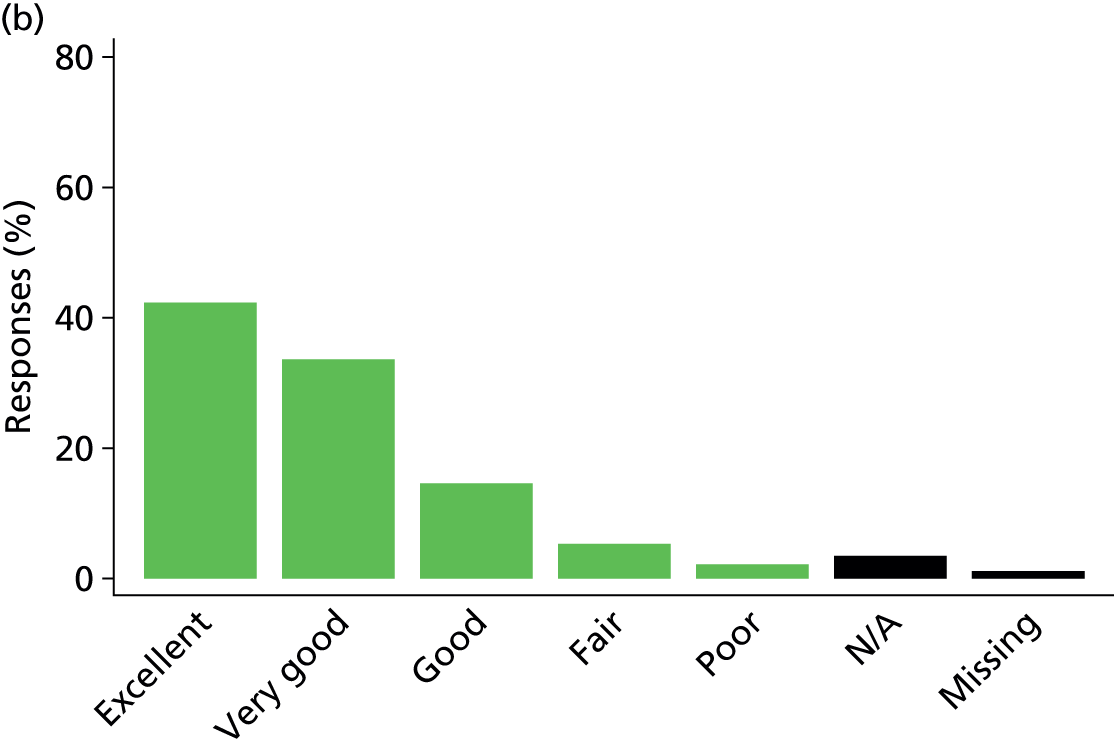
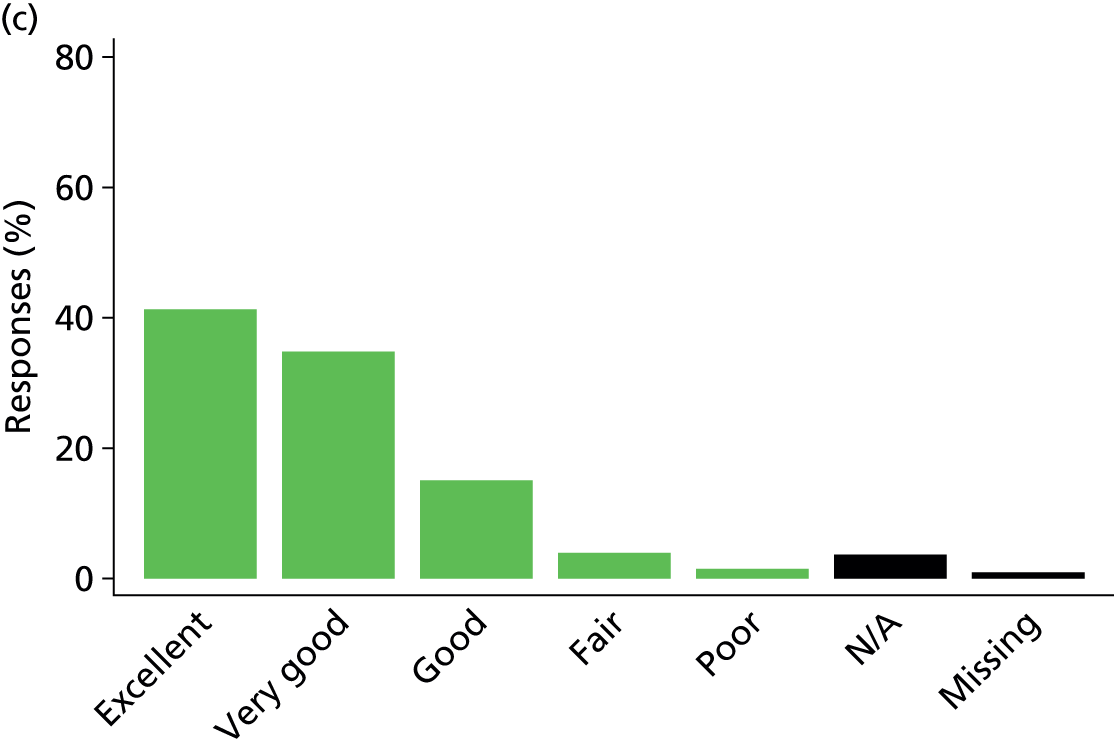
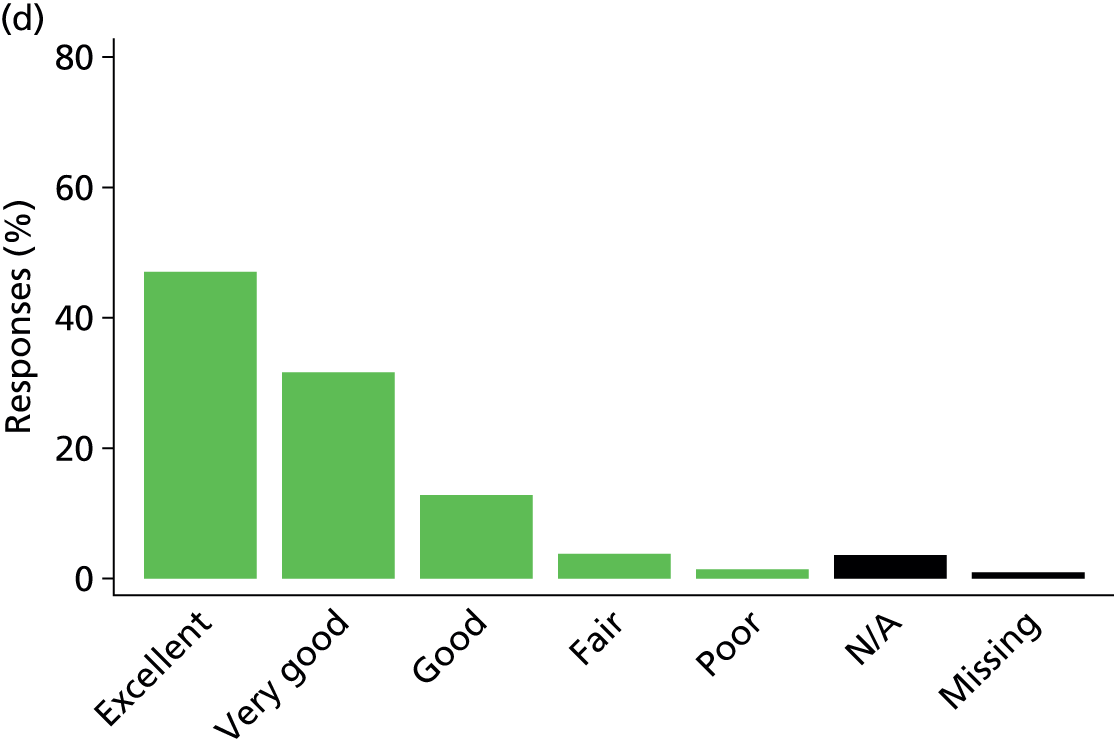
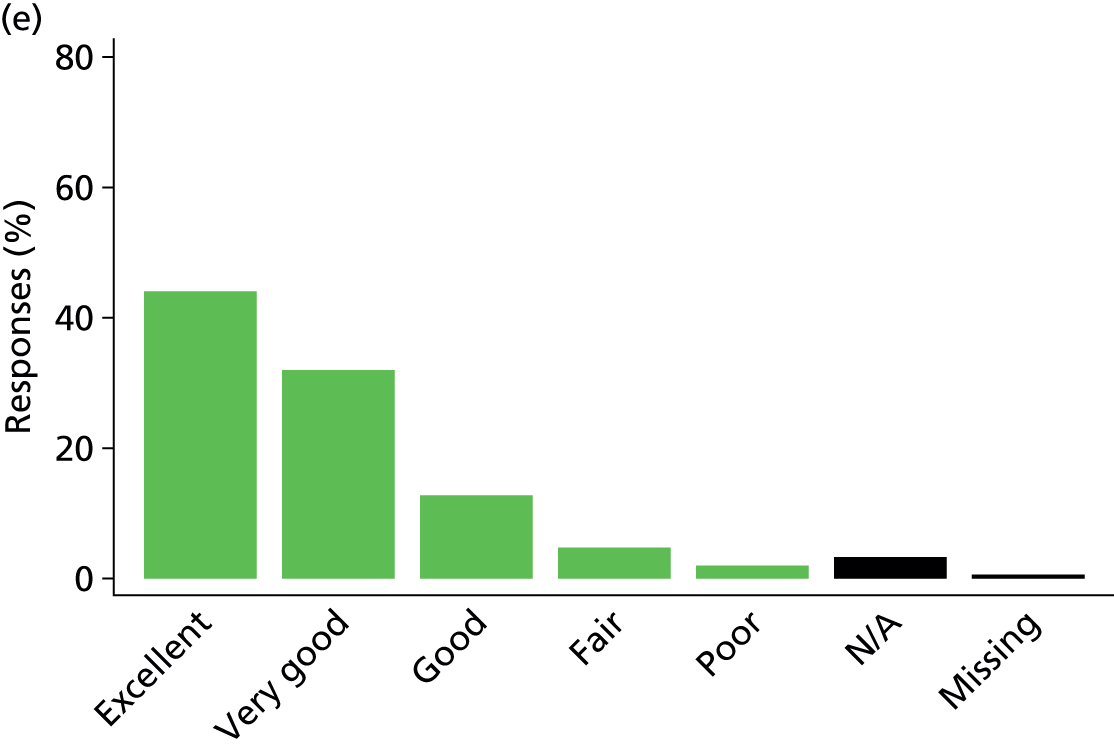
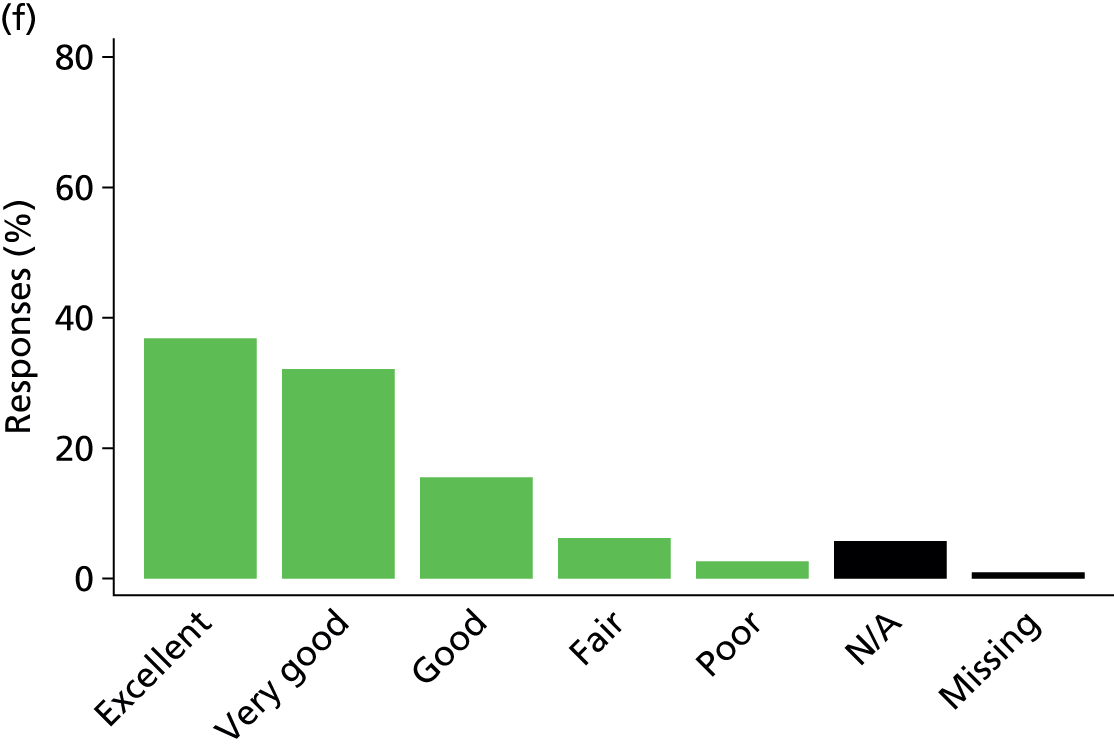
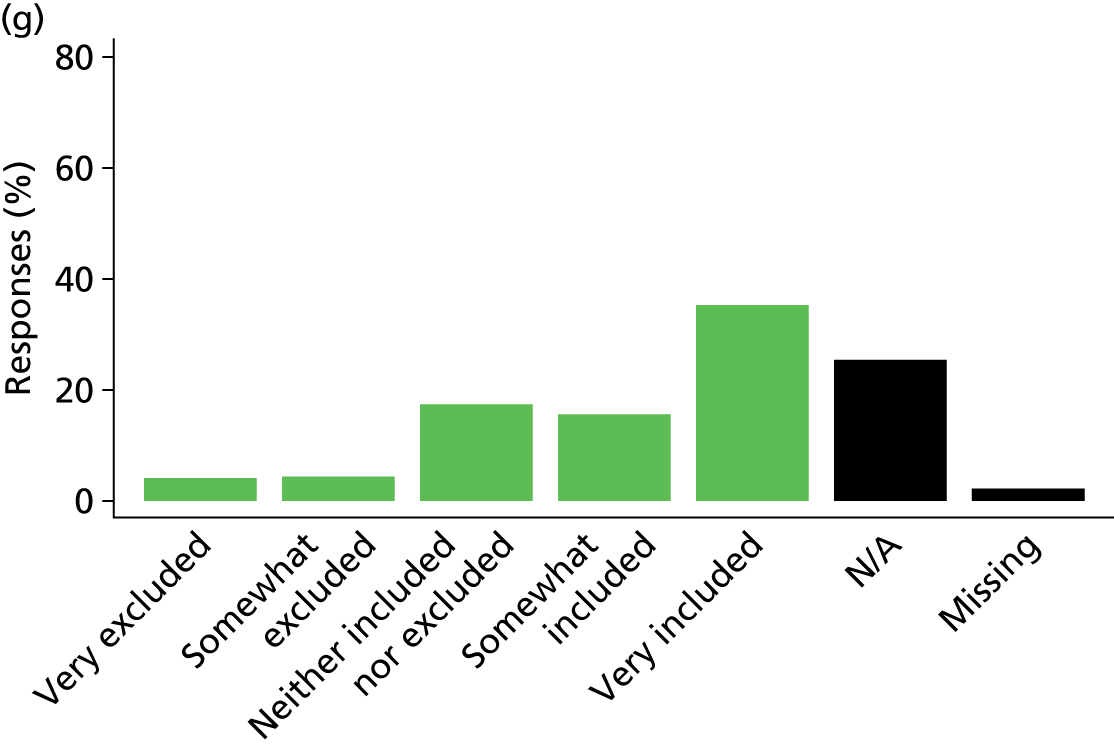
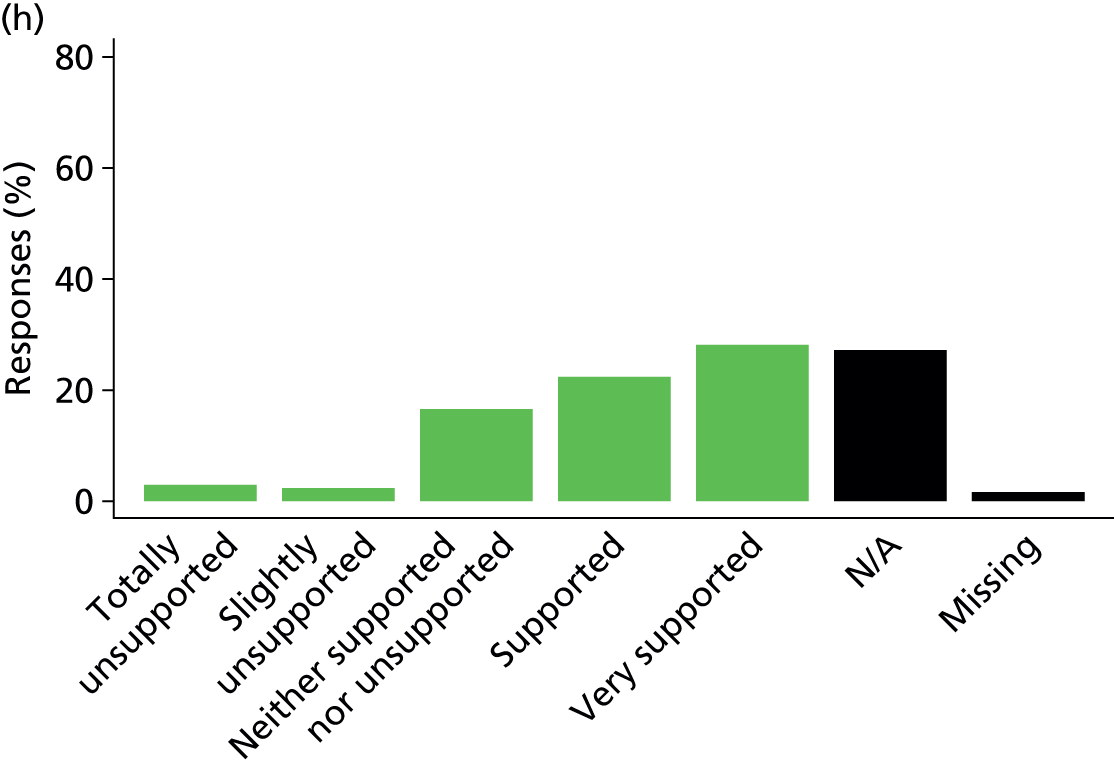
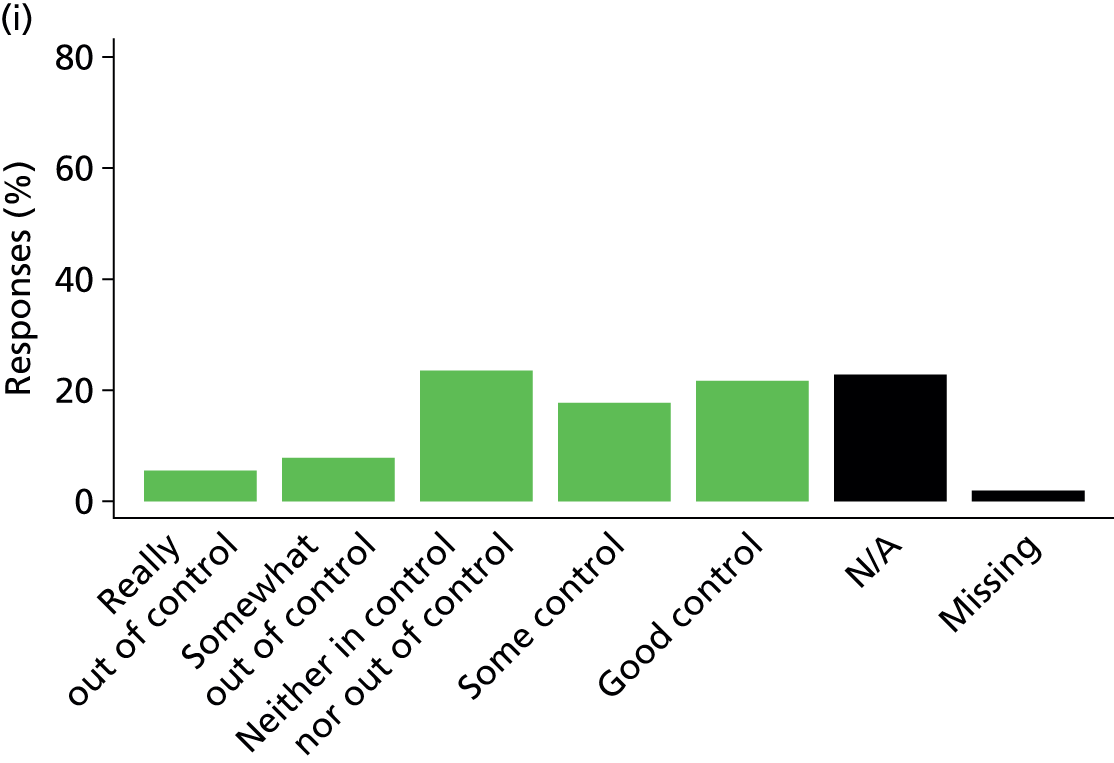
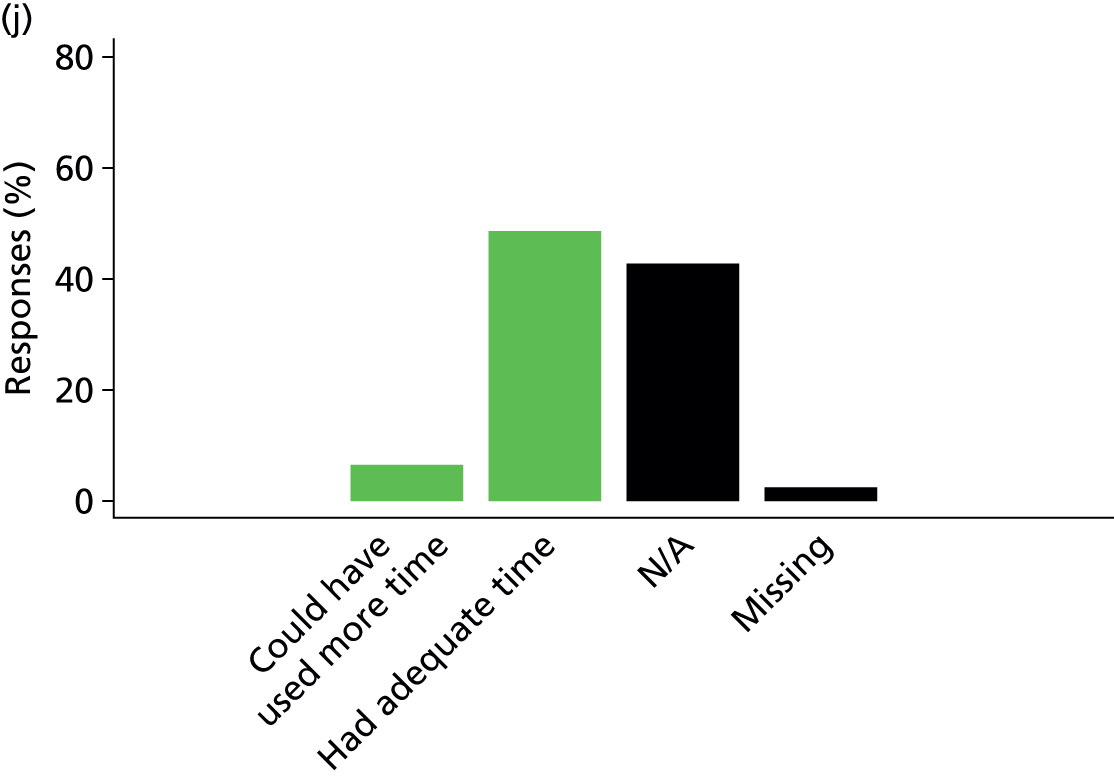
Of the 7019 questionnaires received, 3476 (40.5%) had complete responses for all 10 items constituting the satisfaction with decision-making domain. The proportion of missing data (no response) for all items was low but was highest for the items about the process of making decisions (had adequate time for making decisions, 2.0%; felt control over the care of the patient, 1.8%; felt included in the decision-making process, 1.6%; felt supported during the decision-making process, 1.6%). When combined with a response of ‘not applicable’, the proportion of missing data was high – again, highest for the process of making decisions items (had adequate time for making decisions, 44.8%; felt supported during the decision-making process, 28.6%; felt included in the decision-making process, 26.5%; felt control over the care of the patient, 24.4%).
When we examined patterns of missing data (Figure 27), we found that most frequently a response was missing for item D10 only (‘when making decisions, did you have adequate time to have your concerns addressed and questions answered?’), a combination of items D7 (‘did you feel included inthe decision-making process?’), D8 (‘did you feel supported during the decision-making process?’), D9 (‘did you feel you had control over the care of your family member?’) and D10, or a combination of items D9 and D10.
FIGURE 27.
Common patterns of missing data for the satisfaction with decision-making domain.

The distribution of the numbers of items with missing responses is presented in Figure 28.
FIGURE 28.
Distribution of the numbers of items with missing responses for the satisfaction with decision-making domain.
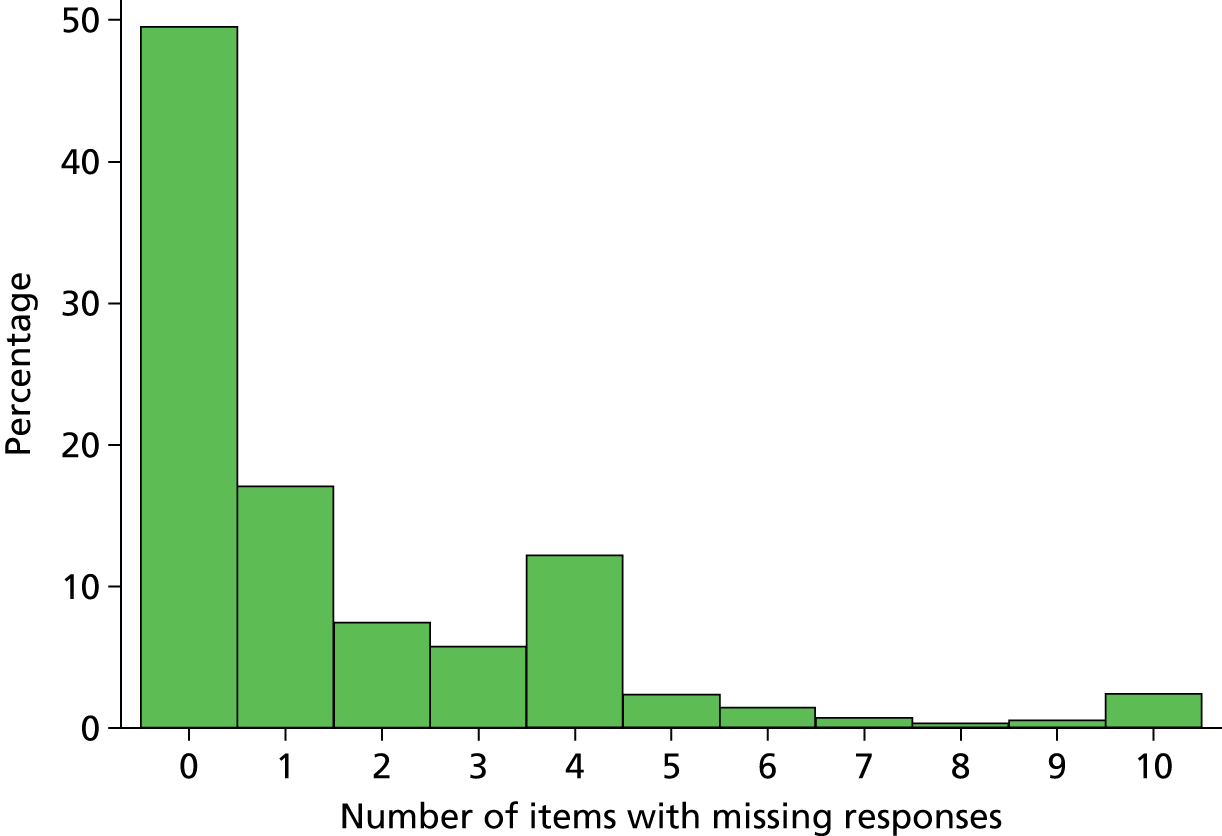
Satisfaction with information
Six items from within the satisfaction with decision-making domain (items D1–D6) constitute the satisfaction with information domain score. Of the 7019 questionnaires received, 6238 (88.9%) had complete responses for all six items. Although the proportion of missing data (no response) was low, a response was most frequently missing for either D1 only (‘frequency of communication with ICU doctors’) or all six items (Figure 29).
FIGURE 29.
Common patterns of missing data for the satisfaction with information domain.
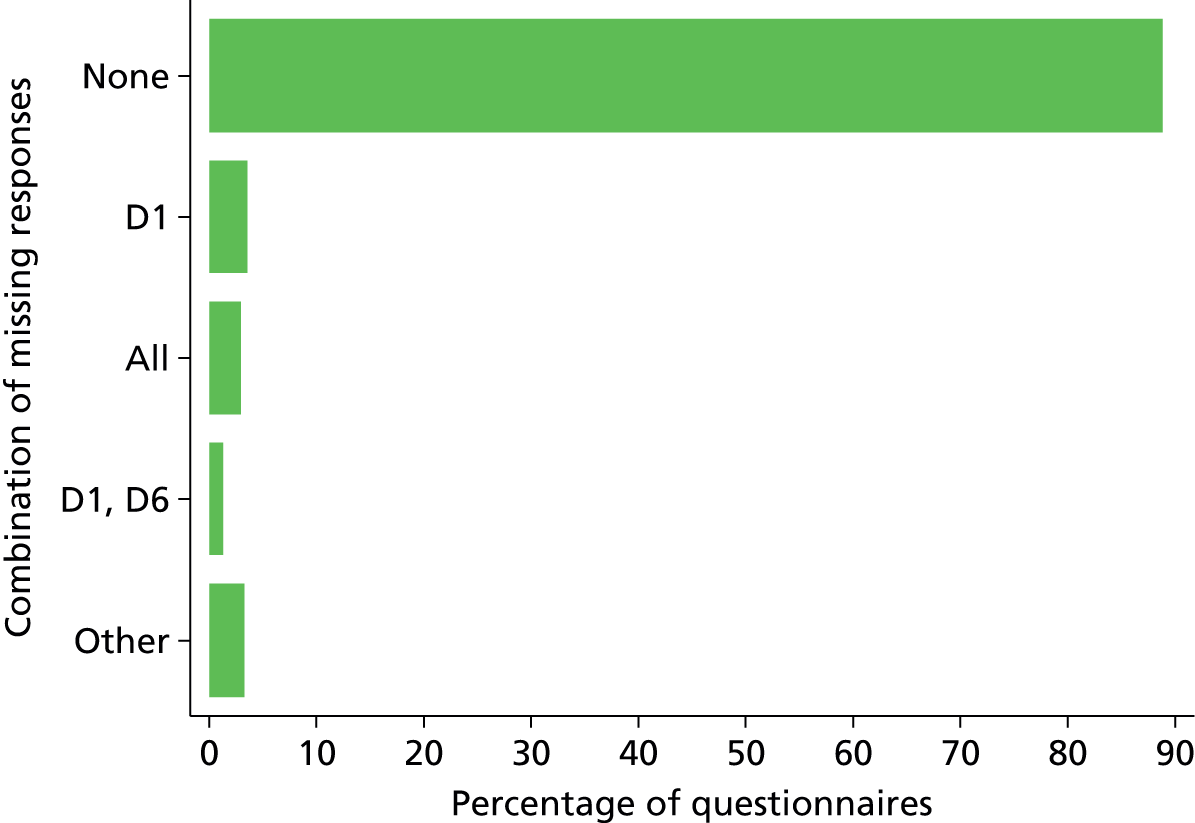
The distribution of the numbers of items with missing responses is presented in Figure 30.
FIGURE 30.
Distribution of the numbers of items with missing responses for the satisfaction with information domain.
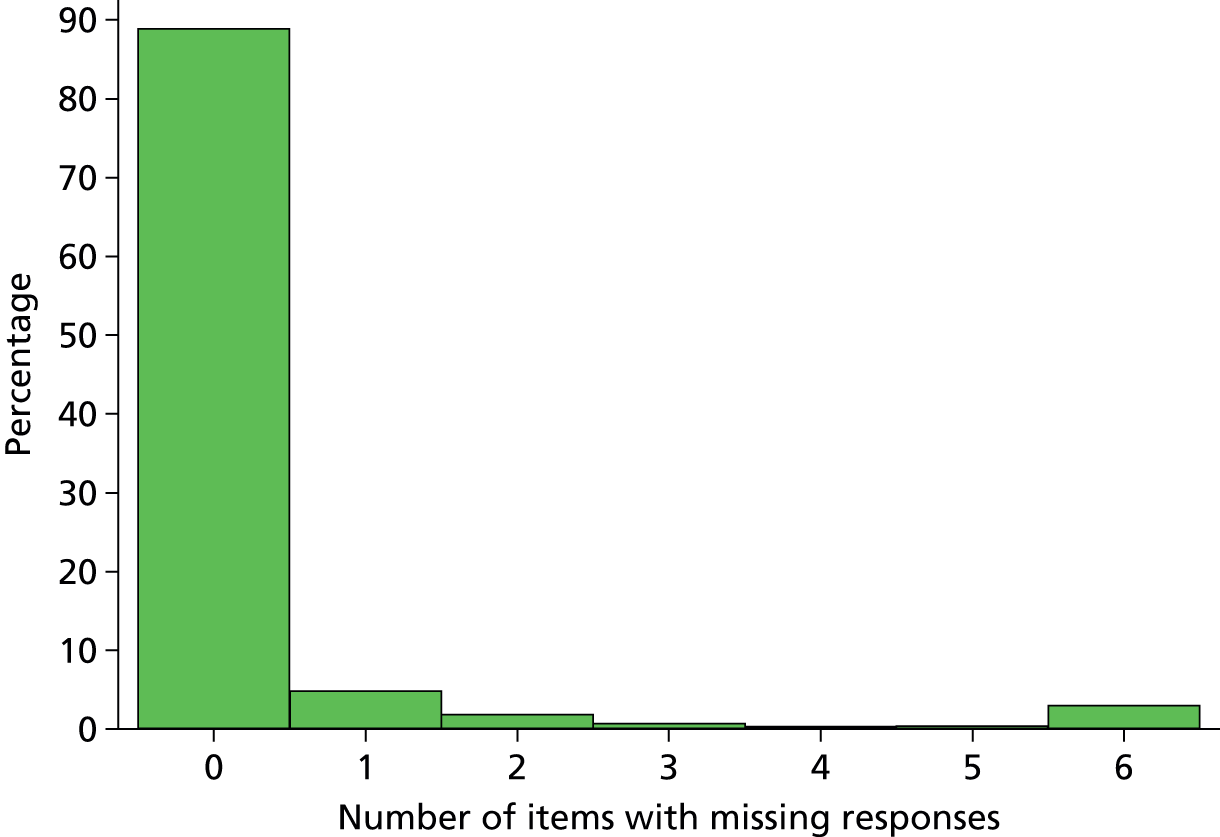
Satisfaction with the decision-making process
Four items from within the satisfaction with decision-making domain (items D7–D10) constitute the satisfaction with the decision-making process domain score. Of the 7019 questionnaires received, 3476 (49.5%) had complete responses for all four items. Most frequently, a response was missing for D10 only (‘when making decisions, did you have adequate time to have your concerns addressed and questions answered?’), all four items – D7 (‘did you feel included in the decision-making process?’), D8 (‘did you feel supported during the decision-making process?’), D9 (‘did you feel you had control over the care of your family member?’) and D10 – or a combination of items D9 and D10 (Figure 31).
FIGURE 31.
Common patterns of missing data for the satisfaction with the decision-making process domain.
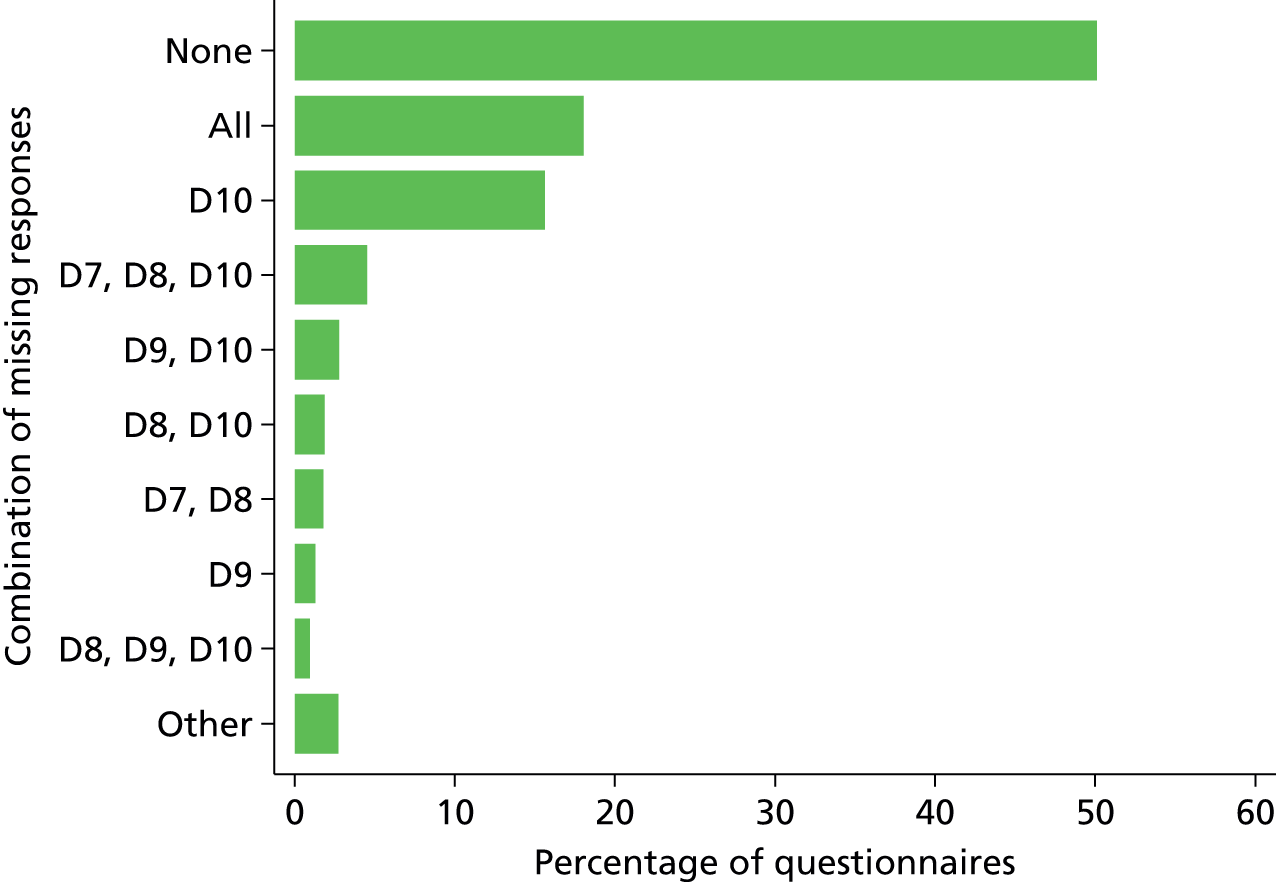
The distribution of the numbers of items with missing responses is presented in Figure 32.
FIGURE 32.
Distribution of the number of items with missing responses for the satisfaction with the decision-making process domain.
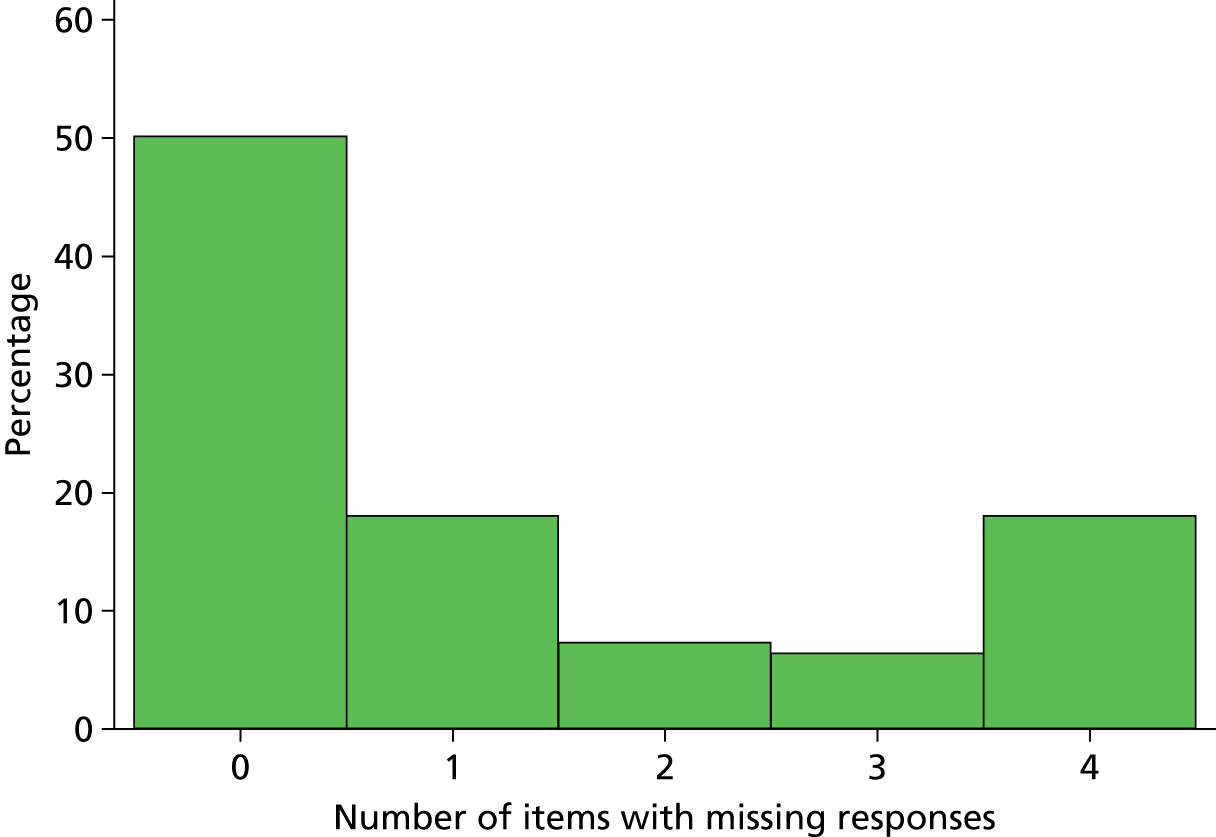
Overall family satisfaction
Twenty-four items (items C1–C14 and D1–D10) constitute the overall family satisfaction score. Of the 7019 questionnaires received, 2898 (41.3%) had complete responses for all 24 items. Most frequently a response was missing for either D10 only (‘when making decisions, did you have adequate time to have your concerns addressed and questions answered?’) or a combination of D7 (‘did you feel included in the decision-making process?’), D8 (‘did you feel supported during the decision-making process?’), D9 (‘did you feel you had control over the care of your family member?’) and D10 (Figure 33).
FIGURE 33.
Common patterns of missing data for the overall family satisfaction score.

The distribution of the number of items with missing responses is presented in Figure 34.
FIGURE 34.
Distribution of the number of items with missing responses for the overall family satisfaction score.
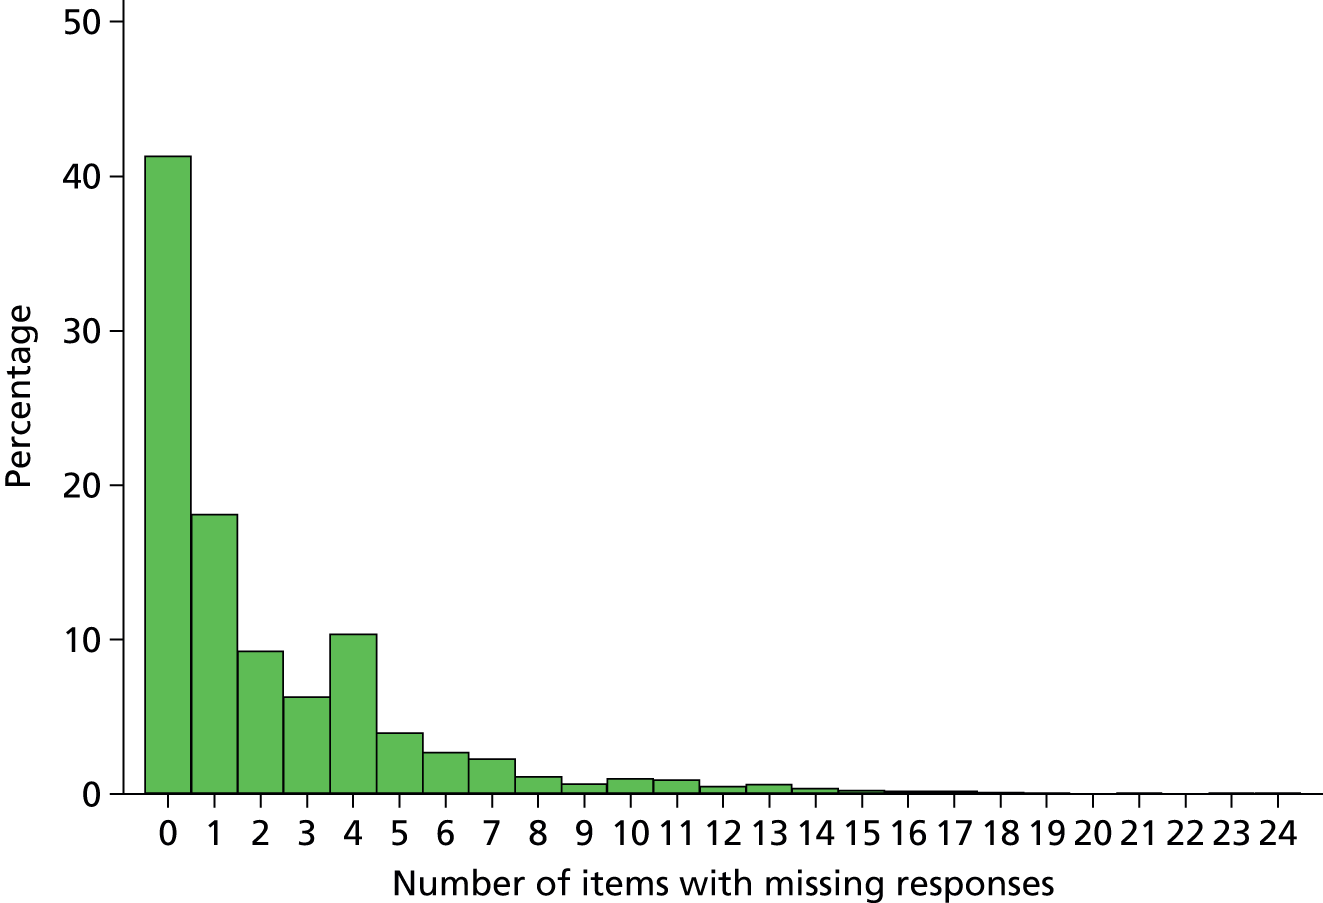
Multiple imputation
As a considerable number of respondents had not completed the question regarding number of visits but instead had given free-text responses such as ‘every day’ or ‘stayed continuously’, we derived a frequency of visits variable categorising a family member as a frequent visitor if they visited at least once per day (including these free-text responders). Dependency was recoded into three categories combining the middle two groups (none, some and total dependency) and type of admission was recoded into non-surgical, elective surgical and emergency surgical. We categorised ethnicity combining all non-white into one category. Age of the family member was analysed as categories rather than continuous, as exact age was available only for respondents.
Preliminary analyses indicated a low percentage of missing values across the family member characteristics used in the main analyses. Where possible, family member characteristics were taken from questionnaire responses; however, before imputation, we recovered information for missing data in key variables from available data recorded on the web portal (age group, sex, relationship to patient, next of kin and lives with patient).
Overall, a complete case analysis model-fitting procedure would eliminate 59% of the sample, potentially biasing the inferences.
Apart from UK FS-ICU-24 items, data were imputed for family member age group (1.1% missing in the full data, respondents and non-respondents), family member sex (0.8%), next of kin (1.9%) and frequency of visits (2.4% missing among respondents, after taking account of free-text responses, but 42.8% missing among all family members, as it was not recorded on the web portal).
The evaluation of the imputed score values (scale-level imputation) for the FREE study showed that, although the observed and imputed values had the same mean and variance, they did not have the same distribution of values, since the imputed values had no skew. When each item was imputed as ordinal (item-level imputation), the mean and variance were consistent as well as the distribution, so this was the approach used for the final analysis.
Summary measures for the overall family satisfaction score and domain scores after multiple imputation of missing values, compared with the alternative approaches reported previously, are shown in Table 42. A comparison of the scores for ICU survivors and non-survivors in the multiply imputed data is shown in Table 43. Family satisfaction was substantially higher among family members of ICU non-survivors than among family members of ICU survivors, particularly for the satisfaction with decision-making domain score and its subdomains.
| Summary measures | All | Complete | Incomplete | ≥ 70% complete | ≥ 60% complete | Multiply imputed data |
|---|---|---|---|---|---|---|
| Overall family satisfaction score | ||||||
| Median (IQR) | 83.8 (70.8–93.4) | 87.5 (76.0–95.8) | 81.3 (67.9–91.7) | 84.4 (71.4–93.8) | 84.2 (71.3–93.8) | 83.3 (70.4–93.0) |
| Mean (SD) | 80.3 (16.8) | 83.4 (15.8) | 78.1 (17.2) | 80.5 (16.7) | 80.4 (16.8) | 79.7 (16.7) |
| 95% CI | 79.9 to 80.7 | 82.8 to 84.0 | 77.5 to 78.6 | 80.1 to 80.9 | 80.0 to 80.8 | 79.2 to 80.1 |
| Satisfaction with care domain score | ||||||
| Median (IQR) | 87.5 (75.0–96.4) | 89.3 (76.8–96.4) | 83.3 (70.6–93.8) | 87.5 (75.0–96.4) | 87.5 (75.0–96.4) | 87.5 (74.3–96.4) |
| Mean (SD) | 83.2 (16.0) | 84.4 (15.5) | 80.2 (16.9) | 83.3 (16.0) | 83.3 (16.0) | 83.1 (16.0) |
| 95% CI | 82.8 to 83.6 | 84.0 to 84.8 | 79.4 to 80.9 | 82.9 to 83.7 | 82.9 to 83.6 | 82.7 to 83.4 |
| Satisfaction with decision-making domain score | ||||||
| Median (IQR) | 80.0 (63.9–92.5) | 85.0 (70.0–95.0) | 75.0 (57.1–87.5) | 80.0 (64.3–92.5) | 80.0 (64.3–92.5) | 79.0 (63.3–90.0) |
| Mean (SD) | 75.4 (21.0) | 79.7 (19.4) | 70.9 (21.8) | 75.5 (20.7) | 75.7 (20.8) | 74.9 (20.0) |
| 95% CI | 74.9 to 75.9 | 79.1 to 80.4 | 70.2 to 71.7 | 75.0 to 76.1 | 75.2 to 76.2 | 74.5 to 75.4 |
| Satisfaction with information domain score | ||||||
| Median (IQR) | 79.2 (66.7–95.8) | 79.2 (66.7–95.8) | 75.0 (55.0–90.0) | 79.2 (66.7–95.8) | 79.2 (66.7–95.8) | 79.2 (66.7–95.8) |
| Mean (SD) | 76.3 (22.2) | 76.9 (21.9) | 70.2 (24.8) | 76.6 (22.0) | 76.5 (22.1) | 76.2 (22.0) |
| 95% CI | 75.8 to 76.9 | 76.4 to 77.4 | 68.1 to 72.2 | 76.1 to 77.1 | 76.0 to 77.1 | 75.7 to 76.7 |
| Satisfaction with the decision-making process domain score | ||||||
| Median (IQR) | 75.0 (50.0–93.4) | 87.5 (68.8–100.0) | 58.3 (50.0–83.3) | 81.3 (58.3–93.4) | 81.3 (58.3–93.4) | 75.6 (59.3–93.1) |
| Mean (SD) | 72.7 (24.8) | 79.7 (21.9) | 61.6 (25.2) | 74.3 (23.9) | 74.3 (23.9) | 73.1 (22.3) |
| 95% CI | 72.0 to 73.3 | 79.0 to 80.4 | 60.6 to 62.7 | 73.6 to 74.9 | 73.6 to 74.9 | 72.5 to 73.6 |
| Summary measures | All family members (n = 7,017a) | Family members of ICU survivors (n = 6,147a) | Family members of ICU non-survivors (n = 870) |
|---|---|---|---|
| Overall family satisfaction score | |||
| Median (IQR) | 83.3 (70.4–93.0) | 82.7 (69.9–92.7) | 87.1 (74.4–94.8) |
| Mean (SD) | 79.7 (16.7) | 79.3 (16.5) | 82.0 (17.5) |
| 95% CI | 79.2 to 80.1 | 78.9 to 79.8 | 80.9 to 83.2 |
| Satisfaction with care domain score | |||
| Median (IQR) | 87.5 (74.3–96.4) | 87.5 (73.6–96.4) | 88.1 (76.8–96.4) |
| Mean (SD) | 83.1 (16.0) | 83.0 (15.9) | 83.8 (16.9) |
| 95% CI | 82.7 to 83.4 | 82.6 to 83.4 | 82.7 to 84.9 |
| Satisfaction with decision-making domain score | |||
| Median (IQR) | 79.0 (63.3–90.0) | 77.5 (62.5–90.0) | 85.0 (71.8–95.0) |
| Mean (SD) | 74.9 (20.0) | 74.3 (19.9) | 79.6 (20.3) |
| 95% CI | 74.5 to 75.4 | 73.8 to 74.8 | 78.2 to 80.9 |
| Satisfaction with information domain score | |||
| Median (IQR) | 79.2 (66.7–95.8) | 79.2 (62.5–95.8) | 83.3 (70.8–100.0) |
| Mean (SD) | 76.2 (22.0) | 75.7 (22.0) | 79.6 (22.9) |
| 95% CI | 75.7 to 76.7 | 75.1 to 76.2 | 78.1 to 81.0 |
| Satisfaction with the decision-making process domain score | |||
| Median (IQR) | 75.6 (59.3–93.1) | 75.0 (57.5–88.8) | 87.5 (68.8–100.0) |
| Mean (SD) | 73.1 (22.3) | 72.1 (22.0) | 79.6 (22.9) |
| 95% CI | 72.5 to 73.6 | 71.6 to 72.7 | 78.1 to 81.1 |
Discussion
Levels of non-response to items in the UK FS-ICU-24 varied considerably across the items, particularly with regard to responses of ‘not applicable’. A complete-case analysis, using only family members who completed all 24 items, would therefore be based on only 59% of respondents, giving considerable potential for bias, particularly as the complete responders tended to have higher levels of satisfaction. Using an item-level approach to multiple imputation of missing values resulted in scores with a similar distribution to alternative approaches such as the traditional approach of averaging responses for family members who completed either 70% or 60%, but it enabled inclusion of all responders, regaining potentially important information from the family members who completed fewer than 60% of items.
Item-level responses were also imputed for non-responders, based on the information recorded on the FREE study web portal, allowing the potential to also include these family members in subsequent analyses. However, as these family members do not provide any additional information on the associations between patient/family member characteristics and satisfaction (as their satisfaction scores are entirely imputed), we concluded that the primary approach for subsequent analyses would be to use multiply imputed data for responders only, with complete case analysis, the traditional approach (based on 60% response) and imputation of satisfaction for non-responders conducted in parallel as sensitivity analyses.
Family satisfaction was substantially higher for family members of ICU non-survivors than for family members of ICU survivors. This may be related to the fact that including family is part of the end-of-life decision-making process in intensive care. These higher family satisfaction scores, in combination with the potential for factors to have different relationships with satisfaction for survivors and non-survivors, led us to select a stratified approach to the subsequent analysis to identify determinants of family satisfaction, developing separate models for ICU survivors and non-survivors.
Chapter 7 Assessing the determinants of family satisfaction using multilevel modelling
Introduction
The aim of this chapter is to explore how family satisfaction, measured with the UK FS-ICU-24, varied by family member characteristics, patient characteristics, ICU/hospital characteristics and other contextual factors.
Methods
Selection of data
The final analysis of the FREE study was based on family members of patients (excluding readmissions) who were discharged from, or died in, the ICU up to 15 August 2014. Family members of patients remaining in the ICU beyond 15 August 2014 were excluded, as they would not have had an opportunity to complete and return a questionnaire before the follow-up database was closed on 12 September 2014 (note that, as family members were not recruited for patients admitted after 30 June 2014, there were very few patients remaining in the ICU beyond this date). Patients with no family members recruited to the FREE study were excluded from the analysis.
Primary analyses were undertaken using responders only (both complete responders and partial responders with missing items imputed). To test if our findings were influenced by using imputed data, we also conducted sensitivity analyses using complete case data (i.e. complete responders only), the modified traditional approach to scoring (using complete responders and partial responders with at least 60% of items completed) and all family members (additionally including non-responders, with their satisfaction imputed).
Statistical analysis
The following family member characteristics were described by mean and SD, median and quartiles, or number and percentage for all family members included in the final analysis, stratified by the patient’s ICU outcome (alive/dead): age in years; age group (< 30 years, 30–39 years, 40–49 years, 50–59 years, 60–69 years, 70–79 years, ≥ 80 years); sex; ethnicity (white, mixed, Asian or Asian British, black or black British, other ethnic group); relationship to patient (partner, parent, child, sibling, other relative, other non-relative); next of kin (yes/no); lives with patient (yes/no); highest level of education (NVQ level 1 or 2, equivalent to GCSE or O level; NVQ level 3, equivalent to A level, AS level or Higher School Certificate; NVQ level 4 or 5, equivalent to degree, higher degree, HNC or HND; other); deprivation (quintiles, using the Index of Multiple Deprivation 2010 for England, Welsh Index of Multiple Deprivation 2008 or Northern Ireland Multiple Deprivation Measure 2010, assigned according to the family member’s postcode); distance from home address to hospital (calculated in kilometres as the straight-line distance from the mid-point of the postcode for the family member to the midpoint of the postcode for the hospital); previous experience of ICU as a family member (yes/no); and frequency of visits.
The following patient characteristics were described by mean and SD, median and quartiles, or number and percentage for patients with a family member included in the final analysis, stratified by the patient’s ICU outcome (alive/dead): age in years; age group (< 30 years, 30–39 years, 40–49 years, 50–59 years, 60–69 years, 70–79 years, ≥ 80 years); sex; ethnicity (white, Asian or Asian British, black or black British, mixed ethnicity or other ethnic group); deprivation (quintiles, defined as for the family members); distance from home address to hospital (defined as for the family members); severe chronic conditions in the past medical history (liver, renal, respiratory, cardiovascular, metastatic cancer, haematological malignancy, immunocompromise – defined according to APACHE II26); prior dependency (able to live without assistance in daily activities, either minor or major assistance with daily activities, total assistance with daily activities); surgical status (planned admission direct from theatre following elective or scheduled surgery, unplanned admission direct from theatre following surgery of any urgency, non-surgical); ICNARC physiology score27 (mean and SD); APACHE II score26 (mean and SD); ICU length of stay (median and quartiles); receipt (number and percentage) and duration (median and quartiles in calendar days) of organ support in the ICU (advanced respiratory support, advanced cardiovascular support, renal support, neurological support); and, for ICU survivors, whether or not the patient died before ultimate discharge from acute hospital.
Variation in family satisfaction was analysed across the following factors: family member characteristics (as above); patient characteristics (as above); ICU/hospital characteristics (hospital teaching status and number of beds in the ICU); and other contextual factors (month of ICU admission and, for family members of ICU survivors, whether or not the questionnaire was received while the patient was still in hospital). These were explored using univariable and multivariable, multilevel linear regression models. There were three levels of the models: family member; patient/ICU admission; and ICU/hospital. The outcome for the primary analyses was the overall family satisfaction score. As secondary analyses, separate models were fitted for each of the original domain scores as well as those resulting from the full psychometric assessment (see Chapter 4). All models were stratified by the patient’s ICU outcome (i.e. separate models were fitted for family members of survivors and non-survivors). The multilevel models were fitted using the ‘xtmixed’ command in Stata/SE version 13.0 (StataCorp, College Station, TX, USA) using ‘mi estimate’ to analyse multiply imputed data.
A simple random intercepts model was fitted to decompose the amount of variance that existed between patient and ICU/hospital levels. The level effect was assessed by the relative contribution of these variances (note: likelihood-based approaches to testing are not applicable with multiply imputed data). The variance partition coefficient reports the proportion of the observed response variation that lies at each level of the model hierarchy and was used to confirm that both the ICU/hospital variance and the patient variance are separately significant.
In order to evaluate the distribution of variance between levels while analysing the contribution of each level’s characteristics, a two-stage model building approach was applied, as follows.
Stage 1: to select the significant characteristics at each level, the step-by-step approach was adopted, following an approach suggested by Raudenbush and Bryk51 and Snijders and Bosker. 52 Three models with fixed slopes were developed. In the first model, family-member-level variables were included in a simple random intercepts model. The second model was extended to include patient-level variables. The third model additionally contained the ICU/hospital-level variables and contextual factors. The opposite, backwards, approach of entering all possible variables at one time and then removing the non-significant ones was not feasible because of the large number of variables and multicollinearity problems. At each step, relationships between the outcome and each variable at that level were tested, one at a time, in multilevel models adjusted for the outcome and the lower-level variables. A significant Z-test for the variable coefficient confirmed that adjusting for this variable significantly improved the fit of the model. The differential explanatory power of the variable was evaluated by examining the total and level-specific changes in variance and adjusted intraclass correlation coefficient. A number of key variables were identified a priori to be carried forward to the full multivariable models (family member age, sex, relationship to the patient, next of kin and lives with the patient, and patient age, sex and ICU length of stay). Other variables were carried forward to the multivariable model if the results of the significance test and or the evaluation of explanatory power showed an important effect in the model. At each step, a Wald test was used to confirm the joint significance of all variables added at that level.
The variables that were not selected in the original multivariable model were added into the final model to assess the joint significance of these variables, adjusted for the selected variables, and changes were made to the model, if necessary.
Stage 2: in the final, three-level, model, with random intercepts at level 2 (patient) and level 3 (ICU/hospital), interaction terms specified a priori were considered (patient age with sex and ICU length of stay with receipt of advanced respiratory support). Determinants in the model that might better be modelled with random coefficients at level 2 were investigated, one at a time, to judge the impact of setting them as random effects. The inclusion of interactions as well as models with random slopes were judged by the size of the variance corresponding to the slope.
Results
Descriptive statistics and univariable analyses
The comparisons of family member and patient characteristics for ICU survivors and non-survivors are presented in Tables 44 and 45, respectively. Univariable analyses of the association between each variable and family satisfaction are shown in Table 46 (family characteristics), Table 47 (patient characteristics) and Table 48 (ICU/hospital characteristics and contextual factors).
| Family member characteristic | Family members of ICU survivors (n = 6149) | Family members of ICU non-survivors (n = 870) |
|---|---|---|
| Mean age (years)a (SD) [N] | 54 (15.0) [5937] | 52 (15.2) [846] |
| Age group (years),b n (%) | 6142 | 869 |
| < 30 | 448 (7.3) | 68 (7.8) |
| 30–39 | 605 (9.9) | 106 (12.2) |
| 40–49 | 1273 (20.7) | 180 (20.7) |
| 50–59 | 1454 (23.7) | 215 (24.7) |
| 60–69 | 1396 (22.7) | 179 (20.6) |
| 70–79 | 786 (12.8) | 87 (10.0) |
| ≥ 80 | 180 (2.9) | 34 (3.9) |
| Sex,b n (%) | 6147 | 870 |
| Male | 2080 (33.8) | 277 (31.8) |
| Female | 4067 (66.2) | 593 (68.2) |
| Ethnicity,c n (%) | 6149 | 870 |
| White | 5738 (93.3) | 817 (93.9) |
| Asian | 114 (1.9) | 24 (2.8) |
| Black | 50 (0.8) | 4 (0.5) |
| Mixed ethnicity or other ethnic group | 84 (1.4) | 4 (0.5) |
| Not stated | 163 (2.7) | 21 (2.4) |
| Relationship to patient,b n (%) (‘I am the patient’s . . .’) | 6148 | 870 |
| Partner | 1891 (30.8) | 205 (23.6) |
| Child | 1893 (30.8) | 346 (39.8) |
| Parent | 622 (10.1) | 32 (3.7) |
| Sibling | 624 (10.1) | 80 (9.2) |
| Other relative | 799 (13.0) | 170 (19.5) |
| Other non-relative | 319 (5.2) | 37 (4.3) |
| Next-of-kin,b n (%) [N] | 3153 (51.4) [6138] | 367 (42.3) [868] |
| Lives with patient,b n (%) [N] | 2311 (37.6) [6148] | 248 (28.5) [870] |
| Highest level of education,c n (%) | 5071 | 748 |
| NVQ level 1 or 2 | 1465 (28.9) | 218 (29.1) |
| NVQ level 3 | 989 (19.5) | 134 (17.9) |
| NVQ level 4 or 5 | 1537 (30.3) | 232 (31.0) |
| Other | 1080 (21.3) | 164 (21.9) |
| Quintile of deprivation,c n (%) | 5861 | 818 |
| 1 (least deprived) | 1164 (19.9) | 159 (19.4) |
| 2 | 1281 (21.9) | 181 (22.1) |
| 3 | 1238 (21.1) | 181 (22.1) |
| 4 | 1189 (20.3) | 169 (20.7) |
| 5 (most deprived) | 989 (16.9) | 128 (15.6) |
| Median distance (km) from home to hospitalc (IQR) [N] | 12.4 (5.5–34.1) [5890] | 12.3 (5.1–33.2) [824] |
| Previous experience of ICU as a family member,a n (%) [N] | 1641 (27.1) [6052] | 200 (23.3) [860] |
| Frequent visitor,a n (%) [N] | 4713 (78.6) [6000] | 690 (81.2) [850] |
| Patient characteristics | ICU survivors (n = 4007) | ICU non-survivors (n = 499) |
|---|---|---|
| Mean age (years) (SD) | 62.5 (17.3) | 68.5 (13.2) |
| Age group (years), n (%) | ||
| < 30 | 246 (6.1) | 8 (1.6) |
| 30–39 | 223 (5.6) | 9 (1.8) |
| 40–49 | 384 (9.6) | 28 (5.6) |
| 50–59 | 586 (14.6) | 57 (11.4) |
| 60–69 | 966 (24.1) | 134 (26.9) |
| 70–79 | 1003 (25.0) | 156 (31.3) |
| ≥ 80 | 599 (14.9) | 107 (21.4) |
| Sex, n (%) | ||
| Male | 2264 (56.5) | 297 (59.5) |
| Female | 1743 (43.5) | 202 (40.5) |
| Ethnicity, n (%) | ||
| White | 3706 (92.5) | 470 (94.2) |
| Asian or Asian British | 69 (1.7) | 12 (2.4) |
| Black or black British | 39 (1.0) | 3 (0.6) |
| Mixed ethnicity or other ethnic group | 74 (1.8) | 5 (1.0) |
| Not stated | 119 (3.0) | 9 (1.8) |
| Quintile of deprivation, n (%) | 3974 | 495 |
| 1 (least deprived) | 690 (17.4) | 84 (17.0) |
| 2 | 812 (20.4) | 93 (18.8) |
| 3 | 822 (20.7) | 106 (21.4) |
| 4 | 841 (21.2) | 109 (22) |
| 5 (most deprived) | 809 (20.4) | 103 (20.8) |
| Median distance (km) from home to hospital (IQR) | 9.5 (4.4–20.2) | 8.2 (4.1–16.4) |
| APACHE II severe comorbidities, n (%) | ||
| Liver | 94 (2.3) | 30 (6.0) |
| Renal | 97 (2.4) | 11 (2.2) |
| Respiratory | 119 (3.0) | 27 (5.4) |
| Cardiovascular | 100 (2.5) | 17 (3.4) |
| Metastatic cancer | 110 (2.7) | 11 (2.2) |
| Haematological malignancy | 81 (2.0) | 22 (4.4) |
| Immunocompromise | 318 (7.9) | 51 (10.2) |
| Prior dependency, n (%) | ||
| Able to live without assistance | 2944 (73.5) | 323 (64.7) |
| Minor or major assistance | 1004 (25.1) | 167 (33.5) |
| Total assistance | 42 (1.0) | 5 (1.0) |
| Unknown | 17 (0.4) | 4 (0.8) |
| Surgical status, n (%) | ||
| Non-surgical | 2396 (59.8) | 412 (82.6) |
| Planned admission following elective or scheduled surgery | 686 (17.1) | 16 (3.2) |
| Unplanned admission following surgery of any urgency | 925 (23.1) | 71 (14.2) |
| Mean ICNARC physiology score (SD) | 17.5 (7.9) | 25.7 (8.1) |
| Mean APACHE II score (SD) | 16.2 (6.1) | 21.2 (6.2) |
| Median ICU length of stay (days) (IQR) | 4.8 (2.8–9.0) | 6.0 (3.6–10.6) |
| Organ support received in the ICU, n (%) | ||
| Advanced respiratory support | 2124 (53.0) | 416 (83.4) |
| Advanced cardiovascular support | 1037 (25.9) | 288 (57.7) |
| Renal support | 510 (12.7) | 181 (36.3) |
| Neurological support | 503 (12.6) | 114 (22.8) |
| Median duration (calendar days) of organ support among those receiving the support (IQR) | ||
| Advanced respiratory support | 4 (2–9) | 6 (4–10) |
| Advanced cardiovascular support | 2 (2–4) | 3 (2–5) |
| Renal support | 4 (3–8) | 4 (3–8) |
| Neurological support | 3 (2–7) | 3 (2–5) |
| Death before acute hospital discharge, n (%) | 353 (8.9) | Not applicable |
| Variable | Family members of ICU survivors (n = 6147a) | Family members of ICU non-survivors (n = 870) | ||||
|---|---|---|---|---|---|---|
| Coefficient | 95% CI | p-value | Coefficient | 95% CI | p-value | |
| Age (years) (vs. < 30) | 0.031 | 0.033 | ||||
| 30–39 | 1.56 | –0.22 to 3.33 | 2.68 | –1.80 to 7.17 | ||
| 40–49 | 0.42 | –0.10 to 0.94 | 1.61 | 0.21 to 3.01 | ||
| 50–59 | 2.12 | 0.61 to 3.64 | 5.49 | 1.49 to 9.50 | ||
| 60–69 | 1.96 | 0.39 to 3.52 | 6.01 | 1.78 to 10.25 | ||
| 70–79 | 1.98 | 0.28 to 3.68 | 7.39 | 2.58 to 12.19 | ||
| ≥ 80 | –0.55 | –3.05 to 1.95 | 2.62 | –3.48 to 8.73 | ||
| Female (vs. male) | 0.40 | –0.34 to 1.14 | 0.29 | 0.44 | –1.59 to 2.47 | 0.67 |
| White ethnicity (vs. non-white) | 3.60 | 1.46 to 5.75 | 0.001 | 8.78 | 1.85 to 15.70 | 0.013 |
| Relationship (vs. partner) | < 0.001 | 0.28 | ||||
| Parent | 0.00 | –1.39 to 1.39 | 0.08 | –5.73 to 5.90 | ||
| Child | –0.94 | –1.83 to –0.05 | –1.274 | –3.69 to 1.14 | ||
| Sibling | –2.16 | –3.50 to –0.82 | 0.909 | –3.02 to 4.84 | ||
| Other-relative | –1.63 | –2.81 to –0.44 | –0.619 | –3.60 to 2.36 | ||
| Other-non relative | –3.42 | –5.22 to –1.62 | –6.134 | –11.69 to -0.58 | ||
| Next of kin | 1.74 | 1.05 to 2.44 | < 0.001 | 2.69 | 0.78 to 4.59 | 0.006 |
| Lives with patient | 1.95 | 1.20 to 2.69 | < 0.001 | 1.15 | –0.99 to 3.29 | 0.29 |
| Education (vs. NVQ 1 or 2) | < 0.001 | 0.16 | ||||
| NVQ 3 | –0.60 | –1.77 to 0.57 | 1.14 | –2.09 to 4.37 | ||
| NVQ 4 or 5 | –2.43 | –3.49 to –1.37 | –2.07 | –4.92 to 0.77 | ||
| Other | –0.18 | –1.35 to 0.98 | –1.75 | –4.73 to 1.24 | ||
| Quintile of deprivation (vs. 1, least deprived) | 0.63 | 0.77 | ||||
| 2 | 0.49 | –0.74 to 1.72 | 0.64 | –2.73 to 4.01 | ||
| 3 | 0.96 | –0.29 to 2.20 | 0.84 | –2.59 to 4.26 | ||
| 4 | 0.32 | –0.97 to 1.60 | –1.07 | –4.59 to 2.44 | ||
| 5 (most deprived) | 0.67 | –0.70 to 2.05 | 0.79 | –3.10 to 4.69 | ||
| Distance from home to hospital (per 10 km) | –0.05 | –0.11 to 0.01 | 0.12 | 0.05 | –0.09 to 0.18 | 0.49 |
| Previous experience of ICU as a family member | 0.25 | –0.63 to 1.14 | 0.58 | –0.68 | –3.22 to 1.87 | 0.60 |
| Frequent visitor | 2.52 | 1.63 to 3.41 | < 0.001 | 2.91 | 0.36 to 5.47 | 0.030 |
| Variable | Family members of ICU survivors (n = 6147a) | Family members of ICU non-survivors (n = 870) | ||||
|---|---|---|---|---|---|---|
| Coefficient | 95% CI | p-value | Coefficient | 95% CI | p-value | |
| Age (per 10 years) | –0.09 | –0.36 to 0.17 | 0.49 | 1.12 | 0.11 to 2.14 | 0.030 |
| Female (vs. male) | 0.67 | –0.25 to 1.59 | 0.16 | 2.04 | –0.66 to 4.74 | 0.14 |
| White ethnicity (vs. non-white) | 2.39 | 0.11 to 4.68 | 0.040 | 9.25 | 2.38 to 16.12 | 0.008 |
| Quintile of deprivation (vs. 1, least deprived) | 0.76 | 0.95 | ||||
| 2 | 0.86 | –0.66 to 2.38 | –1.28 | –5.85 to 3.29 | ||
| 3 | 0.62 | –0.90 to 2.13 | –0.68 | –5.12 to 3.75 | ||
| 4 | 0.77 | –0.75 to 2.28 | –1.62 | –6.03 to 2.78 | ||
| 5 (most deprived) | 1.00 | –0.57 to 2.57 | –1.49 | –6.04 to 3.06 | ||
| Distance from home to hospital (per 10 km) | 0.12 | 0.00 to 0.24 | 0.047 | 0.18 | –0.05 to 0.41 | 0.12 |
| Severe comorbidities | ||||||
| Liver | 3.18 | –0.01 to 6.38 | 0.050 | 1.25 | –4.67 to 7.19 | 0.68 |
| Renal | –0.45 | –3.57 to 2.66 | 0.77 | –8.87 | –18.35 to 0.60 | 0.067 |
| Respiratory | 0.01 | –2.84 to 2.85 | 1.00 | –1.02 | –7.23 to 5.19 | 0.75 |
| Cardiovascular | –0.14 | –3.23 to 2.94 | 0.93 | 1.40 | –6.46 to 9.26 | 0.73 |
| Metastatic cancer | –2.81 | –5.78 to 0.15 | 0.063 | 3.26 | –6.38 to 12.90 | 0.51 |
| Haematological malignancy | 2.25 | –1.09 to 5.61 | 0.19 | –7.88 | –14.62 to –1.13 | 0.022 |
| Immunocompromise | –0.91 | –2.74 to 0.90 | 0.33 | –3.90 | –8.55 to 0.74 | 0.10 |
| Dependency (vs. none) | 0.30 | 0.85 | ||||
| Minor or major | –0.14 | –1.36 to 1.08 | 0.63 | –2.34 to 3.60 | ||
| Total | –3.63 | –8.21 to 0.94 | 2.73 | –10.21 to 15.67 | ||
| Surgical status (vs. non-surgical) | 0.005 | 0.78 | ||||
| Planned elective/scheduled | –2.17 | –3.51 to –0.83 | –2.83 | –10.75 to 5.10 | ||
| Unplanned | –0.17 | –1.29 to 0.96 | –0.06 | –3.89 to 3.76 | ||
| ICNARC physiology score (per point) | 0.19 | 0.13 to 0.25 | < 0.001 | 0.19 | 0.02 to 0.35 | 0.026 |
| ICU length of stay (per day) | 0.02 | –0.03 to 0.06 | 0.44 | –0.34 | –0.48 to –0.20 | < 0.001 |
| Advanced respiratory support | 3.62 | 2.63 to 4.61 | < 0.001 | 1.96 | –1.84 to 5.76 | 0.31 |
| Advanced cardiovascular support | 2.06 | 0.89 to 3.22 | 0.001 | 0.83 | –2.06 to 3.72 | 0.58 |
| Renal support | 1.52 | 0.11 to 2.93 | 0.034 | 0.04 | –2.83 to 2.91 | 0.98 |
| Neurological support | 1.96 | 0.39 to 3.54 | 0.014 | 2.95 | –0.42 to 6.32 | 0.086 |
| Duration of advanced respiratory support (per day) | 0.11 | 0.05 to 0.16 | < 0.001 | –0.16 | –0.32 to 0.00 | 0.051 |
| Duration of advanced cardiovascular support (per day) | 0.40 | 0.15 to 0.65 | 0.002 | 0.11 | –0.33 to 0.56 | 0.62 |
| Duration of renal support (per day) | 0.16 | 0.00 to 0.32 | 0.048 | –0.15 | –0.43 to 0.13 | 0.28 |
| Duration of neurological support (per day) | 0.10 | –0.09 to 0.29 | 0.31 | 0.05 | –0.43 to 0.53 | 0.84 |
| Death before acute hospital discharge | –0.49 | –1.52 to 0.55 | 0.36 | Not applicable | ||
| Variables | Family members of ICU survivors (n = 6147a) | Family members of ICU non-survivors (n = 870) | ||||
|---|---|---|---|---|---|---|
| Coefficient | 95% CI | p-value | Coefficient | 95% CI | p-value | |
| Hospital type (vs. non-university) | 0.51 | 0.62 | ||||
| University | 0.06 | –3.63 to 3.75 | –0.32 | –4.72 to 4.07 | ||
| University affiliated | 1.93 | –1.56 to 5.42 | 1.68 | –2.29 to 5.65 | ||
| Number of ICU beds (per bed) | –0.05 | –0.23 to 0.14 | 0.63 | 0.02 | –0.22 to 0.26 | 0.85 |
| Month of ICU admission (vs. January) | 0.95 | 0.85 | ||||
| February | –0.61 | –2.87 to 1.65 | –0.03 | –6.90 to 6.83 | ||
| March | 0.09 | –2.12 to 2.30 | –0.06 | –6.73 to 6.60 | ||
| April | 0.54 | –1.71 to 2.79 | 0.07 | –6.93 to 7.07 | ||
| May | –0.06 | –2.31 to 2.18 | 0.73 | –5.62 to 7.08 | ||
| June | –0.66 | –2.65 to 1.34 | 0.84 | –4.95 to 6.64 | ||
| July | 0.85 | –1.41 to 3.11 | 3.91 | –2.71 to 10.52 | ||
| August | 0.65 | –1.64 to 2.93 | –0.70 | –6.87 to 5.46 | ||
| September | 0.09 | –2.14 to 2.31 | 1.74 | –4.76 to 8.25 | ||
| October | 0.44 | –1.76 to 2.63 | 1.15 | –5.69 to 7.98 | ||
| November | 0.60 | –1.65 to 2.85 | 2.21 | –4.10 to 8.53 | ||
| December | 0.69 | –1.57 to 2.96 | 5.16 | –1.13 to 11.46 | ||
| Questionnaire received while patient still in hospital | 0.087 | –1.50 to 1.67 | 0.91 | Not applicable | ||
Multilevel multivariable models
Family satisfaction was not associated with the deprivation of the family member for survivors or non-survivors. Although family satisfaction declined with increasing level of education among family members of survivors, it was not considered in the multivariable models because there were higher than expected proportions of both not stated (17%) and other (21% of complete responses), suggesting a lack of comprehension of the categorisation used. Neither distance from home to hospital nor previous experience of ICU as a family member was associated with satisfaction. Other family-member-level variables (ethnicity and frequent visitor) were statistically significant and were carried forward to the multivariable models along with the a priori key family member variables (age, sex, relationship to the patient, next of kin and lives with patient).
Although statistically significant, patient ethnicity was not carried forward to the multivariable models because it was collinear with family member ethnicity. As for family members, patient deprivation was not associated with family satisfaction for either survivors or non-survivors. Distance from home to hospital was significant for survivors, but did not remain significant when carried forward to the multivariable model and was dropped. None of the severe comorbidities were associated with family satisfaction for either survivors or non-survivors, except for haematological malignancy for non-survivors, and neither was dependency prior to acute hospital admission. However, dependency was carried forward to the multivariable model because of its controlling effect on the estimates of other coefficients in the model. Once included in the multivariable model for non-survivors, haematological malignancy was no longer significant and was dropped from the model. Surgical status was significant for survivors but not for non-survivors; however, it was retained in the multivariable models for both survivors and non-survivors because of its controlling effect on other coefficients. Acute severity of illness (ICNARC physiology score) was significant for both survivors and non-survivors and was carried forward to the multivariable models. Organ support received in the ICU and duration (calendar days) of organ support among those receiving the support were significant among the family members of survivors, but not among the family members of non-survivors. Once included in the multivariable model for survivors, only advanced respiratory support remained significant and the other organ support variables were dropped from the model. The binary variable of receipt of advanced respiratory support was found to be preferable to the alternative variable of the duration of advanced respiratory support, which was correlated with ICU length of stay. Death before acute hospital discharge was not associated with satisfaction for family members of patients who survived to ICU discharge.
There was no evidence of differences in family satisfaction according to hospital teaching status or the number of beds in the ICU; however, these ICU/hospital level variables were retained in the multivariable models because of their controlling effect on the other coefficients in the models.
No variations in family satisfaction were associated with the contextual factors of month of admission to the ICU or, for family members of survivors only, the questionnaire being received while the patient was still in hospital. These variables were not carried forward to the multivariable models.
There was a strong multicollinearity between relationship to the patient and the other key variables of ‘next of kin’ and ‘lives with patient’, with very high proportions of family members who were both the next of kin and living with the patient for certain relationships (especially partner, 96.9%) and relatively small proportions for others (particularly other relatives and other non-relatives). We found that the variables were confounded with each other and attempts to separately disentangle their effects led to very imprecise estimates because of the multicollinearity. For these reasons, we chose not to use the variables ‘next of kin’ or ‘lives with patient’ in the same multivariable model as relationship to the patient. The information from the two variables ‘next of kin’ and ‘lives with patient’ were combined into a single variable with three categories (lives with patient; next of kin, does not live with patient; and not next of kin, does not live with patient) in a first multivariable model (model 1). This combined variable was replaced with the relationship with the patient variable in a second, alternative, multivariable model (model 2).
Interaction terms and random slopes specified a priori did not improve the fit of the models, so these terms were not retained.
The results of model 1 (including the next of kin/lives with patient combination) are shown in Table 49. Among family members of ICU survivors, there was evidence of an independent association with overall family satisfaction for each of the following variables: family member age group; family member ethnicity; next of kin/lives with patient; frequency of visits; ICNARC physiology score; and receipt of advanced respiratory support. Among family members of ICU non-survivors, the only variables found to be significant were family member ethnicity; patient age; ICNARC physiology score; and ICU length of stay.
| Variables | Family members of ICU survivors (n = 6143a) | Family members of ICU non-survivors (n = 869a) | ||||
|---|---|---|---|---|---|---|
| Coefficient | 95% CI | p-value | Coefficient | 95% CI | p-value | |
| Fixed effects: family member level | ||||||
| Constant | 68.30 | 63.42 to 73.17 | < 0.001 | 55.70 | 42.26 to 69.14 | < 0.001 |
| Family member age (years) (vs. < 30) | 0.041 | 0.18 | ||||
| 30–39 | 1.97 | 0.11 to 3.82 | 2.01 | –2.64 to 6.66 | ||
| 40–49 | 1.65 | 0.02 to 3.29 | 3.37 | –1.01 to 7.75 | ||
| 50–59 | 1.96 | 0.35 to 3.56 | 4.12 | –0.09 to 8.33 | ||
| 60–69 | 1.35 | –0.31 to 3.01 | 4.26 | –0.25 to 8.79 | ||
| 70–79 | 1.32 | –0.52 to 3.17 | 5.92 | 0.69 to 11.14 | ||
| ≥ 80 | –1.34 | –4.06 to 1.37 | –0.18 | –6.80 to 6.43 | ||
| Family member sex: female (vs. male) | 0.32 | –0.48 to 1.12 | 0.44 | 0.66 | –1.45 to 2.77 | 0.54 |
| Family member ethnicity: white (vs. non-white) | 3.59 | 1.38 to 5.80 | 0.001 | 7.12 | –0.00 to 14.25 | 0.050 |
| Next of kin/lives with patient (vs. lives with patient) | < 0.001 | 0.26 | ||||
| Next of kin, does not live with patient | –1.39 | –2.56 to –0.22 | 1.08 | –2.39 to 4.55 | ||
| Not next of kin, does not live with patient | –2.33 | –3.26 to –1.41 | –1.24 | –3.88 to 1.40 | ||
| Frequent visitor | 2.83 | 1.82 to 3.84 | < 0.001 | 1.53 | –1.34 to 4.39 | 0.30 |
| Fixed effects: patient level | ||||||
| Patient age (per 10 years) | 0.01 | –0.28 to 0.31 | 0.93 | 1.18 | 0.09 to 2.27 | 0.033 |
| Patient sex: female (vs. male) | 0.26 | –0.73 to 1.25 | 0.61 | 1.92 | –0.85 to 4.70 | 0.17 |
| Dependency (vs. none) | 0.15 | 0.74 | ||||
| Minor or major | –0.30 | –1.60 to 1.00 | –0.22 | –3.36 to 2.92 | ||
| Total | –4.62 | –9.32 to 0.07 | 4.98 | –8.10 to 18.07 | ||
| Surgical status (vs. non-surgical) | 0.15 | 0.82 | ||||
| Planned elective/scheduled | –0.74 | –2.24 to 0.77 | –2.61 | –10.77 to 5.54 | ||
| Unplanned | –0.26 | –1.46 to 0.94 | –0.08 | –3.95 to 3.80 | ||
| ICNARC physiology score (per point) | 0.16 | 0.09 to 0.24 | < 0.001 | 0.17 | 0.00 to 0.34 | 0.045 |
| ICU length of stay (per day) | –0.02 | –0.07 to 0.03 | 0.44 | –0.30 | –0.46 to –0.15 | < 0.001 |
| Advanced respiratory support | 2.96 | 1.80 to 4.11 | < 0.001 | Not included | ||
| Fixed effects: ICU/hospital level | ||||||
| Hospital type (vs. non-university) | 0.49 | 0.55 | ||||
| University | 0.86 | –3.61 to 5.32 | –1.51 | –7.51 to 4.50 | ||
| University affiliated | 1.97 | –1.26 to 5.20 | 1.77 | –2.55 to 6.09 | ||
| Number of ICU beds (per bed) | –0.00 | –0.23 to 0.23 | 0.97 | 0.26 | –0.08 to 0.61 | 0.13 |
| Random effects, SD (SE) | ||||||
| Between ICUs | 2.91 (0.60) | 2.81 (1.10) | ||||
| Within ICUs between patients | 10.94 (0.29) | 11.16 (0.69) | ||||
| Within patients between family members | 11.98 (0.21) | 12.26 (0.44) | ||||
| Variance partition (%) | ||||||
| Between ICUs | 3 | 2 | ||||
| Between patients | 44 | 44 | ||||
Variances at both the patient and ICU/hospital levels were statistically significant but the variance partition coefficients at the ICU/hospital level were small in both the null and final multilevel models (4% and 3% for ICU survivors and 2% and 2% for ICU non-survivors, respectively; Tables 49 and 50), which means that differences in overall family satisfaction scores were mainly at the patient and family member levels. Variance at the patient level represented 44% of the total variance in overall family satisfaction in the final models for family members of both ICU survivors and ICU non-survivors.
| Variables | Family members of ICU survivors (n = 6143a) | Family members of ICU non-survivors (n = 869a) |
|---|---|---|
| Fixed effect (SE; 95% CI) | ||
| Constant (predicted mean score) | 79.85 (0.74; 78.39 to 81.31) | 82.62 (0.85; 80.95 to 84.28) |
| Random effects, SD (SE) | ||
| Between ICUs | 3.14 (0.58) | 2.20 (0.97) |
| Within ICUs between patients | 10.78 (0.27) | 11.47 (0.64) |
| Within patients between family members | 11.41 (0.18) | 11.92 (0.41) |
| Variance partition (%) | ||
| Between ICUs | 4 | 2 |
| Between patients | 45 | 48 |
Similar findings of the determinants of overall family satisfaction found in model 2 (incorporating relationship to the patient; Table 51). Compared with partners of ICU survivors, family members with other relationships had lower satisfaction (p = 0.029), particularly siblings, with a reduction of between 0.49 and 3.40 points, and ‘other non-relatives’, with a reduction of between 0.67 and 4.75 points. No significant variation in overall family satisfaction was found according to relationship to the patient for family members of ICU non-survivors (p = 0.23). The coefficients for other variables were similar to those from model 1.
| Variable | Family members of ICU survivors (n = 6143a) | Family members of ICU non-survivors (n = 869a) | ||||
|---|---|---|---|---|---|---|
| Coefficient | 95% CI | p-value | Coefficient | 95% CI | p-value | |
| Fixed effects: family member level | ||||||
| Constant | 68.22 | 63.18 to 73.26 | < 0.001 | 52.97 | 39.03 to 66.92 | < 0.001 |
| Family member age, years (vs. < 30) | 0.11 | 0.18 | ||||
| 30–39 | 1.59 | –0.28 to 3.46 | 2.06 | –2.59 to 6.72 | ||
| 40–49 | 1.39 | –0.30 to 3.08 | 3.70 | –0.78 to 8.18 | ||
| 50–59 | 1.80 | 0.06 to 3.55 | 4.49 | –0.02 to 8.99 | ||
| 60–69 | 1.38 | –0.57 to 3.34 | 4.72 | –0.54 to 9.97 | ||
| 70–79 | 1.46 | –0.77 to 3.70 | 6.16 | –0.03 to 12.35 | ||
| ≥ 80 | –1.17 | –4.26 to 1.92 | 0.13 | –7.61 to 7.88 | ||
| Family member sex: female (vs. male) | 0.30 | –0.51 to 1.10 | 0.46 | 0.60 | –1.51 to 2.71 | 0.58 |
| Family member ethnicity: white (vs. non-white) | 3.40 | 1.18 to 5.61 | 0.003 | 7.25 | 0.12 to 14.36 | 0.046 |
| Relationship to patient (vs. partner) | 0.027 | 0.23 | ||||
| Parent | –0.08 | –1.85 to 1.67 | 1.17 | –5.43 to 7.77 | ||
| Child | –0.86 | –2.20 to 0.47 | –0.45 | –4.10 to 3.20 | ||
| Sibling | –2.03 | –3.49 to –0.58 | 1.25 | –2.87 to 5.37 | ||
| Other relative | –1.42 | –2.84 to –0.01 | 1.10 | –2.72 to 4.91 | ||
| Other non-relative | –2.62 | –4.65 to –0.58 | –6.21 | –12.18 to –0.26 | ||
| Frequent visitor | 2.92 | 1.87 to 3.96 | < 0.001 | 2.00 | –0.88 to 4.89 | 0.17 |
| Fixed effects: patient level | ||||||
| Patient age (per 10 years) | –0.01 | –0.42 to 0.39 | 0.94 | 1.36 | 0.06 to 2.66 | 0.040 |
| Patient sex: female (vs. male) | 0.28 | –0.72 to 1.26 | 0.59 | 1.94 | –0.84 to 4.72 | 0.17 |
| Dependency (vs. none) | 0.20 | 0.76 | ||||
| Minor or major | –0.27 | –1.58 to 1.03 | –0.04 | –3.18 to 3.11 | ||
| Total | –4.24 | –8.94 to 0.47 | 4.77 | –8.34 to 17.88 | ||
| Surgical status (vs. non-surgical) | 0.65 | 0.71 | ||||
| Planned elective/scheduled | –0.70 | –2.21 to 0.81 | –2.82 | –10.98 to 5.33 | ||
| Unplanned | –0.25 | –1.45 to 0.95 | –0.11 | –4.00 to 3.78 | ||
| ICNARC physiology score (per point) | 0.16 | 0.09 to 0.24 | < 0.001 | 0.17 | 0.00 to 0.34 | 0.050 |
| ICU length of stay (per day) | –0.02 | –0.07 to 0.04 | 0.43 | –0.29 | –0.45 to –0.14 | < 0.001 |
| Advanced respiratory support | 2.93 | 1.77 to 4.08 | < 0.001 | Not included | ||
| Fixed effects: ICU/hospital level | ||||||
| Hospital type (vs. non-university) | 0.49 | 0.56 | ||||
| University | 0.86 | –3.59 to 5.30 | –1.25 | –7.31 to 4.80 | ||
| University affiliated | 1.96 | –1.26 to 5.18 | 1.85 | –2.50 to 6.20 | ||
| Number of ICU beds (per bed) | –0.00 | –0.23 to 0.23 | 0.99 | 0.28 | –0.07 to 0.62 | 0.11 |
| Random effects, SD (SE) | ||||||
| Between ICUs | 2.90 (0.60) | 2.86 (1.11) | ||||
| Within ICUs between patients | 10.96 (0.29) | 11.18 (0.69) | ||||
| Within patients between family members | 12.00 (0.21) | 12.23 (0.44) | ||||
| Variance partition (%) | ||||||
| Between ICUs | 3 | 3 | ||||
| Between patients | 44 | 44 | ||||
Secondary analyses
The overall family satisfaction score was split into the original and new domain scores to further explore determinants of variation in family satisfaction (Tables 52–55).
| Variable | Family members of ICU survivors (n = 6143a) | Family members of ICU non-survivors (n = 869a) | ||||
|---|---|---|---|---|---|---|
| Coefficient | 95% CI | p-value | Coefficient | 95% CI | p-value | |
| Fixed effects: family member level | ||||||
| Constant | 71.45 | 66.67 to 76.22 | < 0.001 | 55.29 | 41.76 to 68.82 | < 0.001 |
| Family member age (years) (vs. < 30) | 0.001 | 0.16 | ||||
| 30–39 | 2.60 | 0.81 to 4.38 | 2.50 | –1.97 to 6.97 | ||
| 40–49 | 2.73 | 1.16 to 4.31 | 4.31 | 0.09 to 8.54 | ||
| 50–59 | 2.91 | 1.36 to 4.44 | 4.99 | 0.93 to 9.04 | ||
| 60–69 | 2.67 | 1.08 to 4.26 | 4.89 | 0.54 to 9.23 | ||
| 70–79 | 2.66 | 0.90 to 4.41 | 5.91 | 0.88 to 10.94 | ||
| ≥ 80 | –0.17 | –2.76 to 2.41 | 1.85 | –4.51 to 8.21 | ||
| Family member sex: female (vs. male) | 0.42 | –0.35 to 1.20 | 0.29 | 0.22 | –1.81 to 2.25 | 0.83 |
| Family member ethnicity: white (vs. non-white) | 3.87 | 1.77 to 5.97 | < 0.001 | 6.99 | 0.19 to 13.81 | 0.044 |
| Next of kin/lives with patient (vs. lives with patient) | < 0.001 | 0.15 | ||||
| Next of kin, does not live with patient | –1.14 | –2.26 to –0.02 | 0.95 | –2.39 to 4.29 | ||
| Not next of kin, does not live with patient | –2.44 | –3.32 to –1.55 | –1.58 | –4.11 to 0.94 | ||
| Frequent visitor | 2.49 | 1.52 to 3.46 | < 0.001 | 1.49 | –1.27 to 4.25 | 0.29 |
| Fixed effects: patient level | ||||||
| Patient age (per 10 years) | 0.03 | –0.25 to 0.31 | 0.83 | 1.21 | 0.16 to 2.26 | 0.024 |
| Patient sex: female (vs. male) | 0.06 | –0.85 to 0.98 | 0.87 | 1.85 | –0.79 to 4.5 | 0.17 |
| Dependency (vs. none) | 0.006 | 0.68 | ||||
| Minor or major | –0.74 | –1.96 to 0.46 | –0.94 | –3.98 to 2.09 | ||
| Total | –6.77 | –11.18 to –2.36 | 3.62 | –8.71 to 15.95 | ||
| Surgical status (vs. non-surgical) | 0.68 | 0.47 | ||||
| Planned elective/scheduled | –0.62 | –2.04 to 0.78 | –4.85 | –12.71 to 2.99 | ||
| Unplanned | –0.15 | –1.27 to 0.95 | –0.57 | –4.29 to 3.13 | ||
| ICNARC physiology score (per point) | 0.14 | 0.07 to 0.21 | < 0.001 | 0.14 | –0.03 to 0.30 | 0.10 |
| ICU length of stay (per day) | –0.02 | –0.06 to 0.02 | 0.39 | –0.30 | –0.45 to –0.15 | < 0.001 |
| Advanced respiratory support | 2.74 | 1.66 to 3.82 | < 0.001 | Not included | ||
| Fixed effects: ICU/hospital level | ||||||
| Hospital type (vs. non-university) | 0.51 | 0.58 | ||||
| University | 0.94 | –3.58 to 5.47 | –1.48 | –7.8 to 4.84 | ||
| University affiliated | 1.92 | –1.34 to 5.19 | 1.79 | –2.75 to 6.34 | ||
| Number of ICU beds (per bed) | –0.01 | –0.24 to 0.23 | 0.96 | 0.24 | –0.12 to 0.59 | 0.19 |
| Random effects, SD (SE) | ||||||
| Between ICUs | 2.98 (0.60) | 3.25 (1.11) | ||||
| Within ICUs between patients | 9.76 (0.28) | 10.47 (0.66) | ||||
| Within patients between family members | 11.96 (0.19) | 11.92 (0.42) | ||||
| Variable | Family members of ICU survivors (n = 6143a) | Family members of ICU non-survivors (n = 869a) | ||||
|---|---|---|---|---|---|---|
| Coefficient | 95% CI | p-value | Coefficient | 95% CI | p-value | |
| Fixed effects: family member level | ||||||
| Constant | 64.11 | 58.43 to 69.77 | < 0.001 | 49.89 | 33.97 to 65.82 | < 0.001 |
| Family member age (years) (vs. < 30) | 0.19 | 0.21 | ||||
| 30–39 | 0.91 | –1.46 to 3.28 | 1.26 | –4.36 to 6.9 | ||
| 40–49 | 0.06 | –2.01 to 2.13 | 2.07 | –3.2 to 7.35 | ||
| 50–59 | 0.56 | –1.46 to 2.60 | 2.97 | –2.11 to 8.06 | ||
| 60–69 | –0.58 | –2.71 to 1.54 | 3.69 | –1.75 to 9.15 | ||
| 70–79 | –0.61 | –2.97 to 1.73 | 6.08 | –0.26 to 12.42 | ||
| ≥ 80 | –3.11 | –6.60 to 0.36 | –2.77 | –10.83 to 5.29 | ||
| Family member sex: female (vs. male) | 0.12 | –0.87 to 1.12 | 0.81 | 1.22 | –1.33 to 3.79 | 0.35 |
| Family member ethnicity: white (vs. non-white) | 3.13 | 0.37 to 5.88 | 0.026 | 8.01 | –0.54 to 16.55 | 0.066 |
| Next of kin/lives with patient (vs. lives with patient) | < 0.001 | 0.51 | ||||
| Next of kin, does not live with patient | –1.8 | –3.31 to 0.31 | 1.45 | –2.71 to 5.62 | ||
| Not next of kin, does not live with patient | –2.19 | –3.38 to 1.01 | –0.63 | –3.85 to 2.59 | ||
| Frequent visitor | 3.38 | 2.06 to 4.69 | < 0.001 | 1.74 | –1.7 to 5.19 | 0.32 |
| Fixed effects: patient level | ||||||
| Patient age (per 10 years) | –0.02 | –0.39 to 0.35 | 0.92 | 1.43 | 0.13 to 2.73 | 0.031 |
| Patient sex: female (vs. male) | 0.50 | –0.74 to 1.74 | 0.43 | 1.72 | –1.57 to 5.01 | 0.31 |
| Dependency (vs. none) | 0.80 | 0.60 | ||||
| Minor or major | 0.28 | –1.34 to 1.92 | 0.98 | –2.67 to 4.65 | ||
| Total | –1.62 | –7.51 to 4.26 | 7.18 | –8.71 to 23.07 | ||
| Surgical status (vs. non-surgical) | 0.63 | 0.97 | ||||
| Planned elective/scheduled | –0.91 | –2.81 to 0.98 | –1.08 | –10.71 to 8.53 | ||
| Unplanned | –0.39 | –1.92 to 1.13 | 0.07 | –4.51 to 4.67 | ||
| ICNARC physiology score (per point) | 0.19 | 0.09 to 0.28 | < 0.001 | 0.17 | –0.03 to 0.37 | 0.096 |
| ICU length of stay (per day) | –0.02 | –0.08 to 0.04 | 0.59 | –0.33 | –0.51 to –0.14 | < 0.001 |
| Advanced respiratory support | 3.23 | 1.77 to 4.69 | < 0.001 | Not included | ||
| Fixed effects: ICU/hospital level | ||||||
| Hospital type (vs. non-university) | 0.49 | 0.72 | ||||
| University | 0.80 | –3.83 to 5.43 | –1.61 | –8.17 to 4.96 | ||
| University affiliated | 2.06 | –1.29 to 5.43 | 1.20 | –3.51 to 5.90 | ||
| Number of ICU beds (per bed) | –0.01 | –0.25 to 0.24 | 0.96 | 0.32 | –0.05 to 0.69 | 0.097 |
| Random effects, SD (SE) | ||||||
| Between ICUs | 2.92 (0.65) | 2.74 (1.26) | ||||
| Within ICUs between patients | 13.75 (0.36) | 12.92 (0.87) | ||||
| Within patients between family members | 14.61 (0.30) | 14.90 (0.55) | ||||
| Variable | Family members of ICU survivors (n = 6143a) | Family members of ICU non-survivors (n = 869a) | ||||
|---|---|---|---|---|---|---|
| Coefficient | 95% CI | p-value | Coefficient | 95% CI | p-value | |
| Fixed effects: family member level | ||||||
| Constant | 66.07 | 59.78 to 72.21 | < 0.001 | 55.86 | 39.34 to 72.38 | < 0.001 |
| Family member age (years) (vs. < 30) | 0.63 | 0.28 | ||||
| 30–39 | 0.28 | –2.22 to 2.79 | 1.23 | –4.92 to 7.39 | ||
| 40–49 | 0.00 | –2.21 to 2.21 | 1.88 | –3.92 to 7.68 | ||
| 50–59 | 0.55 | –1.62 to 2.72 | 2.88 | –2.70 to 8.48 | ||
| 60–69 | –0.1 | –2.35 to 2.14 | 4.24 | –1.71 to 10.2 | ||
| 70–79 | –0.41 | –2.89 to 2.08 | 6.43 | –0.45 to 13.31 | ||
| ≥ 80 | –2.67 | –6.35 to 1.01 | –1.96 | –10.71 to 6.79 | ||
| Family member sex: female (vs. male) | 0.20 | –0.89 to 1.30 | 0.72 | 1.01 | –1.81 to 3.82 | 0.49 |
| Family member ethnicity: white (vs. non-white) | 4.73 | 1.78 to 7.68 | 0.002 | 9.34 | 0.47 to 18.21 | 0.039 |
| Next of kin/lives with patient (vs. lives with patient) | < 0.001 | 0.38 | ||||
| Next of kin, does not live with patient | –2.39 | –3.97 to 0.81 | 1.43 | –3.09 to 5.95 | ||
| Not next of kin, does not live with patient | –2.57 | –3.83 to 1.31 | –1.21 | –4.69 to 2.28 | ||
| Frequent visitor | 2.11 | 0.74 to 3.48 | 0.002 | 0.44 | –3.33 to 4.22 | 0.82 |
| Fixed effects: patient level | ||||||
| Patient age (per 10 years) | –0.22 | –0.61 to 0.18 | 0.28 | 0.92 | –0.43 to 2.27 | 0.18 |
| Patient sex: female (vs. male) | 0.32 | –0.98 to 1.62 | 0.63 | 1.93 | –1.48 to 5.35 | 0.27 |
| Dependency (vs. none) | 0.61 | 0.51 | ||||
| Minor or major | –0.49 | –2.2 to 1.2 | –0.28 | –4.11 to 3.53 | ||
| Total | –2.69 | –8.92 to 3.52 | 9.15 | –6.57 to 24.87 | ||
| Surgical status (vs. non-surgical) | 0.88 | 0.84 | ||||
| Planned elective/scheduled | –0.32 | –2.32 to 1.66 | –0.88 | –10.97 to 9.21 | ||
| Unplanned | 0.23 | –1.33 to 1.80 | –1.4 | –6.16 to 3.36 | ||
| ICNARC physiology score (per point) | 0.23 | 0.13 to 0.33 | < 0.001 | 0.15 | –0.04 to 0.36 | 0.13 |
| ICU length of stay (per day) | –0.05 | –0.11 to 0.01 | 0.14 | –0.43 | –0.62 to -0.24 | < 0.001 |
| Advanced respiratory support | 3.34 | 1.83 to 4.85 | < 0.001 | Not included | ||
| Fixed effects: ICU/hospital level | ||||||
| Hospital type (vs. non-university) | 0.45 | 0.58 | ||||
| University | 1.69 | –3.71 to 7.08 | 0.35 | –6.42 to 7.13 | ||
| University affiliated | 2.48 | –1.42 to 6.40 | 2.53 | –2.32 to 7.39 | ||
| Number of ICU beds (per bed) | –0.03 | –0.31 to 0.24 | 0.81 | 0.21 | –0.17 to 0.61 | 0.27 |
| Random effects, SD (SE) | ||||||
| Between ICUs | 3.48 (0.73) | 2.81 (1.37) | ||||
| Within ICUs between patients | 13.64 (0.41) | 12.38 (0.97) | ||||
| Within patients between family members | 16.88 (0.27) | 17.02 (0.60) | ||||
| Variable | Family members of ICU survivors (n = 6143a) | Family members of ICU non-survivors (n = 869a) | ||||
|---|---|---|---|---|---|---|
| Coefficient | 95% CI | p-value | Coefficient | 95% CI | p-value | |
| Fixed effects: family member level | ||||||
| Constant | 61.65 | 55.17 to 68.14 | < 0.001 | 39.62 | 20.14 to 59.09 | < 0.001 |
| Family member age, years (vs. < 30) | 0.061 | 0.40 | ||||
| 30–39 | 1.66 | –1.63 to 4.95 | 1.37 | –5.35 to 8.10 | ||
| 40–49 | 0.02 | –2.76 to 2.82 | 2.73 | –3.47 to 8.95 | ||
| 50–59 | 0.52 | –2.21 to 3.25 | 3.34 | –2.61 to 9.31 | ||
| 60–69 | –1.43 | –4.48 to 1.61 | 3.35 | –3.05 to 9.77 | ||
| 70–79 | –1.09 | –4.32 to 2.13 | 6.25 | –1.36 to 13.88 | ||
| ≥ 80 | –3.87 | –8.43 to 0.69 | –3.13 | –12.88 to 6.61 | ||
| Family member sex: female (vs. male) | –0.18 | –1.42 to 1.04 | 0.77 | 1.66 | –1.37 to 4.71 | 0.28 |
| Family member ethnicity: white (vs. non-white) | 0.81 | –2.67 to 4.30 | 0.65 | 6.46 | –4.24 to 17.15 | 0.24 |
| Next of kin/lives with patient (vs. lives with patient) | 0.10 | 0.86 | ||||
| Next of kin, does not live with patient | –0.93 | –2.93 to 1.05 | 1.39 | –3.49 to 6.28 | ||
| Not next of kin, does not live with patient | –1.65 | –3.22 to 0.07 | 0.48 | –3.49 to 4.46 | ||
| Frequent visitor | 5.31 | 3.38 to 7.23 | < 0.001 | 3.84 | –0.21 to 7.91 | 0.063 |
| Fixed effects: patient level | ||||||
| Patient age (per 10 years) | 0.26 | –0.20 to 0.73 | 0.27 | 2.19 | 0.61 to 3.78 | 0.007 |
| Patient sex: female (vs. male) | 0.79 | –0.84 to 2.43 | 0.34 | 1.29 | –2.67 to 5.26 | 0.52 |
| Dependency (vs. none) | 0.44 | 0.47 | ||||
| Minor or major | 1.34 | –0.74 to 3.43 | 2.91 | –1.48 to 7.29 | ||
| Total | 0.11 | –7.42 to 7.64 | 4.27 | –17.36 to 25.91 | ||
| Surgical status (vs. non-surgical) | 0.25 | 0.68 | ||||
| Planned elective/scheduled | –1.83 | –4.35 to 0.68 | –1.09 | –12.59 to 10.41 | ||
| Unplanned | –1.35 | –3.41 to 0.71 | 2.35 | –3.20 to 7.91 | ||
| ICNARC physiology score (per point) | 0.12 | 0.01 to 0.24 | 0.040 | 0.19 | –0.04 to 0.44 | 0.12 |
| ICU length of stay (per day) | 0.03 | –0.04 to 0.11 | 0.39 | –0.17 | –0.39 to 0.03 | 0.11 |
| Advanced respiratory support | 3.03 | 1.08 to 4.97 | 0.002 | Not included | ||
| Fixed effects: ICU/hospital level | ||||||
| Hospital type (vs. non-university) | 0.50 | 0.55 | ||||
| University | –0.41 | –4.27 to 3.46 | –4.44 | –12.41 to 3.53 | ||
| University affiliated | 1.51 | –1.37 to 4.39 | –0.86 | –6.56 to 4.83 | ||
| Number of ICU beds (per bed) | 0.02 | –0.19 to 0.23 | 0.85 | 0.47 | 0.02 to 0.93 | 0.042 |
| Random effects, SD (SE) | ||||||
| Between ICUs | 2.06 (0.66) | 3.33 (1.50) | ||||
| Within ICUs between patients | 17.24 (0.50) | 15.84 (1.06) | ||||
| Within patients between family members | 17.02 (0.40) | 16.81 (0.66) | ||||
For family members of ICU survivors, frequency of visits, the patient’s acute severity of illness and receipt of advanced respiratory support were significantly associated with satisfaction for all domain scores, and ethnicity and whether or not the family member was the patient’s next of kin and/or lived with the patient were significant for all domain scores except for satisfaction with the decision-making process. The association with family member age was stronger for the satisfaction with care domain score than the overall family satisfaction score, and was not significantly associated with the satisfaction with decision-making domain score or either of the new subdomain scores. The patient’s dependency prior to admission to acute hospital was also found to be significantly associated with the satisfaction with care domain score (p = 0.006).
For family members of ICU non-survivors, the patient’s age was significantly associated with satisfaction for all domain scores except satisfaction with information, and the patient’s ICU length of stay was significantly associated with all domain scores except satisfaction with the decision-making process. Although the coefficients were similar in magnitude across all models to those from the model for the overall family satisfaction score, the family member’s ethnicity was statistically significant in the models only for the satisfaction with care and satisfaction with information domain scores, and the patient’s acute severity of illness (ICNARC physiology score) was not statistically significant in any of the domain models. The number of beds in the ICU was significantly, but weakly, associated with the satisfaction with the decision-making process domain score, with an average increase of 0.05 points for each additional bed [95% confidence interval (CI) 0.01 to 0.93; p = 0.042]. All other factors considered in the multilevel models were non-significant, as for the model for the overall family satisfaction score.
Sensitivity analyses
Sensitivity analyses showed that, in general, the direction and order of magnitude of coefficients that were significant in the models estimated using imputed data were similar to those estimated using either the traditional approach to scoring or complete case data (Tables 56 and 57). However, the material loss of power led to some coefficients being estimated as non-significant in the complete case analyses. The models using data from all family members, including imputed satisfaction scores for non-responders, gave similar results to the primary models, which may be expected because the non-responders provide no additional information regarding the association between characteristics and satisfaction.
| Variable | Complete case (n = 2351) | Traditional approach (n = 5756) | All family members (n = 10,353) | ||||||
|---|---|---|---|---|---|---|---|---|---|
| Coefficient | SE | p-value | Coefficient | SE | p-value | Coefficient | SE | p-value | |
| Fixed effects: family member level | |||||||||
| Constant | 72.60 | 3.18 | < 0.001 | 70.35 | 2.49 | < 0.001 | 69.08 | 2.39 | < 0.001 |
| Family member age (years) (vs. < 30) | |||||||||
| 30–39 | 0.13 | 1.40 | 0.61 | 1.47 | 0.97 | 0.20 | 0.95 | 0.48 | 0.24 |
| 40–49 | 0.85 | 1.22 | 1.41 | 0.86 | 0.21 | 0.15 | |||
| 50–59 | 0.66 | 1.20 | 1.58 | 0.84 | 0.75 | 0.44 | |||
| 60–69 | 0.65 | 1.30 | 1.47 | 0.88 | 0.50 | 0.48 | |||
| 70–79 | 0.77 | 1.47 | 1.69 | 0.98 | 0.31 | 0.55 | |||
| ≥ 80 | –3.06 | 2.26 | –1.22 | 1.50 | –0.73 | 0.90 | |||
| Family member sex: female (vs. male) | 0.94 | 0.60 | 0.12 | 0.21 | 0.43 | 0.63 | 0.57 | 0.30 | 0.066 |
| Family member ethnicity: white (vs. non-white) | 7.58 | 1.58 | < 0.001 | 3.99 | 1.16 | 0.001 | 4.89 | 0.90 | < 0.001 |
| Next of kin/lives with patient (vs. lives with patient) | |||||||||
| Next of kin, does not live with patient | –1.69 | 0.85 | 0.071 | –1.36 | 0.61 | 0.002 | –1.19 | 0.43 | < 0.001 |
| Not next of kin, does not live with patient | –1.42 | 0.72 | –1.70 | 0.50 | –2.16 | 0.31 | |||
| Frequent visitor | 1.18 | 0.82 | 0.15 | 2.21 | 0.55 | < 0.001 | 1.64 | 0.34 | < 0.001 |
| Fixed effects: patient level | |||||||||
| Patient age (per 10 years) | –0.09 | 0.22 | 0.67 | –0.07 | 0.15 | 0.64 | 0.01 | 0.15 | 0.91 |
| Patient sex: female (vs. male) | –1.20 | 0.73 | 0.10 | 0.13 | 0.52 | 0.79 | 0.46 | 0.45 | 0.31 |
| Dependency (vs. none) | |||||||||
| Minor or major | –0.44 | 0.92 | 0.70 | –0.19 | 0.68 | 0.45 | 0.20 | 0.66 | 0.21 |
| Total | –2.19 | 2.98 | –3.14 | 2.51 | –3.88 | 2.31 | |||
| Surgical status (vs. non-surgical) | |||||||||
| Planned elective/scheduled | –3.11 | 1.30 | 0.056 | –0.93 | 0.80 | 0.47 | –1.11 | 0.87 | 0.39 |
| Unplanned | –0.44 | 0.88 | 0.02 | 0.62 | –0.19 | 0.60 | |||
| ICNARC physiology score (per point) | 0.08 | 0.05 | 0.14 | 0.15 | 0.04 | < 0.001 | 0.18 | 0.04 | < 0.001 |
| ICU length of stay (per day) | –0.04 | 0.03 | 0.28 | –0.04 | 0.03 | 0.17 | –0.06 | 0.02 | 0.025 |
| Advanced respiratory support | 1.39 | 0.87 | 0.11 | 2.40 | 0.60 | < 0.001 | 2.35 | 0.54 | < 0.001 |
| Fixed effects: ICU/hospital level | |||||||||
| Hospital type (vs. non-university) | |||||||||
| University | 0.56 | 2.36 | 0.42 | 1.45 | 2.22 | 0.34 | 0.90 | 2.46 | 0.68 |
| University affiliated | 2.24 | 1.72 | 2.34 | 1.61 | 1.54 | 1.75 | |||
| Number of ICU beds (per bed) | 0.07 | 0.12 | 0.59 | –0.02 | 0.11 | 0.83 | 0.02 | 0.13 | 0.87 |
| Variable | Complete case (n = 547) | Traditional approach (n = 851) | All family members (n = 1444) | ||||||
|---|---|---|---|---|---|---|---|---|---|
| Coefficient | SE | p-value | Coefficient | SE | p-value | Coefficient | SE | p-value | |
| Fixed effects: family member level | |||||||||
| Constant | 54.46 | 7.72 | < 0.001 | 56.28 | 6.80 | < 0.001 | 63.30 | 5.74 | < 0.001) |
| Family member age (years) (vs. < 30) | |||||||||
| 30–39 | 4.38 | 3.01 | 0.17 | 3.14 | 2.44 | 0.086 | 1.12 | 1.35 | 0.38 |
| 40–49 | 7.51 | 2.75 | 4.87 | 2.31 | 0.54 | 0.42 | |||
| 50–59 | 6.19 | 2.62 | 4.50 | 2.22 | 1.80 | 1.27 | |||
| 60–69 | 7.41 | 2.85 | 5.94 | 2.37 | 1.31 | 1.43 | |||
| 70–79 | 6.99 | 3.69 | 7.07 | 2.82 | 2.42 | 1.65 | |||
| ≥ 80 | 7.52 | 4.41 | 0.32 | 3.61 | –1.73 | 2.04 | |||
| Family member sex: female (vs. male) | –0.02 | 1.43 | 0.99 | 0.40 | 1.11 | 0.72 | 0.26 | 0.63 | 0.68 |
| Family member ethnicity: white (vs. non-white) | 9.64 | 4.21 | 0.022 | 7.47 | 3.58 | 0.037 | 5.19 | 2.73 | 0.062 |
| Next of kin/lives with patient (vs. lives with patient) | |||||||||
| Next of kin, does not live with patient | 0.13 | 2.20 | 0.97 | 1.27 | 1.82 | 0.38 | 0.27 | 1.17 | 0.010 |
| Not next of kin, does not live with patient | –0.32 | 1.81 | –0.82 | 1.40 | –1.99 | 0.82 | |||
| Frequent visitor | 1.32 | 1.96 | 0.50 | 0.99 | 1.51 | 0.51 | 1.25 | 0.93 | 0.18 |
| Fixed effects: patient level | |||||||||
| Patient age (per 10 years) | 0.69 | 0.66 | 0.29 | 1.09 | 0.55 | 0.048 | 0.87 | 0.50 | 0.088 |
| Patient sex: female (vs. male) | 1.56 | 1.69 | 0.36 | 2.02 | 1.41 | 0.15 | 2.24 | 1.20 | 0.063 |
| Dependency (vs. none) | |||||||||
| Minor or major | –0.61 | 1.86 | 0.47 | –0.32 | 1.58 | 0.66 | 0.13 | 1.42 | 0.78 |
| Total | 8.53 | 7.42 | 5.59 | 6.45 | 4.36 | 5.99 | |||
| Surgical status (vs. non-surgical) | |||||||||
| Planned elective/scheduled | –0.33 | 5.61 | 0.84 | –4.86 | 4.22 | 0.51 | –3.21 | 3.73 | 0.71 |
| Unplanned | –1.38 | 2.33 | –0.44 | 1.95 | 0.11 | 1.81 | |||
| ICNARC physiology score (per point) | 0.24 | 0.10 | 0.022 | 0.18 | 0.09 | 0.041 | 0.18 | 0.08 | 0.020 |
| ICU length of stay (per day) | –0.27 | 0.09 | 0.003 | –0.33 | 0.08 | < 0.001 | –0.23 | 0.06 | < 0.001 |
| Fixed effects: ICU/hospital level | |||||||||
| Hospital type (vs. non-university) | |||||||||
| University | –1.15 | 3.20 | 0.83 | –0.11 | 3.01 | 0.77 | –0.56 | 2.66 | 0.59 |
| University affiliated | 0.84 | 2.29 | 1.49 | 2.17 | 1.78 | 2.00 | |||
| Number of ICU beds (per bed) | 0.25 | 0.19 | 0.17 | 0.21 | 0.17 | 0.23 | 0.18 | 0.15 | 0.24 |
Discussion
For family members of ICU survivors, the factors associated with overall family satisfaction were family member age; ethnicity; whether or not the family member was the patient’s next of kin and/or lived with the patient (or, in an alternative model specification, the relationship to the patient); whether or not the family member visited the patient at least once per day; the acute severity of illness of the patient; and whether or not the patient received advanced respiratory support (i.e. invasive mechanical ventilation) during their ICU stay.
For family members of ICU non-survivors, the factors associated with overall family satisfaction were the patient’s age; acute severity of illness; and ICU length of stay. No family member characteristics were found to be significantly associated with satisfaction for family members of ICU non-survivors; however, the sample size for ICU non-survivors was considerably smaller than for ICU survivors, and the magnitude and direction of the model coefficients suggested that some similar associations to those seen among family members of ICU survivors may have been present. For example, the association with family member ethnicity was almost twice the magnitude for family members of ICU non-survivors as for family members of survivors but did not meet the threshold for statistical significance (p = 0.050). There also appeared to be a consistent association with family member age, with increasing satisfaction up to 70–79 years and a decrease thereafter, but again this was not statistically significant (p = 0.18). There was no association between the size or teaching status of the ICU/hospital and overall family satisfaction, and there was no evidence of seasonality in the reported levels of overall family satisfaction. Although there was significant variation in satisfaction between ICUs, this accounted for only 3% of the variation in the overall family satisfaction score among family members of ICU survivors and 2% among family members of ICU non-survivors.
A number of previous studies have reported results of regression models to assess variation in family satisfaction (assessed using the FS-ICU-24) according to family member and/or patient characteristics, either as a specific aim of the study or in presenting full results of an adjusted model to assess the impact of a particular intervention or exposure. Sample sizes in these studies were generally small (between 40 and 275 family members, with the exception of one previous study among 996 family members) and the findings are inconsistent.
Curtis et al. 53 (in an adjusted pre-/post-intervention analysis of a quality improvement intervention to improve palliative care) found that, among 275 family members of ICU non-survivors, increasing family member age was associated with increasing satisfaction both overall and for the satisfaction with care domain score, but the other factors included in the model (family member sex and patient age, sex, ethnicity and diagnoses) were not. However, in a subsequent publication using data from the same study, Lewis-Newby et al. 54 reported that patient age (analysed in three categories of < 35, 35–64 and ≥ 65 years) was associated with satisfaction both before and after adjustment for other patient and family member characteristics (the effects of other factors included in the adjusted model were not reported).
Stricker et al. 55 (in a multicentre evaluation of factors associated with family satisfaction using the German version of the FS-ICU-34 but scored using the 24 items of the FS-ICU-24) found that, among 996 family members of both ICU survivors and non-survivors in 23 ICUs, increasing acute severity of illness of the patient [evaluated using the Simplified Acute Physiology Score (SAPS) II] was associated with increasing satisfaction on the overall family satisfaction score, and lower satisfaction was associated with ICU-level characteristics of a written admission/discharge policy and a higher patient–nurse ratio. Family member characteristics of sex and relationship to the patient were included in the multivariable model but not found to be significantly associated with satisfaction. Family member age was significantly associated with the overall family satisfaction score in univariable analysis, but was not included in the multivariable model because large amounts of data were missing. Patient characteristics considered and found not to be significant were age, sex, emergency status, surgery before admission, diagnostic group, ICU length of stay and ICU outcome. ICU/hospital characteristics considered and found not to be significant were ICU type, hospital funding/teaching status, number of ICU beds, presence of an ICU waiting room, length of visiting hours, ICU information policy, provision of written information to family members and presence of an emergency department in the hospital. In a model for the satisfaction with care domain score, family members who were children of the patient had lower satisfaction than other relationship categories, and patients who were admitted with a gastroenterology diagnosis had lower satisfaction; the acute severity of the illness of the patient was not significant, and the only significant ICU/hospital characteristic was the patient–nurse ratio. In a model for the satisfaction with decision-making domain score, the only significant characteristics were the acute severity of illness of the patient and the patient–nurse ratio.
Garland et al. 56 (in an adjusted analysis of a pilot study comparing different ICU staffing patterns) found that, among 119 family members of both ICU survivors and non-survivors, parents had significantly lower satisfaction than spouses, but there were no significant differences according to the family member’s age, sex or other categories of relationship to the patient, or between family members of ICU survivors and non-survivors.
Dalisay-Gallardo and Perez38 (in a single-centre evaluation of satisfaction with end-of-life care using the Filipino version of the FS-ICU-24) found that, among 40 family members of ICU non-survivors, increasing closeness of relationship (spouses vs. children vs. siblings or other relatives) was associated with decreasing odds of satisfaction (defined as a score of ≥ 75) on the satisfaction with decision-making domain, but there was no association with family member age, sex, living with the patient or area of residence, and there was no association of any family member characteristics with the overall family satisfaction score or the satisfaction with care domain score. 38 In a separate model investigating patient factors, a diagnosis of stroke or pneumonia was associated with higher odds of satisfaction on the satisfaction with decision-making domain, but patient age, sex, ‘do not resuscitate’ status and ICU length of stay were not associated with satisfaction, and no patient factors were associated with the overall family satisfaction score or the satisfaction with care domain score.
Schwarzkopf et al. 39 (in a multicentre evaluation of family satisfaction using the German version of the FS-ICU-24) found no factors significantly associated with the overall family satisfaction score among 215 family members of both ICU survivors and non-survivors. The factors considered were family member age, sex, relationship to patient and number of visits per week, and patient age, sex, median Sequential Organ Failure Assessment Score, median SAPS II, admission type, development of severe sepsis, ICU length of stay and ICU mortality.
Khalaila57 (in an adjusted analysis of the impact of unmet needs on family satisfaction using the Hebrew version of the FS-ICU-24) found that, among 70 family members of both ICU survivors and non-survivors, in addition to items from the Critical Care Family Needs Inventory, increasing years of education were associated with decreasing satisfaction, overall and on the satisfaction with care domain score, but not on the satisfaction with decision-making domain score. The family member’s age, sex, employment status, marital status and relationship to the patient (parent/sibling/spouse versus others) were not associated with satisfaction, either overall or on the two domain scores.
Finally, Geramisou-Angelidi et al. 41 (in an adjusted analysis of the impact of nursing activities on family satisfaction using the Greek version of the FS-ICU-24) found that, among 106 family members of both ICU survivors and non-survivors, increasing nursing activities (assessed using the Nursing Activities Score) were associated with higher odds of satisfaction (defined as a score of ≥ 83 – the median in the cohort) on the overall family satisfaction score. There was no association between satisfaction and the patient’s age, SAPS II or ICU length of stay. Family member characteristics were not included in the model.
It is of note that one of the largest-magnitude associations in the FREE study was the finding that white family members of both ICU survivors and non-survivors had higher satisfaction, on average, than those of other ethnicities. Further investigation of this issue is warranted to understand whether this reflects, for example, either cultural variation in family members’ expectations or a need to engage better and communicate with family members who may not have English as their first language (17% of family members of non-white ethnicity indicated that their first language was not English, compared with fewer than 1% of those of white ethnicity).
Chapter 8 Variation in family satisfaction across intensive care units before and after adjustment for family member and patient characteristics
Introduction
The aim of this chapter is to explore how family satisfaction, measured with the UK FS-ICU-24, varies across ICUs, before and after adjustment for the family member and patient characteristics identified in Chapter 7 as being associated with family satisfaction.
Methods
Selection of data
The data used for these analyses were the same as those used in Chapter 7.
Statistical analysis
Variation in family satisfaction across ICUs was assessed graphically using funnel plots, which plot the average family satisfaction score for each critical care unit against the number of family members returning questionnaires. 58 As sample size increases, the precision with which the average family satisfaction score can be estimated improves, so, if there were no underlying true variation in satisfaction between ICUs, the points would be expected to lie in a funnel shape, with greater variation around the overall mean at small sample sizes and less variation at large sample sizes. Control limits can be placed at 2 and 3 SDs around the overall mean to indicate the regions of the funnel within which we would expect 95% and 99.8% of points to lie if all variation were due to chance.
Funnel plots were produced based on the original responses (both using complete responders only and applying the modified traditional approach to scoring based on completion of at least 60% of items) and after multiple imputation of partial responders. Each of these approaches was applied both with and without adjustment using the multilevel multivariable models from Chapter 7.
Results
Figures 35–39 show the funnel plots for the overall family satisfaction score and each domain score by each alternative approach, before and after adjustment.
FIGURE 35.
Variation across ICUs in the mean overall family satisfaction score for (a) complete responders (unadjusted); (b) complete responders (adjusted); (c) modified traditional (unadjusted); (d) modified traditional (adjusted); (e) multiple imputation (unadjusted); and (f) multiple imputation (adjusted).
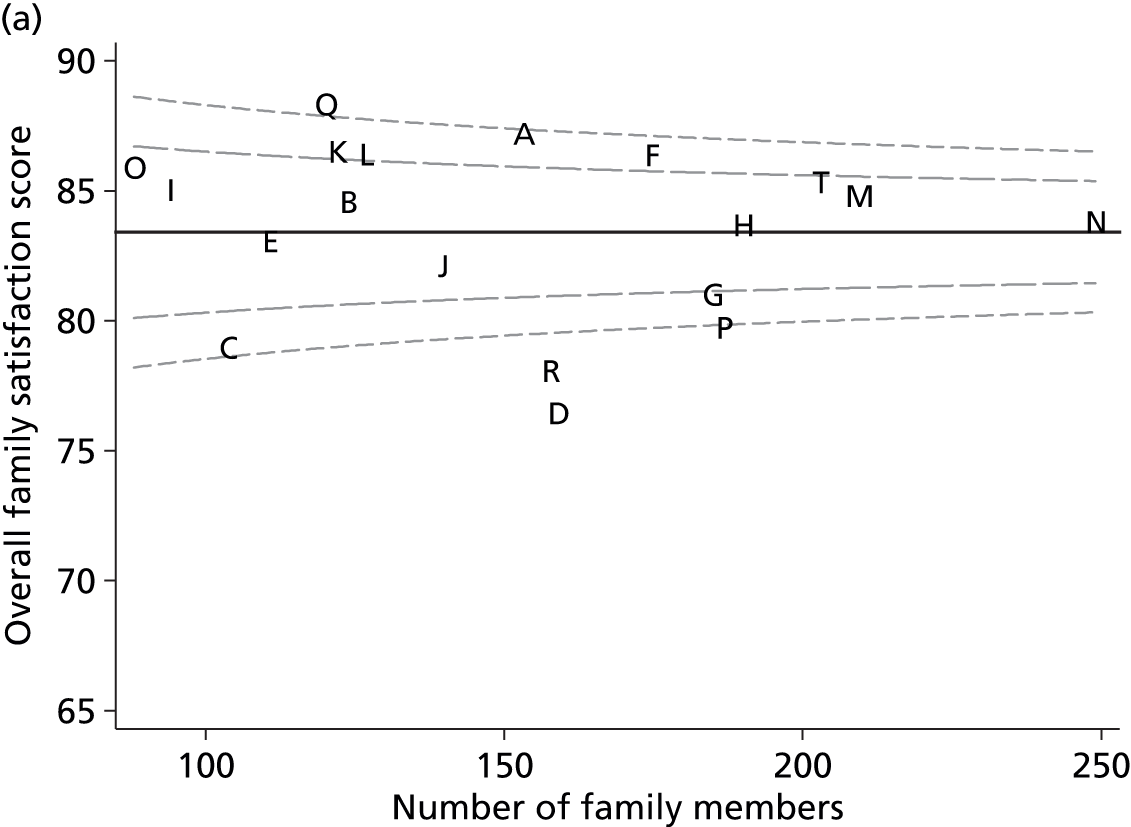
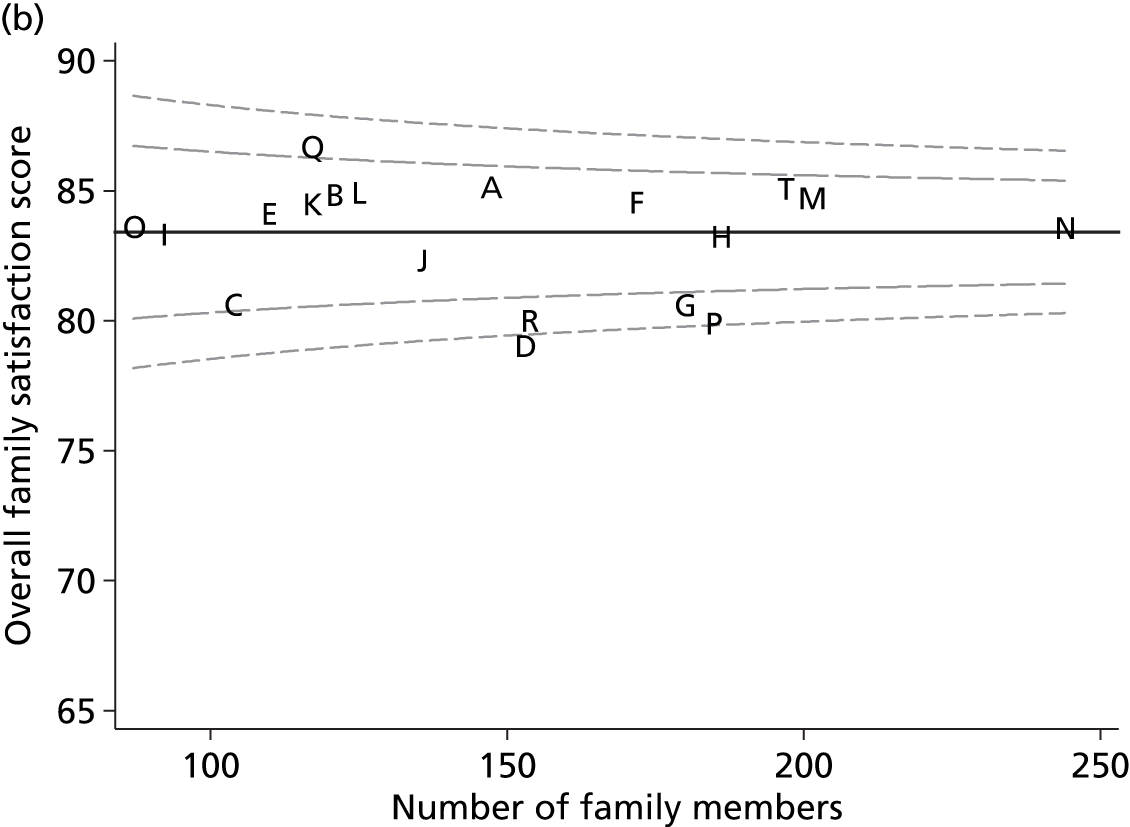
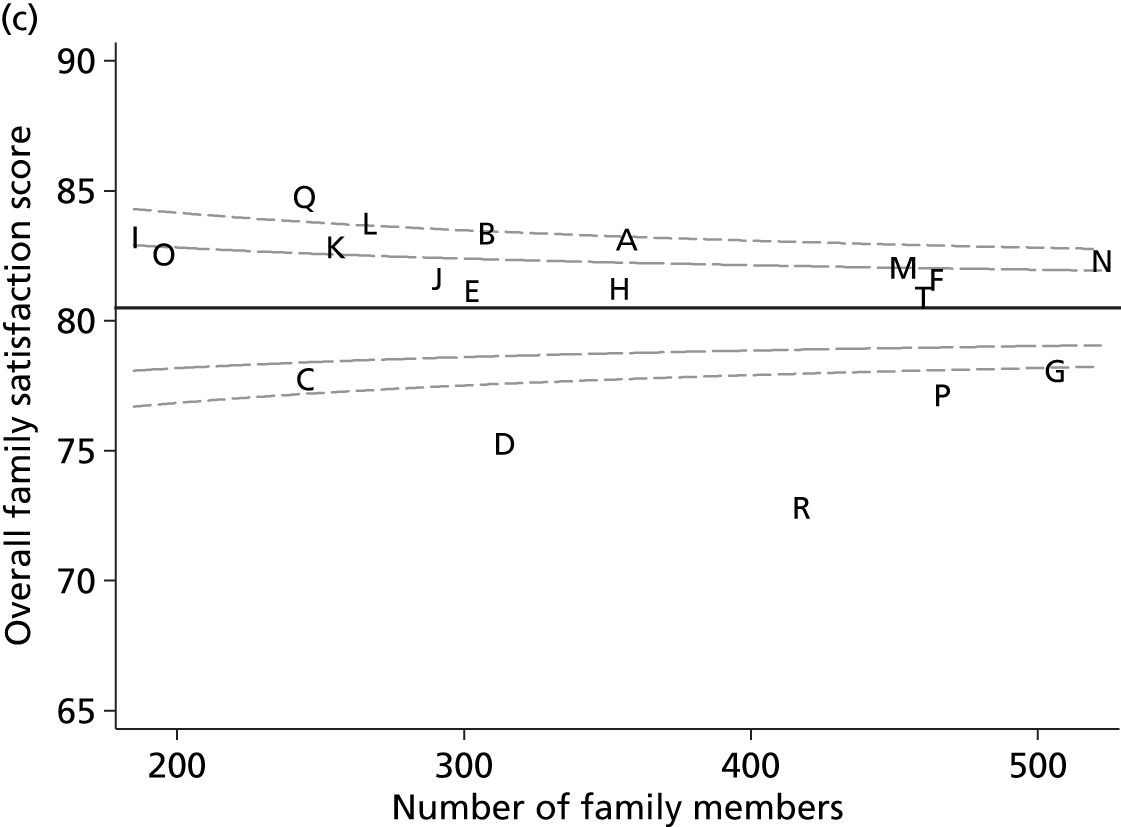

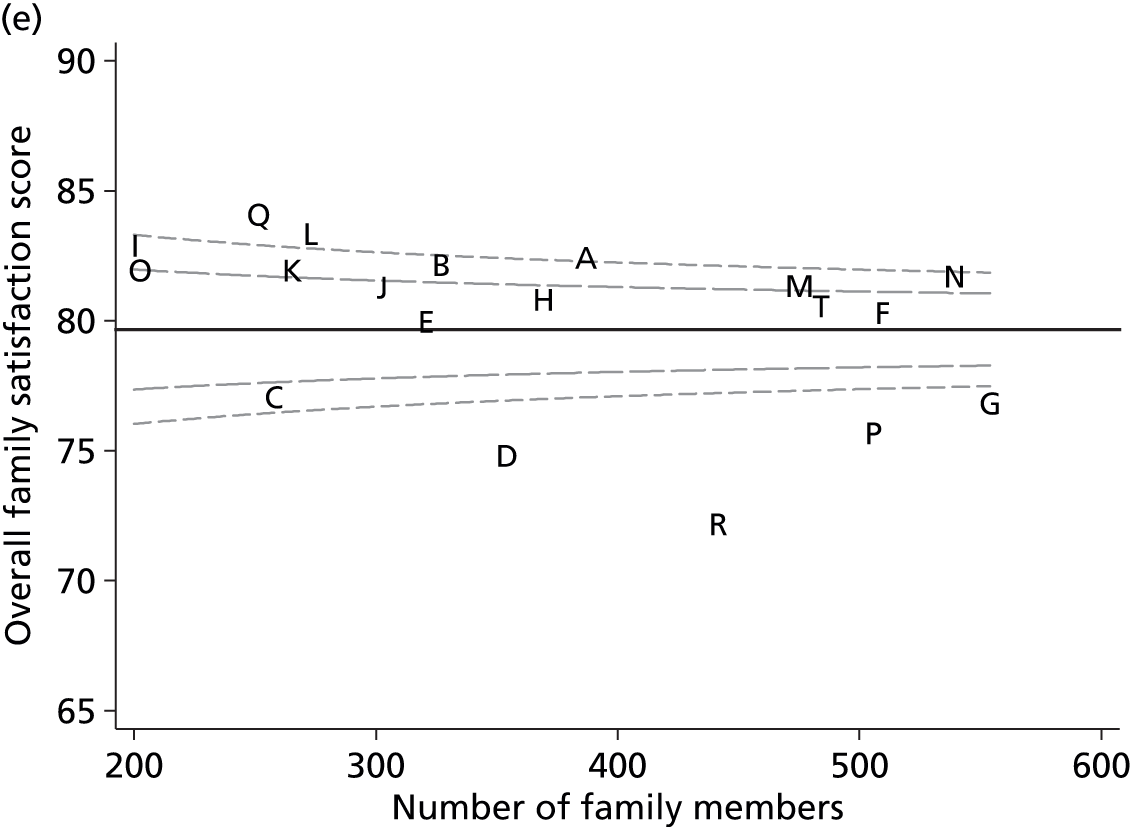

FIGURE 36.
Variation across ICUs in the mean satisfaction with care domain score for (a) complete responders (unadjusted); (b) complete responders (adjusted); (c) modified traditional (unadjusted); (d) modified traditional (adjusted); (e) multiple imputation (unadjusted); and (f) multiple imputation (adjusted).
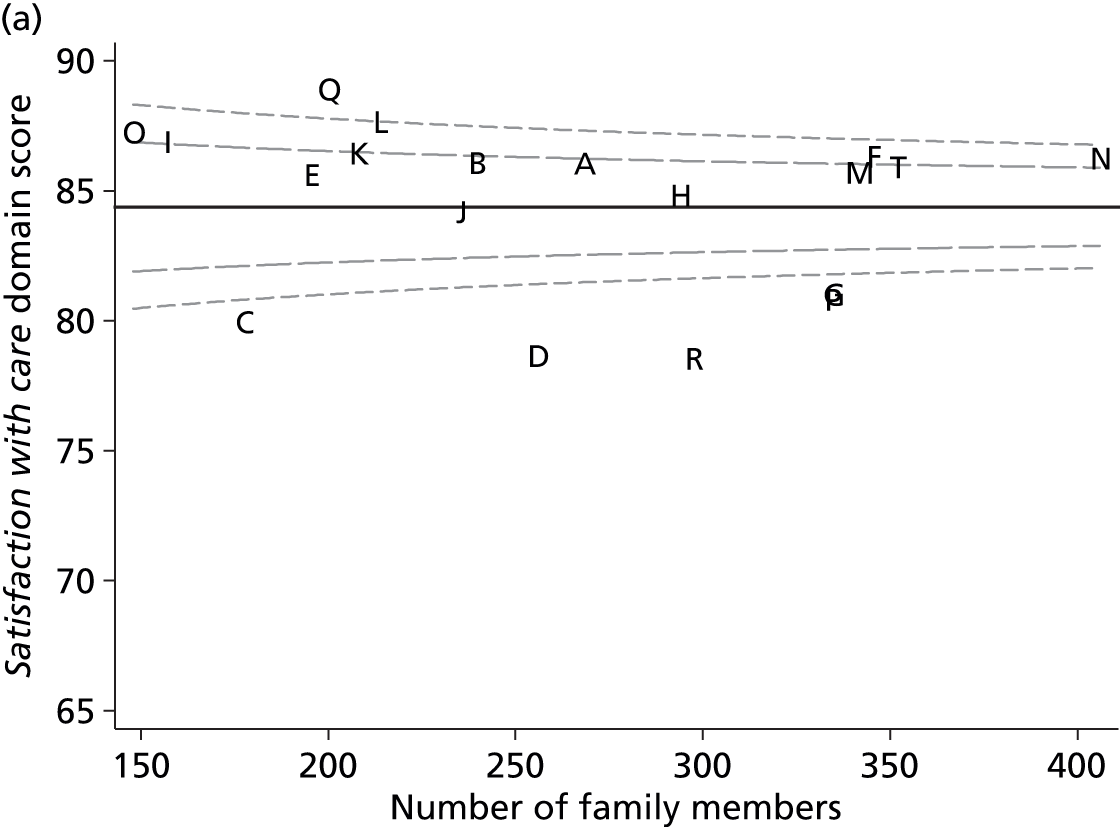
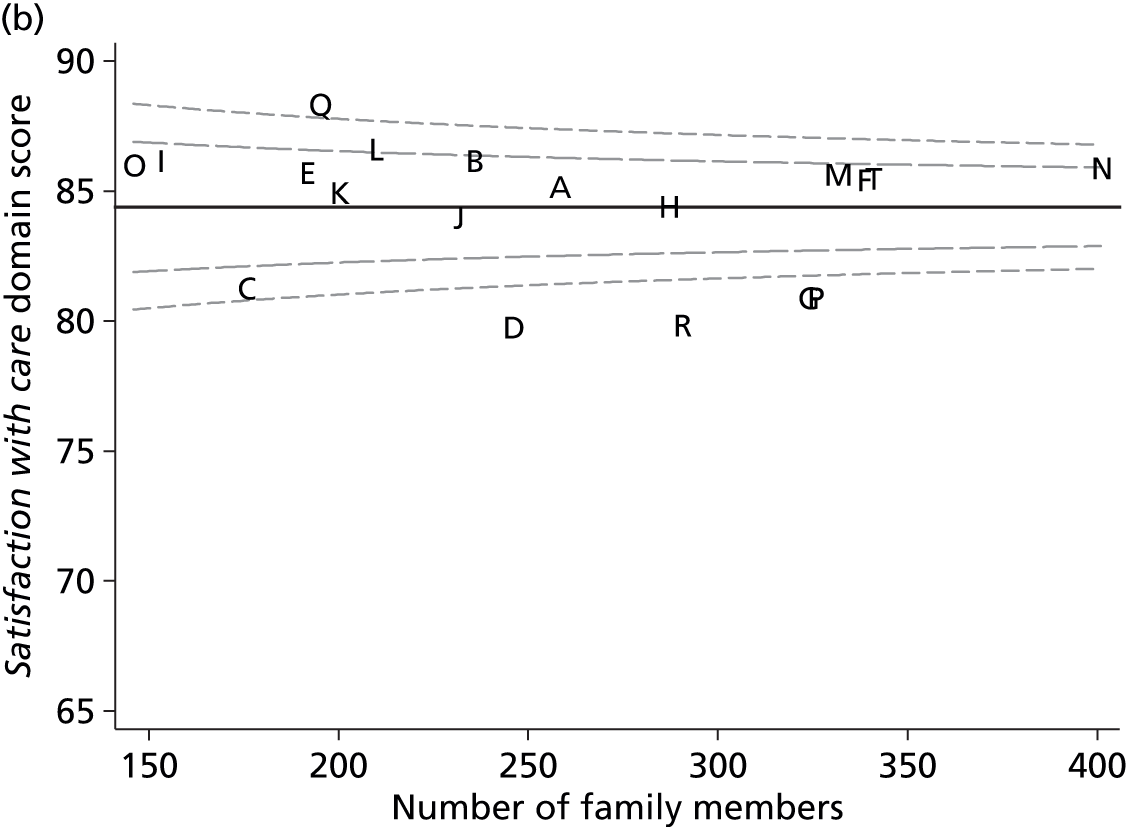


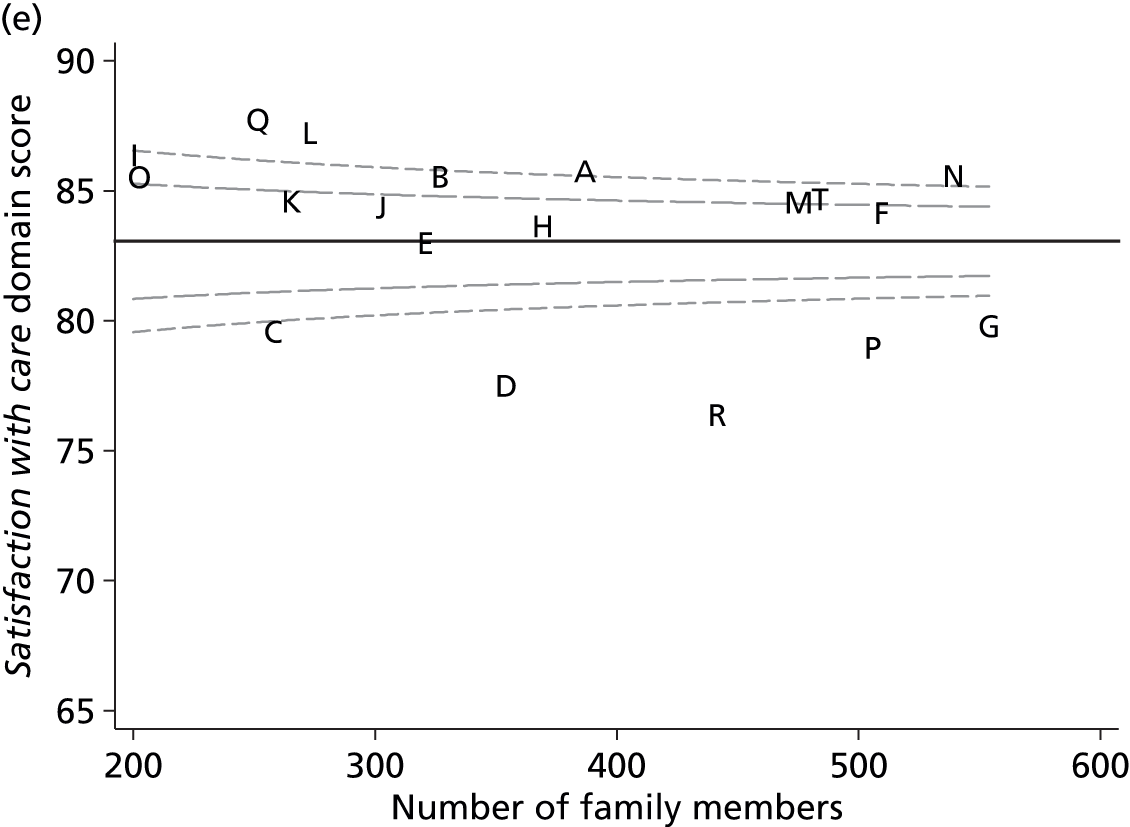
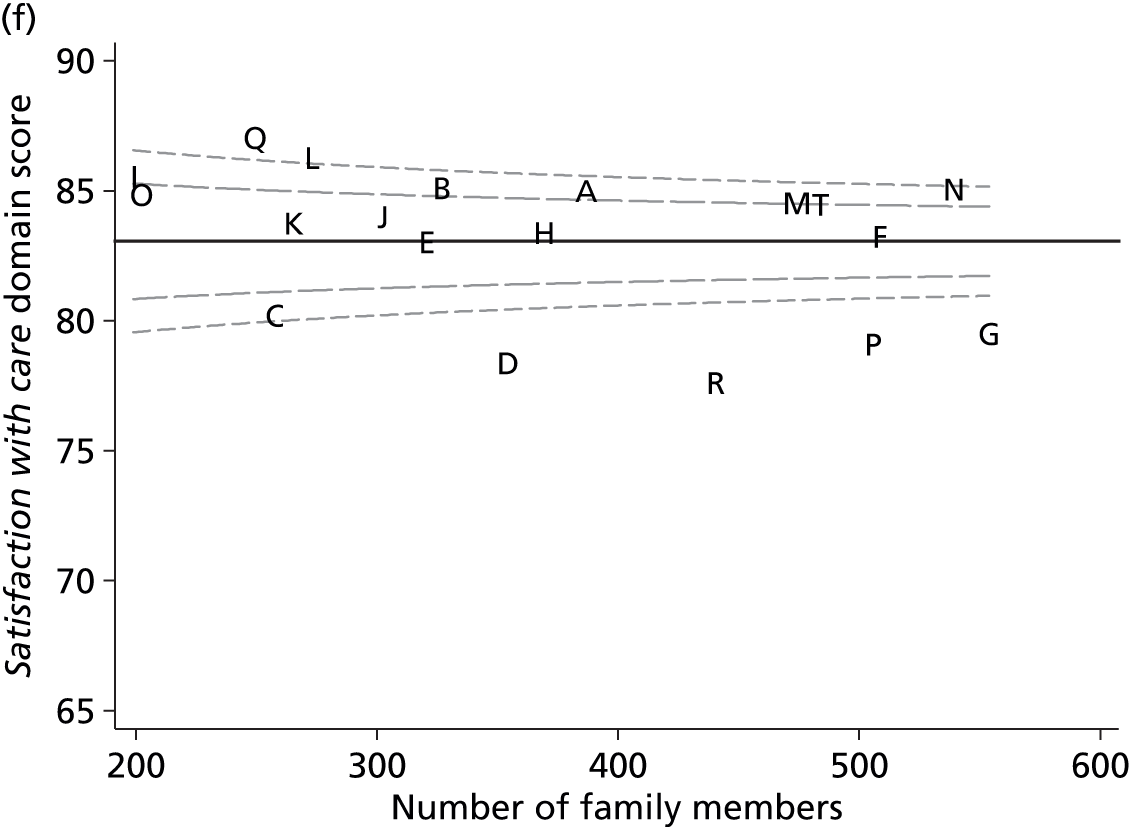
FIGURE 37.
Variation across ICUs in the mean satisfaction with decision-making domain score for (a) complete responders (unadjusted); (b) complete responders (adjusted); (c) modified traditional (unadjusted); (d) modified traditional (adjusted); (e) multiple imputation (unadjusted); and (f) multiple imputation (adjusted).
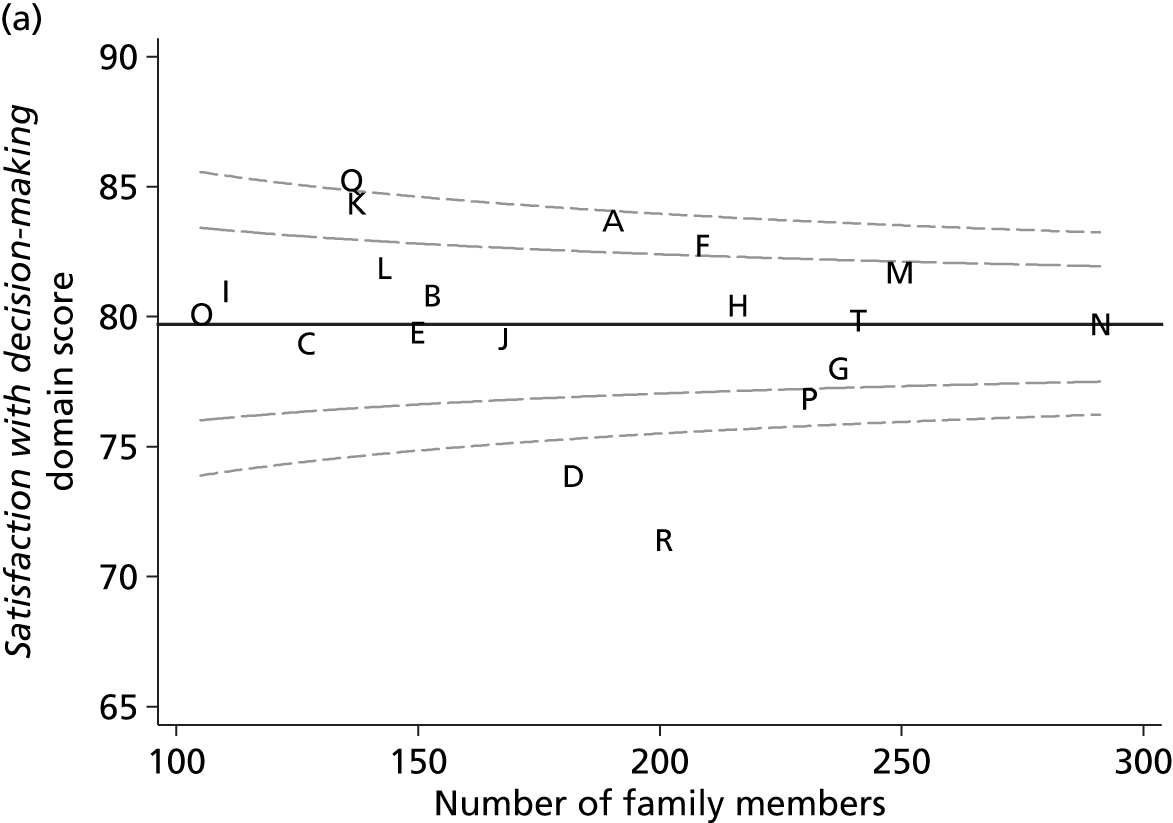

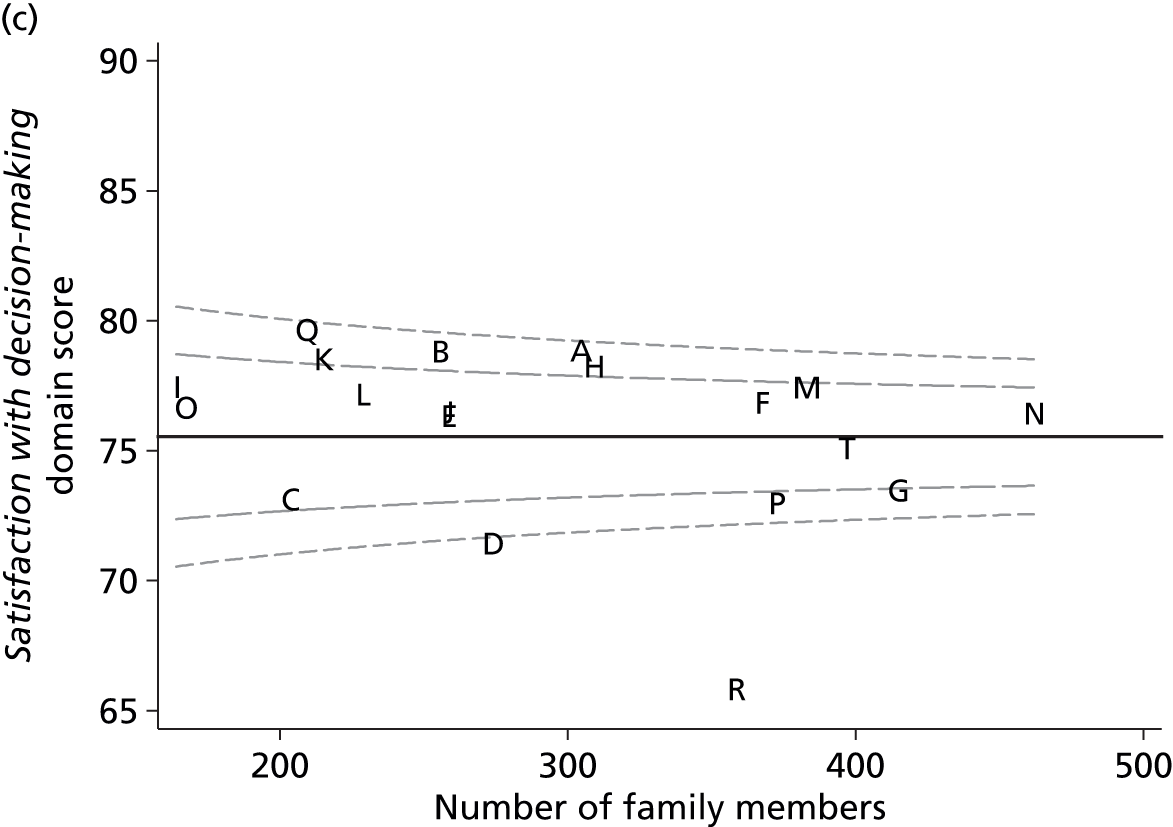
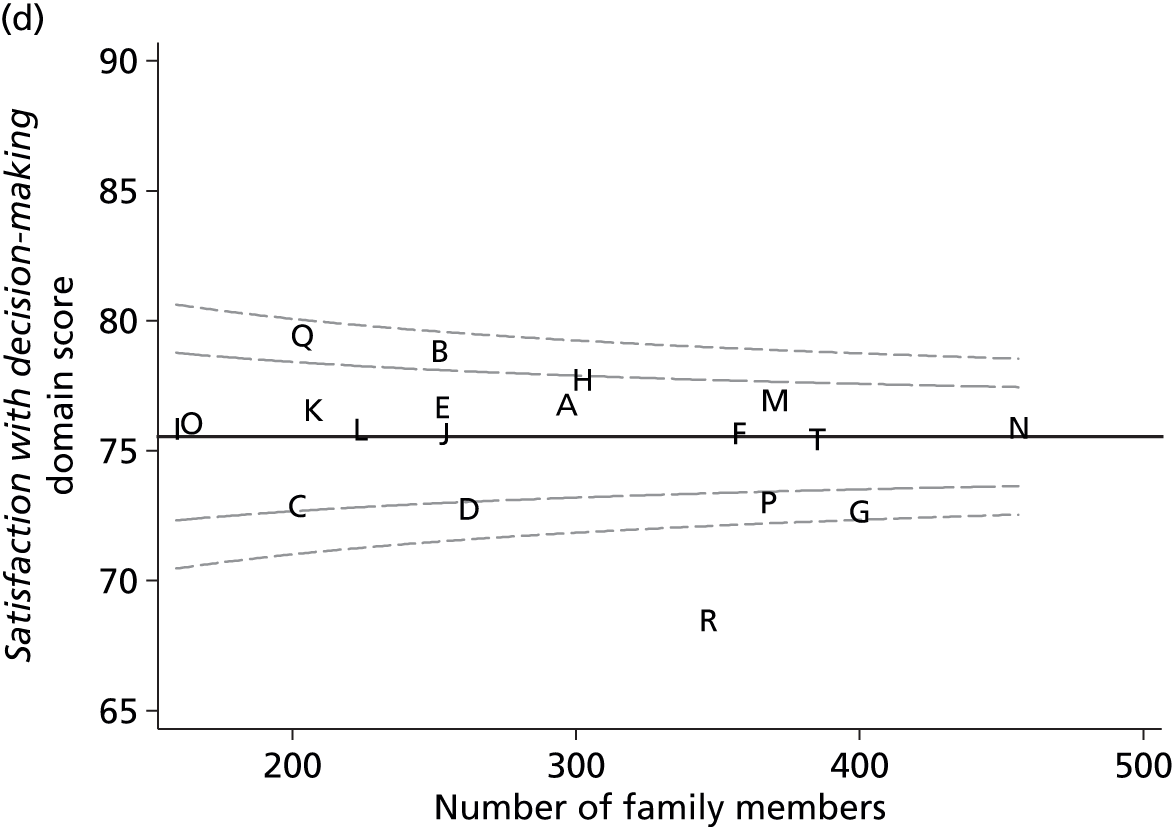
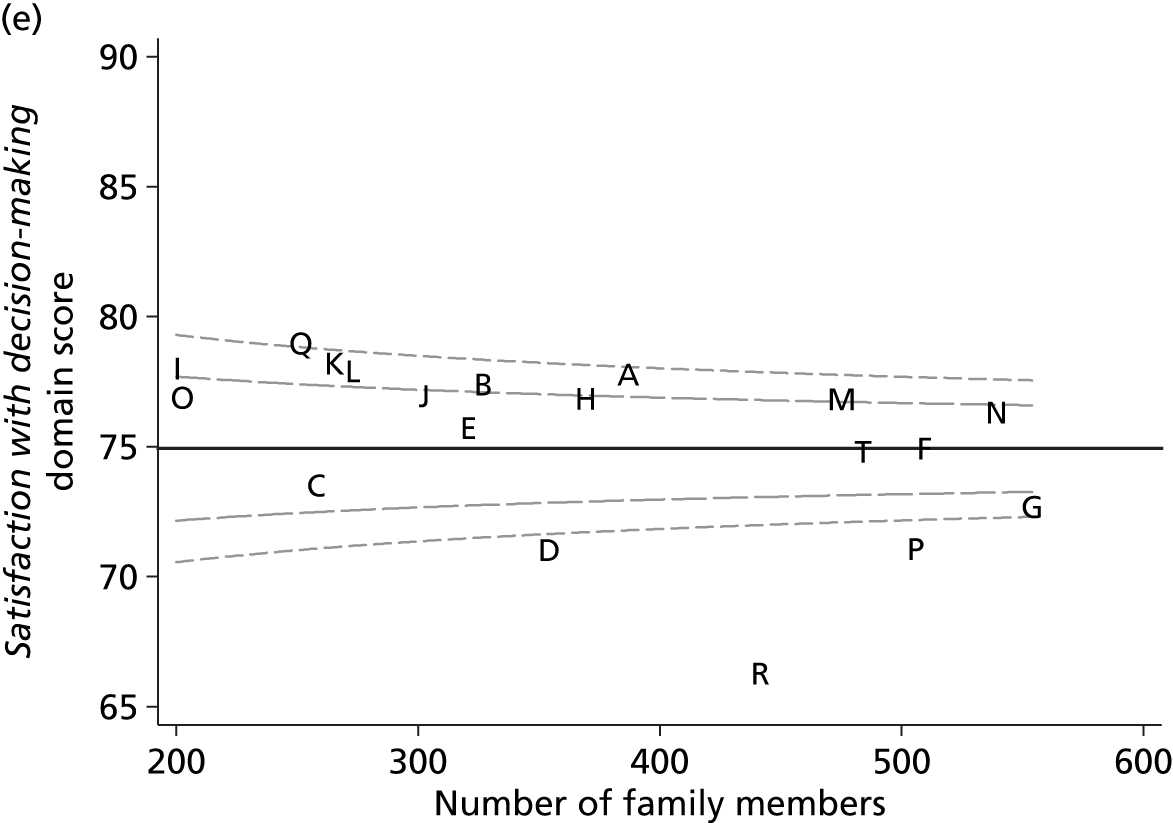

FIGURE 38.
Variation across ICUs in the mean satisfaction with information domain score for (a) complete responders (unadjusted); (b) complete responders (adjusted); (c) modified traditional (unadjusted); (d) modified traditional (adjusted); (e) multiple imputation (unadjusted); and (f) multiple imputation (adjusted).
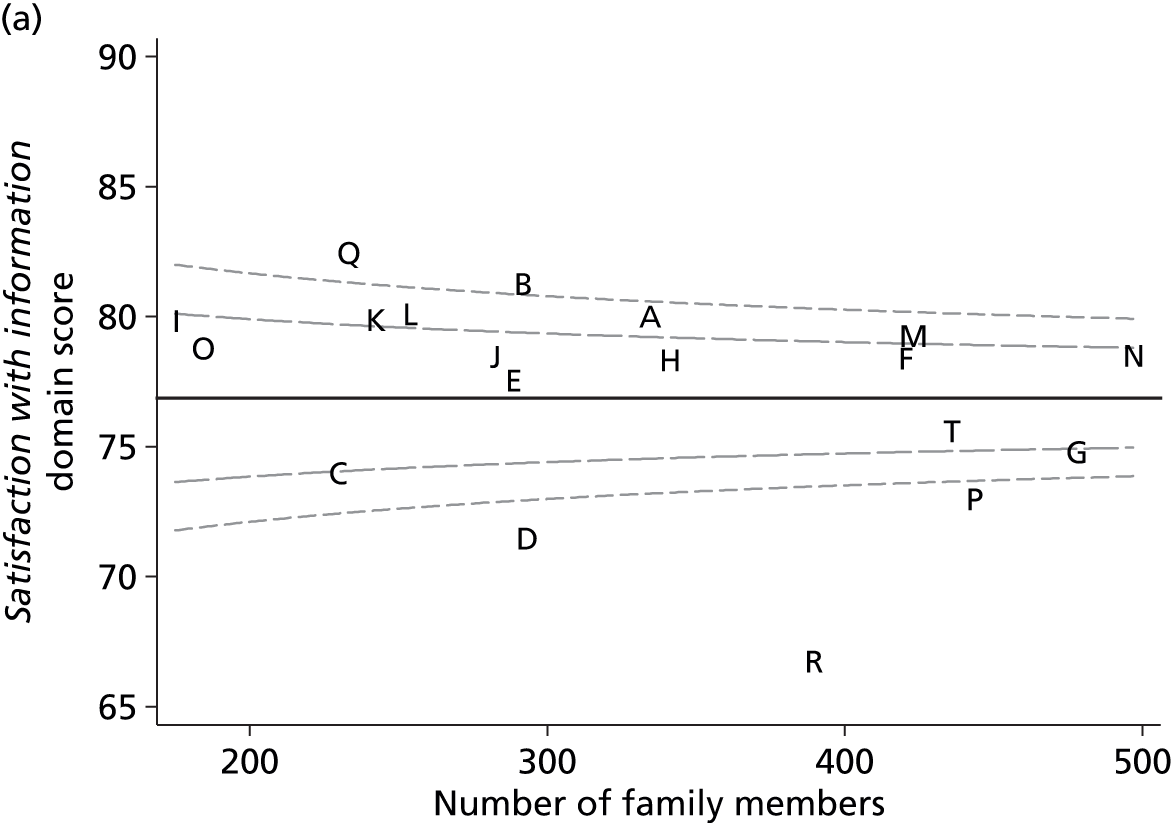

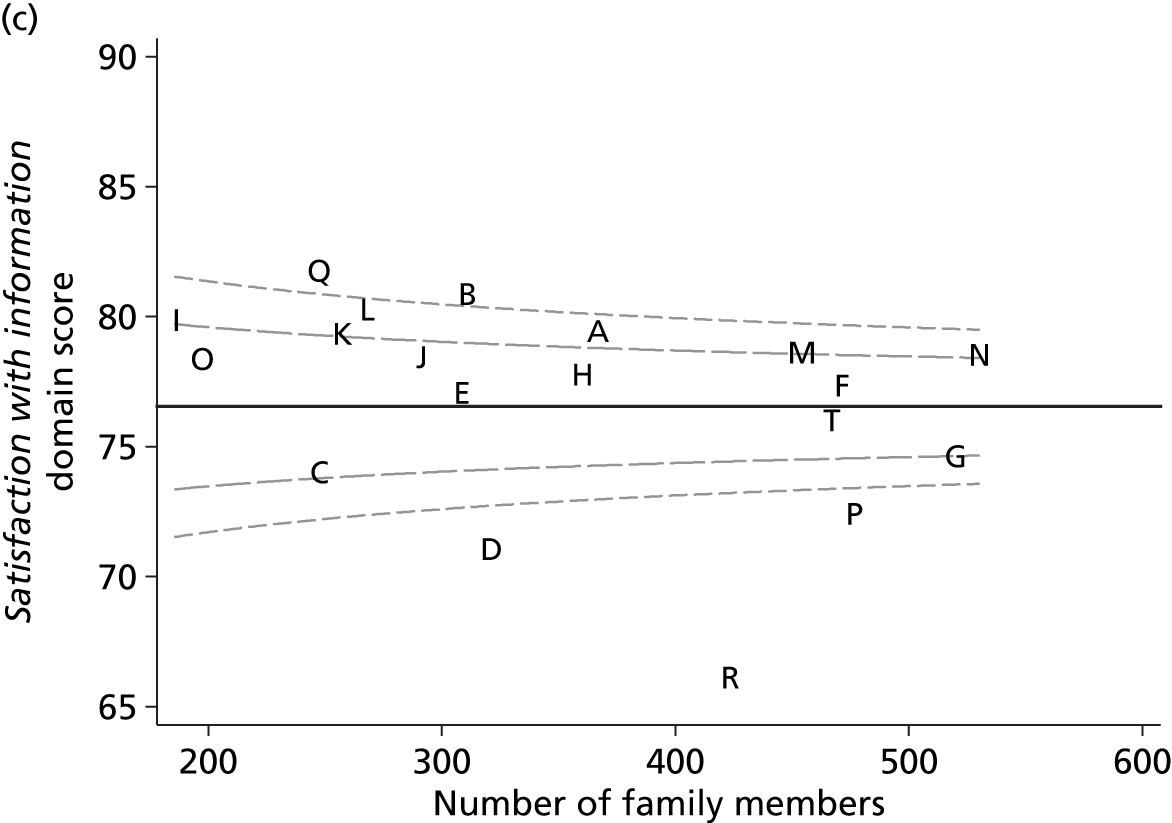

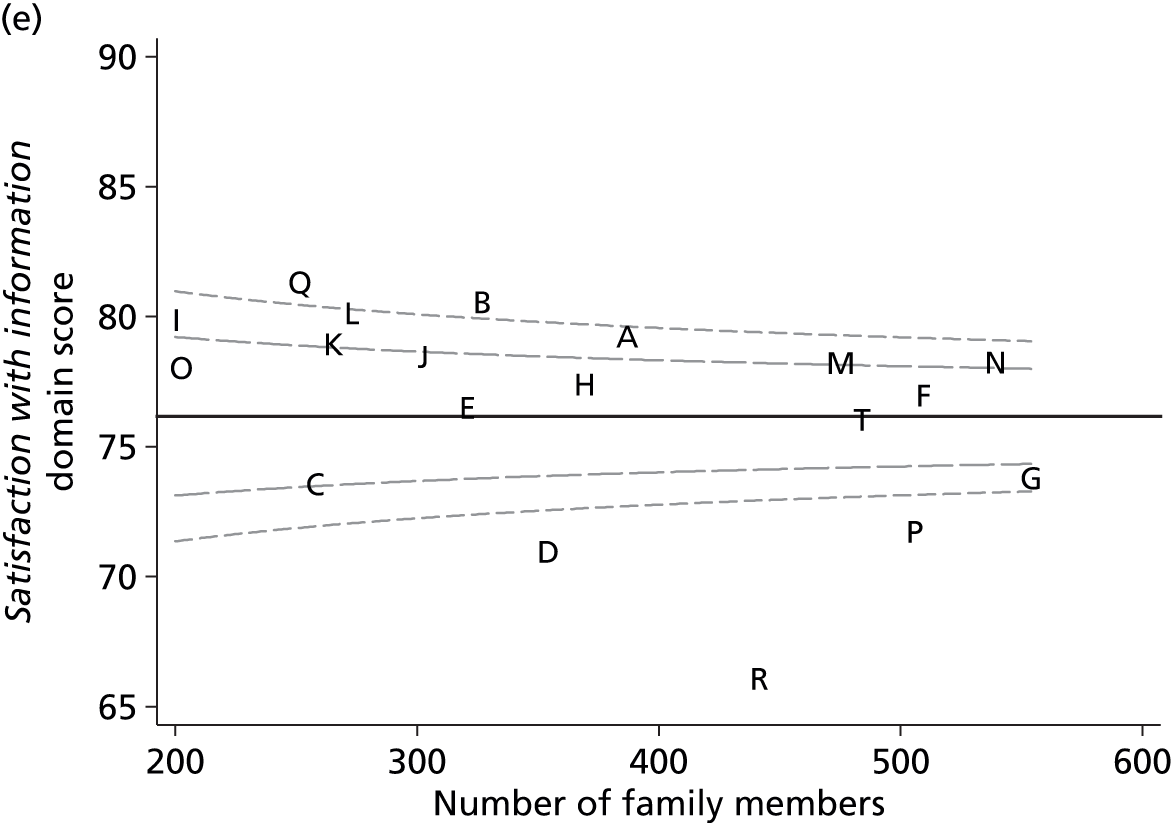

FIGURE 39.
Variation across ICUs in the mean satisfaction with the decision-making process domain score for (a) complete responders (unadjusted); (b) complete responders (adjusted); (c) modified traditional (unadjusted); (d) modified traditional (adjusted); (e) multiple imputation (unadjusted); and (f) multiple imputation (adjusted).

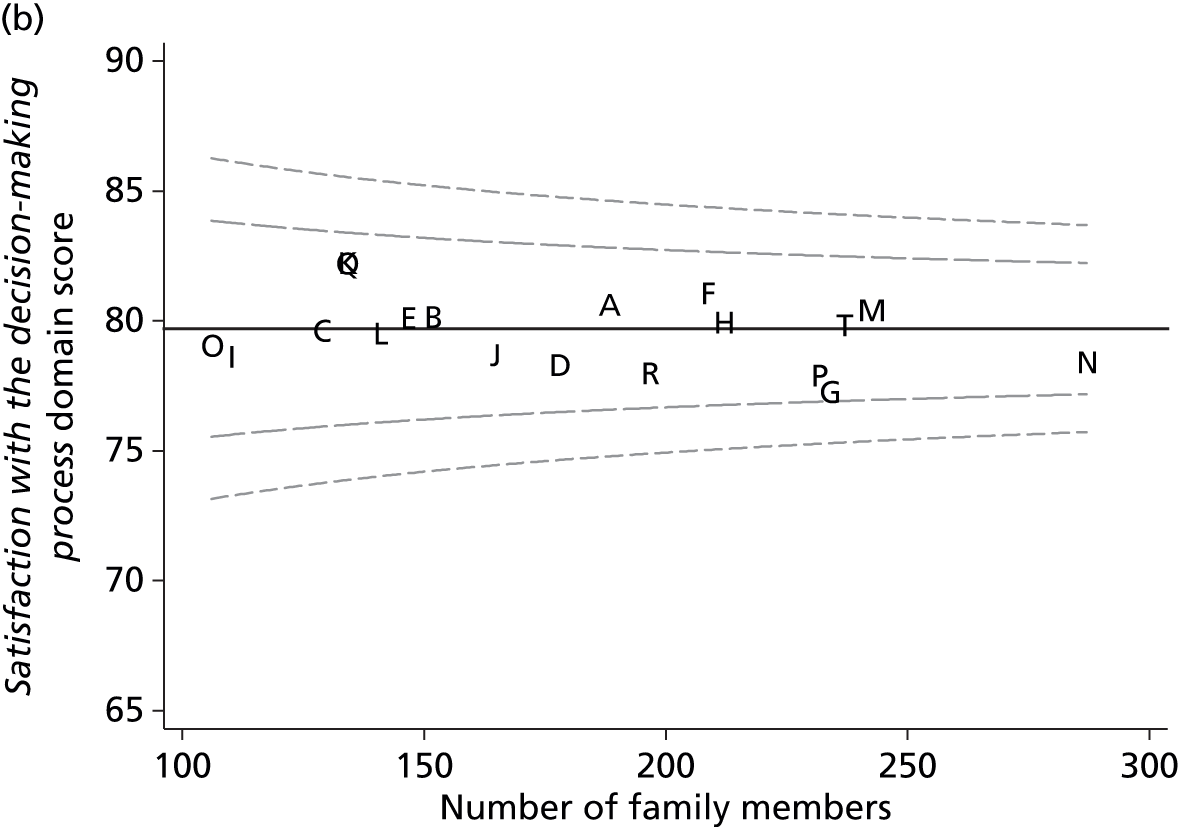
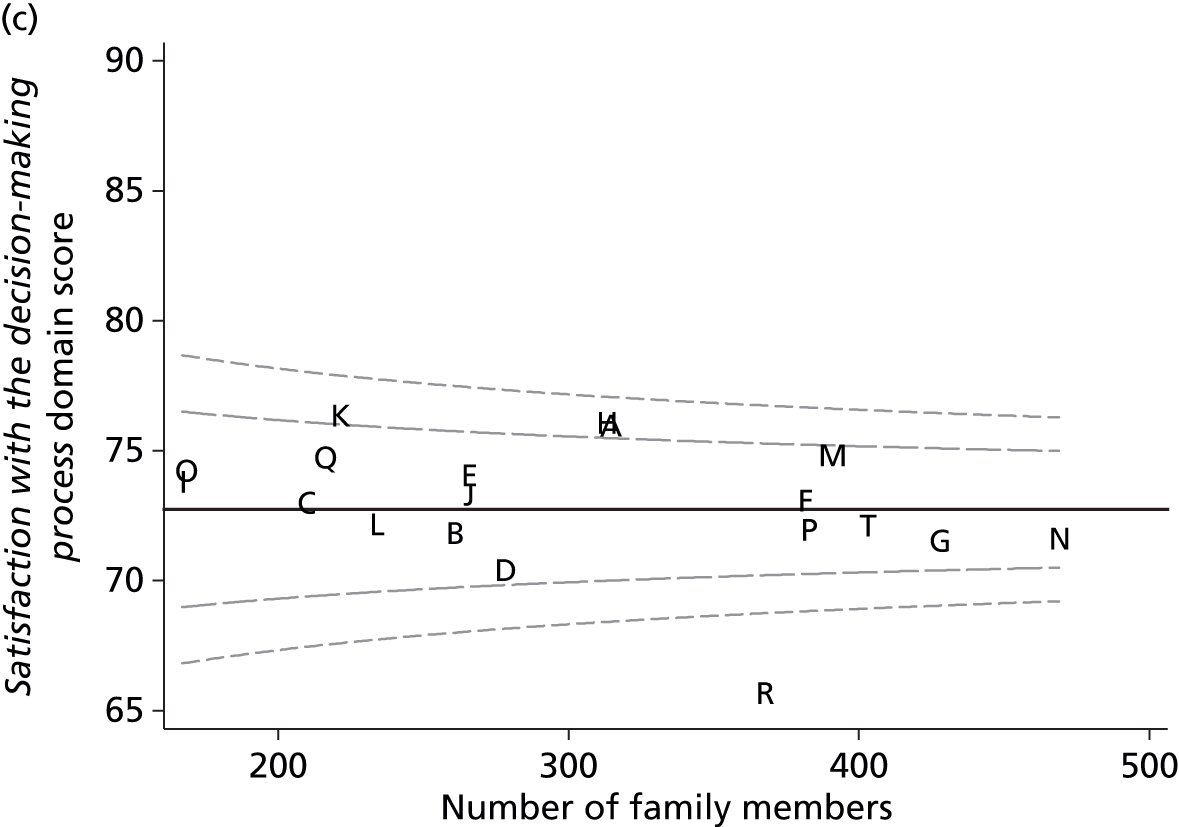
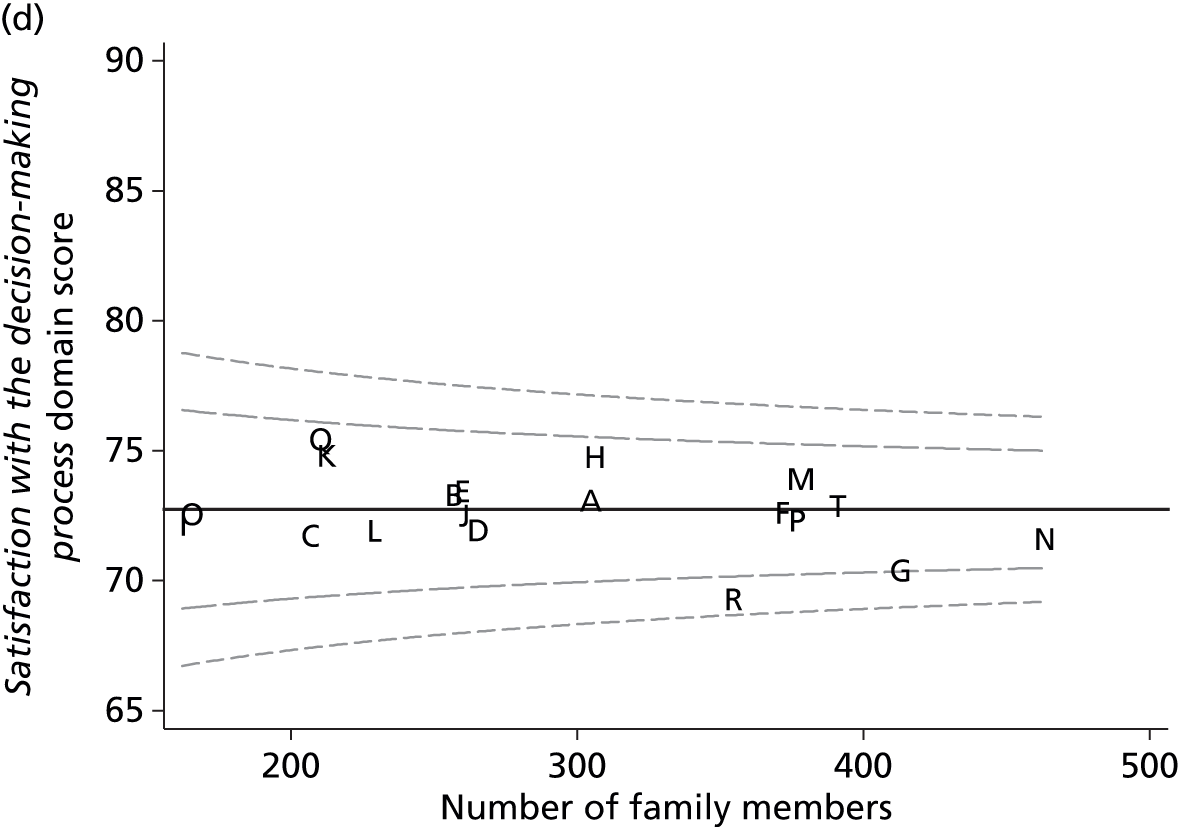
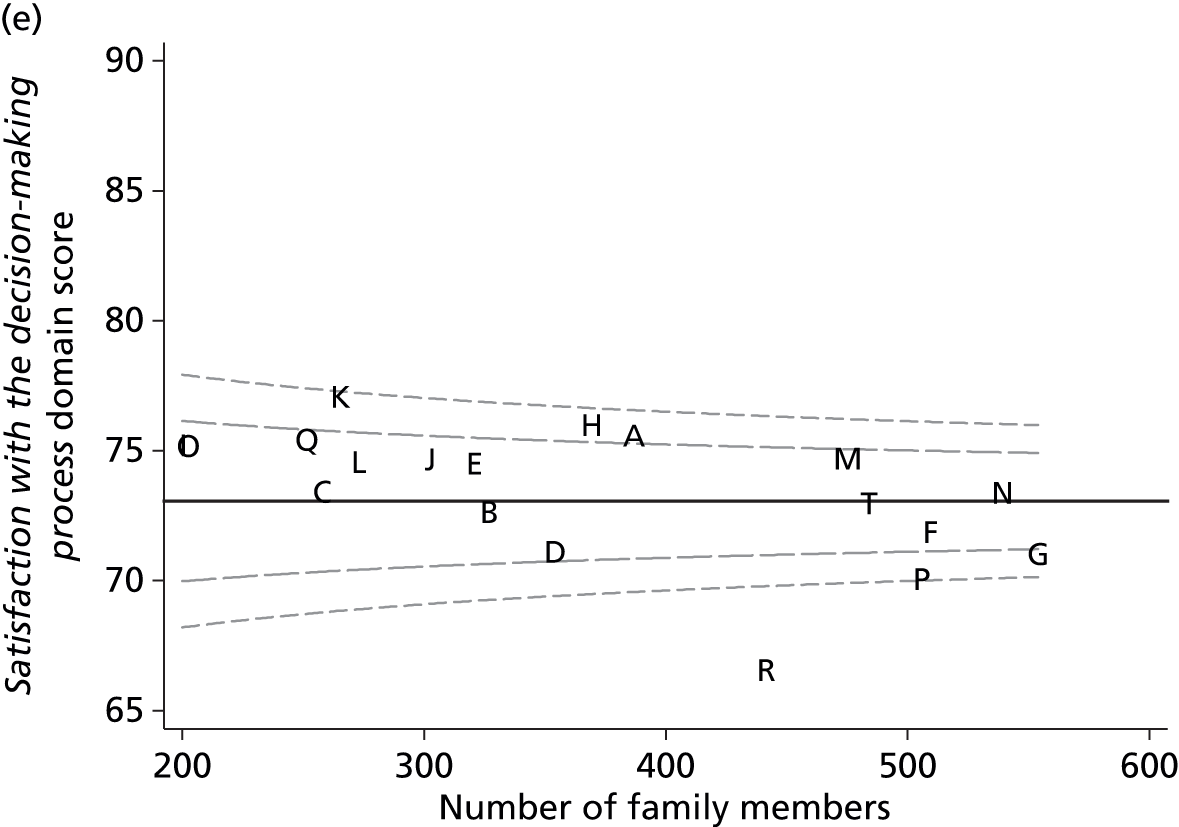

Table 58 summarises the number and percentage of ICUs within each funnel plot that are within the control limits (‘in control’), above the upper 2-SD control limit (i.e. have higher than average satisfaction) and below the lower 2-SD control limit (i.e. have lower than average satisfaction). On average, the multiple imputation approach tended to identify larger numbers of potential outliers because the larger sample sizes led to narrower funnels. Adjusting for family member and patient characteristics reduced the variability across ICUs, resulting in fewer ICUs outside the funnel plot control limits, particularly at the upper end.
| Position | Complete responders | Modified traditional | Multiple imputation | |||
|---|---|---|---|---|---|---|
| Unadjusted | Adjusted | Unadjusted | Adjusted | Unadjusted | Adjusted | |
| Overall family satisfaction score | ||||||
| Above | 5 (26) | 1 (5) | 7 (37) | 2 (11) | 9 (47) | 7 (37) |
| In control | 9 (47) | 14 (74) | 7 (37) | 12 (63) | 5 (26) | 7 (37) |
| Below | 5 (26) | 4 (21) | 5 (26) | 5 (26) | 5 (26) | 5 (26) |
| Satisfaction with care domain score | ||||||
| Above | 5 (26) | 2 (11) | 8 (42) | 4 (21) | 8 (42) | 6 (32) |
| In control | 9 (47) | 12 (63) | 6 (32) | 10 (53) | 6 (32) | 8 (42) |
| Below | 5 (26) | 5 (26) | 5 (26) | 5 (26) | 5 (26) | 5 (26) |
| Satisfaction with decision-making domain score | ||||||
| Above | 4 (21) | 1 (5) | 5 (26) | 2 (11) | 6 (32) | 1 (5) |
| In control | 12 (63) | 14 (74) | 11 (58) | 13 (68) | 9 (47) | 14 (74) |
| Below | 3 (16) | 4 (21) | 3 (16) | 4 (21) | 4 (21) | 4 (21) |
| Satisfaction with information domain score | ||||||
| Above | 6 (32) | 2 (11) | 7 (37) | 2 (11) | 7 (37) | 2 (11) |
| In control | 8 (42) | 12 (63) | 8 (42) | 13 (68) | 8 (42) | 13 (68) |
| Below | 5 (26) | 5 (26) | 4 (21) | 4 (21) | 4 (21) | 4 (21) |
| Satisfaction with the decision-making process domain score | ||||||
| Above | 3 (16) | 0 (0) | 3 (16) | 0 (0) | 3 (16) | 0 (0) |
| In control | 14 (74) | 19 (100) | 15 (79) | 18 (95) | 13 (68) | 16 (84) |
| Below | 2 (11) | 0 (0) | 1 (5) | 1 (5) | 3 (16) | 3 (16) |
Discussion
Funnel plots of the overall family satisfaction score and domain scores confirmed that there was significant variation in family satisfaction across the ICUs participating in the FREE study. The same ICUs tended to be identified as potential outliers, both across the alternative scores and across the alternative methods. The multiple imputation approach had greater power to identify potentially outlying ICUs due to regaining information through the imputation. Adjusting for family member and patient characteristics using the FREE study multilevel multivariable models reduced the variation across ICUs and resulted in fewer ICUs being identified as potential outliers. Adjustment is, therefore, important to avoid falsely identifying ICUs as outliers as a result of characteristics of the patients or their family members.
Chapter 9 Simulation study of alternative sampling frames for roll-out of family satisfaction surveys into routine practice in the NHS
Introduction
The aim of this chapter is to evaluate, through simulations based on the FREE study data set, alternative sampling frames for selecting family members to survey in any future roll-out of family satisfaction surveys into routine practice in adult general intensive care in the NHS.
Methods
Selection of data
The data used for these analyses were the same as those used in Chapter 7.
Statistical analysis
A number of different approaches to sampling family members were defined, based on varying the duration of recruitment, the patient’s ICU length of stay and which family member to recruit, and these sampling frames were applied to the FREE study data set to obtain simulated results of applying each approach in routine practice.
All sampling frames considered involved recruiting a single family member for each patient; as a significant proportion of variation was found at the patient level in the multilevel models, this is a more efficient approach. The criteria included within the sampling frames were based on the earlier findings of the FREE study: first, that family members of patients with a longer ICU length of stay were more likely to be successfully recruited and, second, that next of kin were more likely to respond than other family members. Although other family member characteristics, for example age and sex, were also associated with response rates, it would be inappropriate to target family members according to these characteristics.
The sampling frames (Table 59) consisted of each combination of the following: a duration of recruitment of either 4 weeks or 6 weeks (based on the date of the patient’s discharge or death) or each ICU recruiting until 40 family members had been recruited; recruiting family members of patients who stayed either 24 hours or 48 hours; recruiting the patients’ nominated next of kin or recruiting the first family member to visit the patient. As no significant seasonality was identified in Chapter 6, time of year of the survey was not considered as a factor in the sampling frames, but rather four alternative start dates were selected (the second Monday of each alternate month from September 2013 to March 2014) and results for each approach were averaged across the four resulting simulations. For each sampling frame, it was assumed that data entry of questionnaires would end 12 weeks after the final family member was recruited (i.e. allowing 9 weeks from the first questionnaire being sent).
| Approach | Characteristics of sampling frame | ||
|---|---|---|---|
| Duration | Patient | Family member | |
| 1 | 4 weeks | ICU stay ≥ 24 hours | Next of kin |
| 2 | 6 weeks | ICU stay ≥ 24 hours | Next of kin |
| 3 | Until 40 family members | ICU stay ≥ 24 hours | Next of kin |
| 4 | 4 weeks | ICU stay ≥ 48 hours | Next of kin |
| 5 | 6 weeks | ICU stay ≥ 48 hours | Next of kin |
| 6 | Until 40 family members | ICU stay ≥ 48 hours | Next of kin |
| 7 | 4 weeks | ICU stay ≥ 24 hours | First family member |
| 8 | 6 weeks | ICU stay ≥ 24 hours | First family member |
| 9 | Until 40 family members | ICU stay ≥ 24 hours | First family member |
| 10 | 4 weeks | ICU stay ≥ 48 hours | First family member |
| 11 | 6 weeks | ICU stay ≥ 48 hours | First family member |
| 12 | Until 40 family members | ICU stay ≥ 48 hours | First family member |
Within each simulation, the overall family satisfaction score and domain scores were calculated using the modified traditional approach (based on responders who had completed at least 60% of items). The resulting scores were adjusted for the characteristics of the patients and recruited family members using the FREE study multilevel multivariable models.
Results
Recruiting for only 4 weeks (approaches 1, 4, 7 and 10) resulted in mean sample sizes (of returned questionnaires) ranging from 12 to 14 (Table 60). For some smaller ICUs, the sample with these approaches was as low as five family members, which would probably be too small to calculate reliable averages. With a 6-week recruitment window (approaches 2, 5, 8 and 11), the sample size was, as expected, approximately 50% higher. Alternatively, if each ICU continued to recruit until 40 family members were recruited (approaches 3, 6, 9 and 12), then the sample sizes were, on average, larger (mean 25–26) and also less variable across ICUs (SD 2–3). The cost of this was that recruitment periods were both longer (mean 57–70 days) and more variable (SD 24–29 days) across ICUs.
| Approach | Duration of recruitment (days), mean (SD) | Number of eligible patients per site, mean (SD) | Number of family members recruited per site, mean (SD) | Number of family members returning questionnaires per site, mean (SD) |
|---|---|---|---|---|
| 1 | 28 (0) | 49 (25) | 22 (10) | 14 (5) |
| 2 | 42 (0) | 73 (37) | 33 (14) | 21 (8) |
| 3 | 62 (25) | 90 (16) | 40 (0) | 26 (2) |
| 4 | 28 (0) | 34 (18) | 19 (9) | 12 (5) |
| 5 | 42 (0) | 51 (26) | 28 (13) | 18 (7) |
| 6 | 70 (29) | 71 (10) | 40 (0.6)a | 25 (3) |
| 7 | 28 (0) | 49 (25) | 23 (10) | 14 (5) |
| 8 | 42 (0) | 73 (37) | 35 (15) | 22 (8) |
| 9 | 57 (24) | 84 (15) | 40 (0) | 25 (3) |
| 10 | 28 (0) | 34 (18) | 20 (9) | 12 (5) |
| 11 | 42 (0) | 51 (26) | 30 (13) | 19 (7) |
| 12 | 66 (28) | 66 (10) | 40 (0.3)a | 25 (3) |
Recruiting next of kin (approaches 1–6), compared with recruiting the first family member to visit the patient (approaches 7–12), resulted in slightly lower recruitment rates (as some patients did not have a next of kin identified) but higher response rates (Table 61). Recruiting family members of only patients who stayed at least 48 hours in the ICU (approaches 4–6 and 10–12), compared with recruiting family members of patients who stayed 24 hours (approaches 1–3 and 7–9), resulted in higher recruitment rates and similar response rates (see Table 61) but lower overall sample sizes for the fixed-duration approaches (see Table 60).
| Approach | Recruitment rate, mean (SD)a | Follow-up rate, mean (SD)b |
|---|---|---|
| 1 | 45.9 (9.6) | 65.0 (7.1) |
| 2 | 45.9 (8.0) | 65.4 (6.2) |
| 3 | 46.7 (7.4) | 64.3 (5.7) |
| 4 | 57.7 (9.7) | 64.3 (7.8) |
| 5 | 57.6 (8.5) | 65.0 (6.6) |
| 6 | 57.7 (7.2) | 63.9 (6.4) |
| 7 | 49.3 (9.8) | 62.1 (6.5) |
| 8 | 49.3 (8.3) | 63.4 (6.2) |
| 9 | 50.0 (7.8) | 62.2 (6.6) |
| 10 | 61.6 (9.5) | 61.1 (6.8) |
| 11 | 61.7 (8.1) | 62.8 (6.4) |
| 12 | 62.3 (7.9) | 62.0 (6.5) |
As compared with the reference values from the full FREE study data set after applying multiple imputation, the unadjusted overall and domain scores (Table 62) tended to be overestimated by all approaches to sampling, except for the satisfaction with the decision-making process domain score, which was slightly underestimated by most approaches. Adjustment using the multivariable, multilevel model, developed in Chapter 7, resulted in estimates that were closer to the reference values (Table 63). The average precision of the estimates (reflected by the mean value across ICUs of the standard error of the ICU-specific estimates) improved as sample sizes increased and the variability in the precision (SD across ICUs of the standard error) was lower for approaches with a similar sample size in each ICU. Individual ICU estimates for the overall family satisfaction score and domain scores against the reference values are shown in Figures 40–44.
| Approach | Overall family satisfaction score, mean (SD) | Satisfaction with care domain score, mean (SD) | Satisfaction with decision-making domain score, mean (SD) | Satisfaction with information domain score, mean (SD) | Satisfaction with the decision-making process domain score, mean (SD) | |||||
|---|---|---|---|---|---|---|---|---|---|---|
| Mean | SE | Mean | SE | Mean | SE | Mean | SE | Mean | SE | |
| Referencea | 79.7 (2.7) | – | 83.2 (2.8) | – | 74.9 (2.5) | – | 76.2 (3.1) | – | 73.0 (1.7) | – |
| 1 | 81.3 (3.4) | 4.4 (1.0) | 84.7 (3.2) | 4.1 (1.1) | 75.8 (4.2) | 5.8 (1.1) | 77.2 (4.9) | 5.9 (1.2) | 72.4 (4.3) | 7.7 (1.5) |
| 2 | 81.3 (3.0) | 3.7 (0.6) | 84.6 (3.1) | 3.4 (0.7) | 76.0 (3.3) | 4.8 (0.8) | 77.5 (4.1) | 4.9 (0.8) | 72.3 (3.3) | 6.2 (1.4) |
| 3 | 81.0 (3.0) | 3.2 (0.4) | 84.5 (3.0) | 3.0 (0.5) | 75.7 (3.5) | 4.1 (0.5) | 77.1 (4.1) | 4.2 (0.5) | 72.0 (3.4) | 5.3 (0.5) |
| 4 | 81.2 (3.4) | 4.8 (1.1) | 84.8 (3.3) | 4.4 (1.2) | 75.7 (4.1) | 6.3 (1.4) | 77.2 (4.7) | 6.4 (1.5) | 72.0 (4.3) | 8.4 (2.0) |
| 5 | 81.3 (3.0) | 4.0 (0.7) | 84.6 (3.1) | 3.7 (0.7) | 76.0 (3.3) | 5.2 (1.0) | 77.5 (4.2) | 5.3 (0.9) | 72.2 (3.2) | 6.7 (1.8) |
| 6 | 81.0 (2.9) | 3.2 (0.4) | 84.5 (2.8) | 3.0 (0.4) | 75.8 (3.3) | 4.1 (0.5) | 77.3 (3.9) | 4.3 (0.5) | 71.9 (2.8) | 5.3 (0.7) |
| 7 | 81.2 (3.4) | 4.8 (1.6) | 84.3 (3.3) | 4.3 (1.1) | 76.1 (4.0) | 6.0 (2.0) | 77.3 (5.1) | 6.2 (1.9) | 73.3 (3.4) | 7.8 (2.4) |
| 8 | 81.0 (2.9) | 3.8 (0.7) | 84.0 (3.2) | 3.5 (0.7) | 75.9 (3.0) | 4.8 (0.9) | 77.2 (4.1) | 4.9 (0.9) | 72.5 (2.8) | 6.1 (1.2) |
| 9 | 80.8 (2.9) | 3.3 (0.5) | 83.9 (3.1) | 3.1 (0.5) | 75.7 (3.2) | 4.2 (0.5) | 76.9 (4.0) | 4.4 (0.6) | 72.2 (3.0) | 5.4 (0.5) |
| 10 | 81.3 (3.4) | 5.1 (1.8) | 84.4 (3.4) | 4.7 (1.3) | 76.2 (4.0) | 6.5 (2.2) | 77.6 (5.0) | 6.6 (2.1) | 73.1 (3.8) | 8.4 (3.0) |
| 11 | 81.0 (3.0) | 4.0 (0.9) | 84.0 (3.4) | 3.8 (0.9) | 76.0 (3.2) | 5.1 (1.1) | 77.4 (4.2) | 5.3 (1.1) | 72.5 (3.0) | 6.6 (1.4) |
| 12 | 80.8 (2.9) | 3.3 (0.4) | 83.9 (3.2) | 3.1 (0.5) | 75.7 (3.1) | 4.2 (0.5) | 77.1 (3.8) | 4.4 (0.5) | 72.0 (2.9) | 5.4 (0.6) |
| Approach | Overall family satisfaction score, mean (SD) | Satisfaction with care domain score, mean (SD) | Satisfaction with decision-making domain score, mean (SD) | Satisfaction with information domain score, mean (SD) | Satisfaction with the decision-making process domain score, mean (SD) | |||||
|---|---|---|---|---|---|---|---|---|---|---|
| Mean | SE | Mean | SE | Mean | SE | Mean | SE | Mean | SE | |
| Referencea | 79.7 (2.7) | – | 83.2 (2.8) | – | 74.9 (2.5) | – | 76.2 (3.1) | – | 73.0 (1.7) | – |
| 1 | 80.3 (3.3) | 4.5 (1.0) | 83.6 (3.0) | 4.2 (1.0) | 75.1 (4.0) | 5.8 (1.2) | 76.3 (4.6) | 6.0 (1.3) | 71.9 (4.1) | 7.6 (1.5) |
| 2 | 80.2 (2.7) | 3.8 (0.7) | 83.4 (2.8) | 3.5 (0.7) | 75.1 (3.0) | 4.8 (0.9) | 76.5 (3.8) | 5.0 (0.9) | 71.6 (3.2) | 6.2 (1.4) |
| 3 | 80.0 (2.9) | 3.2 (0.4) | 83.3 (2.8) | 3.0 (0.5) | 74.9 (3.4) | 4.1 (0.5) | 76.2 (3.8) | 4.3 (0.5) | 71.4 (3.5) | 5.2 (0.5) |
| 4 | 80.1 (3.4) | 4.9 (1.1) | 83.5 (3.3) | 4.5 (1.1) | 74.8 (3.9) | 6.4 (1.5) | 76.2 (4.6) | 6.5 (1.5) | 71.2 (4.2) | 8.3 (1.9) |
| 5 | 80.1 (2.8) | 4.0 (0.8) | 83.3 (2.9) | 3.7 (0.7) | 74.9 (3.2) | 5.2 (1.1) | 76.4 (3.9) | 5.4 (1.0) | 71.3 (3.3) | 6.6 (1.8) |
| 6 | 79.8 (2.8) | 3.2 (0.4) | 83.2 (2.7) | 3.0 (0.4) | 74.6 (3.2) | 4.1 (0.5) | 76.0 (3.6) | 4.3 (0.5) | 71.0 (3.1) | 5.3 (0.7) |
| 7 | 80.8 (3.2) | 4.8 (1.6) | 83.7 (3.0) | 4.3 (1.1) | 75.8 (3.9) | 6.0 (2.0) | 77.0 (4.9) | 6.2 (1.9) | 73.0 (3.4) | 7.8 (2.4) |
| 8 | 80.5 (2.8) | 3.8 (0.7) | 83.4 (3.0) | 3.5 (0.7) | 75.5 (3.0) | 4.8 (0.9) | 76.8 (4.0) | 4.9 (0.9) | 72.1 (2.8) | 6.1 (1.2) |
| 9 | 80.3 (2.7) | 3.3 (0.5) | 83.4 (2.9) | 3.1 (0.5) | 75.3 (3.0) | 4.2 (0.5) | 76.6 (3.7) | 4.4 (0.6) | 71.8 (3.1) | 5.4 (0.4) |
| 10 | 80.7 (3.3) | 5.1 (1.8) | 83.7 (3.3) | 4.7 (1.3) | 75.7 (3.9) | 6.5 (2.2) | 77.1 (4.9) | 6.6 (2.1) | 72.5 (3.9) | 8.4 (3.0) |
| 11 | 80.4 (3.0) | 4.0 (0.9) | 83.3 (3.2) | 3.8 (0.9) | 75.4 (3.2) | 5.1 (1.1) | 76.8 (4.2) | 5.3 (1.1) | 71.9 (3.0) | 6.6 (1.4) |
| 12 | 80.2 (2.7) | 3.3 (0.4) | 83.2 (2.9) | 3.1 (0.5) | 75.2 (3.1) | 4.2 (0.5) | 76.6 (3.6) | 4.4 (0.5) | 71.4 (3.1) | 5.4 (0.6) |
FIGURE 40.
Individual ICU estimates of overall family satisfaction score under each sampling frame, compared with the FREE study (reference value). The diagonal line indicates perfect agreement between the observed and reference values.
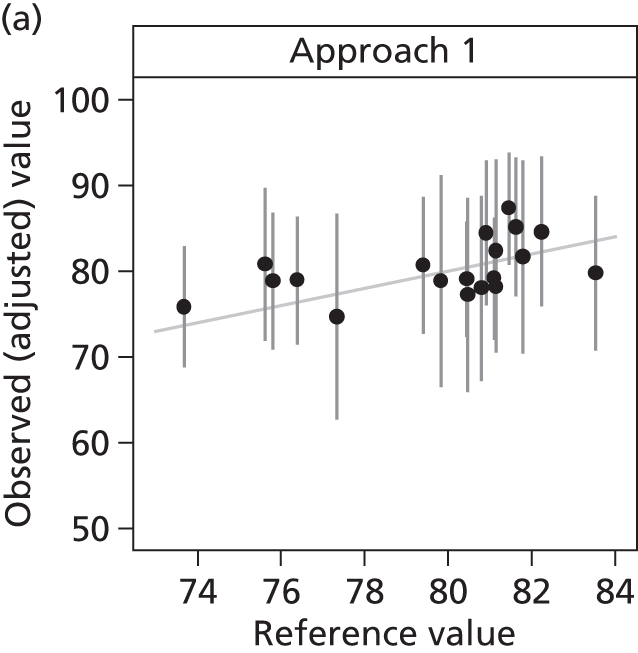
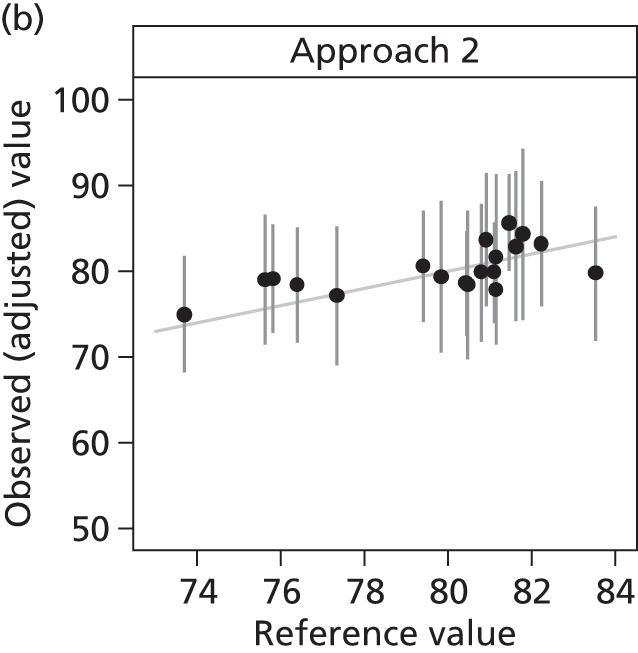
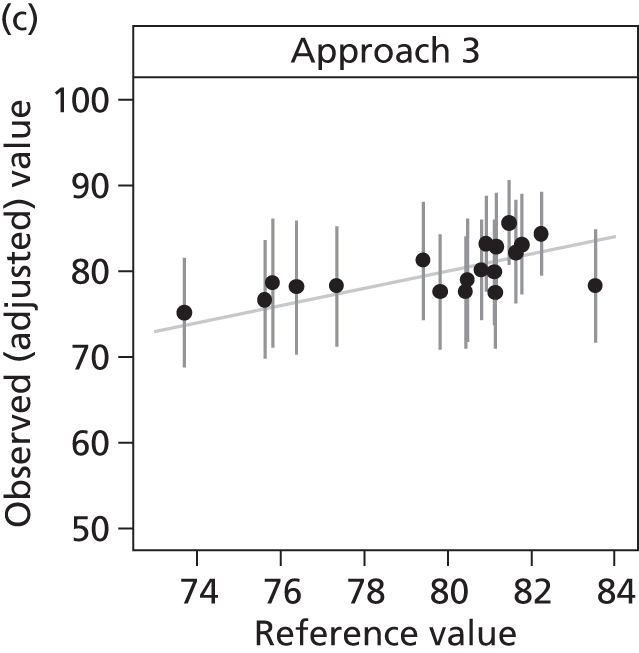
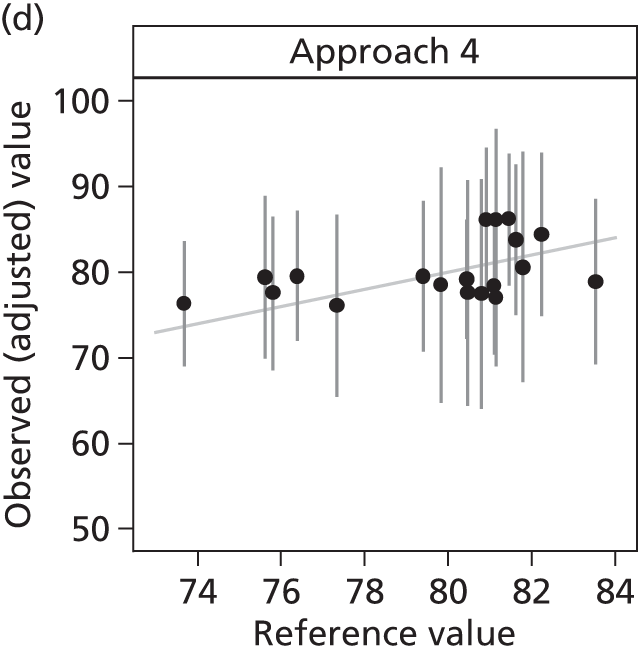
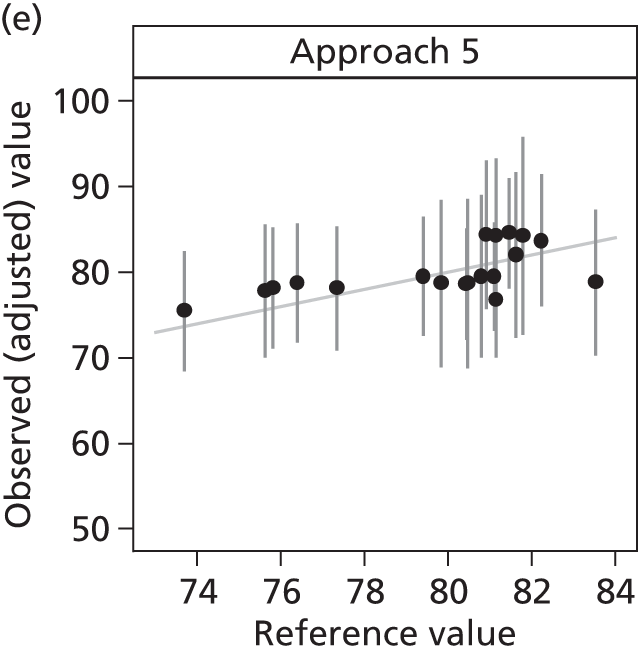
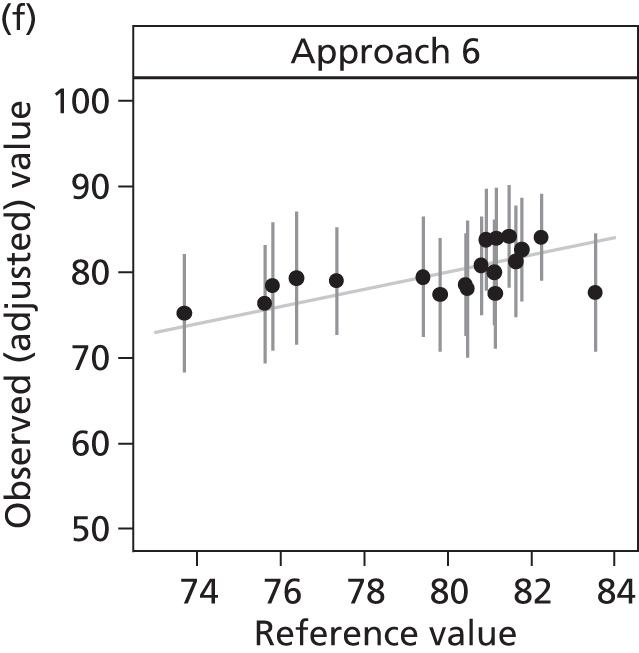

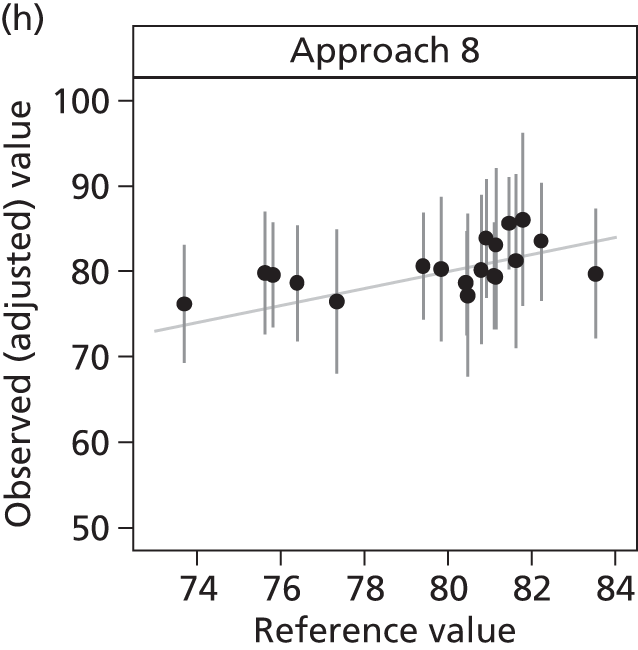
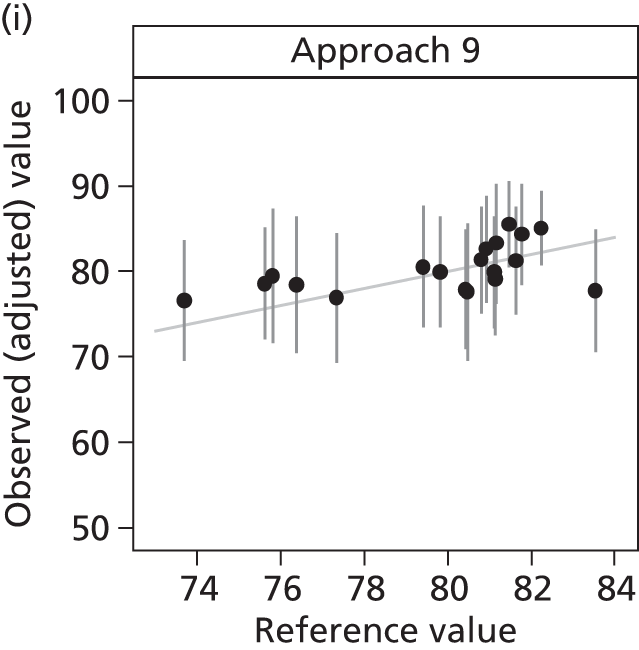
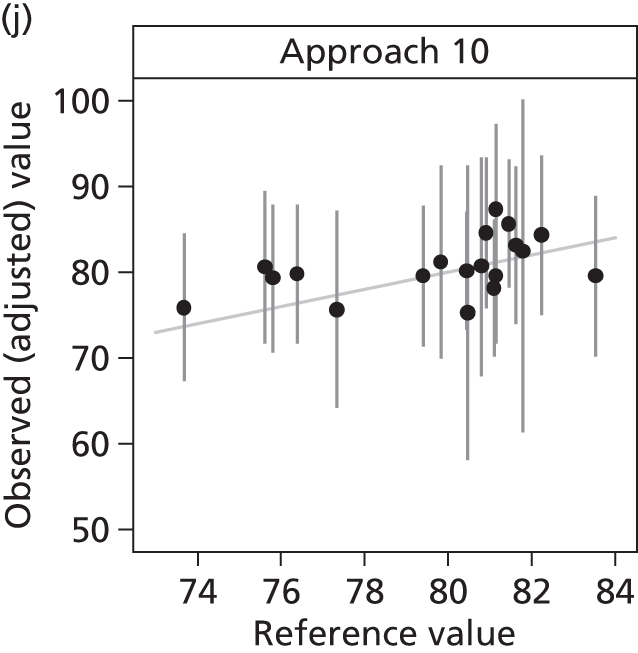
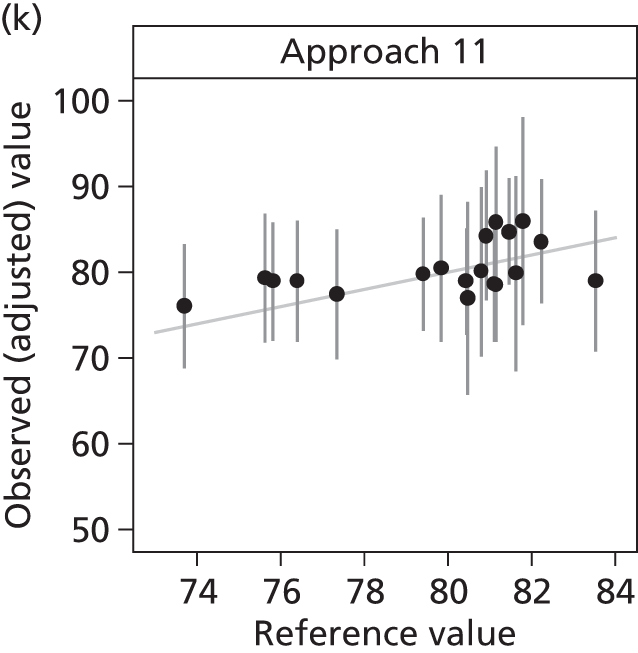
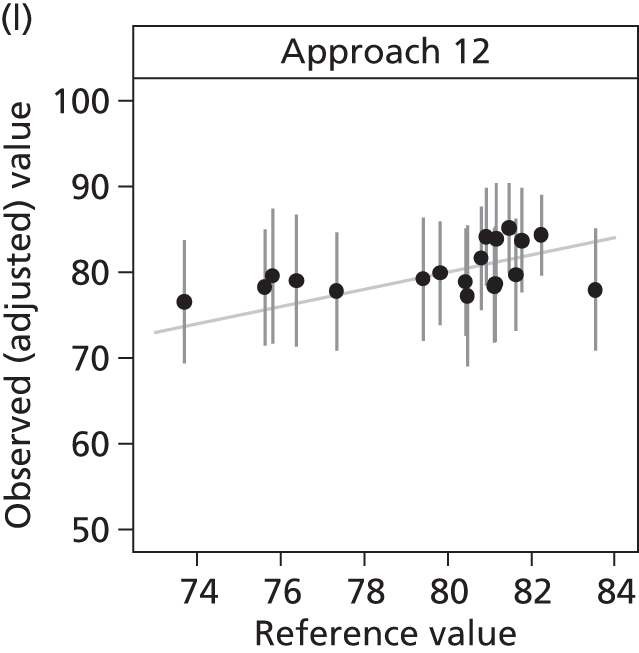
FIGURE 41.
Individual ICU estimates of satisfaction with care domain score under each sampling frame, compared with the FREE study (reference value). The diagonal line indicates perfect agreement between the observed and reference values.
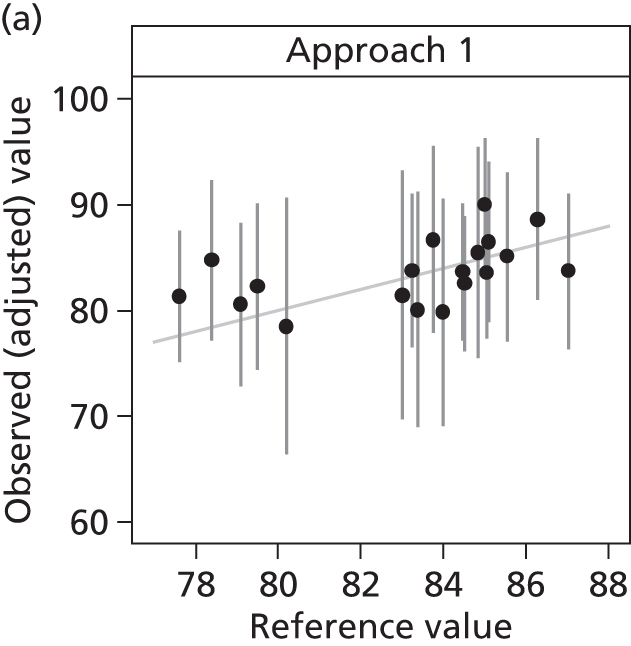
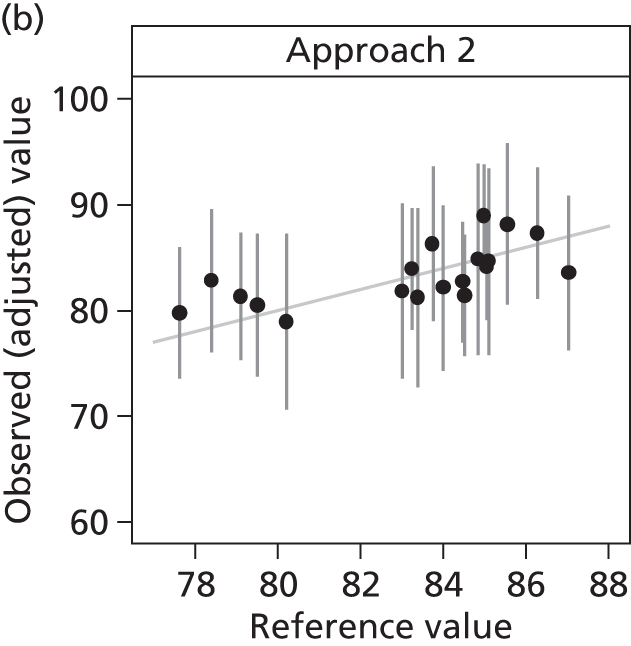
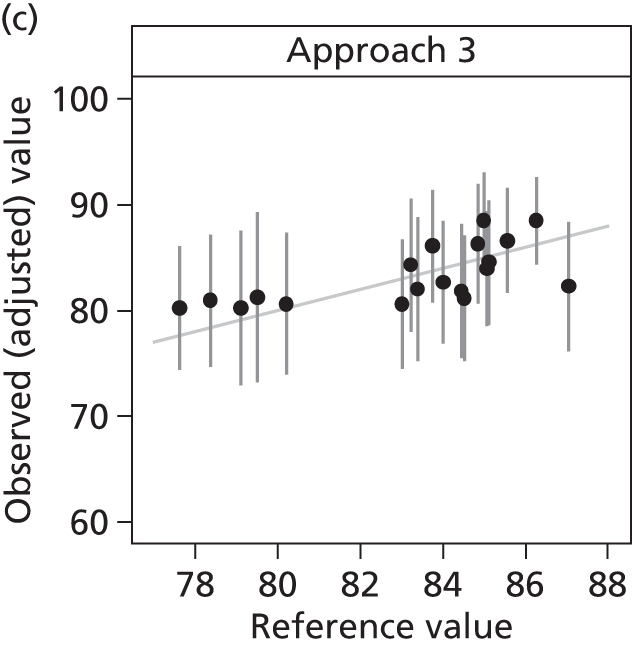
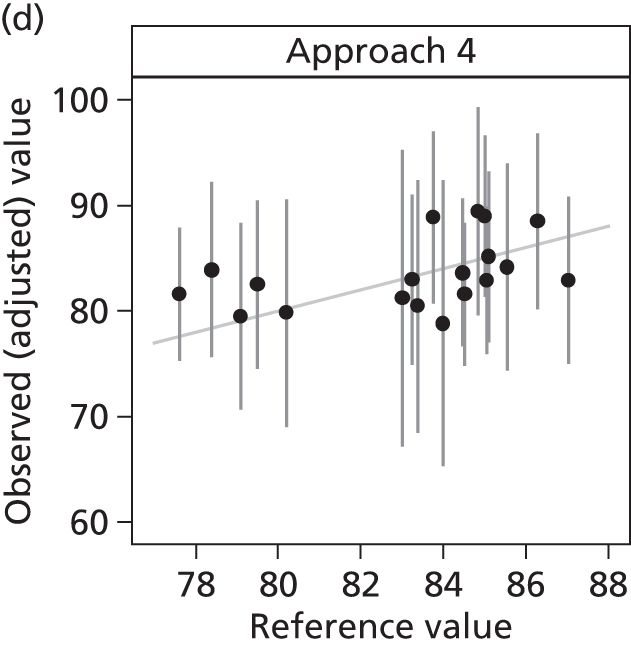
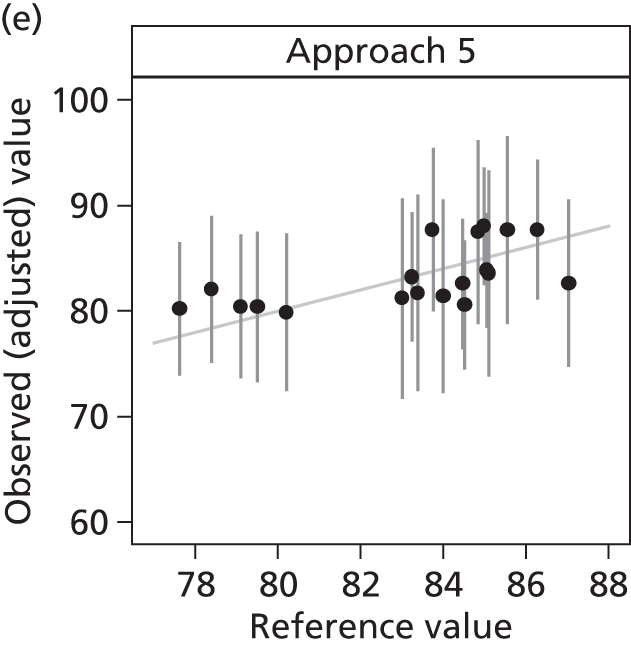
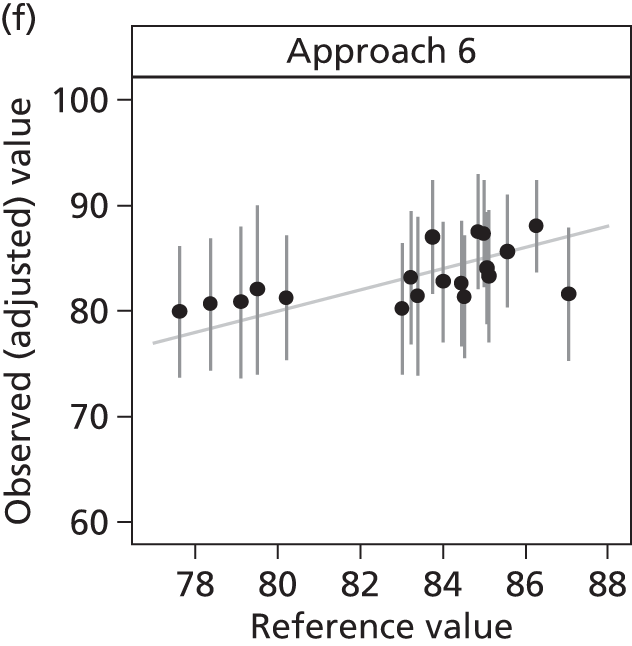

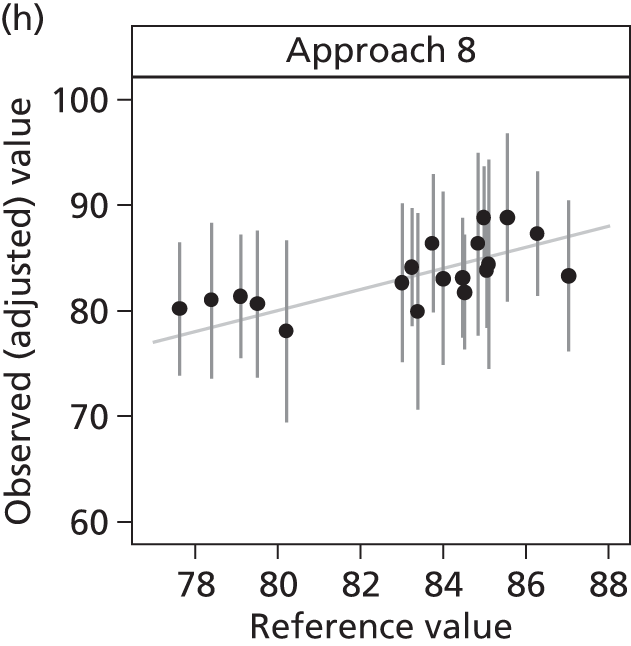
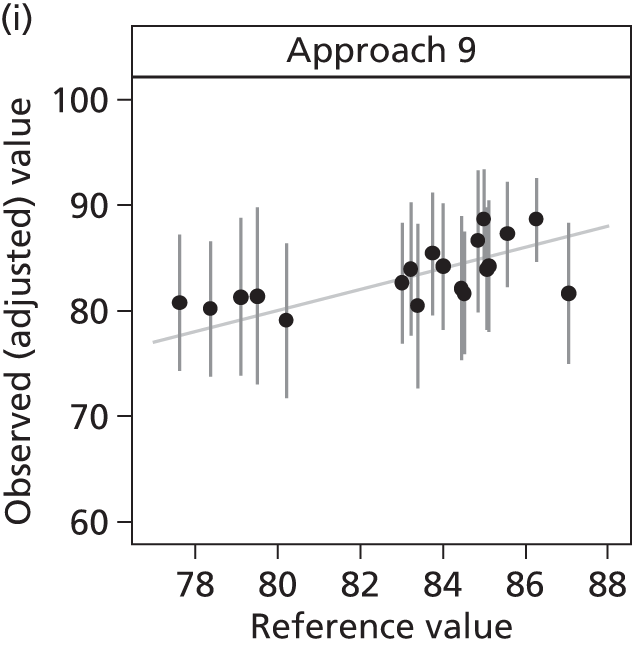
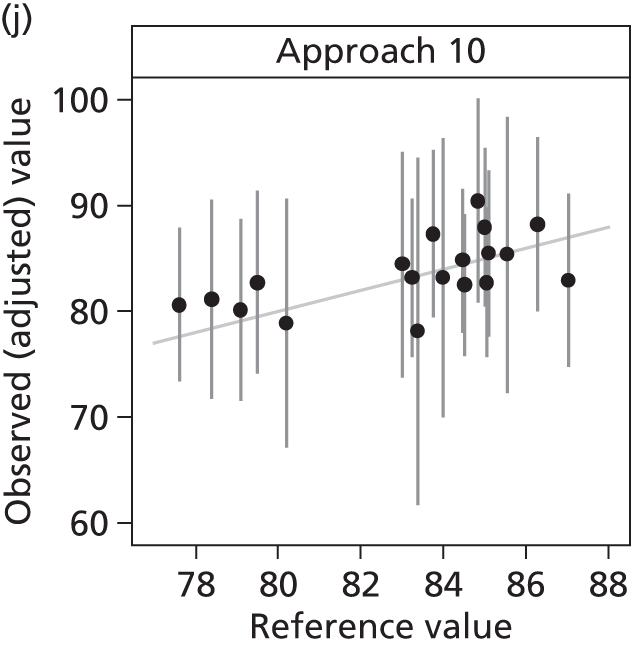
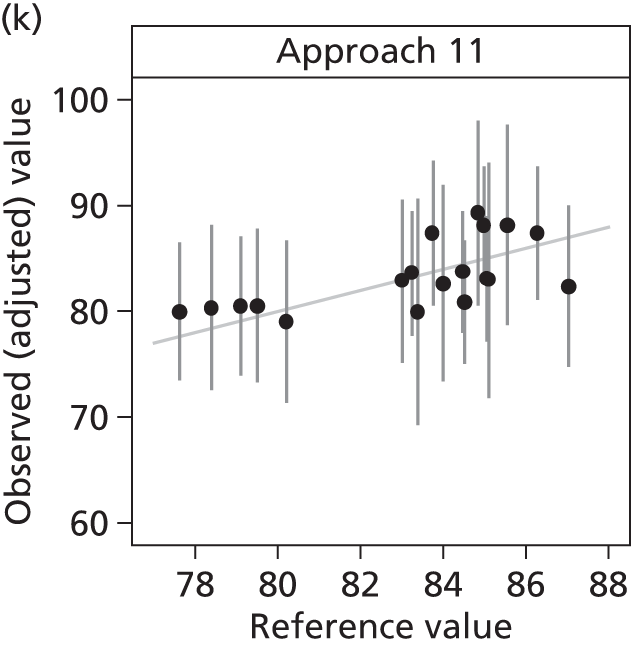
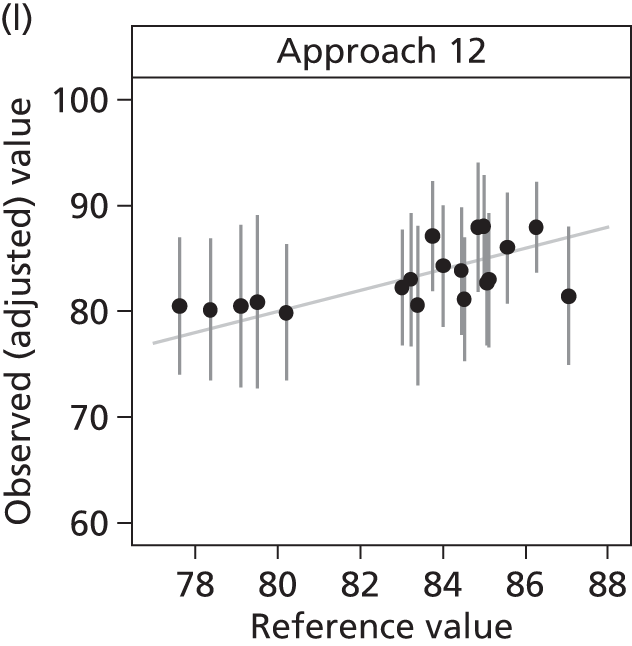
FIGURE 42.
Individual ICU estimates of satisfaction with decision-making domain score under each sampling frame, compared with the FREE study (reference value). The diagonal line indicates perfect agreement between the observed and reference values.
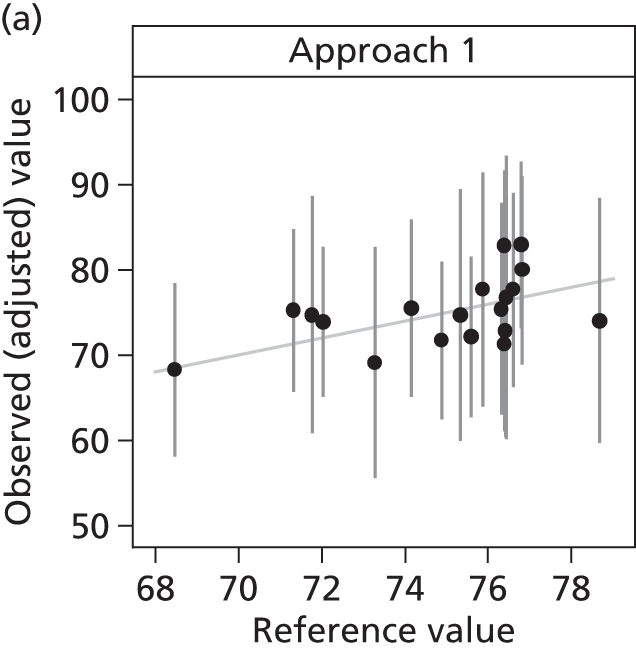

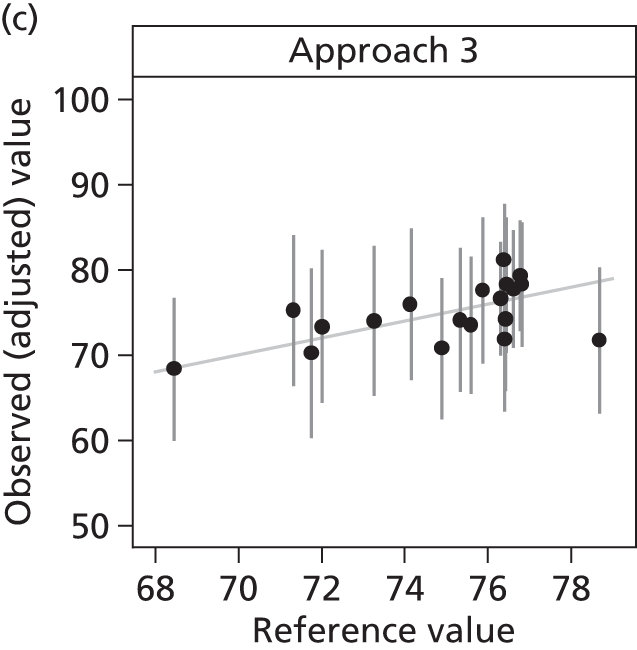
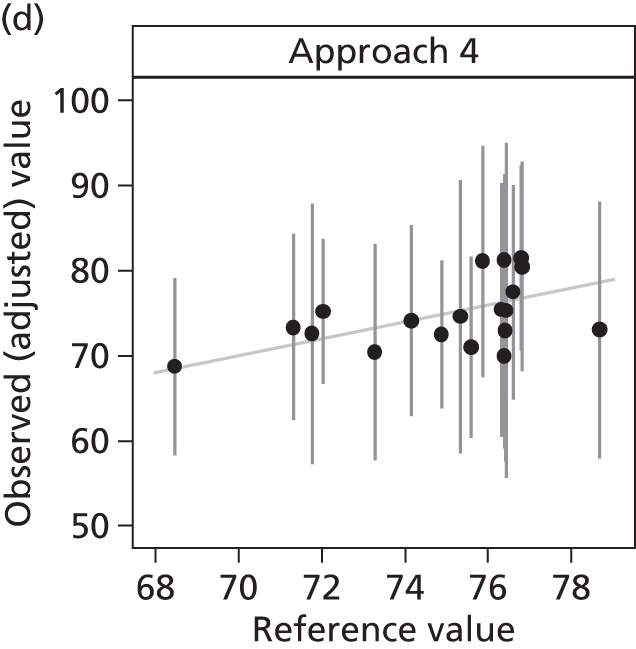
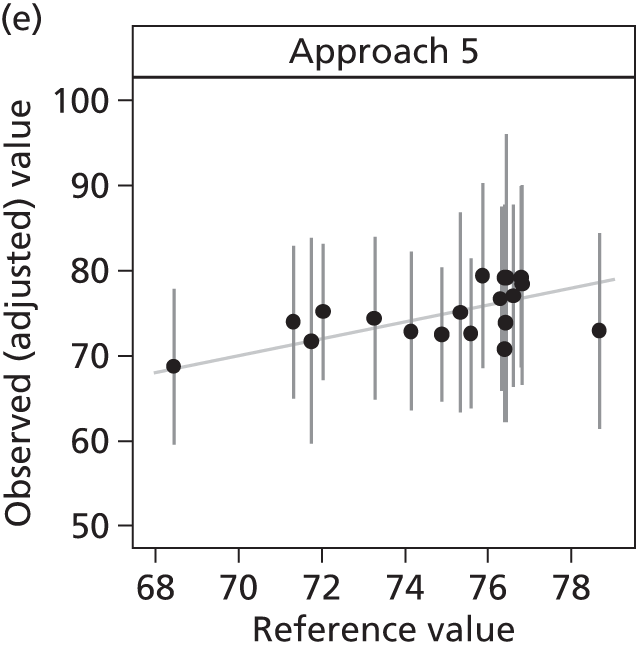
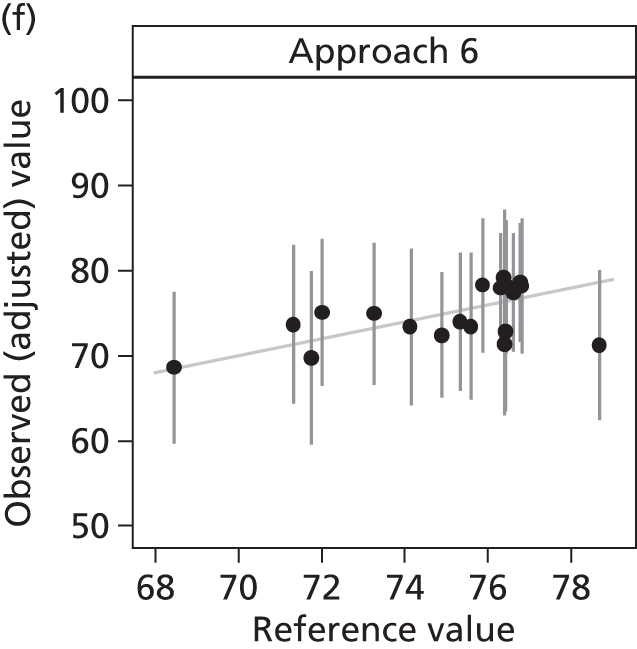

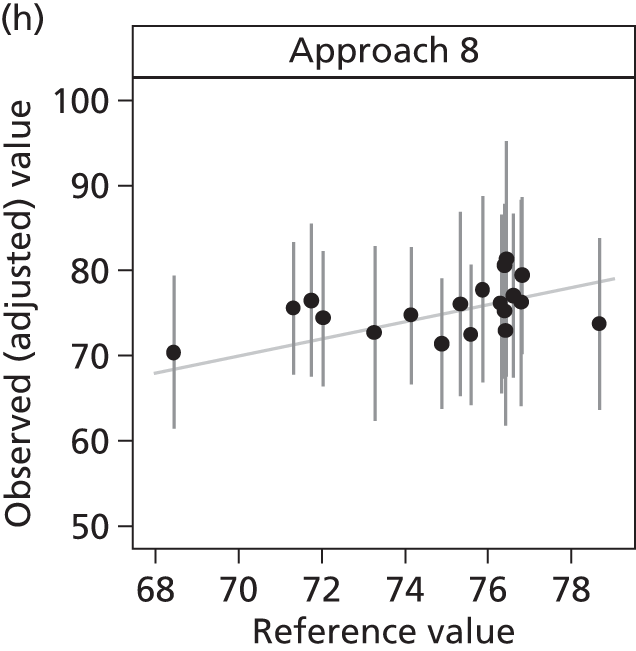
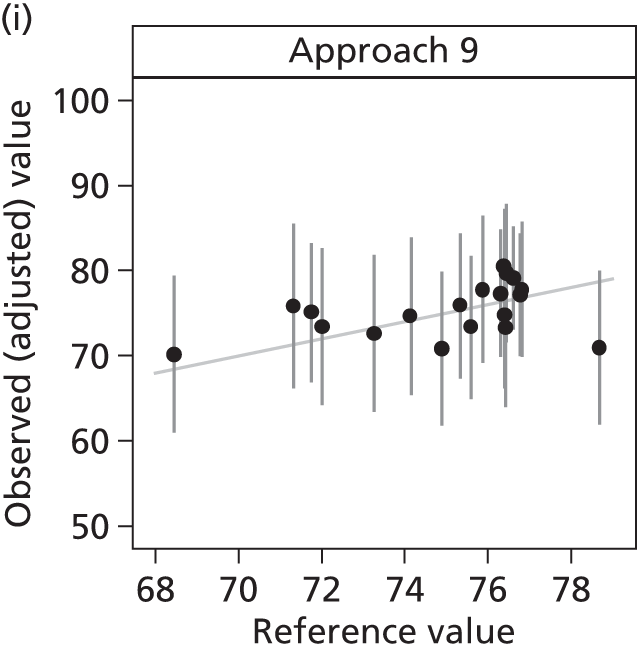
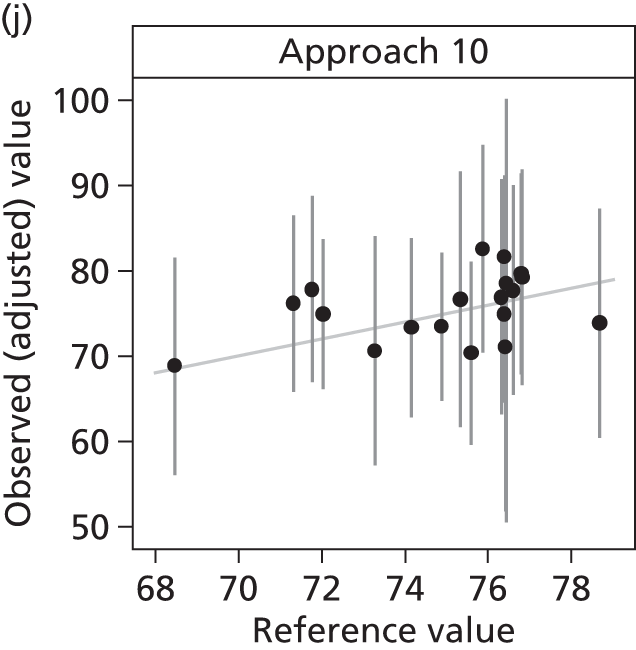
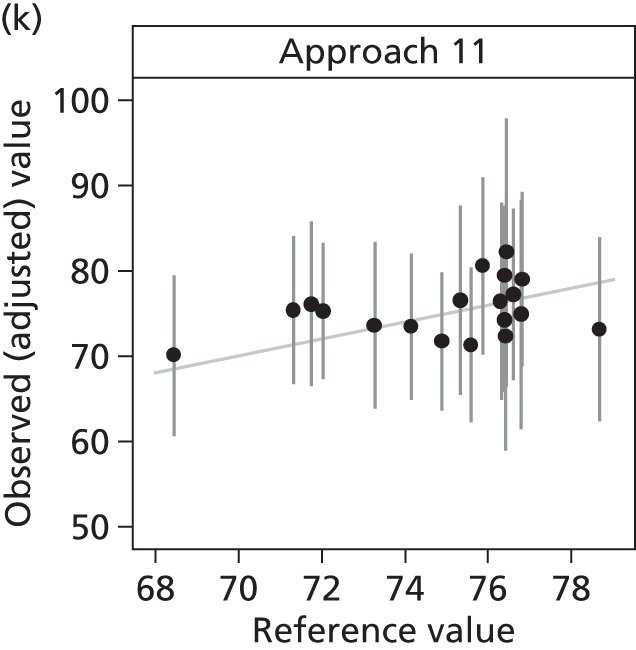
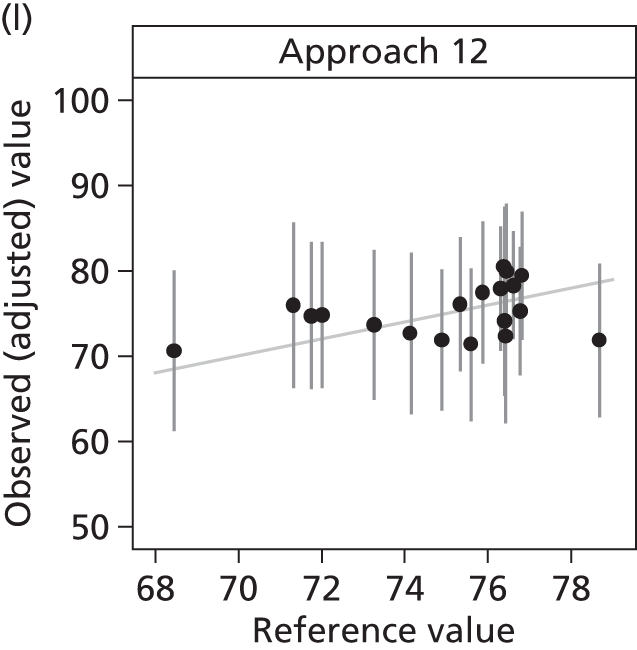
FIGURE 43.
Individual ICU estimates of satisfaction with information domain score under each sampling frame, compared with the FREE study (reference value). The diagonal line indicates perfect agreement between the observed and reference values.
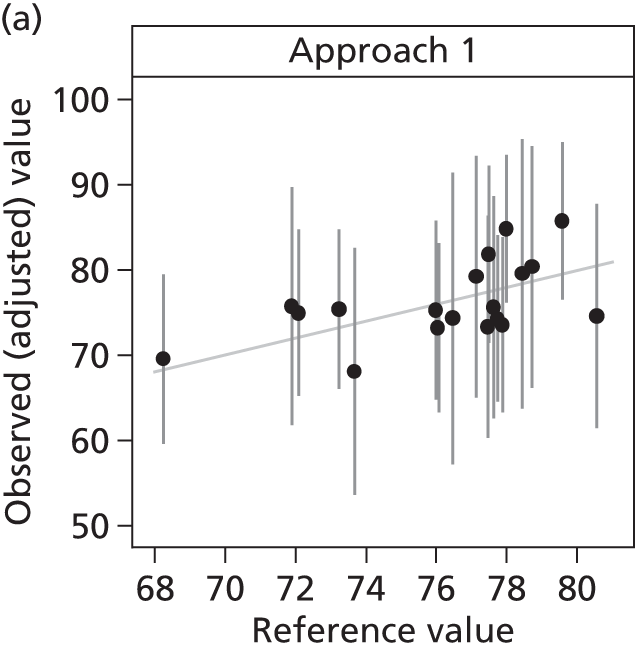
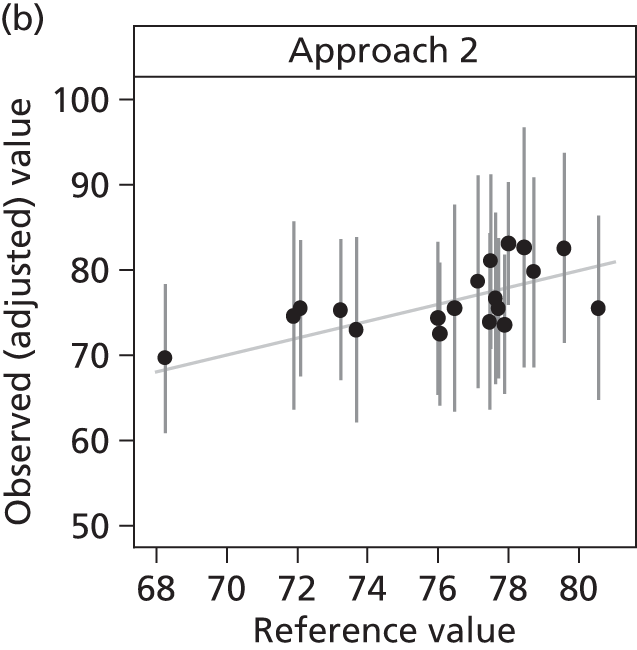
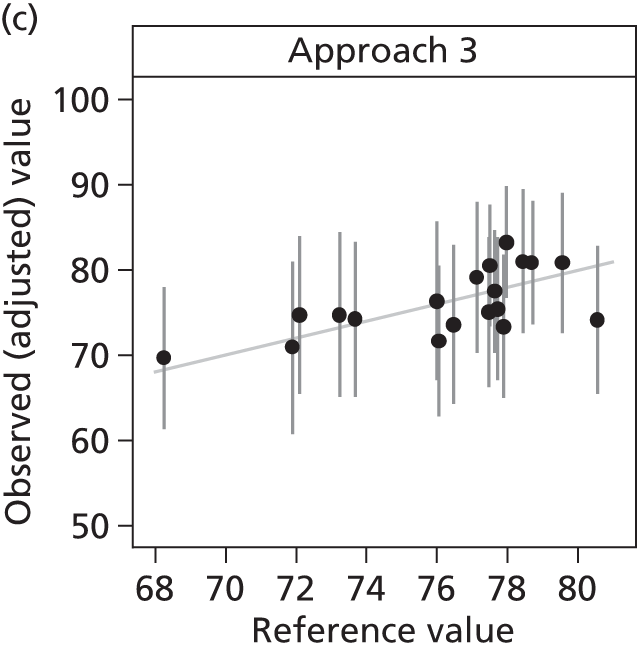
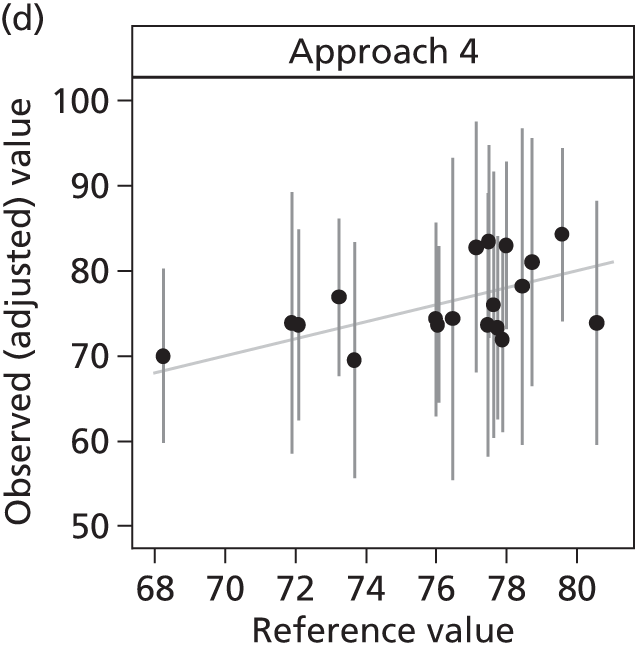
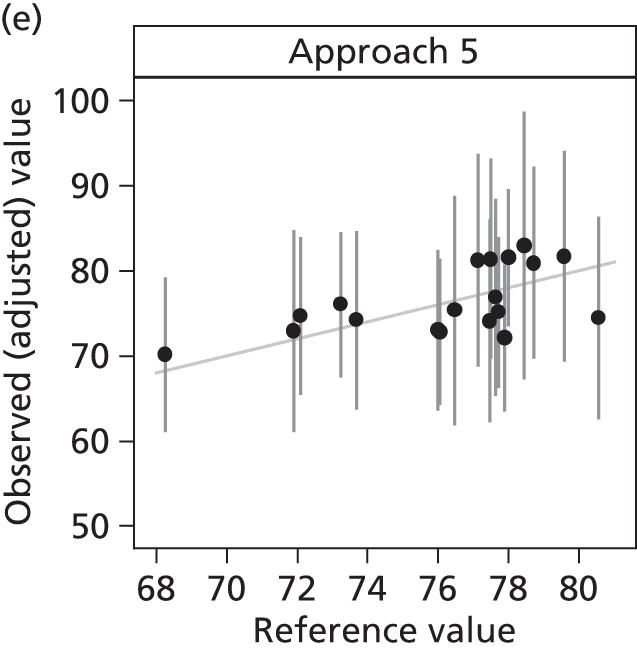
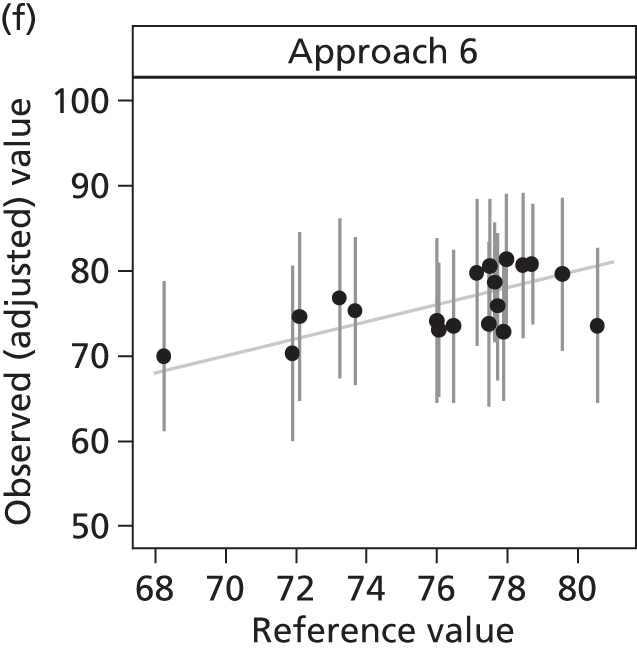

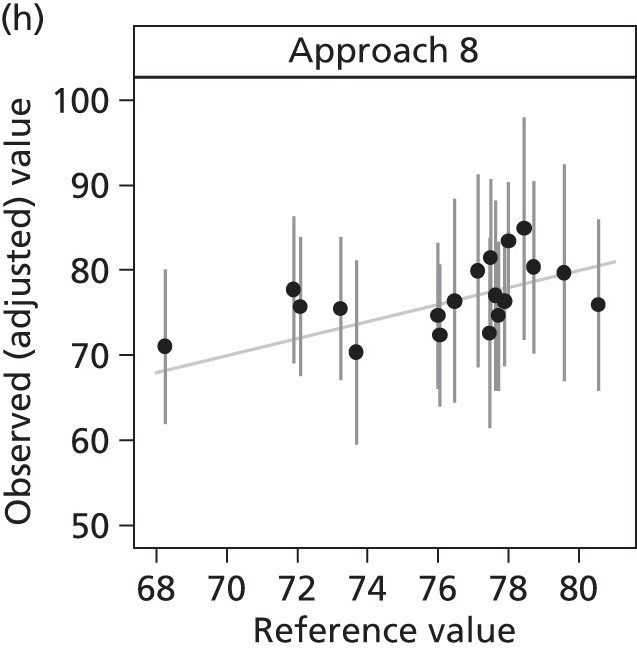
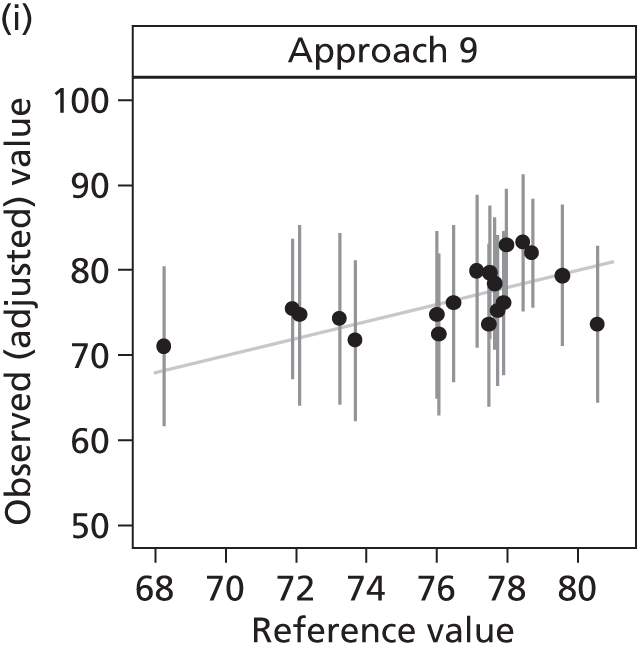
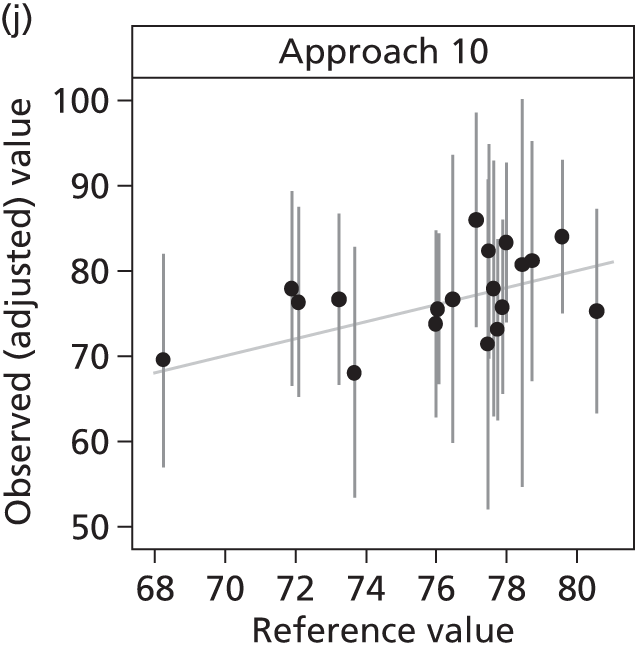
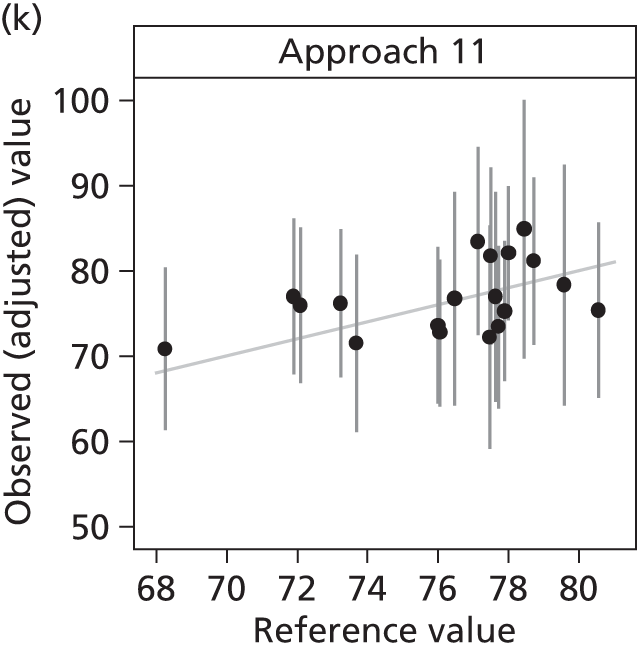
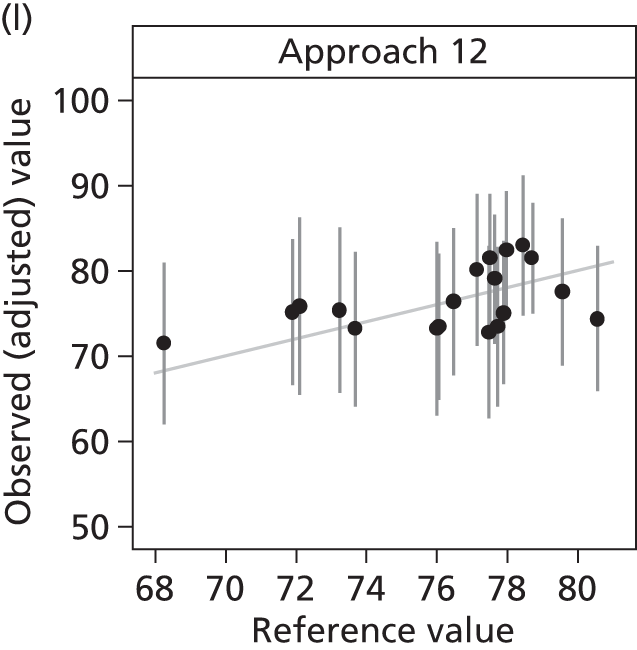
FIGURE 44.
Individual ICU estimates of satisfaction with the decision-making process domain score under each sampling frame, compared with the FREE study (reference value). The diagonal line indicates perfect agreement between the observed and reference values.


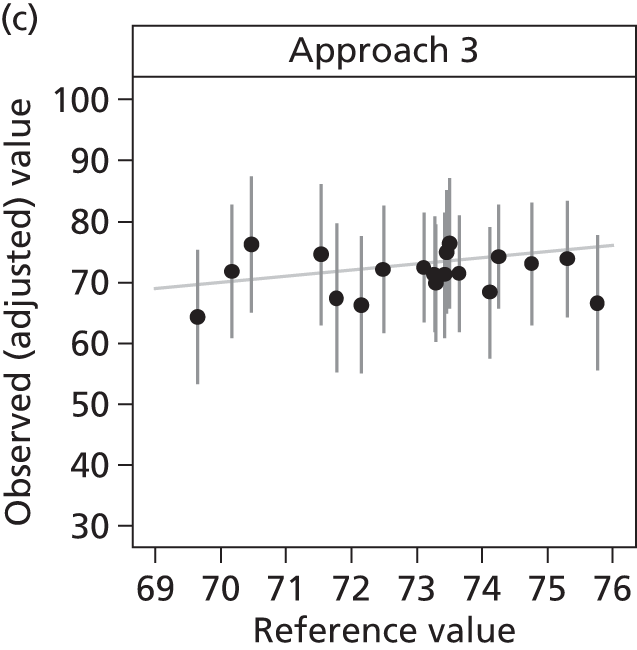
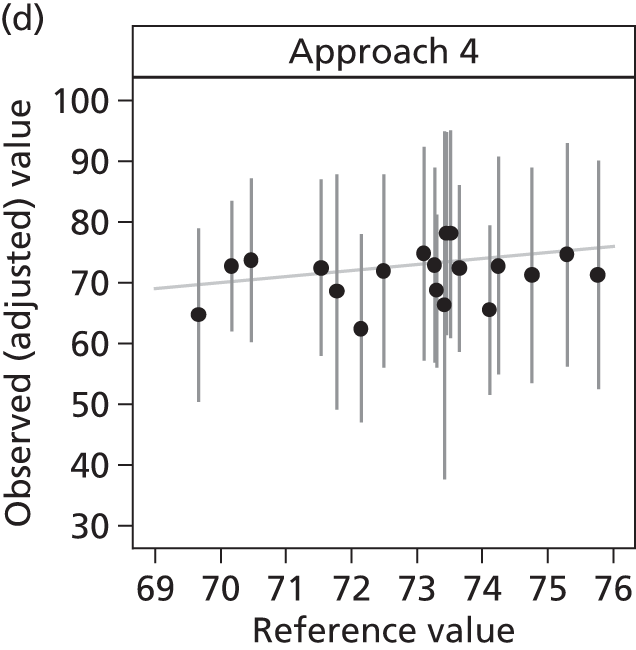
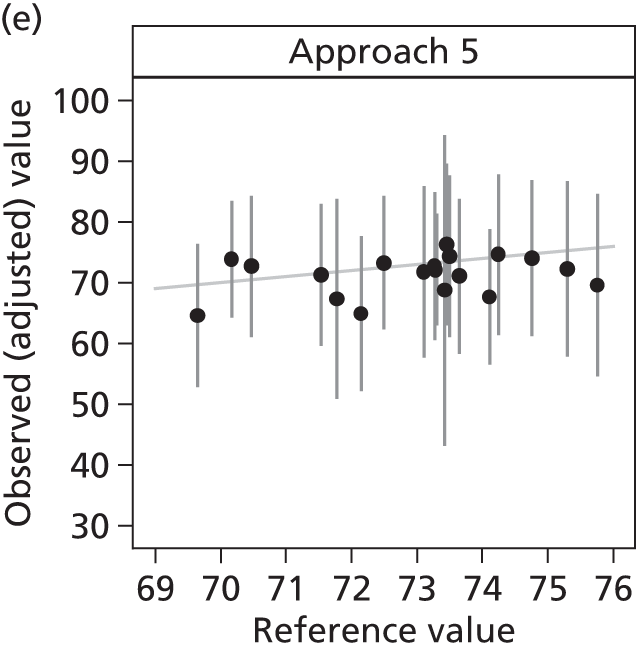
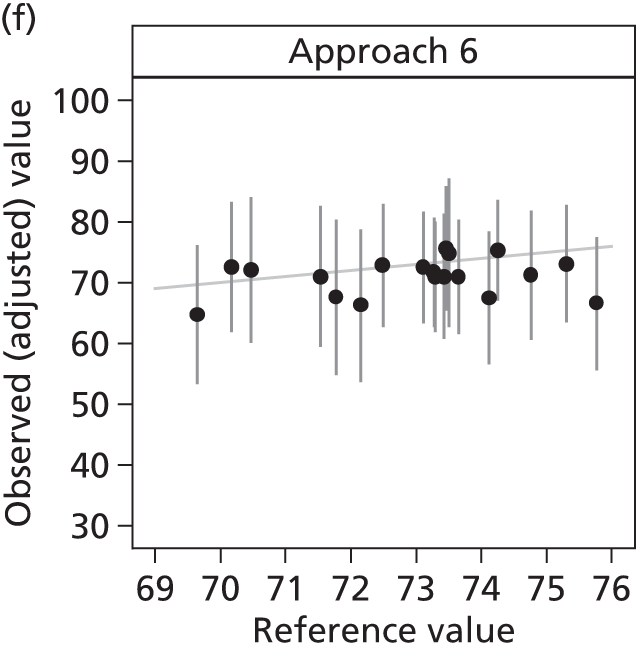
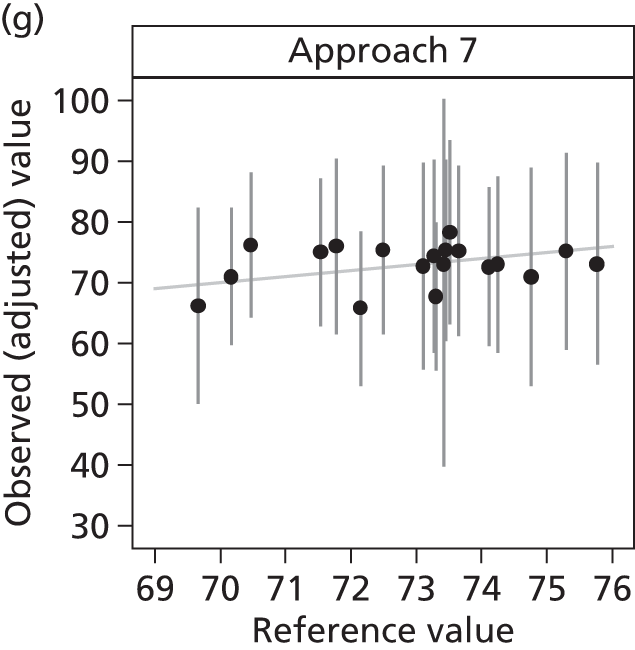
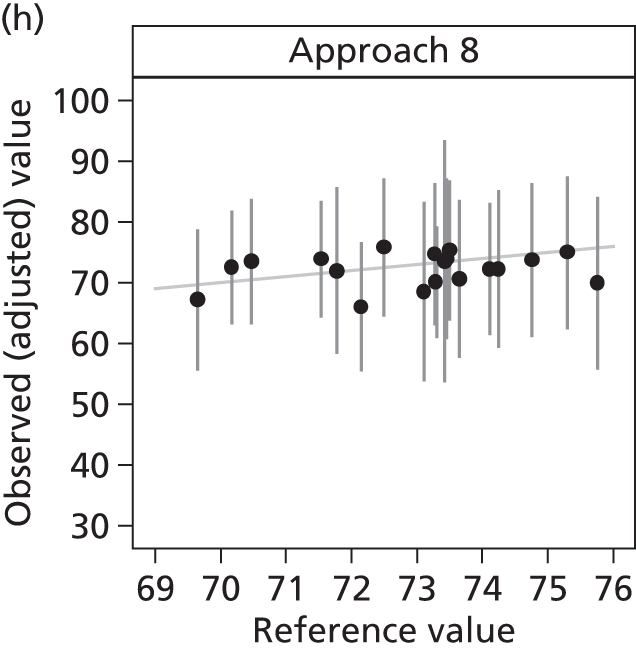

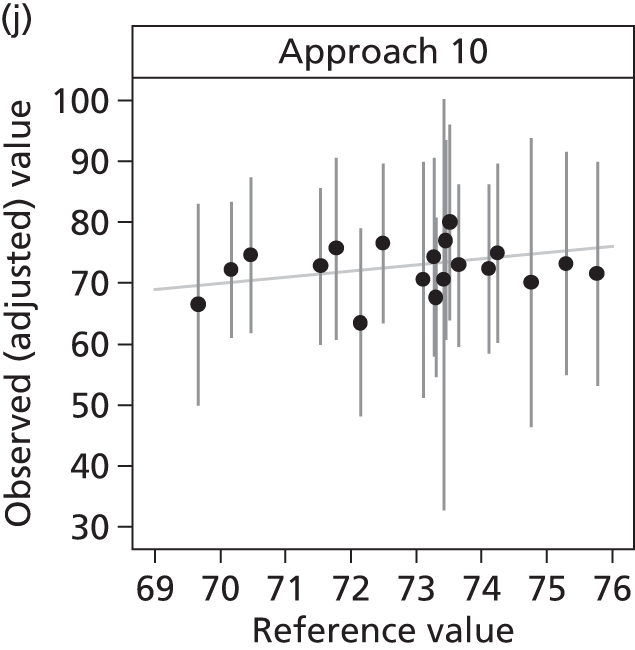

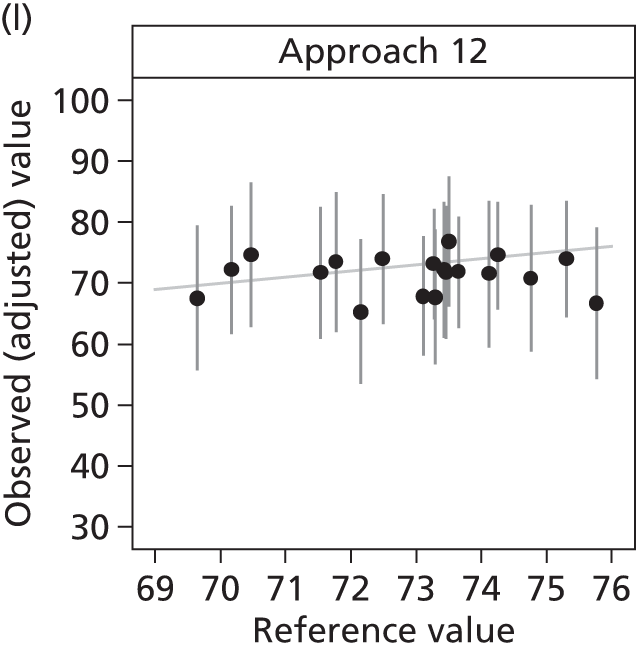
Discussion
Simulations based on the FREE study data suggest that family satisfaction surveys using short recruitment windows can produce relatively unbiased estimates of the ‘true’ average family satisfaction. However, these recruitment windows may need to be 6 weeks or longer to obtain sufficient sample size from smaller ICUs, particularly if exclusion criteria are to be applied at the patient or family member level. One alternative approach is for each ICU to recruit until a fixed sample size is reached. This gave more stability in the precision of the estimated family satisfaction scores across the ICUs, but may be harder to manage in practice because of the resulting variation across ICUs in the length of the recruitment window. Recruiting each patient’s nominated next of kin resulted in higher response rates and is therefore likely to be the preferred approach because of the resulting increase in efficiency. Recruiting only family members of patients who stayed in the ICU for at least 48 hours resulted in higher recruitment rates, as patients who stayed less than 48 hours were more likely to have no family members visit or to have family members missed, but required a longer recruitment window to achieve the same final sample size of returned questionnaires.
As there was no association between month of the year and family satisfaction, the timing of satisfaction surveys during the year appears to be unimportant. In the simulations, we evaluated recruiting for fixed blocks of time. An alternative approach would be to collect over a larger number of small recruitment windows, for example recruiting for 1 week every alternate month, and pooling the results at the end of each year.
One limitation of this simulation approach is that we could consider changing parameters only within the confines of the FREE study design. For example, we could explore the effect of narrowing the patient inclusion criteria to those staying at least 48 hours, but we could not investigate widening the inclusion criteria to patients staying less than 24 hours, as these patients’ family members were not recruited to the FREE study.
Chapter 10 International comparison
Introduction
As described earlier (see Chapter 1), the FS-ICU was developed in 2001 as a 34-item questionnaire providing two domain scores: satisfaction with care and satisfaction with decision-making. 8 In 2007, the FS-ICU was further refined to a shorter, 24-item questionnaire, validating the two main conceptual domains, and reporting the concept of an overall family satisfaction score. 11
Methods
A systematic search of the literature was conducted, from 2001 onwards, for any quantitative studies employing the FS-ICU, or any stated adaptation of the FS-ICU, to compare with the FREE study.
Results
Setting
Excluding the publications conducted to develop, validate and refine the FS-ICU (and considering publications based on either the same cohort of data or overlapping cohorts of data as a single study), 21 separate studies were identified. Brief details of these studies are presented in Table 64.
| Study | Publication | Country | Number of ICUs | Type of ICU(s) | FS-ICU |
|---|---|---|---|---|---|
| 1 | Heyland et al. 20029 | Canada | 6 | Adult general | 34 |
| Heyland et al. 200310 | |||||
| 2 | Dowling et al. 200559 | USA | 2 | Adult general | 34 |
| Dowling and Wang 200560 | |||||
| 3 | Wall et al. 200761 | USA | 6 | Mix of separate specialty ICUs | 24 |
| Curtis et al. 200853 | |||||
| Lewis-Newby et al. 201154 | |||||
| Khandelwal et al. 201462 | 2a | Adult general | |||
| Johnson et al. 201463 | 6 | Mix of separate specialty ICUs | |||
| 4 | Stricker et al. 200717 | Switzerland | 1 | Adult general | 34 |
| 5 | Stricker et al. 200955 | Switzerland | 23 | Adult general | 34 |
| 6 | Gries et al. 200864 | USA | 15 | Adult general | 24 |
| Gerstel et al. 200865 | |||||
| Curtis et al. 201166 | |||||
| Osborn et al. 201267 | |||||
| Kross et al. 201268 | |||||
| DeCato et al. 201369 | |||||
| Kross et al. 201470 | |||||
| Long et al. 201471 | |||||
| 7 | Jacobowski et al. 201072 | USA | 1 | Adult general | 24 |
| 8 | Hunziker et al. 201273 | USA | 9 | Adult general | 34 |
| 9 | Garland et al. 201256 | Canada | 2 | Adult general | 24 |
| 10 | Dalisay-Gallardo and Perez 201238 | Philippines | 1 | Adult general | 24 |
| 11 | Dodek et al. 201274 | Canada | 23 | Adult general | 24 |
| 12 | Jongerden et al. 201375 | Netherlands | 1 | Adult general | 34 |
| 13 | Epstein et al. 201376 | USA | 1 | Paediatric cardiothoracic | 24 |
| Epstein et al. 201477 | |||||
| 14 | Schwarzkopf et al. 201339 | Germany | 4 | Mix of separate specialty ICUs | 24 |
| 15 | Khalaila 201357 | Israel | 1 | Adult general | 24 |
| 16 | Shaw et al. 201478 | USA | 3 | Adult general | 24 |
| 17 | Dhillon et al. 201479 | USA | 1 | Surgical | 24 |
| 18 | Gerasimou-Angelidi et al. 201441 | Greece | 1 | Adult general | 24 |
| 19 | Kourti et al. 201442 | Greece | 1 | Adult general | 24 |
| 20 | Kodali et al. 201480 | USA | 2 | Adult general | 24 |
| 21 | Tastan et al. 201440 | Turkey | 2 | Adult general | 24 |
Of the 21 studies, 16 were based on single publications from a single cohort17,38–42,55–57,72–75,78–80 and five were based on multiple publications from overlapping cohorts. 9,10,53,54,59–71,76,77 These studies are reported between 2002 and 2014.
Most of the studies were based in North America – the USA (n = 9)53,54,59–73,76–80 and Canada (n = 3)9,10,56,74 – with other studies based in Greece (n = 2),41,42 Switzerland (n = 2),17,55 Germany (n = 1),39 Israel (n = 1),57 the Netherlands (n = 1),75 the Philippines (n = 1)38 and Turkey (n = 1). 40
Nine studies were single centre, with the remainder being multicentre, ranging from 2 to 23 centres. All studies were based in ICUs: adult general (mixed medical/surgical) ICUs (n = 17), a mix of separate specialty ICUs (n = 2), a surgical ICU (n = 1) or a paediatric cardiothoracic ICU (n = 1).
Six studies used the FS-ICU-34 (or a modification),9,10,17,55,73,75 two used extensively modified versions of the FS-ICU-24 (preventing direct comparison with the FREE study)76,77,79 and 13 studies used either the original FS-ICU-24 or a slight modification,38–42,53,54,56,57,61–72,74,78,80 and the results of these studies formed the comparison with the FREE study.
Methodological detail for studies using the 24-item Family Satisfaction in the Intensive Care Unit questionnaire
Thirteen studies used the FS-ICU-24 or a slight modification and these were reported on, completely or in part, in 24 separate publications. These studies were based either in adult general (mixed medical/surgical) ICUs or in a mix of separate specialty ICUs, ranging from 1 to 23 ICUs in any individual study (see Table 64).
The 13 studies using the FS-ICU-24 had data collected between 2003 and 2012. Inclusion criteria for patients (whose family members were to be surveyed) varied across studies (and sometimes across publications employing the same or overlapping cohort of data), with selection based on a combination of factors including age; receipt of mechanical ventilation; duration of stay in ICU; and survival status at discharge from ICU (or at some later time point). Few reported additional patient exclusion criteria (Table 65).
| Publication | Year data collection commenced | Inclusion criteria | Exclusion criteria |
|---|---|---|---|
| Wall et al. 200761 | 2003 | ≥ 6 hours in ICU | Not stated |
| Curtis et al. 200853 | 2003 |
|
Not stated |
| Lewis-Newby et al. 201154 | 2003 |
|
Not stated |
| Khandelwal et al. 201462 | Not stated |
|
Not stated |
| Johnson et al. 201463 | 2003 |
|
Not stated |
| Gries et al. 200864 | 2003 | ICU non-survivors only | Not stated |
| Gerstel et al. 200865 | 2003 | ICU non-survivors only | Died on full life support |
| Curtis et al. 201166 | 2004 |
|
Not stated |
| Osborn et al. 201267 | 2004 |
|
Not stated |
| Kross et al. 201268 | 2004 |
|
Not stated |
| DeCato et al. 201369 | 2003 |
|
Not stated |
| Kross et al. 201470 | 2003 |
|
Brain dead |
| Long et al. 201471 | 2003 |
|
|
| Jacobowski et al. 201072 | 2006 | ≥ 24 hours in ICU | No primary contact |
| Garland et al. 201256 | 2008 | ICU experience within a single model |
|
| Dalisay-Gallardo and Perez 201238 | 2011 |
|
Not stated |
| Dodek et al. 201274 | 2006 | ≥ 48 hours in ICU | Not stated |
| Schwarzkopf et al. 201339 | 2011 | ≥ 48 hours in ICU | Not stated |
| Khalaila 201357 | 2007 | ≥ 48 hours in ICU | Not stated |
| Shaw et al. 201478 | 2010 | Not stated | Not stated |
| Gerasimou-Angelidi et al. 201441 | 2009 | ≥ 24 hours in ICU | Not stated |
| Kourti et al. 201442 | 2008 | ≥ 48 hours on mechanical ventilation | Not stated |
| Kodali et al. 201480 | 2012 | ≥ 18 years old |
|
| Tastan et al. 201440 | 2008 | ≥ 48 hours in ICU | Not stated |
Selection of family members varied across the 13 studies but the family member selected was usually reported either as legal next of kin or as close family member or friend and, in all cases (where ascertainable), one family member per eligible patient was identified. Across the 24 publications (13 studies), method of consent was not reported in 10 publications. Where required (in six studies), the FS-ICU-24 was translated into the relevant language(s), with all studies employing back translation (Table 66).
| Publication | Selection | Inclusion criteria | Exclusion criteria | Identified | Consent |
|---|---|---|---|---|---|
| Wall et al. 200761 | Not stated | Specific weekdays for ICU survivors |
|
1 | Not reported |
| Curtis et al. 200853 |
|
Not stated | Not stated | 1 | Not reported |
| Lewis-Newby et al. 201154 | Not stated | Not stated | Not stated | 1 | Not reported |
| Khandelwal et al. 201462 | Close family member or friend | Not stated | Not stated | 1 | Not reported |
| Johnson et al. 201463 | Close family member or friend | Not stated | Not stated | 1 | Written |
| Gries et al. 200864 |
|
Not stated | No contact information | 1 | Not reported |
| Gerstel et al. 200865 |
|
Not stated | Not stated | 1 | Written |
| Curtis et al. 201166 | Close family member or friend | Not stated | Not stated | 1 | Not reported |
| Osborn et al. 201267 | Close family member or friend | Not stated | Not stated | 1 | Not reported |
| Kross et al. 201268 |
|
Not stated | Not stated | 1 | Written |
| DeCato et al. 201369 | Close family member or friend | Not stated | Not stated | 1 | Not reported |
| Kross et al. 201470 | Not stated | Not stated | Not stated | 1 | Written |
| Long et al. 201471 | Close family member | Not stated | Not stated | 1 | Not reported |
| Jacobowski et al. 201072 | Nominated NOK | Not stated | Limited English | 1 | Verbal |
| Garland et al. 201256 | Not stated | Visited ICU within a single model | ICU experience in both models | 1 | Consented |
| aDalisay-Gallardo and Perez 201238 | Nominated NOK |
|
Comprehension barriers | 1 | Verbal Written |
| Dodek et al. 201274 | Not stated | ≥ 1 visit | Not stated | 1 | Implied |
| aSchwarzkopf et al. 201339 | Family member | ≥ 1 visit | Visited outside ICU visiting times | 1 | Waived |
| aKhalaila 201357 | Family member |
|
Not stated | Not stated | Consented |
| Shaw et al. 201478 | Family member | Not stated | Not stated | 1 | Consented |
| aGerasimou-Angelidi et al. 201441 | Not stated |
|
Not stated | 1 | Written |
| aKourti et al. 201442 | Close family member or friend | 2 consecutive visits (≥ 10 minutes) | Not stated | 1 | Not reported |
| Kodali et al. 201480 | Legal NOK | Not stated | Could not be contacted | 1 | Implied |
| aTastan et al. 201440 | Close family member |
|
Not stated | 1 | Written |
In most studies, the family member was asked to complete a paper questionnaire (delivered either in hospital or by post); however, in three studies, it was completed through interview. 38,57,72 Timing of completion varied from while the patient was still in the ICU, through completion at patient discharge from ICU, to between 3 and 20 weeks after discharge from ICU and, in some studies, timing varied by survivorship of the patient (Table 67).
| Publication | FS-ICU | Mode of delivery (ICU survivors) | Mode of delivery (ICU non-survivors) | Timing (ICU survivors) | Timing (ICU non-survivors) | Follow-up |
|---|---|---|---|---|---|---|
| Wall et al. 200761 | Paper | Posted | Posted | 4–8 weeks | 4–8 weeks |
|
| Curtis et al. 200853 | Paper | N/A | Posted | N/A | 4–6 weeks |
|
| Lewis-Newby et al. 201154 | Paper | N/A | Posted | N/A | 4–6 weeks | Not stated |
| Khandelwal et al. 201462 | Paper | N/A | Posted | N/A | 4–6 weeks | Not stated |
| Johnson et al. 201463 | Paper | N/A | Posted | N/A | 4 weeks |
|
| Gries et al. 200864 | Paper | N/A | Posted | N/A | 4–8 weeks |
|
| Gerstel et al. 200865 | Paper | N/A | Posted | N/A | 4–8 weeks |
|
| Curtis et al. 201166 | Paper | N/A | Posted | N/A | 4–6 weeks |
|
| Osborn et al. 201267 | Paper | N/A | Posted | N/A | 4–6 weeks |
|
| Kross et al. 201268 | Paper | N/A | Posted | N/A | 4–8 weeks |
|
| DeCato et al. 201369 | Paper | N/A | Posted | N/A | 4–6 weeks |
|
| Kross et al. 201470 | Paper | N/A | Posted | N/A | 4–8 weeks |
|
| Long et al. 201471 | Paper | N/A | Posted | N/A | 4–6 weeks |
|
| Jacobowski et al. 201072 | Interview | Telephone call | Telephone call | 4 weeks | 12–20 weeks | Not stated |
| Garland et al. 201256 | Paper | In hospital | Posted | ICU discharge | 4 weeks | Not stated |
| Dalisay-Gallardo and Perez 201238 | Paper; Interview | N/A |
|
N/A | 4–6 weeks | Not stated |
| Dodek et al. 201274 | Paper | In hospital | Posted | ICU discharge | 3 weeks | Not stated |
| Schwarzkopf et al. 201339 | Paper | In hospital | In hospital | Next visit | Next visit | At visits to ICU or hospital |
| Khalaila 201357 | Interview | Face to face in hospital | Face to face in hospital | After consent | After consent | Not stated |
| Shaw et al. 201478 | Paper | Posted | Posted | 4–8 weeks | 4–8 weeks | Not stated |
| Gerasimou-Angelidi et al. 201441 | Paper | In hospital | In hospital | ICU discharge | ICU death | Not stated |
| Kourti et al. 201442 | Not stated | In hospital | In hospital |
|
|
Not stated |
| Kodali et al. 201480 | Paper | Posted | Posted | Not stated | Not stated |
|
| Tastan et al. 201440 | Paper | In hospital | In hospital | Not stated | Not stated | Not stated |
Mode of delivery varied from face-to-face or telephone interview, through hand-delivery of the questionnaire, to a questionnaire posted to either the patient’s or the family member’s address. In some studies, mode of delivery varied by survivorship of the patient. In some studies, family members were chased for response (see Table 67).
Response rates
The number of family members surveyed varied from 4338 to 312470 in any given publication.
Family member response, where a denominator was reported, varied from 8.3%78 to 93.0%. 38 In those publications that surveyed family members of ICU survivors, the response rate varied from 51.6%61 to 68.6%. 74 In those publications that surveyed family members of ICU non-survivors, the response rate varied from 37.9%70 to 93.0%. 38
Figure 45 shows the overall response rate in the FREE study compared with publications that reported an overall response rate (i.e. for family members of ICU survivors and ICU non-survivors). Even with the FREE study having the largest sample size, the overall response rate for the FREE study was similar to the other publications.
FIGURE 45.
Response rate for family members of combined ICU survivors and ICU non-survivors (by publication).
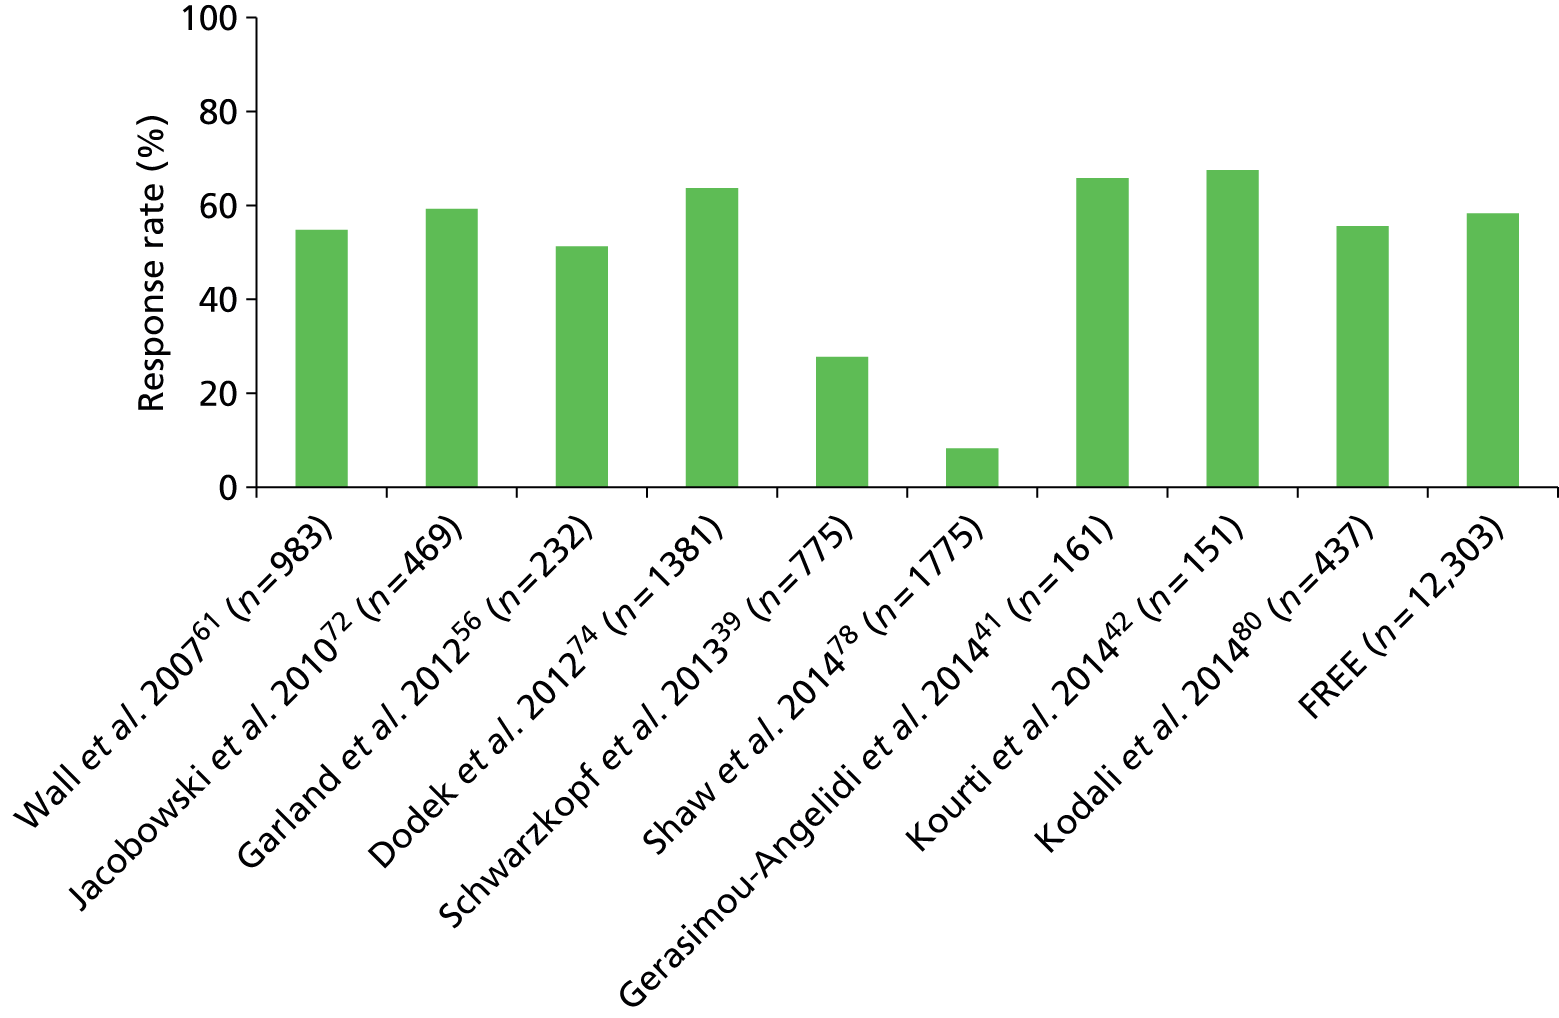
Figure 46 shows the response rate for family members of ICU survivors in the FREE study compared with publications that reported a response rate for family members of ICU survivors. Like the overall response rate, the response rate for family members of ICU survivors for the FREE study was similar to the other publications.
FIGURE 46.
Response rate for family members of ICU survivors (by publication).
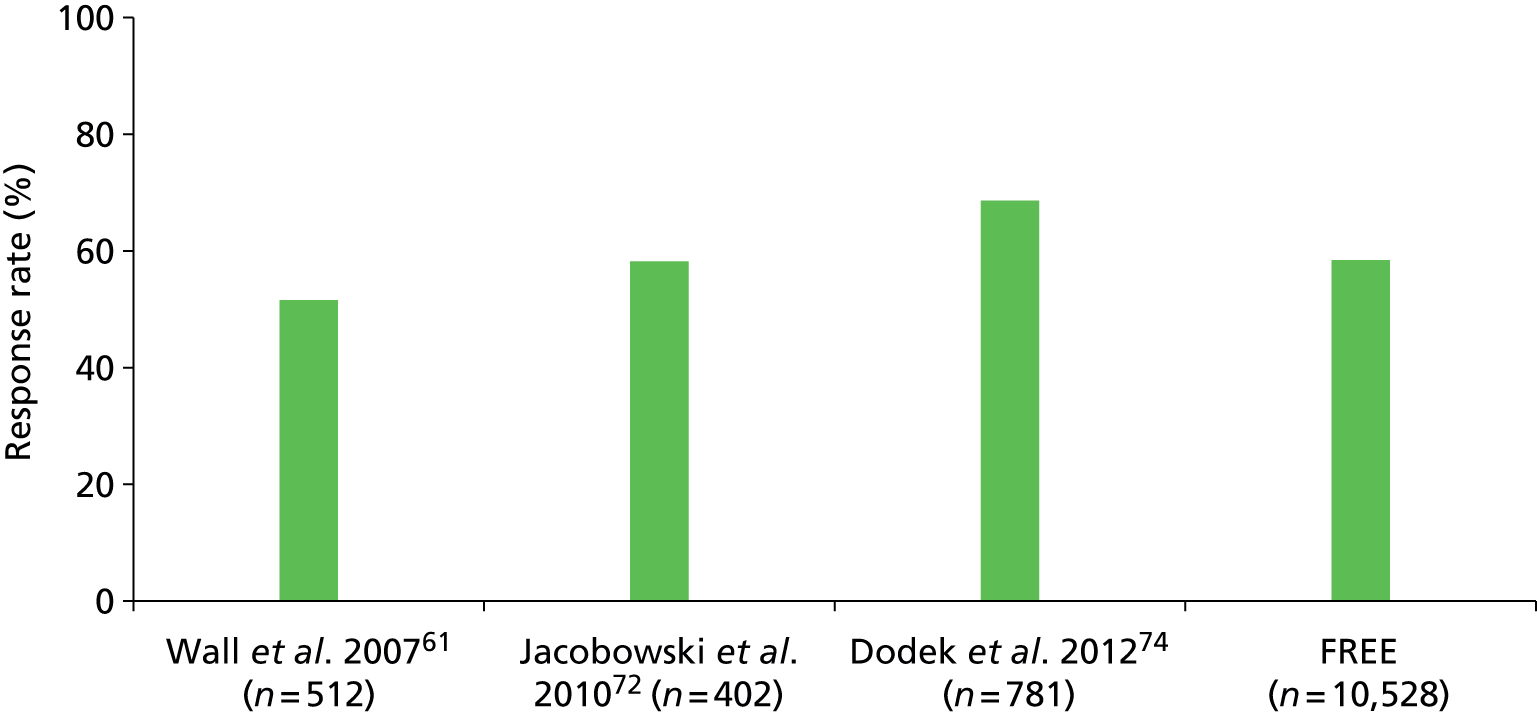
Figure 47 shows the response rate for family members of ICU non-survivors in the FREE study compared with publications that reported a response rate for family members of ICU non-survivors. The response rate for family members of ICU non-survivors for the FREE study was higher than in most of the other publications; one publication did achieve a higher response rate (93.0%), but the sample size was relatively small. 38
FIGURE 47.
Response rate for family members of ICU non-survivors (by publication). a, Only family members of ICU non-survivors participated.
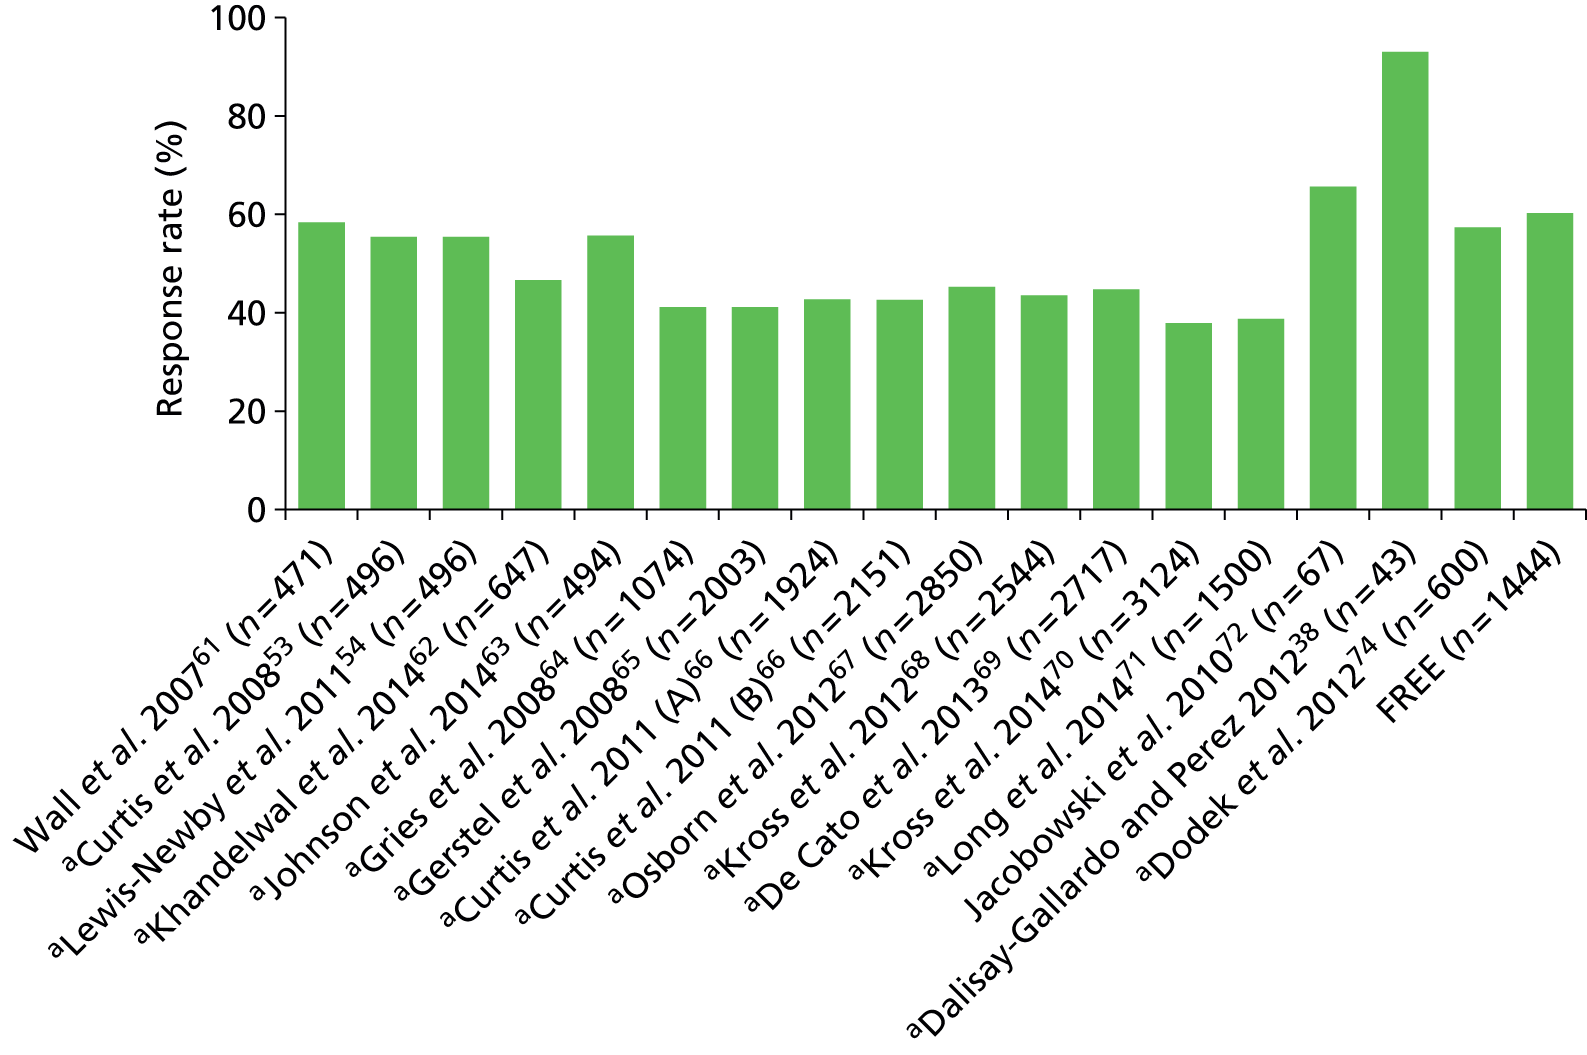
Satisfaction scores
Of the 24 publications using the FS-ICU-24, for 14 publications direct comparisons with the FREE study were not possible. This was because the patient and family member eligibility criteria reported were too specific or too broad to enable comparison, or the publication did not report the family satisfaction scores (overall and/or domain scores). The remaining 10 publications fell into two distinct surveyed groups: all family members of patients staying ≥ 48 hours in ICU;39,40,57,74 and legal or nominated next of kin of ICU non-survivors. 53,62,66,67,69,70 Data from patients and family members in the FREE study meeting these eligibility criteria were extracted to facilitate comparison of the scores between the FREE study and the 10 publications. Of these 10 publications, one reported only the domain scores74 and two reported only the overall family satisfaction score. 40,62
The first group examined was all family members of patients staying ≥ 48 hours in ICU. For overall family satisfaction score, the FREE study was similar to the four publications in this group (Figure 48). It was also similar to these publications on the domain scores for satisfaction with care (Figure 49) and for satisfaction with decision-making (Figure 50).
FIGURE 48.
Overall family satisfaction score for all family members of patients staying ≥ 48 hours in ICU (by publication).
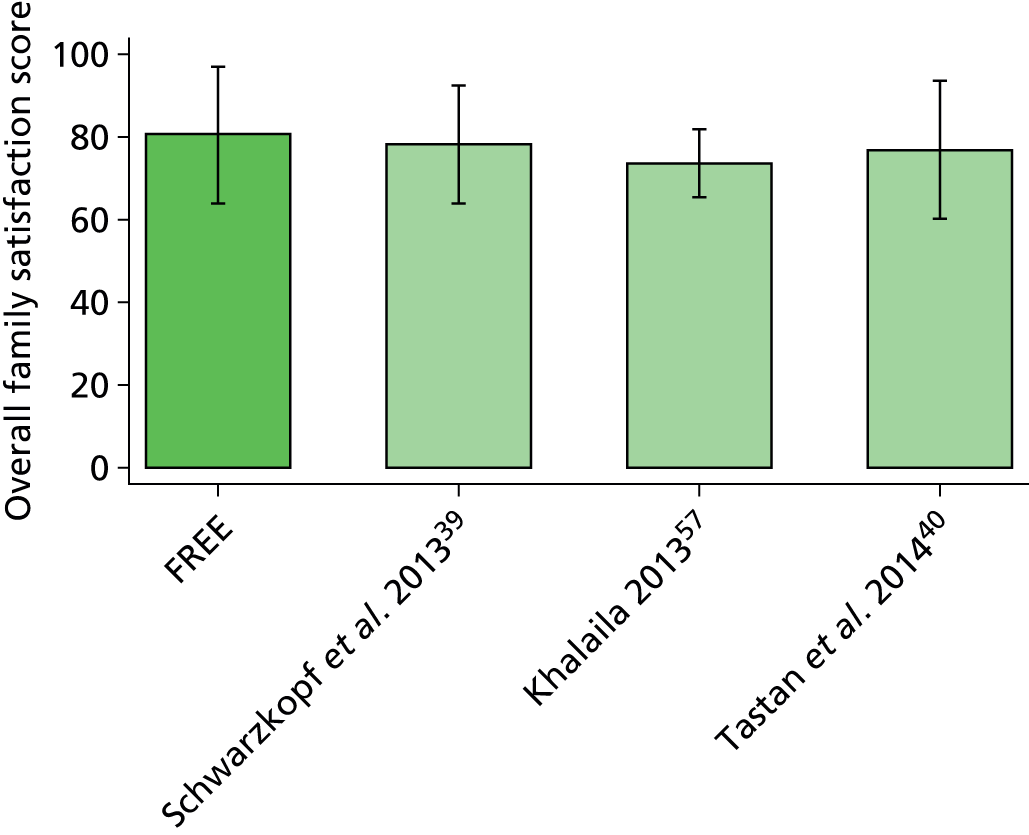
FIGURE 49.
Satisfaction with care domain score for all family members of patients staying ≥ 48 hours in ICU (by publication).
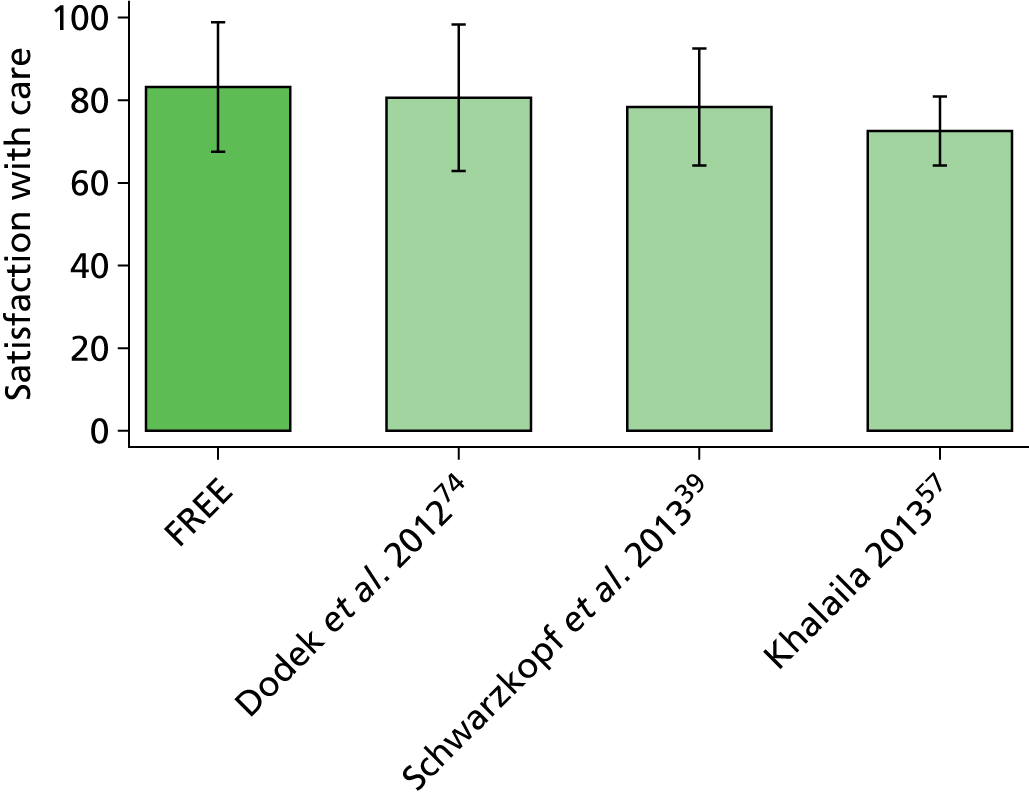
FIGURE 50.
Satisfaction with decision-making domain score for all family members of patients staying ≥ 48 hours in ICU (by publication).
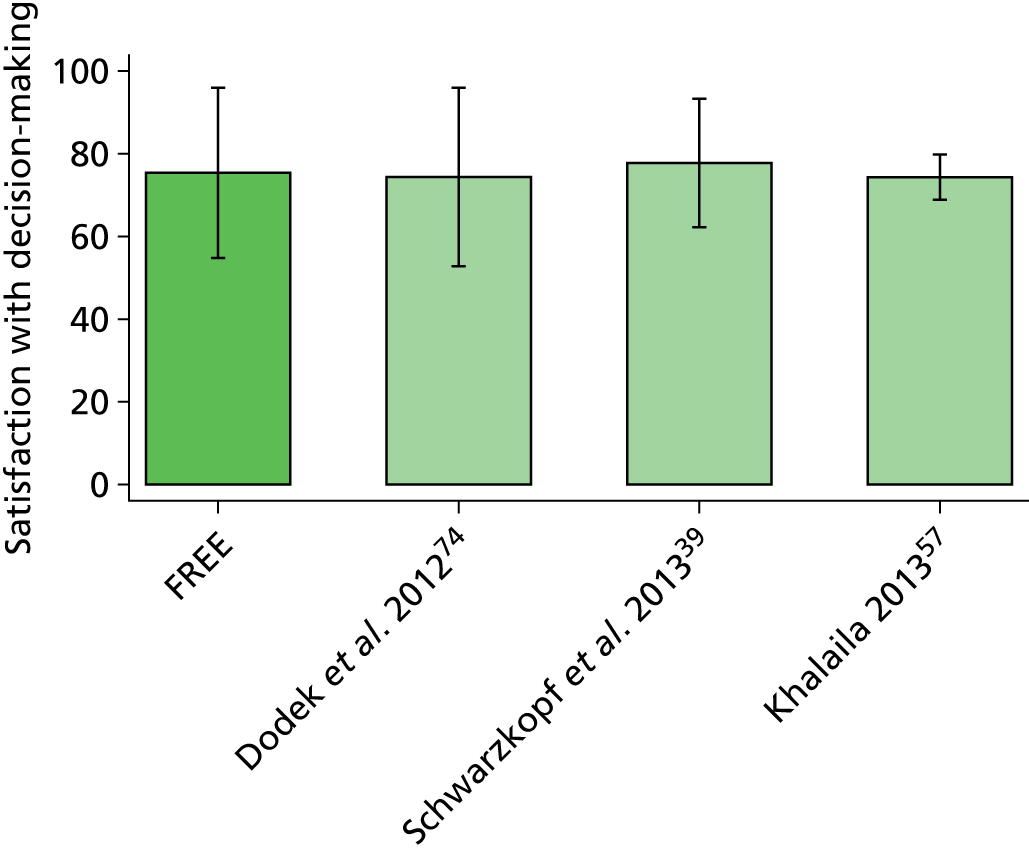
The second group examined was legal or nominated next of kin of ICU non-survivors. For two of the publications, all three scores were reported: pre- and post-intervention53 and by study arm (control/intervention) and time point (baseline/follow-up period). 66 For overall family satisfaction score, the FREE study was similar to the six publications in this group (Figure 51). It was also similar to these publications on the domain scores for satisfaction with care (Figure 52) and for satisfaction with decision-making (Figure 53).
FIGURE 51.
Overall family satisfaction score for next of kin of ICU non-survivors (by publication). C-BL, control group at baseline; C-FU control group at follow-up; I-BL, intervention group at baseline; I-FU, intervention group at follow-up; post, post-intervention; pre, pre-intervention.
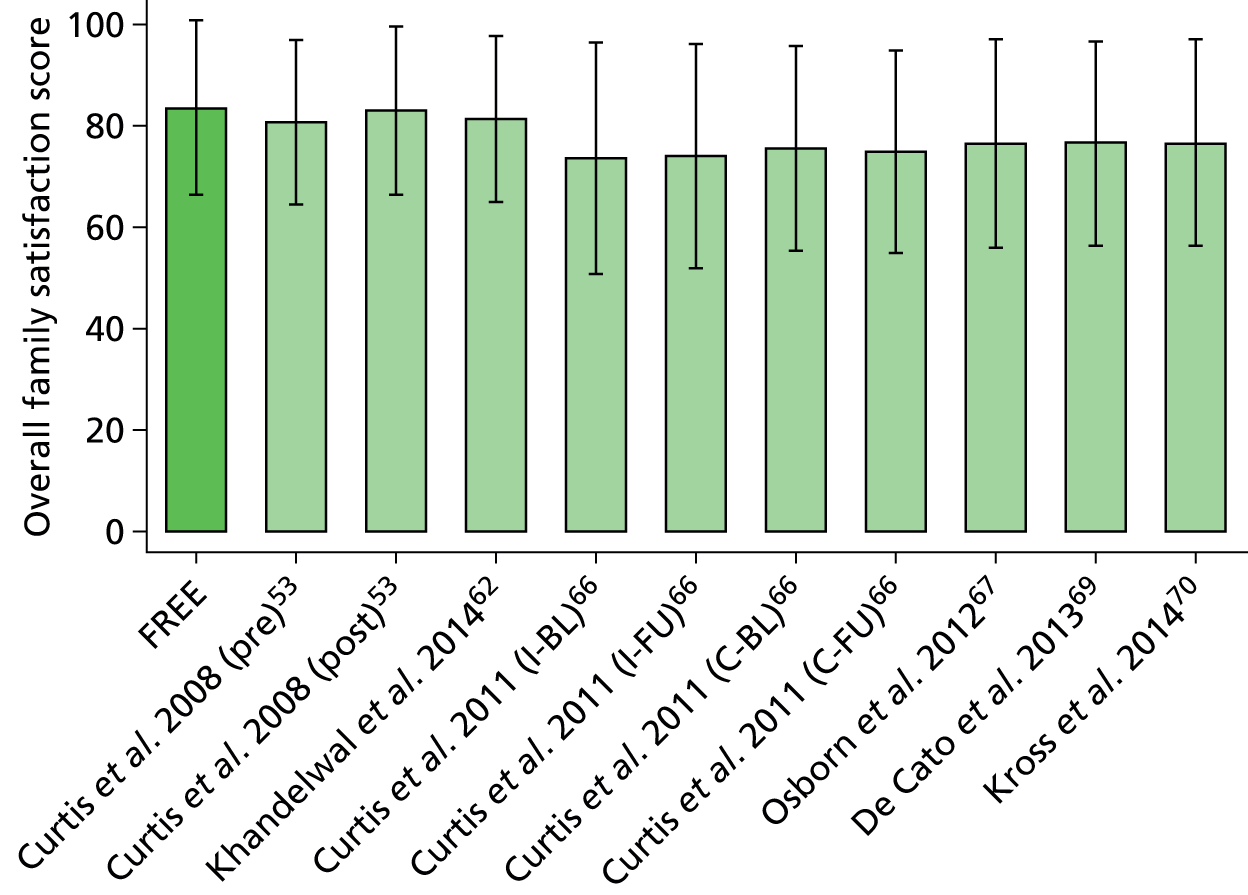
FIGURE 52.
Satisfaction with care domain score for next of kin of ICU non-survivors (by publication). C-BL, control group at baseline; C-FU control group at follow-up; I-BL, intervention group at baseline; I-FU, intervention group at follow-up; post, post-intervention; pre, pre-intervention.
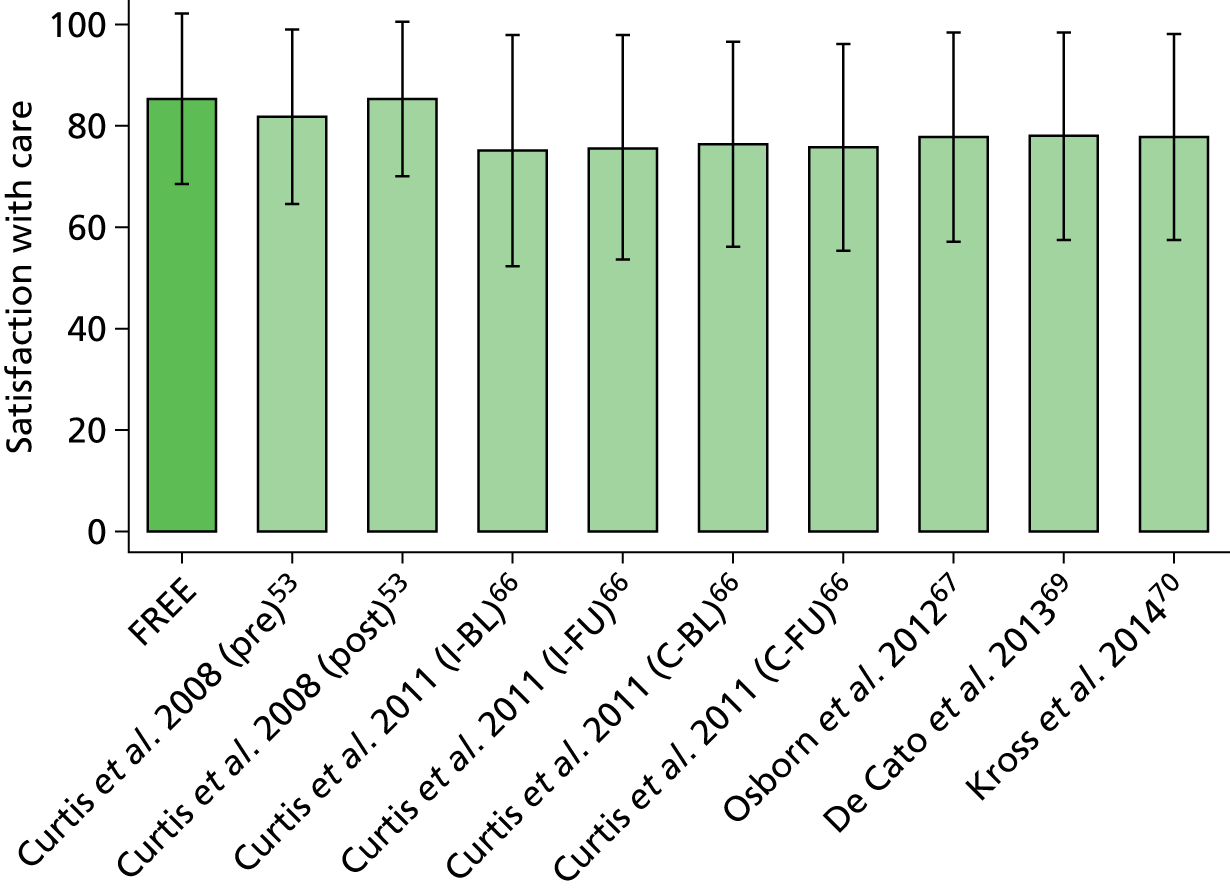
FIGURE 53.
Satisfaction with decision-making domain score for next of kin of ICU non-survivors (by publication). C-BL, control group at baseline; C-FU control group at follow-up; I-BL, intervention group at baseline; I-FU, intervention group at follow-up; post, post-intervention; pre, pre-intervention.
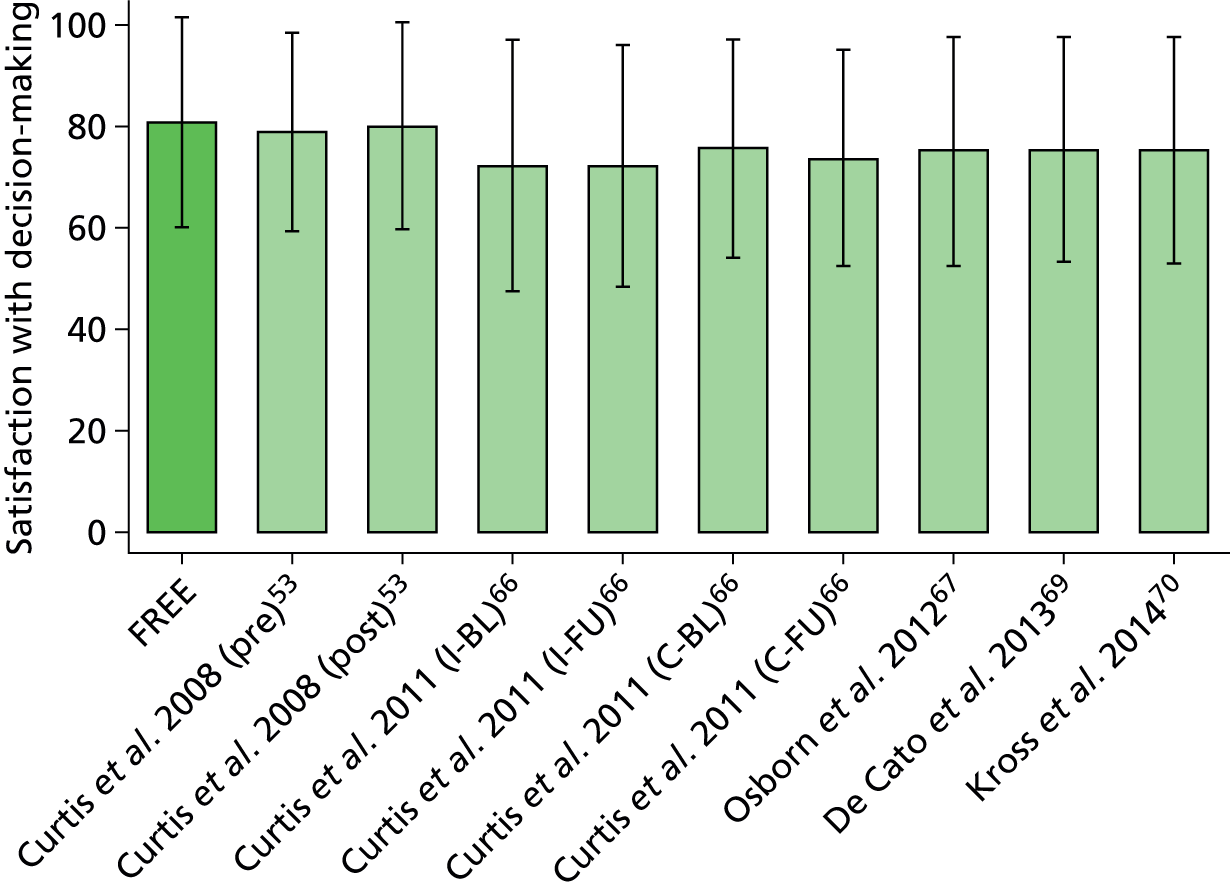
Discussion
In comparison with the 13 studies (24 publications) using the FS-ICU-24, the FREE study obtained similar response rates, even with a much larger sample size, and had a similar overall family satisfaction score and domain scores for satisfaction with care and for satisfaction with decision-making. It was difficult to draw these comparisons given the lack of standardisation and consistent reporting in patient and family member eligibility criteria and method of questionnaire distribution; this led to being able to make a direct comparison on the family satisfaction scores only with fewer than half of the publications.
Chapter 11 Conclusions and recommendations
The qualitative study that constituted phase 1 of the FREE study revealed that, while there were subjective differences in how health professionals and family members interpreted some items in the original FS-ICU-24, adaptation to the UK setting required only relatively minor edits: changes to section heading titles, clarification of the wording of questions, clarification of North American English to UK English, addition to existing guidance, general formatting and enhanced design of the layout. The quantitative study that constituted phase 2 of the FREE study, nested in the CMP (the national clinical audit of adult critical care), provided a large sample of ICUs, family members and patients for the psychometric assessment of the UK FS-ICU-24, which indicated a high degree of internal consistency, criterion validity among family members of ICU non-survivors (no suitable instrument was available to establish criterion validity among family members of ICU survivors) and good comprehensibility and acceptability. However, the two-factor solution for the original FS-ICU-24, with domains of satisfaction with care and satisfaction with decision-making, was not a good fit and exploratory factor analysis suggested that the domain of satisfaction with decision-making encompassed two separate constructs, which we termed satisfaction with information and satisfaction with the decision-making process.
In general, overall family satisfaction mean scores and domain mean scores were high (ranging from 76 to 88 across the overall and domain scores) and all showed a left-skewed distribution. Determinants of family satisfaction varied by whether or not the patient survived the ICU. Factors associated with overall family satisfaction for family members of ICU survivors were, with respect to family members, age, ethnicity, relationship to patient (next of kin and/or lived with patient) and visit frequency; and, with respect to patients, acute severity of illness and receipt of invasive mechanical ventilation. There were no family member factors associated with overall family satisfaction for family members of ICU non-survivors; the patient factors were age, acute severity of illness and duration of stay. Despite the large size of the FREE study, there was some indication that the smaller sample size of family members of ICU non-survivors may have hindered identification of other factors seen for family members of ICU survivors, for example ethnicity. Neither the ICU/hospital factors investigated nor seasonality was associated with overall family satisfaction. The finding that ethnicity was associated with overall family satisfaction (white family members of both ICU survivors and non-survivors reported higher satisfaction, on average) warrants further investigation.
Funnel plots of overall family satisfaction scores and domain scores confirmed that there was significant variation in family satisfaction across the ICUs participating in the FREE study. Multiple imputation provided greater power to identify potentially outlying ICUs. Adjusting for family member and patient characteristics using the multilevel multivariable models from the FREE study reduced the variation across ICUs and resulted in fewer ICUs being identified as potential outliers. Adjustment is therefore important to avoid falsely identifying ICUs as outliers because of the characteristics of either their patients or the patients’ family members.
Limited to the confines of the FREE study (patients staying in the ICU for 24 hours or more and timing/administration of questionnaires), simulations based on the FREE study data suggested that family satisfaction surveys using short recruitment windows can produce relatively unbiased estimates of the ‘true’ average family satisfaction. Recruitment windows may need to be 6 weeks or longer to obtain sufficient sample size from smaller ICUs, though an alternative approach, whereby each ICU recruits until a fixed sample size is reached, gave more stability in the precision of the estimated family satisfaction scores across ICUs. Recruiting each patient’s nominated next of kin resulted in higher response rates and is therefore likely to be the preferred approach. Recruiting only family members of patients who stayed in the ICU for at least 48 hours also resulted in higher recruitment rates. Given no association with seasonality, the timing of satisfaction surveys appeared to be unimportant.
Comparison with other studies using the FS-ICU-24, internationally, indicates the strengths of the FREE study. Other than the requirement for a patient to be in the ICU for 24 hours, no further selection of patients or of family members occurred; this was, first, to avoid biases that selection might introduce and, second, to provide an empirical basis to inform selection of patients and family members in future studies evaluating family satisfaction in critical care using the FS-ICU-24 or equivalent, to maximise recruitment and response. A further strength of the FREE study was the use of evidence-based practice for maximising response to postal surveys, which yielded a very similar response rate to other studies but in a much larger sample size of family members and ICUs. Employing the same mode and timing of delivery of the FS-ICU-24, for family members both of ICU survivors and of ICU non-survivors, is a further strength, allowing meaningful comparison between these groups. The large sample size has allowed important multilevel multivariable modelling of the determinants of family satisfaction and indicates that all previous studies have been too small and, therefore, underpowered when attempting to evaluate these. One weakness of the FREE study was the burden on ICUs to recruit up to four family members for each patient staying ≥ 24 hours over a 12-month period and the resultant recruitment rate. The FREE study and the FREE study database will be an important foundation and resource for future studies evaluating family satisfaction in UK critical care.
In conclusion, the FREE study has provided a UK-adapted, psychometrically valid questionnaire providing an overall family satisfaction score and three domain scores: satisfaction with care, satisfaction with information and satisfaction with the decision-making process. The large sample size of both ICUs and family members has allowed robust multilevel multivariable modelling of factors associated with overall family satisfaction to inform important adjustment of any future evaluation using this questionnaire. Finally, a potential sampling frame has been proposed for routine use.
So, are we ready to move into routine evaluation alongside the CMP? We have some reservations about the current UK FS-ICU-24 questionnaire.
The UK FS-ICU-24 provides high mean overall family satisfaction scores and domain scores, in general, thus leaving little room for even higher scores to indicate the impact of any improvement measures. In addition, other, more qualitative data collected as part of the FREE study indicate that the questionnaire may not be sensitive to all aspects of family satisfaction.
In preparation for feeding back comparative and individual results of the FREE study to participating ICUs, a coding framework was developed, based on the structure of the UK FS-ICU-24, to code the free-text responses to the three questions:
-
Do you have any suggestions on how to make care provided in the ICU better?
-
Do you have any comments on things we did well?
-
Please add any comments or suggestions that you feel may be helpful to the staff of this ICU.
Overall, 72% of family members (5157 of 7173) responded to at least one of these three questions. Although formal analysis of these more qualitative data did not form part of this proposal, brief analysis has indicated that there may be scope for improvement of the UK FS-ICU-24 and that a detailed analysis of the rich data generated as part of the FREE study, combining both quantitative and qualitative, is warranted.
A few examples are cited below.
‘How did we treat your family member (the patient)?’, item 1, concern and caring by ICU staff (the courtesy, respect and compassion your family member (the patient) was given), had response options ‘excellent/very good/good/fair/poor/not applicable’. This item was rated excellent by one responder, yet their comment noted:
The only issue to detract from the excellent service given in ICU was the action of [staff name], his bedside manner was atrocious he seemed insensitive to both patient and family and his attitude continued after [patient name] left ICU, we will be putting in a formal complaint letter.
This suggested that response options might be improved, along the lines of ‘all ICU staff were concerned and caring/most ICU staff . . ./few ICU staff . . ./no ICU staff . . .’ and, even with such response options, an additional item might be required to reflect that concern and caring occurred all the time/most of the time/some of the time/none of the time.
Other responders who also rated this item excellent also noted:
On two occasions, a doctor asked my mother fairly pressing questions (early on in care) about either pressing on with treatment or making comfortable and not carrying out any invasive surgery. These were asked early in the morning with no one from family to support her and when asked later in the day with two of us present, was surprised that mum had changed her mind. I think that the patient needs to be fully awake and supported to answer these questions.
One member of the night staff was very curt with my husband and called him a ‘very difficult patient’, unfortunately I did not get a chance to see or meet with the above.
Some of the team did not talk to my partner or explain to him what they were doing, or to myself. When I asked for help with his needs or medicine etc. one nurse did not seem to have any care or compassion in anything she was doing for my partner.
When [patient name] was put on the pathway care he was totally alone. The screens were around him and he was left completely alone – no nurses and no medication. I came back after going home – he was cold from the feet up and no one was with him. I had to ask for help. It was as if he didn’t exist.
‘How did we treat your family member (the patient)?’, item 2a, symptom management: pain (how well the ICU staff assessed and treated your family member’s symptoms), had response options ‘excellent/very good/good/fair/poor/not applicable’. This item was rated excellent by one responder, yet their comment noted:
I noticed redness on my son’s buttocks due to pressure. I pointed this out but the skin was allowed to deteriorate further. Pressure area care is a very basic nursing skill as prolonged pain is caused and the risk of infection is present.
‘How did we treat you?’, item 4, emotional support (how well the ICU staff provided emotional support) had response options ‘excellent/very good/good/fair/poor/not applicable’. This item was rated excellent by one responder, yet their comment noted:
I think the only thing I could suggest is at times the consultants I feel didn’t have a lot of people skills. They were amazing at what they did, but when talking to family members I didn’t feel compassion was there.
Another responder who also rated this item ‘excellent’ also noted:
I would like to add that the ICU consultants were by and large very negative. One consultant even stated that ‘if he survives he will probably need 24 hour care’. We felt that this was a very unnecessary prognosis 10 days after his crisis and caused us much anguish for a few days. This prognosis was unfounded and was not helpful. The language use by this consultant was very harsh.
‘Information needs’, item 2, ease of getting information (willingness of ICU staff to answer your questions) had response options ‘excellent/very good/good/fair/poor/not applicable’. This item was rated ‘excellent’ by one responder, yet their comment noted:
Care was excellent but whatever care was given was never discussed with the family as we were not allowed to visit when the doctors were making their rounds (and decisions).
Other responders who also rated this item ‘excellent’ also noted:
I did not see or speak to a doctor at all. This would have made such a difference to me and my daughter.
The doctors/nurses did not openly volunteer information unless we asked. There could have been better feedback as to how he was progressing during his time in ICU.
Although we recognise that this is only an informal analysis of a very large number of comments (approximately 60% of family members commented), it raises concerns that the current items/response options on the FS-ICU-24 may be too insensitive and we would recommend a formal analysis of these data.
Recommendations for research
Recommendation 1: further development of the UK 24-item Family Satisfaction in the Intensive Care Unit questionnaire
We recommend a combination of (1) a formal secondary analysis of the rich quantitative and qualitative data in the FREE study data set to inform further development of the UK FS-ICU-24 questionnaire for use in evaluating family satisfaction in UK ICUs and (2) primary research to test the psychometric properties of the new questionnaire.
Recommendation 2: further testing of the new UK 24-item Family Satisfaction in the Intensive Care Unit questionnaire
We recommend primary research to test the utility of the new UK FS-ICU-24 questionnaire, focusing on its ability to detect change, that is its sensitivity.
Recommendation 3: evaluation of the association of ethnicity with family satisfaction
The finding that ethnicity was associated with overall family satisfaction (white family members of both ICU survivors and non-survivors reported higher satisfaction, on average) warrants further investigation.
Acknowledgements
We are grateful to the NIHR Health Services and Delivery Research programme for funding this project. We wish to thank all the patients, family members and staff from all the units that participated in the study.
We wish to thank Arthur Affleck for his contribution to the acquisition, analysis and interpretation of the data used in adapting the FS-ICU questionnaire for UK use; Lorraine McSweeney for her contribution to the development of the coding frame used to categorise the free-text comments for feedback to units; Imran Khan and Steven Saunders for their contribution to coding the free-text comments; and David Allen and Peter Gibb from ICUsteps for their support in setting up the focus groups. A thank-you also to all the staff at ICNARC, with special thanks to Zainab Ali, Lucy Lloyd-Scott and Francesca Parrott.
Research staff at participating units
We acknowledge that there have been many other individuals who made a contribution within the participating units. It is impossible to thank everyone personally; however, we would like to thank the following research staff:
C Smalley and R Jacob (Arrowe Park Hospital, Wirral); S Chau, S A Pearson, K Ellis and R Watmough (Barnsley Hospital, Barnsley); M Faulkner, L Evans and H Robertson (Countess of Chester Hospital, Chester); P Wakefield, R Abrahams, N Summers and H Wooldridge (Darent Valley Hospital, Dartford); H McMillan, S Tyson, K Tantam, S Olver, C Brown and C Tippett (Derriford Hospital, Plymouth); S Moreton, S Jones, A Deeney, J Gibbins and A Oglesby (Dorset County Hospital, Dorchester); C Randell, M Allsop, K Harris, C Scott and C Boyd (Freeman Hospital, Newcastle upon Tyne); E Coughlan, A Jefferies and K Wylie (Manchester Royal Infirmary, Manchester); C Plowright, C Pegg, L Cooper and T Hatton (Medway Maritime Hospital, Gillingham); P Doble, P Richards, D Bayford and K Adams (Musgrove Park Hospital, Taunton); J Spimpolo, M Burt and R Pillai (Northampton General Hospital, Northampton); K A Simeson and S Buckley (Pinderfields Hospital, Wakefield); A Jackson, M Nadolski and H Baker (Royal Devon and Exeter Hospital, Wonford); N Mason, U Gunter and L Roberts (Royal Gwent Hospital, Newport); T Evans, E Cooke, M Ogden and P Dark (Salford Royal Hospital, Salford); M Cody, F Hogg and D McCahery (South West Acute Hospital, Fermanagh); D Dawson, J Mellinghoff, S Prudden, N Poonuth and C Ryan (St George’s Hospital, London); G Mandersloot, A Smith (The Royal London Hospital); S Hagan, L Humphries and E Murphy (Ulster Hospital, Belfast); E Walker, H Payne and X Zhao (Watford General Hospital, Watford); C Edmondson, S Anglesea and H Williams (Wrexham Maelor Hospital, Wrexham).
Contributions of authors
Dr Stephen E Wright (consultant in anaesthesia and intensive care) contributed to the design of the study, contributed to the acquisition, analysis and interpretation of the data, and drafted and critically reviewed the manuscript.
Emma Walmsley (study co-ordinator) co-ordinated the study, contributed to the acquisition and interpretation of the data, and drafted and critically reviewed the manuscript.
Dr Sheila E Harvey (CTU manager and senior research fellow) contributed to the design of the study, contributed to the acquisition, analysis and interpretation of the data, and drafted and critically reviewed the manuscript.
Emily Robinson (study statistician) contributed to the analysis and interpretation of the data, and drafted the manuscript.
Paloma Ferrando-Vivas (statistician/risk modeller) contributed to the analysis and interpretation of the data, and drafted and critically reviewed the manuscript.
Dr David A Harrison (senior statistician and honorary senior lecturer in medical statistics) contributed to the design of the study, contributed to the analysis and interpretation of the data, and drafted and critically reviewed the manuscript.
Ruth R Canter (research assistant) contributed to the analysis and interpretation of the data, and drafted and critically reviewed the manuscript.
Professor Elaine McColl (director of Newcastle CTU and professor of health services research) contributed to the design of the study, contributed to the acquisition, analysis and interpretation of the data, and drafted and critically reviewed the manuscript.
Annette Richardson (nurse consultant in critical care) contributed to the design of the study, contributed to the acquisition of data, and critically reviewed the manuscript.
Michael Richardson (sole proprietor) contributed to the design of the study and critically reviewed the manuscript.
Dr Lisa Hinton (senior qualitative researcher in primary care health sciences) contributed to the design of the study and critically reviewed the manuscript.
Professor Daren K Heyland (director of the Kingston General Hospital Clinical Evaluation Research Unit and professor of medicine and epidemiology) contributed to the design of the study, contributed to the analysis and interpretation of the data, and critically reviewed the manuscript.
Professor Kathryn M Rowan (director of scientific and strategic development at ICNARC and honorary professor) conceived and designed the study, contributed to the acquisition, analysis and interpretation of the data, and drafted and critically reviewed the manuscript.
Study management team
Emma Walmsley (study co-ordinator); Catrina Adams (previous research administrator); Dr Sheila Harvey (CTU manager and co-investigator); Alvin Richards-Belle (previous research administrator); Emily Robinson (study statistician); Professor Kathryn Rowan (chief investigator); and Steven Saunders (research administrator).
Study Management Group
Dr Daren Heyland (co-investigator); Dr David Harrison (senior statistician and co-investigator); Dr Sheila Harvey (CTU manager and co-investigator); Dr Lisa Hinton (co-investigator); Professor Elaine McColl (co-investigator); Annette Richardson (co-investigator); Michael Richardson (co-investigator); Professor Kathryn Rowan (chief investigator); and Dr Stephen Wright (lead clinical investigator).
Study Steering Committee
Dr Kathleen Daly (independent chair); Andrina Colquoun (independent); Dr Maureen Dalziel; Kirsty Everingham (independent); Doreen Henry (independent); Joan Pearson (independent); Catherine Plowright; Dr Laura Price (independent); Professor Kathryn Rowan; Professor Mervyn Singer (independent); and Dr Stephen Wright.
Data sharing statement
Data can be obtained from the corresponding author.
Disclaimers
This report presents independent research funded by the National Institute for Health Research (NIHR). The views and opinions expressed by authors in this publication are those of the authors and do not necessarily reflect those of the NHS, the NIHR, NETSCC, the HS&DR programme or the Department of Health. If there are verbatim quotations included in this publication the views and opinions expressed by the interviewees are those of the interviewees and do not necessarily reflect those of the authors, those of the NHS, the NIHR, NETSCC, the HS&DR programme or the Department of Health.
References
- Equity and Excellence: Liberating the NHS. London: The Stationery Office; 2010.
- The NHS Outcomes Framework 2011/12. London: Department of Health; 2010.
- High Quality Care for All: NHS Next Stage Review. London: Department of Health; 2008.
- Black N, Jenkinson C. Measuring patients’ experiences and outcomes. BMJ 2009;339. http://dx.doi.org/10.1136/bmj.b2495.
- healthtalk.org . Intensive Care: Patients’ Experiences 2006 n.d. www.healthtalk.org/peoples-experiences/intensive-care/intensive-care-patients-experiences/topics (accessed 6 November 2015).
- healthtalk.org . Intensive Care: Experiences of Family &Amp; Friends 2006 n.d. www.healthtalk.org/peoples-experiences/intensive-care/intensive-care-experiences-family-friends/topics (accessed 6 November 2015).
- Rothen HU, Stricker KH, Heyland DK. Family satisfaction with critical care: measurements and messages. Curr Opin Crit Care 2010;16:623-31. http://dx.doi.org/10.1097/MCC.0b013e32833e9718.
- Heyland DK, Tranmer JE. Measuring family satisfaction with care in the intensive care unit: the development of a questionnaire and preliminary results. J Crit Care 2001;16:142-9. http://dx.doi.org/10.1053/jcrc.2001.30163.
- Heyland DK, Rocker GM, Dodek PM, Kutsogiannis DJ, Konopad E, Cook DJ, et al. Family satisfaction with care in the intensive care unit: results of a multiple center study. Crit Care Med 2002;30:1413-18. http://dx.doi.org/10.1097/00003246-200207000-00002.
- Heyland DK, Cook DJ, Rocker GM, Dodek PM, Kutsogiannis DJ, Peters S, et al. Decision-making in the ICU: perspectives of the substitute decision-maker. Intensive Care Med 2003;29:75-82.
- Wall RJ, Engelberg RA, Downey L, Heyland DK, Curtis JR. Refinement, scoring, and validation of the Family Satisfaction in the Intensive Care Unit (FS-ICU) survey. Crit Care Med 2007;35:271-9. http://dx.doi.org/10.1097/01.CCM.0000251122.15053.50.
- Bullinger M, Anderson R, Cella D, Aaronson N. Developing and evaluating cross-cultural instruments from minimum requirements to optimal models. Qual Life Res 1993;2:451-9. http://dx.doi.org/10.1007/BF00422219.
- Bullinger M, Alonso J, Apolone G, Leplege A, Sullivan M, Wood-Dauphinee S, et al. Translating health status questionnaires and evaluating their quality: the IQOLA Project approach. J Clin Epidemiol 1998;51:913-23. http://dx.doi.org/10.1016/S0895-4356(98)00082-1.
- Jenkinson C, Wright L, Coulter A. Criterion validity and reliability of the SF-36 in a population sample. Qual Life Res 1994;3:7-12. http://dx.doi.org/10.1007/BF00647843.
- Jenkinson C, Stewart-Brown S, Petersen S, Paice C. Assessment of the SF-36 version 2 in the United Kingdom. J Epidemiol Commun H 1999;53:46-50. http://dx.doi.org/10.1136/jech.53.1.46.
- Bowling A, Bond M, Jenkinson C, Lamping DL. Short Form 36 (SF-36) Health Survey questionnaire: which normative data should be used? Comparisons between the norms provided by the Omnibus Survey in Britain, the Health Survey for England and the Oxford Healthy Life Survey. J Public Health Med 1999;21:255-70. http://dx.doi.org/10.1093/pubmed/21.3.255.
- Stricker KH, Niemann S, Bugnon S, Wurz J, Rohrer O, Rothen HU. Family satisfaction in the intensive care unit: cross-cultural adaptation of a questionnaire. J Crit Care 2007;22:204-11. http://dx.doi.org/10.1016/j.jcrc.2006.12.008.
- Singh R, Nelson J, Wright SE. Audit of Family Satisfaction With Patient Care and Decision Making on an Intensive Care Unit n.d.
- Willis GB. Cognitive Interviewing: A Tool for Improving Questionnaire Design. Thousand Oaks, CA: Sage Publications; 2005.
- Mental Capacity Act 2005. London: The Stationery Office; 2005.
- CARENET . Family Satisfaction Downloads n.d. www.thecarenet.ca/216-family-satisfaction-downloads (accessed 6 November 2015).
- Healthcare Quality Improvement Partnership . HQIP Quality Accounts n.d. http://hqip.org.uk/national-programmes/quality-accounts/ (accessed 6 November 2015).
- Curtis JR, Patrick DL, Engelberg RA, Norris K, Asp C, Byock I. A measure of the quality of dying and death: initial validation using after-death interviews with family members. J Pain Symptom Manag 2002;24:17-31. http://dx.doi.org/10.1016/S0885-3924(02)00419-0.
- Department of Health . The Health Service (Control of Patient Information) Regulations 2002 n.d. www.legislation.gov.uk/uksi/2002/1438/body/made (accessed 6 November 2015).
- Edwards PJ, Roberts I, Clarke MJ, Diguiseppi C, Wentz R, Kwan I, et al. Methods to increase response to postal and electronic questionnaires. Cochrane Database Syst Rev 2009;3. http://dx.doi.org/10.1002/14651858.mr000008.pub4.
- Knaus WA, Draper EA, Wagner DP, Zimmerman JE. APACHE II: a severity of disease classification system. Crit Care Med 1985;13:818-29. http://dx.doi.org/10.1097/00003246-198510000-00009.
- Harrison DA, Parry GJ, Carpenter JR, Short A, Rowan K. A new risk prediction model for critical care: the Intensive Care National Audit & Research Centre (ICNARC) model. Crit Care Med 2007;35:1091-8. http://dx.doi.org/10.1097/01.CCM.0000259468.24532.44.
- Institute for Digital Research and Education . Stata FAQ: How Can I Do Factor Analysis With Missing Data in Stata? n.d. www.ats.ucla.edu/stat/stata/faq/factor_missing.htm (accessed 6 November 2015).
- Truxillo C. Maximum Likelihood Parameter Estimation With Incomplete Data n.d.
- Cronbach L. Coefficient alpha and the internal structure of tests. Psychometrika 1951;16:297-302. http://dx.doi.org/10.1007/BF02310555.
- Bollen KA. Structural Equations with Latent Variables. New York, NY: Wiley; 1989.
- Hooper D, Coughlan J, Mullen MR. Structural equation modelling: guidelines for determining model fit. Electron J Bus Res Methods 2008;6:53-60.
- Bernstein IH, Teng G. Factoring items and factoring scales are different: spurious evidence for multidimensionality due to item categorization. Psychol Bull 1989;105:467-77. http://dx.doi.org/10.1037/0033-2909.105.3.467.
- Kaiser HF. The varimax criterion for analytic rotation in factor analysis. Psychometrika 1958;23:187-200. http://dx.doi.org/10.1007/BF02289233.
- Hendrickson AE, White PO. Promax: a quick method for rotation to oblique simple structure. Br J Math Stat Psychol 1964;17:65-70. http://dx.doi.org/10.1111/j.2044-8317.1964.tb00244.x.
- van Buuren S. Multiple imputation of discrete and continuous data by fully conditional specification. Stat Methods Med Res 2007;16:219-42. http://dx.doi.org/10.1177/0962280206074463.
- Dodek PM, Heyland DK, Rocker GM, Cook DJ. Translating family satisfaction data into quality improvement. Crit Care Med 2004;32:1922-7. http://dx.doi.org/10.1097/01.CCM.0000139920.53790.61.
- Dalisay-Gallardo MI, Perez E. Family members’ satisfaction in the end-of-life care in the ICU in a tertiary hospital setting. Philippine J Intern Med 2012;50:1-11.
- Schwarzkopf D, Behrend S, Skupin H, Westermann I, Riedemann NC, Pfeifer R, et al. Family satisfaction in the intensive care unit: a quantitative and qualitative analysis. Intensive Care Med 2013;39:1071-9. http://dx.doi.org/10.1007/s00134-013-2862-7.
- Tastan S, Iyigun E, Ayhan H, Kilickaya O, Yilmaz AA, Kurt E. Validity and reliability of Turkish version of family satisfaction in the intensive care unit. Int J Nurs Pract 2014;20:320-6. http://dx.doi.org/10.1111/ijn.12153.
- Gerasimou-Angelidi S, Myrianthefs P, Chovas A, Baltopoulos G, Komnos A. Nursing Activities Score as a predictor of family satisfaction in an adult Intensive Care Unit in Greece. J Nurs Manag 2014;22:151-8. http://dx.doi.org/10.1111/jonm.12089.
- Kourti M, Fildisis G, Christofilou E, Floros I, Kallergis G. Family satisfaction with the care of patients in the intensive care unit. Arch Hellenic Med 2014;31:60-7.
- Malliarou M, Sarafis P, Karathanasi K, Sotiriadou K, Moustaka H, Zyga S. Reliability of the FS-ICU 24 questionnaire for the assessment of the family satisfaction with care in the intensive care unit among health professionals. Hυgeía@εργασiα 2012;3:127-34.
- Gottschall AC, West SG, Enders CK. A comparison of item-level and scale-level multiple imputation for questionnaire batteries. Multivariate Behav Res 2012;47:1-25. http://dx.doi.org/10.1080/00273171.2012.640589.
- Royston P, Sauerbrei W. Building multivariable regression models with continuous covariates in clinical epidemiology with an emphasis on fractional polynomials. Methods Info Med 2005;44:561-71.
- von Hippel PT. Should a normal imputation model be modified to impute skewed variables?. Sociol Methods Res 2013;42:105-38. http://dx.doi.org/10.1177/0049124112464866.
- Carpenter J, Goldstein H. Multiple imputation in MLwiN. Multilevel Modelling Newsletter 2005;16:9-18.
- Carpenter JR, Goldstein H, Kenward MG. REALCOM-IMPUTE software for multilevel multiple imputation with mixed response types. J Stat Software 2011;45:1-14. http://dx.doi.org/10.18637/jss.v045.i05.
- Goldstein H. REALCOM-IMPUTE: Multiple Imputation Using MLwin. Bristol: Centre for Multilevel Modelling, University of Bristol; 2014.
- Rubin DB. Multiple Imputation for Nonresponse in Surveys. New York, NY: John Wiley & Sons; 1987.
- Raudenbush SW, Bryk AS. Hierarchical Linear Models: Applications and Data Analysis Methods. Newbury Park, CA: Sage Publications; 2002.
- Snijders TAB, Bosker RJ. Multilevel Analysis: An Introduction to Basic and Advanced Multilevel Modeling. Thousand Oaks, CA: Sage Publications; 1999.
- Curtis JR, Treece PD, Nielsen EL, Downey L, Shannon SE, Braungardt T, et al. Integrating palliative and critical care: evaluation of a quality-improvement intervention. Am J Respir Crit Care Med 2008;178:269-75. http://dx.doi.org/10.1164/rccm.200802-272OC.
- Lewis-Newby M, Curtis JR, Martin DP, Engelberg RA. Measuring family satisfaction with care and quality of dying in the intensive care unit: does patient age matter?. J Palliat Med 2011;14:1284-90. http://dx.doi.org/10.1089/jpm.2011.0138.
- Stricker KH, Kimberger O, Schmidlin K, Zwahlen M, Mohr U, Rothen HU. Family satisfaction in the intensive care unit: what makes the difference?. Intensive Care Med 2009;35:2051-9. http://dx.doi.org/10.1007/s00134-009-1611-4.
- Garland A, Roberts D, Graff L. Twenty-four-hour intensivist presence: a pilot study of effects on intensive care unit patients, families, doctors, and nurses. Am J Respir Crit Care Med 2012;185:738-43. http://dx.doi.org/10.1164/rccm.201109-1734OC.
- Khalaila R. Patients’ family satisfaction with needs met at the medical intensive care unit. J Adv Nurs 2013;69:1172-82. http://dx.doi.org/10.1111/j.1365-2648.2012.06109.x.
- Spiegelhalter DJ. Funnel plots for comparing institutional performance. Stat Med 2005;24:1185-202. http://dx.doi.org/10.1002/sim.1970.
- Dowling J, Vender J, Guilianelli S, Wang B. A model of family-centered care and satisfaction predictors: the Critical Care Family Assistance Program. Chest 2005;128:81S-92S. http://dx.doi.org/10.1378/chest.128.3_suppl.81S.
- Dowling J, Wang B. Impact on family satisfaction: the Critical Care Family Assistance Program. Chest 2005;128:76S-80S. http://dx.doi.org/10.1378/chest.128.3_suppl.76S.
- Wall RJ, Curtis JR, Cooke CR, Engelberg RA. Family satisfaction in the ICU: differences between families of survivors and nonsurvivors. Chest 2007;132:1425-33. http://dx.doi.org/10.1378/chest.07-0419.
- Khandelwal N, Engelberg RA, Benkeser DC, Coe NB, Curtis JR. End-of-life expenditure in the ICU and perceived quality of dying. Chest 2014;146:1594-603. http://dx.doi.org/10.1378/chest.14-0182.
- Johnson JR, Engelberg RA, Nielsen EL, Kross EK, Smith NL, Hanada JC, et al. The Association of Spiritual Care Providers’ activities with family members’ satisfaction with care after a death in the ICU. Crit Care Med 2014;42:1991-2000. http://dx.doi.org/10.1097/CCM.0000000000000412.
- Gries CJ, Cuitis JR, Wall RJ, Engelberg RA. Family member satisfaction with end-of-life decision making in the ICU. Chest 2008;133:704-12. http://dx.doi.org/10.1378/chest.07-1773.
- Gerstel E, Engelberg RA, Koepsell T, Curtis JR. Duration of withdrawal of life support in the intensive care unit and association with family satisfaction. Am J Respir Crit Care Med 2008;178:798-804. http://dx.doi.org/10.1164/rccm.200711-1617OC.
- Curtis JR, Nielsen EL, Treece PD, Downey L, Dotolo D, Shannon SE, et al. Effect of a quality-improvement intervention on end-of-life care in the intensive care unit: a randomized trial. Am J Respir Crit Care Med 2011;183:348-55. http://dx.doi.org/10.1164/rccm.201006-1004OC.
- Osborn TR, Curtis JR, Nielsen EL, Back AL, Shannon SE, Engelberg RA. Identifying elements of ICU care that families report as important but unsatisfactory: decision-making, control, and ICU atmosphere. Chest 2012;142:1185-92. http://dx.doi.org/10.1378/chest.11-3277.
- Kross EK, Nielsen EL, Curtis JR, Engelberg RA. Survey burden for family members surveyed about end-of-life care in the intensive care unit. J Pain Symptom Manage 2012;44:671-80. http://dx.doi.org/10.1016/j.jpainsymman.2011.11.008.
- DeCato TW, Engelberg RA, Downey L, Nielsen EL, Treece PD, Back AL, et al. Hospital variation and temporal trends in palliative and end-of-life care in the ICU. Crit Care Med 2013;41:1405-11. http://dx.doi.org/10.1097/CCM.0b013e318287f289.
- Kross EK, Engelberg RA, Downey L, Cuschieri J, Hallman MR, Longstreth WT, et al. Differences in end-of-life care in the ICU across patients cared for by medicine, surgery, neurology, and neurosurgery physicians. Chest 2014;145:313-21. http://dx.doi.org/10.1378/chest.13-1351.
- Long A, Kross EK, Engelberg RA, Downey L, Nielsen EL, Back AL, et al. Quality of dying in the ICU: is it worse for patients admitted from the hospital ward compared to those admitted from the emergency department?. Intensive Care Med 2014;40:1688-97. http://dx.doi.org/10.1007/s00134-014-3425-2.
- Jacobowski NL, Girard TD, Mulder JA, Ely EW. Communication in critical care: family rounds in the intensive care unit. Am J Crit Care 2010;19:421-30. http://dx.doi.org/10.4037/ajcc2010656.
- Hunziker S, McHugh W, Sarnoff-Lee B, Cannistraro S, Ngo L, Marcantonio E, et al. Predictors and correlates of dissatisfaction with intensive care. Crit Care Med 2012;40:1554-61. http://dx.doi.org/10.1097/CCM.0b013e3182451c70.
- Dodek PM, Wong H, Heyland DK, Cook DJ, Rocker GM, Kutsogiannis DJ, et al. The relationship between organizational culture and family satisfaction in critical care. Crit Care Med 2012;40:1506-12. http://dx.doi.org/10.1097/CCM.0b013e318241e368.
- Jongerden IP, Slooter AJ, Peelen LM, Wessels H, Ram CM, Kesecioglu J, et al. Effect of intensive care environment on family and patient satisfaction: a before–after study. Intensive Care Med 2013;39:1626-34. http://dx.doi.org/10.1007/s00134-013-2966-0.
- Epstein D, Unger JB, Ornelas B, Chang JC, Markovitz BP, Moromisato DY, et al. Psychometric evaluation of a modified version of the family satisfaction in the ICU survey in parents/caregivers of critically ill children. Pediatr Crit Care Med 2013;14:e350-6. http://dx.doi.org/10.1097/PCC.0b013e3182917705.
- Epstein D, Unger J, Ornelas B, Chang J, Markovitz B, Dodek P, et al. Satisfaction with care and decision-making among parents/caregivers in the pediatric ICU: a comparison between English-speaking Caucasians and Latinos. J Crit Care 2014;30:236-41. http://dx.doi.org/10.1016/j.jcrc.2014.11.009.
- Shaw DJ, Davidson JE, Smilde RI, Sondoozi T, Agan D. Multidisciplinary team training to enhance family communication in the ICU. Crit Care Med 2014;42:265-71. http://dx.doi.org/10.1097/CCM.0b013e3182a26ea5.
- Dhillon A, Tardini F, Bittner E, Schmidt U, Allain R, Bigatello L. Benefit of using a ‘bundled’ consent for intensive care unit procedures as part of an early family meeting. J Crit Care 2014;29:919-22. http://dx.doi.org/10.1016/j.jcrc.2014.07.004.
- Kodali S, Stametz RA, Bengier AC, Clarke DN, Layon AJ, Darer JD. Family experience with intensive care unit care: association of self-reported family conferences and family satisfaction. J Crit Care 2014;29:641-4. http://dx.doi.org/10.1016/j.jcrc.2014.03.012.
Appendix 1 24-item Family Satisfaction in the Intensive Care Unit questionnaire (FS-ICU-24)
Appendix 2 UK 24-item Family Satisfaction in the Intensive Care Unit questionnaire (UK FS-ICU-24)
Appendix 3 Quality of Dying and Death questionnaire
Appendix 4 Poster and leaflet
Appendix 5 Participant information sheet
Appendix 6 Questionnaire pack
Appendix 7 Data collection form
List of abbreviations
- APACHE
- Acute Physiology and Chronic Health Evaluation
- CD
- coefficient of determination
- CFI
- comparative fit index
- CI
- confidence interval
- CLRN
- comprehensive local research network
- CMP
- Case Mix Programme
- CRN
- Clinical Research Network
- CTU
- Clinical Trials Unit
- FREE
- Family-Reported Experiences Evaluation
- FS-ICU
- Family Satisfaction in the Intensive Care Unit questionnaire
- ICNARC
- Intensive Care National Audit & Research Centre
- ICU
- intensive care unit
- ICUsteps
- Intensive Care Unit Support Teams for Ex-Patients
- IQR
- interquartile range
- NIHR
- National Institute for Health Research
- NVQ
- National Vocational Qualification
- PI
- principal investigator
- QODD
- Quality of Dying and Death
- R&D
- research and development
- RMSEA
- root-mean-squared error of approximation
- SAPS
- Simplified Acute Physiology Score
- SD
- standard deviation
- SMG
- Study Management Group
- SSC
- Study Steering Committee
- TLI
- Tucker–Lewis index