Notes
Article history
The research reported in this issue of the journal was funded by the HSDR programme or one of its preceding programmes as project number 14/04/22. The contractual start date was in December 2018. The final report began editorial review in March 2019 and was accepted for publication in April 2020. The authors have been wholly responsible for all data collection, analysis and interpretation, and for writing up their work. The HSDR editors and production house have tried to ensure the accuracy of the authors’™ report and would like to thank the reviewers for their constructive comments on the final report document. However, they do not accept liability for damages or losses arising from material published in this report.
Permissions
Copyright statement
© King’s Printer and Controller of HMSO 2022. This work was produced by Brady et al. under the terms of a commissioning contract issued by the Secretary of State for Health and Social Care. This issue may be freely reproduced for the purposes of private research and study and extracts (or indeed, the full report) may be included in professional journals provided that suitable acknowledgement is made and the reproduction is not associated with any form of advertising. Applications for commercial reproduction should be addressed to: NIHR Journals Library, National Institute for Health and Care Research, Evaluation, Trials and Studies Coordinating Centre, Alpha House, University of Southampton Science Park, Southampton SO16 7NS, UK.
2022 King’s Printer and Controller of HMSO
Chapter 1 Background
Parts of this report have been adapted with permission from Brady et al. 1 © Wolters Kluwer Health Inc.
Aphasia
Of the estimated 10.3 million people worldwide who experience a stroke each year, 3.6 million people (35%2) are likely to have a stroke-related language impairment known as aphasia. Each year, an estimated 35,000 people in the UK experience a newly acquired aphasia, affecting not only their language abilities (ability to speak, understand, read and write words and sentences), but may also affect their ability to use gesture, tell the time, use money and perform simple mathematical calculations. Of those who experience aphasia, 61% continue to have communication problems 1 year later. 3 Approximately 350,000 people in the UK are thought to be living with aphasia. 4
Impact of aphasia
Aphasia is one of the most common and most devastating long-term consequences of stroke5 and extends beyond the communication domain. Stroke survivors with aphasia have poorer functional recovery (p = 0.007)6 {comprehension deficits, in particular, affect activities of daily living [odds ratio (OR) 5.38, 95% confidence interval (CI) 2.35 to 12.34; p < 0.001]},7 continence (p = 0.003)8 and emotional well-being (r = 0.51; p = 0.001)9 after stroke than stroke survivors without aphasia. People with aphasia receive less pain medication than other stroke surviors. 10 Aphasia also negatively affects hospital discharge destination (p = 0.002),6 the likelihood of successful return to work (p = 0.009)11 and self-rated health after stroke. 12 These outcomes are despite people with aphasia having more contact with rehabilitation specialists2 and more rehabilitation interventions13 (contributing to the higher cost of care for people with aphasia) than those without. 14 In the USA alone, the presence of aphasia at the time of stroke adds US$2.16B, annually, to the cost of acute stroke care. 15 The communicative quality of those rehabilitation interactions may, thus, benefit from closer investigation.
Aphasia and psychosocial impacts
Aphasia directly influences a person’s perception of their own identity16,17 isolating the person with the communication impairment from their spouse, family and wider social networks. 18,19 Family members have also described feeling isolated. 20 Aphasia intensifies social problems more generally associated with a stroke, restricting or altering social activities. 21 This leads to fewer friendships and smaller social networks than before the stroke, and than both healthy peers and stroke survivors with preserved language abilities. 18,21 With restricted opportunities for social participation, people with aphasia become socially isolated, which severely affects their emotional well-being. 19 Spontaneous recovery of language and communication abilities has been thought to be limited beyond the first year after aphasia onset. 22 Emerging research has questioned this premise,23 and further evidence indicates that focused therapeutic interventions may provide benefit in later stages after stroke. 24–26
Aphasia recovery
Aphasia recovery and participant demographics
Clinical guidelines recommend that people with aphasia are provided with ‘realistic recovery prospects’ following aphasia,27 but, based on current evidence, accurate prognosis is difficult. Although age has been associated with language recovery, the nature of that interaction remains unclear. 3,13,28,29 Patient sex has been reported by some to be linked to the incidence of aphasia13 and initial aphasia profile (but not recovery3,28), although several large, well-controlled studies found no evidence of this effect. 2,3,30 Conducting a large-scale investigation of aphasia after stroke has often required compromise, with language data based on a single item in a global stroke severity scale,2,3,29 and, in some cases, restricted to one aspect of language use. 3 Details on the ability to speak, understand, read, write and participate in everyday communication activities are often unavailable in these tools, thereby limiting our clinical interpretation of aphasia impact and recovery.
The contribution that socioeconomic status and educational background make to recovery may also be relevant, but the interconnectedness of these factors with cognition and performance on measures of language ability makes this a difficult concept to untangle. 3,31–33 The incidence of aphasia is similar among monolingual and bilingual stroke survivors, although it has been suggested that bilinguals experience a milder aphasia. 34 However, studies using imaging data found that bilinguals’ performances on a detailed language assessment protocol were worse than monolinguals’ performances. 35 Social support prior to and following a stroke may also positively influence outcome36,37 and, although opportunities to practise functional language use have been shown to decrease as a consequence of aphasia,18 they are also an important factor in aphasia recovery38,39 and research. 38
Aphasia recovery and stroke profile
Initial stroke severity13,28 and time since stroke may be important factors in language recovery, the latter specifically in relation to the acceptability of high-intensity therapy. 40,41 There is growing evidence that the site and size of stroke lesion (although perhaps not structural connectivity) are indicators of language recovery. 31,42 Stroke-related problems, including depression and cognition, vision and hearing impairments, are also thought to be important to language recovery and rehabilitation. 43–45 Others suggest that the initial aphasia profile (i.e. severity, domains involved, abilities retained) may predict the pattern of language recovery. 3,28,31 Concomitant stroke-related speech disorders, such as dysarthria (a motor speech disorder) and apraxia (disordered planning of movement to produce speech), may also affect initial functional outcomes and recovery. 46
Speech and language therapy for people with aphasia after stroke
Effective management and rehabilitation of aphasia is vital. 41 People with aphasia experience significant benefits on measures of functional communication, understanding and spoken language after stroke following speech and language therapy (SLT) than those who do not receive therapy. 41 SLT for people with aphasia is highly complex47 and typically tailored to a heterogeneous group (Figure 1).
FIGURE 1.
Speech and language therapy for aphasia.
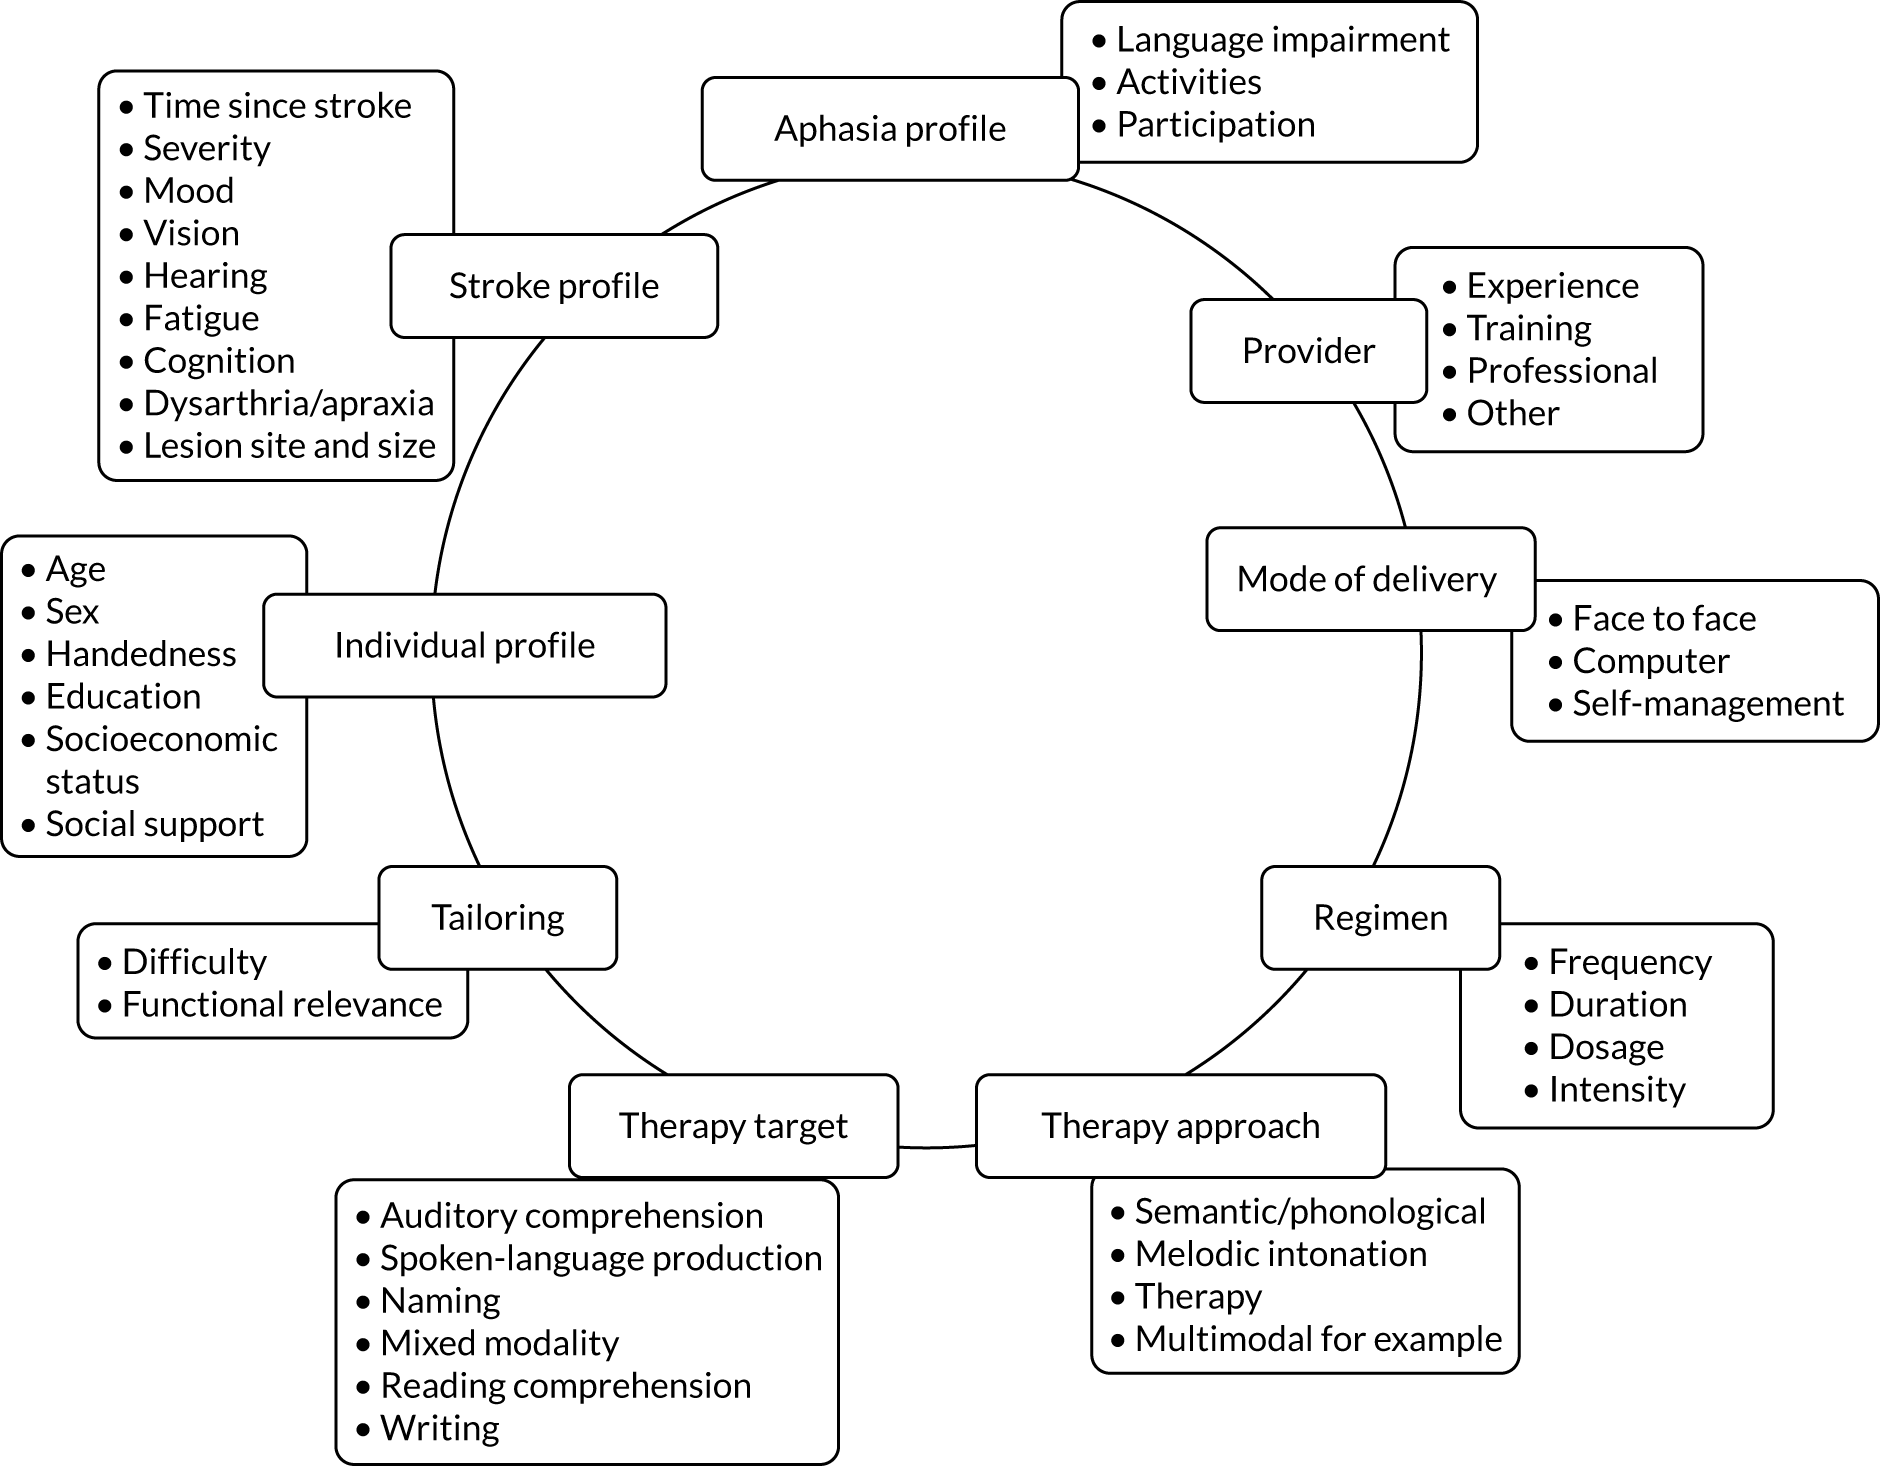
Therapy activities may be delivered by a range of therapist-trained providers (therapists, volunteers or family members). 41 There is no indication that individual, group or self-managed therapy delivery approaches using personalised computer software, for example, affect SLT benefits for people with aphasia. 41 Therapy interventions may target a range of language domains (e.g. spoken language, auditory comprehension, writing) or aim to educate carers and staff to maximise communicative effectiveness through conversational support for the person with aphasia. Interventions may adopt any one or more of several theoretical approaches (e.g. melodic intonation or functional, semantic, phonological or multimodal therapy), while the optimum intervention regimen (timing, intensity, frequency, duration and dosage) remains uncertain. 22,41,48,49
Regimen
Early stroke rehabilitation has been advocated50 to maximise the period of neuronal reorganisation in the brain subsequent to the stroke lesion,51 in a context of enhanced rehabilitation environments and stimulation. 52,53 Recent randomised controlled trials (RCTs) of SLT interventions have recruited within clinically relevant timelines (days to weeks after stroke)54–56 with mixed results, whereas others have demonstrated benefits among more chronic participants. 57 The optimal timing of language rehabilitation for people with aphasia after stroke continues to be uncertain, and evidence of the most effective SLT intervention regimen, based on therapy frequency (number of therapy sessions weekly), duration (start to end of therapy intervention), intensity (number of hours weekly) or dosage (total hours) provided, is also unclear.
Intensive SLT intervention has been found to benefit functional communication, written language and severity of aphasia, but significantly more people withdrew from (dropouts for any reason p = 0.005), or declined to continue with (non-adherence p < 0.00001), intensive therapy than less intensive therapy. 41 Interestingly, differential withdrawal and non-adherence rates and the language recovery benefits were observed only among people within 3 months of their stroke. Thus, therapy regimen and participant factors may be important independent and interdependent factors in the effectiveness of and tolerance to SLT for aphasia after stroke.
Clinical guideline recommendations
UK and international clinical guidelines on aphasia after stroke highlight the paucity of guidance to support therapists’ provision of aphasia rehabilitation interventions. 58 Evidence-based stroke clinical guidelines rarely offer specific therapy approach, regimen or mode of delivery recommendations, in contrast to movement rehabilitation recommendations for strength and fitness training, orthoses, electric stimulation and more. 59–61
Early62,63 and high-intensity SLT64 may be effective, but these historic reviews of SLT for aphasia were limited in their design (time-bound, English language only, small number of studies included, summary data analysis only). The Cochrane review (57 RCTs, n = 3002 participants) found that the potential benefit of high-intensity SLT was confounded by a significantly higher dropout rate from intensive SLT groups. 41 Tailoring to the individual is considered essential,65 but is based on best practice recommendation. High-quality information from large-scale research projects does not currently exist to guide therapists’ choice of an effective therapeutic approach best suited to a specific patient with aphasia (and their families).
Data sets capturing a large number of people with aphasia after stroke are typically based on single-centre data with relatively small numbers of individual participant data (IPD). In studies for which larger numbers of IPD are available (n > 200), the quality of information on language outcomes is often restricted, informed by a language data item on a generic stroke scale or screening tool gathered by non-language specialists2,3,29 and lacking a full description across a range of language skills.
Availability of speech and language therapy for people with aphasia
Information on clinical services for people with aphasia after stroke is difficult to gather. A 2003 UK survey found that therapists providing adult services reported that only one-quarter of their time was spent on aphasia. Of available SLT time for aphasia, just 5% was spent on interventions with an intensity of > 3 hours weekly. 66 Half of SLT time was invested in interventions at an intensity of < 3 hours weekly. 66 An earlier survey reported in 2000 indicated that the average total duration of SLT interventions for people with aphasia ranged from one to five sessions in the UK and Australia. 67 North American SLT interventions ranged from 16 to 20 sessions. 67 Since then, hospital-based SLT in Australia may have increased, with a 2009 survey describing typical intervention intensity of 4 hours weekly (2 hours weekly in acute settings). 68 Information about the SLT received by 278 people with aphasia from across the UK prior to their involvement in the Big Clinical and cost-effectiveness of aphasia computer treatment versus usual stimulation or attention control long term post-stroke (Big CACTUS) trial69 showed that, in the first 3 months from the index stroke and pre recruitment, participants had received a total dosage of 11 hours of SLT, delivered at an intensity of approximately 1 hour weekly. People who were ≥ 5 years after the index stroke received a total dosage of 2.75 hours over the preceding 3-month period, delivered at an intensity of 45 minutes monthly,69 even lower than the 1 hour weekly reported for people with aphasia in the Australian community. 68
National audits, although capturing information on access to clinical services, rarely distinguish between time spent with a speech and language therapist for dysphagia (swallowing problems) and aphasia. 2 The Sentinel Stroke National Audit Programme (SSNAP) does, however, highlight the lack of resources for SLT services, a sentiment echoed by therapists. 70 The 2016–17 SSNAP data71 highlighted stroke specialist services with no speech and language therapist, whereas others had a very limited service (one or less full-time equivalent therapist), leaving service provision for aphasia vulnerable should a therapist be on leave, move post or retire.
There is some suggestion, however, that standard SLT services may be changing in some centres. Usual care provided to participants with aphasia in a recent Australian Phase III trial72 found that the usual care arm provided early SLT intervention to 81% of participants, compared with just 12% in the Phase II trial. 56 Similarly, the Phase III trial72 usual care participants received more frequent SLT, and a SLT dosage of 9.5 hours over the first 7 weeks (approximate intensity of 1.5 hours of SLT weekly), compared with an average intensity of 14 minutes of SLT weekly in the Phase II trial. 56 Although the triallists acknowledge that this could be related to the sites simply being part of a trial (the observer effect), it may also suggest a shift in usual SLT interventions over time in those centres. 56,72
Aphasia: a research priority
Aphasia intervention research was identified twice in the shared top 10 research priorities by stroke survivors, family members and health-care professionals in the 2011 James Lind Alliance Priority Setting Partnership. 73 Effective aphasia rehabilitation and support interventions for people with aphasia and their families were agreed to be urgent unmet research needs. 73 More recently, the Royal College of Speech and Language Therapists (in the UK) identified aphasia research as a top five research priority topic among their membership. 74 Two further priority-setting initiatives for aphasia research also identified the need for clinically relevant information regarding aphasia therapy intervention approaches, timing, intensity, duration, dose of therapy and therapy provider among the research priorities. 48,49
Rehabilitation of aphasia after stroke: a research challenge
The recent priority-setting initiatives have highlighted the gaps in evidence informing the delivery of SLT to people with aphasia. Growing recognition of the importance of focused, early rehabilitation after stroke (for example by Bernhardt et al. 75) has occurred in parallel with increasingly constrained NHS therapy budgets. Prognostic indicators may inform the development of predictive models that acknowledge the existence of parallel spontaneous recovery alongside the benefits of early intervention and brain plasticity. 51 The diversity among people with aphasia and the range of therapeutic interventions have led some to question whether or not large RCTs of SLT for aphasia is the optimal approach to gaining insights into what works best and for whom. 76
Complex SLT interventions (see Figure 1) may be optimised, and specific patient subgroups may benefit from particular SLT interventions. Large-scale investigations of SLT for aphasia are possible and worthwhile. 25,26,55–57,72 International collaboration in this field may be further challenged by the difference in languages across centres and the lack of non-English-language aphasia assessment measures. However, examining the impact of the many permutations of a complex intervention such as SLT on a complex population, which varies by participant, aphasia and stroke profile, would need decades of large, logistically challenging and costly RCTs. Much insight may be gained to inform the design of clinical services and future aphasia research by exploring existing aphasia research data sets.
Synthesising pre-existing aphasia research data
Data synthesis and secondary analysis of large, aphasia-specific data sets has informed our understanding of SLT for aphasia after stroke. Pooling of group-level summary (aggregated) data demonstrated the effectiveness of SLT for aphasia across language domains. It also identified a possible interaction between the SLT regimen and timing of therapy after stroke, and also methodologically in relation to the choice of attention control interventions. 38,41 Meta-analysis has provided a cost-effective way to inform our understanding of aphasia recovery and rehabilitation before moving forward with costlier RCTs. Such an approach, however, also has limitations.
Traditional meta-analysis makes paired comparisons (therapy A vs. therapy B), but does not easily permit a comparison of therapy A versus B versus C versus D. Clinically, SLT interventions are tailored to individual patients’ degrees of language impairment across modalities, attention or levels of fatigue. Group-level summary statistics prevent examination of the influence of participant-level covariates (e.g. age, time since stroke, aphasia severity or sex) on treatment effects.
Secondary analysis of IPD ensures that individuals (their aphasia and stroke profile, recovery and, when relevant, tailored therapy approach) would be analysed in the context of their individual data set, and not aggregated and averaged across a highly heterogeneous group. A collaborative, international approach to data-sharing and retrieval of published and unpublished data sets would support the development of a substantive database to explore key clinical and research questions, such as the patterns and predictors of language recovery, optimum SLT approaches for aphasia rehabilitation and treatment effect modifiers, benefiting researchers, therapists and people with aphasia.
Aims
The aims were to explore the contribution that individual characteristics (including stroke and aphasia profiles) and intervention components make to the natural history of recovery and rehabilitation of people with aphasia following stroke, and to inform future research design by utilising pre-existing aphasia data to explore the following:
-
the natural history of language recovery
-
the patient, aphasia, stroke and environmental characteristics that are linked to good language recovery
-
the components of effective therapy interventions.
Research questions
The research questions are in Box 1.
-
What is the pattern of language recovery following stroke-related aphasia?
-
What is the natural history of language recovery?
-
When is language recovery most likely to occur?
-
Which components of language are most/least likely to recover (overall language ability, spoken language, auditory comprehension, reading comprehension and writing)?
-
Does this vary by language?
-
-
What are the predictors of language recovery outcomes following aphasia in relation to:
-
Aphasia profile (the degree to which overall language ability, auditory comprehension, spoken language, reading comprehension and writing have each been affected in one or more languages)?
-
Individual characteristics (age, education, cognition, mono- or multilingual)?
-
Rehabilitation environment (social support, socioeconomic demographics, ethnicity)?
-
Stroke profile (severity, lesion type, size, location)?
-
-
What are the components of effective aphasia rehabilitation interventions in relation to:
-
Timing of intervention?
-
Frequency, duration, intensity and dose of intervention?
-
Repetition and adherence to home-based therapy tasks?
-
Functional relevance and theoretical approach?
-
-
Are some interventions (or intervention components) more beneficial for some patient subgroups (individual, stroke or aphasia characteristics) than others?
Chapter 2 Methods
Overview
We created an international, multilingual database that included IPD on demographics, language impairment, stroke and SLT interventions. The purpose of our database was to support exploration of a range of key clinical questions relating to SLT for aphasia after stroke. The REhabilitation and recovery of peopLE with Aphasia after StrokE (RELEASE) IPD meta-analysis and network meta-analysis study followed a prespecified protocol and identified suitable data sets following a systematic review of the literature (PROSPERO CRD42018110947). We did not employ a strict experimental approach and hypothesis-testing. Instead, we sought to use statistical inferencing to identify promising lines of enquiry for specific investigation in future large-scale definitive experimental investigations in which participant populations and data items could be well defined.
The RELEASE study database (Integrated Research Application System number 179505) (Figure 2) met existing data-sharing guidelines78 and the International Committee of Medical Journal Editors’ proposal,79 and the reporting observes the Preferred Reporting Items for Systematic Reviews and Meta-Analyses (PRISMA) and relevant extensions. 80–85 We employed the Template for Intervention Description and Replication (TIDieR) to support data extraction of the complex SLT interventions,86 the Guidance for Reporting Involvement of Patients and the Public (GRIPP2)87 and the Grading of Recommendations Assessment, Development and Evaluation (GRADE) system to support judgements of the impact of the quality of the evidence on our findings. 88
FIGURE 2.
Creation of the RELEASE study database. ID, identification.

Studies included in the review
Types of studies
Data sets with IPD on people with aphasia after stroke were sought. We particularly looked for IPD data sets from RCTs, recognising their rigour and robustness for our planned analyses, by using a RCT-optimised search strategy. However, other study designs that met our eligibility criteria were also included, for example non-RCT, cohort and case series studies,89,90 as well as clinical and research registries (Box 2). Non-RCT designs (including cohort and case series) were included in covariate-adjusted analyses of recovery profiles and predictors of prognosis after stroke. 89,91 We applied no restrictions to study design, data set age, country, minimum number of time points, duration of follow-up, language of data collection or publication.
We accepted data sets that contained anonymised IPD:
-
collected as part of an ethically approved primary research study or clinical or research register
-
on a minimum of 10 individual participants with aphasia because of stroke
-
on aphasia severity
-
on time since stroke (or time since aphasia onset) at the time of initial assessment
-
relating to formal measures of functional language use, language expression, auditory comprehension, reading or writing.
Data sets were excluded if they were:
-
qualitative data only
-
non-language data only (e.g. response times)
-
presenting group summary level data only.
Types of study designs included
The primary research studies included in the RELEASE study were categorised according to study design:
-
RCTs – participants were randomly allocated to study groups that typically differed in the intervention received [or received a control (or no) intervention].
-
Non-RCT studies – participants were recruited but random allocation was not applied to group selection by the primary research team.
-
Cohort/case series – data sets from a single participant group that did not compare different SLT interventions.
-
Registries – clinical or research databases holding information (e.g. demographic, stroke, aphasia and SLT intervention details) on people with aphasia after stroke, which was not directly gathered to address a single research question.
Interventional or non-interventional
Studies were also classified according to whether they were (1) interventional, whereby SLT was provided in the context of the study, or (2) non-interventional, whereby no SLT was provided in the context of the study.
Crossover data sets
We identified crossover data sets (crossover RCTs or non-RCTs) and carefully extracted all data up to the point of crossing over.
Types of participants
We screened all participants for inclusion in the RELEASE study database and subsequent analyses. We had no exclusion criteria relating to participants’ time since stroke, age, language impairment or access to SLT. If aphasia was not the result of a stroke, those participants’ data were excluded and the remaining IPD from that data set (when all other eligibility criteria were met) were included. We defined three participant subgroups relevant to our analysis:
-
Natural history subgroup – participants recruited within 15 days of first stroke and allocated to receive no SLT intervention for a defined period of time in the primary research study. These participants were unlikely to have received significant historical language rehabilitation or SLT.
-
Historical SLT subgroup – participants allocated to receive no SLT intervention in a primary research study, but recruited beyond 15 days of stroke onset. Given the context of aphasia research activity, we assumed that these participants had some clinical access to SLT for their aphasia prior to their study entry.
-
SLT subgroup – participants allocated to receive SLT in the context of a primary research study (research SLT) or permitted continued access to standard SLT during the study period and recruited any time after onset of aphasia.
Speech and language therapy interventions
Speech and language therapy was defined as ‘any targeted practice or rehabilitation tasks that aimed to improve language or communication abilities, activities, or participation.’41 When relevant, we sought primary research studies that included a description of a SLT intervention (Table 1) to inform our research questions. Although therapy was typically delivered by a speech and language therapist (a protected professional title in the UK), we also included other therapy providers, as this was one aspect of our planned analysis.
| Type of SLT | Description |
|---|---|
| Therapy approach defined by treatment target | |
| 1. Mixed SLT | Targets both auditory comprehension and spoken-language impairments |
| 2. Spoken-language SLT | Targets rehabilitation of spoken language |
| 3. Auditory comprehension SLT | Targets rehabilitation of auditory comprehension |
| 4. Word-finding SLT | Targets rehabilitation of word retrieval or naming |
| 5. Reading comprehension SLT | Targets rehabilitation of reading comprehension |
| 6. Writing SLT | Targets rehabilitation of written language |
| Therapy approach defined by theoretical approach | |
| 7. Functional or pragmatic SLT | Targets improvement in communication activities and tasks considered useful in day-to-day functioning and often involves targeted practice in real-world communication situations |
| 8. Phonological SLT | Uses phonological approaches and seeks to improve the sound structure of language by targeting improvements in phonological input and output routes |
| 9. Semantic SLT | Uses semantic approaches that focus on interpretation of language, with the aim of improving semantic processing |
| 10. Semantic and phonological SLT | Employs a treatment programme that uses both semantic and phonological approaches |
| 11. Constraint-induced aphasia therapy | Participants are required to use spoken communication alone. Other communicative methods such as gesture may be discouraged |
| 12. Melodic intonation therapy | Employs rhythm and formulaic language to support recovery of language and exaggerated melodic sentence patterns to elicit spontaneous speech |
| 13. Conversational partner-training SLT | Targets communication interaction between the person with aphasia and their conversation partner(s). Conversational partners may be spouse, family member, friends or health-care professionals |
| 14. Verbal therapy | Seeks to improve verbal communication through tasks that include auditory comprehension, spoken language, repetition, naming, sentence construction, semantic or phonological judgements, reading or writing, but do not include music, singing, drawing or gesture-cueing tasks |
| 15. Multimodal therapy | Therapy tasks as listed for verbal therapy (auditory comprehension, spoken language, repetition, naming, sentence construction, semantic or phonological judgements, reading or writing), but that include music, singing, drawing or gesture, with the aim of improving (1) verbal communication (multimodal verbal), whereby non-verbal modalities are employed to facilitate or augment language rehabilitation or (2) total communication (multimodal total), whereby non-verbal modalities are a method of communication |
Speech and language therapy interventions were summarised to support clinically meaningful data synthesis and meta-analyses. Narrative descriptions of the SLT approaches, materials and procedures employed were initially extracted as direct quotations (when possible) from published reports. Descriptions were then tabulated and similar approaches were grouped by an experienced speech and language therapist. These narrative descriptions and preliminary groupings were shared among the collaborators for review and discussion. Following discussion and consensus, we identified 15 possible SLT approaches categorised from two perspectives:
-
the impairment target, for example rehabilitation of spoken language
-
the theoretical approach, for example semantic therapy.
Categories were not mutually exclusive, that is one SLT intervention could include more than one component, and thus be profiled across several categories.
Social support and stimulation of communication
Social support and stimulation interventions provided informal support and functional language stimulation to the person with aphasia, but did not include targeted therapeutic interventions that aimed to resolve participants’ speech and language impairments. Historically they have been used as an attention control in trials of SLT for aphasia or as an adjunct to SLT providing an opportunity to apply new learning in functionally relevant communicative situations.
Conventional speech and language therapy
Interventions described as ‘conventional’, ‘traditional’, ‘standard’, ‘typical’, ‘as directed by the therapist’ or ‘usual’ SLT (and for which absence of detail prevented more specific categorisation) were referred to as ‘conventional SLT’. Such interventions were often delivered in a comparative group or clinical registry. We recognise that conventional therapy in one context may not be comparable with another.
Speech and language therapy co-interventions
We did not explore the impact of pharmacological or neurostimulation (e.g. magnetic or electrical stimulation such as transcranial direct-current stimulation) co-interventions, which are not typically within the remit of therapists in the UK. Examining the contribution of these co-interventions to language recovery among people with aphasia was beyond the scope and remit of the RELEASE study. We extracted information about the presence of such co-interventions and the timing of delivery and noted this in the data analysis.
Types of outcome measures
Improved ability to use language in real-world situations is the primary goal for aphasia rehabilitation and research. People with aphasia and their family members prioritise functional language use [linked to the International Classification of Functioning, Disability and Health (ICF) components of activity and participation], alongside improvements in language ability (body function). 93 Meta-analysis of functional communication measures is methodologically challenging, as they may be self-reports or proxy reports using rating scales, profiles or questionnaires. Discourse analysis, which observes the use of communication features within a sample of functional language, offers yet another approach, and debate continues about its usefulness and rigour. 94,95 In trials of aphasia rehabilitation, measurement of ‘real-world’ language use and functional communication is uncommon,41 and inconsistently captured across studies. 93 Measures of language impairment are considerably more common,41,96 and reflect overall language abilities (or aphasia severity) across several subtests, which typically include auditory comprehension, spoken language, reading, writing and functional language use.
Main outcome
The main outcome was change from baseline to follow-up in language performance (language recovery) on formal measures of language ability across six prespecified domains (overall language ability, auditory comprehension, spoken-language production, reading comprehension, writing and functional communication) (Box 3).
-
Demographic information (age, sex, handedness, education, cognition, dysarthria, apraxia, languages spoken, depression, other neurological diagnosis, vision and hearing abilities, ethnicity).
-
Environmental descriptors (living environment, social support, socioeconomic status).
-
Stroke characteristics (hemisphere, type, time since stroke, severity, first or subsequent stroke).
-
Overall language ability.
-
Auditory comprehension.
-
Spoken-language production.
-
Reading.
-
Writing.
-
Functional communication.
-
Design.
-
Inclusion/exclusion criteria (e.g. dementia, prior stroke).
-
Recruitment dates (or publication).
-
Number of participants.
-
Country and language of data collection.
-
Data collection time point(s).
-
Blinding.
-
Dropouts.
-
Randomisation (RCTs only).
-
Concealment of allocation (RCTs only).
-
Who: provider.
-
How: delivery mechanism(s).
-
Where: context of intervention.
-
How much: duration (total number of weeks over which therapy was delivered).
-
How much: intensity (hours of therapy provided on a weekly basis).
-
How much: frequency (how many days therapy was provided on a weekly basis).
-
How much: dosage (total number of hours of therapy provided, home-based practice tasks).
-
Tailoring: by difficulty, by functional relevance.
-
How well: adherence (data capture and actual adherence rates).
-
What: theoretical approach.
-
What: treatment target.
Adapted with permission from Brady et al. 92 This is an Open Access article distributed in accordance with the terms of the Creative Commons Attribution (CC BY 4.0) license, which permits others to distribute, remix, adapt and build upon this work, for commercial use, provided the original work is properly cited. See: https://creativecommons.org/licenses/by/4.0/. The box includes minor additions and formatting changes to the original box.
Given the multinational and multidisciplinary nature of this study, we did not predefine a list of all relevant language assessments and language versions of those measures. Instead, we established eligibility criteria that included any language assessment that (1) captured an outcome of relevance to this study, (2) was published and (3) met with the approval of the RELEASE study collaborators. Agreement was achieved on all measures included and their alignment with specific language domains. We excluded screening tools owing to their variable psychometric properties and lack of sensitivity (due to ceiling effects), and the subsequent impact that this would have on our analysis. 97
Data collection time points
We extracted data on participants at recruitment or entry to the primary research study and at all available time points following this. When follow-up data were available, the time of follow-up was recorded in a continuous fashion in days since primary study baseline. When time to follow-up was given in a category (e.g. 3–6 months), the mean of this time span was taken (i.e. 4.5 months in this example) and converted to days.
Identification of data sets for inclusion
Electronic search methods
We searched the following databases from inception to September 2015 using a RCT-optimised search strategy: Cochrane Stroke Group Trials Register, Cochrane Central Register of Controlled Trials and other Cochrane Library databases (Cochrane Database of Systematic Reviews, Database of Abstracts of Reviews of Effects and Health Technology Assessment Database), MEDLINE, EMBASE, Cumulative Index to Nursing and Allied Health Literature, Allied and Complementary Medicine Database, Linguistic and Language Behavior Abstracts and SpeechBITE (see Appendix 1). We also reviewed all studies included in and excluded from a 2016 systematic review. 41 We imposed no language restrictions.
Study records
All study records identified in the searches were screened for eligibility for inclusion. When references described potentially eligible data sets, we invited the primary research teams to confirm eligibility and (where appropriate) to contribute their IPD data sets to our RELEASE study database. We also extended an invitation to contribute through our pre-existing networks, including the Collaboration of Aphasia Trialists [www.aphasiatrials.org (accessed 5 June 2020)].
Selection of studies
One researcher (LRW or KVB) screened titles and abstracts of the records identified using the methods described above and applied the inclusion criteria. Obviously irrelevant titles or reports were excluded. Full-text copies of all the remaining data set reports were reviewed by an independent researcher (KVB, LRW or MCB). Eligibility criteria were ascertained through review of published reports for each study. When published reports were unavailable (for recently completed studies, clinical registries or similar), we clarified eligibility through discussion with the primary research team. Any disagreements about eligibility were resolved through discussion with a third reviewer.
Data collection
For all potentially eligible records identified, we used a systematic approach, starting with an e-mail to the corresponding author describing the aims and objectives of the RELEASE study, enquiring about the potential eligibility of their data set, inviting them to confirm the data set’s eligibility and to contribute the anonymised electronic data set. If there was no response, a second approach was attempted 1 month later. When e-mail addresses were invalid, or when there was no response to the second approach, we attempted contact with other members of the authorship team. If these attempts went unanswered, we recorded this as ‘no response’. All unavailable data sets and associated IPD were recorded.
We recorded all communications with primary research teams, including queries around eligibility, invitations to contribute and other correspondence. If the primary research team expressed an interest in contributing, we invited them to submit a copy of their anonymised electronic data set in an encrypted format through the Collaboration of Aphasia Trialists’ website [www.aphasiatrials.org (accessed 5 June 2020)]. We requested that all electronic data set contributions were accompanied by a data dictionary, a funder report or other reporting of that data set and findings if available. Evidence of gatekeeper (data controller) approval to share the data set with the RELEASE study collaborators and ethics approval for primary research studies were required. When the primary research team required additional permissions to share the data set for the purposes of secondary data analysis, we requested a copy. We also identified eligible IPD data sets in the public domain and extracted the relevant data for inclusion.
Data extraction
We developed and piloted a data extraction table to support systematic retrieval of data. The data items were identified with reference to our research questions and best practice in reporting of complex interventions and meta-analyses. 82,84–86 (see Box 3). Information sources included published reports and communication with the primary research team to gather data that were otherwise unavailable. When possible, we confirmed data extraction with the primary research team for accuracy and completeness. Following the query resolution process, data items unreported or unavailable from other data sources were recorded as unreported. Items not relevant to that data set were marked as not applicable. For all data sets, a second researcher (MCB) double-checked the data extraction. Disagreements were resolved through discussion or the involvement of a third data extractor.
Risk of bias in included studies
We extracted information on the quality of each data set using both Cochrane quality items relating to RCTs98 and the data items from the Joanna Briggs Institute critical appraisal checklists for case–control studies, case series, cohort studies, non-RCTs (quasi-experimental studies) and analytical cross-sectional studies. 99 Aspects irrelevant to our analysis were not extracted; details of the statistical analysis processes applied in the primary research were not relevant to the RELEASE study as we were working with the IPD and not summary statistics; information about exposure to the cause was irrelevant, as aphasia following stroke was a RELEASE study entry criterion; and criteria for the outcome measures used were prespecified for the RELEASE study. Similarly, items relating to data interpretation (e.g. strategies to deal with confounders) were not extracted and synthesised, as these activities reflected on the reporting of the primary research data set and not on the IPD contributed to the RELEASE study database or the planned analysis.
We considered the methodological quality of each included data set in terms of the following potential sources of bias:
-
Selection bias – using reported data, we checked whether or not there was any risk of bias in the allocation of individual participants to a specific group in an included trial. In the context of RCTs, for example, we considered whether or not the randomisation sequence generated was truly random and whether or not the sequence allocation was concealed up to the time the individual was allocated to a group. In non-RCT group comparison data sets, we considered whether or not it may have been possible to randomly allocate participants across the groups.
-
Performance bias – we documented any co-interventions delivered and whether or not there was any difference between RCT or non-RCT studies. Blinding participants to the delivery of SLT (or not) is almost impossible, although we did seek any examples of when it may have occurred (e.g. computer-based language stimulation vs. a non-verbal cognitive task).
-
Detection bias – for all data sets with data collection at baseline and at a post-SLT intervention (or comparison group) follow-up time point, we extracted data on whether or not outcome assessors were blinded to the group, time since onset or other key information.
-
Attrition bias – we examined whether or not there was evidence of a systematic difference between comparison groups in the number of dropouts (withdrawals for any reason) or number of non-adherents (those who decline to continue participation during the intervention) after study entry.
-
Other biases – we considered other possible sources of bias, such as the similarity of comparison group at baseline, the primary study’s relevance to our research questions and outcome reporting bias, when outcomes collected were unavailable and did not contribute to the data synthesis.
For all possible risks of bias, we coded the studies as being at a low, unclear or high risk of bias. We also considered the impact of any potential biases on the findings using sensitivity analyses or narratively.
Data management
Data encryption and storage
All data contributed to the RELEASE study database were stored at the Nursing, Midwifery and Allied Health Professions (NMAHP) Research Unit at Glasgow Caledonian University (GCU), UK, according to the university’s information systems policy. Original primary research data sets and any additional study data were stored on a secure hard drive [a 1 terabyte IronKey™ Enterprise H300 password-protected and encrypted external hard drive (Kingston Technology Corporation, Fountain Valley, CA, USA)] with centralised management. The hard drive was kept in locked storage in a password-protected room. These data were available as data descriptors on the GCU hard drive, which restricted access to the GCU-based project management team only. The primary research data sets were preserved unmodified. Anonymised, password-protected working copies of these primary research data sets were created and stored on the NMAHP Research Unit’s designated portion of the university server. Adjustments to these working data sets did not affect the original primary research data.
Security and access
Primary research IPD data sets, data sets created for this project and analyses data sets were accessed only by the RELEASE study project management team at GCU. 100 Data were not accessible to those outside the project collaboration. The project management team and collaborators governed use of the research data, and participated in data analysis plans, interpretation of the findings and preparation and review of the manuscripts based on the planned analyses. All collaborators had an opportunity to contribute to the planned secondary analyses [which were conducted in SAS® version 2.8 (SAS Institute Inc., Cary, NC, USA)].
Data preparation for analysis
We undertook a rigorous process of preparing the IPD data sets for analysis to ensure that the data were valid, as complete as possible, consistent and uniform.
Quality assurance and verification
Each data set was cross-checked against the primary source, such as published papers, protocols and other outputs. We checked within data sets for duplicate participant data sets. We also identified duplication of participant demographics whereby participants taking part in one study went on to participate in a subsequent study led by the same research team, or were reported across dual publications (e.g. as a study group in one study but a comparison group in another). Duplicate participants were identified through (1) careful review of the supporting literature and study materials across primary research teams, (2) checking demographic data across IPD data sets contributed by the same primary research teams and (3) when possible, correspondence with the primary research team. Duplicate entries and any risk of double-counting participant data were excluded from the analysis. This was achieved by removing duplicate participant data sets from one of the data sets, and removing duplicate demographic data prior to any overview in which the participant descriptors would be double-counted. Other data were considered on a variable-by-variable and analysis-by-analysis basis.
Variable labels for data sets collected in non-English languages were translated by the contributing primary research teams. We confirmed the accuracy and completeness of translations with contributors. Following data extraction, the representative from each primary research team was sent an overview of the data items and details relating to their contributed data set. They were asked to confirm that the information was accurate and complete.
Data cleaning and mapping to unit of analysis
Data were contributed in a range of different formats such as Microsoft Excel® (Microsoft Corporation, Redmond, WA, USA), SAS and Statistical Product and Service Solutions (SPSS) (formerly Statistical Package for the Social Sciences) [IBM Corporation, Armonk, NY, USA (IBM SPSS Statistics from version 19 onwards) or SPSS Inc., Chicago, IL, USA (version 18 and below)]. In the first instance, we cleaned all data sets to reclassify duplicated variable names, removed blank lines and transposed data into a one row per participant format (short form). We converted all data sets into SAS. Prior to analysis, data relating to prespecified variables needed for the RELEASE study analyses (see Box 3) were cleaned. These variables were decided a priori by the research and analysis team and presented to the wider RELEASE study collaboration for review and comment. We ensured that the variable entry matched an agreed uniform format to inform our planned analyses. For example, time since stroke was recorded in days, months and years across RELEASE data sets; the RELEASE collaboration agreed to record ‘time since stroke’ in the format of ‘days since stroke’. When necessary, entries as years or months after stroke were converted to days. In some cases, the record format was a date entry from which days since stroke could be calculated when date of study entry was considered. For each variable of relevance, the primary research data sets and other data sources (publications, protocols, data dictionary) were searched for that variable or indicative surrogate measures. Decisions on how to synthesise these data into a common nomenclature were based on agreement of the wider collaboration. A decision tree was used to ensure standardisation of variable names and ranges when converting data from the original data sets to the RELEASE study analysis data sets.
For some variables, the relevant data were common to all participants across a data set and not included in the contributed electronic IPD data set. For example, if the primary research entry criteria specified right-handed participants, then all participants in that data set were right-handed, whether or not this was recorded in the submitted electronic data set. Similarly, when a specific intervention was delivered to one randomised group, then (unless otherwise specified) the intervention description was common to all participants in that group. In such cases, we imputed and translated those data using one-to-many merging and in keeping with the agreed format for the RELEASE study analyses.
The collaboration then agreed on standard definitions to describe therapeutic interventions in terms of the theoretical and target approach (see Box 3). These definitions were applied to all intervention studies. In some instances, those participants who were allocated to no SLT were permitted to receive usual care SLT after the study’s active intervention period had finished. In these cases, we identified the follow-up times that corresponded to the duration of no SLT and took those observations forward for analysis in the no-SLT group. We also identified cases of usual SLT care, study SLT intervention and the corresponding follow-up time points associated with each. We identified the presence of crossover in treatment and took all measurements up to the point of crossover. These data were identified, cleaned to a standardised format and entered into the analysis data set.
According to the needs of the analysis, data-cleaning processes included examining the data set for validity of contents, such as receipt of all relevant participants’ data; matching numbers of IPD transferred with those reported in publications; matching variable names to known published assessments and ascertaining any missing domains of assessment from the original data set; examining the content of fields to ensure that they matched prescribed minimums and maximums for known assessments; ascertaining any transformations of data that had occurred prior to transfer and resolving such queries [e.g. use of a mix of t-scores and raw scores in the Aachen Aphasia Test (AAT) across studies]; examining odd values in a given range (e.g. data sets containing a zero value for assessments when this indicated that no assessment had been conducted); and converted data into a numeric format.
Data integrity and validation
Ensuring data integrity was essential to the project. We audited the data sets using statistical and database methods to detect anomalies and contradictions. For example, we checked the validity and plausibility of contributed data, specifically ensuring that data entries were within the acceptable ranges of variables and outcome measures used in the primary research. When this was not the case, we cross-checked the data with all study records or publications, and communicated with the primary research teams to confirm extreme outliers or other questionable values. 98 We examined distributions and descriptive statistics to audit contributed data and identified irregularities or inconsistencies that required further clarification. These were manually checked with the source data, the data report (if available) and the SAS file.
We checked for any imbalance at baseline between individuals included in RCT or non-randomised groups. Working with IPD at the study level, we used the Wilcoxon signed-rank test to look for significant between-group differences in baseline characteristics, including age, sex, years in education, handedness, time since stroke onset (days) and aphasia severity. For comparisons of sex and handedness between groups, we used the chi-squared test.
Measures of treatment effect
We identified language outcome measures and worked with outcome data, transformed to the anchor measure, for each domain (see Anchor and minority measures and Data transformation). We defined measure of treatment effect as the mean of the absolute change from baseline on transformed measures for each of the domains of interest. Effect sizes were estimated and reported with 95% CIs and significance was set at the 5% threshold throughout.
Sample size
We prespecified that each analysis would be based on a minimum of two data sets. As our eligibility criteria dictated that each data set would have a minimum of 10 IPD, our minimum sample size was 20 people with aphasia after stroke.
Data conversion and reformatting data files
Data were converted and stored in SAS version 9.4 format for ease of management.
Data synthesis
Most SLT interventions were described at the primary research study or group level, and only rarely were aspects of that intervention (e.g. the duration or dosage) reported at IPD level in an electronic data set. SLT intervention data were therefore extracted from narrative descriptions in the primary research protocol, electronic data set, published report or through discussion with the primary research team.
A separate data set was generated for each of the following:
-
study description and participant demography
-
outcomes describing the domains of interest
-
SLT intervention and language rehabilitation (and co-interventions when present).
Each data set contained the unique identifier (ID) for constituent participants. This meant that multiple data sets could be linked using this ID to generate a complete picture of the participant’s profile across multiple data sets, and all unique participants could be brought together for each of the planned analyses.
Anchor and minority measures
We prespecified several language domains or outcomes for analysis in the RELEASE study:
-
overall language ability
-
auditory comprehension
-
spoken-language production (including naming)
-
reading comprehension
-
writing
-
functional communication.
For each of these outcomes, a range of assessments (sometimes in various language adaptations) was used. To synthesise the IPD from across these multiple measures, we first identified the most commonly used measurement for each outcome. We profiled all measures used to capture data on that outcome, the number of studies using that measure and the number of IPD available, and calculated the median score, interquartile range (IQR), minimum and maximum for each measurement tool. Language or version variations were treated as separate tools.
An ‘anchor measure’ was identified for each language domain (e.g. reading) as the measurement instrument used by the most data sets in the RELEASE study database. When this approach resulted in two possible anchor measures, the assessment that had the greater number of IPD in that language domain was identified as the anchor measure. All other assessment tools measuring the same domain, but which were informed by smaller numbers of data sets, were considered ‘minority measures’. Minority measures were then transformed to match the format and range of each anchor measure (one for each language domain) through an adapted version of the method previously used in large-scale data synthesis (see Appendix 2, Box 4).
Data transformation
Our transformation process was based on the underlying assumption that the anchor and minority measures for a described outcome were similar. 101 The transformations were based on an investigation of the medians, IQRs, minima and maxima of both the anchor and minority measures according to an algorithm (see Appendix 2, Box 4). A linear transformation from each minority measure to the anchor measure was applied to each quartile and repeated for each language outcome. Each threshold in the minority instrument was mapped to the corresponding threshold in the anchor measure. Values in the minority measure that fell within a quadrant were mapped to the anchor measure relative to the distance from the quadrant edges. The formula was repeated for each quadrant. In this way, the clinical relevance of changes in scores on the anchor measure was retained.
Three alternative approaches to transformation (normalising, internal normalising and direct linear) were considered but rejected. Normalising transformations (e.g. van der Waerden102) requiring pooled ranks across the measures would not be feasible owing to the differences in the width of the various scales. For both normalising and internal normalising approaches, the clinical meaning of any scores or change of scores would be lost. Direct linear transformation would retain the anchor measure values and, thus, clinical relevance. However, it would require mapping the distribution of the minority measures to the anchor measures without retaining the distribution of the anchor measure itself and, as the measures are often naturally skewed in different directions, this would affect the interpretability.
For each of our analyses, values were generated first for the anchor measure and then for the minority measures. Checks were performed to assess whether or not the ranges, values and directions of changes observed for each anchor measure were consistently reflected when transforming each minority measure into the anchor measure.
Meta-synthesis methods
Four research questions were addressed in the context of the RELEASE study, in line with the study objectives (see Box 1). The RELEASE study database supported investigation of (1) the progression of language recovery over time following aphasia after stroke, (2) the individual factors, such as demographic and aphasia profile, that potentially play a role in language recovery over time following aphasia after stroke, (3) the components of effective rehabilitation interventions that best facilitate recovery over time following aphasia after stroke and (4) whether or not certain interventions (or intervention components) are more beneficial for some participant subgroups than others.
Meta-analysis and network meta-analysis
Meta-analyses of aphasia intervention research already exist and have provided evidence-based review and data synthesis of the clinical effectiveness of SLT for aphasia after stroke (e.g. Brady et al. ,41 Robey63 and Bhogal et al. 64). Methodologically, these meta-analyses are usually based on the data synthesis of aggregate group-level summary data. Large group summary approaches taken by RCTs and meta-analysis of RCTs have limitations, particularly in relation to the risk of ecologic bias; aggregate data generated across a complex participant population, such as people with aphasia, risk concealing the possibility of varying individual response to a complex rehabilitation intervention. 76
Traditional meta-analysis is limited to direct between-treatment (or control) comparisons and group-level descriptors of interventions and aggregated group data on the treatment effects. 103 A more detailed examination of the effectiveness of a specific therapy component is not possible owing to the variability of complex SLT across data sets. Similarly, such approaches cannot accommodate or control for participant demographics or other factors relevant to recovery. 41 Network meta-analysis approaches, however, allow for an estimate of the difference between two (or more) treatments that are not directly compared. For example, studies comparing A versus B or A versus C (direct comparisons) can be combined to give an estimate of B versus C (indirect comparison). 104
Individual participant data network analysis approach
Network meta-analysis can be applied to aphasia intervention research using group-level summary statistics,38 but this approach does not address the limitations of ecological bias, highlighted in the previous section. Confounding is also a risk. We conducted a network meta-analysis based on a large IPD database, which allowed us to explore the subtleties of a highly heterogeneous group of people with aphasia after stroke, control for individual predictors and support the detailed exploration of the influence of participant-level covariates on SLT treatment effects across a range of language-specific measures. 104 Meta-analyses based on aggregated data are typically unable to examine such interactions. In addition, we were aware of some studies that had recorded valuable information on SLT intervention at IPD level.
One-stage versus two-stage approach
There are two main approaches to an IPD network meta-analysis: a one- or two-stage approach. 104 Two-stage approaches are very similar to the standard meta-analysis approach, working first with IPD to centrally generate aggregate data for each contributed data set (rather than using the primary research team’s reported summary statistics). These aggregate data could then be meta-analysed with summary statistics from other trials for which only aggregate data were available. This approach can, however, lead to bias in effects, greater heterogeneity and lower power to detect associations between language outcomes and continuous variables. 104 It is also very similar in methodology to existing reviews and meta-analyses of summary data.
In contrast, a one-stage approach would allow all available IPD from across the contributed data sets and IPD retrieved from the public domain, filtered for relevance to each analysis, to be combined into a single model (which considered the clustering of IPD within a study). One benefit of this methodological approach is that it can address confounding by enabling the examination of the impact of several participant and language variables on an intervention effect at the same time.
Network meta-analysis
We performed our one-stage network meta-analysis in SAS, using PROC MIXED, with fixed demographic and treatment effects, and study as a random effect. The variance structure was allowed to be unstructured. Study homogeneity was assessed by examining the variance parameters. Network diagrams for each treatment factor were drawn up. Each comparison within each domain was illustrated by a network graph, and supplemented by a table of the number of available IPD in each RCT and treatment node. We used the graphs to explore the balance of the networks and whether or not all levels in a treatment were compared across and within studies. Each comparison in each domain was illustrated by a network graph, and supplemented by a table of the number of available IPD in each RCT and treatment level. Feasibility was contingent on the number of trials and IPD available.
The populations in each data set were expected to differ, and so a base model of age, sex, time since stroke and baseline score was created for each language domain. We also planned to examine interactions between demographic characteristics and treatments, should sample sizes be sufficient. Given the number of tests likely to be undertaken, we were aware of the high risk of false positives. However, the aim of the RELEASE study exploratory analysis was not to generate definitive answers, but to use inference to suggest priority avenues for future research; therefore, we were more concerned with estimated effect sizes than statistical significance.
Primary analysis
We used RCT data as the gold standard for each planned analysis, with only participants from RCTs included in the primary analyses. Analyses that included data from non-RCTs, cohort/case series studies, observational studies, registries and other study design types (as relevant) followed the primary analysis, to judge whether or not they supported the RCT findings (see Appendix 3, Figure 26). When they did not agree, the data were further explored to quantify this difference.
To maintain the independence of subjects, we ensured that IPD did not appear in more than one data set for intervention type comparisons, although they could appear in more than one data set when grouped by language domains (e.g. overall language ability, auditory comprehension, reading) (see Appendix 3, Figure 26).
Patterns of language recovery
We examined language recovery among people with aphasia across the prespecified language domains: overall language ability, auditory comprehension, naming, other spoken-language production, reading comprehension, writing and functional communication. Analyses were based initially on RCT data, and then expanded to include all study design types (non-RCT group comparisons, cohort, case series and registry data sets).
Descriptions of the patterns of aphasia recovery were generated using four methods across each language domain. As data availability permitted, we described the:
-
natural history of recovery among participants that had no access to SLT
-
trajectory of language recovery over time among participants by assessing their baseline and follow-up scores
-
distribution of language domain scores for participants at study entry
-
absolute proportion of change in language scores from study entry to first follow-up across all domains.
Natural history of language recovery
We defined the natural history population as a population for whom no active SLT intervention was present, and for whom there was no history of previous SLT. People who were allocated to the no-SLT group in a study were typically permitted to receive usual care SLT after the intervention period of the study had been completed. Any SLT intervention could have an impact on the post-intervention follow-up measures. Depending on the time since the onset of their aphasia, they may also have had historical SLT prior to entering the study as part of usual care. We therefore implemented the following restrictions when extracting eligible IPD to support the examination of the natural history of aphasia recovery:
-
Allocation to the no SLT group in an intervention study.
-
Enrolment to the study with baseline assessment commencing within 15 days of index stroke, to reduce the possibility of unreported initiation of SLT as part of usual care.
-
No history of prior stroke.
-
When longer-term follow-up measurements were available, we reported on the first post-intervention follow-up only, when applicable, to eliminate all instances of access to SLT as part of usual care SLT after the study intervention period, as identified in our data extraction.
We plotted baseline language domain scores along with corresponding language domain values that were available at first follow-up, to examine the trajectory of the natural history of language recovery over time in those participants who were allocated to no-SLT groups.
Language recovery in the context of speech and language therapy
We also examined the trajectory of language recovery among participants who had access to SLT; we identified those who had access to SLT either as a study participant (SLT group) or reported (or reasonable grounds to assume) historical access to SLT as part of standard health care prior to study enrolment (historical SLT group). We also identified those who were allocated to the historical SLT group (with enrolment beyond 15 days post stroke to exclude those who were part of the natural history analysis) and assessed whether or not there were sufficient data available at the first follow-up period. We sought to eliminate the impact of any SLT intervention (even usual care) in any follow-up data collection time points.
We described baseline and follow-up scores in all available groups for each language domain, when sufficient data were available. Data were presented as plots of language domain scores over time (relative to study entry) and, when applicable, stratified by SLT, no SLT or historical SLT intervention.
Language recovery: change in language scores from baseline by time since stroke
We examined the role that time since index stroke and study enrolment played on the proportion of recovery observed for each domain score. The study enrolment period in the primary data set was stratified into the following groupings:
-
0–1 month
-
> 1–3 months
-
> 3–6 months
-
> 6 months following index stroke.
We ascertained whether or not participants were allocated to receive a SLT intervention; when possible, we described the absolute proportion of change observed for SLT versus historical SLT (excluding those who were assessed as part of the natural history analysis). We calculated the proportion of change (%) in each language domain score from baseline to first follow-up and plotted these proportion changes by study enrolment period (as categorised earlier). This was described for the RCT population, and then for all study types. We plotted each language domain separately to visualise the proportion of change observed in each domain at different study entry time points. We opted not to stratify data according to baseline severity stratum in combination with aphasia chronicity, as this would have resulted in very small strata and much wider confidence limits, thus precluding informative analyses. We also accounted for the skewness of data measuring language impairment by opting to present medians and IQRs, rather than means and standard errors of the means.
Distribution of language scores at study entry by time since stroke
All participants were selected from the total population of people with aphasia after stroke. We identified all data available at study entry for each language domain. This time point was selected as all participants were assessed prior to receiving any study intervention. We then ascertained the time of assessment relative to stroke onset. We plotted all transformed language domain observations available at study entry against time of study entry, relative to stroke onset, for each language domain. We then fitted a regression line to these observations and conducted linear regression analyses to describe whether there was a significant trend towards increased or decreased language domain scores with later time to study entry. We considered whether or not the baseline data reflected the trajectory findings based on participants’ language scores over time (see Chapter 4). We considered the distribution of language scores at clinically relevant time points (e.g. study entry between 0 and 1000 days since stroke). Finally, we considered whether or not there was any suggestion of selection bias in recruitment to aphasia studies based on participants’ language scores over time since stroke.
Predictors of language recovery
Demographic and stroke covariates identified as statistically significant from the patterns of language recovery analysis (see Appendix 3, Figure 26a) informed our primary statistical analysis of the predictors of language recovery over time. We considered evidence informing other areas of stroke rehabilitation and common assumptions in the context of aphasia rehabilitation.
Whether or not participants had received SLT in the primary research study (SLT/historical SLT or no SLT) was also included in the analyses (see Appendix 3, Figure 26b). Language recovery on a continuous scale was regressed onto the covariates of interest. Initially, each predictor was checked using univariable analysis; covariates significantly associated with the primary outcome at a univariable level (i.e. a p-value of < 0.1) were included in the multivariable regression analysis. Thereafter, covariates were introduced and retained in the final multivariable model only if found to be statistically significant. Each analysis included the study ID as a random covariate, to account for possible variability in the outcome measure between studies.
Participants’ stroke profiles, demographic characteristics and living contexts at baseline and follow-up (when available) were explored graphically and using summary statistics by showing means and standard deviations for continuous and count data (or median and IQR if data were skewed), and frequency and percentages for binary and categorical data. Standard statistical tests (e.g. chi-squared tests) were employed to check formally for statistical differences.
Factors associated with language score changes: age, sex and time since stroke
We performed regression, modelling a trend towards increasing proportion of change, and including age, sex and time since stroke (days) as covariates in this model, to ascertain whether or not there was a relationship between age, sex and time since index stroke on the degree of recovery observed.
Distribution of language scores at study entry: age, sex and living context
Building on the earlier analyses, we identified all participants’ data from across all data sets for the specified language domains at study entry in advance of any study-level intervention. Using the data on time since stroke, we plotted the language scores and explored their distribution across different age groups (≤ 55, 56–65, 66–75 and > 75 years), sex and living contexts.
Optimum approach to speech and language therapy for aphasia
The demographic and stroke covariates identified as statistically significant in earlier analyses were used to create the baseline model to consider the components of effective rehabilitation interventions for people with aphasia after stroke. Once the model was built, additional SLT variables were examined for impact on the primary outcomes (see Appendix 3, Figure 26c). Data were analysed as mixed-effects models, with data set as the random effect. Components of therapy (see Box 3) were considered on a continuum and explored for meaningful categories.
Beneficial speech and language therapy approaches to language recovery for participant subgroups
We explored whether or not some interventions (or intervention components) may be more beneficial for some participant subgroups than others. When demographic/stroke variables were significant to the model, a series of one-stage subset analyses were carried out to explore whether or not certain participant groups responded better to certain therapy interventions (see Appendix 3, Figure 26d). We also examined participant clustering within trials, which would allow us to distinguish individual participant-based interactions from any data set-based interactions. 103
Risk of meta-biases
We considered not only the risk of bias in relation to the primary research data sets (see Risk of bias in included studies), but also how bias might be a risk in how we conducted our IPD meta-analyses and network meta-analyses. We used the Risk Of Bias In Systematic reviews (ROBIS) tool framework to structure our deliberations on our approach and possible risk of bias; for consideration of the potential risk of bias in the RELEASE study meta-analysis and network meta-analysis, see Chapter 8. 105 Risks of selection bias, publication bias and availability bias were among those considered (detailed in the following sections) by a single researcher, and reviewed and discussed with an independent researcher. Consideration was given to any concerns relating to the specification of study eligibility (risk of selection bias), methods used to identify and select studies (risk of selection bias, publication bias), the methods used to collect data (availability bias) and appraise studies and any concerns with the synthesis and findings of our work.
Selection bias
We incorporated a systematic review component as the first stage to building our IPD database and actively invited data set contributions from primary research teams that we had no prior collaboration with. We also identified and extracted IPD reported in the public domain, including the grey literature, from primary research teams with which we had no contact. We considered the possible impact of potentially eligible but unavailable IPD data sets. 106 When relevant, we tested the comparability of groups at baseline.
Publication bias
Through our rigorous approach to identification and selection of eligible data sets, we identified IPD that were conducted across a range of languages, unpublished or reported in the grey literature, thus reducing the risk of reporting bias. 107 Where the limited availability of suitable data sets rendered a funnel plot unfeasible, we examined risk of publication bias by looking at the distribution between sample size and those studies that reported significant findings. It was not possible to look at publication bias in the unpublished registry data sets.
Availability bias
We considered the impact of potentially eligible data sets that were unattainable, unavailable to our study or for which the researchers were uncontactable.
Other biases
We considered the possible risk from other sources of bias, including relevance of the primary research study’s objectives. We used the ROBIS tool to consider to what extent the RELEASE study meta-analysis and network meta-analysis were at risk of bias. 105
Missing data
Not all included data sets had collected (or had available) data on all variables of interest to our analyses. In such situations, the analysis was restricted to the subset of data sets with available data on the variable. However, when primary research materials indicated that a data item was collected but that it was unavailable in the contributed electronic data set, we attempted to extract that data from alternative sources, including:
-
retrieving the data from the text descriptions of published manuscripts or reports
-
retrieving the data from unpublished materials
-
requesting the missing data items from the primary research team.
If, despite our efforts, specific variable data remained unavailable, then that data item was marked unavailable (labelled in the data set as unreported). If a variable had > 20% missing data from the primary research data set, this variable was excluded from the primary analyses.
Missing completely at random
Data were examined for patterns of loss or whether or not the data were missing completely at random by recoding the variable of interest into ‘missing’ or ‘not missing’. This variable was compared with demographic variables that may have had an influence on recording that information (e.g. participants’ age, sex, stroke), and then with the other variables available. We used the t-test for comparisons of missing data with continuous variables such as age (or the Mann–Whitney U-test, depending on the normality of the distribution). When comparisons involved categorical variables, we used the chi-squared test to indicate whether or not the missing data were substantially different from the data reported (not missing). When there was no evidence of an influence, the data were treated as if assumed to be missing completely at random. Data missing at random were excluded from our modelling and analysis.
Assessment of heterogeneity
We considered the degree to which there was any variability in the data sets gathered and synthesised in our analysis in relation to clinical, methodological or statistical heterogeneity. We considered the impact of between-study methodological differences such as study design, randomisation and blinding of outcome measurement in the context of risk of bias (see Chapter 3). Between-study differences in the choice of outcome captured or the measurement tool employed were accommodated in the data extraction and synthesis approach, which restricted data extraction to published assessment tools. We sought agreement across our international collaboration on the categorisation of outcome measurement tools and the transformation of data to an anchor measure. The objectives were to explore the impact of a wide range of SLT interventions, but, for each analysis, we collated, synthesised, analysed and presented the relevant data separately, ensuring that each meta-analysis was homogeneous in terms of participants, therapy and outcomes. 98
The analysis was not a standard meta-analysis of a series of RCTs in which the treatment effect to be measured was captured using the same tool across all eligible RCTs; thus, the standard assessments of heterogeneity (e.g. the I2) were unsuitable for our meta-analyses purposes and mostly not calculable. Instead, we assessed heterogeneity by examining the relative size of the variability due to study differences to the overall variability in the data. Analyses with > 25% of variability due to data set differences underwent careful examination of the contributing data sets to ensure that no data set was having an undue influence on the findings and that the groupings (e.g. the thresholds for dosage) were reasonable and not highly unbalanced. When a contributing data set did have undue influence or groupings were unbalanced, the thresholds were adjusted. When the relative variability exceeded 50%, then the findings were highlighted as unreliable and were not taken forward or presented.
For the network IPD meta-analysis, we undertook a series of intervention comparisons within and between data sets, also known as direct and indirect comparisons. Direct comparisons would occur in the context of a single data set for which treatment A was compared with treatment B and another data set compared treatment B with treatment C. As previously described, using network meta-analysis allowed us to make comparisons between data sets; thus, we were able to directly compare treatments A and B, B and C and indirectly compare A with C. We made every attempt to ensure that, in developing the networks, we had no orphan interventions (an intervention that appears in only one study and has no direct comparison with any other intervention).
Sensitivity analyses
We conducted a series of sensitivity analyses to examine the robustness of any data synthesis decisions on the findings.
Choice of language measurement
We explored the impact of our prespecified choice of assessment tool in situations in which a data set had two or more assessment tools eligible for synthesis in a single language outcome. We considered the impact on findings had the alternative assessment been selected to go forward to data synthesis.
Exclusion of minority measures
We considered what impact the exclusion of the minority measures had on the findings. To examine the contribution that each language assessment tool made to the transformed language measures, we plotted the distribution of transformed language measures over time, stratified by the original assessment tool and presented by language domain.
Random or fixed effects
We examined the impact of including the data set identifier as the random effect or as a fixed effect using the Wu–Hausman test. 108 For simplicity, the comparison was based on a simple model of language change by baseline. The model was run twice, once with data set as a fixed effect and once with data set as a random effect. The differences between the estimates of the covariate and the standard error of the baseline score were used to calculate both the Wu–Hausman and the alternative Wu–Hausman for one parameter. If the W-score was < 3.841 (≈ χ2 with 1 degree of freedom), or the alternative W was < –1.96 or > 1.96 [≈ N(0,1)], then we rejected the null hypothesis that random effects were more efficient.
The inclusion of historic data sets
We explored what bias there may have been in the inclusion of historic data sets (e.g. collected prior to the establishment of specialist inpatient stroke units), when approaches to the provision of stroke care differed. 109,110 Response to treatment may be influenced by overall health and improvements in stroke care, such as thrombolysis, which has been linked to better aphasia recovery. 29 Similarly, a response to SLT for aphasia depends on the therapy provided, and such approaches can change over time (as suggested by Godecke et al. 56,72). We conducted a sensitivity analysis (RCT data sets only) to consider whether or not the recruitment date had any impact on recovery patterns by language domain.
Excluding non-randomised controlled trial data sets
We explored the impact of excluding data sets graded as being at a high risk of bias, in particular the non-RCT data sets, from the analysis. In each analysis (except the planned subgroup analysis; see Subgroup analysis), we analysed and presented the IPD gathered in the context of RCT studies before then conducting the analysis on the wider data set inclusive of non-RCT designs.
Registry data sets and impact on findings
We explored the impact and contribution that registry data sets (clinical and other research archives contributed to the RELEASE study) made to the analysis and considered whether or not these data sets may have altered the findings.
Subgroup analysis
As time since stroke, age and stroke severity are likely to affect language recovery, we conducted subgroup analyses of these variables, in addition to including them as covariates in the modelling process.
Confidence in cumulative evidence
We reviewed the quality of the data contributing to our analyses together with the quality of our meta-synthesis and analysis approaches and considered the impact this may have had on our confidence in the cumulative results. When appropriate, one researcher independently applied the GRADE approach111 or similar tools to suggest a level of evidence.
Summary
We established an international database of IPD gathered from pre-existing primary research and clinical data sets identified through a systematic review process. Contributions were invited and additional data sets were identified in the public domain. Language measures were transformed to a single anchor measure for each language domain. We explored patterns of language recovery over time among people with no access to SLT, access to historical SLT or SLT in the context of the primary research and participants’ language performance at study enrolment. We explored the data for predictors of language recovery after aphasia. We undertook a one-stage IPD meta-analysis, incorporating network meta-analysis, to explore the impact of complex SLT interventions on language recovery for people with aphasia after stroke. We also considered whether or not specific therapy approaches were associated with the best language recovery outcomes for specific subgroups of people with aphasia.
Chapter 3 Description of individual participant data, data sets and risk of bias
Overview
In this chapter, we report the systematic review-informed development of the RELEASE database, the data sources and the data sets identified that were unavailable to us. We consider the design of the contributed data sets, the participant demographics, the language measures used, the risk of bias in the primary data sets, the data transformation and synthesis approaches, and risk of meta-biases.
Results of the systematic search
Our search strategy identified 11,314 records; once duplicates were removed, we screened 5256 records for eligibility and excluded 2935 (Figure 3). After reviewing 2341 abstracts, 1210 were excluded and 1131 full texts were retrieved. The primary research teams that were linked to 698 references identified (including trial registrations), which appeared eligible for inclusion, were invited to confirm the eligibility and availability of the data set described in the identified report. We received 125 expressions of interest (see Figure 3).
FIGURE 3.
The PRISMA flow diagram indicating the search, identification, screening, exclusions, invitations to contribute and final data set. Reproduced with permission from Williams et al. 112 This is an Open Access article distributed in accordance with the terms of the Creative Commons Attribution (CC BY 4.0) license, which permits others to distribute, remix, adapt and build upon this work, for commercial use, provided the original work is properly cited. See: https://creativecommons.org/licenses/by/4.0/. The figure includes minor additions and formatting changes to the original figure.
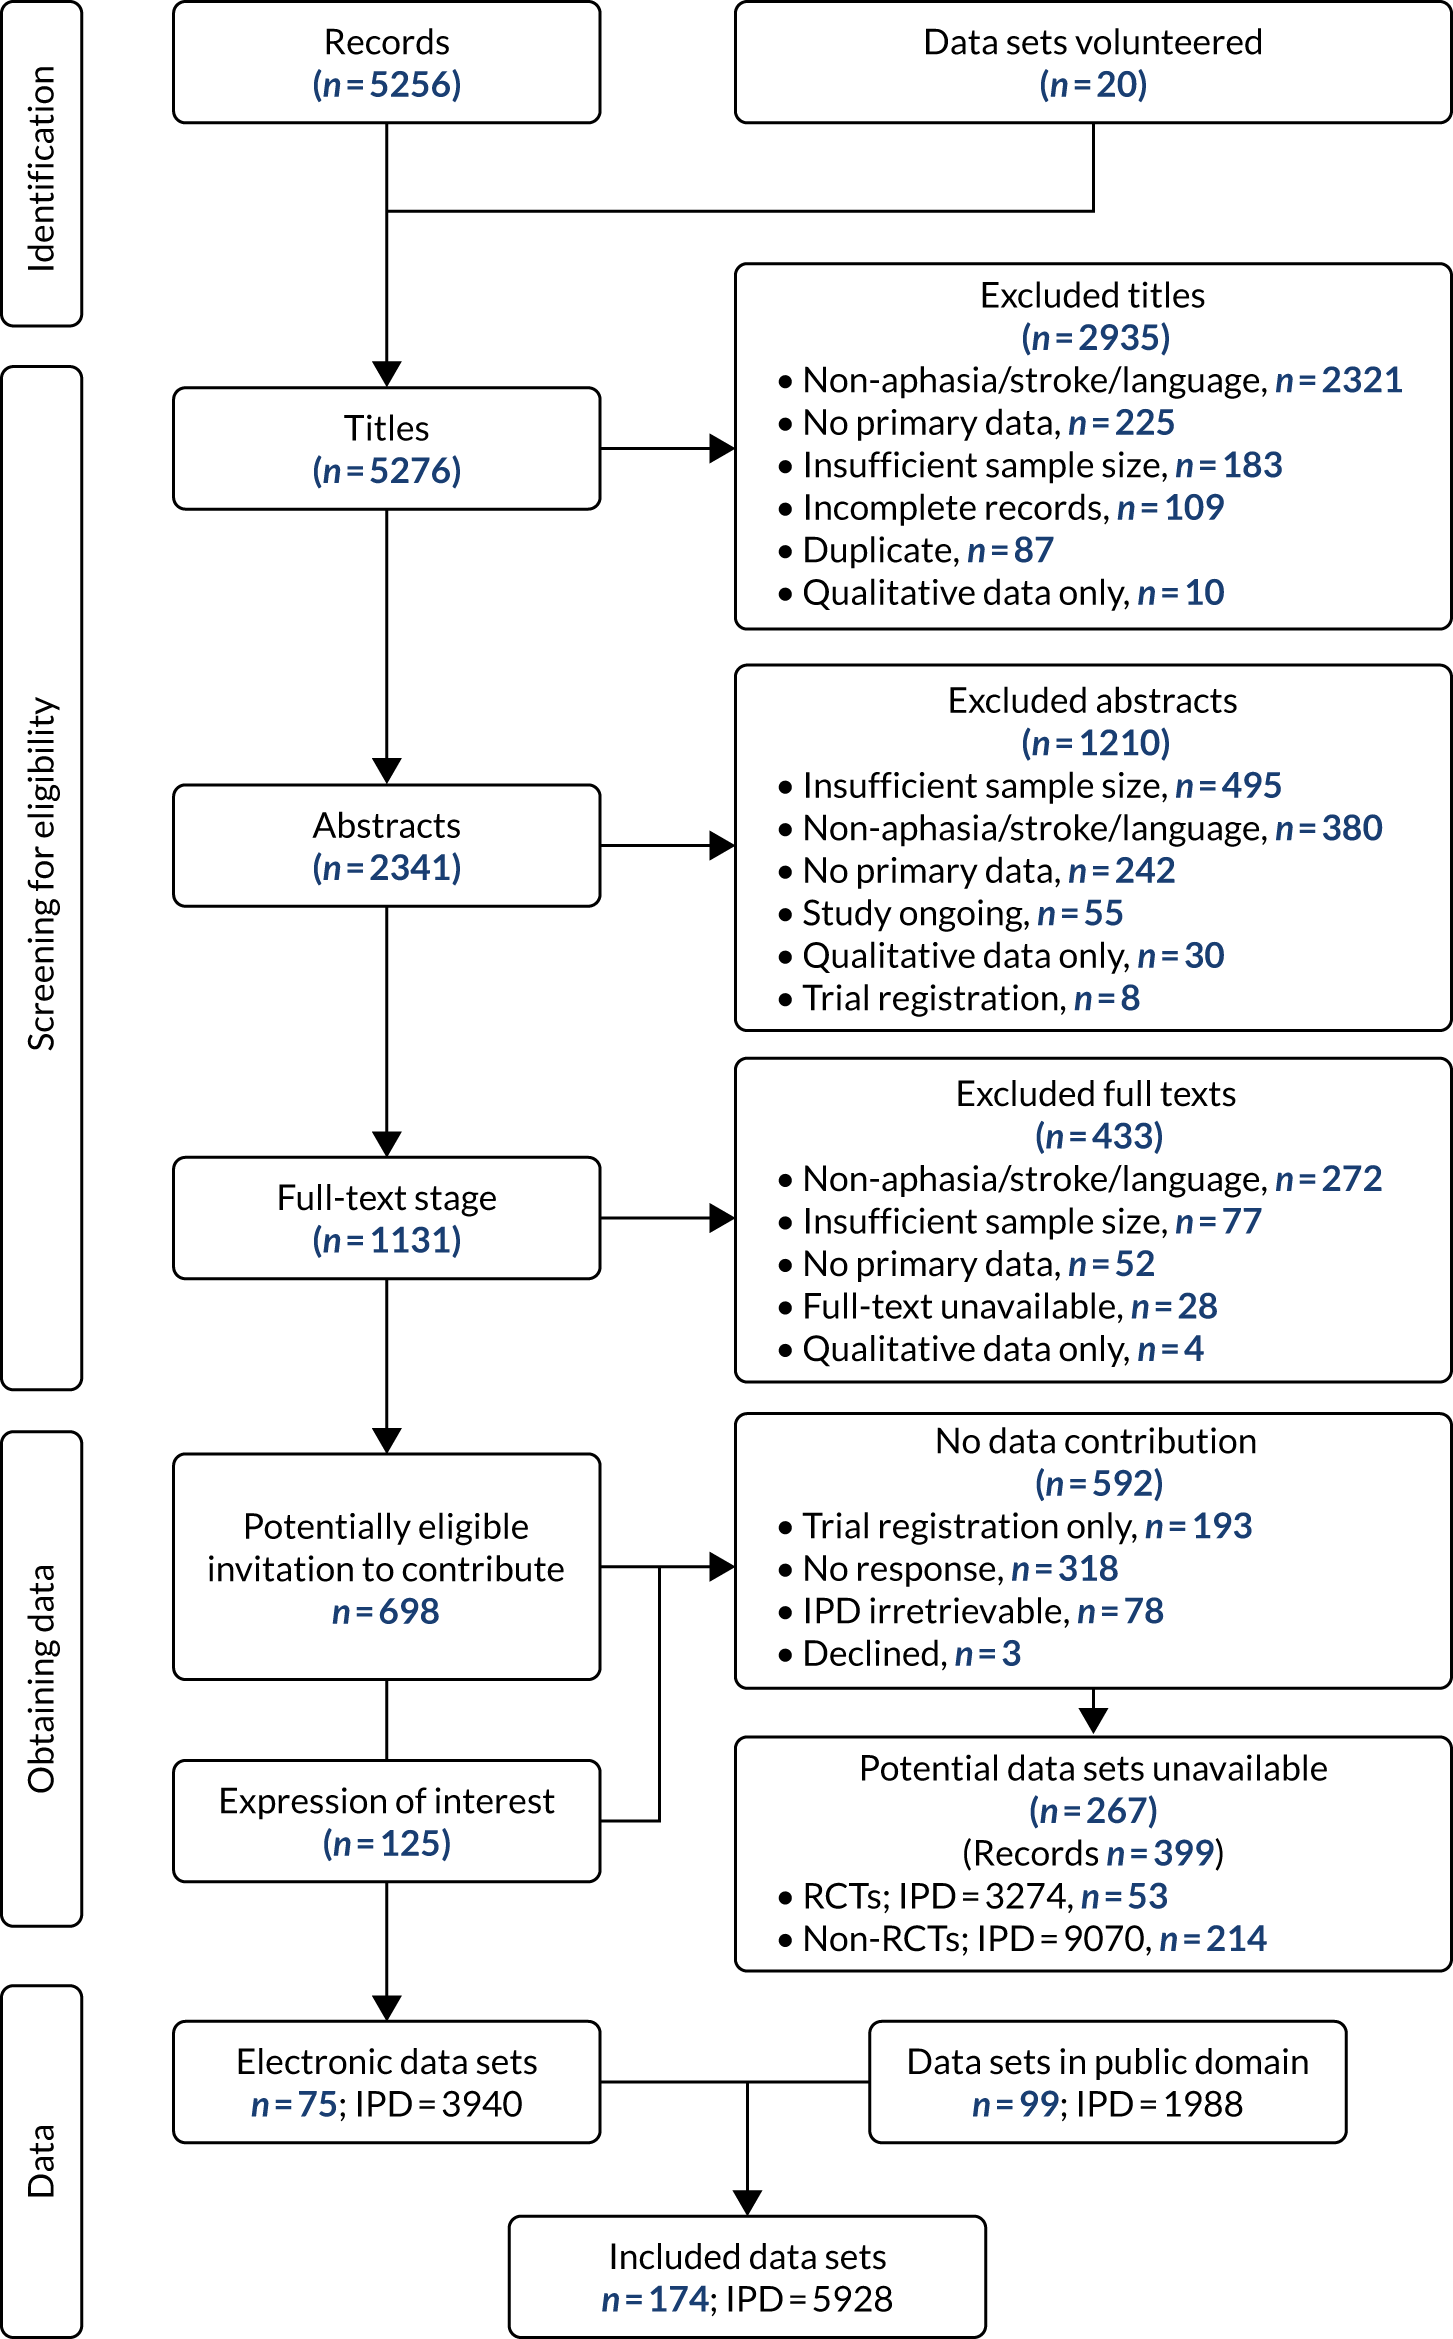
We created a RELEASE study database of 174 data sets comprising 5928 IPD. Electronic data set contributions included 3940 out of 5928 IPD (66.5%) gathered in 75 out of 174 data sets (43.1%). A total of 1988 out of 5928 IPD (33.5%) appeared in 99 out of 174 (56.9%) eligible data sets reported in the public domain, and these were also included in our database (see Figure 3). Ineligible IPD (e.g. people with aphasia following traumatic brain injury) from mixed study population groups were excluded.
Excluded data sets
We excluded 433, out of 1131, full texts that failed to meet our eligibility criteria; 77 data sets had fewer than 10 IPD; four data sets had qualitative data only; 272 data sets were not about aphasia, stroke or language impairment; and 52 were reviews, secondary data analysis or commentary pieces (see Figure 3).
Unavailable data sets
We were unable to confirm whether or not the 267 remaining data sets identified as potentially eligible (reported across 399 records) met the RELEASE study inclusion criteria. Following careful review, it is possible that 53 were RCTs and 214 were a non-RCT design (see Figure 3). Of the 53 RCTs, 46 included, but did not necessarily evaluate, a SLT intervention.
Included data sets
Source
The date of participant recruitment was available for 79 out of 174 (45.4%) primary research studies (Table 2). These data sets reflected participants recruited from 1973 to 2016, although most were recruited since 2000 [67/79 (84.8%)]. Recruitment dates were unavailable for 95 out of 174 data sets (54.6%), particularly those from the public domain. We considered date of publication as a surrogate indicator of data set age [161/174 data sets (92.5%); 4627/5928 IPD (78%)]. Thirteen data sets did not have an associated publication, including recently completed research or clinical registries. Of the 161 data sets that were published between 1973 and 2017, most [135/161 (77.6%)] were published since 2000.
| Date of recruitment/publication or country | Data sets, n (%) (N = 174) | IPD, n (%) (N = 5928) |
|---|---|---|
| Year of recruitment | ||
| 1973 | 1 (0.6) | 18 (0.3) |
| 1974 | 1 (0.6) | 24 (0.4) |
| 1976 | 2 (1.1) | 43 (0.7) |
| 1981 | 1 (0.6) | 155 (2.6) |
| 1990 | 1 (0.6) | 26 (0.4) |
| 1993 | 1 (0.6) | 119 (2.0) |
| 1994 | 1 (0.6) | 51 (0.9) |
| 1995 | 1 (0.6) | 50 (0.8) |
| 1996 | 1 (0.6) | 89 (1.5) |
| 1998 | 1 (0.6) | 57 (1.0) |
| 1999 | 1 (0.6) | 59 (1.0) |
| 2000 | 2 (1.1) | 101 (1.7) |
| 2001 | 5 (2.9) | 69 (1.2) |
| 2002 | 1 (0.6) | 36 (0.6) |
| 2003 | 5 (2.9) | 276 (4.7) |
| 2004 | 4 (2.3) | 122 (2.1) |
| 2005 | 2 (1.1) | 34 (0.6) |
| 2006 | 7 (4.0) | 568 (9.6) |
| 2007 | 3 (1.7) | 180 (3.0) |
| 2008 | 6 (3.4) | 198 (3.3) |
| 2009 | 7 (4.0) | 156 (2.6) |
| 2010 | 6 (3.4) | 239 (4.0) |
| 2011 | 1 (0.6) | 11 (0.2) |
| 2012 | 7 (4.0) | 426 (7.2) |
| 2013 | 3 (1.7) | 110 (1.9) |
| 2014 | 1 (0.6) | 39 (0.7) |
| 2015 | 3 (1.7) | 440 (7.4) |
| 2016 | 4 (2.3) | 477 (8.0) |
| Unreported | 95 (54.6) | 1755 (29.6) |
| Publication date | ||
| 1973–9 | 3 (1.7) | 61 (1.0) |
| 1980–9 | 8 (4.6) | 287 (4.8) |
| 1990–9 | 15 (8.6) | 316 (5.3) |
| 2000–4 | 19 (10.9) | 562 (9.5) |
| 2005–9 | 32 (18.4) | 648 (10.9) |
| 2010–14 | 68 (39.1) | 2022 (34.1) |
| 2015–17 | 16 (9.2) | 731 (12.3) |
| Unpublished | 13 (7.5) | 1301 (22.0) |
| Country of study | ||
| Australia | 14 (8.0) | 295 (5) |
| Brazil | 1 (0.6) | 50 (0.8) |
| Canada | 3 (1.7) | 62 (1.0) |
| China | 1 (0.5) | 105 (1.8) |
| Croatia | 1 (0.5) | 13 (0.2) |
| Denmark | 1 (0.5) | 68 (1.2) |
| Egypt | 1 (0.5) | 29 (0.5) |
| Finland | 1 (0.5) | 36 (0.6) |
| France | 2 (1.2) | 121 (2.0) |
| Germany | 17 (9.8) | 420 (7.1) |
| Greece | 1 (0.5) | 38 (0.6) |
| Islamic Republic of Iran | 2 (1.2) | 77 (1.3) |
| Italy | 11 (6.3) | 230 (3.9) |
| Japan | 3 (1.8) | 75 (1.3) |
| The Netherlands | 5 (2.9) | 276 (4.7) |
| Belgium (and the Netherlands) | 1 (0.5) | 80 (1.4) |
| New Zealand | 1 (0.5) | 14 (0.2) |
| Norway | 3 (1.8) | 69 (1.2) |
| Poland | 3 (1.8) | 88 (1.5) |
| Portugal | 3 (1.8) | 74 (1.3) |
| Russian Federation | 1 (0.5) | 26 (0.4) |
| Republic of Korea | 3 (1.8) | 128 (2.2) |
| Spain | 3 (1.8) | 296 (5.0) |
| Sweden | 3 (1.8) | 333 (5.6) |
| Switzerland | 2 (1.2) | 26 (0.4) |
| Turkey | 1 (0.5) | 53 (0.9) |
| UK | 30 (17.2) | 1529 (25.8) |
| USA | 56 (32.2) | 1317 (22.2) |
| Total | 174 (100.0) | 5928 (100.0) |
Data set design
One-quarter of the primary research data sets included were RCTs [47/174 data sets (27.0%); 1778/5928 IPD (30.0%)]. The remainder were case series or cohort studies [104/174 data sets (59.8%); 2886/5928 IPD (48.7%)] and non-RCTs [18/174 data sets (10.3%); 411/5928 IPD (6.9%)]. Five data sets were derived from registries [5/174 data sets (2.9%); 853/5928 IPD (1.4%)]. Approximately half the data sets included a SLT intervention [91/174 data sets (52.3%); 2834/5928 IPD (47.8%)], whereas the remainder were non-interventional in nature.
In 20 data sets (11.5%; 311 IPD), participants crossed over from one intervention to another. An additional five data sets (2.9%; 240 IPD) delayed the start of treatment for a group. Seven data sets (4%; 128 IPD) allocated participants across three arms, and three data sets (1.7%; 84 IPD) allocated across four arms.
Some participants contributed to more than one data set, in some instances, participating in a follow-on study conducted by the same research group. In such cases, their demographic details were counted only once in our data set (e.g. Table 3). For other participants their language performance data had been duplicated across data sets. We identified these duplications and removed them from our database.
| Participants (% of total IPD); data sets | IPD, n (%) (of reported) or median (IQR) |
|---|---|
| Sex: n = 5550 (93.6%); 158 data sets | |
| Female | 2143 (38.6) |
| Male | 3407 (61.4) |
| Age (years): n = 5785 (97.6%); 169 data sets | |
| Median (IQR) | 63 (53–72) |
| Education (years): n = 3125 (52.7%); 84 data sets | |
| Median (IQR) | 12 (10–16) |
| Handedness: n = 3879 (65.4%); 111 data sets | |
| Right | 3719 (95.9) |
| Left | 133 (3.4) |
| Ambidextrous | 27 (0.7) |
| Ethnicity: n = 1475 (24.9%); 24 data sets | |
| White | 1116 (75.7) |
| Asian | 248 (16.8) |
| Black | 67 (4.5) |
| Latino/Hispanic | 9 (0.6) |
| Mixed | 2 (0.1) |
| Other | 33 (2.2) |
| Living context: n = 701 (11.8%); 21 data sets | |
| Living with others | 473 (67.5) |
| Alone | 146 (20.8) |
| Formal care environment | 70 (10) |
| Mixed | 12 (1.7) |
| Stroke type: n = 3416 (57.6%); 97 data sets | |
| Ischaemic | 2795 (81.8) |
| Intracerebral haemorrhage | 548 (16.0) |
| Subarachnoid haemorrhage | 31 (0.9) |
| Mixed | 42 (1.2) |
| Hemisphere: n = 4130 (69.7%); 130 data sets | |
| Left | 3965 (96.0) |
| Right | 81 (2.0) |
| Bilateral | 84 (2.0) |
| Time since stroke (days): n = 5841 (98.5%); 173 data sets | |
| Median (IQR) | 321 (30–1156) |
| Prior stroke: n = 1274 (21.5%); 45 data sets | |
| Yes | 110 (8.6) |
| No | 1164 (91.4) |
| NIHSS: n = 716 (12.1%); 8 data sets | |
| Median (IQR) | 11 (5–17) |
| mRS: n = 489 (8.2%); 6 data sets | |
| Median (IQR) | 4 (3–4) |
| Barthel Index: n = 442 (7.5%); 5 data sets | |
| 0–20 scale, median (IQR) | 16 (9–20) |
| 0–100 scale, median (IQR) | 60 (15–95) |
| Inclusion and exclusion criteria | |
| Depression: n = 2075 (35.6%); 62 data sets | |
| Excluded/no depression | 1723 (83.0) |
| Depression reported | 352 (17.0) |
| Cognitive impairment: n = 3945 (66.5%); 100 data sets | |
| Excluded/no cognitive impairment | 3347 (84.8) |
| Impairment reported | 7 (0.2) |
| Cognitive score reported | 591 (15.0) |
| Hearing impairment: n = 2848 (48.0%); 82 data sets | |
| Excluded/no hearing impairment | 1767 (62.0) |
| Eligible for inclusion (including corrected hearing) | 1081 (38.0) |
People with aphasia
Of the 5928 people with aphasia following stroke represented in the RELEASE study database, 61.4% were male (3407/5928 IPD) and 38.6% (2143/5928) were female. They had a median age of 63 years (IQR 53–72 years). Most were right-handed [3719/3879 IPD (95.9%)]; the remainder were left-handed [133/3879 (3.4%)] or ambidextrous [27/3879 (0.7%)]. The median number of years of formal education, for those participants who had such information recorded [84/174 data sets (48.3%); 3125/5928 IPD (52.7%)], was 12 (IQR 10–16 years). Ethnicity was recorded for one-quarter of participants [1475/5928 IPD (24.9%)] across 24 out of 174 data sets (13.8%). Three-quarters of participants were from a White ethnic background [1116/1475 IPD (75.7%)]; the remainder were recorded as being of Asian [248/1475 (16.8%)], Black [67/1475 (4.5%)], Latino/Hispanic [9/1475 (0.6%)], Mixed [2/1475 (0.1%)] or Other [33/1475 (2.2%)] ethnic backgrounds (see Table 3).
Living context
At the time of data collection, two-thirds of participants were living at home with other people [473/701 IPD (67.5%)], and one-fifth lived alone [146/701 (20.8%)], with a smaller number [70/701 (10.%)] living in a formal care environment. This is based on information from 21 out of 174 data sets (12.1%) and 701 out of 5928 IPD (11.8%) (see Table 3).
Language
The database was predominantly based on English-speaking participants [3162/5928 IPD (53.3%)]: the largest data set contributions were from the USA [56/174 data sets (32.2%); 1317/5928 IPD (22.2%)] and the UK [30/174 data sets (17.2%); 1529/5928 IPD (25.8%)]. The remaining data sets were collected across 22 other languages. One data set included bilingual data from 12 out of 5928 IPD (0.2%) (Table 4).
| Language | IPD, n (%) |
|---|---|
| Arabic | 59 (1.0) |
| Cantonese | 105 (1.8) |
| Croatian | 13 (0.2) |
| Danish | 68 (1.2) |
| Dutch | 357 (6.0) |
| English | 3162 (53.3) |
| Finnish | 36 (0.6) |
| French | 163 (2.8) |
| German | 420 (7.1) |
| Greek | 38 (0.6) |
| Greek/English | 12 (0.2) |
| Italian | 231 (3.9) |
| Japanese | 75 (1.3) |
| Korean | 128 (2.2) |
| Mandarin | 23 (0.4) |
| Norwegian | 69 (1.2) |
| Patois | 1 (0.02) |
| Persian | 47 (0.8) |
| Polish | 88 (1.5) |
| Portuguese | 124 (2.1) |
| Russian | 26 (0.4) |
| Spanish | 297 (5.0) |
| Swedish | 333 (5.6) |
| Turkish | 53 (0.9) |
| Total | 5928 (100.00) |
Stroke
Among those for whom we had information on time since stroke [5841/5928 IPD (98.5%)] the median time since stroke was 321 (IQR 30–1156) days. When reported, this was mostly in the left hemisphere [3965/4130 (96.0%)], ischaemic [2795/3416 (81.8%)] and, in most cases, their first stroke [1164/1275 (91.4%)] (see Table 3).
Stroke severity at study entry was moderate to severe on the National Institutes of Health Stroke Scale (NIHSS) [median score 11 (IQR 5–17); 8/174 data sets (4.6%); 716/5928 IPD (12.1%)], the modified Rankin Scale (mRS) [median score 4 [IQR 3–4]; 6/174 data sets (3.4%); 489/5928 IPD (8.2%)] and the Barthel Index [the 0–100 scale: median score 60 (IQR 15–95); the 0–20 scale: median score 16 (IQR 9–20); 5/174 data sets (2.9%); 442/5928 IPD (7.5%)]. Interestingly, despite all included participants having aphasia, all stroke and disability scales included participants who had no stroke symptoms [NIHSS = 0; 15/716 IPD (2.1%)], no symptoms at all [mRS = 0; 6/489 IPD (1.2%)] or scored as ‘independent’ [Barthel Index = 100; 48/442 IPD (10.9%)] (see Table 3).
Concomitant symptoms
Cognitive impairment was an inclusion or exclusion criteria for 100 out of 174 data sets (57.5%) involving 3945 out of 5928 IPD (66.5%), of whom 7 IPD participants were recorded as having a cognitive impairment. Cognitive scores were available for 591 out of 3945 IPD (15.0%), and an additional 3347 IPD (84.8%) participants did not have a cognitive impairment. Similarly, depression was listed in the inclusion or exclusion criteria for 62 out of 174 (35.6%) data sets relating to 2075 out of 5928 IPD (35.0%). Depression was reported for 352 out of 2075 IPD (17.0%) participants; most [1723/2075 IPD (83.0%)] were not depressed.
Measures of language
All data sets included IPD on one or more of the following language outcomes: overall language ability [2699/5928 IPD (45.5%); 80/174 data sets (46.0%)], auditory comprehension [(2750/5928 IPD (46.4%); 71/174 data sets (40.8%)], naming [2886/5928 IPD (48.7%); 75/174 data sets (43%)], other spoken language [380/5928 IPD (6.4%); 9/174 data sets (5.2%)], reading comprehension [770/5928 IPD (13.0%); 12/174 data sets (6.9%)], writing [724/5928 IPD (12.2%); 13/174 data sets (7.5%)], functional communication observer-rated [1591/5928 IPD (26.8%); 29/174 data sets (16.7%)], functional communication self-rated [68/5928 IPD (1.1%); 3/174 data sets (1.7%)] and discourse analysis [213/5928 IPD (3.9%); 5/174 data sets (2.9%)] (Table 5).
| IPD | Language outcome, n (N data points) [n data sets] | ||||||||
|---|---|---|---|---|---|---|---|---|---|
| Overall language ability | Auditory comprehension | Naming | Other spoken language | Reading comprehension | Writing | Functional communication (observer rated) | Functional communication (self-rated) | Discourse analysis | |
| Collected data | 2699 (5123) [80] | 2750 (5834) [71] | 2886 (5130) [75] | 380 (621) [9] | 770 (1085) [12] | 724 (1061) [13] | 1591 (5085) [29] | 68 (268) [3] | 213 (423) [5] |
| Merged with demographic data | 2684 (5108) [80] | 2728 (5783) [71] | 2810 (4928) [73] | 380 (621) [9] | 729 (980) [11] | 684 (957) [12] | 1563 (5021) [29] | 68 (268) [3] | 213 (423) [5] |
| Merged with intervention data | 929 (2338) [29] | 1058 (2969) [31] | 1149 (2701) [37] | 250 (491) [7] | 200 (309) [6] | 136 (249) [8] | 989 (3394) [21] | 43 (218) [2] | 97 (258) [2] |
| Removed duplicate records | 929 (1939) [29] | 1055 (2021) [31] | 1018 (2189) [37] | 250 (491) [7] | 200 (309) [6] | 136 (249) [8] | 984 (2084) [21] | 43 (123) [2] | 97 (258) [2] |
| Exclude trials with no baseline or no follow-up data | 704 (1714) [18] | 695 (1732) [21] | 672 (1843) [22] | 238 (479) [6] | 160 (269) [4] | 98 (211) [6] | 818 (1918) [19] | 43 (123) [2] | 97 (258) [2] |
| Exclude non-RCT IPD | 524 (1351) [11] | 591 (1485) [16] | 419 (1302) [13] | 187 (369) [3] | 11 (33) [1] | 47 (104) [3] | 697 (1632) [14] | 11 (28) [1] | 97 (258) [2] |
| Exclude IPD with no baseline or no follow-up data | 488 (488) [11] | 556 (556) [16] | 391 (391) [13] | 182 (182) [3] | 11 (11) [1] | 47 (47) [3] | 544 (544) [14] | 11 (11) [1] | 90 (90) [2] |
Speech and language therapy interventions
We identified 91 out of 174 data sets (52.3%) [2746/5928 IPD (46.3%)] that delivered a SLT intervention. Two registry data sets included some participants in receipt of SLT, but the interventions were not standard across the data set and were inconsistently recorded, so these were excluded from our analysis of the impact of SLT components on outcomes. Language outcome data availability at baseline and at the end of intervention limited the number of data sets that could inform our planned intervention analysis to 67 out of 174 (38.5%) data sets [2330/5928 IPD (39.3%)] (Table 6).
| Participants | IPD, n (%) (N = 2330) | Data sets (N = 67) |
|---|---|---|
| Overall intervention group | ||
| No therapy | 167 (7.2) | 11 |
| Social support | 169 (7.3) | 2 |
| SLT (defined) | 1456 (62.5) | 62 |
| Conventional | 529 (22.7) | 8 |
| SLT intervention delivery | ||
| Days since stroke onset | 2084 (89.4) | 64 |
| Mode of delivery | ||
| Face to face | 1957 (84.0) | 60 |
| Computer | 315 (13.5) | 15 |
| Telephone | 15 (0.6) | 1 |
| Self-management | 106 (4.5) | 4 |
| Living context | 322 (13.8) | 11 |
| Alone | 88 (3.8) | 7 |
| Formal care environment | 39 (1.7) | 3 |
| With others | 195 (8.4) | 9 |
| Therapy setting | ||
| Health-care setting (clinic, hospital, rehabilitation centre, therapy clinic, university) | 1866 (80.1) | 48 |
| Home (home, community) | 575 (24.7) | 17 |
| Therapy theoretical approach | ||
| Functional/pragmatic | 246 (10.6) | 8 |
| Phonological | 124 (5.3) | 9 |
| Semantic and phonological | 260 (11.2) | 15 |
| Semantic | 34 (1.5) | 2 |
| Constraint-induced aphasia therapy | 113 (4.8) | 7 |
| Melodic intonation therapy | 61 (2.6) | 4 |
| Therapy language rehabilitation target | ||
| Mixed auditory comprehension and spoken language | 583 (25.0) | 20 |
| Auditory comprehension | 68 (2.9) | 4 |
| Reading | 10 (0.4) | 1 |
| General spoken-language expression | 245 (10.5) | 11 |
| Word-finding | 489 (21.0) | 30 |
| Co-intervention | 423 (18.2) | 15 |
| Therapy context | ||
| One to one | 1613 (69.2) | 47 |
| Self-management | 84 (3.6) | 6 |
| Group | 148 (6.4) | 8 |
| Mixed | 207 (8.9) | 9 |
| Provider | ||
| Professional | 1871 (80.3) | 62 |
| Non-professional | 274 (11.8) | 7 |
| Self-management | 10 (0.4) | 1 |
| Intensity (hours per week) | 1882 (80.8) | 60 |
| Frequency (number of sessions per week) | 2057 (88.3) | 66 |
| Duration (total number of days, start to finish) | 1960 (84.1) | 64 |
| Dose (hours of SLT) | 1978 (84.9) | 62 |
| Home practice (yes/no) | 1306 (56.1) | 31 |
Interventions included conventional therapy [8/67 data sets (11.9%); 529/2330 IPD (22.7%)], social support [2/67 data sets (3.0%); 169/2330 IPD (7.3%)] or a defined SLT intervention that could be categorised by impairment target or theoretical approach [62/67 data sets (92.5%); 1456/2330 IPD (62.5%)] (see Table 6). Twenty of these defined SLT interventions included a pharmacological or electrical brain stimulation co-intervention, which may have contributed to language outcomes [20/67 data sets (29.8%); 423/2330 IPD (18.1%)]. Eleven data sets included a comparison group that had no access to therapy [11/67 data sets (16.4%); 167/2330 IPD (7.2%)]. One intervention targeted change in communication behaviours among a health-care professional group and so did not contribute to our analysis of SLT interventions delivered to people with aphasia.
Intervention context
Most participants receiving an intervention lived at home with others [195/2330 IPD (8.4%)]. Interventions were typically delivered in a formal health-care setting [1866/2330 IPD (80.1%)] on a one-to-one [1613/2330 IPD (69.2%)], face-to-face [1957/2330 IPD (84.0%)] basis, where therapy was provided by a professional [1871/2330 IPD (80.3%)] (see Table 6).
Intervention description
Therapy targeted a range of language impairments including spoken language and/or naming [734/2330 IPD (31.5%)], auditory comprehension [68/2330 IPD (2.9%)], mixed spoken language and auditory comprehension [583/2330 IPD (25%)] and reading [10/2330 IPD (0.4%)]. No intervention specifically targeted the rehabilitation of writing. Most of the spoken-language interventions targeted improvements on naming (also known as word-finding) therapy [489/2330 IPD (21%)].
A range of theoretical approaches were identified, including semantic [34/2330 IPD (1.5%)], phonological [124/2330 IPD (5.3%)], semantic and phonological [260/2330 IPD (11.2%)], constraint-induced aphasia therapy [113/2330 IPD (4.8%)], melodic intonation therapy [61/2330 IPD (2.6%)] and functional–pragmatic therapy approaches [246/2330 IPD (10.6%)].
Intervention regime
We gathered data on the frequency [2057/2330 IPD (88.3%); 66/67 data sets (98.5%)], duration [1960/2330 IPD (84.1%); 64/67 data sets (95.5%)], intensity [1882/2330 IPD (80.8%); 60/67 data sets (89.6%)] and dosage [1978/2330 IPD (84.9%); 62/67 data sets (92.5%)] of the SLT interventions. Information on whether or not the SLT intervention had been tailored by difficulty of the tasks was available for 1145 out of 1373 IPD (83.4%) [34/67 data sets (50.7%)]; information on whether or not the SLT intervention had been tailored by functional relevance to the individual participant was available for 649 out of 928 (69.9%) IPD [22/67 data sets (32.8%)]. Whether or not participants had been prescribed home-based practice tasks was available for 1306 out of 2330 IPD (56.1%) [31/67 data sets (46.3%)] (see Table 6).
Risk of bias
The sample size of the primary research data sets ranged from 10 IPD of people with aphasia after stroke [25/174 data sets (14.4%)] to one data set with 420 IPD. An overview of each contributing data set can be found in Report Supplementary Material 1, but a summary is provided in Quality of primary research data sets.
Quality of primary research data sets
Selection bias
A total of 47 RCTs were included in the RELEASE study. Of these, 27 employed an adequate approach to the generation of the random number sequence (such as a random numbers table). Concealment of allocation was confirmed in 22 RCTs. We also included 18 non-RCTs that did not employ randomisation.
When data availability permitted, we checked individual RCT comparison groups at baseline for similarity. We identified six out of 47 RCTs for which there was a significant between-group difference at baseline by reported age (3/45 RCTs), sex (1/45 RCTs), time since stroke (2/45 RCTs) and language impairment (1/45 RCTs) (see Appendix 4, Table 12). Only two out of nine non-RCT group comparison data sets were found to differ at baseline in relation to reported time since stroke (see Appendix 5, Table 13) and one dataset differed with regard to sex (see Appendix 5, Table 13).
Detection bias
Although participant blinding in SLT studies is often unachievable, the blinding of outcome assessors is important when considering risk of bias and can usually be achieved. Blinding of outcome assessors was reported in 48 out of 174 data sets (27.5%), and an additional 9 out of 174 (5.2%) data sets described partial blinding (blinding for a subset of data) for participants. The remaining 117 data sets either did not report on blinding (92/117) or clearly indicated that blinding was not present (25/117). These figures reflect the use of blinding across all data sets in the RELEASE study database. In many cases, blinding was simply irrelevant to the primary purpose of that data set (e.g. a clinical registry or observational study). Risk of detection bias will be considered more specifically in relation to our analysis in Chapters 6 and 8.
Attrition bias
One-third of data sets [58/174 (33.3%)] reported participants who failed to complete the study (i.e. who dropped out). Such withdrawals are to be expected in a participant population after stroke. However, although there is a risk of incomplete outcome data, most researchers provided details of dropouts (for any reason) and of those who did not adhere to the intervention. By contrast, 116 out of 174 data sets did not report any loss of participants over time.
Reporting bias
We identified a risk of reporting bias among data sets that were only partially represented in the RELEASE study database. One-third of included IPD [1988/5928 IPD (33.5%); 99/174 data sets (56.6%)] were extracted from the public domain. Although some data sets were fully reported in the public domain, most were only partially available (e.g. baseline data only).
Similarly, some primary research data set electronic contributions were also incomplete. Cross-referencing with the published reports indicated that additional data items were available at the point of publication. It is possible that some data items (e.g. IPD on therapy dosage) had not been stored electronically as part of the main data set or had been lost over time.
Other biases
Inclusion and exclusion criteria were available for 170 out of 174 (97.7%) and 120 out of 174 (69.0%) of the data sets, respectively. Both inclusion and exclusion criteria were reported by 115 out of 174 (66.1%) data sets. Eight data sets were based on retrospective data collection [8/174 (4.6%)]. Eleven out of 174 (6.3%) data sets were collected in the context of primary research studies that aimed to develop or validate an outcome measure or assessment. One intervention study targeted arm movement recovery, whereas the SLT intervention functioned as an attention control intervention (32 IPD).
Other quality data items included reporting on the context of data collection (2441 IPD) and the presence of co-interventions (423 IPD). We planned to consider these items in our analysis and interpretation of findings. Adherence to a SLT intervention was captured for only 27 out of 91 (29.7%) intervention data sets.
Data synthesis
Transformations
A total of 64 assessments were used across data sets to capture participants’ language performance. Some assessments comprised several subtests, which also contributed to the data synthesis for other language domains [e.g. Western Aphasia Battery (WAB) data contributed to overall language ability, auditory comprehension, naming and reading outcomes]. Language-specific adaptations of an original assessment were profiled individually to accommodate differences between languages.
We collated and categorised each assessment and their relevant subtests by language domain. For each data set, we noted the scoring format. Data from some tools [e.g. the Token Test (TT)] were reported in raw scores, percentiles, t-scores and error scores and were either positively or negatively scored. All scores were converted to raw scores and positive scoring.
For each language domain, we identified the assessment used by the most data sets as the ‘anchor measure’ (see Appendix 7, Table 14). In most cases, this choice also reflected the assessment with the greatest availability of IPD. The availability of IPD on an assessment contributed to the choice of anchor measure only in situations in which the greatest number of data sets using an assessment was shared across an equal number of data sets.
We examined the contribution that each assessment made to the overall data for that language domain and plotted the distribution of each score at baseline across increasing time since stroke time points and stratified by the original assessment (see Appendix 6, Figure 27). We concluded that the data points generated by each of the minority and anchor measures were valid and within the expected ranges.
The maximum, minimum, median, lower quartile (LQs) and upper quartile (UQs) were calculated for each of the identified anchor measures (see Appendix 7, Table 14). The values for the maximum, minimum, median, LQ and UQ were calculated for each of the remaining assessment tools that captured that language domain (minority measures). These values were then transformed to the anchor measure scale, ensuring that the values remained within the minimum and maximum values of the anchor measure scale (see Appendix 7, Table 14).
For each analysis, we collated the data with other required data items (e.g. participant demographic data items or intervention data), which resulted in a reduction of overall data to inform our analysis. We profile this drop-off in data availability in Table 5.
Risk of bias in our individual participant data meta-analyses
Selection bias in data set recruitment
The systematic review-based approach to the identification of eligible data sets recruited an additional 122 data sets to those originally identified through our research network alone, yielding important demographic and language IPD. For example, our final database has 5928 IPD on time since stroke (our original recruitment estimate was 3181 IPD) and 2922 IPD on naming outcomes (originally estimated as 2007 IPD). Methodologically, employing a review-informed approach to building the database was essential. It reduced the risk of bias from an analysis based only on data sets contributed through pre-existing networks and increased the feasibility of analysis on a sparse database with limited overlap in outcomes and demographic data across data sets.
Publication bias in data set recruitment
Overall, the database included data sets collected across 28 countries and 23 international languages (see Tables 2 and 4). We included 13 unpublished data sets. We considered the risk of publication bias by examining the proportion of significantly reported results by decade or other suitable period grouping. Any suggested imbalance was tested with the chi-squared test (and is reported in Chapter 8).
Availability bias in data set recruitment
In the systematic review, we identified 399 out of 698 (57.2%) records reporting 267 potentially eligible data sets, which, despite best efforts, were not included (see Report Supplementary Material 2). Of these, 53 data sets appeared to be RCTs, with 46 out of the 53 RCTs including a SLT intervention that was part of the study protocol or standard care. Of the of 47 RCTs that contributed group summary level data to the Cochrane review meta-analysis of SLT for aphasia after stroke,41 we secured IPD for 17. We also secured IPD from five RCTs that were ‘ongoing’ at the time of the Cochrane review41 and from a further four RCTs that were identified but unavailable to the Cochrane review. 41
Summary
We created an international database of 5928 IPD on people with aphasia after stroke, gathered from 174 data sets from across 28 countries. Half of the data sets were based on an English-speaking population, one-quarter were RCTs and 13 were unpublished. All data sets included participants for whom data were available on time since the index stroke and a measure of language impairment on overall language ability, auditory comprehension, spoken language (including naming), reading comprehension, writing or functional communication. Within this, approximately half of the dataset had a language measurement as well as corresponding data on baseline demography. Half of the included data sets referred to a SLT intervention.
Interventions were wide-ranging and classification of SLT approach by impairment target and theoretical approach required a consensus approach. We considered risk of bias both at the primary data set level and at the meta-analysis level and, when possible, took methodological approaches to address any risk of bias or to consider its possible impact when interpreting the findings. We transformed all language measures to a single anchor measure for each language domain and filtered IPD based on the overlapping availability of the required variables for each planned analysis.
Chapter 4 Language recovery after stroke
Overview
We explored aphasia recovery after stroke using eligible data from across the database, as relevant for each analysis. We investigated:
-
the natural history of language recovery in participants with no access to SLT
-
language recovery over time in participants with access to SLT
-
distribution of language scores at study entry
-
change in scores from baseline to first follow-up after study access to SLT.
Natural history of language recovery
To meet the criteria for the natural history population, participants had to be enrolled in the primary study within 15 days of their first stroke and allocated to a no-SLT group. For these participants, only one data set reported IPD on overall language ability (n = 61), auditory comprehension (n = 6), naming (n = 6) or functional communication (observer-rated activity and participation, both n = 51), respectively. As we had prespecified that we would not base an analysis on a single data set, there were insufficient data to ascertain the natural history of language recovery in relation to these domains for this population. For the remaining domains (other spoken language, reading comprehension and writing), we identified no eligible IPD for exploring natural history of language recovery.
Language recovery over time in participants with study access to speech and language therapy
We examined the pattern of language recovery over time in each language domain for participants who had access to SLT during the primary study. We also examined language recovery among participants who were allocated to receive no SLT during the primary study. These participants were not considered in our natural history analysis as they were enrolled beyond 15 days of index stroke, and we had clear evidence or reasonable grounds to assume that they had historical access to SLT as part of standard health care before the start of the study. When participants were allocated to receive no therapy intervention in the primary study but were permitted access to SLT after the active comparison period had been completed, we truncated our analysis of follow-up to the first assessment following the study intervention period, thus excluding any impact of later access to SLT in this group.
Trajectory of overall language ability over time
We examined the trajectory of overall language ability over time by looking at scores on aphasia test batteries transformed to the anchor measure [Western Aphasia Battery-Aphasia Quotient (WAB-AQ)], in which higher scores indicated better language performance. We had no data capturing overall language ability over time for participants who had received only historical SLT in the RCT population, meaning we could not conduct comparative analyses with the participants who had SLT during the primary studies on this population. We therefore present the trajectory of overall language ability scores over time for participants allocated to SLT in RCTs (601 IPD; 18 RCTs; Figure 4a) and across all study designs (2345 IPD; 74 data sets; see Figure 4b). In both cohorts, there was a trend towards increased scores on aphasia language batteries over time.
FIGURE 4.
Overall language ability scores over time. (a) RCTs; and (b) all study types.
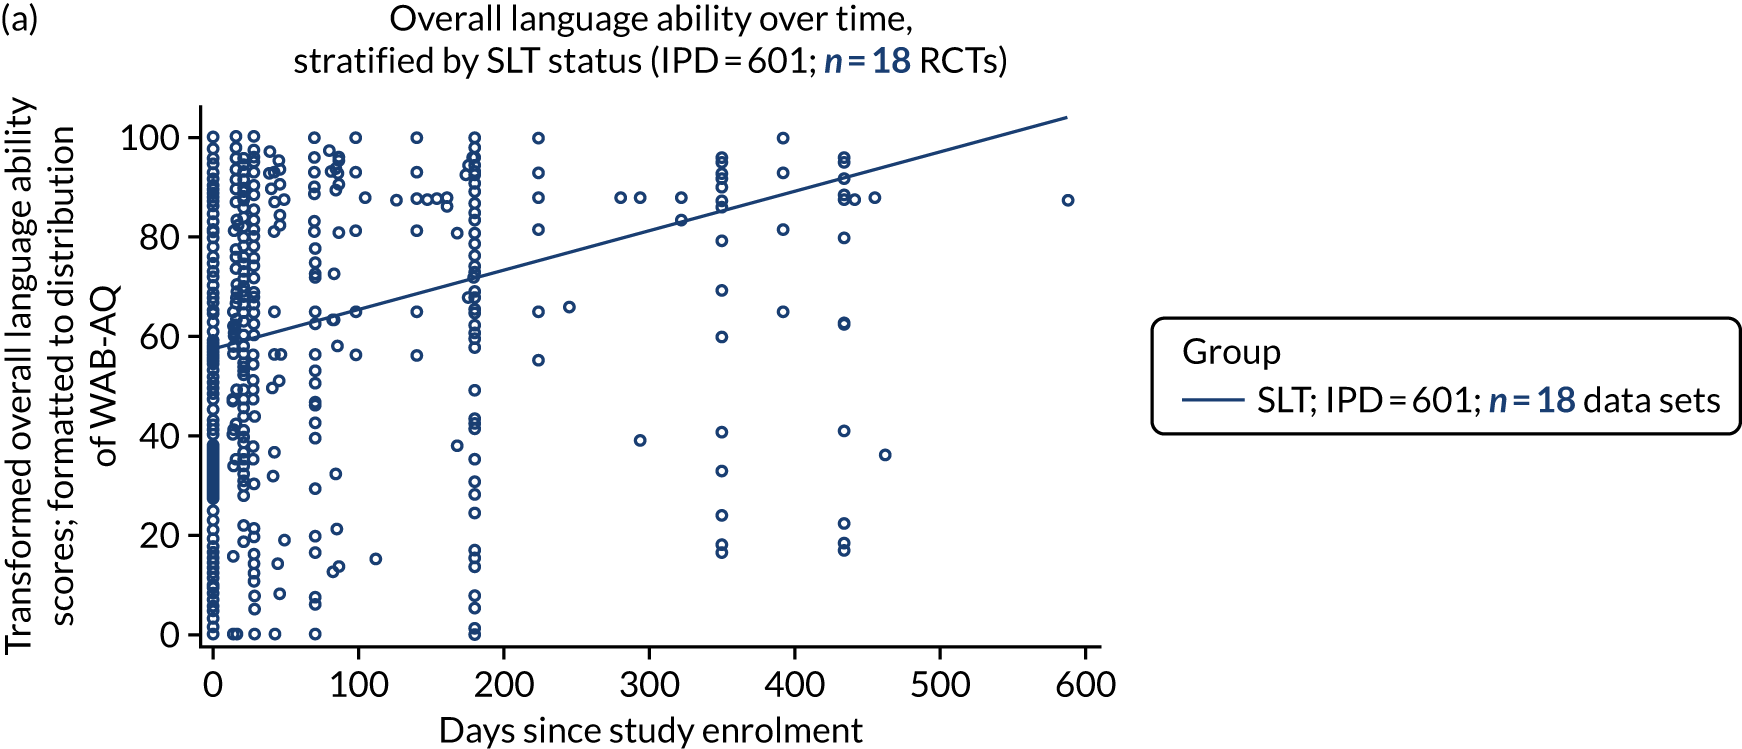
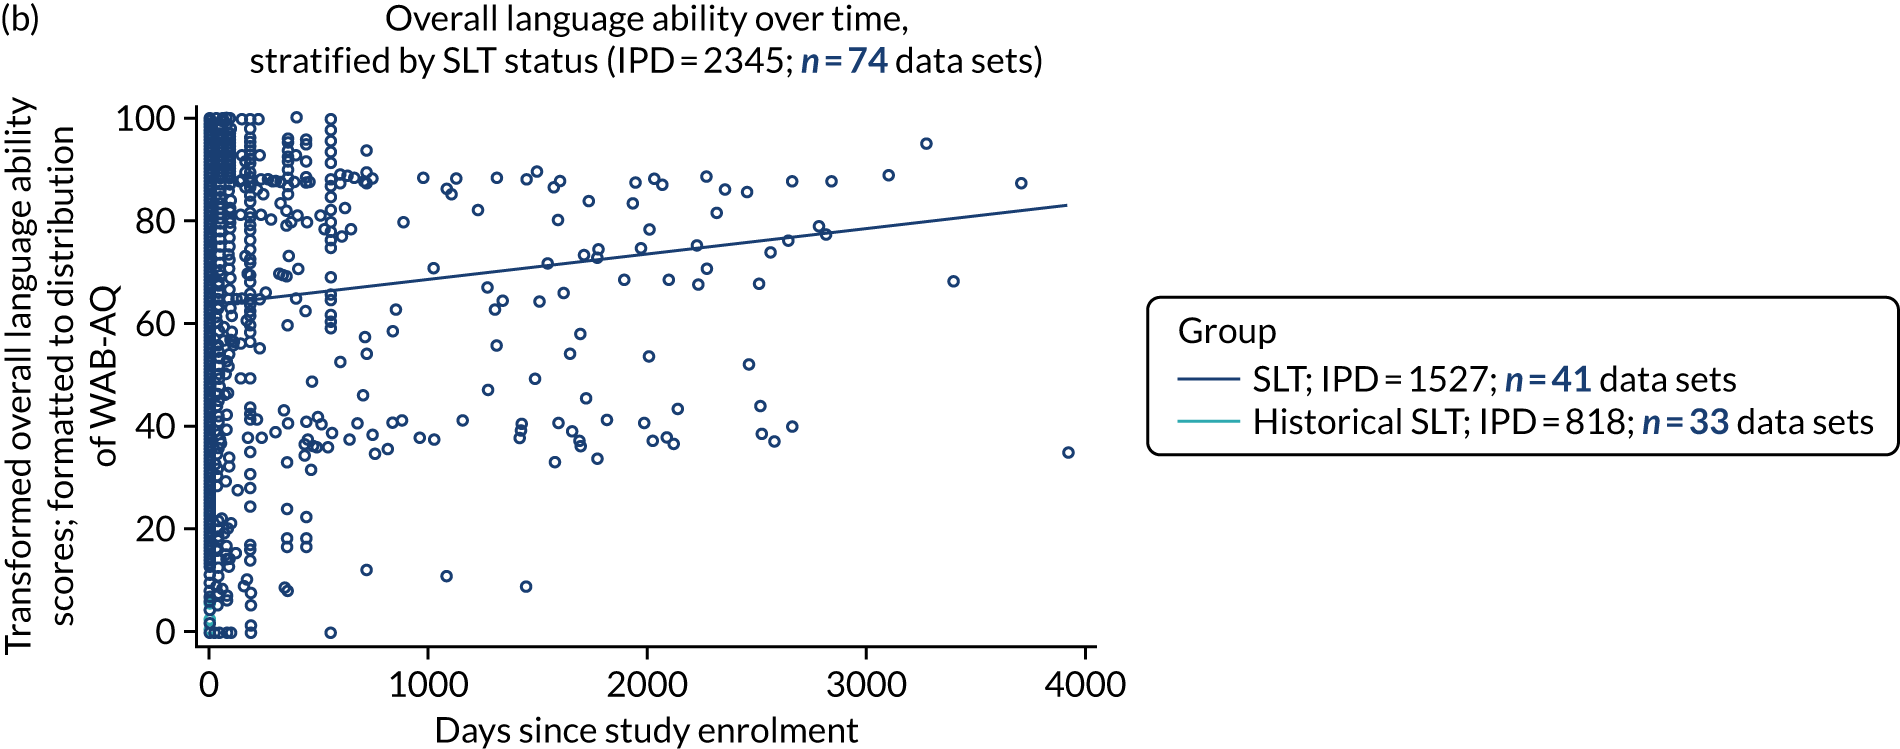
Trajectory of auditory comprehension over time
In our database, all participants who were allocated to receive no study-based SLT went on to receive SLT after the study intervention period was over. Due to inadequate longer-term follow-up assessments beyond the study intervention period, we could not describe the trajectory of auditory comprehension scores over longer time periods in those allocated to SLT versus those who received only historical SLT. We examined the trajectory of auditory comprehension scores over time in both the RCT population (536 IPD; 17 data sets; Figure 5a) and using all study designs (2463 IPD; 62 data sets; see Figure 5b). The anchor measure was Token Test from the Aachen Aphasia Test (TT-AAT).
FIGURE 5.
Auditory comprehension scores over time. (a) RCTs; (b) all study types; (c) within earlier follow-up times in RCTs; and (d) earlier follow-up times in all study types.
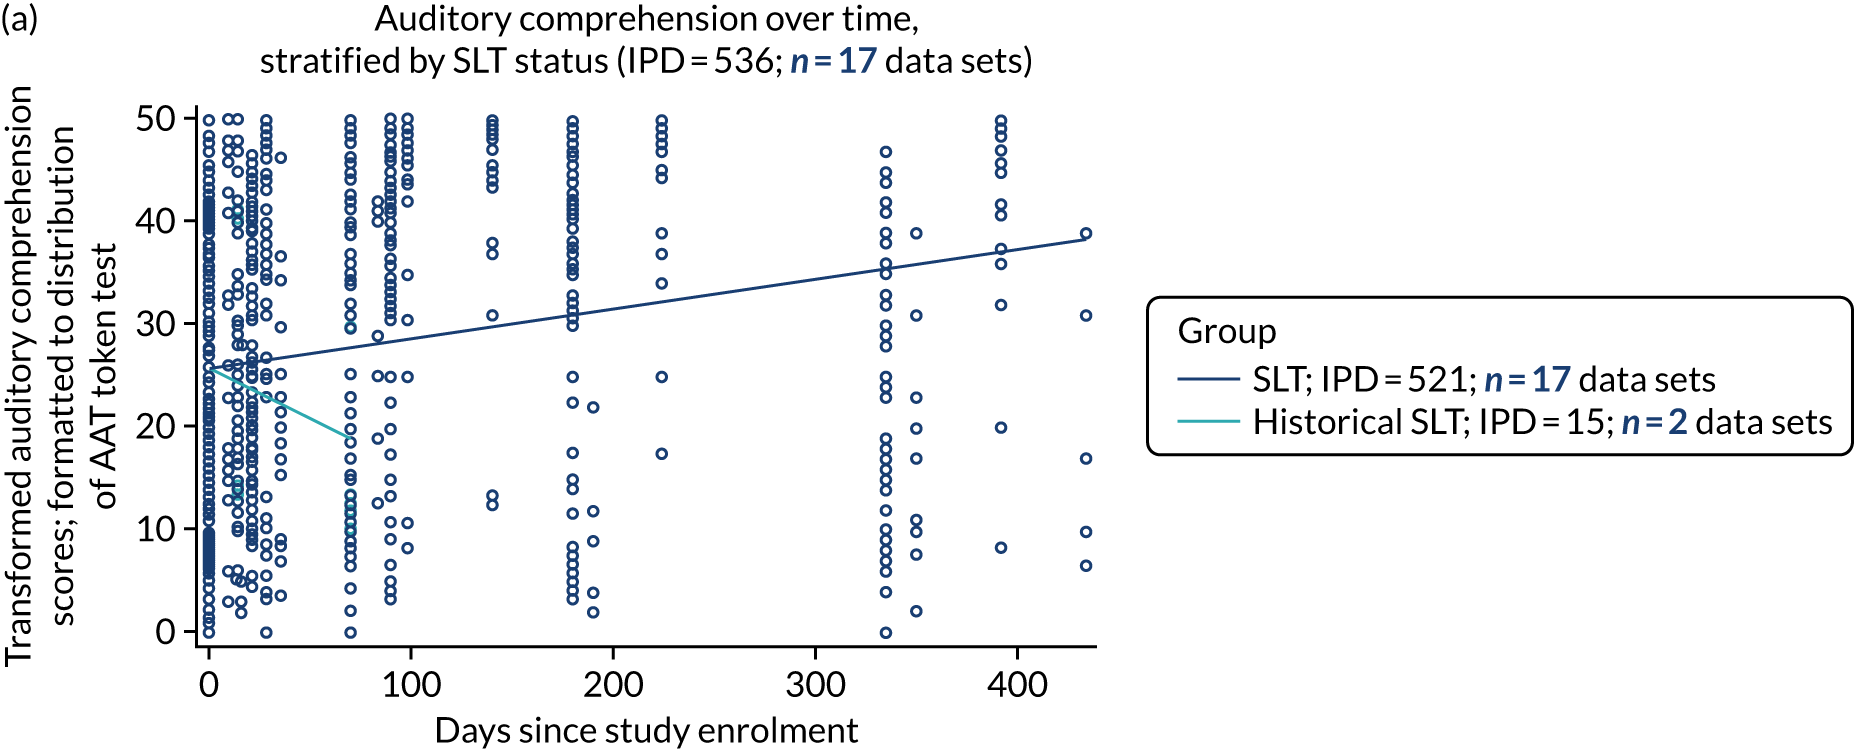
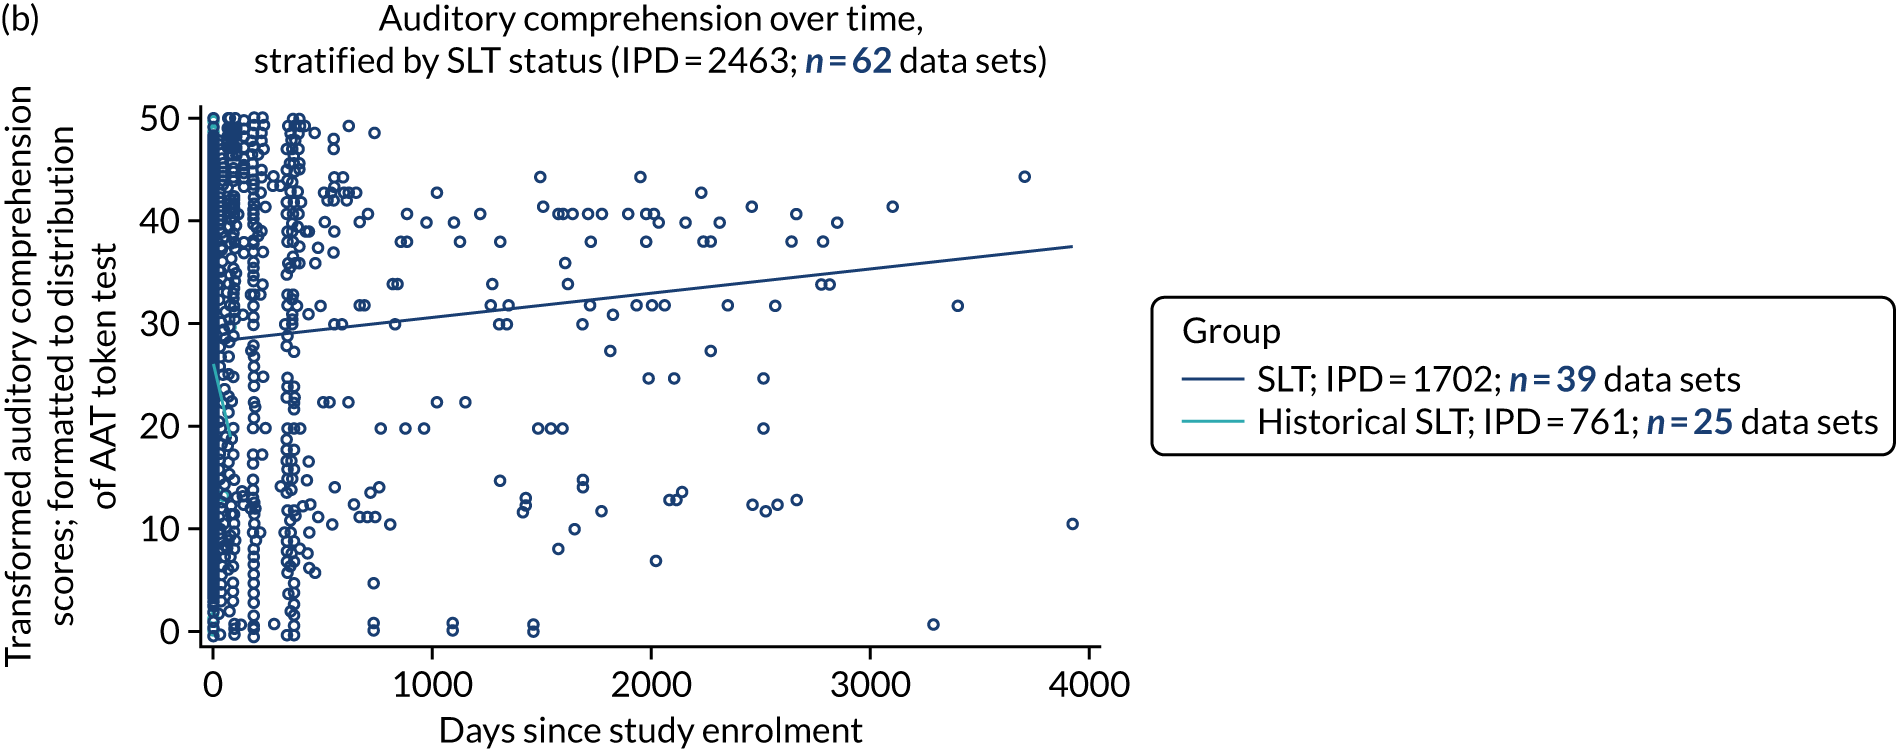
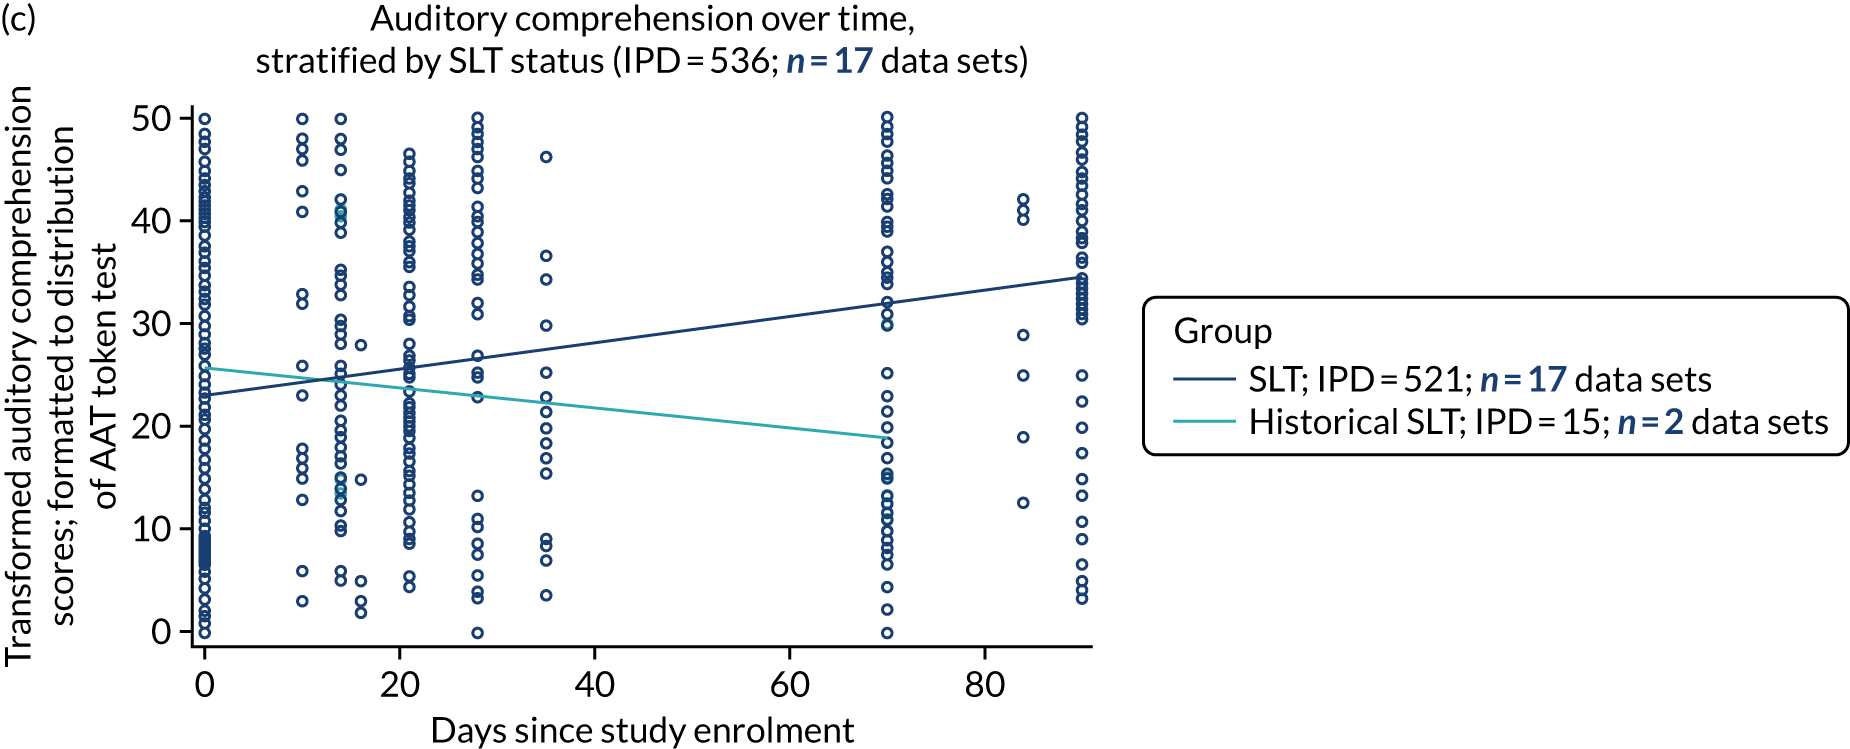
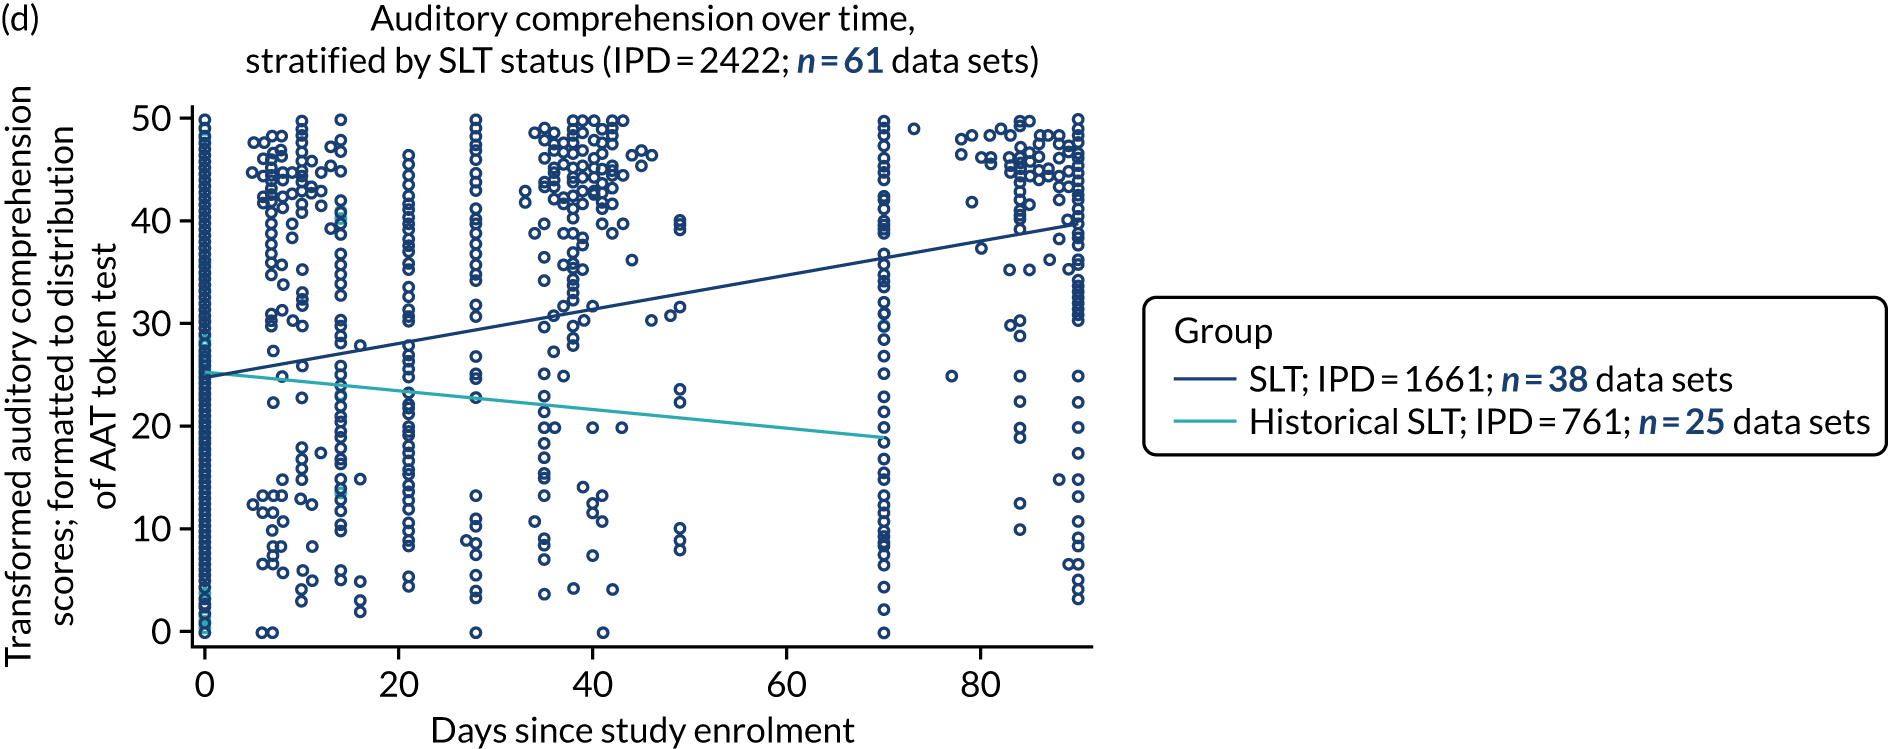
Of 536 IPD from 17 RCTs, 521 IPD (17/17 RCTs) were allocated to receive a SLT intervention, whereas 15 IPD (2/17 RCTs) received historical SLT only (see Figure 5a). Those with historical SLT experienced a decline in their auditory comprehension scores over time. In contrast, those who had study access to SLT experienced an increase in auditory comprehension scores over time. We examined this trajectory more closely by plotting follow-up between the two groups up to 90 days (see Figure 5c).
Despite randomisation, we observed slightly higher initial auditory comprehension scores at baseline in the historical SLT group; this declined over time. Across all primary research study designs (2463 IPD; 62 data sets; see Figure 5b), participants allocated to receive SLT demonstrated an increase in auditory comprehension scores over time. Data from participants who received only historical SLT in this population were available at only three time points and were therefore too sparse to make strong inferences (see Figure 5d).
Trajectory of naming over time
We transformed all naming scores to the Boston Naming Test (BNT) distribution. There were inadequate naming data at follow-up time points immediately after study intervention comparison periods from historical SLT participants in the primary studies (29 IPD; 3 RCTs). We therefore could not compare the trajectory of naming scores over longer follow-up time periods between participants with study access to SLT and participants with historical access to SLT in the RCT population. Instead, we present the trajectory of naming scores over shorter follow-up times (up to 90 days) for participants in RCTs (623 IPD; 22 RCTs; Figure 6a) and across all study designs (2592 IPD; 68 data sets; see Figure 6b).
FIGURE 6.
Naming scores over time. (a) RCTs; (b) all study types; and (c) within earlier follow-up times in RCTs.
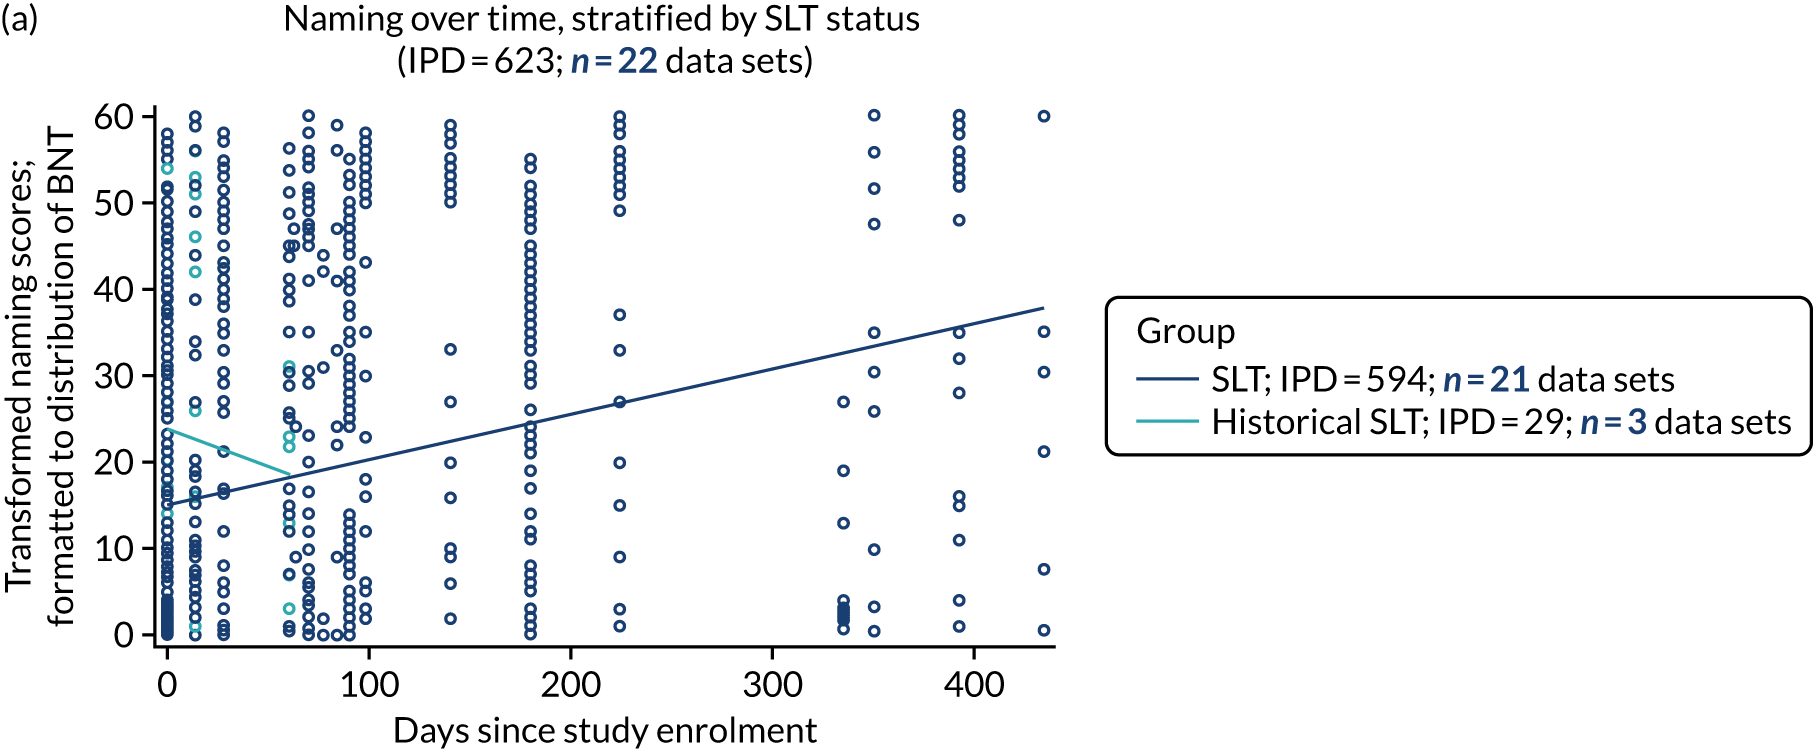
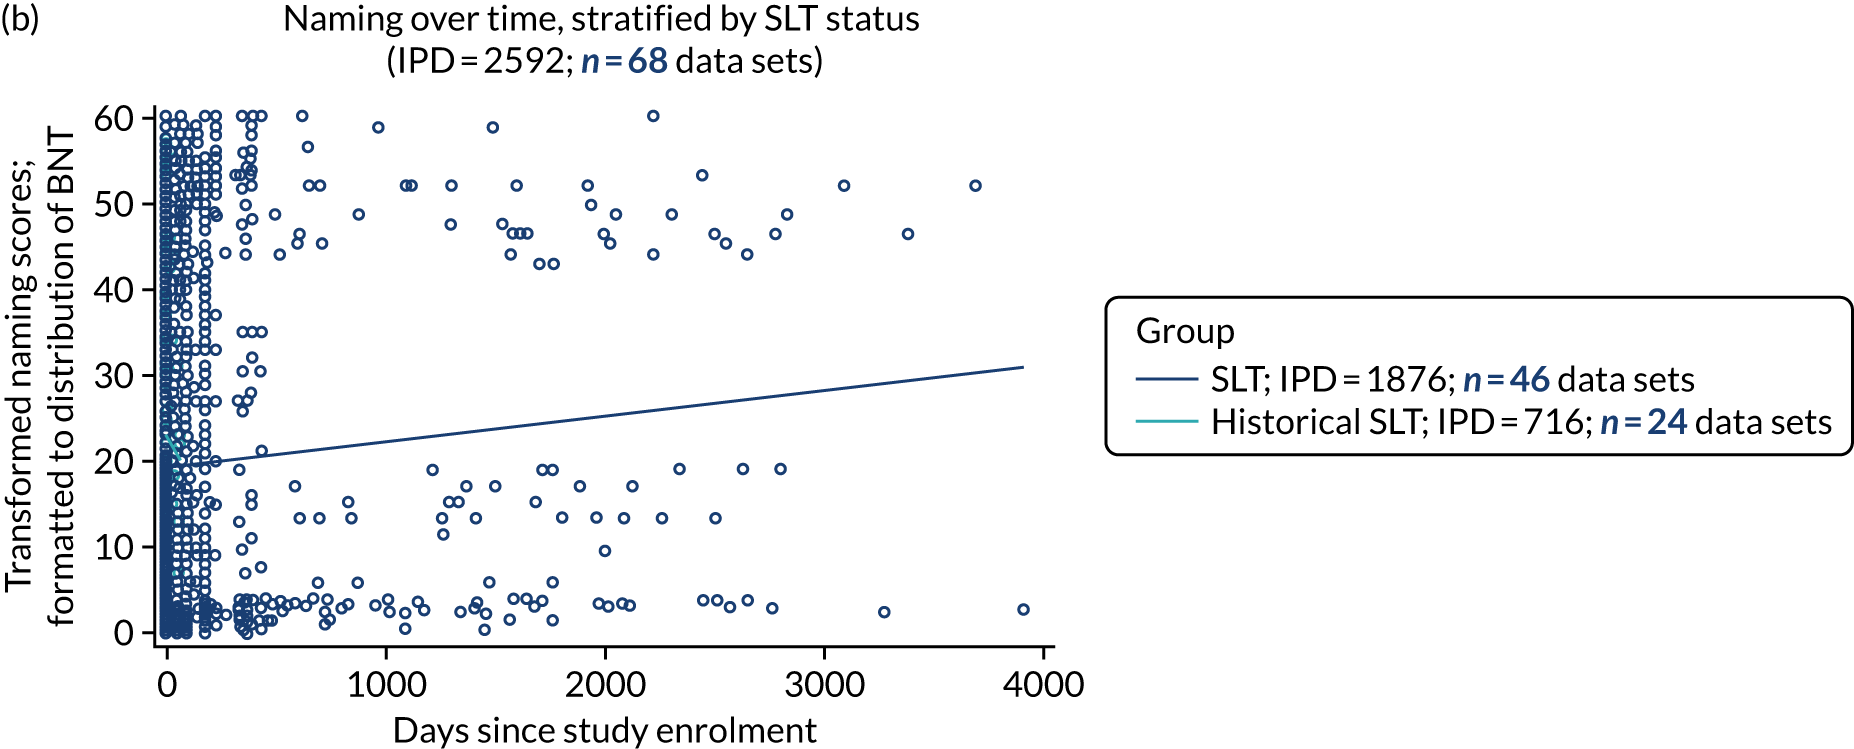
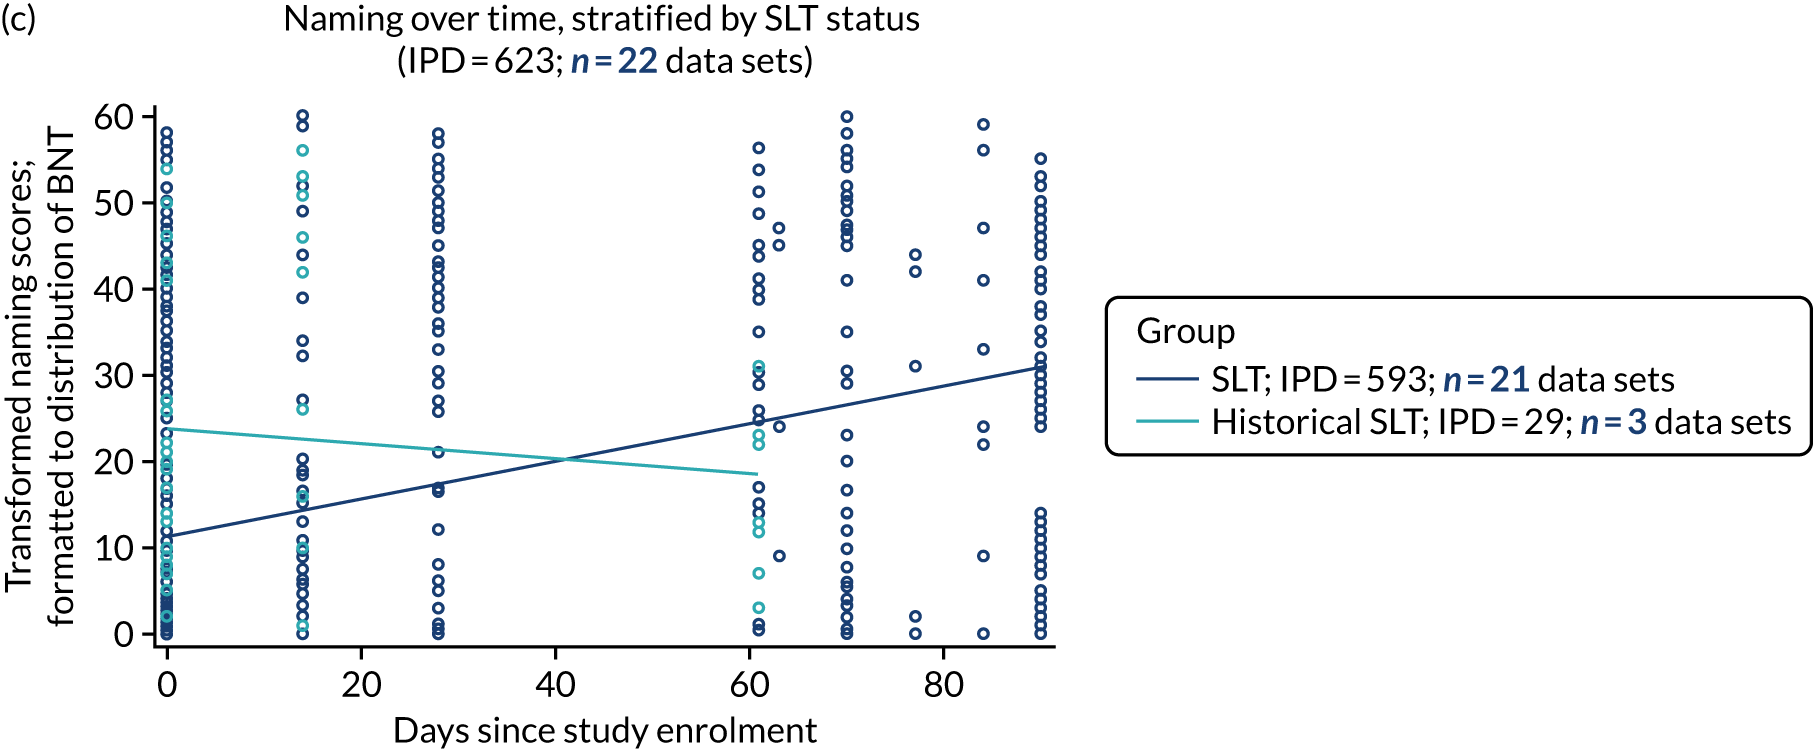
Historical SLT participants had higher naming scores at baseline than those allocated to receive SLT. Naming scores appeared to decline over time for the historical SLT participants, whereas scores for the SLT group experienced a steady upwards trajectory over time (see Figure 6a–c). Across all study types, there were limited data on naming scores among the historical SLT participants. For those who had study SLT access, naming scores increased with time (2592 IPD; 68 data sets; see Figure 6b).
Trajectory of other spoken language over time
There were no data available on other spoken-language outcomes for participants who received only historical SLT in RCTs. This meant that we could not describe the trajectory of spoken-language scores among this group or make any comparison with the trajectory of spoken-language scores over time among participants allocated to study SLT. We therefore present the trajectory of spoken-language scores over time [transformed to the verbal (1) subtest of the Porch Index of Communicative Ability (PICA)] for participants allocated to SLT in a RCT (172 IPD; 3 RCTs; Figure 7a) and across all study types (353 IPD; 8 data sets; see Figure 7b). The trajectory appeared to be stable over time in both populations.
FIGURE 7.
Other spoke language scores over time. (a) RCTs; and (b) all study types.

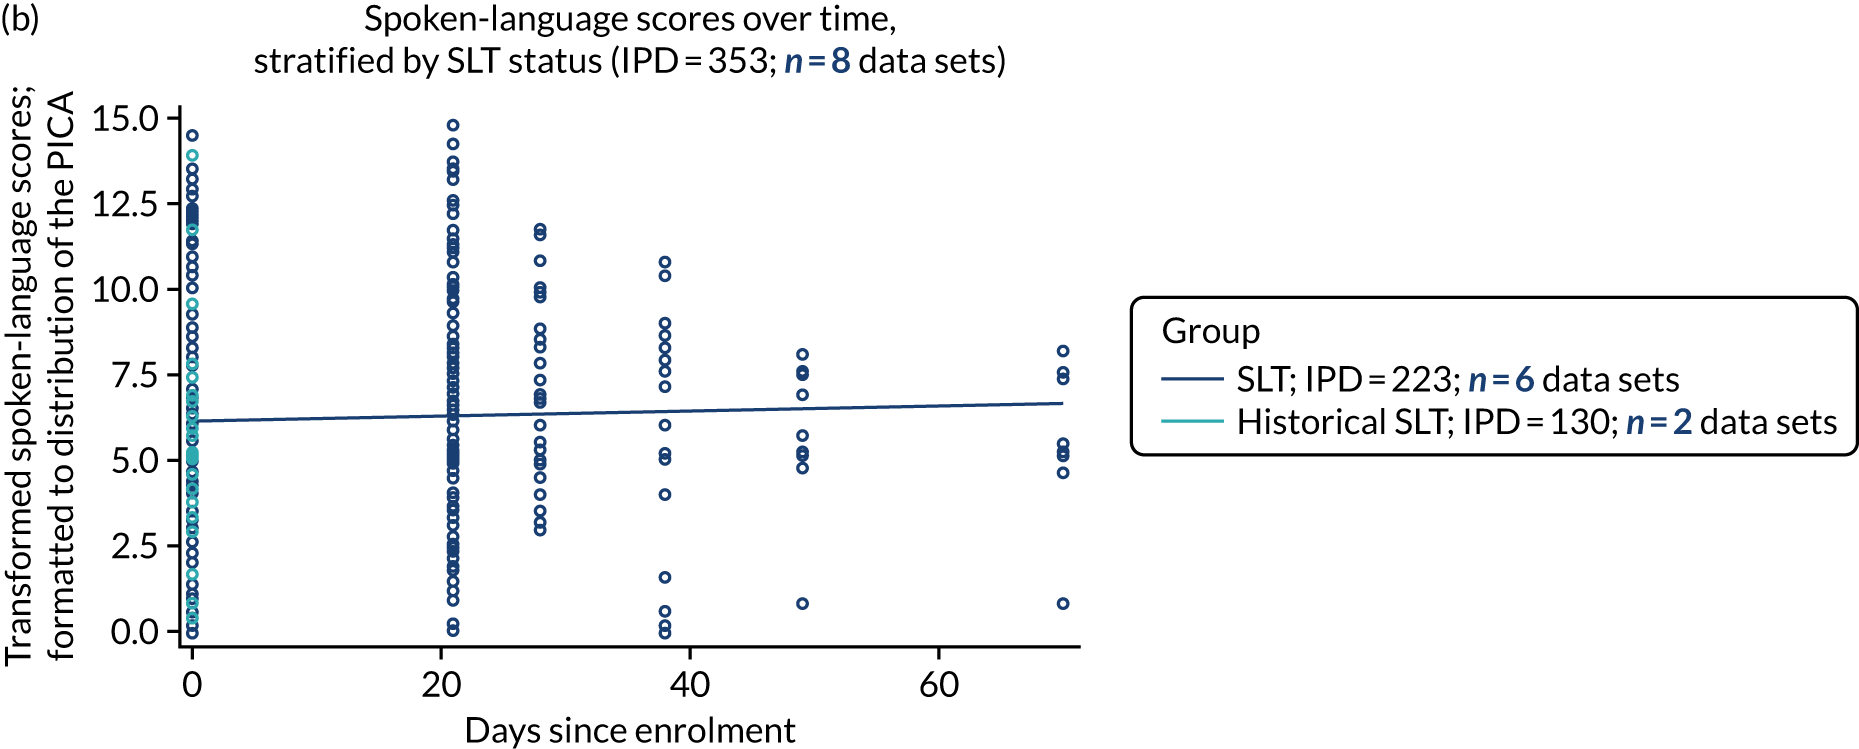
Trajectory of reading comprehension over time
We reviewed the transformed reading comprehension scores [transformed to fit the range of the Comprehensive Aphasia Test (CAT) reading subtest] for historical SLT participants and for those who had access to SLT in the primary studies. All historical SLT participants were permitted access to conventional SLT beyond the active intervention comparison period. Reading comprehension data beyond the immediate study intervention periods were inadequate for comparative meta-analysis. The stable trajectory of available reading comprehension scores over time among participants who had SLT across all primary studies is presented in Figure 8 (650 IPD; 9 data sets).
FIGURE 8.
Reading comprehension scores over time for all study types.
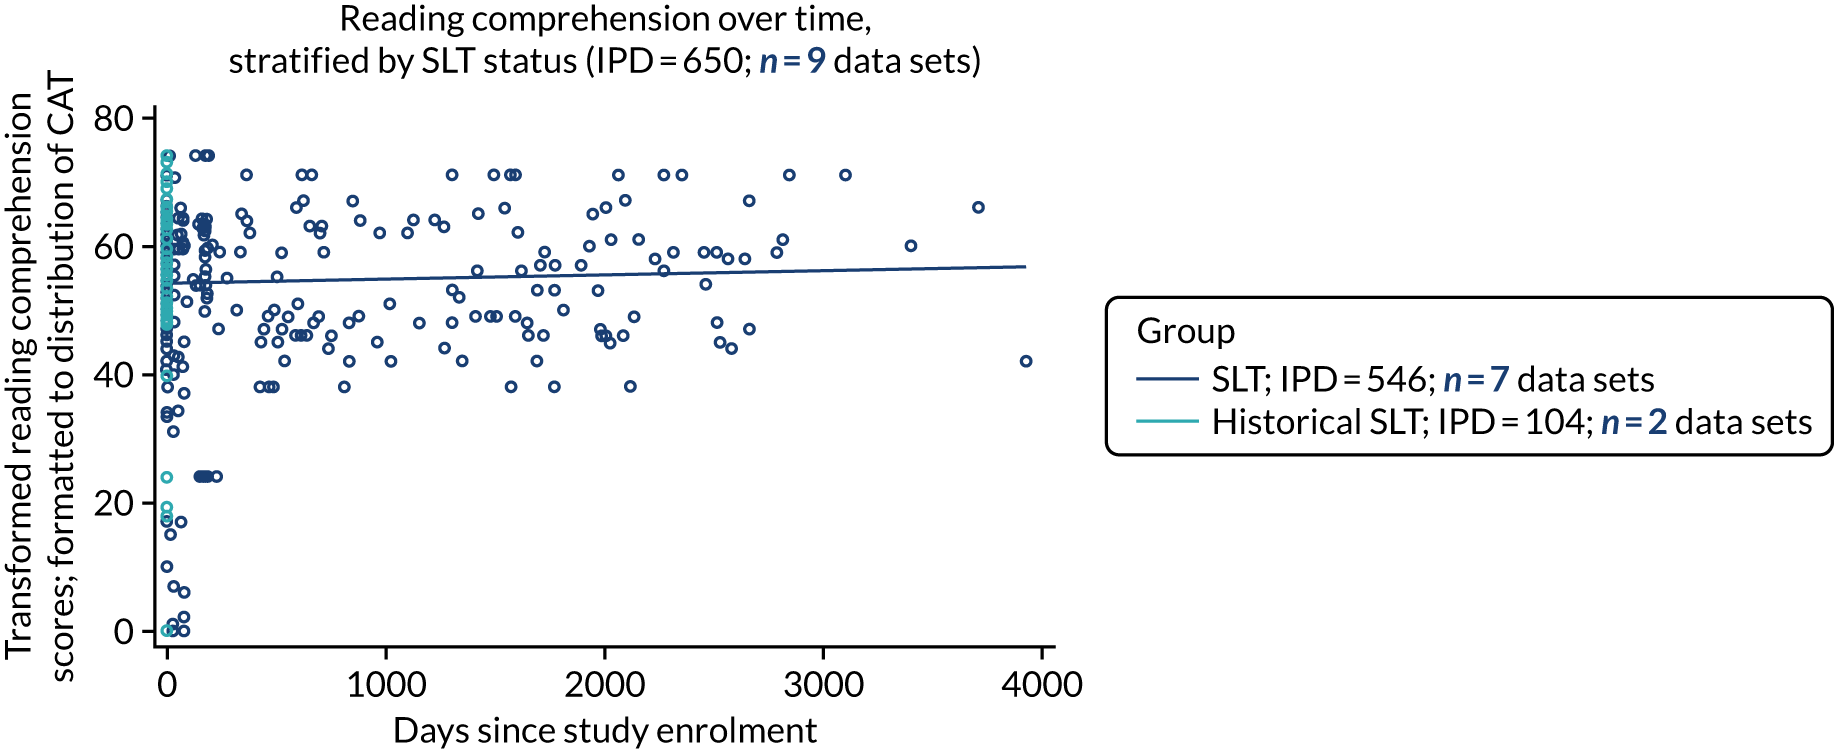
Trajectory of writing over time
Participants with available writing scores who received only historical SLT during the primary studies were typically given access to SLT immediately after the study intervention comparison period. Thus, writing data from later follow-up time points were insufficient to permit comparative meta-analysis by SLT status over time. We report writing data from SLT participants only. Data from three RCTs (41 IPD; Figure 9a) suggest a slight score decline across time. Across all study types (635 IPD; 10 data sets; see Figure 9b), following transformation to the anchor score (CAT writing subtest), we observed stable writing scores over time.
FIGURE 9.
Writing scores over time. (a) RCTs; and (b) all study types.

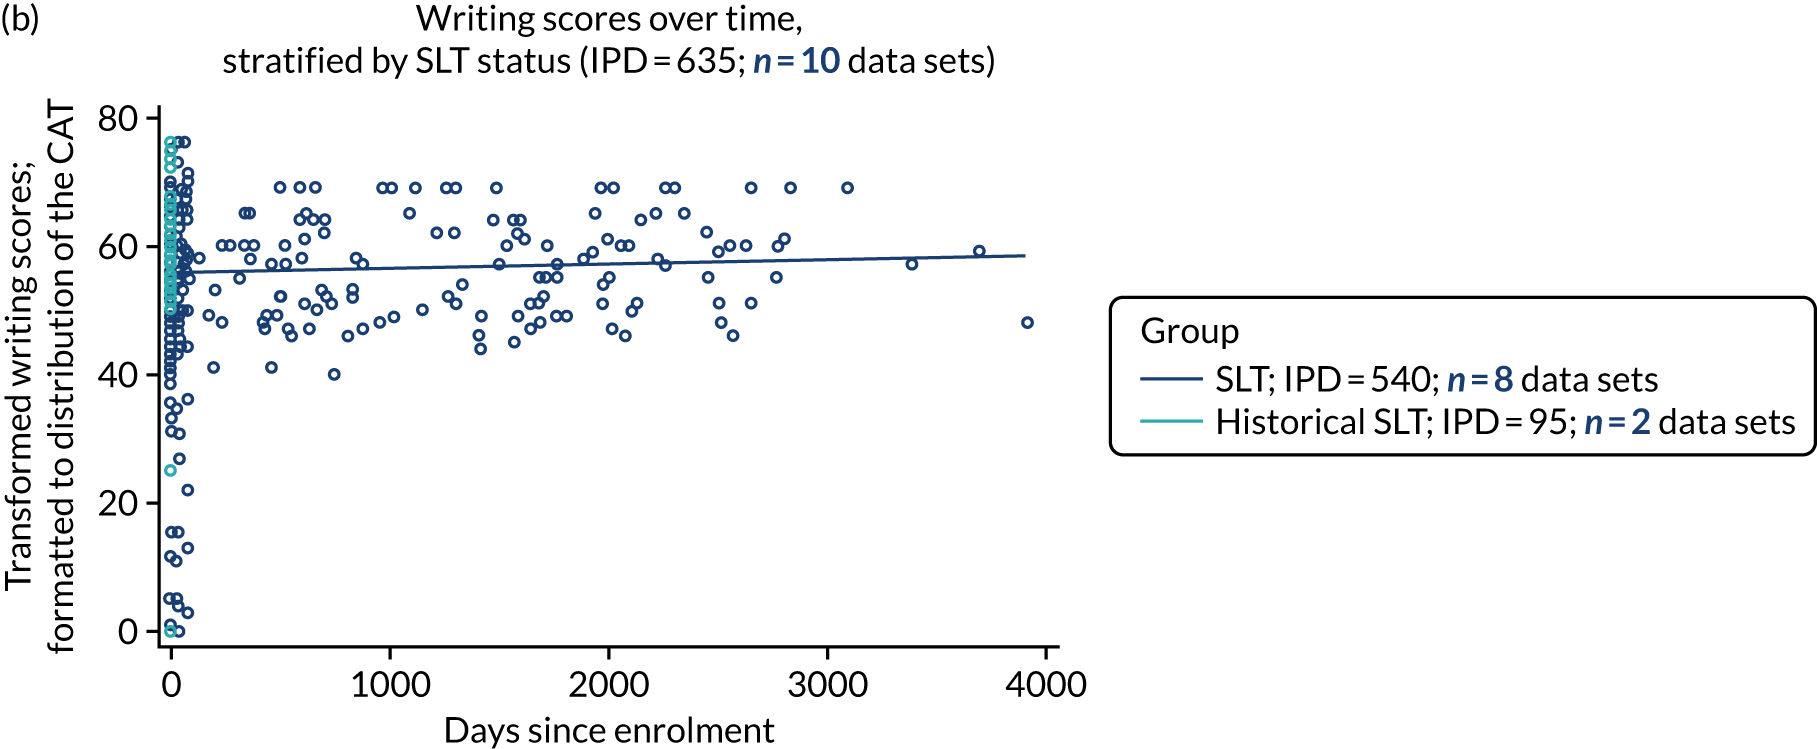
Trajectory of observer-rated functional communication (activity) over time
For functional communication (activity) over time, we examined 828 IPD from 17 RCTs (Figure 10a). The anchor measure for functional communication domain (activity) was the Aachen Aphasia Test-Spontaneous Speech Communication (AAT-SSC). There were inadequate data on participants who received only historical SLT, which did not permit comparison of trajectories with the SLT group; once again, there were few after-intervention data points and people who received only historical SLT during the study were all permitted to receive SLT after the intervention period was complete. In the SLT group, we observed better observer-rated activity scores over time. This was also evident when looking at all study types (1272 IPD; 28 data sets; see Figure 10b). Data on observer-rated participation measures showed the same patterns for better participation scores over time (see Report Supplementary Material 3, figure 1).
FIGURE 10.
Observer-rated activity scores over time. (a) RCTs; and (b) all study types.
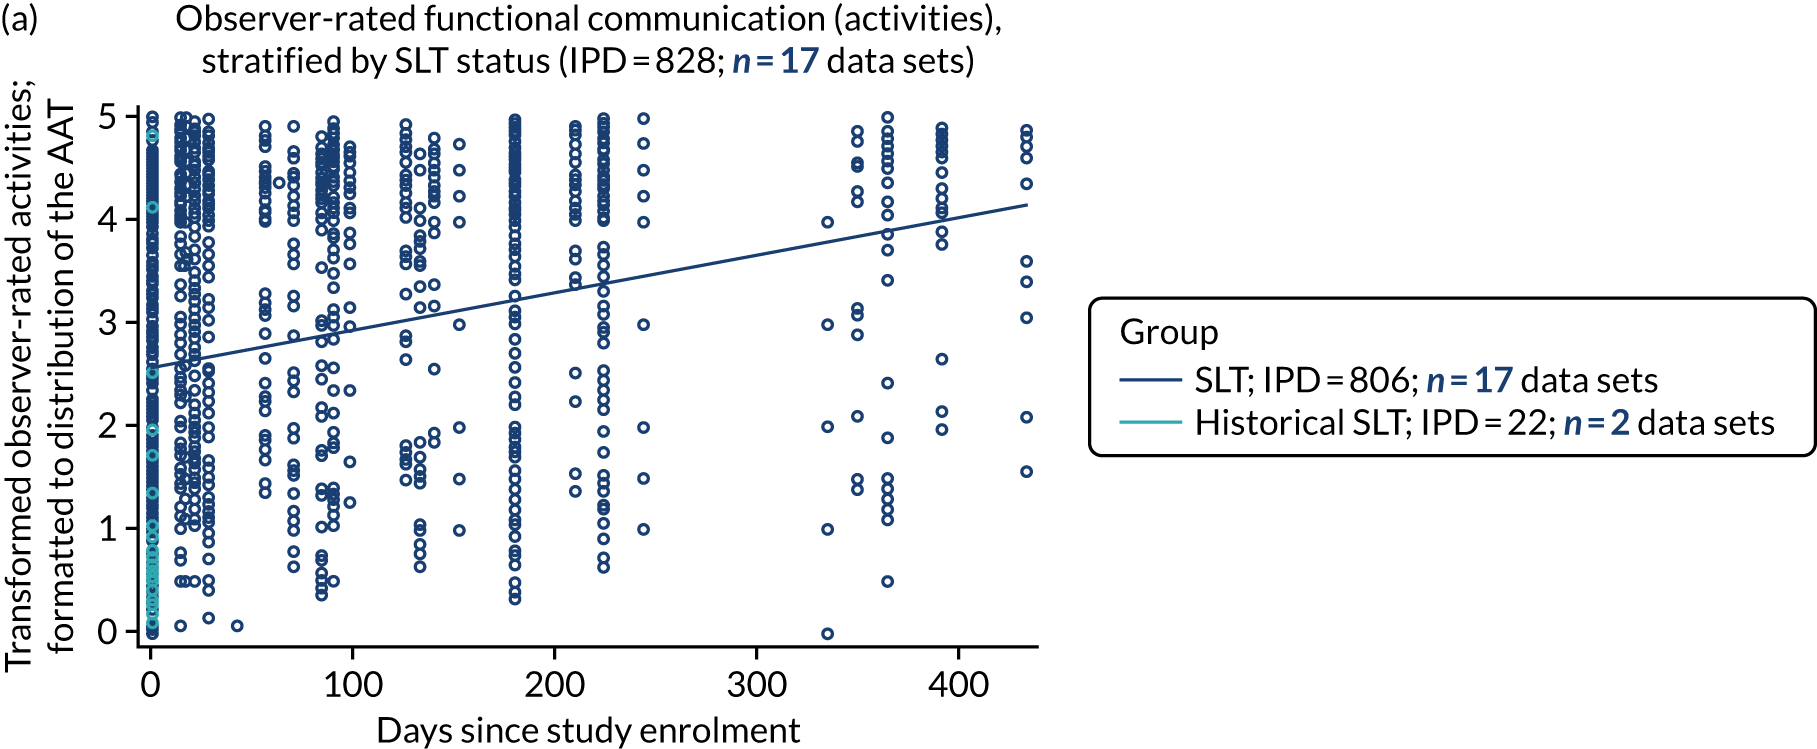

Trajectory of self-rated functional communication (activity) over time
Data were available on self-rated activity scores for 11 IPD (one RCT), and for 43 IPD (two data sets of all study types). The anchor measure for self-rated activity scores was the Assessment for Living with Aphasia (ALA). We observed an increase in self-rated activity scores with time (Figure 11) when using all study designs. Similar observations were seen for self-rated participation scores (see Report Supplementary Material 3, figure 2).
FIGURE 11.
Self-rated activities over time in all study types.

Distribution of language scores at study entry
We examined the distribution of participants’ language scores for each domain, as measured at study entry. We selected this time point to mitigate any treatment effect due to access to study SLT. Scores gathered using minority measures were transformed to match the distribution of the relevant anchor measure for that language domain. We considered the distribution of language scores across all study entry time points (days since the index stroke for that study), first for RCT data sets, and then across all study designs. When data permitted, we also considered the distribution of scores within what collaborators agreed were clinically applicable time periods for typical enrolment in aphasia studies (0–1000 days since the index stroke).
Overall language ability at study entry
Following transformation of overall language ability scores from minority measures to match the range of the WAB-AQ (anchor measure), we plotted language ability scores at study entry for RCT participants (700 IPD; 19 RCTs), and for all participants across all study designs for which overall language ability data were available (2571 IPD; 78 data sets).
Regression analyses based on data from the RCT population revealed that time since stroke at baseline (in months) was positively associated with better overall language ability (OR 1.010, 95% CI 1.006 to 1.014; p < 0.0001) (see Report Supplementary Material 3, figure 3). We observed similar overall increasing language ability with increasing time since stroke among all participants across all study designs (OR 1.003, 95% CI 1.002 to 1.005; p < 0.0001) (see Report Supplementary Material 3, figure 3).
When examining the distribution of overall language ability scores within more clinically applicable study enrolment time frames since index stroke (0–1000 days; 1780 IPD; 78 data sets), we observed a similar trend towards greater overall language ability with increasing time (in months) since stroke at baseline (OR 1.026, 95% CI 1.017 to 1.035; p < 0.0001). A 1-year increase in time from stroke to study enrolment was associated with an improvement in overall language ability scores (OR 1.36, 95% CI 1.22 to 1.51; p < 0.0001).
Spontaneous recovery (overall language ability)
A further breakdown of overall language ability scores for study entry at 0–15, 15–30, 30–90, 90–180, 180–365 and 365–1095 days can be found in Report Supplementary Material 3; figures 4 (RCTs) and 5 (all study types). Spontaneous recovery within this domain could be most readily examined by looking at study entry between 0 and 90 days post index stroke, in adjunct with natural history data (which were not available). Examination of the distribution of overall language ability scores at study entry within this time period revealed relatively stable distributions as time increased from 0 to 30 days (45–50 points on the WAB-AQ). Scores appeared to plateau beyond 3–6 months (scores of between 60 and 70); however, this appears to be confounded by sparse data in this time period (see Report Supplementary Material 3, figures 4 and 5). Data should also be interpreted with caution, as scores at study entry (particularly beyond 15 days of index stroke) did not account for SLT exposure prior to study entry.
Auditory comprehension at study entry
Auditory comprehension scores were transformed to fit the range of the anchor measure (the TT-AAT). We plotted these transformed scores at study entry for the RCT population (633 IPD; 19 RCTs; see Report Supplementary Material 3, figure 6) and across all study designs (2597 IPD; 67 data sets; see Report Supplementary Material 3, figure 6).
In the RCT population, auditory comprehension scores appeared to be stable with increased time to study entry. We examined whether or not the slope of the regression line was influenced by the small number of baseline data from later time points by examining the distribution within a more clinically applicable enrolment period of up to 1000 days since stroke in RCTs (506 IPD; 19 data sets; see Report Supplementary Material 3, figure 6). We observed a stable trend in auditory comprehension scores as time since stroke increased (see Report Supplementary Material 3, figure 6). This association was not significant when all baseline time to inclusion was considered (OR 1.001, 95% CI 0.996 to 1.005; p = 0.7312) nor when time to inclusion was limited to 1000 days after stroke (OR 0.999, 95% CI 0.980 to 1.019; p = 0.9571).
We then examined the distribution of auditory comprehension scores at increasing time to enrolment in all study types (see Report Supplementary Material 3, figure 6). In contrast to the RCT data set, we observed a slight increase in auditory comprehension scores at baseline with increasing time since stroke (2597 IPD; 67 data sets; see Report Supplementary Material 3, figure 6). Regression analysis showed no significant association between time to enrolment (in months) and auditory comprehension at baseline (OR 1.001, 95% CI 0.999 to 1.002; p = 0.3763). We examined the distribution of baseline auditory comprehension scores further, looking at clinically applicable enrolment periods of 0–1000 days since stroke for all study types (1879 IPD; 66 data sets; see Report Supplementary Material 3, figure 6). There was no association between time since stroke at baseline (months) and auditory comprehension scores for the 0–1000 days since stroke (OR 1.008, 95% CI 0.999 to 1.017; p = 0.0863).
Spontaneous recovery (auditory comprehension)
A further breakdown of auditory comprehension scores for study entry at 0–15, 15–30, 30–90, 90–180, 180–365 and 365–1095 days can be found in Report Supplementary Material 3, figures 7 (RCTs) and 8 (all study types). Spontaneous recovery within this domain could be most readily examined by looking at study entry between 0 and 90 days post index stroke, in adjunct with natural history data (which were not available). Examination of the distribution of auditory comprehension scores at study entry within this time period (i.e. 0–90 days post index stroke) revealed higher scores between days 1 and 15 (ranging between 27 and 28 points on the TT-AAT), and diminishing with time up to 3 months (ranging between 15 and 18 points on the TT between 1 and 3 months). However, this observation appears to be confounded by sparse data within this time period (see Report Supplementary Material 3, figure 7) and the fact that data did not account for SLT exposure prior to study entry, particularly for enrolment beyond 15 days of stroke.
Naming scores at study entry
We described the distribution of naming scores at study entry in RCTs (748 IPD; 25 RCTs; see Report Supplementary Material 3, figure 9) and all study designs (2760 IPD; 72 data sets; see Report Supplementary Material 3, figure 9). In the RCT population, naming scores appeared to be stable with increasing time from stroke to study entry (OR 1.00, 95% CI 0.996 to 1.003; p = 0.95). In contrast, for all study designs, an increase in baseline time (in months) was associated with increased naming scores (OR 1.005, 95% CI 1.004 to 1.007; p < 0.0001). A similar trend towards better naming scores with increased time from stroke to study enrolment (months) was observed within a clinically applicable period of 0–1000 days (1836 IPD; 71 data sets; see Report Supplementary Material 3, figures 9–11) (OR 1.031, 95% CI 1.022 to 1.040; p ≤ 0.0001).
Spontaneous recovery (naming)
A further breakdown of naming scores for study entry at 0–15, 15–30, 30–90, 90–180, 180–365 and 365–1095 days can be found in Report Supplementary Material 3, figures 10 (RCTs) and 11 (all study types). Spontaneous recovery within this domain could be most readily examined by looking at study entry between 0 and 90 days post index stroke, in adjunct with natural history data (which were not available). Examination of the distribution of naming scores at study entry within this time period (i.e. 0–90 days post index stroke) revealed higher scores between days 1 and 15 (ranging between 10 and 22 points on the BNT), and diminishing with time after 3 months (ranging between 7 and 12 points on the BNT between 1 and 3 months). However, this observation appears to be confounded by sparse data within this time period (see Report Supplementary Material 3, figures 10 and 11) and the fact that data did not account for SLT exposure prior to study entry.
Other spoken language at study entry
We described the distribution of other spoken-language scores at study entry for participants who were enrolled in a RCT (163 IPD; 2 RCTs; see Report Supplementary Material 3, figure 12) and across all study designs (344 IPD; 7 data sets; see Report Supplementary Material 3, figure 12). We observed relatively stable spoken-language scores among the RCT population as study entry time increased (OR 0.999, 95% CI 0.992 to 1.005; p = 0.69). There appeared to be relatively stable spoken-language scores with increasing time to study enrolment among participants from all study types (OR 1.002, 95% CI 0.998 to 1.007; p = 0.26) (see Report Supplementary Material 3, figure 12). Similar patterns were observed when examining a clinically applicable study enrolment period (0–1000 days; see Report Supplementary Material 3, figure 12).
Reading comprehension at study entry
We plotted the distribution of reading comprehension scores at study entry. These scores were transformed to fit the range of the CAT reading comprehension subtest. Data from the RCT population were available for only 11 IPD from one RCT, and therefore did not meet our prerequisites for analysis. We examined data at study entry from all study types (652 IPD; 9 data sets; see Report Supplementary Material 3, figure 13). We observed stable reading scores over time from stroke to study enrolment (OR 1.001, 95% CI 0.999 to 1.003; p = 0.46). We examined the distribution of scores during a more clinically applicable time span of 0–1000 days (see Report Supplementary Material 3, figure 13). We observed similarly stable reading comprehension scores among participants recruited later after stroke onset (OR 0.996, 95% CI 0.978 to 1.014; p = 0.68).
Writing at study entry
Randomised controlled trial data on writing scores at study entry were available for only 11 IPD from one RCT, and were therefore not taken forward for further analysis. Data on 673 IPD (11 data sets; see Report Supplementary Material 3, figure 14) were available across all study types. Writing scores appeared to increase slightly with increasing time to study enrolment, but this was not significant (OR 1.000, 95% CI 0.998 to 1.002; p = 0.96), nor was it significant within a more clinically applicable period of 0–1000 days (421 IPD; 11 data sets; see Report Supplementary Material 3, figure 14) (OR 1.003, 95% CI 0.986 to 1.021; p = 0.71).
Observer-rated functional communication (activity) at study entry
Data on observer-rated functional communication (activity) were converted to match the range of the AAT-SSC domain. Data were available for 998 IPD from 18 RCTs. We observed stable activity scores with increasing time to inclusion in RCTs (see Report Supplementary Material 3, figure 15) (OR 0.999, 95% CI 0.994 to 1.003; p = 0.51). We observed increased activity scores with increasing time to enrolment in RCTs when examining a more clinically applicable time period (0–1000 days after stroke; see Report Supplementary Material 3, figure 15) (OR 1.021; 95% CI 1.001 to 1.042; p = 0.036).
Data were available on activity measures for 1437 IPD from 29 data sets across all study types (see Report Supplementary Material 3, figure 15). We observed relatively stable activity scores with increasing time from stroke to study enrolment (OR 1.0; 95% CI 0.997 to 1.003; p = 0.94). Within a clinically meaningful enrolment period (0–1000 days after stroke), we observed similarly stable scores with increasing time to study enrolment (OR 1.005, 95% CI 0.992 to 1.019; p = 0.46) (see Report Supplementary Material 3, figure 15).
Observer-rated participation data were derived from this data set and also demonstrated similar observations across RCTs and all study types (see Report Supplementary Material 3, figure 16). A further breakdown of language ability scores for study entry at 0–15, 15–30, 30–90, 90–180, 180–365 and 365–1095 days can be found in Report Supplementary Material 3, figure 17 (RCTs) and 18 (all study types).
Spontaneous recovery [observer-rated functional communication (activity)]
Spontaneous recovery within this domain could be most readily examined by looking at study entry between 0 and 90 days post index stroke, in adjunct with natural history data (which were not available). Examination of the distribution of observer-rated activity scores at study entry within this time period (i.e. 0–90 days post index stroke) revealed higher scores between days 1 and 30 (ranging between 1.5 and 2.5 points on the AAT-SSC), and stabilising with time after 3 months (ranging between 2 and 2.5 points on the AAT-SSC). However, this observation appears to be confounded by sparse data within this time period (see Report Supplementary Material 3, figures 16 and 17) and the fact that data did not account for SLT exposure prior to study entry.
Observed-rated functional communication (participation) at study entry
Observer-rated participation data were also derived from this data set and also demonstrated similar observations across RCTs and all study types (see Report Supplementary Material 3, figure 18).
Self-rated functional communication at baseline
Data were available for only 11 IPD from one RCT on self-rated activity and participation. Data were therefore examined from all study types (see Report Supplementary Material 3, figure 19). Across all baseline times to study inclusion, self-rated activity scores appeared stable (OR 1.004, 95% CI 0.993 to 1.014; p = 0.48). This was also apparent when examining a more clinically meaningful enrolment period of 0–1000 days (OR 0.991, 95% CI 0.914 to 1.075; p = 0.83). Data on self-rated participation were also generated from these IPD and showed similar distributions (see Report Supplementary Material 3, figure 20).
Language recovery: absolute proportion of change in language scores from baseline to first follow-up after access to speech and language therapy
We examined the median absolute proportion of change observed across each language domain from baseline to the first follow-up after SLT. Chapter 7 details dichotomised sensitivity analyses that take into account recovery in participants relative to their initial language impairment.
The absolute proportion of change was calculated independently from the transformed scores and the maximum possible score on the relevant anchor measure. Data were presented in absolute percentages, so as to compare recovery across each domain. We first considered data extracted from RCTs (Figure 12a) followed by data extracted across all study types, regardless of study design (see Figure 12b). Figures are presented as medians and IQRs.
FIGURE 12.
Absolute proportion of change (median and IQR) in domain scores between baseline to first follow-up. (a) RCTS; and (b) all study types.
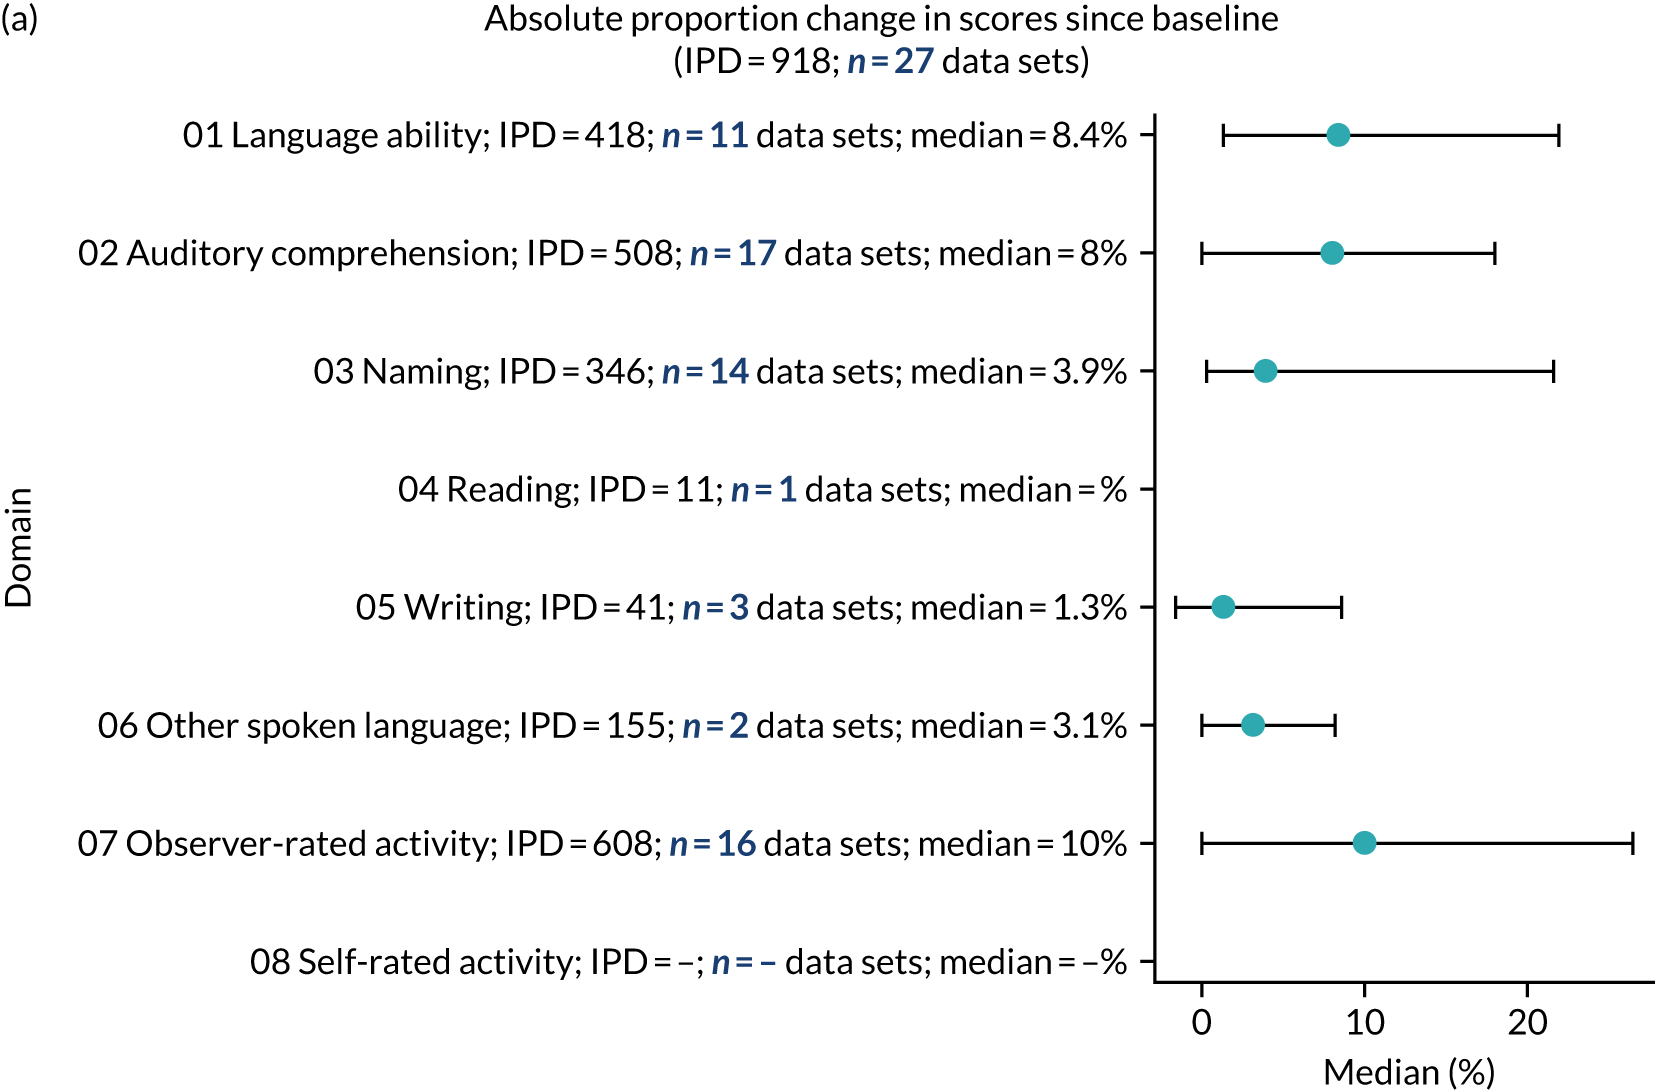
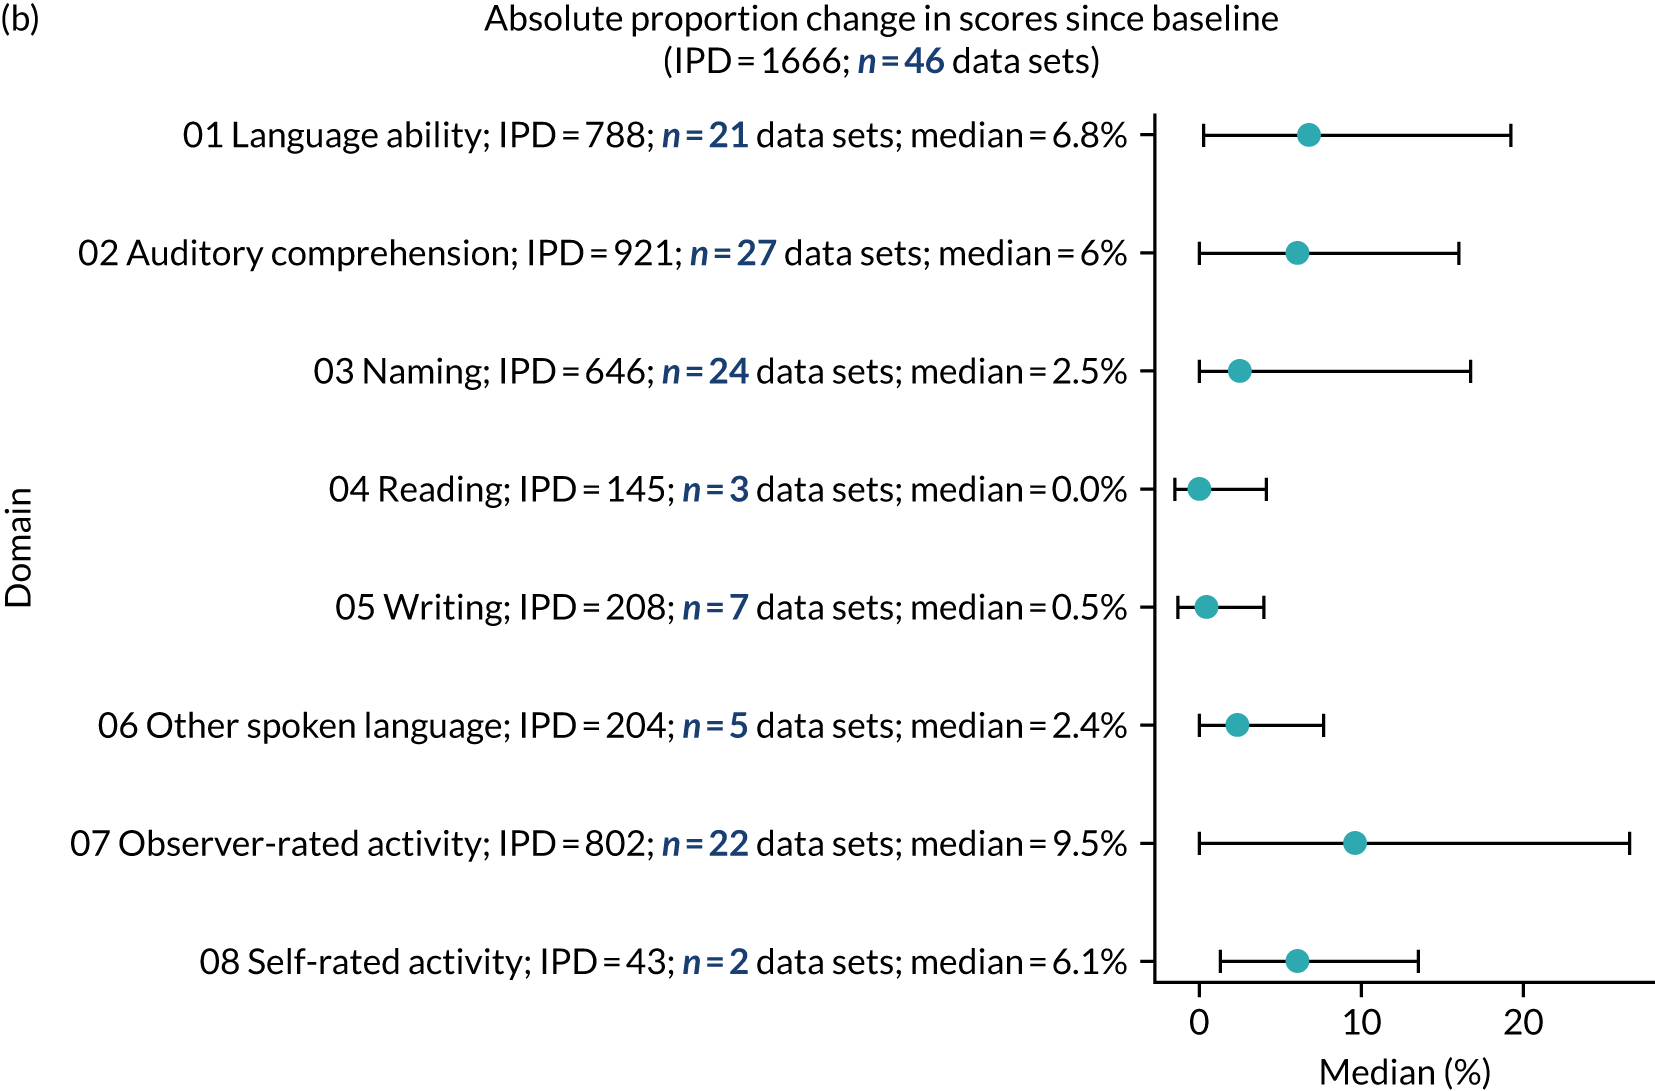
We identified suitable data on measures of overall language ability (418 IPD; 11 RCTs), auditory comprehension (508 IPD; 17 RCTs), naming (346 IPD; 14 RCTs), other spoken language (155 IPD; 2 RCTs), reading (11 IPD; 1 RCT), writing (41 IPD; 3 RCTs) and functional communication (activity and participation) (608 IPD; 16 RCTs). For participants who had access to SLT in a RCT, we observed the greatest median percentage changes since baseline in observer-rated activity scores (10%) and overall language ability scores (8.4%), followed by auditory comprehension (8.0%).
We then considered the wider data set, inclusive of participants from all study designs. We identified suitable data on overall language ability (788 IPD; 21 data sets), auditory comprehension (921 IPD; 27 data sets), naming (646 IPD; 24 data sets), spoken language (204 IPD; 5 data sets), reading scores (145 IPD; 3 data sets), writing measures (208 IPD; 7 data sets) and functional communication (observer-rated activity: 802 IPD from 22 data sets; self-rated activity: 43 IPD from 2 datasets; see Figure 12). Participants allocated to SLT had the highest median percentage change since baseline in observer-rated functional communication activity scores (9.5%), followed by overall language ability (6.8%) and auditory comprehension (6%) (see Figure 12).
Change in domain scores stratified by time to enrolment
We explored the role that time since index stroke and study enrolment played on the proportion of recovery observed for each domain score. Time since stroke at inclusion in the primary data set was stratified into the following groupings:
-
0–1 month
-
> 1–3 months
-
> 3–6 months
-
> 6 months following index stroke.
There were no participants in the no-SLT group (those who received only historical SLT) for whom values were available at the first follow-up period (in order to calculate change in language domain scores from baseline). Although data were available at later follow-up time points for this population, in the interim period SLT had been administered. This meant that there was no way to ascertain accurately the impact of no SLT on changes in language domain scores from baseline. Results are therefore presented for participants who had access to SLT, for RCTs (Figure 13) and across all study types (see Report Supplementary Material 3, figure 21). As the distribution of data within each domain were skewed, we presented data on the medians and IQRs for each time point.
FIGURE 13.
Proportion of recovery (median and IQR) across all language domains, stratified by time to study entry across RCTs. (a) Overall language ability; (b) auditory comprehension; (c) naming; (d) other spoken language; (e) writing; (f) observer-rated activities; and (g) observer-rated participation.
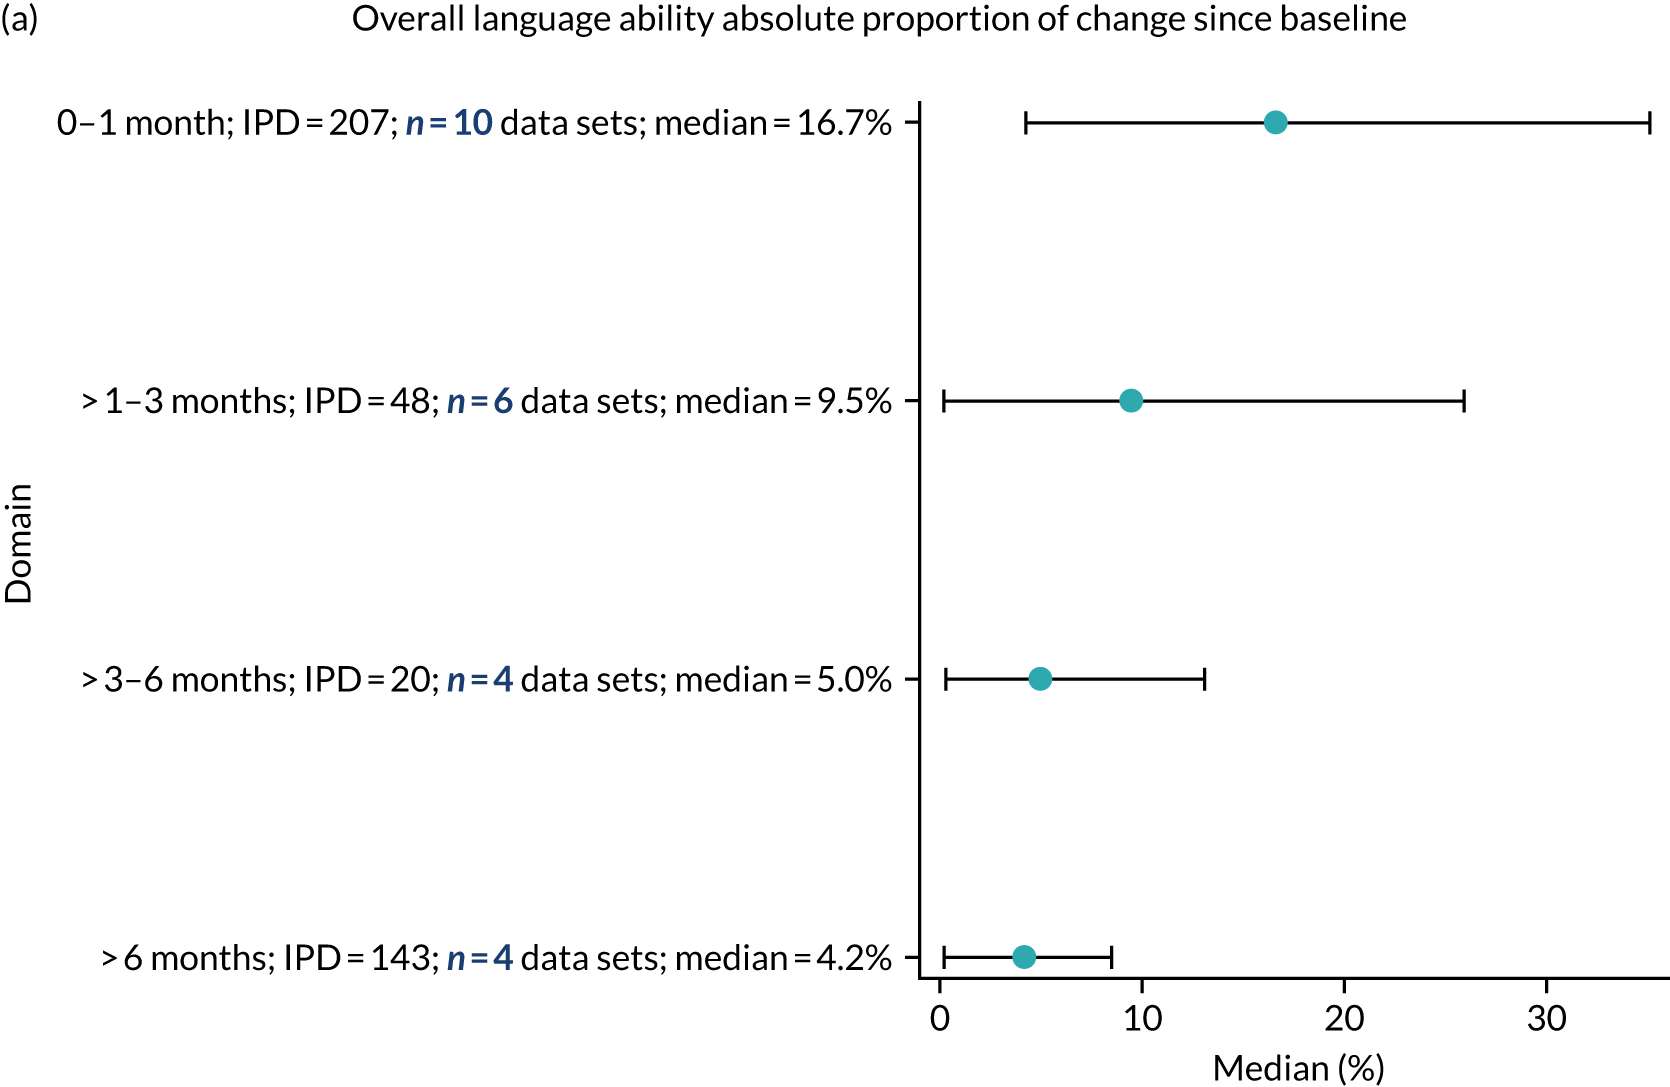

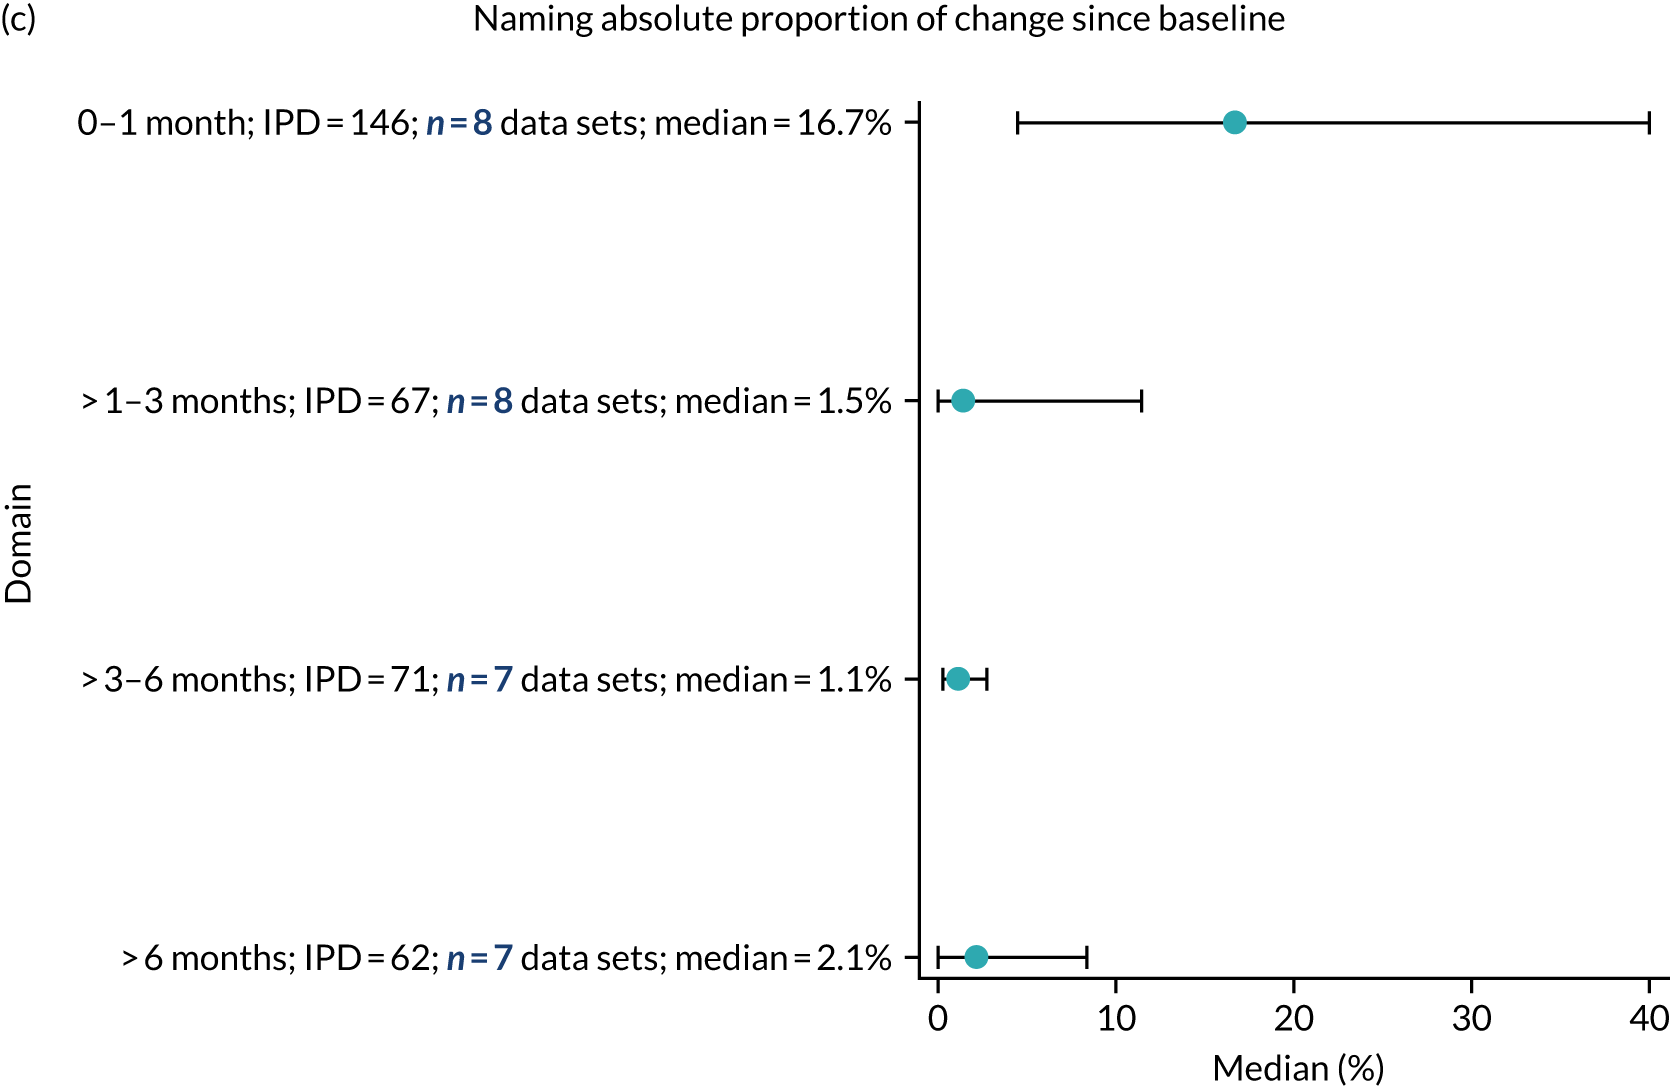
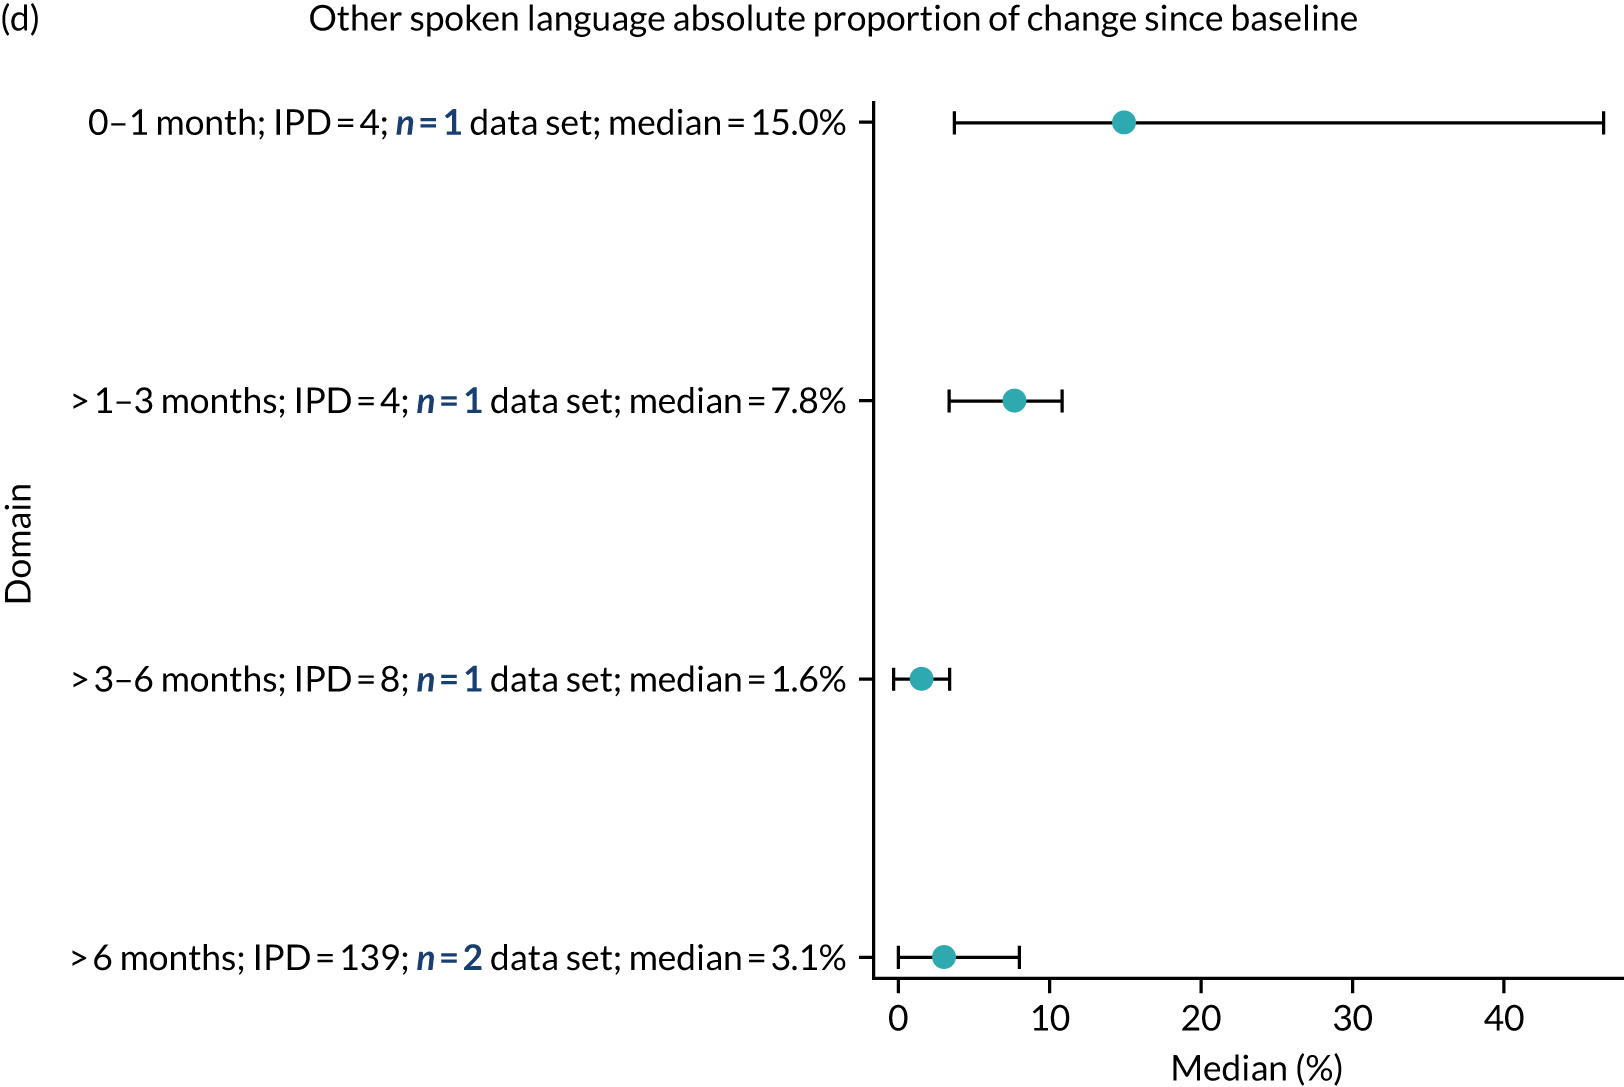
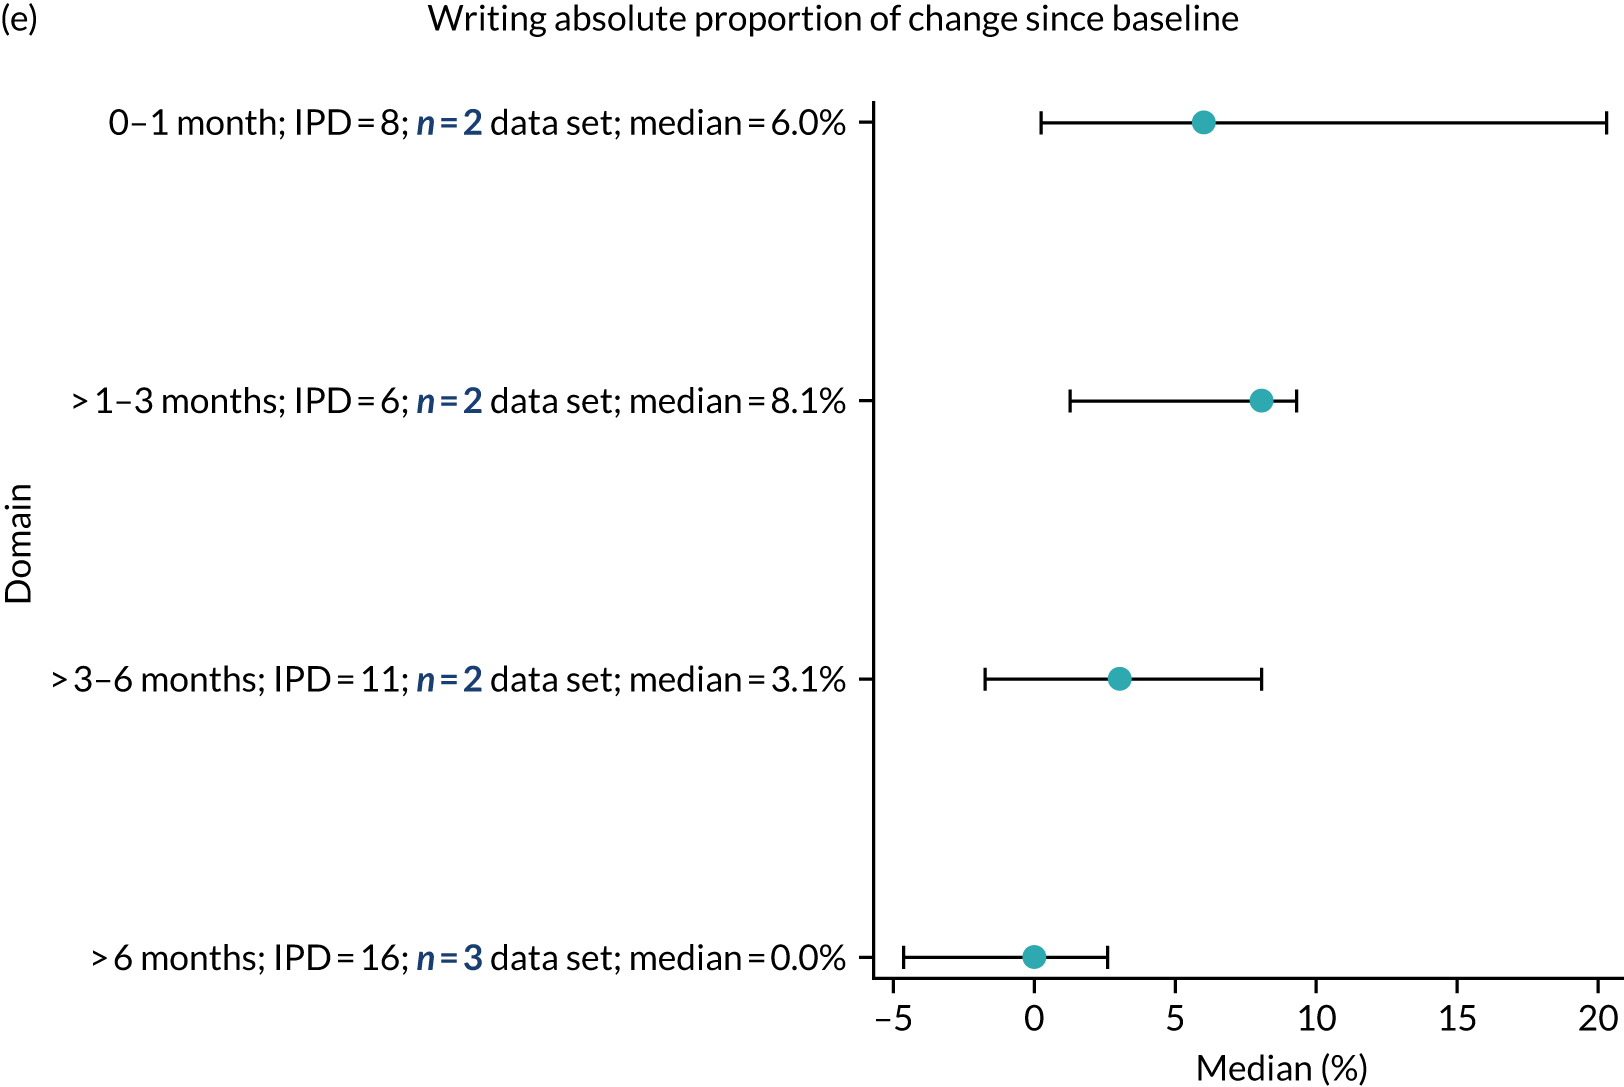
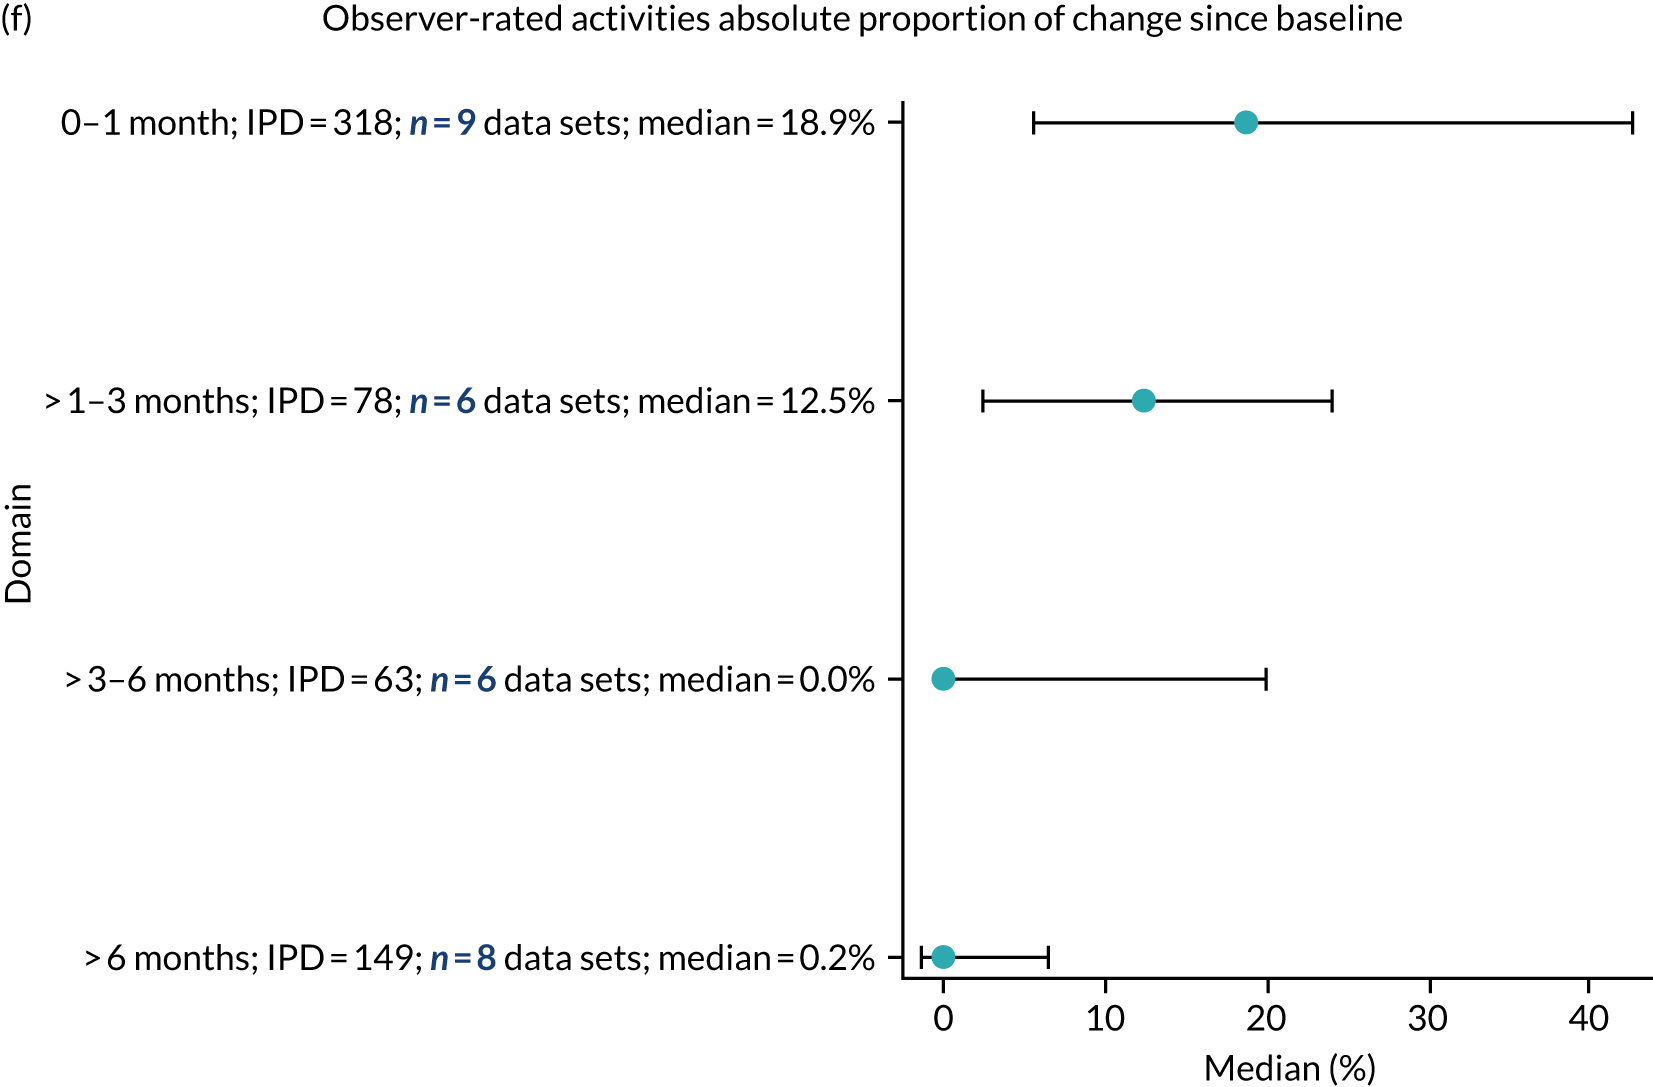
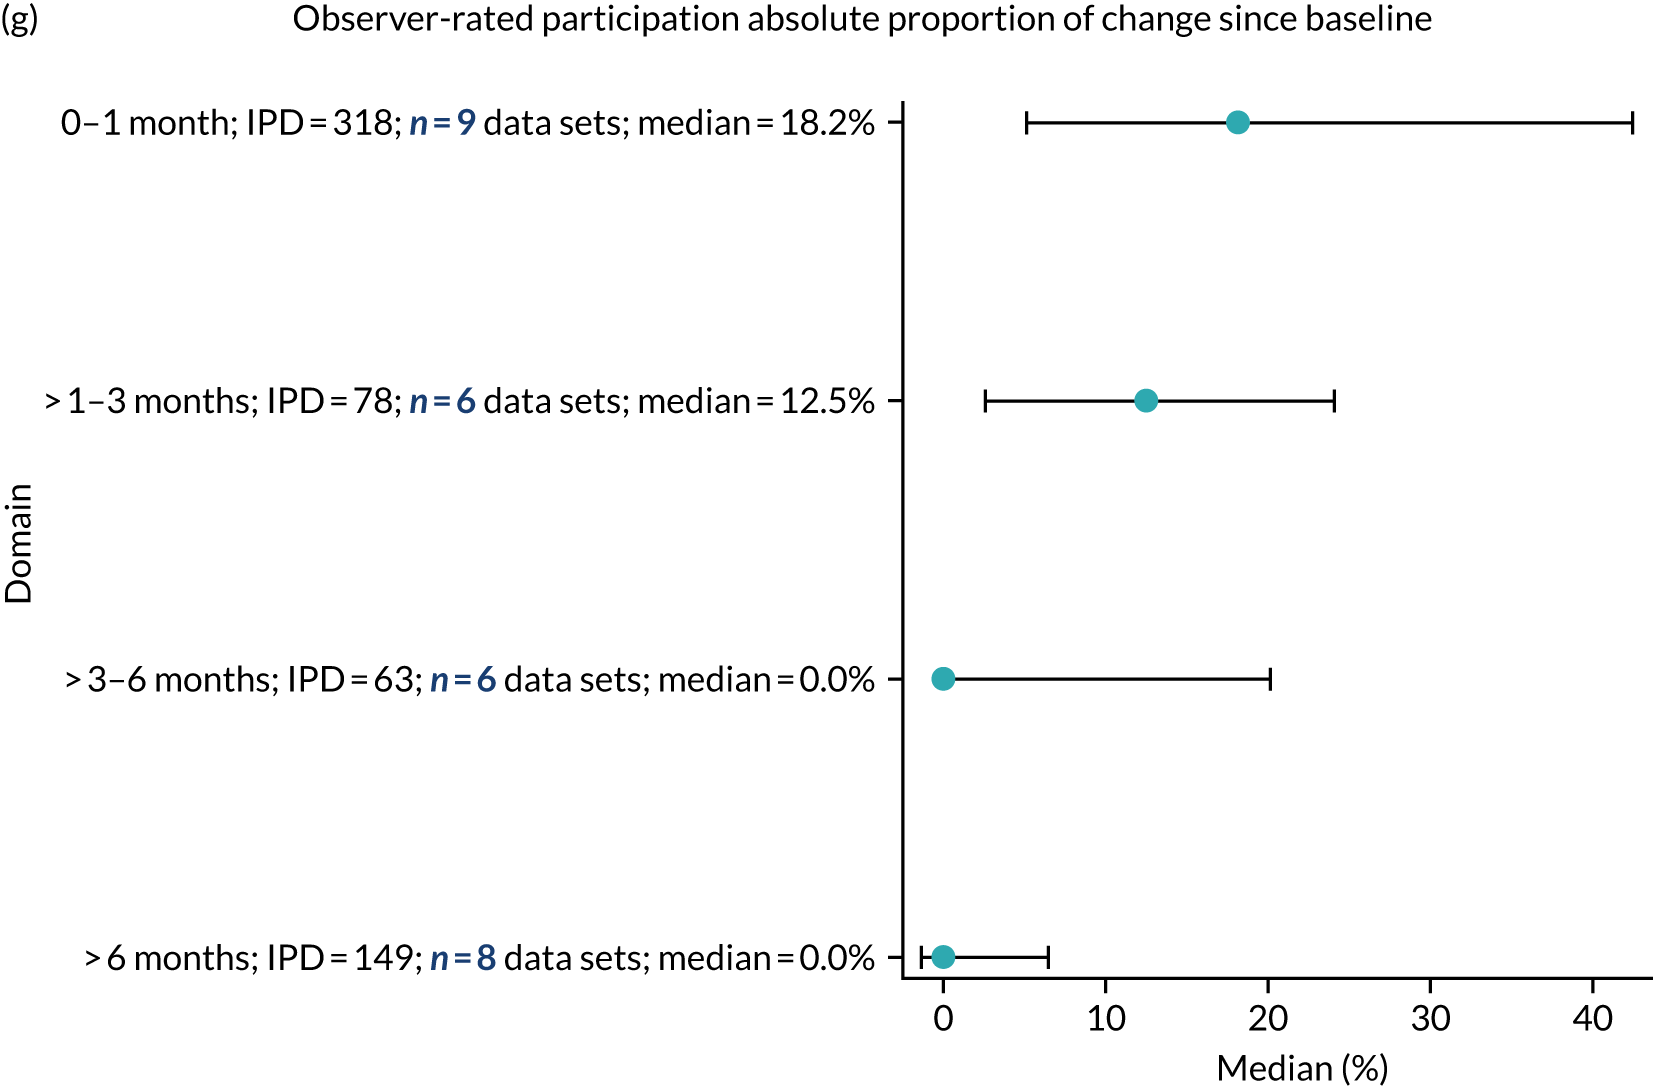
Recovery in the randomised controlled trial population
Overall language ability
In those enrolled within 1 month of stroke, the median change in overall language ability score was 16.7% (207 IPD; 10 data sets). This median change since baseline decreased for those enrolled between > 1 and 3 months of index stroke (median 9.5%; 48 IPD; 6 data sets), those enrolled between > 3 and 6 months of index stroke (median 5%; 20 IPD; 4 data sets) and those enrolled beyond 6 months of stroke (median 4.2%; 143 IPD; 4 data sets). The largest proportion of change in overall language ability scores was seen in those who were enrolled within 1 month of index stroke (see Figure 13a).
Auditory comprehension
For those enrolled within 1 month of stroke, the median change in auditory comprehension score was 12.4% (151 IPD; 10 data sets). This decreased to 8.8% for those who were enrolled between > 1 and 3 months of index stroke (69 IPD; 9 data sets), to 6% for those enrolled between > 3 and 6 months of stroke (69 IPD; 7 data sets) and to 4% for those enrolled after 6 months of index stroke (219 IPD; 9 data sets). The largest proportion of change in auditory comprehension scores was seen in those who were enrolled within 1 month of index stroke (see Figure 13b).
Naming
For those enrolled within 1 month of stroke, the median change in naming score was 16.7% (146 IPD; 8 data sets). For those enrolled between > 1 and 3 months of stroke, the median change was 1.5% (67 IPD; 8 data sets). For participants enrolled between > 3 and 6 months of stroke, the median change in naming score had decreased to 1.1% (71 IPD; 7 data sets); for those enrolled beyond 6 months of index stroke, the median change was 2.1% (62 IPD; 7 data sets). The largest changes in naming scores were seen in those enrolled within the first month of index stroke (see Figure 13c).
Other spoken language
There were inadequate data for a reliable description of median change in other spoken-language score within 1 month of stroke (4 IPD; 1 data set), between > 1 and 3 months of stroke (4 IPD; 1 data set) and between > 3 and 6 months of stroke (8 IPD; 1 data set). For those enrolled beyond 6 months of stroke, the median change was 3.1% (139 IPD; 2 data sets). These data should be interpreted with caution as the IPD at each time point were very small (see Figure 13d).
Reading comprehension
Data on changes in reading comprehension scores were not available for participants enrolled at 0–1 months, > 1–3 months or > 3–6 months after stroke. Data for those enrolled in a study > 6 months after index stroke could not be analysed as they did not meet our prespecified minimum data set requirement for analysis (11 IPD; 1 data set).
Writing
For those enrolled within 1 month of stroke, the median change in writing score was 6% (8 IPD; 2 data sets). For those enrolled between > 1 and 3 months of stroke, the median change was 8.1% (6 IPD; 2 data sets); for enrolment between > 3 and 6 months of stroke, this had decreased to 3.1% (11 IPD; 2 data sets), and in those enrolled beyond 6 months of stroke, the median change was 0% (16 IPD; 3 data sets). There were inadequate data for clinically meaningful analyses (see Figure 13e).
Observer-rated functional communication (activity)
Within an enrolment period of 0–1 months of the index stroke, the median percentage change in observer-rated functional communication (activity) was 18.9% (318 IPD; 9 data sets). At > 1–3 months of enrolment, it was 12.5% (78 IPD; 6 data sets); at > 3–6 months, it was 0% (63 IPD; 6 data sets); and by > 6 months, it was 0.2% (149 IPD; 8 data sets). The highest proportion of change was seen for earlier time points (see Figure 13f).
Observer-rated functional communication (participation)
There were 318 IPD from nine data sets on functional communication (participation) for study entry between 0 and 1 month after index stroke (median change 18.2%). The median change in participation at > 1–3 months was 12.5% (78 IPD; 6 data sets); at > 3–6 months, it was 0% (63 IPD; 6 data sets); and by > 6 months it was 0% (149 IPD; 8 data sets). The highest proportion of change was seen for earlier time points (see Figure 13g).
Self-rated functional communication
Data were available at only > 6 months for self-rated functional communication, thereby precluding any further analyses.
Recovery in all study types
Overall language ability
For those enrolled within 1 month of stroke, the median change in overall language ability score was 16.3% (389 IPD; 15 data sets). This median change since baseline decreased for those enrolled between > 1 and 3 months of index stroke (median 8.6%; 57 IPD; 9 data sets), for those enrolled between > 3 and 6 months of index stroke (median 1.5%; 30 IPD; 7 data sets) and for those enrolled beyond 6 months of stroke (median 2.2%; 312 IPD; 11 data sets). The largest proportion of change in overall language ability scores was seen in those enrolled within 1 month of index stroke (see Report Supplementary Material 3, figure 21).
Auditory comprehension
For those enrolled within 1 month of stroke, the median change in auditory comprehension score was 10% (339 IPD; 14 data sets); this similar to the change for those enrolled between > 1 and 3 months of index stroke (median 8.8%; 80 IPD; 11 data sets). The median change had decreased for those enrolled between > 3 and 6 months of stroke (median 4%; 82 IPD; 10 data sets) and for those enrolled beyond 6 months of stroke (median 2.7%; 420 IPD; 16 data sets). The largest proportion of change in auditory comprehension scores was seen in those enrolled within 1 month of index stroke (see Report Supplementary Material 3, figure 21).
Naming
For those enrolled within 1 month of stroke, the median change in naming score was 8.3% (198 IPD; 10 data sets). For those enrolled between > 1 and 3 months of stroke, the median change was 1.9% (77 IPD; 10 data sets); for participants enrolled between > 3 and 6 months of stroke, this decreased to 0.9% (84 IPD; 10 data sets). For those enrolled beyond 6 months of stroke, the median change in naming scores was 1.9% (287 IPD; 16 data sets). The largest changes in naming scores were seen in those enrolled within 1 month of index stroke (see Report Supplementary Material 3, figure 21).
Other spoken language
There were inadequate data for a reliable description of median change in other spoken-language score for those enrolled within 1 month of stroke (6 IPD; 2 data sets), and for those enrolled between > 1 and 3 months of stroke (7 IPD; 2 data sets). For those enrolled within between > 3 and 6 months of stroke, the median change was 1.9% (13 IPD; 2 data sets), and for those enrolled beyond 6 months of stroke, the median change was 2.4% (178 IPD; 5 data sets). Proportion of change in other spoken-language scores increased very slightly from > 3–6 months to beyond 6 months. However, these data should be interpreted with caution as the IPD available at each time point were very small (see Report Supplementary Material 3, figure 21).
Reading comprehension
Data on reading comprehension were not available for participants enrolled between 0 and 1 month of stroke; for those who were enrolled in a study between > 1–3 months and > 3–6 months of stroke, only six IPD were available. By > 6 months of index stroke, the median change in scores at final follow-up was 0% (133 IPD; 3 data sets).
Writing
For those enrolled within 1 month of stroke, the median change in writing score was 9.1 (10 IPD; 3 data sets). For those enrolled between > 1 and 3 months of stroke, the median change was 3.9% (13 IPD; 4 data sets); for those enrolled between > 3 and 6 months of stroke, this decreased to 2.1% (21 IPD; 4 data sets), and for those enrolled beyond 6 months of stroke, it was 0% (164 IPD; 7 data sets). Larger changes in writing scores were seen in those enrolled within 0–1 month after index stroke (see Report Supplementary Material 3, figure 21).
Observer-rated functional communication (activity)
Within an enrolment period of 0–1 month after the index stroke, the median percentage change for observer-rated functional communication (activity) was 16.2% (442 IPD; 11 data sets). The median change in activity for those enrolled within > 1–3 months of stroke was 12.5% (80 IPD; 7 data sets); for those enrolled within > 3–6 months, it was 0% (64 IPD; 7 data sets), and for those enrolled beyond 6 months, it was 1.1% (216 IPD; 12 data sets). The highest proportion of change was seen for earlier time points (see Report Supplementary Material 3, figure 21).
Observer-rated functional communication (participation)
There were 397 IPD from 10 data sets on observer-rated functional communication (participation) for study entry within 0–1 month after index stroke (median change 16.3%). The median change in activity for those enrolled between > 1 and 3 months of stroke was 12.5% (78 IPD; 6 data sets); for those enrolled between > 3 and 6 months, it was 0% (64 IPD; 7 data sets), and for those enrolled beyond 6 months, it was 0.6% (216 IPD; 12 data sets). The highest proportion of change was seen for earlier time points (see Report Supplementary Material 3, figure 21).
Self-rated functional communication
Data were available at only > 6 months for self-rated functional communication, thereby precluding any further analyses.
Summary
There were insufficient data with which to ascertain the natural history of language impairment progression following aphasia due to stroke. Many data sets in which participants were allocated to the no-SLT group (historical SLT only) were permitted to receive SLT following completion of the study intervention period. Coupled with sparse post-intervention assessment time points, this limited the data available for the natural history analyses.
Similarly, we could not compare the trajectory of language scores over time for historical SLT with that for SLT-treated populations. Data in the historical comparison group were either available at baseline only, did not have a corresponding post-intervention follow-up value or did not meet our minimum eligibility criteria for the analysis. For those who had access to SLT, we observed an improvement in scores over time. This was less pronounced for ‘other spoken-language production.’
Examining the scores for each language domain at study entry for all study types suggested better scores with increased time to study enrolment. However, these were only significant for overall language ability and naming.
The median proportion of change was selected to describe the change since baseline across all domains, as it was a more accurate reflection of the distribution of the skewed populations across each language domain. The greatest proportion of change was seen in the domains of observer-rated functional communication (10.0%) and overall language ability (8.4%), followed by auditory comprehension (8.0%), although the CIs were wide for each of these domains, and overlapped. For each of our analyses, similar results were observed whether examining the RCT population alone or all study types. The proportion of change in each domain score since baseline appeared to decrease with increasing time since index stroke. Although many of these differences since baseline did not appear to be significantly different across different domains (e.g. the 95% CIs overlapped), the proportions were notable from a clinical standpoint for some domains (e.g. 16.7% change on the WAB-AQ from baseline for overall language ability; 18.9% change in AAT-SSC for observer-rated activities), and were therefore presented.
Chapter 5 Predictors of language recovery
Overview
In this chapter, we explore the distribution of language data at study entry according to key demographic factors (age, sex and living context). We then examine the relationship between key demographic factors and absolute proportion of recovery at follow-up for each language domain. Finally, we examine predictors of language recovery following aphasia after stroke; this was done by undertaking a series of meta-analyses on selected subsets of the IPD. We used a one-stage approach, simultaneously analysing all relevant IPD from the entire database, and included the individual study as a random effect in all analyses.
We examined both significance and the absolute change in raw scores. Analyses could reveal non-significant results with notable effect sizes from a clinical perspective. We therefore reported on significant as well as non-significant results, when a notable clinical effect size existed.
Language performance at study entry, stratified by age
We described language performance on each language domain for participants on study entry (baseline assessment). This time point was selected as no study intervention had yet been administered, and data were available for pre-intervention assessments across a range of time points since aphasia onset, thereby providing an indication of the distribution of language domain scores across different time points since the index stroke.
Age and overall language ability at baseline
We examined the distribution of overall language ability in RCTs (700 IPD; 19 RCTs; Figure 14a), stratified by four age groups: ≤ 55 years (209 IPD; 19 data sets), 56–65 years (204 IPD; 19 data sets), 66–75 years (149 IPD; 18 data sets) and aged 75+ years (138 IPD; 13 data sets). As time to inclusion increased, so too did baseline language ability scores across all age strata. When examining a clinically meaningful enrolment period (0–1000 days post stroke; see Figure 14c), the CIs for all age groups appeared to overlap, indicating that these differences were not significant.
FIGURE 14.
Overall language ability scores by age for all participants at baseline. (a) RCTs; (b) all study types; (c) for enrolment in RCTs within 0–1000 days of stroke; and (d) for enrolment in all study types within 0–1000 days of stroke.
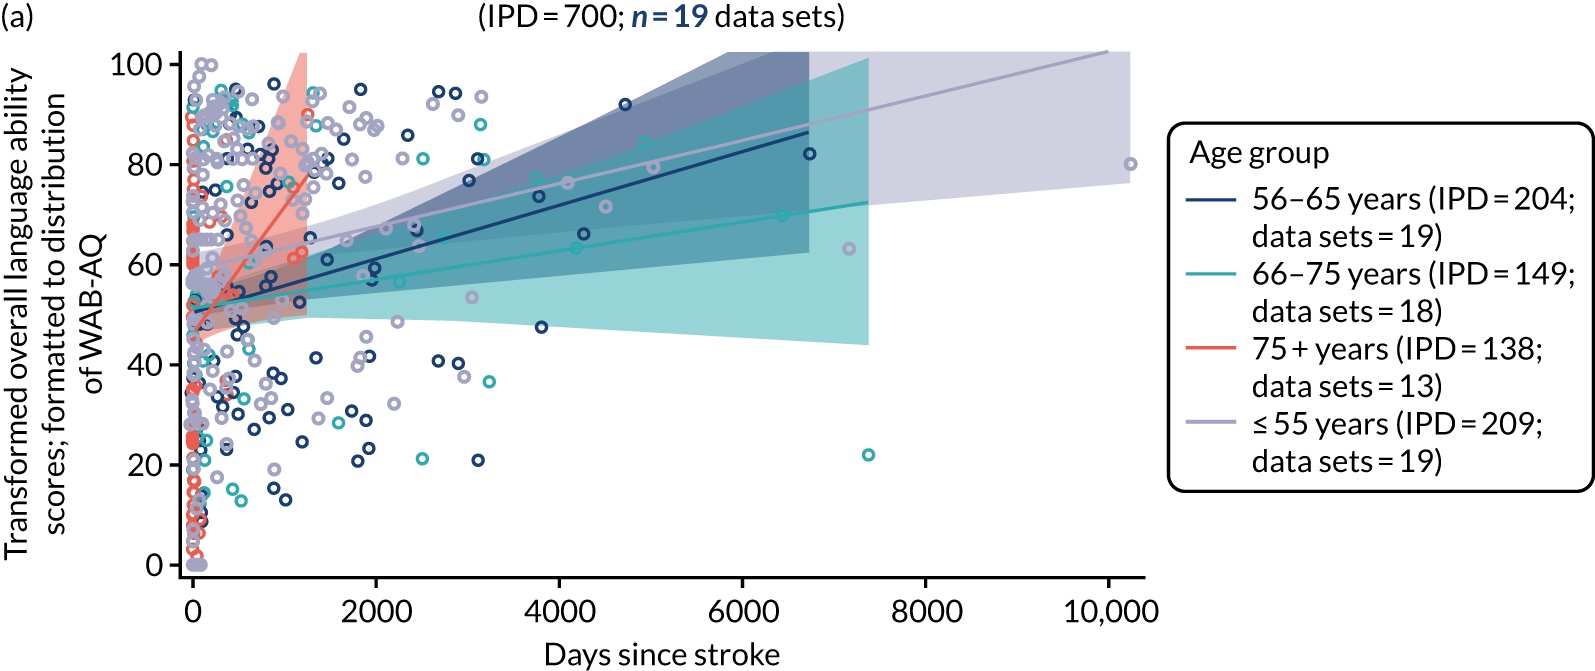
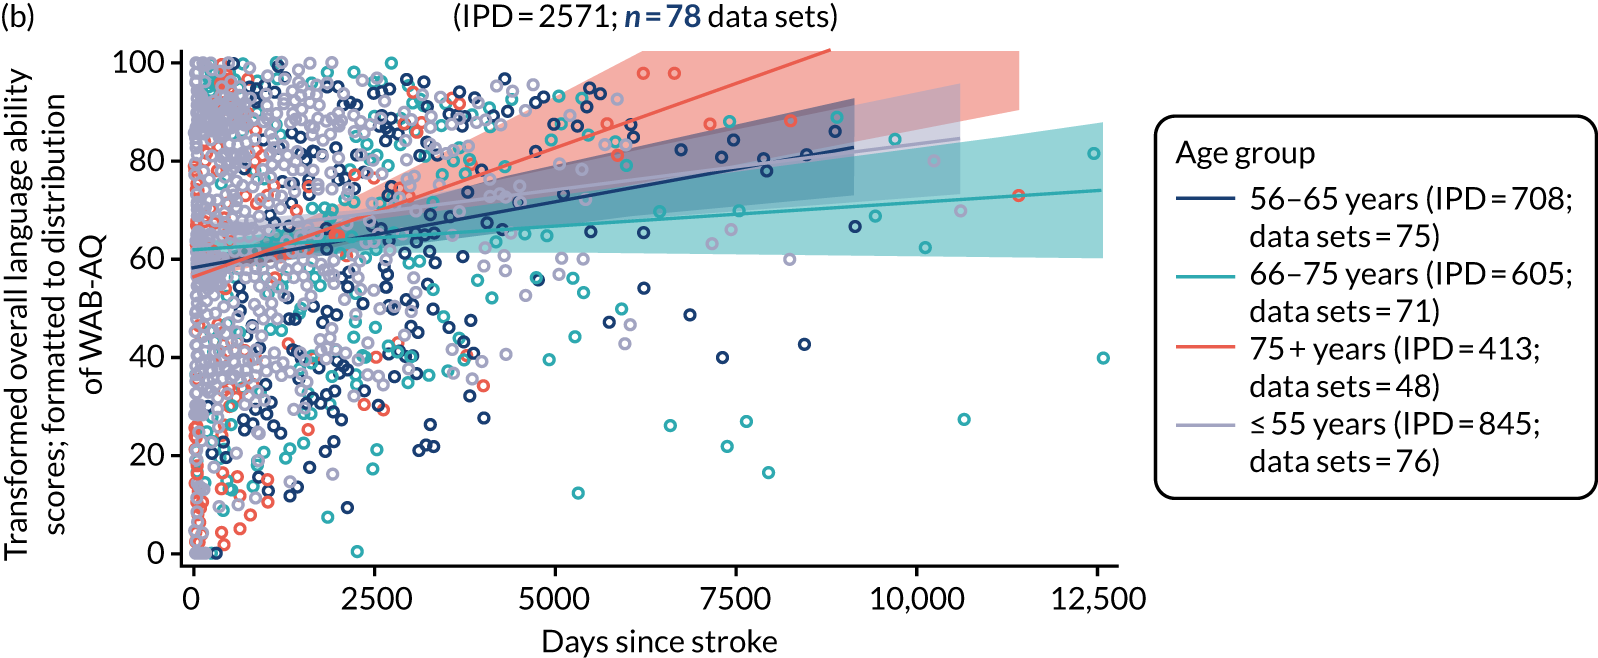
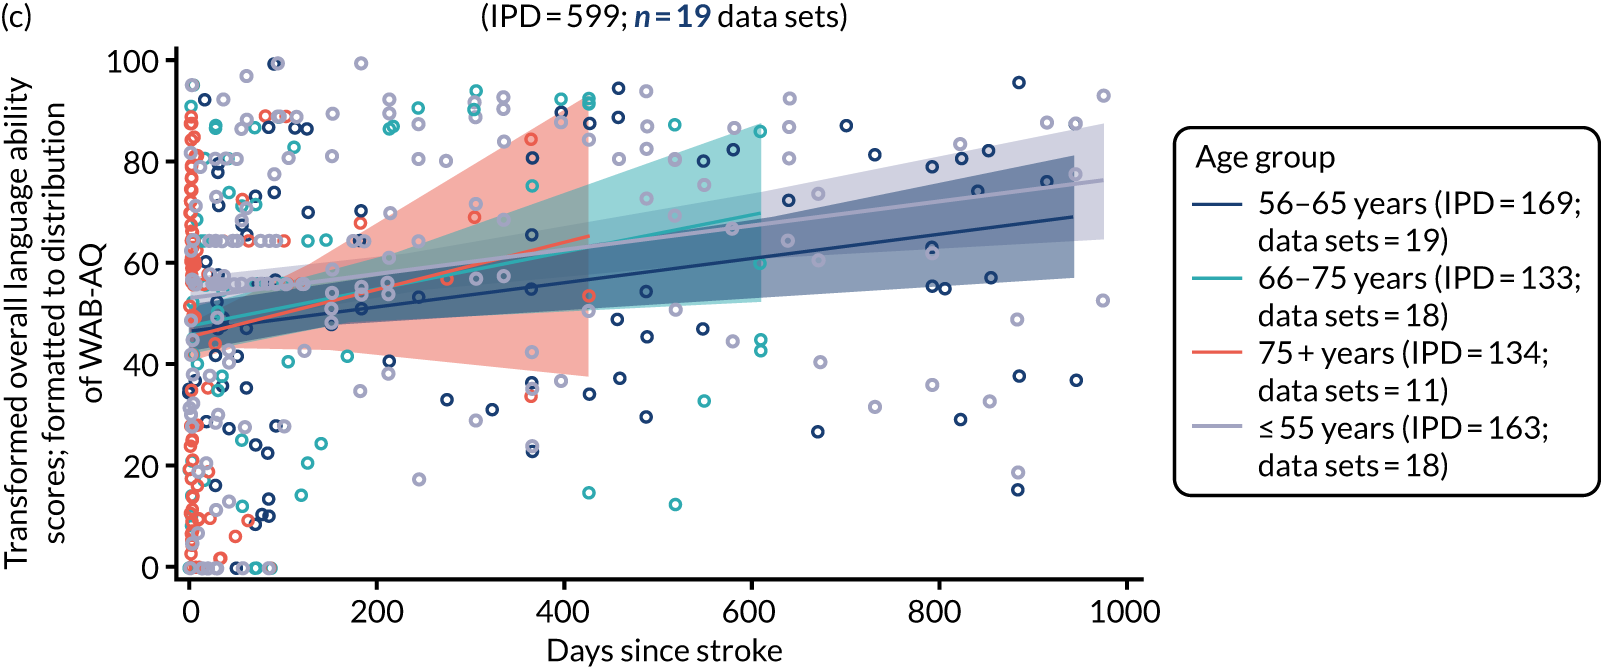

We then examined overall language ability at baseline for participants in all study types (2571 IPD; 78 data sets; see Figure 14b). Data were available for the following age groups: ≤ 55 years (845 IPD; 76 data sets), 56–65 years (708 IPD; 75 data sets), 66–75 years (605 IPD; 71 data sets) and 75 + years (413 IPD; 48 data sets). All age groups appeared to have increased overall language ability scores as time since stroke at baseline increased. We examined overall severity scores up to 1000 days after stroke onset to reflect typical trial recruitment periods after index stroke (see Figure 14c and 14d). For participants recruited within 1000 days of index stroke, the confidence limits for each age group overlapped, indicating no difference in the distributions of overall language ability scores by age in all study types.
Age and auditory comprehension at baseline
We examined the distribution of auditory comprehension scores at different baseline time points, stratified by age (633 IPD; 19 RCTs; Figure 15a). Data were available on participants aged ≤ 55 years (208 IPD; 19 RCTs), 56–65 years (201 IPD; 19 RCTs), 66–75 years (137 IPD; 18 RCTs) and > 75 years (87 IPD; 14 RCTs). The confidence limits overlapped for each age stratum, indicating that there was no evidence of a difference in distributions of auditory comprehension scores across each age group (see Figure 15a), with similar findings for the data from all study designs (2597 IPD; 67 data sets; see Figure 15b). Across all study designs, data on auditory comprehension scores at baseline were available for participants aged ≤ 55 years (939 IPD; 65 data sets), 56–65 years (721 IPD; 67 data sets), 66–75 years (626 IPD; 64 data sets) and > 75 years (311 IPD; 44 data sets). When we examined data for enrolment within 1000 days of index stroke (see Figure 15c and d), we observed similar overlaps in auditory comprehension scores across each age stratum, indicating no significant difference in the scores across different age groups.
FIGURE 15.
Auditory comprehension scores by age for all participants at baseline. (a) RCTs; (b) all study types; (c) for enrolment in RCTs within 0–1000 days of stroke; and (d) for enrolment in all study types within 0–1000 days of stroke.
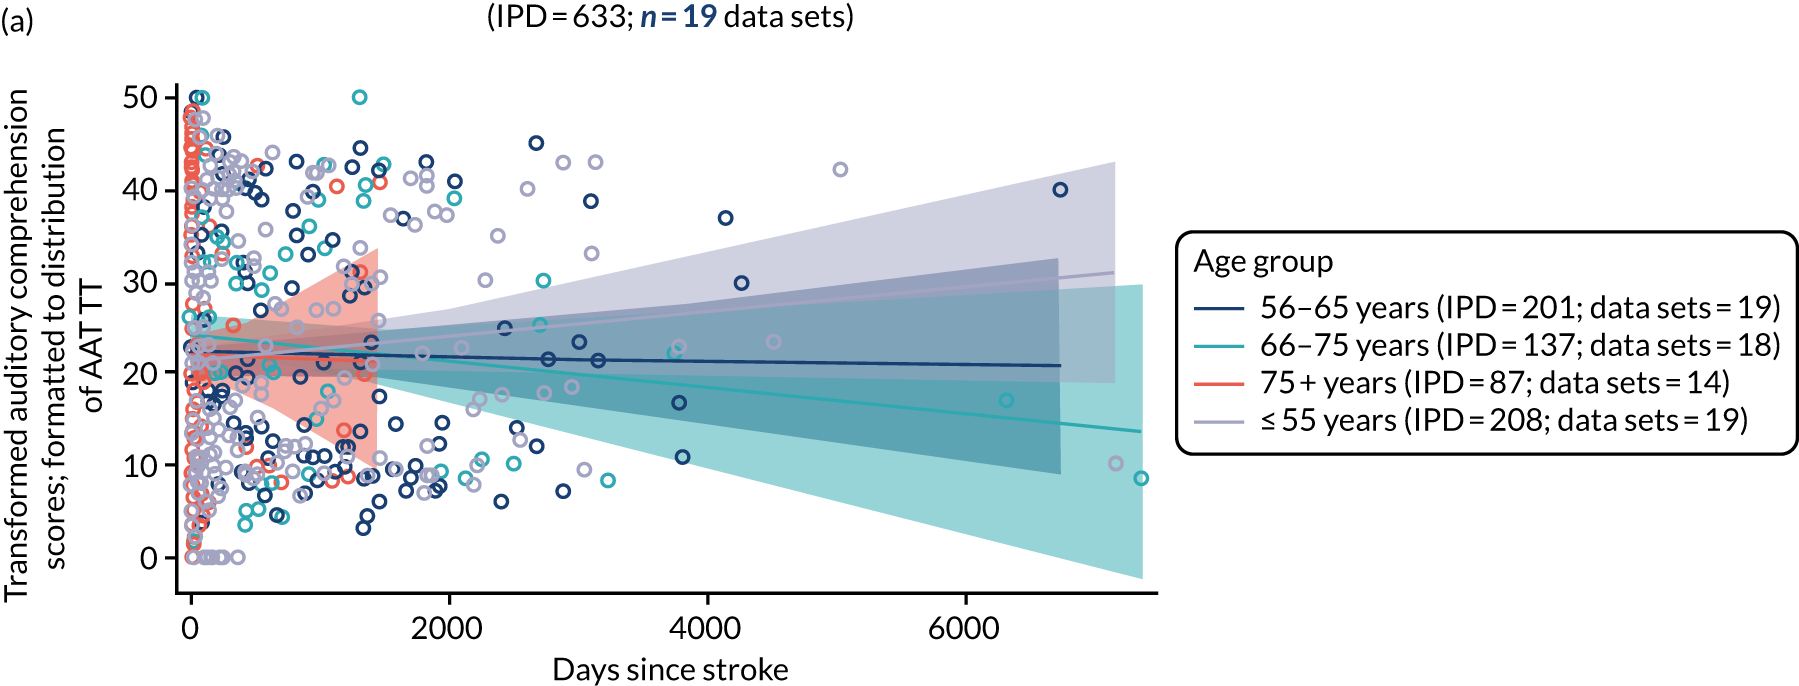
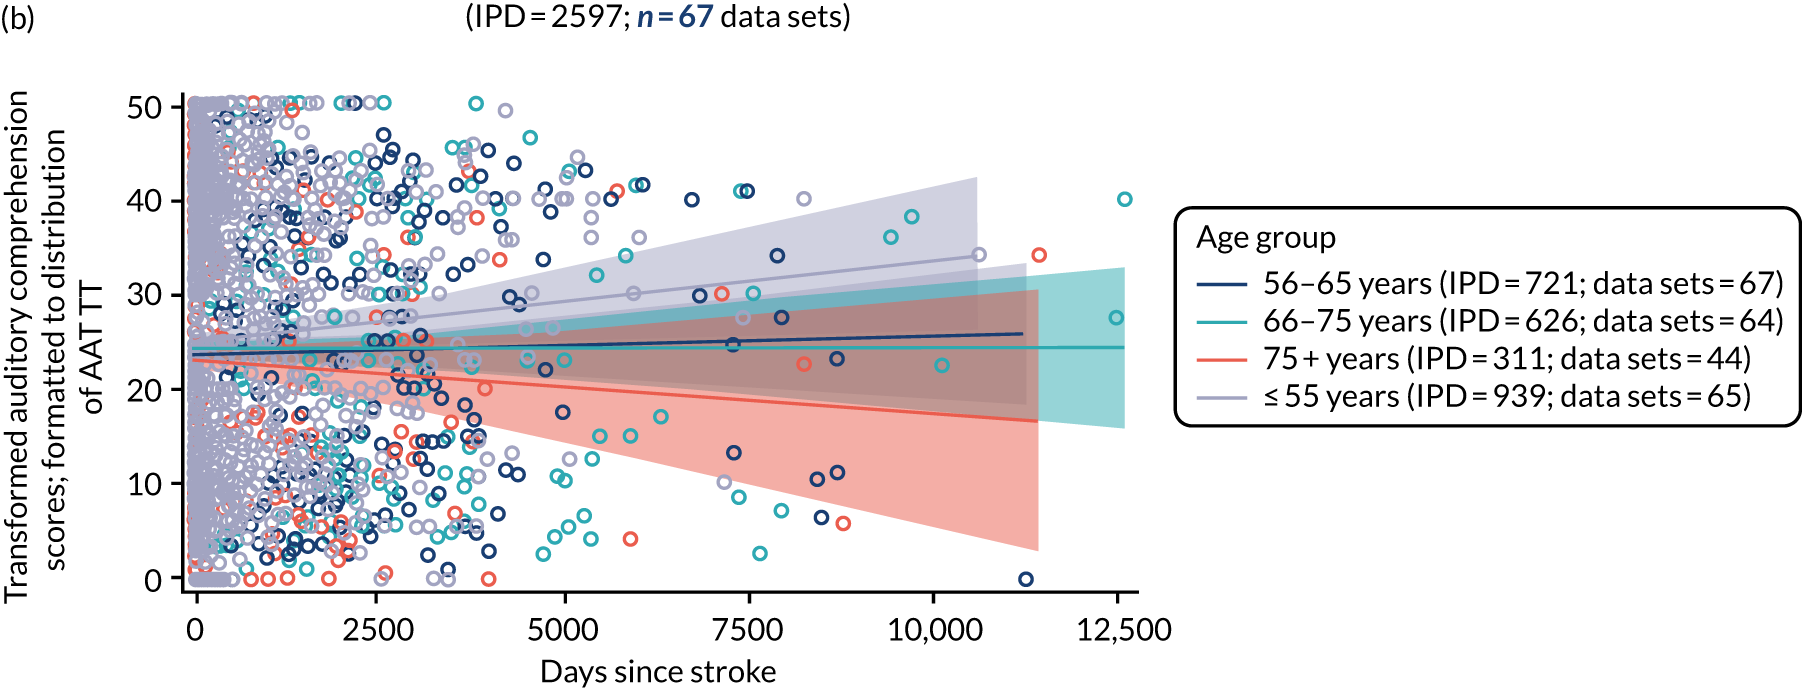

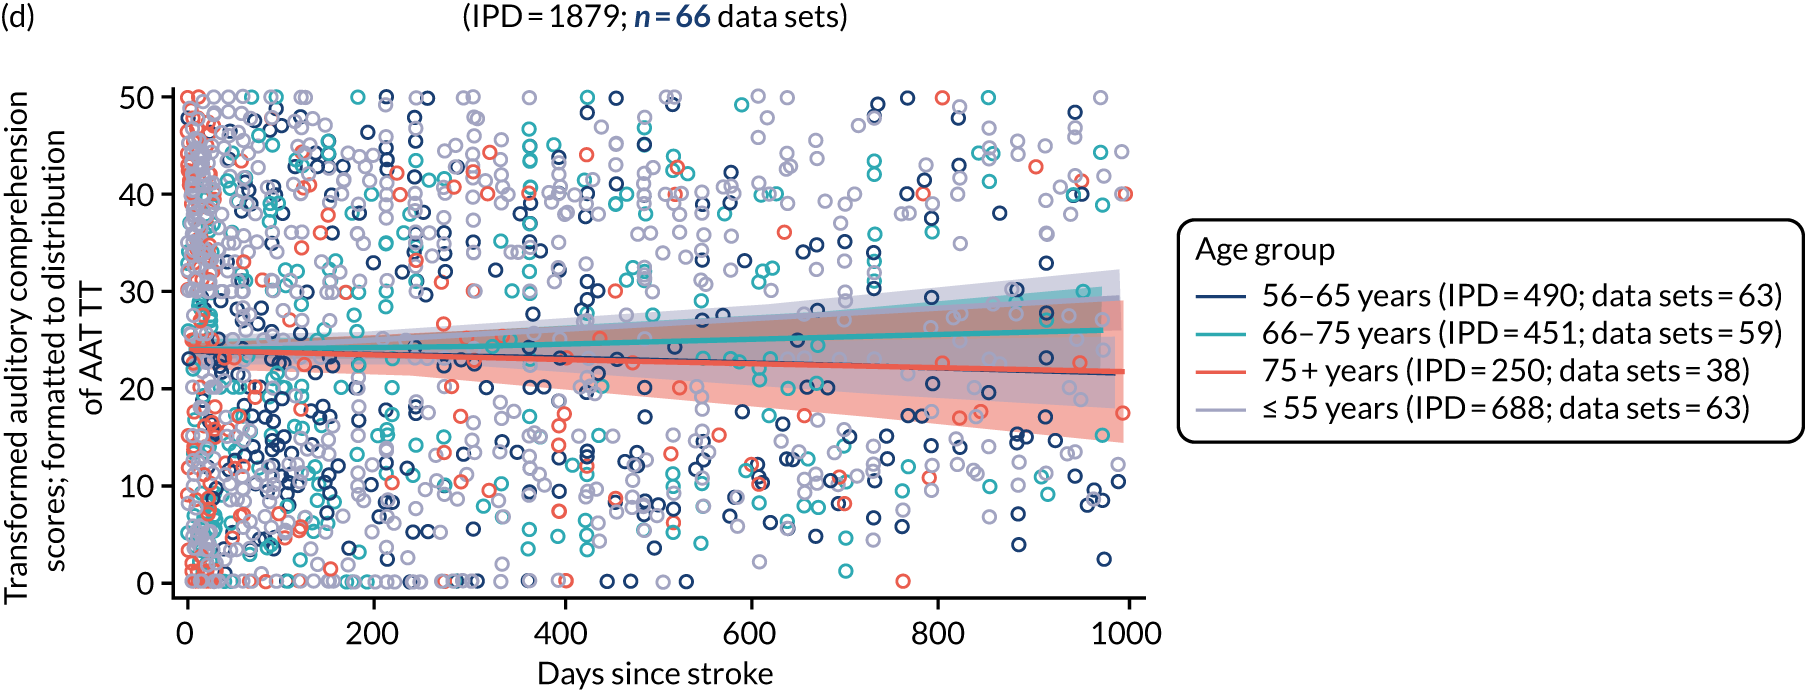
Age and naming at baseline
We examined the distribution of naming scores at baseline by time since stroke and stratified by age in RCTs (748 IPD; 25 RCTs) and in all study designs (2760 IPD; 72 data sets; Figure 16a and 16b).
FIGURE 16.
Naming scores by age for all participants at baseline. (a) RCTs; (b) all study types; (c) for enrolment in RCTs within 0–1000 days of stroke; and (d) for enrolment in all study types within 0–1000 days of stroke.
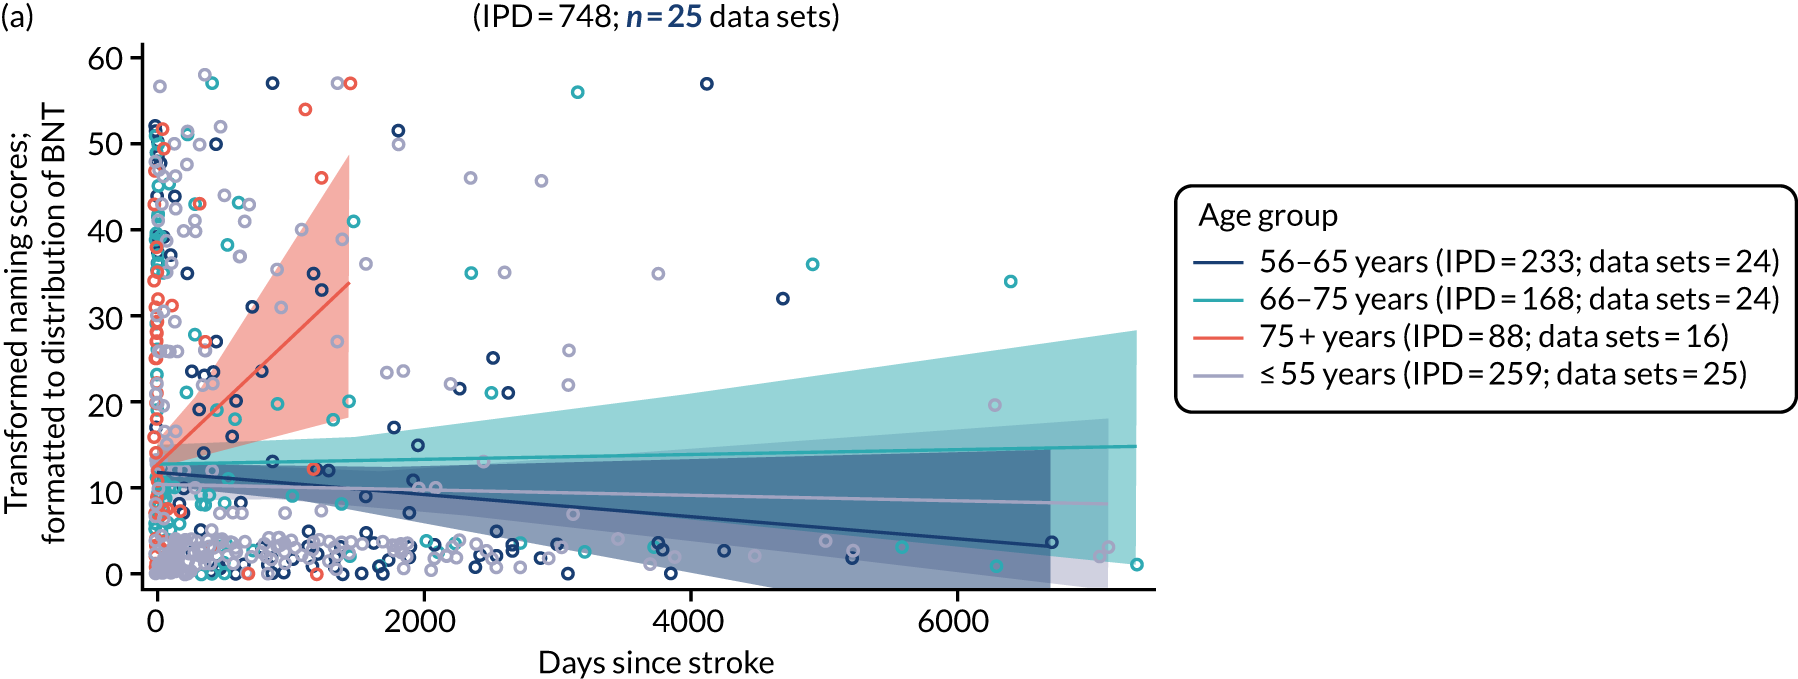
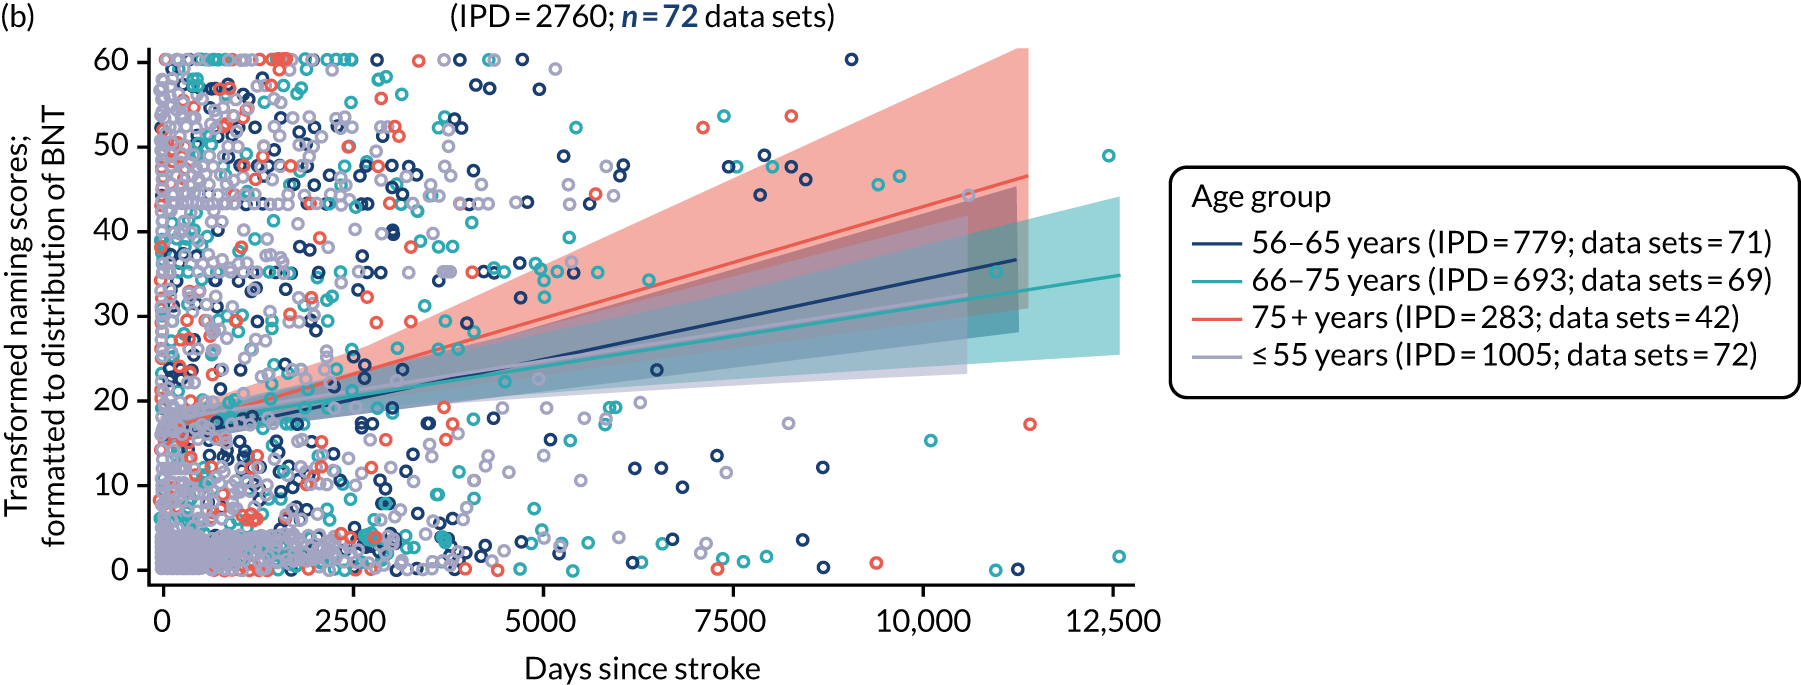
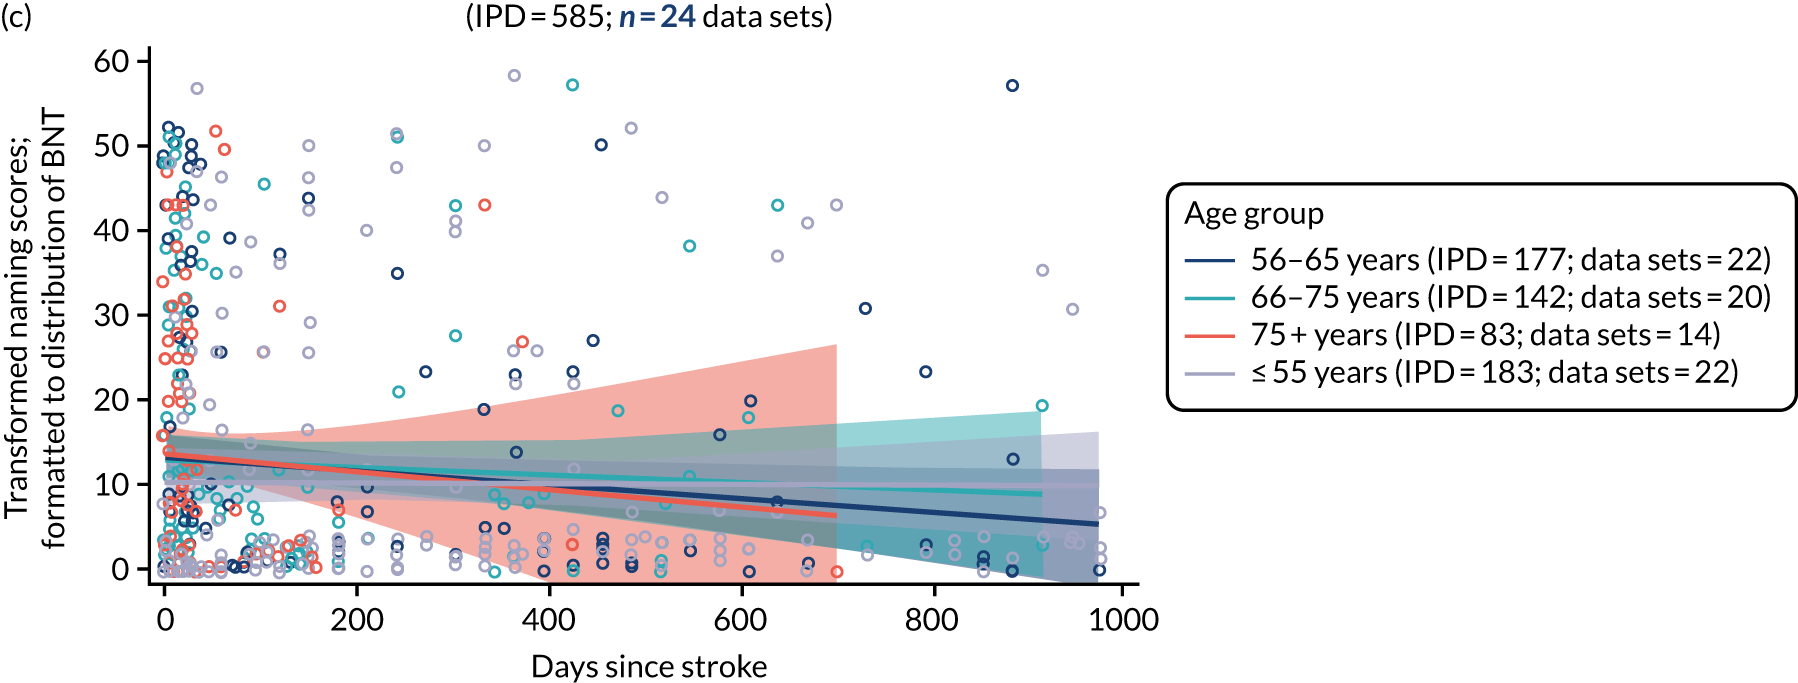
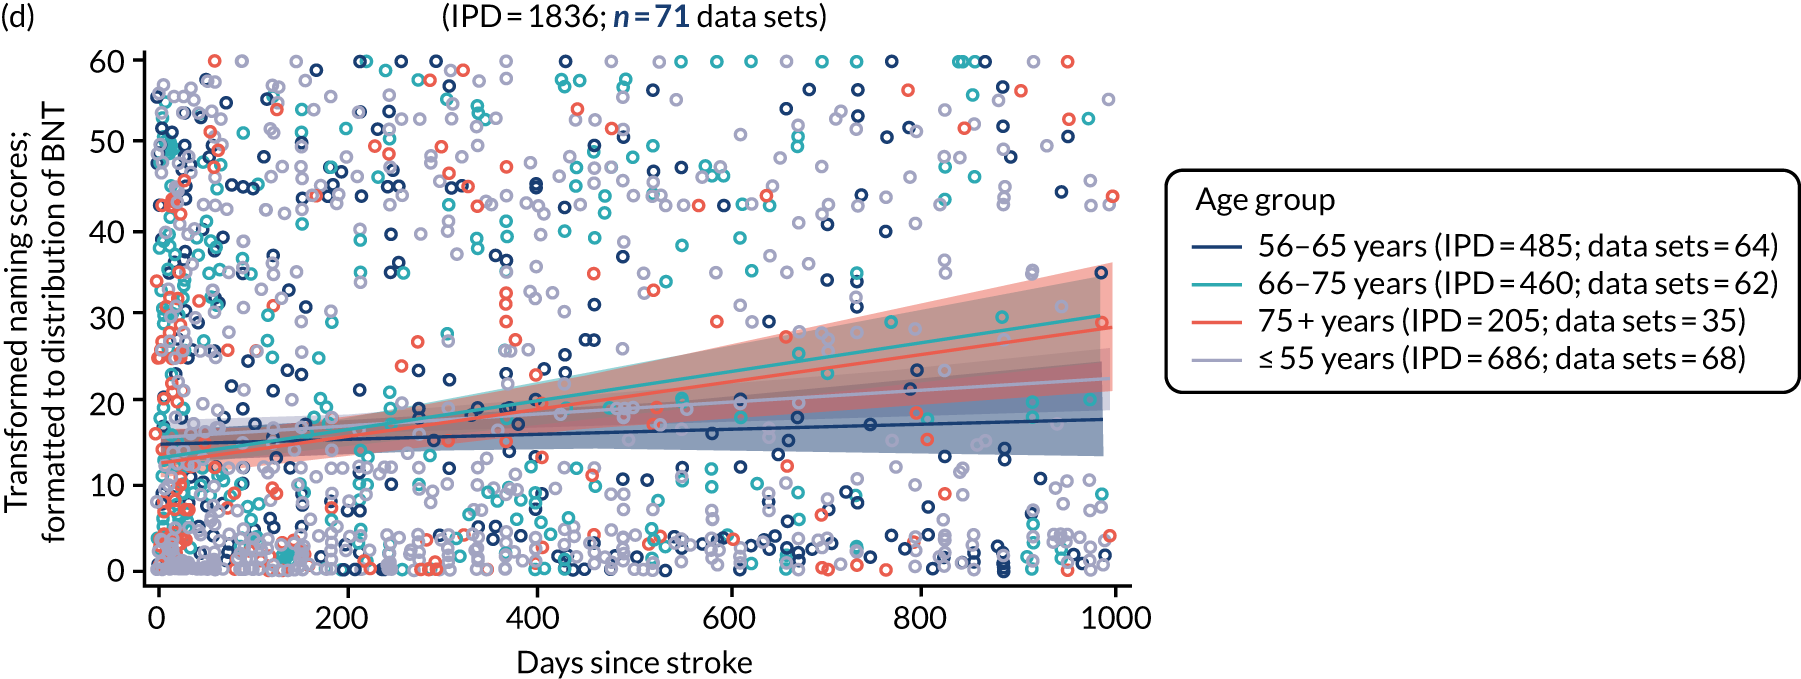
Participants’ naming scores in RCTs were stratified into the following age groups: ≤ 55 years (259 IPD; 25 RCTs), 56–65 years (233 IPD; 24 RCTs), 66–75 years (168 IPD; 24 RCTs) and > 75 years (88 IPD; 16 RCTs) (see Figure 16a). RCT participants aged > 75 years appeared to suggest better naming scores as time since stroke increased at baseline; however, this could be a function of the relatively short time to baseline period for which data on this stratum were available. When examining RCT enrolment within 0–1000 days of stroke, the distribution of naming scores did not appear to differ in those aged > 75 years (see Figure 16c).
We plotted the distribution of participants’ naming scores at baseline across all study types and stratified by age (2760 IPD; 72 data sets; see Figure 16b). Data were available for participants aged ≤ 55 years (1005 IPD; 72 data sets), 56–65 years (779 IPD; 71 data sets), 66–75 years (693 IPD; 69 data sets) and > 75 years (283 IPD; 42 data sets). Once again, among participants aged > 75 years, a trend towards better naming scores was apparent when time from stroke to enrolment increased, compared with the younger participant age categories, but this difference was not significant, nor was it evident within 0–1000 days of stroke (see Figure 16b and 16d).
Age and other spoken language at baseline
We considered the distribution of other spoken-language scores at increasing time from index stroke to study entry, stratified by age, looking first at 163 IPD from two RCTs (see Report Supplementary Material 4, figure 1). Data were available for participants aged ≤ 55 years (90 IPD; 2 data sets), 56–65 years (58 IPD; 2 data sets) and 66–75 years (15 IPD; 1 data set). There were no IPD for those aged > 75 years.
Other spoken-language scores at baseline remained stable across various times since stroke for the different age groups. There appeared to be no significant differences in the distributions of other spoken-language scores by age group. We found similar distributions in the 344 participants from across seven data sets of all study designs [aged ≤ 55 years (191 IPD; 7 data sets), 56–65 years (112 IPD; 7 data sets), 66–75 years (37 IPD; 4 data sets) and > 75 years (4 IPD; 2 data sets)]. Inadequate data on study entry within 0–1000 days of stroke precluded further meaningful analyses of other spoken language (98 IPD; 2 data sets).
Age and reading comprehension at baseline
We examined the distribution of baseline reading scores at different baseline time points, stratified by age. Data were available from only one RCT and did not meet the prespecified criteria for analysis.
Participants’ reading comprehension scores across all study types at baseline (652 IPD; 9 data sets) were distributed across several age groups: ≤ 55 years (240 IPD; 8 data sets), 56–65 years (185 IPD; 9 data sets), 66–75 years (160 IPD; 8 data sets) and > 75 years (67 IPD; 6 data sets) (see Report Supplementary Material 4, figure 2). Participants aged > 75 years appeared to suggest higher reading scores with greater time since stroke at baseline when compared with participants in the other age groups, but this difference was not significant. We examined whether or not sparse data points at later time points contributed to the slopes of any of the regression lines (see Report Supplementary Material 4, figure 2) and found that reading scores at baseline did not significantly differ between different age strata for enrolment within 1000 days of index stroke.
Age and written language at baseline
We examined the distribution of writing scores among participants across all study types at baseline, stratified by age. There were insufficient data to consider RCT participants’ written language scores in isolation: data were available on 47 IPD from three RCTs. For participants across all study types (673 IPD; 11 data sets; Figure 17a), data on written language scores were available across the following age groups: ≤ 55 years (265 IPD; 11 data sets), 56–65 years (189 IPD; 11 data sets), 66–75 years (156 IPD; 8 data sets) and > 75 years (63 IPD; 5 data sets). There was no evidence of a difference in the distributions of writing scores for different age strata across the whole baseline sample, or when study entry was within 0–1000 days of index stroke.
FIGURE 17.
Writing scores by age for all participants at baseline. (a) All study types; and (b) for enrolment in all study types within 0–1000 days of stroke.
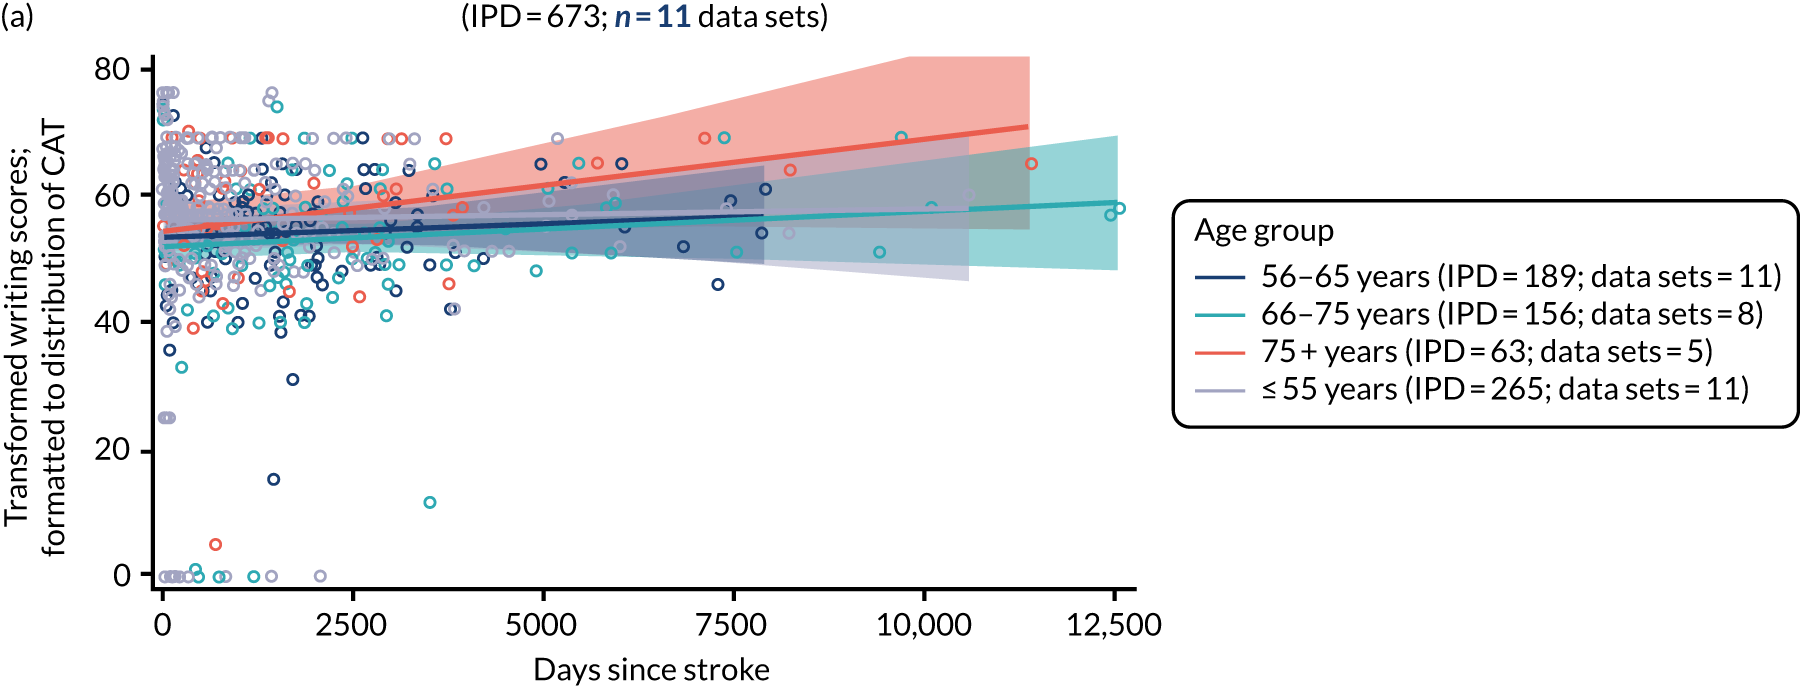
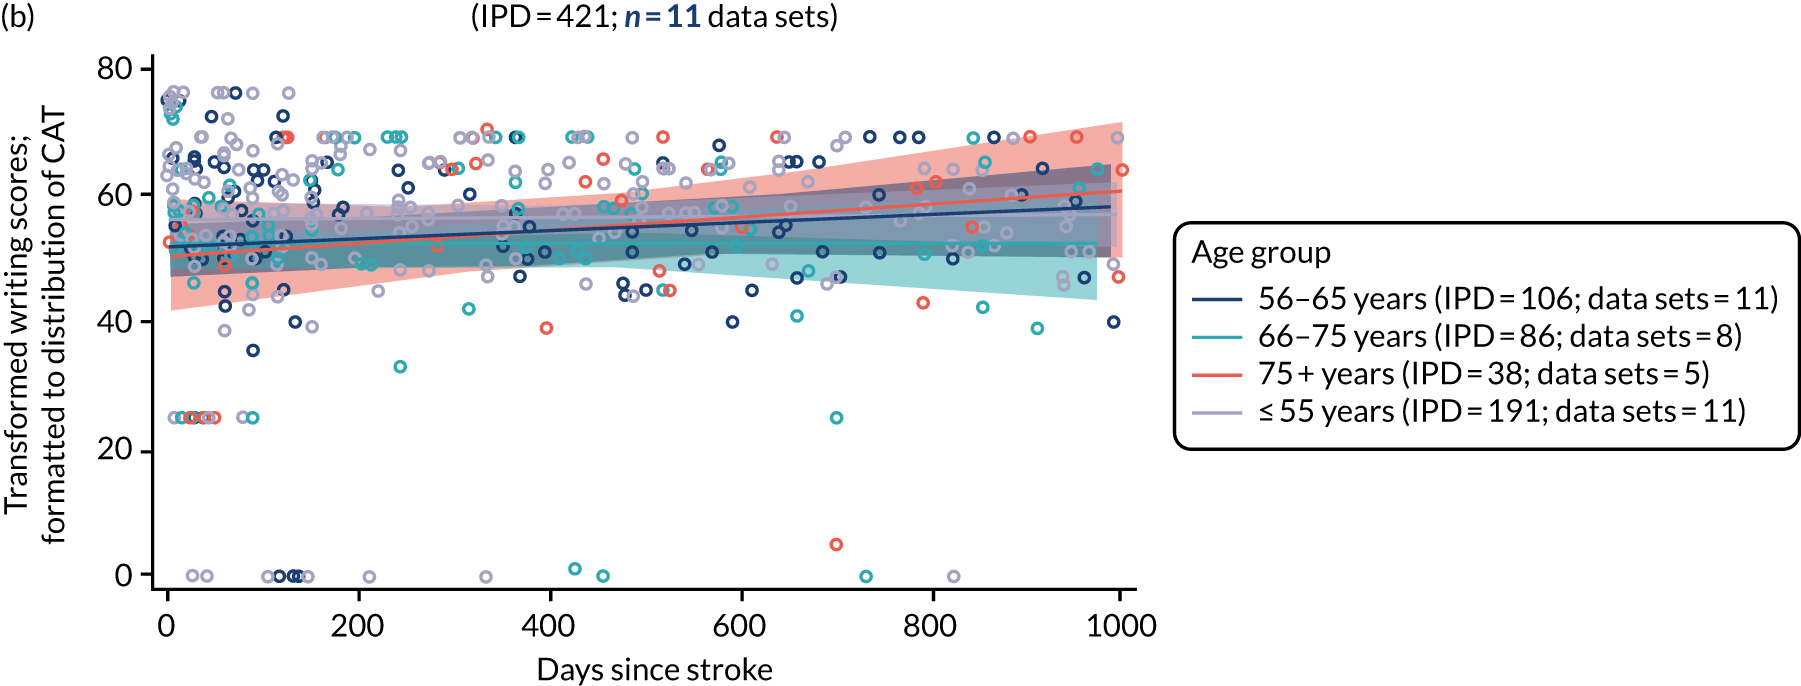
Age and observer-rated functional communication (activity) at baseline
We examined the distribution of observer-rated functional communication (activity) in RCTs (998 IPD; 18 RCTs; Figure 18a), stratified by four age groups: ≤ 55 years (207 IPD; 18 data sets), 56–65 years (236 IPD; 17 data sets), 66–75 years (283 IPD; 18 data sets) and > 75 years (272 IPD; 15 data sets). Observer-rated activity scores overlapped across each age stratum. This pattern was also seen when examining all study types (1437 IPD; 29 data sets; see Figure 18b) and when examining a clinically meaningful enrolment period of 0–1000 days post stroke (see Figure 18c and 18d).
FIGURE 18.
Observer-rated functional communication (activity) scores by age for all participants at baseline. (a) RCTs; (b) all study types; (c) for enrolment in RCTs within 0–1000 days of stroke; and (d) for enrolment in all study types within 0–1000 days of stroke.
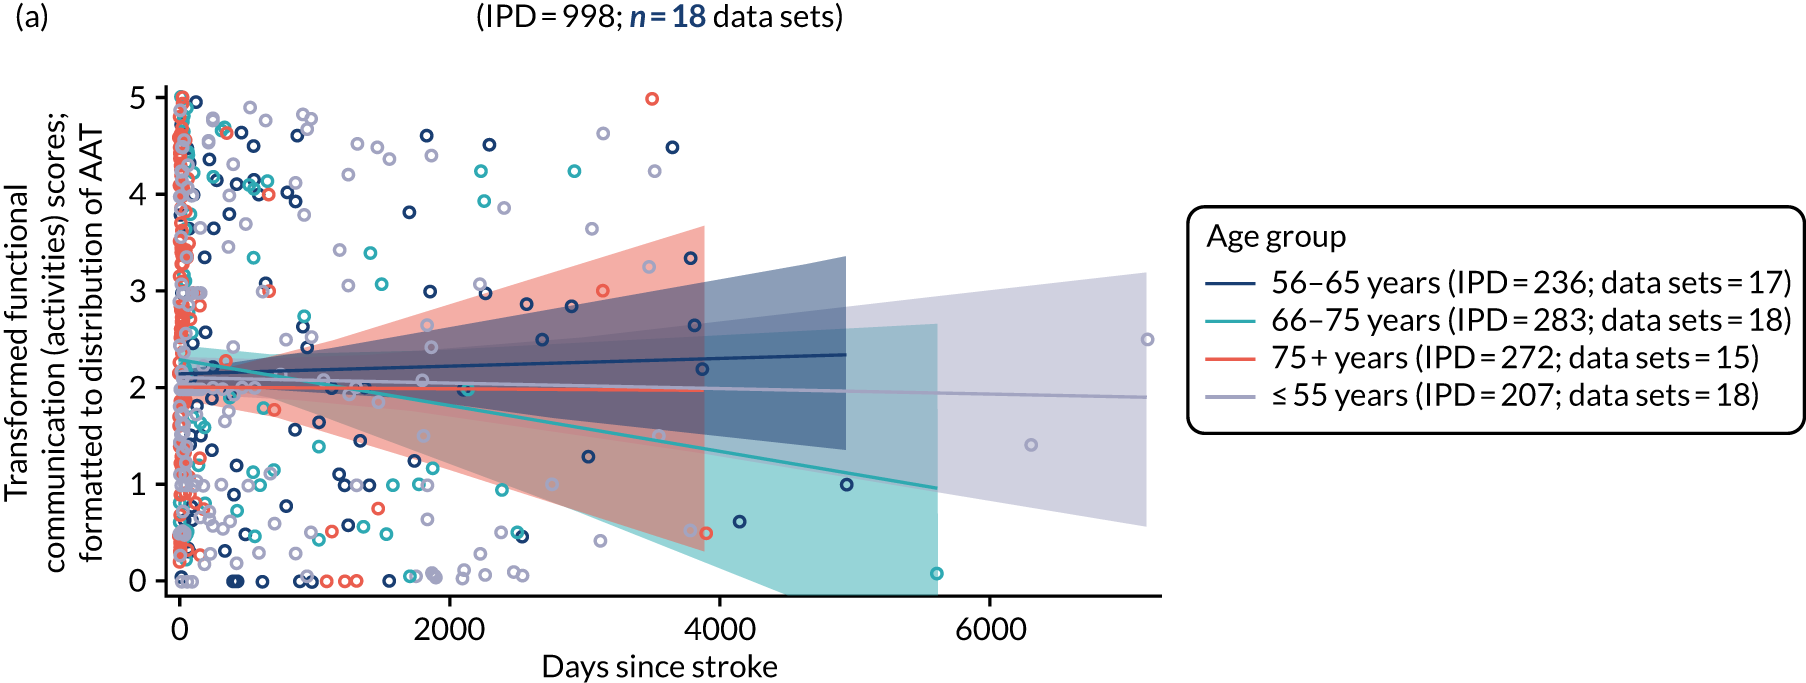


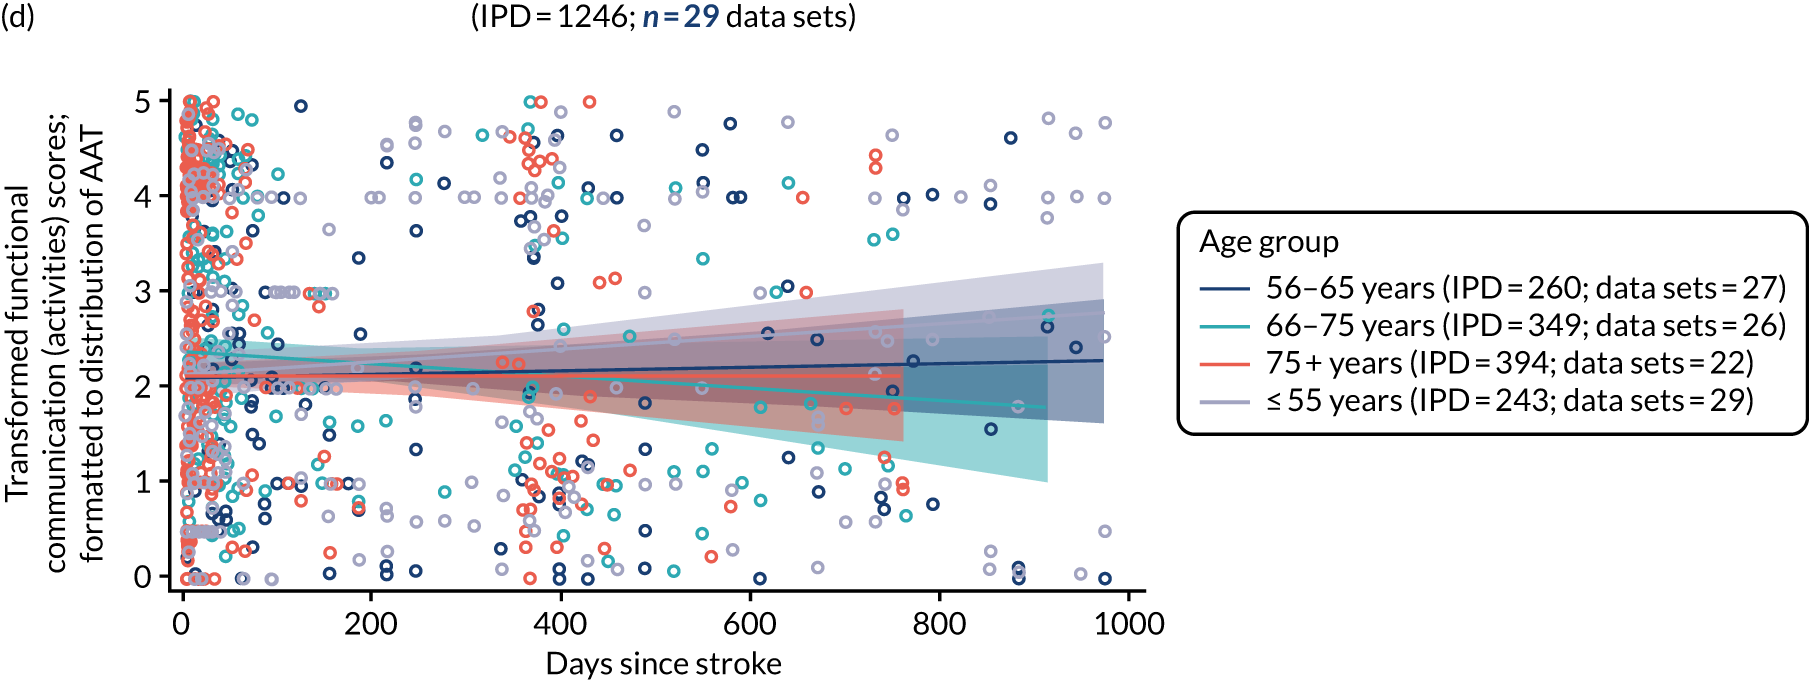
Observer-rated participation scores were based on the same populations, and, similarly, showed no significant differences across each age stratum, regardless of study type and within clinically meaningful enrolment periods.
Age and self-rated functional communication (activity) at baseline
Data on self-rated functional communication (activity) scores were available on only 11 IPD in one RCT, and therefore did not meet our prerequisites for analysis. For all study types, data were available on 62 IPD from three data sets across all baseline time points, and for 43 IPD from three data sets for which enrolment occurred within 1000 days of index stroke (see Report Supplementary Material 4, figure 3). We observed no significant differences in the self-rated functional communication (activity) scores across each age stratum. Data on self-rated functional communication (participation) were derived from the same data set and showed similar results (see Report Supplementary Material 4, figure 4).
Language performance at baseline, stratified by sex
Sex and overall language ability at baseline
When data were available, we considered overall language ability at baseline by sex for participants in RCTs (700 IPD; 19 RCTs; Figure 19). The confidence bands overlapped, indicating that this difference was not significant. We found similar patterns when we examined IPD across all study designs (2380 IPD; 68 data sets; see Figure 19b).
FIGURE 19.
Overall language ability scores by sex for all participants at baseline. (a) RCTs; (b) all study types; (c) for enrolment in RCTs within 0–1000 days of stroke; and (d) for enrolment in all study types within 0–1000 days of stroke.
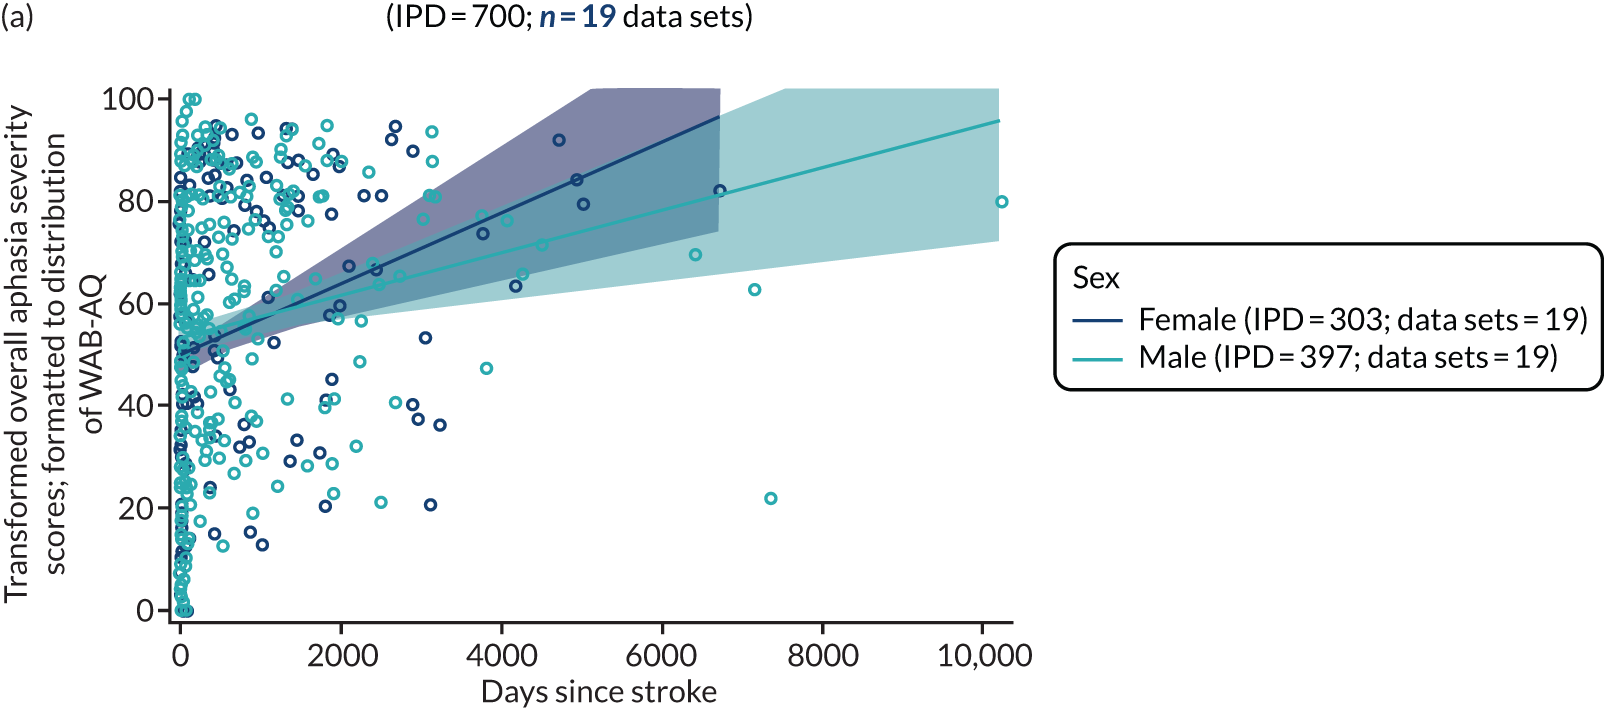
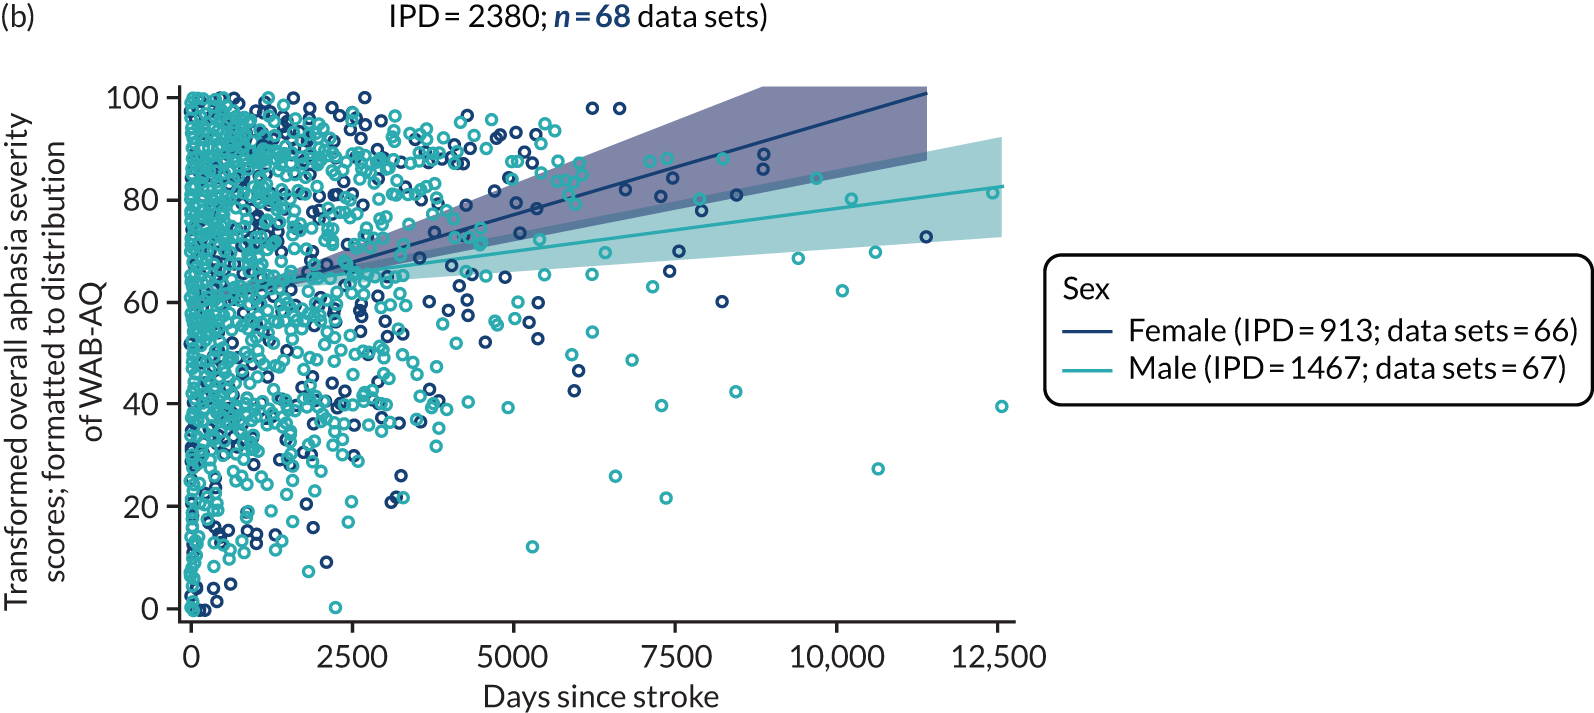
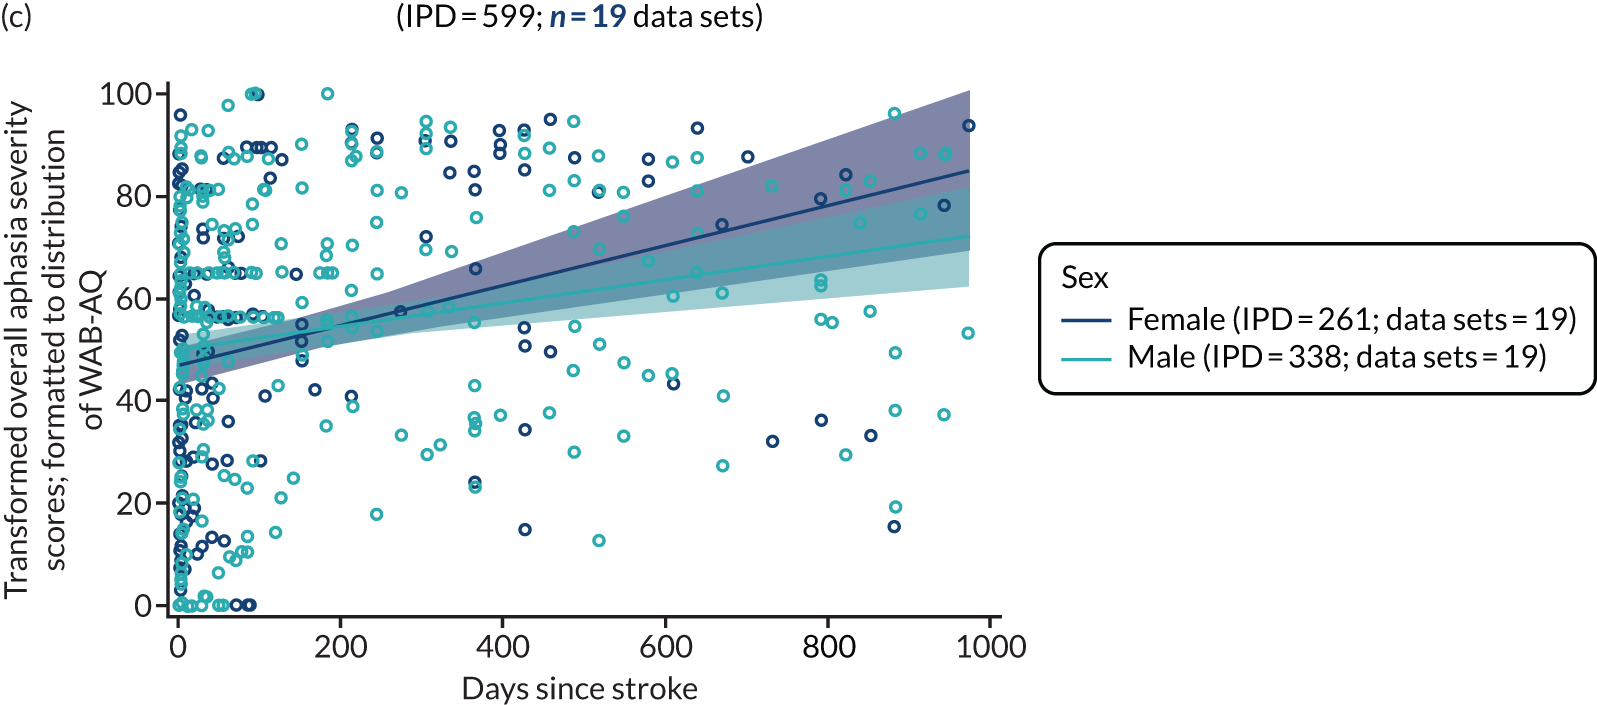
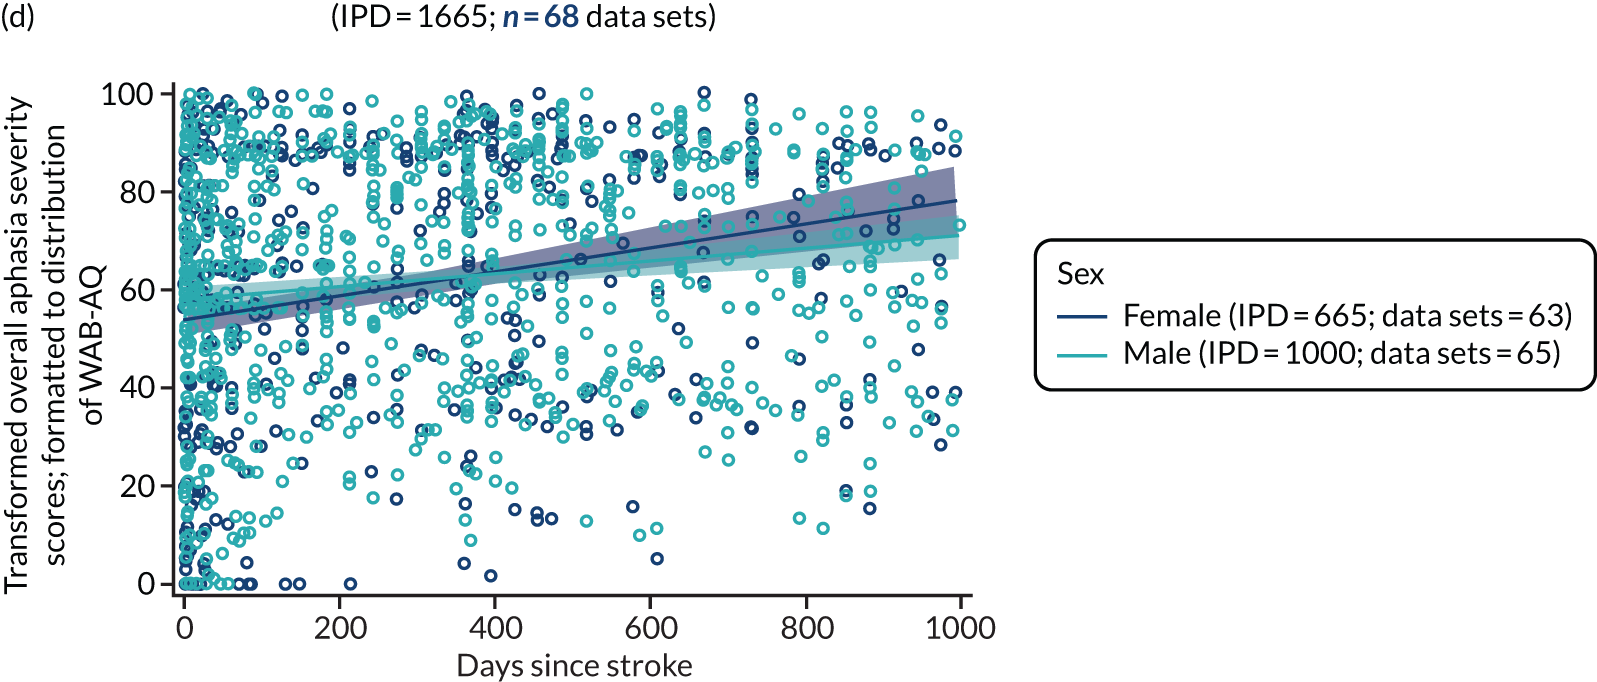
When we examined overall language ability scores within a more clinically relevant time point of 0–1000 days since stroke (599 IPD; 19 data sets; see Figure 19c), the data suggested that women appeared to have higher scores at later baseline time points than men, but there was no significant difference in the distributions. The findings were similar when applied to the data gathered at baseline within 1000 days of index stroke from all study designs (1665 IPD; 68 data sets; see Figure 19d).
Sex and auditory comprehension at baseline
We stratified the distribution of auditory comprehension scores at baseline time points by sex. Data were available from RCTs (622 IPD; 19 RCTs; Figure 20a) and across all study designs (2428 IPD; 60 data sets; see Figure 20b). Sex differences were not significant (see Figure 20).
FIGURE 20.
Auditory comprehension scores by sex for all participants at baseline. (a) RCTs; (b) all study types; (c) for enrolment in RCTs within 0–1000 days of stroke; and (d) for enrolment in all study types within 0–1000 days of stroke.
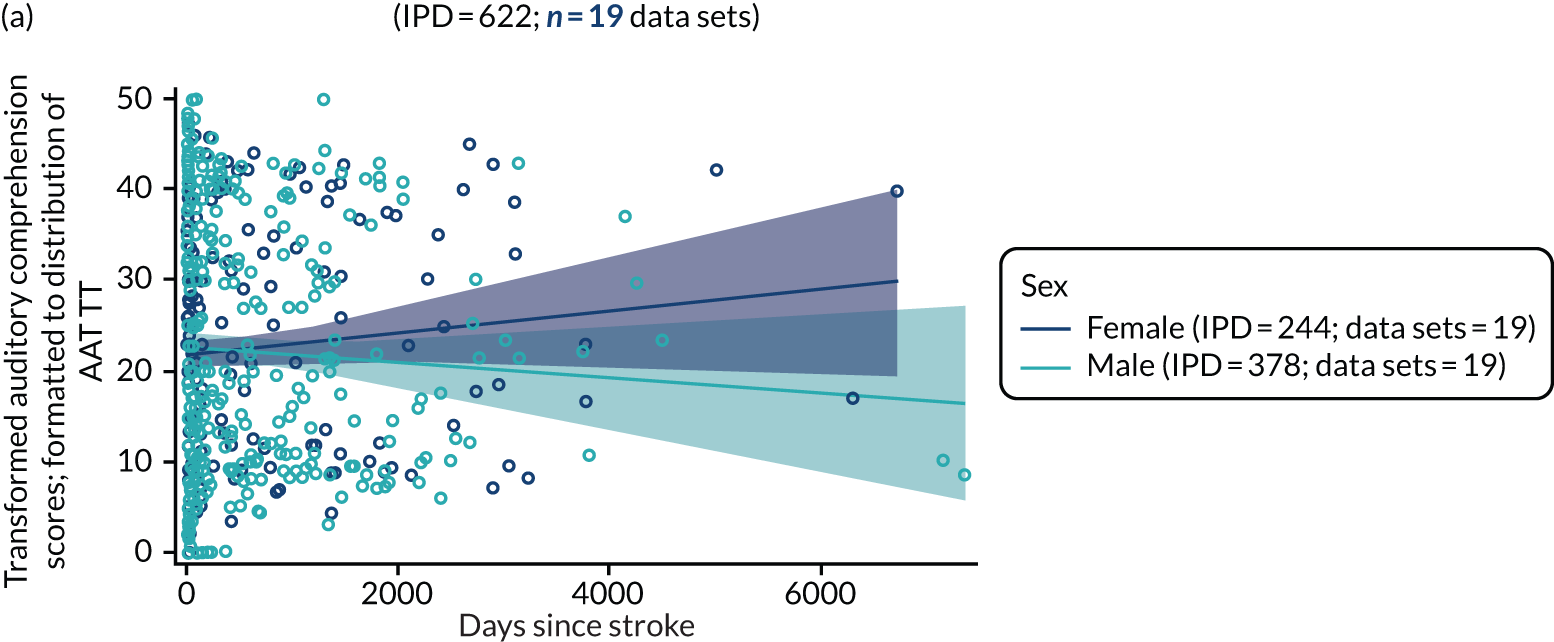
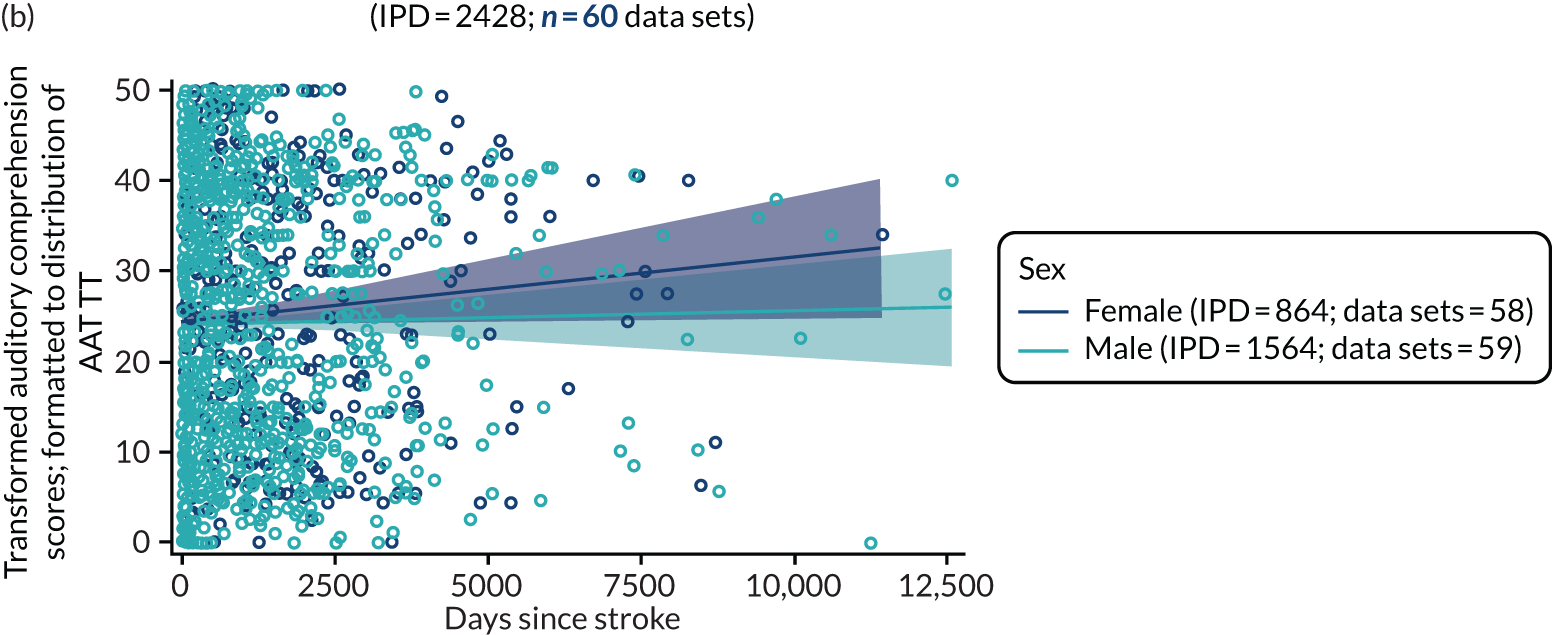
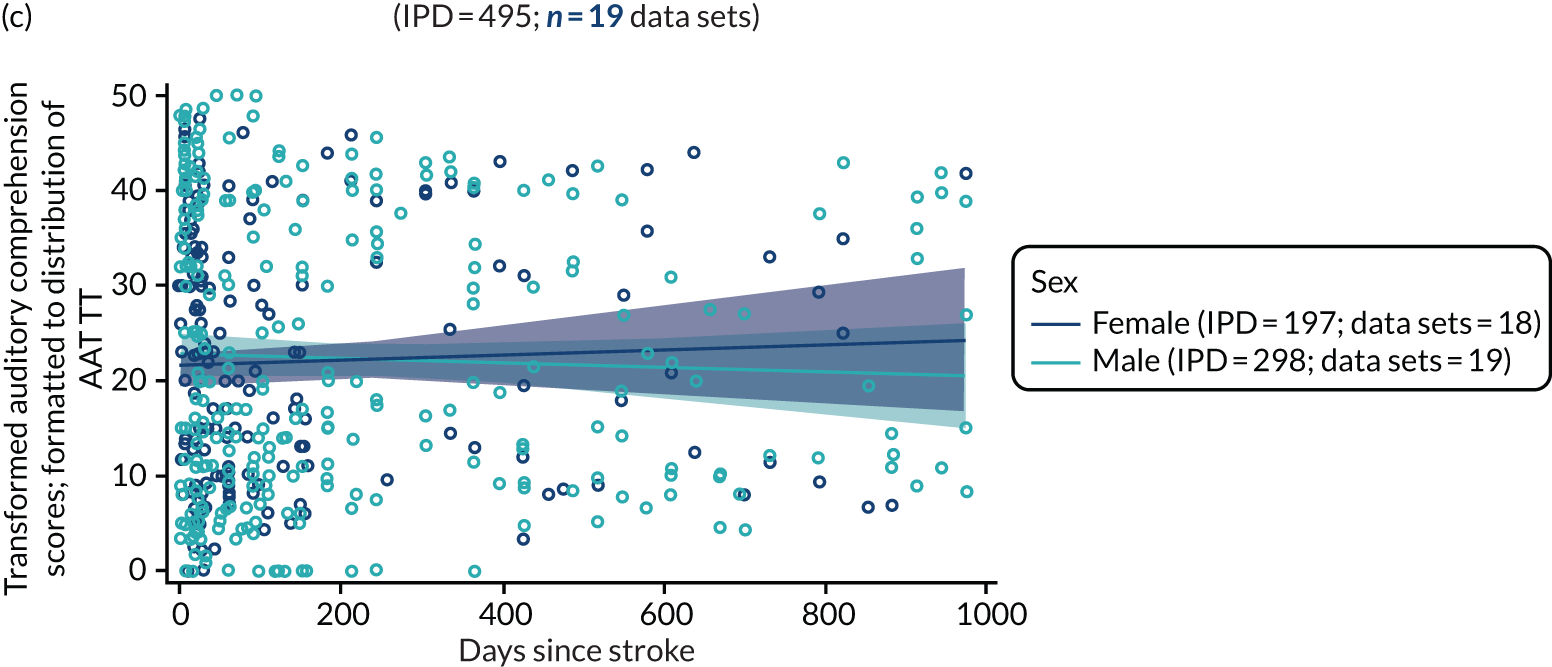
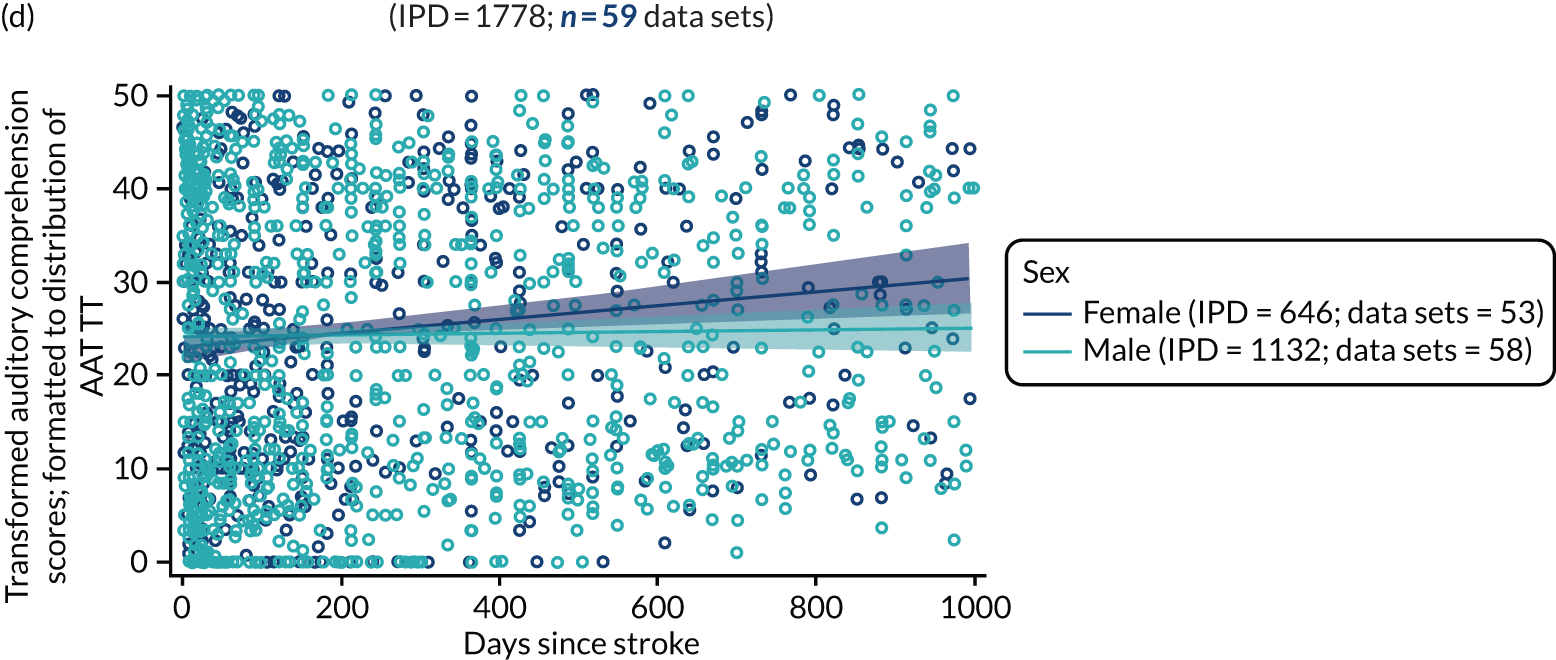
We then examined whether or not the presence of a smaller number of data points at later baseline time periods influenced the slope of the regression line by plotting scores within a more clinically relevant recruitment period (1778 IPD; 59 data sets; see Figure 20c and d), but we found similar distributions and no evidence of a sex difference.
Sex and naming at baseline
We examined the available naming data at baseline for RCT data sets (745 IPD; 25 RCTs; Figure 21a) and across all study designs (2629 IPD; 65 data sets; see Figure 21b). With increasing time from stroke to study entry, naming scores declined in the RCT population. Women maintained marginally higher scores than men. However, the confidence limits overlapped, thus indicating that there was no significant sex difference between the distributions of naming scores. Overlapping confidence limits between men and women were also observed across all study designs (see Figure 21b and 21d). When examining these differences in a more clinically relevant enrolment period of 0–1000 days since stroke at baseline, we found a trend towards women having higher naming scores than men, as time to baseline assessment increased in RCTs (583 IPD; 24 RCTs; see Figure 21c) and across all data sets (1766 IPD; 64 data sets; see Figure 21d).
FIGURE 21.
Naming scores by sex for all participants at baseline. (a) RCTs; (b) all study types; (c) for enrolment in RCTs within 0–1000 days of stroke; and (d) for enrolment in all study types within 0–1000 days of stroke.
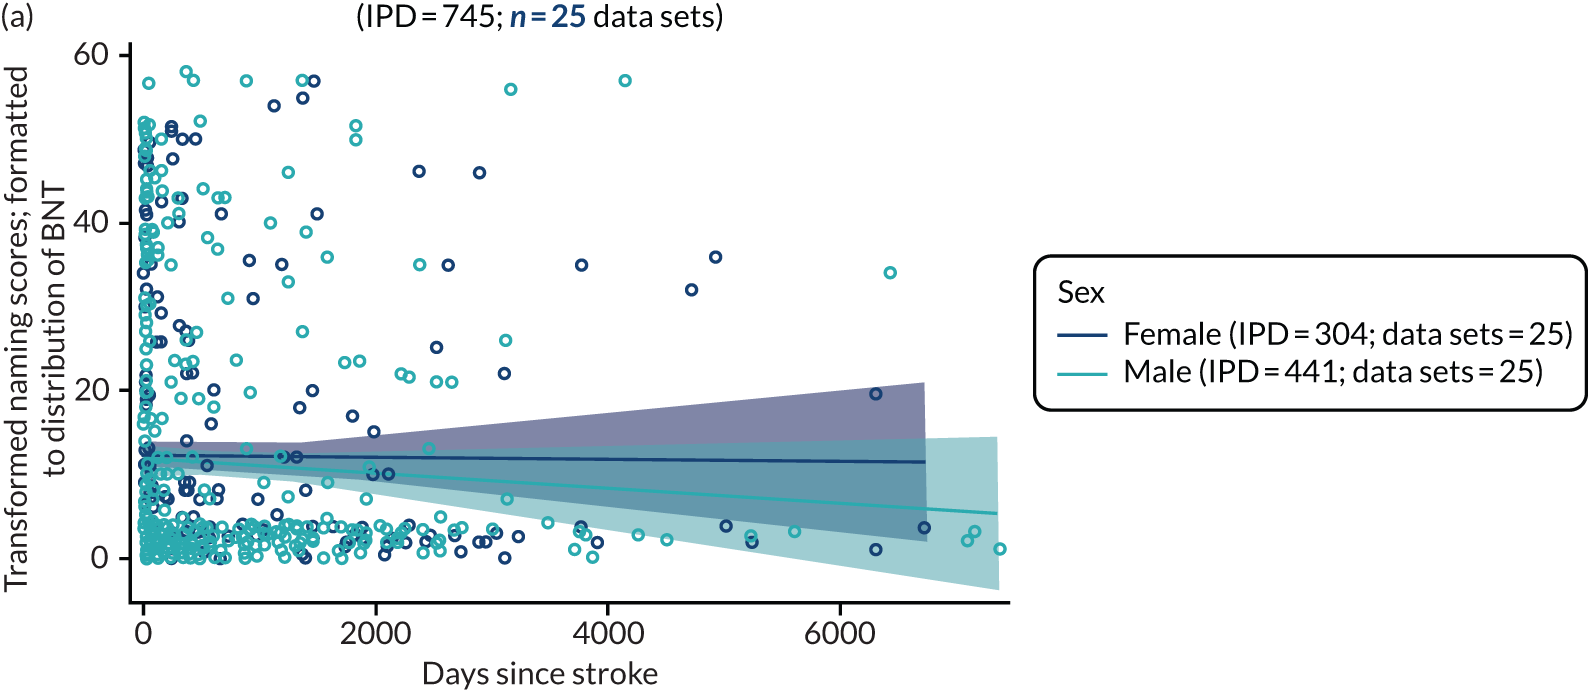
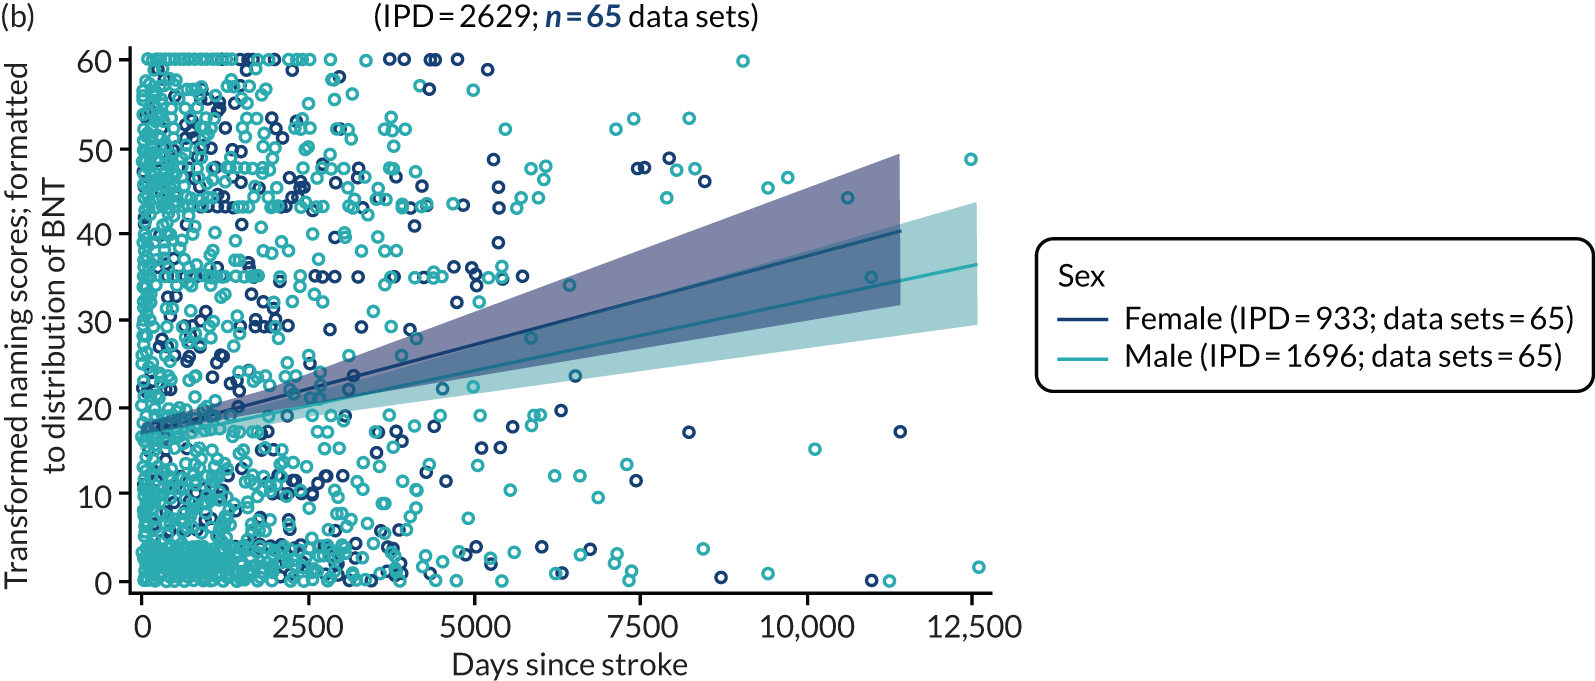
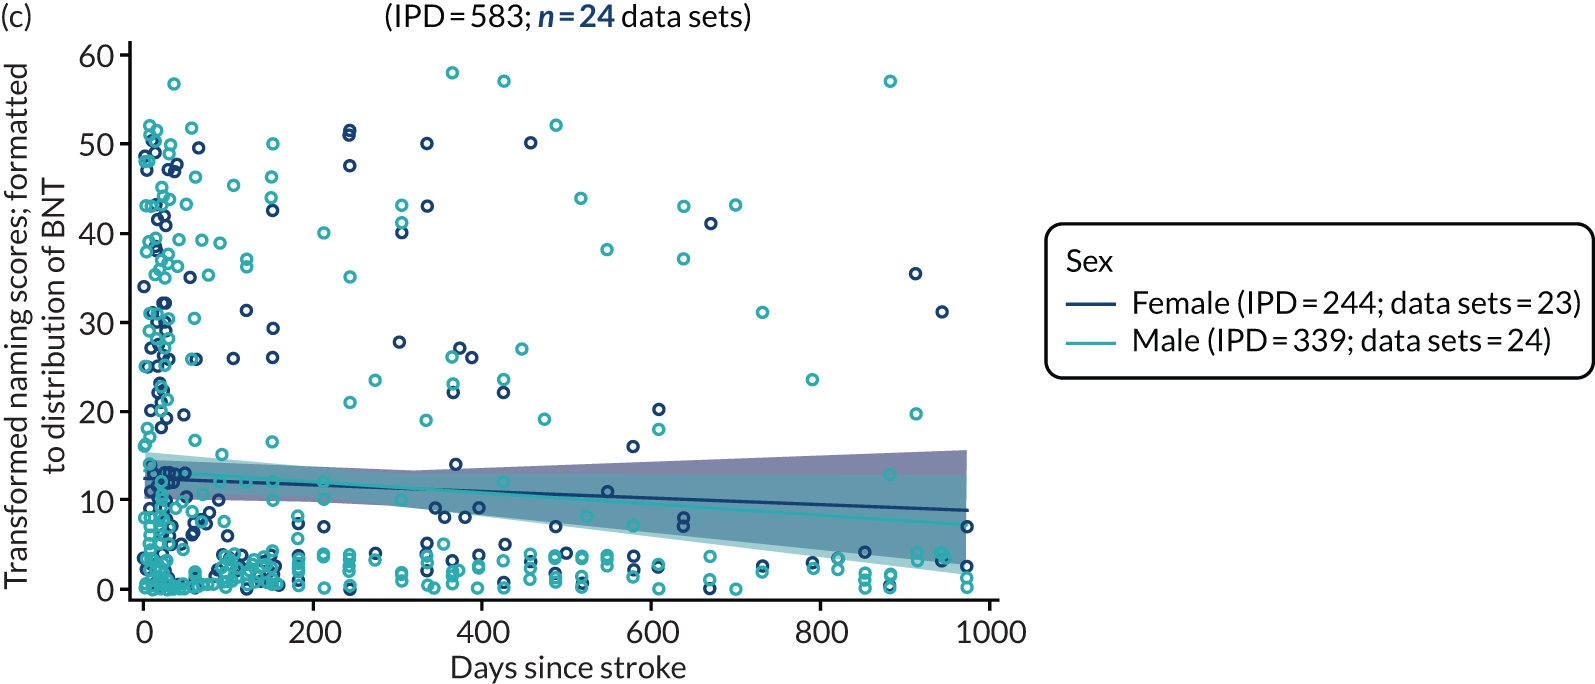
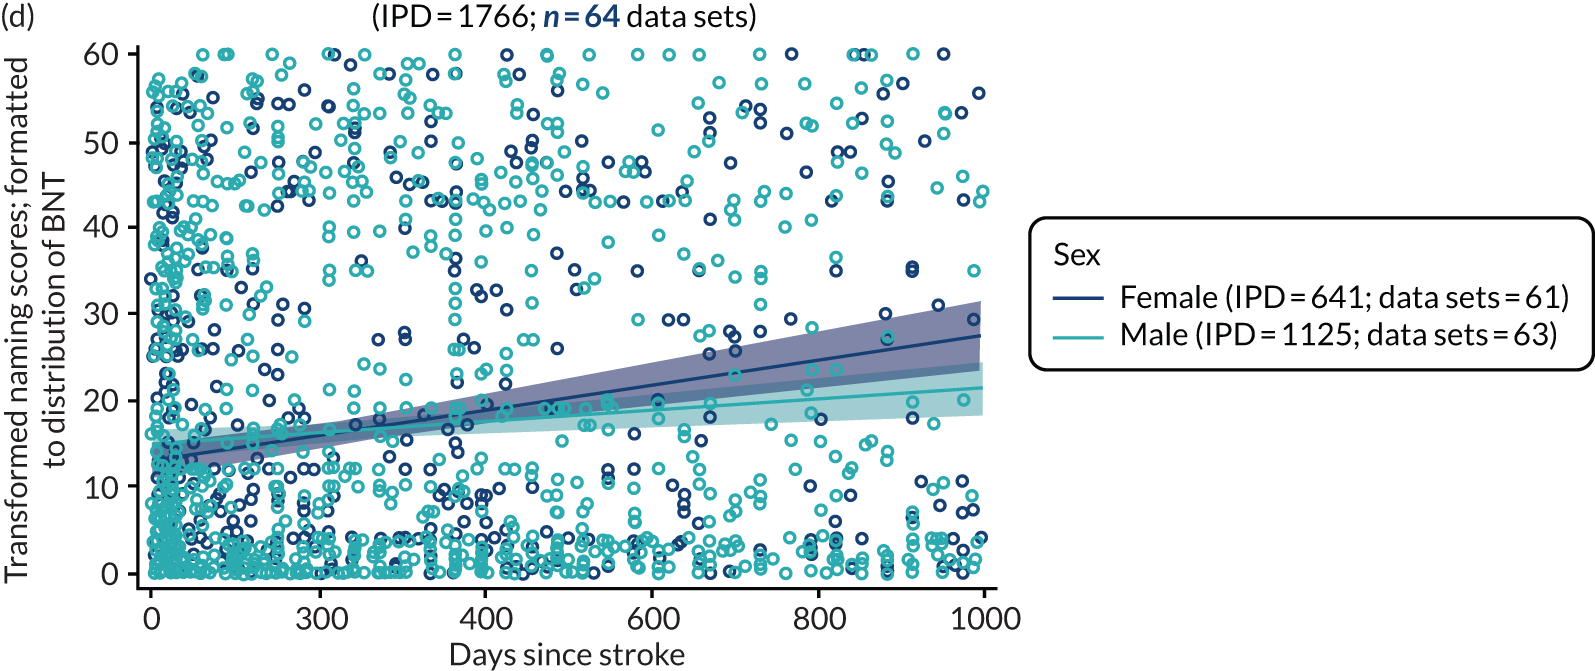
Sex and other spoken language at baseline
We considered the distribution of other spoken-language scores at baseline by time since stroke and stratified by sex for RCT data sets (163 IPD; 2 RCTs; Figure 22a) and across all study types (344 IPD; 7 data sets; Figure 22b). There did not appear to be any sex differences in the distributions of spoken-language scores at baseline assessment in RCT data sets or across all study designs.
FIGURE 22.
Other spoken-language scores by sex for all participants at baseline. (a) RCTs; (b) all study types; (c) for enrolment in RCTs within 0–1000 days of stroke; and (d) for enrolment in all study types within 0–1000 days of stroke.
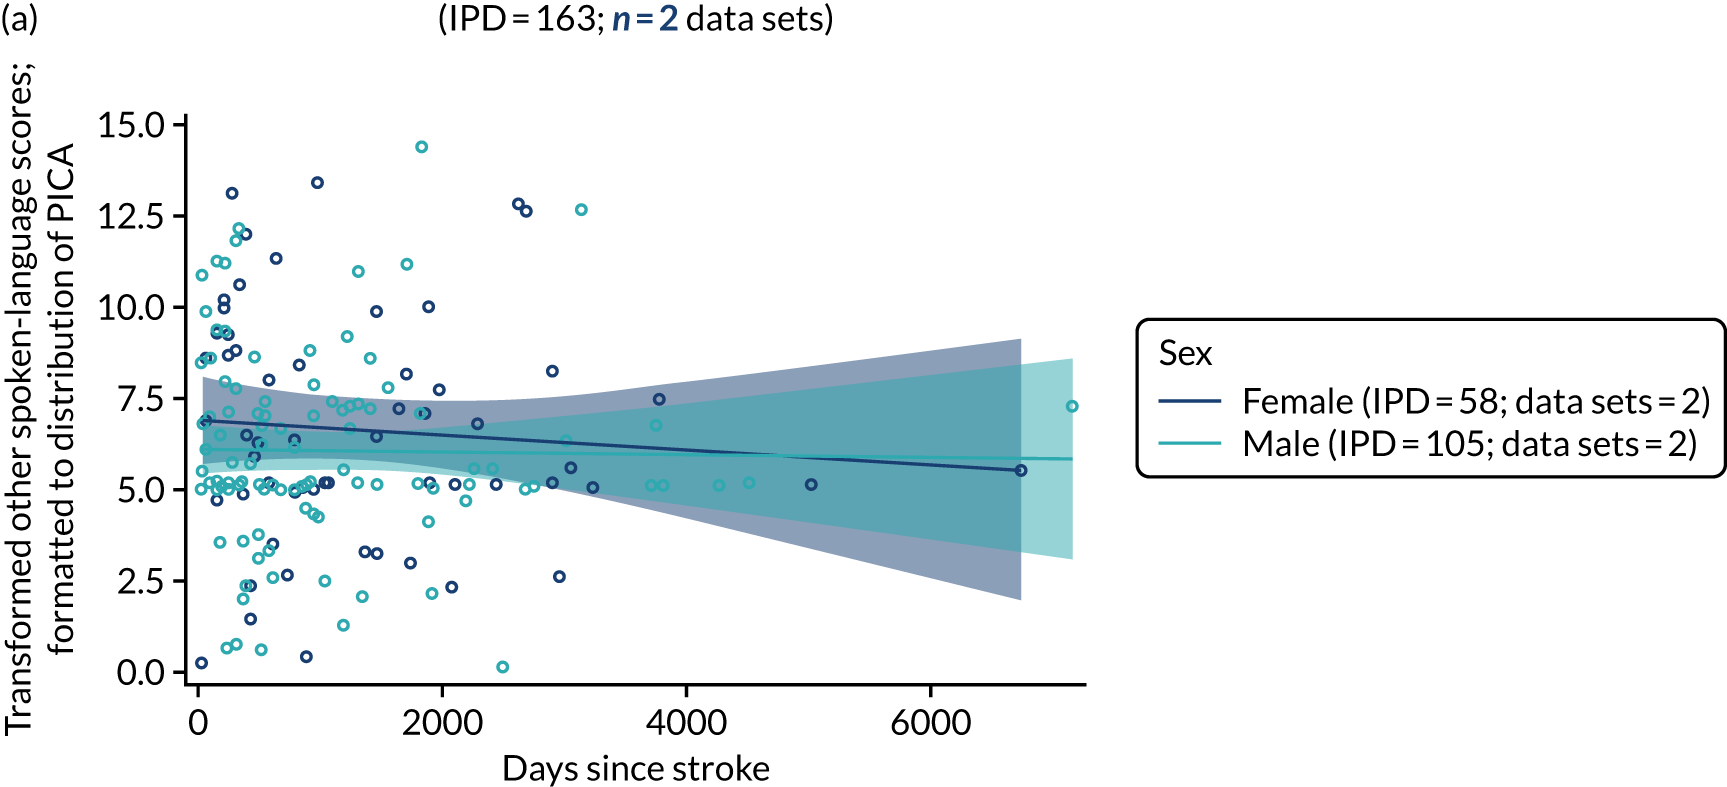
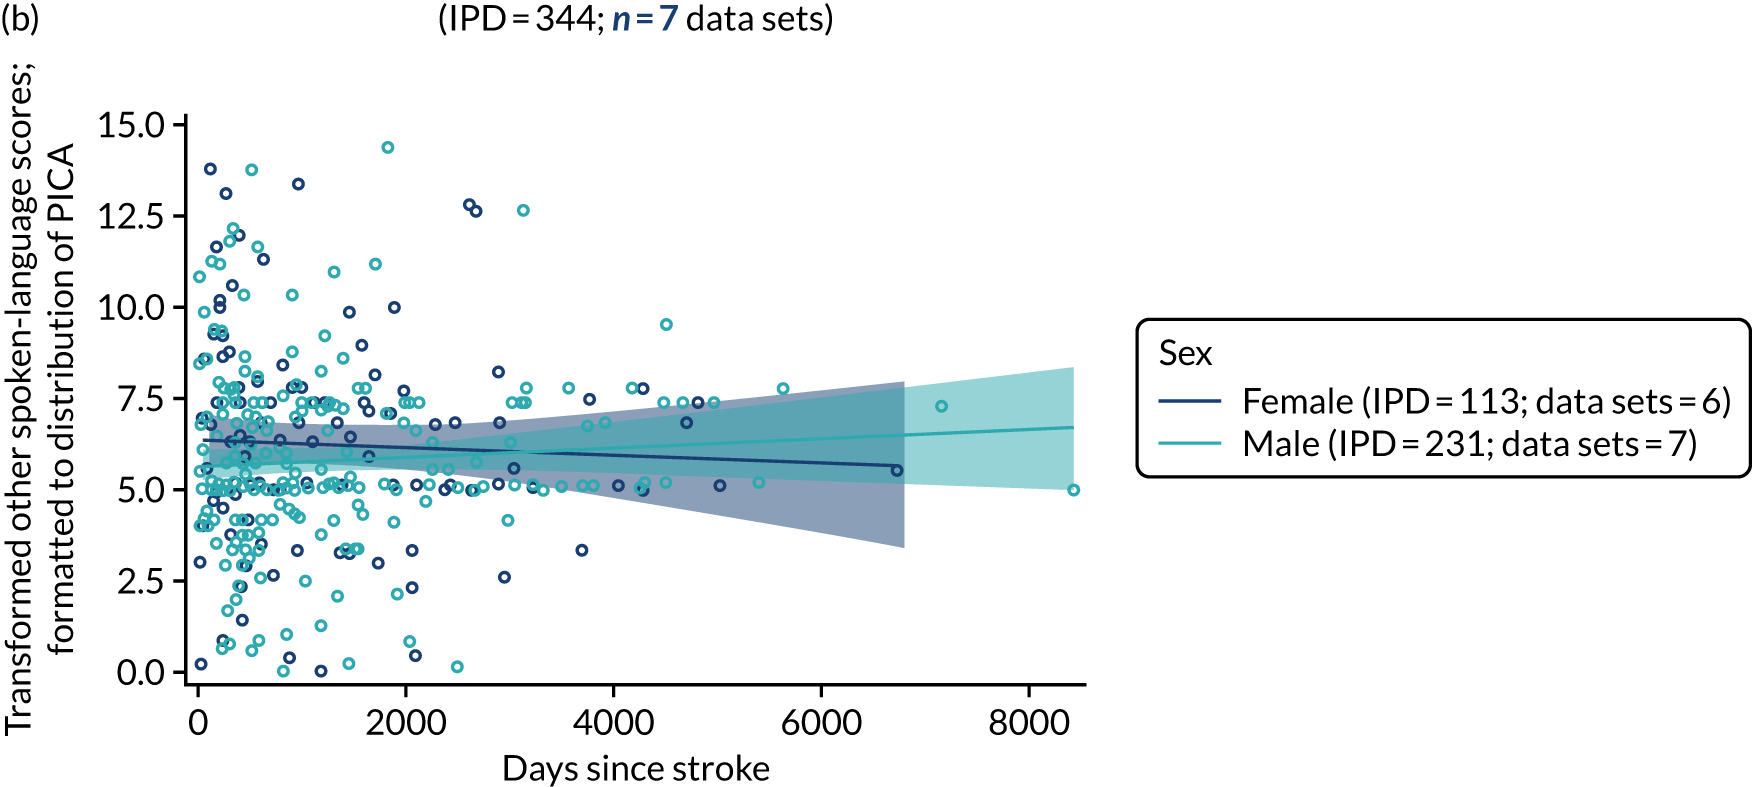

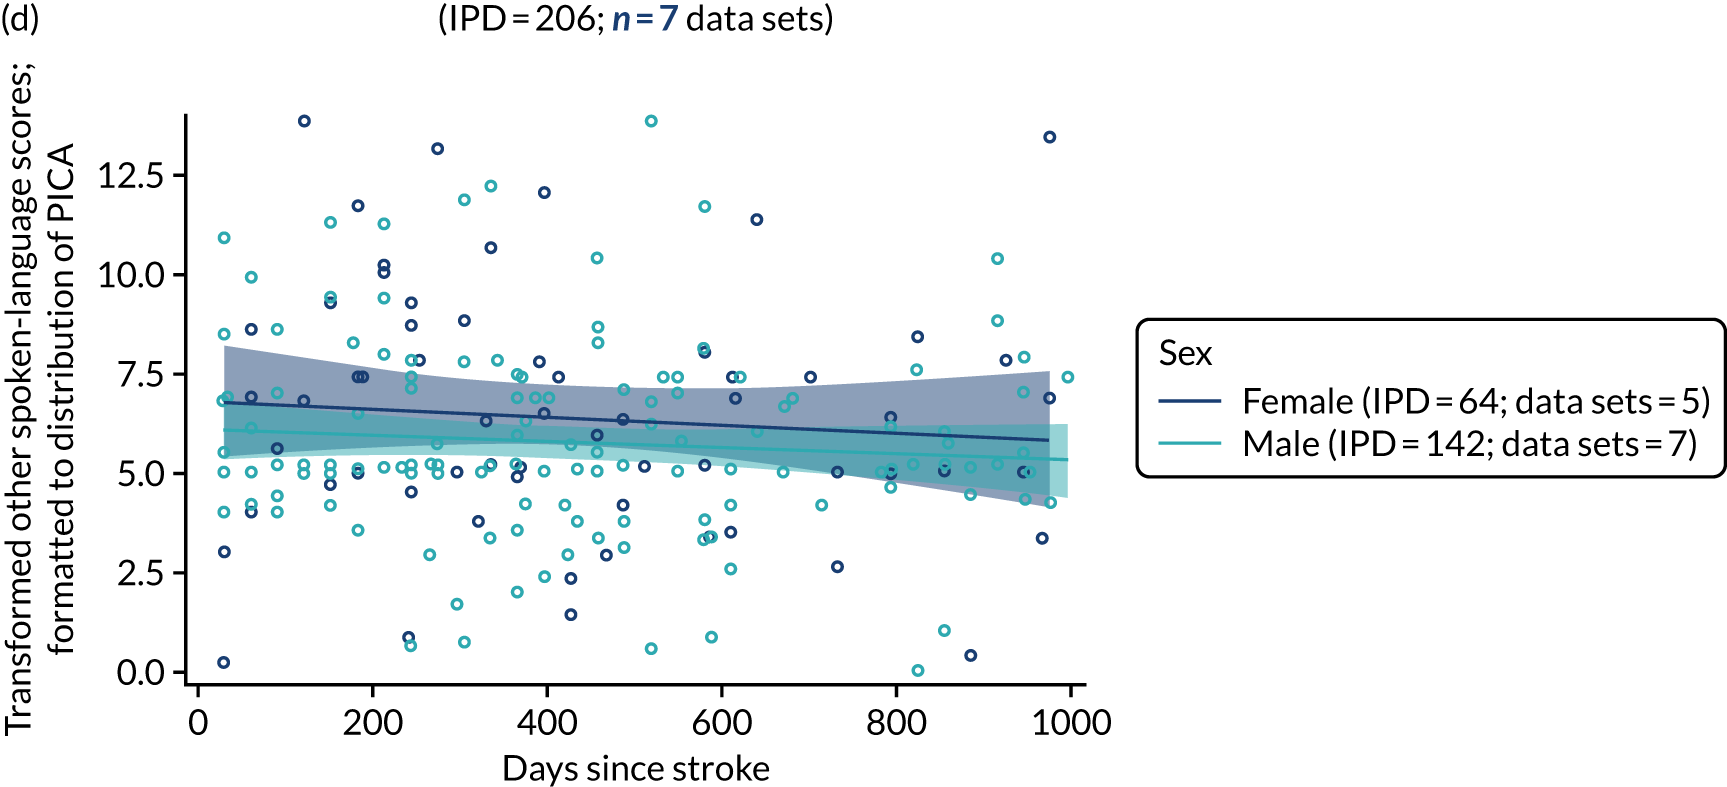
Sex and reading comprehension at baseline
Data on reading comprehension in the RCT population were available for only 11 IPD in one data set and were therefore not taken forward for further analysis. When data were available, reading comprehension scores at baseline were plotted against time since stroke at baseline and stratified by sex across all study types (652 IPD; 9 data sets; Figure 23). Data suggested that women appeared to have better reading scores at baseline time points later after stroke than men at a similar stage since stroke, but this difference was non-significant.
FIGURE 23.
Reading comprehension scores by sex for all participants at baseline. (a) All study types; and (b) for enrolment in all study types within 0–1000 days of stroke.
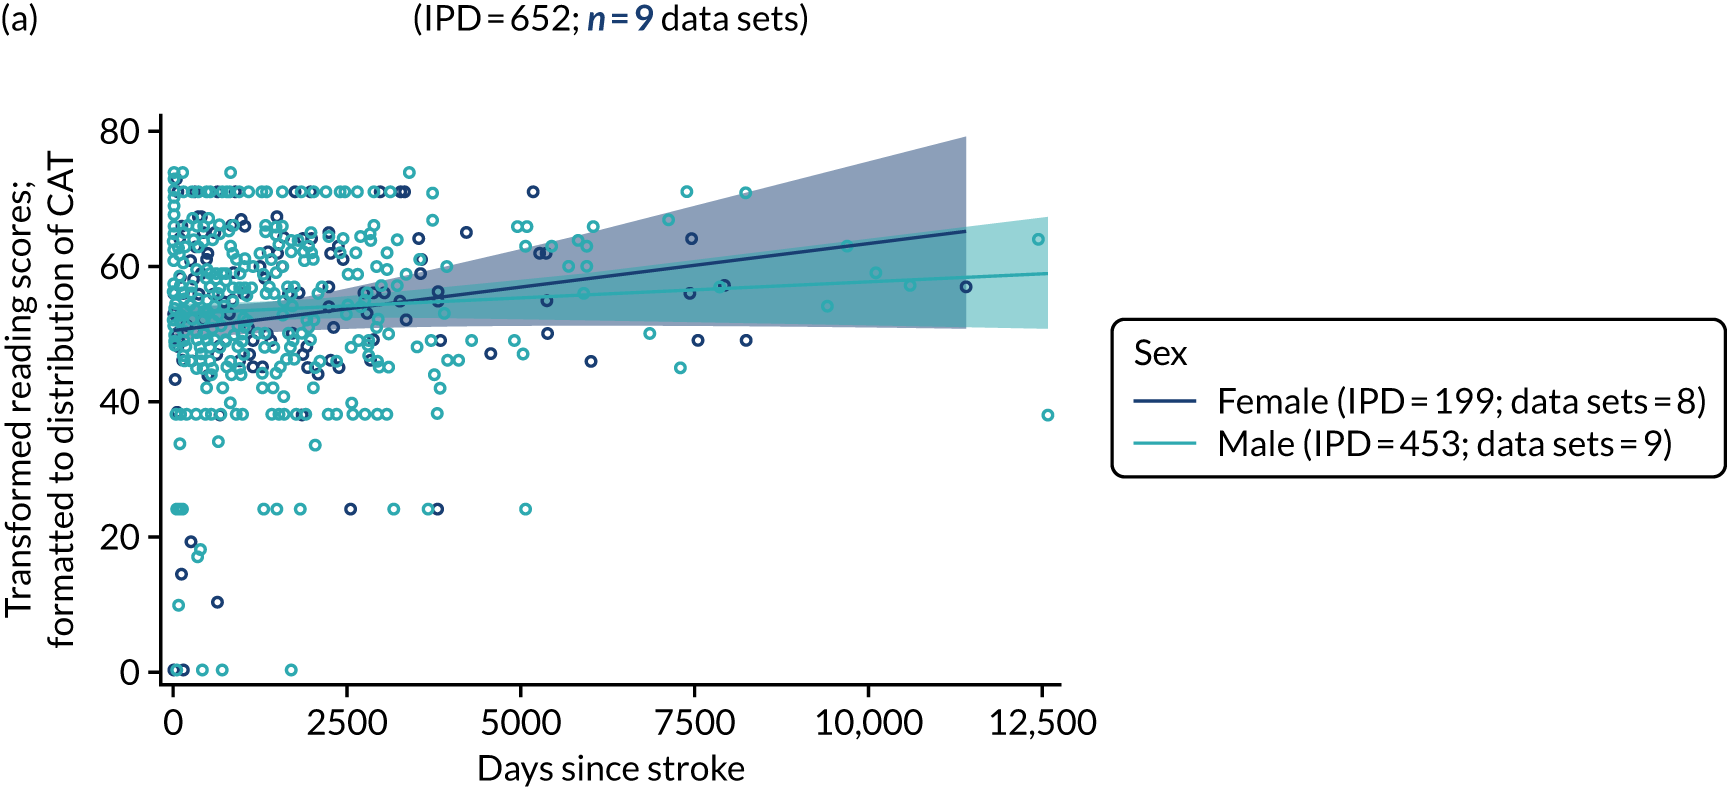
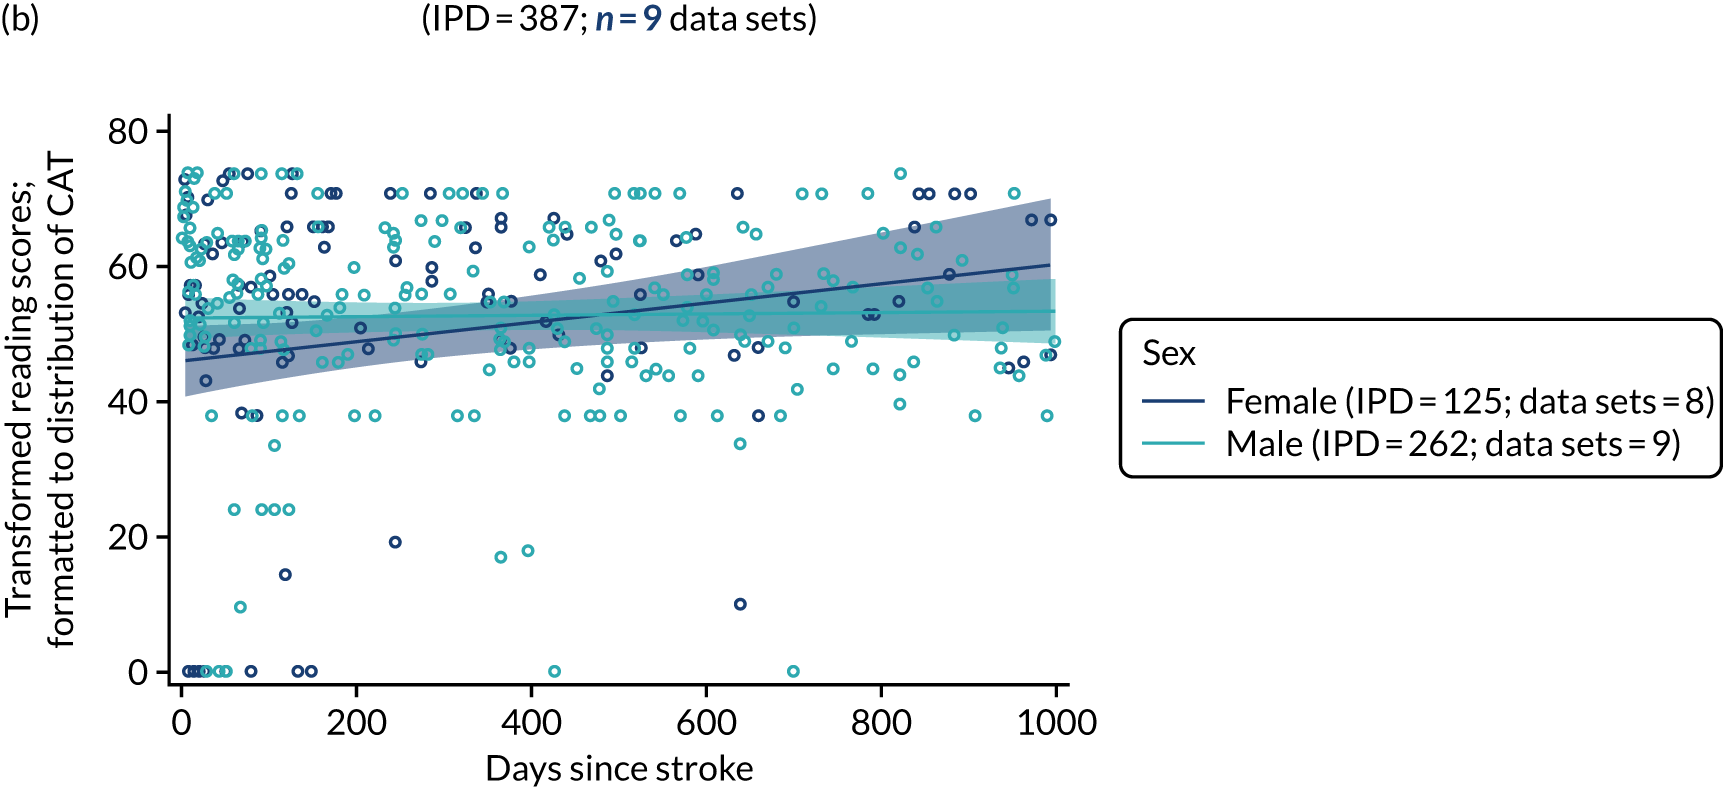
Sex and writing at baseline
We also examined writing scores at baseline by time since stroke and stratified by sex. In the RCT population (47 IPD; 3 RCTs; Figure 24a) and all study types (673 IPD; 11 data sets; see Figure 24b), there were no significant differences in writing scores between men and women. Examination of a more clinically relevant time point (of 0–1000 days) also revealed no significant differences between women and men (see Figure 24c and 24d).
FIGURE 24.
Writing scores by sex for all participants at baseline. (a) RCTs; (b) all study types; (c) for enrolment in RCTs within 0–1000 days of stroke; and (d) for enrolment in all study types within 0–1000 days of stroke.
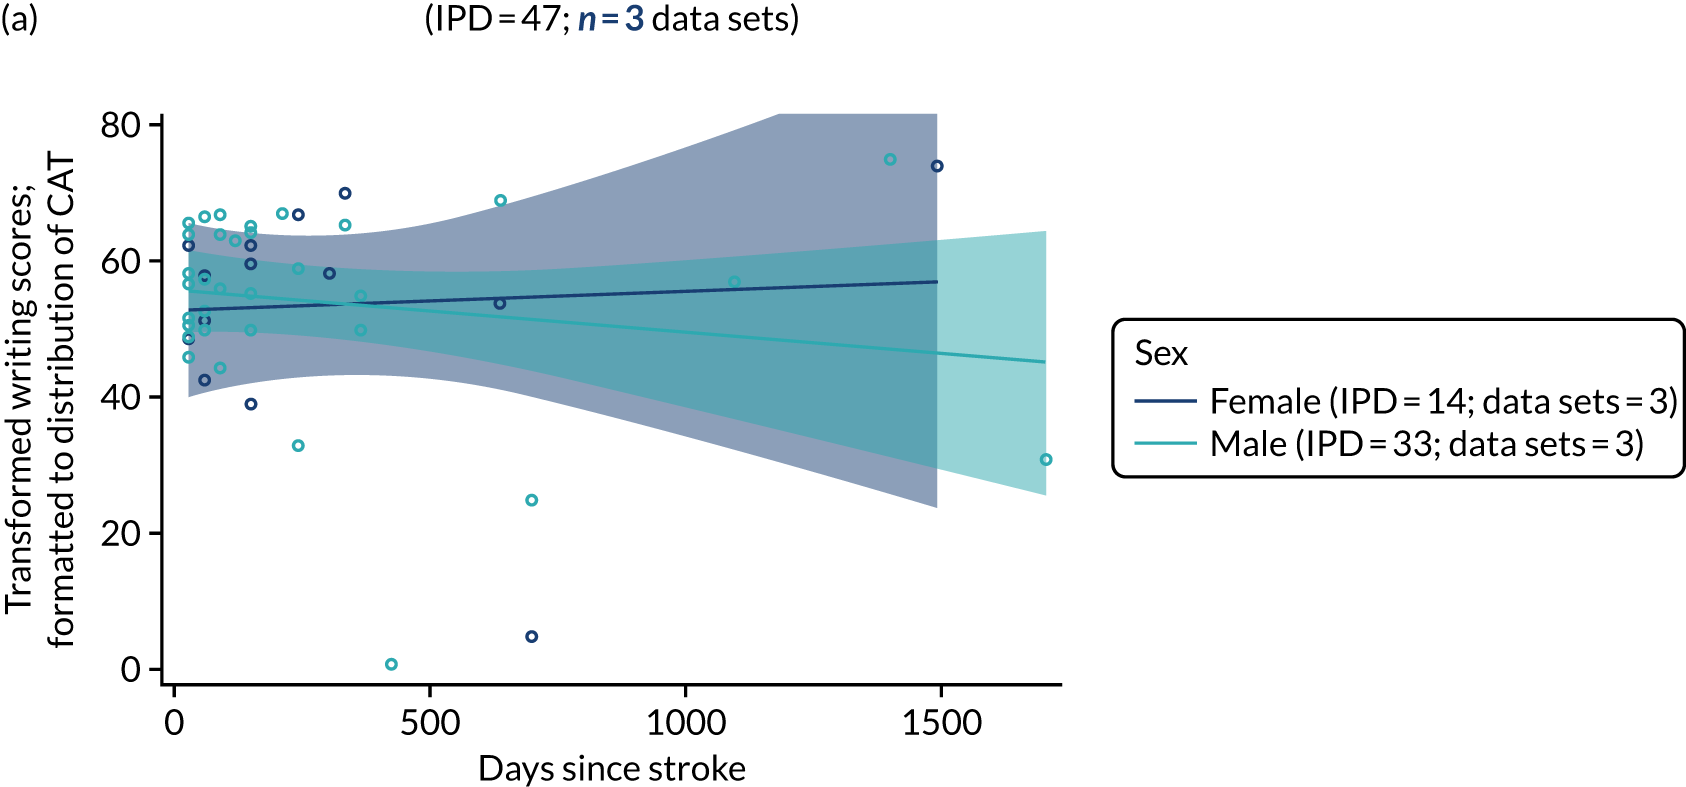

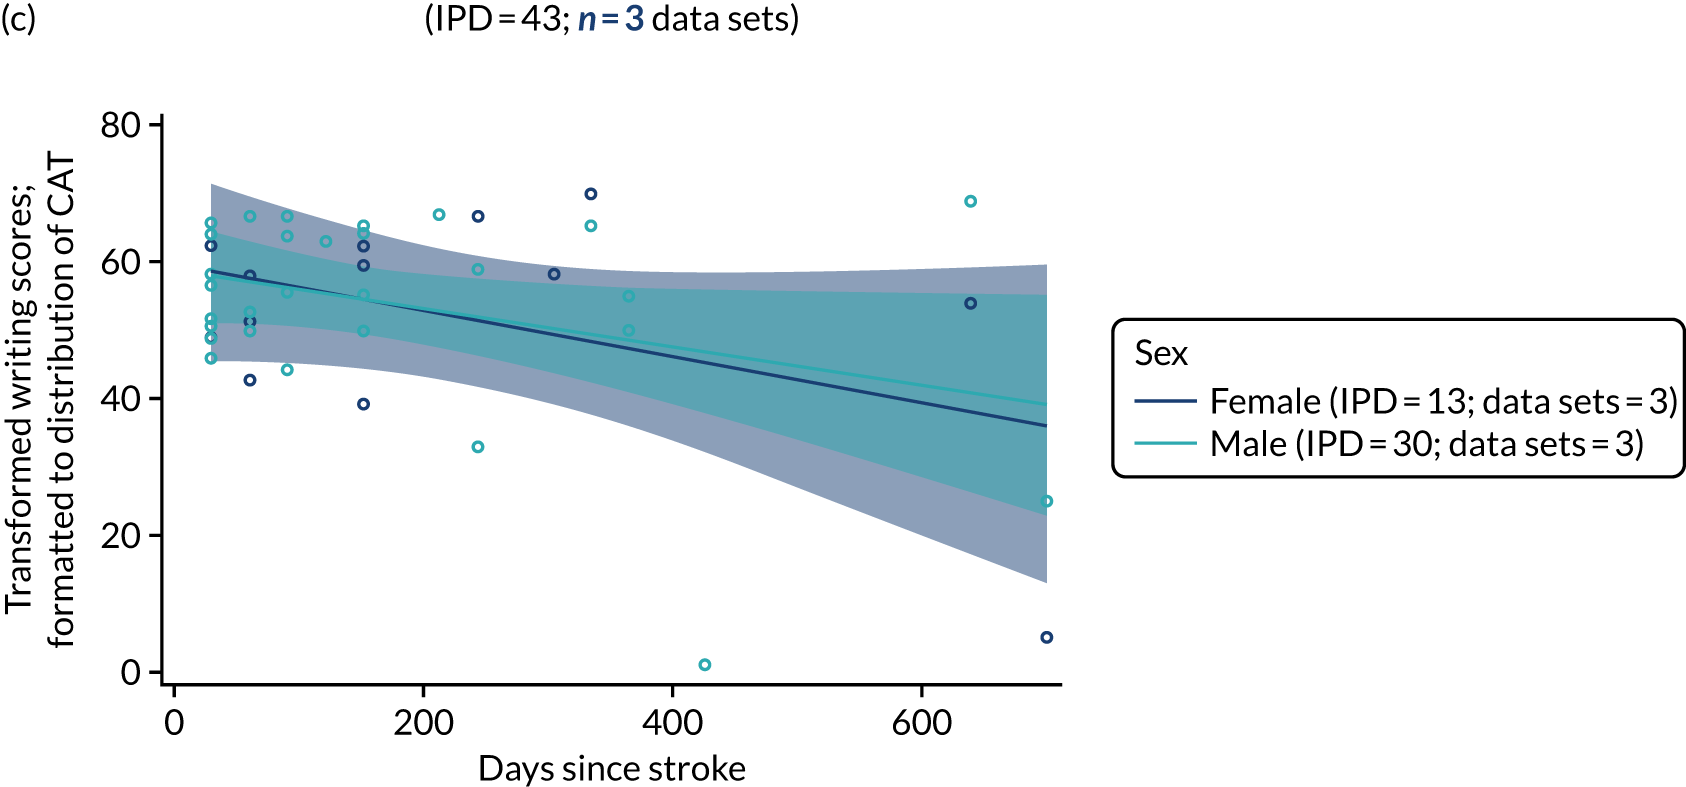
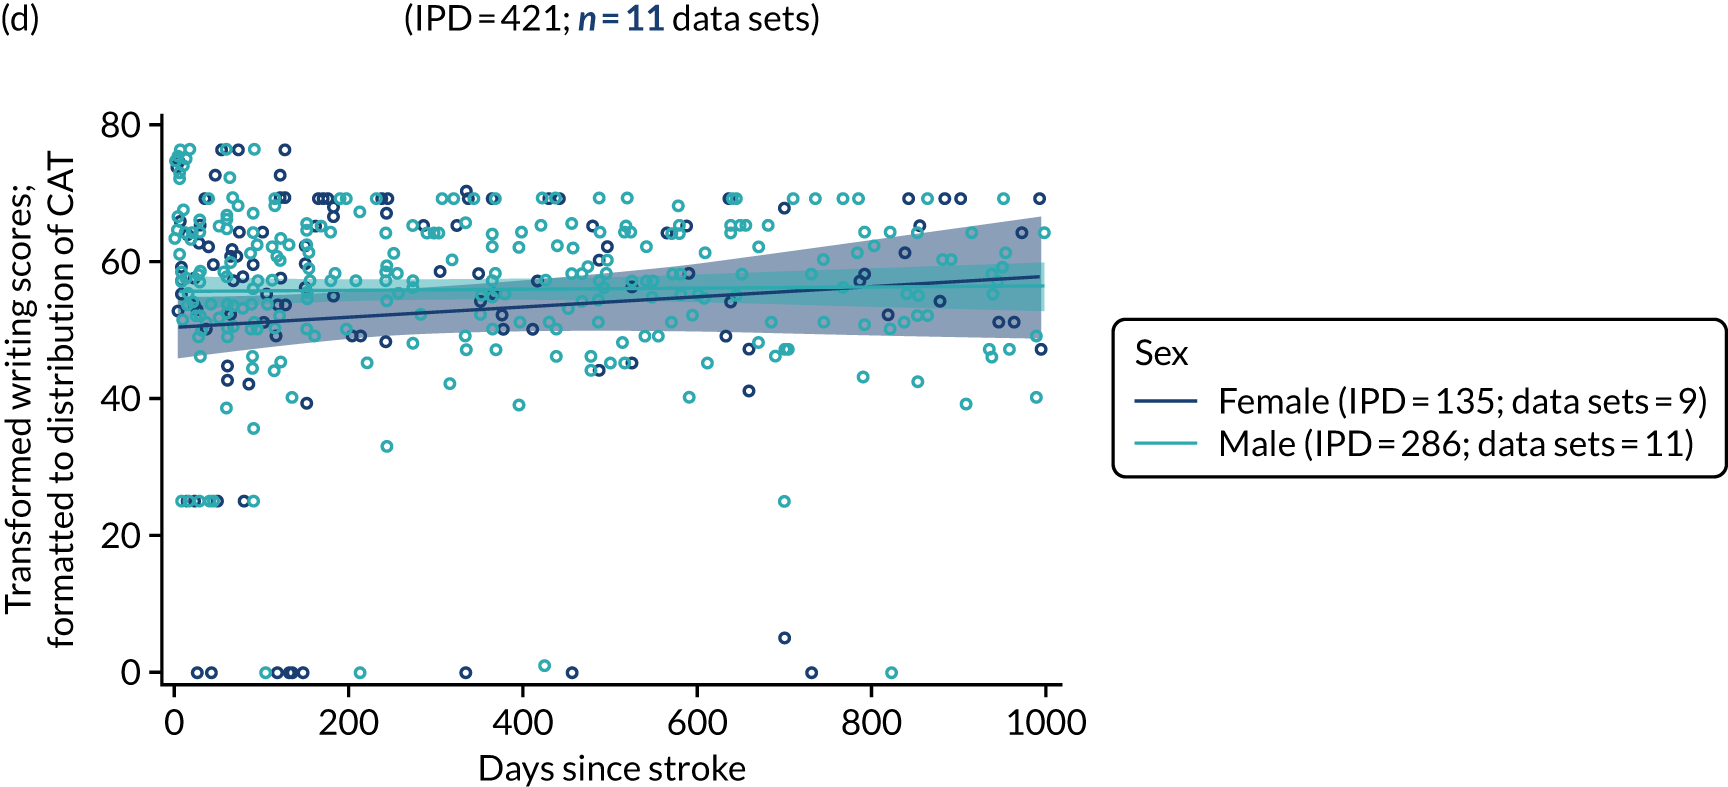
Sex and observer-rated functional communication (activity) at baseline
When examining observer-rated functional communication activity measures (Figure 25), men in the RCT population (995 IPD; 18 RCTs) appeared to have better observer-rated activity scores; however, this observation was not apparent when looking at a more clinically relevant enrolment period (see Figure 25a and 25c). In all study types (1434 IPD; 29 data sets; see Figure 25b), there was no significant difference in the scores observed between men and women. Observer-rated participation scores were also based on this data set and displayed the same pattern.
FIGURE 25.
Observer-rated functional communication (activity) scores by sex for all participants at baseline. (a) RCTs; (b) all study types; (c) for enrolment in RCTs within 0–1000 days of stroke; and (d) for enrolment in all study types within 0–1000 days of stroke.
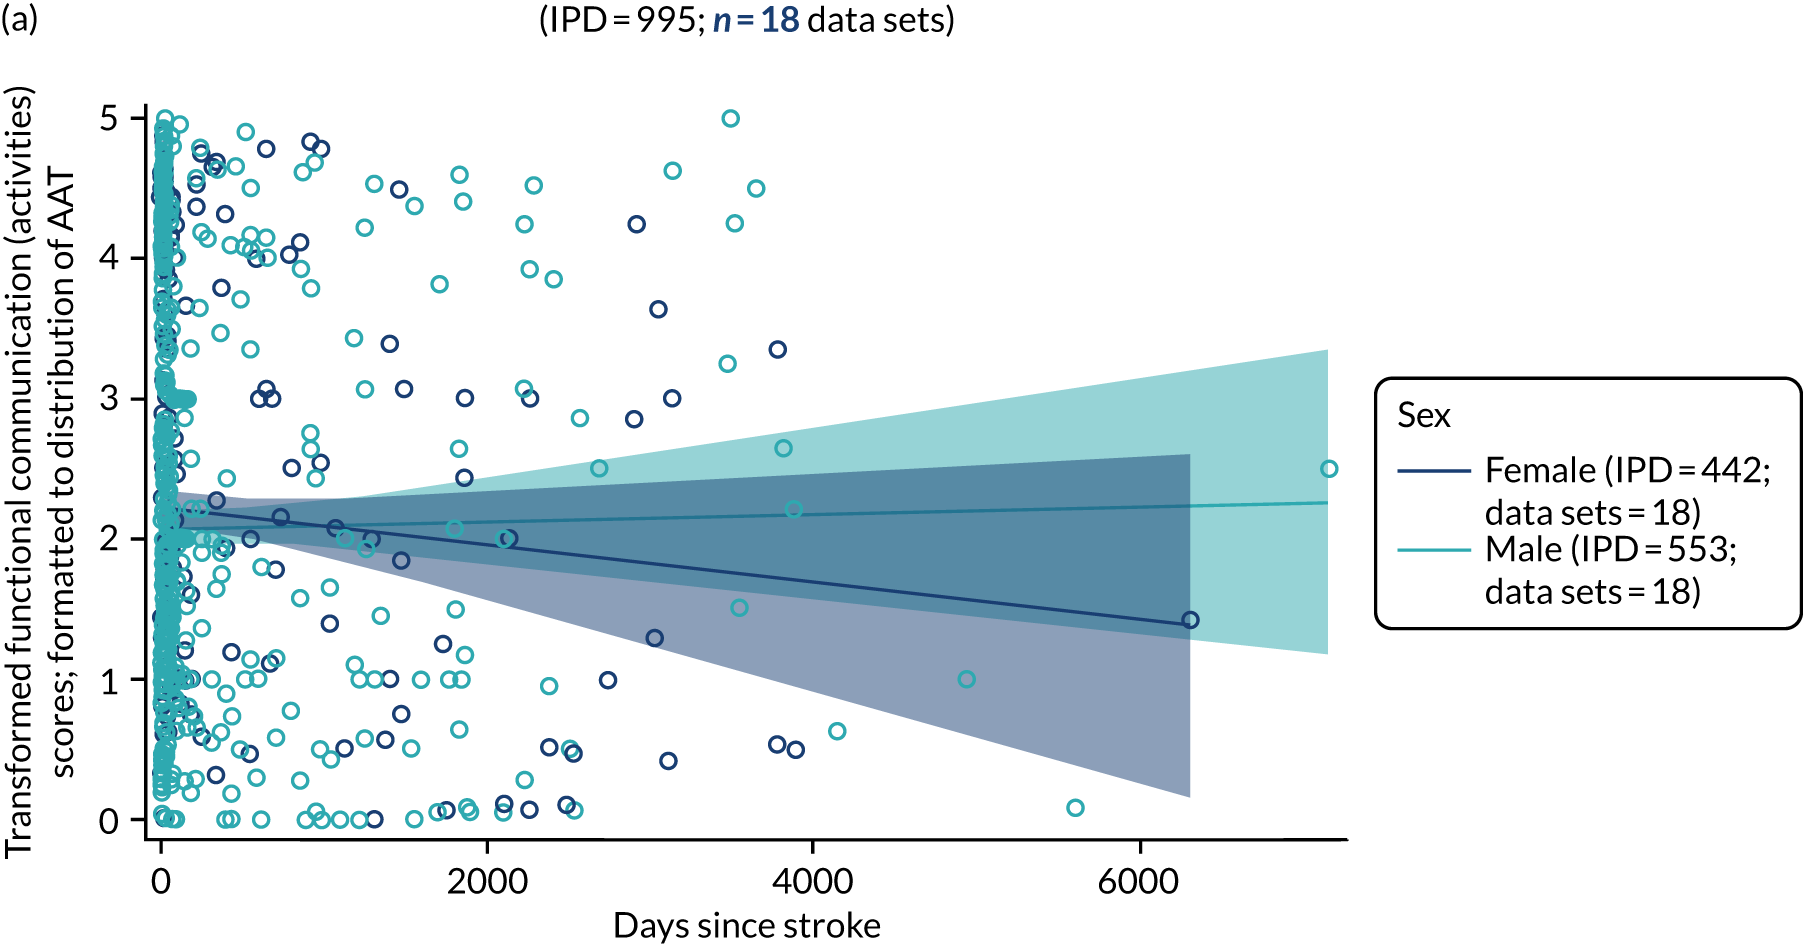

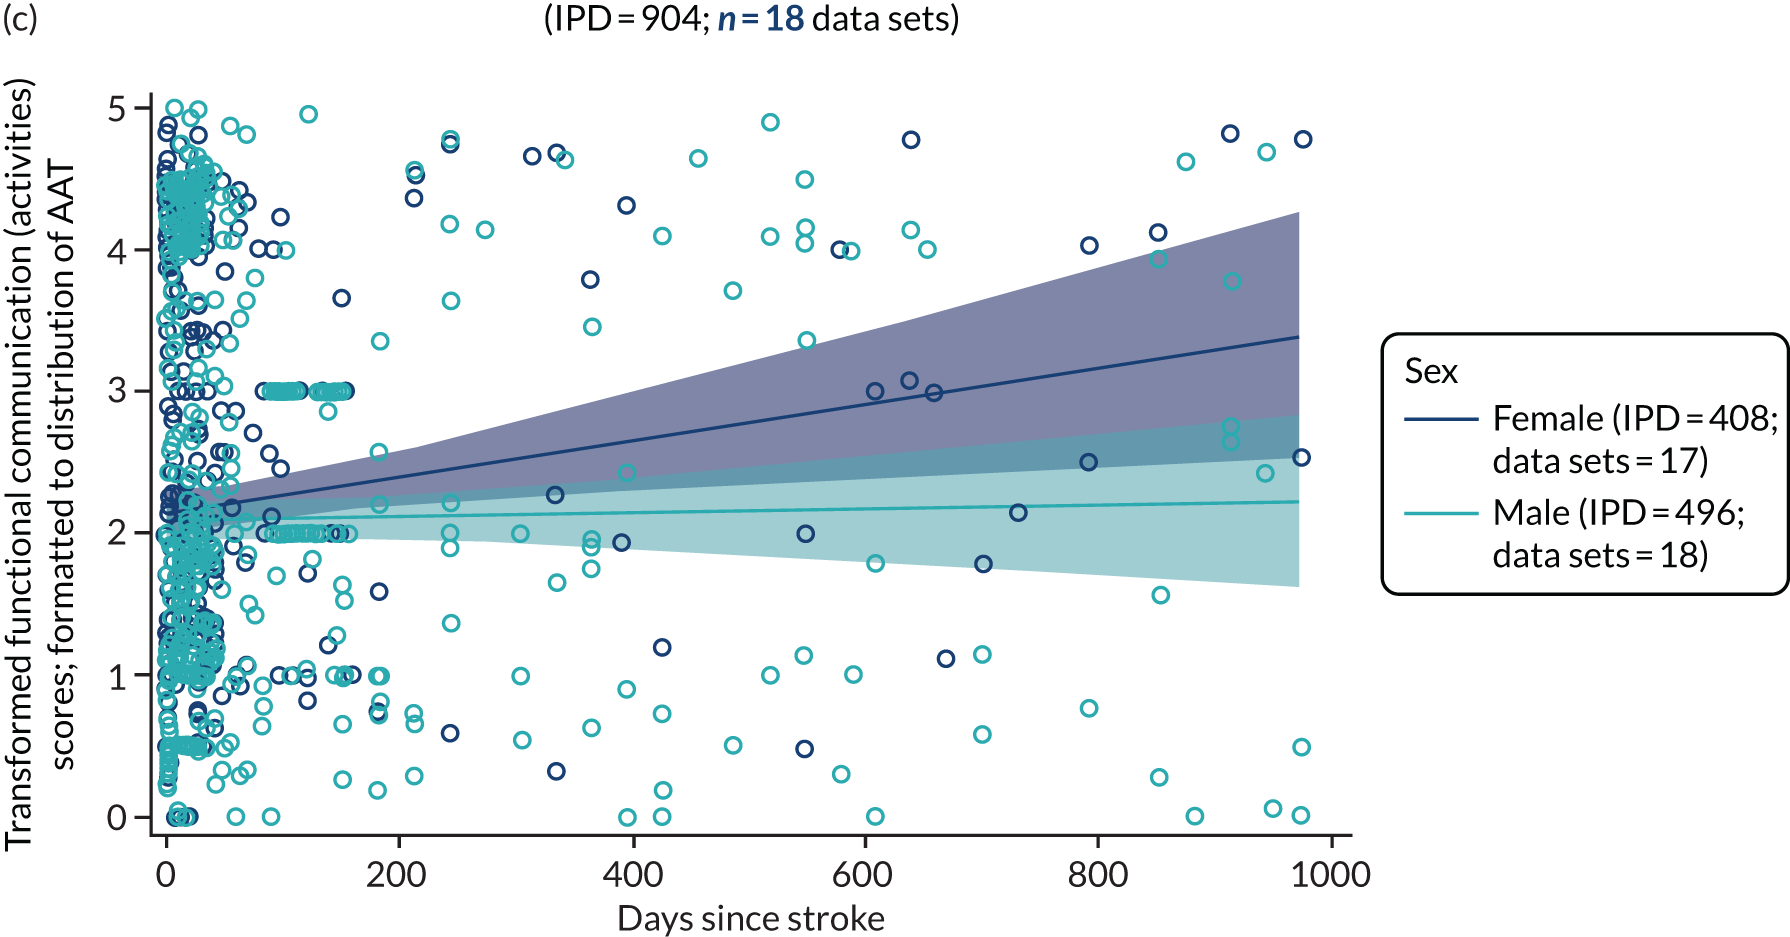
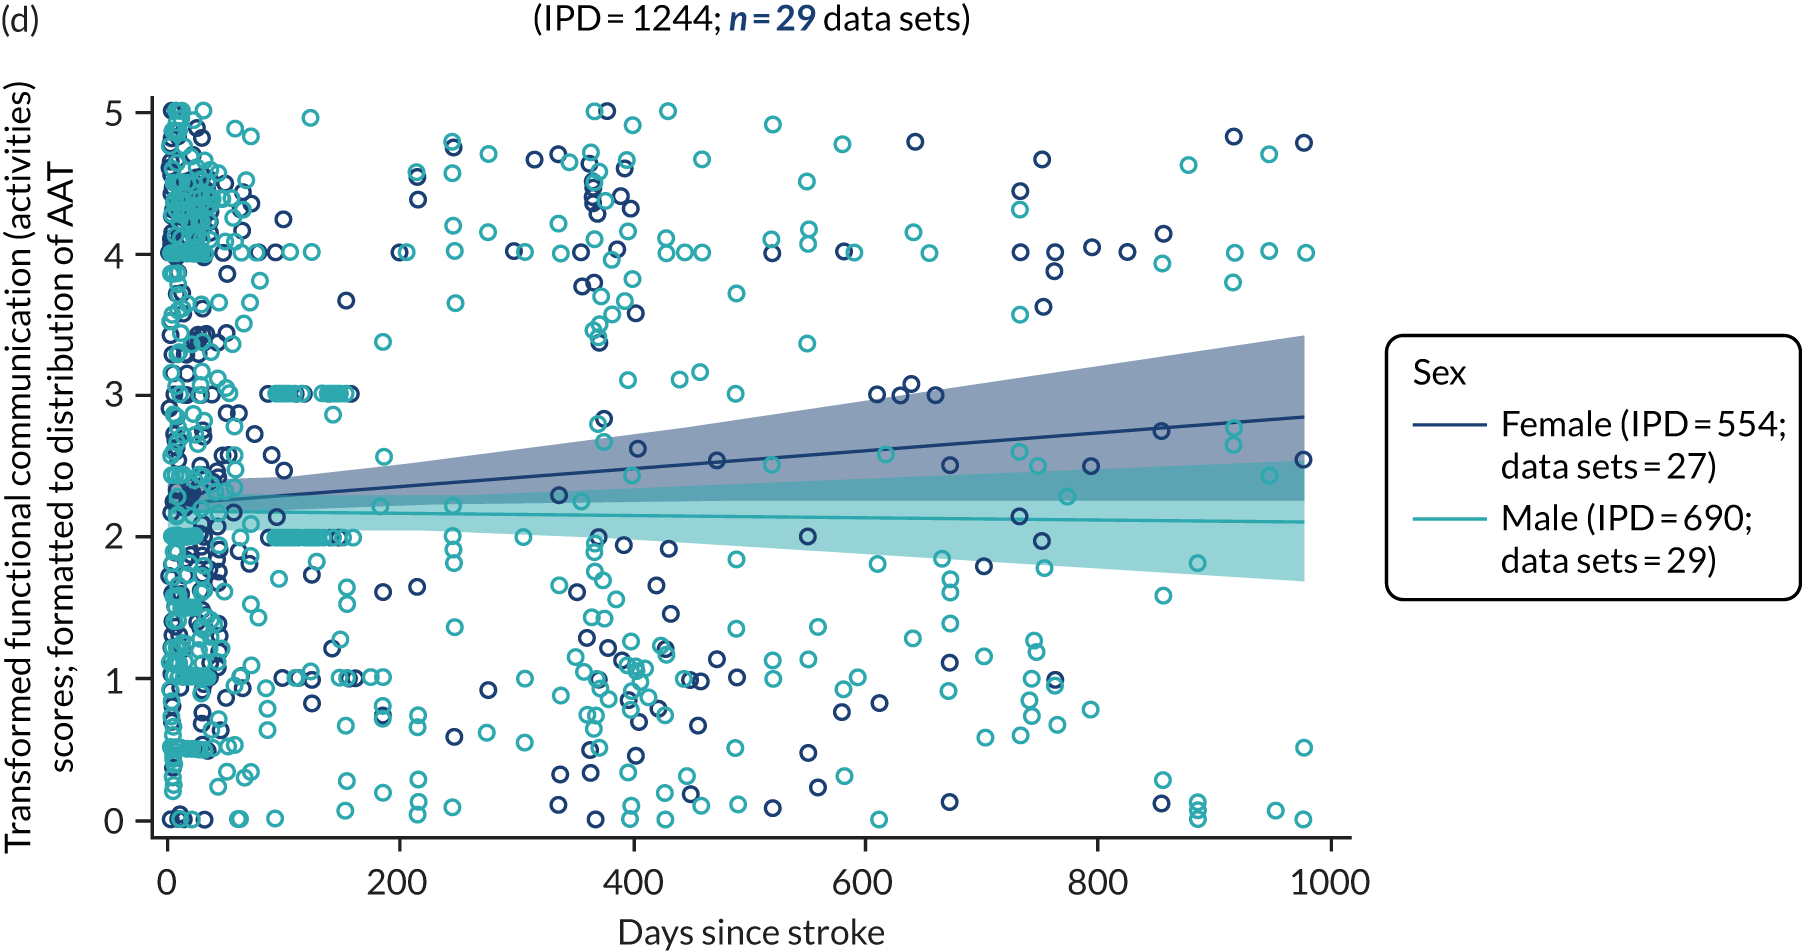
Sex and self-rated functional communication (activity) at baseline
Randomised controlled trial data were available for only 11 IPD from one data set. Therefore, these data were not carried forward to further analyses. Data for self-rated participation scores were also derived from this data set and were also not carried forward to further analyses. Data were available for 62 IPD from three data sets (see Report Supplementary Material 4, figure 5). We observed overlaps in activity scores (and participation scores; see Report Supplementary Material 4, figure 6) in men and women across all baseline time points, and across all clinically relevant enrolment time points.
Language performance by living context after stroke
Living context and overall language ability
When data permitted, we examined the distribution of overall language ability scores at baseline by time since stroke and stratified by living context, in RCTs (158 IPD; 3 RCTs; see Report Supplementary Material 4, figure 7) and across all designs (282 IPD; 8 data sets; see Report Supplementary Material 4, figure 7). There were insufficient data points to compare overall language ability scores at baseline by living context in RCTs. Using data from all study designs, it appeared that people living in formal care environments trended towards better overall language ability at baseline with greater time since stroke than those who were living alone. However, as the confidence limits overlapped, and there were sparse data points, these differences were not significant.
Living context and auditory comprehension
We examined the distribution of auditory comprehension scores at baseline across different time points after stroke and stratified by a participant’s living context, in RCT data sets (121 IPD; 3 RCTs; see Report Supplementary Material 4, figure 8). There were too few data points with the RCT data to adequately establish a relationship between living context and auditory comprehension scores over time. When we included data from all study designs (143 IPD; 5 data sets), there continued to be inadequate data at common baseline time points to enable comparison of patterns of auditory comprehension scores.
Living context and naming
We examined the baseline naming scores at time points since stroke and stratified by living context since stroke among RCT participants (163 IPD; 6 RCTs) and across all study types (176 IPD; 7 data sets; see Report Supplementary Material 4, figure 9). There were insufficient data points to adequately examine the differences in participants’ living contexts and naming.
Living context and spoken language, reading comprehension and writing
We sought data on other spoken-language scores at baseline, by time since stroke and participants’ living context after stroke, but identified only 10 IPD (from one data set), preventing further examination. Similarly, we lacked sufficient data to examine reading comprehension (10 IPD; 1 data set) or writing (10 IPD; 1 data set) at baseline.
Living context and observer-rated functional communication (activity)
Randomised controlled trial data on observer-rated functional communication (activity) were available for 280 IPD from six data sets, and for 290 IPD from seven data sets for all study types (see Report Supplementary Material 4, figure 10). There were inadequate data points at longer times to enrolment to permit reliable analyses or description after stratification by living context. Functional communication (participation) measures were also derived from this data set and showed similar results.
Living context and self-rated functional communication (activity)
Only 11 IPD from one RCT were available, which did not meet the prerequisite minimum data set for analysis. There were no further IPD available for self-rated activity or participation by living context across all study types.
Following these exploratory analyses of the data and predictive factors identified in other stroke recovery research,114–117 we identified age, sex and time since stroke as potential key variables for further examination in relation to recovery and absolute change in scores across each language domain.
Factors associated with increased proportion of change in each language domain
We examined the potential factors that were associated with a trend towards a greater absolute percentage change from baseline to first follow-up in each of the language domains using regression and adjusting for common covariates (age, sex and time since stroke), when these data were available.
After excluding participants from the natural history group (who were allocated to no SLT and were enrolled within 15 days of stroke), there were only two RCTs (22 IPD) and three data sets in all study types (34 IPD) comprising participants who received only historical SLT, and for whom data were available at the first follow-up time point following study intervention. For most of this group, participants had been permitted to receive SLT following the study intervention period and had follow-up time points that were inclusive of that usual care intervention. We were thus unable to separate out the effects of only historical SLT from study SLT in these participants. Analyses were therefore based on participants who had access to SLT in all study types to maximise available data.
Overall language ability
Regression analyses of 418 IPD (11 data sets) on age, sex, time since stroke and overall language ability recovery revealed that increasing the time between stroke onset and study enrolment by 1 month was associated with a 1% decrease in the proportion of change observed for language ability (OR 0.99, 95% CI 0.98 to 1.0; p = 0.002) (see Table 7).
| Domain | Parameter | RCTs | All study types | ||||
|---|---|---|---|---|---|---|---|
| OR | 95% CI | p-value | OR | 95% CI | p-value | ||
| Overall language ability | Age | 1.02 | 1.00 to 1.04 | 0.02 | 1.01 | 1.0 to 1.02 | 0.08 |
| Sex (female vs. male) | 1.11 | 0.73 to 1.69 | 0.62 | 1.27 | 0.93 to 1.729 | 0.14 | |
| Time since strokea | 0.99 | 0.98 to 1.0 | 0.002 | 0.99 | 0.98 to 0.99 | < 0.0001 | |
| Auditory comprehension | Age | 0.99 | 0.98 to 1.02 | 0.92 | 0.98 | 0.97 to 0.99 | 0.003 |
| Sex (female vs. male) | 1.40 | 0.92 to 2.12 | 0.12 | 1.32 | 0.95 to 1.84 | 0.097 | |
| Time since strokea | 0.99 | 0.99 to 1.00 | 0.003 | 0.99 | 0.99 to 0.99 | < 0.0001 | |
| Naming | Age | 0.99 | 0.98 to 1.01 | 0.45 | 0.99 | 0.98 to 1.00 | 0.13 |
| Sex (female vs. male) | 0.95 | 0.62 to 1.46 | 0.82 | 0.98 | 0.71 to 1.36 | 0.91 | |
| Time since strokea | 0.99 | 0.98 to 0.99 | 0.002 | 0.99 | 0.99 to 0.99 | < 0.0001 | |
| Other spoken language | Age | 0.97 | 0.94 to 1.00 | 0.08 | 0.97 | 0.94 to 1.00 | 0.074 |
| Sex (female vs. male) | 0.99 | 0.55 to 1.78 | 0.98 | 1.04 | 0.60 to 1.81 | 0.89 | |
| Time since strokea | 0.99 | 0.98 to 1.0 | 0.0006 | 0.99 | 0.98 to 1.00 | 0.0012 | |
| Reading | Age | – | – | – | 0.96 | 0.94 to 0.99 | 0.01 |
| Sex (female vs. male) | – | – | – | 0.89 | 0.40 to 1.95 | 0.76 | |
| Time since strokea | – | – | – | 0.99 | 0.99 to 1.00 | 0.004 | |
| Writing | Age | 1.04 | 0.99 to 1.10 | 0.14 | 0.99 | 0.97 to 1.02 | 0.60 |
| Sex (female vs. male) | 0.82 | 0.25 to 2.72 | 0.75 | 0.84 | 0.45 to 1.58 | 0.59 | |
| Time since strokea | 0.87 | 0.80 to 0.93 | 0.0001 | 1.00 | 0.99 to 1.00 | 0.22 | |
| Observer-rated functional communication (activity) | Age | 1.01 | 1.00 to 1.03 | 0.16 | 1.02 | 1.00 to 1.03 | 0.01 |
| Sex (female vs. male) | 1.21 | 0.84 to 1.75 | 0.31 | 1.18 | 0.84 to 1.64 | 0.34 | |
| Time since strokea | 0.98 | 0.98 to 0.99 | < 0.0001 | 0.99 | 0.98 to 0.99 | < 0.0001 | |
| Observer-rated functional communication (participation) | Age | 1.01 | 1.00 to 1.03 | 0.16 | 1.02 | 1.00 to 1.03 | 0.01 |
| Sex (female vs. male) | 1.21 | 0.84 to 1.75 | 0.31 | 1.18 | 0.84 to 1.64 | 0.34 | |
| Time since strokea | 0.98 | 0.98 to 0.99 | < 0.0001 | 0.99 | 0.98 to 0.99 | < 0.0001 | |
| Self-rated functional communication (activity) | Age | – | – | – | 0.97 | 0.93 to 1.02 | 0.24 |
| Sex (female vs. male) | – | – | – | 2.55 | 0.65 to 10.04 | 0.18 | |
| Time since strokea | – | – | – | 1.01 | 0.99 to 1.02 | 0.37 | |
| Self-rated functional communication (participation) | Age | – | – | – | 0.97 | 0.93 to 1.02 | 0.24 |
| Sex (female vs. male) | – | – | – | 2.55 | 0.65 to 10.04 | 0.18 | |
| Time since strokea | – | – | – | 1.01 | 0.99 to 1.02 | 0.37 | |
Auditory comprehension
We analysed data on 508 IPD (17 data sets) on the proportion of change in auditory comprehension scores, age, sex and time since stroke. We found that an increase in time since stroke by 1 month was associated with a 1% decrease in the proportion of change in auditory comprehension scores (OR 0.99, 95% CI 0.99 to 1.0; p = 0.003; see Table 7).
Naming
Data were available on 346 IPD (14 data sets) for whom change in naming score, age, sex and time since stroke had been captured. An increase in time since stroke of 1 month was associated with a 1% decrease in the proportion of change in naming scores (see Table 7).
Other spoken language
Data were available on 155 participants from two data sets for whom change in other spoken-language scores, age, sex and time since stroke were captured. An increase in time since stroke of 1 month was associated with a 1% decrease in the proportion of change since baseline in other spoken-language scores (OR 0.99, 95% CI 0.98 to 1.00; p = 0.0006) (see Table 7).
Reading comprehension
Data were available on 11 IPD from one RCT, and therefore did not meet our prespecified criteria for analysis.
Writing
Data were available on 41 IPD (3 RCTs) for whom age, sex, time since stroke and change in writing scores since baseline were captured. Increasing time since stroke was associated with decreased proportion of change in writing score (OR 0.87, 95% CI 0.80 to 0.93; p = 0.0001) (see Table 7).
Observer-rated functional communication (activity)
Data were available on 608 IPD from 16 RCTs for whom observer-rated functional communication (activity) scores, age, sex and time since stroke were captured. An increase by 1 month in time to study entry was associated with a 2% decrease in the proportion of change since baseline in activity (see Table 7).
Observer-rated functional communication (participation)
Data were available on 608 IPD from 16 RCTs for whom observer-rated functional communication (activity) scores, age, sex and time since stroke were captured. An increase of 1 month in time to study entry was associated with a 2% decrease in the proportion of change since baseline in participation (see Table 7).
Self-rated functional communication
Data were available from only one RCT, and therefore did not meet our prespecified analysis criteria.
Factors associated with increased proportion of change using data from all study types
Overall language ability
Regression analyses of 749 IPD (19 data sets) on age, sex, time since stroke and overall language ability recovery revealed that an increase of 1 month in the time between stroke onset and study enrolment was associated with a 1% decrease in the proportion of change observed for language ability (OR 0.98, 95% CI 0.98 to 0.99; p < 0.0001) (see Table 7).
Auditory comprehension
We analysed data on 921 IPD (27 data sets) on the proportion of change in auditory comprehension scores, age, sex and time since stroke. This analysis revealed that increasing age (OR 0.98, 95% CI 0.97 to 0.99; p = 0.003) was associated with decreased proportion of change and an increase in time since stroke of 1 month was associated with a 1% decrease in the proportion of change in auditory comprehension scores.
Naming
Data were available on 636 IPD (23 data sets) for whom change in naming score, age, sex and time since stroke had been captured. An increase in time since stroke of 1 month was associated with a 1% decrease in the proportion of change in naming scores (see Table 7).
Other spoken language
Data were available on 204 participants from five data sets for whom change in other spoken-language scores, age, sex and time since stroke were captured. An increase of 1 month in time since stroke was associated with a 1% decrease in the proportion of change since baseline in other spoken-language scores (OR 0.99, 95% CI 0.98 to 1.00; p = 0.0012) (see Table 7).
Reading comprehension
Data were available on 145 IPD (3 data sets) for whom change in reading scores, age, sex and time since stroke were captured. An increase of 1 year in age was associated with a decreased proportion of change in reading comprehension (OR 0.96, 95% CI 0.94 to 0.99; p = 0.01) (see Table 7). Increasing the time since stroke to study inclusion by 1 month was associated with a 1% decrease in the proportion of change in reading scores.
Writing
Data were available on 208 IPD (7 data sets) for whom age, sex, time since stroke and change in writing scores since baseline were captured. Age, sex and time since stroke were each not associated with proportion of change in writing score (see Table 7).
Observer-rated functional communication (activity)
Data were available on 802 IPD from 22 data sets for whom observer-rated functional communication (activity) scores, age, sex and time since stroke were captured. An increase of 1 month in time to study entry was associated with a 1% decrease in the proportion of change since baseline in activity (see Table 7).
Observer-rated functional communication (participation)
Data were available on 755 IPD from 21 data sets for whom observer-rated functional communication (participation) scores, age, sex and time since stroke were captured. An increase of 1 month in time to study entry was associated with a 1% decrease in the proportion of change since baseline in activity (see Table 7).
Self-rated functional communication (activity)
Data were available on 43 IPD from two data sets for whom self-rated functional communication (activity) scores were available. Age, sex and time since stroke were not significantly associated with recovery, although the sample was very small.
Self-rated functional communication (participation)
Data were available on 43 IPD from two data sets for whom self-rated functional communication (participation) scores were available. Age, sex and time since stroke were not significantly associated with recovery, although the sample was very small.
Predictors of recovery following aphasia after stroke
We sought to examine the predictors of aphasia recovery across seven language domains in relation to participant demographics and stroke profile. Generalised linear models were used to estimate the impact of the initial severity of language impairment on subsequent recovery outcomes (defined as the absolute changes in raw scores since baseline), and this was repeated for each language domain (overall language ability, auditory comprehension, naming, other spoken language, reading comprehension, writing and functional communication).
In these analyses, we quantified the association between aphasia and eight variables (baseline score, sex, hemisphere of stroke, type, handedness, language used, age and time since stroke) using univariable and multivariable analyses. We considered language measures at baseline and first post-intervention period follow-up.
There were insufficient data on bilingualism (12 IPD available). Data on ethnicity (1475 IPD available) were also limited, but were further minimised as the variable was distributed across seven possible categories. Socioeconomic status was reported in several formats and no single composite score could be derived to describe socioeconomic status across data sets. Educational history was reported for 3125 IPD, but the variable was recorded in multiple formats, including ‘years spent in education’, ‘highest qualification’ and ‘age on leaving full-time education, making synthesis of these variables uncertain. Alternatively, analysis of years of education alone resulted in an insufficient data set. Consequently, we did not consider monolingualism/multilingualism, ethnicity, socioeconomic status or educational history in our analysis. Similarly, when a variable at each level was available only in an isolated data set, the effect of that variable on the outcome could not be distinguished from the study effect. In such cases, it was not possible to calculate estimates of the effect for non-English languages.
We first retrieved the key demographic data and identified the availability of overlapping IPD with interventions data, before excluding duplicate records, IPD that had no baseline or no follow-up data points, and non-RCT data (see Table 5). We then looked at the availability of IPD on age, sex, handedness, language used, stroke type, hemisphere, time since stroke and aphasia baseline score which would inform our planned analyses (see Appendix 8, Table 15). As prespecified, we removed variables with missing data > 20% and adjusted for initial aphasia severity. Sex, time since stroke and age are key predictive factors in recovery from stroke;114–117 although they were not always significant in this model, we included them in the analysis of population characteristics to adjust for differences between studies and changes in magnitude of effect and to inform later stages of the analyses (Table 8).
| Parameter | RCTs | All data sets | ||||||
|---|---|---|---|---|---|---|---|---|
| Data sets (n) | IPD (n) | Estimate of means | 95% CI | Data sets (n) | IPD (n) | Estimate of means | 95% CI | |
| Overall language ability, WAB-AQ | ||||||||
| Sex | ||||||||
| Female | 11 | 206 | 14.25 | 9.01 to 19.50 | 16 | 250 | 14.15 | 9.66 to 18.65 |
| Male | 11 | 276 | 12.30 | 7.16 to 17.44 | 17 | 378 | 12.17 | 7.89 to 16.46 |
| Age (years) | ||||||||
| ≤ 55 | 11 | 136 | 15.43 | 9.95 to 20.91 | 17 | 192 | 16.51 | 10.03 to 22.99 |
| 56–65 | 11 | 141 | 12.36 | 6.90 to 17.82 | 16 | 178 | 12.88 | 6.38 to 19.38 |
| 66–75 | 10 | 96 | 11.49 | 5.73 to 17.25 | 14 | 123 | 13.22 | 6.69 to 19.75 |
| > 75 | 7 | 109 | 13.81 | 7.82 to 19.81 | 9 | 135 | 13.83 | 6.94 to 20.73 |
| Time since stroke | ||||||||
| 0–1 month | 8 | 260 | 19.14 | 13.89 to 24.39 | 9 | 335 | 20.99 | 13.78 to 28.20 |
| > 1–3 months | 6 | 64 | 16.17 | 10.20 to 22.13 | 8 | 71 | 16.44 | 9.02 to 23.86 |
| > 3–6 months | 3 | 16 | 9.60 | 0.07 to 19.14 | 5 | 19 | 9.58 | –0.07 to 19.22 |
| > 6 months | 4 | 142 | 8.19 | –0.12 to 16.50 | 8 | 203 | 9.44 | 2.81 to 16.07 |
| Random (no) | 6 | 146 | 14.17 | 7.36 to 20.99 | ||||
| Random (yes) | 11 | 482 | 12.37 | 7.70 to 17.04 | ||||
| Auditory comprehension on TT-AAT | ||||||||
| Sex | ||||||||
| Female | 16 | 211 | 3.82 | 0.98 to 6.66 | 22 | 239 | 4.92 | 2.15 to 7.70 |
| Male | 16 | 329 | 3.10 | 0.35 to 5.85 | 21 | 402 | 4.35 | 1.65 to 7.04 |
| Age (years) | ||||||||
| ≤ 55 | 16 | 178 | 6.05 | 3.16 to 8.94 | 22 | 232 | 7.05 | 4.32 to 9.77 |
| 56–65 | 16 | 182 | 2.83 | –0.04 to 5.71 | 22 | 212 | 4.31 | 1.52 to 7.09 |
| 66–75 | 15 | 116 | 3.50 | 0.46 to 6.53 | 19 | 131 | 4.61 | 1.65 to 7.58 |
| > 75 | 12 | 64 | 1.46 | –1.90 to 4.82 | 14 | 66 | 2.57 | –0.74 to 5.88 |
| Time since stroke | ||||||||
| 0–1 month | 6 | 139 | 5.25 | 1.69 to 8.82 | 6 | 139 | 6.33 | 2.57 to 10.08 |
| > 1–3 months | 9 | 97 | 4.27 | 1.07 to 7.47 | 10 | 106 | 5.16 | 1.99 to 8.34 |
| > 3–6 months | 6 | 61 | 2.88 | –1.81 to 7.56 | 8 | 65 | 4.32 | 0.04 to 8.60 |
| > 6 months | 9 | 243 | 1.44 | –1.85 to 4.72 | 15 | 331 | 2.73 | 0.12 to 5.34 |
| Random (no) | 5 | 101 | 6.11 | 1.65 to 10.57 | ||||
| Random (yes) | 16 | 540 | 3.16 | 0.67 to 5.65 | ||||
| Naming on BNT | ||||||||
| Sex | ||||||||
| Female | 13 | 165 | 6.92 | 2.47 to 11.36 | 21 | 219 | 7.54 | 3.84 to 11.23 |
| Male | 13 | 220 | 6.70 | 2.33 to 11.07 | 21 | 333 | 7.73 | 4.10 to 11.36 |
| Age (years) | ||||||||
| ≤ 55 | 13 | 103 | 9.31 | 4.71 to 13.90 | 21 | 181 | 9.72 | 6.00 to 13.44 |
| 56–65 | 13 | 124 | 7.34 | 2.79 to 11.90 | 21 | 169 | 8.08 | 4.30 to 11.87 |
| 66–75 | 12 | 97 | 6.16 | 1.48 to 10.84 | 18 | 134 | 7.35 | 3.48 to 11.22 |
| > 75 | 11 | 61 | 4.42 | –0.56 to 9.40 | 15 | 68 | 5.38 | 1.11 to 9.66 |
| Time since stroke | ||||||||
| 0–1 month | 5 | 129 | 11.12 | 5.71 to 16.54 | 6 | 138 | 11.35 | 6.62 to 16.09 |
| > 1–3 months | 8 | 93 | 7.74 | 2.89 to 12.59 | 10 | 116 | 8.70 | 4.56 to 12.84 |
| > 3–6 months | 6 | 70 | 4.26 | –1.58 to 10.10 | 9 | 92 | 5.70 | 1.17 to 10.23 |
| > 6 months | 7 | 93 | 4.11 | –1.08 to 9.29 | 15 | 206 | 4.78 | 1.08 to 8.48 |
| Random (no) | 8 | 167 | 8.56 | 2.88 to 14.24 | ||||
| Random (yes) | 13 | 385 | 6.71 | 2.57 to 10.85 | ||||
| Other spoken language on the PICA | ||||||||
| Sex | ||||||||
| Female | 3 | 67 | – | – | 5 | 73 | 1.02 | 0.33 to 1.73 |
| Male | 3 | 115 | – | – | 6 | 158 | 0.93 | 0.32 to 1.57 |
| Age (years) | ||||||||
| ≤ 55 | 3 | 93 | – | – | 6 | 119 | 1.18 | 0.54 to 1.86 |
| 56–65 | 3 | 64 | – | – | 6 | 82 | 0.71 | 0.07 to 1.39 |
| 66–75 | 2 | 25 | – | – | 4 | 30 | 1.03 | 0.24 to 1.87 |
| > 75 | 0 | 0 | – | – | 0 | 0 | – | – |
| Time since stroke | ||||||||
| 0–1 month | 1 | 12 | – | – | 1 | 12 | 1.29 | 0.14 to 2.55 |
| > 1–3 months | 2 | 23 | – | – | 3 | 31 | 1.94 | 1.13 to 2.78 |
| > 3–6 months | 1 | 6 | – | – | 2 | 8 | 0.27 | –0.90 to 1.56 |
| > 6 months | 2 | 141 | – | – | 5 | 180 | 0.46 | –0.12 to 1.07 |
| Reading on the CAT | ||||||||
| Sex | ||||||||
| Female | 1 | 0 | – | – | 3 | 30 | 0.92 | –1.27 to 3.47 |
| Male | 1 | 0 | – | – | 4 | 58 | 0.87 | –1.02 to 3.03 |
| Age (years) | ||||||||
| ≤ 55 | 1 | 2 | – | – | 4 | 32 | 5.54 | 2.65 to 8.91 |
| 56–65 | 1 | 2 | – | – | 4 | 25 | –0.87 | –3.03 to 1.68 |
| 66–75 | 1 | 5 | – | – | 3 | 24 | 1.53 | –0.87 to 4.34 |
| > 75 | 1 | 2 | – | – | 3 | 7 | –1.68 | –5.00 to 2.73 |
| Time since stroke | ||||||||
| 0–1 month | 0 | 0 | – | – | 1 | 9 | –0.38 | –3.71 to 3.93 |
| > 1–3 months | 0 | 0 | – | – | 1 | 15 | 3.97 | 0.55 to 8.14 |
| > 3–6 months | 0 | 0 | – | – | 1 | 18 | 0.42 | –2.22 to 3.61 |
| > 6 months | 1 | 11 | – | – | 4 | 46 | –0.06 | –1.92 to 2.06 |
| Writing on the CAT | ||||||||
| Sex | ||||||||
| Female | 3 | 14 | 2.87 | –2.35 to 8.08 | 3 | 14 | RCT data only | RCT data only |
| Male | 3 | 33 | 3.72 | –1.39 to 8.82 | 3 | 33 | RCT data only | RCT data only |
| Age (years) | ||||||||
| ≤ 55 | 3 | 24 | 2.92 | –0.97 to 6.82 | 3 | 24 | RCT data only | RCT data only |
| 56–65 | 3 | 15 | 0.21 | –4.86 to 5.29 | 3 | 15 | RCT data only | RCT data only |
| 66–75 | 2 | 6 | 4.43 | –3.55 to 12.40 | 2 | 6 | RCT data only | RCT data only |
| > 75 | 1 | 2 | 5.60 | –7.47 to 18.66 | 1 | 2 | RCT data only | RCT data only |
| Time since stroke | ||||||||
| 0–1 month | 0 | 0 | – | – | 0 | 0 | – | – |
| > 1–3 months | 2 | 21 | 7.84 | 2.26 to 13.43 | 2 | 21 | RCT data only | RCT data only |
| > 3–6 months | 2 | 8 | 3.06 | –4.33 to 10.46 | 2 | 8 | RCT data only | RCT data only |
| > 6 months | 3 | 18 | –1.04 | –5.55 to 3.48 | 3 | 18 | RCT data only | RCT data only |
| Functional communication (observer-rated), AAT-SSC | ||||||||
| Sex | ||||||||
| Female | 14 | 237 | 0.76 | 0.48 to 1.03 | 18 | 275 | 0.69 | 0.40 to 0.98 |
| Male | 14 | 296 | 0.57 | 0.30 to 0.84 | 19 | 372 | 0.54 | 0.26 to 0.83 |
| Age (years) | ||||||||
| ≤ 55 | 14 | 147 | 0.75 | 0.46 to 1.04 | 19 | 181 | 0.69 | 0.39 to 0.99 |
| 56–65 | 13 | 145 | 0.70 | 0.41 to 1.00 | 18 | 170 | 0.66 | 0.36 to 0.96 |
| 66–75 | 14 | 122 | 0.55 | 0.25 to 0.85 | 18 | 148 | 0.52 | 0.21 to 0.82 |
| > 75 | 12 | 119 | 0.65 | 0.34 to 0.96 | 15 | 148 | 0.61 | 0.30 to 0.92 |
| Time since stroke | ||||||||
| 0–1 month | 6 | 232 | 1.05 | 0.70 to 1.40 | 7 | 277 | 0.97 | 0.61 to 1.34 |
| > 1–3 months | 5 | 68 | 0.87 | 0.51 to 1.23 | 6 | 70 | 0.83 | 0.46 to 1.21 |
| > 3–6 months | 4 | 63 | 0.40 | –0.06 to 0.87 | 5 | 63 | 0.37 | –0.10 to 0.83 |
| > 6 months | 7 | 170 | 0.33 | 0.00 to 0.66 | 11 | 237 | 0.30 | 0.01 to 0.60 |
| Random (no) | 5 | 115 | 0.57 | 0.11 to 1.03 | ||||
| Random (yes) | 14 | 532 | 0.67 | 0.41 to 0.94 | ||||
| Functional communication (self-rated), Assessment for Living with Aphasia | ||||||||
| Sex | ||||||||
| Female | 1 | 4 | – | – | 2 | 9 | – | – |
| Male | 1 | 7 | – | – | 2 | 34 | – | – |
| Age (years) | ||||||||
| ≤ 55 | 1 | 2 | – | – | 2 | 16 | – | – |
| 56–65 | 1 | 2 | – | – | 2 | 9 | – | – |
| 66–75 | 1 | 5 | – | – | 2 | 15 | – | – |
| > 75 | 1 | 2 | – | – | 2 | 3 | – | – |
| Time since stroke | ||||||||
| 0–1 month | 0 | 0 | – | – | 0 | 0 | – | – |
| > 1–3 months | 0 | 0 | – | – | 0 | 0 | – | – |
| > 3–6 months | 0 | 0 | – | – | 0 | 0 | – | – |
| > 6 months | 1 | 11 | – | – | 2 | 43 | – | – |
Overall language ability
Eleven RCTs (518 IPD) had data on overall language ability at study baseline, but only 482 IPD had both baseline and follow-up data of an SLT intervention and were eligible for analysis. Missing data were observed for the following variables: education (56%), handedness (44%), ethnicity (95%) and hemisphere of stroke (30%).
Demographic analysis
The outcome was absolute change in the raw score from baseline to the first follow-up after the study intervention period. A positive change indicated an improvement in overall language abilities. At univariable level, we observed statistically significant associations between baseline measures of language ability and positive change at follow-up (p < 0.0001; see Appendix 8, Table 15). Length of time since the onset of aphasia (grouped) was also a significant predictor of improvement (p = 0.017). As initial language ability scores at baseline were strongly associated with an increase in overall language abilities at follow-up, we examined an adjusted association between time since stroke and baseline language ability in a bivariable model (see Appendix 8, Table 15).
After adjusting for the effect of baseline language ability score, time since stroke was no longer associated with overall language ability scores at follow-up, whereas the language spoken by participants became significant (p = 0.021); however, as highlighted in Predictors of recovery following aphasia after stroke, this finding should be treated with caution as there were no within-data set comparisons of languages spoken and so it was not possible to distinguish a language effect from a data set effect.
The multivariable analysis revealed a similar finding, with language ability scores at baseline continuing to have a significant, positive association with language ability scores at follow-up. When handedness was included in this multivariable analysis, language ability at baseline, sex and language used were all significantly positively associated with recovery (see Appendix 8, Table 15).
We observed slightly better improvement on measures of overall language ability among women than men [female estimate mean 14.3 points (95% CI 9.01 to 19.5 points) vs. male estimate mean 12.3 points (95% CI 7.2 to 17.4 points); see Table 8]; however, this difference was not significant (p = 0.1870) (see Appendix 8, Table 15). We also observed a non-significant trend towards improvements among younger participants and those in the early stages after stroke (see Appendix 8, Table 15). For people aged < 55 years, we observed an estimate mean change of 15.4 points on the WAB-AQ, followed by an estimate mean change of 12.4 points for people aged 56–65 years (see Table 8). Similarly, for people enrolled in RCTs within 0–1 month of stroke, the estimate mean change was 19.1 points; for those enrolled within 1–3 months of stroke, the estimate mean change was 16.2 points. This could reflect the influence of spontaneous recovery in the early stages after stroke. Although the groupings by age and time since stroke were not significant at a multivariable level, the observed changes in language ability since baseline were notable and may require further study.
When analysing data from all study types, similar results were observed; time group became significantly negatively associated with improvement in overall language ability (p = 0.0098). Enrolment within 28 days of index stroke was associated with an estimate mean change of 21.0 points on the WAB-AQ, whereas enrolment within 1–3 months of stroke was associated with an estimate mean change of 16.4 points on the WAB-AQ (see Table 8).
Auditory comprehension
A total of 556 IPD from 16 RCTs had auditory comprehension data at baseline and follow-up, but only 550 IPD had both baseline and follow-up auditory comprehension analysis, relevant demographic data and a SLT intervention to support the planned analysis (see Appendix 8, Table 15).
Demographic analysis
The values in the ‘change from baseline’ variable were not normally distributed (skewed). When modelled using the baseline score as a linear function of the ‘change from baseline’, the residuals were reasonably normally distributed. Thus the ‘change from baseline’ values remained untransformed. As with measures of overall language ability, baseline auditory comprehension scores were positively associated with change at first follow-up (p < 0.0001). At univariable level, age was also inversely significantly associated with recovery (p = 0.003). This association remained strong when baseline score was controlled for. Auditory comprehension scores at baseline were significantly associated with change in scores at follow-up in multivariable analyses and age (grouped) (p = 0.002) (see Appendix 8, Table 15).
Although sex and time since stroke were not significant predictors in the model (see Appendix 8, Table 15), we included them in the analysis together with age. We considered differences between studies and changes in magnitude of effect to inform the later stages of the planned analyses. We observed little difference on measures of auditory comprehension between female and male participants [female estimate mean 3.8 points (95% CI 0.98 to 6.66 points) vs. male estimate mean 3.1 points (95% 0.35 to 5.85 points)]. We also observed greater improvements among younger participants and those in the early months after aphasia onset (p = 0.047); those aged < 55 years had an estimate mean change of 6.05 (95% CI 3.12 to 8.94) points on the TT-AAT. The inclusion of non-RCT data supported these findings (see Table 8).
Naming
We identified 13 RCT data sets involving 391 IPD with naming measures available at baseline and follow-up. Six participants who received a social support intervention were excluded; therefore, the naming analysis was based on 385 IPD (13 RCTs; see Appendix 8, Table 15).
Demographic analysis
Although the data on changes from baseline were skewed, the residuals from the model with baseline were normally distributed, and so the change value remained untransformed. Only English and Dutch languages were languages of data collection in more than one trial; although this made language of data collection a candidate for a subset analysis comparing languages, there were no within-study comparisons of language, meaning that the significant results should be interpreted with caution (see Appendix 8, Table 15). There was a trend towards a difference between age groups; because age, time since stroke and sex are typically considered in studies of stroke recovery and rehabilitation, they were included in our model to account for population differences.
An earlier time point for study enrolment (and subsequent follow-up) was associated with a higher impact on change in naming scores [estimated mean change of 11.12 points (95% CI 5.7 to 16.5 points) on the BNT] than interventions at 3–6 months after stroke, for which the mean change was non-significant (estimated mean change of 4.3 points, 95% CI –1.6 to 10.1 points) (see Table 8). Although the time group for intervention was not significant, the point estimates indicate that these trends may warrant further examination. Early intervention after stroke appeared to have the highest impact on change (with spontaneous recovery possibly contributing to recovery profile in the early phases post stroke), as did younger age, with people aged < 55 years estimated to change by 9.31 points on the BNT (95% CI 4.7 to 13.9 points), whereas older age groups had a non-significant change of 4.42 points (see Table 8).
Other spoken language
Three RCTs (182 IPD) and three non-RCT data sets (49 IPD) reported other spoken-language outcome measures. The data were transformed to the anchor measures (PICA with a scale of 0–16). There were too few comparisons using RCT data sets only, and so we report an analysis that was inclusive of all data sets (see Appendix 8, Table 15). Other spoken language scores by time and age group at baseline were significantly associated with change in scores at follow up in multivariable analyses age (group p = 0.015) and time since stroke (group p = 0.01) (see Appendix 8, Table 15).
Demographic analysis
All participants from baseline to their first follow-up after the end of treatment (when there were multiple options) were included (231 IPD; 6 data sets). As the baseline score was not a statistically significant predictor of ‘change from baseline’, we did not conduct a bivariate (baseline plus other predictive variable) analysis as we did for other domains reported in this section (see Appendix 8, Table 15).
Intervention within the first 3 months of index stroke significantly benefited spoken-language outcomes (estimated mean change of 1.9 points on the spoken-language PICA 16-point scale) compared with study enrolment > 6 months after stroke (non-significant mean change; see Table 8).
Reading comprehension
Only one RCT (11 IPD) reported reading outcomes, and so the following analyses were performed on that RCT and three non-RCT data sets (77 IPD) with reading data on participants at baseline and follow-up (see Table 8). All data (88 IDP; 4 data sets) were transformed to the CAT reading subtest (scale of 0–74).
Demographic analysis
Residuals were skewed and so the change from baseline in the following sections (see Appendix 8, Table 15) has been transformed on the log scale.
Interventions delivered earlier after stroke (between 4 weeks and 3 months since stroke) were associated with the greatest benefits of intervention on measures of reading comprehension (4.0 points on the CAT; see Table 8), possibly due, in part, to spontaneous recovery after stroke. As for other variables, younger age groups (< 55 years of age) benefited most, with a mean change of 5.5 points on the reading comprehension outcome (see Table 8).
Writing
On review of the data, we identified three RCTs (47 IPD) that reported data on writing at baseline and at a subsequent follow-up time point (see Appendix 8, Table 15). No non-RCT data sets provided writing data at these time points. All writing data were transformed to the anchor measures (the CAT with a scale of 0–76).
Demographic analysis
We analysed participants from baseline to the first follow-up after the end of treatment (when there were multiple options). Neither the data on change from baseline nor the residual values were skewed; thus, the change value remained untransformed. As the baseline writing score was not significant, we did not conduct a bivariable analysis as we did for other domains reported in this section (see Appendix 8, Table 15).
Early intervention (between 4 weeks and 3 months) was associated with a mean benefit of 7.8 points on writing domain outcomes (95% CI 2.3 to 13.4 points on the CAT writing subtest). No other significant changes were noted for other time points after stroke (see Table 8).
Functional communication
Functional communication was captured using three distinct measurement approaches: (1) tools that captured data using an observer-rated approach, (2) tools that asked participants to self-rate their functional communication abilities and (3) discourse analysis approaches that captured and quantified the presence of particular language or communicative features in a defined sample of language. Measures captured using the three different approaches could not be meta-analysed across approaches, and are thus analysed and presented separately.
Functional communication: observer-rated measures
A total of 14 RCTs (544 IPD) that reported functional communication using observational measures at baseline and at a subsequent post-intervention time point were identified. An additional five non-RCT data sets (115 IPD) provided additional functional communication data at these time points (see Table 8).
Demographic analysis
We analysed participants from baseline to the first follow-up after the end of treatment. For one measure [the Therapy Outcome Measure (TOM)], two subtests (activity or participation) were used in a single RCT capturing data on the same participants. For our purposes, either subtest could be included in the functional communication meta-analysis. Both were equally valid inclusions. We arbitrarily included the activity subtest data (see Appendix 8, Table 15) and conducted a sensitivity analysis to examine whether or not there was any change in the findings had we included the participation subtest data (reported in Appendix 9, Tables 16–17).
Using the activity subtest data from the TOMs, we found that the data on change from baseline were skewed, but the residuals from the model with baseline were reasonably normally distributed, and so the change value remained untransformed. Time since stroke was significant in univariable and multivariable analyses (see Appendix 8, Table 15). Age and sex were significant in the participant subset with complete data. All three variables were retained in the basic model.
Eleven participants did not have information on their time since stroke in a suitable format for data synthesis and were excluded from the analysis; therefore, the effective sample size from RCT data set was 533 IPD (see Table 8). Female participants had higher mean observational scores than male participants (mean 0.76, 95% CI 0.48 to 1.0, on the AAT-SSC), and the youngest participants (< 55 years of age) had higher mean scores (mean 0.75, 95% CI 0.46 to 1.0, on the AAT-SSC) than older age groups. Similarly, participants within 1 month of aphasia onset had a mean score of 1.05 on the AAT-SSC (95% CI 0.70 to 6.99), compared with participants who were > 6 months after aphasia onset (mean 0.33, 95% CI 0.00 to 0.66; see Table 8). The findings based on the non-RCT IPD supported those found above (see Table 8).
Functional communication: self-rated measures
There were insufficient data (11 IPD; 1 data set with baseline and follow-up data) to support the analysis of univariable and multivariable relationships to functional communication as rated by people with aphasia. Inclusion of the non-RCT data did not change the feasibility of the planned analysis (43 IPD; 2 data sets).
Discourse analysis
Discourse analysis data were similarly sparse (423 IPD; 5 data sets), with limited overlap in the method of data sampling and data items recorded. We were unable to synthesise these data to support the planned analysis of univariable and multivariable relationships.
Summary
Age was significantly associated with change in absolute percentage score across selected domains and time since stroke was significantly associated with absolute proportion of change since baseline across all language domains. These variables will be taken forward to be included in statistical base models in subsequent analyses, when appropriate, in Chapter 6. Across each of the multivariable analyses, baseline language domain score, age, sex and time since stroke were selectively significantly associated with absolute change in the raw language domain scores.
Further to the observations of time having a significant association with change in selected domain scores at follow-up, we observed that, across all language domains, the highest absolute change in scores from baseline were seen in those participants enrolled in a study within 1 month of index stroke and those who were aged < 55 years. Females also appeared to have a trend towards better recovery on measures of overall language ability and functional communication than males.
Chapter 6 Optimising speech and language therapy interventions for aphasia after stroke
Overview
We examined the impact of the modifiable components of SLT interventions for aphasia after stroke (e.g. regimen, intervention approach and delivery; see Table 1 and Box 3). We included age, time since aphasia onset and sex to account for population differences between data sets, in advance of the planned network meta-analysis considering the impact of intervention variables. These factors are considered important predictors of general stroke recovery and were important predictors for language recovery in the preceding analysis across selected language domains for absolute changes in raw scores from baseline to first follow-up (see Chapters 4 and 5).
We considered language measures at first follow-up after SLT intervention periods. Data sets and IPD filtering in preparation for analysis were reported in Table 5. We explored the impact of SLT intervention by regimen, therapy approach, delivery model and tailoring. When a SLT intervention variable was reported for an isolated data set only, then the effect of that variable on language could not be distinguished from the study effect, and findings were treated with caution.
Network meta-analysis
Each SLT intervention variable was considered simultaneously (with continuous dose variables such as frequency grouped) in the context of language recovery (overall language ability, auditory comprehension, naming and functional communication). There were insufficient data to consider the impact of SLT variables on other spoken language, reading comprehension, writing or functional communication (self-rated) domains (see Table 5). The following analysis presents the overall language ability, auditory comprehension, naming and functional communication (observer-rated) findings (see Appendices 11–14).
The functional communication domain includes data gathered on the TOMs, when subtest data on communication activity or participation were available. We arbitrarily included the TOMs activity data set in the main analysis, but conducted a sensitivity analysis, repeating the analysis inclusive of the participation data to consider whether or not our decision had affected the findings (see Appendix 9, Tables 16–18, and Chapter 8).
Within-study clustering was examined for the four language domains and the four treatment regimen categories: frequency, duration, intensity and dosage (see Appendix 15, Table 19). This form of structuring of the data, which allows for correlation between patients within studies, did not significantly improve the fit of our predictive model to the data. The additional modelling of within study clustering was either non-significant or caused the failure of the analysis due to the G matrix not being positive definite (see Appendix 15, Table 19).
We examined the contribution to the model (which included baseline score, sex, age group and time since stroke) of each SLT intervention by regimen (frequency, duration, intensity, dosage, home practice), intervention approach (impairment target, theoretical approach) and delivery (provider expertise, context, tailoring by functional relevance and difficulty). We explored the magnitude of differences seen with different degrees of the SLT component of interest (e.g. providing 5 or 14 or 20 hours of SLT; see overview in Appendix 16, Table 20).
Frequency of speech and language therapy for aphasia
We started with a base model that included the language domain absolute raw score as the outcome, and age, sex and time since stroke as covariates. We added frequency of SLT (i.e. the number of days per week that SLT was delivered) to this model and assessed its impact on language domain scores. Frequency, in addition to age, sex and time since stroke, significantly contributed to auditory comprehension (p = 0.0091) and naming (p = 0.03) outcomes, but not to overall language ability or functional communication outcomes (see Report Supplementary Material 5). We saw significant improvements in participants’ scores from baseline to first follow-up across overall language ability, auditory comprehension, naming and functional communication language domains. Data on reading outcomes were absent from included RCTs (see Appendix 17, Table 21). Based on RCT IPD, the greatest overall language ability [14.95 points (95% CI 8.67 to 21.23 points) on the WAB-AQ (194 IPD; 6 RCTs)] and functional communication gains [0.78 points (95% CI 0.48 to 1.09 points) on the AAT-SSC (155 IPD; 8 RCTs)] occurred alongside delivery of SLT 4 to 5 days weekly. The highest auditory comprehension gains [5.86 points (95% CI 1.64 to 10.01 points) on the TT-AAT (114 IPD; 5 RCTs)] were associated with receiving SLT 3 to 4 days weekly. The greatest naming gains [12.05 points (95% CI 6.52 to 17.59 points) on the BNT (42 IPD; 3 RCTs)] occurred alongside receiving SLT up to 2 days weekly, but this was based on small numbers of IPD and RCTs, and a network geometry with limited connections; therefore, caution should be used when interpreting this finding (see Appendix 13, Figure 31). The non-RCTs IPD supported these findings (see Appendix 17, Table 21).
Duration of speech and language therapy for aphasia
Speech and language therapy duration reflected the total number of weeks that the intervention lasted. The addition of the duration variable to the base model was significantly associated with auditory comprehension outcomes (p = 0.0013; see Report Supplementary Material 6), but not with other domains. Importantly, the SLT duration network meta-analysis geometry was unstable, with few studies comparing therapy durations and little variation on maximum gains in the context of SLT of different durations (see Appendices 11–14 and 18); thus, the SLT duration findings should be interpreted with caution. The greatest gains on overall language ability [17.27 points (95% CI 9.71 to 24.82 points) on the WAB-AQ (45 IPD; 3 RCTs)] and auditory comprehension [6.79 points (95% CI 1.69 to 11.88 points) on the TT-AAT (93 IPD; 5 RCTs)] were associated with SLT lasting 10–20 weeks. Naming gains from baseline were greatest [8.38 points (95% CI 1.24 to 15.51 points) on the BNT (134 IPD; 3 RCT)] alongside > 20 weeks of SLT. The best gains in functional communication [0.8 points (95% CI 0.29 to 1.31 points) on the AAT-SSC (57 IPD; 2 RCTs)] occurred with 4–10 weeks of SLT (see Appendix 18, Table 22). Non-RCT data were generally confirmatory (see Appendix 18, Table 22).
Intensity of speech and language therapy for aphasia
Intensity of SLT was measured by the number of SLT hours delivered weekly. Including the intensity variable in the base model (with age, sex and time since stroke) significantly contributed to auditory comprehension outcomes (p = 0.0004), but not to any other domains (see Report Supplementary Material 7). Although clinically similar gains occurred alongside different SLT intensities, peak gains on overall language ability [15.85 points (95% CI 8.06 to 23.64 points) on the WAB-AQ (74 IPD; 3 RCTs)], naming [13.23 points (95% CI 5.83 to 20.64 points) on the BNT (18 IPD; 2 RCTs)] and functional communication [0.77 points (95% CI 0.36 to 1.19 points) on the AAT-SSC (83 IPD; 4 RCTs)] were all associated with receiving SLT for up to 2 hours weekly. In contrast, peak auditory comprehension gains [7.3 points (95% CI 4.09 to 10.52 points) on the TT-AAT (141 IPD; 6 RCTs)] occurred when delivery of SLT was in excess of 9 hours weekly. The non-RCT data set provided similar findings (see Appendix 19, Table 23).
Dosage of speech and language therapy for aphasia
Including the SLT dosage variable (total number of SLT hours) to the base model of age, sex and time since stroke significantly contributed to naming (p = 0.040) and functional communication (p = 0.018) outcomes, but not to other domains (see Report Supplementary Material 8).
The greatest gains in overall language ability [18.37 points (95% CI 10.58 to 26.16 points) on the WAB-AQ (31 IPD; 4 RCTs)] and auditory comprehension [5.23 points (95% CI 1.51 to 8.95 points) on the TT-AAT (90 IPD; 7 RCTs)] were associated with 20–50 hours of SLT. Functional communication gains [0.94 points (95% CI 0.34 to 1.55 points) on the AAT-SSC (11 IPD; 3 RCTs)] were highest in the context of a slightly lower SLT dosage of 14–20 hours. Naming gains were highest alongside up to 5 hours of SLT [12.48 points (95% CI 1.34 to 23.63 points) on the BNT (28 IPD; 2 RCTs)] (see Appendix 20, Table 24). For functional communication and naming gains, IPD and RCT numbers were low and the naming network analysis geometry was unstable (see Appendix 13, Figure 31). It is noteworthy that, for both functional communication and naming, the second-highest gains occurred in the context of 20–50 hours of SLT [naming: 9.23 points (95% CI 1.75 to 16.7 points) on the BNT (81 IPD; 5 RCTs); functional communication: 0.77 points (95% CI 0.43 to 1.1 points) on the AAT-SSC (96 IPD; 9 RCTs)] (see Appendix 20, Table 24). Addition of the non-RCT IPD was generally confirmatory, although the greatest (and only significant) naming gains from baseline [11.32 points (95% CI 5.92 to 16.72 points) on the BNT (135 IPD; 8 data sets)] were associated with 20–50 hours of SLT (see Appendix 20, Table 24).
Home practice
Prescribed SLT home practice augments face-to-face therapy dosage. Included data sets rarely described home practice dosage, so we considered whether or not data sets reported the prescription of home practice (yes/no). When home practice was not reported, we assumed that it was not present. Adding the home practice variable to the base model (sex, age, time since stroke) significantly contributed to auditory comprehension outcomes (p = 0.019; see Report Supplementary Material 9), but not to other language domains. The best gains from baseline on overall language ability [16.69 points (95% CI 10.01 to 23.37 points) on the WAB-AQ (87 IPD; 2 RCTs)] and auditory comprehension [5.28 points (95% CI 2.19 to 8.37 points) on the TT-AAT (278 IPD; 7 RCTs)] were associated with prescribed home practice. In contrast, naming gains [7.08 points (95% CI 1.81 to 12.35 points) on the BNT (166 IPD; 9 RCTs)] and functional communication gains [0.74 points (95% CI 0.39 to 1.09 points) on the AAT-SSC (267 IPD; 10 RCTs)] were slightly higher in RCTs that did not report home practice than in those that did. Including the non-RCT data generally confirmed these findings, except for functional communication, when greater gains were achieved by the group for which home practice was reported [0.69 points (95% CI 0.34 to 1.04 points) on the AAT-SSC (187 IPD; 5 RCTs) than by the group for which home practice was not reported (see Appendix 21, Table 25).
Speech and language therapy regimen
We considered the contribution that unit increases in the SLT intervention regimen (frequency, duration, dosage and intensity) made to specific language outcomes using simple linear regression models and using the IPD RCT data set only (Table 9). For example, for every unit increase in SLT intensity (i.e. every additional SLT hour weekly), the average overall language ability score change from baseline was an increase of 0.23 points on the WAB-AQ. These average changes by regimen, language domain and anchor measure are presented in Table 9. Examination of the categorical data suggests that excess treatment may have a negative effect on participants in some domains. Naming scores appear to be negatively affected by increased SLT frequency, intensity and dosage; thus, further examination of SLT regimen in the context of network meta-analyses is required. Changes from baseline may have been reduced in the higher-dose bandings.
| SLT regimen | Estimate (slope) [SE] | Intercept [SE] |
|---|---|---|
| Frequency of SLT (days per week) | ||
| Overall language ability (WAB-AQ) | 0.58 [0.37] | 18.19 [5.10] |
| Auditory comprehension (TT-AAT) | 0.57 [0.24] | 2.86 [2.25] |
| Naming (BNT) | –0.87 [0.37] | 5.38 [3.21] |
| Functional communication (AAT-SSC) | 0.28 [0.11] | 2.63 [1.06] |
| Duration of SLT (total weeks) | ||
| Overall language ability (WAB-AQ) | 0.06 [0.09] | 19.19 [4.92] |
| Auditory comprehension (TT-AAT) | –0.29 [0.07] | 6.75 [2.33] |
| Naming (BNT) | 0.03 [0.08] | 2.56 [3.16] |
| Functional communication (AAT-SSC) | 0.04 [0.03] | 3.08 [1.06] |
| Intensity of SLT (hours per week) | ||
| Overall language ability (WAB-AQ) | 0.23 [0.26] | 18.61 [5.00] |
| Auditory comprehension (TT-AAT) | 0.30 [0.11] | 2.66 [2.27] |
| Naming (BNT) | –0.21 [0.16] | 4.13 [3.26] |
| Functional communication (AAT-SSC) | 0.06 [0.06] | 2.96 [1.16] |
| Dosage of SLT (total hours) | ||
| Overall language ability (WAB-AQ) | 0.02 [0.03] | 19.82 [4.89] |
| Auditory comprehension (TT-AAT) | 0.01 [0.02] | 4.60 [2.22] |
| Naming (BNT) | –0.07 [0.03] | 5.51 [3.50] |
| Functional communication (AAT-SSC) | 0.03 [0.01] | 2.64 [0.98] |
Target of speech and language therapy intervention
Including the SLT target variable in the base model did not significantly contribute to the language outcomes (see Report Supplementary Material 10). Few significant gains from baseline were observed. The greatest gains in overall language ability [15.62 points (95% CI 8.82 to 22.43 points) on the WAB-AQ (245 IPD; 8 RCTs)] and functional communication [1.05 points (95% CI 0.52 to 1.58 points) on the AAT-SSC (72 IPD; 3 RCTs)] were associated with mixed SLT approaches (see Appendix 22, Table 26). The greatest gains in auditory comprehension [4.46 points (95% CI 0.31 to 8.62 points) on the TT-AAT (136 IPD; 7 RCTs)] and naming [8.82 points (95% CI 3.15 to 14.49 points) on the BNT (174 IPD; 7 RCTs)] were associated with word-finding SLT. The inclusion of non-RCT data was generally confirmatory (see Appendix 22, Table 27).
Theoretical approach of speech and language therapy intervention
Including the SLT theoretical approach variable in the base model of age, sex and time since stroke did not significantly contribute to the model on any language domain (see Report Supplementary Material 11). The numbers of IPD, data sets and network connections were generally low (see Appendices 11–14); therefore, the data were unreliable, and findings should be considered cautiously. Few significant gains from baseline were observed. When the greatest gains were identified, overall language ability [20.39 points (95% CI 1.90 to 38.88 points) on the WAB-AQ (60 IPD; 2 RCTs)] and auditory comprehension gains [11.93 points (95% CI 1.44 to 22.43 points) on the TT-AAT (35 IPD; 1 RCT)] were associated with semantic–phonological SLT approaches. Functional/pragmatic approaches were associated with the greatest functional communication gains [1.82 points (95% CI 0.36 to 3.28 points) on the AAT-SSC (8 IPD; 1 RCT)] (see Appendix 23, Table 27).
Adding multimodal approaches to the base model together with age, sex and time since stroke significantly contributed to functional communication outcomes, but not to any other outcome (see Report Supplementary Material 12). Functional communication gains (as measured by the AAT-SSC) were observed in the context of multimodal approaches [verbal: 1.96 points, 95% CI 0.85 to 3.07 points (38 IPD; 2 RCTs); total: 1.90 points, 95% CI 0.86 to 2.93 points (66 IPD; 3 RCTs)] and verbal SLT approaches [1.95 points, 95% CI 0.92 to 2.99 points (273 IPD; 10 RCTs)] (see Appendix 24, Table 28). No significant gains from baseline were observed in the context of multimodal SLT (verbal or total) on auditory comprehension or naming (see Appendix 24, Table 28).
Expertise
We categorised the expertise of the person delivering SLT as either professional (therapist or researcher) or non-professional (trained volunteer or family member). Adding the expertise variable to the base model of age, sex and time since stroke did not significantly contribute to any outcomes (see Report Supplementary Material 13). The availability of IPD based on non-professional-delivered SLT interventions was poor (< 15 IPD across the language domains), and findings should be interpreted with caution (see Appendix 25, Table 29). Inclusion of the non-RCT data did not alter these findings.
Context of delivery
The SLT context (whether participants were inpatients or outpatients during their therapy sessions) was extracted. Adding this variable to the model of age, sex and time since stroke did not make a significant contribution to language outcomes when based on IPD from RCTs or non-RCT data (see Report Supplementary Material 14). The SLT context made little impact on the gains made from baseline (see Appendix 26, Table 30).
Mode of delivery
We considered the SLT delivery mode as either face to face, computer supported or self-managed. Adding the delivery mode variable to the base model did not significantly contribute to the language outcomes (see Report Supplementary Material 15).
Overall, we observed some slight, but clinically insignificant, difference in gains between face-to-face SLT and non-face-to-face approaches, for example overall language ability (as measured on the WAB-AQ) gains associated with face-to-face SLT (14.13 points, 95% CI 8.34 to 19.91 points) versus non-face-to-face SLT (11.06 points, 95% CI 2.63 to 19.49 points) (351 IPD; 11 RCTs) (see Appendix 27, Table 31).
Tailoring
The content of a SLT intervention may be tailored to an individual patient’s needs in two ways: tailoring by functional relevance and/or tailoring by level of language difficulty. When tailoring was not reported, we assumed that it had not taken place. There were no within-study comparisons of tailored and untailored approaches.
Tailoring by functional relevance
The addition of the tailoring by functional relevance variable to the base model significantly contributed to auditory comprehension outcomes (p = 0.029), but not to other domains (see Report Supplementary Material 16).
When significant changes were observed, higher gains occurred in the context of functionally relevant SLT for overall language ability [16.47 points (95% CI 10.95 to 21.99 points) on the WAB-AQ (232 IPD; 6 RCTs)], naming [8.79 points (95% CI 1.95 to 15.63 points) on the BNT (113 IPD; 5 RCTs)] and functional communication [0.74 points (95% CI 0.38 to 1.10 points) on the AAT-SSC (249 IPD; 6 RCTs)] than with non-tailored SLT interventions. Similarly, significant gains from baseline for auditory comprehension were only evident in the context of SLT tailored by functional relevance [5.26 points (95% CI 2.05 to 8.47 points) on the TT-AAT (194 IPD; 7 RCTs)] (see Appendix 28, Table 32). The analysis inclusive of IPD from non-RCTs confirmed these findings.
Tailoring by difficulty
Including the SLT tailoring by difficulty variable in the base model significantly contributed to auditory comprehension outcomes (p = 0.043), but not to any other language outcome. Inclusion of the non-RCT data supported this finding (see Report Supplementary Material 17).
Tailoring of SLT by difficulty was associated with higher gains in overall language ability [14.46 points (95% CI 8.82 to 20.09 points) on the WAB-AQ (210 IPD; 7 RCTs)] than was untailored SLT [13.24 points (95% CI 7.50 to 18.99 points) on the WAB-AQ (207 IPD; 6 RCTs)], but this difference is not clinically relevant. In contrast, auditory comprehension gains from baseline were only significant in the context of SLT tailored for level of difficulty [4.57 points, 95% CI 1.55 to 7.60 points (331 IPD; 10 RCTs)] as participants receiving SLT untailored by level of language difficulty made no significant gains (see Appendix 29, Table 33).
In contrast, SLT untailored to participants’ levels of language difficulty was associated with higher gains in naming [10.21 points (95% CI 2.75 to 17.67 points) on the BNT (79 IPD; 4 RCTs)] and functional communication [0.81 points (95% CI 0.34 to 1.27 points) on the AAT-SSC (141 IPD; 5 RCTs)] than tailored SLT (see Appendix 29, Table 33). The non-RCT data supported these findings.
Heterogeneity
We considered heterogeneity with reference to risk of selection bias, study variability and methodological quality.
We examined the similarity of participant groups in the primary data sets (RCTs and non-RCTs) at baseline, comparing participants’ age, sex, time since stroke, aphasia severity, handedness and years of education (when available), and they were broadly similar (see Appendices 4 and 5).
Speech and language therapy interventions included in the analysis differed between intervention groups and across studies, but there was consensus that all were SLT interventions. Variations in SLT approaches (by delivery, intervention approach and regimen) were explored in the analysis.
The early pilot analysis resulted in unacceptably high relative study variability, in excess of 25%. Following careful examination of the contributing data sets and groupings in this analysis (e.g. the dose thresholds), data set checks and a minor adjustment to the algorithm (see Appendix 2, Box 4), the variance subsequently lay between 10% and 25% and all remained under 30%. Higher variance values observed were considered to be related to small IPD in some cells. No analysis exceeded the prespecified threshold of 50% relative variability due to study differences.
Summary
Having established a base model of the language domain absolute raw scores as outcomes, and age, time since stroke and sex as covariates, we included SLT intervention parameters in succession. We found that several SLT intervention parameters significantly contributed to selective language domain outcomes: auditory comprehension and SLT frequency, intensity, home practice and tailoring (by functional relevance and difficulty); naming and SLT frequency and dosage; and functional communication and SLT dosage. The addition of SLT impairment target, provider’s expertise, the mode of SLT and therapy context to the base model made no significant contribution to language outcomes.
The greatest gains across language outcomes were observed in the context of SLT regimens that varied by frequency, intensity and dosage; these are summarised in Chapter 8. Duration and naming data were treated with caution across all language domains because of unstable network geometry and, in many cases, small numbers of IPD and data sets.
Overall language ability gains were highest in the context of receiving SLT 4 to 5 days weekly, for up to 2 hours weekly and over 20–50 hours in total, using mixed expressive and receptive language impairment approaches, tailored to the participant (by functional relevance and level of difficulty) and with prescribed home practice tasks.
The highest auditory comprehension gains were associated with receiving SLT 3 days weekly, for > 9 hours weekly, for a total of 20–50 hours, tailored to the participant (by functional relevance and level of difficulty) word-finding SLT approaches augmented with prescribed home practice tasks.
Participants’ functional communication gains were best in the context of receiving SLT 4 to 5 days weekly, for up to 2 hours weekly, for 14–50 hours in total, using functionally relevant approaches, targeting expressive and receptive language impairment (mixed SLT). The mode of delivery (face to face, computer supported or self-managed) and the context of SLT (inpatient vs. outpatient settings) made little clinical difference to the language gains observed from baseline. As planned, variability in language outcome gains and the SLT context in which they occur was further explored by participant subgroups (age, sex, time since stroke and aphasia severity), and is reported in Chapter 7.
Chapter 7 Speech and language therapy interventions for subgroups of people with aphasia
Overview
We undertook prespecified subgroup analyses to explore language change in the context of SLT frequency, duration, intensity and dosage, and whether or not the findings varied by participants’ age, time since aphasia onset and aphasia severity. Building on the preceding results (see Chapters 4–6), the post hoc subgroup analysis also considered whether or not language gains made by males and females varied in the context of different SLT interventions. Reflecting IPD availability, we restricted these subgroup analyses to four language domains (overall language ability, auditory comprehension, naming and functional communication) and to IPD from RCT data sets only. We considered data set variability for each analysis.
Speech and language therapy and language outcomes by subgroup
Subgroup analyses were conducted using IPD network meta-analysis (see Chapter 6) to evaluate participants’ language gains according to baseline criteria: age, time since aphasia onset and stroke severity. In the context of the observations in relation to language recovery and sex (Chapters 4–6) and the known relationship between sex and other stroke outcomes, we included a post hoc comparison between female and male participants’ responses to SLT on language outcomes.
We had functional communication (observer-rated) data from some participants on the TOMs activity and participation subtests. Previously, we found no indication that the choice of which TOMs subtest to include in the analysis affected the findings (see Chapter 6 and Appendix 9, Tables 16–18). Thus, we conducted the subgroup analysis inclusive of the TOMs activity data only.
We dichotomised RCT participants based on their median baseline language score, age (± 65 years), time since aphasia onset at baseline (± 3 months) and sex. To represent the entire database population, median baseline language scores were calculated from all RCT and non-RCT IPD, regardless of the availability of SLT regimen or follow-up data. Age, however, was dichotomised, to reflect the age groups used earlier in the analysis (≤ 65 years and > 65 years; see Chapters 5 and 6) rather than the median of all IPD (which was 63 years; see Chapter 3).
We considered relative variance, highlighting analyses where it exceeded 25%. We report variance that exceeded 50% in the tables for completeness, but we do not include such results when reporting the findings. Across the subgroups (and when significant changes from baseline were observed), generally we continued to see the highest gains in language performance from baseline among the participants aged < 65 years, females and those who received SLT within 3 months of the index stroke (Table 10).
| Characteristic | Language domain | Age (years) | Time since aphasia onset | Aphasia severity at baseline | Sex | ||||
|---|---|---|---|---|---|---|---|---|---|
| Young (≤ 65) | Old (> 65) | Early (≤ 3 months post onset) | Late (> 3 months post onset) | Mild–moderate | Moderate–severe | F | M | ||
| Age (years) | Overall language ability | ≤ 55 | ≤ 55 | ≤ 65 | ≤ 55 | ≤ 55 and > 75 | ≤ 55 and > 75 | ||
| Auditory comprehension | ≤ 55 | ≤ 55 | NS | ≤ 55 | 56 to 65 | ≤ 55 | |||
| Naming | ≤ 55 | ≤ 65 | ≤ 75 | ≤ 65 | ≤ 55 | ≥ 55 | |||
| Functional communication | ≤ 55 | NS | NS | > 56 to 65 | 56 to 65 | > 75 | |||
| Time since stroke onset (months) | Overall language ability | ≤ 3 | ≤ 1 | ≤ 1 | ≤ 3 | ≤ 1 | ≤ 1 | ||
| Auditory comprehension | ≤ 1 | ≤ 3 | NS | ≤ 3 | ≤ 3 | ≤ 3 | |||
| Naming | ≤ 1 | ≤ 1 | ≤ 1 | ≤ 1 | ≤ 1 to 3 | ≤ 1 | |||
| Functional communication | ≤ 1 | ≤ 1 | ≤ 1 | ≤ 1 | ≤ 1 to 3 | ≤ 1 | |||
| Sex | Overall language ability | F = M | F > M | F > M | F > M | F = M | F > M | ||
| Auditory comprehension | F > M | F = M | NS | F > M | NS | M > F | |||
| Naming | F > M | NS | M > F | F > M | F = M | F = M | |||
| Functional communication | F > M | F > M | F > M | NS | NS | F > M | |||
Age
We investigated whether or not the younger (≤ 65 years; 277 IPD) and older participants’ (> 65 years; 205 IPD) language recoveries differed in the context of SLT variations. Relative variance was modest (< 50%) across comparisons.
Age and speech and language therapy frequency
Younger participants gained most on overall language ability (measured on the WAB-AQ) in the context of SLT 5 or more days weekly [15.12 points, 95% CI 8.15 to 22.08 points (107 IPD; 6 RCT)], and older participants gain most when they received SLT more than 5 days weekly [17.19 points, 95% CI 3.85 to 30.53 points (10 IPD; 2 RCT)]. Younger and older participants’ auditory comprehension (measured on the TT-AAT) made the best gains when SLT occurred 4 or more days weekly [young: 6.78 points, 95% CI 2.33 to 11.22 points (64 IPD; 5 RCTs); old: 8.48 points, 95% CI 2.04 to 14.93 points (50 IPD; 3 RTCs)]. Similarly, both groups made the highest naming gains (measured on the BNT) in the context of receiving SLT up to 2 days weekly [young: 15.02 points, 95% CI 8.95 to 21.10 points (26 IPD; 4 RCTs); old: 9.83 points, 95% CI 2.44 to 17.22 points (16 IPD; RCTs 4)]. Younger participants gained most functional communication (measured on the AAT-SSC) alongside SLT occurring more than 5 days weekly [1.18 points, 95% CI 0.28 to 2.08 points (but based only on 3 IPD; 2 RCTs)], whereas the older group gained most when SLT occurred at least 4 or 5 days weekly [0.78 points, 95% CI 0.15 to 1.40 points (54 IPD; 3 RCTs)] (see Appendix 30, Table 34, and Appendix 34, Table 38).
Age and speech and language therapy duration
The younger group’s greatest overall language [22.69 points (95% CI 15.20 to 30.19 points) on the WAB-AQ (25 IPD; 3 RCTs)], auditory comprehension [8.41 points (95% CI 2.62 to 14.20 points) on the TT-AAT (60 IPD; 5 RCTs)] and naming gains [11.27 points (95% CI 5.44 to 17.11 points) on the BNT (59 IPD; 4 RCTs)] were associated with between 10 and 20 weeks of SLT. In contrast, the older participants’ greatest gains in overall language [20.60 points (95% CI 7.77 to 33.42 points) on the WAB-AQ (15 IPD; 2 RCTs)] and naming [11.23 points (95% CI 2.03 to 20.43 points) on the BNT (71 IPD; 3 RCTs)] occurred when SLT lasted for > 20 weeks. We found no evidence of significant auditory comprehension gains for the older group (see Appendix 30, Table 34, and Appendix 34, Table 38).
Age and speech and language therapy intensity
Younger participants made the best overall language ability [16.97, 95% CI 9.96 to 23.98 (78 IPD; 3 RCTs)] and auditory comprehension gains [8.96 points, 95% CI 5.35 to 12.56 points (108 IPD; 4 RCTs)] alongside > 9 hours of SLT weekly. Although the older group’s best auditory comprehension gains were also associated with > 9 hours of SLT weekly [5.34 points (95% CI 0.67 to 10.02 points) on the TT-AAT (33 IPD; 6 RCTs)], their best overall language gains occurred when SLT was received for up to 2 hours weekly [16.92 points (95% CI 3.80 to 30.04 points) on the WAB-AQ (37 IPD; 3 RCTs)]. Similarly, SLT for up to 2 hours weekly was also associated with the highest naming gains (measured on the BNT) for both groups [young: 17.35 points, 95% CI 8.32 to 26.38 points (10 IPD; 2 RCTs); old: 11.12 points, 95% CI 1.41 to 20.82 points (8 IPD; 2 RCTs)], although this finding was based on small IPD and data set numbers. Whereas the older group also made their highest functional communication gains [0.97 points (95% CI 0.38 to 1.57 points) on the AAT-SSC (41 IPD; 4 RCT)] in the context of receiving SLT for up to 2 hours weekly, younger participants’ greatest functional communication gains were associated with 3–4 hours of SLT weekly [0.87 points (95% CI 0.53 to 1.22 points) on the AAT-SSC (74 IPD; 5 RCTs)] (see Appendix 30, Table 34, and Appendix 34, Table 38).
Age and speech and language therapy dosage
In the context of a total SLT dosage of 20–50 hours, both younger and older age groups made their highest gains on overall language ability (as measured on the WAB-AQ) [young: 23.38 points, 95% CI 13.47 to 33.28 points (15 IPD; 3 RCTs); old: 15.95 points, 95% CI 5.08 to 26.83 points (16 IPD; 4 RCTs)], auditory comprehension (as measured on the TT-AAT) [young: 6.06 points, 95% CI 1.75 to 10.36 points (59 IPD; 6 RTCs); old: 5.80 points, 95% CI 1.35 to 10.24 points (34 IPD; 7 RCTs)] and naming (as measured on the BNT) [young: 13.56 points, 95% CI 5.30 to 21.79 points (57 IPD; 5 RCTs); old: 8.32 points, 95% CI 0.55 to 16.08 points (24 IPD; 5 RCTs)] (see Appendix 30, Table 34, and Appendix 34, Table 38). Similarly, the older group’s highest functional communication gains (as measured on the AAT-SSC) were also associated with the same dosage of 20–50 SLT hours [0.86 points, 95% CI 0.36 to 1.36 points (31 IPD; 9 RCTs)], whereas the younger group’s gains were best when SLT lasted 14–20 hours [1.12 points, 95% CI 0.47 to 1.78 points (6 IPD; 3 RCTs)] (see Appendix 32, Table 34, and Appendix 34, Table 38).
Time since aphasia onset
Participants for whom it was ≤ 3 months since their aphasia onset (early group: 324 IPD) showed higher change scores across all domains than participants for whom it was > 3 months after stroke (late group: 158 IPD), potentially reflecting spontaneous recovery alongside SLT intervention benefits. Relative variance was modest (< 50%) across comparisons (see Appendix 30, Table 34, and Appendix 34, Table 39).
Time since onset and speech and language therapy frequency
The highest gains for the early group on overall language [27.75 points (95% CI 3.56 to 51.93 points) on the WAB-AQ (3 IPD; 1 RCT)] were seen alongside SLT 3 days per week, but this was based on few participants and one dataset. The next highest gain for the early group [21.42 points (95% CI 13.45 to 29.39 points); 150 IPD; 5 RCTs] occurred alongside SLT that was delivered 5 days weekly, which was when the late group’s highest gains were also observed [6.32 points (95% CI 1.58 to 11.07 points); 44 IPD; 1 RCT]. The early group’s best functional communication gains [1.55 points (95% CI 0.59 to 2.52 points) on the AAT-SSC (80 IPD; 1 RCT)] were seen when SLT was delivered three or four times weekly. The late group made no significant gains on functional communication (see Appendix 30, Table 34, and Appendix 34, Table 39).
The highest naming gains (measured on the BNT) for the early group [16.96 points, 95% CI 7.68 to 26.24 points (33 IPD; 3 RCTs)] were associated with SLT twice weekly, whereas the late group made their only significant gain alongside SLT 3 days weekly [2.81 points, 95% CI 0.60 to 5.02 points (78 IPD; 3 RCTs)]. The late group’s best auditory comprehension gains were associated with SLT 4 or 5 days weekly [3.71 points (95% CI 1.41 to 6.00 points) on the TT-AAT (89 IPD; 5 RCTs)], and we found no evidence of significant auditory comprehension gains for the early group in this analysis (see Appendix 30, Table 34, and Appendix 34, Table 39).
Time since onset and speech and language therapy duration
There was no clear pattern in relation to SLT duration and best language gains by time since stroke. The early group made the best overall language ability gains [24.73 points (95% CI 12.53 to 36.92 points) on the WAB-AQ (26 IPD; 3 RCTs)] when SLT lasted > 4–10 weeks, best functional communication gains [1.16 points (95% CI 0.56 to 1.77 points) on the AAT-SSC (40 IPD; 3 RCTs)] when SLT lasted at least 10–20 weeks and best naming gains [12.50 points (95% CI 0.39 to 24.61 points) on the BNT (86 IPD; 3 RCTs)] in the context of > 20 weeks of SLT. Relative variance for auditory comprehension analysis and the early group was unacceptably high, at > 50% (see Appendix 30, Table 34, and Appendix 34, Table 39).
The late group’s best overall language ability [9.30 points (95% CI 3.12 to 15.48 points) on the WAB-AQ (14 IPD; 1 RCT)] and auditory comprehension gains [5.20 points (95% CI 2.52 to 7.88 points) on the TT-AAT (49 IPD; 1 RCT)] were both associated with > 20 weeks of SLT. The late group’s best (and only significant) naming gains occurred with > 10–20 weeks of SLT [4.12 points (95% CI 1.79 to 6.45 points) on the BNT (33 IPD; 2 RCTs)]. Significant gains for the late group’s functional communication were not evident in this analysis.
Time since onset and speech and language therapy intensity
The early group’s highest overall language ability [24.27 points (95% CI 13.37 to 35.18 points) on the WAB-AQ (62 IPD; 2 RCTs)], naming [the only significant gain noted was 17.66 points (95% CI 3.95 to 31.36 points) on the BNT (10 IPD; 1 RCT)] and functional communication gains [1.29 points (95% CI 0.64 to 1.95 points) on the AAT-SSC (57 IPD; 2 RCTs)] were associated with receiving SLT for up to 2 or 3 hours weekly. The late group made their best overall language [6.25 points (95% CI 2.19 to 10.32 points) on the WAB-AQ (25 IPD; 2 RCTs)] and naming gains [5.58 points (95% CI 3.56 to 7.60 points) on the BNT (27 IPD; 2 RCTs)] alongside 3–4 hours of SLT weekly. In contrast, both early and late groups’ only auditory comprehension gains (measured on the TT-AAT) occurred in the context of > 9 hours of SLT weekly [early: 9.26 points, 95% CI 2.04 to 16.47 points (20 IPD; 2 RCT); late: 4.60 points, 95% CI 2.43 to 6.77 points (121 IPD; 4 RCTs)] (see Appendix 30, Table 34, and Appendix 34, Table 39).
Time since onset and speech and language therapy dosage
Early-group participants achieved their greatest overall language [27.52 points (95% CI 18.32 to 36.71 points) on the WAB-AQ (27 IPD; 3 RCTs)], naming [20.67 points (95% CI 2.87 to 38.47 points) on the BNT (31 IPD; 2 RCTs)] and functional communication gains [1.25 points (95% CI 0.69 to 1.81 points) on the AAT-SSC (31 IPD; 3 RCTs)] in the context of between 20 and 50 hours of SLT. The late group also achieved their best (and only) significant naming gain alongside 20–50 hours of SLT [3.02 points (95% CI 0.90 to 5.15 points) on the BNT (50 IPD; 4 RCTs)], but, in contrast to the early group, their highest overall language [10.11 points (95% CI 4.22 to 16.0 points) on the WAB-AQ (15 IPD; 1 RCT)] and auditory comprehension gains [4.17 points (95% CI 1.68 to 6.66 points) on the TT-AAT (76 IPD; 3 RCT)] were associated with ≥ 50 and ≥ 14 hours of SLT in total. No significant gains from baseline were observed on measures of functional communication for the late group (see Appendix 30, Table 34, and Appendix 34, Table 39).
Aphasia severity
Based on their language abilities at baseline, participants were dichotomised into mild–moderate (253 IPD) and moderate–severe aphasia groups (280 IPD). For each domain, median transformed language scores on the anchor measures, together with all available IPD in the RELEASE study database, supported the creation of two aphasia severity groups (see Appendix 34, Table 40). Across all domains, participants with moderate–severe aphasia achieved higher gains from baseline than those with mild–moderate aphasia. It is possible that the mild–moderate group’s recovery on the anchor measures may have been masked by the assessments’ ceiling effects, whereas the moderate–severe group had more scope to improve (see Appendix 30, Table 34, and Appendix 34, Table 40).
Severity and speech and language therapy frequency
The moderate–severe group’s highest overall language [18.25 points (95% CI 8.04 to 28.46 points) on the WAB-AQ (38 IPD; 5 RCTs)] and auditory comprehension gains [8.48 points (95% CI 3.67 to 13.28 points) on the TT-AAT (80 IPD; 5 RCTs)] were associated with receiving SLT 3 to 4 days weekly. The moderate–severe group’s best naming gains were associated with receiving SLT up to twice weekly [13.07 points (95% CI 6.99 to 19.14 points) on the BNT (36 IPD; 4 RCTs)], and their best functional communication gains were associated with receiving SLT 4 days weekly [1.00 points (95% CI 0.48 to 1.51 points) on the AAT-SSC (55 IPD; 2 RCTs)].
The analysis found for the mild–moderate group, but their best gains for overall language and functional communication occurred when SLT occurred over at least 5 days weekly [9.85 points (95% CI 4.37 to 15.33 points) on the WAB-AQ (16 IPD; 2 RCTs)] and [0.66 points (95% CI 0.36 to 0.96) on the AAT-SSC (55 IPD; 8 RCTs)], respectively. Their best gains for naming [11.11 points (95% CI 5.61 to 16.60 points) on the BNT (11 IPD; 3 RCTs)] occurred when SLT took place 5 days weekly. These findings were based on small IPD numbers and data sets and should be interpreted with caution. Relative variance was unacceptably high (> 50%) for the analysis relating to the mild–moderate group’s auditory comprehension (see Appendix 30, Table 34, and Appendix 34, Table 40).
Severity and speech and language therapy duration
The moderate–severe group’s best language gains on measures of overall language ability [23.53 points (95% CI 12.09 to 34.96 points) on the WAB-AQ (18 IPD; 2 RCTs)], functional communication [1.14 points (95% CI 0.78 to 1.49 points) on the AAT SSC (61 IPD; 4 RCTs)] and auditory comprehension [10.61 points (95% CI 3.91 to 17.30 points) on the TT-AAT (105 IPD; 3 RCTs)] were associated with SLT lasting > 20 weeks. Few significant changes were observed among the mild–moderate group, but their best overall language [10.01 points (95% CI 2.42 to 17.60 points) on the WAB-AQ (16 IPD; 2 RCTs)] and naming gains [16.01 points (95% CI 6.60 to 25.41 points) on the BNT (26 IPD; 2 RCTs)] were also seen alongside SLT that lasted in excess of 20 weeks. For the moderate–severe group, the highest naming gains were associated with > 10–20 weeks of SLT [7.52 points (95% CI 1.08 to 13.97 points) on the BNT (71 IPD; 4 RCTs)]. Relative variance for auditory comprehension analysis and the mild-moderate group was unacceptably high, at > 50% (see Appendix 30, Table 34, and Appendix 34, Table 40).
Severity and speech and language therapy intensity
The moderate–severe group achieved their highest auditory comprehension [9.07 points (95% CI 2.57 to 15.58 points) on the TT-AAT (9 IPD; 2 RCTs)] and naming gains [12.45 points (95% CI 4.25 to 20.64 points) on the BNT (16 IPD; 2 RCTs)] in the context of up to 2 hours of SLT weekly, but IPD and RCT numbers were very low. The greatest overall language ability [20.04 points (95% CI 10.14 to 29.94 points) on the WAB-AQ (64 IPD; 4 RCTs)] and functional communication gains [0.98 points (95% CI 0.40 to 1.55 points) on the AAT-SSC (20 IPD; 4 RCTs)] for the moderate–severe group were associated with ≤ 2 and up to 3 SLT hours weekly and (on some measures) in excess of 9 hours weekly. For the mild–moderate group, the best gains on overall language ability [7.97 points (95% CI 3.37 to 12.57 points) on the WAB-AQ (48 IPD; 3 RCTs)] and naming [9.45 points (95% CI 4.64 to 14.26 points) on the BNT (19 IPD; 4 RCTs)] occurred in the context of > 9 hours of SLT weekly with similar gains at other SLT intensities. Similarly, functional communication gains for the mild-moderate group were highest when SLT was > 4 and up to 9 hours weekly [0.63 points (95% CI 0.26 to 1.01) on the AAT-SCC (27 IPD, 4 RCTs)]. Relative variance was unacceptably high (> 50%) for the mild–moderate group’s auditory comprehension analysis (see Appendix 30, Table 34, and Appendix 34, Table 40).
Severity and dosage
Both severity groups made their greatest gains on overall language ability (as measured on the WAB-AQ) with at least 20–50 hours of SLT [moderate–severe group: 23.49 points, 95% CI 13.50 to 33.48 points (23 IPD; 3 RCTs); mild–moderate group: 8.73 points, 95% CI 1.95 to 15.51 points (8 IPD; 2 RCTs)]. The moderate–severe group’s highest auditory comprehension and functional communication gains were associated with > 50 hours of SLT [8.89 points (95% CI 4.49 to 13.30 points) on the TT-AAT (142 IPD; 6 RCTs)], and [1.07 points (95% CI 0.78 to 1.37 points)] on the AAT-SSC (72 IPD; 6 RCTs)]. The mild–moderate group’s highest naming gains were associated with a SLT dosage in excess of 100 hours [12.96 points (95% CI 8.51 to 17.41 points) on the BNT (11 IPD; 3 RCTs)]. Relative variance was unacceptably high (> 50%) for naming gains (moderate–severe group) and auditory comprehension (mild–moderate group) analysis (see Appendix 30, Table 34, and Appendix 34, Table 40).
Sex
Generally, female participants (211 IPD) had higher language gains across all domains than male participants (329 IPD), although these differences declined with increasing age (> 66 years for naming and > 75 years for functional communication). Interestingly, the best overall language gains for the oldest females [> 75 years: 16.6 points (95% CI 8.38 to 24.89 points) on the WAB-AQ (68 IPD; 6 RCTs)] were similar to those of the youngest females [≤ 55 years: 16.3 points, 95% CI 8.84 to 23.72 points (55 IPD; 10 RCTs)] (see Appendix 30, Table 34, and Appendix 34, Table 38). Relative variance was modest (< 50%) (see Appendix 30, Table 34, and Appendix 34, Table 41).
Sex and speech and language therapy frequency
Male participants’ best overall language [13.59 points (95% CI 4.3 to 22.88 points) on the WAB-AQ (21 IPD; 2 RCTs)] and functional language gains [0.81 points (95% CI 0.09 to 1.53 points) on the AAT-SSC (6 IPD; 3 RCTs)] were associated with receiving SLT at least 5 or more days weekly. In contrast, females’ highest overall language gains [24.22 points (95% CI 7.73 to 40.71 points) on the WAB-AQ (5 IPD; 2 RCTs)] occurred alongside receiving SLT 3 days weekly, whereas their best functional language [1.01 points (95% CI 0.21 to 1.81 points) on the AAT-SSC (49 IPD; 3 RCTs)] and auditory comprehension gains [8.13 points (95% CI 2.65 to 13.60 points) on the TT-AAT (52 IPD; 5 RCTs)] were associated with receiving SLT 4 days weekly. The males’ best auditory comprehension gains [5.06 points (95% CI 1.41 to 8.71 points) on the TT-AAT (99 IPD; 8 RCTs)] also occurred alongside receiving SLT 4 or 5 days weekly. For both groups, their highest naming gains (on the BNT) also occurred when SLT was received up to twice weekly [females: 17.05 points, 95% CI 9.47 to 24.64 points (17 IPD; 4 RCT); males: 10.58 points, 95% CI 4.29 to 16.86 points (25 IPD; 4 RCTs)] (see Appendix 30, Table 34, and Appendix 34, Table 41).
Sex and speech and language therapy duration
Male participants’ best gains on overall language ability [16.72 points (95% CI 7.79 to 25.65 points) on the WAB-AQ (26 IPD; 3 RCTs)], naming [11.03 points (95% CI 5.38 to 16.67 points) on the BNT (51 IPD; 4 RCT)] and functional communication [0.67 points (95% CI 0.40 to 0.95 points) on the AAT-SSC (46 IPD; 4 RCT)] were all associated with > 10–20 weeks of SLT. Relative variance was unacceptably high for auditory comprehension (> 50%).
In contrast, female participants made their highest overall language [24.52 points (95% CI 13.22 to 35.81 points) on the WAB-AQ (12 IPD; 2 RCTs)] and auditory comprehension gains [6.97 points (95% CI 0.83 to 13.11 points) on the TT-AAT (63 IPD; 3 RCTs)] with > 20 weeks of SLT. Their functional communication gains were best alongside between 4 and > 20 weeks of SLT [0.97 points (95% CI 0.09 to 1.84 points) on the AAT-SSC (16 IPD; 2 RCTs)]. Relative variance was unacceptably high (> 50%) for auditory comprehension (male group) and naming (female group) (see Appendix 30, Table 34, and Appendix 34, Table 41).
Sex and speech and language therapy intensity
For the female group, SLT for up to 2 hours weekly was associated with the highest gains on overall language ability [18.53 points (95% CI 7.46 to 29.59 points) on the WAB-AQ (37 IPD; 3 RCTs)], auditory comprehension [7.91 points (95% CI 1.82 to 14.00 points) on the TT-AAT (10 IPD; 2 RCTs) based on small numbers] and functional communication [1.15 points (95% CI 0.47 to 1.87 points) on the AAT-SSC (39 IPD; 4 RCTs)]. Their best naming gains occurred in the context of ≤ 2 to 3 hours of SLT weekly [13.48 points (95% CI 4.67 to 22.30 points) on the BNT (38 IPD; 5 RCT)].
In contrast, the male group’s highest gains on overall language [15.13 points (95% CI 7.92 to 22.34 points) on the WAB-AQ (61 IPD; 3 RCTs)] and auditory comprehension [7.63 points (95% CI 3.77 to 11.48 points) on the TT-AAT (91 IPD; 6 RCTs)] were associated with > 9 hours of SLT weekly. Male participants’ best functional communication [0.65 points (95% CI 0.40 to 0.89 points) on the AAT-SSC (97 IPD; 5 RCTs)] and naming gains [15.54 points (95% CI 6.94 to 24.14 points) on the BNT (10 IPD; 2 RCT)] were observed alongside between 2 and > 9 hours of SLT and up to 2 hours SLT weekly, respectively (see Appendix 30, Table 34, and Appendix 34, Table 41).
Sex and speech and language therapy dosage
For both female and male participants, the best gains on overall language ability (measured on the WAB-AQ) were associated with at least 20–50 hours of SLT [females: 24.37 points, 95% CI 12.22 to 36.52 points (13 IPD; 2 RCTs); males: 15.61 points, 95% CI 6.23 to 25.00 points (18 IPD; 4 RCTs)], although IPD and RCT numbers were low.
Functional communication gains (measured on the AAT-SSC) were best for the male group alongside > 50 hours of SLT [0.70 points, 95% CI 0.48 to 0.91 points (93 IPD; 6 RCT)], whereas the female group’s best gains occurred with 14–20 hours of SLT [1.59 points, 95% CI 0.57 to 2.61 points (4 IPD; 2 RCTs)], but this was based on very low IPD and RCT numbers. The next highest gain on functional communication for the female group was in the context of 20–50 hours of SLT [0.90 points (95% CI 0.38 to 1.42 points) on the AAT-SSC (43 IPD; 8 RCTs)]. Relative variance for both groups on the naming analysis was unacceptably high (> 50%) (see Appendix 30, Table 34, and Appendix 34, Table 41).
Summary
Optimal language gains for younger and older participants were generally associated with similar levels of SLT frequency and dosage. Younger participants’ best overall language and auditory comprehension gains were associated with high-intensity SLT (> 9 hours weekly). Although older participants’ best auditory comprehension gains were also associated with high-intensity SLT, their highest overall language, naming and functional communication gains were associated with lower-intensity SLT (≤ 2 hours weekly).
Generally, when differences were noted, participants in the early stages of aphasia recovery made their best overall language gains in the context of SLT that was less intensive and at a lower dosage than participants with long-standing aphasia (late group), who made their greatest gains alongside SLT that was at a slightly higher intensity and dosage.
The analysis of the mild–moderate group’s language gains was limited by possible ceiling effects, although the group’s best overall language and naming gains were associated with high intensity SLT (> 9 hours weekly). In contrast, the moderate–severe group’s best gains on these measures were associated with less intensive SLT interventions (3–4 hours and up to 2 hours weekly, respectively).
Male participants’ highest language gains were, when differences were observed, typically associated with SLT that was more frequent and intensive than the SLT regimens associated with the female participants’ best language gains. The subgroup analyses were exploratory and, in some cases, based on small IPD and RCT numbers. The findings highlight some possible associations between specific participant subgroups’ best language gains and SLT frequency, duration, intensity and dosage worthy of consideration in future research.
Chapter 8 Confidence in cumulative evidence
Overview
In this chapter, we consider the methodological quality of the RELEASE study, the meta-syntheses, risk of bias and confidence in the exploratory findings. Risk of bias at primary data set level (and IPD) is detailed in Chapter 3. We used the ROBIS tool to support our reflections on (1) the methodological steps taken to reduce the risk of meta-bias and (2) whether or not meta-biases may have affected the data synthesis and findings. We describe the results of investigations into heterogeneity, inconsistency and missing data, and present the findings from the prespecified sensitivity analyses.
Methodological quality of the primary research data sets
Across the meta-syntheses, we prioritised IPD derived from RCT data sets, followed by re-analysis using the full data set inclusive of non-RCT IPD. Risk of selection bias was moderate in the RCTs informing our IPD network meta-analysis across language domains (see Appendix 10, Figure 28), with between 50% and 75% reporting adequate randomisation. Primary research study participant groups were comparable at baseline; only three data sets had participant groups that differed by age, sex or time since stroke. Risk of detection bias was low.
Three-quarters (75%) of RCT data sets included in the network meta-analyses across language domains reported outcome assessor blinding. Attrition bias was low (see Appendix 10, Figure 28). Many data sets retained participants to the end of the study, whereas others reported dropouts and non-adherence. Risk of reporting bias was highlighted, with some public domain IPD available at baseline only or partial contribution of some electronic data sets. However, these partial RCT data sets often lacked follow-up or intervention data, and thus were excluded from the network meta-analyses. By contrast, full IPD RCT data sets were also extracted from the public domain and some electronic data set contributions included IPD unreported in associated publications. Thus, the IPD RCT data sets informing the network meta-analyses were considered to be at a moderate to low risk of selection bias.
Meta-synthesis and risk of bias
Supported by the ROBIS tool, we considered the extent to which the meta-analyses and network meta-analyses were at risk of bias. 105
Specification of study eligibility criteria; selection bias
The systematic review yielded a large number of records, which we screened for eligibility (see Chapters 2 and 3). Research teams were invited to contribute and collaborate. We had had no prior collaboration with 55 data set contributors. The systematic, inclusive approach to recruitment supported data set contributions that may not otherwise have been volunteered. We identified and extracted IPD from the public domain and grey literature in a range of languages (including 183 IPD from four RCTs, and 1988 IPD from 96 non-RCTs). These methodological steps were important in reducing the risk of selection bias in the meta-analyses.
The systematic development of the RELEASE study database used a priori eligibility criteria; reflected the scope of the research questions; and incorporated participant, study design and outcome data and IPD availability. Some research questions required SLT intervention data (see Chapters 6 and 7). Non-intervention data sets were also important, contributing to the exploration of patterns and predictors of language recovery (see Chapters 4 and 5). The database eligibility criteria were deliberately inclusive and were adhered to throughout.
We accepted diagnosis of participants’ aphasia in the primary research, confirming that it followed stroke. Aphasia associated with other neurological aetiologies was excluded. Formal approaches to aphasia diagnosis rely on validated language assessments, data required for inclusion in the study database and which informed our analysis. Data collection that was not quantitative or based on informal measures of language, were excluded as they were irrelevant to the research questions and analysis plan. We had no exclusions by study date, language of data collection or source, which might have affected electronic database searching or the contribution of unpublished clinical data sets. We made no other exclusions.
Data set identification and selection; availability bias
We made substantial efforts to identify all eligible IPD data sets, employing a broad search strategy (see Appendix 1) across databases and grey literature, and systematically inviting contributions from identified (potentially eligible) records and members of the Collaboration of Aphasia Trialists (see Chapter 3). The RELEASE study database also reflects data sharing with large independent aphasia databases [e.g. AphasiaBank, the Cantonese Aphasia Bank, Predicting Language Outcome and Recovery After Stroke (PLORAS)119] and clinical registries.
The RCT-optimised systematic search applied no restrictions to date, language or publications. We independently screened titles and abstracts, followed by double-checking to minimise any errors in the selection of eligible texts. We listed the data sets identified as potentially eligible for inclusion but for which the IPD were unavailable, which suggests additional RCTs (46 inclusive of a standard care or experimental SLT intervention) may exist (see Report Supplementary Material 2). We were unable to confirm that these data sets (and associated IPD) typically described as aggregate data in full text reports met our eligibility criteria or that the IPD remained available. Confirmation of the eligibility of included datasets was only possible following communication with the primary researchers and careful review of the IPD (see Chapter 3). Yet, it is probable that some eligible IPD existed but were unavailable to our analysis.
From a research-waste perspective, the possible existence of eligible but unavailable data is disappointing given that several of the planned analyses were not possible or unstable owing to lack of data availability (see Chapters 4–7). Additional data would have strengthened the network meta-analyses, potentially providing more links between network nodes (see Chapters 6 and 7) and greater insights. The number of included data sets, however, was sufficient to address the main RELEASE research questions.
The RELEASE study data set was predominantly based on data from English-speaking, high-income countries with well-developed SLT and stroke services. Non-English-language aphasia assessment tools are lacking, and limited (or absent) SLT services are important constraints on data-gathering in some countries. Thus, it is unlikely that we omitted many large, robust language data sets from non-English speaking countries.
Data collection and study appraisal (ROBIS domain 3)
We sought to minimise data extraction and synthesis errors. Data extraction was rigorously checked by a second reviewer. Data extraction of the complex SLT intervention descriptions was independently conducted by two researchers and was reviewed by the primary researchers. Collaborators informed the categorisation of narrative descriptions of SLT interventions by (i) target of impairment and (ii) a theoretical approach that supported data synthesis and analysis. We provided an opportunity to examine the data sets that informed the analyses, presenting aggregate data set descriptions (see Chapter 3) and individual data set overviews (see Report Supplementary Material 1). We detailed the approach to data synthesis, data item descriptions and group labels used in the analysis (see Chapter 3). Formal approaches to risk-of-bias analysis at primary data set level were described and undertaken by an independent reviewer, with a second reviewer rigorously checking that analysis (see Chapter 3).
Synthesis and findings
Data restrictions
We experienced restrictions in retrieving potentially eligible IPD data sets (described above) and limitations in accessing the full IPD data sets for some electronically contributed and public domain data sets. Other unavailable data included data sets that used a comprehensive aphasia assessment battery (comprising several subtests), but only summary test scores were recorded and reported. We experienced no other restrictions on data availability.
Bias
We found no evidence of publication bias based on study size (see Appendix 32), although publications with an earlier date had a higher proportion of non-significant results than findings reported in later publications (p = 0.014). We sought to reduce the risk of researcher bias by assigning data sets numerical IDs, so that collaboration-wide consensus decisions could be reached based on anonymised data sets, rather than the primary research teams.
Data synthesis
The primary data sets focused on language recovery and people with aphasia. Some included a SLT intervention; these were included in the network meta-analyses. Clinically, individual data sets were very similar in population, intervention, comparators and outcomes (see Report Supplementary Material 1), but this was not formally tested.
We used a random-effects model. Application of the Wu–Hausman108 test for fixed- versus random-effects model (described below) indicated that there was no difference based on these two models of analysis (see Appendix 33, Table 37). We considered heterogeneity by measuring relative variance. Any analysis that breached the prespecified threshold of acceptable variance (> 50%) was omitted from the interpretation of the data.
The one-stage IPD network meta-analyses did not incorporate aggregate summary data. We prioritised IPD derived from RCTs, but also considered the findings inclusive of IPD from non-RCTs, which were typically in keeping with the RCT IPD findings. Analysis on a single data set was not conducted. The prespecified minimum data analysis sample of two data sets (minimum of 20 IPD) was adhered to. However, the analysis occasionally generated clusters of small IPD or data set numbers; in such cases, these were treated with caution.
When IPD availability allowed, we conducted a prespecified subgroup analysis (see Chapter 7) to explore the possibility of heterogeneity between clinically relevant participant subpopulations. Based on the preparatory exploration of the data set, we included one post hoc subgroup. Alternative approaches to the data synthesis are unlikely to alter the findings.
Quality of the evidence
We considered the degree to which we could be confident of the study findings, based on the quality of the evidence. The patterns of language recovery findings lacked data for several planned analyses, and these were ungraded (Table 11, part A). The distribution of language scores at baseline was based on large numbers of IPD and it is unlikely that additional research will affect the finding. We have assigned a GRADE rating of ‘high’ (see Table 11, part A).
| Absolute proportion change scores | Overall language ability (WAB-AQ) (0–100) | Auditory comprehension (TT-AAT) (0–50) | Naming (BNT) (0–60) | Other spoken language (PICA) (0–16) | Reading comprehension (CAT reading) (0–74) | Writing (CAT writing) (0–76) | Functional communication (observer-rated) (AAT-SSC) (0–5) | Quality of the evidence (GRADE) |
|---|---|---|---|---|---|---|---|---|
| (A) Pattern of language recovery | ||||||||
| Natural history: insufficient data | – | |||||||
| No SLT (historical SLT) vs. SLT-treated participants: insufficient follow-up data | – | |||||||
| As time to study enrolment increased, the proportion of change from baseline seen all across domains decreased | High | |||||||
| Median (IQR) (%) | 8.4 (1.3–22) | 8.0 (0–18) | 3.9 (0.3–21.7) | 3.1 (0–8.1) | – | 1.3 (–1.6–8.6) | 10 (0–26.6) | Moderatea |
| IPD (RCTs) (n) | 418 (11) | 508 (17) | 346 (14) | 155 (2) | – | 41 (3) | 608 (16) | |
| (B) Predictors of language recovery: severity, age, time since stroke and sex | ||||||||
| Multivariable |
|
|
Severity: p = 0.0052 |
|
|
Time: p = 0.027 |
|
Moderatea |
| IPD | 482 | 550 | 385 | 231 | 88 | 47 | 544 | |
| p-value, points (95% CI) |
|
|
Time: p = 0.002, 0.99 (0.98 to 0.99) | Time: p = 0.0001, 0.87 (0.80 to 0.93) | – | Time: p = 0.0002, 0.90 (0.86 to 0.95) | Time: p < 0.0001, 0.98 (0.98 to 0.99) | |
| IPD (RCTs) (n) | 418 (11) | 508 (17) | 346 (14) | 155 (2) | – | 41 (3) | 608 (16) | |
| (C) SLT and peak rehabilitation gains by language domain | ||||||||
| Parameter (95% CI) | Functional communication (AAT-SSC) (0–5) | |||||||
| Frequency of SLT | 14.95 (8.7 to 21.2) | 5.86 (1.6 to 10.0) | 12.05 (6.5 to 17.6) | – | – | – | 0.78 (0.48 to 1.1) | |
| SLT > 4 to 5 days weekly | SLT > 3 to 4 days weekly | SLT up to 2 days weekly | – | – | – | SLT > 4 to 5 days weekly | ||
| IPD 194 (6 RCTs) | IPD 114 (5 RCTs) | IPD 42 (3 RCTs) | – | – | – | IPD 155 (8 RCTs) | ||
| Duration of SLT | 17.27 (9.7 to 24.8) | 6.79 (1.7 to 11.9) | 8.38 (1.2 to 15.5) | – | – | – | 0.8 (0.3 to 1.3) | |
| > 10–20 weeks of SLT | > 10–20 weeks of SLT | > 20 weeks of SLT | – | – | – | ≥ 4 to 10 weeks of SLT | ||
| IPD 45 (3 RCTs) | IPD 93 (5 RCTs) | IPD 134 (3 RCTs) | – | – | – | IPD 57 (2 RCTs) | ||
| Intensity of SLT | 15.9 (8.1 to 23.6) | 7.3 (4.1 to 10.5) | 13.2 (5.8 to 20.6) | – | – | – | 0.77 (0.36 to 1.2) | |
| SLT for up to 2 hours weekly | SLT for > 9 hours weekly | SLT for up to 2 hours weekly | – | – | – | SLT for up to 2 hours weekly | ||
| IPD 74 (3 RCTs) | IPD 141 (6 RCTs) | IPD 18 (2 RCTs) | – | – | – | IPD 83 (4 RCTs) | ||
| Dosage of SLT | 18.37 (10.6 to 26.2) | 5.23 (1.5 to 9.0) | 12.48 (1.3 to 23.6) | – | – | – | 0.94 (0.3 to 1.6) | |
| > 20 to < 50 hours of SLT | > 20 to < 50 hours of SLT | Up to 5 hours of SLT | – | – | – | > 14 to 20 hours of SLT | ||
| IPD 31 (4 RCTs) | IPD 90 (7 RCTs) | IPD 28 (2 RCTs) | – | – | – | IPD 11 (3 RCTs) | ||
We graded the evidence informing the absolute proportion change scores, multivariable analysis and the predictors of recovery (based on RCT IPD) as moderate level of evidence (see Table 11, part A). This was downgraded from high in recognition of the number of potentially eligible data sets identified, but which were not included in the analysis. We graded reading, writing and other spoken-language findings as low because greater availability of data is likely to alter these findings (see Table 11, part B).
The network meta-analyses considering the optimum SLT intervention regimen by language domain was rated low for duration comparisons and naming outcomes, downgraded from moderate because of the lack of IPD and/or unstable network geometry (see Table 11, part C). Further research will contribute to the data, changing confidence in the findings. The overall language ability, auditory comprehension and functional communication findings relating to SLT frequency, intensity and dosage were rated as moderate because of the higher IPD numbers informing these network meta-analyses and more stable network geometry (≈ 500 IPD; see Appendices 11–14) (see Table 11, part C). The subgroup network meta-analyses were based on even smaller IPD numbers, and were thus also graded as very low (see Appendix 30, Table 34).
Heterogeneity
We noted more instances of high heterogeneity (identified as > 50% relative variance) in the subgroup network meta-analysis, due, in part, to smaller IPD sample sizes and more instances of orphan interventions. These subgroup analyses were more exploratory than confirmatory. We chose to present all the results, highlighting instances of high heterogeneity (> 50%) in the relevant tables for information (see Appendices 30 and 34).
Exploration for inconsistency
Owing to the scarcity of direct comparisons for most pairwise nodes in the network meta-analysis (see Appendices 11–14 many contained a single study and were often based on a small number of IPD; see Appendix 34), a comparison of direct and indirect evidence was not useful. Direct comparisons within small, single RCTs would be likely to have large CIs that would be difficult to show a difference in, unless that difference was excessive. Instead, we examined inconsistency between studies by calculating the relative proportion of the variability (the difference between the predicted value and the actual value) that appeared to be solely due to differences between studies, and that of the null model (fitting only an intercept or constant term). A high proportion in this case would imply that most of the differences in the data were due to differences between studies, and thus imply that the studies were heterogeneous and thus too dissimilar for reliable meta-analysis.
Missing data/missing completely at random
Contributed data sets tended to have either nearly complete or nearly incomplete data for the majority of variables, and so rarely exceeded the prespecified threshold of 20% missing data. Many variables of interest were insufficiently collected across the data sets to include in the analyses. Comparisons of missingness with the main demographic variables did not reveal any systematic relationships (i.e. not missing at random). Other variables were well represented and were sufficient across the database and by primary research data set to include in our analyses (e.g. stroke type), but there was a lack of variability in subclassifications (e.g. some stroke types had only a few participants), making estimates for that variable imprecise, and, invariably, non-significant.
Publication bias
We included both published and unpublished IPD (including three clinical registry data sets and a RCT) in the RELEASE study. Funnel plots were not possible because of the nature of the data set. Instead, we considered the distribution of studies based on the number of participants recruited and the publication of a significant finding. We found no evidence of publication bias by sample size (p = 0.77; see Appendix 32).
Other biases
The risk of potential carry-over within crossover data sets was addressed by extracting the data up to the point of crossing over, but not beyond. We extracted primary research details (see Report Supplementary Material 1) and, although some data sets did not share language recovery and rehabilitation as their main study objective, there was no indication that this had any impact on the data extracted for the RELEASE study.
Sensitivity analyses
We conducted a series of pre-planned sensitivity analyses to examine decisions made in the data synthesis and the potential impact that these decisions may have had on the findings.
Choice of language measurement
Some primary data sets had IPD on two or more assessment tools that were eligible contributors to data synthesis relating to a single language outcome. Inclusion of all relevant data was not possible as it would result in ‘double-counting’ participants in that outcome. We chose which language assessment would contribute to the data synthesis for that language domain (see Report Supplementary Material 18) using a structured, systematic approach to support decision-making:
-
We reviewed the numbers of missing data (considering data at study entry and follow-up time points). The more complete data set (IPD) was prioritised.
-
When there was equivocation (i.e. both assessments had equal IPD numbers, including at follow-up), we prioritised the inclusion of IPD collected on the anchor measure.
Most overlapping data situations were resolved using this approach. Only a few remained, involving a small number of IPD and data sets, and these decisions were unlikely to affect the study findings and conclusions. For example, one data set using the TOMs included data from both activity and participation subtests, available on equal numbers of IPD. We arbitrarily included the activity data, but conducted a sensitivity analysis by replacing the activity item with the participation data in the network analysis (see Appendix 9, Tables 16–18). There was no indication of a notable difference between the findings. Each case of overlapping data eligibility was recorded, along with the choices available and decisions reached (see Report Supplementary Material 18). The numbers of IPD and data sets were insufficient to support any formal sensitivity analysis or the production of any meaningful result.
Exclusion of minority measures
We plotted the distribution of all transformed measures over time and by language domain, and observed that the spread of data points gathered on all language measures as profiled by each language domain overlapped (see Appendix 6, Figure 27 and Appendix 7, Table 14). There did not appear to be a clustering of transformed language measures that were generated from any one contributing assessment. The transformed values generated by each of the language assessments were valid and within an expected range.
Random or fixed effects
We considered the impact of the choice of a random-effects model over a fixed-effects model, using both the Wu–Hausman and the alternative Wu–Hausman. We compared the difference between the estimates of the covariate and standard error of baseline score. We had inadequate data for the reading comprehension item (one RCT). For all other language domains, the W score was < 3.841. For the alternative W, most values were < –1.96 or > 1.96, except for those based on functional communication (–1.9680). We also noted a relative variability of 41.1% for the naming data set, although this dropped to 30% when other variables were included in the model (see Appendix 33, Table 37). We rejected the null hypothesis that fixed effects were more efficient.
The inclusion of historic data sets
We explored the availability of historic data sets and what bias there may be in the inclusion of data sets gathered in the 1970s, as treatment responses may reflect health-care interventions (SLT and stroke related) at that time. We found no evidence that date of recruitment contributed to the findings based on language outcomes (see Appendix 31).
Excluding non-randomised controlled trial data sets
Throughout the analysis relating to patterns of recovery, predictors of recovery and optimum approaches to SLT, we prioritised the data analysis on IPD from RCT data sets only, and then re-ran the analysis inclusive of IPD from non-RCT data sets. We observed only modest (non-significantly) higher values in the context of some analyses inclusive of non-RCT data set (often with wider CIs) (see Chapters 4–6). Inclusion of the non-RCT data sets augmented the IPD on language abilities of people with aphasia at a specified time point from onset and in analyses where RCT data were lacking or absent. The IPD derived from non-RCTs and RCTs contributed to the calculation of median aphasia severity and age at the baseline assessment for the prespecified subgroup analysis (see Chapter 7). However, given the challenges and risk of overstating subgroup analysis results, we restricted the subgroup analyses to RCT IPD only.
Registry data sets and impact on findings
The database included five registry data sets (853/5928 IPD; 14%) that provided valuable data on international, clinical populations with aphasia. Summary statistics on the registry population demographics indicated that the data sets were broadly similar to other non-RCT data sets in terms of age, sex, time since stroke, aphasia severity, handedness and years of education (see Appendix 5, Table 13). Registry data contributed to the analysis of patterns and predictors of recovery only (see Chapter 4). Reporting of therapy interventions in the registries was mostly absent or insufficient to support profiling of the intervention, and thus inclusion in that analysis.
Summary
The RELEASE study analysis was based on high- and moderate-quality data sets (see Chapters 4–7). Wherever possible, we sought to reduce the risk of selection and availability bias, and bias in the data collection, study appraisal and data synthesis processes. We found no indication of important clinical or significant statistical heterogeneity. Isolated cases of high relative variance were reported but not taken forward into the findings. We found no indication of publication or historical bias, or that any decisions taken during the meta-synthesis may have biased the findings.
Chapter 9 Discussion and conclusions
Overview
In this chapter, the exploratory findings relating to the patterns and predictors of language, optimal SLT interventions and potential tailoring of SLT for subgroups of people with aphasia after stroke are summarised. We then consider the strengths and limitations of these findings, before describing the study’s patient and public involvement (PPI), the clinical and research implications, and the conclusions.
Summary of findings
Patterns of language recovery
We explored the patterns of language recovery among participants who had access to SLT (in the context of the primary research). We looked at when recovery occurred and in what language domain. We had insufficient data to consider whether or not the patterns of language recovery varied by different languages spoken.
Participants allocated to receive SLT demonstrated higher language scores over the study duration across all language domains, with modest gains observed on measures of other spoken language, reading comprehension and writing. Data for participants who had only historical SLT were limited, as many were permitted SLT access after the comparison group completed the SLT intervention period and prior to follow-up data collection points (see Table 11).
We had insufficient data from a pure natural history population (participants who, we could be reasonably confident, had no access to SLT after stroke) to plot language recovery by language domain. With the benefits of SLT for aphasia well established, it is ethically unlikely that such data will be available in the future, unless gathered in an international context in which SLT for aphasia is not part of usual care; however, in such contexts, other aspects of stroke care are also likely to differ.
When considering participant data at study entry time points only, time since stroke was inversely associated with the severity of language impairment across all language domains, suggesting spontaneous improvement or selection bias in data sets recruiting at later time points following stroke. Absolute proportion of change in participants’ language abilities over time was greatest on measures of functional communication, overall language ability and auditory comprehension.
Predictors of recovery
We explored the predictors of language recovery outcomes following aphasia by individual characteristics (age, education, cognition, monolingual or multilingual), rehabilitation environment (social support, socioeconomic demographics, ethnicity), stroke profile (severity, lesion type, size, location) and by language domain (overall language ability, auditory comprehension, spoken language, reading comprehension and writing). We were unable to take some analyses forward because of insufficient data (the role of monolingualism or multilingualism, ethnicity, cognition) or because the format of available data prevented meaningful synthesis (education, socioeconomic demographics). Lesion type and size are currently being investigated by a collaborating research group (e.g. PLORAS119); to avoid research waste, these were not taken forward in this study.
Across all language domains, when a significant change from baseline was evident, the greatest change in language performance from baseline was among participants enrolled within 1 month of stroke. Change in language performance scores from baseline appeared to lessen with increasing time from stroke to study enrolment.
Using regression, we examined the proportion of recovery within each language domain and found that increasing time from stroke to study entry was significantly associated with poorer recovery on all language domains. Increasing age was significantly associated with poorer recovery on overall language ability. Sex was also included owing to its known relationship with other stroke outcomes (see Table 7). Each of these covariates contributed to base models in subsequent analyses (see Table 11).
Optimum speech and language therapy interventions for aphasia after stroke
Using a one-stage network meta-analysis with direct and indirect comparisons, we explored language recovery in the context of SLT aphasia rehabilitation intervention regimen (timing, frequency, duration, intensity, dosage, home-based therapy), approach (theoretical approach and impairment target) and delivery model (functional relevance, one to one or group).
Controlling for age, time since stroke and sex, we found that SLT frequency, duration, intensity and dosage were significantly and selectively associated with language outcomes. Auditory comprehension gains were associated with the frequency, intensity, dosage (including home practice) and tailoring of SLT. Naming gains were associated with the frequency and dosage of SLT. Functional communication gains were associated with dosage (see Report Supplementary Materials 5–17).
We considered language gains made from baseline, and found that SLT regimen was associated with language recovery and varied by domain. Overall language ability and functional communication scores improved most in the context of receiving SLT for up to 2 hours weekly, delivered daily (> 4–5 days weekly). Auditory comprehension gains were greatest alongside SLT in excess of 9 hours weekly, over 3–4 days. The best overall language gains were associated with 20–50 hours of SLT. The greatest overall language and functional communication gains were seen in the context of mixed SLT approaches, whereas SLT aimed at improving word-finding was associated with the greatest gains in auditory comprehension. Language recovery on these measures was greatest in the context of SLT tailored by functional relevance to the participant and when home practice was prescribed. We found no indication that the expertise of the SLT provider, the mode of therapy (face to face, group or computer-based), the context of SLT delivery or the theoretical approach were related to participants’ language change from baseline, although naming, duration and the theoretical approach findings were based on a limited data set (see Table 11).
Speech and language therapy interventions: age, time since stroke, severity and sex subgroups
Subgroups were defined by individual (age, sex), stroke (time since onset) and aphasia characteristics (severity at baseline). The association between language scores and SLT intervention components was examined using a network meta-analysis approach. Participant numbers were low and the findings were treated with caution.
Language recovery was best for both younger and older participants in the context of 20–50 hours of SLT over several SLT days weekly. For both groups, auditory comprehension improved most when associated with highly intensive SLT (> 9 hours weekly). The best language gains for the older group on other domains occurred alongside less intensive approaches (up to 2 hours of SLT weekly).
When significant changes from baseline were observed, participants within 3 months of aphasia onset made most language gains in the context of 20–50 hours of SLT, delivered two to four times weekly for up to 2 hours each week. In contrast, participants starting SLT > 3 months after stroke made their best gains alongside SLT in excess of 50 hours in total, delivered four to five times weekly, for 3–4 hours weekly. The only variation to this profile was that, regardless of time since onset, both groups made their best gains in auditory comprehension with > 9 hours of SLT weekly.
Language gains from baseline were greater for participants with moderate–severe aphasia than for those with a milder aphasia across language domains. People with milder aphasia, already scoring highly on assessments, may have had less scope to demonstrate improvement on assessment tools unable to capture language change at or close to the highest possible score (the ceiling effect). The moderate–severe group’s best language gains were associated with frequent SLT (three to five times weekly), for between 2 and 4 hours weekly, and a total dosage of 14–50 hours, or more, depending on the language outcome.
Language gains across all domains were higher for females than for males. Females’ highest language gains occurred with up to 2 hours of SLT weekly, delivered over 2–4 days. Males’ highest language gains occurred with intensive, daily SLT (3–4, or even > 9, hours weekly, depending on language modality). Males’ and females’ best overall language gains were associated with 20–50 hours of SLT, although higher SLT dosage (> 50 hours) was associated with the highest auditory comprehension gains for female participants and the highest functional communication gains for male participants.
Strengths
Diversity of data set
This international collaboration of multidisciplinary researchers created one of the largest IPD data sets on 5928 people with aphasia and on language after stroke, gathered across 174 clinical or research settings, incorporating pre-existing databases, RCTs, non-RCT designs and clinical registries. The diversity of data sets, languages, severities and contexts (clinical and research) supports generalisation of the results. The primary research data sets met all the eligibility criteria and were further filtered for each research question. The database was sparse, with each data set typically including just some of the variables relevant to the analysis. Thus, the high number of data sets included in the database was essential to ensure sufficient overlap in the availability of variables to support the planned analysis. In addition, we required enough data sets to ensure an adequate sample size to explore the characteristic diversity of this population group, a wide range of language outcomes and the complexity of SLT interventions for aphasia.
Quality of data set
The database included RCTs generally graded as being at a low risk of bias (random sequence generation, concealment of allocation, blinding and few with unexplained attrition). For non-RCT data sets, the lack of randomisation was a risk of bias. Blinding of outcome assessors and the comparability of the groups at baseline were reassuring. The analyses based on IPD derived from RCTs were typically similar to the analyses that included the non-RCT IPD data sets.
We included unpublished IPD and eligible data sets identified by the systematic review. Responses to invitations to contribute data sets and inclusion of extensive IPD from the public domain (including complete RCT data sets) contributed to a reduction in the risk of publication bias. The formal assessment of publication and historical bias found no evidence to suggest that the findings were influenced by such biases.
Data relevant to the analyses were carefully identified, extracted and subsequently checked by a second researcher and (when possible) the contributing primary researchers. Data were additionally checked by reviewing plots and distributions, network graphs and through constant reference to the primary research data set to ensure accuracy. We standardised language recovery outcome by language domain across data sets and categorisation of SLT interventions by impairment target and theoretical approach through consensus with collaborators.
Language data
The language data reflect participants’ performance across several language modalities, gathered using specialised language measurement tools rather than a brief language item on a stroke scale. 29 Only published language measures were included. Screening tool data were excluded. 97 We preserved a clinically relevant language measurement reference, transforming the data to a single anchor measure for each outcome. Thus, measures of language change could be interpreted in the context of a clinically relevant scale as used in aphasia rehabilitation. The international multilingual collaboration supported data extraction and analysis of non-English aphasia assessment tools.
Speech and language therapy data
Working across an international, multilingual context supported the SLT data extraction, analysis and interpretation. Classification of SLT approaches by treatment target and theoretical approach was undertaken by the collaboration, and, following consensus review and approval (with minor edits), was sustained throughout the project. The aphasia intervention classification framework is an important adjunct to the TIDieR checklist to encourage transparency of reporting in SLT intervention studies for aphasia after stroke. 86
Individual participant data one-stage approach to meta-analysis
Findings from IPD and group summary meta-analysis can be equivalent, but the IPD data synthesis approach allowed inclusion of different data in existing meta-analyses. We included unpublished, clinical data sets, IPD, outcomes and extended follow-up time points excluded from aggregated published reports addressing some of the risks of outcome reporting bias. Using participants as the unit of analysis, we also had more power to identify clinically relevant interactions, which can be more easily interpreted to specific clinical populations than data derived from aggregate data alone. Study variability was monitored; only findings for which study variability was low to modest were reported, and these variations were highlighted to the reader. The multiple analyses were presented in a balanced manner, with all non-significant findings available for reference.
Limitations
Exploratory approach
We adopted an exploratory approach to the analysis, and results should be interpreted in this context. The ambition was to inform prioritisation, design, delivery and reporting of definitive research to confirm (or refute) these findings. It was impossible to anticipate the completeness of the final database. Network diagrams accompanied each comparison by language domain and every effort was made to ensure well-constructed networks. When it was not possible to make comparisons between all interventions, this was reported as an unreliable analysis. There were few direct comparisons or, when available, comparison was limited to one or two data sets. Network graphs were reasonably balanced, but only because of the sparsity of direct comparisons between each node. The availability of data and the network geometry highlighted comparisons that were unavailable; these evidence gaps should be addressed as a priority in future RCTs.
Diversity of data set
This database demonstrated a marked imbalance towards English-language data (more than half the data set), with other languages often represented by a single data set. We applied no language restrictions to the searching or inclusion criteria. The imbalance in language representation is reflective of the wider aphasia research literature. Recovery from aphasia in monolingual and bilingual stroke survivors may differ. Languages vary from each other in grammatical structure (e.g. English grammar, compared with agglutinating languages such as Finnish) and writing systems (Latin alphabetic, e.g. English, vs. Greek alphabet or Chinese logographic scripts). Non-English aphasia research has historically been hampered by the lack of rigorous, valid and reliable aphasia assessments, although some co-ordinated initiatives are under way that aim to change this landscape. 120
Reading comprehension and writing interventions and outcomes were also limited in their representation in the database, hindering the insight into impact on and recovery of these language domains.
Data collection limitations
Demographic, language and SLT intervention data, although sufficient for the purposes of the primary research activities, were often limited in their contribution to the secondary data analyses. For example, the analysis was often limited by a lack of outcome data captured at both baseline and follow-up time points. Historical SLT groups were rarely measured following the comparator intervention period. Participants allocated to receive SLT in the primary research had limited post-intervention follow-up, thereby limiting our insight into long-term maintenance of language recovery gains.
We also undertook a comprehensive literature search and systematically invited contributions and included IPD from the public domain to ensure that the breadth of included data sets would compensate for the anticipated sparsity of the data. Data extraction of IPD in the public domain was, as expected, often limited to baseline data, but also included four complete RCT IPD data sets. It was not possible to include all datasets identified as potentially eligible. In many cases we had no response to our inviation, while in others the IPD was no longer available.
Descriptions of speech and language therapy interventions
Speech and language therapy intervention descriptions typically lacked information on tailoring, adherence and home practice tasks. SLT intervention descriptions were rarely available at IPD level, and SLT intervention data were insufficient to support all the planned analyses, in some cases resulting in a network meta-analysis with too few connections to permit complete direct and indirect comparisons. For other networks, we used a reference group to close the analysis loop and strengthen the analysis, but some orphan groups were still evident (see Appendices 11–14). These networks gaps should be addressed in targeted RCT-based comparisons. Other SLT interventions are reported in the wider literature, but these were not represented in this database because of unavailability or issues with eligibility.
Language outcome limitations
We sought to adopt the ICF framework in the RELEASE study to describe the impact of aphasia and rehabilitation interventions. Language impairment was well represented across several language domains. Measures of communication participation or activity items, however, were typically represented by isolated data sets and available data items could not be meaningfully synthesised. The development of new assessments that capture such constructs121 and recent consensus on a core outcome set for aphasia research122 are important steps to ensuring that future aphasia research will reflect outcomes of importance to people with aphasia, their families and health-care professionals. 122
Stroke description limitations
The description of stroke (and related health data) was limited in the included aphasia data sets. Stroke severity and acute care stroke interventions, such as thrombolysis, are important rehabilitation and recovery factors. 29,123 Comorbidities and stroke risk factors are relevant to aphasia recovery29 and stroke rehabilitation. 124 Standardisation of data collection on these items across all stroke and aphasia recovery research would support further clarity on their relevance to aphasia recovery. 125,126
Inclusion limitations
The planned analysis focused on specific language outcomes to ensure feasibility; however, we acknowledge that many other important questions remain, including the role of repetition and word fluency in recovery, quality of life, and the impact of aphasia on (and interventions for) carers. Information on stroke lesion location and size were also excluded from the analysis. We included non-RCT and RCT data sets to support the research questions. Although non-RCT data sets pose a higher risk of bias (because of lack of randomisation), many of those we included were of high quality, reporting outcome assessor blinding and comparability of groups at baseline. The analysis prioritised IPD derived from RCT data sets, before we included IPD from non-RCT data sets. In analyses where RCT data was lacking, the non-RCT data provided an overview of the available data to date. Where RCR data was available to support the analysis, we found little indication of a difference in the findings (see Chapters 4–7).
Methodological limitations
Across the study, we undertook multiple subgroup analyses, and we acknowledge the risk of false-positive findings. The prespecified statistical analysis plan developed with the collaborators had a strong rationale for conducting the exploratory analyses in this way. We considered compensating for this risk statistically, but, given the exploratory approach, it was important to highlight all future research avenues. The findings should be interpreted in this context. The analysis approach could not consider or adjust for all possible confounders (e.g. dropout rates, interactions between age or severity and delivery of services). The examination of spontaneous recovery following aphasia in a natural history group was hampered by the lack of data availability. Ethically, it may be difficult to gather such data now in a clinically relevant population. Participants ranged from a few days to 38 years from stroke at study enrolment. We used the term ‘study entry’ to highlight this and controlled for time since stroke in the analysis. Despite these steps, it was not possible to distinguish spontaneous recovery of language from treatment-induced effects in the analysis. Aphasia researchers and therapists alike continue to work in this context.
Interpretation of the data in relation to other research
The results are in keeping with previous meta-analyses, although this IPD meta-analysis approach afforded a greater insight into the interactions between participant profile, therapy interventions and language outcomes than is possible in an aggregate data meta-analysis. Some meta-analyses were based on language-limited literature searching (e.g. English only),62–64 included RCTs only,41 included both RCT and non-RCT data sets,62 and highlighted data availability limitations. 41,62
Others have suggested the importance of early intervention after stroke,62,63 reporting it to be twice as effective as spontaneous recovery. 62 Gains made later after stroke were acknowledged, but were smaller. 62 Some meta-analyses have suggested that ≥ 2 hours of SLT weekly is the optimal intensity,63 whereas others indicated that this may be subtherapeutic and that a minimum of 9 hours of SLT weekly is required for gains. 64 Interventions that provided a total dosage in excess of 90 hours of therapy found benefits while those providing a dose of less than 44 hours did not. 64
One review based on 23 case studies (57 participants), concluded that time since stroke was not a predictor of rehabilitation effect. 127 A 2016 Cochrane review update41 found that intensive SLT benefited measures of overall language ability (group summary data from five RCTs) and functional language (two RCTs); however, these gains occurred alongside significantly higher numbers of dropouts from the intensive SLT compared with less intensive SLT approaches. They suggest that not all patients may be able to tolerate high-intensity SLT interventions for aphasia (4–15 hours per week). 41 A 2018 SLT RCT of an SLT intervention for aphasia did not experience the same level of dropout. 26
Patient and public involvement
Stroke survivors, carers and health-care professionals identified enhanced interventions for people with aphasia as a research priority. 49,73 The RELEASE project sought to address this objective. The research plans were supported by organisations in the Aphasia Alliance (a UK collective of organisations supporting people with aphasia and their carers) and international counterparts (e.g. the Australian Aphasia Association). During the study, we worked closely with a group of people with aphasia and their carers based in Norwich (facilitated by Dr Simon Horton, University of East Anglia).
As a secondary data analysis project, the PPI involvement aim was not to inform the development of accessible information sheets, consent forms or appraise the acceptability of the intervention as might be expected in a primary research context,128,129 but to facilitate communication of the findings to people with aphasia, their families, health-care professionals and commissioners. We scheduled a series of meetings with the group (at the project start, mid-way and on availability of the final results) during which we shared information in an accessible format prior to meetings, providing meeting updates and opportunities for questions and comments arising. At the third and final meeting, we sought their input into future dissemination plans.
To date, the output from the group has included outlining possible routes to dissemination for people with aphasia, their families, health-care professionals and members of the public with an aphasia awareness-raising goal. Although the PPI group has had a limited influence on the secondary analysis methodologies (in keeping with the PPI aims), its input was vital to the dissemination planning stage. We will continue to seek their contribution to the development, interpretation and dissemination of the study findings. Working together with the PPI group ensures the relevance and accessibility of the findings. In addition, we will share our findings with commissioning groups in the UK. Communication with comparable international groups of people with aphasia, carers and health-care professionals will be facilitated by the RELEASE study collaborators and the Collaboration of Aphasia Trialists.
Clinical implications
The limited insights into current SLT services for people with aphasia suggest that access to rehabilitation, in the context of the current evidence base, is inadequate. The findings of this study would support that assertion. The greatest language gains observed were associated with higher-dose SLT (frequency, duration, intensity and dosage) than has been described in recent reports of current practice,69 raising the question of whether or not current levels of clinical intervention are subtherapeutic. Some subgroups of people with aphasia, however, may experience optimum language recovery in the context of SLT at lower or higher frequencies, intensities or dosage. Specific language gains may require high-intensity intervention more than others. High-quality RCTs are required to definitively address these questions.
Should these RCTs support the findings, it is unrealistic to expect that the intensity, duration and dosage that may be required for optimal language gains can be supported in the traditional model of SLT services, namely one-to-one, face-to-face contact with a qualified speech and language therapist. 69 Alternative approaches to the provision and augmentation of therapy intervention regimens developed and co-ordinated by qualified therapists could be investigated and their effectiveness evaluated. 130 In this context, face-to-face therapy sessions could continue to focus on specialist therapeutic tasks, assessment, prescription of home practice tasks, generalisation, training of family members to provide therapy and support language stimulation and conversational interactions.
We would welcome use of the augmented TIDieR classification framework developed during the course of this study to support the description of SLT interventions132 in the development of future clinical guidelines to support, transparent and clinically implementable therapeutic intervention recommendations for aphasia after stroke. 132
Research implications
Further randomised controlled trials
Targeted RCTs of aphasia treatment interventions are required to address the many uncertainties identified in the research. We noted many high-quality non-RCT data sets, which could have greatly reduced the risk of possible bias and increased confidence in the study findings with the application of a randomisation process on recruitment of the participants.
We noted the limited availability of data sets describing interventions that targeted improvements in reading comprehension and writing or reporting of reading and writing language outcomes. Greater research focus on these language domains is warranted.
A co-ordinated series of RCTs is required to definitively address the questions raised by this exploratory research and the possibility of a SLT–language recovery dose–response relationship. Researchers should specifically consider the development of participant inclusion criteria, subgroups of interest and experimental SLT interventions in the context of these findings. Understanding of complex rehabilitation interventions delivered to a complex population can be enhanced and methodologically addressed through improvements in research design, data capture, description and reporting, and the continuation of collaborative initiatives such as the RELEASE study.
Time since stroke at enrolment and clinical relevance
We noted a trend towards better language scores with increasing time and across all domains among participants at study entry, which may suggest a risk of selection bias. Time since stroke was also a predictor of language recovery. Thus, time since aphasia onset should be considered in participant recruitment, interpretation of study findings and their clinical relevance.
Core data set
The aphasia research community recently achieved international consensus on a core outcome set, but we also require consensus on a core data set that supports adequate description of participant demographics, stroke profile and, potentially, biomarkers, alongside a comprehensive measurement of language.
Similarly, advances made in the transparent reporting of complex interventions using the TIDieR checklist could be further enhanced when reporting complex SLT interventions by including a description of the language impairment target and the theoretical approach. 132 In the light of the findings from this study, details on tailoring of the SLT interventions to participants by functional relevance or level of difficulty, and the prescription of home-based practice tasks (and adherence to those practice tasks) would enhance the reporting of therapy dosage.
Legacy database
This collaborative, international, multidisciplinary initiative has resulted in the creation of a large IPD database that (subject to approvals from the contributing research gatekeepers) will continue to support future secondary-analysis aphasia research activities.
Future research
Future research targeting the evidence gaps identified in this comprehensive search, data extraction and analysis would be welcomed. The network meta-analysis highlights SLT treatment approaches lacking sufficient RCT comparisons.
Greater focus on the recruitment and documentation of non-English-speaking participants in aphasia research would enhance the representation of a clinically representative research population and provide greater insights into optimal rehabilitation approaches for people with aphasia in non-English languages and across more than one language. Greater involvement of multilingual and non-English speaking populations will require research investment in the development and validity of aphasia assessment tools for languages other than English. Supporting this endeavour would increase the international capacity for aphasia research activities, support recruitment of adequate sample sizes powered to address the research questions and inform clinical service development for non-English speaking and multilingual populations.
Recent trials have ensured that they achieved the requisite sample size and greater generalisability of the findings and engagement with the clinical speech and language therapists across multiple national sites. 55,57 Although international studies are increasingly common in the context of stroke rehabilitation, the linguistic and assessment restrictions to conducting aphasia research internationally represents a specific challenge for aphasia rehabilitation researchers. Despite this, some [e.g. the Very Early Rehabilitation in Speech (VERSE) III trial72] have demonstrated the feasibility and benefits of an international recruitment strategy.
Conclusions
The RELEASE study represents the largest aphasia research database developed to date, with collated IPD on demographics and language domains following a range of SLT interventions. The exploratory findings plotted the patterns of language recovery for people with aphasia who received SLT after stroke. Time since stroke, age, severity of aphasia at baseline and sex were found to be significantly associated with language recovery in selected domains. The best language gains from baseline across language domains were associated with SLT interventions at different levels of frequency, duration, intensity and dosage. The greatest language gains were seen in the context of SLT interventions that were delivered over several days a week, for several hours weekly, for a total of 20–50 hours. Exceptions to this pattern were typically associated with a small number of participants or data sets. Some subgroups may achieve higher language gains in the context of specific SLT interventions, but these exploratory findings require further definitive investigation to enhance the delivery of SLT for aphasia after stroke for the benefit of people with aphasia, their families and health-care professionals.
Acknowledgements
This project was funded by the National Institute for Health and Care Research (NIHR) Health and Social Care Delivery Research programme (project number 14/04/22) and the Tavistock Trust for Aphasia. The scientific content was reviewed and informed by discussion with the NIHR Complex Reviews Support Unit, also funded by NIHR (project number 14/178/29; project in progress). The study also received infrastructural support from its location in the NMAHP Research Unit, which is funded by the Chief Scientist Office, Scottish Government Health and Social Care Directorates.
Administrative support
We would like to thank Dr Avril Nicoll, NMHAP Research Unit, Glasgow Caledonian University, for her excellence in administrative support, co-ordinating the efforts of the collaboration, communications and in formatting the final report.
The RELEASE study database contributors
The IPD meta-analysis builds on the considerable efforts of the contributing primary researchers and their generosity and collaborative approach to data sharing for the benefit of people with aphasia, their families and health-care professionals.
People with aphasia
We acknowledge the time and effort of people with aphasia to inform the primary data set activities, and whose data have, in turn, informed this IPD meta-analysis.
University of East Anglia Aphasia Research Collaboration
We thank the members of the PPI group based in Norwich (and facilitated by Dr Simon Horton, University of East Anglia) for their review of the proposed project, database creation, data extraction and analysis plans, the study findings and dissemination plans.
Other acknowledgements
For their statistical input to the development of the RELEASE project:
-
Mr Andy Elders, NMAHP Research Unit, Glasgow Caledonian University
-
Professor Jon Godwin, Glasgow Caledonian University
-
Dr Anastasia (Natalie) Karachalia Sandri, NMAHP Research Unit, Glasgow Caledonian University.
For IPD data extraction from the public domain:
-
Mrs Brenda Bain, NMAHP Research Unit, Glasgow Caledonian University.
For statistical commentary:
-
Dr Yiqiao Xin, NIHR Complex Review Support Unit, University of Glasgow.
For data synthesis methodological input:
-
Dr Pauline Campbell, NMAHP Research Unit, Glasgow Caledonian University.
Contributions of authors
Marian C Brady (https://orcid.org/0000-0002-4589-7021) conceived, designed and led the grant application and study; screened records, abstracts and full titles; extracted data; assessed the risk of bias; checked data extraction and risk of bias; and drafted and finalised the final report.
Myzoon Ali (https://orcid.org/0000-0001-5899-2485) was a co-applicant and contributor to the grant application, contributed to the statistical analysis, drafted Chapter 4 and co-drafted Chapter 5.
Kathryn VandenBerg (https://orcid.org/0000-0001-5035-9650) and Louise R Williams (https://orcid.org/0000-0003-2430-1142) screened records, abstracts and full titles; retrieved papers; extracted data; and checked data extraction and risk of bias.
Linda J Williams (https://orcid.org/0000-0002-6317-1718) led and conducted the statistical analysis.
Masahiro Abo (https://orcid.org/0000-0001-6701-4974), Frank Becker (https://orcid.org/0000-0002-0857-0628), Audrey Bowen (https://orcid.org/0000-0003-4075-1215), Caitlin Brandenburg (https://orcid.org/0000-0002-6992-7790), Caterina Breitenstein (https://orcid.org/0000-0002-6408-873X), Stefanie Bruehl (https://orcid.org/0000-0003-4826-1990), David A Copland (https://orcid.org/0000-0002-2257-4270), Tamara B Cranfill (https://orcid.org/0000-0001-7608-6443), Marie di Pietro-Bachmann (https://orcid.org/0000-0001-8027-2337), Pamela Enderby (https://orcid.org/0000-0002-4371-9053), Joanne Fillingham (https://orcid.org/0000-0002-0363-8021), Federica Lucia Galli (https://orcid.org/0000-0001-9244-9179), Marialuisa Gandolfi (https://orcid.org/0000-0002-0877-4807), Bertrand Glize (https://orcid.org/0000-0001-9618-2088), Erin Godecke (https://orcid.org/0000-0002-7210-1295), Katerina Hilari (https://orcid.org/0000-0003-2091-4849), Jacqueline Hinckley (https://orcid.org/0000-0002-4052-1420), Simon Horton (https://orcid.org/0000-0002-2133-1410), Petra Jaecks (https://orcid.org/0000-0002-5878-1327), Elizabeth Jefferies (https://orcid.org/0000-0002-3826-4330), Luis MT Jesus (https://orcid.org/0000-0002-8534-3218), Maria Kambanaros (https://orcid.org/0000-0002-5857-9460), Eun Kyoung Kang (https://orcid.org/0000-0001-5315-1361), Eman M Khedr (https://orcid.org/0000-0001-5679-9833), Anthony Pak-Hin Kong (https://orcid.org/0000-0002-6211-0358), Tarja Kukkonen (https://orcid.org/0000-0002-8189-0337), Marina Laganaro (https://orcid.org/0000-0002-4054-0939), Matthew A Lambon Ralph (https://orcid.org/0000-0001-5907-2488), Ann Charlotte Laska (https://orcid.org/0000-0002-7330-940X), Béatrice Leemann (https://orcid.org/0000-0003-2226-6777), Alexander P Leff (https://orcid.org/0000-0002-0831-3541), Roxele R Lima (https://orcid.org/0000-0002-9914-4789), Antje Lorenz (https://orcid.org/0000-0002-0200-1977), Brian MacWhinney (https://orcid.org/0000-0002-4988-1342), Rebecca Shisler Marshall (https://orcid.org/0000-0001-9313-5454), Flavia Mattioli (https://orcid.org/0000-0002-4912-5520), İlknur Maviş (https://orcid.org/0000-0003-3924-1138), Marcus Meinzer (https://orcid.org/0000-0003-1370-3947), Reza Nilipour (https://orcid.org/0000-0003-4180-7989), Enrique Noé (https://orcid.org/0000-0002-2547-8727), Nam-Jong Paik (https://orcid.org/0000-0002-5193-8678), Rebecca Palmer (https://orcid.org/0000-0002-2335-7104), Ilias Papathanasiou (https://orcid.org/0000-0003-0999-696X), Brígida F Patrício (https://orcid.org/0000-0002-2619-470X), Isabel Pavão Martins (https://orcid.org/0000-0002-9611-7400), Cathy Price (https://orcid.org/0000-0003-0111-9364), Tatjana Prizl Jakovac (https://orcid.org/0000-0002-5018-9556), Elizabeth Rochon (https://orcid.org/0000-0001-5521-0513), Miranda L Rose (https://orcid.org/0000-0002-8892-0965), Charlotte Rosso (https://orcid.org/0000-0001-7236-1508), Ilona Rubi-Fessen (https://orcid.org/0000-0002-9775-3812), Marina B Ruiter (https://orcid.org/0000-0001-6147-5235), Claerwen Snell (https://orcid.org/0000-0001-8606-7801), Benjamin Stahl (https://orcid.org/0000-0003-3957-1495), Jerzy P Szaflarski (https://orcid.org/0000-0002-5936-6627), Shirley A Thomas (https://orcid.org/0000-0003-0704-9387), Mieke van de Sandt-Koenderman (https://orcid.org/0000-0002-8104-6937), Ineke van der Meulen (https://orcid.org/0000-0002-6156-3873), Evy Visch-Brink (https://orcid.org/0000-0001-7833-0112), Linda Worrall (https://orcid.org/0000-0002-3283-7038) and Heather Harris Wright (https://orcid.org/0000-0001-6922-6364) contributed IPD primary data.
Audrey Bowen, Erin Godecke, Katerina Hilari, Jacqueline Hinckley, Simon Horton, David Howard (https://orcid.org/0000-0001-9141-5751), Tarja Kukkonen, Ann Charlotte Laska, Brian MacWhinney, Rebecca Palmer, Cathy Price, Shirley A Thomas, Evy Visch-Brink and Linda Worrall were co-applicants and contributors to the grant application.
Frank Becker, Marialuisa Gandolfi, Luis MT Jesus, Matthew A Lambon Ralph and Ineke van der Meulen were named collaborators on the grant application.
Simon Horton co-ordinated and facilitated PPI in the study.
Neil Hawkins (https://orcid.org/0000-0003-3199-221X) advised on the statistical analyses.
All authors were involved in interpretation of the results and reviewing and approving the final report.
Publications
Brady MC, Ali M, VandenBerg K, Williams LJ, Williams LR, Abo M, et al. Communicating simply, but not too simply: reporting of participants and speech and language interventions for aphasia after stroke. Int J Speech Lang Pathol 2020;22:302–12.
Brady M, Ali M, VandenBerg K, Williams LJ, Williams LR, Abo M, et al. RELEASE: a protocol for a systematic review based, individual participant data, meta- and network meta-analysis, of complex speech-language therapy interventions for stroke-related aphasia. Aphasiology 2020;34:137–57.
Williams LR, Ali M, VandenBerg K, Williams LJ, Abo M, Becker F, et al. Utilising a systematic review-based approach to create a database of individual participant data for meta- and network meta-analyses: the RELEASE database of aphasia after stroke. Aphasiology 2022;36:513–33.
The REhabilitation and recovery of peopLE with Aphasia after StrokE (RELEASE) Collaborators, Ali M, VandenBerg K, Williams LJ, Williams LR, Abo M, et al. Predictors of poststroke aphasia recovery. Stroke 2021;52:1778–87.
The REhabilitation and recovery of peopLE with Aphasia after StrokE (RELEASE) Collaborators. Dosage, intensity, and frequency of language therapy for aphasia: a systematic review-based, individual participant data network meta-analysis. Stroke 2022;53:956–67.
Brady M, Ali M, VandenBerg K, Williams LJ, Williams LR, Abel S, et al. REhabilitation and recovery of peopLE with Aphasia after StrokE (RELEASE): a protocol for a systematic review-based Individual Participant Data (IPD) meta- and network meta-analysis. Aphasiology 2019;34:137–57.
The RELEASE Collaborators. Communicating things simply, but not too simply – TIDieR descriptions of speech and language therapy interventions and transparent reporting of participant descriptors in aphasia research. Int J Speech Lang Pathol 2020;22:302–12.
The RELEASE Collaborators. Predictors of post-stroke aphasia recovery: a systematic review-informed individual participant data (IPD) meta-analysis. Stroke (in press).
The RELEASE Collaborators. Williams LR, Ali M, VandenBerg K, Williams LJ, Abo M, Becker F, et al. Utilising a systematic review-based approach to create a database of individual participant data for meta-and network meta-analysis: the RELEASE database of aphasia after stroke. Aphasiology (in press).
Data-sharing statement
We will work with all data contributors to facilitate access to a version of the RELEASE study database. Access to each data set in the database was subject to the data-sharing agreement between the primary research team and the RELEASE study. Ethical agreements which supported sharing of some primary data sets, restricted access to those datasets solely for the purpose of informing the RELEASE study and analysis. Some data sets are separate databases in their own right (e.g. AphasiaBank, Cantonese Aphasia Bank and PLORAS119). Interested parties should approach those databases directly. Further information can be obtained from the corresponding author.
Patient data
This work uses data provided by patients and collected by the NHS as part of their care and support. Using patient data is vital to improve health and care for everyone. There is huge potential to make better use of information from people’s patient records, to understand more about disease, develop new treatments, monitor safety, and plan NHS services. Patient data should be kept safe and secure, to protect everyone’s privacy, and it’s important that there are safeguards to make sure that it is stored and used responsibly. Everyone should be able to find out about how patient data are used. #datasaveslives You can find out more about the background to this citation here: https://understandingpatientdata.org.uk/data-citation.
Disclaimers
This report presents independent research funded by the National Institute for Health and Care Research (NIHR). The views and opinions expressed by authors in this publication are those of the authors and do not necessarily reflect those of the NHS, the NIHR, the HSDR programme or the Department of Health and Social Care. If there are verbatim quotations included in this publication the views and opinions expressed by the interviewees are those of the interviewees and do not necessarily reflect those of the authors, those of the NHS, the NIHR, the HSDR programme or the Department of Health and Social Care.
References
- The REhabilitation and recovery of peopLE with Aphasia after StrokE (RELEASE) Collaborators . Dosage, intensity, and frequency of language therapy for aphasia: a systematic review-based, individual participant data network meta-analysis. Stroke 2022;53:956-67. https://doi.org/10.1161/STROKEAHA.121.035216.
- Dickey L, Kagan A, Lindsay MP, Fang J, Rowland A, Black S. Incidence and profile of inpatient stroke-induced aphasia in Ontario, Canada. Arch Phys Med Rehabil 2010;91:196-202. https://doi.org/10.1016/j.apmr.2009.09.020.
- Pedersen PM, Vinter K, Olsen TS. Aphasia after stroke: type, severity and prognosis. The Copenhagen aphasia study. Cerebrovasc Dis 2004;17:35-43. https://doi.org/10.1159/000073896.
- Stroke Association . Aphasia and Its Effects n.d. www.stroke.org.uk/what-is-aphasia/aphasia-and-its-effects (accessed 5 January 2021).
- Lam JM, Wodchis WP. The relationship of 60 disease diagnoses and 15 conditions to preference-based health-related quality of life in Ontario hospital-based long-term care residents. Med Care 2010;48:380-7. https://doi.org/10.1097/MLR.0b013e3181ca2647.
- Gialanella B, Prometti P. Rehabilitation length of stay in patients suffering from aphasia after stroke. Top Stroke Rehabil 2009;16:437-44. https://doi.org/10.1310/tsr1606-437.
- Paolucci S, Matano A, Bragoni M, Coiro P, De Angelis D, Fusco FR, et al. Rehabilitation of left brain-damaged ischemic stroke patients: the role of comprehension language deficits. A matched comparison. Cerebrovasc Dis 2005;20:400-6. https://doi.org/10.1159/000088671.
- Gelber DA, Good DC, Laven LJ, Verhulst SJ. Causes of urinary incontinence after acute hemispheric stroke. Stroke 1993;24:378-82. https://doi.org/10.1161/01.str.24.3.378.
- Thomas SA, Lincoln NB. Predictors of emotional distress after stroke. Stroke 2008;39:1240-5. https://doi.org/10.1161/STROKEAHA.107.498279.
- Kehayia E, Korner-Bitensky N, Singer F, Becker R, Lamarche M, Georges P, et al. Differences in pain medication use in stroke patients with aphasia and without aphasia. Stroke 1997;28:1867-70. https://doi.org/10.1161/01.str.28.10.1867.
- Black-Schaffer RM, Osberg JS. Return to work after stroke: development of a predictive model. Arch Phys Med Rehabil 1990;71:285-90.
- Mavaddat N, Sadler E, Lim L, Williams K, Warburton E, Kinmonth AL, et al. Perceptions of self-rated health among stroke survivors: a qualitative study in the United Kingdom. BMC Geriatr 2018;18. https://doi.org/10.1186/s12877-018-0765-8.
- Bersano A, Burgio F, Gattinoni M, Candelise L. PROSIT Study Group . Aphasia burden to hospitalised acute stroke patients: need for an early rehabilitation programme. Int J Stroke 2009;4:443-7. https://doi.org/10.1111/j.1747-4949.2009.00349.x.
- Ellis C, Simpson AN, Bonilha H, Mauldin PD, Simpson KN. The one-year attributable cost of poststroke aphasia. Stroke 2012;43:1429-31. https://doi.org/10.1161/STROKEAHA.111.647339.
- Boehme AK, Martin-Schild S, Marshall RS, Lazar RM. Effect of aphasia on acute stroke outcomes. Neurology 2016;87:2348-54. https://doi.org/10.1212/WNL.0000000000003297.
- Clarke P, Black SE. Quality of life following stroke: negotiating disability, identity, and resources. J Appl Gerontol 2016;24:319-36. https://doi.org/10.1177/0733464805277976.
- Parr S, Byng S, Gilpin S, Ireland C. Talking About Aphasia: Living with Loss of Language After Stroke. Buckingham: Open University Press; 1997.
- Hilari K, Northcott S. ‘Struggling to stay connected’: comparing the social relationships of healthy older people and people with stroke and aphasia. Aphasiology 2016;31:674-87. https://doi.org/10.1080/02687038.2016.1218436.
- Wray F, Clarke D. Longer-term needs of stroke survivors with communication difficulties living in the community: a systematic review and thematic synthesis of qualitative studies. BMJ Open 2017;7. https://doi.org/10.1136/bmjopen-2017-017944.
- Grawburg M, Howe T, Worrall L, Scarinci N. Third-party disability in family members of people with aphasia: a systematic review. Disabil Rehabil 2013;35:1324-41. https://doi.org/10.3109/09638288.2012.735341.
- Cruice M, Worrall L, Hickson L. Quantifying aphasic people’s social lives in the context of non-aphasic peers. Aphasiology 2006;20:1210-25. https://doi.org/10.1080/02687030600790136.
- Royal College of Physicians . National Clinical Guidline for Stroke 2012. www.strokeaudit.org/Guideline/Historical-Guideline.aspx (accessed 22 August 2014).
- Holland A, Fromm D, Forbes M, MacWhinney B. Long-term recovery in stroke accompanied by aphasia: a reconsideration. Aphasiology 2017;31:152-65. https://doi.org/10.1080/02687038.2016.1184221.
- Meinzer M, Djundja D, Barthel G, Elbert T, Rockstroh B. Long-term stability of improved language functions in chronic aphasia after constraint-induced aphasia therapy. Stroke 2005;36:1462-6. https://doi.org/10.1161/01.STR.0000169941.29831.2a.
- Palmer R, Cooper C, Enderby P, Brady M, Julious S, Bowen A, et al. Clinical and cost effectiveness of computer treatment for aphasia post stroke (Big CACTUS): study protocol for a randomised controlled trial. Trials 2015;16. https://doi.org/10.1186/s13063-014-0527-7.
- Palmer R, Cross L, Harrison M, Bradley E, Witts H, Hughes H, et al. A Study to Assess the Clinical and Cost Effectiveness of Aphasia Computer Treatment Versus Usual Stimulation or Attention Control Long Term Post Stroke (CACTUS). Sheffield: Sheffield University; 2018.
- Royal College of Speech and Language Therapists . Royal College of Speech and Language Therapists Clinical Guidelines 2005. www.rcslt.org/members/publications/rcslt_clinical_guidelines (accessed 22 August 2014).
- Laska AC, Hellblom A, Murray V, Kahan T, Von Arbin M. Aphasia in acute stroke and relation to outcome. J Intern Med 2001;249:413-22. https://doi.org/10.1046/j.1365-2796.2001.00812.x.
- Ali M, Lyden P, Brady M. VISTA Collaboration . Aphasia and dysarthria in acute stroke: recovery and functional outcome. Int J Stroke 2015;10:400-6. https://doi.org/10.1111/ijs.12067.
- Wallentin M. Sex differences in post-stroke aphasia rates are caused by age. A meta-analysis and database query. PLOS ONE 2018;13. https://doi.org/10.1371/journal.pone.0209571.
- Plowman E, Hentz B, Ellis C. Post-stroke aphasia prognosis: a review of patient-related and stroke-related factors. J Eval Clin Pract 2012;18:689-94. https://doi.org/10.1111/j.1365-2753.2011.01650.x.
- Connor LT, Obler LK, Tocco M, Fitzpatrick PM, Albert ML. Effect of socioeconomic status on aphasia severity and recovery. Brain Lang 2001;78:254-7. https://doi.org/10.1006/brln.2001.2459.
- Reis A, Petersson KM. Educational level, socioeconomic status and aphasia research: a comment on Connor et al. (2001) – effect of socioeconomic status on aphasia severity and recovery. Brain Lang 2003;87:449-52. https://doi.org/10.1016/S0093-934X(03)00140-8.
- Paplikar A, Mekala S, Bak TH, Dharamkar S, Alladi S, Kaul S. Bilingualism and the severity of poststroke aphasia. Aphasiology 2018;33:58-72. https://doi.org/10.1080/02687038.2017.1423272.
- Hope TM, Parker J, Grogan A, Crinion J, Rae J, Ruffle L, et al. Comparing language outcomes in monolingual and bilingual stroke patients. Brain 2015;138:1070-83. https://doi.org/10.1093/brain/awv020.
- Venna VR, Xu Y, Doran SJ, Patrizz A, McCullough LD. Social interaction plays a critical role in neurogenesis and recovery after stroke. Transl Psychiatry 2014;4. https://doi.org/10.1038/tp.2013.128.
- Boden-Albala B, Litwak E, Elkind MS, Rundek T, Sacco RL. Social isolation and outcomes post stroke. Neurology 2005;64:1888-92. https://doi.org/10.1212/01.WNL.0000163510.79351.AF.
- Brady MC, Godwin J, Kelly H, Enderby P, Elders A, Campbell P. Attention control comparisons with SLT for people with aphasia following stroke: methodological concerns raised following a systematic review. Clin Rehabil 2018;32:1383-95. https://doi.org/10.1177/0269215518780487.
- Venna VR, McCullough LD. Role of social factors on cell death, cerebral plasticity and recovery after stroke. Metab Brain Dis 2015;30:497-506. https://doi.org/10.1007/s11011-014-9544-1.
- Ali M, Bath PM, Lyden PD, Bernhardt J, Brady M. VISTA Collaboration. Representation of people with aphasia in randomized controlled trials of acute stroke interventions. Int J Stroke 2014;9:174-82. https://doi.org/10.1111/ijs.12043.
- Brady MC, Kelly H, Godwin J, Enderby P, Campbell P. Speech and language therapy for aphasia following stroke. Cochrane Database Syst Rev 2016;6. https://doi.org/10.1002/14651858.CD000425.pub4.
- Hope TMH, Leff AP, Price CJ. Predicting language outcomes after stroke: is structural disconnection a useful predictor?. Neuroimage Clin 2018;19:22-9. https://doi.org/10.1016/j.nicl.2018.03.037.
- Thomas SA, Walker MF, Macniven JA, Haworth H, Lincoln NB. Communication and Low Mood (CALM): a randomized controlled trial of behavioural therapy for stroke patients with aphasia. Clin Rehabil 2013;27:398-40. https://doi.org/10.1177/0269215512462227.
- Brownsett SL, Warren JE, Geranmayeh F, Woodhead Z, Leech R, Wise RJ. Cognitive control and its impact on recovery from aphasic stroke. Brain 2014;137:242-54. https://doi.org/10.1093/brain/awt289.
- Gilmore N, Meier EL, Johnson JP, Kiran S. Nonlinguistic cognitive factors predict treatment-induced recovery in chronic poststroke aphasia. Arch Phys Med Rehabil 2019;100:1251-8. https://doi.org/10.1016/j.apmr.2018.12.024.
- Kim G, Min D, Lee EO, Kang EK. Impact of co-occurring dysarthria and aphasia on functional recovery in post-stroke patients. Ann Rehabil Med 2016;40:1010-17. https://doi.org/10.5535/arm.2016.40.6.1010.
- Medical Research Council . Developing and Evaluating Complex Interventions: New Guidance 2008.
- Shrubsole K, Worrall L, Power E, O’Connor DA. Priorities for closing the evidence-practice gaps in poststroke aphasia rehabilitation: a scoping review. Arch Phys Med Rehabil 2018;99:1413-23. https://doi.org/10.1016/j.apmr.2017.08.474.
- Franklin S, Harhen D, Hayes M, Demos Mc Manus S, Pollock A. Top 10 research priorities relating to aphasia following stroke. Aphasiology 2017;32:1388-95. https://doi.org/10.1080/02687038.2017.1417539.
- Paolucci S, Antonucci G, Grasso MG, Morelli D, Troisi E, Coiro P, et al. Early versus delayed inpatient stroke rehabilitation: a matched comparison conducted in Italy. Arch Phys Med Rehabil 2000;81:695-700. https://doi.org/10.1016/S0003-9993(00)90095-9.
- Johansson BB. Brain plasticity and stroke rehabilitation. The Willis lecture. Stroke 2000;31:223-30. https://doi.org/10.1161/01.str.31.1.223.
- Wahl AS, Schwab ME. Finding an optimal rehabilitation paradigm after stroke: enhancing fiber growth and training of the brain at the right moment. Front Hum Neurosci 2014;8. https://doi.org/10.3389/fnhum.2014.00381.
- Janssen H, Ada L, Bernhardt J, McElduff P, Pollack M, Nilsson M, et al. An enriched environment increases activity in stroke patients undergoing rehabilitation in a mixed rehabilitation unit: a pilot non-randomized controlled trial. Disabil Rehabil 2014;36:255-62. https://doi.org/10.3109/09638288.2013.788218.
- Laska AC, Kahan T, Hellblom A, Murray V, von Arbin M. A randomized controlled trial on very early speech and language therapy in acute stroke patients with aphasia. Cerebrovasc Dis Extra 2011;1:66-74. https://doi.org/10.1159/000329835.
- Nouwens F, de Lau LM, Visch-Brink EG, van de Sandt-Koenderman WM, Lingsma HF, Goosen S, et al. Efficacy of early cognitive-linguistic treatment for aphasia due to stroke: a randomised controlled trial (Rotterdam Aphasia Therapy Study-3). Eur Stroke J 2017;2:126-36. https://doi.org/10.1177/2396987317698327.
- Godecke E, Ciccone NA, Granger AS, Rai T, West D, Cream A, et al. A comparison of aphasia therapy outcomes before and after a Very Early Rehabilitation programme following stroke. Int J Lang Commun Disord 2014;49:149-61. https://doi.org/10.1111/1460-6984.12074.
- Breitenstein C, Grewe T, Flöel A, Ziegler W, Springer L, Martus P, et al. Intensive speech and language therapy in patients with chronic aphasia after stroke: a randomised, open-label, blinded-endpoint, controlled trial in a health-care setting. Lancet 2017;389:1528-38. https://doi.org/10.1016/S0140-6736(17)30067-3.
- The RELEASE Collaboration . Communicating simply, but not too simply: reporting of participants and speech and language interventions for aphasia after stroke. Int J Speech-Lang 2020;22:302-12. https://doi.org/10.1080/17549507.2020.1762000.
- National Institute for Health and Care Excellence . Stroke Rehabilitation in Adults 2013. www.nice.org.uk/guidance/cg162 (accessed 14 August 2018).
- Royal College of Physicians . National Clinical Guidelines for Stroke 2016. www.strokeaudit.org/Guideline/Full-Guideline.aspx (accessed 14 August 2018).
- Rohde A, Worrall L, Le Dorze G. Systematic review of the quality of clinical guidelines for aphasia in stroke management. J Eval Clin Pract 2013;19:994-1003. https://doi.org/10.1111/jep.12023.
- Robey RR. The efficacy of treatment for aphasic persons: a meta-analysis. Brain Lang 1994;47:582-608. https://doi.org/10.1006/brln.1994.1060.
- Robey RR. A meta-analysis of clinical outcomes in the treatment of aphasia. J Speech Lang Hear Res 1998;41:172-87. https://doi.org/10.1044/jslhr.4101.172.
- Bhogal SK, Teasell R, Speechley M. Intensity of aphasia therapy, impact on recovery. Stroke 2003;34:987-93. https://doi.org/10.1161/01.STR.0000062343.64383.D0.
- Royal College of Speech and Language Therapists . Royal College of Speech and Language Therapists: Resource Manual for Commissioning and Planning Services for Speech, Language and Communication Needs 2013.
- Code C, Heron C. Services for aphasia, other acquired adult neurogenic communication and swallowing disorders in the United Kingdom, 2000. Disabil Rehabil 2003;25:1231-7. https://doi.org/10.1080/09638280310001599961.
- Katz RC, Hallowell B, Code C, Armstrong E, Roberts P, Pound C, et al. A multinational comparison of aphasia management practices. Int J Lang Commun Disord 2000;35:303-14. https://doi.org/10.1080/136828200247205.
- Verna A, Davidson B, Rose T. Speech–language pathology services for people with aphasia: a survey of current practice in Australia. Int J Speech Lang Pathol 2009;11:191-205. https://doi.org/10.1080/17549500902726059.
- Palmer R, Witts H, Chater T. What speech and language therapy do community dwelling stroke survivors with aphasia receive in the UK?. PLOS ONE 2018;13. https://doi.org/10.1371/journal.pone.0200096.
- Bixley M. In search of consensus on aphasia management. R Coll Speech Lang Ther Bull 2011:18-20.
- Royal College of Physicians, Sentinel Stroke National Audit Programme (SSNAP), Healthcare Quality Improvement Partnership (HQIP) . The Fourth Annual SSNAP Report. Rising to the Challenge: Stroke Care Received Between April 2016 to March 2017 n.d. www.strokeaudit.org/Documents/AnnualReport/2016-17-SSNAP-Annual-Report.aspx (accessed 8 June 2020).
- Godecke E, Armstrong E, Rai T, Ciccone N, Rose ML, Middleton S, et al. A randomized control trial of intensive aphasia therapy after acute stroke: The Very Early Rehabilitation for SpEech (VERSE) study [published online ahead of print October 6 2020]. Int J Stroke 2020.
- Pollock A, St George B, Fenton M, Firkins L. Top 10 research priorities relating to life after stroke – consensus from stroke survivors, caregivers, and health professionals. Int J Stroke 2014;9:313-20. https://doi.org/10.1111/j.1747-4949.2012.00942.x.
- Royal College of Speech and Language Therapists . Aphasia Priority Setting Initiative (In Progress) n.d. www.rcslt.org/members/research_centre/research_priorities/RCSLT (accessed 14 August 2018).
- Bernhardt J, Godecke E, Johnson L, Langhorne P. Early rehabilitation after stroke. Curr Opin Neurol 2017;30:48-54. https://doi.org/10.1097/WCO.0000000000000404.
- Pring T. Ask a silly question: two decades of troublesome trials. Int J Lang Commun Disord 2004;39:285-302. https://doi.org/10.1080/13682820410001681216.
- Godecke E, Rai T, Cadilhac DA, Armstrong E, Middleton S, Ciccone N, et al. Statistical analysis plan (SAP) for the Very Early Rehabilitation in Speech (VERSE) after stroke trial: an international 3-arm clinical trial to determine the effectiveness of early, intensive, prescribed, direct aphasia therapy. Int J Stroke 2018;13:863-80. https://doi.org/10.1177/1747493018790055.
- Knoppers BM. Framework for responsible sharing of genomic and health-related data. Hugo J 2014;8. https://doi.org/10.1186/s11568-014-0003-1.
- Taichman DB, Backus J, Baethge C, Bauchner H, de Leeuw PW, Drazen JM, et al. Sharing clinical trial data: a proposal from the International Committee of Medical Journal Editors. Lancet 2016;387:e9-e11. https://doi.org/10.1016/S0140-6736(15)01279-9.
- Moher D, Shamseer L, Clarke M, Ghersi D, Liberati A, Petticrew M, et al. Preferred reporting items for systematic review and meta-analysis protocols (PRISMA-P) 2015 statement. Syst Rev 2015;4. https://doi.org/10.1186/2046-4053-4-1.
- Shamseer L, Moher D, Clarke M, Ghersi D, Liberati A, Petticrew M, et al. Preferred reporting items for systematic review and meta-analysis protocols (PRISMA-P) 2015: elaboration and explanation. BMJ 2015;350. https://doi.org/10.1136/bmj.g7647.
- Hutton B, Salanti G, Caldwell DM, Chaimani A, Schmid CH, Cameron C, et al. The PRISMA extension statement for reporting of systematic reviews incorporating network meta-analyses of health care interventions: checklist and explanations. Ann Intern Med 2015;162:777-84. https://doi.org/10.7326/M14-2385.
- Beller EM, Glasziou PP, Altman DG, Hopewell S, Bastian H, Chalmers I, et al. PRISMA for Abstracts: reporting systematic reviews in journal and conference abstracts. PLOS Med 2013;10. https://doi.org/10.1371/journal.pmed.1001419.
- Stewart LA, Clarke M, Rovers M, Riley RD, Simmonds M, Stewart G, et al. PRISMA-IPD Development Group . Preferred Reporting Items for Systematic Review and Meta-Analyses of individual participant data: the PRISMA-IPD Statement. JAMA 2015;313:1657-65. https://doi.org/10.1001/jama.2015.3656.
- Guise JM, Butler ME, Chang C, Viswanathan M, Pigott T, Tugwell P. Complex Interventions Workgroup . AHRQ series on complex intervention systematic reviews-paper 6: PRISMA-CI extension statement and checklist. J Clin Epidemiol 2017;90:43-50. https://doi.org/10.1016/j.jclinepi.2017.06.016.
- Hoffmann TC, Glasziou PP, Boutron I, Milne R, Perera R, Moher D, et al. Better reporting of interventions: template for intervention description and replication (TIDieR) checklist and guide. BMJ 2014;348. https://doi.org/10.1136/bmj.g1687.
- Staniszewska S, Brett J, Simera I, Seers K, Mockford C, Goodlad S, et al. GRIPP2 reporting checklists: tools to improve reporting of patient and public involvement in research. BMJ 2017;358. https://doi.org/10.1136/bmj.j3453.
- Meader N, King K, Llewellyn A, Norman G, Brown J, Rodgers M, et al. A checklist designed to aid consistency and reproducibility of GRADE assessments: development and pilot validation. Syst Rev 2014;3. https://doi.org/10.1186/2046-4053-3-82.
- Anglemyer A, Horvath HT, Bero L. Healthcare outcomes assessed with observational study designs compared with those assessed in randomized trials. Cochrane Database Syst Rev 2014;4. https://doi.org/10.1002/14651858.MR000034.pub2.
- Faber T, Ravaud P, Riveros C, Perrodeau E, Dechartres A. Meta-analyses including non-randomized studies of therapeutic interventions: a methodological review. BMC Med Res Methodol 2016;16. https://doi.org/10.1186/s12874-016-0136-0.
- Abo-Zaid G, Sauerbrei W, Riley RD. Individual participant data meta-analysis of prognostic factor studies: state of the art?. BMC Med Res Methodol 2012;12. https://doi.org/10.1186/1471-2288-12-56.
- Brady M, Ali M, VandenBerg K, Williams LJ, Williams LR, Abo M, et al. RELEASE: a protocol for a systematic review based, individual participant data, meta- and netwrok meta-analysis, of complex speech-language therapy interventions for stroke-related aphasia. Aphasiology 2020;34:137-57.
- Wallace SJ, Worrall L, Rose T, Le Dorze G, Cruice M, Isaksen J, et al. Which outcomes are most important to people with aphasia and their families? An international nominal group technique study framed within the ICF. Disabil Rehabil 2017;39:1364-79. https://doi.org/10.1080/09638288.2016.1194899.
- Dietz A, Boyle M. Discourse measurement in aphasia research: have we reached the tipping point?. Aphasiology 2017;32:459-64. https://doi.org/10.1080/02687038.2017.1398803.
- Bryant L, Ferguson A, Spencer E. Linguistic analysis of discourse in aphasia: a review of the literature. Clin Linguist Phon 2016;30:489-518. https://doi.org/10.3109/02699206.2016.1145740.
- Xiong T, Bunning K, Horton S, Hartley S. Assessing and comparing the outcome measures for the rehabilitation of adults with communication disorders in randomised controlled trials: an International Classification of Functioning, Disability and Health approach. Disabil Rehabil 2011;33:2272-90. https://doi.org/10.3109/09638288.2011.568666.
- El Hachioui H, Visch-Brink EG, de Lau LM, van de Sandt-Koenderman MW, Nouwens F, Koudstaal PJ, et al. Screening tests for aphasia in patients with stroke: a systematic review. J Neurol 2017;264:211-20. https://doi.org/10.1007/s00415-016-8170-8.
- Higgins JPT, Thomas J, Chandler J, Cumpston M, Li T, Page MJ, et al. Cochrane Handbook for Systematic Reviews of Interventions Version 6.0 2019. www.training.cochrane.org/handbook (accessed 27 February 2019).
- Joanna Briggs Institute . The Joanna Briggs Institute Critical Appraisal Tools for Use in JBI Systematic Reviews 2018. http://joannabriggs.org/research/critical-appraisal-tools.html (accessed 20 November 2018).
- Brady MC, Ali M, VandenBerg K, Williams LJ, Williams LR, Abo M, et al. RELEASE: a protocol for a systematic review based, individual participant data, meta-and network meta-analysis, of complex speech-language therapy interventions for stroke-related aphasia. Aphasiology 2020;34:137-57.
- Peto R, Davies C, Godwin J, Gray R, Pan HC, Clarke M, et al. Comparisons between different polychemotherapy regimens for early breast cancer: meta-analyses of long-term outcome among 100,000 women in 123 randomised trials. Lancet 2012;379:432-44. https://doi.org/10.1016/S0140-6736(11)61625-5.
- van der Waerden BL . Order tests for the two-sample problem and their power. Proc Kon Nederl Akad Wetensch 1952;A:453-8. https://doi.org/10.1016/S1385-7258(52)50063-5.
- Tierney JF, Pignon JP, Gueffyier F, Clarke M, Askie L, Vale CL, et al. Meta-analysis Methods Group. How individual participant data meta-analyses have influenced trial design, conduct, and analysis. J Clin Epidemiol 2015;68:1325-35. https://doi.org/10.1016/j.jclinepi.2015.05.024.
- Debray TP, Schuit E, Efthimiou O, Reitsma JB, Ioannidis JP, Salanti G, et al. An overview of methods for network meta-analysis using individual participant data: when do benefits arise?. Stat Methods Med Res 2018;27:1351-64. https://doi.org/10.1177/0962280216660741.
- Whiting P, Savović J, Higgins JP, Caldwell DM, Reeves BC, Shea B, et al. ROBIS: A new tool to assess risk of bias in systematic reviews was developed. J Clin Epidemiol 2016;69:225-34. https://doi.org/10.1016/j.jclinepi.2015.06.005.
- Ahmed I, Sutton AJ, Riley RD. Assessment of publication bias, selection bias, and unavailable data in meta-analyses using individual participant data: a database survey. BMJ 2012;344. https://doi.org/10.1136/bmj.d7762.
- Liebeskind DS, Kidwell CS, Sayre JW, Saver JL. Evidence of publication bias in reporting acute stroke clinical trials. Neurology 2006;67:973-9. https://doi.org/10.1212/01.wnl.0000237331.16541.ac.
- Wu D-M. Alternative tests of independence between stochastic regressors and disturbances. Econometrica 1973;41:733-50. https://doi.org/10.2307/1914093.
- Stroke Unit Trialists’ Collaboration . Organised inpatient (stroke unit) care for stroke. Cochrane Database Syst Rev 2013;9.
- Stroke Unit Trialists’ Collaboration . How do stroke units improve patient outcomes? A collaborative systematic review of the randomized trials. Stroke 1997;28:2139-44. https://doi.org/10.1161/01.STR.28.11.2139.
- Guyatt GH, Oxman AD, Schünemann HJ, Tugwell P, Knottnerus A. GRADE guidelines: a new series of articles in the Journal of Clinical Epidemiology. J Clin Epidemiol 2011;64:380-2. https://doi.org/10.1016/j.jclinepi.2010.09.011.
- Williams LR, Ali M, VandenBerg K, Williams LJ, Abo M, Becker F, et al. Utilising a systematic review-based approach to create a database of individual participant data for meta- and network meta-analyses: the RELEASE database of aphasia after stroke. Aphasiology 2022;36:513-33. https://doi.org/10.1080/02687038.2021.1897081.
- Brady MC, Ali M, VandenBerg K, Williams LJ, Williams LR, Abo M, et al. Communicating simply, but not too simply: reporting of participants and speech and language interventions for aphasia after stroke. Int J Speech Lang Pathol 2020;22:302-12.
- Hacke W, Kaste M, Bluhmki E, Brozman M, Dávalos A, Guidetti D, et al. Thrombolysis with alteplase 3 to 4.5 hours after acute ischemic stroke. N Engl J Med 2008;359:1317-29. https://doi.org/10.1056/NEJMoa0804656.
- Silvestrelli G, Parnetti L, Paciaroni M, Caso V, Corea F, Vitali R, et al. Early admission to stroke unit influences clinical outcome. Eur J Neurol 2006;13:250-5. https://doi.org/10.1111/j.1468-1331.2006.01187.x.
- Nakayama H, Jørgensen HS, Raaschou HO, Olsen TS. The influence of age on stroke outcome. The Copenhagen Stroke Study. Stroke 1994;25:808-13. https://doi.org/10.1161/01.str.25.4.808.
- Bagg S, Pombo AP, Hopman W. Effect of age on functional outcomes after stroke rehabilitation. Stroke 2002;33:179-85. https://doi.org/10.1161/hs0102.101224.
- Ali M, VandenBerg K, Williams LJ, Williams LR, Abo M, . The REhabilitation and recovery of peopLE with Aphasia after StrokE (RELEASE) Collaborators . Predictors of Poststroke Aphasia Recovery. Stroke 2021;52:1778-87. https://doi.org/10.1161/STROKEAHA.120.031162.
- Seghier ML, Patel E, Prejawa S, Ramsden S, Selmer A, Lim L, et al. The PLORAS Database: a data repository for Predicting Language Outcome and Recovery After Stroke. Neuroimage 2016;124:1208-12. https://doi.org/10.1016/j.neuroimage.2015.03.083.
- Fyndanis V, Lind M, Varlokosta S, Kambanaros M, Soroli E, Ceder K, et al. Cross-linguistic adaptations of The Comprehensive Aphasia Test: challenges and solutions. Clin Linguist Phon 2017;31:697-710. https://doi.org/10.1080/02699206.2017.1310299.
- Bowen A, Hesketh A, Patchick E, Young A, Davies L, Vail A, et al. Effectiveness of enhanced communication therapy in the first four months after stroke for aphasia and dysarthria: a randomised controlled trial. BMJ 2012;345. https://doi.org/10.1136/bmj.e4407.
- Wallace SJ, Worrall L, Rose T, Le Dorze G, Breitenstein C, Hilari K, et al. A core outcome set for aphasia treatment research: the ROMA consensus statement. Int J Stroke 2019;14:180-5. https://doi.org/10.1177/1747493018806200.
- Godecke E, Rai T, Ciccone N, Armstrong E, Granger A, Hankey GJ. Amount of therapy matters in very early aphasia rehabilitation after stroke: a clinical prognostic model. Semin Speech Lang 2013;34:129-41. https://doi.org/10.1055/s-0033-1358369.
- Luker JA, Bernhardt J, Grimmer-Somers KA. Demographic and stroke-related factors as predictors of quality of acute stroke care provided by allied health professionals. J Multidiscip Healthc 2011;4:247-59. https://doi.org/10.2147/JMDH.S22569.
- Kwakkel G, Lannin NA, Borschmann K, English C, Ali M, Churilov L, et al. Standardized measurement of sensorimotor recovery in stroke trials: consensus-based core recommendations from the Stroke Recovery and Rehabilitation Roundtable. Int J Stroke 2017;12:451-61. https://doi.org/10.1177/1747493017711813.
- Boyd LA, Hayward KS, Ward NS, Stinear CM, Rosso C, Fisher RJ, et al. Biomarkers of stroke recovery: consensus-based core recommendations from the Stroke Recovery and Rehabilitation Roundtable. Neurorehabil Neural Repair 2017;31:864-76. https://doi.org/10.1177/1545968317732680.
- Moss A, Nicholas M. Language rehabilitation in chronic aphasia and time postonset: a review of single-subject data. Stroke 2006;37:3043-51. https://doi.org/10.1161/01.STR.0000249427.74970.15.
- Brady MC, Fredrick A, Williams B. People with aphasia: capacity to consent, research participation and intervention inequalities. Int J Stroke 2013;8:193-6. https://doi.org/10.1111/j.1747-4949.2012.00900.x.
- Jayes MJ, Palmer RL. Stroke research staff’s experiences of seeking consent from people with communication difficulties: results of a national online survey. Top Stroke Rehabil 2014;21:443-51. https://doi.org/10.1310/tsr2105-443.
- Reynolds AL, Vick JL, Haak NJ. Telehealth applications in speech-language pathology: a modified narrative review. J Telemed Telecare 2009;15:310-16. https://doi.org/10.1258/jtt.2009.081215.
- Vale CL, Rydzewska LH, Rovers MM, Emberson JR, Gueyffier F, Stewart LA, et al. Meta-analysis Methods Group. Uptake of systematic reviews and meta-analyses based on individual participant data in clinical practice guidelines: descriptive study. BMJ 2015;350. https://doi.org/10.1136/bmj.h1088.
- The RELEASE Collaborators . Communicating simply, but not too simply: reporting of participants and speech and language interventions for aphasia after stroke. Int J Speech Lang Pathol 2020;22:302-12.
- Wilcoxon F. Individual comparisons by ranking methods. Biometrics Bulletin 1945;1:80-3. https://doi.org/10.2307/3001968.
- Cochran WG. The χ2 test of goodness of fit. Ann Math Statist 1952;23:315-45. https://doi.org/10.1214/aoms/1177729380.
- De Renzi E, Vignolo LA. The Token Test: a sensitive test to detect receptive disturbances in aphasics. Brain 1962;85:665-78. https://doi.org/10.1093/brain/85.4.665.
- De Renzi E, Faglioni P. Normative data and screening power of a shortened version of the Token Test. Cortex 1978;14:41-9. https://doi.org/10.1016/S0010-9452(78)80006-9.
- Arvedson JC, McNeil MR, West TL. Prediction of Revised Token Test overall, subtest, and linguistic unit scores by two shortened versions. Clinical Aphasiology 1986;16:57-63.
- Lincoln NB. An Investigation of the Effectiveness of Language Retraining Methods With Aphasic Stroke Patients 1979.
- Snodgrass JG, Vanderwart M. A standardized set of 260 pictures: norms for name agreement, image agreement, familiarity, and visual complexity. J Exp Psychol Hum Learn 1980;6:174-215. https://doi.org/10.1037/0278-7393.6.2.174.
Appendix 1 Example search strategies
Reproduced with permission from Brady et al. 92 This is an Open Access article distributed in accordance with the terms of the Creative Commons Attribution (CC BY 4.0) license, which permits others to distribute, remix, adapt and build upon this work, for commercial use, provided the original work is properly cited. See: https://creativecommons.org/licenses/by/4.0/. The text includes minor additions and formatting changes to the text.
MEDLINE
MEDLINE (via Ovid).
Date range searched: 1946 to 22 September 2015.
Date searched: 22 September 2015.
Search strategy
-
exp aphasia/
-
language disorders/or speech disorders/or anomia/
-
(aphasi$ or dysphasi$ or anomia or anomic).tw.
-
((speech or language$ or linguistic or communicat$) adj5 (disorder$ or impair$ or problem$ or dysfunction or difficult$)).tw.
-
1 or 2 or 3 or 4
-
exp aphasia/rh, th or language disorders/rh, th or speech disorders/rh, th or anomia/rh, th
-
speech-language pathology/or exp “rehabilitation of speech and language disorders”/
-
((speech or language$ or linguistic or aphasi$ or dysphasi$ or anomia or anomic) adj5 (therap$ or train$ or rehabilitat$ or treat$ or remediat$ or intervention$ or pathol$)).tw.
-
(SLT or SLP).tw.
-
(melodic intonation therap$ or MIT).tw.
-
6 or 7 or 8 or 9 or 10
-
Randomized Controlled Trials as Topic/
-
random allocation/
-
Controlled Clinical Trials as Topic/
-
control groups/
-
clinical trials as topic/or clinical trials, phase i as topic/or clinical trials, phase ii as topic/or clinical trials, phase iii as topic/or clinical trials, phase iv as topic/
-
double-blind method/
-
single-blind method/
-
Placebos/
-
placebo effect/
-
cross-over studies/
-
randomized controlled trial.pt.
-
controlled clinical trial.pt.
-
(clinical trial or clinical trial phase i or clinical trial phase ii or clinical trial phase iii or clinical trial phase iv).pt.
-
(random$ or RCT or RCTs).tw.
-
(controlled adj5 (trial$ or stud$)).tw.
-
(clinical$ adj5 trial$).tw.
-
((control or treatment or experiment$ or intervention) adj5 (group$ or subject$ or patient$)).tw.
-
(quasi-random$ or quasi random$ or pseudo-random$ or pseudo random$).tw.
-
((control or experiment$ or conservative) adj5 (treatment or therapy or procedure or manage$)).tw.
-
((singl$ or doubl$ or tripl$ or trebl$) adj5 (blind$ or mask$)).tw.
-
(cross-over or cross over or crossover).tw.
-
(placebo$ or sham).tw.
-
trial.ti.
-
(assign$ or allocat$).tw.
-
controls.tw.
-
or/12-36
-
5 and 11 and 37
-
exp animals/not humans.sh.
-
38 not 39
-
(pediatric or paediatric or infant or infants or child or children$ or childhood or neonat$ or juvenile$ or toddler$).ti.
-
(child/or child, preschool/or adult children/or adolescent/or exp infant/) not exp adult/
-
41 or 42
-
40 not 43
-
36 not 39.
Cumulative Index to Nursing and Allied Health Literature
Cumulative Index to Nursing and Allied Health Literature (via EBSCOhost).
Date range searched: 1982 to 22 September 2015.
Date searched: 22 September 2015.
Search strategy
-
(MH “Aphasia+”)
-
(MH “Speech Disorders”) or (MH “Language Disorders”) or (MH “Anomia”)
-
TI (aphasi* or dysphasi* or anomia or anomic) OR AB (aphasi* or dysphasi* or anomia or anomic)
-
TI ((speech or language* or linguistic or communicat*) N5 (disorder* or impair* or problem* or dysfunction or difficult*)) or AB ((speech or language* or linguistic or communicat*) N5 (disorder* or impair* or problem* or dysfunction or difficult*))
-
1 OR 2 OR 3 OR 4
-
(MH “Aphasia+/RH/TH”) or (MH “Speech Disorders/RH/TH ”) or (MH “Language Disorders/RH/TH”) or (MH “Anomia/RH/TH ”)
-
(MH “Rehabilitation, Speech and Language”) or (MH “Speech-Language Pathologists”) or (MH “Speech-Language Pathology”) or (MH “Speech Therapy+”) or (MH “Language Therapy”)
-
TI ((speech or language or linguistic or aphasi* or dysphasi* or anomia or anomic) N5 (therap* or train* or rehabilitat* or treat* or remediat* or intervention* or pathol*)) or AB ((speech or language or linguistic or aphasi* or dysphasi* or anomia or anomic) N5 (therap* or train* or rehabilitat* or treat* or remediat* or intervention* or pathol*))
-
TI (SLT or SLP) or AB (SLT or SLP)
-
TI (melodic intonation therap* or MIT) or AB (melodic intonation therap* or MIT)
-
6 OR 7 OR 8 OR 9 OR 10
-
(MH “Randomized Controlled Trials”) or (MH “Random Assignment”) or (MH “Random Sample+”)
-
(MH “Clinical Trials”) or (MH “Intervention Trials”) or (MH “Therapeutic Trials”)
-
(MH “Double-Blind Studies”) or (MH “Single-Blind Studies”) or (MH “Triple-Blind Studies”)
-
(MH “Control (Research)”) or (MH “Control Group”) or (MH “Placebos”) or (MH “Placebo Effect”)
-
(MH “Crossover Design”) OR (MH “Quasi-Experimental Studies”)
-
PT (clinical trial or randomized controlled trial)
-
TI (random* or RCT or RCTs) or AB (random* or RCT or RCTs)
-
TI (controlled N5 (trial* or stud*)) or AB (controlled N5 (trial* or stud*))
-
TI (clinical* N5 trial*) or AB (clinical* N5 trial*)
-
TI ((control or treatment or experiment* or intervention) N5 (group* or subject* or patient*)) or AB ((control or treatment or experiment* or intervention) N5 (group* or subject* or patient*))
-
TI ((control or experiment* or conservative) N5 (treatment or therapy or procedure or manage*)) or AB ((control or experiment* or conservative) N5 (treatment or therapy or procedure or manage*))
-
TI ((singl* or doubl* or tripl* or trebl*) N5 (blind* or mask*)) or AB ((singl* or doubl* or tripl* or trebl*) N5 (blind* or mask*))
-
TI (cross-over or cross over or crossover) or AB (cross-over or cross over or crossover)
-
TI (placebo* or sham) or AB (placebo* or sham)
-
TI trial
-
TI (assign* or allocat*) or AB (assign* or allocat*)
-
TI controls or AB controls
-
TI (quasi-random* or quasi random* or pseudo-random* or pseudo random*) or AB (quasi-random* or quasi random* or pseudo-random* or pseudo random*)
-
12 OR 13 OR 14 OR 15 OR 16 OR 17 OR 18 OR 19 OR 20 OR 21 OR 22 OR 23 OR 24 OR 25 OR 26 OR 27 OR 28 OR 29
-
5 AND 11 AND 30
-
TI (pediatric or paediatric or infant or infants or child or children* or childhood or neonat* or juvenile* or toddler*)
-
((MH “Adolescence+”) or (MH “Child+”) or (MH “Infant+”)) not (MH “Adult”)
-
32 OR 33
-
31 not 34
Appendix 2 Transformation process
Non-anchor measures were transformed into a format that could be compared with the chosen anchor measure using the formula in Box 4.
Xanchor is an observation transformed into the anchor measurement instrument.
Xminority is an observation measured on the non-anchor (minority) measurement instrument.
If we consider the data in the anchor measure and minority measure to be a series of quartiles, such that Q0 = minimum, Q1 = lower quartile, Q2 = median, Q3 = upper quartile and Q4 = maximum, then we can linearly transform each Xminority value to within its corresponding quartile in the anchor measure.
If Xminority lies between Minority_Qn and Minority_Qn+1, then we can transform the data thus:
and
ExampleThe anchor measure for overall severity was chosen to be the WAB-AQ. So the anchor quartiles are as follows:
Q0 = 0, Q1 = 56.3, Q2 = 64.9, Q3 = 89.4 and Q4 = 100.
Suppose we have a data point from the NGA data set of 80, for which the minority quartiles are as follows:
Q0 = 0, Q1 = 64, Q2 = 110, Q3 = 161 and Q4 = 217.
We find that 90 lies between Q1 = 64 and Q2 = 110 in the minority measure, with the corresponding anchor Q1 = 56.3 and Q2 = 64.9.
Therefore, Y = (64.9 – 56.3)/(110 – 64) = 8.6/46 = 0.1870.
On the anchor scale, Xanchor = 64.9 + (80 – 110) × 0.1870 = 64.9 – 5.6 = 59.3.
NGA, Norsk Grunntest for Afasi.
With thanks to Professor Jon Godwin, Glasgow Caledonian University, for an earlier version of this formula, which he reported as regularly being used by the Early Breast Cancer Trialists Group (2018, personal communication). The version above has been further adapted by Dr Linda J Williams, University of Edinburgh.
Appendix 3 Logic models
FIGURE 26.
Logic models 1–4. (a) Logic model 1; (b) logic model 2; (c) logic model 3; and (d) logic model 4.
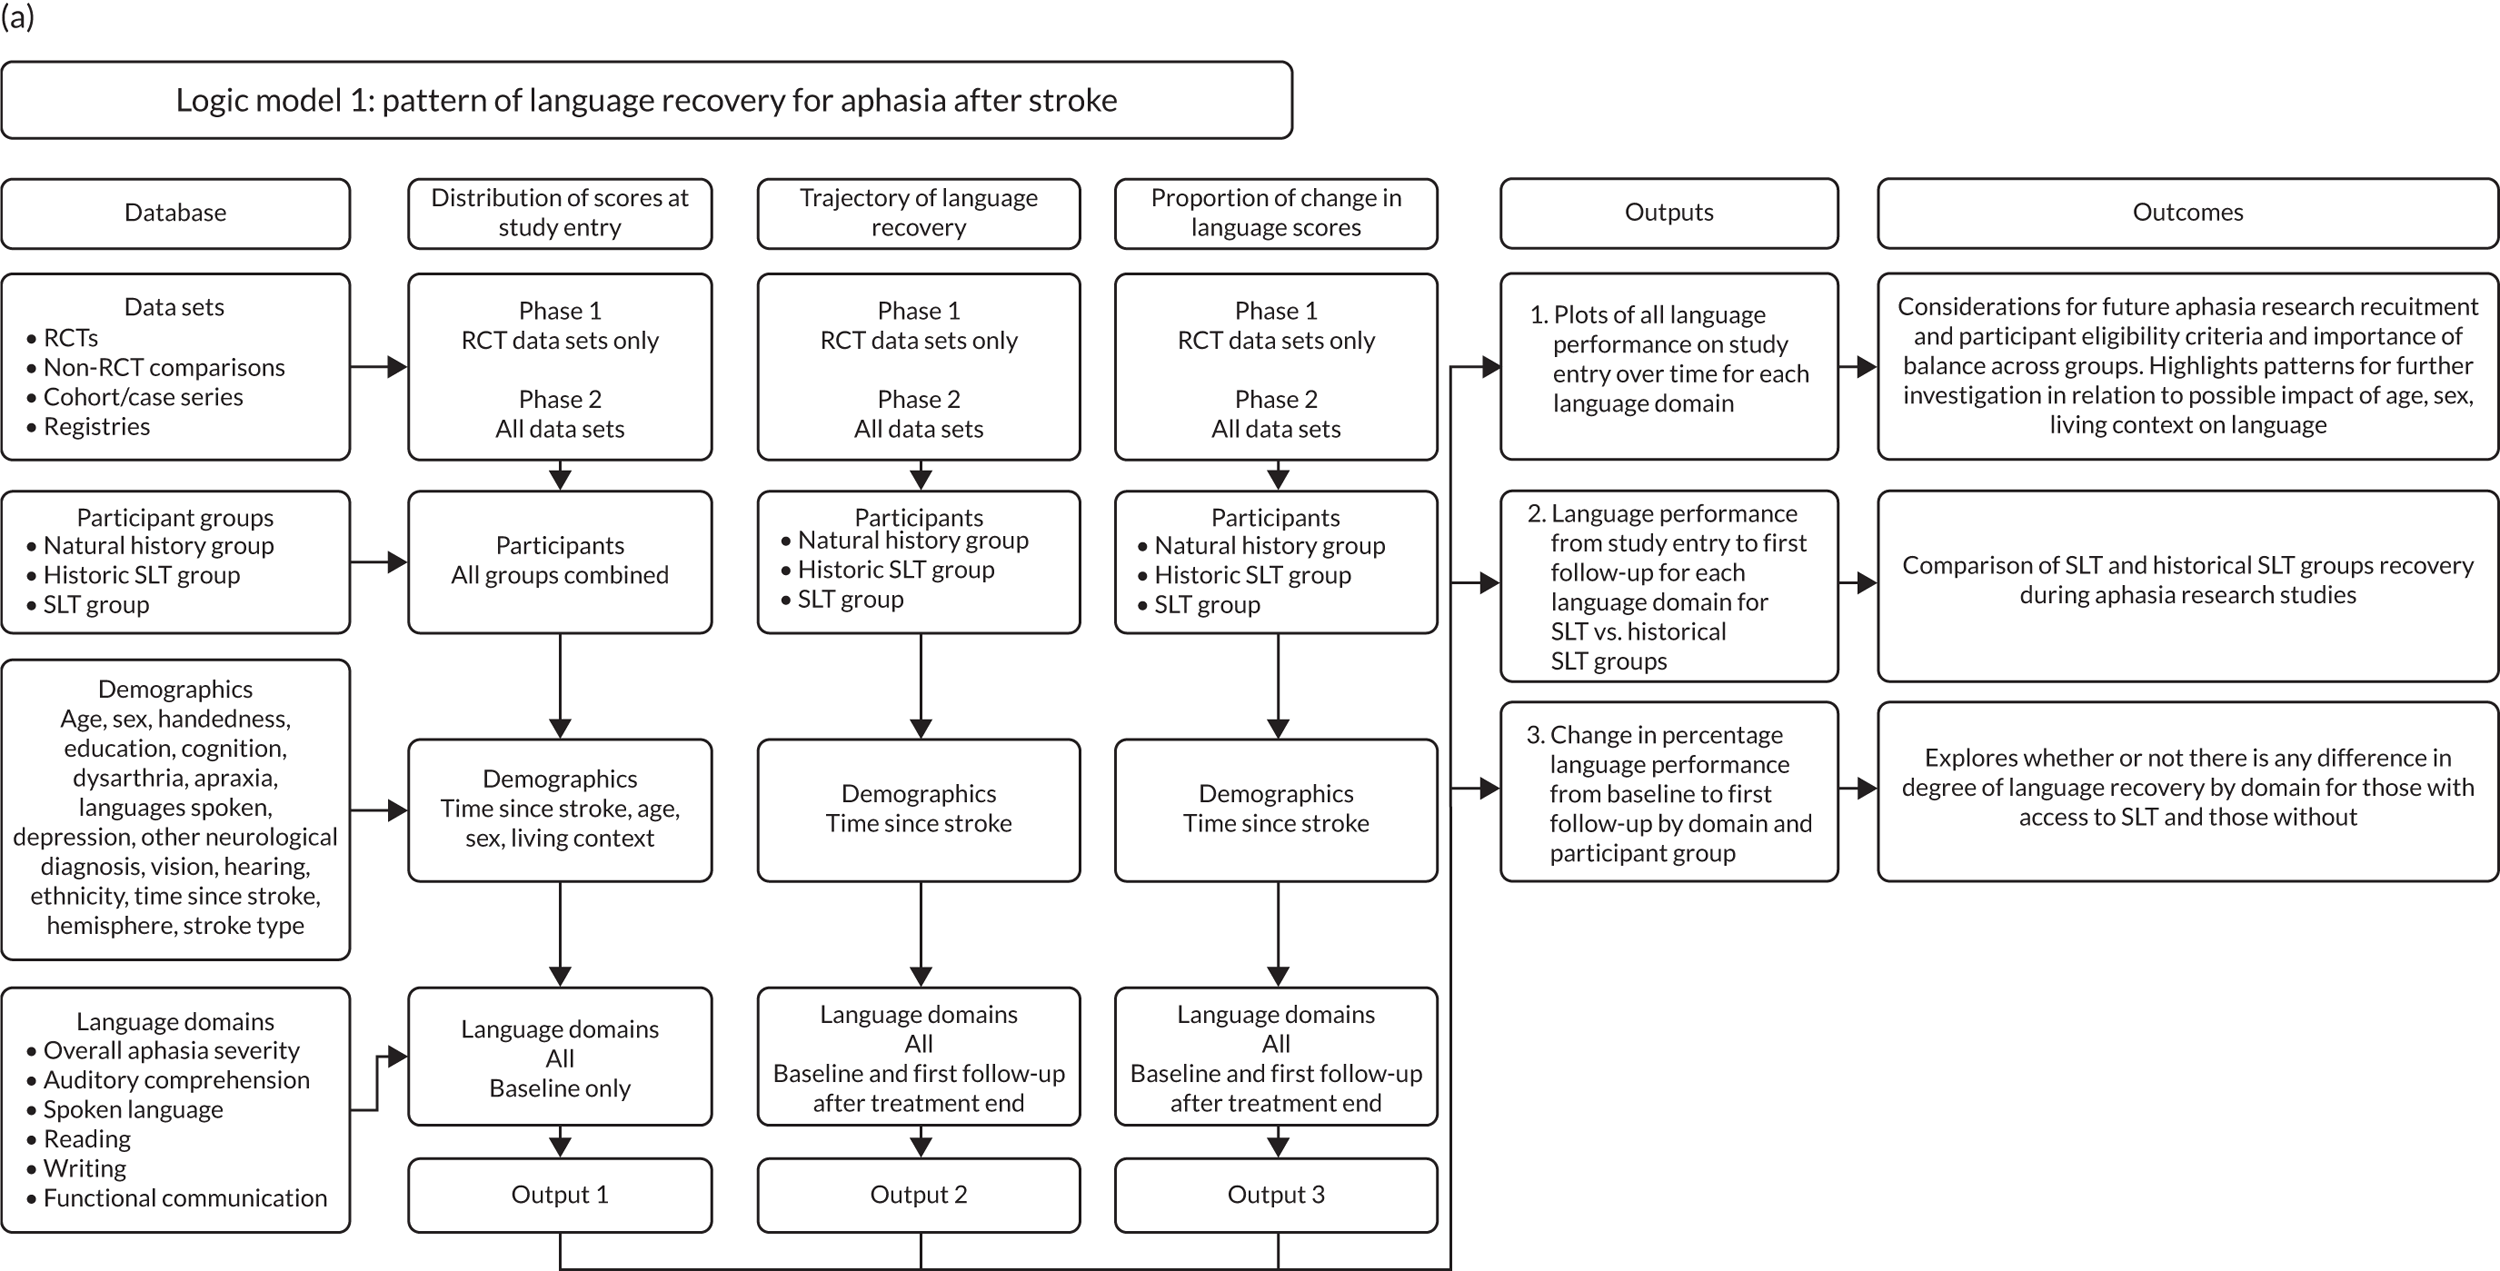
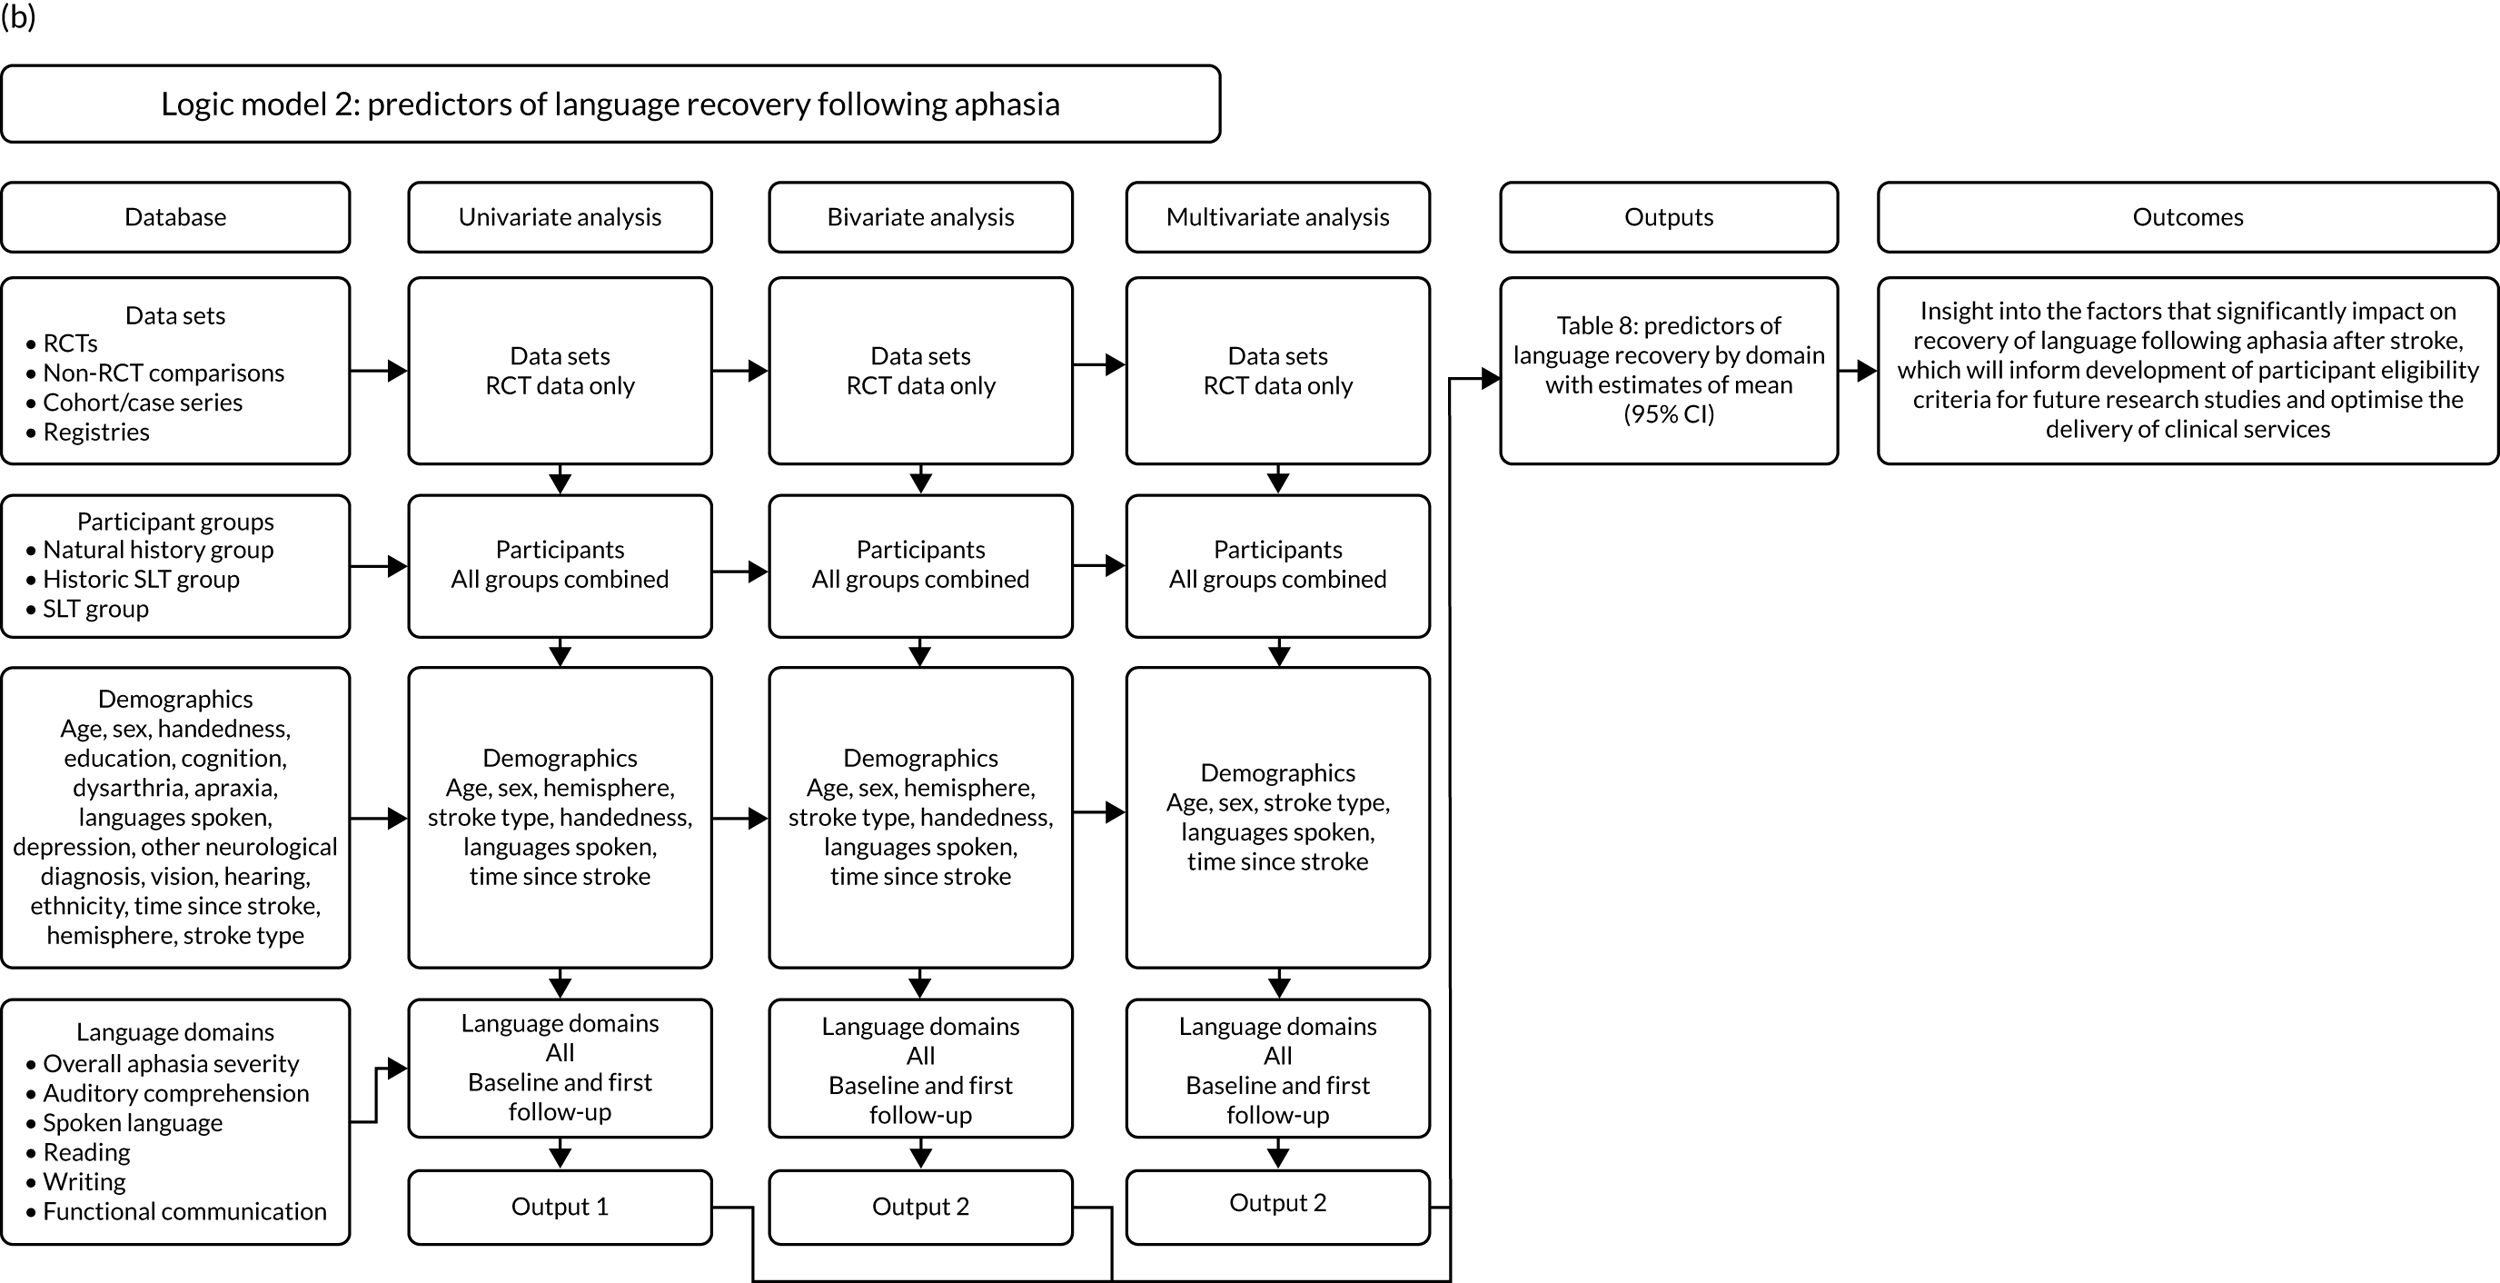
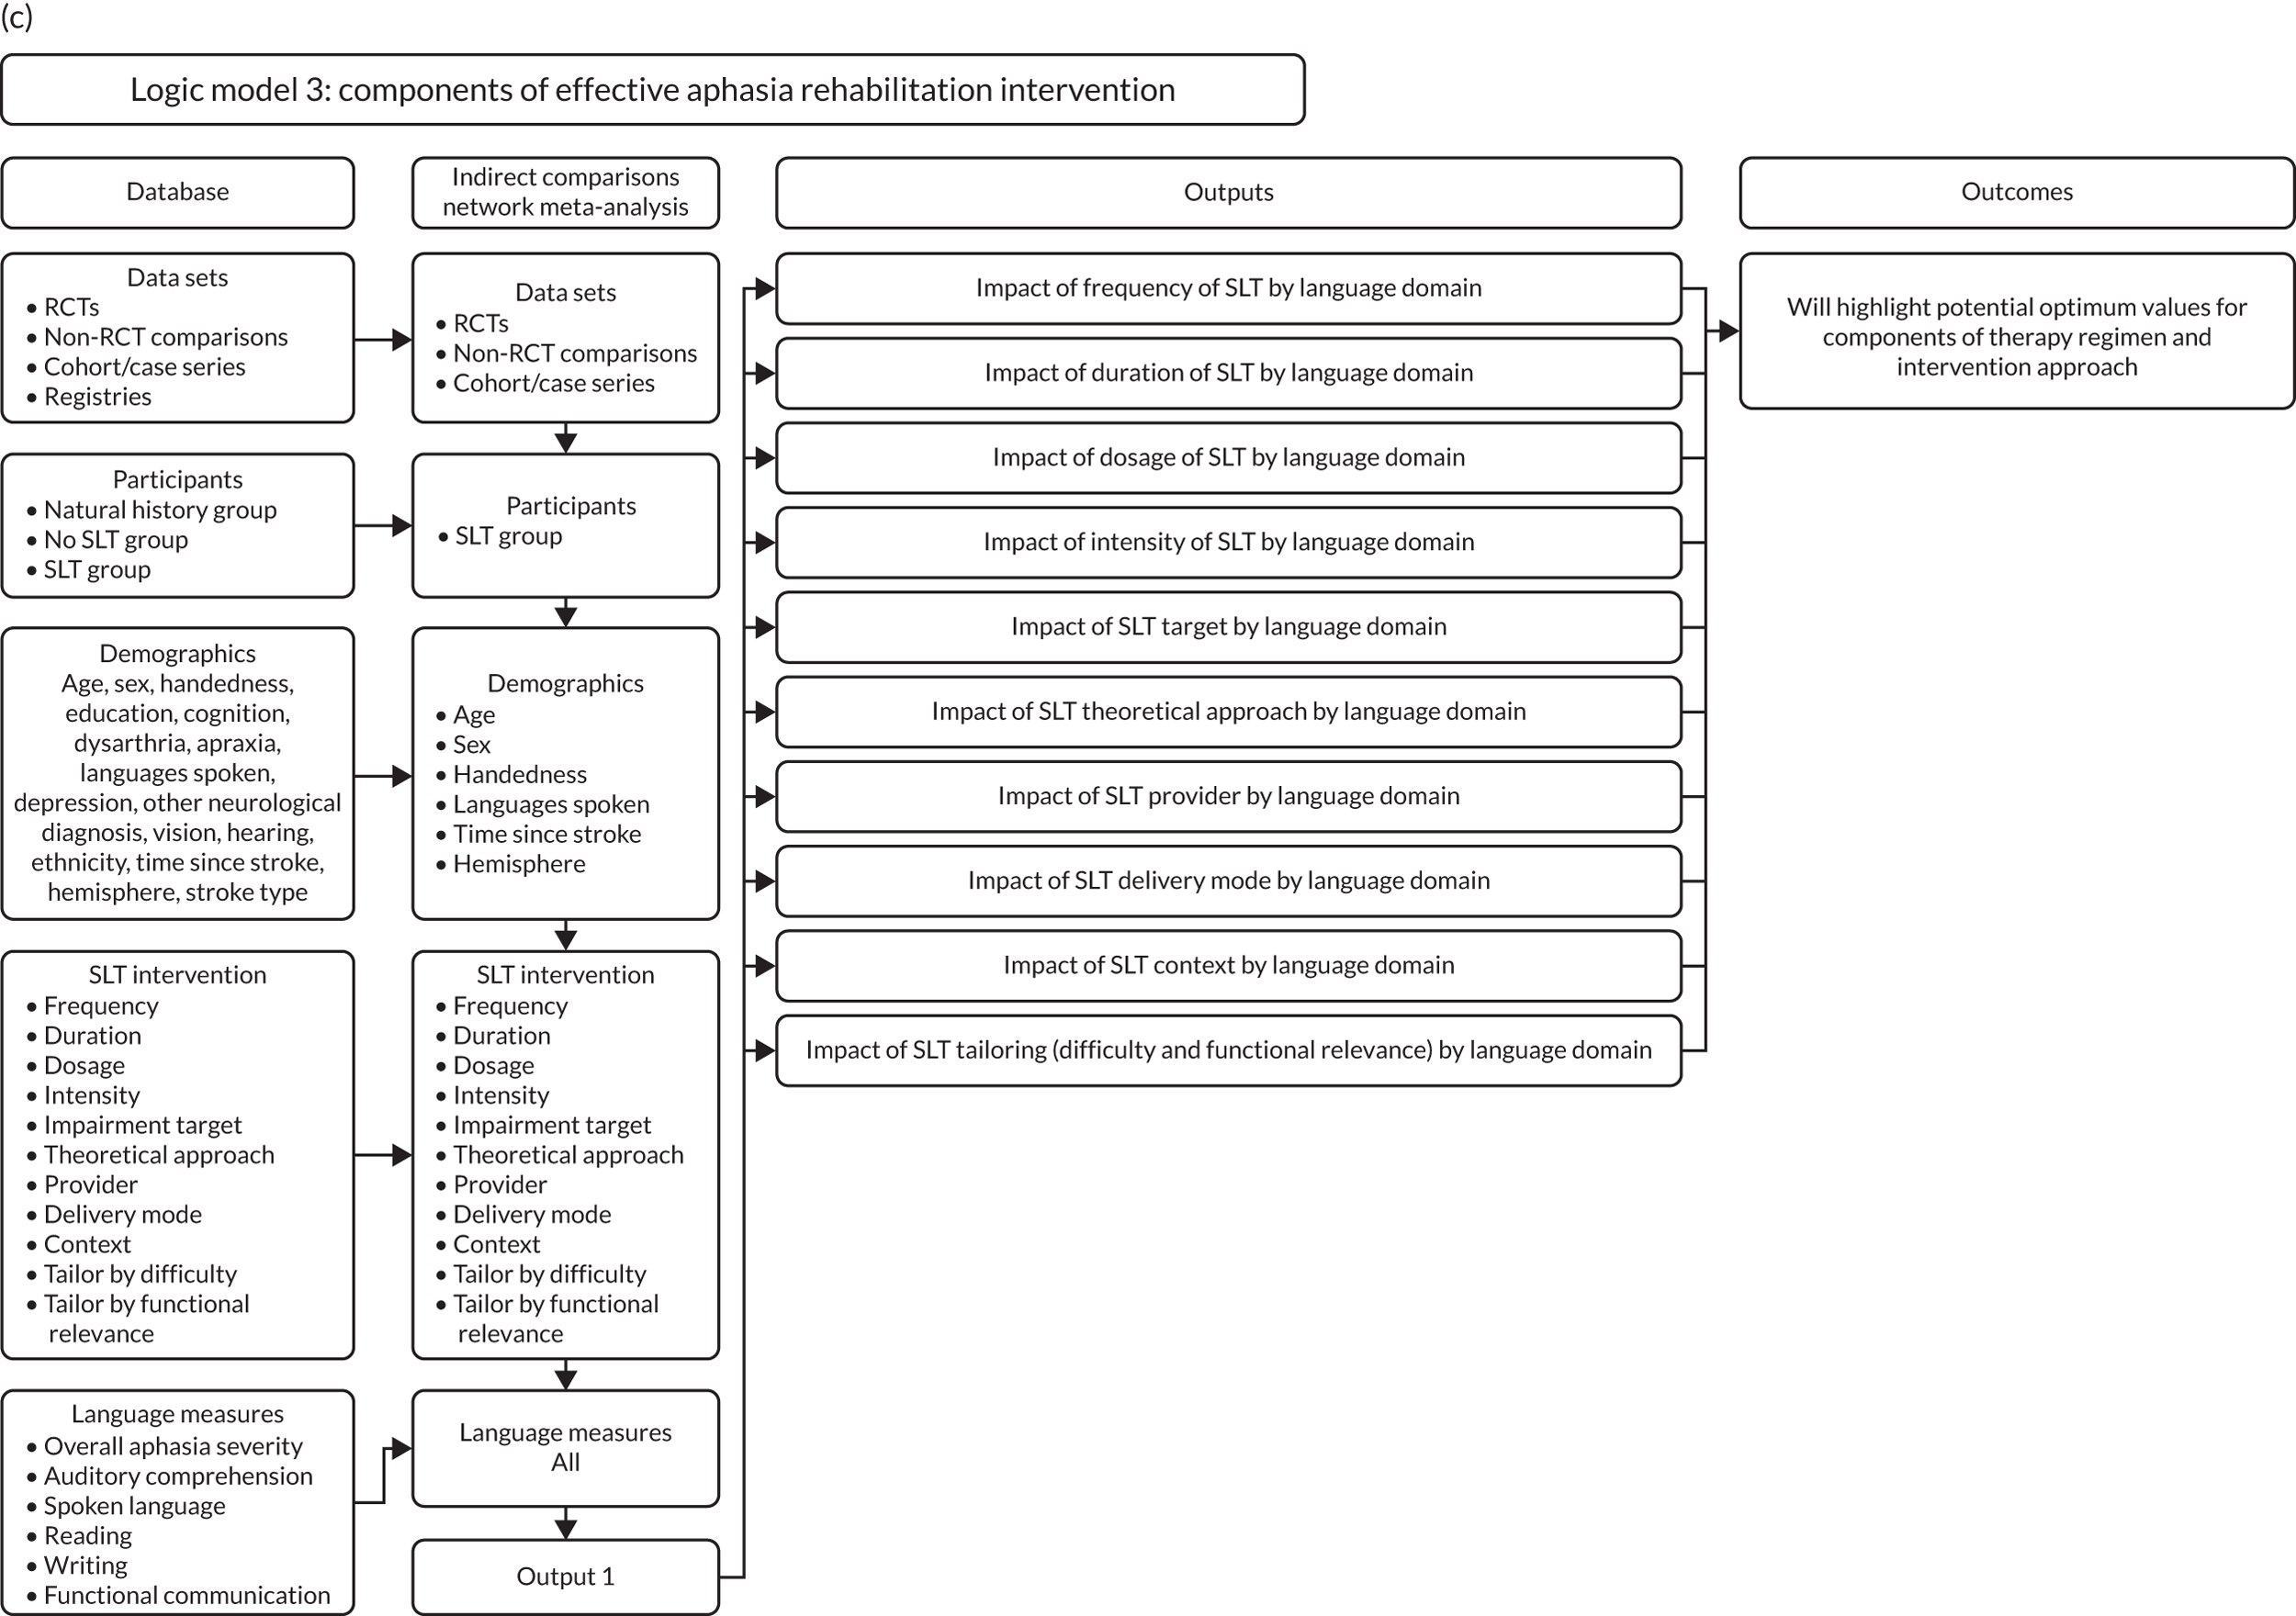
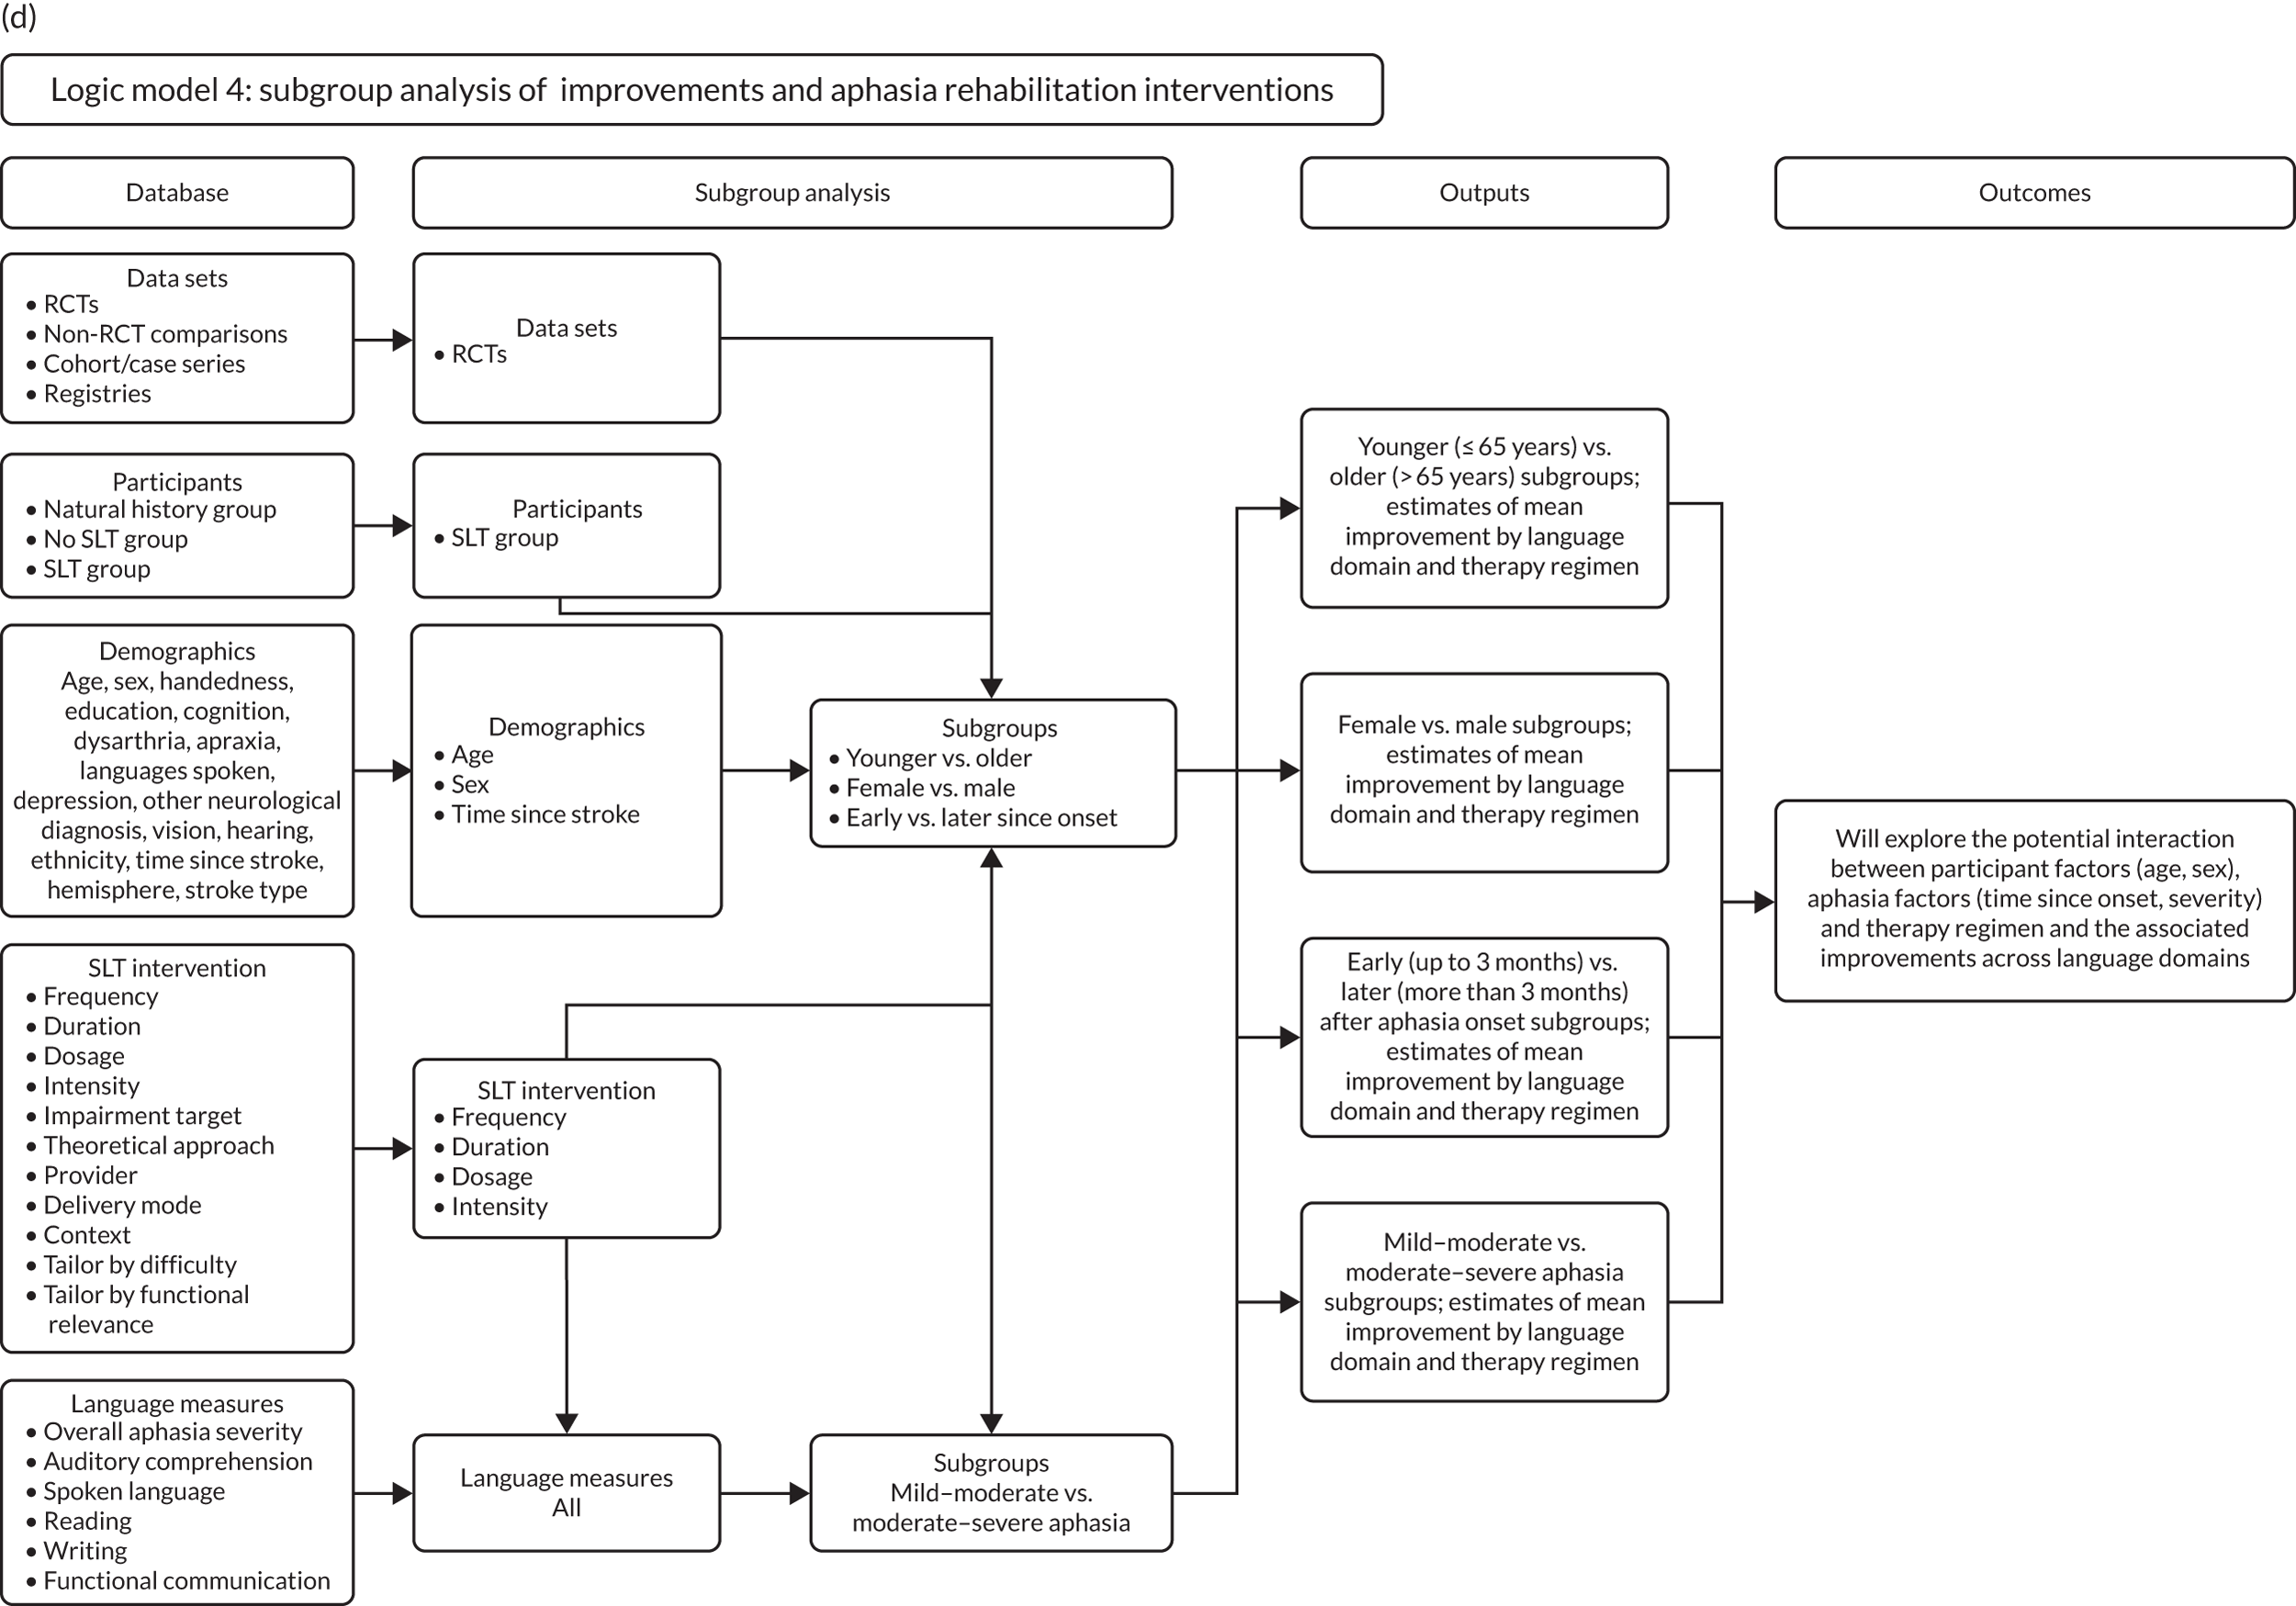
Appendix 4 Between-group comparisons (randomised controlled trials)
| Study | Treatment group | Number of participants in each group allocation | Age (years), median (IQR) | Wilcoxon signed-rank test133 for age differences between groups (p-value) | Male sex, n (%) | Chi-squared test134 for sex differences between groups (p-value) | Time between stroke onset and inclusion (days), median (IQR) | Wilcoxon signed-rank test133 for time differences between groups (p-value) | Aphasia severity (WAB-AQ) transformed score, median (IQR) | Wilcoxon signed-rank test134 for overall aphasia severity differences between groups (p-value) | Right handedness, n (%) | Chi-squared test133 for handedness differences between groups (p-value) | Years of education, median (IQR) | Wilcoxon signed-rank test134 for years of education differences between groups (p-value) |
|---|---|---|---|---|---|---|---|---|---|---|---|---|---|---|
| 002 | A | 44 | 76 (67.5–81) | 0.72 | 25 (56.8) | 0.90 | 6 (2.5–8) | 0.66 | – | – | – | – | – | – |
| B | 45 | 76 (67–82) | 25 (55.6) | 6 (3–8) | – | – | – | |||||||
| 003 | A | 64 | 75.5 (66–84) | 0.23 | 33 (53.2) | 0.08 | 3 (2–4) | 0.19 | 57.1 (28.2–64.4) | 0.78 | – | – | – | – |
| B | 61 | 79 (72–85) | 23 (37.7) | 3 (2–4) | 58.0 (28.2–64.7) | – | – | |||||||
| 004 | A | 77 | 71 (63–78) | 0.60 | 42 (54.6) | 0.81 | 12 (9–16) | 0.73 | – | – | – | – | – | – |
| B | 76 | 72 (63–78.5) | 40 (52.6) | 11 (9–18) | – | – | – | |||||||
| 006 | A | 5 | 55 (47–66) | 0.37 | 4 (80) | 0.49 | 1887 (1745–2092) | 0.84 | – | – | 5 (100) | – | 10 (10–16) | 0.68 |
| B | 5 | 48 (45–53) | 3 (60) | 2259 (1871–2478) | – | 5 (100) | 16 (9–19) | |||||||
| 008 | A | 17 | 71 (65–80) | 0.30 | 9 (52.9) | 0.29 | 2031.5 (1096–3127) | 0.53 | – | – | – | – | – | – |
| B | 17 | 66 (53–76) | 12 (70.6) | 2042 (1761–3512) | – | – | – | |||||||
| 010 | A | 15 | 70 (64–74) | 0.54 | 5 (83.3) | 0.63 | 426 (365–609) | 0.36 | – | – | 15 (100) | – | 4.5 (4–5) | 0.16 |
| B | 17 | 67 (56–73) | 11 (73.3) | 183 (91–914) | – | 17 (100) | 5 (5–7) | |||||||
| 011a | A | 6 | 45 (28–57) | 0.29a | 5 (83.3) | 0.43 | 106.5 (30–244) | 0.88 | 75.9 (71.4–81.2) | 0.67a | 6 (100) | 0.37 | – | – |
| B | 7 | 55 (52–63) | 6 (85.7) | 61 (30–61) | 73.8 (55.9–80.3) | 7 (100) | – | |||||||
| C | 5 | 52 (47–54) | 3 (60) | 152 (61–152) | 72.1 (58.1–90.1) | 5 (100) | – | |||||||
| D | 6 | 56 (48–58) | 3 (50) | 91 (61–152) | 65.7 (59.2–72.1) | 5 (83.3) | – | |||||||
| 011c | A | 6 | 55.5 (49–63) | 1.0 | 5 (83.3) | 0.51 | 61 (30–122) | 0.48 | 39.4 (35.4–47.8) | 0.44 | 6 (100) | – | – | – |
| B | 6 | 53.5 (49–62) | 4 (66.7) | 121.5 (30–335) | 48.7 (42.7–56.3) | 6 (100) | – | |||||||
| 015 | A | 72 | 55 (46.5–60) | 0.70 | 49 (68.1) | 0.24 | 822.5 (396–1462) | 0.056 | 70.4 (40.7–87.9) | 0.80 | 67 (93.1) | 0.29 | 10 (10–17) | 0.17 |
| B | 70 | 54 (50–61) | 41 (58.6) | 1263.5 (487–2071) | 67.2 (44.1–84.8) | 64 (91.4) | 10 (10–10) | |||||||
| 016 | A | 6 | 69.5 (63–75) | 0.53 | 4 (66.7) | 0.56 | 2.5 (2–3) | 1.00 | – | – | 6 (100) | – | 8 (5–8) | 0.33 |
| B | 6 | 61.5 (59–72) | 3 (50) | 2 (2–3) | – | 6 (100) | 5 (5–8) | |||||||
| 022 | A | 51 | 72 (57–79) | 0.24 | 29 (56.9) | 0.22 | 264 (125–782) | 0.52 | – | – | – | – | – | – |
| B | 54 | 67.5 (55–75) | 37 (68.5) | 275 (149–1172) | – | – | – | |||||||
| 023 | A | 32 | 72.5 (62.5–79) | 0.52 | 14 (43.8) | 0.37 | 2.5 (2–4) | 0.59 | 31 (9.75–54.5) | 0.045 | – | – | – | – |
| B | 27 | 67 (58–79) | 15 (55.6) | 3 (2–4) | 9 (0–34.1) | – | – | |||||||
| 024 | A | 17 | 65 (57–71) | 0.23 | 10 (58.8) | 0.10 | 105 (56–126) | 0.28 | 74.9 (42–87.3) | 0.54 | – | – | – | – |
| B | 14 | 69.5 (59–74) | 12 (85.7) | 175 (70–364) | 55.3 (34.2–87.7) | – | – | |||||||
| 025 | A | 14 | 55.5 (50–67) | 0.11 | 9 (64.3) | 0.48 | 1141.5 (426–2223) | 0.75 | – | – | 14 (100) | 0.20 | – | – |
| B | 10 | 51.5 (41–54) | 5 (50) | 913.5 (335–2101) | – | 8 (88.9) | – | |||||||
| 026 | A | 9 | 72 (64–77) | 0.23a | 4 (44.4) | 0.50 | 7 (7–7) | 1.00a | 56.3 (0–81.2) | 0.46 | 9 (100) | – | 6.5 (6.5–6.5) | 0.80a |
| B | 8 | 63 (58.5–69) | 4 (50) | 7 (7–7) | 60.6 (56.3–81.2) | 8 (100) | 6.5 (6.5–6.5) | |||||||
| C | 9 | 64 (61–72) | 7 (77.8) | 7 (7–7) | 64.9 (56.3–64.9) | 9 (100) | 6.5 (4–6.5) | |||||||
| D | 10 | 66.5 (59–75) | 6 (60) | 7 (7–7) | 56.3 (0–64.9) | 10 (100) | 6.5 (4–6.5) | |||||||
| 027 | A | 15 | 57 (51–72) | 0.12 | 10 (66.7) | 0.70 | 56 (42–70) | 0.74 | 29 (11.5–67.9) | 0.62 | 15 (100) | – | 4 (4–9) | 0.96 |
| B | 15 | 64 (58–71) | 9 (60) | 42 (28–70) | 43.1 (16.3–64.7) | 15 (100) | 4 (4–9) | |||||||
| 028 | A | 10 | 65.5 (56–69) | 0.02 | 9 (90) | 0.26 | 1324.5 (1066–1797) | 0.059 | – | – | – | – | 11 (9–13) | 1.00 |
| B | 10 | 47.5 (43–61) | 7 (70) | 913.5 (548–1035) | – | – | 11 (9–13) | |||||||
| 035 | A | 8 | 64.3 (56.4–70) | 0.57 | 4 (50) | 1.00 | 360.5 (345–383.5) | 0.19 | – | – | 7 (87.5) | 0.25 | 9 (6–10) | 0.40 |
| B | 10 | 67.4 (56.3–74.3) | 5 (50) | 373.5 (367–447) | – | 10 (100) | 7.5 (6–9) | |||||||
| 038 | A | 10 | 56.5 (51–61) | 0.34 | 5 (50) | 0.68 | 28 (14–35) | 0.37 | 28.2 (0–56.3) | 0.72 | 10 (100) | – | – | – |
| B | 19 | 61 (54–68) | 8 (42.1) | 28 (14–56) | 0 (0–56.3) | 19 (100) | – | |||||||
| 041 | A | 7 | 68 (56–77) | 0.32 | 5 (71.4) | 0.48 | 639 (365–700) | 0.85 | – | – | – | – | – | – |
| B | 4 | 61.5 (37–67.5) | 2 (50) | 1020 (441.5–1446.5) | – | – | – | |||||||
| 054 | A | 38 | 68 (62–78) | 0.95 | 14 (36.8) | 0.07 | 22.5 (17–26) | 0.95 | – | – | 31 (81.6) | 0.35 | 12 (12–13) | 0.55 |
| B | 42 | 69.5 (57–79) | 24 (57.1) | 22 (19–24) | – | 35 (85.4) | 12 (12–13) | |||||||
| 056 | A | 35 | 60 (52–71) | – | 16 (45.7) | – | 94 (87–99) | – | 64.9 (56.3–89.4) | – | 32 (94.1) | – | 12 (11–15) | – |
| 060 | A | 28 | 64.9 (58.7–73.9) | 0.075 | 18 (64.3) | 0.34 | 116.5 (102.5–145) | 1.00 | – | – | 25 (89.3) | 0.36 | 12 (8–14) | 0.94 |
| B | 29 | 58.3 (50.1–69.1) | 15 (51.7) | 115 (101–147) | – | 27 (93.1) | 12 (10–14) | |||||||
| 065 | A | 5 | 60 (56–67) | 1.00 | 4 (80) | – | 1328 (313–5040) | 0.24 | 66 (58.5–91.2) | – | 5 (100) | – | 9 (9–12) | 0.09 |
| B | 5 | 65 (60–66) | 4 (80) | 213 (180–241) | 59.5 (58.5–64.1) | 5 (100) | 16 (12–16) | |||||||
| 067 | A | 18 | 54 (49–61) | 0.98 | 11 (61.1) | 0.22 | 106.5 (61–1127) | 0.71 | – | – | 18 (100) | 0.40 | 15 (13–15) | 0.20 |
| B | 26 | 55.5 (48–61) | 11 (42.3) | 61 (61–548) | – | 25 (96.2) | 13 (10–15) | |||||||
| 069 | Multimodal therapy | 26 | 60.5 (48–67) | – | 15 (57.7) | – | 700.5 (457–1583) | – | – | – | – | – | 16 (14–18) | – |
| 076 | A | 15 | 67 (65–73) | 0.71 | 9 (60) | 0.14 | 47 (28–69) | 0.37 | – | – | 15 (100) | – | – | – |
| B | 15 | 70 (59–47) | 5 (33.3) | 38 (24–56) | – | 15 (100) | – | |||||||
| 078 | A | 11 | 63 (61.4–67.8) | 0.55 | 11 (100) | 0.038 | 1242 (438–2703) | 0.55 | – | – | 9 (81.8) | 0.18 | – | – |
| B | 9 | 62.4 (50.2–66.5) | 6 (66.7) | 657 (438–1863) | – | 9 (100) | – | |||||||
| 081 | A | 8 | 57.5 (53.5–66.5) | 0.97 | 7 (87.5) | 0.19 | 853 (365.5–3014.5) | 0.12 | – | – | – | – | 14 (12.5–15) | 0.99 |
| B | 12 | 54.5 (49.5–69) | 6 (50) | 213.5 (122–594) | – | – | 13 (9.5–16) | |||||||
| C | 18 | 61 (48–67) | 13 (72.2) | 198 (152–1248) | – | – | 14 (11–16) | |||||||
| 085 | A | 12 | 74.5 (53–83.5) | 0.76 | 9 (75) | 0.09 | 5 (4–8) | 0.38 | 45.5 (14.6–70.4) | 0.62 | – | – | – | – |
| B | 8 | 76.5 (65.5–82.5) | 3 (37.5) | 6.5 (4.5–8.5) | 51.1 (17.7–68.1) | – | – | |||||||
| 301 | NA | 16 | 53 (43–57.5) | – | 15 (93.8) | – | 244 (183–883) | – | – | – | – | – | – | – |
| 312 | A | 10 | 54 (49–64) | 0.89 | 6 (60) | 0.25 | 2375 (1157–5237) | 0.024 | – | – | 8 (80) | 0.76 | 10 (10–13) | 0.57 |
| B | 7 | 56 (48–62) | 6 (85.7) | 457 (305–1370) | – | 6 (85.7) | 10 (9–13) | |||||||
| 313 | A | 71 | 70 (65–75) | 0.007 | 38 (53.5) | 0.45 | 28 (28–49) | 0.18 | – | – | – | – | – | – |
| B | 84 | 67 (59–72) | 50 (59.5) | 35 (28–49) | – | – | – | |||||||
| 316 | A | 20 | 58.5 (54–69.5) | 0.53 | 10 (50) | 0.53 | 28.5 (18–51) | 0.39 | 56.3 (56.3–73.1) | 0.40 | 20 (100) | – | 12 (10–13) | 0.095 |
| B | 20 | 67 (51.5–71.5) | 8 (40) | 26.5 (15.5–47.5) | 64.9 (56.3–81.2) | 20 (100) | 13.5 (11–16) | |||||||
| 330 | A | 14 | 53.5 (50–60) | 0.038 | 7 (50) | 0.25 | 548 (402–913) | 0.013 | – | – | 14 (100) | – | – | – |
| B | 14 | 46 (43–48) | 10 (71.4) | 1315 (767–3653) | – | 14 (100) | – | |||||||
| 334 | A | 10 | 65 (52–72) | 0.20 | 7 (70) | 0.33 | 66 (42–103) | 0.17 | 64.9 (56.3–64.9) | 0.95 | 10 (100) | – | 12.5 (10–14) | 0.30 |
| B | 14 | 56 (54–60) | 7 (50) | 46 (28–76) | 64.9 (56.3–64.9) | 14 (100) | 14 (12–17) | |||||||
| 339 | A | 24 | 58 (51.5–68.5) | – | 13 (54.2) | – | 837.5 (456.5–1553) | – | 66.3 (55.2–83.4) | – | – | – | 16 (14–16) | – |
| 345 | A | 7 | 66 (62–80) | 0.40a | 3 (42.9) | 0.56 | 23 (20–30) | 0.71a | 48 (9.9–58.4) | 0.50a | 7 (100) | – | 9 (9–12) | 0.61a |
| B | 7 | 65 (49–78) | 4 (57.1) | 23 (20–35) | 57.8 (19–58.1) | 7 (100) | – | 12 (9–16) | ||||||
| C | 7 | 64 (55–72) | 5 (71.4) | 22 (18–35) | 38.1 (20.7–48.8) | 7 (100) | – | 12 (9–16) | ||||||
| 357 | A | 5 | 59 (53–64) | 0.47a | 2 (40) | 0.06 | 1462 (1279–1675) | 0.15a | 81.2 (64.9–81.2) | 0.59 | – | – | – | – |
| B | 6 | 58 (45–62) | 5 (83.3) | 639.5 (365–1309) | 81.2 (81.2–81.2) | – | – | |||||||
| C | 6 | 51 (36–63) | 6 (100) | 381 (183–639) | 81.2 (81.2–81.2) | – | – | |||||||
| 382 | NA | 12 | 62 (56.5–70) | – | 10 (83.3) | – | 334.5 (274–1095.5) | – | 49.1 (31.4–74.2) | – | 12 (100) | – | – | – |
| 383 | NA | 12 | 49.5 (34.5–54) | – | 6 (50) | – | 334.5 (197.5–958.5) | – | – | – | 12 (100) | – | – | – |
| 388 | NA | 12 | 62 (52.5–65) | – | 8 (66.7) | – | 1263 (593.5–1628.5) | – | – | – | 12 (100) | – | – | – |
| 392 | A | 6 | 62 (54–66) | 0.28 | 4 (66.7) | 0.51 | 1218 (914–1614) | 0.70 | – | – | 6 (100) | – | 13 (10–16) | 0.94 |
| B | 6 | 68.5 (63–72) | 5 (83.3) | 1111.5 (822–1462) | – | 6 (100) | 13 (12–14) | |||||||
| 401 | A | 10 | 69 (57–79) | – | 8 (80) | – | 1279 (548–1553) | – | – | – | – | – | 13.5 (12–16) | – |
| 410 | NA | 10 | 61 (60–65) | – | 7 (100) | – | 1628.5 (883–2527) | – | – | – | – | – | 17 (14–18) | – |
| 416 | NA | 10 | 67.5 (58–75) | – | 5 (50) | – | 1537 (426–1948) | – | – | – | 10 (100) | – | 13 (12–16) | – |
| 471 | NA | 16 | – | – | – | – | 365 (152–623.5) | – | 81.2 (81.2–92.9) | – | 16 (100) | – | – | – |
| 520 | NA | 12 | 52 (45–59.5) | – | 7 (58.3) | – | 2206 (1354–3210) | – | – | – | 12 (100) | – | 14 (10.5–17) | – |
Appendix 5 Between-group comparisons (non-randomised controlled trials)
| Study ID | Group allocation | n | Age (years), median (IQR) | Wilcoxon signed-rank test133 for age differences between groups (p-value) | Male sex, n (%) | Chi-squared test134 for sex differences between groups (p-value) | Time between stroke onset and inclusion (days), median (IQR) | Wilcoxon signed-rank test133 for time differences between groups (p-value) | Aphasia severity (WAB-AQ) transform score, median (IQR) | Wilcoxon two sample t-test133 for overall aphasia severity differences between groups (p-value) | Right handedness, n (%) | Chi-squared test134 for handedness differences between groups (p-value) | Years of education, median (IQR) | Wilcoxon signed-rank test133 for years of education differences between groups (p-value) |
|---|---|---|---|---|---|---|---|---|---|---|---|---|---|---|
| 001 | – | 119 | 77 (71–82) | – | 64 (53.8) | – | 5 (3–8) | – | 65.1 (56.3–89.4) | – | 106 (93) | – | – | – |
| 005 | – | 301 | 63.5 (54.7–70.8) | – | 183 (60.8) | – | 1442.5 (694–2622.5) | – | – | – | 273 (90.7) | – | 16 (13–17) | – |
| 007 | – | 50 | 65.5 (58–71) | – | 36 (73.5) | – | 15 (15–15) | – | – | – | – | – | – | – |
| 009 | – | 25 | 55 (46–67) | – | 13 (52) | – | 487.2 (182.7–791.7) | – | – | – | – | – | 8 (4–11) | – |
| 011b | SLT | 18 | 48.5 (43–56) | – | 12 (66.7) | – | 91 (61–183) | – | 40.6 (37.5–53.5) | – | 13 (100) | – | – | – |
| 013 | – | 23 | 52 (43–66) | – | 14 (60.9) | – | 365 (274–761) | – | – | – | – | – | 13 (8–17) | – |
| 014 | – | 12 | 70 (66.5–73.5) | – | 8 (66.7) | 913.5 (731–1826) | – | – | – | 12 (100) | – | 5 (2.5–6) | – | |
| 018 | – | 32 | 73 (61–78.5) | – | 20 (62.5) | – | 14 (14–14) | – | – | – | – | – | – | – |
| 019 | – | 16 | 57 (52.7–63.2) | – | 9 (56.3) | – | 103.5 (67.5–184.5) | – | 63.7 (33.2–87.2) | – | 16 (100) | – | 12 (11–13) | – |
| 020 | – | 14 | 62.5 (52.4–68.6) | – | 10 (71.4) | – | 146.5 (122–179) | – | 72.5 (47.8–87.2) | – | 14 (100) | – | 14 (11–17) | – |
| 021 | – | 39 | 55.5 (46.2–61.9) | – | 21 (53.9) | – | 94 (64–118) | – | 70.1 (42.3–86.9) | – | – | – | 11 (11–16) | – |
| 029 | – | 19 | 70 (62–76) | – | 11 (57.9) | – | 152 (122–152) | – | – | – | 19 (100) | – | 5 (5–8) | – |
| 030 | A | 53 | 81 (69–87) | 0.39 | 22 (41.5) | 0.29 | 6 (2–12) | < 0.0001 | – | – | – | – | – | – |
| B | 42 | 77 (66–84) | 22 (52.4) | 22 (8–29) | – | – | – | |||||||
| 033 | – | 50 | 65 (56–73) | – | 28 (56) | – | 2192 (1096–3287) | – | – | – | – | – | – | |
| 034 | – | 83 | 65 (51–74) | – | 52 (62.7) | – | 1096 (398–1501) | – | – | – | – | – | – | – |
| 036 | – | 12 | 57.5 (48.5–66) | – | 7 (58.3) | – | 988.5 (713–1398.5) | – | 65.7 (55.9–89.3) | – | – | – | – | – |
| 037 | – | 50 | 69.5 (62–80) | – | 30 (60) | – | 346 (225–468) | – | – | – | 45 (90) | – | – | – |
| 039 | A | 16 | 54 (50.5–67) | 0.25 | 14 (87.5) | 0.46 | 807 (411–1796) | 0.11 | 48.8 (37.1–66.9) | 0.82 | 15 (93.8) | 0.62 | – | – |
| B | 18 | 59 (54–71) | 14 (77.8) | 487 (365–670) | 44.5 (41.1–61.3) | 16 (88.9) | – | |||||||
| 040 | – | 15 | 65 (55–72) | – | 7 (46.7) | – | 1736 (457–2893) | – | 62.6 (57.6–89.4) | – | – | – | 14 (12–16) | – |
| 042 | – | 13 | 59 (48–62) | – | 7 (53.9) | – | 59 (19–172) | – | 45.7 (40.3–51) | – | – | – | 12 (11–14) | – |
| 043 | – | 10 | 48 (43–51) | – | 7 (70) | – | 411 (274–609) | – | – | – | 7 (100) | – | – | – |
| 045 | SLT | 13 | 47 (44–58) | – | 10 (71.4) | – | 1233 (761–1492) | – | – | – | 14 (100) | – | 10 (9–13) | |
| 047 | – | 70 | 67 (56–74) | – | 53 (75.7) | – | 1157.5 (670–2101) | – | 81.2 (64.9–92.9) | – | 70 (100) | – | 11 (11–13) | – |
| 048 | A | 3 | 62 (58–66) | 0.28a | 3 (100) | 0.04 | 1462 (457–3502) | 0.38a | 58.9 (37.2–87.2) | 0.86a | 3 (100) | – | – | – |
| B | 5 | 53 (46–67) | 3 (60) | 1188 (853–1188) | 45.5 (18–100) | 5 (100) | – | |||||||
| C | 11 | 55 (46–59) | 11 (100) | 914 (639–1218) | 69.2 (43.6–85.5) | 11 (100) | – | |||||||
| D | 5 | 58 (51–63) | 5 (100) | 792 (548–822) | 78.5 (75–92.9) | 5 (100) | – | |||||||
| 049 | – | 86 | 70 (59–79) | – | 45 (52.3) | – | 14 (14–14) | – | 56.3 (0–81.2) | – | 86 (100) | – | – | – |
| 050 | 420 | 62 (51.8–70.7) | – | 298 (71) | – | 1091.5 (491–2375.5) | – | 71.5 (42.6–87.3) | – | 370 (88.1) | – | 11 (11–16) | – | |
| 052 | A | 7 | 62 (33–80) | 0.82 | 3 (42.9) | 0.18 | 61 (61–91) | 0.04 | – | – | – | – | – | – |
| B | 3 | 54 (51–54) | 0 (0) | 183 (183–3654) | – | – | – | |||||||
| 053 | A | 5 | 56 (53–64) | 1.00 | 3 (60) | 0.74 | 670 (670–1218) | 0.33 | – | – | 5 (100) | – | 16 (15–17) | 0.11 |
| B | 6 | 61.5 (49–66) | 3 (50) | 1400.5 (761–2345) | – | 6 (100) | 15 (13–15) | |||||||
| 057 | – | 51 | 52 (43–64) | – | 26 (51) | – | 442 (61–1087) | – | – | – | 51 (100) | – | 12 (12–14.5) | – |
| 058 | – | 10 | 57 (51–64) | – | 5 (50) | – | 56 (49–70) | – | – | – | 8 (80) | – | 10 (10–14) | – |
| 059 | A | 5 | 65 (56–67) | 0.42 | 2 (40) | 0.20 | 183 (122–487) | 1.00 | – | – | 5 (100) | – | – | – |
| B | 5 | 56 (52–66) | 3 (60) | 183 (122–244) | – | 5 (100) | – | |||||||
| 061 | – | 24 | 71 (59–80.5) | – | 10 (41.7) | – | 152 (30–609) | – | – | – | – | – | 12 (12–16) | – |
| 062 | – | 11 | 73 (64–74) | – | 9 (81.8) | – | – | – | – | – | – | – | – | – |
| 063 | – | 13 | 65 (58–69) | – | 8 (61.5) | – | 883 (365–2040) | – | – | – | 13 (100) | – | – | – |
| 064 | – | 16 | 49.5 (46.5–60.5) | – | 10 (62.5) | – | 80 (49.5–487.5) | – | 77.2 (64.9–89.4) | – | 15 (93.8) | – | – | – |
| 066 | – | 53 | 60 (52,67) | – | 41 (77.4) | – | 213 (91–502.5) | – | 65.7 (56.3–89.4) | – | – | – | 8 (5–12) | – |
| 068 | – | 47 | 56 (51–62) | – | 30 (63.8) | – | 1035 (244–1614) | – | 59.5 (56.7–91.1) | – | 43 (91.5) | – | 12 (8–14) | – |
| 069 | A | 26 | 60.5 (48–67) | – | 15 (57.7) | – | 700.5 (457–1583) | – | – | – | – | – | 16 (14–18) | – |
| 070 | – | 147 | 70 (58–79) | – | 69 (46.9) | – | 8 (8–8) | – | – | – | 127 (88.2) | – | 12 (12–14) | – |
| 071 | – | 258 | 60.5 (49.8–69.9) | – | 172 (66.7) | – | 94 (37–213) | – | – | – | 255 (99.6) | – | 8 (8–12) | – |
| 072 | – | 26 | 49 (44–64) | – | 17 (65.4) | – | 40 (15–326) | – | 81.2 (60.6–89.4) | – | – | – | – | – |
| 073 | – | 19 | 74 (67–80) | – | 11 (61.1) | – | 2740.5 (1918.5–3380) | – | – | – | – | – | 11 (10–11) | – |
| 074 | – | 15 | 64 (51–75) | – | – | – | 122 (76–274) | – | 64.9 (56.3–81.2) | – | 15 (100) | – | – | – |
| 077 | – | 97 | 65 (53–71) | – | 60 (61.9) | – | 20 (10–35) | – | 64.9 (56.3–89.4) | – | 90 (98.9) | – | 12 (9–16) | – |
| 079 | – | 105 | 54 (48–60) | – | 70 (66.7) | – | 1010 (422–2505) | – | 64.9 (56.3–89.4) | – | 105 (100) | – | 9 (6–11) | – |
| 080 | – | 30 | 65.5 (56–71) | – | 15 (50) | – | 167.5 (64–279) | – | 64.8 (52.7–83.2) | – | 25 (83.3) | – | 8.5 (0–12) | – |
| 082 | – | 14 | 63 (55–65) | – | 10 (71.4) | – | 30 (16–57) | – | – | – | 14 (100) | – | 12 (8–13) | – |
| 083 | – | 10 | 61 (52–71) | – | 6 (60) | – | 1369.5 (913–4383) | – | – | – | 10 (100) | – | 13.5 (12–18) | – |
| 084 | – | 35 | 62 (57–70) | – | 22 (62.9) | – | 1340 (579–2710) | – | 77.8 (42.8–88.5) | – | 32 (91.4) | – | 11 (9–12) | – |
| 086 | A | 5 | 65 (47–71) | 1.01 | 3 (60) | 0.77 | 304 (243–426) | 0.55 | – | – | 5 (100) | – | – | – |
| B | 58 (53–61) | 3 (60) | 365 (274–1096) | – | 5 (100) | – | ||||||||
| C | 52 (47–53) | 2 (40) | 304 (213–487) | 5 (100) | – | |||||||||
| 087 | – | 17 | 53 (46–65) | – | 8 (47.1) | – | 274 (182–700) | – | – | – | 17 (100) | – | – | – |
| 088 | – | 19 | 56 (46–63) | – | 15 (79) | – | 670 (335–2375) | – | 76.4 (57.9–79.8) | – | 19 (100) | – | – | – |
| 303 | – | 19 | 59 (46–64) | – | 17 (89.5) | – | 670 (274–2558) | – | – | – | 19 (100) | – | 13 (12–16) | – |
| 304 | – | 14 | 52 (50–57) | – | 14 (100) | – | 929 (365–1127) | – | 43.8 (36.3–80.9) | – | 13 (92.9) | – | – | – |
| 305 | – | 15 | 71 (58–75) | – | 8 (53.3) | – | 280 (231–392) | – | – | – | – | – | – | – |
| 306 | – | 10 | 51.5 (41–72) | – | 4 (40) | – | 244 (122–639) | – | – | – | – | – | 13 (8–15) | – |
| 307 | A | 13 | 68 (64–69) | 0.90 | 10 (76.9) | 1.00 | 30 (30–30) | 1.00 | – | – | 13 (100) | – | 5 (5–8) | 0.86 |
| B | 13 | 66 (66–69) | 10 (76.9) | 30 (30–30) | – | – | 13 (100) | 5 (5–6) | ||||||
| 308 | – | 14 | 66.5 (55–76) | – | 7 (50) | – | 1385.5 (792–1766) | – | – | 13 (92.9) | – | – | – | |
| 310 | – | 20 | 64.5 (52–68.5) | – | 11 (55) | – | 1278.5 (731–1643.5) | – | – | – | – | – | – | – |
| 314 | – | 68 | 74.5 (67–78.5) | – | 34 (50) | – | 400 (365.5–450.5) | – | 65.2 (25.9–91.2) | – | – | – | – | – |
| 315 | – | 42 | 60.4 (50.4–69.1) | – | – | – | 749 (475–1534) | – | – | – | – | – | – | – |
| 317 | – | 18 | 59 (54–65) | – | 13 (72.2) | – | 1370 (457–2832) | – | 77.7 (71.4–90.2) | – | – | – | 16 (14–18) | – |
| 320 | – | 30 | 55.5 (47–63) | – | – | – | 1431.5 (426–3197) | – | 76.8 (62.4–92.2) | – | – | – | 14 (12–16) | – |
| 321 | – | 31 | 64 (56–67) | – | 21 (67.7) | – | 822 (426–1401) | – | 82.6 (59–90) | – | 31 (100) | – | – | – |
| 322 | – | 13 | 69 (64–77) | – | 14 (46.7) | – | 974.5 (700–1918) | – | 78.1 (64.2–87.8) | – | – | – | 9.5 (8–14) | – |
| 325 | – | 30 | 58.5 (53–65) | – | 14 (46.7) | – | 731 (365–1583) | – | 54.7 (31.8–86.2) | – | 30 (100) | – | – | – |
| 326 | – | 29 | 63 (51–71) | – | 14 (48.3) | – | 950 (548–1972) | – | – | – | – | – | 14 (12–16) | – |
| 329 | – | 28 | 52 (47–66) | – | 14 (50) | – | 1126.5 (883–1568.5) | – | – | – | 28 (100) | – | – | – |
| 332 | – | 27 | 58 (53–64) | – | 24 (88.9) | – | 518 (274–1066) | – | – | – | 27 (100) | – | – | – |
| 333 | – | – | – | – | – | – | 402 (365–548) | – | – | – | 26 (100) | – | – | – |
| 335 | – | 26 | 62 (57–71) | – | 14 (53.9) | – | 426 (213–639) | – | 87.3 (80.8–87.4) | – | 26 (100) | – | 12 (10–14) | – |
| 336 | – | 25 | 62.7 (60.5–67.8) | – | – | – | 1278 (475–1863) | – | – | – | – | – | – | – |
| 337 | – | 25 | 57 (49–67) | – | 14 (56) | – | 1899 (840–2959) | – | 89 (83–93) | – | – | – | 17 (15–18) | – |
| 338 | – | 24 | 55 (52–64.5) | – | 14 (58.3) | – | 11 (7–18.5) | – | – | – | 24 (100) | – | – | – |
| 340 | – | 23 | 66 (49–72) | – | – | – | 670 (244–1552) | – | – | – | 22 (95.7) | – | – | – |
| 342 | – | 23 | 55 (46–60) | – | 14 (60.9) | – | 822 (487–1797) | – | – | – | 23 (100) | – | 9 (9–14) | – |
| 346 | – | 23 | 61 (47–75) | – | – | – | 97 (55–335) | – | – | – | 23 (100) | – | 12 (12–12) | – |
| 348 | A | 11 | 55.4 (52.5–62.7) | 1.00 | 9 (81.8) | 0.18 | 719 (356–1328) | 0.88 | – | – | 10 (90.9) | 0.51 | – | – |
| B | 9 | 61.4 (49.1–64.5) | 9 (100) | 761 (344–1185) | – | 7 (77.8) | – | |||||||
| 349 | – | 36 | 58 (50.5–65.5) | – | 26 (72.2) | – | 122 (91–2101) | – | – | – | 36 (100) | – | – | – |
| 351 | – | 20 | 66 (54–71) | – | 13 (65) | – | 305 (259–365) | – | – | – | 20 (100) | – | 12 (8–13) | – |
| 352 | – | 20 | 57 (50–61) | – | 13 (65) | – | 2588.5 (1507.5–3623.5) | – | – | – | 20 (100) | – | – | – |
| 353 | – | 19 | 68 (59–73) | – | 7 (36.8) | – | 91 (91–122) | – | – | – | 19 (100) | – | – | – |
| 358 | – | 17 | 60 (53–69) | – | – | – | 639 (305–1309) | – | 69.8 (41.7–87.2) | – | 17 (100) | – | – | – |
| 359 | – | 17 | 63 (52–74) | – | 10 (58.8) | – | 1461 (731–2557) | – | 74.7 (66.4–88.6) | – | – | – | – | – |
| 360 | – | 17 | 66 (59–69) | – | 12 (70.6) | – | 1127 (518–2375) | – | – | – | 17 (100) | – | – | – |
| 361 | – | 16 | 60.5 (53–69) | – | 11 (68.8) | – | 715.5 (426–1142) | – | 79 (51.2–87.2) | – | 13 (100) | – | – | – |
| 362 | – | 14 | 52 (48–55) | – | 8 (57.1) | – | 639.5 (274–1675) | – | – | – | 14 (100) | – | – | – |
| 364 | – | 16 | 57 (50.5–70) | – | 9 (56.3) | – | 1430.5 (898–2009) | – | 72.9 (63.6–86.3) | – | 16 (100) | – | – | – |
| 365 | – | 16 | 58 (47.5–65.5) | – | 12 (75) | – | 761 (396–1643) | – | 73.1 (67.9–86.8) | – | – | – | – | – |
| 367 | – | 15 | 58 (50–63) | – | 9 (60) | – | 1826 (1095–3986) | – | 61.7 (58.1–87) | – | 15 (100) | – | 12.8 (12–16) | – |
| 369 | – | 10 | 65.5 (45–68) | – | 8 (80) | – | 760.5 (456–1278) | – | – | – | 10 (100) | – | 12 (2–12) | – |
| 370 | – | 15 | 68 (60–78) | – | 13 (86.7) | – | 1095 (761–1917) | – | – | – | 15 (100) | – | 11.5 (9–12) | – |
| 371 | – | 15 | 60 (51–66) | – | 8 (53.3) | – | 1582 (1217–2678) | – | 87.8 (71.4–93.2) | – | 15 (100) | – | 16 (15–17) | – |
| 372 | – | 15 | 68 (52–72) | – | 10 (66.7) | – | 426 (274–1248) | – | – | – | 15 (100) | – | 13.5 (12–14) | – |
| 374 | – | 14 | 67.5 (61–72) | – | 10 (71.4) | – | 791 (456–1795) | – | 94.6 (85.4–96) | – | 14 (100) | – | 16 (14–16) | – |
| 375 | A | 8 | 61.5 (50.5–69.5) | 0.57 | – | – | 898 (502–1445) | 0.42 | 46.3 (32.3–61.6) | 0.24 | – | – | – | – |
| B | 6 | 67 (60–74) | – | 1886.5 (274–2830) | 56.9 (46.6–74.5) | – | – | |||||||
| 377 | – | 14 | 66 (60–70) | – | – | – | 1096 (1096–1826) | – | 84.2 (41.4–88.5) | – | 14 (100) | – | – | – |
| 378 | – | 13 | 55 (50–63) | – | – | – | 1430 (852–2191) | – | 35.6 (24.9–56.2) | – | – | – | – | – |
| 379 | – | 13 | 69 (55–73) | – | 9 (69.2) | – | 1644 (913–2009) | – | – | – | – | – | 10 (10–11) | – |
| 381 | – | 11 | 61 (46–66) | – | – | – | 1369 (1126–2921) | – | 64.9 (60.6–92.9) | – | – | – | 12 (12–16) | – |
| 394 | – | 12 | 56.5 (43.5–65.5) | – | 5 (41.7) | – | 1416 (685–3273) | – | 69 (41.7–86.2) | – | – | – | – | – |
| 396 | – | 10 | 54 (46–58) | – | 4 (40) | – | 532.5 (274–1218) | – | 74 (47–92.5) | – | – | – | 13 (12–15) | – |
| 397 | – | 11 | 63 (54–66) | – | 9 (81.8) | – | 365 (365–1096) | – | – | – | 11 (100) | – | – | – |
| 398 | – | 11 | 56 (41–68) | – | 8 (72.7) | – | 1188 (670–1583) | – | – | – | 11 (100) | – | 11 (8–13) | – |
| 399 | – | 11 | 73 (63–83) | – | 5 (45.5) | – | 91 (61–244) | – | – | – | 9 (81.8) | – | 12 (11–14) | – |
| 402 | – | 10 | 69.5 (60–74) | – | 4 (40) | – | 1157 (639–2497) | – | – | – | 10 (100) | – | 12 (12–12) | – |
| 403 | – | 10 | 57.5 (48–65) | – | 7 (70) | – | 639.5 (365–1096) | – | 66.4 (57.2–77.4) | – | 9 (90) | – | 16 (16–18) | – |
| 405 | – | 10 | 61.5 (58–70) | – | 8 (80) | – | 1964 (974–3075) | – | 47.9 (31.8–63.5) | – | 10 (100) | – | – | – |
| 407 | – | 10 | 59 (48–64) | – | 10 (100) | – | 517 (365–1583) | – | – | – | 9 (90) | – | 10 (9–11) | – |
| 409 | – | 10 | 58.5 (53–73) | – | 4 (40) | – | 1446 (668–3258) | – | 68.4 (64.8–75.1) | – | – | – | – | – |
| 411 | – | 10 | 55.5 (51–59) | – | 7 (70) | – | 654 (426–1095) | – | – | – | – | – | – | – |
| 412 | – | 10 | 62 (48–68) | – | 4 (40) | – | 1643.5 (1095–2191) | – | – | – | 10 (100) | – | – | – |
| 413 | – | 10 | 54.5 (36–75) | – | 4 (40) | – | 883 (426–1218) | – | – | – | 10 (100) | – | – | – |
| 414 | – | 10 | 50.5 (45–55) | – | 7 (70) | – | 1853 (1734–2191) | – | – | – | 10 (100) | – | 10.5 (9–16) | – |
| 415 | – | 10 | 67 (61–69) | – | 10 (100) | – | 1159.5 (487–2375) | – | 68.4 (37.6–80.4) | – | – | – | – | – |
| 421 | – | 18 | 67 (55–75) | – | – | – | 1506.5 (730–3410) | – | 44.3 (26.7–86.7) | – | 18 (100) | – | 14 (12–16) | – |
| 424 | – | 20 | 57.5 (46.5–63) | – | 13 (65) | – | 228 (137–775.5) | – | – | – | 17 (85) | – | 12 (12–16) | – |
| 425 | – | 42 | 60 (50–68) | – | 26 (61.9) | – | 730.5 (475–1571) | – | – | – | 42 (100) | – | 16 (12–18) | – |
| 462 | – | 36 | – | – | – | – | 16.5 (14–18) | – | 82.9 (43.9–90.4) | – | 36 (100) | – | – | – |
| 466 | – | 28 | 62.5 (58–65) | – | 28 (100) | – | 49 (28–164.5) | – | – | – | 28 (100) | – | – | – |
| 470 | – | 14 | 66 (63–73) | – | 7 (50) | – | 943.5 (578–1339) | – | 51.9 (17.4–80.3) | – | – | – | – | – |
| 473 | – | 12 | 58 (54.5–67.5) | – | 7 (58.3) | – | 1217 (471.5–2571.5) | – | 80.4 (73.5–93.2) | – | 12 (100) | – | – | – |
| 512 | – | 12 | 67.5 (61.5–73) | – | 7 (58.3) | – | 1096 (913–1644.5) | – | – | – | – | – | – | – |
| 524 | – | 22 | – | – | 22 (100) | – | 28 (21–147) | – | – | – | 22 (100) | – | – | – |
| 528 | – | 10 | 55 (48–67) | – | – | – | 836.5 (517–3165) | – | 81.6 (69.8–87.5) | – | – | – | 16 (14–18) | – |
| 529 | – | 10 | 48.5 (46–61) | – | 6 (60) | – | 1719.5 (791–2465) | – | 82.1 (68–85.8) | – | 10 (100) | – | 12 (12–14) | – |
| 534 | – | 15 | 73 (64–77) | – | 7 (46.7) | – | 1156 (669–1522) | – | 46.7 (27.2–61.7) | – | – | – | 9 (8–12) | – |
Appendix 6 Reliability checks for the transformation algorithm
FIGURE 27.
Summary of transformed measures by contributing assessment tool. (a) Overall language ability in RCTs; (b) overall language ability in all data sets; (c) auditory comprehension in RCTs; (d) auditory comprehensionin all data sets; (e) naming in RCTs; (f) naming in all data sets; (g) other spoken language in RCTs; (h) other spoken language in all data sets in RCTs; (i) reading comprehension; (j) writing; (k) functional communication: observer-rated (with activity data) in RCTs; (l) functional communication: observer-rated (with activity data) in all data sets. ADD, Afazi Dil Değerlendirme Testi; ADHD, attention deficit hyperactivity disorder; AHS, Aphasia Handicap Scale; ANELT, Amsterdam Nijmegen Everyday Language Test; ASHA, American Speech–Language–Hearing Association; ASRS, Aphasia Severity Rating Scale; BADA, Batteria per l’Analisi dei Deficit Afasici; BASA, Boston Assessment of Severe Aphasia; BDAE, Boston Diagnostic Aphasia Examination; BDAE-GK, Boston Diagnostic Aphasia Examination – Greek; BDAE-PO, Boston Diagnostic Aphasia Examination – Polish; BETA, Batería para la Evaluación de los Trastornos Afásicos; BNT-GK, BNT – Greek; BNT-K, BNT – Korean; BNT-S, BNT – Short Form; CAL, Communicative Activity Log; FCP, Functional Communication Profile; CDP, Communication Disability Profile; CETI, Communication Effectiveness Index; NGA, Norsk Grunntest for Afasi; NGAS, Norsk Grunntest for Afasi – short; PAL, Psycholinguistic Assessment of Language; Peabody, Peabody Picture Vocabulary Test; PNT, Philadelphia Naming Test; SAPS, Sprachsystematische Aphasiescreening; Scen, Scenario Test; SLTA, Standard Language Test of Aphasia; TOMs-A, TOMs Activity; VNT, Verb Naming Test; WAB-C, WAB – Cantonese; WAB-J, WAB – Japanese; WAB-K, WAB – Korean; WAB-M, WAB – Mandarin; WAB-P, WAB – Persian; WAB-R, WAB – Revised. Reproduced with permission from Ali et al. 118 This is an Open Access article distributed in accordance with the terms of the Creative Commons Attribution (CC BY 4.0) license, which permits others to distribute, remix, adapt and build upon this work, for commercial use, provided the original work is properly cited. See: https://creativecommons.org/licenses/by/4.0/. The figure includes minor additions and formatting changes to the original figure.


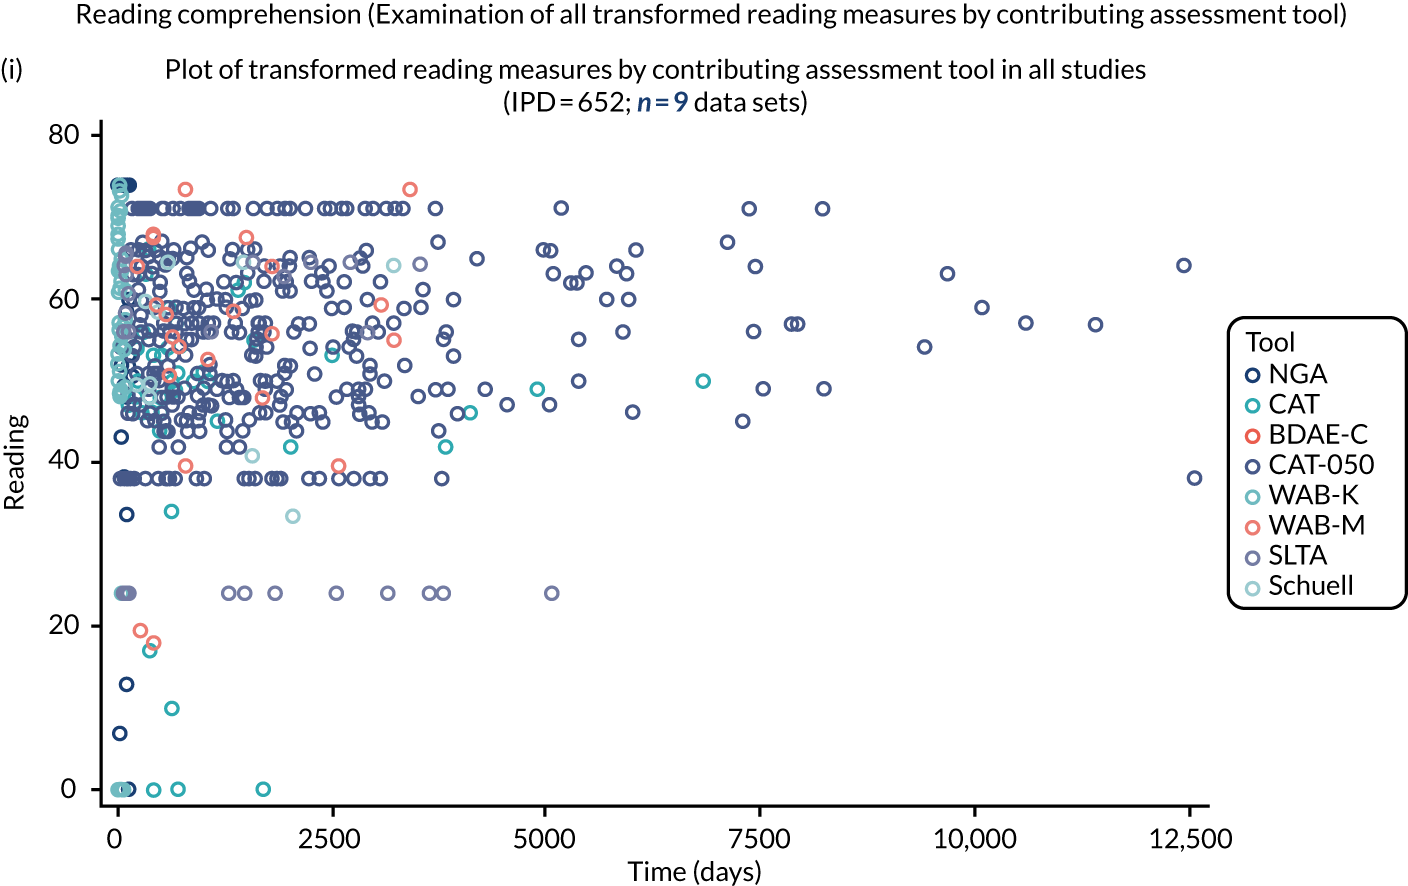
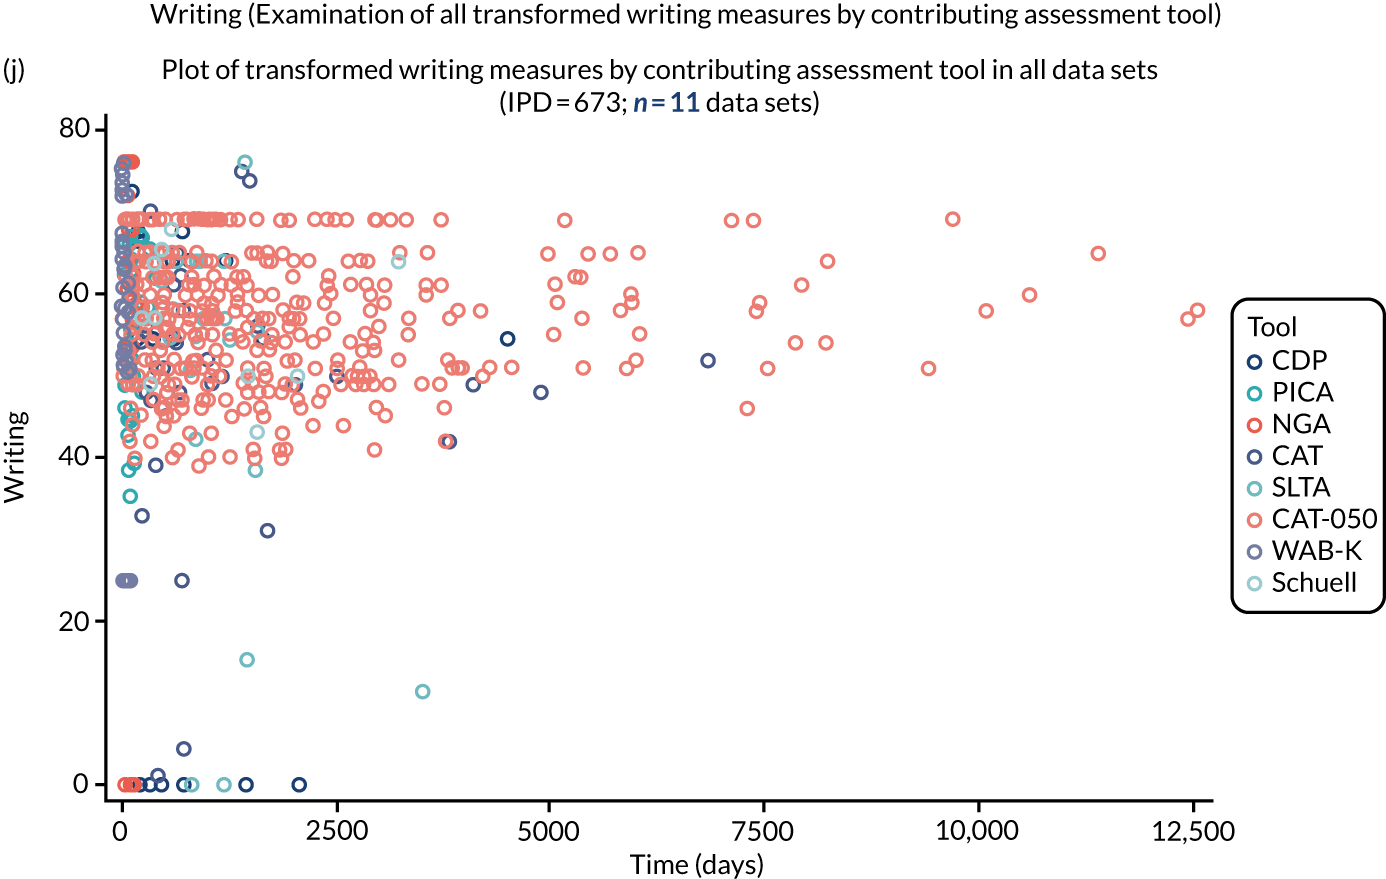
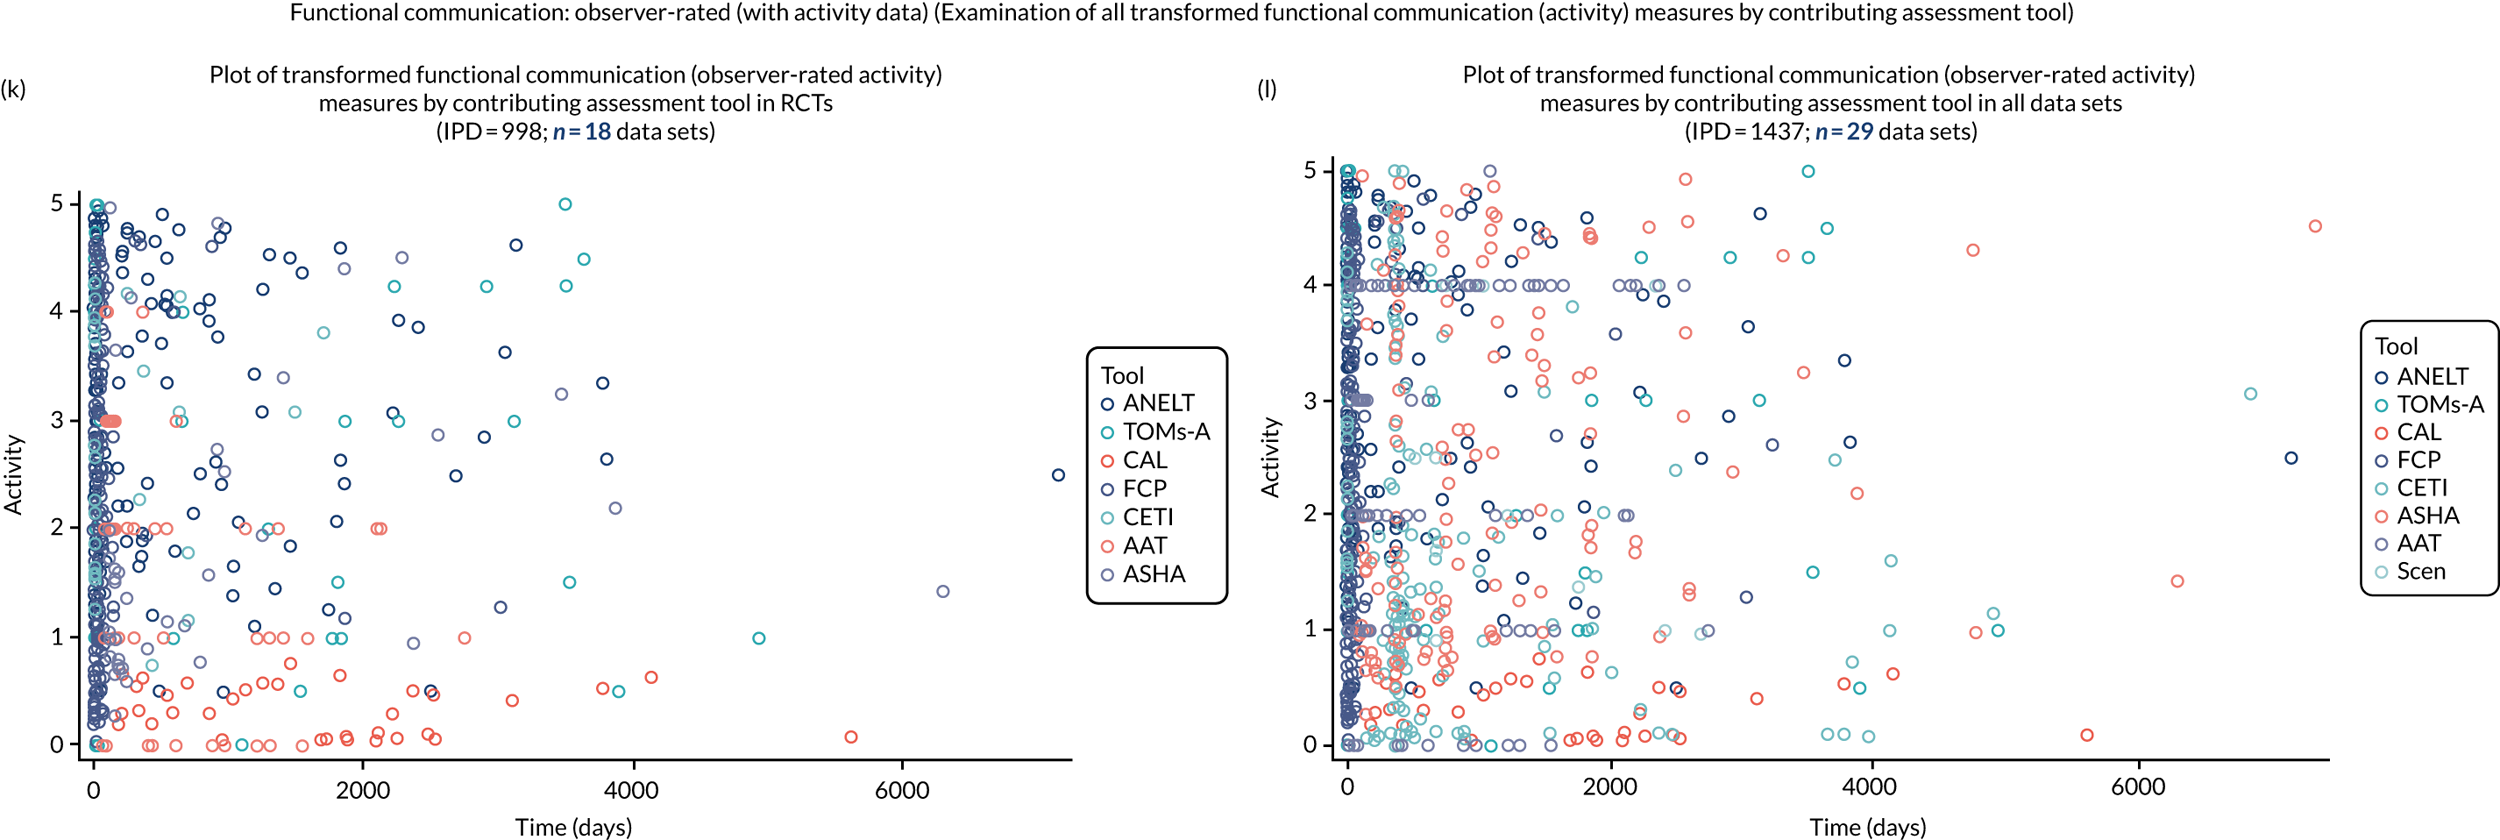
Figure 27, parts a and b: overall language ability (examination of all transformed overall language ability measures by contributing assessment tool)
We observed that the spread of data points overlapped, and there did not appear to be a clustering of transformed overall language ability measures that were generated from any one particular measurement tool. We therefore concluded that the transformed overall language ability values that were generated by each of the assessment tools were valid and within an expected range.
Figure 27, parts c and d: auditory comprehension (examination of all transformed auditory comprehension measures by contributing assessment tool)
We observed that the spread of data points overlapped, and there did not appear to be a clustering of transformed auditory comprehension measures that were generated from any one particular contributing assessment tool. We therefore concluded that the transformed auditory comprehension values that were generated by each of the assessment tools were valid and within an expected range.
Figure 27, parts e and f: naming (examination of all transformed naming measures by contributing assessment tool)
We observed that the spread of data points overlapped, and there did not appear to be a clustering of transformed naming measures that were generated from any one particular contributing assessment tool. We therefore concluded that the transformed naming values that were generated by each of the assessment tools were valid and within an expected range.
Figure 27, parts g and h: other spoken language (examination of all transformed other spoken-language measures by contributing assessment tool, stratified by time post stroke)
We observed that the spread of data points overlapped, and there did not appear to be a clustering of transformed spoken-language measures that were generated from any one particular contributing assessment tool. We therefore concluded that the transformed spoken-language values that were generated by each of the assessment tools were valid and within an expected range.
Figure 27, part i: reading comprehension (examination of all transformed reading measures by contributing assessment tool)
We observed that the spread of data points overlapped, and there did not appear to be a clustering of transformed reading comprehension measures that were generated from any one particular contributing assessment tool. We therefore concluded that the transformed reading comprehension values that were generated by each of the assessment tools were valid and within an expected range.
Figure 27, part j: writing (examination of all transformed writing measures by contributing assessment tool)
We observed that the spread of data points overlapped, and there did not appear to be a clustering of transformed writing measures that were generated from any one particular contributing assessment tool. We therefore concluded that the transformed writing values that were generated by each of the assessment tools were valid and within an expected range.
Figure 27, parts k and l: functional communication, observer rated (with activity data) [examination of all transformed functional communication (activity) measures by contributing assessment tool]
The spread of data points observed overlapped, and there was no indication of clustering of transformed functional communication scores (observer rated) that were generated from any one particular contributing assessment tool. We therefore concluded that the transformed functional communication values that were generated by each of the assessment tools were valid and within an expected range.
Appendix 7 Aphasia assessment tools
| Aphasia assessment tool | Data sets reporting use of (part) measure, n | Data sets (IPD) not reporting outcome (outcome data unavaliable), n (IPD) | Data sets with available data (n) | IPD available (missing) | Median score (IQR) |
|---|---|---|---|---|---|
| Overall language ability | |||||
| AAT overall severity score | 16 | 15 (537) | 1 | 12 (0) | 52 (48.4–55.4) |
| Aphasia Severity Rating Scale | 14 | 0 (0) | 14 | 441 (6) | 2 (1–3) |
| NGA | 3 | 0 (0) | 3 | 62 (0) | 110 (64–161) |
| PICA | 8 | 0 (0) | 8 | 171 (1) | 9.7 (7.9–12.0) |
| WAB-AQa | 35 | 0 (0) | 35 | 733 (0) | 69.8 (42.1–87.1) |
| WAB-AQ Revised | 6 | 1 (18) | 5 | 69 (0) | 74.4 (51.9–85.2) |
| WAB-Korean | 3 | 0 (0) | 3 | 125 (3) | 29.6 (11.8–64) |
| WAB-Persian | 2 | 0 (0) | 2 | 86 (0) | 44.6 (26.7–74.2) |
| WAB-Cantonese | 1 | 0 (0) | 1 | 105 (0) | 84 (66.4–93.1) |
| WAB-Japanese | 1 | 0 (0) | 1 | 24 (0) | 81 (37–91) |
| ADD | 1 | 0 (0) | 1 | 30 (23) | 95 (34–160) |
| CAT | 8 | 5 (180) | 3 | 433 (37) | 57.6 (51.1–62.5) |
| SLTA | 2 | 1 (36) | 1 | 24 (0) | 148 (98.5–158) |
| Aphasia Handicap Scale | 2 | 0 (0) | 2 | 39 (19) | 3 (2–4) |
| NGA–Short | 2 | 0 (0) | 2 | 241 (0) | 022 (6–45) |
| BASA | 1 | 0 (0) | 1 | 15 (0) | 39 (30–42) |
| SAPS | 1 | 0 (0) | 1 | 133 (9) | 470.5 (339–578) |
| Auditory comprehension at baseline | |||||
| AAT | 16 | 13 (353) | 3 | 194 (2) | 51 (44–57) |
| BDAE | 7 | 0 (0) | 7 | 115 (0) | 83 (36–97.5) |
| BAAL | 2 | 0 (0) | 2 | 55 (0) | 7 (5–8) |
| NGA | 3 | 0 (0) | 3 | 62 (0) | 46 (30–62) |
| PICA | 8 | 5 (120) | 3 | 52 (0) | 11.4 (9–13.9) |
| WAB | 22 | 19 (371) | 3 | 54 (0) | 181 (102–193) |
| WAB-Revised | 6 | 1 (15) | 5 | 71 (1) | 9.5 (6.4–24) |
| WAB-Korean | 3 | 1 (10) | 2 | 117 (1) | 91 (48–157) |
| WAB-Cantonese | 1 | 0 | 0 | 105 (0) | 9 (6.8–9.7) |
| ADD | 1 | 0 | 0 | 53 (0) | 44 (26–54) |
| CAT | 8 | 2 (31) | 6 | 576 (6) | 53 (45–60) |
| SLTA | 2 | 0 (0) | 2 | 60 (0) | 5 (0–33) |
| CDP | 2 | 1 (19) | 1 | 6 (0) | 9 (8–12) |
| Peabody Picture Vocabulary Test | 2 | 0 (0) | 2 | 33 (3) | 81 (40–94) |
| Pizzamigglion Sentence Comprehension Test | 1 | 0 (0) | 1 | 25 (11) | 68 (53–70) |
| BADA | 2 | 1 (6) | 1 | 12 (0) | 40 (40–40) |
| DeRenzi and Vignolo TT/62135 | 2 | 0 (0) | 2 | 34 (0) | 29 (15–48) |
| DeRenzi and Faglioni TT/36136 | 10 | 0 (0) | 10 | 639 (0) | 12 (3.5–22) |
| Revised TT, Arvedson, McNeil and West/five item137 | 1 | 0 (0) | 1 | 16 (0) | 2.3 (1.3–3.6) |
| AAT Italian version of TT | 1 | 0 (0) | 1 | 11 (0) | 62 (54–70) |
| TT-AATa | 15 | 0 (0) | 15 | 505 (0) | 23 (11–39) |
| TT/15 | 1 | 0 (0) | 1 | 25 (0) | 12.4 (11.3–13.5) |
| Greek version of BDAE (G-BDAE) | 2 | 0 (0) | 2 | 50 (0) | 49.5 (36.5–57) |
| BASA | 1 | 0 (0) | 1 | 15 (0) | 12 (8–14) |
| SAPS | 1 | 0 (0) | 1 | 136 (6) | 263 (184–303.5) |
| Schuell | 1 | 0 (0) | 1 | 10 (0) | 58.5 (46.5–68.5) |
| Montreal–Toulouse language assessment battery for aphasia | 1 | 0 (0) | 1 | 11 (0) | 87 (68–100) |
| PAL | 2 | 0 (0) | 2 | 79 (5) | 32 (30–32) |
| BDAE-3 | 1 | 0 (0) | 1 | 29 (0) | 73 (47–90) |
| BDAE-12 | 1 | 0 (0) | 1 | 11 (0) | 8 (7–9) |
| TT-AAT t-score | 2 | 0 (0) | 2 | 27 (0) | 44 (34–63) |
| Modified Short Form of De Renzi 1978138 | 0 (0) | 53 (0) | 2 (1–6) | ||
| Naming at baseline | |||||
| AAT | 16 | 1 (11) | 15 | 524 (14) | 70 (38–97.5) |
| BDAE | 7 | 7 (115) | 0 | 0 | N/A |
| BAAL | 2 | 0 (0) | 0 | 55 (0) | 5 (0–10) |
| NGA | 3 | 2 (23) | 1 | 39 (0) | 11 (2–31) |
| PICA: verbal | 8 | 5 (120) | 3 | 52 (0) | 7 (4.8–9.4) |
| WAB | 22 | 20 (381) | 2 | 44 (0) | 70 (0–85.5) |
| WAB-Revised | 6 | 1 (15) | 5 | 72 (0) | 8.4 (4.2–10) |
| WAB-Korean | 3 | 1 (10) | 2 | 117 (1) | 12 (0–52) |
| WAB-Cantonese | 1 | 0 (0) | 1 | 105 (0) | 8 (5.5–8.7) |
| WAB-Mandarin | 1 | 0 (0) | 1 | 23 (0) | 50 (25–65) |
| ADD | 1 | 0 (0) | 1 | 53 (0) | 12 (0–28) |
| CAT | 8 | 4 (129) | 4 | 479 (5) | 58 (49–64) |
| SLTA | 2 | 1 (24) | 1 | 36 (0) | 2.5 (0–6.5) |
| BNT/60a | 30 | 0 (0) | 30 | 831 (0) | 12 (1–35) |
| BNT Short Form | 3 | 0 (0) | 3 | 129 (0) | 5 (1–10) |
| BNT/30 | 2 | 0 (0) | 2 | 21 (0) | 15 (9–22) |
| Philadelphia Naming Test | 2 | 0 (0) | 2 | 25 (0) | 49 (11–70) |
| Snodgrass and Vanderwort139 | 3 | 0 (0) | 3 | 80 (0) | 46 (17–89) |
| BADA | 2 | 1 (6) | 1 | 12 (0) | 5 (3.5–6) |
| BETA | 1 | 0 (0) | 1 | 127 (134) | 0 (0–15) |
| Graded Naming Test | 1 | 0 (0) | 1 | 11 (0) | 1 (0–2) |
| Cambridge Naming Test | 1 | 0 (0) | 1 | 70 (0) | 41 (9–54) |
| Verb Naming Test | 1 | 0 (0) | 1 | 260 (54) | 16 (9–20) |
| Object Naming Test | 3 | 0 (0) | 3 | 53 (0) | 1 (0–6) |
| PAL | 2 | 0 (0) | 2 | 81 (3) | 28 (22–31) |
| PALPA 53 | 1 | 0 (0) | 1 | 11 (0) | 14 (4–26) |
| Korean BNT | 1 | 0 (0) | 1 | 10 (0) | 24.5 (8–49) |
| Greek BDAE | 2 | 1 (12) | 1 | 38 (0) | 29 (6–52) |
| Polish BDAE | 1 | 0 (0) | 1 | 40 (0) | 60 (6–107) |
| Greek BNT | 1 | 0 (0) | 1 | 38 (0) | 5.3 (1–12.5) |
| Other spoken language at baseline | |||||
| WAB-Korean | 3 | 2 (107) | 1 | 21 (0) | 2 (0–4) |
| WAB-Cantonese | 1 | 0 (0) | 1 | 105 (0) | 15 (12–19) |
| SLTA | 2 | 1 (36) | 1 | 24 (0) | 41.5 (25–45.5) |
| CDP | 1 | 0 (0) | 1 | 25 (0) | 9 (6–12) |
| SAPS | 1 | 0 (0) | 1 | 139 (3) | 302 (187–364) |
| Schuell | 1 | 0 (0) | 1 | 10 (0) | 58.8 (56–68) |
| PICAa | 8 | 6 (132) | 2 | 40 (0) | 5.1 (5–8) |
| Greek BDAE | 2 | 1 (12) | 1 | 38 (0) | 16 (10–21) |
| Reading comprehension at baseline | |||||
| AAT | 16 | 14 (493) | 2 | 54 (2) | 38 (32–47) |
| BDAE | 7 | 6 (102) | 1 | 13 (0) | 0 (0–18) |
| NGA | 3 | 2 (23) | 1 | 39 (0) | 16 (10–22) |
| WAB | 22 | 21 (412) | 1 | 13 (0) | 0 (0–0) |
| WAB-Korean | 3 | 2 (31) | 1 | 81 (16) | 37 (2–74) |
| WAB-Mandarin | 1 | 0 (0) | 1 | 23 (0) | 90 (75–97) |
| CATa | 8 | 5 (146) | 3 | 460 (7) | 56 (48–64) |
| SLTA | 2 | 1 (24) | 1 | 36 (0) | 1 (0–4.5) |
| BETA | 1 | 0 (0) | 1 | 126 (135) | 14.5 (0–29) |
| Schuell | 1 | 0 (0) | 1 | 10 (0) | 65.8 (63–73) |
| PALPA 48 | 1 | 0 (0) | 1 | 10 (0) | 33.5 (28–37) |
| PALPA 31 | 1 | 0 (0) | 1 | 11 (0) | 51 (16–65) |
| Greek BDAE | 2 | 1 (12) | 1 | 38 (0) | 11 (3–22) |
| Writing at baseline | |||||
| BDAE | 7 | 6 (102) | 1 | 13 (0) | 0 (0–18) |
| NGA | 3 | 2 (23) | 1 | 39 (0) | 3 (1–7) |
| PICA | 8 | 5 (120) | 3 | 51 (1) | 6.9 (6–7.7) |
| WAB-Korean | 3 | 2 (31) | 1 | 71 (26) | 16 (0–64) |
| CATa | 8 | 5 (146) | 3 | 454 (13) | 57 (50–64) |
| SLTA | 2 | 1 (36) | 1 | 24 (0) | 33 (13–39) |
| CDP | 1 | 0 (0) | 1 | 24 (0) | 2.5 (1–6) |
| Schuell | 1 | 0 (0) | 1 | 10 (0) | 48.5 (44–62.5) |
| Greek BDAE | 2 | 1 (12) | 1 | 38 (0) | 4 (0–9) |
| Functional communication at baseline (observer rated) | |||||
| AAT-SSCa | 16 | 8 (147) | 8 | 402 (4) | 2 (1–4) |
| American Speech–Language–Hearing Association Functional Assessment of Communication Skills | 3 | 0 (0) | 3 | 135 (0) | 5.7 (4.9–6.4) |
| Amsterdam–Nijmegen Everyday Language Test | 7 | 0 (0) | 7 | 453 (142) | 1.95 (1–3.4) |
| Communicative Activity Log | 1 | 0 (0) | 1 | 10 (0) | 65.6 (53–84) |
| Mini Communicative Activity Log | 1 | 0 (0) | 1 | 24 (0) | 26 (15.5–31) |
| Communication Effectiveness Index | 7 | 0 (0) | 7 | 300 (0) | 65 (40.3–86.2) |
| Communicative–Pragmatic Screening [Kommunikativ–Pragmatisches Screening (KOPS)] | 1 | 0 (0) | 1 | 131 (11) | 230 (190.5–253.5) |
| Scenario Test (2010) | 1 | 0 (0) | 1 | 11 (0) | 46 (33–54) |
| TOMs Activity | 3 | 0 (0) | 3 | 257 (1) | 2 (1–3) |
| TOMs Participation | 3 | 0 (0) | 3 | 257 (1) | 2 (1–3) |
| Functional Communication Profile | 4 | 0 (0) | 4 | 249 (5) | 37.1 (19.5–54.3) |
| Functional communication at baseline (self-rated) | |||||
| Assessment for Living with Aphasiaa | 2 | 0 (0) | 2 | 43 (2) | 98.5 (88.5–111.5) |
| Communication Confidence Rating Scale for Aphasia | 1 | 0 (0) | 1 | 32 (2) | 67.8 (53–74.5) |
| CDP Auditory comprehension | 1 | 0 (0) | 1 | 6 (19) | 9 (8–12) |
| CDP Spoken language | 1 | 0 (0) | 1 | 25 (0) | 9 (6–12) |
| CDP Writing | 1 | 0 (0) | 1 | 24 (1) | 2.5 (1–6) |
| CDP Activity | 1 | 0 (0) | 1 | 25 (0) | 5 (3–11) |
| CDP Participation | 1 | 0 (0) | 1 | 25 (0) | 39.6 (26.6–48.4) |
Appendix 8 Relationships between demography and language domains
| Language domain | IPD (n) | Univariable (p-value) | Bivariable (including baseline) | Multivariablea (p-value) | Multivariable (p-value) |
|---|---|---|---|---|---|
| Overall language ability by variable | N = 482 | N = 482 | N = 264 | ||
| Baseline score | 482 | < 0.0001 | – | < 0.0001 | < 0.0001 |
| Sex | 481 | 0.19 | 0.12 | 0.17 | 0.018 |
| Hemisphereb | 334 | 0.14 | 0.43 | – | 0.89 |
| Type | 482 | 0.26 | 0.66 | 0.95 | 0.72 |
| Handedness | 274 | 0.45 | 0.46 | – | 0.41 |
| Language of data collection | 482 | 0.28 | 0.021 | 0.094 | < 0.0001 |
| Age (grouped) (years) | 482 | 0.86 | 0.27 | 0.21 | 0.32 |
| Time since stroke (grouped) | 482 | 0.017 | 0.083 | 0.39 | 0.56 |
| Auditory comprehension by variable | N = 550 | N = 522 | N = 492 | ||
| Baseline score | 550 | < 0.0001 | – | < 0.0001 | < 0.0001 |
| Sex | 540 | 0.32 | 0.19 | 0.35 | 0.36 |
| Hemisphereb | 509 | 0.13 | 0.13 | – | 0.08 |
| Type | 536 | 0.34 | 0.44 | 0.41 | 0.78 |
| Handedness | 536 | 0.26 | 0.40 | 0.47 | 0.25 |
| Language of data collection | 550 | 0.03 | 0.12 | 0.33 | 0.55 |
| Age (years) | 540 | 0.003 | 0.002 | – | – |
| Age (four groups) (years) | 540 | 0.0008 | 0.0004 | 0.002 | 0.003 |
| Time since stroke (grouped) | 540 | 0.20 | 0.20 | 0.33 | 0.26 |
| Naming by variable | N = 385 | N = 381 | N = 316 | ||
| Baseline score | 385 | 0.0098 | – | 0.026 | 0.0052 |
| Sex | 385 | 0.80 | 0.75 | 0.87 | 0.74 |
| Hemisphereb | 355 | 0.32 | 0.33 | – | 0.30 |
| Typec | 381 | 0.49 | 0.57 | 0.83 | 0.85 |
| Handedness | 333 | 0.96 | 0.99 | – | 0.86 |
| Language | 385 | 0.0005 | 0.0027 | 0.012 | 0.024 |
| Age (years) | 385 | 0.011 | 0.011 | – | – |
| Age (four groups) (years) | 385 | 0.036 | 0.054 | 0.074 | 0.18 |
| Time since stroke (grouped) | 385 | 0.095 | 0.11 | 0.19 | 0.19 |
| Other spoken language variable | N = 231 | N = 215d | |||
| Baseline score | 0.36 | – | – | 0.20 | |
| Sex | 231 | 0.93 | – | – | 0.73 |
| Hemisphereb | 226 | 0.79 | – | – | 0.81 |
| Type | 231 | 0.56 | – | – | 0.41 |
| Handedness | 225 | 0.47 | – | – | 0.40 |
| Language | 231 | 0.01 | – | – | 0.53 |
| Age (years) | 231 | 0.63 | – | – | – |
| Age (grouped) (years) | 231 | 0.26 | – | – | 0.02 |
| Time since stroke | 231 | 0.04 | – | – | – |
| Time since stroke (grouped) | 231 | 0.006 | – | – | 0.01 |
| Reading comprehension by variable | N = 88 | Bivariable (including baseline)d | Multivariable (p-value) (N = 88)d,e | Multivariable (p-value) (N = 75)e,f | |
| Baseline score | 88 | 0.0049a | – | 0.0005 | 0.0004 |
| Sex | 88 | 0.50a | 0.67 | 0.96 | 0.98 |
| Hemisphereb | 76 | 0.81a | 0.40 | – | – |
| Type | 88 | 1.00a | 0.75 | 0.88 | 0.98 |
| Handedness | 76 | 0.70a | 0.74 | – | 0.68 |
| Language | 88 | 0.89a | 0.45 | 0.52 | 0.70 |
| Age (years) | 88 | 0.0027a | 0.0009 | – | – |
| Age (grouped) (years) | 88 | 0.013a | 0.001 | 0.002 | 0.0094 |
| Time since stroke | 88 | 0.40a | 0.43 | – | – |
| Time since stroke (grouped) | 88 | 0.15a | 0.12 | 0.21 | 0.36 |
| Writing by variable | N = 47 | Multivariabled (p-value) | |||
| Baseline score | 47 | 0.39 | – | – | 0.65 |
| Sex | 47 | 0.53 | – | – | 0.77 |
| Hemisphereb | 36 | 0.081a | – | – | – |
| Type | 47 | All unclassified | – | – | – |
| Handedness | 35 | All right | – | – | – |
| Language | 47 | All English | – | – | – |
| Age (years) | 47 | 0.21 | – | – | – |
| Age (grouped) (years) | 47 | 0.68 | – | – | 0.74 |
| Time since stroke | 47 | < 0.0001a | – | – | – |
| Time since stroke (grouped) | 47 | 0.032a | – | – | 0.027 |
| Functional communication (observer rated) | N = 544 | Multivariable (p-value) (N = 529)f | N = 319 | ||
| Baseline score | 544 | < 0.0001 | – | < 0.0001 | < 0.0001 |
| Sex | 544 | 0.039 | 0.0046 | 0.011 | 0.021 |
| Hemisphereb | 408 | 0.59 | 0.55 | – | 0.34 |
| Type | 540 | 0.47 | 0.39 | 0.12 | 0.091 |
| Handedness | 349 | 0.56 | 0.74 | – | 0.70 |
| Language | 544 | 0.47 | 0.71 | 0.65 | 0.73 |
| Age (years) | 544 | 0.10 | 0.061 | – | – |
| Age (grouped) (years) | 544 | 0.56 | 0.27 | 0.28 | 0.038 |
| Time since stroke | 533 | 0.40 | 0.55 | – | – |
| Time since stroke (grouped) | 533 | 0.0009 | 0.0024 | 0.18 | 0.54 |
Appendix 9 Functional communication (observer-rated) data with participation data
| Parameter | RCT data only | All data | ||||
|---|---|---|---|---|---|---|
| RCTs only (n) | IPD (n) | Estimate of meana (95% CIs) | All data sets (n) | IPD (n) | Estimate of meana (95% CIs) | |
| Sex | ||||||
| Female | 14 | 237 | 0.71 (0.44 to 0.98) | 18 | 275 | 0.70 (0.41 to 0.99) |
| Male | 14 | 296 | 0.55 (0.28 to 0.81) | 19 | 372 | 0.58 (0.30 to 0.86) |
| Age (years) | ||||||
| < 55 | 14 | 147 | 0.74 (0.46 to 1.03) | 19 | 181 | 0.72 (0.43 to 1.02) |
| 56–65 | 13 | 145 | 0.66 (0.37 to 0.94) | 18 | 170 | 0.66 (0.36 to 0.96) |
| 66–75 | 14 | 122 | 0.50 (0.21 to 0.80) | 18 | 148 | 0.53 (0.22 to 0.84) |
| > 75 | 12 | 119 | 0.62 (0.31 to 0.92) | 15 | 148 | 0.65 (0.33 to 0.96) |
| Time since stroke | ||||||
| 0–1 month | 6 | 232 | 1.07 (0.73 to 1.41) | 7 | 277 | 1.07 (0.71 to 1.42) |
| 1–3 months | 5 | 68 | 0.84 (0.48 to 1.20) | 6 | 70 | 0.87 (0.48 to 1.25) |
| 3–6 months | 4 | 63 | 0.35 (–0.13 to 0.82) | 5 | 63 | 0.35 (–0.13 to 0.83) |
| > 6 months | 7 | 170 | 0.26 (–0.06 to 0.58) | 11 | 237 | 0.28 (–0.01 to 0.56) |
| Random (no) | 5 | 115 | 0.64 (0.18 to 1.10) | |||
| Random (yes) | 14 | 532 | 0.64 (0.39 to 0.90) | |||
| Effect | RCT data only | All data | ||||||
|---|---|---|---|---|---|---|---|---|
| Number DF | Denominator DF | F-value | p-value | Number DF | Denominator DF | F-value | p-value | |
| Frequency of SLT | ||||||||
| Baseline score | 1 | 499 | 34.78 | < 0.0001 | 1 | 563 | 36.18 | < 0.0001 |
| Sex | 1 | 499 | 4.18 | 0.042 | 1 | 563 | 4.13 | 0.043 |
| Age group | 3 | 499 | 0.97 | 0.41 | 3 | 563 | 0.74 | 0.53 |
| Time since stroke group | 3 | 499 | 4.72 | 0.0029 | 3 | 563 | 4.56 | 0.0036 |
| Randomisation | – | – | – | – | 1 | 563 | 0.01 | 0.94 |
| Frequency group | 5 | 499 | 1.05 | 0.39 | 1 | 563 | 1.14 | 0.34 |
| Duration of SLT | ||||||||
| Baseline score | 1 | 448 | 41.68 | < 0.0001 | 1 | 512 | 43.99 | < 0.0001 |
| Sex | 1 | 448 | 4.28 | 0.039 | 1 | 512 | 4.26 | 0.04 |
| Age group | 3 | 448 | 0.91 | 0.43 | 3 | 512 | 0.70 | 0.55 |
| Time since stroke group | 3 | 448 | 5.03 | 0.0019 | 3 | 512 | 4.17 | 0.0062 |
| Randomisation | – | – | – | – | 1 | 512 | 0.34 | 0.56 |
| Duration group | 5 | 448 | 1.15 | 0.33 | 5 | 512 | 1.52 | 0.18 |
| Intensity of SLT | ||||||||
| Baseline score | 1 | 506 | 39.91 | < 0.0001 | 1 | 616 | 55.11 | < 0.0001 |
| Sex | 1 | 506 | 3.72 | 0.055 | 1 | 616 | 2.28 | 0.13 |
| Age group | 3 | 506 | 1.42 | 0.24 | 3 | 616 | 1.18 | 0.32 |
| Time since stroke group | 3 | 506 | 4.50 | 0.0039 | 3 | 616 | 3.94 | 0.0084 |
| Randomisation | – | – | – | – | 1 | 616 | 0.01 | 0.91 |
| Intensity group | 5 | 506 | 1.16 | 0.33 | 5 | 616 | 1.26 | 0.28 |
| Dosage of SLT | ||||||||
| Baseline score | 1 | 497 | 40.35 | < 0.0001 | 1 | 560 | 41.50 | < 0.0001 |
| Sex | 1 | 497 | 5.70 | 0.017 | 1 | 560 | 5.73 | 0.017 |
| Age group | 3 | 497 | 0.96 | 0.41 | 3 | 560 | 0.78 | 0.51 |
| Time since stroke group | 3 | 497 | 4.11 | 0.0067 | 3 | 560 | 3.95 | 0.0083 |
| Randomisation | – | – | – | – | 1 | 560 | 0.00 | 0.95 |
| Dosage group | 5 | 497 | 2.74 | 0.019 | 5 | 560 | 3.11 | 0.0089 |
| Home practice of SLT | ||||||||
| Baseline score | 1 | 431 | 38.38 | < 0.0001 | 1 | 531 | 52.96 | < 0.0001 |
| Sex | 1 | 431 | 2.83 | 0.093 | 1 | 531 | 1.61 | 0.21 |
| Age group | 3 | 431 | 1.92 | 0.13 | 3 | 531 | 1.63 | 0.18 |
| Time since stroke group | 3 | 431 | 4.24 | 0.0057 | 3 | 531 | 4.52 | 0.0039 |
| Randomisation | – | – | – | – | 1 | 531 | 0.02 | 0.90 |
| Home practice | 1 | 431 | 0.40 | 0.53 | 1 | 531 | 0.41 | 0.52 |
| SLT target | ||||||||
| Baseline score | 1 | 345 | 28.00 | < 0.0001 | 1 | 409 | 29.79 | < 0.0001 |
| Sex | 1 | 345 | 4.90 | 0.028 | 1 | 409 | 5.08 | 0.025 |
| Age group | 3 | 345 | 1.68 | 0.17 | 3 | 409 | 1.44 | 0.23 |
| Time since stroke group | 3 | 345 | 2.34 | 0.07 | 3 | 409 | 1.92 | 0.13 |
| Randomisation | – | – | – | – | 1 | 409 | 0.01 | 0.91 |
| SLT target | 3 | 345 | 0.73 | 0.53 | 4 | 409 | 0.70 | 0.59 |
| SLT theoretical approach | ||||||||
| Baseline score | 1 | 234 | 17.09 | < 0.0001 | 1 | 292 | 16.26 | < 0.0001 |
| Sex | 1 | 234 | 3.93 | 0.049 | 1 | 292 | 3.94 | 0.048 |
| Age group | 3 | 234 | 2.19 | 0.09 | 3 | 292 | 2.25 | 0.083 |
| Time since stroke group | 3 | 234 | 2.16 | 0.09 | 3 | 292 | 3.15 | 0.025 |
| Randomisation | – | – | – | – | 1 | 292 | 0.04 | 0.84 |
| Theoretical approach | 6 | 234 | 0.75 | 0.61 | 6 | 292 | 1.94 | 0.075 |
| Expertise–non-professional | ||||||||
| Baseline score | 1 | 509 | 39.51 | < 0.0001 | 1 | 619 | 53.99 | < 0.0001 |
| Sex | 1 | 509 | 3.71 | 0.055 | 1 | 619 | 2.38 | 0.12 |
| Age group | 3 | 509 | 1.42 | 0.24 | 3 | 619 | 1.22 | 0.30 |
| Time since stroke group | 3 | 509 | 3.88 | 0.0092 | 3 | 619 | 4.56 | 0.0036 |
| Randomisation | – | – | – | – | 1 | 619 | 0.00 | 0.96 |
| Expertise–professional | 1 | 509 | 2.96 | 0.086 | 1 | 619 | 3.58 | 0.059 |
| Expertise–non-professional | 1 | 509 | 1.56 | 0.21 | 1 | 619 | 1.64 | 0.20 |
| Context of therapy | ||||||||
| Baseline score | 1 | 509 | 38.36 | < 0.0001 | 1 | 619 | 52.61 | < 0.0001 |
| Sex | 1 | 509 | 3.67 | 0.056 | 1 | 619 | 2.42 | 0.12 |
| Age group | 3 | 509 | 1.27 | 0.28 | 3 | 619 | 1.09 | 0.35 |
| Time since stroke group | 3 | 509 | 5.84 | 0.0006 | 3 | 619 | 6.39 | 0.0003 |
| Randomisation | – | – | – | – | 1 | 619 | 0.01 | 0.94 |
| Inpatient | 1 | 509 | 1.43 | 0.23 | 1 | 619 | 2.26 | 0.13 |
| Outpatient | 1 | 509 | 2.08 | 0.15 | 1 | 619 | 2.25 | 0.13 |
| Mode of therapy | ||||||||
| Baseline score | 1 | 508 | 39.41 | < 0.0001 | 1 | 618 | 54.99 | < 0.0001 |
| Sex | 1 | 508 | 3.75 | 0.05 | 1 | 618 | 2.44 | 0.12 |
| Age group | 3 | 508 | 1.52 | 0.21 | 3 | 618 | 1.29 | 0.28 |
| Time since stroke group | 3 | 508 | 2.59 | 0.05 | 3 | 618 | 2.85 | 0.037 |
| Randomisation | – | – | – | – | 1 | 618 | 0.02 | 0.88 |
| Mode: face to face | 1 | 508 | 3.48 | 0.063 | 1 | 618 | 3.34 | 0.068 |
| Mode: computer | 1 | 508 | 0.57 | 0.45 | 1 | 618 | 1.17 | 0.28 |
| Functional relevance | ||||||||
| Baseline score | 1 | 422 | 39.28 | < 0.0001 | 1 | 532 | 54.02 | < 0.0001 |
| Sex | 1 | 422 | 3.02 | 0.083 | 1 | 532 | 1.84 | 0.18 |
| Age group | 3 | 422 | 2.05 | 0.11 | 3 | 532 | 1.63 | 0.18 |
| Time since stroke group | 3 | 422 | 3.25 | 0.022 | 3 | 532 | 3.92 | 0.0087 |
| Randomisation | – | – | – | – | 1 | 532 | 0.06 | 0.81 |
| Functional relevance | 1 | 422 | 0.00 | 1.00 | 1 | 532 | 0.35 | 0.56 |
| Level of difficulty | ||||||||
| Baseline score | 1 | 431 | 38.43 | < 0.0001 | 1 | 541 | 54.16 | < 0.0001 |
| Sex | 1 | 431 | 2.87 | 0.091 | 1 | 541 | 1.74 | 0.19 |
| Age group | 3 | 431 | 1.89 | 0.13 | 3 | 541 | 1.51 | 0.21 |
| Time since stroke group | 3 | 431 | 4.20 | 0.006 | 3 | 541 | 4.73 | 0.0029 |
| Randomisation | – | – | – | – | 1 | 541 | 0.06 | 0.81 |
| Level of difficulty | 1 | 431 | 0.35 | 0.55 | 1 | 541 | 0.33 | 0.56 |
| Functional communication including participation data from the TOMs | Estimate, slope (SE) | Intercept (SE) |
|---|---|---|
| Frequency of SLT | ||
| Functional communication (observer rated) | 0.05 (0.02) | 0.34 (0.22) |
| Duration | ||
| Functional communication (observer rated) | 0.005 (0.01) | 0.44 (0.22) |
| Intensity | ||
| Functional communication (observer rated) | 0.01 (0.01) | 0.39 (0.23) |
| Dosage | ||
| Functional communication (observer rated) | –0.001 (0.01) | 0.52 (0.23) |
Appendix 10 Risk of bias
FIGURE 28.
Risk of bias. (a) Overall language ability and risk of bias; n = 11 RCT data sets; (b) overall language ability and risk of bias; n = 7 non-RCT data sets; (c) auditory comprehension and risk of bias; n = 15 RCT data sets; (d) auditory comprehension and risk of bias; n = 6 non-RCT data sets; (e) naming and risk of bias; n = 13 RCT data sets; (f) naming and risk of bias; n = 8 non-RCT data sets; (g) other spoken language and risk of bias; n = 3 RCT data sets; (h) other spoken language and risk of bias; n = 3 non-RCT data sets; (i) reading and risk of bias; n = 4 non-RCT data sets; (j) writing and risk of bias; n = 3 RCT data sets (no non-RCT writing outcomes were available); (k) functional communication (observer rated) and risk of bias; n = 14 RCT data sets; and (l) functional communication (observer rated) and risk of bias; n = 5 non-RCT data sets.


Appendix 11 Network meta-analysis geometry for overall language ability
FIGURE 29.
Network meta-analysis direct and indirect comparisons: overall language ability network geometry. (a) SLT frequency (days per week); (b) SLT duration (weeks); (c) SLT intensity (hours per week); (d) SLT dosage (total hours); (e) therapy approach; (f) SLT approach by treatment target; (g) SLT by theoretical approach; (h) expertise of SLT provider; (i) mode of SLT delivery; (j) context of delivery; (k) SLT tailored; (l) SLT tailored by difficulty; (m) SLT tailored by functional relevance; and (n) SLT home practice. CIAT, constraint-induced aphasia therapy; Ref, reference.

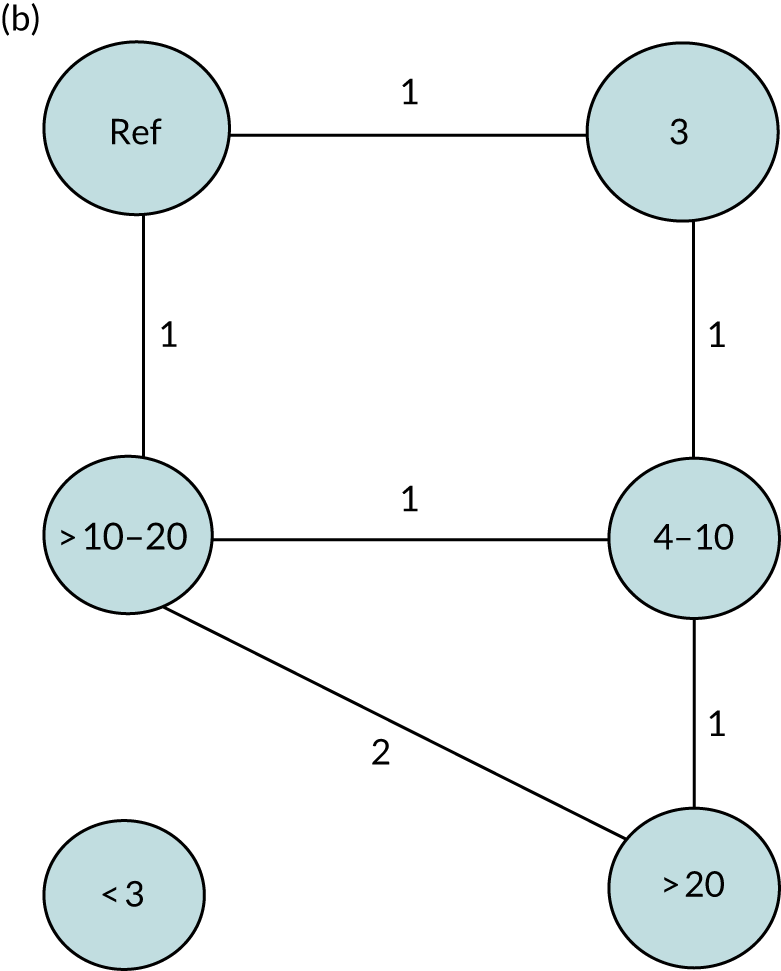

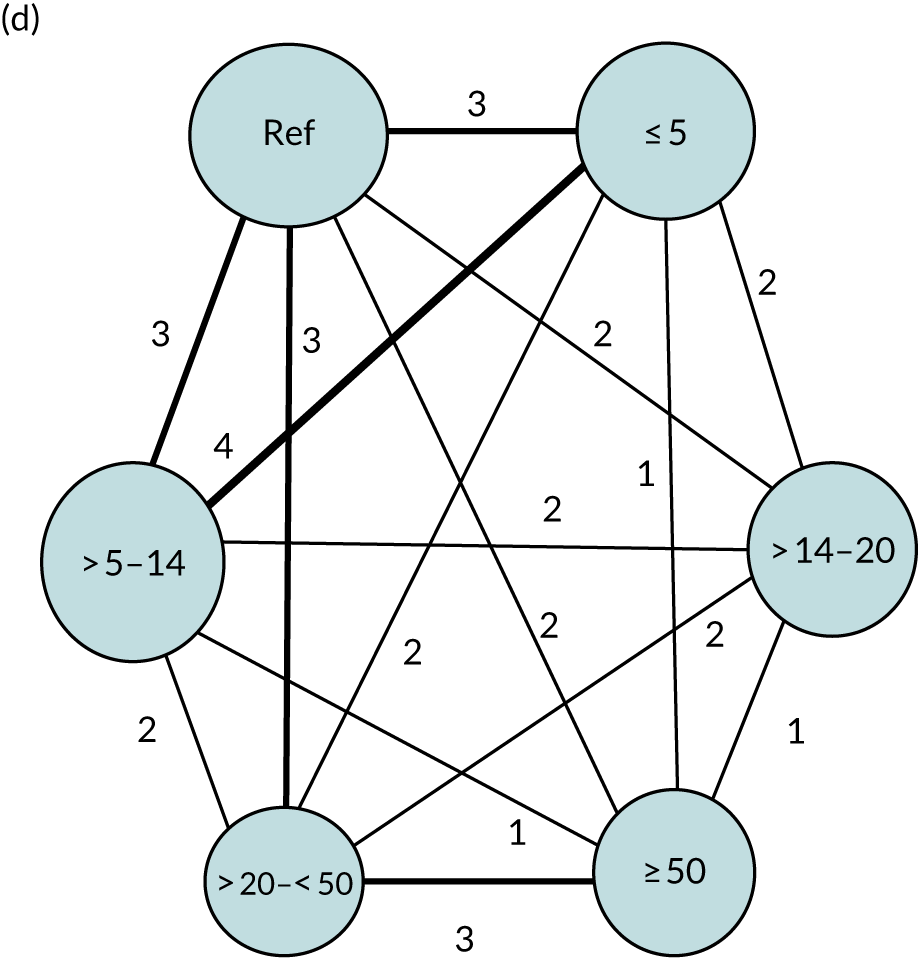

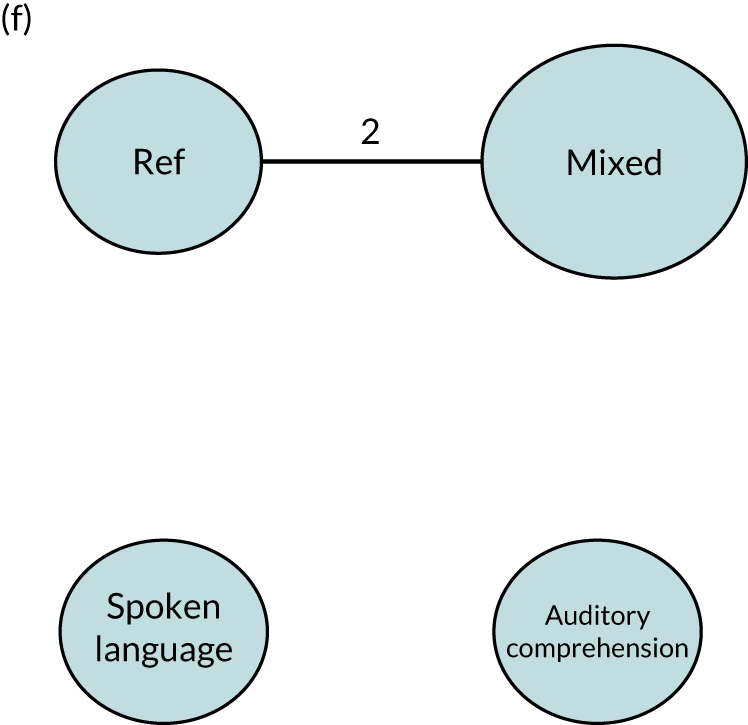
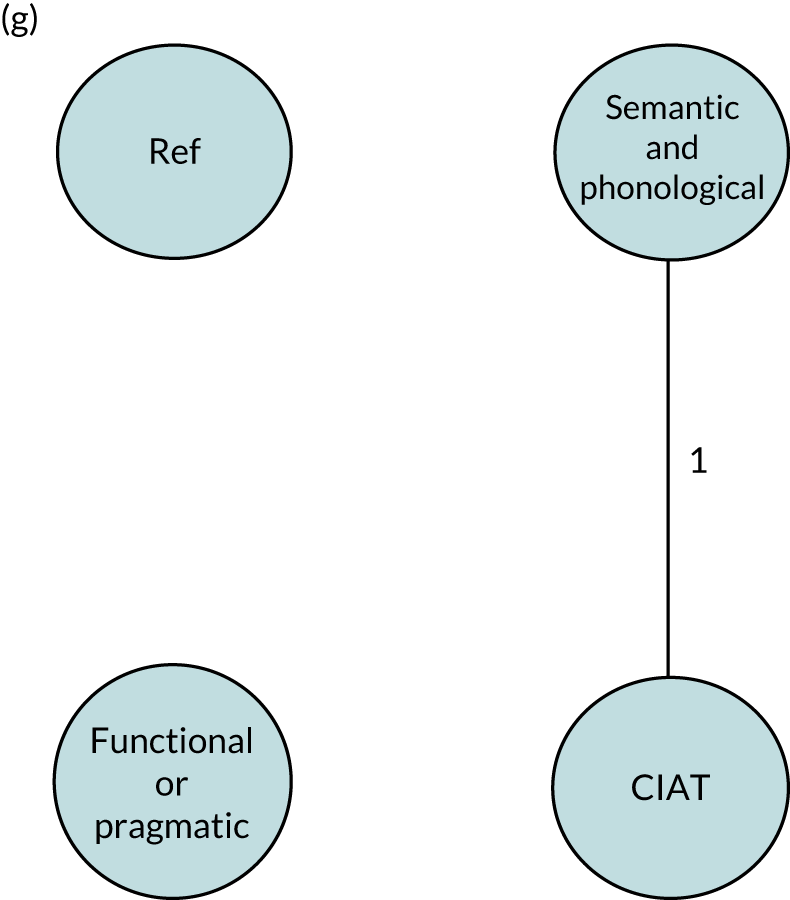
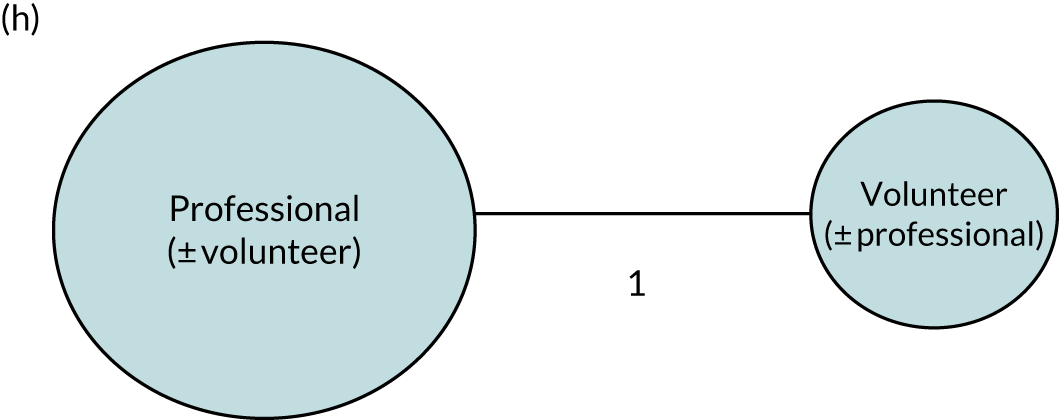
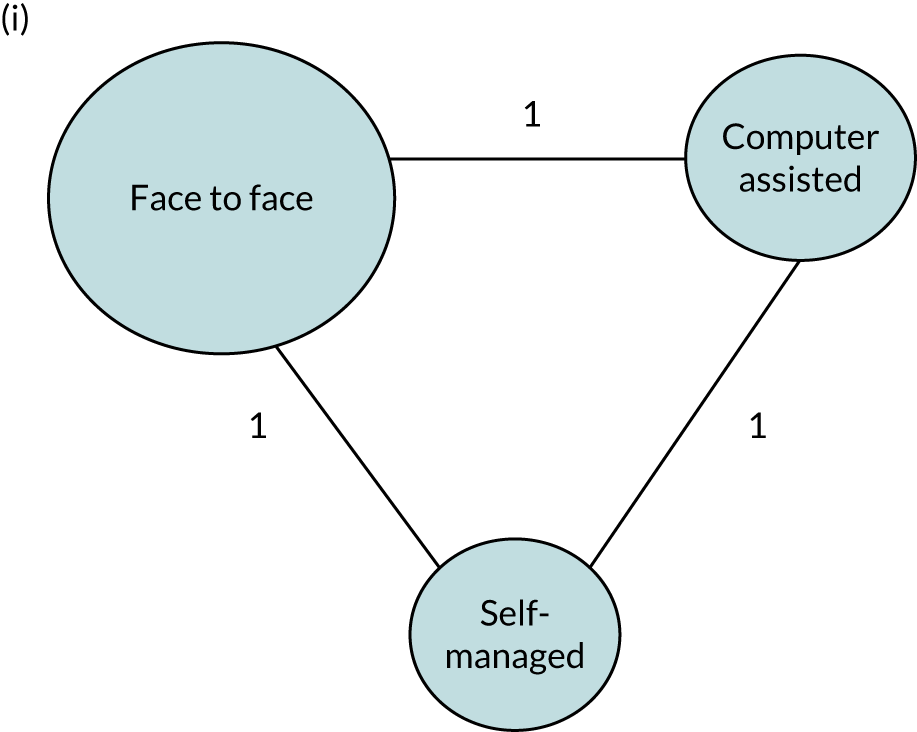

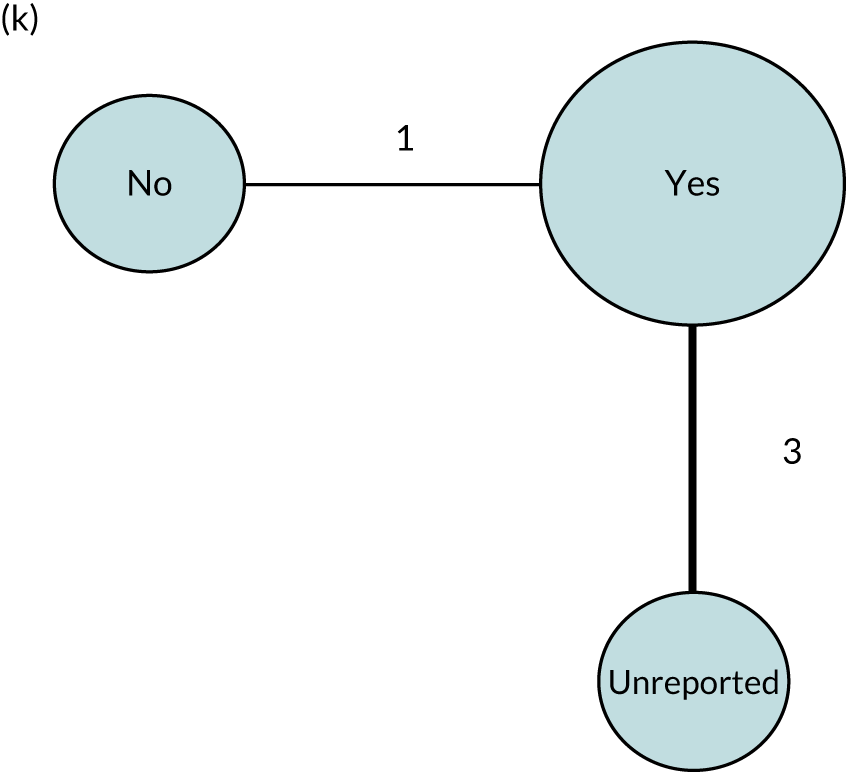

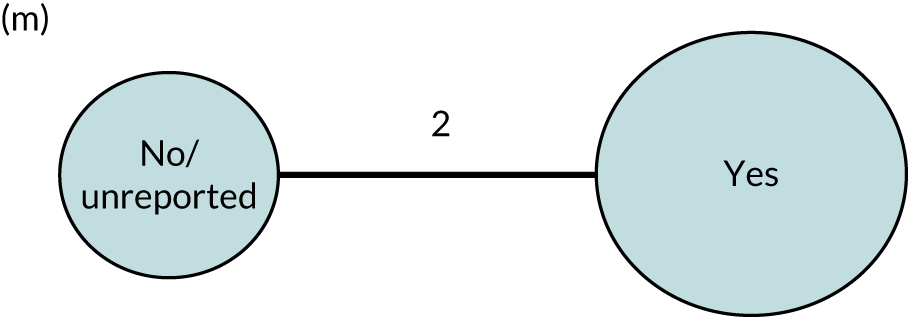

The network meta-analyses presented are based on the availability of IPD from RCT participants, the frequency of SLT per week and overall language ability.
Appendix 12 Network meta-analysis geometry for auditory comprehension
FIGURE 30.
Network meta-analysis direct and indirect comparisons: auditory comprehension network geometry. (a) SLT frequency (days per week); (b) SLT duration (weeks); (c) SLT intensity (hours per week); (d) SLT dosage (total hours); (e) SLT approach by role; (f) SLT approach by treatment target; (g) SLT by theoretical approach; (h) expertise of provider; (i) mode of SLT delivery; (j) context of SLT delivery; (k) tailored SLT; (l) SLT tailored by difficulty; (m) SLT tailored by functional relevance; and (n) SLT home practice. CIAT, constraint-induced aphasia therapy; MIT, melodic intonation therapy; MM, multimodal; Ref, reference.


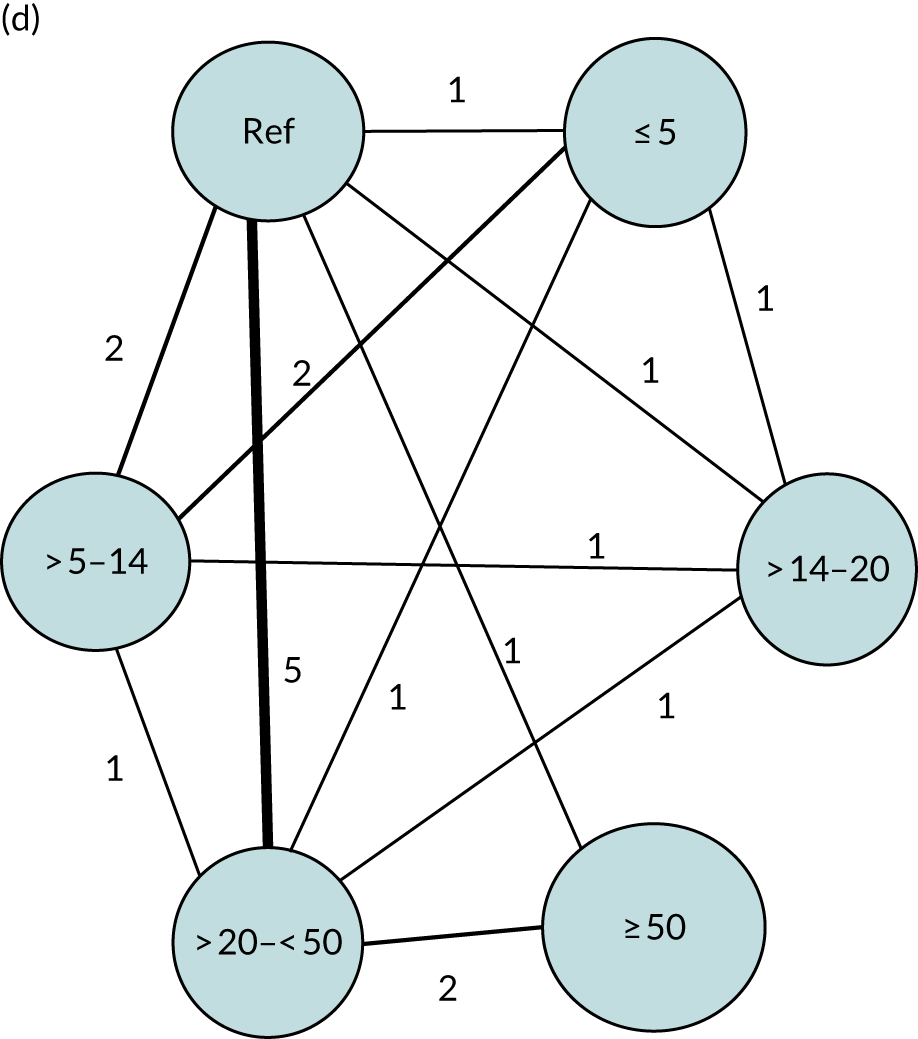
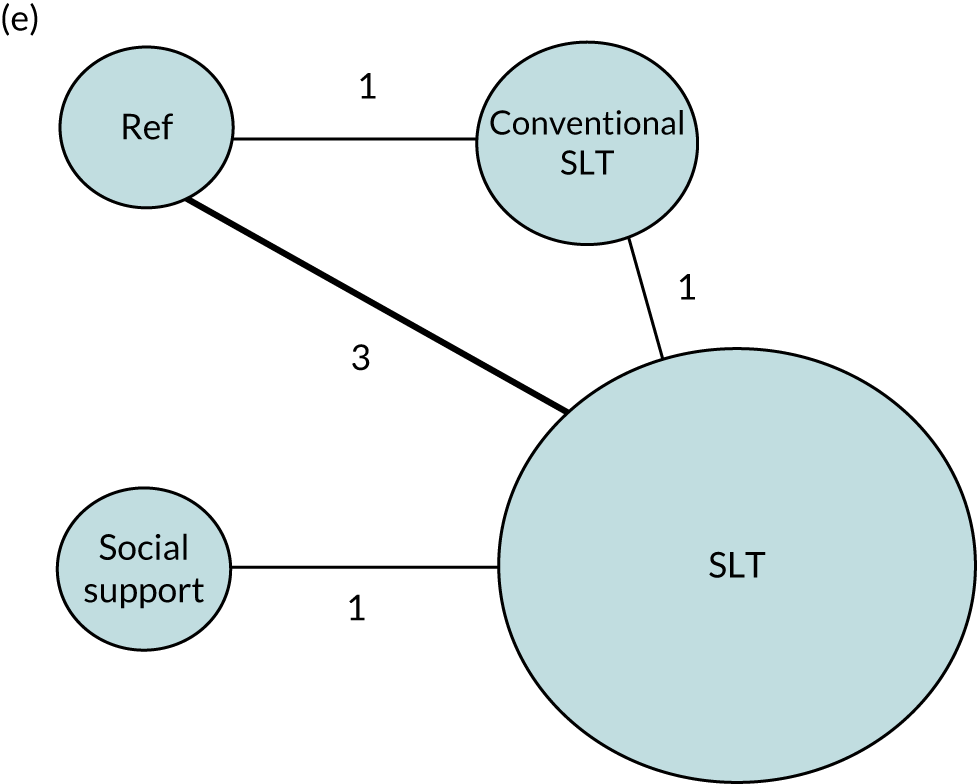
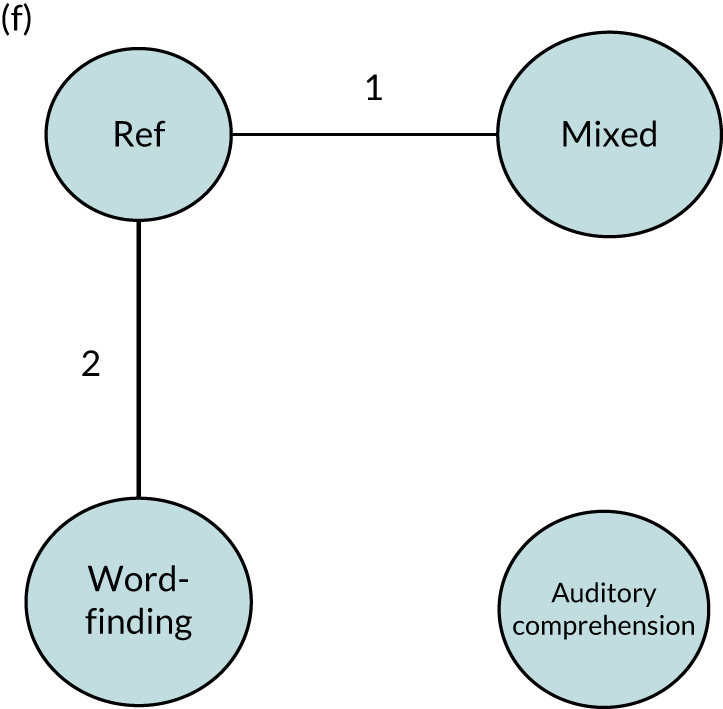
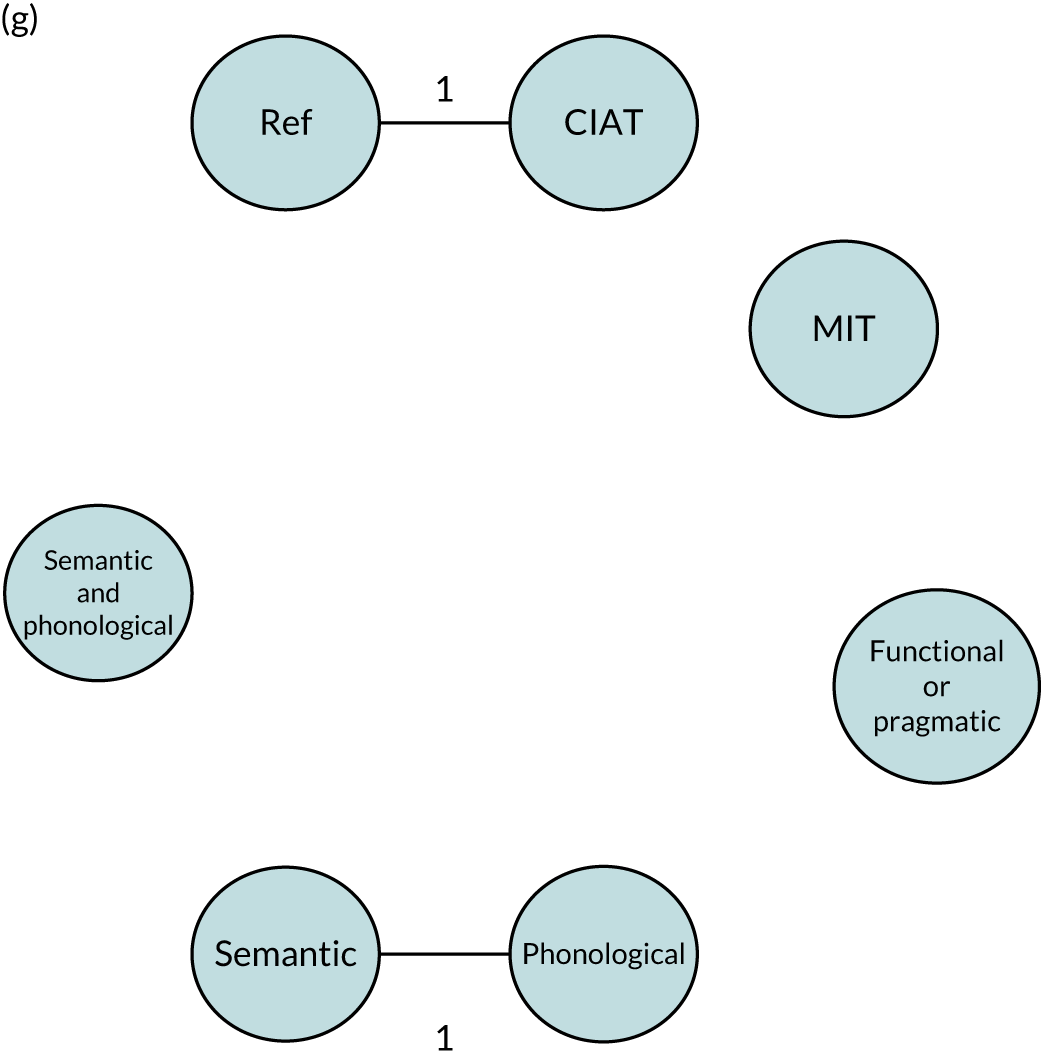
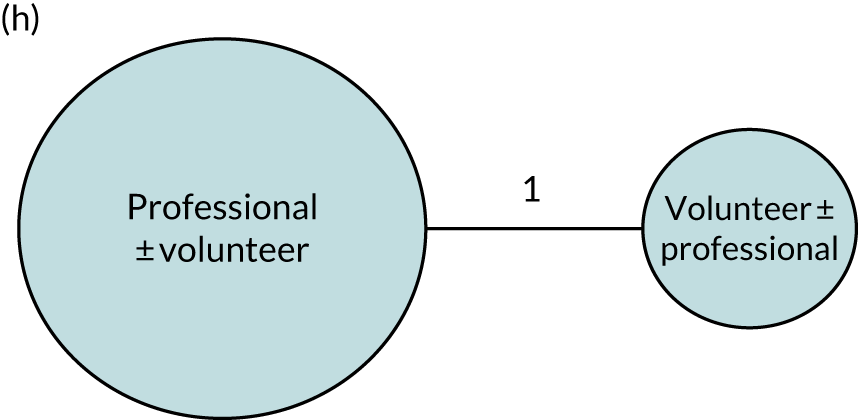
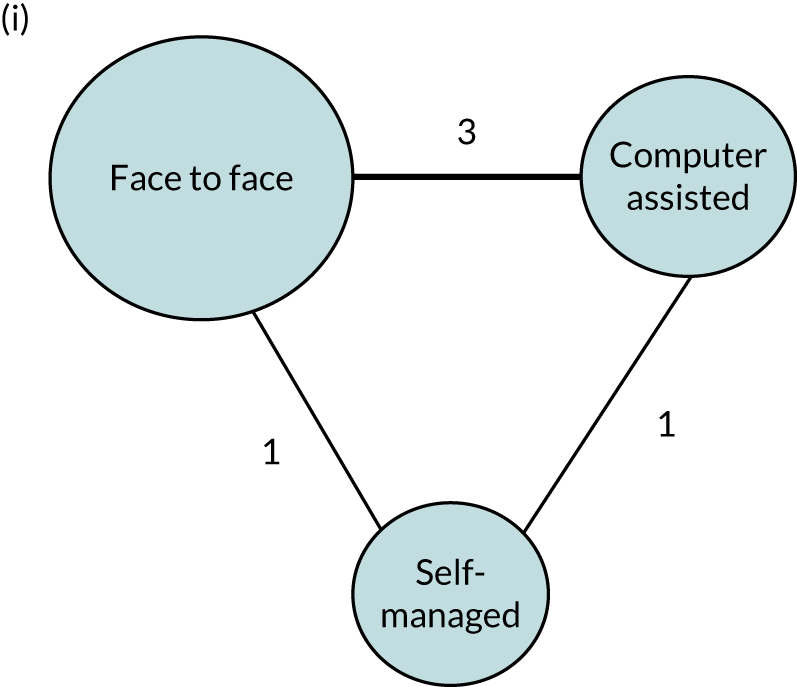

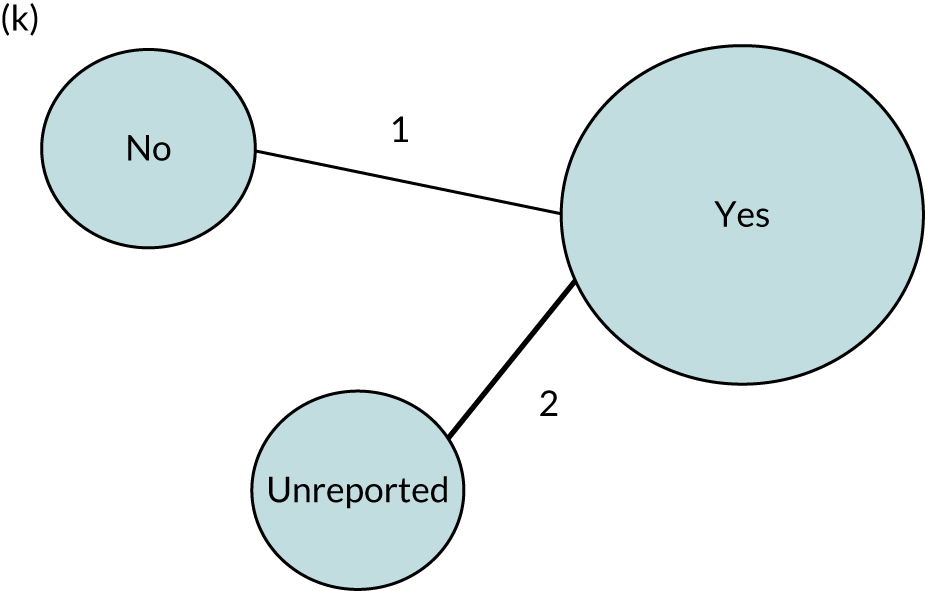
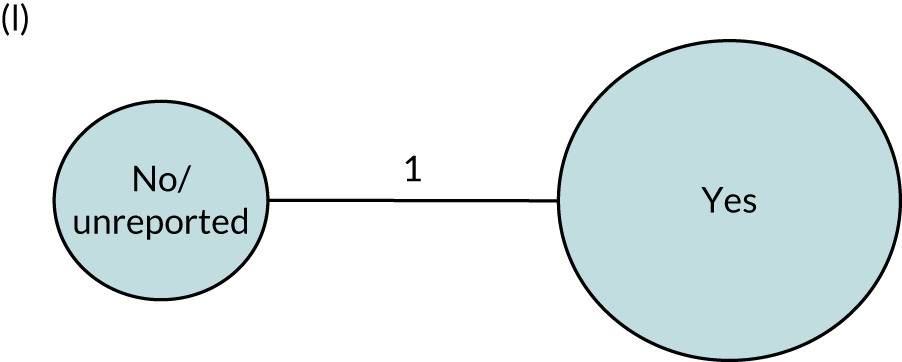
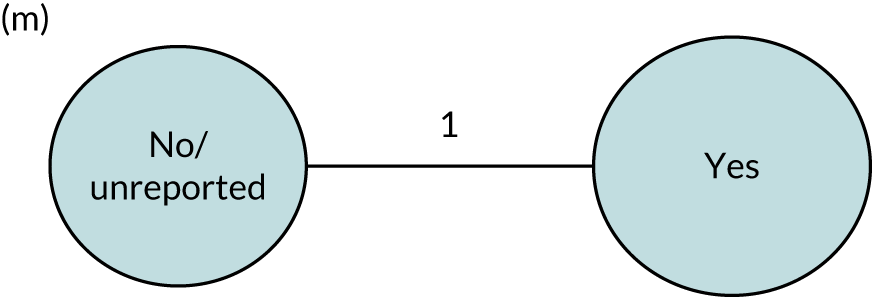
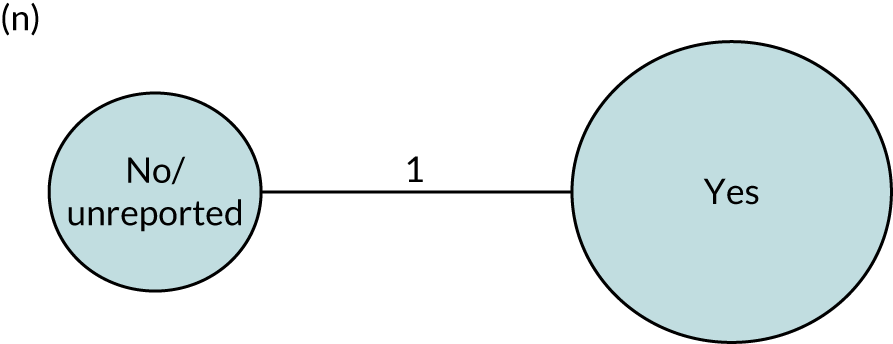
Appendix 13 Network meta-analysis geometry for naming
FIGURE 31.
Network meta-analysis direct and indirect comparisons: naming network geometry. (a) SLT frequency (days per week); (b) SLT duration (weeks); (c) SLT intensity (hours per week); (d) SLT dosage (total hours); (e) SLT therapy approach by role; (f) SLT approach by treatment target; (g) SLT by theoretical approach; (h) expertise of provider; (i) mode of SLT delivery; (j) context of SLT delivery; (k) multimodal SLT; (l) tailored SLT; (m) SLT tailored by difficulty; (n) SLT tailored by functional relevance; and (o) SLT home practice. CIAT, constraint-induced aphasia therapy; MIT, melodic intonation therapy; MM, multimodal; Ref, reference.
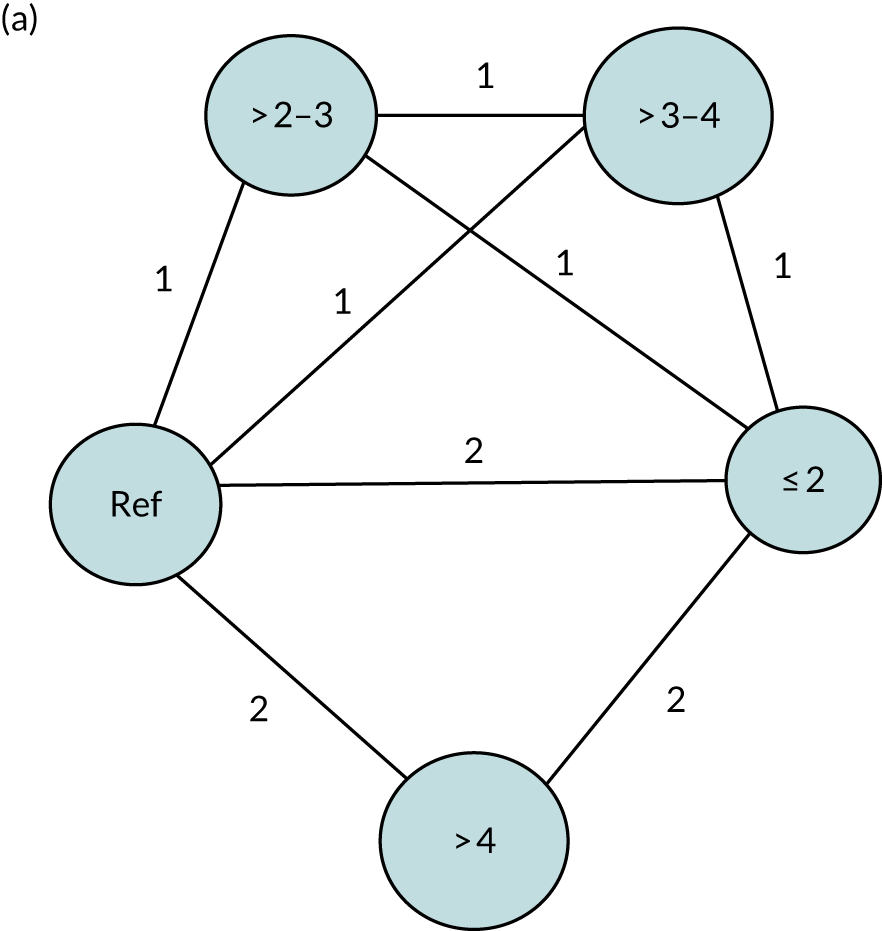
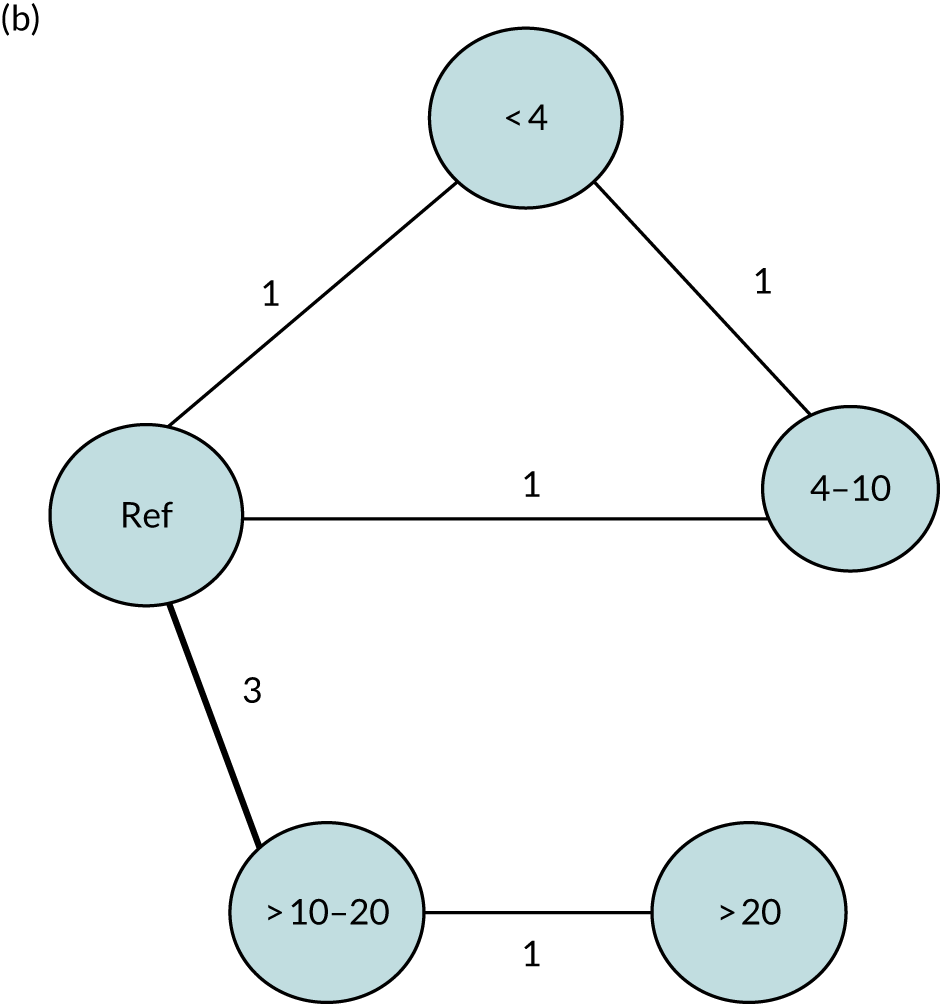
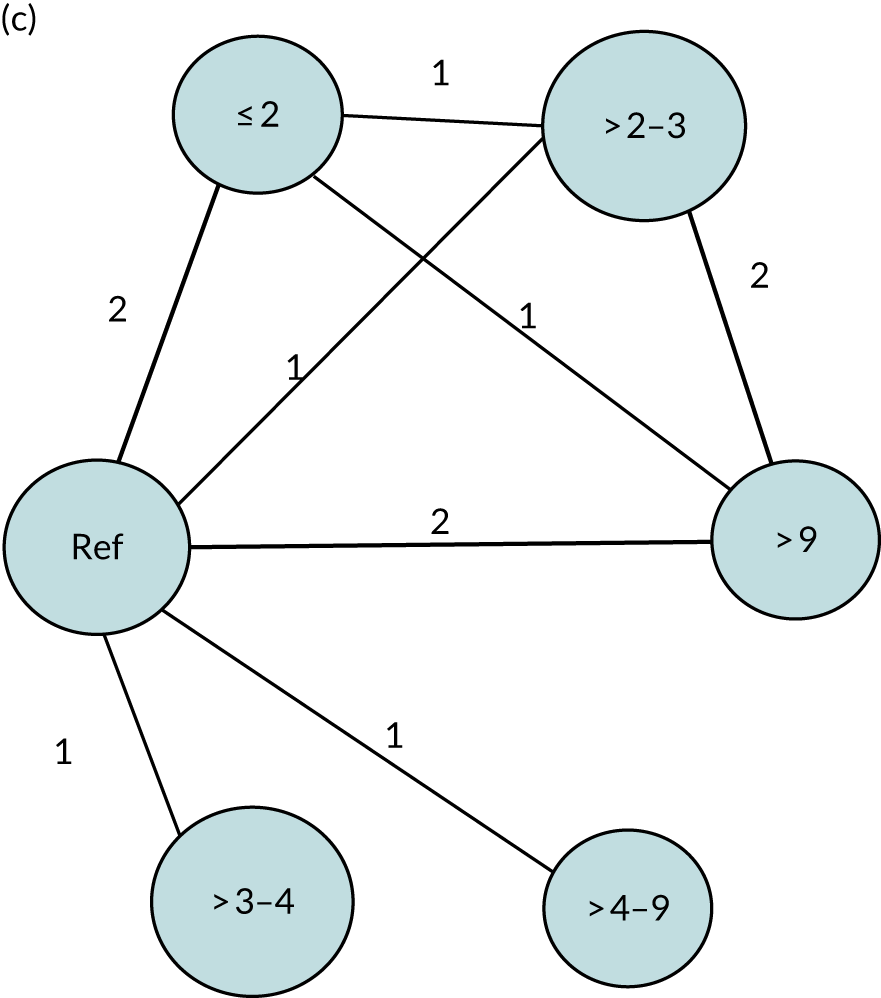


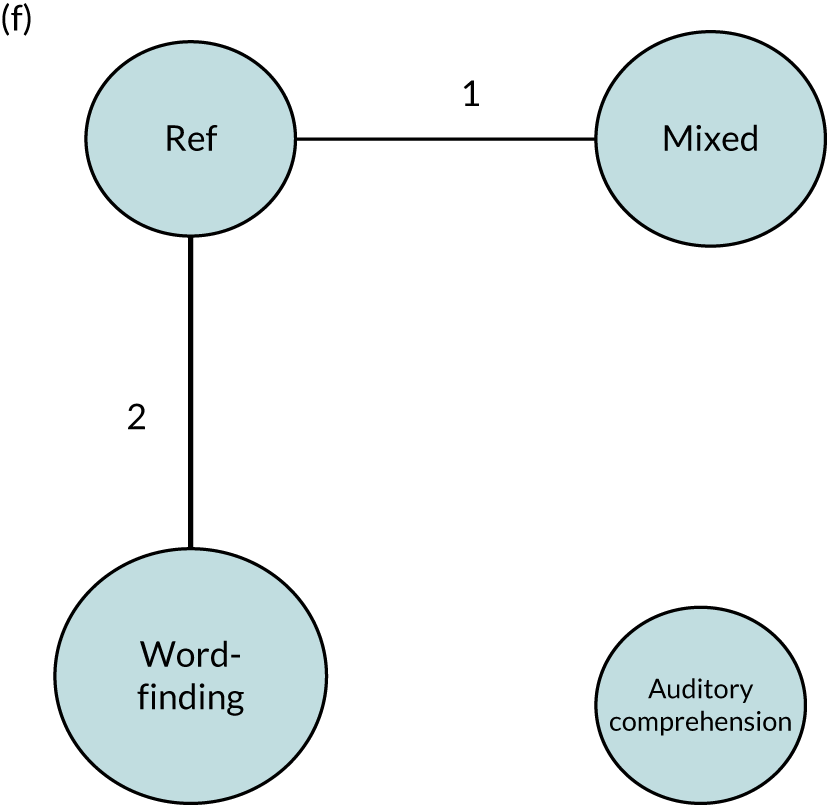
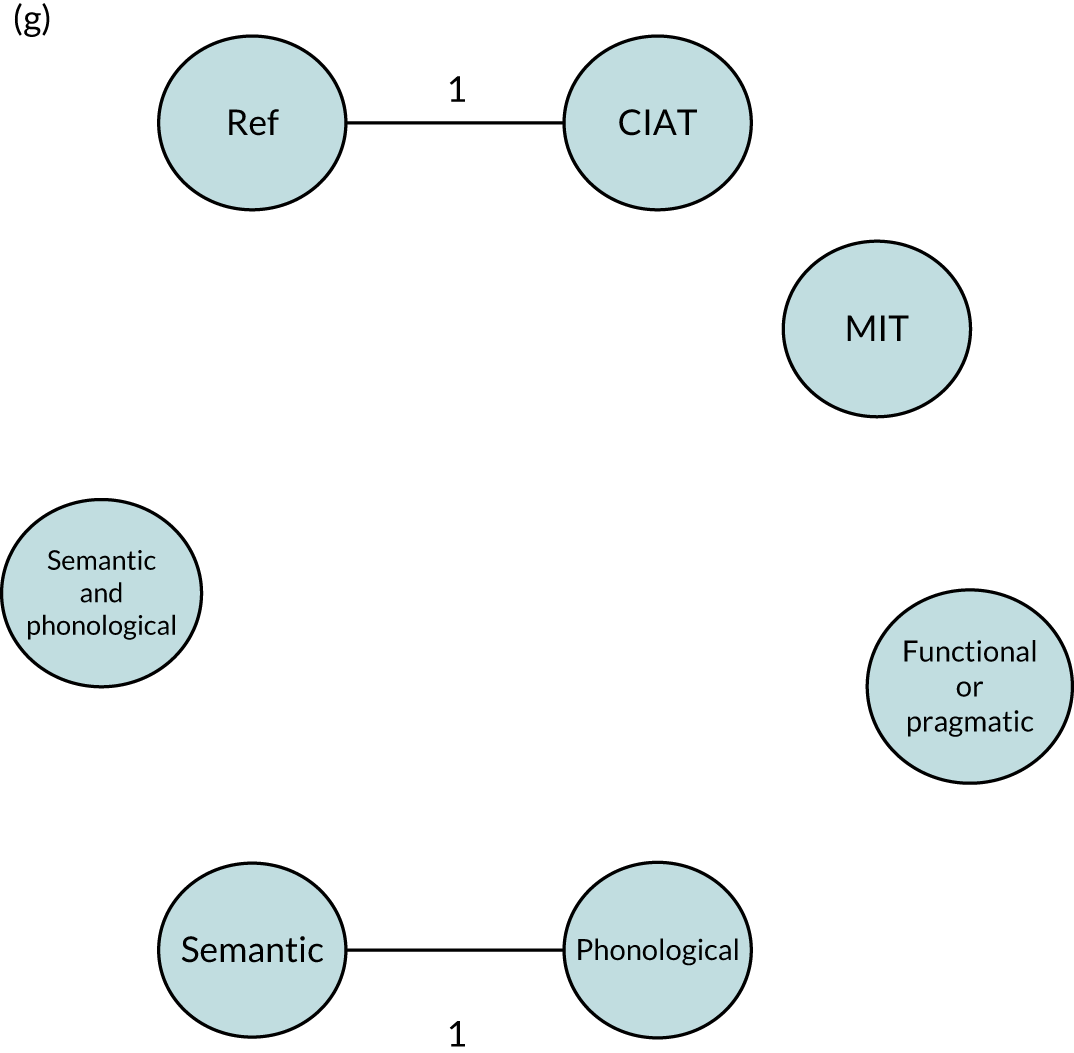
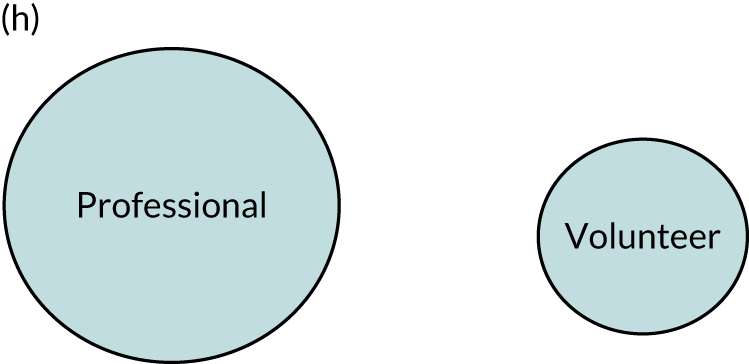

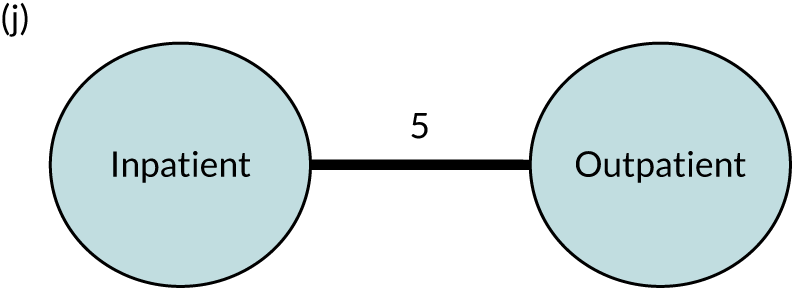
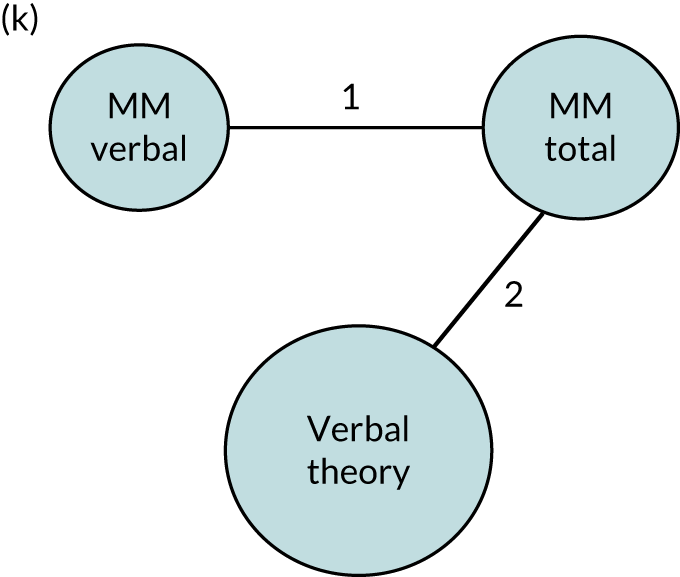
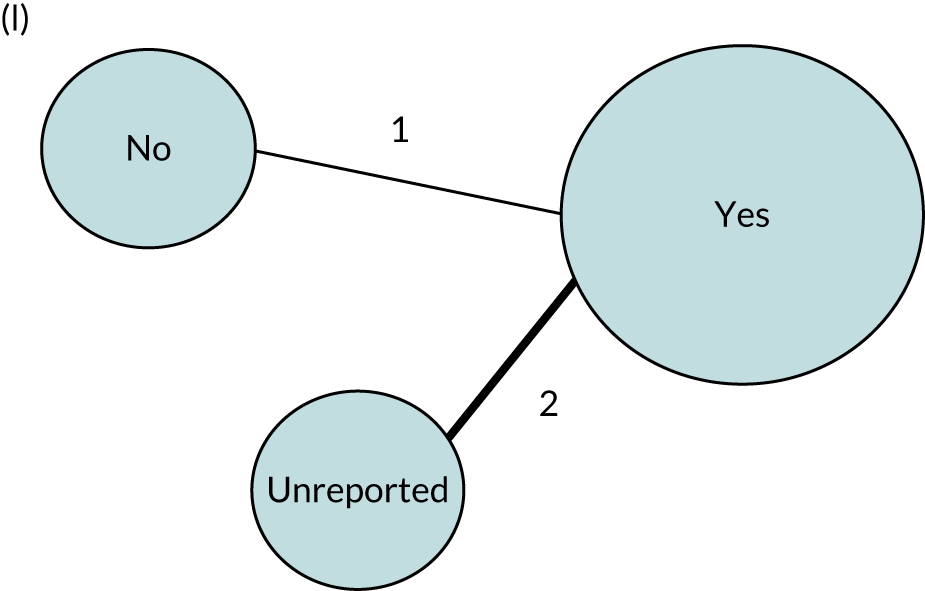


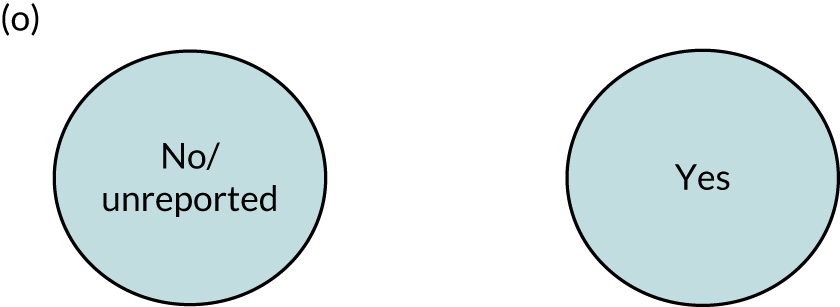
Appendix 14 Network meta-analysis geometry for functional communication
FIGURE 32.
Network meta-analysis direct and indirect comparisons: functional communication (observer-rated) network geometry. (a) SLT (days per week); (b) SLT duration (weeks); (c) SLT intensity (hours per week); (d) SLT dosage (total hours); (e) SLT approach by role; (f) SLT by treatment target; (g) SLT by theoretical approach; (h) expertise of provider; (i) mode of SLT delivery; (j) context of SLT delivery; (k) multimodal SLT; (l) tailored SLT; (m) SLT tailored by difficulty; (n) SLT tailored by functional relevance; and (o) SLT home practice. CIAT, constraint-induced aphasia therapy; MIT, melodic intonation therapy; MM, multimodal; Ref, reference.
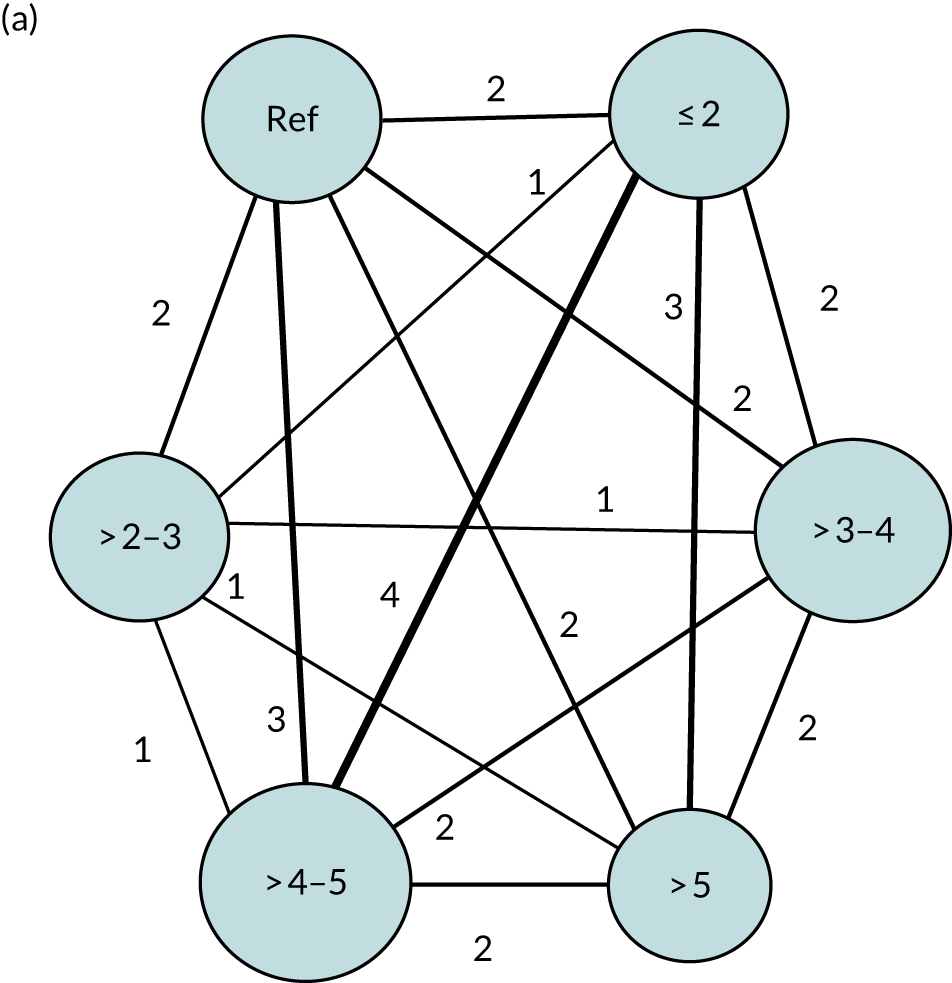

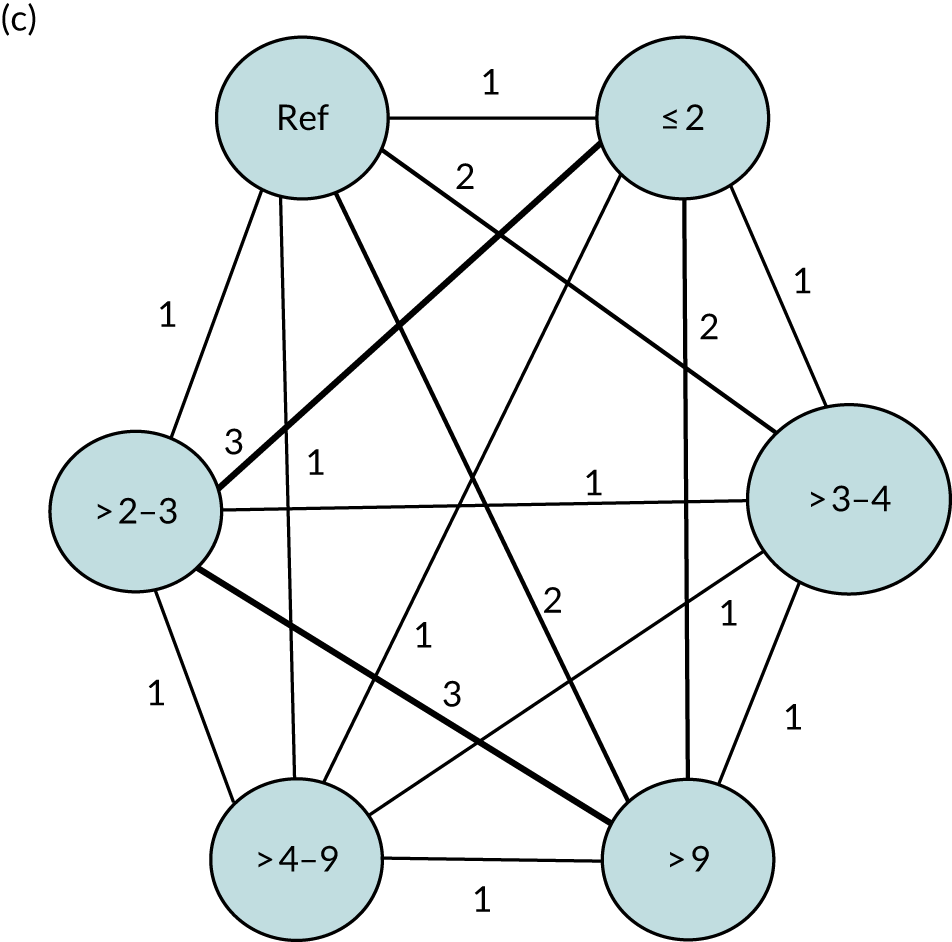

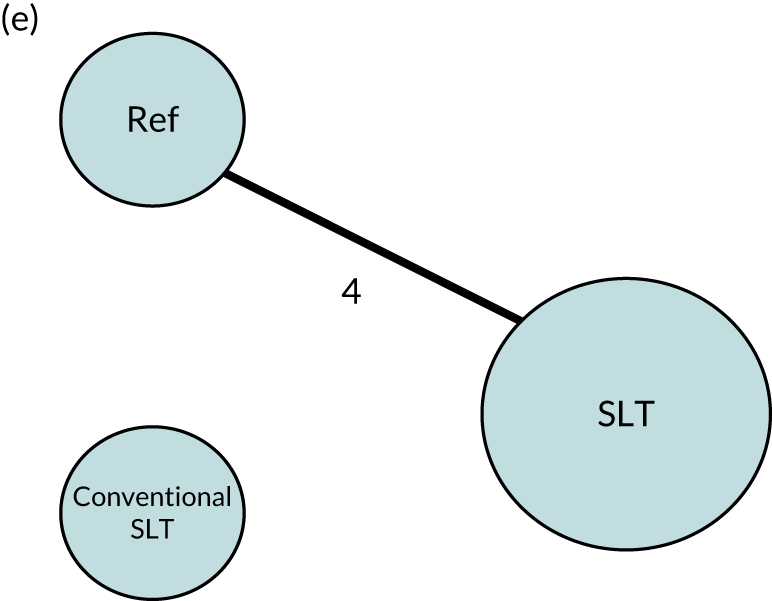
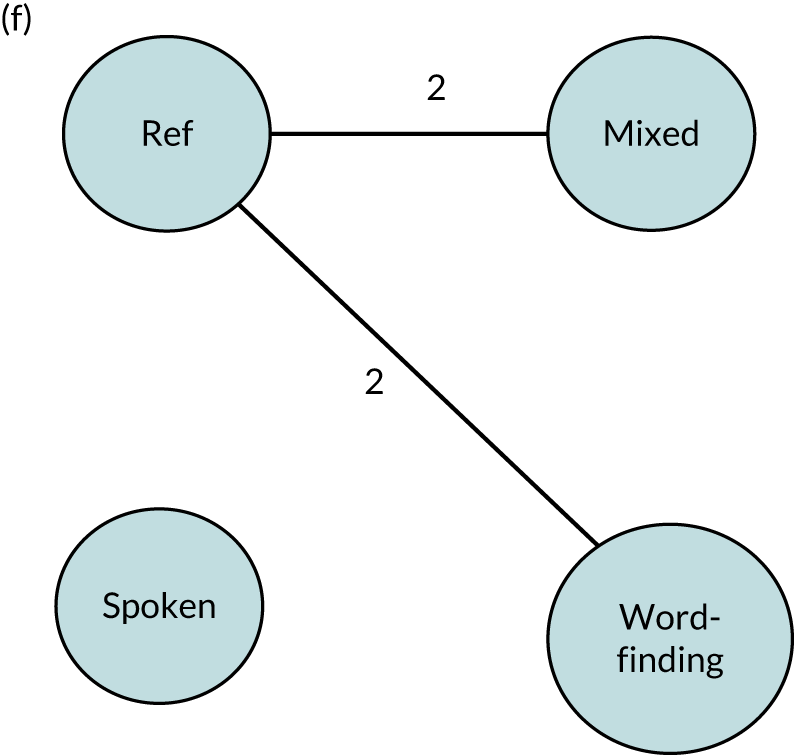
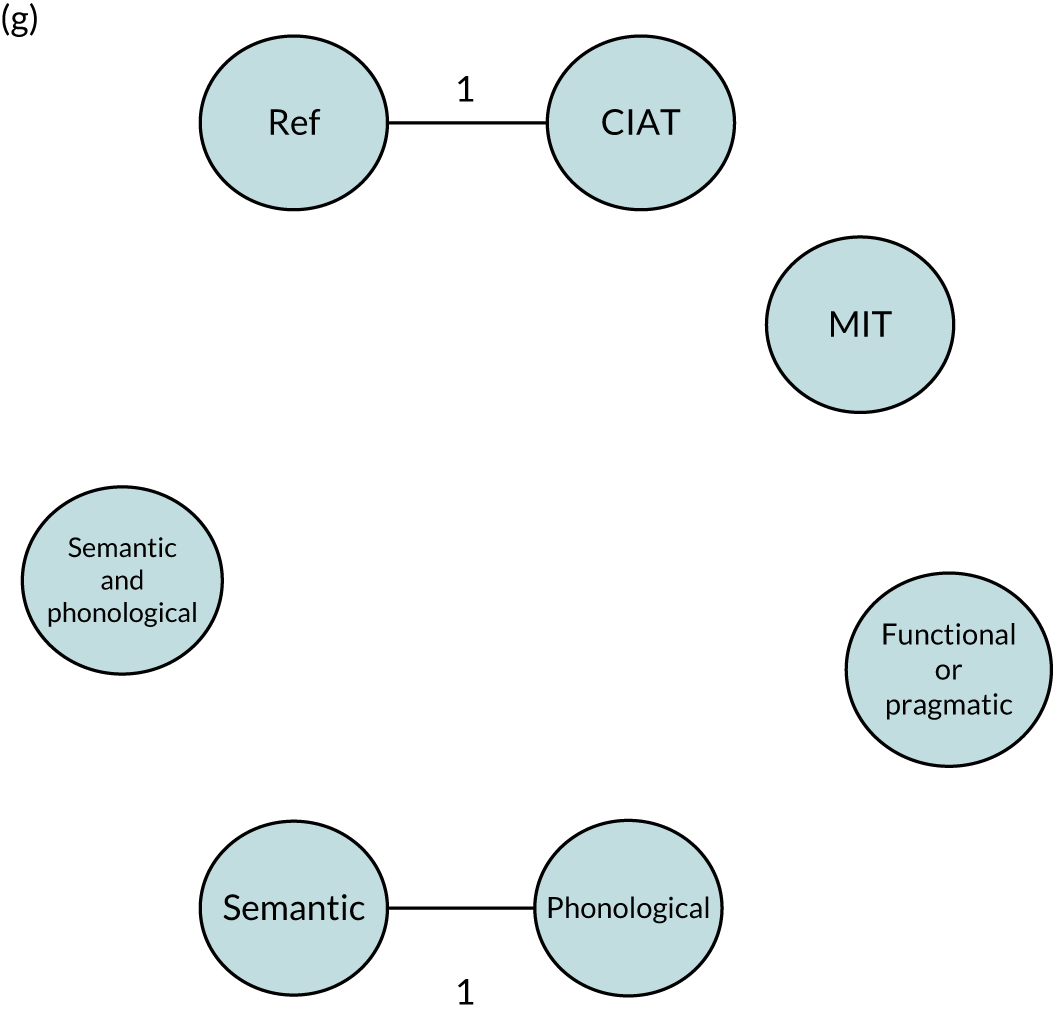
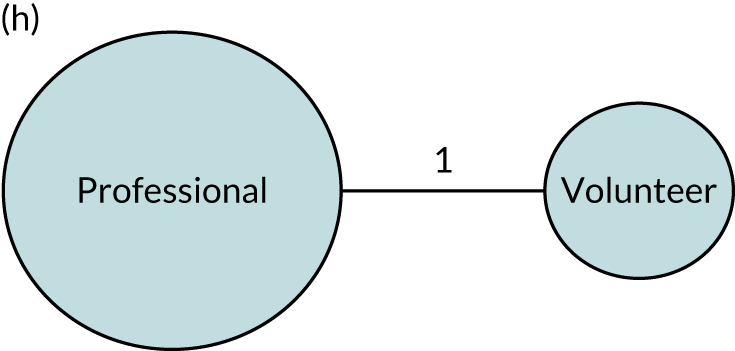
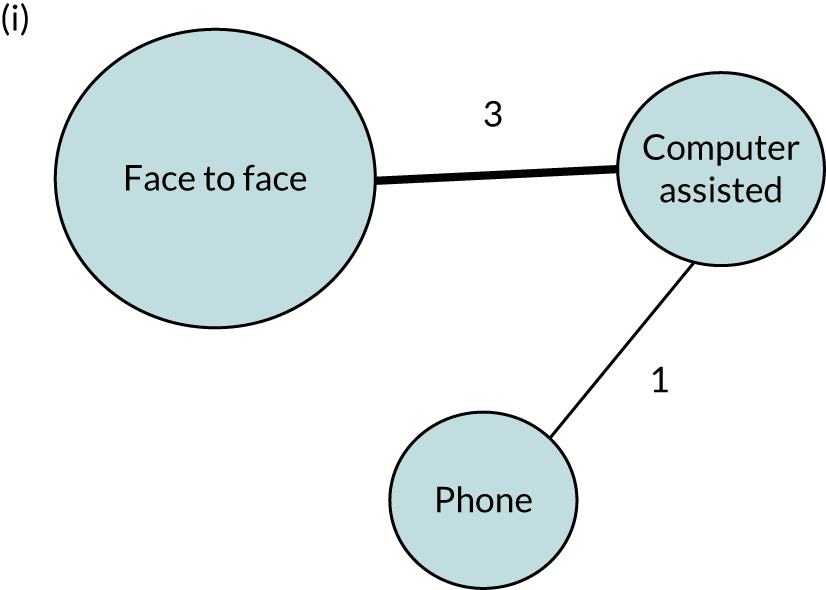
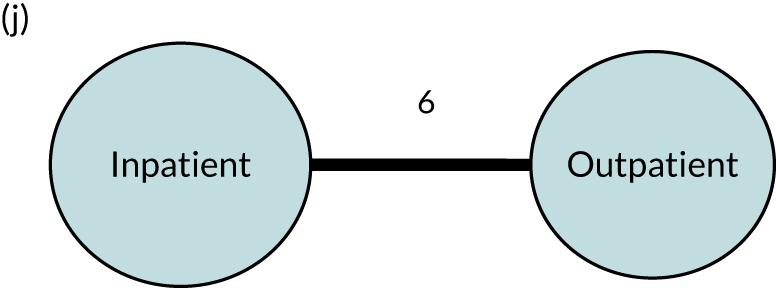
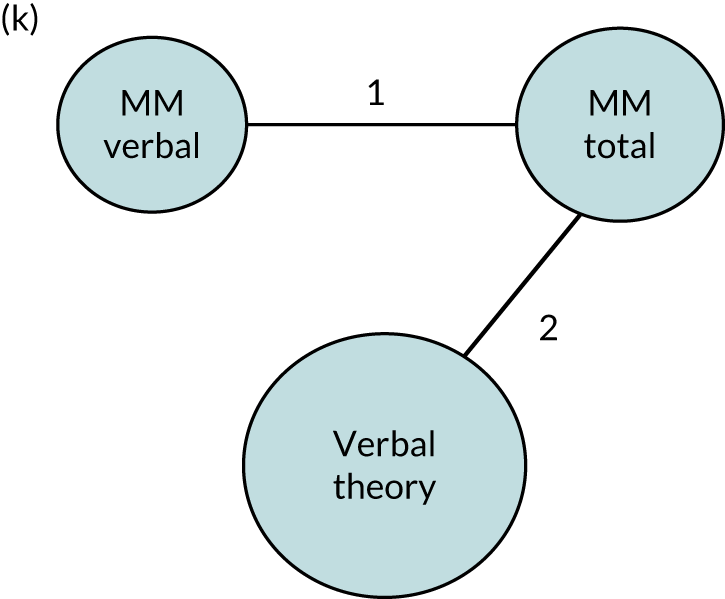
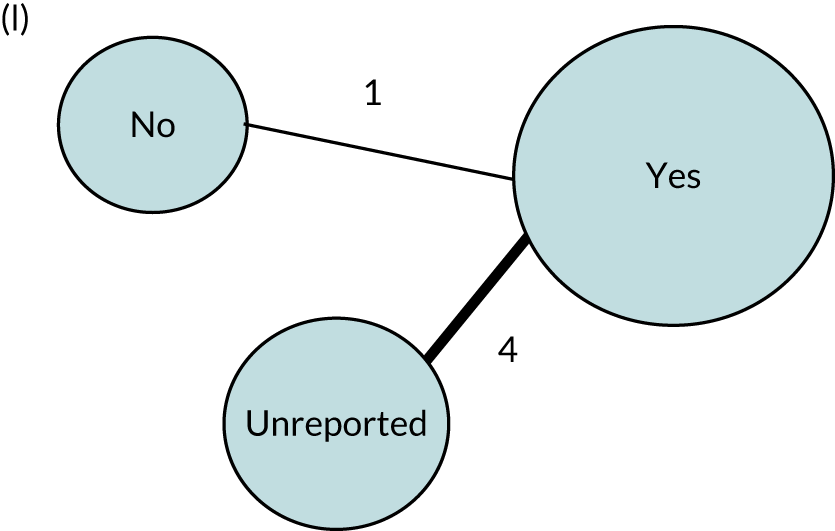

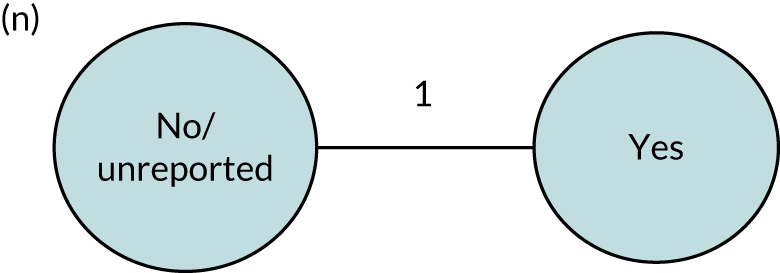
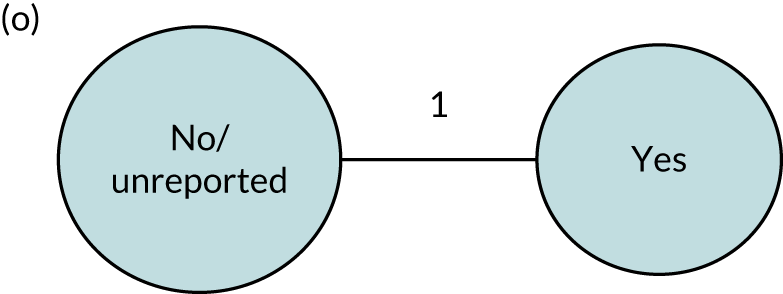
Appendix 15 Cluster-effect analysis
Appendix 16 Gains in language domains for regimen, approach and context
| SLT component | Language domain | |||
|---|---|---|---|---|
| Overall language ability | Auditory comprehension | Naming | Functional communication | |
| Regimen | ||||
| Frequency (number of SLT days weekly) | > 4 | 3 to 4 | Up to 2 | > 4 |
| Duration (of SLT, in weeks) | ≥ 10 | 3 or ≥ 10 | ≥ 20 | ≥ 4 |
| Intensity (mean number of hours per week) | Up to 2; 3–4; ≥ 9 | ≥ 9 | Up to 2 | Up to 3 |
| Dosage (total number of hours of SLT delivered) | 20–50 | 20–50 | Up to 5 | 14–20 |
| Home practice tasks prescribed | Yes | Yes | No | No |
| SLT approach | ||||
| SLT target | Mixed | Word-finding | Word-finding | Mixed |
| Theoretical approach | Semantic/phonological | Semantic/phonological | Non-significant change from baseline | Functional/pragmatic |
| Multimodal (verbal; total) or verbal approach | N/A | Non-significant change from baseline | No | Yes |
| Tailoring by functional relevance | Yes | Yes | Yes | Yes |
| Tailoring by difficulty | Yes | Yes | No | No |
Appendix 17 Frequency of speech and language therapy intervention by language outcome
| Frequency of SLT | RCT data only (n) | IPD (n) | Estimate of mean (95% CI) | All data sets (n) | IPD (n) | Estimate of mean (95% CI) |
|---|---|---|---|---|---|---|
| Overall language ability (WAB-AQ, range 0–100) | ||||||
| Up to 2 days weekly | 5 | 90 | 10.24 (3.51 to 16.97) | 6 | 92 | 9.73 (3.53 to 15.94) |
| > 2–3 days weekly | 2 | 21 | 13.35 (4.29 to 22.41) | 3 | 25 | 11.63 (3.49 to 19.77) |
| > 3–4 days weekly | 5 | 76 | 13.08 (5.40 to 20.76) | 9 | 171 | 13.92 (8.24 to 19.60) |
| > 4–5 days weekly | 6 | 194 | 14.95 (8.67 to 21.23) | 6 | 194 | 14.31 (8.37 to 20.25) |
| > 5 days weekly | 2 | 32 | 14.14 (5.99 to 22.29) | 4 | 75 | 13.15 (6.63 to 19.68) |
| Reference group | 3 | 71 | 13.16 (5.74 to 20.58) | 3 | 71 | 12.84 (5.76 to 19.92) |
| Auditory comprehension (TT-AAT, range 0–50) | ||||||
| Up to 2 days weekly | 4 | 64 | –0.51 (–4.09 to 3.08) | 5 | 68 | 1.62 (–1.80 to 5.03) |
| > 2–3 days weekly | 4 | 89 | 1.86 (–2.06 to 5.78) | 5 | 94 | 2.60 (–1.17 to 6.38) |
| > 3–4 days weekly | 5 | 114 | 5.86 (1.64 to 10.01) | 6 | 121 | 6.51 (2.58 to 10.45) |
| > 4–5 days weekly | 8 | 171 | 4.63 (1.48 to 7.77) | 11 | 206 | 6.19 (3.16 to 9.22) |
| > 5 days weekly | 3 | 51 | 2.38 (–1.64 to 6.39) | 7 | 101 | 3.64 (0.28 to 7.00) |
| Reference group | 6 | 51 | 2.62 (–1.09 to 6.33) | 6 | 51 | 3.92 (0.17 to 7.66) |
| Naming (BNT, range 0–60) | ||||||
| Up to 2 days weekly | 3 | 42 | 12.01 (6.52 to 17.59) | 6 | 56 | 12.24 (7.35 to 17.12) |
| > 2–3 days weekly | 3 | 84 | 6.45 (0.23 to 12.68) | 4 | 89 | 7.19 (1.37 to 13.01) |
| > 3–4 days weekly | 4 | 103 | 7.80 (1.23 to 14.37) | 9 | 204 | 8.77 (4.28 to 13.26) |
| > 4 days weekly | 6 | 104 | 4.07 (–0.93 to 9.08) | 9 | 151 | 4.58 (0.34 to 8.82) |
| Reference group | 5 | 52 | 7.25 (2.24 to 12.25) | 5 | 52 | 7.81 (2.89 to 12.72) |
| Reading comprehension (CAT reading subtest, range 0–74) | ||||||
| Up to 2 days weekly | – | 0 | 0 | – | ||
| > 2–3 days weekly | – | 1 | 10 | 2.74 (–3.61 to 5.98) | ||
| > 3–4 days weekly | – | 2 | 58 | 2.76 (–0.96 to 2.79) | ||
| ≥ 5 days weekly | – | 2 | 19 | 2.81 (–2.07 to 6.20) | ||
| Reference group | – | 0 | 0 | – | ||
| Functional communication (observer rated, AAT-SSC, range 0–5), inclusive of activity data | ||||||
| Up to 2 days weekly | 5 | 82 | 0.52 (0.18 to 0.87) | 5 | 82 | 0.49 (0.08 to 0.89) |
| > 2–3 days weekly | 3 | 92 | 0.62 (0.22 to 1.01) | 3 | 92 | 0.59 (0.12 to 1.06) |
| > 3–4 days weekly | 4 | 102 | 0.70 (0.25 to 1.15) | 6 | 126 | 0.88 (0.47 to 1.29) |
| > 4–5 days weekly | 8 | 155 | 0.78 (0.48 to 1.09) | 11 | 171 | 0.70 (0.33 to 1.07) |
| ≥ 5 days weekly | 3 | 9 | 0.66 (–0.01 to 1.33) | 5 | 37 | 0.55 (0.06 to 1.03) |
| Reference group | 6 | 85 | 0.45 (0.13 to 0.78) | 6 | 85 | 0.42 (0.02 to 0.81) |
Appendix 18 Duration of speech and language therapy intervention by language outcome
| Duration of SLT | RCT data only (n) | IPD (n) | Estimate of mean (95% CI) | All data sets (n) | IPD (n) | Estimate of mean (95% CI) |
|---|---|---|---|---|---|---|
| Overall language ability (WAB-AQ, range 0–100) | ||||||
| Up to 3 weeks | 2 | 50 | 4.86 (–4.87 to 14.59) | 3 | 74 | 7.12 (0.03 to 14.21) |
| 3 weeks | 3 | 158 | 13.13 (7.29 to 18.98) | 3 | 158 | 12.29 (6.75 to 17.84) |
| 4–10 weeks | 4 | 78 | 12.16 (5.96 to 18.36) | 7 | 110 | 10.94 (5.82 to 16.06) |
| > 10–20 weeks | 3 | 45 | 17.27 (9.71 to 24.82) | 6 | 126 | 16.76 (11.08 to 22.45) |
| > 20 weeks | 2 | 34 | 16.93 (8.57 to 25.29) | 3 | 43 | 17.57 (10.75 to 24.39) |
| Reference group | 2 | 65 | 13.20 (6.39 to 20.02) | 2 | 65 | 12.66 (6.12 to 19.21) |
| Auditory comprehension (TT-AAT, range 0–50) | ||||||
| Up to 3 weeks | 6 | 93 | 6.06 (0.84 to 11.29) | 8 | 127 | 7.39 (2.80 to 11.98) |
| 3 weeks | 2 | 105 | 3.60 (–3.42 to 10.62) | 2 | 105 | 4.63 (–0.75 to 10.01) |
| 4–10 weeks | 3 | 68 | 2.12 (–4.70 to 8.95) | 6 | 113 | 2.98 (–1.97 to 7.93) |
| > 10–20 weeks | 5 | 93 | 6.79 (1.69 to 11.88) | 5 | 93 | 9.61 (4.51 to 14.71) |
| > 20 weeks | 3 | 136 | 6.43 (1.55 to 11.30) | 4 | 158 | –0.91 (–6.69 to 4.87) |
| Reference group | 5 | 45 | 5.49 (0.31 to 10.67) | 5 | 45 | 7.74 (2.56 to 12.92) |
| Naming (BNT, range 0–60) | ||||||
| Up to 4 weeks | 5 | 86 | 5.68 (–0.42 to 11.79) | 7 | 114 | 5.53 (0.37 to 10.69) |
| 4–10 weeks | 3 | 27 | 6.18 (–1.21 to 13.56) | 6 | 89 | 8.02 (2.71 to13.32) |
| > 10–20 weeks | 4 | 86 | 7.30 (1.62 to 12.98) | 6 | 106 | 8.49 (3.37 to 13.61) |
| > 20 weeks | 3 | 134 | 8.38 (1.24 to 15.51) | 4 | 191 | 8.73 (2.35 to 15.11) |
| Reference group | 5 | 52 | 6.84 (1.22 to 12.47) | 5 | 52 | 7.86 (2.53 to 13.18) |
| Functional communication (observer rated, AAT-SSC, range 0–5), inclusive of activity data | ||||||
| Up to 3 weeks | 4 | 55 | 0.40 (–0.07 to 0.87) | 4 | 55 | 0.33 (–0.24 to 0.90) |
| 3 weeks | 2 | 56 | 0.66 (0.22 to 1.10) | 2 | 71 | 0.52 (0.10 to 0.93) |
| 4–10 weeks | 2 | 57 | 0.80 (0.29 to 1.31) | 2 | 110 | 0.79 (0.39 to 1.19) |
| > 10–20 weeks | 4 | 76 | 0.77 (0.40 to 1.15) | 4 | 76 | 0.67 (0.20 to 1.14) |
| > 20 weeks | 4 | 151 | 0.76 (0.34 to 1.18) | 4 | 151 | 0.65 (0.10 to 1.20) |
| Reference group | 5 | 79 | 0.44 (0.08 to 0.80) | 5 | 79 | 0.33 (–0.10 to 0.76) |
Appendix 19 Intensity of speech and language therapy intervention by language outcome
| Intensity of SLT (hours per week) | RCT data only (n) | IPD (n) | Estimate of mean (95% CI) | All data sets (n) | IPD (n) | Estimate of mean (95% CI) |
|---|---|---|---|---|---|---|
| Overall language ability (WAB-AQ, range 0–100) | ||||||
| Up to 2 hours | 3 | 74 | 15.85 (8.06 to 23.64) | 4 | 86 | 13.65 (6.94 to 20.36) |
| > 2–3 hours | 7 | 93 | 10.18 (4.03 to 16.32) | 7 | 93 | 9.56 (3.31 to 15.82) |
| > 3–4 hours | 4 | 104 | 15.80 (8.85 to 22.74) | 5 | 118 | 15.88 (9.49 to 22.28) |
| > 4–9 hours | 2 | 50 | 12.22 (4.53 to 19.91) | 5 | 151 | 12.84 (6.95 to 18.74) |
| > 9 hours | 3 | 96 | 15.64 (9.14 to 22.13) | 4 | 115 | 14.98 (9.34 to 20.62) |
| Reference group | 2 | 65 | 14.37 (6.68 to 22.07) | 2 | 65 | 14.40 (7.08 to 21.73) |
| Auditory comprehension (TT-AAT, range 0–50) | ||||||
| Up to 2 hours | 2 | 19 | 6.50 (1.72 to 11.27) | 4 | 39 | 6.80 (2.83 to 10.78) |
| > 2–3 hours | 7 | 120 | 0.32 (–3.11 to 3.75) | 8 | 122 | 0.70 (–2.87 to 4.27) |
| > 3–4 hours | 3 | 112 | 6.01 (1.04 to 10.98) | 5 | 115 | 4.15 (–0.45 to 8.76) |
| > 4–9 hours | 5 | 103 | 2.47 (–0.97 to 5.92) | 7 | 126 | 2.99 (–0.38 to 6.36) |
| > 9 hours | 6 | 141 | 7.30 (4.09 to 10.52) | 10 | 194 | 7.63 (4.58 to 10.67) |
| Reference group | 5 | 45 | 2.43 (–1.44 to 6.29) | 5 | 45 | 2.75 (–1.21 to 6.71) |
| Naming (BNT, range 0–60) | ||||||
| Up to 2 hours | 2 | 18 | 13.23 (5.83 to 20.64) | 3 | 34 | 12.87 (6.25 to 19.50) |
| > 2–3 hours | 5 | 101 | 6.05 (–0.06 to 12.17) | 6 | 111 | 7.31 (1.56 to 13.05) |
| > 3–4 hours | 3 | 127 | 9.70 (2.70 to 16.69) | 3 | 127 | 10.90 (3.66 to 18.15) |
| > 4–9 hours | 2 | 41 | 5.71 (–2.08 to 13.50) | 5 | 124 | 8.06 (2.57 to 13.55) |
| > 9 hours | 4 | 46 | 2.87 (–3.24 to 8.98) | 8 | 104 | 3.65 (–1.36 to 8.67) |
| Reference group | 5 | 52 | 7.47 (1.78 to 13.17) | 5 | 52 | 8.54 (3.14 to 13.95) |
| Functional communication (observer rated, AAT-SSC, range 0–5), inclusive of activity data | ||||||
| Up to 2 hours | 4 | 83 | 0.77 (0.36 to 1.19) | 6 | 134 | 0.75 (0.36 to 1.13) |
| > 2–3 hours | 5 | 73 | 0.76 (0.34 to 1.18) | 6 | 75 | 0.70 (0.27 to 1.12) |
| > 3–4 hours | 5 | 178 | 0.70 (0.35 to 1.06) | 6 | 180 | 0.69 (0.29 to 1.08) |
| > 4–9 hours | 3 | 59 | 0.53 (0.13 to 0.92) | 4 | 73 | 0.68 (0.30 to 1.05) |
| > 9 hours | 6 | 60 | 0.69 (0.33 to 1.06) | 10 | 106 | 0.51 (0.17 to 0.85) |
| Reference group | 5 | 79 | 0.41 (0.06 to 0.76) | 5 | 79 | 0.40 (0.02 to 0.79) |
Appendix 20 Dosage of speech and language therapy intervention by language outcome
| Dosage (total number of hours of SLT) | RCT data only (n) | IPD (n) | Estimate of mean (95% CI) | All data sets (n) | IPD (n) | Estimate of mean (95% CI) |
|---|---|---|---|---|---|---|
| Overall language ability (WAB-AQ, range 0–100) | ||||||
| Up to 5 hours | 6 | 101 | 9.71 (3.94 to 15.48) | 7 | 106 | 8.79 (3.29 to 14.29) |
| > 5–14 hours | 4 | 114 | 15.08 (9.31 to 20.85) | 6 | 145 | 13.67 (8.58 to 18.76) |
| > 14–20 hours | 4 | 89 | 14.63 (8.73 to 20.53) | 4 | 89 | 13.64 (7.79 to 19.49) |
| > 20–< 50 hours | 4 | 31 | 18.37 (10.58 to 26.16) | 5 | 33 | 17.98 (10.83 to 25.12) |
| ≥ 50 hours | 4 | 68 | 13.87 (7.04 to 20.71) | 8 | 176 | 14.74 (9.86 to 19.63) |
| Reference group | 4 | 77 | 11.63 (5.22 to 18.04) | 4 | 77 | 10.74 (4.71 to 16.77) |
| Auditory comprehension (TT-AAT, range 0–50) | ||||||
| Up to 5 hours | 3 | 64 | 0.23 (–4.09 to 4.54) | 5 | 71 | 1.99 (–1.79 to 5.77) |
| > 5–14 hours | 4 | 86 | 1.42 (–2.67 to 5.51) | 7 | 90 | 2.83 (–0.60 to 6.26) |
| > 14–20 hours | 2 | 66 | 3.72 (–0.62 to 8.07) | 3 | 66 | 5.11 (1.16 to 9.07) |
| > 20–< 50 hours | 7 | 90 | 5.23 (1.51 to 8.95) | 9 | 105 | 6.01 (2.45 to 9.58) |
| ≥ 50 hours | 6 | 183 | 4.18 (0.30 to 8.06) | 9 | 227 | 5.89 (2.50 to 9.27) |
| Reference group | 6 | 51 | 3.46 (–0.42 to 7.34) | 6 | 51 | 4.43 (0.55 to 8.32) |
| Naming (BNT, range 0–60) | ||||||
| Up to 5 hours | 2 | 28 | 12.48 (1.34 to 23.63) | 3 | 35 | 8.05 (–0.17 to 16.28) |
| > 5–20 hours | 4 | 61 | 5.35 (–2.85 to 13.55) | 5 | 70 | 5.44 (–1.35 to 12.24) |
| > 20–< 50 hours | 5 | 81 | 9.23 (1.75 to 16.70) | 8 | 135 | 11.32 (5.92 to 16.72) |
| > 50–99 hours | 2 | 122 | 7.56 (–6.73 to 21.85) | 5 | 162 | 7.24 (–1.07 to 15.56) |
| ≥ 100 hours | 3 | 41 | –0.85 (–9.46 to 7.77) | 5 | 98 | 2.22 (–4.39 to 8.83) |
| Reference group | 5 | 52 | 7.85 (0.42 to 15.28) | 5 | 52 | 9.66 (3.87 to 15.45) |
| Functional communication (observer rated, AAT-SSC, range 0–5), inclusive of activity data | ||||||
| Up to 5 hours | 3 | 47 | 0.29 (–0.13 to 0.72) | 4 | 48 | 0.33 (–0.14 to 0.80) |
| > 5–14 hours | 5 | 104 | 0.68 (0.33 to 1.03) | 6 | 107 | 0.70 (0.29 to 1.11) |
| > 14–20 hours | 3 | 11 | 0.94 (0.34 to 1.55) | 4 | 12 | 0.91 (0.31 to 1.52) |
| > 20–< 50 hours | 9 | 96 | 0.77 (0.43 to 1.10) | 11 | 127 | 0.81 (0.43 to 1.20) |
| ≥ 50 hours | 7 | 174 | 0.73 (0.37 to 1.08) | 10 | 205 | 0.62 (0.25 to 0.98) |
| Reference group | 7 | 91 | 0.40 (0.07 to 0.73) | 7 | 91 | 0.42 (0.03 to 0.82) |
Appendix 21 Home practice speech and language therapy tasks by language outcome
| Home practice | RCT data only (n) | IPD (n) | Estimate of mean (95% CI) | All data sets (n) | IPD (n) | Estimate of mean (95% CI) |
|---|---|---|---|---|---|---|
| Overall language ability (WAB-AQ, range 0–100) | ||||||
| Yes | 2 | 87 | 16.69 (10.01 to 23.37) | 3 | 101 | 16.56 (10.69 to 22.43) |
| No | 10 | 330 | 13.35 (8.21 to 18.48) | 15 | 462 | 13.05 (8.80 to 17.30) |
| Auditory comprehension (TT-AAT, range 0–50) | ||||||
| Yes | 7 | 278 | 5.28 (2.19 to 8.37) | 8 | 300 | 6.68 (3.60 to 9.77) |
| No | 10 | 217 | 2.27 (–0.67 to 5.22) | 15 | 296 | 3.53 (0.83 to 6.23) |
| Naming (BNT, range 0–60) | ||||||
| Yes | 4 | 167 | 6.94 (–0.57 to 14.46) | 5 | 224 | 7.34 (0.26 to 14.42) |
| No | 9 | 166 | 7.08 (1.81 to 12.35) | 15 | 265 | 8.06 (3.70 to 12.43) |
| Functional communication (observer rated, AAT-SSC, range 0–5), inclusive of activity data | ||||||
| Yes | 5 | 187 | 0.61 (0.18 to 1.04) | 5 | 187 | 0.69 (0.34 to 1.04) |
| No | 10 | 267 | 0.74 (0.39 to 1.09) | 14 | 371 | 0.55 (0.03 to 1.07) |
Appendix 22 Target of speech and language therapy intervention by language outcome
| Target | RCT data only (n) | IPD (n) | Estimate of mean (95% CI) | All data sets (n) | IPD (n) | Estimate of mean (95% CI) |
|---|---|---|---|---|---|---|
| Overall language ability (WAB-AQ, range 0–100) | ||||||
| Mixed | 8 | 245 | 15.62 (8.82 to 22.43) | 9 | 259 | 17.77 (9.48 to 26.07) |
| Spoken language | 2 | 70 | 12.83 (–0.99 to 26.64) | 3 | 94 | 15.31 (5.33 to 25.30) |
| Auditory comprehension | 1 | 6 | 11.91 (–7.05 to 30.87) | 1 | 6 | 21.12 (0.34 to 41.90) |
| Word-finding | 0 | 0 | – | 2 | 21 | 11.08 (–4.33 to 26.48) |
| Reference group | 2 | 65 | 12.23 (3.75 to 20.70) | 2 | 65 | 16.65 (7.13 to 26.17) |
| Auditory comprehension (TT-AAT, range 0–50) | ||||||
| Mixed | 5 | 142 | 3.37 (–1.20 to 7.93) | 6 | 164 | 5.38 (0.49 to 10.27) |
| Spoken language | 0 | 0 | – | 1 | 22 | 3.69 (–7.41 to 14.78) |
| Auditory comprehension | 2 | 17 | 1.25 (–7.58 to 10.09) | 2 | 17 | 2.48 (–6.84 to 11.79) |
| Word-finding | 7 | 136 | 4.46 (0.31 to 8.62) | 9 | 196 | 5.61 (1.10 to 10.12) |
| Reading | 0 | 0 | – | 1 | 10 | 1.53 (–10.18 to 13.24) |
| Reference group | 4 | 29 | 2.54 (–2.40 to 7.47) | 4 | 29 | 3.98 (–1.61 to 9.57) |
| Naming (BNT, range 0–60) | ||||||
| Mixed | 4 | 84 | 7.33 (0.58 to 14.08) | 4 | 84 | 8.97 (2.08 to 15.86) |
| Auditory comprehension | 2 | 25 | 0.33 (–11.29 to 11.95) | 3 | 41 | 1.59 (–7.40 to 10.58) |
| Word-finding | 7 | 174 | 8.82 (3.15 to 14.49) | 13 | 268 | 10.00 (5.44 to 14.56) |
| Reference group | 3 | 27 | 10.24 (3.56 to 16.92) | 3 | 27 | 11.66 (5.19 to 18.13) |
| Functional communication (observer rated, AAT-SSC, range 0–5), inclusive of activity data | ||||||
| Mixed | 3 | 72 | 1.05 (0.52 to 1.58) | 3 | 72 | 1.02 (0.41 to 1.63) |
| Spoken language | 1 | 52 | 0.68 (–0.40 to 1.77) | 1 | 52 | 0.67 (–0.49 to 1.83) |
| Word-finding | 8 | 184 | 0.72 (0.33 to 1.10) | 11 | 242 | 0.67 (0.21 to 1.12) |
| Reading | 0 | 0 | – | 1 | 10 | 1.00 (–0.28 to 2.28) |
| Reference group | 4 | 58 | 0.75 (0.26 to 1.23) | 4 | 58 | 0.72 (0.14 to 1.29) |
Appendix 23 Theoretical approach to speech and language therapy intervention by language outcome
| Theoretical approach | RCT data only (n) | IPD (n) | Estimate of mean (95% CI) | All data sets (n) | IPD (n) | Estimate of mean (95% CI) |
|---|---|---|---|---|---|---|
| Overall language ability (WAB-AQ, range 0–100) | ||||||
| Semantic/phonological | 2 | 60 | 20.39 (1.90 to 38.88) | 3 | 74 | 16.55 (4.93 to 28.16) |
| Phonological | 0 | 0 | – | 2 | 21 | 9.07 (–7.34 to 25.49) |
| CIAT | 1 | 10 | 16.11 (–4.87 to 37.09) | 2 | 34 | 12.60 (–0.19 to 25.38) |
| Functional/pragmatic | 2 | 83 | 13.50 (–1.48 to 28.47) | 2 | 83 | 8.18 (–9.27 to 25.63) |
| Reference group | 2 | 65 | 23.46 (4.98 to 41.95) | 2 | 65 | 18.46 (3.00 to 33.92) |
| Auditory comprehension (TT-AAT, range 0–50) | ||||||
| Semantic/phonological | 1 | 35 | 11.93 (1.44 to 22.43) | 2 | 45 | 8.05 (1.42 to 14.68) |
| Semantic | 1 | 27 | 3.29 (–4.90 to 11.48) | 1 | 27 | 2.62 (–3.96 to 9.21) |
| Phonological | 2 | 45 | 5.95 (–1.56 to 13.46) | 3 | 63 | 5.32 (–0.35 to 10.99) |
| CIAT | 2 | 32 | 7.46 (0.67 to 14.25) | 3 | 54 | 6.02 (0.25 to 11.79) |
| MIT | 1 | 23 | 0.26 (–10.08 to 10.59) | 1 | 23 | 1.42 (–11.14 to 8.31) |
| Functional/pragmatic | 3 | 98 | 5.52 (–0.86 to 11.91) | 3 | 98 | 3.89 (–2.86 to 10.63) |
| Reference group | 4 | 29 | 2.33 (–3.53 to 8.20) | 4 | 29 | 0.63 (–5.29 to 6.55) |
| Naming (BNT, range 0–60) | ||||||
| Semantic/phonological | 1 | 35 | 19.38 (–13.50 to 52.27) | 2 | 45 | 15.48 (–0.53 to 31.49) |
| Semantic | 1 | 26 | –2.48 (–35.82 to 30.87) | 1 | 26 | 2.75 (–11.13 to 16.62) |
| Phonological | 1 | 25 | –1.66 (–34.92 to 31.60) | 2 | 54 | 4.08 (–9.30 to 17.45) |
| CIAT | 1 | 13 | 15.53 (–4.48 to 35.55) | 2 | 18 | 12.43 (–0.91 to 25.77) |
| MIT | 1 | 20 | –2.25 (–35.04 to 30.53) | 1 | 20 | 1.00 (–22.78 to 24.78) |
| Functional/pragmatic | 2 | 32 | 4.91 (–18.39 to 28.22) | 3 | 64 | 10.61 (–3.01 to 24.23) |
| Reference group | 3 | 27 | 14.78 (–4.60 to 34.15) | 3 | 27 | 13.51 (0.30 to 26.71) |
| Functional communication (observer rated, AAT-SSC range 0–5), inclusive of activity data | ||||||
| Semantic/phonological | 3 | 100 | 0.71 (–0.15 to 1.55) | 4 | 110 | 0.77 (0.18 to 1.37) |
| Semantic | 1 | 26 | 0.35 (–1.15 to 1.86) | 1 | 26 | 0.25 (–0.53 to 1.03) |
| Phonological | 1 | 25 | 0.37 (–1.11 to 1.84) | 2 | 44 | 0.28 (–0.42 to 0.97) |
| CIAT | 1 | 13 | 0.77 (–0.22 to 1.75) | 2 | 18 | 0.57 (–0.14 to 1.28) |
| MIT | 1 | 24 | 0.20 (–1.11 to 1.50) | 1 | 24 | 0.18 (–0.85 to 1.21) |
| Functional/pragmatic | 1 | 8 | 1.82 (0.36 to 3.28) | 2 | 36 | 1.60 (0.83 to 2.36) |
| Reference group | 4 | 58 | 0.68 (–0.10 to 1.46) | 4 | 58 | 0.61 (–0.04 to 1.26) |
Appendix 24 Multimodal and verbal speech and language therapy theoretical approach by language outcome
| SLT approach | RCT data only (n) | IPD (n) | Yes/no | Estimate of mean (95% CI) | All data sets (n) | IPD (n) | Yes/no | Estimate of mean (95% CI) |
|---|---|---|---|---|---|---|---|---|
| Auditory comprehension (TT-AAT, range 0–50) | ||||||||
| Multimodal verbal | 2 | 45 | Yes | 2.23 (–13.21 to 17.67) | 2 | 45 | Yes | 7.23 (–2.89 to 17.34) |
| No | 3.84 (–0.22 to 7.91) | No | 4.88 (1.20 to 8.57) | |||||
| Multimodal total | 3 | 67 | Yes | 2.63 (–12.21 to 17.48) | 4 | 89 | Yes | 7.49 (–1.82 to 16.80) |
| No | 3.44 (–0.97 to 7.85) | No | 4.62 (0.52 to 8.71) | |||||
| Verbal approach | 13 | 299 | Yes | 1.59 (–13.20 to 16.38) | 19 | 400 | Yes | 6.36 (–2.88 to 15.61) |
| No | 4.49 (–0.62 to 9.59) | No | 5.75 (0.91 to 10.58) | |||||
| Naming (BNT, range 0–60) | ||||||||
| Multimodal verbal | 2 | 47 | Yes | 8.02 (–9.45 to 25.50) | 3 | 57 | Yes | 8.00 (–10.18 to 26.16) |
| No | 6.83 (2.00 to 11.67) | No | 6.97 (2.11 to 11.83) | |||||
| Multimodal total | 3 | 60 | Yes | 6.86 (–9.80 to 23.51) | 3 | 60 | Yes | 6.75 (–10.78 to 24.29) |
| No | 8.00 (2.80 to 13.21) | No | 8.21 (3.26 to 13.16) | |||||
| Verbal approach | 11 | 224 | Yes | 7.32 (–9.27 to 23.92) | 16 | 308 | Yes | 7.21 (–10.27 to 24.69) |
| No | 7.53 (1.51 to 13.56) | No | 7.75 (2.01 to 13.50) | |||||
| Functional communication (observer rated, AAT-SSC, range 0–5), inclusive of activity data | ||||||||
| Multimodal verbal | 2 | 38 | Yes | 1.96 (0.85 to 3.07) | 2 | 38 | Yes | 1.95 (0.68 to 3.22) |
| No | 0.57 (0.28 to 0.86) | No | 0.65 (0.29 to 1.00) | |||||
| Multimodal total | 3 | 66 | Yes | 1.90 (0.86 to 2.93) | 3 | 66 | Yes | 1.89 (0.68 to 3.09) |
| No | 0.63 (0.32 to 0.95) | No | 0.71 (0.32 to 1.10) | |||||
| Verbal approach | 10 | 273 | Yes | 1.95 (0.92 to 2.99) | 10 | 335 | Yes | 1.94 (0.75 to 3.14) |
| No | 0.58 (0.19 to 0.97) | No | 0.65 (0.19 to 1.11) | |||||
Appendix 25 Expertise and delivery of speech and language therapy intervention by language outcome
| SLT provider | RCT data only (n) | IPD (n) | Yes/no | Estimate of mean (95% CI) | All data sets (n) | IPD (n) | Yes/no | Estimate of mean (95% CI) |
|---|---|---|---|---|---|---|---|---|
| Overall language ability (WAB-AQ, range 0–100) | ||||||||
| Professional | 11 | 405 | Yes | 14.75 (6.97 to 22.53) | 16 | 532 | Yes | 13.34 (5.79 to 20.89) |
| No | 11.52 (3.93 to 19.11) | No | 12.43 (5.22 to 19.64) | |||||
| Non-professional | 1 | 12 | Yes | 14.18 (1.79 to 26.57) | 1 | 12 | Yes | 12.83 (0.59 to 25.07) |
| No | 12.09 (6.43 to 17.74) | No | 12.94 (8.34 to 17.54) | |||||
| Auditory comprehension (TT-AAT, range 0–50) | ||||||||
| Professional | 16 | 485 | Yes | 5.16 (0.55 to 9.78) | 19 | 546 | Yes | 6.57 (2.90 to 10.25) |
| No | 4.08 (–0.36 to 8.51) | No | 5.56 (1.83 to 9.29) | |||||
| Non-professional | 1 | 10 | Yes | 6.28 (–1.25 to 13.81) | 2 | 3 | Yes | 8.11 (2.35 to 13.87) |
| No | 2.96 (0.02 to 5.91) | No | 4.03 (1.28 to 6.77) | |||||
| Functional communication (observer rated, AAT-SSC, range 0–5), inclusive of activity data | ||||||||
| Professional | 14 | 447 | Yes | 0.52 (0.06 to 0.99) | 17 | 533 | Yes | 0.49 (0.01 to 0.96) |
| No | 0.31 (–0.24 to 0.86) | No | 0.26 (–0.28 to 0.81) | |||||
| Non-professional | 1 | 9 | Yes | 0.61 (0.32 to 0.90) | 1 | 9 | Yes | 0.18 (–0.67 to 1.03) |
| No | 0.22 (–0.64 to 1.08) | No | 0.57 (0.28 to 0.86) | |||||
Appendix 26 Context of delivery of speech and language therapy by language outcome
| SLT context | RCT data only (n) | IPD (n) | Estimate of mean (95% CI) | All data sets (n) | IPD (n) | Estimate of mean (95% CI) |
|---|---|---|---|---|---|---|
| Overall language ability (WAB-AQ, range 0–100) | ||||||
| Inpatient | 10 | 306 | 13.64 (8.76 to 18.52) | 14 | 431 | 13.38 (9.10 to 17.66) |
| Not an inpatient | 13.46 (7.98 to 18.94) | 14.16 (9.31 to 19.01) | ||||
| Outpatient | 6 | 207 | 15.00 (9.77 to 20.22) | 7 | 226 | 14.48 (9.71 to 19.26) |
| Not an outpatient | 12.11 (7.00 to 17.22) | 13.06 (8.73 to 17.39) | ||||
| Auditory comprehension (TT-AAT, range 0–50) | ||||||
| Inpatient | 12 | 348 | 3.62 (0.81 to 6.43) | 15 | 409 | 4.77 (2.08 to 7.45) |
| Not an inpatient | 3.17 (–0.01 to 6.35) | 4.10 (1.00 to 7.19) | ||||
| Outpatient | 9 | 289 | 3.82 (0.91 to 6.72) | 13 | 351 | 5.09 (2.37 to 7.93) |
| Not an outpatient | 2.98 (–0.14 to 6.09) | 3.77 (0.70 to 6.85) | ||||
| Naming (BNT, range 0–60) | ||||||
| Inpatient | 11 | 298 | 6.89 (2.47 to 11.30) | 14 | 403 | 7.37 (3.39 to 11.36) |
| Not an inpatient | 6.77 (1.16 to 12.38) | 6.96 (2.40 to 11.50) | ||||
| Outpatient | 6 | 204 | 7.18 (1.62 to 12.73) | 9 | 267 | 7.63 (3.00 to 12.26) |
| Not an outpatient | 6.48 (1.76 to 11.21) | 6.70 (2.60 to 10.81) | ||||
| Functional communication (observer rated, AAT-SSC, range 0–5), inclusive of activity data | ||||||
| Inpatient | 11 | 376 | 0.70 (0.44 to 0.96) | 13 | 451 | 0.67 (0.40 to 0.95) |
| Not an inpatient | 0.59 (0.30 to 0.88) | 0.54 (0.26 to 0.83) | ||||
| Outpatient | 9 | 271 | 0.74 (0.46 to 1.01) | 12 | 328 | 0.52 (0.24 to 0.80) |
| Not an outpatient | 0.56 (0.29 to 0.83) | 0.70 (0.42 to 0.98) | ||||
Appendix 27 Mode of delivery of speech and language therapy intervention by language outcome
| Delivery mode | RCT data only (n) | IPD (n) | Yes/no | Estimate of mean (95% CI) | IPD (n) | Yes/no | Estimate of mean (95% CI) | |
|---|---|---|---|---|---|---|---|---|
| Overall language ability (WAB-AQ, range 0–100) | ||||||||
| Face to face | 11 | 351 | Yes | 14.13 (8.34 to 19.91) | 16 | 478 | Yes | 14.90 (9.34 to 20.47) |
| No | 11.06 (2.63 to 19.49) | No | 14.18 (5.61 to 22.74) | |||||
| Computer assisted | 1 | 62 | Yes | 12.26 (6.92 to 17.61) | 2 | 81 | Yes | 13.50 (4.74 to 22.26) |
| No | 12.92 (3.45 to 22.39) | No | 15.58 (2.70 to 28.46) | |||||
| Self-managed | – | – | – | – | 1 | 62 | Yes | 16.98 (2.09 to 31.87) |
| No | 12.10 (4.00 to 20.20) | |||||||
| Auditory comprehension (TT-AAT, range 0–50) | ||||||||
| Face to face | 14 | 390 | Yes | 5.06 (1.76 to 8.37) | 18 | 461 | Yes | 6.46 (3.16 to 9.76) |
| No | 5.04 (0.08 to 10.00) | No | 6.50 (1.72 to 11.28) | |||||
| Computer assisted | 4 | 145 | Yes | 5.10 (0.85 to 9.34) | 6 | 173 | Yes | 6.30 (2.47 to 10.15) |
| No | 5.01 (–0.67 to 10.68) | No | 6.66 (1.45 to 11.86) | |||||
| Self-managed | 1 | 66 | Yes | 6.74 (–0.09 to 13.58) | 1 | 66 | Yes | 8.44 (2.08 to 14.80) |
| No | 3.36 (–0.11 to 6.83) | No | 4.52 (1.45 to 7.58) | |||||
| Naming (BNT, range 0–60) | ||||||||
| Face to face | 12 | 325 | Yes | 5.71 (0.11 to 11.30) | 17 | 429 | Yes | 7.06 (2.66 to 11.47) |
| No | 5.94 (–0.53 to 12.41) | No | 7.44 (2.40 to 12.47) | |||||
| Computer assisted | 2 | 58 | Yes | 4.38 (–5.15 to 13.90) | 4 | 87 | Yes | 6.51 (–0.63 to 13.66) |
| No | 7.27 (2.62 to 11.92) | No | 7.99 (4.04 to 11.93) | |||||
| Functional communication (observer rated, AAT-SSC, range 0–5), inclusive of activity data | ||||||||
| Face to face | 12 | 366 | Yes | 0.70 (0.20 to 1.19) | 15 | 434 | Yes | 0.67 (0.16 to 1.18) |
| No | 0.46 (–0.05 to 0.96) | No | 0.45 (–0.07 to 0.96) | |||||
| Computer assisted | 4 | 76 | Yes | 0.72 (0.06 to 1.37) | 6 | 105 | Yes | 0.41 (–0.10 to 0.91) |
| No | 0.43 (–0.09 to 0.96) | No | 0.71 (0.07 to 1.34) | |||||
Appendix 28 Functional relevance of speech and language therapy intervention by language outcome
| Functional relevance | RCT data only (n) | IPD (n) | Estimate of mean (95% CI) | All data sets (n) | IPD (n) | Estimate of mean (95% CI) |
|---|---|---|---|---|---|---|
| Overall language ability (WAB-AQ, range 0–100) | ||||||
| Tailored | 6 | 232 | 16.47 (10.95 to 21.99) | 6 | 232 | 16.76 (11.28 to 22.23) |
| Not tailored | 7 | 185 | 12.05 (6.90 to 17.20) | 13 | 331 | 12.72 (8.44 to 17.00) |
| Auditory comprehension (TT-AAT, range 0–50) | ||||||
| Tailored | 7 | 194 | 5.26 (2.05 to 8.47) | 7 | 194 | 6.71 (3.35 to 10.08) |
| Not tailored | 10 | 301 | 2.43 (–0.57 to 5.43) | 16 | 402 | 3.91 (1.14 to 6.68) |
| Naming (BNT, range 0–60) | ||||||
| Tailored | 5 | 113 | 8.79 (1.95 to 15.63) | 14 | 145 | 12.38 (6.02 to 18.74) |
| Not tailored | 8 | 220 | 5.95 (0.57 to 11.32) | 6 | 298 | 6.68 (2.43 to 10.93) |
| Functional communication (observer rated, AAT-SSC, range 0–5), inclusive of activity data | ||||||
| Tailored | 6 | 249 | 0.74 (0.38 to 1.10) | 10 | 336 | 0.75 (0.36 to 1.13) |
| Not tailored | 8 | 195 | 0.71 (0.32 to 1.11) | 9 | 223 | 0.57 (0.24 to 0.90) |
Appendix 29 Level of difficulty of speech and language therapy intervention by language outcome
| Level of difficulty | RCT data only (n) | IPD (n) | Estimate of mean (95% CI) | All data sets (n) | IPD (n) | Estimate of mean (95% CI) |
|---|---|---|---|---|---|---|
| Overall language ability (WAB-AQ, range 0–100) | ||||||
| Tailored for difficulty | 7 | 210 | 14.46 (8.82 to 20.09) | 10 | 267 | 14.11 (9.31 to 18.91) |
| Not tailored | 6 | 207 | 13.24 (7.50 to 18.99) | 9 | 296 | 13.00 (8.18 to 17.82) |
| Auditory comprehension (TT-AAT, range 0–50) | ||||||
| Tailored for difficulty | 10 | 331 | 4.57 (1.55 to 7.60) | 12 | 371 | 5.73 (2.69 to 8.78) |
| Not tailored | 7 | 164 | 1.95 (–1.30 to 5.20) | 11 | 225 | 3.34 (0.36 to 6.31) |
| Naming (BNT, range 0–60) | ||||||
| Tailored for difficulty | 9 | 254 | 5.66 (0.74 to 10.58) | 11 | 362 | 7.26 (2.48 to 12.03) |
| Not tailored | 4 | 79 | 10.21 (2.75 to 17.67) | 9 | 138 | 8.61 (3.40 to 13.82) |
| Functional communication (observer rated, AAT-SSC, range 0–5), inclusive of activity data | ||||||
| Tailored for difficulty | 10 | 313 | 0.65 (0.32 to 0.98) | 12 | 360 | 0.59 (0.23 to 0.95) |
| Not tailored | 5 | 141 | 0.81 (0.34 to 1.27) | 8 | 208 | 0.70 (0.31 to 1.10) |
Appendix 30 Subgroup analysis summary of significant gains
| SLT regimen | Overall language ability (WAB-AQ, score 0–100 points) | Auditory comprehension (TT-AAT, score 0–50 points) | Naming (BNT, score 0–60 points) | Functional communication (AAT-SSC, score 0–5 points) | GRADE rating |
|---|---|---|---|---|---|
| Frequency of SLT (days per week) | |||||
| Age group | |||||
| Younger (≤ 65 years) (95% CI) | 15.12 (8.2 to 22.1) SLT 5 days weekly | 6.78 (2.3 to 11.2) SLT 4 days weekly | 15.02 (8.9 to 21.1) SLT ≤ 2 days weekly | 1.18 (0.28 to 2.08) SLT > 5 days weekly | Very lowa for all language domains |
| IPD (RCTs) | IPD 107 (6) | IPD 64 (5) | IPD 26 (4) | IPD 3 (2) | |
| Older (> 65 years) (95% CI) | 17.19 (3.9 to 30.5) SLT > 5 days weekly | 8.48 (2.0 to 14.9) SLT 4 days weekly | 9.83 (2.4 to 17.2) SLT ≤ 2 days weekly | 0.78 (0.15 to 1.4) SLT > 3 to 4 days weekly | Very lowa for all language domains |
| IPD (RCTs) | IPD 10 (2) | IPD 50 (3) | IPD 16 (4) | IPD 54 (3) | |
| Time after aphasia onset | |||||
| SLT ≤ 3 months from aphasia onset (95% CI) | 21.4 (13.5 to 29.4) SLT 5 days weekly | NS | 17.0 (7.7 to 26.2) SLT ≤ 2 days weekly | 1.6 (0.59 to 2.5) SLT 4 days weekly | Very lowa for all language domains |
| IPD (RCTs) | IPD 150 (5) | IPD 33 (3) | IPD 80 (1) | ||
| SLT > 3 months from aphasia onset (95% CI) | 6.3 (1.6 to 11.1) SLT 5 days weekly | 3.7 (1.4 to 6.0) SLT 4 to 5 days weekly | 2.8 (0.6 to 5.0) SLT 3 days weekly | NS | Very lowa for all language domains |
| IPD (RCTs) | IPD 44 (1) | IPD 89 (5) | IPD 78 (3) | ||
| Aphasia severity | |||||
| Mild–moderate aphasia (95% CI) | 9.9 (4.4 to 15.3) SLT > 5 days weekly | NS | 11.1 (5.6 to 16.6) SLT ≥ 3 to 5 days weekly | 0.7 (0.4 to 1.0) SLT ≥ 4 days weekly | Very lowa for all language domains |
| IPD (RCTs) | IPD 16 (2) | IPD 11 (3) | IPD 55 (8) | ||
| Moderate–severe aphasia (95% CI) | 18.2 (8.0 to 28.5) SLT ≥ 3 days weekly | 8.5 (3.7 to 13.3) SLT 4 days weekly | 13.1 (7.0 to 19.1) SLT ≤ 2 days weekly | 1.0 (0.5 to 1.5) SLT 4 days weekly | Very lowa for all language domains |
| IPD (RCTs) | IPD 38 (5) | IPD 80 (5) | IPD 36 (4) | IPD 55 (2) | |
| Sex | |||||
| Female (95% CI) | 24.2 (7.7 to 40.7) SLT 3 days weekly | 8.1 (2.7 to 13.6) SLT 4 days weekly | 17.1 (9.5 to 24.6) SLT ≤ 2 days weekly | 1.0 (0.2 or 1.8) SLT 4 days weekly | Very lowa for all language domains |
| IPD (RCTs) | IPD 5 (2) | IPD 52 (5) | IPD 17 (4) | IPD 49 (3) | |
| Male (95% CI) | 13.6 (4.3 or 22.9) SLT > 5 days weekly | 5.1 (1.4 to 8.7) SLT > 4 to 5 days weekly | 10.6 (4.3 to 16.7) SLT ≤ 2 days weekly | 0.8 (0.09 to 1.5) SLT > 5 days weekly | Very lowa for all language domains |
| IPD (RCTs) | IPD 21 (2) | IPD 99 (8) | IPD 25 (4) | IPD 6 (3) | |
| Duration of SLT (in weeks) | |||||
| Age group | |||||
| Younger (≤ 65 years) (95% CI) | 22.7 (15.2 to 30.2) > 10–20 weeks of SLT | 8.4 (2.6 to 14.2) > 10–20 weeks of SLT | 11.3 (5.4 to 17.1) > 10–20 weeks of SLT | 1.2 (0.63 to 1.8) 3 to 10 weeks of SLT | Very lowa for all language domains |
| IPD (RCTs) | IPD 25 (3) | IPD 60 (5) | IPD 59 (4) | IPD 27 (2) | |
| Older (> 65 years) (95% CI) | 20.6 (7.8 to 33.4) > 20 weeks of SLT | NS | 11.2 (2.0 to 20.4) > 20 weeks of SLT | 1.3 (0.5 to 2.1) 4–10 weeks of SLT | Very lowa for all language domains |
| IPD (RCTs) | IPD 15 (2) | IPD 71 (3) | IPD 9 (2) | ||
| Time after aphasia | |||||
| SLT ≤ 3 months from aphasia onset (95% CI) | 24.7 (12.5 to 36.9) > 4 weeks of SLT | 8.8 (1.2 to 16.4) > 10–20 weeks of SLT | 12.5 (0.39 to 24.6) > 20 weeks of SLT | 1.2 (0.56 to 1.8) > 10–20 weeks of SLT | Very lowa for all language domains |
| IPD (RCTs) | IPD 26 (3) | IPD 53 (4) | IPD 86 (3) | IPD 40 (3) | |
| SLT > 3 months from aphasia onset (95% CI) | 9.3 (3.1 to 15.5) > 20 weeks of SLT | 5.2 (2.5 to 7.9) > 20 weeks of SLT | 4.1 (1.8 to 6.5) > 10–20 weeks of SLT | NS | Very lowa for all language domains |
| IPD (RCTs) | IPD 14 (1) | IPD 49 (1) | IPD 33 (2) | ||
| Aphasia severity | |||||
| Mild–moderate aphasia (95% CI) | 10.0 (2.4 to 17.6) > 10 weeks of SLT | NS | 16.0 (6.6 to 25.4) > 20 weeks of SLT | 0.6 (0.1 to 1.2) 3–20 weeks of SLT | Very lowa for all language domains |
| IPD (RCTs) | IPD 16 (2) | IPD 26 (2) | IPD 45 (2) | ||
| Moderate–severe aphasia (95% CI) | 23.5 (12.1 to 35.0) > 10 weeks of SLT | 10.6 (3.9 to 17.3) > 20 weeks of SLT | 7.5 (1.1 to 14.0) > 10–20 weeks of SLT | 1.1 (0.8 to 1.5) > 20 weeks of SLT | Very lowa for all language domains |
| IPD (RCTs) | IPD 18 (2) | IPD 105 (3) | IPD 71 (4) | IPD 61 (4) | |
| Sex | |||||
| Female (95% CI) | 24.5 (13.2 to 35.8) > 20 weeks of SLT | 7.0 (0.8 to 13.1) > 20 weeks of SLT | 20.3 (9.4 to 31.2) >20 weeks of SLT | 1.0 (0.1 to 1.8) > 4 weeks of SLT | Very lowa for all language domains |
| IPD (RCTs) | IPD 12 (2) | IPD 63 (3) | IPD 62 (3) | IPD 16 (2) | |
| Male (95% CI) | 16.7 (7.8 to 25.7) > 10–20 weeks of SLT | 9.3 (2.9 to 15.6) > 10–20 weeks of SLT | 11.0 (5.4 to 16.7) > 10–20 weeks of SLT | 0.7 (0.4 to 1.0) > 10–20 weeks of SLT | Very lowa for all language domains |
| IPD (RCTs) | IPD 26 (3) | IPD 58 (5) | IPD 51 (4) | IPD 46 (4) | |
| Intensity of SLT (in weeks) | |||||
| Age group | |||||
| Younger (≤ 65 years) (95% CI) | 17.0 (10.0 to 24.0) > 9 hours SLT weekly | 9.0 (5.4 to 12.6) > 9 hours SLT weekly | 17.3 (8.3 to 26.4) ≤ 2 hours SLT weekly | 0.9 (0.5 to 1.2) > 3–4 hours SLT weekly | Very lowa for all language domains |
| IPD (RCTs) | IPD 78 (3) | IPD 108 (4) | IPD 10 (2) | IPD 74 (5) | |
| Older (> 65 years) (95% CI) | 16.9 (3.8 to 30.0) ≤ 2 hours SLT weekly | 5.3 (0.67 to 10.0) > 9 hours SLT weekly | 11.1 (1.4 to 20.8) ≤ 2 hours SLT weekly | 1.0 (0.4 to 1.6) ≤ 2 hours SLT weekly | Very lowa for all language domains |
| IPD (RCTs) | IPD 37 (3) | IPD 33 (6) | IPD 8 (2) | IPD 41 (4) | |
| Time after aphasia onset | |||||
| SLT ≤ 3 months from aphasia onset (95% CI) | 24.3 (13.4 to 35.2) ≤ 2 hours SLT weekly | 9.3 (2.1 to 16.5) > 9 hours SLT weekly | 17.7 (4.0 to 31.4) ≤ 2 hours SLT weekly | 1.3 (0.6 to 1.9) ≤ 2 hours SLT weekly | Very lowa for all language domains |
| IPD (RCTs) | IPD 62 (2) | IPD 20 (2) | IPD 10 (1) | IPD 57 (2) | |
| SLT > 3 months from aphasia onset (95% CI) | 6.3 (2.2 to 10.3) > 3 to 4 hours SLT weekly | 4.6 (2.4 to 6.8) > 9 hours SLT weekly | 5.6 (3.6 to 7.6) > 3–4 hours SLT weekly | NS | Very lowa for all language domains |
| IPD (RCTs) | IPD 25 (2) | IPD 121 (4) | IPD 27 (2) | ||
| Aphasia severity | |||||
| Mild–moderate aphasia (95% CI) | 8.0 (3.4 to 12.6) ≤ 2 and > 9 hours SLT weekly | NS | 9.4 (4.6 to 14.3) > 3–4 and > 9 hours SLT weekly | 0.6 (0.3 to 1.0) > 9 hours weekly | Very lowa for all language domains |
| IPD (RCTs) | IPD 48 (3) | IPD 19 (4) | IPD 27 (4) | ||
| Moderate–severe aphasia (95% CI) | 20.0 (10.1 to 29.9) > 3 to 4 hours SLT weekly | 9.1 (2.6 to 15.6) ≤ 2 hours and > 9 hours SLT weekly | 12.4 (4.3 to 20.6) ≤ 2 hours SLT weekly | 0.98 (0.3 to 1.6) ≤ 3 hours weekly | Very lowa for all language domains |
| IPD (RCTs) | IPD 64 (4) | IPD 9 (2) | IPD 16 (2) | IPD 42 (3) | |
| Sex | |||||
| Female (95% CI) | 18.5 (7.5 to 29.6) ≤ 2 hours SLT weekly | 7.9 (1.8 to 14.0) ≤ 2 hours SLT weekly | 13.5 (4.7 to 22.3) > 2–3 hours SLT weekly | 1.2 (0.47 to 1.8) ≤ 2 hours SLT weekly | Very lowa for all language domains |
| IPD (RCTs) | IPD 37 (3) | IPD 10 (2) | IPD 38 (5) | IPD 39 (4) | |
| Male (95% CI) | 15.1 (7.9 to 22.3) > 9 hours SLT weekly | 7.6 (3.8 to 11.5) > 9 hours SLT weekly | 15.5 (6.9 to 24.1) ≤ 2 hours SLT weekly | 0.65 (0.4 to 0.89) > 3–4 hours SLT weekly | Very lowa for all language domains |
| IPD (RCTs) | IPD 61 (3) | IPD 91 (6) | IPD 10 (2) | IPD 97 (5) | |
| Dosage (in weeks) | |||||
| Age group | |||||
| Younger (≤ 65 years) (95% CI) | 23.4 (13.5 to 33.3) SLT > 20–50 hours | 6.1 (1.8 to 10.4) SLT > 14–50 + hours | 13.5 (5.3 to 21.8) SLT ≤ 5 and > 20–50 hours | 1.1 (0.47 to 1.78) SLT > 14 to 20 hours | Very lowa for all language domains |
| IPD (RCTs) | IPD 15 (3) | IPD 59 (6) | IPD 57 (5) | IPD 6 (3) | |
| Older (> 65 years) (95% CI) | 15.95 (5.1 to 26.8) SLT > 5–50 + hours | 5.8 (1.3 to 10.2) SLT > 20–50 + hours | 8.3 (0.55 to 16.1) SLT > 20–50 hours | 0.86 (0.36 to 1.36) SLT > 20–50 hours | Very lowa for all language domains |
| IPD (RCTs) | IPD 16 (4) | IPD 34 (7) | IPD 24 (5) | IPD 31 (9) | |
| Time after aphasia onset | |||||
| SLT ≤ 3 months from aphasia onset (95% CI) | 27.5 (18.3 to 36.7) SLT > 20–50 hours | NS | 20.7 (2.9 to 38.5) SLT > 20–50 hours | 1.3 (0.69 to 1.8) SLT > 20–50 hours | Very lowa for all language domains |
| IPD (RCTs) | IPD 27 (3) | IPD 31 (2) | IPD 31 (3) | ||
| SLT > 3 months from aphasia onset (95% CI) | 10.1 (4.2 to 16.0) SLT ≥ 50 hours | 4.2 (1.7 to 6.7) SLT ≥ 50 hours | 3.0 (0.90 to 5.1) > 20–50 hours | NS | Very lowa for all language domains |
| IPD (RCTs) | IPD 15 (1) | IPD 76 (3) | IPD 50 (4) | ||
| Aphasia severity | |||||
| Mild–moderate aphasia (95% CI) | 8.7 (2.0 to 15.5) SLT > 20 hours | NS | 13.0 (8.5 to 17.4) SLT > 100 hours | 0.7 (0.2 to 1.2) SLT > 14–20 hours | Very lowa for all language domains |
| IPD (RCTs) | IPD 8 (2) | IPD 11 (3) | IPD 8 (3) | ||
| Moderate–severe aphasia (95% CI) | 23.5 (13.5 to 33.5) SLT > 20–50 hours | 8.9 (4.5 to 13.3) SLT ≥ 50 hours | 14.4 (2.1 to 26.8) SLT up to 5 hours | 1.1 (0.8 to 1.4) SLT ≥ 50 hours | Very lowa for all language domains |
| IPD (RCTs) | IPD 23 (3) | IPD 142 (6) | IPD 28 (2) | IPD 72 (6) | |
| Sex | |||||
| Female (95% CI) | 24.4 (12.2 to 36.5) SLT > 20–50 hours | 7.0 (2.9 to 11.2) SLT ≥ 50 hours | 10.9 (1.96 to 19.9) SLT > 20–50 hours | 1.6 (0.57 to 2.6) SLT > 4–20 hours | Very lowa for all language domains |
| IPD (RCTs) | IPD 13 (2) | IPD 77 (6) | IPD 32 (5) | IPD 14 (2) | |
| Male (95% CI) | 15.6 (6.2 to 25.0) SLT > 20–50 hours | 6.5 (1.8 to 11.2) SLT > 20–50 hours | 11.8 (5.1 to 18.5) SLT > 20–50 hours | 0.70 (0.48 to 0.90) SLT ≥ 50 hours | Very lowa for all language domains |
| IPD (RCTs) | IPD 18 (4) | IPD 56 (7) | IPD 49 (5) | IPD 93 (6) | |
Appendix 31 Risk of date of recruitment bias
In this sensitivity analysis, we considered the possibility of bias related to the age of included data sets. The oldest data set was from 1973, whereas the more recent data sets were from 2016. We took recruitment date as reported by the primary research team and, when unavailable (e.g. in some public domain data sets), we took the date of the first associated publication. Data sets were categorised as pre 2000 and post 2000. Recruitment year groups were added to the basic model of baseline score, sex, time since index event and age (see Chapter 5; RCT data set only) to examine whether or not there was any evidence of an effect of date of recruitment. We found no evidence that date of participant recruitment contributed to the findings in relation to overall language ability, auditory comprehension, naming or functional communication (observer rated) (Figure 33).
FIGURE 33.
Risk of date of recruitment bias. (a) Overall language ability; (b) auditory comprehension; (c) naming; and (d) functional communication (observer rated, activity data included). DF, degrees of freedom.
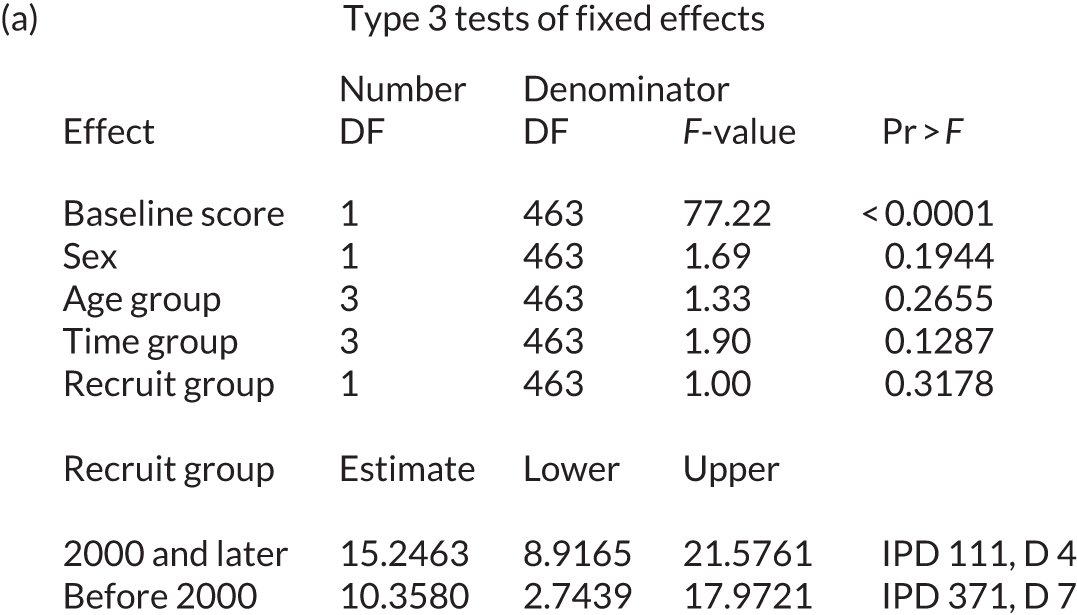
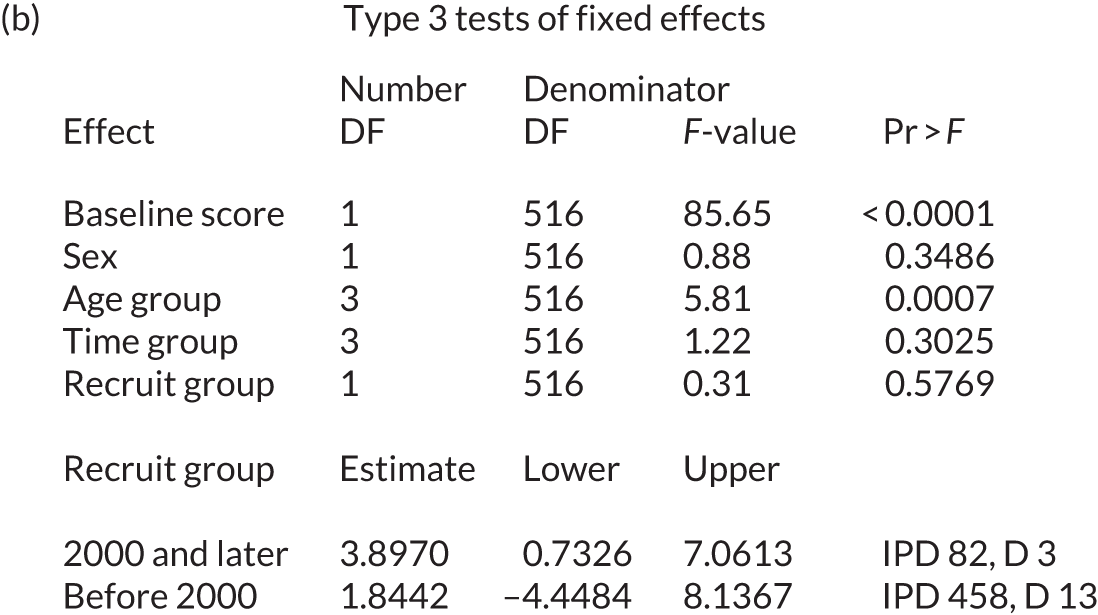

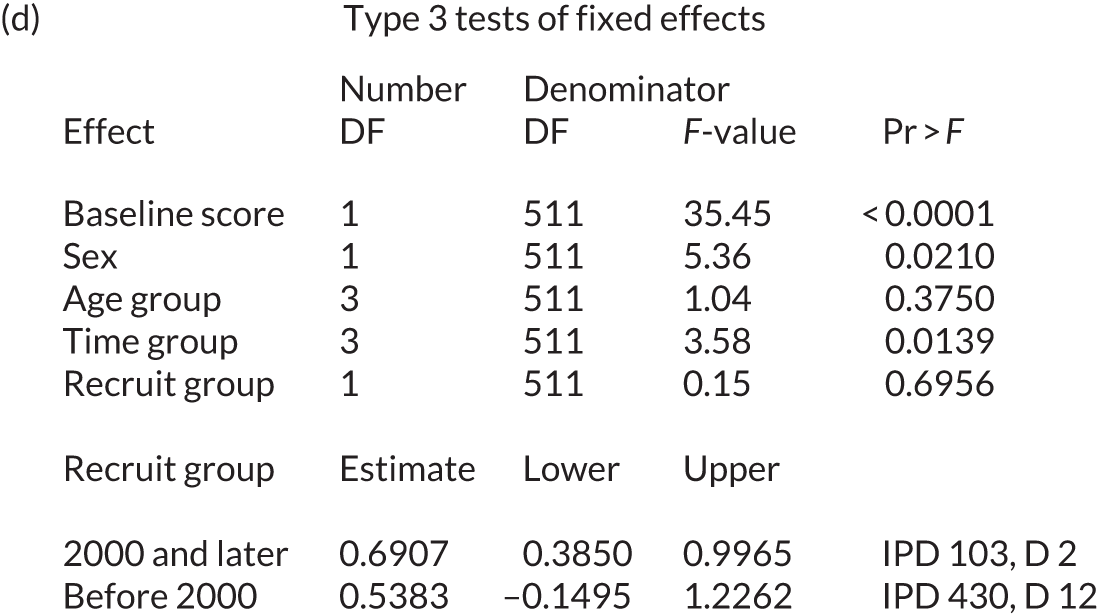
Appendix 32 Risk of publication bias
We considered risk of publication bias (the risk of an imbalance in the literature towards reporting of significant findings). We were unable to use a funnel plot to explore publication bias because of the nature of the data set.
We looked at the distribution of studies, with similar numbers of participants (in age groups), and those that reported a significant finding. The analysis was restricted to 164 data sets with an associated publication and we used a chi-squared test. We found no evidence to suggest a publication bias by sample size (p = 0.77; Table 35).
| Sample size (group) (n participants) | Reported a significant result, n (% of total publications) | |
|---|---|---|
| No | Yes | |
| > 100 | 3 | 5 (63) |
| 51–100 | 3 | 8 (73) |
| 31–50 | 3 | 15 (83) |
| 21–30 | 8 | 25 (76) |
| 11–20 | 12 | 57 (83) |
| Up to 10 | 5 | 20 (80) |
We also considered the historic nature of the data sets and whether or not there was an association between the age of a publication and the reporting of significant (or non-significant) findings. The analysis was also restricted to 164 data sets with an associated publication and we used a chi-squared test. We found evidence to suggest a publication bias by date of publication (p = 0.014). Earlier publications had a higher proportion of non-significant results than findings reported in later publications (Table 36).
| Year of publication | Reported a significant result, n (% of total publications) | |
|---|---|---|
| No | Yes | |
| 1973–89 | 7 | 4 (37) |
| 1990–99 | 2 | 13 (87) |
| 2000–4 | 3 | 16 (84) |
| 2005–9 | 4 | 28 (88) |
| 2010–14 | 15 | 53 (78) |
| 2015–17 | 3 | 12 (80) |
Appendix 33 Wu–Hausman test
| Language domain | W | W-alternative | Fixed effect (p-value for data set) | Relative variability due to data set (%) |
|---|---|---|---|---|
| Overall language ability | 0.13 | 0.36 | < 0.0001 | 19.3 |
| Auditory comprehension | 3.55 | –1.88 | < 0.0001 | 24.3 |
| Naming | 0.37 | –0.61 | < 0.0001 | 41.4 |
| Other spoken language | 0.55 | 0.74 | 0.0002 | 16.7 |
| Reading comprehensiona | < 0.001 | < 0.001 | Not assessable | 0 |
| Writing | 2.29 | –1.51 | 0.06 | 13.8 |
| Functional communication (observer rated) | 3.49 | –1.97 | < 0.0001 | 30.8 |
Appendix 34 Subgroup analysis
| RCTs (n) | IPD (n) | Estimate of mean (95% CI) | Data sets (n) | IPD (n) | Estimate of mean (95% CI) | |
|---|---|---|---|---|---|---|
| Base model | ||||||
| Overall language ability on the WAB-AQ, range 0–100 | ||||||
| Female | 11 | 97 | 13.97 (7.98 to 19.97) | 9 | 109 | 13.86 (6.92 to 20.79) |
| Male | 11 | 180 | 12.21 (6.53 to 17.89) | 10 | 96 | 11.74 (5.02 to 18.45) |
| 0–1 month | 8 | 97 | 17.89 (11.84 to 23.95) | 8 | 163 | 22.36 (16.78 to 27.95) |
| > 1–3 months | 6 | 45 | 16.44 (9.77 to 23.11) | 5 | 19 | 11.71 (2.60 to 20.82) |
| > 3–6 months | 3 | 10 | 9.52 (–1.33 to 20.36) | 1 | 6 | 11.18 (–5.05 to 27.41) |
| > 6 months | 4 | 125 | 8.53 (–0.33 to 17.39) | 2 | 17 | 5.94 (–6.00 to 17.88) |
| Auditory comprehension on the TT-AAT, range 0–50 | ||||||
| Female | 16 | 135 | 4.63 (1.73 to 7.53) | 13 | 76 | 4.50 (1.09 to 7.92) |
| Male | 16 | 225 | 3.95 (1.20 to 6.69) | 15 | 104 | 3.22 (0.05 to 6.38) |
| 0–1 month | 6 | 62 | 7.66 (3.49 to 11.82) | 6 | 77 | 4.77 (0.70 to 8.83) |
| > 1–3 months | 9 | 70 | 3.91 (0.54 to 7.27) | 8 | 27 | 6.63 (2.22 to 11.05) |
| > 3–6 months | 5 | 37 | 3.80 (–1.48 to 9.08) | 3 | 24 | 2.54 (–3.95 to 9.03) |
| > 6 months | 9 | 191 | 1.79 (–1.65 to 5.23) | 7 | 52 | 1.50 (–2.48 to 5.48) |
| Naming on the BNT, range 0–60 | ||||||
| Female | 13 | 87 | 9.85 (5.30 to 14.40) | 11 | 78 | 4.01 (–0.96 to 8.98) |
| Male | 13 | 140 | 7.21 (2.87 to 11.54) | 12 | 80 | 7.44 (2.61 to 12.27) |
| 0–1 month | 5 | 55 | 14.61 (8.33 to 20.88) | 5 | 74 | 11.56 (5.29 to 17.83) |
| > 1–3 months | 8 | 65 | 9.15 (4.16 to 14.14) | 7 | 28 | 6.68 (0.26 to 13.10) |
| > 3–6 months | 5 | 44 | 5.21 (–1.06 to 11.47) | 3 | 26 | 1.91 (–6.48 to 10.31) |
| > 6 months | 7 | 63 | 5.15 (–0.22 to 10.52) | 5 | 30 | 2.74 (–4.02 to 9.50) |
| Functional communication (observer rated)a on the AAT-SSC, range 0–5 | ||||||
| Female | 14 | 109 | 0.79 (0.52 to 1.06) | 14 | 127 | 0.69 (0.41 to 0.97) |
| Male | 14 | 183 | 0.55 (0.29 to 0.81) | 13 | 113 | 0.57 (0.30 to 0.83) |
| 0–1 month | 6 | 78 | 1.19 (0.83 to 1.55) | 6 | 154 | 1.11 (0.82 to 1.39) |
| > 1–3 months | 5 | 46 | 0.86 (0.50 to 1.22) | 5 | 22 | 0.87 (0.37 to 1.36) |
| > 3–6 months | 3 | 38 | 0.27 (–0.20 to 0.75) | 3 | 24 | 0.28 (–0.27 to 0.84) |
| > 6 months | 7 | 130 | 0.36 (0.05 to 0.67) | 7 | 40 | 0.25 (–0.13 to 0.63) |
| Frequency of SLT | ||||||
| Overall language ability on the WAB-AQ, range 0–100 | ||||||
| ≤ 2 days per week | 5 | 62 | 9.24 (1.84 to 16.63) | 5 | 28 | 11.75 (2.17 to 21.32) |
| > 2–3 days per week | 2 | 20 | 13.38 (4.17 to 22.59) | 1 | 1 | 7.13 (–28.53 to 42.79) |
| > 3–4 days per week | 5 | 46 | 12.99 (4.63 to 21.34) | 3 | 28 | 14.00 (4.05 to 23.96) |
| > 4–5 days per week | 6 | 107 | 15.12 (8.15 to 22.08) | 6 | 87 | 11.71 (3.68 to 19.74) |
| > 5 days per week | 2 | 22 | 14.23 (5.19 to 23.24) | 2 | 10 | 17.19 (3.85 to 30.53) |
| Reference group | 3 | 20 | 13.53 (4.13 to 22.93) | 3 | 51 | 10.74 (1.22 to 20.26) |
| Auditory comprehension on the TT-AAT, range 0–50 | ||||||
| ≤ 2 days per week | 4 | 52 | –0.35 (–4.15 to 3.45) | 4 | 12 | 1.92 (–3.91 to 7.76) |
| > 2–3 days per week | 4 | 57 | 2.36 (–1.82 to 6.53) | 3 | 32 | 5.06 (–0.81 to 10.94) |
| > 3–4 days per week | 5 | 64 | 6.78 (2.33 to 11.22) | 3 | 50 | 8.48 (2.04 to 14.93) |
| > 4–5 days per week | 8 | 113 | 5.76 (2.47 to 9.04) | 8 | 58 | 2.41 (–1.53 to 6.36) |
| > 5 days per week | 3 | 36 | 3.24 (–1.26 to 7.74) | 3 | 15 | 5.06 (–0.79 to 10.91) |
| Reference group | 6 | 38 | 4.27 (0.18 to 8.36) | 6 | 13 | 0.85 (–4.51 to 6.21) |
| Naming on the BNT, range 0–60 | ||||||
| ≤ 2 days per week | 4 | 26 | 15.02 (8.95 to 21.10) | 4 | 16 | 9.83 (2.44 to 17.22) |
| > 2–3 days per week | 3 | 55 | 7.61 (1.24 to 13.98) | 2 | 29 | 6.77 (–2.71 to 16.24) |
| > 3–4 days per week | 4 | 54 | 9.24 (2.66 to 15.83) | 2 | 49 | 7.79 (–2.54 to 18.11) |
| > 4–5 days per week | 6 | 54 | 5.66 (0.45 to 10.86) | 6 | 50 | 1.82 (–4.41 to 8.04) |
| > 5 days per week | 0 | – | 0 | – | ||
| Reference group | 5 | 38 | 8.43 (3.26 to 13.59) | 5 | 14 | 8.54 (1.10 to 15.99) |
| Functional communication (observer rated)a on the AAT-SSC, range 0–5 | ||||||
| ≤ 2 days per week | 5 | 57 | 0.49 (0.16 to 0.83) | 5 | 25 | 0.60 (0.06 to 1.12) |
| > 2–3 days per week | 3 | 64 | 0.55 (0.18 to 0.92) | 3 | 28 | 0.57 (–0.08 to 1.23) |
| > 3–4 days per week | 4 | 48 | 0.73 (0.31 to 1.15) | 3 | 54 | 0.78 (0.15 to 1.40) |
| > 4–5 days per week | 9 | 72 | 0.85 (0.54 to 1.15) | 8 | 83 | 0.69 (0.30 to 1.08) |
| > 5 days per week | 2 | 3 | 1.18 (0.28 to 2.08) | 3 | 6 | 0.43 (–0.53 to 1.39) |
| Reference group | 6 | 45 | 0.32 (–0.02 to 0.65) | 6 | 40 | 0.58 (0.11 to 1.06) |
| Duration of SLT | ||||||
| Overall language ability on the WAB-AQ, range 0–100 | ||||||
| ≤ 2 weeks | 2 | 32 | 2.97 (–4.89 to 10.82) | 2 | 18 | 11.24 (–3.17 to 25.67) |
| 3 weeks | 3 | 105 | 12.67 (7.75 to 17.60) | 2 | 53 | 10.88 (–0.19 to 21.94) |
| 4–10 weeks | 4 | 60 | 12.53 (7.11 to 17.94) | 4 | 18 | 8.67 (–3.39 to 20.73) |
| > 10–20 weeks | 3 | 25 | 22.69 (15.20 to 30.19) | 3 | 20 | 12.92 (1.15 to 24.69) |
| > 20 weeks | 2 | 19 | 14.58 (6.75 to 22.41) | 2 | 15 | 20.60 (7.77 to 33.42) |
| Reference group | 2 | 15 | 17.52 (8.65 to 26.39) | 2 | 50 | 9.95 (–1.45 to 21.36) |
| Auditory comprehension on the TT-AAT, range 0–50 | ||||||
| ≤ 2 weeks | 6 | 47 | 7.26 (1.03 to 13.50) | 6 | 46 | 3.04 (–1.78 to 7.85) |
| 3 weeks | 2 | 95 | 3.92 (–4.50 to 12.35) | 1 | 10 | 0.71 (–8.48 to 9.90) |
| 4–10 weeks | 2 | 58 | 1.87 (–6.46 to 10.20) | 3 | 10 | 1.51 (–6.08 to 9.10) |
| > 10–20 weeks | 5 | 60 | 8.41 (2.62 to 14.20) | 5 | 33 | 4.66 (–0.21 to 9.53) |
| > 20 weeks | 3 | 67 | –7.08 (–14.64 to 0.48) | 3 | 69 | 5.96 (–0.24 to 12.15) |
| Reference group | 5 | 33 | 7.53 (1.61 to 13.45) | 5 | 12 | 0.69 (–5.39 to 6.78) |
| Naming on the BNT, range 0–60 | ||||||
| ≤ 4 weeks | 5 | 49 | 6.62 (0.24 to 12.99) | 4 | 37 | 2.79 (–5.95 to 11.52) |
| 4–10 weeks | 3 | 18 | 7.34 (–1.49 to 16.16) | 3 | 9 | 4.56 (–5.64 to 14.75) |
| > 10–20 weeks | 4 | 59 | 11.27 (5.44 to 17.11) | 4 | 27 | 3.03 (–4.92 to 10.97) |
| > 20 weeks | 3 | 63 | 8.60 (1.25 to 15.96) | 3 | 71 | 11.23 (2.03 to 20.43) |
| Reference group | 5 | 38 | 9.50 (3.63 to 15.36) | 5 | 14 | 5.47 (–2.92 to 13.86) |
| Functional communication (observer rated)a on the AAT-SSC, range 0–5 | ||||||
| ≤ 3 weeks | 4 | 27 | 0.37 (–0.12 to 0.87) | 4 | 28 | 0.30 (–0.17 to 0.77) |
| 3 weeks | 2 | 27 | 1.20 (0.63 to 1.77) | 2 | 29 | 0.31 (–0.22 to 0.83) |
| 4–10 weeks | 2 | 48 | 1.16 (0.57 to 1.76) | 2 | 9 | 1.32 (0.51 to 2.13) |
| > 10–20 weeks | 4 | 54 | 0.66 (0.26 to 1.05) | 4 | 22 | 0.63 (0.15 to 1.11) |
| > 20 weeks | 4 | 72 | 0.70 (0.25 to 1.14) | 4 | 78 | 0.76 (0.43 to 1.09) |
| Reference group | 5 | 40 | 0.28 (–0.11 to 0.67) | 5 | 39 | 0.36 (–0.09 to 0.81) |
| Intensity of SLT | ||||||
| Overall language ability on the WAB-AQ, range 0–100 | ||||||
| ≤ 2 hours weekly | 3 | 37 | 13.41 (4.98 to 21.84) | 3 | 37 | 16.92 (3.80 to 30.04) |
| > 2–3 hours weekly | 7 | 70 | 10.46 (3.78 to 17.14) | 6 | 23 | 10.13 (–0.47 to 20.73) |
| > 3–4 hours weekly | 4 | 39 | 14.75 (6.77 to 22.72) | 3 | 65 | 14.78 (4.56 to 25.01) |
| > 4–9 hours weekly | 2 | 38 | 12.68 (4.70 to 20.65) | 2 | 12 | 12.20 (–3.64 to 28.04) |
| > 9 hours weekly | 3 | 78 | 16.97 (9.96 to 23.98) | 3 | 18 | 11.46 (–0.05 to 22.96) |
| Reference group | 2 | 15 | 15.60 (5.40 to 25.79) | 2 | 50 | 13.22 (2.07 to 24.37) |
| Auditory comprehension on the TT-AAT, range 0–50 | ||||||
| ≤ 2 hours weekly | 2 | 15 | 8.15 (2.67 to 13.63) | 2 | 4 | 5.11 (–3.58 to 13.79) |
| > 2–3 hours weekly | 7 | 81 | 0.43 (–3.42 to 4.28) | 6 | 39 | 3.00 (–1.64 to 7.63) |
| > 3–4 hours weekly | 3 | 46 | 6.38 (1.04 to 11.72) | 2 | 66 | 7.03 (–0.08 to 14.14) |
| > 4–9 hours weekly | 5 | 77 | 4.05 (0.25 to 7.85) | 5 | 26 | 1.50 (–3.73 to 6.74) |
| > 9 hours weekly | 4 | 108 | 8.96 (5.35 to 12.56) | 6 | 33 | 5.34 (0.67 to 10.02) |
| Reference group | 5 | 33 | 4.38 (–0.07 to 8.84) | 5 | 12 | 0.22 (–5.55 to 5.99) |
| Naming on the BNT, range 0–60 | ||||||
| ≤ 2 hours weekly | 2 | 10 | 17.35 (8.32 to 26.38) | 2 | 8 | 11.12 (1.41 to 20.82) |
| > 2–3 hours weekly | 5 | 71 | 7.92 (1.72 to 14.12) | 4 | 30 | 7.57 (–0.61 to 15.75) |
| > 3–4 hours weekly | 3 | 54 | 10.38 (3.18 to 17.59) | 3 | 73 | 5.75 (–2.61 to 14.12) |
| > 4–9 hours weekly | 2 | 28 | 5.43 (–2.57 to 13.42) | 2 | 13 | 1.92 (–9.87 to 13.71) |
| > 9 hours weekly | 4 | 26 | 6.15 (–0.59 to 12.89) | 4 | 20 | 2.98 (–4.76 to 10.73) |
| Reference group | 5 | 38 | 8.42 (2.57 to 14.28) | 5 | 14 | 8.24 (0.43 to 16.05) |
| Functional communication (observer rated)a on the AAT-SSC, range 0–5 | ||||||
| ≤ 2 hours weekly | 4 | 42 | 0.61 (0.22 to 1.01) | 4 | 41 | 0.97 (0.38 to 1.57) |
| > 2–3 hours weekly | 4 | 43 | 0.78 (0.36 to 1.21) | 5 | 31 | 0.61 (0.05 to 1.17) |
| > 3–4 hours weekly | 5 | 74 | 0.87 (0.53 to 1.22) | 4 | 104 | 0.61 (0.17 to 1.06) |
| > 4–9 hours weekly | 2 | 52 | 0.48 (0.12 to 0.84) | 2 | 7 | 0.41 (–0.51 to 1.34) |
| > 9 hours weekly | 6 | 41 | 0.74 (0.39 to 1.09) | 6 | 19 | 0.64 (0.05 to 1.23) |
| Reference group | 5 | 40 | 0.29 (–0.06 to 0.64) | 5 | 39 | 0.54 (0.04 to 1.04) |
| Dosage of SLT | ||||||
| Overall language ability on the WAB-AQ, range 0–100 | ||||||
| ≤ 5 hours | 5 | 69 | 8.68 (2.45 to 14.90) | 6 | 32 | 8.60 (–0.36 to 17.57) |
| > 5–14 hours | 4 | 61 | 12.87 (6.48 to 19.27) | 3 | 53 | 13.90 (4.79 to 23.08) |
| > 14–20 hours | 4 | 67 | 13.34 (7.13 to 19.56) | 3 | 22 | 14.90 (4.09 to 25.70) |
| > 20–< 50 hours | 3 | 15 | 23.38 (13.47 to 33.28) | 4 | 16 | 15.95 (5.08 to 26.83) |
| ≥ 50 hours | 4 | 40 | 14.82 (7.24 to 22.39) | 4 | 28 | 14.51 (5.29 to 23.73) |
| Reference group | 4 | 24 | 12.88 (4.96 to 20.80) | 4 | 53 | 10.37 (0.85 to 19.89) |
| Auditory comprehension on the TT-AAT, range 0–50 | ||||||
| ≤ 5 hours | 3 | 50 | 0.93 (–3.73 to 5.60) | 3 | 14 | –1.08 (–7.91 to 5.75) |
| > 5–14 hours | 4 | 57 | 2.36 (–2.15 to 6.87) | 3 | 27 | 1.38 (–4.38 to 7.13) |
| > 14–20 hours | 2 | 61 | 5.04 (0.36 to 9.73) | 1 | 5 | 2.44 (–6.18 to 11.07) |
| > 20–< 50 hours | 6 | 59 | 6.06 (1.75 to 10.36) | 7 | 34 | 5.80 (1.35 to 10.24) |
| ≥ 50 hours | 6 | 95 | 4.51 (0.06 to 8.96) | 6 | 88 | 5.61 (1.67 to 9.54) |
| Reference group | 6 | 38 | 4.89 (0.51 to 9.26) | 6 | 13 | 1.49 (–4.08 to 7.07) |
| Naming on the BNT, range 0–60 | ||||||
| ≤ 5 hours | 2 | 17 | 13.24 (1.35 to 25.12) | 2 | 11 | –2.06 (–16.15 to 12.04) |
| > 5–20 hours | 4 | 37 | 4.44 (–4.66 to 13.54) | 2 | 24 | 5.93 (–4.91 to 16.77) |
| > 20–< 50 hours | 5 | 57 | 13.56 (5.30 to 21.79) | 5 | 24 | 8.32 (0.55 to 16.08) |
| 50–< 100 hours | 2 | 55 | 9.06 (–5.74 to 23.87) | 2 | 67 | 5.96 (–4.96 to 16.89) |
| ≥ 100 hours | 3 | 23 | –2.15 (–13.10 to 8.80) | 3 | 18 | 5.12 (–3.39 to 13.63) |
| Reference group | 5 | 38 | 11.38 (3.13 to 19.62) | 5 | 14 | 8.96 (0.59 to 17.33) |
| Functional communication (observer rated)a on the AAT-SSC, range 0–5 | ||||||
| ≤ 5 hours | 2 | 34 | 0.53 (0.12 to 0.95) | 3 | 13 | –0.13 (–0.81 to 0.56) |
| > 5–14 hours | 5 | 47 | 0.61 (0.28 to 0.95) | 5 | 57 | 0.78 (0.30 to 1.26) |
| > 14–20 hours | 3 | 6 | 1.12 (0.47 to 1.78) | 1 | 5 | 0.75 (–0.27 to 1.76) |
| > 20–< 50 hours | 7 | 65 | 0.50 (0.21 to 0.80) | 9 | 31 | 0.86 (0.36 to 1.36) |
| ≥ 50 hours | 6 | 87 | 0.96 (0.66 to 1.25) | 7 | 88 | 0.64 (0.20 to 1.08) |
| Reference group | 7 | 49 | 0.19 (–0.10 to 0.48) | 7 | 42 | 0.53 (0.04 to 1.02) |
| Early (≤ 3 months) | Late (> 3 months) | |||||
|---|---|---|---|---|---|---|
| RCTs (n) | IPD (n) | Estimate of mean (95% CI) | RCTs (n) | IPD (n) | Estimate of mean (95% CI) | |
| Base model | ||||||
| Overall language ability on the WAB-AQ, range 0–100 | ||||||
| Female | 10 | 150 | 21.54 (15.70 to 27.38) | 4 | 56 | 13.86 (6.92 to 20.79) |
| Male | 10 | 174 | 17.99 (12.35 to 23.64) | 4 | 102 | 11.74 (5.02 to 18.45) |
| ≤ 55 years | 10 | 55 | 21.13 (14.30 to 27.96) | 4 | 81 | 6.98 (4.30 to 9.65) |
| 56–65 years | 10 | 87 | 18.98 (12.73 to 25.23) | 3 | 54 | 4.13 (1.06 to 7.19) |
| 66–75 years | 9 | 76 | 18.60 (12.15 to 25.05) | 2 | 20 | 2.70 (–1.67 to 7.06) |
| > 75 years | 6 | 106 | 20.35 (13.86 to 26.85) | 1 | 3 | 5.33 (–5.08 to 15.73) |
| Auditory comprehension on the TT-AAT, range 0–50 | ||||||
| Female | 11 | 112 | 4.00 (–0.78 to 8.79) | 10 | 99 | 2.58 (0.50 to 4.66) |
| Male | 11 | 124 | 3.36 (–1.41 to 8.12) | 11 | 205 | 1.93 (0.11 to 3.75) |
| ≤ 55 years | 10 | 53 | 7.12 (1.93 to 12.30) | 9 | 125 | 4.03 (2.06 to 6.01) |
| 56–65 years | 11 | 79 | 2.51 (–2.37 to 7.39) | 9 | 103 | 1.80 (–0.27 to 3.86) |
| 66–75 years | 9 | 59 | 4.12 (–1.05 to 9.29) | 9 | 57 | 1.37 (–0.95 to 3.70) |
| > 75 years | 7 | 45 | 0.97 (–4.41 to 6.35) | 6 | 19 | 1.82 (–1.70 to 5.33) |
| Naming on the BNT, range 0–60 | ||||||
| Female | 9 | 104 | 9.29 (1.49 to 17.09) | 8 | 61 | 2.20 (0.58 to 3.82) |
| Male | 9 | 118 | 9.35 (1.60 to 17.10) | 9 | 102 | 1.26 (–0.20 to 2.73) |
| ≤ 55 years | 8 | 44 | 13.30 (4.93 to 21.66) | 8 | 59 | 3.28 (1.68 to 4.88) |
| 56–65 years | 9 | 76 | 9.20 (1.33 to 17.07) | 7 | 48 | 2.23 (0.41 to 4.05) |
| 66–75 years | 7 | 58 | 8.18 (–0.06 to 16.41) | 7 | 39 | 1.17 (–0.71 to 3.05) |
| > 75 years | 6 | 44 | 6.60 (–1.87 to 15.08) | 6 | 17 | 0.24 (–2.44 to –2.92) |
| Functional communication observer rateda on the AAT-SSC, range 0–5 | ||||||
| Female | 8 | 151 | 1.12 (0.77 to 1.48) | 8 | 86 | 0.37 (–0.06 to 0.69) |
| Male | 8 | 149 | 0.93 (0.57 to 1.29) | 9 | 147 | 0.14 (–0.23 to 0.51) |
| ≤ 55 years | 7 | 53 | 1.15 (0.73 to 1.58) | 8 | 94 | 0.29 (–0.09 to 0.67) |
| 56–65 years | 8 | 71 | 1.05 (0.65 to 1.44) | 7 | 74 | 0.25 (–0.14 to 0.64) |
| 66–75 years | 7 | 79 | 0.89 (0.49 to 1.28) | 9 | 43 | 0.14 (–0.26 to 0.54) |
| > 75 years | 7 | 97 | 1.02 (0.63 to 1.42) | 6 | 22 | 0.23 (–0.23 to 0.69) |
| Frequency of SLT | ||||||
| Overall language ability on the WAB-AQ, range 0–100 | ||||||
| ≤ 2 days per week | 4 | 56 | 15.88 (7.00 to 24.75) | 2 | 34 | 2.37 (–2.54 to 7.28) |
| > 2–3 days per week | 1 | 3 | 27.75 (–3.56 to 51.93) | 2 | 18 | 2.52 (–3.12 to 8.16) |
| > 3–4 days per week | 4 | 41 | 19.24 (7.71 to 30.76) | 3 | 33 | 5.06 (0.90 to 9.22) |
| > 4–5 days per week | 5 | 150 | 21.42 (13.45 to 29.39) | 1 | 44 | 6.32 (1.58 to 11.07) |
| > 5 days per week | 1 | 9 | 18.35 (3.23 to 33.47) | 1 | 23 | 5.41 (0.04 to 10.77) |
| Reference group | 2 | 65 | 19.53 (10.30 to 28.76) | 1 | 6 | 2.41 (–5.78 to 10.59) |
| Auditory comprehension on the TT-AAT, range 0–50 | ||||||
| ≤ 2 days per week | 3 | 27 | –1.80 (–8.77 to 5.16) | 2 | 37 | 0.13 (–2.92 to 3.19) |
| > 2–3 days per week | 3 | 10 | 0.81 (–8.66 to 10.27) | 4 | 79 | 1.78 (–0.82 to 4.39) |
| > 3–4 days per week | 3 | 87 | 7.47 (–2.22 to 17.17) | 3 | 27 | 3.49 (0.16 to 6.82) |
| > 4–5 days per week | 5 | 82 | 4.70 (–1.61 to 11.02) | 5 | 89 | 3.71 (1.41 to 6.00) |
| > 5 days per week | 1 | 7 | 0.17 (–9.77 to 10.11) | 2 | 44 | 2.76 (–0.21 to 5.73) |
| Reference group | 3 | 23 | 4.61 (–2.54 to 11.76) | 4 | 28 | –0.76 (–3.86 to 2.35) |
| Naming on the BNT, range 0–60 | ||||||
| ≤ 2 days per week | 3 | 33 | 16.96 (7.68 to 26.24) | 2 | 9 | 3.26 (–0.79 to 7.30) |
| > 2–3 days per week | 2 | 6 | –0.99 (–15.84 to 13.86) | 3 | 78 | 2.81 (0.60 to 5.02) |
| > 3–4 days per week | 3 | 83 | 9.44 (–3.29 to 22.18) | 2 | 20 | 1.04 (–2.08 to 4.17) |
| > 4–5 days per week | 5 | 85 | 8.67 (0.11 to 17.23) | 3 | 19 | 1.55 (–1.48 to 4.59) |
| > 5 days per week | – | – | – | – | – | |
| Reference group | 2 | 15 | 15.86 (5.15 to 26.57) | 4 | 37 | 0.02 (–2.14 to 2.18) |
| Functional communication observer rateda on the AAT-SSC, range 0–5 | ||||||
| ≤ 2 days per week | 3 | 43 | 0.89 (0.37 to 1.41) | 2 | 39 | 0.07 (–0.36 to 0.51) |
| > 2–3 days per week | 1 | 3 | 0.41 (–1.09 to 1.91) | 3 | 90 | 0.20 (–0.20 to 0.61) |
| > 3–4 days per week | 1 | 80 | 1.55 (0.59 to 2.52) | 3 | 22 | 0.16 (–0.31 to 0.63) |
| > 4–5 days per week | 5 | 119 | 1.11 (0.67 to 1.54) | 6 | 36 | 0.36 (–0.05 to 0.77) |
| > 5 days per week | 1 | 5 | 0.61 (–0.45 to 1.67) | 2 | 4 | 0.62 (–0.15 to 1.38) |
| Reference group | 3 | 50 | 0.77 (0.26 to 1.28) | 4 | 35 | 0.002 (–0.40 to 0.41) |
| Duration of SLT | ||||||
| Overall language ability on the WAB-AQ, range 0–100 | ||||||
| ≤ 2 weeks | 2 | 50 | 11.15 (–0.70 to 23.01) | 0 | 0 | – |
| 3 weeks | 2 | 69 | 19.37 (9.23 to 29.51) | 2 | 89 | 3.22 (–1.64 to 8.07) |
| 4–10 weeks | 3 | 26 | 24.73 (12.53 to 36.92) | 3 | 52 | 0.88 (–4.21 to 5.96) |
| > 10–20 weeks | 3 | 42 | 22.45 (12.85 to 32.05) | 1 | 3 | 6.90 (–5.32 to 19.12) |
| > 20 weeks | 2 | 20 | 21.96 (10.47 to 33.46) | 1 | 14 | 9.30 (3.12 to 15.48) |
| Reference group | 2 | 65 | 19.51 (9.58 to 29.44) | 0 | 0 | – |
| Auditory comprehension on the TT-AAT, range 0–50 | ||||||
| ≤ 2 weeks | 3 | 56 | 3.04 (–6.29 to 12.36) | 4 | 37 | 3.69 (1.04 to 6.34) |
| 3 weeks | 1 | 11 | 8.33 (–11.40 to 28.06) | 2 | 94 | 3.30 (1.05 to 5.56) |
| 4–10 weeks | 1 | 7 | –6.40 (–26.57 to 13.76) | 3 | 61 | 1.61 (–0.76 to 3.98) |
| > 10–20 weeks | 4 | 53 | 8.81 (1.23 to 16.39) | 3 | 41 | 2.40 (–0.10 to 4.89) |
| > 20 weeks | 3 | 87 | –3.52 (–12.34 to 5.30) | 1 | 49 | 5.20 (2.52 to 7.88) |
| Reference group | 3 | 23 | 9.89 (1.85 to 17.93) | 3 | 22 | –2.54 (–5.66 to 0.58) |
| Naming on the BNT, range 0–60 | ||||||
| ≤ 4 weeks | 3 | 61 | 5.17 (–8.86 to 19.20) | 4 | 25 | 1.54 (–0.99 to 4.08) |
| 4–10 weeks | 1 | 7 | 4.95 (–20.49 to 30.39) | 3 | 20 | 1.48 (–1.04 to 4.00) |
| > 10–20 weeks | 3 | 53 | 11.81 (–0.10 to 23.72) | 2 | 33 | 4.12 (1.79 to 6.45) |
| > 20 weeks | 3 | 86 | 12.50 (0.39 to 24.61) | 1 | 48 | 1.89 (–0.59 to 4.37) |
| Reference group | 2 | 15 | 15.56 (1.92 to 29.20) | 4 | 37 | 0.48 (–1.47 to 2.44) |
| Functional communication observer rateda on the AAT-SSC, range 0–5 | ||||||
| ≤ 2 weeks | 1 | 29 | 0.76 (–0.42 to 1.95) | 4 | 26 | 0.08 (–0.43 to 0.59) |
| 3 weeks | 1 | 35 | 0.94 (0.17 to 1.72) | 1 | 21 | 0.41 (–0.29 to 1.11) |
| 4–10 weeks | 0 | – | 2 | 57 | 0.47 (–0.17 to 1.11) | |
| > 10–20 weeks | 3 | 40 | 1.16 (0.56 to 1.77) | 2 | 36 | 0.17 (–0.39 to 0.73) |
| > 20 weeks | 3 | 94 | 1.08 (0.41 to 1.74) | 2 | 57 | 0.36 (–0.32 to 1.03) |
| Reference group | 3 | 50 | 0.77 (0.10 to 1.43) | 3 | 29 | –0.06 (–0.58 to 0.46) |
| Intensity of SLT | ||||||
| Overall language ability on the WAB-AQ, range 0–100 | ||||||
| ≤ 2 hours weekly | 2 | 62 | 24.27 (13.37 to 35.18) | 1 | 12 | 3.27 (–2.75 to 9.30) |
| > 2–3 hours weekly | 4 | 75 | 16.33 (8.79 to 23.87) | 3 | 18 | 0.24 (–5.05 to 5.53) |
| > 3–4 hours weekly | 3 | 79 | 24.14 (15.22 to 33.06) | 2 | 25 | 6.25 (2.19 to 10.32) |
| > 4–9 hours weekly | 1 | 21 | 15.06 (–3.04 to 33.16) | 1 | 29 | 2.87 (–1.81 to 7.56) |
| > 9 hours weekly | 2 | 22 | 20.32 (9.79 to 30.85) | 1 | 74 | 5.83 (1.97 to 9.69) |
| Reference group | 2 | 65 | 22.27 (13.06 to 31.47) | 0 | 0 | – |
| Auditory comprehension on the TT-AAT, range 0–50 | ||||||
| ≤ 2 hours weekly | 1 | 7 | 6.72 (–2.55 to 15.99) | 1 | 12 | 4.27 (–0.19 to 8.74) |
| > 2–3 hours weekly | 6 | 42 | 0.63 (–5.27 to 6.53) | 5 | 78 | 2.13 (–0.35 to 4.60) |
| > 3–4 hours weekly | 2 | 104 | 9.19 (–0.66 to 19.04) | 2 | 8 | 1.09 (–4.15 to 6.34) |
| > 4–9 hours weekly | 3 | 40 | 0.43 (–6.81 to 7.66) | 3 | 63 | 1.50 (–1.02 to 4.01) |
| > 9 hours weekly | 2 | 20 | 9.26 (2.04 to 16.47) | 4 | 121 | 4.60 (2.43 to 6.77) |
| Reference group | 3 | 23 | 5.06 (–1.72 to 11.84) | 3 | 22 | –2.12 (–5.51 to 1.28) |
| Naming on the BNT, range 0–60 | ||||||
| ≤ 2 hours weekly | 1 | 10 | 17.66 (3.95 to 31.36) | 1 | 8 | 3.68 (0.11 to 7.26) |
| > 2–3 hours weekly | 5 | 41 | 8.14 (–2.83 to 19.12) | 3 | 60 | 1.33 (–0.08 to 2.73) |
| > 3–4 hours weekly | 2 | 100 | 9.02 (–9.00 to 27.05) | 2 | 27 | 5.58 (3.56 to 7.60) |
| > 4–9 hours weekly | 2 | 34 | 11.80 (–2.02 to 25.61) | 1 | 7 | 0.55 (–3.33 to 4.43) |
| > 9 hours weekly | 2 | 22 | 2.82 (–9.19 to 14.82) | 2 | 24 | 2.05 (–0.17 to 4.27) |
| Reference group | 2 | 15 | 14.39 (1.91 to 26.87) | 4 | 37 | 0.75 (–0.94 to 2.44) |
| Functional communication observer rateda on the AAT-SSC, range 0–5 | ||||||
| ≤ 2 hours weekly | 2 | 57 | 1.29 (0.64 to 1.95) | 2 | 26 | 0.23 (–0.28 to 0.73) |
| > 2–3 hours weekly | 3 | 18 | 1.23 (0.58 to 1.88) | 3 | 56 | 0.24 (–0.31 to 0.78) |
| > 3–4 hours weekly | 3 | 144 | 1.04 (0.60 to 1.48) | 3 | 34 | 0.35 (–0.14 to 0.83) |
| > 4–9 hours weekly | 1 | 14 | 0.57 (–0.23 to 1.37) | 2 | 45 | 0.13 (–0.31 to 0.58) |
| > 9 hours weekly | 2 | 17 | 1.17 (0.49 to 1.85) | 4 | 43 | 0.29 (–0.14 to 0.72) |
| Reference group | 3 | 50 | 0.73 (0.27 to 1.19) | 3 | 29 | 0.05 (–0.42 to 0.52) |
| Dosage of SLT | ||||||
| Overall language ability on the WAB-AQ, range 0–100 | ||||||
| ≤ 5 hours | 5 | 65 | 14.35 (6.74 to 21.96) | 2 | 36 | 0.95 (–4.14 to 6.04) |
| > 5–14 hours | 3 | 69 | 23.58 (15.93 to 31.23) | 2 | 45 | 3.20 (–1.81 to 8.22) |
| > 14–20 hours | 3 | 37 | 23.09 (14.11 to 32.08) | 2 | 52 | 3.82 (–1.01 to 8.65) |
| > 20–50 hours | 3 | 27 | 27.52 (18.32 to 36.71) | 2 | 4 | –0.22 (–9.51 to 9.08) |
| ≥ 50 hours | 4 | 53 | 19.08 (11.32 to 26.84) | 1 | 15 | 10.11 (4.22 to 16.00) |
| Reference group | 3 | 71 | 19.44 (11.76 to 27.11) | 1 | 6 | 1.05 (–7.21 to 9.32) |
| Auditory comprehension on the TT-AAT, range 0–50 | ||||||
| ≤ 5 hours | 2 | 25 | 0.92 (–9.56 to 11.41) | 2 | 39 | –0.48 (–3.67 to 2.70) |
| > 5–14 hours | 3 | 38 | –0.96 (–9.10 to 7.18) | 3 | 48 | 1.35 (–1.72 to 4.43) |
| > 14–20 hours | 1 | 11 | 8.75 (–7.38 to 24.89) | 2 | 55 | 3.39 (0.46 to 6.32) |
| > 20–50 hours | 3 | 32 | 4.60 (–2.50 to 11.70) | 6 | 58 | 2.78 (0.43 to 5.12) |
| ≥ 50 hours | 4 | 107 | 4.84 (–2.20 to 11.88) | 3 | 76 | 4.17 (1.68 to 6.66) |
| Reference group | 3 | 23 | 6.00 (–1.14 to 13.15) | 4 | 28 | –1.26 (–4.21 to 1.69) |
| Naming on the BNT, range 0–60 | ||||||
| ≤ 5 hours | 2 | 25 | 13.43 (–4.74 to 31.59) | 1 | 3 | 0.28 (–6.16 to 6.72) |
| > 5–20 hours | 3 | 43 | 0.06 (–16.34 to 16.46) | 4 | 18 | 1.40 (–1.52 to 4.32) |
| > 20–50 hours | 2 | 31 | 20.67 (2.87 to 38.47) | 4 | 50 | 3.02 (0.90 to 5.15) |
| > 50–100 hours | 2 | 74 | 8.54 (–13.30 to 30.39) | 1 | 48 | 1.75 (–1.36 to 4.86) |
| ≥ 100 hours | 2 | 34 | 6.29 (–11.67 to 24.25) | 1 | 7 | 2.42 (–2.12 to 6.96) |
| Reference group | 2 | 15 | 21.31 (2.90 to 39.71) | 4 | 37 | 0.30 (–1.85 to 2.46) |
| Functional communication observer rateda on the AAT-SSC, range 0–5 | ||||||
| ≤ 5 hours | 2 | 10 | 0.08 (–0.68 to 0.84) | 1 | 37 | 0.05 (–0.48 to 0.58) |
| > 5–14 hours | 3 | 73 | 1.22 (0.71 to 1.73) | 3 | 31 | 0.01 (–0.50 to 0.51) |
| > 14–20 hours | 1 | 8 | 1.24 (0.40 to 2.08) | 2 | 3 | 0.62 (–0.27 to 1.50) |
| > 20–50 hours | 3 | 31 | 1.25 (0.69 to 1.81) | 7 | 65 | 0.30 (–0.10 to 0.70) |
| ≥ 50 hours | 5 | 120 | 0.99 (0.49 to 1.48) | 3 | 55 | 0.37 (–0.22 to 0.96) |
| Reference group | 4 | 56 | 0.76 (0.26 to 1.26) | 4 | 35 | 0.03 (–0.41 to 0.46) |
| RCTs (n) | IPD (n) | Estimate of mean (95% CI) | RCTs (n) | IPD (n) | Estimate of mean (95% CI) | |
|---|---|---|---|---|---|---|
| Base model | ||||||
| Overall language ability on the WAB-AQ, range 0–100 | ||||||
| Below the median: < 64.9 (n = 319) | Above the median: ≥ 64.9 (n = 163) | |||||
| Female | 11 | 138 | 17.81 (11.13 to 24.50) | 9 | 68 | 5.95 (1.36 to 10.55) |
| Male | 11 | 181 | 14.66 (8.17 to 21.15) | 10 | 95 | 6.87 (2.34 to 11.40) |
| ≤ 55 years | 11 | 76 | 19.60 (12.49 to 26.71) | 9 | 60 | 7.50 (2.8 to 12.19) |
| 56–65 years | 11 | 91 | 13.99 (6.93 to 21.06) | 6 | 50 | 8.36 (3.61 to 13.12) |
| 66–75 years | 10 | 71 | 14.23 (6.94 to 21.53) | 7 | 25 | 5.66 (0.52 to 10.80) |
| > 75 years | 7 | 81 | 17.13 (9.33 to 24.93) | 6 | 28 | 4.11 (–1.04 to 9.26) |
| 0–1 month | 7 | 199 | 24.10 (17.62 to 30.59) | 7 | 61 | 10.95 (6.18 to 15.73) |
| > 1–3 months | 6 | 46 | 22.15 (14.43 to 29.86) | 3 | 18 | 5.21 (–0.68 to 11.10) |
| > 3–6 months | 3 | 10 | 9.25 (–4.43 to 22.93) | 2 | 6 | 5.54 (–1.71 to 12.79) |
| > 6 months | 4 | 64 | 9.45 (–2.25 to 21.16) | 4 | 78 | 3.94 (–2.19 to 10.06) |
| Auditory comprehension on the TT-AAT, range 0–50 | ||||||
| Below the median: < 35 (n = 395) | Above the median: ≥ 35 (n = 145) | |||||
| Female | 16 | 155 | 5.40 (2.11 to 8.69) | 12 | 56 | 0.65 (–3.83 to 5.13) |
| Male | 16 | 240 | 5.59 (2.37 to 8.83) | 12 | 89 | –1.24 (–5.61 to 3.13) |
| ≤ 55 years | 15 | 133 | 8.22 (4.90 to 11.56) | 9 | 45 | 1.50 (–3.24 to 6.22) |
| 56–65 years | 16 | 132 | 5.33 (1.99 to 8.68) | 13 | 50 | –1.24 (–5.75 to 3.28) |
| 66–75 years | 15 | 88 | 5.21 (1.70 to 8.73) | 9 | 28 | –0.46 (–5.28 to 4.37) |
| > 75 years | 11 | 42 | 3.20 (–0.80 to 7.20) | 8 | 22 | –0.98 (–5.94 to 3.97) |
| 0–1 month | 6 | 88 | 8.63 (4.51 to 12.75) | 5 | 51 | –0.12 (–5.82 to 5.59) |
| > 1–3 months | 9 | 80 | 6.72 (3.11 to 10.32) | 5 | 17 | 0.21 (–5.52 to 5.93) |
| > 3–6 months | 4 | 50 | 4.37 (–1.43 to 10.17) | 4 | 11 | –1.77 (–8.08 to 4.54) |
| > 6 months | 9 | 177 | 2.25 (–1.49 to 5.99) | 8 | 66 | 0.50 (–4.79 to 5.79) |
| Naming on the BNT, range 0–60 | ||||||
| Below the median: < 23 (n = 304) | Above the median: ≥ 23 (n = 81) | |||||
| Female | 12 | 130 | 6.84 (1.98 to 11.71) | 8 | 35 | 7.59 (3.79 to 11.38) |
| Male | 13 | 174 | 6.99 (2.27 to 11.70) | 8 | 46 | 8.36 (4.57 to 12.14) |
| ≤ 55 years | 12 | 79 | 9.53 (4.50 to 14.56) | 7 | 24 | 8.79 (4.59 to 13.00) |
| 56–65 years | 12 | 97 | 7.39 (2.38 to 12.39) | 7 | 27 | 8.13 (4.05 to 12.21) |
| 66–75 years | 12 | 84 | 6.76 (1.67 to 11.84) | 6 | 13 | 6.74 (1.66 to 11.82) |
| > 75 years | 9 | 44 | 3.98 (–1.59 to 9.56) | 6 | 17 | 8.22 (3.43 to 13.02) |
| 0–1 month | 5 | 99 | 12.22 (6.35 to 18.09) | 3 | 30 | 11.61 (6.25 to 16.97) |
| > 1–3 months | 8 | 78 | 7.99 (2.67 to 13.30) | 3 | 15 | 9.37 (3.76 to 14.97) |
| > 3–6 months | 6 | 62 | 3.56 (–3.10 to 10.21) | 2 | 8 | 6.83 (0.32 to 13.33) |
| > 6 months | 7 | 65 | 3.89 (–1.81 to 9.59) | 5 | 28 | 4.08 (–0.37 to 8.54) |
| Functional communication on the AAT-SSC,a range 0–5 | ||||||
| Below the median (moderate–severe): < 2 (n = 280) | Above the median (mild–moderate): ≥ 2 (n = 253) | |||||
| Female | 121 | 14 | 0.88 (0.59 to 1.16) | 116 | 12 | 0.54 (0.27 to 0.82) |
| Male | 159 | 14 | 0.63 (0.36 to 0.89) | 137 | 12 | 0.52 (0.24 to 0.79) |
| ≤ 55 years | 74 | 10 | 0.80 (0.47 to 1.12) | 73 | 12 | 0.58 (0.29 to 0.87) |
| 56 to 65 years | 73 | 11 | 0.80 (0.47 to 1.12) | 72 | 12 | 0.52 (0.23 to 0.81) |
| 66 to 75 years | 66 | 14 | 0.60 (0.27 to 0.93) | 56 | 12 | 0.51 (0.21 to 0.81) |
| > 75 years | 67 | 12 | 0.81 (0.47 to 1.16) | 52 | 9 | 0.51 (0.19 to 0.82) |
| 0–1 month | 131 | 6 | 1.41 (1.07 to 1.75) | 101 | 6 | 0.86 (0.53 to 1.19) |
| > 1–3 months | 43 | 4 | 0.83 (0.41 to 1.24) | 25 | 5 | 0.81 (0.44 to 1.18) |
| > 3–6 months | 20 | 3 | 0.40 (–1.16 to 0.97) | 43 | 3 | 0.14 (–0.34 to 0.62) |
| > 6 months | 86 | 7 | 0.37 (0.04 to 0.69) | 84 | 5 | 0.31 (–0.08 to 0.69) |
| Frequency of SLT | ||||||
| Overall language ability on the WAB-AQ, range 0–100 | ||||||
| Below the median: < 64.9 (n = 319) | Above the median: ≥ 64.9 (n = 163) | |||||
| ≤ 2 days per week | 5 | 62 | 11.18 (2.38 to 19.98) | 4 | 28 | 7.21 (2.13 to 12.29) |
| > 2–3 days per week | 2 | 10 | 17.48 (3.43 to 31.53) | 2 | 11 | 3.57 (–2.35 to 9.49) |
| > 3–4 days per week | 5 | 38 | 18.25 (8.04 to 28.46) | 4 | 36 | 5.42 (0.11 to 10.73) |
| > 4–5 days per week | 5 | 145 | 17.47 (9.18 to 25.75) | 5 | 49 | 6.30 (1.59 to 11.01) |
| > 5 days per week | 2 | 16 | 16.08 (4.01 to 28.16) | 2 | 16 | 9.85 (4.37 to 15.33) |
| Reference group | 3 | 48 | 13.65 (3.37 to 23.94) | 3 | 23 | 8.08 (2.74 to 13.43) |
| Auditory comprehension on the TT-AAT, range 0–50 | ||||||
| Below the median: < 35 (n = 395) | Above the median: ≥ 35 (n = 145) | |||||
| ≤ 2 days per week | 4 | 37 | 2.93 (–1.38 to 7.23) | 3 | 27 | –2.63 (–7.87 to 2.62) |
| > 2–3 days per week | 3 | 72 | 3.49 (–1.03 to 8.00) | 3 | 17 | –1.64 (–7.71 to 4.44) |
| > 3–4 days per week | 5 | 80 | 8.48 (3.67 to 13.28) | 3 | 34 | 0.90 (–5.48 to 7.27) |
| > 4–5 days per week | 8 | 134 | 5.88 (2.31 to 9.45) | 6 | 37 | 1.03 (–3.96 to 6.03) |
| > 5 days per week | 3 | 37 | 6.01 (1.17 to 10.86) | 3 | 14 | –2.17 (–7.80 to 3.46) |
| Reference group | 6 | 35 | 4.46 (0.10 to 8.82) | 5 | 16 | –0.19 (–5.60 to 5.22) |
| Naming on the BNT, range 0–60 | ||||||
| Below the median: < 23 (n = 304) | Above the median: ≥ 23 (n = 81) | |||||
| ≤ 2 days per week | 4 | 36 | 13.07 (6.99 to 19.14) | 3 | 6 | 7.36 (0.56 to 14.16) |
| > 2–3 days per week | 3 | 77 | 6.17 (–0.66 to 13.00) | 1 | 7 | 10.53 (2.88 to 18.18) |
| > 3–4 days per week | 4 | 58 | 8.18 (0.20 to 16.17) | 3 | 45 | 5.96 (1.92 to 10.01) |
| > 4–5 days per week | 6 | 93 | 3.78 (–1.61 to 9.16) | 3 | 11 | 11.11 (5.61 to 16.60) |
| > 5 days per week | – | – | – | – | – | – |
| Reference group | 5 | 40 | 7.72 (2.16 to 13.28) | 4 | 12 | 7.51 (2.17 to 12.86) |
| Functional communication on the AAT-SSC,a range 0–5 | ||||||
| Below the median (moderate–severe): < 2 (n = 280) | Above the median (mild–moderate): ≥ 2 (n = 251) | |||||
| ≤ 2 days per week | 38 | 5 | 0.52 (0.08 to 0.97) | 44 | 5 | –0.52 (0.21 to 0.83) |
| > 2–3 days per week | 27 | 3 | 0.84 (0.31 to 1.38) | 66 | 3 | 0.34 (0.01 to 0.68) |
| > 3–4 days per week | 55 | 2 | 1.00 (0.48 to 1.51) | 47 | 3 | 0.58 (0.18 to 0.99) |
| > 4–5 days per week | 100 | 9 | 0.78 (0.47 to 1.09) | 55 | 8 | 0.66 (0.36 to 0.96) |
| > 5 days per week | 1 | 1 | 1.06 (–1.06 to 3.18) | 8 | 3 | 0.63 (–0.13 to 1.14) |
| Reference group | 57 | 6 | 0.55 (0.19 to 0.91) | 28 | 5 | 0.40 (0.06 to 0.73) |
| Duration of SLT | ||||||
| Overall language ability on the WAB-AQ, range 0–100 | ||||||
| Below the median: < 64.9 (n = 319) | Above the median: ≥ 64.9 (n = 163) | |||||
| ≤ 2 weeks | 2 | 48 | 5.75 (–5.85 to 17.35) | 1 | 2 | –4.50 (–19.47 to 10.46) |
| 3 weeks | 3 | 87 | 17.05 (9.33 to 24.76) | 3 | 71 | 4.50 (–0.80 to 9.81) |
| 4–10 weeks | 4 | 46 | 15.00 (6.91 to 23.09) | 3 | 32 | 4.20 (–1.46 to 9.86) |
| > 10–20 weeks | 3 | 28 | 21.64 (11.30 to 31.97) | 3 | 17 | 9.28 (3.06 to 15.51) |
| > 20 weeks | 2 | 18 | 23.53 (12.09 to 34.96) | 2 | 16 | 10.01 (2.42 to 17.60) |
| Reference group | 2 | 47 | 14.91 (5.65 to 24.17) | 2 | 18 | 13.65 (3.37 to 23.94) |
| Auditory comprehension on the TT-AAT, range 0–50 | ||||||
| Below the median: < 35 (n = 395) | Above the median: ≥ 35 (n = 145) | |||||
| ≤ 2 weeks | 6 | 70 | 4.02 (–0.64 to 8.69) | 4 | 23 | 3.66 (–0.63 to 7.95) |
| 3 weeks | 2 | 68 | 5.89 (–0.08 to 11.86) | 2 | 37 | 3.01 (–7.08 to 13.09) |
| 4–10 weeks | 3 | 55 | 3.66 (–2.08 to 9.40) | 1 | 13 | 2.57 (–7.60 to 12.75) |
| > 10–20 weeks | 5 | 65 | 4.85 (0.20 to 9.51) | 5 | 28 | 2.73 (–1.52 to 6.97) |
| > 20 weeks | 3 | 105 | 10.61 (3.91 to 17.30) | 3 | 31 | 3.94 (–3.19 to 11.06) |
| Reference group | 5 | 32 | 3.27 (–1.63 to 8.16) | 4 | 13 | 2.22 (–1.98 to 6.43) |
| Naming on the BNT, range 0–60 | ||||||
| Below the median: < 23 (n = 304) | Above the median: ≥ 23 (n = 81) | |||||
| ≤ 4 weeks | 5 | 63 | 4.59 (–2.87 to 12.05) | 3 | 23 | 4.35 (–2.34 to 11.04) |
| > 4–10 weeks | 3 | 22 | 8.22 (–0.44 to 16.88) | 2 | 5 | 1.32 (–7.67 to 10.30) |
| > 10–20 weeks | 4 | 71 | 7.52 (1.08 to 13.97) | 3 | 15 | 8.87 (2.92 to 14.82) |
| > 20 weeks | 3 | 108 | 7.79 (–0.11 to 15.69) | 2 | 26 | 16.01 (6.60 to 25.41) |
| Reference group | 5 | 40 | 7.80 (1.32 to 14.29) | 4 | 12 | 5.60 (–0.80 to 12.00) |
| Functional communication on the AAT-SSC,a range 0–5 | ||||||
| Below the median (moderate–severe): < 2 (n = 243) | Above the median (mild–moderate): ≥ 2 (n = 231) | |||||
| ≤ 3 weeks | 35 | 3 | 0.42 (–0.003 to 0.85) | 20 | 2 | 0.71 (–0.03 to 1.44) |
| 3 weeks | 32 | 2 | 0.56 (0.09 to 1.03) | 24 | 2 | 0.54 (0.01 to 1.07) |
| 4–10 weeks | 12 | 2 | 0.74 (0.04 to 1.44) | 45 | 2 | 0.63 (0.08 to 1.19) |
| > 10–20 weeks | 47 | 4 | 0.92 (0.56 to 1.28) | 29 | 4 | 0.50 (0.06 to 0.95) |
| > 20 weeks | 61 | 4 | 1.14 (0.78 to 1.49) | 90 | 4 | 0.44 (–0.04 to 0.91) |
| Reference group | 56 | 5 | 0.46 (0.12 to 0.79) | 23 | 4 | 0.44 (–0.02 to 0.90) |
| Intensity of SLT | ||||||
| Overall language ability on the WAB-AQ, range 0–100 | ||||||
| Below the median: < 64.9 (n = 319) | Above the median: ≥ 64.9 (n = 163) | |||||
| ≤ 2 hours weekly | 3 | 55 | 18.40 (6.72 to 30.09) | 3 | 19 | 7.13 (1.94 to 12.31) |
| > 2–3 hours weekly | 7 | 70 | 13.13 (5.07 to 21.19) | 6 | 23 | 4.32 (–0.48 to 9.12) |
| > 3–4 hours weekly | 4 | 64 | 20.04 (10.14 to 29.94) | 4 | 40 | 6.30 (1.54 to 11.07) |
| > 4–9 hours weekly | 2 | 35 | 13.85 (2.80 to 24.89) | 1 | 15 | 6.31 (0.68 to 11.94) |
| > 9 hours weekly | 3 | 48 | 19.59 (10.41 to 28.78) | 3 | 48 | 7.97 (3.37 to 12.57) |
| Reference group | 2 | 47 | 16.40 (5.44 to 27.36) | 2 | 18 | 8.91 (3.46 to 14.36) |
| Auditory comprehension on the TT-AAT, range 0–50 | ||||||
| Below median: < 35 (n = 395) | Above the median: ≥ 35 (n = 145) | |||||
| ≤ 2 hours weekly | 2 | 9 | 9.07 (2.57 to 15.58) | 2 | 10 | 1.13 (–4.61 to 6.87) |
| > 2–3 hours weekly | 7 | 87 | 4.26 (0.02 to 8.50) | 6 | 33 | –3.23 (–8.25 to 1.78) |
| > 3–4 hours weekly | 3 | 80 | 5.80 (–0.29 to 11.88) | 3 | 32 | 3.28 (–3.19 to 9.74) |
| > 4–9 hours weekly | 5 | 90 | 3.94 (–0.09 to 7.98) | 3 | 13 | –2.22 (–7.76 to 3.31) |
| > 9 hours weekly | 6 | 97 | 8.90 (4.98 to 12.81) | 6 | 44 | 1.45 (–3.24 to 6.15) |
| Reference group | 5 | 32 | 3.59 (–1.05 to 8.22) | 4 | 13 | 0.71 (–4.90 to 6.31) |
| Naming on the BNT, range 0–60 | ||||||
| Below the median: < 23 (n = 304) | Above the median: ≥ 23 (n = 81) | |||||
| ≤ 2 hours weekly | 2 | 16 | 12.45 (4.25 to 20.64) | 1 | 2 | –0.70 (–12.57 to 11.16) |
| > 2–3 hours weekly | 5 | 84 | 6.61 (–0.30 to 13.52) | 3 | 17 | 7.32 (1.89 to 12.75) |
| > 3–4 hours weekly | 3 | 96 | 9.60 (1.64 to 17.57) | 2 | 31 | 8.21 (3.01 to 13.40) |
| > 4–9 hours weekly | 2 | 41 | 6.40 (–2.02 to 14.83) | – | – | – |
| > 9 hours weekly | 4 | 27 | 1.43 (–5.72 to 8.58) | 4 | 19 | 9.45 (4.64 to 14.26) |
| Reference group | 5 | 40 | 8.17 (1.73 to 14.62) | 4 | 12 | 7.63 (2.01 to 13.24) |
| Functional communication on the AAT-SSC,a range 0–5 | ||||||
| Below the median (moderate–severe): < 2 (n = 280) | Above the median (mild–moderate): ≥ 2 (n = 253) | |||||
| ≤ 2 hours weekly | 42 | 3 | 0.98 (0.34 to 1.62) | 41 | 4 | 0.61 (0.24 to 0.98) |
| > 2–3 hours weekly | 20 | 4 | 0.98 (0.40 to 1.55) | 54 | 5 | 0.52 (0.11 to 0.93) |
| > 3–4 hours weekly | 98 | 5 | 0.85 (0.45 to 1.25) | 80 | 5 | 0.49 (0.14 to 0.84) |
| > 4–9 hours weekly | 31 | 2 | 0.30 (–0.24 to 0.85) | 28 | 2 | 0.59 (0.20 to 0.99) |
| > 9 hours weekly | 33 | 6 | 0.85 (0.35 to 1.35) | 27 | 4 | 0.63 (0.26 to 1.01) |
| Reference group | 56 | 5 | 0.46 (0.06 to 0.86) | 23 | 4 | 0.45 (0.06 to 0.84) |
| Dosage of SLT | ||||||
| Overall language ability on the WAB-AQ, range 0–100 | ||||||
| Below the median: < 64.9 (n = 319) | Above the median: ≥ 64.9 (n = 163) | |||||
| ≤ 5 hours | 6 | 79 | 10.88 (3.58 to 18.17) | 5 | 22 | 3.86 (–1.26 to 8.98) |
| > 5–14 hours | 4 | 72 | 18.17 (10.62 to 25.73) | 4 | 42 | 5.97 (1.01 to 10.93) |
| > 14–20 hours | 4 | 48 | 19.17 (11.47 to 26.88) | 4 | 41 | 5.10 (0.22 to 9.99) |
| > 20–< 50 hours | 3 | 23 | 23.49 (13.50 to 33.48) | 2 | 8 | 8.73 (1.95 to 15.51) |
| ≥ 50 hours | 4 | 42 | 17.92 (9.24 to 26.61) | 3 | 26 | 8.39 (2.55 to 14.24) |
| Reference group | 4 | 53 | 11.66 (3.06 to 20.26) | 4 | 24 | 7.00 (1.81 to 12.19) |
| Auditory comprehension on the TT-AAT, range 0–50 | ||||||
| Below the median: < 35 (n = 395) | Above the median: ≥ 35 (n = 145) | |||||
| ≤ 5 hours | 3 | 54 | 0.94 (–3.83 to 5.71) | 1 | 10 | –0.04 (–7.25 to 7.17) |
| > 5–14 hours | 3 | 61 | 2.65 (–1.87 to 7.16) | 2 | 25 | –1.77 (–8.43 to 4.89) |
| > 14–20 hours | 2 | 45 | 5.44 (0.56 to 10.32) | 2 | 21 | 0.84 (–5.88 to 7.55) |
| > 20–< 50 hours | 5 | 58 | 5.47 (1.03 to 9.92) | 7 | 32 | 0.75 (–4.50 to 5.99) |
| ≥ 50 hours | 6 | 142 | 8.89 (4.49 to 13.30) | 5 | 41 | –1.51 (–7.12 to 4.09) |
| Reference group | 6 | 35 | 3.81 (–0.78 to 8.39) | 5 | 16 | 0.84 (–4.69 to 6.36) |
| Naming on the BNT, range 0–60 | ||||||
| Below the median: < 23 (n = 304) | Above the median: ≥ 23 (n = 81) | |||||
| ≤ 5 hours | 2 | 28 | 14.44 (2.05 to 26.84) | – | – | – |
| > 5–20 hours | 4 | 46 | 6.66 (–2.87 to 16.18) | 2 | 15 | 2.86 (–1.68 to 7.41) |
| > 20–50 hours | 5 | 62 | 8.90 (0.11 to 17.69) | 4 | 19 | 9.44 (5.57 to 13.31) |
| > 50–100 hours | 2 | 98 | 8.82 (–7.65 to 25.29) | 1 | 24 | 7.24 (2.27 to 12.20) |
| > 100 hours | 3 | 30 | –4.80 (–14.98 to 5.38) | 3 | 11 | 12.96 (8.51 to 17.41) |
| Reference group | 5 | 40 | 8.11 (–0.59 to 16.81) | 4 | 12 | 8.21 (3.33 to 13.09) |
| Functional communication on the AAT-SSC,a range 0–5 | ||||||
| Below the median (moderate–severe): < 2 (n = 275) | Above the median (mild–moderate): ≥ 2 (n = 248) | |||||
| ≤ 5 hours | 19 | 3 | –0.10 (–0.62 to 0.42) | 28 | 3 | 0.54 (0.13 to 0.96) |
| > 5–14 hours | 48 | 5 | 0.64 (0.29 to 1.99) | 56 | 5 | 0.49 (0.12 to 0.85) |
| > 14–20 hours | 3 | 1 | 0.84 (–0.36 to 2.04) | 8 | 3 | 0.69 (0.15 to 1.22) |
| > 20–50 hours | 71 | 7 | 0.82 (0.53 to 1.15) | 25 | 7 | 0.55 (0.17 to 0.92) |
| ≥ 50 hours | 72 | 6 | 1.07 (0.78 to 1.37) | 102 | 7 | 0.57 (0.23 to 0.92) |
| Reference group | 62 | 7 | 0.41 (0.12 to 0.71) | 29 | 6 | 0.40 (0.04 to 0.77) |
| Female (IPD 211) | Male (IPD 329) | |||||
|---|---|---|---|---|---|---|
| RCTs (n) | IPD (n) | Estimate of mean (95% CI) | RCTs (n) | IPD (n) | Estimate of mean (95% CI) | |
| Base model | ||||||
| Overall language ability on the WAB-AQ, range 0–100 | ||||||
| 55 years | 10 | 55 | 16.28 (8.84 to 23.72) | 11 | 81 | 14.08 (7.70 to 20.46) |
| 56–65 years | 10 | 42 | 13.68 (6.01 to 21.36) | 11 | 99 | 10.92 (4.70 to 17.14) |
| 66–75 years | 9 | 41 | 15.07 (7.15 to 22.99) | 10 | 55 | 8.86 (2.03 to 15.68) |
| > 75 years | 6 | 68 | 16.63 (8.38 to 24.89) | 7 | 41 | 12.17 (4.75 to 19.59) |
| 0–1 month | 7 | 127 | 22.86 (16.17 to 29.55) | 8 | 133 | 16.07 (9.99 to 22.16) |
| > 1–3 months | 5 | 23 | 18.46 (9.78 to 27.13) | 6 | 41 | 14.58 (7.56 to 21.59) |
| > 3–6 months | 3 | 7 | 11.15 (–3.24 to 25.54) | 3 | 9 | 8.29 (–3.37 to 19.95) |
| > 6 months | 3 | 49 | 9.20 (–3.52 to 21.93) | 4 | 93 | 7.09 (–2.10 to 16.27) |
| Auditory comprehension on the TT-AAT, range 0–50 | ||||||
| ≤ 55 years | 13 | 75 | 6.27 (2.95 to 9.59) | 15 | 103 | 6.05 (2.72 to 9.39) |
| 56–65 years | 15 | 60 | 3.98 (0.58 to 7.38) | 16 | 122 | 2.36 (–0.90 to 5.61) |
| 66–75 years | 13 | 42 | 5.87 (2.15 to 9.59) | 15 | 74 | 2.47 (–1.00 to 5.94) |
| > 75 years | 8 | 34 | 2.93 (–1.06 to 6.91) | 10 | 30 | 1.13 (–3.16 to 5.42) |
| 0–1 month | 6 | 67 | 5.53 (1.55 to 9.51) | 6 | 72 | 6.00 (1.58 to 10.41) |
| > 1–3 months | 9 | 45 | 5.13 (1.36 to 8.90) | 9 | 52 | 4.19 (0.30 to 8.09) |
| > 3–6 months | 3 | 22 | 5.70 (–0.84 to 12.24) | 6 | 39 | 1.43 (–4.12 to 6.97) |
| > 6 months | 8 | 77 | 2.69 (–1.41 to 6.80) | 8 | 166 | 0.39 (–3.34 to 4.12) |
| Naming on the BNT, range 0–60 | ||||||
| ≤ 55 years | 11 | 48 | 10.35 (4.35 to 16.34) | 12 | 55 | 7.88 (3.32 to 12.44) |
| 56–65 years | 13 | 39 | 9.44 (3.33 to 15.54) | 13 | 85 | 6.42 (2.13 to 10.71) |
| 66–75 years | 11 | 41 | 6.69 (0.46 to 12.91) | 12 | 56 | 6.68 (2.10 to 11.25) |
| > 75 years | 10 | 37 | 3.59 (–2.70 to 9.89) | 8 | 24 | 7.72 (2.03 to 13.42) |
| 0–1 month | 5 | 63 | 8.54 (1.45 to 15.63) | 5 | 66 | 15.93 (10.23 to 21.63) |
| > 1–3 months | 8 | 41 | 8.86 (2.34 to 15.39) | 7 | 52 | 7.62 (2.75 to 12.52) |
| > 3–6 months | 4 | 26 | 7.46 (–0.85 to 15.76) | 6 | 44 | 2.10 (–4.03 to 8.24) |
| > 6 months | 6 | 35 | 5.21 (–2.15 to 12.57) | 7 | 58 | 3.05 (–2.08 to 8.18) |
| Functional communication on the AAT-SSC,a range 0–5 (female, n = 237; male, n = 296) | ||||||
| ≤ 55 years | 12 | 70 | 1.01 (0.56 to 1.46) | 13 | 77 | 0.49 (0.25 to 0.72) |
| 56–65 years | 12 | 39 | 0.81 (0.33 to 1.30) | 13 | 106 | 0.56 (0.35 to 0.76) |
| 66–75 years | 14 | 52 | 0.74 (0.27 to 1.21) | 13 | 70 | 0.44 (0.20 to 0.67) |
| > 75 years | 12 | 76 | 0.77 (0.31 to 1.23) | 10 | 43 | 0.60 (0.30 to 0.91) |
| 0–1 month | 6 | 115 | 1.07 (0.54 to 1.60) | 6 | 117 | 1.15 (0.93 to 1.38) |
| > 1–3 months | 5 | 36 | 1.05 (0.51 to 1.59) | 5 | 32 | 0.65 (0.31 to 0.99) |
| > 3–6 months | 2 | 23 | 0.80 (0.01 to 1.59) | 4 | 40 | 0.11 (–0.25 to 0.47) |
| > 6 months | 7 | 63 | 0.41 (–0.10 to 0.93) | 7 | 107 | 0.17 (–0.07 to 0.40) |
| Frequency of SLT | ||||||
| Overall language ability on the WAB-AQ, range 0–100 | ||||||
| ≤ 2 days per week | 5 | 37 | 15.51 (6.22 to 24.80) | 5 | 53 | 7.96 (0.25 to 15.67) |
| > 2–3 days per week | 2 | 5 | 24.22 (7.73 to 40.71) | 2 | 16 | 8.63 (–1.37 to 18.64) |
| > 3–4 days per week | 5 | 24 | 14.27 (3.66 to 24.89) | 4 | 50 | 11.38 (2.98 to 19.77) |
| > 4–5 days per week | 5 | 90 | 16.44 (8.10 to 24.78) | 6 | 104 | 13.20 (6.13 to 20.27) |
| > 5 days per week | 2 | 11 | 15.95 (3.07 to 28.84) | 2 | 21 | 13.59 (4.30 to 22.88) |
| Reference group | 3 | 39 | 12.12 (1.84 to 22.41) | 3 | 32 | 15.00 (6.14 to 23.87) |
| Auditory comprehension on the TT-AAT, range 0–50 | ||||||
| ≤ 2 days per week | 4 | 25 | 3.25 (–1.49 to 7.98) | 4 | 39 | –2.32 (–6.61 to 1.97) |
| > 2–3 days per week | 4 | 30 | 4.42 (–1.09 to 9.92) | 4 | 59 | 0.87 (–3.61 to 5.35) |
| > 3–4 days per week | 5 | 52 | 8.13 (2.65 to 13.60) | 4 | 62 | 4.93 (0.03 to 9.84) |
| > 4–5 days per week | 8 | 72 | 4.32 (0.52 to 8.12) | 8 | 99 | 5.06 (1.41 to 8.71) |
| > 5 days per week | 3 | 14 | 2.65 (–2.99 to 8.30) | 3 | 37 | 2.82 (–1.96 to 7.60) |
| Reference group | 6 | 18 | 3.25 (–1.72 to 8.30) | 6 | 33 | 1.89 (–2.54 to 6.32) |
| Naming on the BNT, range 0–60 | ||||||
| ≤ 2 days per week | 4 | 17 | 17.05 (9.47 to 24.64) | 4 | 25 | 10.58 (4.29 to 16.86) |
| > 2–3 days per week | 3 | 28 | 6.99 (–2.22 to 16.19) | 3 | 56 | 5.93 (–0.70 to 12.55) |
| > 3–4 days per week | 4 | 48 | 8.83 (0.24 to 17.43) | 3 | 54 | 8.56 (1.45 to 15.67) |
| > 4–5 days per week | 6 | 50 | 3.47 (–3.18 to 10.12) | 6 | 54 | 5.30 (0.01 to 10.58) |
| > 5 days per week | – | – | – | – | – | – |
| No SLT/0 | 5 | 21 | 7.35 (0.36 to 14.33) | 5 | 31 | 8.01 (2.53 to 13.49) |
| Functional communication observer rated on the AAT-SSC,a range 0–5 (female, n = 237; male, n = 296) | ||||||
| ≤ 2 times a week | 4 | 32 | 0.80 (0.23 to 1.38) | 5 | 50 | 0.38 (0.06 to 0.69) |
| > 2–3 days per week | 3 | 32 | 0.95 (0.27 to 1.64) | 3 | 61 | 0.47 (0.14 to 0.81) |
| > 3–4 days per week | 3 | 49 | 1.01 (0.21 to 1.81) | 3 | 53 | 0.58 (0.21 to 0.94) |
| > 4–5 days per week | 9 | 78 | 0.80 (0.31 to 1.29) | 9 | 77 | 0.68 (0.42 to 0.95) |
| > 5 days per week | 1 | 3 | 0.27 (–1.03 to 1.58) | 3 | 6 | 0.81 (0.09 to 1.53) |
| Reference group | 6 | 41 | 0.69 (0.16 to 1.22) | 6 | 44 | 0.25 (–0.05 to 0.56) |
| Duration of SLT | ||||||
| Overall language ability on the WAB-AQ, range 0–100 | ||||||
| ≤ 2 weeks | 2 | 25 | 5.80 (–5.07 to 16.66) | 2 | 25 | 1.78 (–9.87 to 13.44) |
| 3 weeks | 3 | 65 | 12.19 (5.05 to 19.33) | 3 | 93 | 11.62 (4.75 to 18.49) |
| 4–10 weeks | 3 | 23 | 15.19 (6.54 to 23.85) | 4 | 55 | 9.43 (2.32 to 16.53) |
| > 10–20 weeks | 3 | 19 | 19.73 (9.16 to 30.27) | 3 | 26 | 16.72 (7.79 to 25.65) |
| > 20 weeks | 2 | 12 | 24.52 (13.22 to 35.81) | 2 | 22 | 13.20 (3.33 to 23.08) |
| Reference group | 2 | 36 | 8.09 (–0.87 to 17.06) | 2 | 29 | 16.58 (8.16 to 25.00) |
| Auditory comprehension on the TT-AAT, range 0–50 | ||||||
| ≤ 2 weeks | 5 | 38 | 4.36 (–0.71 to 9.43) | 6 | 55 | 5.28 (–1.23 to 11.79) |
| 3 weeks | 2 | 42 | 4.31 (–2.21 to 10.82) | 2 | 63 | 3.37 (–5.33 to 12.06) |
| 4–10 weeks | 3 | 18 | 3.13 (–3.46 to 9.73) | 3 | 50 | 1.47 (–6.98 to 9.92) |
| > 10–20 weeks | 5 | 35 | 4.36 (–0.58 to 9.29) | 5 | 58 | 9.25 (2.91 to 15.59) |
| > 20 weeks | 3 | 63 | 6.97 (0.83 to 13.11) | 3 | 73 | –10.75 (–19.03 to –2.48) |
| Reference group | 5 | 15 | 3.55 (–2.14 to 9.23) | 5 | 30 | 6.17 (–0.27 to 12.61) |
| Naming on the BNT, range 0–60 | ||||||
| ≤ 4 weeks | 5 | 38 | 5.18 (–3.82 to 14.19) | 5 | 48 | 4.74 (–1.22 to 10.69) |
| 4–10 weeks | 3 | 9 | 4.21 (–6.64 to 15.07) | 3 | 18 | 7.66 (–0.25 to 15.58) |
| > 10–20 weeks | 3 | 35 | 4.11 (–4.39 to 12.60) | 4 | 51 | 11.03 (5.38 to 16.67) |
| > 20 weeks | 3 | 62 | 20.29 (9.39 to 31.18) | 3 | 72 | 4.99 (–1.83 to 11.74) |
| Reference group | 5 | 21 | 2.78 (–5.62 to 11.18) | 5 | 31 | 10.12 (4.26 to 15.98) |
| Functional communication observer rated on the AAT-SSC,a range 0–5 (female, n = 237; male, n = 296) | ||||||
| ≤ 3 weeks | 4 | 30 | 0.45 (–0.31 to 1.20) | 3 | 25 | 0.22 (–0.14 to 0.59) |
| 3 weeks | 2 | 24 | 0.54 (–0.20 to 1.28) | 2 | 32 | 0.59 (0.24 to 0.93) |
| 4–10 weeks | 2 | 16 | 0.97 (0.09 to 1.84) | 2 | 41 | 0.58 (0.20 to 0.96) |
| > 10–20 weeks | 4 | 30 | 0.90 (0.25 to 1.54) | 4 | 46 | 0.67 (0.40 to 0.95) |
| > 20 weeks | 4 | 71 | 0.90 (0.25 to 1.54) | 4 | 80 | 0.62 (0.38 to 0.85) |
| Reference group | 5 | 38 | 0.58 (–0.04 to 1.21) | 5 | 41 | 0.20 (–0.10 to 0.49) |
| Intensity of SLT | ||||||
| Overall language ability on the WAB-AQ, range 0–100 | ||||||
| ≤ 2 hours weekly | 3 | 37 | 18.53 (7.46 to 29.59) | 3 | 37 | 13.28 (4.07 to 22.50) |
| > 2–3 hours weekly | 7 | 37 | 16.54 (7.34 to 25.74) | 7 | 56 | 6.56 (–0.13 to 13.25) |
| > 3–4 hours weekly | 4 | 41 | 14.68 (4.33 to 25.03) | 4 | 63 | 14.73 (7.21 to 22.24) |
| > 4–9 hours weekly | 2 | 20 | 13.14 (1.42 to 24.85) | 2 | 30 | 10.72 (2.17 to 19.26) |
| > 9 hours weekly | 3 | 35 | 15.60 (5.95 to 25.25) | 3 | 61 | 15.13 (7.92 to 22.34) |
| Reference group | 2 | 36 | 10.19 (–1.50 to 21.89) | 2 | 29 | 17.69 (8.82 to 26.57) |
| Auditory Comprehension on the TT-AAT, range 0–50 | ||||||
| ≤ 2 hours weekly | 2 | 10 | 7.91 (1.82 to 14.00) | 2 | 9 | 5.94 (–0.68 to 12.55) |
| > 2–3 hours weekly | 7 | 42 | 3.29 (–1.00 to 7.57) | 7 | 79 | –0.73 (–4.74 to 3.29) |
| > 3–4 hours weekly | 3 | 57 | 6.35 (0.27 to 12.42) | 3 | 55 | 6.61 (0.76 to 12.46) |
| > 4–9 hours weekly | 5 | 37 | 3.55 (–0.93 to 8.03) | 5 | 66 | 2.22 (–1.91 to 6.34) |
| > 9 hours weekly | 6 | 50 | 6.97 (2.89 to 11.04) | 6 | 91 | 7.63 (3.77 to 11.48) |
| Reference group | 5 | 15 | 3.91 (–1.54 to 9.35) | 5 | 30 | 1.12 (–3.53 to 5.77) |
| Naming on the BNT, range 0–60 | ||||||
| ≤ 2 hours weekly | 2 | 8 | 12.19 (1.72 to 22.65) | 2 | 10 | 15.54 (6.94 to 24.14) |
| > 2–3 hours weekly | 5 | 38 | 13.48 (4.67 to 22.30) | 5 | 63 | 4.53 (–1.41 to 10.47) |
| > 3–4 hours weekly | 3 | 59 | 7.24 (–3.10 to 17.57) | 3 | 68 | 8.87 (2.10 to 15.63) |
| > 4–9 hours weekly | 2 | 20 | 4.74 (–6.96 to 16.40) | 2 | 21 | 5.18 (–3.11 to 13.46) |
| > 9 hours weekly | 4 | 19 | 1.34 (–7.34 to 10.02) | 4 | 27 | 6.54 (0.13 to 12.95) |
| Reference group | 5 | 21 | 5.01 (–3.31 to 13.32) | 5 | 31 | 8.91 (3.13 to 14.68) |
| Functional communication on the AAT-SSC,a range 0–5 (female, n = 237; male, n = 296) | ||||||
| ≤ 2 hours weekly | 4 | 39 | 1.15 (0.47 to 1.87) | 4 | 44 | 0.48 (0.14 to 0.83) |
| > 2–3 hours weekly | 5 | 30 | 1.03 (0.34 to 1.73) | 5 | 44 | 0.58 (0.23 to 0.92) |
| > 3–4 hours weekly | 5 | 81 | 0.75 (0.16 to 1.34) | 5 | 97 | 0.65 (0.40 to 0.89) |
| > 4–9 hours weekly | 2 | 25 | 0.65 (–0.03 to 1.32) | 2 | 34 | 0.37 (–0.01 to 0.74) |
| > 9 hours weekly | 6 | 24 | 0.74 (0.12 to 1.37) | 6 | 36 | 0.60 (0.26 to 0.93) |
| Reference group | 5 | 38 | 0.63 (0.06 to 1.20) | 5 | 41 | 0.22 (–0.09 to 0.53) |
| Dosage of SLT | ||||||
| Overall language ability on the WAB-AQ, range 0–100 | ||||||
| ≤ 5 hours | 6 | 48 | 12.70 (4.67 to 20.74) | 6 | 53 | 6.63 (–0.39 to 13.66) |
| > 5–> 14 hours | 4 | 44 | 17.52 (9.07 to 25.97) | 4 | 70 | 11.63 (4.86 to 18.40) |
| 14.1–20 hours | 4 | 32 | 18.07 (9.50 to 26.63) | 4 | 57 | 11.44 (4.55 to 18.33) |
| > 20.1–< 50 hours | 2 | 13 | 24.37 (12.22 to 36.52) | 4 | 18 | 15.61 (6.23 to 25.00) |
| ≥ 50 hours | 4 | 28 | 14.21 (4.78 to 23.64) | 4 | 40 | 15.25 (6.97 to 23.53) |
| Reference group | 4 | 40 | 11.98 (2.44 to 21.52) | 4 | 37 | 11.60 (3.80 to 19.39) |
| Auditory comprehension on the TT-AAT, range 0–50 | ||||||
| ≤ 5 hours | 3 | 24 | 2.36 (–2.86 to 7.58) | 3 | 40 | –1.07 (–6.32 to 4.18) |
| > 5–> 14 hours | 4 | 34 | 2.80 (–2.02 to 7.62) | 4 | 52 | 0.23 (–4.70 to 5.17) |
| > 14–20 hours | 2 | 24 | 5.07 (–0.16 to 10.31) | 2 | 42 | 2.95 (–2.38 to 8.27) |
| > 20–< 50 hours | 6 | 34 | 4.45 (0.08 to 8.83) | 7 | 56 | 6.48 (1.78 to 11.17) |
| ≥ 50 hours | 6 | 77 | 7.02 (2.88 to 11.15) | 6 | 106 | 3.28 (–1.44 to 8.01) |
| Reference group | 6 | 18 | 2.70 (–2.23 to 7.64) | 6 | 33 | 3.75 (–1.09 to 8.59) |
| Naming on the BNT, range 0–60 | ||||||
| ≤ 5 hours | 2 | 10 | 6.25 (–10.42 to 22.93) | 2 | 18 | 7.55 (–2.64 to 17.73) |
| > 5–20 hours | 4 | 28 | 6.15 (–3.95 to 16.25) | 4 | 33 | 3.51 (–4.05 to 11.08) |
| > 20–< 50 hours | 5 | 32 | 10.91 (1.96 to 19.87) | 5 | 49 | 11.76 (5.07 to 18.45) |
| 50–< 100 hours | 2 | 58 | 7.60 (–8.13 to 23.33) | 2 | 64 | 7.31 (–3.08 to 17.70) |
| ≥ 100 hours | 3 | 16 | 5.19 (–5.55 to 15.93) | 3 | 25 | 2.60 (–5.66 to 10.86) |
| Reference group | 5 | 21 | 7.80 (–1.27 to 16.87) | 5 | 31 | 10.50 (3.69 to 17.30) |
| Functional communication on the AAT-SSC,a range 0–5 (female, n = 237; male, n = 296) | ||||||
| ≤ 5 hours | 3 | 21 | 0.46 (–0.20 to 1.13) | 3 | 26 | 0.27 (–0.12 to 0.66) |
| > 5–14 hours | 5 | 42 | 0.92 (0.35 to 1.49) | 5 | 62 | 0.42 (0.17 to 0.67) |
| > 14–20 hours | 2 | 4 | 1.59 (0.57 to 2.61) | 2 | 7 | 0.46 (–0.20 to 1.12) |
| > 20–< 50 hours | 8 | 43 | 0.90 (0.38 to 1.42) | 8 | 53 | 0.60 (0.32 to 0.88) |
| ≥ 50 hours | 7 | 82 | 0.81 (0.26 to 1.36) | 6 | 93 | 0.70 (0.48 to 0.91) |
| Reference group | 7 | 42 | 0.67 (0.13 to 1.21) | 7 | 49 | 0.16 (–0.11 to 0.43) |
Glossary
- Anchor measure
- The measurement instrument (scale) used by the most primary research data sets for each language domain. The identified anchor measure was the scale to which all other scales (minority measures see Domains of Language) were transformed to support meta-analysis and clinical interpretation of the findings.
- Aphasia
- An acquired neurological impairment that affects a person’s ability to participate in any activity that depends on language (i.e. activities that involve understanding what is heard, producing language when speaking, reading or writing).
- Auditory comprehension
- The ability to understand the meaning of a spoken word (or sequence of words).
- Co-interventions
- Pharmacological, brain stimulation or other interventions that may be offered alongside, or as an alternative to, speech and language therapy, with the aim of improving a person’s language or communication abilities, activities or participation.
- Conventional speech and language therapy
- An umbrella term for a speech and language therapy intervention that is delivered but not described beyond a generic label (e.g. therapy that was conventional, traditional, standard, typical, as directed by the therapist, usual).
- Domains of language
- The different modalities or categories of the ways in which we use language. Changes in language abilities are typically measured within these modalities. For the REhabilitation and recovery of peopLE with Aphasia after StrokE study, these were prespecified as overall ability (or, conversely, severity of language impairment), auditory comprehension, spoken-language production (reported as naming and other spoken language), reading comprehension, writing and functional communication.
- Dosage of intervention
- The total number of hours for which a defined speech and language therapy intervention was provided.
- Duration of intervention
- The total number of weeks over which a defined speech and language therapy intervention was delivered.
- Frequency of intervention
- The average number of days each week that a defined speech and language therapy intervention was delivered.
- Functional communication
- The ability to communicate in a ‘real-world’ functionally relevant situation. Typically, functional communication considers ‘real-world’ communication with another person, with the opportunity in a face-to-face situation of using all forms of communication, such as gestures and facial expression, as well as spoken words. It also reflects the ability to understand the speaking partner’s contribution to that interaction.
- Individual participant data
- Information about individual people gathered during their involvement in a primary research study, which may include information on their language abilities, the therapy they received and their recovery over time.
- Intensity of intervention
- The number of hours each week that a defined speech and language therapy intervention was delivered.
- Minority measure
- Any measurement instrument (scale) used in the primary research studies that contributed to the language domains of interest but was not identified as the anchor measure; data gathered on minority measures were transformed to the scale of the anchor measure to support meta-analysis interpreted in the context of the anchor measure scale.
- Mode of delivery
- The way in which a speech and language therapy intervention was delivered (face to face, computer supported or self-managed, one to one or group).
- Overall language ability
- A global measure of language abilities that typically includes auditory comprehension, spoken-language production, reading comprehension and writing abilities.
- Reading comprehension
- The ability to read written word(s) and assign meaning to them.
- Recovery
- Improvement over time on language measurements taken at the start of the study to those taken at subsequent points in time.
- Regimen
- The description of therapy in terms of the frequency, intensity, duration and dosage of the intervention.
- Social support and stimulation
- The provision of informal encouragement and general opportunities to use language in everyday situations.
- Speech and language therapy
- The provision of targeted practice or rehabilitation tasks that aim to improve a person’s language or communication abilities, activities or participation.
- Spoken-language production
- The ability to communicate a concept to others by speaking a word (e.g. naming an object) or sentences.
- Study entry
- The time point of a participant’s enrolment in a primary research study, expressed (in the context of the REhabilitation and recovery of peopLE with Aphasia after StrokE study) as the numbers of days since the onset of aphasia.
- Tailoring
- The act of customising interventions for individuals by changing the level of task difficulty and/or making them more relevant to the person’s everyday communication needs.
- Target of intervention
- The aspects of language impairment that an intervention is intended to address [categorised, by consensus, based on the REhabilitation and recovery of peopLE with Aphasia after StrokE study data set as spoken-language speech and language therapy, auditory comprehension speech and language therapy, mixed speech and language therapy (both spoken and auditory comprehension of language are targeted), word-finding speech and language therapy, reading comprehension speech and language therapy and writing speech and language therapy].
- Theoretical approach of intervention
- The underlying rationale for the speech and language therapy (categorised, by consensus, based on the REhabilitation and recovery of peopLE with Aphasia after StrokE study data set as functional or pragmatic therapy, phonological therapy, semantic therapy, semantic and phonological therapy, constraint-induced aphasia therapy, melodic intonation therapy, conversational partner-training therapy, verbal therapy and multimodal therapy).
- Transformation
- The process by which individual participant data gathered using a minority measure was systematically adjusted using a mathematical operation, on each observation, to the scale of the anchor measure, for each language domain.
- Writing
- The ability to communicate through sequencing written symbols (letters) to create words and sequencing of words to create sentences that another person can read and comprehend the intended meaning.
List of abbreviations
- AAT
- Aachen Aphasia Test
- AAT-SSC
- Aachen Aphasia Test-Spontaneous Speech Communication
- BNT
- Boston Naming Test
- CAT
- Comprehensive Aphasia Test
- CI
- confidence interval
- GCU
- Glasgow Caledonian University
- GRADE
- Grading of Recommendations Assessment, Development and Evaluation
- ICF
- International Classification of Functioning, Disability and Health
- ID
- identifier
- IPD
- individual participant data
- IQR
- interquartile range
- mRS
- modified Rankin Scale
- NIHR
- National Institute for Health and Care Research
- NIHSS
- National Institutes of Health Stroke Scale
- NMAHP
- Nursing, Midwifery and Allied Health Professions
- OR
- odds ratio
- PICA
- Porch Index of Communicative Ability
- PLORAS
- Predicting Language Outcome and Recovery After Stroke
- PPI
- patient and public involvement
- PRISMA
- Preferred Reporting Items for Systematic Reviews and Meta-Analyses
- RCT
- randomised controlled trial
- RELEASE
- REhabilitation and recovery of peopLE with Aphasia after StrokE
- ROBIS
- Risk Of Bias In Systematic reviews
- SLT
- speech and language therapy
- SSNAP
- Sentinel Stroke National Audit Programme
- TIDieR
- Template for Intervention Description and Replication
- TOM
- Therapy Outcome Measure
- TT
- Token Test
- TT-AAT
- Token Test from the Aachen Aphasia Test
- WAB
- Western Aphasia Battery
- WAB-AQ
- Western Aphasia Battery-Aphasia Quotient
Notes
-
Unavailable potentially eligible data sets and individual participant data
-
Speech and language therapy frequency and goodness of fit to baseline, sex, age and time; model by language domain
-
Speech and language therapy duration and goodness of fit to model by language domain
-
Speech and language therapy intensity and goodness of fit to baseline, sex, age, time since index stroke; model by language domain
-
Speech and language therapy dosage and goodness of fit to baseline, sex, age, time; model by language domain
-
Speech and language therapy home practice tasks and goodness of fit to model by language domain
-
Speech and language therapy target of intervention and goodness of fit to model by language domain
-
Speech and language therapy theoretical approach and goodness of fit to model by language domain
-
Speech and language therapy multimodal and verbal theoretical approaches and goodness of fit to model by language domain
-
Speech and language therapy expertise and goodness of fit to model by language domain
-
Speech and language therapy context of delivery and goodness of fit to model by language domain
-
Speech and language therapy mode of delivery and goodness of fit to model by language domain
-
Speech and language therapy functional relevance of speech and language therapy and goodness of fit to model by language domain
-
Speech and language therapy level of difficulty and goodness of fit to model by language domain
Supplementary material can be found on the NIHR Journals Library report page (https://doi.org/10.3310/RTLH7522).
Supplementary material has been provided by the authors to support the report and any files provided at submission will have been seen by peer reviewers, but not extensively reviewed. Any supplementary material provided at a later stage in the process may not have been peer reviewed.
